2018 ecological profile - Quezon City Government
222
-
Upload
khangminh22 -
Category
Documents
-
view
3 -
download
0
Transcript of 2018 ecological profile - Quezon City Government


1
CHAPTER 1: The Envisioned City of Quezon
1.1 THE ENVISIONED CITY OF QUEZON
Quezon City was conceived in a vision of a man incomparable - the late President Manuel Luis
Quezon – who dreamt of a central place that will house the country’s highest governing body and will
provide low-cost and decent housing for the less privileged sector of the society. He envisioned the
growth and development of a city where the common man can live with dignity
“I dream of a capital city that, politically shall be the seat of the national government;
aesthetically the showplace of the nation--- a place that thousands of people will come and
visit as the epitome of culture and spirit of the country; socially a dignified concentration of
human life, aspirations and endeavors and achievements; and economically as a
productive, self-contained community.” --- President Manuel L. Quezon
Equally inspired by this noble quest for a new metropolis, the National Assembly moved for
the creation of this new city. The first bill was filed by Assemblyman Ramon P. Mitra with the new
city proposed to be named as “Balintawak City”. The proposed name was later amended on the
motion of Assemblymen Narciso Ramos and Eugenio Perez, both of Pangasinan to “Quezon City”.
1.2 THE CREATION OF QUEZON CITY
On September 28, 1939 the National Assembly approved Bill No. 1206 as Commonwealth Act
No. 502, otherwise known as the Charter of Quezon City. Signed by President Quezon on October 12,
1939, the law defined the boundaries of the city and gave it an area of 7,000 hectares carved out of
the towns of Caloocan, San Juan, Marikina, Pasig, and Mandaluyong, all in Rizal Province. The law
likewise specified the manner in which the city was to be governed. All the city officials were to be
appointed by the President with President Quezon himself being the first acting Mayor. He served
from October 12 to November 4, 1939, after which Tomas Morato, then Mayor of Calauag, Tayabas,
was appointed as his successor.
The original physical plan of the City, which was prepared in 1940 by Harry T. Frost,
architectural adviser of the Commonwealth, reflect a big quadrangle in the heart of the City from
which four (4) avenues radiate toward the outskirts with rotundas placed on the four (4) corners, the
largest being the 26–hectare elliptical center, now known as the Quezon Memorial Circle.
Progress in Quezon City continued until the outbreak of World War II on December 8, 1941.
Just before the Japanese occupied the city, President Quezon issued Executive Order No. 400, dated
January 1, 1942, incorporating Quezon City with Greater Manila for synchronized and coordinated
activity in such time of emergency. Under the order, the Mayors of Quezon City, San Juan,
Mandaluyong, Parañaque, Caloocan and Makati became the assistants to the Mayor of Greater Manila,
who at that time was Jorge Vargas. However, when Mayor Morato was arrested by the Japanese in
mid-1942, Dr. Florencio Cruz then City Health Officer was installed as Chief of the City (being a
district of Greater Manila) until liberation.
As soon as the war was over, in April 1945, the Secretary of Interior Tomas Confesor
designated Oscar Castelo, who was then an Assistant Fiscal of Manila, as Acting Mayor of Quezon City,

2
and therefore, Assistant to the Mayor of Manila Juan Nolasco. The house of President Quezon on
Gilmore Avenue was used by Castelo as temporary office of the city government.
Capt. Sabino de Leon, former Quezon City Police Chief, was designated as Acting Assistant
Mayor of Quezon City on October 1, 1945 while Castelo returned to his job as Assistant City Fiscal of
Manila. Capt. De Leon moved the city government offices to a market site along South 9th Street near
Sampaloc Avenue (now the site of Roces High School). Quezon City regained its separate political
existence from Greater Manila on January 2, 1947 by virtue of Republic Act No. 45. Ponciano A.
Bernardo was appointed City Mayor.3.1.1 Population Size and Growth Rate
1.3 QUEZON CITY AS THE CAPITAL CITY
Upon assumption of office of President Manuel A. Roxas as the first president of the second
Philippine Republic in 1946, he announced his intention to restore Quezon City as a regular
chartered city. Various sectors declared their protests by citing the city’s economic and financial
bankruptcy, dismal health and sanitary conditions, and high rate of criminality during the post-war
period.
On July 25, 1946, President Roxas, created a committee that would study the selection of the
official capital of the Philippines. By virtue of Administrative Order No. 5, the Selection Committee
was given the task of “selection of the most suitable site on which to build the capital city of the
Philippines and the capitol building/s”. Then Senator Melecio Arranz, who was appointed committee
head, declare d that Manila, although inevitably a key point in the selection of the capital city site, has
“become undesirable as a national capital” due to postwar damages, congestion of commercial
activities, and government and military requirements, among others. On the other hand, the city of
Quezon had worked on the reparation of post-war vestiges.
The selection process underwent series of extensive studies, researches, discussions, and
public hearings which primarily focused on the following considerations: “general sanitation, public
works development, strategic considerations, scenic beauty, and administrative coordination.” Out of
the sixteen (16) nominated sites, three sites emerged as the top choices: IpoNovaliches area; Baguio;
and, Quezon City-Novaliches. The contiguous areas of Ipo-Quezon City-Novaliches proved to be the
ideal choice for the nation’s capital and still garnered the highest composite average rating over the
second placer Baguio. Thus, the Arranz Selection Committee concluded: “…the area now covered by
Quezon City extending northward along Marikina River to the upper limits of Novaliches reservoir
watershed, [and] West to the boundary line…comprising an approximate total area of 16,200
hectares…one-fourth of which is owned by the Government, is the best…[site] to be made as the
Capital City of the Republic.”
The committee also cited the following advantages of the City as the choice nation’s capital:
“[The City’s] proximity to Manila, the best port of entry from foreign countries and the commercial and financial center of the country…;
Its accessibility from all the important inhabited areas in the Philippines either by land, air, sea; Its already available conveniences from the standpoint of a municipal entity…[-as an organized
and partially developed chartered city]; Its public works facilities with regard to the provision of water supply, easy drainage, availability
of power and proximity to commercial, industrial, and manufacturing establishments engaged in the sale, production, and distribution of construction materials and equipment;
Its geological qualities, which provide a satisfactory foundation for buildings and other structures, at the same time allowing the construction of underground structures;

3
Its larger area of government-owned land right in its central zone which will permit a substantial economy in the development of public improvements as well as more freedom and liberal assignments for streets, parks, and playground areas;
Its healthfulness due to its elevation (it averages about 250feet above sea level) together with the availability of an abundant and wholesome water supply and excellent drainage which are the most important requirements for the development of modern cities; and,
Its historical background; consideration of public expenditures already made; administrative commitments and evident public support.”

4
However, before the selection was made, President Roxas died of heart attack in Clark Field,
Pampanga. It was President Elpidio R. Quirino, his successor, who signed Republic Act No. 333 on
July 17, 1948, which made Quezon City the capital of the Philippines. The Act created the Capital City
Planning Commission to prepare the general development plan and supervise the improvements to
be done in the Capital City. Archt. Juan Arellano headed the architectural division of the Commission
while Mayor Bernardo handled public relations. After almost one year, on April 8, 1949, the Master
Plan was signed by President Quirino. It further stipulated “the appropriation of funds for the
acquisition of private estates within the boundary limits of the city, and authorized the issuance of
bonds… for the construction of streets, bridges, waterworks, sewerage…” and other city
improvements.
In July 1947, the City Hall building was constructed along Highway 54 (now Epifanio delos
Santos Avenue or EDSA) on what used to be the site of the pre-war public market. It was occupied in
February 1948, housing all the city government’s offices and departments with the exception of the
police department.
Quezon City was formally inaugurated as the national capital of the Philippines on October 12,
1949. President Quirino laid the cornerstone of the proposed Capitol Building at Constitution Hills.
The Welcome Arch (now Mabuhay Rotunda) at the boundary of Manila and Quezon City was built;
the construction of Roxas Homesite by the Philippine Homesite and Housing Corporation, consisting
of 1,104 housing units on an area of 40 hectares, started
The City’s territorial boundaries were revised four times since its creation on October 12,
1939. Originally, Quezon City had only about 7,000 hectares extending from La Loma to Marikina
River and from Pasong Tamo River down to (and including) Wack Wack Golf Club in Mandaluyong. It
was first amended in 1941 by Commonwealth Act 659 which returned the portions west of Marikina
River to Marikina, a reduction of about 500 hectares. After the war, Republic Act 333 dated July 17,
1948 which declared the City as the National Capital, incorporated the areas of Novaliches and
Payatas thereby greatly increasing the territory by more than double: from 6,500 hectares to 15,660.
A third revision which decreased the City’s area by about 300 hectares was made in 1950 by RA 537
when parts of the territory east of Marikina River were given back to Montalban and San Mateo, as
well as Wack Wack and Camp Crame to Mandaluyong and San Juan, respectively.
The final amendment was made on June 16, 1956 by virtue of RA 1575 which again reduced
the City’s area by 260 hectares from 15,359 to 15,106 hectares, when areas west of Marikina River
were again reverted to Montalban and San Mateo even as Camp Crame was reintegrated to the City.
This is the present official territorial boundary of Quezon City. However, graphical plots made on this
present boundary of the city gave an area of 16,112 hectares, about 1,000 hectares more than the
officially declared land area
Table H-1: Changes in Land Areas of Quezon City
Commonwealth
Act 502 Commonwealth
Act 659 Republic Act
333 Republic Act
537 Republic Act 537
Date Approved October 12, 1939 June 21, 1941 June 17, 1950 June 16, 1950 June 16, 1956
Land Area 7,006 has.* 6,497 has* 15,660 has. 15,359 has 15,106 Has.* 16,112 has*
* Figures obtained thru graphical computations only ** Based on 1995 GIS graphical plot

5
1.4 CHANGING FORTUNES OF QUEZON CITY
For twenty-seven (27) years, Quezon City held the distinct status of being the nation’s capital.
However, two Presidential Decrees issued by President Ferdinand E. Marcos would have
substantially changed the political stature and landscape of the city.
Presidential Decree 824 authorized the creation of the Metropolitan Manila and Metropolitan
Manila Commission which would exercise territorial and political jurisdiction over seventeen (17)
municipalities and cities, including Quezon City. The Decree was deemed necessary due to “rapid
growth of population and…of social and economic requirements in the contiguous communities”.
Too, the Decree served to address the imperative for integrated development, service delivery, and
management in terms of peace and order and eradication of social and economic ills which were
considered then as among the reform measures under Martial Law.
It was around this period and under the leadership of appointed mayor Norberto S.
Amoranto, that the city attained an impressive performance record in terms of financial standing,
delivery of services, particularly that of medical and health services, establishment of buildings, and
community beautification projects which were also supported by then First Lady Imelda R. Marcos.
On June 24, 1976, then President Marcos issued Presidential Decree (PD) 940, which
effectively conferred back the role of the nation’s capital to the City of Manila and mandated the area
prescribed under PD 824 as Metropolitan Manila, now known as the National Capital Region (NCR),
to be the permanent seat of national government.
Three months prior to this declaration, Quezon City set another record by having the first
lady chief executive appointed to office after Mayor Amoranto resigned from his post. Mayor Adelina
S. Rodriguez then led the city during the transition towards the period when it was no longer the
nation’s capital. During her first year in office, Mayor Rodriguez formulated the nowfamous City
Development Program, which functioned as basis for integrating problem solution. She underscored
the importance of the city’s mandate in terms of employment generation and delivery of basic
services despite limited resources. With the successful implementation of the city’s Seven-Point
Management Program that would bring about “community awareness and consciousness of
maintaining ecological balance”, the city also recorded significant improvements in terms of income
generation and crime reduction.
A Letter of Instruction (LOI) No. 473 was issued by President Marcos and under which the
Constitution Hills and Reclamation Areas, both situated in Quezon City, were designated as the site of
the country’s parliamentary building or the Batasang Bayan and other government offices, such as
Department of Education and Culture (DEC) and the Civil Service Commission (CSC).
Indeed, even as Quezon City was no longer the capital city, it proved to be a vast and teeming
city which by then attained a steadily increasing income and occupied one-third of Metro Manila’s
total land area. It has implemented its development plan and served as the government center with
the national legislature and other important government offices located in its area.
All of these are reminiscent of the same noble dream that brought forth the creation of the
City

6
1.5 CAPITALIZING ON THE “QUEZON CITY” VISION
The original vision of President Quezon for the City became the thread that weave and will
continue to weave a very vibrant and rich past, present, and future for the city.
Important people, places, and events that shaped the course of history in the struggle for
freedom and sovereignty including the “Cry of Pugad Lawin” led by the Great Plebeian and
revolutionary hero Andres Bonifacio, the People Power Revolution in EDSA that toppled the regime
of President Marcos and the installation of President Corazon Aquino under the restored democracy
took place in areas that now comprise the city.
Currently, Quezon City is the largest among the Metropolitan Manila’s cities in terms of
population and land area. The “Quezon dream-vision” continues to guide efforts for the attainment of
a progressive and peaceful, clean and orderly place conducive and hospitable to living, employment,
and business, “A Quality Community that is Quezon City”.
Effective fiscal management, aggressive tax management strategies, increasing efficiency and
growing discipline in the management and use of resources as well as participatory governance have
made Quezon City one of the most competitive cities in the Philippines today. In particular, the city
recorded the highest net income in the Philippines, produced an annual budget surplus averaging
P307 million for seven consecutive years from 2002 thru 2008, and earned an income of P8.02 billion
in 2008. The City takes pride in its strong economic viability and financial standing, rational
development of systems to curb graft, rigid budgeting process that considers the city’s development
planning strategies and priorities and the most pressing needs of its constituents.
The city has also achieved various firsts in many areas such as computerized revenue
collection and assessment system, fiscal control and capability building in the barangay level, various
environmental and solid waste management programs, women and children protection, and
institutionalization of citizen participation in governance thru the City Development Council.
Due to its achievements and innovations, Quezon City was recognized and cited for the
dynamism of its local economy, the quality of life of its residents and the responsiveness of the local
government in addressing business needs, among others. In 2007, Quezon City took the 7th place in
the “Asian City of the Future” survey commissioned by the London Financial Times. In a 2008
Tholons Global Outsourcing and Investments special report, the city ranked as the number 21
emerging global outsourcing city, the highest among all nine new entrants.
The city manifests the same criteria for the nation’s capital being at the center of trade,
commerce, education and culture, seat of the national government, modern transportation,
communication and accommodation facilities and other physical attributes of a modern city

7
Q U
E Z
O N
C I T Y
QUEZON
MEMORIA
L CIRCLE
NORTH AVE
1896
1938 AUGUST 23, 1896
Andress Bonifacio and his men tear their cedulas at Pugad Lawin, found
within the territorial jurisdiction of the future city, and ignite the Filipino
Revolution against Spain 1939 NOVEMBER 10, 1939
Tomas Morato is sworn into Office as Mayor of
Quezon City
OCTOBER 12, 1939 Pres. Manuel L. Quezon
signs into Law the Commonwealth Act No.
502, officially establishing Quezon City and assumes the position of Mayor in a
concurrent capacity
SEPTEMBER 28, 1939 The Philippine National Assembly approves Bill
No. 1206 as Commonwealth Act
proposing the creation of Quezon City
1945 DECEMBER 17, 1945
Pres. Sergio S. Osmena issues Proclamation No. 32 launching the nationwide campaign to raise funds for the erection of a national
monument in honor of Pres. Quezon 1948
1950
JULY 17, 1948 Pres. Elpidio R. Quirino signs Republic Act No. 333, which
declares Quezon City as the new capital of the Republic
JANUARY 6, 1950 Ignacio Santos Diaz
replaces Nicanor Roxas as Quezon City Mayor
JUNE 16, 1950 The City Charter is revised
by Republic Act No. 537 which decreased the city’s
area 1956
JUNE 16, 1956 The City Charter is revised by Republic Act No. 537, radically
changing the geographic composition and extending the city’s boundaries to its present land area of 15,106 hectares
1975 NOVEMBER 7, 1975
Presidential Decree No. 824 of Pres. Ferdinand E. Marcos is promulgated. The Decree established
Metropolitan Manila which covered 17 cities /municipalities including Quezon City
1978 MARCH 31, 1978
Pres Marcos declares 1978 as Manuel L. Quezon centenial Year and orders the transfer of the remains of Pres
Quezon from the Manila North Cemetery to the Quezon Memorial Circle Monument within the Quezon Elliptical
Road
1986 FEBRUARY 22-25, 1986
Quezon City is the site of the EDSA “People Power
Revolution”
1995 MAY 8, 1995
The people of Quezon City give Mayor Mathay another mandate , Herbert Bautista is elected Vice
Mayor
1989 FEBRUARY 22-25, 1986
Quezon City is the site of the EDSA “People Power
Revolution”
1999 OCTOBER 23, 1999
In a plebiscite, an overwhelming majority of Quezon City residents
rejects RA 8553 or the secession of Novaliches from Quezon City
2004 JULY 1, 2004
Mayor Belmonte and Vice Mayor Bautista wins fresh mandate from
their constituents 2013
Mayor Bautista and Vice Mayor Belmonte gets reelected in the office. QC formally activates the
QCDRRMO tasked to respond to situations brought about by natural of human-made induced disasters 2015
Garner awards in labor and employment, local legislation , dynamic economy, and GIS among
many others
OCTOBER 10, 1938 The People’s Homesite Corporation purchases 1,529 hectares from the vast Diliman Estate of the Tuazon Family as site for the future capital city
1943 MARCH 11, 1943 Assemblyman Guillermo Villanueva of Negros Oriental files a bill seeking to make Quezon City the seat of government of the Philippines
1946 JULY 25, 1946 President Roxas, creates a committee for the selection of a new official capital of the Philippines. The committee was headed by then Senator Melecio Arranz
JANUARY 1, 1946 Ponciano Bernardo is appointed Mayor of Quezon City by Pres. Osmena
1949 MAY 4, 1949 Nicanor Roxas is appointed Mayor of the City
OCTOBER 12, 1949 Quezon City isformally inaugurated as the national capital of the Philippines on. The cornerstone of the proposed Capitol Building is laid at Constitution Hills 1954
FEBRUARY 4, 1954 President Ramon Magsaysay formally appoints Norberto S. Amoranto as acting Mayor of Quezon City.
1976 JUNE 24, 1976 Presidential Decree No. 940, issued by President Marcos, confers the capital city title back to Manila and designates theareas covered by Metro Manila to be the permanent seat of government.
1972 NOVEMBER 30, 1972 The 1971 Constitutional Convention is held in Quezon City.
MARCH 31, 1976 Adelina Rodriguez, known to be the first lady mayor, succeeds Norberto S. Amoranto, who resigns as Mayor of Quezon City
1980 JANUARY 1980 In the first local elections after martial law, Adelina Rodriguezand Stephen Sarino are elected Mayor and Vice Mayor, respectively 1988
FEBRUARY 2, 1988 Brigido Simon, Jr. and Vicente Sotto are sworn into office as duly elected Mayor and Vice Mayor, respectively. 1992
JULY 1, 1992 Ismael A. Mathay Jr., is elected Mayor with Charito Planas as vice Mayor. 1998
FEBRUARY 23, 1998 President Fidel V. Ramos signs Republic Act 8535 which provided for the creation of the City of Novaliches comprising the 15 northernmost barangays of Quezon City.
MAY 11, 1998 Mayor Mathay is re-elected for his third and final term. His running mate Connie Angeles is elected Vice Mayor
2001 JULY 1, 2001 Feliciano S. Belmonte, Jr. assumes office as elected Mayor with Herbert Bautista as Vice Mayor
2007 JULY 1, 2007 Mayor Belmonte and Vice-Mayor Bautista serves for their third consecutive terms 2010
Herbert Bautista wins his first term as QC mayor with Joy Belmonte as vice-mayor. The city sets key programs in social housing, environmental management, and DRR. 2014
Celebrates its 75th Founding Anniversary. 2017
On the national front, Quezon City has merited the Seal of Good Local Governance
2018 For the third time in a row,
Quezon City was ranked the Most Competitive City in the
Philippines,
2019 Josefina Alimurong-Belmonte wins the 2019 Mayoralty race with Gian Sotto as Vice-Mayor
HISTORICAL HIGHLIGHTS : 1938 - 2019


22
CHAPTER 3: Demographic Profile and Social Development
The Demographic and Social Development Profile discusses sub-sectors on Population, the Status of
Well-Being which includes Health, Education, Social Welfare Services, Housing, Sports and Recreation
and Protective Services.
3.1 POPULATION
3.1.1 Population Size and Growth Rate
Population Size
The 2015 official census of the Philippine Statistics Authority (PSA) formerly National
Statistics Office (NSO) shows that the city has a population of 2,936,116, an increase of 174,396
persons or 6.31% more over the 2010 population of 2,761,720. Quezon City’s population is the
largest, comprising 22.80% or almost ¼ of the NCR’s population of 12.88M and 2.91% of the
100.98M Philippine population (See Figure DS-1). Of the 33 highly urbanized cities (HUC) in the
country, the city also ranks first with the largest population.
Figure DS-1: Distribution of Population; Metro Manila: 2015
Records from various census years showed that the population of the city has increased
tremendously over the past years. The city’s population in 1939 was 39,013 persons. It surpassed the
one million mark in 1980 with a population of 1,165,865; hit the two million population with
2,173,931 in 2000; and, reached almost three million population in the latest PSA census of
2,936,116 in 2015. (See Table DS-1)
Quezon City 2.94M (23%)
Manila City 1.78M 14%
Caloocan City 1.58M 12%
Taguig City 0.81M
6%
Pasig City 0.76M
6%
Parañaque City 0.67M
5%
Valenzuela City 0.62M
5%
Las Piñas City 0.59M
5%
Makati City 0.58M
4%
Muntinlupa City 0.51M
4%
Marikina City 0.45M
3%
Pasay City 0.42M
3%
Mandaluyong City 0.39M
3%
Malabon City 0.37M
3%
Navotas City 0.25M
2%
San Juan City 0.12M
1%
Pateros 0.06M
0%

23
Growth Rate
In terms of the city’s annual population growth rate, it was highest between 1939-1948 at
12.20%, decreasing to 11.32% in 1948-1960 and decreasing further to 6.60% between 1960-1970.
From thereon, the annual population growth rate gradually decreased to 4.87% in 1970-1975; 4.03%
in 1975-1980; 3.64% in 1980-1990; and 3.60% in 1990-1995. There was a significant decrease
between 1995-2000 at 1.92% but the growth rate increased in 2000-2007 at 2.92% and slightly
decreased to 2.42% in period 2007-2010. The lowest growth rate was registered at 1.17% in the
latest census of 2015. (Refer to Table DS-1)
Table DS-1: Total Population and Growth Rate by Census Year
Quezon City: 1939-2015
Census Year Total Population Annual
Growth Rate 1939 39,013 1948 107,977 12.20
1960 397,990 11.32 1970 754,452 6.60
1975 956,864 4.87 1980 1,165,865 4.03
1990 1,666,766 3.64 1995 1,989,419 3.60
2000 2,173,931 1.92 2007 2,679,450 2.92
2010 2,761,720 2.42 2015 2,936,116 1.17
Source: Philippine Statistics Authority
Viewing it in a larger geographical scale, the city’s latest annual population growth rate of
1.17% is lower compared to the National Capital Region’s (NCR) rate of 1.58% as well as the national
growth rate of 1.72% (See Figure DS-2). It was noted however, that for the past years, the city’s
population growth rate was consistently higher than that of the NCR and Philippines.
At the current growth rate, the city’s population doubling time is 59 years, which is 30 years
longer compared to only 29 years in the 2010 census.
Figure DS-2: Annual Population Growth Rate in Various Census Periods; Quezon City: 1980-2015
4.03 3.64
3.60
1.92
2.92
2.42
1.17
2.75
2.35 2.32
2.34 2.11
1.79 1.58 1.56
2.61
3.30
1.06
2.04 1.90
1.72
0.00
0.50
1.00
1.50
2.00
2.50
3.00
3.50
4.00
4.50
1980 1990 1995 2000 2007 2010 2015
Quezon City
NCR
Philippines

24
Population Size and Growth Rate by District
The redistricting of the city into the six (6) Legislative Districts affected the population size of
the former District II which, prior to being reapportioned in 2012 under Republic Act 10170 into the
additional Districts V and VI, represented more than half (58%) of the city’s total population in 2010.
Among the city’s six (6) Districts, however, District II remains to have the largest population
with 688,773 or 23.46% of the total population. But as to population growth rate, District V has the
fastest with 1.79% which is even higher than the city’s growth rate of 1.17%. District I had a negative
growth rate of 0.23. (See Table DS-2)
Table DS-2: Population Distribution and Growth Rate by District;
Quezon City: 2010, 2015
DISTRICT 2010 2015 2010-2015
POPULATION PERCENT POPULATION PERCENT GROWTH RATE I 414,039 14.99 409,162 13.94 (0.23) II 635,967 23.03 688,773 23.46 1.53
III 307,638 11.14 324,669 11.06 1.03 IV 428,555 15.52 446,122 15.19 0.77
V 488,172 17.68 535,798 18.25 1.79 VI 487,349 17.65 531,592 18.10 1.67
TOTAL 2,761,720 100.00 2,936,116 100.00 1.17 Source: Philippine Statistics Authority
Barangay Population and Growth Rate
At the barangay level, Bgy. Commonwealth in District II remains to be the most populated
barangay with 198,285, a 6.29% increase from 186,543 persons in the 2010 census. Bgy. Quirino 3-A
in District III is the least populated barangay with 1,140, a 3.31% decrease from 1,180 persons in
2010.
Barangay New Era in District VI is noted to have the fastest growth rate of 14.26%. It had a
population of only 6,638 in 2010, but doubled to 13,365 in a span of only 5 years. Majority (71.83%)
or 102 barangays have increased growth rate ranging from 0.01 to 14.16 mostly in Districts II, V & VI.
Meanwhile, forty (40) barangays have negative growth rate particularly those in District I, III & IV.
3.1.2 Population Density
The city’s population density increased from 17,140 persons per km2 in 2010 to 18,222 persons per km2 in 2015. This is lower compared to Metro Manila’s 20,247 persons per km2
.
Table DS-3: Population Density (person per km2);
Quezon City, NCR and the Philippines: 2010 and 2015
AREA LAND AREA
(km2) 2010 2015
POPULATION DENSITY POPULATION DENSITY
Quezon City 161.125 2,761,720 17,140 2,936,116 18,222
NCR 636.000 11,855,975 18,641 12,877,253 20,247
Philippines 300,000.000 92,337,852 308 100,981,437 337
Source: Philippine Statistics Authority

25
District II is the most densely populated district with 31,566 per km2 followed by District VI
with 24,196 and District I with 20,886 persons per km2. The least dense district is District III at
14,865 persons per km2 which is attributed to the presence of first class residential subdivisions in
the area such as the La Vista, White Plains, Corinthians, Blue Ridge, Green Meadows, St. Ignatius, etc.
Table DS-4: Population Size and Density per District
Quezon City: 2010 and 2015
DISTRICT AREA
(SQ.KM.) 2010 2015
POPULATION DENSITY POPULATION DENSITY I 19.59 414,039 21,135 409,162 20,886 II 21.82 635,961 29,146 688,773 31,566 III 21.84 307,638 14,086 324,669 14,865 IV 23.42 428,555 18,299 446,122 19,057 V 28.03 488,172 17,416 535,798 19,115 VI 21.97 487,349 22,182 531,592 24,196
Reservoir 24.44 TOTAL 161.125 2,761,720 17,140 2,936,116 18,223
Source: Philippine Statistical Authority
3.1.3 Natural Increase in Population
Increase in population is attributed to net natural increase and in-migration. Natural increase
is computed as total live births less total deaths. The natural increase in the population for the period
2010-2015 constitutes 129,826 or 74.44% of the 174,396 population increase. The remaining
25.56% or 44,570 people are presumed to be brought about by migration. (Refer to Table DS-5). It
was observed that the assumed migration rate in the city is now lower compared to the 47.73% in
2010.
The migration data from the PSA 2010 Census of Housing and Population has validated the
said observation noting it is Region IVA or CALABARZON that continues to be the most preferred
area of migrants with 28.00% of long distance movers, followed by Metro Manila with 20.00% and
Region III with 13.00% of the long distance movers. Some cited reasons or factors for migration
include the lack of employment and livelihood opportunities in their locality and the mismatch of
educational attainment and available economic activities in the area of origin. Migration decisions are
also facilitated by existing social support and network like having relatives or friends in the area of
destination.
Table DS-5: Yearly Natural Increase of Population; Quezon City: 2007-2015
YEAR POPULATION
TOTAL YEARLY
POPULATION INCREASE
TOTAL YEARLY
NATURAL INCREASE (BIRTHS-DEATHS)
BIRTHS DEATHS
2010 2,761,720 2011 2,836,875 75,155 41,822 12,982 28,840 2012 2,915,774 78,899 42,380 20,353 22,027 2013 2,998,658 82,884 43,038 21,570 21,468 2014 3,085,786 87,128 56,958 21,934 35,024 2015 2,936,116 -149,670 43,617 21,150 22,467
TOTAL 174,396 227,815 97,989 129,826 TOTAL INCREASE (%) 100.00 74.44
Source: Philippine Statistical Authority; Quezon City Health Department

26
3.1.4 Household Size
The average household size in the city in 2015 is 4.3 members which is the same as the
average household size of 4.3 in year 2010.This comprises more or less a couple with 2 or 3 children
or other members of the household. Both Quezon City and Metro Manila have the same average
household size of 4.3 members.
3.1.5 Age and Sex Composition
The population of the city as of 2015 is generally young with an average age of 28 years.
Females comprise 50.71% (1,488,765) while males comprise 49.29% (1,447,351).
Based on the 2015 disaggregated data by PSA, the child and youth population alone (0-30
years old) constituted more than half (58.78% or 1,725,832) of the total population. About 51,480 or
1.75% belong to 0-11 mos. or infant population and 208,844 (7.11%) 1-4 yr. old or child population.
A young population is viewed both as an asset because it implies more human resources and a
liability because more services will be needed to serve this sector.
Total labor force or working age population 15 yrs. old and above in 2015 is 2,041,025 or
69.51% of the total population, 48.93% of whom are male and 51.07% are female.
There are 196,388 or 6.69% persons comprising the 60 years old and over population, with
the elderly female population making up 57.85% compared to the 42.15% elderly male population.
Figure DS-3: Population by Sex and Age Classification; Quezon City: 2015
Dependency ratio in 2015 was computed to be 44 dependents per 100 persons in the working
age population. As to sex dependency ratio it shows that out of the 44 dependents, both male and
6,136
7,056
11,283
22,317
35,994
51,463
66,750
80,688
91,769
108,087
121,746
140,483
155,285
146,455
132,326
134,261
135,252
13,672
12,233
16,658
28,064
42,975
58,361
73,121
86,603
94,805
111,110
123,414
142,057
159,780
150,079
125,597
125,164
125,072
80 & above
75-79
70-74
65-69
60-64
55-59
50-54
45-49
40-44
35-39
30-34
25-29
20-24
15-19
10-14
5-9
Under 5
Male
Female
Source: Philippine Statistical Authority

27
female dependents are equally distributed (22 male and 22 female dependents). Young dependency
ratio is higher (38 dependents) than the elderly (6 dependents).
Female populace in 2015 was 1,488,765 of which 58.29% or 867,848 are of reproductive ages
(15-49 years old). The number of women in the reproductive age is an important population
indicator since it signifies increased birth rates in the future. The 2014-2018 average annual fertility
rate or the number of births per 1,000 women of childbearing age was registered at 92.70.
3.1.6 Population Distribution by Marital Status, Religion, Language Spoken, and
Ethnicity
In 2015, out of the total of 2,400,247 household population aged 10 years old and over, single
population constituted 46.23% and married comprised 37.12%. The rest of the population were
categorized as follows: common-law and live-in marital arrangement (10.69%), widowed (3.77%)
and divorced/separated (2%). In almost all of the categories for marital status, females outnumbered
the males except for the single category (Refer to Table DS-6).
Table DS-6: Household Population 10 Years Old and Over
by Civil Status and Sex; Quezon City: 2015
CIVIL STATUS TOTAL PERCENT MALE PERCENT FEMALE PERCENT
Single 1,109,760 46.23 566,566 51.05 543,194 48.95 Married 891,078 37.12 439,749 49.35 451,329 50.65 Common Law/ Live-in 256,536 10.69 126,873 49.46 129,663 50.54 Widowed 90,427 3.77 17,752 19.63 72,675 80.37 Divorced/Separated 47,931 2.00 15,520 32.38 32,411 67.62 Unknown 4,515 0.19 1,973 43.70 2,542 56.30
TOTAL 2,400,247 100 1,168,433 48.68 1,231,814 51.32 Source: Philippine Statistical Authority
The predominant religion in the city is Roman Catholic including Catholic Charismatic
(86.25%). The rest are categorized as follows: Protestant Christians (5.63%) composed of the
Protestant, Methodist, Baptist, Pentecostal, and Adventist churches; Iglesia ni Cristo (4.62 %); Islam
(1.1%); Non-Trinitarian Christians (0.63%), which include the Church of Jesus Christ of the Latter
Day Saints, Jehovah’s Witnesses; and others (see Table DS-7).
Table DS-7: Total Population by Sex and by Religion;
Quezon City: 2015
RELIGIOUS AFFILIATION TOTAL PERCE
NT MALE
PERCENT
FEMALE PERCENT
Roman Catholic including Catholic Charismatic
2,532,395 86.25 1,251,000 49.4 1,281,395 50.6
Protestant Christians 165,162 5.63 78,390 47.46 86,772 52.54 Iglesia Ni Cristo 135,566 4.62 68,040 50.19 67,526 49.81 Islam 32,242 1.1 16,198 50.24 16,044 49.76 Non-Trinitarian Christians 18,442 0.63 8,550 46.36 9,892 53.64 Other Religious Affiliations 39,397 1.34 19,027 48.30 20,370 51.70 Not Reported 10,124 0.34 4,800 47.41 5,324 52.59 None 2,788 0.09 1,346 48.28 1,442 51.72
TOTAL 2,936,116 100 1,447,351 49.29 1,488,765 50.71 Source: Philippine Statistical Authority

28
Tagalog is the most commonly used language spoken by 46.78% of the population. The rest are
Bisaya/Binisaya (13.47%) Bicolanos (9.03%), Ilocanos (8.13%) and others (Refer to Table DS-8).
Table DS-8: Household Population by Ethnicity and Sex;
Quezon City: 2010
Source: Philippine Statistical Authority
3.2 HEALTH 3.2.1 Health Status
Table DS-9: Summary of Vital Health Statistics; Quezon City: 2015-2018
2015 2016 2017 2018
NO. RATE NO. RATE NO. RATE NO. RATE
Live Birth 76,495 24.07 71,565 24.06 65,670 21.79 67,800 22.19
Death 21,150 6.66 22,216 7.47 22,104 7.33 14,189 4.64
Neo-Natal Death 639 8.35 670 9.36 692 10.54 582 8.58
Infant Death 1,165 15.23 1,259 17.59 1,099 16.74 1,007 14.85
Maternal Death 42 54.91 35 48.91 37 56.34 27 39.82
Fertility Rate
96.68
96.63
87.5
86.7
Child Death 412 1.20 419 1.30 375 1.24 294 1.19
Source: Quezon City Health Department
ETHNICITY TOTAL PERCENT MALE PERCENT FEMALE PERCENT
Tagalog 1,287,154 46.78 622,768 48.38 664,386 51.62 Bisaya / Binisaya 370,580 13.47 177,341 47.85 193,239 52.15 Bicolano 248,588 9.03 124,947 50.26 123,641 49.74 Ilocano 223,692 8.13 111,095 49.66 112,597 50.34 Hiligaynon / Ilonggo 119,473 4.34 56,769 47.52 62,704 52.48 Pangasinan / Panggalatok
72,582 2.64 36,658 50.51 35,924 49.49
Cebuano 70,090 2.55 33,898 48.36 36,192 51.64 Kapampangan 47,437 1.72 23,815 50.20 23,622 49.80 Masbateño / Masbateñon
15,763 0.57 7,915 50.21 7,848 49.79
Boholano 14,156 0.51 7,182 50.73 6,974 49.27 Others 281,399 10.23 140,167 49.81 141,232 50.19 None 482 0.02 288 59.75 194 40.25 Not reported 183 0.01 70 38.25 113 61.75
TOTAL 2,751,579 100 1,342,913 48.81 1,408,666 51.19

29
3.2.2 Maternal Health
Ensuring good health of the mother and child starts from conception and sustained after birth
delivery. Maternal care for safe motherhood should thus, be observed and this can be gauged by the
quality of pre-natal, natal and post natal care and services given to mothers.
Pre-natal check-up of 93,183 pregnant women in 2018 exceeds by 10,680 or 12.94% more of
the 82,503 target pregnant women, of which 54.73% had early pre-natal check-up or first trimester
check-up which is higher than the 49.41% early pre-natal coverage in 2015. More than half (56.51%)
of the 93,183 pregnant women were given complete iron supplementation, to prevent or treat iron
deficiency anemia.
On the other hand, the provision of at least 2 doses of tetanus toxoid immunization (TT2) was
accorded to 43.05% of the target pregnant women seen which is higher compared to Metro Manila’s
30.46% coverage. Tetanus toxoid is given to pregnant women to prevent tetanus in newborn babies.
Birth rate decreased from 24.07 per 1,000 population in 2015 to 22.36 per 1,000 population
in 2018. There are more (52.50%) male births than female (47.50%) births.
Most of birth deliveries were attended by physicians (75.39%), midwives (23.29%) and
nurses (0.02%) or 98.70% attended by skilled health personnel which is higher compared to 96.38%
attended by skilled health personnel in 2015. Noted is the significant decrease of birth deliveries
attended by “hilots”, from 3.62% or 1,581 deliveries in 2015 to 1.20% or 814 deliveries in 2018. (See
Figure DS-4)
Source: Quezon City Health Department
Figure DS-4: Births Attended by Health Personnel Quezon City: 2015-2018
The figures on the deliveries attended by skilled personnel may be associated with the place
of delivery. Figure DS-5 shows that 93.97% are facility-based deliveries (64% in hospitals and
29.97% in public/private lying-in-clinics) or 0.69% slight decrease from the 94.66% deliveries in
public and private facilities in 2015. On the other hand, deliveries done at home was only 1.07%
compared t 5.34% in 2015. (Refer to Figure DS-5)
2015 2016 2017 2018
Physicians 61.7 72.99 66.03 75.39
Midwives 34.64 25.43 32.63 23.29
Nurses 0.04 0.37 0.12 0.02
Hilots 3.62 1.52 1.19 1.2
Others 0 0.01 0.07
61
.7
72
.99
66
.03
75
.39
34
.64
25
.43
32
.63
23
.29
0.0
4
0.3
7
0.1
2
0.0
2
3.6
2
1.5
2
1.1
9
1.2
0
20
40
60
80

30
Source: Quezon City Health Department
Figure DS-5: Births by Place of Delivery Quezon City: 2015-2018
Maternal mortality rate in 2015 decreased from 54.91 per 100,000 live births or 42 maternal
deaths to 48.91 per 100,000 live births or 35 maternal deaths in 2016 but had increased to 56.34 per
100,000 live births or 37 maternal deaths in 2017. However, in 2018, it declined to only 39.82 per
100,000 live births or 27 maternal deaths in 2018. If compared with the Metro Manila’s maternal
mortality rate, the graph below also shows that for the last two (2) years, the city’s rate is
consistently higher from 2016 to 2017 and only in 2018 that it was noted to be lower against 60.16
per 100,000 live births or 149 maternal deaths in the National Capital Region. (See Figure DS-6)
Source: Quezon City Health Department & Center for Health & Development. DOH-NCR
Figure DS-6: Trends of Maternal Mortality Rate (Per 100,000 Live Births)
Quezon City & Metro Manila: 2015-2018
Maternal deaths may be attributed to the number of mothers who still deliver their babies
through “Hilots”. Pre-Eclampsia/Eclampsia, Uterine Atony/Postpartum Hemorrhage, and Amniotic
Fluid Embolism were the first 3 primary causes of maternal deaths.
57
.71
60
.29
64
.03
64
.00
36
.95
37
.62
34
.59
29
.97
5.3
4
2.0
7
1.3
6
1.0
7
0
0.0
1
0 4
.93
0
25
50
75
100
2015 2016 2017 2018
Hospitals
Lying-in (Private / Public)
Home
Other Places
54.91
48.91 56.34
39.82
60.27
45.02 50.69
60.16
0
20
40
60
80
100
2015 2016 2017 2018
QC
MM

31
3.2.3 Child Health
The growth and development of a child depends largely on sustainable and good health
condition. Children are more susceptible to the risk of dying if not given enough care and food
supplements at the early stage of their lives. Infants 0-11 months should have completed their
vaccination against preventable diseases such as Diphtheria, Polio, Tuberculosis, Measles and
Hepatitis B.
In 2018, fully immunized children (0-11 mos.) covered a total of 84,522 children or 102% of
the 82,503 target children. The percentage coverage is higher compared with the 96.94% or 83,169
children in 2015 however this is below the 85,791 target children. Data showed that in 2018, 92% or
74,523 infants were exclusively breastfed up to 6 months, which is higher compared to 67.66% or
58,053 of the 85,791 covered in 2015.
The infant mortality rate of 15.23 per 1,000 live births in 2015 increased to 17.59 in 2016.
However, in 2017, this decreased to 16.74 per 1,000 live births and decreased again to 14.85 in 2018.
This is slightly lower compared to NCR’s infant mortality rate of 15.04 per 1,000 live births. The
graph below (Figure DS-7) also shows that for two (2) consecutive years (2016 and 2017), infant
mortality rate in the city is higher than the NCR but decreased significantly in 2018.
There are more (54.22%) male infant deaths than female (45.77%) infant deaths out of the
1,007 cases of infant deaths in 2018.
Source: Quezon City Health Department Center for Health & Development, DOH-NCR DOH
Figure DS-7: Trends of Infant Mortality Rate (Per 1,000 Live Births) Quezon City and National Capital Region: 2015-2018
Pneumonia, Disease of the Heart and Prematurity are the 3 leading causes of death among
infants. Prematurity has always been among the top 3 causes of deaths in the last three years.
Other causes of infant deaths include Gastrointestinal Disease/Bleed, Congenital Anomalies,
Asphyxia, Meningitis, Seizure, Dengue and Measles. (Refer to Figure DS-8)
15.23
17.59 16.74
14.85
15.30
13.70
14.70
15.04
10
12
14
16
18
20
2015 2016 2017 2018
QC
MM

32
Source: Quezon City Health Department
Figure DS-8: Number of Infant Death by Type of Causes (Per 1,000 Live Births) Quezon City: 2018
On the other hand, deaths among children 1-4 years old for the last 3 years showed that
although there was a decrease from 1.20 per 1,000 population aged 1-4 years old or 412 cases in
2015 to 1.19 or 294 cases in 2018, the child mortality rate in the city is much lower compared to
Metro Manila’s child mortality rate of 21.20 per 1,000 population of children 1-4 years old. (Refer to
Figure DS-9)
Source: Quezon City Health Department Center for Health & Development, DOH
Figure DS-9: Trend of Child Mortality Rate (Per 1,000 Population 1-4 Years Old) Quezon City and National Capital Region: 2015-2018
More male children (54.19%) aged 1-4 years old died at an early stage than female (45.81%).
The top 3 leading causes of child mortality in 2018 are: Pneumonia, Disease of the Heart, Diarrhea
and Gastroenteritis. For the last three years, Bronchopneumonia and Gastroenteritis consistently
ranked 1st and 2nd as top leading causes of child mortality.
120
16 13 11 8 4 4 4 4 0
20
40
60
80
100
120
140
1.20 1.30 1.24 1.19
20.30 18.60
21.20 21.20
0.00
15.00
30.00
2015 2016 2017 2018
QC
MM

33
3.2.4 Nutrition
The Operation Timbang conducted in 2018 covered 397,275 or 96% of children aged 0-6
years old. Of this, 393,268 children or 99% are normal, 1,685 or 0.42% are overweight, 1,695 or
0.43% are underweight and 627 or 0.16% are severely underweight children. The underweight and
severely underweight constitute the incidence of malnutrition of 0.59% or a total 2,322 cases of
malnourished children in the city. This was, however, noted to have decreased from the 1.27%
malnutrition rate in 2015 or 6,098 malnourished children. The identified underweight and severely
underweight children in 2018 were all given iron supplementation. (Refer to Table DS-10)
Table DS-10 : Percent and Total Distribution of Children Weighed (0-6 Years Old);
Quezon City: 2015-2018
CLASSIFICATION 2015 2016 2017 2018
NO. % NO. % NO. % NO. %
Severely underweight
1,390 0.29 1,047 0.21 816 0.18 627 0.16
Underweight 4,708 0.98 3,236 0.66 2,545 0.55 1,695 0.43
Normal 473,638 98.09 487,237 99 456,404 99 393,268 99
Overweight 3,108 0.64 1,490 0.30 1,698 0.37 1,685 0.42
Actual Actual Actual Actual
Operation Timbang
482,844 93.73 493,010 93.00 461,463 95.00 397,275 96.00
Source: Quezon City Health Department
Comparing the city’s prevalence of malnutrition with that of Metro Manila, the data gathered
showed that the city’s 2018 rate of 0.59% is lower against the Metro Manila’s 1.26%. The graph
below also showed that for the last four (4) years (2015-2018), Quezon City has consistently
maintained lower malnutrition rate than Metro Manila. (Refer to Figure DS-10)
Source: National Nutrition Council-NCR
Figure DS-10: Prevalence of Malnutrition among Children (0-71 mos. old);
Quezon City and National Capital Region: 2015-2018
1.27
0.87 0.73
0.59
2.26
1.68
1.45 1.26
0
0.5
1
1.5
2
2.5
2015 2016 2017 2018
QC
MM

34
Looking into the malnutrition rates among the 16 cities and one municipality in the National
Capital Region (NCR), Quezon City has improved from ranked 13th in 2015 to ranked 14th in 2018.
The City of Manila had the highest prevalence of malnutrition at 2.95%, followed by Malabon with
2.86% and Las Pinas at 2.76%. (See Table DS-11)
Table DS-11: Prevalence of Malnutrition of Cities and Municipalities Ranked Accordingly National Capital Region: 2015-2018
2015 2018 Rank Cities/Municipality % Rank Cities/Municipality % 1 Caloocan 4.59 1 Manila 2.95 2 Malabon 3.90 2 Malabon 2.86 3 Manila 3.19 3 Las Pinas 2.76 4 Pasay 3.17 4 Pateros 1.97 5 Las Pinas 2.91 5 Paranaque 1.58 6 Muntinlupa 2.87 6 Caloocan 1.53 7 Navotas 2.19 7 Pasay 1.38 8 Paranaque 1.99 8 Navotas 1.37 9 San Juan 1.81 9 Pasig 1.17 10 Valenzuela 1.54 10 Valenzuela 1.03 11 Pasig 1.51 11 Muntinlupa 1.02 12 Pateros 1.44 12 Marikina 1.01
13 Quezon City 1.26 13 Mandaluyong 0.60
14 Marikina 1.16 14 Quezon City 0.58 15 Mandaluyong 0.86 15 San Juan 0.55 16 Makati 0.57 16 Makati 0.45 17 Taguig 0.55 17 Taguig 0.33
Source: National Nutrition Council-NCR
At the district level, District II had the highest prevalence of malnutrition at 0.66%. Other
districts got lower prevalence malnutrition rates of 0.63 % in District VI; 0.61% in District V; 0.51%
in District I and IV and; 0.45% in District III.
3.2.5 Family Planning
In managing birth rate, various family planning methods were used. The city’s current users
increased from 325,323 in 2015 to 350,734 or 7.81% in 2018. As for the contraceptive prevalence
rate for 2018, this was registered at 93.13%, higher compared to only 83.10% in 2015. The increase
in the number of family planning users may be attributed to massive information and education
campaign (TV, radio, mass media, Internet, health events) and personal contact with advocates
(Community Health Team field operations and Family Planning-Maternal and Child Health
integration at point service).
Pills remain to be the most commonly used contraceptive with 129,557 or 36.94% of the total
current users followed by Condom 75,677 or 21.58% and Injectable Depomedroxyprogesterone
Acetate (DPMA) with 56,079 users or 15.99% of the family planning current users. (Refer to Table
DS-12)

35
6.66 7.47 7.33
4.64
5.79 5.89 6.23 5.35
0
1
2
3
4
5
6
7
8
2015 2016 2017 2018
QC
MM
Table DS-12 : Family Planning Users by Methods; Quezon City: 2015-2018
METHODS C U R R E N T U S E R S
2015 2016 2017 2018
Bilateral Tubal Ligation (BTL) 31,631 32,808 33,483 32,983 VASECTOMY 380 356 321 829 PILLS 110,411 121,921 128,782 129,557 Intrauterine Contraceptive Device (IUD)
26,179 28,980 31,276 33,773
Injectable Depomedroxyprogesterone Acetate (DMPA)
49,326 50,011 54,485 56,079
CONDOM 63,959 76,011 79,180 75,677 Implant 7,938 8,428 6,691 5,064 Natural Family Planning (NFP) Lactational Amenorrhea Method (LAM) 33,572 32,183 31,550 14,728 Cervical Mucus Method (CM) 106 47 21 24 Mercedes Wilson 0 0 0 0 Basal Body Temperature Method (BBT) 3 0 0 0 2 Day Method 0 0 0 0 Symtothermal Method (STM) 0 0 0 0 Standard Day Method (SDM) 1,818 1,983 1,924 2,020 Total (NFP) 35,499 34,213 33,495 16,772 Current Users 325,323 352,728 367,713 350,734 Eligible Population 391,619 366,573 371,481 376,612 Contraceptive Prevalence Rate 83.10 96.2 98.99 93.13
Source: Quezon City Health Department 3.2.6 Mortality
The primary indicator of mortality is the crude death rate. This indicator refers to the number
of deaths per 1,000 population in a given year. Mortality rate for all ages between 2015 and 2016
increased from 6.66 per 1,000 population in 2015 to 7.47 in 2016 but slightly decreased to 7.33 in
2017 and declined further to 4.64 in 2018. There are more male deaths (55.50%) than female deaths
(44.50%).
The 2018 city’s mortality
rate for all ages of 4.64 was also
noted to be lower than Metro
Manila’s rate of 5.35 per 1,000
population. In three (3) previous
years from 2015 to 2017, the city’s
mortality rate was higher than
Metro Manila. It is only in 2018 that
it got a lower mortality rate than
Metro Manila (Refer to Figure DS-
11).
Source: Quezon City Health Department,
Center for Health and Development, DOH
Figure DS-11 : Trends of Mortality Rate (All Ages) Quezon City & Metro Manila: 2015-2018

36
From the 10 leading causes of death for all ages in the city, Pneumonia, Myocardial Infarction
and Hypertension are the top 3 leading causes of death in 2018. The Table below shows that for the
year 2015-2018, Pneumonia was consistently recorded as the number one leading cause of death
while Hypertension which was 7th in 2015 went up to number 3 from 2016-2018. Myocardial
Infarction was ranked 3rd in 2015 going down to number 4 in 2017 but soared to number 2 in 2018.
Cancer, Tuberculosis and Diabetes Mellitus have been recorded consistently as the leading causes of
death.
Table DS-13: Leading Causes of Death (All Ages)
Quezon City: 2015-2018
Source: Quezon City Health Department
3.2.7 Morbidity
In 2018, cases of illness reported were 90, 348, a decrease of 28.91% or 36,741 cases over the
127,089 record in 2015. This is a good indication of an improved health status of the populace.
Upper Respiratory Tract Infection (Upper and Lower) remains to be the number one cause of
morbidity in 2018, followed by Hypertension, Pulmonary diseases and Skin Diseases. Pulmonary
Tuberculosis (PTB) was ranked 6th in 2015, went up as number 4 in 2016, back to rank 6th in 2017.
However in 2018, it was no longer included in the top ten (10) leading causes of illnesses.
RANK LEADING CAUSES OF DEATH
2015 No. 2016 No. 2017 No. 2018 No.
1 Pneumonia 1821 Pneumonia 3683 Pneumonia 4327 Pneumonia 2970
2 Cancer (All Forms) 1765 Cardiovascular/Cor
onary Artery Disease
2564 Cancer (All Forms) 3349 Myocardial Infarction 2088
3 Myocardial Infarction
1558 Hypertension 1550 Hypertension 3117 Hypertension 2082
4 CVA/Bleed/
Infarct 1096 Cancer (All Forms) 1229 Myocardial Infarction 2230 Cancer (All Forms) 1776
5
Coronary Artery Disease (CAD) / Ischemic Heart Disease (IHD) / Coronary Heart Disease (CHD)
930 Cerebrovascular
Disease 885 Diabetes Mellitus 1019 Diabetes Mellitus 666
6 Diabetes Mellitus 898 Diabetes Mellitus 608 Cardiovascular
Disease 1005 Cerebrovascular Accident 503
7 Hypertension 894 Tuberculosis 421 Prematurity 632 Cardiovascular Disease 487
8 Tuberculosis (All
Forms) 684
Gunshot Wounds/Injuries
376 Cerebrovascular
Accident 478
Accidents/ Traumatic Injuries
389
9 Other Lung Disease 642 Carcinoma/ Mass
Other Forms 210
Pulmonary Tuberculosis
430 Disease Of The Heart 387
10
Hypertensive Cardiovascular
Disease (HCVD) / Hypertensive
Arteriosclerotic Cardiovascular
Disease (HASCVD) / Arteriosclerotic Heart Disease
(ASHD) / Atherosclerosis
547 Accidents/ Trauma
Injuries 199 Disease of The Heart 403 Tuberculosis (All Forms) 296

37
Table DS-14: Top Ten Leading Causes of Morbidity Quezon City: 2015 – 2018
Source: Quezon City Health Department
It was observed that for both mortality and morbidity cases, the disease of the respiratory
system was noted as the leading cause of mortality and morbidity in the city, an indicator of a
deteriorating environment characterized by climate change, pollution, congested living conditions
and unsanitary surroundings.
3.2.8 Disease Prevention and Control Pulmonary Tuberculosis Cases
The 2018 ten (10) leading causes of deaths for all ages include Pulmonary Tuberculosis (TB
all forms). TB case detection rate shows that it significantly decreased from 108.00% in 2015 to 69%
in 2018. This is lower against Metro Manila’s TB Case detection rate of 73%. Among the city’s six (6)
districts, District IV got the lowest case detection rate of 49% while District II has the highest TB case
detection rate of 90%.
TB Cure Rate now called the Treatment Success Rate (TSR) declined from 93% in 2015 to
87% in 2018 lower than the Metro Manila’s TSR of 89%. This is due to the increasing number of TB
patients who discontinued and failed to complete their treatment. District VI had the highest
Treatment Success Rate of 95% while District IV had the lowest TSR of 87%.
Dengue Cases
Dengue deaths reported in 2018 is 74 or 0.91% of the 8158 reported dengue cases in the city.
There was an increase of 35 cases of deaths from 39 cases or 0.60% dengue fatality rate in 2015.
The dengue deaths were reported more in District V with 1.32% fatality rate; District II with
1.09%; District I with 0.94%; District III with 0.76%; District VI with 0.74%; and lowest in District IV
of only 0.64% fatality rate.(See Table DS-15)
Rank LEADING CAUSES OF MORBIDITY
2015 2016 2017 2018
1 Upper Respiratory Tract
Infection Upper Respiratory Tract
Infection Respiratory Tract Infection
Respiratory Tract Infection
2 Skin Disease Hypertension Urinary Tract Infection Hypertension
3 Urinary Tract Infection Lower Respiratory Tract
Infection Hypertension Pulmonary Diseases
4 Hypertension Tuberculosis All Forms Skin Infection Skin Diseases/
Infection
5 Intestinal Parasitism Urinary Tract Infection Intestinal Parasitism Gastrointestinal
Diseases 6 Tuberculosis Diarrhea And Gastroenteritis Tuberculosis (All Forms) Diabetes Mellitus 7 Acute Gastroenteritis Diabetes Mellitus Diarrhea And Gastroenteritis Urinary Tract Infection 8 Viral Infection Abdominal Pregnancy Viral Infection Systemic Viral Infection
9 Conjunctivitis Intestinal Parasitism Diabetes Mellitus Abrasion/ Laceration/
Wound
10 Asthma Cutaneous Abscess, Furuncle
And Carbuncle Allergic Reaction
Musculoskeletal Disorder

38
Table DS-15: Dengue Case Fatality Rate per District Quezon City: 2015 & 2018
Dengue Case Fatality Rate
2015 2018
Quezon City 0.60 0.91
District I 0.53 0.94
District II 1.16 1.09
District III 1.08 0.76
District IV 0.25 0.64
District V 0.21 1.32
District VI 0.60 0.74
Source: Quezon City Health Department
3.2.9 Access to Safe Water
Based on the records of the Department of Health-NCR and Quezon City Health Department,
households with access to safe water had reached 100% in 2018 from 98.06% in 2015. These figures
are higher compared with NCR’s 92.19% households with access to potable water. All the City’s
district levels have 100% access to potable water.
3.2. 10 Access to Sanitary Toilets
Records showed that households with access to sanitary toilets in 2018 were 99.00%. The
rates are higher than Metro Manila’s 87.23% households with sanitary toilets in 2018.
3.2.11 Health Facilities/Services
Improved health condition of the city populace depends largely on the effective delivery of
basic health services and existence of adequate health facilities and personnel.
Health Centers/Super Health Centers
The city has a total of sixty-six (66) health centers, seven (7) of which are super health
centers with lying-in clinics and fifty-nine (59) are classified as regular health centers providing
primary health care services. There are also ten (10) sub-health stations. Majority of the health
centers/super health centers are certified Sentrong Sigla which means that these facilities have met
the standards set by the Department of Health (DOH) in promoting availability of good quality health
services to the city’s constituents.
The distribution of these facilities by district shows that thirteen (13) are in District 1 with 12
regular health centers and one super health center (San Francisco Super Health Center). District II
has 10 regular health centers and 2 super health centers (Batasan and Betty Go Belmonte SHCs),
District III with 8 regular health centers and one super health center (Murphy SHC), District IV has 10

39
regular and one super health center (Kamuning SHC), District V has 10 regular health centers and
two (2) super health centers (Novaliches and Sta. Lucia SHCs). District VI has no super health center
but with 9 regular health centers.
Integrated or within some of the city’s health center compounds are four (4) Social Hygiene
Clinics (Proj. 7, Batasan and P. Bernardo and Novaliches), four (4) Male Sundown clinics (Klinika
Bernardo, Klinika Novaliches, Klinika Proj. 7 and Batasan Hills), three (3) adolescent teen health
quarters (Cubao, Commonwealth and NGC) and thirty two (32) microscopy centers performing TB-
DOTS and other laboratory procedures.
The fifty nine (59) regular health centers operate daily except weekends and holidays from
8:00 am to 5:00 pm while the seven (7) super health centers operate 24 hours catering to lying-
in/obstetrics patients and other emergency cases. On the other hand, social hygiene clinics offer
services from 8:00 am to 5:00 pm while the sundown clinics provide services from 3:00 pm to 11:00
pm to cater to call center employees and to ensure privacy of the patients availing of their services.
While the average patients served per day varies on the location of the health center, in 2018,
Gulod Health Center has the highest number of patients served per day with 282 patients while
Masambong Health Center has the least number with 29 patients served per day.
The establishment of every health center follows a standard of one (1) health center per fifty
thousand (50,000) population (1:50,000). The table on the health center–population ratio per
district below indicates that only District II and District VI have a deficiency of two (2) health centers
each while the rest (Districts I, III, IV and V) have more than the required number of health centers to
meet the standard of 1:50,000. (See Table DS-16)
Table DS-16: Health Center - Population Ratio by District; Quezon City: 2018
District Population Existing Health
Centers Required
Health Centers
Health Center
Needs Excess
District I 423,732 13 8 5
District II 713,300 12 14 2
District III 336,231 9 7 2
District IV 462,009 11 9 2
District V 554,878 12 11 1
District VI 550,522 9 11 2
Total 3,040,672 66 60 6
In addition, the city has one (1) employees’ clinic, two (2) upgraded Public Health Laboratory
located at the Quezon City Health Department and Novaliches District Center (NDC) and one (1)
Quality Assurance Laboratory Center performing external quality assessment of all TB microscopy
laboratories situated at Bgy. Bagong Pagasa.

40
Hospitals
The city is host to a total of seventy-one (71) hospitals, 17 of which are government-owned
and 54 are privately-owned hospitals. Of the total number of hospitals located in the city, thirty seven
(37) are classified as tertiary hospitals or hospitals with metro wide and nationwide service areas
and usually have complete service facilities. Nineteen (19) other hospitals are classified as secondary
and fifteen (15) are primary hospitals.
The tertiary types of hospitals are mostly found in District I and IV. Some of these are offering
highly specialized services, among which are the Philippine Heart Center for Asia, National Kidney
and Transplant Institute, Lung Center of the Philippines and the ultra-modern St. Luke’s Medical
Center.
The two (2) city-owned hospitals, the Quezon City General Hospital (QCGH), a tertiary
hospital, and Novaliches District Hospital (NDH), a secondary hospital, serve as referral centers for
the different health centers and other hospitals and clinics. Since the creation of said hospitals, both
have pursued the objective of providing the people, particularly the low-income residents of the city
the best medical care that the city government can afford. The QCGH and NDH provides patient
treatment, ambulatory and domiciliary care and preventive services and serves as center for training
of health workers and allied professions and for advancement of medical services through research.
On the other hand, there is also an ongoing construction of a Level two (2) Rosario Maclang Bautista
Hospital with 107 beds situated at Bgy. Batasan Hills.
Hospital Bed Capacity
The city’s combined total bed capacity is 10,599 (public and private) with an over-all bed-
population ratio of 1:287 in 2018. This is way above the standard bed population ratio of 1:2,000.
District IV where most of the tertiary and specialized hospitals are found, recorded the most number
of hospitals with 4,889 bed capacity.
About 55.42% or 5,874 beds belong to government hospitals while 44.58% or 4,725 beds
from the private hospitals. District VI recorded the lowest bed capacity with 260 beds in the 6
hospitals. District IV, on the other hand, registered 4,889 beds of the combined 18 hospitals. District I
has combined bed capacity of 3,155 in 16 hospitals and those located in District V which are
classified mostly as secondary health institutions have 1,016 bed capacity in 20 hospitals while
District III has 1279 beds in 11 hospitals. The Quezon City General Hospital (QCGH) with 250 beds in
District I and Novaliches District Hospital (NDH) with 100 beds in District V are the two (2) city-run
public hospitals that cater mostly to urban poor residents particularly, the northeastern portion of
the district while East Avenue Medical Center and Quirino Memorial Medical Center both found in
District IV are national government operated hospitals with regional service area.
Considering that public hospitals cater to the urban poor residents numbering about 810,761
in 2018, the bed population ratio for public hospitals alone is 1 bed per 405 persons which is way
above the standard bed-population ratio of 1:2000. The hospital bed requirement for this number of
persons is computed to be 302 beds. The city therefore, has no shortage of hospital beds considering
that the existing number of beds for government hospitals catering to the public which includes
Quezon City General Hospital, Novaliches District Hospital, East Ave Medical Center, Quirino
Memorial Medical Center, Quezon Institute, National Children’s Hospital, Philippine Children’s
Medical Center and Veterans Memorial Medical Center is 2,686 beds.

41
Bed occupancy rates for the 2 city operated hospitals for the year 2018 is 82.19 % for the
Quezon City General Hospital and 317 % for the Novaliches District Hospital.
Other Health Facilities
There are 2,652 various health and wellness facilities like: medical clinics (1024), Lying-in
Clinic/Birthing Home/Maternity Clinics (173) optical clinics (76), dental clinics (442), dental
laboratory (4), dermatology clinics (108), skin care clinics (72), diagnostic centers (297), dialysis
centers/clinics (77), veterinary (38), surgical clinic (3), psychiatric rehabilitation centers (18) and
combined various health and wellness facilities (320)
Responsible for the treatment and rehabilitation of drug dependents is the City’s Drug
Treatment and Rehabilitation Center popularly known as “TAHANAN” which occupies an
approximately 3,000 sq.m. property situated at Diamond Hills, Brgy. Payatas.
Funeral and burial needs of the populace are being taken care of by three (3) public
cemeteries and three (3) private Memorial Parks. There are forty five (45) funeral parlors in the city,
including eleven (11) private crematoriums/ columbarium/ossuary.
Health Personnel
In 2018, the city’s total health personnel was 2,103. The Quezon City Health Department has
1,142 medical staff, the Quezon City General Hospital has 541 and the Novaliches District Hospital
has 420. The current number of the city’s medical personnel increased by 461 or 28.07% from
1,642 in 2015. Of the city’s total health staff, 459 are physicians, 550 are nurses, 64 are dentists, 237
midwives and the remaining 793 belong to the non-paramedical staffs, which include Medical, dental
and Laboratory support, Dental aide, Nutritionists-Dietician, Food-Drug regulation staff, Medical
Technologist, Radiologic Technologists, Laboratory Aide and Dialysis Technician, HIV/AIDS Lecturer,
THQ Health Educator and administrative staff and barangay health workers (BHWs).
The 2018 government physician-population ratio and dentist-population ratio is 1:804 and
1:47,510 respectively. The physician-population ratio is way above the standard ratio of 1:20,000
while that of the dentist-population is far below the standard of 1:20,000. This means that there is no
shortage of physicians but the city is in need of more dentists. On the other hand, the government
nurse-population ratio is 1:668 against the standard ratio of 1:15,000 and the government midwife-
population ratio is 1:5,836, which is below the standard ratio of 1:5,000. It shows that the city is no
longer in need of additional nurses but is short of 87 midwives.
3.3. EDUCATION
3.3.1 Literacy and Highest Grade Completed
The city has a high literacy rate of 99.71% based on the 2015 PSA official census. This is
slightly lower (0.03%) than the 2010 literacy rate of 99.74%. For both census years, male and female
literacy rate in the city is almost equal (99.71% male and 99.72% female) for 2015 and (99.74% male
and 99.73% female) for 2010. (See Figure DS-12)

42
Comparing the city’s literacy rate in 2010 with the NCR, it was noted that this is higher than
NCR’s 99.20%. For both census years, the city’s literacy rate is higher than the national literacy rate
of 90.3% per 2013 Functional Literacy Education and Mass Media Survey (FLEMMS).
Figure DS-12: Literacy Rate by Sex; Quezon City: 2010 and 2015
Of the 2,409,418 literate population 10 years old and over, 42.20% are ages 35 years old and
over, 35.93% belong to 10-24 years old, 11.71% are ages 25-29 and 10.16% are 30-34 years old.
On the other hand, the 6,949 illiterate population 10 years old and over, shows that more
than half (56.38%) are in the ages 10-24 years old which is the age group that should have been in
school. About 11.01% are ages 25-34 years old, while 2,266 (32.61%) are in the ages 35 and over.
Illiteracy among males is slightly higher (0.29%) than among females (0.28%). (See Table DS-17)
Table DS-17: Literacy of Households Population 10 Years Old and Over by Age Group and Sex; Quezon City: 2015
AGE GROUP
LITERATE TOTAL ILLITERATE TOTAL OVERALL
MALE FEMALE NO %
MALE FEMALE NO. %
NO. % NO. % NO. % NO. % NO. %
10 - 24 431,903 36.78 433,701 35.12 865,604 35.93 2163 62.77 1755 50.10 3918 56.38 869,522 35.98
25 - 29 140,238 11.94 141,881 11.49 282,119 11.71 245 7.11 176 5.02 421 6.06 282,540 11.69
30 - 34 121,559 10.35 123,257 9.98 244,816 10.16 187 5.43 157 4.48 344 4.95 245,160 10.15
35 & Over 480,692 40.93 536,187 43.42 1,016,879 42.20 851 24.70 1415 40.39 2266 32.61 1,019,145 42.18
TOTAL 1,174,392 100.00 1,235,026 100.00 2,409,418 100.00 3446 100.00 3503 100.00 6949 100.00 2,416,367 100.00
Literacy Rate
99.71 99.72 99.71 0.29 0.28 0.29 100.00
Source: Philippine Statistics Authority
Of the 2,675,792 population aged 5 years old and over 528,710 (19.78%) completed
elementary, 1,026,264 (38.40%) were able to reach or complete high school, 413,215 (15.46%) were
college undergraduates while 494,623 (19.48%) were academic degree holders.
Those who took up vocational courses was 78,915 (2.95%) and 10,517 (0.39%) have masters
degrees. Only 1.58% or 42,224 have no grade completed at all. (See Figure DS-13)
99.74 99.73 99.71 99.72
0.26 0.27 0.29 0.28
95
96
97
98
99
100
Male Female Male Female
2010 2015
Illiterate
Literate

43
Figure DS-13: Population Distribution by Educational Attainment 5 Years Old and Above; Quezon City: 2015
School-age population (3-21 yrs. old) in 2015 was 1,044,072 or 35.56% of the total
population. In terms of sex distribution, 528,942 are males representing 50.66% and 515,130 are
females comprising 49.34%.
The school-age population in the elementary level ages 6-11 yrs. old (29.74%) is slightly
higher than the tertiary level (24.02%) ages 18-21 yrs. old while those in the secondary level ages
12-15 yrs. old represent 20.23% and the senior high school (16-17 yrs. old) is 10.99%. Pre-school
children 3-5 yrs. old constitute 15.02%. Those in kindergarten ages 5 yrs. old (5.02%) and day care
children 3-4 yrs. old (10.00%). (See Figure DS-14)
Source: Philippine Statistics Authority
Figure DS-14: Percent Distribution of School Age Population by School Level; Quezon City: SY 2015
16,902 (0.63%)
42,224 (1.58%)
3,143 (0.12%)
61,279 (2.29%)
528,710 (19.76%)
1,026,264 (38.35%)
413,215 (15.44%)
494,623 (18.49%)
78,915 (2.95%)
10,517 (0.39%)
0 200,000 400,000 600,000 800,000 1,000,000 1,200,000
Not Stated
No Grade Completed
Special Education
Pre-School
Reached / Completed Elementary
Reached / Completed High School
College Undergraduate
Academic Degree Holder
Master Courses
Vocational Courses
3-4 years old 10.00% 5 years old
5.02%
6-11 years old 29.74% 12-15 years
old 20.23%
16-17 years old
10.99%
18-21 years old
24.02%
Source: PSA

44
14
3,4
18
13
3,3
98
13
6,6
36
13
3,7
71
12
5,3
61
12
7,0
59
27
7,1
89
25
8,7
59
26
3,6
95
0
50,000
100,000
150,000
200,000
250,000
300,000
2015-2016 2016-2017 2017-2018
Male
Female
Total
3.3.2 Enrollment Performance Indicators
For SY 2017-2018, the total enrollment in public kindergarten school is 34,081, an increase of
6,885 or 25.32% from the 27,196 enrollment in SY 2015-2016. There are more males (17,773 or
52.15%) enrolled than females (16,308 or 47.85%). The increasing enrollment trend in kindergarten
was brought about by the enactment of Republic Act 10533 also known as the K-to-12 Program and
RA 10157 or the Kindergarten Education Act of 2011 compelling all 5 year old children to avail
kindergarten education as the first stage of compulsory and mandatory formal education. (Refer to
Figure DS-15)
Figure DS-15: Enrollment in Public Kindergarten Schools; Quezon City: SY 2015-2016 to SY 2017-2018
The total enrollment in public elementary and secondary schools as of SY 2017-2018 reached
420,765 a decrease of 0.19% from the 421,578 enrollment in SY 2015-2016.
Of the total
enrollment, 263,695 or
62.67% were enrollees in the
elementary level. There were
more male enrollees
(136,636 or 51.82%) than
females (127,059 or
48.18%). It was noted that
there was a decrease of
13,494 students from the
277,189 elementary students
in SY 2015-2016 enrollment.
(See Figure DS-16)
Source: Schools Division Office
Figure DS-16: Enrollment in Public Elementary Schools; Quezon City: SY 2015-2016 to SY 2017-2018
13
,82
0
12
,78
4
17
,77
3
13
,37
6
11
,70
2
16
,30
8
27
,19
6
24
,48
6
34
,08
1
0
5,000
10,000
15,000
20,000
25,000
30,000
35,000
40,000
2015-2016 2016-2017 2017-2018
Male
Female
Total
Source: Schools Division Office

45
On the other hand, enrollees at the high school level constitute 37.33% or 157,070 students of
the total enrolled students in SY 2017-2018, an increase of 12,681 students from the 144,389
enrollees in SY 2015-2016. More female are enrolled in high school than male. (Refer to Figure DS-17)
Source: Schools Division Office
Figure DS-17: Enrollment in Public Secondary Schools; Quezon City: SY 2015-2016 to 2017-2018
The increasing trend of enrollment for secondary level in the last two (2) years may be
attributed to the full implementation of Senior High School. The table below shows that out of the
total 157,070 high school enrollees for SY 2017-2018, 91.87% or 144,302 are in Junior High School
and the remaining 8.13% or 12,768 are in Senior High School.
Table DS-18: Enrollment in Public Junior and Senior High School
Quezon City: SY 2016-2017 to SY 2017-2018
Grade Level
SY 2016-2017 SY 2017-2018
Male Female Total Male Female Total
Junior High School 68,283 71,378 139,661 71,507 72,795 144,302
Senior High School 2,556 2,498 5,054 6,546 6,222 12,768
Source: Schools Division Office
Of the total enrollees for levels, 3,439 or 0.82% are special children, a decrease of about 527
or 13.29% from only 3,966 enrolled in SY2015-2016. Special children are those with mental
retardation, giftedness and talent, learning disabilities, deafness, blindness and low vision, physical
disabilities, health impairments and severe disabilities who experience difficulties in learning the
basic educational curriculum. These children need a modified or functional curriculum, as well as
those whose performance is do superior that they need a differentiated special education curriculum
to help them attain their full potential.
Majority (3,005 or 87.38%) of the enrolled special children are in the public elementary
schools while 434 or 12.62% are in the public secondary schools. As of 2018, there are 45 (32 Non-
SPED & 13 SPED Center) public elementary schools and 12 (3 Non-SPED & 9 SPED Center) secondary
schools including National Orthopedic Hospital (NOH) offering Special Education Classes (SPED).
71
,63
9
70
,83
9
78
,05
3
72
,75
0
73
,87
6
79
,01
7
14
4,3
89
14
4,7
15
15
7,0
70
0
20,000
40,000
60,000
80,000
100,000
120,000
140,000
160,000
180,000
2015-2016 2016-2017 2017-2018
Male
Female
Total

46
Enrollment at the district level shows that District II had the highest number of students
(118,209 or 28.09%) for both public elementary and secondary schools which comprise 28.15% and
28.01% respectively of the total enrolment and the least is District III. (See Figure DS-18)
Source: Schools Division Office
Figure DS-18: Percent Distribution of Elementary and Secondary Schools Enrollment by District;
Quezon City: SY 2017-2018
The combined Enrollment Participation rate (EPR) in public and private schools decreased
from 95.43% in SY 2015-2016 to 94.70% in SY 2017-2018 in elementary level while in the
secondary level it increased from 85.90 in SY 2015-2016 to 94.17 in 2017-2018
In details, the EPR for private in both elementary and secondary schools slightly decreased
from 23.48 and 23.91 in SY 2015-2016 to 23.38 and 23.02 in SY 2017-2018 respectively. Likewise,
the EPR in public elementary level also decreased from 71.94 in SY 2015-2016 to 71.32 in SY 2017-
2018 while in secondary level it increased from 61.99 in SY 2015-2016 to 71.15 in SY 2017-2018.
(Refer to Table DS-19)
Table DS-19: Participation Rate in Public and Private Elementary and Secondary Schools;
Quezon City: SY 2015-2016 to SY 2017-2018
ELEMENTARY SECONDARY
SY 2015-2016
SY 2016-2017
SY 2017-2018
SY 2015-2016
SY 2016-2017
SY 2017-2018
Public & Private 95.43 94.73 94.70 85.90 91.90 94.17
Private 23.48 71.32 23.38 23.91 23.02
Public 71.94 23.40 71.32 61.99 71.15
Source: Schools Division Office
13.78
28.15
9.67
10.65
23.36
14.39
15.4
28.01
7.39
13.9
23.35
11.95
0 5 10 15 20 25 30
District I
District II
District III
District IV
District V
District VI
Elementary
Secondary

47
At the pre-school level, out of the 162,284 estimated 2018 population ages 3-5years old,
130,933 or 80.68 % are enrolled in public or private kindergarten schools and day care centers in SY
2017-2018. The pre-school enrollment participation rate of increased by 31.46% from 49.22 % EPR
in SY 2015-2016.
For children ages 3-4 years old, 84,461 or 78.17 % of the 2018 estimated 108,053 children
are enrolled in private kindergarten schools, public day care centers/supervised neighborhood play
and learning centers operated or managed by NGOs and POs in SY 2017-2018 while 46,472 children
ages 5-year old and below were enrolled in public and private kindergarten schools.
3.3.3 Academic Performance Indicator
The National Achievement Test is an examination given to assess the competency of students’
knowledge and skills in five (5) major subjects (Mathematics, English, Science, Filipino and Hekasi for
elementary and Mathematics, English, Science, Filipino and Araling Panlipunan for secondary). The
test is administered by the Department of Education’s (DepEd) National Testing and Research Center
and the results are intended to guide the efforts towards the improvement of the quality of education
and to provide appropriate intervention for the students.
Achievement rates for both elementary and secondary levels in public and private schools
had a decreasing trend. At the elementary level, the line graph below shows that from the
achievement rate of 50.13 in SY2014-2015 it decreased to 44.94 in SY2016-2017 and decreased
further to only 40.64 in SY2017-2018. On the secondary level it was recorded to be 48.83 in SY2014-
2015 a slight increase in SY2016-2017 at 49.00 then lowering it again to 48.65 in SY 2017-2018.
It was observed however, that while there is a decreasing trend in the achievement rates for
public and private schools, the performance in private elementary schools may be considered as
better than the public schools while in the secondary level, achievement rates in public schools is
higher than in the private schools except for SY 2016-2017. (See Figure DS-19A & B)
Source: Schools Division Office
Figure DS-19A: Achievement Rate in Public and Private Elementary Schools;
Quezon City: SY 2014-2015 to SY 2017-2018
52.62
42.27 41.31
48.67
50.78 50.7
50.13
44.94
40.64 40
42
44
46
48
50
52
54
SY 2014-2015 SY 2016-2017 SY 2017-2018
PUBLIC
PRIVATE
PUBLIC & PRIVATE

48
Source: Schools Division Office
Figure DS-19B: Achievement Rate in Public and Private Secondary Schools; Quezon City: SY 2014-2015 to SY 2017-2018
For the past 3 years, the city’s academic performance among the 16 cities and 1 municipality
in Metro Manila may be considered as low. As of SY2017-2018, the achievement test results showed
that Quezon City was ranked 14th in the elementary level and 6th in the secondary level. It also ranked
10th in the elementary level and 4th in the secondary in SY2016-2017 and ranked 15th and 10th in
SY2014-2015 respectively. The City of San Juan was noted to be on the lead or ranked 1st in
elementary and Makati City for secondary level per SY 2017-2018 achievement test results followed
by Pasig City as ranked 2nd for both levels. (Refer to Figure DS-20)
Table DS-20A: Academic Performance in Public and Private Elementary Schools;
Quezon City & Other Metro Manila Cities/Municipality: SY 2014-2015 to SY 2017-2018
CITY / MUNICIPALITY
ELEMENTARY
SY 2014-2015 SY 2016-2017 SY 2017-2018
RANK RATE RANK RATE RANK RATE
Caloocan City 9 60.74 15 42.74 16 38.18
Las Piñas City 5 64.06 7 46.26 12 41.35
Makati City 2 67.60 2 52.27 3 47.91
Malabon City 3 64.79 14 43.11 11 42.83
Mandaluyong City 8 60.88 4 46.50 9 43.91
Manila 10 59.52 6 46.32 8 45.98
Marikina City 14 52.42 3 48.83 6 47.35
Muntinlupa City 13 54.79 11 44.44 10 43.01
Navotas City 6 63.37 16 40.57 15 39.26 Parañaque City 4 64.52 13 43.64 4 47.70
Pasay City 7 62.79 8 45.63 5 47.52
Pasig City 16 49.86 9 45.21 2 49.83
Quezon City 15 50.13 10 44.94 14 40.64 San Juan City 11 59.51 1 52.68 1 40.53 Taguig / Pateros 1 68.32 5 46.46 7 47.15
Valenzuela City 12 56.59 12 43.83 13 41.05
Source: Schools Division Office
51.39
44.79
54.39
46.28
49.86 49.72 48.83 49.00 48.65
40.00
42.00
44.00
46.00
48.00
50.00
52.00
54.00
56.00
SY 2014-2015 SY 2016-2017 SY 2017-2018
PUBLIC
PRIVATE
PUBLIC & PRIVATE

49
Table DS-20B: Academic Performance in Public and Private Secondary Schools; Quezon City & Other Metro Manila Cities/Municipality: SY 2014-2015 to SY 2017-2018
CITY / MUNICIPALITY
SECONDARY
SY 2014-2015 SY 2016-2017 SY 2017-2018
RANK RATE RANK RATE RANK RATE
Caloocan City 16 44.53 12 45.73 8 47.93
Las Piñas City 11 48.82 6 47.60 12 45.59
Makati City 2 52.90 3 51.26 1 55.33
Malabon City 13 48.38 15 43.60 4 49.28
Mandaluyong City 12 48.55 5 48.04 7 48.37
Manila 4 51.37 2 51.26 5 48.87 Marikina City 5 49.75 10 46.75 3 49.38
Muntinlupa City 8 49,06 8 46.92 14 44.69
Navotas City 14 46.84 16 42.63 13 45.21
Parañaque City 9 48.86 13 45.71 11 46.73
Pasay City 6 49.56 9 46.81 15 44.53
Pasig City 7 49.39 7 47.09 2 51.12
Quezon City 10 48.83 4 49.00 6 48.65
San Juan City 3 51.82 1 53.64 10 46.75
Taguig / Pateros 1 57.11 11 46.49 9 47.48
Valenzuela City 15 46.57 14 44.99 16 43.32 Source: Schools Division Office
Another academic performance indicator is Cohort survival rate. This is the percentage of
those who in the beginning grade reached the final grade of the required number of years for the
elementary and high school level.
The cohort survival rate for public and private elementary and secondary levels have
increased from 73.11% and 80.98% in SY 2016-2017 to 100% and 93.67% respectively, in SY 2017-
2018.
In public elementary and secondary schools, cohort survival rate are lowest at 94.53% and
85.66% than in private schools with both 100% rating. (Refer to Table DS-21).
Table DS-21 Cohort Survival and Drop-Out Rate in Public and Private Elementary and Secondary Schools; Quezon City: SY 2016-2017 and SY 2017-2018
INDICATOR
ELEMENTARY SECONDARY
SY 2016-2017 SY 2017-2018 SY 2016-2017 SY 2017-2018
PUBLIC PRIVATE PUBLIC & PRIVATE PUBLIC PRIVATE PUBLIC &
PRIVATE PUBLIC PRIVATE PUBLIC & PRIVATE PUBLC PRIVATE PUBLIC &
PRIVATE
COHORT SURVIVAL
RATE 91.26 35.13 73.11 94.53 100 100 88.72 61.97 80.98 85.66 100 93.67
DROP-OUT RATE
1.33 0.77 1.21 1.08 0.30 0.88 1.94 1.49 1.83 1.54 0.64 1.32
Source: Schools Division Office
Drop-out rate which is another performance indicator is defined as the proportion of pupils
who left school during a school year. For SY 2017-2018, the combined drop-out rate in public and

50
private elementary and secondary schools both decreased from 1.21% and 1.83% in school SY 2016-
2017 to 0.88 % and 1.32% in SY 2017-2018. This means that for every 100 elementary students
enrolled, 1 eventually leaves school while for every 100 high school students enrolled, 2 will most
likely leave school. Some of the possible causes of dropping out are financial problems, lack of
personal interest, illness/disability, and inability to cope with school work, teenage pregnancy, and
transfer of residence or employment.
The drop-out rate in both public elementary and secondary schools decreased from 1.33%
and 1.94% in SY 2016-2017 to 1.08% and 1.54% in SY 2017-2018. The drop-out rate in public
elementary and secondary levels however, was noted high compared to private schools (See Table
DS-18).
3.3.4 Classroom-Student Ratio
The over-all classroom-student ratio based on 2 shifts per standard classroom-student ratio
of 1:45 is 1:32 in public elementary schools and 1:31 in secondary schools for both Junior High
School (JHS) and Senior High School (SHS).
However, the present classroom-student ratio varies for each district and for each school
level. The figures indicate that for the elementary and secondary school levels, there is deficiency in
the existing number of classrooms. This inadequacy exists only in District II where the classroom-
student ratio is computed to be 1:48 for elementary and 1:56 in the secondary level. This means that
a single classroom accommodates as many as 56 students in each session compared with the ideal
ratio of 1:45. The classroom deficiency is made even more significant considering that both public
elementary and high schools hold two shifts or sessions each day. Fortunately, the situation is better
in other Districts such as in District III where the ratio is 1:22, District IV with a ratio of 1:27, District
I having a ratio of 1:24, District V 1:33 and District VI 1:33. This is further substantiated with the
observation that there are excess classrooms in the other Districts. The over-all actual or existing
number of classrooms of 6,656 (4,147 in the elementary and 2,509 in the secondary) is more than
the required number of classrooms of only 4,678 (2,931 in the elementary and 1,747 in secondary
schools) except in District II. To address the deficiency in District II, the city needs to construct about
144 more classrooms (49 for elementary and 95 for secondary) to meet the present demand. (See
Table DS-22)
Table DS-22: Elementary and Secondary School (JHS & SHS) Classroom-Student Ratio by District; Quezon City: SY 2017-2018
ELEMENTARY SECONDARY (JHS & SHS)
DIST NO. OF
SCHOOL
SY 2017-2018
NO. OF CLASSROOMS
NO. OF SCHOOL
SY 2017-2018
NO. OF CLASSROOMS
ACTUAL REQUIRED NEEDS
CLASS- ROOM-
STUDENT RATIO
ACTUAL REQUIRED NEEDS CLASSROOM
-STUDENT RATIO
I 22 36,338 747 404 0 1:24 14 (3) 24,195 554 269 0 1:22
II 13 74,221 776 825 49 1:48 6 43,988 394 489 95 1:56
III 17 25,507 592 283 0 1:22 8 (1) 11,601 287 129 0 1:20
IV 13 28,074 515 312 0 1:27 14 (4) 21,835 605 243 0 1:18
V 18 61,608 937 685 0 1:33 10 (3) 36,681 450 408 0 1:41
VI 12 37,947 580 422 0 1:33 6 (1) 18,770 219 209 0 1:43
TOTAL 95 263,695 4,147 2,931 49 1:32 58 (12 SHS) 157,070 2,509 1,747 95 1:31
Source: Schools Division Office

51
3.3.5 Teacher-Student Ratio
Based on the total enrollment and the actual number of teachers, the over-all teacher-student
ratio is 1:32 in public elementary schools and 1:25 in public secondary schools. This is within the
standard teacher-student ratio of 1:45 in all school districts.
Table DS-23: Elementary and Secondary School Teacher-Student Ratio by District;
Quezon City: SY 2017-2018
ELEMENTARY SECONDARY
DISTRICT NO. OF
SCHOOL
SY 2017-2018
NO. OF TEACHERS NO. OF
SCHOOL
SY 2017-2018
NO. OF TEACHERS
ACTUAL NEEDS TEACHER-STUDENT
RATIO ACTUAL NEEDS
TEACHER-STUDENT
RATIO
I 22 36,338 1,077 0 1:34 14(3) 24,195 967 0 1:25
II 13 74,221 2,098 0 1:35 6 43,988 1,706 0 1:26
III 17 25,507 1456 0 1 :18 8(1) 11,601 521 0 1:22
IV 13 28,074 816 0 1:34 14 (4) 21,835 952 0 1:23
V 18 61,608 1,843 0 1:33 10(3) 36,681 1,329 0 1:28
VI 12 37,947 1,066 0 1:36 6 (1) 18,770 738 0 1:25
TOTAL 95 263,695 8,356 0 1:32 58 (12 SHS) 157,070 6,213 0 1:25
Source: Schools Division Office
3.3.6 Textbook-Student Ratio
Data given by the Schools Division Office (SDO) show that the textbook-student ratio for both
elementary and secondary levels is 1:1 which means that each student has one (1) textbook per basic
subject (Mathematics, Science, Hekasi, Filipino and English). Of the total 1,767,511 textbooks
provided by the national government in 2018, only about 61.94% or 1,094,835 are for the
elementary level, 33.82% or 597,686 textbooks are for the Junior High School and the remaining
4.24% or 74,990 are for Senior High School.
3.3.7 Educational Programs
Educational programs for both public and private schools in elementary and secondary levels
are in accordance with the curricula prescribed by Republic Act 10533 or the Enhanced Basic
Education Act of 2013, known as the K-to-12 Program which covers kindergarten and 12 years of
basic education (six years of primary education, four years of junior high school and two years of
senior high school).
Senior High School is a specialized upper-secondary education composed of Core Subjects and
Track Subjects. Both have 15 and 16 subjects respectively. Each track will have strands
(specialization within a track such as Accountancy, Business and Management (ABM), Science,
Technology, Engineering and Mathematics (STEM), Humanities, Education, Social Sciences (HUMSS)
and Liberal Arts for ACADEMIC TRACK, Safety and First Aid for SPORT TRACK, Arts assessment and
Guidance for ARTS AND DESIGN and lastly, TESDA training Regulations-Based Specialization for
TECH-VOC TRACK.

52
Services like the Alternative Learning System (ALS0) are being offered to the people who
have not finished the elementary or secondary education. ALS is an alternative or substitute, a
parallel learning system that provides a particular option to the existing formal education when one
does not have or cannot access formal education in school. It includes both non-formal and informal
sources of knowledge and skills. For SY 2017-2018, total ALS enrollees was 13,811, consisting of
“Kasambahays” or household helps and out of school youth and adults. Majority, 7,928 or 57.40% are
male and 5,883 or 42.60% are female ALS enrollees. There are 157 ALS Learning Centers (ALCs), 79
are public school-based, 37 are barangay-based, 35 are run by Local Government Unit (LGU)/Non-
Government Organizations (NGOs) and 6 are extension centers.
Madrasah education program to Muslim students is also being offered in seventeen (17)
public schools (15 ES and 2 HS). It offers basic education in Islamic values and Arabic language
conducted every Saturday and Sunday. There are about 1,542 enrolled students with 42 Muslim
teachers or “Azatids”. The program aims to harmonize the traditional Philippine Education
curriculum with the Madrasah system thereby ensuring educational parity across regions and
cultures.
Further educational support is provided by the Quezon City Polytechnic University (QCPU). It
was established in 1994 under City Council Ordinance No. SP-171, S-1994 as Skills Training Center
and this was converted into the Quezon City Polytechnic University through Ordinance No. SP-544,
Series of 1997 and later on provided with the University Charter by SP-1030, Series of 2001. The
institution was created to undertake the training of skilled workers in response to the manpower
requirement by industry and business establishments within the city. The organization of the
Polytechnic as local government educational institution included the old skills and training center.
The QCPU
Main Campus is at
Bgy. San Bartolome.
It offers Bachelor of
Science and/or
baccalaureate
courses or 4 year
courses such as
General Education,
BS Information
Technology, BS
Entrepreneurship,
BS Industrial
Engineering and BS
Electronics
Engineering and
Senior High School.
The university satellites are located at Bgy. Sto. Cristo within San Francisco High School compound
which offers degree courses only and at Bgy. Batasan Hills along IBP Road that offers degree courses
and Senior High School which started in SY 2016-2017 with 680 students. The university enrollment
trend is decreasing from 8,748 in SY 2015-2016 to 5,520 students in SY 2017-2018 in baccalaureate
courses or a decrease of 3,228 or 36.90% enrollees and from 423 to 0 students in
Vocational/Technical courses. The total number of graduates for SY 2017-2018 was 2,455 of which
713 are BS Entrepreneurial Management graduates, 375 for BS Industrial Engineering, 52 for BS
680 1,191
8,748
6,647
5,520
423 10 0
0
1000
2000
3000
4000
5000
6000
7000
8000
9000
10000
2015-2016 2016-2017 2017-2018
SHS
Degree
Voc-Tech
Source: Quezon City Polytechnic University
Figure DS-20: Enrollment in Quezon City Polytechnic University;
Quezon City: SY 2015-2016 to SY 2017-2018

53
Electronics Engineering, 729 for BS Information Technology and 586 for Senior High School
graduates. (See Figure DS-20)
Added to this, the city government is also extending scholarship assistance to the city’s under
privileged college students or those belonging to low income/indigent families. With the
implementation of the Free Tuition Fee Law in 2018 giving full tuition subsidy for students in State
Universities and Colleges (SUCs), local universities and colleges and state-run technical-vocational
schools, the city provides stipend of ₱1,500.00 for economic/regular scholars including HB Centrex
scholars and SK elected officials scholars as well. The honor students in public schools (1st and 2nd
Honors) are also given scholarship assistance at ₱40,000.00 for tuition fees and ₱10,000.00 stipend
while 3rd to 8th honor students are given ₱15,000.00 tuition fees and ₱5,000.00 stipend per semester
charged under the General Fund and Legislative Fund from selected Councilors. Masteral /Post-
Graduate scholarship assistance is granted to qualified QC Hall employees with ₱20,000.00 tuition
fees and ₱15,000.00 stipend per semester. The beneficiaries of this category of scholars may enroll in
any university of their choice. A total of 2,921 in SY 2017-2018 benefited in the city’s scholarship
assistance, a decrease of 60.99% from 7,488 scholars in SY 2014-2015 mainly because of the
implementation of the K to 12 program of DepEd which started in SY 2016-2017.
Source: Scholarship and Youth Development Program (SYDP)
Figure DS-21: Number of Quezon City Government Scholars;
Quezon City: SY 2014-2015 to SY 2017-2018
3.3.8 Educational Facilities
The number of public schools increased from 141 in 2015 to 153 in 2018. The increase of
number of public schools is due to the establishment of Senior High Schools (Stand Alone). Of these,
58 are public secondary schools (JHS & SHS) and 95 are elementary schools. All public elementary
schools are offering pre-school classes. Also existing are 3 public schools offering vocational and
technical courses namely; QCPU Main at San Bartolome & QCPU Batasan satellite and HB Negotech at
Barangay Tatalon, this city.
About 638 private schools offer different levels of education such as preparatory, elementary,
and secondary or a combination of two or more levels. There are also 109 colleges and universities
and, the more prominent ones found in the city include Miriam College, Ateneo de Manila and the
7,488 7,671
6,931
2,921
2,000
3,000
4,000
5,000
6,000
7,000
8,000
9,000
10,000
2014-2015 2015-2016 2016-2017 2017-2018

54
state-run University of the Philippines. The city has nineteen (19) Public libraries; one main library,
“a state of the art library” located at the City Hall Compound and eighteen (18) branches situated in
the six (6) districts of the city.
3.3.9 Special Education Fund (SEF) Utilization
The Special Education Fund is the proceeds of the additional one percent tax on real property
tax which is automatically released to the Local School Boards.
Records gathered from the Local School Board and City Budget Department show that for the
last four (4) years, the city’s annual approved amount under SEF is more than ₱1 Billion a year, the
highest allocation was in 2017 with P1, 700,000,000.00. The SEF average utilization rate for the 4
year period is 71.14% (See Table DS-24). Joint Memorandum Circular No. 1; Series of 1998 issued by
the DepEd, DBM and DILG dated April 14, 1998 prescribed the rules and regulation to be observed by
the Local School Boards in the utilization of this fund. Among the priority expenses chargeable
against SEF include operation and maintenance of public schools, including organization of extension
classes, non-formal, remedial and summer classes, as well as payment of existing allowances of
teachers granted by local government unit, subject to existing budgeting rules and regulations;
construction and repairs of school buildings, facilities and equipment including the acquisition, titling
and improvement of school sites; educational research; acquisition/procurement of books,
instructional materials, periodicals and equipment including information technology resources and
expenses for school sports activities at the national, regional, division, district and barangay levels as
well for other DepEd related activities including co-curricular activities.
Table DS-24: Approved and Actual Utilization of Special Education Fund; Quezon City: 2015-2018
CALENDAR YEAR
APPROVED AMOUNT (P)
ACTUAL EXPENDITURE (P)
UTILIZATION RATE
2015 1,216,000,00.00 800,299,194.51 65.81
2016 1,430,000,000.00 1,136,095,770.68 79.45
2017 1,700,000,000.00 867,652,387.26 51.04
2018 1,520,000,000.00 1,341,428,749,.90 88.25
Source: Local School Board Secretariat; City Budget Department
3.4 SOCIAL WELFARE SERVICES
Social Welfare Services are provided by the City to its residents through the Social Services and
Development Department (SSDD). Beneficiaries are mostly the city’s indigent families which include
the children, youth, elderly, disabled/special groups, mendicants, women and distressed or displaced
groups. Various welfare programs and services that are being extended are as follows;
Community Welfare Program is a comprehensive social welfare service to uplift the living
conditions of the distressed and disadvantaged families and individuals to enable them to become
self-reliant, improve quality of life and actively participate in national development.

55
Welfare and Relief Program is a program for the city’s constituents who are in crises situation brought about by illness, loss of jobs, victim of natural and man-made calamities and other economic problems.
Residential and Rehabilitation Program caters to the needy and disadvantaged clients that provide custodial care and temporary shelter. These facilities are Molave Youth Home (MYH), a detention home for children in conflict with the law (CICL), the Halfway Home or “Bahay Aruga” for released CICL and other Children in Need of Special Protection (Abused, Neglected, Abandoned and Victims of Trafficking) and the Reception and Action Center (RAC) that caters to the needy and disadvantaged clients such as street children, abandoned youth and adults, neglected, abused and victims of exploitation including mendicants, vagrants and stranded.
Vocational and Skills Training Program is an integrated package of assistance to target beneficiaries that provides livelihood opportunities with Skills trainings, and other pro-poor projects to sustain the basic needs.
In 2018, the SSDD extended welfare services to 253,896 (110,721 male & 143,175 female) clients either individually, group or as families, an increase of 76,342 clients or 43% from 177,554 served in 2015. The recorded figure on the number of actual beneficiaries in 2018 however, represents more (39.33%) of the 182,215 target clientele for the year.
Majority of the total clients served for both 2015 and 2018 have availed of the Community Welfare Program. The 2018 data shows that the number of clients served on Community Welfare Program constitute 77.67% or 197,212 clients of the total clients served, followed by Welfare and Relief Rehabilitation Program with 18.75% or 47,611 clients. Vocational and Skills Training Program had 2.78% or 7,045 and the least is Residential and Rehabilitation Program with 2,028 clients or 0.80% of the total clients served (See Table DS-25).
Table DS-25 : Number of Clients Served by Type of Welfare Services; Quezon City: 2015 & 2018
Programs/Projects 2015 2018
M F T M F T
Community Welfare Program Child Welfare Program 11,864 12,109 23,973 12,149 12,072 24,221 Youth Welfare Program 4,585 3,177 7.762 3,693 3,127 6,820 Family Welfare Program 29,882 30,907 60,789 65,357 86,466 151,823 Women Welfare Program - 4,837 4,837 - 4,364 4,364 Disabled Welfare Program 5,633 4,633 10,266 1,521 1,391 2,912 Elderly Welfare Program 409 5,914 6,323 1,077 5,995 7,072 Sub-Total 52,373 61,577 113,950 83,797 113,415 197,212
Welfare & Relief Program Financial Assistance Program 6,364 6,967 13,331 2,237 2,053 4,290 Disaster Relief Program 11,170 11,159 22,329 10,192 10,027 20,219 Food for Work Program 91 200 291 75 126 201 Referrals 2,070 3,655 5,725 11,156 10,388 21,544 Special Cases 46 53 99 - - - Volunteer and Auxiliary Program 329 718 1,047 395 865 1,260 Other Collaborative Project 4,368 5,283 9,651 31 66 97 Sub-Total 24,438 28,035 52,473 24,086 23,525 47,611
Residential and Rehabilitation Program Molave Youth Home 1,137 178 1,315 1,322 134 1,456 Reception & Action Center 336 228 564 398 174 572
Sub-Total 1,473 406 1,879 1,720 308 2,028
Vocational & Skills Training Program Skills Training Program 454 6,364 6,818 879 3,975 4,854 Small Income Generating Assistance 29 308 337 172 1,062 1,234 Other Special Projects 335 1,762 2,097 67 890 957 Sub-Total 818 8,434 9,252 1,118 5,927 7,045
Grand Total 79,102 98,452 177,554 110,721 143,175 253,896 Source: Social Services Development Department (SSDD)

56
3.4.1 Early Childhood Care and Development (ECCD) Services
Under the Child Welfare Program of SSDD are two (2) major projects namely; Supplemental
Feeding and Day Care Services. Pre-school children are ages 3-5 yrs. old, enrolled in day care Centers
(DCCs), Supervised Neighborhood Play (SNP), Public and Private (Non-Government Organizations
and Peoples Organizations) Pre-schools. For SY 2017-2018 a total of 130,933 pre-school children
were enrolled representing 80.68% of the estimated 2018 pre-school age population of 162,284. This
is higher compared to 49.22% EPR in SY 2015-2016.
Of the 130,933 pre-school enrollees, 84,461 are day care children ages 3-4 years old enrolled
in various facilities. The figure represents 78.17% of the 108,053 estimated 3-4 yrs. old children in
2018 which has increased tremendously over the 53,041 enrolled day care children in 2015. The
significant increase may be attributed to the intensified tracking made by SSDD which considers not
only enrollees in the city’s DCCs and SNPs but also those from existing learning centers operated or
managed by NGOs and POs which were not available in the previous years. It appears that there are
still 23,592 unserved 3-4 yrs. old children for day care services and if computed based on the ideal
day care center-pupil ratio of 1:25 the requirement for DCCs is computed to be 2,161 DCCs and 1,351
DCCs at 1:40 in two (2) shifts.
Enrollees in the city’s day care centers alone gradually increased through the years from
92,595 in SY 2015-2016 to 130,933 in SY 2017-2018. The gradual increase in DCC enrollees can be
attributed to the SSDD’s policy of limiting enrollees to a maximum of 40 pupils per class in order for
the day care teachers to individually supervise the children with the help of day care parents. The
city is adopting the day care center classroom-pupil ratio of 1:40 in two (2) shifts/session per day,
which is below the standard ratio of 1:25 (See Table DS-26).
Table DS-26: Pre-School Enrolment by Sex, by District; QC SY-2015-2016 & SY 2017-2018
DAYCARE ENROLLEES (3-4 yrs old)
SY 2015-2016 SY 2017-2018
M F T M F T
City DCCS/SNPs
I 1,879 1,919 3,790 1,921 1,899 3,820 II 2,183 2,247 4,430 2,278 2,262 4,540 III 1,854 1,856 3,710 1,866 1,874 3,740 IV 1,834 1,871 3,705 1,756 1,739 3,495 V 2,454 2,456 4,910 2,620 2,560 5,180 VI 1,516 1,554 3,070 1,649 1,611 3,260
Sub-Total 11,720 11,895 23,615 12,090 11,945 24,035 Private pre-schools
5,236
NGOs/POs - - 24,190 - - 60,426 Total 53,041 - - 84,461
KINDER ENROLLEES (below 5 years old) Public elementary schools
I 2,127 2,027 4,154 2,583 2,369 4,952 II 3,429 3,384 6,813 4,781 4,338 9,119 III 1,400 1,405 2,805 1,773 1,660 3,433 IV 1,491 1,435 2,926 1,923 1,774 3,697 V 3,293 3,166 6,459 4,079 3,740 7,819 VI 2,080 1,959 4,039 2,634 2,427 5,061
Sub-Total 13,820 13,376 27,196 17,773 16,308 34,081

57
Private pre-schools I 941 1,150 2,091 - - - II 3,029 3,060 6,089 - - - III 841 878 1,719 - - - IV 928 1,079 2,007 - - - V 135 108 243 - - - VI 100 109 209 - - -
Sub-Total 5,974 6,384 12,358 - - - Total 19,794 19760 39,551 - - 12,391 OVER- ALL TOTAL
31,514 31,136 92,595 - - 130,933
Source: Social Services Development Department, Division of City Schools
3.4.2 Children In Need of Special Protection (CNSP)
In 2018, the number of Children in Need of Special Protection (CNSP) served was 201 (68
male and 133 female). Services rendered are in the form of Rescue/Temporary Shelter, Protective
Services/After Care and Follow ups or Monitoring.
Cases of Child Abuse
Reported victim of abused children in 2018 was 133, a decrease of 163 cases from the 296
figure in 2015. There are more female (96) abused children than male (37) in both years. Most of the
reported cases in 2018 were child custody followed by sexually abused and neglected children. The
improved level of awareness of the populace on the consequences of inflicting abuse on children as
provided for under Republic Acts 7610 and 9262 otherwise known as Anti-Child Abuse Act and
Violence against Women and Children Act encourages people to report, thus contributes in the
increase and decrease of reported cases (See Table DS-27 ).
In 2018, there were 68 children (31 male and 37 female) assessed and recommended for
issuance of Certificate for legal adoption by the Department of Social Welfare and Development
(DSWD).
Table DS-27: Reported Cases of Child Abuse by Sex; QC: 2015 & 2018
CASES 2015 2018
M F T M F T Sexual Abuse 29 70 99 4 11 15 Physical Abuse 33 29 62 5 4 9 Neglected 40 41 81 7 4 11 Abandoned 10 3 13 1 1 2 Verbal Abuse 15 6 21 0 1 1 Psychological 14 6 20 1 4 5 Child Trafficking - - - 0 2 2 Institutionalization 1 2 3 Child Custody 18 67 85 TOTAL 141 155 296 37 96 133
Source: Social Services Development Department
Unregistered Births/Registered late
The United Nations Convention on the Rights of the Child which the Philippines signed and
ratified recognizes that all children have the right to Survival, Development, Protection, and
Participation. Every child has the inherent right to life and to the needs that are most basic to

58
existence, the right to a name and nationality. Among the Child-Friendly Commitments of every
barangay is that all children should be registered at birth.
To support this, City Council Ordinance No. SP-1610, S-2005 was passed and approved
which “Provides exemption from payment of registration fees by parents or guardians whose gross
income does not exceed Sixty Thousand pesos (P60,000.00) annually in the registration of live birth of a
child with the City Civil Registry recognizing the right of the child to bear a name and status for a
lifetime and providing further penalties for the violation thereof.” The massive campaign on “Operation
Birth Right” of the City Civil Registry Department (CCRD) has encouraged every family of the
barangay to register for free the newly QC born child and unregistered children ages 31 days above
and below 18 years old.
Total birth registered for 2018 was 68,096 of which, 56,857 or 83.50% were registered on
time and 11,239 or 16.50% were late birth registration. The late registrant shows that based on the
records of the CCRD, they comprised 96.90% of the 11,598 applicants for delayed birth registration
and 359 or 3.10% were unregistered births. Some of the reasons for not registering the child would
be the inability to comply with the requirements and limited resources of parents to pursue birth
registration of their children. Other reasons for unregistered births is the lack of awareness on the
importance of registering the child’s birth not only on time but a must, to establish identity of the
child and avoid the hassle of securing birth certificates when the child starts schooling.
Cases of Child Labor
Child Labor refers to any work or economic activity performed by a child that subjects
him/her to any form of exploitation or is harmful to his/her health and safety or physical, mental or
psychosocial development. These children are below 17 years old who often worked to help support
their families, deprived of their childhood and forced to forgo education. In accordance and in
support of Republic Act No. 9231, or the Elimination of the Worst Forms of Child Labor, the city
government has passed Ordinance No.SP-784 which penalizes the owner or operators of any
business and/or entertainment establishment in Quezon City for hiring/employing children and
minors. Likewise, Ordinance No.SP-1594, S-2005 which prohibits the employment of minors below
fifteen (15) years of age in public and private undertakings within the territorial jurisdiction of
Quezon City.
In the 2014 survey conducted by DOLE in the National Capital Region (NCR), result shows
that there were 1,075 child laborers exclusive those at risk victims or in hazardous workplace from
the city’s 26 barangays. The PIC reclassified these child laborers into two types such as; Formal and
Informal employment. Formal employment includes; the batang kasambahay, factory worker,
gasoline boy, carwash boy and construction workers while those in the Informal employment are the
vendors, scavengers, parking boys, barkers, kargador and freelance sex workers.
Out of the 1,075 reported baseline data of DOLE on child labor cases, there were still 222
child laborers who were not provided with intervention programs in 2017. Thus, the city
government through the QC Program Implementation Committee (QCPIC) on Child Laborer has
conducted various programs and activities to benefit the remaining child laborers. In 2018, there
were ninety one (91) child laborers who participated in the Project Angel Tree and they were
provided with bags, toys and foods. Successively, forty (40) child laborers joined the Lakbay Aral at
Pag-asa Weather Forecast, Planetarium, PHILVOCS and Presidential CAR Museum while, there were
eighty five (85) children given school supplies and groceries. The remaining six (6) children were not
provided with necessary interventions since their families were relocated to other cities.

59
3.4.3 Youth Welfare Services
In 2018, there were 6,820 youth ages 6-17 years old (3,693 male & 3,127 female) that
availed the services under Youth Welfare Program. The figure is lower compared to 7,762 in 2015.
The decrease maybe attributed due to the city’s constant advocacy campaign on the existing national
and local laws pertaining to children.
Under RA 9344 otherwise known as the Juvenile Justice and Welfare Act, Youth Offenders
below 15 years of age are released to the custody of parents or guardians or to a responsible welfare
agency and given proper interventions. The detention facility is the Molave Youth Home (MYH)
which serves as a residential and rehabilitation center or a halfway house for children in conflict with
the law (CICL), for both male and female ages 15 to 17 years old who committed crimes and arrested
within the vicinity of QC regardless of their residence. It aims to provide temporary secure custody
and care for youth offenders while undergoing trial.
For 2018, there were 616 reported cases of youth offenders under RA 9344, a decreased of
more than half or 53.71% from 1,147 cases in 2015. Majority, 562 are male and 54 are female.
Programs and services rendered to CICL clients include social/treatment, homelife, medical, values
and spiritual formation, vocational/skills training, non-formal education and various recreational
and cultural services.
Other youth served by the SSDD includes; thirty-one (31) youth with behavioral problems
(22 males and 9 females), street children served were 813 (504 male and 309 female). There was a
huge increase of 551 from the 262 served in 2015 as well as abused youth with an increase of 288,
from the 125 served in 2015 to 413 in 2018 (See Table DS-28 ).
Table DS-28: Number of Youth (6-17 Years Old) Served by Type; QC: 2015 & 2018
TYPE CHILDREN/YOUTH
2015 2018 MALE FEMALE TOTAL % MALE FEMALE TOTAL %
Street Children 192 70 262 9.19 504 309 813 33.21
Out-of-School Youth 633 611 1,244 43.63 383 192 575 23.49
Youth Offenders under RA 9344/CICL
1,008 139 1,147 40.23 562 54 616 25.16
Youth with Behavioral Problems
49 24 73 2.56 22 9 31 1.27
Abused Youth 74 51 125 4.39 230 183 413 16.87
TOTAL 1,956 895 2,851 100.00 1,701 747 2,448 100.00
Source: Social Services Development Department
3.4.4 Women in Especially Difficult Circumstances (WEDC)
A total of 4,364 women were served under the Women Welfare Program in the form of
rescue, provision of temporary shelter, case management and capability building services. A total of
3,564 women were given capability services and 500 are reported incidence of WEDC.
The 500 reported incidence of WEDC in 2018, showed significant decrease of 135 cases from
the 635 reported cases in 2015. The decrease may also be partially brought about by an intensive
information dissemination on RA 9262 (Violence against Women and Children Act), RA 9208 (Anti-
Trafficking in Persons Act), RA 7877 (Anti-Sexual Harassment Act) and others. The reported number
of WEDC cases showed that violence against women has the highest with 290 or 58%, followed by

60
victims of prostitution 110 or 22%, 75 or 15% are victims of trafficking and 25 or 5% are abused
kasambahay. (See Table DS-29)
Table DS-29: Reported Number and Incidence of Women in Especially Difficult Circumstances; QC: 2015 & 2018
WOMEN CASES 2015 2018
NUMBER PERCENT NUMBER PERCENT
1. VAWC 290 58.00
Physically / Verbally Abused
260 41.00 - -
Sexually Abused 17 2.67 - -
Emotionally & Psychologically Abused
143 22.51 - -
Economically Abused 94 14.80 - -
2. Victims of Prostitution 50 7.87 110 22.00
3. Victims of Trafficking 60 9.44 75 15.00
4. Abused Kasambahay 5 0.78 25 5.00
5. Victims of Illegal Recruitment
3 0.47 - -
6. Unwed Pregnant women 3 0.47 - -
TOTAL 635 100.00 500 100.00
Source: Social Services Development Department
3.4.5 Persons with Disabilities (PWDs)
The estimated number of persons with disabilities in 2018 was 30,406. There were
more female differently abled persons (15,419) than male (14,987). Of the figure, only
2,912 or 9.58% were served by SSDD. Type of disability of the persons served includes;
psychological, mental, physical and orthopedically handicap, hearing and speech, visual
disabilities and multiple disability. Learning disability are the most number of PWDs served
with 649 cases or 22.29% of the total number of PWDs served, followed by Physical or
Orthopedically handicapped persons 639 or 21.94%, Hearing/Speech Impairment 515 or
17.69%, visual disability 448 or 15.38%, psychological disability with 416 cases or 14.29%,
multiple disability with 160 or 5.49% and mental disability with 85 or 2.92% of the total
PWDs served.
Types of services provided include Case Management, Capability Building Program,
Educational Assistance and Community Based Rehabilitation (CBR). Out of the 2,912 PWDs
served, 2,037 were provided with Capability Building Program, 503 for Case Management,
200 persons with disability were benefitted with Educational Assistance while there were
172 PWDs served under the CBR. (See Table DS-30)

61
Table DS-30: Number of PWDs Served by Type of Disability and Reported Cases of Abandoned/Neglected PWDs by Sex; QC: 2018
TYPE OF
DISABILITY
Types of services provided
TOTAL
PERCENT Case Management
Capability Building
Educational assistance
Community Based
Rehabilitation Psychological Disability
91 325 - - 416 14.29
Mental 40 41 4 - 85 2.92
Learning Disability 90 407 80 72 649 22.29
Visual Disability 69 366 10 3 448 15.38
Physical/Orthopedic Disability
101 427 50 61 639 21.94
Hearing/Speech Impairment
80 387 40 8 515 17.69
Multiple Disability 32 84 16 28 160 5.49
TOTAL 503 2,037 200 172 2,912 100
Source: Social Services Development Department
The Disabled Persons Affairs Committee (DPAC) was created thru City Ordinance No. SP-158,
S-94 in recognition of the need to more active participation and involvement of disabled persons in
the formulation of policies that would affect their lives. In 2002, the Disabled Persons Affairs Office
(DPAO) now known as Persons with Disability Affairs Office (PDAO) was made functional thru the
City Council Ordinance No. SP-1141, S-2002, which provides for the structural and functional
reorganization of the DPAO to be created in lieu of DPAC.
The issuance of PWD IDs is being handled by PDAO as part of their functions and
responsibility and extends various programs to city’s PWD constituents as follows; Capacity Building
Program, Advocacy and Monitoring, Resource generation and Partnership-Building, Linkages and
Referrals.
3.4.6 Older Persons (OPs)
The elderly population is among the vulnerable group in Quezon City that is in need of special
attention and protection. In order to enjoy the senior citizens twilight years, the government
programs for the elderly have been expanded to include projects that will enable them to interact
with their peers, articulate their needs, express their interests and participate in developmental
undertakings.
The following are the benefits and privileges as cited under Section 4 of Republic Act 9994
otherwise known as Expanded Senior Citizens Act of 2010 “An act Granting Additional Benefits and
Privileges to Senior Citizens, Further amending RA 7432 of 1992 as amended by RA 9257 of 2003”;
Free medical and dental services, diagnostic and laboratory services in all government facilities;
20% discount for medicines;
20% discount in hotels, restaurants, recreation centers;
20% discount in theaters, cinema houses and concert halls;
20% discount in medical/dental services, diagnostic and laboratory fees in private facilities;
20% discount in fare in domestic air, sea, travel and public transportation;
5% discount in basic necessities and prime commodities;

62
12% VAT exemption on the purchase of goods and services which are entitled to the 20%
discount;
5% discount for the monthly utilization of water and electricity provided that the water and
electricity meter bases are under the name of the senior citizens;
Exemption from the payment of individual income taxes of senior citizens who are considered to
be minimum wage earners in accordance with RA No. 9504;
Exemption from training fees for socio-economic programs;
DOH shall administer free vaccination against the influenza virus and pneumococcal disease for
indigent senior citizen patients;
Educational assistance to senior citizens to pursue postsecondary, tertiary, post tertiary,
vocational and technical education, as well as short term courses for retooling in both public and
private schools;
The continuance of the same benefits and privileges given by the GSIS, SSS and the PAG-IBIG , as
the case may be, as are enjoyed by those in actual service;
Provision of express lanes for senior citizens in all commercial and government establishments; in
the absence thereof, priority shall be given to them; and
Death benefit assistance of a minimum of Two Thousand pesos (Php2,000.00) shall be given to
the nearest surviving relative of a deceased senior citizen
Aside from the aforementioned elderly benefits and privileges, the city has passed various
City Ordinances and Resolutions for the advantage of the city’s elderly. Among these include:
Ordinance No. SP 1986, S-2009 - An Ordinance giving due recognition and reward to city
residents aged 100 years or more as part of the city’s effort to support senior citizens.
Resolution No. SP 4629, S-2009 – A resolution urging all cinema operators in QC to grant free
admission to all senior citizens of the city every Monday & Tuesday of all films shown in their
establishment.
Ordinance No. SP-2370, S-2014 – “An ordinance amending Ordinance No. SP-1986, S-2009 by
bestowing the title of ‘Centenarian Citizens’ to the residents of Quezon City reaching the age of
One Hundred (100) years old, and increasing their corresponding financial rewards to fifty
thousand pesos (P50,000.00), as additional cash incentive”
Ordinance No. SP-2472, S-2015 - “ An ordinance exempting all senior citizens of QC from the
payment of initial rate for parking fees in establishments, malls, hospitals parking areas or any
other similar places charging the same situated within the territorial jurisdiction of the city &
providing penalties for violations thereof”.
Ordinance No. SP-2544, S-2016 – “An ordinance granting death benefit welfare assistance in the
amount of at least five thousand pesos (Php 5,000) to the bereaved families of registered resident
senior citizens of Quezon City”
The city’s estimated number of persons 60 years old and over in 2018 is 203,553 (85,221
male and 118,331 female). The Office of the Senior Citizens Affairs Office (OSCA) has issued a total of
536,213 senior citizens card from 1993-2018. The figure however, may include cases of lost cards
that were replaced and also deceased elderly. There is also the problem of inability to track down
their present status.

63
The SSDD on the other hand has served about 7,072 elderly (1,077 male & 5,995 female)
senior citizens under their Elderly Welfare Program. Reported number of older persons needing
special attention increased from 53 cases in 2015 to 61 in 2018. There were (30) reported cases of
abandoned elderly, 27 neglected and 4 maltreated elderly (See Table DS-31).
Table DS-31: Reported Cases of Older Persons in Need of Special Attention
By Sex; QC: 2015 & 2018
CASES 2015 2018
MALE FEMALE TOTAL MALE FEMALE TOTAL Abandoned 7 9 16 9 21 30
Neglected 16 20 36 7 20 27
Maltreated - 1 1 2 2 4
TOTAL 23 30 53 18 43 61
Source: Social Services Development Department
3.4.7 Families
A total of 151,823 families have availed of the Family Welfare Program in 2018. Of this, 4,657
were served under the Solo Parent services. More female solo parents (4,433) were served than male
(224). PhilHealth IDs were issued to 46,047 indigent families (26,284) male household heads and
(19,763) female household heads.
The city is included in the Pantawid Pamilyang Pilipino Program (4Ps) or Conditional Cash
Transfer Program of the Department of Social Welfare and Development (DSWD) since 2008. This is
a poverty reduction strategy that is a right based program and focuses on human capital investment
through provision of health and education cash grants to eligible poor households. Its aim is to
enable the poor households meet certain human development goals and break the intergenerational
cycle of poverty through investment in human capital (health, nutrition and education).
The provision of cash grants is conditional upon the compliance of the beneficiaries with the
conditionality of the program with specific verifiable behaviors such as pregnant women undergoing
preventive health check-ups, children 0-5 years old undergoing growth monitoring and receiving
vaccinations, and children aged three to fourteen years old enrolled in day care, kindergarten,
primary and secondary and alternative delivery modes of education maintaining at least an 85%
attendance.
As one of the various social assistance programs that have been patterned from Latin
American and other developing countries, Pantawid Pamilya contributes to the improvement of
attendance of children in school, improve maternal and child health and nutrition and in preventing
child labor.
For 2018, there were 129 barangays or 90.84% covered by the Pantawid Pamilyang Pilipino
Program out of the city’s 142 barangays. These were the barangays identified with families below
poverty threshold through a Proxy Means Test (PMT) done by DSWD. Table DS-32 below shows that
all barangays in District II (5 bgys.), District V (14 bgys.) and District VI (11bgys) were covered by the
program. The rest of the districts covered barangays are as follows: 32 Barangays from District I out
of 36 barangays, 33 out of 37 barangays in District III and 34 barangays in District IV out of 38
barangays.

64
Table DS-32 Number of Barangays by District Covered by Pantawid Pamilya Pilipino Program; QC: 2018
District No. of Barangays No. of Barangays covered by 4PS
I 37 32 II 5 5 III 37 33 IV 38 34 V 14 14 VI 11 11
TOTAL 142 129 Source: Social Services Development Department
There are 36,555 4Ps partner-beneficiaries from 2008-2018 in eight (8) sets or batches, Set 6
in 2013 has the highest registered beneficiaries with 21,327 or 58.34% of the total beneficiaries
while the lowest registered Pantawid Pamilya Members is from Set 2 in 2009 with 105 beneficiaries.
(See Table DS-33)
Table DS-33: Number of Pantawid Pamilya Beneficiaries Per district/Set; QC: 2008-2015
District
Sets/Year
TOTAL 2008
Set 1 2009 Set 2
2010 Set 3
2011 Set 4
2012 Set 5
2013 Set 6
2014 Set 7
2015 Set 8
I 11 6 10 803 50 2,738 977 75 4,670
II 1,119 44 53 808 133 7,170 1,323 25 10,675
III 9 4 6 505 19 2,001 524 38 3,106
IV 19 10 9 1,128 58 2,383 1,192 14 4,813
V 29 27 23 2,604 84 3,072 1,846 146 7,831
VI 16 14 19 291 51 3,963 1,081 25 5,460
TOTAL 1,203 105 120 6,139 395 21,327 6,943 323 36,555
Source: Social Services Development Department
3.4.8 Social Welfare Facilities
Social welfare services for various sectors were extended by SSDD to its clients in the
following welfare service facilities: 296 day care centers in 2018, an increase of 2 DCCs from 294 in
2015; 24 Supervised Neighborhood Play (SNP); 10 Night Minding Centers and/or Micro-Geo Net in
various barangays specifically, at Bgys. Paang Bundok, Project 6, Batasan Hills, Quirino 3-A, Loyola
Heights, Libis, Dona Imelda, Fairview, Novaliches Proper, and Tandang Sora. These centers were
established to provide temporary shelter/care to children aged below nine years old whose parents
are working/vendors at night and rescued street children; 2 Community Based Therapeutic
Rehabilitation Centers for PWDs; 1 QC Women Crisis Center located at the QCGH which is a one-stop
shop; 1 Reception and Action Center; 1 Molave Youth Home currently being constructed at Diamond
Hills, Bgy. Payatas; 1 Senior Citizens Day Center; 1 Drug Treatment & Rehabilitation Center
(TAHANAN) and 1 Halfway Home or “Bahay Arugaan” for children in need of special protection
particularly abandoned and neglected children located at P. Bernardo Park, Bgy. Kamuning

65
3.4.9 Other Welfare Institutions/Organizations
There were 32 registered non-government organizations providing welfare services in the
city compared to 46 in 2007. The decreased is due to inability to renew accreditation with DSWD on
their license to operate.
Majority of the programs/services of these welfare agencies are community based especially
in the city’s informal settlements in close coordination with the barangay and community leaders of
target areas. Activities/services are being undertaken either in barangay halls, health centers, multi-
purpose halls and other facilities.
3.5 HOUSING
3.5.1 Introduction
By population, Quezon City is the largest city in the country. The Philippine Statistics
Authority (PSA) census of 2015 showed that there were 2,936,116 people living in the city. With a
growth rate of 1.17%, the population was estimated to be 3,040,672 in 2018 and is expected to
grow to 3,076,345 in 2019. High population results to problems like poverty, unemployment,
urban blight, traffic congestion, high solid waste generation, inadequate health and educational
facilities, and housing shortage. Urban governance in the City is faced with the huge challenge of
matching the growth in population with corresponding growth in basic services and facilities, given
the limited amount of resources at its disposal. The challenge is even made difficult by the fact
that approximately 31% of the population is poor, that sector most in need of assistance to
improve their quality of life.
Section 9 (Urban Reform and Housing), Article XIII (Social Justice and Human Rights) of the
1987 Philippine Constitution provides that, "The state shall, by law, and for the common good,
undertake in cooperation with the private sector, a continuing program of urban land reform
and housing which will make available at affordable cost decent housing and basic services to
underprivileged and homeless citizens in urban centers and resettlements areas. It shall also promote
adequate employment opportunities to such citizens. In the implementation of such program the State
shall respect the rights of small property owners."
Decent housing, according to the PSA, are housing units with permanent roofing material,
strong outer walls and has a security of tenure.
The 2010 PSA survey showed that the proportion of occupied housing units with outer walls
made of concrete/brick/stone increased from 46.2% in 2000 to 67.2%. Those with outer walls made
of half concrete/brick/stone and half wood decreased from 32.3% in 2000 to 21.8% in 2010.
Meanwhile, majority (89.2%) of the occupied housing units in 2010 had roof made of galvanized
iron/aluminum, which is higher than the proportion of 77.7% recorded in 2000.
As prescribed in the Implementing Rules and Regulations (IRR) of PD 957 and Batas Pambansa
220 (BP 220) (amended per Board Resolution No. 824, S-2008), the minimum lot and floor area
requirements (in sq. m.) for the types of housing unit and the housing project is presented in the
table below:

66
Table DS-34 Shelter Component Minimum Lot Area (LA) & Floor Area (FA) (sq. m.)
TYPE OF HOUSING UNIT PD 957 BP 220
OPEN MARKET MEDIUM COST ECONOMIC SOCIALIZED LA FA LA FA LA FA LA FA
Single Detached 120 42 100 30 72 22 64 18
Duplex/Single Attached 96 42 80 30 54 22 48 18
Row House 60 42 50 30 36 22 28 18
Source: Housing & Land Use Regulatory Board (HLURB)
Note:
1. Saleable lots designated as duplex/single attached and/or row house lots shall be provided with housing components.
2. Price of saleable lots intended for single detached units shall not exceed 40% of the maximum selling price of the house and lot
package.
3. Mandatory provision of firewall for duplexes/single-attached units and at every unit for row houses.
4. The number of row houses shall not exceed 20 units per block/cluster but in no case shall this be more than 100 meters in
length.
The minimum floor area (FA) requirement (in sq. m.) per type of housing project are the same
for all types of housing units.
Affordable housing, on the other hand are housing units with the most reasonable price based
on the needs and financial capability of Program beneficiaries and appropriate financing schemes.
It should not exceed 30% of the HH income spent on housing and utilities.
Urban housing is the single most visible problem in the city as it involves the use of exposed
physical resources which are land and the dwelling structure. The urban poor consisting of informal
settler families (ISFs) and slum dwellers and tenants in low-cost but poor rental dwelling units
contribute immensely to the city’s housing backlog. Existing government shelter programs cater
mostly to ISFs. The tenants and renters in apartments and low-cost but poor rental units are usually
neglected despite the fact that they spend a considerable portion of their income on rents; refraining
from squatting and keeping their tenurial status legitimate while also aspiring to have housing of
their own. Aside from them, new households being formed every year expand the sector in need of
shelter. The Local Government Code of 1991 (RA 7160) provides the statutory framework for the
devolution of local public administration and service delivery responsibilities as well as revenue
mobilization powers to LGUs. The Urban Development Housing Act of 1992 (UDHA or RA 7279)
requires LGUs to provide socialized housing and other mass dwellings especially for the poor and
underprivileged.
3.5.2 Current State of Housing in Quezon City
Households & Occupied Dwelling Units
The PSA survey made in 2010 indicated that there were 634,346 households occupying
609,830 dwelling units. This translates to a ratio of 104 households for every 100 occupied housing
units. Average household size was 4.3 persons which is lower than the average household size of
4.8 in 2000. In 2015, the number of PSA survey was 683,126 and the number of occupied dwelling
units was 656,689. In 2018, the estimated total number of households was 707,133 while the total
number of dwelling units was 679,936. (Refer to Figure DS-1)

67
1 2 3 4 5 6 7
Year 1990 1995 2000 2007 2010 2015 2018
Households 332,283415,788480,624594,832634,346683,126707,133
Dwelling Units 305,807355,443447,369571,812609,830656,689679,936
0
100000
200000
300000
400000
500000
600000
700000
800000
No
. of
Ho
use
ho
lds/
Dw
ellin
g U
nit
s
Figure DS-22: Comparative Number of Households
& Occupied Dwelling Units; Quezon City: 1990-2018
It is to be noted that forty-seven percent (47%) of the 634,346 households owned or
amortized the lots they occupied, higher than the 2000 survey at 36.3% of the 480,624 households.
Moreover, 30.8% of the households rented the lots they occupied, 12.1% occupied lots which were
rent-free and with consent of the owner while 8.5%, 53,943 HH or 231,955 persons are
informal settlers occupying lots which were rent-free but without the owner's consent. (Refer to
Figure DS-23)
Figure DS-23: Number of Households by Tenure Status of the Lot: Q.C. 2010
Owned
47%
Rented
31%
Rent-free with consent
12%
Rent-free without consent
8%
not reported
0% Not
Applicable
2%
Source: Philippine Statistics Authority (PSA)

68
Doubled-up Households
Doubled-up household exists when one swelling unit is shared by 2 or more households. In
2018, it is estimated that the number of households is 707,133 while the number of occupied
dwelling units is 679,936. By these figures alone, the doubled-up households is determined to be
27,197, not considering the fact that many of the existing dwelling units are already in a state of
deterioration, needing either improvement or total replacement.
Homeless
These are individuals or households living in parks, along sidewalks, and all those without any
form of shelter.
Using a factor of 0.1% (0.001) of the total household population, it is estimated that there are
707 homeless people in the city. Each homeless is counted as one household to be provided with
housing.
Unacceptable and Makeshift Dwelling Units
“Unacceptable housing units” is defined as 5% of housing units made of “mixed materials”
which on the other hand is defined as housing units with walls and roofs made of wood,
cogon/nipa/anahaw, asbestos and others. The PSA data show that the number of this type of
housing in QC is diminishing by 9.14% annually since the materials are not grown and they are
commonly used in the rural areas where they are easily harvested. The makeshift housing units
were likewise decreasing by 8.52%. According to the PSA data of 2010, the city had a total number of
only 13 unacceptable housing units and 2,596 makeshift/salvaged/impoverished housing units. By
2015, all these types of dwellings number only a total of 1,110 units.
Informal settlers
A large section of the city population in need of
adequate shelter consists of informal settlers
occupying idle, public and private lands. Public lands
consist of parcels owned by different government
agencies, designated open spaces, road right-of-ways,
aqueducts, and danger areas like dumpsites and
easements of transmission lines, rivers and creeks.
Relocation is the only intervention option for those in
danger zones and sites for government infrastructure
projects as provided by UDHA.
The results of the census-survey done by the Housing
Community Development and Resettlement
Department (HCDRD) (formerly Urban Poor Affairs
Office - UPAO) as a continuing activity showed the
number of ISFs to be increasing from 2008 to 2010. A
decreasing trend however was observed from 2011-
2013, mainly attributed to massive relocation
activities for ISFs occupying danger areas particularly
river and creek easements affected by flooding and the
clearing of the list and database of ISFs by HCDRD.
There was a significant increase of ISFs residing in
Danger Areas/Waterways/Infrastructure from 2011 to 2015, factors of which are the following: In-
ISF Map

69
migration (transfer within the City from one barangay to another); Natural Growth (Birth)and other
supervening and unavoidable circumstances. The number of ISFs in these areas then decreased from
2015 to 2018.
In 2014, there was a slight increase in the total number of ISFs, but, a significant decrease was
observed from 2015 to 2018. The number of ISFs in 2014 increased to 195,875 housed in 155,184
structures. Actual census in 2015 covered 194,736 ISFs housed in 153,892 structures, a decrease of
1,757 ISFs from 2014 census survey. In 2016, the number of ISFs decreased to 193,403 housed in
155,780 structures. It further decreased in 2017 and 2018, to 190,718 and 188,549 ISFs,
respectively. (See Table DS-35)
Table DS-35: Number and Percent Distribution of Informal Settler Families
in Quezon City by District:2012-2015
Source: Housing Community Development & Resettlement Department (HCDRD)
In contrast to the census data in July 2010 which was exclusively conducted by HCDRD (then
UPAO), the subsequent census data were culled from the consolidated census reports of HCDRD and
other local and national government agencies.
Their needs are in terms of resettlement or on-site upgrading through any of a combination of
tenurial and/or infrastructural upgrading (145,181) and structural improvement (9,828). (Refer to
Table DS-28)
Source: HCDRD
Figure DS-25: Number of Informal Settler Families (ISFs) & Structures in Q.C. (2010-2018)
2010 2011 2012 2013 2014 2015 2016 2017 2018
No. of ISFs 232,43 230,69 195,28 190,70 196,31 195,81 193,40 190,71 188,54
No. of Structures 188,39 179,76 146,59 150,59 155,90 155,18 153,89
-
50,000
100,000
150,000
200,000
250,000
District 2012 2013 2014 2015
No. % No. % No. % No. % I 24,882 12.81 25,248 13.24 27,689 14.14 28,436 14.60 II 53,849 27.72 49,468 25.94 51,887 26.49 52,308 26.86 III 20,191 10.39 19,882 10.42 20,080 10.25 19,355 9.94 IV 31,334 16.13 31,673 16.61 31,289 15.97 29,319 15.06 V 30,189 15.54 30,385 15.94 28,777 14.69 28,314 14.54 VI 33,842 17.42 34,050 17.85 36,153 18.46 37,004 19.00
TOTAL 194,287 100.00 190,706 100.00 195,875 100.00 194,736 100.00

70
At the district level, for both 2014 and 2015, the bulk of ISFs are in District II representing
26.49% and 26.86% respectively, of the total ISFs in the city, followed by Districts VI and IV (Refer to
Table DS-26). However from 2016 to 2018, there was no data disaggregation on the distribution of
ISFs per district.
Considering the magnitude of ISFs, majority 90,778 families or 48.14% are occupying private
properties, 43,368 families or 23.00% in danger areas and government infrastructures, while
54,403families or 28.86% are within government lots, government projects (including the declared
area for priority development (APD) sites)and some open spaces.
Table DS-36 shows the magnitude of informal settlers in the city by area classification and the
possible interventions with which to address the problem.
Table DS-36: Magnitude of Informal Settler Families by Area Classification Quezon City, 2010-2018
Area Classification
Year
Location 2010 2011 2012 2013 2014 2015 2016 2017 2018 1.a. Danger Areas
Waterways 11,000 10,649 14,181 16,358 16,441 15,577 14,313
44,450
43,368
Transmission Lines
3,100 4,483 7,895 7,895 7,895 7,895 7,472
Dumpsite 1,150 953 907 907 907 907 907
Under The Bridge 532 745 693 693 732 710 710
Landslide zone 0 0 296 296 296 296 296 1.b. Government
Infrastructures
Sidewalk 1,923 2,878 2,634 2,567 2,840 2,534 2,534
RROW / Road lot 1,247 6,365 9,554 5,760 6,504 6,743 6,354
MNTC / Republic Ave.
0 0 0 3,667 3,806 3,806 3,806
MWSS 222 5,767 5,749 7,506 10,841 10,842 10,085
2. Government Properties
80,779 77,581 34,453 34,203 34,325 35,426 36,831 36,831 36,179
3. Government Projects
1,813 818 769 1,182 2,784 2,638 2,563 2,563 2,563
4. Area for Priority Development (APD)
14,767 14,846 14,715 14,715 14,715 13,269 13,269 13,269 13,269
5. Open Space 2,663 2,663 2,658 2,974 3,005 2,392 2,392 2,392 2,392
6.Private properties 101,320 102,946 100,783 91,983 90,784 91,701 91,871 91,213 90,778
Grand Total 232,430 230,694 195,287 190,706 195,875 194,736 193,403 190,718 188,549
Source: Housing Community Development & Resettlement Department (HCDRD)
Legend: DP - displaced
TU - Tenurial Upgrading

71
Dwelling Units Needing Improvement
Structures needing improvement due to deterioration and obsolescence are also considered in
determining the city’s total housing requirements. Based on a factor of 2% of the total housing stock
(excluding the informal settlers), there are about 9,800 housing units needing improvement.
Summary of Shelter Needs
In summary, the city needs a total of 123,000 new housing units for all segments of the
population arising from the current housing backlog and population growth. The other requirements
come from 9,800 households of the population excluding the informal settlers whose structures
need improvement and from the remaining 145,181 ISFs occupying lands not for clearing yet. A mix
of upgrading options like stabilization of land/housing tenure and improvement of infrastructure
facilities and structures is intervention required for these big bulk of ISFs. (See Table DS-37)
Table DS-37: Summary of Shelter Needs (2018-2023)
Shelter Needs Present
Needs (2018)
Future Needs
(2019-2023) Total
New Housing Units Due To
Housing Backlog
Doubled-up households
Unacceptable housing units
Homeless
Displaced Units
27,197
1,110
707
43,368
27,197
1,110
707
43,368
Sub-total 72,382 72,382
Formation Of New Households 50,642 123,024
Total 77,539 50,642 123,024
Upgrading Needs
Structural (2% of formal
population)
9,828
Tenurial/infrastructural 145,181
3.5.3 Sources of Housing Supply and Tenure Types
Open Market
Condominiums
Investing a condominium unit in Quezon City is a lucrative decision, personally and financially.
Most developments in the city are located in or near key districts, and neighboring shopping centers,
such as in Cubao and North Avenue, providing residents easy access to anything and everything they
need for daily living and leisure. Other key locations are near schools, such as in Katipunan Avenue
and Diliman.
Today, more and more people are opting to choose the condominium lifestyle as it is perceived
to be the most practical, especially in highly urbanized areas. These high-rise residential buildings
offer recreational amenities, such as swimming pools, gyms, day care centers, landscaped gardens
and 24-hour security. Flats are also flood-free and earthquake-proof as these buildings have to pass

72
certain standards that ensure its safety amidst any possible natural occurrences. While most
students rent a condo or a room in a dormitory for the duration of their stay, families and newly
married couples buy units in preparation for the long-term education of their children. For
enterprising individuals, buying a condo in these areas also mean continuous occupancy (continuous
income) because of the high demand.
From 2014 to 2018, the City Planning & Development Office has issued a total of 37 Locational
Clearances (LC) for condominium projects, with Districts 3 and 4 having the same number of LCs
issued with 11, while District 2 has none. In 2018, thirteen (13) LCs for condominium projects were
issued.
Table DS-38-A: Number of Locational Clearances Issued for Condominium Projects in Quezon City (2014-2018)
Year Locational Clearances Issued
Total DIST. 1 DIST. 2 DIST. 3 DIST. 4 DIST. 5 DIST. 6
2014 1 0 3 5 0 1 10 2015 4 0 2 1 1 1 9 2016 0 0 0 1 0 1 3 2017 0 0 0 1 0 1 2 2018 5 0 4 4 0 0 13
TOTAL 10 0 11 11 2 3 37 Source: Zoning Administration Unit, City Planning & Development Office
Table below shows the list of selected condominiums in Quezon City, the features, floor area
and its price per unit.
Table DS-38-B: List Of Selected Condominiums in Quezon City
Name of Condominium / Location Features Price
(PhP M) FA
(sq. m.)
DMCI Homes / E. Rodriguez cor T. Morato Ave., Bgy. Laging Handa 2 BR, 1 T&B 4.67 56
Zinnia Towers / EDSA Munoz, Bgy. Apolonio Samson 3 BR, 2 T&B 5.43 75
Columbia Garden / Bgy. Batasan Hills 4 BR, 3 T&B 6.50 113
Victoria Towers 2 / Timog cor Panay Ave., Bgy. Pinagkaisahan 2 BR, 1 T&B 2.98 41
Zinnia Towers North Tower / Katipunan Avenue 1 BR, 1 T&B 2.96 42
Penthouse Condo / Tandang Sora & Katipunan Ave. 2 BR, 1 T&B 4.40 56
Manhattan Plaza Tower 1 / Araneta Center, Cubao Bgy. Socorro 2 BR, 1 T&B 12.20 105
Amaia Skies Cubao / EDSA cor. P/ Tuazon Ave., Bgy. Socorro 1 BR, 1T&B 2.20 27
Eastwood Legrand 1 / Eastwood City, Bgy. Bagumbayan 1 BR, 1 T&B 5.50 42
Phinma Properties Midrise Condo / Novaliches, QC 1 BR, 1 T&B 1.39 30
Avida Towers New Manila / Boni Serrano Ave., Bgy. Bagong Lipunan ng Crame
2 BR, 1 T&B 3.80 46
Redwoods Condo, DMCI Homes / Quirino Highway, Novaliches 2 BR, 1 T&B 4.50 56.5
One Orchard Condominium / Bgy. Libis 1 BR, 1 T&B 5.00 57
Capitol Plaza Condo / Matalino St., Diliman, QC 1 BR, 1 T&B 2.65 27
Hacienda Balai / Zabarte Rd., Novaliches QC 1 BR, 1 T&B 1.14 30
Francesca Royale Condo / Bgy. Alicia 1 BR, 1 T&B 1.88 26
Trees Residences / Bgy. Pasong Putik, Novaliches 2 BR, 1 T&B 2.29 30
Francesca Royale Condo / Mindanao Ave., Novaliches QC 1 BR, 1 T&B 2.73 41
Source: Lamudi, Philippines

73
Townhouses
The city has a large number of registered residents, and this number is steadily increasing. Its
large landscape however, allows for everyone to be accommodated. It has also allowed for a diverse
real estate market. Townhouses for sale in Quezon City are just one of the many options, and are the
most recommended property type for new residents of the city.
Townhouses are significantly more affordable than traditional house and lots, but still allow
residents to enjoy the same sense of privacy and security of having their own home. While priced
closely to modern condominiums, they offer more room, and are more suitable for families. Similar to
condos however, they are located closer to business districts than traditional houses.
A townhouse is always readily available in the city. Notable areas where one should look for a
Quezon City townhouse for sale are in the following:
Teachers Village and U.P. Village in Diliman
Katipunan Avenue
Batasan Hills, BF Homes QC, and Filinvest 1-2 in Commonwealth Avenue
Cubao
Timog Avenue and the Scout Areas
Novaliches
New Manila
Buyers will be pleased to know that the city offers many housing options within a wide range of
prices are available in the city. Homes within the subdivisions in Tandang Sora are being sold from
PhP7.50 M to 9.80 M. Those within Commonwealth Avenue are being sold for PhP5.50 M and
PhP6.78 M, respectively. For the truly affordable, there are townhouses in the Novaliches area that
are being sold for less than PhP 5.0M while high-end townhouses in the Scout area are being sold for
PhP25.0 M more or less.
From 2014 to 2018, the City Planning & Development Office has issued a total of 705 Locational
Clearances (LC) for townhouse projects, with Districts 5 having the most number of LCs issued with
345, while District 3 has the least, with 36. In 2016, three hundred fifteen (315) LCs for townhouse
projects were issued.
Table DS-39-A: Number of Locational Clearances Issued for Townhouse Projects in Quezon City (2014-2018)
Year Locational Clearances Issued
Total DIST. 1 DIST. 2 DIST. 3 DIST. 4 DIST. 5 DIST. 6
2014 5 9 2 3 4 6 29 2015 20 14 5 11 47 51 148 2016 26 20 19 19 207 24 315 2017 29 10 6 16 48 24 133 2018 13 1 4 5 39 18 80
TOTAL 93 54 36 54 345 123 705 Source: Zoning Administration Unit, City Planning & Development Office

74
Table DS-39-B: List of Selected Townhouses in Quezon City
Name of Townhouse / Location Features Price
(PhP M)
Floor Area
(sq. m.) RFO Townhouses, Kathleen Place (near TV5), Novaliches, QC 3 BR, 3 T&B 4.59 104
2-sty. Townhouse, Project 8, Bgy. Bahay Toro 3 BR, 3 T&B 6.90 120
4-Car Garage New Manila Townhouse / New Manila, QC 4 BR, 4 T&B 45.50 510
4-sty. Townhouse / near EDSA-Araneta, Cubao, Q.C. 3 BR, 3 T&B 11.90 250
3-sty. Townhouse, near Commonwealth Avenue, West Fairview, Q.C. 3 BR, 3 T&B 5.50 141
2-Car Garage Townhouse, Mindanao Avenue near Wilcon Depot, Q.C. 3 BR, 2 T&B 4.00 120
Duplex Type Townhouse, Scout Area near Tomas Morato Avenue, Q.C. 5 BR, 4 T&B 24.90 330
3-sty. Townhouse / Tandang Sora-Visayas Ave., QC 4 BR, 4 T&B 9.80 216
3-sty. Townhouse / Cenacle Drive, Bgy. Culiat, QC. 4 BR, 3 T&B 12.50 232
Project Balintawak Townhouse, Q.C. 4 BR, 4 T&B 21.80 280
4-sty. Townhouse / V. Luna, Bgy. Pinyahan, Diliman QC 5 BR, 5 T&B 16.50 280
3-sty. Townhomes / Congressional Ave. Ext. & TS Ave., Bgy. Culiat QC 4 BR, 3 T&B 7.50 175
Sunny Villas Condominium 4 BR, 4 T&B 12.90 277
3-sty. Townhouse, Bgy. Batasan Hills, Q.C. 3 BR, 3 T&B 7.95 140
3-sty. Townhouse / E. Rodriguez Ave., Cubao, QC 4 BR, 3 T&B 13.50 155
Townhouse, Commonwealth Ave. (near QC Circle, UP Technohub), QC 3 BR, 3 T&B 6.78 129
Townhouse / Aurora Blvd. Cubao, Bgy. Silangan 3 BR, 3 T&B 7.90 139
Source: Lamudi, Philippines
Condominium Units for Rent
A condominium for rent in Quezon City is one of the best ways to get the most out of living in
the Metro. Units provide easy access to key areas, and renting as opposed to buying allows for
financial flexibility, especially if one would rather have a house in the future. Monthly rental rates
range from PhP10,000.00 for a studio unit to PhP33,700.00 for a two-bedroom flat. Renters who are
ready to become buyers also have an option to opt for rent-to-own properties, which are just as
popular in QC.
For those who prefer a condo unit for rent in Quezon City that is only walking distance from
office towers and shopping malls, then the many residential buildings in Eastwood City offer a great
choice. It is a combined commercial and residential district that provides its occupants everything in
just one place, whether it is work, groceries, or leisure. While one of the more popular areas in the
city, Eastwood City is hardly the only place to find quality residences.
Notable estates currently available for students looking to live near their chosen college or
university can be found along Katipunan. These flats offer potential tenants proximity to the city’s
top schools, such as AteneoDe Manila University, Miriam College, and UP Diliman.
As one of the busiest business districts of the city, Cubao is yet another neighborhood with
plenty of condo options. This area is an ideal choice particularly for those who work in one of the
bustling business process outsourcing (BPO) offices.
From multiple bedrooms to a studio type for rent in Quezon City, condos in the huge city may
also be in stand-alone self-contained estates. These projects are like communities in their own right,
many of which boast exclusive amenities residents can enjoy. Among these projects include DMCI’s
Accolade Place and The Manors at Celebrity Place, Robinsons Magnolia in Aurora Boulevard, and 53
Benitez by the Rockwell subsidiary, Rockwell Primaries.

75
Table below shows the list of some of the condominium units for rent in Quezon City, the
features, floor area and its respective rental rate per unit.
Table DS-40: Condominium Units For Rent in Quezon City
Location Features Floor Area
(sq. m.)
Rental rate (in PhP)
Congressional Avenue, Quezon City 1 BR, 1 T&B 23.55 17,000.00
SMDC Place, Panay Avenue, Bgy. South Triangle 1 BR, 1 T&B 30.08 20,000.00
TecPhil Suites, Upsilon Drive, Bgy. Matandang Balara 2 BR, 1 T&B 28.00 9,500.00
Princeton Residences, Aurora Blvd., Bgy. Valencia 1 BR, 1 T&B 23.47 18,750.00
Magnolia Residences, N. Domingo cor. Dona Hemady St. 1BR, 1 T&B 36.00 26,000.00
Avida Towers (w/ balcony), Bgy. Bagong Lipunan ng Crame 2 BR, 1 T&B 50.00 19,000.00
Trees Residences, Novaliches, QC 1 BR, 1 T&B 23.00 20,000.00
Zinnia Towers, North Avenue, Q.C. 1 BR, 2 T&B 40.00 23,000.00
SMDC Berkeley Residences, Katipunan Avenue, Q.C. 2 BR, 2 T&B 46.85 32,000.00
Eastwood City Cyber Park, Bgy. Bagumbayan, Q.C. 1 BR, 1 T&B 36.00 26,000.00
Grand Palazzo Eastwood, Bgy. Bagumbayan, Q.C. 1 BR, 1 T&B 57.00 25,000.00
Avida Towers Vila, near Quezon Ave., Bgy. Bagong Pagasa 1 BR, 1 T&B 20.87 18,000.00
Vista 309 (Studio-Type), Katipunan Ave, Bgy. Loyola Heights 1 BR, 1 T&B 21.00 16,000.00
Greenhills Garden Square, Boni Serrano Ave., Bgy. Bagong Lipunan ng Crame
1 BR, 1 T&B 57.50 18,000.00
Vivaldi Residences (Studio-type), Cubao, Q.C. 1 BR, 1 T&B 18.00 10,000.00
SMDC Sun Residences, Mayon St., Bgy. Sta. Teresita 1 BR, 1 T&B 20.00 12,500.00
Binondo Condo Penthouse, Ayson Bldg., Bgy. Salvacion 3 BR, 3 T&B 184.47 80,000.00
Source: Lamudi, Philippines
Apartment Units for Rent
Apartments for rent in Quezon City are one of the best ways to experience the city if one is new
to the area or are unsure of how long they will be staying. The city’s many residential areas are
abound with flats for every budget.
In the Scout Area between Timog Avenue, EDSA, and Quezon Avenue, one can find a low-rise
Quezon City apartment for rent with rates that range from PhP10,000.00 to PhP 20,000.00 per
month, depending on the square footage. This area is popular among people who frequent Tomas
Morato where numerous restaurants and artsy eateries can be found. Further north
in Congressional Avenue are contemporary-designed row houses with rental rates that range from
PhP20,000.00 to PhP40,000.00 per month. These flats offer larger living spaces, yards, and garage
space for up to three cars.
Quezon City is a large place, and arguably less hampered by space constraints than other cities
in the Metro like Makati or Mandaluyong. As a result, the option is not only a studio type apartment
for rent in Quezon City to save money. An apartment for rent in QC can provide almost as much
indoor space as a modest house yet still have the conveniences of a high-rise condominium.
Table below shows the list of apartment units for rent in Quezon City, the features, floor area
and its respective rental rate per unit.

76
Table DS-41: Apartment Units For Rent in Quezon City
Location Floor Area
(sq. m.) Features
Mo. rental (in PhP)
Project 4, Bgy. Milagrosa Q.C. 18.00 1 BR, 1 T&B 10,000.00
Bgy. Teacher's Village East, Q.C. 33.00 1 BR, 1 T&B 15,000.00
General Wood St., SFDM, Bgy. Damayan 85.00 2 BR, 1 T&B 14,000.00
14 Cabotage St., Bgy. Paltok 75.00 2 BR, 1 T&B 15,000.00
11 Kawayan Ext. St., Napocor Village, Bgy. Pasong Tamo 50.00 2 BR, 1 T&B 12,000.00
1347 UP Bliss, Diliman, Q.C. 68.00 2 BR, 1 T&B 15,000.00
Bgy. Teachers Village West 40.00 1 BR, 1 T&B 11,500.00
Apartment Studio-type, E. Rodriguez Avenue, Q.C. 24.00 1 BR, 1 T&B 10,000.00
B51 L17 Panyo Palaran St., Bgy. Greater Lagro 60.00 2 BR, 2 T&B 15,000.00
Apartment Studio-type, Pine Crest, Aurora Blvd. Bgy. Horseshoe, Q.C.
28.75 1BR, 1 T&B 15,000.00
9 Illinois St., Cubao, Q.C. 65.00 2 BR, 1 T&B 25,700.00
West Avenue cor. Cavite St., Bgy. Paltok, Q.C. 80.00 2 BR, 2 T&B 38,000.00
Bgy. Sta. Teresita, Q.C. 200.00 3 BR, 2 T&B 30,000.00
Source: Lamudi, Philippines
Rent-to-Own Housing Scheme
Rent-to-Own homes, also called a lease contract with an option to buy or a lease-to-own
contract, are quickly becoming popular in the Philippines especially in Metro Manila. It is an
alternative way for homebuyers to buy a home upfront, even if at the moment they do not have
enough cash for down-payment. In a rent to own transaction, a homebuyer will be paying a monthly
credit on top of the rent for the property. For example, a house for sale in Quezon City with a selling
price of PhP5 million is also being rented out for PhP20,000.00. But with the rent to own option in
place, the renter/buyer might pay a rent PhP25,000.00 a month for an agreed-upon lease duration of
two years: PhP20,000.00 is for the actual rent of the house and PhP5,000.00 goes to the rent-to-own
credits.
The rent to own contract may stipulate that after the two-year rent period, the renter/buyer
should buy the house, either in cash or through a housing loan, and the PhP120,000.00 rent credits
he or she has accumulated over two years will form part of the down payment. If the renter/buyer
needs to shell out 10% as down-payment for the property, after two years he has already
accumulated PhP120,000.00 and will only need to pay PhP380,000.00 more. What is good about this
arrangement is that the homebuyer will have ample time to save enough money for the rest of the
down-payment and fix his credit standing to qualify for a housing loan.
To avail of a house under a rent-to-own option, the renter/buyer must enter into an agreement
with a lessor/seller and draft a contract. Therefore, it is very important to seek the help of a lawyer in
drafting the said contract to make that all terms are legal and fair to all concerned parties. One very
important aspect of a rent to own agreement is for both parties (lessor/owner and renter/buyer) to
strictly abide by the contract. If the buyer/renter violates the contract, he or she risks getting his rent
credits voided (the extra PhP5,000.00 he or she has paid every month). On the other hand, if the
seller violates the contract, he or she must return all the rent credits the renter/buyer has paid
during the lease period and will have to go back and find a new tenant/buyer.

77
There may be downsides with a rent-to-own transaction. Licensed brokers recommend to both
the buyer and selling parties to be very, very sure before signing anything because when they do,
they must abide by what is stipulated in the contract. But definitely there are upsides, too, especially
for homebuyers. One is that a rent-to-own transaction buys them enough time to build their down
payment and fix their credit history, and finally becoming a homeowner in the process.
Rent-to-own Housing Financial Scheme
Package Price Of Housing Unit : Php 450,000.00 Rental Period : 60 Months (5 Years) Rental Fee : Php 1,300.00 per month Carryover Payments : Php 60,000.00 (Php 1,000.00 per mo.) Package Price After 5 Years : Php 390,000.00 Interest Rate After 5 Years : 5.08292 % Payment Period : 30 YEARS Monthly Amortization After 5 Yrs : Php 2,113.41 (excl MRI & Fire Insurance) Financing Institution After 5 Yrs : HDMF / SHFC / IN-HOUSE FINANCING
Equivalent Interest Rate : 4.5 % of HDMF Source: HCDRD
National Government
The National Housing Authority (NHA), upon request of local government units, provides
technical and other forms of assistance in the implementation of their respective urban development
and housing programs with the objective of augmenting and enhancing local government capabilities
in the provision of housing benefits to their constituents. Said agency is the key player in providing
house and lot units in off-city resettlement areas while the City Government is involved in providing
financial, trucking and food assistance during relocation.
The number of ISFs from danger areas relocated to NHA resettlement sites from 2010 to 2018
was 26,272 broken down as follows:
Waterways : 10,918
Infrastructure : 8,363
North Triangle : 6,664
Fire Victims : 327
At present, resettlement sites provided by the NHA for the displaced city ISFs are in the
municipality/city of Pandi, San Jose del Monte, Norzagaray, Bocaue and Balagtas in Bulacan and the
municipality of Rodriguez, Teresa and Morong in Rizal. However, the number of relocation
allocation provided by NHA is not enough to accommodate the City’s demand.
Table below shows the breakdown on the number of ISFs relocated to identified NHA
resettlement sites per area classification.
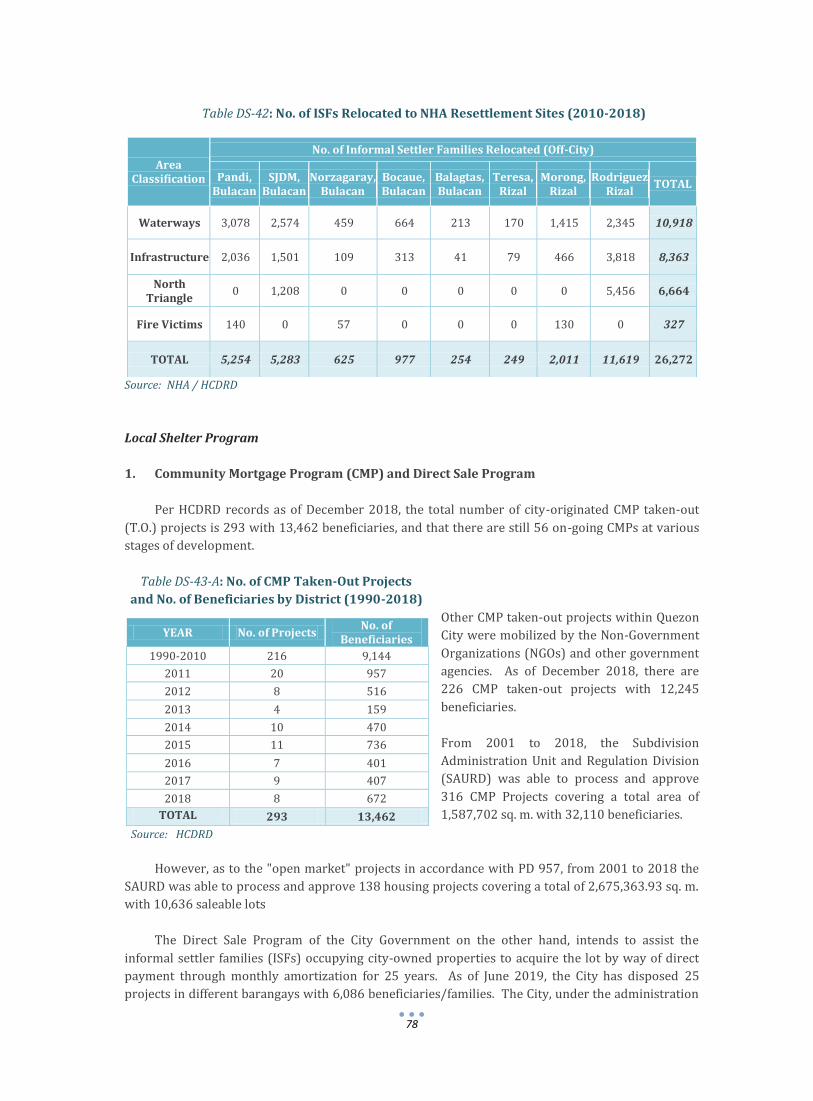
78
Table DS-42: No. of ISFs Relocated to NHA Resettlement Sites (2010-2018)
Source: NHA / HCDRD
Local Shelter Program
1. Community Mortgage Program (CMP) and Direct Sale Program
Per HCDRD records as of December 2018, the total number of city-originated CMP taken-out
(T.O.) projects is 293 with 13,462 beneficiaries, and that there are still 56 on-going CMPs at various
stages of development.
Table DS-43-A: No. of CMP Taken-Out Projects
and No. of Beneficiaries by District (1990-2018)
Other CMP taken-out projects within Quezon
City were mobilized by the Non-Government
Organizations (NGOs) and other government
agencies. As of December 2018, there are
226 CMP taken-out projects with 12,245
beneficiaries.
From 2001 to 2018, the Subdivision
Administration Unit and Regulation Division
(SAURD) was able to process and approve
316 CMP Projects covering a total area of
1,587,702 sq. m. with 32,110 beneficiaries.
However, as to the "open market" projects in accordance with PD 957, from 2001 to 2018 the
SAURD was able to process and approve 138 housing projects covering a total of 2,675,363.93 sq. m.
with 10,636 saleable lots
The Direct Sale Program of the City Government on the other hand, intends to assist the
informal settler families (ISFs) occupying city-owned properties to acquire the lot by way of direct
payment through monthly amortization for 25 years. As of June 2019, the City has disposed 25
projects in different barangays with 6,086 beneficiaries/families. The City, under the administration
Area Classification
No. of Informal Settler Families Relocated (Off-City)
Pandi, Bulacan
SJDM, Bulacan
Norzagaray, Bulacan
Bocaue, Bulacan
Balagtas, Bulacan
Teresa, Rizal
Morong, Rizal
RodriguezRizal
TOTAL
Waterways 3,078 2,574 459 664 213 170 1,415 2,345 10,918
Infrastructure 2,036 1,501 109 313 41 79 466 3,818 8,363
North Triangle
0 1,208 0 0 0 0 0 5,456 6,664
Fire Victims 140 0 57 0 0 0 130 0 327
TOTAL 5,254 5,283 625 977 254 249 2,011 11,619 26,272
YEAR No. of Projects No. of
Beneficiaries
1990-2010 216 9,144
2011 20 957
2012 8 516
2013 4 159
2014 10 470
2015 11 736
2016 7 401
2017 9 407
2018 8 672
TOTAL 293 13,462
Source: HCDRD

79
of Mayor Herbert M. Bautista have also provided assistance for the segregation of titles of
beneficiaries, of which 730 of them are now TCT holders.
Table DS-43-B: Awarded Projects Under Direct Sale Program (as of June 2019)
NO BARANGAY DIST PROJECT BEN CTS DOAS TCT
Trans
1 Alicia 1 Block 55 Bago Bantay 30 10 3 1
2 Baesa 6 ASAMBA* 297 301 131 94
3 Baesa 6 Sitio Pajo 325 325 84 35
4 Bagong Silangan 2 Asprer 491 253 0 0
5 Bagong Silangan 2 Covenant* 341 369 81 20
6 Bagong Silangan 2 Lot 106 790 749 338 210
7 Bagong Silangan 2 Sambasila 43 43 8 0
8 Bagumbuhay 3 F. Castillo 84 84 84 10
9 Bahay Toro 1 Shorthorn 52 48 38 27
10 Bungad 1 Lot 21 Block 17* 100 103 47 20
11 Escopa III 3 Escopa MRB 60 41 0 0
12 Escopa III 3 Escopa PUD 542 381 80 45
13 Fairview 5 SIRNAI, SAPAMANAI, RABOSNA 1,125 799 148 0
14 Fairview 5 Sto. Nino 116 128 1 0
15 Kaligayahan 5 Pangasinan 60 60 20 2
16 Kaligayahan 5 Tawid Sapa II Phase I 360 360 219 141
17 Kaligayahan 5 Tawid Sapa II Phase II 384 370 67 31
18 Kaligayahan 5 Tawid Sapa II Phase III 87 88 72 7
19 Manresa 1 Manresa 93 94 41 0
20 Novaliches Proper 5 Emerald 36 36 0 0
21 Payatas 2 SANDIG 210 141 0 0
22 Quirino 2-B 3 Tampoy St. 37 32 25 19
23 San Antonio 1 Lot 5* 153 168 116 40
24 San Jose 1 Samahang Magkakapitbahay* 179 215 79 28
25 Sta. Lucia 5 Samahang M. Aquino Neighborhood 91 82 4 0
TOTAL 6,086 5,280 1,686 730
Source: HCDRD
Note: * Subdivision of lots due to increase in the number of beneficiaries
BEN - Beneficiaries
CTS - Contract To Sell
DOAS - Deed of Absolute Sale
2. Quezon City Socialized Housing Program ("BistekVille" Housing Program)
The Quezon Task Force on Socialized Housing and Development of Blighted Areas (Task Force
Housing) was created to direct and coordinate multi department participation on housing and
community development related activities: (engineering, social services, planning and development,
housing and resettlement). It was the driving force behind the creation of the new in-city housing

80
community called "BistekVille" (BV) housing projects, with the HCDRD, non-government
organizations (NGOs) and housing financial institutions as partners in development.
The main objective of the Quezon City Socialized Housing Program is to create slum-free
communities. Thus, the focus is to transform slums within the city, into well-organized and livable
communities, with multi-purpose facilities through which government can extend public services
such as, health, livelihood and daycare education. This way, the upgrading of the living conditions of
the poor and the removal of urban blight, which benefits neighboring areas as well, are twin aims
that are being achieved simultaneously.
To date, there are thirty five (35) BistekVille Housing Projects in the City of which fourteen (14)
housing project sites with 3,415 units have already been completed, while twenty-one (21) housing
project sites with 3,014 units are at various stages of development.
Table DS-44 BistekVille (BV) Housing Projects (as of June 2019)
COMPLETED & ON-GOING PROJECTS 35
On-site Projects 29
Off-site Projects 6
Completed Projects (before June 30, 2019) 14
On-going Projects (beyond June 30, 2019) 21
TOTAL NUMBER OF UNITS 6,427
Developed lots only 301
Socialized one-storey rowhouse units 1,091
Socialized two-storey walk-up units 1,180
Socialized three-storey walk-up units 3,600
Economic units 255
PROJECT STATUS AS OF MARCH 2019
Completed units 3,415
Units in near completion 93
Units under construction 881
Units for construction 1,496
Units for bidding 241
Developed lots - under Direct Sale Program 301
Source: HCDRD
BV Lot Previous
Owner Lot Area (sq. m.)
Mode of Acq
Location Developer
Number of Units
Status Total No.
Unit Descriptions
1 (Off) Lot 9-B Psd 00-036995
Fermina S. Oviedo
15,561 Direct Sale
Molave St., Bgy. Payatas
Land: Solid Rock Const. & Dev't Corp Housing: MOA with Habitat for Humanity
355 21 Developed lots 100% completed
190 Socialized Rowhouse
144 Socialized Condominium
2 (On) Lot 614 & Lot D (LRA) Psd-384988
Ofelia Arce Property (conveyed to LGU-QC)
48,876 Conveyance thru MOA
Bgy. Kaligayahan
Land & Housing: MOA with Phinma Property Holdings Corp. & Atty. O. Arce
1,118 40 Developed lots 100% completed
703 Socialized Rowhouse
375 Socialized Condominium

81
BV Lot Previous
Owner Lot Area (sq. m.)
Mode of Acq
Location Developer
Number of Units
Status Total No.
Unit Descriptions
3 (On) Lots 36, 37 & 38 Pcs-00-014047
R.P./DENR 4,436 under MOA
Banana Island, Burol & Libis area, Bgy. Escopa II
Land & Housing: MRB II Const. Corp.
104 104 Socialized Rowhouse
90% completed
4 (On) Lot 644-A-7-D (LRC) Psd-32238
Mariano Tiong 9,200 Expropriation
Limqueco Road, Bgy. Culiat
Land: Diadema Enterprises Housing: Habitat for Humanity Philippines
266 266 Socialized Condominium
90% completed
5 (On) Lot 12 Pcs-2491
Magnolia W. Antonino
10,903 Direct Sale
Madyaas Road, Bgy. Payatas
Land: Solid Rock Const. & Dev't Corp. Housing: Habitat for Humanity Philippines
204 124 Developed lots 90% completed
80 Socialized Rowhouse
6 (On) Conso of Lots 8 and 16, Blk 12 and Road Lot 11 (LRA) Pcs-12376
LGU-QC (formerly B.C. Regalado & Co., Inc.)
16,890 Donation Chestnut St., Bgy. Fairview
Land & Housing: MPM Builders
224 116 Developed lots 100% completed
108 Socialized Rowhouse
7 (On) Lot 3 Block 1 Psd-0062447
Housing & Urban Renewal Authority
1,872 Conveyance
J.P. Burgos St. PUD Site, Bgy. Escopa III
Land & Housing: MRB II Const. Corp.
84 84 Socialized Condominium
100% completed
8 (On) Lot 176-A-8 Psd-34977
LGU-QC (formerly Bienvenido Tan property)
1,973 Donation Int. King Michael St., Bgy. Bagbag
Land: ARV Construction & Supply, Inc. Housing: Compact Builders
105 105 Socialized Condominium
100% completed
9 (Off) Lot 109 Blk 1 Psd-13199 & Lot 2-B Psd-24313
Rodolfo V. Quizon
4,238 Direct Sale
Nenita Ext., Bgy. Gulod
Land & Housing: Sold Rock Development & Housing Corporation
192 192 Socialized Condominium
100% completed
10 (On) Lot 13 Blk. 4 (LRC) Pcs-941
LGU-QC (formerly Mariano Tancinco Property)
1,286 Donation Buenamar St., Bgy. Novaliches Proper
Land & Housing: Rosand Builders
63 63 Socialized Condominium
100% completed
11 (On) Lot 85-A-1-C Psd 007404 030208-D
G.B. Francisco, Inc.
877 Direct Sale
Sarmiento St., Bgy. Sta. Monica
Land & Housing: Rosand Builders
42 42 Socialized Condominium
100% completed
12 (Off) Lot 161-New-C-3 Psd-2110
Precita & Eleazar Biglang-awa
4,000 Direct Sale
SB Diversion Road, Bgy. Nagkaisang Nayon
Land: Grandeur Construction Housing: Vibrant Realty Inc.
138 138 Socialized Condominium
100% completed

82
BV Lot Previous
Owner
Lot Area (sq. m.)
Mode of Acq
Location Developer
Number of Units
Status Total No.
Unit Descriptions
13 (On) Lot 176-A-16 Psd-23748
Horacio Castillo
2,584 Direct Sale
King Christopher St., Kingspoint Subd. Bgy. Bagbag
66 66 Socialized Condominium
30% completed
14 (On) Lots 25 & 26 Fls-2696-D
G.B. Francisco, Inc.
1,633 Direct Sale
Sta. Barbara St., Bgy. Gulod
Land & Housing: Centiare Const. & Trading Corp.
69 69 Socialized Condominium
30% completed
15 (Off) Lot 554-B-4-D (LRC) Psd-270021 & Lot 596-B (LRC) Psd-99855
A.O. Knitting Mfg. Co., Inc.
19,893 Direct Sale
Richland Drive, Bgy. Sauyo
Land & Housing: Persan Construction, Inc.
777 621 Socialized Condominium
60% completed
156 Economic Condominium
100% completed
16 (Off) Lots 1186-A, 1186-B, 1186-C & 1186-D Psd-19166
Prescilla Arce 7,164 Direct Sale
SB Diversion Road, Bgy. Nagkaisang Nayon
Land &Housing: Mascot Corporation
210 111 Socialized Condominium
100% completed
99 Economic Condominium
17 (Off) Lot 2-A-1-A
Wright Park Residences & Dev't Corp.
7,884 Under MOA
Bgy. Payatas Land &Housing: WPRDC
234 234 Socialized Condominium
70% completed
18 (On) PWD Housing
R.P./DENR 5,083 Under MOA
NVRC Compound, Bgy. Escopa III
Land: R.S. Gatbonton Construction Housing: Habitat for Humanity Philippines & Gawad Kalinga
130 130 Socialized Condominium
85% completed
19 (On) Lot 797-C-5 Psd 21048
Bangko Sentral ng Pilipinas
10,000 Direct Sale
Luzon Ave., Bgy. Matandang Balara
Land & Housing: Solid Rock Construction Corporation
342 342 Socialized Condominium
50% completed
20 (On) Lot 58 SWO-16801 Plan RS-00-001500
Pedro Aldana Garcia
2,980 Direct Sale
Villa Beatriz Ext., Bgy. Matandang Balara
Land & Housing: Compact Builders
135 135 Socialized Condominium
60% completed
22 (On) Lot 176-C-6-B Psd 257321
Bartolome Property
2,700 Direct Sale
Damong Maliit, Bgy. Nagkaisang Nayon
Land & Housing: Amaranth Const. Corp.
82 82 Socialized Condominium
100% completed
23 (On) Lot 3 Blk 3 Psd 63164
Carmelo Barbero
1,058 Forfeiture thru Auction Sale
Hilltop Subd., Bgy. Greater Lagro
48 48 Socialized Condominium
80% completed
24 (On)
Lot 30 Block 30 Pcs 04-000208
Royal Monarch Corp.
1,288 Forfeiture thru Auction Sale
Banaba Dulo, Bgy. Kaligayahan
Land & Housing: Rockford Dev't Corp.
54 54 Socialized Condominium
100% completed
25 (On) Lot 750-A-3 Psd 51165
Inductivo Bartolome
1,000 Forfeiture thru Auction Sale
Bgy. San Agustin
54 54 Socialized Condominium
80% completed

83
BV Lot Previous
Owner
Lot Area (sq. m.)
Mode of Acq
Location Developer
Number of Units
Status Total No.
Unit Descriptions
26 (On) Lot 681-D-12 Psd 28126
Ramon Escarilla
1,000 Forfeiture thru Auction Sale
Bgy. Culiat 26 14 Socialized Rowhouse
100% completed
12 Socialized Condominium
27 (Off) Lot 1 to 6 (LRC) Pcs-27767
Benitez Property
1,668 Direct Sale
Sta. Barbara St., Bgy. Gulod
60 60 Socialized Condominium
60% completed
28 (On) Lot 178-B-4 (LRC) Psd 198561
Ernesto Chan et. Al
4,646 Direct Sale
Damong Maliit, Bgy. Nagkaisang Nayon
204 204 Socialized Condominium
65% completed
29 (Off) Lot 735-Z Fls 2563-D
Erlinda M. Saludes et al
2,300 Direct Sale
Placida St., Bgy. Gulod
99 99 Socialized Condominium
60% completed
30 (On) Lot 1 Blk 1 (LRC) Psd 70489
Jesus Lagman 1,169 Forfeiture thru Auction Sale
Bgy. Sta. Lucia
30 30 Socialized Condominium
30% completed
31 (On) Lots 1, 2 & 3 (LRC) Pcs-31210, L 7-K-2-C Psd-26193
John KC Ng 5,503 Direct Sale
Cambridge St., Bgy. E. Rodriguez
276 276 Socialized Condominium
10% completed
32 (On) Lot 3-A Psd-00-093861
Sto. Cristo Resources, Inc. Pangilinan
3,864 Direct Sale
Sto. Cristo St., Bgy. Balingasa
174 174 Socialized Condominium
20% completed
33 (On) Lot 1023-B Psd 38414
Francisco C. Reyes
2,000 Direct Sale
Bgy. Baesa 108 108 Socialized Condominium
10% completed
34 (Off) Lot 3-C-2-B (LRA) PSD E2019003788
Noel Co/Madlambayan
3,993 Under MOA
Bgy. Bagong Silangan
Land & Housing: Tradition Homes Project Manager Developers, Inc.
110 110 Socialized Condominium
40% completed
36 (On) Lots 1-6 Blk 7 & Lot 28 Blk 7 Pcs 04-000208
Royal Monarch Corp.
3,811 Forfeiture thru Auction Sale
Greenfields Subd., Bgy. Kaligayahan
120 120 Socialized Condominium
10% completed
37 (On) Lots 11,12,14-16,18-23,25-27 Blk 19 Pcs 04-000208
Royal Monarch Corp.
3,811 Forfeiture thru Auction Sale
Greenfields Subd., Bgy. Kaligayahan
124 124 Socialized Condominium
10% completed
Source: HCDRD

84
Source: HCDRD
Figure DS-4: BistekVille Housing Project Sites (BV1 to BV20)
3.5.4 Affordability Levels
Household Income and Expenditure
The PSA is conducting the Family Income and Expenditure Survey (FIES) every three years.
From 1985 to 2000, the data released contained city disaggregated data on income and expenditure.
However, in 2003, 2006, 2012 and 2015, the FIES indicate results for only for NCR and the
Philippines. However based on the 2009 Final Results of Family Income and Expenditure Survey
(FIES) - Small Area Estimates, Quezon City families registered an estimated monthly income of P
29,441.00 which is 99.2% of MM, or 171.5% of the entire Philippines, and monthly expenditure of P
26,169.00 which is 101.6% of MM, or 178.4% of the entire Philippines (See Table DS-45).
Table DS-45: Average Household Income and Expenditure
QC, NCR and Philippines (2000-2012)
Year Income Expenditure
QC NCR PH QC NCR PH
2015 35,417 22,250 29,083 17,917
2012 31,583 19,583 27,083 16,083
2009 29,441 29,670 17,167 26,169 25,747 14,667
2006 25,916 14,394 21,500 12,263
2003 22,204 12,324 18,159 10,308
2000 32,757 25,025 12,093 29,577 22,204 9,903
Source: NSO, FIES
No city disaggregation for year 2003, 2006 and 2012

85
Potential Percentage of Income Available for Housing
On the average, the Metro Manila family is earning P 35,417.00 per month and is spending
P29,083.00 in 2015.
Major portion of income is spent on basic needs such as food, shelter and utilities (water,
electricity, gas and other fuels) and transportation.
In the pattern of Total Family Expenditure Item in the NCR for 2012, the percentage spent
on housing and utilities constitute 27.0% or P 7,852.00 which is 6.9% higher than that of the entire
country. (See Table DS-30)
Table DS-46: Percent Distribution of Total Family Expenditure
by Expenditure Group: Philippines & NCR (2015)
Expenditure Item Philippines NCR
Food expenditures: 41.9 36.3 a) Foods consumed at home 33.7 25.0 b) Food regularly consumed outside the home 8.2 11.3
Alcoholic beverages 0.5 0.4 Tobacco 1.1 0.8 Clothing and footwear 2.4 2.0 Furnishings and Routine Household Maintenance 2.5 2.8 Health 3.7 2.9 House Rent/Rental Value 12.2 18.2 Water, Electricity, Gas and Other Fuels 7.9 8.8 Transportation 6.2 6.6 Communication 2.2 2.9 Recreation and Culture 0.8 0.8 Education 3.8 3.5 Accommodation Services 0.2 0.0 Miscellaneous Goods and Services 6.3 6.3 Durable Furniture and Equipment 2.5 1.5 Special Family Occasion 2.5 1.5 Other expenditures 3.1 4.6 Total 100.0 100.0
Non-essential expenditure items are potential sources which could be made available for housing:
Alcoholic Beverages, Tobacco, Recreation and Culture, Accommodation services, Miscellaneous goods and
services and Other Expenditures
Housing Loans Available From The National Government (HDMF/SHFC/In-house
financing)
Package for a Home unit
Package Price : Php 450,000.00
Cashout : Php 10,000.00 (for miscellaneous expenses
: Meralco, Maynilad, Annotations, Notary,
Certified True Copy… Etc)
Loanable Amount : Php 450,000.00
Payment Period (Max.) : 30 Years
Age Limit (Max.) : 70 Year Old

86
Individual Loans
Under the Pag-Ibig Housing Loan Program (In-house program of the Pag-Ibig Fund)
1. End-User Home Financing Program
doubled the loanable amount from P 3.0 M to P 6.0 M
Interest rate for as low as 6.5% per annum from 11.5%
Risk-based interest rates
Adoption of a Borrowers Evaluation System to improve Underwriting
2. Affordable Housing Program (AHP) / Abot-Kamay Pabahay Program
Designed for minimum wage earners and Overseas Filipno workers (OFW), the AHP
caters to the actual need of the borrower based on his capacity to pay.
Loan amount from P 450,000.00 up to P750,000.00
Interest rate as low as 3.0% (for monthly income of PhP 15,000.00 & below) with a
monthly amortization of P 1,855.06 (including MRI & Fire), and as high as 6.375%
(for monthly income of above PhP 15,000.00) with a monthly amortization of P
2,745.03 (including MRI & Fire)
3. Institutional Loan Programs
Direct Developmental Loan Program
a) Developmental financing for developers under easier terms and conditions
b) Loan may be used for the development of residential subdivision or medium-rise
buildings or for the construction of housing units
* as of September 1, 2013
Group Housing Loan Program (GHLP)
a) Engage the participation and involvement of project proponents, through land
development and house construction on the land owned and provided by the
project proponent.
b) Units from the project to be financed shall be offered for sale to the project
beneficiaries.
Community Mortgage Program (CMP)1
Under the Social Housing Finance Corporation’s (SHFC) Community Mortgage Program
(engaged with community or group mortgages), organized associations of residents of
blighted/depressed areas are assisted to own the lots they occupy, providing them security of
tenure and eventually improve their neighborhood and homes to the extent of their
affordability. The project covers three stages namely: land acquisition, site
development/community upgrading and house construction.
1 Source: www.shfc.gov.ph
Wholesale Loan Rates
1-Year Fixing 6.125%
2-Year Fixing 6.750%
3-Year Fixing 7.875%

87
Community Association
SHFC Originators
Landowner
Offers to buy
Intends/Agrees to sell
Delivers the necessary documents for
assessment
Pays off / amortizes Seeks legal &
technical assistance for its application to
the CMP
Issues payment for the land
Revised Loan Entitlement Amounts applicable for both Metro Manila and highly urbanized
cities, and other areas, without distinction, have been increased as follows: (See Table below)
Table DS-47: CMP Loan Windows
Purpose Maximum Loan
Amount Monthly
Amortization
Land Acquisition 100,000.00 685.30
Site Development / Community Upgrading
30,000.00 205.59
House Construction 120,000.00 834.60
Loan Package 250,000.00 1,725.49
Source: www.shfc.gov.ph
The CMP loan will bear 6% interest per annum based on the outstanding balance and will be
payable over a maximum period of 25 years in equal amortizations.
Table DS-48: CMP Subsidy Implementation
Capital Subsidy Technical Subsidy Terms of the Loan
6% interest
Loan amortization payments
(straight amount – 25 years
to pay)
Technical Support:
Assistance in loan requirements
compliance
Capacity Building:
Training of CMP-Mobilizers on CMP
Processes
Training of CA for CMP
Figure DS-27: Framework For CMP Implementation

88
High Density Housing Program (HDH)2
The High Density Housing (HDH) Program was initiated in 2013 by the Social Housing
Finance Corporation (SHFC) as a response to the P50 billion Housing Program Fund of the
Aquino administration for the ISFs residing along waterways and other danger areas in Metro
Manila. The qualified beneficiaries are validated and certified by the Department of Interior
and Local Government (DILG).
It enables the SHFC to extend financing assistance to organized communities in danger areas
for the implementation of multi-storey housing projects in the National Capital Region (NCR).
It adopts the CMP’s “Community Driven Approach” in creating the People’s Plan which will
be the basis for their housing projects.
The loan will bear 4.5% interest per annum based on the outstanding balance and will be
payable over a period of 30 years on the following amortizations: Php 1,072.86 during the 1st
year, with an increase of 10% until the 11th year; Php 2,782.71 from 11th year until the 30th
year (including MRI and Fire Insurance)
Table DS-49: HDH Subsidy Implementation
Capital Subsidy Technical Subsidy Terms of the Loan
4.5% interest
Graduated for the first 10 years
and fixed amount starting on the
11th up to 30th
Tenurial Arrangement
Usufruct on Land – to sell to the
community when they are
already capable
Technical Assistance Subsidy
Subsidy Fund (10% of the Project Cost)
for taxes & permits
for CSO service fees
for insurance
for payment of professional fees
Capacity Building and Estate
Management
In-House Financing of LGU-QC
Qualified beneficiaries for the said financing scheme are ISFs of on-site projects that are
located along waterways, fire hazard and other blighted areas that were declared and approved
by the Quezon City Council.
The loan will bear 5.1% interest per annum based on the outstanding balance and will be
payable over a period of 30 years on the following amortizations: Php 1,500.00 during the 1st
year, with an increase of 10% until the 5th year; Php 2,500.00 from 6th year until the 30th year
(exclusive of MRI and Fire Insurance.)
Local Housing Funds
Idle Lands Tax
The annual budget of the city's housing program is limited considering the tremendous
housing requirement of the city. The City Government is undertaking revenue generation
2 Source: www.shfc.gov.ph

89
measures within its power mandated by R.A. 7160 or The Local Government Code of 1991. It
has started collecting the idle land tax in 2011, which is equivalent to 3% of the assessed value
of all idle lands located along national roads, and/or 1% of the assessed value of all idle lands
located in other areas which shall be in addition to the basic real property tax.
Paragraph “e”, Section 42, Article XI of RA 7279, states that funds for urban development and
housing program may come from the proceeds from the Socialized Housing Tax and, subject to
the concurrence of the local government units concerned, Idle Land Tax as provided in Section
236 of the Local Government Code of 1991 and other existing laws.
An annual average of about PhP130.0M of idle land tax was collected by the City Government
from 2011-2018.
Socialized Housing Tax
In addition, the City has also imposed the collection of the Socialized Housing Tax as
provided for under Section 43 of R.A. 7279 otherwise known as the Urban Development and
Housing Act (UDHA) of 1992, Local Finance Circular No. 1-97 of the Department of Finance and
thru Ordinance No. SP-2095, S-2011 of the Honorable City Council. Said tax is equivalent to one
half percent (0.5%) on assessed value of all lands in Quezon City exceeding One Hundred
Thousand Pesos (PhP100,000.00).
The City Government has started collecting the socialized housing tax in 2011, and an annual
average of about P93.0M was collected up to 2018
Table DS-42: Special Levy on Idle Lands and Socialized Housing Tax Collections (2011-2018)
Year Special Levy on Idle Lands Socialized Housing Tax Total
2011 69,867,732.51 - 69,867,732.51
2012 87,516,243.91 144,561,688.15 232,077,932.06
2013 90,417,551.47 152,460,627.57 242,878,179.04
2014 281,679,471.89 30,139,006.99 311,818,478.88
2015 113,880,247.83 - 113,880,247.83
2016 122,139,119.34 160,578,167.23 282,717,286.57
2017 164,079,974.84 129,221,444.57 293,301,419.41
2018 124,799,396.13 126,636,724.55 251,436,120.68
TOTAL 1,054,379,737.92 743,597,659.06 1,797,977,396.98
AVE. 131,797,467.24 92,949,707.38
Source: Financial Accounts & Analysis Division, City Accounting Department
Socialized Housing Special Account
This special account was created by virtue of Ordinance SP-2226, S-2013 of the Honorable
City Council of which, all proceeds collected under the Quezon City Housing Programs such as
CMP, Direct Sale, Socialized Housing Tax, Idle Land Tax, etc. are all deposited to be utilized
solely for Socialized Housing purposes.

90
Balanced Housing Development
As provided for under Section 18 of R.A. 7279, the Program shall include a system to be
specified in the Framework plan whereby developers of proposed subdivision projects shall be
required to develop an area for socialized housing equivalent to at least twenty percent (20%)
of the total subdivision area or total subdivision project cost, at the option of the developer,
within the same city or municipality, whenever feasible, and in accordance with the standards
set by the Housing and Land Use Regulatory Board and other existing laws. The balanced
housing development as herein required may also be complied with by the developers
concerned in any of the following manner:
a. Development of new settlement;
b. Slum upgrading or renewal of areas for priority development either through zonal
improvement programs or slum improvement and resettlement programs;
c. Joint-venture projects with either the local government units or any of the housing
agencies; or
d. Participation in the community mortgage program.
Resources
1. Land Requirement and Inventory
Land Area Needed
The priority of this shelter plan is the delivery of socialized housing to the poor and low-income
segment of the population. The basic assumptions employed in planning are as follows:
- 40-sq.m. gross area allocation for each household resettled in a socialized housing subdivision
or resettlement site
- 1-hectare land allocation for every 450 households
On top of the priority are the households that should be relocated from danger zones and the
homeless consisting of 44,075 families. Assuming that 75% or 33,056 can be accommodated in a
socialized housing or resettlement project and 25% or 11,019 will avail of Medium Rise Housing
(MRH)/High Density Housing (HDH), an area of 156.71 hectares is required for them alone. The rest
of the households within the housing backlog (assuming 28% of the doubled-up households and
those with unacceptable housing units) need 23.69 hectares. Assuming 28% of the new households
formed need 44.12 hectares. A total of 227.97 hectares is required to address the socialized housing
needs due to housing backlog and population growth.
2. Infrastructure
The city government has consistently prioritized road construction and improvement to link
communities and growth centers and make previously hard-to-reach areas accessible. It gives focus
to road provision in establishing socialized housing projects.
Power, water and communication utility companies adequately serve the city. They give
assurance that they have the capability to supply the needs of the present and future population.

91
3. Financing
Funding Required
The following assumptions are employed in estimating the funding requirement of the city’s
socialized housing program:
- P 250,000.00 cost allocation for every household resettled in a socialized housing or
resettlement site
- P 450,000.00 cost allocation for a household housed in the MRH/high density housing (HDH)
With the same assumption that 25% of the households to be relocated from danger areas to
MRH/HDH and 75% to be resettled in resettlement sites with house and lot package, P 13.22 billion
is required. For the rest covered by the housing backlog, the amount of P 3.05 billion is involved.
With the assumption of 28% of the new households to be formed in 2019 to 2023 on the basis of
50% availing of socialized housing subdivision units and 50% accommodated in MRH/HDH, the
housing project will require P 4.96 billion. The total amount needed to provide socialized housing is
P 21.19 billion.
Possible Funding Sources
National Housing Assistance/Funding
The city’s housing projects are tied up with the Social Housing Finance Corporation
(SHFC) since land acquisition and project development are too costly for the city to finance
alone. The Home Mutual Development Fund (HDMF) or the Pag-Ibig fund also provides such
assistance.
Bond Flotations
The 1991 Local Government Code has given local government units more authority to
increase financial resources. It allows LGUs to create indebtedness and avail of credit facilities
to finance infrastructure and other socio-economic development projects to include housing.
Other funds sources of the City Government are:
LGU Budget for Housing
The annual budget of the city’s housing program is limited considering the tremendous
housing requirement of the city. The city government is now in undertaking revenue
generation measures within its power mandated by the Local Government Code. It has
started collecting the idle land tax, and imposed the 0.5% socialized housing tax.
Public-Private Partnerships
Given the corporate power of the LGU’s and their authority to generate and efficiently
harness resource, LGU’s can enter into partnerships with the private sector (landowners and
private developers) in the development of blighted properties close to their project areas. The
benefit derived from this is that the removal of blight will greatly increase the value of their
own properties.

92
3.5.5 Local Shelter Organizations
Housing delivery by the city government is done through a number of its
offices/instrumentalities.
Housing Community Development & Resettlement Department (HCDRD)
The main actor in the provision of socialized housing is the Housing Community Development
and Resettlement Department (HCDRD) (formerly Urban Poor Affairs Office) being the implementer
of the several Community Mortgage Programs (CMP) and Direct Land Sale in the city. This office is
conducting survey of informal settlements and keeps the inventory of ISFs in the city. It organizes
people’s organizations and lends them technical and other assistance in upgrading their
communities.
Housing and Urban Renewal Authority (HURA)
The Housing and Urban Renewal Authority (HURA) is also responsible for shelter delivery in
Quezon City. It was created by virtue of City Council Ordinance No. SP-1236, S-2003 approved by
Hon. Feliciano Belmonte, Jr. on 01 April 2003, and was mandated to undertake and/or to promote
the development of housing for marginal and low-income families and urban renewal and
redevelopment in Quezon City. It is comprised of seven (7) Board of Directors with the City Mayor as
the Chairman of the Board. Its officers include the Head of the HURA as the President/General
Manager, while the City Treasurer and the City Administrator act as Corporate Secretary and
Corporate Treasurer, respectively.
Local Housing Board
Prior to the creation of HURA, the City Mayor approved City Council Ordinance No. SP-1111,
S-2002 on 22 March 2002 which created the Quezon City Local Housing Board which was mandated
to formulate, develop and ensure the implementation of policies in the provision for housing and
resettlement areas and the observance of the right of the underprivileged and homeless to a just and
humane eviction and demolition. The Board was convened on April 14, 2011. The Board is composed
of the City Mayor as Chairman; the Vice-Mayor as Vice-Chair; and five (5) representatives of duly
accredited QC People’s organizations (POs), two (2) representatives of duly accredited QC Non-
Government Organizations (NGOs), five (5) members appointed by the Mayor, two (2) members
representing the City Council to be elected by among themselves, Head of the QC Urban Poor Affairs
Office (UPAO) (now Housing Community Development & Resettlement Department (HCDRD)) who
shall also act as the Board Secretary, and representative from the Housing & Urban Development
Coordinating Council (HUDCC) to be designated by the HUDCC Chair as members.
Task Force on Socialized Housing and Development of Blighted Areas
In June 2010, the City Mayor created the Special Task Force on Socialized Housing and
Development of Blighted Areas thru E.O. No. 6, S-2010 to implement the transformation of blighted
areas into decent communities and provide appropriate assistance to the families who will be
affected by the development. It consists of the Secretary to the Mayor as Chairman and the Chief of
Staff of the Mayor, Head of HCDRD, the City Engineer, City Planning and Development Officer, Head of
the Social Services and Development Department (SSDD), and Head of Task Force COPRISS as
members. It is the driving force behind the creation of the new in-city housing community called
"BistekVille" housing projects, with its aim of creating slum-free communities, transforming blighted

93
areas within the city into well-organized housing projects, and providing decent and affordable
housing to the city's ISFs in particular, those living along danger areas.
Task Force COPRISS
The Task Force COPRISS is an ad hoc body reorganized thru E.O. No. 1, S-1996 acting as the
anti-squatting group of the city government. It is responsible in removing new and on-going
constructions and in providing manpower assistance during relocation operations.
Social Services Development Department (SSDD)
The SSDD provides food and material assistance to affected families and coordinates the
Balik-Probinsya Program during relocation.
Private Sector, NGOs and POs
There is consensus among stakeholders that housing delivery is not an exclusive
responsibility of the government or the private sector but rather a multi-sectoral concern that should
also involve the community, non-government organizations and other stakeholders in the civil
society.
Both the PO’s and NGO’s in Quezon City have demonstrated on countless occasions that they
have the resources and capability to undertake community development initiatives. More than 400
PO’s and NGO’s have secured accreditation with the City Council so they can formally and actively
engage themselves in the planning and implementation of development in the city. Fifty of them sit as
members of the City Development Council.
The participation of NGO’s in shelter delivery includes capacitating the community in self-
organization and improving their living condition. Many actually act as originators in CMP’s. HCDRD
lists the following among these NGO’s:
- Gawad Kalinga Foundation
- Habitat For Humanity
- Pusong Makabayan Foundation, Inc.
- Foundation for Development Alternatives, Inc.
- Universal Component Foundation
- Crown Circle Builders
- Kristong Hari Foundation
- Golden Grains Livelihood Foundation, Inc.
- Share Foundation, Inc.
- Welfare for the Community, Inc.
- Center for Urban Poor Services, Inc.
- Center for Housing and Human Ecology Development Foundation, Inc.
- Center for Housing Innovative and Component Services, Inc.
The private sector is a proven partner in community development. Efficient and endowed
with great amount of resources, they have contributed immensely to the growth of QC. They express
willingness to be key players in the delivery of housing.

94
3.6 SPORTS AND RECREATION
A necessary feature of urban life is the sports and recreation area. Here, city dwellers can
satisfy their leisure and recreational needs to help them cope with the rigors of urban living. Areas
for sports and recreation, therefore, provide opportunities for the tired and weary to rejuvenate and
engage in active physical and athletic development.
3.6.1 Outdoor Sports and Recreation Facilities
The city-maintained Amoranto Memorial Sports Complex in District IV offers an outdoor
sports experience for those who are on-look for an activity outside the confines of a walled structure.
The place consists of a velodrome, badminton / tennis courts, covered and open basketball courts, a
swimming pool, shooting range, volleyball courts and a multi-purpose hall. In 2018, the construction
of a four-storey multi-level Bautista Arena within the sports complex started which affected the
shooting range, covered badminton court, tennis court and the two-storey multi-purpose hall. The
arena shall serve as venue for basketball, concerts and other events. It shall also house the function
rooms, press rooms, office, lounge and VIP room.
Other sport facilities that are also available in the city but with limited access are three (3)
private sport complexes like the renovated Smart-Araneta Coliseum, the Capitol City Sports Plaza and
the QC Celebrity Sports Plaza. Several golf courses with driving range are also located in the city such
as the Capitol Hills Golf and Country Club, Maru International Golf Range, Rod Taylor Sports
Company, Inc., GPL International, Inc., the Veterans Memorial Golf Course and those situated inside
Camp Aguinaldo and Teresa Heights Subdivision in District II.
In 2018, there were 24 public swimming pools compared to 12 in 2015. Nine (9) of which are
located in District 5 which has the most number of public swimming pools. Three are located in Bgy.
Kaligayahan and two (2) are in Bgy. Greater Lagro, one each are found in Bgys. Fairview, North
Fairview, Sta. Monica, and Nagkaisang Nayon. District 3 has five (5) swimming pools, three (3) in
Bgy. Old Balara and one each are situated in Bgy. Loyola Heights; Bgy. White Plains. In District 6,
there are a total of three (3) located in Bgy. Sauyo and two (2) are in Bgy. Culiat. Each of the other
Districts (1, 2, and 4) have two (2) swimming pools. All of these public swimming pools are city
owned except one (1) owned by the national government which is located in Balara Filtration Plant
in Bgy. Old Balara.
In the community level, most of the city’s barangays have at least one basketball court. In
total, there are currently 190 covered basketball courts, 27 open courts and 9 half courts in 2018.
These are usually located in the barangay’s identified open space, near the barangay hall or parish
church. These structures also serve as sites for other community activities and events such as
tiangge, bingo socials, meetings and dialogues. Where there is available space, there are also tennis,
badminton and volleyball courts that are put up.
Apart from these, several subdivisions, particularly the more affluent ones, have their own
swimming pools, parks and playgrounds and clubhouses.
For those who may prefer not-so vigorous activities the likes of which are offered by sports,
they can take delight in the various parks and playgrounds. There are 598 parks and playgrounds,
326 of which developed and partially developed. The three major parks consist of the Quezon
Memorial Park/Circle which is being maintained and operated by the City, the Ninoy Aquino Parks
and Wildlife under the Protected Areas and Wildlife Bureau of the Department of Environment and

95
Figure 1: QC Police Stations, 2018
Natural Resources (DENR) and the La Mesa Eco Park managed by Bantay Kalikasan. The Quezon
Memorial Circle continuing improvement and development will entice more people to come and
ultimately boost business and tourism industry in the city. As for the Ninoy Aquino Parks and
Wildlife, its features include a lagoon, a mini amphitheater, a zoo and a botanical garden.
Parks are considered important recreational areas since they are accessible to all social and
economic groups of the city’s populace. Moreover, they offer various types of recreation catering to
all ages such as bicycle lanes, picnic areas and promenades.
3.6.2 Indoor Sports and Recreation Facilities
The city is also home for numerous indoor sports and recreational facilities. In 2018 there are
nine hundred thirty-eight (938) registered private sports and recreation businesses and facilities, an
increase of 67 or 7.69% from 871 in 2015. The figure includes 102 indoor sports facilities which
consist of nine (9) bowling lanes; thirty three (33) billiard pool halls; thirteen (13) badminton courts;
thirty one (31) swimming pools; seven (7) shooting ranges; four (4) tennis/squash courts; one (1)
archery range; one (1) basketball court; and three (3) sports plazas. QC also has 598 indoor
amusement and kiddie centers which includes one hundred forty-two (142) amusement centers and
kiddie rides; four hundred fifty-one (451) recreational facilities such as bingo halls, dance studios,
videoke bars, OTBs, etc.; four (4) kiddie play stations; and one (1) learning and activity center. Other
entertainments and recreations in the city include twenty (20) malls; sixty-two (62) cinemas and
theaters; one hundred fifty-five (155) physical fitness gyms; and one (1) indoor park.
3.7 PROTECTIVE SERVICES
3.7.1 Police Services
Quezon City was formerly under the
jurisdiction of the Northern Police District
which also covered Caloocan, Navotas,
Malabon and Valenzuela. With the
creation of the Central Police District now
Quezon City Police District (QCPD) in
October 1990, QCPD is mainly responsible
for the maintenance of the peace and
order situation of the entire Quezon City
only. The QCPD Headquarter is located at
Camp Karingal, Sikatuna Village in District
IV.
The total police force of the QCPD as
of 2018 is 5,139, an increase of 1,574 or
44.15% from 3,565 police personnel in
2015. The police manpower is comprised
of 307 Police Commission Officers (PCOs),
4,666 Police Non-Commissioned Officers
(PNCOs) and 166 Non-Uniformed
Personnel (NUP).

96
Of the total police personnel, 4,356 or 84.76% are males and 783 or 15.24% are females. With
the city’s 2018 population of 3,040,672, police-population ratio is 1:591. The standard police-
population ratio is one (1) police to 500 population (1:500) for urbanized areas such as Quezon City.
It was noted that the current police-population ratio has greatly improved compared to 1:824 ratio in
2015. To attain the ideal ratio, the City needs to add 942 more policemen.
To complement, if not to augment the present police force, the City maintains some 2,148
Barangay Protection Security Officers (BPSOs) who are primarily tasked to maintain peace and order
within the barangay through nightly “rondas”, rescue operation assistance and disaster prevention
and mitigation. These public safety officers are provided by the city with a P600.00 monthly
allowance.
The QCPD has twelve (12) police stations and twenty-seven (27) Police Community Precincts
(PCPs). Aside from these, the QCPD has also established the Barangay Police Community Precincts
(BPCPs) in each of the city’s 142 barangays by deploying an average of three (3) police officers for
each barangay. The BPCP’s program implemented a system of community-oriented policing aimed to
provide efficient police service to the people by protecting their rights and upholding the law. It is
primarily bilateral, meaning, the police and the city residents alike are responsible for crime
prevention. The police station-population ratio in 2018 was 1:253,289 which is way above the
standard police station population ratio of 1:100,000 meaning one police station covers more than
twice the population it has to ideally serve. With this situation, the city’s required number of police
station is 30 or a deficiency of 18 more police stations that need to be established.
For the last nine (9) years, the city donated 2,750 short/long firearms, 744 communication
equipment which include mobile-base and handheld radios, 60 vehicles and 291 motorcycles. Aside
from these, the QCPD were also provided with 149 computers, 500 pcs. battery packs, 3,600 helmet,
300 camera, 3,809 bullet proof and 6,271 other equipment. The QCPD were also given 300 body
worn cameras and 42,400 ammunition, (bullets and shells). The QCPD has 112 investigative
equipment; eight (8) fingerprint kits, eight (8) investigative kits, seventy (70) first aid and
responders’ kits, one (1) video camera, 13 blotter, 13 police line and four (4) digital cameras being
used by the police force in their conduct of investigation.
3.7.2 Crime Incidence
In 2018 the city’s recorded crime incidences was slightly higher at 12,865 cases or 4.09%
compared from the 12,359 reported cases in 2017. Reported crime volume in 2016 was 14,293. A
decrease of 30.54% from the 2015 total crime volume of 20,578.
The city’s average monthly crime rate therefore, in 2018 is 35.25% per 100,000 population
which is higher compared to Metro Manila’s average monthly crime rate of 28.15% per 100,000
population. Crime solution efficiency on the other hand increased from 41.64% in 2015 to 67.03% in
2018.
Data by classification of offense shows that of the 12,865 crime volume in 2018, 34.55% or
4,445 cases are considered as index crimes while more than half 65.45% or 8,420 cases are classified
as non-index crime. Crime against Persons and Property are classified as index crimes which are
sufficiently significant and occur with regularity to be considered as an indicator of the crime
situation. Violation of special laws such as; estafa, vagrancy, trespassing, seduction, coercion,
gambling, scandal are among those classified as non-index crimes.

97
In the last 4 years, the three (3) most prevalent crimes are theft, physical injury and robbery.
The reported number of crimes in 2018 shows, that there were 1,838 (41.34%) cases of theft, 994
(22.36%) physical injury and robbery with 833 (18.74%). Reported rape cases was however, noted
to have slightly decreased from 308 in 2015 to 298 in 2018. (See Table DS-51)
Table DS-51: Reported Number of Crimes by Classification of Offense Quezon City: 2015 – 2018
CLASSIFICATION OF OFFENSE 2015 2016 2017 2018
No. % No. % No. % No. %
Crime Against Persons 2,953 26.58 1,915 28.77 1,895 32.95 1,465 32.96
Murder 207 1.86 325 4.88 325 5.65 135 3.04
Homicide 77 0.69 21 0.32 54 0.94 38 0.85
Physical Injuries 2,361 21.25 1,371 20.59 1,308 22.74 994 22.36
Rape 308 2.77 198 2.97 208 3.62 298 6.70
Crime Against Property 8,155 73.42 4,742 71.23 3,857 67.05 2,980 67.04
Robbery 2,162 19.46 1,391 20.90 1,104 19.19 833 18.74
Theft 4,986 44.89 2,860 42.96 2,378 41.34 1,838 41.35
Carnapping 1,007 9.07 491 7.38 375 6.52 309 6.95
TOTAL INDEX CRIMES 11,108 53.98 6,657 46.58 5,752 46.54 4,445 34.55
Violation of Special Laws 4,303 45.44 3,927 51.43 3,413 51.66 5,859 69.58
Other Non-Index Crimes 5,167 54.56 3,709 48.57 3,194 48.34 2,561 30.42
TOTAL NON-INDEX CRIMES 9,470 46.02 7,636 53.42 6,607 53.46 8,420 65.45
TOTAL CRIME VOLUME 20,578 100.00 14,293 100.00 12,359 100.00 12,865 100.00
CRIME RATE 743 481.15 411.22 423
SOLVED CASES
CRIME SOLUTION EFFICIENCY 41.64 61.70 80.83 67.03 QC AVERAGE MONTHLY CRIME RATE
61.92 39.19 34.27 35.25
Metro Manila AVERAGE MONTHLY CRIME RATE
55.52 90.36 28.15
Source: Central Police District Command

98
3.7.3 Fire Protection and Prevention
Fire protection and
prevention services are rendered
by the Quezon City Fire District
(QCFD) which has twenty six (26)
fire sub-stations in 2018 against
only 24 fire sub-stations in 2015.
These facilities are distributed in
the city’s six (6) congressional
districts.
In 2018, there were 576
firefighters or an additional 5
firemen from 571 firemen in 2015
complemented by 35 civilians.
There are also 47 fire aides that
were provided by the city
government. The present firemen-
population ratio stands at 1:5,278
way below the standard ratio of
1:2,000. At the present ratio, the
number of persons a city fireman
services is more than twice the
number of people he can
effectively serve. Clearly there is a
shortage in the city’s firefighting
force of about 944 firemen. The
city has 27 fire trucks, but only
twenty one (21) are serviceable,
two (2) under repair and four (4) unserviceable. There are also two (2) emergency vehicles, but only
one is functional. The two (2) aerial ladders are both functional.
The 2018 fire-substation to land area ratio is 1:6 sq.km. against 1:7 sq.km. in 2015. Although
there was a reduction in the fire-substation-land area ratio due to the existence of additional three
(3) fire-substations from the previous number of said facility, the ratio is still below the standard
fire-substation land area ratio of 1:4 sq.km. The required fire-substation in the city therefore is 40,
thus with the existing 26 fire-substation there is still an acute shortage of 14 fire-substations.
3.7.4 Fire Incidence
In 2018, the Quezon City Fire District responded to 1,034 fire incidences, a decrease of 214
incidences from the 2016 figure of 1,248. The amount of losses due to these fire incidences is
₱22,407,300.00. Of the said fire incidences, 21.57% or 223 were structural in nature involving
buildings, houses and other structures while 78.43% or 811 are non-structural (grass, rubbish,
forest, motor vehicle). More than half (71.86%) of the causes of fire was electrical or those involving
MERALCO/NAPOCOR facilities such as electrical posts, primary and secondary distribution lines and
transformers, while 28.14% of the fire incidences are non-electrical causes such as cigarette butts
smoke and LPG tanks/stove. Majority of the fire incidences occurred in District II wherein a great
Figure DS-29: QC Fire Stations, 2018

99
number of informal settlers are located particularly in Barangays Commonwealth and Batasan Hills.
(See Table DS-48)
Table DS-52: Number of Reported Fire Incidence and Responded to
by the QC Fire Department, Quezon City: 2015 - 2018
FIRE INCIDENTS BY TYPE 2015 2016 2017 2018
No. % No. % No. % No. %
Causes of Fire
Electrical 541 52.32 733 50.73 705 67.20 743 71.86
Combustible/Heat Bonfire 10 0.97 2 0.16 7 0.68 17 1.64
Open Flames/Cooking
45 3.60 56 5.34 56 5.42
Cigarette Butts Smoke 177 17.12 198 15.87 130 12.39 142 13.73
Fireworks/Explosive Sparks
2 0.19 1 0.10
Flammable Liquids
4 0.38 2 0.19
LPG Tanks/Stove 20 1.93 34 2.72 54 5.15 17 1.64
Unknown/Others
236 18.91 91 8.67
Unattended Cooking Stove 19 1.84
Unattended Lighted Candle 14 1.35
Under Investigation 253 24.47
56 5.42
TOTAL 1,034 100 1,248 100 1,049 100 1,034 100
Motives
Intentional 13 1.26 4 0.32 6 0.57 4 0.39
Accidental 768 74.27
990 94.38 974 94.20
Under Investigation 253 24.47 1,244 99.68 53 5.05 56 5.41
TOTAL 1,034 100 1,248 100 1049 100 1,034 100
Nature
Structural 794 76.79 389 31.17 264 25.17 223 21.57
Vehicular
86 6.89 73 6.96 62 6.00
Grass
104 8.33 19 1.81 35 3.38
Chemical
2 0.16 52 4.96 16 1.55
Rubbish 174 16.83 93 7.45 104 9.91 119 11.55
Forest
Ship
Transformer explosion
1 0.10
Post fire
240 19.23 207 19.73
Secondary Wire
9 0.86
Service Entrance
6 0.57
Electric Fan
10 0.95
Tree Fire
Transmission Line/High Tension
Others (Electrical Fixture) 66 6.38 334 26.76 304 28.98 579 6.00
TOTAL 1,034
1,248 100 1,049 100 1,034 100
Estimated Damages (in Pesos)
53,127,200.00 123,420,964.86 25,409,600.00 22,407,300.00
Source: QC Fire Department

100
3.7.5 Administration of Justice
The delivery and administration of justice at the local level is a collective responsibility of the
Office of the City Prosecutor, the Metropolitan Trial Court and the Regional Trial Court.
In 2018, the Metropolitan Trial Court recorded 14,499 cases, a decrease of 4,705 cases or 25%
from the 19,204 recorded cases in 2015 of which 7,539 cases or 52% were disposed. The Regional
Trial Court on the other hand, received and recorded 7,858 cases in 2018 for prosecution and
disposed 5,264 cases or 67.00% which is higher compared to the disposed cases in the three (3)
previous years. (See Table DS-53)
The Quezon City Hall of Justice houses sixty one (61) court branches, thirteen (13) of which are
Metropolitan Trial Court branches, and forty eight (48) are Regional Trial Court branches both
presided over by an equal number of judges and ninety one (91) Prosecutor’s Offices. Personnel in
both courts and the Office of the City Prosecutor including City Fiscals and Judges total to 1,455 of
which 607 or 41.72% males and 848 or 58.28% females.
Table DS-53: Recorded and Disposed Cases
Quezon City: 2015-2018
ADMINISTRATION OF JUSTICE
2015 2016 2017 2018
NO. % NO. % NO. % NO. %
Metropolitan Trial Court
Recorded 19,204
14,262
15,564
14,499
Disposed 9,218 48.00 5276 37.00 6,692 43.00 7,539 52.00
Regional Trial Court
Recorded 9,525 10,871 3,367 7,858
Disposed 5,905 61.99 3,587 33.00 1,649 49.00 5,264 67.00
3.7.6 Reformatory Institutions
The City has three (3) reformatory institutions, the Molave Youth Home, the Quezon City Jail
and the Quezon City Drug Treatment and Rehabilitation (TAHANAN).
The Quezon City jail located in a 0.2 has. land space within Bernardo Park Bgy. Pinagkaisahan
along EDSA can be considered as the most highly congested safekeeping institution in Metro Manila
with male inmate’s jail population of 4,234 as of 2018, 47.17% increase from the 2,877 inmates in
2015. The existing city jail has fifteen (15) cells with a total floor area of 6,300 sq.m. and ideally it has
to accommodate only 1,340 inmates following the standard space requirement per inmate of 4.7
sq.m. based on the Bureau of Jail Management and Penology (BJMP) manual , but due to its limited
space, the inmates are all housed in the said facility. Basic utilities such as water supply and sewerage
facilities are inadequate resulting in unsanitary and unhealthful condition inside the jail. Similarly,
Camp Karingal, where female inmates are housed is congested. In 2018 there were 1,049 female
inmates, almost double from the 2015 data of 503 inmates.
The city jail is managed by 162 police officers assigned to guard the inmates and secure them
during scheduled hearings. Thirty seven (37) officers were assigned to escort the scheduled hearing
of inmates. These jail guard officers had escorted during court hearings an average of 93 inmates per

101
day. The present jail guard/custodial – inmate ratio is 1:26 which is way below the ideal ratio of 1:7,
while escort-inmate present ratio is 1:114 as against the ideal 1:1. Current shortage of jail guards is
443.
The new Quezon City Jail is presently under construction by the BJMP within a portion (2.4 has.)
of the 3.4 has. city property located at Litex Road, Barangay Bagong Silangan, this city.
The QC Drug Treatment and Rehabilitation Center (TAHANAN) located in Diamond Hills
Subdivision, Bgy. Payatas offers services for the treatment of drug dependents. Table DS-54 shows
that in 2018, there were 396 clients (341 male & 55 female) served, an increase of 143 or 56.52%
clients from 253 recorded clients in 2015. At the district level, it shows that 87 clients are from
District V followed by District I with 80 and District IV with 75 clients. As to their civil status, 58.84%
are single, 11.36% married, 25% common-law partners while 4.80% are separated. The clients are
accommodated in three (3), 2-storey wards with an approximate floor area of 182.62 sq.m. for each
building. The center is being managed by 98 personnel.
Table DS-54: Number of Drug Dependents/Clients Served at TAHANAN by District Quezon City; 2015-2018
DISTRICT 2015 2016 2017 2018
I 39 20 55 80
II 63 80 56 40
III 31 25 31 40
IV 45 33 52 75
V 43 62 68 87
VI 30 11 31 41
Non-QC residents 2 4 14 33
Total 253 235 307 396
Source: Vice Mayor’s Office
3. 8 CULTURE
In spite of its young history, Quezon City,
like other cities in the country, has many
historical spots that speak of its rich heritage.
There are twenty-four (24) historical
sites/landmarks, foremost is the Santuario de
San Pedro Bautista, also known as the San
Francisco del Monte Church built in 1590 at San
Francisco del Monte and the Church of the Holy
Sacrifice at UP Diliman. Also, situated at the
heart of the city and adjacent to the City Hall
compound is the towering Quezon Memorial
Shrine, the site of several historic occasions such
as the mass officiated by His Holiness, Pope Paul
VI on November 29, 1970 and Pope John Paul II
on February 18, 1981.
The City museum located at the base of
the Quezon Memorial Shrine houses the remains Figure DS-30: Historical Sites Map, QC 2018

102
of the late President Manuel L. Quezon, aside
from other memorabilia. Other historical spots
are Gen. Fulton Monument in Barrio Bagong
Silangan, where American General Lawton was
actually killed by the Katipuneros and at Sitio
Pugad Lawin situated on a rocky area near
Project 8 where the Katipuneros led by Andres
Bonifacio launched the revolution against the
Spanish Colonial rule in 1896. Added to this is
the resting place of the remains of Melchora
“Tandang Sora” Aquino at Banlat, Barangay
Tandang Sora. The Cloverleaf road complex,
where the Balintawak monument in honor of
Bonifacio is situated is being converted into a
tourist spot of the city. Camp Aguinaldo and
Camp Crame can both be considered historical
sites for being the center of the EDSA
Revolution last February 25, 1986.
To date, there are twenty-five (25)
museums/art galleries in the city, nine (9) are
public museums and sixteen (16) private
museums. The public museums include the
Armed Forces Museum and George Vargas
Museum and the QCX Museum. The QCX Museum is located at the eastside portion of the QC
Memorial Circle near the Philcoa Entrance, comprised of a five-building complex in a sprawling area
of 20,000 sq.m. which includes Gallery A, B, C, Administrative Building and Business Center. It is the
first of its kind; a socio-cultural interactive museum that showcases the city’s humble beginnings up
to the present, encompassing its society and culture. It also aims its visitors and guests to be
entrenched and re-live the “Quezon City Experience”.
Three (3) heritage houses are also found in the city, one in Cubao named MIRA-NILA Heritage
House, the Quezon Heritage House formerly located at No. 45 Gilmore St., New Manila which was
transferred and restored to its new location within Quezon Memorial Circle. Likewise, in honor of the
late Pres. Corazon C. Aquino who was once a resident of the city, a replica of their residence at Times
Street, Bgy. West Triangle was also constructed near Quezon Heritage House in QMC which is now
both being considered as tourist destinations of the city and cultural site that could be visited by the
students in their educational trips.
Inspired by Pres. Quezon’s vision that Quezon City shall be the seat of the national
government, the city has retained its importance and distinction as the main National Government
Center for it is where the historic building of the Batasang Pambansa and other national government
buildings such as the Department of Social Welfare and Development (DSWD) and Civil Service
Commission (CSC) can be found. Other institutional buildings and offices located in the city are the
Quezon City Civic Center, Novaliches District Center, Philippine Heart Center for Asia, the Philippine
Lung Center, the National Children’s Hospital, Philippine Children’s Medical Center, East Avenue
Medical Center, the Atomic Energy Commission, Social Security System (SSS), Bangko Sentral ng
Pilipinas, Quezon Institute, the Philippine Orthopedic Center, La Mesa Dam and the Balara Filters
Plant. Here is also where the University of the Philippines can be found and the UP Oblation.
Source: Quezon City Tourism Department
Figure DS-31: QC Landmarks , 2018

103
The Division of City Schools has also been very active in promoting activities that motivate
pride of the nation’s rich cultural heritage among residents as part of its on-going educational
program.
The Quezon City Tourism Department and the Quezon City Performing Arts of the city
government are involved in actively enhancing and promoting culture and arts among city residents.

103

104
CHAPTER 4: Economic Profile and Development
The Economic Profile focuses on the sub-sectors on Labor and Employment, Family Income and
Expenditure, Trade and Industry and Tourism
4.1 LABOR AND EMPLOYMENT
The Labor Force Survey (LFS) conducted quarterly every year by the Philippine Statistics
Authority (PSA) has been the main employment data of the city. From the year 2004 onwards,
city level data were no longer made available in the LFS. The increase in population over the
years required increasing area samples in the survey. With no increase in the sample size, city
level figures became less accurate with a wider margin of error, therefore no longer reflected in
the results. Due to absence of city data and for the purpose of getting more updated labor and
employment statistics, NCR figures have been used to represent those of the city. This is
attributed to the large representation of the city’s population and land area to the NCR. The city
population as of 2015 based on PSA official census result is almost one-fourth or 23% of the total
population of the NCR and one-fifth or 20% of its land area which provide a great influence in
regional economic status. Even from past LFS data, when city level data were still available, it
could be noted that the city’s figures were not far off or just followed closely those of the region.
Quezon City’s projected population in 2018 is 3,040,672 or 23% of the NCR’s population
(based on official result as per PSA 2015 Census of Population). The projected working age
population 15 years old and over is 2,153,455 (70.8% of the entire population based on the
official PSA result).
The working age population is divided into:
1. The economically active population or those in the labor force.
This group is 60.3% (1,298,533) of the working age population composed of the employed
and the unemployed. Using the NCR’s rates, employment has been placed at 93.4% representing
about 1,212,830 of city’s population which also includes the underemployed (those who are
working less than the regular 8-hours per day and still looking for additional work) of 7.2% or
87,324. There are more employed males (55.8% or 676,759) than females (44.2% or 536,071).
The unemployment on the other hand, is placed at 6.6% or about 85,703 of city’s population.
(Table ED-1)
2. The economically inactive population or those not in the labor force.
The economically inactive or those not in the labor force on the other hand, makes up
39.7% or about 854,922 of the working age population not looking for work composed of
students, housewives, retirees, the sick, PWDs , etc.

105
Table ED-1:: NCR / QC Population by Employment Status -2018
EMPLOYMENT STATUS NUMBER % SHARE
Working Age Population 15 years old and over
2,153,455 100%
Labor Force Population 1,298,533 60.3
- Employed (includes the underemployed of 7.2% (87,324)
1,212,830
93.4
- Unemployed 85,703 6.6
Total 100.0
Not in the Labor Force (students, housewives, retirees, sick, PWDs)
854,922
Source: Philippines Statistics Authority (PSA) Labor Force Survey
Table ED-2 : Labor Force Participation: Employment, Unemployment Underemployment and Not in the Labor Force; Rates of NCR/QC: 2010-2018
YEAR
LABOR FORCE PARTICIPATION EMPLOYMENT UNEMPLOYMENT
UNDER EMPLOYMENT
NOT IN THE LABOR FORCE
NUMBER RATE NUMBER RATE NUMBER RATE NUMBER RATE NUMBER RATE 2010 1,215,998 62.4 1,076,158 88.5 139,840 11.5 128,063 11.9 732,717 37.6
2011 1,265,745 63.0 1,122,716 88.7 143,029 11.3 163,917 14.6 743,374 37.0
2012 1,303,012 63.1 1,164,893 89.4 138,119 10.6 167,745 14.4 761,983 36.9
2013 1,348,546 63.5 1,209,646 89.7 138,900 10.3 134,271 11.1 775,148 36.5
2014 1,407,399 64.4 1,263,844 89.8 143,555 10.2 136,495 10.8 778,003 35.6
2015 1,307,948 62.9 1,196,772 91.5 111,176 8.5 119,677 10.0 771,460 37.1
2016 1,323,291 62.9 1,234,631 93.3 88,660 6.7 107,413 8.7 780,510 37.1
2017 1,300,505 61.1 1,204,268 92.6 96,237 7.4 111,997 9.3 827,981 38.9
2018 1,298,533 60.3 1,212,830 93.4 85,703 6.6 87,324 7.2 854,922 39.7
Source: PSA Labor Force Survey (2010 & 2015 figures are Official Census results, figures for other years are
projected / estimates)
The employment rate is shown to be slightly improving every year. Underemployment
(which is part of the employment figure) in the last five years (2011 to 2016) is also favorably
decreasing but slightly increased in 2017 in spite of the growing labor force but also decreased to
7.2% in 2018. (Table ED-2)
Figure ED-1 : Labor Force 2018
Being supported by the employed population are 1,827,841 dependent population
composed of the following:
- those in the dependent age below 15 years old (887,216)
- the economically inactive (854,922)
- and the unemployed persons (85,703)
1,212,830 (93.4%)
85,703 (6.6%)
Employed Unemployed

106
Dependency ratio is therefore computed at 1.5:1 (dependent:worker) which means that
there are about three dependents for every two (2) workers for a household with an average size
of five (5) persons.
On Employment by Class of Worker (PSA data using the NCR rate), majority (988,589) or
about 81.51% of those employed are wage and salaried workers (worked for private household,
private establishment, worked for government or government controlled corporation and worked
with pay in own family-operated farm or business), followed by the self-employed without any
paid employee with about 186,898 or 15.41%, Employer in own Family-operated Farm or
Business 21,002 or 1.73% and Worked without pay in own Family-operated Farm or Business
16,341 or 1.35%. There are more male Wage and Salaried Workers 57.90 % (702,229) than
female 42.10% (510,601).
As to Major occupation in 2018 based on the NCR rate, the top 3 major occupations are
persons employed in Service, shops and market sales workers with 19.54% (236,944),
Elementary occupations (laborers and unskilled workers) 17.36% (210,587) and Managers
(Officials of Government, special interest organizations, corporate executives, managers,
managing proprietors and supervisors) with 16.65% (201,899). By sex segregation, males
formed the largest percentage group with 57.90% than females with 42.10%.
Table ED-3 : Number and Percentage Distribution of Employed Person by Major Occupation and by Sex: Quezon City Using NCR Rate: 2018
MAJOR OCCUPATION MALE FEMALE BOTH SEXES
NUMBER % NUMBER % NUMBER %
Elementary Occupations (laborers and unskilled workers)
124,295 17.70 86,292 16.90 210,587 17.36
Service, Shops and Market sales workers 117,974 16.79 118,970 23.30 236,944 19.52
Plant and machine operators and assemblers 103,228 14.70 7,659 1.50 110,887 9.14
Managers (Official of government and special interests organizations, corporate executives, managers, managing proprietors and supervisors)
96,205 13.69 105,694 20.70 201,899 16.64
Craft and related trade workers 94,099 13.40 14,807 2.90 108,906 9.05
Clerks (clerical support workers) 66,010 9.40 87,823 17.20 153,833 12.68
Technicians and associate professional 48,454 6.90 37,785 7.40 86,239 7.11
Professional 46,347 6.62 51,571 10.10 97,918 8.07
Skilled agricultural workers (farmers), forestry workers and fishery workers (fishermen)
2,809 0.40 - - 2,809 0.23
Armed Forces Occupation (special occupations)
2,808 0.40 - - 2,808 0.23
Total 702,229 100.00 510,601 100.00 1,212,830 100.00
In a separate study or census of the PSA on 2017 Business Establishments by Industry
and Employment, NCR as in the past has been shown to have the highest share (37.66%) in the
country’s total employment figure as it has been known to be the center of major business
activities in the country. The top three (3) NCR cities on employment are: Quezon City registered
the highest employment (708,369) with 24.0% of the total regional employment (2,949,627),
followed by Makati 19.23% (567,358) and Manila 10.60% (312,707) See Table ED-4.

107
Table ED – 4 Number and Percentage of Employed Persons in the
Philippines, NCR, by Other Cities in NCR, 2017
GEOGRAPHICAL
COVERAGE 2017 % from Phils. % from NCR
Philippines 7,832,089 National Capital Region 2,949,627 37.66 Quezon City 708,369 9.04 24.02 Makati City 567,358 7.24 19.23 Manila City 312,707 3.99 10.60 Pasig City 247,513 3.16 8.39 Taguig City 198,020 2.53 6.71 Mandaluyong City 180,902 2.31 6.13 Paranaque City 148,604 1.90 5.04 Pasay City 114,505 1.46 3.88 Caloocan City 107,213 1.37 3.63 Muntinlupa City 101,600 1.30 3.44 Valenzuela City 92,839 1.19 3.15 San Juan City 44,588 0.57 1.51 Las Piñas City 41,156 0.53 1.40 Marikina City 31,360 0.40 1.06 Malabon City 30,220 0.39 1.02 Navotas City 19,150 0.24 0.65 Pateros 3,523 0.04 0.12
The city’s top five industries with highest employment are: Administrative and Support
Service Activities with 219,891 or 31.04%, Wholesale and Retail Trade and Repair of Motor
Vehicles and Motorcycles with 143,406 (20.24%), Construction with 72,290 (10.21%),
Accommodation and Food Services/Hotel and Restaurant with 59,588 (8.41%) and
Manufacturing with 56,871 or 8.03%.
Table ED-5 Number and Percentage of Employed Persons by Type of Industry Classification, Quezon City: 2017
INDUSTRY CLASSIFICATION NUMBER %
Administrative and Support Services Activities 219,891 31.04 Wholesale and Retail Trade; Repair of Motor Vehicles and Motorcycles
143,406 20.24
Construction 72,290 10.21 Accommodation and Food Service Activities 59,558 8.41 Manufacturing 56,871 8.03 Education 28,925 4.08 Information and Communication 25,006 3.53 Financial and Insurance Activities 20,750 2.93 Professional, Scientific and Technical Activities 18,739 2.65 Human Health and Social Work Activities 17,986 2.54 Other Service Activities 17,707 2.50 Transport and Storage 8,655 1.22 Real Estate Activities 8,653 1.22 Arts, Entertainment and Recreation 2,972 0.42 Water Supply, Sewerage, Waste Management and Remediation Activities
2,252 0.32
Electricity, Gas, Steam and Air Conditioning Supply 2,239 0.32 Agriculture, Forestry and Fisheries 1,694 0.24 Mining and Quarrying 775 0.11 Total 708,369 100.00
Source: Philippine Statistics Authority (PSA)

108
The Informal Sector/Economy
In view of the limited employment opportunities, many are forced to engage in small-
scale entrepreneurial activities mostly unregistered, unregulated, unmonitored. These are those
who irregularly engaged in entrepreneurial activities working in full, part time or seasonal basis
who are not normally paying taxes. Section 4 of the Quezon City Ordinance No. SP-2512, S-2016
known as “The Quezon City Informal Economy Ordinance” classified the informal economy
workers into home-based workers (own account/self-employed), vendors, transportation
sectors, non-corporate construction workers and others such as street workers, waste workers
and volunteer service workers in private and public. On the other hand, Section 3 (a) defines
Informal Economy as all economic activities by workers and economic units that are in law or in
practice not covered or insufficiently covered by formal arrangements and does not cover illicit
activities. However, to uphold the rights, ensure the protection and promote the welfare of these
workers, the city government enacted said Ordinance, providing the basic framework for the
development programs for the workers in the informal economy and created the Informal
Economy Development Council.
Data available from the Market Development and Administration Department (MDAD)
had recorded 54 temporary vending sites in six (6) Districts of the city with 2,026 vendors. The
Tricycle Regulation Unit (TRU) under the Department of Public Order and Safety had 152
Tricycle Operators and Drivers Associations (TODA) operating with 24,756 units and drivers
with approved route measured capacity (RMC) by the Tricycle Franchising Board (TFB). The
Public Employment Service Office (PESO) in coordination with DOLE is the agency in-charge in
the documentation and monitoring of 779 marginalized/disadvantaged beneficiaries in the
provision of emergency short-term wage employment assistance Program through the Tulong
Panghanapbuhay sa Ating Disadvantaged workers (TUPAD).
Overseas Filipino Workers (OFW)
For better employment opportunities, many are forced to seek employment abroad.
These are the Overseas Filipino Workers (OFWS), who contribute on nations’ economic well-
being. The OFW’s foreign currency remittances constitute a big part of the Philippines National
Gross Product (GNP). Based on records of Overseas Workers Welfare Administration (OWWA)
membership as of 2018, OFW from Quezon City ranked highest in the NCR with 193,101 or
21.83% share. Male is 109,970 or 56.95%, Female comprises of 74,921 or 38.80% and Not
stated 8,300 or 4.30%
By type, land-based OFWs show a bigger number with 149,052 (77.19%) compared to
sea-based 37,570 (19.46%). The land-based and sea-based OFWs are largely dominated by
males with 52.79% and 76.69% share respectively.
According to Philippine Overseas Employment Administration (POEA) records in 2017,
there were eleven thousand five hundred forty (11,540) OFW new hires from Quezon City
deployed in foreign countries, 35.85% (4,105) are males and 64.93% (7,435) are females. In the
NCR, there are more female 20.48% (36,305) OFWs than male 19.81% (20,720) OFWs deployed
in foreign countries. Majority were deployed in the Middle East Countries such as: Saudi Arabia,
Qatar, United Arab Emirates, Kuwait, Bahrain, Oman, Jordan while the remaining others were
deployed in other Asian countries, Canada and Guam. Contributing to the city’s unemployment
problems are the returning OFWs with finished and non-renewed work contracts from abroad.
Some have returned as they have been maltreated and abused by employer, jailed for various

109
reasons/offenses, or repatriated due to armed conflicts/civil war in the country where they
worked from.
According to their job and skills, QC-OFWs deployed in foreign countries were ranked
accordingly: Domestic Cleaners and Helpers 17.00% (1,962), Manufacturing Laborers 6.79%
(783), Waiters 3.62% (418), Dancers and Choreographers 1.97% (227), Home Based Personal
Care Workers 1.59% (183), Nursing Professionals 1.58% (182), Musicians, Singers and
Composers 1.31% (151), Health Care Assistants 1.10% (127), and others.
Various Programs are continuously undertaken by the city on employment generation,
promotion and protection where such services are mostly lodged with the PESO. Among these
programs are: Jobs Fair/Jobs Referrals, Workers Hiring for Infrastructure Projects (WHIP),
Youth Employment Programs Summer Job, TUPAD, National Skills Registry System (a
comprehensive skill/job mapping and matching service facility), Retooling Assistance for
Employment of Returning OFWs, creation of a Migrants Resource Center and profiling of OFWs of
QC. The QC Small Business Development and Promotions Office (SBDPO) also undertakes
livelihood technology skills training (e.g. on production of processed food, recycled paper-based
products, cloth and personal care products, etc.) and entrepreneurship seminars. It also has the
Micro-Credit Program or Puhunang Pangkaunlaran ng Sikap Buhay (PPSB) another Livelihood
assistance program that provides financial assistance including assistance in the Formation of
Cooperatives (Cooperative Development Program).
A cooperative is an autonomous association of persons who voluntarily collaborate for
their mutual social, economic and cultural benefit. Economic benefits are distributed
proportionally to each member’s level of participation in the cooperative. There are several
types of cooperatives most common of which are the Multi-purpose, Credit, Service, Consumer,
Transport, Housing, Federation, Labor, Producers and other like Workers Union, insurance,
marketing and cooperative bank. The 2018 records of the Cooperative Development Authority
(CDA) shows that there are 463 registered Cooperatives operating in Quezon City.
Table ED-6 Registered Cooperatives by Type: Quezon City 2018
TYPE OF COOPERATIVE NUMBER %
Multi-Purpose 211 45.57
Credit 76 16.41
Service 42 9.07
Consumers 37 7.99
Transport 32 5.91
Housing 13 2.81
Federation 12 2.59
Labor Service 10 2.16
Producers 8 1.73
Others 22 4.75
TOTAL 463 100
Source: Cooperative Development Authority (CDA)
In the NCR, there are 2,261 Cooperatives registered in the Cooperative Development
Authority (CDA). Cooperatives that are actively operating are 67.85% or 1,534 while those that
are not actively operating but still registered in the CDA are 32.15% or 727. Quezon City has the

110
highest number of registered cooperatives (active and inactive) with 29.68% of the NCR’s figure,
followed by Manila (13.36%), Makati (8.89%) and Pasig (6.90%).
4.2 FAMILY INCOME AND EXPENDITURES
The Family Income and Expenditure Survey (FIES) is a nationwide survey of households
conducted by the Philippine Statistics Authority (PSA) every three (3) years. The results of the
2015 FIES is presented below inasmuch as the results of 2018 data is expected to be released by
the second quarter of 2019. FIES is the main source of data on family income and expenditure,
which include among others, levels of consumption by item of expenditure as well as sources of
income in cash and in kind. The results of FIES provide information on the levels of living and
disparities in income of Filipino families, as well as their spending patterns.
4.2.1 Family Income
In 2015, Filipino families had an average monthly income of P22,250.00 based on the
results of the 2015 Family Income and Expenditures Survey (FIES) conducted by the Philippine
Statistics Authority (PSA). It increased by 13.6% from the average monthly income of P19,583.00
in the year 2012. On the other hand, families in the National Capital Region (NCR) earned an
average monthly income of P35,417.00 in 2015, increasing by 12.1% from the 2012 figure of
P31,583.00.
In the absence of more updated income statistics, NCR figures have been used to
represent that of the city in view that the population of the city makes up ¼ that of NCR. Even
with past data, it could be noted that the city’s figures were not far off or just followed closely
that of the region’s figures.
Table ED-7: Average Family Income, Expenditure and Savings
Philippines, NCR and Quezon City: 2003 – 2015
YEAR
AVERAGE MONTHLY
INCOME
AVERAGE MONTHLY
EXPENDITURE
AVERAGE MONTHLY
SAVINGS
Phils. NCR QC Phils. NCR QC Phils. NCR QC
2015 22,250 35,417 *** 17,917 29,083 *** 4,333 6,333 ***
2012 19,583 31,583 *** 16,083 27,083 *** 3,500 4,500 ***
2009 17,167 29,670 29,441 14,667 25,747 26,169 2,500 3,923 3,272
2006 14,394 25,916 *** 12,263 21,500 *** 2,131 4,416 ***
2003 12,324 22,204 *** 10,308 18,159 *** 2,016 4,045 ***
Source: PSA-FIES *** No city disaggregation for years 2003, 2006 and 2012 & 2015
Families were grouped and ranked into per capita income deciles. The richest decile
represents families belonging to the highest ten percent in terms of per capita income, while the
poorest decile represents families in the lowest ten percent.
In the Philippines from 2012 to 2015, average annual family income in all deciles
increased, the average ranged from Php86,000.00 for the first income decile (lowest 10 percent)
to Php786,000.00 for the tenth income decile (highest 10 percent) in 2015. The average annual
family income of the tenth decile in 2015 was about 9 times that of the first decile, while it was 10
times that of the first decile in 2012 (Table ED-5).

111
ANNUAL MONTHLY ANNUAL MONTHLY ANNUAL MONTHLY ANNUAL MONTHLY ANNUAL MONTHLY ANNUAL MONTHLY
First Decile 86,000 7,167 174,000 14,500 89,000 7,417 178,000 14,833 (3,000) (250) (4,000) (333)
Second Decile 114,000 9,500 223,000 18,583 110,000 9,167 212,000 17,667 4,000 333 11,000 917
Third Decile 133,000 11,083 260,000 21,667 122,000 10,167 241,000 20,083 11,000 917 19,000 1,583
Fourth Decile 156,000 13,000 282,000 23,500 140,000 11,667 251,000 20,917 16,000 1,333 31,000 2,583
Fifth Decile 182,000 15,167 330,000 27,500 161,000 13,417 284,000 23,667 21,000 1,750 46,000 3,833
Sixth Decile 218,000 18,167 362,000 30,167 189,000 15,750 306,000 25,500 29,000 2,417 56,000 4,667
Seventh Decile 259,000 21,583 411,000 34,250 217,000 18,083 344,000 28,667 42,000 3,500 67,000 5,583
Eighth Decile 320,000 26,667 487,000 40,583 260,000 21,667 398,000 33,167 60,000 5,000 89,000 7,417
Ninth Decile 415,000 34,583 601,000 50,083 326,000 27,167 475,000 39,583 89,000 7,417 126,000 10,500
Tenth Decile 786,000 65,500 1,120,000 93,333 534,000 44,500 799,000 66,583 252,000 21,000 321,000 26,750
Ratio of Tenth Decile
to First Decile
PHILIPPINES NCR
9.1 6.4 6.0 4.5
PHILIPPINES NCRPER CAPITAL
INCOME DECILE
INCOME EXPENDITURE SAVINGS
PHILIPPINES NCR
In the National Capital Region, average annual family income in all deciles also increased,
the average ranged from Php174,000.00 for the first income decile to Php1.12 Million for the
tenth decile. The average annual family income of the tenth decile was about 6 times that of the
first decile in the years 2012 and 2015.
Table ED-8 : Average Income, Average Expenditure and Average Savings of Families by Per
Capita Income Decile, Philippines and NCR 2015
Source: Philippine Statistics Authority (PSA)
Families in the poorest decile registered a negative monthly savings of Php250.00 and
Php333.00 in the Philippines and NCR, respectively. Families in the richest decile registered
monthly savings of Php21,000.00 and Php26,750.00 in the Philippines and NCR, respectively
According to the results from the 2015 FIES, the Gini coefficient, which is a measure of
income inequality within a population, was estimated at 0.4439 for 2015. The figure is slightly
lower than the 2012 ratio of 0.4605 which may indicate some improvement in the income
distribution among families. A Gini coefficient ranges from 0 to 1, with 0 indicating perfect
income equality among families, while a value of 1 indicates absolute income inequality.
Table ED-9: Gini Coefficient, Philippines and NCR: 2003-2015
YEAR PHILIPPINES NCR
2015 0.4439 0.3909
2012 0.4605 0.4028
2009 0.4484 0.3953
2006 0.4580 0.3988
2003 0.4605 0.4021
Source: Philippine Statistics Authority
Sources of Income
In terms of sources of income for families in the NCR and which would likely be
representative of Quezon City, majority or 68.2% of the families in the National Capital Region
rely on salaries/wages as their main source of income; 19.1% rely on other sources of income
which includes cash receipts from local and abroad, pension and retirement, dividends and
investments, house rental, interest income, etc.; and the remaining 12.7% rely on entrepreneurial
activities (wholesale and retail trade, small-scale manufacturing, transportation and
communication services, community, social and other services).

112
Wages and Salaries, 68.2%
Other Source of Income, 12.7%
Entrepreneurial
Activities, 19.1%
Figure ED-2 : Distribution of Families by Main Source of Income NCR 2015
4.2.2 Family Expenditure
Filipino families in 2015 had an average monthly expenditure of P17,917.00 increasing by
11.4% from the average monthly family expenditure of P16,083.00 in 2012. On the other hand,
average monthly expenditure in NCR was registered at P29,083.00 in 2015. It increased by 7.4%
from the average monthly expenditure of P27,083.00 in 2012.
In terms of pattern of expenditure, Filipino families spent about 41.9% on food (33.7%
spent on foods consumed at home and 8.2% regularly spent on foods consumed outside the
home), 12.2% on housing, 7.9% on water, electricity, gas and other fuels and 6.2% on
transportation. Other expenditure items include expenses on education, health, durable
furniture and equipment and special family occasion.
Table ED-10: Percent Distribution of Total Family Expenditure
by Expenditure Group: Philippines & NCR (2015)
Source: Philippine Statistics Authority (PSA)
EXPENDITURE ITEM PHILIPPINES NCR
Food expenditures 41.9 36.3 Alcoholic beverages 0.5 0.4 Tobacco 1.1 0.8 Other Vegetable-Based products 0.0 0.0 Clothing and Footwear 2.4 2.0 Furnishings and Routine Household Maintenance 2.5 2.8 Health 3.7 2.9 House Rent/Rental Value 12.2 18.2 Water, Electricity, Gas and Other Fuels 7.9 8.8 Transport 6.2 6.6 Communication 2.2 2.9 Recreation and Culture 0.8 0.8 Education 3.8 3.5 Accommodation Services 0.2 0.0 Miscellaneous Goods and Services 6.3 6.3 Durable Furniture and Equipment 2.5 1.5 Special Family Occasion 2.5 1.5 Other Expenditure 3.1 4.6
TOTAL 100.0 100.0

113
In the NCR, about 36.3% of the total annual expenditures was spent on food, 18.2% on
House Rental and about 8.8% was spent on basic utilities as water, electricity, gas and other fuels.
Other major expenditures include Transport (6.6%), Education (3.5%) and Health (2.9%).
Food and Poverty Thresholds
Food threshold is the minimum income required to meet the basic food needs, satisfying
the nutritional requirements set by the Food and Nutrition Research Institute (FNRI) to ensure
that one remains economically and socially productive. On the other hand, poverty threshold is
the minimum income required to meet the basic food and non-food needs such as clothing, fuel,
light and water, housing, rental of occupied dwelling units, transportation and communication,
health and education expenses, non-durable furnishing, household operations and personal care
and effects.
In the first semester of 2018, a family of five needed no less than PhP 7,337, on average, to
meet the family’s basic food needs for a month. This amount is the food threshold. On the other
hand, no less than Php10,481.00, on average, was needed to meet both basic food and non-food
needs of a family of five in a month. This amount is the poverty threshold. These are 11% higher
than the food and poverty thresholds from the first semester of 2015.
In the National Capital Region, first semester of 2018, a family of five needed at least
Php8,207.00 (monthly food threshold), on average, every month to meet the family’s basic food
needs and at least Php11,752.00 (monthly poverty threshold), on average, every month to meet
both basic food and non-food needs. Food and poverty threshold in NCR indicate increases of
about 11% from the first semester of 2015 to the first semester of 2018.
Table ED-11: Poverty and Food Thresholds ; Philippines and NCR: 2006, 2009, 2012 & 2015 and First Semester of 2015 and 2018
STATISTICS 2006 2009 2012 2015 2018
Full Year
First Semester
First Semester
Monthly Poverty Threshold: Philippines 5,566 7,030 7,890 9,064 9,064 10,481 National Capital Region (NCR) 6,541 8,011 8,477 10,420 10,420 11,752 Monthly Food Threshold: Philippines 3,878 4,908 5,513 6,329 6,600 7,337 National Capital Region 4,568 5,594 5,919 7,276 7,335 8,207 Source: Philippine Statistics Authority (PSA)
Poverty
Poverty incidence among Filipinos families in the first semester of 2018 was estimated at
16.1 percent. This is defined as the proportion of families whose income is below the poverty line
to the total number of families. This was estimated at 22.2 percent in the same period in 2015.
In the National Capital Region, poverty incidence among families increased by 0.3% in the
first semester of 2018 which was estimated at 4.9% from the 4.6% registered in the first
semester of 2015.
In Quezon City, poverty incidence dropped from 3.9% in the first semester of 2015 to only
3.5% in the same period in 2015.

114
The subsistence incidence among Filipino families was estimated at 6.2 percent in the
first semester of 2018. This is alternatively called as the proportion of Filipino families whose
incomes fall below the food threshold. In the same period in 2015, the proportion of families
who are food poor was recorded at 9.9 percent.
Subsistence incidence in NCR, on the other hand, registered an increase from 1.2% in the
first semester of 2015 to 1.65% in the first semester of 2018. Quezon City’s food poor also
registered an increase from 0.6% in the first semester of 2015 to 0.9% in the first semester of
2018.
Table E-12 : Poverty Incidence NCR, Philippines & Quezon City: 2006-First Semester 2018
2006 2009 2012
2015 2018 STATISTICS FULL
YEAR FIRST
SEMESTER FIRST
SEMESTER Poverty Incidence Among Families Philippines 21.0% 20.5% 19.7% 16.5% 22.2% 16.1% NCR 2.9% 2.4% 2.6% 2.7% 4.6% 4.9% Quezon City 3.2% 2.2% 1.9% 1.9% 3.9% 3.5% Poverty Incidence Among Population Philippines 26.6% 26.3% 25.2% 21.6% 27.6% 21.0% NCR 4.7% 3.6% 3.9% 3.9% 6.6% 6.6% Quezon City 4.9% 3.3% 2.4% 2.9% 5.8% 5.0% Subsistence Incidence Among Families Philippines 8.8% 7.9% 7.5% 5.7% 9.9% 6.2% NCR 0.5% 0.3% 0.3% 0.4% 1.2% 1.6% Quezon City 0.2% 0.3% 0.3% 0.1% 0.6% 0.9% Subsistence Incidence Among Population Philippines 12.0% 10.9% 10.4% 8.1% 13.0% 8.5% NCR 0.9% 0.5% 0.5% 0.7% 1.9% 2.0% Quezon City 0.3% 0.5% 0.4% 0.3% 1.0% 1.1% Source: Philippines Statistics Authority (PSA)
Minimum Wage
The new minimum wage rates for agricultural workers, firms in the manufacturing
sector with at most 10 workers, and firms in the retail as well as service sectors with at most 15
workers will earn at least Php500.00 daily, from the previous Php475.00. Non-agricultural
workers, meanwhile, will have a daily minimum wage of Php537.00 from Php512.00. Under
Wage Order No. 22, the Php10.00 cost of living allowance (COLA) will also become part of the
basic pay. Previously, the minimum basic pay ranged from P465 to P502, with an additional
Php10.00 COLA. The integration of COLA in the basic pay means bigger computations for
overtime pay and 13th month pay.
Table ED-13: CURRENT DAILY MINIMUM WAGE RATES National Capital Region (NCR), Per Wage Order No. NCR-22 (Effective: 22 November 2018)
SECTOR / INDUSTRY BASIC WAGE /
INTEGRATION OF COLA
BASIC WAGE INCREASE
NEW MINIMUM WAGE RATES
Non-Agriculture Php 512.00 Php 25.00 Php 537.00 Agriculture
Php 475.00 Php 25.00 Php 500.00
Retail Establishments Employing 15 workers or less Manufacturing establishments regularly employing less than 10 workers

115
4.3 FOOD SECURITY
Food Security “exists when all people, at all times, have physical and economic access to
sufficient, safe and nutritious food to meet their dietary needs and food preferences for an active
and healthy life”. The four (4) elements on the definition of food security are as follows: 1)
Availability - there must be adequate food supply to meet people’s needs; 2) Accessibility - it
considers people’s incomes/expenditures, markets and prices in achieving food security. 3)
Utilization - It is the way the body takes in the nutritional value of the food they consumed. 4)
Stability - it is having suitable food intake not only on a periodic basis but at all times.
The major sources of food supply come from the country’s Agricultural Sector: the
agricultural, fisheries, aqua-culture and forestry products. The country is therefore undertaking
great efforts to improve productivity of the sector. Food security is not all food but also having
access to clean water sources and sanitation facilities. Insufficient food consumption, its
deficiencies, imbalances in the consumption, the incapability of acquiring acceptable food result
to hunger or malnutrition. The national goal is to end hunger for all Filipinos.
With urbanization comes the challenges in food security. Metro Manila is a highly
urbanized region in the country with Quezon City as one of its most populated cities. Food
systems are required to ensure efficient and sustainable production, distribution and delivery of
goods from the farm to the metropolis or to all its local units.
4.3.1 Food Availability
As a highly urbanized city, with a very minimal agricultural activities to readily supply
food requirements, food is sourced by the city from nearby provinces. Agricultural produce are
brought to the city in bulk, at trading areas or “bagsakan” areas and sold mostly to wholesale
clients who then distributes said goods to other market outlets located in various areas in the
city. The trading area of the city is the Balintawak Cloverleaf Market and the Mega Q-Mart
located at EDSA. The distribution or retail outlets are: city’s eight (8) public markets, twenty
nine (29) private markets, and thirty one (31) talipapa. There are also now many other
available suppliers of basic goods and commodities/distribution outlets such as supermarkets,
mini marts, groceries strategically located in various areas of the city.
Table ED-14: Number of Public-Private-Talipapa/Satellite Markets with Occupied and Vacant Stalls , Quezon City by District: 2018
TYPE OF MARKET
NUMBER NUMBER OF STALL
DIST. 1 DIST. 2 DIST. 3 DIST. 4 DIST. 5 DIST. 6 TOTAL Public 8 52 - 727 2,512 - - 3,291 Private 29 1,317 1,937 858 541 638 892 6,183 Talipapa/Satellite 31 248 110 33 16 372 - 779
Total 68 1,617 2,047 1,618 3,069 1,010 892 10,253 Source: Market Development and Administration Department (MDAD)
Through the years, the number of private markets have decreased considering the
opening of the new and modern supermarkets and groceries (e.g. SM Supermarket/Hypermarket,
Robinson’s Supermarket, Savemore, Puregold, Robinsons etc.) which became a preference by
market-goers due to better and more convenient facilities that they offer. This has posed a
challenge to many operators of private wet and dry markets.

116
Food distribution in the city is also channeled through the numerous food outlets such
the neighborhood stores, restaurants and some 205 food establishments engaged in food
processing and 4 food manufacturing companies.
The city, in coordination with the national agencies, e.g. Department of Trade and
Industry, National Food Authority, Department of Agriculture, National Meat Inspection Service
(NMIS), etc., constantly controls and monitors operations on food supply and distribution in
order to stabilize its supply and demand.
On Rice
Rice is considered to be a staple food of the Filipinos. The major source of rice
distributed by the National Food Authority (NFA) particularly for the NCR are from top
producing provinces in Luzon namely: Pangasinan, Nueva Ecija, Tarlac, Pampanga, Bulacan,
Cagayan, Isabela and Mindoro. The country has been ranked as one of the top rice producers in
Aisa but data from the NFA, that in the past years when the country experienced deficit in
production, rice was imported from the following countries: Vietnam, Thailand and India to
ensure stability of supply. The country is working to becoming self-sufficient in rice production
for the coming years.
On Fish and Vegetables
Sources of fish sold in markets, flea markets, supermarkets in the city mainly come from
the Navotas Fish Port, with others coming from Cavite, Batangas, Quezon and as far as the
provinces in the Visayas and Mindanao.
Vegetables in the city are sourced mostly from the northern provinces in Luzon: Baguio,
Pangasinan, Isabel, Bulacan, and Pampanga. These are brought to city’s major
trading/”bagsakan” area at the Cloverleaf Balintawak Market which through the years became
known as a trading site for agricultural produce coming in from the north. Other trading areas
are the Mega Q- Mart. Other food retailers also go directly to the major sources for supply.
On Livestock and Poultry
Slaughtered meat are sourced from the city’s slaughterhouses. The live animals (hogs,
cattle, carabao, goats) brought in for slaughtering in the city’s abattoirs are mainly sourced from
nearby provinces Bulacan, Nueva Ecija, Batangas, etc. Some families are also engaged in
backyard livestock or poultry raising as their main source of income. The city has three (3)
existing slaughterhouses: Novaliches Slaughterhouse (the only accredited slaughterhouse of
the city by the NMIS), Labudahon Slaughterhouse and Mega Q- Mart Abbatoir–(a temporary
Slaughterhouse). There are also the non-NMIS accredited small slaughterhouse of the “lechonan”
operators at La Loma serving specifically the city’s lechon industry requirements. Chicken/fowls
on the other hand, are also sourced out from nearby provinces and brought in to various public
market stallholders for slaughtering. Quezon City does not have a city-owned slaughterhouse,
but all slaughterhouse operations in the city are monitored and inspected by its City Veterinary
Department (CVD) to see to that operations are in accordance with national and local regulation.

117
Based on a market assessment study conducted by the city, the daily total production
capacity from existing slaughterhouse as monitored by the CVD shows a big deficiency in
supply (see table below). To cope with the meat requirements of the city, many
distributors/traders (e.g. public & private markets, supermarkets, groceries etc.) get their meat
supply from other sources namely:
- Slaughtered meat from nearby cities and municipalities
- Local processed meat suppliers/manufacturers namely :Pure foods, Monterey, Magnolia, CDO,
Bounty Fresh, and other meat companies; and
- Imported frozen products (USA and Canada as the country’s major suppliers).
This shows that there is a big market for slaughtered meat products/services.
Table ED-15 : 2015 Daily Meat Demand and Supply Of Quezon City
TYPE AVERAGE DAILY
CONSUMPTION*
**MEAT REQUIREMENTS /
DEMAND** PRODUCTION CAPACITY
Hogs 0.05137 1,142 hogs 550 (220 from lechoneros)
Cattle 0.00677 183 cattle 54
Goat - - 136
Chicken 0.03496 68,431 chicken 8,449
Sources:* PSA Consumption Study; ** City Veterinary Department
Risk of Supply Disruption
Food insecurity exists when there is the risk of supply disruption- a situation when
people lack secure access to sufficient safe and nutritious food for normal growth and
development and an active and healthy life. The factors that could affect food security are: poor
quality of transport infrastructure, climate change, typhoon, strong rains, disasters, farmers’ lack
of lands to be irrigated and lack of income which can be grouped into economic, environmental,
demographic, political conditions, and risks, hazards and shocks.
Programs undertaken by the city on food availability are: urban farming, vertical
gardening for public schools, barangays with open/vacant spaces.
4.3.2 Food Affordability
This category measures the ability of consumers to purchase food, their vulnerability to
price shocks, and the presence of programs and policies to support them when shocks occur.
The capacity to afford good-quality food without undue stress is a crucial aspect of food
security. Food affordability considers first, whether an average individual in a country has
sufficient means to purchase food, and second, the public structures that have been established
to respond to personal or societal shocks. Together, these provide a holistic treatment of
affordability, exploring elements of ability to pay and cost under a broad array of environmental
conditions.

118
Food Consumption as a Share of Household Expenditure
This indicator captures the relative importance of food in household budgets. The lower
the share of household expenditure on food, the easier it is for a household to cope with price
increases and shocks.
Income plays an important role to food security. It is the determining factor of how much
food can be bought by the consumer household. When consumers’ income increase their choices
expand to include food quality. Food spending as percentage share to total expenditures
generally declines as income increases. In the Philippines, the average household earned Php
267,000 in 2015 (PSA FIES Survey). In the country, 41.9% of total spending is on food, while in
the NCR, 36.3% of income earned by families are spent on food alone. NCR estimates are also
used by QC in the absence of data in the PSA–FIES Survey. The big percentage being spent on
food just show that still many of the city’s families still belong to the low income group.
The QC Local Price Coordinating Council has been created for the proper efficient and
effective enforcement of the “price act” by virtue of RA 7581, The Price Act of 1991, (a national
policy that ensures the availability of basic necessities/commodities at reasonable at all times). It
protects consumers on price manipulation and other illegal acts on profiteering by some
businesses especially during times of emergency/calamities.
To make food supply (agricultural produce) also more affordable to residents, the city has
tied up with some neighboring provinces such as Ilocos Norte and the Department of Trade and
Industry (DTI) for a food caravan projects, where the farmers/food suppliers bring in directly to
the designated City Hall covered area their goods for immediate sale to residents on a regular
basis. This direct sale and omission of middlemen costs in the food supply system makes the food
supply readily available and more affordable to city residents. It hopes to expand this program
thru coordination most especially with sister cities.
4.3.3 Food Security, Safe, and Quality
Food security, safety and quality is a condition where foods are fit for human
consumption. Food and water must be edible and potable at all times. Security and protection of
human is basically dependent on the food we eat and water we intake. Comprehensive, intensive
and effective food control system are essential to protect and safeguard the health, safety and
welfare of the consumers. It is also critical to assure the security, safety and quality of foods
entering the country and local territories. The food regulatory agencies of both national and local
governments are responsible for setting food safety standards, regulating food establishments
and food business operators as well as the products they manufacture, offer for sale, or
distribute, by conducting inspections to ensure compliance with the law.
National and Local government agencies responsible for the implementation of laws on
food security, safety and quality with regulatory functions:
National Agencies:
National Food Authority (NFA) for rice, corn and other grains
National Meat Inspection Services (NMIS) for meats
Bureau of Fisheries and Aquatic Resources (BFAR) for fresh fish, and other sea foods including those
grown by aquaculture
Bureau of Animal Industry (BAI) for food derived from animals including eggs and honey production
National Dairy Authority (NDA) for milk production and post- harvest handling

119
Bureau of Plant and Industry (BPI) for plant foods
Philippine Coconut Authority (PCA) for fresh coconut
Sugar Regulatory Administration (SRA) for sugar cane production and marketing
Fertilizer & Pesticide Authority (FPA) for pesticides and fertilizers used in the production of plants and
animal foods
Others : Department of Health (DOH), Food & Drug Administration (FDA), Department of Trade and
Industry (DTI), Food development Center (FDC) under NFA, Bureau of Agricultural and Fisheries
standards (BAFPS), Bureau of Quarantine (BOQ), National Epidemiology Center (NEC), Research
Institute of Tropical Medicine (RITM), National Center for Disease Prevention and Control (NCDPC),
National Center for Health Promotion (NHCP)
Local Government Agencies:
Quezon City Health Department (QCHD)
Quezon City Veterinary Department (QCVD)
Market Development and Administration Department (MDAD)
In Quezon City, some issues and concerns on food security and safety which are
addressed are the following: sale of hot/double dead meats known as “botcha” in public and
private markets; distribution and sale of expired bottled and canned goods and others.
4.4 INDUSTRY AND SERVICE
The city’s economy continues to be dominated by small to medium-scale business
establishments engaged mostly in the distribution of finished products and in the provision of
basic services.
Table ED-16: Number of Registered New and Renewing Business Establishments: 2010-2018
YEAR NEW RENEWAL TOTAL GROWTH
RATE 2010 12,382 45,019 57,401 -
2011 12,765 48,567 61,332 6.85
2012 13,074 49,628 62,702 2.23
2013 13,417 51,098 64,515 2.89
2014 13,679 52,965 66,644 3.30
2015 12,107 54,989 67,096 0.68
2016 12,116 57,088 69,204 3.14
2017 12,368 59,961 72,329 4.52
2018 13,117 63,146 76,263 5.44
Source: Quezon City Information Technology Development Department (QC-ITDD)
As to industry type, registered businesses were classified using the Philippine Standard
Industry Classification (PSIC), the classification also used by the national agencies. The PSIC
provides three (3) major divisions namely: Agriculture, Industry and Services and further
subdivided into sub-classes/industries. Majority of businesses (about 91.01%) belong to the
Service Sector, while the Industry Sector has only 8.99% share of the total businesses. There are
no business operations that registered in the Agriculture Sector, the usual case in highly
urbanized cities. Furthermore, majority of city’s businesses are under the micro and small size
categories.

120
Table ED-17: Number of Registered Business Establishments by PSIC Type: 2011-2017
INDUSTRY CLASSIFICATION 2013 2014 2015 2016 2017 % to TOTAL
(2017) INDUSTRY 3,947 3,973 3,558 4,098 6,508 8.99 Electricity, Gas, Steam, and Air Conditioning Supply; Water Supply; Sewerage, Waste Management and Remediation Activities
5 5 13 7 - -
Construction 1,709 1,739 1,561 1,744 3,517 4.86 Manufacturing 2,233 2,229 1,984 2,347 2,991 4.13 SERVICE 60,568 62,671 63,438 65,105 65,821 91.01 Wholesale and Retail Trade; Repair of Motor Vehicles and Motorcycles
27,922 28,306 25,044
28,721 17,423 24.09
Transport and Storage Information and Communication
1,872 2,063 3,514 2,423 6,126 8.47
Accommodation and Food Service Activities 4,318 4,567 4,758 4,794 3,719 5.14 Finance and Insurance Activities 2,855 3,058 3,318 3,087 8,553 11.83 Real Estate Activities; Professional, Scientific and Technical Activities; Administrative and Support Service Activities
17,461 17,870 15,973 18,204 11,262 15.57
Education 919 1,028 985 1,047 1,960 2.71 Human Health and Social Work Activities 1,274 1,378 1,572 1,388 3,220 4.46 Arts, Entertainment and Recreation; Other Service Activities
3,947 4,401 8,274 5,441 13,558 18.74
Total 64,515 66,644 66,996 69,203 72,329 100.00
Source: QC-Information Technology Development Department (QC-ITDD)
Table ED-18: Number of Registered Business Establishments by PSIC Type and by District: 2017
INDUSTRY CLASSIFICATION 1 2 3 4 5 6 CITYWIDE TOTAL
INDUSTRY 1,072 1,028 783 620 801 793 1,411 6,508 Electricity, Gas, Steam, and Air Conditioning Supply
- - - - - - - -
Water Supply, Sewerage, Waste Management and Remediation Activities
- - - - - - - -
Construction 511 559 495 376 437 496 643 3,517 Manufacturing 561 469 288 244 364 297 768 2,991 SERVICE 8,697 11,497 13,377 7,975 5,125 4,352 16,798 65,821 Wholesale and Retail Trade; Repair of Motor Vehicles and Motorcycles
3,115 1,989 3,597 1,340 1,340 1,103 3,446 17,423
Transport and Storage 451 342 859 496 496 523 506 3,769 Information & Communication 73 83 155 217 217 236 1,446 2,357 Accommodation and Food Service Activities
817 115 647 569 569 195 1,024 3,719
Financial and Insurance Activities 1,261 946 2,989 329 329 528 1,773 8,553 Real Estate Activities 1,063 2,117 1,924 770 770 598 1,162 9,143 Professional, Scientific and Technical Activities; Administrative and Support Service Activities
108 268 147 303 303 445 585 2,119
Education 128 256 367 150 150 166 751 1,960 Human Health and Social Work Activities
338 1,087 323 198 198 88 805 3,220
Arts, Entertainment and Recreation 108 2,018 472 89 89 27 964 3,811 Other Service Activities 1,235 2,276 1,897 664 664 443 2,336 9,747
Total 9,769 12,525 14,160 8,595 5,926 5,145 18,209 72,329 Source: QC-Information Technology Development Department (QC-ITDD)
There has been an increasing trend in the number of registered businesses from 2010 to
2018. For 2018, registered businesses are broken down as follows – 13,117 new businesses and

121
63,146 renewing businesses totaling to 76,263, a 5.44% increase from the previous year. The
biggest increase in the number of registered businesses was in 2011, an increase of 6.85%.
Average annual growth rate of registered business establishments on said period is computed at
3.63%.
Although there is an average of 12,781 new businesses that come in and register, it could
be noted that the average annual increase in total number of businesses every year is only about
2,096 primarily attributed to the big annual number of non-renewing firms.
Table ED-19: Number and Percentage of Non-Renewing Business Establishments: 2010-2018
YEAR NEW RENEWAL TOTAL NON-
RENEWAL
% of NON-
RENEWED FIRMS
FROM NO. OF
RENEWED
BUSINESSES
% of NON-
RENEWED FIRMS
FROM TOTAL NO.
OF BUSINESSES
2009 10,474 43,277 53,751
2010 12,382 45,019 57,401 8,732 19.40 15.21
2011 12,765 48,567 61,332 8,834 18.19 14.40
2012 13,074 49,628 62,702 11,704 23.58 18.67
2013 13,417 51,098 64,515 11,604 22.71 17.99
2014 13,679 52,965 66,644 11,550 21.81 17.33
2015 12,107 54,989 67,096 11,655 21.20 17.37
2016 12,116 57,088 69,204 10,008 17.53 14.46
2017 12,368 59,961 72,329 9,243 15.42 12.78
2018 13,117 63,146 76,263 9,183 14.54 12.04
Average 12,781 53,607 66,387 10,279 19.37 15.58
Source: QC-ITDO
Every year, some 15.58% of the total registered businesses do not renew their permits in
the succeeding year. These non-renewing firms are those that have shut down operations due to
bankruptcy, mismanagement, etc. or those that may have just continued operations without
securing the required permits.
There are many businesses that may have shut down operations but have not
registered/declared retirement with the city due to the high cost of retiring a business (back
taxes are required to be paid) and create a tedious process as many documents have to be
submitted. From July 21, 2016 to December 2018, a total of 7,496 businesses or an average of
2,500 have declared retirement as per report from the Office of the City Treasurer.
Table ED- 20: Number of Retired Businesses: 2018
YEAR FULL PARTIAL TOTAL
2016 914 14 928
2017 2,958 35 2,993
2018 3,523 52 3,575
Total 6,995 101 7,496
The city government is therefore undertaking a great efforts not only in generating
growth in new investments but also maintaining if not sustaining growth of old investments thru
more improved and systematic business registration processing, provision of tax incentives,

122
conduct of inspections with apprehension of operators without permits (Suyod Buwis), and
better coordination with the barangays.
4.4.1 Services
Data for the year 2017 show that majority or 91% of registered businesses belong to the
Service Sector.
The biggest shares are those business firms engaged in the Wholesale/Retail Trade
activities which total to 17,423 or 24.09% of the total registered businesses. It is also the number
one business revenue source of the city and shown to have the highest increase amongst all
sectors in number in the last three (3) years. Such is evidenced by the existence of numerous
shopping malls where many retail stores operate. These malls include the five SM Malls, the
Ayala Malls (Trinoma, UP Town Center and Fairview Terraces), the Robinsons Mall (Fairview,
Magnolia and Galleria) and Ever-Gotesco Mall, Eton Centris, Gateway Mall and Fishermall, as well
as supermarkets and groceries/convenience stores located in various parts of the city. There are
also many home-based retail stores such as sari-sari stores, bakeries, carinderias mostly located
in a high density residential areas. Many of these establishments engaged in the
Wholesale/Retail Trade are concentrated in Districts 1 and 4.
The second major business type in the city is the Real Estate Activities; i.e. those engaged
in leasing of real properties, consultancy and law offices, janitorial/messengerial/labor services,
real estate broker and developer which registered a total of 9,143 and many of which are from
District 1 and 4 also. Those engaged In Financial and insurance activities (composed of banks,
pawnshops, money shops and financing and holding companies, etc.) with 8,553 ranked third
mostly found in District 3 & 1. The other succeeding types are the following: Arts, Entertainment
and Recreation (radio and TV networks, call centers etc.) with 3,811, Transport and Storage
(transport companies/operators, trucking/hauling services, forwarding/freight services.
Accommodation and Food Service activities mostly found in District 1, 3 & 4 at Banawe, Quezon
& West Avenues, SM North, Trinoma, Cubao Commercial Area, Eastwood City, SM Centerpoint
and South Triangle areas totaling to 3,719. The increasing numbers of BPO locators in the city
account for a big number of businesses in category.
The Human Health and Social Work activities (hospitals, clinics, laboratories, etc.) with
3,220 and Professional, Scientific and Technical Activities; Administrative and Support Service
Activities with 2,119, Information and Communication with 2,357 and lastly Education
(composed of the colleges, universities, vocational schools and other training institutions)that
recorded 1,960. Other Service activities (e.g. beauty salons, dress shops, tailoring shops, etc.) has
a total of 9,747 registered businesses.
4.4.2 Industry
The Industry Sector has only 8.99% share of the total businesses numbering to 6,508 in
2017. This is composed of Construction businesses (construction of buildings, site preparation
and development, Architectural and Engineering works, etc.) with 3,517 followed by the
Manufacturing businesses (printing/publishing, assembly of motor vehicles, fabrication of metal,
steel and aluminum products, etc.)
It could be noted that the manufacturing industry in particular are no longer growing in
number through the years due to a national policy on industry dispersal outside Metro Manila
during the 70s. Those Manufacturing businesses-labor intensive, clean industries not harmful to

123
the environment may however need to be revitalized and encouraged to grow due to economic
benefits that such industries entail. These are mostly located in the city’s traditional industrial
areas at District 5 and 6 – the Balintawak and Novaliches area.
Business Data from Other National Sources / Statistics
For comparative and information purposes on the city’s standing in distribution and
ranking of businesses in the country and in the region, the 2017 List of establishments, Census &
Technical Coordination Office, Philippine Statistics Authority data gathered and analyzed
showed that 20.99% of the total businesses in the Philippines are in the NCR. Top four (4) cities
with the highest number of businesses in the region are: Quezon City (39,777), Manila (36,965),
Caloocan (18,339) and Makati (16,304). Wholesale and Retail Trade; Repair of Motor vehicles
and Motorcycles activities and Accommodation and Food Services Activities are two (2)
businesses found dominating types similar to all four localities.
Table ED-21: Number of Business Establishments by PSIC: Top Five (5) Cities in NCR for 2017
PSIC CLASSIFICATION PHILIPPINES NCR QC Manila Caloocan Makati Valenzuela
Agriculture, Forestry and
Fishing
9,209 223 45 11 28 33 23
Mining and Quarrying 930 89 8 3 3 31 -
AGRICULTURE 10,139 312 53 14 31 64 24
Manufacturing 117,035 19,826 3,782 2,725 2,874 1,013 2,283
Electricity, Gas, Steam, and Air
Conditioning Supply
1,234 140 16 6 36 3
Water Supply, Sewerage,
Waste Management and
Remediation Activities
1,466 171 29 10 9 54
Construction 3,387 1,434 458 101 59 184 59
INDUSTRY 123,122 21,571 4,285 2,842 2,949 1,242 2,417
Wholesale and Retail Trade;
Repair of Motor Vehicles and
Motorcycles
424,061 81,631 15,687 17,290 2 4,962 4,922
Transportation and Storage 8,496 3,157 386 1,068 14 260 160
Accommodation and Food
Service Activities
121,821 25,118 5,701 4,648 2,100 2,210 1,626
Information and
Communication
35,730 8,054 1,199 1,666 1,088 785 503
Financial and Insurance
Activities
41,143 9,091 2,059 1,592 456 1,410 269
Real Estate Activities 9,748 4,238 782 671 177 881 293
Professional, Scientific and
Technical Activities
16,885 5,332 1,087 696 201 1,304 119
Administrative and Support
Service Activities
16,194 5,916 1,242 1,421 220 918 176
Education 17,504 4,239 1,183 661 371 322 149
Human Health and Social Work
Activities
27,422 7,504 1,944 1,334 589 669 294
Arts, Entertainment and
Recreation
14,956 2,356 525 425 238 120 125
Other Service Activities 57,500 15,615 3,644 2,637 1,573 1,157 756
SERVICE 791,460 172,251 35,439 34,109 15,359 14,998 9,366
Total 924,721 194,134 39,777 36,965 18,339 16,304 11,814
Source: 2017 List of Establishments, Census & Technical Coordination Office, Philippine Statistics Authority
From this same data, the locational quotient (LQ) was computed to get information on
which industries of the city are more unique, higher concentrated and have greater advantage

124
over the region. The Service Industry, which include Wholesale and Retail Trade,
Accommodation and Food Service Activities, Financial and Insurance Activities, Human Health
and Social Work Activities is considered to be the city’s highly concentrated industry.
Another business data source is the Business World Publication on the Top 1,000
Corporations in the Philippine Economy 2017. From this publication, majority or about 75% of
the top corporations in the country were shown to be located in the National Capital Region
(NCR) with Quezon City (111 firms) ranking second to Makati City (with 223 firms) in terms of
number of business establishments (mostly engaged in the Wholesale and retail activities).
Various efforts have been undertaken to improve services. Processes on business
registration has been simplified and made easier thru:
Existence of a Business-One-Stop-Shop (BOSS) which had reduced time and requirements in
securing business permits.
Improving the payment system of taxes & fees thru the opening of more satellite offices, use of
over-the-counter payments in accredited banks internet banking, automated teller machines
and mobile money service providers.
Operationalizing the Philippine Business Registry (PBR) which utilizes an online integrated
system connecting various concerned national government agencies (DTI, BIR, SEC, HDMF,
SSS and Philhealth) in the registration of new businesses. The QC government was also the
first LGU in the country to operationalize the PBR.
Passage/Implementation of the following:
- Ordinance No. SP-2219, S-2013, the QC Economic Development Incentives Code of 2013 to
encourage and to accelerate Inflow of investments – the entry, expansion, modernization
of the service and industry sectors in various areas of the city. It provided the creation of
an Economic Development and Investment Board (EDIB), the policy making body tasked to
promote, regulate and monitor investments in the city; and a Local Economic Investment
Promotions Office (LEIPO) that shall serve as the implementing arm/Technical secretariat
of the Board and coordinate the drafting of the QC Investment Priorities Plan and ensure
compliance with the plan.
- Ordinance adopting a Magna Carta for Micro Small Business Enterprises in QC (Ordinance
No. SP-2360, S-2014) with the following development objectives:
o Business environment (BE) – create an enabling business environment that is
conducive to the establishment, innovation, development and sustainable growth of
MSEs and entrepreneurship in the city;
o Access to Financing (A2F) – enable MSEs and entrepreneurs to conveniently access
appropriate and affordable financial services and assistance;
o Access to Markets (A2M) - enable MSEs and entrepreneurs to maintain their current
markets and penetrate new markets; and
o Productivity and Efficiency (P & E) – enable MSEs and entrepreneurs to be innovation
active and improve their capacities to develop, produce and deliver competitive
products and services for the local, national and international markets.
- Creation of the QC Small Business Development & Promotion Office (QC-SBDPO) –
Ordinance No. SP-2364, S-2014) – QC-SBDPO was created to serve as implementing arm of

125
the Micro and Small Enterprises Development Council (MSED Council) and shall also function
as the Technical Secretariat of the MSED Council.
City plus factors
The city continues to attract investors with its various plus factors, namely:
Expansive Land – it has 160 sq. kilometer urban landscape spread over one-fourth of
Metropolitan Manila.
Reasonably Priced Real Estate – real estate land value and taxes are lower compared to other
cities providing cost effective location.
Strategic Location - It is in the heart of Metro Manila; it is accessible from the major highways
and thoroughfares and mass transit system of Metro Manila
Young Manpower Pool – about 1/3 of the city’s population are less than 15 years old;
strengthening this young population are the numerous colleges/universities and training
centers which included the prestigious University of the Philippines, Ateneo de Manila,
Miriam College, etc.
Large Consumer Market – the city has the largest population in the country providing a big
consumer market for investors.
Other factors that are continuously being improved/ maintained:
Close private partnership with various Business sectors
Various strategies/ programs undertaken by the city to include efficient assistance services
(expeditious processing of business permits), good infrastructures, improved communication,
stable policies and provision of various incentives.
The city also makes available the following national and local incentives which largely applied
for firms that are registered with the Philippine Economic Zone Authority (PEZA), the Tourism
Infrastructure and Enterprise Zone Authority (TIEZA), and the Board of Investments (BOI).
National Incentives:
100% foreign equity in all investments except those reserved for Filipinos by mandate of the
Philippine Constitution;
Income Tax Holiday for six (6) years for pioneer firms and four (4) years to non-pioneer
firms;
Tax credit on raw materials, supplies and semi-manufactured products;
Special Investors’ Resident Visa;
Employment of foreign nationals;
Granting of Special Economic Zone status to tourism development zones and tourism estate
and other incentives provided for under the Special Economic Zone Act of 1995 (RA 7916);
and
Private sector participation thru the Public-Private-Partnership (PPP) arrangement with the
national implementing agencies and the local government units (LGUs).
Local Incentives:
10% discount on prompt annual payment of Business Taxes;
50% discount on business taxes to business enterprises with assistance of not more than P3M
(Barangay Micro Business Enterprises – BMBEs Law: RA No. 9178)

126
4.4.3 Tourism
Tourism is an important sector for the Philippine economy. It is currently the largest and
fastest growing industry in the world and has been utilized by countries and local governments
as one of the foundation of economy. In the year 2017, the travel and tourism industry in the
Philippines contributes almost eleven per cent (11%) to the Philippine Gross Domestic Product
(GDP). The Department of Tourism (DOT) recorded 6.62 million tourists visiting the country in
2017, the highest recorded tourist arrival data. It posted an 11% growth from the 5.96 million
visitors in 2016 in spite of the calamites that continue to hit the country. The strong performance
of the industry imprinted significant milestones in the Philippine history which attributed to the
intensified marketing campaigns. The influx of visitors during the Christmas holidays, the
international media exposure of the country during major international events such as the papal
visit of Pope Francis in January 2015, the country’s hosting of tourism events, the Miss Universe
pageant in January 2017 that help boost the country’s tourism arrivals to the country.
Table ED-22: Distribution of Tourist Arrivals by Type of Tourist, NCR and Philippines: 2009-2018
YEAR NCR PHILIPPINES GROWTH
RATE Foreign Domestic Total Foreign Domestic Total 2009 1,205,127 702,689 1,907,816 2,756,581 260,518 3,017,099 2010 1,480,871 815,604 2,296,475 3,239,960 280,511 3,520,471 16.68 2011 1,729,862 997,595 2,727,457 3,667,089 259,544 3,926,633 11.54 2012 1,533,450 909,212 2,442,662 4,019,167 253,644 4,272,811 8.82 2013 1,751,191 854,515 2,605,706 4,435,205 246,102 4,681,307 9.56 2014 1,122,860 748,379 1,871,239 4,582,072 251,296 4,833,368 3.25 2015 848,320 568,755 1,417,075 5,099,745 260,937 5,360,682 10.91 2016 245,138 249,545 494,683 5,719,356 247,649 5,967,005 11.31 2017 324,746 382,061 716,807 6,418,343 202,565 6,620,908 10.95 2018 6,984,808 142,870 7,127,678 7.65
Source: Department of Tourism (DOT)
In 2017, a total of 1.60 million South Koreans visited the Philippines. It is followed by
China, USA, Japan, Australia, Taiwan, Canada, United Kingdom, Singapore & Malaysia which grew
in number compared to previous years. In 2017, the country attracted 6,620,908 visitors and in
2018, the country welcomed a total of 7,127,768 arrivals, which hit the Seven Million mark. It had
shown that during the last 5 years (2015-2018) South Korea has been the largest source of
visitors to the Philippines.
The purposes of tourist visits were the following: to spend holidays, to visit friends and
relatives, for official/business trips, for educational/studies, religious and civic missions, for
convention, for incentives, for health/medical treatment/consultation, for shopping and others.
Quezon City as compared to its other major neighboring cities in the NCR gets only a
limited share of the region’s tourist market due to its distance to entry points (airport and
seaport), and existence of only few accommodation facilities, most importantly internationally
managed hotels. The construction of a Convention Center within the Quezon City Hall Compound
this year will be of great benefit for those who come to the city to host various
national/international summits, conferences, conventions and all kinds of events that require
large sitting capacity.
Quezon City has 42 registered hotels (with estimated 4,680 hotel rooms) mostly in the
standard & economy classification. It has five (5) existing resorts, 79 apartelles, 4 inns and 3
pension houses. In spite the big number of hotels, only thirteen (13) are accredited with the

127
(DOT) namely: Crown Plaza Galleria Manila, Novotel Manila, Seda Vertis North, Eastwood
Richmonde Hotel, Luxent Hotel, B Hotel – Quezon City, Hotel 99 Inc. – Cubao, Hotel Icon Timog,
Madison 101 Hotel & Tower, Microtel by Wyndham Acropolis, Microtel by Wyndham UP Techno
Hub, Oracle Hotel and Residences, and Soleste Suites.
Table ED- 23 Number of Hotels by Classification, Quezon City: 2018
Source: For NCR & Philippines – DOT; For Quezon City – Tourism Department
Based on the Tourism Research and Statistics Division, Office of the Tourism Planning
Research and Information Management, Department of Tourism, the average length of stay of
guests of accredited hotels in 2017 is 3.45 and an occupancy rate of 64.72% while the non-
accredited hotels in Metro Manila was 6.99 nights and occupancy rates of 64.51%. The overall
average occupancy rate of hotels in Metro Manila for 2017 was also placed at 64.72%, a little bit
lower compared to year 2016 which is 66.77%.
The Local Tourism Development Plan aims to transform the city into a “premier urban
destination and the showcase of sustainable urban tourism development in the Philippines”. It
identified tourism districts for development and promotion. These are areas with inherent
advantages and unique character which have become known for and particularly possessing
potentials of attracting tourists/visitors. Urban design, structural and aesthetics enhancement
specific to these areas shall be adopted to turn these areas into attractive and viable tourist
attractions. The nine (9) identified tourism district areas cited in Development Plan are as
follows: the Civic Center District, the Lifestyle District, the Eastwood City Cyberpark, the Knowledge
Community District, the Cubao Growth Center District, the Quezon City China Town, the La Loma
District, the Sergeant Esguerra Avenue District, and the Maginhawa Art and Food District. Out of
this, only three (3) was declared thru Ordinance No. SP-2439, s—2015 the Maginhawa Arts and
Food Hub, Quezon City Chinatown at Banawe Street (thru Ordinance No SP-2453 s-2015) and
Cubao Growth Center (Araneta Center (thru Ordinance No. 2796, s-2018). There is a need to
pursue the declaration of the other six (6) tourism Districts.
Tourism is considered a powerful growth engine in economic development. It produces
huge exchange movements and accommodates big investments. The city capitalizes on the
following tourism marketing points/assets:
QC as a Wellness Center
Quezon City is the only city in the Philippines with a large number of internationally
renowned specialty hospitals that can form the base of a thriving health and wellness industry. It
has the most number of hospitals, with the biggest bed capacity in the country. Its bed to
population ratio is 1:287 is above the required standard of 1:500. As of 2018, there are now
seventy one (71) hospitals in the city (17 government; 54 private) including the internationally
known St. Luke’s Medical Center (a 644-bed, international-standard hospital facility), Philippine
Heart Center (well equipped, specialty hospital in cardiovascular), National Kidney and
Transplant Institute (premier, ISO-certified facility for renal disease and organ transplant), Lung
Center (specialty hospital for pulmonary diseases) and the Philippine Orthopedic Hospital. The
CLASSIFICATION QUEZON CITY
De Luxe 3
1st Class 2
Standard 14
Economy 23
Total 42

128
city is also a pioneer in the stem cell therapy, the famous upscale medical treatment which is
available at NKTI and St. Luke’s Hospital. It has the abundance of wellness and physical fitness
centers, diagnostic, dental health and beauty clinics, rehabilitation centers, nursing homes, health
spas, and alternative healing centers.
Other hospital facilities in the city: the Providence Hospital at West Triangle,
Commonwealth Hospital and Medical Center at the Neopolitan Business Park, the Metro North
Medical Center at Mindanao Avenue, the World Citi at Aurora Boulevard and the newly improved
Fe del Mundo Medical Center at Banawe Street. Such development stimulates growth of medical
tourism in the city. Not only do these medical institutions provide a ready place to get good
medical care but they serve as grounds/site for new learnings/trainings or venue for summits, or
seminars in the medical field. Though the number of medical/hospital facilities has increased, the
quality of services however still needs to be greatly improved to face challenge in the global
competition.
Quezon City as ICT Capital
The ICT, with all its power to provide virtual travel experience and on-line impersonal
communication for the “Global Villagers”, provides tourism in person-to-world experience, a
window-shop to the world. Information Communication Technology (ICT) empowers tourism,
with the developed e-commerce system already taking over the entire country. Tourism finds an
effective marketing ally in ICT.
Business Process Outsourcing (BPO), continues to be one of the major economic drivers
of the country, in the NCR and in the city contributing greatly to Gross Domestic Product and
generation of employment. As of 2018 data, there are a total of 560 IT Parks and
Center/Buildings operating in the country and registered with the Philippine Economic Zone
Authority (PEZA). Majority or 313 of these firms are in the NCR. Makati has the most number of
IT Parks /Buildings (with 71); followed by Quezon City (with 56), and Pasig City (with 50). There
are other more strong competition arising in this industry from other cities in the region such as
Taguig (Global City), Mandaluyong, Pasay etc. .
Quezon City also, ranked number one in terms of declared area with the PEZA devoted to
IT operations with 202.8 hectares. The city’s biggest IT Parks are: the Eastwood City Cyberpark
(The first IT Park in the country), UP Science and Technology Park (North)/Ayala TechnoHub,
Eton Centris, Araneta Cyberpark and the Vertis North Ayala Park. Many IT developments have
also been integrated in the various mall complexes.
With the continuous growth of the IT industry in the city, employment is projected to
increase this year and the succeeding years. The most recent employment data gathered from the
different IT-related enterprises in Quezon City as of 2015 reached to a total of 372,000 persons
employed.
Recognizing the economic contributions of the Contact Center and Business Process
Industry, the QC-Information and Communication Technology–Global Service Outsourcing
(QC-ICT/GSO) Task Force was created to promote global services (outsourcing) industry to
generate investments and employment in the city. And as support to the industry, the city
provides talent development interventions to provide locators with the required competent
workforce (formulated with industry partners, other stakeholders and the Kor-Phil IT Training
Center).

129
Quezon City as Shopping Mecca of the Country
Quezon City can be called the shopping mecca of the country due to the existing big
shopping malls/complexes sitting center stage in practically every dense community cluster.
Among these are five (5) giant SM Malls, Robinson Malls, Ever Gotesco Mall, Gateway, the giant
Trinoma Shopping Complex, the Eastwood City Mall, Eton Centris Mall, the Ayala Fairview
Terraces Mall, the Walter Mart and the newly developed UP Town Center. All these shopping
Centers are of international standards and fit for tourist visitors. Inside these malls are excellent
recreational and entertainment facilities such as amusement centers, physical fitness centers,
modern cinemas and restaurants (from fine dining to fast food which fits the tourists’ pleasure).
The city is also home to other tourism facilities and activities that would also attract tourists:
Table ED-24: Famous Significant Historical Sites/ Landmarks in the City
HISTORICAL SITES LOCATION
Quezon Memorial Shrine QMC, Elliptical Road, Bgy. Central
Pugad Lawin Shrine Bgy. Bahay Toro
Mabuhay Rotunda Quezon Ave. corner E, Rodriguez Ave.
Batasan Pambansa Batasan Road
Tandang Sora Shrine Banlat Road, Bgy. Pasong Tamo
La Mesa Dam Lagro
Bantayog ng mga Bayani Along EDSA, Quezon Avenue
Camp Aguinaldo EDSA
Camp Crame EDSA
People Power Monument EDSA, Bgy. Ugong Norte
Gen. Lawton Monument Bgy. BagongSilangan
Balintawak Monument EDSA, Bgy. Balingasa
EDSA Shrine EDSA, Bgy. Ugong Norte
San Pedro Bautista Church Bgy. Damayan
Himlayan Pilipino Bgy. Pasong Tamo
Pres. Quezon Heritage House QMC, Elliptical Road, Bgy. Central
Sto. Domingo Church Quezon Avenue, Bgy. Sto. Domingo
Iglesia ni Cristo Central Complex Commonwealth Avenue, New Era
Araneta Coliseum Cubao, Bgy. Socorro
Philippine Nuclear Research Institute Commonwealth Avenue, Bgy. Culiat
La Loma Cockpit Bgy. N.S.Amoranto
Quezon City Hall Elliptical Road, Bgy. Central
Pres. Aquino Heritage House QC Circle
Ninoy Aquino Monument Quezon Avenue corner West Avenue

130
Festivals/Events
The city also hosts different festivals and activities where local and foreign visitors are
gaining interest. These events are cited in the succeeding table:
Table ED -25 Important Events/Festivals in Quezon City
ACTIVITY EVENT
Tandang Sora Birth Anniversary January 6
Chinese New Year February 1st week
Anniversary of People Power (EDSA 1&2) February 25
Flag Day March
Santacruzan / Flores de Mayo May
Lechon Festival 3rd Sunday May
Independence Day June 12
Birthday of Dr. Jose Rizal June 19
Death Anniversary of Pres. Manuel L. Quezon August 1
Birth Anniversary of Pres. Manuel L. Quezon August 19
Death Anniversary of Pres. Benigno Aquino August 21
Cry of Pugad Lawin August 23
Alay Lakad September (2nd Sunday)
Feast of La Naval October 8
Quezon City Foundation Day October 12
Birth Anniversary of Andres Bonifacio November 30
Battle of San Mateo December 19
Death Anniversary of Jose Rizal December 30
Sister-city Agreements
Tourists and potential investors are also expected to visit the city as a result of sister-city
agreements forged by city officials. The city has entered tie ups with sister cities within and
outside the country that promotes socio-economic and cultural exchange activities. The city
however is encourage to engage more ties with highly urbanized or more industrialized cites in
other countries to learn and gain advantage from the agreement.
The existing sister cities of Quezon City are as follows:
CITIES IN OTHER COUNTRIES LOCAL CITIES
Salt Lake City, Utah, USA Pura, Tarlak
Maui, Hawaii, USA Wao, Lanao Del Sur
Chiba City, Japan (Miyagi) Cotabato City
Taipei City, Taiwan General Santos City
Daly City, California, USA Banaybay, Davao Oriental
Agana, Guam, USA Puerto Princesa, Palawan
Fort Walton Beach, Florida, USA La Trinidad, Benguet
Kenosha City, Wisconsin, USA Sagada, Mountain Province
New Westminster, British Columbia, Canada Iloilo City
Shenyang City, People’s Republic of China Baler, Aurora
Republic of the Union of Myanmar, Yangon Region Roxas City, Capiz
The three (3) embassies in Quezon City: the Embassy of Columbia in Araneta Center,
Cubao, the Embassy of Guatemala in Barangay Blue Ridge and the Embassy of Cyprus in Barangay
South Triangle.

130

131
CHAPTER 5: Solid Waste The Environment Sector has five (5) areas of concern – Solid Waste, Air Quality, Water Quality, Parks
and Open Spaces and Biodiversity.
5.1 SOLID WASTE
5.1.1 Domestic Solid Waste
Generation
Latest data from the Metropolitan Manila Development Authority (MMDA) showed that Quezon City,
with its high concentration of social and economic activities and it being the most populous in the
National Capital Region, produces the largest volume of garbage daily. In the Waste Analysis and
Characterization Study (WACS) conducted by the QC Environmental Protection and Waste
Management Department (EPWMD) in 2003, each person in the City produced 0.66 kg of solid waste
each day.
Another WACS was conducted by the same Office in 2013 which showed that waste
generation has increased to 0.88 kg/capita/day.The same study also indicated that every year, per
capita waste generation increases by 3.33%. Thus, it may be concluded that for CY 2016, 2017 and
2018, the city’s per capita waste generation are 9.709 kg., 1.0032 kg and 1.0366 kg., respectively.
From the 2013 WACS and estimates based on corresponding projected population and per
capita waste generation, the city produced about 3,169,220 kg. of solid waste everyday in 2018,
mostly coming from residential use. Apart from which, other waste sources contribute largely
enough for Quezon City’s waste generation. Refer to Table En-1 below.
Table En- 1: Other Waste Sources; 2015-2017
Main Activity 2015 2016 2017
Manufacturer/Producer/Repacker 1,056 1,026 1,028 Wholesaler 6,270 6,724 7,216 Exporter 85 88 79 Retailer 16,348 16,488 16,905
Contractor 19,459 20,255 21,325 Financial Institutions (Banks, Pawnshops, Insurance, Security& Stocks Dealers)
2,772 2,924 3,164
Franchise Holder 10 9 9 Restaurant and Eating Establishment 3,000 3,364 3,428
Proprietor, Lessor and Operator Hotels/Motels/Inns/Pension/Boarding and Other Lodging Houses
6,901 7,180 7,431
Amusement Center, Establishment, Bars, Cocktail Lounge, Gaming Activities and Social Recreation
441 459 526
Proprietor, Lessor and Operators Shopping Center and Private Markets
46 50 57
Importer 1,262 1,228 1,278 Learning Institution 575 579 579
Other Business and Business with Fix Rates 4,448 4,621 4,872 Multiple Activity 4,417 4,202 4,421 Unknown Activity 6 7 11
TOTAL 67,096 69,204 72,329 Source: EPWMD using BPLO and ITDO data

132
Waste Composition
Based on the 2013 WACS, biodegradable
wastes account for 53.95% of total waste
generated while 20.30%, 18.75% and 7% belong
to recyclables, residuals, and special wastes,
respectively.(Refer to Table En-2)
Collection
The City is implementing a Macro and
Micro Cell-Based Collection System, wherein the
waste generation of an area or a cell is equivalent
to one truckload of garbage or 16 cubic meters of
waste. The system of collection was established
primaril to gauge the required number of
vehicles needed to collect the daily waste
generation of Quezon City, assign proper coding of the service areas and administer proper
scheduling of waste collection. It also is being used as basis for the Package Clean-up Collection
System wherein private contractors were given the full responsibility to administer and directly
carry out in their specific assigned area the actual collection, cleaning and disposal of solid wastes
from different sources. They are also responsible for street sweeping activities, cleaning and clearing
operations as well as enforcement of environmental laws and information dissemination.
In terms of collection schedule, the city has three service schedules:
Main Thoroughfares – collection of garbage is done daily from 4:00 AM to 7:00AM, with mopping-
up operations not later than 9:00 AM and 2:00 PM. Mopping of follow-up collection are
undertaken to collect late and untimely disposals. The main throughfare areas are of mixed
sectors, composed mostly of commercial establishments, some industries and residential houses.
Stationary collection – route for public markets and hospitals (domestic wastes only. Collection is
done on a daily basis. For government-owned institutions, collection of waste depends on waste
colume. Collection is done on a daily, twice or thrice weekly basis.
Barangay (residential) collection – scheduled twice a week, Mondays & Thrusdays, Tuesday and
Fridays, and Wednesday and Saturdays. The Barangay areas are composed mostly of residential
houses mixed with some other sectors like commercial and industrial, etc.
Segreagated collection of waste is a regular practice in the city, being done in some barangays
especially those practicing good solid waste management in coordination with the City. Some
residential areas are also practicing waste segregation at surce in view of the proliferation of
junkshops buying recycalbe materials. Some of the barangays deploy their own garbage trucks in
collecting household wastes from selected pilot areas within their jurisdiction.
These components ensure the overall upkeep of the City. Table En-3 shows volume of solid
waste collected and number of trips administered for the upkeep of assigned service area.
Table En- 2: Solid Waste Composition; Quezon City: 2013
Type of Waste 2013
Biodegradables 53.95 % Food/Kitchen Waste Yard/Garden Waste Others
43.17 % 9.43 % 1.35 %
Recyclables 20.30 % Plastic Paper Glass/Bottle Metals
9.64 % 8.65 % 1.15 % 0.86 %
Residuals 18.75 % Special Wastes 7.00% Source: EPWMD

133
Table En- 3:Volume of Solid Waste Collected (cu.m.) and Number of Trips; Quezon City: 2016-2018
Type of Collection 2016 2017 2018
Volume of Solid Waste Collected (cu.m.) 2,343,787 1,832,689 1,628,554
Number of Trips 193,501 134,509 78,380
Source: EPWMD
During the period of 2016-2018 the volume of solid waste collected annually was less compared
to the projected generation. (Refer to Table En-4)
Table En- 4:Estimated Volume of Solid Waste Generated, Volume of Waste Collected and
Disposed: 2013-2015
Year
Projected
Population
Per Capita Estimated Waste Generation Volume of Solid Waste
Collected/Disposed
Kg/d Kg/d cu.m./year cu.m./year
2016 2,975,876 .9709 1,057,475,751 281,288,549,786 2,343,787
2017 3.016,277 1.0032 1,104,464,117 293,787,454,999 1,832,689
2018 3,057,322 1.0366 1,156,765,295 307,699,568,363 1,628,554
Source: EPWMD
Note: Projected Population: 2016 and 2017 based on 2010 NSO Population Survey
2018 based on 2015 PSA Census of Population Waste Generation/day: Based on updated 10-year Solid Waste Management Plan 2015-2021 Waste Density: 266 kg/cu.m.
Table En- 5: Volume of Waste Reduction: 2016-2018
Year Waste Reduction
cu.m. Tons/day %
2016 2,677,451 562,264.70 53.31%
2017 3,330,255 699,353.52 64.47%
2018 2,720,188 723,570.00 62.55%
Source: EPWMD
Table En- 6: Barangays with Programs and Projects in Compliance with Republic Act 9003: 2018
RA 9003 Requirements District
I II III IV V VI Total
With Solid Waste Management Committee 37 5 37 38 14 11 142
With Solid Waste Management Plan 37 5 37 38 14 11 142
With Materials Recovery Facility 13 3 18 13 5 5 57
With Materials Recovery System 24 2 19 25 9 6 85
Source: EPWMD

134
Disposal Since the closure of the Payatas Sanitary Landfill in July 2017, the disposal of the City’s solid
wastes has transferred to the 19 hectare Rizal Provincial Sanitary Landfill (formerly called
Montalban Landfill) operated by the Rizal Provincial Government.
Post-Closure Care and Maintenance of the Payatas Controlled Disposal Facility
The post closure care of the Payatas Controlled Disposal Facility is being undertaken to
ensure its safety to human health and the environment. As part of the greening program, there are
about 12,000 trees planted in the facility and landfill area covering more than 3,200 sqm. In addition
to the tree-planting project, the following activities and improvements were undertaken thereat:
Asphalt Overlay on Access Road, Land Development, Filling and Compaction, Perimeter Fence with
Vertical Garden, Energy Efficient Streetlight, Improvement and Repair of Leachate Collection System,
Improvement and Repair of Drainage System, Slope Protection and Erosion Control, Installation of
Pre-Fabricated Plant Box and Improvement of Security Post.
Monitoring and ground maintenance is also implemented as part of the post-closure and
maintenance. About 25,000 sqm or 11% of the total area of the facility was cleared and cleaned thru
grass cutting and de-clogging of the drainage system. Coordination with the Engineering Department
resulted to the on-going Sheet Pile Project which commenced last November 2018. The project,
which will take a year to complete, will be installed to prevent lateral movement of slopes that will
protect the residents and the nearby areas.
Also, a comprehensive solid waste management plan for the landfill is underway. The study
shows that three alternative schemes are possible for the final land use of the facility: as a
recreational park (which will require passive site intervention), as a memorial park (which will
require moderate site intervention), and as a mixed-use development (which will require aggressive
site intervention).
Solid Waste Management
In compliance with Republic Act 9003, Quezon City was the first city in Metro Manila to have its
own 10- year Solid Waste Management Plan approved by the National Solid Waste Management
Commission through its Resolution No. 1074,S- 2018 (Annex ____) . This has gained national acclaim
as the first urban city to implement the Solid Waste Management Act produced and spearheaded by
the EPWMD. The QC Solid Waste Management Plan of QC is continuously updated to include a long
term and sustainable solution to QC’s growing waste generation by considering modern technologies
that are both environment friendly and socially acceptable.
Solid Waste Management Projects
- Materials Recovery Project – The facility was established to further reduce the amount of
wastes that are disposed at landfills. Eight (8) MRF Stations were set up and manned waste
pickers and junk traders were organized to do further segregation and buying of recyclable
materials and other saleable goods.

135
- Biogas Emission Reduction Project–The City operates the first Clean Development Mechanism
(CDM) project. The biogas emission reduction facility is the product of an agreement of the city
government with the Italian firm, PANGEA Green Energy and its local counterpart, PANGEA
Philippines. Memorandum of Agreement with PANGEA was signed on February 14, 2007. The
facility extracts, collects, processes and converts biogas into electricity. The project does not only
reduce the greenhouse gas emission of the landfill but also acts as source of renewable energy
which financially benefits the City thru the 5% share from the sale of electricity to Meralco .It also
provides power to the Sanitary Landfill.
Report from the EPWMD showed that as of February 2018, the total power exported to Meralco is
27,681,431.20 kWh since the implementation of the commercial expanded plant in March 2013.
With that figure, the City already received a total amount of Php6,678,488.84 as part of its share
from the sale of electricity.
On November 2018, the City Government and PANGEA entered into a Lease Agreement for
another nine (9) years which commenced on March 1, 2018. Under the new Agreement, the City
will receive biogas royalties in the amount equivalent to 1% of its net proceeds from electricity
sales as payment for the biogas extracted from the Facility. It is also indicated in the Agreement
that any emission or discharge brought about by the Biogas Plant Facility shall be addressed by
PANGEA.
- Establishment of Waste to Energy (WTE) Project– In September 2016, a consortium led by
Metro Pacific Investments Corporation (MPIC) submitted an Unsolicited Proposal to the Quezon
City Government for the establishment of an Integrated Solid Waste Management Facility that will
process and convert the City’s solid waste into clean energy. The Project involves the design,
financing, construction, operation and maintenance of an integrated solid waste-to-energy facility
capable of processing up to 3,000 metric tons per day of solid waste.
The Project will be awarded to the consortium/original proponent since no comparative
proposals were received by the city government on bid submission date in February 2019.
However, the City Council failed to pass a resolution authorizing the Mayor to enter into a
contract with the consortium as the Council went on recess early due to the midterm elections.
Waste Management Initiatives
Collection and Disposal Services
- Package Clean-Up System – The City has been recognized as the first local government unit
to implement a successful and effective package clean up system on garbage collection and
disposal. In a Package Clean Up System, the private sector is given full responsibility to
administer and directly carry-out the management of solid wastes from various sources in
the total environmental upkeep of the assigned service area. Contracting out to private
service providers is done thru competitive bidding i.e., thru provision of the following:
Solid Waste Cleaning, Collection and Disposal Services
Street Sweeping Services
Street Sweeping Services
IEC Campaign & Enforcement support, and
Operation and maintenance of staging areas

136
This system has made the city’s garbage collection consistently more than 99% efficient thru
the years.
- Dedicated Collection – Door-to-door collection system for biodegradable and non-
biodegradable wastes
- Community-based Projects
- Hiwa-hiwalay na Basurasa Barangay Project – Waste segregation at source and dedicated
collection of wastes
- Kitchen Wastes Collection – The project was implemented in barangays without Materials
Recovery Facility or composting sites. EPWMD has accredited kitchen waste collectors for the
project. This also does not entail additional hauling cost on the part of the City.
- Bulky Waste Collection –Collection of bulky wastes such as logs, branches of trees and other
bulky garden wastes. Collection is done every Sunday upon request by the barangay.
- Recycling Activities – includes recyclables trading, operation of Materials Recovery Facility
(MRF) or Materials Recovery System (MRS), junkshop integration and waste market day.
- Institution-based Projects
- QC Hall Waste Management Segregation Project – This involves the implementation of waste
segregation at source and recycling at the QC Hall Complex. As support to the Project, an MRF
was constructed near Gate 3 of the Compound.
- Recyclables Trading at QC Malls – The project promotes a convenient drop-off and buy back
center in QC malls for both traditional and non-traditional recyclable wastes. It is a collaborative
effort of Quezon City Government, QC Malls, junkshops and other recycling companies.
- For scavengers making a livelihood from trash at Payatas, alternative livelihood opportunities
are offered through trainings by QCLGU's Small Business Promotions Office.
- School-based Projects
- Batang QC Eco-savers Club –aims to establish a waste segregation and recycling program in all
public elementary and high schools in the hope of making recycling a part of their daily routine.
The corresponding points recorded in the students’ passbooks are used to “buy” school supplies
or groceries.
- Junior Environment Police (JEP) – This activity seeks to mobilize a movement for sustainable
environmental management thru awareness, respect for law and the environment among the
youth, thereby molding a responsible and environmentally-concerned citizen.
- Clean-Up Operations
- Special Cleaning Operations –The Special Cleaning Operations Groups (SCOG) is formed to
conduct cleaning and clearing operations in preparation for various events and activities.
- War on Waste –The city conducts annual war on waste project and encourages public and
private participation to do massive clean-up operations to help combat solid waste problems.
- Environmental Enforcement & Inspection
- Zero Litter Campaign – serves as a total clean-up mechanism for the City which includes the
apprehension of violators on proper solid waste management, cleaning and beautification,
clearing of obstructions, collection of garbage and massive IEC campaign thru distribution of
letters and IEC materials.

137
- Deputized Environmental Enforcers to conduct regular roving, fixed-posting and night
operations along city’s major thoroughfares and identified litter or dumping-prone areas to
ensure cleanliness in the city.
- Green Desk Project – Police officers from twelve (12) police stations were deputized to handle
environment-related cases.
- Community (Barangay) Participatory Watch – aims to monitor and ensure the compliance of
barangays and to assess and improve their solid waste management system.
- Incentive Mechanism
- Deputized cash incentives for communities/barangays practicing effective waste reduction
measures.
- Cash incentives for communities/barangays utilizing their own barangay truck for the
collection of solid wastes.
- Recognition thru various awards such as Seal of Good Housekeeping, Recognition of Best
Practices by the QC Solid Waste Management Board, etc.
- Provision of financial support for the establishment of Materials Recovery Facilities,
procurement of tri-bikes and pushcarts for the door-to-door collection of recyclable materials.
5.1.2 Hazardous Wastes
Hazardous Wastes – Under DENR Administrative Order No. 29 Series of 1992, hazardous waste
is defined as substances that are without any safe commercial, industrial, agricultural or economic
usage. It also refer to by-products, side-products, process residues, spent reaction media,
contaminated plant or equipment or other substances from manufacturing operations and as
consumer discards of manufactured products which present unreasonable risk and/or injury to
health and safety and to the environment.
In Quezon City, hazardous wastes are excluded in the scope of regular collection of solid wastes.
With this, the City implemented City Council Ordinance No. SP-1483, S-2005 which required all
residents and business establishments to segregate spent fluorescent light bulbs from the regular
collection of solid waste. Selected MRFs are being used as areas for disposal for busted bulbs from
households.
Of the almost 65,000 registered businesses in Quezon City, 2,233 (3.46%) are generally
categorized as manufacturing which does not allow the distinction of industries actually producing
toxic and hazardous wastes. The monitoring system is too weak to pinpoint sources.
Program/Project
- Collection, Transport, Treatment and Disposal of Busted Fluorescent Lights (BFLs) and
Used Household Batteries– The project, which is carried out in partnership with
DOLOMATRIX TSD Facility, aims to ensure that busted fluorescent lamps and spent households
batteries are handled properly and separately from other non-toxic/non-hazardous household,
commercial, industrial and institutional wastes for proper treatment and stabilization before its
final disposal.

138
5.2 AMBIENT AIR QUALITY
5.2.1 Total Suspended Particulates (TSP)
Total Suspended Particulates is defined as the “small airborne particles such as dust, fume and
smoke with diameters of less than 100 micrometers. They are emitted from various sources
including power stations, construction activities, incineration and vehicles.
The Environmental Management Bureau- National Capital Region (EMB-NCR) is operating and
maintaining twelve (12) manual ambient air quality monitoring stations which are strategically
located in various areas in Metro Manila, namely:
- Manila Observatory Compound –Ateneo de Manila University Campus, Katipunan Road;
- National Ecology Center-East Avenue;
- National Printing Office, EDSA
- Marikina Sports Complex, Sumulong Highway;
- DOH, Rizal Avenue
- Mandaluyong City Hall, Maysilo Circle
- MMDA Compound, EDSA
- Pasay Rotunda Station, EDSA cor Taft Avenue;
- Radyong Bayan Compound in Marulas Valenzuela,
- NAMRIA Compound
- Lawton Avenue
- MuntinlupaBilibid Prison Compound.
Manila Observatory Compound at Ateneo de Manila University is dedicated for general ambient
air monitoring while National Ecology Center-East Avenue and National Printing Office, EDSA are for
the measurements of roadside ambient air monitoring.
Valenzuela
AteneoEastAve
Marikina
DOH-Manila
Mandaluyong
Makati
Series1 86 48 97 104 109 158 111
0
20
40
60
80
100
120
140
160
180
An
nu
al
Ge
om
etr
ic M
ea
n i
n u
g/N
cm
Long Term Guideline Value –
90 ug/Ncm (1 year)
Source: DENR-EMB
Figure En-1: TSP Concentration Annual Geometric Mean Registered at
Different Monitoring Stations (2015)

139
67 61 60
42
25
0
10
20
30
40
50
60
70
80
NPO-Edsa Marikina DOH-Manila MMDA-Edsa Muntinlupa
Source: DENR-EMB
Figure En-2:Annual Comparative Readings of PM-10 at Different
Stations (2015)
Long Term Guideline Value
–60 ug/Ncm (1 year)
Above graph shows the results of the ambient (roadside and general monitoring in the seven
(7) air quality monitoring stations measuring Total Suspended Particulates for 2015. Ateneo station
recorded annual geometric mean average of 48 ug/Ncm which is 53% lower than the guideline value
of 90ug/Ncm. The data reveals that despite the heavy traffic situation in Katipunan Avenue during
school days, the carbon emission is sequestered with the presence of thriving flora along the
periphery and within the grounds of the Ateneo de Manila Campus. Another is from East Avenue
Station reflected an annual TSP geometric average of 97ug/Ncm which is slightly higher than the
long term guideline value. Moderate to heavy traffic was observed within the vicinity almost
throughout the year as it is bounded by the National Government Center, tertiary hospitals and
commercial establishments. Conversely, other monitoring stations located outside Quezon City did
not meet the standard annual TSP long term guideline value of 90 μg/ except in Marulas, Valenzuela
City with a recorded annual geometric mean average of 86 ug/Ncm.
5.2.2 Particulate Matter (PM10 )
PM10 are smaller particles that are likely responsible for adverse health effects because of
their ability to reach the lower regions of the respiratory tract. The PM10 standard includes particles
with a diameter of 10 micrometers or less (0.0004 inches or one/seventh (1/7) of the diameter of a
human hair. The long term guideline value set for PM10 is 60 mcg/cm.
Potential health effects of exposure to PM10 include the effects on breathing and respiratory
system, damage to lung tissue, cancer, and premature death. The elderly, children, and people with
chronic lung disease, influenza, or asthma, are especially sensitive to the effects of particulate matter.
PM10 comes from mobile and stationary motor vehicles, woodstoves, power plants, domestic and
industrial fuel burning activities to name a few. Their chemical and physical compositions vary
widely. Particulate matter can be directly emitted or can be formed in the atmosphere when gaseous
pollutants such as SO2 and NOx react to form fine particles.
From graph below,
showed that NPO-EDSA
station registered the
highest concentration
which exceeded the long
term guideline value of 60
ug/Ncm. This station is
located roadside and is
exposed to motor vehicle
exhaust emission and
other area sources.
5.2.3 Greenhouse Gas
Inventory
Emissions inventory is an estimate of air pollutants based on an emission factor and an activity
indicator. It typically changes over time because of improvements in data or changes in source
operating conditions. A capacity building program on the conduct of a Greenhouse Gas (GHG)
Inventory was initiated by the City Government in 2011 for the Environment Policy Management

140
Council (EPMC). The following table shows the results of the Government Operations GHG Emissions
inventory:
Table En- 7: GHG Emission Inventory Result on
Government Operations: 2011
Sector Total eCO2 (kg) % share
Buildings 39,000,857.99 62
Transport 6,289,050.28 10
Streetlights 14,922,134.77 24
Waste 2,268,847.17 4
Total 62,480,890.21 100
Year 2010 was used as the base year since it was the most complete year showing emissions
from the owned and operated facilities of the Quezon City Government. A total of 62,480,890.21
kgs.of carbon dioxide (eCO2) has been computed.
On the same year, a similar project spearheaded by Climate Change and Clean Energy Project
(Cenergy) was conducted in the community level, results of which were the following:
Table En- 8: GHG Emission Inventory Result in the Community Level; 2011
Emission Sources 2010 Volume Unit Total
Emissions (tCO2e)
% per Emission
Source
Transportation 289,775,687.47 Liters 709,806,272.66 99.51
Other Sectors:
StationaryEnergy – Electricity 3,926,193 MWh 2,038,479.59
Stationary Energy – Fuel 403,328 Liters 961,844.98
SolidWastes 705,640 Tons 270,605.34
WasteWater – Septic Tanks 37,290,341 kgBOD 234,929.15
Sub‐Total of Other Sectors 445,250,234.61 3,505,859.06 0.49
Total 713,312,131.72
(Forestry) 2,546 hectares (31,742.86)
Grand Total 713,280,388.86 100
The calculated greenhouse gas emissions from fuel sales, electricity consumed and solid
wastes and wastewater generated in the city in 2010 is 713,312,131.72 tons of carbon dioxide
equivalent. With 2,545.89 hectares of forest land that is able to sequester approximately 31,743 tons
of carbon dioxide equivalent, the total emissions of the city has been reduced to 713,280,388.86 tons
of carbon dioxide equivalent.
In 2016, the Quezon City Government, as member of the C40 Cities Climate Leadership Group,
received technical assistance in the update the city’s GHG inventory. Using 2016 as base year, the

141
GHG Inventory was updated through the Global Protocol for Community-Scale (GPC) using the City
Inventory Reporting and Information System (CIRIS) Tool established by the C40 Group.
The inventory shows that stationary energy, which covers electricity consumption, is
the predominant source of GHG emissions in the city.
5.2.4. Energy Efficiency
Street lighting comprised 65 percent of Quezon City’s electricity costs or about 5 percent of its
annual budget. The desire to reduce energy costs and allocate resources to other priorities was a key
driver behind Quezon City’s action on energy efficient street lighting.
Lighting System
In addition to Quezon City’s long commitment to environmental improvement, its recent
experience promulgating energy efficiency policies and the availability of technical assistance from
the World Bank Institute (WBI) were additional factors enabling the City’s LED streetlight initiative
The City Government, in cooperation with the Road Board thru its, National Lightning Project
is converting the city’s streetlights into more energy-efficient LED (Light Emitting Diode) lights. The
LED lampposts are being installed around the Quezon Memorial Circle, along Quezon Avenue,
Commonwealth Avenue(Philcoa to TandangSora), along Mother Ignacia, Timog, Tomas Morato and
East Avenues. LED conversion will eventually reduce the annual electricity consumption of the city.
Another project is the replacement of incandescent bulbs with more energy-efficient compact
fluorescent (CFL) bulbs in the city’s markets such as Frisco, Galas, Litex, Luzon and Murphy in
partnership with Global Philips Electronics & Lightning, Incorporated.
Table En-9 showed that, as of 2015, a total of 25,193 streetlights are existing in the city and
8,948 are being replaced by LED (Light Emitting Diode)lights and the remaining 16,245 will be
replaced in the next two years.
Other Alternative Energy Solution Initiatives
Electricity from the biogas emission reduction project- In November 2018, the City Government
and PANGEA entered into a 9-year lease agreement where the QC-LGU will receive biogas
royalties in the amount equivalent to 1% of its net proceeds from electricity sales as payment for
the biogas extracted from the facility.
Table: En-9:_Status of Existing Streetlight per District (2015)
District
Total Existing Streetlight
LED Installed
No. Of streetlights to be converted
I 4413 1,372 3041
II 2227 715 1512
III 3115 1024 2091
IV 6487 3324 3163 V 5009 1285 3724
VI 3942 1128 2714
Total 25,193 8,948 16,245
Source: Task Force Street Lightning

142
Electrical Vehicles - The city has started to promote green transport by purchasing electronic
tricycles and electronic jeepneys. Key benefits of using EVs is its zero emission of harmful air
pollutants and greenhouse gases which greatly reduces the smoke emitted from fossil fuels of gas-
fed vehicles. In June 2019, QC has been a recipient of 300 electric tricycles (e-trikes) from the
Department of Energy (DOE’s) program to promote energy efficiency and clean technologies in
the transport sector. The deployment of these e-trikes is a big part of the city governments’
initiatives to eventually replace around 25,000 tricycles with e-trikes in the city.
Solar panel system - Mindful of the high electricity expenses needed to maintain the city’s large
network of public schools, using alternative and renewable sources of energy such as solar power
has been adopted by the city government since 2014. Presently, the city has already installed
solar panels to three buildings in Commonwealth High School and is set to further solarize 146
public schools all over the city to save on utility bills .
WTE Plant - QC has been quite aggressive in the field of renewable energy and is set to build its
own waste-to-energy plant as part of its green waste management program. The project which
will be undertaken through a joint venture between the QC government and the Metro Pacific
Investments Corporation (MPIC). a pioneering program and the First in the Philippines, the
project is set to process and convert up to 3,000 metric tons of municipal solid waste a day into 42
megawatts of renewable energy over a concession period of 35 years.
5.2.5 Compliance to Green Building Ordinance
The Quezon City Green Building Ordinance of 2009 (Ordinance No. SP-1917, S-2009) which
necessitates that buildings (for both new structures and those undergoing retrofitting) within the
city including movable properties and other structures follow minimum standards of green
infrastructure in their design and construction is lodged under the Department of the Building
Official. Since its enactment in 2009, a total of 153 green building applications were already given
preliminary certifications, about 38 are on process while 23 were given final green building
certifications;; 98 applications are subject to review and evaluation.
Under the IRR, commercial, institutional or industrial buildings with floor areas of at least
2,000 square meters are required to comply with the Green Building Standards. While the ordinance
would surely add to the cost of construction of new buildings, it provides an incentive in the form of
tax credits for land users, developers and planners who would use environment-friendly
technologies in their buildings.
5.2.6 Compliance to Environmental Standards
The Environmental Management Bureau –National Capital Region (EMB-NCR) is authorized to
process and evaluate applications for Environmental Compliance Certificate (ECC). Based on DENR
Administrative Order (DAO) 2003-30, projects that are located within environmentally critical areas
and are considered to pose significant environmental threats and adverse environmental impacts,
are subject to the application of ECC. On the other hand, projects that do not fall within the purview
of the Philippines Environmental Impact System are subject to the application of Certificate of Non-
Coverage (CNC). As per Bureau’s report, a total of 364 new and amended ECCs and 319 CNCs were

143
processed and issued for the year 2015 in National Capital Region. The highest number of application
was observed in Quezon City with 58 and 120 respectively.
Pollution Control Programs
- Clean Air Program
- Anti-Smoke Belching – roadside apprehension of drivers and operators and testing of motor
vehicles using the certified smoke emission testing machine along roadsides. Flyers are also
distributed to passing motorists to bolster information and education campaign. Through
continuous anti-smoke belching operations, motorists are influenced to follow set emission
standards to improve the people’s health and well-being and contribute to environmental
protection.
In the conduct of anti-smoke belching operations within Quezon City, two(2) units of E-vehicles
arepresently being used by the Anti-Smoke Belching Unit of the EPWMD. Three (3) teams are
deployed, each composed of eight (8) personnel with pecific designated positions, namely:
Team Leader, Spotter, Flagger, Apprehending Officer, Machine Operator, Depressor, Prober, and
Ticket Issuing Officer.
- Transport Summit – To increase awareness on air pollution and proper vehicle maintenance
to lessen emissions of harmful pollutants.
- Industrial Inspection and Monitoring of Business Establishments – includes rigid inspection
and monitoring of business establishments prior to the issuance of pollution clearance.
- Closing down of unscrupulous emission testing centers
- Creation and promotion of routes for E-vehicles and bike lanes
- Banningof open-pit burning and smog creating-activities
5.3 WATER QUALITY
5.3.1 Groundwater Resource
Groundwater Levels
According to the final report on the 2004 study on the Water Resources Assessment for
Prioritized Critical Areas (Phase I) of the National Water Resources Board (NWRB), the groundwater
levels in Metro Manila have declined sharply over the decades. A comparison between the 1955 and
1994 piezometric water levels showed that the groundwater flow pattern significantly changed due
to excessive extraction of water from the aquifer. Three prominent cones of depression were noted in
Paranaque, Pasig and Valenzuela. In Quezon City, a relatively small area adjacent to Caloocan and
Valenzuela had a groundwater level 20 meters below mean sea water level and the Libis-Ugong
Norte near Pasig had 40 to 80 meters below sea level in 1994. In 2004, the decline progressed

144
steeply as almost the whole stretch of Novaliches from Balintawak to Kaligayahan experienced levels
ranging from -20 to -120 meters – said to be among the deepest declines happening in Metro Manila
over the years. This only means much great danger of saltwater intrusion and having groundwater
unfit for human consumption in the city.
Groundwater Abstraction
The decline in water levels and the depletion
of groundwater resource are attributed to
massive withdrawal of water from the aquifer.
Aside from the groundwater abstraction of MWSS
equivalent to 3% of the total water supply for
Metro Manila, wells legally registered with the
NWRB were extracting groundwater at the rate of
12,823.53 liters/second in 2010. However, it is
believed that the actual withdrawal is 70% more
due to illegal abstraction. NWRB has no
segregated data for Quezon City except for the
number of well permits granted as of December
2013. (Refer to Table En- 10)
5.3.2 Natural Waterways
Numerous rivers and creeks crisscross the territory of Quezon City. They are extensive and
serve best as network for natural drainage. They form part of the river basins covering the city’s
landscape, the largest of which are the Malabon –Navotas – Tullahan–Tinajeros River System and the
San Juan – Pasig River Basin. Two major concerns that confront the City’s natural waterways are
pollution and the loss of creek and river easements.
Pollution of the City’s River System in Relation to Pasig River
The greater part of Quezon City and its river system drains into the Pasig River System. The QC
area comprises 80 sq.km of San Juan River Basin(which has an area of 87 sq.km.) and about 8 to 9 sq.
km.) of the Marikina Downstream River Basin (covering an area of 17 sq. km.). Aside from high
population concentration in these areas, the greater majority of commercial and industrial
establishments in the city are likewise located here.
Pollution of the City’s River System in Relation to Manila Bay
Situated in the northern part of Quezon City, the Novaliches watershed is the upstream of
the Malabon – Navotas – Tullahan–Tinajeros (MaNaTuTi) River Systemwhich runs through the cities
of Malabon and Navotas, and finally empties to Manila Bay. The river system has a combined length
of 23km and the widest span width of 60m in Navotas City. The MaNaTuTi River System has a
catchment area of 69.25 square kilometers. The La Mesa Dam controls the headwater of the said
river system. The area is highly populated and majority of industrial establishments are located.
Table En- 10: Well Permitees by Purpose; Quezon City: as of December 2013
Purpose No. of Permits
Granted
Commercial 27 Domestic 47 Industrial 26 Hospitals 8 Irrigation 7 Livestock 3 Municipal 9 Fire Protection 1 Total 128 Source: NWRB
2004 GROUNDWATER SURFACE MAP

145
Sources of Water Pollution
There are two (2) general sources of pollution: point source and non-point source. Point source
means any identifiable pollution source with specific discharge point into a particular water body.
Non-point sources have no identifiable source and include run-off from irrigation or rainwater that
picks up pollutants from farm and urban areas.
A study shows that domestic wastewater discharge accounts for the highest pollution load
introduced to Manila Bay. Only 18 percent of the wastewater generated in Metro Manila
householdsis collected by localized separate sewerage systems. Nearly all of these are discharged
through outfalls into Manila Bay. Most residential wastewater of about 82% is discharged into the
public drainage system either directly or through septic tanks. These septic tanks are not desludged
and the effluent discharged into the water bodies are essentially untreated, causing heavy pollution
everywhere in Metro Manila, particularly in high density areas. (Sources:
http//www.worldbank.org.ph and MWSS, 2003)
The water quality degradation of the fresh water bodies could be attributed to the wastewater
effluent coming from the industries, leaking sewers and septic tanks, direct discharge of animal
wastes and of polyphosphates from detergents, run-offs and improper dumping of solid wastes.
Non-Biodegrable Wastes
Studies have identified plastic bags as a significant contributor to waterways pollution. The city
government has taken a strong position on the regulation on the use of plastic bags from consumers
through the Plastic Bag Ordinance (SP2140,S-2012). Consumers who opt to use plastic bags are
charged P2.00/bag that goes into a “Green Fund”. Since its enactment (last quarter of 2012 ), total
green fund collected has already amounted to Php 337,147,576.00. Of this amount, Php 23.8 million
has been used to fund environmental projects proposed by the retailers themselves. In addition,
7,985,108 pieces of plastic bags have been recovered since its implementation.
Table En-11 : Green Fund Projects 2017-2018
Data of Implementation
Project Title Project Partner Retailer Amount Utilized
May 2017 Shoot that Kalat 10 sets of segregation bins for each of the 27 selected QC public schools
Puregold Price Club 1571572.80
June 2017 Clean drive one trash bin, one cleaner future
10 sets of segregation bins for each of the 18 selected QC public schools
Robinsons Handyman
880,000.00
Sept 2017 Recycled school chairs
800 recycled school chairs to Demetrio Tuazon Elem. School
SM Cubao 1450000.00
Oct 2017 e-Bike 7 e-bicycles for each of the 5 selected QC police stations
Mercury Drug 669200

146
Oct 2018 MRF and composting
Establish MRF and composting area at Ponciano Bernardo Elem School
Zagu Foods Corp 299,574.72
Dec 2018 e-Trikes for community Safety and Security
2 e-trikes for each of the 34 selected bgys in QC
Rustan Supercenters , Inc.
17,208,600.00
Source: EPWMD
The Green Fund Project is an instrument produced by the EPWMD which is intended to
evaluate the current solid waste management practices, provide the vision and direction for future
solid waste management, and set guideposts for waste disposal over a 10-year period. Waste-to-
Energy project, another break through being considered by the QC Government is part of this vision
and direction.
Water Quality Assessment
Water quality is assessed on the basis of a set of beneficial uses as defined in the DENR
Administrative Order 34, S-1990. There are thirty-three (33) parameters that define the desired
water quality per water body classification. Parameters monitored include:
- Dissolved oxygen (DO), biochemical oxygen demand (BOD), total suspended solids (TSS), total
dissolved solids (TDS), and heavy metals for inland surface waters.
- Fecal Coliform, nitrates, and salinity (chloride content) for groundwater as defined in the
Philippine National Standards for Drinking Water (PNSDW)
- DO, Coliform, and heavy metals for coastal and marine waters.
Lack of dissolved oxygen (DO) in the river during the dry season is the main reason for its
offensive odor and the lack of biological life. Low DO levels are the result of the discharge of
domestic and industrial wastes from communities and industrial sites.
Biological oxygen demand (BOD), on the other hand, measures the amount of oxygen consumed
by microorganisms in decomposing organic matter in stream water. The higher BOD value indicates
more pollution.
Water Quality Monitoring Stations
Malabon – Navotas – Tullahan–Tinajeros River System
There are fifteen (15) monitoring stations established in MaNaTuTi River System, five (5) stations
are located in Quezon City namely, Sarmiento Station in Bgy. Sta. Monica, Gulod Station in Gulod
Bridge, Bgy. Gulod, Northridge Station in Northridge Park Subd. Bgy. Sta. Monica, Dahlia Station in
Dahlia Avenue, and Fairview Stationin Fairview Bridge both located in Bgy. Fairview.
Pollution Category by source, 2001-2005
Source: DENR-EMB
Pollution Category by source, 2001-2005
Source: DENR-EMB

147
Based on the Table En-12, the annual recorded results of all the monitoring stations located in
Quezon City, and also the other monitoring stations located in Malabon and Navotas did not pass the
DENR Water Quality Criterion for the past 3 years. This indicates that Matatuti River System is not
capable in carrying aquatic life.
San Juan – Pasig River System
There are eight (8) water monitoring stations located in Quezon City, namely Ermitanyo Station in
Aurora Blvd.Cubao, Diliman Station in Umbel St. Bgy. Kalusugan, Kaliraya Station in Bgy. Tatalon,
Mariablo Station in Roosevelt Avenue, Bgy. Sta. Cruz, Talayan Station in Bgy. Talayan, Caroline
Station in MH delPilar, Bgy. San Antonio, Dario Station in EDSA and Culiat Station in Bgy.Culiat.
Table En-13_: Results of the different water quality parameters: San Juan River Monitoring Stations; 2014-2015
Location of Station Name of
Creek
Biochemical
Oxygen
Demand(BOD)
7 mg/L below
Dissolve
Oxygen(DO)
5 mg/L Up)
Total
Suspended
Solids(TSS)
10 mg/L
Oil & Grease
(2 mg/L)
2014 2015 2014 2015 2014 2015 2014 2015
Aurora Blvd. Broadway Ermitanyo 58.00 54.75 0.00 0.42 0.00 53.33 5.60 5.18
Umbel St., Kalusugan Diliman 56.00 76.42 0.00 0.34 0.00 61.67 5.80 6.08
Kaliraya St. Tatalon Kaliraya 57.8 57.67 0.00 0.36 0.00 51.67 5.20 5.45
Roosevelt Avenue, Sta.
Cruz Mariablo 57.5 54.76 0.00 0.58 0.00 54.17 4.70 5.32
Araneta, Talayan Talayan 83.22 78.58 0.00 0.33 0.00 64.17 6.30 5.71
MH Del Pilar, San
Antonio Caroline 52.5 58.08 0.00 0.50 0.00 49.17 4.30 5.23
EDSA Dario 63.50 57.08 0.00 0.86 0.00 51.67 5.00 5.23
Edsa, Culiat Culiat 48.5 53.00 0.00 1.02 0.00 50.00 4.20 5.14
Based on the Table En-12, the recorded results of all the monitoring stations located in Quezon
City did not pass the DENR Water Quality Criterion for the past 2 years. This implies that San Juan
River System is not capable of supporting marine life.
Table En-12: Results of the Water Quality Monitoring Stations: Meycauayan-Navotas-
Tullahan-Tenejeros River System (Matatuti); 2013-2015
Water Quality Parameters 2013 2014 2015
Mg/L
Biochemical Oxygen Demand(BOD) 7 mg/L below 35.86 39.19 39.00
Dissolve Oxygen(DO) 5 mg/L Up) 00.06 00.00 00.00
Total Suspended Solids(TSS) 10 mg/L 33.89 39.61 13.00
Oil & Grease (2 mg/L) 4.64 4.17 4.10

148
Encroachment of Creeks and River Easements
Ocular inspection of the rivers and creeks
and their tributaries shows that easements
and riverbanks, as defined and provided for
by the law, are no longer existent. Many are
occupied by structures belonging to affluent
and poor families alike.
According to the 2016 census of the
Housing, Community Development and
Resettlement Department (HCDRD), there
are 14,313 families occupying 12,780
structures along creek and river easements. (See Table En-14)
Physical development in some areas has also resulted in the narrowing of creeks and rivers and
even loss of some segments on these waterways. There are also instances where the creek has been
covered, diverted, and in some cases, reclaimed to generate building lots.
Programs/Projects
Riverways Cleaning and Management Program–The program seeks to clean and maintain the
aesthetic condition of the city’s rivers and creeks with active community involvement. The project
has visible impact in terms of enhancing the physical environment and demonstrating strong
partnership with the community and at the same time provide employment opportunity to poor
residents.
For 2018, the Riverways Cleaning Operations Group (RCOG) of the EPWMD, through the conduct
of manual clean-up operations, collected a total of 1,499.34 cubic meters of river wastes covering
approximately 202.7 linear kilometers of riverways
Said undertaking likewise is a coordinative effort for the inter-agency implementation of the
Supreme Court Continuing Mandamus (a court order handed down on ______ ordering all
concerned government agencies to coordinate in the clean up, rehabilitation, preservation,
restoration and maintenance of the waters of Manila Bay to a Class B level. In a recently
concluded LGU Compliance Assessment in relation to the Manila Bay Clean up Program, Quezon
City ranked 1st among all LGU’s in Metro Manila with an overall average score of 95%.
Clean-up Operation for Dengue Prevention – This project is being implemented to reduce
dengue cases in highly affected barangays in the city.
Adopt-an-Estero WaterbodyProgram –engaging stakeholders and partners as a collaborative
undertaking among the DENR, LGUs, estero communities and donor-partners to select a
beneficiary creek/estero for its rehabilitation and maintenance.
Lingap-Sapa – a citywide effort that promotes community participation in the clean-up of
waterways.
Table En-14_: Illegally Encroached Structures
Along Rivers and Creeks, 2016
Waterways No. of
Families
No. of
Structures
Creekside 7,384 6,047
San Juan River 1,335 987
PRRC 2,454 2,481
Tullahan River 1,621 1,908 Marikina River – Flood Plains 1,519 1,357 Total 14,313 12,780 Source: HCDRD
Pollution Category by source, 2001-2005
Source: DENR-EMB

149
International Coastal Clean-Up – The city government supports and participates in the annual
International Coastal Clean-up (ICC) conducted every September.
Posting of Signage and Plates – Ordinance plates and signage are posted along conspicuous and
dumping prone areas within the city so that the constituency may be reminded to keep the
environment clean and garbage-free at all times.
Automatic Trash Rake (ATR) Facility –It aims to
design and develop an alternative measure to de-clog
rivers/creeks and improve the operation of flood control
facility. The ATR is an inclined conveyor-type garbage
collection mechanism intended to improve garbage
collection compared with the manual method which is
used in Quezon City. The automatic trash rake facility is
located at Balingasa Creek specifically along G. Araneta
(Center Island) near Mauban St., at the boundary of
Barangays Manresa and Masambong. It was turned-over by the Department of Science and
Technology to the Quezon City Government on December 3, 2014 and became fully operational on
February of 2015.
5.4 PARKS AND OPEN SPACES
Endowed with the biggest land resource in Metro Manila, Quezon City boasts of numerous
parks and open spaces, both vast and small. The inventory consists of major and special parks that
are themselves unique in terms of size, features, and even biodiversity; historical parks and shrines.
It also includes reserves and potential areas adding to the City’s expansive network of open spaces
like institutional grounds (UP, Ateneo de Manila University, Miriam College, Congress, and the like),
golf courses, corridors or right-of-ways and river easements.
The Quezon City Parks Development and Administration Department (PDAD) reported that out of
the city’s 598 parks and open spaces, 259 are developed, 67 are partially developed and 275 are
undeveloped. District V has the most number of developed and undeveloped parks numbering to70
and 60 respectively. (See Table En-15)
Table En-15: Status of Parks/Open Spaces per District: December 2018
Status DISTRICT
Total I II III IV V VI
Developed 38 23 42 27 70 59 259
Partially Developed 2 4 7 1 25 28 67
Undeveloped 42 49 31 36 60 54 275
Total 82 76 80 64 155 141 598
Source: PDAD
Automatic Trash Rake Facility in Balingasa Creek

150
5.4.1 Major and Special Parks
Quezon Memorial Circle
The Quezon Memorial Circle (QMC), the central park of the city, is a 25-hectare public realm best
known for being home to the Shrine, Museum and remains of Manuel L. Quezon. Located at the heart
of the City, it serves as the core and unifying element of the city’s Open Space Network System
(Garden City) because of its strategic location and high visibility.
The major components of the QMC are the following:
▪ Quezon Memorial Monument (Pylon) and shrine, the central element of QMC and the point
reference for all development programs, projects and activities
▪ QCX and Museum
▪ Meditative area
▪ Parks, playground and other recreational areas
▪ Venue for social interaction, socio-cultural exchange, celebrations and other public gatherings
▪ Venue for facilities for arts and culture and historical heritage promotion
▪ Environment protection showcase area
▪ Economic enterprise area
Data from the QMC Administration Office showed that visitors of the park ranged from 12,000 to
15,000 during weekdays and 25,000 to 30,000 during weekends and holidays.
Ninoy Aquino Parks and Wildlife Center
The Ninoy Aquino Parks and Wildlife Center (NAPWC) is the only zoological and botanical garden
with an area of 19.29 has.located at the southwest of the Quezon Memorial Circle. It houses various
species of endemic and endangered birds, mammals, reptiles and amphibians in the open-air mini-
zoo and Wildlife Rescue Center.It also serves as a venue for public education, as a training and
research facility for future veterinarians and biologists, and as a source of wildlife stock for local zoos
and DENR-accredited facilities for their public education, breeding, and other conservation-oriented
undertakings. Other amenities include cottages for conferences, meetings, seminars and other
gatherings, amphitheater, children’s playground, visitor’s center, a man-made lagoon for fishing, tea
house, picnic sheds, a rock garden and a craft village.
The NAPWC was proclaimed as a protected area and component of Republic Act No. 7586 or the
National Integrated Protected Areas System (NIPAS) Act of 2004 as amended by RA 11038
(Expanded NIPAS Act of 2018) which envisions the Center as a world-class ecotourism destination
and a venue for biodiversity conservation and education on Philippine endemic and rare wild flora
and fauna.

151
NAPWC Office reported that visitors of NAPWC in the year 2014 and 2015 were 515,281 and
471,600 respectively. Total income generated in that period amounted to P 8,866,935.46.
La Mesa Watershed
The 24 hectare La Mesa Watershed is the last remaining forest of its size in Metro Manila – the so-
called “Green Lung” of the Metropolis. With an area of about 2,700 hectares, it was declared as
Watershed Reservation by virtue of Presidential Proclamation No. 1336 on 25 July 2007. Previously,
the control of the La Mesa Watershed was under the jurisdiction of the Metropolitan Manila
Waterworks and Sewerage System (MWSS) from 1971 by virtue of Republic Act No. 6234 until 2007.
By virtue of Presidential Proclamation Number 1336, the Watershed is now under the joint
administrative jurisdiction, supervision and control of the MWSS and the Department of
Environment and Natural Resources (DENR).
Within the watershed is a reservoir of about 179 hectares that serves as water impounding
structure supplying water for domestic and commercial use of some 12 million people in Metro
Manila.
Another attraction that gives impact in the area is the 30-Hectare La Mesa Ecopark Resort, the
biggest eco-tourism destination in Metro Manila. In a multi-stakeholder partnership among the QC
LGU, ABS-CBN’s Bantay Kalikasan Foundation and the MWSS, the park has been maintained and
preserved as a combined a natural recreational refuge with educational purposes of an outdoor
classroom envisioned to bring the people back to La Mesa as it did in the old days. Amenities include
the Orchidarium, Butterfly Garden, Hanging Bridge, Picnic area and Eco-trails.
UP Arboretum
Measuring a mere sixteen hectares of the 493-hectare academic institution that is the Diliman
campus of the University of the Philippines, the UP Botanical Garden and Arboretum supports a
diverse collection of plants and wildlife, which, while not necessarily remarkable as compared to
undisturbed ecosystems, can still be considered a compelling attempt at environmental preservation
in the face of urban accretion and human threat.
Balara Filters Park
Balara Filters Park is a 60-hectare (150-acre) park located in the Diliman village of Bgy. Pansol, and is
one of the oldest recreation areas in Quezon City having been first opened to the public in 1953. It
occupies part of the old Balara Filtration Plant complex, one of the main treatment facilities for water
coming from the La Mesa Dam. A surprising recreation spot where you get to travel back in time
and marvel at Art Deco buildings. It features an elevated picnic grove, a mini-park for kids, the Balara
Filtration Windmill, a replica of the Carriedo Fountain, the Anonas Amphitheate and buildings that
stood the test of time. The park is administered by the Manila Water company in partnership with
the Quezon City Parks Development and Administration Department.

152
Historical Parks and Shrines
The historical parks consist of the PugadLawin Shrine, TandangSora Shrine, A. Bonifacio
Monument, Gen. Geronimo Monument, BantayogngmgaBayani, and People’s Power Monument.
Other Open Spaces
Adding to the inventory of open spaces in the city are large institutional grounds like those of
University of the Philippines, Ateneo de Manila University, Miriam College, QC Hall, House of
Representatives compound, Veteran’s Memorial Medical Center compound, V. Luna Medical Center,
Camp Crame, and Camp Aguinaldo.
5.5 BIODIVERSITY
The City has richer wildlife compared with other cities in Metro Manila due to the size and
nature of its parks and open spaces. Studies show that the parks and open spaces in Quezon City are
habitat to numerous species of flora and fauna, some of which are classified as endemic or
indigenous, exotic, endangered, highly endangered, or vulnerable.
In 2018, the City Government through the Environmental Protection and Waste Management
Department, Parks Development and Administration Department and the City Planning and
Development Department became part of the Urban Biodiversity Program of the Biodiversity
Management Bureau (BMB) of the Department of Environment and Natural Resources.The program’s
objective is to do an inventory and conduct an assessment of the city’s flora and fauna to create a City
Biodiversity Index which will serve as a manual in the assessment and monitoring of the city’s
greening program that can be replicated by other LGUs. The three (3) areas selected as sites for the
implementation of the program are the Quezon Memorial Circle, La Mesa Watershed and the NAPWC.
The following table shows the actual number of flora and fauna (bats and birds only) in QMC and La
Mesa Watershed.
*Tagged in August – September 2018 during Phase 1 of the Program Source: BMB-DENR
Programs/Projects
Quezon City Biodiversity Profiling –The Quezon City Biodiversity Profiling aims to develop a
database of tree inventories in the parks and open spaces in the City. Aside from the identification
of tree species, the Project includes geo-tagging fieldwork with the use of a handheld Global
Positioning System (GPS) to get the exact locations of trees. Maps were also generated using
Table En-16_: Number of Flora and Fauna in Quezon Memorial Circle
and La Mesa Watershed: 2018
Area
Flora Fauna
Bats Birds
Species Identified
Individual Count
Species Identified
Individual Count
Species Identified
Individual Count
QMC 42 204 3 47 10 40
La Mesa Watershed
46 279 2 77 27 180

153
Geographic Information Systems (GIS) software. The Special Projects on Climate Change of the
EPWMD is in charge of tagging of trees located in public parks and schools. For the period 2016-
2018, trees tagged number to 31,893.
Gabriela Silang Ecological Park – To lessen the heat island effect that may be caused by the
numerous infrastructures within the Quezon City Hall compound, the EPWMD in coordination
with the City Architect Department, City Engineering Office and Parks Development and
Administration Department, established the Gabriela Silang Ecological Park at the northeastern
corner of the city hall compound. The park was inaugurated in December 2018 and features an
urban garden, vertical garden, aviary and rainwater harvesting component, among others.
Museum of Philippine Biodiversity - A Biodiversity museum to be located at the Ninoy Aquino
Parks and Wildlife Center in Quezon City envisioned to be an instrument for people to appreciate
the natural bounty of our country, realize the effects of our exploitative practices, and hopefully
be engaged in efforts to rehabilitate and preserve what is left of our protected areas and
biodiversity.


154
CHAPTER 6: Institutional Profile and Development
6.1 LOCAL GOVERNMENT ORGANIZATION
6.1.1 Evolution of the Quezon City Government
The organizational structure of the government of Quezon City evolved into what is now a
complex form from a lean set-up of 10 offices and a 5-member City Council when it was created on
October 12, 1939 by virtue of Commonwealth Act 502, the City’s original charter. The passage of a
series of acts by the National Assembly (before the war) and by the Philippine Congress (after the
war) effected the changes, both minor and significant, to the City’s organizational structure.
The original structure was composed of the Offices of the Mayor, the Vice Mayor, and six (6)
offices, namely: the City Health, the City Engineer, the City Police, the City Treasurer, the City
Assessor and the City Attorney as part of the Executive Branch; the City Council with the Mayor, the
Vice Mayor and three (3) other members supported by the Office of the City Secretary comprised the
Legislative Branch; and the Justice of the Peace Court with an auxiliary justice as the Judiciary
Branch. All the city officials then were appointed by the President of the Philippines.
Commonwealth Act 659 dated June 21, 1941 amended the structure when the Office of the
Justice of the Peace Court was renamed as the City’s Municipal Court with two (2) branches: the First
and the Second Branch. This Act also created the position of the Clerk of Court and increased the
number of Assistant City Attorneys from one (1) to three (3).
On June 16, 1950 (after the war), Republic Act 537, also known as the revised charter of
Quezon City increased the membership of the City Council to ten (10) - the Mayor, the Vice Mayor
and eight (8)councilors. Also, the different city offices were elevated into department level. The Act
also created the City Fire Department.
Later, on June 16, 1956, Republic Act 1575 increased to three (3) the members of branches of
the Municipal Court.
It is worthy to note at this point that the positions of the Mayor, the Vice Mayor and the City
Council which used to be appointive were declared elective on June 19, 1959 by Republic Act 2259.
The first local election for these offices was held on November 10, 1959.
Further amendments to the City’s organization were made on June 18, 1960 by Republic Act
2649 with the creation of the Office of the City Fiscal in lieu of the Office of the City Attorney, with six
(6) levels of Assistant Fiscals compared to only four (4) Assistant City Attorney levels.
The position of Assistant Chiefs of the various departments including that of the Secretary to
the Mayor (also ranked as Assistant Department Chief) was created by Republic Act 3663 dated June
22, 1963.

155
Among the significant structural changes that the City experienced was the division of the City
into four (4) Councilor Districts each to be represented by four (4) Councilors elected by district,
thereby increasing the Council membership to sixteen (16). This was by virtue of Republic Act 5441
on September 8, 1968.
The Act however, removed the voting power of the Vice Mayor in the City Council except only
in case of a tie. The same Act also elevated the position of Secretary to the Mayor into department
level and created the position of Assistant Secretary to the Mayor.
It was however the creation of the Metropolitan Manila Commission on November 7, 1975 by
virtue of Presidential Decree 824 that bears major impact not only on the City’s organization but on
its autonomy as well. Said decree made Quezon City along with the sixteen (16) other Local
Governments in the Greater Manila Area as component units of a higher-level, commission-type
government agency directly under the Office of the President. The Commission was vested powers
encompassing both the legislative function and some executive responsibilities previously held by
the local government.
Local councils in Metro Manila were terminated on December 31, 1975. The Commission has
the following salient feature.
The Commission acts as the central government that formulates programs and policies,
including review and approval of local programs and administers its own programs like fire control,
garbage disposal, and traffic management.
It was also empowered to review, amend, revise or repeal local ordinances and enact new
ordinances and resolutions – powers that used to belong to the local councils.
The Commission was composed of the Governor, the Vice-Governor and three (3)
Commissioners: one for planning, another for finance, and the third for operations – all of whom
were appointees of the President.
It was appropriated an initial fund (P2,500,000) from the National Treasury plus proceeds
from certain taxes accruing from contributions of the component LGUs and outlays in the Annual
General Appropriations Decree.
While the National Assembly passed the Local Government Code in 1983 (Batas Pambansa
Blg. 337 which was approved on February 10, 1983) which embodies the declared principle of
autonomy of local government units, the act exempted Metro Manila area from its coverage. Hence,
PD 824 continued to be in effect.
It was only with the ratification of the New Constitution in 1986 that the City, as with the rest
of Metro Manila, regained its autonomy, especially the power to legislate. The first local elections
after martial law and as called for by the new constitution was held in January 1988. Posts to be filled
were those of the City Mayor, Vice Mayor and twenty - four (24) councilors with six each from the
four (4) districts.

156
For four (4) years, from 1986 to 1990, the fate of the Metro Manila Commission (MMC) was
uncertain. Executive Order 392 of January 9, 1990 reconstituted it to become the Metropolitan
Manila Authority (MMA) composed of the heads of the seventeen (17) Local Government units of the
region as its Council, the chairman of which is elected from among its members for a six (6) month
term. In contrast to the previous Commission, the Authority’s jurisdiction was trimmed to general
executive functions involving services of metrowide concern but none that will directly intervene
with the legislative functions of the local councils.
The support structure of the MMC headed by three commissioners was retained. However,
the commissioners were renamed Assistant General Managers while a new position for General
Manager which used to be held by the Chairman was created.
MMA’s existence was more of “interim” in nature, pending Congress action on a permanent
entity to administer Metro Manila. On March 1, 1995, the President approved RA 7924 creating the
Metropolitan Manila Development Authority (MMDA) which replaced MMA. The basic
composition/organization and functions of MMA, however, remained unchanged except for the
following:
• the inclusion of the presidents of the Vice Mayors League and the Councilors League of Metro
Manila in the Council;
• the Council Chairperson shall be appointed by the President whose term shall be on the latter’s
discretion and has the rank of a cabinet member;
• additional funding shall come from the General Appropriations Act.
Quezon City is within the National Capital Region (NCR) a metropolitan government under
the MMDA. MMDA is not a political unit of government, but a development authority likened to a
national agency that is tasked to oversee the delivery of basic services. The power delegated to
MMDA through the Metro Manila Council – the MMDA’s governing and policy-making body is limited
only to the promulgation of administrative rules and regulations in the implementation of the
MMDA’s plans, programs and projects.
On the administrative character, the MMDA Chairman is a presidential appointee, with the
rank of a cabinet member. One of the Chairman’s functions is to perform such other duties as may be
assigned to him by the President. In LGUs, the President of the Philippines merely exercises
supervisory authority.
The MMDA has no power to enact ordinances for the welfare of the community. It is the local
government units, acting through their respective legislative councils that possess legislative and
police powers. This is in line with the local autonomy being enjoyed by the LGUs.
6.1.2 Existing Organizational Structure of Quezon City Government
The present organizational set-up of the Local Government of Quezon City is a structure with
two (2) distinct branches, the Executive and the Legislative. See Figure In-1 for the Existing QC
Government Organizational Structure)

157
The Executive Branch
The Executive Branch is composed of thirty-four (34) departments and five (5) offices which
are further divided into services, divisions and sections. At the helm of the organization is the City
Mayor from whom all executive authority and responsibilities emanate. The City Administrator and
the Secretary to the Mayor stand next in the hierarchy as they exercise delegated authority to
supervise the operations of line and staff departments/ offices and units. There are also program-
based units, committees and Task Forces operating directly under the Office of the Mayor. The
existing departments/offices, and task forces and their mandatess are shown in Appendix 1.
Under Council Ordinance No. 154, S-90, three (3) positions of Assistant City Administrator
were created to assist the City Administrator in the performance of his functions relating to the
proper supervision, coordination and monitoring of development programs and other services being
delivered by the city. They are: the Assistant City Administrator for Operations, the Assistant City
Administrator for General Affairs and the Assistant City Administrator for Fiscal Affairs.
The position of Assistant Secretary to the Mayor was renamed as Assistant Secretary to the
Mayor for Internal Affairs, while another position, that of the Assistant Secretary to the Mayor for
External Affairs was also created under Council Ordinance 154 -S-90 (sec. 7).
The positions of the City Administrator, Secretary to the Mayor, and Assistant Secretary to the
Mayor for Internal and External Affairs are co-terminus with the appointing power.
Other co-terminus positions are the City Legal Officer, Head of the Department of Public
Order and Safety.
The Legislative Branch
Another structural change in the City was by virtue of Republic Act No. 10170 dated July 2,
2012 apportioning the 2nd legislative district of QC. This created two (2) additional districts and
twelve (12) Sangguniang Panglunsod seats. By said Act, QC is now comprised of six (6) legislative
districts and has now six (6) district representatives and thirty six (36) city councilors.
The City Council, the legislative body of the city, is composed of the Vice-Mayor as the
Presiding Officer, the 36 regular council members, and the President of the city chapter of the Liga ng
mga Barangay, and Sangguniang Kabataan Person. The Office of the Vice Mayor has also supervisory
control over the following special projects such as:
Table In-1 : Special Projects supervised by the Vice Mayor
Project Title Project Description/Objectives
Quezon City Drug Treatment and Rehabilitation Center (TAHANAN)
Takes charge of the treatment and rehabilitation of drug dependents whether on voluntary or compulsory confinement.
Sports Development Council Plans and supervises an integrated sports promotion and development program, coordinates with the 142 barangays relative to implementation of sports projects.

158
Task Force Greening Extends assistance through livelihood projects which will provide job opportunity and income for the families of Quezon City.
QC Anti-Drug Abuse Council Prepares/formulates plans and programs to minimize, if not eradicate drug abuse and a comprehensive drug rehabilitation program
Healthy Cities Initiatives Program
Prepares plans and programs for the Quezon City Healthy Cities Initiatives consistent with the WHO guidelines and the National Health Cities Initiative Committee.
Performing Arts Plans and implements trainings/projects and activities that promote various disciplines of performing arts for the city’s talented youth.
Legislative Investigative Action Group
Complies and categorizes all ordinances with penal provisions and disseminates the same to all Quezon City-based establishments, law enforcement agencies and all barangays.
Quezon City Film Development Commission
Develops and implements incentives and awards for producers, script writers, cinematographers, and the like to encourage production of quality films; Encourages and undertakes activities to promote development of local film industry and participation in both domestic and foreign markets; Develops and promotes programs to enhance skills and expertise of Filipino talents in the film industry; Undertakes the annual Quezon City Film Festival; Prescribes the procedures for the exercise of the Quezon City Film Foundation; Determines the organizational and staff pattern of both the Commission of the foundation and; Performs such other functions as may be necessary to carry-out the provisions of the ordinance.
Computerization Unit Administers the data banking of all approved Ordinance/Resolutions of the City Council, and implements the IT development of the Legislative Department
Special Investigation Committee on Administrative Cases Against Elective Barangay Officials
The Committee shall receive and evaluate all the evidence/s presented; Listen to the testimonies of the parties and their respective witnesses; If any, prepares and submit its report in the form of a resolution, stating clearly and distinctly the facts and the law on which it is based, its findings, conclusions and recommendations, to the City Council, thru the City Secretary.

159
Radio
Communications Service
OFFICE OF THE VICE MAYOR
QUEZON CITY COUNCIL
(37 COUNCILORS) Office of the
Secretary to the Sangguniang Panlungsod
Tricycle Franchising
Board OFFICE OF THE CITY
ADMINISTRATOR
OFFICE OF THE SECRETARY TO
THE MAYOR
Novaliches District Center Quezon
Memorial Circle
City Planning &
Development Department
Engineering Department
City Legal Department
City Civil Registry
Department
Department of Public
Order & Safety
Quezon City Health
Department
Novaliches District Hospital
Quezon City General Hospital
Social Services&
Development Department
Market Development & Administration
Department
Parks Development& Administration
Department
Public Affairs & Info.
Services
Department
Business Permits & Licensing
Department
Department of the
Building Official
Quezon City Public
Library
Human Resource
Management Department
City Assessor’s
Department
City Treasury Department
City General Services
Department
City Accounting Department
City Budget Department
City Architect
Department Procurement Department
P A L A O
L L R B
Quezon City
University
City Veterinary
Department
Information Technology & Development
Department
Quezon City Anti-
Drug Abuse Council
Quezon City Drug
Treatment & Rehabilitation
Center
Public Employment Service Office
Quezon City Small Business
Development & Promotion
Office
Quezon City Youth
Development Office
Local Economic
Investment Promotions
Office
SPECIAL OPERATING UNITS C.
Amoranto Sports Complex Office of Senior Citizens Affairs
Task Force COPRISS Liga ng mga Barangay
GAD
SPECIAL ASSISTANCE UNITS for NGAs
Metropolitan Trial Court (MTC) Regional Trial Court (RTC)
City Prosecutor’s Office Division of City Schools
QC Police District QC Fire Department
QC Jail Commission on Audit (COA)
QC Probation & Parole Office National Bureau of Investigation
Metro Manila Development Authority
Rosario Maclang Bautista General
Hospital
Environmental Protection &
Waste Management Department
Housing Community Dev’t and
Resettlement
Department
Barangay & Community
Relations Department
Secretary to the Board of Assessment
Appeals
Quezon City Tourism
Department
Quezon City Development
Authority
Board of Assessment
Appeals
Office of the Deputy City Administrators (3)
Peoples Law Enforcement
Board
Disabled Person Affairs
Office
Disaster Risk Reduction & Management
Office
Figure In-1 :| Quezon City Government Organizational Structure
6.1.3 QC Government Manpower Complement
As of December 2018 the Quezon City Government employs a total of 16,326 personnel
broken down under the following types and of employment status:
Elective - These are the officials of the city elected by the qualified voters during election
period and whose term of office is three years but shall not serve for more than three consecutive
years in the same position. They are the City Mayor, City Vice Mayor, the 36 regular members of the
City Council and the two sectoral representatives (the Youth and the ABC sectors). There are 40
elective officials.

160
Permanent - issued to a person who meets all the minimum qualification standards of the
position to which he is being appointed as prescribed by the Civil Service Commission (CSC).
Personnel holding this nature of appointment enjoy security of tenure and all benefits accruing to
government employees. The city government has 5,345 employees with permanent appointment.
Temporary - issued to a person who meets the education, skills and experience requirements
to the position to which he is being appointed. The appointee however, has to complete 12 months
period before he is recommended to permanent appointment. There are 125 of this kind.
Co-Terminus - issued to a person whose entrance and continuity in the service is based on
trust and confidence of the appointing authority. The term of the City Legal Officer, the City
Administrator, Secretary to the Mayor, Head of the Department of Public Order and Safety (DPOS),
Confidential Secretary are co-terminus with the appointing power. The staff of the City Council is also
co-terminus with the term of the city councilors. There are 218 co-terminus employees.
Contractual - This refers to employment where the contracts of services are not covered by
the Civil Service laws but covered by Commission on Audit (COA) rules. Contractual services
rendered are not considered government services. The Executive Branch has 6,702 contractual
personnel for special projects, various task forces, committees and several line departments/ offices
which also employ appointment of this kind while the Legislative Branch has 3,416. The total
contractual personnel is 10,118, as of December 2018.
Consultant - Issued to a person with technical expertise essential to a service. The city has
480 consultants. (See Table In-2 & Fig. In-2)
Of the 8,894 plantilla positions, 5,728 are filled-up and 3,166 are vacant. Of the filled up slots,
2,671 are female (46.63%) and 3,057 are male (53.37%).
Being a government entity, Quezon City Government operates in accordance with existing
laws or guidelines on managing and developing human resources as prescribed by the Civil Service
Commission, particularly the Omnibus Rules/Implementing Book V of Executive Order No. 292.
Table In-2 : Manpower Complement; QC Government 2016-2018
Type of Appointment 2016 2017 As of December
2018 Elective 40 40 40 Permanent 4,603 4,747 5,345 Temporary 79 95 125 Co-Terminus 235 237 218 Contractual (Exec) 6,124 6,294 6,702 Contractual (Legis) 3,311 3,414 3,416 Consultant 421 475 480
TOTAL 14,813 15,302 16,326 No. of Plantilla Positions 8,104 9,134 8,894 No. of filled up Positions 4,957 5,119 5,728

161
Classification of Manpower Support
The existing manpower support has been classified according to functional hierarchy:
Executive / Managerial. This is the top level executive group performing primarily management functions. This is where policies and objectives that guide the activities of the various departments/offices of the entire organization originate. The group is composed of elected officials and Heads of the various departments/offices operating vital units in the organizational structure. Salary grade falls between 25-30. There are 163 of this type.
Second Level. This group coordinates and supervises staff activities of their office. It is responsible in enforcing proper performance of their delegated functions in order to attain the office/unit and ultimately the organization’s thrusts and objectives. This group includes Assistant Office Heads, Chiefs of other special operating units, Division and Assistant Division Heads, and Section Chiefs. Salary grade is 18-24. The number of personnel under this level is 3,756.
First Level. All salary grade 17 and below belongs to this group. This includes the technical
group responsible in translating city plans, programs and projects into implementable forms through
researches and development. This group consists of the Urban Planners, Statisticians, Researchers,
Computer Programmers, Analysts, and the administrative group or support staff involved in
providing clerical, general services, security, transport, and area maintenance. This group is
composed of positions such as Staff Aides, Clerks, Drivers, Security Guards, among others. There are
4,975 personnel under this category.
6.1.4 Physical Plant and Facilities
The head offices of the QC government organization are located at the City Hall Complex
though some departments / offices operate sub - offices/ branches and stations in various parts of
the city.
71
871
2,115
48
1,445
1,178
- 500 1,000 1,500 2,000 2,500 3,000 3,500
Exec / Managerial
Second Level
First Level
Exec / Managerial Second Level First Level
Male 71 871 2,115
Female 48 1,445 1,178
Figure In-2: Manpower Complement; QC Government 2018

162
The main building is a 14-storey structure built during the term of the late Mayor Norberto S.
Amoranto and inaugurated on January 1, 1972.
In the year 1981, a fire gutted the 3-storey left wing of the QC Hall destroying property worth
P10 million. On June 11, 1988, another fire razed the main building from the 7th to 14th floors
causing property damage of about P240 million. The main building was again hit by fire on August 7,
1998, destroying the fifth floor and affecting the fourth and sixth floor as well. On May 6, another fire
hit the south wing housing the Accounting Unit, Fiscal and Administrative Units of the City
Treasurer’s Office. At present, the main building is undergoing structural retrofitting and being
renovated.
Major developments are also taking place in the complex. Fifteen (15) New buildings have
been constructed or undergoing construction that houses some offices; the DRRM and DPOS Building
and a three-storey Civic Center Building C where the City Civil Registry Department (CCRD), the
Housing Community Development and Rehabilitation Department (HCDRD) and the Task Force
COPRISS are located. All these offices are transacting heavily with the public. The Civic Center D also
called as Building Regulatory Office where the Department of Building Official, City Planning and
Development Office, the City Architect Department and Environmental Protection and Waste
Management Department are located. We also have the New Justice Hall Building, the National
Agency Building which housed national and regional offices operating in the city like NBI, the Police,
and DILG-NCR among others. The new state of the art City Library in front of the Main Building has
become very helpful in the research works of our students, young and old. The City Hall Parking in
the City Hall compound is also now operating and serving our taxpayers and employees. The office of
the Social Services Development Department (SSDD), the Health Department Building, the QC
Convention Center, and the Finance Building where the finance offices will be located are still under-
going construction.
District II, V, VI are served by a “Mini City Hall”, the Novaliches District Center, which houses
the following government agencies: City Treasurer’s Office Business Permits and Licensing Department (BPLD) Liquor Licensing Regulatory Board (LLRB) City Health Department Tricycle Regulatory Unit (TRU) DRRMO Market Development and Administration Department (MDAD) Office of Senior Citizen Affairs (OSCA) City Engineering Department Social Services Development Department (SSDD) Parks Development Administration Department (PDAD) City Civil Registry Department (CCRD) Public Employment Service Office (PESO) QC Police Department
QC Fire Department

163
6.1.5 Management System & Operations
Major innovations introduced and practiced in different service areas:
Strategic Planning Workshops – An organization-wide planning workshop participated in by
heads of department and offices, to assess the city’s action plans and formulate interventions
that suit the needs of city residents.
Clustering of Offices – is done to give the City Mayor various options on mechanisms which can
be used to effect closer coordination of offices under his general supervision.
– Governance & Administration;
– Economic Development;
– Security, Peace and Disaster Preparedness;
– Environmental Protection and Climate Change Adaptation
– Poverty Reduction and Social Development and Welfare and;
– Infrastructure, Housing and Urban Planning and Development
Regular conduct of Executive Staff and Management Committee Meetings - Given the size of
QC, the city government officials track the direction as to where the city is going thru the weekly
consultative meetings. Here, the city executives are regularly kept abreast with programs and
developments in other areas of the city government. This also enhances each other’s gains and
complements efforts not needlessly waste resources through duplication. The Management
Group composed of 6-7 top management members also meet during the alternating week. In this
group, ideas are freely discussed and exchanged.
Resource Allocation - Achieving more with less use of human and material resources is an
underlying principle of resource allocation efforts of the city government. For example, a process
that guides fuel allocation thru the use of fleet card thereby minimizing improper use and waste
was adopted.
Systems Improvement - QC is one of the first to computerize its real estate assessment and
payment systems and the process for securing business permits. Operational improvement in
business processing was adopted to shorten the period thru the Business One Stop Shop (BOSS)
Center. Official receipts for tax payment have security features that are hard to counterfeit and
anti-graft cases against erring employees were filed at the Office of the Ombudsman.
The City Government maintains two One Stop Shops:
1. The Business Permits One Stop Shop (BOSS) is the integrated location for new business
permit applications and for renewals of business permits. Through BOSS, an applicant for a new
business goes through a single location for the basic requirements for starting his or her
business in Quezon City. At BOSS, the application is processed simultaneously by the Business
Permits and Licensing Department for business registration, by the Zoning Administrator for the
locational clearance, and by the Bureau of Fire protection-Quezon City, for fire safety inspection.
It is also in this location where the applicant pays for all fees and charges, through a single Tax
Bill, and where he or she receives the corresponding Business Permit and Business Plate, once
the application is approved. A concierge is available to assist the new applicant through the
process.

164
2. The One-Stop Shop for Construction Permits (OSSCP) is a single location for the processing of
construction and occupancy permits for simple structures. Simple structures are:
a) Structures with floor area of not more than 1,500 sq m.
b) Single family dwellings up to 3-storeys high
c) Interior renovations inside a building which already has an occupancy permit
d) Simple warehouse up to 2-storeys high, which are for noncombustible materials
e) Commercial buildings up to 2-storeys high
The OSSCP offers a single, integrated application process for locational clearance, fire safety
evaluation, building permit, and occupancy permit. The system follows a linear process of
evaluation, starting from zoning compliance, to fire safety, and then compliance to the National
Building Code.
Meralco has a service kiosk near the OSSCP for the application of the electrical connections.
In lieu of the above, the City Government is also developing a new one stop shop called the
Building Registration One Stop Shop (BROSS) that will also help the public to easily process and
simplify their work.
In project identification/selection systematic method for selecting and prioritizing was
formulated to determine their distribution throughout the districts and for identifying sources of
funds. The principle is for a balanced development.
In addition, the following systems improvements were put in place.
Quality Management System (QMS-ISO). This involves improvement of systems in service
delivery and efficiency to the level of ISO standard in order to satisfy/meet the
needs/expectations of the QC residents. The Revenue Cluster, Economic sector consisting of 15
departments/offices having passed the system’s requirement was able to register and receive ISO
9001:2008 in May 2016. The next round of ISO 9001-2015 Certification programmed will cover
the city hospitals, social services and public order and safety departments as well as the
Governance and Administrative Cluster Department. Efficiency and increased productivity while
minimizing errors and waste are the key results of the systems’ standard.
Service Modernization Program. With the objective to make it easy for constituents to pay city
taxes, Quezon City now offers the full cycle of electronic payment system for real property taxes
and business taxes. This means the taxpayers can choose 2 ways to pay their taxes conveniently
24/7 without going to City Hall. One is through mobile money payment using G cash and a Globe
or TM cellphone lines for real property and business tax payments up to Php 100,000.00. Another
way is an online payment system available for Landbank and Bancnet ATM and debit card account
holders. With this system, taxpayers can print electronic receipts which have been approved by
the Commission on Audit. For taxpayers who insist on going to City Hall, the Treasurer’s cashiers
are open six (6) days a week to accept payments.
eFinancial System. This is QC LGU’s electronic-based integrated system that links the financial
transactions of key government departments with financial functions. This system promotes
greater transparency and efficiency.

165
Enhanced Tax mapping System. The use of Geographic Information System (GIS) leads to
systematic management of real property units for taxation purposes.
Computerized Health Information Tracking System (CHITS). An open source electronic
reporting and data base management system that makes it easier to generate and maintain health
records and manage patients’ scheduling system at health centers.
Retooling and Modernizing the Bureaucracy. To raise the level of public service performance,
there is a need to continuously retool the city personnel and reconfigure the organizational units.
– Continuing capacity building is one of the significant programs that reinforce the city
personnel to further enhance their capabilities through attendance in various trainings,
seminars and workshops. These venues have become instruments that update/upgrade the
management mechanisms and technical know-how that will suit the current needs of the
government personnel. With the flourishing and fast paced development of information
technology, it is necessary that the bureaucracy sustain the level of information services to
build its capacity and share knowledge with other stakeholders to maintain its standing in the
global map.
– Rationalization efforts are also underway to modernize the city’s organizational structure and
bring the city performers to the 21st century organizations. Offices that undergone Rat Plan
and approved by DBM are Novaliches District Hospital, Barangay Community Relations Dept.
(BCRD), City Health Dept., City Planning & Development Dept.,
– Administration Management Office (reverted to Admin Division under Office of the Mayor),
Small Business Development & Promotion Office, QC Tourism Dept., City Civil Registry Dept.,
Human Resource Management Dept., DPOS (Creation of Green Transport Office), Housing
Community Dev’t and Resettlement Dept., Social Services and Dev’t Dept, City Architect
Department, Buss. Permits & Licensing Dept., QC General Hospital (Creation of Ophthalmology
Dept. and Human Milk Bank), QC Public Library, Information Technology and Dev’t Dept.,
Public Affairs and Information Services Dept., Procurement Department, Public Employment
Services Office, Rosario Maclang Bautista General Hospital Level 1 & Level 2 and QCDRRMO.
Offices submitted to DBM for approval are City General Services Dept. and Dept of Building
Official. Offices with approved Ordinances are QC Youth and Dev’t Office, City Legal Dept., QC
University and Environmental Protection and Waste Management Dept. while Offices that are
still for review and evaluation of HRMD are the Department of Public Order and Safety, QC
General Hospital, Department of Engineering, QC Health Department and the City Treasurer’s
Office.
– Policies are updated and standards are localized, such as those embodied in the New Market
Code, Veterinary Code, Sanitation Code and Building Code to attune these relevant legislations
to changing times.

166
Table In-3 : Awards Received, Quezon City (2016-2018)
2016 2017 2018
Winning Excellence Award, given by the Asian Hospital Management Awards, to the Quezon City General Hospital
Top Performing Local Government Unit in NCR, according to the 2017 Local Peace and Order Council Audit
First among all Local Government Units in NCR, by the DILG, based on the LGU Compliance Assessment evaluating the progress of compliance of all LGUs within the Manila Bay Region to the standing mandamus ruling of the Supreme Court for the clean-up, rehabilitation, and preservation of Manila Bay.
First eGov Award for Digital Finance, at the 8th National ICT Summit organized by the National ICT Confederation of the Philippines and the Department of Interior and Local Government
OpenGov Recognition of Excellence Award at the Philippine OpenGov Leadership Forum 2017 conferred by Singapore-based OpenGov Asia, which has initiated a series of awards for the public sector in ASEAN, for leaders who are leading their localities through digital transformation
Gold Awardee – 2018 Anti-Drug Abuse Council Performance Award
Most Business Friendly Local Government Unit (Level 1 – Highly Urbanized City), from the Philippine Chamber of Commerce and Industry
Seal of Good Local Governance (SGLG) by the Department of Interior and Local Government (DILG), passing all progressive assessment system adopted by the Department to give distinction to remarkable local government performance across several areas
Seal of Good Local Governance (SGLG) by the Department of Interior and Local Government (DILG), for exhibiting excellence in meeting performance benchmarks in all 7 core areas: financial administration, disaster preparedness, social protection, peace and order, business friendliness and competitiveness, environmental protection, and tourism.
Most Competitive City in the Philippines, from the National Competitiveness Council
Most Competitive City in the Philippines, by the National Competitiveness Council, during the 5th Annual Regional Competitiveness Summit; in the ‘competitiveness’ sub-categories: Quezon City was no. 1 in Infrastructure, and no. 2 in Economic Dynamism, Government Efficiency, and Resiliency.
Most Competitive City in the Philippines, by the Department of Trade and Industry, at the 6th Regional Annual Competitiveness Summit; in the competitiveness sub-categories, Quezon City was no. 1 in Economic Dynamism and no. 1 in Infrastructure
First Place, Regional 2nd Place -National Gawad Kalasag Award for Best City in Disaster Risk Reduction and Management (DRRM) and Humanitarian Assistance Award, for the highly urbanized city category for the Quezon City Disaster
Risk Reduction and Management Council, conferred at the 18th Annual Regional Gawad Kalasag in 2017 * Quezon City Department of Public Order and Safety (DPOS) was also named as second best government emergency management team (GEM - urban category) * Barangay Sto. Cristo in Quezon City was the Best Barangay Disaster Risk Management Committee (urban category) * Melencio M. Castelo Elementary School in Batasan was the Best School in the Public School category
First Place, Regional and National Gawad Kalasag Award for the Best City Disaster Risk Reduction and Management Council in NCR, by the assessment of the National Disaster Risk Reduction and Management Council of the Philippines and the Office of Civil Defense.

167
Quality Management System, ISO 9001:2008 Certified
Mapagkalinga Award for the Office of Senior Citizens Affairs, from the Department of Social Welfare and Development NCR, for the city government’s programs and services for the elderly
Quality Management System, ISO 9001:2015 certified
2nd Place - Best Government Emergency Management Service (Advanced Urban GEMS category) in the National Capital Region,
Apolinario Mabini Award, from the Philippine Foundation for the Rehabilitation of the Disabled, for “exceptional services to the mass of citizens with disabilities within its jurisdiction”
ApolinarioMabini Award – Conferred by the Philippine Foundation for the Rehabilitation of the Disabled (PFRD)
Quezon City Accounting Department, for being one of 2017 Outstanding Accounting Offices evaluated nationwide in terms of quality, timeliness and accuracy of the city government’s 2017 financial reports, from the Commission on Audit.
Multiple awards from the Department of Health, for exemplary Local Health Systems and Innovations in providing health services to QC constituents. These are: 7 awards in the ‘Over 1 Million Population’ Category - including a Plaque of Appreciation “for QC-LGU’s commitment and support in strengthening the health systems within the National Capital Region (NCR) for better health outcomes and quality of life of Metro Manilans;” Outstanding Local Government Unit for: unparalleled performance and innovations in the implementation of the National AIDS/STI Prevention and Control Program in NCR, for the implementation of the National Blood Services Program, and for the implementation of the Dangerous Drug Abuse Prevention and Treatment Program; the Purple Ribbon Award for exemplary practices in the implementation of the Reproductive Health and Family Planning Program; and exemplary performance in the achievement of program goals and targets of the National Tuberculosis Control Program.

168
Champion for Best in Government Inter-Operability (G2G) category, and Finalist, for the Seal of Excellence given to private lying-in clinics as the city’s Best in Customer Empowerment entry and rCHITS for its Best in Government Inter-Operability entry, at the 6th e-Gov Awards, organized by the National ICT Confederation of the Philippines (NICP), in cooperation with the Department of Interior and Local Government and the Department of Information and Communications Technology.
First Place, Regional and National Awards for Best City Disaster Risk Reduction and Management Council – Highly Urbanized City Category” at the 19th Gawad KALASAG, by the National Disaster Risk Reduction and Management Council (NDRRMC)
First Place - Best City Disaster Risk Reduction and Management Council (Highly Urbanized City Category), Best Government Emergency Management Service First Place; QC’s Barangay Sto. Cristo was awarded 1st place for Best Barangay Disaster Risk Reduction and Management Committee (Urban Barangay Category) and Melencio Castelo Elementary School was Best Public School 1st place awardee (Urban Category)
6.1.6 The Barangay
The basic political units we know today as “barangays” serve as the primary planning and
implementing unit of government policies, plans, programs, projects and activities in the community
and as the forum wherein the collective views of the people may be expressed, crystallized and
considered and where disputes may be amicably settled. The barangays emanated from what were
then called “barrios” which exist and operate as quasi-municipal entities that perform particular
government functions thru its “barrio council” and under the supervision of the Mayor. Republic Act
2370 of June 21, 1959 or the Barrio Charter governed the activities of barrios.
Creation of Barangays
In the period of the Marcos administration, particularly during the martial law period, barrio
assemblies came to be called as citizen’s assemblies as prescribed by PD 86 dated December 31,
1972. When PD 557 was issued on September 21, 1974, these barrios were renamed as barangays
and the Barrio Charter, as amended by RA 3590 of June 22, 1963 was adopted as the Barangay
Charter. In Quezon City, prior to PD 86, there already existed forty- four (44) barrios that were
constituted by the then City Council. In

169
1973, pursuant to PD 86, eighty - nine (89) more civic assemblies were created and later all
these one hundred thirty three (133) barrios and civic assemblies were declared as barangays thru
Executive Orders No. 20 to 35 dated June 25, 1975 of then Mayor Norberto S. Amoranto in
compliance with PD 557. The boundary descriptions and maps which formed part of the said
Executive Orders, were prepared by the then Quezon City Secretariat on the Delineation of Barangay
Boundaries. These were submitted to then, Department of Local Government and Community
Development (DLGCD) on December 9, 1975 for confirmation.
Subsequent barangays created in the City were either thru Presidential Decrees (1978 to
1981)- three (3) barangays, or thru Batas Pambansa (1982 to 1984) - another three (3), making a
total of 139 barangays.
However, since the entire City was already covered by the respective territories of the 133
barangays, these newly created barangays were merely “carved - out” of existing barangays.
Meanwhile, the area now known as Barangay Payatas was declared as separate barangay from
Barangay Commonwealth thru a court order rendered by Quezon City Court of First Instance,
Branch 31, on March 5, 1976, hence, is of a special case. However, said court order did not
define the exact metes and bounds of Barangay Payatas.
The latest addition to the list is thru Ordinance No. SP 439, S-96 dated September 10, 1996
dividing Barangay Pasong Putik into three (3) barangays namely: Greater Lagro, Pasong Putik
Proper, and North Fairview.
The City is presently made up of 142 barangays each with a barangay council composed of
one (1) Punong Barangay, seven (7) Barangay Kagawad Members (1) Sangguniang Kabataan
Chairperson, (1) Barangay Secretary, (1) Barangay Treasurer and (1) Lupon Tagapamayapa.
These barangay officials are the City government’s presence in communities and the
grassroots. They are deemed persons of authority in their jurisdiction, being designated by law to
take charge of the maintenance of public order, protection and security of life and property and
maintenance of a desirable and balanced environment. With the passage of Local Government Code
of 1991 (RA 7160), the barangays were granted more powers and prerogatives.
In terms of land area, Barangay Bagong Silangan with 594.82 ha. is the biggest while
Barangay Escopa I with 1.28 ha. is the smallest. In terms of population, Barangay Commonwealth has
the biggest with 205,324 and Barangay Manga has the least with 1,083.
Empowering the Barangay
The Quezon City Government institutionalized measures of good governance for its 142
barangays through its Ordinance No. SP-2273, adopting the Barangay Seal of Good Housekeeping in
2014. The evaluation criteria and performance review were done jointly by the QCG and the DILG.
The best performing barangays in terms of transparency in governance, financial management,
functional barangay-based institutions as well as best practices and innovation were conferred the
highest award Gawad Dangal ng Lungsod. Awardees were Barangays Commonwealth, Kaligayahan
and San Bartolome. Each were given Seal of Good Housekeeping and cash incentive of

170
PhP500,000.00. The next highest award, Gawad sa Huwarang Pamamahala, was received by Seven
(7) barangays, namely: Damar; Talayan; Batasan Hills; Bagumbayan; UP Campus; Novaliches Proper;
and Sangandaan. They were each given a Seal and PhP200,000.00 for their respective local
development projects. Another highest award, Hall of Fame, was given to Barangay Greater Lagro
and received a cash incentive of Php5,000,000.00.
Special awards were also given to other barangays such as Best in Legislative Practices and
Innovation (31 Barangays), Good Financial Housekeeping (10 Barangays), and Most Functional
Barangay-Based Institution (3 Barangays).
Gawad sa Huwarang Pamamahala Awardees
Barangay Punong Barangay 1. Damar Edgar C. Tengki 2. Talayan Jerry L. Ongtauco 3. Batasan Hills John M. Abad 4. Bagumbayan Alex Y. Cruz 5. UP Campus Zenaida P. Lectura 6. Novaliches Proper Asuncion M. Visaya 7. Sangandaan Marivic O. Hefti
Best in Legislative Practices" Awardees
Barangay Punong Barangay 1. BagongPag-asa Rodolfo S. Palma 2. Bahay Toro Dennis A. Caboboy 3. Balingasa Ma. Teresa V. Montalbo 4. Damayan Gualberto B. Casaje, Jr. 5. Lourdes Mary Catherine C. Sioson 6. Maharlika Isaac C. Tan, Jr. 7. Nayong Kanluran Eunice C. Bucsit 8. Philam Simplicio EJ. Hermogenes 9. Salvacion Danilo B. Soriano 10. San Isidro Labrador Joselito D. Sahagun 11. San Jose Mario DR. Alacantara, Jr. 12. Sta. Teresita Lorenzo S. Reyes, V 13. Sto. Cristo Rey Mark John C. Navarro 14. East Kamias Octavio P. Garces 15. Escopa I Marvin C. Morales 16. Loyola Heights Darwin B. Hayes 17. Milagrosa Alejandro H. Cuizon 18. Central Rosa D. Magpayo 19. Horseshoe Francisco M. Aguilar 20. Laging Handa Jose Maria M. Rodriguez
21. Mariana Regina Celeste C. San Miguel
22. Tatalon Rodel N. Lobo 23. UP Village Virgilio S. Ferrer, II 24. Valencia Ma. Anna DG. Millonado 25. Nagkaisang Nayon Feliciano F. Dela Cruz 26. Pasong Putik Evangeline F. Dungca 27. Sta. Monica Nelson C. Alcantara 28. Culiat Victor D. Bernardo 29. Bagong Pag-asa Rodolfo S. Palma 30. Bahay Toro Dennis A. Caboboy 31. Balingasa Ma. Teresa V. Montalbo
Good Financial Housekeeping Awardees Barangay Punong Barangay
1. Lourdes Mary Catherine C. Sioson 2. Maharlika Isaac C. Tan, Jr. 3. Manresa Arturo D. Tambis 4. N.S. Amoranto Arturo C. De Guzman 5. E. Rodriguez Marciano R. Buena-Agua, Jr. 6. St. Ignatius Edwin S. Tansingco 7. Horseshoe Francisco M. Aguilar 8. UP Village Virgilio S. Ferrer, II 9. North Fairview Manuel A. Chua 10. San Agustin Ramiro S. Osorio
Most Functional Barangay Based Institutions
(BBIs) Awardees Barangay Punong Barangay
1. MatandangBalara Allan P. Franza 2. Paligsahan Cecilia S. Tiamson 3. Culiat Victor D. Bernardo
Dangal ng Lungsod Hall of Fame Awardee
Barangay Punong Barangay 1. Greater Lagro Leo B. Garra, Jr. 2.
Gawad Dangal ng Lungsod Awardees Barangay Punong Barangay
1. Commonwealth Manuel A. Co 2. Kaligayahan Alfredo S. Roxas 3. San Bartolome Pascual L. Lamberto

171
Of the 142 barangays, Commonwealth in District II and Pasong Tamo in District VI have the
highest income with Php 121.49 million and Php 67.50 million respectively, while Barangays Escopa
II in District III and Old Capitol Site in District IV have the lowest with Php 5,018,205.73 and Php
5,048,550.58 respectively. In terms of share on Real Property Tax (RPT), Barangay Socorro in District
III and South Triangle, District IV, have the highest share with Php 29.39 million and Php 18.43
million, respectively, while Barangays Payatas in District II and Escopa IV, District III posted the
lowest with only Php 2,911,243.17 and Php 2,911,563.85 million respectively. On the other hand,
Barangay Commonwealth in District II and Pasong Tamo in District VI got the biggest share on IRA
with Php 111.16 million and Php58.26 million mainly due to its big population and large area and
Barangays Quirino 3-A in District III and Old Capitol Site in District IV got the smallest share, with
only Php 1.60 million and Php 1.63 million, respectively.
Table In-4 : Barangay Income Profile (2017)
Operation of the barangays is funded out of the following major sources: (See Table In-5)
Highest Lowest
Barangay Income
Brgy. Bahay Toro D1 53,244,722.23 Brgy. Nayong Kanluran D1 6,651,738.31
Brgy. Commonwealth D2 121,486,282.23 Brgy. Bagong Silangan D2 58,131,726.45
Brgy. Matandang Balara D3 53,858,448.08 Brgy. Escopa II D3 5,018,205.73
Brgy. Tatalon D4 46,759,924.38 Brgy. Old Capitol Site D4 5,048,550.58
Brgy. Fairview D5 43,049,879.85 Brgy. Capri D5 12,095,826.94
Brgy. Pasong Tamo D6 67,496,318.10 Brgy. Unang Sigaw D6 8,496,036.43
Share on RPT
Brgy. Sto. Cristo D1 11,367,486.15 Brgy. Alicia D1 3,129,840.56
Brgy. Batasan Hills D2 9,606,291.33 Brgy. Payatas D2 2,911,243.17
Brgy. Socorro D3 29,392,098.98 Brgy. Escopa IV D3 2,911,563.85
Brgy. South Triangle D4 18,432,725.11 Brgy. Krus na Ligas D4 2,913,801.47
Brgy. Greater Lagro D5 11,656,420.47 Brgy. Capri D5 2,952,609.84
Brgy. Apolonio Samson D6 12,080,969.83 Brgy. New Era D6 3,334,008.94
Share on IRA
Brgy. Bahay Toro D1 40,296,543.00 Brgy. Damar D1 1,880,280.00
Brgy. Commonwealth D2 111,157,788.00 Brgy. Bagong Silangan D2 50,035,650.00
Brgy. Matandang Balara D3 40,434,363.00 Brgy. Quirino 3-A D3 1,599,638.00
Brgy. Tatalon D4 36,048,014.00 Brgy. Old Capitol Site D4 1,627,980.00
Brgy. Bagbag D5 32,606,399.00 Brgy. Capri D5 9,071,937.00
Brgy. Pasong Tamo D6 58,260,959.00 Brgy. UnangSigaw D6 5,004,018.00

172
Table In-5 : Barangay Fund Sources
Sources Share / Distribution
Internal Revenue Allotment (IRA) 20% of IRA from National Taxes
Community Tax 50% of the community tax collected through the Barangay Treasurer
Real Property Tax (RPT) 30% of the Real Property Tax is distributed among the component barangays a. 50% accrues to the barangay where the property is located b. 50% accrues equally to all component barangays of the city
Quezon City is the first local government unit to give Barangay officials full fiscal control over
their share of real property tax starting 2002, which are given them on a quarterly basis.
Coordination with the various barangay is being handled by the Barangay and Community
Relations Department.
The term of office of all local elective officials is three (3) years but shall not serve for more
than three (3) consecutive years in the same position.
Quezon City is home to 142 barangays dispersed in the city’s six (6) districts. Each barangay
has its own barangay hall. Of the 142 barangays, 122 have permanent structure in a permanent site,
17 have permanent structure occupying a temporary site, either as private, sidewalk and/or creek
easement namely: Bgys. Silangan, Socorro, West Kamias, East Kamias, Quirino 2-C, San Roque,
Tagumpay, Sacred Heart, Obrero, Pinagkaisahan, Immaculate Concepcion, Kaunlaran, Bagong
Lipunan ng Crame, Damayang Lagi, Don Manuel, Doña Josefa and Central, while three (3) barangays:
Paraiso, San Isidro Labrador and Salvacion are renting a space. (Refer to Table In-6)
Table In-6 : Status of Barangay Halls: QC 2018
DISTRICT NO. OF BARANGAYS
PER DISTRICT NO. OF PERMANENT
BARANGAY HALL NO. OF TEMPORARY
BARANGAY HALL I 37 34 3 II 5 5 - III 37 30 7 IV 38 28 10 V 14 14 - VI 11 11 -
TOTAL 142 122 20 Source: Barangay and Community Relations Department
6.1.7 National Government Agencies
The Local Government Code of 1991, provides that national agencies and offices with project
implementation functions shall coordinate with the local government units in the discharge of these
functions. They shall ensure the participation of local government units both in the planning and
implementation of national projects.
For this purpose, the city exercises close coordination with the national agencies like DPWH,
MWSS and the MMDA in regard to their respective plans and projects to be undertaken in the City.

173
This is to prevent overlapping and/or duplication of projects in the City as well as to ensure a smooth
implementation of the projects.
Some national government agencies (NGAs) have branches based operating in the city that
are rendering services to the city residents. Among them are:
Regional Trial Court (Department of Justice)
City Prosecutor’s Office (Department of Justice)
Metropolitan Trial Court (Department of Justice)
City Auditor’s Office (Commission on Audit)
Civil Service Commission Field Office (Civil Service Commission)
Central Police District Command (DILG)
QC Fire District (with 16 Fire-Sub Stations, DILG)
Division of City Schools (Dep Ed)
QC City Jail (BJMP, DILG)
DILG Field Office (DILG)
Bureau of Immigration (DFA)
Adjudication, controlling, protective services are, among others, the type of public services
rendered by these agencies to the city residents and the city government as well. The basic services
and facilities herein above enumerated are funded from the share of local government units in the
proceeds of national taxes, other local revenues and funding support from National Government (RA
7160, Sec. 17, 4g).
Other national government agencies that are housed in the Quezon City Hall Compound and
providing direct service to the QC residents and general public as well through extension offices are
the Philippine National Red Cross (PNRC), National Bureau of Investigation (NBI), and the
Department of Foreign Affairs (Bureau of Immigration).
6.2 GOVERNMENT INCOME AND EXPENDITURE
6.2.1 Government Income
Sources of government revenue can be classified as regular income and non-regular income.
Regular income covers traditional sources as taxation, internal revenue allotment, fees and charges
and other receipts. Non-regular income, on the other hand, are sources of financing allowed for local
government units (LGUs) which include among others as credit financing, bond flotation,
privatization, etc.
On nominal basis, total revenue of P20.2B as of end-2018 was more than 96% of year 2010
level of P10.3B. The increase in revenues was consistent during the nine-year period 2010-2018,
with average growth rate of 10.66%. Considering the post-transition full years of 2011-2018, average
incremental rate was 9.04%. The highest annual increment of 16.03% was attained in year 2015
mainly attributed to the increase of 18.96% in tax collections specifically business taxes which went
up by 24.46%.

174
Real Property Tax, 1,989,516.32 , 10%
Business Tax, 10,128,676.48 , 50%
Other Taxes, 936,540.07 , 5%
Internal Revenue Allotment,
4,650,499.68 , 23%
Non-Tax Revenues, 1,929,828.77 , 10%
Grants, 6,484.61 , 0%
Other Shares from National Taxes, 516,816.71 , 2%
However, the velocity of revenue sourcing from taxes slowed in year 2016 with a resulting
mere 3.60% annual increment at its lowest due to the Temporary Restraining Order (TRO) issued by
the Supreme Court under G.R. No. 210551. Taxes for socialized housing and garbage fees collection
dropped from P2.39B in year 2015 to P2.02B in year 2016,
Steadily though, the last two years 2017 and 2018 recorded growth rates of 8.17% and 8.95%
with an observed higher increase of 9.11% in tax revenues. (See Fig. In-3)
Figure In-3: Local Government Income Growth; QC: 2010-2018
10
,28
6,5
82
.32
11
,70
0,0
54
.69
12
,46
6,7
43
.38
13
,08
1,2
32
.76
14
,22
9,4
08
.72
16
,51
0,5
93
.82
17
,10
5,0
52
.84
18
,50
2,5
11
.76
20
,15
8,3
62
.64
-
5,000,000.00
10,000,000.00
15,000,000.00
20,000,000.00
25,000,000.00
2010 2011 2012 2013 2014 2015 2016 2017 2018
Figure In-4: Local Government Income by Source; QC: 2018

175
Tax Revenues
Tax collections are expectedly the highest contributor to the City’s revenue bucket. Taxes
represents 64.76% of the 2018 total revenues and continue to be the top inflow since year 2010.
Growth rates were 11.02% from 2010-2018 and 9.51% in year 2018. While revenue from taxes was
high in 2015, a minimal net increase of only 1.61% flowed in 2016 because of the reduction of Real
Property taxes. This is the result of the TRO issued by QC courts requiring the City to stop collecting
taxes from socialized housing and garbage fees.
Internal Revenue Allotment (IRA) contributed second largest revenue source increasing
yearly at an average of 7.76%. Non-tax revenues also increased annually by 4.86%.
Despite the tax receipts slowdown in 2016, the collection turnout in 2017 and 2018 showed
positive momentum with 4.73% and 9.11% net increase respectively. (See Fig In-3)
Total revenues of P20.16B raised in year 2018 registered an increase of 8.95% from the 2017
total income of P18.50B. Sources were tax revenues (64.76%), IRA (23.07%), non-tax revenues
(9.57%) and Other External Shares (2.60%). (See Fig In-3)
Real Property Tax
Collections from real property tax grew at an average of 10.14% during the period 2010-
2018.
In 2018, Real Property Tax collections reached P1.99B or about 9.87% of total city income
and recorded a minimal increase of 0.68% compared with the preceding year, 2017. It stayed third
among the biggest revenue sources of the city. The 9.87% ratio to total income is lower compared
with the percentage to total income since year 2010 which ranged from 17.56%.
Business Tax
Collections from business tax are the most dominant revenue source of the city at an average
growth rate of 17.95% from 2010-2018. In 2018, it reached P10.13B or about 50.25% of total city
income, an increase of 10.05% from 2017’s P9.20B.
Other Taxes
Other taxes include tax of
transfer of real property
ownership, professional tax
and community tax.
Collection of these taxes
provided the City an average
increase of 9.72% during the
2010-2018. In 2018,
revenues from other taxes reached P936.54M, an increase of 19.32% from the 2017 figure of
P784.91M. The P936.54M represents about 4.65% of total city income in 2018.
Table In-7 : Share to Total Income by Type of Tax
Type of Tax Amount Share to
Total Income
Real Property Tax P1,989,516.32 9.87%
Business Tax P10,128,676.48 50.25%
Other Taxes P936,540.07 4.65%

176
Internal Revenue Allotment
The Internal Revenue Allotment (IRA) or the City’s share in the national revenue taxes
amounted to P4.65B in 2018 or about 23.07% of total City income. During the period 2010-2018, IRA
grew by an average of 7.76% annually. Compared with 2017, year 2018, IRA increased by 7.37%.
From the P2.73B in 2010, the increase was 69.82% in 2018.
Non-Tax Revenues
Non-Tax revenues or income from regulatory fees, service user charges and receipts from
economic enterprises such as the city’s markets, reached P1.93B in 2018, an increase of 12.28% from
the 2017 figure of P1.72B. It comprised about 9.57% of total city income in 2018 and grew by an
average of 4.86% during the period 2010-2018. It registered a 43.73% increase from the 2010 level.
(See Fig. In-5).
It is worthy to note that under Bautista Administration, Quezon City did not resort to any
loans/borrowings to operate the city like the previous administration or the Belmonte
Administration.
Figure In-5 : Percentage Share of Government Income by Source; 2010-2018
6.2.2 Government Expenditure
By Major Function
The city’s expenditures increased at an average of 8% annually during the period 2010-2018.
Year 2018 expenditures of P12.1B, however, noticeably increased by 20.08% compared with the
preceding year of 2017 total expenditures of P10.1B. (See Fig. In-6).
0%
10%
20%
30%
40%
50%
60%
70%
80%
90%
100%
2010 2011 2012 2013 2014 2015 2016 2017 2018
Real Property Tax 1,806,3 2,020,4 2,397,9 2,522,8 2,304,3 2,392,7 2,016,3 1,976,1 1,989,5
Non-Tax Revenues 1,342,7 1,604,7 1,315,7 1,263,7 1,619,4 1,650,4 1,688,7 1,718,7 1,929,8
Other Taxes 499,532483,774586,415618,093642,383755,259769,724784,914936,540
Source: City Treasurer’s Office

177
Figure In-6 : Government Expenditure; QC: 2010-2018
On a year-on-year basis, year 2012 recorded the highest percentage increase in expenditures
by 25.57%, which was subsequently reversed in Year 2013 with a net decrease of 0.54%. Comparing
2010 and 2018 total expenditures, an increase of 71.89% or P5.0B is registered. Annual increase in
expenditures is at 7.99% from 2010 to 2018.
Since year 2010, the top two expenditures were for General Public Services and Health,
Nutrition and Population Control. Recently, projects for Housing and Community Development were
allocated bigger share since year 2016.
While General Services represented 52.60% of total expenditures, its average increase was
only 0.34% in 2010-2018 and 9.15% in 2018. It was on an increasing trend from 2010 to 2014 but
started dropping modestly in year 2015 but sharply by 42.91% in year 2016 as funds were
noticeably shifted to Housing and Community Development. Hence, from P6.2B in 2010, it was not
far at P6.3B in end-2018.
Health, Nutrition and Population Control grew annually by 41.83% in 2010-2018 but its
increase in 2018 from 2017 level was only 15.06%. It registered a sharp increase of 177.06% in year
2012 until it reached P1.5B in year 2018 or a leap of 375.7% from its meager P321M in year 2010.
This is in line of being the Health and Wellness Capital of the Asia Pacific region.
Housing and Community Development’s increment rate was tremendously high at
12,129.71% from 2010-2018. Its biggest increase by 2,629.35% was in year 2016. It amounted to
P2.1B or 17.06% for 2018 from P1.1B in 2017 increasing by 85.71%. This is a result of the City’s aim
to provide its residence with low-cost and affordable living.
-
2,000,000.00
4,000,000.00
6,000,000.00
8,000,000.00
10,000,000.00
12,000,000.00
14,000,000.00
2010 2011 2012 2013 2014 2015 2016 2017 2018

178
Figure In-8 : Expenditure by Allotment Class; QC: 2018
Personal Services
3,086,676.52
Maintenance and Other Operating Expenses
8,451,473.70
Property, Plant and
Equipment 1,374,240.81
Lump Sum Appropriations 1,654,928.41
Statutory, Mandatory Obligation
1,300.00
Other city expenditures with less than 10%, in descending order includes as follows,
Economic Service with 7.34% or P885.75M, Education, Culture and Sports/Manpower with 6.57% or
P793.13M, Social Services and Social Welfare with 3.56% or P430.10M and Labor and Employment
with 0.21% or P25.42M.
Figure In-7 : Government Expenditure by Major Function QC: 2018
By Allotment Class / Object
Quezon City’s
expenses for the year
2018 classified as to
allotment class/object
are as follows:
Personal Services –
P3.9B, Maintenance
and Other Operating
Expenses – P8.5B,
Property, Plant and
Equipment – P1.4B,
Lump Sum
Appropriations –
P1.7B and Statutory
Mandatory Obligation
– P1,3M. Figure In-7
shows the percentage
components of city
expenses by allotment
class.
General Public Services 6,348,892.30
52.60%
Education, Culture & Sprots/Manpower Dev't. 793,129.48
6.57%
Health, Nutrition and Population
Control 1,527,452.55 12.66%
Labor and Employment
25,418.72 0.21%
Housing and Community
Development 2,059,156.18 17.06%
Social Security Services and Welfare
430,097.94 3.56%
Economic Services 885,754.44 7.34%
Debt Services 0%
Other Purposes
0%

179
2010 2011 2012 2013 2014 2015 2016 2017 2018
Income 10,286 11,700 12,466 13,081 14,229 16,510 17,105 18,502 20,158
Expenditure 7,021, 8,152, 10,237 10,181 11,025 11,308 9,234, 10,051 12,069
-
5,000,000.00
10,000,000.00
15,000,000.00
20,000,000.00
25,000,000.00
Personal Services of P3.09B posted an increment of P510M or 19.79% from the 2017 level
2.6B. The components of this expense class are Salaries and Wages, Other Compensation, Personnel
Benefits Contribution and Other Personnel Benefits. Personal Services registered an average annual
growth rate of 13.81% during the period 2016-2018 indicating that the city operates on a lean but
mean organizational set up. It has Personal Services which is way below the allowable expenditure
on the same based on the Local Government Code which allows Personal Services to be 45% of its
total budget.
Maintenance and Other Operating Expenses of the city increased by P920M or 12.22% from
P7.53B in 2017 to P8.45B in 2018. Average growth rate posted by this expenditure item is 11.95%
during the period 2016-2018.
Property, Plant and Equipment grew by P1.37B or 100% from 2017 indicating various
infrastructure projects implemented in 2018. Property, Plant and Equipment dropped at an average
annual rate of 15.38% during the 2016-2018 period.
Lump Sum Appropriations on the other hand increased by almost P897.31M in 2017 or
118.44% from P757.62M in 2017 to P1.66B in the current year.
A comparison of Income and Expenditure for the last nine (9) years based on figures as
presented by the City Treasurer’s Office and City Budget Department is presented.
Figure In-9: Local Government Income and Expenditure, 2010-2018

180
Figure In-10: Local Government Surplus / (Deficit), 2010-2018
The city averaged a nine (9) year surplus of P4.97B from 2010-2018 with a high of P8.45B
registered in 2017 and a low of P2.3B in 2012. 2018 surplus is lower by 4.29% as compared to the
2017 surplus of P8.45B. This is because of increased expenditure from PS and MOEE.
2018 Expenditures meanwhile increased by 20.08% or P12.07B for 2018 from P10.05B in
2017. The bulk of expenditures were earmarked for General Public Services, which includes Salaries
and Wages, Other Compensation, Personnel Benefits Contribution and Other Personnel Benefits.
Health, Nutrition and Population Control, Education, Culture and Sports/Manpower Development,
Social Security Services and Welfare and Economic Services contributed to the 2018 expenditures.
Noticeable under the chart is the 2018 surplus dropped by 4.29% as compared to 2017
figures from P8.45B to P8.09B. Government expenditures for this year had significant increases
compared with the previous year.
General Public Service increased by 9.15% or to P6.35B from P5.82B the previous year,
Education, Culture & Sports/Manpower Dev’t by 16.10% or to P793.13M from P6.83M, Health,
Nutrition & Population Control by 15.06% or to P1.53B from P1.33B, Labor employment by 25.69%
or to
P25.42M from P20.22M, Housing & Community Development by 85.71% or to P2.06B from
P1.11B, Social Security Services Welfare by 12.40% or to P430.10M from P382.65M and Economic
Services by 24.33% or to P885.75M from P712.42M.
3,2
64
,59
7.4
4
3,5
47
,63
5.2
4
2,2
29
,53
5.5
2
2,8
99
,56
9.3
2
3,2
04
,05
8.7
2
5,2
02
,27
3.0
0 7
,87
0,2
28
.90
8,4
51
,16
6.2
8
8,0
88
,46
1.0
4
-
1,000,000.00
2,000,000.00
3,000,000.00
4,000,000.00
5,000,000.00
6,000,000.00
7,000,000.00
8,000,000.00
9,000,000.00
2010 2011 2012 2013 2014 2015 2016 2017 2018

181
Figure In-11: Comparative Government Expenditure (2017-2018) – OPTIONAL
6.3 LOCAL LEGISLATION
As the legislative body of the City, the Council enacts ordinances that would facilitate
implementation of social and economic development projects and activities and approves resolutions
and appropriates funds for the general welfare of the City residents.
The Office of the City Secretary serves as the Secretary to the Council, providing legislative,
administrative, and secretarial support services to the body. As such, the City Secretary is also
responsible for the documenting and monitoring of all legislative measures and documents allowing
the LGU to store and retrieve information regarding its legislative processes.
The thirty-six (36) city councilors have their
own areas of political jurisdiction known as Councilor’s
Area of Responsibility (CAR). There are 36 CARs which
serve as the extension area of the City Mayor thru the
City Councilors to rationalize and facilitate the delivery
of basic services to the residents comprising the area.
The 36 councilors also function as chairpersons,
vice-chairpersons and/or member of regular
committees at the city council.
-
2,000,000.00
4,000,000.00
6,000,000.00
8,000,000.00
10,000,000.00
12,000,000.00
14,000,000.00
20172018
Economic Services
Social Security Services &Welfare
Housing & Community Dev't
Labor & Employment
Health, Nutrition & PopulationControl
Education, Culture &Sports/Manpower Dev't
General Public Services
Table In-8 : Brief Profile of Districts
District No. of
Brgy
Land Area
(Has.)
District
Population
1 37 1,959.39 406,401
2 5 4,626.52 720,894
3 37 2,184.52 334,821
4 38 2,341.89 456,852
5 14 2,802.57 565,071
6 11 2,197.39 558,654
Total 142 16,112.58 3,042,323
Source: “Actual and Projected Population by District
and by Barangay;;QC 2015-2020

182
Legislative Outputs
The Quezon City Council, from January 2017 up to December 2018 has passed and approved a
total of 986 legislative measures which were classified into 12 areas for planning purposes however,
he classification was further reduced to 5 development sectors.
Table In-10 : Legislative Outputs, Quezon City Jan. 2017 – Dec. 2018
No. of
Ordinances
No. of
Resolutions
City Properties & General Services, Local Governance and Administration 41 220
Taxation, Assessment, Budgeting & Property Valuation 12 10
Education, Science, Technology, Culture, Tourism and Internal Relations 24 50
Peace and Order, Public Safety, Transportation and Traffic Mgt. 37 45
Public Works, Infrastructure, Building, Zoning, Subdivision & Housing 61 133
Public Health and Social Welfare Services, Senior Citizens, Handicapped People,
Women, Family, Domestic Relations & Civil Registration 30 73
Legal Affairs, Justice, Human Rights, Public Information & Assistance, and
People’s Participation 17 20
Commerce, Industry, Markets, Slaughterhouses, Economic Enterprises,
Livelihood and Employment 4 18
Youth Welfare, Sports, Amusement/Entertainment, Games and Drugs 15 67
Barangay Affairs, Urban Poor and Human Settlements 14 20
Parks, Environment and Garbage 2 9
Energy, Water Resources, Public Services, Utilities and Telecommunications 1 63
Total 258 728
Table In-11 | Legislative Outputs, Quezon City Jan. 2017 – Dec. 2018
Sector Approved
Ordinances
%
Equivalent
Approved
Resolutions
%
Equivalent Social 120 47 255 35
Economic 16 6 28 4
Land Use/Infra 62 24 196 27
Environment 2 1 9 1
Institutional 58 22 240 33
Total 258 100 728 100
Table In-12 : Subject Classifications of Legislative Measures (As of January 2017 to December 2018)
Legislative Measures Ord./Res. No.
City Properties & General Services, Local Governance and Administration ORD.-41, RESO.-220
Taxation, Assessment, Budgeting & Property Valuation ORD.-12, RESO.-10
Education, Science, Technology, Culture, Tourism and Internal Relations ORD.-24, RESO.-50
Peace and Order, Public Safety, Transportation and Traffic Mgt. ORD.-37, RESO.-45
Public Works, Infrastructure, Building, Zoning, Subdivision & Housing ORD.-61, RESO.-133
Public Health and Social Welfare Services, Senior Citizens, Handicapped People,
Women, Family, Domestic Relations & Civil Registration ORD.-30, RESO.-73
Legal Affairs, Justice, Human Rights, Public Information & Assistance, and People’s ORD.-17, RESO.-20

183
6.4 PEOPLE’S PARTICIPATION
The Philippine Constitution of 1987 promotes the involvement of people’s groups and the
private sector at all levels of government. It is provided in the Local Government Code (RA 7160, Sec.
3 (l), 34, 35, 36) that local government units shall promote the establishment and operation of
people’s and non-governmental organizations (POs/NGOs) to become active partners in the pursuit
of local autonomy.
Sec. 3 (l) RA 7160 : “ The participation of the private sector in local governance, particularly in
the delivery of basic services, shall be encouraged…”
Sec. 34 RA 7160 : “ Government units shall promote the establishments and operation of
people’s and non-governmental organization to become active partners in the pursuit of local
autonomy …”
Sec. 35 RA 7160 : “ Government units may enter into joint ventures and such other
cooperative arrangement with people’s and nongovernmental organizations…
All organizations seeking representation to the local development council shall apply for
accreditation at the City Council through the City Council’s Committee on People’s Participation in
the selection of sectoral representatives to the Local Development Council (LDC). Only accredited
organizations shall be qualified for representation in the local special bodies.
There are also non-LDC members which are actively participating in program/project
development like the ABS – CBN Foundation, GMA Kapuso Foundation, Inc., etc.
The Barangay Community Relations Department (BCRD) handles the coordination with the
people’s organizations, non-governmental organizations and other community organizations. It also
generates feedback from constituents that may help improve local government services.
6.4.1 Local Special Bodies
To enhance the people’s active participation in the process of effective governance and
development, people’s and non-governmental organizations are represented in the local special
bodies where they will actively participate in the formulation of development plans and investment
programs. (See Table In-12).
Participation
Commerce, Industry, Markets, Slaughterhouses, Economic Enterprises, Livelihood
and Employment ORD.-4, RESO.-18
Youth Welfare, Sports, Amusement/Entertainment, Games and Drugs ORD.-15, RESO.-67
Barangay Affairs, Urban Poor and Human Settlements ORD.-14, RESO.-20
Parks, Environment and Garbage ORD.-2, RESO.-9
Energy, Water Resources, Public Services, Utilities and Telecommunications ORD.-1, RESO.-63

184
Although the Implementing Rules and Regulations of the Local Government Code includes the
People’s Law Enforcement Board as one among the local special bodies, the provision of the Code as
to the manner of selecting representatives to the local special bodies does not apply to the PLEBs.
In 2016, the Quezon City Council thru the Committee on People’s Participation was able to
accredit a total of 1081 organizations (SP- Ordinance No. 2524, s-2016), from which 50 sectoral
representatives were elected and became members of the local development council (LDC). The
City’s LDC was first convened and reconstituted on February 27, 2003 with complete membership
and since then has become a functioning LDC. (See Figure In-12 & Table In-13)
Table In-12 : Local Special Bodies and Their Functions
Local Special Bodies Functions
City Development Council Assists the Sanggunian in setting the direction of economic and
social development and coordinating development efforts within
its territorial jurisdiction.
City Health Board Serves as an Advisory Committee to the Sanggunian on health
matters and/ or application of local appropriations for public
health purposes.
School Board Serves as an Advisory Committee to the Sanggunian on
educational matters and the use of local appropriation
City Peace and Order Council Formulates plans and recommends measures which will
improve/ enhance peace and order and public safety in the local
level
People’s Law Enforcement
Boards *
Receives citizen’s complaints against PNP officials or members;
recommends imposition of penalties after hearing and due
process.
Bids and Awards Committee Primarily responsible for the conduct of pre-qualification of
contractors, biddings, evaluation of bids and recommendation of
awards concerning local infrastructure projects and goods

185
Primary Functions
LDC :
Formulate development plans and policies ;
Formulate public investment programs;
Appraise and prioritize programs and projects Formulate investment incentives
Coordinate, monitor and evaluate implementation of development programs
and projects.
Executive Committee :
Represent the LDC when it is not in session;
Ensure that the LDC decisions are faithfully carried out and act on matters
needing immediate attention by the LDC;
Formulate plans, policies and programs based on principles and priorities
laid out by LDC.
Secretariat :
Provide technical support to the LDC;
Document proceedings;
Prepare reports;
Other support functions as may be necessary.
Sectoral or Functional Committee:
Assist the LDC in the performance of its functions;
Provide the LDC with data and information essential to the formulation of plans, programs and activities;
Define sectoral or functional objectives, set targets and identify programs,
projects and activities;
Collate and analyze data and conduct studies;
Conduct public hearings on sectoral planning projects and ; activities; Monitor and evaluate programs and projects; and Perform functions assigned by the LDC.
LDC Structure
Executive Committee
LDC
Sectoral or Functional
Committees
Social
Economic
Infrastructure
Environment and Natural
Resources
Institutional
Secretariat
Table In- 13 : CDC Membership in Plenary
CDC Membership in Plenary
Chairman Local Chief Executive
Members 6 District Representatives
142 Barangay Captains
At least ¼ of the total membership of the fully organized council representing
non-government sectors
Chair of the Appropriations Committee of the City Council
Figure In-12 : LDC Structure

186
The accredited organizations adopt their internal rules of procedure to govern the selection
of the sectoral representatives to the LDC. The designated sectoral representatives are co-terminus
with the mandate of the local chief executive. Should a vacancy arise, the selected POs and NGOs shall
designate a replacement for the unexpired term.
Through a selection process coordinated by the DILG-NCR, in an assembly enacted for the
purpose, the 50 organizations were elected with their duly authorized representative to comprise the
25% requirement of the CDC membership. In the said accredited organizations, there is a big number
of active Urban Poor and HOA/Neighbourhood organizations, hence, they posted the bigger
representation. (See Table In-14).
Table In-14: NGO/PO Representatives to the CDC
Sector No. of Representative/s
Urban Poor 12
Cooperative 1
Charitable/Civic 1
Education Academic 1
Livelihood/Vendors 1
Labor/Workers 1
Social Justice/Peace & Order 2
Women 4
Sr. Citizens 6
Youth and Children 1
Business 1
Environment 1
HOA/Neighbourhood 12
Health/Sanitation 1
Social/Cultural Development 1
Transportation 1
Professional 1
Religious 1
Persons with Disability 1
Total 50

187
Table In-15: City Development Council Membership Social Development Committee Economic Development Committee
Committee Member Barangay/Organization Committee Member Barangay/Organization Elizabeth De Jesus Apolonio Samson Rodrigo A. Corro Alicia
Crisell Beltran Bagong Silangan Catherine G. Maglalang Balon Bato Rodolfo Palma Bagong Pagasa John M. Abad Batasan Hills
Alex Y. Cruz Bagumbayan Gabriel C. Legaspi Blue Ridge A Ma. Teresa V. Montalbo Balingasa Sherilyn D. Corpuz Bungad
Vergilio B. Dela Cruz Quirino 3-A Gualberto B. Casaje Damayan Christian A. Cando Capri Cornelio G. Pabustan Del Monte Victor D. Bernardo Culiat Rocky DC. Rabanal Kalusugan
Renato Tanyag Damayang Lagi Alejandro Z. Mejia, Jr. Kristong Hari
Leolibeth S. Daluraya Escopa III Leny Leticia P. Glivano Libis
Laila C. Arcega Escopa IV Mary Catherine Sioson Lourdes
Darwin B. Hayes Loyola Heights Isaac C. Tan, Jr. Maharlika
Perla U. Daniega Masagana Arsenia R. Flores Masambong
Eunice C. Bucsit Nayong Kanluran Allan P. Franza Matandang Balara
Reynaldo B. Ebron New Era Alejandro H. Cuizon Milagrosa
Maria Abigail A. Parwani Pag-ibig sa Nayon Asuncion Visaya Novaliches Proper
Edgardo A. Paragua, Jr. Paltok Arturo C. De Guzman NS Amoranto
Joseph P. Mahusay Pansol Manuel N. Guarin Payatas
Emmanuel A. Pilar Pasong Tamo Ritche E. Poblacion Quirino 2B
Marlon J. Janoras Quirino 2-C Orlando P. Casimiro Roxas
Noel R. Agdeppa Quirino 2-A John M. Reyno San Isidro Galas
Cesar C. Dionisio Ramon Magsaysay Mario DR. Alcantara, Jr. San Jose
Danilo B. Soriano Salvacion Iris Ann C. Barcelona San Martin de Porres
Lamberto L. Pascual San Bartolome Emma C. De Jesus Siena
Daniel Leon S. Berroya San Antonio Teodulo O. Santos Socorro
Telesforo A. Mortega San Roque Marlou C. Ulanday Tandang Sora
Noel F. Vitug Sauyo Rodel N. Lobo Tatalon
Pedro D. Battung, Jr. South Triangle YasmineXenelle Jorge Ugong Norte
Rey Mark John C. Navarro Sto. Cristo VirgilioFerrer UP Village
Sergio Gonzalvo Sto. Niño Emiliano R. Lagco, Jr. Barangay Fairview TODA, Inc.
Zenaida P. Lectura UP Campus Amelita R. Ibañez Batasan Women's League, Angel's Chapter
Roberto Fortuno Vasra Emmanuel Solidum BF Homes, QC Homeowner's Community
Assn.
Anthony G. Dacones West Kamias Miranda Verdadero Kapit-bisig QC Vendors Asso. Inc.
Josephine L. Velasco 4Ks Task Force Solo Assn, Inc. Brian James Lu National Economic Protectionist Association,
Inc.
Emma J. Barja (VC) Advocates for Human Power and Comm. Devt. Carlos A. Natavio People's Consultative Council
Bonjerico L. Untalasco Alyansa ng mga Kabataan para sa Demokrasya at
Kaunlaran Patricia P. Cabasal
Samahan ng mga Kababaihan sa Area 9 Vet Village P. Tamo, Inc.
Alexander L. Mendoza Caucus of Persons with Disability Phil., Inc. Restituto E. Perez, Jr. Senior Citizen Federation of District II, QC,
Inc.
Ma. Teresa G. Margallo Damayan Ladies Association, District I, Area IV,
QC, Inc. Patricio P. Achas Welfare for the Community Foundation Inc.
Arlene Anita A. Reyes Felipe St., Neighborhood Assn., Inc. Merly Christina Barlaan Women's Federation for World Peace, Phil.,
Inc.
Marietta C. Nacional Konpederasyon ng mga Samahanng NGC East Side
Teresita B. Monera Pagkakaisa at Gabay ng Samahan ng HOA
Marilyn P. Maluping Samahan ng Magkakapit bahay sa Abbey Rd.
Sigfredo A. Novila Samahang Pinagbuklod ng 99 A Sauyo Rd.,
Eden B. Ruiz Senior Citizens Association of Vasra
Romeo F. Alvarez Unified Senior Citizens Asso. Of D-3, QC,

188
Environmental Development Committee Land Use and Infrastructure Development Committee
Committee Member Barangay/Organization Committee Member Barangay/Organization
Arsenio De Guzman Amihan Richard V. Ambita Bagbag Raulito R. Datiles Bagumbuhay Dennis Caboboy Bahay Toro
Mark Anthony L. Escusa Bayanihan Ronald N. Tagle Claro Esperanza C. Lee Blue Ridge B Edgar C. Tengki Damar
Manuel Co Commonwealth Judy A. Concepcion Dioquino Zobel Carlo S. De Mesa Duyan-Duyan Antonio Calma Don Manuel
Marciano R. Buena-Agua, Jr. E. Rodriguez Louie G. Muñoz Doña Josefa Octavio P. Garces East Kamias Marvin C. Morales Escopa
Eduardo M. Zabala Escopa II Leo B. Garra, Jr. Greater Lagro Jose Arnel O. Quebal Fairview Francisco Aguilar Horseshoe Rey AldrinTolentino Gulod Ramon Salas Immaculate Concepcion
Feliciana B. Ong Malaya Alfredo S. Roxas Kaligayahan Nenita C. Valdez Mariblo Julious C. Secillano Katipunan
Lawrence V. Tiglao Paang Bundok Maria Maurina F. Magalong Krus na Ligas Ryan Navero Paraiso Jose Maria Rodriguez Laging Handa
Simplicio Ej Hermogenes Phil-Am Arturo D. Tambis Manresa Jesus Lipnica III Pinyahan Regina Celeste C. San Miguel Mariana
Vicente Honorio C. Llamas V Project 6 Feliciano F. Dela Cruz Nagkaisang Nayon Edwin S. Tansingco St. Ignatius Manuel A. Chua North Fairview
Jerry L. Ongtauco Talayan Evangeline F. Dungca Pasong Putik Proper Eric R. Juan Talipapa Grazielle C. Saab Pinagkaisahan
Ma. Anna Millonado Valencia Ma. Francesca Camille R. Malig Sacred Heart Josefina L. Landingin Veterans Village Joselito Sahagun San Isidro Labrador
Danilo C. Mojica Villa Maria Clara Eduardo S. Nieto Santol Elmer Timothy J. Ligon West Triangle Annabella Curacho Sikatuna Village
Raymond Moses B. Tenchavez White Plains Gary E. Arroyo St. Peter
Virginia S. Malinao Botanical Community
Organization Jomar B. Baetiong Sta. Cruz
Eugenio N. Katigbak CBE Town Senior Citizens Asso.,
Inc. Nelson C. Alcantara Sta. Monica
Carlito C. Samala Greater Heights Christian
Worship Center Michelle Ann L. Yu Sto. Domingo
Henry Asistin Kapatirang Bayan Bagong Pilipino
Foundation, Inc. Ventura E. Ferreras, Jr. Tagumpay
Rizza Joy E. Laurea Order of Triskelion, QCH Chapter,
Inc. Luz P. Savilla Alyansang Maralita sa Nova, Inc.
Evelyn S. Galang ROTC Hunters Neighborhood
Asso. Josephine B. Custodio Arlegui HOA, Inc.
Josebel A. Peralta Samahan ng Nagkakaisang-Kapitbahay ng Manresa, Inc.
Hubert M. Raymundo Brgy. Pinyahan Sr. Citizens Asso.
Inc.
Elvera Allado Samcao Block 2 Homeowners
Asso. Vicente R. Puerta
Construction Industry Workers Council, Inc.
Shirlita Flores Upper Everlasting Block 2 Herminigildo P. Aviles Kapatiran Kaunlaran HOA Romeo Escobar Magkakasama HOA Inc. Renato N. Robel NFA Multi-Purpose Coop
Shirley M. Barnedo Samahan ng Magkakapitbahay
ng No. 4 Katipunan, Inc. Ma. Theresa M. Nator United Tribu Block I HOA
Zacarias P. Asuncion Urban Poor Alliance of Bgy
Nagkaisang Nayon

189
Institutional Development Committee
Committee Member Barangay/Organization Committee Member Barangay/Organization
Lottie Gemma D. Juan Baesa Ricky B. Lacad Unang Sigaw Eleucita T. Feliciano Bagong Lipunan ng Crame Ruel S. Marpa Sta. Lucia
Rosalyn R. Ballad Botocan Marivic O. Hefti Sangandaan Gregory R. Tolentino Camp Aguinaldo Lorenzo V. Reyes Sta. Teresita
Rosa D. Magpayo Central Reynaldo Nitro Silangan
Zandy A. Zacate Doña Aurora Rhodora A. Bohol Brgy. Paligsahan Sr. Citizens
Assn., Inc.
Fernand C. Ubaldo Doña Imelda Rachel Martin Council for the Restoration of
Filipino Values FelicitoValmocina Holy Spirit Solita T. Anda Jubilee East Ville HOA, Inc.
Armida S. Castel Kamuning Joven Evangelista Legal na Ayuda para sa mga
Inaapi at Dukha, Inc. Christopher M. Cheng Kaunlaran Marissa A. Cañega New Sunshine HOA
Cesar R. DelaFuenta, Jr. Mangga Kevin Agcaoili Nutrition Foundation of the Phil.
Raul Addatu Marilag Rolando P. Montiel People's Movement for
Democratic Governance, Inc. Jose Segundo Obrero Harry D. Francisco Rising Sun II HOA
Rodelio C. Cabigas Old Capitol Site Reynante P. Cunanan Samahang Makatao at
Makatarungang Paninirahan sa NGC Inc.
Cecilia S. Tiamson Paligsahan Lottie Gemma D. Juan Baesa Ramiro Osorio San Agustin Eleucita T. Feliciano Bagong Lipunan ng Crame
Wilfredo E. Real San Vicente Ruel S. Marpa Sta. Lucia Lolita Singson Teachers Village East Marivic O. Hefti Sangandaan
Ana Liza N. Rosero Teachers Village West


190
CHAPTER 7: RISK PROFILE 7.1 HAZARDS
As defined in the QC Disaster Risk Reduction Management Plan (DRRMP) 2014-2020, hazard
is a dangerous natural phenomenon, substance, human activity or condition that may cause loss of
lie, injury or other health impacts, property damage, loss of livelihood and services, social and
economic disruption or environmental damage. Hazards, both natural and human-induced, happen
due to geological, meteorological, oceanic, biological and technological sources, sometimes acting in
combination (DILG, 2011).
7.1.1 Meteorological Hazards
Meteorological hazards are weather-related events such as typhoons, extreme rain, floods
(caused by rain), droughts, landslide, sea level rise and extreme temperatures among others
Typhoon
A typhoon is a mature tropical cyclone that develops in the western part of the North Pacific
Ocean which is referred to as the Northwestern Pacific Basin and is the most active tropical cyclone
basin on earth. Due to its geographic location, the Philippines is one of the most highly exposed
countries to typhoons. About twenty (20) typhoons hit the country every year, and majority of these
form between the months of June and November while typhoon formation is at minimum between
December and May.
Typhoon Ketsana (Ondoy)
In 2009, Typhoon Ondoy (International name: Ketsana) was the most destructive typhoon to
hit the Philippines surpassing typhoon Patsy (Yoling) in 1970. The typhoon’s rainfall was very
unanticipated and unprepared for which caused widespread flooding in Metro Manila and the nearby
provinces of Bulacan, Rizal, Laguna and other Southern Tagalog areas. Marikina City was the most
devastated region in the country as almost all of the city’s area was submerged in water up to ten feet
deep and knee-deep mud.
Then President Gloria Macapagal-Arroyo declared as state of national calamity via
Presidential Proclamation No. 1898 to allow officials to utilize emergency funds for relief and rescue.
Due to damage and deaths it caused, the names Ketsana and Ondoy were retired. On the
Western Pacific Basin, Ketsana was replaced by Champi and PAG-ASA selected Odette to replace
Ondoy.
Quezon City was not spared from the devastation brought about by Typhoon Ondoy, as report
obtained from the Disaster Control Division, (DCD) of the Department of Public Order and Safety
(DPOS) revealed that six thousand four hundred and eighty five (6,485) families were affected and
were brought to various temporary evacuation centers. DCD also recorded eighty-three (83)
fatalities coming from various barangays while twenty-one (21) individuals were missing.

191
The table below shows tropical cyclones which affected Quezon City and the rest of Metro
Manila from 2006-2018.
Habagat
In the past years, rains brought by the southwest monsoon, locally known as Habagat, and
enhanced by nearby storms have become as destructive as the typhoons that enter the Philippine
Area of Responsibility (PAR). For instance, in August 2012, the Habagat was enhanced by Typhoon
Saola (Gener) and strengthened by typhoon Haikui which has not yet entered the PAR. The 2012
Table R-1: Typhoons that Affected Quezon City and Metro Manila: 2006-2018
Typhoon (International
Name)
Period of Occurrence
Lowest Pressure
Highest Wind Speed Casualties
(Phils) Damages (Dollar)
Glenda (Rammasun)
Formed: Jul 9, 2014 935mbar(hPa)
27.61 inHg
10-minute sustained: 165 kmh 1-minute
sustained:250 kmh
195 fatalities 102 dead
$7.13B
Basyang (Conson)
Formed: Jul 1, 2010 Dissipated: Jul 18,
2010
970 mbar (hPa); 28.64 inHg
10-minute sustained: 130 kmh
1-minute sustained: 150 kmh
46 missing $77.8M
Reming (Durian)
Formed: Nov. 25, 2006
Dissipated: Dec. 6, 2006
915 mbar (hPa) 27.02 in Hg
10-minute sustained: 195 kmh
1-minute sustained: 250 kmh
More than 1,500
fatalities
At least $530M
Milenyo (Zangsane)
Formed: Sept. 25, 2006
Dissipated: Oct 2, 2006
940 mbar (hPa); 27.76 inHg
10-minute sustained: 155 kmh
1-minute sustained: 230 kmh
At least 310 fatalities
$750M
Caloy (Chanchu)
Formed: May 8, 2006 Dissipated: May 23,
2006
930 mbar (hPa) 27.46 inHg
10-minute sustained: 175 kmh
1-minute sustained: 230 kmh
309 dead $879M
Frank (Fengshen)
Formed:Jun. 17, 2008 Dissipated: Jun. 27,
2008
945 mbar (hPa) 27.91 inHg
10-minute sustained: 165 kmh
1-minute sustained: 205 kmh
At least 1,300 fatalities
87 missing $480M
Ondoy (Ketsana)
Formed: Sept.23, 2009
Dissipated: Sept. 30, 2009
960 mbar (hPa) 28.35 inHg
10-minute sustained: 130 kmh
1-minute sustained: 165 kmh
710 fatalities 37 missing
$1.09B
Mario (Fung-wong)
Formed: Sept. 17, 2014 Dissipated: Sept. 18,
2014
985 mbar (hPa) 29.09 in Hg
10-minute sustained: 95 kmh
1-minute sustained: 95 kmh
21 fatalities $75.5M
Lando (Koppu) Formed: Oct. 12, 2015
Dissipated: Oct. 21, 2015
925 hPa (mbar) 27.32 in Hg
10-minute sustained: 185 kmh
1-minute sustained: 240 kmh
62 fatalities S313M
Lawin (Haima) Formed: Oct. 14, 2016
Dissipated: Oct. 26, 2016
900 hPa (mbar) 26.58 inHg
10-minute sustained: 215 kmh
1-minute sustained: 270 kmh
19 fatalities $972.2M
Source: Wikipedia, Rappler

192
Habagat was an almost-a-week period of heavy rain and thunderstorm. Its effect centered in Metro
Manila and the surrounding provinces of Region 3 and 4-A. The Habagat in 2012 caused typhoon-
like damage similar to Ondoy of September 2009. The heavy rains caused the Marikina River to
overflow which triggered a landslide in the Commonwealth area, buried residential structures and
killed nine (9) people. The La Mesa Dam was near to overflowing and the continuing rise of water
affected the low-lying areas along Tullahan River which caused flooding in some areas in Lagro and
Regalado Highway as well as portions of Barangay North Fairview and Sta. Lucia. Losses throughout
the country from Habagat reached almost 604.63M.
In 2013, the country experienced another Habagat, which, while weaker than that of the
previous year, was enhanced by typhoon Trami (Maring) and also caused severe flooding which
paralyzed Metro Manila and inundated the nearby provinces of Bulacan, Pampanga, Tarlac,
Zambales, Bataan, Rizal, Laguna and Cavite. The following table shows the comparative data on
Typhoon Ondoy, Habagat of 2012 and 2013 in terms of accumulated rainfall, affected population,
flooding, etc.
Table R-2 : Comparative Information on Tropical Storm Ondoy
and the Habagat of 2012 and 2013
Tropical Storm Ondoy
(Ketsana) Habagat 2012 Habagat 2013
Dates Sept 24-27, 2009 Aug 6-8, 2012 Aug 17-21, 2013 Highest Measured
Accumulated Rainfall 556.1 mm of rain
(4-day period)
measured in Science
Garden, Quezon City
1,007.4 mm of rain
(3-day period)
measured in Science
Garden, Quezon City
1,120.2 mm of rain
(5-day period)
measured in Sangley
Point, Cavite Affected Population 993,227 families or
4,901,763 persons in 2,018 barangays, 172 municipalities, 16 cities, and 26 provinces in 12 regions
934,285 families or
4,236,151 persons in
2,634 barangays,
175 municipalities,
36 cities, and
17 provinces in 6 regions
689,527 families or
3,096,392 persons in
2,124 barangays,
160 municipalities,
37 cities, and
18 provinces in 6 regions Evacuation Centers 244 evacuation centers
15,798 families or
70,124 persons
656 evacuation centers
48,784 families or
212,632 persons
outside evacuation centers
166,979 families or
776,370 persons
159 evacuation centers
5,761 families or
23,364 persons
outside evacuation
centers
5,192 families or
26,907 persons Status of Lifelines 57 roads and 1 bridge
impassable to all
vehicles in Regions II, III,
IV, CAR, and NCR (at the
height of the storm)
16 roads and 3 bridges
impassable to all
vehicles in Regions III, IV-
A, CAR, and NCR (as of Aug
17, 2012)
8 roads impassable to
all vehicles in Regions I,
III, IV-B, and CAR (as of
Aug 30, 2013)
Flooding 184 cities/municipalities
in 12 regions
59 cities/municipalities
in 3 regions
19 cities/municipalities
in 3 regions
State of Calamity 23 provinces and
Metro Manila
Pres. Arroyo declared a
state of national calamity
via Proclamation No. 1898
on Oct 2, 2009
9 provinces,
12 cities, and
13 towns in 7 regions
5 provinces,
10 cities,
18 towns, and
7 barangays in 5 regions
Source: Rappler

193
Flood
Flooding is a primary impact brought about by the increased precipitation or extreme weather
events such as storms or cyclones.
Flooding Situation
Quezon City has higher elevation compared to Manila and other Metro Manila cities but it
experiences regular flooding despite this physical attribute.
The city has undulating terrain and is within the catchment area of five river systems- San Juan
River, Tullahan River, Marikina River, Pasig River and Meycauayan River and their tributaries and
creeks with a total length of almost 200 km. These river systems receive tremendous amount of
water during heavy rainfall and have great potential to flood low-lying areas.
With elevation ranging from 2 meters above sea level (a.s.l.) on the south near Manila up to 232
meters a.s.l. on the northernmost tip of the La Mesa Reservoir, the City is generally not affected by
tidal flooding. The low-lying areas along San Juan River in Barangays Dona Imelda, Damayang Lagi,
Talayan, Roxas and Kalusugan are prone to overflow flooding usually when San Juan River backflows
from the junction with Pasig River. The areas near Manila like Simon, Maria Clara, Calamba and
Cuenco Streets and Matimyas and Mindanao Streets where the Galas drainage culverts are located
are also prone to backflow flooding.
In built-up areas, the local drainage collectors consisting of concrete piped and box culverts
empty into the river or creek. The drainage system fails when there is lack of drop-inlets or
insufficiently-sized drainage pipes get silted or clogged. The result is flash flooding in many places.
Flood Risk Assessment
In 2013, the Quezon City Disaster Risk
Reduction and Management Plan (QCDRRMP)
2014-2020 was formulated by the Quezon City
Disaster Risk Reduction and Management
Council (QCDRRMC) in partnership with
Earthquake and Megacities Initiatives (EMI)
for the joint undertaking of the “Building a
Disaster Resilient Quezon City“ Project.
Among the outputs of the project are the
Hazards, Vulnerability and Risk Assessment
(HVRA) Report and the Disaster Risk
Reduction and Management Plan (DRRMP)
2014-2020 for managing earthquake and
flood risks.
EMI takes the 100-year NOAH Hazard
map as the modelling basis for determining
the flood susceptibility of Quezon City. (Refer
to Figure R-1)
Source: QC DRRMP (2014-2020)
Figure R-1 : Flood Susceptible Areas in Quezon City

194
Key findings in the HVRA Report indicated the following:
The top five (5) barangays for emergency response are Barangays Talayan, Damayang Lagi, Roxas,
St. Peter and Dona Imelda.
In addition, Barangays Sto. Domingo (Matalahib), Tatalon, North Fairview, Bagumbayan and
Dioquino Zobel constitute a second tier for prioritizing emergency management planning and
preparedness actions.
A total of 700,000 are
estimated to be affected in
Quezon City.
- 16% in low susceptibility
areas
- 30% moderate flood
susceptibility areas
- 54% in high flood
susceptibility areas
The top three Barangays that
have greater than 80% within
the high flood susceptibility
area are Barangays Capri,
Talayan and Katipunan.
The Japan International
Corporation Agency (JICA)
model estimates that climate
change can increase the
affected areas in Quezon City
by 2050 by as much as 7%.
Casualties Caused by Floods
It is estimated that 111
casualties in Quezon City will
be caused by a 100- year flood.
Areas which are in a high susceptibility flood zone (inundation depth greater than 200cm) are
likely to encounter casualties 2.5 times greater than medium susceptibility areas (inundation
depth between 50cm and 20cm) and 5 times greater than low susceptibility areas (inundation
depth below 50cm).
The largest number of casualties is expected to be in Barangays Batasan Hills, Tatalon, Sta Lucia
and Bagong Silangan due to their higher populations which are affected by high flood exposure
levels. These barangays have more informal settlement buildings than average in Quezon City.
This is also probably due to the many informal settlements located nearby river systems
Source: QC DRRM Plan (2014-2020)
Figure R-2 : Barangay Hotspots Based on Flood Hazard
and Vulnerability Population affected by floods

195
For every 1,500 informal settlement buildings, an average of 1 extra casualty is estimated to
occur.
30% of the population of Quezon City is under 15 years old and are at greater risk of becoming a
casualty.
Population Displaced and Affected by Floods
Around 68,619 people are estimated to be displaced.
The largest number of people displaced are expected to be in Barangays Batasan Hills, Tatalon,
Sta. Lucia and Bagong Silangan due to their higher populations which are affected by high flood
exposure levels.
There is one casualty for every 1,000 people displaced.
Around 700,000 people are expected to be affected with additional people due to possible power
or utility issues.
Economic Losses
Considering a 100 year flood return period, the total economic loss resulting from this study
comes out to be 319 million USD of which about 245 million USD is capital stock related.
Table R-3 : Impact on Critical and High Loss Potential Facilities
Facility Top 5 Barangays
Hospitals and Healthcare Centers
Doña Imelda, Damayang Lagi, Kalusugan, Central, Bagumbuhay
Emergency and Rescue Operation Centers
Masambong, N. S. Amoranto (GintongSilahis), Libis, San Antonio, Matandang Balara
High Loss Potential Facilities Fairview, BagongLipunanngCrame, Bagumbayan, E. Rodriguez, Holy Spirit
Hazardous Facilities Tatalon, Manresa, Bagumbayan, Sto. Domingo (Matalahib), Talayan
Major Roads Pag-ibig s aNayon, Commonwealth, Sta. Monica, Capri, Duyan-duyan
Source: QC Disaster Risk Reduction Management Plan (2014-2020)
Post-Flood Health Issues - Adapted JICA Outbreak Model
High disease incidence rate after a flood combined with systemic failures of healthcare systems
and parallel infrastructure such as the water and sanitation system constitute a major vulnera-
bility.
In 2008, more than 2,089 people were treated for bacterial infection in Manila and in surrounding
provinces 162 people have died as a result of Leptospirosis infections, more than five times the
number of Leptospirosis deaths in the entire country (Balbuena et al., 2010).
Dose-response relationships for the indicator pathogen (E. coli) using different ingestion rates as
a function of flood inundation depth and age show that as many as 6,800 people in Quezon City
are at risk to gastrointestinal illness via incidental ingestion of flood water.
People under the age of 15 are at significantly higher risk.

196
Table R-4 : Summary of Flood Related Consequences to Sectors
Core Elements Primary Hazards Flood Inundation
Primary Damage Building Material Non-structural/
Equipment Primary Loss:
Life/Injury, Repair Costs, Function,
Communication/Control
Secondary Hazard/Damage Liquefaction, Landslide, Fire,
Hazmat, Flooding… Secondary Loss:
Business/Operations, Interruptions, Market Share,
Reputation
Population 66 Barangays District I -20 District II - 5 District III - 11 District IV - 11 District V - 11 District VI - 8
*46% out of 142 barangays
Affected Est. Population:
1.334 M
150 deaths (Based on
Ondoy)
Economic
Activity
Novaliches
Bagong Silangan
Batasan Hills
Bagumbayan
Sto. Domingo
Talayan
Del Monte
Santol
Dona Imelda
Damayang Lagi
Kalusugan
Tatalon
Roxas
Masambong
San Antonio
Gulod
Structural Damage Roads & bridges Residential Commercial structures Drainage system Rip-raps
Loss of lives & property
Loss of income & livelihood
Access to
Income/Service
s
Places near Tullahan River Capri Gulod Novaliches Proper Nagkaisang Nayon North Fairview Sta. Lucia
Barangays Near San
Francisco River Siena Del Monte San Antonio Tatalon Damayan Talayan
Barangays near San Juan
River Tatalon Doña Imelda Damayan Lagi Roxas Pasong Tamo Culiat Vasra
Displaced Families
Casualties
Disease Outbreak

197
Core Elements Primary Hazards Flood Inundation
Primary Damage Building Material Non-structural/
Equipment Primary Loss:
Life/Injury, Repair Costs, Function,
Communication/Control
Secondary Hazard/Damage Liquefaction, Landslide, Fire,
Hazmat, Flooding… Secondary Loss:
Business/Operations, Interruptions, Market Share,
Reputation
Along Marikina River/San
Mateo Bridge Bagong Silangan Batasan Payatas Matandang Balara Libis Bagumbayan
Emergency
Management
and First
Responders
Quick Rise of Flood Water
Flash Floods
Tatalon - Villa Espana - Araneta Avenue - Victory Avenue
Dona Imelda - Kapilingan Street - Betty Go Belmonte
Barangay Roxas - Gumamela - Waling-waling
Damayang Lagi - Calvary Hills
- Area 5
Loss of lives
Damage/loss of priorities
Roads & Bridges Damage
Widespread evacuation
Damage to powerlines
Food/medicine shortage Water-borne disease outbreaks Electricity & water supply Contamination of portable water Stranded disruption of essential services (e.g. transportation) Suspension of classes
Institutional
and Land Use
Administrators
All barangays traversed by
rivers & creeks Tatalon Dona Imelda Roxas Tlayan BagongSilangan Sta Lucia Gulod
Structural damages ISFs Residential Establishments Commercial Establishments
Drainage System
Ripraps
Bridges & Roads
Utilities (water &
powerlines)
Loss of lives, properties &
livelihood
Outbreak of diseases Contamination of water supply Disruption of public services, commercial activities
Source: QC Disaster Risk Reduction Management Plan (2014-2020)

198
Table R- 5 : Summary of Consequences of Floods to Sector Including Initial Recommendations to Reduce Consequences
Core Elements Consequences to Sector
of Flood Initial Recommendation
Population Affected Est. Population:
1.334 M
150 deaths (Based on
Ondoy)
Full implementation of the QC Shelter Program
Intercity Flood Control Program
Recovery of easements
Strict implementation of RA 9003
Economic
Activity
1. Loss of lives & damage to properties
2. Disruption of public services
3. Lifeline Disruptions (Communication, water, power)
1. Provision of budget for livelihood (start-up budget for livelihood)
2. Trainings for livelihood & income 3. Additional rubber boat, generators and relief goods (food,
medicine, clothes 4. Provision of evacuation areas
Access to
Income/
Services
1. Loss of lives and injuries 2. Health and Sanitation 3. Livelihood & Shelter 4. Lifeline are damaged 5. Unemployment 6. Mobility and
Accessibility
1. Identify relocation sites/evacuation centers 2. Community-based trainings DRRM - First Aid Training 3. Involve NGOs 4. Budget Allocation 5. Basic Training, using indigenous materials/resources 6. Create livelihood programs for rehabilitation “work for
food”
Emergency
Management
and First
Responders
1. Declogging of canals/drainages/rivers 2. Develop protocols on alert levels/ communication during
inclement weather (between brgys and QCDRRMC) 3. Relocation sites of ISF located along riverways/creeks 4. Formulate contingency plan of barangay 5. Enhancement training & capacity building of BERT 6. Install CCTV & Flood markers to flood prone areas 7. Ordinance for force evacuation 8. Increase capacity through accredited community
Institutional and
Land Use
Administrators
1. Structural Damages 2. Loss of lives, properties
& livelihood 3. Presence of informal
settlers along rivers & creeks
1. Review & revision of CLUP & Zoning Ordinance 2. Locate activities & functions in flood free areas 3. Strict implementation of the water code (3-M creek
easement)
Physical
Resources
1. Water Contamination (waterways & portable water
2. Waste Accumulation 3. Damage to parks and
wildlife
1. Strict monitoring of compliance of water companies 2. Construction of retaining wall & desiltation of rivers 3. Strict implementation of waste segregation policies 4. IEC on proper waste segregation 5. Desiltation & construction of retaining wall
Source: QC Disaster Risk Reduction Management Plan (2014-2020)
To closely monitor water level during occurrences of flooding, the Disaster Risk Reduction
and Management Office (DRRMO) has a systematic early warning systems for specific hazards in the
locality that are found useful in preventive efforts at potential hazards. Currently, there are six (6)
Automated Rain Gauges (ARG) and eleven (11) Automated Water Level Stations (AWLS) located in
strategic locations.

199
Location of Automated Rain Gauge (ARG)
1. Quezon City Polytechnic University, Quirino Highway
2. PAG-ASA, Science Garden
3. Barangay Hall, Barangay San Bartolome
4. La Mesa Dam, Headwork Controller Office
5. Novaliches District Office
6. ASTI DOST, CP Garcia Avenue
Location of Automated Water Level Stations (AWLS)
1. G. Araneta Bridge, Araneta Avenue, Barangay Dona Imelda
2. Del Monte Bridge, Del Monte Avenue (BA Bridge)
3. Duyan-duyan Bridge, Xavierville Avenue
4. Panay Avenue, Barangay Pinyahan
5. Quezon Avenue Bridge, Quezon Avenue
6. Maria Clara Street, Barangay Sto. Domingo and Talayan Boundary
7. E. Rodriguez Avenue, Barangay Kaunlaran
8. Aurora Boulevard, Quezon City and San Juan City Boundary
9. Commonwealth Avenue, Barangay Fairview
10. P. Tuazon Boulevard, Barangay Tagumpay
11. Barangay Loyola Heights
The City through the Disaster Risk Reduction and Management Office Emergency Operations
Center (DRRMO-EOC) also monitors the frequency of rainfall within the City all year round. Figure
R-3_shows the frequency of rainfall incidents in Quezon City in 2018. As expected, rainfall was most
frequent during the wet season on June to September.
Source: QC DRRMO Accomplishment Report 2018
Figure R-3 : 2018 Monitored Rainfall Events in QC
0
4
0 0 0
58
39 37
13
0 1
22
0
10
20
30
40
50
60
70
JAN FEB MAR APR MAY JUN JUL AUG SEPT OCT NOV DEC

200
Likewise DRRMO EOC also monitors the frequency of thunderstorms incidents in the City.
Thunderstorm incidents gained momentum from April, peaked in June, and then continued until
October last year.
Extreme Rainfall and Temperature
Climate change has major long term effects. These are temperature change, rainfall change, sea
level rise and the increase of frequency in extreme events (rainfall and temperature).
Temperature change could be noticed from the increase or decrease of average temperatures
resulting in changes in the number of hot or cold days and nights. Rainfall change on the other hand,
means a change of the amount of water that drops into the earth in a year during different seasons
such as rainy season which is longer or shorter having an increase or decrease of frequency and
intensity. The increase in extreme events is the abnormal weather events that could be identified
from storm, extreme heat, drought or heavy rain.
The succeeding data and discussions were taken from a 2011 Study of the Department of
Science and Technology- Philippine Atmospheric, Geophysical and Astronomical Services
Administration (DOST-PAGASA) entitled “Climate Change in the Philippines.” The study highlighted
key findings of the present (baseline) climates, projections of future climates in 2020 and 2050 in the
Philippines.
To generate projections of the temperature increase and rainfall change in the Philippines for
2020 and 2050, DOST-PAGASA used the PRECIS (Providing Regional Climates for Impact Studies)
Regional Climate Model (RCM). Two time slices centered on 2020 (2006-2035) and 2050 (2036-
2065) were used in the climate simulations using three emission scenarios: namely, the A2 (high-
Source: QC DRRMO Accomplishment Report 2018
Figure R-4 : 2018 Monitored Thunderstorm Events, QC
1 0 0
10
25
53
0
47
43
0 0
5
0
10
20
30
40
50
60
JAN FEB MAR APR MAY JUN JUL AUG SEPT OCT NOV DEC

201
range emission scenario), the A1B (medium-range emission scenario) and the B2 (low-range
emission scenario) defined as follows:
The A2 scenario is at the higher end of the emission scenarios and is preferred by most countries
because from an impacts and adaptation point of view, if man can adapt to a larger climate
change, then the smaller climate changes of the lower end scenarios can also be adapted to.
The A1B scenario is considered because the future climates in the next 30-40 years will be greatly
influenced by past emissions, principally due to long lifetimes of carbon dioxide.
The B2 scenario representing the low-range emissions, the most unlikely, even if it represents the
low end, is the most likely.
The climate trends were analyzed using available observed data from 1951 to 2009 with the
average for the period of 1971-2000 as the reference value. The key findings are as follows:
There has been an increase in annual mean temperature by 0.65 0C.
In terms of maximum and minimum temperatures, the increases have been 0.36 oC and 0.1 oC.
Results of analysis of trends of tropical cyclone occurrence within the Philippine Area of
Responsibility (PAR) show that an average of twenty (20) tropical cyclones form and/or cross the
PAR each year with strong multi-decadal variability and that there is still no indication of increase
in the frequency, but with a very slight increase in the number of tropical cyclones with maximum
sustained winds greater than 150kph and above (typhoon category) being exhibited during El
Niño years.
The analysis of trends of extreme daily temperatures and extreme daily rainfall indicate
significant increase in number of hot days but decrease in cool night, and those of rainfall
(extreme rainfall intensity and frequency) are not clear, both in magnitude (by what amounts)
and direction (whether increasing or decreasing), with very little spatial coherence.
For future climate in 2020 and 2050, outputs of the simulations under the mid-range scenario are
used with the following findings:
Seasonal Temperature Change
All areas in the Philippines will get warmer, especially in the relatively warmer summer months.
Annual mean temperature (average of maximum and minimum temperatures) in all areas in the
country are expected to rise by 0.9 ºC to 1.1 ºC in 2020 and by 1.8 ºC to 2.2 ºC in 2050.
Seasonal Rainfall Change
Reduction in rainfall in most provinces during the summer season March, April and May (MAM)
making the usually dry season drier.
Rainfall increases are likely in most areas of Luzon and Visayas during the southwest monsoon
June, July, and August (JJA) locally known as “Habagat” and the September, October, and
November (SON) seasons, making these seasons still wetter, and thus, with likelihood of both
droughts and floods in areas where these are projected.
During the northeast monsoon December, January, and February (DJF) season locally known as
Amihan, rainfall is projected to increase, particularly for areas characterized by Type II climate
with potential for more flooding.

202
Extreme Rainfall Events
During the southwest monsoon season JJA larger increases in rainfall is expected in provinces in
Luzon (0.9% to 63%) and Visayas (2% to 22%) but generally decreasing trend is expected in most
of the provinces in Mindanao.
Extreme Temperature Events
Projections for extreme events in 2020 and 2050 show that hot temperatures (indicated by the
number of days with maximum temperature exceeding 35 ºC) will continue to become more
frequent, number of dry days (days with less than 2.5mm of rain) will increase in all parts of the
country and heavy daily rainfall (exceeding 300mm) event will also continue to increase in
number in Luzon and Visayas.
Climate Projections in 2020 and 2050 in NCR (National Capital Region)
Under the same study, climate projections were also undertaken in the 17 administrative regions
of the Country also using the medium-range emission scenario. Findings for the National Capital
Region include the following:
The projected seasonal temperature increase (Table R-6), and seasonal rainfall change (Table R-
6) and frequency of extreme events (Table R-8) in 2020 and 2050 under the medium-range emission
scenario in the provinces in the National Capital Region (NCR) are presented in the succeeding
sections.
To use the tables and arrive at values of seasonal mean temperature and seasonal rainfall in 2020
and 2050, the projections are added to the observed values.
For example, in Metro Manila, the projected values in 2020 are:
a. DJF mean temperature = (26.1 °C+1.0 °C) = 27.1 °C
b. DJF rainfall = {107.5mm+107.5(-12.8%)mm} = (107.5-13.8)mm or 93.7mm
c. number of days with Tmax > 35 °C in Quezon City during the 2006-2035 period (centered at
2020) = 1,984
d. number of dry days in Quezon City during the 2006-2035 period (centered at 2020) = 6,302
e. number of days with rainfall > 300mm in Quezon City during the 2006-2035 period (centered at
2020) = 8.
Table R-6: Seasonal Temperature Increases (in °C) in 2020 and 2050 Under Medium-
Range Emission Scenario in NCR
Observed Baseline Change In 2020 Change In 2050
(1971-2000) (2006-2035) (2036-2065)
DJF MAM JJA SON DJF MAM JJA SON DJF MAM JJA SON
26.1 28.8 28.0 27.4 1.0 1.1 0.9 1.0 2.0 2.1 1.8 1.9

203
Table R- 6:I Seasonal Rainfall Change (in %) in 2020 and 2050 Under Medium-Range Emission Scenario in NCR
Observed Baseline Change In 2020 Change In 2050
(1971-2000) mm (2006-2035) (2036-2065)
DJF MAM JJA SON DJF MAM JJA SON DJF MAM JJA SON
107.5 198.5 1170.2 758.7 -12.8 -33.3 8.5 0.0 -17.3 -38.5 21.3 3.7
Table R-7 : Frequency of Extreme Events in 2020 and 2050 Under Medium-
Range Emission Scenario in NCR
Stations
No. of Days w/ Tmax >35 °C No. of Dry Days No. of Days w/ Rainfall
>200mm
OBS (1971-2000)
2020 2050 OBS 2020 2050 OBS 2020 2050
Port Area 299 1176 2118 7380 6445 6382 12 12 13
Science Garden
1095 1984 3126 7476 6302 6220 9 13 17
Note: For Kalookan North, Quezon City, Marikina, Pasig, Taguig, San Juan Mandaluyong, use values of
Science Garden. For Navotas, Kalookan South, Malabon and Valenzuela, use values of Port Area.
OBS - Observed Baseline
Data for Quezon City were also obtained from the DOST-PAGASA showing the city’s Annual
Mean Temperature, Projected Change in Monthly Rainfall, Projected Change in Monthly Average
Mean Temperature, Projected Change in Monthly Average Maximum Temperature, and Projected
Change in Monthly Average Minimum Temperature under Medium-range Emission Scenario (A1B).
Figure R-5 indicates that Quezon City had an increase of 1.46 oC from 1961 to 2013 (52 years).
Source: DOST-PAGASA
Figure R-5 : Annual Mean Temperature; PAGASA Science Garden: 1961-2013

204
The study shows too that the city will have an increase in rainfall in 2020 and 2050 particularly
during the wet season ((June, July and August). Heavy daily rainfall events (rainfall exceeding
300mm) will continue to become frequent in 2020 and 2050 (Figure R-6).
As reflected in Table R-8 and Figure R-7, Quezon City has a projected change in monthly average
mean temperature of 0.7 oC to 1.2 oC in 2020 and 1.7 oC to 2.4 oC by 2050.
Table R-8 : Mean Temperature (1971-2000) and Projected Change in Mean Temperature (2020 and 2050); QC
Science Garden
Month
MEAN
BIAS
Projected Change (%)
BIAS CORRECTED PROJECTED CHANGE
Observed 1971-2000
Model 1971-2000
2020 2050 TMEAN
1971-2000 2020 2050 Jan 25.4 24.8 -0.6 1 2 25.4 26.4 27.4 Feb 26.1 25.3 -0.8 1.1 2 26.1 27.2 28.1 Mar 27.4 26.9 -0.5 0.9 2 27.4 28.3 29.4 Apr 29.1 28.2 -0.9 1.1 2 29.1 30.2 31.1 May 29.5 27.8 1.1 1.2 2.4 29.5 30.7 31.9 Jun 28.6 26.9 1.2 1 1.9 28.6 29.6 30.5 Jul 27.8 26.5 1 0.8 1.7 27.8 28.6 29.5
Aug 27.5 26.4 0.8 0.8 1.7 27.5 28.3 29.2 Sept 27.6 26.2 0.8 0.8 1.7 27.6 28.4 29.3 Oct 27.3 26.3 0.8 1.1 2 27.3 28.4 29.3 Nov 26.7 25.9 1.1 1 2 26.7 27.7 28.7 Dec 25.8 25.4 1 0.7 1.9 25.8 26.5 27.7
Source: DOST – PAGASA
Source: DOST-PAGASA
Figure R-6 : Projected Change in Monthly Average Rainfall (mm) under Medium-range Emission Scenario (A1B); Science Garden, QC

205
Source: DOST-PAGASA
Figure R-7 : Mean Temperature (1971-2000) and Projected Change in Mean Temperature (2020 and 2050); QC
The projected
Change in Monthly
Average Maximum
Temperature for
Quezon City for
2020 and 2050 is
0.7C to 1.4C and
1.6C to 2.7C,
respectively. There
would be an
increase in the
number of days
greater than 35 ºC
particularly in 2050.
(Refer to Table R-9
and Figure R-8)
Table R-9 : Maximum Temperature (1971-2000) and Projected Change in Maximum Temperature (2020 and 2050); QC
Science Garden
Month MEAN
BIAS
Projected Change (%)
BIAS CORRECTED PROJECTED CHANGE
Observed 1971-2000
Model 1971-2000
2020 2050 TMEAN
1971-2000 2020 2050 Jan 30.4 28.2 -2.2 1.1 2.2 30.4 31.5 32.6
Feb 31.6 29.4 -2.2 1.2 2.1 31.6 32.8 33.7
Mar 33.3 31.6 0.9 0.9 2.1 33.3 34.2 35.4
Apr 34.9 32.9 1.3 1.3 2.1 34.9 36.23 37.0
May 34.6 31.2 1.4 1.4 2.7 34.6 36.0 37.3
Jun 32.9 29.1 0.9 0.9 1.8 32.9 33.8 34.7
Jul 31.6 28.4 0.7 0.7 1.6 31.6 32.3 33.2
Aug 31.1 28.3 0.7 0.7 1.4 31.1 31.8 32.5
Sept 31.5 28.2 0.9 0.9 1.7 31.5 32.4 33.2
Oct 31.3 29.3 1.1 1.1 2.1 31.3 32.4 33.4
Nov 31.1 29 1.1 1.1 2.2 31.1 32.2 33.3
Dec 30.3 28.4 0.8 0.8 2.0 30.3 31.1 32.3
Source: DOST-PAGASA
Source: DOST-PAGASA
Figure R-8 : Maximum Temperature (1971-2000) and Projected Change in Maximum Temperature (2020 and 2050); QC

206
Table R-10 and Figure R-9 show that Quezon City has a projected change in monthly average
minimum temperature of 0.7C to 1.1C in 2020 and 1.8C to 2.2C in 2050.
Source: DOST-PAGASA
Figure R-9 : Minimum Temperature (1971-2000)
and Projected % Change in Minimum Temperature (2020 and 2050); QC
Table R-10 : Minimum Temperature (1971-2000) and Projected Change in
Minimum Temperature (2020 and 2050); QC Science Garden
Month
MEAN
BIAS
Projected Change (%)
BIAS CORRECTED PROJECTED CHANGE
Observed 1971-2000
Model 1971-2000
2020 2050 TMEAN
1971-2000 2020 2050
Jan 20.4 22.7 2.3 20.4 1.9 20.4 21.3 22.3
Feb 20.6 22.7 2.1 20.6 2 20.6 21.6 22.6
Mar 21.6 23.8 2.2 21.6 2 21.6 22.6 23.6
Apr 23.3 24.9 1.6 23.3 2.1 23.3 24.4 25.4
May 24.4 25.4 1 24.4 2.2 24.4 25.5 26.6
Jun 24.3 25.2 0.9 24.3 2.2 24.3 25.4 26.5
Jul 23.9 25.1 1.2 23.9 1.9 23.9 24.9 25.8
Aug 23.9 25.2 1.3 23.9 1.9 23.9 24.8 25.8
Sept 23.7 24.9 1.2 23.7 1.8 23.7 24.5 25.5
Oct 23.2 24.2 1 23.2 2.1 23.2 24.3 25.3
Nov 22.4 24.1 1.7 22.4 1.9 22.4 23.4 24.3
Dec 21.3 23.7 2.4 21.3 1.8 21.3 22 23.1
Source: DOST-PAG-ASA

207
In 2016, the Quezon
City Local Climate Change
Action Plan (QC LCCAP)
2017-2027 was
formulated by the City
Government spearheaded
by the Environmental
Protection and Waste
Management Department
(EPWMD) in partnership
with the UP Planning and
Development Research
Foundation, Inc. (UP
PLANADES) for the joint
undertaking of the
“Consultation Services for
Building Climate Change
Mitigation and Adaptation
(CCMA) for Quezon City
Stakeholders” Project.
The succeeding
discussion was derived by
the QC LCCAP.
One of the significant
outputs in the LCCAP is
the mapping of the urban
morphology types and the
estimation of surface
cover of the City as well
as the performance of a
survey cover analysis.
These information are
essential for determining
the environment
performance of the City.
Figure R-10 shows the Urban Morphology Type of the City while the proportional surface cover
types of the City by sub-areas is presented in Figure R-11 shows that around 53% consist of buildings
comprising residential, commercial institutional, recreational or built-up areas, around 27.9% are
composed of impervious surfaces due to the presence utilities and vacant lands while around 18.3%
consist of green and blue surfaces (evapotranspiring), this would account for the open spaces forest,
agriculture and water and 6% consist of cemetery, bare soil or gravel surfaces.
Source: QCLCCAP 2017-2027
Figure R-10: Urban Morphology Type, QC

208
The succeeding Figures R-
12 to R-17 show the
Residential Green Area
Segregation (RGAS) in the six
districts. RGAS was done to
determine the green and blue
areas. Accordingly, this
information is usually done to
measure and differentiate
impervious and
evapotranspiring areas. Figure
R-18 on the other hand, shows
the comparative surface cover
types of the six (6) districts.
The graph indicates that
District V has the highest
percentage of 50% in green
surface, this may be attributed
to the presence of the La Mesa Watershed in the said district. Districts I, II, III, and VI accounted for
only 1%-1.96% of green surface while District IV has no green surface at all.
Source: QCLCCAP 2017-2027
Figure R-11: Proportional Surface Cover Types
Blue Surfaces, 0.92%
Bare Soil or Gravel
Surfaces, 6.00%
Impervious Surfaces, 27.90%
Buildings, 53.00%
Green Surface, 17.38%

209
Figure R-18 Proportional Cover Types by District in %
Figure R-19 : Surface Cover, Quezon City Figure R-20 : Surface Cover by Districts, Quezon City
Survey cover analysis was also
undertaken in the study. This
was done by calculating the total
areas of evapotranspiring (green
and water), impervious
(cemented area of residential,
commercial, institutional and
roads) and bare soil.
Results of the surface cover
analysis revealed that eighty-
one (81%) percent of the city’s
area is currently impervious,
18% is evapotranspiring and
1% is bare soil. It is represented
in Figure R-19. Figure R-20
represents the comparative
surface cover analysis of the six
districts.
High temperature in Quezon City is due to rapid urbanization and increased human activities are
potential draw to Urban Heat Island (UHI) Quezon City is developing aggressively, and could be a
potential to urban heat island (UHI). The city government should be prudent in converting these
evapotranspiring areas into impervious land by protecting the remaining green and blue areas.
Further, strategies for mitigating UHI should be considered especially in districts where green
areas are at its least or none at all. Significant mitigation strategies in combatting UHI are as follows:
1) planting trees and vegetation as this helps cool urban climates through shading and
evapotranspiration 2) Developing better roof designs example are roofs incorporated with
vegetation 3) Incorporating cool pavements such as reflective and permeable pavements which
allow air, water, and water vapor into the voids of the pavement 4) Incorporating cool roofs such as
products made of highly reflective and emissive materials 5) reducing anthropogenic (human-
made)heat release.

210
CLIMATE CHANGE INITIATIVES AND INVESTMENTS
Climate Change Expenditure Tagging (CCET)
Joint Memorandum Circular 2014-01 issued on August 2014 by the Department of Budget and
Management (DBM), Climate Change Commission (CCC) and the Department of Interior and Local
Government (DILG) encourages LGUs to track their climate expenditures in their Annual
Investment Programs.
The objective of CCET is to identify and tag climate change programs, projects and activities
(PPAs) to take stock of climate change PPAs and to track and report climate change expenditures
of the LGUs.
Climate Change Expenditure Tagging (CCET), undertaken in the 2018 Annual Investment
Program (AIP) revealed that out of the Quezon City total fund of PhP 27.05B, PhP 2.05B has been
tagged as climate initiatives. It has earmarked an amount of PhP 1.54 B for climate change
adaptation program and projects while 0.49 B for climate mlitigation programs and projects.
A total of 32 related PPAs have been identified in the 2018 Annual Investment Plan (AIP).
Big impact investment programmed for 2015 are PPAs aim to build better and safer Quezon City.
These include:
Climate Change Adaptation (CCA)
▪ Development of disaster and climate risk monitoring system and installation of Early Warning
Systems
▪ Construction of socialized housing, low cost housing, and other mass dwellings to climate resilient
design standards
Climate Change Mitigation (CCM)
▪ QC has identified measures that help sequester and reduce greenhouse gas emissions such as
carbon dioxide and methane
▪ Waste diversion programs
Climate Change Adaptation,
1,524,979,400.00
Climate Change Mitigation,
490,293,674.00
Non-related CC Projects,
25,029,982,199.80
Figure R-20 : Surface Cover by Districts, Quezon City

211
▪ Energy Efficient Street Lighting using Light Emitting Diode (LED)
▪ Urban Greening and Beautification Projects
▪ Urban Gardening Program
▪ Traffic Management to reduce GHG emissions
▪ Green Fund Summit to strengthen institution in developing policies to mobilize carbon finance
Other Significant Investments
▪ Construction of climate resilient elementary and secondary school buildings (safe from climate
hazards: considers climate risks
▪ Demolition of illegal structures occupied by informal settlers in high risk areas/relocation of
informal settlers
Drought
Droughts are the primary impact of increased temperature. They are a recurrent feature of
climate.They are characterized by a deficiency of precipitation over an extended period of time.
Drought is also related to the timing of precipitation. Other climatic factors such as high
temperature, high wind, and low relative humidity are often associated with drought.
Impacts of drought involve water stock reduction in reservoir, water supply shortages, depletion
of groundwater, soil moisture reduction and decrease in food production.
Droughts can have serious social, economic
and environmental impacts. Social impact
involves public safety, health and conflicts
between water users. Economic impact on the
other hand, relates to losses in yields in both
crop and livestock production while some of the
environmental impacts are environmental losses
due to damages to plant and animal species,
wildlife habitat, air and water quality,
degradation of landscape quality, loss of
biodiversity and soil erosion.
Quezon City’s vast areas of parks and open
spaces such as the La Mesa Watershed, Ninoy
Aquino Parks and Wildlife, Quezon City
Memorial Circle, UP Diliman, Miriam College,
Ateneo de Manila Campus which are habitat to
numerous species of flora and fauna are
perceived most vulnerable during the
occurrence of drought in the city. Droughts
occurring in distant regions, however, may still
impact the city should such region is the source
of agricultural produce, water or power supply
of the city..
Source: QC DRRMP (2014-2020)
Figure R- 21 ; The West Valley Fault System

212
7.1.2 Geological Hazards
Earthquake
One of the major active faults in the Philippines is the Valley Fault System (VFS). The 100 kms
long West Valley Fault (WVF), one of the two major segments of the VFS, transects various parts of
Metro Manila including Quezon City. The WVF in QC runs from northeast through the southeast
sections of Quezon City and passes through Barangays Bagong Silangan, Batasan Hills, Matandang
Balara, Pansol, Blue Ridge B, St. Ignatius, Libis, White Plains, Bagumbayan and Ugong Norte. (Refer to
Figure R-21).
The WVF moves roughly every 400 to 600 years and has moved four (4) times in the last 1,400
years. The last major earthquake generated by this fault was 360 years ago, in 1658. This means
that the fault could possibly trigger a large earthquake within the next few years, or few ten years.
Also, the 2004 Metro Manila Earthquake Impact Reduction Study (MMEIRS) of JICA projects the
occurrence of a magnitude 7.2 earthquake from the movement of the WVF System.
Earthquake Risk Assessment
The Hazard Vulnerability Risk
Assessment (HVRA) Report of
“Building a Disaster Resilient Quezon
City” Project also dealt extensively on
the risks, consequences, and impacts of
a 7.2 magnitude earthquake generated
from the movement of the West Valley
Fault System.
Top five barangays to prioritize for
earthquake impacts are Barangays
Bagumbayan, St. Ignatius, Ugong Norte
Bagong Silangan and Batasan Hills
while barangays which constitute a
second tier for prioritizing emergency
management planning and prepared-
ness actions are Barangays White
Plains, Blue Ridge B, Kaligayahan, Libis
and Commonwealth. (Refer to Figure R-
22).
Following Impact
Based on Model 8 Scenario, it is
projected that 4,800 buildings may be
burnt in case of an 8-meter per second
wind.
Liquefaction Impact
Liquefaction is the loss of cohesion of sediment layers from extreme ground shaking, manifested
as ground subsidence, spreading, and sandboils.
Source: QC DRRMP (2014-2020)
Figure R-22 : Barangay Hotspots Based on Earthquake Hazard and Vulnerability

213
Ground Motion Shaking Severity
Barangays with strongest intensity of
ground motion are Barangay Bagumbayan
(9.76), Ugong Norte (9.36), Batasan Hills
(9.28), Libis (9.26) and Bagong Silangan
(9.25). (Refer to Figure R-10).
• The following barangays will
suffer the most with building collapse:
Batasan Hills (449 buildings), Bagong
Silangan (249), Payatas (134), Matandang
Balara (112), and Commonwealth (101). These barangays are located towards the eastern region
of Quezon City. These same barangays will also suffer the most with buildings that will receive
very heavy damages.
• The barangays that will suffer
the most from buildings
sustaining heavy damages are
Commonwealth (1,414),
Batasan Hills (1,348), Payatas
(957), Holy Spirit (908), and
Pasong Tamo (747).
• The barangays that will suffer the most from buildings that will sustain partial damages are Batasan Hills (5,741), Com-monwealth (5,198), Payatas (3,705), Holy Spirit (3,236), and Bagong Silangan (3,155).
• The barangays that will suffer most fatalities are Batasan Hills (1,557), Commonwealth (948), Bagong Silangan (878), Holy Spirit (680), and Matandang Balara (650).
• The barangays that will suffer the most injuries are Batasan Hills (4,324), Commonwealth (3,130), Tandang Sora (2,571), Bagong Silangan (2,442), and Holy Spirit (2,240).
Table R-11 : Liquefaction-Prone Barangays
Barangay Liquefaction Potential
Bagumbayan Damayang Lagi Doña Imelda Kalusugan Libis Lourdes Mariana Mariblo Matandang Balara Roxas
Santol Sienna St. Ignatius St. Peter Sta. Cruz Sto. Domingo (Matalahib) Talayan Tatalon White Plains
Relative High
Bagumbayan
Ugong Norte
Relative Low
Source: Source: QC DRRM Plan 2014-2020
Figure R-23 : Modified Mercalli Intensity Scale
Distribution per Barangay; QC

214
Table R-12 : Summary of the Impacts to Sectors from a M7.2 Earthquake from the
West Valley Fault
Core Elements Primary Hazards: Faulting, shaking,
liquefaction, landslide
Primary Damage: Building/Structural
Non- structural/Equipment Primary Loss:
Life/Injury, Repair Costs, Function,
Communication/Control
Secondary Hazard/Damage:
Liquefaction. Landslide Fire, Hazmat, Flooding…
Secondary Loss: Business /Operations Interruptions, Market
Share, Reputation Population Shaking
Silangan BF Homes Subd. Barangay Proper South Cemetery Petines Filinvest II
Ugong Norte Mercury C-5 Greenmeadows Acropolis
Libis
Eastwood Cyberpark C. Atienza
C. Industria
Blue Ridge B. left side of bridge
Pansol
White Plains
Building Collapse Residential /Commercial, Industrial, Institutional, Reservoir Schools (Bagong Silangan ES/ HS) Churches, markets, hospitals Roads & Bridges (C-5)
Cracking, damage to La Mesa Dam
Expected % life loss - 3,000 (estimated) Injured - 9,000 (Estimated) 3000 * 2 = 6,000
9000* 2 = 18,000
Estimated 16 * 5000 = 90000 students 1350 - injured, 67 deaths
Landslide Payatas (open dumpsite) Bagong Silangan
Flooding
Disruption of: Basic services/supply (food, water, electricity) Slowing down/stoppage of business
Economic Activity Faulting & Shaking Damage to Malls, Condominiums and
Residences Bagumbayan White Plains
Buildings Collapse Bagumbayan
Landslide Bagong Silangan Batasan Hills Informal Settlers
Food & Water Shortage
Communication & Power
Interruption
Access to
Income/Services
Ground Shaking
Bagumbayan
Escopa
Loyola Heights
Pansol
Old Balara
Batasan
Bagong Silangan
Damage to Balara Filter Plant & Main
Water Aqueduct
Damage to La Mesa Dam
Damage to Schools Red: Bagong Silangan ES, Bagong Silangan HS, Bagumbayan ES, OB ES Orange: Payatas ES, Judge Cecilia Palma ES, Batasan Hills ES, Balara ES, Batino ES, T. Alonzo ES, JP Laurel HS, Camp Aguinaldo, PV Kalaw, Libis Orange: Murphy HC, Camp Aguinaldo
Possible flooding of barangays
along Tullahan River
Informal Settlers Fire Prone Flash flood Loss of Lives (mass casualties)
Water supply interruption
Health and Sanitation Problems -
>
Disease Outbreak
Disruption of Health Services

215
Table R-12 : Summary of the Impacts to Sectors from a M7.2 Earthquake from the West Valley Fault
Core Elements Primary Hazards: Faulting, shaking,
liquefaction, landslide
Primary Damage: Building/Structural
Non- structural/Equipment Primary Loss:
Life/Injury, Repair Costs, Function,
Communication/Control
Secondary Hazard/Damage:
Liquefaction. Landslide Fire, Hazmat, Flooding…
Secondary Loss: Business /Operations Interruptions, Market
Share, Reputation Station Hospital, Quirino Memorial Medical Center, Proj. 4 HC, Villarosa Gen. Hospital, Escopa HC, Payatas A HC, Payatas B HC, Lupang Pangako, Commonwealth
Primary Damage-Bridges and Roads Red: Bagong Silangan – (Joyful St.), San Mateo – Batasan, Bagumbayan (Calle Industria)
Damage to Health Centers & Hospitals Red: Pansol HC, Libis HC, Bagong Silangan HC, Batasan Super and Batasan Annex HC, Doña Nicasia, Camarilla ES, Libis ES, Fort Aguinaldo ES, Belarmino Sports Complex
Life lines are cut
Suspension of Classes Mass Casualties (Death, Injuries)
Disease Outbreak
Loss of Lives
Injuries
Demand for services
Delayed Emergency Response
due to inaccessible roads
Emergency
Management and
First Responders
Those affected by primary
hazards:
Blue Ridge B
Libis
St. Ignatius
Bagumbayan
Power Cut-off
Loss of Communication, Water Supply
Faulting along C5: Road Damage
Flyover Libis-Katipunan Collapse
Buildings and Hotels Collapse
Casualties/ Injuries
Loss of Lives
Work, school, suspension
Contamination of Waterways
Liquefaction in Brgy.
Bagumbayan
Residential Fire
Industrial Fire (e.g. Gas station,
Factories)
Industrial & Chemical Leaks in
Bagumbayan
Residential Areas prone to
landslide
Food/Medical Shortage
Security Threat (Chaos among
civilians), looting
Closure of business/transactions
Prolonged restoration of
electrical & water supply
Hampered PNP & other law
enforcement response
Institutional and
Land Use
Administrators
Bagong Silangan
Batasan Hills
Matandang Balara
Pansol
St. Ignatius
Blue Ridge B
White Plains
Bagumbayan
Ugong Norte
Libis
Roads & Bridges Damage
Building Damage Government Offices, Churches Batasan National HS Batasan ES BagongSilangan ES Bagong Silangan HS QC Polytechnic University Ateneo de Manila University Miriam College LupangPangako ES Payatas-A ES
Liquefaction Batasan Hills B. Silangan Bagumbayan Ugong Norte
Landslide Matandang Balara BatasanHIlls B. Silangan

216
Table R-12 : Summary of the Impacts to Sectors from a M7.2 Earthquake from the West Valley Fault
Core Elements Primary Hazards: Faulting, shaking,
liquefaction, landslide
Primary Damage: Building/Structural
Non- structural/Equipment Primary Loss:
Life/Injury, Repair Costs, Function,
Communication/Control
Secondary Hazard/Damage:
Liquefaction. Landslide Fire, Hazmat, Flooding…
Secondary Loss: Business /Operations Interruptions, Market
Share, Reputation Corazon Aquino ES Daycare centers Health care centers Private schools Hospitals Barangay halls Commercial and industrial establishments (in Libis)
Fire High-density areas, communities
Flooding Access issues Extra human loss
Table R-13 : Summary of Consequences to Sector of a M7.2 Earthquake Including Initial Recommendations to Reduce the Consequences
Core Elements Consequences to Sector of
M7.2 EQ Initial Recommendation
Population 1. Loss of Life, Possible injuries
2. Destruction of the environment
3. Loss of properties or infrastructure
1. Reduce % of deaths through increasing the level of awareness on DRRM in the community
2. Greening the buffer zone of the fault line (5m on both sides)
3. Strict implementation of the National Building Code. 4. Relocation of the ISF located along the fault line 5. Proper Waste Management 6. Reduce risk by: Identifying hazards 7. Empowerment of the people
Economic Activity 1. Landslide 2. Roads & Bridges Damage 3. Shortage of Relief Goods
(Foods and Medicine)
1. Resettlement of I.S.F. 2. Construct EQ-proof bridges and all other roads and
frequent inspections 3. Pre-deployed relief good to strategic areas
Access to Income/
Services
1. Casualties and injuries 2. Damaged school buildings 3. Damaged roads and bridges
1. Preparedness Drills 2. Retrofitting of treatment plants 3. Education 4. Advocacies 5. Capacitate vulnerable groups 6. Relocation 7. Train health personnel and community on first aid,
rescue and water sanitation & hygiene 8. Capacitate community - provide emergency kits and
logistics for primary care services 9. Coordination & networking 10. Inspection of roads and bridges 11. Retrofitting and repair 12. Identify alternative routes to transport people,
supplies and other needed resources
Emergency
Management and
First Responders
1. Landslide in Residential areas (Blue Ridge B)
2. Civil unrest (Brgy. Libis 3. Chemical Leak (Fire)
1. Provide early warning signage 2. IEC (Trainings & Drills) materials 3. Relocation of ISFs from danger zones 4. Identification of evacuation centers 5. Prepare contingency plan on the part of PNP during

217
Table R-13 : Summary of Consequences to Sector of a M7.2 Earthquake Including Initial Recommendations to Reduce the Consequences
Core Elements Consequences to Sector of
M7.2 EQ Initial Recommendation
civil unrest 6. Frequent exercise of fire and EQ drills 7. Conduct Barangay-Ugnayan 8. Identify the kinds of chemicals present 9. Contingency plan in cases of emergency, in
coordination with QC BFP
Institutional and
Land Use
Administrators
1. Depreciation of Land Values 2. Structural Damage
(Infrastructure) 3. Disruption of government
services and operations
1. Conversion of Use 2. Repair and rehab (make the structures more resilient) 3. Strict Compliance & implementation of the National
Building Code and Zoning Ordinance 4. Review and revision of the CLUP 5. Identify areas where the services & operations can
resume
Physical Resources 1. Contamination of waterways
2. Uprooting of trees 3. Accumulation of wastes
1. Invest on Earthquake-resistant drainage systems 2. Retrofitting of treatment plants 3. Reinforcement of huge old trees 4. Continuous improvement of the existing disposal sites 5. Retrofitting of roads
In 2015, the DOST-PHIVOLCS in close coordination with the Quezon City Government made an
earthquake hazard assessment relative to real estate properties directly transected or located near
the West Valley Fault. Based on the assessment, it revealed that there are six hundred fifty nine
(659) lots that are directly transected by the WVF, while sixty two (62), fifty-four (54), forty-six (46)
and forty-two (42) lots that are located approximately one (1), two (2), three (3), and four (4) meter
away from the WVF respectively. Table 16 reveals the number of real estate properties transected
or located near the WVF.
Table R-14: QC Number of Real Estate Properties Transected or Located near the WVF
Barangay
Assessment Relative to the West Valley Fault (WVF)
No. of real estate
properties transected by
the WVF
No. of real estate
properties approx. 1 meter away from the
WVF
No. of real estate properties
approx. 2 meter away from the
WVF
No. of real estate properties
approx. 3 meter away from the
WVF
No. of real estate
properties approx. 4
meter away from the WVF
Total
Bagong Silangan 181 24 20 18 10 253
Batasan Hills 235 27 20 15 13 310 Matandang
Balara 59 2 1 2 5 69
Pansol 33 - 2 3 4 42 Blue Ridge B 9 2 - - - 11
Libis 14 1 2 1 1 19 White Plains 31 4 5 4 1 45 Bagumbayan 48 1 2 2 3 55 Ugong Norte 49 3 2 1 5 60
TOTAL 659 62 54 46 42 864 Source: DOST-PHIVOLCS

218
7.1.3 Anthropogenic Hazards
Anthropogenic hazards also known as human-made hazards which can result in the form of a
man-made disaster. “Anthropogenic” means threats having an element of human intent, error or
negligence or involving a failure of a man-made system causing one or more identifiable disastrous
events. This hazard may include fire, industrial explosion, stampede, and terrorism
Fire
Fire Incidence
For the year 2015-2018, Quezon City had a total of 4,362 reported fire incidents with a total
estimated amount of damages of P224M. Year 2016 recorded the most number of fire incident at
1,248 occurrences while year 2016 had the highest cost of damages at P123.42M. Yearly, the average
number of fire incident is 1,091 while the average cost of damages is P56M.
Over the four-year period, electrical (e.g. faulty wiring, etc.) is the leading fire incident type
reported with an average of 744 occurrences a year. This is followed by cigarette butt/smoking with
about 157 fire incidents a year and unknown/others with an average of 82 fire incidents a year.
Most of the fire incidents were accidental in nature averaging 743 per year. In terms of nature,
structural account the most at an average of 418 fire occurrences a year.
Table R-15 : Comparative Number of Reported Fire Incident
nd Estimated Damages: 2015-2018
FIRE INCIDENTS BY TYPE 2015 2016 2017 2018
Ave. Number Percent Number Percent Number Percent Number Percent
Causes of Fire
Electrical 793 52.32 733 50.73 705 67.20 743 71.86 744
Combustible/Heat Bonfire 10 0.97 2 0.16 7 0.68 17 1.64 9
Open Flames/Cooking
45 3.60 56 5.34 56 5.42 39
Cigarette Butts Smoke 159 17.12 198 15.87 130 12.39 142 13.73 157
Fireworks/Explosive Sparks
2 0.19 1 0.10 1
Flammable Liquids
4 0.38 2 0.19 2
LPG Tanks/Stove 20 1.93 34 2.72 54 5.15 17 1.64 31
Unknown/Others
236 18.91 91 8.67
82
Unattended Cooking Stove 19 1.84
5
Unattended Lighted Candle
14 1.35
4
Under Investigation 16 24.47
56 5.42 4 TOTAL 1,031 100 1,248 100 1,049 100 1,034 100 1091
Motives
Intentional 9 1.26 4 0.32 6 0.57 4 0.39 6 Accidental 1009 74.27
990 94.38 974 94.20 743

219
Table R-15 : Comparative Number of Reported Fire Incident nd Estimated Damages: 2015-2018
FIRE INCIDENTS BY TYPE 2015 2016 2017 2018
Ave. Number Percent Number Percent Number Percent Number Percent
Under Investigation 16 24.47 1,244 99.68 53 5.05 56 5.41 342 TOTAL 1034 100 1,248 100 1049 100 1034 100 1091
Nature
Structural 794 76.79 389 31.17 264 25.17 223 2.57 418 Vehicular
86 6.89 73 6.96 62 6.00 55
Grass
104 8.33 19 1.81 35 3.38 40 Chemical
2 0.16 52 4.96 16 1.55 18
Rubbish 174 16.83 93 7.45 104 9.91 119 11.55 123 Forest
Ship
Transformer explosion
1 0.10
0.3
Post fire
240 19.23 207 19.73
112
Secondary Wire
9 0.86
2
Service Entrance
6 0.57
2
Electric Fan
10 0.95
3
Tree Fire
Transmission Line/High Tension
Others (Electrical Fixture)
66 6.38 334 26.76 304 28.98 579 6.00 321
TOTAL 1,034
1,248 100 1,049 100 1,034 100 1091
Estimated Damages (in Pesos)
53,127,200.00 123,420,964.86 25,409,600.00 22,407,300.00 56,091,266.
22
Fire Protection and Prevention
Fire protection and prevention services are rendered by the Quezon City Fire District (QCFD)
which has twenty-six (26) fire sub-stations in 2018 against only 24 fire sub-stations in 2015. These
facilities are distributed to the city’s six (6) congressional districts.
In 2018, there are 576 firefighters or an additional 5 firemen from the 571 firemen in 2015
complemented by 35 civilians. There are also 47 fire aides that are provided by the city government.
At present firemen-population ratio is at 1:5,278 which is below the standard ration of 1:2,000.
With this ratio, there is a shortage of 944 firemen.
Quezon City has 27 firefighting vehicles, but only 21 are operational. There are also two (2)
emergency vehicles, however, only one (1) is functional. Two (2) aerial ladders are also available.
The 2018 fire-substation to land area ratio is 1:6 sq.km. This is below the standard ration of
1:4 sq.km. This also means that one (1) fire sub-station has double the land area it has to cover. The
city’s required number of fire sub-station is 40. With the existing 26 fire sub-stations, there is a
shortage of 14 sub-stations.

220
Industrial Hazards
Industrial hazards are threats to people and life-support systems that arise from the mass
production of goods and services. When these threats exceed human coping capabilities or the
absorptive capacities of environmental systems they give rise to industrial disasters. Industrial
hazards can occur at any stage in the production process, including extraction, processing,
manufacture, transportation, storage, use, and disposal. This usually occurs in the form of explosions,
fires, spills, leaks, or wastes. Releases may occur because of factors that are internal to the industrial
system or they may occur because of external factors. Releases may be sudden and intensive, as in a
power-plant explosion, or gradual and extensive, as in the build-up of ozone-destroying chemicals in
the stratosphere or the progressive leakage of improperly disposed toxic wastes.
Industrial Explosion
Industrial explosion involves the production of a pressure discontinuity or blast wave resulting
from a rapid release of energy. A pressure disturbance is generated into the surrounding medium. Air
becomes heated due to its compressibility and this leads to an increase in the velocity of sound,
causing the front of disturbance to steepen as it travels through the air. The loading and hence the
damage to the nearby targets are governed by the magnitude of and duration of pressure waves. The
explosion mainly occurs due to the rapid combustion of a flammable material but can be brought
about by the chemical reactions other than combustion, provided they release large amount of
energy (heat).
Types of Industrial Explosion
Chemical Explosion
Chemical explosions in plant or in vessel can arise due to exothermic reaction occurring
internally. Such reaction may involve decomposition of unstable substances, polymerization of
monomers, or combustion of fuel oxidant mixtures. Heating and increase of molecular number can
result in a rise in pressure to the bursting point of the vessel, and explosives decompose so quickly
that confinement and the development of pressure are self-imposed.
Physical Explosion
Physical Explosion occurs simply due to over pressure as in the case of steam boiler and air
receiver explosions. Fire is not necessarily a consequence. But fire involving stock, buildings and
plant ancillaries can cause physical explosions due to overheating followed by overpressure in
vessels and also fireballs if contents are flammable.
Industrial establishments commonly used hazardous substances. Said substances are
compounds and mixtures that pose a threat to health and property because of their toxicity,
flammability, explosive potential, radiation or other dangerous properties. Hazardous chemicals may
present physical hazards, although this is more common in transportation and industrial incidents.
Common causes of industrial explosion: Boilers that are not properly cared for; Careless cigarette smoking while on premises; Malfunctioning and dangerous equipment;

221
Improper maintenance of machinery; Unseen corrosion; The use of impure or dirty chemicals; and Failing to properly train all employees. Environmentally-sound management of these hazardous chemicals being produced, stored, used,
treated or disposed of in industrial facilities should be done to minimize the incidence of explosion.
Incidence of Industrial/Gas Explosion
In 2012, incidence of gas leakage was reported in Barangay Sta. Cruz where about 300 people
was affected. Some of the victims were temporarily sheltered in the barangay hall while some were
brought to the hospital due to eye irritation and difficulty in breathing. It was known that the gas
that has leaked was Ammonia or “anhydrous ammonia” a colorless, corrosive and highly irritating
gas with suffocating smell that can irritate or burn the nose, throat and respiratory tract, eyes and
skin and can cause dizziness and nausea among victims. Ammonia is commonly used refrigerant in
large freezing and refrigeration plants such as those involved in ice making, dairy products
manufacturing and cold storage.
Meanwhile, fume leakage was also experienced in Barangay Pinyahan. Said fumes leaked from
a chemical tank which was described as the smell of a muriatic acid. Victims of such leak were
brought to hospitals.
Another incident was in Bgy. Pinyahan, wherein several people were hospitalized due to fumes
that leaked from a chemical tank which was described the smell to that of muriatic acid.
Industrial explosion may possibly occur in industrial establishments under high risk category
such as big scale manufacturing industry, junkshops, gasoline station, LPG retailer, etc.
Mass Hysteria/Stampede
The term stampede was derived from the 19th Century Mexican Spanish word “estampida”
which means “uproar” (Encarta Encyclopedia DVD Premium, 2009). It is an uproarious occurrences
characterized by a sudden headlong surge of crowd in an uncontrolled rush for safety or competitive
scramble for a valued objective.
Stampede is an act of mass impulse, which occurs in times of “massive flight’ or “massive craze’
response (Fruin,1993:4). In this sense, the occurrence of stampede is a consequence of impulsive
response to a stimulus. The stimulus can be a sense of imminent danger or an attempt to get the
better of the crowd in the context of a competitive struggle for advantage such as viewing an event or
person, or gaining a privileged seat in a stadium, material advantage, among others. Other possible
triggers of stampede include fire outbreak, riots, gun fire, explosions and false alarm purporting
safety threats.
Stampede situations are characteristically chaotic. These situations are marked by mass
freight, anxiety, distress and panic. In large stampedes there are large injuries and fatalities resulting
from pushing, trampling and crushing.

222
Effects of Stampede
The crowds, or the large concentration of people, occur frequently in the modern society particularly
during religious gatherings or pilgrimages, large-scale sporting, music or entertainment events.
Crowded situations are inherently disaster-prone or stampede-prone. Human stampede is a typical
instance of a crowd disaster (Fruin, 1993, 2010: Helbing & Mukerji, 2012;Still, 2014).
Hereunder are some prominent circumstances wherein a human stampede is likely to occur:
Mass political gatherings such as rallies, campaigns
Large scale social events
Mega sporting events
Religious festivals such as pilgrimages, mass initiation
Massive job selection screening
Complex emergency situations such as terrorists attacks, military siege
Natural disaster situations such as the occurrence of earthquake, flood, tsunamis, etc.
As a form of disaster, stampede has critical consequences such as the following:
Loss of life. Traumatic asphyxia being the most common cause of death and serious injuries.
Asphyxia is defined as the lack of oxygen or excess of carbon dioxide in the body that results in
unconsciousness and often death.
Human injury
Structural damage of public facilities
Psychological trauma or distress
Loss of material valuables
Causes of stampede
The true cause of human stampede does not rest with the crowd per se; it is rather a
consequence of systematic failures in respect of space crowd control cum optimization (Helbing &
Mukerji, 2012). As briefly observed by Fruin (1993:1), “Crowds occur frequently, usually without
serious problems. Occasionally, venue inadequacies and deficient crowd management results in
injuries and fatalities”. One of the most culpable risk factors in crowd disaster is poor or ineffective
utilization of space (Still, 2014).
Human stampede is a global phenomenon. It has occurred in various parts of the world over
the years.
Research on the Wikipedia revealed that there are thirty (30) notable world’s human
stampede that occurred in 2005-2013:

223
Incidentally, one of the human stampedes listed above occurred in the Philippines, known as
the Wowowee Stampede. This incident happened on February 4, 2006 at the Philsports Football
Stadium (formerly ULTRA) in Pasig City. The stampede resulted in the loss of many lives and injured
Table R-16 : List of human stampedes across the world: 2005-2018
Date of Occurrence Event/Location Casualties
January 2005 Hindu pilgrims stampede/Maharashtra, India 265 people died August 31, 2005 Baghdad bridge 1000 people died December 2005 Flood relief supplies distribution/Southern India 42 people died January 12, 2006 Stoning of the Devil Ritual/Jamarat Bridge,
Mecca 345 people died
February 4, 2006 First Anniversary of ABS-CBN’s Wowowee/Philippines Sports Arena, Philippines
78 people died, hundreds injured
September 12, 2006 Governorate, Yemen 51 people died and more than 200 injured
June 2, 2007 Football game between Zambia and Republic of Congo/Chililabombwe, Zambia
12 people died
October 3, 2007 Train station in Northern India 14 women died October 5, 2007 Public execution in a stadium/Sunchon, North
Korea 6 people died and more than 30 injured
November 11, 2007 Carrefour Supermarket sale on cooking oil/Chongging, China
3 people died and more than 30 injured
March 27, 2008 Indian Temple Pilgrimage/India 8 people died and 10 injured June 20, 2008 Police raid/ Mexico Nightclub, Mexico 12 people died and 13 injured August 3, 2008 Rain shelter collapse/Naina Devi Temple,
Himachal Pradesh, India At least 162 people died and 47 injured
September 14, 2008 Football match/Butembo, Democratic Republic of Congo
11 people died
September 20, 2008 Chamunda Devi Temple/Jodhpur, India 147 people died October 2, 2008 Children’s Dance Hall/Tanzania 20 children died March 29, 2009 World cup qualifier/Houphouet-Boigny Arena 19 people died and 130 injured March 4, 2010 Ram Janki Tempe, Kunda, India 71 people died and over 200
injured May 4, 2010 Remembrance of the Dead/Dam Square,
Amsterdam 63 peopled injured
June 6, 2010 Soccer Match between Nigeria and North Korea/Makulong Stadium
14 people injured
July 24, 2010 The Love Parade/Duisburg, Germany 21 people died and more than 500 injured
November 22, 2010 Water Festival/Phnom Penh At least 347 people died January 15, 2011 Sabarimala Temple, Kerala, India 102 people died; 100 people
injured January 15, 2011 Budapest 3 girls died; 14 people injured November 8, 2011 Religious Ceremony, Haridwar, India 16 people died January 1, 2013 New Year’s Firework, Abidian, Ivory Coast 60 people died; 200 injured January 1, 2013 New Year,s Eve Vigil, Estadio da Cidadela 10 people died; 168 injured January 23, 2013 Night Club fire, Santa Maria, Barzil 242 people died;168 injured February 10, 2013 Hindu Festival Kumph Mela, Train Station in
Allahabad, Uttar Pradesh, India 36 people died; 39 injured
October 13, 2013 Hindu Festival, Madhya Pradesh, India 115 people died; more than 100 injured
November 19, 2017 food-aid distribution in Sidi Boulaalam, Morocco 15 women; 40 women injured December 18, 2017 Exiting sloped gateway into the Rima
Community Center 10 people died; more than 50 injured
June 16, 2018 Caracas, Venezuela 21 people died

224
hundreds of people from the almost 30,000 people who waited in long queue outside the stadium to
participate in the said event. According to reports, most of the victims were elderly women who
were crushed against a steel gate on the stadium’s slope entrance and one child also died. A fact-
finding team created to investigate the case revealed that there was lack of coordination between the
security guards of the organizers, PhilSport security guards, local police and relevant government
agencies and the absence of a worked-out contingency plan for the huge crowd.
It may also be recalled that a stampede occurred when a fire broke out in the Ozone Disco
Nightclub in Quezon City on the tragic night of March 18, 1996 where there were reported 162
deaths and 95 injuries.
Generally, the cases of human stampede have resulted in massive human injury as well as
appreciable death tolls.
Quezon City is not spared from possible occurrences of stampede due to the presence of big
shopping malls, concert, sports, entertainment venues such as the Araneta Coliseum, SM Skydome,
etc. The existence of the Light Rail Transit (LRT) and Metro Rail Transit (MRT) is also potential
location of human stampede.
The following are some suggestions on how to mitigate this form of disaster:
For planned mass gatherings or where mass crowd is anticipated
Make sure that the infrastructure such as roads, corridors, open spaces, entrances and exits is
suitable for the mass gathering so that there is enough capacity and there are no bottlenecks or
other compression points.
There should be crowd management plan that is followed, which includes crowd monitoring,
scheduling and control.
There should be good contingency plans (e.g. evacuation) in case anything goes wrong
Creation of functional mobile clinics.
Provision of stationary ambulance(s).
Provision of well multiple “marked and manned” emergency entrances and exits in public event
centers.
There should be pragmatic crowd control mechanism based on pro-active and early warning
techniques to prevent occurrence of crowd disasters.
Optimization of human volume and movements at public event centers to avoid stiff congestion
as well as pressure on available space and facilities.
Terrorism
Terrorism, as defined by Merriam-Webster dictionary, is the systematic use of terror especially
as a means of coercion. It is the unlawful use of force or violence by a person or an organized group
against people or property with the intention of intimidating or coercing societies or government,
often for ideological or political reasons. In the Philippines, terrorism perpetrated by rebel
organizations against the government, its citizens and supporters. Most terrorist acts in the country
are conducted by separatist groups like the Moro Islamic Liberation Front (MILF), Moro National
Liberation Front (MNLF) and the Abu Sayyaf Group (ASG). The Philippine government is also fighting
a long running war with the communist New People’s Army who are much larger that the Islamic
terrorist groups.

225
Trauma, 1874, 51%
Medical Case, 1075, 30%
Fire Incident, 143, 4%
Stand by, 389, 11%
Others, 156, 4%
Figure 24 : Type of Incidents Reported and Responded to by QCDRRMO Rescue 2018
Public mass transport and places of big gatherings such as churches, street markets and people
assemblies are favorite targets of terrorists.
Since 2000, Islamic separatist forces have carried over 40 major terrorist attacks, mostly
bombing, against civilians and properties. These mostly happened in the southern region of the
country like Basilan, Jolo and other nearby islands. Numerous attacks have also been carried out in
and around Metro Manila.
Incidence of Terrorism
The Rizal Day bombings were a series of bombings that occurred during a national holiday
(December 30, 2000) in close sequence within a span of a few hours. More than twenty (20) fatalities
were reported and about a hundred more were non-fatal injuries. The blast occurred in five (5)
different locations in Manila namely: Plaza Ferguson in Malate; cargo handling area of the Ninoy
Aquino International Airport; at a gasoline station along EDSA across the Dusit Hotel in Makati City;
inside a bus while travelling along EDSA and a train cab at the Blumentritt Station of the LRT Line 1.
The explosion at the LRT Line 1 claimed the most number of casualties. Three of the several arrested
members of the Jemaah Islamiyah were later sentenced by the Manila Trial Court of imprisonment
for multiple murder and multiple frustrated murder.
In Quezon City, one recorded terrorist act is the vehicle bomb explosion which happened on
November 13, 2007 near the south lobby of the main building of the House of Representatives and
claimed the lives of six (6) people including Basilan congressman Wahab Akbar and his congressional
aides. Several staffs were also hospitalized in the attack. It was alleged that the Abu Sayyaf group
claimed responsibility for the act.
INCIDENTS RESPONDED BY THE CITY
The Quezon City Disaster Risk Reduction and Management Office (QCDRRMO) is the lead
agency of the City to matters related to local disaster risk reduction and management. The Office
oversees DRRM plans, programs, projects, activities and formulates policies related to its mandate.
Since its establishment in 2014, the QCDRRMO has demonstrated its capability to handle
disaster response operations. The goal of disaster respone is to provide life preservation and meet
the basic subsistence needs of the affected population based on acceptable standards during or
immediately after a
disaster. In normal
situations in which
disaster response is not
required from the
QCDRRMO, the
QCDRRMO Rescue
provides 24/7
emergency medical
services and
consequence
management to incidents
reported through the QC
122 hotline.

226
1,342
338
1497
377
0
200
400
600
800
1000
1200
1400
1600
VEHICULAR ACCIDENT SUICIDE ATTEMPTS
TRAUMA CASES
2017 2018
Figure 25 : Dispatch/Response Operations for Trauma Cases 2017 V.S. 2018
In 2018 alone, a total of 3,637 incidents and events (planned or emergency) were responded
to or attended by the QCDRRMO Rescue. More than half (51%) are trauma incidents while 30% are
medical cases. The rest consist of operations for consequence management in fire incidents, calls for
standby medical teams, and other special requests such as support in camp management, tree-
cutting, ocular inspections of risk areas, etc.
Trauma Cases
Also In 2018, a total of 1,874 trauma cases were responded to by the QCDRRMO. These
trauma cases include those that are cause by vehicular accidents and suicide attempts. The office
received a peak in calls around March, May, and June.
Trauma cases responded to increased from 1,680 to 1,874 while there had been an increase of
131 medical cases this year as well. Aside from the increase in population and vehicle volume within
the city, improved community awareness to the QC Response Hotline 122 contributed to the increase
in reported cases to the QCDRRMO. This is also attributed to the enhanced capability of the city to
respond to more cases that were previously unattended due to lack of manpower, vehicles, and
equipment.
In all of the reported trauma cases,
1,249 people treated by the QCDRRMO were
injured from vehicular accidents while 296
were injured in suicide attempts.
Month No. of Reported
Incidents
March 185
May 184
June 182
December 163
January 161
April 160
February 158
July 157
October 144
September 139
August 130
November 111
TOTAL 1,874
920
213
1249
296
0
200
400
600
800
1000
1200
1400
VEHICULAR ACCIDENT SUICIDE ATTEMPTS
2017 2018
Figure 26 : Injured Persons in Trauma in 2017 V.S. 2018

227
944
1075
850
900
950
1000
1050
1100Medical Cases
2017 2018
Figure 27 : Dispatch/Medical Operations for Medical Cases 2017 vs 2018
Medical Cases
A total of 1,075 medical cases were responded to by the QCDRRMO. Medical cases include
request calls for hypertension, stroke, cardiac arrests, difficulty in breathing, poisoning, etc. The
office received the most number of medical calls in May and December, with January, June and
August close behind.
Operationalization of the Incident Command
System
The following are the planned and unplanned
incidents that have been managed by the QCDRRMO
using the Incident Command System for the year
2018:
Legislations Relative to Disaster Risk Reduction
and Management
ORDINANCE NO. SP 1560, S-2005 An ordinance
mandating that all personnel of Barangay Disaster
Coordinating Councils in Quezon City should
undergo periodic and refresher courses in Safety
and Disaster Prevention and Mitigation in order to
improve the capability of such councils to
immediately address such incidents and problems in their areas of jurisdiction.
EXECUTIVE ORDER NO. 23 SERIES OF 2010, Organizing the Quezon City DRRMC and defining
the functions, the composition and the specific roles and responsibilities of its members.
EXECUTIVE ORDER NO. 71 SERIES OF 2011, Creating a special task group called the West
Valley Fault Task Group under the Quezon City DRRMC. This group is tasked to focus on
Month No. of Reported
Incidents May 99
December 99
January 95
June 95
August 95
October 93
September 92
March 87
November 81
July 87
April 77
February 75
TOTAL 1,075
Table R-18 : 2018 List of Incidents Managed by the City (DRRMO) Using
Incident Command System (ICS)
Activity Date
1st Quarter National
Simultaneous Earthquake Drill Feb 15
Holy Week Mar 29 – Apr 01
TY Domeng Apr 09-11
TY Henry Jul 17
Metro Shake Drill Jul 19
SONA Jul 22-23
TY Karding Aug 11-12
TY Maring Sep 12
STY Ompong Sep 14-15
Smart Cities Summit 2018 Oct 18
TY Rosita Oct 29-31
OPLAN Undas Nov 01-02

228
earthquake mitigation measures and to ensure the safety of the inhabitants within the five (5) to
ten (10) meter buffer zone of the west valley fault, and to determine the response of the Quezon
City Government (QCG). The task group is led by the city vice mayor and represented by different
offices of the QCG.
EXECUTIVE ORDER NO. 5 SERIES OF 2013, Establishing and tasking the Quezon City Disaster
Risk Reduction and Management Office (QC DRRMO) to begin a coherent, integrated, proficient
and responsible management system to address all forms of disasters, reduce risk to human life
and property, mitigate potential damage and destruction including the implementation of fast
recovery and rehabilitation efforts in post-disaster conditions.
ORDINANCE NO. SP-2290, S-2014, Creating the Quezon City Disaster Risk Reduction and
Management Office (QC DRRMO), defining its functions, duties and responsibilities, providing for
its composition, appropriating funds thereof and for other purposes.
RESOLUTION NO. SP-6006, S-2014, Requesting the City Mayor, Honorable Herbert M. Bautista,
to direct the concerned Department/Office of the Quezon City Government who are desiring to
be disaster volunteers for accreditation in the Quezon City Disaster Risk Reduction and
Management Office and the barangay where the employee-volunteers is residing.
ORDINANCE NO. SP-2262, S-2014, Mandating all private and public school teaching and non-
teaching personnel to undergo Risk Reduction Training pursuant to Republic Act No. 10121,
otherwise known as the Philippine Disaster Risk Reduction Management Act 2010.
QCDRRMC Resolutions that have been approved by the QCDRRMC during the council
meetings in 2018:
QCDRRMC Nr 2018-01
A RESOLUTION EXTENDING IMMEDIATE ASSISTANCE TO THE LOCAL GOVERNMENT UNITS IN
THE PROVINCE OF ALBAY WHICH ARE ADVERSELY AFFECTED BY THE ERUPTION OF MAYON
VOLCANO THRU THE “MAYON CARAVAN”
QCDRRMC Nr 2018-02
A RESOLUTION ADOPTING THE MUNICIPALITIES OF BUINOBATAN, CAMALIG, DARAGA, STO.
DOMINGOMALILIPOT, BACACAY ANC CITIES OF LIGAO, LEGAZPI AND TABACO, ALL IN THE
PROVINCE OF ALBAY TO BE FPROVIDED WITH FINANCIAL AND OTHER MEANS OF
HUMANITARIAN SUPPORT BY THE QUEZON CITY GOVERNMENT IN THE AMOUNT OF NINE
MILLION PESOS (PHP 9,000,000.00)
QCDRRMC Nr 2018-03
A RESOLUTION EXTENDING ONE MILLION PESOS (PHP 1,000,000.00) TO THE PROVINCE OF
ALBAY AND OTHER MEANS OF HUMANITARIAN SUPPORT BY THE QUEZON CITY
GOVERNMENT
QCDRRMC Nr 2018-04
A RESOLUTION ADOPTING THE UPDATED “QUEZON CITY CONTINGENCY PLAN FOR
EARTHQUAKE” SUBJECT TO ALL LAWS AND EXISTING LEGAL RULES AND REGULATIONS

229
QCDRRMC Nr 2018-05
A RESOLUTION EXTENDING FINANCIAL ASSISTANCE TO THE CITY OF ORMOC LEYTE
THROUGH THE LOCAL DISASTER RISK REDUCTION AND MANAGEMENT FUND IN THE
AMOUNT OF THIRTY-FOUR MILLION TWENTY-SIX THOUSAND NINE HUNDRED TWENTY-NINE
PESOS AND TEN CENTAVOS (PHP 34,026,929.10) FOR THE REHABILITATION OF THE ORMOC
GRANDSTAND, FOLLOWING THE MAGNITUDE 6.5 EARTHQUAKE IN LEYTE LAST 6 JULY 2017
QCDRRMC Nr 2018-06
A RESOLUTION ADOPTING THE “QUEZON CITY DISASTER RISK REDUCTION AND
MANAGEMENT PLAN (QCDRRMP 2018)”, SUBJECT TO ALL EXISTING LAWS RULES AND
REGULATIONS
QCDRRMC Nr 2018-07
A RESOLUTION FORMALIZING THE AGREEMENTS AMONG THE HOSPITALS AND OTHER
MEDICAL FACILITIES LOCATED ALONG THE NOVALICHES AREA AND TO SUBSUME THEIR
RESOURCESUNDER THE HEALTH RESPONSE CLUSTER OF THE CONTINGENCY PLAN FOR
EARTHQUAKE
QCDRRMC Nr 2018-08
A RESOLUTION ALLOCATING AN AMOUNT OF PHP 100M (ONE-HUNDRED MILLION) PESOS IN
THE LDRRMF AS FINANCIAL ASSISTANCE TO PHILIPPINE LOCAL GOVERNMENT UNITS
AFFECTED BY DISASTERS OR COMPLEX EMERGENCIES IN ACCORDANCE WITH RELEVANT
LAWS AND EXISTING RULES AND REGULATIONS
QCDRRMC Nr 2018-09
A RESOLUTION REQUIRING BUSINESSES, EDUCATIONAL INSTITUTIONS, AND HEALTH CARE
FACILITIES TO SUBMIT THEIR DRRM PLANS, CONTINGENCY, EMERGENCY PLANS AND OTHER
RELATED PLANS TO THE QUEZON CITY GOVERNMENT FOR INTEGRATION INTO THE CITY’S
PLANS FOR DRRM
QCDRRMC Nr 2018-10
A RESOLUTION ADOPTING THE “UNEXPENDED FUND 2013-2017” SUBJECT TO ALL RELEVANT
LAWS AND EXISTING RULES AND REGULATIONS
QCDRRMC Nr 2018 – 11
A RESOLUTION ADOPTING THE UPDATED “QUEZON CITY CONTINGENCY PLAN FOR
HYDROMETEOROLOGICAL HAZARDS – EXTREME RAINFALL” SUBJECT TO RELEVANT LAWS
AND EXISTING RULES AND REGULATIONS
QCDRRMC Nr 2018 – 12
A RESOLUTION ADOPTING THE “LOCAL DISASTER RISK REDUCTION AND MANAGEMENT FUND
AND QUICK RESPONSE FUND FOR FISCAL YEAR 2019” SUBJECT TO RELEVANT LAWS AND
EXISTING RULES AND REGULATIONS

230
QCDRRMC Nr 2018- 13
A RESOLUTION ADOPTING THE “QUEZON CITY DISASTER RISK REDUCTION AND
MANAGEMENT PLAN (QCDRRMP 2018)”, SUBJECT TO ALL EXISTING LAWS RULES AND
REGULATIONS
QCDRRMC Nr 2018- 14
A RESOLUTION ADOPTING “QUEZON CITY CONTINGENCY PLAN FOR HIGH DENSITY
POPULATION GATHERINGS” SUBJECT TO RELEVANT LAWS AND EXISTING RULES AND
REGULATIONS