2018 Chittenden County ECOS Plan
103
2018 Chittenden County ECOS Plan Supplement 5 – Metropolitan Transportation Plan Second Public Hearing Draft 4/6/2018 For a healthy, inclusive, and prosperous community This plan is the Regional Plan, Metropolitan Transportation Plan, and Comprehensive Economic Development Strategy in one. This plan can be found online at: www.ecosproject.com/plan
-
Upload
khangminh22 -
Category
Documents
-
view
2 -
download
0
Transcript of 2018 Chittenden County ECOS Plan
2018 Chittenden County ECOS Plan
Supplement 5 – Metropolitan Transportation Plan Second Public Hearing Draft 4/6/2018
For a healthy, inclusive, and prosperous community
This plan is the Regional
Plan, Metropolitan
Transportation Plan, and
Comprehensive Economic
Development Strategy in
one.
This plan can be found
online at:
www.ecosproject.com/plan
2018 Chittenden County ECOS Plan
ii
Contents
METROPOLITAN TRANSPORTATION PLAN ........................................................................................ 1
INTRODUCTION AND BACKGROUND 1
TRANSPORTATION GOAL, ISSUES, AND SUMMARY OF MTP INVESTMENTS 3
ISSUES, TRENDS, OBSERVATIONS & SUMMARY OF MTP INVESTMENTS .......................................................... 3
SUMMARY OF MTP INVESTMENTS ............................................................................................................... 5
KEY TRANSPORTATION INDICATORS & PERFORMANCE MEASURES 6
PERFORMANCE MANAGEMENT .................................................................................................................. 11
EXISTING METROPOLITAN TRANSPORTATION SYSTEM 17
CURRENT TRANSPORTATION CONDITIONS ................................................................................................. 17
FINANCIAL PLAN 37
INTRODUCTION ......................................................................................................................................... 37
FINANCIAL PLAN PART 1: OVERALL CONSTRAINT ....................................................................................... 37
FINANCIAL PLAN PART 2: SYSTEM OPERATIONS & MAINTENANCE ELEMENT ............................................... 41
CONCLUSION AND PROPOSED FUTURE ALLOCATIONS ................................................................................ 43
SCENARIO PLANNING REVIEW AND FUTURE CONDITIONS 46
INTRODUCTION ......................................................................................................................................... 46
FUTURE TRANSPORTATION SCENARIOS ..................................................................................................... 47
SCENARIO RESULTS .................................................................................................................................. 49
MTP SCENARIO ........................................................................................................................................ 55
MTP SCENARIO RESULTS ......................................................................................................................... 56
MTP SCENARIO GREENHOUSE GAS EMISSIONS ........................................................................................ 60
MTP CORRIDORS 61
REGIONAL CORE ...................................................................................................................................... 62
NORTHERN CORRIDOR ............................................................................................................................. 66
NORTHEASTERN CORRIDOR ...................................................................................................................... 68
ROUTE 15 WEST CORRIDOR ..................................................................................................................... 69
SOUTHEASTERN CORRIDOR ...................................................................................................................... 70
VERMONT ROUTE 116 CORRIDOR ............................................................................................................. 71
EASTERN CORRIDOR ................................................................................................................................ 72
SOUTHERN CORRIDOR .............................................................................................................................. 74
CROSS COUNTY CORRIDOR ...................................................................................................................... 76
CORRIDOR SUMMARY ............................................................................................................................... 78
METROPOLITAN TRANSPORTATION PLAN INVESTMENTS AND PROJECT LIST 79
MTP MAJOR INVESTMENTS ....................................................................................................................... 79
2018 Chittenden County ECOS Plan
iii
MTP PROJECT LIST .................................................................................................................................. 81
ENVIRONMENTAL CONSULTATION AND MITIGATION 95
INTRODUCTION ......................................................................................................................................... 95
CONSULTATION BACKGROUND .................................................................................................................. 96
THE ECOS IMPACT IN DEVELOPING TRANSPORTATION STRATEGY ............................................................. 96
ENVIRONMENTAL MITIGATION .................................................................................................................... 97
List of Figures Figure 1 – Percent of Workers Commuting by SOV and Non-SOV ......................................................... 3
Figure 2 – Chittenden County Driving Alone to Work ............................................................................... 6
Figure 3 – Chittenden County Daily Vehicle Miles Traveled Per Person .................................................. 6
Figure 4 – Chittenden County Walking & Biking Infrastructure ................................................................. 7
Figure 5 – Sustainable Funding, System Preservation by Fiscal Year ..................................................... 7
Figure 6 – GMT Ridership in Chittenden County ...................................................................................... 8
Figure 7 – Number of Trips Provided by the Special Services Transportation Agency (SSTA) ............... 8
Figure 8 – CarShare Vermont Membership .............................................................................................. 9
Figure 9 – Chittenden County Electric Vehicle Registrations ................................................................... 9
Figure 10 – Number of Vehicle Crashes Per Million Annual Vehicle Miles Traveled in Vermont ........... 10
Figure 11 – Number of Reported Vehicle Crashes Involving Bicycles or Pedestrians in Vermont ......... 10
Figure 12 – Annual Fatalities & 5-Year Average Fatalities ..................................................................... 13
Figure 13 – Annual Serious Injuries & 5-Year Average Serious Injuries ................................................ 13
Figure 14 – 5-Year Fatality Rate ............................................................................................................. 14
Figure 15 – 5-Year Average Serious Injury Rate .................................................................................... 14
Figure 16 – Statewide Annual Bike & Pedestrian Fatalities and Serious Injuries ................................... 15
Figure 17 – Chittenden County Annual Bike & Pedestrian Fatalities and Serious Injuries ..................... 16
Figure 18 – Chittenden County VMT per Capita ..................................................................................... 19
Figure 19 – 2011 – 2016 Chittenden county vehicle crashes ................................................................. 21
Figure 20 – Chittenden county vehicle crashes resulting in deaths and injuries .................................... 22
Figure 21 – GMT Ridership: FY2000 - FY2016 ...................................................................................... 26
Figure 22 – Where do Chittenden County Employees Live? .................................................................. 36
Figure 23 – Vermont Federal Transportation Funding History in 2016 $ FY10 to FY16 ......................... 38
Figure 24 – Estimated Funding Shares 2016-2050 ................................................................................ 44
Figure 25 – Countywide Daily Delay per Capita ..................................................................................... 51
Figure 26 - Countywide Daily Vehicles Miles Traveled (VMT) ................................................................ 52
Figure 27 - Countywide Daily Total Vehicle Trips ................................................................................... 53
Figure 28 - Countywide Daily Vehicle Miles Traveled (VMT) per Capita ................................................ 54
Figure 29 - Countywide Daily Transit, Walking, and Biking Mode Split .................................................. 55
Figure 30 – Countywide Daily Greenhouse Gas Emissions ................................................................... 60
List of Tables Table 1 – Chittenden County Future Funding Estimates .......................................................................... 5
Table 2 – VTrans and CCRPC Safety Performance Targets 2018 ......................................................... 12
2018 Chittenden County ECOS Plan
iv
Table 3 – Amtrak Vermonter Ridership................................................................................................... 27
Table 4 – VTrans Federal Transportation Funding By Year ................................................................... 39
Table 5 – CCRPC’s Share of Statewide Federal Funds ......................................................................... 39
Table 6 – Projected Annual and Cumulative funding available for Chittenden county projects (millions)
at 3% annual inflation ............................................................................................................................. 40
Table 7 – Comparison of Chittenden county Federal funding history by project categories ................... 42
Table 8 – Projected Annual funding for new or committed project in Chittenden county (millions) ........ 43
Table 9 – Estimated Federal Funding for Chittenden County: Comparison of Maintenance Funding
Options ................................................................................................................................................... 44
Table 10 – Proposed 2050 Program Allocations .................................................................................... 45
Table 11 – Chittenden County Demographics ........................................................................................ 46
Table 12 – Scenarios for Transportation ................................................................................................. 47
Table 13 – MTP Scenario Description .................................................................................................... 56
Table 14 – Regional Core Strategies/Projects ........................................................................................ 65
Table 15 – Northern Corridor Strategies/Projects ................................................................................... 67
Table 16 – Northeastern Corridor Strategies/Projects ............................................................................ 68
Table 17 – Route 15 West Corridor Strategies/Projects ......................................................................... 70
Table 18 – Southeastern Corridor Strategies/Projects ........................................................................... 71
Table 19 – Vermont Route 116 Corridor Strategies/Projects .................................................................. 71
Table 20 – Eastern Corridor Strategies/Projects .................................................................................... 73
Table 21 – Southern Corridor Strategies/Projects .................................................................................. 75
Table 22 – Cross County Corridor Strategies/Projects ........................................................................... 77
Table 23 – Other Countywide Strategies/Projects .................................................................................. 78
Table 24 – MTP Project List by Municipality and VTRANS Capital Program Status - Federal Fiscal
years 2017 - 2050 .................................................................................................................................. 83
Table 25 – Possible Mitigation Strategies ............................................................................................... 98
List of Maps Map 1 – 2017 Metropolitan Transportation System ................................................................................ 18
Map 2 – 2015 Available Roadway Capacity (Volume/Capacity) ............................................................. 20
Map 3 – 2012-2016 High Crash Locations – Intersections .................................................................... 23
Map 4 – 2012-2016 High Crash Locations – Segments ......................................................................... 24
Map 5 – 2050 MTP Scenario Available Roadway Capacity (Volume/Capacity) ..................................... 57
Map 6 – 2050 MTP Scenario Levels of Delay (Delay/Mile) .................................................................... 58
Map 7 – 2050 MTP Scenario Delay Changes vs 2050 Base .................................................................. 59
Map 8 – Transportation Corridors ........................................................................................................... 63
Map 9 – Future Transportation Projects Map ......................................................................................... 94

2018 Chittenden County ECOS Plan
Introduction and Background | Metropolitan Transportation Plan 1
Metropolitan Transportation Plan
Introduction and Background
The MTP is the region’s principal transportation planning document that sets regional transportation
priorities. It consists of short- and long-range strategies to address transportation needs that lead to the
development of an integrated, inter-modal transportation system that facilitates the efficient movement
of people and goods.
As mandated by federal regulations, the MTP must both articulate and work towards the region’s
comprehensive long-range land use plans, development objectives, and overall social, economic,
environmental, system performance and energy conservation goals and objectives. It should also be
consistent with the statewide transportation plan. In addition, the CCRPC is required to make special
efforts to engage all interested parties in its development.
Federal regulations also mandate that the MTP considers the following:
• Ten planning factors:
“(1) Support the economic vitality of the metropolitan area, especially by enabling global
competitiveness, productivity, and efficiency;
(2) Increase the safety of the transportation system for motorized and non-motorized users;
(3) Increase the security of the transportation system for motorized and non-motorized users;
(4) Increase accessibility and mobility of people and freight;
(5) Protect and enhance the environment, promote energy conservation, improve the quality of
life, and promote consistency between transportation improvements and State and local
planned growth and economic development patterns;
(6) Enhance the integration and connectivity of the transportation system, across and between
modes, for people and freight;
(7) Promote efficient system management and operation;
(8) Emphasize the preservation of the existing transportation system;
(9) Improve the resiliency and reliability of the transportation system and reduce or mitigate
stormwater impacts of surface transportation; and
(10) Enhance travel and tourism.”
• Look out a minimum 20 years into the future and be updated every five;
• Identify existing and proposed projects and strategies that together function as an integrated
metropolitan transportation system;
2018 Chittenden County ECOS Plan
2 Introduction and Background | Metropolitan Transportation Plan
• Maintain a multi-modal focus that includes transit and bicycle and pedestrian facilities;
• Estimate costs and identify revenue sources that are reasonably expected to be available for
operation, maintenance and capital investments;
• Identify measures and targets to gauge transportation system performance;
• Determine ways to preserve existing facilities and services and make efficient use of the
existing system; and
• Discuss potential environmental mitigation of MTP projects and strategies.
The MTP is one of three primary responsibilities of Metropolitan Planning Organizations or MPOs (the
CCRPC is serving as the MPO for Chittenden County). The others are the Transportation Improvement
Program (TIP) and the Unified Planning Work Program (UPWP). The TIP is the annually updated four-
year list of project priorities identified for federal funding. The UPWP, also updated every year, is the
CCRPC’s work program that describes, and allots funding for transportation planning activities in the
county by CCRPC staff, its consultants, and other transportation and planning partner agencies in the
region.
The 2018 MTP incorporates by reference two plans that were adopted/approved by the CCRPC Board.
These are: 1) Regional Active Transportation Plan (https://www.ccrpcvt.org/our-work/our-
plans/regional-bikeped-plan/), adopted April19, 2017; and 2) Chittenden County Intelligent
Transportation Systems (ITS) Plan (https://www.ccrpcvt.org/our-work/our-plans/intelligent-
transportation-systems/), approved January 20, 2016.
Following this introduction, here is the sequence of MTP elements of this ECOS Supplement:
• Transportation Goal, Issues, and Summary of MTP Investments
• Key Transportation Indicators & Performance Measures
• Existing Metropolitan Transportation System
• Financial Plan
• Scenario Planning Review and Future Conditions
• MTP Corridors
• MTP Investments and Project List
• Environmental Impacts and Mitigation Report

2018 Chittenden County ECOS Plan
Transportation Goal, Issues, and Summary of MTP investments | Metropolitan Transportation
Plan
3
Transportation Goal, Issues, and Summary of MTP
investments
Provide accessible, safe, efficient, interconnected, secure, equitable and sustainable mobility choices for our region’s businesses, residents and visitors.
ISSUES, TRENDS, OBSERVATIONS & SUMMARY OF MTP INVESTMENTS
The CCRPC advocates for the concentration of at least 80% of future growth in 15% of Chittenden
County’s land area. Low-density development in rural areas will raise Vehicle Miles Traveled (VMT),
increase traffic congestion and contribute to more harmful air pollutants and greenhouse gases.
Directing transportation investments to serve mobility and accessibility in compact settlements will
result in a more cost-effective and efficient transportation system.
In Chittenden County, our rate of driving alone to work increased from 56% in 1980 to 73% according to
the latest 5-year American Community Survey average. On the other hand, VMT per person has been
on a downward trend. From 2007 to 2014, VMT per capita declined from 27 daily miles driven to 25.
However, since 2014, it has increased slightly to 25.3 daily miles driven, probably due to significantly
lower fuel prices in the past few years. Continued increases in VMT could increase congestion and
traffic delays on our highways and have negative impacts on economic development, the environment
and human health.
FIGURE 1 – PERCENT OF WORKERS COMMUTING BY SOV AND NON-SOV
56%
73%
76%
71%
73%
44%
27%
24%
29%
27%
0% 20% 40% 60% 80% 100% 120%
1980 Census
1990 Census
2000 Census
2010 Census
2015 ACS5 Year Data
Source: US Census
Drove Alone Non-SOV
2018 Chittenden County ECOS Plan
4 Transportation Goal, Issues, and Summary of MTP investments | Metropolitan Transportation
Plan
Even though low fuel prices have a number of negative impacts on transportation behavior and
choices, we should be cognizant that as fuel prices rise, rural and low-income residents are
disproportionately impacted by increases in household transportation costs.
It is imperative that we continue to support efforts to reduce VMT per capita and single-occupancy
vehicle (SOV) travel. More robust investment in transit, walking/biking, carsharing and ridesharing, and
other Transportation Demand Management (TDM) measures could reduce VMT, traffic delays and
congestion and the use of single-occupancy vehicles; enhance the economic well-being of our
residents, businesses and visitors; reduce social isolation and improve public health. The lack of safe
and convenient alternatives to automobile travel disproportionately affects vulnerable populations.
Some population segments – youth, the elderly, low-income, minorities and new Americans– lack
access to viable public and private transportation options. The lack of safe, reliable, and complete
connections within the transportation system and between transport modes reduces access to
employment, and social, economic, and recreation opportunities; and limits access to basic needs by
means other than a personal vehicle.
There is a significant link between transportation choices and public health. The degree to which
individuals in a community are physically active is directly dependent on transportation opportunities,
infrastructure, and community design. Walkable communities with safe and contiguous infrastructure to
support active transportation and a robust transit network, generally encourage physical activity and
have a lower dependency on automobiles. The health benefits of physical activity and its role in
reducing risk for chronic disease has a cross-cutting societal impact.
According to the 2017 VTrans Public Transit Route Performance Report, over half of all public transit
trips in Vermont occur in Chittenden County. While access to public transit has improved in the greater
Burlington area, some suburban and most rural populations lack access to transit. Implementing the
recommendations from Green Mountain Transit’s NextGen Transit Plan will improve the service levels,
route directness and service convenience on their urban network.
The overall condition of the arterial highways in Chittenden County has improved significantly since
2013. In 2013, over 50% of Chittenden County arterials were rated poor or worse in terms of roadway
condition. Today, that figure has dropped to just under 28%. While roadway conditions have improved,
there is still a concern that transportation funding is overly reliant on the state and federal gas taxes,
which are decreasing in value as inflation lowers purchasing power and revenues decline due to
improved vehicle fuel efficiency and a growing number of electric and hybrid vehicles. The prospect of
less funding to maintain our existing system and invest in new transportation improvements is a
disconcerting trend that has not been adequately addressed at the federal or state level.
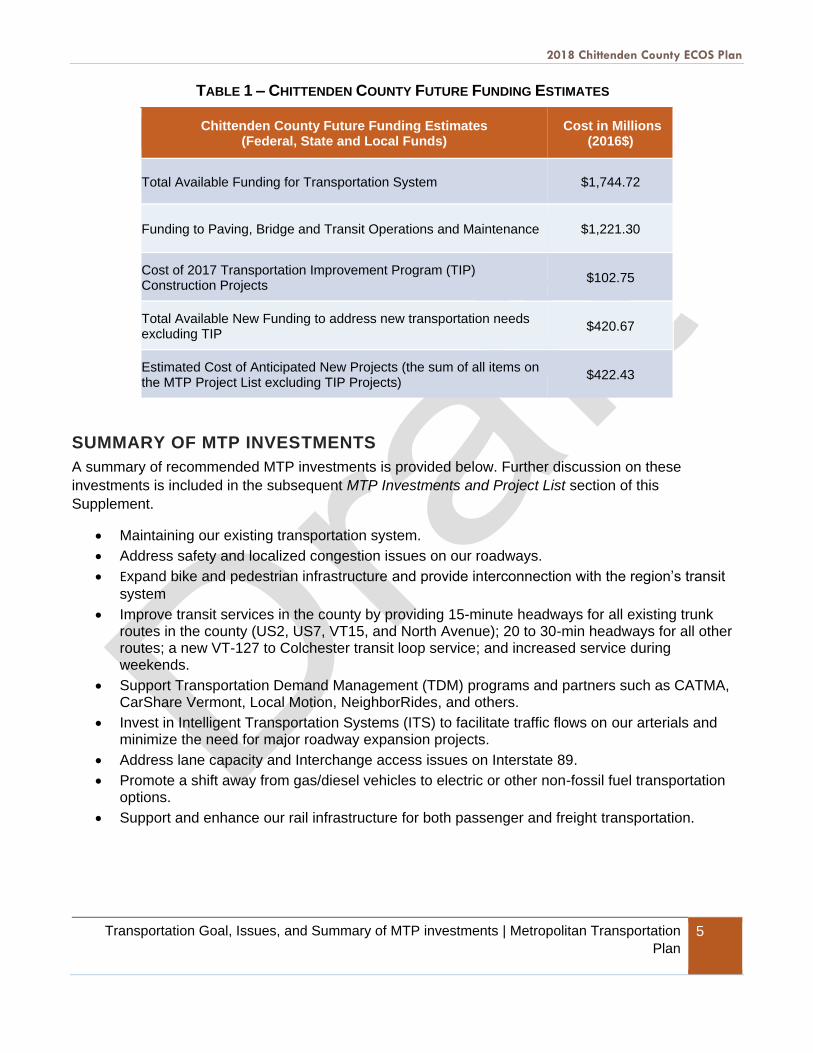
The MTP must be fiscally constrained to the funding anticipated for investment in the planning horizon
through 2050. Table 1 outlines the funds anticipated to be available to address transportation needs in
Chittenden County through 2050.
2018 Chittenden County ECOS Plan
Transportation Goal, Issues, and Summary of MTP investments | Metropolitan Transportation
Plan
5
TABLE 1 – CHITTENDEN COUNTY FUTURE FUNDING ESTIMATES
Chittenden County Future Funding Estimates (Federal, State and Local Funds)
Cost in Millions (2016$)
Total Available Funding for Transportation System $1,744.72
Funding to Paving, Bridge and Transit Operations and Maintenance $1,221.30
Cost of 2017 Transportation Improvement Program (TIP) Construction Projects
$102.75
Total Available New Funding to address new transportation needs excluding TIP
$420.67
Estimated Cost of Anticipated New Projects (the sum of all items on the MTP Project List excluding TIP Projects)
$422.43
SUMMARY OF MTP INVESTMENTS
A summary of recommended MTP investments is provided below. Further discussion on these
investments is included in the subsequent MTP Investments and Project List section of this
Supplement.
• Maintaining our existing transportation system.
• Address safety and localized congestion issues on our roadways.
• Expand bike and pedestrian infrastructure and provide interconnection with the region’s transit
system
• Improve transit services in the county by providing 15-minute headways for all existing trunk routes in the county (US2, US7, VT15, and North Avenue); 20 to 30-min headways for all other routes; a new VT-127 to Colchester transit loop service; and increased service during weekends.
• Support Transportation Demand Management (TDM) programs and partners such as CATMA, CarShare Vermont, Local Motion, NeighborRides, and others.
• Invest in Intelligent Transportation Systems (ITS) to facilitate traffic flows on our arterials and minimize the need for major roadway expansion projects.
• Address lane capacity and Interchange access issues on Interstate 89.
• Promote a shift away from gas/diesel vehicles to electric or other non-fossil fuel transportation options.
• Support and enhance our rail infrastructure for both passenger and freight transportation.
2018 Chittenden County ECOS Plan
6 Key Transportation Indicators & Performance Measures | Metropolitan Transportation Plan
Key Transportation Indicators & Performance Measures
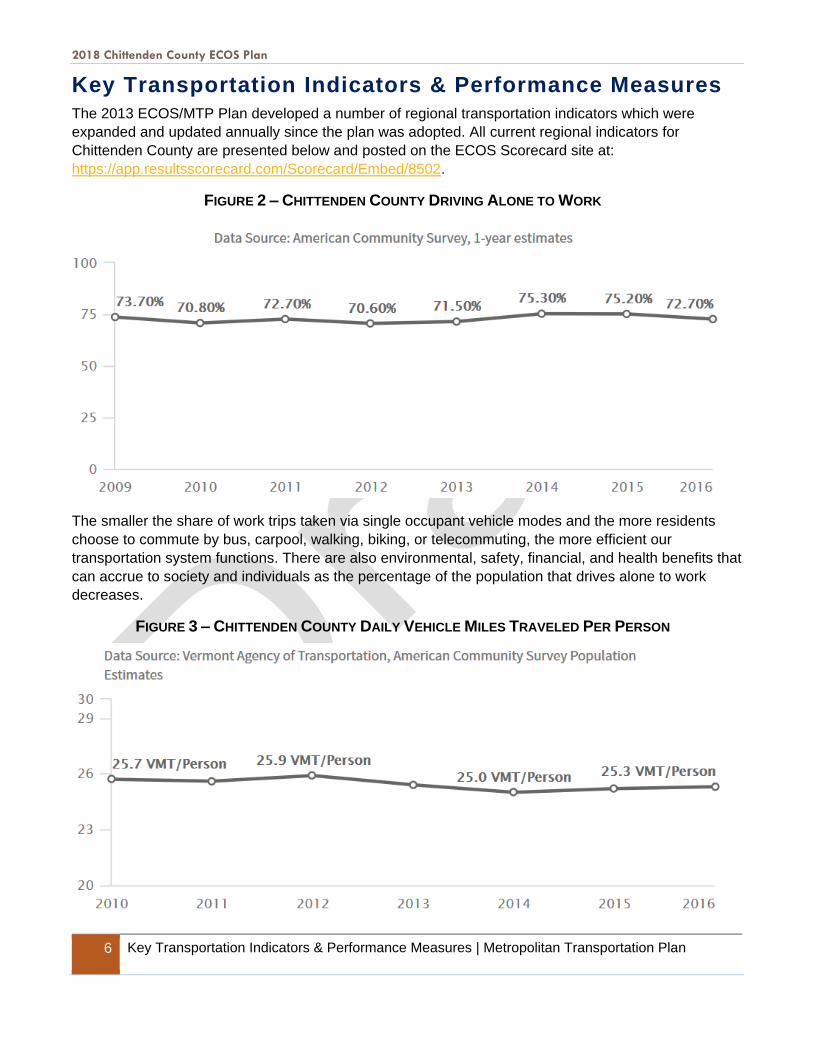
The 2013 ECOS/MTP Plan developed a number of regional transportation indicators which were
expanded and updated annually since the plan was adopted. All current regional indicators for
Chittenden County are presented below and posted on the ECOS Scorecard site at:
https://app.resultsscorecard.com/Scorecard/Embed/8502.
FIGURE 2 – CHITTENDEN COUNTY DRIVING ALONE TO WORK
The smaller the share of work trips taken via single occupant vehicle modes and the more residents
choose to commute by bus, carpool, walking, biking, or telecommuting, the more efficient our
transportation system functions. There are also environmental, safety, financial, and health benefits that
can accrue to society and individuals as the percentage of the population that drives alone to work
decreases.
FIGURE 3 – CHITTENDEN COUNTY DAILY VEHICLE MILES TRAVELED PER PERSON
2018 Chittenden County ECOS Plan
Key Transportation Indicators & Performance Measures | Metropolitan Transportation Plan 7
We would like to see a continued downward trend for this indicator to demonstrate less driving alone. A
decrease in VMT per person indicates more efficient use of our system and a greater reliance on
transportation alternatives – factors that contribute to a more sustainable and balanced transportation
system.
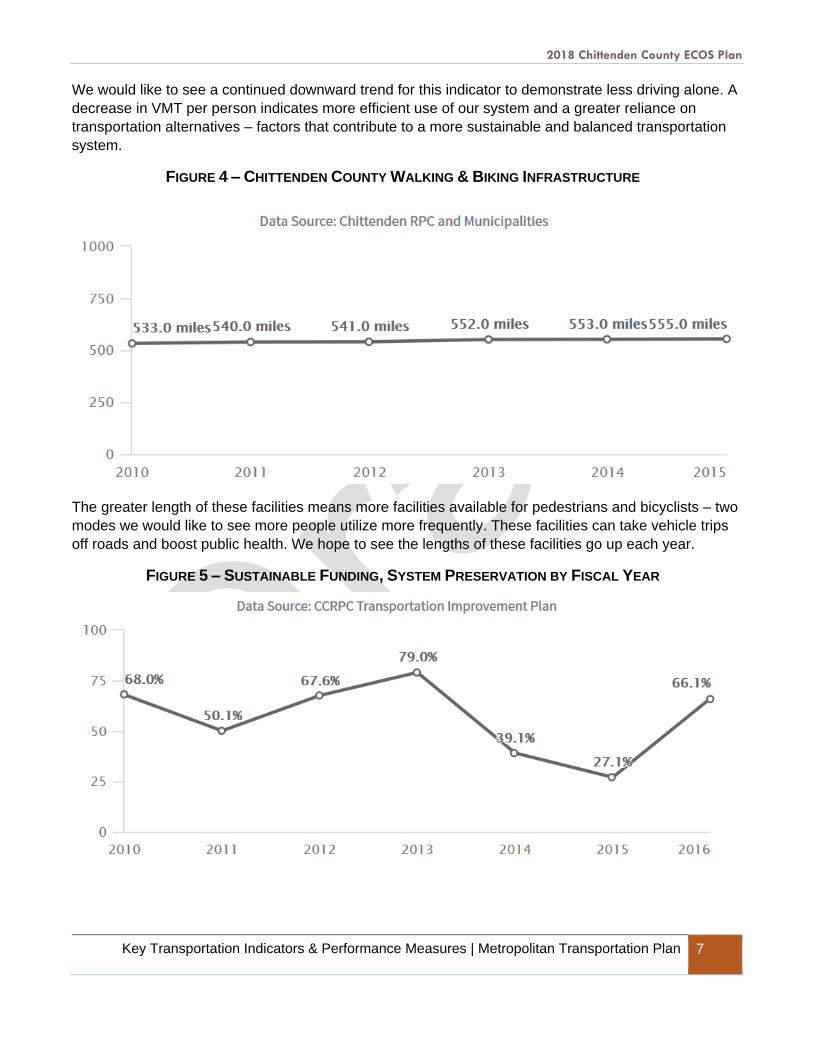
FIGURE 4 – CHITTENDEN COUNTY WALKING & BIKING INFRASTRUCTURE
The greater length of these facilities means more facilities available for pedestrians and bicyclists – two
modes we would like to see more people utilize more frequently. These facilities can take vehicle trips
off roads and boost public health. We hope to see the lengths of these facilities go up each year.
FIGURE 5 – SUSTAINABLE FUNDING, SYSTEM PRESERVATION BY FISCAL YEAR
2018 Chittenden County ECOS Plan
8 Key Transportation Indicators & Performance Measures | Metropolitan Transportation Plan
Maintaining our existing transportation system is a critically important task and a top sustainable
transportation priority. The ECOS Plan estimates that 64% of anticipated future transportation funds, on
average, will need to go to system preservation in order to sustain its integrity and protect public safety.
This annual calculation will be tracked to assure adequate system maintenance investment (while
realizing there may be year to year fluctuations).
FIGURE 6 – GMT RIDERSHIP IN CHITTENDEN COUNTY
Public transit not only provides essential mobility for those without a vehicle, it also removes cars from
the roads for those who choose this mode for other reasons. Higher transit use helps sustain an
efficient transportation system.
FIGURE 7 – NUMBER OF TRIPS PROVIDED BY THE SPECIAL SERVICES TRANSPORTATION AGENCY
(SSTA)
The Special Services Transportation Agency is a private not-for-profit corporation that provides
Americans with Disabilities Act (ADA) paratransit services for persons unable to use the GMT fixed
2018 Chittenden County ECOS Plan
Key Transportation Indicators & Performance Measures | Metropolitan Transportation Plan 9
route bus system because of a disability. This is a critical service that gives elderly and disabled
populations that transportation needed for social interaction, job training and employment, medical
services and therapy.
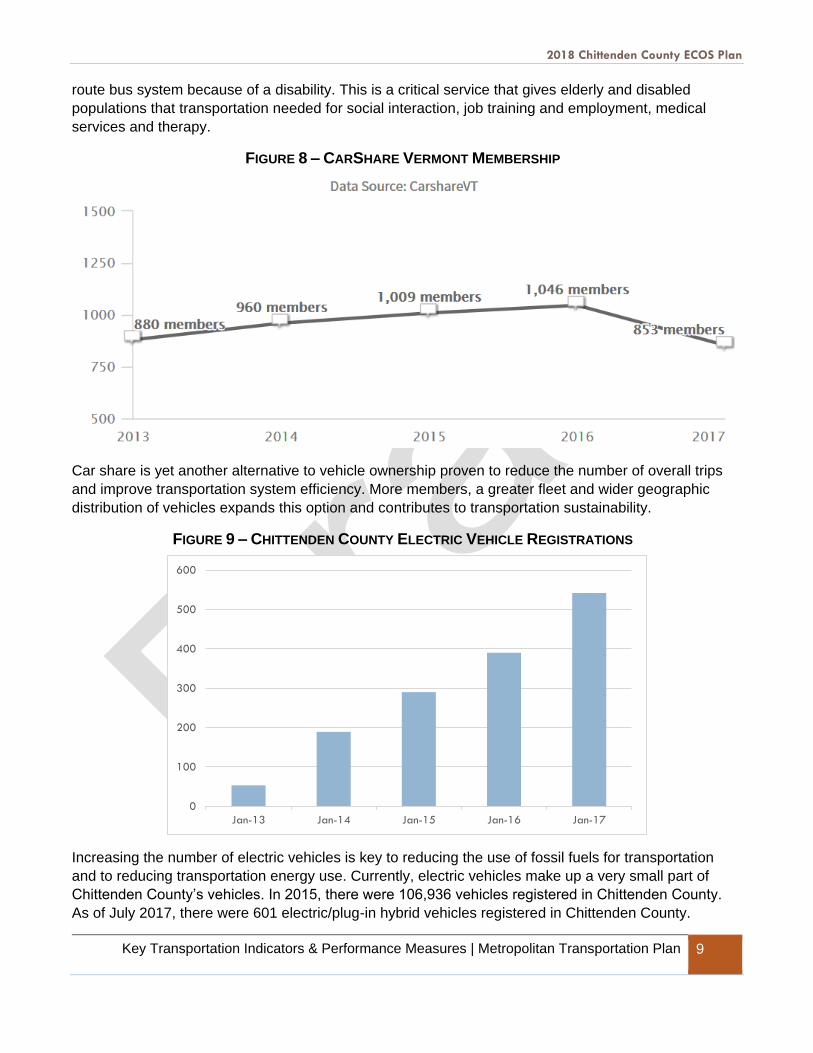
FIGURE 8 – CARSHARE VERMONT MEMBERSHIP
Car share is yet another alternative to vehicle ownership proven to reduce the number of overall trips
and improve transportation system efficiency. More members, a greater fleet and wider geographic
distribution of vehicles expands this option and contributes to transportation sustainability.
FIGURE 9 – CHITTENDEN COUNTY ELECTRIC VEHICLE REGISTRATIONS
Increasing the number of electric vehicles is key to reducing the use of fossil fuels for transportation
and to reducing transportation energy use. Currently, electric vehicles make up a very small part of
Chittenden County’s vehicles. In 2015, there were 106,936 vehicles registered in Chittenden County.
As of July 2017, there were 601 electric/plug-in hybrid vehicles registered in Chittenden County.
0
100
200
300
400
500
600
Jan-13 Jan-14 Jan-15 Jan-16 Jan-17
2018 Chittenden County ECOS Plan
10 Key Transportation Indicators & Performance Measures | Metropolitan Transportation Plan
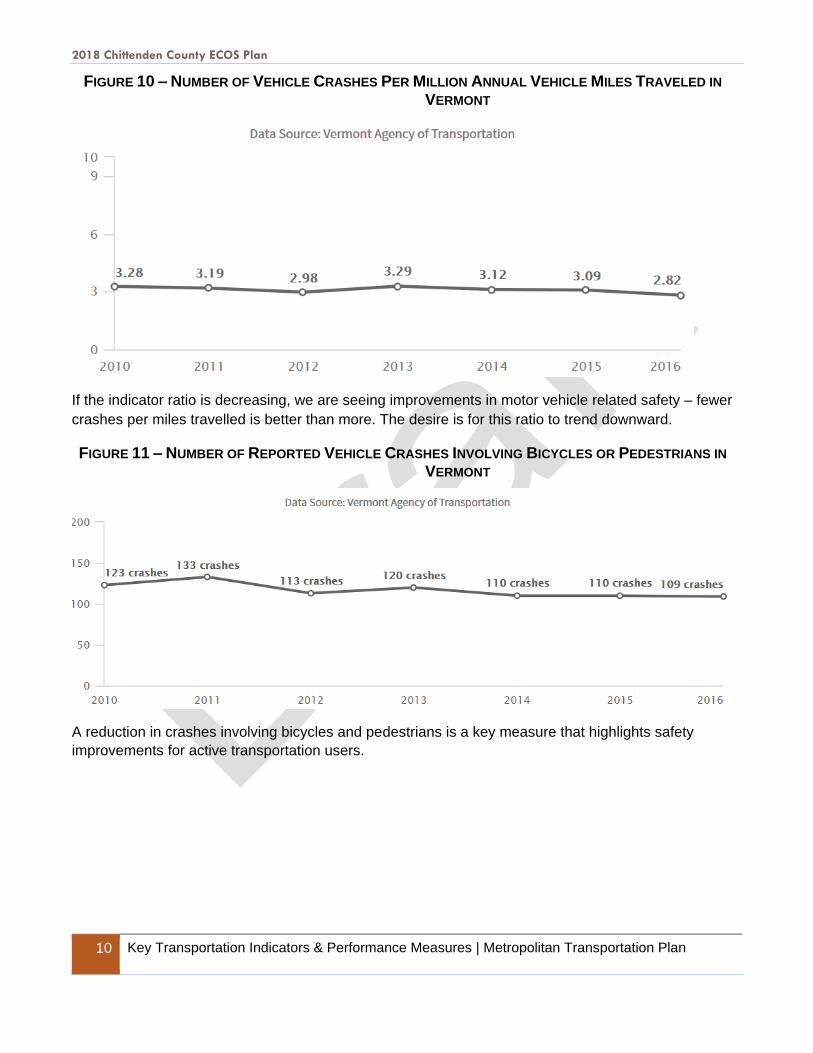
FIGURE 10 – NUMBER OF VEHICLE CRASHES PER MILLION ANNUAL VEHICLE MILES TRAVELED IN
VERMONT
If the indicator ratio is decreasing, we are seeing improvements in motor vehicle related safety – fewer
crashes per miles travelled is better than more. The desire is for this ratio to trend downward.
FIGURE 11 – NUMBER OF REPORTED VEHICLE CRASHES INVOLVING BICYCLES OR PEDESTRIANS IN
VERMONT
A reduction in crashes involving bicycles and pedestrians is a key measure that highlights safety
improvements for active transportation users.
2018 Chittenden County ECOS Plan
Key Transportation Indicators & Performance Measures | Metropolitan Transportation Plan 11
PERFORMANCE MANAGEMENT
The most recent federal law on transportation authorization (FAST-ACT) places considerable emphasis
on system performance and directs State Departments of Transportation (DOTs) and MPOs to evaluate
how well the system is doing. At the national level, Performance Management has become part of the
Federal Highway Administration’s (FHWA)Transportation Performance Management (TPM) program.
The TPM program is a strategic initiative implemented to achieve national transportation performance
goals. The intent is to measure progress against the national goals through a reliable data-driven
process. FHWA has established measures in the following areas:
• Safety
• Infrastructure Condition
• Congestion
• System Reliability
• Freight
• Air Emissions
The established performance measures under each of these categories are:
• Safety
1. Number of Fatalities
2. Rate of Fatalities per 100 million Vehicle Miles Traveled (VMT)
3. Number of Serious Injuries
4. Rate of Serious Injuries per 100 million VMT
5. Number of Non-Motorized Fatalities and Non-Motorized Serious Injuries
• Infrastructure Condition
Pavement
1. Percentage of pavement on the Interstate in good condition
2. Percentage of pavement on the Interstate in poor condition
3. Percentage of pavement on the non-Interstate National Highway System (NHS) in
good condition
4. Percentage of pavement on the non-Interstate National Highway System (NHS) in
poor condition
Bridges
1. Percentage of NHS bridges in good condition
2. Percentage of NHS bridges in poor condition
• Congestion
NOTE - Not required in Vermont because we don’t exceed national air quality standards
• National Highway System Reliability
1. Interstate travel time reliability
2. Non-Interstate NHS travel time reliability
3. Freight reliability measure (truck travel time)
• Air Emissions – percent change in tailpipe carbon dioxide (CO2) emissions on the National
Highway System (NOTE: FHWA now proposes repeal of this measure)
Having established the measures, it’s up to state DOTs and MPOs to set quantifiable targets to gauge
progress toward national goals. The schedule to establish targets, varies by measure. Federal

2018 Chittenden County ECOS Plan
12 Key Transportation Indicators & Performance Measures | Metropolitan Transportation Plan
regulations generally have state DOTs set performance targets in the various categories and then give
MPOs another 180 days to either adopt the State targets or establish their own.
In addition to the FHWA, the Federal Transit Administration (FTA) has a performance management
program as well. Their program establishes a system to monitor and manage public transportation
assets for improved safety, reliability and performance with the goal of maintaining transit assets in a
State of Good Repair (SGR). Green Mountain Transit (GMT formerly CCTA), under this program, is
tasked with developing a Transit Asset Management (TAM) Plan to include the following elements:
• An inventory of their capital assets.
• Condition assessment of these assets
• Description of the analytic or support tool used to prioritize investments
• Investment prioritization
GMT will develop their TAM plan, establishing performance targets, in cooperation with the CCRPC
and VTrans.
Along with target setting comes reporting progress to FHWA and FTA. Currently reporting dates for the
various measures varies by measure. Several national transportation organizations have request that
USDOT extend by one year some reporting deadlines to establish a common reporting date for all
measures and their targets.
Safety Performance Measures & Targets Five performance measures were established under the Safety category in support of the Highway
Safety Improvement Program (HSIP). Targets are set by DOTs and MPOs to evaluate performance on
reducing fatalities and serious injuries on our highways. State HSIP targets are reported by August 31
each year and MPOs must establish targets within 180 days of the State reporting their targets or by
February 27 of each year.
VTrans has developed and reported the following safety targets in the summer of 2017, in collaboration
with the CCRPC and other partners. The CCRPC Board accepted the statewide targets set by VTrans
and decided not to establish separate targets for the MPO area at their February 21, 2018 meeting.
TABLE 2 – VTRANS AND CCRPC SAFETY PERFORMANCE TARGETS 2018
Number of Fatalities 57.0
Number of Fatalities per 100M VMT 0.830
Number of Serious Injuries 280.0
Number of Serious Injuries per 100M VMT 4.0
Number of Non-Motorized Fatalities and Non-Motorized
Serious Injuries39.4
2018 TargetVTrans Safety Performance Management Targets
(5-Year Averages)

2018 Chittenden County ECOS Plan
Key Transportation Indicators & Performance Measures | Metropolitan Transportation Plan 13
The following charts illustrate the Chittenden County and statewide data tracked to help establish
VTrans’ and CCRPC’s safety targets:
FIGURE 12 – ANNUAL FATALITIES & 5-YEAR AVERAGE FATALITIES
FIGURE 13 – ANNUAL SERIOUS INJURIES & 5-YEAR AVERAGE SERIOUS INJURIES
73
87
6673 74 71
55
7770
44
5762
7 9 7 6 513
7 10 5 9 9 7
81.8 8178.6 79.4
74.6 74.2
67.870 69.4
63.460.6 62
10.6 9.8 9.6 8.66.8 8 7.6 8.2 8 8.8 8 8
R² = 0.0098
R² = 0.9433
0
10
20
30
40
50
60
70
80
90
100
2005 2006 2007 2008 2009 2010 2011 2012 2013 2014 2015 2016
Statewide vs Chittenden County
Statewide:Fatalities
ChittendenCounty: Fatalities
Statewide:Fatalities 5 yrAvg.
ChittendenCounty: Fatalities5 yr Avg.
481 487
384427
395 410387
311 308 290 296322
63 85 84 82 66 75 8966 66 55 55 55
100.282.6 79 78.4 76 78.4 79.2 75.6 72.4 70.2 66.2 59.4
501.2
466.4 455.8443.6 434.8
420.6400.6
386362.2
341.2318.4
305.4
0
100
200
300
400
500
600
Axis Title
Axis
Title
Statewide vs Chittenden County
Statewide:SeriousInjuries(does NOTinclFatalities)
ChittendenCounty:SeriousInjuries(does NOTinclFatalities)ChittendenCountySeriousInjury 5 yrAvg.

2018 Chittenden County ECOS Plan
14 Key Transportation Indicators & Performance Measures | Metropolitan Transportation Plan
FIGURE 14 – 5-YEAR FATALITY RATE
FIGURE 15 – 5-YEAR AVERAGE SERIOUS INJURY RATE
1.05 1.041.02
1.05
0.99 1.00
0.930.96 0.96
0.890.85 0.86
0.690.65 0.64
0.57
0.46
0.540.51
0.55 0.540.60
0.54 0.54
R² = 0.885
R² = 0.3105
0
0.2
0.4
0.6
0.8
1
1.2
2005 2006 2007 2008 2009 2010 2011 2012 2013 2014 2015 2016
Statewide vs Chittenden CountyFATALITY RATEStatewide 5 YRAVG
FATALITY RATEChittendenCounty: 5 YRAVG
Linear(FATALITY RATEStatewide 5 YRAVG)
Linear(FATALITY RATEChittendenCounty: 5 YRAVG)
6…
6.015.92
5…5.79
5.66
5.48 5.32
4.99
4.77
4.454.24
6.54
5.45
5.245.25 5.13
5.28
5.355.12
4.914.75
4.47
4.00
R² = 0.958
R² = 0.7468
3
3.5
4
4.5
5
5.5
6
6.5
7
2005 2006 2007 2008 2009 2010 2011 2012 2013 2014 2015 2016
Statewide vs Chittenden CountyStatewideSeriousInjury Rate5 Yr Avg
ChittendenCountySeriousInjury Rate5 Yr Avg
Linear(StatewideSeriousInjury Rate5 Yr Avg)
2018 Chittenden County ECOS Plan
Key Transportation Indicators & Performance Measures | Metropolitan Transportation Plan 15
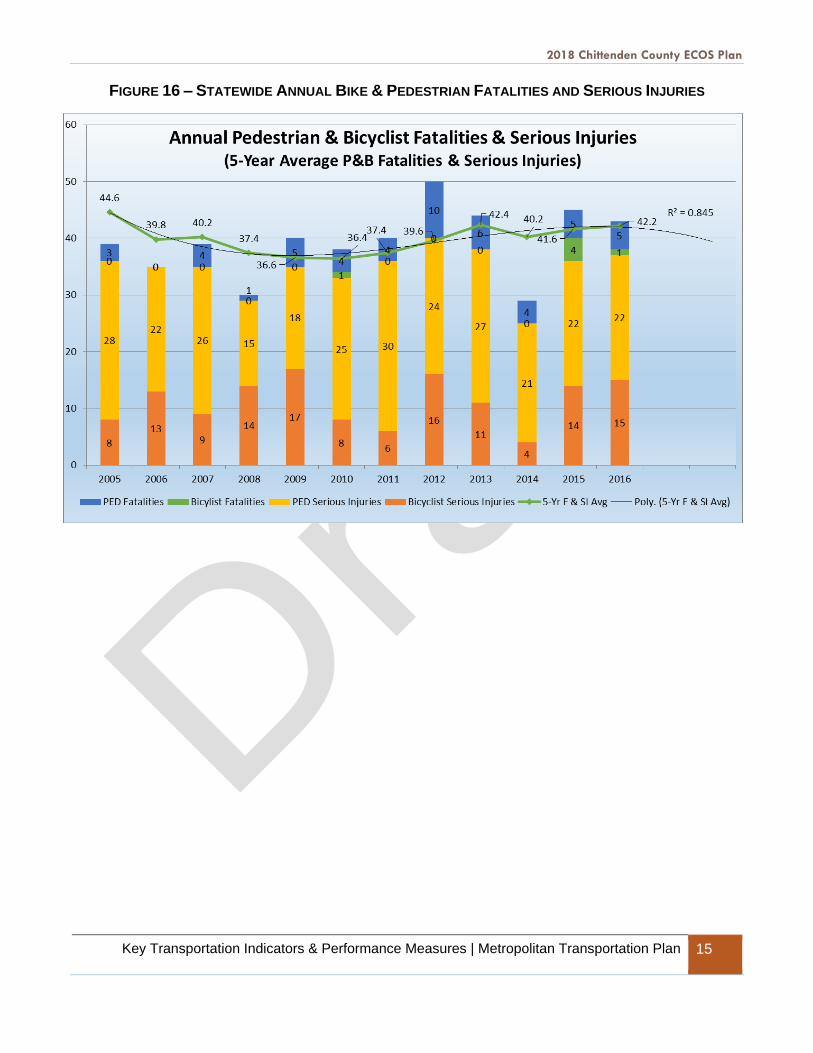
FIGURE 16 – STATEWIDE ANNUAL BIKE & PEDESTRIAN FATALITIES AND SERIOUS INJURIES

2018 Chittenden County ECOS Plan
16 Key Transportation Indicators & Performance Measures | Metropolitan Transportation Plan
FIGURE 17 – CHITTENDEN COUNTY ANNUAL BIKE & PEDESTRIAN FATALITIES AND SERIOUS INJURIES
CCRPC’s Transportation Performance Management Report The CCRPC will continue to coordinate and collaborate with VTrans and GMT (as appropriate) to set
targets for performance measures under the general categories of Safety, Infrastructure Condition,
National Highway System Reliability and the Transit Asset Management (TAM) Plan, to ensure that
national, state and regional transportation goals are achieved.
The CCRPC will develop a separate Transportation Performance Management Report for the
metropolitan region where all relevant performance measures and targets will be presented and
discussed. This report will also discuss how the CCRPC is achieving the established targets and will
detail how future investment priorities are linked to various measures and targets.
Lastly, the CCRPC has an agreement with VTrans and GMT dated May 18, 2016
(https://www.ccrpcvt.org/wp-content/uploads/2016/02/CCTA-CCRPC-VTrans-Agreement-May-
2016.pdf) that describes our intent to work collaboratively in carrying out the performance based
planning as outlined in the discussion above.
2
7
4
97
46
7
4
1
54
5
512
7
4
13
18
10
8
8
9
70
0
0 0
0
1
0
0
0
0
1
0
0
0
00
3
1
1
1
0
2
0
2
13.4
12 11.8
13.4
13
15.4
1818.4
17.6 17
16.2
13.8
R² = 0.3908
0
5
10
15
20
25
30
2005 2006 2007 2008 2009 2010 2011 2012 2013 2014 2015 2016
Chitt. County PED Fatalities Chitt. County Bicylist FatalitiesChitt. County PED Serious Injuries Chitt. County Bicyclist Serious InjuriesChitt. County 5-Yr Fatality & SerInj Avg Linear (Chitt. County 5-Yr Fatality & SerInj Avg)

2018 Chittenden County ECOS Plan
Existing Metropolitan Transportation System | Metropolitan Transportation Plan 17
Existing Metropolitan Transportation System
The primary focus of the MTP is the Metropolitan Transportation System (MTS). The MTS is the
multimodal network of highways, arterial and major collector roadways, transit services, traffic signal
systems, rail lines and stations, walk/bike facilities, park-and-ride facilities, Burlington International
Airport, and other intermodal facilities critical to the movement of people and goods in the region. It is
also the system (with the inclusion of all public bridges over twenty feet in length) eligible for federal
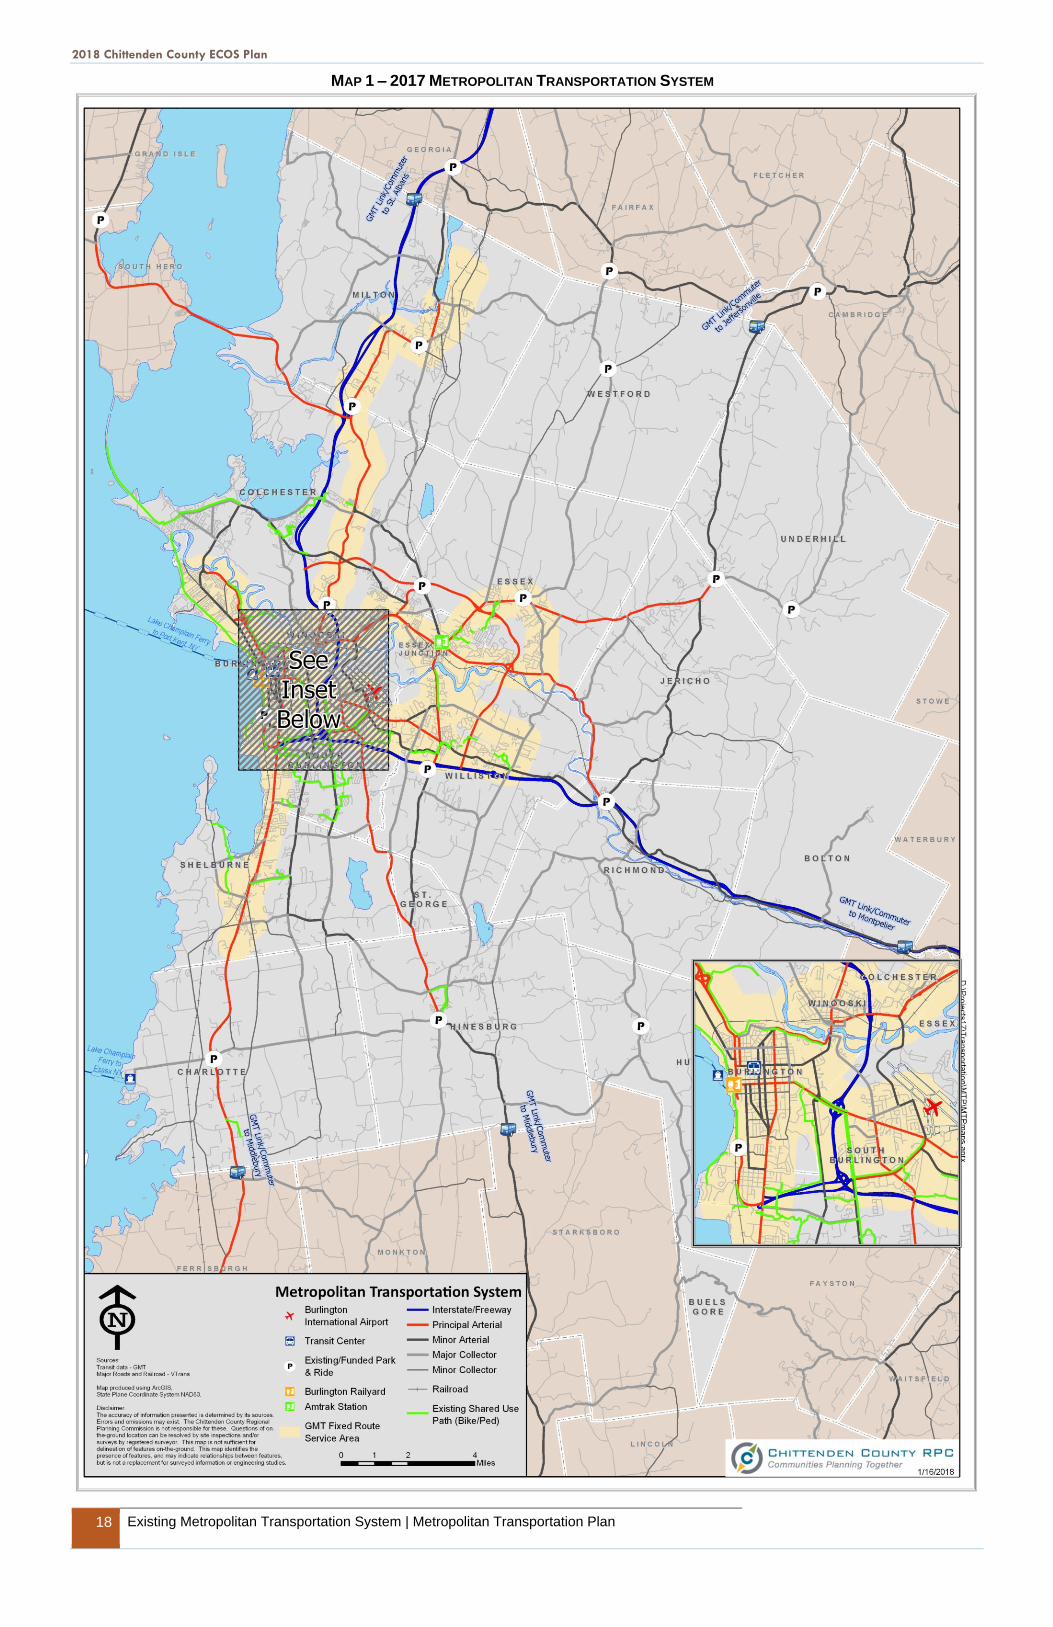
transportation funding investment. Map 1 – 2017 Metropolitan Transportation SystemMap 1 depicts the
existing Chittenden County MTS. To examine in detail, see the larger scale version here:
https://map.ccrpcvt.org/ChittendenCountyVT/
While not specifically addressed in this plan, local roads are also an important part of the road network
in Chittenden County. Local roads are owned and maintained by the municipality in which they are
located and are generally not eligible for federal transportation funding investment.
Evaluating transportation facilities on a system-wide basis using the MTS framework facilitates
identifying problems, developing solutions, and evaluating performance across the entire interrelated
transportation system. The MTS distinguishes locally important transportation facilities and services
from those that are strategically significant at the regional, state and federal levels. The regionally
significant facilities and services form the modal components critical to Chittenden County’s mobility
needs. As the transportation system evolves and grows over time based on the recommendations later
in this MTP, the MTS continues to change to accommodate those new facilities and services. The MTS
is not stagnant but a dynamic system requiring periodic updates.
This MTP recognizes that by addressing the transportation system as a single entity of interrelated
elements, we become more aware of and address potential conflicts at the planning stage, rather than
finding unexpected consequences later in the project implementation phase.
CURRENT TRANSPORTATION CONDITIONS
The current condition of the region’s Metropolitan Transportation System is assessed in the following
sections. This assessment supports the need for maintaining the existing MTS, and also highlights the
major issues and concerns about the system condition and identifies areas where improvements are
necessary.
Roadways, VMT, and Congestion The MTS in Chittenden County consists of highways classified as Interstate Highways, Principal
Arterials, Minor Arterials, Major Collectors, and Minor Collectors. The classification system is organized
as a hierarchy of facilities based on the degree to which the roadway facility serves mobility and access
to adjacent land uses. Interstates and Arterials make up just over 12 percent of County road mileage,
yet carry 67 percent of all vehicle miles traveled (see: VTrans 2015 VMT data:
http://vtrans.vermont.gov/sites/aot/files/2015_Extent_and_Travel_Report.pdf).
2018 Chittenden County ECOS Plan
18 Existing Metropolitan Transportation System | Metropolitan Transportation Plan
MAP 1 – 2017 METROPOLITAN TRANSPORTATION SYSTEM
2018 Chittenden County ECOS Plan
Existing Metropolitan Transportation System | Metropolitan Transportation Plan 19
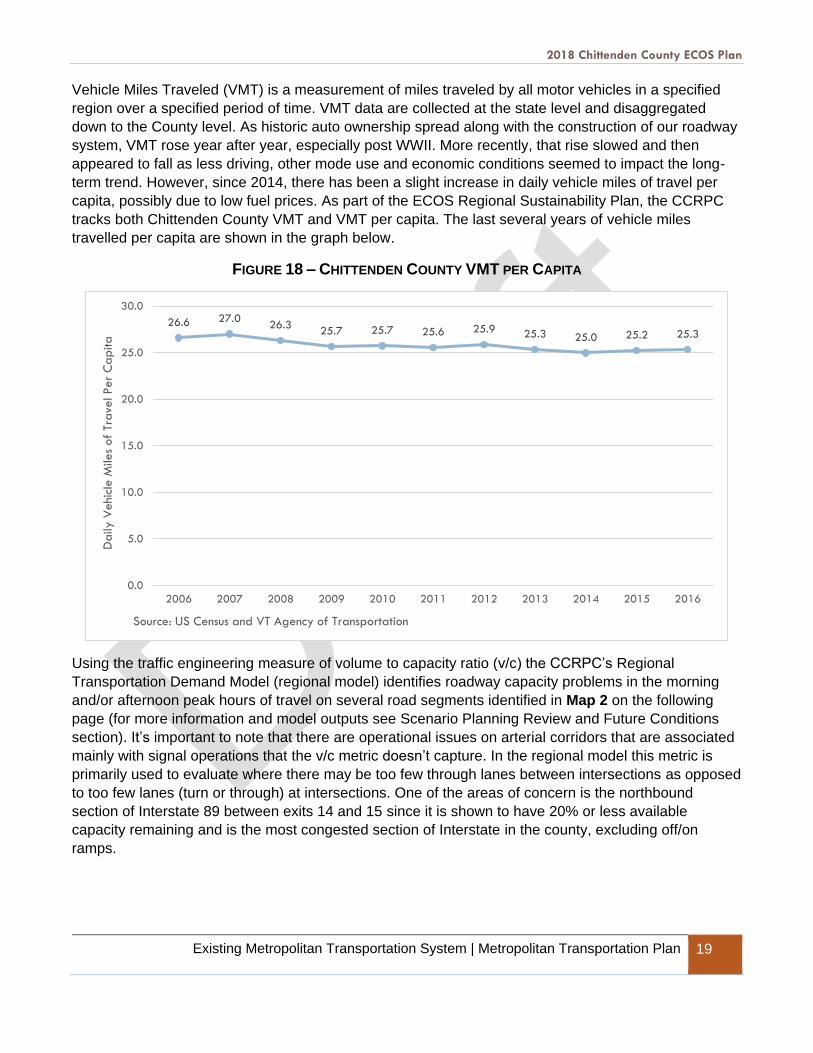
Vehicle Miles Traveled (VMT) is a measurement of miles traveled by all motor vehicles in a specified
region over a specified period of time. VMT data are collected at the state level and disaggregated
down to the County level. As historic auto ownership spread along with the construction of our roadway
system, VMT rose year after year, especially post WWII. More recently, that rise slowed and then
appeared to fall as less driving, other mode use and economic conditions seemed to impact the long-
term trend. However, since 2014, there has been a slight increase in daily vehicle miles of travel per
capita, possibly due to low fuel prices. As part of the ECOS Regional Sustainability Plan, the CCRPC
tracks both Chittenden County VMT and VMT per capita. The last several years of vehicle miles
travelled per capita are shown in the graph below.
FIGURE 18 – CHITTENDEN COUNTY VMT PER CAPITA
Using the traffic engineering measure of volume to capacity ratio (v/c) the CCRPC’s Regional
Transportation Demand Model (regional model) identifies roadway capacity problems in the morning
and/or afternoon peak hours of travel on several road segments identified in Map 2 on the following
page (for more information and model outputs see Scenario Planning Review and Future Conditions
section). It’s important to note that there are operational issues on arterial corridors that are associated
mainly with signal operations that the v/c metric doesn’t capture. In the regional model this metric is
primarily used to evaluate where there may be too few through lanes between intersections as opposed
to too few lanes (turn or through) at intersections. One of the areas of concern is the northbound
section of Interstate 89 between exits 14 and 15 since it is shown to have 20% or less available
capacity remaining and is the most congested section of Interstate in the county, excluding off/on
ramps.
26.6 27.026.3
25.7 25.7 25.6 25.9 25.3 25.0 25.2 25.3
0.0
5.0
10.0
15.0
20.0
25.0
30.0
2006 2007 2008 2009 2010 2011 2012 2013 2014 2015 2016
Da
ily V
ehi
cle M
iles
of
Tra
vel Per
Ca
pita
Source: US Census and VT Agency of Transportation

2018 Chittenden County ECOS Plan
20 Existing Metropolitan Transportation System | Metropolitan Transportation Plan
MAP 2 – 2015 AVAILABLE ROADWAY CAPACITY (VOLUME/CAPACITY)

2018 Chittenden County ECOS Plan
Existing Metropolitan Transportation System | Metropolitan Transportation Plan 21
High Crash Locations High Crash Locations (HCLs), as defined by VTrans, are road segments and intersections where the
rate of crashes exceeds an established threshold known as the critical rate. Locations are ranked by
calculating a ratio between the critical rate and actual rate. According to the VTrans High Crash
Location Report for 2012 through 2016, there are 113 HCL road segments in Chittenden County, and
47 HCL intersections. Fourteen of the top 20 intersections in Vermont with the highest crash ratios are
located in Chittenden County. On the other hand, only three of the top 20 road segments in Vermont
with the highest crash ratios are located in the county.
The location of Chittenden County’s high crash intersections and road segments are identified in Map
3. The most severe intersection sites are located in Burlington, Winooski and Essex. The most severe
road segments for crashes are in Buels Gore and South Burlington. Nearly all high crash intersections
fall within the urban or suburban towns, while the road crash segments are spread throughout both
urban and rural communities. Since 2011, the total number of vehicle crashes in Chittenden County has
been declining, with the exception of a small spike upward in 2015 (see Figure 19). The number of
crashes that resulted in injuries declined from 2011 through 2014 but increased slightly in 2015 and
2016 (see Figure 20). During this same period of time, there were 4 to 8 annual fatalities on Chittenden
County roadways.
FIGURE 19 – 2011 – 2016 CHITTENDEN COUNTY VEHICLE CRASHES
4177
3996
3953
3809
3911
3660
3600
3700
3800
3900
4000
4100
4200
4300
2011 2012 2013 2014 2015 2016
2018 Chittenden County ECOS Plan
22 Existing Metropolitan Transportation System | Metropolitan Transportation Plan
FIGURE 20 – CHITTENDEN COUNTY VEHICLE CRASHES RESULTING IN DEATHS AND INJURIES
7 7 4 7 6 8
569
531
498487
525 518
0
100
200
300
400
500
600
2011 2012 2013 2014 2015 2016
Deaths Injuries

2018 Chittenden County ECOS Plan
Existing Metropolitan Transportation System | Metropolitan Transportation Plan 23
MAP 3 – 2012-2016 HIGH CRASH LOCATIONS – INTERSECTIONS

2018 Chittenden County ECOS Plan
24 Existing Metropolitan Transportation System | Metropolitan Transportation Plan
MAP 4 – 2012-2016 HIGH CRASH LOCATIONS – SEGMENTS

2018 Chittenden County ECOS Plan
Existing Metropolitan Transportation System | Metropolitan Transportation Plan 25
Public Transit In 2016, after completing a merger with the Green Mountain Transit Authority, the Chittenden County
Transportation Authority (CCTA) became Green Mountain Transit (GMT). This regional public transit
provider has been providing transit services in parts of Chittenden County since 1974, and with the
merger, now all of northwestern Vermont. GMT currently serves the Chittenden County communities of
Burlington, Essex, South Burlington, Shelburne, Williston, Winooski, Milton, Hinesburg, Jericho,
Underhill and a section of Colchester with over a dozen scheduled transit routes. Additionally, GMT
operates LINK Express routes that connect Chittenden County communities with Montpelier,
Middlebury, and St. Albans. School tripper service, limited Sunday service, and targeted shuttle
services round out GMT’s transit offerings.
GMT is also responsible for providing Americans with Disabilities Act (ADA) paratransit services for
persons unable to use the GMT fixed route bus system because of a disability. Paratransit services are
required to be provided to areas within three-quarters of a mile of each side of each fixed transit route.
The ADA service is currently contracted out to the Special Services Transportation Agency (SSTA), a
private not-for-profit paratransit operator whose service area covers most of Chittenden County. Of
SSTA’s total 136,000 rides in 2016, 40% were ADA trips. SSTA is also the contracted transportation
provider to a number of other client groups through a variety of social service agencies.
GMT also runs a program with area colleges - UVM, Champlain and St. Michael’s - called Unlimited
Access, allowing faculty, staff, and students to use their college ID cards as fare-free unlimited transit
passes. This privately funded program was first initiated in 2003 through a collaborative partnership
with GMT and the Chittenden Area Transportation Management Association (CATMA). Additionally,
GMT also partners with the Go! Chittenden County program to provide employers with support and
information to facilitate transportation benefit offerings to their employees with support from CATMA,
CarShare Vermont, and Local Motion. More information on these organizations is provided in later
sections of this plan.
GMT currently provides over two-and-a-half million trips per year, a 65% increase over the past
seventeen years. However, in recent years, GMT has experienced a downward trend in ridership,
which matches the overall national trend due in large part to low gasoline prices. (See Figure 21 - GMT
Ridership, FY2000 – 2016). Note that the ridership dip in FY14 was likely due to the three-week drivers’
strike when virtually all service was halted. In the past, public transit service in Chittenden County had
served mostly non-driving segments of the population (low income, seniors and children) with a limited
ability to attract people with access to cars. However, GMT has made significant strides to improve
passenger amenities and services with onboard Wi-Fi, fifteen-minute frequencies at peak times on
select local routes (Essex Junction, Williston and Pine Street) and enhanced multimodal coordination.
GMT’s entire fleet is also equipped with bike racks to encourage this type of multimodal trip making.
During the fall of 2016, GMT unveiled its new Downtown Transit Center on St. Paul Street in Burlington.
The Downtown Transit Center replaced the former Cherry Street station, which was originally
constructed over 30 years ago. Plans for a new transit center in Burlington date back to 1992. The
Downtown Transit Center features free wireless internet, a climate-controlled indoor waiting area,
bathrooms, real-time electronic bus monitors, outdoor radiant heating, and a roof that covers the
outdoor platform. Moreover, long-distance transit providers such as Megabus, Vermont Translines, and
Greyhound have included the new Downtown Transit Center for regional pickups and drop-offs.
2018 Chittenden County ECOS Plan
26 Existing Metropolitan Transportation System | Metropolitan Transportation Plan
FIGURE 21 – GMT RIDERSHIP: FY2000 - FY2016
GMT is in the process of developing its NextGen Transit Development Plan to improve transit service
throughout its northern Vermont service area. The NextGen Plan will identify methods to enhance
public transportation by making it more convenient, direct, and simple to use. GMT will also evaluate
ways to better integrate urban and rural services throughout its service area. A comprehensive service
analysis will also be conducted to improve outdated service routes and address shifting demographics.
Furthermore, GMT will gather extensive public and stakeholder input throughout the development of the
NextGen Plan. For more information see: http://ridegmt.com/nextgen/
A complement to transit and paratransit services is Neighbor Rides, a volunteer driver program of the
United Way of Northwestern VT. Neighbor Rides uses a collective impact approach, partnering with
multiple organizations, to improve access to transportation for elders and persons with disabilities in the
region. The program began in 2013 with initial funding from the ECOS project and others with the intent
to improve efficiencies of the transportation system. By utilizing volunteer drivers, Neighbor Rides is
lowering the cost of trips while providing needed transportation for those without other transport
options.
Passenger Rail Passenger rail service available in Chittenden County consists of Amtrak’s Vermonter train, with
Vermont stops in Essex Junction, Brattleboro, White River Junction, Montpelier, Waterbury, and St
Albans. This service was established in April 1995 as a reconfiguration of the discontinued Montrealer
train from Montreal to Washington, D.C. The Vermonter service runs daily between Washington, D.C.,
and St. Albans, with numerous stops including Baltimore, Philadelphia, and New York City. Table 3
provides the most recent history of ridership on this service. As with GMT’s public transit ridership,
Amtrak has also experienced a decrease in ridership from 2015 to 2016.
0
500,000
1,000,000
1,500,000
2,000,000
2,500,000
3,000,000
FY00 FY01 FY02 FY03 FY04 FY05 FY06 FY07 FY08 FY09 FY10 FY11 FY12 FY13 FY14 FY15 FY16
Rid
ers
hip
Fiscal Year
2018 Chittenden County ECOS Plan
Existing Metropolitan Transportation System | Metropolitan Transportation Plan 27
TABLE 3 – AMTRAK VERMONTER RIDERSHIP
YEAR 2008 2009 2010 2011 2012 2013 2014 2015 2016
RIDERS 72,655 74,016 86,245 77,783 82,086 84,109 89,640 92,699 89,318
Source: Amtrak
In recent years, the State of Vermont has been pursuing multiple initiatives to expand passenger rail
service. Planning is underway to extend Amtrak’s Vermonter service north to Montréal. In 2015, U.S.
and Canadian officials signed an agreement to develop a preclearance facility for both U.S. Customs
and Border Protection and the Canada Border Security Agency at Central Station in Montréal. This
facility would allow Amtrak passengers to clear the customs and immigration process without the need
to physically stop at the border between the U.S. and Canada. The U.S. Congress signed the
necessary legislation into law in December 2016 and the Canadian Parliament passed the enabling
legislation required to construct the preclearance facility in December 2017. However, there are several
operating agreements that must be finalized with various stakeholders before this cross-border service
can be officially restored.
Another top priority for VTrans has been to reconnect Rutland to Burlington through the Ethan Allen
Express, which currently operates between Rutland and New York City by way of Albany. In 2016,
Vermont's congressional delegation announced that they had secured a $10 million Transportation
Investment Generating Economic Recovery (TIGER) grant to fund three new passenger platforms,
replace numerous crossing gates, and upgrade 11 miles of track. After the track improvements are
made, passenger trains will be able to reach a maximum speed of 59 miles per hour while traveling
from Rutland to Burlington’s Union Station.
Commuter Rail While no commuter rail service currently operates within Vermont, there has been renewed interest in
establishing a commuter rail network. In early 2017, VTrans published the Montpelier to St. Albans
Commuter Rail Service Feasibility Study to examine the feasibility of developing a commuter rail line
between Montpelier, Burlington, and St. Albans. Conceptual capital cost estimates to establish
commuter rail service were between $300 million and $363 million for upgraded rail infrastructure,
stations, new rolling stock and additional implementation costs. Moreover, the annual operating
expenses were projected to be up to $9 million. There are currently about 7,814 daily commute trips
within the Montpelier to St. Albans corridor. When evaluating existing daily transit demand, the study
envisioned a system-wide transit demand of between 135 transit users on the low end and 2,850 users
in the highest percentage scenario. The higher ridership estimate factors in an aggressive promotional
campaign along with new transit-focused policies. In response to this study, several rail advocates
have asserted that the cost of this service could be dramatically reduced by purchasing refurbished
rolling stock, which was not evaluated in this study.
Intercity Bus There are currently three carriers that provide intercity bus services in Chittenden County: Greyhound
Lines, Megabus, and Vermont Translines. These services carry passengers, baggage and packages on
fixed routes and schedules. Greyhound runs four daily trips between Montreal and Boston with stops in
White River Junction, Montpelier, Burlington International Airport and GMT’s Downtown Transit Center.

2018 Chittenden County ECOS Plan
28 Existing Metropolitan Transportation System | Metropolitan Transportation Plan
Megabus connects Burlington (at Downtown Transit Center) to both Montpelier and Boston with one trip
daily. In the past, Megabus had operated a route from Burlington to New York City, but the carrier
recently cut this service due to dwindling demand. Vermont Translines is the most recent addition to the
intercity bus options available to Vermonters. Founded in 2013 by Premier Coach and funded in part by
VTrans, Vermont Translines offers three Chittenden County pickup and drop-off locations; in
Colchester, Burlington, and South Burlington, with service along the Route 7 corridor to Albany, New
York.
Freight: Rail and Truck Facilities Since the passage of the Intermodal Surface Transportation Efficiency Act (ISTEA) in 1991, MPOs
have been strongly encouraged to include freight planning as part of the metropolitan transportation
planning process. Freight transportation plays a fundamental role in the economic health of Chittenden
County communities. About 6.3 million tons of freight flow into, out of, or within the region each year, far
more than in any other region of Vermont. According to the 2012 Vermont Freight Plan, over 9 million
tons of freight will pass through Chittenden County annually by 2035. As reported by the 2001 CCMPO
Regional Freight Study and Plan (the most recent detailed look at freight in the region), more than 91
percent of the freight tonnage moved in the County moves by truck, while rail moves 5.7 percent. Rail
has historically been used to carry large volumes of bulk materials, such as fuel, stone, wood chips,
and salt. Nearly 60 percent of the region’s freight flows to or comes from nearby – other parts of
Vermont, New Hampshire, or New York.
In recent years, the County’s freight distribution system has had to adapt to a changing and more
competitive marketplace. With the advent of new information technologies truck containers, rail cars
and airplanes are increasingly viewed as mobile warehouses that feed goods into the production
process or on to market shelves to meet immediate demand.
The Regional Freight Study noted that the freight infrastructure in Vermont does not meet national
industry standards for motor carriers and railroads and this affects freight access to Chittenden County.
These freight system deficiencies were also cited in the more recent 2010 Western Corridor Study. For
example, US 7 and VT 22A do not meet industry standards and are the only north/south highways in
western Vermont. Further, part of the Essex-Burlington rail line has weight and clearance limits that
affect its ability to function effectively in the regional, national and North American rail systems. The
amount of freight transported by rail has decreased over the last few decades and, as a result, the
number of direct rail sidings and transload facilities – facilities that connect rail to trucks in order to
transfer goods – has reduced. However, a new transload facility opened in late 2010 in the Vermont
Railway yard in Burlington.
Since the Regional Freight Study was completed, there have been numerous upgrades to address
freight-related deficiencies. In 2010 Vermont received a $50 million federal grant award which,
combined with the NECR’s $19.5 million match, provided a sizeable reinvestment opportunity for the
entire NECR line through the state. Now completed, the improvements allow 286,000 pounds gross
weight rail car capacity from St. Albans to the VT/MA state line, bringing this entire line up to the
national standard. These improvements do not apply to the NECR spur from Essex Junction to
Burlington, where track and bridge repairs are still needed.
There are two rail freight operators in Chittenden County: 1) The Genesee & Wyoming who purchased
the New England Central Railroad (NECR)/RailAmerica and currently has a base in St. Albans. The
former NECR was Vermont’s largest privately owned and operated rail operating freight service from
2018 Chittenden County ECOS Plan
Existing Metropolitan Transportation System | Metropolitan Transportation Plan 29
Alburgh, VT to New London, CT. NECR, now G&WR, also operates on the spur line that connects their
mainline in Essex Junction to Burlington. 2) The Vermont Railway is based on the waterfront in
Burlington and operates on state owned lines south to Bennington, branching off in Rutland to
Whitehall, NY and Bellows Falls, VT.
In 2017, representatives from the CCRPC, FHWA, and VTrans formed a Vermont freight working group
to evaluate freight provisions of the FAST Act, identify national goals and plans that are relevant to
Vermont, and discuss ongoing freight issues. In addition to monitoring national freight policies and
strategies, the working group will also evaluate potential corridors to designate as Critical Urban and
Rural Freight Corridors. These corridors provide access and connection to the Primary Highway Freight
System and the Interstate with ports, public transportation centers, and intermodal transportation
facilities. The Primary Highway Freight System is an identified network of highways that contain the
most vital portions of the U.S. freight transportation system, based on measurable and objective
national data.
Active Transportation Facilities Active transportation facilities create opportunities to increase physical activity, support healthy
communities, enhance economic development, and promote environmental sustainability.
Furthermore, communities that support walking and biking provide transportation access to all residents
regardless of age, gender, or socioeconomic status. Chittenden County has a range of dedicated
transportation facilities to accommodate bicyclists, pedestrians, and other physically active forms of
transportation. Facilities dedicated to non-motorized uses (such as sidewalks and off-road, shared use
paths) are concentrated in and around the metropolitan core. Non-dedicated facilities that bicyclists
and pedestrians share with motorized users are located throughout the region. According to ECOS
Scorecard data (https://app.resultsscorecard.com/Scorecard/Embed/8502) since the last
comprehensive inventory in 2008, there has been an increase in the shared use path mileage. Most
shared use paths were recently built and are currently in good condition. There are also about 404
miles of existing sidewalks in Chittenden County. These mileage figures are expected to increase
annually as planned bicycle and pedestrian projects continue to be implemented.
Between 2005 and 2015, the CCRPC facilitated a municipal sidewalk grant program to provide
communities with access to federal funds to improve public sidewalk systems. The program was
established to advance the development of an integrated sidewalk system and encourage connections
between neighborhoods, schools, parks, town centers, and other public spaces to support active
transportation in Chittenden County. Since 2005, 12 Chittenden County municipalities have received a
total of nearly $3 million for 38 new sidewalk projects. Sidewalk projects have been, and continue to be,
funded through two VTrans programs: Transportation Alternatives and the Bicycle & Pedestrian
Program.
Community support for non-motorized facilities is substantial, as surveys in 2000, 2006, and 2012
revealed. These facilities have rated second highest (only following transportation system maintenance)
on the list of transportation improvements the public desires. This survey will be replicated again in
2018 to evaluate the transportation-related attitudes and opinions of Chittenden County residents.
The CCRPC has regularly updated its regional Pedestrian/Bicycle Plan, most recently in 2017 – see:
http://www.ccrpcvt.org/our-work/our-plans/regional-bikeped-plan/. The updated Chittenden County
Active Transportation Plan (ATP) identifies its goal as creating a safe, comfortable, and connected

2018 Chittenden County ECOS Plan
30 Existing Metropolitan Transportation System | Metropolitan Transportation Plan
regional network of pedestrian and bicycle routes that appeal to all ages and abilities. After a robust
public input process, detailed existing conditions assessment, and a Level of Traffic Stress model
analysis, the ATP outlines recommendations for both non-infrastructure and infrastructure
improvements to enhance network connectivity for active transportation in Chittenden County. The ATP
recommendations focus on priority corridors as opposed to defining detailed facility types in specific
places.
Intermodal Facilities There are numerous strategically located intermodal transportation facilities in Chittenden County.
These multi-functional facilities serve as hubs where connections occur between transportation
systems and various travel modes. The CCRPC is committed to advancing the development of new
and existing intermodal facilities to support the efficient movement of people and goods throughout
Chittenden County. Current facilities fitting this category are the Downtown Transit Center on St. Paul
Street in Burlington, the Essex Junction Amtrak station, University Mall in South Burlington, Burlington
International Airport, the Vermont Railway Yard in Burlington, two privately operated ferry terminals
(Charlotte and Burlington), and eight designated park-and-ride facilities scattered around the region.
Park-and-ride facilities span a spectrum from small undesignated lots to large, federally funded, high-
capacity facilities like the one at I-89 Exit 11 in Richmond, which was enlarged in 2014 with 53 new
spaces and improved bus accommodations. The most common intermodal connection made by
commuters at park-and-ride facilities is transferring to a shared carpool. However, some facilities such
as the Richmond and Colchester park-and-ride facilities off of I-89 also offer links to public
transportation. VTrans’ 2015 Park-and-Ride Facilities Plan calls for enhanced transit access at State-
owned facilities. (http://vtrans.vermont.gov/sites/aot/files/planning/documents/planning/Appendix_2015-
12.pdf)
The CCRPC regularly updates a regional park-and-ride plan, most recently in 2011. The 2011 Park-
and-Ride & Intercept Facility Plan details high-priority sites and projects, while also offering
recommendations to support a regional network of park-and-ride facilities that are accessible by
multiple modes of transportation. A robust network of strategically spaced and located park-and-ride
facilities will help to promote multimodal transportation options, decrease carbon emissions, and reduce
traffic congestion. See http://www.ccrpcvt.org/wp-content/uploads/2016/01/
Parknride_InterceptFacility_FinalPlan_20110615.pdf.
The Railyard Enterprise Project in Burlington is a current and significant intermodal planning projects.
The project encompasses the Burlington Railyard, which is a National Highway System (NHS)-
designated intermodal facility located on Burlington’s south waterfront. The overall purpose of the
project is to expand a network of multimodal transportation infrastructure to support economic
development, improve neighborhood livability, and enhance intermodal connections to the Burlington
Railyard.
Air Service Facilities Burlington International Airport (BTV) is the largest airport in the State of Vermont. BTV is located in
South Burlington and owned by the City of Burlington. It is governed by an Airport Commission that
oversees general airport operations and guides future development. The airport is accessed primarily
from US 2 (Williston Road) and serves as a vital link to the national air transportation system for the
residents and businesses of northwestern Vermont and northern New York State. Additionally, about
2018 Chittenden County ECOS Plan
Existing Metropolitan Transportation System | Metropolitan Transportation Plan 31
40% of BTV’s passengers are from Quebec, Canada. There are currently five commercial airlines that
provide 31 daily departures directly serving 12 destinations from BTV. The airport is also serviced by
UPS Air Cargo and FedEx Express commercial parcel carriers, two general aviation/fixed base
operators, and two airframe and power plant maintenance facilities. The airport also serves as home to
a unit of the Air National Guard fleet of F-16s (soon to be upgraded to F-35s), a National Guard
Blackhawk helicopter air ambulance service and a maintenance and repair facility for Blackhawks and
F-16s. There are 94 aircraft based at BTV, which includes both general aviation and military aircraft.
Since it saw a record of 759,021 enplanements in 2008, BTV has experienced a steady decline in
passenger volumes through 2015. However, from 2015 to 2016, enplanements rose by 1.77% to
604,576, ending the seven-year decline. The 2016 enplanements data represent a 20% drop since
2008, which is in contrast with the 2011 BTV Airport Master Plan vision of 1.6 million annual
enplanements by 2030.
Landside connections to the airport are provided by private auto, taxi, GMT fixed route service, and
intercity bus via Greyhound Lines and Vermont Translines. Vermont’s recent Statewide Intercity Bus
Study (2013) noted that there is a public transportation service gap between the airport and GMT’s
Downtown Transit Center as this trip is not direct, requiring a transfer at University Mall.
Bridges There are 178 bridge structures greater than or equal to 20 feet in length in Chittenden County. Of
these, 85 are owned by the State and the remaining 93 by local governments. Nearly all of the state-
owned bridges over 20 feet long are located on major highways, i.e. principal arterials and major
collectors. The majority of municipally owned bridges over 20 feet long are located on less heavily
traveled highways, i.e. minor collectors and local roads. Note that many bridges and other structures
less than 20 feet long are also owned and maintained by both the State and municipalities.
The condition of all bridges over 20 feet in length on public roadways are evaluated every two years by
VTrans. Using a sufficiency rating system developed by the U.S. Department of Transportation, bridges
are assigned a value between 0 and 100. Ratings are based on evaluations in three areas – structural
adequacy and safety, importance of the bridge for public use, and serviceability and functional
obsolescence – with special reductions given for extreme safety problems and lack of alternative
routes.
Since the sufficiency rating of a bridge is a single aggregate number that is based on a variety of
factors, a low sufficiency rating does not necessarily mean that a bridge is unsafe or in need of
immediate repair but indicates that upgrades may be necessary. Based on this system and VTrans’
latest inspection reports, 4 percent (7 of 178) of Chittenden County bridges have a sufficiency rating
below 50, or in poor condition, and nearly half of the total number of bridges hold a rating between 50
and 80 (87 of 178) indicating that rehabilitation may be necessary. The remaining 83 bridges (47
percent) are deemed sufficient with ratings above 80. Of the bridges with a sufficiency rating below 50,
replacement is being planned for one bridge. The CCRPC has requested another to be added to the
bridge replacement candidate list. The remaining bridges are on low volume roads that have been
deemed adequate for current uses as of the most recent inspection reports. Since 2010, there has
been a marked improvement in the number of bridges with a sufficiency rating below 50, down to 7
from 18, a 56 percent improvement. Bridge rating data can be found here:
http://vtransparency.vermont.gov/#.

2018 Chittenden County ECOS Plan
32 Existing Metropolitan Transportation System | Metropolitan Transportation Plan
Transportation Demand Management Programs Transportation Demand Management, or TDM, is a general term for policies, programs or strategies
that result in more efficient use of transportation resources. Two organizations in the region have
notable programs generally fitting this broad category. These are 1) CarShare Vermont, and 2) the
Chittenden Area Transportation Management Association (CATMA).
CarShare Vermont, a non-profit organization founded in 2008, strives to provide an accessible and
affordable car sharing service to reduce the need for individuals to own vehicles and to improve mobility
for people of all income levels. CarShare Vermont currently has a fleet of 17 vehicles at 11 locations
around the Greater Burlington area. Vehicles are available 24 hours a day, 7 days a week and can be
used to drive to any destination. CarShare members pay for vehicle use based on how much they
drive. The organization provides routine maintenance, roadside assistance, car washes, insurance,
gas, and parking. The program is designed to save members money (less need to own a vehicle) and
reduce unnecessary trips that impact the environment. Since 2013, CarShare Vermont has added
seven vehicles to its fleet and 166 new members, for a total of 1,046 members in 2016. CarShare
Vermont recently expanded into Winooski by adding a vehicle pod behind Winooski City Hall. In 2015,
CarShare Vermont partnered with VTrans to implement a two-year pilot project to add two vehicles
outside Montpelier’s City Hall. However, a year after the start of the pilot, CarShare Vermont
announced that it would cease service in Montpelier because of declining membership and revenues.
CATMA, also a non-profit membership-based organization, was formed in 1992 to jointly address, plan
and manage a viable, cost-effective and sustainable transportation and parking network in and around
Burlington’s educational institutions. CATMA’s founding members -- UVM, UVM Medical Center,
Champlain College and American Red Cross – worked to efficiently coordinate land use planning,
share resources, and administer transportation and parking programs, infrastructure and associated
facilities through CATMA, while minimizing environmental impacts. In order to effectively promote and
administer transportation demand management programs at a larger scale, CATMA expanded its
service area to businesses and developers throughout Chittenden County starting in 2015. CATMA
TDM strategies include: free and reduced-cost transit pass, bike-walk rewards program, the guaranteed
ride home program, CarShare Vermont campus membership program, staggered work and class
scheduling, coordinated carpool and vanpool services, frequent drawings and contests, and outreach
and consistent messaging.
In 2011, after receiving a grant from the Transportation, Community and System Preservation program
(TCSP), the CCRPC established Go! Chittenden County. Go! Chittenden County is a regional TDM
program that serves as a one-stop resource for information about transit, carpooling, vanpooling, car-
sharing, bicycling, and walking. The Go! Chittenden County project was a comprehensive effort to
achieve regional transportation goals outlined in the ECOS Regional/Metropolitan Transportation Plan,
as well as address national policy objectives including the need to conserve energy, reduce reliance on
energy imports, lessen congestion, and clean our nation's air. With specific TDM projects funded by the
TCSP grant successfully completed, and with the countywide expansion of CATMA, specific promotion
of Go! Chittenden County as a brand and resource will cease at the end of 2017. The goal of Go!
Chittenden County to connect individuals and businesses with transportation resources and solutions
will continue through individual partners including CATMA, CarShare Vermont, Local Motion, Green
Mountain Transit and VTrans.

2018 Chittenden County ECOS Plan
Existing Metropolitan Transportation System | Metropolitan Transportation Plan 33
In addition to reducing roadway congestion and providing multiple ways to get around, the impact of
widespread TDM program implementation could significantly benefit Chittenden County municipalities
by enhancing mobility, reducing dependence on fossil fuels, improving air quality, and supporting high
levels of community livability. While only 5.9% of Chittenden County workers currently work from home
(2011-2015 American Community Survey), the CCRPC’s 2012 Transportation Survey revealed that
over 23% of Chittenden County employees work for an employer that allows them to work from home.
Employers need encouragement and support to implement an employee commute program that will
assist in reducing congestion and parking demand, resulting in less strain on our existing roadways and
influencing individual transportation behavior. There is an opportunity to focus on shifting transportation
costs to a sustainable model and better integrating land use and transportation.
Transportation and Climate Change The overwhelming majority of scientists agree that changes in climate worldwide can be mainly
attributed to human activities, primarily the burning of fossil fuels. In Vermont, the largest contributor of
greenhouse gas (GHG) emissions is the transportation sector – mostly carbon dioxide (CO2) coming
from the combustion of petroleum-based fuels, like gasoline and diesel in internal combustion engines.
Transportation’s 45% statewide contribution to GHG emissions is closely mirrored by our 49%
Chittenden County estimate ( http://climatechange.vermont.gov/climate-pollution-goals) and is
substantially higher than the nationwide share of 27% from transportation according to the 2015 EPA
Greenhouse Gas Emissions data. Transportation’s higher contribution is mainly due to the rural nature
of Vermont and the higher annual Vehicles Miles Traveled (VMT) per Capita in the state (11,680,000)
compared to the nationwide VMT per Capita (9,630,000) according to the 2017 Vermont Transportation
Energy Profile.
To address this continuing and growing environmental issue, while also combating climate change,
emissions from the transportation sector need to be reduced. By 2025, Vermont’s Comprehensive
Energy Plan has a goal to reduce statewide transportation energy by 10%. Reducing the number of
vehicle miles traveled (VMT), increasing investment in alternative forms of transportation, and shifting
to low or zero-emission fuels, are strategies that could be implemented to achieve this goal.
Transportation planning looks at the problem from two perspectives: 1) How to mitigate climate
changes through policies, programs, and technologies, and 2) How to adapt transportation
infrastructure and services to the coming climate changes.
Climate change is only one of many factors to consider as we plan the region’s future transportation
investments, but we need to carefully monitor its potential impacts while implementing programs that
will slow its progress. For more information go to the air quality and climate sections of the CCRPC
website.
Transportation and Public Health The ten principles that the ECOS Plan uses to guide planning efforts are integrally linked to community
health. This connection underscores the need for public health professionals to be included in
transportation and community planning. There is an extensive body of research that details the impact
of transportation on health, particularly with regard to safety/injury, air quality, physical activity,
equitable access to opportunities and noise.
Physical Activity - The degree to which individuals in a community are physically active is directly dependent on transportation opportunities, infrastructure and community design. The health benefits of
2018 Chittenden County ECOS Plan
34 Existing Metropolitan Transportation System | Metropolitan Transportation Plan
physical activity and its role in reducing the risk for chronic disease has numerous positive societal impacts. Most risk factors for chronic disease do not occur randomly but are closely linked to the characteristics of neighborhoods in which people live, work, and play. In Chittenden County, 71% of adults report using community resources for physical activity. Walkable communities with a reliable transit network generally have a lower dependence on automobiles and encourage physical activity. Hybrid commutes, that is, trips completed using several modes are an effective option when distance and areas not served by transit are barriers to a more active commute, such as walking or biking. With few exceptions, proximity to public transit stops is linked to higher transit use and higher levels of physical activity among adults. A study in the Journal of Preventative Medicine found that commuting by public transportation instead of by car increased energy expenditures equivalent to the loss of one pound of body fat per six weeks. Access – Access to education, healthy food, healthcare, recreation, social interactions and employment
all contribute to health and quality of life. A lack of safe and convenient alternatives to automobile travel
limits an individual’s options forcing trade-offs in money or time thereby compromising equitable choice.
This dearth of options disproportionately affects vulnerable populations, the elderly, people living in
poverty, persons with disabilities, and children. Improvements to walking and bicycling facilities benefit
current and new users, particularly those who are living with physical disability and/or economic
hardship, by providing access to essential services and activities.
Air Quality – Motor vehicle emissions are a major contributor of contaminants such as particulates,
nitrogen oxides and carbon monoxide. Chemical reactions between nitrogen oxides and volatile organic
compounds (VOC) in the presence of sunlight produce surface ozone which also compromises air
quality. Overall, Vermont's air quality is good. Even so, there are days when high levels of fine
particulate matter in the air create potentially unhealthy conditions for groups such as older adults,
children, and people with chronic conditions such as asthma to engage in outdoor activity. Chittenden
County has a very low percentage of days per year when the surface ozone level and concentration of
ambient particulate matter register above National Ambient Air Quality Standards (NAAQS). As the
population of Chittenden County increases over the coming decades, bolstering the transit system,
creating a contiguous infrastructure for active modes of transportation, and focusing on dense
development patterns that encourage non-motorized trips will help to maintain healthy air quality.
Injury Prevention – Nationally, in 2015 nearly 190,000 pedestrians, just under 500,000 bicyclists and
over 2,600,000 motor vehicle occupants were injured. The most current available data shows
Chittenden County has the lowest non-fatal motor vehicle related injury rate in the state, but over
decades the projected population increase may begin to have a bearing on that indicator. Motor vehicle
crashes are a leading cause of injury in Vermont. Established safety measures such as safety belts, air
bags and car seats and emerging safety technologies such as pedestrian detection systems, lane
departure warnings and the like are improving safety on our roads. Policies to reduce VMT, increase
investment in safe and efficient walking and biking facilities, transit and TDM programs will promote
healthier behaviors by making the default choice the healthier choice. A health impact assessment
(HIA) of public transportation estimated that increased spending on public transportation and
sustainable modes of transportation can benefit health and reduce social inequalities.
The State of VT Health in All Policies Task Force has identified best practices that take into
consideration the evolution and growth of our transportation system and the health of Vermonters. The
task force recommends support for the development of cleaner bus and truck fleets and investment in
2018 Chittenden County ECOS Plan
Existing Metropolitan Transportation System | Metropolitan Transportation Plan 35
freight rail infrastructure to reduce greenhouse gas emissions, improve local air quality, promote health,
and foster energy independence. It is important to increase investments in public transportation and
walk/bike infrastructure improvements to support active transportation modes and emphasize
accessibility instead of simply mobility, in transportation policies and programs.
Regional Travel Patterns Residents of Chittenden County make hundreds of thousands of trips every day by various means of
transportation (driving, biking, walking, or busing). Transportation planners often categorize travel as
either peak or off-peak. Peak travel consists of the trips that coincide with the typical commute to work
in the early morning (AM peak) and back home in the late afternoon (PM peak) while off-peak trips
occur the remaining hours of the day. Peak and off-peak trips make different demands on the
transportation network. Peak period travel places the greatest strain on the transportation system,
because of high traffic volumes in shorter time periods, that consequently exhibits the worst congestion
seen throughout the day. Even though it is important to evaluate peak hour conditions on our roadways
it is equally important to understand off-peak conditions – the CCRPC’s Regional Travel Demand
Model has the capability to examine both peak and off-peak (daily) travel and its impact on roadway
congestion.
Chittenden County is the population and employment center of a larger area encompassing all of
northwestern Vermont. Its economic and cultural impacts spread well beyond the county boundaries.
Data from the U.S. Census Bureau’s Longitudinal Employer-Household Dynamics show that 32,295
residents from neighboring counties come to Chittenden County for work, while 69,948 Chittenden
County residents are employed within Chittenden County. Proximity and easy highway access to
Chittenden County have been determinants as to which towns in our neighboring counties have grown
the fastest. Franklin County’s fastest growing towns are those along the I-89 corridor and/or bordering
our northern municipalities. The northern tier communities in Addison County have likewise grown at
faster rates than other towns, and in Lamoille County, Cambridge and Stowe have been two of the
fastest growing communities.
Figure 22 shows a slight increase over time in the number of people that work in Chittenden County
but live outside the county. Even though this trend is based on various factors (housing affordability in
Chittenden County, highway accessibility, and others) it directly impacts and exacerbates capacity
issues on Interstate 89, especially between Exits 14 and 15. Unless this trend is reversed and there is a
substantial shift from SOV travel to other modes of transportation, Interstate 89 will continue to
experience congestion during the peak hours and a major capacity project between Exits 14 and 15
might be necessary in the future.
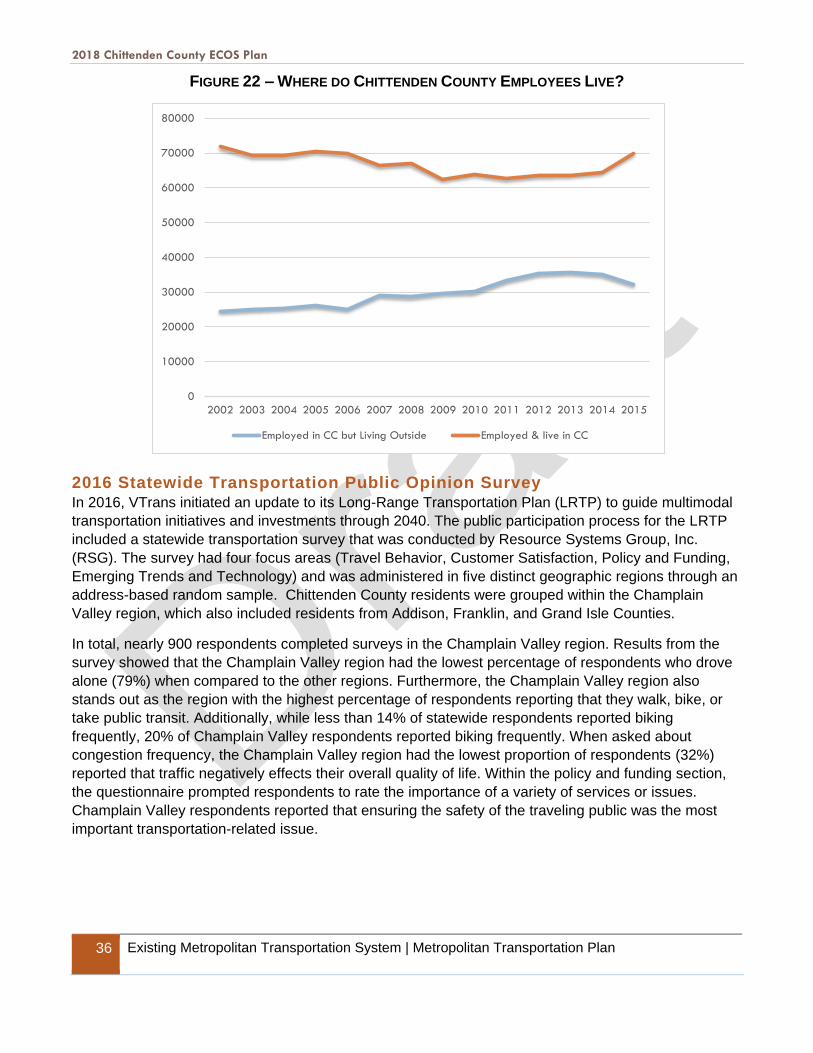
2018 Chittenden County ECOS Plan
36 Existing Metropolitan Transportation System | Metropolitan Transportation Plan
FIGURE 22 – WHERE DO CHITTENDEN COUNTY EMPLOYEES LIVE?
2016 Statewide Transportation Public Opinion Survey In 2016, VTrans initiated an update to its Long-Range Transportation Plan (LRTP) to guide multimodal
transportation initiatives and investments through 2040. The public participation process for the LRTP
included a statewide transportation survey that was conducted by Resource Systems Group, Inc.
(RSG). The survey had four focus areas (Travel Behavior, Customer Satisfaction, Policy and Funding,
Emerging Trends and Technology) and was administered in five distinct geographic regions through an
address-based random sample. Chittenden County residents were grouped within the Champlain
Valley region, which also included residents from Addison, Franklin, and Grand Isle Counties.
In total, nearly 900 respondents completed surveys in the Champlain Valley region. Results from the
survey showed that the Champlain Valley region had the lowest percentage of respondents who drove
alone (79%) when compared to the other regions. Furthermore, the Champlain Valley region also
stands out as the region with the highest percentage of respondents reporting that they walk, bike, or
take public transit. Additionally, while less than 14% of statewide respondents reported biking
frequently, 20% of Champlain Valley respondents reported biking frequently. When asked about
congestion frequency, the Champlain Valley region had the lowest proportion of respondents (32%)
reported that traffic negatively effects their overall quality of life. Within the policy and funding section,
the questionnaire prompted respondents to rate the importance of a variety of services or issues.
Champlain Valley respondents reported that ensuring the safety of the traveling public was the most
important transportation-related issue.
0
10000
20000
30000
40000
50000
60000
70000
80000
2002 2003 2004 2005 2006 2007 2008 2009 2010 2011 2012 2013 2014 2015
Employed in CC but Living Outside Employed & live in CC

2018 Chittenden County ECOS Plan
Financial Plan | Metropolitan Transportation Plan 37
Financial Plan
INTRODUCTION
The CCRPC’s long range transportation plan must incorporate a financial section that estimates how
much funding over the life of the plan will be needed, how much will be available for the recommended
transportation investments, and the costs to maintain and operate the existing system. The financial
section must outline how the CCRPC can reasonably expect to fund all included projects and programs
within a fiscally constrained environment, drawing on all anticipated revenues from the federal and state
governments, regional or local sources, the private sector and user charges.
Federal regulations establish the requirement for the financial plan in 23 CFR 450.324(g)(11)1. The
operative requirements of that regulation are summarized here. The adopted MTP shall include:
(11) A financial plan that demonstrates how the adopted transportation plan can be
implemented. Key components of this plan to include:
(i) System-level estimates of costs and revenues to adequately operate and
maintain Federal-aid highways and public transportation.
(ii) Agreed upon estimates of funds that will be available to support plan
implementation.
(iii) Recommendations on any additional financing strategies with strategies for
ensuring their continued availability.
(iv) Funding to include all federally funded projects, both highway and transit.
Projected funds to reflect “Year of Expenditure dollars.” (YoE)
The financial projections extend to the MTP planning horizon of 2050.
The completed financial plan will contain three parts:
1. The overall level of fiscal constraint including projection of future transportation funding in
Chittenden County and factors that are anticipated to affect this.
2. The base level of investment required for system operations and maintenance as called for
under 23 CFR 450.324(g)(11)(i).
3. An estimate and analysis of the costs associated with MTP recommended improvements
themselves.
FINANCIAL PLAN PART 1: OVERALL CONSTRAINT
CCRPC MTP funds, guided by the contents of the 2050 MTP, are limited to federal transportation funds
allocated to the Chittenden County metropolitan area under federal transportation acts. The Fixing
America's Surface Transportation Act or "FAST Act" is the current law governing the use of federal
1 For more details on federal regulations regarding MPO long range planning, see
https://www.ecfr.gov/cgi-bin/text-
idx?c=ecfr;sid=e2662fc63c225d496d1fa6ce22ea6cb8;rgn=div5;view=text;node=23%3A1.0.1.5.11;idno=23;cc=ecfr#sp23.1.450.c

2018 Chittenden County ECOS Plan
38 Financial Plan | Metropolitan Transportation Plan
transportation funds. FAST Act was signed into law on December 4, 2015 and largely maintains
previous program structures and funding shares between highways and transit.
The Chittenden County region does not currently access other sources of transportation funding such
as tolls or private contributions. The primary funding source for significant transportation projects on
highways, and transit eligible for federal aid, is expected to be federal funds plus state and local match.
The single most critical issue for establishing how much MTP funding will be available between 2016
and 2050 is therefore the future availability of federal funds. For the purposes of this plan, an estimate
of available future funding has been developed based on the history of statewide federal funding and
CCRPC’s historic share of that funding. This methodology represents the most reasonable estimate of
funding availability for two reasons:
• Actual funding available to the CCRPC over the past ten plus years is variable and has
depended on the timing of specific projects. Statewide spending patterns exhibit a more
consistent trend, and
• The FAST Act will continue funding programs at levels similar to what its predecessors MAP-21
and SAFETEA-LU previously provided.
FIGURE 23 – VERMONT FEDERAL TRANSPORTATION FUNDING HISTORY IN 2016 $ FY10 TO FY16
Source: FHWA and FTA Formula Fund amounts provided by VTrans and adjusted to 2016 dollars using
US Inflation Calculator
Total statewide federal funding was projected for future years based on historical funding levels as
depicted on the chart above. NOTE: The estimates began in FY2010 because FY2009 included an
infusion of additional funding from the American Recovery and Reinvestment Act (ARRA)
Over the last seven years there was no discernable increasing or decreasing trend in constant dollar
funding to Vermont. Therefore, the MTP assumes flat statewide funding over the 25-year planning
horizon at the level of $211,609,103 per year in 2016 dollars. See Table 4 for recent history.
$-
$50,000,000
$100,000,000
$150,000,000
$200,000,000
$250,000,000
FY 2010 FY 2011 FY 2012 FY 2013 FY 2014 FY 2015 FY 2016
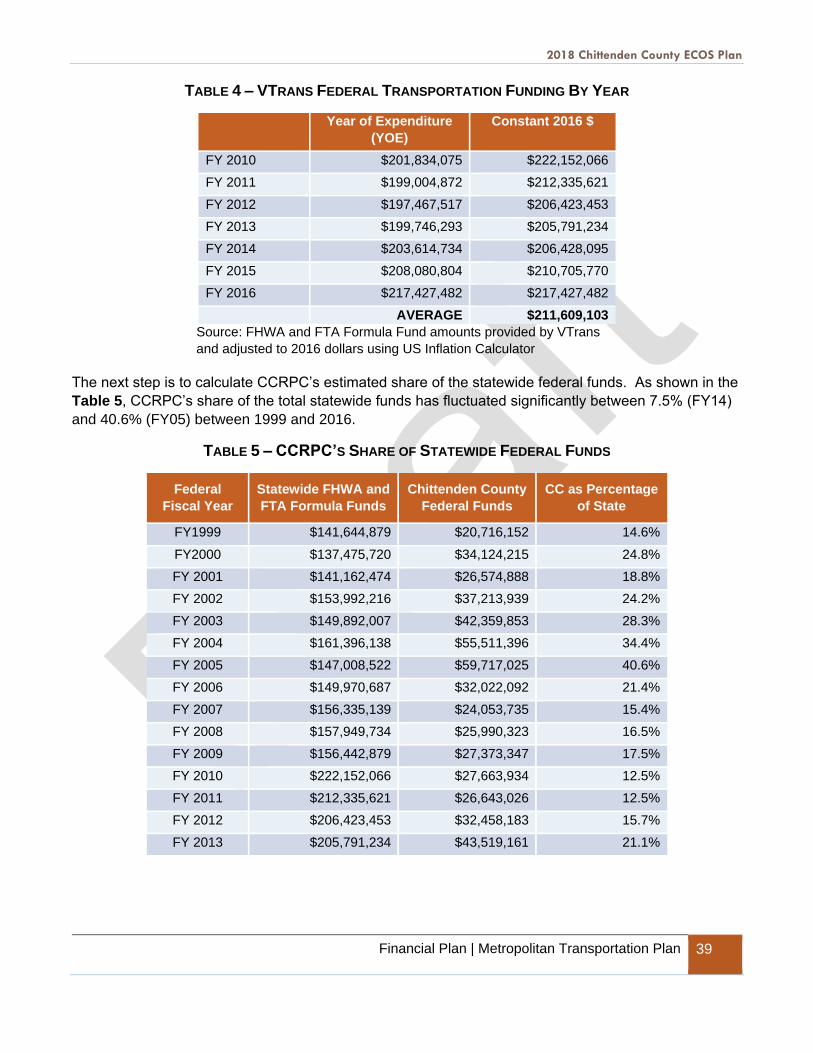
2018 Chittenden County ECOS Plan
Financial Plan | Metropolitan Transportation Plan 39
TABLE 4 – VTRANS FEDERAL TRANSPORTATION FUNDING BY YEAR
Year of Expenditure
(YOE)
Constant 2016 $
FY 2010 $201,834,075 $222,152,066
FY 2011 $199,004,872 $212,335,621
FY 2012 $197,467,517 $206,423,453
FY 2013 $199,746,293 $205,791,234
FY 2014 $203,614,734 $206,428,095
FY 2015 $208,080,804 $210,705,770
FY 2016 $217,427,482 $217,427,482
AVERAGE $211,609,103
Source: FHWA and FTA Formula Fund amounts provided by VTrans
and adjusted to 2016 dollars using US Inflation Calculator
The next step is to calculate CCRPC’s estimated share of the statewide federal funds. As shown in the
Table 5, CCRPC’s share of the total statewide funds has fluctuated significantly between 7.5% (FY14)
and 40.6% (FY05) between 1999 and 2016.
TABLE 5 – CCRPC’S SHARE OF STATEWIDE FEDERAL FUNDS
Federal
Fiscal Year
Statewide FHWA and
FTA Formula Funds
Chittenden County
Federal Funds
CC as Percentage
of State
FY1999 $141,644,879 $20,716,152 14.6%
FY2000 $137,475,720 $34,124,215 24.8%
FY 2001 $141,162,474 $26,574,888 18.8%
FY 2002 $153,992,216 $37,213,939 24.2%
FY 2003 $149,892,007 $42,359,853 28.3%
FY 2004 $161,396,138 $55,511,396 34.4%
FY 2005 $147,008,522 $59,717,025 40.6%
FY 2006 $149,970,687 $32,022,092 21.4%
FY 2007 $156,335,139 $24,053,735 15.4%
FY 2008 $157,949,734 $25,990,323 16.5%
FY 2009 $156,442,879 $27,373,347 17.5%
FY 2010 $222,152,066 $27,663,934 12.5%
FY 2011 $212,335,621 $26,643,026 12.5%
FY 2012 $206,423,453 $32,458,183 15.7%
FY 2013 $205,791,234 $43,519,161 21.1%
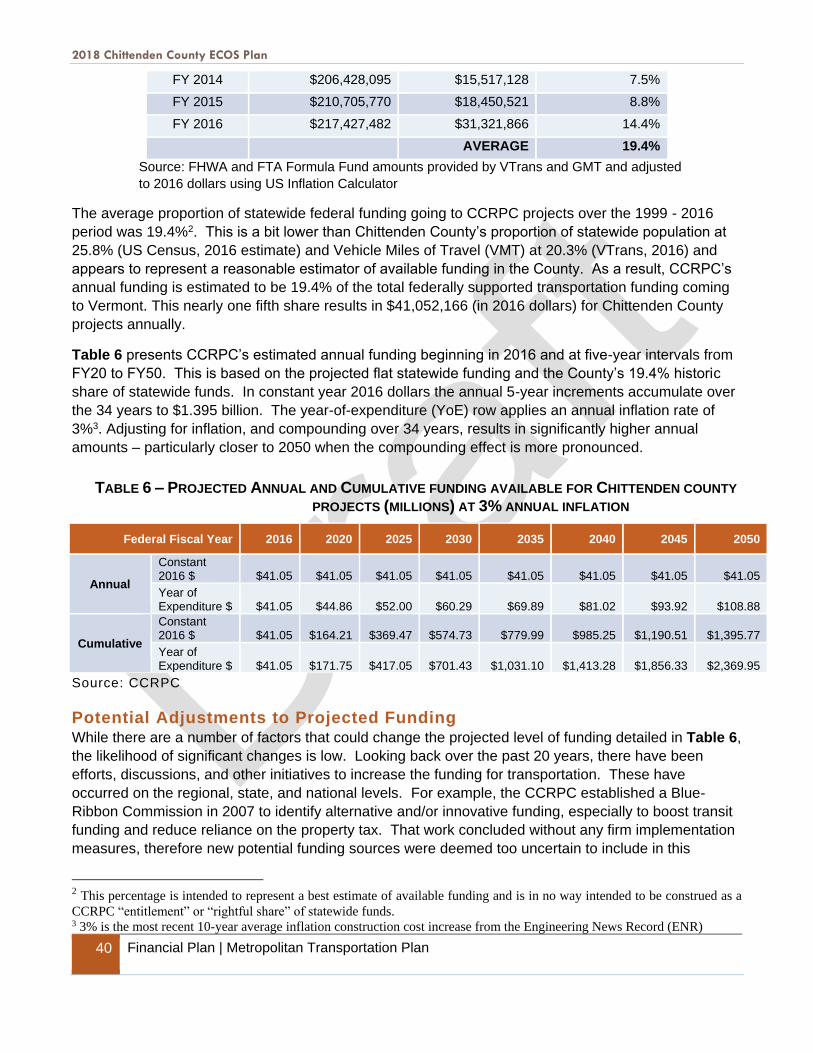
2018 Chittenden County ECOS Plan
40 Financial Plan | Metropolitan Transportation Plan
FY 2014 $206,428,095 $15,517,128 7.5%
FY 2015 $210,705,770 $18,450,521 8.8%
FY 2016 $217,427,482 $31,321,866 14.4%
AVERAGE 19.4%
Source: FHWA and FTA Formula Fund amounts provided by VTrans and GMT and adjusted
to 2016 dollars using US Inflation Calculator
The average proportion of statewide federal funding going to CCRPC projects over the 1999 - 2016
period was 19.4%2. This is a bit lower than Chittenden County’s proportion of statewide population at
25.8% (US Census, 2016 estimate) and Vehicle Miles of Travel (VMT) at 20.3% (VTrans, 2016) and
appears to represent a reasonable estimator of available funding in the County. As a result, CCRPC’s
annual funding is estimated to be 19.4% of the total federally supported transportation funding coming
to Vermont. This nearly one fifth share results in $41,052,166 (in 2016 dollars) for Chittenden County
projects annually.
Table 6 presents CCRPC’s estimated annual funding beginning in 2016 and at five-year intervals from
FY20 to FY50. This is based on the projected flat statewide funding and the County’s 19.4% historic
share of statewide funds. In constant year 2016 dollars the annual 5-year increments accumulate over
the 34 years to $1.395 billion. The year-of-expenditure (YoE) row applies an annual inflation rate of
3%3. Adjusting for inflation, and compounding over 34 years, results in significantly higher annual
amounts – particularly closer to 2050 when the compounding effect is more pronounced.
TABLE 6 – PROJECTED ANNUAL AND CUMULATIVE FUNDING AVAILABLE FOR CHITTENDEN COUNTY
PROJECTS (MILLIONS) AT 3% ANNUAL INFLATION
Federal Fiscal Year 2016 2020 2025 2030 2035 2040 2045 2050
Annual
Constant 2016 $ $41.05 $41.05 $41.05 $41.05 $41.05 $41.05 $41.05 $41.05
Year of Expenditure $ $41.05 $44.86 $52.00 $60.29 $69.89 $81.02 $93.92 $108.88
Cumulative
Constant 2016 $ $41.05 $164.21 $369.47 $574.73 $779.99 $985.25 $1,190.51 $1,395.77
Year of Expenditure $ $41.05 $171.75 $417.05 $701.43 $1,031.10 $1,413.28 $1,856.33 $2,369.95
Source: CCRPC
Potential Adjustments to Projected Funding While there are a number of factors that could change the projected level of funding detailed in Table 6,
the likelihood of significant changes is low. Looking back over the past 20 years, there have been
efforts, discussions, and other initiatives to increase the funding for transportation. These have
occurred on the regional, state, and national levels. For example, the CCRPC established a Blue-
Ribbon Commission in 2007 to identify alternative and/or innovative funding, especially to boost transit
funding and reduce reliance on the property tax. That work concluded without any firm implementation
measures, therefore new potential funding sources were deemed too uncertain to include in this
2 This percentage is intended to represent a best estimate of available funding and is in no way intended to be construed as a
CCRPC “entitlement” or “rightful share” of statewide funds. 3 3% is the most recent 10-year average inflation construction cost increase from the Engineering News Record (ENR)

2018 Chittenden County ECOS Plan
Financial Plan | Metropolitan Transportation Plan 41
estimation of future available funds. The Vermont Legislature has also tinkered with transportation
finance, allowing limited bonding and modest fuel tax increases for transportation uses and, while these
funding sources could lead to an increase in funding for the MPO region, they are too small or
inconsistent to reliably count on for a 35-year planning horizon.
At the federal level, given the passing of the FAST Act in late 2015, it appears that funding from this
source should remain stable for the near future. However, future federal funding levels are determined
by the federal government and may change over time.
In general, the above factors related to funding adjustments and potential uncertainty are too
questionable or short lived to significantly impact the quantitative estimates of future transportation
funding for Chittenden County. The discussion is intended to highlight some of the uncertainties which
may affect CCRPC’s ability to fund transportation projects into the future.
Overall Funding Constraint Conclusion Funding for CCRPC transportation projects is presently dependent on federal funding, which is
generally matched on an 80% federal / 20% non-federal basis at the state and local levels. Historically,
CCRPC has accounted for 19.4% of the annual federal transportation funds available statewide. A
review of funding levels over the past seven years reveals that funding is essentially flat in constant
dollar terms. Total funding available, over the coming 35 years, is estimated to be $1,395.8 million in
constant 2016 dollars, however budget decisions in Washington DC could impact future funding levels.
Additional funding sources, especially for transit operating, will be critical for the preservation and future
expansion of transit services in the region.
FINANCIAL PLAN PART 2: SYSTEM OPERATIONS & MAINTENANCE
ELEMENT
The operations and maintenance element is a fundamental component of the MTP financial plan. As
directed by federal regulations, the estimate of funds available to implement new plan initiatives is the
total constraint amount as detailed in Part 1 minus the funds necessary to operate and maintain the
existing investment in transportation infrastructure to an acceptable standard of service. Defining the
acceptable standard and the appropriate programs to operate and maintain facilities and services is the
purpose of this element of the financial plan.
To calculate anticipated future maintenance and operations funding for the existing system, we have
looked at historical expenditures (see Table 7) in the relevant funding categories from annual
Transportation Improvement Programs (TIPs). When reviewing the TIP obligation history over the past
17 years (FY00 – FY16) and using the categories of Bridge, Paving, Slope and Ledge Improvements,
and Transit Operations and Maintenance, as our maintenance/operation proxies, the average percent
of the overall funding to those categories is just under 55.1%. However, if we examine a shorter window
of time – the past 7 years (FY10 – FY16) we feel are more representative of current maintenance first
policies – the maintenance/operations share goes to 73.6%. Projecting this higher share into the future
defines a reasonable, if conservative, standard of system operation and maintenance investment.
Given the significant historical fluctuation in the share of funding for operations and maintenance, and
to simplify our analysis of future funding, we’ve rounded the 73.6% down to 70%. (For historical
comparison we used 64% in our last MTP). The total annualized costs (applying the 70% to the
projected $41+ million) for system operations and maintenance are $28.74M in 2016 dollars.
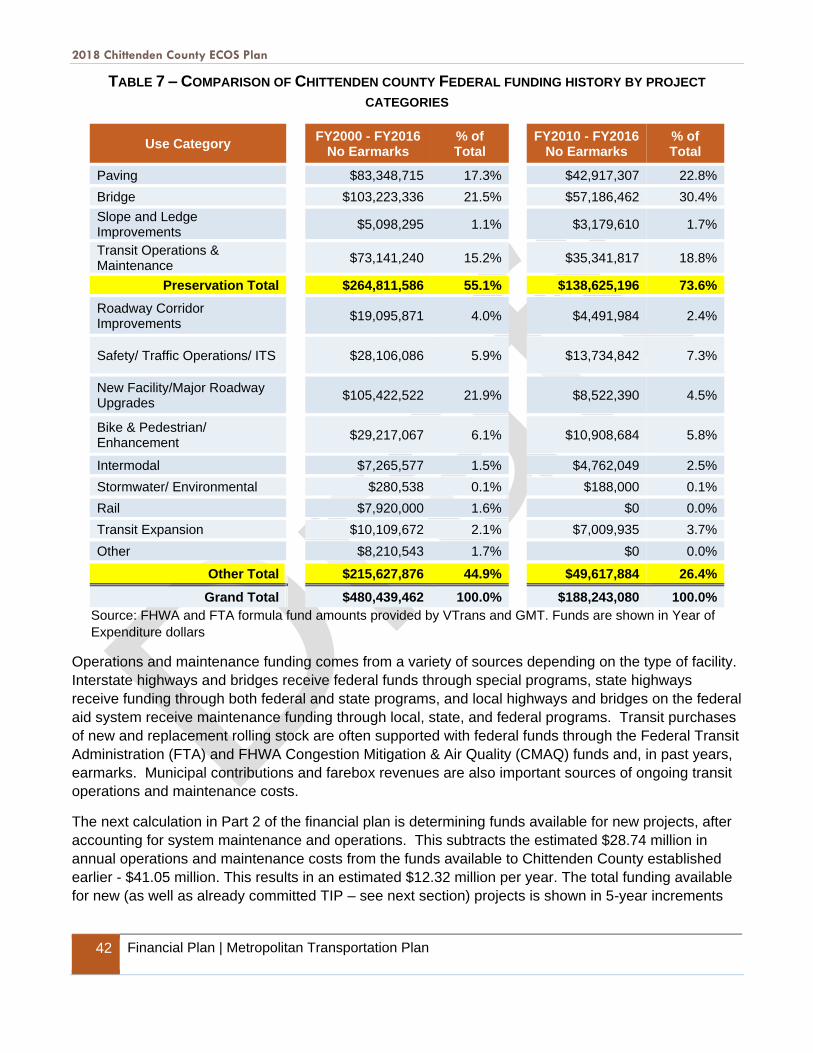
2018 Chittenden County ECOS Plan
42 Financial Plan | Metropolitan Transportation Plan
TABLE 7 – COMPARISON OF CHITTENDEN COUNTY FEDERAL FUNDING HISTORY BY PROJECT
CATEGORIES
Use Category FY2000 - FY2016
No Earmarks % of Total
FY2010 - FY2016 No Earmarks
% of Total
Paving $83,348,715 17.3% $42,917,307 22.8%
Bridge $103,223,336 21.5% $57,186,462 30.4%
Slope and Ledge Improvements
$5,098,295 1.1% $3,179,610 1.7%
Transit Operations & Maintenance
$73,141,240 15.2% $35,341,817 18.8%
Preservation Total $264,811,586 55.1% $138,625,196 73.6%
Roadway Corridor Improvements
$19,095,871 4.0% $4,491,984 2.4%
Safety/ Traffic Operations/ ITS $28,106,086 5.9% $13,734,842 7.3%
New Facility/Major Roadway Upgrades
$105,422,522 21.9% $8,522,390 4.5%
Bike & Pedestrian/ Enhancement
$29,217,067 6.1% $10,908,684 5.8%
Intermodal $7,265,577 1.5% $4,762,049 2.5%
Stormwater/ Environmental $280,538 0.1% $188,000 0.1%
Rail $7,920,000 1.6% $0 0.0%
Transit Expansion $10,109,672 2.1% $7,009,935 3.7%
Other $8,210,543 1.7% $0 0.0%
Other Total $215,627,876 44.9% $49,617,884 26.4%
Grand Total $480,439,462 100.0% $188,243,080 100.0%
Source: FHWA and FTA formula fund amounts provided by VTrans and GMT. Funds are shown in Year of
Expenditure dollars
Operations and maintenance funding comes from a variety of sources depending on the type of facility.
Interstate highways and bridges receive federal funds through special programs, state highways
receive funding through both federal and state programs, and local highways and bridges on the federal
aid system receive maintenance funding through local, state, and federal programs. Transit purchases
of new and replacement rolling stock are often supported with federal funds through the Federal Transit
Administration (FTA) and FHWA Congestion Mitigation & Air Quality (CMAQ) funds and, in past years,
earmarks. Municipal contributions and farebox revenues are also important sources of ongoing transit
operations and maintenance costs.
The next calculation in Part 2 of the financial plan is determining funds available for new projects, after
accounting for system maintenance and operations. This subtracts the estimated $28.74 million in
annual operations and maintenance costs from the funds available to Chittenden County established
earlier - $41.05 million. This results in an estimated $12.32 million per year. The total funding available
for new (as well as already committed TIP – see next section) projects is shown in 5-year increments

2018 Chittenden County ECOS Plan
Financial Plan | Metropolitan Transportation Plan 43
below. The forecast funding resources available for planned improvements in the MTP is estimated at
$418.73 million in 2016 constant dollars.
TABLE 8 – PROJECTED ANNUAL FUNDING FOR NEW OR COMMITTED PROJECT IN CHITTENDEN COUNTY
(MILLIONS)
Federal Fiscal Year 2016 2020 2025 2030 2035 2040 2045 2050
Annual
Constant 2016 $ $12.32 $12.32 $12.32 $12.32 $12.32 $12.32 $12.32 $12.32
Year of Expenditure $ $12.32 $13.46 $15.60 $18.09 $20.97 $24.31 $28.18 $32.67
Cumulative
Constant 2016 $ $12.32 $49.26 $110.84 $172.42 $234.00 $295.58 $357.15 $418.73
Year of Expenditure $ $12.32 $51.52 $125.12 $210.43 $309.33 $423.98 $556.90 $710.98
Notes: Inflation based on 3% annual and system preservation requirements are estimated at $28.7 million
annually in 2016$.
CONCLUSION AND PROPOSED FUTURE ALLOCATIONS
This financial plan concludes that Chittenden County has $12.32 million per year for new transportation
investments and for projects already committed to as identified in our TIP (see more on this below).
This level of funding is expected to remain fairly stable in terms of buying power to 2050. By the plan
horizon year in 2050 CCRPC expects to have $418.73 million (2016 $) in cumulative federal only
funding available for new projects. When factoring inflation into the calculation of the cumulative
funding available, the total amount of funds increases to $711 million in year of expenditure dollars.
There is, however, one more factor to take into account before finalizing the level of funds available for
new projects. Maintenance and operations needs have been well documented but the CCRPC has
other funds committed to projects not accounted for here, namely those non-preservation projects
identified in our Transportation Improvement Program (TIP). Table 9 summarizes all anticipated
revenues and costs out to 2050 for two System Preservation scenarios, including the new factor of
already committed TIP funds.
NOTE: All of the calculations above only included funds from the federal government. As stated
earlier almost all federal funds require a 20% non-federal match. As a result, the non-federal
match of 20% is added into Table 9 and all subsequent sections of this financial plan content.
The total committed to TIP projects is calculated at $102.75 million in 2016 constant dollars.
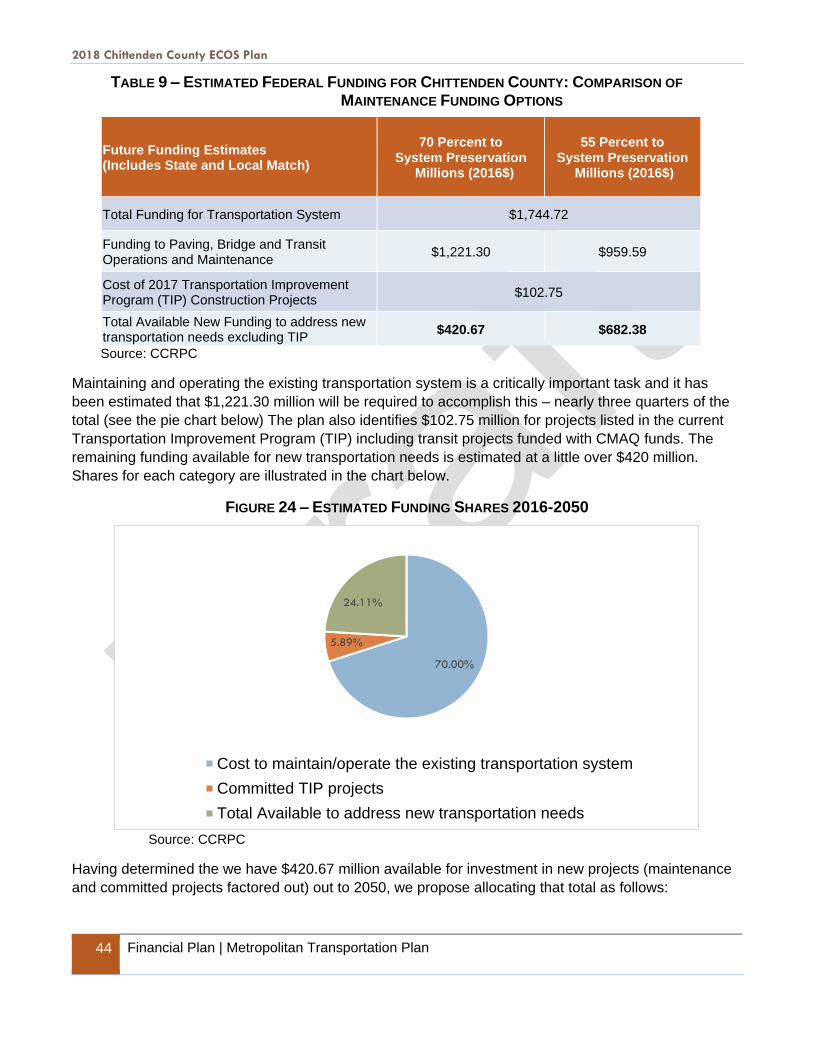
2018 Chittenden County ECOS Plan
44 Financial Plan | Metropolitan Transportation Plan
TABLE 9 – ESTIMATED FEDERAL FUNDING FOR CHITTENDEN COUNTY: COMPARISON OF
MAINTENANCE FUNDING OPTIONS
Future Funding Estimates (Includes State and Local Match)
70 Percent to System Preservation
Millions (2016$)
55 Percent to System Preservation
Millions (2016$)
Total Funding for Transportation System $1,744.72
Funding to Paving, Bridge and Transit Operations and Maintenance
$1,221.30 $959.59
Cost of 2017 Transportation Improvement Program (TIP) Construction Projects
$102.75
Total Available New Funding to address new transportation needs excluding TIP
$420.67 $682.38
Source: CCRPC
Maintaining and operating the existing transportation system is a critically important task and it has
been estimated that $1,221.30 million will be required to accomplish this – nearly three quarters of the
total (see the pie chart below) The plan also identifies $102.75 million for projects listed in the current
Transportation Improvement Program (TIP) including transit projects funded with CMAQ funds. The
remaining funding available for new transportation needs is estimated at a little over $420 million.
Shares for each category are illustrated in the chart below.
FIGURE 24 – ESTIMATED FUNDING SHARES 2016-2050
Source: CCRPC
Having determined the we have $420.67 million available for investment in new projects (maintenance
and committed projects factored out) out to 2050, we propose allocating that total as follows:
70.00%
5.89%
24.11%
Cost to maintain/operate the existing transportation system
Committed TIP projects
Total Available to address new transportation needs

2018 Chittenden County ECOS Plan
Financial Plan | Metropolitan Transportation Plan 45
TABLE 10 – PROPOSED 2050 PROGRAM ALLOCATIONS
Program Category MTP Allocations Percent FY00-16 TIP Obligation
Percentages
Interstate and Interchange Projects $74,300,000 17.7% 12.6%
Multimodal Roadway Improvements
(includes Corridor Improvements, New
Facilities/ Major Roadway Upgrades,
and Safety/ Traffic Operations/ ITS)
$214,700,000 51.0% 61%
Bike/Pedestrian/ Enhancement $70,000,000 16.6% 14.1%
Transit Expansion $40,000,000 9.5% 4.9%
Park &Ride/ Intermodal $5,700,000 1.4% 3.5%
Rail Outside our Fiscal Constraint 3.8%
Stormwater/ Environmental $16,000,000 3.8% 0.1%
New Improvements $420,700,000 100.0% 100.0%
Total Funding (2050): $1,744.72 million
TIP/Capital Program Front of the Book Projects: $102.75 million
Preservation Projects (Operate and Maintain Transit, Pavement, Bridges): $1,221.30 million
Source: CCRPC
The last column showing 17 years of historical obligations has been added for comparison purposes
and reveals that while not a radical departure from historic norms, we do propose significant increases
to transit and environmental projects.
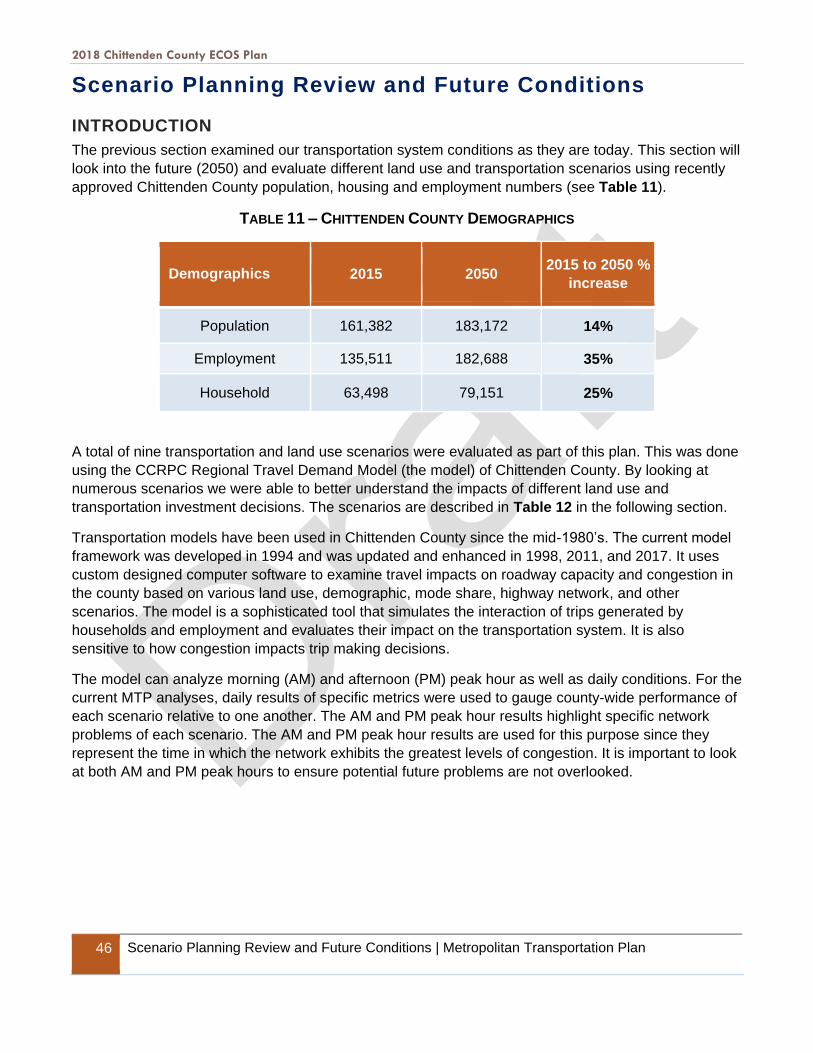
2018 Chittenden County ECOS Plan
46 Scenario Planning Review and Future Conditions | Metropolitan Transportation Plan
Scenario Planning Review and Future Conditions
INTRODUCTION
The previous section examined our transportation system conditions as they are today. This section will
look into the future (2050) and evaluate different land use and transportation scenarios using recently
approved Chittenden County population, housing and employment numbers (see Table 11).
TABLE 11 – CHITTENDEN COUNTY DEMOGRAPHICS
Demographics 2015 2050 2015 to 2050 %
increase
Population 161,382 183,172 14%
Employment 135,511 182,688 35%
Household 63,498 79,151 25%
A total of nine transportation and land use scenarios were evaluated as part of this plan. This was done
using the CCRPC Regional Travel Demand Model (the model) of Chittenden County. By looking at
numerous scenarios we were able to better understand the impacts of different land use and
transportation investment decisions. The scenarios are described in Table 12 in the following section.
Transportation models have been used in Chittenden County since the mid-1980’s. The current model
framework was developed in 1994 and was updated and enhanced in 1998, 2011, and 2017. It uses
custom designed computer software to examine travel impacts on roadway capacity and congestion in
the county based on various land use, demographic, mode share, highway network, and other
scenarios. The model is a sophisticated tool that simulates the interaction of trips generated by
households and employment and evaluates their impact on the transportation system. It is also
sensitive to how congestion impacts trip making decisions.
The model can analyze morning (AM) and afternoon (PM) peak hour as well as daily conditions. For the
current MTP analyses, daily results of specific metrics were used to gauge county-wide performance of
each scenario relative to one another. The AM and PM peak hour results highlight specific network
problems of each scenario. The AM and PM peak hour results are used for this purpose since they
represent the time in which the network exhibits the greatest levels of congestion. It is important to look
at both AM and PM peak hours to ensure potential future problems are not overlooked.
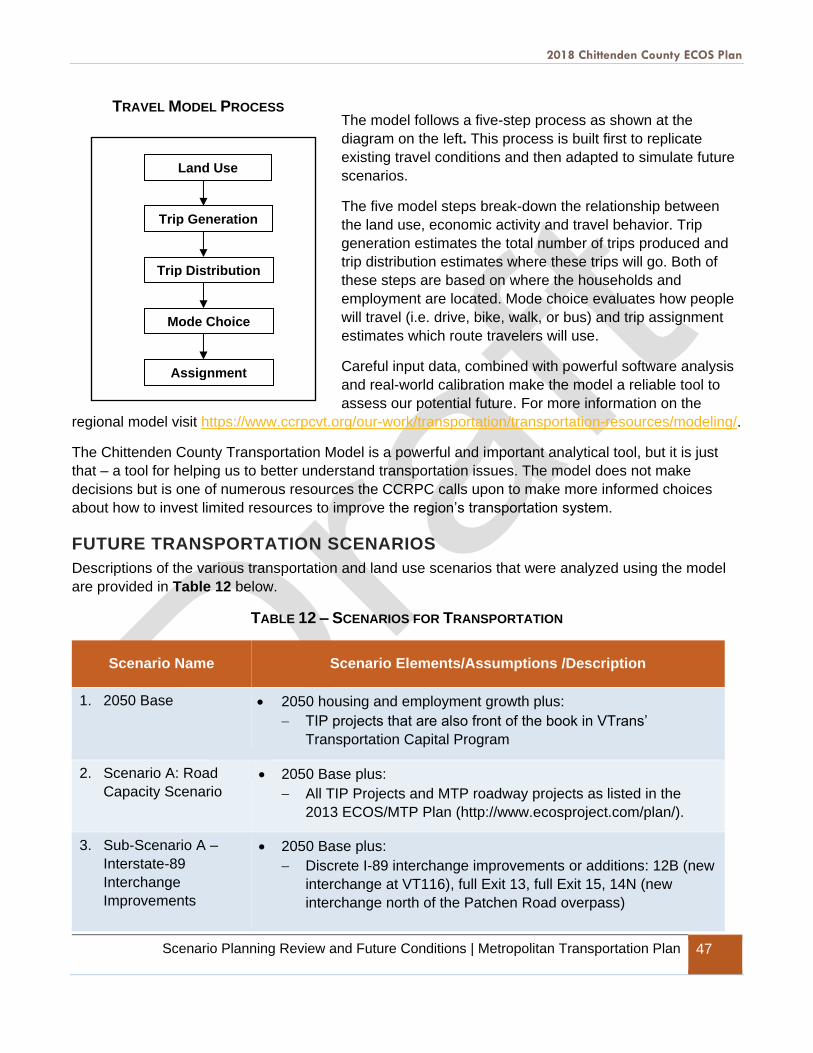
2018 Chittenden County ECOS Plan
Scenario Planning Review and Future Conditions | Metropolitan Transportation Plan 47
The model follows a five-step process as shown at the
diagram on the left. This process is built first to replicate
existing travel conditions and then adapted to simulate future
scenarios.
The five model steps break-down the relationship between
the land use, economic activity and travel behavior. Trip
generation estimates the total number of trips produced and
trip distribution estimates where these trips will go. Both of
these steps are based on where the households and
employment are located. Mode choice evaluates how people
will travel (i.e. drive, bike, walk, or bus) and trip assignment
estimates which route travelers will use.
Careful input data, combined with powerful software analysis
and real-world calibration make the model a reliable tool to
assess our potential future. For more information on the
regional model visit https://www.ccrpcvt.org/our-work/transportation/transportation-resources/modeling/.
The Chittenden County Transportation Model is a powerful and important analytical tool, but it is just
that – a tool for helping us to better understand transportation issues. The model does not make
decisions but is one of numerous resources the CCRPC calls upon to make more informed choices
about how to invest limited resources to improve the region’s transportation system.
FUTURE TRANSPORTATION SCENARIOS
Descriptions of the various transportation and land use scenarios that were analyzed using the model
are provided in Table 12 below.
TABLE 12 – SCENARIOS FOR TRANSPORTATION
Scenario Name Scenario Elements/Assumptions /Description
1. 2050 Base • 2050 housing and employment growth plus:
− TIP projects that are also front of the book in VTrans’
Transportation Capital Program
2. Scenario A: Road
Capacity Scenario
• 2050 Base plus:
− All TIP Projects and MTP roadway projects as listed in the
2013 ECOS/MTP Plan (http://www.ecosproject.com/plan/).
3. Sub-Scenario A –
Interstate-89
Interchange
Improvements
• 2050 Base plus:
− Discrete I-89 interchange improvements or additions: 12B (new
interchange at VT116), full Exit 13, full Exit 15, 14N (new
interchange north of the Patchen Road overpass)
Land Use
Trip Generation
Trip Distribution
Mode Choice
Assignment
TRAVEL MODEL PROCESS
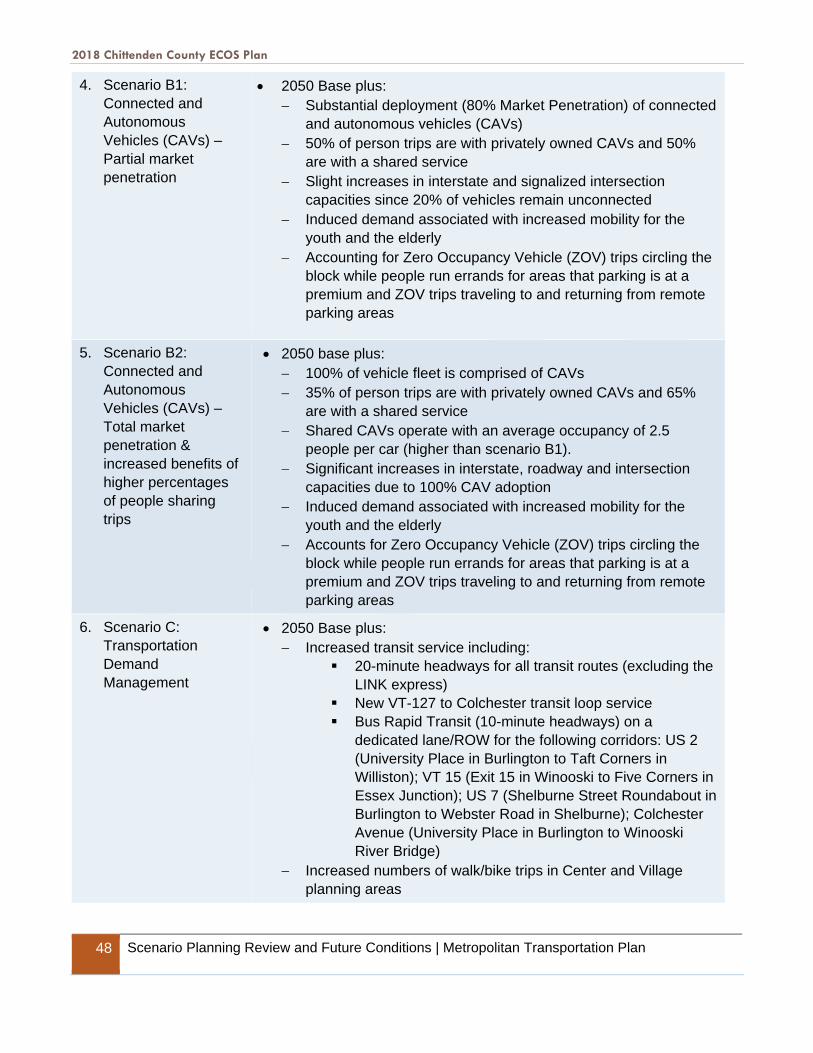
2018 Chittenden County ECOS Plan
48 Scenario Planning Review and Future Conditions | Metropolitan Transportation Plan
4. Scenario B1:
Connected and
Autonomous
Vehicles (CAVs) –
Partial market
penetration
• 2050 Base plus:
− Substantial deployment (80% Market Penetration) of connected
and autonomous vehicles (CAVs)
− 50% of person trips are with privately owned CAVs and 50%
are with a shared service
− Slight increases in interstate and signalized intersection
capacities since 20% of vehicles remain unconnected
− Induced demand associated with increased mobility for the
youth and the elderly
− Accounting for Zero Occupancy Vehicle (ZOV) trips circling the
block while people run errands for areas that parking is at a
premium and ZOV trips traveling to and returning from remote
parking areas
5. Scenario B2:
Connected and
Autonomous
Vehicles (CAVs) –
Total market
penetration &
increased benefits of
higher percentages
of people sharing
trips
• 2050 base plus:
− 100% of vehicle fleet is comprised of CAVs
− 35% of person trips are with privately owned CAVs and 65%
are with a shared service
− Shared CAVs operate with an average occupancy of 2.5
people per car (higher than scenario B1).
− Significant increases in interstate, roadway and intersection
capacities due to 100% CAV adoption
− Induced demand associated with increased mobility for the
youth and the elderly
− Accounts for Zero Occupancy Vehicle (ZOV) trips circling the
block while people run errands for areas that parking is at a
premium and ZOV trips traveling to and returning from remote
parking areas
6. Scenario C:
Transportation
Demand
Management
• 2050 Base plus:
− Increased transit service including:
▪ 20-minute headways for all transit routes (excluding the
LINK express)
▪ New VT-127 to Colchester transit loop service
▪ Bus Rapid Transit (10-minute headways) on a
dedicated lane/ROW for the following corridors: US 2
(University Place in Burlington to Taft Corners in
Williston); VT 15 (Exit 15 in Winooski to Five Corners in
Essex Junction); US 7 (Shelburne Street Roundabout in
Burlington to Webster Road in Shelburne); Colchester
Avenue (University Place in Burlington to Winooski
River Bridge)
− Increased numbers of walk/bike trips in Center and Village
planning areas

2018 Chittenden County ECOS Plan
Scenario Planning Review and Future Conditions | Metropolitan Transportation Plan 49
7. Scenario D1 –
Increase land use
density
• 2050 Base with following land use:
− 90% of adopted 2050 household growth is allocated to the
Center and Village planning areas for all towns
8. Scenario D2 –
Increase land use
density
• 2050 Base with following land use:
− 90% of the approved 2050 household growth is allocated to
Areas Planned for Growth with concentration in the Urban
Centers and Village planning areas
9. Scenario D3 –
Increase households
in the county to
improve our
jobs/housing balance
• 2050 Base with following land use:
− County population and households are increased by 10% over
adopted projections.
− Additional household growth is allocated to Center and Village
planning areas for all towns as in scenario D1
SCENARIO RESULTS
The capacity building scenario (A) resulted in reduced congestion and delay on the transportation
system when compared to the 2050 Base. The sub-scenarios that looked at individual I-89 interchange
expansions or additions did not have substantial reductions in countywide delay (see Figure 25). When
the interchange sub-scenarios were analyzed in greater detail, results indicated that they all helped to
decrease congestion at areas around the interchanges, with Exits 12B (VT 116) and 14N (Patchen Rd)
having the most benefit. On the downside the capacity building scenarios caused the vehicle miles
traveled (VMT) to slightly increase compared to the 2050 Base since the reductions in delay made it
easier to travel.
The Connected and Autonomous Vehicle (CAV) scenarios (B1 & B2) were developed to begin to
consider how this technology could affect our transportation system, land use patterns and our
communities overall. Scenarios B1 and B2 are two vastly different possible futures. Scenario B1
exhibited the greatest increases in vehicle miles traveled (VMT), delay, and trip making. Scenario B2
also saw increases in VMT and trip making (see Figure 25) but saw decreased delay when compared
to the 2050 Base (see Figure 25). This was due to the assumptions of CAV proliferation, 80% vs
100%, and private ownership, 50% vs 35%, for Scenarios B1 and B2 respectively. The jump to 100%
CAV proliferation in Scenario B2 allowed for significant increases in the carrying capacity of existing
roadways and intersections. Drivers currently keep a distance equivalent to 1 to 3 seconds of travel
time behind the vehicle in front of them whereas CAVs can reduce this distance to one-half a second or
less. Scenario B1 was not as efficient as B2 due to the assumption that 20% of vehicles remained
unconnected and prone to human error. The ownership assumptions in Scenario B2 helped reduce
congestion because of the increase in the number of shared trips (2-3 people sharing a vehicle at a
time) whereas the assumption is that privately owned vehicles are typically only moving one person.
The increased number of zero-occupancy vehicle (ZOV) trips assumed with privately owned CAVs also
contributed to the poorer performance of Scenario B1 when compared to B2.
The Transportation Demand Management (TDM) scenario (C) reduced an individual’s delay as much
as the capacity building scenario (A) (see Figure 25). This is directly related to the increase in mode
2018 Chittenden County ECOS Plan
50 Scenario Planning Review and Future Conditions | Metropolitan Transportation Plan
shift towards transit, walking and biking, as shown in Figure 29. This scenario also had a slight
decrease in VMT when compared to the 2050 Base.
The land use scenarios (D1, D2, and D3) analyzed the effect of concentrating land uses and increasing
densities on the transportation system. Generally, these scenarios decreased delay and VMT when
compared to the 2050 Base (see Figure 25). This was due to the increased viability of transit, walking,
and biking that occurs when more people live closer to transit routes and there is transportation
infrastructure that supports walking and biking. Scenario D3 is the only scenario that analyzed an
increase in households and consequently population in the county beyond the adopted population
forecasts. This scenario was designed to see what might happen if Chittenden County were able to
reverse the trend of people living outside and commuting into the county for work. Results of Scenario
D3 indicated that despite a 10% increase in county households, the overall delay per capita, VMT and
total number of vehicle trips decreased (see Figure 25).

2018 Chittenden County ECOS Plan
Scenario Planning Review and Future Conditions | Metropolitan Transportation Plan 51
FIGURE 25 – COUNTYWIDE DAILY DELAY PER CAPITA
0.0
2.0
4.0
6.0
8.0
10.0
12.0
14.0
16.0
18.0
Min
ute
s

2018 Chittenden County ECOS Plan
52 Scenario Planning Review and Future Conditions | Metropolitan Transportation Plan
FIGURE 26 - COUNTYWIDE DAILY VEHICLES MILES TRAVELED (VMT)
0
1,000,000
2,000,000
3,000,000
4,000,000
5,000,000
6,000,000
7,000,000
8,000,000
Mile
s

2018 Chittenden County ECOS Plan
Scenario Planning Review and Future Conditions | Metropolitan Transportation Plan 53
FIGURE 27 - COUNTYWIDE DAILY TOTAL VEHICLE TRIPS
0
100,000
200,000
300,000
400,000
500,000
600,000
700,000
800,000
900,000
1,000,000
Trip
s
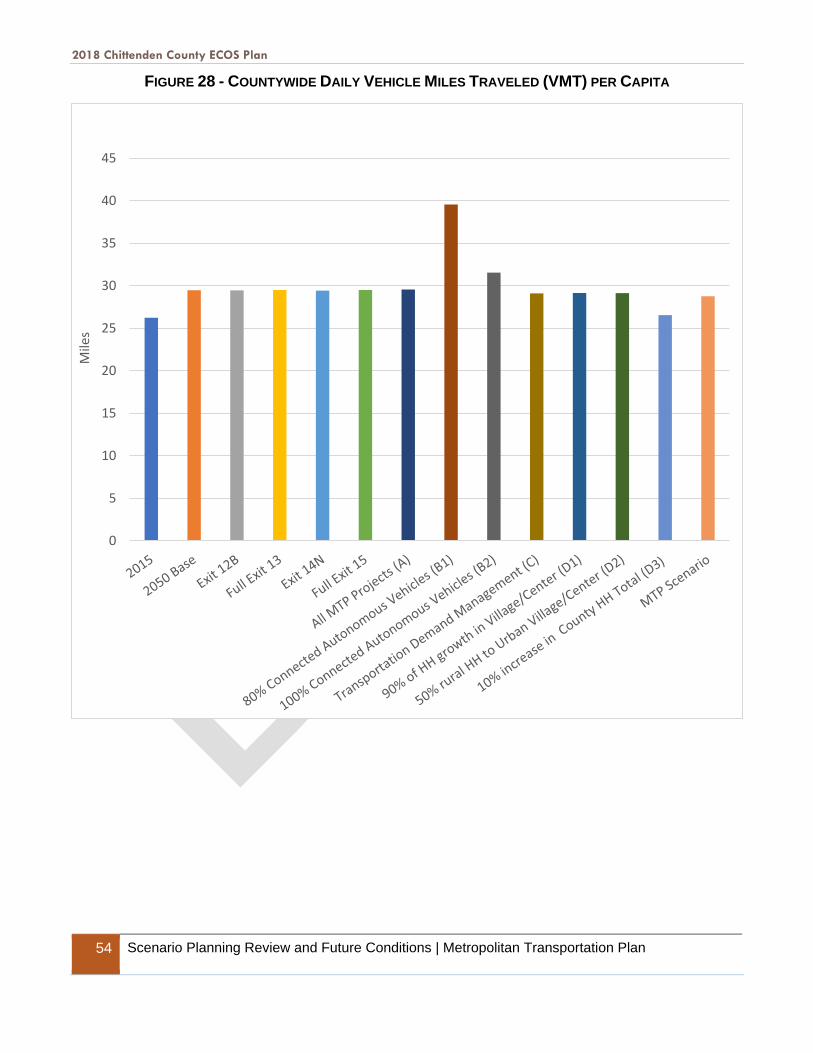
2018 Chittenden County ECOS Plan
54 Scenario Planning Review and Future Conditions | Metropolitan Transportation Plan
FIGURE 28 - COUNTYWIDE DAILY VEHICLE MILES TRAVELED (VMT) PER CAPITA
0
5
10
15
20
25
30
35
40
45
Mile
s

2018 Chittenden County ECOS Plan
Scenario Planning Review and Future Conditions | Metropolitan Transportation Plan 55
FIGURE 29 - COUNTYWIDE DAILY TRANSIT, WALKING, AND BIKING MODE SPLIT
MTP SCENARIO
All future scenarios developed and evaluated are starkly different from one another and from the past
historical programmatic transportation investments and are unlikely to proceed in the manner outlined
in each individual scenario. However, results from the various scenarios helped frame the conversation
about what to include in our MTP Scenario so it is a more balanced, achievable and sustainable future
transportation program. The MTP Scenario is described in Table 13.
0%
2%
4%
6%
8%
10%
12%
14%
16%
18%
Per
cen
t
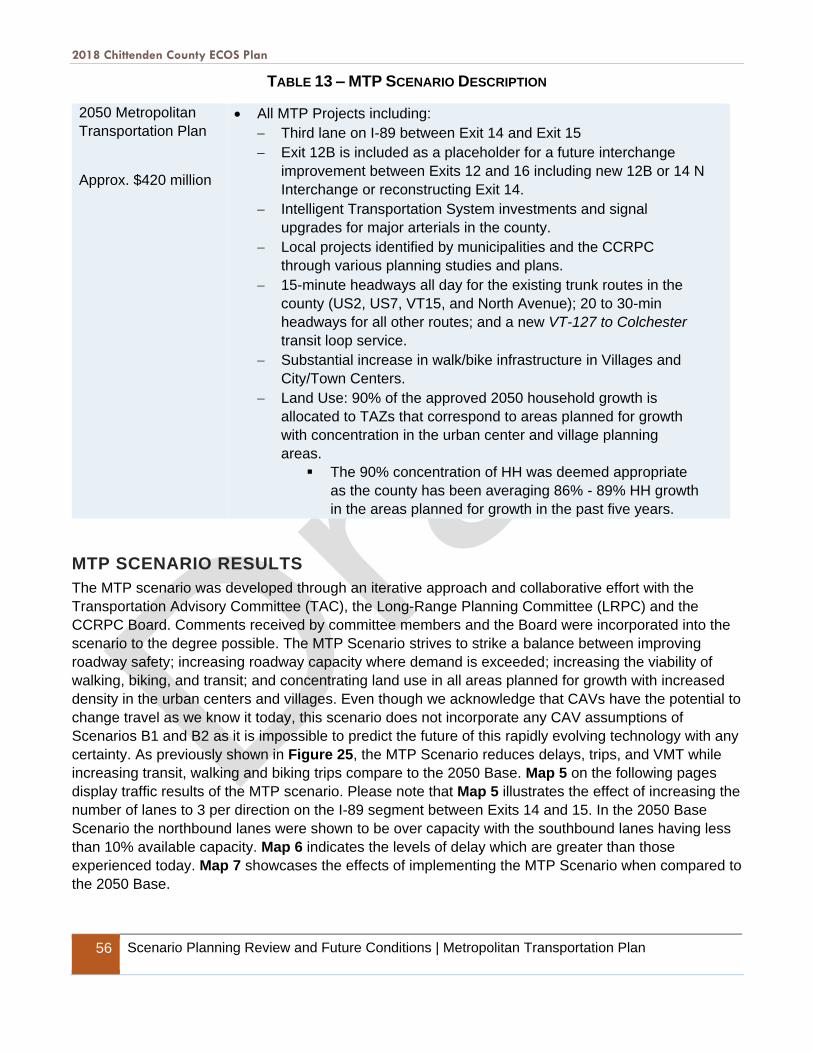
2018 Chittenden County ECOS Plan
56 Scenario Planning Review and Future Conditions | Metropolitan Transportation Plan
TABLE 13 – MTP SCENARIO DESCRIPTION
2050 Metropolitan
Transportation Plan
Approx. $420 million
• All MTP Projects including:
− Third lane on I-89 between Exit 14 and Exit 15
− Exit 12B is included as a placeholder for a future interchange
improvement between Exits 12 and 16 including new 12B or 14 N
Interchange or reconstructing Exit 14.
− Intelligent Transportation System investments and signal
upgrades for major arterials in the county.
− Local projects identified by municipalities and the CCRPC
through various planning studies and plans.
− 15-minute headways all day for the existing trunk routes in the
county (US2, US7, VT15, and North Avenue); 20 to 30-min
headways for all other routes; and a new VT-127 to Colchester
transit loop service.
− Substantial increase in walk/bike infrastructure in Villages and
City/Town Centers.
− Land Use: 90% of the approved 2050 household growth is
allocated to TAZs that correspond to areas planned for growth
with concentration in the urban center and village planning
areas.
▪ The 90% concentration of HH was deemed appropriate
as the county has been averaging 86% - 89% HH growth
in the areas planned for growth in the past five years.
MTP SCENARIO RESULTS
The MTP scenario was developed through an iterative approach and collaborative effort with the
Transportation Advisory Committee (TAC), the Long-Range Planning Committee (LRPC) and the
CCRPC Board. Comments received by committee members and the Board were incorporated into the
scenario to the degree possible. The MTP Scenario strives to strike a balance between improving
roadway safety; increasing roadway capacity where demand is exceeded; increasing the viability of
walking, biking, and transit; and concentrating land use in all areas planned for growth with increased
density in the urban centers and villages. Even though we acknowledge that CAVs have the potential to
change travel as we know it today, this scenario does not incorporate any CAV assumptions of
Scenarios B1 and B2 as it is impossible to predict the future of this rapidly evolving technology with any
certainty. As previously shown in Figure 25, the MTP Scenario reduces delays, trips, and VMT while
increasing transit, walking and biking trips compare to the 2050 Base. Map 5 on the following pages
display traffic results of the MTP scenario. Please note that Map 5 illustrates the effect of increasing the
number of lanes to 3 per direction on the I-89 segment between Exits 14 and 15. In the 2050 Base
Scenario the northbound lanes were shown to be over capacity with the southbound lanes having less
than 10% available capacity. Map 6 indicates the levels of delay which are greater than those
experienced today. Map 7 showcases the effects of implementing the MTP Scenario when compared to
the 2050 Base.
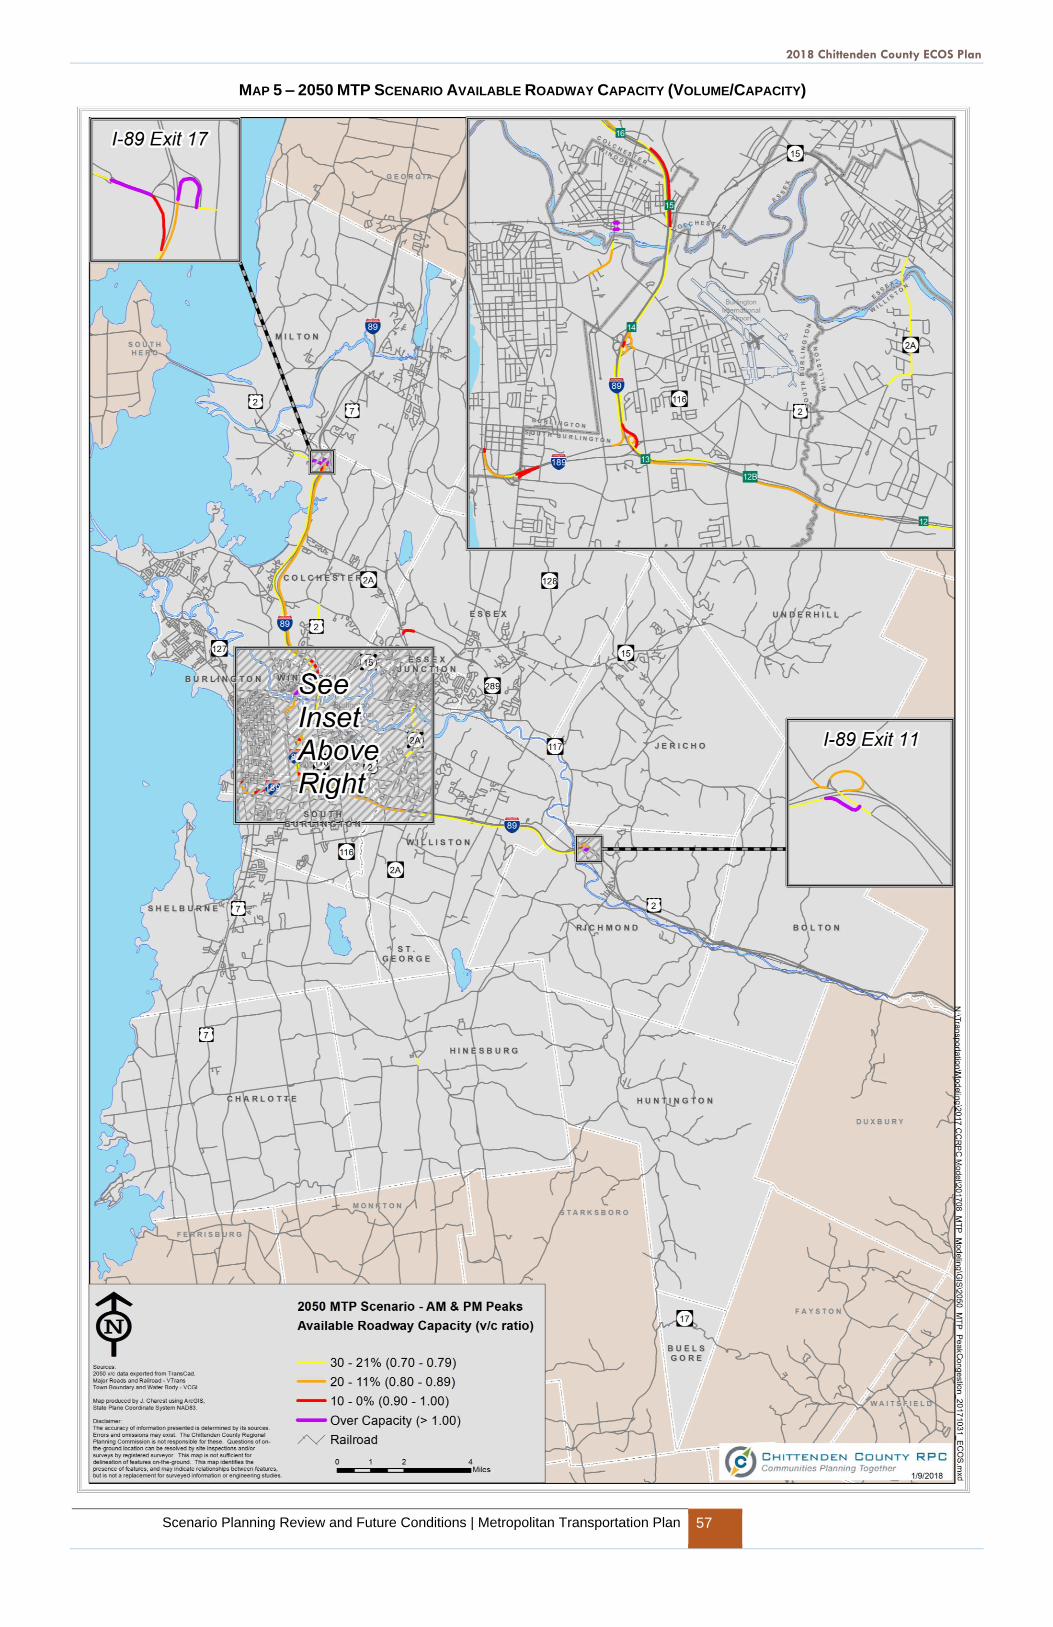
2018 Chittenden County ECOS Plan
Scenario Planning Review and Future Conditions | Metropolitan Transportation Plan 57
MAP 5 – 2050 MTP SCENARIO AVAILABLE ROADWAY CAPACITY (VOLUME/CAPACITY)
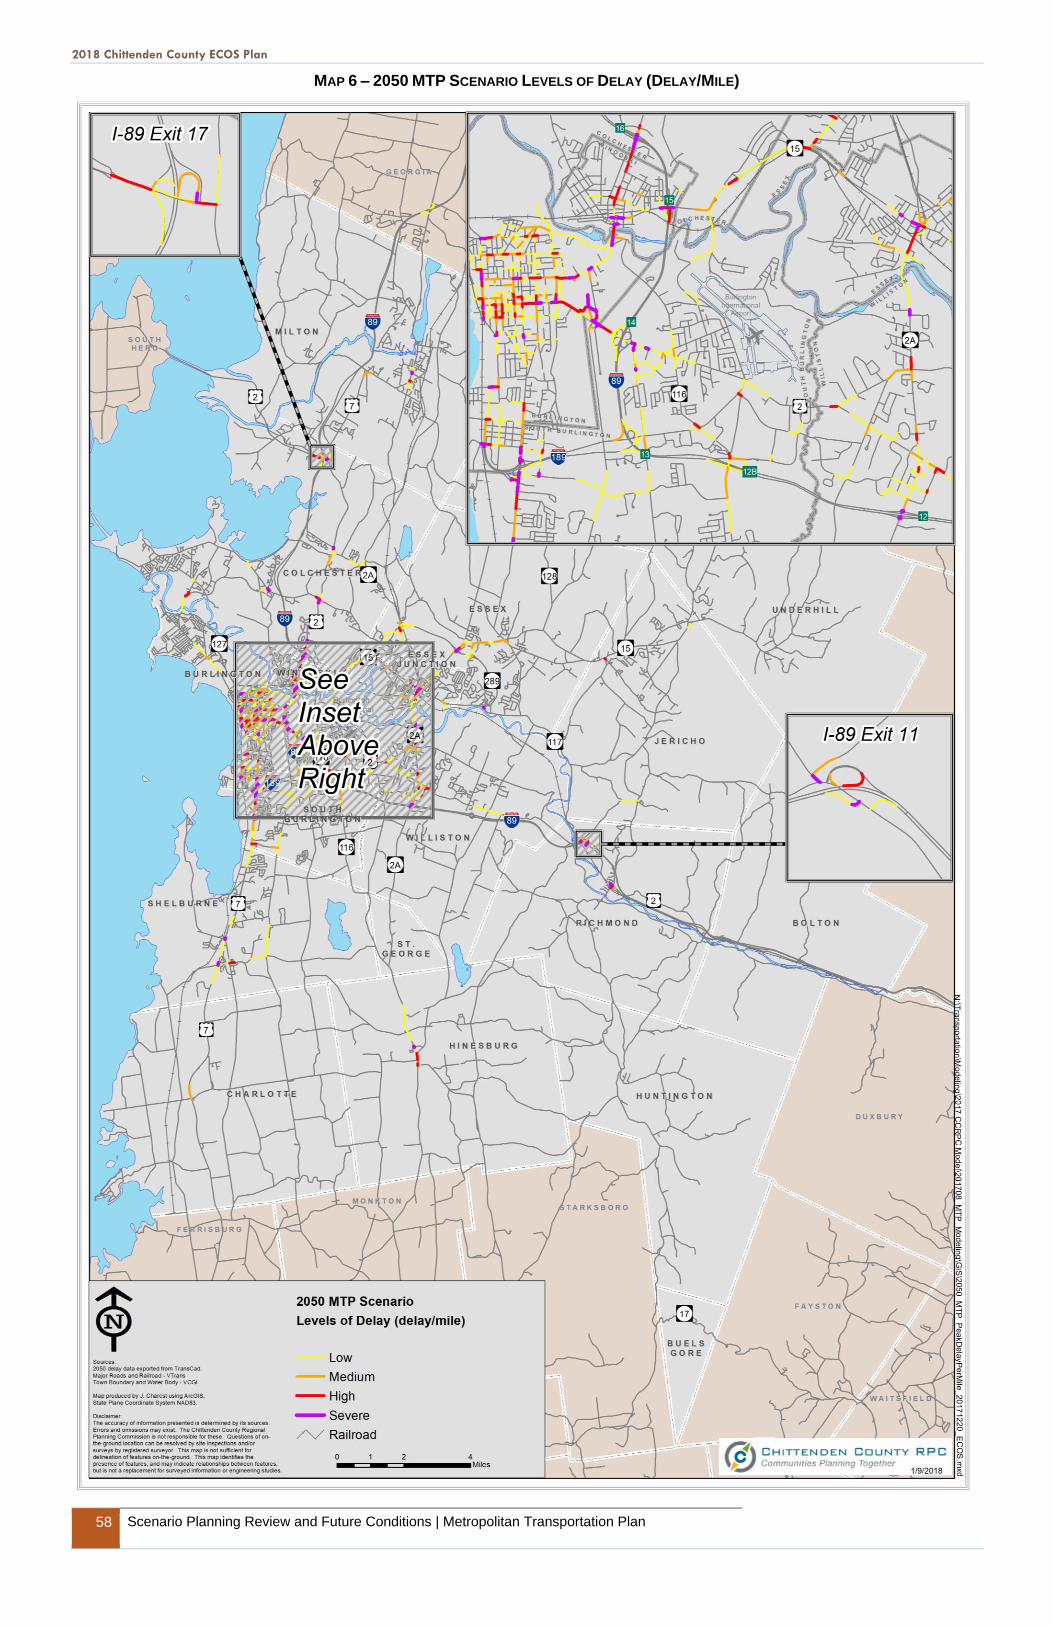
2018 Chittenden County ECOS Plan
58 Scenario Planning Review and Future Conditions | Metropolitan Transportation Plan
MAP 6 – 2050 MTP SCENARIO LEVELS OF DELAY (DELAY/MILE)
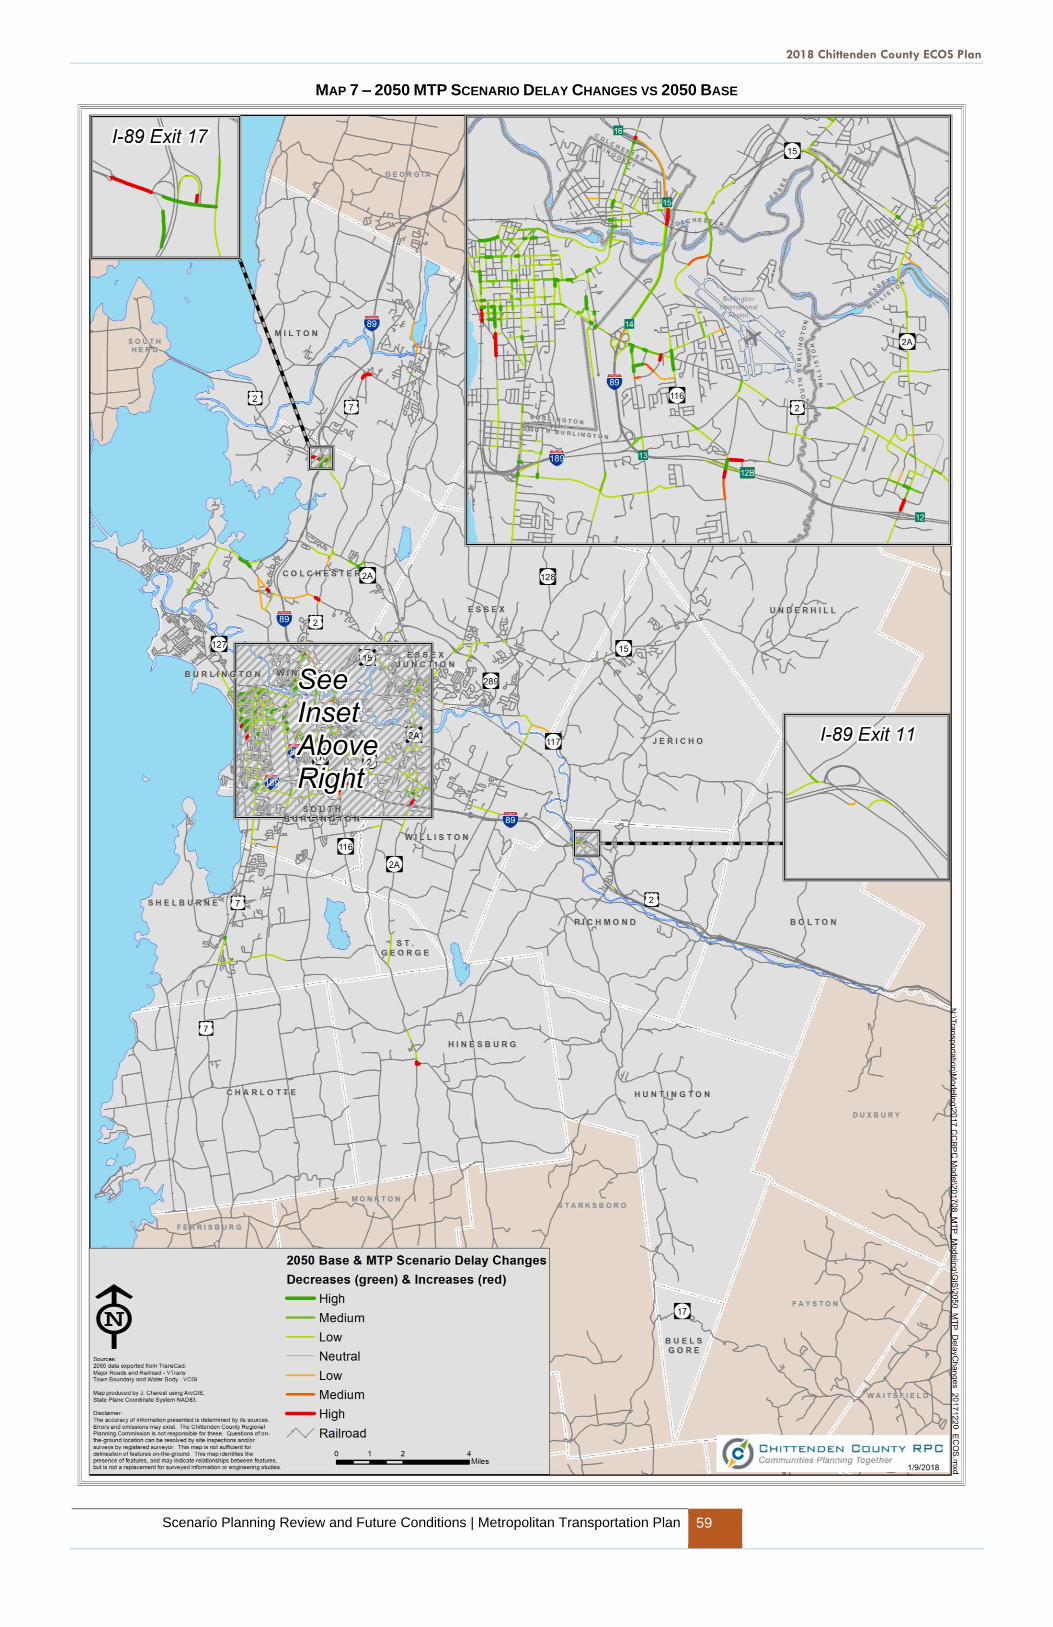
2018 Chittenden County ECOS Plan
Scenario Planning Review and Future Conditions | Metropolitan Transportation Plan 59
MAP 7 – 2050 MTP SCENARIO DELAY CHANGES VS 2050 BASE
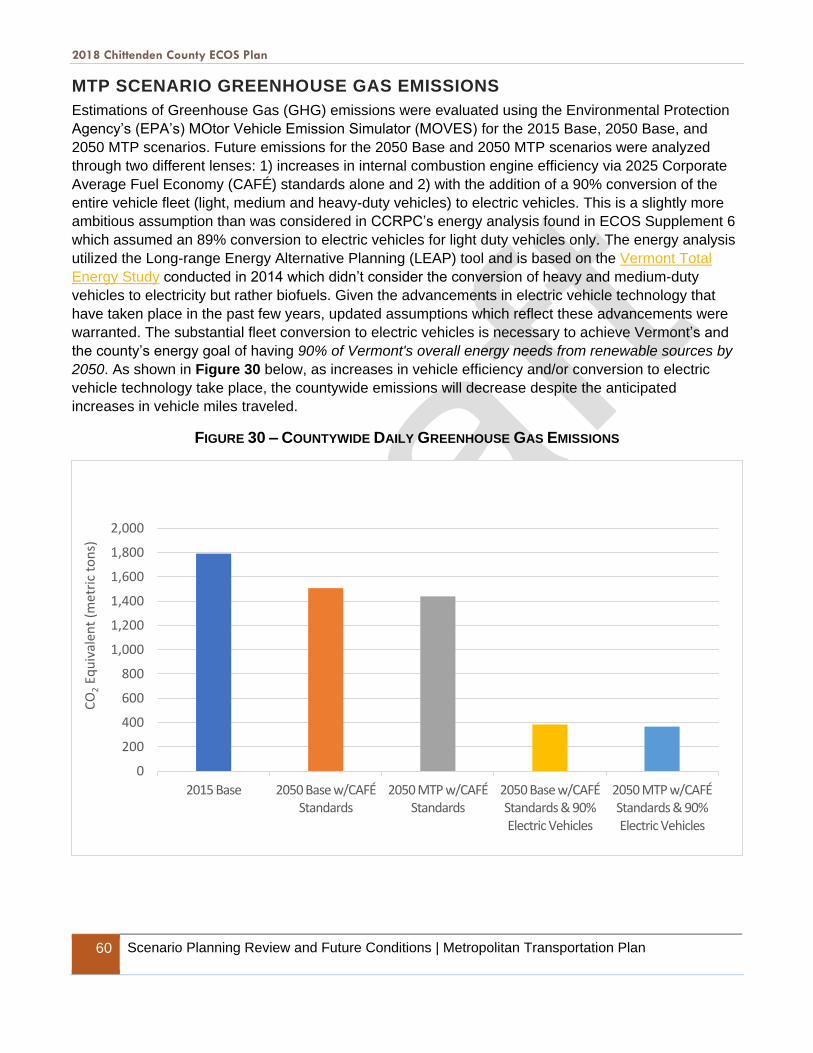
2018 Chittenden County ECOS Plan
60 Scenario Planning Review and Future Conditions | Metropolitan Transportation Plan
MTP SCENARIO GREENHOUSE GAS EMISSIONS
Estimations of Greenhouse Gas (GHG) emissions were evaluated using the Environmental Protection
Agency’s (EPA’s) MOtor Vehicle Emission Simulator (MOVES) for the 2015 Base, 2050 Base, and
2050 MTP scenarios. Future emissions for the 2050 Base and 2050 MTP scenarios were analyzed
through two different lenses: 1) increases in internal combustion engine efficiency via 2025 Corporate
Average Fuel Economy (CAFÉ) standards alone and 2) with the addition of a 90% conversion of the
entire vehicle fleet (light, medium and heavy-duty vehicles) to electric vehicles. This is a slightly more
ambitious assumption than was considered in CCRPC’s energy analysis found in ECOS Supplement 6
which assumed an 89% conversion to electric vehicles for light duty vehicles only. The energy analysis
utilized the Long-range Energy Alternative Planning (LEAP) tool and is based on the Vermont Total
Energy Study conducted in 2014 which didn’t consider the conversion of heavy and medium-duty
vehicles to electricity but rather biofuels. Given the advancements in electric vehicle technology that
have taken place in the past few years, updated assumptions which reflect these advancements were
warranted. The substantial fleet conversion to electric vehicles is necessary to achieve Vermont’s and
the county’s energy goal of having 90% of Vermont's overall energy needs from renewable sources by
2050. As shown in Figure 30 below, as increases in vehicle efficiency and/or conversion to electric
vehicle technology take place, the countywide emissions will decrease despite the anticipated
increases in vehicle miles traveled.
FIGURE 30 – COUNTYWIDE DAILY GREENHOUSE GAS EMISSIONS
0
200
400
600
800
1,000
1,200
1,400
1,600
1,800
2,000
2015 Base 2050 Base w/CAFÉ Standards
2050 MTP w/CAFÉ Standards
2050 Base w/CAFÉ Standards & 90% Electric Vehicles
2050 MTP w/CAFÉ Standards & 90% Electric Vehicles
CO
2Eq
uiv
alen
t (m
etri
c to
ns)
2018 Chittenden County ECOS Plan
MTP Corridors | Metropolitan Transportation Plan 61
MTP Corridors
This section presents the projects, programs, and strategies to implement MTP recommendations by
roadway corridor. Building the MTP around these corridors facilitates an inter-municipal/regional
understanding of transportation conditions and priorities and can help decision-makers as they grapple
with the diverse needs of a complex system. Corridor-oriented planning also strengthens the CCRPC’s
ability to look across municipal boundaries and beyond isolated single-mode solutions to holistically
address transportation issues on these corridors. As we invest in new projects and programs within the
corridors listed below, it is important to repeat and stress that maintaining our existing
transportation infrastructure is critically important and should remain the County’s top priority.
The broad priorities established here include:
• System maintenance, defined as keeping the existing transportation infrastructure of roads, bridges,
transit, bicycle and pedestrian facilities, and intermodal facilities in acceptable operational condition.
Future conditions will be evaluated using the Performance Management measures and targets set
by VTrans and the CCRPC as well as other infrastructure management measures.
• Encouraging higher density and mixed-use land development, as proposed by the CCRPC’s ECOS
Regional Plan to improve the efficiency of transportation investments.
• Completing all projects identified in the CCRPC’s FY2018-2021 Transportation Improvement
Program (TIP).
• Expanding the Green Mountain Transit’s system for more reliable and productive service levels in
urban and suburban areas and into adjoining regions.
• Expanding the bicycle and pedestrian networks with on- and off-road bike facilities and more
sidewalks.
• Implementing Complete Streets as required on all roadway projects to facilitate multimodal travel by
users of all ages and abilities.
• Employing more Transportation Demand Management (TDM) strategies through employer-based
trip reduction programs, an expanded network of park-and-ride facilities, and by supporting the
efforts of Green Mountain Transit (GMT).
• Implementing Transportation System Management (TSM) strategies and investing in Intelligent
Transportation Systems (ITS) as well as access management along major arterials, to improve the
operational efficiency of the system.
• Addressing corridor congestion and safety issues along key arterials with operational and capacity
enhancements as needed.
Corridor-oriented planning considers the transportation connections between major settlement areas of
Chittenden County. These corridors represent easily recognizable and dominant directional movements
of persons and goods, while also accounting for localized travel. The corridor delineations identified
below are based on the analysis of existing and emerging travel and land use patterns. They are tied to
the various trip origins and destinations both within and outside of the region. The defining feature of
each corridor is one or more major state highway.

2018 Chittenden County ECOS Plan
62 MTP Corridors | Metropolitan Transportation Plan
Map 8 presents key corridors in Chittenden County. These include:
1. Regional Core: The transportation network in the Greater Burlington area;
2. Northern Corridor: US 2/7 and I-89 from Winooski to the County line, VT 127 through Colchester,
and the rail line north from Essex Junction;
3. Northeast Corridor: Essex Junction to the County line along VT 128 and VT 15;
4. Route 15 West Corridor: Winooski to Essex Junction including Winooski Branch rail line;
5. Southeastern Corridor: Richmond to Buels Gore, including Huntington Road and Main Road;
6. Route 116 Corridor: VT 116, South Burlington, through Hinesburg, to the County line;
7. Eastern Corridor: US 2, I-89, VT 117, and the Burlington and Essex Junction rail line east to the
County line;
8. Southern Corridor: US 7 and rail line from Burlington south to County line;
9. Cross County Corridor: VT 2A and VT 289 from St. George/Williston to Essex and Colchester.
REGIONAL CORE
The Regional Core is defined as the City of Burlington and adjoining areas of Winooski and South
Burlington. This area is both origin and destination for much of the region’s travel, and the evolution of
the road network servicing it clearly demonstrates its relative importance in the state’s economic and
cultural history.
Multimodal options in the Regional Core are the best in the state. Part of the reason modes other than
Single Occupancy Vehicles (SOVs) are attractive is due to the dense development and resulting
volume of vehicles producing congested conditions. This is the region’s primary activity center and
congestion is a condition of its vibrancy and vitality. The walk/bike/transit modes will remain attractive
as alternatives as long as the vehicle speeds remain relatively low.
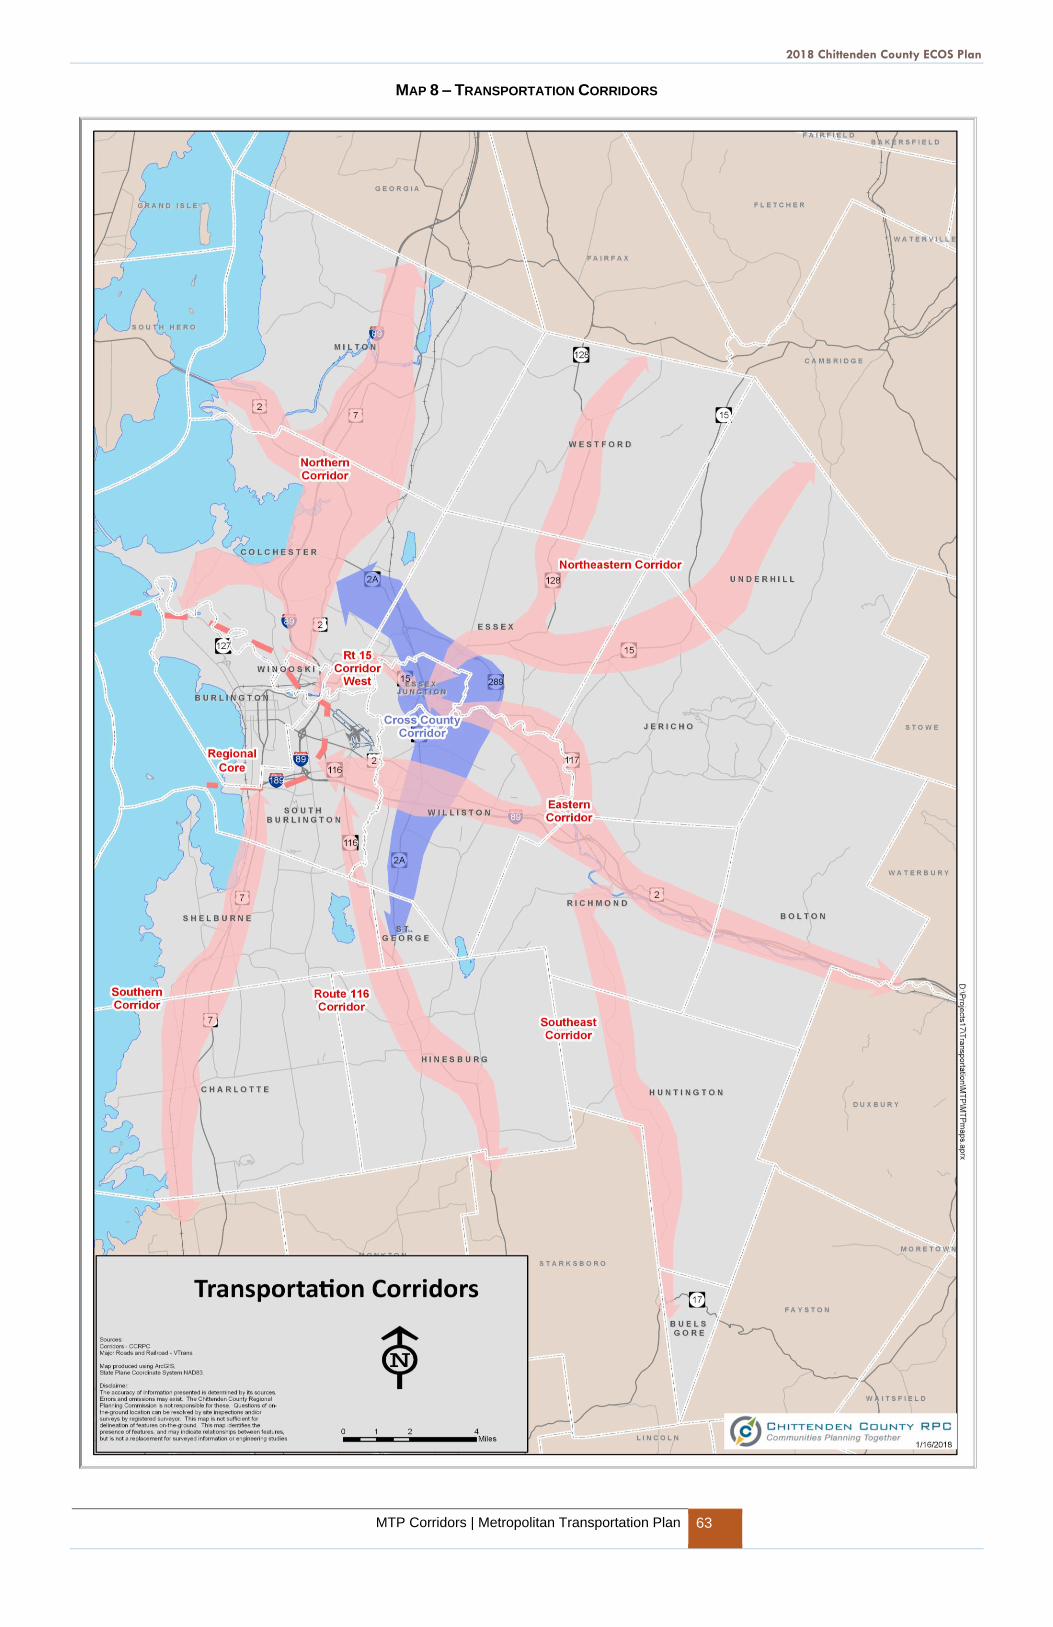
2018 Chittenden County ECOS Plan
MTP Corridors | Metropolitan Transportation Plan 63
MAP 8 – TRANSPORTATION CORRIDORS

2018 Chittenden County ECOS Plan
64 MTP Corridors | Metropolitan Transportation Plan
Establishing intercept park-and-ride facilities at the Regional Core’s periphery that focus on commuter
trips - intercepting SOV trips by employees and transferring them to other modes - is a strategy used
currently for the Hill Institutions (UVM Medical Center, UVM, Champlain College) and is examined more
closely to relieve this area’s parking and congestion issues.
Because the Regional Core has a significant residential component yet provides a conduit for high
traffic volumes and possesses a well-connected grid street system, knowledgeable drivers can use
neighborhood streets to avoid congested arterials. To minimize this practice, traffic-calming techniques
should be used in those cut-through neighborhoods to maintain safety, enhance street life, encourage
walking and bicycling, and direct the cut-through traffic back onto the arterials.
Parking is perceived as constrained despite inventory information to the contrary. However, parking
costs are higher than elsewhere in the region, where undeveloped land is considerably less expensive.
Locating, designing, and funding parking facilities poses a dilemma and businesses can be attracted by
less costly and more welcoming expansion opportunities outside the Regional Core. Striking a parking
balance between many competing interests is a vexing challenge here.
A well-developed sidewalk network already exists in the Regional Core, although due to its age it needs
significant reinvestment to maintain its integrity and meet federal accessibility requirements. Bicycling is
well provided for in the shared use path network around this area; however, many of these trips start
and end in places served only by city streets. A well signed and designed on-street network, especially
focusing on north/south travel, is needed to provide area-wide, safe, on-road bicycle travel.
Public transit coverage here is superior to anywhere else in the state. However, new services, with
adequate funding, can improve this. Higher frequency levels, more hours of service during the day, and
more weekend service, will help the system grow and attract a wider traveling public. GMT’s new
Downtown Transit Center is a welcome enhancement to transit service quality.
Go! Vermont, Travel Smarter and TDM programs at the Hill Institutions and beyond, provided by
CATMA, have helped promote transportation alternatives, reduce parking pressures, and have better
managed traffic flow in and around these facilities served by their programs. Expanding these programs
to additional Regional Core employers could help relieve congestion and parking demand.
VT Railway operates a line within this corridor and has its headquarters and railyard on the Burlington
waterfront. Another rail line, now owned by Genesee & Wyoming links the waterfront to their mainline in
Essex Junction. Bringing Amtrak service into Burlington along the western rail corridor is a state goal
and service is expected to begin in 2020.
Corridor Strategies/Projects Because the character of the Regional Core significantly differs from the corridors that feed and sustain
its vibrancy, the types of transportation strategies and projects recommended below differ from those
recommended in other corridors. Table 14 identifies the regional project and program priorities for this
area. NOTE: Transportation Improvement Program (TIP) projects are listed first. These are the region’s
near term (next four years) project priorities. The listed sequence beneath the TIP projects does not
denote priority rank.
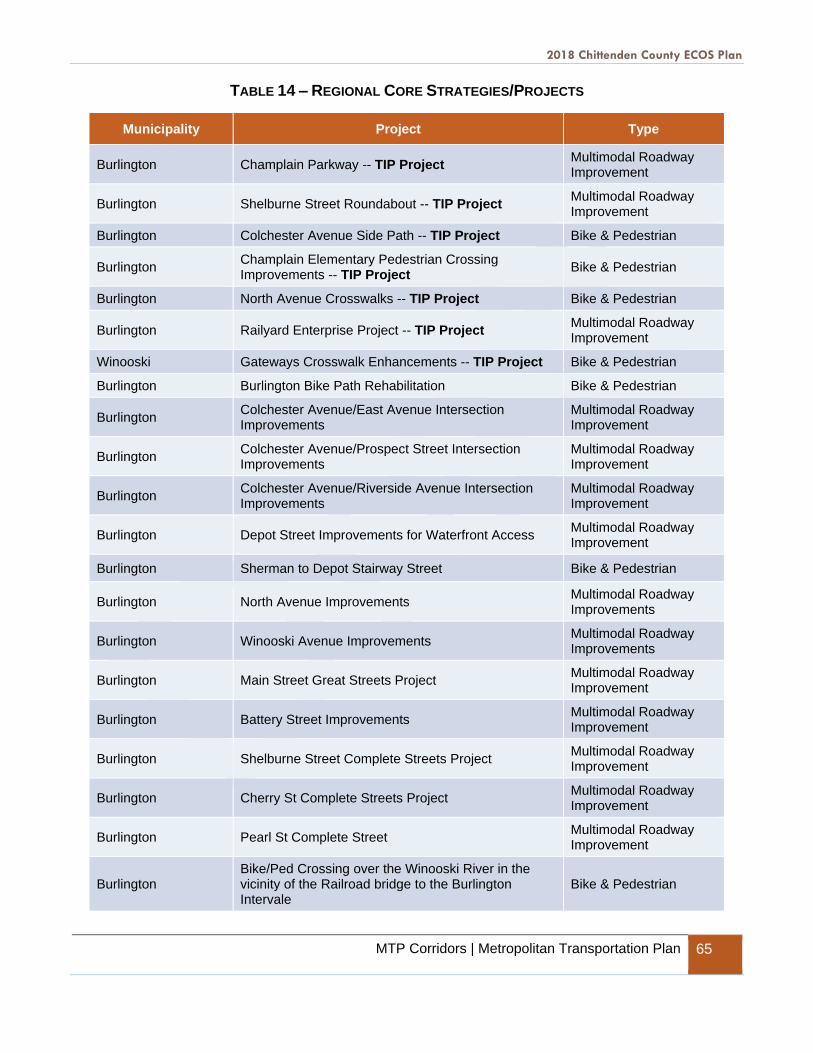
2018 Chittenden County ECOS Plan
MTP Corridors | Metropolitan Transportation Plan 65
TABLE 14 – REGIONAL CORE STRATEGIES/PROJECTS
Municipality Project Type
Burlington Champlain Parkway -- TIP Project Multimodal Roadway Improvement
Burlington Shelburne Street Roundabout -- TIP Project Multimodal Roadway Improvement
Burlington Colchester Avenue Side Path -- TIP Project Bike & Pedestrian
Burlington Champlain Elementary Pedestrian Crossing Improvements -- TIP Project
Bike & Pedestrian
Burlington North Avenue Crosswalks -- TIP Project Bike & Pedestrian
Burlington Railyard Enterprise Project -- TIP Project Multimodal Roadway Improvement
Winooski Gateways Crosswalk Enhancements -- TIP Project Bike & Pedestrian
Burlington Burlington Bike Path Rehabilitation Bike & Pedestrian
Burlington Colchester Avenue/East Avenue Intersection Improvements
Multimodal Roadway Improvement
Burlington Colchester Avenue/Prospect Street Intersection Improvements
Multimodal Roadway Improvement
Burlington Colchester Avenue/Riverside Avenue Intersection Improvements
Multimodal Roadway Improvement
Burlington Depot Street Improvements for Waterfront Access Multimodal Roadway Improvement
Burlington Sherman to Depot Stairway Street Bike & Pedestrian
Burlington North Avenue Improvements Multimodal Roadway Improvements
Burlington Winooski Avenue Improvements Multimodal Roadway Improvements
Burlington Main Street Great Streets Project Multimodal Roadway Improvement
Burlington Battery Street Improvements Multimodal Roadway Improvement
Burlington Shelburne Street Complete Streets Project Multimodal Roadway Improvement
Burlington Cherry St Complete Streets Project Multimodal Roadway Improvement
Burlington Pearl St Complete Street Multimodal Roadway Improvement
Burlington Bike/Ped Crossing over the Winooski River in the vicinity of the Railroad bridge to the Burlington Intervale
Bike & Pedestrian
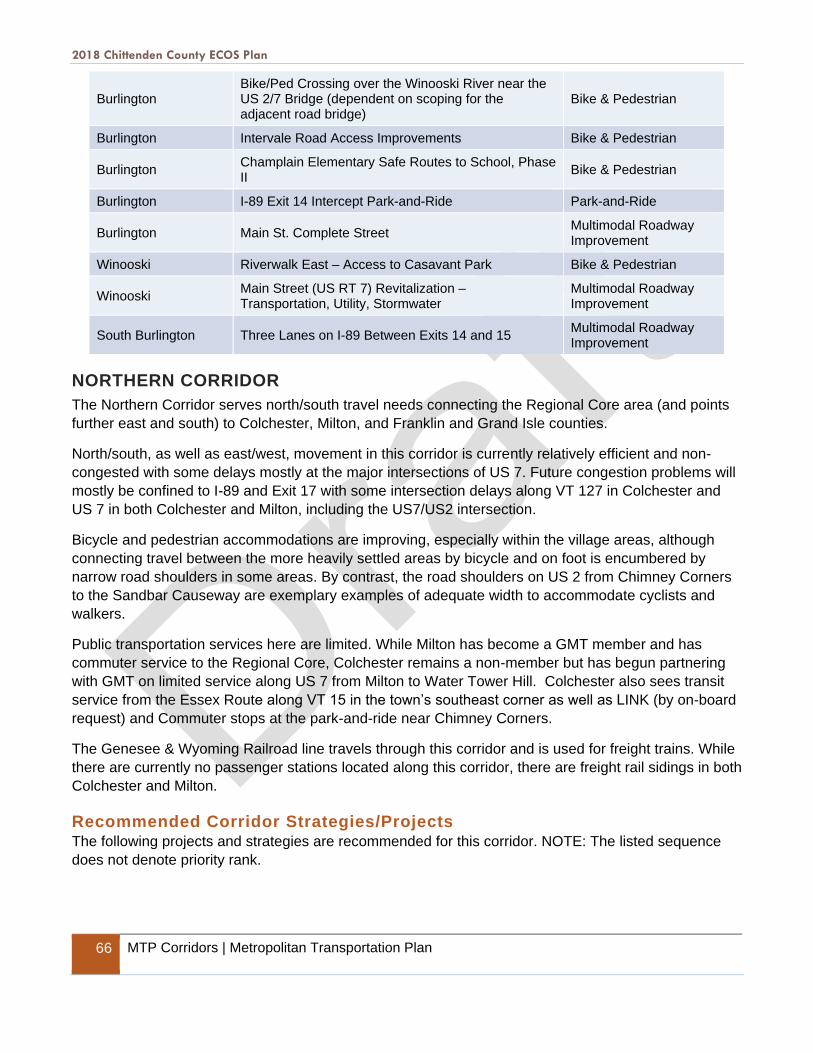
2018 Chittenden County ECOS Plan
66 MTP Corridors | Metropolitan Transportation Plan
Burlington Bike/Ped Crossing over the Winooski River near the US 2/7 Bridge (dependent on scoping for the adjacent road bridge)
Bike & Pedestrian
Burlington Intervale Road Access Improvements Bike & Pedestrian
Burlington Champlain Elementary Safe Routes to School, Phase II
Bike & Pedestrian
Burlington I-89 Exit 14 Intercept Park-and-Ride Park-and-Ride
Burlington Main St. Complete Street Multimodal Roadway Improvement
Winooski Riverwalk East – Access to Casavant Park Bike & Pedestrian
Winooski Main Street (US RT 7) Revitalization – Transportation, Utility, Stormwater
Multimodal Roadway Improvement
South Burlington Three Lanes on I-89 Between Exits 14 and 15 Multimodal Roadway Improvement
NORTHERN CORRIDOR
The Northern Corridor serves north/south travel needs connecting the Regional Core area (and points
further east and south) to Colchester, Milton, and Franklin and Grand Isle counties.
North/south, as well as east/west, movement in this corridor is currently relatively efficient and non-
congested with some delays mostly at the major intersections of US 7. Future congestion problems will
mostly be confined to I-89 and Exit 17 with some intersection delays along VT 127 in Colchester and
US 7 in both Colchester and Milton, including the US7/US2 intersection.
Bicycle and pedestrian accommodations are improving, especially within the village areas, although
connecting travel between the more heavily settled areas by bicycle and on foot is encumbered by
narrow road shoulders in some areas. By contrast, the road shoulders on US 2 from Chimney Corners
to the Sandbar Causeway are exemplary examples of adequate width to accommodate cyclists and
walkers.
Public transportation services here are limited. While Milton has become a GMT member and has
commuter service to the Regional Core, Colchester remains a non-member but has begun partnering
with GMT on limited service along US 7 from Milton to Water Tower Hill. Colchester also sees transit
service from the Essex Route along VT 15 in the town’s southeast corner as well as LINK (by on-board
request) and Commuter stops at the park-and-ride near Chimney Corners.
The Genesee & Wyoming Railroad line travels through this corridor and is used for freight trains. While
there are currently no passenger stations located along this corridor, there are freight rail sidings in both
Colchester and Milton.
Recommended Corridor Strategies/Projects The following projects and strategies are recommended for this corridor. NOTE: The listed sequence
does not denote priority rank.
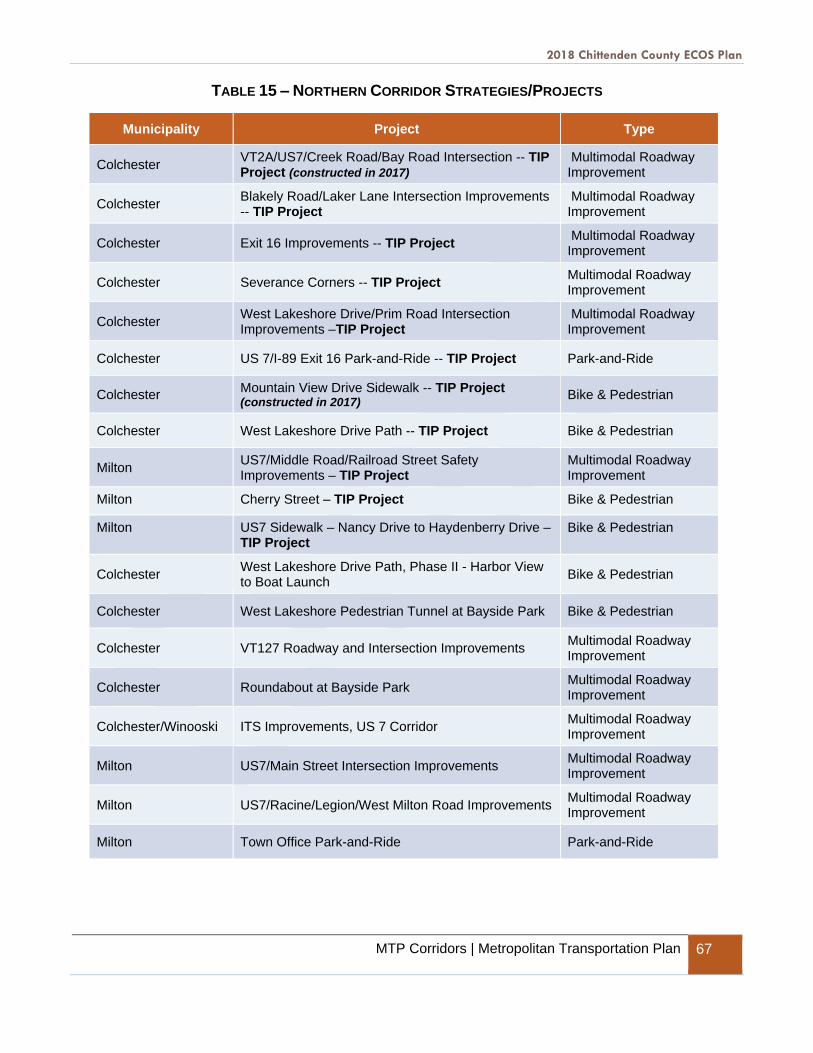
2018 Chittenden County ECOS Plan
MTP Corridors | Metropolitan Transportation Plan 67
TABLE 15 – NORTHERN CORRIDOR STRATEGIES/PROJECTS
Municipality Project Type
Colchester VT2A/US7/Creek Road/Bay Road Intersection -- TIP Project (constructed in 2017)
Multimodal Roadway Improvement
Colchester Blakely Road/Laker Lane Intersection Improvements -- TIP Project
Multimodal Roadway Improvement
Colchester Exit 16 Improvements -- TIP Project Multimodal Roadway Improvement
Colchester Severance Corners -- TIP Project Multimodal Roadway Improvement
Colchester West Lakeshore Drive/Prim Road Intersection Improvements –TIP Project
Multimodal Roadway Improvement
Colchester US 7/I-89 Exit 16 Park-and-Ride -- TIP Project Park-and-Ride
Colchester Mountain View Drive Sidewalk -- TIP Project (constructed in 2017)
Bike & Pedestrian
Colchester West Lakeshore Drive Path -- TIP Project Bike & Pedestrian
Milton US7/Middle Road/Railroad Street Safety Improvements – TIP Project
Multimodal Roadway Improvement
Milton Cherry Street – TIP Project Bike & Pedestrian
Milton US7 Sidewalk – Nancy Drive to Haydenberry Drive – TIP Project
Bike & Pedestrian
Colchester West Lakeshore Drive Path, Phase II - Harbor View to Boat Launch
Bike & Pedestrian
Colchester West Lakeshore Pedestrian Tunnel at Bayside Park Bike & Pedestrian
Colchester VT127 Roadway and Intersection Improvements Multimodal Roadway Improvement
Colchester Roundabout at Bayside Park Multimodal Roadway Improvement
Colchester/Winooski ITS Improvements, US 7 Corridor Multimodal Roadway Improvement
Milton US7/Main Street Intersection Improvements Multimodal Roadway Improvement
Milton US7/Racine/Legion/West Milton Road Improvements Multimodal Roadway Improvement
Milton Town Office Park-and-Ride Park-and-Ride

2018 Chittenden County ECOS Plan
68 MTP Corridors | Metropolitan Transportation Plan
Milton I-89/West Milton Road New Interchange Multimodal Roadway Improvement
Winooski Main Street (US7) Revitalization – Transportation, Utility, Stormwater
Multimodal Roadway Improvement
NORTHEASTERN CORRIDOR
The Northeastern Corridor serves the municipalities of Essex, Westford, Jericho, and Underhill,
providing a link to the employment and commercial centers of the greater Burlington area via VT 15 and
VT 128. These roads also connect parts of Franklin and Lamoille counties to Chittenden County. Old
Stage Road in Essex and Westford, and River Road/Pleasant Valley Road in Underhill form parallel
collectors channeling traffic through this corridor as well.
Travel into this corridor from the outlying towns and counties flows relatively well today. However, it is
expected that in the out years of this plan’s horizon (2050), stretches of VT 15 through the Lang Farm,
Essex Center, and VT 289 area will experience relatively high levels of traffic delay.
Bicycle and pedestrian improvements are advancing in this corridor, especially in the designated
growth areas of Essex Junction, Lang Farm/Essex Center, and Underhill Flats. Roadway improvements
to accommodate bicyclists are needed and are planned for when the arterials are rehabilitated or
reconstructed. Currently, much of the corridor features inadequate shoulder width for safe bicycling but
should see steady incremental improvements over the coming years.
There is peak hour high frequency public transportation available in the more densely populated
southwestern part of the corridor linked to the Burlington area. Northeast from Essex Junction, transit is
less frequent with two limited routes to Essex Center and Jeffersonville.
Minor intersection improvements and signal upgrades along the VT 15 corridor from Five Corners in
Essex Junction through Essex Center are planned to improve traffic flow.
Corridor Strategies/Projects The Plan identifies specific projects and strategies to meet existing and future needs. In this corridor
these are identified below. NOTE: The listed sequence does not denote priority rank.
TABLE 16 – NORTHEASTERN CORRIDOR STRATEGIES/PROJECTS
Municipality Project MTP Category
Jericho VT15/Browns Trace Intersection – TIP Project Multimodal Roadway
Improvement
Jericho Browns Trace Multimodal Connection – Pratt Road
to Lee River Road – TIP Project Bike & Pedestrian
Jericho Browns River Middle School and Union ID school
Crossings –TIP Project Bike & Pedestrian
Jericho Lee River Road Sidewalk – TIP Project Bike & Pedestrian
Essex VT15/Sand Hill Road Traffic Signal – TIP Project Multimodal Roadway
Improvement

2018 Chittenden County ECOS Plan
MTP Corridors | Metropolitan Transportation Plan 69
Essex Junction
Crescent Connector Road – TIP Project (project
also listed under Cross County Corridor and Eastern
Corridor)
Multimodal Roadway
Improvement
Essex Towers Road Sidewalk – TIP Project Bike & Pedestrian
Underhill Underhill Flats Sidewalk – TIP Project Bike & Pedestrian
Jericho Browns Trace Multimodal Connection – MMU to Lee
River Road Bike & Pedestrian
Jericho VT 15/Dickinson Street Modifications Multimodal Roadway
Improvement
Essex Essex Center, VT15/VT289 Park-and-Ride Park-and-Ride
Essex VT 15 Sidewalk – Old Stage Road to Essex Way Bike & Pedestrian
Westford Browns River Path, Common to school Bike & Pedestrian
ROUTE 15 WEST CORRIDOR
Parts of the roadway network from the Northeastern, Northern, and Eastern corridors intersect in the
Route 15 West Corridor, and feed into the Regional Core area. This results in significant traffic volumes
substantially put on one arterial roadway, VT 15 from Essex Junction to Winooski. One of the feeder
roads, Susie Wilson Road in Essex Town, carries the majority of traffic to and from the Northern and
Northeastern Corridors.
In contrast to the other major corridors discussed, significant traffic volumes travel on VT 15 west with
no parallel alternative route available. Not surprisingly, the capacity of the Genesee & Wyoming freight
rail line running by its side has, in the past, been examined for its potential to alleviate some of VT 15’s
traffic demands. Congestion problems have also spurred interest in Intelligent Transportation Systems
(ITS) investments, such as improved signal coordination and enhanced real time traveler information, to
improve traffic flow.
GMT’s most heavily used route (the Essex Junction Route) follows VT 15 and features 15-minute
headways in the peak hours.
The pedestrian environment is relatively good in this corridor with extensive sidewalk networks in Essex
Junction and Winooski. Along VT 15, there is a sidewalk along the north side primarily but both sides in
Essex Junction that provides safe pedestrian travel all along the corridor. However, the need for a
parallel bicycle facility has been clear, as on-road bicycle travel on high-volume arterials with limited
roadway shoulders make for a stressful experience for most cyclists. A shared use path from Susie
Wilson Road to Lime Kiln Road is on the TIP and should be constructed in 2019.
A corridor carrying such high traffic volumes—over 25,000 vehicles per day with no alternative routes—
needs to be managed carefully to keep the traffic moving efficiently, including signal coordination,
access management, and multimodal strategies. As development increases, access demands to VT 15
will increase as well. Effective access management, in combination with more and safer walking, biking
and transit, will be crucial to keep people and goods moving safely and efficiently.

2018 Chittenden County ECOS Plan
70 MTP Corridors | Metropolitan Transportation Plan
Corridor Strategies/Projects The list that follows identifies each of the projects or strategies that are part of the 2050 MTP. These
were analyzed and shown to be effective in addressing future transportation problem areas. NOTE: The
listed sequence does not denote priority rank.
TABLE 17 – ROUTE 15 WEST CORRIDOR STRATEGIES/PROJECTS
Municipality Project Type
Essex Junction Pearl Street/Post Office Square/Five Corners
Improvements – TIP Project (constructed in 2017)
Multimodal Roadway
Improvement
Colchester/Essex/Essex
Junction
VT 15 Multi Use Path, Lime Kiln Rd to Susie
Wilson Rd –TIP Project Bike & Pedestrian
Colchester Fort Ethan Allen Sidewalks – TIP Project (constructed in 2017)
Bike & Pedestrian
Essex Pinecrest Drive Sidewalk – TIP Project Bike & Pedestrian
Colchester VT 15/Lime Kiln Road Intersection Improvements Multimodal Roadway
Improvement
Colchester/Essex/Essex
Junction
VT 15 Multi Use Path, I-89 Exit 15 to Lime Kiln
Road Bike & Pedestrian
Colchester/Essex/Essex
Junction
VT 15 Multi Use Path, Susie Wilson Road to West
Street Extension Bike & Pedestrian
Essex Junction VT15/West Street Intersection Improvements Multimodal Roadway
Improvement
Essex Susie Wilson Road Improvements and
Intersections Including VT 15 and Kellogg Road
Multimodal Roadway
Improvement
SOUTHEASTERN CORRIDOR
The Southeastern Corridor serves the rural southern part of Richmond and the Huntington River Valley.
Though the least-traveled of the corridors examined, the Southwestern Corridor is one of the most
scenic. Most morning peak-hour traffic is headed north, then west to the greater Burlington area for
jobs, shopping and other activities. There is some tourist traffic using the corridor to get to the
recreational areas to the east in the Mad River Valley, accessing Camels Hump hiking trails or enjoying
the fall foliage. There is also a notable use of the corridor by heavy log trucks bringing timber from the
north to processing facilities to the south.
Traffic volumes are very low in this corridor by regional standards and congestion is only an issue in the
morning peak hour at the Bridge Street/US 2 intersection in Richmond. No congestion problems are
foreseen in this corridor over the life of this Plan. Heavy log truck use may lead to surface and
subsurface road deterioration sooner leading to more frequent road maintenance.
Pedestrian opportunities are limited and increasing traffic volumes will likely impact walkers’ safety.
Similarly, with bicyclists, the potential for more vehicle conflicts exists with increasing traffic thereby
reducing safety margins. The Huntington Road/Main Road and Hinesburg Hollow Road are identified in
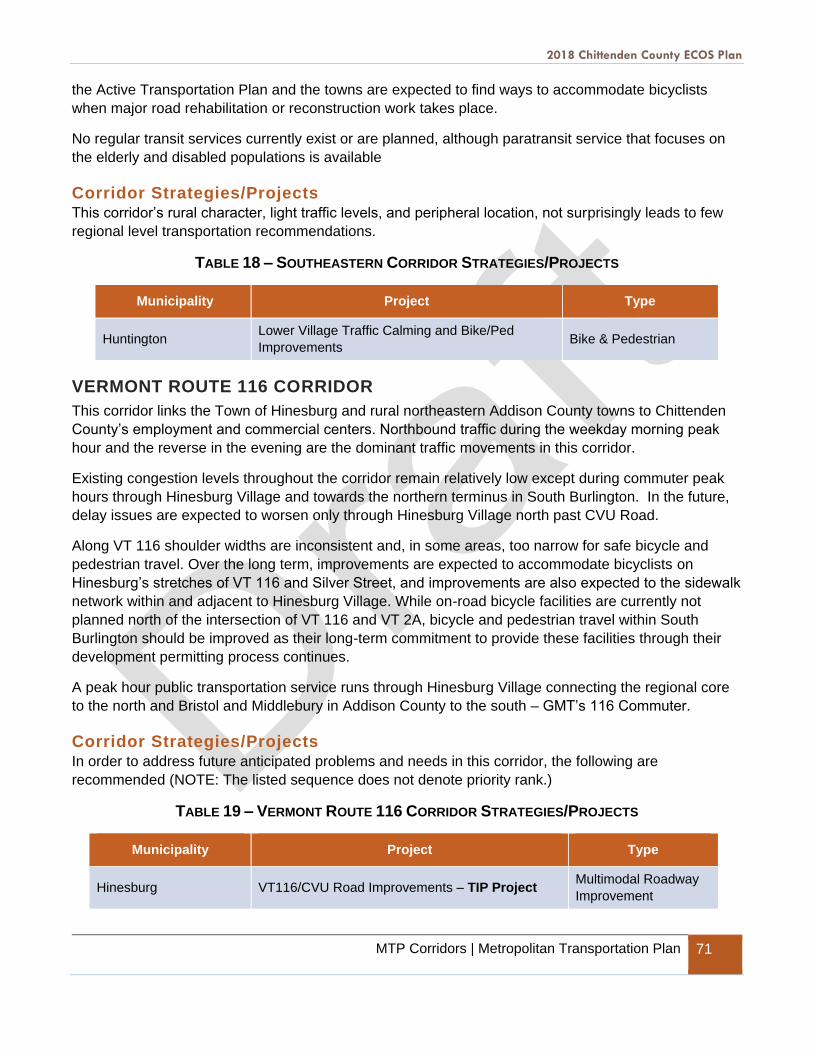
2018 Chittenden County ECOS Plan
MTP Corridors | Metropolitan Transportation Plan 71
the Active Transportation Plan and the towns are expected to find ways to accommodate bicyclists
when major road rehabilitation or reconstruction work takes place.
No regular transit services currently exist or are planned, although paratransit service that focuses on
the elderly and disabled populations is available
Corridor Strategies/Projects This corridor’s rural character, light traffic levels, and peripheral location, not surprisingly leads to few
regional level transportation recommendations.
TABLE 18 – SOUTHEASTERN CORRIDOR STRATEGIES/PROJECTS
Municipality Project Type
Huntington Lower Village Traffic Calming and Bike/Ped
Improvements Bike & Pedestrian
VERMONT ROUTE 116 CORRIDOR
This corridor links the Town of Hinesburg and rural northeastern Addison County towns to Chittenden
County’s employment and commercial centers. Northbound traffic during the weekday morning peak
hour and the reverse in the evening are the dominant traffic movements in this corridor.
Existing congestion levels throughout the corridor remain relatively low except during commuter peak
hours through Hinesburg Village and towards the northern terminus in South Burlington. In the future,
delay issues are expected to worsen only through Hinesburg Village north past CVU Road.
Along VT 116 shoulder widths are inconsistent and, in some areas, too narrow for safe bicycle and
pedestrian travel. Over the long term, improvements are expected to accommodate bicyclists on
Hinesburg’s stretches of VT 116 and Silver Street, and improvements are also expected to the sidewalk
network within and adjacent to Hinesburg Village. While on-road bicycle facilities are currently not
planned north of the intersection of VT 116 and VT 2A, bicycle and pedestrian travel within South
Burlington should be improved as their long-term commitment to provide these facilities through their
development permitting process continues.
A peak hour public transportation service runs through Hinesburg Village connecting the regional core
to the north and Bristol and Middlebury in Addison County to the south – GMT’s 116 Commuter.
Corridor Strategies/Projects In order to address future anticipated problems and needs in this corridor, the following are
recommended (NOTE: The listed sequence does not denote priority rank.)
TABLE 19 – VERMONT ROUTE 116 CORRIDOR STRATEGIES/PROJECTS
Municipality Project Type
Hinesburg VT116/CVU Road Improvements – TIP Project Multimodal Roadway
Improvement

2018 Chittenden County ECOS Plan
72 MTP Corridors | Metropolitan Transportation Plan
Hinesburg Village North Sidewalk – TIP Project Bike & Pedestrian
Hinesburg Village South Sidewalk – TIP Project Bike & Pedestrian
Hinesburg Richmond Road Sidewalk, CVU Road to North
Street Bike & Pedestrian
Hinesburg VT116/Charlotte Road Signal Improvements Multimodal Roadway
Improvement
Hinesburg Hinesburg Village Park-and-Ride Park-and-Ride
Hinesburg Route 16 East Sidewalk – Commerce Street to
Mechanicsville Road Bike & Pedestrian
Hinesburg Mechanicsville Road Sidewalk Bike & Pedestrian
South Burlington VT 116 Bike Path – US 2 to Kennedy Drive Bike & Pedestrian
St. George VT116/VT2A Intersection Improvements Multimodal Roadway
Improvement
St. George VT116/VT2A Intersection Park-and-Ride Park-and-Ride
EASTERN CORRIDOR
The Eastern Corridor serves east/west travel needs connecting suburban Chittenden County and points
further east and south to the Regional Core area. The primary road facilities are Interstate 89, US 2,
and VT 117, which branches off US 2 in Richmond and serves parts of Jericho and Essex before
terminating in Essex Junction.
Traffic flow along US 2 is currently delayed through several intersections and along some segments
during commuter peak hours, including Taft Corners (VT 2A), Industrial Avenue, Airport Drive/Kennedy
Drive, Hinesburg Road and especially Dorset Street. These same areas are anticipated to be the main
points of traffic delay in the future. VT 117 through parts of Jericho and Essex is not expected to see
any significant areas of delay until reaching the Five Corners area in Essex Junction.
Bicycle and pedestrian travel is relatively low in the eastern part of the corridor, although adequate
shoulder widths on US 2 through Bolton make for relatively safe conditions. Moving closer to
Burlington, the level of bicycle and pedestrian travel increases, as well as the presence of off-road
shared-use paths and sidewalks. Richmond, however, has some shoulder choke points especially
between the Village and I-89 Exit 11. US 2 lane widths are mostly adequate through Williston, and
increasingly in South Burlington, despite the higher traffic volumes and more numerous curb cuts that
can make for challenging on-road bicycling. Along VT 117 bicyclists and walkers face a less than ideal
environment although with relatively lower traffic volumes and fewer curb cuts than US 2. Once into
Essex Junction the environment changes with on-road designated bicycle lanes, slower vehicular
speeds, and sidewalks. Both US 2 and VT 117 through Richmond/Jericho are scheduled for repaving in
the near future and, to the extent feasible, additional shoulder width will be designated for bike lanes.
GMT transit services have expanded into Williston over the past decade. Additionally, the LINK Express
inter-regional commuter bus from Burlington to Montpelier now runs with a stop at the I-89 Exit 11
Richmond Park-and-Ride. The frequency of transit service diminishes the further east one travels in this
corridor. Over time, growth and development in Williston will likely lead to demands for increases in

2018 Chittenden County ECOS Plan
MTP Corridors | Metropolitan Transportation Plan 73
transit service. In order to improve the multimodal travel options here, more investments in park-and-
ride facilities are planned –a new facility at Exit 12 and possible another in the Taft Corners vicinity.
The Genesee & Wyoming rail line traverses the corridor moving freight and the Amtrak Vermonter to
and from points north and south.
Corridor Strategies/Projects In order to meet future transportation needs, while managing increased congestion, the following
multimodal approach is recommended. NOTE: The listed sequence does not denote priority rank.
TABLE 20 – EASTERN CORRIDOR STRATEGIES/PROJECTS
Municipality Project Type
Essex Junction Crescent Connector Road – TIP Project Multimodal Roadway
Improvement
South Burlington Market Street – TIP Project Multimodal Roadway
Improvement
Williston US2/Industrial Avenue Intersection – TIP Project Multimodal Roadway
Improvement
Williston Park-and-Ride South of I-89 – TIP Project Park-and-Ride
Williston US2/Trader Lane Signal – TIP Project Multimodal Roadway
Improvement
South Burlington VT116 Sidewalk to Tilley Drive – TIP Project (constructed in 2017)
Bike & Pedestrian
Bolton US 2/Bolton Access Road Park-and-Ride Park-and-Ride
Richmond US 2 Path – Village to Exit 11 Park-and-Ride Bike & Pedestrian
Essex VT 117/North Williston Road Intersection
Improvements
Multimodal Roadway
Improvement
Essex North Williston Road Flood Plain Notification
Improvements
Multimodal Roadway
Improvement
Williston Exit 12 Improvements – All stages (project also
listed under Cross County Corridor)
Multimodal Roadway
Improvement
Williston/South
Burlington Shared Use Path over Muddy Brook Bike & Pedestrian
Williston Industrial Avenue Sidewalks Bike & Pedestrian
Jericho VT 117/Skunk Hollow Road intersection Multimodal Roadway
Improvement
South Burlington US2 – Dorset Street to Hinesburg Road
Improvements
Multimodal Roadway
Improvement
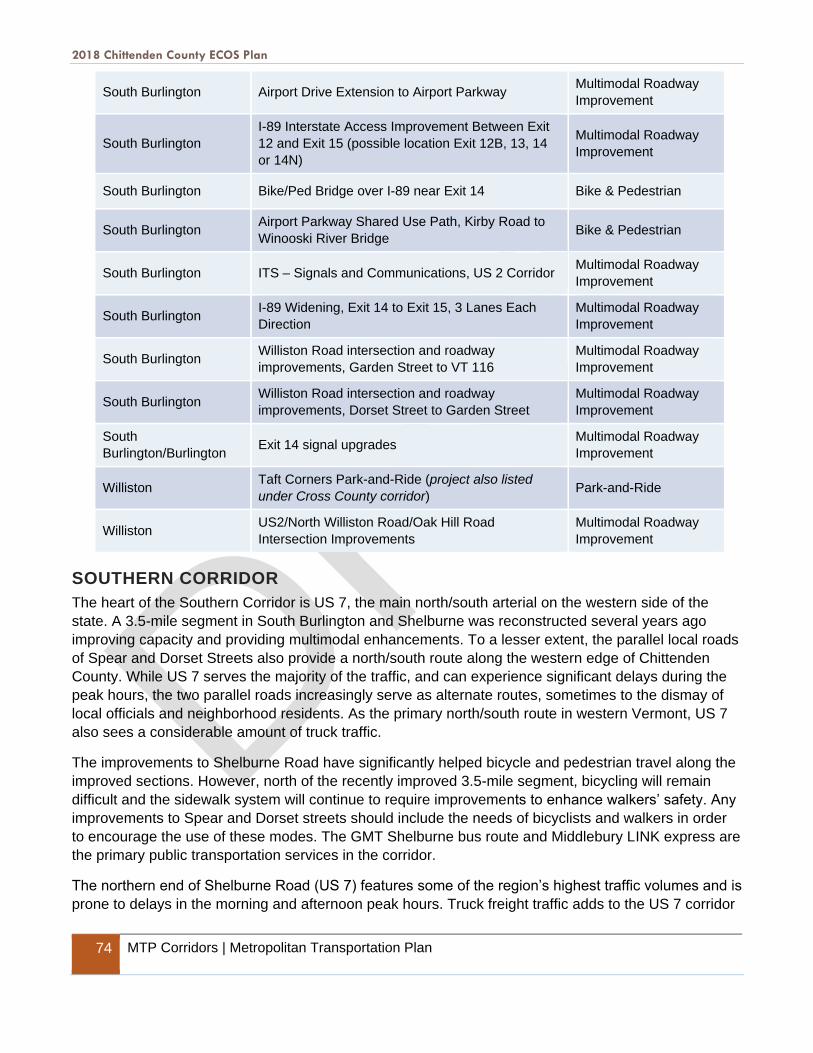
2018 Chittenden County ECOS Plan
74 MTP Corridors | Metropolitan Transportation Plan
South Burlington Airport Drive Extension to Airport Parkway Multimodal Roadway
Improvement
South Burlington
I-89 Interstate Access Improvement Between Exit
12 and Exit 15 (possible location Exit 12B, 13, 14
or 14N)
Multimodal Roadway
Improvement
South Burlington Bike/Ped Bridge over I-89 near Exit 14 Bike & Pedestrian
South Burlington Airport Parkway Shared Use Path, Kirby Road to
Winooski River Bridge Bike & Pedestrian
South Burlington ITS – Signals and Communications, US 2 Corridor Multimodal Roadway
Improvement
South Burlington I-89 Widening, Exit 14 to Exit 15, 3 Lanes Each
Direction
Multimodal Roadway
Improvement
South Burlington Williston Road intersection and roadway
improvements, Garden Street to VT 116
Multimodal Roadway
Improvement
South Burlington Williston Road intersection and roadway
improvements, Dorset Street to Garden Street
Multimodal Roadway
Improvement
South
Burlington/Burlington Exit 14 signal upgrades
Multimodal Roadway
Improvement
Williston Taft Corners Park-and-Ride (project also listed
under Cross County corridor) Park-and-Ride
Williston US2/North Williston Road/Oak Hill Road
Intersection Improvements
Multimodal Roadway
Improvement
SOUTHERN CORRIDOR
The heart of the Southern Corridor is US 7, the main north/south arterial on the western side of the
state. A 3.5-mile segment in South Burlington and Shelburne was reconstructed several years ago
improving capacity and providing multimodal enhancements. To a lesser extent, the parallel local roads
of Spear and Dorset Streets also provide a north/south route along the western edge of Chittenden
County. While US 7 serves the majority of the traffic, and can experience significant delays during the
peak hours, the two parallel roads increasingly serve as alternate routes, sometimes to the dismay of
local officials and neighborhood residents. As the primary north/south route in western Vermont, US 7
also sees a considerable amount of truck traffic.
The improvements to Shelburne Road have significantly helped bicycle and pedestrian travel along the
improved sections. However, north of the recently improved 3.5-mile segment, bicycling will remain
difficult and the sidewalk system will continue to require improvements to enhance walkers’ safety. Any
improvements to Spear and Dorset streets should include the needs of bicyclists and walkers in order
to encourage the use of these modes. The GMT Shelburne bus route and Middlebury LINK express are
the primary public transportation services in the corridor.
The northern end of Shelburne Road (US 7) features some of the region’s highest traffic volumes and is
prone to delays in the morning and afternoon peak hours. Truck freight traffic adds to the US 7 corridor
2018 Chittenden County ECOS Plan
MTP Corridors | Metropolitan Transportation Plan 75
delays and finding ways to divert freight to the parallel rail line could help both congestion levels and
wear-and-tear on the roadway.
Parallel to US 7 is the Vermont Railway’s line whose primary role is to move freight and support their
customers in its Burlington yard and move cargo to the Genesee & Wyoming’s line via the Winooski
Branch to Essex Junction. Future Amtrak service to Burlington connecting to points south is anticipated
to begin in 2020 along the western rail corridor.
While the Southern Corridor moves north/south traffic relatively efficiently, it has long been recognized
that east/west movement across the corridor is quite limited and inefficiently connected. As
development has increased toward Williston, the need for better east/west connections has become
evident. The City of South Burlington has recognized this need and proposed new roadways to address
the problem. These connections are planned to coincide with residential developments in the City’s
Southeast Quadrant as this area grows and recognized on the City’s Official Map.
Corridor Strategies/Projects The following will address the longer-term issues over the wider corridor. NOTE: The listed sequence
does not denote priority rank.
TABLE 21 – SOUTHERN CORRIDOR STRATEGIES/PROJECTS
Municipality Project Type
Charlotte US7 Reconstruction – TIP Project (constructed
2017)
Multimodal Roadway
Improvement
Charlotte US 7/Ferry Road intersection improvements – TIP
Project
Multimodal Roadway
Improvement
Shelburne Village Sidewalks and Crosswalks – TIP Project Bike & Pedestrian
Charlotte Village Parking Improvements Park-and-Ride
Charlotte Town Link Trail Bike & Pedestrian
Shelburne Falls Road Bike/Ped Bridge Bike & Pedestrian
Shelburne Bay Road Pedestrian Bike Safety Improvements Bike & Pedestrian
Shelburne Southern Gateway (South of Bostwick/Marsett) Bike & Pedestrian
Shelburne Town Center Park-and-Ride Park-and-Ride
Shelburne US7/Harbor Road Improvements Multimodal Roadway
Improvement
South Burlington
Implement Signal Control and Pedestrian
Upgrades on Shelburne Road between IDX Drive
and Queen City Park Road
Multimodal Roadway
Improvement
2018 Chittenden County ECOS Plan
76 MTP Corridors | Metropolitan Transportation Plan
South Burlington
Shelburne Road Streetscape and Bike/Ped
Improvements from IDX Drive to Queen City Park
Road
Multimodal Roadway
Improvement
South Burlington Swift/Spear Street Intersection Improvements Multimodal Roadway
Improvement
South Burlington US7/I-189 Intersection Intercept Park-and-Ride Park-and-Ride
South Burlington Spear Street Shared Use Path, South of US 2 Bike & Pedestrian
South Burlington Lindenwood Drive Path and Crossing
Improvements Bike & Pedestrian
South Burlington Spear Street Bike/Ped Improvements – Allen Road
to Exiting Path north of I-189 Underpass Bike & Pedestrian
South Burlington Dorset Street Shared Use Path, from Nowland
Farm South Bike & Pedestrian
South Burlington Allen Road Shared Use Path West From Spear
Street Bike & Pedestrian
South Burlington Allen Road Shared Use Path – US 7 to Existing
Path Bike & Pedestrian
CROSS COUNTY CORRIDOR
The corridors discussed previously either directly link other parts of the region to the Regional Core or
primarily feed those corridors. The Cross County Corridor is different. While it feeds other corridors to
and from the Regional Core, it also provides links between activity centers separate from and
bypassing the Regional Core. The corridor provides connections between points south and the activity
and employment centers in Williston, Essex, and Essex Junction, and to the growing residential and
mixed-use areas of Colchester.
The primary road in the corridor today is VT 2A complimented in part by Marshall and Kimball Avenues
and completed segments of the Circumferential Highway – VT 289. Those segments of the
Circumferential Highway through Essex, along with Kellogg Road and Severance Road, also form part
of the corridor.
The pace and scale of growth in the Taft Corners area has led to peak hour traffic delays, most notably
on VT 2A. This applies to segments and intersections from I-89 Exit 12 all the way to the Five Corners
in Essex Junction and north into Colchester. The MTP’s combination of intersection, Interchange,
transit, park-and-ride, walk/bike and ITS/signal projects are anticipated to improve traffic delays
throughout the corridor.
Corridor Strategies/Projects The list below identifies the projects and transportation strategies designed to address the corridor’s
transportation needs. NOTE: The listed sequence does not denote priority rank.
2018 Chittenden County ECOS Plan
MTP Corridors | Metropolitan Transportation Plan 77
TABLE 22 – CROSS COUNTY CORRIDOR STRATEGIES/PROJECTS
Municipality Project Type
Colchester VT2A Colchester Village and Mill Pond/East Roads
Intersection -- TIP Project
Multimodal Roadway
Improvement
Essex VT2A/VT289 Interchange Improvements - TIP
Project
Multimodal Roadway
Improvement
Essex Junction
Crescent Connector Road -- TIP Project (project
also listed under Eastern Corridor and
Northeastern Corridor)
Multimodal Roadway
Improvement
Essex/Williston Signal Upgrades on VT2A and VT15 - TIP Project Multimodal Roadway
Improvement
Williston VT2A/James Brown Drive -- TIP Project Multimodal Roadway
Improvement
Williston VT 2A/Industrial Avenue Improvements and VT2A
Improvements to James Brown Drive -- TIP Project
Multimodal Roadway
Improvement
Williston VT 2A Infill Sidewalks -- TIP Project Bike & Pedestrian
Colchester Severance Road Shared Use Path Bike & Pedestrian
Colchester Mill Pond/Severance Roads Intersection
Improvements
Multimodal Roadway
Improvement
Essex/Williston ITS Improvements – Signals and Communications,
VT2A
Multimodal Roadway
Improvement
Williston Exit 12 Improvements – All stages (also listed
under Eastern Corridor)
Multimodal Roadway
Improvement
Williston Taft Corners Park-and-Ride (project also listed
under Eastern corridor) Park-and-Ride
Williston Mountain View Road Multimodal Improvements:
Old Stage to VT 2A
Multimodal Roadway
Improvement
Williston US2 – Taft Corners to Williston Village Shared Use
Path Bike & Pedestrian
Williston North Williston Road Improvements - scoping
underway. Cost to be updated 2/18
Multimodal Roadway
Improvement
While nearly all projects can be identified by the corridor(s) they’re located in, some defy that
categorization and are less place-specific. Table 23 identifies such projects whose precise location has
yet to be determined or reflect a more regional scale strategy. NOTE: The listed sequence does not
denote priority rank.
2018 Chittenden County ECOS Plan
78 MTP Corridors | Metropolitan Transportation Plan
TABLE 23 – OTHER COUNTYWIDE STRATEGIES/PROJECTS
Municipality Project Type
Regional Sidewalks Sidewalks and Paths in Areas Planned for Growth Bike & Pedestrian
Regional Bicycle
Improvements
Regional projects that facilitate inter-county bicycle
travel Bike & Pedestrian
Regional Stormwater Regional Stormwater Projects Multimodal Roadway
Improvement
Regional Transit
Capital needs to expand transit services in the
urbanized area:15-minute headways on the trunk
routes of US2, US7, VT15 and North Avenue all
day; 20 to 30-minute headways for all other routes.
Transit
Regional Rail Burlington Rail Station Upgrades Rail
Regional Rail Essex Junction Rail Station Upgrades Rail
Regional Rail Upgrade all Trackage in Chittenden County to Class
4 Standard Rail
Regional Rail Freight Improvements to Bridges, Sidings,
Railyards, Crossings and Clearance Rail
Regional Rail Essex Junction to Burlington 286 Rail Upgrade Rail
CORRIDOR SUMMARY
The corridor approach to transportation system description and solutions was selected due to its
simplicity and logical, systematic methodology. Traffic flow is easiest explained using this approach and
multimodal strategies are easily presented and understood as solutions. This methodology also was
previously used in the CCMPO’s 1997 Long Range Transportation Plan,2005 Metropolitan
Transportation Plan and 2013 ECOS Plan
Each of the MTP’s recommended projects and strategies was identified by the corridor to which they
apply. A complete MTP project list is presented in the section below, including projects not identified as
priorities in the corridor discussion above. This list is a comprehensive compilation of projects from
many sources: The 2013 ECOS/MTP, recently completed CCRPC scoping and corridor studies, the
Active Transportation Plan and Park-and-Ride Plan updates, GMT’s Next GEN Plan (in process), and
input from each of the CCRPC member towns.

2018 Chittenden County ECOS Plan
Metropolitan Transportation Plan Investments and Project List | Metropolitan Transportation Plan 79
Metropolitan Transportation Plan Investments and
Project List
In order to meet the major ECOS transportation goal and specific MTP scenario objectives, a number of
major investments are necessary that over the years will help support a balanced, achievable and
sustainable transportation future for Chittenden County. These major MTP investments are discussed
below.
MTP MAJOR INVESTMENTS
a. Adequately fund the maintenance and preservation of our existing transportation assets including
roads, bridges, rail, transit, walking/biking, park-and-ride facilities, and transportation demand
management (TDM) programs.
b. Invest in our transportation system by addressing safety and localized congestion issues on our
roadways.
c. Expand the deployment of Intelligent Transportation Systems (ITS) to facilitate efficient flow of
traffic on the roadway system which will improve safety, reduce delays and congestion, decrease
transportation energy use, and minimize the need for major roadway expansion projects.
d. New transportation system investment should focus on the transportation projects as detailed in the
ECOS/Metropolitan Transportation Plan (MTP) Project List. Transportation Improvement Program
(TIP) projects are expected to be implemented within the next seven years.
e. Future transportation investments will support our areas planned for growth by facilitating a shift
away from Single Occupancy Vehicle (SOV) trips; and focusing on the following areas and
programs:
i. Encourage increased use of public transit by:
1. Increasing investment in GMT transit services in the county to achieve 15-minute
headways all day for all trunk routes in the county (US2, US7, VT15, and North
Avenue) and 20 to 30-minute headways on all other routes (Excluding the LINK
Express).
2. Working in cooperation with GMT on their NextGEN Transit and Transit Development
Plans to identify new and future opportunities for transit expansion. Integrate park-and-
ride facilities with transit routes; including access to the Montpelier LINK at the future
Exit 12 Park-and-Ride.
3. Invest in transit signal priority technology in partnership with GMT, VTrans and
municipalities.
4. Maximize ridership for public school buses and minimize use of private vehicles for
student transport.
ii. Expand walking and biking infrastructure to support active transportation and to provide
interconnection with the region’s transit system by:
1. Implementing the strategies, projects and priorities identified in the 2017 Chittenden
County Active Transportation Plan to provide safe and efficient facilities to connect
common trip origins and destinations.
2. Working with municipalities to update municipal road standards (for maintenance and
new construction) to reflect complete streets principles.

2018 Chittenden County ECOS Plan
80 Metropolitan Transportation Plan Investments and Project List | Metropolitan Transportation Plan
3. Reviewing state and municipal transportation projects to ensure that complete streets
are implemented.
4. Ensuring that site plans include adequate bike and pedestrian infrastructure and safety
measures, through participation in the Act 250 hearing process.
5. Assisting municipalities with scoping of future bike and pedestrian facilities to improve
safety, accessibility, efficiency and continuity of the system. Municipalities could use
the outcomes of the scoping studies to apply for various VTrans implementation
grants.
iii. Promote Transportation Demand Management and Car Sharing programs:
1. Promote and support the Go! Vermont program that links travelers to a variety of
transportation resources and choices and the TravelSmarterVT initiative.
2. Support the continued development and expansion of Chittenden County Park-and-
Ride facilities as recommended in the 2011 Regional Park-and-Ride Plan.
3. Work with the Chittenden Area Transportation Management Association (CATMA) to
support employer programs to encourage telecommuting, carpooling, vanpooling,
walking, and biking for employee commute trips.
4. Support CarShare Vermont’s initiatives.
f. Promote a shift away from gas/diesel vehicles to electric or other non-fossil fuel transportation
options through the following actions:
1. Work with the Clean Cities Coalition to encourage municipal fleets to switch to
biodiesel for heavy-duty vehicles.
2. Work with local employers and nonprofit partners such as the Vermont Energy and
Climate Action Network and Vermont League of Cities and Towns to encourage
broader implementation of EV incentives, such as free or reduced parking costs for EV
and fuel-efficient vehicle owners and preferential access to parking spaces limited in
supply.
3. Promote the Drive Electric Vermont webpage, which connects users to financial
incentives dealers, and recharging stations for EVs.
4. In partnership with Drive Electric Vermont, Vermont Clean Cities Coalitions and other
entities, increase awareness of the benefits of and access to EVs and alternative-fuel
vehicles by:
• Organizing high-visibility events where people can see and test drive EVs, such
as county fairs, energy fairs, and summer festivals. Events should also leverage
local newspaper and public access coverage to showcase local residents and
organizations that are helping to propel the transition to EVs.
• Encouraging municipalities and other entities that operate fleets to switch a
portion of their vehicles to electric or biodiesel-fueled vehicles.
• Providing technical assistance and support to communities interested in
accessing VW diesel settlement funds for EV charging and/or heavy-duty vehicle
replacements according to VT ANR’s mitigation plan that will detail eligible
activities.
• Assisting with deploying EV Infrastructure at workplaces and key public locations.

2018 Chittenden County ECOS Plan
Metropolitan Transportation Plan Investments and Project List | Metropolitan Transportation Plan 81
• Assessing current access to public and workplace charging (to the extent known)
in the community or region and identify strategic locations in busy areas (large
employers or areas of high visitation in downtowns) where charging stations
should be added or expanded.
• Encouraging electric utilities to invest in charging infrastructure, offer incentives
to increase EV ownership, and build awareness of charging opportunities as part
of their strategy for complying with the state’s Renewable Energy Portfolio
Standard.
• Seeking grants to fund the installation of DC fast-charging infrastructure at
strategic locations along major travel corridors and in transit hubs such as park
and-ride locations and along the Interstate 89 Alternative Fuels Corridor (I-89
from New Hampshire to the Canadian border).
• Educating municipalities and providing technical assistance on amending zoning
regulations to include electric vehicle charging infrastructure.
g. Support and enhance our rail infrastructure for both passenger and freight by investing in Amtrak
facilities and the Essex Junction to Burlington line (Winooski branch). Where needed, provide
additional rail infrastructure for the support and promotion of more efficient and safe movement,
handling and storage of goods by rail, thus helping relieve the burden on our existing roadway
network.
MTP PROJECT LIST
The MTP project list in Table 24 and illustrated in Map 9 includes projects identified through the various
CCRPC and municipal planning processes in coordination with VTrans, Chittenden County
municipalities, GMT and other partners, as appropriate. Through the planning process, the CCRPC and
municipalities identify, evaluate and develop alternatives to address transportation needs in various
categories including safety, bike and pedestrian, transit, multimodal connectivity, roadway congestion
and capacity deficiencies, rail, and others.
The MTP project list proposes how federal transportation funds might be spent in Chittenden County
over the next 34 years. However, almost all federal transportation funds received by Vermont flow
through VTrans, and how those funds are spent is detailed in the VTrans Transportation Capital
Program which is approved by the Vermont Legislature. The CCRPC and VTrans work closely on
transportation planning in Chittenden County and VTrans support is necessary to advance any future
transportation projects.
The MTP project list identifies projects that are in the current Chittenden County Transportation
Improvement Program (TIP) and on the VTrans Transportation Capital Program. These projects have
had funding programmed and are considered committed projects. The MTP project list also identifies
projects that are on the VTrans Development and Evaluation List and Candidate List. These projects
have been identified as future needs by VTrans and may have some project development studies
completed or underway. Finally, the MTP list includes projects that municipalities identified as future
needs to improve the transportation system and address multimodal needs in their communities and
are not currently on any VTrans program.

2018 Chittenden County ECOS Plan
82 Metropolitan Transportation Plan Investments and Project List | Metropolitan Transportation Plan
As part of this MTP, the Regional Travel Demand Model was used to prioritize roadway needs based
on safety (high crash locations), congestion and capacity issues to determine the potential need and
the timing of all future MTP roadway projects. Municipalities were then asked to provide comments on
their projects regarding need and priority/implementation timing (short, medium or long). The MTP
Project list reflects conversation with and comments received by all Chittenden County municipalities.
The MTP project list includes a time frame (e.g., short, medium, long) which represents a municipality’s
identified timing need for improvements but may not represent a realistic time frame for project
implementation. In addition, the short-medium time frame indicates that some elements of a project
could move towards implementation in the short-term (by 2025) but the bulk of the project will probably
be implemented in the medium-term (2025 to 2035).
The MTP Financial Plan calculates funding availability beginning in Federal Fiscal Year 2017, which
begins on October 1, 2016. To be consistent with this approach the MTP Project List includes projects
expected to spend funds beginning on October 1, 2016 and does include projects constructed in 2017.
The Estimated Project Cost is the cost estimate as of November 2017 and excludes any funds spent
prior to FY17 -- before October 1, 2016.
2018 Chittenden County ECOS Plan
Metropolitan Transportation Plan Investments and Project List | Metropolitan Transportation Plan 83
TABLE 24 – MTP PROJECT LIST BY MUNICIPALITY AND VTRANS CAPITAL PROGRAM STATUS - FEDERAL FISCAL YEARS 2017 - 2050
Municipality Project Type Project Estimated
Cost * Time
Frame **
Bolton
Need Identified in a Scoping or Planning Study, Not in Capital Program or on TIP
1 Bolton Park and Ride US2/Bolton Access Road Park & Ride $50,000 Medium
Burlington
Capital Program - Front of the Book and On CCRPC TIP
2 Burlington Multimodal Roadway Improvements
Shelburne Street Roundabout $2,460,000 Short
3 Burlington Multimodal Roadway Improvements
Champlain Parkway $25,000,000 Short
4 Burlington Bike & Pedestrian Champlain Elementary Pedestrian Crossing Improvements
$405,000 Short
5 Burlington Bike & Pedestrian Colchester Avenue Sidepath $281,437 Short
6 Burlington Bike & Pedestrian North Avenue Crosswalks $246,750 Short
Capital Program - Development & Evaluation and On CCRPC TIP
7 Burlington Multimodal Roadway Improvements
Railyard Enterprise Project $6,285,000 Short-
Medium
Need Identified in a Scoping or Planning Study, Not in Capital Program or on TIP
8 Burlington Bike & Pedestrian Burlington Bike Path Rehabilitation - Oakledge to Maple Street ($10m project funded at 50% federal)
$5,000,000 Short
9 Burlington Bike & Pedestrian Depot Street Improvements (Bike/Ped) ($1.1m project funded at 50% federal)
$550,000 Short
10 Burlington Bike & Pedestrian Sherman Street Connection to Depot Street - Stairway Street (0.775m project funded at 50% federal)
$387,850 Short
11 Burlington Bike & Pedestrian Intervale Road Access Improvements Further planning
needed Short
12 Burlington Bike & Pedestrian Champlain Elementary Safe Routes to School - Phase II ($425,000 project funded at 20% federal)
$85,000 Short
13 Burlington Multimodal Roadway Improvements
Main Street Great Street ($10.3m project funded at 50% federal)
$5,150,000 Short-
Medium
14 Burlington Multimodal Roadway Improvements
Cherry Street Complete Street $500,000 Short
15 Burlington Multimodal Roadway Improvements
Pearl Street Complete Street ($3.3m project funded at 50% federal)
$1,650,000 Short
16 Burlington Multimodal Roadway Improvements
Winooski Avenue Improvements ($12.9m project funded at 50% federal)
$6,450,000 Short-
Medium
17 Burlington Multimodal Roadway Improvements
Colchester Avenue/Prospect Street Intersection Improvements ($1m project funded at 50% federal)
$500,000 Short
2018 Chittenden County ECOS Plan
84 Metropolitan Transportation Plan Investments and Project List | Metropolitan Transportation Plan
Municipality Project Type Project Estimated
Cost * Time
Frame **
18 Burlington Multimodal Roadway Improvements
North Avenue Improvements ($16.35m project funded at 50% federal)
$8,175,000 Short-
Medium
19 Winooski / Burlington
Bike & Pedestrian Winooski River Bicycle/Pedestrian Bridge (dependent on outcome of Winooski Main Street Bridge scoping)
$1,680,500 Medium
20 Burlington Multimodal Roadway Improvements
Main Street Complete Street - US2 Section $400,000 Medium
21 Burlington Multimodal Roadway Improvements
Battery Street Improvements ($3.5m project funded at 50% federal)
$1,750,000 Medium
22 Burlington Multimodal Roadway Improvements
Shelburne Street Improvements - Complete Streets
$12,900,000 Medium
23 Burlington Multimodal Roadway Improvements
Colchester Avenue/Riverside Avenue Intersection Improvements
$3,400,000 Medium
24 Burlington Multimodal Roadway Improvements
Colchester Avenue/East Avenue Intersection Improvements ($0.78m project funded at 50% federal)
$390,000 Medium
25 Burlington / Winooski
Bike & Pedestrian Bike/Ped Bridge Crossing of the Winooski River in the vicinity of the "Blue Bridge"
Further planning needed
Long
26 Burlington Park and Ride I-89 Exit 14 Intercept Park & Ride Facility Further planning
needed Long
Charlotte
Capital Program - Front of the Book and On CCRPC TIP
27 Charlotte Multimodal Roadway Improvements
US7 Reconstruction (constructed in 2017) $2,500,000 Short
28 Charlotte Multimodal Roadway Improvements
US7/Ferry Road Intersection Improvements $535,000 Short
Need Identified in a Scoping or Planning Study, Not in Capital Program or on TIP
29 Charlotte Bike & Pedestrian Town Link Trail Further planning
required Short
30 Charlotte Park and Ride Charlotte Village Parking $215,000 Medium
Colchester
Capital Program - Front of the Book and On CCRPC TIP
31 Colchester Bike & Pedestrian Ft Ethan Allan Sidewalks (constructed in 2017) Earmark Short
32 Colchester Bike & Pedestrian Mountain View Drive Sidewalk (constructed in 2017)
$370,000 Short
33
Colchester / Essex / Essex Junction
Bike & Pedestrian VT15 Multi-use Path - Phase 1 Lime Kiln Road to Susie Wilson Road - CIRC ALT PHASE II
$1,430,066 Short
34 Colchester Bike & Pedestrian West Lakeshore Drive Path - Phase I $1,800,000 Short
35 Colchester Multimodal Roadway Improvements
VT2A/US7/Creek Road/Bay Road Intersection (constructed in 2017)
$5,754,281 Short
36 Colchester Multimodal Roadway Improvements
Exit 16 Improvements - CIRC ALT PHASE I $8,050,000 Short

2018 Chittenden County ECOS Plan
Metropolitan Transportation Plan Investments and Project List | Metropolitan Transportation Plan 85
Municipality Project Type Project Estimated
Cost * Time
Frame **
37 Colchester Multimodal Roadway Improvements
Severance Corners Improvements - CIRC ALT PHASE II
$3,848,257 Short
38 Colchester Multimodal Roadway Improvements
W Lakeshore Drive / Prim Road Intersection Improvements - CIRC ALT PHASE III
$1,900,000 Short
39 Colchester Multimodal Roadway Improvements
Blakely Road / Laker Lane Intersection Improvements - CIRC ALT PHASE III
$425,000 Short
40 Colchester Park and Ride US7/I-89 Exit 16 Park & Ride $500,000 Short
Capital Program - Development & Evaluation and On CCRPC TIP
41 Colchester Multimodal Roadway Improvements
VT2A Colchester Village and Mill Pond Road/East Road Intersection and Multimodal Improvements - CIRC ALT PHASE III
$3,900,000 Medium
Capital Program - Candidate List
42 Colchester Multimodal Roadway Improvements
I-89 Exit 17/US2/US7 Interchange Improvements $17,238,000 Medium
43
Colchester / Essex / Essex Junction
Bike & Pedestrian VT15 Multi-use Path - Phase 2, I-89 Exit 15 to Lime Kiln Road
$305,700 Long
44
Colchester / Essex / Essex Junction
Bike & Pedestrian VT15 Multi-use Path - Phase 3, Susie Wilson Road to West Street Extension
$537,500 Long
Need Identified in a Scoping or Planning Study, Not in Capital Program or on TIP
45 Colchester Bike & Pedestrian West Lakeshore Drive Path Phase II - Harbor View Plaza to Public Boat Launch
$900,000 Medium
46 Colchester Multimodal Roadway Improvements
VT15/Lime Kiln Road Intersection Improvements $1,030,000 Medium
47 Colchester Multimodal Roadway Improvements
Roundabout at Bayside Park Intersection $3,310,000 Medium
48 Winooski, Colchester
Multimodal Roadway Improvements
Intelligent Transportation System Improvements - Signal and Communications - US7
$600,000 Medium
49 Colchester Bike & Pedestrian Severance Road Shared Use Path - CIRC ALT PHASE III
$2,086,500 Long
50 Colchester Bike & Pedestrian West Lakeshore Pedestrian Tunnel at Bayside Park
$2,000,000 Long
51 Colchester Multimodal Roadway Improvements
VT127 Roadway and Intersection Improvements $24,000,000 Long
52 Colchester Multimodal Roadway Improvements
Mill Pond Road/Severance Road Intersection Improvements
$277,000 Long
53 Colchester Multimodal Roadway Improvements
Heineberg-Blakely Bypass and Shared Use Path $18,952,000 Long
Essex
Capital Program - Front of the Book and On CCRPC TIP
54 Essex Multimodal Roadway Improvements
VT2A/VT289 Interchange Improvements - CIRC ALT PHASE II
$1,467,400 Short

2018 Chittenden County ECOS Plan
86 Metropolitan Transportation Plan Investments and Project List | Metropolitan Transportation Plan
Municipality Project Type Project Estimated
Cost * Time
Frame **
55 Essex Multimodal Roadway Improvements
VT15/Sand Hill Road Signal - CIRC ALT PHASE II
$1,140,453 Short
56 Essex, Williston
Multimodal Roadway Improvements
Signal Upgrades on VT2A and VT15 $3,100,000 Short
57
Colchester / Essex / Essex Junction
Bike & Pedestrian VT15 Multi-use Path - Phase 1 Lime Kiln Road to Susie Wilson Road - CIRC ALT PHASE II
See Line 33 Short
58 Essex Bike & Pedestrian Pinecrest Drive Sidewalk $242,770 Short
59 Essex Bike & Pedestrian Towers Road Sidewalk $169,050 Short
Capital Program - Development & Evaluation and On CCRPC TIP
60 Essex Multimodal Roadway Improvements
Susie Wilson Road Improvements and Intersections including VT15 and Kellogg - CIRC ALT PHASE III
$8,500,000 Short-
Medium
61 Essex Multimodal Roadway Improvements
VT117/North Williston Road Intersection Improvements - CIRC ALT PHASE III
$3,175,000 Medium
Capital Program - Candidate List
62 Essex Multimodal Roadway Improvements
North Williston Road Flood Plain Notification Improvements - CIRC ALT PHASE III
$405,000 Medium
63
Colchester / Essex / Essex Junction
Bike & Pedestrian VT15 Multi-use Path - Phase 3, Susie Wilson Road to West Street Extension
See Line 44 Medium
64 Essex Bike & Pedestrian VT15 Sidewalk - Old Stage Road to Essex Way - CIRC ALT PHASE III
$160,000 Medium
65
Colchester / Essex / Essex Junction
Bike & Pedestrian VT15 Multi-use Path - Phase 2, I-89 Exit 15 to Lime Kiln Road
See Line 43 Long
Need Identified in a Scoping or Planning Study, Not in Capital Program or on TIP
66 Essex Park and Ride Essex Center, VT15/VT289 Park & Ride $186,000 Long
Essex Junction
Capital Program - Front of the Book and On CCRPC TIP
67 Essex Junction Multimodal Roadway Improvements
VT15 Improvements - Post Office Square to Five Corners Improvements - CIRC ALT PHASE II (constructed in 2017)
$2,750,000 Short
68 Essex Junction Multimodal Roadway Improvements
Crescent Connector Road - VT2A to VT15 - CIRC ALT PHASE I
$6,000,000 Short
Capital Program - Candidate List
69
Colchester / Essex / Essex Junction
Bike & Pedestrian VT15 Multi-use Path - Phase 2, I-89 Exit 15 to Lime Kiln Road
See Line 43 Long
70
Colchester / Essex / Essex Junction
Bike & Pedestrian VT15 Multi-use Path - Phase 3, Susie Wilson Road to West Street Extension
See Line 44 Long
2018 Chittenden County ECOS Plan
Metropolitan Transportation Plan Investments and Project List | Metropolitan Transportation Plan 87
Municipality Project Type Project Estimated
Cost * Time
Frame **
Needs Identified in a Scoping or Planning Study, Not in Capital Program or on TIP
71 Essex Junction Multimodal Roadway Improvements
VT15/West Street Extension Intersection - Additional NB lane on West Street Extension
$206,000 Long
Hinesburg
Capital Program - Front of the Book and On CCRPC TIP
72 Hinesburg Multimodal Roadway Improvements
VT116/CVU Road Improvements $2,872,760 Short
73 Hinesburg Bike & Pedestrian Village North Sidewalk $170,000 Short
74 Hinesburg Bike & Pedestrian Village South Sidewalk $165,000 Short
Need Identified in a Scoping or Planning Study, Not in Capital Program or on TIP
75 Hinesburg Multimodal Roadway Improvements
VT116/Charlotte Road Improvements to facilitate Concurrent Signal Phasing
$150,000 Short
76 Hinesburg Bike & Pedestrian Route 116 East Sidewalk - Commerce Street to Mechanicsville Road
$365,500 Medium
77 Hinesburg Bike & Pedestrian Mechanicsville Road Sidewalk $142,000 Medium
78 Hinesburg Bike & Pedestrian Richmond Road Sidewalk, CVU Road to North Street
$2,485,000 Long
79 Hinesburg Park and Ride Hinesburg Village Park & Ride $90,000 Long
Need Identified in a Scoping or Planning Study, Not in Capital Program or on TIP
80 Huntington Bike & Pedestrian Huntington Lower Village Traffic Calming and Bike/Ped Improvements
$894,100 Medium
Jericho
Capital Program - Front of the Book and On CCRPC TIP
81 Jericho Multimodal Roadway Improvements
VT15/Browns Trace Intersection $2,004,190 Short
82 Jericho Bike & Pedestrian Browns Trace Multimodal Connection -- Pratt Road to Lee River Road
$410,000 Short
83 Jericho Bike & Pedestrian Browns River Middle School and Union ID School Crossing Improvements
$193,200 Short
84 Jericho Bike & Pedestrian Lee River Road Sidewalk $350,000 Short
Need Identified in a Scoping or Planning Study, Not in Capital Program or on TIP
85 Jericho Bike & Pedestrian Browns Trace Multimodal Connection - MMU to Lee River Road
$471,300 Medium
86 Jericho Multimodal Roadway Improvements
VT15/Dickinson Street Modifications $1,600,000 Medium
87 Jericho Multimodal Roadway Improvements
VT117/Skunk Hollow Road Improvements Further planning
needed Medium
2018 Chittenden County ECOS Plan
88 Metropolitan Transportation Plan Investments and Project List | Metropolitan Transportation Plan
Municipality Project Type Project Estimated
Cost * Time
Frame **
88 Jericho Park and Ride VT15 Park and Ride $120,000 Medium
Milton
Capital Program - Front of the Book and On CCRPC TIP
89 Milton Multimodal Roadway Improvements
US7/Middle Road/Railroad Street Safety Improvements
$3,650,000 Short
90 Milton Bike & Pedestrian Cherry Street Railroad Crossing $65,500 Short
91 Milton Bike & Pedestrian US7 Sidewalk - Nancy Drive to Haydenberry Drive $1,078,000 Short
Need Identified in a Scoping or Planning Study, Not in Capital Program or on TIP
92 Milton Multimodal Roadway Improvements
US7/Racine/Legion/Bartlett/West Milton Road Improvements
$515,000 Medium
93 Milton Park and Ride Milton Town Office Park & Ride $870,000 Medium
94 Milton Multimodal Roadway Improvements
US7/Main Street Intersection Improvements $1,030,000 Long
95 Milton Multimodal Roadway Improvements
I-89/West Milton Road New Interchange $30,000,000 Long
Richmond
Need Identified in a Scoping or Planning Study, Not in Capital Program or on TIP
96 Richmond Bike & Pedestrian US2 Path - Park and Ride to Richmond Village $3,388,000 Long
Shelburne
Capital Program - Front of the Book and On CCRPC TIP
97 Shelburne Bike & Pedestrian Village Sidewalks and Crosswalks (constructed 2017)
$137,971 Short
Need Identified in a Scoping or Planning Study, Not in Capital Program or on TIP
98 Shelburne Bike & Pedestrian Falls Road Bike/Ped Bridge $838,800 Medium
99 Shelburne Bike & Pedestrian Bay Road Pedestrian Bike Safety Improvements $20,000 Medium
100 Shelburne Multimodal Roadway Improvements
US7/Harbor Road Improvements $1,420,000 Medium
101 Shelburne Bike & Pedestrian Shelburne Southern Gateway (South of Bostwick/Marsett)
$2,500,000 Medium
102 Shelburne Park and Ride Shelburne Village Park & Ride $15,000 Medium
2018 Chittenden County ECOS Plan
Metropolitan Transportation Plan Investments and Project List | Metropolitan Transportation Plan 89
Municipality Project Type Project Estimated
Cost * Time
Frame **
South Burlington
Capital Program - Front of the Book and On CCRPC TIP
103 South Burlington
Multimodal Roadway Improvements
Market Street ($5m project to be funded with earmark funds)
Earmark Short
104 South Burlington
Bike & Pedestrian VT116 Sidewalk to Tilley Drive (constructed 2017)
$173,000 Short
Capital Program - Candidate List
105 South Burlington
Multimodal Roadway Improvements
Airport Drive Extension to Airport Parkway $12,167,000 Medium
106 South Burlington
Multimodal Roadway Improvements
I-89 Interstate Access Improvement between Exit 12 and 15 (possible location 12B, 13, 14 or 14N)
$37,302,000 Long
Need Identified in a Scoping or Planning Study, Not in Capital Program or on TIP
107 South Burlington
Bike & Pedestrian Bike/Ped Bridge over I-89 in the vicinity of Exit 14 ($14m project to be funded at 50% federal (excludes possible future grants))
$7,000,000 Medium
108 South Burlington
Bike & Pedestrian Airport Parkway Bike/Ped Facility, Kirby Road to Winooski River Bridge
$1,647,400 Short
109 South Burlington
Bike & Pedestrian Spear Street Shared Use Path, South of US2 $452,400 Short
110 South Burlington
Bike & Pedestrian Lindenwood Drive Path and Crossing Improvements
$360,000 Short
111 South Burlington
Bike & Pedestrian Dorset Street Shared Use Path, Nowland Farm Road South 3.500 feet
$610,000 Short
112 South Burlington
Bike & Pedestrian Allen Road Shared Use Path West of Spear Street - 800-foot gap
$283,600 Short
113 South Burlington
Bike & Pedestrian Allen Road Shared Use Path - US7 to Existing Facility
$200,000 Short
114
South Burlington / Williston
Bike & Pedestrian Shared Use Path Connection over Muddy Brook $3,639,200 Short
115 South Burlington
Multimodal Roadway Improvements
Williston Road Intersection and Roadway Improvements - Garden Street to VT116 ($3.3m project to be funded with local funds)
Locally funded Short
116 South Burlington
Multimodal Roadway Improvements
Williston Road Intersection and Roadway Improvements - Dorset Street to Garden Street ($10m project to be funded with 50% federal funds)
$5,000,000 Short
117 South Burlington
Multimodal Roadway Improvements
Implement Signal Control and Pedestrian Upgrades, Shelburne Road between IDX Drive and I-189 ($1.236 m project to be funded with AID grant)
AID Grant Short
118 South Burlington
Bike & Pedestrian Spear Street Bike/Ped Improvements - Allen Road to US Forest Service/ I-89
$4,000,000 Medium
2018 Chittenden County ECOS Plan
90 Metropolitan Transportation Plan Investments and Project List | Metropolitan Transportation Plan
Municipality Project Type Project Estimated
Cost * Time
Frame **
119 South Burlington
Multimodal Roadway Improvements
Shelburne Road Streetscape and Bike/Ped Improvements - IDX Drive to Queen City Park Road
$5,000,000 Medium
120 South Burlington
Multimodal Roadway Improvements
Exit 14 Area Signal Upgrades Earmark Medium
121 South Burlington
Multimodal Roadway Improvements
Swift Street/Spear Street Intersection Improvements ($572,000 project to be funded with local funds)
Locally funded Medium
122 South Burlington
Bike & Pedestrian VT116 Bike Path - US2 to Kennedy Drive $500,000 Long
123 South Burlington
Multimodal Roadway Improvements
I-89 Widening, Exit 14, South Burlington to Exit 15, Winooski (3 lanes in each direction)
$37,000,000 Long
124 South Burlington
Park and Ride US7/I-189 Intercept Park & Ride Further planning
needed Long
St. George
Need Identified in a Scoping or Planning Study, Not in Capital Program or on TIP
125 St. George Park and Ride VT116/VT2A Intersection Park & Ride $248,000 Medium
126 St. George Multimodal Roadway Improvements
VT116/VT2A Intersection Improvements Further planning
needed Long
Underhill
Capital Program - Front of the Book and On CCRPC TIP
127 Underhill Bike & Pedestrian Underhill Flats Sidewalk $360,000 Short
Westford
Need Identified in a Scoping or Planning Study, Not in Capital Program or on TIP
128 Westford Bike & Pedestrian Browns River Path Common to School Further planning
needed Short
Williston
Capital Program - Front of the Book and On CCRPC TIP
129 Williston Multimodal Roadway Improvements
US2/Trader Lane Signal - CIRC ALT PHASE II No Federal Short
130 Williston Multimodal Roadway Improvements
US2/Industrial Avenue Intersection $5,760,000 Short
131 Williston Multimodal Roadway Improvements
VT2A/James Brown Drive - CIRC ALT PHASE I $1,889,189 Short
132 Williston Multimodal Roadway Improvements
VT2A/Industrial Avenue Improvements and Improvements to VT2A to James Brown Drive - CIRC ALT PHASE III
$4,550,000 Short
133 Essex, Williston
Multimodal Roadway Improvements
Signal Upgrades on VT2A and VT15 See Line 56 Short
134 Williston Park and Ride Park and Ride South of I-89 $1,400,000 Short

2018 Chittenden County ECOS Plan
Metropolitan Transportation Plan Investments and Project List | Metropolitan Transportation Plan 91
Municipality Project Type Project Estimated
Cost * Time
Frame **
135 Williston Bike & Pedestrian VT2A Infill Sidewalks $86,083 Short
Capital Program - Development & Evaluation and On CCRPC TIP
136 Williston Multimodal Roadway Improvements
Exit 12 Stage 1 - Shared Use Path and VT2A lane, Marshall to I-89 - CIRC ALT PHASE III
$2,000,000 Medium
137 Williston Multimodal Roadway Improvements
Exit 12 Stage 2 - New Grid Streets and VT2A Intersection - CIRC ALT PHASE III
$9,300,000 Medium
138 Williston Multimodal Roadway Improvements
Exit 12 Stage 3 - Diverging Diamond Interchange - CIRC ALT PHASE III
$22,900,000 Medium
139 Williston Multimodal Roadway Improvements
Exit 12 Stage 4 - VT2A Boulevard - CIRC ALT PHASE III
$11,400,000 Long
Capital Program - Candidate List
140 Williston Bike & Pedestrian US2 - Taft Corners to Williston Village - Shared Use Path - CIRC ALT PHASE III
$2,900,000 Medium
141 Williston Multimodal Roadway Improvements
Mountain View Road Multimodal Improvements: Old Stage Road to VT2A - CIRC ALT PHASE III
$3,853,000 Long
142 Williston Park and Ride Taft Corners Park & Ride $255,000 Long
Need Identified in a Scoping or Planning Study, Not in Capital Program or on TIP
143
South Burlington / Williston
Bike & Pedestrian Shared Use Path Connection over Muddy Brook See Line 114 Medium
144 Williston Multimodal Roadway Improvements
US2/North Williston Road/Oak Hill Road Intersection
$989,000 Long
145 Williston Bike & Pedestrian Industrial Avenue Sidewalks $421,600 Long
146 Williston Multimodal Roadway Improvements
North Williston Road Improvements - scoping underway. Cost to be updated 2/18
TBD Long
Winooski
Capital Program - Front of the Book and On CCRPC TIP
147 Winooski Bike & Pedestrian Gateways Crosswalk Enhancements $360,580 Short
Need Identified in a Scoping or Planning Study, Not in Capital Program or on TIP
148 Winooski / Burlington
Bike & Pedestrian Winooski River Bicycle/Pedestrian Bridge See Line 19 Medium
149 Winooski Multimodal Roadway Improvements
Main Street (US7) Revitalization - Transportation, Utility, Stormwater
Further planning needed
Short-Medium
150 Winooski, Colchester
Multimodal Roadway Improvements
Intelligent Transportation System Improvements - Signal and Communications - US7
See Line 48 Medium
151 Winooski Bike & Pedestrian Riverwalk East- Access to Casavant Park $1,800,000 Long
152 Burlington / Winooski
Bike & Pedestrian Bike/Ped Bridge Crossing of the Winooski River in the vicinity of the "Blue Bridge"
See Line 25 Long

2018 Chittenden County ECOS Plan
92 Metropolitan Transportation Plan Investments and Project List | Metropolitan Transportation Plan
Municipality Project Type Project Estimated
Cost * Time
Frame **
Regional Stormwater
153 Regional Stormwater Regional Stormwater Projects $16,000,000 Ongoing
Regional Sidewalks
Need Identified in a Scoping or Planning Study, Not in Capital Program or on TIP
154 Regional Bike & Pedestrian Sidewalks/Paths In Areas Planned for Growth $2,000,000 Ongoing
Regional Transit
On CCRPC TIP
155 Regional Transit Burlington-Montpelier Inter-Regional Bus Service $152,166
156 Regional Transit Burlington-Waterbury Inter-Regional Bus Service $341,031
157 Regional Transit Essex Evening $186,869
158 Regional Transit Hinesburg Route $348,646
159 Regional Transit Jeffersonville Commuter (CMAQ funding ending in FY18)
$172,000
160 Regional Transit Milton Route $880,958
161 Regional Transit Milton/Colchester to Burlington (CMAQ funding ends in FY18)
$59,676
162 Regional Transit North Avenue Increased Peak Frequencies (CMAQ funding begins in FY20)
$690,000
163 Regional Transit US2 Corridor $3,834,722
164 Regional Transit Williston Mid-Day (CMAQ funding ends in FY18) $30,670
Need Identified in a Scoping or Planning Study, Not in Capital Program or on TIP
165 Regional Transit Transit Capital $40,000,000
Regional Rail
166 Regional Rail Rail Burlington Rail Platform Upgrades - $1,000,000 TIGER Funding
167 Regional Rail Rail Essex Junction Train Station Upgrades - $3,000,000
$3,000,000
168 Regional Rail Rail Bring all Tracks in Chittenden County to Class 4 standard - $67,000,000
FTA or FRA
169 Regional Rail Rail Freight Improvements to bridges, sidings, railyards, crossings and clearance - $10,000,000
FTA or FRA
170 Regional Rail Rail Essex Junction to Burlington 286 Rail Upgrade - $15,000,000
FTA or FRA

2018 Chittenden County ECOS Plan
Metropolitan Transportation Plan Investments and Project List | Metropolitan Transportation Plan 93
Municipality Project Type Project Estimated
Cost * Time
Frame **
Regional Aviation
171 Regional Aviation Projects Aviation projects at Burlington International Airport FAA Ongoing
Total Cost of All Projects $525,177,625
TIP/Capital Program Front of the Book Projects $102,747,675
Costs Excluding TIP Projects $422,429,950
Estimated Funds Available $420,669,379
Excess Project Cost -$1,760,571
Notes:
* The Estimated project cost is the cost estimate as of November 2017 and excludes any funds spent prior to October 1, 2016. This cost estimate includes federal as well as state + local match.
**Time frame: Short -- by 2025, Medium -- from 2025 to 2035, Long -- from 2035 to 2050

2018 Chittenden County ECOS Plan
94 Metropolitan Transportation Plan Investments and Project List | Metropolitan Transportation Plan
MAP 9 – FUTURE TRANSPORTATION PROJECTS MAP

2018 Chittenden County ECOS Plan
Environmental Consultation and Mitigation | Metropolitan Transportation Plan 95
Environmental Consultation and Mitigation
INTRODUCTION
The construction, maintenance and operations of any transportation infrastructure, facility or services,
while enhancing economic and social well-being, can also contribute to environmental degradation and
cultural resource impacts. Such impacts are not always clear, and they can be direct or indirect and can
accumulate over time. Impacts can also be at different geographic (local to global) and temporal
(momentary to many years) scales. The chart below (EPA, 1996) provides a broad overview of causes
and effects of transportation activities through consequent environmental and societal impacts. For the
purposes of this regional transportation plan we focus on the impacts from infrastructure construction
and upgrades as well as travel activities – those factors that our planning can clearly influence.
Federal requirements call for all MTPs to consult with groups that represent environmental and cultural
resource constituencies to discuss and identify mitigation strategies for those planned MTP projects or
services that could impact environmental and cultural resources.
As noted in previous sections, a significant thrust of this MTP is to 1) focus first on system preservation
and maintenance and less on major system expansion; 2) invest in alternative modes (walking, biking
and transit) and Transportation Demand Management programs that improve the efficiency of the
existing system; 3) Address safety issues and improve localized congestion on our roadways; and 4)
invest in Intelligent Transportation Systems (ITS) to improve operational performance on major arterials
in the county.
2018 Chittenden County ECOS Plan
96 Environmental Consultation and Mitigation | Metropolitan Transportation Plan
CONSULTATION BACKGROUND
The CCRPC began its first environmental consultation process while updating the previous MTP in May
2009. A comprehensive list of natural resource related interest groups and government agencies was
assembled, and their representatives invited to a meeting to inform/educate these groups on
transportation plans and the CCRPC’s responsibilities regarding environmental mitigation. RPC staff
explained the federal guidelines requiring input from resource agencies, gave background information
on CCRPC responsibilities, and presented the strategy areas from the previous MTP. Staff also
explained that it was likely that many recommendations in the updated MTP could mirror those from
previous plans.
In November 2017, staff repeated this process, inviting representatives from resource agencies to a
consultation meeting to discuss potential resource impacts of MTP projects. The presentation included
an overview of MTP content as well as development process. The draft chapters were also presented,
and the following synopsis of its recommendations offered:
• Maintenance first – keep what’s been invested in in acceptable operational condition
• Transit enhancements – more buses, more often, every day on all routes
• Intelligent Transportation System (ITS) Investments – employ computing and communications
technologies to improve the existing systems efficiency, such as signal system upgrades
• Active transportation – more safe walking and biking facilities, especially in areas planned for
growth
• I-89 improvements – three lanes between Exits 14 and 15 and possible interchange
expansions
• Select roadway improvements to address localized congestion and safety issues – various
locations around the County
• Concentrating land use development – continue the trend of up to 90% of all new housing
growth in areas planned for growth.
Staff also described the financial element and briefly explained the regulations on resource consultation
and mitigation. The 2013 ECOS Plan’s environmental impact table was shown where each
recommended project was identified along with its potential resource impacts. The comparison was
done using CCRPC’s GIS map viewer: http://map.ccrpcvt.org/ChittendenCountyVT/ A list of potential
mitigation strategies from the last plan was also shown and discussed.
For this update the project specific approach was not used but rather a broader discussion of how MTP
policies, programs and strategies will address the consultation and mitigation requirements
THE ECOS IMPACT IN DEVELOPING TRANSPORTATION STRATEGY
The thrust of the ECOS project, which our last MTP was a component of, was to look at transportation
more comprehensively than before with the intent to move transportation priorities in a more
sustainable direction. The broad ECOS goal under which transportation was included states: Make
public and private investments in the built environment to minimize environmental impact, maximize
financial efficiency, optimize social equity and benefits, and improve public health.
2018 Chittenden County ECOS Plan
Environmental Consultation and Mitigation | Metropolitan Transportation Plan 97
As a result, the ECOS project pushed our recommendations toward investing in more alternative
modes and efficiency programs and projects – and away from facility expansion. That shift is reflected
in the financial plan’s apportionment of funding assigned to these categories.
ENVIRONMENTAL MITIGATION
The MTP recommends a series of specific projects, and more broadly transportation strategies, to meet
current and projected future transportation demand. These recommendations are designed to provide
a safe system meeting the public’s needs, while limiting any negative environmental and cultural
impacts and thus more closely reflecting the overall values expressed in ECOS. Some impacts
however may be unavoidable. The focus of this section is to highlight potential impacts and discuss
ways to mitigate potential negative consequences when projects move to implementation.
Mitigating the environmental and cultural resource impacts of transportation projects and strategies
covers a spectrum of possible actions. For example, mitigation can mean any of the following:
• Avoiding impacts altogether
• Minimizing impacts by limiting the extent of the action
• Repairing the impact through a restoration or rehabilitation process
• Reducing impacts through on-going preservation and maintenance operations
• Compensating for the impact by replacing or providing a substitute resource
Whichever option above is used, the intent is the same: Restore, enhance or preserve natural
resources to compensate for the resource impacts, and to ensure ecosystems remain sustainable and
productive into the future.
It should be noted the MTP’s general direction and overall investment recommendations appear to
have low environmental impacts. In fact, some recommendations will likely have positive environmental
contributions. For instance, the Bike, Pedestrian, Transit system improvements recommended and the
investments in Transportation Demand Management (TDM) programs should reduce the single
occupancy vehicle travel and congestion on our roads thereby reducing GHG emission and improve air
quality. Buses use the existing road network therefore do not impact natural or cultural resources
through expansion projects outside existing rights-of-way. Similarly, the TDM and Intelligent
Transportation System (ITS) programs recommended in this MTP are designed to facilitate the shift of
people out of Single Occupancy Vehicles (SOVs) and into alternative transportation modes and to more
efficiently use the transportation infrastructure already in place. These programs and projects would
reduce the need for major expansion/capital roadway projects.
Other MTP projects will more clearly impact our natural environment and cultural resources, and some
in negative ways should we fail to recognize them and identify appropriate mitigation strategies. One
way to identify natural and cultural resource impacts is by employing the map viewer described earlier:
CCRPC’s Geographic Information Systems (GIS) resources inventory maps which can then be overlain
with the recommended transportation project to identify impacts and reveal potential resource conflicts.
Other resources such as steep slopes, impaired watersheds, contaminated sites, and agricultural soils
can also be considered in reviews.

2018 Chittenden County ECOS Plan
98 Environmental Consultation and Mitigation | Metropolitan Transportation Plan
The online mapping tool at the CCRPC (http://map.ccrpcvt.org/ChittendenCountyVT/) can reveal
potential impacts in considerable detail. These maps can be viewed at relatively large scales to more
precisely detail the impacts and interested readers are encouraged to use this tool for their own
analysis. Natural and cultural resource data layers included in CCRPC’s map viewer are:
• rare plant and animal communities,
• natural areas, parks and other conserved lands,
• floodplains, wetlands,
• streams, deer wintering areas, historic sites/buildings, and
• historic districts
While the MTP can point out some of the resource conflicts early on, identification, evaluation and
mitigation of environmental and cultural impacts of transportation projects start at the project definition
phase (scoping) and continues into the environmental permitting phase. Depending on funding and
other factors, project could go through various reviews and permitting processes including the National
Environmental Policy Act (NEPA), the Federal Advisory Council on Historic Preservation’s Section 106,
FHWA’s Section 4(F), and possibly Vermont Act 250. In these regulatory proceedings the precise
mitigation strategy, if needed, will be defined.
Table 25 identifies the organizations that need to be involved in the respective resource issues and
identifies possible mitigation strategies and locations. Through project definition and the project
development phases beyond, these parties and activities will become more prominent.
TABLE 25 – POSSIBLE MITIGATION STRATEGIES
Resource Regulatory and Information
Contacts
Mitigation Activities Mitigation Areas
Cultural and
Historic
Resources
VTrans Historic Preservation
and Archeology Officers, VT
Agency of Commerce and
Community Development
Historic Preservation Office
Avoid or minimize impacts;
appropriate landscaping;
excavation for archeological
sensitive areas; project design
exceptions; environmental
compliance monitoring
Preserve in place;
on-site
landscaping; on-
site mitigation of
archeological
impacts
Water Resources,
Wetlands, Rivers
and Floodplains
VT Agency of Natural
Resources: Dept. of
Environmental Conservation
Watershed Management
Division, Dept. of Fish and
Wildlife. US Army Corps of
Engineers, US Fish and Wildlife
Service, US EPA’s Green
Infrastructure Collaborative,
Lake Champlain Basin Program,
Winooski Valley Park District
Mitigation sequence: avoid,
minimize, compensate (could
include preservation, creation,
restoration, riparian buffers);
design exceptions;
environmental compliance
monitoring; floodplain
management for eligible
activities; stormwater system
retrofits; application of Green
Stormwater Infrastructure; low-
cost, low-tech infiltration
improvements
On site to the
extent
possible/appropria
te; off-site through
mitigation banking
program as
permitting requires
Parks/Recreation
Areas
VT Agency of Natural Resources
Dept. of Parks and Recreation,
Avoidance, minimization,
mitigation; design exceptions;
On site screening
or facility
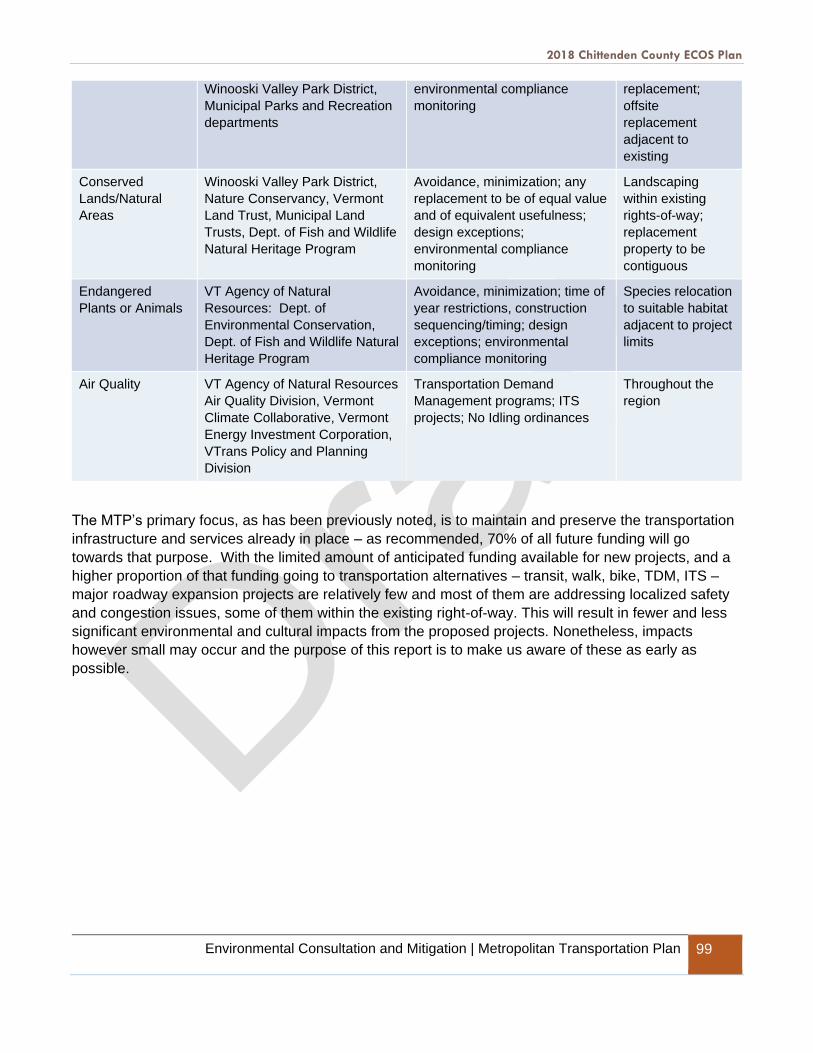
2018 Chittenden County ECOS Plan
Environmental Consultation and Mitigation | Metropolitan Transportation Plan 99
Winooski Valley Park District,
Municipal Parks and Recreation
departments
environmental compliance
monitoring
replacement;
offsite
replacement
adjacent to
existing
Conserved
Lands/Natural
Areas
Winooski Valley Park District,
Nature Conservancy, Vermont
Land Trust, Municipal Land
Trusts, Dept. of Fish and Wildlife
Natural Heritage Program
Avoidance, minimization; any
replacement to be of equal value
and of equivalent usefulness;
design exceptions;
environmental compliance
monitoring
Landscaping
within existing
rights-of-way;
replacement
property to be
contiguous
Endangered
Plants or Animals
VT Agency of Natural
Resources: Dept. of
Environmental Conservation,
Dept. of Fish and Wildlife Natural
Heritage Program
Avoidance, minimization; time of
year restrictions, construction
sequencing/timing; design
exceptions; environmental
compliance monitoring
Species relocation
to suitable habitat
adjacent to project
limits
Air Quality VT Agency of Natural Resources
Air Quality Division, Vermont
Climate Collaborative, Vermont
Energy Investment Corporation,
VTrans Policy and Planning
Division
Transportation Demand
Management programs; ITS
projects; No Idling ordinances
Throughout the
region
The MTP’s primary focus, as has been previously noted, is to maintain and preserve the transportation
infrastructure and services already in place – as recommended, 70% of all future funding will go
towards that purpose. With the limited amount of anticipated funding available for new projects, and a
higher proportion of that funding going to transportation alternatives – transit, walk, bike, TDM, ITS –
major roadway expansion projects are relatively few and most of them are addressing localized safety
and congestion issues, some of them within the existing right-of-way. This will result in fewer and less
significant environmental and cultural impacts from the proposed projects. Nonetheless, impacts
however small may occur and the purpose of this report is to make us aware of these as early as
possible.