
ecos-2019.pdf - Interreg NWE
17
PROCEEDINGS OF ECOS 2019 - THE 32 ND INTERNATIONAL CONFERENCE ON EFFICIENCY, COST, OPTIMIZATION, SIMULATION AND ENVIRONMENTAL IMPACT OF ENERGY SYSTEMS JUNE 23-28, 2019, WROCLAW, POLAND Towards techno-economic evaluation of renewable hydrogen production from wind curtailment and injection into the Irish gas network Tubagus Aryandi Gunawan a,b,c,* , Alessandro Singlitico a,b,c, , Paul Blount d , James G. Carton e , Rory F.D. Monaghan a,b,c a College of Engineering and Informatics, National University of Ireland Galway b Ryan Institute for Marine, Environmental and Energy Research, National University of Ireland Galway c MaREI Research Centre for Marine and Renewable Energy Research, Galway d Coillte CGA Ireland e Mechanical Engineering, Dublin City University Abstract This paper presents the results of techno-economic modelling of hydrogen production from otherwise wasted wind energy in the Republic of Ireland (ROI), and its transportation to the natural gas network, for injection. The model includes the production of hydrogen by electrolysis powered by curtailed and constrained (wind curtailment) wind energy at every wind farm in the ROI, compression to 300 bar, and transportation by tube trailer to the nearest potential injection point to the natural gas grid. This system is referred to as a wind-hydrogen system (WHS). The model does not currently include the costs of converting the hydrogen to methane or injecting the hydrogen/methane into the grid. The WHS model selects an optimum electrolyser size for each wind farm that minimises levelised cost of hydrogen (LCOH) from that farm. Compressors and storage tanks for each wind farm are scaled to the farm’s electrolyser. Central to the WHS model is a correlation that relates optimum electrolyser size to each wind farm’s power capacity (CP), annual capacity factor (CF) and percentage wind curtailment (%CW). This correlation was developed from hourly CW time series data for 75 wind farms in the ROI. Capital, operating and other costs were obtained from literature. Results show that not all wind farms in ROI are suitable for WHS, as indicated by high LCOH at farms of capacity <1 MW. However, 6 kilotonnes of hydrogen, equivalent to 204 GWh or 1% of ROI’s natural gas demand, are producible from 209 wind farms in the ROI. 76% of WHSs, accounting for 79% of renewable hydrogen capacity, are located less than 100 km from their nearest grid injection point. LCOH for hydrogen production and transportation to the nearest grid injection point are in the range 26-46 €/kg excluding injection tariff. Keywords: Wind energy, Hydrogen, Energy system, Energy storage, Geographic information system.
-
Upload
khangminh22 -
Category
Documents
-
view
5 -
download
0
Transcript of ecos-2019.pdf - Interreg NWE

PROCEEDINGS OF ECOS 2019 - THE 32ND INTERNATIONAL CONFERENCE ON
EFFICIENCY, COST, OPTIMIZATION, SIMULATION AND ENVIRONMENTAL IMPACT OF ENERGY SYSTEMS
JUNE 23-28, 2019, WROCLAW, POLAND
Towards techno-economic evaluation of renewable hydrogen production from wind curtailment and injection into the Irish gas
network
Tubagus Aryandi Gunawan a,b,c,*, Alessandro Singlitico a,b,c,, Paul Blount d, James G.
Carton e, Rory F.D. Monaghan a,b,c
a College of Engineering and Informatics, National University of Ireland Galway b Ryan Institute for Marine, Environmental and Energy Research, National University of Ireland Galway
c MaREI Research Centre for Marine and Renewable Energy Research, Galway d Coillte CGA Ireland
e Mechanical Engineering, Dublin City University
Abstract
This paper presents the results of techno-economic modelling of hydrogen production
from otherwise wasted wind energy in the Republic of Ireland (ROI), and its
transportation to the natural gas network, for injection. The model includes the production
of hydrogen by electrolysis powered by curtailed and constrained (wind curtailment)
wind energy at every wind farm in the ROI, compression to 300 bar, and transportation
by tube trailer to the nearest potential injection point to the natural gas grid. This system
is referred to as a wind-hydrogen system (WHS). The model does not currently include
the costs of converting the hydrogen to methane or injecting the hydrogen/methane into
the grid. The WHS model selects an optimum electrolyser size for each wind farm that
minimises levelised cost of hydrogen (LCOH) from that farm. Compressors and storage
tanks for each wind farm are scaled to the farm’s electrolyser. Central to the WHS model
is a correlation that relates optimum electrolyser size to each wind farm’s power capacity
(CP), annual capacity factor (CF) and percentage wind curtailment (%CW). This
correlation was developed from hourly CW time series data for 75 wind farms in the ROI.
Capital, operating and other costs were obtained from literature. Results show that not all
wind farms in ROI are suitable for WHS, as indicated by high LCOH at farms of capacity
<1 MW. However, 6 kilotonnes of hydrogen, equivalent to 204 GWh or 1% of ROI’s
natural gas demand, are producible from 209 wind farms in the ROI. 76% of WHSs,
accounting for 79% of renewable hydrogen capacity, are located less than 100 km from
their nearest grid injection point. LCOH for hydrogen production and transportation to
the nearest grid injection point are in the range 26-46 €/kg excluding injection tariff.
Keywords:
Wind energy, Hydrogen, Energy system, Energy storage, Geographic information
system.

1. Introduction Global installed capacity of wind energy increased by 450% from 2007 to 2017, accounting for half
of the worldwide renewable installed capacity in 2017 [1]. Wind energy installed capacity in the
Republic of Ireland (ROI) increased by 320% to 3,368 MW over the same period, and now accounts
for 25% of electricity production, the second highest percentage in the world [1]. ROI has the potential
to deliver 70% renewable electricity by 2030 [2]. However, 277 GWh (4%) of wind energy was lost
in 2017 due to the electricity grid’s technical inability to receive all generated wind energy. This
figure is projected to rise to 7-14% by 2020 depending on future wind energy penetration [3]. Large-
scale, long-term energy storage can help to reduce this figure. Hydrogen can be produced from this
otherwise lost renewable electricity via electrolysis and used as a zero-carbon emissions fuel for
power generation, heating or transport. It can be injected to the natural gas transmission network at
concentrations up to 12% by volume [4]. If produced at wind farms, renewable hydrogen can
therefore (1) enable energy storage on site, (2) reduce wasted available wind energy, (3) decrease
fossil fuel consumption and carbon emissions, (4) increase clean fuel supply into the gas grid, and (5)
enable sector coupling between power, heating and transportation.
The transformation route to produce hydrogen from renewable power is known as power-to-hydrogen
[5, 6, 7]. The electricity is used to electrolyse water to hydrogen and oxygen. When hydrogen is used
to produce methane, it is described as power-to-gas (P2G) [4, 8]. As illustrated in Figure 1, the wind
hydrogen system (WHS) is an integration of each wind farm with an electrolyser, compressor, bundle
storage and tube-trailer. A tube-trailer delivers compressed hydrogen to its closest gas grid injection
point. Investigation by [9] describes that there are 42 potential locations for injection to gas network
in ROI, which are known as above ground installations (AGIs). Thus, the hydrogen production costs
from CW and its transportation costs to injection point can be calculated.
Figure 1. Wind hydrogen system boundary
Wind turbine
Electrolyser
Compressor
Bundle storage
Tube-trailer
Gas network
Injection point
Closest route
Electricity
Hydrogen
System boundary

2. Methodology 2.1 System Description The WHS is proposed to convert the surplus wind energy to renewable hydrogen. It comprises
distribution panel, electrolyser, compressor, storage, and vehicle. The distribution panel manages the
input flow of electrolyser power from wind turbine or/and electrical grid. Due to fluctuating CW
profiles, additional electricity supply is required and can be delivered by the electricity grid as backup
every time the surplus wind energy cannot meet electrolyser minimum input power. The electrolyser
system is where water is converted to hydrogen and oxygen. As illustrated in Figure 1, it is an
integrated unit of transformer and rectifier (power supplier), safety devices to control the system, inlet
pump, treatment, heat exchanger, water circulation pump, proton exchange membrane (PEM)
electrolyser stacks, gas water separators, demisters and gas drying (gas purifier) [10]. Then hydrogen
is compressed and cooled before it is kept in a storage system. The hydrogen production and storage
subsystems are placed at existing wind farms and served by a tube-trailer to transport hydrogen to the
nearest gas injection point.
Figure 2. Block diagram of wind-hydrogen system (WHS)
2.2 Technoeconomic submodel
The material in an electrolyser stack can degraded with time [11]. Therefore, a minimum of 5% of
the electrolyser nominal rated capacity (Pnom) must be maintained to achieve stack’s economic
lifetime of 5 years. The detailed techno-economic parameters of the electrolyser system are shown in
Table 1.
Table 1. Technical parameters of electrolyser system [10, 11, 12]
Units PEM (30 bar) Selected
Nominal input power kW 1,000 – 20,000 1,000 – 20,000
Minimum input power % Pnom 5 5
Pressure output Bar 30 30
Power consumption at P nom kWhe/kg 63 - 55 55
Wind turbine
Distribution panel
Storage system
Electrical grid
Electrolyser system
Electrolyser stacks
Power supply
Control system
Gas purification
Water management
Compressor system
Compressor
Control system
Cooling system
Electricity
Hydrogen
Tube-trailer Injection point
System boundary
Water consumption L/kg 15 15
System economic lifetime Years 20 20
Stacks economic lifetime hr 40,000 43,800 (5 years)
System degradation %/1,000h 0.25 0.25
Annual availability %/year >98% 98%
To calculate hydrogen production cost, levelised cost of hydrogen (LCOH) is used as the key
economic metric in this evaluation [5, 6, 7]. The equation for LCOH (equation (2)) follows the general
variables from levelised cost of energy (LCOE) shown in equation (1).
0
0
1
1
t TCAPEX OPEX
tt
t T
tt
C C
rLCOE
E
r
(1)
2
0 0 0
0
1 1 1
1
t T t T t T
inv FOM VOM
t t t
t t t
t TH
t
t
Lr
COH
C C C
r r
M
r
(2)
Equation (2) requires total investment cost and hydrogen production (𝑀𝐻2) to calculate hydrogen
production cost in € per kg. Total investment cost is the sum of investment capital cost (𝐶𝑖𝑛𝑣), fixed
(𝐶𝐹𝑂𝑀) and variable (𝐶𝑉𝑂𝑀) operation and maintenance costs. A discount rate (𝑟) of 6% is assumed
over a 20-years economic lifetime (𝑇).
𝐶𝑖𝑛𝑣 = (𝐶𝑊𝐸 + 𝐶𝐶𝑜𝑚𝑝 + 𝐶𝑆𝑡𝑜𝑟 + 𝐶𝑂𝑡ℎ𝑒𝑟) (3)
Investment capital cost consists of water electrolyser cost (𝐶𝑊𝐸), compressor cost (𝐶𝐶𝑜𝑚𝑝), storage
cost (𝐶𝑆𝑡𝑜𝑟), and other costs (𝐶𝑂𝑡ℎ𝑒𝑟). Each of 𝐶𝑊𝐸 and 𝐶𝐶𝑜𝑚𝑝 includes costs for distributed control
system, energy management unit, engineering, interconnection, commissioning, and start-up costs.
Operation and maintenance cost is divided into fixed 𝐶𝐹𝑂𝑀 and variable 𝐶𝑉𝑂𝑀 components.
Maintenance of electrolyser (𝐶𝑀𝑎𝑖𝑛, 𝑊𝐸), compressor (𝐶𝑀𝑎𝑖𝑛, 𝑐𝑜𝑚𝑝) and storage (𝐶𝑀𝑎𝑖𝑛, 𝑠𝑡𝑜𝑟), together
with stack replacement (𝐶𝑆𝑅) are included in 𝐶𝐹𝑂𝑀, where 𝐶𝑉𝑂𝑀 accounts for the electricity (𝐶𝐸𝑙𝑒𝑐)
and water costs (𝐶𝑊𝑎𝑡) as written in (4) and (5). Expense for electricity is the total purchase of grid
electricity and wind curtailment.
, , , FOM Main WE Main comp Main stor SRC C C C C (4)
VOM Elec WatC C C (5)
Annual hydrogen production (𝑀𝐻2) can be calculated from input power for the electrolyser system at
defined electrolyser size (𝐸𝐸𝑆) multiplied by the efficiency of electrolyser system (η), then divided

by lower heating value of hydrogen (𝐿𝐻𝑉𝐻2). The method used to size electrolysers at each wind farm
is described in Section 2.4.
2
2
0 η
t T
EStH
H
EM
LHV
(6)
2.3 Wind curtailment submodel
Ireland’s Single Electricity Market Operator (SEM-O) provides the data required to calculate CW
profile from wind farms in ROI with capacity larger than 10 MW. At least three essential pieces of
data can be downloaded from the SEM-O website (www.lg.sem-o.com): actual availability (AA),
dispatch quantity (DQ) and metered generation (MG). Each data is in hourly basis within a time-
series of one year or 8760 hours. AA is the available power a wind farm can deliver to the grid. MG
is the active power exported by a wind farm. To calculate bid offer acceptance on each imbalance
settlement period, SEM-O also provides DQ, which is based on dispatch instruction [13]. Finally, the
actual CW can be computed by following equation (7) and (8).
, t t t t t
CW AA Max DQ or MG if AA DQ (7)
0,
t t
t t
CW if AA DQ
AA DQ
(8)
2.4 Electrolyser sizing submodel
There are several WHS pilot plants operating across Europe. According to [7, 14, 15], LCOH varies
from 3 €/kg to 28 €/kg. The electrolyser contributes single largest share of up to 40% of total
expenditure, followed by compressor and storage vessels [7, 16]. Therefore, all the cost parameters
are set to be functions of electrolyser size (ES), as listed in Table 2. The LCOH is calculated iteratively
and started at an ES of 10 kW, increasing in increments of 50 kW to the wind farm rated output. The
ES that results in the minimum LCOH for a given wind farm is selected as the optimum ES for that
wind farm.
Table 2. Economic parameters in WHS, calculated from [10, 17, 18, 19]
Symbol Unit Parameter
Total investment cost
Electrolyser system cost 𝐶𝑊𝐸 €/kW 3872 ∙ 𝐸𝑆−0.075
Compressor cost 𝐶𝐶𝑜𝑚𝑝 €/kW 7670.1 ∙ 𝐸𝑆−0.34
Bundle steel storage 𝐶𝑆𝑡𝑜𝑟 €/kg 470 ∙ (��𝐻2∙ 48)
Equipment costs 𝐸𝐶 € 𝐸𝑆 ∙ (𝐶𝑊𝐸 + 𝐶𝐶𝑜𝑚𝑝)
Other cost 𝐶𝑂𝑡ℎ𝑒𝑟 € (1.5652 ∙ 𝐸𝑆−0.154) ∙ 𝐸𝐶
Fixed operation & maintenance cost
Electrolyser maintenance 𝐶𝑀𝑎𝑖𝑛, 𝑒𝑙𝑒𝑐 %𝐶𝑊𝐸 167.42 ∙ ES−0.305
Compressor maintenance 𝐶𝑀𝑎𝑖𝑛, 𝑐𝑜𝑚𝑝 €/kW 2% ∙ 𝐶𝐶𝑜𝑚𝑝
Storage maintenance 𝐶𝑀𝑎𝑖𝑛, 𝑠𝑡𝑜𝑟 €/kW 2% ∙ 𝐶𝑆𝑡𝑜𝑟
Stack replacement 𝐶𝑆𝑅 €/kW 1355.2 ∙ 𝐸𝑆−0.075
Variable operation & maintenance cost

Average grid electricity price in ROI 𝑃𝐸𝑙𝑒𝑐 €/kWh 0.1263
Average LCOE of onshore wind farm 𝑃𝐶𝑊 €/kWh 0.08
Average water price in ROI 𝑃𝑊𝑎𝑡 €/m3 2.38
2.5 Compressor and storage submodel
In the hydrogen industry, reciprocating compressors are widely used, so are used in this study.
Compression from 30 barg to 300 barg requires two stages to maintain the discharge temperature at
135 oC, with efficiency of 50% and power consumption of 1.7 kWhe/kg [10, 20, 21].
For a long-term storage system with capacity from 10 hours to many months, bundles of steel storage
cylinders are selected due to their capability to store up to 300 bar. Depending on the average
hydrogen production rate, hydrogen will be kept in the storage system before it is transported to the
injection points.
2.6 Transportation submodel
As mentioned in the system description section, there are 42 AGI locations along the ROI natural gas
network that can potentially be utilised for renewable hydrogen injection points. Therefore, a
transportation cost submodel is created to calculate the additional transportation cost for each WHS
in ROI. A tube-trailer with pressure 300 bar is used to transport 500 kg hydrogen per trip. Geographic
Information System (GIS) is used to identify the nearest injection point to each wind farm, and the
shortest road route. To carry out this, GIS requires the detailed road network in ROI, which can be
obtained from [22]. The parameters of transportation cost are calculated from [23, 24] and shown in
Table 3.
Table 3. Parameters in transportation cost model
Parameters Symbol Unit Value
Hydrogen trailer cost € /kg 464
Vehicle cost 𝐶𝑣 € /truck 232,000
Vehicle lifetime years 10
Salary 𝐶𝑠 € /person 38,000
Employers person 1
Fuel cost 𝐶𝑓 € /km 0.20
Other running costs 𝐶𝑜𝑐 € /km 0.34
Tube-trailer capacity 𝐶𝑎𝑝𝑣 kg/ trip 500
Average speed km/h 50
Hydrogen pressure bar 300
Trip numbers per year 𝑇𝑅𝑦𝑒𝑎𝑟 calculation
Distance between WHS and AGI 𝐷𝑊𝐻𝑆.𝐴𝐺𝐼 calculation
Delivered mass per year 𝑀𝐻2 calculation
As an additional cost to existing LCOH, the transportation cost (𝐶𝑡𝑟𝑎𝑛𝑠) must be a ratio of total
transportation (𝐶 𝑡𝑜𝑡) over hydrogen production capacity (𝑀𝐻2). The equation to calculate
transportation cost is shown below.
2
tottrans
H
CC
M
(9)
The total transportation cost is the sum of investment cost (𝐶𝑖𝑛𝑣) and travel cost (𝐶𝑡𝑟𝑎𝑣𝑒𝑙). Investment
cost calculates the vehicle cost (𝐶𝑣) and its operation cost (𝐶𝑠). On the other hand, travel cost takes

into account the shortest distance between WHS and injection points (𝐷𝑊𝐻𝑆.𝐴𝐺𝐼), total annual trip
numbers (𝑇𝑅𝑦𝑒𝑎𝑟), fuel cost (𝐶𝑓), other cost (𝐶𝑜𝑐) and return trip as indicated by two as written in the
following equation.
tot inv travelC C C (10)
inv v sC C C (11)
. 2travel WHS AGI year f ocC D TR C C (12)
To obtain the optimum travel cost, the number of trips is calculated based on the average length of
storage time (𝑆𝑇𝑑𝑎𝑦𝑠) according to each WHS daily average production (𝑀𝐻2,𝑎𝑣𝑒) and tube-trailer
capacity (𝐶𝑎𝑝𝑣), as shown below.
365year
days
TRST
(13)
2
vdays
H
CapST
M
(14)
2.7 Solution algorithm
To exploit the usage of CW in the entire country, WHSs are designed to be decentralised and sited at
each wind farm throughout the island. SEM-O collects hourly power generation data from at least 74
wind farms. Three years of hourly CW from 2015 to 2017 of each wind farm are the data source to
calculate the average CW. This CW profile is then used in the electrolyser sizing submodel to
calculate LCOH using different ES from 10 kW to 20 MW. The optimum ES is selected at the
minimum LCOH. The transportation cost is then added to the minimum LCOH. As depicted in Figure
3, required and calculated values are indicated by square boxes, where mathematical models are
shown in round edge boxes. To help understanding the model, preparation data from SEM-O are
shown in blue boxes, calculation of technical production with purple boxes and production cost within
cream boxes.

Figure 3. Model to calculate minimum LCOH
3. Results and Discussion
3.1 Electrolyser sizing for a sample wind farm
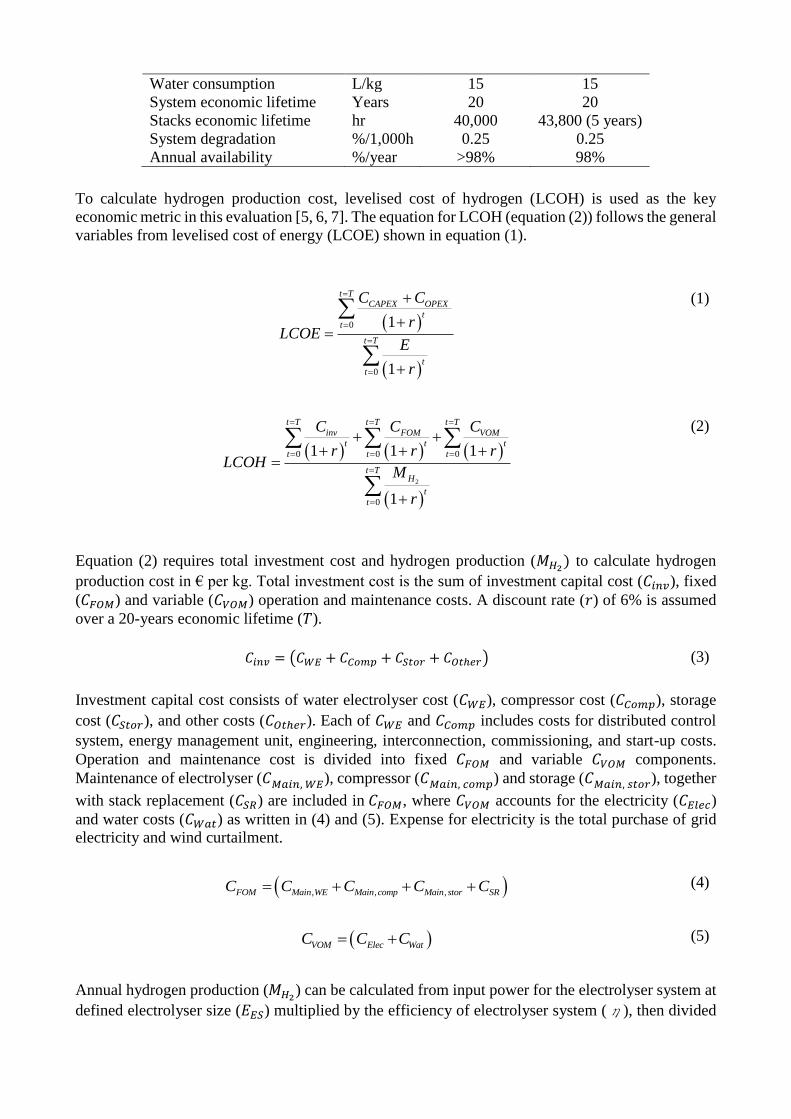
Figure 4 shows the CW profile of Ballincollig Hill wind farm in 2015. The grey line illustrates the
exported power to the grid, where surplus energy is indicated by black line. This 15 MW wind farm
runs with 31% capacity factor and 13% CW. As a result, 5204 MWh wind energy is wasted. CW
occurs 65% of the time, where half the occurrences are below 2.2 MW and the largest curtailment
reaches 11 MW.
𝐸𝑆𝑛
𝐸𝐶𝑊,𝐸𝑆(𝑡𝑜𝑡)
𝐸𝑆𝑀𝑃
𝐸𝐸𝐺
𝐶𝑀��𝐻2,𝐸𝑆 𝑀𝐻2,𝐸𝑆(𝑡𝑜𝑡)
= 𝑇𝑃𝐶𝑊(𝐸𝑆)
∙ η
𝐿𝐻𝑉𝐻2
𝐸𝐸𝐺(𝑡𝑜𝑡) = 𝐸𝐸𝑆𝑀𝑃 + 𝐸𝐶𝑀��𝐻2
,𝐸𝑆
𝐸𝐸𝐺(𝑡𝑜𝑡)
𝑀𝐻2𝑂, 𝐸𝑆=
𝑀𝐻2,𝐸𝑆(𝑡𝑜𝑡)∙ 15
1000
𝐸𝐶𝑊(𝑡)
��𝐻2
𝐸𝐶𝑊(𝑡𝑜𝑡)
𝐴𝐴(𝑡)
𝐷𝑄(𝑡)
𝑀𝐺(𝑡)
Iteration started with n= 10 kW
n= 10 kW, … , 20 MW
𝐿𝐶𝑂𝐻𝐸𝑆
𝐿𝐶𝑂𝐻𝐸𝑆,𝑜𝑝𝑡
minimum
𝐶𝐹𝑂𝑀, 𝐸𝑆 = (𝐶𝑀𝑎𝑖𝑛, 𝐸𝑆 + 𝐶𝑆𝑅, 𝐸𝑆)
𝐶𝑉𝑂𝑀, 𝐸𝑆 = (𝐸𝐸𝐺(𝑡𝑜𝑡) ∙ 𝑃𝑒𝑙𝑒𝑐) + (𝑀𝐻2𝑂,𝐸𝑆 ∙ 𝑃𝐻2𝑂)
𝑖𝑓 AA(𝑡) > 𝐷𝑄(𝑡) ; AA(𝑡) − 𝑀𝑎𝑥 (𝐷𝑄(𝑡)𝑜𝑟 𝑀𝐺(𝑡))
𝑖𝑓 𝐴𝐴(𝑡) = 𝐷𝑄(𝑡) ; 0
𝑖𝑓 AA(𝑡) < 𝐷𝑄(𝑡) ; 0
𝐶𝑖𝑛𝑣, 𝐸𝑆 = 𝐶𝑊𝐸, 𝐸𝑆 + 𝐶𝐶𝑜𝑚𝑝, 𝐸𝑆 + 𝐶𝑆𝑡𝑜𝑟, 𝐸𝑆
𝐿𝐶𝑂𝐻𝐸𝑆,𝑜𝑝𝑡,𝑡𝑟𝑎𝑛𝑠 2
tottrans
H
CC
M
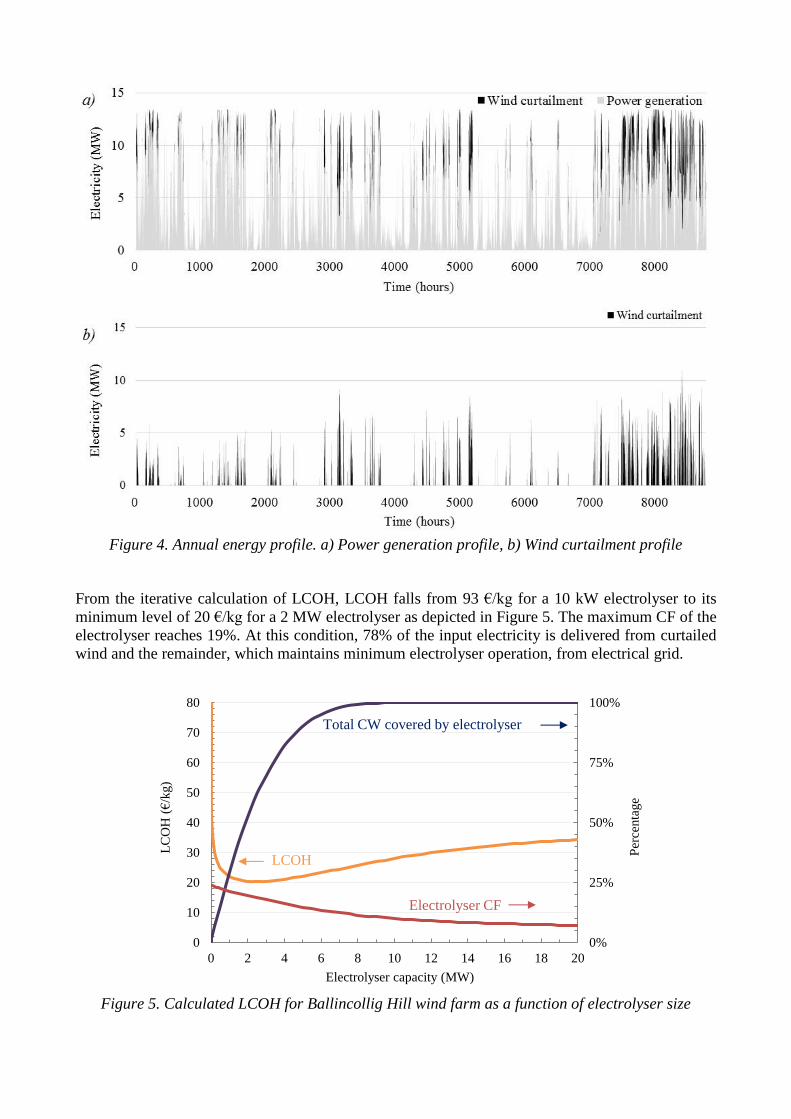
Figure 4. Annual energy profile. a) Power generation profile, b) Wind curtailment profile
From the iterative calculation of LCOH, LCOH falls from 93 €/kg for a 10 kW electrolyser to its
minimum level of 20 €/kg for a 2 MW electrolyser as depicted in Figure 5. The maximum CF of the
electrolyser reaches 19%. At this condition, 78% of the input electricity is delivered from curtailed
wind and the remainder, which maintains minimum electrolyser operation, from electrical grid.
Figure 5. Calculated LCOH for Ballincollig Hill wind farm as a function of electrolyser size
0%
25%
50%
75%
100%
0
10
20
30
40
50
60
70
80
0 2 4 6 8 10 12 14 16 18 20
Per
centa
ge
Electrolyser capacity (MW)
LC
OH
(€
/kg)
Electrolyser CF
LCOH
Total CW covered by electrolyser

3.2 Optimal electrolyser sizing for all ROI wind farms
A statistical model can be developed for the 74 wind farms in ROI that have detailed hourly data.
There are however 238 wind farms in total in ROI, so a method must be developed to size
electrolysers and WHSs for these sites. The dependence of optimum electrolyser size for the 74 wind
farms at minimum LCOH on total annual CW is shown in Figure 6. Additionally, the strong reliance
of hydrogen production on the amount of wasted energy at wind farm also illustrated in the same
figure.
Figure 6. Dependence of (a) optimum electrolyser size and (b) annual hydrogen production, on
total wind curtailment volume for detailed wind generation data wind farms in ROI
These statistical models are used to broaden LCOH calculation to all wind farms in ROI where only
limited data are available. Instead of using complete data from SEM-O, three important data are taken
from Sustainable Energy Authority of Ireland (SEAI) and the Eirgrid annual report [25]. They are
ratio of lost energy over available wind energy (%CW), ratio of wind power production over annual
wind energy production capacity (%CF) and its wind farm capacity (CP). From these limited data,
total CW can be computed for all wind farms in ROI and minimum LCOH at each wind farm can be
obtained from the developed statistical model.
3.3 Production-only LCOH at optimum electrolyser size
By using the statistical model, the optimum ES for 238 WHS in ROI can be found. The potential
hydrogen production range is from 0.08 to 178 tonnes per year. There are 10 wind farms with capacity
lower than 250 kW and each produces less than 1 ton per year. These hydrogen production rates are
very low and do not benefit from economies of scale, therefore LCOH significantly increases to more
ES(opt) = 0.3868 ∙ ECW(tot) + 0.01
0
5
10
15
20
0 10 20 30 40 50 60
ES
(opt)
(M
W)
ECW(tot) (GWh)
MH2,ES = 22.426∙ ECW(tot)0.8503
0
200
400
600
800
0 10 20 30 40 50
MH
2,E
S(t
onnes
/y)
ECW(tot) (GWh)
a)
b)

than 50 €/kg. 19 wind farms with capacities between 250 kW and 1 MW have production costs of 30-
50 €/kg. All other wind farms in Ireland have capacities greater than 1 MW and have LCOH between
25 and 30 €/kg, as shown in Figure 7.
Figure 7. LCOH, excluding transportation costs, calculated by the WHS model for all wind farms in
ROI
3.4. Transportation analysis
The duration of storage at each WHS in ROI has to be measured due to the fact that most of the daily
hydrogen production from 238 wind farms are less than 500 kg/day. The 11 MW Kingsmountain
wind farm produces 108 kg hydrogen per day, therefore the storage system accumulates hydrogen in
more or less 5 days until hydrogen can be delivered by a tube-trailer in full capacity of 500 kg, as
shown in Figure 8 for 10-days profile. This occurs due to the absence of CW, consequently
electrolyser relies on electrical grid during this period and produces minimum hydrogen amount.
Total number of trips of tube-trailer is 96 times per year as illustrated in the same figure for annual
profile.

Figure 8. Hydrogen storage profile. a) 10-days profile, b) annual profile
3.5 Production and transportation LCOH
As mentioned previously in transportation submodel, the model accounts for the minimum road
distance between each WHS and its nearest injection point, as shown in Figure 9. All wind farms
below 1 MW have total production and transportation costs of higher than 50 €/kg. The larger capacity
wind farms, at least 209 WHSs, have total costs between 26 and 46 €/kg, with average LCOH of 30.8
€/kg. The results show most of these WHSs are located less than 100 km from their nearest injection
point, where the longest distance reaches 343 km. WHSs in the far northwest of ROI have longer
distance to reach nearest injection locations compared to WHSs in the middle and southern parts of
the island. This is because AGIs in Northern Ireland, which part of the UK, have not been included
in the current analysis. Figure 10 shows that at least 76% of WHSs, which deliver 79% of hydrogen
capacity, are located below 100 km to the nearest gas injection locations. The total hydrogen
production potential from all WHSs reaches 6 kilotonnes. This is equivalent to 204 GWh or 1% of
ROI’s natural gas demand in 2017 [26]. These costs depend on each WHS’s hydrogen production
rate, transport distance to injection point. The exclude any injection tariff or costs of conversion to
methane in a power-to-gas system.
0
100
200
300
400
500
0 1 2 3 4 5 6 7 8 9 10
Sto
rage
level
(kg)
Time (days)
0
100
200
300
400
500
0 50 100 150 200 250 300 350
Sto
rage
level
(kg)
Time (days)
5 days
a)
b)

Figure 9. LCOH, including transportation costs to the nearest grid injection points, calculated by
the WHS model for all wind farms in ROI
Figure 10. Share of hydrogen capacity and number of WHSs as functions of distance from WHS to
injection points
3.6 Limitations and future work
Future work must focus on implementing commercial sizes and costs of electrolyser and compressor.
It is also necessary to advance the WHS model and design by developing new arrangement of multiple
electrolyser size and battery combination. In the transportation analysis, potential injection points for
renewable hydrogen in Northern Ireland must be included in the GIS analysis, so that WHSs in the
northern part of the island can have less travel distance to injection points. It is also important to
review the potential constraints on hydrogen injection in ROI. These may include maximum hydrogen
percentage and the capacities of AGIs. Additionally, there is also an opportunity to study new
0% 10% 20% 30% 40% 50% 60%
< 50
50 - 100
100 - 150
150 - 200
> 200
Percentage
Dis
tance
(km
)
Hydrogen capacity
WHSs

transportation systems to carry small quantities of hydrogen from small wind farms, so that all
hydrogen can be transported efficiently. As complementary work, it is important to evaluate an
alternative distribution scenario to cover energy demand in non-grid connected areas.
4. Conclusions A wind-hydrogen system (WHS) is proposed and designed to harness wasted wind energy to generate
renewable hydrogen gas supply and deliver it natural gas network. In designing a WHS, annual CW
profile is crucial in the minimum LCOH calculation due to the strong dependence electrolyser sizing
has on electrolyser input energy. Based on CW data, statistical models are generated to calculate
LCOH for all wind farms in ROI. GIS supports the additional transportation cost calculation at each
WHS.
This evaluation shows that minimum LCOH for all wind farms in ROI can be found by using three
essential values of %CF, %CW and CP. Afterwards, GIS can be a reliable tool to plot the shortest
road route between WHS and injection locations. As a result, wind farms with capacity lower than 1
MW are not suitable to the proposed WHS, as indicated by very high LCOH. On the other hand,
results also show 76% of the above 1 MW wind farms in ROI are located below 100 km to nearest
injection point and have potential to supply 79% renewable hydrogen potential with average
production plus transportation costs of 30.8 €/kg. The total hydrogen production potential reaches 6
kilotonnes which is equivalent to 204 GWh or 1% of ROI’s natural gas demand in 2017.
The future stages of this work is to improve the accuracy of the WHS model based on commercial
size and costs of electrolyser and compressor. It also important to broaden GIS analysis to potential
hydrogen injection points in Northern Ireland. New distribution mechanism to cover small wind farms
and non-gird connected areas is also necessary to be developed and evaluated in the future.
Acknowledgments The authors acknowledge funding from the EU Interreg Northwest Europe (NWE) programme under
the GENCOMM (GENerating energy secure COMMunities through smart Renewable Hydrogen)
project.
Nomenclature C Cost, €
D Distance, km
E Energy generated, MWh
LCOE Levelised cost of energy, €/ MWh
LCOH Levelised cost of hydrogen, €/ kg
LHV Lower Heating Value, kWh/kg
M Mass, kg
M Mass flow rate, kg/h
ST Storage duration per year, days/y
t Time, h
TR Number of trips per year, trips/y
Greek symbols
η efficiency

Subscripts and superscripts
AA Actual availability
AGI Above ground installation
CAPEX Capital expenditure
CM Compressor capacity
Comp Compressor
CW Wind curtailment
DQ Dispatch quantity
EC Equipment cost
Elec Electricity
Eng Engineering
ES Electrolyser size
𝑓 Fuel
FOM Fixed operation & maintenance
𝐻2 Hydrogen gas
inv Investment capital
LCOE Levelised Cost of Electricity
LCOH Levelised Cost of Hydrogen
Main Maintenance
MG Metered generation
OPEX Operation and maintenance expenditure
opt Optimum
Other Other expenditure
r Discount rate
𝑠 Operaton expenditure
SR Stack replacement
Stor Storage
trans Transportation
travel Travel expenditure
𝑣 Vehicle expenditure
VOM Variable operation & maintenance
Wat Water
WE Water electrolyser
WHS Wind hydrogen system
𝑂𝐶 Operation costs
References
[1] PWT Communications Inc, “IEA Wind TCP 2017 Annual Report : Technology Collaboration
Programme,” IEA Wind Technology Collaboration Programme ISBN: 978-0-9905075-8-1,
Washington, 2018.
[2] M. Turner, “A 70% Renewable Electricity Vision for Ireland in 2030,” Baringa Partners LLP,
London, 2018.

[3] E. M. Garrigle, “How much wind energy will be curtailed on the 2020 Irish power system?,”
Renewable Energy, vol. 55, no. http://dx.doi.org/10.1016/j.renene.2013.01.013, pp. 544-553,
2013.
[4] M. Gotz, “Renewable Power-to-Gas: A technological and economic review,” Renewable
Energy, vol. 85, no. http://dx.doi.org/10.1016/j.renene.2015.07.066, pp. 1371-1390, 2016.
[5] W. Kuckshinrichs, “Economic Analysis of Improved Alkaline Water Electrolysis,” Frontiers
in Energy Research 5:1, no. DOI: 10.3389/fenrg.2017.00001, 2017.
[6] S. HussainSiyal, “Economic analysis of standalone wind-powered hydrogen refueling stations
for road transport at selected sites in Sweden,” International Journal of Hydrogen Energy, vol.
40, no. 32, pp. 9855-9865, 2015.
[7] L. Viktorsson, “A Step towards the Hydrogen Economy—A Life Cycle Cost Analysis of A
Hydrogen Refueling Station,” Energies, vol. 10(6), no. https://doi.org/10.3390/en10060763, p.
763, 2017.
[8] E. P. Ahern, “A perspective on the potential role of renewable gas in a smart energy island
system,” Renewable Energy, vol. 78, no. https://doi.org/10.1016/j.renene.2015.01.048, pp. 648-
656, 2015.
[9] A. Singlitico, “Evaluation of the potential and geospatial distribution of waste and residues for
bio-SNG production: A case study for the Republic of Ireland,” Renewable and Sustainable
Energy Reviews, vol. 98, no. https://doi.org/10.1016/j.rser.2018.09.032, pp. 288-301, 2018.
[10] C. Chardonnet, “Study on Early Business Cases for H2 in Energy Storage and More Broadly
Power to H2 Applications,” Fuel Cells and Hydrogen Joint Undertaking, Brussels, 2017.
[11] O. Schmidt, “Future cost and performance of water electrolysis: An expert elicitation study,”
International Journal of Hydrogen Energy, vol. 42, pp. 30470-30492, 2017.
[12] A. Buttler, “Current status of water electrolysis for energy storage, grid balancing and sector
coupling via power-to-gas and power-to-liquids: A review,” Renewable and Sustainable Energy
Reviews, vol. 82, no. http://dx.doi.org/10.1016/j.rser.2017.09.003, p. 2440–2454, 2018.
[13] SEM-O, “Single Electricity Market Operator,” SEM-O, [Online]. Available: www.sem-
o.com/MarketDevelopment/MarketRules/Glossary.docx.. [Accessed 10 08 2018].
[14] J. Linnemann, “Realistic costs of wind-hydrogen vehicle fuel production,” International
Journal of Hydrogen Energy, vol. 32, no. DOI | 10.1016/j.ijhydene.2006.10.029, pp. 1492-
1499, 2007.
[15] C. J.Greiner, “A Norwegian case study on the production of hydrogen from wind power,”
International Journal of Hydrogen Energy, vol. 32, no. 10–11, pp. 1500-1507, 2007.
[16] G. Saur, “Wind-To-Hydrogen Project: Electrolyzer Capital Cost Study,” Technical Report
NREL/TP-550-44103, Colorado, 2008.
[17] SEAI, “Electricity & Gas Prices in Ireland 2017,” Sustainable Energy Authority of Ireland,
Dublin, 2018.
[18] NCC, “Costs of Doing Business in Ireland 2017,” National Competitiveness Council, Dublin,
2017.
[19] IRENA, “Renewable Power Generation Costs,” in Renewable Power Generation Costs in 2017,
International Renewable Energy Agency, Abu Dhabi, 2018.
[20] A. Léon, “Hydrogen Technology: Mobile and Portable Applications,” in Hydrogen Storage,
Heidelberg, Springer, 2008, p. 86.

[21] S. Hall, “Rules of Thumb for Chemical Engineers,” in Fans, Blowers, and Compressors,
Waltham, Gulf Professional Publishing, 2012, p. 123.
[22] Geofabrik, “OpenStreetMap Shapefiles,” Geofabrik, [Online]. Available:
https://www.geofabrik.de/data/shapefiles.html. [Accessed 1 12 2018].
[23] Antoniotti, “Impact of High Capacity CGH2-Trailers,” DeliverHy.
[24] TNEI Services Ltd, “Constrained Renewables and Green Hydrogen Production Study,” Scottish
Enterprise, Manchester, 2018.
[25] Eirgrid, “Annual Renewable Energy Constraint and Curtailment Report,” Eirgrid, Dublin, 2018.
[26] SEAI, “Energy in Ireland,” Sustainable Energy Authority of Ireland, Dublin, 2018.