Marin County Community Development Agency February 2018
222
Marin County Community Development Agency February 2018
-
Upload
khangminh22 -
Category
Documents
-
view
1 -
download
0
Transcript of Marin County Community Development Agency February 2018

Marin County Community Development Agency
February 2018

Collaboration: Sea-Level Marin Adaptation Response TeamMarin County Community Development AgencyFebruary 2018 | Marin County, CA | marinslr.org

A Call to Action for West Marin Residents West Marin is abundant with natural resources that are integral to its cultural identify as demonstrated by the long heritage of open space preservation and appreciation. Federal, state and local parklands abutting the Pacific Ocean provide a retreat from the hustle and bustle of Bay Area living. Coastal bluffs, beaches, wetlands, and more draw millions of international visitors for surfing, birding, kayaking, hiking, picnicking and more. Protected ranchlands are stewarded by multi-generation family farming operations which feed the region with milk, cheese, yogurt, butter, ice-cream and other products. Nestled within these vast swaths of open space are small but mighty communities that serve as both visitor hubs and homes to residents who cherish and value the unique sense of place.
Climate change presents unprecedented threats to West Marin. Wetlands and beaches could be drowned with rising waters, and native plants and animal populations could plummet from changes in temperature and precipitation, ocean acidification, invasive species, and more. Coastal flooding and erosion threaten homes, roads, and utilities that are critical to the long- term sustainability of West Marin.
Spearheaded by the Marin County Community Development Agency in 2014, Collaboration: Sea Level Rise Adaptation Response Team (C-SMART) is a partnership based community planning approach to solve some of these challenges. The Marin Ocean Coast Sea Level Rise Vulnerability Assessment analyzed the vulnerabilities of natural and built assets from near- to long-term combined sea level rise and storm scenarios. This document, The Marin Ocean Coast Sea Level Rise Adaptation Report sets the foundation for continued adaptation planning to prepare West Marin for more intense future environmental hazards.
To plan for a resilient future, public involvement is critical. The time for you to act is now. Marin County plans continued collaboration with community members on next phases of C-SMART as local expertise and experiences are invaluable to ensure successful adaptation to changing conditions.
Best,
Dennis Rodoni, 4th District Marin County Board of Supervisors

This page is intentionally left blank.

CONTENTS | 1
ContentsAcknowledgments 3
List of Acronyms 6
Executive Summary 7
1) Introduction 311.1) Project Intent and Goals 321.2) Project Partners 321.3) Planning Area 331.4) The C-SMART Process 341.5) Guiding Principles 351.6) Vulnerability Assessment 381.7) Prioritize Adaptive Needs 421.8) Programs and Documents Referenced in the Report 44
2) C-SMART Participants 512.1) Community Workshops 522.2) Stakeholder and Technical Advisory Committees 552.3) Center for Ocean Solutions 552.4) Greater Farallones National Marine Sanctuary 562.5) Environmental Science Associates 57
3) Adaptation Framework 593.1) Adaptation Options 603.2) Prioritization Criteria 623.3) Trigger Points for Adaptive Management 663.4) Recent, Ongoing and Anticipated Adaptations 71
4) Governance 734.1) Public Outreach & Education 744.2) Emergency Management 754.3) Local Assessment Districts 754.4) Interagency Governmental Collaboration 764.5) Land Use & Zoning 764.6) Public Trust Doctrine 804.7) County Permitting Agencies 81
5) Asset Adaptation 835.1) Strategy Options – All 855.2) Parcels & Buildings 885.3) Transportation 1095.4) Utilities 1155.5) Working Lands 1165.6) Natural Resources 1185.7) Recreation 1305.8) Emergency Services 1325.9) Historic and Archaeological Resources 134

2
6) Community Alternatives 1386.1) Community PATCHs (Plans for Adaptation To Coastal Hazards) 1396.2) Muir Beach 1416.3) Stinson Beach 1476.4) Bolinas 1676.5) Inverness 1766.6) East Shore 1866.7) Point Reyes Station 1966.8) Dillon Beach 201
7) Conclusion 2077.1) Next Steps 2087.2) Lessons learned 210
Glossary 211Bibliography 215
AppendicesA) Adaptation Strategy CompilationB) ESA Memo – Marin County Coastal Hazards and SLR Adaptation StrategiesC) Adaptation Poll ResultsD) Potential Sea Level Rise MapsE) Climate-Smart Adaptation for North-central California Coastal HabitatsF) Point Blue Conservation Science Final ReportG) Adaptation Plan Passport Results Summary
All images courtesy of Marin County Community Development Agency, unless otherwise noted.

ACKNOWLEDGMENTS | 3
AcknowledgmentsMarin County Board of Supervisors District 1—Damon ConnollyDistrict 2—Katie RiceDistrict 3—Kathrin SearsDistrict 4—Dennis RodoniDistrict 5—Judy Arnold
Marin County Planning Commission Margaret CurranDon Dickenson David Paoli Margot Biehle John Eller Christina DesserPeter Theran
Project Funders California Coastal Commission California Ocean Protection Council Marin County
Primary C-SMART Staff and AuthorsLauren Armstrong, AICP, Planner, Marin County Community Development AgencyAlex Westhoff, AICP, Planner, Marin County Community Development Agency
Project ManagerJack Liebster, Planning Manager, Marin County Community Development Agency
Executive Steering CommitteeDennis Rodoni, District 4 Supervisor, Marin County Board of Supervisors Kathrin Sears, District 3 Supervisor, Marin County Board of Supervisors
Additional AuthorsJeremy Pi, Planning Intern, Marin County Community Development AgencyBridgit Van Belleghem, AICP, Planner, Marin County Community Development Agency Leslie Lacko, Planner, Marin County Community Development Agency
ConsultantsBy DesignEnvironmental Science AssociatesPoint Blue Conservation Science
Project PartnersGreater Farallones National Marine SanctuaryUnited States Geological SurveyPoint Blue Conservation ScienceCoravai Center for Ocean SolutionsGensler
Technical PresentersBob Battalio, Environmental Science AssociatesEd Curtis, Federal Emergency Management AgencyKellan Dammann, Marin County Community Development Agency Sustainability TeamKelsey Ducklow and Shannon Fiala, California Coastal CommissionElizabeth English, University of Waterloo, Buoyant Foundation ProjectUrsula Hanks, Marin County Office of Emergency ServicesRoger Leventhal, Marin County Department of Public WorksGail Napell, GenslerPeter Wijsman, Arcadis
Additional AdvisorsFederal Emergency Management Agency National Oceanic and Atmospheric Administration Local and neighboring county experts

4
Technical Advisory Committee Sarah Allen, Ocean and Coastal Resources Program, National Park ServiceVictor Bjelajac, Maintenance Chief, Marin District, California Parks and RecreationJulia Biggar, Associate Transportation Planner, California Department of TransportationChris DeGabriele, General Manager, North Marin Water DistrictKelsey Ducklow, Local Coastal Program Grant Manager, California Coastal CommissionLesley Ewing, Senior Coastal Engineer, California Coastal CommissionShannon Fiala, Coastal Planner, California Coastal CommissionDarren Fong, Aquatic Ecologist, Golden Gate National Recreation AreaUrsula Hanks, Emergency Services Coordinator, Marin County Emergency ServicesChris Kelley, Wastewater Inspector, Stinson Beach County Water DistrictNeysa King, Watershed Coordinator, Tomales Bay Watershed CouncilRoger Leventhal, Senior Engineer, Marin County Department of Public WorksJeannine Manna, District Supervisor, California Coastal CommissionScott McMorrow, General Manager/Board President, Inverness Public Utility DistrictCraig Richardson, Open Space Planner, Marin County Parks and Open SpaceNancy Scolari, Executive Director, Marin County Resource Conservation DistrictEd Schmidt, General Manager/Secretary to the Board, Stinson Beach County Water DistrictJustin Semion, Aquatic Ecologist, WRA Environmental ConsultantsJack Siedman, Board President, Bolinas Community Public Utility DistrictAnita Tyrrell-Brown, Fire Chief, Bolinas Fire Protection DistrictKristen Ward, Wetland Ecologist, Golden Gate National Recreation Area
Stakeholder Advisory CommitteeCommunity RepresentativesAlex Hinds, InvernessBob Johnston, Ph. D., Point Reyes StationMichael Lawson, Dillon Beach/North CountyJeffrey Loomans, Stinson Beach (Seadrift)Gerald Pearlman, Muir BeachJennie Pfeiffer, BolinasArthur Walenta, East Shore/Marshall
Topical Area RepresentativesBrian Aviles, National Park ServiceKatie Beacock, Local Business OwnerChristopher Harrington, Local BusinessMichael Lawson, AgricultureGerald Pearlman, RecreationAmy Trainer, Environmental Action CommitteeDaphne Hatch, National Park Service (Alternate)Ben Becker, National Park Service (Alternate)
Volunteer FacilitatorsLeslie AldenDana ArmaninoYanna BadetPatricia BassetAmy BrownBrian CrawfordKellen DammannJocelyn DrakeKristin DrummChristine GimmlerShelley IngramTom LaiVivian LoVicki NicholsMaureen PartonMarina PsarosHeidi ScobleTammy TaylorJeremy TejirianSandy Wallenstein
ACKNOWLEDGMENTS | 5
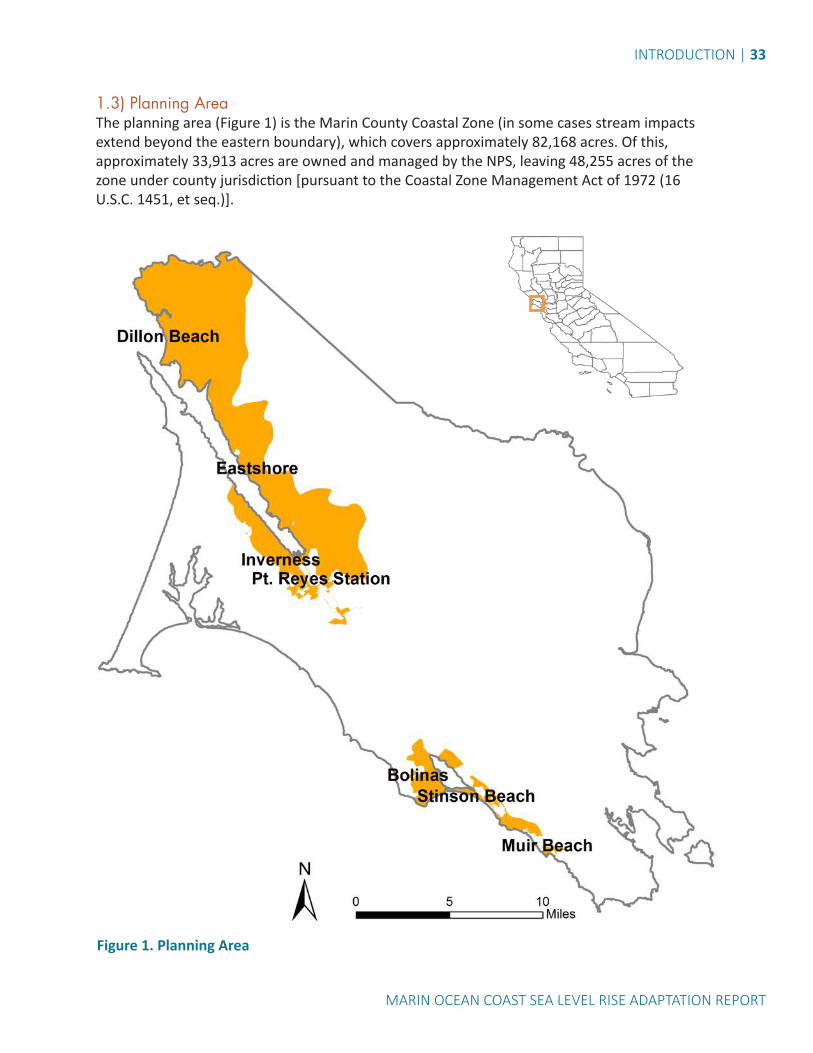
Climate-Smart Adaptation Working Group of the Greater Farallones National Marine Sanctuary Advisory CouncilChairAnne Morkill, US Fish and Wildlife Service; Greater Farallones National Marine Sanctuary
Working GroupSarah Allen, National Park Service Debbie Aseltine-Nielsen, California Department of Fish and WildlifeKate Bimrose, Greater Farallones AssociationMarlene Finley, San Mateo CountyJoel Gerwein, California State Coastal ConservancyEric Hartge, Center for Ocean Solutions, Daphne Hatch, Golden Gate National Recreation AreaMaya Hayden, National Oceanic and Atmospheric Administration Office of Coastal ManagementDeborah Hirst, San Mateo CountyJaime Jahncke, Point Blue Conservation ScienceJoanne Kerbavaz, California State Department of Parks and RecreationIrina Kogan, Resource Conservation District of San Mateo CountyDavid Ledig, Bureau of Land ManagementJack Liebster, Marin CountyMary Matella, California Coastal CommissionGerry McChesney, US Fish and Wildlife ServiceAndrea O’Neill, US Geological SurveyHilary Pappendick, San Mateo CountyBrenna Rudd-Mahoney, California State Coastal ConservancyKristen Ward, Golden Gate National Recreation AreaJames Weigand, Bureau of Land ManagementAlex Westhoff, Marin County
Technical ExpertsJohn Largier, Bodega Marine Laboratories, UC DavisAndrew Gunther, Bay Area Ecosystems Climate Change Consortium
Staff to the Working GroupLara Hansen, EcoAdaptSara Hutto, Greater Farallones National Marine SanctuaryKaren Reyna, Greater Farallones National Marine SanctuaryWhitney Reynier, EcoAdaptSam Veloz, Point Blue Conservation Science

6
List of AcronymsBCDC………….San Francisco Bay Conservation and Development CommissionBFE…………....Base Flood ElevationCaltrans……..California Department of
Transportation Cal OES………California Governor’s Office of
Emergency ServicesCCC…………...California Coastal CommissionCDA…………...Marin County Community
Development AgencyCOS……………Center for Ocean SolutionsCoSMoS……..Coastal Storm Modeling SystemC-SMART……Collaboration Sea-level Marin
Adaptation Response TeamCSP…………….California State Department of
Parks and RecreationCWP…………..countywide planDEM…………..digital elevation modelDFW…………..California Department of Fish
and WildlifeDPW…………..Department of Public Works
(Marin County)EHS…………...Environmental Health Services
(Marin County)EPA…………… Environmental Protection AgencyESA………….…Environmental Science
AssociatesFEMA………...Federal Emergency Management
Agency FIGR……….….Federated Indians of Graton
RancheriaFIRM…..……..Flood Insurance Rate MapGFNMS……...Greater Farallones National
Marine SanctuaryGGNRA….…..Golden Gate National Recreation
AreaLCP…………....Local Coastal ProgramLHMP………...Local Hazard Mitigation PlanMALT……......Marin Agricultural Land TrustMBCSD……...Muir Beach Community Services
District
MTC……….….Marin TransportationCommission
NFIP…………..National Flood InsuranceProgram
NGO…………..nongovernmental organizationNMFS…...…..National Marine Fisheries ServiceNOAA….…….National Oceanic and
Atmospheric AdministrationNPS……….…..National Park ServiceNRC…………..National Research CouncilNRCS…………Natural Resources Conservation ServiceOCOF………...Our Coast, Our FutureOES……………Sheriff’s Office of Emergency
ServicesOHP…….…….Office of Historic PreservationOPC…….……..Ocean Protection CouncilOSPR……...…Office of Spill Prevention and
ResponseOWTS……..…on-site wastewater-treatment
systemsPATCH…….….Plans for Adapting to Coastal
HazardsPBCS………….Point Blue Conservation SciencePWA ………….Phillip Williams AssociatesRCD …..………Resource Conservation DistrictRCD …..………Regional Concentration PathwaySAC…………...Stakeholder Advisory CommitteeSBCWD….…..Stinson Beach County Water
DistrictSLR…………....sea level riseSFHA………….special flood hazard areaSTP…………….Surface Transportation ProgramSCC…………….California State Coastal
ConservancySWRCB………State Water Resources Control
BoardTAC……...……Technical Advisory CommitteeTAM……..……Transportation Authority of
MarinTMDL…………total maximum daily loadUSGS…………US Geological Survey


8
EXECUTIVE SUMMARYClimate experts estimate that by 2100, sea level could rise by up to 70 inches and that the frequency, intensity and flood-effects of storms could increase. People in coastal areas should understand how sea level rise (SLR) may affect their homes, schools, roads, public facilities, natural resources and habitat areas, and how to prepare for these impacts. Marin County’s “Collaboration: Sea-level Marin Adaptation Response Team” (C-SMART) is a multi-stakeholder, inter-governmental partnership that is working to develop this understanding of SLR and its potential impacts for Marin’s ocean coast, so that together, we can prepare to meet the challenge of SLR.
Stakeholder-Based PlanningC-SMART’s Stakeholder Advisory Committee (SAC) is made up of representatives from each West Marin community: Muir Beach, Stinson Beach, Bolinas, Point Reyes Station, Inverness, Marshall, and Dillon Beach.
The Technical Advisory Committee (TAC) is made up of resource managers, utility providers, conservation scientists, and other local and regional experts.
Members of the public joined the conversation through a series of community workshops and local stakeholder meetings, providing valuable input to the study from July 2014 through June 2017.
The SLR Vulnerability Assessment The Marin Ocean Coast Sea Level Rise Vulnerability Assessment identifies vulnerabilities of parcels and buildings, transportation, utilities, working lands, natural resources, recreation, emergency services, and historic and archaeological resources. It then outlines vulnerabilities for each West Marin town in community profiles.
Information for the assessment was gathered by first mapping affected assets using the United States Geological Survey’s SLR model, which is available online at Our Coast, Our Future (OCOF), followed by interviews conducted by CDA staff with community asset managers (water-supply managers, road-maintenance managers, etc.) to identify sensitivity, adaptive capacity, and planned management actions.
The Vulnerability Assessment looks at impacts over three periods: “Near term” refers to 2030, “medium term” refers to 2050, and “long term” refers to 2100. This assessment of vulnerabilities serves as the foundation for the adaptation options of this report.

EXECUTIVE SUMMARY | 9
MARIN OCEAN COAST SEA LEVEL RISE ADAPTATION REPORT
Headlines from the Vulnerability Assessment include the following:
• In the Marin County Coastal Zone, over 20 percent of buildings are vulnerable at the low end of the long-term scenarios (i.e., scenario 4 in table 1), which could occur around 2100.
• Vulnerable buildings are concentrated in the Calles and Patios neighborhoods of Stinson Beach, as well as downtown Bolinas and the Tomales Bay shorelines in Inverness and East Shore.
• Nearly 20 miles of public and private roadways could be compromised by flooding and permanent inundation.
• Roadways exposed in the near term include Shoreline Highway between Bolinas and Stinson Beach, Calle del Arroyo, all the Calles and Patios streets, Wharf Road in Bolinas, and several creek crossings and bridges.
• In addition, other low-lying portions of Shoreline Highway, Sir Francis Drake Boulevard, and local roads are vulnerable in the long term.
• Coastal communities also rely on septic systems, water-supply systems, and shared septic or sewage systems that could be vulnerable to SLR and flooding from storms.
• Certain roadways and utilities are critical lynchpin assets, meaning that their dysfunction or destruction will likely have negative consequences for nearly all other built assets.
The SLR Adaptation ReportThis document, the Marin Ocean Coast Sea Level Rise Adaptation Report, presents potential actions to accommodate, protect against, or retreat from the threats of SLR and coastal hazards.1 California Executive Order. No. S-13-08, (November 2008), https://www.gov.ca.gov/news.php?id=110362 S. Jevrejeva, A. Grinsted, and J.C. Moore, "Upper limit for sea level projections by 2100," Environmental Research Letters 9 (April 2014): 4, http://iopscience.iop.org/article/10.1088/1748-9326/9/10/104008/pdf.
The objective of this report is to present options for increasing resiliency in existing natural and built assets and systems in the face of increased SLR and coastal storms. It is not meant to facilitate new development in hazardous areas. Continuing discussions with stakeholders and technical experts will be required to identify the adaptation solutions that will be most appropriate in each location as part of an ongoing adaptive management approach. Strategies which maximize environmental benefits, social equity, and economic well-being will be prioritized.
A 2008 Governor’s Executive Order states: “California must begin now to adapt and build our resiliency to coming climate changes through a thoughtful and sensible approach with local, regional, state, and federal government using the best available science.”1 The C-SMART project represents the response to this executive order and is the foundation of the county and state agencies’ long-term commitment to plan for SLR and other climate-change impacts.
The Marin County Community Development Agency (CDA) is considering two sets of planning scenarios for SLR:
1. For SLR adaptation planning, this report uses five scenarios. Scenarios 1 and 2 represent the near-term, and correspond to the 2030 National Research Council (NRC) projected sea level range. Scenario 3 is considered medium-term and is within the 2050 NRC range. Scenarios 4 and 5 represent the long-term. Scenario 4 corresponds to the 2100 NRC range. Scenario 5 represents levels based on additional research theorizing the worst case: that by 2100 sea level rise is nearing 70 inches globally.2 The CoSMoS option

10
that most closely reflects that is a rise of 200 centimeters, or 77 inches, and is referenced as 80 inches in this assessment.
Table 1. C-SMART Sea Level Rise & Storms Scenarios from COSMOS
Sea Level Rise Scenario Term1 10 inches + annual storm Near2 10 inches + 20-year storm Near3 20 inches + 20-year storm Medium4 40 inches + 100-year storm Long5 80 inches + 100-year storm Long
2. For Local Coastal Program (LCP) elevation policy purposes, Marin County uses the SLR projection of 3 feet (≈100cm), which represents a midpoint of projections for the year 2100 from the 2012 NRC3 and 2013 Coastal and Ocean Working Group of the California Climate Action Team4 estimates.
Asset AdaptationProperties A possible adaptation approach for West Marin is to protect existing homes, businesses and other assets through building elevation, floodproofing, and nature-based strategies with flood protection and habitat benefits in the near- to-medium term. Additionally community-wide solutions such as elevating/armoring roads and developing shared wastewater treatment systems are recommended for consideration.
In the long term, a variety of solutions including exploring retreat alternatives are suggested. Near-term refers to 2030, medium-term refers to 2050, and long-term refers to 2100. Moreover formalizing working relationships with CDA and other government agencies/stakeholder groups is a
3 National Research Council, Sea-Level Rise for the Coasts of California, Oregon and Washington (2012), 107. 4 Coastal and Ocean Working Group of the California Climate Action Team, State of California Sea-Level Rise Guidance Document (2013), 2.
key recommendation as a means to continue discussions and implement solutions.
In the near term, property owners can elevate or otherwise retrofit structures to be safe from temporary flooding during storms and high tides. The county can facilitate this process through updated Local Coastal Program (LCP) policies that build on the existing regulatory framework for flood-hazard areas and that encourage additional elevation for buildings threatened by SLR.
Pending LCP certification, when existing structures are elevated by the minimum amount necessary, a resulting building height of up to 30 feet above grade could be deemed to comply with coastal hazard, public view, and community character provisions of the LCP, while structures over 30 feet tall could require an individual evaluation of conformance with the relevant LCP provisions.
Stinson Beach homes at king tide, 2015. Credit: J. Lamphier
In the medium- to long-term, communities will need to consider the tradeoffs of various adaptation approaches, and decide whether to remain in current locations or consider relocating to safer areas. Flood insurance

EXECUTIVE SUMMARY | 11
MARIN OCEAN COAST SEA LEVEL RISE ADAPTATION REPORT
rates and coastal armoring mitigation requirements are anticipated to increase in the coming years, which may influence property-owner decisions more than development regulations.
TransportationRoads vulnerable to temporary flooding will be subject to increasing temporary closures, in some cases preventing emergency access. The Local Hazard Mitigation Plan (LHMP) identifies near-term approaches to maintaining safety during and after disasters.
General approaches and relative costs of various adaptation options for transportation infrastructure have been prepared by the Marin County Department of Public Works (DPW), and will be used to guide evaluation of actions.
Standards for road flooding closure need legal definition and should be publicized with signage to alert drivers as to what they should expect.
Road repairs may be an opportunity to plan for higher water levels. Design standards and best practices can help guide capital improvement projects and road repairs, to ensure that roads will be more resilient to SLR and other flood events related to climate change.
Permitting remains a challenge as raising roadways typically requires expanding the roadway footprint and may impact existing natural areas. In some locations, expanding the roadway footprint will not be possible. In the long term, specific stretches of roads identified as being highly vulnerable to floodwaters could be converted into recreational trails and possibly incorporated into the California Coastal Trail.
The cost of elevating, armoring, or relocating exceeds the amount of funding available for road repairs and will require ongoing collaboration between the California Department of Transportation (Caltrans) and the county to identify opportunities for additional funding. A formalized working agreement for Shoreline Highway planning support, such as a MOU, could be developed with Caltrans, the Marin Transportation Commission (MTC) and the Transportation Authority of Marin (TAM) as part of the Regional Transportation Plan. Capital-improvement projects and road repairs could account for SLR when cost-effective and funded to ensure that roads are more resilient to flooding. Over time, agencies may evaluate the feasibility of relocating critical access roads to higher ground.
Shoreline Highway Along Bolinas Lagoon, 2017. Credit: B. Wood

12
Utilities As utility systems become increasingly compromised by temporary (and eventually permanent) flooding, the CDA will support ongoing efforts to elevate or otherwise protect electrical, fuel, sewage-management and water systems from high-tide levels. Adaptation strategies include retrofits to water-meter connections to withstand saltwater and retrofitting septic systems to meet current regulations, or flip switches that can be shut off during flooding.
The CDA can continue to work with utility districts to determine a trigger point after which communities would need to develop alternatives to compromised septic leach fields, such as shared public wastewater systems.
New public capital-improvement projects should consider 3 feet of SLR, and development policies should be consistent with adaptation strategies (e.g., consider eliminating requirements to bury utilities in areas vulnerable to SLR).
As SLR progresses, the CDA could continue to work with local service providers to determine the point at which communities need to convert to community shared public wastewater systems and explore the feasibility of relocating wells and sewage lift stations.
The county can connect with the PG&E task force and other service providers to move forward with long-term, coordinated approaches for utilities.
Working LandsWorking lands dedicated to agriculture and mariculture will be primarily impacted by loss of road access. The County should work with farmers whose lands are vulnerable to SLR to identify appropriate solutions.
Natural Resources Natural resources would need to be monitored over time to enhance understanding of the impacts of SLR on beaches, wetlands, and other habitat areas.The Climate-Smart Adaptation Working Group of the Greater Farallones National Marine Sanctuary (GFNMS) Advisory Council developed a report (Appendix E) on potential strategic management actions, which served as the basis for natural resource strategies identified in this report.
The county and willing partners could continue to evaluate and pursue funding opportunities for innovative living-shorelines approaches to SLR protection, such as dune and wetland restoration, horizontal levees, native oyster beds, eelgrass, and bluff vegetation.
Another key strategy is to enhance SLR education programs through partnerships with educational organizations and citizen-science initiatives.
Shoreline-erosion rates would need to be monitored seasonally and before and after major storms to enhance understanding of the impacts of SLR on natural resources.Funding remains a primary challenge under all scenarios, as the available resources are inadequate to meet future requirements.
Boy at Stinson Beach. Credit: Dvorin

EXECUTIVE SUMMARY | 13
MARIN OCEAN COAST SEA LEVEL RISE ADAPTATION REPORT
Recreation Water-based recreation, including surfing, kayaking, fishing, bird-watching, and more, is a key component of West Marin’s economy. To ensure economic sustainability, other forms of recreation and tourism could be promoted, including biking, hiking, and agritourism and farm trails.
Emergency ServicesEmergency access can be considered in road improvement projects, though raising roads can be problematic for emergency access as large vehicles may need a certain grade to navigate over the roads.
Alternative evacuation routes need to be developed for communities (e.g., Bolinas) with one major road that may face future chronic flooding. Water based emergency evacuation routes could be explored.
Historic and Archaeological ResourcesAdaptation planning should consider impacts on historic and archaeological resources. Discussions with the Federated Indians of Graton Rancheria (FIGR) should continue to ensure that tribal concerns are addressed in the adaptation-planning processes.
Marin County’s Local Coastal Program Historic Study, conducted in 1981, could be updated so the full extent of vulnerable properties can be assessed. Vulnerable historic structures could be documented before they are damaged by SLR or significantly altered by adaptation measures.
Community AdaptationAll CommunitiesAll West Marin communities can benefit from common strategies to improve resiliency to flood events and maintain safety in coastal-hazard areas. SLR will cause areas that flood temporarily at present to flood permanently at daily high tides in the future.
Homeowners can prepare by elevating or otherwise retrofitting buildings and utilities in the near term while considering communitywide protective measures such as living shorelines, elevation and/or armoring of critical assets, or managed retreat over time. Understanding the implications and trade-offs of different approaches (protect, accommodate, or retreat) will require continued study and community dialogue around adaptation.
While not all adaptation solutions are permanent solutions, public and private projects to address SLR in the near term and the medium term can still help with some level of protection in the future, and these merit consideration. Cost estimates for various strategies are included in this report, but, as they come from a variety of sources, they could be out of date or inconsistent with one another. Further analysis is necessary to fully assess specific costs, taking into consideration implementation, environmental review, permitting, maintenance, and more.
Muir Beach The recently completed Redwood Creek restoration project is an example of a nature-based adaptation to SLR. This project restored natural creek function, in part, by realigning vulnerable assets and infrastructure that impeded natural processes. This improved habitat function while simultaneously increasing resiliency to flooding and SLR.
In the near-term, homeowners on bluffs vulnerable to erosion can improve storm-water drainage to stabilize bluffs. Revegetation and netting can also be used for bluff stabilization.

14
It will be very difficult to obtain a permit for new shoreline armoring. However, the Coastal Act allows for maintenance of existing structures under certain circumstances, and for new structures to protect existing development in danger of erosion when designed to eliminate or mitigate adverse impacts on local shoreline sand supply.
Low-lying sections of Pacific Way and Shoreline Highway may be subject to closures during flood events, and may eventually need to be elevated or realigned. Resizing culverts and the Pacific Way Bridge would help to mitigate flooding as part of a suite of climate change resiliency best practices.
Stinson BeachAccommodation of vulnerable structures, roads and utilities, primarily through elevation and retrofits, is a near- and medium-term priority for Stinson Beach. Elevation of homes would protect them from temporary flooding and permanent SLR, though road access would continue to be an issue. Many respondents of the 2015 West Marin Sea Level Rise Adaptation Poll supported “reasonable policies that allow property owners to develop in ways that protect against SLR.” However, permits for structures in vulnerable areas may be conditioned to prove that the structure will be safe from coastal hazards.
Calle del Arroyo is the County road of most immediate concern, as it frequently floods and provides the only access to Seadrift, the Patios, and many of the Calles. If Calle del Arroyo were elevated, private roads would also need to be elevated, or at least sloped up to meet Calle del Arroyo. Elevating Shoreline Highway along Bolinas Lagoon will become a priority toward the middle of the century, as access to the community becomes impaired with increasing frequency.
If not yet retrofitted, Onsite Wastewater Treatment Systems (OWTS) can be updated to include shutoff valves, which will make them resilient to saltwater intrusion in the near-term. In the medium to long term, development-code amendments could be implemented that allow for mounded septic systems or replacement of leach fields with holding tanks.
The Stinson Beach County Water District plans to continue retrofitting water-meter connections in the near term to withstand saltwater corrosion. The water district office itself will likely need to be elevated or relocated in the near term.
Utilities located beneath buildings will also need to be elevated or retrofitted. Fire Station No. 2 is already elevated on a mound, and the district has plans to relocate the facility before SLR impacts it in the medium term.
A comparison of conceptual adaptation strategies for Stinson Beach is described in the Community Alternatives section and in Appendix A. A potential dune- and beach- protection strategy would involve placing sand on a cobble berm and adding sand at regular intervals and after major storm events, as a hybrid protection approach. However, the costs for these strategies are large and greatly exceed available funding.
Brighton Beach in Bolinas. Credit: S. Hutto

EXECUTIVE SUMMARY | 15
MARIN OCEAN COAST SEA LEVEL RISE ADAPTATION REPORT
BolinasAccommodation of threatened structures and utilities through elevation and retrofitting could be the priority action.
Shoreline Highway and Wharf Road are of primary concern in the near term, while Olema-Bolinas Road and the bridge at Pine Creek Gulch may need to be elevated or rerouted in the medium term.
Blufftop homes may need to be removed once the bluff edge erodes to within a certain distance of the structures.
The Bolinas Community Public Utility District sewage-treatment facility will need to be protected and other critical facilities and community resources like the grocery store, emergency shelter, and the library will need to be elevated or relocated in the medium term.
The post office and Bolinas-Stinson School will need to be elevated or relocated in the long term.
Nature-based protection measures such as a native oyster reef and/or a horizontal levee in Bolinas Lagoon may help protect Gospel Flats, which may eventually be conserved and returned to wetland. Wetland-protection and wetland-enhancement efforts (currently underway as part of the Bolinas Lagoon Ecosystem Restoration Project) will also have flood-protection benefits.
InvernessHomes and other structures currently near or over water could be further elevated, and portions of critical roadways like Sir Francis Drake and Shoreline Highway could also be raised to maintain access at high water levels.
Additionally in the near-term, converting affected segments of Sir Francis Drake Boulevard into a levee would protect the water pipeline beneath the road.
Old fishing boat in Inverness. Credit: J. Wong
Wetland restoration and native oyster reefs in the near term and a horizontal levee in the medium term are potential nature-based solutions.
Restoring and enhancing living shorelines along Tomales Bay offers near- to medium-term protection against temporary flooding, storm surge, and wave impacts. Habitat-restoration techniques can be used to manage the shoreline, reduce coastal erosion, and maintain coastal processes.
East ShoreHomes and other structures currently over water could be raised higher and portions of Shoreline Highway could also be raised to maintain access at higher water levels.
Wetland restoration and native oyster reefs in the near term, and possibly horizontal levees in the medium term, are potential nature-based solutions.
Maintaining bulkheads under homes along the East Shore and Marshall is a high priority to protect Tomales Bay from sewage.
Raising houses along the Marshall waterfront is very difficult and expensive, and creative solutions from people familiar with Tomales Bay are needed. As water levels rise, the area under houses becomes less accessible

16
for foundation work. There is a great deal of interest from residents in developing a communitywide solution by coordinating the elevation of multiple homes. This could help provide a better economy of scale for permitting, design, and construction. Such a pilot project could be modeled after the Marshall Community Wastewater System, a coordinated effort to protect water quality and share costs between government agencies and property owners, although specific funding sources would need to be identified.
Point Reyes StationFlooding, erosion, and increased salinity could degrade surrounding wetlands and marshes, including the Giacomini Wetlands and the Olema Marsh.
Water-district pipes traversing under the marsh and the road could be damaged by higher groundwater and would benefit from elevation or other protection.
Flooding is probable on portions of Shoreline Highway in the long-term scenario; however, Green Bridge is vulnerable in the near term.
Dillon BeachPriority actions for Dillon Beach include supporting dune-restoration efforts as a protective measure, researching alternatives for managing flooding on Bay Drive, and implementing policies to ensure that blufftop homes are safe from erosion.
The owners of Lawson’s Landing are developing plans for dune restoration and enhancement. Planting native vegetation to augment existing beach grass may help encourage natural augmentation of the dunes. This is considered a cost-effective and environmental approach compared to importing sand. A monitoring plan could be developed to contribute to the body of
research on the efficacy of this measure at reducing coastal erosion and protecting recreational facilities at Lawson’s Landing from wave run-up.
Implementation PhasingStrategiesStrategies were prioritized based on criteria determined by the county with input from the SAC and the TAC. The criteria include projected onset of impacts, timing and duration of the strategy, co-benefits, legal, political, and community acceptability.
General cost-benefit analyses were performed on various alternative scenarios, using a published range of costs, to provide a basis for the evaluation of next steps. Priority for adaptation alternatives ready for action, further study, or long-term implementation were further refined through working sessions with DPW and Environmental Science Associates (ESA). DPW provided an evaluation guide outlining general strengths and weaknesses for trnasportation adaptation alternatives (Table 18) and ESA provided SLR adaptation strategies (Appedices A and B). See table 2 at the end of this executive summary for an outline of priority strategies. Further detail is provided in chapters 5 and 6.
Next StepsExploring OptionsThis report summarizes adaptation options that have arisen through C-SMART to date. Adaptation options presented are in general terms and are a good starting point for detailed analysis and merit further consideration as sea level rise problems/impacts develop in Marin County. Inclusion of an option in this report does not imply financial commitment by the county, and completion of certain tasks is dependent on acquiring additional funding.

EXECUTIVE SUMMARY | 17
MARIN OCEAN COAST SEA LEVEL RISE ADAPTATION REPORT
The Adaptation-Plan Passport SurveyAs a means of soliciting input from residents on the next steps county staff could undertake, the fifth set of C-SMART public workshops included a survey, the West Marin Sea Level Rise Adaptation Plan Passport, which was posted online for further distribution via traditional and social media. Participants were asked to give a High, Medium, or Low ranking to 11 possible next-step options spanning four categories: site-scale improvements, community-scale planning, continued partnerships, and public education. Space was also provided for comments on each ranking, as was space to suggest entirely new options.
A total of 83 passports were completed. Indicated after each bullet below is the number of High votes and the topic’s rank among the 11 next step options. (Options that tied for High votes share a ranking position, hence there are two number 1 and number 10 options). The complete survey summary can be found in Appendix G.
Rankings of the 11 options
Site Scale Improvements• Develop a “Homeowner’s Guide to
Preparing for Sea Level Rise” to help property owners navigate regulatory system and funding opportunities to elevate or otherwise retrofit homes to accommodate sea level rise and storms. Topics could cover:
• the county permitting process• coastal permit development
requirements• agency compliance (the Federal
Emergency Management Agency [FEMA], the California Coastal Commission [CCC], etc.)
• potential estimated building-elevation increase.
This option received 58 High votes, tying for the number 1 ranking among the 11 options.
• Develop and distribute technical information and guidance on home-retrofitting options which could include elevation, wet or dry floodproofing, flood gates, drainage improvements, amphibiation, etc.
This option received 39 High votes, ranking it number 5 among the 11 options.
Community Scale Planning • Develop a subcommittee with Marin
County BOS representation and community/local agency representatives to prioritize C-SMART next steps.
This option received 31 High votes, ranking it number 9 among the 11 options.
• Initiate Community Plans for Adapting to Coastal Hazards (Community PATCHs) in conjunction with community members and asset managers for smaller-scale planning centered on vulnerable assets of communitywide importance:
• Identify subarea boundaries for prioritization, possibly based on timing, area of impact, costs, equity, environment, economy, etc.
• Develop planning time frames around the point at which flooding creates recurring significant problems.
• Evaluate adaptation alternatives with cost estimates in more detail, which may include armoring, elevation, realignment, etc.
This option received 48 High votes, ranking it number 3 among the 11 options.
• Consider SLR in capital-improvement projects (roads, utilities, armoring, etc.), including both incremental repairs and maintenance and new projects. Develop

18
a financing matrix for identifying possible funding sources, including federal and state grants, local assessment districts, philanthropic resources, and public-private partnerships.
This option received 58 High votes, tying for the number 1 ranking among the 11 options.
• Evaluate land-use planning, zoning, and legal frameworks for addressing SLR that could include height limits, construction standards, and post-storm prohibitions. Such options could be integrated in the LCP Implementation Program and Marin Countywide Plan updates.
This option received 37 High votes, ranking it number 6 among the 11 options.
• Consider SLR resiliency in the next Marin Countywide Plan update as a basis for developing countywide policies and programs.
This option received 33 High votes, ranking it number 8 among the 11 options.
Continued Partnerships• Develop an interagency sea level
rise task force, with a membership that includes county supervisors and agencies that oversee West Marin assets (transportation, utilities, public lands, natural resources, etc.). Participants could include:
• Caltrans, the MTC, and the TAM for transportation planning support
• the National Park Service (NPS), the Golden Gate National Recreation Area (GGNRA), the California State Department of Parks and Recreation (CPS), and Marin County Parks and Recreation (Marin County Parks)
• PG&E and local service providers to discuss utility adaptation.
This option received 43 High votes, ranking it number 4 among the 11 options.
• Continue to work with the Sonoma/Marin County Sediment Management Working Group to assist with the development of a regional sediment-management plan to:
• encourage beneficial reuse of available, non-polluted sediment
• restore and maintain coastal beaches• reduce shoreline erosion and coastal
storm damages• sustain recreation, tourism, public
safety, and access.
This option received 36 High votes, ranking it number 7 among the 11 options.
Public Education• Establish a citizen-science monitoring
program for community members to gather data on West Marin SLR impacts, which could include measuring beach widths, documenting king tides and flooding, and monitoring wetlands.
This option received 23 High votes, ranking it number 10 among the 11 options.
• Pursue funding and partnerships to formalize an SLR public-education program for high school students.
This option received 23 High votes, ranking it number 10 among the 11 options.

EXECUTIVE SUMMARY | 19
MARIN OCEAN COAST SEA LEVEL RISE ADAPTATION REPORT
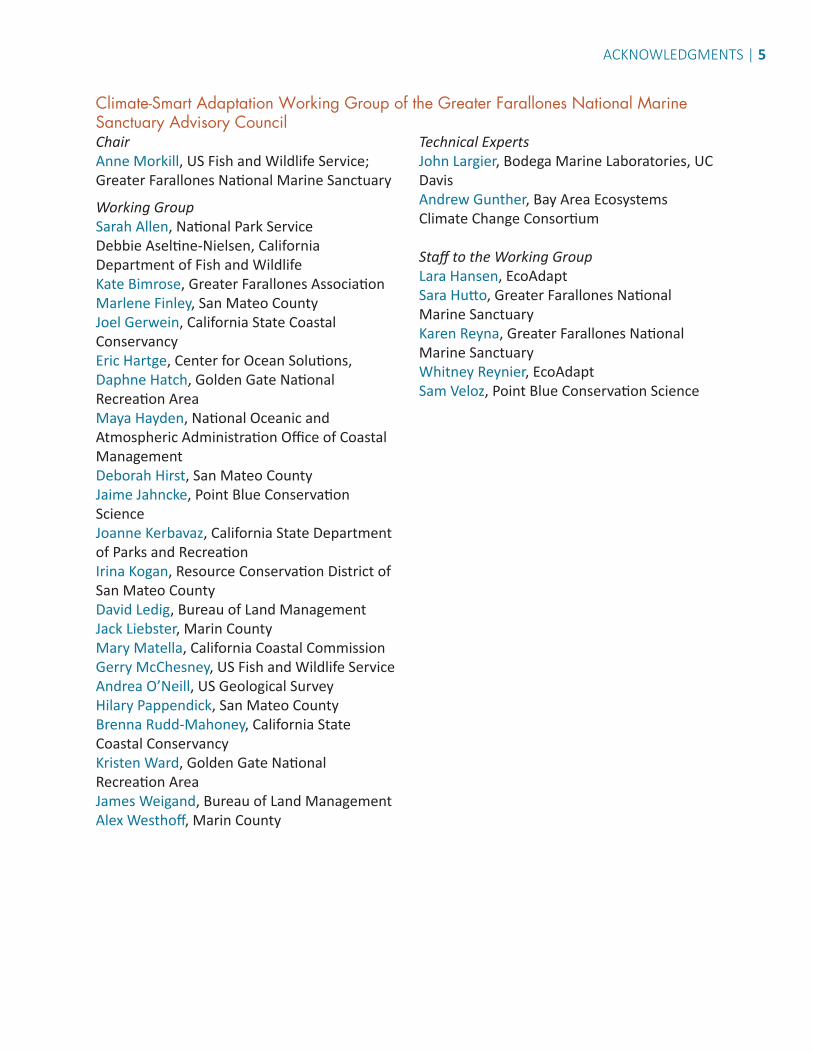
Table 2. Priority Sea Level Rise Adaptation StrategiesThis table is a list of potential near-term, medium-term, and long-term adaptation actions to protect the vulnerable assets along coastal Marin County. It also serves as a guide to the full report, with page numbers of where to find more detailed information on each topic.
Potential Management Action Potential Partners Resources Pages ALL ASSETS
NEA
R /
ON
GO
ING A-1
Explore the feasibility of experimental and innovative coastal-protection options and, where possible, implement demonstration projects, including constructed wetlands or horizontal levees, offshore reefs or native oyster beds, and dune restoration or beach nourishment. Evaluate the effectiveness of such projects to inform future efforts across the region.
CDA, GFNMS, NPS, California Department of Fish and Wildlife (DFW), universities, CCC, California State Coastal Conservancy (SCC), Center for Ocean Solutions (COS), property owners
Staff, partners, financial resources, agency coordination
60, 79, 85, 154, 155, 156, 158, 159, 167, 170, 176, 180, 181, 184, 185, 186, 196, 199, 201, 203, 204, 205
A-2
Participate and support existing local community programs, including but not limited to education, outreach, and emergency preparedness, that promote community resilience.
CDA, Community Groups
Staff, community groups
75, 85, 171, 172, 205
PARCELS & BUILDINGS
NEA
R /
ON
GO
ING
B-1
Through LCP Environmental Hazards policies, ensure new development is safe and limit development in hazardous areas. Require property owners to assume and disclose risks from coastal hazards, including impacts from 3 feet of SLR.
CDA, CCC, Property owners
Staff, private time/ financial resources
76, 88, 88, 160

20
Potential Management Action Potential Partners Resources Pages PARCELS & BUILDINGS (Cont.)
NEA
R /
ON
GO
ING
B-2
Require 3 feet of additional elevation of structures in special flood hazard areas (SFHAs) in addition to FEMA Base Flood Elevation to accommodate 3 feet of SLR. In areas outside SFHA that are nevertheless exposed to SLR, the 3-foot building elevation would also be required. The policy would apply when a new or remodeled building requires a coastal permit, based on actual site conditions. FEMA grant funding for structural elevation could be sought, possibly including the Marin County Structure Elevation Program, a FEMA Hazard Mitigation Grant Program.
CDA, CCC, FEMA, property owners
Staff, public and/or private funding
77, 88, 88, 160
B-3
Support efforts to develop and implement alternatives to elevating structures that would reduce or eliminate flood damage. Measures would need to be adopted by FEMA to qualify as acceptable alternatives to elevation under the National Flood Insurance Program (NFIP). Such alternatives could include wet or dry floodproofing, flood gates, drainage improvements, amphibiation, etc. Encourage homeowners to implement voluntary flood-proofing measures.
CDA, CCC, FEMA, property owners
Staff, agency coordination
79, 88, 88, 96
B-4
Develop a “Homeowner’s Guide to Preparing for Sea Level Rise” to help homeowners navigate regulatory system and funding opportunities to elevate or otherwise retrofit homes for SLR and storms. Topics could cover:
• checklist for site-vulnerability analysis, mitigation measures and funding sources for flood and storm preparedness
• the county permitting process• coastal permit development
requirements (Figure 9) • agency compliance (FEMA, CCC, etc.)• Potential estimated building elevation
increase
CDA, FEMA, CCC, property owners
Staff, public outreach materials
89
EXECUTIVE SUMMARY | 21
MARIN OCEAN COAST SEA LEVEL RISE ADAPTATION REPORT
Potential Management Action Potential Partners Resources Pages PARCELS & BUILDINGS (Cont.)
NEA
R /
ON
GO
ING
B-5
Use Marin Map as a platform to show regulatory boundaries (e.g., FEMA, GFNMS, CCC jurisdiction, categorical exclusion), county-developed potential SLR maps, and other existing coastal-hazard boundaries.
CDA, CCC, FEMA, GFNMS
Staff, agency coordination, Marin Map
89
B-6Conduct a comprehensive finished floor elevation inventory to fully assess West Marin building vulnerabilities.
CDA, DPWStaff, intern or volunteer time
89
MED
IUM
B-7
Explore the feasibility of programs (incentives, transfers of development rights, acquisition or buyout) and potential receiving sites to relocate existing vulnerable development.
CDA, NPS, CSP, Marin Agricultural Land Trust (MALT)
Staff, legal coordination, precedents, upland property
59, 61, 89, 145, 165, 173, 183, 194, 199, 204
TRANSPORTATION
NEA
R /
ON
GO
ING
T-1Consider planning for Shoreline Highway and county-maintained roads as part of the Regional Transportation Plan.
Caltrans, MTC, TAM, DPW, GFNMS, community members
Staff, agency coordination
78, 79, 109, 110 119, 144, 152, 162-163, 170, 173, 176, 180, 182, 186, 192, 193, 195, 196, 199, 199, 200
T-2
Further investigate Shoreline Highway vulnerability along Tomales Bay in the East Shore area. Determine whether bulkheads below homes help protect highway. If so, examine long-term adaptation strategies for continued protection in collaboration with homeowners.
Caltrans, property owners
Staff, agency coordination, homeowner participation
110, 193
T-3 Consider new capital improvement projects to account for 3 feet of SLR. CDA, DPW, Caltrans Staff, agency
coordination77, 109, 110, 115
T-4
Identify triggers for maximum flood depth or frequency as thresholds at which roads will need to be elevated, relocated, seasonally closed, or abandoned. This could include community surveys to understand the point at which flooding is perceived as chronic and causing public inconvenience.
CDA, Caltrans, DPW, other technical experts
Staff, agency coordination, technical assistance
57, 66, 68, 110, 140, 144, 162, 173, 182, 193, 199, 203, 204

22
Potential Management Action Potential Partners Resources Pages TRANSPORTATION (Cont.)
NEA
R /
ON
GO
ING T-5
Support post-disaster repairs as an opportunity to plan for higher water levels.
CDA, DPW, Caltrans Agency coordination, staff
110
T-6
Standards for road-flooding closure need legal definition and should be publicized with signage to alert drivers as to what they should expect.
CDA, DPW, Caltrans Agency coordination, staff, legal counsel, signage
111
MED
IUM
T-7
Explore the feasibility of realigning vulnerable roads landward. Utilize table 18, below, to guide evaluation of transportation-adaptation alternatives.
CDA, DPW, Caltrans Agency coordination, staff
69, 78, 114-115, 121, 163, 173, 183, 192, 195, 200, 204
UTILITIES
NEA
R /
ON
GO
ING
U-1
Continue efforts to elevate or otherwise protect electrical, fuel, sewage management, and water systems from high-tide levels. Retrofit OWTS with flip switch that turn off automatically when flooded.
CDA, utilities, homeowners associations, property owners
Staff, public/ private funding
67, 82, 76, 107, 122, 163, 164, 186, 190, 201, 201, 213
U-2
Consistent with proposed LCP home-elevation requirements, require new capital-improvement projects to evaluate impacts and costs for 3 feet of SLR.
CDA, DPW, Marin County Parks, other agencies as necessary
Staff, public funding
77, 80, 76, 114, 117, 122
U-3
Ensure that development policies are consistent with strategies for accommodating SLR (e.g., consider eliminating requirements to bury utilities in areas vulnerable to SLR).
CDA, CCC Staff 67, 122
U-4
Work with the Stinson Beach County Water District (SBCWD) and the county’s Environmental Health Services (EHS) to determine whether SLR will raise groundwater levels to impair OWTS.
CDA, SBCWD, EHS Staff, agency coordination 119
MED
IUM
U-5
Work with local service providers to determine the point at which communities would need to convert to shared public wastewater system alternatives to accommodate for SLR.
CDA, Local service providers
Staff, agency coordination
122, 155, 177, 201

EXECUTIVE SUMMARY | 23
MARIN OCEAN COAST SEA LEVEL RISE ADAPTATION REPORT
Potential Management Action Potential Partners Resources Pages UTILITIES
MED
IUM
U-6
Identify potential upland areas to retreat or relocate utility systems, including wells and wastewater infrastructure which may include sewage pumps, lift stations and septic leach fields. NPS lands could be considered, in close coordination with NPS.
CDA, Local service providers, NPS, CSP, MALT
Staff, spatial data, GIS
122, 124, 155
LON
G
U-7 Establish community shared public wastewater systems in relevant areas.
CDA, Landowners, Local service providers, Local assessment district
Staff, upland property, private and/or public financial resources
123, 155, 177, 201
WORKING LANDS
NEA
R /
ON
GO
ING
W-1Maintain and adapt coastal armoring. In some cases, consider removal for natural protection.
CDA, Property Owners, CCC
Staff, private financial resources
77, 71, 125, 164, 186
W-2 Work with agricultural interests to respond to SLR.
CDA, Property Owners, Resource Conservation District (RCD)
CDA, property owners, farm bureau, land trusts, RCD, UC Cooperative Extension
125
MED
IUM
W-3Work with agricultural operators and funding organizations to secure rights to allow wetlands to expand inland with SLR.
CDA, Property owners, MALT, SCC, CA DFW, CCC
Willing property owners, public and private funding
125

24
Potential Management Action Potential Partners Resources Pages NATURAL RESOURCES
NEA
R /
ON
GO
ING
N-1
Enhance SLR education programs through partnerships with educational organizations and other public entities, including:
• partnerships with environmental education organizations, schools, and other public entities
• social media and other communication strategies, such as SLR visualizations and crowdsourcing king tides photos
• interpretive signage• expansion of Marin County’s existing
Youth-Exploring Sea Level Rise Science (YESS) program
• marsh and tide pool education and interpretation programs through training and guidance to communicate implications of climate change
• volunteer docent program for highly visited areas, which could augment existing programs (e.g., at the Duxbury Reef Marine State Conservation Area). Docent training could include information about climate-change impacts on intertidal habitats, as well as tide pool etiquette and safety
CDA, GFNMS, California Academy of Sciences, NPS, CSP, Marine Mammal Center, Headlands Institute, Marin County Parks, other educational organizations
Financial resources, staff, volunteers, curricula trainings, classrooms
74, 126, 153

EXECUTIVE SUMMARY | 25
MARIN OCEAN COAST SEA LEVEL RISE ADAPTATION REPORT
Potential Management Action Potential Partners Resources PagesNATURAL RESOURCES (cont.)
MED
IUM
N-2
Stabilize cliffs through revegetation (with native, climate-appropriate species) and natural netting (e.g., jute, not chain-link fence). Design any hardening methods to take into account ecosystem needs (e.g., seabird nesting). Consider the listed showy rancheria clover (Trifolium amoenum), including assisted migration to locations farther upslope. Avoid armoring and encourage relocation of infrastructure to allow for managed retreat. Minimize nonclimate stressors, including human and livestock access.
CCC, California Native Plant Society, Caltrans, land owners and managers (public and private)
Financial resources, staff, permits, engineering studies
19, 88, 126, 153
N-3
Consider nature-based adaptation options for eelgrass habitat.
• In the near term, map potential landward transgressional areas and protect potential transition habitat.
• As water rises, monitor trends in eelgrass extent; possibly plant in shallower water to kick-start colonization of areas available for landward transgression.
• Minimize nonclimate stressors, including restoration of areas lost from moorings, minimizing disturbance to existing beds, and monitoring changes in turbidity.
CDA, GFNMS, DFW, community members, business owners
Financial resources, staff, community members, mapping and monitoring equipment and software, plant propagules, possible land acquisition/ easements for habitat restoration
127, 187, 199, 203, 212

26
Potential Management Action Potential Partners Resources Pages NATURAL RESOURCES
NEA
R /
ON
GO
ING
N-4
Consider nature-based adaptation options for tidal-marsh habitat.
• Consider mapping potential landward transgressional areas and protecting potential transition habitat, and allowing for habitat transition
• Consider removing potential barriers to landward migration or accommodating transgression through modifications such as culverts and causeways (e.g., Highway 1 bridge in the Walker Creek Delta, Sir Francis Drake Boulevard between Inverness and Point Reyes Station, Bear Valley Road and Highway 1, Shoreline Highway in Marshall, Shoreline Highway in Bolinas Lagoon)
• Identify ownership of and acquire potential transition zones upstream of current marsh footprint
• If high-value resources and functions are present, consider augmenting sediment in the long term to allow for accretion of marsh within existing footprint (e.g., Walker Creek Delta, Giacomini Wetland Restoration Project footprint)
• Nonclimate stressors such as invasive species should be minimized
• Allow for marsh loss in cases of less high-value resources (could include Tomales Bay area in Inverness) and instead, prioritize action on more significant areas of intact marshes nearby (e.g., Point Reyes Station and Lagunitas Creek delta)
• Engage with ongoing efforts (e.g., Bolinas Lagoon Ecosystem Restoration Project) to ensure that planning includes future SLR
• Engineer marshlands to enhance water flow and balance sediment transport by including design elements such as sinuous channelization
CDA, Marin County Parks, Point Reyes National Seashore, GFNMS, GGNRA, DFW, community members, business owners
Financial resources, staff, local community involvement, mapping/ monitoring equipment and software, plant propagules, possible land acquisition/ easements etc. for habitat restoration, volunteer/ citizen scientist monitors, engineering studies, permits
60, 79, 79, 79, 85, 126, 153, 154, 156, 166, 170, 187, 187, 189, 198, 199, 199, 203, 212, 212, 212, 220, 220, 225, 227

EXECUTIVE SUMMARY | 27
MARIN OCEAN COAST SEA LEVEL RISE ADAPTATION REPORT
Potential Management Action Potential Partners Resources Pages NATURAL RESOURCES (cont.)
MED
IUM
N-5
Consider nature-based adaptation options for beach and dune habitat:
• Determine whether topography and land use or infrastructure allows for inland movement of beach and dune habitat. Where feasible, remove or relocate shoreward constraints to dune movement and evolution.
• Restore, construct, or augment coastal dunes. This could include placement of sand, graded and planted to form back-beach dunes, or placement of cobble. Drought-tolerant and heat-resistant species or strains should be used. In cases where dredge materials are used, make sure materials are screened for contaminant exposure.
• Where applicable, minimize human and pet access through dunes to protect stability and disturbance, which could include fencing, creating walkways, and informational signage. Beach grooming should be stopped, as should any activity that adversely affects the sediment supply of dunes.
• Identify potential sources of compatible sediment (considering appropriate grain size and structure) for vulnerable beaches in order to enable potential nourishment.
NPS, property owners
Sand, financial resources, staff, permits,
60, 79, 85, 153, 166, 187, 225, 227
N-6
In cases where coastal armoring is exacerbating erosion, explore natural alternatives that create sloped, transitional habitat (e.g., artificial reef, horizontal levee, or dune). If armoring can’t be removed, implement living-shoreline techniques in conjunction with new construction or repairs.
GFNMS, NPS, DFW, Universities, SCC
Financial resources, staff, permits, public outreach
130

28
Potential Management Action Potential Partners Resources Pages NATURAL RESOURCES (cont.)
MED
IUM
N-7
In cases in which roads need to be realigned or relocated due to trigger points being reached (e.g., causing public inconvenience), siting and design should allow for natural expansion of habitats. Areas should be identified that are critical for estuary expansion, and roads could be realigned accordingly.
Caltrans, GFNMS, U.S. Army Corps of Engineers, San Francisco Regional Water Quality Control Board, property owners
Agency coordination, financial resources, staff, permits
130
N-8
Establish a monitoring program to detect impacts of climate change and management actions on natural resources, including the following steps:
• Postulate hypotheses of habitat change, based on scenarios and literature, of how habitats will evolve in response to climate change.
• Design the monitoring programs to measure hypothesized changes.
• Identify indicator species for selected habitats, and set tentative population parameter goals based on current status and knowledge of the species.
• Design the monitoring program to estimate the population parameter, and determine the extent and intensity of sampling required to achieve the monitoring goals, including sources of data, precision in parameter estimation, and costs.
• Review costs versus expected probability of monitoring goals to choose final indicator species, monitoring targets, data sources, survey effort, and costs.
CDA, scientific partners, local community members, environmental nonprofits
Financial resources, staff, mapping and monitoring equipment and software, citizen-scientist monitors
126

EXECUTIVE SUMMARY | 29
MARIN OCEAN COAST SEA LEVEL RISE ADAPTATION REPORT
Potential Management Action Potential Partners Resources Pages RECREATION
NEA
R
R-1
Increase awareness of seasonal flooding on public lands and trails through signage and social media.
NPS, CSP, Marin County Parks
Staff, public outreach materials, social media apps
139
LON
G
R-2
Retrofit or relocate recreation and visitor-serving facilities, including trails and access points. Acquire new parklands as existing parks become unusable from flooding, inundation, erosion, etc.
CDA, property owners, business owners, NPS, CSP, CCC, Marin County Parks
Public and private funding, permits, receiving sites, materials
80, 139, 140, 202, 213, 215, 55
EMERGENCY SERVICES
NEA
R/O
NG
OIN
G
E-1Partner with LHMP efforts to coordinate near-term disaster preparedness with long-term community resilience.
CDA, Sheriff’s OES, DPW, Marin County Fire Department, FEMA, Cal OES, local emergency-response teams
Staff, agency coordination, outreach materials
142
MED
IUM
E-2Adapt or relocate vulnerable emergency facilities (e.g., fire stations, emergency generators).
CDA, Sheriff's OES, Stinson Beach Volunteer Fire Department
Staff, property, financial resources
75, 142, 164, 186
LON
G
E-3
Develop additional emergency response teams and resources required for disaster response, recovery and mitigation, as well as temporary housing and other sustainability needs.
CDA, Sheriff's OES, local emergency-response teams
Staff, coordination, public financial resources, housing
74, 142
E-4
Build redundancy into the system by providing alternate evacuation routes where feasible. This is particularly critical for communities such as Bolinas with one primary access road in and out that could be inoperable from chronic flooding.
CDA, DPW, Caltrans, Community members
Staff, financial resources, adequate space for alternate routes, materials and supplies, permits
79, 67, 114, 121, 142, 154, 201

30
Potential Management Action Potential Partners Resources Pages HISTORIC & ARCHAEOLOGICAL RESOURCES
NEA
R /
ON
GO
ING
H-1
Adaptation planning and implementation efforts should consider the impacts on historic structures and archaeological sites consistent with applicable state/federal regulations as well as local community input. In cases where projects could have adverse effects, efforts should be made to avoid, minimize or mitigate the impacts consistent with relevant statutes (CEQA, Section 106 of the National Historic Preservation Act, etc.).
CDA, State Office of Historic Preservation (OHP), Federated Indians of Graton Rancheria (FIGR)
Staff 80, 144, 190
H-2
Continue discussions with the FIGR for consideration of archaeological sites in future vulnerability assessments, adaptation plans, and adaptation strategy implementation.
FIGRStaff and agency coordination
80, 144
H-3
Update the 1981 Marin County Local Coastal Program Historic Study. This could include inventorying historic sites with lists, photographs, and descriptions and revising and expanding historic district boundaries. An updated study could:
• inform future SLR and climate-change vulnerability assessments to more fully understand the extent of West Marin’s threatened historic resources
• inform future adaptation planning for historic resources
• document the resources in case coastal hazards damage or destroy the structures.
CDA, CCC, OHP
Staff, consultant assistance, financial resources
80, 144
MED
IUM
H-4
Recognize and consider projects that protect or mitigate historic and cultural resources in the county’s LHMP. Use FEMA’s how-to guide Integrating Historic Property and Cultural Resource Considerations into Hazard Mitigation Planning. On FEMA approval, such projects will be eligible for federal funding.
CDA, Sheriff’s OES, DPW, Marin County Fire Department, FEMA
Staff, agency coordination, FEMA grant funding
80, 144


32
1) IntroductionIn this section, you will find:
• a statement of project intent and goal • a list of the project partners• the C-SMART planning areas • guiding principles• a Vulnerability Assessment summary
1.1) Project Intent and GoalsGlobal sea level rise (SLR) has opened questions about the wisdom of rebuilding or protecting vulnerable assets, versus relocating or abandoning them as part of a managed retreat program. With over one-quarter of properties in the Marin County Coastal Zone and hundreds of threatened natural and community assets, the county is engaged in the critical task of planning how to prepare for and adapt to, change in sea level. SLR is a pressing global issue that locally will increase the potential for erosion, increase the extent of chronic inundation in low lying areas and result in more severe storm flooding.
The Marin Ocean Coast Sea Level Rise Vulnerability Assessment (Vulnerability Assessment) and this document, the Marin Ocean Coast Sea Level Rise Adaptation Report (Adaptation Report), lay the groundwork for an adaptive management approach to addressing SLR. The Adaptation Report presents near-, medium-, and long-term options to accommodate, protect against, or retreat from the threats of SLR and extreme events. There is no silver bullet for adapting to the changes coming to our coastline, and measures will have varying economic, environmental, and social costs and effects. The goals of adaptation planning are to protect human life, health and property, ensure the safety of development, maintain public access, and protect beaches, wetlands, and other natural resources.
This document is intended to inform Marin County’s Local Coastal Program (LCP), coastal permitting, and other county goals related to SLR preparation. This document would also be considered by the Local Hazard Mitigation Plan (LHMP) and the Marin Countywide Plan (CWP). The adaptation options provided in this report are intended to be useful in developing strategies throughout county operations, including securing funding and establishing ongoing programming. This report serves as a tool for Marin County governmental departments, individual property owners, state and federal parks, state transportation agencies, asset managers, and coastal residents. The county’s adaptation planning process may also serve as an example for other communities.
1.2) Project PartnersLed by the Marin County Community Development Agency (CDA), Collaboration: Sea-Level Marin Adaptation Response Team (C-SMART) began in July 2014 with financial support from the state Ocean Protection Council (OPC) and the California Coastal Commission (CCC).
Project partners include the GFNMS, the USGS, Point Blue Conservation Science (PBCS), Coravai, the Center for Ocean Solutions (COS), and the Department of Public Works (DPW). The technical advisory committee includes staff from FEMA, Caltrans, the National Oceanic and Atmospheric Administration (NOAA), NPS, and others. The stakeholder advisory committee includes representatives from Marin’s coastal communities of Muir Beach, Stinson Beach, Bolinas, Inverness, Point Reyes Station, East Shore and Dillon Beach, and topical area representatives from local businesses, agriculture, recreation and natural resources.
INTRODUCTION | 33
MARIN OCEAN COAST SEA LEVEL RISE ADAPTATION REPORT
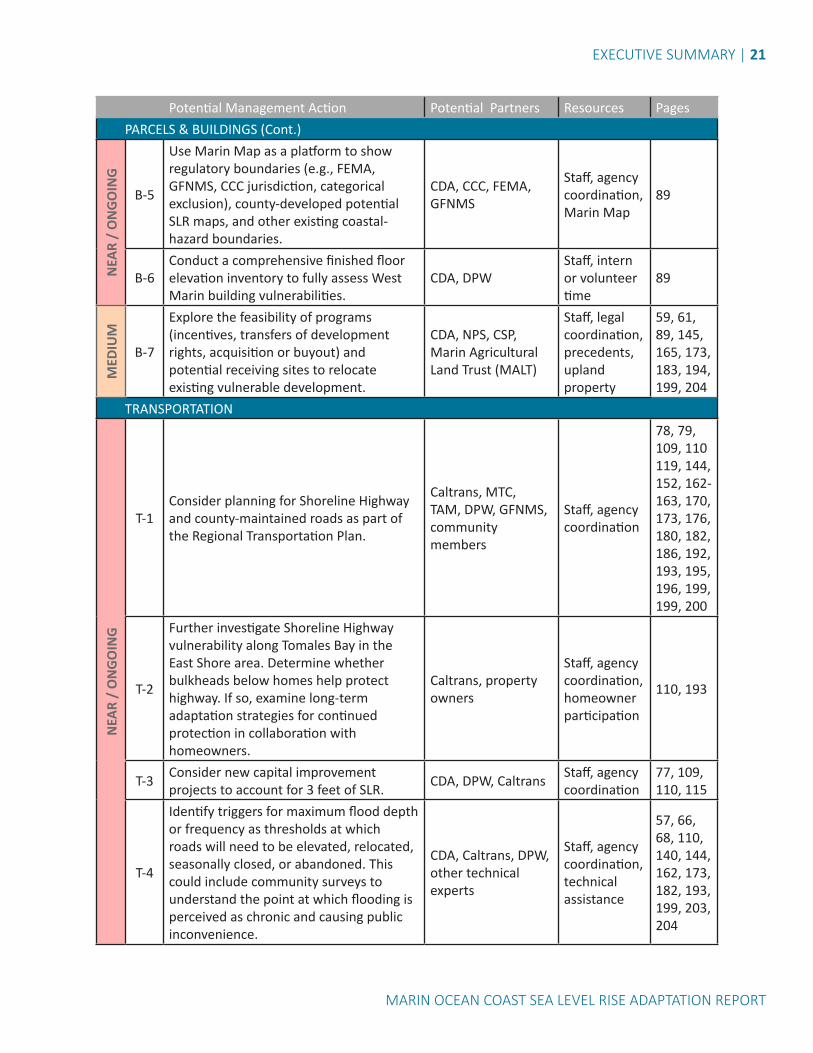
1.3) Planning AreaThe planning area (Figure 1) is the Marin County Coastal Zone (in some cases stream impacts extend beyond the eastern boundary), which covers approximately 82,168 acres. Of this, approximately 33,913 acres are owned and managed by the NPS, leaving 48,255 acres of the zone under county jurisdiction [pursuant to the Coastal Zone Management Act of 1972 (16 U.S.C. 1451, et seq.)].
Figure 1. Planning Area

34
1.4) The C-SMART ProcessThe C-SMART process is in the adaptation-plan phase, as shown in figure 2. This document incorporates findings from the Vulnerability Assessment. The Vulnerability Assessment provides data and the best available science for SLR and how it could impact coastal Marin. Ideas for adaptation strategies came from a wide variety of sources. CDA staff have done extensive literature review to identify potential strategies based on comparable case studies. Insights and additional ideas were generated in engaging coastal residents in community workshops addressing SLR vulnerability and adaptation. C-SMART’s TAC and SAC provided ideas on adaptation strategies through advisory committee meetings. Finally, this plan utilizes the expertise of several partner organizations, including ESA, Stanford University’s Center for Ocean Solutions, and the GFNMS, among many others. Methodologies from stakeholder, technical-expert, and C-SMART partner processes are described in greater detail below.
The options were gathered from the community, technical experts, and literature and case study research and vetted to answer the following questions:
1. Does the strategya. protect?b. retreat?c. accommodate?d. preserve (natural resources)?
2. Is the strategy suited fora. infrastructure?b. developed properties?c. vacant properties?
3. Is the strategy useful in thea. short term?b. medium term?c. long term?
4. Does the strategy have positive, neutral, or negative impacts ona. economy?b. environment?c. social equity?d. administrative issues?e. legal issues?
5. Is the strategy suited fora. coastal shoreline or blufftops?b. bay or estuarine environments?c. riverine environments?
6. Does the strategy reduce impacts ofa. temporary flooding?b. inundation?c. erosion?d. wave surge?e. high winds?
7. Where has this strategy been implemented?
8. What are the estimated costs?
Figure 2. C-SMART Process

INTRODUCTION | 35
MARIN OCEAN COAST SEA LEVEL RISE ADAPTATION REPORT
1.5) Guiding PrinciplesPrinciples were developed to guide the adaption-planning process and vetted with stakeholders. These include the following:
General Approach• Recognize that West Marin is affected by
the world around it.5
• Recognize that SLR is one of several climate change and other potential coastal hazards (earthquakes, fires, sandy soils, creek and river flooding, storm winds and waves, and fluctuating tides) current and future residents will likely face. Interrelationships between these factors will impact the coast and can be monitored moving forward.
• Facilitate adaptation of existing development to reduce vulnerability to SLR impacts over time.6
• Prioritize SLR adaptation strategies that minimize adverse impacts while encouraging co-benefits.
• Design adaptation to fit into existing programs and mechanisms where possible, so as to not create additional layers of bureaucracy
• Adaptation planning, and initial plan implementation, must begin now, and can be refined as more information becomes available.7
5 National Adaptation Forum, "Adaptation Pledge," May 9-11, 2017, www.nationaladaptationforum.org/about/ad-aptation-pledge.6 ICLEI Local Governm-ents for Sustainability. Sea Level Rise Adaptation Strategy for San Diego Bay (2012), 4.7 Delaware Coastal Programs. Preparing for Tomorrow’s High Tide: Recommendations for Adapting to Sea Level Rise in Delaware (2013), x. 8 Ibid.9 Ibid.10 ICLEI Local Governments for Sustainability. Sea Level Rise Adaptation Strategy for San Diego Bay, 3.11 California Coastal Commission. California Coastal Commission Sea Level Rise Policy Guidance: Interpretive Guidelines for Addressing Sea Level Rise in Local Coastal Programs and Coastal Development Permits (2015), 15.12 Ibid., 16.13 Ibid.
• Due to the high degree of uncertainty, use an adaptive-management approach with indicators and established monitoring. Adaptation policies need to be flexible enough for circumstances that may not yet be fully predictable. Avoid unnecessarily prescriptive adaptation actions. Encourage decisions at the local level.8
• Acknowledge that there will be losses, and rationally assign budgets and efforts to those assets that have the highest value and the best chances of survival. Discuss value of adding some life to certain assets while forgoing long-term preservation, rather than complete preservation. Strike a balance between protection of homes and infrastructure and conservation of natural resources. 9
• Utilize a precautionary approach to minimize risk borne by local communities.10
• Avoid and, where unavoidable, minimize significant coastal hazard risks to new development and redevelopment over the life of authorized structures.11
• Warn property owners that they need to understand and assume the risk of development in hazardous areas.12
• Encourage priority for coastal-dependent and coastal-related development over other development.13

36
• Recognize public-trust boundary changes resulting from SLR.
• Avoid maladaptation by not undertaking actions that, relative to alternatives increase emissions of greenhouse gases, disproportionately burden the most vulnerable, have high opportunity costs, reduce incentives to adapt, and set paths that limit the choices available to future generations.14
Available Science• Use available science and knowledge to
consider present, past, and foreseeable future conditions15 and use best available technology for decision-making and adaptation strategies and actions. Take account of locally relevant and context-specific SLR projections in planning, project design, and permitting reviews.16
• Consider the cumulative impacts and regional contexts of planning and permitting decisions.17
Equity• Work to ensure the equitable sharing of
the benefits and costs of SLR. Consider equity in selection and funding of adaptation measures. Safeguard integrity: Encourage transparency, accountability, and follow-through.18
• Adaptation measures should consider the distinct vulnerabilities of potentially affected subpopulations.19
14 Alexandre Magnan."Avoiding Maladaptation to Climate Change," S.A.P.I.EN.S 7.1 (September 2014): 4.15 National Adaptation Forum.16 California Coastal Commission, 15.17 Ibid., 16.18 National Adaptation Forum.19 Magnan."Avoiding Maladaptation to Climate Change," 4.20 California Coastal Commission, 16.21 ICLEI Local Governments for Sustainability, 322 Sea Level Rise Adaptation Strategy for San Diego Bay.23 California Coastal Commission Sea Level Rise Policy Guidance.24 Preparing for Tomorrow’s High Tide: Recommendations for Adapting to Sea Level Rise in Delaware.
Tomales Bay. Credit: D.Wilson
Engagement• Engage broad public participation in
adaptation decisions.20 Foster collaborative problem solving and involve relevant stakeholders in considering the adaptation strategy.21
• Strive to establish and maintain partnerships between government, tribes, businesses, property owners, and nongovernmental organizations (NGOs) in development and implementation of adaptation strategy recommendations.22 Support each other in research and monitoring efforts.23
• Coordinate and consider consequences of adaptation among jurisdictions and resource types.24
• Communicate within and between the coastal communities to share information, successes, failures, and funding resources. Maintain an ongoing public-outreach program.

INTRODUCTION | 37
MARIN OCEAN COAST SEA LEVEL RISE ADAPTATION REPORT
Environment• Maximize natural shoreline values and
minimize shoreline armoring.25
• Protect ocean and coastal ecosystems. Protect public access to coastal areas and beaches, natural shorelines, and park and recreational resources. 26
• Address potential coastal resource impacts (wetlands, habitat, scenic, etc.) and recognize the desirability of measures to protect coastal resources in all coastal planning and regulatory decisions.27
Economy• Identify and address potential impacts to
the local and regional economy from SLR.
• preserve and enhance healthy working and living conditions, provide a continuing draw for tourism and recreational industries, and stimulate related economic opportunities.
• Appropriate and timely adaptation measures can benefit the economy by maintaining a diverse and sustainable local economy and providing for the safe and efficient movement of people and goods.28
Sunrise at Nick’s Cove. Credit: Klingel
25 Ibid.26 Sea Level Rise Adaptation Strategy for San Diego Bay.27 California Coastal Commission Sea Level Rise Policy Guidance.28 Marin Countywide Plan, Marin Community Development Agency.

38
1.6) Vulnerability Assessment The Marin Coast Sea Level Rise Vulnerability Assessment, published in December 2015, presents community assets profiles describing their vulnerability. These assets are parcels and buildings, transportation networks, utilities, working lands, natural resources, recreational activities, emergency services, and historic and archaeological resources. It also includes community profiles highlighting the vulnerable assets in Muir Beach, Stinson Beach, Bolinas, Inverness, Point Reyes Station, East Shore, and Dillon Beach (which includes north of Dillon Beach to the county line).
Each profile details key issues, geographic locations, existing policies, and other economic, environmental, equity, and management considerations related to SLR vulnerability. Each profile can be used independently of the others to enable asset managers to focus on their professional area and community members, elected officials, and others to read the results by community.
Vulnerability is based on an asset’s exposure, sensitivity, and adaptive capacity to rising waters and storm threats. If an exposed asset is sensitive to SLR impacts, with low to no adaptive capacity, the asset is considered vulnerable. The project team interviewed asset managers with questions developed by county staff to quantify assets’ sensitivities and adaptive capacities to flooding (permanent and temporary), erosion, and other impacts. The interview results were combined with geographic data and citizen input gathered during public workshops to develop the Vulnerability Assessment.
Table 3 shows the range of SLR projections for California adopted by the National Research Council (NRC) in 2012.
Table 3. Sea Level Rise Projections for San Francisco, CA Region (NRC 2012)
Time Period Projected Rangeby 2030 1.6 – 11.8 inchesby 2050 4.7 – 24 inchesby 2100 16.6 – 65.8 inches
Given the uncertainty in the magnitude and timing of future SLR, Marin County used a scenario-based approach to assess a range of potential SLR impacts. The five scenarios selected were derived from the USGS Coastal Storm Modeling System (CoSMoS), which identified areas that may flood at 10 various sea levels (ranging from 0 to 500 centimeters above the current level) and four storm severities (none, annual, 20-year storm, 100-year storm). All these scenarios are available on Our Coast, Our Future’s online flood map.
The key findings of the vulnerability assessment are based on the five sea-level and storm combinations given below in table 4, representing near-term, medium-term, and long-term futures.
Scenarios 1 and 2 represent the near term and correspond to the NRC’s projected sea-level range for 2030.
Scenario 3 is considered medium term and is within the NRC’s 2050 range.
Scenarios 4 and 5 represent the long term. Scenario 4 corresponds to the NRC’s 2100 range. Scenario 5 represents levels based on additional research theorizing the worst case: that by 2100, SLR will near 70 inches globally. The CoSMoS option that most closely reflects that is a rise of 200 centimeters, or 77 inches, and is referenced as 80 inches in this assessment.

INTRODUCTION | 39
MARIN OCEAN COAST SEA LEVEL RISE ADAPTATION REPORT
The five scenarios selected for the C-SMART analysis are shown in table 4.
Table 4. C-SMART SLR & Storms Scenarios (OCOF)
Sea Level Rise Scenario Term1 10 inches + annual storm Near2 10 inches + 20-year storm Near3 20 inches + 20-year storm Medium4 40 inches + 100-year storm Long5 80 inches + 100-year storm Long
The scenarios include SLR, tides, storm surge, El Niño effects, wave setup, and wave run-up. CoSMoS scales down global and regional climate and wave models to produce local hazard projections.29 High-quality elevation data incorporated in the digital elevation model (DEM) is used to create maps of mean higher high-water (MHHW) tidal elevation plus SLR heights and provides the option to add storm impacts. Mean higher high water is the average of the higher high-water height of each tidal day observed over the National Tidal Datum Epoch, which is he specific 19-year period adopted by the National Ocean Service as the official time segment over which tide observations are taken and reduced to obtain mean values (e.g., mean lower low water) for tidal data.30 Because the analysis uses high tide, properties nearest the limit of the exposure area exposed to MHHW could be dry at lower tides, while inundation could be deeper for the period of the cycle where water levels are above MHHW. Note that the CoSMoS model accounts only for ocean levels and does not incorporate impacts from creek flooding during storms or changes in the coastline (geomorphology) as erosion continues.
29 G. Ballard, P.L. Barnard, L. Erikson, M. Fitzgibbon, K. Higgason, M. Psaros, S. Veloz, J. Wood. Our Coast Our Future, 2014.30 Center for Operational Oceanographic Products and Services, NOAA/National Ocean Service. Tidal Datums. Accessed Oct. 19, 2015 (last updated Oct. 15, 2013).

40
Sea Level Rise Science UpdateIn April 2017, the Ocean Science Trust released "Rising Seas in California" to reflect recent advances in ice-loss science and SLR projections based on four emission scenarios adopted by the Intergovernmental Panel on Climate Change (IPCC). The report highlights increasing ice loss from Greenland and Antarctic ice sheets, which could cause higher SLR in California than the global average. Projections vary dramatically past midcentury, with a high-end of ten feet by 2100. This high range of uncertainly underscores the importance of staying abreast of continually evolving science, and maintaining flexibility in adaptation planning.
Figure 3: Projections of: (a) Global mean sea level, and; (b) Relative sea level in San Francisco, California. The IPCC emission scenarios are known as representative concentration pathways' (RCPs). The graphs below include the high scenario (RCP 8.5) representing a future with no significant reduction of global CO2 emissions, and a low scenario (RCP 2.6) that assumes CO2 emissions will be significantly reduced. The H++ scenario corresponds to an extreme scenario of a world consistent with rapid Antarctic ice sheet mass loss. Although the world is not presently following the H++ scenario, this does not exclude the possibility of getting onto this path later in the century. The historical global mean sea level curve in (a) is from Hay et al. (2015).
(a) Global mean sea level
(b) Relative sea level in San Francisco, California

INTRODUCTION | 41
MARIN OCEAN COAST SEA LEVEL RISE ADAPTATION REPORT
Figure 4 (top). Water Surface Diagram. Source: OCOF 2016.Figure 5 (bottom). Flood Depth Diagram. Source: OCOF 2016.
Note: While Figure 4 depicts MHW, the CoSMoS model uses MHHW to project inland extent of flooding.

42
Using the . data for SLR and its extent into the coastal areas, the vulnerability assessment determined the exposure of the eight assets. Table 5 lists the number and percentage of parcels and buildings in the Marin County Coastal Zone exposed in each of the five scenarios.
Table 5. Number of Exposed Parcels & Buildings (Source: Marin Map, OCOF)
Parcels BuildingsScenario # % # %
1 824 16% 372 8%2 1,046 20% 588 10%3 1,085 21% 680 11%4 1,150 21% 853 14%5 1,298 25% 1,076 18%
In the Marin County Coastal Zone, over 20 percent of buildings are exposed at the low end of the long-term scenario (scenario 4) and 25 percent are exposed at the high end of the long-term scenario (scenario 5).
These buildings are concentrated in the Calles and Patios neighborhoods in Stinson Beach, downtown Bolinas, and the Tomales Bay shorelines in Inverness and East Shore (Marshall).
The vulnerability assessment also finds that on the East Shore, 90–100 percent of commercial parcels and 78–84 percent of residential parcels are exposed in the medium term and the high end of the long term, respectively, representing the majority of buildings along the eastern shore of Tomales Bay. In Bolinas, 27–87 percent of commercial properties are exposed in the medium term and in the high end of the long term, respectively, including both resident and visitor services. In Stinson Beach, nearly 70 percent of residential parcels are exposed in the medium term and onward.
Nearly 20 miles of public and private roadways could be compromised. Roadways exposed in the short term include Shoreline Highway between Bolinas and Stinson Beach, which accounts for 20 percent of road length in the Marin County Coastal Zone and represents the only roadway between the two communities, not to mention the primary accessway within the Marin County Coastal Zone. In Stinson Beach, Calle del Arroyo and the other Calles and the Patios are compromised. In Bolinas, Wharf Road, as well as several creek crossings and bridges, are compromised. Other low-lying portions of Shoreline Highway, several local roads, and 17 percent of Sir Francis Drake Boulevard are vulnerable in the long term.
Coastal communities also rely on septic systems, water-supply systems, and shared septic or sewage systems that could be exposed to SLR and storms. Roadways and utilities are linchpin assets, such that their dysfunction or destruction will have negative consequences for nearly all other built assets.
1.7) Prioritize Adaptive NeedsPrioritization is based on potential impacts, existing adaptive capacity, and the risk and onset identified by the vulnerability assessment. For example, higher priority is assigned to strategies addressing impacts with greater potential severity or longer ramp-up times. Impacts that are predicted to arise further in the future, offering more time to mobilize a response based on ongoing monitoring, would rank with relatively lower priority.
Based on the findings of the vulnerability assessment, overall, the most vulnerable assets (in order of timing and flood depth) of coastal Marin are listed below. The full list of exposed assets with flooding depths by scenario can be found in table 6:

INTRODUCTION | 43
MARIN OCEAN COAST SEA LEVEL RISE ADAPTATION REPORT
Near Term• Beaches, underground OWTS, buildings,
and streets in Stinson Beach (west of Shoreline Highway)
• Shoreline Highway between Stinson Beach Bolinas and at Green Bridge in Point Reyes Station, the Walker Creek crossing in Marshall, and bridges on Middle Road and School Road in Valley Ford
• Beaches, beachfront, and downtown buildings and streets in Bolinas
• Septic systems, beaches, marshes, and buildings along the eastern and western shores of Tomales Bay on the East Shore and in Inverness
• Water-distribution pipe extending underneath Shoreline Highway and Sir Francis Drake Boulevard serving Inverness residents
• Intertidal rocky lands in Muir Beach and at Agate Beach (Duxbury Reef State Marine Conservation Area)
• Fire-service facilities and tsunami routes in Stinson Beach
• Recreational facilities at Dillon Beach Resort and Lawson’s Landing
Medium Term• Olema-Bolinas Road, the primary access
road to Bolinas
• Further north into downtown Bolinas, including the historic district
• The Bolinas Community Public Utilities District lift station
• Shoreline Highway in Point Reyes Station Sir Francis Drake Boulevard in Inverness
Long Term• Shoreline Highway along the East shore in
the medium and long-terms
• Buildings in Inverness west of Sir Francis Drake Boulevard
• Downtown Bolinas up to Bridgton Road along Olema-Bolinas Road, including the market, library, community center, gas station, museum, and several other valued places
Several of these vulnerabilities will impact both human and wildlife communities. In several cases not only is the asset vulnerable, but so are the means for accessing the asset, whether it is a building at the end of a flooded road, or an access point to reach a beach or trail.
Underground resources will likely be impacted before the assets above (buildings, roads, etc.) will be. Road segments were measured at high and low depth points along the vulnerable segments described.
Community members and decision-makers will need to decide whether to adapt by protecting, accommodating, retreating, or combining strategies in the face of SLR and increased threats from extreme events. For each of these choices, several other strategies, programs, and policies will need to be established to carry out these efforts using the most equitable, environmentally friendly, and economically efficient methods possible.
Table 6 shows the ranking of assets, first by chronological order of onset and, secondarily, by the highest flood depth measured.
1.8 Programs and Documents Referenced in the Report
C-SMART C-SMART is an effort led by the Marin County CDA to understand the potential impacts of SLR in West Marin and work with communities to prepare for a resilient future. Through developing a sound scientific and technical basis for assessing vulnerabilities, C-SMART has identified possible response and resiliency strategies, coordinated with partner agencies and local communities, and informed Marin’s Local Coastal Program.
Vulnerability Assessment As a first step in SLR planning, C-SMART’s Vulnerability Assessment identifies West Marin assets that could be impacted over five scenarios from near to long term. The report includes asset profiles describing vulnerabilities of parcels and buildings, transportation, utilities, working lands, natural resources, recreation, emergency services, and historic and archaeological resources; and community profiles highlighting vulnerabilities of Muir Beach, Stinson Beach, Bolinas, Inverness, Point Reyes Station, East Shore, and Dillon Beach.
Adaptation Report (this report)This report presents potential actions to accommodate, protect against, or retreat from the threats of SLR and coastal hazards that can be considered by communities, homeowners, and asset managers. These options were developed in consultation with technical experts, local, state, and federal agencies, and locatl residents through extensive community engagement. Possible adaptation options are broken down by the asset and community profiles categories used in the Vulnerability Assessment. Possible next steps are discussed to inform C-SMART Phase II.
BayWAVE The Marin Bay Waterfront Adaptation Vulnerability Evaluation (BayWAVE) is the parallel program for assessing Marin’s bayside SLR vulnerabilities and possible adaptation options. BayWAVE yielded the Marin Shoreline Sea Level Rise Vulnerability Assessment, which was finalized April 2017.
Local Coastal Program Informed by C-SMART, Marin’s Local Coastal Program Environmental Hazards chapter is currently being revised. In accordance with the California Coastal Act, policies guide development in West Marin communities with the recognition of SLR and other hazards.
Marin County’s Multi-Jurisdictional Local Hazard Mitigation Plan With a five-year planning cycle, Marin County’s Multi-Jurisdictional Local Hazard Mitigation Plan (LHMP), is part of an ongoing planning process facilitated by the county OES to meet the requirements of the federal Disaster Mitigation Act of 2000 to maintain continued eligibility for certain FEMA hazard-mitigation programs. The LHMP is intended to improve the ability to recover after disasters such as earthquakes, fires, floods, tsunamis, and landslides.
Marin Countywide Plan The Marin Countywide Plan (CWP), last updated in 2007, is the comprehensive long-range general plan that guides land use and development in the unincorporated areas of Marin County. With the overarching theme of “planning sustainable communities”, the CWP promotes leading-edge strategies started in 1974 when Marin County initiated policies to constrain development and protect open space.

INTRODUCTION | 45
MARIN OCEAN COAST SEA LEVEL RISE ADAPTATION REPORT
Community Asset
High-Tide & Extreme Event Flooding Depths VulnerabilityTF: temporary flooding during extreme events; I: inundated at mean highest high tide; E: erosion; WT: water table; SI: salt water intru-sion; WS: wave surge; HW: high wind, HS: habitat shift
(Underlined values indicate tidal flooding at mean higher high water (MHHW) based on one geographic point located at the landward limit of the first scenario overlapping the asset. Oth-er values represent extreme-event flooding. Roads received a high value, used for ranking, and low value along the line seg-ment.)
Scen. 1 Scen. 2 Scen. 3 Scen. 4 Scen. 5
Stinson Beach
Septic systems west of Shoreline Highway
underground resource 6’4” 9’7” I, WT, WS, TF
Stinson BeachWater-distribution lines
underground resource 6’4” 9’7” E, WS, TF, I, SI, ES
Inverness
North Marin Water District (NMWD) pipeline
underground resource (see Shoreline Highway, Point Reyes Station to Inverness, for depths) WT, SI, E
Point Reyes Station
NMWD pipeline
underground resource (see Shoreline Highway, Point Reyes Station to Inverness, for depths) I, SI
Stinson Beach Calle del Arroyo 7”–6’11” 3”–6’ 8” 8”–9’ 6” 2’ 5”–12’
2”5’ 11”–13’ 9” I, TF
Stinson Beach Upton Beach 4’ 7” 6’ 2” 7’ 5” 9’ 8” 14’ 9” I, E
Stinson Beach
Seadrift, Patios, and Calles buildings
≤1.5’–4.5’ ≤1.5’–7.5’ ≤1.5’–9’ ≤1.5’–10.5’
≤1.5’–13.5’ I, WT, WS, TF
Bolinas Bolinas buildings ≤1.5’–4.5’ ≤1.5’–4.5’ ≤1.5’–6’ ≤1.5’–7.5’ ≤1.5’–
10.5’ I, WT, WS, TF
Inverness Inverness buildings ≤1.5’–4.5’ ≤1.5’–4.5’ ≤1.5’–6 ≤1.5’–7.5’ ≤1.5’–
10.5’ I, WT, WS, TF
East shore East Shore buildings ≤1.5’–3’ ≤1.5’–4.5’ ≤1.5’–6’ ≤1.5’–7.5’ ≤1.5’–
10.5’ I, WT, WS, TF
Inverness Inverness Yacht Club 3’2” 4’1” 4’11” 6’10” 10’1” I, WS, HW
InvernessBrock Schreiber Boathouse
2’7” 3’6” 4’ 5’10” 9’2” I, E
Table 6. Vulnerability Ranking of Exposed Assets by Scenario

46
Community Asset
High-Tide & Extreme Event Flooding Depths VulnerabilityTF: temporary flooding during extreme events; I: inundated at mean highest high tide; E: erosion; WT: water table; SI: salt water intru-sion; WS: wave surge; HW: high wind, HS: habitat shift
(Underlined values indicate tidal flooding at mean higher high water (MHHW) based on one geographic point located at the landward limit of the first scenario overlapping the asset. Oth-er values represent extreme-event flooding. Roads received a high value, used for ranking, and low value along the line seg-ment.)
Scen. 1 Scen. 2 Scen. 3 Scen. 4 Scen. 5
East ShoreWalker Creek Access Point
2’4” 3’3” 4’2” 6’1” 9’3” I
BolinasTsunami evacuation route
2’4” 1’8” 2’5” 4’2” 7’9” TF, I, WS, E
East Shore Brighton Beach 2’2” 3’5” 4’11” 6’ 9’11” E, WS
East Shore
Cypress Grove Research Center with Audubon Canyon Ranch Buildings
2’1” 3’1” 3’11” 5’10” 9’2” I
East Shore Hog Island Oyster 2’1” 2’1” 2’10” 4’10” 8’1” I
Inverness Martinelli Park 1’1” 2’ 2’2” 4’1” 7’3” I, E
Bolinas Wharf Road 6”–2’1” 3”–2’4” 2”–2’9” 1”–5’4” 10”–7’4” I, TF
East Shore Shoreline Highway 3”–1’ 7” 3”–2’ 4” 3”–3’ 2’–4’ 6” 6”–8’ 1” I, TF
Bolinas Agate Beach 2’1” 1’11” 2’8” 4’8” 9’3” I
Stinson Beach to Bolinas
Shoreline Highway 0”–1’8” 0”–2’3” 0”–3’1” 0.4”–
4’10” 0.4”–8’6” I, TF
East Shore Marconi Boat Launch 1’ 1” 2’ 2’ 11” 4’ 10” 8’ 2” I
Inverness Tomales Bay State Park 10” 1’10” 2’8” 4’7” 7’10” I, HS

INTRODUCTION | 47
MARIN OCEAN COAST SEA LEVEL RISE ADAPTATION REPORT
Community Asset
High-Tide & Extreme Event Flooding Depths VulnerabilityTF: temporary flooding during extreme events; I: inundated at mean highest high tide; E: erosion; WT: water table; SI: salt water intru-sion; WS: wave surge; HW: high wind, HS: habitat shift
(Underlined values indicate tidal flooding at mean higher high water (MHHW) based on one geographic point located at the landward limit of the first scenario overlapping the asset. Oth-er values represent extreme-event flooding. Roads received a high value, used for ranking, and low value along the line seg-ment.)
Scen. 1 Scen. 2 Scen. 3 Scen. 4 Scen. 5
East Shore Tony’s Restaurant 8” 1’8” 2’6” 4’5” 7’9” I
East ShoreTomales Bay Oyster Company
8” 1’5” 2’3” 4’1” 7’5” I, TF
Stinson BeachWater District Office
7” 3’3” 4’8” 6’6” 8’8” TF, I
Stinson Beach Walla Vista Walkway 3” 1’8” 2’ 4’4” 10’4” I, E
Dillon BeachLawson’s Landing Facilities
2” 1’1” 2’11” 3’10” 7’3” I, E, WS, HW, HS
Point Reyes Station Green Bridge no depth
datano depth
data 2” 2’ 9’ 10” I, TF
Bolinas Historic District 3’ 10” 4’ 8” 6’ 4” 10’ I, E
Stinson Beach
Stinson Beach VFD Fire Station No. 2
3’ 6” 5’ 3” 6’ 10” 9’ 1” I, TF, WT
InvernessSir Francis Drake Boulevard
1”–3’6” 1”–4’6” 1”–7’10” I, TF, WS
Bolinas Sewage lift station 3’3” 5’ 8’7” TF, I
Bolinas Olema-Bolinas Road 2’8” 4”–4’4” 2”–7’11” I, TF
Point Reyes Station
White House Pool and Trail
2’5” 2’3” 5’11” I
Inverness Inverness Store 2’5” 4’4” 7’6” TF, I, WT

48
Community Asset
High-Tide & Extreme Event Flooding Depths VulnerabilityTF: temporary flooding during extreme events; I: inundated at mean highest high tide; E: erosion; WT: water table; SI: salt water intru-sion; WS: wave surge; HW: high wind, HS: habitat shift
(Underlined values indicate tidal flooding at mean higher high water (MHHW) based on one geographic point located at the landward limit of the first scenario overlapping the asset. Oth-er values represent extreme-event flooding. Roads received a high value, used for ranking, and low value along the line seg-ment.)
Scen. 1 Scen. 2 Scen. 3 Scen. 4 Scen. 5
BolinasBolinas Super Market
8” 2’6” 6’1” I, E, SI
Point Reyes Station to Inverness
Shoreline Highway 6” 3”–1’5” 1’9”–9’7” I, TF
InvernessDana Marsh and beach access
3’ 6’2” I, E, SI, HS
Inverness Motel Inverness 2’9” 5’10” I, WS, HW
East Shore Nick’s Cove 2’6” 5’10” I, TF, E, WS
East Shore Millerton Point 2’5” 5’8” I, E
East Shore Historic District 2’5” 4’5” I
Inverness Historic District 2’1” 5’1” TF
Bolinas Bolinas Library 1’8” 5’3” I, TF
Bolinas Bo-Gas Station 1’7” 5’3” I
Bolinas Gospel Flats 1’7” 5’3” I, WT, SI, TF
Bolinas
Community Center emergency shelter
1’7” 5’2” I, E
BolinasCommunity Land Trust Housing
1’2” 4’10” I

INTRODUCTION | 49
MARIN OCEAN COAST SEA LEVEL RISE ADAPTATION REPORT
Community Asset
High-Tide & Extreme Event Flooding Depths VulnerabilityTF: temporary flooding during extreme events; I: inundated at mean highest high tide; E: erosion; WT: water table; SI: salt water intru-sion; WS: wave surge; HW: high wind, HS: habitat shift
(Underlined values indicate tidal flooding at mean higher high water (MHHW) based on one geographic point located at the landward limit of the first scenario overlapping the asset. Oth-er values represent extreme-event flooding. Roads received a high value, used for ranking, and low value along the line seg-ment.)
Scen. 1 Scen. 2 Scen. 3 Scen. 4 Scen. 5
InvernessShell Beach, Tomales Bay State Park
5” 3’4” TF, I, WT
Stinson Beach California Coastal Trail 0.4” 1’3” TF, E
Bolinas Calvary Church 5’10” I, TF
Bolinas Bob Stewart Trail 4’8” I, TF
Inverness Tomales Bay Resort 4’ TF
Inverness Inverness Post Office 3’7” TF, I, WS, E
East Shore Shoreline Highway 3’5” I, E
Stinson BeachStinson Beach picnic area
3’3” TF
BolinasBolinas People’s Store
3’ I, TF
Bolinas Bolinas Post Office 2’9 TF, I
Point Reyes Station
Olema Marsh Trail 2’9” I
BolinasBolinas Stinson School
2’2” I, TF, E, WS
Dillon BeachDillon Beach Resort parking lot
1’6” I

50
Community Asset
High-Tide & Extreme Event Flooding Depths VulnerabilityTF: temporary flooding during extreme events; I: inundated at mean highest high tide; E: erosion; WT: water table; SI: salt water intru-sion; WS: wave surge; HW: high wind, HS: habitat shift
(Underlined values indicate tidal flooding at mean higher high water (MHHW) based on one geographic point located at the landward limit of the first scenario overlapping the asset. Oth-er values represent extreme-event flooding. Roads received a high value, used for ranking, and low value along the line seg-ment.)
Scen. 1 Scen. 2 Scen. 3 Scen. 4 Scen. 5
Point Reyes Station
Gallagher Well
underground resource SI
Dillon Beach (north)
Stemple Creek Recreation Area
X X X X X HS
Stinson Beach/Bolinas
Bolinas Lagoon water resource HS
Inverness/East Shore
Tomales Bay and marshes water resource HS
North of Dillon Beach
Estero Americano water resource HS
Dillon BeachSewage-pump station
blufftop asset E


52
2) C-SMART Participants2.1) Community Workshops To date, CDA has hosted five sets of public workshops throughout West Marin with various objectives to further engage local stakeholders in C-SMART and educate residents about SLR impacts and future adaptation options. Workshops were promoted extensively through both traditional outreach (flyers, posters, postcards, press releases, etc.) and the internet or social media (website, email lists, Facebook, Nextdoor, etc.). Workshop participation ranged from around 20 to 170 attendees. More details, including methods, materials, presentations, and summary reports, can be found at marinSLR.org.
Workshop 1—Kickoff July 10, 2014—Point Reyes National Seashore This evening meeting commenced the C-SMART public-engagement process. Items included an introduction on the C-SMART timeline and scope by CDA staff, plus presentations from USGS staff on the OCOF modeling methods and website tools available to the public. Participants were also invited to apply to join the SAC.
Workshops 2 – Vulnerability AssessmentOctober 28, 29 and 30, 2014—Inverness, Stinson Beach, and TomalesThese evening meetings introduced the vulnerability-assessment process with several participatory activities. On large poster boards, as a means to spotlight local values, attendees were asked to identify what they love about West Marin. Next, participants were invited to mark up the draft community-asset exposure maps compiled by CDA staff. This crowdsourcing activity identified over 70 additional assets for consideration in the C-SMART vulnerability assessment. Finally, facilitated small-group discussions elicited
residents’ current observations of climactic impacts, future concerns, and potential strategies to address these concerns.
Workshops 3—Game of Floods and Adaptation May 30 and June 6, 2015—Point Reyes Station and Stinson BeachThese Saturday workshops educated stakeholders on adaptation strategies through The Game of Floods, a small-group participatory activity spotlighting a wide array of strategies including traditional and hard engineering (seawalls, levees, etc.), green infrastructure (horizontal levees, wetlands, beach nourishment, etc.), managed retreat, and accommodation (retrofitting buildings, realigning roads, etc.). Centered around a game board with a map of the fictitious Marin Island, players were asked to protect an asset they valued through applying a suite of the aforementioned strategies. Information on environmental impacts, costs, effectiveness, and more were provided to inform the decision-making process.
Once the game was completed, attendees were given individual workbooks with a map of the attendee’s community that identified exposed assets. Participants were asked to suggest adaptation strategies for consideration to protect the vulnerable assets they valued. Workbooks were anonymous and were handed to CDA staff once complete.

C-SMART PARTICIPANTS | 53
MARIN OCEAN COAST SEA LEVEL RISE ADAPTATION REPORT
Game of Floods Session
Workshop 4—Adaptation PollingNovember 14, 2015—Stinson Beach This Saturday workshop included presentations from a variety of technical experts (including staff of FEMA, the CCC, Arcadis, ESA, and the DPW) on adaptation-strategy case studies throughout California that highlighted pros, cons, and lessons learned from other areas. With this plethora of information, participants were given a poll to inquire about conceptual adaptation strategies that could be applied to their community. Included were questions on LCP policy amendments that could guide new and existing development to accommodate for changing conditions likely to result from SLR and other climactic impacts. Poll results have informed CDA staff about general community interests and concerns for continued adaptation planning, including the Community Acceptability column in table 6.
Marin County planners also presented updates on the C-SMART study in spring 2016 at meetings with the East Shore Planning Group, the Stinson Beach Village Association, the Muir Beach Community Service District and Muir Beach residents, and the Point Reyes Village Association.
Workshops 5—Next Steps June 8 and 14, 2017—Point Reyes Station and Stinson Beach These evening meetings overviewed the draft adaptation report and C-SMART next steps. The workshops were held during the 30-day adaptation report review period, and digital copies of the report were provided for interested attendees. Marin County planners recapped the C-SMART process to date, presented the adaptation report’s priority options, and answered questions.
The primary activity was the West Marin Sea Level Rise Adaptation Plan Passport, a survey to solicit input from residents on next steps the county could undertake following completion of the report. Attendees were given time to complete this passport individually, with the option of discussing responses in small neighborhood-based groups. In addition, the passport could be taken home for submission at a later date and was posted online for further distribution via traditional and social media. A total of 83 participants provided passport responses.
Resilient Stinson Design CharretteFebruary 3, 2016—Stinson Beach In partnership with Gensler and the Marin County CDA, hosted the Resilient Stinson Design Charrette. The goals of the charrette were to define community character in residents’ and design professionals’ words and to collect aesthetic feedback on potential flood-response options. This information was used to inform both practical and aesthetic considerations of the design principles. Around 40 attendees, including local residents, as well as architects, planners, engineers, and other professionals, were convened.

54
The event began with an introduction about potential impacts of SLR on Stinson Beach. Staff shared future SLR hazard maps of the Calles and Patios neighborhood. Recently released FEMA Flood Insurance Rate Maps (FIRM) were also shared to indicate locations subject to more near-term flooding as well as FEMA compliance requirements. A variety of home-retrofitting strategies were presented, including the innovative concept of amphibiation, in which buoyant foundations are installed, enabling homes to float when floodwaters hit.
Next, local homeowners led guided walking tours of properties vulnerable to both coastal and riverine flooding. This step exposed participants to the variety of architectural styles, building heights, materials, existing retrofitting approaches, etc.
Over lunch, small groups shared initial impressions on community character, including discussion of intangible “look-and-feel” characteristics that would guide building elevation that does not compromise sense of place. The activity used a large sheet of paper with a bull’s-eye and cards featuring a variety of images intended to characterize Stinson Beach as a place, including depictions of various architectural styles and the community’s relationship to nature and water.
Resilient Stinson Design Charrette, February 2016. Credit: Gensler
Participants placed images representing more widely preferred characteristics near the center of the bullseye, while characteristics that were not preferred were placed farther out. Each small group then reported back to the larger group to discuss commonalities.
The main exercise was an evaluation of different retrofitting options to accommodate homes to increased water levels, including:
• structure elevation: piers and columns• semi-enclosed ground level• landscaped ground level• bunker houses• structure elevation: communal• breakaway walls• waterproof construction• amphibious architecture• floating development• floodable development• moveable walls
In small groups, participants filled out pros-and-cons matrices of each option from an aesthetic perspective. Included in the matrices were “maximize the pro” and “mitigate the con.” After a couple of hours of small-group discussions, summary points were shared with the larger group.
This event helped articulate community character, which helped CDA staff develop urban-design principles (page 81). In addition, it helped staff understand aesthetic considerations of the various home-retrofitting options that could be applied for flood and SLR protection (pages 89–104).
Workshops SummaryIn summary, public workshops were an effective means to educate residents on SLR impacts and possible responses, as well as the C-SMART process. Additionally, they provided a means for CDA staff to better understand potential adaptation solutions from the public perspective. Such adaptation strategies have been incorporated into this report for consideration.

C-SMART PARTICIPANTS | 55
MARIN OCEAN COAST SEA LEVEL RISE ADAPTATION REPORT
2.2) Stakeholder Advisory and Technical Advisory CommitteesC-SMART SAC and TAC were developed to guide C-SMART through providing input from community-organization and technical-organization representatives. (A roster of both committees can be found in the acknowledgments section of this report.) Both committees met periodically throughout the process to advise CDA staff on topics including public-outreach activities, vulnerability-assessment processes, C-SMART deliverables, and more. To further obtain input on adaptation options, a joint meeting of the SAC, TAC, and partners was held on February 10, 2016, in Point Reyes Station. Meeting products were intended to mirror the deliverables produced by the Climate-Smart Adaptation Working Group, convened by the Greater Farallones Sanctuary Advisory Council to inform the GFNMS. (See more details below on the working group’s process and products, which serve as the basis for this report’s natural resources section.)
At the joint TAC, SAC, and partner meeting, participants were presented with spreadsheets of adaptation options spanning seven of the eight asset categories spotlighted in this report (parcels and buildings, transportation, utilities, working lands, recreation, emergency services, and historic and archaeological resources). Natural resources were not discussed at this meeting, due to the aforementioned GFNMS working group’s efforts. CDA staff had compiled draft spreadsheets with adaptation options from staff’s literature reviews, consultant deliverables, public workshops, and the adaptation poll. Spreadsheet columns included the approach, strategic management action, spatial or site-specific details, time frame, impacts addressed, key partners, required resources, and other asset categories.
Strategic management actions included the spectrum of adaptation strategies (retreat, defend, accommodate, etc.), plus other activities that could be undertaken in West Marin to help minimize, avoid, and mitigate SLR and storm impacts, including public outreach and education, surveying and documentation, policy development, and more. (These ideas are not staff recommendations or in any way endorsed by Marin County or project partners, but simply a compilation of options suggested through the C-SMART process that merit further consideration. The options were not intended to be collectively viewed as a plan, are not all currently feasible, and in some cases may conflict with one another.)
At a February 2016 meeting, the TAC, the SAC, and project partners were asked to further elaborate on existing options or suggest new options for incorporation. After the meeting, CDA staff synthesized the options presented in Chapter 5.
2.3) Center for Ocean SolutionsTo support decision-makers in their efforts to manage coastal resources in a changing climate, the COS engaged with CDA staff by mapping and assessing the presence and relative importance of coastal habitats along Marin’s Pacific coast. In addition, the effects of coastal adaptation strategies on services provided by coastal habitats were evaluated. The role of natural habitat in providing the ecosystem service of coastal protection was assessed using the Integrated Valuation of Environmental Services and Tradeoffs (InVEST) decision-support tool, a suite of tools to map and value the goods and services from nature. The InVEST Coastal Vulnerability (CV) model was specifically utilized for this assessment.
InVEST is a free open-source suite of software models created by the Natural Capital Project at Stanford University. The InVEST

56
CV model, which incorporates a scenario-based approach to evaluate the role of natural habitats in reducing exposure to coastal erosion and inundation during storms, produces a qualitative estimate of coastal exposure. The Exposure Index differentiates areas with relatively high or low exposure to erosion and inundation during storms.
Spatial data inputs include 1) geomorphology, 2) coastal habitat, 3) wind and wave exposure, 4) surge potential, 5) relief: A DEM representing the topography and (optionally) the bathymetry of the coastal area, 6) SLR: rates of (projected) net sea level change derived from the National Research Council 2012 report, and 7) hard armoring: a data-set inventory of artificial structures and natural coastal barriers that have the potential to retain sandy beach area in California.
Results can help evaluate trade-offs between approaches to climate-adaptation strategy. In this assessment, the COS compared the InVEST Exposure Index results both with and without the protective services provided by natural habitats. This approach (computing the difference between exposure indices) provides a priority index for locations in which coastal habitats play the largest relative role in reducing exposure to erosion and inundation. These locations are then further investigated for nature-based strategies to reduce vulnerability.
The ecosystem-service and adaptation-policy research focuses on three specific areas of interest: Muir Beach, Dillon Beach, and Bolinas Lagoon (including Bolinas and Stinson Beach). For each location, the COS mapped and assessed the natural habitats, the role of those habitats in reducing exposure to storm impacts, the potential adaptation options to address these impacts, and the policy considerations relevant for each strategy. In addition, the COS identified general
considerations for pursuing approaches to land-use policy as well as a summary of our analysis methodology.
This assessment involved a combination of ecosystem-services modeling as well as adaptation-policy research to identify high-priority locations for nature-based strategies that reduce vulnerability of critical assets using feasible methods of land-use policy.
2.4) Greater Farallones National Marine SanctuaryThe GFNMS Advisory Council served as a key partner in the development of options for climate-change adaptation for natural resources (beaches and dunes, rocky intertidal areas, cliffs, and wetlands and estuaries). Building on Phase 1 of the GFNMS Climate-Smart Adaptation Project, which assessed vulnerability to climate and nonclimate stressors for select species, habitats, and ecosystem services, a working group of the GFNMS Advisory Council undertook a yearlong multi-agency process to develop climate-smart adaptation strategies for the study area, which included the GFNMS, the Cordell Bank National Marine Sanctuary, and part of the Monterey Bay National Marine Sanctuary. CDA staff participated as members of the working group alongside representatives from a variety of other local, state, and federal agencies, nonprofit organizations, and academic institutions. The working group was also staffed and advised by sanctuary representatives, as well as members of the scientific and conservation community. Five meetings, numerous conference calls, and various online discussions were held to develop the recommendations. Meetings included group brainstorming exercises to generate ideas, focused discussions to further flesh out options, and an exercise to prioritize options based on criteria including co-benefits and

C-SMART PARTICIPANTS | 57
MARIN OCEAN COAST SEA LEVEL RISE ADAPTATION REPORT
legal, economic, and institutional feasibility. More details on the process can be found in the final report (Appendix E).
In early 2016, final recommendations were presented to the GFNMS Advisory Council, which approved 78 strategies spanning several categories:
• Alleviate climate impacts• Manage dynamic conditions• Promote education• Protect and restore habitat• Limit human disturbance• Address invasive species• Promote landward migration• Invest in science needs• Protect species• Manage water quality
Recommendations relevant to C-SMART (e.g., within the study area and addressing SLR) serve as the basis of the natural resources section of this report, along with findings from the COS and the PBCS. Strategies with additional co-benefits, (e.g., protection of economic, social, and infrastructure assets) were prioritized.
2.5) Environmental Science AssociatesESA served as project consultants with contributions including advice on trigger points and analysis of adaptation options. ESA’s final deliverable is Appendix B of this report, and portions of their work have been incorporated throughout relevant sections as well.
Trigger Points In order to shape a tiered approach to adaptation, ESA advised on the setting of triggers for inundation and temporary flooding. Such an understanding can help inform plan and policy development while considering the range of near-term to long-term impacts. Specifically, ESA characterized triggers for roads and buildings, answering questions such as “What flooding frequency
or depth triggers the need to elevate or relocate homes or roads?”
Broad Analysis of Adaptation Options ESA broadly reviewed alternative options to better understand costs, considerations, and implications as follows:
• Muir Beach (blufftop development)• Protect
• Restore dunes• Armor
• Retreat• Bolinas
• Armor• Nature based (beach nourishment and
horizontal levee)• Accommodate
• Elevation of homes and Wharf Road• Culverts at streams versus causeway
at sections (Shoreline Highway along Bolinas Lagoon)
• Dillon Beach• Dune restoration• Retreat (wells and road)
Detailed Analysis of Adaptation Options Additionally, ESA provided detailed analysis of specific adaptation options, including economic implications, specific costs, environmental impacts, and other considerations for:• Stinson Beach/Seadrift
• Armoring approach–how do you protect homes?
• Extend Seadrift’s sand-covered revetment
• Elevate homes• Reroute Easkoot Creek and Calle del
Arroyo (from the Marin County DPW’s existing flood study)
• East Shore/Tomales Bay• Elevate homes• Raise or relocate road• Create native oyster reefs for Tomales
Bay

This page is intentionally left blank.


60
3) Adaptation Framework
31 Environmental Science Associates (ESA). Sea Level Rise Adaptation Options for Marin County, 2015.32 Center for Ocean Solutions, Natural Capital Project. Coastal Adaptation Policy Assessment, 2016.
3.1) Adaptation Options Adaptation strategy options were gathered from a variety of sources, including project consultants ESA, several existing adaptation plans from other jurisdictions, and several guidance and research publications, such as the California Coastal Commission Sea Level Rise Policy Guidance. Adaptation strategies generally fall into three main categories: protect, accommodate, and retreat. An approach of “no action” may be considered an option but will likely result in greater safety hazards, economic costs, and environmental impacts in the long run.
ProtectProtection strategies are those that employ some sort of engineered structure or other measure to defend development (or other resources) in its current location without changes to the development itself. Protection strategies can be further divided into hard and soft armoring, or defensive measures. “Hard armoring” refers to engineered structures such as seawalls, revetments, and bulkheads to defend against coastal hazards like wave impacts, erosion, and flooding. Such armoring is a fairly common response to coastal hazards, but it can result in serious negative impacts to coastal resources, particularly as sea level rises. Most significant, hard structures form barriers that impede the ability of natural beaches and habitats to migrate inland over time. If they are unable to move inland, public recreational beaches, wetlands, and other habitats will be lost as sea level continues to rise.
Not all these measures are favored by regulatory agencies and stakeholders that are primarily concerned with natural assets
such as beaches and wetlands. Implementing these strategies will likely follow a relatively traditional permitting process involving the local permitting agencies, the CCC, the California State Lands Commission, and, for those located below mean high water (MHW), the GFNMS and the US Army Corps of Engineers (USACE).31 Also, regulatory requirements may make certain protection strategies unfeasible.
Soft armoring includes nature-based solutions such as horizontal levees, wetland restoration, and dune restoration. As such approaches are relatively new concepts, their effectiveness has not yet been fully demonstrated. However, many favor such alternatives over hard engineering due to potential public benefits, including those regarding habitat, recreation, aesthetic considerations, and other factors. For example, dune habitat in Stinson Beach and wetlands in Bolinas Lagoon help absorb energy from storms and protect against shoreline erosion.32
AccommodateAccommodation strategies employ methods that modify existing developments or design new developments to decrease hazard risks and thus increase the resiliency of development to the impacts of SLR. On an individual project scale, these accommodation strategies include actions such as elevating structures, retrofits, and/or the use of materials meant to increase the strength of development, building structures that can easily be moved and relocated, or requiring adequate setbacks from eroding blufftops and shorelines. On a community scale, accommodation strategies include any of the land-use designations, zoning ordinances,

ADAPTATION FRAMEWORK | 61
MARIN OCEAN COAST SEA LEVEL RISE ADAPTATION REPORT
or other measures that require the above types of actions, as well as strategies such as locating development in less vulnerable areas or requiring mitigation actions to provide for protection of natural areas even as development is protected. 33
Structural adaptation is modification of design, construction, and placement of structures sited in or near coastal hazardous areas to improve their durability and/or facilitate their eventual removal. This is often done through elevation of structures or specific site placement. Structural modification entails reconfiguring development to withstand progressively increasing coastal hazards. Examples are pile foundations that allow wave run-up and erosion to progress without damage to structures, and floodproofing or reinforcing for severe events. Structural adaptation can be applied to any parcel or infrastructure, although the cost and technical feasibility of an effective modification would be required. Cost may be high depending on the density of development on the coast (ESA 2015). Regulatory requirements may make certain protection strategies unfeasible.
Relocate/Managed RetreatManaged retreat allows the shoreline to advance inward unimpeded. As the shore erodes, buildings and other infrastructure are either demolished or relocated inland. It can also involve setting back a line of actively maintained defenses to a new line inland of the original and promoting the creation of intertidal habitat between the old and new defenses. This can either be a complete removal or a breach of the defense.
A managed-retreat approach typically involves establishing thresholds to trigger demolition
33 California Coastal Commission. Sea Level Rise Policy Guidance. August 2015.34 Center for Climate Change Law, Columbia Law School. Managed Coastal Retreat: A Legal Handbook on Shifting Development Away from Vulnerable Areas, October 2013.
or relocation of structures threatened by erosion. Therefore, this approach is frequently coupled with several other planning and regulatory techniques, including shoreline planning to identify high-risk areas where this type of policy would be the only cost-effective, long-term solution; regulating the type of structure allowed near the shore to ensure that buildings are constructed in a way to facilitate relocation when needed; and instituting relocation assistance and/or buy-back programs to help with relocation costs or compensate property owners when their property becomes unusable.34 More detail about potential mechanisms for managed retreat is provided in Appendix A.
Some challenges to implementing managed-retreat, particularly in areas with existing development, include uncertainty over who pays, who benefits and quantification of benefits. Another challenge is identifying sufficient space or land for relocation. The costs for retreat in areas consisting of private property could be estimated by assessing the value of the property and identifying the compensation mechanism (e.g., purchase or easement). Managed retreat requires ongoing and long-term commitment from government agencies and citizens.
In California, managed retreat has typically been used by government agencies on public properties such as beach parks. Erosion has been a consistent problem at Surfers’ Point, a popular surfing spot in Ventura, California, for more than 20 years. Multiple options were explored by the city and nongovernmental groups, including the Surfrider Foundation. The strategy included relocation of a bike path and a parking lot, beach renourishment, habitat restoration, and riprap removal.

62
Pacifica State Beach is another example of managed retreat. Despite the use of stabilizing structures, flooding of San Pedro Creek and coastal erosion at Pacifica/Linda Mar State Beach has been a recurring problem for the City of Pacifica. In the early 1990s, the city partnered with state and federal agencies, scientists, engineers, and nonprofit organizations to work toward a managed-retreat strategy for Pacifica State Beach as well as restore wetlands and banks along San Pedro Creek. These actions reduced flooding and erosion threats and restored habitat, which is likely to buffer the system against future climate-related changes such as SLR.35
Hybrid StrategiesHybrid strategies involve phased approaches combining accommodation, protection, and/or relocation. Local government can update land-use designations and zoning ordinances and enact redevelopment restrictions and permit conditions to discourage rebuilding of existing development or siting of new development in hazard areas. Recent experience indicates that hybrid approaches that include a mix of adaptation measures may be the most practical in some situations. The mix of measures in a hybrid solution varies depending on the conditions at that location. For example, the Ocean Beach Master Plan includes a hybrid approach at the south end of San Francisco’s Ocean Beach, where prior development and erosion have resulted in an acute hazard.
35 Climate Adaptation Knowledge Exchange. Restoration and Managed Retreat of Pacifica State Beach, December 2010.
At this location, a low-height seawall is proposed but at a location established as far landward as possible, which requires removal of roadway and parking within a managed-retreat framework.3,6 The plan also includes beach nourishment and dune construction, and includes adaptive management with revisions anticipated for higher sea level rise after 2050.
3.2) Prioritization CriteriaBroad strategies have been characterized in table 7 based on the projected onset of impacts; cost estimates (both initial and ongoing); calculated effectiveness; timing and duration of the strategy; full spectrum of environmental, recreational, and habitat benefits; and legal, political, and community acceptability. Cost estimates were developed by Marin County staff and should be used only generally to compare relative costs. Legal acceptability is based on project staff’s interpretation of the California Coastal Act and the California Coastal Commission Sea Level Rise Policy Guidance. Political acceptability is from the C-SMART Executive Steering Committee. Community acceptability is based on responses to the West Marin Sea Level Rise Adaptation Poll (See Appendix C) and feedback received from community members.
Figure 6. Conceptual Section Diagram of Hybridized Adaptation Strategies

ADAPTATION FRAMEWORK | 63
MARIN OCEAN COAST SEA LEVEL RISE ADAPTATION REPORT
Table 7. Adaptation Strategy CharacteristicsCa
tego
ry
Stra
tegy
Publ
ic B
enefi
ts
Envi
ronm
enta
l Im
pact
s (+
= p
ositi
ve, 0
= n
eutr
al/
varie
d, –
= n
egati
ve) Cost
Floo
d Pr
otec
tion
Acceptability:H=High
M=MediumL=Low
Uni
t
Cost
($)
Lega
l
Politi
cal
Com
mun
ity
Hard
Pro
tecti
on
Seawall/revetment Public safety - Km
37,000,000 (seawall)
22,000,000 (revetment)
M L M M
Elevate bulkheads Public safety, recreation/tourism - Km 590,000 M L L M
Breakwaters, artificial reefs, and groins
Public safety, recreation/tourism 0 Km 30,000,000 -
44,000,000 M L M M
Traditional levee Public safety, recreation/tourism - Km 5,500,000 M L M M
Pump station Public safety - Ea 500,000-4,000,000 L L M N/A
Tidal gate Public safety, recreation and tourism - Ea 1,000,000 to
2,000,000 M L M N/A
Nat
ure
- bas
ed
Beach nourishment Recreation and tourism, aesthetics 0 Ac 500,000 M M H M
Dune Restoration/Nourishment
Recreation and tourism, aesthetics + Ac 200,000 M M H M
Offshore structures
Public health, recreation and tourism, aesthetics, carbon sequestration, air and water quality
+ Ac 2,000,000 M M M M
Wetland creation
Public health, recreation and tourism, aesthetics, carbon sequestration, air and water quality, storm-water management
+ Ac 20,000 M H H H
Horizontal levee
Public health and safety, recreation and tourism, aesthetics, carbon sequestration, air and water quality, storm-water management
+ Km 4,000,000 to 4,500,000 H M H L

64
Cate
gory
Stra
tegy
Publ
ic B
enefi
ts
Envi
ronm
enta
l Im
pact
s (+
= p
ositi
ve, 0
= n
eutr
al/
varie
d, –
= n
egati
ve) Cost
Floo
d Pr
otec
tion
Acceptability:H=High
M=MediumL=Low
Uni
t
Cost
($)
Lega
l
Politi
cal
Com
mun
ity
Acco
mm
odat
e
Elevate buildings
Public safety, seismic safety, recreation and tourism, aesthetics, storm-water management
+ sf
140 (flood zone)
250 (wave zone)
M M M M
Elevate roads on trestles
Public safety, seismic safety, recreation and tourism, aesthetics, storm-water management
+ sf 570M to H
M M H
Raise grades Public safety, seismic safety - High cost–varies H M M M
Floodproof buildingsPublic health and safety, recreation and tourism, aesthetics
0Varies (see Retrofitting Options section, pp. 95–110)
L H H M
Floodable and floatable development
Public safety, recreation and tourism, aesthetics, storm-water management
0 Varies M M M M
Retr
eat
Reconstruct roadsPublic safety, seismic safety recreation and tourism
+ sf 280 (secondary roads) H M H M
Managed retreat/relocation
Public safety, recreation and tourism, aesthetics, storm-water management
+ Varies H L L L
Zoning and overlay zones
Public health and safety, recreation and tourism, aesthetics
+ Varies H L L L
Setbacks for development
Public safety, recreation and tourism, aesthetics
+ Varies H L M L
Siting and design requirements
Public safety, recreation and tourism, aesthetics
+ Varies H L M L
Capital improvement programs
Public safety, seismic safety, recreation and tourism, aesthetics
+ Varies H L M L

ADAPTATION FRAMEWORK | 65
MARIN OCEAN COAST SEA LEVEL RISE ADAPTATION REPORT
Cate
gory
Stra
tegy
Publ
ic B
enefi
ts
Envi
ronm
enta
l Im
pact
s (+
= p
ositi
ve, 0
= n
eutr
al/
varie
d, –
= n
egati
ve) Cost
Floo
d Pr
otec
tion
Acceptability:H=High
M=MediumL=Low
Uni
t
Cost
($)
Lega
l
Politi
cal
Com
mun
ity
Retr
eat
Acquisition/buy-out
Public health/safety, seismic safety, recreation and tourism, aesthetics
+ Varies H L M L
Conservation easements
Public health and safety, seismic safety, recreation and tourism, aesthetics
+ Varies H H H M
Rolling easements
Public health and safety, seismic safety, recreation and tourism, aesthetics
+ Varies H H H M
Transfer of development credit/rights
Public health and safety, seismic safety, recreation and tourism, aesthetics
+ Varies H H M M

66
3.3) Trigger Points for Adaptive ManagementIn addition to amplifying erosion hazards, SLR will increase the extent of frequent (chronic) inundation in low lying areas and result in more severe storm (event) flooding. Adaptation measures can be tailored to the governing flood hazard mechanism (chronic or event), and will be initiated at determined “trigger points.”
The concept of “trigger points” means that adaptation strategies would be initiated when projected hazards surpass a certain level of risk, either in frequency or severity. ESA described various erosion and flooding mechanisms to inform the county and its residents about potential trigger options to consider while deciding when to implement adaptation measures, such as: nourishing beaches and raising or relocating homes, roads and other infrastructure.
The trigger type depends on the level of service the infrastructure provides (e.g. critical roadway versus park driveway) and what consequence (how deep or far) and frequency of erosion or flooding impact is acceptable. The science behind both erosion and flooding triggers is summarized below. (The information about potential triggers in this report is advisory only and subject to revision based on additional information and further analysis.)
Flooding Triggers based on water level could be based on tide data from the Point Reyes tide gauge:
• Mean High Water (MHW) — Average of all high tides over the National Tidal Datum Epoch of 19 years. MHW is 5.1 feet North American Vertical Datum (NAVD) and occurs 1–2 times per day for a few minutes to a few hours.
• Extreme Monthly High Water (EMHW)—Highest high-water level reached once in a month. EMHW is approximately 6.9 feet NAVD.
• 1-Year Water Level—Water level exceeded on average once every year, or that has a 99 percent chance of being exceeded in any year from a storm event. The 1-year water level is about 7.1 feet.
Acceptable flood levels will vary by asset. For example, a road used only to access a beach park can tolerate flooding once a month, but flooding every other day would limit access. On the other hand, a critical road such as Calle del Arroyo in Stinson Beach that is the only access route to residences should have a higher level of acceptable impact so that it is operable for emergency situations. In this case, a more frequent flood level could be used to set a trigger points.
For underground utilities such as gas and septic leach fields that could be affected by high groundwater, research could be conducted to identify how MHW level could affect groundwater levels. Additional factors could play into the trigger selection, such as infrastructure materials (pavement that degrades quicker under prolonged flooding versus a building that is floodable up to a certain depth).

ADAPTATION FRAMEWORK | 67
MARIN OCEAN COAST SEA LEVEL RISE ADAPTATION REPORT
ErosionErosion rates and storm-erosion impact distances indicate beaches and waterfront property vulnerabilities, and are used to suggest potential triggers. Such indicators are:
Toe elevation–Where the beach meets a back-beach dune, cliff, or armoring structure. Toe elevation is compared to total water levels and used as an indicator of the amount of wave energy that could reach the back beach and cause erosion and overtopping. This elevation varies as the beach erodes in the winter and spring and accretes in the summer and fall. Extreme low values are an indication of erosion during heavy winter storms.
Dry-beach and dune width—Dry-beach width buffers the backshore from waves. “Dry beach” is defined as beach width above the shoreline. (See below for definition of shoreline.) Narrow beaches offer little protection, as more wave energy reaches the backshore, which results in greater run-up, erosion of dunes and bluffs, and impacts to coastal armoring structures.
Shoreline position—The shoreline location is used to track shore changes and estimate the volume of sand in the beach. In combination with the backshore location, a dry-beach width can be calculated. The shoreline is typically defined as the elevation of MHW, Mean Higher High Water (MHHW), or a similar measurement.
Toe elevation, beach width, and shoreline position are influenced by wave exposure and littoral processes. In the case of an armored backshore (e.g., Seadrift Beach), the beach elevation at the toe of structures indicates the exposure of the structure to wave action. As sea level rises and storm intensity increases, beach elevation drops and the structure experiences more scour from deeper and
36 ESA, 2015.
faster-moving wave run-up and reflection of wave energy by the structure. Reduced beach elevation results in more wave overtopping and degradation of the structure. To guide long-term and emergency-management activities, the following vulnerability triggers and potential actions are proposed:
Toe-Elevation Triggers Long-term “maintenance” trigger = Elevation of the beach berm (break in slope) that typically occurs several feet above high tide, depending on wave exposure.
• Action: Increase monitoring frequency, evaluate resources at risk, consider actions (nourishment, notify residents, etc.).
Critical-condition trigger = Mean tide or sea level.
• Action: Emergency nourishment, evaluate resources at risk, consider other actions.
Beach-Width TriggersLong-term maintenance trigger = Beach width equal to or greater than typical summer-winter change plus allowance for an extreme erosion event. Provisionally, this distance is about 85 feet at Stinson Beach and Seadrift beaches, based on available storm erosion estimates. 36 In some areas, the beach is already very narrow, and a smaller distance of 50 feet may be applicable. Information on past seasonal beach-width fluctuations, along with future monitoring, would further refine the selected trigger distance.
• Action: Increase monitoring frequency, including the use of inexpensive aerial photography to track beach width, evaluate resources at risk, and consider other actions (e.g., nourish the beach and notify residents).

68
Critical-condition trigger = When beach widths in the summer and fall are less than typical seasonal recession due to winter conditions, it is possible the beach will narrow to the point of providing nearly no protection to the backshore in case of severe storm or swell. Monitoring surveys would inform this seasonal fluctuation distance along the beach (e.g., 25 feet).
• Action–Sand placement in a berm or embankment shape to temporarily raise the backshore elevation and limit wave runup, absorb wave power, and provide sand to the beach during erosion events. Consider other actions such as sand bags, blocking low areas that might be used for access but also provide a pathway for wave run-up, and contingency preparation for evacuation and utility shutdown.
Timing of Adaptation TriggersThe timing of implementation for an adaptation measure depends on lead time required to effectively plan, permit, design, and construct. Caltrans (2011) has published guidance on planning and development of project-initiation documents. A previous study by GHD, ESA, (formerly Philip Williams and Associates [PWA]), and Trinity Associates (GHD et. al, 2014) identified and evaluated a range of adaptation options to address SLR vulnerabilities at four example locations in Northern California. For the GHD study, designs were developed to provide protection against a king tide (1-year tide) plus 1 foot, but were not specific about the initiation selection. Marin County could consider adopting an evolving assessment methodology that incorporates the latest SLR and climate-change science.
While uncertainty may be high for future water level predictions, a sufficient level of elevation could be chosen to limit the risk of planning for too little SLR. This trigger-timing process could also be applied to shrinking beaches and backshore adaptation strategies with SLR or stream bridge and culvert crossings with climate-driven precipitation changes.
Figure 7. Timing of Adaptation Triggers – Suggested Methodology
Figure 7. Example Adaptation Trigger Timeline for Road
Figure 8. Example Adaptation Trigger Timeline for Road

ADAPTATION FRAMEWORK | 69
MARIN OCEAN COAST SEA LEVEL RISE ADAPTATION REPORT
Critical-condition trigger = When beach widths in the summer and fall are less than typical seasonal recession due to winter conditions, it is possible the beach will narrow to the point of providing nearly no protection to the backshore in case of severe storm or swell. Monitoring surveys would inform this seasonal fluctuation distance along the beach (e.g., 25 feet).
• Action–Sand placement in a berm or embankment shape to temporarily raise the backshore elevation and limit wave runup, absorb wave power, and provide sand to the beach during erosion events. Consider other actions such as sand bags, blocking low areas that might be used for access but also provide a pathway for wave run-up, and contingency preparation for evacuation and utility shutdown.
Timing of Adaptation TriggersThe timing of implementation for an adaptation measure depends on lead time required to effectively plan, permit, design, and construct. Caltrans (2011) has published guidance on planning and development of project-initiation documents. A previous study by GHD, ESA, (formerly Philip Williams and Associates [PWA]), and Trinity Associates (GHD et. al, 2014) identified and evaluated a range of adaptation options to address SLR vulnerabilities at four example locations in Northern California. For the GHD study, designs were developed to provide protection against a king tide (1-year tide) plus 1 foot, but were not specific about the initiation selection. Marin County could consider adopting an evolving assessment methodology that incorporates the latest SLR and climate-change science.
Figure 7. Example Adaptation Trigger Timeline for Road
Shoreline Monitoring Due to the uncertainty of future rates of SLR and thus anticipated shoreline response, it is important to monitor the shore into the future to properly assess vulnerability to coastal hazards. A shoreline-monitoring program could include periodic transect surveys along reaches of concern to track the following beach attributes: shoreline position, toe elevation at the backshore, and dry-beach width or dune width.
In the case of an armored backshore (e.g. Seadrift Beach) monitoring the beach elevation at the toe of structures will indicate the exposure of the structure to wave action. Residents in a FEMA V-Zone (with or without fronting armor structure) may consider actions to protect their home if the long-term triggers for dry-beach width (or toe elevation) are reached. Homes closest to the ocean are most vulnerable to wave loads, and would benefit the most from structural-modification measures such as elevation. However, the homes farther inland may be lower due to the pre-existing grades, and may be more subject to deeper flooding that may persist after a wave- overtopping event. While Easkoot Creek is also a hazard source, it was not addressed in this study due to lack of models that integrate riverine and coastal sea level rise. However, Easkoot Creek hazards were considered in the Stinson Beach Flood Control Alternatives Study (Marin County DPW, 2014).
A complete shoreline-monitoring program could be developed by a coastal engineer, and data could eventually be collected by county staff or other entities. In example projects by ESA in South Ocean Beach and Surfers’ Point, a survey team of at least two people is dispatched to collect topographic data at evenly spaced intervals twice a year (late summer and early fall and late winter and early spring) to capture seasonal
shore changes, as well as before and after a significant coastal storm event. Approximate storm-retreat amounts, scour depth, and other impacts are quantified and applied to subsequent erosion-control measure implementations. Erosion-control measures such as sandbag structures and sand placements are also monitored.
The Ocean Beach project establishes a framework for evaluating shoreline conditions, will inform the need for immediate interventions, and sets forth a methodology for tracking and reporting shoreline changes over the next five years. Environmental data about waves, tides, and weather are archived annually for each monitoring period to improve the understanding of the shore response to storm events and seasonal changes over the course of a year. Additionally, aerial surveys could be conducted to generate a continuous DEM and aerial imagery for desktop analysis of structures and shoreline position.
Relocate/Managed RetreatIn the absence of human development, coastal ecosystems would likely adapt to SLR by migrating inland, with sediment transport and replenishment from erosion providing some stability during these migrations. Due to human development, migration is impossible and sediment transport is inhibited in many areas. On coastlines around the world, and especially in California, there is a delicate balance between protecting private-property rights by allowing homeowners to defend their properties against rising waters, while protecting natural resources and public access to the coast.
Marin County does not promote mandatory retreat as a near-term solution to SLR. However, adaptation strategies should be developed with long-term consequences in mind, and in some areas homeowners,

70
communities and asset managers will need to take adaptive-management actions that may involve relocation or abandonment of vulnerable assets over time. The county can help facilitate an orderly and voluntary managed-retreat program as a long-term strategy.
Managed-retreat programs involve the purchase or abandonment of properties vulnerable to coastal hazards. Structures are typically demolished or relocated. Properties can be restored to a natural state and used for open space or recreation. As part of a land-exchange or Transfer of Development Rights program, lands of lesser habitat value and hazard vulnerability could be rezoned or made available in exchange for properties in hazard areas, along with equitable financing arrangements. Managed retreat can be incorporated into other adaptation measures; for example, a road realigned inland could be protected by a horizontal levee, which requires a large right-of-way.
The costs for retreat in areas consisting of private property are not well known, but could be approximately estimated by assessing the property value and, if appropriate, the compensation mechanism (e.g. purchase and easement). One of the most difficult elements of this measure is uncertainty over who pays and who benefits, and quantification of benefits. Typically, this measure is part of a strategy that includes public cost to rebuild public infrastructure and compensate private-property owners for their property net the costs associated with shore armoring. Case studies of managed-retreat projects in Ventura and Pacifica, among others, are available on the website of the Climate Adaptation Knowledge Exchange website (www.cakex.org). 37 ESA, 2015.38 Melius and Caldwell. Environment and Natural Resources Law & Policy Program, Stanford Law School. 2015. Cali-fornia Coastal Armoring Report: Managing Coastal Armoring and Climate Change Adaptation in the 21st Century.
Although managed retreat may be the most straightforward method for protecting development under imminent or long-term threat of being damaged, it is often assumed to be technically or financially unfeasible. Often, there is not sufficient space or land available for the structure to be relocated, and the property owner is often responsible for the full cost of the relocation. Accordingly, this approach has been most typically used for public property and by government agencies such as the CSP in this region. 37
Removal and/or relocation of development in vulnerable areas would provide important habitat and recreation benefits, as beaches and wetlands could have space to migrate inland. Armoring prevents ecosystems from migrating inland and cuts off sand supply by preventing natural erosion processes, causing beaches to narrow and eventually disappear. Statewide policies are evolving in response to concerns about the impacts of armoring, essentially moving away from allowing armoring and toward natural infrastructure or managed retreat as a SLR response. The California Coastal Armoring Report38 identifies a conflict between the language in Section 30235 of the California Coastal Act of 1976, which states that the CCC “shall” allow armoring to protect existing structures in danger of erosion, and the overarching goals and objectives of chapter 3 of the Coastal Act, which call for protection of beach access, coastal resources, and scenic views. The need to avoid “maladaptive” protection measures is important to California’s natural resources and public access to the coastline. However, policies must be formulated in a way that reasonably protects private property rights and is legally defensible.
The idea of managed retreat received very

ADAPTATION FRAMEWORK | 71
MARIN OCEAN COAST SEA LEVEL RISE ADAPTATION REPORT
little support from respondents to the West Marin Sea Level Rise Adaptation Poll, and many residents felt strongly that retreat should be voluntary. There are few examples of managed retreat in developed residential areas. A major challenge is that there is very limited space to retreat to in the coastal areas, as most land is protected or unsuitable for development.
The county could identify regulatory constraints that may conflict with SLR adaptation and potential “receiving areas” for a managed retreat program, to prepare for future implementation of this strategy (most likely after storms damage vulnerable development). The County could work with land trust organizations to convert at risk areas to open space, establish transfer of development rights programs, and work with these organizations to conduct ongoing monitoring activities. Similarly, existing open areas can be designated as conservation zones to protect and provide upland areas for wetland and habitat migration or for additional agricultural land.
3.4) Recent, Ongoing, and Anticipated Adaptations Because the coast is a dynamic place and changing conditions are already having impacts on coastal assets, several areas are already making improvements to reduce their vulnerability.
Most recently, homes and businesses along the East Shore have relocated and consolidated their OWTSs in a community system leach field landward, east of Shoreline Highway to maintain functioning systems and to prevent polluting Tomales Bay with wastewater.
In the low-lying areas of Stinson Beach, the Stinson Beach County Water District has and continues to work with property owners to
update underground gravity fed OWTS to include an off switch that triggers during high water events. This will provide short-term improvements; however, when the water is high enough often enough, these systems will become inoperable more frequently, likely prompting a second phase of OWTS adaptation.
Stinson Beach Fire Station No. 2, which will become vulnerable, will likely relocate landward regardless of SLR because larger fire trucks require larger facilities than Fire Station No. 2 can provide.
In June 2014, the Marin County Parks and Open Space (County Parks) began developing a feasibility study and conceptual design plans for a restoration project located at the north end of Bolinas Lagoon that was recommended in the document Bolinas Lagoon Ecosystem Restoration Project: Recommendations for Restoration and Management (2008) and by a scientific design-review group. The project objectives are to alleviate chronic flooding of county and state roadways at the Bolinas Wye, improve the function of Lewis and Wilkins Creeks, enhance riparian and wetland habitats, and allow for future expansion of Bolinas Lagoon as sea level rises. The scope of services was developed in collaboration with the DPW, the GFNMS, Gulf of the Farallones National Marine Sanctuary, Point Reyes National Seashore, and the GGNRA. Given the status of Bolinas Lagoon as a Wetland of International Importance, strong community interest in the lagoon, and the project’s potential to affect the road into Bolinas, CDA staff will refine a community-outreach plan at the time of project initiation.
In March 2015, Marin County Parks made an agreement with the NOAA for the management, operation, maintenance, and repair of a tide gauge at Bolinas Lagoon.

This page is intentionally left blank.


74
4) GovernanceA number of other plans, policies, and laws affect the choices communities and homeowners will be able to make in response to SLR threats. Among these are local hazard and emergency-evacuation plans, land-use and zoning regulations, local assessment districts, and state law governing the state’s jurisdiction over public waterways. All of these must be considered through the process of determining not just the best strategy for the situation but also which option will be allowed under current permitting rules.
4.1) Public Outreach and EducationThe C-SMART process built strong public engagement around planning for SLR and coastal hazards, and a number of community members, stakeholders, and technical advisers suggested priority topics for ongoing public outreach. A few ideas for informational materials to be developed and disseminated to assist property owners are:
Guide to Coastal Zone RegulationsOverlapping and sometimes contradictory regulatory requirements from federal, state, and local agencies can make project applications a lengthy and expensive process for property owners. Due to nuances in location, conditions, project type, etc., there is no simple or general answer for permit requirements. Getting a planning permit is usually only one step in the development process; other permits may be necessary, and utilities and other services must be provided. Multiple public agencies work together during the permit process, each specializing in their field of expertise.
Amendments to the Local Coastal Program (LCP), further discussed in the next section, attempt to facilitate property owners’ efforts to protect their homes. In addition
to information available at the county’s LCP website and at the CDA planning counter, the county can provide further guidance to navigating coastal regulations through targeted outreach materials. The County can develop a process map for navigating the regulatory environment of Marin’s ocean coast, and identify basic information homeowners will need to provide (and potential sources for that information) in order to determine what regulations may apply to their proposed project.
A diagram outlining development requirements for structures in flood-hazard areas is available in the Assets section of this report under section 5.2, “Parcels and Buildings.”
Homeowners’ Guide to Sea Level RiseHomeowners could benefit from a guide and checklist for SLR and storm preparation. For example, the guide could inform property owners about elevating their electrical and mechanical systems and openings above high-tide levels; ensuring that windows, vents, doors, etc., are not below predicted flood levels; and elevating and floodproofing their homes to avoid threats from temporary flooding. Improvements to roofing, siding, and other home-exterior materials can reduce sensitivity to high wind and wave impacts during storms.

GOVERNANCE | 75
MARIN OCEAN COAST SEA LEVEL RISE ADAPTATION REPORT
4.2) Emergency ManagementEmergency preparedness is a key element of managing flood risks in vulnerable areas. Some steps the county and its partners can take to help citizens prepare for disasters, which will be magnified by the onset of SLR, include
• Ensure that emergency staging locations are not sited in areas subject to temporary or permanent flooding or landslides or in tsunami zones or other hazardous areas.
• Support additional emergency-response teams and subsequent resources required for response, recovery, and mitigation, including temporary housing.
• Ensure redundancy through providing alternate routes for emergency evacuation. Relocate vulnerable emergency facilities (e.g., fire stations and emergency generators).
• Distribute information and technical assistance to households on emergency preparedness, response, recovery, and mitigation protocols.
Local Hazard Mitigation PlanThe county’s Multi-Jurisdictional Local Hazard Mitigation Plan (LHMP) is part of an ongoing planning process facilitated by the Sheriff’s OES to meet the requirements of the Disaster Mitigation Act of 2000 to maintain continued eligibility for certain FEMA hazard-mitigation programs. The LHMP is intended to improve the ability to recover after a variety of disasters: earthquakes, fires, floods, tsunamis, and landslides. Once approved by FEMA, LHMP projects are positioned to receive federal funding.
The LHMP both identifies hazards and includes mitigation strategies such as capital-improvement projects intended to protect lives, property, and the environment in times of disaster. Likewise, C-SMART includes two
components: the vulnerability assessment, which identifies assets susceptible to increased SLR, and adaptation plans with strategies to protect these assets. The LHMP, with a five-year planning cycle, focuses on near-term strategies to protect people from current hazards, while C-SMART focuses on strategies to protect people from future hazards. Due to the complementary nature of these efforts, they should be integrated as closely as possible. Some projects stemming from C-SMART are appropriate to consider for integration into a LHMP to position them for federal funding.
4.3) Local Assessment DistrictsLocal assessment districts, such as community services districts (CSD), geologic hazard abatement districts (GHAD), or similar neighborhood-level entities could enable communities to pool resources to obtain insurance coverage, conduct a local coastal-hazards analysis, and fund local risk-reduction and adaptation measures (e.g., raising private roads).
A CSD is typically formed to provide water, sewer or garbage services, fire protection, public recreation, street lighting, mosquito abatement, police services, library services, street improvements, conversion of overhead electric and communication facilities to underground locations, ambulance services, airport facilities, and transportation services. The board of directors may consist of three or five members elected at large, or may be the Board of Supervisors.
A GHAD is an independent, state-enabled public agency that oversees geologic-hazard prevention, mitigation, abatement, and control. GHADs may offer an effective means to mitigate the effects of future sea level rise. By accumulating a reserve for future maintenance and rehabilitation, a GHAD can provide the financial resources necessary for

76
potential future expansion of flood-control structures. However, no current examples of using a GHAD as a mechanism for financing SLR adaptation measures exist.
The county can support property-owners’ efforts to form local entities to plan and implement adaptation measures.
4.4) Interagency Governmental CollaborationCounty government departments and local service providers should maintain working relationships with state agencies to identify plan amendments and projects in support of SLR preparation. Building on relationships developed during the LCP amendment, Vulnerability Assessment, and C-SMART TAC, SLR task forces can be formed to advance the recommendations of this study. Subgroups can be developed to focus on assets that should be addressed on similar time frames. For example, adaptation strategies for homes may be considered on a shorter time frame than those for public utilities and roadways.
In 2008, Executive Order S-13-08 required the state Natural Resources Agency to prepare California’s first climate-adaptation strategy, which was released in 2016 as Safeguarding California: Implementation Action Plans. State agencies such as the CCC, the State Lands Commission, the Office of Planning and Research, Caltrans, CSP, and the DFW have collaborated throughout this effort. Federal agencies such as the NPS, FEMA, and the Environmental Protection Agency (EPA) are also developing adaptive responses to SLR. The county will continue to coordinate adaptation planning with other jurisdictions through regional networks such as the California Coastal Adaptation Network, the Coastal Hazards Adaptation Resiliency Group, Coastal Resilience, the Bay Area Regional Collaborative, and the Alliance of Regional Collaboratives for Climate Adaptation.
Transportation infrastructure and utility systems especially require a long-term and coordinated management approach. As the county and Caltrans move forward with adaptation planning and capital-improvement projects, it will be important for them to collaborate with other local and state agencies as well as private-property owners and to consider cost efficiencies and multiple benefits to other vulnerable infrastructure when planning for adaptation of the transportation system. For example, the findings of the vulnerability assessment could help inform a Caltrans climate-vulnerability study for District 4, similar to the pilot assessment for District 1.
Resilient infrastructure can be financed through creative means such as infrastructure-financing districts and tax-increment financing. County staff should continue to explore best practices from other regions and work with community groups to identify projects that may qualify for state or federal assistance.
4.5) Land Use and Zoningin April 2016 the County Board of Supervisors adopted Amendments to the LCP revising policies governing development in the Marin County Coastal Zone, which includes all the West Marin communities mentioned in this report. These policies are subject to change through the Coastal Commission’s LCP amendment process. Following is an abridged summary of county-proposed LCP policies related to environmental hazards, including sea level rise.
• New development must be safe and must not contribute to hazards.
• Coastal permit applicants assume liability for property damage from environmental hazards and acknowledge that future shoreline armoring is prohibited.

GOVERNANCE | 77
MARIN OCEAN COAST SEA LEVEL RISE ADAPTATION REPORT
• Development in flood-hazard areas must comply with existing FEMA standards, plus additional elevation to accommodate potential SLR. Structural modifications consistent with identified standards shall be facilitated through a streamlined permitting process such as coastal-permit exemptions and categorical exclusions when consistent with the requirements of these exemptions or exclusion orders.
• Ensure that new blufftop development is safe from bluff retreat and other coastal hazards without a reliance on shoreline protective devices.
• Ensure that new shoreline development is safe from shoreline erosion and flooding hazards, taking into account 3 feet of projected SLR. New development must be designed to be relocated and/or removed before new shoreline protection is needed.
• Ensure proper drainage for any development on blufftop parcels.
• Prohibit structures on bluff faces, except for public-access structures where no feasible alternative means of public access exists.
• For new development within flood-hazard areas, building floor elevation must be high enough to accommodate flood levels identified by FEMA 2015 Base Flood Elevation (BFE) and from an SLR scenario of 3 feet, shown on maps of potential SLR to be prepared and adopted by the county.
• For new development within flood-hazard areas, the maximum allowable building height shall be 25 feet above grade or 15 feet above the minimum floor elevation, whichever is greater. Where development consists solely of raising an existing structure to meet FEMA and SLR standards, a building height of up to 30
feet above grade may be allowed through the coastal-permit process, subject to conditions of approval prohibiting future increases in the height, mass, and bulk of the structure.
• For new development within the Seadrift subdivision located in the FEMA special flood-hazard area (Zone V), measure the maximum allowable building height of 15 feet from the minimum required floor elevation.
• Within flood-hazard areas, allow existing legal nonconforming buildings that are encroaching into a required yard setback to be raised without the need for a variance, as long as the extent of the encroachment is not extended.
• Discourage shoreline protective devices in the Marin County Coastal Zone, and encourage their removal and site restoration where feasible, due to their coastal-resource impacts. Allow the construction, reconstruction, expansion, and/or replacement of a shoreline protective device only if a number of criteria are met to prevent environmental damage, and for a period specified by the coastal permit. Shoreline protective devices shall be required to mitigate impacts to shoreline sand supply, public access and recreation, and any other relevant coastal-resource impacts.
• Ensure that the design and construction of any shoreline protective device shall minimize impacts to the natural environment and public access.
• Accessory structures in hazardous areas are allowed only if consistent with other LCP policies, sited no closer than 5 feet from the edge, designed to be movable, relocated when threatened by erosion, and not protected by a shoreline protective device.

78
• Public-access facilities, including walkways, overlooks, stairways, and/or ramps, may be allowed within the shoreline or blufftop setback only if they are consistent with all other applicable LCP policies; are sited and designed to be easily removable; and will not cause, expand, or accelerate instability of a bluff.
• Prohibit the division of land near the shoreline, including bluffs, areas abutting the ocean, bays, lagoons, or other coastal water bodies, unless the new or reconfigured parcels can be developed in a manner safe from geologic and other hazards, and only if shoreline protective devices are prohibited.
• To minimize visual and shoreline sand-supply impacts, require that any permit granted to construct a shoreline protective device include the reestablishment of the preexisting dune contour and appearance, where applicable and feasible.
• Encourage property owners subject to ocean-front erosion hazards to develop individual and/or collective responses to such hazards prior to emergency conditions.
• Emergency shoreline protective devices may be approved on a temporary basis only and require removal of the structure unless a regular coastal permit is approved.
• The county will consider the best available recent scientific information with respect to the effects of long-range SLR when establishing SLR maps, scenarios, and assumptions for use in geologic, geotechnical, hydrologic, and engineering investigations, including the coastal-hazards analysis. Support scientific studies that increase and refine the body of knowledge regarding potential SLR in Marin, and possible responses to it. LCP
policies related to SLR shall be reevaluated and modified and readopted as necessary through an LCP amendment in 2026.
• Building on the C-SMART Vulnerability Assessment, continue to gather information on the effects of SLR on the county’s Marin County Coastal Zone shoreline, including identifying the most vulnerable areas, structures, facilities, and resources.
• Update maps charting potential sea level rise every 5 years or as necessary to allow for incorporation of new SLR science, monitoring results, and information on coastal conditions.
• Research the potential for relocation of existing or planned development to safer locations. Explore the feasibility of a managed-retreat program, which may involve protecting vacant land through zoning or conservation easements and/or removing development from areas vulnerable to SLR and restoring those areas to a natural state for open space or recreation. Evaluate possible receiver sites and identify potential mechanisms and incentives for implementation. Work with entities that plan or operate infrastructure, such as Caltrans and PG&E, to plan for potential realignment of public infrastructure impacted by SLR, with emphasis on critical accessways, including affected segments of Shoreline Highway and Sir Francis Drake Boulevard.
• Support efforts to monitor SLR impacts to natural resources and habitat areas, including Bolinas Lagoon, Tomales Bay, Estero de San Antonio and Estero Americano and other wetland areas; and Lagunitas, Walker, Estero Americano, Dillon, Stemple and other creeks; rocky intertidal areas, beaches and other habitat types vulnerable to SLR. Collaborate with

GOVERNANCE | 79
MARIN OCEAN COAST SEA LEVEL RISE ADAPTATION REPORT
the GFNMS, the Tomales Bay Watershed Council, and other local, regional, state and federal entities to establish monitoring methods and track the effects of SLR.
• Promote green infrastructure pilot projects (horizontal levees, dune restoration, etc.) with environmental benefits that may help protect assets from SLR and increased storm surges. Study and monitor such projects over time and share lessons learned with other jurisdictions.
• Update mapping information for Environmentally Sensitive Habitat Area (ESHA) buffers and setbacks to account for SLR, based on the best available science and considering the effects of shoreline development on landward migration of wetlands.
• Support efforts to develop and implement innovative design alternatives to elevating structures that would reduce or eliminate flood damage. Measures would need to be adopted by FEMA to qualify as acceptable alternatives to elevation under the National Flood Insurance Program (NFIP). Such alternatives could include wet or dry floodproofing, flood gates, drainage improvements, amphibiation, etc. Encourage homeowners to implement voluntary floodproofing measures in conjunction with development that would not otherwise be required to be elevated.
• Update other relevant sections of the LCP to support SLR adaptation measures:
Biological resources• C-BIO-9: Prohibit development that
would adversely impact natural sand-dune formation and sandy beach habitat.
Community Design• C-DES-4: Refer to Environmental
Hazards policies regarding building heights for structures elevated in response to flood hazards.
Community Development• C-CD-5: Refer to Environmental Hazards
policies regarding building heights for structures elevated in response to flood hazards.
• C-CD-6: Acknowledge that SLR will cause the public trust boundary to move inland. The State Lands Commission may require structures or debris to be removed in the event that they encroach on state tidelands.
Transportation• C-TR-3: Address impacts of SLR on
Shoreline Highway.
Historic and Archaeological Resources• C-HAR-1: Maintain information on
historic and archaeological resources that may be impacted by SLR.
• C-HAR-6: Provide standards for altering historic structures.
• Develop additional C-EH policies to address impacts associated with elevation of development along the shoreline. Policies may include mitigation of coastal-resource impacts over time, removal and restoration triggers, public-trust triggers, and policies to address continuation of public and/or private services.
• Analysis of increased erosion potential and shoreline retreat is included in the vulnerability assessment. The coastal erosion-hazard maps present the results of models that predict the geomorphic evolution of cliffs, beaches, and marshes. Update the shoreline-retreat analysis every 5–10 years or as needed.

80
4.6) Public Trust DoctrineThe common law public-trust doctrine requires the State of California to hold its sovereign lands—such as tidelands and submerged lands and the beds of navigable waterways—for the benefit, use, and enjoyment of the public.39 Tidelands are defined as lands that fall between the mean high and low-tide lines. The mean high tide line is the intersection of the shoreline with the elevation of the average of all high tides calculated over an 18.6-year tidal epoch.40
In a majority of cases, tidelands are owned by the State of California and managed by the State Lands Commission to promote and enhance the statewide public’s enjoyment of the lands and ensure appropriate uses of public-trust lands. Even where tidelands have been granted to private parties or local governments, the state generally retains a public-trust easement and may limit the use of such tidelands.
As a common law doctrine, the courts have significantly shaped the geographic boundaries of sovereign land ownership and the public-trust doctrine.41 One notable case that explains California’s current common law definition of the location and mobility of the landward boundary of tidelands is Lechuza Villas West v. Cal. Coastal Commission 70 Cal. Rptr. 2d 399 (Cal. Ct. App. 1997). Two variables affect the location of the mean high tide line: (1) the height of the mean high tide and (2) the erosion or buildup of the shore. In conjunction with fluctuations in the mean high tide, the natural erosion or buildup of the shore affects the location of the mean high tide line on the shore, especially on a sandy beach.
39 Marks v. Whitney, 6 Cal.3d 251 (Cal. 1971) 40 California Coastal Commission. Sea Level Rise Policy Guidance. August 2015.41 See e.g., People v. California Fish Co. 166 Cal. 576 (Cal. 1913); Oakland v. Buteau, 180 Cal. 83 (Cal. 1919); Borax Consol., Ltd. v. Los Angeles, 296 U.S. 10 (1935); City of Long Beach v. Mansell, 476 P.2d 423 (Cal. 1970); Lechuza Villas West v. Cal. Coastal Commission 70 Cal. Rptr. 2d 399 (Cal. Ct. App. 1997).
The boundary between state-owned tidelands and private or publicly owned uplands—the mean high tide line—is anticipated to continue shifting landward due to sea-level rise, affecting coastal land-ownership boundaries in many circumstances. In the absence of human development, coastal ecosystems would likely adapt to sea-level rise by migrating inland, with sediment transport and replenishment from erosion providing some stability during these migrations. However, due to human development, migration is impossible and sediment transport is inhibited in many areas, thus negatively impacting the public’s interest in tidelands. State and local governments are currently determining the best way to mitigate these negative impacts of human land use by utilizing the broad authority to protect tidelands under the public-trust doctrine. The county has determined that the best way to mitigate these negative impacts is to implement the policies outlined in this report.
Accelerating SLR will likely lead to more disputes over shoreline property boundaries. These disputes will affect determinations about what kinds of structures and uses may be allowed or maintained in areas that, because of SLR, either are already seaward of the mean high tide line, are likely to become seaward of the mean high tide line in the future, or would be seaward of the mean high tide line if not for artificial alterations to the shoreline.
California case law does not explicitly address how shoreline structures that prevent inland movement of the mean high tide line affect property boundaries, if at all. The U.S. Court

GOVERNANCE | 81
MARIN OCEAN COAST SEA LEVEL RISE ADAPTATION REPORT
of Appeals for the Ninth District, however, has interpreted federal common law as allowing the owner of tidelands to bring a trespass action against a neighboring upland property owner who built a revetment that prevented the natural inland movement of the mean high tide line. The court ruled that the actual property boundary was where the mean high tide line would have been if the revetment were not there, and that the owner of the tidelands could require the upland owners to remove the portions of the revetment that were no longer located on the upland owners’ properties. (United States v. Milner [9th Cir. 2009] 583 F.3d 1174, 1189-1190.)42
The Ocean Protection Council (OPC) is charged with coordinating all state coastal and ocean management agencies in discussions around coastal land use and SLR. The creation of the OPC as a coordinating body was intended to improve governance of coastal and ocean ecosystems. The Safeguarding California Plan calls on the OPC to assist the State Coastal Leadership Group on Sea-Level Rise in “address[ing] the issue of changing boundaries between public trust lands and private lands” and “[d]escribing a range of tools that can be utilized to reduce risk while maximizing conservation of natural resources and public access, consistent with the public trust doctrine”43. The relationship between SLR and public trust is dynamic and may evolve.
As mentioned previously, the general rule of state sovereignty in tidelands does not apply in all areas. In some parts of Tomales Bay, private ownership of the tidelands extends below the mean high tide line under patents issued pursuant to authority of the California legislature. These private-property owners own fee title to the tidelands that 42 California Coastal Commission. Sea Level Rise Policy Guidance. August 2015.43 California Natural Resources Agency. Safeguarding California: Reducing Climate Risk. July 2014.44 Marks v. Whitney, 6 Cal.3d 251 (Cal. 1971).
are within the deeded property boundaries, but the state owns any submerged lands below the mean low water line. Generally, the State Lands Commission requires leases for private piers or other improvements that extend either over submerged lands or in tidelands beyond the patented property boundaries. Additionally, the state retains its public trust easement over all privately owned tidelands.44
Home in Marshall on Tomales Bay.
4.7) County Permitting AgenciesMarin County is widely regarded as one of the most desirable areas to live in the Bay Area, with natural open areas, safe communities, high-quality schools, and proximity to urban life. The CDA’s Planning Division regulates real estate development in the unincorporated areas of Marin by requiring property owners to obtain permits and meet certain standards. We understand that the county’s planning process can be daunting at first, which is why an application guide has been created, available on the county’s website.
Getting a planning permit is usually only one step in the development process; other permits may be necessary, and there are utilities and other services that must be provided. Multiple public agencies work

82
together during the permit process, each specializing in their field of expertise. The key agencies and their roles in the development process are briefly discussed below.
The Planning Division reviews planning-permit applications, such as those for variances, conditional-use permits, and subdivisions, to ensure that projects are consistent with the county’s policies and regulations.
The CDA’s Environmental Health Services Division reviews applications for individual sewage disposal systems and water wells, and conducts restaurant inspections, among other services.
The Department of Public Works (DPW) reviews site-preparation details of development projects, including grading plans, drainage plans, retaining walls, parking requirements, and circulation requirements. The DPW also reviews applications for creek permits, dam permits, encroachment permits, and grading permits.
The county tax assessor’s office is involved when modifications to lot lines are made and when lots are created or eliminated.
The CDA’s Building and Safety Division is administers the provisions of the California Building Standards Code by providing plan-check and building-inspection services.
The various fire districts and departments throughout the county are involved with ensuring emergency access, safe construction practices, and vegetation management.
Special districts, such as water and sanitary districts, and utility companies are responsible for connecting development to infrastructure.
This list is intended to assist property owners, business owners, and community members to better understand the review process for planning permits. Preparation is the key to success. It’s a good idea to be familiar with the possible costs and requirements for permits or hook-ups from all the relevant public agencies. It is their responsibility to gain an understanding of all the requirements that apply and how to meet them before beginning a project.
Several of Marin County's departments are housed in the Marin County Civic Center, a Frank LLoyd Wright building erected in the 1960s, in San Rafael.

83

84
5) Asset AdaptationThis section looks at assets spanning the eight categories from the Vulnerability Assessment: parcels and buildings, transportation, utilities, working lands, natural resources, recreation, emergency services, and historic and archaeological resources Within each asset category, strategies are presented that apply to that asset type. The “Strategy Options–All” section below precedes the specific asset categories and includes strategies applicable to all eight asset categories.
Adaptation strategies presented in this section were reviewed by Marin County staff and technical and stakeholder advisers and could be feasible and worth exploring further for the Marin coast. The report intentionally includes alternatives that may be difficult to permit under current conditions, since the regulatory climate is subject to evolve and adapt with climate change. The goal is to identify a wide range of reasonable and effective alternatives.
The options are intended to address hazards to built and natural resources, for the near, medium, and long term. These collective efforts are intended to be part of an iterative adaptation management strategy. The strategies are presented in a format consistent with the organization of the Local Coastal Program.
Building on broad strategies previously mentioned (accommodate, protect, relocate, and managed retreat), these options have been suggested through the C-SMART process to date. This section organizes such options in matrices under each of the eight asset categories. Draft spreadsheets had been compiled by CDA staff with adaptation options from staff’s literature reviews, public workshops, and the adaptation poll.
Spreadsheet columns (consistent with the products of the GFNMS Working Group) include the approach, potential management action, spatial or site-specific details, time frame, impacts addressed, potential partners, required resources, and other asset categories. Potential management actions include the spectrum of adaptation activities that could be undertaken in West Marin to help minimize, avoid, and/or mitigate SLR and storm impacts. General approaches include outreach, plan, policy, coordination, management, monitoring, and inventory. These ideas are not staff recommendations or in any way endorsed by the county, but simply a collection of options suggested through the C-SMART process that merit further consideration. Strategies are listed as ‘priority action’ based on recommendations of individual TAC and/or SAC members. The compilation of options is not intended to be viewed as a plan, as not all strategies identified are currently feasible, and in some cases may conflict with one another. However, they provide a basis for discussion as the county and partners move forward to address the problems associated with increasing SLR as outlined in the “Next Steps” (pages 14–15).

ASSET ADAPTATION | 85
MARIN OCEAN COAST SEA LEVEL RISE ADAPTATION REPORT
5.1) Strategy Options – AllPriority ActionsThe following are the top priority actions for consideration, with additional actions in the table below: Near Term/OngoingA-1) Explore the feasibility of experimental
and innovative coastal-protection options, and where possible implement demonstration projects, including constructed wetlands and horizontal levees, offshore reefs and native oyster beds, and dune restoration and beach nourishment. Evaluate the effectiveness of such projects to inform future efforts across the region.
Possible Locations: Offshore, Muir Beach, Stinson Beach, Bolinas Lagoon, Tomales Bay, Dillon Beach Potential Key Partners: CDA, GFNMS, NPS, DFW, universities, CCC, SCC, COS, property owners Necessary Resources: Staff, partners, financial resources, agency coordination
A-2) Participate and support existing local community programs, including but not limited to education, outreach, and emergency preparedness, that promote community resilience.
Possible Locations: West Marin Communities Potential Key Partners: CDA, community groups Necessary Resources: Staff, community

86
Table 8. Additional Sea Level Rise Adaptation Strategies
# Approach Potential Management Action Example Location(s)
Impacts Addressed
Potential Partners
Required Resources
Other Assets Notes
NEA
R/O
NG
OIN
G
A-3 Outreach Continue outreach to vulnerable populations, including multi-lingual outreach to non-English speakers
West Marin Temporary flooding
CDA, local interest groups
Staff, coordination
All
A-4 Protect Maintain existing seawalls and revetments throughout communities to protect existing development
Stinson Beach, Bolinas
Temporary flooding
CDA, local assessment district
Staff, financial resources, materials/supplies
All Could block inland migration of beaches and wetlands
A-5 Protect Implement floodwalls and gates in feasible locations
Stinson Beach, other possible locations
Temporary flooding, wave surge, high wind
CDA, homeowners
Financial resources, homeowner buy-in
All Possible environmental impacts
A-6 Protect Explore the feasibility of floating islands, breakwaters, constructed barrier islands, artificial reefs, or other offshore structures
Offshore Temporary flooding, erosion, wave surge
CDA, NPS, local assessment district, NGOs for funding, CCC, SCC, GFNMS
Staff, financial resources, available land, materials, contractors, permits
All Not allowed under current GFNMS regulations
A-7 Protect Explore the feasibility of coastal armoring (seawalls, revetments, levees breakwaters, groins)
Stinson Beach, Bolinas, Tomales Bay, Dillon Beach
Temporary flooding
CDA, local assessment district, CCC
Staff, financial resources, permits, materials/supplies
All Possible public access and environmental impacts
A-8 Monitor Update best available data as it becomes available
West Marin Temporary flooding
CDA, scientific organizations (e.g., USGS and NOAA)
Staff, funding for scientific research, coordination
All

ASSET ADAPTATION | 87
MARIN OCEAN COAST SEA LEVEL RISE ADAPTATION REPORT
# Approach Potential Management Action Example Location(s)
Impacts Addressed
Potential Partners
Required Resources
Other Assets NotesM
EDIU
M
A-9 Protect Beach nourishment and dune restoration and enhancement
Muir Beach, Stinson Beach, Bolinas, Lawson’s Landing, Dillon Beach
Temporary flooding, erosion, wave surge, high wind
CDA, CSP, NPS, local assessment district, property owners, DFW, CCC
Staff, financial resources, sand, plant material, necessary permits
All
A-10 Protect Enhance and restore living shorelines in sheltered bays
Bolinas Lagoon, Tomales Bay
Temporary flooding,
CDA, NPS, local assessment district, SCC, DFW
Staff, financial resources (e.g., grant funding), fill material, plant material, permitting and
All
A-11 Monitor Assess steep slope and high risk areas
West Marin areas with bluff
Erosion CDA Staff/consultant time, financial resources, equipment
All
LON
G
A-12 Protect Use site-stabilization techniques to prevent beach and bluff erosion, including sloping or grading, vegetation, terracing, riprap boulders or geotextile fabric, low-profile rock
West Marin Erosion CDA, property owners, NGOs for funding
Staff/consultant time, financial resources, equipment
All May have sediment supply impacts

88
5.2) Parcels and BuildingsThe following are top priority actions for consideration (though LCP policy development is still underway):
Near term/Ongoing B-1) Through LCP Environmental Hazards
policies, ensure new development is safe and limit development in hazardous areas. Require property owners to assume and disclose risks from coastal hazards, including impacts from 3 feet of SLR.
Possible Locations: West Marin communities Potential Key Partners: CDA, CCC, property owners Necessary Resources: staff, private time and financial resources
B-2) Require three feet additional elevation of structures in SFHAs in addition to FEMA BFE to accommodate 3 feet of SLR. In areas outside SFHAs that are nevertheless exposed to SLR, the 3-foot building elevation would also be required. The policy would apply when a new or remodeled building requires a coastal permit, based on actual site conditions.
FEMA grant funding for structural elevation could be sought, possibly including the Marin County Structure Elevation Program, a FEMA Hazard Mitigation Grant Program.
Possible Locations: West Marin communities Potential Key Partners: CDA, CCC, FEMA, property owners Necessary Resources: staff, public and/or private funding
Table 9. Exposed buildings (SLR/Storms)May be considered for retrofit or retreat
Community Scenario 1 Scenario 5Stinson Beach 223 660
Bolinas 13 98Inverness 23 75
Point Reyes Station
0 36
East Shore 103 163Dillon Beach 0 5
Other 10 39Total 372 1,076
B-3) Support efforts to develop and implement alternatives to elevating structures that would reduce or eliminate flood damage. Measures would need to be adopted by FEMA to qualify as acceptable alternatives to elevation under the National Flood Insurance Program (NFIP). Such alternatives could include wet or dry floodproofing, flood gates, drainage improvements, amphibiation, etc. Encourage homeowners to implement voluntary flood-proofing measures.
Possible Locations: West Marin communities Potential Key Partners: CDA, CCC, FEMA, property owners Necessary Resources: staff, agency coordination

ASSET ADAPTATION | 89
MARIN OCEAN COAST SEA LEVEL RISE ADAPTATION REPORT
B-4) Develop a “Homeowner’s Guide to Preparing for Sea Level Rise” to help homeowners navigate regulatory system and funding opportunities to elevate or otherwise retrofit homes for SLR and storms. Topics could cover:
• checklist for site-vulnerability analysis, mitigation measures and funding sources for flood and storm preparedness
• county permitting process• coastal permit development
requirements (Figure 9)• agency compliance (FEMA, CCC, etc.)• potential estimated building elevation
increase.
Possible Locations: West Marin communities Potential Key Partners: CDA, FEMA, CCC, property owners Necessary Resources: staff, public outreach materials
B-5) Use Marin Map as a platform to show regulatory boundaries (e.g., FEMA, GFNMS, CCC jurisdiction, categorical exclusion), county-developed maps showing potential SLR and other existing coastal-hazard boundaries.
Possible Locations: West Marin Potential Key Partners: CDA, CCC, FEMA, GFNMS Necessary Resources: staff, agency coordination, Marin Map
B-6) Conduct a comprehensive finished floor elevation inventory to fully assess West Marin building vulnerabilities.
Possible Locations: West Marin communities Potential Key Partners: CDA, DPW Necessary Resources: staff, intern, or volunteer time
B-7) Explore the feasibility of programs (incentives, transfers of development rights, acquisition or buyout) and potential receiving sites to relocate existing vulnerable development.
Possible Locations: West Marin communities Potential Key Partners: CDA, NPS, CSP, Marin Agricultural Land Trust (MALT) Necessary Resources: staff, legal coordination, precedents, upland property
ADAPTATION AND MITIGATION of Older Buildings
In addition to allowing communities to remain intact, continued use of older buildings has environmental benefits. Retrofitting existing homes through elevation and floodproofing can extend their lives in the face of SLR and increased storms, thus avoiding the immediate need for new construction. Building reuse is almost always less environmentally taxing then new construction, and it can take 10 to 80 years for a new building that is 30% more energy efficient than an average performing existing building to overcome negative climate impacts from construction.1 Materials production and transport, building construction, and demolition waste disposal all yield environmental impacts, which could be avoided through preserving/protecting existing buildings.
1 National Trust for Historic Preservation. 2011. The Greenest Building: Quantifying the Environmental Value of Building Reuse.

90
# Approach Potential Management Action Example Location(s)
Impacts Addressed
Potential Partners
Required Resources
Other Assets NotesN
EAR/
ON
GO
ING
B-8 Protect Protect bluffs with armoring Bolinas Temporary flooding, inundation, erosion, wave surge, high wind
CDA, local assessment district, CCC
Staff, financial resources, materials and supplies
Transportation, utilities
B-9 Accommodate Retrofit homes for high wind and wave protection through
deep pilings (also for seismic retrofitting)reinforcing garage doorsprotecting windows and doors with coversstrengthening wall systemssite preparations, including removal of dead branches and potential windborne projectilesroof and siding improvementsrebuilding or reinforcing foundation to address flood loads (e.g., add interior piers, bracing, or tensile strengthening)
Stinson Beach, Bolinas, Dillon Beach
Wave surge, high wind
CDA, home and business owners, FEMA
Staff, private time and financial resources
Utilities
B-10 Accommodate Ensure that windows, vents, doors, etc., are not below predicted flood levels
Vulnerable properties in Stinson Beach, Bolinas, Inverness, East Shore
Temporary flooding, inundation
CDA, FEMA, homeowners
Staff, private time and financial resources
Utilities
B-11 Outreach Develop homeowner lookup table for residents to look up, for permitting purposes, the projected flood depth of their property
Countywide Temporary flooding, inundation
CDA Staff, web page, technical assistance
Table 10. Additional Sea Level Rise Adaptation Strategies

ASSET ADAPTATION | 91
MARIN OCEAN COAST SEA LEVEL RISE ADAPTATION REPORT
# Approach Potential Management Action Example Location(s)
Impacts Addressed
Potential Partners
Required Resources
Other Assets NotesN
EAR/
ON
GO
ING B-12 Inventory Develop trigger for flood impacts—
at what frequency of flooding does the community and affected agencies feel that action should be taken and do homeowners feel that it is no longer acceptable?
Stinson Beach, Bolinas, Inverness, Point Reyes Station, East Shore
Temporary flooding, inundation, erosion, wave surge, high wind
CDA, academic partners, community members
Staff, partner participation, methods and processes, stakeholder participation
Transportation, utilities
MED
IUM
B-13 Accommodate Explore the feasibility of adapting to houseboats, and, if possible, move forward
Inverness, East Shore
Inundation CDA, CCC, property owners
Private time and financial resources, permitting, policy changes
Utilities
B-14 Protect Construct low-profile sand-covered seawall from end of existing Seadrift revetment toward southeast end of beach
Stinson Beach
Temporary flooding, inundation, erosion, wave surge, high wind
CDA, local assessment district, CCC
Staff, financial resources, materials and supplies
Transportation, utilities
B-15 Accommodate Limit basements and first floor habitable spaces
Stinson Beach, Bolinas, Inverness, Point Reyes Station, East Shore
Temporary flooding, inundation
CDA, homeowners
Private financial resources , design guidelines
Utilities
B-16 Retreat Explore the use of conservation or rolling easements (policies that allow coastal lands and habitats to migrate landward overtime)
Stinson Beach, Bolinas, Inverness, Point Reyes Station, East Shore
Temporary flooding, inundation, erosion, wave surge, high wind
CDA, CCC, SCC, property owners
Staff, legal coordination, precedents and examples
Transportation, utilities

92
Figure 9. Coastal Permit Development Requirements Based on Height, Square Footage, and Location.

ASSET ADAPTATION | 93
MARIN OCEAN COAST SEA LEVEL RISE ADAPTATION REPORT
Figure 9 (continued). Coastal Permit Development Requirements Based on Height, Square Footage, and Location.

94
Design Principles West Marin is a region encompassing communities and environmental areas as diverse and noteworthy as anywhere in the country. Steeped in a long tradition of conservation and environmental consciousness, West Marin nevertheless finds itself vulnerable in the coming years to SLR and fluctuations in weather patterns.
West Marin features a wide range of geographic and built contexts, and community aesthetics including building facades, architectural styles, and scale, that collectively contribute to the region’s identity. Changes to the built environment must therefore be carefully designed and formulated, maintaining the overall community appearance that draws and retains residents and visitors alike.
Although a number of retrofitting strategies exist to address anticipated concerns of flooding and changes in water level, a concentrated effort to uphold local character and community culture must work in tandem with such projects. This set of design principles can be utilized to ensure homes and buildings are geared to address SLR as well as preserve community characteristics.
These principles were drafted by staff following the February 2016 Resilient Stinson Design Charrette. This event articulated community character descriptors and helped staff and project partners better understand unique and diverse attributes of the community that contribute to its sense of place.
Preservation of Small-Town characterFrom Muir Beach’s tight bluff-top neighborhoods to Inverness’ bay shore community, West Marin towns are a unique collection of coastal areas characterized by welcoming residents and a deep-seated pride in community history. Homes differ significantly and include Stinson Beach’s stretch of elevated beachfront homes as well as Dillon Beach’s more traditional cul-de-sacs. Throughout these areas, however, is a desire to preserve and maintain a small-town feel and culture. Consequently, all infrastructure projects and even home renovations should take into consideration their impact on the overall community character and remain compatible with the small-town look and feel.

ASSET ADAPTATION | 95
MARIN OCEAN COAST SEA LEVEL RISE ADAPTATION REPORT
Relationship to NatureWest Marin is situated in an incredibly diverse environmental area, encapsulating a range of unique ecosystems and microclimates. Stretches of open space including nationally recognized beaches and wetlands provide both recreational opportunities and native flora and fauna habitat. These natural resources are deeply embedded in local culture, reflecting the county’s long heritage of open-space appreciation, and residents generally value the close connection to nature. Retrofitting should maintain buildings’ relationship to environmental features such as the beach and coast as closely as possible.
Diverse styles and appearancesWest Marin communities such as Stinson Beach have been described by residents as “funky” and “eclectic” due the diversity of buildings. Homes, even if adjacent to one another, vary significantly in features, including roof shape, building heights, textures, details, colors, landscaping, and more. Thus, visual compatibility from one home to the next currently does not exist, and therefore not critical to maintain existing character and sense of place, and may not even be possible.
Minimize IntrusivenessRetrofitting systems and techniques such as stilts, floodgates, and floodwalls have the potentially to be aesthetically intrusive, which could detract from sense of place, community characters, and/or property values. To the fullest extent possible, structures should be modified in ways that protect them from future flood events while minimizing any negative visual impacts. Mitigation techniques, such as screening, panels, vegetation, landscaping, that soften or avoid such impacts, could be integrated, and unnecessary retrofitting (e.g., excessive elevation) should be avoided altogether.

96
Home Retrofitting OptionsCurrently, elevation is the only technique permitted under the county’s floodplain ordinance. Elevation is a viable approach for protecting units from structural damage and allows communities in West Marin to remain intact as economic and social hubs. However, a number of drawbacks exist, including costs, possible Americans with Disabilities Act accessibility challenges, and potential aesthetic and community-character impacts.
As elevation may not be feasible in every situation, other alternatives must be explored to protect life and property. Given that communities and homes in West Marin vary significantly in size, architectural style, and flood-zone classification, it is worth considering an array of retrofitting methods that cater to specific needs.
Alternative strategies outlined in this section are intended to be site-specific and may not represent long-term, singular solutions, given uncertainties in SLR projections and the anticipated life span of homes. Despite this, these strategies merit consideration as near-term alternatives and could be combined with other strategies that consider regional and communitywide policies. Financial incentives are also factors, as some methods may be eligible for assisted funding or reduced flood-insurance premiums. Unless indicated otherwise, cost estimates in this section come from FEMA and may be inconsistent with the county’s estimates in other parts of this report.
In unincorporated areas, the county’s CDA regulates development, requiring permits and certain standards to be met. Specifics will vary depending on the nature and extent of development.
Typical West Marin dwelling units are one- or two-story wood-frame structures, and all retrofitting strategies presented in this section are structurally feasible for such types of homes. Strategies for structures built with other materials (e.g., brick or stone masonry) or structures taller than two stories are not outlined here. This section is intended to provide only a general overview of options, and more details about several of these options and others can be found in the following FEMA manuals:
• Floodproofing Non-Residential Structures. FEMA 102 / May 1986.
• Above the Flood: Elevating Your Floodprone House. FEMA P-347 / May 2000.
• Selecting Appropriate Mitigation Measures for Floodprone Structures. FEMA 551 / March 2007.
• Engineering Principles and Practices of Retrofitting Floodprone Residential Structures. FEMA P-259 / January 2012.
• Homeowner’s Guide to Retrofitting: Six Ways to Protect Your House from Flooding. FEMA P-312 / June 2014.
• Reducing Flood Risk to Residential Buildings That Cannot Be Elevated. FEMA P-1037 / September 2015.

ASSET ADAPTATION | 97
MARIN OCEAN COAST SEA LEVEL RISE ADAPTATION REPORT
Table 11. Building Retrofitting Options45
Construction Type Existing Foundation
Measure Retrofit Relative Cost
Frame, Masonry Veneer, or Masonry
Crawlspace or Basement
Wet Floodproofing Wet floodproof crawlspace to a height of 4 feet above lowest adjacent grade or wet floodproof unfinished basement to a height of 8 feet above basement floor
Lowest
Highest
Masonry Veneer, or Masonry
Slab-on-Grade or Crawlspace
Dry Floodproofing
Dry floodproof to a maximum height of 3 feet above lowest adjacent grade
Frame, Masonry Veneer, or Masonry
Basement, Crawlspace, or Open Foundation
Barrier SystemsLevee constructed to 6 feet above grade or floodwall constructed to 4 feet above grade
Frame, Masonry Veneer, or Masonry
Basement, Crawlspace, or Open Foundation
Elevation
Elevate on continuous foundation walls or open foundation
Frame, Masonry Veneer, or Masonry
Basement, Crawlspace, or Open Foundation
Relocation
Elevate on continuous foundation walls or open foundation
Frame, Masonry Veneer, or Masonry Slab-on-Grade
Elevation
Elevate on continuous foundation walls or open foundation
Frame, Masonry Veneer, or Masonry Slab-on-Grade
Relocation
Elevate on continuous foundation walls or open foundation
Frame, Masonry Veneer, or Masonry
Slab-on-Grade, Crawlspace, Basement, or Open Foundation
Demolition
Demolish existing building and buy or build a home elsewhere Varies
45 FEMA. 2014. Homeowner's Guide to Retrofitting

98
RelocationRelocation includes moving houses to higher grounds, either to another location on the same property or to a new property altogether. Abundant land for mass relocation is likely not present in all West Marin communities, but specifics are still outlined below for consideration. Where flood hazards are most severe or in areas that could be subject to future severe flood hazards, relocation may be particularly appropriate.
Process The basic process includes jacking homes and placing them on wheeled vehicles for delivery. At the new site, the house is installed on a new foundation and connected to utilities.46
ApplicationWhile one-story houses are easiest to move, larger houses of all types can be relocated, though masonry home relocation is costlier. Home contents can often remain in place. Routes should be charted in advance and narrow roads and overpasses can be restrictive.
FEMA Compliance FEMA considers relocation the most effective retrofitting method.47
Home Relocation.
Credit: Galveston Historical Foundation
46 FEMA 1998. Homeowner’s Guide to Retrofitting47 Ibid.48 Ibid.
Table 12. Relocation Costs48:Construction Type
Existing Foundation
Cost (per square footprint or house foot-print)
FrameBasement $32Crawlspace $27Slab-on-grade $51
MasonryBasement $49Crawlspace $32Slab-on-grade $61
Other Considerations While relocation can be a permanent solution to move houses out of hazardous areas, it can break up existing communities, thus detracting from local economies and sense of place. Sufficient land must be available for relocation, and infrastructure, including roads and utilities, would need to be in place with sufficient capacity for increased usage. Developable land in West Marin is generally sparse, and therefore community-scale relocation is questionable. Additionally, as West Marin roads are relatively narrow, clearance would likely be a major constraint.
Same home as left image, after relocation. Credit: Galveston Historical Foundation

ASSET ADAPTATION | 99
MARIN OCEAN COAST SEA LEVEL RISE ADAPTATION REPORT
ElevationElevation refers to a technique in which a structure is raised and suspended on a foundation of piles, long columns driven deep into the ground that provide not only stability but also a buffer zone between inhabitable space and floodwaters, thereby protecting it from anticipated floodwater levels. Especially in areas prone to ocean flooding such as along Marin’s Pacific Coast, elevating structures above expected floodwater levels is an effective and proven strategy to combat flooding and ensures homeowners that property and possessions will be safe from not only flooding but also coastal erosion.
Structures are elevated using jacks to meet or exceed the BFE—a measured point that indicates anticipated floodwater levels. Depending on local conditions, environmental factors, and structural considerations, heights typically range from 3 to 15 feet above the ground. Once raised, the structure is placed on a foundation of piles: long columns driven deep into the ground that provide not only stability but also a buffer zone between inhabitable space and floodwaters. The area below can remain exposed or partially enclosed for alternative use as storage or parking.
There are two types of elevation techniques to consider:• Open foundations: The entire structure
is lifted and placed on a new elevated foundation supported by piers, columns, or piles.
• Continuous foundation walls: Only the interior floor of the building is raised above anticipated water levels, and the walls are built up to match the new elevation.
Galveston, Texas home before elevation.
Credit: Galveston Historical Foundation
Galveston, Texas home after elevation. Credit: Galveston Historical Foundation
Continuous foundation wall.
Credit: Galveston Historical Foundation

100
Process1. All utility lines (water, sewage, gas,
electric, phone, etc.) are disconnected, to be re-connected once the elevation process is complete
2. Holes are drilled at regular intervals in the foundation and steel I-beams inserted along the entire span of the structure
3. Hydraulic jacks are used to raise the beams and the structure they’re supporting to the desired height
4. Once the structure has been elevated, a new foundation is constructed and the structure is then lowered and brought to rest upon the new foundation. If enclosed, this foundation will feature flood openings that allow water when water level rises.
Beyond supporting the weight of the structure, the foundation must be able to withstand anticipated wave impacts, water pressure brought on by flooding, debris impact, and erosion.
FEMA compliance Elevation is FEMA’s predominant method for flood protection. Elevating the lowest floor above the BFE can reduce flood-insurance premiums (through NFIP), and flood insurance is required for homeowners with federally backed mortgages. Federal funding may be available for projects that satisfy certain requirements.
Communities that participate in the NFIP must require that new residential buildings, substantially improved residential buildings, and substantially damaged residential buildings be elevated above the BFE to minimize future flood exposure. Required elevation techniques vary from properties in Zone A and Zone V.
Application Continuous foundation walls or open foundation methods can be applied for structures Zone A. These structures are located further inland from coasts, where the chances of prolonged exposure to waves or high-velocity floodwater are lower. The lowest floor must be elevated to be at or above the BFE.
• Eligible neighborhoods include portions of Stinson Beach, Bolinas, Inverness, East Shore, and Dillon Beach.
An open foundation is required for structures in Zone V. These structures are located directly along coastlines, where prolonged exposure to waves or high-velocity floodwaters is expected. The bottom of the lowest horizontal structural member (e.g., floor support beam) must be at or above the BFE.
• Eligible neighborhoods include portions of Stinson Beach, Inverness, East Shore and Dillon Beach.
Buildings in Zone V may not be supported by continuous foundation walls below the BFE. As Zone V is more hazardous due to higher wave impacts, erosion, and more, the continuous walls and supported buildings could be more susceptible to damage.

ASSET ADAPTATION | 101
MARIN OCEAN COAST SEA LEVEL RISE ADAPTATION REPORT
CostsEligible foundation types are categorized based on Zone A and Zone V classification. Estimated costs provided recently from ESA are $140 per square foot (Zone AO and Zone AE)49 and $250 per square foot (Zone V and Zone VE)50, while FEMA’s general estimates from 2007 based on building materials are listed in table 12. It is important to remember that actual home-elevation costs will vary depending on project, BFE, site characteristics, building condition, and other factors.
Table 13. General Estimates of the Unit Costs for Typical Elevation Projects51 Wood frame building on piles, posts, or columns
$36/square foot
Wood frame on con-crete or block foun-dation walls
$32/square foot
Brick Walls $43/square footSlab-on-grade $45/square foot
Note: Above estimates are from FEMA and vary from county estimates. Estimates are intended to provide a general sense of relative costs and should not be used solely as a basis for making home-retrofitting decisions.
Aesthetic Considerations Visual mitigation techniques for pier foundations include lattice screening or breakaway walls that create usable enclosed space. Landscaping could also be used to soften visual impacts, though design techniques can mimic natural conditions, which could include the use of sand dunes and native vegetation. No precedents have yet been identified of places with similar environmental condition and elevated homes that have used such mitigation measures.49 ESA. Personal communications, 2015. 50 ESA. Marin County Coastal Hazards and SLR Adaptation Strategies, 2016.51 FEMA. 2007. Selecting Appropriate Mitigation Measures for Floodprone Structures.
Credit: Galveston Historical Foundation
Other Considerations Accessibility: Elevated homes can cause challenges for people with limited mobility, including elderly and disabled people.Sense of place: Elevating structures may distance residents from a close physical proximity to water, diminishing a highly desirable amenity of beach-front property.Shadow: Elevation can increase shadow impacts to neighboring areas.Views: Elevated homes could block views from neighboring properties.
Credit: Galveston Historical Foundation

102
AmphibiationAn amphibious structure floats on a buoyant foundation when flooding occurs. Unlike houseboats, amphibious structures are built on solid ground and designed to float only when conditions are appropriate. To prevent the structure from floating indiscriminately, the structure is anchored to long piles that serve to guide the structure upward in flood events. Ordinarily, the structures only require 3–5 feet of water to float, depending on weight and design. The flotation system itself can take several forms: specialized concrete, prefabricated pontoons, and Styrofoam held together by a steel frame have all been successfully applied in different contexts.
ProcessFor existing homes, utility lines (water, sewage, gas, electric, etc.) are disconnected, to be reconnected once the flotation system is in place. Utilities are eventually stored in designated compartments (i.e., inside the anchor piles), or redesigned and repurposed to allow vertical extension. The structure is lifted so that a new foundation can be laid underneath. Special buoyancy blocks are incorporated into the foundation to allow flotation. Anchor piles are also drilled and attached to the structure with flexible chains.
ApplicationCurrent designs are not intended for coastal regions subject to storm-surge inundation or wave action with high velocity flow. Rather, amphibiation is intended for homes in non–Zone V conditions and located farther inland from coasts, or adjacent to more sheltered bodies of water, including rivers, creeks, or bays without dramatic waves and not subject to permanent inundation from SLR. Based on building material, amphibiation can be 52 E. English, Buoyant Foundation Project. Personal communication, 2015.53 E. English, “Amphibious Foundations and the Buoyant Foundation Project: Innovative Strategies for Flood-Resil-ient Housing,” paper presented at the International Conference on Urban Flood Management, Paris, November 25–27, 2009, 7 (appendices, 412).
applied to any structure that can be elevated. Amphibiation is not compliant with current FEMA regulations and therefore does not qualify for the NFIP. Regulatory approvals may require variances, as the method is not covered under current local codes.
CostsCosts depend on local environmental contexts, as well as materials used. Generally, building amphibiation can cost 30–60% less than elevation.52 Retrofitting an existing house with a floating foundation costs up to $25,000 compared, with the $40,000 to $60,000 it can cost homeowners to elevate. 53
Aesthetics and local character: As structures remain in place most of the time, amphibiation has little visual impacts.Accessibility: Structures remain low to the ground, except during floods, so flights of stairs are not required, aiding in accessibility.Earthquake: Amphibiation is as yet untested in seismic zones. Lateral stability during seismic events should be engineered by a professional, which will add cost, though this is likely minimal for small structures.
Rendering of home with buoyant foundation Source: Elizabeth English

ASSET ADAPTATION | 103
MARIN OCEAN COAST SEA LEVEL RISE ADAPTATION REPORT
FloodproofingFloodproofing describes techniques designed specifically to reduce or eliminate flood damage to a structure, its contents, and accompanying utilities and equipment. Although these techniques do not completely eliminate the potential for all flood damages, such retrofits can be effective temporary and cost-efficient measures installed without significant intrusion on existing structures and systems. Floodproofing is effective for depths up to 6 feet from seasonal temporary inundation but less applicable to properties subject to permanent inundation from SLR.
There are two types of floodproofing: dry and wet. Dry floodproofing entails making a building watertight and resistant to anticipated flood loads, while wet floodproofing uses construction techniques to intentionally allow areas of the structure to flood.
Dry FloodproofingThe goal of dry floodproofing is to retrofit structures so that they are both impermeable to floodwater and resistant to flood loads. In general, this entails the reinforcement of walls to withstand water and impact forces caused by floating debris and the installation of shields and barriers designed to keep floodwater from entering openings. When successfully applied, dry floodproofing can sustain up to 3 feet of standing floodwater.
Dry floodproofing is especially applicable for commercial buildings that can employ a number of measures and combinations simultaneously. However, because the walls are exposed to floodwaters for an extended period of time, dry floodproofing is practical for residential homes with masonry or poured concrete walls only. Dry floodproofing is also not recommended for homes featuring crawlspace foundations.
Dry floodproofing takes several forms, contingent on the makeup of the existing structure as well as anticipated flood levels.• Sealants: Sealants can be applied to
exterior or interior walls and serve to reinforce structural integrity as well as protect against see page. They can also be applied to utility systems and prevent water intrusion at utility connections. Sealants usually come in the form of lacquers or waterproof paint.
• Flood barriers and shields: Shields and walls constructed of corrosion and rust-resistant aluminum and steel can seal off exterior doors or windows from floodwater. Such shields are either mounted manually prior to imminent flooding or exist on rail or hinged systems that allow for quick and easy installation. Watertight doors can also be installed in interior settings to protect entire rooms.
• Drainage systems: When paired with other techniques such as sealants or floodwalls, drainage systems like sump pumps and backflow valves are an effective way of removing intruding water and allowing existing sewage and water systems to operate even in the event of a flood.
Waterproof paint on bottom few feet of building.

104
Process1. Complete a thorough site and building
evaluation to determine viable options: Structural engineers and licensed professionals will determine whether the existing structure can be cost-effectively retrofitted based on anticipated flood activity, environmental factors, and current structural conditions.
2. Based on recommendations from the site evaluation, appropriate materials and methods will be selected and properly installed.
3. Depending on scope of renovations and retrofitting, utility lines may need to be temporarily disconnected, spaces emptied of contents, or buildings left unoccupied while retrofits are properly installed.
ApplicationDry floodproofing techniques can be applied to any existing structure, residential or commercial, located within A-Zones. In residential applications, however, FEMA states that dry floodproofing is appropriate only for homes with masonry or poured concrete walls.
Furthermore, dry floodproofing is not designed to accommodate floodwaters long term (defined by FEMA as longer than 12 hours) or areas prone to frequent and regular flooding (which may include places subject to increased tidal flooding from SLR). It will also not protect against potential damage from high-velocity flood flow and wave action.
Wall heights must be consistent and in scale with neighboring structures and landscaping.
Aesthetic Considerations Flood shields may not be visually pleasing or in keeping with the overall exterior character of a structure.
54 FEMA 2007. Selecting Appropriate Mitigation Measures for Floodprone Structures
FEMA ComplianceDry floodproofing techniques are prohibited in all V-Zones (coastal areas subject to inundation by the 1 percent annual chance flood event with additional hazards associated with storm-induced waves) and Coastal A-Zones (those subject to inundation by the 1 percent annual chance flood event). In addition, dry floodproofing techniques may not be used to bring substantially damaged or improved residential homes into compliance with community floodplain-management ordinances. Nonresidential and commercial buildings may, however, employ dry floodproofing techniques regardless of existing conditions.
CostsCosts are contingent on several factors, including quality of materials selected, existing structural conditions, and scope of work. Table 14 may be used as a general reference.
Table 14. Cost of Dry Floodproofing54
Waterproofing a concrete-block or brick-faced wall by applying a polyethylene sheet or other impervious material and cover-ing with a facing material such as brick
$3.50/ft2
Acrylic latex wall coating $3.00/ft2
Caulking/sealant—a high-perfor-mance electrometric urethane sealant is recommended
$2.50/lft
Bentonite grout (below-grade waterproofing, 6 feet deep)
$20/lft

ASSET ADAPTATION | 105
MARIN OCEAN COAST SEA LEVEL RISE ADAPTATION REPORT
Other Considerations• Systems require regular maintenance and
testing in order to confirm effectiveness: Materials may need to be replaced over time if effectiveness is shown to have diminished.
• Flood shields may require manual installation, a potentially hazardous activity that may not be feasible without adequate warning.
• Dry floodproofing is typically less costly than other retrofitting methods.
• Home exteriors are still susceptible to damage during floods.
• Dry floodproofing reduces airflow. This can lead to mold and air-quality issues if it is used on walls of enclosed occupied spaces.
Low-tiered flood wall and gate installed at a commercial building in Marinship. Opening allows for
manual insertion of a flood barrier.
Flood wall and gate in masked with landscaping. Credit: E. Doldan Schujman
Wet FloodproofingWet floodproofing is a technique characterized by allowing portions of structures to intentionally flood during temporary flood events, rather than work to keep water out (as in dry floodproofing). Small exposed openings placed at intervals along the foundation wall intentionally allow in water that rises and falls at the same rate as exterior floodwaters. By allowing water to enter the uninhabited areas of the structure, wet floodproofing is designed to counteract water pressure on walls, floors, and supports by equalizing interior and exterior water levels. Once floodwaters recede, the flooded area underneath the structure dissipates accordingly or is pumped out with the aid of a sump pump.
In some instances, the entire first floor of an existing structure can be converted into uninhabitable, floodable space. Especially in areas expecting floodwaters whose levels exceed narrow crawlspaces, an additional story can be constructed, consistent with height limits, to replace the loss of previously habitable space. The retrofitted first floor may then be used for parking or temporary storage and allow for higher floodwater levels.
Utilizing water-resistant materials is also a passive form of wet floodproofing. Traditional materials used in ordinary construction such as carpet, drywall, or plywood are all vulnerable in the presence of standing water. These materials can be replaced in all areas below anticipated water levels with flood damage–resistant materials such as tile, masonry, and non-paper-faced gypsum board that will neither deteriorate nor be damaged if exposed to or submerged by water.

106
Bunker-style coastal homes in Santa Cruz feature elevated ground floors intentionally allowed to flood.
Credit: K & G Adelman.55
Table 15. Flood damage-resistant materials56
Type Acceptable Unacceptable
Structural floor materials
Concrete, naturally decay-resistant lumber, pressure-treated plywood
Engineered wood or laminate flooring, oriented-strand board
Finish flooring materials
Clay tile, ceramic or porcelain tile, terrazo tile; vinyl tile or sheets
Engineered wood or laminate flooring; carpeting, wood flooring
Structural wall & ceiling materials
Brick face, con-crete, cement board, pres-sure-treated plywood, struc-tural lumber
Fiberglass insulation, paper-faced gypsum board, oriented-strand board
Finish wall & ceiling materials
Glass blocks, metal cabinets or doors, latex paint
Wood or particleboard cabinets and doors; non-latex paint; wallpaper
55 Copyright (C) 2002-2017 Kenneth & Gabrielle Adelman, California Coastal Records Project, www.Californiacoastline.org56 FEMA 2014. Homeowner’s Guide to Retrofitting
Process1. Complete a thorough site and building
evaluation to determine viable options: Structural engineers and licensed professionals will determine whether the existing structure can be cost-effectively retrofitted based on anticipated flood activity, environmental factors, and current structural conditions.
2. Based on recommendations from the site evaluation, appropriate materials and methods will be selected and properly installed.
3. Depending on scope of renovations and retrofitting, utility lines may need to be temporarily disconnected, spaces emptied of contents, or buildings left unoccupied while retrofits are properly installed.
Specialized hinged vents are designed to allow water in once specific pressure loads are met Openings incorporated into a garage door allow for entry of water
ApplicationAs structures retrofitted with wet floodproofing techniques are designed to accommodate floodwaters typically limited to 3–5 feet, wet floodproofing is allowed only in Zone A areas. Furthermore, wet floodproofing loses effectiveness if the duration of the flood is longer than one day. Consequently, it cannot be applied where inundation will occur due to SLR.
FEMA compliance Wet floodproofing does not reduce flood-insurance premium rates on residential structures. Wet floodproofing techniques are also largely restricted to uninhabitable areas such as spaces used for parking, accessibility, or storage.

ASSET ADAPTATION | 107
MARIN OCEAN COAST SEA LEVEL RISE ADAPTATION REPORT
Costs Costs are contingent on several factors, including the existing foundation type, scope of work, and local environmental factors. Table 16 may be used as a general reference: Table 16. Costs of Wet Floodproofing57
Height of wet floodproofing (feet above basement floor or low-est adjacent grade)
Existing foun-dation
Cost (per square foot of house floodproofed)
2Basement* $1.70Crawlspace $1.30
4Basement* $3.50Crawlspace $3.25
8Basement* $10.00Crawlspace NA
* Unfinished
Aesthetic ConsiderationsAesthetics: There are minimal aesthetic impacts, as the floodable areas is typically out of view and doesn’t require extensive landscaping or exterior work to mask.
Other Considerations• Wet floodproofing is typically less costly
than other retrofitting methods.• Home exteriors are still susceptible to
damage during floods.• Extensive cleanup may be required once
floodwaters have receded: Excess water may need to be pumped out of flooded area; contaminated sewage, chemicals, or debris may enter the house along with floodwaters.
57 FEMA 1998. Homeowner’s Guide to Retrofitting
Floodwalls, Levees, and Flood Gates• Floodwalls and levees both act as
protective barriers against temporary floodwaters. Floodwalls are built with flood-damage-resistant materials, while levees are made of compacted soil.
• These barriers are usually constructed away from the main buildings along property lines and, unlike dry floodproofing, are designed to combat floods greater than 4 feet high.
• Gates and openings along walls or levees allow for regular access and are designed to be easily sealed in anticipation of flooding.
Home ImprovementsMini floodwalls protect openings using cost-effective materials like brick or concrete.Electric utilities (including telephone, TV, and internet), HVAC ductwork, and mechanical equipment (water heaters, air conditioning units, and exhaust fans) should be placed behind floodwalls or elevated above anticipated water levels.
On-site sump pumps and toilet and sink backflow valves can be installed to prevent plumbing systems from being overwhelmed.
Gaps between buildings and walls such as this one at Stinson Beach represent possible floodgate locations.

108
Site ImprovementsAside from significant construction renovations to existing structures, a number of smaller-scale measures can be implemented to address anticipated flooding issues. These techniques can be applied as stand-alone improvements or as part of a larger floodproofing plan and usually require a smaller investment of time and resources than other retrofitting options. They are, however, limited in their scope and effectiveness and generally address only occasional flooding. Caution should be used when considering these strategies for properties subject to more frequent flooding or inundation from SLR. Options also vary in terms of cost and applicability and may not reduce flood-insurance premiums.
Alternative retrofitting options can be particularly relevant to both residential and nonresidential applications, especially when other methods such as elevation or floodproofing are not feasible or applicable based on structural or economic considerations.
LandscapingLandscape features and vegatation can help with temporary flood control while offering aesthetic and habitat benefits. • Rain gardens, grassy swales, and bioswales
constructed on sidewalks, embankments, or yards are depressions that can assist with stormwater management. Rain gardens can filter pollutants thus improving water quality in nearby water bodies and can reduce downcutting, erosion and other storm impacts through slowing water flow. Other co-benefits include carbon sequestration and habitat, particularly if native vegetation is used.
• Permeable concrete applied on sidewalks, driveways, and parking lots reduce water runoff and reduce the need for separate areas for storm-water retention.

ASSET ADAPTATION | 109
MARIN OCEAN COAST SEA LEVEL RISE ADAPTATION REPORT
5.3) Transportation Temporary closure of flooded roadways is a potential adaptation measure. Roadway closure can be a major concern for emergency services, and agencies are legally required to maintain roads for emergency-access purposes. However, agencies may cease maintenance of a road if the reasons are sufficiently documented.
The goal to limit water intrusion and avoid damage to the roadway system, including drainage facilities, is not easily met. Raising a road, pumping water, adding a seawall or levee system, or developing an alternate route are solutions usually involving land acquisition and/or work outside the existing road right-of-way. In addition, measures to ensure that adjacent properties are not impacted by the proposed improvements must also be identified. Environmental review would also likely be required to implement any of the adaptation alternatives. Identification of cost-effective and environmentally feasible solutions will require a site-specific engineering study with partnerships from local stakeholders and permitting agencies. The typical fee for a feasibility study for each asset is $50,000–$250,000 and maybe more depending on the scope of the study to identify an appropriate solution or improvement and to prepare a cost estimate. It is anticipated that the cost to implement adaptation alternatives will be high.
Most impacts to roadways occur during extreme events, and policies will play out in post-disaster recovery. Road repairs are an opportunity to plan for higher water levels. Design standards and best practices can help guide capital-improvement projects and road repairs to ensure that roads will be more resilient to SLR and other flood events related to climate change. Following established guidelines may also improve
funding opportunities. The requirement to meet design standards could be triggered by a set number of days per year that total water levels exceed a certain amount.
In 2012, Caltrans issued Director’s Policy 30 (DP-30) on Climate Change, which directs the coordination of climate-change mitigation and adaptation across all Caltrans programs to include design and construction of transportation infrastructure, support of research related to climate change, ensuring that adequate resources are allocated toward project-level studies related to climate change, and further development, coordination, and implementation of Caltrans climate-change policy.
Despite efforts to plan for climate change, there may be discrepancies between existing guidelines and implementation of adaptation measures such as roadway elevation. The Marin State Route 1 Repair Guidelines, adopted in July 2015, provide Caltrans staff and stakeholders with a consistent vision and direction when working on or reviewing damage-repair projects. Design guidelines are as follows: “The character of the existing horizontal and vertical alignment should be generally maintained. Where alterations may be warranted, primarily because of a demonstrated crash history, any necessary new alignment should avoid and mitigate resource impacts and be carefully fitted and blended in with the existing topography. Repair projects should consider alternatives that provide for staying within the existing roadway bench and right-of-way. Encroachments into NPS or CSP lands should be avoided. Preserving the existing, scenic two-lane character of Shoreline Highway is the primary goal; less than 12-foot lane widths may be considered.” Raising a roadway also requires widening the roadbed (typically a 3:1 ratio), so elevation as an adaptation

110
measure is constrained by the above design guidelines, which do not consider future SLR, and by the realities of road maintenance. Furthermore, expanding roadway footprints in some locations will be constrained or prohibited by permitting requirements, which protect archaeological and/or natural resources. Despite such concerns, widening a road adds the potential benefits of safety and space for bike lanes.
The Caltrans District 1 Climate Change Vulnerability Assessment and Pilot Studies58 for Del Norte, Humboldt, Mendocino, and Lake Counties provides a framework to evaluate adaptation alternatives that defend the road (i.e. armoring), adapt the road (i.e. elevate), or plan for retreat out of hazard zones (i.e. relocation). This framework also included consideration of a “do nothing” scenario, and policy changes that could have bearing on future project decisions.
The following are top priority actions for consideration, with additional options outlined on pages 63-68.
Near Term/OngoingT-1) Consider planning for Shoreline Highway
and county-maintained roads as part of the Regional Transportation Plan.
Possible Locations: Stinson Beach, Bolinas, Marshall
Potential Key Partners: Caltrans, MTC, TAM, DPW, residents, GFNMS Necessary Resources: Staff, agency coordination
T-2) Further investigate Shoreline Highway vulnerability along Tomales Bay in the East Shore area. Determine whether bulkheads below homes help protect the highway. If so, examine long-term adaptation strategies for continued
58 California Department of Transportation. District 1 Climate Change Vulnerability Assessment and Pilot Studies: FHWA Climate Resilience Pilot Final Report, December 2014.
protection in collaboration with homeowners.
Possible Locations: East Shore Potential Key Partners: Caltrans, property owners Necessary Resources: Staff, agency coordination, homeowners
T-3) Consider new capital-improvement projects to account for 3 feet of SLR.
Possible Locations: West Marin Potential Key Partners: CDA, DPW, Caltrans Necessary Resources: Staff, agency coordination
T-4) Identify triggers for maximum flood depth or frequency as thresholds at which roads will need to be elevated, relocated, seasonally closed, or abandoned. This could include community surveys to understand the point at which flooding is perceived as chronic and causing public inconvenience.
Possible Locations: West Marin Potential Key Partners: CDA, Caltrans, DPW, other technical experts Necessary Resources: Staff, agency coordination, technical assistance
T-5) Support post-disaster repairs as an opportunity to plan for higher water levels.
Possible Locations: West Marin Potential Key Partners: CDA, DPW, Caltrans Necessary Resources: Staff, agency coordination

ASSET ADAPTATION | 111
MARIN OCEAN COAST SEA LEVEL RISE ADAPTATION REPORT
T-6) Standards for road-flooding closure need legal definition and should be publicized with signage to alert drivers as to what they should expect.
Possible Locations: West Marin Potential Key Partners: CDA, DPW, Caltrans Necessary Resources: Staff, agency coordination, legal counsel, signage
T-7) Explore the feasibility of realigning vulnerable roads landward. Utilize table 18, below, to guide evaluation of transportation-adaptation alternatives.
Possible Locations: Stinson Beach, Bolinas, Tomales Bay Potential Key Partners: CDA, DPW, Caltrans Necessary Resources: Staff, agency coordination
East Shore homes and Shoreline Highway abut Tomales Bay. Credit: K & G Adelman.59 59 Copyright (C) 2002-2017 Kenneth & Gabrielle Adelman, California Coastal Records Project, www.Californiacoastline.org

112
Table 17. Additional Strategies# Approach Potential Management Action Example
Location(s)Impacts Addressed
Potential Partners
Required Resources
Other Assets NotesN
EAR/
ON
GO
ING
T-8 Accom-modate
Install culverts under roads to allow for larger passage for high-flow events.
West Marin Temporary flooding, ero-sion
CDA, DPW, Caltrans
Agency coordina-tion, staff, materials
Parcels and buildings, utilities
Maintenance plan would also be re-quired as pipes will silt up through normal operations
T-9 Plan Set priorities for adaptation plan-ning through identification of most vulnerable road segments.
West Marin Temporary flooding, inun-dation, erosion, wave surge, high wind
CDA, DPW, Caltrans
Agency co-ordination, vulnerabil-ity assess-ment
T-10 Manage Temporary road closures during flood events.
West Marin Temporary flooding, wave surge
CDA, DPW, Caltrans
Public outreach, staff
T-11 Plan Analyze regulatory constraints and recommend policy changes to sup-port adaptation measures.
West Marin Temporary flooding, inun-dation, erosion, wave surge, high wind
CDA Staff Parcels and buildings, utilities
LON
G
T-12 Protect Convert vulnerable roads to levees Sir Fran-cis Drake Boulevard in Inver-ness, Calle del Arroyo, Olema-Boli-nas Road
Temporary flooding, inun-dation, erosion, wave surge, high wind
CDA, DPW, CCC, Cal-trans, lo-cal service provid-ers, San Francisco Regional Water Quality Control Board, GFNMS, USACE
Staff, public financial resources, permits, materials and sup-plies, base for road
Parcels and buildings, utilities, recreation, emergency services
When roads are raised, they also need to be widened. This conflicts with Caltrans design guidelines for Highway 1 to maintain narrow, rural charac-ter.

ASSET ADAPTATION | 113
MARIN OCEAN COAST SEA LEVEL RISE ADAPTATION REPORT
Table 18. Potential Adaptation Options for Transportation Systems: General Strengths and WeaknessesAdaptation Concept *
Relative Construction Cost
Strengths Limitations Primary Design Considerations
Construct a seawall system
High Protect road infrastructure from SLR; can be constructed within a limited right-of-way; proven engineering technology
Difficult to fund and get approval for. Potential environmental impacts to coast. May also require a complex drainage and pumping system.
Requires a foundation design that accounts for wave action and erosion. Account for ground vibrations in construction especially when in close proximity to existing structures. Materials shall be highly corrosive resistant.
Raise road facility by rebuilding on top of a levee system
High Protect road infrastructure from SLR. Could protect residences and structures in addition to roads.
Difficult to fund and could require additional right-of-way (land acquisition). May also require detailed environmental review with possible mitigation costs.
Roadway slopes would expand the footprint, as each side slope is recommended to achieve 4:1 (width to height) ratio to be considered traversable and recoverable in a vehicle or 3:1 ratio to be considered traversable. Any new embankment slopes would need to be treated for future erosion control by seeding, vegetation planting, erosion blankets, straw waddles, etc. Could necessitate retaining walls and/or new guardrails. Would likely affect adjacent driveways, drainage facilities, intersections, etc. Would likely result in completely new structural pavement section. Could require significant utility adjustments.
Add levee system
High Protect road infrastructure from SLR
Difficult to fund and maintain. Potential environmental impacts. Would generally require additional right-of-way (land acquisition) and a complex drainage and pumping system; may have impacts to habitat depending on location.
Levee should have a minimum 2 feet of freeboard with side slopes typically at 3:1 ratio; FEMA accreditation may require more conservative design.

114
Adaptation Concept *
Relative Construction Cost
Strengths Limitations Primary Design Considerations
Provide an alternate route
High to very high Provide access between communities and locations with expected SLR
Assume alternate route would not have a significant delay from the existing route. Availability of existing roads to provide an alternate route. Very difficult to fund and get agreement and approval for new roadway if suitable land is available. (See adaptation concept of abandoning and relocating roadway.) To date in West Marin, no alternate routes for the roads impacted by SLR have been identified; however, any private roads that could be considered would need to become part of the county-maintained system and brought up to county standards.
Alternate route would comply with all current county design and safety standards.
Abandon and relocate roadway
Very high Where feasible, would provide an alternative transportation route more resilient to SLR.
In many locations of West Marin, there are no lands suitable for alternative routes. Building in steep terrain is prohibitively expensive.
ROW acquisition. Anticipate full environmental impact report. Anticipate environmental mitigation. Road to comply with all current county design and safety standards.
Construct a causeway
Extremely high Provide access between communities and locations with expected SLR. Would likely eliminate the existing roadway or allow it to be submerged for increased wetlands.
Very difficult to fund. New construction with environmental, right-of-way, and permitting reviews and costs. Removal of abandonment of existing roadway and construction of a bridge with abutments and approaches will be very costly. Must identify acceptable location to redirect water to.
Drainage should be reviewed, since water blocked by the road would be free to expand with the existing roadway barrier removed or the sea level overtopping it. Requires detailed geotechnical assessment for deep foundations. Deep foundations built in saturated soils are more difficult to construct, leading to increased cost. Significant coordination with utility agencies that have facilities along the roadway.
* Maintenance cost of adaptation concepts will be a long-term cost beyond any capital expense for which existing gas-tax revenue is insufficient. These sepa-rate maintenance cost would be beyond existing levels and would potentially increase a shortfall in deferred maintenance.

ASSET ADAPTATION | 115
MARIN OCEAN COAST SEA LEVEL RISE ADAPTATION REPORT
5.4) UtilitiesOf West Marin’s utilities, septic systems have been recognized as meriting highest priority for adaptation due to high vulnerability and high negative impacts of failure (e.g., sewage entering the ocean). Currently, coastal residences and businesses dispose of their wastewater through privately owned OWTS; small waste-water systems with waste-discharge permits from the San Francisco Regional Water Quality Control Board or public wastewater systems. In Stinson Beach’s Calles, Patios, and Seadrift neighborhoods, approximately 20 of the 700 OWTS per year are upgraded to turn off when flood waters are too high.60
The following are top priority actions for consideration, with additional actions on the table to follow:
Near Term/Ongoing U-1) Continue efforts to elevate or otherwise
protect electrical, fuel, sewage management, and water systems from high-tide levels. Retrofit OWTSs with flip switch that turn off automatically when flooded.
Possible Locations: West Marin Potential Key Partners: CDA, utilities, homeowners associations, property owners Necessary Resources: Staff, public/private funding
60 Marin County Community Development Agency. Marin Ocean Coast Sea Level Rise Vulnerability Assessment Public Review Draft. December 2015.
U-2) Consistent with proposed LCP home-elevation requirements, require new capital-improvement projects to evaluate impacts and costs for 3 feet of SLR.
Possible Locations: West Marin Potential Key Partners: CDA, DPW,
Marin County Parks, other agencies as necessary
Necessary Resources: Staff, public funding
U-3) Ensure that development policies are consistent with strategies for accommodating SLR (e.g., consider eliminating requirements to bury utilities in areas vulnerable to SLR).
Possible Locations: West Marin Potential Key Partners: CDA, CCC Necessary Resources: Staff
U-4) Work with the SBCWD and the EHS to determine whether SLR will raise groundwater levels to impair OWTS.
Possible Locations: Stinson Beach Potential Key Partners: CDA, SBCWD, EHS Necessary Resources: Staff, agency coordination
Medium Term U-5) Work with local service providers
to determine the point at which communities need to convert to shared public wastewater alternative systems to accommodate for SLR.
Possible Locations: Stinson Beach, Bolinas, Dillon Beach Potential Key Partners: CDA, local service providers Necessary Resources: Staff, agency coordination
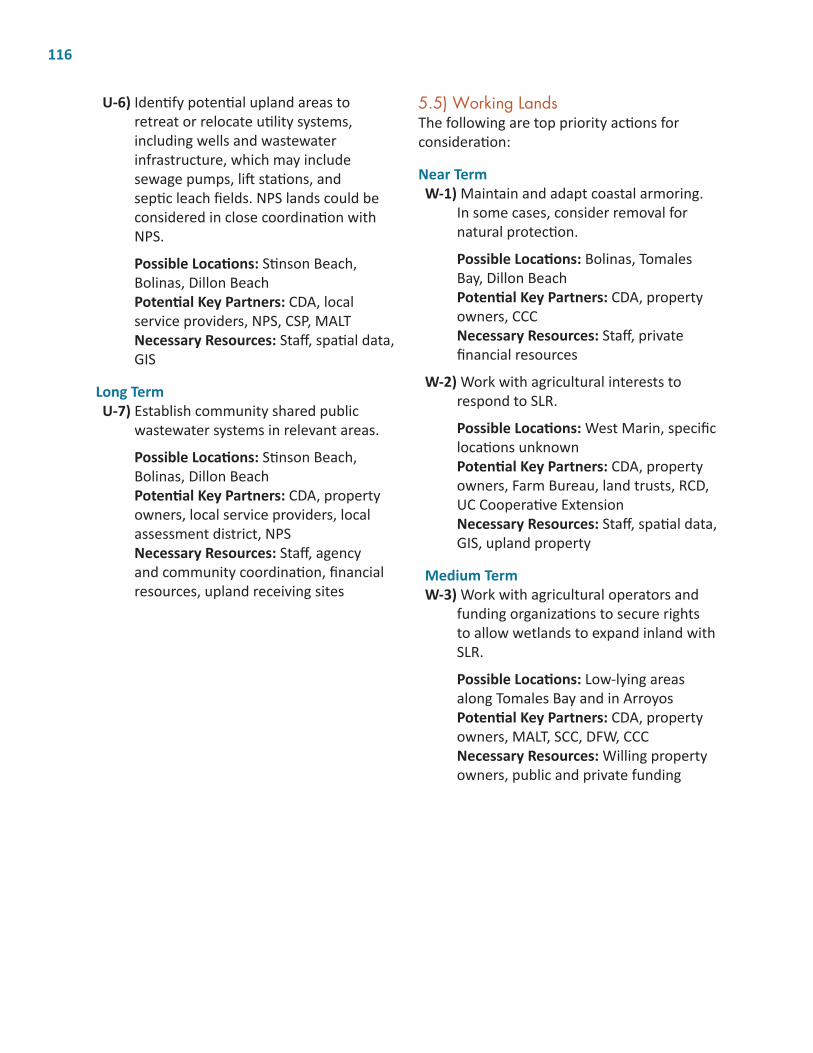
116
U-6) Identify potential upland areas to retreat or relocate utility systems, including wells and wastewater infrastructure, which may include sewage pumps, lift stations, and septic leach fields. NPS lands could be considered in close coordination with NPS.
Possible Locations: Stinson Beach, Bolinas, Dillon Beach Potential Key Partners: CDA, local service providers, NPS, CSP, MALT Necessary Resources: Staff, spatial data, GIS
Long Term U-7) Establish community shared public
wastewater systems in relevant areas.
Possible Locations: Stinson Beach, Bolinas, Dillon Beach Potential Key Partners: CDA, property owners, local service providers, local assessment district, NPS
Necessary Resources: Staff, agency and community coordination, financial resources, upland receiving sites
5.5) Working LandsThe following are top priority actions for consideration:
Near Term W-1) Maintain and adapt coastal armoring.
In some cases, consider removal for natural protection.
Possible Locations: Bolinas, Tomales Bay, Dillon Beach Potential Key Partners: CDA, property owners, CCC Necessary Resources: Staff, private financial resources
W-2) Work with agricultural interests to respond to SLR.
Possible Locations: West Marin, specific locations unknown Potential Key Partners: CDA, property owners, Farm Bureau, land trusts, RCD, UC Cooperative Extension Necessary Resources: Staff, spatial data, GIS, upland property
Medium TermW-3) Work with agricultural operators and
funding organizations to secure rights to allow wetlands to expand inland with SLR.
Possible Locations: Low-lying areas along Tomales Bay and in Arroyos Potential Key Partners: CDA, property owners, MALT, SCC, DFW, CCC
Necessary Resources: Willing property owners, public and private funding
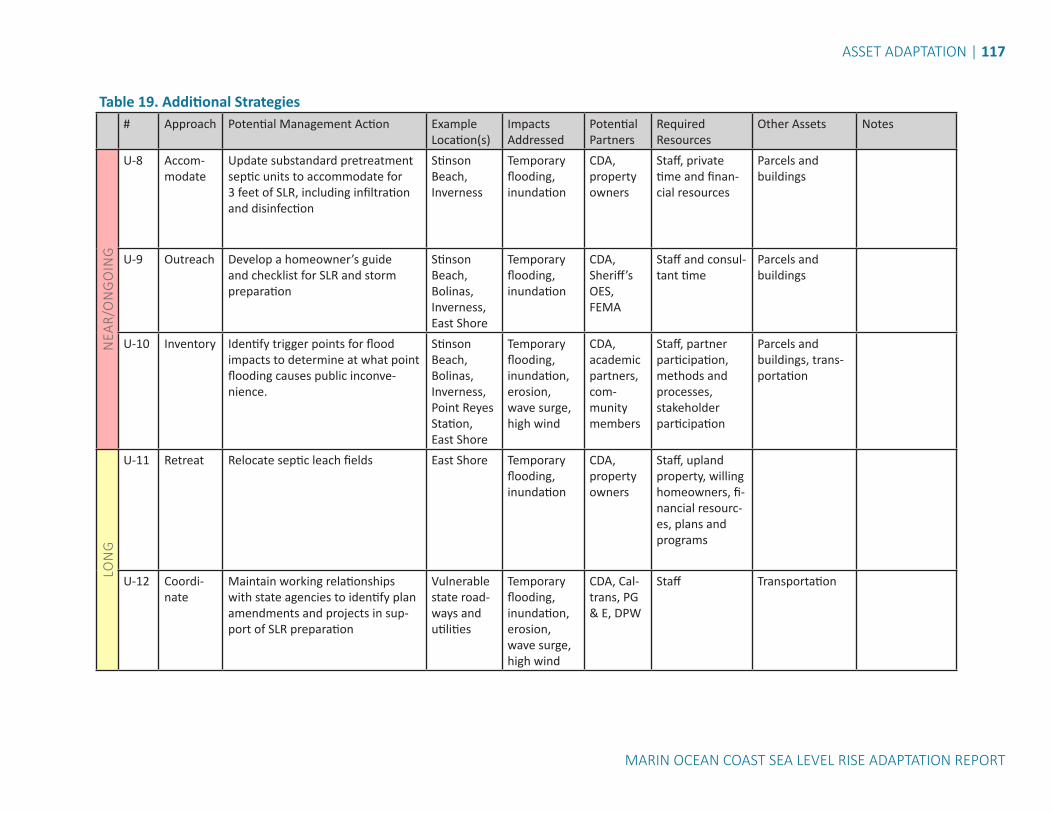
ASSET ADAPTATION | 117
MARIN OCEAN COAST SEA LEVEL RISE ADAPTATION REPORT
Table 19. Additional Strategies# Approach Potential Management Action Example
Location(s)Impacts Addressed
Potential Partners
Required Resources
Other Assets NotesN
EAR/
ON
GO
ING
U-8 Accom-modate
Update substandard pretreatment septic units to accommodate for 3 feet of SLR, including infiltration and disinfection
Stinson Beach, Inverness
Temporary flooding, inundation
CDA, property owners
Staff, private time and finan-cial resources
Parcels and buildings
U-9 Outreach Develop a homeowner’s guide and checklist for SLR and storm preparation
Stinson Beach, Bolinas, Inverness, East Shore
Temporary flooding, inundation
CDA, Sheriff’s OES, FEMA
Staff and consul-tant time
Parcels and buildings
U-10 Inventory Identify trigger points for flood impacts to determine at what point flooding causes public inconve-nience.
Stinson Beach, Bolinas, Inverness, Point Reyes Station, East Shore
Temporary flooding, inundation, erosion, wave surge, high wind
CDA, academic partners, com-munity members
Staff, partner participation, methods and processes, stakeholder participation
Parcels and buildings, trans-portation
LON
G
U-11 Retreat Relocate septic leach fields East Shore Temporary flooding, inundation
CDA, property owners
Staff, upland property, willing homeowners, fi-nancial resourc-es, plans and programs
U-12 Coordi-nate
Maintain working relationships with state agencies to identify plan amendments and projects in sup-port of SLR preparation
Vulnerable state road-ways and utilities
Temporary flooding, inundation, erosion, wave surge, high wind
CDA, Cal-trans, PG & E, DPW
Staff Transportation

118
5.6) Natural ResourcesPriority Actions Natural resources strategies have come from a variety of expert sources, including the GFNMS, the COS, and the PBCS. Highest-priority options have additional co-benefits such as the protection of economic, social, or infrastructure assets in West Marin. Such options could receive strong community support and be attractive to a variety of funding sources. Strategies that don’t conflict with protection of other resources have been given medium priority.
Near TermN-1) Enhance SLR education programs
through partnerships with educational organizations and other public entities, including:• partnerships with environmental
education organizations, schools, and other public entities
• social media and other communication strategies, such as SLR visualizations and crowdsourcing of king-tides photos
• interpretive signage• expansion of Marin County’s existing
Youth-Exploring Sea Level Rise Science (YESS) program
• marsh and tidepool education and interpretation programs through training and guidance to communicate implications of climate change
• volunteer docent program for highly visited areas, which could augment existing programs (e.g., at the Duxbury Reef State Marine Conservation Area). Docent training could include information about climate-change impacts on intertidal habitats, as well as tide pool etiquette and safety.
Possible Locations: High school environmental education classrooms, highly visited beaches, estuaries and tide pools
Potential Key Partners: CDA, GFNMS, California Academy of Sciences, NPS, CSP, County Parks, Marine Mammal Center, Headlands Institute, other existing education programs Necessary Resources: Financial resources, staff, volunteers, curricula trainings, classrooms
N-2) Stabilize cliffs through revegetation (with native, climate-appropriate species) and natural netting (e.g., jute, not chain-link fence). Design any hardening methods to take into account ecosystem needs (e.g., seabird nesting). Consider the listed showy rancheria clover (Trifolium amoenum), including assisted migration to locations farther upslope. Avoid armoring, and encourage relocation of infrastructure to allow for managed retreat. Minimize nonclimate stressors, including human and livestock access.
Possible Locations: Muir Beach, Bolinas, and Stinson Beach to Rocky Point (cliff locations) Potential Key Partners: CCC, California Native Plant Society, Caltrans, land owners and managers (public and private) Necessary Resources: Financial resources, staff, permits, engineering studies

ASSET ADAPTATION | 119
MARIN OCEAN COAST SEA LEVEL RISE ADAPTATION REPORT
N-3) Consider nature-based adaptation options for eelgrass habitat. • In the near term, map potential
landward transgressional areas and protect potential transition habitat.
• As water rises, monitor trends in eelgrass extent; possibly plant in shallower water to kick-start colonization of areas available for landward transgression.
• Minimize nonclimate stressors, including restoration of areas lost from moorings, minimizing disturbance to existing beds, and monitoring changes in turbidity.
Possible Locations: Tomales Bay eelgrass beds including the Walker Creek Delta Potential Key Partners: CDA, GFNMS, DFW, community members Necessary Resources: Financial resources, staff, community members, mapping and monitoring equipment and software, plant propagules, possible land acquisition and easements for habitat restoration
N-4) Consider nature-based adaptation options for tidal-marsh habitat.• In the near term, consider
accommodation strategies, including mapping potential landward transgressional areas and protecting potential transition habitat, and allowing for habitat transition
• Consider removing potential barriers to landward migration or accommodating transgression through modifications such as culverts and causeways (e.g., Highway 1 bridge in the Walker Creek Delta, Sir Francis Drake Boulevard between Inverness and Point Reyes Station, Bear Valley Road and Highway 1, Shoreline Highway in Marshall,
Shoreline Highway in Bolinas Lagoon)• Identify ownership of and acquire
potential transition zones upstream of current marsh footprint
• If high-value resources and functions are present, consider augmenting sediment in the long term to allow for accretion of marsh within existing footprint (e.g., Walker Creek Delta, Giacomini Wetland Restoration Project footprint)
• Nonclimate stressors such as invasive species should be minimized
• Allow for marsh loss in cases of less high-value resources (could include Tomales Bay area in Inverness) and instead, prioritize action on more significant areas of intact marshes nearby (e.g., Point Reyes Station and Lagunitas Creek delta)
• Engage with ongoing efforts (e.g., Bolinas Lagoon Ecosystem Restoration Project) to ensure that planning includes future SLR
• Engineer marshlands to enhance water flow and balance sediment transport by including design elements such as sinuous channelization
Possible Locations: Walker Creek Delta, Tomales Bay (Inverness and Marshall), Point Reyes Station, Lagunitas Creek Delta, Bolinas Lagoon Potential Key Partners: CDA, Marin County Parks, Point Reyes National Seashore, GFNMS, GGNRA, community members, business owners, DFW Necessary Resources: Financial resources, staff, community members, mapping and monitoring equipment and software, plant propagules, possible land acquisition and easements for habitat restoration, engineering studies, permits and environmental reviews

120
Figure 10. Carbon Sequestration Process
ADAPTATION AND MITIGATION
Green infrastructure such as restored wetlands and horizontal levees have a myriad of public benefits including habitat, flood protection, recreation and aesthetic/sense of place. Additionally, research shows that restoring marshes is incredibly effective for removing carbon from the atmosphere through a process known as sequestration, thus helping to curb the accelerating rate at which climate change is occurring.1 Tidal marshes, such as those found in Tomales Bay and Bolinas Lagoon, are extremely productive habitats that can capture large amounts of atmospheric carbon for storage in marsh soils. 1 Trulia, L., J. Callaway, S. Crooks. 2007. White Paper on Carbon Sequestration and Tidal Salt Marsh Restoration. 4 pp.

ASSET ADAPTATION | 121
MARIN OCEAN COAST SEA LEVEL RISE ADAPTATION REPORT
Medium TermN-5) Consider nature-based adaptation
options for beach and dune habitat.• Determine whether topography and
land use and infrastructure allows for inland movement of beach and dune habitat. Where feasible, remove and relocate shoreward constraints to dune movement and evolution.
• Restore, construct, or augment coastal dunes. This could include placement of sand graded and planted to form back-beach dunes, or placement of cobble. Drought-tolerant and heat-resistant species or strains of plants should be used. In cases where dredge materials are used, make sure materials are screened for contaminant exposure.
• Where applicable, minimize human and pet access through dunes to protect stability and disturbance, which could include installing fencing, creating walkways, and providing informational signage. Beach grooming should be ceased, as well as any activity that adversely affects the sediment supply of dunes.
• Identify potential sources of compatible sediment (considering appropriate grain size and structure) for vulnerable beaches in order to enable potential nourishment.
Possible Location: Muir Beach, Stinson Beach, Dillon Beach Potential Key Partners: NPS, property owners Necessary Resources: Sand, financial resources, staff, permits
N-6) In cases where coastal armoring is exacerbating erosion, explore natural alternatives that create sloped, transitional habitat (e.g., artificial reef, horizontal levee or dune). If armoring can’t be removed, implement living-shoreline techniques in conjunction with new construction and repairs.
Possible Locations: Bolinas Lagoon, Stinson Beach, Tomales Bay Potential Key Partners: GFNMS, NPS, CDFW, universities, SCC
Necessary Resources: Financial resources, staff, permits, public outreach
N-7) In cases in which roads need to be realigned or relocated due to trigger points being reached (e.g., causing public inconvenience), siting and design should allow for natural expansion of habitats. Areas should be identified that are critical for estuary expansion, and roads could be realigned accordingly.
Possible Locations: Bolinas Lagoon Potential Key Partners: Caltrans, GFNMS, U.S. Army Corps of Engineers, San Francisco Regional Water Quality Control Board, property owners Necessary Resources: Agency coordination, financial Resources, staff, permits and environmental review

122
N-8) Consider a monitoring program to detect impacts of climate change and management actions on natural resources, including the following steps:• Postulate hypotheses of habitat
change, based on scenarios and literature, of how habitats will evolve in response to climate change.
• Design the monitoring programs to measure hypothesized changes.
• Identify indicator species for selected habitats, and set tentative population parameter goals based on current status and knowledge of the species.
• Design the monitoring program to estimate the population parameter, and determine the extent and intensity of sampling required to achieve the monitoring goals, including sources of data, precision in parameter estimation, and costs
• Review costs versus expected probability of monitoring goals to choose final indicator species, monitoring targets, data sources, survey effort, and costs.
Possible Location: Countywide Potential Key Partners: CDA, scientific partners, local community members, environmental nonprofits Necessary Resources: Financial resources, staff, mapping and monitoring equipment and software, citizen-scientist monitors
More details can be found in Appendices E and F.

ASSET ADAPTATION | 123
MARIN OCEAN COAST SEA LEVEL RISE ADAPTATION REPORT
Figures 11-13. Locations where habitat can play the highest relative role in coastal protection. Based on the InVEST Coastal Vulnerability Model. Credit: Center for Ocean Solutions

124
Table 20. Addiitonal Strategies# Approach Potential Management Action Example
Location(s)Impacts Addressed
Potential Partners
Required Resources Other Assets
NotesN
EAR/
ON
GO
ING
N-9 Plan Encourage a climate-smart response to erosion events that smother the rocky intertidal by developing a diagnostic decision support tool so management agencies know how to respond to either 1) recover the habitat by removing material, 2) leave material and encourage surf-grass growth or 3) leave material and take advantage of the new situ-ation due to erosion events. Ideally would have some options with the ultimate goal of leveraging resourc-es to provide the best response.
Muir Beach, Duxbury Reef (Bolinas), and Estero Americano (north of Dillon Beach)
Erosion, wave surge
USGS Modeling done by USGS Con-sider which ac-tions could avoid im-pend-ing col-lapse of struc-tures onto the inter-tidal.
N-12 Retreat Research a coastal-protection tax credit that incentivizes waiving of rights to future seawalls in permits for shoreline-habitat protection
County-wide
Tem-porary flooding, inunda-tion, ero-sion, wave surge
CCC, proper-ty owners
Agency coordination

ASSET ADAPTATION | 125
MARIN OCEAN COAST SEA LEVEL RISE ADAPTATION REPORT
# Approach Potential Management Action Example Location(s)
Impacts Addressed
Potential Partners
Required Resources Other Assets
NotesN
EAR/
ON
GO
ING
N-10 Plan Create climate informed local and regional sediment management plans.
County-wide
Erosion, Wave Surge, High Wind
USACE Coast-al Sediment Management Workgroup, CSP, San Francisco Bay Conser-vation and Development Commission (BCDC), local flood-control districts, Na-tional Marine Fisheries Ser-vice (NMFS), DFW, CCC, NPS, local cities and counties
Funding and staff All
N-11 Plan In the aftermath of a spill of oil or another contaminant, ensure that restoration of affected areas takes into account climate considerations (type of restoration, location of restoration, what should actually be restored based on climate-envelope modeling to predict what species will likely become dominant)
County-wide
Tem-porary flooding, erosion, wave surge
DFW, Office of Spill Pre-vention and Response (OSPR), NOAA Resto-ration Office, NPS, U.S. Fish and Wildlife Service (US-FWS)
Collaboration of the responsible party with federal, state, and tribal trustee agencies; climate-change modeling

126
# Approach Potential Management Action Example Location(s)
Impacts Addressed
Potential Partners
Required Resources Other Assets
NotesN
EAR/
ON
GO
ING
N-13 Monitor Conduct regional modeling to identify how existing estuaries may change and identify areas for estu-ary expansion; use this information to set regional adaptation priorities. This effort includesidentifying where future estuary habitat may movebetter understand how habitat types may changebetter understanding and modeling system dynamics and how they may change (e.g, how tidal prism may change)
Regional Tem-porary flooding, inun-dation, erosion
GFNMS to convene regional partnership of numerous land-man-agement agencies, scientists, and funders
Funding: Variety of sources and joint ventures (NOAA, NPS, Stanford Natural Capital Project, universities, Federal Highway Administration, foundations)
Modeling: Leverage current data from and combine with new model-ing. Will need someone to lead data aggregation, plus someone to model (consider PBCS and/or USGS):
• OCOF: Use to identify which areas will be flooded; combine with saltwater-intrusion model-ing, riverine-flooding modeling (e.g., FEMA flood maps); includ-ing maximum projections
• Pollutant hotspots (critical to know whether polluted area will be inundated; get data from EPA and regional and local environ-mental health agencies)
• historic and archeological re-sources (NPS, CSP, counties)
• sediment availability (identify whether each estuary requires more or less sediment)
• armoring and infrastructure • Demonstration projects and
lessons learned from regional projects (e.g., Muir Beach, Gia-comini Wetlands, South Bay salt ponds)
Can create a decision matrix to facili-tate future updates and repetitions

ASSET ADAPTATION | 127
MARIN OCEAN COAST SEA LEVEL RISE ADAPTATION REPORT
# Approach Potential Management Action Example Location(s)
Impacts Addressed
Potential Partners
Required Resources Other Assets
NotesN
EAR/
ON
GO
ING
N-14 Monitor Capitalize on natural extreme events to increase monitoring and knowledge of estuary processes and climate-change impacts to inform adaptive management (e.g., mon-itor impacts of projected El Niño, study closed and open estuaries)
Study area Inun-dation, erosion, wave surge
GFNSM, DFW, Ocean Science Trust, NPS, property owners
Data-management and data-acqui-sition staff (GFNMS), rapid-response teams, standardized monitoring framework; identify sites through monitoring and inventorying action
N-15 Manage Within public lands, designate, expand, and increase enforcement of resource management areas, sensitive habitat, and off-limit zones to enhance and support special protections for target species
Study area Inun-dation, erosion
USFWS, GFNMS, NPS, CSP, relevant land manag-ers
permitting

128
# Approach Potential Management Action Example Location(s)
Impacts Addressed
Potential Partners
Required Resources Other Assets
NotesN
EAR/
ON
GO
ING
N-16 Manage For sediment-heavy estuaries, conduct instream and upstream restoration work throughout the watershed to reduce sediment delivery and flash floods. Note this action will need to be dynamic and respond to changing conditions. Ac-tivities could include the following:
• Restore impaired and incised creeks and add woody debris
• Reconnect creeks to floodplain• Restore incised creeks by raising
elevation to allow overflows and sediment deposition
• Dechannelize upstream seg-ments
• Restore stream complexity• Remove old road crossings and
legacy roads, parking lots, and other impervious surfaces
• Plant native vegetation• Incentivize best land-manage-
ment practices that enhance soil health and decrease runoff and erosion (e.g., rotate land uses on agricultural upland properties, plant drought-toler-ant natives)
• Build retention ponds and catchments
• Create a climate-informed sediment-management plan (in-cluding reconsideration of total maximum daily loads [TMDLs])
Develop a sediment-monitoring plan
Bolinas Lagoon, Tomales Bay
Inunda-tion
Property owners, Nat-ural Resourc-es Conserva-tion Service (NRCS), RCD, local cities (up the watershed), SWRCB (TMDL information), SCC, upland managers
Site-specific research to avoid inva-sive species introduction (vegetation management, impact assessments), education and outreach for public buy-in, possible permitting and envi-ronmental review

ASSET ADAPTATION | 129
MARIN OCEAN COAST SEA LEVEL RISE ADAPTATION REPORT
# Approach Potential Management Action Example Location(s)
Impacts Addressed
Potential Partners
Required Resources Other Assets
NotesM
EDIU
M
N-17 Accom-modate
Augment haul-out and nesting sites: floating haul-outs, larger buoys, offshore structures
Study area Inun-dation, erosion
USFWS, NMFS, U.S. Coast Guard, GFNMS, NPS, CSP, Marin County Parks, DFW, Division of Boating and Waterways
CCC permitting
N-18 Monitor and Man-age
Confirm suitable habitat within 6-foot SLR exposure zone, and if suitable habitat exists, monitor for yellow larkspur. If species is pres-ent, consider assisted migration to locations further upslope.
Estero Americano and Estero de San Antonio:
Inunda-tion
CDA, scientif-ic partners
Financial resources, staff, mapping and monitoring equipment and soft-ware, volunteer and citizen-scientist monitors
LON
G
N-19 Inventory Identify future viable locations for rocky intertidal habitat migration inland either though modeling or through known information. (How do rocky intertidal areas form, and would there be available rock under the cliff bluffs or under the sand?) Identify future viable locations for seabird and marine mammal breed-ing and haul-outs.
TBD through modeling analysis and site analysis
Erosion, wave surge, high wind
USGS, uni-versities
Modeling, coordination,

130
5.7) RecreationNear Term/Ongoing R-1) Increase awareness of
seasonal flooding on public lands and trails through signage and social media.
Possible Locations: Muir Beach, Stinson Beach, Tomales Bay Potential Key Partners: NPS, CSP, Marin County Parks Necessary Resources: Staff, public outreach material, social media apps
Long Term R-2) Retrofit or relocate
recreation and visitor-serving facilities, including trails and access points. Acquire new parklands as existing parks become unusable from flooding, inundation, erosion, etc.
Possible Locations: Stinson Beach, Bolinas, Tomales Bay, Point Reyes Station Potential Key Partners: CDA, property owners, business owners, CCC, NPS, CSP, Marin County Parks Necessary Resources: Public and private funding, permits, receiving sites, materials

ASSET ADAPTATION | 131
MARIN OCEAN COAST SEA LEVEL RISE ADAPTATION REPORT
Table 21. Additional Strategies# Approach Potential Management Action Example
Location(s)Impacts Addressed
Potential Partners
Required Resources
Other Assets NotesN
EAR/
ON
GO
ING
R-3 Plan Encourage the diversification of West Marin’s recreation and tourism opportunities to ensure economic resiliency in the face of climate impacts. Projects and policies that support agritourism (dairies, farm tours) and maricul-ture tourism (oyster farms) could be explored and promoted.
West Marin Temporary flooding, inundation, erosion, wave surge, high wind
CDA, business owners, property owners, farmers
Staff, interested business owners
R-4 Plan If roads are abandoned but subject to only occasional storm flooding, explore the feasibility of conversion to recreational trails. Efforts could be modeled after CSP establishes strategies and processes for suc-cessful conversion of abandoned roads where feasible.
West Marin Temporary flooding, inundation, erosion, wave surge, high wind
CDA, NPS, CSP, Marin County Parks
Staff, roadways, bike trail infra-structure
Parcels and buildings
LON
G
R-5 Retreat Relocate visitor parking lots Dillon Beach
Temporary flooding, inundation
CDA, property owners, Marin County Parks
Staff, proper-ty, financial resources
R-6 Monitor Support research on cli-mate-change impacts to recreation and public access
West Marin Temporary flooding, inundation, erosion, wave surge, high wind
CDA, NPS, academic partners, funding entities
Staff, agency coordination, grants and fund-ing mechanisms

132
5.8) Emergency ServicesNear Term E-1) Partner with LHMP efforts to coordinate
near-term disaster preparedness with long-term community resilience.
Possible Locations: West Marin Potential Key Partners: CDA, Sheriff’s OES, DPW, Marin County Fire Department, FEMA, Cal OES, local emergency-response teams Necessary Resources: Staff, agency coordination
Medium Term E-2) Adapt or relocate vulnerable emergency
facilities (e.g., fire stations, emergency generators).
Possible Locations: Stinson Beach, Bolinas, Inverness Potential Key Partners: CDA, Sheriff’s OES, Stinson Beach Volunteer Fire Department Necessary Resources: Staff, property, public financial resources
Long Term E-3) Develop additional emergency response
teams and resources required for disaster response, recovery and mitigation, as well as temporary housing and other sustainability needs.
Possible Locations: West Marin Potential Key Partners: CDA, Sheriff’s OES, local emergency-response teams Necessary Resources: Staff, coordination, financial resources, temporary housing
E-4) Build redundancy into the system by providing alternate evacuation routes where feasible. This is particularly critical for communities such as Bolinas with one primary access road in and out that could be inoperable from chronic flooding.
Possible Locations: Stinson Beach, Bolinas, Inverness, Point Reyes Station, East Shore, Dillon Beach Potential Key Partners: CDA, DPW, Caltrans, Community members Necessary Resources: Staff, financial resources, adequate space for alternate routes, materials and supplies, permits
Stinson Beach Flooding, 1982. Credit: SF Examiner

ASSET ADAPTATION | 133
MARIN OCEAN COAST SEA LEVEL RISE ADAPTATION REPORT
Table 22. Additional Strategies# Approach Potential Management Action Example
Location(s)Impacts Addressed
Potential Partners
Required Resources
Other Assets NotesN
EAR/
ON
GO
ING
E-6 Outreach Distribute information and tech-nical assistance to households on hazard-mitigation, emergen-cy-preparedness, evacuation, and recovery protocol
Stinson Beach, Bolinas, Inverness, Point Reyes Station, East Shore, Dillon Beach
Temporary flooding, erosion, wave surge, high wind
CDA, FEMA, Cal OES, local emer-gency-re-sponse teams
Staff, distribu-tion materials
E-7 Plan Ensure that emergency staging locations are not sited in areas subject to temporary or permanent flooding or landslides or in tsunami zones or other hazardous areas
West Marin Temporary flooding, inundation, erosion, wave surge, high wind
CDA, FEMA, Cal OES, local emer-gency-re-sponse teams
Staff, coordina-tion
LON
G
E-10 Plan Protect residential buildings from increased building-system outages, which may happen with increased storm severity
West Marin Temporary flooding, erosion, wave surge, high wind
CDA, Cal OES, local emer-gency-re-sponse teams
Staff, financial resources

134
5.9) Historic and Archaeological ResourcesThe following are top priority actions for consideration, with additional options outlined on pages 97–100.
Near term/Ongoing H-1) Adaptation planning and
implementation efforts should consider the impacts on historic structures and archaeological sites consistent with applicable state and federal regulations as well as local community input. In cases where projects could have adverse effects, efforts should be made to avoid, minimize, or mitigate the impacts consistent with relevant statutes (CEQA, Section 106, etc.).
Possible Locations: West Marin Potential Key Partners: CDA, State OHP, FIGR Necessary Resources: Staff
H-2) Continue discussions with the FIGR for consideration of archaeological sites in future vulnerability assessments, adaptation plans, and adaptation strategy implementation
Possible Location: West Marin Potential Key Partners: FIGR
Necessary Resources: Staff, agency coordination
H-3) Update the 1981 Marin County Local Coastal Program Historic Study. This could include inventorying historic sites with lists, photographs, and descriptions and revising and expanding historic district boundaries. An updated study could: • inform future SLR and climate change
vulnerability assessments to more fully understand the extent of West Marin’s threatened historic resources
• inform future adaptation planning for historic resources
• document the resources in case coastal hazards damage or destroy the structures.
Possible locations: West Marin Potential Key Partners: CDA, CCC, State OHP Necessary Resources: Staff, consultant assistance, financial resources
H-4) Recognize and consider projects that protect or mitigate historic and cultural resources in the county’s LHMP. Use FEMA’s how-to guide Integrating Historic Property and Cultural Resource Considerations into Hazard Mitigation Planning. On FEMA approval, such projects will be eligible for federal funding.
Possible Location: West Marin Potential Key Partners: CDA, Sheriff’s OES, DPW, Marin County Fire Department, FEMA Necessary Resources: Staff, agency coordination, FEMA grant funding
ADAPTATION AND MITIGATION
Through analysis of elements such as pollen, seeds, shells, and bones, archaeological data can reveal which plants and animals thrived during past climactic periods (e.g., the mid Holocene) with land and water temperatures comparable to potential future conditions.1 Such data could be of great value to inform future ecosystem restoration and land management plans. Thus it is critical to inventory vulnerable archaeological sites and collect data that may have future pertinance.
1 Newland, Michael (Sonoma State Anthropological Studies Center). 2015. Personal Communications

ASSET ADAPTATION | 135
MARIN OCEAN COAST SEA LEVEL RISE ADAPTATION REPORT
Table 23. Additional Strategies# Approach Potential Management Action Example
Location(s)Impacts Addressed
Potential Partners
Required Resources
Other Assets NotesN
EAR/
ON
GO
ING
H-6 Inventory Conduct comprehensive archaeo-logical survey to document vulnera-ble sites before they are lost to SLR, erosion, or other climate impacts
Vulnera-ble areas including low-lying sites threat-ened by SLR and storms, and higher bluffs threatened by coastal erosion
Temporary flooding, inundation, erosion, wave surge, high wind
CDA, FIGR, Sonoma State Uni-versity’s Anthro-pological Studies Center
Financial re-sources, archae-ological consul-tant, staff, tribal coordination
H-7 Inventory Collaborate with FIGR to identify and rank archaeological sites based on highest intrinsic value
Vulnerable archaeolog-ical sites
Temporary flooding, inundation, erosion, wave surge, high wind
CDA, FIGR Financial re-sources, archae-ological consul-tant, staff, tribal coordination
LON
G
H-8 Protect Develop plan to protect highest-pri-ority archaeological sites
Vulnerable archaeo-logical sites identified as highest priory for protection
Temporary flooding, inundation, erosion, wave surge, high wind
CDA, FIGR Financial re-sources, archae-ological consul-tant, staff, tribal coordination

This page is intentionally left blank.


138
6) Community AlternativesA possible approach for adapting to near-term SLR and storm flooding in West Marin is to protect existing homes and businesses with elevation and retrofits and protect assets in the near to medium term (with a preference for nature-based protection strategies) while considering additional options over the long term. Hybrid approaches that include a mix of adaptation measures may be the most practical in many situations. Adaptive management over time will allow for response to changing conditions (ESA 2015). Each community profile includes a “No Action” section that describes general SLR impacts if adaptation is not undertaken, along with community alternative options spanning the categories of protect, accommodate, and relocate or engage in managed retreat. Priority adaptation actions for each West Marin community are based on the findings of the Vulnerability Assessment, input from stakeholders and technical advisers, and the guiding principles in this report.
NOTE: The “Community Alternatives” section of this adaptation report provides an overview of possible measures to address the impacts of SLR, with examples of potential locations for implementation. The strategies presented below do not necessarily reflect the position of Marin County, but are included for discussion purposes. Further feasibility analysis and context-sensitive design is a necessary next step in developing any of the strategies.
A series of public meetings were held during fall 2015 and spring 2016, and over 200 residents participated in the West Marin Sea Level Rise Adaptation Poll (Appendix C). The level of potential community support for each strategy is shown as percent of total respondents for that community’s section of the poll, expressed as strong, moderate, or little support. The poll results should be considered as one indicator of public support, not as a definitive measurement.
Adaptation Workshop in Stinson Beach
As next steps to move adaptation options outlined in this report forward, community-scale plans could be undertaken for each of West Marin’s seven communities. Plans would focus on adapting infrastructure of community wide importance to coastal hazards. Plans would identify funding mechanism, and implementation opportunities. These Plans for Adaptation to Coastal Hazards (PATCHs) would be for specified timeframes based on best available SLR and storm projections and trigger points at which flooding becomes chronic. PATCHs would be conducted in conjunction with partners such as DPW or Caltrans. A proposed process to develop PATCHs is as follows: 1. Using the C-SMART Vulnerability Assessment, identify vulnerable infrastructure assets of
community wide importance.2. With the use of CoSMOS, determine flooding frequency, intensity, and duration for the
identified assets under different future scenarios. 3. Survey community members to determine trigger points for vulnerable infrastructure—the
frequency, intensity, and duration points at which flooding becomes chronic, causing public inconveniences that may include frequent road closures, overwhelmed storm drains, and compromised infrastructure.
4. Use the most recent adopted state policy to link the trigger points to specific time frame s (e.g., 2030, 2050).
5. In conjunction with community members and asset managers, initiate PATCHs around the identified time frame (the planning horizon) with the objective of PATCH implementation prior to chronic flooding occurring.
6. Develop adaptation alternatives for evaluation (e.g., elevation, relocation, and alignment). Populate matrices with information including costs, impacts, and benefits. The matrices would guide the determination of a preferred alternative based on maximizing public bene-fits while minimizing costs and negative impacts.
7. Collaborate with partners such as DPW or Caltrans to implement the preferred alternative through a capital-improvement program.
6.1) Community PATCHs (Plans for Adaptation to Coastal Hazards)
Stinson Beach’s Calle Del Arroyo already floods during King Tides. Credit: Jeff Loomans

COMMUNITY ALTERNATIVES | 139
MARIN OCEAN COAST SEA LEVEL RISE ADAPTATION REPORT
As next steps to move adaptation options outlined in this report forward, community-scale plans could be undertaken for each of West Marin’s seven communities. Plans would focus on adapting infrastructure of community wide importance to coastal hazards. Plans would identify funding mechanism, and implementation opportunities. These Plans for Adaptation to Coastal Hazards (PATCHs) would be for specified timeframes based on best available SLR and storm projections and trigger points at which flooding becomes chronic. PATCHs would be conducted in conjunction with partners such as DPW or Caltrans. A proposed process to develop PATCHs is as follows: 1. Using the C-SMART Vulnerability Assessment, identify vulnerable infrastructure assets of
community wide importance.2. With the use of CoSMOS, determine flooding frequency, intensity, and duration for the
identified assets under different future scenarios. 3. Survey community members to determine trigger points for vulnerable infrastructure—the
frequency, intensity, and duration points at which flooding becomes chronic, causing public inconveniences that may include frequent road closures, overwhelmed storm drains, and compromised infrastructure.
4. Use the most recent adopted state policy to link the trigger points to specific time frame s (e.g., 2030, 2050).
5. In conjunction with community members and asset managers, initiate PATCHs around the identified time frame (the planning horizon) with the objective of PATCH implementation prior to chronic flooding occurring.
6. Develop adaptation alternatives for evaluation (e.g., elevation, relocation, and alignment). Populate matrices with information including costs, impacts, and benefits. The matrices would guide the determination of a preferred alternative based on maximizing public bene-fits while minimizing costs and negative impacts.
7. Collaborate with partners such as DPW or Caltrans to implement the preferred alternative through a capital-improvement program.
6.1) Community PATCHs (Plans for Adaptation to Coastal Hazards)
Stinson Beach’s Calle Del Arroyo already floods during King Tides. Credit: Jeff Loomans
As the only road through Stinson Beach’s Calles and Patios area and into Seadrift, Calle del Arroyo is of communitywide importance for both daily use and emergency access. A PATCH could focus on adaptation alternatives for the roadway with a time horizon for preferred project implementation in advance of chronic flooding. Stinson Beach residents would be consulted through the planning process, and asset managers would serve as project partners.

140
6.2) Muir BeachPRIMARY VULNERABILITIES PRIORITY ACTIONS• Flooding during extreme events already
occurs.• Ensure safety of blufftop development.
• Long-term impacts will compromise beach access and tourism.
• Improve bluff stability by following best practices for drainage and vegetation.
• Those impacted include one business owners, property owners, the Muir Beach Homeowners Association, and the Muir Beach Fire Department.
• Continue outreach and education around SLR and coastal hazards.
StrategyTime Frame/Term: NT = Near MT = Medium LT = Long
Support: L = Low 0–40%M = Moderate 41–70%S = Strong 71%+NA = Not available
PROTECTResearch dune maintenance NT M to SResearch beach nourishment NT M to SMaintain existing armoring NT S
ACCOMMODATEConvene working group to explore solutions for Pacific Way bridge vulnerability
NT S
ID triggers for elevating Shoreline Highway and Pacific Way
LT S
Elevate buildings in flood plain MT MMonitor Redwood Creek restoration NT MMonitor water quality and require wastewater systems to meet code
NT S
Monitor water quality and move wells upland MT S
RELOCATE/MANAGED RETREATResearch managed retreat program, including buyout option
LT M
Remove seawall to maintain sediment supply NT LImplement a rolling conservation-easement program to prevent new shoreline armoring
LT L to M

COMMUNITY ALTERNATIVES | 141
MARIN OCEAN COAST SEA LEVEL RISE ADAPTATION REPORT
Pacif
ic...
Shoreline
Suns
et
Coastal Fire
Green GulchSeacape
Lagoon
Whi
teDiaz Ridge Fire
Shoreline
MarinMap
0 0.10.05Miles¯
Sea Level Rise (SLR) ScenariosBaseline No SLR / No Storm
25 cm (≈1 foot) SLR w/annual storm
25 cm (≈1 foot) SLR w/20 year storm
50 cm (≈2 feet) SLR w/20 year storm
100 cm (≈3 feet) SLR w/100 year storm
200 cm (≈6.5 feet) SLR w/100 year storm
This map was developed for planningand discussion purposes. The County ofMarin is not responsible or liable foruse of this map beyond its intendedpurpose. This map is representationalonly and does not constitute an officialmap or dataset of the County of Marin.
Muir Beach
Figure 14. Muir Beach Exposure Map. Does not include geomorphic change.

142
No Action Blufftop buildings could be impacted by erosion under all scenarios. Temporary flooding on Pacific Way may worsen with SLR, and the perimeter road around the edge of the restored wetland may flood in the long term. Habitats in Redwood Creek and Green Gulch Creek may shift landward with increased salinity downstream.
Muir Beach during king tide, 2015. Credit: Lighthawk Aerial
MUIR BEACH : LONG-TERM IMPACTSBeach access compromised
Property OwnersMB HOAMB Fire
Department
Extreme event impacts already occur
1 business Tourism
Sources: MarinMap, OCOF, asset-manager interviews
Priority ActionsIn the near term, blufftop development should comply with applicable setback standards in the LCP Environmental Hazards policies. Existing information about coastal erosion potential can be found in the Vulnerability Assessment. In many cases, erosion rates are uncertain, and a site-specific analysis is necessary to determine the safety of a structure from cliff erosion.
61 Philip Williams & Associates. California Coastal Erosion Response to Sea Level Rise: Analysis and Mapping, 2009.
Table 24. Muir Beach Blufftop Buildings Vulnerable to Accelerated Erosion*
BuildingsScenarios 1&2 12Scenario 3 17Scenario 4 49Scenario 5 53* This analysis does not include storms
Source: Marin Map, CoSMoS
Ensure safety of blufftop developmentNew development must be set back from the bluff edge a sufficient distance to ensure its stability and structural integrity for a minimum of 100 years and to eliminate the need for shoreline protective devices. Coastal-hazards analyses for individual sites must include a slope-stability analysis that considers historical bluff-retreat data as well as accelerated erosion due to SLR. For informational purposes and to guide the identification of potential planning triggers for removal of existing structures in hazardous areas, ESA utilized past model-input data from the OPC study61 to model and map coastal erosion amplified by the various SLR scenarios. (For further discussion of blufftop setbacks, see the “Bolinas” section of this report.) This strategy received moderate support from poll respondents (58%).
Improve bluff stability by following best practices for drainage and vegetationHomeowners can improve bluff stability by following best practices, which include limiting surface and shallow subsurface drainage to the bluff edge, which can cause erosion and slides; limiting disturbance caused by vertical access; identifying preferred vegetation for bluff stability; and stabilizing slopes. These approaches

COMMUNITY ALTERNATIVES | 143
MARIN OCEAN COAST SEA LEVEL RISE ADAPTATION REPORT
are highlighted in “Green Strategy: Bluff Management in Muir Beach” in this section. This strategy received strong support from poll respondents (92%).
Continue public outreach and education around sea level rise and coastal hazards Muir Beach residents, led by the Muir Beach Community Services District (MBCSD), expressed interest in continuing to engage with government agencies to explore solutions to flooding and bluff erosion. For example, residents would like more information about the community’s ability to maintain long-term safety, and the tradeoffs of maintaining hard protective structures versus removing them.
The community is well-organized for emergency preparedness. The MBCSD board is committed to furthering public engagement around the management of community assets such as water, roads, and recreation. Poll respondents requested that the county notify the MBCSD of any changes so it can bring changes to the attention of residents most affected in a timely manner to continue to work collaboratively with the MBCSD and partner with both the MBCSD and the Muir Beach Volunteer Fire Department on continued public outreach around SLR and coastal-hazard preparedness.
The following sections provide additional information about strategies considered during C-SMART. They are grouped according to general approach: protect, accommodate, or relocate or engage in managed retreat.
ProtectIn Muir Beach, low dunes and surfgrass immediately surrounding the beach play a significant role in helping reduce beach exposure to erosion and inundation. Recently, the NPS completed restoration of Redwood
62 ESA, 2015
Creek at Muir Beach. The project objectives were to create a natural creek system, reconnect the floodplain, reduce flooding, improve access along Pacific Way, and create habitat for Coho salmon, steelhead trout, and red-legged frog. The beach and tidal lagoon were allowed room to migrate landward with SLR, and the parking lot was reconfigured away from direct wave action to minimize storm-surge impacts.
Research feasibility of dune maintenancePotential short- and medium-term opportunities for habitat-based protection include dune maintenance, which would build on the Redwood Creek restoration project, and/or beach nourishment.
Dune restoration may not protect Muir Beach blufftop homes, as the beach is already squeezed or absent in front of the bluff toe and sand placed for dune creation would likely not last. Additionally, nourishment would not affect erosion processes at the blufftop. This strategy received moderate support from poll respondents (62%).
Maintain existing seawalls and other existing hard protectionSome armoring structures are already in place at the bluff toe fronting homes at Muir Beach. This solution could be effective in limiting erosion of the bluff face but will result in less sediment delivery, lead to local scour at the toe of the structure and ultimately lead to rapid degradation and failure of the structure. Furthermore, a toe revetment may not prevent additional erosion of the upper bluff face. Armoring requires maintenance, and SLR will result in increased loadings that will likely require reconstruction. Therefore, armoring may not be a sustainable approach.62 However, the ideas of maintaining existing hard protection received strong support from poll respondents (73%).

144
In addition to protection strategies that address erosion of the bluff toe, elements of drainage control, disturbance avoidance, vegetation management, and slope stabilization could be employed to limit (but not completely prevent) erosion of the blufftop and face.
AccommodateRegular impacts to the perimeter road around the edge of the restored wetland may not be felt until the long term, but storms may interrupt road access at any time, and residents should be prepared with emergency supplies.
Convene a working group of county and local stakeholders to brainstorm a resolution to the Pacific Way bridge vulnerabilityEarlier plans to widen and elevate the Pacific Way bridge were considered too large-scale by the community. However, flooding exacerbated by the current bridge continues to be a problem. Further collaborative work between government agencies and residents is needed to find an appropriate solution. One idea was to have a separate pedestrian and bicycle bridge parallel to the main auto bridge, to reduce the necessary width. The idea of convening a working group around this issue received strong support from poll respondents (85%).
A related medium-term strategy is to explore the feasibility of constructing a new Pacific Way bridge appropriate to the community character and to accommodate the Redwood Creek floodplain. This idea received strong support from the community (92%).
Identify triggers for elevation of vulnerable sections of Pacific Way and Shoreline HighwayWater levels for daily high tides or extreme high tides could be identified to determine when Pacific Way would need to be adapted
to allow for continued access to homes and the public beach. While the road sometimes floods during storms, it is not expected to be impacted by “permanent inundation” (daily during high tide) until later in the century. This strategy received strong support from poll respondents (92%).
Elevate buildings in the floodplain to meet FEMA safety requirements plus additional height for SLRDraft Local Coastal Program policies follow the approach of requiring additional elevation for homes in the FEMA coastal flooding zones that are also projected to be impacted by SLR. Floodproofing is an alternative way to maintain home safety from storm events. This strategy received moderate support from poll respondents (62%).
Support efforts to monitor Redwood Creek restoration project as a nature-based adaptation to SLRContinued monitoring of the Redwood Creek project may provide evidence about the resiliency and protective effects of restored natural habitats, building support for other restoration projects. This strategy received strong support from poll respondents (69%).
Continue to monitor water quality and require onsite wastewater systems to meet code and adapt to saltwater intrusion as neededAs saltwater intrusion leads to degradation and ultimately failure of septic systems, it will be important to monitor water quality and ensure that septic systems continue to meet codes. Over time, affected septic systems may need to become aboveground mound systems, have a flip switch to prevent environmental contamination during flood events, or have sealed tanks that are pumped out periodically. Ultimately, affected homeowners might consider developing a community wastewater system on higher

COMMUNITY ALTERNATIVES | 145
MARIN OCEAN COAST SEA LEVEL RISE ADAPTATION REPORT
ground, similar to the system developed in Marshall along Tomales Bay. This strategy received strong support from poll respondents (85%).
A related strategy is to monitor water quality and move wells upland if needed, which received strong support from poll respondents (85%).
Relocate/ Managed RetreatAny managed-retreat strategy to remove or prevent development in vulnerable areas would need to be carefully tailored and defined in consultation with the community.
Research feasibility of a managed retreat program to provide property owners with options for moving out of hazardous areas, especially after damaging stormsThe county could research potential costs and community interest in a long-term buyout or property-acquisition strategy if rising sea levels or erosion impacts become imminent threats to homeowners in Muir Beach. The county could also consider having a plan and specific proposals in place in case of a major storm or flood event that makes homeowners more likely to be interested in the buyout. This strategy received moderate support from poll respondents (62%).
Remove seawall to maintain sediment supplyThe existing seawall may be effective in limiting erosion of the bluff face, but it reduces sediment delivery to the beach, which could eventually disappear with SLR. Local scour at the toe of the seawall could ultimately lead to degradation and failure of the structure. The idea of removing the existing seawall received low support from poll respondents (19%).
Implement a rolling conservation-easement program to prevent new shoreline armoringBecause Muir Beach is bordered by land under state and federal protection and by lands protected by a conservation easement, over the long term there is a potential opportunity in the area zoned as Residential Agriculture for property acquisition or buyouts or for purchasing conservation or rolling easements to allow for natural erosion. This strategy received moderate support from poll respondents (46%).
The following section highlights a few best management practices for bluff management.

146
Green Strategy : Bluff Management in Muir Beach
Muir Beach from public parking lot, 2015 Muir
Muir Beach from public parking lot, 2015
Muir Beach is characterized by a low-lying floodplain surrounding Redwood Creek, flanked by steep eroding bluffs. Homes built on the tops of bluffs will continue to be at risk as sea level rise accelerates erosion of bluffs.
A few general best management practices can be followed to reduce blufftop erosion. Finding appropriate solutions to these processes depends on local geology and existing drainage patterns that must be gathered through site-specific analysis. Example solutions include drains to intercept and reroute groundwater from the blufftop.
Eroding bluffs will continue to supply sand to the beach, in turn increasing the buffer the beach provides from wave action on the bluff toe. A planned retreat, realignment, or landward redevelopment strategy may include one or more of the following:
• Drainage control: Limit surface and shallow subsurface drainage to the bluff edge that can cause erosion and slides.
• Disturbance avoidance: Limit access, especially uncontrolled vertical access.
• Vegetation management: Identify preferred vegetation for bluff stability.
• Slope stabilization: Employ surface and shallow stabilization techniques to slow the pace and extent of bluff recession (an interim approach before implementing a long-term retreat).
• Structure modification or relocation: Move structures landward or modify them to allow for bluff recession.
• Land-use measures: Employ mechanisms like rolling easements; development regulations can facilitate fair and orderly landward relocation.
Figure 15. Bluff erosion best management practices. (Source: ESA 2015)

COMMUNITY ALTERNATIVES | 147
MARIN OCEAN COAST SEA LEVEL RISE ADAPTATION REPORT
6.3) Stinson BeachPRIMARY VULNERABILITIES PRIORITY ACTIONS• Storm and tidal flooding already occur • Elevate homes subject to
temporary flooding• Elevate or reroute roads
and utilities• Update OWTS.• Elevate or relocate water
district office.• Relocate Fire Station # 2.
• Long-term flooding will impact 773 homes, 630 people, 6 businesses, and two principal access roads.
• Costs of long-term flooding will reach nearly $200 million in assessed value and $1.5 billion in market value.
• Those impacted will include property owners, the Seadrift Association, the Stinson Beach Volunteer Fire Department, the Stinson Beach County Water District (SBCWD), the DPW, and residential tourists.
StrategyTerm: NT = Near MT = Medium LT = Long
Support: L = Low 0–40%M=Med. 41–70%S = Strong 71%+NA = Not available
PROTECTMaintain existing Seadrift revetment and nourish beach NT NAExtend revetment along Stinson Beach MT M to SFund artificial reef with special assessment district MT LEnhance living shoreline in Bolinas Lagoon funded by special assessment district
NT L
Build horizontal levee with impervious barrier NT-MT L
ACCOMMODATEElevate existing homes to comply with FEMA and LCP NT-MT NAElevate Shoreline Highway along Bolinas Lagoon NT SRealign Shoreline Highway along Bolinas Lagoon NT LElevate Calle del Arroyo MT SElevate local roads in a coordinated approach MT LConstruct flood bypass across beach for storm runoff NT NABoardwalk entire neighborhoods MT LUpgrade substandard septic systems NT LConvert septic tanks to holding vessels MT-LT LDevelop community waste-water system LT L
RELOCATE/MANAGED RETREATResearch long-term buyout and rolling-easements NT NAPrevent total erosion of beach by removing all armoring and homes in path of inland migration
LT L

148
Figure 16. Stinson Beach Exposure Map. Does not include geomorphic change.
Shoreline
Calle del Arroyo
Calle del Mar
Belvedere
Dips
ea
Seadrift
Avenida Farralone
Wall
a Vist
a
Calle
del O
nda
Calle
del S
ierra
Calle
del P
inos
Calle
del P
rade
ro
Calle
del R
esac
a
Calle
del R
iber
a
Avenida Balboa
Puen
ta R
izal
Calle
del O
ccid
ente
Rafa
el Pa
tio
Jose
Patio
Calle
del E
mba
rcade
ro
Sono
ma P
atio
Puen
ta D
el M
ar
Sacra
men
to Pa
tio
Joaq
uin
Patio
Walla V
ista
MarinMap
0 0.10.05Miles¯
BolinasPotential Sea Level Rise Map - DRAFT
Sea Level Rise (SLR) ScenariosBaseline No SLR / No Storm
25 cm (≈1 foot) SLR w/annual storm
25 cm (≈1 foot) SLR w/20 year storm
50 cm (≈2 feet) SLR w/20 year storm
100 cm (≈3 feet) SLR w/100 year storm
200 cm (≈6.5 feet) SLR w/100 year storm
Stinson Beach
This map was developed for planning anddiscussion purposes. The County of Marin is notresponsible or liable for use of this map beyondits intended purpose. This map isrepresentational only and does not constitute anofficial map or dataset of the County of Marin.
1
1
2
2
3
3
4
5
7
8
9
Includes Seadrift
223 429 468 589 660
Exposed Buildingsplus some septic systemsand water distribution lines
Vulnerable AssetsSite Specific Assets Identified on Map
Calle del Arroyo
Upton Beach
Shoreline Highway
Water District Office
Walla Vista Walkway
Stinson Fire Department
CA Coastal Trail
Stinson Picnic Area
Bolinas Lagoon
1
2
3
4
5
6
7
8
96

COMMUNITY ALTERNATIVES | 149
MARIN OCEAN COAST SEA LEVEL RISE ADAPTATION REPORT
Seadrift
Dipsea
Shoreline
McKennas Gulch Fire
Calle del Arroyo
Wall
a Vist
a
MarinMap
0 0.250.125Miles¯
BolinasPotential Sea Level Rise Map - DRAFT
Sea Level Rise (SLR) ScenariosBaseline No SLR / No Storm
25 cm (≈1 foot) SLR w/annual storm
25 cm (≈1 foot) SLR w/20 year storm
50 cm (≈2 feet) SLR w/20 year storm
100 cm (≈3 feet) SLR w/100 year storm
200 cm (≈6.5 feet) SLR w/100 year storm
Seadrift
This map was developed for planning anddiscussion purposes. The County of Marin is notresponsible or liable for use of this map beyondits intended purpose. This map isrepresentational only and does not constitute anofficial map or dataset of the County of Marin.
1
2
2
3
4
Includes Stinson Beach's Calles andPatios neighborhood
Buildings Potentially FacingHazardous Conditionsplus some septic systemsand water distribution lines
Vulnerable AssetsSite Specific Assets Identified on Map
Calle del Arroyo
Seadrift Beach
Shoreline Highway
Bolinas Lagoon
1
2
3
4
223 429 468 589 660
Figure 17. Seadrift Exposure Map. Does not include geomorphic change.

150
Figure 18. Stinson Beach Beach Loss by Sea Level Rise Amount (no storms)
Shoreline
Seadrift
Dipsea
...
Willow Cam
p Fire
Laur
el
McK
enna
s Gul
ch F
ire
Calle del Arroyo BelvedereCalle del M
ar
Buena Vista
Panoramic
Avenida OlemaW
alla V
ista
Avenida Las Baulinas
Calle
del O
nda
Calle
del P
inos
MarinMap
0 0.30.15Miles¯
BolinasPotential Sea Level Rise Map - DRAFT
Sea Level Rise (SLR) ScenariosBeach around end of century)
Beach Loss @ 80 inches SLR
Beach Loss @ 40 inches SLR
Beach Loss @ 20 inches SLR
Beach Loss @ 10 inches SLR
Stinson Beach
This map was developed for planning anddiscussion purposes. The County of Marin isnot responsible or liable for use of this mapbeyond its intended purpose. This map isrepresentational only and does notconstitute an official map or dataset of theCounty of Marin.
ShorelineCalle del Arroyo
Calle del Mar
Calle
del O
nda
Calle
del S
ierra
Calle
del P
inos
Calle
del P
rade
ro
Calle
del R
esac
a
Calle
del R
iber
a
MarinMap
...
Shoreline
MarinMap

COMMUNITY ALTERNATIVES | 151
MARIN OCEAN COAST SEA LEVEL RISE ADAPTATION REPORT
Figure 19. Stinson Beach Conceptual Adaptation options

152
6.3) Stinson BeachNo Action Homes, buildings, and facilities west of Shoreline Highway could be exposed to storms, septic failure, failure of water-distribution pipes, and flooding. Calle del Arroyo, a principal access road to the Calles, Patios, and Seadrift neighborhoods, may face increased flooding in the near term and eventually permanent inundation, severely limiting access to portions of the community. Flooding from Bolinas Lagoon and Easkoot Creek already occur and will likely worsen with more extreme climate patterns and as they are combined with SLR. Incremental beach loss due to erosion is likely to occur by the end of the century.63
Damage to or destruction of Stinson Beach’s buildings and natural resources would have devastating impacts on the local economy, people’s lives, and sense of place. Excluding the effects of storm waves, homes on the Easkoot Creek side of the Calles and Patios neighborhood may be vulnerable to permanent SLR sooner than homes on the beach side. Due to topography, homes near Easkoot Creek sit approximately 5–10 feet lower than those directly on the beach.
Priority ActionsAccommodation of vulnerable structures, roads and utilities, primarily through elevation and retrofits, is a near- and medium-term priority for Stinson Beach. Elevation of homes would protect them from temporary flooding and permanent SLR, though road access would continue to be an issue. Many poll respondents supported “reasonable policies that allow property owners to develop in ways that protect against SLR.” However, permits for structures in vulnerable areas may be conditioned to prove that the structure will be safe from erosion over a set time frame.
63 ESA, 2015.
STINSON BEACH : LONG-TERM IMPACTS 773 homes, 55 percent
vacation rental630 people
Storm and tidal impacts already occur
6 businesses
Nearly $200
million of assessed value and
$1.5 billion in market
value exposed
ResidentialTourism
Property OwnersSeadrift
AssociationSB Fire
DepartmentSB Water District
County DPW
Calle del Arroyo is the county road of most immediate concern, as it frequently floods and provides the only access to Seadrift, the Patios, and many of the Calles. The Stinson Beach Watershed Program Flood Study and Alternatives Assessment identified the potential construction cost of elevating the entirety of Calle del Arroyo between State Highway 1 and Seadrift Road as $1 million–$2 million, along with costs of several other flood-control and mitigation options. Private roads would also need to be elevated, or sloped up to meet Calle del Arroyo. Elevating Shoreline Highway along Bolinas Lagoon will become a priority toward the middle of the century, as access to the community becomes impaired with increasing frequency.
OWTS can be updated to meet code, which will make them resilient to saltwater intrusion in the near term. In the medium to long term, code revisions allowing for mounded septic systems, or replacement of leach fields with holding tanks, could be implemented. The Stinson Beach County Water District plans to continue retrofitting water-meter connections in the near term to withstand saltwater corrosion. Electric utilities located beneath

COMMUNITY ALTERNATIVES | 153
MARIN OCEAN COAST SEA LEVEL RISE ADAPTATION REPORT
buildings will also need to be elevated or retrofitted. The water district’s office will likely need to be elevated or relocated in the near term. Fire Station No. 2 is already elevated on a mound, and the has plans to relocate the facility before it is impacted by SLR in the medium term.
Maintenance of existing protective structures is allowed by law under certain circumstances, but permitting the construction of new shoreline armoring can be very difficult. In the long term, as accommodation and protection of existing buildings becomes increasingly costly, exposure to coastal hazards grows, and negative impacts to coastal ecosystems mount, homeowners and government officials will need to identify alternatives. This could involve major beach restoration and
nourishment, prohibitions on rebuilding structures destroyed by storms, more restrictions on new development allowed in hazard zones, buyout, and relocation and/or removal of structures.
The following sections provide additional information about strategies considered during the C-SMART project. They are grouped according to general approach: protect, accommodate, or retreat. Unless otherwise indicated, cost estimates in this section are from ESA, and more details can be found in Appendix A.
It is beneficial to consider a range of adaptation measures to evaluate and select a preferred strategy, which may be a hybrid of hard or soft protection strategies.
Figure 20. Example Solution Space of Adaptation Strategies

154
Green Strategy : Beach Nourishment at Stinson Beach
Stinson Beach during king tide, 2015.
Credit: Lighthawk Aerial
Benefits: Recreation, Tourism, HabitatCost: $44M+ over long-term
Beach and dune nourishment provides protection against coastal storm erosion while maintaining natural habitat and geomorphic response mechanisms. Dune restoration would include placement of sand, graded and planted to form dunes. A variant of the beach- and dune-nourishment strategy includes placement of cobble (rounded rock), which can then be covered with sand. The cobble berm would be as far landward as possible. Details, including costs, are from ESA, and more details can be found in Appendix B.
Along 3,450-foot-long Stinson Beach, a 13-foot-tall, 50-foot-wide dune nourishment would cost roughly $6 million, while a 50-foot-wide beach nourishment would cost roughly $11 million each time the beach is nourished. The dunes and beach would need nourishment after extreme storms. A cobble berm would cost roughly $6 million and could be designed high enough to limit excess erosion if the entire dune is sacrificed during a large storm.
Due to uncertainties around the availability of local, clean sand, cost estimates are very approximate. This analysis assumes a cost of $61 per cubic yard to import sand from the central San Francisco Bay, truck it to Stinson, and spread by bulldozer. Further analysis could estimate costs via a barge and slurry pipe.
Potential problems with beach nourishment include the near-term construction impact to people and beach ecology and long-term changes to shore conditions. The success of the nourishment depends on the volume of material, the grain size, and sand-retention structures. As sea level rises, the frequency of required nourishment increases unless the beach is allowed to retreat landward.

COMMUNITY ALTERNATIVES | 155
MARIN OCEAN COAST SEA LEVEL RISE ADAPTATION REPORT
Sand placement provides a temporary benefit until the sand erodes and migrates. Some of the sand potentially placed on Stinson Beach could end up in Bolinas Lagoon, and some may migrate south toward Muir Beach (PWA 2006)64. In general, increased sand supply is considered beneficial to most beach areas but can be problematic at harbors and drain outlets. Whether the sand could be dredged and retrieved and recycled is not known, due to the potential for impacts from dredging. With SLR, increased sediment supply may be a net benefit to mitigate rapid changes.
Monitoring will play an important role in determining the timing of the first potential sand placement and identifying the need for additional nourishments in the future. Monitoring could focus on the annual minimum beach width and dune width. The storm-erosion buffer for Stinson Beach for a two- to five-year recurrence storm is 43–52 feet.65 Triggers and potential actions:
• Maximum seasonal beach width (end of summer) drops below 50-foot trigger:• Beach nourishment of affected reach.
Implications: temporary construction impact to people and ecology, cost ($2 million–$11 million for 50-foot-wide beach along Stinson Beach)
• Dune width drops below two-year storm buffer (50-foot) trigger distance:• Replenish and revegetate dune system.
Implications: temporary construction impact to people and ecology, cost $1 million–$6 million for 50-foot-wide dune nourishment along Stinson Beach, depending on local free sand availability. (Cost of $6 million assumes dredged and imported sand.)
64 PWA, 200665 Environmental Science Associates. Marin County Coastal Hazards and SLR Adaptation Strategies, 2016.
Since the initial dune nourishment would occupy existing beach, the trigger distance is reached more quickly, requiring nourishment in 2040. Subsequent nourishments are applied on a 30-year interval. Future nourishments will likely need to be more frequent. At any time, a major storm-erosion event may require beach nourishment. Beyond 2100, the first seaward row of homes and utilities may be severely exposed.
San Andreas Graben?The San Andreas graben lies between two strands of the San Andreas Fault off Marin's Open Coast, with as much as 57 meters of sediment in 20 meters of water (Johnson, et al). The USGS is currently studying sediment grain size and other physical properties to inform its feasibility as a sediment supply source for beach and dune nourishment. Through the Sonoma/Marin County Sediment Management Working Group, C-SMART staff are discussing the graben and other potential sediment suppliers for Stinson Beach.
Figure 21. San Andreas Graben location and sediment thickness (Johnson, et. al) Any use of trade, product, or firm names in this publication is for descriptive purposes only and does not imply endorsement by the
U.S. Government
This map was printed on an electronic plotter directly from digital files. Dimensional calibration may vary between electronic plotters and between X and Y directions on the same plotter, and paper may change size due to atmospheric conditions; therefore, scale and proportions may not be true on plots of this map.
For sale by U.S. Geological Survey, Information Services, Box 25286, Federal Center, Denver, CO 80225, 1–888–ASK–USGS
Digital files available at http://dx.doi.org/10.3133/ofr20151135
Suggested Citation: Johnson, S.Y., Hartwell, S.R., Sliter, R.W., Watt, J.T., Phillips, E.L., Ross, S.L., and Chin, J.L., 2015, Local (Offshore of Bolinas map area) and regional (offshore from Bolinas to Pescadero) shallow-subsurface geology and structure, California, sheet 9 in Cochrane, G.R., Dartnell, P., Johnson, S.Y., Greene, H.G., Erdey, M.D., Golden, N.E., Hartwell, S.R., Endris, C.A., Manson, M.W., Sliter, R.W., Kvitek, R.G., Watt, J.T., Ross, S.L., Bruns, T.R., and Chin, J.L. (G.R. Cochrane and S.A. Cochran, eds.), California State Waters Map Series—Offshore of Bolinas, California: U.S. Geological Survey Open-File Report 2015–1135, pamphlet 36 p., 10 sheets, scale 1:24,000, http://dx.doi.org/10.3133/ofr20151135.
ISSN 2331-1258 (online)
http://dx.doi.org/10.3133/ofr20151135
Kilometers0 5 10
0 5 10Nautical Miles
122°40' 122°20'
38°
37°40'
37°20'
SanFranciscoBay
Area ofMap
Limit of California’sState Waters
CALIF.
MAP LOCATION
Figure 1. USGS high-resolution minisparker seismic-reflection profile GG–09B (collected in 2006 on survey L–1–06–NC; see Map A for location), which crosses shelf south of Stinson Beach. Dashed red lines show faults (San Andreas Fault, Potato Patch Fault, Golden Gate Fault, and the east strand of San Gregorio Fault) that bound and (or) transect boundaries of San Andreas graben (Cooper, 1973; Bruns and others, 2002; Ryan and others, 2008). Magenta symbols show fold axes (diverging arrows, anticlines; converging arrows, syncline). Blue shading shows inferred uppermost Pleistocene and Holocene strata, deposited since last sea-level lowstand about 21,000 years ago; thickness of this uppermost stratigraphic unit is shown in Maps B and D, and depth to base of unit is shown in Maps A and C. Dashed blue lines in southwestern part of profile show significant erosional unconformities. Dashed green lines highlight continuous reflections that reveal structure (not distinctive stratigraphic markers). Dashed yellow line is seafloor multiple (echo of seafloor reflector). Purple triangle shows location of California’s State Waters limit (yellow line on Maps A, B, C, D, E).
1 km
VERTICAL EXAGGERATION ~12.5
NORTHEAST
160
0
App
roxi
mat
e de
pth,
in m
eter
s
80
Two-
way
trav
el ti
me,
in se
cond
s
0
0.1
0.2
SOUTHWEST
Golden Gate FaultSan Andreas Fault
Potato PatchFault
San Gregorio Fault Zone,east strands
San Andreas graben
DISCUSSIONThis sheet includes maps that show the interpreted thickness and the depth to base of
uppermost Pleistocene and Holocene deposits in California’s State Waters for the Offshore of Bolinas map area (Maps A, B), as well as for a larger area that extends about 91 km along the coast from Bolinas to Pescadero (Maps C, D) to establish a regional context. This uppermost stratigraphic unit (blue shading in seismic-reflection profile of fig. 1; see also, figs. 2, 3, 6, 7, 8, 9 on sheet 8) is inferred to have been deposited during the post–Last Glacial Maximum (LGM) sea-level rise in the last about 21,000 years (see, for example, Peltier and Fairbanks, 2006; Stanford and others, 2011). The unit commonly is characterized either by “acoustic transpar-ency” or by parallel, low-amplitude, low- to high-frequency, continuous to moderately continu-ous, diffuse reflections (terminology from Mitchum and others, 1977). The acoustic transparency can be caused by extensive wave winnowing, which results in a uniform sediment grain size and the consequent lack of acoustic-impedance contrasts needed to produce seismic reflections. On the continental shelf, the contact with underlying units is a transgressive surface of erosion commonly marked by angularity, channeling, or a distinct upward change to lower amplitude, more diffuse reflections. Within rapidly subsiding shelf basins such as the San Andreas graben (fig. 1), the contact can be parallel with underlying units, and it is inferred largely based on contrasts in reflection amplitude.
To make these maps, water bottom and depth to base of the post-LGM horizons were mapped from seismic-reflection profiles (fig. 1; see also, sheet 8). The difference in the two horizons was exported for every shot point as XY coordinates (UTM zone 10) and two-way travel time (TWT). The thickness of the post-LGM unit (Maps B, D) was determined by applying a sound velocity of 1,600 m/sec to the TWT. The thickness points were interpolated to a preliminary continuous surface, overlaid with zero-thickness bedrock outcrops (see sheet 10), and contoured, following the methodology of Wong and others (2012).
The thickness data points are dense along tracklines (about 1 m apart) and sparse between tracklines (1 km apart), resulting in minor contouring artifacts. To incorporate the effect of a few rapid thickness changes along faults, to remove irregularities from interpolation, and to reflect other geologic information and complexity, minor manual editing of the preliminary thickness contours was undertaken. Contour modifications and regridding were repeated several times to produce the final sediment-thickness maps. Information for the depth to base of the post-LGM unit (Maps A, C) was generated by adding the sediment-thickness data to water depths deter-mined by multibeam bathymetry (see sheet 1).
The thickness of the post-LGM unit in the Offshore of Bolinas map area ranges from 0 to 57 m (Map B), and the depth to base of the unit ranges from less than 10 to 78 m (Map A). These large ranges in values are attributed to the area’s active tectonic setting. The map area, which straddles the right-lateral transform boundary between the North American and Pacific
plates, is cut by several active northwest-striking faults; these include the San Andreas Fault, the east strand of the San Gregorio Fault Zone, the Golden Gate Fault, and the Potato Patch Fault (fig. 1; see also, Jachens and Zoback, 1999; Zoback and others, 1999; Bruns and others, 2002; Ryan and others, 2008). Sediment cover is thin or absent west of the east strand of the San Gregorio Fault Zone, where uplift has brought bedrock to the surface or near to the surface. Sediment is thickest in the fault-bounded San Andreas graben, which is inferred to have formed as a stepover basin caused by at least partial eastward transfer of lateral slip from the San Gregorio, Potato Patch, and San Andreas Faults to the Golden Gate Fault (Cooper, 1973; Jachens and Zoback, 1999; Zoback and others, 1999; Bruns and others, 2002; Ryan and others, 2008). The basin is filled with sediment and, thus, has no seafloor expression. The abrupt northern margin of the basin may have formed either (1) as an extensional normal fault that resulted from the eastward slip transfer, or (2) as a gentle, northwest-striking restraining bend in the Golden Gate Fault as its trace converges northward with the San Andreas Fault. The south-ern margin of the basin, which is more diffuse, lies offshore of San Francisco within a sea-level-lowstand paleovalley.
Five different “domains” of sediment thickness are recognized on the regional sediment-thickness map (Map D): (1) the Bolinas shelf, located west of the east strand of the San Grego-rio Fault Zone, in the northwestern part of the regional map (Map D); (2) the San Andreas graben, located between the San Gregorio Fault Zone and the Golden Gate Fault, east-southeast of the Bolinas shelf and both southwest and southeast of the Marin shelf; (3) the Marin shelf, located both northeast and northwest of the San Andreas graben and north of the San Francisco ebb-tidal delta paleovalley; (4) the northeast-trending San Francisco ebb-tidal delta paleovalley, located outside the Golden Gate at the mouth of San Francisco Bay, between the Marin shelf and San Andreas graben on the north and the Pacifica-Pescadero shelf on the south; and (5) the Pacifica-Pescadero shelf, which is located south of the San Francisco ebb-tidal delta paleovalley and which extends south all the way to Pescadero Point.
The five sediment-thickness domains have distinct geologic controls. The Bolinas and Pacifica-Pescadero shelves are uplifting and are relatively sediment poor (mean sediment thicknesses of 0.8 and 3.6 m, respectively). Thicker sediment accumulations (as much as 20 m) on the western margins of the Pacifica-Pescadero shelf (within California’s State Waters) are associated with west-side-down slip on the west strand of the San Gregorio Fault Zone and with deposition on the outboard, west-dipping Pigeon Point block (McCulloch, 1987) farther south, offshore of Pescadero Point. The San Andreas graben is a rapidly subsiding, fault-controlled sedimentary basin (Cooper, 1973; Ryan and others, 2008) that has sediment thicknesses of as much as 57 m; the Marin shelf forms the uplifted northeastern and northwestern margins of this basin. The San Francisco ebb-tidal delta is filling a paleovalley that formed during the last sea-level lowstand, with sediment thicknesses of as much as 32 m along the trough axis.
Although the southern part of the San Andreas graben may extend into the paleovalley, the north flank of the paleovalley is used here as the boundary when calculating sediment volumes for the five sediment-thickness domains (see table 7–1 in accompanying pamphlet). Subsidence in the San Francisco ebb-tidal delta paleovalley and the San Andreas graben can be partly attributed to the northward change in strike of both the San Andreas and San Gregorio Fault Zones offshore of San Francisco, which has resulted in the local change from contractional deformation to extensional deformation (Zoback and others, 1999).
Map E shows the regional pattern of major faults and of earthquakes occurring between 1967 and April 2014 that have inferred or measured magnitudes of 2.0 and greater. Fault locations, which have been simplified, are compiled from our mapping within California’s State Waters (see sheet 10) and from the U.S. Geological Survey’s Quaternary fault and fold database (U.S. Geological Survey and California Geological Survey, 2010). Earthquake epicenters are from the Northern California Earthquake Data Center (2014), which is maintained by the U.S. Geological Survey and the University of California, Berkeley, Seismological Laboratory. Map E also shows the inferred location of the devastating great 1906 California earthquake (M7.8, 4/18/1906), thought to have nucleated on the San Andreas Fault offshore of San Francisco (see, for example, Bolt, 1968; Lomax, 2005). Map E clearly shows that the largest number of earthquakes in the region occur within the broad San Andreas Fault Zone between Pacifica and Bolinas; events west of the east strand of the San Gregorio Fault Zone and east of the Golden Gate Fault are much less common.
REFERENCES CITED Bolt, B.A., 1968, The focus of the 1906 California earthquake: Bulletin of the Seismological
Society of America, v. 58, p. 457–471.Bruns, T.R., Cooper, A.K., Carlson, P.R., and McCulloch, D.S., 2002, Structure of the
submerged San Andreas and San Gregorio Fault zones in the Gulf of the Farallones off San Francisco, California, from high-resolution seismic-reflection data, in Parsons, T., ed., Crustal structure of the coastal and marine San Francisco Bay region, California: U.S. Geological Survey Professional Paper 1658, p. 77–117, available at http://pubs.usgs.gov/pp/1658/.
Cooper, A.K., 1973, Structure of the continental shelf west of San Francisco, California: U.S. Geological Survey Open-File Report 73–48, 65 p.
Jachens, R.C., and Zoback, M.L., 1999, The San Andreas fault in the San Francisco Bay Region—Structure and kinematics of a young plate boundary: International Geology Review, v. 41, p. 191–205.
Lomax, A., 2005, A reanalysis of the hypocentral location and related observations for the Great 1906 California earthquake: Bulletin of the Seismological Society of America, v. 95, p.
861–877, doi:10.1785/0120040141.McCulloch, D.S., 1987, Regional geology and hydrocarbon potential of offshore central
California, in Scholl, D.W., Grantz, A., and Vedder, J.G., eds., Geology and resource potential of the continental margin of western North America and adjacent ocean basins—Beaufort Sea to Baja California: Circum-Pacific Council for Energy and Mineral Resources, Earth Science Series, v. 6, p. 353–401.
Mitchum, R.M., Jr., Vail, P.R., and Sangree, J.B., 1977, Seismic stratigraphy and global changes of sea level, part 6—Stratigraphic interpretation of seismic reflection patterns in depositional sequences, in Payton, C.E., ed., Seismic stratigraphy—Applications to hydrocarbon exploration: Tulsa, Okla., American Association of Petroleum Geologists, p. 117–133.
Northern California Earthquake Data Center, 2014, Northern California earthquake catalog: Northern California Earthquake Data Center database, accessed April 5, 2014, at http://www.ncedc.org/ncsn/.
Peltier, W.R., and Fairbanks, R.G., 2006, Global glacial ice volume and Last Glacial Maximum duration from an extended Barbados sea level record: Quaternary Science Reviews, v. 25, p. 3,322–3,337, doi:10.1016/j.quascirev.2006.04.010.
Ryan, H.F., Parsons, T., and Sliter, R.W., 2008, Vertical tectonic deformation associated with the San Andreas Fault Zone offshore of San Francisco, California: Tectonophysics, v. 429, p. 209–224, doi:10.1016/j.tecto.2008.06.011.
Stanford, J.D., Hemingway, R., Rohling, E.J., Challenor, P.G., Medina-Elizalde, M., and Lester, A.J., 2011, Sea-level probability for the last deglaciation—A statistical analysis of far-field records: Global and Planetary Change, v. 79, p. 193–203, doi:10.1016/j.gloplacha.2010.11.002.
U.S. Geological Survey and California Geological Survey, 2010, Quaternary fault and fold database of the United States: U.S. Geological Survey database, accessed April 5, 2014, at http://earthquake.usgs.gov/hazards/qfaults/.
Wong, F.L., Phillips, E.L., Johnson, S.Y., and Sliter, R.W., 2012, Modeling of depth to base of Last Glacial Maximum and seafloor sediment thickness for the California State Waters Map Series, eastern Santa Barbara Channel, California: U.S. Geological Survey Open-File Report 2012–1161, 16 p., available at http://pubs.usgs.gov/of/2012/1161/.
Zoback, M.L., Jachens, R.C., and Olson, J.A., 1999, Abrupt along-strike change in tectonic style—San Andreas Fault zone, San Francisco Peninsula: Journal of Geophysical Research, v. 104 (B5), p. 10,719–10,742.
Local (Offshore of Bolinas Map Area) and Regional (Offshore from Bolinas to Pescadero) Shallow-Subsurface Geology and Structure, CaliforniaBy
Samuel Y. Johnson, Stephen R. Hartwell, Ray W. Sliter, Janet T. Watt, Eleyne L. Phillips, Stephanie L. Ross, and John L. Chin2015
ONE MILE = 0.869 NAUTICAL MILES
5 10 KILOMETERS10 0
40000 FEET40000 2000030000 10000 0
510 0 10 MILESSCALE 1:200 000
ONE MILE = 0.869 NAUTICAL MILES
1 0 1 KILOMETER0.5
7000 0 7000 FEET3500
2 0 2 MILES1SCALE 1:50 000
APPROXIMATE MEANDECLINATION, 2015
MA
GN
ETI
C N
OR
TH
14 °
TRU
E N
OR
TH
APPROXIMATE MEANDECLINATION, 2015
MA
GN
ETI
C N
OR
TH
14 °
TRU
E N
OR
TH
Onshore elevation data from U.S. Geological Survey (2012) National Elevation dataset (available at http://ned.usgs.gov/). California's State Waters limit from NOAA Office of Coast SurveyUniversal Transverse Mercator projection, Zone 10N
Depth and thickness mapped by Samuel Y. Johnson and Steven R. Hartwell, 2011–2012GIS database and digital cartography by Stephen R. Hartwell
Depth and thickness mapped by Samuel Y. Johnson and Stephen R. Hartwell, 2011–2012GIS database and digital cartography by Stephen R. HartwellManuscript approved for publication July 21, 2015
Onshore elevation data collected by Earth Eye in 2010 for San Francisco State University and U.S. Geological Survey (available at http://ned.usgs.gov/). California's State Waters limit from NOAA Office of Coast SurveyUniversal Transverse Mercator projection, Zone 10N
122°20'
122°20'
122°40'
122°40'
37°40' 37°40'
37°20' 37°20'
3-nautical-mile limit of California’s State Waters
Earthquake magnitude
7.8
Great 1906 San Francisco earthquake
Regional faults and earthquake epicenters, 1967 - 2013
2.0 - 2.5
2.5 - 3.0
3.0 - 3.5
3.5 - 4.0
4.0 - 5.5
Fault—Dashed wherelocations inferred. Abbreviations: GGF, Golden Gate Fault; PF, Pilarcitos Fault; PPF, Potato Patch Fault; SAF, San Andreas Fault Zone; SGE, San Gregorio Fault Zone, east strand; SGW, San Gregorio Fault Zone, west strand
PillarPoint
San Francisco Bay
Pacific Ocean
Marin Headlands
Bolinas
Pescadero Point
San Gregorio
Half Moon Bay
Pacifica
San Francisco
Golden Gate
SAF
SAF
GGF
PF
SGE
SGE
SGW
PPFSGW
Map E
SANTA CRUZ MO
UNTAINS
Offshore of Bolinas map area and area of Maps A, B
Pescadero
San Gregorio
Pacifica
San Francisco
Golden Gate
Marin Headlands
Bolinas
122°20'
122°20'
122°40'
122°40'
37°40' 37°40'
37°20' 37°20'
Offshore of Bolinas map area and area of Maps A, B
0 – 0.1
0.1 – 2.5
2.5 – 5
5 – 7.5
7.5 – 10
10 – 12.5
12.5 – 15
15 – 17.5
17.5 – 20
20 – 22.5
22.5 – 25
25 – 27.5
27.5 – 30
30 – 32.5
32.5 – 35
35 – 37.5
37.5 – 40
40 – 42.5
42.5 – 45
45 – 47.5
47.5 – 50
50 – 52.5
52.5 – 55
55 – 57.5
EXPLANATIONThickness of uppermost Pleistocene and
Holocene sediment, in meters
Thickness contoursIndex (10-m intervals)Intermediate
3-nautical-mile limit of California’s State Waters
Boundary of sediment-thickness domainArea of “no data”—Areas where data are
insufficient for contouring
PACFICA-PESCADEROSHELF DOMAIN
SAN FRANCISCOPALEOVALLEYDOMAIN
SAN ANDREASGRABEN DOMAIN
BOLINASSHELFDOMAIN
MARIN SHELF DOMAIN San Francisco Bay
Pacific Ocean
Half Moon Bay
Map D
Pescadero
San Gregorio
Half Moon Bay
Pacifica
San Francisco
Golden Gate
Marin Headlands
Bolinas
122°20'
122°20'
122°40'
122°40'
37°40' 37°40'
37°20' 37°20'
Offshore of Bolinasmap area and areaof Maps A, B
San Francisco Bay
Pacific Ocean
-10 – -5
-5 – -0
-85 – -80
-80 – -75
-75 – -70
-70 – -65
-65 – -60
-60 – -55
-55 – -50
-50 – -45
-45 – -40
-40 – -35
-35 – -30
-30 – -25
-25 – -20
-20 – -15
-15 – -10
EXPLANATIONDepth to base of uppermost Pleistocene and
Holocene sediment, in meters
Depth-to-base contoursIndex (10-m intervals)Intermediate
3-nautical-mile limit of California’s State Waters
Area of “no data”—Areas where data are insufficient for contouring
Map C
122°35'
122°35'
122°40'
122°40'
122°45'
122°45'
37°55' 37°55'
37°50' 37°50'
Bolinas
BolinasLagoon
Golden Gate Fault
Potato Patch Fault
San Andreas Fault
San Gregorio Fault
BOLINAS SHELF
SAN AN
DR
EAS GR
ABEN
Map B
MARIN SHELF
0 – 0.1
0.1 – 2.5
2.5 – 5
5 – 7.5
7.5 – 10
10 – 12.5
12.5 – 15
15 – 17.5
17.5 – 20
20 – 22.5
22.5 – 25
25 – 27.5
27.5 – 30
30 – 32.5
32.5 – 35
35 – 37.5
37.5 – 40
40 – 42.5
42.5 – 45
45 – 47.5
47.5 – 50
50 – 52.5
52.5 – 55
55 – 57.5
EXPLANATIONThickness of uppermost Pleistocene and
Holocene sediment, in meters
Thickness contoursIndex (10-m intervals)Intermediate
Fault—Solid where location is certain, dashed where location is approximate, dotted where location is inferred or concealed
Folds—Solid where location is certain, dashed where location is approximate, dotted where location is inferred or concealed, queried where uncertain
Anticline
Syncline
3-nautical-mile limit of California’s State Waters
Area of “no data”—Areas where data are insufficient for contouring
StinsonBeach
122°35'
122°35'
122°40'
122°40'
122°45'
122°45'
37°55' 37°55'
37°50' 37°50'
Bolinas
BolinasLagoon
Golden Gate Fault
San Andreas Fault
San Gregorio Fault
Potato Patch Fault
BOLINAS SHELF
SAN AN
DR
EAS GR
ABEN
Map A
Figure 1
MARIN SHELF
EXPLANATIONDepth to base of uppermost Pleistocene and
Holocene sediment, in meters
Depth-to-base contoursIndex (10-m intervals)Intermediate
Fault—Solid where location is certain, dashed where location is approxi-mate, dotted where location is inferred or concealed
Folds—Solid where location is certain, dashed where location is approxi-mate, dotted where location is inferred or concealed, queried where uncertain
Anticline
Syncline
Trackline of seismic-reflection profile shown in figure 1
3-nautical-mile limit of California’s State Waters
Area of “no data”—Areas where data are insufficient for contouring
-10 – -5
-5 – 0
-45 – -40
-40 – -35
-35 – -30
-30 – -25
-25 – -20
-20 – -15
-15 – -10
-85 – -80
-80 – -75
-75 – -70
-70 – -65
-65 – -60
-60 – -55
-55 – -50
-50 – -45
StinsonBeach
Open-File Report 2015–1135Sheet 9 of 10
Pamphlet accompanies map
U.S. Department of the InteriorU.S. Geological Survey

156
Table 25. Cost Estimate for Beach/ Dune Nourishment at Stinson BeachYear Cost
EstimateNote
2015 $12M Nourish 50 feet of dune with cobble toe (takes up 50 feet of existing beach)
2040 $11M Nourish 50 feet of beach when beach drops below trigger
2070 $11M Nourish 50 feet of beach after 30 years
2100 $40M Nourish 50 feet of beach after 30 years, raise homes in FEMA Zone V
Total net present value (2015)
$44M Assumes 1% discount rate
Anytime $11M Emergency 50-foot beach nourishment if extreme storm erosion occurs; dune nourishment not considered (add $6M)
NOTE: The table above does not include the area fronting Seadrift.
ProtectStinson Beach is a partially dune-backed beach, with either homes or park facilities built behind. It is a major recreational attraction, and thus preserving the beach can be a priority when developing adaptation strategies. In Stinson Beach, a potential short-term option is to hold the line, or protect existing green and gray infrastructure in place by using physical barriers. These could include enhancement of shoreline vegetation along the Bolinas Lagoon side and beach nourishment and/or dune restoration along the Stinson Beach coastline. Coordination
with NPS should be integrated into strategy evaluation to understand potential effects from strategies to NPS beach downdrift of revetment.
Maintain Seadrift revetment The existing bulkhead and seawall around Seadrift is maintained by residents. Individual homeowners in other areas of the community also maintain protective structures, many of which were constructed prior to the Coastal Act. The continued presence of seawalls and revetments could accelerate beach erosion, which would need to be evaluated to better understand. Shoreline protective devices contribute to erosion, but SLR can drown the beach altogether. This strategy, which would continue to be implemented by property owners or local assessment districts, received strong support from poll respondents (100%).
Rebuild and upgrade of the Seadrift rock revetment would cost approximately $51 million every 30 years. Beach nourishment along the 7,500-foot stretch would cost roughly $24 million. The beach is projected to surpass the critical trigger width at 2050, requiring a 50-foot beach nourishment repeated after 30 years. (See table 25.) The appropriate frequency of future nourishments will, in reality, likely be higher. As the required backshore modifications become increasingly intensive, the homes will need to be raised (assumed at 2100). At any time, a major

COMMUNITY ALTERNATIVES | 157
MARIN OCEAN COAST SEA LEVEL RISE ADAPTATION REPORT
erosion event may erode the beach to a dangerous condition, requiring revetment repairs and or beach nourishment.
Extend revetment along Stinson BeachSome community members expressed interest in extending revetment from Seadrift southeast to Calle de Pinos to protect homes along Stinson Beach. Drawing on cost estimates previously developed for the county, a revetment extension of 3,540 feet would cost about $24 million.66
The revetment could be built along the alignment of the existing dune face from Walla Vista to the residence at the end of Calle del Embarcadero, and sand excavated for the revetment could be placed in front of and on top of the revetment for aesthetics, but additional sand may be required if complete burial of the revetment is desired.
For the remaining stretch of homes from Calle del Embarcadero to Calle de Pinos, a new revetment would have to occupy existing beach area, and sand would need to be imported to cover the structure, increasing cost. This approach could limit erosion and wave run-up on homes in the near term. However, without increased maintenance of the revetment and fronting beach, long-term SLR will eventually overload the revetment as the fronting beach is eroded and waves damage and overtop the revetment. To remedy this, subsequent beach nourishments will be required to maintain the beach fronting the revetment. Narrow sections of beach in front of Seadrift serve as an example of possible future conditions in Stinson Beach without continued beach nourishment. (See table 25.)
To be consistent with GFNMS regulations, revetment could not extend into the mean high water.
66 ESA, 2015
Table 26. Cost Estimate for Revetment Strategy at Stinson BeachYear Cost Estimate Note 2015 $24M Construct
revetment along Stinson Beach
2045 $24M Rebuild and upgrade revetment after 30-year life
2060 $11M Nourish 50 feet of beach when beach drops below trigger
2075 $24M Rebuild and upgrade revetment after 30-year life
2090 $11M Nourish 50 feet of beach after 30 years
2100 $29M Raise homes in FEMA Zone V
Total net present value (2015)
$80M Assumes 1% discount rate
Anytime $11M Emergency 50-foot beach nourishment if extreme storm erosion occurs; revetment repair not considered
NOTE: The table above does not include the area fronting Seadrift.

158
Table 27. Cost Estimate for Revetment Maintenance at Seadrift BeachYear Cost
EstimateNote
2015 — Assume revetment was adequately maintained
2045 $51M Rebuild and upgrade revetment after 30-year life
2050 $24M Nourish 50 feet of beach when beach drops below trigger
2075 $51M Rebuild and upgrade revetment after 30-year life
2080 $24M Nourish 50 feet of beach after 30 years
2100 $81M Raise homes in FEMA Zone V
Total net present value (2015)
$130M Assumes 1% discount rate
Anytime $24M Emergency 50-foot beach nourishment if extreme storm erosion occurs; revetment repair not estimated
NOTE: The table above does not include the area fronting Seadrift.
Low-profile wall and cobble bermAn alternative adaptation measure to a rock revetment, the low-profile wall and cobble berm may be preferable owing to less wave reflection, flatter slopes, and easier walking under eroded conditions if the beach drops. 67 Environmental Science Associates (ESA). Ocean Beach Master Plan, 2012.
This estimate was modified from the Ocean Beach Master Plan, and the cost equals $55 million per mile. Considering construction of just the cobble berm that acts as a last defense behind a dune (no wall), the cost equals $8 million per mile.
Mouth of Bolinas Lagoon. Credit: Lighthawk Aerial
Offshore structuresOffshore breakwaters and artificial reefs are large coastal engineering structures often used in conjunction with large beach nourishment to retain sand. Offshore breakwaters are effective at preventing erosion because wave sheltering and diffraction reduces sand transport directly. They consist of fill in the surf zone, typically quarry stone arranged in a mound that penetrates the water surface. These solutions were found to net negative cost benefit in southern Monterey Bay, primarily due to a high construction cost of $44 million per kilometer.67 Offshore structures are currently prohibited by GFNMS regulations.
Offshore artificial reefs consist of fill in the surf zone that reduces wave power reaching shore and changes the pattern of sand transport, thereby conceptually reducing transport of sand from the beach. Offshore reefs are considered less effective than offshore breakwaters because wave sheltering is reduced by the low crest height, which allows wave overtopping.

COMMUNITY ALTERNATIVES | 159
MARIN OCEAN COAST SEA LEVEL RISE ADAPTATION REPORT
Artificial reefs installed to act as submerged breakwaters have received increased attention in recent years as a means of shore stabilization and erosion control, primarily due to their low aesthetic impact and enhanced water exchange relative to traditional emergent breakwaters and the potential to enhance local surfing conditions.68 If constructed offshore from Stinson Beach, an artificial reef could reduce wave impacts but would not provide protection from permanent SLR. This strategy received low support from poll respondents (13%).
Enhance living shorelinesEnhancing the living shoreline of Bolinas Lagoon could help with temporary flood protection. However, shoreline vegetation alone does not protect against permanent inundation that would become an issue in the medium term and long term. This measure, which would likely be funded by a government grant or local assessment district, received moderate support from poll respondents (28%).
A horizontal levee, with an impervious barrier on the landward side of the wetland, would require a large right-of-way. Further considerations for horizontal levees are discussed in the Bolinas section, since it may be an option for the Gospel Flats area. This strategy, which could be implemented through a local assessment district, received moderate support from poll respondents (33%).
AccommodateElevate homes Most parcels in Stinson Beach are already developed, and many structures are vulnerable to flooding in their current condition. New structures must meet flood-protection standards, and in many cases, 68 Sea Level Rise Adaptation Alternatives for Marin County.
there is a need to elevate existing structures. Instead of constructing new revetment or dunes along the Calles, homes could be raised to limit wave run-up and erosion damages to homes as the dune is allowed to erode during coastal storms. Applying the cost estimate of $250 per square foot, to lift Stinson homes in the effective, preliminary FEMA Zone V (89 individual structures), the total cost would equal roughly $29 million. It is important to remember, however, that actual project costs will vary depending on building condition, site characteristics, and more.
One advantage of raising homes over building a revetment is that doing so allows limited migration and persistence of a fronting beach in the near term. If additional measures such as beach and dune nourishment are not taken in the future, the shoreline may continue to migrate past homes and potentially damage roads, infrastructure, and even the homes if the pilings are undermined. Still, this option could have advantages over armoring in the sense that the back beach is allowed to evolve naturally. As the backshore migration approaches property lines, dunes could be replenished to improve the aesthetics and habitat function at the backshore, as well as limit future damages in areas that are eroded during storm events.
A quantitative trigger for dune and beach replenishment could be tied to estimated storm erosion mentioned above. When dune width fronting a home shrinks below the threshold distance (50 feet), beach and dune replenishment will be needed. The implications include a temporary construction impact to people and ecology and a cost of about $12 million for a 50-foot-wide dune and a 50-foot-wide beach along Stinson Beach.
Table 28 shows an approximate cost schedule for structure elevation. Initially, homes in the

160
FEMA V-Zone would be lifted. As the beach narrows with SLR, beach nourishments will be needed to maintain a buffer to the back beach as well as for recreation and ecological function. The first nourishment occurs at 2060 and again at 2090, and the appropriate frequency of future nourishments will likely be higher. At any time, a major storm-erosion event may require beach and dune nourishment. Beyond 2100, the first seaward row of homes will likely need relocation, as they may be severely exposed.
Table 28. Cost Estimate for Home Elevation Strategy at Stinson BeachYear Cost
EstimateNote
2015 $29M Raise homes in FEMA Zone V
2060 $11M Nourish 50 feet of beach at Stin-son Beach when beach drops below trigger
2090 $11M Nourish 50 feet of beach after 30 years
Total net present value (2015)
$41M Assumes 1% discount rate
Anytime $11M Emergency 50-foot beach nourishment if extreme storm erosion occurs; dune nourishment not considered (add $6M)
Note: Estimates from ESA (2016) and actual costs may vary depending on building condition, site characteristics and other factors.
The cost of elevating homes and associated utilities would likely be borne by individual
homeowners within West Marin’s Flood Control and Water Conservation District Zones 5 and 10 (Stinson Beach and Inverness, respectively), property owners may be eligible for the Marin County Structure Elevation Program, a FEMA Hazard Mitigation Grant Program. Many Stinson Beach homeowners would like to be able to elevate their homes to meet FEMA standards to be safe from storm flooding and SLR without facing onerous permitting requirements. Some poll respondents indicated that they would want to make significant improvements to their home when they elevate it, especially for older homes in poor condition. This would extend the life of structures in known hazardous areas. Residents felt that elevating structures would be consistent with the existing eclectic community character.
Many Stinson Beach homes are located within FEMA SFHAs, or 100-year floodplain—in which case elevating the home results in a lower flood insurance rate. Homes are required to meet FEMA standards if a proposed remodel or building project exceeds 50% of the property’s market value.
Development in flood-hazard areas is regulated through the Local Coastal Program and Title 23 of the Marin County Code, administered by the Department of Public Works. FEMA FIRM maps in 2015 that identify BFEs for structures in coastal areas, incorporating coastal wave hazards.
LCP Program Policy C-EH-8 – Minimum Floor Elevations in Flood Hazard Areas, would apply when a new or substantially improved building requires a coastal permit, based on actual site conditions. This policy requires subject building elevations to accommodate three feet of SLR above and in addition to the FEMA’s Base Flood Elevation (BFE) requirements, as described below. This would apply to properties within SFHAs (Areas

COMMUNITY ALTERNATIVES | 161
MARIN OCEAN COAST SEA LEVEL RISE ADAPTATION REPORT
VE, AO, or AE, as indicated on the Potential Sea Level Rise Maps (Appendix D)). In areas outside SFHAs that are nevertheless subject to SLR, the 3- foot building elevation would also be required to accommodate for future SLR (Base SLR Elevation, or BFE).
FEMA’s BFE is an existing regulatory requirement for elevating and floodproofing of structures within SFHAs based on high-intensity storm-floodwater elevations that have a projected 1 percent chance to occur in any given year (commonly referred to as the “100-year flood”). SFHAs include lands that would be impacted by floodwaters and for West Marin consist of VE zones (those subject to wave velocity), and AE and AO zones (those subject to rising waters without waves). (See Appendix D for West Marin maps with FEMA flood zones.) SFHAs are delineated and BFEs are determined based on historical flooding trends and do not account for future SLR, which is not reflected in FEMA’s FIRMs.
The intent of the proposed county policy is to fully prepare for future SLR conditions by requiring buildings to elevate 3 feet above the required BFE in SFHAs (VE, AO, or AE zones, as indicated on the Potential SLR Maps) and 3 feet above existing underlying topography in areas projected to be affected by SLR located outside of SFHAs (SLR exposure zones as indicated on the county’s Potential SLR Maps).
Three feet approximately equals 100 cm, which is a midpoint projection of SLR for 2100 based on the National Research Council’s report Sea Level Rise for the Coasts of California, Oregon, and Washington: Past, Present, and Future, which provides state level guidance for SLR adaptation. Flood Insurance Program (NFIP) regulatory purposes. BFEs used to inform the Potential Sea Level Rise Maps are from FEMA’s 2015 preliminary FIRMs for the county.
The Potential Sea Level Rise Maps illustrate SFHAs, as well as areas exposed to 3 feet of SLR outside of SFHAs (the SLR exposure zone). Numeric values in parenthesis represent BFEs based on an official vertical datum related to current sea level (referred to as NAVD88), plus 3 additional feet to account for future SLR. Required building elevations would be determined by actual measurements case by case, taking into account a building’s existing elevation above sea level (NAVD88). In VE zones, measurements are made from the sea level (NAVD88) to the lowest horizontal structural member (e.g., floor joists). In Zone A, the measurement is to the lowest finished floor. In SFHAs, the values colored goldenrod represent the approximate difference in elevation between the required BFE plus 3 feet and the average underlying topography shown on county base maps.
Figure 22. Section diagram of potential future building elevation with 3 feet SLR

162
Where the proposed county policy would apply to lots located outside of SFHAs (i.e., no BFE requirement), those values represent the height distances based on 3 feet of SLR alone. Most, if not all, existing buildings are already elevated above the underlying grade, so the actual height to which existing buildings would have to be raised to meet the proposed policy is less than the values shown in goldenrod. (For example, if a remodel project is subject to a required elevation of 9 NAVD88 pursuant to the proposed policy, and the existing home is at elevation 4 NAVD88, the remodeled home would be elevated 5 feet to satisfy the proposed policy.) Finally, the white numbers show the elevation of the white topographic lines.
Data are not comprehensive, and this analysis is intended only to give a general sense of how many homes would potentially need to elevate to meet FEMA and county flood safety requirements.
Building improvements and designs should take a holistic approach that includes connection to the existing infrastructure and utilities. The current use of individual OWTS may not be a viable long-term solution for treatment and dispersal of wastewater with a significant rise of sea level, which results in homeowners to raise their homes. Before looking at building solutions, there should be a review of the existing infrastructure: electricity, gas, septic, water, and roadways. Homeowners seeking to make improvements to their homes are advised to consult with SBCWD staff before going to the county’s CDA, since building improvements are limited by infrastructure.69
69 Stinson Beach County Water District. Onsite Wastewater Management Program Report. 2015.
Stinson during king tide, January 2017.
Credit: J. Lamphier.
Elevate Shoreline Highway, Calle del Arroyo, and private roads General approaches for adapting roads to SLR include identifying water-level triggers for management actions, and coordinating with the DPW and Caltrans. They are further described in section 5.3 of this report.
Even if homes are elevated, access will remain a challenge during temporary flooding and a severe problem with permanent inundation
California Coastal Analysis and Mapping Project Open Pacific Coast Study
FEMA completed detailed coastal engineering analysis and mapping of the Pacific coast of California in 2015. The analysis and mapping are used to update the flood and wave data for FIRM panels along the open coast. Public workshops were held in Stinson Beach and Marshall in spring 2016.
To learn more about the Open Pacific Coast Study, visit www.r9map.org/Pages/CCamp-Main.aspx. For more information about flood protection and FEMA standards, visit www.floodsmart.gov/floodsmart.
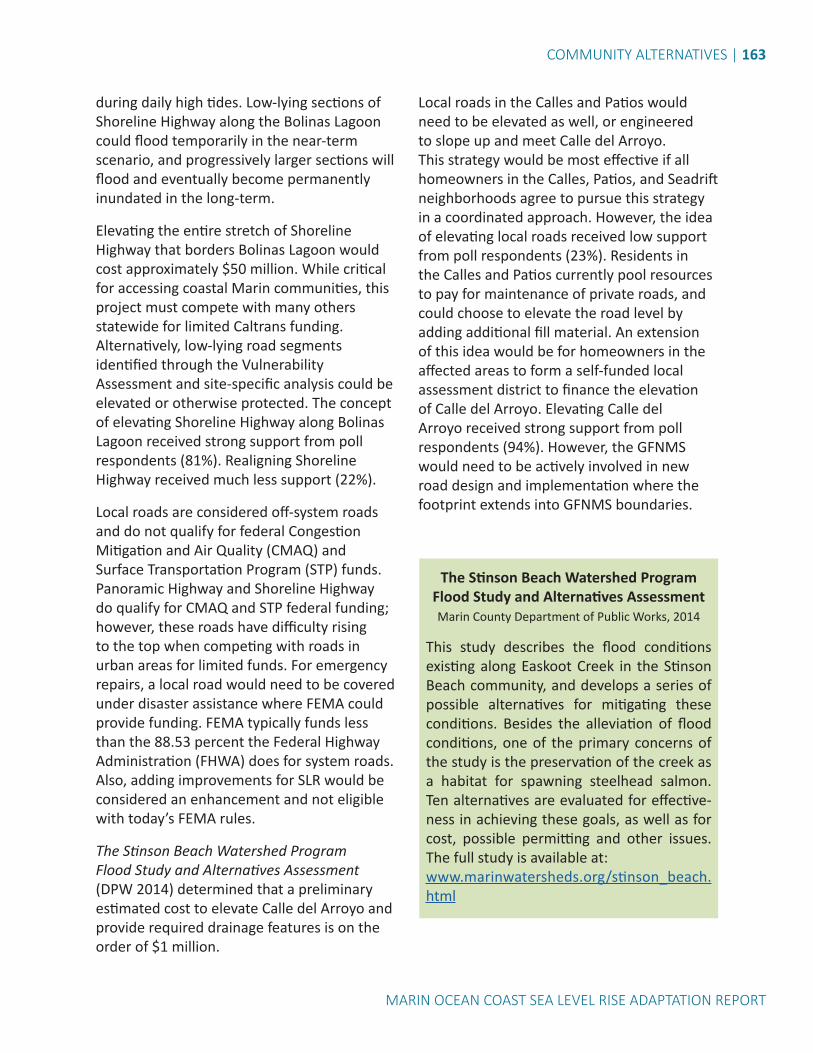
COMMUNITY ALTERNATIVES | 163
MARIN OCEAN COAST SEA LEVEL RISE ADAPTATION REPORT
during daily high tides. Low-lying sections of Shoreline Highway along the Bolinas Lagoon could flood temporarily in the near-term scenario, and progressively larger sections will flood and eventually become permanently inundated in the long-term.
Elevating the entire stretch of Shoreline Highway that borders Bolinas Lagoon would cost approximately $50 million. While critical for accessing coastal Marin communities, this project must compete with many others statewide for limited Caltrans funding. Alternatively, low-lying road segments identified through the Vulnerability Assessment and site-specific analysis could be elevated or otherwise protected. The concept of elevating Shoreline Highway along Bolinas Lagoon received strong support from poll respondents (81%). Realigning Shoreline Highway received much less support (22%).
Local roads are considered off-system roads and do not qualify for federal Congestion Mitigation and Air Quality (CMAQ) and Surface Transportation Program (STP) funds. Panoramic Highway and Shoreline Highway do qualify for CMAQ and STP federal funding; however, these roads have difficulty rising to the top when competing with roads in urban areas for limited funds. For emergency repairs, a local road would need to be covered under disaster assistance where FEMA could provide funding. FEMA typically funds less than the 88.53 percent the Federal Highway Administration (FHWA) does for system roads. Also, adding improvements for SLR would be considered an enhancement and not eligible with today’s FEMA rules.
The Stinson Beach Watershed Program Flood Study and Alternatives Assessment (DPW 2014) determined that a preliminary estimated cost to elevate Calle del Arroyo and provide required drainage features is on the order of $1 million.
Local roads in the Calles and Patios would need to be elevated as well, or engineered to slope up and meet Calle del Arroyo. This strategy would be most effective if all homeowners in the Calles, Patios, and Seadrift neighborhoods agree to pursue this strategy in a coordinated approach. However, the idea of elevating local roads received low support from poll respondents (23%). Residents in the Calles and Patios currently pool resources to pay for maintenance of private roads, and could choose to elevate the road level by adding additional fill material. An extension of this idea would be for homeowners in the affected areas to form a self-funded local assessment district to finance the elevation of Calle del Arroyo. Elevating Calle del Arroyo received strong support from poll respondents (94%). However, the GFNMS would need to be actively involved in new road design and implementation where the footprint extends into GFNMS boundaries.
The Stinson Beach Watershed Program Flood Study and Alternatives AssessmentMarin County Department of Public Works, 2014
This study describes the flood conditions existing along Easkoot Creek in the Stinson Beach community, and develops a series of possible alternatives for mitigating these conditions. Besides the alleviation of flood conditions, one of the primary concerns of the study is the preservation of the creek as a habitat for spawning steelhead salmon. Ten alternatives are evaluated for effective-ness in achieving these goals, as well as for cost, possible permitting and other issues. The full study is available at:www.marinwatersheds.org/stinson_beach.html

164
Calle del Arroyo during king tide, 2015. Credit: Loomans
Easkoot Creek flooding In addition to coastal hazards, Stinson Beach is subject to fluvial flooding hazards from Easkoot Creek. Three of the ten strategies in the Stinson Beach Watershed Program Flood Study and Alternatives Assessment included a flood bypass across the beach that would convey enough flow during a storm event to reduce flooding of the Calles and restore or enhance wetland habitat that once existed in the NPS south parking lot.
The preferred strategy identified in the DPW study is consistent with SLR adaptation planning. The restoration of a lagoon-wetland feature and overflow to the Pacific across the beach is particularly attractive, as it reduces the need for structural modification of homes while providing ecological benefits in a sustainable manner, is consistent with restoration of historic conditions, and may have a broader potential for funding. Structural adaptation to use pile foundations and raise homes above flood levels is also potentially viable and complementary to other strategies, as well as responsive to coastal flooding.
70 Sustainable Planning and Urban Research, Strategies for Managing Sea Level Rise, 2009.
Boardwalk entire neighborhoodsConstruction of boardwalk access to elevated homes would alter the community character but reduce the need to place large amounts of fill on roads to maintain access under permanent SLR inundation scenarios. Some examples of boardwalk-type communities exist on Marin’s bayside in Sausalito, Corte Madera, and Larkspur, with elevated homes built on poles over tidal salt marshes. This strategy allows structures to be built on an encroaching shoreline or in a vulnerable area, with a low risk of flooding, and may be a good tool for retrofitting certain low-lying infrastructure. Elevated development has the advantage of avoiding SLR threats for a longer time.70 (Vehicular access could be restricted to portions of the community.) This strategy, which could be funded by a local assessment district, received low support (5%).
Elevate entire neighborhoods on fillElevating entire neighborhoods on fill would require a great deal of agreement and coordination among homeowners. “Super-levees” in Japan have removed existing development, added fill to create a large elevated surface, and provided attractive financing options for displaced homeowners to live in the new development. However, this approach would be extremely costly if applied to protecting existing homes, or would require an intensification of development that is highly unlikely to occur in Marin’s coastal zone. Elevation of entire neighborhoods on fill would also have negative environmental impacts.
Update substandard septic systemsOn-site wastewater-treatment systems (OWTS) west of Shoreline Highway are vulnerable to saltwater intrusion and failure, leading to potential contamination of surface water. The SBCWD recommends that homeowners continue upgrading substandard

COMMUNITY ALTERNATIVES | 165
MARIN OCEAN COAST SEA LEVEL RISE ADAPTATION REPORT
septic systems to meet current codes. This strategy received moderate support from poll respondents (34%). An option for the medium term and the long term is to abandon leach fields and convert septic tanks to holding vessels that would need to be pumped out periodically or connected to a community wastewater system. This strategy received low support from poll respondents (15%), though the SBCWD supports this option. Elevating septic systems in earthen mounds would reduce the impact of saltwater intrusion.
Develop community wastewater systemThe Marshall Community Wastewater System is an example of this strategy, with a centralized treatment facility serving a neighborhood on Tomales Bay. Such a strategy could be pursued in the long term by the SBCWD and/or a local assessment district. The idea received low support from poll respondents (9%).
Retrofit potable water pipes and connectionsBeginning 2014, the SBCWD began a program to replace all water pipelines in the Calles and Patios. The SBCWD received a grant in 2015 to continue retrofitting potable-water-meter connections to resist corrosion from saltwater.
Allow small-scale desalination plantsSLR can contaminate groundwater supplies with saltwater due to landward and upward movement of sea water in coastal aquifers.71 Community members suggested that allowing small-scale desalination plants could improve resilience without negatively impacting the environment. Desalination could also reduce the demand on wells facing increased salinity.
National Parks Service beach The NPS beach that extends southeast of Calle del Pinos is backed by nourished dunes and parking and amenities. The low-lying area, 71 U.S. Geological Survey (USGS). Coastal Groundwater Systems, accessed August 2016.72 Stinson Beach County Water District. Onsite Wastewater Management Program 2016 Annual Report, 2016.73 Laura Tam. “Strategies for Managing Sea Level Rise,” the Urbanist, November 2009.
once a lagoon, is subject to flooding from Easkoot Creek. Landward of the beach are non-NPS public or private county assets that will become at risk if the natural shoreline defense is compromised. Adaptation-alternative cost schedules were not developed for the beach. However, the NPS is unlikely to armor to protect the backshore, but would instead facilitate the natural development of future habitat (Caffrey and Beavers 2013). Coordination will be required between federal and local jurisdictions in the future to ensure effective risk management of Stinson Beach assets that exist inland of NPS land.
The NPS will likely employ a retreat strategy that may include maintaining the dunes and beach and reduce parking and amenities as the shore migrates inland with SLR. In 2015, the NPS replaced the beach park’s four septic drain fields with a centralized drain field located inland where groundwater and anticipated SLR are not an issue. Septic systems at each park facility will provide primary treatment and settlement of raw sewage, then each facility’s lift station will pump effluent to a centralized drain-field system for disposal.72
Relocate/ Managed RetreatThe county could research potential costs and community interest in a long-term buyout or property-acquisition strategy if SLR or storm impacts become imminent threats to homeowners. The county could also consider having a plan and specific proposals in place in case of a major storm or flood event that makes homeowners more likely to be interested in the buyout.73 Rolling easements and other land-use policies could be used to limit further construction and investment in the most hazardous areas.

166
Removing seawalls, bulkheads, homes, and other development that would limit the inland migration of the beach and marsh would allow these habitats to shift in response to SLR and support continued public access and recreational opportunities. Otherwise, without beach nourishment, the beach is predicted to erode almost completely by 2100.74 However, this strategy would endanger and ultimately eliminate, existing homes, and received low support (2%).
74 Sea Level Rise Adaptation Alternatives for Marin County.
Potential locations for adaptation strategies are shown in map 16. These strategies respond to vulnerabilities based on the C-SMART scenarios using the CoSMoS model. It is important to keep in mind that additional geomorphological changes, such as beach erosion, are not reflected in the CoSMoS models and therefore community vulnerabilities may be more extreme. Future community-scale analysis could combine all relevant models to date including coastal and riverine sea level rise and storm surge and coastal erosion.
Throughout Stinson Beach's history, storms, coastal flooding, and erosion have devastated lives and properties. Rising sea levels and storms which are likely to intensify with climate change can exacerbate the severity of future disasters and understanding past events can help inform preparedness. The Stinson Beach Historical Society's virtual exhibit with images and descriptions of past floods can be accessed at: stinsonbeachhistoricalsociety.org
1956 1978
1983 1983 Photos Credit: Stinson Beach Historical Society

COMMUNITY ALTERNATIVES | 167
MARIN OCEAN COAST SEA LEVEL RISE ADAPTATION REPORT
6.4) BolinasPRIMARY VULNERABILITIES PRIORITY ACTIONS• Storm and tidal impacts already occur • Elevate homes subject to temporary
flooding• Protect sewage-treatment facility.• Continue restoring wetlands in Bolinas
Lagoon.• Accommodate threatened structures
through elevation and retrofitting.• Elevate or reroute threatened roads.• Elevate or relocate grocery store,
emergency shelter, and library.
• Long-term flooding will impact 98 buildings and 1,620 people.
• Costs of long-term impacts to exposed assets will be $18 million.
• Those impacted will include the crabbing and tourism industries and the Bolinas Community Public Utilities District
StrategyTerm: NT = Near MT = Medium LT = Long
Support: L = Low 0–40%M=Med. 41–70%S = Strong 71%+NA = Not available
PROTECTMaintain existing shoreline armoring at risk of causing more bluff and beach erosion
NT NA
Install new armoring along cliffs NT LNourish beach, especially along Brighton Beach NT L
ACCOMMODATEElevate development, particularly in downtown area MT LElevate or realign Wharf Road and Olema-Bolinas Road at the bridge over Pine Gulch Creek
NT-MT L
RELOCATE/MANAGED RETREATResearch costs and interest of long-term buyout or acquisition strategy
LT NA
Remove armoring at Brighton Beach, relocate structures inland, allow inland migration of beach
LT M
Require blufftop setbacks based on 50-year time frame and analysis
NT NA
Establish a blufftop-erosion trigger for removal of structures
NT NA

168
Figure 23. Bolinas Exposure Map. Does not include geomorphic change.
Wharf
Altura
Brighton
Crescente
Olema Bolinas
Miramonte
Park
Newport
MarinMap
0 0.0650.0325Miles¯
BolinasPotential Sea Level Rise Map - DRAFTBolinas
This map was developed for planning anddiscussion purposes. The County of Marin is notresponsible or liable for use of this map beyondits intended purpose. This map isrepresentational only and does not constitute anofficial map or dataset of the County of Marin.
10
12
13
2
3
4
5
6
8 79
Vulnerable AssetsSite Specific Assets Identified on Map
Historic District
Sea Level Rise (SLR) ScenariosBaseline No SLR / No Storm
25 cm (≈1 foot) SLR w/annual storm
25 cm (≈1 foot) SLR w/20 year storm
50 cm (≈2 feet) SLR w/20 year storm
100 cm (≈3 feet) SLR w/100 year storm
200 cm (≈6.5 feet) SLR w/100 year storm
11
1
Buildings Potentially FacingHazardous Conditionsplus some septic systemsand water distribution lines
98
Olema-Bolinas Road / Tsunami Evacuation Rte.
Wharf Road
Historic District
Sewage Lift Station
Bolinas Super Market
Bolinas Library
Bo-Gas Station
Bolinas Community Center/ Emergency Shelter
Bolinas Community Land Trust
12
3456789
Calvary Church
10
Bolinas People's Store
11
Bolinas Post Office
1213
Bolinas Lagoon
13 16 24 30

COMMUNITY ALTERNATIVES | 169
MARIN OCEAN COAST SEA LEVEL RISE ADAPTATION REPORT
Figure 24. Bolinas Conceptual Adaptation Options

170
No ActionIn the near term, downtown buildings could be affected by temporary storm flooding. More intense storms and wave action may hasten bluff erosion, jeopardizing blufftop homes. Beaches trapped by armoring and development could disappear. SLR and erosion could significantly impact sewage-collection and water-distribution systems in downtown and on the Little Mesa. Inundation of the Olema-Bolinas Road or its bridges for extended periods of time could have drastic impacts for both emergency access and regular usage by residents and visitors.
Priority ActionsAccommodation of threatened structures and utilities through elevation and retrofitting could be a priority action. Shoreline Highway and Wharf Road are of primary concern in the near term, while Olema-Bolinas Road and the bridge at Pine Creek Gulch may need to be elevated or rerouted in the medium term. Blufftop homes may need to be removed once the bluff edge erodes to the extent that it endangers the structure and those living in it.
The sewage-treatment facility will need to be protected, and other critical facilities and community resources like the grocery store, the emergency shelter, and the library will need to be elevated or relocated in the medium term. The post office and Bolinas-Stinson School will need to be elevated or relocated in the long term.
Wetland protection and enhancement efforts (currently underway as part of the Bolinas Lagoon Ecosystem Restoration Project) will also have flood-protection benefits and should continue to be planned for, incorporating future SLR and storm-surge scenarios.
BOLINAS : LONG-TERM IMPACTS 98 buildings 1,620 people
Storm and tidal impacts already occur
12 businesses
$18 million worth of
assets exposed
Residential, crabbing, tourism
Property OwnersBPUD
County Public Works
Bolinas public stairwell flooding, 2013.
Credit: A. Rappaport
The following sections provide additional information about strategies considered during the C-SMART project. They are grouped according to general approach: protect, accommodate, or retreat.

COMMUNITY ALTERNATIVES | 171
MARIN OCEAN COAST SEA LEVEL RISE ADAPTATION REPORT
ProtectMaintain seawalls and revetments Homes built at the top of steep eroding cliffs will become increasingly jeopardized. Existing hazards are apparent from the rock revetment and seawalls presently built in front of homes and along bluff toes in the area. In the near term, property owners could maintain existing revetments, seawalls, and levees. However, if shoreline protective devices remain along the cliffs in Bolinas, the beach can be expected to erode and be inundated by SLR and eventually disappear, affecting recreational opportunities and ecology. If further armoring measures are taken along the cliffs in Bolinas, the supply of sediment from the cliffs to the beach will be further reduced, likely accelerating beach loss. Reduced beach widths result in increased loadings and structural requirements on seawalls, and maintenance and improvement costs may outweigh the values of the properties.75 This strategy received moderate support from poll respondents (40%).
Place sand on beachesBeach nourishment could provide short-term benefits of maintaining a beach for ecology and recreation services, while reducing wave run-up on seawalls and bluffs along the south-facing shores of Bolinas west of the Bolinas Lagoon mouth. For example, beach nourishment could be used to maintain Brighton Beach and the protection it provides to oceanfront homes.
In the long term, beach nourishment will become more expensive, as sand sources are limited and the amount of sand required increases with SLR. The presence of seawalls along the western-facing stretch near the Brighton Avenue beach access has contributed to accelerated erosion. As in Stinson Beach, this strategy would require 75 Environmental Science Associates (ESA). Sea Level Rise Adaptation Alternatives for Marin County. 2015. 76 Gulf of the Farallones National Marine Sanctuary. Bolinas Lagoon Ecosystem Restoration Project: Recommenda-tions for Restoration and Management, August 2008.
continued sand placement over time, and is not a sustainable long-term solution. Beach nourishment, which could be financed through a local assessment district, received moderate support from poll respondents (40%).
Inside the lagoon mouth along Wharf Road, nature-based strategies for managing SLR may be difficult to implement. This would require an evaluation of how the lagoon mouth is likely to evolve, how it interacts with the lagoon and the cliffs and what opportunities or constraints this might create. The lagoon mouth’s configuration and the slough channel along Wharf Road are hurdles to implementing an adaptation measure such as a horizontal levee. The slough channel would need to be realigned, limiting boat access from Wharf Road homes.
Support Bolinas Lagoon restoration efforts Many of the recommendations of the Bolinas Lagoon Ecosystem Restoration Project focus on removing impediments to the exchange of flow and sediment from the lagoon and its watershed, enhancing wetland habitats using natural processes to allow the lagoon to move inland where possible, and preserving the lagoon's adaptive capacity. Other key recommendations involve remediation of watershed disturbances, restoration of Kent Island as a dynamic flood shoal island, restoration of eelgrass if suitable habitat is available in Bolinas Lagoon, investigation of managing tidal exchange of Seadrift Lagoon to promote tidal circulation, and active planning for and management of SLR (See next page). The county and Caltrans could plan for roadway and culvert improvements, including possible elevation of roadways to reduce impacts to the lagoon and improve habitat connectivity. 76

172
The San Francisco Bay Joint Venture sponsored a scientific panel of experts to evaluate the Bolinas Lagoon Ecosystem Restoration Project. Marin County Parks hired one of the participants, Dr. Peter Baye, to summarize the meeting. The following are the general recommendations that emerged from this group:77
The important new perspectives from the meeting are as follows:
• Accelerated SLR replaces previous concerns over the loss of tidal prism as the overriding impact to the lagoon’s ecosystem structure and function.
• In the context of SLR, sediment can be an important asset to the lagoon.
• Accommodation room for the lagoon to migrate inland as sea level rises is necessary for the long-term health and stability of Bolinas Lagoon.
• Bolinas Lagoon’s barrier spit and tidal inlet are essential components of its evolution and response to SLR.
The project’s Design Review Group (DRG) also made the following general recommendations:
• Revised conceptual models of Bolinas Lagoon should be developed to guide ecosystem planning, project prioritization, public education, and project re-evaluation.
• Planning for various SLR and storm surge scenarios should be incorporated into the restoration project.
• Armoring is a liability for lagoon resilience and adaptation to SLR.
77 Conclusions and Recommendations of the Bolinas Lagoon Restoration Project Design Review Group, March 2014.
Finally, the DRG made the following project and area specific recommendations:
• Maintaining the channelization of Pine Gulch Creek is detrimental to the long-term evolution of the lagoon.
• The Pine Gulch Creek delta and its floodplain are essential for the future rising lagoon edges and may provide area for habitat to shift and evolve as sea levels rise.
• There was no consensus about whether the Pine Gulch Creek delta is a liability to the lagoon’s resilience to SLR.
• The Lewis and Wilkins Gulches (the area known as “the Y”) is another highly important zone for lagoon accommodation space, tidal marsh and floodplain migration, and sediment- management opportunities in response to SLR.
• The drainages of the eastern shore of Bolinas Lagoon are also important to accommodate the lagoon’s inland migration.
• The DRG noted that the county and the GGNRA evaluated potential alternatives to address flooding along Easkoot Creek through a separate process.

COMMUNITY ALTERNATIVES | 173
MARIN OCEAN COAST SEA LEVEL RISE ADAPTATION REPORT
AccommodateElevate homes Many structures in Bolinas, particularly in the historic downtown area, are vulnerable to flooding in their current condition. The typical cost of elevating a structure ranges from $140 per square foot in the flood zone to $230 per square foot in the wave zone.78 The cost of elevating homes and associated utilities would be borne by individual homeowners. Buildings on Wharf Road could be further elevated on their existing pier foundations. By including proper storm-water features such as flap gates, an elevated Wharf Road could also protect the low-lying neighborhood behind it. (See the Stinson Beach section for a discussion of FEMA requirements and potential impacts of home elevation.) This strategy received moderate support from poll respondents (40%).
Elevate roadsGeneral approaches for adapting roads to SLR include identifying water-level triggers for management actions, and coordinating with DPW and Caltrans. (They are further described in section 5.3 of this report.)
Elevation (or realignment) could be considered for county-owned roads, including Wharf Road and Olema-Bolinas Road at the bridge over Pine Gulch Creek. However, these projects must compete with many others for limited funds. This strategy received moderate support from poll respondents (40%).
SLR will impact Shoreline Highway along Bolinas Lagoon. If anticipated precipitation patterns change with climate change to more flashy storms, culverts on many streams will need to be upgraded to convey higher peak flows. This requires either larger culverts or raising the roadway on piles to allow 78 Environmental Science Associates (ESA). Sea Level Rise Adaptation Alternatives for Marin County. 2015.79 Coastal Adaptation Policy Assessment.
conveyance of storm runoff. In the context of sea-level rise, a piled causeway design could provide further ecological benefit by allowing migration of habitat under the roadway and upland.
The GFNMS prefers road elevation in Bolinas to allow for wetland migration. The GFNMS would need to be involved in new road design and construction review, including recommending measures to avoid risks of materials entering the sanctuary.
Relocate/ Managed RetreatThe county could research potential costs and community interest in a long-term buyout or property-acquisition strategy if rising sea levels or storm impacts become imminent threats to homeowners. It could also consider having a plan and specific proposals in place in case of a major storm or flood event that makes homeowners more likely to be interested in a buyout.79 Rolling easements and other land-use policies could be used to limit further construction and investment in the most hazardous areas.
To maintain Brighton Beach, existing armoring could be removed and development removed or relocated. Services such as utilities and roads could be realigned in an orderly manner over time to limit costs and avoid catastrophic failure and hazardous conditions. The idea of removing shoreline protective devices that limit the inward migration of beaches received moderate support from poll respondents (60%).

174
Blufftop development setbacksUnder the county’s proposed LCP standards, new development must be set back from the bluff edge a sufficient distance to ensure its stability and structural integrity for a minimum of 100 years and to eliminate the need for shoreline protective devices. Coastal-hazards analyses for individual sites must include a slope-stability analysis that considers historical bluff-retreat data as well as accelerated erosion due to SLR.80
For informational purposes and to guide the identification of potential planning triggers for removal of existing structures in hazardous areas, ESA produced bluff-erosion hazard zones for both projected historic rates and amplified rates from SLR. These rates and buffers are summarized and compared against other suggested values in table 29 below. Setbacks are specified for each planning time frame; ESA setbacks are referenced to 2010 conditions. Corresponding erosion rates are reported for historic and 2100 accelerated conditions from a 2009 Pacific Institute study81 that considers high SLR.
The ESA setbacks for each reach were determined using the average erosion rate plus one or two standard deviations within each reach. It is helpful to think about the average and standard deviations of erosion rates as the likelihood of exceedance; the average plus two standard deviations describes a setback that is not likely to be exceeded (around 2 percent of locations and times), whereas adding one standard deviation indicates exceedance may occur around 15 percent of the locations and times, and use of the average (no additional standard deviation) indicates the distance could be exceeded at about 50 percent of the locations and times. Thus, there is uncertainty 80 Marin County Community Development Agency. Draft Local Coastal Program, Environmental Hazards Chapter LUPA. April 201681 Pacific Institute. The Impacts of Sea Level Rise on the California Coast, 2009.
in all estimates of future erosion distances, and selection of the distances is affected by tolerance for risk such as loss of property.
Setbacks for development and planning in Bolinas (and elsewhere) should use a minimum 100-year analysis and apply SLR-accelerated erosion rates with a factor of safety (1–2 standard deviations of the erosion rate, with an additional landslide offset where applicable). Site-specific evaluation of erosion rates is required; the average values in table 29 could be considered as a minimum.
New Construction: Setback should consider long-term erosion plus accelerated erosion due to SLR, plus a factor of safety that includes erosion variability and/or landslides or block failure widths where applicable. For the example of a new structure with a structure life of 50 years, this setback could be 225 feet (a 50-year offset from average erosion plus two standard deviations).
Existing Structures (planning trigger): The county could consider identifying a minimum distance between existing structures and bluff edge, at which point planning for structure removal would be initiated. Local studies are required to assess local geologic conditions and characteristic block failure (or landslide) widths. Generally, a planning timeframe could be established that determines a distance set by long term plus accelerated erosion and a factor of safety. For example, assume it takes five years for permitting and planning to remove or relocate a structure. Using a near-term retreat rate of 3.7 feet per year (average plus two standard deviations) and a 45-foot block-failure factor, the trigger distance (from structure to bluff edge) to start planning would be about 64 feet (3.7 feet per year times five years equals 18.5 feet, plus 45 feet).

COMMUNITY ALTERNATIVES | 175
MARIN OCEAN COAST SEA LEVEL RISE ADAPTATION REPORT
Table 29. Bolinas Open Coast Bluff Erosion Setbacks Considering Various GuidelinesErosion Buffers and Rates 40 yrs.
(2050) 50 yrs. (2060)
100 yrs. (2110)
150 yrs. (2160)
Erosion Rate (R)
FOS (+X StDev)
Equivalent Rate (R +FOS)
Coastal Commission Interpretive Guidelines for Marin County: Minimum setback for new construction:
(120 ft.) 150 ft. (300 ft.) (450 ft.) 3 ft./yr. - -
Environmental Hazards Element of the Marin Countywide Plan: Little Mesa to Duxbury Reef 80 ft. (100 ft.) (200 ft.) (300 ft.) 2 ft./yr. - - Duxbury Reef to Point Reyes 120 ft. (150 ft.) (300 ft.) (450 ft.) 3 ft./yr. - - Bolinas Gridded Mesa Plan (1985): Overlook to Duxbury Point - 145 ft. 245 ft. 345 ft. 2 ft./yr.
(+45 ft.) - -
Duxbury Point to Poplar Road
- 170 ft. 295 ft. 415 ft. 2.5 ft./yr. (+45 ft.)
- -
ESA—considering only USGS historic (1929–1998) erosion rates:Little Mesa to Duxbury Reef (+1 StDev)
116 ft. 145 ft. 290 ft. 435 ft. 1.5 ft./yr. 1.4 ft./yr. 2.9 ft./yr.
Duxbury Point to Poplar Road (+1 StDev)
80 ft. 100 ft. 200 ft. 300 ft. 1.3 ft./yr. 0.7 ft./yr. 2 ft./yr.
Little Mesa to Duxbury Reef (+2 StDev)
172 ft. 215 ft. 430 ft. 645 ft. 1.5 ft./yr. 2.8 ft./yr. 4.3 ft./yr.
Duxbury Point to Poplar Road (+2 StDev)
108 ft. 135 ft. 270 ft. 405 ft. 1.3 ft./yr. 1.4 ft./yr. 2.7 ft./yr.
ESA—considering accelerated erosion rates due to SLR (PWA 2009): Little Mesa to Duxbury Reef (+1 StDev)
212 ft. 160 ft. 475 ft.* N/A 1.5–4.3 ft./yr.**
1.1–3.1 ft./yr.**
2.6–7.3 ft./yr.**
Duxbury Point to Poplar Road (+1 StDev)
82 ft. 104 ft. 228 ft.* N/A 1.3–1.5 ft./yr.**
0.7–0.9 ft./yr.**
2.0–2.6 ft./yr.**
Little Mesa to Duxbury Reef (+2 StDev)
171 ft. 225 ft. 671 ft.* N/A 1.5–4.3 ft./yr.**
2.2–6.2 ft./yr.**
3.7–10.5 ft./yr.**
Duxbury Point to Poplar Road (+2 StDev)
110 ft. 140 ft. 309 ft.* N/A 1.3–1.5 ft./yr.**
1.4–1.8 ft./yr.**
2.7–3.3 ft./yr.**
* Extrapolated to 2110 using 2100 rate ** Range: historic to SLR-amplified rate at 2100

176
6.5) InvernessPRIMARY VULNERABILITIES PRIORITY ACTIONS• Storm and tidal flooding already occur • Accommodate existing
development by elevating and retrofitting.
• Protect assets with nature-based strategies.
• Long-term flooding will impact 1,130 buildings, 10 businesses, and 1,304 people.
• Costs of long-term impacts to exposed assets will be $11 million.
• Others impacted will include the residential-tourism industry, the DPW, the Inverness Public Utility District (IPUD), the NMWD, and property owners.
StrategyTerm: NT = Near MT = Medium LT = Long
Support: L = Low 0–40%M=Med. 41–70%S = Strong 71%+NA = Not available
PROTECTRestore/enhance wetlands along Tomales Bay shoreline NT-MT SCreate a native oyster reef in Tomales Bay NT-MT LConstruct horizontal levees in Tomales Bay MT L
ACCOMMODATEElevate buildings and utilities MT MFloodproof existing buildings NT MElevate Sir Francis Drake Boulevard on a levee to prevent flooding and protect existing water pipeline under road
MT M
Elevate Shoreline Highway MT MUpdate old septic systems prior to saltwater intrusion NT SDevelop a community wastewater system MT MCreate offshore boat moorings as marinas become inundated
NT M
RELOCATE/MANAGED RETREATRelocate coastal access points MT MRemove shoreline protective devices that limit inland migration of shoreline habitats
MT M
Remove development that limits inland migration (phased based on triggers)
MT-LT M
Realign Sir Francis Drake Boulevard MT M

COMMUNITY ALTERNATIVES | 177
MARIN OCEAN COAST SEA LEVEL RISE ADAPTATION REPORT
Figure 25. Inverness Exposure Map. Does not include geomorphic change.
Vision
Sir Francis Drake
Keith
Kehoe
...AberdeenMadrone
Stirlin
g Argyle
Miwok Pine Hill
Woodhaven
Rannoch
Via de la Vista
Cameron Ca
llend
er
Camino del Mar
Park
Balmoral
Drake
Lower
Vision
...
...
MarinMap
0 0.150.075Miles¯
BolinasPotential Sea Level Rise Map - DRAFT
Sea Level Rise (SLR) ScenariosBaseline No SLR / No Storm
25 cm (≈1 foot) SLR w/annual storm
25 cm (≈1 foot) SLR w/20 year storm
50 cm (≈2 feet) SLR w/20 year storm
100 cm (≈3 feet) SLR w/100 year storm
200 cm (≈6.5 feet) SLR w/100 year storm
Inverness (N)This map was developed for planning anddiscussion purposes. The County of Marin is notresponsible or liable for use of this map beyondits intended purpose. This map isrepresentational only and does not constitute anofficial map or dataset of the County of Marin.
1
7
3
2
6
4
5
8
Vulnerable AssetsSite Specific Assets Identified on Map
NMWD Pipeline
Inverness Yacht Club
Brock Schreiber Boathouse
Tomales Bay State Park
Sir Francis Drake Blvd.
23 23 34 61 75
Dana Marsh / Beach Access
Shell Beach
Tomales Bay Resort and Marina
1
2
3
4
5
6
7
8
Inverness Buildings PotentiallyFacing Hazardous Conditionsplus some septic systemsand water distribution lines

178
Figure 26. Inverness Exposure Map. Does not include geomorphic change.
Sir Francis Drake
...
Dream Farm
Inverness
ParkHawthornden
Glen
Dream Farm
...
...
...
MarinMap
0 0.150.075Miles¯
BolinasPotential Sea Level Rise Map - DRAFT
Sea Level Rise (SLR) ScenariosBaseline No SLR / No Storm
25 cm (≈1 foot) SLR w/annual storm
25 cm (≈1 foot) SLR w/20 year storm
50 cm (≈2 feet) SLR w/20 year storm
100 cm (≈3 feet) SLR w/100 year storm
200 cm (≈6.5 feet) SLR w/100 year storm
Inverness (S)This map was developed for planning anddiscussion purposes. The County of Marin is notresponsible or liable for use of this map beyondits intended purpose. This map isrepresentational only and does not constitute anofficial map or dataset of the County of Marin.
1
7
2
6 3
4
5
Vulnerable AssetsSite Specific Assets Identified on Map
Martinelli Park
Estuarine and Marine Wetlands
Inverness Store
Motel Inverness
Historic District
Inverness Post Office
Sir Francis Drake Blvd.
1
2
3
4
5
6
7
HistoricDistrict
23 23 34 61 75
Inverness Buildings PotentiallyFacing Hazardous Conditionsplus some septic systemsand water distribution lines

COMMUNITY ALTERNATIVES | 179
MARIN OCEAN COAST SEA LEVEL RISE ADAPTATION REPORT
Figure 27. Inverness Conceptual Adaptation Options.
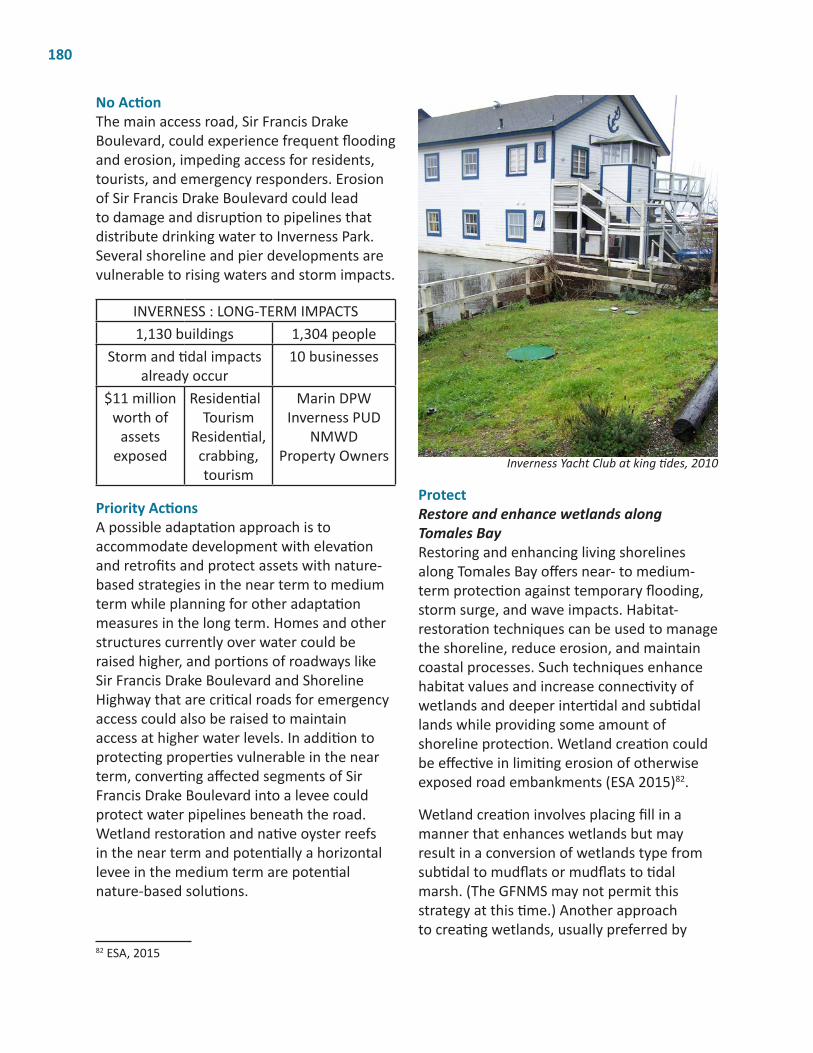
180
No ActionThe main access road, Sir Francis Drake Boulevard, could experience frequent flooding and erosion, impeding access for residents, tourists, and emergency responders. Erosion of Sir Francis Drake Boulevard could lead to damage and disruption to pipelines that distribute drinking water to Inverness Park. Several shoreline and pier developments are vulnerable to rising waters and storm impacts.
INVERNESS : LONG-TERM IMPACTS 1,130 buildings 1,304 people
Storm and tidal impacts already occur
10 businesses
$11 million worth of
assets exposed
ResidentialTourism
Residential, crabbing, tourism
Marin DPWInverness PUD
NMWDProperty Owners
Priority ActionsA possible adaptation approach is to accommodate development with elevation and retrofits and protect assets with nature-based strategies in the near term to medium term while planning for other adaptation measures in the long term. Homes and other structures currently over water could be raised higher, and portions of roadways like Sir Francis Drake Boulevard and Shoreline Highway that are critical roads for emergency access could also be raised to maintain access at higher water levels. In addition to protecting properties vulnerable in the near term, converting affected segments of Sir Francis Drake Boulevard into a levee could protect water pipelines beneath the road. Wetland restoration and native oyster reefs in the near term and potentially a horizontal levee in the medium term are potential nature-based solutions.
82 ESA, 2015
Inverness Yacht Club at king tides, 2010
ProtectRestore and enhance wetlands along Tomales BayRestoring and enhancing living shorelines along Tomales Bay offers near- to medium-term protection against temporary flooding, storm surge, and wave impacts. Habitat-restoration techniques can be used to manage the shoreline, reduce erosion, and maintain coastal processes. Such techniques enhance habitat values and increase connectivity of wetlands and deeper intertidal and subtidal lands while providing some amount of shoreline protection. Wetland creation could be effective in limiting erosion of otherwise exposed road embankments (ESA 2015)82.
Wetland creation involves placing fill in a manner that enhances wetlands but may result in a conversion of wetlands type from subtidal to mudflats or mudflats to tidal marsh. (The GFNMS may not permit this strategy at this time.) Another approach to creating wetlands, usually preferred by

COMMUNITY ALTERNATIVES | 181
MARIN OCEAN COAST SEA LEVEL RISE ADAPTATION REPORT
permitting agencies, is to excavate soils from existing vacant uplands down to the appropriate grades to allow tidal or seasonal wetlands to form (DPW 2015). Wetlands projects are complex to design and permit, since they must accommodate habitat and flood-protection needs. This strategy may involve a moderate to high cost and will not prevent inundation of low-lying areas unless it is backed by a flood-protection levee.83 The effectiveness of wetland solutions will diminish with higher levels of SLR unless grades are raised, as the wave-dampening ability of tidal wetlands diminishes with increased water depth.84 Wetland restoration, which could be funded by a local assessment district or a government grant, received strong support from poll respondents (100%).
Create native oyster reefs in Tomales BayAnother component of living shorelines, native oyster reefs can mitigate erosion and flood hazards where waves are small and weak enough to be dissipated by the limited reef structures. Oyster reefs consist of a hard oyster-settlement substrate placed onto a supporting structure, such as wooden pallets or a PVC base, with eelgrass beds later planted between the oyster structures. Scientists and engineers are studying pilot projects near San Rafael through the San Francisco Bay Living Shorelines Project to monitor biological recruitment, as well as sedimentation rates behind the oyster reefs, to evaluate their erosion-protection efficacy. 85 A native oyster reef, which could be funded by a local assessment district or a government grant, received moderate support from poll respondents (33%). The GFNMS could also strongly support demonstration projects of native oyster reefs and provide information to help inform the most ideal locations.
83 DPW, 201584 Ibid.85 ESA, 2015
Construct horizontal levee along Tomales BayHorizontal levees are earthen levees with flatter side slopes toward the water’s edge that use the wave-attenuation benefits of expanded wetlands in front of the levee. Horizontal-levee projects combine flood-protection benefits with habitat benefits and are frequently discussed by bay scientists and environmental engineers as a viable approach to multi-objective flood protection.
However, there are a number of challenges and uncertainties associated with horizontal levees. In addition to challenges related to permitting that are associated with any fill of Tomales Bay, there are also uncertainties associated with how many flood-protection, water-quality, and habitat benefits horizontal levees provide. Significant wave attenuation across a tidal marsh requires a minimum width of several hundred feet. Costs for importing and placing fill vary significantly depending on the location and quality of the borrowing source of sediment. Generally, the estimated cost is medium to high relative to other strategies.
In the medium term, horizontal levees may serve as protection against SLR where land use, space, and habitat allow. All the marshes in Inverness are vulnerable because they are confined by the roadway. As sea levels rise, much of the low salt marsh will be converted to mudflats and sand flats. Because the Inverness shore is steep, marsh transition areas shrink with SLR. Areas near Martinelli Park and Dana Marsh may be good candidates for assessing the feasibility of a horizontal levee.
To the extent that other natural habitats in Tomales Bay can be protected, restored, or enhanced, the county may bolster the

182
benefits provided by a horizontal-levee project and mitigate some of the associated potential technical and financial risks. The bay itself is zoned as open area, though detailed analysis would be required to understand whether a horizontal levee would impose on surrounding residentially zoned parcels.
AccommodateElevate buildings and utilitiesCost estimates for structural elevation are around $140 per square foot for structures in the flood zone, and $230 per square foot for structures in the wave zone. Continued livability within elevated structures would also require elevation of associated utilities and roads, which could increase the overall cost significantly. This strategy, which would be implemented by property owners, received moderate support from poll respondents (67%). One respondent commented that they support this strategy only if financial assistance is provided to homeowners.
Flood proof buildingsThis strategy, which would be implemented by property owners, received moderate support from poll respondents (50%).
Permit houseboats Houseboats are not recommended as an adaptation strategy due to strong wind and wave action during storms, increased threat of discharges and marine debris, and lack of houseboat marinas and services. This strategy received no support from poll respondents.
Elevate Sir Francis Drake BoulevardLike other SLR road-adaptation efforts, approaches include identifying water-level triggers for management actions and coordinating with DPW and Caltrans. They are further described in section 5.3 of this report.
Sir Francis Drake Boulevard could be elevated on an earthen levee to protect access, utilities under the roads, and assets on the landward side of the road. Conversion of affected segments of Sir Francis Drake Boulevard to levees would also protect the NMWD water pipeline in Inverness Park and downtown. Levees require a large right-of-way, and costs vary significantly based on the type and location of fill material. This measure, which could be implemented by the county and/or local service providers, received moderate support from poll respondents (67%).
Elevate Shoreline Highway This strategy, which would be implemented by Caltrans, received moderate support from poll respondents (67%). See the “East Shore” section of this report for further discussion of options for Shoreline Highway.
Update old septic systems Saltwater intrusion due to rising sea levels can lead to septic failure, especially for older systems. Updating old septic systems, which would be implemented by property owners, received strong support from poll respondents (83%). Across Tomales Bay in East Shore, the Marshall Community Wastewater System is a model for coordinated effort to protect water quality and share costs between government agencies and property owners.
Develop community wastewater systemThis strategy, which would be implemented by a local service provider or a local assessment district, and received moderate support from poll respondents (50%). The recently installed Marshall Community Wastewater System relocated several independent leach fields to a shared leach field east of Shoreline Highway due to water-quality violations. However, individual septic tanks and the pipes connecting these homes to the community system will still be vulnerable to corrosion in the long term.

COMMUNITY ALTERNATIVES | 183
MARIN OCEAN COAST SEA LEVEL RISE ADAPTATION REPORT
Create boat mooringsOnce marinas become unusable due to inundation, the state, the county, or boat owners could create offshore moorings. This measure received moderate support from poll respondents (50%). The marina at the Tomales Bay Resort is often silted in, so it would potentially benefit from SLR. In 2014, the GFNMS and the State Lands Commission commenced the Tomales Bay Mooring Program to permit and lease moorings in Tomales Bay. By November 2016, all abandoned moorings were removed by the GFNMS, which contributed to the decrease in the total number of moorings. Although this decrease could be due to the program’s costs and requirements, this action freed up space for more moorings on the bay.
Ferry on Tomales BayThere is some interest among residents in bringing back the ferry from Point Reyes Station to Inverness.
Relocate/Managed RetreatIn the long term, realignment of development farther landward within a managed-retreat context is an option that would maintain no net loss of ecological function of coastal assets and would limit costs and increase resilience. For example, the cost associated with structural modification is reduced if the structure is moved inland, though moving costs would need to be considered to fully determine net savings or losses.
Relocation of coastal access points, which would be implemented by the county, received moderate support from poll respondents (67%). Removing shoreline protective devices that limit inland migration of beaches and wetlands, which would be implemented by property owners, received moderate support from poll respondents (67%). (Removal of development that limits inland migration of beaches and marshes is
noted in the discussion of horizontal levees above.) Relocation of buildings, which could be phased according to identified triggers, and would be implemented by property owners, received moderate support from poll respondents (50%). Realignment of affected segments of Sir Francis Drake Boulevard along Tomales Bay, which would be implemented by the county in collaboration with affected property owners, received moderate support from poll respondents (50%).
The county could research potential costs and community interest in a long-term buyout or property-acquisition strategy if SLR or storm impacts become imminent threats to homeowners. The county could also consider having a plan and specific proposals in place in case of a major storm or flood event that makes homeowners more likely to be interested in the buyout. Easements and other land-use policies could be used to limit further construction and investment in the most hazardous areas. These easements would roll, or move, with bluff and shore erosion.
Potential locations of adaptation strategies are shown on figure 32.

184
Green Strategy : Beach Nourishment at Stinson Beach
SF Bay Living Shorelines Project. Credit: S. Kiriakopolos, 2014
Benefits: Public health, recreation, tourism, carbon sequestration, water quality Costs: Unknown Living shorelines projects use habitat- restoration techniques to manage the shoreline, reduce coastal erosion, and maintain coastal processes while protecting, restoring, and creating natural habitat for aquatic flora and fauna. Such techniques enhance habitat values and increase connectivity of wetlands and deeper intertidal and subtidal lands, while providing some amount of shoreline protection.
ESA is monitoring the SF Bay Living Shorelines Project, a pilot project investigating the ideal configurations and size scales of oyster reefs and eelgrass beds for habitat enhancement. Oyster and eelgrass reefs were constructed at two sites in 2012 (at China Camp State Park in San Rafael, and near Eden Landing in Hayward).
Oyster elements all consist of a hard oyster-settlement substrate of some type placed onto a supporting structure. In past projects, a wooden pallet has been used
86 ESA, 201587 Ibid.
to support oyster shell or other substrates, while this project uses a PVC-base structure. Oyster-bag mounds were then placed on the base as an oyster-recruitment structure. (Other small pilot projects use inexpensive modular cement structures.)
Experimental treatment plots of 32 by 10 meters were constructed parallel to shore, approximately 250 meter from the shore, with eelgrass beds later planted between the oyster structures using shoot transplants as well as buoy-deployed seeding. In addition to biological-recruitment monitoring by others, ESA is actively monitoring the sedimentation behind these oyster reefs to evaluate the efficacy of erosion protection.86
Oyster reefs are considered potential measures for erosion and flood-hazard mitigation where waves are small and weak enough to be dissipated by the limited reef structures. Hence, this measure is potentially viable only in estuarine areas such as Tomales Bay and Bolinas Lagoon.87
Oyster-bag mounds. Credit: M. Latta

COMMUNITY ALTERNATIVES | 185
MARIN OCEAN COAST SEA LEVEL RISE ADAPTATION REPORT
also has specific water-flow and clarity
Oyster reefs may not be a viable solution to erosion and flooding hazards in deeper bay areas. However, relatively shallow areas may be suitable for oyster reefs as a nature-based erosion-mitigation alternative to shoreline revetment. Oyster-reef growth requirements, which may further restrict applicability. In the absence of detailed bathymetric data in Tomales Bay, the DEM utilized in the OCOF hazard mapping study was used to identify potential areas where relatively shallow slopes exist near human development. These areas mostly occur along the Inverness shoreline and at Millerton. A detailed feasibility analysis could be conducted to fully understand the possible opportunities and constraints to using oyster reefs in Tomales Bay.
Eelgrass beds, also studied in the San Francisco Bay Living Shorelines Project, are another possible means of wave-energy attenuation. Various studies have examined wave attenuation from sea grasses in low-energy environments (Bradley & Houser 2009; Fonseca & Calahan 1992; Wu & Cox 2015). Similar to oyster reefs, seagrass beds require shallow water, among other factors, to flourish and are thus limited in applicability to wide, shallow areas in Tomales Bay, including the Walker Creek Delta area.
Figure 29. Bathymetry of Tomales Bay Source: ESA (2015); DEM source: USGS (Foxgrover & Barnard 2012)
Eelgrass Restoration. M. Latta.

186
6.6) East ShorePRIMARY VULNERABILITIES PRIORITY ACTIONS• Storm and tidal flooding already occur • Elevate and retrofit existing
development. • Protect assets with nature-
based strategies.
• Long-term flooding will impact 163 buildings, including 10 businesses.
• Costs of long-term impacts to exposed assets will be $14 million.
• Others impacted will be the residential tourism and aquaculture industries, Caltrans, and property owners.
StrategyTerm: NT = Near MT = Medium LT = Long
Support: L = Low 0–40%M=Med. 41–70%S = Strong 71%+NA = Not available
PROTECTRestore/enhance wetlands along Tomales Bay NT-MT SCreate an oyster reef in Tomales Bay NT-MT MConstruct horizontal levee in Tomales Bay MT LArmor segments of Shoreline Highway NT S
ACCOMMODATERedesign or relocate Walker Creek Coastal Access Point NT SElevate Shoreline Highway NT SElevate existing buildings and utilities NT-MT SFlood proof existing buildings NT MCreate offshore boat moorings NT NADevelop a community wastewater system MT NA
RELOCATE/MANAGED RETREATResearch costs and interest of long-term buyout or acquisition strategy
LT S
Relocate coastal access points NT MRealign Shoreline Highway MT M

COMMUNITY ALTERNATIVES | 187
MARIN OCEAN COAST SEA LEVEL RISE ADAPTATION REPORT
Figure 28. East Shore Exposure Map. Does not include geomorphic change.
...
Shoreline
Snake
Clark
Pierce Point
Cerin
i
Marshall Beach
...
...
...
...
...
...
...
...
...
...
...
...
MarinMap
0 0.80.4Miles¯
BolinasPotential Sea Level Rise Map - DRAFT
Sea Level Rise (SLR) ScenariosBaseline No SLR / No Storm
25 cm (≈1 foot) SLR w/annual storm
25 cm (≈1 foot) SLR w/20 year storm
50 cm (≈2 feet) SLR w/20 year storm
100 cm (≈3 feet) SLR w/100 year storm
200 cm (≈6.5 feet) SLR w/100 year storm
East Shore (N)This map was developed for planning anddiscussion purposes. The County of Marin is notresponsible or liable for use of this map beyondits intended purpose. This map isrepresentational only and does not constitute anofficial map or dataset of the County of Marin.
1
2
3
Vulnerable AssetsSite Specific Assets Identified on Map
Walker Creek Access PointCypress Grove Research Center with Audubon Canyon Ranch BuildingsNick's Cove
103 109 121 135 163
1
2
Shoreline Highway4
34
Eastshore Buildings PotentiallyFacing Hazardous Conditions

188
Figure 29. East Shore Exposure Map. Does not include geomorphic change.
...
Shoreline
Marshall Petaluma
Jeps
on
Shee
p Ran
ch
Duck Cove
Pierce Point
Marshall Beach
Synanon
...
...
...
...
...
...
...
...
...
...
...
...
MarinMap
0 0.60.3Miles¯
BolinasPotential Sea Level Rise Map - DRAFT
Sea Level Rise (SLR) ScenariosBaseline No SLR / No Storm
25 cm (≈1 foot) SLR w/annual storm
25 cm (≈1 foot) SLR w/20 year storm
50 cm (≈2 feet) SLR w/20 year storm
100 cm (≈3 feet) SLR w/100 year storm
200 cm (≈6.5 feet) SLR w/100 year storm
East Shore (S)This map was developed for planning anddiscussion purposes. The County of Marin is notresponsible or liable for use of this map beyondits intended purpose. This map isrepresentational only and does not constitute anofficial map or dataset of the County of Marin.
1
7
2
6
3
4
5 Vulnerable AssetsSite Specific Assets Identified on Map
Hog Island Oyster
Marconi Boat Launch
Tony's Restaurant
Tomales Bay Oyster Company
Historic District
103 109 121 135 163
Shoreline Highway
Marshes
1
2
3
4
5
6
7
HistoricDistrict
Eastshore Buildings PotentiallyFacing Hazardous Conditions

COMMUNITY ALTERNATIVES | 189
MARIN OCEAN COAST SEA LEVEL RISE ADAPTATION REPORT
Figure 30. East Shore Conceptual Adaptation Options
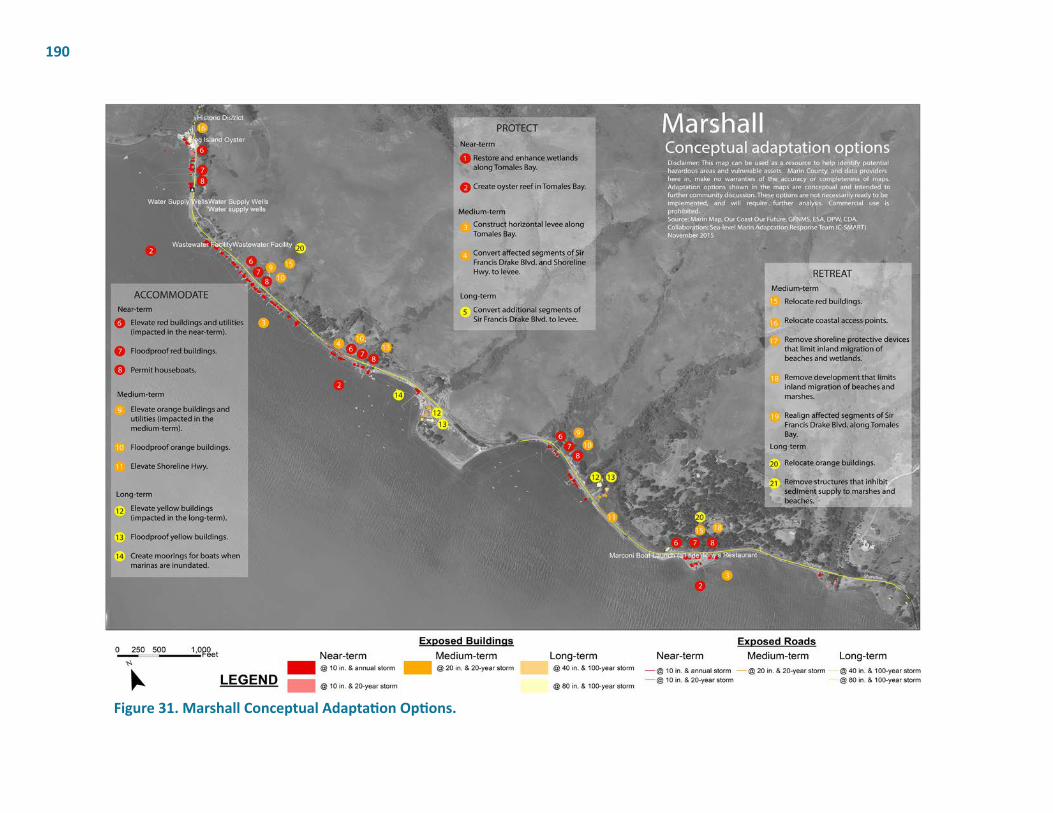
190
Figure 31. Marshall Conceptual Adaptation Options.

COMMUNITY ALTERNATIVES | 191
MARIN OCEAN COAST SEA LEVEL RISE ADAPTATION REPORT
No ActionAccess to, from, and along Shoreline Highway could be compromised by temporary flooding in the near- to medium-term and permanently in the long-term. The area near Walker Creek often floods during storms and high tides. Waterfront housing, which acts as a first line of defense for Shoreline Highway, will face increasing challenges from rising waters. Homes on piers may see reduced ability to perform maintenance or repair, as low tides also become higher and in some cases do not expose mudflats along the shore. Utilities such as septic, water, and electrical systems may see increasing damage from flooding and saltwater intrusion. Tidal marshes may convert to mudflats or open water, and beaches may disappear where development or topography prevents inland migration.
EAST SHORE : LONG-TERM IMPACTS 163 buildings
10 businessesStorm and tidal impacts already occur
$14 million worth of
assets exposed
ResidentialTourism
Aquaculture, crabbing
CaltransProperty Owners
East Shore Homes
Marshall Community Wastewater System
Developed in 2014, the Marshall Community Wastewater System is an example of an effective community-level strategy to protect water quality and adapt vulnerable individual OWTS. Community members in Marshall petitioned Marin County to create an onsite wastewater treatment zone, which was then approved through a local election. Because Marshall is located adjacent to a Clean Water Act Section 303(d) designated impaired body of water, Tomales Bay, class II repair was developed and installed. The system serves over 90 percent of the properties in central Marshall (a 3-plus-mile stretch) and over 50 percent of the 90 homes and businesses in Marshall.
The Marshall Community Wastewater System Assessment District owns the septic system from the point of connection at each property up to and including the treatment equipment and the 15-acre upland leach field it purchased specifically for that purpose. The county administers the program and outsources operations and maintenance to a service provider. Property owners pay the annual maintenance fee with their property taxes.
East Shore Homes

192
Priority ActionsThe recommended adaptation approach is to accommodate development with elevation and retrofits, and protect assets with nature-based strategies in the near to medium term, while considering additional options in the long term. Homes and other structures currently over water could be raised higher, and portions of Shoreline Highway could be raised to maintain access at higher water levels. Wetland restoration and oyster reefs in the near-term and potentially horizontal levee in the medium term are potential nature-based solutions.
ProtectRestore/enhance Tomales Bay wetlands Restoring and enhancing living shorelines along Tomales Bay offers near- to medium-term protection against temporary flooding, storm surge, and wave impacts. Habitat-restoration techniques can be used to manage the shoreline, reduce coastal erosion, and maintain coastal processes. Such techniques enhance habitat and increase connectivity of wetlands and deeper intertidal and subtidal lands, while providing some level of shoreline protection. While design and permitting could be complex, wetland creation could be effective in limiting erosion of otherwise exposed road embankments.88
This strategy may involve a moderate to high cost, and will not prevent inundation of low-lying areas unless backed by a flood- protection levee.89 The effectiveness will diminish with higher levels of SLR unless grades are raised, as the wave-dampening ability of tidal wetlands diminishes with increased water depth.90 This measure, which could be funded by a local assessment district or government grant, received strong support from poll respondents (100%).88 ESA, 201589 DPW, 201590 Ibid.
Create oyster reef in Tomales BayOyster reefs may be feasible in limited areas of Tomales Bay and are not likely to be effective at reducing wave impacts right off of Marshall, since water is relatively deep offshore. However, residents expressed support for adaptation approaches that look holistically at all of Tomales Bay and the Marin coast. This measure, which could be funded by a local assessment district or a government grant, received moderate support from poll respondents (60%). The GFNMS could also strongly support native oyster-reef demonstration projects and provide information to inform ideal locations.
Construct horizontal levee along Tomales BayIn the medium term, horizontal levees may serve as protection against SLR where land use, space, and habitat allow. To the extent that other natural habitats in the bay can be protected, restored, or enhanced, the county can bolster the benefits provided by a horizontal-levee project and mitigate some of the technical and financial risks associated with the project.
Fluvial inputs associated with two watersheds, Walker Creek and Lagunitas Creek, are large enough to create local estuarine gradients within the bay. The largest tidal marshes are associated with the alluvial deltas of these creeks.
These areas are also vulnerable to SLR and may be good candidate areas to investigate the feasibility of horizontal levees. As sea level rises, the high marshes are able to transgress inland along the valley profile. While these are areas with gently sloping migrating transition zones, some realignment of infrastructure such as roads and culverts may have to occur if they are to be realized.

COMMUNITY ALTERNATIVES | 193
MARIN OCEAN COAST SEA LEVEL RISE ADAPTATION REPORT
This strategy, which could be funded by a local assessment district or a government grant, received moderate support from poll respondents (40%). A public meeting participant suggested that Marconi State Park might be an appropriate location for a horizontal levee.
Armor segments of Shoreline HighwayErosion and flooding threaten segments of Shoreline Highway, particularly where no structures are present. Armoring exposed segments, which could be implemented by the state and/or local service providers, received strong support from poll respondents (100%). For discussion of constraints to armoring segments of Shoreline Highway, see section 5.3.
AccommodateImprove coastal access facility or trail to account for SLR The Walker Creek access point could be relocated or redesigned to be resilient to SLR. This strategy, which could be implemented by the county and the state, received strong support from poll respondents (100%).
Elevate Shoreline Highway General approaches for adapting roads to SLR include identifying water-level triggers for management actions, and coordinating with the DPW and Caltrans. The Walker Creek area in particular experiences temporary flooding that will only worsen with SLR. This strategy, which would be implemented by Caltrans, received strong support from poll respondents (100%). See section 5.3 for discussion of road-elevation considerations.
The GFNMS prefers road elevation along Tomales Bay to allow for wetland migration. The GFNMS would need to be involved in new road design and construction review, including recommending measures to avoid risks of materials entering the sanctuary.
Elevate buildings and utilitiesStructures fronting Tomales Bay may be impacted by rising waters to varying degrees based on building construction and existing elevation above the water. One solution is to allow and encourage houses to be raised and seawalls maintained to protect houses, septic tanks, and Shoreline Highway. Maintaining bulkheads under Marshall homes is a high priority to protect the homes, as well as possibly protecting Shoreline Highway from flooding.
Although properties look the same on a map, the reality on the ground varies significantly, and individual lots require different adaptation approaches. Homes are at varying elevations, and construction methods have changed over time. About six houses are below high water. Some places—for example, the fisherman’s village on the peninsula—may need armoring, not elevation.
Raising houses along the Marshall waterfront is very difficult and expensive, requiring creative solutions. As water levels rise, the area under houses becomes less accessible for foundation work. Home elevation is estimated to cost approximately $100,000 per 1,000 square feet in this area.
There was a great deal of interest from residents in developing a community-wide solution to raise all homes through a coordinated effort. This could help provide a better economy of scale for permitting, design work, and construction. Such a pilot project could potentially acquire funding through a government grant, and homeowners could pay off their share over time through property taxes. The community set a precedent for taking a collaborative approach through the Marshall Community Wastewater System, where Federal, State, and County grants covered 63%-65%

194
Depending on community desires, the timing of elevating structures could be determined by a chosen acceptable level of protection against monthly high water (EMHW) or greater (1-year or 10-year flood), as explained in section 3.3 of this report. The strategy of structural elevation, which would be implemented by property owners in partnership with government agencies, and received strong support from poll respondents (80%).
Community members noted that policies requiring mitigation for loss of sand supply by preventing erosion and other matters could make both coastal armoring and elevation of homes prohibitively expensive, even if permitting requirements could be eased and streamlined.
Flood proof buildingsFEMA provides guidelines for wet floodproofing and dry floodproofing. This strategy, which would be implemented by property owners, received moderate support from poll respondents (60%).
Boat mooringsApart from Lawson’s Landing at Dillon Beach (which provides seasonal moorings), there are no active marinas on the east shore of Tomales Bay. Pontoons at the Marshall Boat Works seasonally host a couple of boats. The demand and number of moorings has dwindled over the years. In 2014, the GFNMS and the State Lands Commission commenced the Tomales Bay Mooring Program to permit and lease moorings in Tomales Bay. By November 2016, the GFNMS had removed all abandoned moorings, which contributed to the decrease in the total number. Although this decrease could be due to the program’s costs and requirements, this action freed up space for more moorings on the bay.
Houseboats Houseboats are not recommended as an adaptation strategy due to harsh wind and wave conditions, increased threat of discharges and marine debris, and the lack of houseboat marinas and services. This strategy received low support from poll respondents (20%). There are no county, state, or federal laws that prevent someone from living aboard a boat in Tomales Bay, except within a quarter-mile of the Point Reyes National Seashore shore on the west side of the bay, north of Duck Cove. The NPS formerly restricted overnighters through camping regulations, but they have since changed their maps and enforcement activities to reflect revised jurisdictional boundaries.
Relocate/ Managed RetreatThe county could research potential costs and community interest in a long-term buyout or property acquisition strategy if rising sea levels or storm impacts become imminent threats to homeowners. The county could also consider having a plan and specific proposals in place in case of a major storm or flood event that makes homeowners more likely to be interested in the buyout.
Easements and other land use policies could be used to limit further construction and investment in the most hazardous areas.
Relocation of buildings, which eventually be implemented by property owners, and received moderate support from poll respondents (40%). Relocation of any remaining shorefront septic leach fields to the east of Shoreline Highway, which could be implemented by a local assessment district and/or the county, and received strong support from poll respondents (100%).
Relocation of coastal access points at Walker Creek and at the Cypress Grove Preserve at Livermore Marsh, which could

COMMUNITY ALTERNATIVES | 195
MARIN OCEAN COAST SEA LEVEL RISE ADAPTATION REPORT
be implemented by the county and state, received moderate support from poll respondents (60%).
Realignment of affected segments of Shoreline Highway, which could be implemented by Caltrans in collaboration with affected property owners and stakeholders, received moderate support from poll respondents (60%). (See section 5.3 for discussion of considerations for road realignment.)
Potential locations of adaptation strategies are shown in map 54, East Shore Adaptation Map (North) and map 55, Marshall Adaptation Map (South).
Marshall Historic District. Credit: K & G Adelman.91
91 Copyright (C) 2002-2017 Kenneth & Gabrielle Adelman, California Coastal Records Project, www.Californiacoastline.org

196
6.7) Point Reyes Station
PRIMARY VULNERABILITIES PRIORITY ACTIONS• Storm and tidal flooding already occur • Accommodate existing
development by elevating and retrofitting.
• Protect assets with nature-based strategies.
• Long-term flooding will impact 36 buildings, four businesses, and 700 people.
• Costs of impacts to exposed assets will be $2 million.• Others impacted will include the residential-tourism
industry, Caltrans, and the NMWD.
StrategyTerm: NT = Near MT = Medium LT = Long
Support: L = Low 0–40%M=Med. 41–70%S = Strong 71%+NA = Not available
PROTECTRestore/enhance wetlands along Tomales Bay NT SConstruct horizontal levee in Tomales Bay MT LArmor segments of Shoreline Highway LT M
ACCOMMODATEElevate Green Bridge NT SElevate Shoreline Highway MT MElevate Sir Francis Drake Boulevard MT MElevate existing buildings MT MFlood proof existing buildings NT-MT L
RELOCATE/MANAGED RETREATResearch costs and interest of long-term buyout or acquisition strategy
LT NA
Relocation of buildings LT LRelocation of Gallegher well upstream LT MRemoval of development and shoreline protection that limit inland migration of habitats
LT M

COMMUNITY ALTERNATIVES | 197
MARIN OCEAN COAST SEA LEVEL RISE ADAPTATION REPORT
Figure 32. Point Reyes Station Exposure Map. Does not include geomorphic change.
B
C
A
Shoreline
...
Mesa
Sir Francis Drake
Bear Valley
6th
4th
5th
3rd
2nd
Silver Hills
Toby
Fox
Manana
Giacomini
Lorraine
Com
mod
ore
Web
ster
...
...
MarinMap
0 0.150.075Miles¯
BolinasPotential Sea Level Rise Map - DRAFT
Sea Level Rise (SLR) ScenariosBaseline No SLR / No Storm
25 cm (≈1 foot) SLR w/annual storm
25 cm (≈1 foot) SLR w/20 year storm
50 cm (≈2 feet) SLR w/20 year storm
100 cm (≈3 feet) SLR w/100 year storm
200 cm (≈6.5 feet) SLR w/100 year storm
Point Reyes Station
This map was developed for planning anddiscussion purposes. The County of Marin is notresponsible or liable for use of this map beyondits intended purpose. This map isrepresentational only and does not constitute anofficial map or dataset of the County of Marin.
1
1
2
2
34
5
Buildings Potentially FacingHazardous Conditionsplus some septic systemsand water distribution lines
Vulnerable AssetsSite Specific Assets Identified on Map
NMWD Pipeline
Green Bridge
White House Pool/Trail
Sir Francis Drake Blvd
Olema Marsh Trail
1
2
3
4
5
0 0 0 0 36
Historic District

198
Figure 33. Point Reyes Station Conceptual Adaptation Options

COMMUNITY ALTERNATIVES | 199
MARIN OCEAN COAST SEA LEVEL RISE ADAPTATION REPORT
No ActionSurrounding wetlands and marshes, including the Giacomini Wetlands and the Olema Marsh, could be degraded by flooding, erosion, and increased salinity. Water-district pipes traversing under the marsh and road could be damaged by higher groundwater. Flooding is probable on portions of Shoreline Highway in the long-term scenarios; however, Green Bridge is vulnerable in the near term.
POINT REYES STATION : LONG-TERM IMPACTS
36 buildings 700 people
Storm and tidal impacts already occur 4 businesses
$2 million worth of
assets exposed
ResidentialTourism
CaltransNMWD
Priority ActionsThe recommended adaptation approach is to accommodate development with elevation and retrofits, and protect assets with nature-based strategies in the near- to-medium term, while considering additional options in the long-term.
ProtectRestore/ enhance wetlands along Tomales BayThis strategy, which could be funded by government grants, received strong support from poll respondents (100%).
Armor segments of Shoreline HighwayGeneral approaches for adapting roads to SLR include identifying water-level triggers for management actions, and coordinating with the DPW and Caltrans. (They are further described in section 5.3 of this report.)
This strategy, which would be implemented by Caltrans, received moderate support from poll respondents (54%). (See section 5.3 for discussion of considerations for armoring Shoreline Highway.)
Horizontal levee along Tomales Bay This strategy, which would be implemented by a local assessment district or government grant, received low support from poll respondents (15%). (For more information about horizontal levees, see section 2.7 of Appendix A.)
AccommodateElevating Green Bridge received strong support from poll respondents (85%). Improving coordination among government agencies is a key aspect of adaptation planning. Elevating affected segments of Shoreline Highway, which would also be implemented by Caltrans, and received moderate support from poll respondents (69%). Elevating Sir Francis Drake Boulevard received moderate support from poll respondents (62%).
Elevating buildings, which would be implemented by property owners, received moderate support from poll respondents (54%). Floodproofing buildings, which would be implemented by property owners, received low support from poll respondents (15%).
Relocate/ Managed RetreatThe county could research potential costs and community interest in a long-term buyout or property-acquisition strategy if rising sea levels or storm impacts become imminent threats to homeowners. The county could also consider having a plan and specific proposals in place in case of a major storm or flood event that makes homeowners more likely to be interested in the buyout. Easements and other land-use policies could be used to limit further construction and investment in

200
the most hazardous areas. These easements would move (or “roll”) with bluff and shore erosion.
Relocation of buildings, which would be implemented by property owners, received low support from poll respondents (23%). Relocation of the Gallagher well upstream, which would be implemented by North Marin Water District, received moderate support from poll respondents (62%). Removal of development and/or shoreline protective devices that limit inland migration of beaches and marshes, which would be implemented by property owners, received moderate support from poll respondents (62%).
Relocation of coastal access points, which would be implemented by the county and state, received moderate support from poll respondents (46%).
Realignment of affected segments of Shoreline Highway, which would be implemented by Caltrans, received moderate support from poll respondents (38%). (See section 5.3 for discussion of considerations for realigning Shoreline Highway.)
Potential locations of adaptation strategies are shown in Map 70.

COMMUNITY ALTERNATIVES | 201
MARIN OCEAN COAST SEA LEVEL RISE ADAPTATION REPORT
6.8) Dillon BeachPRIMARY VULNERABILITIES PRIORITY ACTIONS• Storm and tidal flooding already occur • Support dune restoration
efforts as a protective measure.
• Research alternatives for managing flooding on Bay Drive.
• Implement policies to ensure that blufftop homes are safe from erosion.
• Long-term SLR will impact two businesses, the residential tourism, and agriculture industries, as well as private tourism assets.
• Others impacted will include the Ocean Marin Homeowners Association, Lawson’s Landing, the Dillon Beach Resort, and property owners.
StrategyTerm: NT = Near MT = Medium LT = Long
Support: L = Low 0–40%M=Med. 41–70%S = Strong 71%+NA = Not available
PROTECTRestore dunes near Lawson’s Landing NT NASupport dune restoration pilot programs NT NA
ACCOMMODATEID water level triggers for management actions NT NAElevate and floodproof existing structures at Lawson’s Landing
NT M
RELOCATE/MANAGED RETREATResearch costs and interest of long-term buyout or acquisition strategy
LT NA
Relocate the well on Dillon Creek at Bay Drive NT M
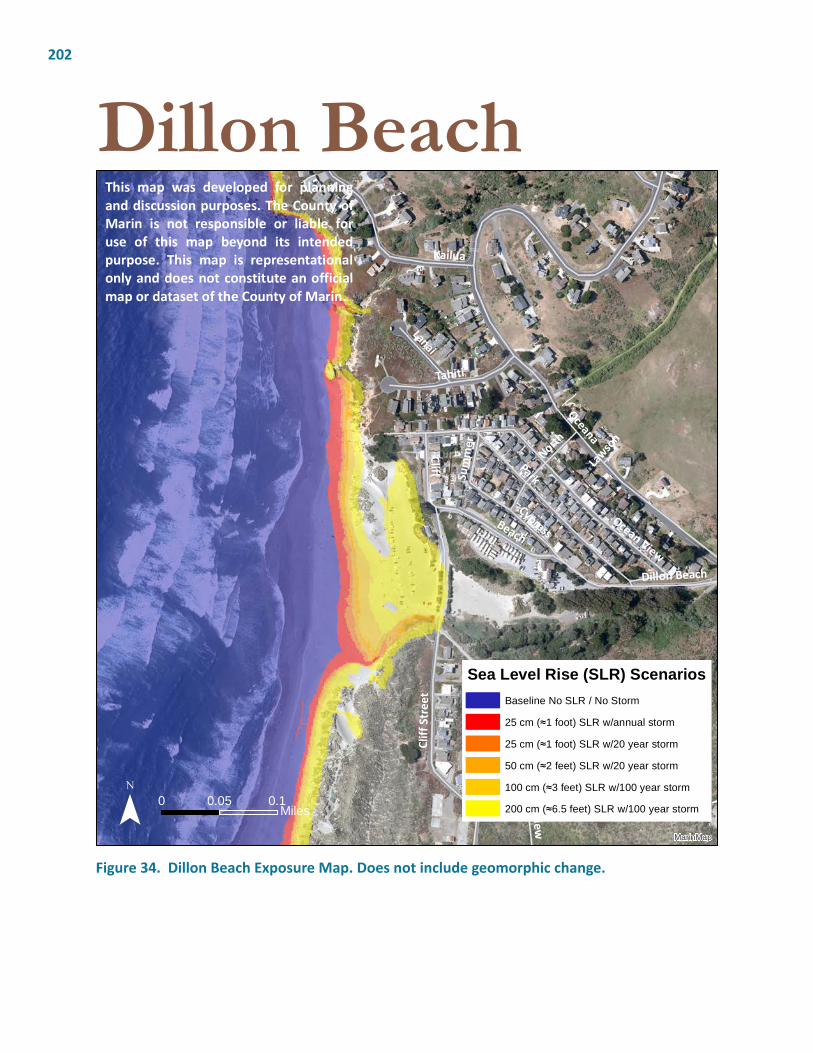
202
Bay
Oceana
Park
Cliff
Str
eet
Kailua
CypressOcean View
Beach
TahitiCliff
North
Lanai
Marine View
Dillon Beach
Sum
mer
Lawso
n
MarinMap
0 0.10.05Miles¯
Sea Level Rise (SLR) ScenariosBaseline No SLR / No Storm
25 cm (≈1 foot) SLR w/annual storm
25 cm (≈1 foot) SLR w/20 year storm
50 cm (≈2 feet) SLR w/20 year storm
100 cm (≈3 feet) SLR w/100 year storm
200 cm (≈6.5 feet) SLR w/100 year storm
This map was developed for planningand discussion purposes. The County ofMarin is not responsible or liable foruse of this map beyond its intendedpurpose. This map is representationalonly and does not constitute an officialmap or dataset of the County of Marin.
Dillon Beach
Figure 34. Dillon Beach Exposure Map. Does not include geomorphic change.

COMMUNITY ALTERNATIVES | 203
MARIN OCEAN COAST SEA LEVEL RISE ADAPTATION REPORT
No Action Flooding could affect Bay Drive leading to Lawson’s Landing. The centralized Oceana Marin Sewer System could be degraded by erosion and waves. Bluff top homes could experience heightened erosion risks as sea levels rise. Camping capacity at Lawson’s Landing could be reduced due to inundation and erosion. North of Dillon Beach, agriculture could face vehicular-access constraints and decreases in land area due to erosion and higher water levels.
DILLON BEACH : LONG-TERM IMPACTS
Storm and tidal impacts already occur 2 businesses
Private tourism assets
exposed
ResidentialTourism
Agriculture
Ocean Marin HOA
Lawson’s Landing
Dillon Beach Resort
Property Owners
Priority ActionsSupport dune restoration efforts as a protective measure, research alternatives for managing flooding on Bay Drive, and implement policies to ensure that bluff top homes are safe from erosion. Plans for dune restoration and enhancement are being developed for Lawson’s Landing. Planting native vegetation to augment existing beach grass may help encourage natural augmentation of the dunes. (This is considered a cost-effective and environmental approach, compared to importing sand.) A monitoring plan will be developed to contribute to the body of research on the efficacy of this measure at reducing coastal erosion and protecting Lawson’s Landing recreational facilities from wave run-up.
ProtectDunes aid in protecting Bay Drive and the small community at Lawson’s Landing while also providing key recreational beach going and camping opportunities. The surfgrass along Kailua Way leading north towards the agricultural areas bordering Estero de San Antonio play a lower relative role in reducing exposure to coastal impacts.
In the near term, managers of Lawson’s Landing may pursue a dune-restoration project on the south end of the beach with experimental design areas and monitoring to help test the protective services dunes provide. Dune restoration would help to protect exposed parcels zoned Residential (including residential structures) as well as the areas zoned Resort and Commercial Recreation, including Bay Drive. The county could be at the forefront of helping to develop data to determine dune-restoration design metrics and elements of success as well as how hydrological and geomorphological conditions in different areas contribute to the success or failure of restored dunes as a natural infrastructure alternative to armoring. This project would add to the body of evidence from similar demonstration sites recently funded by the SCC in Humboldt and Monterey counties. Coastal dune restoration on the west coast of North America was pioneered in the Lanphere Dunes in Humboldt County in the 1980s, and many case studies published from the dune-restoration projects can provide valuable support.
Prioritizing dune-habitat protection and restoration can ensure the protective service for the community of Dillon Beach while also continuing to provide recreational opportunities so important to the region.

204
Due to relative exposure risks and relative undeveloped nature of the area, this may be a lower priority for the county, especially since restoration would require significant funding. However, the SCC and other funding sources are available for these types of projects, and as mentioned above, this strategy would help reduce uncertainties associated with the extent of flood-protection and habitat benefits dune-restoration provides. In addition, a reduction in exposure to Bay Drive ultimately leads to a reduction in exposure for Lawson’s Landing, as that is the main transportation corridor for the community.
AccommodateGeneral approaches for adapting roads to SLR include identifying water-level triggers for management actions and coordinating with the DPW and Caltrans. (They are further described in section 5.3 of this report.)
An additional option is to continue to elevate and/or floodproof affected structures, primarily at Lawson’s Landing, where the existing cottages are designed to be moveable. This strategy received moderate support from poll respondents (50%).
Relocate/ Managed RetreatThe county could research costs and local interest in a long-term buyout or property-acquisition strategy if bluff erosion become imminent threats to homeowners. Easements and other land use policies could limit further construction and investment in the most hazardous areas. These easements would move (or “roll”) with bluff and shore erosion.
Relocating the well along Dillon Creek at Bay Drive inland would prevent saltwater intrusion that could occur in the near term. The community could also consider relocating the sewage pump (50%) and parking lot (100%) inland in the medium to long term. Bay Drive could be realigned inland.
Dillon Beach. Credit: K & G Adelman.92
92 Copyright (C) 2002-2017 Kenneth & Gabrielle Adelman, California Coastal Records Project, www.Californiacoastline.org
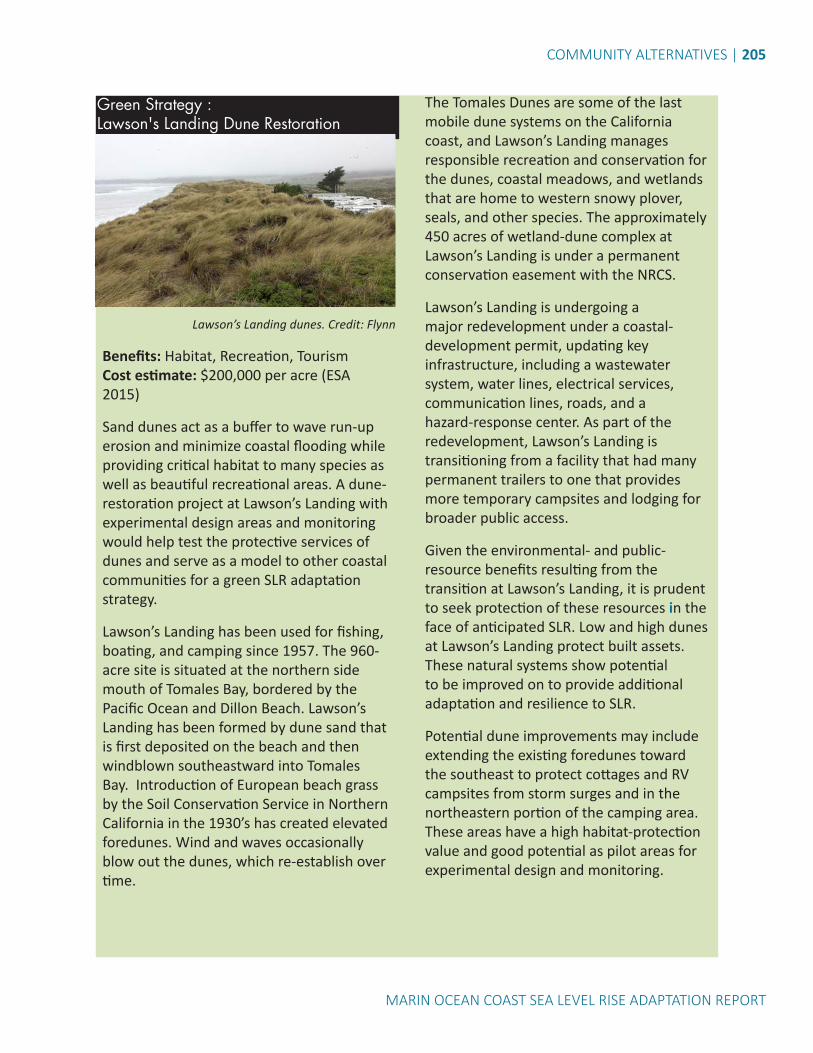
COMMUNITY ALTERNATIVES | 205
MARIN OCEAN COAST SEA LEVEL RISE ADAPTATION REPORT
Green Strategy : Lawson's Landing Dune Restoration
Lawson’s Landing dunes. Credit: Flynn
Benefits: Habitat, Recreation, TourismCost estimate: $200,000 per acre (ESA 2015)
Sand dunes act as a buffer to wave run-up erosion and minimize coastal flooding while providing critical habitat to many species as well as beautiful recreational areas. A dune-restoration project at Lawson’s Landing with experimental design areas and monitoring would help test the protective services of dunes and serve as a model to other coastal communities for a green SLR adaptation strategy.
Lawson’s Landing has been used for fishing, boating, and camping since 1957. The 960-acre site is situated at the northern side mouth of Tomales Bay, bordered by the Pacific Ocean and Dillon Beach. Lawson’s Landing has been formed by dune sand that is first deposited on the beach and then windblown southeastward into Tomales Bay. Introduction of European beach grass by the Soil Conservation Service in Northern California in the 1930’s has created elevated foredunes. Wind and waves occasionally blow out the dunes, which re-establish over time.
The Tomales Dunes are some of the last mobile dune systems on the California coast, and Lawson’s Landing manages responsible recreation and conservation for the dunes, coastal meadows, and wetlands that are home to western snowy plover, seals, and other species. The approximately 450 acres of wetland-dune complex at Lawson’s Landing is under a permanent conservation easement with the NRCS.
Lawson’s Landing is undergoing a major redevelopment under a coastal-development permit, updating key infrastructure, including a wastewater system, water lines, electrical services, communication lines, roads, and a hazard-response center. As part of the redevelopment, Lawson’s Landing is transitioning from a facility that had many permanent trailers to one that provides more temporary campsites and lodging for broader public access.
Given the environmental- and public- resource benefits resulting from the transition at Lawson’s Landing, it is prudent to seek protection of these resources in the face of anticipated SLR. Low and high dunes at Lawson’s Landing protect built assets. These natural systems show potential to be improved on to provide additional adaptation and resilience to SLR.
Potential dune improvements may include extending the existing foredunes toward the southeast to protect cottages and RV campsites from storm surges and in the northeastern portion of the camping area. These areas have a high habitat-protection value and good potential as pilot areas for experimental design and monitoring.

206
Draft goals of the Lawson’s Landing pilot project for natural adaptation strategies to address SLR are:
1. Re-establish certain native dune plant species while facilitating dune enhancement.
2. Protect environmental and recreational value using geomorphological processes to provide adaptation to SLR.
3. Assess effects of a biotechnical approach to SLR on nearby boathouse, pier, seawall, and other high-value recreation assets. (i.e. how to best align with storm surges).
4. Determine appropriate interventions to improve resilience and adaptation.
5. Capture and stabilize sand moving through area rather than losing it.
6. Install interpretative signage to explain adaptation strategies and collaborative and/or complementary efforts and organizations.
7. Enhance public awareness of Lawson’s Landing efforts to mitigate and adapt to climate change and protect low-cost coastal access.
Accumulation of sand and dune plant colonization around high value recreation area at Lawson’s Landing provides a timely opportunity for natural adaptation strategies consistent with environmental and coastal access protection. Monitoring this project would add to the body of evidence from similar demonstration sites recently approved for funding by the SCC in Humboldt and Monterey.
93 Pickart AJ. Dune Restoration Over Two Decades at the Lanphere and Ma-le’l Dunes in Northern California. 2013.
This project would add to the body of evidence from similar demonstration sites recently funded by the SCC in Humboldt and Monterey counties. Coastal dune restoration on the west coast of North America was pioneered in the Lanphere Dunes in Humboldt County in the 1980s, and many case studies published from the dune-restoration projects can provide valuable support.93


208
7) CONCLUSION7.1) Next StepsThis report summarizes adaptation options that have arisen through the C-SMART process to date. These options are not endorsed by the Marin County or project partners, are not all necessarily feasible (economically, socially, environmentally, etc.), and in some cases may conflict with one another. However, the options presented in this report have been recognized as meriting further consideration. Option inclusion in this report does not imply financial commitment by Marin County, and completion of certain tasks is dependent on acquiring additional funding, which would require exploring various funding sources and types.
The fifth set of C-SMART public workshops included the West Marin Sea Level Rise Adaptation Plan Passport as a survey to solicit input from residents on next steps county staff could undertake. Additionally, the passport was posted online for further distribution via traditional and social media. Participants were asked to prioritize the possible next steps listed below with a high, medium, or low ranking. Space was also provided for comments on each ranking, as well as space to suggest entirely new options.
A total of 83 passports were completed. Indicated on each bullet below is the number of High votes, and the complete response summary can be found in Appendix G.
Site Scale Improvements• Develop a “Homeowner’s Guide to
Preparing for Sea Level Rise” to help property owners navigate regulatory system and funding opportunities to elevate or otherwise retrofit homes to accommodate sea level rise and storms. Topics could cover:
• the county permitting process• coastal permit development
requirements• agency compliance (the Federal
Emergency Management Agency [FEMA], the California Coastal Commission [CCC], etc.)
• potential estimated building-elevation increase.
This option received 58 High votes, tying for the number 1 ranking among the 11 options.
• Develop and distribute technical information and guidance on home-retrofitting options which could include elevation, wet or dry floodproofing, flood gates, drainage improvements, amphibiation, etc.
This option received 39 High votes, ranking it number 5 among the 11 options.
Community Scale Planning • Develop a subcommittee with Marin
County BOS representation and community/local agency representatives to prioritize C-SMART next steps.
This option received 31 High votes, ranking it number 9 among the 11 options.
• Initiate Community Plans for Adapting to Coastal Hazards (Community PATCHs) in conjunction with community members and asset managers for smaller-scale planning centered on vulnerable assets of community-wide importance:
• Identify subarea boundaries for prioritization, possibly based on timing, area of impact, costs, equity, environment, economy, etc.
• Develop planning time frames around

CONCLUSION | 209
MARIN OCEAN COAST SEA LEVEL RISE ADAPTATION REPORT
the point at which flooding creates recurring significant problems.
• Evaluate adaptation alternatives with cost estimates in more detail, which may include armoring, elevation, realignment, etc.
This option received 48 High votes, ranking it number 3 among the 11 options.
• Consider SLR in capital-improvement projects (roads, utilities, armoring, etc.), including both incremental repairs and maintenance and new projects. Develop a financing matrix for identifying possible funding sources, including federal and state grants, local assessment districts, philanthropic resources, and public-private partnerships.
This option received 58 High votes, tying for the number 1 ranking among the 11 options.
• Evaluate land-use planning, zoning, and legal frameworks for addressing SLR that could include height limits, construction standards, and post-storm prohibitions. Such options could be integrated in the LCP Implementation Program and Marin Countywide Plan updates.
This option received 37 High votes, ranking it number 6 among the 11 options.
• Consider SLR resiliency in the next Marin Countywide Plan update as a basis for developing countywide policies and programs.
This option received 33 High votes, ranking it number 8 among the 11 options.
Continued Partnerships• Develop an interagency sea level
rise task force, with a membership that includes county supervisors and agencies that oversee West Marin assets (transportation, utilities, public lands,
natural resources, etc.). Participants could include:
• Caltrans, the MTC, and the TAM for transportation planning support
• the National Park Service (NPS), the Golden Gate National Recreation Area (GGNRA), the California State Department of Parks and Recreation (CPS), and Marin County Parks and Recreation (Marin County Parks)
• PG&E and local service providers to discuss utility adaptation.
This option received 43 High votes, ranking it number 4 among the 11 options.
• Continue to work with the Sonoma/Marin County Sediment Management Working Group to assist with the development of a regional sediment-management plan to:
• encourage beneficial reuse of available, nonpolluted sediment
• restore and maintain coastal beaches• reduce shoreline erosion and coastal
storm damages• sustain recreation, tourism, public
safety, and access.
This option received 36 High votes, ranking it number 7 among the 11 options.
Public Education• Establish a citizen-science monitoring
program for community members to gather data on West Marin SLR impacts, which could include measuring beach widths, documenting king tides and flooding, and monitoring wetlands.
This option received 23 High votes, ranking it number 10 among the 11 options.
• Pursue funding and partnerships to formalize an SLR public-education program for high school students.
This option received 23 High votes, ranking it number 10 among the 11 options.

210
7.2) Lessons LearnedFew existing precedents exist for adaptation plans and proposals. Thus, through this process, CDA staff have learned quite a bit of valuable information that can be applied to continued Marin County planning efforts and shared with other jurisdictions. Specific lessons learned include the following:
• Adopt a process that is understandable to local residents to gain support. Public participation is critical to successful planning and implementation. Avoid jargon and adopt consistent talking points for robust public outreach.
• Gain a full understanding of available models. Several SLR models are available for both the general public and professionals including FEMA, OCOF, and NOAA. Understand the specifics of each model, and the rationale for applying the chosen model. Discussions of models will likely come up in public processes, and having answers to FAQs is critical.
• Focus public outreach on existing groups. Due to meeting fatigue and schedules, it is often challenging for residents to attend public meetings, especially for threats perceived as distant such as SLR. Thus, augment public processes by reaching out to existing community groups and attending meetings.
• Collaborate early and often with other agencies. As SLR sees no jurisdictional boundaries and can have widespread impacts on a variety of asset types, regular collaboration with entities carrying out similar work can strengthen processes and products. Formalized working relationships can ensure regular communications and strengthen partnerships, setting the stage for continued adaptation planning.

GLOSSARY | 211
GLOSSARY100-year floodSevere flood levels with a one-in-100 likelihood of occurring in any given year.
Adaptation strategyEmployment of methods that modify existing assets or design new assets to decrease hazard risks and thus increase the resiliency of the asset to the impacts of sea level rise. This can include “hard” engineering strategies like seawalls, levees, and tidal gates; “soft” engineering strategies such as wetlands enhancement and buffers for shoreline-erosion protection; and infrastructure and lifestyle changes such as elevating structures on pilings, floodproofing homes, and planned retreat.
Adaptive capacityThe ability of a system to adjust to climate change (including climate variability and extremes) in order to moderate potential damages, take advantage of opportunities, or cope with the consequences.
Adaptive managementA structured, iterative process of robust decision-making in the face of uncertainty, with the aim of reducing uncertainty over time via system monitoring.
ArmoringThe placement of fixed engineering structures, typically rock or concrete, on or along the shoreline to mitigate the effects of coastal erosion and protect infrastructure; such structures include seawalls, revetments, bulkheads, and rip-rap.
Base Flood ElevationThe regulatory requirement for elevation or floodproofing of structures, shown on Flood Insurance Rate Maps (FIRMs) and on flood profiles.
Beach nourishmentThe practice of adding sand or sediment to beaches to combat erosion and increase beach width.
Chronic flooding The theshold of sea level rise-induced flooding that makes normal routines impossible and drives hard choices.
Climate changeA statistically significant variation in either the mean state of the climate or in its variability, persisting for an extended period (typically, decades or longer). Climate change may be due to natural internal processes or external forces caused or influenced by humans.

212
Climate scenarioA coherent, internally consistent, and plausible description of possible climatic conditions. It is not a forecast; rather, each scenario is one alternative image of how the climate can unfold.
Extreme monthly high water (EMHW)The highest high water level reached once a month. EMHW is approximately 6.9 feet NAVD.
Hard armoringThe traditional approach to shoreline protection, which includes construction of bulkheads, seawalls, revetments, dikes, tidal gates, and groins using rock, cement, steel, and other hard structures. Hard armoring can protect valuable development and critical infrastructure from coastal flooding, but it has a number of drawbacks, including visual impacts, inflexibility under changing conditions, and loss of beach or water access.
High waterMaximum height reached by a rising tide. The height may be solely due to the periodic tidal forces, or it may be affected by prevailing meteorological conditions. Nontechnically also called the high tide.
King tideAn especially high tide event that occurs during alignment of the gravitational pull between the sun and the moon, causing water levels to rise to higher-than-normal levels.
Living shorelineA natural alternative to bulkheads and seawalls to provide shoreline protection and maintain valuable habitat. Living shoreline projects utilize a variety of structural and organic materials, such as wetland plants, submerged aquatic vegetation, oyster reefs, coir (coconut-fiber logs), and sand fill. The benefits of living shorelines include stabilization of the shoreline, buffering of surrounding riparian and intertidal environment from waves and storms, improvement of water quality via filtration of upland run-off, and creation of habitat for aquatic species.
Managed retreatManaged retreat typically involved demolition or relocation of structures in hazardous areas to allow the shoreline to advance inward unimpeded. Various planning and regulatory techniques could be integrated into a managed retreat program which may include risk assessment, zoning changes, development ordinances, and relocation assistance.
Mean high water (MHW)The average of all high tides over the National Tidal Datum Epoch of 19 years. MHW is 5.1 feet and occurs 1–2 times per day for a few minutes to a few hours. It averages both high tides of the day, one of which will be slightly lower than the other. Mean higher high water (MHHW) averages only the highest tide of each day.
Mean high tide lineThe mean high tide line is the intersection of the shoreline with the elevation of the average of all high tides calculated over a 19-year tidal epoch.

GLOSSARY | 213
Mean higher high water (MHHW)The average height of the higher high tides of each day during the current National Tidal Datum Epoch of 19 years.
Mean sea level (MSL)The still water level, i.e., the level of the sea with high-frequency motions such as tides and wind waves averaged out, averaged over a period of time such as a month or a year.
National Tidal Datum EpochThe latest 19-year time period over which the National Oceanic and Atmospheric Administration (NOAA) has computed and published official tidal datums and local mean sea-level elevations from tide station records.
NAVD88The North American Vertical Datum of 1988, a fixed reference adopted as a standard geodetic datum for elevations. NAVD88 supersedes NGVD29.
Protection strategyStrategies that employ some sort of engineered structure or other measure to defend development (or other resources) in its current location without changes to the development itself. Engineered concrete seawalls and bulkheads protect the shore from strong wave action. Earthen levees protect low-lying land, often from river flooding. Other beach-protection strategies include offshore breakwaters and groins.
RevetmentA sloped facing of stone, concrete, etc., built to protect a scarp, embankment, or shore structure against erosion by wave action or currents.
Saltwater intrusion/encroachmentDisplacement of fresh surface water or groundwater by the advance of saltwater due to its greater density, usually in coastal and estuarine areas.
Sea level riseAn increase in the mean level of the ocean. Relative sea level rise occurs where there is a net increase in the level of the ocean relative to local land movements.
SeawallA wall or embankment erected to prevent the sea from encroaching on or eroding an area of land. A seawall is typically more massive than (and therefore capable of resisting greater wave forces than) a bulkhead.
Soft armoringArmoring alternatives that attempt to work with natural processes and use natural systems that eliminate or reduce the need for hard materials to achieve engineering goals. Wetlands systems have been proven to provide important flood-control benefits by serving as natural buffers that attenuate wave heights and energies, while also providing other benefits such as habitat. Examples of soft-armoring tools include wetlands enhancement, wetlands creation, dune restoration, levees with wetlands transition zones, and living shorelines.

214
Special Flood Hazard AreaThe land area covered by floodwaters of the base flood. National Flood Insurance Program’s (NFIP’s) floodplain-management regulations must be enforced in Special Flood Hazard Areas.
Storm surge A rise or piling up of water against shore, produced by strong winds blowing onshore. A storm surge is most severe when it occurs in conjunction with a high tide.
Structural adaptationModification of the design, construction, and placement of structures sited in or near coastal hazardous areas to improve their durability and/or facilitate their eventual removal.
ThresholdA trigger point at which a particular asset is so compromised by flooding or other environmental hazards that they no longer function as intended and merit adaptation.
TideThe regular upward and downward movement of the level of the ocean due to the gravitational attraction of the moon and the sun and the rotation of the earth.
Wave run-upThe upper levels reached by a wave on a beach or coastal structure relative to still water level.
Wave attenuationThe loss or dissipation of wave energy, resulting in a reduction of wave height.

BIBLIOGRAPHY | 215
BIBLIOGRAPHYA.J. Pickart. “Dune Restoration Over Two Decades at the Lanphere and Ma-le’l Dunes in Northern California,” in M.L. Martinez, J.B. Gallego-Fernández, and P.A. Hesp, Restoration of Coastal Dunes, New York: Springer, 2013.
G. Ballard, P.L. Barnard, L. Erikson, M. Fitzgibbon, K. Higgason, M. Psaros, S. Veloz, J. Wood. Our Coast Our Future, 2014.
K. Bradley, and C. Houser. Relative velocity of seagrass blades: Implications for wave attenuation in low-energy environments. November 2007.
Buoyant Foundation Project. Accessed May 4, 2016.
California Coastal Commission. California Coastal Commission Sea Level Rise Policy Guidance: Interpretive Guidelines for Addressing Sea Level Rise in Local Coastal Programs and Coastal Development Permits, August 2015.
California Department of Transportation. District 1 Climate Change Vulnerability Assessment and Pilot Studies: FHWA Climate Resilience Pilot Final Report, December 2014.
California Department of Transportation. Final Marin State Route 1 Repair Guidelines, July 2015.
California Department of Transportation. Personal communications, July 2015.
California Natural Resources Agency. Safeguarding California: Reducing Climate Risk. July 2014.
Center for Climate Change Law, Columbia Law School. Managed Coastal Retreat: A Legal Handbook on Shifting Development Away from Vulnerable Areas, October 2013.
Center for Operational Oceanographic Products and Services, NOAA/National Ocean Service. Tidal Datums. Accessed Oct. 19, 2015 (last updated Oct. 15, 2013).
Center for Ocean Solutions, Natural Capital Project. Coastal Adaptation Policy Assessment, 2016.
Climate Adaptation Knowledge Exchange. Restoration and Managed Retreat of Pacifica State Beach, December 2010.
Coastal and Ocean Working Group of the California Climate Action Team, State of California Sea-Level Rise Guidance Document (2013), 2.
Columbia Center for Climate Change Law. Managed Coastal Retreat: A Legal Handbook on Shifting Development Away from Vulnerable Areas. October 2013.
Conclusions and Recommendations of the Bolinas Lagoon Restoration Project Design Review Group, March 2014.
Delaware Coastal Programs. Preparing for Tomorrow’s High Tide: Recommendations for Adapting to Sea Level Rise in Delaware, September 2013.
English, E. “Amphibious Foundations and the Buoyant Foundation Project: Innovative Strategies for Flood-Resilient Housing,” (paper presented at the International Conference on Urban Flood Management, Paris, France, November 25-27, 2009), 7 (appendices, 412).

216
English, E., The Buoyant Foundation Project. Personal communication, Dec. 9, 2015.
Environmental Science Associates. Geomorphic Response of Beaches and Marshes. August 2015.
Environmental Science Associates. Personal communications, Aug. 6, 2015.
Environmental Science Associates. Marin County Coastal Hazards and SLR Adaptation Strategies, April 2016.
Environmental Science Associates. Ocean Beach Master Plan. 2012.
Environmental Science Associates. Sea Level Rise Adaptation Options for Marin County. 2015.
Environmental Science Associates. Evaluation of Erosion Mitigation Alternatives for Southern Monterey Bay. 2012.
Federal Emergency Management Agency. Homeowner’s Guide to Retrofitting, 1998.
Federal Emergency Management Agency. Selecting Appropriate Mitigation Measures for Floodprone Structures, 2007.
Federal Emergency Management Agency. Reducing Flood Risk to Residential Buildings That Cannot Be Elevated, 2015.
Fonesca, M.S. and J.A. Cahalan. A Preliminary Evaluation of Wave Attenuation by Four Species of Seagrass. 1992
GHD, PWA, and Trinity Associates. District 1 Climate Change Vulnerability Assessment and Pilot Studies: FHWA Climate Resilience Pilot Final Report. Prepared for CalTrans and Humboldt County Association of Governments, 2014.
Griggs, G., Árvai, J., Cayan, D., DeConto, R., Fox, J., Fricker, H.A., Kopp, R.E., Tebaldi, C., Whiteman, E.A. (California Ocean Protection Council Science Advisory Team Working Group). Rising Seas in California: An Update on Sea-Level Rise Science, Ocean Science Trust, April 2017.
Gulf of the Farallones National Marine Sanctuary. Bolinas Lagoon Ecosystem Restoration Project: Recommendations for Restoration and Management, August 2008.
ICLEI-Local Governments for Sustainability. Sea Level Rise Adaptation Strategy for San Diego Bay. January 2012.
Jevrejeva, S., A. Grinsted, and J.C. Moore, "Upper limit for sea level projections by 2100," Environmental Research Letters 9 (April 2014): 4, http://iopscience.iop.org/arti-cle/10.1088/1748-9326/9/10/104008/pdf.
Johnson, S. Hartwell, S.R., Sliter, R.W., Watt, J.T., Phillips, E.L., Ross, S.L. and J.L. Chin. Local (Offshore of Bolinas Map Area) and Regional (Offshore from Bolinas to Pescadero) Shallow-Subsurface Geology and Structure, California. 2015
Magnan, Alexandre."Avoiding Maladaptation to Climate Change," S.A.P.I.EN.S 7.1 (September 2014): 1-11. http://journals.openedition.org/sapiens/1680.
Marin County Community Development Agency. Marin Countywide Plan. November 2007.

BIBLIOGRAPHY | 217
Marin County Community Development Agency. Marin Ocean Coast Sea Level Rise Vulnerability Assessment Public Review Draft. December 2015.
Marin County Community Development Agency. Planning Application Guide. September 2015.
Marin County Community Development Agency. Environmental Hazards Policies, April 2016.
Marin County Department of Public Works. Stinson Beach Watershed Program Flood Study and Alternatives Assessment, 2014.
Marks v. Whitney, 6 Cal.3d 251 (Cal. 1971).
Melius, M.L., and M.R. Caldwell. Managing Coastal Armoring and Climate Change Adaptation in the 21st Century, Environment and Natural Resources Law & Policy Program, Stanford Law School. 2015.
National Adaptation Forum. Adaptation Pledge, accessed Nov. 21, 2015.
National Research Council, Sea-Level Rise for the Coasts of California, Oregon and Washington (2012), 107.
National Trust for Historic Preservation. The Greenest Building: Quantifying the Environmental Value of Building Reuse, 2011.
National Oceanic and Atmospheric Administration. “Carbon Sequestration 101,” accessed April 27, 2016.
Pacific Institute. The Impacts of Sea Level Rise on the California Coast. 2009.
Pickart AJ. Dune Restoration Over Two Decades at the Lanphere and Ma-le’l Dunes in Northern California. 2013.
Philip Williams & Associates. California Coastal Erosion Response to Sea Level Rise: Analysis and Mapping, 2009.
Raives, J.. Conclusion and Recommendations of the Bolinas Lagoon Restoration Project Design Review Group (Memo). 2014.
Stinson Beach County Water District. Onsite Wastewater Management Program Annual Report, 2016.
Sustainable Planning and Urban Research (SPUR). Strategies for Managing Sea Level Rise, 2009.
Tam, L. “Strategies for Managing Sea Level Rise,” the Urbanist, November 2009.
Trulio, L., Callaway, J., and Crooks, S. White Paper on Carbon Sequestration and Tidal Salt Marsh Restoration, 2007.
U.S. Geological Survey. Coastal Groundwater Systems, accessed August 2016.

This page is intentionally left blank.