2017-18 to FY 2019-20 OF UTTAR PRADESH UNDER ATAL ...
314
MINISTRY OF URBAN DEVELOPMENT GOVERNMENT OF INDIA NEW DELHI 2017 STATE MISSION DIRECTORATE (AMRUT) URBAN LOCAL BODIES DIRECTORATE UTTAR PRADESH, URBAN DEVELOPMENT DEPARTMENT GOVERNMENT OF UTTAR PRADESH, 8 th FLOOR INDIRA BHAVAN, ASHOK MARG LUCKNOW (U.P.) PIN-226001 Government of Uttar Pradesh Final 3rd STATE ANNUAL ACTION PLAN (3rd SAAP) FOR FY: 2017-18 to FY 2019-20 OF UTTAR PRADESH UNDER ATAL MISSION FOR REJUVENATION AND URBAN TRANSFORMATION (AMRUT)
-
Upload
khangminh22 -
Category
Documents
-
view
0 -
download
0
Transcript of 2017-18 to FY 2019-20 OF UTTAR PRADESH UNDER ATAL ...

MINISTRY OF
URBAN DEVELOPMENT
GOVERNMENT OF INDIA
NEW DELHI
2017
STATE MISSION DIRECTORATE (AMRUT)
URBAN LOCAL BODIES DIRECTORATE
UTTAR PRADESH,
URBAN DEVELOPMENT DEPARTMENT
GOVERNMENT OF UTTAR PRADESH,
8th FLOOR INDIRA BHAVAN,
ASHOK MARG LUCKNOW (U.P.)
PIN-226001
Government of Uttar Pradesh
Final 3rd STATE ANNUAL ACTION PLAN (3rd SAAP) FOR FY: 2017-18 to FY
2019-20 OF UTTAR PRADESH UNDER ATAL MISSION FOR REJUVENATION
AND URBAN TRANSFORMATION (AMRUT)

Final 3rd STATE ANNUAL ACTION PLAN (3rd SAAP) FOR FY: 2017-18 to FY 2019-20 OF UTTAR PRADESH UNDER ATAL MISSION FOR
REJUVENATION AND URBAN TRANSFORMATION (AMRUT)
2017
STATE MISSION DIRECTORATE (AMRUT) UTTAR PRADESH, 8TH FLOOR, INDIRA BHAWAN, ASHOK MARG, LUCKNOW-226001 1 | P a g e

Final 3rd STATE ANNUAL ACTION PLAN (3rd SAAP) FOR FY: 2017-18 to FY 2019-20 OF UTTAR PRADESH UNDER ATAL MISSION FOR
REJUVENATION AND URBAN TRANSFORMATION (AMRUT)
2017
STATE MISSION DIRECTORATE (AMRUT) UTTAR PRADESH, 8TH FLOOR, INDIRA BHAWAN, ASHOK MARG, LUCKNOW-226001 2 | P a g e
TABLE OF CONTENTS
CHAPTER S.N. DESCRIPTION PAGES
CHECKLIST CONSOLIDATED STATE ANNUAL ACTION PLAN
(SAAP) OF ALL AMRUT CITIES 6-7
MINUTES OF 5TH STATE HIGH POWERED STEERING
COMMITTEE (SHPSC) MEETING DATED 30-01-2017 8-15
CHAPTER-1 PROJECT BACKGROUND AND SUMMARY 16-30
1.1 NAME AND CONTACT INFORMATION OF THE
ORGANIZATION SUBMITTING THE SAAP PROPOSAL 17
1.2 URBANIZATION TREND IN UTTAR PRADESH 17-19
1.3 AMRUT CITIES IN UTTAR PRADESH 20
1.4 EXISTING SERVICES LEVEL OF BASIC SERVICES IN
AMRUT CTIES 21-24
1.5 AMRUT MISSION BACKGROUND IN UTTAR PRADESH 25-30
CHAPTER-2 REVIEW OF FIRST AND SECOND STATE ANNUAL
ACTION PLAN (SAAP) FOR FY 2015-16 & 2016 31-93
2.1 SUMMARY OF PROJECT PROGRESS 33
2.2 IMPLEMENTATION OF APPROVED 1ST SAAP-UP FOR
2015-16 34
2.3 IMPLEMENTATION OF APPROVED 2ND SAAP-UP FOR
2016-17 35
2.4 FIRST STATE ANNUAL ACTION PLAN (1ST SAAP FOR
FY 2015-16) 36-51
2.5 SECOND STATE ANNUAL ACTION PLAN (2ND SAAP
FOR FY 2016-17) 52-71
2.6 SERVICE LEVELS 71-75
2.7 CAPACITY BUILDING 75-77

Final 3rd STATE ANNUAL ACTION PLAN (3rd SAAP) FOR FY: 2017-18 to FY 2019-20 OF UTTAR PRADESH UNDER ATAL MISSION FOR
REJUVENATION AND URBAN TRANSFORMATION (AMRUT)
2017
STATE MISSION DIRECTORATE (AMRUT) UTTAR PRADESH, 8TH FLOOR, INDIRA BHAWAN, ASHOK MARG, LUCKNOW-226001 3 | P a g e
TABLE OF CONTENTS
CHAPTER S.N. DESCRIPTION PAGES
2.8 REFORMS 77-90
2.9 USE OF A&OE FUND 91-92
2.10 FUND FLOW 92-93
2.11 FUND DISBURSEMENT AND CONDITIONS 93
CHAPTER-3 THIRD (FINAL) STATE ANNUAL ACTION PLAN (SAAP)
FOR FY 2017-18 TO FY 2019-20 94-126
3.1 THIRD (FINAL) STATE ANNUAL ACTION PLAN (SAAP)
FOR FY 2017-18 TO FY 2019-20 95-96
3.2 DETAILS OF PROJECTS SECTOR WISE FOR THE
APPROVAL OF APEX COMMITTEE FOR FY : 2017-20 96-111
3.3 PRINCIPLES OF PRIORITIZATION 111-117
3.4 IMPORTANCE OF O&M 117-118
3.5 ANNUAL CAPACITY BUILDING PLAN 119-122
3.6 ADMINISTRATIVE AND OTHER EXPENSES (A&OE) 122-123
3.7 FINANCING OF PROJECTS 123-126
CHAPTER-4 TABLES 127-
TABLE 1.1 BREAKUP OF TOTAL MOUD ALLOCATION FOR AMRUT 128
TABLE 1.2 SECTORAL BREAKUP OF TOTAL GOI ALLOCATION
AND 1ST INSTALMENT TO BE RELEASED 129
TABLE 1.2.1 ABSTRACT-SECTOR WISE PROPOSED TOTAL PROJECT
FUND AND SHARING PATTERN 130
TABLE 1.2.2 ABSTRACT-BREAK-UP OF TOTAL FUND SHARING
PATTERN 131

Final 3rd STATE ANNUAL ACTION PLAN (3rd SAAP) FOR FY: 2017-18 to FY 2019-20 OF UTTAR PRADESH UNDER ATAL MISSION FOR
REJUVENATION AND URBAN TRANSFORMATION (AMRUT)
2017
STATE MISSION DIRECTORATE (AMRUT) UTTAR PRADESH, 8TH FLOOR, INDIRA BHAWAN, ASHOK MARG, LUCKNOW-226001 4 | P a g e
TABLE OF CONTENTS
CHAPTER S.N. DESCRIPTION PAGES
TABLE 1.3 ABSTRACT-USE OF FUNDS ON PROJECTS: ON GOING
AND NEW 132
TABLE 1.4 ABSTRACT-PLAN FOR ACHIEVING SERVICE LEVEL
BENCHMARKS 133
TABLE 2.1 SLIP – MASTER PLAN OF ALL PROJECTS TO ACHIEVE
UNIVERSAL COVERAGE OF WATER SUPPLY AND
SEWERAGE & SEPTAGE MANAGEMENT DURING
CURRENT MISSION PERIOD (FY: 2015-16 TO 2019-20)
134-154
TABLE 2.2 SLIP - DETAILS OF PRIORITIZED PROJECTS PROPOSED
UNDER AMRUT 155-173
TABLE 2.3.1 SLIP - PROPOSED FUNDING AND SHARING PATTERN:
SECTOR WISE 174-185
TABLE 2.3.2 SLIP- SOURCE OF FUNDS FROM GOI /STATE/ULB (FOR
ALL SECTORS AND PRIORITIZED PROJECTS) 186-198
TABLE 2.4 SLIP - YEAR WISE BREAKUP OF INVESTMENTS (FOR
ALL SECTORS & ALL FYS: 2015-16, 2016-17 & 2017-20) 199-215
TABLE 2.5 SLIP - PLAN FOR ACHIEVING SERVICE LEVEL
BENCHMARKS 216-237
TABLE 3.1 SAAP – MASTER PLAN OF ALL PROJECTS DETAILS TO
ACHIEVE UNIVERSAL COVERAGE DURING THE
CURRENT MISSION PERIOD BASED ON TABLE 2.1 (FY
2015-16 TO 2019-20)
238-240
TABLE 3.2 SAAP - SECTOR WISE BREAKUP OF CONSOLIDATED
INVESTMENTS FOR ALL ULBS IN THE STATE 241-244
TABLE 3.3 SAAP - ULB WISE SOURCE OF FUNDS FOR ALL
SECTORS 245-257
TABLE 3.4 SAAP - YEAR WISE SHARE OF INVESTMENTS FOR ALL
SECTORS (ULB WISE) 258-260
TABLE 3.5 SAAP- – STATE LEVEL PLAN FOR ACHIEVING SERVICE
LEVEL BENCHMARKS 261

Final 3rd STATE ANNUAL ACTION PLAN (3rd SAAP) FOR FY: 2017-18 to FY 2019-20 OF UTTAR PRADESH UNDER ATAL MISSION FOR
REJUVENATION AND URBAN TRANSFORMATION (AMRUT)
2017
STATE MISSION DIRECTORATE (AMRUT) UTTAR PRADESH, 8TH FLOOR, INDIRA BHAWAN, ASHOK MARG, LUCKNOW-226001 5 | P a g e
TABLE OF CONTENTS
CHAPTER S.N. DESCRIPTION PAGES
TABLE 3.6 SAAP – STATE LEVE PLAN OF ACTION FOR PHYSICAL
AND FINANCIAL PROGRESS DURING MISSION PERIOD
2015-20
262-275
TABLE 4 SAAP - BROAD PROPOSED ALLOCATIONS FOR
ADMINISTRATIVE AND OTHER EXPENSES 276
TABLE 5.2 SAAP - REFORMS TYPE, STEPS AND TARGET FOR
AMRUT CITIES FY-2016-2017 277-279
TABLE 7.2 ANNUAL ACTION PLAN FOR CAPACITY
BUILDING 280
TABLE
7.2
FORM
7.2.1 FUND REQUIREMENT FOR INDIVIDUAL
CAPACITY BUILDING AT ULB LEVEL 280
TABLE
7.2
FORM
7.2.2 FUND REQUIREMENT FOR STATE LEVEL
ACTIVITIES 281
TABLE
7.2
FORM
7.2.3 TOTAL FUND REQUIREMENT FOR CAPACITY
BUILDING 282
TABLE
7.2
FORM
7.2.4 DETAILS OF INSTITUTIONAL CAPACITY
BUILDING 283-284
TABLE 7.4 QUARTERLY SCORE CARDS FOR STATES FINANCIAL
AND PHYSICAL PROGRESS ON CAPACITY BUILDING
(STATE LEVEL)
285
TABLE
7.2
FORM
7.2.1
FUND REQUIREMENT FOR INDIVIDUAL CAPACITY
BUILDING AT ULB LEVEL (ULB WISE) 286-313

Final 3rd STATE ANNUAL ACTION PLAN (3rd SAAP) FOR FY: 2017-18 to FY 2019-20 OF UTTAR PRADESH UNDER ATAL MISSION FOR
REJUVENATION AND URBAN TRANSFORMATION (AMRUT)
2017
STATE MISSION DIRECTORATE (AMRUT) UTTAR PRADESH, 8TH FLOOR, INDIRA BHAWAN, ASHOK MARG, LUCKNOW-226001 6 | P a g e
CHECKLIST: CONSOLIDATED STATE ANNUAL ACTION PLAN OF ALL AMRUT CITIES
Name of State: Uttar Pradesh
S.
No.
Points of Consideration Yes/
No
Details
1. Have all the Cities prepared SLIP as per
the suggested approach?
Yes Yes, all 61 AMRUT cities have prepared
the SLIP as per suggested approach.
2. Has the SAAP prioritized cities for
investment as per priority sectors and
gap assessment?
Yes Cities are prioritised based on existing
service levels for water supply & sewerage
where the sewer line exists to achieve
universal coverage.
3. Is the indicator wise summary of
improvements proposed (both
investments and management
improvements) by State in place?
Yes Indicator wise summary of improvements
proposed for both investments and
management improvements by the state.
4. Have all the cities under Mission
identified/done baseline assessments of
service coverage indicators?
Yes The baseline service coverage indicators
have already been identified from FY
2010-11 onwards every year on the
recommendation of 13th CFC (now 14th
CFC) which have also been published in
the state gazette annually.
5. Is the SAAP derived from an approach
towards meeting Service Level
Benchmarks agreed by Ministry for
each Sector?
Yes SAAP of the state has been prepared to
achieve the service level benchmarks
published by MOUD
6. Is the investment proposed
commensurate to the level of
improvement envisaged in the
indicator?
Yes Investment proposed is commensurate to
the level of improvement envisaged in the
indicator
7. Are State Share and ULB share in line
with proposed Mission approach?
Yes State government has decided the state
share more than 20% against the minimum
mandatory requirement given in the
Mission guidelines. Which is as under:
For towns having population more
than 10 lacs sharing is: - ACA: State:
ULB: 33.33%:36.67%:30%
For towns having population less than
10 lacs sharing is: - ACA: State: ULB:
50%:30%:20%
The parks and green spaces projects is
ACA: State: ULB: 50%:30%:20%
decided for all types of cities.
8. Is there a need for additional resources
and have state considered raising
additional resources (State programs,
aided projects, additional devolution to
cities, 14th Finance Commission,
external sources)?
Yes Efforts are being made to mobilize
additional resources in the form of
Revolving Fund which is interest free loan,
convergence with other central and state
sector programs, dovetailing with SFC
devolution, 14th CFC and infrastructure
fund.

Final 3rd STATE ANNUAL ACTION PLAN (3rd SAAP) FOR FY: 2017-18 to FY 2019-20 OF UTTAR PRADESH UNDER ATAL MISSION FOR
REJUVENATION AND URBAN TRANSFORMATION (AMRUT)
2017
STATE MISSION DIRECTORATE (AMRUT) UTTAR PRADESH, 8TH FLOOR, INDIRA BHAWAN, ASHOK MARG, LUCKNOW-226001 7 | P a g e
CHECKLIST: CONSOLIDATED STATE ANNUAL ACTION PLAN OF ALL AMRUT CITIES
Name of State: Uttar Pradesh
S.
No.
Points of Consideration Yes/
No
Details
9. Does State Annual Action Plan verify
that the cities have undertaken financial
projections to identify revenue
requirements for O&M and
repayments?
Yes SAAP has been prepared considering the
O&M charges and details of O&M are
being worked out while preparing the DPR
in each sector.
10. Has the State Annual Action Plan
considered the resource mobilization
capacity of each ULB to ensure that
ULB share can be mobilized?
Yes SAAP has been prepared considering the
financial position of ULBs and accordingly
state share has been decided by the state
government.
11. Has the process of establishment of
PDMC been initiated and completed?
Yes Two PDMC have been established.
12. Has a roadmap been prepared to realize
the resource potential of the ULB?
Yes Evaluation of resource potential of ULBs
is underway and efforts are being made to
explore the possibilities of market funding
of infrastructure projects.
13. Is the implementation plan for projects
and reforms in place (Timelines and
yearly milestones)?
Yes The implementation plan for projects and
reforms are in place and reforms timeline
committed in previous SAAP has been
adhered.
14. Has the prioritization of projects in
ULBs been done in accordance with
para 7.2 of the guidelines?
Yes Prioritization of projects in ULBs been
done in accordance with para 7.2 of the
guidelines.
(Rakesh Kumar Mishra) State Mission Director (AMRUT)
Government of Uttar Pradesh

Final 3rd STATE ANNUAL ACTION PLAN (3rd SAAP) FOR FY: 2017-18 to FY 2019-20 OF UTTAR PRADESH UNDER ATAL MISSION FOR
REJUVENATION AND URBAN TRANSFORMATION (AMRUT)
2017
STATE MISSION DIRECTORATE (AMRUT) UTTAR PRADESH, 8TH FLOOR, INDIRA BHAWAN, ASHOK MARG, LUCKNOW-226001 8 | P a g e
MINUTES OF 5th STATE HIGH POWERED STEERING COMMITTEE (SHPSC) MEETING DATED 30-01-2017
Approval Of 3rd SAAP 2017-
20 From 5th SHPSC

Final 3rd STATE ANNUAL ACTION PLAN (3rd SAAP) FOR FY: 2017-18 to FY 2019-20 OF UTTAR PRADESH UNDER ATAL MISSION FOR
REJUVENATION AND URBAN TRANSFORMATION (AMRUT)
2017
STATE MISSION DIRECTORATE (AMRUT) UTTAR PRADESH, 8TH FLOOR, INDIRA BHAWAN, ASHOK MARG, LUCKNOW-226001 9 | P a g e

Final 3rd STATE ANNUAL ACTION PLAN (3rd SAAP) FOR FY: 2017-18 to FY 2019-20 OF UTTAR PRADESH UNDER ATAL MISSION FOR
REJUVENATION AND URBAN TRANSFORMATION (AMRUT)
2017
STATE MISSION DIRECTORATE (AMRUT) UTTAR PRADESH, 8TH FLOOR, INDIRA BHAWAN, ASHOK MARG, LUCKNOW-226001 10 | P a g e

Final 3rd STATE ANNUAL ACTION PLAN (3rd SAAP) FOR FY: 2017-18 to FY 2019-20 OF UTTAR PRADESH UNDER ATAL MISSION FOR
REJUVENATION AND URBAN TRANSFORMATION (AMRUT)
2017
STATE MISSION DIRECTORATE (AMRUT) UTTAR PRADESH, 8TH FLOOR, INDIRA BHAWAN, ASHOK MARG, LUCKNOW-226001 11 | P a g e

Final 3rd STATE ANNUAL ACTION PLAN (3rd SAAP) FOR FY: 2017-18 to FY 2019-20 OF UTTAR PRADESH UNDER ATAL MISSION FOR
REJUVENATION AND URBAN TRANSFORMATION (AMRUT)
2017
STATE MISSION DIRECTORATE (AMRUT) UTTAR PRADESH, 8TH FLOOR, INDIRA BHAWAN, ASHOK MARG, LUCKNOW-226001 12 | P a g e

Final 3rd STATE ANNUAL ACTION PLAN (3rd SAAP) FOR FY: 2017-18 to FY 2019-20 OF UTTAR PRADESH UNDER ATAL MISSION FOR
REJUVENATION AND URBAN TRANSFORMATION (AMRUT)
2017
STATE MISSION DIRECTORATE (AMRUT) UTTAR PRADESH, 8TH FLOOR, INDIRA BHAWAN, ASHOK MARG, LUCKNOW-226001 13 | P a g e

Final 3rd STATE ANNUAL ACTION PLAN (3rd SAAP) FOR FY: 2017-18 to FY 2019-20 OF UTTAR PRADESH UNDER ATAL MISSION FOR
REJUVENATION AND URBAN TRANSFORMATION (AMRUT)
2017
STATE MISSION DIRECTORATE (AMRUT) UTTAR PRADESH, 8TH FLOOR, INDIRA BHAWAN, ASHOK MARG, LUCKNOW-226001 14 | P a g e
Final 3rd STATE ANNUAL ACTION PLAN (3rd SAAP) FOR FY: 2017-18 to FY 2019-20 OF UTTAR PRADESH UNDER ATAL MISSION FOR
REJUVENATION AND URBAN TRANSFORMATION (AMRUT)
2017
STATE MISSION DIRECTORATE (AMRUT) UTTAR PRADESH, 8TH FLOOR, INDIRA BHAWAN, ASHOK MARG, LUCKNOW-226001 15 | P a g e
Final 3rd STATE ANNUAL ACTION PLAN (3rd SAAP) FOR FY: 2017-18 to FY 2019-20 OF UTTAR PRADESH UNDER ATAL MISSION FOR
REJUVENATION AND URBAN TRANSFORMATION (AMRUT)
2017
STATE MISSION DIRECTORATE (AMRUT) UTTAR PRADESH, 8TH FLOOR, INDIRA BHAWAN, ASHOK MARG, LUCKNOW-226001 16 | P a g e
PROJECT BACKGROUND AND SUMMARY
CHAPTER -1
Final 3rd STATE ANNUAL ACTION PLAN (3rd SAAP) FOR FY: 2017-18 to FY 2019-20 OF UTTAR PRADESH UNDER ATAL MISSION FOR
REJUVENATION AND URBAN TRANSFORMATION (AMRUT)
2017
STATE MISSION DIRECTORATE (AMRUT) UTTAR PRADESH, 8TH FLOOR, INDIRA BHAWAN, ASHOK MARG, LUCKNOW-226001 17 | P a g e
CHAPTER-1: PROJECT BACKGROUND
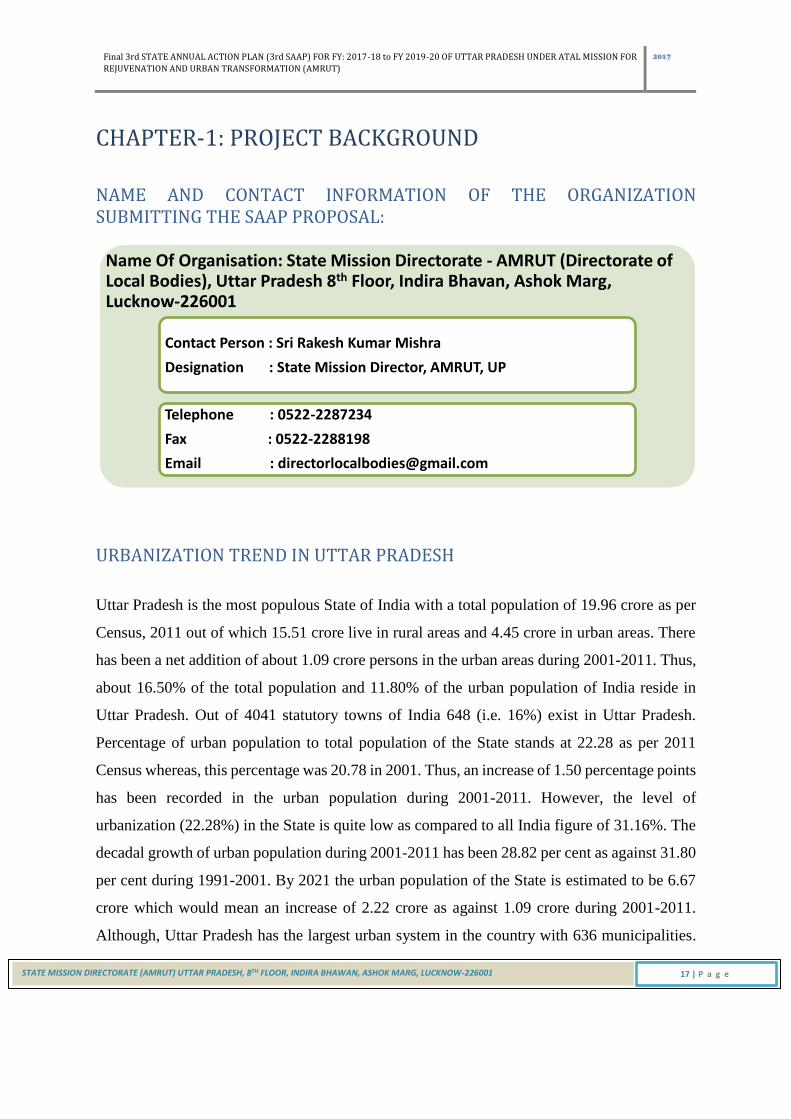
NAME AND CONTACT INFORMATION OF THE ORGANIZATION SUBMITTING THE SAAP PROPOSAL:
URBANIZATION TREND IN UTTAR PRADESH
Uttar Pradesh is the most populous State of India with a total population of 19.96 crore as per
Census, 2011 out of which 15.51 crore live in rural areas and 4.45 crore in urban areas. There
has been a net addition of about 1.09 crore persons in the urban areas during 2001-2011. Thus,
about 16.50% of the total population and 11.80% of the urban population of India reside in
Uttar Pradesh. Out of 4041 statutory towns of India 648 (i.e. 16%) exist in Uttar Pradesh.
Percentage of urban population to total population of the State stands at 22.28 as per 2011
Census whereas, this percentage was 20.78 in 2001. Thus, an increase of 1.50 percentage points
has been recorded in the urban population during 2001-2011. However, the level of
urbanization (22.28%) in the State is quite low as compared to all India figure of 31.16%. The
decadal growth of urban population during 2001-2011 has been 28.82 per cent as against 31.80
per cent during 1991-2001. By 2021 the urban population of the State is estimated to be 6.67
crore which would mean an increase of 2.22 crore as against 1.09 crore during 2001-2011.
Although, Uttar Pradesh has the largest urban system in the country with 636 municipalities.
Name Of Organisation: State Mission Directorate - AMRUT (Directorate of Local Bodies), Uttar Pradesh 8th Floor, Indira Bhavan, Ashok Marg, Lucknow-226001
Contact Person : Sri Rakesh Kumar Mishra
Designation : State Mission Director, AMRUT, UP
Telephone : 0522-2287234
Fax : 0522-2288198
Email : [email protected]

Final 3rd STATE ANNUAL ACTION PLAN (3rd SAAP) FOR FY: 2017-18 to FY 2019-20 OF UTTAR PRADESH UNDER ATAL MISSION FOR
REJUVENATION AND URBAN TRANSFORMATION (AMRUT)
2017
STATE MISSION DIRECTORATE (AMRUT) UTTAR PRADESH, 8TH FLOOR, INDIRA BHAWAN, ASHOK MARG, LUCKNOW-226001 18 | P a g e
However, it ranks 23rd in the level
of urbanization. There are marked
regional imbalances in the level of
urbanization in the State. As per
Census-2011, Western Region with
32.45% urban population is the
most urbanized and Eastern Region
with 13.40% urban population is the
least urbanized. Urban population
of Central and Bundelkhand
Regions stands at 20.06 and 22.74,
respectively. The trend of urban population growth shows that large towns especially class-I
towns are relatively growing faster which is discernible from the fact that class-I towns
contained 33.71% of urban population in 1951 which increased to 60% in 2011. Besides,
number of class-I towns increased from 14 in 1991, to 54 in 2001 and 64 in 2011, whereas
number of metropolitan cities increased from 6 in 2001 to 7 in 2011. Concentration of
population in large cities is indicative of spatial polarization of employment opportunities.
Small towns (especially Class-5 and 6 towns) exhibit a negative rate of growth which is
indicative of growing trend of population shift towards larger (5 lac plus) cities.
Excluding Uttrakhand, UP’s urban population stood at 19.01 million in 1981, increasing to
34.50 million in 2001 and, further, to 44.47 million in 2011. Urban population has been
increasing at a steady rate of around 3.07 % per annum in the past three decades, which is much
higher than the growth rate of 2.38 % per annum in the total population of the State. In 2011,
22.28% of total population of State lives in urban areas which accounts 11.79% of total urban
population of country based on census data of 2011, 4041 statutory towns present in country
out of which 648 exist in UP which is 16% of total number of towns. The past urbanization
trends till the current census 2011 in Table-1 and demographic status of UP in India is tabulated
in Table-2.
1981 1991 2001 2011 2021 2031
UP 18.08 19.67 20.78 22.28 27.22 35.53
India 23.73 25.72 27.81 31.16 36.00 40.00
0.00
5.00
10.00
15.00
20.00
25.00
30.00
35.00
40.00
45.00
PO
PU
LA
TIO
N G
RO
WT
H (
%)
Urban Population Growth Trend in
Uttar Pradesh & India

Final 3rd STATE ANNUAL ACTION PLAN (3rd SAAP) FOR FY: 2017-18 to FY 2019-20 OF UTTAR PRADESH UNDER ATAL MISSION FOR
REJUVENATION AND URBAN TRANSFORMATION (AMRUT)
2017
STATE MISSION DIRECTORATE (AMRUT) UTTAR PRADESH, 8TH FLOOR, INDIRA BHAWAN, ASHOK MARG, LUCKNOW-226001 19 | P a g e
1. TABLE: GROWTH OF URBAN & TOTAL POPULATION OF UP (1981-2011)
Year Urban
population
(lakh)
Total
population
(lakh)
Urban
population
as % of total
population
Decadal
growth of
urban
population
(%)
Decadal
growth of
total
population
(%)
1 2 3 4 5 6
1981 190.08 1051.37 18.08
1991 259.70 1319.99 19.67 36.63 25.55
2001 345.06 1660.53 20.78 26.82 25.78
2011 444.70 1995.81 22.28 28.75 20.09
Source: Calculated from Census Reports-2011.
2. TABLE: THE UTTAR PRADESH IN INDIA {CENSUS 2011}
Indicators India Uttar Pradesh %age of UP in India
Total Population 121.02 Cr 19.96 Cr 16%
Urban Population 37.71 Cr 4.45 Cr 12%
% Urban Population 31.16% 22.28% -
Statutory Towns 4,041 648 16%
Census Towns 3,894 267 7%
Decadal Urban Population
Growth (2001-2011) 9.10 Cr 1.0 Cr 10.95 %
Source: Calculated from Census Reports-2011.

Final 3rd STATE ANNUAL ACTION PLAN (3rd SAAP) FOR FY: 2017-18 to FY 2019-20 OF UTTAR PRADESH UNDER ATAL MISSION FOR
REJUVENATION AND URBAN TRANSFORMATION (AMRUT)
2017
STATE MISSION DIRECTORATE (AMRUT) UTTAR PRADESH, 8TH FLOOR, INDIRA BHAWAN, ASHOK MARG, LUCKNOW-226001 20 | P a g e
AMRUT CITIES OF UTTAR PRADESH:
The 61 cities of Uttar Pradesh
covered under AMRUT, which
includes 14 Nagar Nigam/
Municipal Corporation and 47
Nagar Palika Parishads, later
NPP Ayodhya also included in to
list so now there are 61 AMRUT
cities. The list of AMRUT Cities
of Uttar Pradesh mentioned
ahead:
S N Nagar Palika Parishad Pop_n
15 Loni (NPP) 512296
16 Muzaffarnagar (NPP) 392451
17 Mathura (NPP) 349336
18 Shahjahanpur (NPP) 327975
19 Rampur (NPP) 325248
20 Maunath Bhanjan (NPP) 279060
21 Farrukhabad(NPP) 275754
22 Hapur (NPP) 262801
23 Etawah (NPP) 256790
24 Mirzapur(NPP) 233691
25 Bulandshahar (NPP) 222826
26 Sambhal (NPP) 221334
27 Amroha (Npp) 197135
28 Fatehpur (NPP) 193801
29 Rae Bareli (NPP) 191056
30 Orai (NPP) 187185
31 Bahraich (NPP) 186241
32 Jaunpur (NPP) 168128
33 Unnao (NPP) 178681
34 Sitapur (NPP) 177351
35 Faizabad (NPP) 167544
36 Budaun(NPP) 159221
37 Banda (NPP) 154388
38 Lakhimpur (NPP) 152010
39 Hathras (NPP) 137509
40 Lalitpur (NPP) 133041
S N Nagar Palika Parishad Pop_n
41 Modinagar (NPP) 130161
42 Deoria (NPP) 129570
43 Pilibhit (NPP) 130428
44 Hardoi (NPP) 126890
45 Mainpuri (NPP) 117327
46 Etah (NPP) 118632
47 Basti (NPP) 114651
48 Chandausi (NPP) 114254
49 Gonda (NPP) 114353
50 Akbarpur (NPP) 111594
51 Khurja (NPP) 111098
52 Azamgarh (NPP) 110980
53 Ghazipur (NPP) 110698
54 Mughalsarai (NPP) 110110
55 Sultanpur (NPP) 107914
56 Shikohabad (NPP) 107300
57 Shamli (NPP) 107233
58 Ballia (NPP) 104271
59 Baraut (NPP) 102733
60 Kasganj (NPP) 101241
61 Ayodhya (NPP) 55890
Total 60,98,743
SN Name of the City Population
1 Lucknow (M Corp.) 2815601
2 Kanpur (M Corp.) 2767031
3 Ghaziabad (M Corp.) 1648643
4 Agra (M Corp.) 1574542
5 Meerut (M Corp.) 1309023
6 Varanasi (M Corp.) 1201815
7 Allahabad (M Corp.) 1117094
8 Bareilly (M Corp.) 898167
9 Moradabad (M Corp.) 889810
10 Aligarh (M Corp.) 872575
11 Saharanpur (M Corp.) 703345
12 Gorakhpur (M Corp.) 671048
13 Jhansi (M Corp.) 507293
14 Firozabad (M Corp.) 603797 Total 17579784

Final 3rd STATE ANNUAL ACTION PLAN (3rd SAAP) FOR FY: 2017-18 to FY 2019-20 OF UTTAR PRADESH UNDER ATAL MISSION FOR
REJUVENATION AND URBAN TRANSFORMATION (AMRUT)
2017
STATE MISSION DIRECTORATE (AMRUT) UTTAR PRADESH, 8TH FLOOR, INDIRA BHAWAN, ASHOK MARG, LUCKNOW-226001 21 | P a g e
EXISTING SERVICES LEVEL OF WATER SUPPLY IN AMRUT CITIES:
The COVERAGE OF WATER SUPPLY services in AMRUT cities of Uttar Pradesh shows that
the coverage ranges from 32% to 78% in Municipal Corporations (Nagar Nigams). Allahabad
Municipal Corporation has the highest household level coverage of water supply network
connections at 78% while Saharanpur Municipal Corporation has the lowest coverage level at
32%. In terms of LITRE PER CAPITA WATER availability among Municipal Corporation,
Allahabad has the highest 226 LPCD water availability while Aligarh has the lowest per capita
availability of water at 90 LPCD.
The NON-REVENUE WATER Levels in Municipal Corporation is also found to be very high
in most of the cities. Comparative analysis of NRW in Municipal Corporation shows that
Meerut reported highest NRW with 65% while Municipal Corporation Aligarh has reported
lowest NRW with 21%.
Comparative analysis of household level coverage of water supply connections, per capita
availability of water and non-revenue water shows that at Saharanpur the even though the
coverage is low but the NRW level is very high similar situation is also observed in cities of
Jhansi, Meerut, Kanpur, Moradabad and Varanasi.
0
20
40
60
80
050
100150200250
WATER SUPPLY INDICATOR WISE ANALYSIS- Municipal Corporation
COVERAGE LPCD NRW
• Saharanpur has lowest coverage of water supply (32%) & Allahabad has highest coverage among NNs (78%)
• NRW level is highest in Meerut (65%) & lowest in Aligarh (21%).
• Aligarh (90 LPCD) has lowest per capita availability of water (LPCD) & Highest is in Allahabad (226 LPCD)

Final 3rd STATE ANNUAL ACTION PLAN (3rd SAAP) FOR FY: 2017-18 to FY 2019-20 OF UTTAR PRADESH UNDER ATAL MISSION FOR
REJUVENATION AND URBAN TRANSFORMATION (AMRUT)
2017
STATE MISSION DIRECTORATE (AMRUT) UTTAR PRADESH, 8TH FLOOR, INDIRA BHAWAN, ASHOK MARG, LUCKNOW-226001 22 | P a g e
The COVERAGE OF WATER SUPPLY SERVICES in Nagar Palika Parishads shows that
coverage level ranges from 17% to 72%. Highest being 72% in Nagar Palika Parishad
Modinagar and lowest in Rampur at 17%. Maximum cities have water supply coverage in
between the range of 32% to 48%.
The NON-REVENUE WATER LEVELS are also found to be very high in most of the Nagar
Palika Parishads. Comparative analysis of NRW in Nagar Palika Parishads shows that Sambhal
City reported highest NRW with 75% while Shahjahanpur has reported lowest NRW with 23%.
The PER CAPITA WATER AVAILABILITY in Nagar Palika Parishads shows Amroha
reported lowest availability of water at 45 LPCD and highest at Ghazipur with 300 LPCD.
Among Nagar Palika Parishads (Municipal Councils) 24 cities have per capita availability of
water below the benchmark of 135 LPCD whereas 22 cities lie above the prescribed LPCD
benchmark. The overall trend shows that there is sufficient availability of per capita water in
most of the AMRUT Cities.
0
20
40
60
80
0
100
200
300
400 COVERAGE LPCD NRW
• 29 NPPs have less than 50% Coverage of water and less than 25% in 4 NPPs, Rampur is the lowest (17%)
• NRW level is more than 40% in 20 NPPs & highest in Sambhal (75%)
• 12 NPPs have less than 100 LPCD of water & lowest in Amroha (45)
• 21 NPPs have more than 135 LPCD water & highest water availability in Gonda (281 LPCD) & Ghazipur (300 LPCD).

Final 3rd STATE ANNUAL ACTION PLAN (3rd SAAP) FOR FY: 2017-18 to FY 2019-20 OF UTTAR PRADESH UNDER ATAL MISSION FOR
REJUVENATION AND URBAN TRANSFORMATION (AMRUT)
2017
STATE MISSION DIRECTORATE (AMRUT) UTTAR PRADESH, 8TH FLOOR, INDIRA BHAWAN, ASHOK MARG, LUCKNOW-226001 23 | P a g e
EXISTING SERVICES LEVEL OF SEWERAGE & SEPTAGE IN AMRUT CITIES
Analysis of COVERAGE OF LATRINES in Municipal Corporations shows that most of the
municipal corporations have fair coverage of latrines ranging from 83% to 98%.
In Nagar Palika Parishads the availability of latrines ranges from 39% in Akabarpur to 99% in
Nagar Palika Parishad Loni. In most cities, the coverage of latrines ranges from 80% to 90%.
SEWERAGE NETWORK:
Regarding coverage of sewerage network in Municipal Corporations, highest coverage of
sewerage is in Ghaziabad with 83.82% and lowest is in Aligarh with 3.54% sewerage coverage.
Nagar Nigam Jhansi and Moradabad have no sewerage network.
Among Nagar Palika Parishads the sewerage network ranges from 30% to 0.05%. In more than
34 AMRUT cities there is no sewerage network. These cities have only Septage.
• Highest coverage of sewerage is in Ghaziabad with 83.82% and lowest is in Aligarh with 3.54%
sewerage coverage.
• Nagar Nigam Jhansi and Moradabad have no sewerage network.
• Availability of Latrines is highest in Allahabad (98.21%) & lowest in Firozabad (83.24%)
• Collection efficiency is highest in Allahabad (95%) & Ghaziabad (94.71%).
-
20.00
40.00
60.00
80.00
100.00
120.00
Coverage of Latrines Coverage of Sewer Network (%age)
Status of Sewerage and Sanitation in Nagar Nigams of Uttar Pradesh (AMRUT)

Final 3rd STATE ANNUAL ACTION PLAN (3rd SAAP) FOR FY: 2017-18 to FY 2019-20 OF UTTAR PRADESH UNDER ATAL MISSION FOR
REJUVENATION AND URBAN TRANSFORMATION (AMRUT)
2017
STATE MISSION DIRECTORATE (AMRUT) UTTAR PRADESH, 8TH FLOOR, INDIRA BHAWAN, ASHOK MARG, LUCKNOW-226001 24 | P a g e
EFFICIENCY IN COLLECTION AND TREATMENT OF SEWERAGE:
Efficiency in collection and treatment of sewerage has been reported less than 60% in most of
the Corporation cities. Nagar Nigam Agra reported highest efficiency in collection and
treatment of sewerage. Among Nagar Palika Parishad the efficiency in collection and treatment
of sewerage is reported quite low except Azamgarh which reported 60%. Out of 60 AMRUT
Cities 35 cities have reported zero efficiency regarding collection and treatment of sewerage.
PARKS AND GREEN SPACES:
Per capita availability of open space among AMRUT cities ranges from 2.13 Sq. Mts. to 0.01
Sq. Mts.
Indicator Benchmark Current Status Remarks
Per person open
space in built up
3 Sq. M
(as per URDPFI
Guidelines)
Ranges from 0.01
Sq. Mts to 2.13 Sq.
Mts.
Minimum two
parks have been
proposed for
development.
39
91 90 87 88
58
93 82 98 100
88 99 93 95 75
89 70 76
90 98 84 93
80 87 98 97 68
100 95 97 68 78
95 78
93 99 88 95 99 97 99 90 86 88 85 81
- - - - -4
6
- - - - - - 0 - - - - - - - - - - - - - -
12 14
6
12
-
9
-
5
-
30
- - - - -3
-
6
-
5
10
15
20
25
30
35
-
20
40
60
80
100
120
S T A T U S O F S E W E R A G E A N D S A N I T A T I O N I N N A G A R
P A L I K A P A R I S H A D S O F U T T A R P R A D E S H ( A M R U T )
Coverage of Latrines Coverage of Sewer Network (%age)
• In 34 NPPs under AMRUT there is no sewerage network, treatment & collection.
Final 3rd STATE ANNUAL ACTION PLAN (3rd SAAP) FOR FY: 2017-18 to FY 2019-20 OF UTTAR PRADESH UNDER ATAL MISSION FOR
REJUVENATION AND URBAN TRANSFORMATION (AMRUT)
2017
STATE MISSION DIRECTORATE (AMRUT) UTTAR PRADESH, 8TH FLOOR, INDIRA BHAWAN, ASHOK MARG, LUCKNOW-226001 25 | P a g e
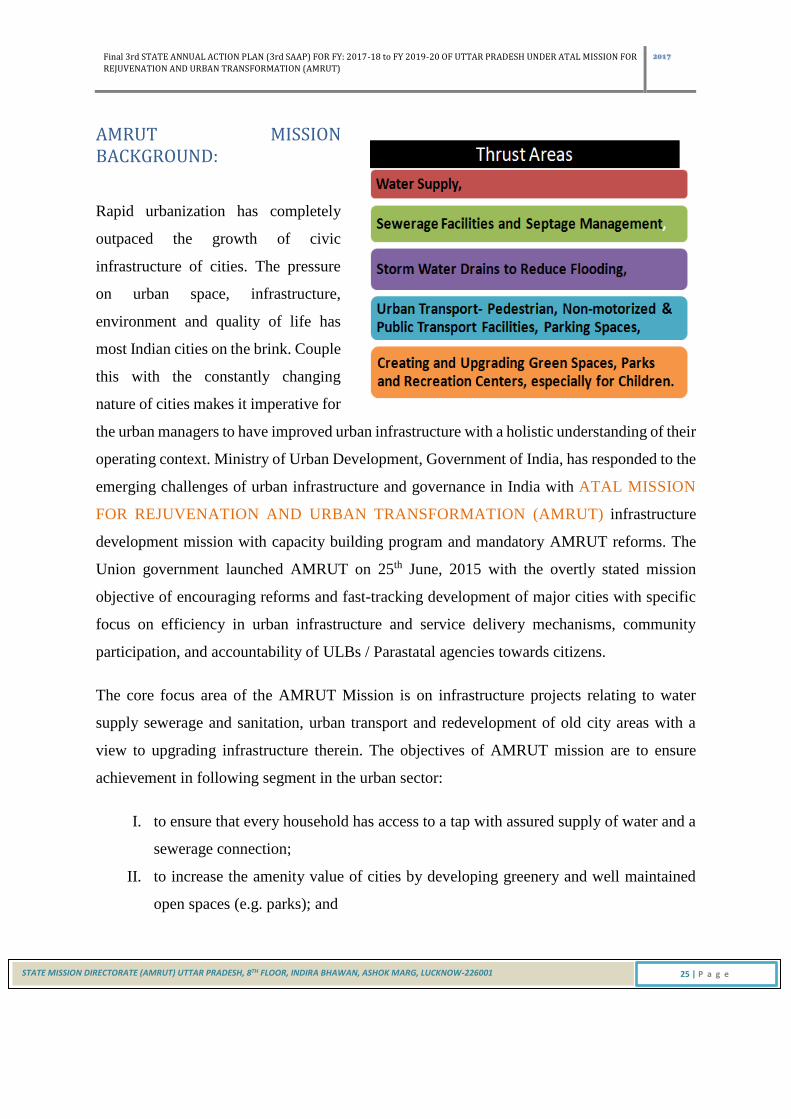
AMRUT MISSION BACKGROUND:
Rapid urbanization has completely
outpaced the growth of civic
infrastructure of cities. The pressure
on urban space, infrastructure,
environment and quality of life has
most Indian cities on the brink. Couple
this with the constantly changing
nature of cities makes it imperative for
the urban managers to have improved urban infrastructure with a holistic understanding of their
operating context. Ministry of Urban Development, Government of India, has responded to the
emerging challenges of urban infrastructure and governance in India with ATAL MISSION
FOR REJUVENATION AND URBAN TRANSFORMATION (AMRUT) infrastructure
development mission with capacity building program and mandatory AMRUT reforms. The
Union government launched AMRUT on 25th June, 2015 with the overtly stated mission
objective of encouraging reforms and fast-tracking development of major cities with specific
focus on efficiency in urban infrastructure and service delivery mechanisms, community
participation, and accountability of ULBs / Parastatal agencies towards citizens.
The core focus area of the AMRUT Mission is on infrastructure projects relating to water
supply sewerage and sanitation, urban transport and redevelopment of old city areas with a
view to upgrading infrastructure therein. The objectives of AMRUT mission are to ensure
achievement in following segment in the urban sector:
I. to ensure that every household has access to a tap with assured supply of water and a
sewerage connection;
II. to increase the amenity value of cities by developing greenery and well maintained
open spaces (e.g. parks); and

Final 3rd STATE ANNUAL ACTION PLAN (3rd SAAP) FOR FY: 2017-18 to FY 2019-20 OF UTTAR PRADESH UNDER ATAL MISSION FOR
REJUVENATION AND URBAN TRANSFORMATION (AMRUT)
2017
STATE MISSION DIRECTORATE (AMRUT) UTTAR PRADESH, 8TH FLOOR, INDIRA BHAWAN, ASHOK MARG, LUCKNOW-226001 26 | P a g e
III. to reduce pollution by switching to public transport or constructing facilities for non-
motorized transport (e.g. walking and cycling).
MISSION COMPONENTS
The components of the AMRUT consist of capacity building, reform implementation, water
supply, sewerage and Septage management, storm water drainage, urban transport and
development of green spaces and parks. During the process of planning, the Urban Local
Bodies (ULBs) will strive to include some smart features in the physical infrastructure
components.
Water Supply
i. Water supply systems including augmentation of existing water supply, water treatment
plants and universal metering.
ii. Rehabilitation of old water supply systems, including treatment plants.
iii. Rejuvenation of water bodies specifically for drinking water supply and recharging of
ground water.
iv. Special water supply arrangement for difficult areas, hill and coastal cities, including those
having water quality problems (e.g. arsenic, fluoride)
Sewerage
i. Decentralized, networked underground sewerage systems, including augmentation of
existing sewerage systems and sewage treatment plants.
ii. Rehabilitation of old sewerage system and treatment plants.
iii. Recycling of water for beneficial purposes and reuse of wastewater.
Final 3rd STATE ANNUAL ACTION PLAN (3rd SAAP) FOR FY: 2017-18 to FY 2019-20 OF UTTAR PRADESH UNDER ATAL MISSION FOR
REJUVENATION AND URBAN TRANSFORMATION (AMRUT)
2017
STATE MISSION DIRECTORATE (AMRUT) UTTAR PRADESH, 8TH FLOOR, INDIRA BHAWAN, ASHOK MARG, LUCKNOW-226001 27 | P a g e
Septage
i. Faecal Sludge Management- cleaning, transportation and treatment in a cost-effective
manner.
ii. Mechanical and biological cleaning of sewers and septic tanks and recovery of operational
cost in full.
Storm Water Drainage
i. Construction and improvement of drains and storm water drains to reduce and eliminate
flooding.
Urban Transport
i. Ferry vessels for inland waterways (excluding port/bay infrastructure) and buses.
ii. Footpaths/walkways, sidewalks, foot over-bridges and facilities for non-motorized transport
(e.g. bicycles).
iii. Multi-level parking.
iv. Bus Rapid Transit System (BRTS).
Green space and parks
i. Development of green space and parks with special provision for child-friendly components.
Reforms management & support
i. Support structures, activities and funding support for reform implementation.
ii. Independent Reform monitoring agencies.

Final 3rd STATE ANNUAL ACTION PLAN (3rd SAAP) FOR FY: 2017-18 to FY 2019-20 OF UTTAR PRADESH UNDER ATAL MISSION FOR
REJUVENATION AND URBAN TRANSFORMATION (AMRUT)
2017
STATE MISSION DIRECTORATE (AMRUT) UTTAR PRADESH, 8TH FLOOR, INDIRA BHAWAN, ASHOK MARG, LUCKNOW-226001 28 | P a g e
Capacity Building
i. It has two components- individual and institutional capacity building.
ii. The capacity building is not limited to the Mission Cities, but extended to other ULBs as
well.
iii. Continuation of the Comprehensive Capacity Building Programme (CCBP) after its
realignment towards the new Missions.
COVERAGE UNDER MISSION
Five hundred cities are taken up under AMRUT. The list of cities is notified. The category of
cities that are covered in the AMRUT is given below:
i. All Cities and Towns with a population of over one lakh with notified Municipalities,
including Cantonment Boards (Civilian areas),
ii. All Capital Cities/Towns of States/ UTs, not covered in (i),
iii. All Cities/ Towns classified as Heritage Cities by MoUD under the HRIDAY Scheme,
iv. Thirteen Cities and Towns on the stem of the main rivers with a population above 75,000
and less than 1 lakh, and
v. Ten Cities from hill states, islands and tourist destinations (not more than one from each
State).
FUND ALLOCATION
The total outlay for AMRUT is Rs. 50,000 crore for five years from FY 2015-16 to FY 2019-
20 and the Mission is operated as a Centrally Sponsored Scheme (CSS). The AMRUT may be
continued thereafter in the light of an evaluation done by the MoUD and incorporating
learnings in the Mission. The Mission fund is divided in following four parts:
i. Project fund - 80% of the annual budgetary allocation.
ii. Incentive for Reforms - 10% of the annual budgetary allocation.

Final 3rd STATE ANNUAL ACTION PLAN (3rd SAAP) FOR FY: 2017-18 to FY 2019-20 OF UTTAR PRADESH UNDER ATAL MISSION FOR
REJUVENATION AND URBAN TRANSFORMATION (AMRUT)
2017
STATE MISSION DIRECTORATE (AMRUT) UTTAR PRADESH, 8TH FLOOR, INDIRA BHAWAN, ASHOK MARG, LUCKNOW-226001 29 | P a g e
iii. State funds for
Administrative & Office
Expenses (A&OE) - 8% of
the
Annual budgetary
allocation
iv. MoUD funds for
Administrative & Office
Expenses (A&OE) - 2% of
the annual budgetary
allocation
However, for FY 2015-16 the
project fund was 90% of the
annual budgetary allocation incentive for Reforms is being given only from FY 2016-17
onwards. The SAAP size of Uttar Pradesh for FY 2017-20 is Rs 4293.60 Cr.
As per the mission guidelines GOI shall provide 50% assistance of the project cost for the
mission cities having population up to 10 lacs and 1/3rd assistance for mission cities having
population above 10 lacs. State govt. respective ULBs will contribute through their own
resources (State Share/SFC/TFC grants etc.) or through financing from financial institutions.
Under AMRUT scheme, the State Govt. has decided to meet not less than 20% of the project
cost, in addition to the Central share. The ULBs are expected to meet the remaining share from
their own funds, 14th Finance Commission Grants and from other sources. The ULBs are trying
to raise their own revenues through improving billing and collection systems and through
public mobilization and awareness campaigns. The ULBs are also preparing themselves to
mobilize finances through financial institutions by obtaining credit rating from accredited
institutions. The O&M cost will be met from the ULB through user charges and other sources.
STATE AND ULB SHARE
State share has been decided by the State Government more than 20% which provided in the
Mission guidelines.
City Level
ULBs will be responsible for Implementation of Mission
State LevelHigh Powered Steering Committee (SHPSC)
chaired by State Chief Secretary
State Level Technical Committee (SLTC) chaired by the Principal Secretary/
Secretary
National Level
Apex Committee (AC) chaired by Secretary (UD)
Final 3rd STATE ANNUAL ACTION PLAN (3rd SAAP) FOR FY: 2017-18 to FY 2019-20 OF UTTAR PRADESH UNDER ATAL MISSION FOR
REJUVENATION AND URBAN TRANSFORMATION (AMRUT)
2017
STATE MISSION DIRECTORATE (AMRUT) UTTAR PRADESH, 8TH FLOOR, INDIRA BHAWAN, ASHOK MARG, LUCKNOW-226001 30 | P a g e
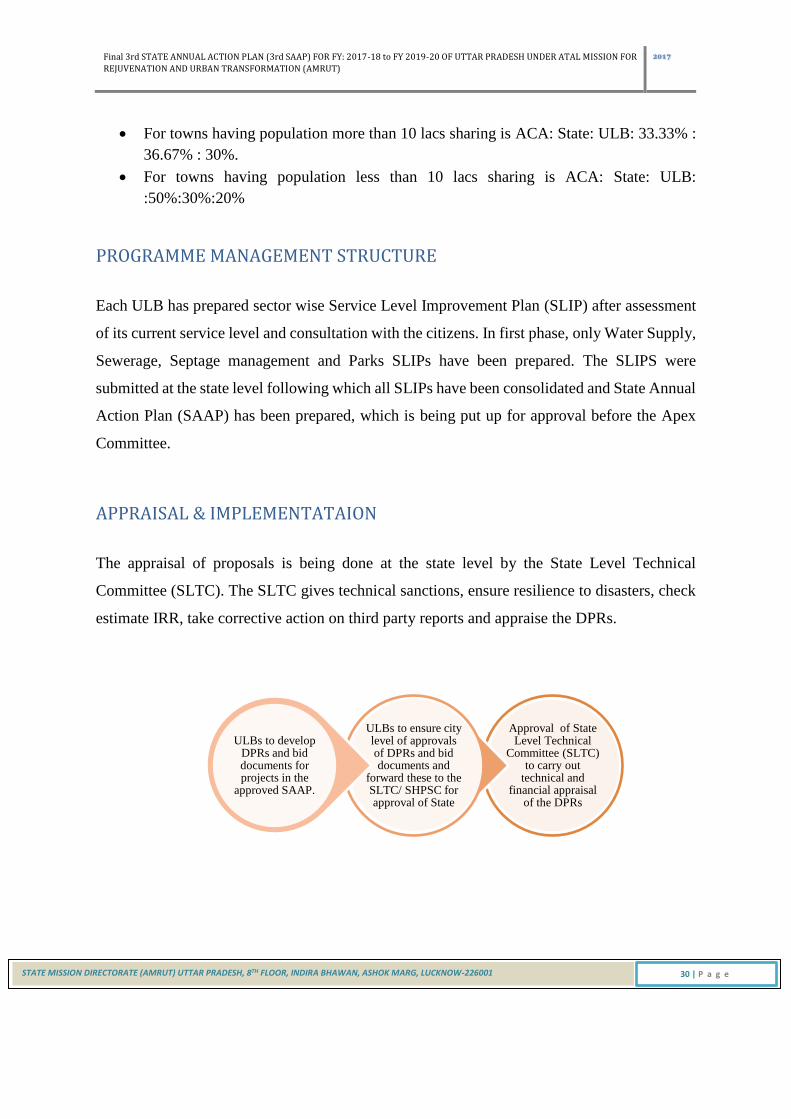
For towns having population more than 10 lacs sharing is ACA: State: ULB: 33.33% :
36.67% : 30%.
For towns having population less than 10 lacs sharing is ACA: State: ULB:
:50%:30%:20%
PROGRAMME MANAGEMENT STRUCTURE
Each ULB has prepared sector wise Service Level Improvement Plan (SLIP) after assessment
of its current service level and consultation with the citizens. In first phase, only Water Supply,
Sewerage, Septage management and Parks SLIPs have been prepared. The SLIPS were
submitted at the state level following which all SLIPs have been consolidated and State Annual
Action Plan (SAAP) has been prepared, which is being put up for approval before the Apex
Committee.
APPRAISAL & IMPLEMENTATAION
The appraisal of proposals is being done at the state level by the State Level Technical
Committee (SLTC). The SLTC gives technical sanctions, ensure resilience to disasters, check
estimate IRR, take corrective action on third party reports and appraise the DPRs.
Approval of State Level Technical
Committee (SLTC) to carry out
technical and financial appraisal
of the DPRs
ULBs to ensure city level of approvals of DPRs and bid documents and
forward these to the SLTC/ SHPSC for approval of State
ULBs to develop DPRs and bid documents for projects in the
approved SAAP.

Final 3rd STATE ANNUAL ACTION PLAN (3rd SAAP) FOR FY: 2017-18 to FY 2019-20 OF UTTAR PRADESH UNDER ATAL MISSION FOR
REJUVENATION AND URBAN TRANSFORMATION (AMRUT)
2017
STATE MISSION DIRECTORATE (AMRUT) UTTAR PRADESH, 8TH FLOOR, INDIRA BHAWAN, ASHOK MARG, LUCKNOW-226001 31 | P a g e
Review of First and Second State Annual Action Plan (SAAP) For FY 2015-16 & 2016-17
CHAPTER-2

Final 3rd STATE ANNUAL ACTION PLAN (3rd SAAP) FOR FY: 2017-18 to FY 2019-20 OF UTTAR PRADESH UNDER ATAL MISSION FOR
REJUVENATION AND URBAN TRANSFORMATION (AMRUT)
2017
STATE MISSION DIRECTORATE (AMRUT) UTTAR PRADESH, 8TH FLOOR, INDIRA BHAWAN, ASHOK MARG, LUCKNOW-226001 32 | P a g e
CHAPTER-2: REVIEW OF FIRST AND SECOND STATE ANNUAL ACTION PLAN (SAAP) FOR FY 2015-16 & 2016-17
MoUD has decided that the following benchmarks must be examined and complied with by States and UTs at the time of considering their 3rd
SAAP:
1. Projects amounting to at least 25% against SAAP I to be contracted.
2. Projects amounting to at least 50% of total approvals (SAAP I & II) to have the DPRs approved.
3. 100% of Central fund and corresponding State share against the SAAP-I and SAAP-II to be transferred to the State Mission Directorate/
ULBs/ Parastatals (as the case may be).
4. PDMC should have been appointed and be in place.
5. Regarding credit rating, work must be awarded for all Mission Cities and credit ratings to be completed by March 2017.
6. Satisfaction of the progress and assurance regarding adoption of Model Building Byelaws, circulated by the Ministry w.r.t its 14 essential
features.
In respect of the States & UTs not meeting the above conditions listed at no 1 to 5, approval of the third and final SAAP will be granted upon
achieving these milestones. In respect of conditions at 5 and 6, progress will be reviewed as per the timelines given at the time of release of funds.
The status of above conditions in respect of SAAP I & II in the state is summarised in the following table:

Final 3rd STATE ANNUAL ACTION PLAN (3rd SAAP) FOR FY: 2017-18 to FY 2019-20 OF UTTAR PRADESH UNDER ATAL MISSION FOR
REJUVENATION AND URBAN TRANSFORMATION (AMRUT)
2017
STATE MISSION DIRECTORATE (AMRUT) UTTAR PRADESH, 8TH FLOOR, INDIRA BHAWAN, ASHOK MARG, LUCKNOW-226001 33 | P a g e
Summary of Project Progress (Amounts in Rs Crore) Size of SAAP I Size of SAAP II Project Awarded Project awarded as % of
SAAP I
DPRs Approved As % of Total SAAP
3287.27 3895.16 1030.75 31% 4796.18 67%
Status of Fund transfer against SAAP I & II
SAAP I Central Share released: 281.81 Central Share transferred: 281.81
State Share due: 221.39 State Share transferred: 221.39
SAAP II Central Share released: 327.60 Central Share transferred: 327.60
State Share due: 270.13 State Share transferred: 76.68
Summary of SAAP III
SAAP Size 4239.24
Central Assistance 1875.39
State Share 1369.51
ULB Share 994.34
A& OE Fund 54.36
Total SAAP III 4293.60
Project Details
Sectors Water Supply Sewerage Parks & Green Spaces Drainage Urban Mobility
No. of Projects 46 47 61
Amount (Rs. Cr) 1996.02 2149.46 93.76
Summary of Major Reforms:
Credit Rating
No. of Mission Cities Mission Cities for which
Credit Rating being done
Mission Cities for which
Credit Rating work
awarded
Mission Cities for which
Credit Rating work
completed
61 61 61
Energy Efficiency
No. of Mission Cities Water Pump Street Lights
Mission Cities identified Mission Cities tied up
with EESL/ others
Mission Cities identified Mission Cities tied up
with EESL/ others
61 61 61 61

Final 3rd STATE ANNUAL ACTION PLAN (3rd SAAP) FOR FY: 2017-18 to FY 2019-20 OF UTTAR PRADESH UNDER ATAL MISSION FOR
REJUVENATION AND URBAN TRANSFORMATION (AMRUT)
2017
STATE MISSION DIRECTORATE (AMRUT) UTTAR PRADESH, 8TH FLOOR, INDIRA BHAWAN, ASHOK MARG, LUCKNOW-226001 34 | P a g e
Implementation of Approved 1st SAAP-UP For 2015-16
SN Sector
UP- SAAP:15-16
sanctioned by AC on
15-12-2015
DPRs approved by
SLTC/ SHPC
Financial Sanction
issued by the GoUP
Tenders Sanctioned
by SLTC Work Started
No. of
Towns
Amount in
Rs Cr
Projects
/Towns
Amt. in
Rs Cr Projects
Amt. in
Rs Cr Projects
Amt. in
Rs Cr Projects
Amt. in
Rs Cr
1 Water
Supply 59 1519.19 86/57 1545.38 69 1135.33 37 340.30 29
2
Sewerage &
Septage
Management
25 1697.62 30/22 1720.88 21 1279.03 22 683.11 18
3
Green
Spaces and
Parks
59 70.45 95/58 71.93 95 71.93 10 6.50
Total 143 3287.26 211 3338.19 185 2486.29 69 1029.91 47

Final 3rd STATE ANNUAL ACTION PLAN (3rd SAAP) FOR FY: 2017-18 to FY 2019-20 OF UTTAR PRADESH UNDER ATAL MISSION FOR
REJUVENATION AND URBAN TRANSFORMATION (AMRUT)
2017
STATE MISSION DIRECTORATE (AMRUT) UTTAR PRADESH, 8TH FLOOR, INDIRA BHAWAN, ASHOK MARG, LUCKNOW-226001 35 | P a g e
Implementation of Approved 2nd SAAP-UP For 2016-17
SN Sector UP- SAAP:16-17
sanctioned by AC on
14-06-2016
DPRs Prepared by
PEA
DPRs approved by
SLTC/ SHPC
Financial Sanction
issued by the
GoUP
Tenders Sanctioned
by SLTC
Work Started
No. of
Towns
Amount
in Rs Cr
Schemes/
Projects
Amt in
Rs Cr
Projects
/Towns
Amt in
Rs Cr
Projects Amt in
Rs Cr
Projects Amt in
Rs Cr
Projects Amt in
Rs Cr
1 Water
Supply 58 2017.42 17/16 617.2 15/14 585.80 1 27.29
2
Sewerage &
Septage
Management 24 1795.84 15/14 1120.81 11/10 844.23 3 238.34 1 0.84 1
3
Green
Spaces and
Parks 60 81.9 146/56 81.15 142/54 78.88 36 18.02
Total 142 3895.16 178/86 1819.16 168/78 1508.91 40 283.65 1 0.84 1

Final 3rd STATE ANNUAL ACTION PLAN (3rd SAAP) FOR FY: 2017-18 to FY 2019-20 OF UTTAR PRADESH UNDER ATAL MISSION FOR
REJUVENATION AND URBAN TRANSFORMATION (AMRUT)
2017
STATE MISSION DIRECTORATE (AMRUT) UTTAR PRADESH, 8TH FLOOR, INDIRA BHAWAN, ASHOK MARG, LUCKNOW-226001 36 | P a g e
FIRST STATE ANNUAL ACTION PLAN (1ST SAAP FOR FY 2015-16)
STATUS OF WATER SUPPLY PROJECTS
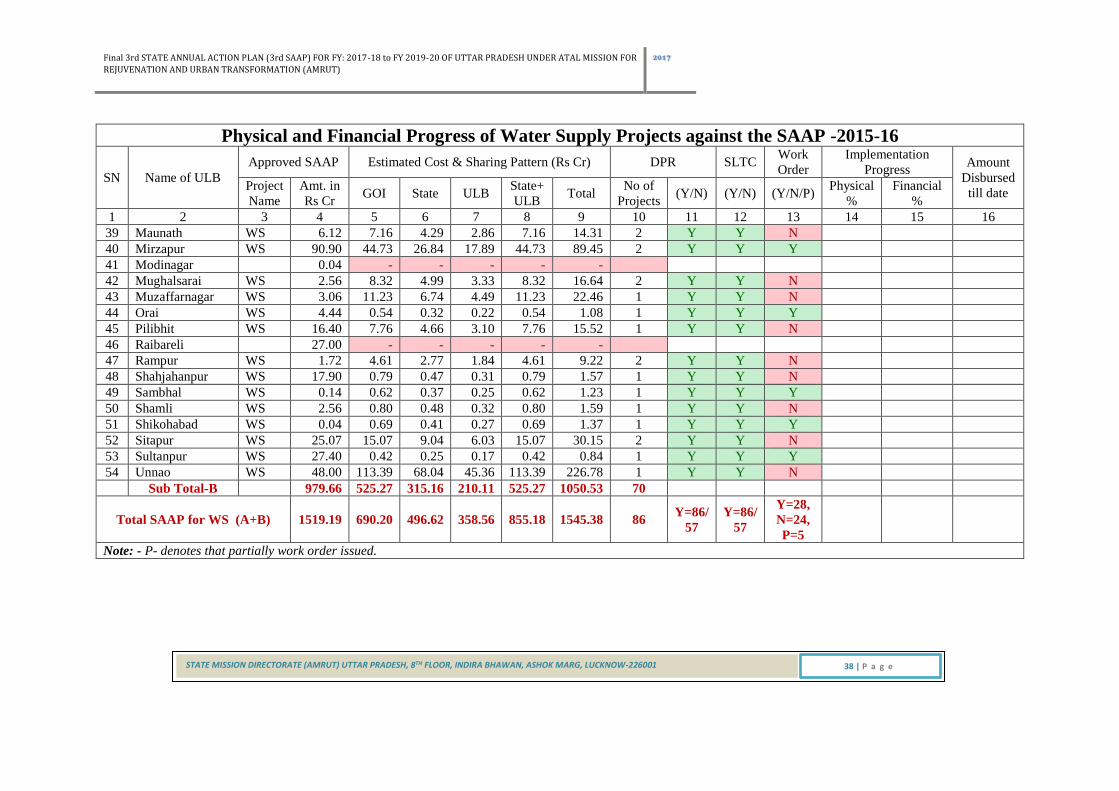
Physical and Financial Progress of Water Supply Projects against the SAAP -2015-16
SN Name of ULB
Approved SAAP Estimated Cost & Sharing Pattern (Rs Cr) DPR SLTC Work
Order
Implementation
Progress Amount
Disbursed
till date Project
Name
Amt. in
Rs Cr GOI State ULB
State+
ULB Total
No of
Projects (Y/N) (Y/N) (Y/N/P)
Physical
%
Financial
%
1 2 3 4 5 6 7 8 9 10 11 12 13 14 15 16
1 Agra WS 13.61 3.46 3.81 3.12 6.92 10.38 1 Y Y N
2 Allahabad WS 55.99 9.58 10.54 8.62 19.16 28.75 1 Y Y Y
3 Ghaziabad WS 45.37 19.69 21.66 17.72 39.39 59.08 2 Y Y P
4 Kanpur WS 134.99 43.17 47.49 38.85 86.35 129.51 3 Y Y P
5 Lucknow WS 139.99 27.86 30.66 25.08 55.74 83.60 4 Y Y P
6 Meerut WS 74.59 17.52 19.27 15.77 35.04 52.56 3 Y Y Y
7 Varanasi WS 74.99 43.65 48.02 39.29 87.31 130.96 2 Y Y N
Sub-Total-A 539.53 164.93 181.46 148.45 329.91 494.85 16
1 Aligarh WS 4.41 4.52 2.71 1.81 4.52 9.04 1 Y Y Y
2 Bareilly WS 16.88 7.84 4.70 3.13 7.84 15.67 1 Y Y N
3 Firozabad WS 0.60 - - - - -
4 Gorakhpur WS 38.00 5.22 3.13 2.09 5.22 10.43 2 Y Y Y
5 Jhansi WS 224.50 98.00 58.80 39.20 98.00 195.99 1 Y Y N
6 Moradabad WS 28.76 12.19 7.31 4.88 12.19 24.38 1 Y Y N
7 Saharanpur WS 26.86 13.06 7.84 5.22 13.06 26.12 1 Y Y N
8 Akbarpur WS 9.64 4.89 2.93 1.95 4.89 9.77 2 Y Y Y
9 Amroha WS 0.12 6.95 4.17 2.78 6.95 13.91 1 Y Y Y
10 Ayodhya - - - - - -
11 Azamgarh WS 4.37 2.94 1.76 1.18 2.94 5.88 2 Y Y N
12 Bahraich WS 42.36 33.45 20.07 13.38 33.45 66.90 2 Y Y Y

Final 3rd STATE ANNUAL ACTION PLAN (3rd SAAP) FOR FY: 2017-18 to FY 2019-20 OF UTTAR PRADESH UNDER ATAL MISSION FOR
REJUVENATION AND URBAN TRANSFORMATION (AMRUT)
2017
STATE MISSION DIRECTORATE (AMRUT) UTTAR PRADESH, 8TH FLOOR, INDIRA BHAWAN, ASHOK MARG, LUCKNOW-226001 37 | P a g e
Physical and Financial Progress of Water Supply Projects against the SAAP -2015-16
SN Name of ULB
Approved SAAP Estimated Cost & Sharing Pattern (Rs Cr) DPR SLTC Work
Order
Implementation
Progress Amount
Disbursed
till date Project
Name
Amt. in
Rs Cr GOI State ULB
State+
ULB Total
No of
Projects (Y/N) (Y/N) (Y/N/P)
Physical
%
Financial
%
1 2 3 4 5 6 7 8 9 10 11 12 13 14 15 16
13 Ballia WS 4.52 2.37 1.42 0.95 2.37 4.75 2 Y Y N
14 Banda WS 16.92 0.95 0.57 0.38 0.95 1.91 1 Y Y N
15 Baraut WS 1.52 2.34 1.41 0.94 2.34 4.69 2 Y Y P
16 Basti WS 8.44 3.02 1.81 1.21 3.02 6.03 1 Y Y N
17 Budaun WS 3.80 5.98 3.59 2.39 5.98 11.96 1 Y Y Y
18 Bulandshahar WS 5.56 3.12 1.87 1.25 3.12 6.24 2 Y Y P
19 Chandausi WS 4.50 0.22 0.13 0.09 0.22 0.45 1 Y Y Y
20 Deoria WS 4.72 3.37 2.02 1.35 3.37 6.75 1 Y Y Y
21 Etah WS 2.78 0.38 0.23 0.15 0.38 0.77 1 Y Y Y
22 Etawah WS - 8.48 5.09 3.39 8.48 16.97 1 Y Y N
23 Faizabad WS 4.68 2.13 1.28 0.85 2.13 4.27 1 Y Y Y
24 Farrukhabad WS 1.80 3.21 1.93 1.28 3.21 6.42 1 Y Y N
25 Fatehpur WS 1.00 6.25 3.75 2.50 6.25 12.50 1 Y Y N
26 Ghazipur WS 4.97 1.09 0.65 0.44 1.09 2.18 2 Y Y Y
27 Gonda WS 3.62 2.23 1.34 0.89 2.23 4.45 1 Y Y N
28 Hapur WS 20.50 10.62 6.37 4.25 10.62 21.25 2 Y Y Y
29 Hardoi WS 7.56 2.26 1.36 0.91 2.26 4.53 2 Y Y Y
30 Hathras WS 16.01 10.90 6.54 4.36 10.90 21.79 2 Y Y Y
31 Jaunpur WS 12.00 3.64 2.18 1.46 3.64 7.28 1 Y Y N
32 Kasganj WS 9.06 0.39 0.23 0.16 0.39 0.78 1 Y Y Y
33 Khurja WS 4.40 3.25 1.95 1.30 3.25 6.50 2 Y Y Y
34 Lakhimpur WS 27.60 14.77 8.86 5.91 14.77 29.53 2 Y Y Y
35 Lalitpur WS 16.00 8.36 5.01 3.34 8.36 16.71 2 Y Y Y
36 Loni WS 14.20 10.41 6.25 4.16 10.41 20.82 1 Y Y Y
37 Mainpuri WS 18.98 9.16 5.49 3.66 9.16 18.31 2 Y Y Y
38 Mathura WS 94.67 1.20 0.72 0.48 1.20 2.39 1 Y Y Y
Final 3rd STATE ANNUAL ACTION PLAN (3rd SAAP) FOR FY: 2017-18 to FY 2019-20 OF UTTAR PRADESH UNDER ATAL MISSION FOR
REJUVENATION AND URBAN TRANSFORMATION (AMRUT)
2017
STATE MISSION DIRECTORATE (AMRUT) UTTAR PRADESH, 8TH FLOOR, INDIRA BHAWAN, ASHOK MARG, LUCKNOW-226001 38 | P a g e
Physical and Financial Progress of Water Supply Projects against the SAAP -2015-16
SN Name of ULB
Approved SAAP Estimated Cost & Sharing Pattern (Rs Cr) DPR SLTC Work
Order
Implementation
Progress Amount
Disbursed
till date Project
Name
Amt. in
Rs Cr GOI State ULB
State+
ULB Total
No of
Projects (Y/N) (Y/N) (Y/N/P)
Physical
%
Financial
%
1 2 3 4 5 6 7 8 9 10 11 12 13 14 15 16
39 Maunath WS 6.12 7.16 4.29 2.86 7.16 14.31 2 Y Y N
40 Mirzapur WS 90.90 44.73 26.84 17.89 44.73 89.45 2 Y Y Y
41 Modinagar 0.04 - - - - -
42 Mughalsarai WS 2.56 8.32 4.99 3.33 8.32 16.64 2 Y Y N
43 Muzaffarnagar WS 3.06 11.23 6.74 4.49 11.23 22.46 1 Y Y N
44 Orai WS 4.44 0.54 0.32 0.22 0.54 1.08 1 Y Y Y
45 Pilibhit WS 16.40 7.76 4.66 3.10 7.76 15.52 1 Y Y N
46 Raibareli 27.00 - - - - -
47 Rampur WS 1.72 4.61 2.77 1.84 4.61 9.22 2 Y Y N
48 Shahjahanpur WS 17.90 0.79 0.47 0.31 0.79 1.57 1 Y Y N
49 Sambhal WS 0.14 0.62 0.37 0.25 0.62 1.23 1 Y Y Y
50 Shamli WS 2.56 0.80 0.48 0.32 0.80 1.59 1 Y Y N
51 Shikohabad WS 0.04 0.69 0.41 0.27 0.69 1.37 1 Y Y Y
52 Sitapur WS 25.07 15.07 9.04 6.03 15.07 30.15 2 Y Y N
53 Sultanpur WS 27.40 0.42 0.25 0.17 0.42 0.84 1 Y Y Y
54 Unnao WS 48.00 113.39 68.04 45.36 113.39 226.78 1 Y Y N
Sub Total-B 979.66 525.27 315.16 210.11 525.27 1050.53 70
Total SAAP for WS (A+B) 1519.19 690.20 496.62 358.56 855.18 1545.38 86 Y=86/
57
Y=86/
57
Y=28,
N=24,
P=5
Note: - P- denotes that partially work order issued.

Final 3rd STATE ANNUAL ACTION PLAN (3rd SAAP) FOR FY: 2017-18 to FY 2019-20 OF UTTAR PRADESH UNDER ATAL MISSION FOR
REJUVENATION AND URBAN TRANSFORMATION (AMRUT)
2017
STATE MISSION DIRECTORATE (AMRUT) UTTAR PRADESH, 8TH FLOOR, INDIRA BHAWAN, ASHOK MARG, LUCKNOW-226001 39 | P a g e
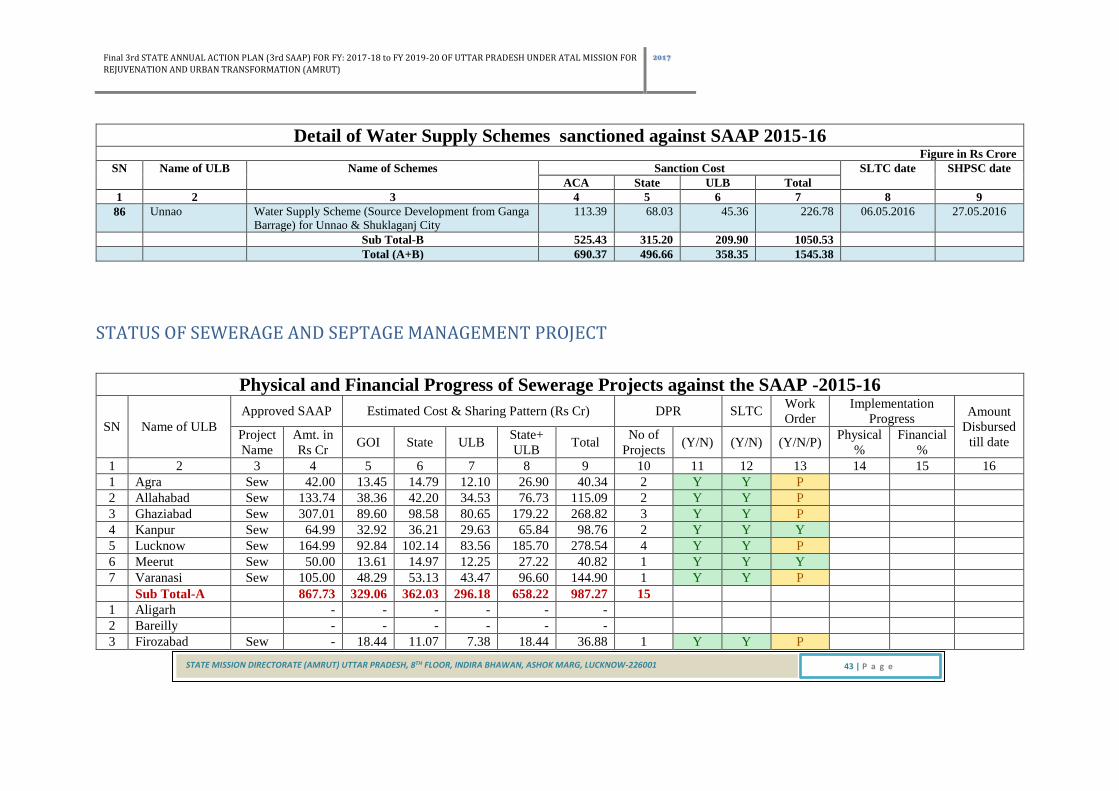
WATER SUPPLY SCHEMES SANCTIONED AGAINST SAAP FOR FY 2015-16
Detail of Water Supply Schemes sanctioned against SAAP 2015-16 Figure in Rs Crore
SN Name of ULB Name of Schemes Sanction Cost SLTC date SHPSC date
ACA State ULB Total
1 2 3 4 5 6 7 8 9
1 Agra Water House Connection, Agra City 3.46 3.81 3.12 10.39 06.05.2016 27.05.2016
2 Allahabad Water House Connection and Automation of 185 TWs &
44 Pumping Plants, Allahabad City
9.58 10.54 8.63 28.75 11.02.2016 30.03.2016
3 Ghaziabad Water House Connection, Ghaziabad City 8.61 9.47 7.75 25.83 11.02.2016 30.03.2016
4 Ghaziabad Water Supply Scheme for CHA Part 2, Ghaziabad 11.09 12.20 9.97 33.26 06.05.2016 27.05.2016
5 Kanpur Water Supply Reorganisation Scheme, East Service
District, Phase 3 Part 1, Kanpur City
16.69 18.36 15.02 50.07 01.08.2016 04.10.2016
6 Kanpur Water Supply Reorganisation Scheme, South Service
District, Phase 3 Part 2, Kanpur City
17.41 19.16 15.67 52.24 01.08.2016 04.10.2016
7 Kanpur Water Supply Reorganisation Scheme, City Service
District, Phase 2 Part 3A, Kanpur City
9.07 9.97 8.16 27.20 26.09.2016 04.10.2016
8 Lucknow Construction of Boundary Wall for protection of 5th
Water Works land, Lucknow City
1.07 1.18 0.96 3.21 06.05.2016 27.05.2016
9 Lucknow Water House Connection in District A, Lucknow City 9.27 10.20 8.34 27.81 06.05.2016 27.05.2016
10 Lucknow Water House Connection in District B, C, D Lucknow
City
12.53 13.78 11.27 37.58 06.05.2016 27.05.2016
11 Lucknow Construction of Boundary Wall, CCTV and Watch
Tower for protection of 3rd Water Works land, Lucknow
City
5.00 5.50 4.50 15.00 26.09.2016 04.10.2016
12 Meerut Water House Connection in 9 zones, Meerut City 4.46 4.91 4.02 13.39 11.02.2016 30.03.2016
13 Meerut Automation of 157 TWs & 9 Zonal Pumping Stations
(SCADA), Meerut City
7.56 8.32 6.81 22.69 11.02.2016 30.03.2016
14 Meerut Water Supply Reorganisation Scheme, Meerut City 5.49 6.04 4.95 16.48 26.09.2016 04.10.2016
15 Varanasi Water House Connection in 5 zones, Varanasi City 8.81 9.69 7.93 26.43 11.02.2016 30.03.2016
16 Varanasi Estimate for laying of new parallel feeder main by micro
tunneling method in CIS Varuna Area
34.84 38.33 31.36 104.53 01.08.2016 04.10.2016
Sub Total-A 164.94 181.46 148.46 494.86

Final 3rd STATE ANNUAL ACTION PLAN (3rd SAAP) FOR FY: 2017-18 to FY 2019-20 OF UTTAR PRADESH UNDER ATAL MISSION FOR
REJUVENATION AND URBAN TRANSFORMATION (AMRUT)
2017
STATE MISSION DIRECTORATE (AMRUT) UTTAR PRADESH, 8TH FLOOR, INDIRA BHAWAN, ASHOK MARG, LUCKNOW-226001 40 | P a g e
Detail of Water Supply Schemes sanctioned against SAAP 2015-16 Figure in Rs Crore
SN Name of ULB Name of Schemes Sanction Cost SLTC date SHPSC date
ACA State ULB Total
1 2 3 4 5 6 7 8 9
17 Aligarh Water House Connection, Aligarh City 4.52 2.71 1.81 9.04 06.05.2016 27.05.2016
18 Bareilly Water House Connection and Extension of pipe line,
Bareilly City
7.84 4.7 3.14 15.68 01.08.2016 04.10.2016
19 Gorakhpur Water House Connection, Gorakhpur City 1.4 0.84 0.55 2.79 06.05.2016 27.05.2016
20 Gorakhpur Automation of TWs (SCADA), Gorakhpur City 3.83 2.3 1.52 7.65 01.08.2016 04.10.2016
21 Jhansi Water Supply Reorganisation Scheme, Phase 1, Jhansi
City
98 58.8 39.19 195.99 06.05.2016 27.05.2016
22 Moradabad Water House Connection, Moradabad City 12.19 7.31 4.88 24.38 01.08.2016 04.10.2016
23 Saharanpur Water Supply Reorganisation Scheme, Part 1, Saharanpur
City
13.06 7.84 5.22 26.12 26.09.2016 04.10.2016
24 Akbarpur Water House Connection, Akbarpur City (Ambedkar
Nagar)
0.95 0.57 0.38 1.90 11.02.2016 30.03.2016
25 Akbarpur Water Supply Reorganisation Scheme, Akbarpur City 3.93 2.36 1.57 7.86 01.08.2016 04.10.2016
26 Amroha Water House Connection in 6 zones, Amroha City 6.96 4.17 2.78 13.91 11.02.2016 30.03.2016
27 Azamgarh Water House Connection, Azamgarh City 0.28 0.17 0.10 0.55 11.02.2016 30.03.2016
28 Azamgarh Water Supply Scheme in Belaisa & Hirapatti Area,
Azamgarh City
2.67 1.6 1.06 5.33 26.09.2016 04.10.2016
29 Bahraich Water House Connection, Baharaich City 0.41 0.25 0.16 0.82 06.05.2016 27.05.2016
30 Bahraich Water Supply Reorganisation Scheme, Baharaich City 33.04 19.82 13.21 66.07 26.09.2016 04.10.2016
31 Ballia Water House Connection, Ballia City 0.91 0.55 0.36 1.82 01.08.2016 04.10.2016
32 Ballia Automation of TWs, CWRs & OHTs (SCADA), Ballia
City
1.46 0.88 0.58 2.92 26.09.2016 04.10.2016
33 Banda Water House Connection, Banda City 0.96 0.57 0.38 1.91 01.08.2016 04.10.2016
34 Baraut Water House Connection & Extension of Pipe Line
(Ward 14, Zone 4), Baraut City
1.08 0.65 0.43 2.16 01.08.2016 04.10.2016
35 Baraut Automation of TWs (SCADA), Baraut City 1.27 0.76 0.50 2.53 01.08.2016 04.10.2016
36 Basti Water House Connection & Water meter installation,
Basti City
3.02 1.81 1.20 6.03 01.08.2016 04.10.2016
37 Budaun Water House Connection & Extension of Pipe Line,
Budaun City
5.98 3.59 2.39 11.96 06.05.2016 27.05.2016
38 Bulandshahar Water House Connection in 6 zones, Bulandshahar City 0.51 0.3 0.20 1.01 11.02.2016 30.03.2016

Final 3rd STATE ANNUAL ACTION PLAN (3rd SAAP) FOR FY: 2017-18 to FY 2019-20 OF UTTAR PRADESH UNDER ATAL MISSION FOR
REJUVENATION AND URBAN TRANSFORMATION (AMRUT)
2017
STATE MISSION DIRECTORATE (AMRUT) UTTAR PRADESH, 8TH FLOOR, INDIRA BHAWAN, ASHOK MARG, LUCKNOW-226001 41 | P a g e
Detail of Water Supply Schemes sanctioned against SAAP 2015-16 Figure in Rs Crore
SN Name of ULB Name of Schemes Sanction Cost SLTC date SHPSC date
ACA State ULB Total
1 2 3 4 5 6 7 8 9
39 Bulandshahar Automation of TWs (SCADA), Bulandshahar City 2.62 1.57 1.04 5.23 01.08.2016 04.10.2016
40 Chandausi Water House Connection, Chandausi City 0.23 0.14 0.08 0.45 11.02.2016 30.03.2016
41 Deoria Water House Connection, Deoria City 3.38 2.03 1.34 6.75 06.05.2016 27.05.2016
42 Etah Water House Connection, Etah City 0.39 0.23 0.15 0.77 06.05.2016 27.05.2016
43 Etawah Water House Connection, Etawah City 8.49 5.09 3.39 16.97 06.05.2016 27.05.2016
44 Faizabad Water House Connection, Faizabad City 2.14 1.28 0.85 4.27 11.02.2016 30.03.2016
45 Farrukhabad Water House Connection, Farrukhabad City 3.21 1.93 1.28 6.42 06.05.2016 27.05.2016
46 Fatehpur Water House Connection, Fatehpur City 6.25 3.75 2.50 12.50 26.09.2016 04.10.2016
47 Ghazipur Water House Connection, Ghazipur City 0.32 0.19 0.12 0.63 06.05.2016 27.05.2016
48 Ghazipur Extension of Distribution System & Water House
Connection, Ghazipur City
0.78 0.47 0.31 1.56 01.08.2016 04.10.2016
49 Gonda Extension of Distribution System, Water House
Connection & Automation Works, Gonda City
2.23 1.34 0.88 4.45 06.05.2016 27.05.2016
50 Hapur Water House Connection in 11 zones, Hapur City 7.2 4.32 2.88 14.40 11.02.2016 30.03.2016
51 Hapur Automation of TWs (SCADA), Hapur City 3.42 2.05 1.37 6.84 26.09.2016 04.10.2016
52 Hardoi Water House Connection, Hardoi City 0.4 0.24 0.15 0.79 06.05.2016 27.05.2016
53 Hardoi Water Supply Reorganisation Scheme, Zone 1, Hardoi
City
1.87 1.12 0.75 3.74 01.08.2016 04.10.2016
54 Hathras Water House Connection, Hathras City 0.63 0.38 0.24 1.25 06.05.2016 27.05.2016
55 Hathras Water Supply Reorganisation Scheme, Zone 1, Hathras
City
10.27 6.16 4.11 20.54 26.09.2016 04.10.2016
56 Jaunpur Water House Connection in Cis & Trans zones, Jaunpur
City
3.64 2.18 1.46 7.28 11.02.2016 30.03.2016
57 Kasganj Water House Connection, Kasganj City 0.39 0.23 0.16 0.78 06.05.2016 27.05.2016
58 Khurja Water House Connection, Khurja City 2.21 1.33 0.88 4.42 11.02.2016 30.03.2016
59 Khurja Automation of TWs (SCADA), Khurja City 1.04 0.62 0.42 2.08 01.08.2016 04.10.2016
60 Lakhimpur Water House Connection, Lakhimpur 0.35 0.21 0.13 0.69 06.05.2016 27.05.2016
61 Lakhimpur Water Supply Reorganisation Scheme, Part 1, Lakhimpur
City
14.42 8.65 5.77 28.84 01.08.2016 04.10.2016
62 Lalitpur Water House Connection, Lalitpur City 1.07 0.64 0.43 2.14 06.05.2016 27.05.2016

Final 3rd STATE ANNUAL ACTION PLAN (3rd SAAP) FOR FY: 2017-18 to FY 2019-20 OF UTTAR PRADESH UNDER ATAL MISSION FOR
REJUVENATION AND URBAN TRANSFORMATION (AMRUT)
2017
STATE MISSION DIRECTORATE (AMRUT) UTTAR PRADESH, 8TH FLOOR, INDIRA BHAWAN, ASHOK MARG, LUCKNOW-226001 42 | P a g e
Detail of Water Supply Schemes sanctioned against SAAP 2015-16 Figure in Rs Crore
SN Name of ULB Name of Schemes Sanction Cost SLTC date SHPSC date
ACA State ULB Total
1 2 3 4 5 6 7 8 9
63 Lalitpur Water Supply Scheme, Nehru Nagar Area, Phase 1,
Lalitpur City
7.29 4.37 2.91 14.57 26.09.2016 04.10.2016
64 Loni Water House Connection in 14 zones (45 wards), Loni
City
10.41 6.25 4.16 20.82 11.02.2016 30.03.2016
65 Mainpuri Water House Connection, Mainpuri City 0.63 0.38 0.25 1.26 06.05.2016 27.05.2016
66 Mainpuri Water Supply Reorganisation Scheme, Phase 1, Mainpuri
City
8.53 5.12 3.41 17.06 01.08.2016 04.10.2016
67 Mathura Water House Connection, Mathura City 1.2 0.72 0.47 2.39 06.05.2016 27.05.2016
68 Maunath Water House Connection, Maunath City 0.82 0.49 0.33 1.64 06.05.2016 27.05.2016
69 Maunath Water Supply Reorganisation Scheme, Maunath City 6.34 3.8 2.53 12.67 01.08.2016 04.10.2016
70 Mirzapur Water House Connection in 12 zones, Mirzapur City 3.21 1.92 1.28 6.41 11.02.2016 30.03.2016
71 Mirzapur Water Supply Reorganisation Scheme, Phase 1, Mirzapur
City
41.52 24.91 16.61 83.04 26.09.2016 04.10.2016
72 Mughalsarai Water House Connection, Mughalsarai City 0.5 0.3 0.20 1.00 06.05.2016 27.05.2016
73 Mughalsarai Water Supply Reorganisation Scheme, Phase 1,
Mughalsarai City
7.82 4.69 3.13 15.64 01.08.2016 04.10.2016
74 Muzaffarnagar Water Supply Reorganisation Scheme, Muzaffarnagar
City
11.23 6.74 4.49 22.46 06.05.2016 27.05.2016
75 Orai Water House Connection, Orai City 0.54 0.32 0.22 1.08 06.05.2016 27.05.2016
76 Pilibhit Water Supply Reorganisation Scheme, Zone 2, 4, 5,
Piliphit City
7.76 4.66 3.10 15.52 01.08.2016 04.10.2016
77 Rampur Extension of Distribution System, Rampur City 1.49 0.89 0.59 2.97 11.02.2016 30.03.2016
78 Rampur Automation of TWs & OHTs (SCADA), Rampur City 3.13 1.88 1.24 6.25 26.09.2016 04.10.2016
79 Shahjahanpur Water House Connection, Shahjahanpur City 0.79 0.47 0.31 1.57 01.08.2016 04.10.2016
80 Sambhal Water House Connection in 8 zones, Sambhal City 0.62 0.37 0.24 1.23 11.02.2016 30.03.2016
81 Shamli Water House Connection, Shamli City 0.8 0.48 0.31 1.59 01.08.2016 04.10.2016
82 Shikohabad Water House Connection in 10 zones, Shikohabad City 0.69 0.41 0.27 1.37 11.02.2016 30.03.2016
83 Sitapur Water House Connection, Sitapur City 0.57 0.34 0.22 1.13 06.05.2016 27.05.2016
84 Sitapur Water Supply Reorganisation Scheme, Phase 1, Sitapur
City
14.51 8.71 5.80 29.02 01.08.2016 04.10.2016
85 Sultanpur Water House Connection, Sultanpur City 0.42 0.25 0.17 0.84 11.02.2016 30.03.2016
Final 3rd STATE ANNUAL ACTION PLAN (3rd SAAP) FOR FY: 2017-18 to FY 2019-20 OF UTTAR PRADESH UNDER ATAL MISSION FOR
REJUVENATION AND URBAN TRANSFORMATION (AMRUT)
2017
STATE MISSION DIRECTORATE (AMRUT) UTTAR PRADESH, 8TH FLOOR, INDIRA BHAWAN, ASHOK MARG, LUCKNOW-226001 43 | P a g e
Detail of Water Supply Schemes sanctioned against SAAP 2015-16 Figure in Rs Crore
SN Name of ULB Name of Schemes Sanction Cost SLTC date SHPSC date
ACA State ULB Total
1 2 3 4 5 6 7 8 9
86 Unnao Water Supply Scheme (Source Development from Ganga
Barrage) for Unnao & Shuklaganj City
113.39 68.03 45.36 226.78 06.05.2016 27.05.2016
Sub Total-B 525.43 315.20 209.90 1050.53
Total (A+B) 690.37 496.66 358.35 1545.38
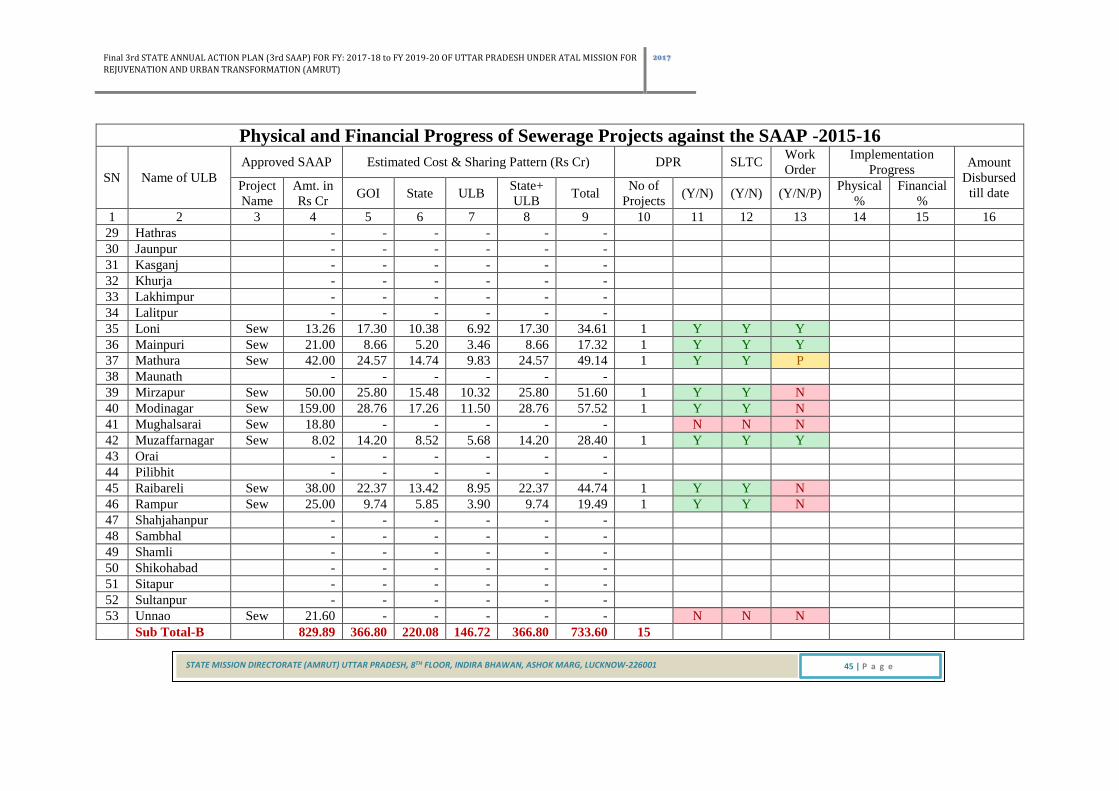
STATUS OF SEWERAGE AND SEPTAGE MANAGEMENT PROJECT
Physical and Financial Progress of Sewerage Projects against the SAAP -2015-16
SN Name of ULB
Approved SAAP Estimated Cost & Sharing Pattern (Rs Cr) DPR SLTC Work
Order
Implementation
Progress Amount
Disbursed
till date Project
Name
Amt. in
Rs Cr GOI State ULB
State+
ULB Total
No of
Projects (Y/N) (Y/N) (Y/N/P)
Physical
%
Financial
%
1 2 3 4 5 6 7 8 9 10 11 12 13 14 15 16
1 Agra Sew 42.00 13.45 14.79 12.10 26.90 40.34 2 Y Y P
2 Allahabad Sew 133.74 38.36 42.20 34.53 76.73 115.09 2 Y Y P
3 Ghaziabad Sew 307.01 89.60 98.58 80.65 179.22 268.82 3 Y Y P
4 Kanpur Sew 64.99 32.92 36.21 29.63 65.84 98.76 2 Y Y Y
5 Lucknow Sew 164.99 92.84 102.14 83.56 185.70 278.54 4 Y Y P
6 Meerut Sew 50.00 13.61 14.97 12.25 27.22 40.82 1 Y Y Y
7 Varanasi Sew 105.00 48.29 53.13 43.47 96.60 144.90 1 Y Y P
Sub Total-A 867.73 329.06 362.03 296.18 658.22 987.27 15
1 Aligarh - - - - - -
2 Bareilly - - - - - -
3 Firozabad Sew - 18.44 11.07 7.38 18.44 36.88 1 Y Y P

Final 3rd STATE ANNUAL ACTION PLAN (3rd SAAP) FOR FY: 2017-18 to FY 2019-20 OF UTTAR PRADESH UNDER ATAL MISSION FOR
REJUVENATION AND URBAN TRANSFORMATION (AMRUT)
2017
STATE MISSION DIRECTORATE (AMRUT) UTTAR PRADESH, 8TH FLOOR, INDIRA BHAWAN, ASHOK MARG, LUCKNOW-226001 44 | P a g e
Physical and Financial Progress of Sewerage Projects against the SAAP -2015-16
SN Name of ULB
Approved SAAP Estimated Cost & Sharing Pattern (Rs Cr) DPR SLTC Work
Order
Implementation
Progress Amount
Disbursed
till date Project
Name
Amt. in
Rs Cr GOI State ULB
State+
ULB Total
No of
Projects (Y/N) (Y/N) (Y/N/P)
Physical
%
Financial
%
1 2 3 4 5 6 7 8 9 10 11 12 13 14 15 16
4 Gorakhpur Sew 60.00 32.16 19.29 12.86 32.16 64.31 1 Y Y N
5 Jhansi - - - - - -
6 Moradabad Sew 80.00 63.65 38.19 25.46 63.65 127.29 1 Y Y Y
7 Saharanpur Sew 53.00 - - - - - N N N
8 Akbarpur - - - - - -
9 Amroha - - - - - -
10 Ayodhya - - -
10 Azamgarh Sew 40.80 8.07 4.84 3.23 8.07 16.14 1 Y Y N
11 Bahraich - - - - - -
12 Ballia Sew 14.86 17.83 10.70 7.13 17.83 35.66 1 Y Y N
13 Banda Sew 13.48 - - - - - N N N
14 Baraut - - - - - -
15 Basti - - - - - -
16 Budaun - - - - - -
17 Bulandshahar Sew 101.07 74.49 44.69 29.80 74.49 148.98 1 Y Y N
18 Chandausi - - - - - -
19 Deoria - - - - - -
20 Etah - - - - - -
21 Etawah - - - - - -
22 Faizabad - - - - - -
23 Farrukhabad - - - - - -
24 Fatehpur - - - - - -
25 Ghazipur Sew 70.00 - - - - - N N N
26 Gonda - - - - - -
27 Hapur Sew - 0.76 0.45 0.30 0.76 1.51 1 Y Y Y
28 Hardoi - - - - - -
Final 3rd STATE ANNUAL ACTION PLAN (3rd SAAP) FOR FY: 2017-18 to FY 2019-20 OF UTTAR PRADESH UNDER ATAL MISSION FOR
REJUVENATION AND URBAN TRANSFORMATION (AMRUT)
2017
STATE MISSION DIRECTORATE (AMRUT) UTTAR PRADESH, 8TH FLOOR, INDIRA BHAWAN, ASHOK MARG, LUCKNOW-226001 45 | P a g e
Physical and Financial Progress of Sewerage Projects against the SAAP -2015-16
SN Name of ULB
Approved SAAP Estimated Cost & Sharing Pattern (Rs Cr) DPR SLTC Work
Order
Implementation
Progress Amount
Disbursed
till date Project
Name
Amt. in
Rs Cr GOI State ULB
State+
ULB Total
No of
Projects (Y/N) (Y/N) (Y/N/P)
Physical
%
Financial
%
1 2 3 4 5 6 7 8 9 10 11 12 13 14 15 16
29 Hathras - - - - - -
30 Jaunpur - - - - - -
31 Kasganj - - - - - -
32 Khurja - - - - - -
33 Lakhimpur - - - - - -
34 Lalitpur - - - - - -
35 Loni Sew 13.26 17.30 10.38 6.92 17.30 34.61 1 Y Y Y
36 Mainpuri Sew 21.00 8.66 5.20 3.46 8.66 17.32 1 Y Y Y
37 Mathura Sew 42.00 24.57 14.74 9.83 24.57 49.14 1 Y Y P
38 Maunath - - - - - -
39 Mirzapur Sew 50.00 25.80 15.48 10.32 25.80 51.60 1 Y Y N
40 Modinagar Sew 159.00 28.76 17.26 11.50 28.76 57.52 1 Y Y N
41 Mughalsarai Sew 18.80 - - - - - N N N
42 Muzaffarnagar Sew 8.02 14.20 8.52 5.68 14.20 28.40 1 Y Y Y
43 Orai - - - - - -
44 Pilibhit - - - - - -
45 Raibareli Sew 38.00 22.37 13.42 8.95 22.37 44.74 1 Y Y N
46 Rampur Sew 25.00 9.74 5.85 3.90 9.74 19.49 1 Y Y N
47 Shahjahanpur - - - - - -
48 Sambhal - - - - - -
49 Shamli - - - - - -
50 Shikohabad - - - - - -
51 Sitapur - - - - - -
52 Sultanpur - - - - - -
53 Unnao Sew 21.60 - - - - - N N N
Sub Total-B 829.89 366.80 220.08 146.72 366.80 733.60 15

Final 3rd STATE ANNUAL ACTION PLAN (3rd SAAP) FOR FY: 2017-18 to FY 2019-20 OF UTTAR PRADESH UNDER ATAL MISSION FOR
REJUVENATION AND URBAN TRANSFORMATION (AMRUT)
2017
STATE MISSION DIRECTORATE (AMRUT) UTTAR PRADESH, 8TH FLOOR, INDIRA BHAWAN, ASHOK MARG, LUCKNOW-226001 46 | P a g e
Physical and Financial Progress of Sewerage Projects against the SAAP -2015-16
SN Name of ULB
Approved SAAP Estimated Cost & Sharing Pattern (Rs Cr) DPR SLTC Work
Order
Implementation
Progress Amount
Disbursed
till date Project
Name
Amt. in
Rs Cr GOI State ULB
State+
ULB Total
No of
Projects (Y/N) (Y/N) (Y/N/P)
Physical
%
Financial
%
1 2 3 4 5 6 7 8 9 10 11 12 13 14 15 16
Total: (A+B) 1697.62 695.86 582.11 442.90 1025.02 1720.88 30
Y=30/
22,
N=5
Y=30/
22,
N=5
Y=7,
N=13,
P=7
Note: - P- denotes that partially work order issued.
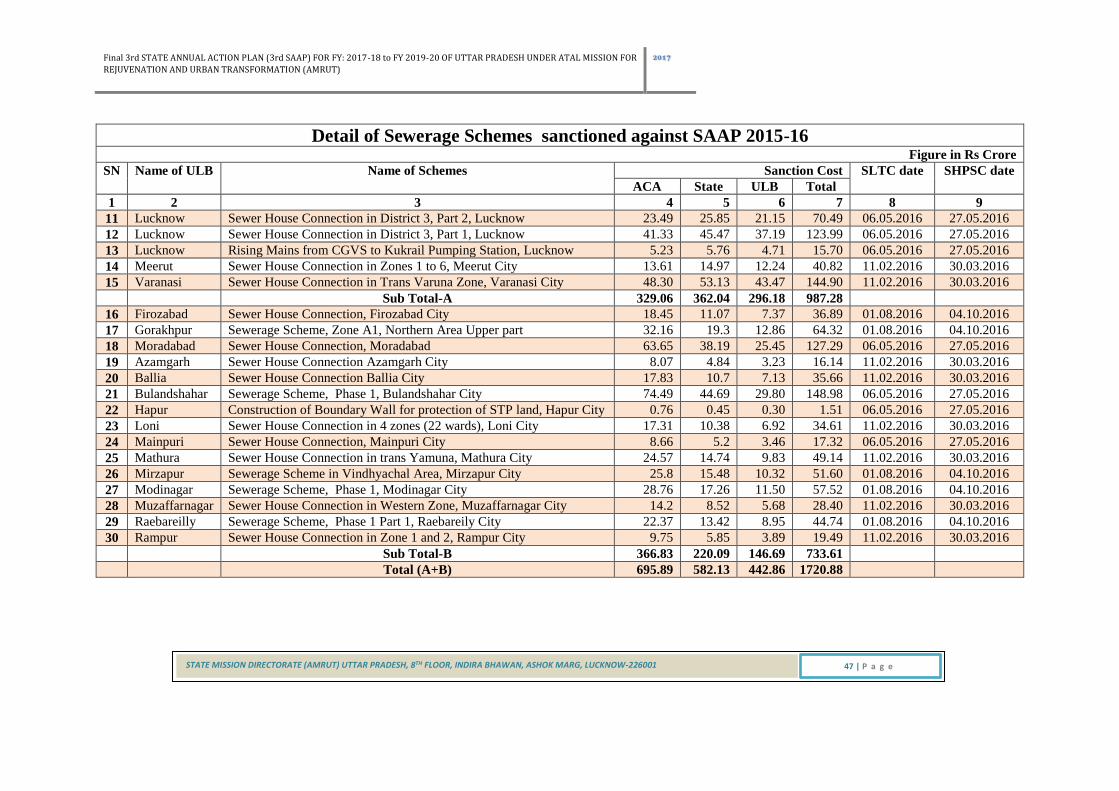
SEWERAGE SCHEMES SANCTIONED AGAINST SAAP FOR FY 2015-16
Detail of Sewerage Schemes sanctioned against SAAP 2015-16 Figure in Rs Crore
SN Name of ULB Name of Schemes Sanction Cost SLTC date SHPSC date
ACA State ULB Total
1 2 3 4 5 6 7 8 9
1 Agra Sewer House Connection, Agra City, Part 1 8.71 9.58 7.84 26.13 06.05.2016 27.05.2016
2 Agra Sewer House Connection, Agra City, Part 2 4.74 5.21 4.27 14.22 01.08.2016 04.10.2016
3 Allahabad Sewer House Connection in District D, Allahabad City 27.25 29.99 24.53 81.77 11.02.2016 30.03.2016
4 Allahabad Sewerage Scheme District F (Phaphamau), Allahabad Ph-1 11.11 12.22 10.00 33.33 26.09.2016 04.10.2016
5 Ghaziabad Sewer House Connection, Ghaziabad City 9.47 10.42 8.52 28.41 11.02.2016 30.03.2016
6 Ghaziabad Rehabilitation of Dudahera Sewer, Ghaziabad 35.57 39.14 32.02 106.73 11.02.2016 30.03.2016
7 Ghaziabad Sewerage Scheme, Ghaziabad 44.56 49.02 40.10 133.68 26.09.2016 04.10.2016
8 Kanpur Sewer House Connection in 4 wards of Kanpur City 9.86 10.85 8.88 29.59 11.02.2016 30.03.2016
9 Kanpur Extension of Sewer Network District 4, Kanpur 23.05 25.36 20.75 69.16 01.08.2016 04.10.2016
10 Lucknow Sewer House Connection in Zone 6 District 1, Lucknow 22.78 25.07 20.51 68.36 11.02.2016 30.03.2016
Final 3rd STATE ANNUAL ACTION PLAN (3rd SAAP) FOR FY: 2017-18 to FY 2019-20 OF UTTAR PRADESH UNDER ATAL MISSION FOR
REJUVENATION AND URBAN TRANSFORMATION (AMRUT)
2017
STATE MISSION DIRECTORATE (AMRUT) UTTAR PRADESH, 8TH FLOOR, INDIRA BHAWAN, ASHOK MARG, LUCKNOW-226001 47 | P a g e
Detail of Sewerage Schemes sanctioned against SAAP 2015-16 Figure in Rs Crore
SN Name of ULB Name of Schemes Sanction Cost SLTC date SHPSC date
ACA State ULB Total
1 2 3 4 5 6 7 8 9
11 Lucknow Sewer House Connection in District 3, Part 2, Lucknow 23.49 25.85 21.15 70.49 06.05.2016 27.05.2016
12 Lucknow Sewer House Connection in District 3, Part 1, Lucknow 41.33 45.47 37.19 123.99 06.05.2016 27.05.2016
13 Lucknow Rising Mains from CGVS to Kukrail Pumping Station, Lucknow 5.23 5.76 4.71 15.70 06.05.2016 27.05.2016
14 Meerut Sewer House Connection in Zones 1 to 6, Meerut City 13.61 14.97 12.24 40.82 11.02.2016 30.03.2016
15 Varanasi Sewer House Connection in Trans Varuna Zone, Varanasi City 48.30 53.13 43.47 144.90 11.02.2016 30.03.2016
Sub Total-A 329.06 362.04 296.18 987.28
16 Firozabad Sewer House Connection, Firozabad City 18.45 11.07 7.37 36.89 01.08.2016 04.10.2016
17 Gorakhpur Sewerage Scheme, Zone A1, Northern Area Upper part 32.16 19.3 12.86 64.32 01.08.2016 04.10.2016
18 Moradabad Sewer House Connection, Moradabad 63.65 38.19 25.45 127.29 06.05.2016 27.05.2016
19 Azamgarh Sewer House Connection Azamgarh City 8.07 4.84 3.23 16.14 11.02.2016 30.03.2016
20 Ballia Sewer House Connection Ballia City 17.83 10.7 7.13 35.66 11.02.2016 30.03.2016
21 Bulandshahar Sewerage Scheme, Phase 1, Bulandshahar City 74.49 44.69 29.80 148.98 06.05.2016 27.05.2016
22 Hapur Construction of Boundary Wall for protection of STP land, Hapur City 0.76 0.45 0.30 1.51 06.05.2016 27.05.2016
23 Loni Sewer House Connection in 4 zones (22 wards), Loni City 17.31 10.38 6.92 34.61 11.02.2016 30.03.2016
24 Mainpuri Sewer House Connection, Mainpuri City 8.66 5.2 3.46 17.32 06.05.2016 27.05.2016
25 Mathura Sewer House Connection in trans Yamuna, Mathura City 24.57 14.74 9.83 49.14 11.02.2016 30.03.2016
26 Mirzapur Sewerage Scheme in Vindhyachal Area, Mirzapur City 25.8 15.48 10.32 51.60 01.08.2016 04.10.2016
27 Modinagar Sewerage Scheme, Phase 1, Modinagar City 28.76 17.26 11.50 57.52 01.08.2016 04.10.2016
28 Muzaffarnagar Sewer House Connection in Western Zone, Muzaffarnagar City 14.2 8.52 5.68 28.40 11.02.2016 30.03.2016
29 Raebareilly Sewerage Scheme, Phase 1 Part 1, Raebareily City 22.37 13.42 8.95 44.74 01.08.2016 04.10.2016
30 Rampur Sewer House Connection in Zone 1 and 2, Rampur City 9.75 5.85 3.89 19.49 11.02.2016 30.03.2016
Sub Total-B 366.83 220.09 146.69 733.61
Total (A+B) 695.89 582.13 442.86 1720.88

Final 3rd STATE ANNUAL ACTION PLAN (3rd SAAP) FOR FY: 2017-18 to FY 2019-20 OF UTTAR PRADESH UNDER ATAL MISSION FOR
REJUVENATION AND URBAN TRANSFORMATION (AMRUT)
2017
STATE MISSION DIRECTORATE (AMRUT) UTTAR PRADESH, 8TH FLOOR, INDIRA BHAWAN, ASHOK MARG, LUCKNOW-226001 48 | P a g e
STATUS OF PARKS AND GREEN SPACES PROJECT
Physical and Financial Progress of Parks and Green Spaces Projects against the SAAP -2015-16 SN Name ULB Approved SAAP Estimated Cost & Sharing Pattern (Rs Cr) DPR SLTC Tender
Approved
Work
Order
Implementation
Progress
No of Parks
Project Name SAAP Amt. in
Rs Cr
DPR Amount
GOI State ULB State+ ULB
Total (Y/N) (Y/N) (Y/N) (Y/N) Physical %
Financial %
1 2 3 4 5 6 7 8 9 10 11 12 13 14 15 16 17
1 Agra
1 Bakeshwar Park
1.8077 1.8102 0.9051 0.5431 0.3620 0.9051 1.8102 Y Y Y N 2 Surya Vatika
3 Ramleela Park
2 Allahabad
4 Bharadwaj Park
3.6040 3.6040 1.8020 1.0812 0.7208 1.8020 3.6040 Y Y N N 5 Phaptamau Park
6 Pritam Nagar 8
3 Ghaziabad
7 Karkar Modal Bada
2.3293 2.3291 1.1646 0.6987 0.4658 1.1645 2.3291 Y Y N N 8 Rajendra Nagar
9 Janakpuri Vrinda
10 Kavi Nagar Park
4 Kanpur
11 Mahabalipuram
6.5700 6.5689 3.2845 1.9707 1.3137 3.2844 6.5689 Y Y N N 12 Dayanand Vihar
13 Indira Park
14 Satyam Vihar
5 Lucknow
15 Viram Khand Z-5
2.1009 2.0860 1.0430 0.6258 0.4172 1.0430 2.0860 Y Y N N 16 South City Park Z-5 G
- 120
17 LD - 54, Z-5, Ward 1
6 Meerut
18 Mangal Pandey Park
3.1580 3.1549 1.5775 0.9465 0.6309 1.5774 3.1549 Y Y N N 19 Jagriti Vihar Park
20 Samudayik Park
7 Varanasi
21 Nati Imli Park
1.2500 1.1113 0.5557 0.3334 0.2222 0.5556 1.1113 Y Y N N 22 Ratnakar Park
23 Chandrika Nagar
24 Tilamandeshwar Park
Sub Total- A 20.8199 20.6644 10.3324 6.1994 4.1326 10.3320 20.6644
8 Aligarh 25 Awas Vikas Ward No.
19 1.3390 1.4437 0.7219 0.4331 0.2887 0.7218 1.4437 Y Y N N

Final 3rd STATE ANNUAL ACTION PLAN (3rd SAAP) FOR FY: 2017-18 to FY 2019-20 OF UTTAR PRADESH UNDER ATAL MISSION FOR
REJUVENATION AND URBAN TRANSFORMATION (AMRUT)
2017
STATE MISSION DIRECTORATE (AMRUT) UTTAR PRADESH, 8TH FLOOR, INDIRA BHAWAN, ASHOK MARG, LUCKNOW-226001 49 | P a g e
Physical and Financial Progress of Parks and Green Spaces Projects against the SAAP -2015-16 SN Name ULB Approved SAAP Estimated Cost & Sharing Pattern (Rs Cr) DPR SLTC Tender
Approved
Work
Order
Implementation
Progress
No of
Parks
Project Name SAAP
Amt. in
Rs Cr
DPR
Amount
GOI State ULB State+
ULB
Total (Y/N) (Y/N) (Y/N) (Y/N) Physical
%
Financial
%
1 2 3 4 5 6 7 8 9 10 11 12 13 14 15 16 17
26 Awas Vikas Ward No.
19
9 Bareilly
27 C I Park
3.8875 3.8874 1.9437 1.1662 0.7775 1.9437 3.8874 Y Y Y N 28 Gandhi Udyan Park
29 Akshar Vihar
10 Firozabad
30 Vibhav Nagar
0.5960 0.5894 0.2947 0.1768 0.1179 0.2947 0.5894 Y Y N N 31 Ganesh Nagar
32 Suhag Nagar
11 Gorakhpur
33 Bank colony
5.3364 5.3363 2.6682 1.6009 1.0672 2.6681 5.3363 Y Y N N 34 Ladiggi Park
35 Rapti Park
12 Jhansi
36 Ward 24 Lahar Grid
7.3000 7.8016 3.9008 2.3405 1.5603 3.9008 7.8016 Y Y N N 37 Gariya Gaon Park
38 Vrindalal Verma
13 Moradabad
39 Madhubani
4.9100 4.8260 2.4130 1.4478 0.9652 2.4130 4.8260 Y Y N N 40 Gautam Buddha
41 Company Bag
42 Shiv Park
14 Saharanpur
43 Hakikat Nagar
0.4293 0.5508 0.2754 0.1652 0.1102 0.2754 0.5508 Y Y N N 44 Chandra Nagar Park
45 Pant Vihar
15 Akbarpur 46 Shiv Baba Park 0.4069 0.4066 0.2033 0.1220 0.0813 0.2033 0.4066 Y Y N N
16 Amroha 47 Awas Vikas Khalsa 0.3845 0.3466 0.1733 0.1040 0.0693 0.1733 0.3466 Y Y N N
17 Ayodhya
48 Kashiram Colony Park
1.3106 0.6553 0.3932 0.2621 0.6553 1.3106 Y Y N N 49 Kashiram Colony Park
II
50 Rajdwar park
18 Azamgarh 51 Old Jail Road Park 3.5780 3.7052 1.8526 1.1116 0.7410 1.8526 3.7052 Y Y N N
19 Bahraich 52 Ghanta Ghar Park 0.4595 0.4400 0.2200 0.1320 0.0880 0.2200 0.4400 Y Y N N
20 Ballia 53 Awas Vikas 1 0.3866 0.3865 0.1933 0.1160 0.0772 0.1932 0.3865 Y Y N N
21 Banda 54 Awasthi Park 0.5569 0.5514 0.2757 0.1654 0.1103 0.2757 0.5514 Y Y N N
22 Baraut 55 Shiv Park 0.3195 0.3194 0.1597 0.0958 0.0639 0.1597 0.3194 Y Y N N
23 Basti 56 TV Tower Park 0.4187 0.4100 0.2050 0.1230 0.0820 0.2050 0.4100 Y Y N N

Final 3rd STATE ANNUAL ACTION PLAN (3rd SAAP) FOR FY: 2017-18 to FY 2019-20 OF UTTAR PRADESH UNDER ATAL MISSION FOR
REJUVENATION AND URBAN TRANSFORMATION (AMRUT)
2017
STATE MISSION DIRECTORATE (AMRUT) UTTAR PRADESH, 8TH FLOOR, INDIRA BHAWAN, ASHOK MARG, LUCKNOW-226001 50 | P a g e
Physical and Financial Progress of Parks and Green Spaces Projects against the SAAP -2015-16 SN Name ULB Approved SAAP Estimated Cost & Sharing Pattern (Rs Cr) DPR SLTC Tender
Approved
Work
Order
Implementation
Progress
No of
Parks
Project Name SAAP
Amt. in
Rs Cr
DPR
Amount
GOI State ULB State+
ULB
Total (Y/N) (Y/N) (Y/N) (Y/N) Physical
%
Financial
%
1 2 3 4 5 6 7 8 9 10 11 12 13 14 15 16 17
24 Budaun 57 Gandhi Nagar Park 0.4480 0.4328 0.2164 0.1298 0.0866 0.2164 0.4328 Y Y N N
25 Bulandshahar 58 Mahatama Gandhi
Park 0.4513 0.3458 0.1729 0.1037 0.0692 0.1729 0.3458 Y Y N N
26 Chandausi 59 Punjabi Colony Park 0.3100 0.3716 0.1858 0.1115 0.0743 0.1858 0.3716 Y Y N N
27 Deoria 60 Chotta Park 1.3420 1.3420 0.6710 0.4026 0.2684 0.6710 1.3420 Y Y N N
28 Etah 61 Awas Vikas No. 1
1.2446 1.2516 0.6258 0.3755 0.2503 0.6258 1.2516 Y Y N N 62 Sunehri Nagar Park
29 Etawah 63 Kandhi Ram Colony
Park 0.1700 0.1718 0.0859 0.0515 0.0344 0.0859 0.1718 Y Y N N
30 Faizabad 64 Angori Bhag 0.3229 0.3288 0.1644 0.0986 0.0658 0.1644 0.3288 Y Y N N
31 Farrukhabad 65 Awas Vikas Lohia
Nagar 0.3845 0.2984 0.1492 0.0895 0.0597 0.1492 0.2984 Y Y N N
32 Fatehpur 66 Hikmatulah Park 0.4050 0.4050 0.2025 0.1215 0.0810 0.2025 0.4050 Y Y N N
33 Ghazipur 67 Dr Rajendra Nagar Park
0.2750 0.3350 0.1675 0.1005 0.0670 0.1675 0.3350 Y Y N N
34 Gonda 68 Awas Vikas Bharat
Puri 0.5047 0.2775 0.1388 0.0833 0.0554 0.1387 0.2775 Y Y N N
35 Hapur 69 Sanjay Vihar 0.7020 0.6697 0.3349 0.2009 0.1339 0.3348 0.6697 Y Y N N
36 Hardoi
70 Koyal Bagh Colony
0.4260 0.2130 0.1278 0.0852 0.2130 0.4260 Y Y N N 71
Awas Vikas Colony (
A Block)
37 Hathras 72 Water Works 0.6946 0.6806 0.3403 0.2042 0.1361 0.3403 0.6806 Y Y N N
38 Jaunpur 73 Bhagat Singh Park 0.2814 0.2853 0.1427 0.0856 0.0570 0.1426 0.2853 Y Y N N
39 Kasganj 74 Sector 2, Awas Vikas 0.3195 0.3130 0.1565 0.0939 0.0626 0.1565 0.3130 Y Y N N
40 Khurja 75 Tilak Park Jewar Stand 0.1976 0.1024 0.0512 0.0307 0.0205 0.0512 0.1024 Y Y N N
41 Lakhimpur 76 Awas Vikas 1 0.5623 0.5622 0.2811 0.1687 0.1124 0.2811 0.5622 Y Y Y N
42 Lalitpur 77 Kashi Ram Awas
Ward 10 0.2398 0.2396 0.1198 0.0719 0.0479 0.1198 0.2396 Y Y Y N
43 Loni 78 B-Block, Lal Bagh 0.2619 0.2617 0.1309 0.0785 0.0523 0.1308 0.2617 Y Y N N
44 Mainpuri 79 Nagla Pajawa 0.4395 0.4389 0.2195 0.1317 0.0877 0.2194 0.4389 Y Y N N
45 Mathura 80 Bhagat Singh Park 0.5180 0.5180 0.2590 0.1554 0.1036 0.2590 0.5180 Y Y Y N
46 Mau 81 Rashtriya Alankrit
Udyan 1.6326 1.6650 0.8325 0.4995 0.3330 0.8325 1.6650 Y Y N N

Final 3rd STATE ANNUAL ACTION PLAN (3rd SAAP) FOR FY: 2017-18 to FY 2019-20 OF UTTAR PRADESH UNDER ATAL MISSION FOR
REJUVENATION AND URBAN TRANSFORMATION (AMRUT)
2017
STATE MISSION DIRECTORATE (AMRUT) UTTAR PRADESH, 8TH FLOOR, INDIRA BHAWAN, ASHOK MARG, LUCKNOW-226001 51 | P a g e
Physical and Financial Progress of Parks and Green Spaces Projects against the SAAP -2015-16 SN Name ULB Approved SAAP Estimated Cost & Sharing Pattern (Rs Cr) DPR SLTC Tender
Approved
Work
Order
Implementation
Progress
No of
Parks
Project Name SAAP
Amt. in
Rs Cr
DPR
Amount
GOI State ULB State+
ULB
Total (Y/N) (Y/N) (Y/N) (Y/N) Physical
%
Financial
%
1 2 3 4 5 6 7 8 9 10 11 12 13 14 15 16 17
47 Mirzapur 82 Rajkiya Gandhi Udyan 0.3860 0.3860 0.1930 0.1158 0.0772 0.1930 0.3860 Y Y N N
48 Modinagar 83 Saheed Jai Prakash 0.3689 0.3764 0.1882 0.1129 0.0753 0.1882 0.3764 Y Y N N
49 Mughalsarai
50 Muzaffarnagar 84 Kamla Nehru Vatika 1.1200 1.0200 0.5100 0.3060 0.2040 0.5100 1.0200 Y Y N N
51 Orai 85 Udisha Park 0.2623 0.2621 0.1311 0.0786 0.0524 0.1310 0.2621 Y Y Y N
52 Pilibhit 86 Nehru Udyan Zone 3 0.1600 0.1604 0.0802 0.0481 0.0321 0.0802 0.1604 Y Y N N
53 Raebareli 87 Malik Mohd Jaisiy
Park 0.2900 0.2900 0.1450 0.0870 0.0580 0.1450 0.2900 Y Y N N
54 Rampur 88 Mumtaz Park 0.2190 0.2190 0.1095 0.0657 0.0438 0.1095 0.2190 Y Y N N
55 Shahjahanpur 89 Shaheed Ramesh Park 0.4063 0.3369 0.1685 0.1011 0.0673 0.1684 0.3369 Y Y N N
56 Sambhal 90 Khel Ka Maidan Park 0.5270 0.5270 0.2635 0.1581 0.1054 0.2635 0.5270 Y Y N N
57 Shamli 91 Community Park SP
Office 0.0590 0.0590 0.0295 0.0177 0.0118 0.0295 0.0590 Y Y N N
58 Shikohabad 92 Awas Vikas Colony 0.2083 0.2121 0.1061 0.0636 0.0424 0.1060 0.2121 Y Y N N
59 Sitapur 93 Sarojini Vatika Park 2.0267 1.7973 0.8987 0.5392 0.3594 0.8986 1.7973 Y Y N N
60 Sultanpur 94 Paryawaran Park Ward
No 21 1.2700 1.2700 0.6350 0.3810 0.2540 0.6350 1.2700 Y Y N N
61 Unnao 95 Panna Lal Park 0.3200 0.3190 0.1595 0.0957 0.0638 0.1595 0.3190 Y Y N N
Sub Total- B 49.6395 51.2694 25.6353 15.3808 10.2533 25.6341 51.2694
Grand Total (A+B) 70.4594 71.9338 35.9677 21.5802 14.3859 35.9661 71.9338 Y=95 Y=95 Y=6
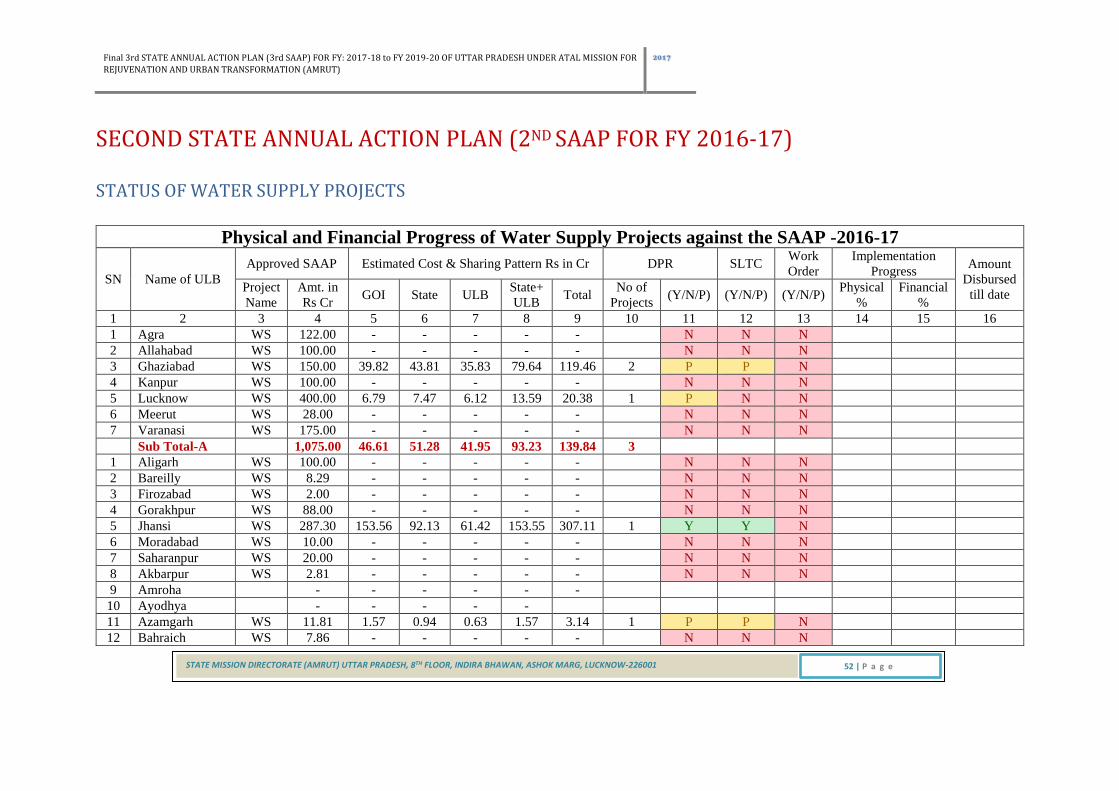
Final 3rd STATE ANNUAL ACTION PLAN (3rd SAAP) FOR FY: 2017-18 to FY 2019-20 OF UTTAR PRADESH UNDER ATAL MISSION FOR
REJUVENATION AND URBAN TRANSFORMATION (AMRUT)
2017
STATE MISSION DIRECTORATE (AMRUT) UTTAR PRADESH, 8TH FLOOR, INDIRA BHAWAN, ASHOK MARG, LUCKNOW-226001 52 | P a g e
SECOND STATE ANNUAL ACTION PLAN (2ND SAAP FOR FY 2016-17)
STATUS OF WATER SUPPLY PROJECTS
Physical and Financial Progress of Water Supply Projects against the SAAP -2016-17
SN Name of ULB
Approved SAAP Estimated Cost & Sharing Pattern Rs in Cr DPR SLTC Work
Order
Implementation
Progress Amount
Disbursed
till date Project
Name
Amt. in
Rs Cr GOI State ULB
State+
ULB Total
No of
Projects (Y/N/P) (Y/N/P) (Y/N/P)
Physical
%
Financial
%
1 2 3 4 5 6 7 8 9 10 11 12 13 14 15 16
1 Agra WS 122.00 - - - - - N N N
2 Allahabad WS 100.00 - - - - - N N N
3 Ghaziabad WS 150.00 39.82 43.81 35.83 79.64 119.46 2 P P N
4 Kanpur WS 100.00 - - - - - N N N
5 Lucknow WS 400.00 6.79 7.47 6.12 13.59 20.38 1 P N N
6 Meerut WS 28.00 - - - - - N N N
7 Varanasi WS 175.00 - - - - - N N N
Sub Total-A 1,075.00 46.61 51.28 41.95 93.23 139.84 3
1 Aligarh WS 100.00 - - - - - N N N
2 Bareilly WS 8.29 - - - - - N N N
3 Firozabad WS 2.00 - - - - - N N N
4 Gorakhpur WS 88.00 - - - - - N N N
5 Jhansi WS 287.30 153.56 92.13 61.42 153.55 307.11 1 Y Y N
6 Moradabad WS 10.00 - - - - - N N N
7 Saharanpur WS 20.00 - - - - - N N N
8 Akbarpur WS 2.81 - - - - - N N N
9 Amroha - - - - - -
10 Ayodhya - - - - -
11 Azamgarh WS 11.81 1.57 0.94 0.63 1.57 3.14 1 P P N
12 Bahraich WS 7.86 - - - - - N N N
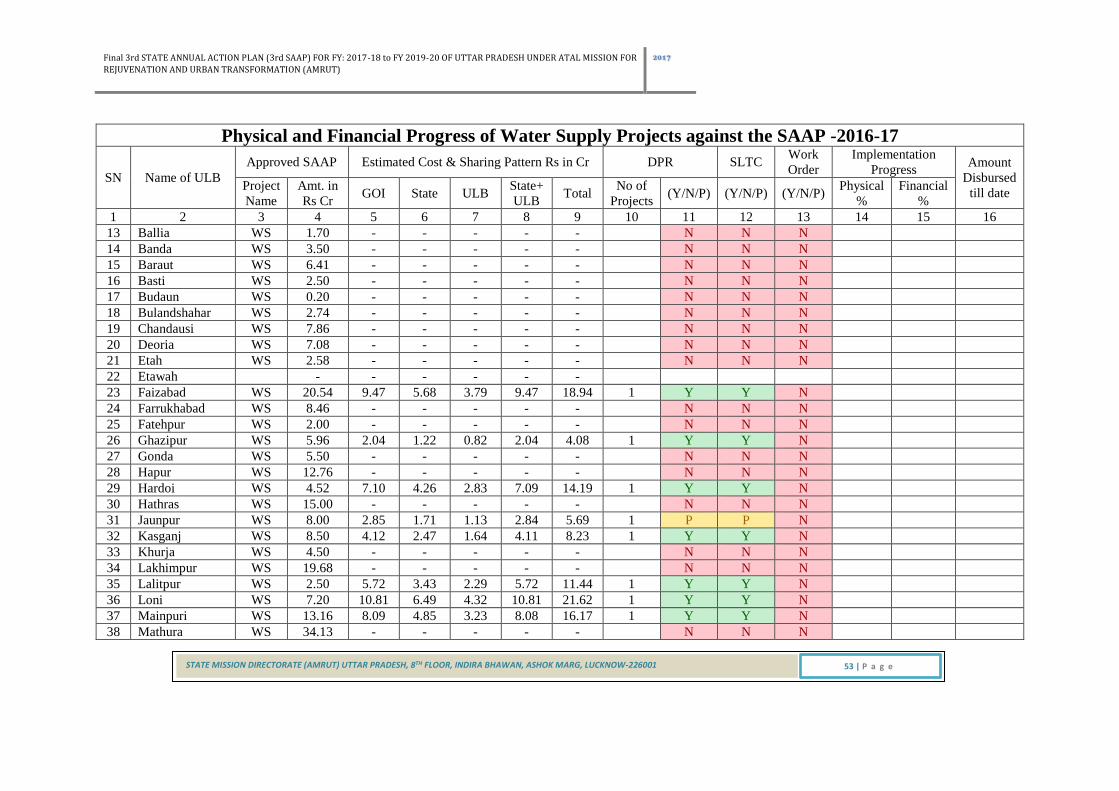
Final 3rd STATE ANNUAL ACTION PLAN (3rd SAAP) FOR FY: 2017-18 to FY 2019-20 OF UTTAR PRADESH UNDER ATAL MISSION FOR
REJUVENATION AND URBAN TRANSFORMATION (AMRUT)
2017
STATE MISSION DIRECTORATE (AMRUT) UTTAR PRADESH, 8TH FLOOR, INDIRA BHAWAN, ASHOK MARG, LUCKNOW-226001 53 | P a g e
Physical and Financial Progress of Water Supply Projects against the SAAP -2016-17
SN Name of ULB
Approved SAAP Estimated Cost & Sharing Pattern Rs in Cr DPR SLTC Work
Order
Implementation
Progress Amount
Disbursed
till date Project
Name
Amt. in
Rs Cr GOI State ULB
State+
ULB Total
No of
Projects (Y/N/P) (Y/N/P) (Y/N/P)
Physical
%
Financial
%
1 2 3 4 5 6 7 8 9 10 11 12 13 14 15 16
13 Ballia WS 1.70 - - - - - N N N
14 Banda WS 3.50 - - - - - N N N
15 Baraut WS 6.41 - - - - - N N N
16 Basti WS 2.50 - - - - - N N N
17 Budaun WS 0.20 - - - - - N N N
18 Bulandshahar WS 2.74 - - - - - N N N
19 Chandausi WS 7.86 - - - - - N N N
20 Deoria WS 7.08 - - - - - N N N
21 Etah WS 2.58 - - - - - N N N
22 Etawah - - - - - -
23 Faizabad WS 20.54 9.47 5.68 3.79 9.47 18.94 1 Y Y N
24 Farrukhabad WS 8.46 - - - - - N N N
25 Fatehpur WS 2.00 - - - - - N N N
26 Ghazipur WS 5.96 2.04 1.22 0.82 2.04 4.08 1 Y Y N
27 Gonda WS 5.50 - - - - - N N N
28 Hapur WS 12.76 - - - - - N N N
29 Hardoi WS 4.52 7.10 4.26 2.83 7.09 14.19 1 Y Y N
30 Hathras WS 15.00 - - - - - N N N
31 Jaunpur WS 8.00 2.85 1.71 1.13 2.84 5.69 1 P P N
32 Kasganj WS 8.50 4.12 2.47 1.64 4.11 8.23 1 Y Y N
33 Khurja WS 4.50 - - - - - N N N
34 Lakhimpur WS 19.68 - - - - - N N N
35 Lalitpur WS 2.50 5.72 3.43 2.29 5.72 11.44 1 Y Y N
36 Loni WS 7.20 10.81 6.49 4.32 10.81 21.62 1 Y Y N
37 Mainpuri WS 13.16 8.09 4.85 3.23 8.08 16.17 1 Y Y N
38 Mathura WS 34.13 - - - - - N N N

Final 3rd STATE ANNUAL ACTION PLAN (3rd SAAP) FOR FY: 2017-18 to FY 2019-20 OF UTTAR PRADESH UNDER ATAL MISSION FOR
REJUVENATION AND URBAN TRANSFORMATION (AMRUT)
2017
STATE MISSION DIRECTORATE (AMRUT) UTTAR PRADESH, 8TH FLOOR, INDIRA BHAWAN, ASHOK MARG, LUCKNOW-226001 54 | P a g e
Physical and Financial Progress of Water Supply Projects against the SAAP -2016-17
SN Name of ULB
Approved SAAP Estimated Cost & Sharing Pattern Rs in Cr DPR SLTC Work
Order
Implementation
Progress Amount
Disbursed
till date Project
Name
Amt. in
Rs Cr GOI State ULB
State+
ULB Total
No of
Projects (Y/N/P) (Y/N/P) (Y/N/P)
Physical
%
Financial
%
1 2 3 4 5 6 7 8 9 10 11 12 13 14 15 16
39 Maunath WS 13.44 6.18 3.71 2.47 6.18 12.36 1 Y Y N
40 Mirzapur WS 29.80 13.65 8.19 5.45 13.64 27.29 1 Y Y N
41 Modinagar WS 0.62 - - - - - N N N
42 Mughalsarai WS 8.91 - - - - - N N N
43 Muzaffarnagar WS 0.50 - - - - - N N N
44 Orai WS 2.50 5.82 3.49 2.32 5.81 11.63 1 Y N N
45 Pilibhit WS 2.34 - - - - - N N N
46 Raibareli WS 26.10 - - - - - N N N
47 Rampur WS 11.66 - - - - - N N N
48 Shahjahanpur WS 12.00 7.74 4.64 3.09 7.73 15.47 1 Y Y N
49 Sambhal WS 3.00 - - - - - N N N
50 Shamli WS 10.86 - - - - - N N N
51 Shikohabad WS 2.08 - - - - - N N N
52 Sitapur WS 11.12 - - - - - N N N
53 Sultanpur WS 6.44 - - - - - N N N
54 Unnao WS 56.00 - - - - - N N N
Sub Total-B 942.42 238.72 143.21 95.43 238.64 477.36 14
Total SAAP for WS (A+B) 2,017.42 285.33 194.49 137.38 331.87 617.20 17 Y=17/
12, P=4
Y=16/
11,
N=2, P=3 N=16
Note: - P- denotes that partially projects approved by SLTC.

Final 3rd STATE ANNUAL ACTION PLAN (3rd SAAP) FOR FY: 2017-18 to FY 2019-20 OF UTTAR PRADESH UNDER ATAL MISSION FOR
REJUVENATION AND URBAN TRANSFORMATION (AMRUT)
2017
STATE MISSION DIRECTORATE (AMRUT) UTTAR PRADESH, 8TH FLOOR, INDIRA BHAWAN, ASHOK MARG, LUCKNOW-226001 55 | P a g e
WATER SUPPLY SCHEMES SANCTIONED AGAINST SAAP FOR FY 2016-17
Detail of Water Supply Schemes sanctioned against SAAP 2016-17 Figure in Rs Crore
SN Name of ULB Name of Schemes Sanction Cost SLTC date SHPSC date
ACA State ULB Total
1 2 3 4 5 6 7 8 9
1 Ghaziabad Water Supply Scheme for CHA Phase 2, Ghaziabad 26.61 29.27 23.95 79.83 01.08.2016 04.10.2016
2 Ghaziabad Water Supply Scheme for THA Part 2, Ghaziabad 13.21 14.53 11.89 39.63 26.09.2016 04.10.2016
Sub Total-A 39.82 43.80 35.84 119.46
3 Jhansi Water Supply Reorganisation Scheme, Phase 2, Jhansi City 153.56 92.13 61.42 307.11 01.08.2016 04.10.2016
4 Azamgarh Water Supply Scheme for Azamgarh City 1.57 0.94 0.63 3.14 30-12-2016 30-01-2017
5 Faizabad Water Supply Scheme for Faizabad City 9.47 5.68 3.79 18.94 30-12-2016 30-01-2017
6 Ghazipur Water Supply Scheme for Ghazipur City 2.04 1.22 0.82 4.08 30-12-2016 30-01-2017
7 Hardoi Water Supply Reorganisation Scheme, Zone 5, Hardoi City 7.10 4.26 2.83 14.19 26.09.2016 04.10.2016
8 Jaunpur Water Supply Reorganisation Scheme, Zone 2G Phase 1, Jaunpur
City
2.85 1.71 1.13 5.69 26.09.2016 04.10.2016
9 Kasganj Water Supply Scheme for Kasganj City 4.12 2.47 1.64 8.23 30-12-2016 30-01-2017
10 Lalitpur Water Supply Scheme, Nehru Nagar Area, Phase 2, Lalitpur City 5.72 3.43 2.29 11.44 26.09.2016 04.10.2016
11 Loni Construction of New & Rebore TWs, Loni City 10.81 6.49 4.32 21.62 26.09.2016 04.10.2016
12 Mainpuri Water Supply Reorganisation Scheme, Phase 2, Mainpuri City 8.09 4.85 3.23 16.17 26.09.2016 04.10.2016
13 Maunath Water Supply Scheme for Maunath City 6.18 3.71 2.47 12.36 30-12-2016 30-01-2017
14 Mirzapur Water Supply Reorganisation Scheme, Phase 2, Mirzapur City 13.65 8.19 5.45 27.92 26.09.2016 04.10.2016
15 Shahjahanpur Water Supply Reorganisation Scheme, Zone 8a 8b Phase 1,
Shahjahanpur City
7.74 4.64 3.09 15.47 26.09.2016 04.10.2016
Sub Total-B 233.21 139.91 93.24 466.36
Total(A+B) 273.03 183.71 129.06 585.80

Final 3rd STATE ANNUAL ACTION PLAN (3rd SAAP) FOR FY: 2017-18 to FY 2019-20 OF UTTAR PRADESH UNDER ATAL MISSION FOR
REJUVENATION AND URBAN TRANSFORMATION (AMRUT)
2017
STATE MISSION DIRECTORATE (AMRUT) UTTAR PRADESH, 8TH FLOOR, INDIRA BHAWAN, ASHOK MARG, LUCKNOW-226001 56 | P a g e
STATUS OF SEWERAGE AND SEPTAGE MANAGEMENT PROJECT
Physical and Financial Progress of Sewerage Projects against the SAAP -2016-17
SN Name of ULB
Approved SAAP Estimated Cost & Sharing Pattern Rs in Cr DPR SLTC Work
Order
Implementation
Progress Amount
Disbursed
till date Project
Name
Amt. in
Rs Cr GOI State ULB
State+
ULB Total
No of
Projects (Y/N/P) (Y/N/P) (Y/N/P)
Physical
%
Financial
%
1 2 3 4 5 6 7 8 9 10 11 12 13 14 15 16
1 Agra Sew 100.00 35.10 38.61 31.59 70.20 105.30 1 Y N N
2 Allahabad Sew 66.00 12.29 13.52 11.07 24.59 36.88 1 P N N
3 Ghaziabad Sew 70.00 - - - -
4 Kanpur Sew 150.00 40.91 45.01 36.81 81.82 122.73 1 P P N
5 Lucknow Sew 180.00 62.32 68.57 56.09 124.66 186.98 2 Y Y N
6 Meerut Sew 100.00 - - - - -
7 Varanasi Sew 95.00 2.98 3.28 2.68 5.96 8.94 1 P P N
Sub Total-A 761.00 153.60 168.99 138.24 307.23 460.83 6
1 Aligarh Sew 80.00 - - - - -
2 Bareilly Sew 40.00 - - - - -
3 Firozabad Sew 40.00 - - - - -
4 Gorakhpur Sew 98.00 46.47 27.88 18.58 46.46 92.93 1 Y Y N
5 Jhansi Sew 3.24 - - - -
6 Moradabad Sew 50.00 - - - - -
7 Saharanpur Sew 50.00 48.34 29.00 19.34 48.34 96.68 1 Y N N
8 Akbarpur - - - - - -
9 Amroha - - - - - -
10 Ayodhya Sew 5.36 3.22 2.14 5.36 10.72 1 Y Y N
10 Azamgarh Sew 10.70 - - - - -
11 Bahraich - - - - - -
12 Ballia Sew 15.00 - - - - -
13 Banda Sew 21.00 - - - - -
14 Baraut - - - - - -

Final 3rd STATE ANNUAL ACTION PLAN (3rd SAAP) FOR FY: 2017-18 to FY 2019-20 OF UTTAR PRADESH UNDER ATAL MISSION FOR
REJUVENATION AND URBAN TRANSFORMATION (AMRUT)
2017
STATE MISSION DIRECTORATE (AMRUT) UTTAR PRADESH, 8TH FLOOR, INDIRA BHAWAN, ASHOK MARG, LUCKNOW-226001 57 | P a g e
Physical and Financial Progress of Sewerage Projects against the SAAP -2016-17
SN Name of ULB
Approved SAAP Estimated Cost & Sharing Pattern Rs in Cr DPR SLTC Work
Order
Implementation
Progress Amount
Disbursed
till date Project
Name
Amt. in
Rs Cr GOI State ULB
State+
ULB Total
No of
Projects (Y/N/P) (Y/N/P) (Y/N/P)
Physical
%
Financial
%
1 2 3 4 5 6 7 8 9 10 11 12 13 14 15 16
15 Basti - - - - - -
16 Budaun - - - - - -
17 Bulandshahar Sew 80.00 43.75 26.25 17.50 43.75 87.50 1 Y Y N
18 Chandausi - - - - - -
19 Deoria - - - - - -
20 Etah Sew 70.00 47.73 28.64 19.09 47.73 95.46 1 Y Y P
21 Etawah - - - - - -
22 Faizabad - - - - - -
23 Farrukhabad - - - - - -
24 Fatehpur - - - - - -
25 Ghazipur Sew 20.00 20.64 12.38 8.25 20.63 41.27 1 Y N N
26 Gonda - - - - - -
27 Hapur Sew 50.00 40.41 24.24 16.16 40.40 80.81 1 Y Y N
28 Hardoi - - - - - -
29 Hathras - - - - - -
30 Jaunpur - - - - - -
31 Kasganj - - - - - -
32 Khurja - - - - - -
33 Lakhimpur - - - - - -
34 Lalitpur - - - - - -
35 Loni Sew 38.00 - - - - -
36 Mainpuri Sew 10.00 - - - - -
37 Mathura Sew 60.00 - - - - -
38 Maunath - - - - - -
39 Mirzapur Sew 40.00 - - - - -
40 Modinagar Sew 40.00 49.62 29.77 19.84 49.61 99.23 1 Y Y N

Final 3rd STATE ANNUAL ACTION PLAN (3rd SAAP) FOR FY: 2017-18 to FY 2019-20 OF UTTAR PRADESH UNDER ATAL MISSION FOR
REJUVENATION AND URBAN TRANSFORMATION (AMRUT)
2017
STATE MISSION DIRECTORATE (AMRUT) UTTAR PRADESH, 8TH FLOOR, INDIRA BHAWAN, ASHOK MARG, LUCKNOW-226001 58 | P a g e
Physical and Financial Progress of Sewerage Projects against the SAAP -2016-17
SN Name of ULB
Approved SAAP Estimated Cost & Sharing Pattern Rs in Cr DPR SLTC Work
Order
Implementation
Progress Amount
Disbursed
till date Project
Name
Amt. in
Rs Cr GOI State ULB
State+
ULB Total
No of
Projects (Y/N/P) (Y/N/P) (Y/N/P)
Physical
%
Financial
%
1 2 3 4 5 6 7 8 9 10 11 12 13 14 15 16
41 Mughalsarai - - - - - -
42 Muzaffarnagar Sew 37.90 - - - - -
43 Orai Sew 10.00 - - - - -
44 Pilibhit - - - - - -
45 Raibareli Sew 50.00 27.69 16.61 11.08 27.69 55.38 1 Y Y N
46 Rampur Sew 91.00 - - - - -
47 Shahjahanpur - - - - - -
48 Sambhal - - - - - -
49 Shamli - - - - - -
50 Shikohabad - - - - - -
51 Sitapur - - - - - -
52 Sultanpur - - - - - -
53 Unnao Sew 30.00 - - - - -
Sub Total-B 1034.84 330.01 197.99 131.98 329.97 659.98 9
Total: (A+B) 1795.84 483.61 366.98 270.22 637.20 1120.81 15
Y=15/
11,
P=3
Y=13/ 8,
N=4, P=2
N=13,
P=1
Note: - P- denotes that partially projects approved by SLTC.
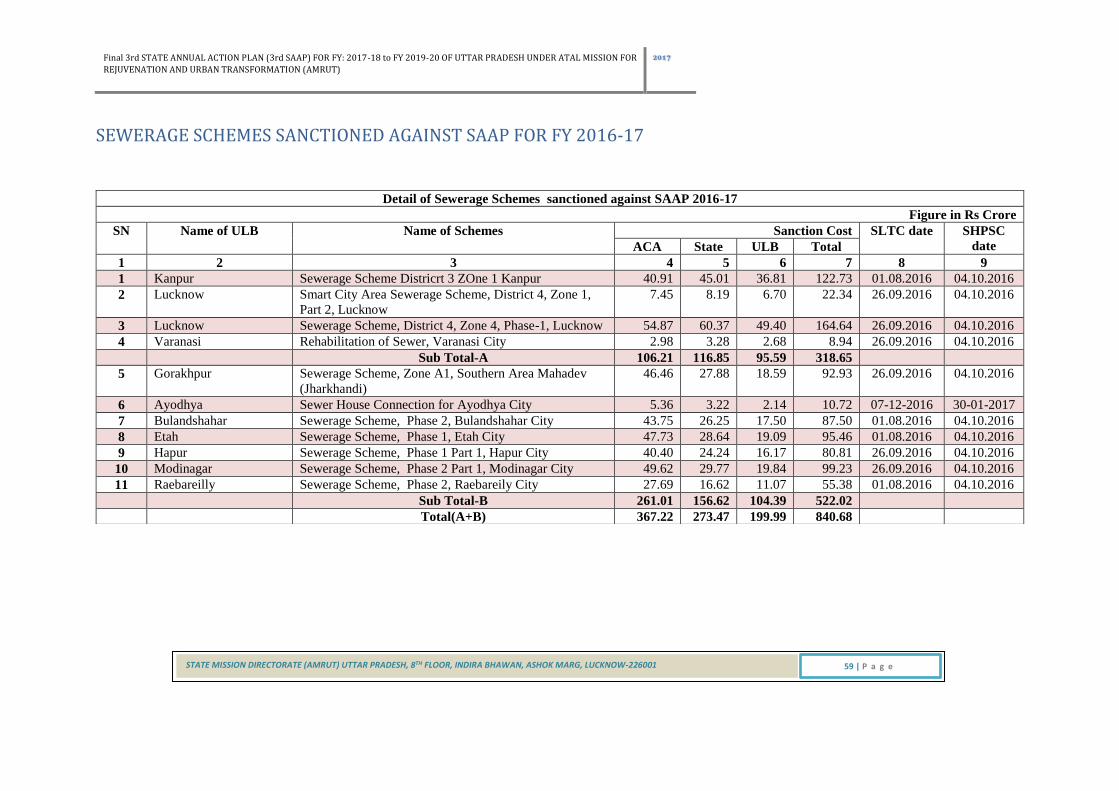
Final 3rd STATE ANNUAL ACTION PLAN (3rd SAAP) FOR FY: 2017-18 to FY 2019-20 OF UTTAR PRADESH UNDER ATAL MISSION FOR
REJUVENATION AND URBAN TRANSFORMATION (AMRUT)
2017
STATE MISSION DIRECTORATE (AMRUT) UTTAR PRADESH, 8TH FLOOR, INDIRA BHAWAN, ASHOK MARG, LUCKNOW-226001 59 | P a g e
SEWERAGE SCHEMES SANCTIONED AGAINST SAAP FOR FY 2016-17
Detail of Sewerage Schemes sanctioned against SAAP 2016-17
Figure in Rs Crore
SN Name of ULB Name of Schemes Sanction Cost SLTC date SHPSC
date ACA State ULB Total
1 2 3 4 5 6 7 8 9
1 Kanpur Sewerage Scheme Districrt 3 ZOne 1 Kanpur 40.91 45.01 36.81 122.73 01.08.2016 04.10.2016
2 Lucknow Smart City Area Sewerage Scheme, District 4, Zone 1,
Part 2, Lucknow
7.45 8.19 6.70 22.34 26.09.2016 04.10.2016
3 Lucknow Sewerage Scheme, District 4, Zone 4, Phase-1, Lucknow 54.87 60.37 49.40 164.64 26.09.2016 04.10.2016
4 Varanasi Rehabilitation of Sewer, Varanasi City 2.98 3.28 2.68 8.94 26.09.2016 04.10.2016
Sub Total-A 106.21 116.85 95.59 318.65
5 Gorakhpur Sewerage Scheme, Zone A1, Southern Area Mahadev
(Jharkhandi)
46.46 27.88 18.59 92.93 26.09.2016 04.10.2016
6 Ayodhya Sewer House Connection for Ayodhya City 5.36 3.22 2.14 10.72 07-12-2016 30-01-2017
7 Bulandshahar Sewerage Scheme, Phase 2, Bulandshahar City 43.75 26.25 17.50 87.50 01.08.2016 04.10.2016
8 Etah Sewerage Scheme, Phase 1, Etah City 47.73 28.64 19.09 95.46 01.08.2016 04.10.2016
9 Hapur Sewerage Scheme, Phase 1 Part 1, Hapur City 40.40 24.24 16.17 80.81 26.09.2016 04.10.2016
10 Modinagar Sewerage Scheme, Phase 2 Part 1, Modinagar City 49.62 29.77 19.84 99.23 26.09.2016 04.10.2016
11 Raebareilly Sewerage Scheme, Phase 2, Raebareily City 27.69 16.62 11.07 55.38 01.08.2016 04.10.2016
Sub Total-B 261.01 156.62 104.39 522.02
Total(A+B) 367.22 273.47 199.99 840.68
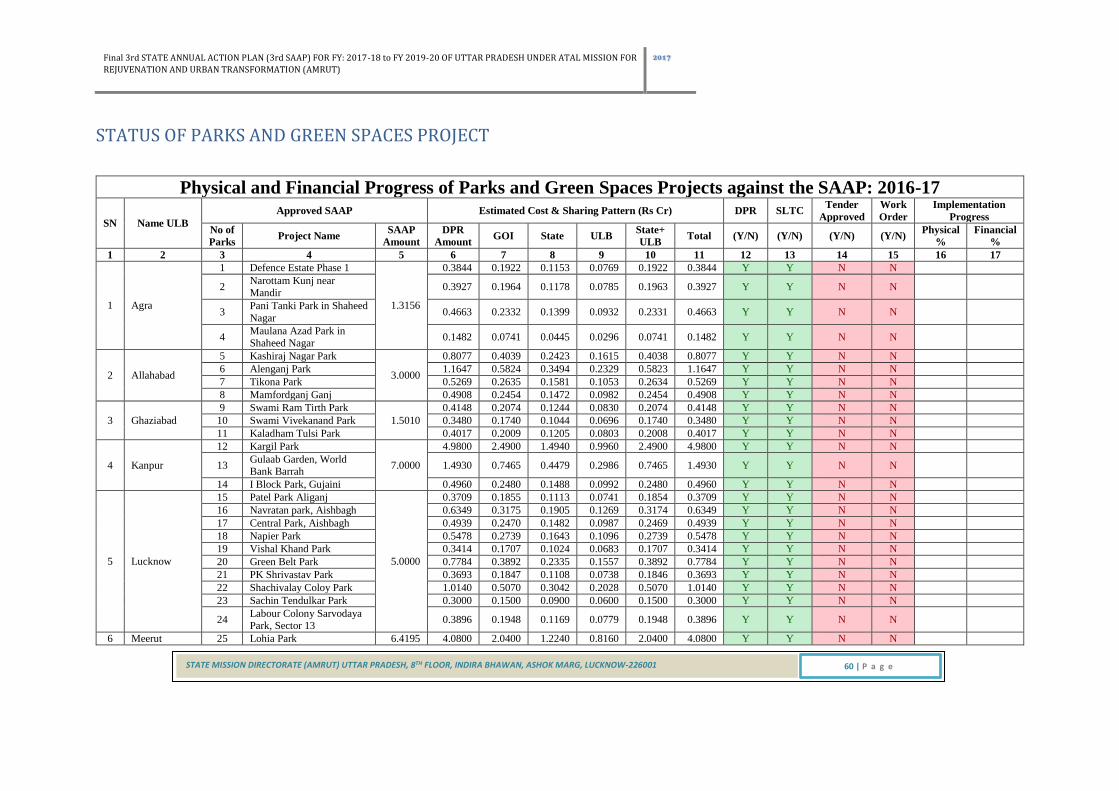
Final 3rd STATE ANNUAL ACTION PLAN (3rd SAAP) FOR FY: 2017-18 to FY 2019-20 OF UTTAR PRADESH UNDER ATAL MISSION FOR
REJUVENATION AND URBAN TRANSFORMATION (AMRUT)
2017
STATE MISSION DIRECTORATE (AMRUT) UTTAR PRADESH, 8TH FLOOR, INDIRA BHAWAN, ASHOK MARG, LUCKNOW-226001 60 | P a g e
STATUS OF PARKS AND GREEN SPACES PROJECT
Physical and Financial Progress of Parks and Green Spaces Projects against the SAAP: 2016-17
SN Name ULB
Approved SAAP Estimated Cost & Sharing Pattern (Rs Cr) DPR SLTC Tender
Approved
Work
Order
Implementation
Progress
No of
Parks Project Name
SAAP
Amount
DPR
Amount GOI State ULB
State+
ULB Total (Y/N) (Y/N) (Y/N) (Y/N)
Physical
%
Financial
%
1 2 3 4 5 6 7 8 9 10 11 12 13 14 15 16 17
1 Agra
1 Defence Estate Phase 1
1.3156
0.3844 0.1922 0.1153 0.0769 0.1922 0.3844 Y Y N N
2 Narottam Kunj near Mandir
0.3927 0.1964 0.1178 0.0785 0.1963 0.3927 Y Y N N
3 Pani Tanki Park in Shaheed
Nagar 0.4663 0.2332 0.1399 0.0932 0.2331 0.4663 Y Y N N
4 Maulana Azad Park in Shaheed Nagar
0.1482 0.0741 0.0445 0.0296 0.0741 0.1482 Y Y N N
2 Allahabad
5 Kashiraj Nagar Park
3.0000
0.8077 0.4039 0.2423 0.1615 0.4038 0.8077 Y Y N N
6 Alenganj Park 1.1647 0.5824 0.3494 0.2329 0.5823 1.1647 Y Y N N
7 Tikona Park 0.5269 0.2635 0.1581 0.1053 0.2634 0.5269 Y Y N N
8 Mamfordganj Ganj 0.4908 0.2454 0.1472 0.0982 0.2454 0.4908 Y Y N N
3 Ghaziabad
9 Swami Ram Tirth Park
1.5010
0.4148 0.2074 0.1244 0.0830 0.2074 0.4148 Y Y N N
10 Swami Vivekanand Park 0.3480 0.1740 0.1044 0.0696 0.1740 0.3480 Y Y N N
11 Kaladham Tulsi Park 0.4017 0.2009 0.1205 0.0803 0.2008 0.4017 Y Y N N
4 Kanpur
12 Kargil Park
7.0000
4.9800 2.4900 1.4940 0.9960 2.4900 4.9800 Y Y N N
13 Gulaab Garden, World Bank Barrah
1.4930 0.7465 0.4479 0.2986 0.7465 1.4930 Y Y N N
14 I Block Park, Gujaini 0.4960 0.2480 0.1488 0.0992 0.2480 0.4960 Y Y N N
5 Lucknow
15 Patel Park Aliganj
5.0000
0.3709 0.1855 0.1113 0.0741 0.1854 0.3709 Y Y N N
16 Navratan park, Aishbagh 0.6349 0.3175 0.1905 0.1269 0.3174 0.6349 Y Y N N
17 Central Park, Aishbagh 0.4939 0.2470 0.1482 0.0987 0.2469 0.4939 Y Y N N
18 Napier Park 0.5478 0.2739 0.1643 0.1096 0.2739 0.5478 Y Y N N
19 Vishal Khand Park 0.3414 0.1707 0.1024 0.0683 0.1707 0.3414 Y Y N N
20 Green Belt Park 0.7784 0.3892 0.2335 0.1557 0.3892 0.7784 Y Y N N
21 PK Shrivastav Park 0.3693 0.1847 0.1108 0.0738 0.1846 0.3693 Y Y N N
22 Shachivalay Coloy Park 1.0140 0.5070 0.3042 0.2028 0.5070 1.0140 Y Y N N
23 Sachin Tendulkar Park 0.3000 0.1500 0.0900 0.0600 0.1500 0.3000 Y Y N N
24 Labour Colony Sarvodaya Park, Sector 13
0.3896 0.1948 0.1169 0.0779 0.1948 0.3896 Y Y N N
6 Meerut 25 Lohia Park 6.4195 4.0800 2.0400 1.2240 0.8160 2.0400 4.0800 Y Y N N

Final 3rd STATE ANNUAL ACTION PLAN (3rd SAAP) FOR FY: 2017-18 to FY 2019-20 OF UTTAR PRADESH UNDER ATAL MISSION FOR
REJUVENATION AND URBAN TRANSFORMATION (AMRUT)
2017
STATE MISSION DIRECTORATE (AMRUT) UTTAR PRADESH, 8TH FLOOR, INDIRA BHAWAN, ASHOK MARG, LUCKNOW-226001 61 | P a g e
Physical and Financial Progress of Parks and Green Spaces Projects against the SAAP: 2016-17
SN Name ULB
Approved SAAP Estimated Cost & Sharing Pattern (Rs Cr) DPR SLTC Tender
Approved
Work
Order
Implementation
Progress
No of
Parks Project Name
SAAP
Amount
DPR
Amount GOI State ULB
State+
ULB Total (Y/N) (Y/N) (Y/N) (Y/N)
Physical
%
Financial
%
1 2 3 4 5 6 7 8 9 10 11 12 13 14 15 16 17
26 Suraj Kund Park 1.3550 0.6775 0.4065 0.2710 0.6775 1.3550 Y Y N N
27 Ladies Park 1.4006 0.7003 0.4202 0.2801 0.7003 1.4006 Y Y N N
7 Varanasi
28 Sanjay Nagar Park
1.7200
0.2718 0.1359 0.0815 0.0544 0.1359 0.2718 Y Y N N
29 Sundar Pur Udhyan 0.3172 0.1586 0.0952 0.0634 0.1586 0.3172 Y Y N N
30 Ashok Vihar 0.3089 0.1545 0.0927 0.0617 0.1544 0.3089 Y Y N N
Sub Total - A 25.9561 25.4889 12.7450 7.6467 5.0972 12.7439 25.4889
8 Aligarh
31 Sashani Gate Park
3.0000
0.4580 0.2290 0.1374 0.0916 0.2290 0.4580 Y Y N N
32 Agra Road awas Vikas Colony Park
0.6600 0.3300 0.1980 0.1320 0.3300 0.6600 Y Y N N
33 Manohar Colony Park 0.3210 0.1605 0.0963 0.0642 0.1605 0.3210 Y Y N N
34 Gyaneshwar Park 0.5410 0.2705 0.1623 0.1082 0.2705 0.5410 Y Y N N
35 Chitragupt Park, LDA Colony
0.5530 0.2765 0.1659 0.1106 0.2765 0.5530 Y Y N N
36 Mahatma Gandhi Park 0.4670 0.2335 0.1401 0.0934 0.2335 0.4670 Y Y N N
9 Bareilly
37 Katghar Park Ward No. 25
2.0000
0.9620 0.4810 0.2886 0.1924 0.4810 0.9620 Y Y N N
38 Ramleela Maidan Park
Ward - 43 1.2953 0.6477 0.3886 0.2590 0.6476 1.2953 Y Y N N
39 Ram Manohar Lohia Park 0.3050 0.1525 0.0915 0.0610 0.1525 0.3050 Y Y N N
10 Firozabad
40 Bodh Ashram Road Park
1.0848
0.2733 0.1367 0.0820 0.0546 0.1366 0.2733 Y Y N N
41 Gandhi Park, Company
Bagh 0.5061 0.2531 0.1518 0.1012 0.2530 0.5061 Y Y N N
42 Tanki Park, Gunjan Colony 0.1805 0.0903 0.0542 0.0360 0.0902 0.1805 Y Y N N
11 Gorakhpur
43 Jhula Park Shastripuram
2.0000
0.5120 0.2560 0.1536 0.1024 0.2560 0.5120 Y Y N N
44 Deewan Badaz Park, New
Colony 0.3150 0.1575 0.0945 0.0630 0.1575 0.3150 Y Y N N
45 Park in front of house no. 368 , Awas Vikas Colony
0.3652 0.1826 0.1096 0.0730 0.1826 0.3652 Y Y N N
46
Park in front of EWS 377,
Ward no 66, Awas Vikas Colony
0.4800 0.2400 0.1440 0.0960 0.2400 0.4800 Y Y N N
47 Park in front of EWS 3,
Ward no. 53 0.3610 0.1805 0.1083 0.0722 0.1805 0.3610 Y Y N N
12 Jhansi 48 Park in Raghunath Mahal, Ward No. 11
6.5220 1.7228 0.8614 0.5168 0.3446 0.8614 1.7228 Y Y N N

Final 3rd STATE ANNUAL ACTION PLAN (3rd SAAP) FOR FY: 2017-18 to FY 2019-20 OF UTTAR PRADESH UNDER ATAL MISSION FOR
REJUVENATION AND URBAN TRANSFORMATION (AMRUT)
2017
STATE MISSION DIRECTORATE (AMRUT) UTTAR PRADESH, 8TH FLOOR, INDIRA BHAWAN, ASHOK MARG, LUCKNOW-226001 62 | P a g e
Physical and Financial Progress of Parks and Green Spaces Projects against the SAAP: 2016-17
SN Name ULB
Approved SAAP Estimated Cost & Sharing Pattern (Rs Cr) DPR SLTC Tender
Approved
Work
Order
Implementation
Progress
No of
Parks Project Name
SAAP
Amount
DPR
Amount GOI State ULB
State+
ULB Total (Y/N) (Y/N) (Y/N) (Y/N)
Physical
%
Financial
%
1 2 3 4 5 6 7 8 9 10 11 12 13 14 15 16 17
49 Bahar Badagaon Park, Ward no. 41
3.7720 1.8860 1.1316 0.7544 1.8860 3.7720 Y Y N N
50 Unnao Gat Park, Ward No.
37 1.0140 0.5070 0.3042 0.2028 0.5070 1.0140 Y Y N N
13 Moradabad
51 Naveen Park
1.3786
0.3433 0.1717 0.1030 0.0686 0.1716 0.3433 Y Y N N
52 Pandit Nagla Park 0.4662 0.2331 0.1399 0.0932 0.2331 0.4662 Y Y N N
53 P.T.C Park 0.5315 0.2658 0.1595 0.1062 0.2657 0.5315 Y Y N N
14 Saharanpur
54 Bhagwati Coloy Park ear
Jain Mandir
0.5120
0.1876 0.0938 0.0563 0.0375 0.0938 0.1876 Y N
N N
55 Prempuri Colony Park, Behat Road
0.2250 0.1125 0.0675 0.0450 0.1125 0.2250 Y N
N N
56 Ambedkar Park near Garhi
Malook No 1 0.9950 0.4975 0.2985 0.1990 0.4975 0.9950 Y
N N N
15 Akbarpur 57 Sadarpur Park 0.2415 0.2410 0.1205 0.0723 0.0482 0.1205 0.2410 Y Y N N
16 Amroha
58 Overhead Tank Park, Awas
Vikas 1 0.8610
0.3133 0.1567 0.0940 0.0626 0.1566 0.3133 Y Y N N
59 Awas Vikas 2 Park, Ward
No. 17 0.3024 0.1512 0.0907 0.0605 0.1512 0.3024 Y Y N N
17 Ayodhaya 60 Rajdwar Park 2.0274 1.0137 0.6082 0.4055 1.0137 2.0274 Y Y N N
18 Azamgarh 61 Mehta Park, Civil Lines 0.3150 0.3601 0.1801 0.1080 0.0720 0.1800 0.3601 Y Y N N
19 Bahraich 62 Hanuman Colony Park
0.7063 0.4130 0.2065 0.1239 0.0826 0.2065 0.4130 Y Y N N
63 Shaheed Park 0.2910 0.1455 0.0873 0.0582 0.1455 0.2910 Y Y N N
20 Ballia 64 Bahadur Colony Park
0.6684 0.3689 0.1845 0.1107 0.0737 0.1844 0.3689 Y Y N N
65 Chandshekar Nagar Park 0.2874 0.1437 0.0862 0.0575 0.1437 0.2874 Y Y N N
21 Banda 66 Ambedkar Park
2.8500 1.8000 0.9000 0.5400 0.3600 0.9000 1.8000 Y Y N N
67 Viklang Vidyalay Park 1.0350 0.5175 0.3105 0.2070 0.5175 1.0350 Y Y N N
22 Baraut
68 Bhagat Singh Park
0.5169
0.2148 0.1074 0.0644 0.0430 0.1074 0.2148 Y Y N N
69 Awas Vikas Park Pani
Tanki 0.3591 0.1796 0.1077 0.0718 0.1795 0.3591 Y Y N N
23 Basti 70 Kateshwar Park 3.7000 3.6090 1.8045 1.0827 0.7218 1.8045 3.6090 Y Y N N
24 Budaun 0.4731 N N N N
25 Bulandshahar 71 Shushil Vihar Park
0.5000 0.3270 0.1635 0.0981 0.0654 0.1635 0.3270 Y Y N N
72 Shastri Park, Ward No 17 0.1870 0.0935 0.0561 0.0374 0.0935 0.1870 Y Y N N
26 Chandausi 73 Lala Lajpat Rai Park 0.5800 0.5200 0.2600 0.1560 0.1040 0.2600 0.5200 Y Y N N

Final 3rd STATE ANNUAL ACTION PLAN (3rd SAAP) FOR FY: 2017-18 to FY 2019-20 OF UTTAR PRADESH UNDER ATAL MISSION FOR
REJUVENATION AND URBAN TRANSFORMATION (AMRUT)
2017
STATE MISSION DIRECTORATE (AMRUT) UTTAR PRADESH, 8TH FLOOR, INDIRA BHAWAN, ASHOK MARG, LUCKNOW-226001 63 | P a g e
Physical and Financial Progress of Parks and Green Spaces Projects against the SAAP: 2016-17
SN Name ULB
Approved SAAP Estimated Cost & Sharing Pattern (Rs Cr) DPR SLTC Tender
Approved
Work
Order
Implementation
Progress
No of
Parks Project Name
SAAP
Amount
DPR
Amount GOI State ULB
State+
ULB Total (Y/N) (Y/N) (Y/N) (Y/N)
Physical
%
Financial
%
1 2 3 4 5 6 7 8 9 10 11 12 13 14 15 16 17
74 Jagjeevan Ram Park 0.0600 0.0300 0.0180 0.0120 0.0300 0.0600 Y Y N N
27 Deoria 75 Hathi Kund Park
1.0000 0.7698 0.3849 0.2309 0.1540 0.3849 0.7698 Y Y N N
76 Town Hall Park 0.2636 0.1318 0.0791 0.0527 0.1318 0.2636 Y Y N N
28 Etah 77 Mehta Park, Maingunj 0.8600 0.8617 0.4309 0.2585 0.1723 0.4308 0.8617 Y N N N
29 Etawah
78 Indira Awas Colony Park
near PAC 0.6280
0.2139 0.1070 0.0642 0.0427 0.1069 0.2139 Y Y N N
79 Lal Bahadur Shasti Park near ITI
0.4275 0.2138 0.1283 0.0854 0.2137 0.4275 Y Y N N
30 Faizabad
80 Keshav Dham Park
0.9000
0.4334 0.2167 0.1300 0.0867 0.2167 0.4334 Y Y N N
81 Park Near Pump house,
Phase 1 0.4279 0.2140 0.1284 0.0855 0.2139 0.4279 Y Y N N
31 Farrukhabad
82 Awas Vikas Colony Park,
Sector 6B/325 Park 0.7570
0.3000 0.1500 0.0900 0.0600 0.1500 0.3000 Y Y N N
83 Rajiv Gandhi Colony Park 0.1800 0.0900 0.0540 0.0360 0.0900 0.1800 Y Y N N
84 Geeta Puram Park 0.2980 0.1490 0.0894 0.0596 0.1490 0.2980 Y Y N N
32 Fatehpur
85 Maharana Pratap Park,
Ward No. 11
0.3200
0.1624 0.0812 0.0487 0.0325 0.0812 0.1624 Y Y N N
86 Ashok Kumar park, Ward
No. 11 0.0926 0.0463 0.0278 0.0185 0.0463 0.0926 Y Y N N
87 Gandhi Park Ward No. 20 0.0699 0.0350 0.0210 0.0139 0.0349 0.0699 Y Y N N
33 Ghazipur 88 Gandhi Park
0.5984 0.3230 0.1615 0.0969 0.0646 0.1615 0.3230 Y Y N N
89 Dr. Rajendra Prakash Park 0.2750 0.1375 0.0825 0.0550 0.1375 0.2750 Y Y N N
34 Gonda 0.3730 N N N N
35 Hapur
90 House no. 756, 760, E-1, Ward No. 23
1.5246
0.1655 0.0828 0.0497 0.0330 0.0827 0.1655 Y Y N N
91 House no. 154, 165, K-3,
K-4 Ward No. 23 0.1022 0.0511 0.0307 0.0204 0.0511 0.1022 Y Y N N
92 House no. 189, 141, K-21, K-22, Ward No. 23
0.3318 0.1659 0.0995 0.0664 0.1659 0.3318 Y Y N N
93 House No. 201, 216, Ward
No. 27 0.1479 0.0740 0.0444 0.0295 0.0739 0.1479 Y Y N N
94 House No. 76, 88 Ward No. 27
0.1430 0.0715 0.0429 0.0286 0.0715 0.1430 Y Y N N

Final 3rd STATE ANNUAL ACTION PLAN (3rd SAAP) FOR FY: 2017-18 to FY 2019-20 OF UTTAR PRADESH UNDER ATAL MISSION FOR
REJUVENATION AND URBAN TRANSFORMATION (AMRUT)
2017
STATE MISSION DIRECTORATE (AMRUT) UTTAR PRADESH, 8TH FLOOR, INDIRA BHAWAN, ASHOK MARG, LUCKNOW-226001 64 | P a g e
Physical and Financial Progress of Parks and Green Spaces Projects against the SAAP: 2016-17
SN Name ULB
Approved SAAP Estimated Cost & Sharing Pattern (Rs Cr) DPR SLTC Tender
Approved
Work
Order
Implementation
Progress
No of
Parks Project Name
SAAP
Amount
DPR
Amount GOI State ULB
State+
ULB Total (Y/N) (Y/N) (Y/N) (Y/N)
Physical
%
Financial
%
1 2 3 4 5 6 7 8 9 10 11 12 13 14 15 16 17
95 House no. 53, 54 Ward No. 27
0.1210 0.0605 0.0363 0.0242 0.0605 0.1210 Y Y N N
96 House No. 483, 490, Ward
No. 27 0.1441 0.0721 0.0432 0.0288 0.0720 0.1441 Y Y N N
97 House No. 439, 464, Ward No. 27
0.1341 0.0671 0.0402 0.0268 0.0670 0.1341 Y Y N N
98 House No. 410, 411, Ward
no. 27 0.1055 0.0528 0.0317 0.0210 0.0527 0.1055 Y Y N N
99 House no. 413, 425, Ward No. 27
0.1285 0.0643 0.0386 0.0256 0.0642 0.1285 Y Y N N
36 Hardoi 100 Awas Vikas Park C
0.4300 0.2460 0.1230 0.0738 0.0492 0.1230 0.2460 Y Y N N
101 Awas Vikas Park D 0.1840 0.0920 0.0552 0.0368 0.0920 0.1840 Y Y N N
37 Hathras 102 Awas Vikas Sector 1 Park
1.9261 0.5731 0.2866 0.1719 0.1146 0.2865 0.5731 Y Y N N
103 Awas Vikas Sector 2 Park 0.6834 0.3417 0.2050 0.1367 0.3417 0.6834 Y Y N N
38 Jaunpur 104
Pandit Deen Dayal
upadhya Park 0.7978 0.3495 0.1748 0.1049 0.0698 0.1747 0.3495 Y Y N N
105 Jaysis Chauraha Park 0.4483 0.2242 0.1345 0.0896 0.2241 0.4483 Y Y N N
39 Kasganj 106 Prabhu Park
0.5890 0.4105 0.2053 0.1232 0.0820 0.2052 0.4105 Y Y N N
107 Church Compound Park 0.1697 0.0849 0.0509 0.0339 0.0848 0.1697 Y Y N N
40 Khurja 0.5000 N N N N
41 Lakhimpur 108 Awas Vikas Park, Maharaj
Nagar Ward 0.6400 0.2760 0.1380 0.0828 0.0552 0.1380 0.2760 Y Y N N
42 Lalitpur
109 Chandra Shekhar Park
1.0000
0.5850 0.2925 0.1755 0.1170 0.2925 0.5850 Y Y N N
110 Kashiram Park, Ward Badapura
0.5620 0.2810 0.1686 0.1124 0.2810 0.5620 Y Y N N
43 Loni
111 Ambedkar park, Ward No.
1, Vikas Nagar 1.0940
0.4880 0.2440 0.1464 0.0976 0.2440 0.4880 Y Y N N
112 Ward No. 10, B-block Indirapuri
0.6946 0.3473 0.2084 0.1389 0.3473 0.6946 Y Y N N
44 Mainpuri 113
Shishupal Singh
Hindpuram Park 0.9754 0.5013 0.2507 0.1504 0.1002 0.2506 0.5013 Y Y N N
114 Ramsneh Ward, Gol Bazar 0.4739 0.2370 0.1422 0.0947 0.2369 0.4739 Y Y N N
45 Mathura 115 Krishna Vihar, Phase-3
Park 0.8166 0.2534 0.1267 0.0760 0.0507 0.1267 0.2534 Y Y N N
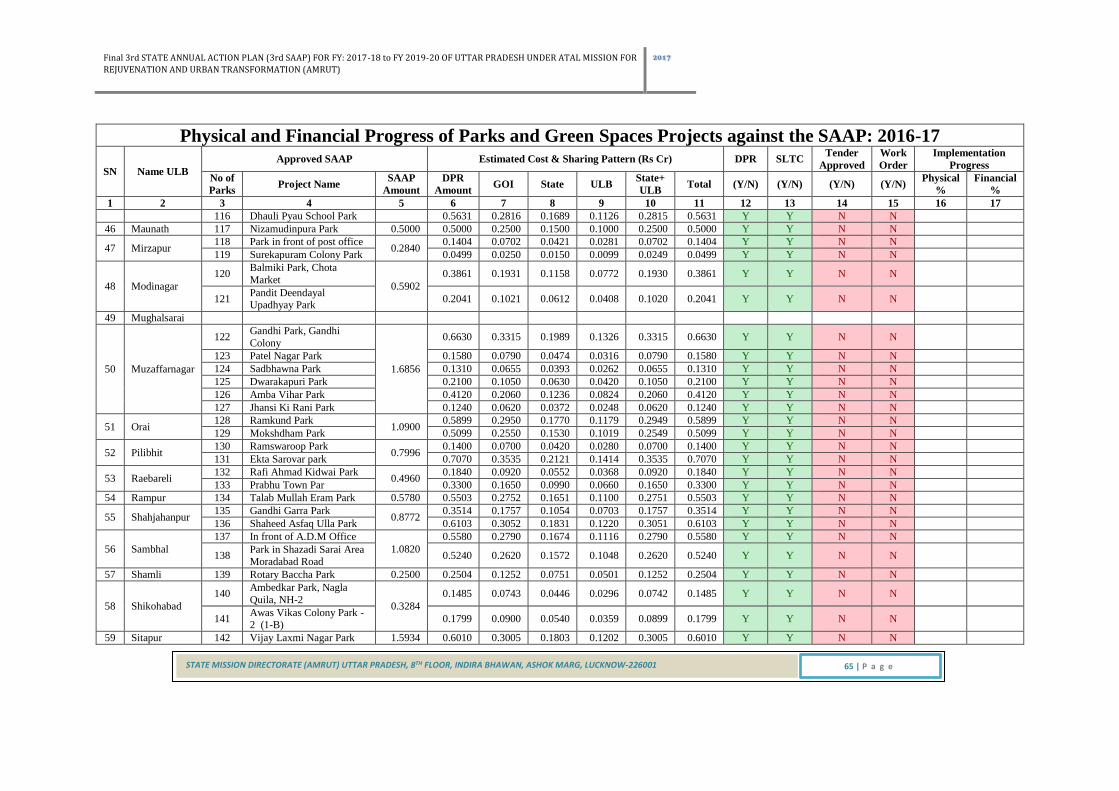
Final 3rd STATE ANNUAL ACTION PLAN (3rd SAAP) FOR FY: 2017-18 to FY 2019-20 OF UTTAR PRADESH UNDER ATAL MISSION FOR
REJUVENATION AND URBAN TRANSFORMATION (AMRUT)
2017
STATE MISSION DIRECTORATE (AMRUT) UTTAR PRADESH, 8TH FLOOR, INDIRA BHAWAN, ASHOK MARG, LUCKNOW-226001 65 | P a g e
Physical and Financial Progress of Parks and Green Spaces Projects against the SAAP: 2016-17
SN Name ULB
Approved SAAP Estimated Cost & Sharing Pattern (Rs Cr) DPR SLTC Tender
Approved
Work
Order
Implementation
Progress
No of
Parks Project Name
SAAP
Amount
DPR
Amount GOI State ULB
State+
ULB Total (Y/N) (Y/N) (Y/N) (Y/N)
Physical
%
Financial
%
1 2 3 4 5 6 7 8 9 10 11 12 13 14 15 16 17
116 Dhauli Pyau School Park 0.5631 0.2816 0.1689 0.1126 0.2815 0.5631 Y Y N N
46 Maunath 117 Nizamudinpura Park 0.5000 0.5000 0.2500 0.1500 0.1000 0.2500 0.5000 Y Y N N
47 Mirzapur 118 Park in front of post office
0.2840 0.1404 0.0702 0.0421 0.0281 0.0702 0.1404 Y Y N N
119 Surekapuram Colony Park 0.0499 0.0250 0.0150 0.0099 0.0249 0.0499 Y Y N N
48 Modinagar
120 Balmiki Park, Chota
Market 0.5902
0.3861 0.1931 0.1158 0.0772 0.1930 0.3861 Y Y N N
121 Pandit Deendayal Upadhyay Park
0.2041 0.1021 0.0612 0.0408 0.1020 0.2041 Y Y N N
49 Mughalsarai
50 Muzaffarnagar
122 Gandhi Park, Gandhi
Colony
1.6856
0.6630 0.3315 0.1989 0.1326 0.3315 0.6630 Y Y N N
123 Patel Nagar Park 0.1580 0.0790 0.0474 0.0316 0.0790 0.1580 Y Y N N
124 Sadbhawna Park 0.1310 0.0655 0.0393 0.0262 0.0655 0.1310 Y Y N N
125 Dwarakapuri Park 0.2100 0.1050 0.0630 0.0420 0.1050 0.2100 Y Y N N
126 Amba Vihar Park 0.4120 0.2060 0.1236 0.0824 0.2060 0.4120 Y Y N N
127 Jhansi Ki Rani Park 0.1240 0.0620 0.0372 0.0248 0.0620 0.1240 Y Y N N
51 Orai 128 Ramkund Park
1.0900 0.5899 0.2950 0.1770 0.1179 0.2949 0.5899 Y Y N N
129 Mokshdham Park 0.5099 0.2550 0.1530 0.1019 0.2549 0.5099 Y Y N N
52 Pilibhit 130 Ramswaroop Park
0.7996 0.1400 0.0700 0.0420 0.0280 0.0700 0.1400 Y Y N N
131 Ekta Sarovar park 0.7070 0.3535 0.2121 0.1414 0.3535 0.7070 Y Y N N
53 Raebareli 132 Rafi Ahmad Kidwai Park
0.4960 0.1840 0.0920 0.0552 0.0368 0.0920 0.1840 Y Y N N
133 Prabhu Town Par 0.3300 0.1650 0.0990 0.0660 0.1650 0.3300 Y Y N N
54 Rampur 134 Talab Mullah Eram Park 0.5780 0.5503 0.2752 0.1651 0.1100 0.2751 0.5503 Y Y N N
55 Shahjahanpur 135 Gandhi Garra Park
0.8772 0.3514 0.1757 0.1054 0.0703 0.1757 0.3514 Y Y N N
136 Shaheed Asfaq Ulla Park 0.6103 0.3052 0.1831 0.1220 0.3051 0.6103 Y Y N N
56 Sambhal
137 In front of A.D.M Office
1.0820
0.5580 0.2790 0.1674 0.1116 0.2790 0.5580 Y Y N N
138 Park in Shazadi Sarai Area Moradabad Road
0.5240 0.2620 0.1572 0.1048 0.2620 0.5240 Y Y N N
57 Shamli 139 Rotary Baccha Park 0.2500 0.2504 0.1252 0.0751 0.0501 0.1252 0.2504 Y Y N N
58 Shikohabad
140 Ambedkar Park, Nagla
Quila, NH-2 0.3284
0.1485 0.0743 0.0446 0.0296 0.0742 0.1485 Y Y N N
141 Awas Vikas Colony Park - 2 (1-B)
0.1799 0.0900 0.0540 0.0359 0.0899 0.1799 Y Y N N
59 Sitapur 142 Vijay Laxmi Nagar Park 1.5934 0.6010 0.3005 0.1803 0.1202 0.3005 0.6010 Y Y N N

Final 3rd STATE ANNUAL ACTION PLAN (3rd SAAP) FOR FY: 2017-18 to FY 2019-20 OF UTTAR PRADESH UNDER ATAL MISSION FOR
REJUVENATION AND URBAN TRANSFORMATION (AMRUT)
2017
STATE MISSION DIRECTORATE (AMRUT) UTTAR PRADESH, 8TH FLOOR, INDIRA BHAWAN, ASHOK MARG, LUCKNOW-226001 66 | P a g e
Physical and Financial Progress of Parks and Green Spaces Projects against the SAAP: 2016-17
SN Name ULB
Approved SAAP Estimated Cost & Sharing Pattern (Rs Cr) DPR SLTC Tender
Approved
Work
Order
Implementation
Progress
No of
Parks Project Name
SAAP
Amount
DPR
Amount GOI State ULB
State+
ULB Total (Y/N) (Y/N) (Y/N) (Y/N)
Physical
%
Financial
%
1 2 3 4 5 6 7 8 9 10 11 12 13 14 15 16 17
143 Mahavir Park 0.6900 0.3450 0.2070 0.1380 0.3450 0.6900 Y Y N N
60 Sultanpur 1.0000 N N N N
61 Unnao
144
In front of Awas Vikas
Colony - B Block, MIG
1045
1.1500
0.5077 0.2539 0.1523 0.1015 0.2538 0.5077 Y Y N N
145 In front of Awas Vikas Colony - B Block, EWS
593
0.1782 0.0891 0.0535 0.0356 0.0891 0.1782 Y Y N N
146 Chandrashekar Azad Park 0.4607 0.2304 0.1382 0.0921 0.2303 0.4607 Y Y N N
Sub Total - B 55.9439 55.6630 27.8335 16.6993 11.1302 27.8295 55.6630
Grand Total (A+B) 81.9000 81.1519 40.5785 24.3460 16.2274 40.5734 81.1519 Y=146 Y=142

Final 3rd STATE ANNUAL ACTION PLAN (3rd SAAP) FOR FY: 2017-18 to FY 2019-20 OF UTTAR PRADESH UNDER ATAL MISSION FOR
REJUVENATION AND URBAN TRANSFORMATION (AMRUT)
2017
STATE MISSION DIRECTORATE (AMRUT) UTTAR PRADESH, 8TH FLOOR, INDIRA BHAWAN, ASHOK MARG, LUCKNOW-226001 67 | P a g e
DETAIL RESPONSE ON THE IMPLEMENTATION OF UP 1ST SAAP 2015-16 AND 2ND SAAP 2016-17
Q1- Have DPRs been prepared for all projects approved earlier? If not, then which are
the projects for which DPR is pending and why? (500 words)
Response: Total 211 projects have been sanctioned by the Apex Committee for SAAP I, out of
which all 211 DPRs have been approved and 168 DPRs against the SAAP II also have
approved, remaining DPRs for SAAP II are under preparation which would be approved
shortly. The status of approved DPRs is given below: -
Schemes sanctioned in various SLTC/SHPSC held against the SAAP I (FY: 2015-16)
Meeting Date Projects Submitted Projects Approved
Funds
Sanctioned
W/S Sew Park Total W/S Sew Park Total (in Cr) 1st SLTC 11-02-2016 20 13 - 33 20 13 - 33
894.15 2nd SHPSC 30-03-2016 20 13 - 33 20 13 - 33 2nd SLTC 06-05-2016 30 9 49 88 29 8 49 86
1261.48 3rd SHPSC 27-05-2016 29 8 49 86 29 8 49 86 3rd SLTC 01-08-2016 24 7 37 68 24 7 37 68
1252.21 4th SLTC 26-09-2016 13 2 9 24 13 2 9 24 4th SHPSC 04-10-2016 37 9 46 92 37 9 46 92
TOTAL 86 30 95 211 86 30 95 211 3408.14
Schemes sanctioned in various SLTC/SHPSC held against the SAAP I (FY: 2016-17)
Meeting Date Projects Submitted Projects Approved
Funds
Sanctioned
W/S Sew Park Total W/S Sew Park Total (in Cr)
3rd SLTC 01-08-2016 2 5 7 2 5 7
1390.57 4th SLTC 26-09-2016 8 6 38 52 8 5 36 49
4th SHPSC 04-10-2016 10 10 36 56 10 10 36 56
5th SLTC 07-12-2016 0 1 37 38 0 1 37 38
118.34 6th SLTC 30-12-2016 5 0 69 74 5 0 69 74
5th SHPSC 30-01-2017 5 1 106 112 5 1 106 112
TOTAL 15 11 142 168 15 11 142 168 1508.91

Final 3rd STATE ANNUAL ACTION PLAN (3rd SAAP) FOR FY: 2017-18 to FY 2019-20 OF UTTAR PRADESH UNDER ATAL MISSION FOR
REJUVENATION AND URBAN TRANSFORMATION (AMRUT)
2017
STATE MISSION DIRECTORATE (AMRUT) UTTAR PRADESH, 8TH FLOOR, INDIRA BHAWAN, ASHOK MARG, LUCKNOW-226001 68 | P a g e
Q2- What is the plan of action for the pending DPRs? (300 words)
Response: Total 211 projects have been sanctioned by the Apex Committee for SAAP I, out of
which all 211 DPRs have been approved and also 168 DPRs against the SAAP II have been
approved, remaining DPRs for SAAP II are under preparation which would be approved
shortly. As per plan of action for the submission of pending DPR, the U.P. Jal Nigam has
committed that the balance DPRs against SAAP 2016-17 will be submitted by 31st March 2017.
Q3- How many SLTC meetings had been held in the State? How many DPRs have been
approved by the SLTC till date? (250 words)
Response: There are 6 SLTC had held so far and all 211 DPRs for SAAP I and 168 DPRs of
SAAP II have approved till now.
Q4- By when will the pending DPRs be approved by the SLTC and when will
implementation start? (250 words)
Response: The remaining DPRs are being prepared & expected to be submitted by 31-03-2017
by U.P. Jal Nigam. Tendering process of those projects which have been approved by the
SHPSC are being done, which is delayed due to state assembly election.
Q5- Based on the identification of delayed projects and the reasons for slow physical
progress, what is the plan of action to speed-up the projects? (300 words)
Response: From previous mission it was learnt that land availability was crucial for timely
execution of projects so land availability is assured before conceptualising the new DPR.

Final 3rd STATE ANNUAL ACTION PLAN (3rd SAAP) FOR FY: 2017-18 to FY 2019-20 OF UTTAR PRADESH UNDER ATAL MISSION FOR
REJUVENATION AND URBAN TRANSFORMATION (AMRUT)
2017
STATE MISSION DIRECTORATE (AMRUT) UTTAR PRADESH, 8TH FLOOR, INDIRA BHAWAN, ASHOK MARG, LUCKNOW-226001 69 | P a g e
Q6- How much amount has been utilized and what is the percentage share of the funding
agencies? Are there any deviations from the approved funding pattern approved by the
Apex Committee? (Tabular form and 500 words)
Response: So far Rs 15 Cr has been transferred to ULBs for the preparation of SLIP. State
share has been decided by the State Government more than 20% which provided in the Mission
guidelines.
For towns having population more than 10 lacs sharing is ACA: State: ULB: 33.33%:
36.67%: 30%.
For towns having population less than 10 lacs sharing is ACA: State: ULB: 50%: 30%:
20%
Q7- List out the projects where release of funds to ULBs by the State was delayed?
Response: The central share against SAAP I & II has been released to SMD account and as
per project wise financial sanction, central share along with the state share is released to
respective ULBs against the DPR sanctioned, therefore no wishful delay happened in the
release of fund.
Q8-In how many ULBs implementation was done by agencies other than ULBs? Was a
resolution taken from all ULBs? (Tabular and 200 words)
Response: Water supply and Sewerage projects are being implemented by the UP-Jal Nigam.
Govt. of Uttar Pradesh through Nagar Vikas Vibhag GO No 5457/nau-5-2015-227sa/2015, Dt.
22.12.2015 authorised the U.P. Jal Nigam to execute water supply & sewerage projects. For
Park, Green spaces & transport, RCUES Lucknow has been nominated as the PDMC and ULB
as executing agency. Most of ULB’s have passed resolution from their board for the said
purpose. Moreover, all the project submitted to SLTC by UPJN and RCUES have been certified
by the concerning ULB.

Final 3rd STATE ANNUAL ACTION PLAN (3rd SAAP) FOR FY: 2017-18 to FY 2019-20 OF UTTAR PRADESH UNDER ATAL MISSION FOR
REJUVENATION AND URBAN TRANSFORMATION (AMRUT)
2017
STATE MISSION DIRECTORATE (AMRUT) UTTAR PRADESH, 8TH FLOOR, INDIRA BHAWAN, ASHOK MARG, LUCKNOW-226001 70 | P a g e
Q9- List out the projects where the assessed value approved by the Apex Committee was
greater than the tendered value and there was a saving? Was this addressed by the
SHPSC in the present SAAP? (Tabular and 200 words)
Response: Till now some tenders have been invited so the variation cannot be assessed, the
variation in the cost of the tender and the approved cost can be assessed only when all tenders
are finalised against the approved SAAPs
Q10- List out the number of city-wise projects where the second and third instalments
were claimed. (Tabular form).
Response: Yet to be claimed.
Q11- List out the city-wise completed projects. Was the targeted benchmark achieved?
Explain the reasons for non-achievement (tabular form and 400 words)
Response: Projects are under initial execution. Since none of the projects of all the three
sectors viz. Water Supply, sewerage and parks has yet been started so the coverage status of
the completed projects are nil. The achievement of targeted bench mark could only be assessed
after the completion of projects.
Q12- List out the details of projects taken up in PPP model. Describe the type of PPP
(tabular; 300 words)
Response: No project of water supply and sewerage have been taken up on PPP model.
Q13- List out and describe any out-of-the-box initiatives/Smart Solutions/resilience
used/incorporated in the projects under implementation. What is the nature of the
innovation in the projects? (Tabular; 300 words)

Final 3rd STATE ANNUAL ACTION PLAN (3rd SAAP) FOR FY: 2017-18 to FY 2019-20 OF UTTAR PRADESH UNDER ATAL MISSION FOR
REJUVENATION AND URBAN TRANSFORMATION (AMRUT)
2017
STATE MISSION DIRECTORATE (AMRUT) UTTAR PRADESH, 8TH FLOOR, INDIRA BHAWAN, ASHOK MARG, LUCKNOW-226001 71 | P a g e
Response: Use of New innovative technology and smart solutions are conceptualised in the
proposed DPRs which are yet to be implemented.
SERVICE LEVELS
The focus of AMRUT is to achieve service level benchmarks, such as universal coverage in
water supply, sewer connections, and so on. In the approved SAAPs, the States/ULBs have
targeted the benchmark of universal coverage. The SAAP has to review the progress towards
targets set by the States/ULBs to move towards achievement of universal coverage, etc. The
status of service level in water supply and sewerage in given below:
Service level in Water Supply Sector
Service Levels in Water Supply Sector SN Name of City Service
Level
Benchmark
SAAP
Baseline
SAAP Mission
Target
For the last Financial
Year
(As in
2015)
2015-16 2016-17 Target upto
beginning of
current FY
Achievement
upto
beginning of
current FY
1 2 3 4 5 6 7 8
1 Agra HH Cov 48 56 59 56 -
2 Allahabad HH Cov 78 81 85 81 -
3 Ghaziabad HH Cov 60 85 88 85 -
4 Kanpur HH Cov 52 58 60 58 -
5 Lucknow HH Cov 63 91 93 91 -
6 Meerut HH Cov 51 63 70 63 -
7 Varanasi HH Cov 67 90 93 90 -
Million Plus Cities- 7
1 Aligarh HH Cov 36 51 62 51 -
2 Bareilly HH Cov 47 51 55 51 -
3 Firozabad HH Cov 40 40 41 40 -
4 Gorakhpur HH Cov 60 66 67 66 -
5 Jhansi HH Cov 35 60 66 60 -
6 Moradabad HH Cov 54 57 58 57 -
7 Saharanpur HH Cov 32 51 55 51 -
8 Akbarpur HH Cov 23 41 45 41 -
9 Amroha HH Cov 32 90 90 90 -
10 Azamgarh HH Cov 50 58 62 58 -
11 Bahraich HH Cov 52 58 60 58 -
12 Ballia HH Cov 26 35 36 35 -
13 Banda HH Cov 53 64 80 64 -
14 Baraut HH Cov 64 70 73 70 -
15 Basti HH Cov 70 80 80 80 -

Final 3rd STATE ANNUAL ACTION PLAN (3rd SAAP) FOR FY: 2017-18 to FY 2019-20 OF UTTAR PRADESH UNDER ATAL MISSION FOR
REJUVENATION AND URBAN TRANSFORMATION (AMRUT)
2017
STATE MISSION DIRECTORATE (AMRUT) UTTAR PRADESH, 8TH FLOOR, INDIRA BHAWAN, ASHOK MARG, LUCKNOW-226001 72 | P a g e
Service Levels in Water Supply Sector SN Name of City Service
Level
Benchmark
SAAP
Baseline
SAAP Mission
Target
For the last Financial
Year
(As in
2015)
2015-16 2016-17 Target upto
beginning of
current FY
Achievement
upto
beginning of
current FY
1 2 3 4 5 6 7 8
16 Budaun HH Cov 38 60 64 60 -
17 Bulandshahar HH Cov 33 37 38 37 -
18 Chandausi HH Cov 40 44 46 44 -
19 Deoria HH Cov 33 39 40 39 -
20 Etah HH Cov 34 42 46 42 -
21 Etawah HH Cov 60 72 75 72 -
22 Faizabad HH Cov 70 92 92 92 -
23 Farrukhabad HH Cov 47 80 85 80 -
24 Fatehpur HH Cov 43 45 46 45 -
25 Ghazipur HH Cov 56 63 67 63 -
26 Gonda HH Cov 37 42 45 42 -
27 Hapur HH Cov 34 90 92 90 -
28 Hardoi HH Cov 36 43 45 43 -
29 Hathras HH Cov 35 44 49 44 -
30 Jaunpur HH Cov 60 94 95 94 -
31 Kasganj HH Cov 45 54 66 54 -
32 Khurja HH Cov 40 92 93 92 -
33 Lakhimpur HH Cov 49 55 58 55 -
34 Lalitpur HH Cov 44 65 76 65 -
35 Loni HH Cov 21 82 83 82 -
36 Mainpuri HH Cov 32 42 42 42 -
37 Mathura HH Cov 59 66 86 66 -
38 Maunath HH Cov 40 48 50 48 -
39 Mirzapur HH Cov 59 92 92 92 -
40 Modinagar HH Cov 72 73 73 73 -
41 Mughalsarai HH Cov 23 34 37 34 -
42 Muzaffarnagar HH Cov 65 70 71 70 -
43 Orai HH Cov 37 40 43 40 -
44 Pilibhit HH Cov 37 39 40 39 -
45 Raibareli HH Cov 48 58 75 58 -
46 Rampur HH Cov 17 25 27 25 -
47 Shahjahanpur HH Cov 58 64 66 64 -
48 Shambhal HH Cov 25 33 35 33 -
49 Shamli HH Cov 56 59 62 59 -
50 Shikohabad HH Cov 27 42 46 42 -
51 Sitapur HH Cov 37 48 52 48 -
52 Sultanpur HH Cov 53 61 65 61 -
53 Unnao HH Cov 31 37 40 37 -
54 Ayodhya HH Cov 64 64
Less Than Million Cities- 54

Final 3rd STATE ANNUAL ACTION PLAN (3rd SAAP) FOR FY: 2017-18 to FY 2019-20 OF UTTAR PRADESH UNDER ATAL MISSION FOR
REJUVENATION AND URBAN TRANSFORMATION (AMRUT)
2017
STATE MISSION DIRECTORATE (AMRUT) UTTAR PRADESH, 8TH FLOOR, INDIRA BHAWAN, ASHOK MARG, LUCKNOW-226001 73 | P a g e
SERVICE LEVEL IN SEWERAGE SECTOR
Service Levels in Sewerage & Sanitation Sector SN Name of City Service
Level
Benchmark
SAAP
Baseline
SAAP Mission
Target
For the last Financial Year
(As in
2015)
2015-16 2016-17 Target upto
beginning of
current FY
Achievement
upto beginning
of current FY
1 2 3 4 5 6 7 8
1 Agra Netwk Cov 40.58 52.00 60.00 52.00 -
2 Allahabad Netwk Cov 48.53 73.00 75.00 73.00 -
3 Ghaziabad Netwk Cov 83.82 87.00 90.00 87.00 -
4 Kanpur Netwk Cov 38.40 42.00 45.00 42.00 -
5 Lucknow Netwk Cov 39.40 58.00 65.00 58.00 -
6 Meerut Netwk Cov 50.63 58.00 59.00 58.00 -
7 Varanasi Netwk Cov 59.85 76.00 80.00 76.00 -
Million Plus Cities- 7
8 Aligarh Netwk Cov 3.54 3.54 20.00 3.54 -
9 Bareilly Netwk Cov 41.40 41.40 45.00 41.40 -
10 Firozabad Netwk Cov 54.00 54.00 60.00 54.00 -
11 Gorakhpur Netwk Cov 11.96 15.00 20.00 15.00 -
12 Jhansi Netwk Cov - - - - -
13 Moradabad Netwk Cov - 40.00 52.00 40.00 -
14 Saharanpur Netwk Cov 18.65 20.00 28.00 20.00 -
15 Akbarpur Netwk Cov - - - - -
16 Amroha Netwk Cov - - - - -
17 Azamgarh Netwk Cov - 36.00 70.00 36.00 -
18 Bahraich Netwk Cov - - - - -
19 Ballia Netwk Cov - 76.00 92.00 76.00 -
20 Banda Netwk Cov 4.00 5.00 8.00 5.00 -
21 Baraut Netwk Cov 6.20 6.20 6.20 6.20 -
22 Basti Netwk Cov - - - - -
23 Budaun Netwk Cov - - - - -
24 Bulandshahar Netwk Cov - - 32.00 - -
25 Chandausi Netwk Cov - - - - -
26 Deoria Netwk Cov - - - - -
27 Etah Netwk Cov - - - - -
28 Etawah Netwk Cov 0.05 0.05 0.05 0.05 -
29 Faizabad Netwk Cov - - - - -
30 Farrukhabad Netwk Cov - - - - -
31 Fatehpur Netwk Cov - - - - -
32 Ghazipur Netwk Cov - - - - -
33 Gonda Netwk Cov - - - - -
34 Hapur Netwk Cov - - - - -
35 Hardoi Netwk Cov - - - - -
36 Hathras Netwk Cov - - - - -
37 Jaunpur Netwk Cov - - - - -
38 Kasganj Netwk Cov - - - - -

Final 3rd STATE ANNUAL ACTION PLAN (3rd SAAP) FOR FY: 2017-18 to FY 2019-20 OF UTTAR PRADESH UNDER ATAL MISSION FOR
REJUVENATION AND URBAN TRANSFORMATION (AMRUT)
2017
STATE MISSION DIRECTORATE (AMRUT) UTTAR PRADESH, 8TH FLOOR, INDIRA BHAWAN, ASHOK MARG, LUCKNOW-226001 74 | P a g e
Service Levels in Sewerage & Sanitation Sector SN Name of City Service
Level
Benchmark
SAAP
Baseline
SAAP Mission
Target
For the last Financial Year
(As in
2015)
2015-16 2016-17 Target upto
beginning of
current FY
Achievement
upto beginning
of current FY
1 2 3 4 5 6 7 8
39 Khurja Netwk Cov - - - - -
40 Lakhimpur Netwk Cov - - - - -
41 Lalitpur Netwk Cov - - - - -
42 Loni Netwk Cov - 14.00 18.00 14.00 -
43 Mainpuri Netwk Cov 12.00 39.00 80.00 39.00 -
44 Mathura Netwk Cov 13.64 39.00 41.00 39.00 -
45 Maunath Netwk Cov 5.50 5.50 5.50 5.50 -
46 Mirzapur Netwk Cov 12.00 15.00 18.00 15.00 -
47 Modinagar Netwk Cov - 10.00 15.00 10.00 -
48 Mughalsarai Netwk Cov 8.69 8.69 8.69 8.69 -
49 Muzaffarnagar Netwk Cov - 10.00 15.00 10.00 -
50 Orai Netwk Cov 5.00 7.00 17.00 7.00 -
51 Pilibhit Netwk Cov - - - - -
52 Raibareli Netwk Cov 30.00 30.00 35.00 30.00 -
53 Rampur Netwk Cov - 12.00 15.00 12.00 -
54 Shahjahanpur Netwk Cov - - - - -
55 Shambhal Netwk Cov - - - - -
56 Shamli Netwk Cov - - - - -
57 Shikohabad Netwk Cov - - - - -
58 Sitapur Netwk Cov 2.94 2.94 2.94 2.94 -
59 Sultanpur Netwk Cov - - - - -
60 Unnao Netwk Cov 6.28 8.00 10.00 8.00 -
61 Ayodhya Netwk Cov 12.00 12.00
Less Than Million Cities- 54
Q1- How many projects, city-wise, have targets not been achieved? What is the Plan for
Action to achieve the targets? (Tabular form; 500 words)
Response: Since none of the projects have been fully implemented as envisaged initially. Hence
there is no remarkable change in the Service Level Bench marks from the initial data of SLIP.
Q2- What are the status of the ongoing DPR preparation and the plan of action for the
pending DPRs? (300 words)

Final 3rd STATE ANNUAL ACTION PLAN (3rd SAAP) FOR FY: 2017-18 to FY 2019-20 OF UTTAR PRADESH UNDER ATAL MISSION FOR
REJUVENATION AND URBAN TRANSFORMATION (AMRUT)
2017
STATE MISSION DIRECTORATE (AMRUT) UTTAR PRADESH, 8TH FLOOR, INDIRA BHAWAN, ASHOK MARG, LUCKNOW-226001 75 | P a g e
Response: The balance DPR against the SAAP 2016-17 are under preparation and expected
to be submitted by March, 2017.
Q3- How many SLTC meetings had been held in the State? How many DPRs have been
approved by the SLTC till date? (250 words)
Response: There are 6 SLTC had held so far and all 211 DPRs for SAAP I and 168 DPRs of
SAAP II have approved till now.
CAPACITY BUILDING
Implementation of Capacity Building Plan No.
of
ULB
Name of
Department
Total
Target (Mission
period)
Target to be trained during the previous Financial Year SAAP III Target Name of Training
Entity (TEs) 2015-16 2016-17 SAAP I &II 2017-
18
2018-
19
2019-
20 Target Achieved Target Achieved Target Achieved
1 2 3 4 5 6 7 8 9 10 11 12 13
636 Elected
Representatives
11,920 600 - 1,260 - 1,860 - 1,260 4,400 4,400 *ISPER
Panchkula
(Haryana)
Finance
Department
586 90 44 90 324 180 368 90 158 158 **RCUES,
Lucknow
Engineering
Department
691 90 120 210 263 300 383 210 91 90 RCUES+***ESCI
Hyderabad
Town Planning - - - - - - - - - -
Administrative
Department
800 150 37 150 210 300 247 150 175 175 RCUES,
Lucknow
Non-
centralized
Services
(AMRUT)
3,561 300 9 390 - 690 9 390 1,241 1,240 RCUES,
Lucknow
Non-
Centralized
Services (other
than AMRUT
Cities)
8,326 270 - 300 - 570 - 300 3,728 3,728 RCUES,
Lucknow
Total 25,884 1,500 210 2,400 797 3,900 1,007 2,400 9,793 9,791
*ISPER- Institute for Spatial Planning and Environment Research
**RCUES- Regional Centre for Urban and Environment Studies
***ESCI- Engineering Staff College of India
Note: In the Financial Year 2014-15, RCUES, Lucknow organized 100 training Programmes under CCBP in
which total 1956 number of persons were trained which included 345 Male Elected Representatives and 28
Female Elected Representatives and remaining 1583 officials were trained.
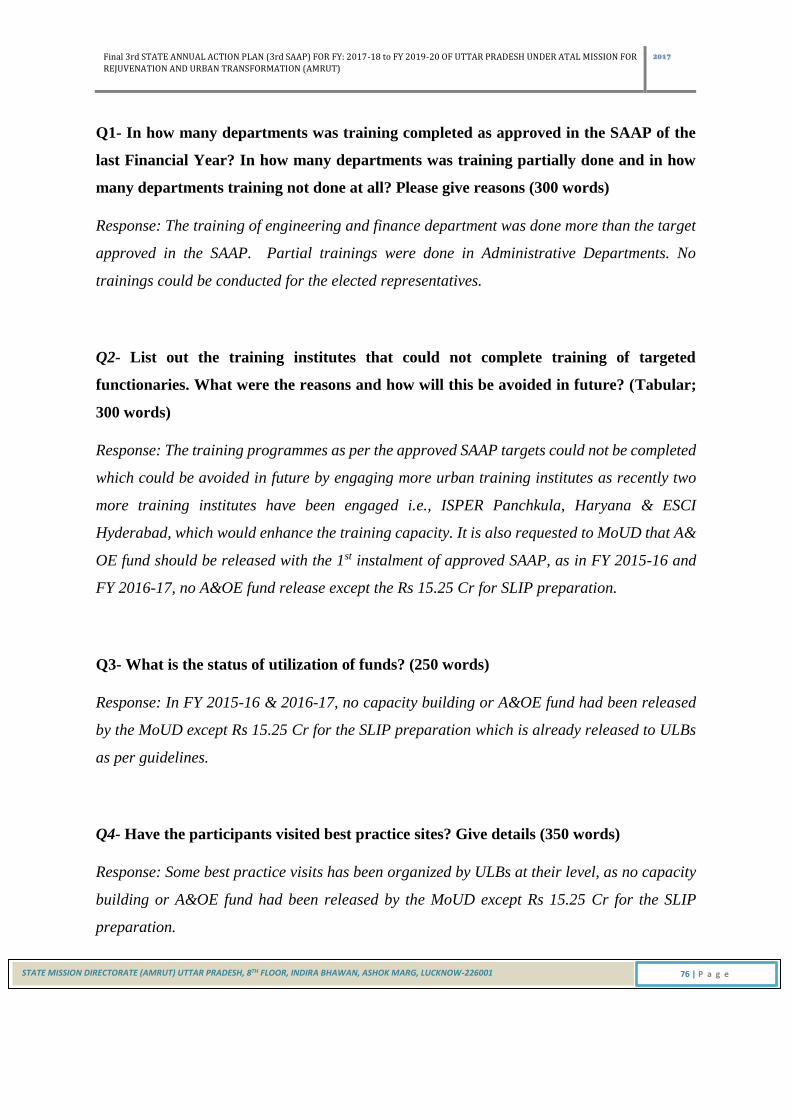
Final 3rd STATE ANNUAL ACTION PLAN (3rd SAAP) FOR FY: 2017-18 to FY 2019-20 OF UTTAR PRADESH UNDER ATAL MISSION FOR
REJUVENATION AND URBAN TRANSFORMATION (AMRUT)
2017
STATE MISSION DIRECTORATE (AMRUT) UTTAR PRADESH, 8TH FLOOR, INDIRA BHAWAN, ASHOK MARG, LUCKNOW-226001 76 | P a g e
Q1- In how many departments was training completed as approved in the SAAP of the
last Financial Year? In how many departments was training partially done and in how
many departments training not done at all? Please give reasons (300 words)
Response: The training of engineering and finance department was done more than the target
approved in the SAAP. Partial trainings were done in Administrative Departments. No
trainings could be conducted for the elected representatives.
Q2- List out the training institutes that could not complete training of targeted
functionaries. What were the reasons and how will this be avoided in future? (Tabular;
300 words)
Response: The training programmes as per the approved SAAP targets could not be completed
which could be avoided in future by engaging more urban training institutes as recently two
more training institutes have been engaged i.e., ISPER Panchkula, Haryana & ESCI
Hyderabad, which would enhance the training capacity. It is also requested to MoUD that A&
OE fund should be released with the 1st instalment of approved SAAP, as in FY 2015-16 and
FY 2016-17, no A&OE fund release except the Rs 15.25 Cr for SLIP preparation.
Q3- What is the status of utilization of funds? (250 words)
Response: In FY 2015-16 & 2016-17, no capacity building or A&OE fund had been released
by the MoUD except Rs 15.25 Cr for the SLIP preparation which is already released to ULBs
as per guidelines.
Q4- Have the participants visited best practice sites? Give details (350 words)
Response: Some best practice visits has been organized by ULBs at their level, as no capacity
building or A&OE fund had been released by the MoUD except Rs 15.25 Cr for the SLIP
preparation.
Final 3rd STATE ANNUAL ACTION PLAN (3rd SAAP) FOR FY: 2017-18 to FY 2019-20 OF UTTAR PRADESH UNDER ATAL MISSION FOR
REJUVENATION AND URBAN TRANSFORMATION (AMRUT)
2017
STATE MISSION DIRECTORATE (AMRUT) UTTAR PRADESH, 8TH FLOOR, INDIRA BHAWAN, ASHOK MARG, LUCKNOW-226001 77 | P a g e
Q5- Have the participants attended any national/international workshops, as per
guideline (Annexure 7)? (350 words)
Response: In FY 2015-16 and 2016-16 no capacity building or A&OE fund had been released
by the MoUD except Rs 15.25 Cr for the SLIP preparation
Q6- What is the plan of action for the pending activities, if any? (400 words)
Response: The pending activities are now planned to be completed in the current financial year
subject to availability of A&OE fund.
REFORMS
Q1- Have the Reform formats prescribed by the TCPO furnished?
Response: Reform list is given in the AMRUT guidelines as Annexure 1 and had been circulated
to all mission cities. To sensitize the ULB officials’ series of meetings and workshops at ULB
Directorate/ Mission Directorate level organised and through power point presentation and
several day long discussion, intent and importance of AMRUT urban reforms was
communicated to officials which has given the good result at the time evaluation and 1st yr
reforms could be achieved as envisaged.
Q2- Did the State as a whole complete 70 percent of Reforms? If, yes was the incentive
claimed? (100 words)
Response: The State has scored the more than 70 percent of Reforms and incentive Rs. 63.47
Cr. has been released by GoI on 30.09.2016 vide F. No. K-16012/2/2016-AMRUT-III, dated
30-09-2016 for achievement of Reforms milestone mandated for financial year 2015-16 as per
para 4.3 of the guidelines of AMRUT.

Final 3rd STATE ANNUAL ACTION PLAN (3rd SAAP) FOR FY: 2017-18 to FY 2019-20 OF UTTAR PRADESH UNDER ATAL MISSION FOR
REJUVENATION AND URBAN TRANSFORMATION (AMRUT)
2017
STATE MISSION DIRECTORATE (AMRUT) UTTAR PRADESH, 8TH FLOOR, INDIRA BHAWAN, ASHOK MARG, LUCKNOW-226001 78 | P a g e
Q3- What is the status of Reforms to be completed in the Mission period? Has advance
action been taken and a Plan of Action prepared? (500 words).
Response: Yes mission period action plan was prepared with SAAP 2016-17 and advance
action has been taken by the State Govt. to achieve the reforms well within the time.
Q5- Give any instances of innovation in Reform implementation. (300 words)
Response: To implement EMAAS as AMRUT reforms, the E- Governance for Municipalities 8
modules like- Birth & Death registration, Centralized Admin Module, Property Tax, Public
Grievance Redressal, E- Procurement and Accrual Based Double Accounting System (DEAS)
etc., have been developed and are being implemented in 14 Nagar Nigams, and 23 other
municipalities. For all 636 ULBs common state level portal has been launched http://www.e-
nagarsewaup.gov.in/ulbapps.
The e governance architecture under this program has been conceived:
State-wide Unified Application for all 636 ULBs
UAT & Go-Live for all 14 Municipal Corporations and 22 Municipalities in first phase
Later, scaling to rest 599 Urban Local Bodies
Capacity Building Awareness, Training & IEC
Integration with Central MMPs, Lokvani/CSCs
Integration with NSDL Payment gateway & SMS Gateway
Services are being provided to Citizens & ULB Staff
Status of E Governance Modules
SN Name of Module Status
1 Birth & Death Registration Live
2 Centralized Admin Module Live
3 Payment of Property Tax Live
4 Water Supply & Other Utilities Live
5 Grievances & Suggestions Live
6 Personnel Information System Live

Final 3rd STATE ANNUAL ACTION PLAN (3rd SAAP) FOR FY: 2017-18 to FY 2019-20 OF UTTAR PRADESH UNDER ATAL MISSION FOR
REJUVENATION AND URBAN TRANSFORMATION (AMRUT)
2017
STATE MISSION DIRECTORATE (AMRUT) UTTAR PRADESH, 8TH FLOOR, INDIRA BHAWAN, ASHOK MARG, LUCKNOW-226001 79 | P a g e
SN Name of Module Status
7 E- Procurement Live (Agra, Lucknow, Kanpur and Allahabad
Started, Saharanpur, and Aligarh are in
process).
8 Works Flow Management Live
9 Monitoring of Projects / Ward Works Live
10 Licenses Live
11 Estates Live
12 Accounting System Live
13 Stores Management Developed and audited
PUBLIC GRIEVANCES – HELP-DESK / CALL CENTER
Call Centre at ULB Dir_te: 24*7 Service initial 2 seat, later scaling
up to 10 seat
32 instantaneous calls - PRI Line approach
PPP Model adopted ( for Service delivery)
Call Back FacilityFacility with Voice Storage/IVR System
3 Digit Toll Free Number – In progress
Toll Free Single Number – In progress ( 1800- 180- 5432)
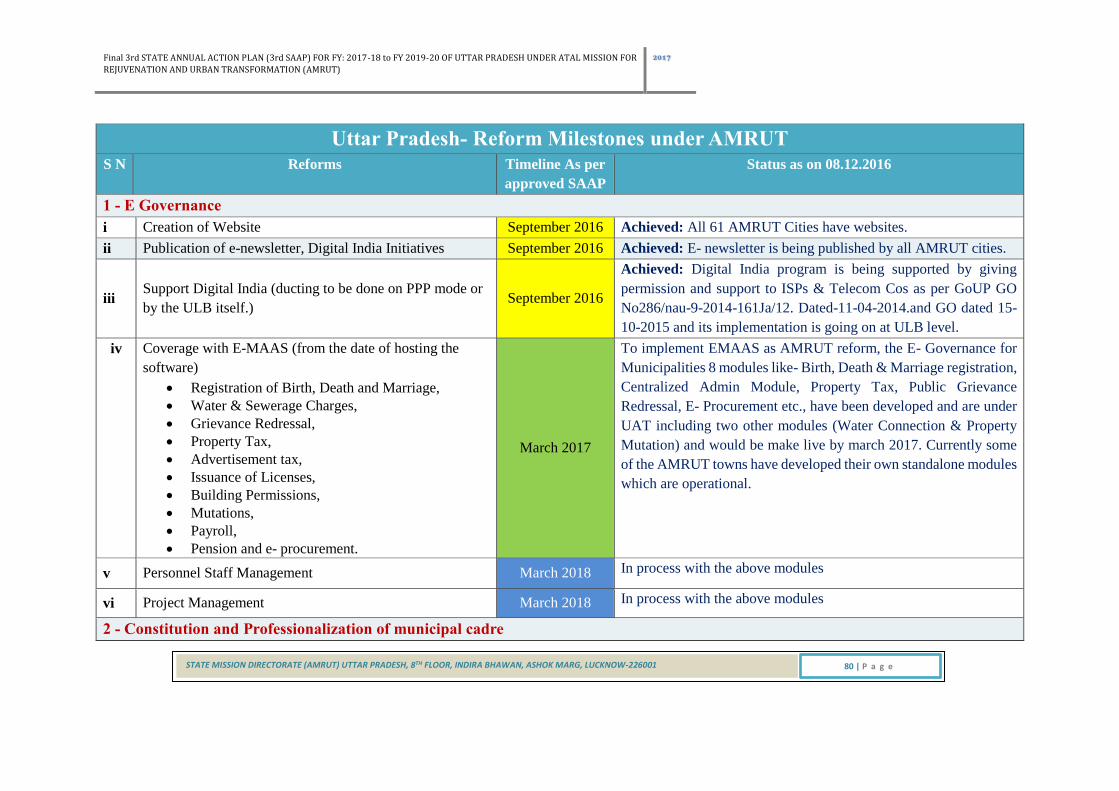
Final 3rd STATE ANNUAL ACTION PLAN (3rd SAAP) FOR FY: 2017-18 to FY 2019-20 OF UTTAR PRADESH UNDER ATAL MISSION FOR
REJUVENATION AND URBAN TRANSFORMATION (AMRUT)
2017
STATE MISSION DIRECTORATE (AMRUT) UTTAR PRADESH, 8TH FLOOR, INDIRA BHAWAN, ASHOK MARG, LUCKNOW-226001 80 | P a g e
Uttar Pradesh- Reform Milestones under AMRUT S N Reforms Timeline As per
approved SAAP
Status as on 08.12.2016
1 - E Governance
i Creation of Website September 2016 Achieved: All 61 AMRUT Cities have websites.
ii Publication of e-newsletter, Digital India Initiatives September 2016 Achieved: E- newsletter is being published by all AMRUT cities.
iii Support Digital India (ducting to be done on PPP mode or
by the ULB itself.) September 2016
Achieved: Digital India program is being supported by giving
permission and support to ISPs & Telecom Cos as per GoUP GO
No286/nau-9-2014-161Ja/12. Dated-11-04-2014.and GO dated 15-
10-2015 and its implementation is going on at ULB level.
iv Coverage with E-MAAS (from the date of hosting the
software)
Registration of Birth, Death and Marriage,
Water & Sewerage Charges,
Grievance Redressal,
Property Tax,
Advertisement tax,
Issuance of Licenses,
Building Permissions,
Mutations,
Payroll,
Pension and e- procurement.
March 2017
To implement EMAAS as AMRUT reform, the E- Governance for
Municipalities 8 modules like- Birth, Death & Marriage registration,
Centralized Admin Module, Property Tax, Public Grievance
Redressal, E- Procurement etc., have been developed and are under
UAT including two other modules (Water Connection & Property
Mutation) and would be make live by march 2017. Currently some
of the AMRUT towns have developed their own standalone modules
which are operational.
v Personnel Staff Management March 2018 In process with the above modules
vi Project Management March 2018 In process with the above modules
2 - Constitution and Professionalization of municipal cadre

Final 3rd STATE ANNUAL ACTION PLAN (3rd SAAP) FOR FY: 2017-18 to FY 2019-20 OF UTTAR PRADESH UNDER ATAL MISSION FOR
REJUVENATION AND URBAN TRANSFORMATION (AMRUT)
2017
STATE MISSION DIRECTORATE (AMRUT) UTTAR PRADESH, 8TH FLOOR, INDIRA BHAWAN, ASHOK MARG, LUCKNOW-226001 81 | P a g e
Uttar Pradesh- Reform Milestones under AMRUT S N Reforms Timeline As per
approved SAAP
Status as on 08.12.2016
i Policy for engagement of interns in ULBs and
implementation September 2016
Achieved: Policy for engagement of interns in ULBs has been
issued as per Govt. Order No.:2034/ukS-5-16-38lk/2016 dated 06-
07-2016. The implementation of policy is under process.
ii Establishment of municipal cadre
March 2017
Municipal Cadre is established for all Municipal Corporations,
Municipal Councils (Nagar Palika Parishad) and transitional areas
(Nagar Panchayat) under section 106 & 112A of UP Municipal
Corporation Act 1959 and section 69-B of UP Municipalities Act
1916 respectively. The rules for service matters, Retirement Benefit,
and Provident Fund etc., are enforced. The recruitment of the
officials of centralized cadre is done by State Govt. through State
Public Service Commission which are transferable between the
municipalities of the state. The Non Centralized officials are
recruited by Municipality concerned which are non-transferable
from One municipality to other. The salary and other benefits are
admissible to all Municipal officials (Centralized and Non-
Centralized) as per recommendation of State Pay Committee from
time to time in the light of recommendations of central pay
commission. Total no. of officials in all municipality is
approximately 1, 31,000. The municipal cadres are restructured
from time to time by state govt. as per requirements.
iii Cadre linked training
March 2017
Policy and strategy for cadre linked training is under consideration
for centralized and non-centralized officials of all categories of
municipalities. The suggestion and comments have been invited

Final 3rd STATE ANNUAL ACTION PLAN (3rd SAAP) FOR FY: 2017-18 to FY 2019-20 OF UTTAR PRADESH UNDER ATAL MISSION FOR
REJUVENATION AND URBAN TRANSFORMATION (AMRUT)
2017
STATE MISSION DIRECTORATE (AMRUT) UTTAR PRADESH, 8TH FLOOR, INDIRA BHAWAN, ASHOK MARG, LUCKNOW-226001 82 | P a g e
Uttar Pradesh- Reform Milestones under AMRUT S N Reforms Timeline As per
approved SAAP
Status as on 08.12.2016
from all ULBs and Resource Center/Training Entity, Regional
Centre for Urban & Environmental Studies Lucknow.
3 - Augmenting Double Entry Accounting
i Complete migration to double entry accounting system and
obtaining an audit certificate to the effect from FY 2012-13
onwards.
September 2016
Achieved: The ULBs maintain their accounts on the basis of accrual
based DEAS and Balance Sheets generated every year, which are
being audited by third party auditor.
ii Publication of annual financial statement on website
September 2016
The Annual Financial Statements and Budget of municipalities on
ULBs is being published and available on the concerning ULB
website.
iii Appointment of internal auditor.
March 2017
The internal auditor (MNLPs and Auditors of Centralized service)
are being appointed in municipal corporations and the policy for
appointment of internal auditor in Nagar Palika Parishad and Nagar
Panchayat is under consideration.
4 - Urban planning and City Development Plans
i Improvement Plans (SLIP) State Annual Action Plans
(SAAP) March 2016
Achieved: 2nd SAAP of UP approved by Apex Committee held on
14 June 2016 & OM No. F. No K-16015/03/2016/AMRUT-II dated
24 June 2016 issued.
ii Make action plans to progressively increase green
cover in cities to 15% in 5 years. March 2016
The State Govt. has issued a policy as per GO:2029/ukS-5-16-
38lk/2016 dated 04-07-2016 for increasing the green cover upto
15% in the light of reform mandate and UP Park, Playground &
Open Spaces Act 1975 and rules 2005
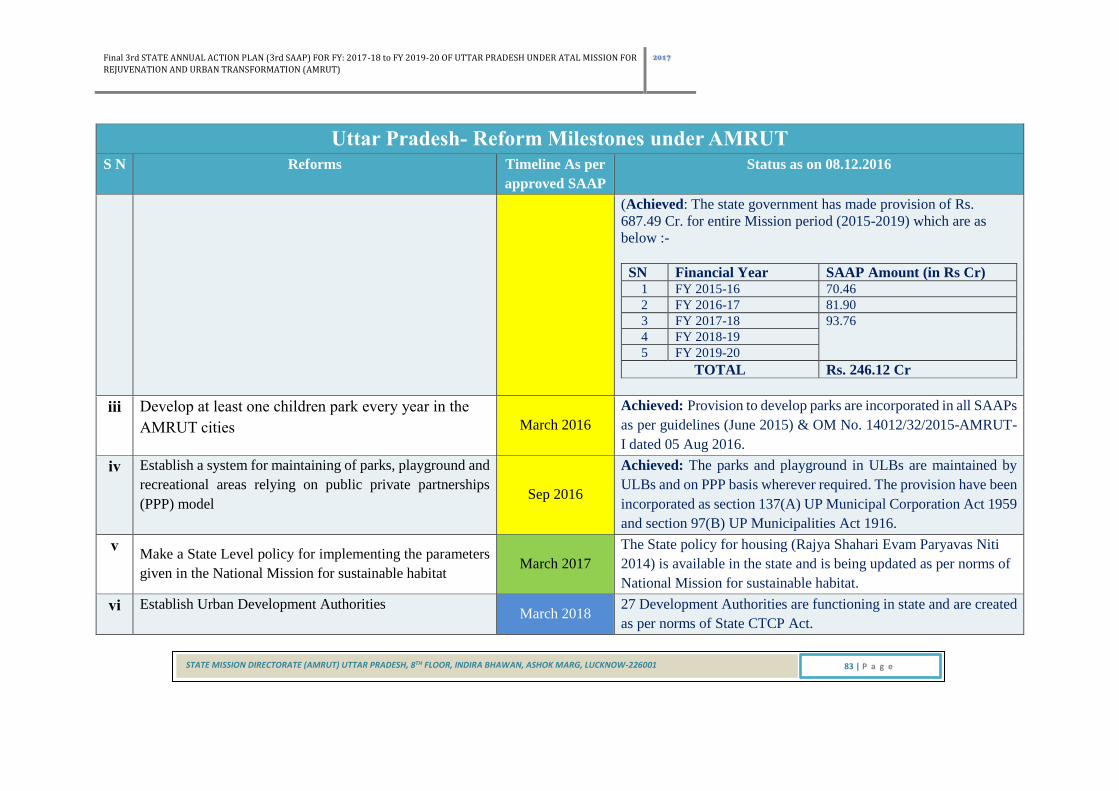
Final 3rd STATE ANNUAL ACTION PLAN (3rd SAAP) FOR FY: 2017-18 to FY 2019-20 OF UTTAR PRADESH UNDER ATAL MISSION FOR
REJUVENATION AND URBAN TRANSFORMATION (AMRUT)
2017
STATE MISSION DIRECTORATE (AMRUT) UTTAR PRADESH, 8TH FLOOR, INDIRA BHAWAN, ASHOK MARG, LUCKNOW-226001 83 | P a g e
Uttar Pradesh- Reform Milestones under AMRUT S N Reforms Timeline As per
approved SAAP
Status as on 08.12.2016
(Achieved: The state government has made provision of Rs.
687.49 Cr. for entire Mission period (2015-2019) which are as
below :-
SN Financial Year SAAP Amount (in Rs Cr) 1 FY 2015-16 70.46
2 FY 2016-17 81.90
3 FY 2017-18 93.76
4 FY 2018-19
5 FY 2019-20
TOTAL Rs. 246.12 Cr
iii Develop at least one children park every year in the
AMRUT cities March 2016
Achieved: Provision to develop parks are incorporated in all SAAPs
as per guidelines (June 2015) & OM No. 14012/32/2015-AMRUT-
I dated 05 Aug 2016.
iv Establish a system for maintaining of parks, playground and
recreational areas relying on public private partnerships
(PPP) model Sep 2016
Achieved: The parks and playground in ULBs are maintained by
ULBs and on PPP basis wherever required. The provision have been
incorporated as section 137(A) UP Municipal Corporation Act 1959
and section 97(B) UP Municipalities Act 1916.
v Make a State Level policy for implementing the parameters
given in the National Mission for sustainable habitat March 2017
The State policy for housing (Rajya Shahari Evam Paryavas Niti
2014) is available in the state and is being updated as per norms of
National Mission for sustainable habitat.
vi Establish Urban Development Authorities March 2018
27 Development Authorities are functioning in state and are created
as per norms of State CTCP Act.
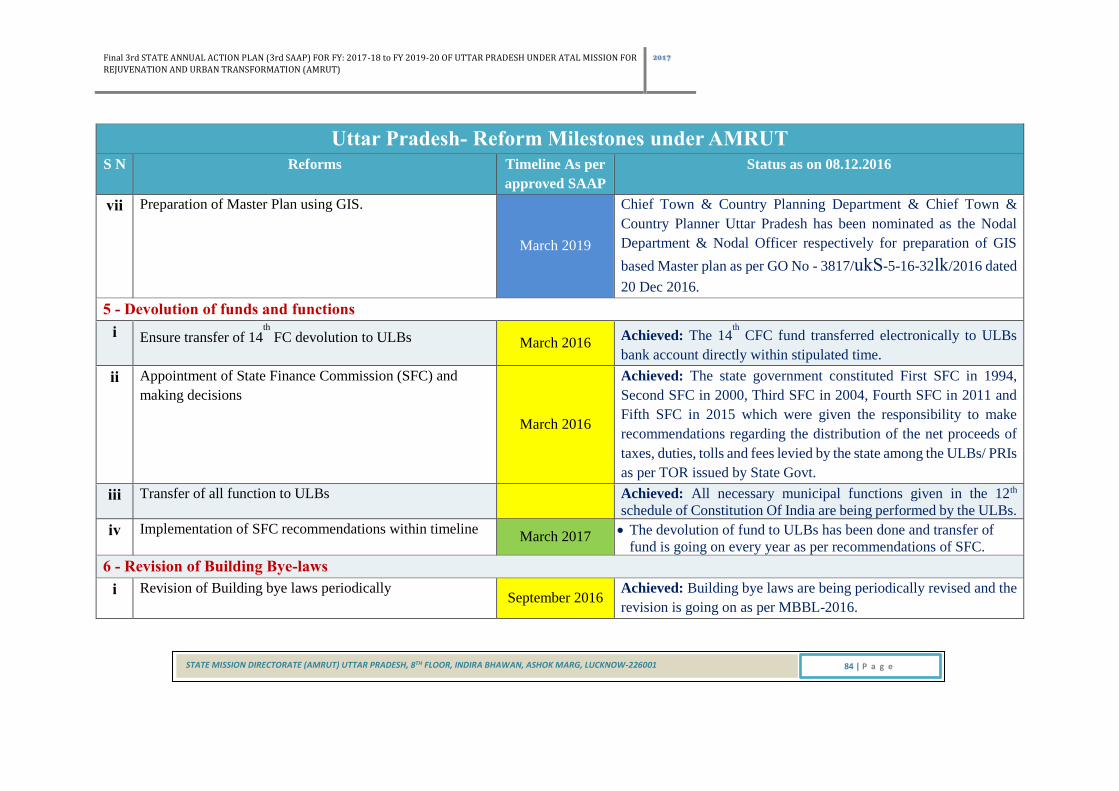
Final 3rd STATE ANNUAL ACTION PLAN (3rd SAAP) FOR FY: 2017-18 to FY 2019-20 OF UTTAR PRADESH UNDER ATAL MISSION FOR
REJUVENATION AND URBAN TRANSFORMATION (AMRUT)
2017
STATE MISSION DIRECTORATE (AMRUT) UTTAR PRADESH, 8TH FLOOR, INDIRA BHAWAN, ASHOK MARG, LUCKNOW-226001 84 | P a g e
Uttar Pradesh- Reform Milestones under AMRUT S N Reforms Timeline As per
approved SAAP
Status as on 08.12.2016
vii Preparation of Master Plan using GIS.
March 2019
Chief Town & Country Planning Department & Chief Town &
Country Planner Uttar Pradesh has been nominated as the Nodal
Department & Nodal Officer respectively for preparation of GIS
based Master plan as per GO No - 3817/ukS-5-16-32lk/2016 dated
20 Dec 2016.
5 - Devolution of funds and functions
i Ensure transfer of 14th
FC devolution to ULBs March 2016 Achieved: The 14
th CFC fund transferred electronically to ULBs
bank account directly within stipulated time.
ii Appointment of State Finance Commission (SFC) and
making decisions
March 2016
Achieved: The state government constituted First SFC in 1994,
Second SFC in 2000, Third SFC in 2004, Fourth SFC in 2011 and
Fifth SFC in 2015 which were given the responsibility to make
recommendations regarding the distribution of the net proceeds of
taxes, duties, tolls and fees levied by the state among the ULBs/ PRIs
as per TOR issued by State Govt.
iii Transfer of all function to ULBs Achieved: All necessary municipal functions given in the 12th
schedule of Constitution Of India are being performed by the ULBs.
iv Implementation of SFC recommendations within timeline March 2017
The devolution of fund to ULBs has been done and transfer of
fund is going on every year as per recommendations of SFC.
6 - Revision of Building Bye-laws
i Revision of Building bye laws periodically September 2016
Achieved: Building bye laws are being periodically revised and the
revision is going on as per MBBL-2016.

Final 3rd STATE ANNUAL ACTION PLAN (3rd SAAP) FOR FY: 2017-18 to FY 2019-20 OF UTTAR PRADESH UNDER ATAL MISSION FOR
REJUVENATION AND URBAN TRANSFORMATION (AMRUT)
2017
STATE MISSION DIRECTORATE (AMRUT) UTTAR PRADESH, 8TH FLOOR, INDIRA BHAWAN, ASHOK MARG, LUCKNOW-226001 85 | P a g e
Uttar Pradesh- Reform Milestones under AMRUT S N Reforms Timeline As per
approved SAAP
Status as on 08.12.2016
ii Create single window clearance for all approvals to give
building permissions September 2016
Achieved by development authorities and Avas Vikas Parishad as
per provisions of chapter Two of UP Building Bye Laws 2008, 2011
& 2016.
iii State to formulate a policy and action plan for having a solar
roof top in all buildings having an area greater than 500
square meters and all public buildings.
March 2017 Building Bye Laws of the state are being amended as per Model
Building Bye laws -2016 issued by GoI.
iv State to formulate a policy and action plan for having
Rainwater harvesting structures in all commercial, public
buildings and new buildings on plots of 300 sq. meters and
above.
March 2017 Building Bye Laws has being amended as per Model Building Bye
laws -2016 issued by GoI UP Building Bye laws 2008, 2011 & 2016.
7 - Set-up financial intermediary at state level
i Establish and operationalize financial intermediary- pool
finance, access external funds, float municipal bonds.
March 2017
In process. The consultant has been appointed and agreement
executed on 19 Feb 2010 for consultancy assignment for the
establishment of Uttar Pradesh Urban Development Fund and Uttar
Pradesh Urban Infrastructure Development & finance Company as
per UP Govt. Order- 6641/ukS-5-2009-145lk/07TC, dated 16-11-
2009. The trust deed and article/memorandum of association are
under consideration to establish the finance company under
Companies Act.
8a- Municipal tax and fees improvement
i At least 90% Coverage September 2016
Achieved: The status of coverage have been presented before GOI
at the time of claiming incentive of reforms. Moreover the ULBs are

Final 3rd STATE ANNUAL ACTION PLAN (3rd SAAP) FOR FY: 2017-18 to FY 2019-20 OF UTTAR PRADESH UNDER ATAL MISSION FOR
REJUVENATION AND URBAN TRANSFORMATION (AMRUT)
2017
STATE MISSION DIRECTORATE (AMRUT) UTTAR PRADESH, 8TH FLOOR, INDIRA BHAWAN, ASHOK MARG, LUCKNOW-226001 86 | P a g e
Uttar Pradesh- Reform Milestones under AMRUT S N Reforms Timeline As per
approved SAAP
Status as on 08.12.2016
instructed to obtain the consultancy service for technical assistance
for municipal tax & fee improvement as per OM No.
K14012/101(5)/2016-SCM-III-V, dated 05 Aug 2016. U.P. Board
for development of Municipal Financial Resources has been
established under UP Nagar Palika Vitya Sansadhan Vikas Board
Act 2011 (Act No. 11 of 2011) for the improvement of financial
resources (Say Tax & Fee) of municipalities of state.
ii At least 90% Collection
Achieved: Same as above.
iii Make policy to periodically revise property tax, levy charges
and other fees
Achieved: Policy already exists for revision of property tax which
every 2nd
year in Municipal Act & concerned rules.
iv Post demand collection book (DCB) of tax details on the
website
Achieved: DCB is being maintained by all ULBs manually which
are to be posted on respective websites.
v Achieve full potential advertisement revenue by making a
policy for destination specific potential having dynamic
pricing module.
Achieved: A model draft for advertisement tax has been circulated
to all ULBs to prepare the byelaws. For obtaining consultancy
services of technical assistance in improvement of revenue from
advertisement tax the instructions has been given to ULB as per OM
No. K14012/101(6)/2016-SCM-III-V dated 29 July 2016.
8b - Improvement in levy and collection of user charges
i Adopt a policy on user charges for individual and
institutional assessment in which a differential rate is
charged for water use and adequate safeguards are included
to take care of interests of the vulnerable.
September 2016
Achieved: The policy adopted by the State Govt. and vide order
dated 26-04-2013 directed to ULBs to implement volumetric tariff
system for water consumption. The ULBs also made byelaws about
water tariff. Action will be taken as per recommendation of

Final 3rd STATE ANNUAL ACTION PLAN (3rd SAAP) FOR FY: 2017-18 to FY 2019-20 OF UTTAR PRADESH UNDER ATAL MISSION FOR
REJUVENATION AND URBAN TRANSFORMATION (AMRUT)
2017
STATE MISSION DIRECTORATE (AMRUT) UTTAR PRADESH, 8TH FLOOR, INDIRA BHAWAN, ASHOK MARG, LUCKNOW-226001 87 | P a g e
Uttar Pradesh- Reform Milestones under AMRUT S N Reforms Timeline As per
approved SAAP
Status as on 08.12.2016
consultant appointed for technical consultancy services as per OM
No K14012/101(6)/2016-SCM-III-V dated 29 July 2016.
ii Make action plan to reduce water losses to less than 20 %
and publish on website
Achieved: The action plan already prepared by ULB in the service
level benchmarking gazette notification as on 31st march every year
which is available on www.localbodies.up.nic.in and the policy for
reduction in NRW for ULBs is under consideration. ULBs are
instructed to take consultancy services for technical assistance in
assessment of NRW and developing strategy and implementation
plans for reduction of NRW as per OM No- K-14012/101(11)/2016-
SCM-III-V dated 29.07.2016.
iii Separate accounts for user charges
Achieved: Separate account has been maintained for user charges
and same separate head of account also created in UP MAAM.
iv At least 90 % billing
Achieved: The policy adopted by the State Govt. and vide order
dated 26-04-2013 directed to ULBs to implement volumetric tariff
system for water consumption. The ULBs also made byelaws about
water tariff. Action will be taken as per recommendation of
consultant appointed for technical consultancy services as per OM
No K14012/101(6)/2016-SCM-III-V dated 29 July 2016.
v At least 90% collection
The policy adopted by the State Govt. and vide order dated 26-04-
2013 directed to ULBs to implement volumetric tariff system for
water consumption. The ULBs also made byelaws about water tariff.
Action will be taken as per recommendation of consultant appointed

Final 3rd STATE ANNUAL ACTION PLAN (3rd SAAP) FOR FY: 2017-18 to FY 2019-20 OF UTTAR PRADESH UNDER ATAL MISSION FOR
REJUVENATION AND URBAN TRANSFORMATION (AMRUT)
2017
STATE MISSION DIRECTORATE (AMRUT) UTTAR PRADESH, 8TH FLOOR, INDIRA BHAWAN, ASHOK MARG, LUCKNOW-226001 88 | P a g e
Uttar Pradesh- Reform Milestones under AMRUT S N Reforms Timeline As per
approved SAAP
Status as on 08.12.2016
for technical consultancy services as per OM No
K14012/101(6)/2016-SCM-III-V dated 29 July 2016.
9 - Credit Rating
i Complete the credit ratings of the ULBs March 2017
Agencies for credit rating of 61 cities has been selected and letter of
award is issued to following agencies as per OM ________:
(ANNEX 9.1)
SN Agency Name City Name
1 M/S CRISIL
Limited (5 cities)
Meerut, Saharanpur, Ghaziabad, Agra &
Aligarh
2 M/S Brickwork
Rating India Pvt. Ltd
(24 cities)
Kanpur, Jhansi, Allahabad, Raebareli,
Varanasi, Badaun, Pilibhit,
Shahjahanpur, Bareilly, Amroha,
Chandausi, Sambhal, Moradabad,
Rampur, Banda, Orai, Lalitpur, Etawah,
Farrukhabad, Lucknow, Hardoi,
Lakhimpur, Sitapur & Unnao
3 M/S Infomerics
Valuation & Rating
Pvt. Ltd
(15 cities)
Firozabad, Mainpuri, Mathura,
Shikohabad, Etah, Hathras, Kasganj,
Baraut, Bulandshahar, Hapur, Khurja,
Loni, Modinagar, Muzaffarnagar &
Shamli
4 M/S India Ratings &
Research Pvt. Ltd.
(17 cities)
Azamgarh, Ballia, Mathura, Fatehpur,
Jaunpur, Mughalsarai, Ghazipur,
Mirzapur, Bahraich, Gonda, Sultanpur,

Final 3rd STATE ANNUAL ACTION PLAN (3rd SAAP) FOR FY: 2017-18 to FY 2019-20 OF UTTAR PRADESH UNDER ATAL MISSION FOR
REJUVENATION AND URBAN TRANSFORMATION (AMRUT)
2017
STATE MISSION DIRECTORATE (AMRUT) UTTAR PRADESH, 8TH FLOOR, INDIRA BHAWAN, ASHOK MARG, LUCKNOW-226001 89 | P a g e
Uttar Pradesh- Reform Milestones under AMRUT S N Reforms Timeline As per
approved SAAP
Status as on 08.12.2016
Akbarpur, Ayodhya, Faizabad,
Gorakhpur, Deoria & Basti
10 - Energy and water audit
i Energy (street lights ) and water audit (including non-
revenue water or losses audit)
September 2016
Achieved: By using internal assessment mechanism of light and
water works department of ULBs, energy and water auditing is being
done. The instructions has been issued to ULBs to obtain the
consultancy services for optimizing energy consumption in street
lights by using energy efficient lights and increasing reliance on
renewable energy as per OM No.-K-16011/76/2016-AMRUT-II
dated 26 Sept 2016.
ii Making STPs and WTPs energy efficient
Achieved: The STPs and WTPs of ULBs use energy efficient
technology to save energy. The correspondence is going on to EESL
Noida (Gautam Buddha Nagar) as per DO. No - K-16011/76/2016-
AMRUT-II dated 26.09.2016 & O.M. No- K-16011/76/2016-
AMRUT-II dated 14.11.2016.
iii Optimize energy consumption in street lights by using
energy efficient lights and increasing reliance on renewable
energy
Achieved: For the energy efficiency and municipal resources saving
various initiatives have been taken such as LED replacement and use
of solar panel in street lighting and office building etc. APJ Abdul
Kalam Saurya Punj Yojna has been launched by the State Govt. for
the use of solar energy.

Final 3rd STATE ANNUAL ACTION PLAN (3rd SAAP) FOR FY: 2017-18 to FY 2019-20 OF UTTAR PRADESH UNDER ATAL MISSION FOR
REJUVENATION AND URBAN TRANSFORMATION (AMRUT)
2017
STATE MISSION DIRECTORATE (AMRUT) UTTAR PRADESH, 8TH FLOOR, INDIRA BHAWAN, ASHOK MARG, LUCKNOW-226001 90 | P a g e
Uttar Pradesh- Reform Milestones under AMRUT S N Reforms Timeline As per
approved SAAP
Status as on 08.12.2016
iv Give incentives for green buildings (e.g. rebate in property
tax or charges connected to building
permission/development charges).
March 2017
Instruction for incentives for green building has been given to
ULBs
The selection of agencies for energy & water audit is in process
11 - Swachh Bharat Mission
i Elimination of open defecation. March 2018 On Going. PMU(SBM) is monitoring regularly
ii Waste Collection (100%), March 2018 On Going. PMU(SBM) is monitoring regularly
iii Transportation of Waste (100%). March 2018 On Going. PMU(SBM) is monitoring regularly
iv Scientific Disposal (100%). March 2018 On Going. PMU(SBM) is monitoring regularly
v The State will prepare a Policy for Right-sizing the number
of municipal functionaries depending on, say, population of
the ULB, generation of internal resources and expenditure
on salaries.
March 2018
The process of restructuring of municipal cadre is going on, out of
which few cadre like Administrative, Revenue, Accounts, Audit,
etc., has been restructured and remaining are under process of
restructuring.

Final 3rd STATE ANNUAL ACTION PLAN (3rd SAAP) FOR FY: 2017-18 to FY 2019-20 OF UTTAR PRADESH UNDER ATAL MISSION FOR
REJUVENATION AND URBAN TRANSFORMATION (AMRUT)
2017
STATE MISSION DIRECTORATE (AMRUT) UTTAR PRADESH, 8TH FLOOR, INDIRA BHAWAN, ASHOK MARG, LUCKNOW-226001 91 | P a g e
USE OF A&OE FUND
Q1- What are the items for which the A&OE has been used? (Tabular; 250 words)
Response: In FY 2015-16 and 2016-17 no A&OE fund had been released by the MoUD except
Rs 15.25 Cr for the SLIP preparation which is already released to ULBs as per guidelines.
Q2- Are the items similar to the approved items in SAAP or there is any deviation? If
yes, list the items with reasons (tabular; 300 words)
Response: In FY 2015-16 & FY 2016-17, no A&OE fund had been released by the MoUD
except Rs 15.25 Cr for the SLIP preparation which is already released to ULBs as per
guidelines.
Q3- What is the utilization status of funds? (Tabular; 250 words)
Response: In FY 2015-16 & 2016-17, no A&OE fund had been released by the MoUD except
Rs 15.25 Cr for the SLIP preparation which is already released to ULBs as per guidelines.
Q4- Has the IRMA been appointed? What was the procedure followed? (250 words) If
not appointed, give reason for delay and the likely date of appointment (100 words)
Response: The IRMA has not been appointed till now because MoUD is directly appointing
IRMA for the states.
Q5- Have you taken up activities connected to E-Municipality as a Service (E-MAAS)?
Please give details. (250 words)
Response: Yes the State has taken up activities connected to implement EMAAS as AMRUT
reforms under the E- Governance for Municipalities 8 modules like- Birth & Death
registration, Centralized Admin Module, Property Tax, Public Grievance Redressal, E-
Procurement and Accrual Based Double Accounting System (DEAS) etc., have been developed
Final 3rd STATE ANNUAL ACTION PLAN (3rd SAAP) FOR FY: 2017-18 to FY 2019-20 OF UTTAR PRADESH UNDER ATAL MISSION FOR
REJUVENATION AND URBAN TRANSFORMATION (AMRUT)
2017
STATE MISSION DIRECTORATE (AMRUT) UTTAR PRADESH, 8TH FLOOR, INDIRA BHAWAN, ASHOK MARG, LUCKNOW-226001 92 | P a g e
and are being implemented in 14 Nagar Nigams, and 23 other municipalities. For all 636 ULBs
common state level portal has been launched http://www.e-nagarsewaup.gov.in/ulbapps
Q6- Have you displayed the logo and tagline of AMRUT prominently on all projects?
Please give list. (Tabular; 100 words)
Response: AMRUT logo and tagline is being displayed prominently on all AMRUT projects.
Q7- Have you utilised the funds on any of the inadmissible components (para 4.4)? If
yes, give list and reasons. (Tabular; 350 words)
Response: In FY 2015-16 no A&OE fund had been released by the MoUD except Rs 15.25 Cr
for the SLIP preparation which is already released to ULBs as per guidelines.
FUND FLOW
Q1- In how many projects, city-wise, has the full funds been sanctioned and disbursed?
(Tabular form; 500 words)
Response: The financial sanctions of Rs 2486.29 Cr against the 185 projects out of all 211
approved projects of SAAP I have been issued, which is in the process of release to respective
ULBs. Likewise, financial sanctions of Rs 283.65 Cr against 40 projects against the SAAP II
have been issued, which is also in the process of release.
Q2- Identify projects where delay in funds release led to delay in project implementation?
(300 words)
Response: The central share against SAAP I & II has been released to SMD account and as
per project wise financial sanction, central share along with the state share is released to

Final 3rd STATE ANNUAL ACTION PLAN (3rd SAAP) FOR FY: 2017-18 to FY 2019-20 OF UTTAR PRADESH UNDER ATAL MISSION FOR
REJUVENATION AND URBAN TRANSFORMATION (AMRUT)
2017
STATE MISSION DIRECTORATE (AMRUT) UTTAR PRADESH, 8TH FLOOR, INDIRA BHAWAN, ASHOK MARG, LUCKNOW-226001 93 | P a g e
respective ULBs against the DPR sanctioned, therefore no wishful delay happened in the
release of fund.
Q3- Give instances of doing more with less during implementation. (400 words)
Response: All approved projects of SAAP I & II are under the process of implementation at
various stages.
FUNDS DISBURSEMENTS AND CONDITIONS
Q1- How many project fund request has been made to the GoI? (250 words)
Response: No request for fund release has been made.
Q2- How many instalments the GoI has released? (250 words)
Response: After the approval of SAAP I, 20% of central assistance of Rs 281.81 Cr received
from GoI as 1st instalment and after approval of SAAP II, Rs 20% of Central Share Rs 327.60
Cr released to State vide GOI order dated 29-06-2016.
Q3- Is there any observation from the GoI regarding the claims made? (350 words)
Response: Since no claim sent to GoI so no observation made.
Q4- List out the conditions imposed by the Apex Committee, State HPSC and the SLTC.
Have all the conditions been complied with? If, no identify the conditions not complied
with and give reasons for non-compliance. (Tabular; 500 words)
Response: All approved projects of SAAP I & II are under the process of implementation at
various stages.

Final 3rd STATE ANNUAL ACTION PLAN (3rd SAAP) FOR FY: 2017-18 to FY 2019-20 OF UTTAR PRADESH UNDER ATAL MISSION FOR
REJUVENATION AND URBAN TRANSFORMATION (AMRUT)
2017
STATE MISSION DIRECTORATE (AMRUT) UTTAR PRADESH, 8TH FLOOR, INDIRA BHAWAN, ASHOK MARG, LUCKNOW-226001 94 | P a g e
Third (Final) State Annual Action Plan (SAAP) For FY 2017-18 to FY 2019-20
CHAPTER-3

Final 3rd STATE ANNUAL ACTION PLAN (3rd SAAP) FOR FY: 2017-18 to FY 2019-20 OF UTTAR PRADESH UNDER ATAL MISSION FOR
REJUVENATION AND URBAN TRANSFORMATION (AMRUT)
2017
STATE MISSION DIRECTORATE (AMRUT) UTTAR PRADESH, 8TH FLOOR, INDIRA BHAWAN, ASHOK MARG, LUCKNOW-226001 95 | P a g e
CHAPTER 3: THIRD (FINAL) STATE ANNUAL ACTION PLAN (SAAP) FOR FY 2017-18 TO FY 2019-20
THE MAJOR COMPONENTS OF UP- SAAP FY 2017-18 TO 2019-20 HAS BEEN DEPICTED IN FOLLOWING CHART.
The AMRUT mission is providing project funds to ULBs through the States based on
proposals submitted in the form of State Annual Action Plan (SAAP). SAAP is basically a
State Level Service Improvement Plan (SLSIP) indicating the year-wise improvements in
water-supply and sewerage connections to households. The basic building block for the SAAP
is SLIP prepared by the ULBs. At the State level, the SLIPs of all Mission cities are aggregated
into the SAAP. The sectoral proposal of project fund and their sharing pattern is being given
in the following graphical presentation. Also, refer the master plan of projects is given in
TABLE 3.1 and state level plan for achieving service levels given in the TABLE 3.5 of Chapter
4.
Water Supply , 1996.02, 47%
Sewerage & Septage Management , 2149.46,
50%
Others (Green Space & Parks),
93.76, 2%
A&OE Fund, 54.36, 1%
Other, 148.12, 3%
UP-3rd SAAP: FY 2017-18 to 2019-20 (Rs 4293.60 Cr)
Water Supply
Sewerage & SeptageManagement
Others (Green Space & Parks)
A&OE Fund

Final 3rd STATE ANNUAL ACTION PLAN (3rd SAAP) FOR FY: 2017-18 to FY 2019-20 OF UTTAR PRADESH UNDER ATAL MISSION FOR
REJUVENATION AND URBAN TRANSFORMATION (AMRUT)
2017
STATE MISSION DIRECTORATE (AMRUT) UTTAR PRADESH, 8TH FLOOR, INDIRA BHAWAN, ASHOK MARG, LUCKNOW-226001 96 | P a g e
THE DETAILS OF THE PROJECTS, SECTOR WISE ARE BEING GIVEN IN FOLLOWING TABLES FOR THE APPROVAL OF THE APEX COMMITTEE FOR FY 2017-18 TO FY 2019-20: -
46
87
8.8
1
64
6.5
1
47
0.7
0
1,9
96
.02
47
94
9.7
0
69
4.8
7
50
4.8
9
2,1
49
.46
61 46
.88
28
.13
18
.75
93
.76
15
4
1,8
75
.39
1,3
69
.51
99
4.3
4
4,2
39
.24
0
500
1000
1500
2000
2500
3000
3500
4000
4500
No. of Projects Centre State ULB Total
3RD UP- SAAP: SECTOR WISE PROPOSED TOTAL PROJECT FUND AND SHARING PATTERN (RS CR)
Water Supply Sewerage & Septage Management
Others (Green Space & Parks) Grand Total

Final 3rd STATE ANNUAL ACTION PLAN (3rd SAAP) FOR FY: 2017-18 to FY 2019-20 OF UTTAR PRADESH UNDER ATAL MISSION FOR
REJUVENATION AND URBAN TRANSFORMATION (AMRUT)
2017
STATE MISSION DIRECTORATE (AMRUT) UTTAR PRADESH, 8TH FLOOR, INDIRA BHAWAN, ASHOK MARG, LUCKNOW-226001 97 | P a g e
WATER SUPPLY PROJECTS
Details of the Water Supply Projects for Approval from Apex Committee (UP-SAAP: 2017-18 to 2019-20)
SN City Name
Pro
ject
Nam
e
No
of
Pro
ject
s Estimated Cost and Sharing Change in Service Levels
GoI State ULB State+ ULB Total Indicator
Ex
isti
ng After
SAAP
2015-16
After
SAAP
2016-17
After
SAAP
2017-20
1 2 3 4 5 6 7 8 9 10 11 12 13 14
Amount in Rs Crore Figure in %age
1 Agra WS 1 26.66 29.34 24.00 53.34 80.00 HH Cov 48 56 59 80
2 Allahabad WS 1 26.66 29.34 24.00 53.34 80.00 HH Cov 78 81 85 95
3 Ghaziabad WS 1 33.33 36.67 30.00 66.67 100.00 HH Cov 60 85 88 90
4 Kanpur WS 1 26.66 29.34 24.00 53.34 80.00 HH Cov 52 58 60 75
5 Lucknow WS 1 83.33 91.68 75.00 166.68 250.01 HH Cov 63 91 93 95
6 Meerut WS 1 8.33 9.17 7.50 16.67 25.00 HH Cov 51 63 70 90
7 Varanasi WS 1 33.33 36.67 30.00 66.67 100.00 HH Cov 67 90 93 95
Sub Total-A 7 238.30 262.21 214.50 476.71 715.01
1 Aligarh WS 1 20.00 12.00 8.00 20.00 40.00 HH Cov 36 51 62 70
2 Bareilly WS 1 7.50 4.50 3.00 7.50 15.00 HH Cov 47 51 55 65
3 Firozabad WS - - - - - HH Cov 40 40 41 75
4 Gorakhpur WS 1 20.00 12.00 8.00 20.00 40.00 HH Cov 60 66 67 80
5 Jhansi WS 1 127.50 76.50 51.00 127.50 255.00 HH Cov 35 60 66 80
6 Moradabad WS 1 5.00 3.00 2.00 5.00 10.00 HH Cov 54 57 58 65
7 Saharanpur WS 1 12.50 7.50 5.00 12.50 25.00 HH Cov 32 51 55 65
8 Akbarpur WS 1 10.00 6.00 4.00 10.00 20.00 HH Cov 23 41 45 95
9 Amroha WS - - - - - HH Cov 32 90 90 90
10 Ayodhya WS 1 9.01 5.40 3.60 9.00 18.01 HH Cov 64 95
11 Azamgarh WS 1 5.00 3.00 2.00 5.00 10.00 HH Cov 50 58 62 70
12 Bahraich WS - - - - - HH Cov 52 58 60 70
13 Ballia WS 1 2.50 1.50 1.00 2.50 5.00 HH Cov 26 35 36 65
14 Banda WS 1 125.00 75.00 50.00 125.00 250.00 HH Cov 53 64 80 85

Final 3rd STATE ANNUAL ACTION PLAN (3rd SAAP) FOR FY: 2017-18 to FY 2019-20 OF UTTAR PRADESH UNDER ATAL MISSION FOR
REJUVENATION AND URBAN TRANSFORMATION (AMRUT)
2017
STATE MISSION DIRECTORATE (AMRUT) UTTAR PRADESH, 8TH FLOOR, INDIRA BHAWAN, ASHOK MARG, LUCKNOW-226001 98 | P a g e
Details of the Water Supply Projects for Approval from Apex Committee (UP-SAAP: 2017-18 to 2019-20)
SN City Name
Pro
ject
Nam
e
No
of
Pro
ject
s Estimated Cost and Sharing Change in Service Levels
GoI State ULB State+ ULB Total Indicator
Ex
isti
ng After
SAAP
2015-16
After SAAP
2016-17
After SAAP
2017-20
1 2 3 4 5 6 7 8 9 10 11 12 13 14
Amount in Rs Crore Figure in %age
15 Baraut WS 1 2.50 1.50 1.00 2.50 5.00 HH Cov 64 70 73 75
16 Basti WS 1 2.50 1.50 1.00 2.50 5.00 HH Cov 70 80 80 80
17 Budaun WS 1 3.00 1.80 1.20 3.00 6.00 HH Cov 38 60 64 75
18 Bulandshahar WS - - - - - HH Cov 33 37 38 65
19 Chandausi WS 1 15.00 9.00 6.00 15.00 30.00 HH Cov 40 44 46 60
20 Deoria WS 1 2.50 1.50 1.00 2.50 5.00 HH Cov 33 39 40 50
21 Etah WS 1 5.00 3.00 2.00 5.00 10.00 HH Cov 34 42 46 55
22 Etawah WS - - - - - HH Cov 60 72 75 80
23 Faizabad WS - - - - - HH Cov 70 92 92 92
24 Farrukhabad WS - - - - - HH Cov 47 80 85 85
25 Fatehpur WS - - - - - HH Cov 43 45 46 75
26 Ghazipur WS 1 3.50 2.10 1.40 3.50 7.00 HH Cov 56 63 67 80
27 Gonda WS - - - - - HH Cov 37 42 45 60
28 Hapur WS - - - - - HH Cov 34 90 92 92
29 Hardoi WS 1 10.00 6.00 4.00 10.00 20.00 HH Cov 36 43 45 60
30 Hathras WS 1 10.00 6.00 4.00 10.00 20.00 HH Cov 35 44 49 55
31 Jaunpur WS 1 5.00 3.00 2.00 5.00 10.00 HH Cov 60 94 95 95
32 Kasganj WS 1 7.50 4.50 3.00 7.50 15.00 HH Cov 45 54 66 70
33 Khurja WS - - - - - HH Cov 40 92 93 93
34 Lakhimpur WS 1 5.00 3.00 2.00 5.00 10.00 HH Cov 49 55 58 65
35 Lalitpur WS 1 2.50 1.50 1.00 2.50 5.00 HH Cov 44 65 76 85
36 Loni WS - - - - - HH Cov 21 82 83 83
37 Mainpuri WS 1 2.50 1.50 1.00 2.50 5.00 HH Cov 32 42 42 80
38 Mathura WS 1 90.00 54.00 36.00 90.00 180.00 HH Cov 59 66 86 90
39 Maunath WS 1 5.00 3.00 2.00 5.00 10.00 HH Cov 40 48 50 55

Final 3rd STATE ANNUAL ACTION PLAN (3rd SAAP) FOR FY: 2017-18 to FY 2019-20 OF UTTAR PRADESH UNDER ATAL MISSION FOR
REJUVENATION AND URBAN TRANSFORMATION (AMRUT)
2017
STATE MISSION DIRECTORATE (AMRUT) UTTAR PRADESH, 8TH FLOOR, INDIRA BHAWAN, ASHOK MARG, LUCKNOW-226001 99 | P a g e
Details of the Water Supply Projects for Approval from Apex Committee (UP-SAAP: 2017-18 to 2019-20)
SN City Name
Pro
ject
Nam
e
No
of
Pro
ject
s Estimated Cost and Sharing Change in Service Levels
GoI State ULB State+ ULB Total Indicator
Ex
isti
ng After
SAAP
2015-16
After SAAP
2016-17
After SAAP
2017-20
1 2 3 4 5 6 7 8 9 10 11 12 13 14
Amount in Rs Crore Figure in %age
40 Mirzapur WS 1 7.50 4.50 3.00 7.50 15.00 HH Cov 59 92 92 92
41 Modinagar WS 1 10.00 6.00 4.00 10.00 20.00 HH Cov 72 73 73 75
42 Mughalsarai WS 1 15.00 9.00 6.00 15.00 30.00 HH Cov 23 34 37 75
43 Muzaffarnagar WS - - - - - HH Cov 65 70 71 75
44 Orai WS 1 10.00 6.00 4.00 10.00 20.00 HH Cov 37 40 43 65
45 Pilibhit WS 1 12.50 7.50 5.00 12.50 25.00 HH Cov 37 39 40 92
46 Raibareli WS - - - - - HH Cov 48 58 75 75
47 Rampur WS 1 2.50 1.50 1.00 2.50 5.00 HH Cov 17 25 27 42
48 Shahjahanpur WS 1 20.00 12.00 8.00 20.00 40.00 HH Cov 58 64 66 75
49 Sambhal WS 1 2.50 1.50 1.00 2.50 5.00 HH Cov 25 33 35 40
50 Shamli WS 1 5.00 3.00 2.00 5.00 10.00 HH Cov 56 59 62 80
51 Shikohabad WS - - - - - HH Cov 27 42 46 60
52 Sitapur WS 1 12.50 7.50 5.00 12.50 25.00 HH Cov 37 48 52 65
53 Sultanpur WS 1 7.50 4.50 3.00 7.50 15.00 HH Cov 53 61 65 85
54 Unnao WS 1 20.00 12.00 8.00 20.00 40.00 HH Cov 31 37 40 96
Sub Total-B 39 640.51 384.30 256.20 640.50 1,281.01
61 Total: A+B 46 878.81 646.51 470.70 1,117.21 1,996.02 46 59 63 76

Final 3rd STATE ANNUAL ACTION PLAN (3rd SAAP) FOR FY: 2017-18 to FY 2019-20 OF UTTAR PRADESH UNDER ATAL MISSION FOR
REJUVENATION AND URBAN TRANSFORMATION (AMRUT)
2017
STATE MISSION DIRECTORATE (AMRUT) UTTAR PRADESH, 8TH FLOOR, INDIRA BHAWAN, ASHOK MARG, LUCKNOW-226001 100 | P a g e
SEWERAGE AND SEPTAGE MANAGEMENT PROJECTS
Details of the Sewerage Projects for Approval from Apex Committee (UP-SAAP: 2017-18 to 2019-20)
S
N
City Name P
roje
ct
Na
me
No
of
Pro
jects
Estimated Cost and Sharing Sewerage
Manage_t
out of
Total in
Col-9
Septage
Manage_t
out of
Total in
Col-9
Change in Service Levels
GoI State ULB State+
ULB
Total Indicator
Ex
isti
ng
After
SAAP
2015-
16
After
SAAP
2016-
17
After
SAAP
2017-
20
1 2 3 4 5 6 7 8 9 10 11 12 13 14 15 16 Amount in Rs Crore
Figure in %age
1 Agra Sew 1 36.66 40.34 33.00 73.34 110.00 100.00 10.00 Netwk Cov 41 52 60 60
2 Allahabad Sew 1 5.00 5.50 4.50 10.00 15.00 - 15.00 Netwk Cov 49 73 75 75
3 Ghaziabad Sew 1 18.33 20.17 16.50 36.67 55.00 40.00 15.00 Netwk Cov 84 87 90 91
4 Kanpur Sew 1 20.00 22.00 18.00 40.00 60.00 50.00 10.00 Netwk Cov 38 42 45 50
5 Lucknow Sew 1 79.99 88.01 72.00 160.01 240.00 230.00 10.00 Netwk Cov 39 58 65 67
6 Meerut Sew 1 58.33 64.17 52.50 116.67 175.00 160.00 15.00 Netwk Cov 51 58 59 65
7 Varanasi Sew 1 31.66 34.84 28.50 63.34 95.00 80.00 15.00 Netwk Cov 60 76 80 83 Sub Total-A
7 249.97 275.03 225.00 500.03 750.00 660.00 90.00
1 Aligarh Sew 1 7.50 4.50 .00 7.50 15.00 - 15.00 Netwk Cov 4 4 20 20
2 Bareilly Sew 1 65.50 39.30 26.20 65.50 131.00 120.00 11.00 Netwk Cov 41 41 45 60
3 Firozabad Sew
- - - - - - - Netwk Cov 54 54 60 84
4 Gorakhpur Sew 1 20.00 12.00 8.00 20.00 40.00 30.00 10.00 Netwk Cov 12 15 20 30
5 Jhansi Sew 1 7.50 4.50 3.00 7.50 15.00 - 15.00 Netwk Cov
6 Moradabad Sew 1 7.50 4.50 3.00 7.50 15.00 - 15.00 Netwk Cov
40 52 52
7 Saharanpur Sew 1 15.00 9.00 6.00 15.00 30.00 20.00 10.00 Netwk Cov 19 20 28 30
8 Akbarpur Sew
- - - - - - - Netwk Cov
9 Amroha Sew 1 5.00 3.00 2.00 5.00 10.00 - 10.00 Netwk Cov
10 Ayodhya Sew 1 17.50 10.50 7.00 17.50 35.00 25.00 10.00
12
90
11 Azamgarh Sew 1 2.50 1.50 1.00 2.50 5.00 - 5.00 Netwk Cov
36 70 70
12 Bahraich Sew
- - - - - - - Netwk Cov
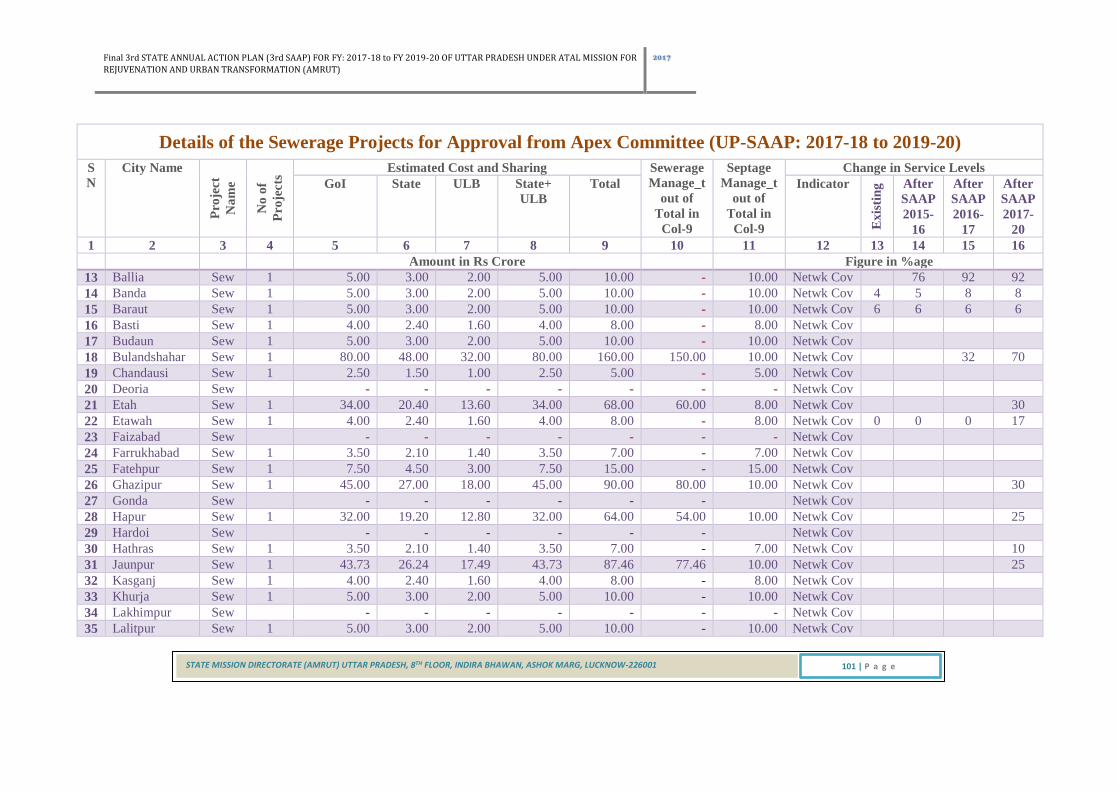
Final 3rd STATE ANNUAL ACTION PLAN (3rd SAAP) FOR FY: 2017-18 to FY 2019-20 OF UTTAR PRADESH UNDER ATAL MISSION FOR
REJUVENATION AND URBAN TRANSFORMATION (AMRUT)
2017
STATE MISSION DIRECTORATE (AMRUT) UTTAR PRADESH, 8TH FLOOR, INDIRA BHAWAN, ASHOK MARG, LUCKNOW-226001 101 | P a g e
Details of the Sewerage Projects for Approval from Apex Committee (UP-SAAP: 2017-18 to 2019-20)
S
N
City Name
Pro
ject
Na
me
No
of
Pro
jects
Estimated Cost and Sharing Sewerage
Manage_t
out of
Total in
Col-9
Septage
Manage_t
out of
Total in
Col-9
Change in Service Levels
GoI State ULB State+
ULB
Total Indicator
Ex
isti
ng
After
SAAP
2015-
16
After
SAAP
2016-
17
After
SAAP
2017-
20
1 2 3 4 5 6 7 8 9 10 11 12 13 14 15 16 Amount in Rs Crore
Figure in %age
13 Ballia Sew 1 5.00 3.00 2.00 5.00 10.00 - 10.00 Netwk Cov
76 92 92
14 Banda Sew 1 5.00 3.00 2.00 5.00 10.00 - 10.00 Netwk Cov 4 5 8 8
15 Baraut Sew 1 5.00 3.00 2.00 5.00 10.00 - 10.00 Netwk Cov 6 6 6 6
16 Basti Sew 1 4.00 2.40 1.60 4.00 8.00 - 8.00 Netwk Cov
17 Budaun Sew 1 5.00 3.00 2.00 5.00 10.00 - 10.00 Netwk Cov
18 Bulandshahar Sew 1 80.00 48.00 32.00 80.00 160.00 150.00 10.00 Netwk Cov
32 70
19 Chandausi Sew 1 2.50 1.50 1.00 2.50 5.00 - 5.00 Netwk Cov
20 Deoria Sew
- - - - - - - Netwk Cov
21 Etah Sew 1 34.00 20.40 13.60 34.00 68.00 60.00 8.00 Netwk Cov
30
22 Etawah Sew 1 4.00 2.40 1.60 4.00 8.00 - 8.00 Netwk Cov 0 0 0 17
23 Faizabad Sew
- - - - - - - Netwk Cov
24 Farrukhabad Sew 1 3.50 2.10 1.40 3.50 7.00 - 7.00 Netwk Cov
25 Fatehpur Sew 1 7.50 4.50 3.00 7.50 15.00 - 15.00 Netwk Cov
26 Ghazipur Sew 1 45.00 27.00 18.00 45.00 90.00 80.00 10.00 Netwk Cov
30
27 Gonda Sew
- - - - - -
Netwk Cov
28 Hapur Sew 1 32.00 19.20 12.80 32.00 64.00 54.00 10.00 Netwk Cov
25
29 Hardoi Sew
- - - - - -
Netwk Cov
30 Hathras Sew 1 3.50 2.10 1.40 3.50 7.00 - 7.00 Netwk Cov
10
31 Jaunpur Sew 1 43.73 26.24 17.49 43.73 87.46 77.46 10.00 Netwk Cov
25
32 Kasganj Sew 1 4.00 2.40 1.60 4.00 8.00 - 8.00 Netwk Cov
33 Khurja Sew 1 5.00 3.00 2.00 5.00 10.00 - 10.00 Netwk Cov
34 Lakhimpur Sew
- - - - - - - Netwk Cov
35 Lalitpur Sew 1 5.00 3.00 2.00 5.00 10.00 - 10.00 Netwk Cov

Final 3rd STATE ANNUAL ACTION PLAN (3rd SAAP) FOR FY: 2017-18 to FY 2019-20 OF UTTAR PRADESH UNDER ATAL MISSION FOR
REJUVENATION AND URBAN TRANSFORMATION (AMRUT)
2017
STATE MISSION DIRECTORATE (AMRUT) UTTAR PRADESH, 8TH FLOOR, INDIRA BHAWAN, ASHOK MARG, LUCKNOW-226001 102 | P a g e
Details of the Sewerage Projects for Approval from Apex Committee (UP-SAAP: 2017-18 to 2019-20)
S
N
City Name
Pro
ject
Na
me
No
of
Pro
jects
Estimated Cost and Sharing Sewerage
Manage_t
out of
Total in
Col-9
Septage
Manage_t
out of
Total in
Col-9
Change in Service Levels
GoI State ULB State+
ULB
Total Indicator
Ex
isti
ng
After
SAAP
2015-
16
After
SAAP
2016-
17
After
SAAP
2017-
20
1 2 3 4 5 6 7 8 9 10 11 12 13 14 15 16 Amount in Rs Crore
Figure in %age
36 Loni Sew 1 20.00 12.00 8.00 20.00 40.00 30.00 10.00 Netwk Cov
14 18 24
37 Mainpuri Sew
- - - - - - - Netwk Cov 12 39 80 80
38 Mathura Sew 1 15.00 9.00 6.00 15.00 30.00 20.00 10.00 Netwk Cov 14 39 41 41
39 Maunath Sew 1 5.00 3.00 2.00 5.00 10.00 - 10.00 Netwk Cov 6 6 6 6
40 Mirzapur Sew 1 5.00 3.00 2.00 5.00 10.00 - 10.00 Netwk Cov 12 15 18 45
41 Modinagar Sew 1 50.00 30.00 20.00 50.00 100.00 90.00 10.00 Netwk Cov
10 15 40
42 Mughalsarai Sew
- - - - - - - Netwk Cov 9 9 9 9
43 Muzaffarnagar Sew 1 5.00 3.00 2.00 5.00 10.00 - 10.00 Netwk Cov
10 15 15
44 Orai Sew
- - - - - -
Netwk Cov 5 7 7 7
45 Pilibhit Sew
- - - - - -
Netwk Cov
46 Raibareli Sew 1 80.00 48.00 32.00 80.00 160.00 150.00 10.00 Netwk Cov 30 30 35 70
47 Rampur Sew 1 5.00 3.00 2.00 5.00 10.00 - 10.00 Netwk Cov
12 15 25
48 Shahjahanpur Sew 1 5.00 3.00 2.00 5.00 10.00 - 10.00 Netwk Cov
49 Sambhal Sew 1 4.00 2.40 1.60 4.00 8.00 - 8.00 Netwk Cov
50 Shamli Sew
- - - - - -
Netwk Cov
51 Shikohabad Sew
- - - - - -
Netwk Cov
52 Sitapur Sew 1 4.00 2.40 1.60 4.00 8.00 - 8.00 Netwk Cov 3 3 3 3
53 Sultanpur Sew 1 5.00 3.00 2.00 5.00 10.00 - 10.00 Netwk Cov
54 Unnao Sew 1 55.00 33.00 22.00 55.00 110.00 100.00 10.00 Netwk Cov 6 8 10 30 Sub Total-B
40 699.73 419.84 279.89 699.73 1,399.46 1,006.46 393.00
61 Total: A+B 47 949.70 694.87 504.89 1,199.76 2,149.46 1,666.46 483.00 10 15 19 27

Final 3rd STATE ANNUAL ACTION PLAN (3rd SAAP) FOR FY: 2017-18 to FY 2019-20 OF UTTAR PRADESH UNDER ATAL MISSION FOR
REJUVENATION AND URBAN TRANSFORMATION (AMRUT)
2017
STATE MISSION DIRECTORATE (AMRUT) UTTAR PRADESH, 8TH FLOOR, INDIRA BHAWAN, ASHOK MARG, LUCKNOW-226001 103 | P a g e
PARKS AND GREEN SPACES PROJECTS
Details of the Parks and Green Spaces Projects for Approval from Apex Committee (UP-SAAP: 2017-18 to 2019-20) SN City Name
Pro
je
ct
Nam e
No o
f
Pro
je
cts Estimated Cost and Sharing
GoI State ULB State+ ULB Total
1 2 3 4 5 6 7 8 9
Amount in Rs Crore
1 Agra P&GS 1 2.84 1.71 1.14 2.85 5.69
2 Allahabad P&GS 1 2.01 1.21 0.81 2.02 4.03
3 Ghaziabad P&GS 1 2.97 1.79 1.19 2.98 5.95
4 Kanpur P&GS 1 5.00 3.00 2.00 5.00 10.00
5 Lucknow P&GS 1 5.09 3.05 2.03 5.08 10.17
6 Meerut P&GS 1 2.37 1.42 0.95 2.37 4.74
7 Varanasi P&GS 1 2.17 1.30 0.87 2.17 4.34
Sub Total-A 7 22.45 13.48 8.99 22.47 44.92
1 Aligarh P&GS 1 1.57 0.95 0.63 1.58 3.15
2 Bareilly P&GS 1 1.62 0.97 0.65 1.62 3.24
3 Firozabad P&GS 1 1.09 0.65 0.44 1.09 2.18
4 Gorakhpur P&GS 1 1.21 0.73 0.48 1.21 2.42
5 Jhansi P&GS 1 0.91 0.55 0.37 0.92 1.83
6 Moradabad P&GS 1 1.60 0.96 0.64 1.60 3.20
7 Saharanpur P&GS 1 1.27 0.76 0.51 1.27 2.54
8 Akbarpur P&GS 1 0.20 0.12 0.08 0.20 0.40
9 Amroha P&GS 1 0.35 0.21 0.14 0.35 0.70
10 Ayodhya P&GS 1 0.10 0.06 0.04 0.10 0.20
11 Azamgarh P&GS 1 0.20 0.12 0.08 0.20 0.40
12 Bahraich P&GS 1 0.33 0.20 0.13 0.33 0.66
13 Ballia P&GS 1 0.19 0.11 0.08 0.19 0.38

Final 3rd STATE ANNUAL ACTION PLAN (3rd SAAP) FOR FY: 2017-18 to FY 2019-20 OF UTTAR PRADESH UNDER ATAL MISSION FOR
REJUVENATION AND URBAN TRANSFORMATION (AMRUT)
2017
STATE MISSION DIRECTORATE (AMRUT) UTTAR PRADESH, 8TH FLOOR, INDIRA BHAWAN, ASHOK MARG, LUCKNOW-226001 104 | P a g e
Details of the Parks and Green Spaces Projects for Approval from Apex Committee (UP-SAAP: 2017-18 to 2019-20) SN City Name
Pro
je
ct
Nam e
No o
f
Pro
je
cts Estimated Cost and Sharing
GoI State ULB State+ ULB Total
1 2 3 4 5 6 7 8 9
Amount in Rs Crore
14 Banda P&GS 1 0.28 0.17 0.11 0.28 0.56
15 Baraut P&GS 1 0.18 0.11 0.07 0.18 0.36
16 Basti P&GS 1 0.20 0.12 0.08 0.20 0.40
17 Budaun P&GS 1 0.29 0.17 0.12 0.29 0.58
18 Bulandshahar P&GS 1 0.40 0.24 0.16 0.40 0.80
19 Chandausi P&GS 1 0.20 0.12 0.08 0.20 0.40
20 Deoria P&GS 1 0.23 0.14 0.09 0.23 0.46
21 Etah P&GS 1 0.21 0.13 0.09 0.22 0.43
22 Etawah P&GS 1 0.46 0.28 0.19 0.47 0.93
23 Faizabad P&GS 1 0.30 0.18 0.12 0.30 0.60
24 Farrukhabad P&GS 1 0.50 0.30 0.20 0.50 1.00
25 Fatehpur P&GS 1 0.35 0.21 0.14 0.35 0.70
26 Ghazipur P&GS 1 0.20 0.12 0.08 0.20 0.40
27 Gonda P&GS 1 0.20 0.12 0.08 0.20 0.40
28 Hapur P&GS 1 0.48 0.29 0.19 0.48 0.96
29 Hardoi P&GS 1 0.23 0.14 0.09 0.23 0.46
30 Hathras P&GS 1 0.25 0.15 0.10 0.25 0.50
31 Jaunpur P&GS 1 0.31 0.18 0.12 0.30 0.61
32 Kasganj P&GS 1 0.19 0.11 0.07 0.18 0.37
33 Khurja P&GS 1 0.20 0.12 0.08 0.20 0.40
34 Lakhimpur P&GS 1 0.28 0.17 0.11 0.28 0.56
35 Lalitpur P&GS 1 0.24 0.14 0.10 0.24 0.48
36 Loni P&GS 1 0.93 0.56 0.37 0.93 1.86
37 Mainpuri P&GS 1 0.21 0.13 0.08 0.21 0.42
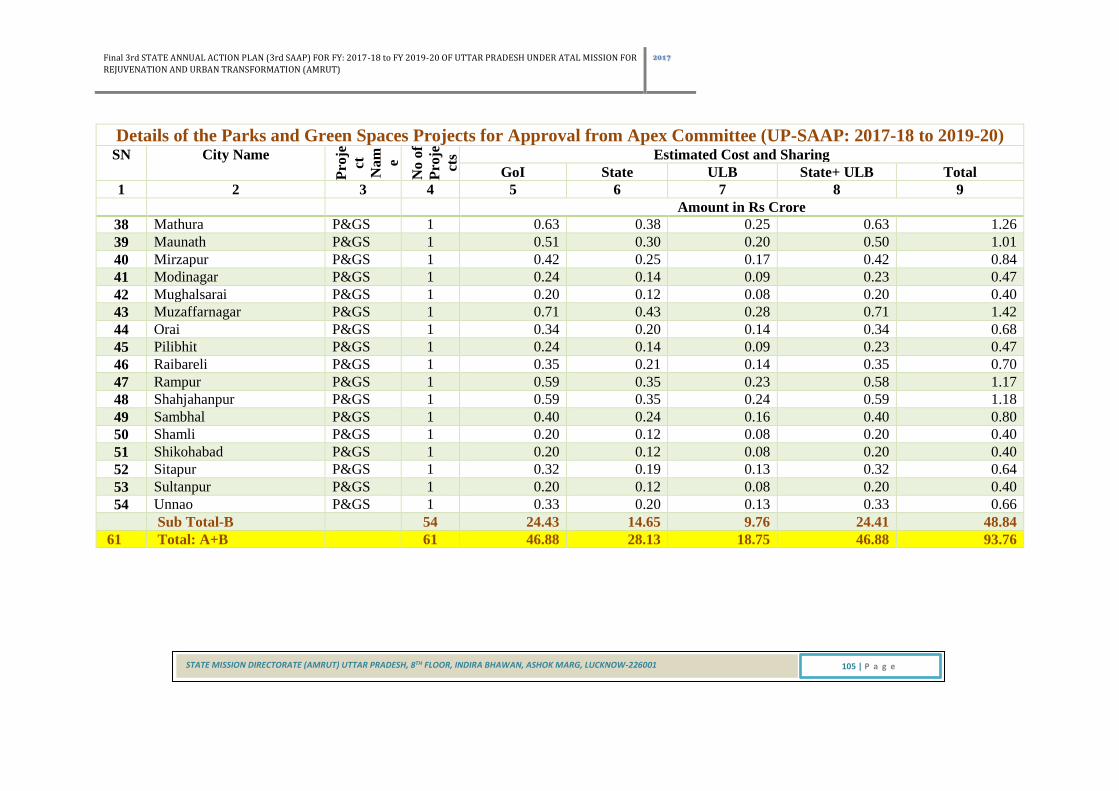
Final 3rd STATE ANNUAL ACTION PLAN (3rd SAAP) FOR FY: 2017-18 to FY 2019-20 OF UTTAR PRADESH UNDER ATAL MISSION FOR
REJUVENATION AND URBAN TRANSFORMATION (AMRUT)
2017
STATE MISSION DIRECTORATE (AMRUT) UTTAR PRADESH, 8TH FLOOR, INDIRA BHAWAN, ASHOK MARG, LUCKNOW-226001 105 | P a g e
Details of the Parks and Green Spaces Projects for Approval from Apex Committee (UP-SAAP: 2017-18 to 2019-20) SN City Name
Pro
je
ct
Nam e
No o
f
Pro
je
cts Estimated Cost and Sharing
GoI State ULB State+ ULB Total
1 2 3 4 5 6 7 8 9
Amount in Rs Crore
38 Mathura P&GS 1 0.63 0.38 0.25 0.63 1.26
39 Maunath P&GS 1 0.51 0.30 0.20 0.50 1.01
40 Mirzapur P&GS 1 0.42 0.25 0.17 0.42 0.84
41 Modinagar P&GS 1 0.24 0.14 0.09 0.23 0.47
42 Mughalsarai P&GS 1 0.20 0.12 0.08 0.20 0.40
43 Muzaffarnagar P&GS 1 0.71 0.43 0.28 0.71 1.42
44 Orai P&GS 1 0.34 0.20 0.14 0.34 0.68
45 Pilibhit P&GS 1 0.24 0.14 0.09 0.23 0.47
46 Raibareli P&GS 1 0.35 0.21 0.14 0.35 0.70
47 Rampur P&GS 1 0.59 0.35 0.23 0.58 1.17
48 Shahjahanpur P&GS 1 0.59 0.35 0.24 0.59 1.18
49 Sambhal P&GS 1 0.40 0.24 0.16 0.40 0.80
50 Shamli P&GS 1 0.20 0.12 0.08 0.20 0.40
51 Shikohabad P&GS 1 0.20 0.12 0.08 0.20 0.40
52 Sitapur P&GS 1 0.32 0.19 0.13 0.32 0.64
53 Sultanpur P&GS 1 0.20 0.12 0.08 0.20 0.40
54 Unnao P&GS 1 0.33 0.20 0.13 0.33 0.66
Sub Total-B 54 24.43 14.65 9.76 24.41 48.84
61 Total: A+B 61 46.88 28.13 18.75 46.88 93.76

Final 3rd STATE ANNUAL ACTION PLAN (3rd SAAP) FOR FY: 2017-18 to FY 2019-20 OF UTTAR PRADESH UNDER ATAL MISSION FOR
REJUVENATION AND URBAN TRANSFORMATION (AMRUT)
2017
STATE MISSION DIRECTORATE (AMRUT) UTTAR PRADESH, 8TH FLOOR, INDIRA BHAWAN, ASHOK MARG, LUCKNOW-226001 106 | P a g e
SUMMARY OF ALL TYPES OF PROJECTS ULB WISE
Details of the All Projects for Approval from Apex Committee (UP-SAAP: 2017-18 to 2019-20) SN City Name
Pro
je
ct
Nam e
No o
f
Pro
je
cts Estimated Cost and Sharing
GoI State ULB State+ ULB Total
1 2 3 4 5 6 7 8 9
Amount in Rs Crore
1 Agra All Projects 3 66.16 71.39 58.14 129.53 195.69
2 Allahabad All Projects 3 33.67 36.05 29.31 65.36 99.03
3 Ghaziabad All Projects 3 54.63 58.63 47.69 106.32 160.95
4 Kanpur All Projects 3 51.66 54.34 44.00 98.34 150.00
5 Lucknow All Projects 3 168.41 182.74 149.03 331.77 500.18
6 Meerut All Projects 3 69.03 74.76 60.95 135.71 204.74
7 Varanasi All Projects 3 67.16 72.81 59.37 132.18 199.34
Sub Total-A 21 510.72 550.72 448.49 999.21 1509.93
1 Aligarh All Projects 3 29.07 17.45 11.63 29.08 58.15
2 Bareilly All Projects 3 74.62 44.77 29.85 74.62 149.24
3 Firozabad All Projects 1 1.09 0.65 0.44 1.09 2.18
4 Gorakhpur All Projects 3 41.21 24.73 16.48 41.21 82.42
5 Jhansi All Projects 3 135.91 81.55 54.37 135.92 271.83
6 Moradabad All Projects 3 14.10 8.46 5.64 14.10 28.20
7 Saharanpur All Projects 3 28.77 17.26 11.51 28.77 57.54
8 Akbarpur All Projects 2 10.20 6.12 4.08 10.20 20.40
9 Amroha All Projects 2 5.35 3.21 2.14 5.35 10.70
10 Ayodhya All Projects 3 26.61 15.96 10.64 26.60 53.21
11 Azamgarh All Projects 3 7.70 4.62 3.08 7.70 15.40
12 Bahraich All Projects 1 0.33 0.20 0.13 0.33 0.66
13 Ballia All Projects 3 7.69 4.61 3.08 7.69 15.38
14 Banda All Projects 3 130.28 78.17 52.11 130.28 260.56

Final 3rd STATE ANNUAL ACTION PLAN (3rd SAAP) FOR FY: 2017-18 to FY 2019-20 OF UTTAR PRADESH UNDER ATAL MISSION FOR
REJUVENATION AND URBAN TRANSFORMATION (AMRUT)
2017
STATE MISSION DIRECTORATE (AMRUT) UTTAR PRADESH, 8TH FLOOR, INDIRA BHAWAN, ASHOK MARG, LUCKNOW-226001 107 | P a g e
Details of the All Projects for Approval from Apex Committee (UP-SAAP: 2017-18 to 2019-20) SN City Name
Pro
je
ct
Nam e
No o
f
Pro
je
cts Estimated Cost and Sharing
GoI State ULB State+ ULB Total
1 2 3 4 5 6 7 8 9
Amount in Rs Crore
15 Baraut All Projects 3 7.68 4.61 3.07 7.68 15.36
16 Basti All Projects 3 6.70 4.02 2.68 6.70 13.40
17 Budaun All Projects 3 8.29 4.97 3.32 8.29 16.58
18 Bulandshahar All Projects 2 80.40 48.24 32.16 80.40 160.80
19 Chandausi All Projects 3 17.70 10.62 7.08 17.70 35.40
20 Deoria All Projects 2 2.73 1.64 1.09 2.73 5.46
21 Etah All Projects 3 39.21 23.53 15.69 39.22 78.43
22 Etawah All Projects 2 4.46 2.68 1.79 4.47 8.93
23 Faizabad All Projects 1 0.30 0.18 0.12 0.30 0.60
24 Farrukhabad All Projects 2 4.00 2.40 1.60 4.00 8.00
25 Fatehpur All Projects 2 7.85 4.71 3.14 7.85 15.70
26 Ghazipur All Projects 3 48.70 29.22 19.48 48.70 97.40
27 Gonda All Projects 1 0.20 0.12 0.08 0.20 0.40
28 Hapur All Projects 2 32.48 19.49 12.99 32.48 64.96
29 Hardoi All Projects 2 10.23 6.14 4.09 10.23 20.46
30 Hathras All Projects 3 13.75 8.25 5.50 13.75 27.50
31 Jaunpur All Projects 3 49.04 29.42 19.61 49.03 98.07
32 Kasganj All Projects 3 11.69 7.01 4.67 11.68 23.37
33 Khurja All Projects 2 5.20 3.12 2.08 5.20 10.40
34 Lakhimpur All Projects 2 5.28 3.17 2.11 5.28 10.56
35 Lalitpur All Projects 3 7.74 4.64 3.10 7.74 15.48
36 Loni All Projects 2 20.93 12.56 8.37 20.93 41.86
37 Mainpuri All Projects 2 2.71 1.63 1.08 2.71 5.42
38 Mathura All Projects 3 105.63 63.38 42.25 105.63 211.26

Final 3rd STATE ANNUAL ACTION PLAN (3rd SAAP) FOR FY: 2017-18 to FY 2019-20 OF UTTAR PRADESH UNDER ATAL MISSION FOR
REJUVENATION AND URBAN TRANSFORMATION (AMRUT)
2017
STATE MISSION DIRECTORATE (AMRUT) UTTAR PRADESH, 8TH FLOOR, INDIRA BHAWAN, ASHOK MARG, LUCKNOW-226001 108 | P a g e
Details of the All Projects for Approval from Apex Committee (UP-SAAP: 2017-18 to 2019-20) SN City Name
Pro
je
ct
Nam e
No o
f
Pro
je
cts Estimated Cost and Sharing
GoI State ULB State+ ULB Total
1 2 3 4 5 6 7 8 9
Amount in Rs Crore
39 Maunath All Projects 3 10.51 6.30 4.20 10.50 21.01
40 Mirzapur All Projects 3 12.92 7.75 5.17 12.92 25.84
41 Modinagar All Projects 3 60.24 36.14 24.09 60.23 120.47
42 Mughalsarai All Projects 2 15.20 9.12 6.08 15.20 30.40
43 Muzaffarnagar All Projects 2 5.71 3.43 2.28 5.71 11.42
44 Orai All Projects 2 10.34 6.20 4.14 10.34 20.68
45 Pilibhit All Projects 2 12.74 7.64 5.09 12.73 25.47
46 Raibareli All Projects 2 80.35 48.21 32.14 80.35 160.70
47 Rampur All Projects 3 8.09 4.85 3.23 8.08 16.17
48 Shahjahanpur All Projects 3 25.59 15.35 10.24 25.59 51.18
49 Sambhal All Projects 3 6.90 4.14 2.76 6.90 13.80
50 Shamli All Projects 2 5.20 3.12 2.08 5.20 10.40
51 Shikohabad All Projects 1 0.20 0.12 0.08 0.20 0.40
52 Sitapur All Projects 3 16.82 10.09 6.73 16.82 33.64
53 Sultanpur All Projects 3 12.70 7.62 5.08 12.70 25.40
54 Unnao All Projects 3 75.33 45.20 30.13 75.33 150.66
Sub Total-B 133 1,364.67 818.79 545.85 1,364.64 2,729.31
61 Total: A+B 154 1,875.39 1,369.51 994.34 2,363.85 4,239.24

Final 3rd STATE ANNUAL ACTION PLAN (3rd SAAP) FOR FY: 2017-18 to FY 2019-20 OF UTTAR PRADESH UNDER ATAL MISSION FOR
REJUVENATION AND URBAN TRANSFORMATION (AMRUT)
2017
STATE MISSION DIRECTORATE (AMRUT) UTTAR PRADESH, 8TH FLOOR, INDIRA BHAWAN, ASHOK MARG, LUCKNOW-226001 109 | P a g e
The response to asked questionnaire is given below:
Q1-Has the State Government diagnosed service level gaps? (250 words)
Response: Yes, State govt. has diagnosed service level gaps for the State as per the information
provided by respective ULBs and parastatal agencies. The SLIPs submitted by the ULBs were
prepared after due consultations with various stakeholders including public representatives.
Service level gaps at City level has been diagnosed and shown in respective SLIP.
Q2- Has the State planned for and financed capital expenditure? (350 words)
Response: Yes, The State has planned for capital expenditure for water supply and sewerage
and has tried to dovetail the various funding sources and converge various schemes and sectors
to achieve the objectives, particularly for water supply, sewerage & septage management
sectors. Apart from the Central Government share and State share, ULB share was also
envisaged in those schemes.
Under AMRUT mission, the State Govt. has decided state share for million plus cities 36.67%
and for less than million 30% of the project cost, in addition to the Central share. The ULBs
are expected to meet the remaining share from their own funds, 14th Finance Commission
Grants and from other sources. The ULBs are trying to raise their own revenues through
improved billing and collection systems and through public mobilization and awareness
campaigns. The ULBs are also preparing themselves to mobilize finances through financial
institutions by obtaining credit rating from accredited institutions. The O&M cost will be met
by the ULBs through imposing user charges and other sources.
Q3- Has the State moved towards achievement of universal coverage in water supply and
sewerage/Septage? (350 words)
Response: Yes, State has assessed the gap in universal coverage of water supply from inputs
submitted by respective ULBs in their SLIPs. The sewerage/septage Management has been
selected in ULBs who have fulfilled the basic requirement of universal water coverage. Several

Final 3rd STATE ANNUAL ACTION PLAN (3rd SAAP) FOR FY: 2017-18 to FY 2019-20 OF UTTAR PRADESH UNDER ATAL MISSION FOR
REJUVENATION AND URBAN TRANSFORMATION (AMRUT)
2017
STATE MISSION DIRECTORATE (AMRUT) UTTAR PRADESH, 8TH FLOOR, INDIRA BHAWAN, ASHOK MARG, LUCKNOW-226001 110 | P a g e
schemes are under implementation/in pipeline/committed/approved either from State fund or
from GoI. The funds available under ongoing/committed projects have been considered and
gap is worked out after ensuring the project requirement by converging with other schemes.
Q4- What is the expected level of the financial support from the Central Government and
how well have State/ULB and other sources of finance been identified and accessed? (300
words)
Response: As per the mission guidelines GOI shall provide 50% assistance of the project cost
for the mission cities having population up to 10 lacs and 1/3rd assistance for mission cities
having population above 10 lacs. State government and respective ULBs will contribute
through their own resources (State Share/SFC/TFC grants etc.) or through financing from
financial institutions.
Q5- How fairly and equitably have the needs of the ULBs been given due consideration?
(300 words)
Response: The SLIPs submitted by the ULBs have been prepared after incorporating
suggestions received from different stake holders. Since the focus is on universal coverage of
water supply and sewerage & septage management, therefore priority is given to these two
sectors. ULBs have prioritized projects based on the extent of gaps in service levels and
financial strength of ULBs.
Q6- Have adequate consultations with all stakeholders been done, including citizens, local
MPs and other public representatives? (350 words)
Response: Yes, several rounds of extensive consultations with the Elected Representatives like
Mayors and Chairpersons, Commissioners, Municipal Engineers, Public Health Engineers etc.
have been done who have brought up several issues into the forefront like coverage, source
augmentation, equity, inclusion, affordability, technology options etc. making the entire

Final 3rd STATE ANNUAL ACTION PLAN (3rd SAAP) FOR FY: 2017-18 to FY 2019-20 OF UTTAR PRADESH UNDER ATAL MISSION FOR
REJUVENATION AND URBAN TRANSFORMATION (AMRUT)
2017
STATE MISSION DIRECTORATE (AMRUT) UTTAR PRADESH, 8TH FLOOR, INDIRA BHAWAN, ASHOK MARG, LUCKNOW-226001 111 | P a g e
exercise a highly consultative and fruitful one. The representatives of U.P. Jal Nigam have also
contributed to the deliberations and enriched the quality of the SLIPs. The elected
representatives have also raised several relevant issues like existing staff being overburdened
due to additional responsibilities, lack of adequate staff and release of funds, permissions etc.
and the State officials have clarified their issues and misgivings, duly offering options to raise
their finances to meet their share of the AMRUT project cost.
IMPORTANT STEPS HAVE BEEN FOLLOWED FOR PREPARATION OF SAAP ARE MENTIONED BELOW.
PRINCIPLES OF PRIORITIZATION
During SLIP preparation, the ULBs have identified the projects based on service level gap
analysis, and following consultative process prioritized those projects to achieve universal
coverage of water supply connections followed by sewerage connections being the top priority.
Followed by development of Green Space/ Parks in each AMRUT City. In the SAAP, the State
has selected those ULBs with higher gaps in coverage of water supply, sewerage and
development of Parks for funding in the preceding years. Potential smart cities have also been
given the priority in fund allocation to achieve convergence.
WATER SUPPLY:
All water supply projects related to the coverage are taken up and priority has been given to
those towns which have lesser coverage, five ULB projects namely: Agra, Varanasi, Lucknow,
Ghaziabad, Jhansi and Allahabad are being considered in phases. Balance provision of
continuing projects sanctioned in SAAP 2015-16 and 2016-17, such as Jhansi water supply.
Priority has also been given to those towns which have less than standard per capita water
supply. Reduction of non-revenue water (NRW) of city and automation of the system, such as
SCADA & domestic water meter.
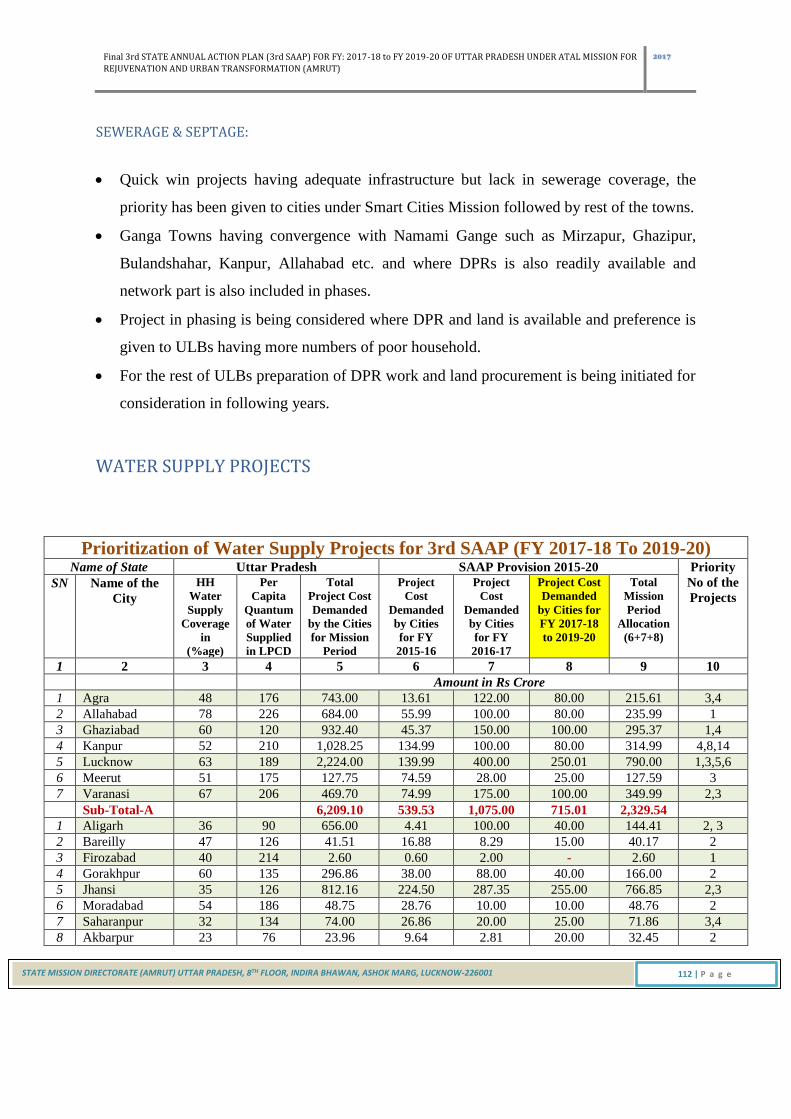
Final 3rd STATE ANNUAL ACTION PLAN (3rd SAAP) FOR FY: 2017-18 to FY 2019-20 OF UTTAR PRADESH UNDER ATAL MISSION FOR
REJUVENATION AND URBAN TRANSFORMATION (AMRUT)
2017
STATE MISSION DIRECTORATE (AMRUT) UTTAR PRADESH, 8TH FLOOR, INDIRA BHAWAN, ASHOK MARG, LUCKNOW-226001 112 | P a g e
SEWERAGE & SEPTAGE:
Quick win projects having adequate infrastructure but lack in sewerage coverage, the
priority has been given to cities under Smart Cities Mission followed by rest of the towns.
Ganga Towns having convergence with Namami Gange such as Mirzapur, Ghazipur,
Bulandshahar, Kanpur, Allahabad etc. and where DPRs is also readily available and
network part is also included in phases.
Project in phasing is being considered where DPR and land is available and preference is
given to ULBs having more numbers of poor household.
For the rest of ULBs preparation of DPR work and land procurement is being initiated for
consideration in following years.
WATER SUPPLY PROJECTS
Prioritization of Water Supply Projects for 3rd SAAP (FY 2017-18 To 2019-20) Name of State Uttar Pradesh SAAP Provision 2015-20 Priority
No of the
Projects SN Name of the
City
HH
Water
Supply
Coverage
in
(%age)
Per
Capita
Quantum
of Water
Supplied
in LPCD
Total
Project Cost
Demanded
by the Cities
for Mission
Period
Project
Cost
Demanded
by Cities
for FY
2015-16
Project
Cost
Demanded
by Cities
for FY
2016-17
Project Cost
Demanded
by Cities for
FY 2017-18
to 2019-20
Total
Mission
Period
Allocation
(6+7+8)
1 2 3 4 5 6 7 8 9 10 Amount in Rs Crore
1 Agra 48 176 743.00 13.61 122.00 80.00 215.61 3,4
2 Allahabad 78 226 684.00 55.99 100.00 80.00 235.99 1
3 Ghaziabad 60 120 932.40 45.37 150.00 100.00 295.37 1,4
4 Kanpur 52 210 1,028.25 134.99 100.00 80.00 314.99 4,8,14
5 Lucknow 63 189 2,224.00 139.99 400.00 250.01 790.00 1,3,5,6
6 Meerut 51 175 127.75 74.59 28.00 25.00 127.59 3
7 Varanasi 67 206 469.70 74.99 175.00 100.00 349.99 2,3 Sub-Total-A
6,209.10 539.53 1,075.00 715.01 2,329.54
1 Aligarh 36 90 656.00 4.41 100.00 40.00 144.41 2, 3
2 Bareilly 47 126 41.51 16.88 8.29 15.00 40.17 2
3 Firozabad 40 214 2.60 0.60 2.00 - 2.60 1
4 Gorakhpur 60 135 296.86 38.00 88.00 40.00 166.00 2
5 Jhansi 35 126 812.16 224.50 287.35 255.00 766.85 2,3
6 Moradabad 54 186 48.75 28.76 10.00 10.00 48.76 2
7 Saharanpur 32 134 74.00 26.86 20.00 25.00 71.86 3,4
8 Akbarpur 23 76 23.96 9.64 2.81 20.00 32.45 2

Final 3rd STATE ANNUAL ACTION PLAN (3rd SAAP) FOR FY: 2017-18 to FY 2019-20 OF UTTAR PRADESH UNDER ATAL MISSION FOR
REJUVENATION AND URBAN TRANSFORMATION (AMRUT)
2017
STATE MISSION DIRECTORATE (AMRUT) UTTAR PRADESH, 8TH FLOOR, INDIRA BHAWAN, ASHOK MARG, LUCKNOW-226001 113 | P a g e
Prioritization of Water Supply Projects for 3rd SAAP (FY 2017-18 To 2019-20) Name of State Uttar Pradesh SAAP Provision 2015-20 Priority
No of the
Projects SN Name of the
City
HH
Water
Supply
Coverage
in
(%age)
Per
Capita
Quantum
of Water
Supplied
in LPCD
Total
Project Cost
Demanded
by the Cities
for Mission
Period
Project
Cost
Demanded
by Cities
for FY
2015-16
Project
Cost
Demanded
by Cities
for FY
2016-17
Project Cost
Demanded
by Cities for
FY 2017-18
to 2019-20
Total
Mission
Period
Allocation
(6+7+8)
1 2 3 4 5 6 7 8 9 10 Amount in Rs Crore
9 Amroha 32 45 8.81 0.12 - - 0.12
10 Ayodhya 64
18.01 18.01
11 Azamgarh 50 196 21.52 4.37 11.81 10.00 26.18 2
12 Bahraich 52 106 59.17 42.36 1.70 - 44.06 2,3
13 Ballia 26 138 6.48 4.52 3.50 5.00 13.02 2,3
14 Banda 53 199 20.92 16.92 6.41 250.00 273.33 2
15 Baraut 64 190 16.63 1.52 2.50 5.00 9.02 3
16 Basti 70 191 16.43 8.44 0.20 5.00 13.64 3
17 Budaun 38 216 19.69 3.80 7.86 6.00 17.66 3
18 Bulandshahar 33 162 8.40 5.56 2.74 - 8.30 2
19 Chandausi 40 100 14.60 4.50 7.85 30.00 42.35 3,4,5
20 Deoria 33 62 11.88 4.72 7.08 5.00 16.80 4
21 Etah 34 203 11.86 2.78 2.58 10.00 15.36 2
22 Etawah 60 140 12.50 - - - -
23 Faizabad 70 145 26.22 4.68 20.54 - 25.22 2
24 Farrukhabad 47 120 14.97 1.80 8.45 - 10.25 2
25 Fatehpur 43 143 5.00 1.00 2.00 - 3.00 2
26 Ghazipur 56 300 12.85 4.97 5.96 7.00 17.93 2
27 Gonda 37 281 10.42 3.62 5.50 - 9.12 2,3
28 Hapur 34 91 33.25 20.50 12.75 - 33.25 2,3
29 Hardoi 36 90 20.76 7.56 4.52 20.00 32.08 2
30 Hathras 35 100 42.00 16.01 15.00 20.00 51.01 1
31 Jaunpur 60 112 21.00 12.00 8.00 10.00 30.00 2
32 Kasganj 45 96 15.24 9.06 8.50 15.00 32.56 2
33 Khurja 40 158 10.99 4.40 4.50 - 8.90 2,3
34 Lakhimpur 49 140 51.13 27.60 19.68 10.00 57.28 2
35 Lalitpur 44 237 26.19 16.00 2.50 5.00 23.50 2
36 Loni 21 88 26.80 14.20 7.20 - 21.40 2,3
37 Mainpuri 32 123 32.68 18.98 13.16 5.00 37.14 2
38 Mathura 59 126 144.29 94.67 34.13 180.00 308.80 2, 3
39 Maunath 40 96 22.58 6.12 13.44 10.00 29.56 3
40 Mirzapur 59 105 139.18 90.90 29.80 15.00 135.70 3,5
41 Modinagar 72 184 24.40 0.04 0.62 20.00 20.66 2
42 Mughalsarai 23 76 17.22 2.56 8.91 30.00 41.47 2
43 Muzaffarnagar 65 191 24.28 3.06 0.50 - 3.56 5
44 Orai 37 157 7.65 4.44 2.50 20.00 26.94 4
45 Pilibhit 37 117 26.99 16.40 2.34 25.00 43.74 2
46 Raibareli 48 66 53.09 27.00 26.09 - 53.09 1
47 Rampur 17 135 14.50 1.72 11.65 5.00 18.37 3
48 Shahjahanpur 58 59 34.89 17.90 12.00 40.00 69.90 3
49 Sambhal 25 105 12.27 0.14 3.00 5.00 8.14 2
50 Shamli 56 179 17.45 2.56 10.86 10.00 23.42 2

Final 3rd STATE ANNUAL ACTION PLAN (3rd SAAP) FOR FY: 2017-18 to FY 2019-20 OF UTTAR PRADESH UNDER ATAL MISSION FOR
REJUVENATION AND URBAN TRANSFORMATION (AMRUT)
2017
STATE MISSION DIRECTORATE (AMRUT) UTTAR PRADESH, 8TH FLOOR, INDIRA BHAWAN, ASHOK MARG, LUCKNOW-226001 114 | P a g e
Prioritization of Water Supply Projects for 3rd SAAP (FY 2017-18 To 2019-20) Name of State Uttar Pradesh SAAP Provision 2015-20 Priority
No of the
Projects SN Name of the
City
HH
Water
Supply
Coverage
in
(%age)
Per
Capita
Quantum
of Water
Supplied
in LPCD
Total
Project Cost
Demanded
by the Cities
for Mission
Period
Project
Cost
Demanded
by Cities
for FY
2015-16
Project
Cost
Demanded
by Cities
for FY
2016-17
Project Cost
Demanded
by Cities for
FY 2017-18
to 2019-20
Total
Mission
Period
Allocation
(6+7+8)
1 2 3 4 5 6 7 8 9 10 Amount in Rs Crore
51 Shikohabad 27 125 4.39 0.04 2.08 - 2.12 2
52 Sitapur 37 89 73.87 25.07 11.12 25.00 61.19 2
53 Sultanpur 53 141 34.59 27.40 6.44 15.00 48.84 3
54 Unnao 31 102 193.00 48.00 56.00 40.00 144.00 4to14
61 Sub-Total-B
3,378.87 979.66 942.42 1,281.01 3,203.09
Grand Total: A+B 46 144 9,587.97 1,519.19 2,017.42 1,996.02 5,532.63
SEWERAGE AND SEPTAGE MANAGEMENT PROJECTS
Prioritization of Sewerage Projects for 3rd SAAP (FY 2017-18 To 2019-20) Name of State Uttar Pradesh SAAP Provision 2015-20 Priority
of the
Projects SN Name of the
City
Per
Capita
Quantum of Water
Supplied
Coverage
of
Latrines
Coverage
of Sewer
Network (%age)
Total
Project
Cost Demanded
for
Sewerage System for
Mission
Period
Project
Cost
Demanded for
Septage
Manag_t For
Mission
Period
Project
Cost
Demanded by Cities
for FY
2015-16
Project
Cost
Demanded by Cities
for FY
2016-17
Project
Cost
Demanded by Cities
for FY
2017-18 to 2019-
20
Total
Mission
Period Allocation
(6+7+8)
1 2 3 4 5 6 7 8 9 10 11 12 Amount in Rs Crore
1 Agra 176 88 41 1,440.12 - 42.00 100.00 110.00 252.00 1
2 Allahabad 226 98 49 538.65 - 133.74 66.00 15.00 214.74 2
3 Ghaziabad 120 93 84 684.02 - 307.01 70.00 55.00 432.01 3
4 Kanpur 210 86 38 2,565.00 - 64.99 150.00 60.00 274.99 6
5 Lucknow 189 90 39 5,950.00 - 164.99 180.00 240.00 584.99 3
6 Meerut 175 98 51 3,036.41 - 50.00 100.00 175.00 325.00 1
7 Varanasi 206 98 60 1,101.07 - 105.00 95.00 95.00 295.00 2 Sub Total-A
15,315.27 - 867.73 761.00 750.00 2,378.73
1 Aligarh 90 95 4 776.99 49.52 - 80.00 15.00 95.00 3,4,5,6
2 Bareilly 126 97 41 384.50 - - 40.00 131.00 171.00 3
3 Firozabad 214 83 54 385.69 - - 40.00 - 40.00 1
4 Gorakhpur 135 94 12 1,338.00 - 60.00 98.00 40.00 198.00 1,3
5 Jhansi 126 85 - 1,787.87 - - 3.25 15.00 18.25 2
6 Moradabad 186 87 - 854.31 - 80.00 50.00 15.00 145.00 1
7 Saharanpur 134 98 19 412.22 2.88 53.00 50.00 30.00 133.00 1
8 Akbarpur 76 39 - 43.53 - - - - -
9 Amroha 45 91 - 181.54 22.58 - - 10.00 10.00
10 Ayodhya
35.00 35.00
11 Azamgarh 196 90 - 40.81 10.87 40.80 10.69 5.00 56.49 3
12 Bahraich 106 87 - 264.50 18.44 - 15.00 - 15.00 2

Final 3rd STATE ANNUAL ACTION PLAN (3rd SAAP) FOR FY: 2017-18 to FY 2019-20 OF UTTAR PRADESH UNDER ATAL MISSION FOR
REJUVENATION AND URBAN TRANSFORMATION (AMRUT)
2017
STATE MISSION DIRECTORATE (AMRUT) UTTAR PRADESH, 8TH FLOOR, INDIRA BHAWAN, ASHOK MARG, LUCKNOW-226001 115 | P a g e
Prioritization of Sewerage Projects for 3rd SAAP (FY 2017-18 To 2019-20) Name of State Uttar Pradesh SAAP Provision 2015-20 Priority
of the
Projects SN Name of the
City
Per
Capita
Quantum of Water
Supplied
Coverage
of
Latrines
Coverage
of Sewer
Network (%age)
Total
Project
Cost Demanded
for
Sewerage System for
Mission
Period
Project
Cost
Demanded for
Septage
Manag_t For
Mission
Period
Project
Cost
Demanded by Cities
for FY
2015-16
Project
Cost
Demanded by Cities
for FY
2016-17
Project
Cost
Demanded by Cities
for FY
2017-18 to 2019-
20
Total
Mission
Period Allocation
(6+7+8)
1 2 3 4 5 6 7 8 9 10 11 12 Amount in Rs Crore
13 Ballia 138 88 - 31.87 - 14.86 21.00 10.00 45.86 1
14 Banda 199 58 4 309.09 13.49 13.48 - 10.00 23.48
15 Baraut 190 93 6 158.00 10.46 - - 10.00 10.00
16 Basti 191 82 - 169.55 14.30 - - 8.00 8.00
17 Budaun 216 98 - 109.50 18.06 - - 10.00 10.00
18 Bulandshahar 162 100 - 423.58 29.65 101.07 80.00 160.00 341.07 2
19 Chandausi 100 88 - - 7.00 - - 5.00 5.00
20 Deoria 62 99 - 100.92 14.20 - - - -
21 Etah 203 93 - 260.93 - - 70.00 68.00 138.00 1
22 Etawah 140 95 0 62.72 17.56 - - 8.00 8.00
23 Faizabad 145 75 - 240.00 - - - - -
24 Farrukhabad 120 89 - 168.30 31.41 - - 7.00 7.00
25 Fatehpur 143 70 - 186.26 15.69 - - 15.00 15.00
26 Ghazipur 300 76 - 154.76 12.98 70.00 20.00 90.00 180.00 1
27 Gonda 281 90 - 170.64 11.81 - - - -
28 Hapur 91 98 - 453.76 - - 50.00 64.00 114.00 1
29 Hardoi 90 84 - 123.35 15.01 - - - -
30 Hathras 100 93 - 94.40 14.17 - - 7.00 7.00
31 Jaunpur 112 80 - 395.00 22.01 - - 87.46 87.46
32 Kasganj 96 87 - 91.24 11.91 - - 8.00 8.00
33 Khurja 158 98 - 136.55 9.60 - - 10.00 10.00
34 Lakhimpur 140 97 - 525.00 - - - - -
35 Lalitpur 237 68 - 101.28 18.66 - - 10.00 10.00
36 Loni 88 100 - 154.75 51.20 13.26 38.00 40.00 91.26 1
37 Mainpuri 123 95 12 32.34 - 21.00 10.00 - 31.00 3
38 Mathura 126 97 14 843.74 - 42.00 60.00 30.00 132.00 3,4 &5
39 Maunath 96 68 6 96.95 27.03 - - 10.00 10.00
40 Mirzapur 105 78 12 214.76 - 50.00 40.00 10.00 100.00 6
41 Modinagar 184 95 - 553.44 - 159.00 40.00 100.00 299.00 1
42 Mughalsarai 76 78 9 39.91 - 18.80 - - 18.80
43 Muzaffarnagar 191 93 - 372.87 22.00 8.02 37.90 10.00 55.92 3
44 Orai 157 99 5 83.26 20.65 - 10.00 - 10.00 2
45 Pilibhit 117 88 - 142.00 15.00 - - - -
46 Raibareli 66 95 30 433.63 - 38.00 50.00 160.00 248.00 2
47 Rampur 135 99 - 328.80 - 25.00 91.00 10.00 126.00 2,3
48 Shahjahanpur 59 97 - 156.90 36.39 - - 10.00 10.00
49 Sambhal 105 99 - - 16.00 - - 8.00 8.00
50 Shamli 179 90 - 191.45 16.39 - - - -
51 Shikohabad 125 86 - 393.29 - - - - -
52 Sitapur 89 88 3 196.85 15.95 - - 8.00 8.00
53 Sultanpur 141 85 - 161.24 17.59 - - 10.00 10.00
54 Unnao 102 81 6 133.50 16.02 21.60 30.00 110.00 161.60 3
61 Sub Total-B
15,466.34 646.48 829.89 1,034.84 1,399.46 3,264.19
Grand Total: A+B 144 88 10 30,781.61 646.48 1,697.62 1,795.84 2,149.46 5,642.92

Final 3rd STATE ANNUAL ACTION PLAN (3rd SAAP) FOR FY: 2017-18 to FY 2019-20 OF UTTAR PRADESH UNDER ATAL MISSION FOR
REJUVENATION AND URBAN TRANSFORMATION (AMRUT)
2017
STATE MISSION DIRECTORATE (AMRUT) UTTAR PRADESH, 8TH FLOOR, INDIRA BHAWAN, ASHOK MARG, LUCKNOW-226001 116 | P a g e
The State has identified projects based on gap analysis and financial strength of ULBs and
chosen those ULBs for FY 2017-20 that have higher gaps in provision of water supply and
sewerage. The response to asked questionnaire is given below: -
Q1- Has consultation with local MPs/ MLAs, Mayors and Commissioners of the
concerned ULBs been carried out prior to allocation of funding? Please give details of
dates and number of participants. (Tabular 250 words)
Response: Yes, Mayors, Chairmen, Municipal Commissioners, Executive Officers and Nodal
Officers of the Parastatal agencies of the concerned ULBs were consulted prior to allocation
of funds to different sectors. The allocation of funds given in the SAAP is based on discussions
held with various field officials. Apart from discussions at State level, discussion was done with
other stakeholders as well.
Q2- Has financially weaker ULBs given priority for financing? Please give list. (200
words)
Response: Universal coverage of water supply is the prime criteria for prioritization.
Q3- Is the ULB with a high proportion of urban poor has received higher share? Please
give list. (250 words)
Response: Prioritization has been done only based on universal coverage of water supply.
Q4- Has the potential smart cities been given preference? Please give list (200 words).
Response: Yes, all Smart Cities of Uttar Pradesh are AMRUT Cities also and have been given
preference.
Q5- What is the quantum of Central Assistance (CA) allocated to the State during 2017-
20? (100 words)

Final 3rd STATE ANNUAL ACTION PLAN (3rd SAAP) FOR FY: 2017-18 to FY 2019-20 OF UTTAR PRADESH UNDER ATAL MISSION FOR
REJUVENATION AND URBAN TRANSFORMATION (AMRUT)
2017
STATE MISSION DIRECTORATE (AMRUT) UTTAR PRADESH, 8TH FLOOR, INDIRA BHAWAN, ASHOK MARG, LUCKNOW-226001 117 | P a g e
Response: The quantum of Central Assistance allocated to Uttar Pradesh is Rs 1875.39 Cr for
the financial year 2017-18 to 2019-20.
Q6- Has the allocation to different ULBs within State is consistent with the urban profile
of the state? How? (260 words)
Response: Yes, the State has made allocations to different ULBs within the State consistent
with the urban profile of the State. Further, various financial options AMRUT, Smart Cities,
SBM and external financial assistance are being explored to converge various schemes and
financing options.
IMPORTANCE OF O&M
It has been observed that ULBs pay little attention to the operation and maintenance of
infrastructure assets created after completion of projects. This tendency on the part of
implementing agencies leads to shear loss off national assets. The response to asked
questionnaire is given below: -
Q1- Do Projects proposed in the SAAP include O & M for at least five years? (Tabular
300 words)
Response: Yes, the projects proposed in SAAP under AMRUT includes O&M for 5 years. O&M
shall be integral part of the original contract so that the agency/contractor who developed the
assets shall be responsible for O&M of the same for 5 years’ period with good quality work.
The O&M cost shall be borne by the ULB through imposing user charges.
Q2- How O&M expenditures are propose to be funded by ULBs/ parastatal? (200 words)
Response: O&M expenditures of the assets created are proposed to be funded through recovery
of user charges, reduction in losses and other modes i.e. PPP, RWAs etc. If there will be any
gap, the same shall be borne by ULB through its own resources/state support.
Final 3rd STATE ANNUAL ACTION PLAN (3rd SAAP) FOR FY: 2017-18 to FY 2019-20 OF UTTAR PRADESH UNDER ATAL MISSION FOR
REJUVENATION AND URBAN TRANSFORMATION (AMRUT)
2017
STATE MISSION DIRECTORATE (AMRUT) UTTAR PRADESH, 8TH FLOOR, INDIRA BHAWAN, ASHOK MARG, LUCKNOW-226001 118 | P a g e
Q3- Is it by way of levy of user charges or other revenue streams? (100 words)
Response: Yes, the focus of the state Govt. and ULB is to recover the O & M expenditure
through imposing user charges.
Q4- Has O&M cost been excluded from project cost for funding? (100 words)
Response: Yes, O&M cost has been excluded from project cost for funding and shall be borne
by ULB through user charges. If there will be any gap in recovery of user charges, same shall
be borne by ULB through its own resources.
Q5- What kind of model been proposed by States/ULBs to fund the O&M? Please discuss.
(250 words)
Response: State of Uttar Pradesh has proposed to recover O & M by ULBs through imposing
user charges. However, user charges may not be sufficient to recover entire O & M cost, for
which innovative proposals like energy saving projects, reuse of treated waste, reduction in
NRW and other losses have been considered. The gap if remains, shall be filled through ULBs
fund/State support.
Q6- Is it through an appropriate cost recovery mechanism to make them self-reliant and
cost-effective? How? (250 words)
Response: State has proposed to recover O & M by ULBs through imposing user charges.
However, user charges may not be sufficient to recover entire O & M cost, for which innovative
proposals like energy saving projects, reuse of treated waste, reduction in NRW and other
losses have been considered. The gap if remains, shall be filled through ULBs fund/State
support.
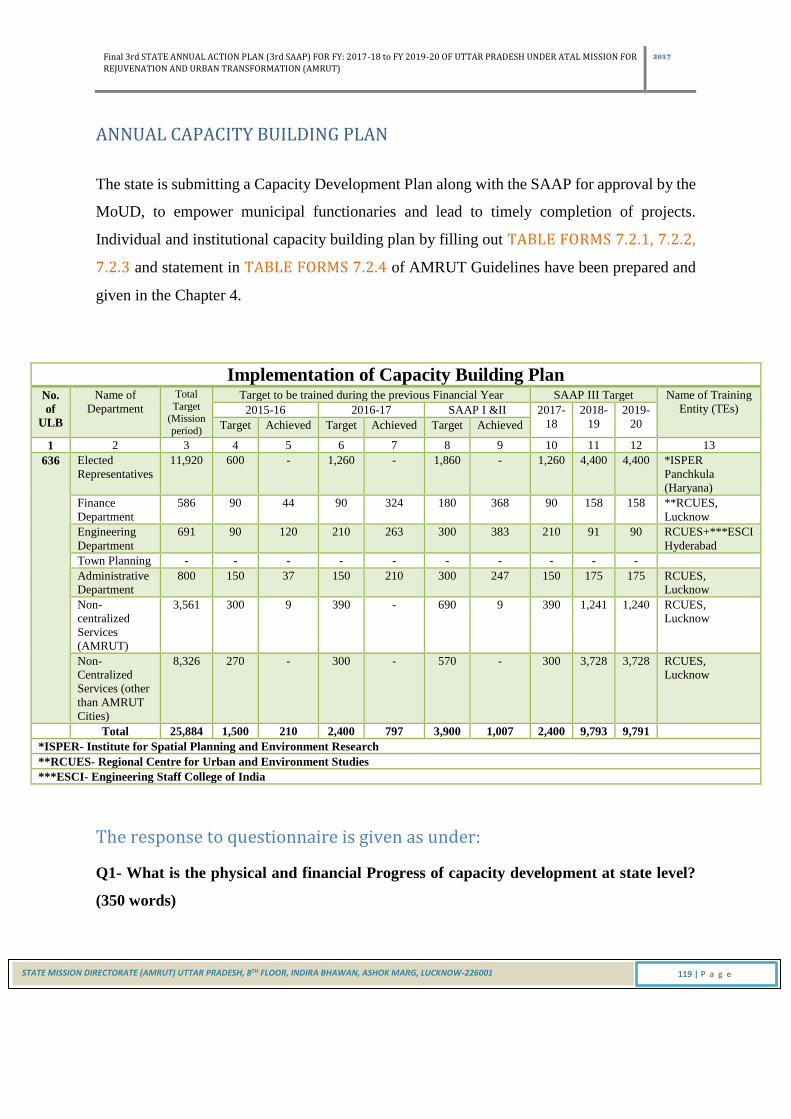
Final 3rd STATE ANNUAL ACTION PLAN (3rd SAAP) FOR FY: 2017-18 to FY 2019-20 OF UTTAR PRADESH UNDER ATAL MISSION FOR
REJUVENATION AND URBAN TRANSFORMATION (AMRUT)
2017
STATE MISSION DIRECTORATE (AMRUT) UTTAR PRADESH, 8TH FLOOR, INDIRA BHAWAN, ASHOK MARG, LUCKNOW-226001 119 | P a g e
ANNUAL CAPACITY BUILDING PLAN
The state is submitting a Capacity Development Plan along with the SAAP for approval by the
MoUD, to empower municipal functionaries and lead to timely completion of projects.
Individual and institutional capacity building plan by filling out TABLE FORMS 7.2.1, 7.2.2,
7.2.3 and statement in TABLE FORMS 7.2.4 of AMRUT Guidelines have been prepared and
given in the Chapter 4.
Implementation of Capacity Building Plan No.
of
ULB
Name of
Department
Total
Target (Mission
period)
Target to be trained during the previous Financial Year SAAP III Target Name of Training
Entity (TEs) 2015-16 2016-17 SAAP I &II 2017-
18
2018-
19
2019-
20 Target Achieved Target Achieved Target Achieved
1 2 3 4 5 6 7 8 9 10 11 12 13
636 Elected
Representatives
11,920 600 - 1,260 - 1,860 - 1,260 4,400 4,400 *ISPER
Panchkula
(Haryana)
Finance
Department
586 90 44 90 324 180 368 90 158 158 **RCUES,
Lucknow
Engineering
Department
691 90 120 210 263 300 383 210 91 90 RCUES+***ESCI
Hyderabad
Town Planning - - - - - - - - - -
Administrative
Department
800 150 37 150 210 300 247 150 175 175 RCUES,
Lucknow
Non-
centralized
Services
(AMRUT)
3,561 300 9 390 - 690 9 390 1,241 1,240 RCUES,
Lucknow
Non-
Centralized
Services (other
than AMRUT
Cities)
8,326 270 - 300 - 570 - 300 3,728 3,728 RCUES,
Lucknow
Total 25,884 1,500 210 2,400 797 3,900 1,007 2,400 9,793 9,791
*ISPER- Institute for Spatial Planning and Environment Research
**RCUES- Regional Centre for Urban and Environment Studies
***ESCI- Engineering Staff College of India
The response to questionnaire is given as under:
Q1- What is the physical and financial Progress of capacity development at state level?
(350 words)

Final 3rd STATE ANNUAL ACTION PLAN (3rd SAAP) FOR FY: 2017-18 to FY 2019-20 OF UTTAR PRADESH UNDER ATAL MISSION FOR
REJUVENATION AND URBAN TRANSFORMATION (AMRUT)
2017
STATE MISSION DIRECTORATE (AMRUT) UTTAR PRADESH, 8TH FLOOR, INDIRA BHAWAN, ASHOK MARG, LUCKNOW-226001 120 | P a g e
Response: In the Financial Year 2014-15, RCUES, Lucknow had organized 100 training
Programmes under CCBP in which total 1956 number of persons were trained which included
345 Male Elected Representatives and 28 Female Elected Representatives and remaining 1583
officials were trained. Under AMRUT, against the target of 3900 total 1007 persons are trained
in various programs.
Q2- Do you feel that there is a need to include any other category of official, new
department or module? (400 words)
Response: Almost all department of municipal cadre have been included.
Q3- What are the issues that are been identified during the review? (350 words)
Response: Through review, it is felt rather the capacity building planning for the municipal
cadres on specific topic we need to design the course content for each municipal cadre and
even before the posting of officials in field they should be trained on foundation and
professional subjects. These courses should be made mandatory for field posting that will
develop basic skill in the municipal functionaries and may result in the improvement of urban
governance.
The present training and sensitization programmes are not sufficient and effective because
they are not designed as per the needs and requirements of these specialized municipal cadres.
For urban management and human resource development state lacks required infrastructure
and institutional setup to work in the spirit of 74th constitutional amendment for empowerment
of hub of urban development, it is urgent need to design training module which must be specific
considering the nature of duties and responsibilities of different type of municipal
functionaries.

Final 3rd STATE ANNUAL ACTION PLAN (3rd SAAP) FOR FY: 2017-18 to FY 2019-20 OF UTTAR PRADESH UNDER ATAL MISSION FOR
REJUVENATION AND URBAN TRANSFORMATION (AMRUT)
2017
STATE MISSION DIRECTORATE (AMRUT) UTTAR PRADESH, 8TH FLOOR, INDIRA BHAWAN, ASHOK MARG, LUCKNOW-226001 121 | P a g e
Q4- Have the activities in your current year Capacity Building Plan – training, exposure
visits (ULB staff and elected representatives), seminars/workshops, etc. – been
vetted/approved by NIUA?
Response: Not yet.
Q5- What is the present institutional capacity in the ULBs of the state; have the RPMC,
UMC, etc. been appointed? Are there other PMUs, PIUs, etc. which are still operational?
Response: The SMMU and CMMUs is some of AMRUT towns are in place and the experts
hired, have been sensitized regarding to their roles and responsibilities from state mission
directorate.
Q6- What has been the progress during the previous year/s in institutional capacity
building, especially but not only in the seven areas that are mentioned in the AMRUT
Guidelines?
Response: In previous years the institutional capacity of ULBs have been strengthened by the
appointment of field level consultant (FLCs) i.e., CA firms, for the implementation of Accrual
Based Double Entry Accounting System, several consultancy firms are also working to develop
municipal applications for e- governance implementation apart from the regular engagement
of expertise for traditional municipal functions such as road, water supply, sewerage,
drainage, sanitation and SWM works. Therefore, institutional capacity is being strengthened
by associating professionals but to assess the quality of work we need to enhance the
fundamental individual capacity of municipal officials. Considering that the State has taken
initiative to establish UP Academy for Urban Development, Research and Training (UP-
AUDRT) for all 654 ULBs in which more than 1 lacs officers and employees are working
presently.

Final 3rd STATE ANNUAL ACTION PLAN (3rd SAAP) FOR FY: 2017-18 to FY 2019-20 OF UTTAR PRADESH UNDER ATAL MISSION FOR
REJUVENATION AND URBAN TRANSFORMATION (AMRUT)
2017
STATE MISSION DIRECTORATE (AMRUT) UTTAR PRADESH, 8TH FLOOR, INDIRA BHAWAN, ASHOK MARG, LUCKNOW-226001 122 | P a g e
Q7- Attach the Quarterly Score Cards as per Mission Guidelines.
Response: The Quarterly score card for state of Uttar Pradesh has been prepared and annexed
as TABLE 7.4.
Q8- Have those issues been addressed? How? (500 words)
Response: To resolve the fundamental issue of lack departmental institutional capacity for
basic professional training and for regular update about recent development in urban
governance the State has taken initiative to establish UP Academy for Urban Development,
Research and Training (UP-AUDRT) for all 654 ULBs in which more than 1 lacs officers
and employees are working presently.
ADMINISTRATIVE AND OTHER EXPENSES (A&OE)
The 10% allocation for A&OE has been divided into two parts, 8% State fund and 2% GoI
fund. The Plan of Action given in the AMRUT Guidelines TABLE 4 has been prepared and
given in Chapter 4. The response to questionnaire is given as under:
Q1- What is the committed expenditure from previous year? (200 words)
Response: The committed expenditure from previous year were the expenses incurred for the
preparation of SLIP and SAAP FY 2015-16, for which an advance of Rs 25 lakh per city total
amount of Rs 15.25 Cr have been transferred to 60 AMRUT cities of State.
Q2- What are the issues that are been identified during the review? (350 words)
Response: During review, it was found that in the initial stage of mission when all institutions
like SMMU, CMMU, PDMC and IRMA etc. needed to be quickly established for the
management and implementation of program no fund (except 15.25 Cr for SLIP preparation
Final 3rd STATE ANNUAL ACTION PLAN (3rd SAAP) FOR FY: 2017-18 to FY 2019-20 OF UTTAR PRADESH UNDER ATAL MISSION FOR
REJUVENATION AND URBAN TRANSFORMATION (AMRUT)
2017
STATE MISSION DIRECTORATE (AMRUT) UTTAR PRADESH, 8TH FLOOR, INDIRA BHAWAN, ASHOK MARG, LUCKNOW-226001 123 | P a g e
has been released so it was desired to flag this issue before MoUD at appropriate place and
also it was directed to make all systems in place so mission targets to be achieved as envisaged
in SAAP-I: 2015-16 and SAAP-II: 2016-17.
Q3- Have the A&OE fund used only for admissible components? (200 words)
Response: No A&OE fund except Rs 15.25Cr for SLIP preparation has been released.
Q4- How the ULB/State wants to carry out the implementation of the projects,
(Establishment of IRMA/PDMC/SMMU/CMMU)? (350 words)
Response: The state has decided to establish SMMU unit at state level to aid and advice the
State Mission Director (AMRUT) comprising the experts required for the mission management.
These experts are being hired from the market on contract basis who will under agreement
perform their duties exclusively for AMRUT mission. On same procedure CMMUs have been
established as per mission guidelines. The PDMC for water and sewerage works has been
established at UP Jal Nigam and for parks and urban transport at RCUES Lucknow level. In
the 3rd SHPSC meeting held on 27-05-2016 it was decided that remaining 5 experts with
support system as per RFP circulated by the MoUD would be outsourced though competitive
open bidding and for this a consulting firm would be selected based on work contract at mission
directorate level.
FINANCING OF PROJECTS
Financing is an important element of the SAAP. Each state has been given the maximum share
which are being allocated annually by the Central Government. The State and ULBs have
planned for the remaining resource generation at the time of preparation of this SAAP for FY
2017-20.

Final 3rd STATE ANNUAL ACTION PLAN (3rd SAAP) FOR FY: 2017-18 to FY 2019-20 OF UTTAR PRADESH UNDER ATAL MISSION FOR
REJUVENATION AND URBAN TRANSFORMATION (AMRUT)
2017
STATE MISSION DIRECTORATE (AMRUT) UTTAR PRADESH, 8TH FLOOR, INDIRA BHAWAN, ASHOK MARG, LUCKNOW-226001 124 | P a g e
Q1- What is the State contribution to the SAAP? (It should greater than 20 percent of the
total project cost, Para 7.4 of AMRUT Guidelines) (150 words)
Response: The State share has been decided more than 20% which is provided in the mission
guidelines.
For towns having population more than 10 lacs sharing is ACA: State: ULB: 33.33%:
36.67%: 30%.
For towns having population less than 10 lacs sharing is ACA: State: ULB:
:50%:30%:20%
Q2- How the residual financing (over and above Central Government share) is shared
between the States, ULBs? (Tabular; 200 words)
Response: The residual financing over and above the central share has been decided by the
State government. The State share has been decided more than 20% which provided in the
mission guidelines. The sharing pattern is given in following table. Also, refer the TABLE 3.4.
SN Type of AMRUT Town Central Share
(ACA)
State Share ULB Share
1 Towns having population
more than 10 lacs
33.33% 36.67% 30%
2 Towns having population less
than 10 lacs
50% 30% 20%
Q3- Has any other sources identified by the State/ULB (e.g. PPP, market borrowing)?
Please discuss. (250 words)
Response: Yes. Alternate sources are being identified. At this stage, exact details have not been
worked out but looking to poor financial position of ULBs and lack of sufficient internal
Final 3rd STATE ANNUAL ACTION PLAN (3rd SAAP) FOR FY: 2017-18 to FY 2019-20 OF UTTAR PRADESH UNDER ATAL MISSION FOR
REJUVENATION AND URBAN TRANSFORMATION (AMRUT)
2017
STATE MISSION DIRECTORATE (AMRUT) UTTAR PRADESH, 8TH FLOOR, INDIRA BHAWAN, ASHOK MARG, LUCKNOW-226001 125 | P a g e
resources, it is imperative that ULBs will arrange finances through options like PPP. Under
AMRUT scheme, the State Govt. has decided to meet not less than 20% of the project cost, in
addition to the Central share. The ULBs are expected to meet the remaining share from their
own funds, 14th Finance Commission Grants and from other sources. The ULBs are trying to
raise their own revenues through improving billing and collection systems and through public
mobilization and awareness campaigns. The ULBs are also preparing themselves to mobilize
finances through financial institutions by obtaining credit rating from accredited institutions.
The O&M cost will be met from the ULB through user charges and other sources. Also, refer
the TABLE 3.3.
Q4- Whether complete project cost is linked with revenue sources in SAAP? How? (250
words).
Response: Yes, it has been attempted but if there will be VGF, the same shall be arranged by
the ULBs through their own resources or funding/loan through financial institutions.
Q5- Has projects been dovetailed with other sectoral and financial programme of the
Centre and State Governments? (250 words)
Response: Yes, all possible dovetailing/convergence of ongoing/sanctioned projects under
JnNURM, UIDSSMT, Smart City, SBM have been considered during preparation of the SLIPs
of the ULBs.
Q6- Has States/UTs explored the possibility of using Public Private Partnerships (PPP),
as a preferred execution model? Please discuss. (300 words)
Response: Yes. The State has already explored the possibility of using PPP mode of execution
model for solid waste management (SWM), park development, providing parking facilities,
bridges etc. with a mix of success and failure.

Final 3rd STATE ANNUAL ACTION PLAN (3rd SAAP) FOR FY: 2017-18 to FY 2019-20 OF UTTAR PRADESH UNDER ATAL MISSION FOR
REJUVENATION AND URBAN TRANSFORMATION (AMRUT)
2017
STATE MISSION DIRECTORATE (AMRUT) UTTAR PRADESH, 8TH FLOOR, INDIRA BHAWAN, ASHOK MARG, LUCKNOW-226001 126 | P a g e
Q7- Are PPP options included appropriate Service Level Agreements (SLAs) which may
lead to the People Public Private Partnership (PPPP) model? How? (300 words)
Response: PPP is seriously under consideration and shall be detailed out during DPR
preparation. While preparing DPR focus will not be only asset creation but on actual service
delivery. Performance based output and payment shall be attempted with the objective of
achieving desired service levels.

Final 3rd STATE ANNUAL ACTION PLAN (3rd SAAP) FOR FY: 2017-18 to FY 2019-20 OF UTTAR PRADESH UNDER ATAL MISSION FOR
REJUVENATION AND URBAN TRANSFORMATION (AMRUT)
2017
STATE MISSION DIRECTORATE (AMRUT) UTTAR PRADESH, 8TH FLOOR, INDIRA BHAWAN, ASHOK MARG, LUCKNOW-226001 127 | P a g e
TABLES
CHAPTER-4

Final 3rd STATE ANNUAL ACTION PLAN (3rd SAAP) FOR FY: 2017-18 to FY 2019-20 OF UTTAR PRADESH UNDER ATAL MISSION FOR
REJUVENATION AND URBAN TRANSFORMATION (AMRUT)
2017
STATE MISSION DIRECTORATE (AMRUT) UTTAR PRADESH, 8TH FLOOR, INDIRA BHAWAN, ASHOK MARG, LUCKNOW-226001 128 | P a g e
Table 1.1: Breakup of Total MoUD Allocation in AMRUT
Name of State Uttar Pradesh 3rd SAAP: FY 2017-18 to 2019-20
Amount in Rs Crore
Total Central Funds
Allocated to State
Allocation of
Central funds for
A&OE (@ 8% of
Total given in
column1)
Allocation of
funds for
AMRUT
(Central share)
Multiply col. 3 by
x3) for AMRUT on
col. 4 (project
proposal to be
three- times the
annual allocation -
CA)
Add equal (col. 4)
State/UL B share
Total AMRUT annual
size (cols.2+4+5)
1 2 3 4 5 6
679.49 54.36 625.13 1875.39 2363.85 4293.60

Final 3rd STATE ANNUAL ACTION PLAN (3rd SAAP) FOR FY: 2017-18 to FY 2019-20 OF UTTAR PRADESH UNDER ATAL MISSION FOR
REJUVENATION AND URBAN TRANSFORMATION (AMRUT)
2017
STATE MISSION DIRECTORATE (AMRUT) UTTAR PRADESH, 8TH FLOOR, INDIRA BHAWAN, ASHOK MARG, LUCKNOW-226001 129 | P a g e
Table 1.2: Sectoral Breakup of Total GOI Allocation and 1st Instalment to be released
Name of State Uttar Pradesh 3rd SAAP: FY 2017-18 to 2019-20
Amount in Rs Crore
Annual Central
Allocation
Allocation of
Central fund
for A&OE
Out of column
1 Allocation
of Central
fund for Parks
(2.5%)
Out of column 1
Allocation of
Central fund for
other projects
Matching State/ULB
Share w.r.t. Cols 3&4
Total AMRUT
annual size (Col
3+4+5)
1st Instalment of
Central share to
be release on 3rd
SAAP approval
1 2 3 4 5 6 7
1875.39 54.36 46.88 1828.51 2363.85 4239.24 375.08

Final 3rd STATE ANNUAL ACTION PLAN (3rd SAAP) FOR FY: 2017-18 to FY 2019-20 OF UTTAR PRADESH UNDER ATAL MISSION FOR
REJUVENATION AND URBAN TRANSFORMATION (AMRUT)
2017
STATE MISSION DIRECTORATE (AMRUT) UTTAR PRADESH, 8TH FLOOR, INDIRA BHAWAN, ASHOK MARG, LUCKNOW-226001 130 | P a g e
Table 1.2.1: Abstract-Sector Wise Proposed Total Project Fund and Sharing Pattern
Name of State: Uttar Pradesh 3rd SAAP: FY 2017-18 to 2019-20
Amount in Rs Crore
SN Sector No. of
Projects Centre State ULB Convergence Others
State
+ULB Total
1 2 3 4 5 6 7 8 9 10
1 Water Supply 46 878.81 646.51 470.70 1117.21 1996.02
2 Sewerage & Septage
Management 47 949.70 694.87 504.89 1199.76 2149.46
3 Drainage
4 Urban Transport
5 Others (Green Space
& Parks) 61 46.88 28.13 18.75 46.88 93.76
Grand Total 154 1875.39 1369.51 994.34 2363.85 4239.24

Final 3rd STATE ANNUAL ACTION PLAN (3rd SAAP) FOR FY: 2017-18 to FY 2019-20 OF UTTAR PRADESH UNDER ATAL MISSION FOR
REJUVENATION AND URBAN TRANSFORMATION (AMRUT)
2017
STATE MISSION DIRECTORATE (AMRUT) UTTAR PRADESH, 8TH FLOOR, INDIRA BHAWAN, ASHOK MARG, LUCKNOW-226001 131 | P a g e
Table 1.2.2: Abstract-Break-up of Total Fund Sharing Pattern
Name of State: Uttar Pradesh 3rd SAAP: FY 2017-18 to 2019-20
Amount in Rs Crore
S
N Sector
Central State ULB
Convergence Others
Total Amount
Demanded Under
AMRUT for
Project Period Mission 14th FC Others Total
14th
FC Others Total
1 2 3 4 5 6 7 8 9 10 11 12
1 Water Supply 878.81 646.51 646.51 470.70 470.70 1,996.02
2
Sewerage &
Septage
Management
949.70 694.87 694.87 504.89 504.89 2,149.46
3 Drainage - - -
4 Urban Transport - - -
5 Others (Green
Space & Parks) 46.88 28.13 28.13 18.75 18.75 93.76
Grand Total 1,875.39 - 1,369.51 1,369.51 994.34 994.34 4,239.24

Final 3rd STATE ANNUAL ACTION PLAN (3rd SAAP) FOR FY: 2017-18 to FY 2019-20 OF UTTAR PRADESH UNDER ATAL MISSION FOR
REJUVENATION AND URBAN TRANSFORMATION (AMRUT)
2017
STATE MISSION DIRECTORATE (AMRUT) UTTAR PRADESH, 8TH FLOOR, INDIRA BHAWAN, ASHOK MARG, LUCKNOW-226001 132 | P a g e
Table 1.3: Abstract-Use of Funds on Projects: On Going and New
Name of State: Uttar Pradesh 3rd SAAP: FY 2017-18 to 2019-20
Amount in Rs Crore
SN Sector
Total
Project
Invest_t
Committed Expenditure (if any) from Previous
Year Proposed Spending during Current Financial Year Balance Carry Forward for Next Financial Year
Centre
State ULB
Centre
State ULB
Centre
State ULB
14th FC
Others Total 14th FC
Others Total 14th FC
Others Total 14th FC
Others Total 14th FC
Others Total 14th FC
Others Total
1 Water
Supply 5532.63 299.93 234.03 173.58 2078.20 1581.00 1165.89
2
Sewerage
&
Septage
Manag_t
5642.92 295.24 231.10 172.24 2129.73 1620.41 1194.20
3 Drainage
4 Urban
Transport
5
Others
(Green
Space &
Parks)
246.12 15.19 9.14 6.05 107.87 64.87 43.00
Grand Total 11421.67 610.36 474.27 351.87 4315.80 3266.28 2403.09

Final 3rd STATE ANNUAL ACTION PLAN (3rd SAAP) FOR FY: 2017-18 to FY 2019-20 OF UTTAR PRADESH UNDER ATAL MISSION FOR
REJUVENATION AND URBAN TRANSFORMATION (AMRUT)
2017
STATE MISSION DIRECTORATE (AMRUT) UTTAR PRADESH, 8TH FLOOR, INDIRA BHAWAN, ASHOK MARG, LUCKNOW-226001 133 | P a g e
Table 1.4: Abstract-Plan for Achieving Service Level Benchmarks
Name of State: Uttar Pradesh Current Mission Period: 2017-18 to 2019-20
SN Proposed
Priority
Projects
Total
Project
Cost
(Rs Cr)
Indicators Baseline Annual Targets based on Master Plan
(Increment from the Baseline Value)
FY 2016 FY
2017
FY
2018
FY
2019
FY
2020
H1 H2
1 2 3 4 5 6 7 8 9 10 11
Water Supply
Water Supply 5532.63
1. Household level coverage of direct water supply connections 46% 59% 62% 69% 73% 76%
2. Per capita quantum of water supplied (LPCD) 142 144 150 151 155 158
3. Quality of water supplied 90% 89% 91% 94% 97% 100%
Sewerage and Septage Management
Sewerage &
Septage
Manage_t
5642.92 4. Coverage of latrines (individual or community) 88% 89% 92% 95% 98% 100%
5. Coverage of sewerage network services 10% 12% 16% 20% 24% 25%
Septage
Manage_t 483.00
6. Efficiency of Collection of Sewerage 13% 15% 18% 29% 45% 62%
7. Efficiency in treatment 17% 18% 21% 32% 49% 64%
Drainage
8. Coverage of storm water drainage network
Urban Transport
9. Service Coverage of urban transport in the city
10. Availability of urban transport per 1000 population

Final 3rd STATE ANNUAL ACTION PLAN (3rd SAAP) FOR FY: 2017-18 to FY 2019-20 OF UTTAR PRADESH UNDER ATAL MISSION FOR
REJUVENATION AND URBAN TRANSFORMATION (AMRUT)
2017
STATE MISSION DIRECTORATE (AMRUT) UTTAR PRADESH, 8TH FLOOR, INDIRA BHAWAN, ASHOK MARG, LUCKNOW-226001 134 | P a g e
Table 2.1: SLIP – Master Plan of all projects to achieve universal coverage of Water Supply and Sewerage &
Septage management during current Mission Period (FY: 2015-16 to 2019-20) Name of State: Uttar Pradesh 3rd SAAP: FY 2017-18 to 2019-20
Amount in Rs Lakhs SN Project Name and Code (List of all projects to achieve universal
coverage)
Priority
Number
FY in which
project proposed to
be implemented
FY in which
project proposed to
be completed
Estimated Cost
1 2 3 4 5 6
SECTOR: WATER SUPPLY
Name of City: Agra
1 Water House Connection, Agra City 1 2015-16 2017-18 1038.35
2 Water Supply Scheme for Agra City 2 2016-17 2018-19 12523.00
3 Water Supply Scheme for Agra City 3 2017-18 2019-20 8000.00
Name of City: Allahabad
1 Water House Connection and Automation of 185 TWs & 44 Pumping Plants,
Allahabad City 1 2015-16 2018-19 2874.57
2 Water Supply Scheme for Allahabad City 2 2016-17 2018-19 12724.00
3 Water Supply Scheme for Allahabad City 3 2017-18 2019-20 8000.00
Name of City: Ghaziabad
1 Water House Connection, Ghaziabad City 1 2015-16 2018-19 2582.78
2 Water Supply Scheme for CHA Part 2, Ghaziabad 2 2015-16 2018-19 3325.48
3 Water Supply Scheme for CHA Phase 2, Ghaziabad 2 2016-17 2018-19 7983.06
4 Water Supply Scheme for THA Part 2, Ghaziabad 2 2016-17 2018-19 3962.62
5 Water Supply Scheme for Ghaziabad City 3 2016-17 2018-19 1624.00
6 Water Supply Scheme for Ghaziabad City 4 2017-18 2019-20 10000.00
Name of City: Kanpur
1 Water Supply Reorganisation Scheme, East Service District, Phase 3 Part 1,
Kanpur City 1 2015-16 2018-19 5007.24
2 Water Supply Reorganisation Scheme, South Service District, Phase 3 Part 2,
Kanpur City 1 2015-16 2018-19 5223.93

Final 3rd STATE ANNUAL ACTION PLAN (3rd SAAP) FOR FY: 2017-18 to FY 2019-20 OF UTTAR PRADESH UNDER ATAL MISSION FOR
REJUVENATION AND URBAN TRANSFORMATION (AMRUT)
2017
STATE MISSION DIRECTORATE (AMRUT) UTTAR PRADESH, 8TH FLOOR, INDIRA BHAWAN, ASHOK MARG, LUCKNOW-226001 135 | P a g e
Table 2.1: SLIP – Master Plan of all projects to achieve universal coverage of Water Supply and Sewerage &
Septage management during current Mission Period (FY: 2015-16 to 2019-20) Name of State: Uttar Pradesh 3rd SAAP: FY 2017-18 to 2019-20
Amount in Rs Lakhs SN Project Name and Code (List of all projects to achieve universal
coverage)
Priority
Number
FY in which
project proposed to
be implemented
FY in which
project proposed to
be completed
Estimated Cost
1 2 3 4 5 6
3 Water Supply Reorganisation Scheme, City Service District, Phase 2 Part 3A,
Kanpur City 1 2015-16 2018-19 2720.00
4 Water Supply Scheme for Kanpur City 2 2016-17 2018-19 10548.00
5 Water Supply Scheme for Kanpur City 3 2017-18 2019-20 8000.00
Name of City: Lucknow
1 Construction of Boundary Wall for protection of 5th Water Works land,
Lucknow City 2 2015-16 2017-18 320.79
2 Water House Connection in District A, Lucknow City 1 2015-16 2018-19 2781.09
3 Water House Connection in District B, C, D Lucknow City 1 2015-16 2018-19 3758.39
4 Construction of Boundary Wall, CCTV and Watch Tower for protection of 3rd
Water Works land, Lucknow City 3 2015-16 2017-18 1500.06
5 Water Supply Scheme for Lucknow City 4 2016-17 2018-19 45639.00
6 Water Supply Scheme for Lucknow City 5 2017-18 2019-20 25001.00
Name of City: Meerut
1 Water House Connection in 9 zones, Meerut City 1 2015-16 2017-18 1339.39
2 Automation of 157 TWs & 9 Zonal Pumping Stations (SCADA), Meerut City 3 2015-16 2018-19 2268.74
3 Water Supply Reorganisation Scheme, Meerut City 2 2015-16 2017-18 1647.50
4 Water Supply Scheme for Meerut City 3 2016-17 2018-19 5003.00
5 Water Supply Scheme for Meerut City 4 2017-18 2019-20 2500.00
Name of City: Varanasi
1 Water House Connection in 5 zones, Varanasi City 1 2015-16 2018-19 2643.43
2 Estimate for laying of new parallel feeder main by micro tunnelling method in
CIS Varuna Area 2 2015-16 2019-20 10453.05

Final 3rd STATE ANNUAL ACTION PLAN (3rd SAAP) FOR FY: 2017-18 to FY 2019-20 OF UTTAR PRADESH UNDER ATAL MISSION FOR
REJUVENATION AND URBAN TRANSFORMATION (AMRUT)
2017
STATE MISSION DIRECTORATE (AMRUT) UTTAR PRADESH, 8TH FLOOR, INDIRA BHAWAN, ASHOK MARG, LUCKNOW-226001 136 | P a g e
Table 2.1: SLIP – Master Plan of all projects to achieve universal coverage of Water Supply and Sewerage &
Septage management during current Mission Period (FY: 2015-16 to 2019-20) Name of State: Uttar Pradesh 3rd SAAP: FY 2017-18 to 2019-20
Amount in Rs Lakhs SN Project Name and Code (List of all projects to achieve universal
coverage)
Priority
Number
FY in which
project proposed to
be implemented
FY in which
project proposed to
be completed
Estimated Cost
1 2 3 4 5 6
3 Water Supply Scheme for Varanasi City 3 2016-17 2018-19 11903.00
4 Water Supply Scheme for Varanasi City 4 2017-18 2019-20 10000.00
Name of City: Aligarh
1 Water House Connection, Aligarh City 1 2015-16 2017-18 903.95
2 Water Supply Scheme for Aligarh City 2 2016-17 2018-19 9537.00
3 Water Supply Scheme for Aligarh City 3 2017-18 2019-20 4000.00
Name of City: Bareilly
1 Water House Connection and Extension of pipe line, Bareilly City 1 2015-16 2017-18 1567.15
2 Water Supply Scheme for Bareilly City 2 2016-17 2018-19 950.00
3 Water Supply Scheme for Bareilly City 3 2017-18 2019-20 1500.00
Name of City: Firozabad
1 Water Supply Scheme for Firozabad 2 2016-17 2018-19 260.00
Name of City: Gorakhpur
1 Water House Connection, Gorakhpur City 1 2015-16 2017-18 278.13
2 Automation of TWs (SCADA), Gorakhpur City 2 2015-16 2017-18 765.16
3 Water Supply Scheme for Gorakhpur City 3 2016-17 2018-19 11557.00
4 Water Supply Scheme for Gorakhpur City 4 2017-18 2019-20 4000.00
Name of City: Jhansi
1 Water Supply Reorganisation Scheme, Phase 1, Jhansi City 1 2015-16 2019-20 19599.00
2 Water Supply Reorganisation Scheme, Phase 2, Jhansi City 1 2016-17 2019-20 30710.71
2 Water Supply Scheme for Jhansi City 2 2016-17 2018-19 870.00

Final 3rd STATE ANNUAL ACTION PLAN (3rd SAAP) FOR FY: 2017-18 to FY 2019-20 OF UTTAR PRADESH UNDER ATAL MISSION FOR
REJUVENATION AND URBAN TRANSFORMATION (AMRUT)
2017
STATE MISSION DIRECTORATE (AMRUT) UTTAR PRADESH, 8TH FLOOR, INDIRA BHAWAN, ASHOK MARG, LUCKNOW-226001 137 | P a g e
Table 2.1: SLIP – Master Plan of all projects to achieve universal coverage of Water Supply and Sewerage &
Septage management during current Mission Period (FY: 2015-16 to 2019-20) Name of State: Uttar Pradesh 3rd SAAP: FY 2017-18 to 2019-20
Amount in Rs Lakhs SN Project Name and Code (List of all projects to achieve universal
coverage)
Priority
Number
FY in which
project proposed to
be implemented
FY in which
project proposed to
be completed
Estimated Cost
1 2 3 4 5 6
3 Water Supply Scheme for Jhansi City 2 2017-18 2019-20 25500.00
Name of City: Moradabad
1 Water House Connection, Moradabad City 1 2015-16 2018-19 2437.57
2 Water Supply Scheme for Moradabad City 2 2016-17 2018-19 1438.00
3 Water Supply Scheme for Moradabad City 3 2017-18 2019-20 1000.00
Name of City: Saharanpur
1 Water Supply Reorganisation Scheme, Part 1, Saharanpur City 1 2015-16 2018-19 2611.70
2 Water Supply Scheme for Saharanpur City 2 2016-17 2018-19 2074.00
3 Water Supply Scheme for Saharanpur City 3 2017-18 2019-20 2500.00
Name of City: Akbarpur
1 Water House Connection, Akbarpur City (Ambedkar Nagar) 1 2015-16 2017-18 190.44
2 Water Supply Reorganisation Scheme, Akbarpur City 2 2015-16 2017-18 786.20
3 Water Supply Scheme for Akbarpur City 3 2016-17 2018-19 260.78
4 Water Supply Scheme for Akbarpur City 4 2017-18 2019-20 2000.00
Name of City: Amroha
1 Water House Connection in 6 zones, Amroha City 1 2015-16 2017-18 1390.50
Name of City: Ayodhya
1 Sewerage Scheme for Ayodhya 2 2017-18 2019-20 1801.00
Name of City: Azamgarh
1 Water House Connection, Azamgarh City 1 2015-16 2017-18 54.67
2 Water Supply Scheme in Belaisa & Hirapatti Area, Azamgarh City 2 2015-16 2017-18 533.08

Final 3rd STATE ANNUAL ACTION PLAN (3rd SAAP) FOR FY: 2017-18 to FY 2019-20 OF UTTAR PRADESH UNDER ATAL MISSION FOR
REJUVENATION AND URBAN TRANSFORMATION (AMRUT)
2017
STATE MISSION DIRECTORATE (AMRUT) UTTAR PRADESH, 8TH FLOOR, INDIRA BHAWAN, ASHOK MARG, LUCKNOW-226001 138 | P a g e
Table 2.1: SLIP – Master Plan of all projects to achieve universal coverage of Water Supply and Sewerage &
Septage management during current Mission Period (FY: 2015-16 to 2019-20) Name of State: Uttar Pradesh 3rd SAAP: FY 2017-18 to 2019-20
Amount in Rs Lakhs SN Project Name and Code (List of all projects to achieve universal
coverage)
Priority
Number
FY in which
project proposed to
be implemented
FY in which
project proposed to
be completed
Estimated Cost
1 2 3 4 5 6
3 Water Supply Scheme for Azamgarh City 3 2016-17 2018-19 1030.00
4 Water Supply Scheme for Azamgarh City 4 2017-18 2019-20 1000.00
Name of City: Bahraich
1 Water House Connection, Bahraich City 1 2015-16 2017-18 82.18
2 Water Supply Reorganisation Scheme, Bahraich City 2 2015-16 2018-19 6607.37
Name of City: Ballia
1 Water House Connection, Ballia City 1 2015-16 2017-18 182.40
2 Automation of TWs, CWRs & OHTs (SCADA), Ballia City 2 2015-16 2017-18 292.25
3 Water Supply Scheme for Ballia City 3 2016-17 2018-19 147.00
4 Water Supply Scheme for Ballia City 4 2017-18 2019-20 500.00
Name of City: Banda
1 Water House Connection, Banda City 1 2015-16 2017-18 190.70
2 Water Supply Scheme for Banda City 2 2016-17 2018-19 1851.00
3 Water Supply Scheme for Banda City 3 2017-18 2019-20 25000.00
Name of City: Baraut
1 Water House Connection & Extension of Pipe Line (Ward 14, Zone 4), Barraut
City 1]2 2015-16 2017-18 215.94
2 Automation of TWs (SCADA), Baraut City 3 2015-16 2017-18 252.63
3 Water Supply Scheme for Baraut City 4 2016-17 2018-19 324.00
4 Water Supply Scheme for Baraut City 5 2017-18 2019-20 500.00
Name of City: Basti

Final 3rd STATE ANNUAL ACTION PLAN (3rd SAAP) FOR FY: 2017-18 to FY 2019-20 OF UTTAR PRADESH UNDER ATAL MISSION FOR
REJUVENATION AND URBAN TRANSFORMATION (AMRUT)
2017
STATE MISSION DIRECTORATE (AMRUT) UTTAR PRADESH, 8TH FLOOR, INDIRA BHAWAN, ASHOK MARG, LUCKNOW-226001 139 | P a g e
Table 2.1: SLIP – Master Plan of all projects to achieve universal coverage of Water Supply and Sewerage &
Septage management during current Mission Period (FY: 2015-16 to 2019-20) Name of State: Uttar Pradesh 3rd SAAP: FY 2017-18 to 2019-20
Amount in Rs Lakhs SN Project Name and Code (List of all projects to achieve universal
coverage)
Priority
Number
FY in which
project proposed to
be implemented
FY in which
project proposed to
be completed
Estimated Cost
1 2 3 4 5 6
1 Water House Connection & Water meter installation, Basti City 1 2015-16 2017-18 603.25
2 Water Supply Scheme for Basti City 2 2016-17 2018-19 491.00
3 Water Supply Scheme for Basti City 3 2017-18 2019-20 500.00
Name of City: Budaun 1 Water House Connection & Extension of Pipe Line, Budaun City 1]2 2015-16 2017-18 1196.34 2 Water Supply Scheme for Budaun City 2016-17 2018-19 20.00 3 Water Supply Scheme for Budaun City 2017-18 2019-20 600.00
Name of City: Bulandshahar
1 Water House Connection in 6 zones, Bulandshahar City 1 2015-16 2017-18 100.84
2 Automation of TWs (SCADA), Bulandshahar City 2 2015-16 2017-18 522.74
3 Water Supply Scheme for Bulandshahar City 3 2016-17 2018-19 206.00
Name of City: Chandausi
1 Water House Connection, Chandausi City 1 2015-16 2017-18 44.72
2 Water Supply Scheme for Chandausi City 2 2016-17 2018-19 1191.00
3 Water Supply Scheme for Chandausi City 3 2017-18 2019-20 3000.00
Name of City: Deoria
1 Water House Connection, Deoria City 1 2015-16 2017-18 674.81
2 Water Supply Scheme for Deoria City 2 2016-17 2018-19 505.19
3 Water Supply Scheme for Deoria City 3 2017-18 2019-20 500.00
Name of City: Etah
1 Water House Connection, Etah City 1 2015-16 2017-18 76.87

Final 3rd STATE ANNUAL ACTION PLAN (3rd SAAP) FOR FY: 2017-18 to FY 2019-20 OF UTTAR PRADESH UNDER ATAL MISSION FOR
REJUVENATION AND URBAN TRANSFORMATION (AMRUT)
2017
STATE MISSION DIRECTORATE (AMRUT) UTTAR PRADESH, 8TH FLOOR, INDIRA BHAWAN, ASHOK MARG, LUCKNOW-226001 140 | P a g e
Table 2.1: SLIP – Master Plan of all projects to achieve universal coverage of Water Supply and Sewerage &
Septage management during current Mission Period (FY: 2015-16 to 2019-20) Name of State: Uttar Pradesh 3rd SAAP: FY 2017-18 to 2019-20
Amount in Rs Lakhs SN Project Name and Code (List of all projects to achieve universal
coverage)
Priority
Number
FY in which
project proposed to
be implemented
FY in which
project proposed to
be completed
Estimated Cost
1 2 3 4 5 6
2 Water Supply Scheme for Etah City 2 2016-17 2018-19 459.00
3 Water Supply Scheme for Etah City 3 2017-18 2019-20 1000.00
Name of City: Etawah
1 Water House Connection, Etawah City 1 2015-16 2017-18 1696.98
Name of City: Faizabad
1 Water House Connection, Faizabad City 1 2015-16 2017-18 426.93
2 Water Supply Scheme for Faizabad City 2 2016-17 2018-19 2095.07
Name of City: Farrukhabad-cum-Fatehgarh
1 Water House Connection, Farrukhabad City 1 2015-16 2017-18 641.95
2 Water Supply Scheme for Farrukhabad-cum-Fatehgarh City 2 2016-17 2018-19 351.00
Name of City: Fatehpur
1 Water House Connection, Fatehpur City 1]2 2015-16 2017-18 1250.27
Name of City: Ghazipur
1 Water House Connection, Ghazipur City 1 2015-16 2017-18 62.76
2 Extension of Distribution System & Water House Connection, Ghazipur City 2 2015-16 2017-18 155.56
3 Water Supply Scheme for Ghazipur City 3 2016-17 2018-19 875.00
4 Water Supply Scheme for Ghazipur City 4 2017-18 2019-20 700.00
Name of City: Gonda
1 Extension of Distribution System, Water House Connection & Automation
Works, Gonda City 1 2015-16 2017-18 445.17
2 Water Supply Scheme for Gonda City 2 2016-17 2018-19 466.83

Final 3rd STATE ANNUAL ACTION PLAN (3rd SAAP) FOR FY: 2017-18 to FY 2019-20 OF UTTAR PRADESH UNDER ATAL MISSION FOR
REJUVENATION AND URBAN TRANSFORMATION (AMRUT)
2017
STATE MISSION DIRECTORATE (AMRUT) UTTAR PRADESH, 8TH FLOOR, INDIRA BHAWAN, ASHOK MARG, LUCKNOW-226001 141 | P a g e
Table 2.1: SLIP – Master Plan of all projects to achieve universal coverage of Water Supply and Sewerage &
Septage management during current Mission Period (FY: 2015-16 to 2019-20) Name of State: Uttar Pradesh 3rd SAAP: FY 2017-18 to 2019-20
Amount in Rs Lakhs SN Project Name and Code (List of all projects to achieve universal
coverage)
Priority
Number
FY in which
project proposed to
be implemented
FY in which
project proposed to
be completed
Estimated Cost
1 2 3 4 5 6
Name of City: Hapur
1 Water House Connection in 11 zones, Hapur City 1 2015-16 2017-18 1440.33
2 Automation of TWs (SCADA), Hapur City 2 2015-16 2017-18 684.18
3 Water Supply Scheme for Hapur City 3 2016-17 2018-19 1201.00
Name of City: Hardoi
1 Water House Connection, Hardoi City 1 2015-16 2017-18 78.66
2 Water Supply Reorganisation Scheme, Zone 1, Hardoi City 2 2015-16 2017-18 374.08
3 Water Supply Reorganisation Scheme, Zone 5, Hardoi City 2 2016-17 2017-18 1418.85
4 Water Supply Scheme for Hardoi City 3 2017-18 2019-20 2000.00
Name of City: Hathras
1 Water House Connection, Hathras City 1 2015-16 2017-18 124.82
2 Water Supply Reorganisation Scheme, Zone 1, Hathras City 2 2015-16 2017-18 2054.34
3 Water Supply Scheme for Hathras City 3 2016-17 2018-19 922.00
4 Water Supply Scheme for Hathras City 4 2017-18 2019-20 2000.00
Name of City: Jaunpur
1 Water House Connection in Cis & Trans zones, Jaunpur City 1 2015-16 2017-18 727.64
2 Water Supply Reorganisation Scheme, Zone 2G Phase 1, Jaunpur City 2 2016-17 2017-18 568.56
3 Water Supply Scheme for Jaunpur City 3 2016-17 2018-19 704.00
4 Water Supply Scheme for Jaunpur City 4 2017-18 2019-20 1000.00
Name of City: Kasganj
1 Water House Connection, Kasganj City 1 2015-16 2017-18 77.89

Final 3rd STATE ANNUAL ACTION PLAN (3rd SAAP) FOR FY: 2017-18 to FY 2019-20 OF UTTAR PRADESH UNDER ATAL MISSION FOR
REJUVENATION AND URBAN TRANSFORMATION (AMRUT)
2017
STATE MISSION DIRECTORATE (AMRUT) UTTAR PRADESH, 8TH FLOOR, INDIRA BHAWAN, ASHOK MARG, LUCKNOW-226001 142 | P a g e
Table 2.1: SLIP – Master Plan of all projects to achieve universal coverage of Water Supply and Sewerage &
Septage management during current Mission Period (FY: 2015-16 to 2019-20) Name of State: Uttar Pradesh 3rd SAAP: FY 2017-18 to 2019-20
Amount in Rs Lakhs SN Project Name and Code (List of all projects to achieve universal
coverage)
Priority
Number
FY in which
project proposed to
be implemented
FY in which
project proposed to
be completed
Estimated Cost
1 2 3 4 5 6
2 Water Supply Scheme for Kasganj City 2 2016-17 2018-19 1678.00
3 Water Supply Scheme for Kasganj City 3 2017-18 2019-20 1500.00
Name of City: Khurja
1 Water House Connection, Khurja City 1 2015-16 2017-18 442.18
2 Automation of TWs (SCADA), Khurja City 2 2015-16 2017-18 207.64
3 Water Supply Scheme for Khurja City 3 2016-17 2018-19 214.00
Name of City: Lakhimpur
1 Water House Connection, Lakhimpur 1 2015-16 2017-18 69.44
2 Water Supply Reorganisation Scheme, Part 1, Lakhimpur City 2 2015-16 2018-19 2884.00
3 Water Supply Scheme for Lakhimpur City 3 2016-17 2018-19 1774.56
4 Water Supply Scheme for Lakhimpur City 4 2017-18 2019-20 1000.00
Name of City: Lalitpur
1 Water House Connection, Lalitpur City 1 2015-16 2017-18 214.36
2 Water Supply Scheme, Nehru Nagar Area, Phase 1, Lalitpur City 2 2015-16 2017-18 1456.88
3 Water Supply Scheme, Nehru Nagar Area, Phase 2, Lalitpur City 2 2016-17 2017-18 1143.55
4 Water Supply Scheme for Lalitpur City 3 2017-18 2019-20 500.00 Name of City: Loni
1 Water House Connection in 14 zones (45 wards), Loni City 1 2015-16 2017-18 2082.30
2 Construction of New & Rebore TWs, Loni City 2 2016-17 2017-18 2162.21
Name of City: Mainpuri
1 Water House Connection, Mainpuri City 1 2015-16 2017-18 125.59

Final 3rd STATE ANNUAL ACTION PLAN (3rd SAAP) FOR FY: 2017-18 to FY 2019-20 OF UTTAR PRADESH UNDER ATAL MISSION FOR
REJUVENATION AND URBAN TRANSFORMATION (AMRUT)
2017
STATE MISSION DIRECTORATE (AMRUT) UTTAR PRADESH, 8TH FLOOR, INDIRA BHAWAN, ASHOK MARG, LUCKNOW-226001 143 | P a g e
Table 2.1: SLIP – Master Plan of all projects to achieve universal coverage of Water Supply and Sewerage &
Septage management during current Mission Period (FY: 2015-16 to 2019-20) Name of State: Uttar Pradesh 3rd SAAP: FY 2017-18 to 2019-20
Amount in Rs Lakhs SN Project Name and Code (List of all projects to achieve universal
coverage)
Priority
Number
FY in which
project proposed to
be implemented
FY in which
project proposed to
be completed
Estimated Cost
1 2 3 4 5 6
2 Water Supply Reorganisation Scheme, Phase 1, Mainpuri City 2 2015-16 2017-18 1705.88
3 Water Supply Reorganisation Scheme, Phase 2, Mainpuri City 2 2016-17 2017-18 1616.80
4 Water Supply Scheme for Mainpuri City 3 2017-18 2019-20 500.00
Name of City: Mathura
1 Water House Connection, Mathura City 1 2015-16 2017-18 239.08
2 Water Supply Scheme for Mathura City 2 2016-17 2018-19 12641.00
3 Water Supply Scheme for Mathura City 3 2017-18 2019-20 18000.00
Name of City: Maunath
1 Water House Connection, Maunath City 1 2015-16 2017-18 164.40
2 Water Supply Reorganisation Scheme, Maunath City 2 2015-16 2017-18 1266.80
3 Water Supply Scheme for Maunath City 3 2016-17 2018-19 525.00
4 Water Supply Scheme for Maunath City 4 2017-18 2019-20 1000.00
Name of City: Mirzapur-cum-vindhyachal
1 Water House Connection in 12 zones, Mirzapur City 1 2015-16 2017-18 641.30
2 Water Supply Reorganisation Scheme, Phase 1, Mirzapur City 2 2015-16 2018-19 8303.57
3 Water Supply Reorganisation Scheme, Phase 2, Mirzapur City 2 2016-17 2018-19 2729.44
4 Water Supply Scheme for Mirzapur-cum-vindhyachal City 3 2016-17 2018-19 126.00
5 Water Supply Scheme for Mirzapur-cum-vindhyachal City 4 2017-18 2019-20 1500.00
Name of City: Modinagar
4 Water Supply Scheme for Modinagar City 1 2016-17 2018-19 66.00
5 Water Supply Scheme for Modinagar City 2 2017-18 2019-20 2000.00

Final 3rd STATE ANNUAL ACTION PLAN (3rd SAAP) FOR FY: 2017-18 to FY 2019-20 OF UTTAR PRADESH UNDER ATAL MISSION FOR
REJUVENATION AND URBAN TRANSFORMATION (AMRUT)
2017
STATE MISSION DIRECTORATE (AMRUT) UTTAR PRADESH, 8TH FLOOR, INDIRA BHAWAN, ASHOK MARG, LUCKNOW-226001 144 | P a g e
Table 2.1: SLIP – Master Plan of all projects to achieve universal coverage of Water Supply and Sewerage &
Septage management during current Mission Period (FY: 2015-16 to 2019-20) Name of State: Uttar Pradesh 3rd SAAP: FY 2017-18 to 2019-20
Amount in Rs Lakhs SN Project Name and Code (List of all projects to achieve universal
coverage)
Priority
Number
FY in which
project proposed to
be implemented
FY in which
project proposed to
be completed
Estimated Cost
1 2 3 4 5 6
Name of City: Mughalsarai
1 Water House Connection, Mughalsarai City 1 2015-16 2017-18 100.36
2 Water Supply Reorganisation Scheme, Phase 1, Mughalsarai City 2 2015-16 2017-18 1563.91
4 Water Supply Scheme for Mughalsarai City 4 2017-18 2019-20 3000.00
Name of City: Muzaffarnagar
1 Water Supply Reorganisation Scheme, Muzaffarnagar City 1 2015-16 2018-19 2246.37
Name of City: Orai
1 Water House Connection, Orai City 1 2015-16 2017-18 108.03
2 Water Supply Scheme for Orai City 2 2016-17 2018-19 585.97
3 Water Supply Scheme for Orai City 3 2017-18 2019-20 2000.00
Name of City: Pilibhit
1 Water Supply Reorganisation Scheme, Zone 2, 4, 5, Pilibhit City 1 2015-16 2017-18 1551.86
2 Water Supply Scheme for Pilibhit City 2 2016-17 2018-19 322.14
3 Water Supply Scheme for Pilibhit City 3 2017-18 2019-20 2500.00
Name of City: Raibareli
2 Water Supply Scheme for Raibareli City 2 2016-17 2018-19 5310.00
Name of City: Rampur
1 Extension of Distribution System, Rampur City 1 2015-16 2017-18 296.52
2 Automation of TWs & OHTs (SCADA), Rampur City 2 2015-16 2017-18 625.36
3 Water Supply Scheme for Rampur City 3 2016-17 2018-19 416.00
4 Water Supply Scheme for Rampur City 4 2017-18 2019-20 500.00

Final 3rd STATE ANNUAL ACTION PLAN (3rd SAAP) FOR FY: 2017-18 to FY 2019-20 OF UTTAR PRADESH UNDER ATAL MISSION FOR
REJUVENATION AND URBAN TRANSFORMATION (AMRUT)
2017
STATE MISSION DIRECTORATE (AMRUT) UTTAR PRADESH, 8TH FLOOR, INDIRA BHAWAN, ASHOK MARG, LUCKNOW-226001 145 | P a g e
Table 2.1: SLIP – Master Plan of all projects to achieve universal coverage of Water Supply and Sewerage &
Septage management during current Mission Period (FY: 2015-16 to 2019-20) Name of State: Uttar Pradesh 3rd SAAP: FY 2017-18 to 2019-20
Amount in Rs Lakhs SN Project Name and Code (List of all projects to achieve universal
coverage)
Priority
Number
FY in which
project proposed to
be implemented
FY in which
project proposed to
be completed
Estimated Cost
1 2 3 4 5 6
Name of City: Sambhal
1 Water House Connection in 8 zones, Sambhal City 1 2015-16 2017-18 123.30
2 Water Supply Scheme for Sambhal City 2 2016-17 2018-19 191.00
3 Water Supply Scheme for Sambhal City 3 2017-18 2019-20 500.00
Name of City: Shahjahanpur
1 Water House Connection, Shahjahanpur City 1 2015-16 2017-18 157.33
2 Water Supply Reorganisation Scheme, Zone 8a 8b Phase 1, Shahjahanpur City 2 2016-17 2017-18 1546.73
3 Water Supply Scheme for Shahjahanpur City 3 2016-17 2019-20 1286.00
3 Water Supply Scheme for Shahjahanpur City 4 2017-18 2019-20 4000.00
Name of City: Shamli
1 Water House Connection, Shamli City 1 2015-16 2017-18 159.28
2 Water Supply Scheme for Shamli City 2 2016-17 2018-19 1182.72
3 Water Supply Scheme for Shamli City 3 2017-18 2019-20 1000.00
Name of City: Shikohabad
1 Water House Connection in 10 zones, Shikohabad City 1 2015-16 2017-18 137.33
2 Water Supply Scheme for Shikohabad City 2 2016-17 2018-19 74.67
Name of City: Sitapur
1 Water House Connection, Sitapur City 1 2015-16 2017-18 112.51
2 Water Supply Reorganisation Scheme, Phase 1, Sitapur City 2 2015-16 2018-19 2902.04
3 Water Supply Scheme for Sitapur City 3 2016-17 2018-19 604.00
4 Water Supply Scheme for Sitapur City 4 2017-18 2019-20 2500.00

Final 3rd STATE ANNUAL ACTION PLAN (3rd SAAP) FOR FY: 2017-18 to FY 2019-20 OF UTTAR PRADESH UNDER ATAL MISSION FOR
REJUVENATION AND URBAN TRANSFORMATION (AMRUT)
2017
STATE MISSION DIRECTORATE (AMRUT) UTTAR PRADESH, 8TH FLOOR, INDIRA BHAWAN, ASHOK MARG, LUCKNOW-226001 146 | P a g e
Table 2.1: SLIP – Master Plan of all projects to achieve universal coverage of Water Supply and Sewerage &
Septage management during current Mission Period (FY: 2015-16 to 2019-20) Name of State: Uttar Pradesh 3rd SAAP: FY 2017-18 to 2019-20
Amount in Rs Lakhs SN Project Name and Code (List of all projects to achieve universal
coverage)
Priority
Number
FY in which
project proposed to
be implemented
FY in which
project proposed to
be completed
Estimated Cost
1 2 3 4 5 6
Name of City: Sultanpur
1 Water House Connection, Sultanpur City 1 2015-16 2017-18 84.22
2 Water Supply Scheme for Sultanpur City 2 2016-17 2018-19 3300.00
3 Water Supply Scheme for Sultanpur City 3 2017-18 2019-20 1500.00
Name of City: Unnao
1 Water Supply Scheme (Source Development from Ganga Barrage) for Unnao &
Shuklaganj City 1 2015-16 2019-20 22678.35
2 Water Supply Scheme for Unnao City 2 2016-17 2018-19 5600.00
3 Water Supply Scheme for Unnao City 3 2017-18 2019-20 4000.00
Total (Water Supply): 583628.59
UP-SAAP_2015-16 (Water Supply) 154537.13
UP-SAAP_2016-17 (Water Supply) 229489.46
UP-SAAP_2017-18 (Water Supply) 199602.00
Total- UP-SAAP_2015-20 (Water Supply) 583628.59
SECTOR: SEWERAGE
Name of City: Agra
1 Sewer House Connection, Agra City, Part 1 1 2015-16 2018-19 2612.44
2 Sewer House Connection, Agra City, Part 2 1 2015-16 2017-18 1421.98
3 Sewerage Scheme for Agra City 2 2016-17 2018-19 10166.00
4 Sewerage Scheme for Agra City 3 2017-18 2019-20 11000.00
Name of City: Allahabad

Final 3rd STATE ANNUAL ACTION PLAN (3rd SAAP) FOR FY: 2017-18 to FY 2019-20 OF UTTAR PRADESH UNDER ATAL MISSION FOR
REJUVENATION AND URBAN TRANSFORMATION (AMRUT)
2017
STATE MISSION DIRECTORATE (AMRUT) UTTAR PRADESH, 8TH FLOOR, INDIRA BHAWAN, ASHOK MARG, LUCKNOW-226001 147 | P a g e
Table 2.1: SLIP – Master Plan of all projects to achieve universal coverage of Water Supply and Sewerage &
Septage management during current Mission Period (FY: 2015-16 to 2019-20) Name of State: Uttar Pradesh 3rd SAAP: FY 2017-18 to 2019-20
Amount in Rs Lakhs SN Project Name and Code (List of all projects to achieve universal
coverage)
Priority
Number
FY in which
project proposed to
be implemented
FY in which
project proposed to
be completed
Estimated Cost
1 2 3 4 5 6
1 Sewer House Connection in District D, Allahabad City 1 2015-16 2018-19 8176.65
2 Sewerage Scheme District F (Phaphamau), Allahabad Ph-1 2 2015-16 2018-19 3332.66
3 Sewerage Scheme for Allahabad City 3 2016-17 2018-19 8465.00
4 Sewerage Scheme for Allahabad City 4 2017-18 2019-20 1500.00
Name of City: Ghaziabad
1 Sewer House Connection, Ghaziabad City 1 2015-16 2018-19 2841.04
2 Rehabilitation of Dudahera Sewer, Ghaziabad 2 2015-16 2019-20 10673.02
3 Sewerage Scheme, Ghaziabad 2 2015-16 2019-20 13367.88
4 Sewerage Scheme for Ghaziabad City 3 2016-17 2018-19 10819.00
5 Sewerage Scheme for Ghaziabad City 4 2017-18 2019-20 5500.00
Name of City: Kanpur
1 Sewer House Connection in 4 wards of Kanpur City 1 2015-16 2018-19 2959.37
2 Extension of Sewer Network District 4, Kanpur 2 2015-16 2018-19 6916.15
3 Sewerage Scheme District 3 Zone 1 Kanpur 2 2016-17 2019-20 12273.08
4 Sewerage Scheme for Kanpur City 3 2016-17 2018-19 0.00
5 Sewerage Scheme for Kanpur City 4 2017-18 2019-20 6000.00
Name of City: Lucknow
1 Sewer House Connection in Zone 6 District 1, Lucknow 1 2015-16 2018-19 6836.47
2 Sewer House Connection in District 3, Part 2, Lucknow 1 2015-16 2018-19 7048.51
3 Sewer House Connection in District 3, Part 1, Lucknow 1 2015-16 2019-20 12398.77
4 Rising Mains from CGVS to Kukrail Pumping Station, Lucknow 3 2015-16 2017-18 1570.48

Final 3rd STATE ANNUAL ACTION PLAN (3rd SAAP) FOR FY: 2017-18 to FY 2019-20 OF UTTAR PRADESH UNDER ATAL MISSION FOR
REJUVENATION AND URBAN TRANSFORMATION (AMRUT)
2017
STATE MISSION DIRECTORATE (AMRUT) UTTAR PRADESH, 8TH FLOOR, INDIRA BHAWAN, ASHOK MARG, LUCKNOW-226001 148 | P a g e
Table 2.1: SLIP – Master Plan of all projects to achieve universal coverage of Water Supply and Sewerage &
Septage management during current Mission Period (FY: 2015-16 to 2019-20) Name of State: Uttar Pradesh 3rd SAAP: FY 2017-18 to 2019-20
Amount in Rs Lakhs SN Project Name and Code (List of all projects to achieve universal
coverage)
Priority
Number
FY in which
project proposed to
be implemented
FY in which
project proposed to
be completed
Estimated Cost
1 2 3 4 5 6
5 Smart City Area Sewerage Scheme, District 4, Zone 1, Part 2, Lucknow 2 2016-17 2018-19 2233.98
6 Sewerage Scheme, District 4, Zone 4, Phase-1, Lucknow 2 2016-17 2019-20 16464.06
7 Sewerage Scheme for Lucknow City 3 2017-18 2019-20 24000.00
Name of City: Meerut
1 Sewer House Connection in Zones 1 to 6, Meerut City 1 2015-16 2018-19 4082.22
2 Sewerage Scheme for Meerut City 2 2016-17 2018-19 10918.00
3 Sewerage Scheme for Meerut City 3 2017-18 2019-20 17500.00
Name of City: Varanasi
1 Sewer House Connection in Trans Varuna Zone, Varanasi City 1 2015-16 2019-20 14489.94
2 Rehabilitation of Sewer, Varanasi City 2 2016-17 2017-18 894.19
3 Sewerage Scheme for Varanasi City 3 2016-17 2018-19 4616.00
4 Sewerage Scheme for Varanasi City 4 2017-18 2019-20 9500.00
Name of City: Aligarh
1 Sewerage Scheme for Aligarh 2 2016-17 2018-19 8000.00
2 Sewerage Scheme for Aligarh 2 2017-18 2019-20 1500.00
Name of City: Bareilly
1 Sewerage Scheme for Bareilly 2 2016-17 2018-19 4000.00
2 Sewerage Scheme for Bareilly 2 2017-18 2019-20 13100.00
Name of City: Firozabad
1 Sewer House Connection, Firozabad City 1 2015-16 2018-19 3688.45
2 Sewerage Scheme for Firozabad City 2 2016-17 2018-19 311.55

Final 3rd STATE ANNUAL ACTION PLAN (3rd SAAP) FOR FY: 2017-18 to FY 2019-20 OF UTTAR PRADESH UNDER ATAL MISSION FOR
REJUVENATION AND URBAN TRANSFORMATION (AMRUT)
2017
STATE MISSION DIRECTORATE (AMRUT) UTTAR PRADESH, 8TH FLOOR, INDIRA BHAWAN, ASHOK MARG, LUCKNOW-226001 149 | P a g e
Table 2.1: SLIP – Master Plan of all projects to achieve universal coverage of Water Supply and Sewerage &
Septage management during current Mission Period (FY: 2015-16 to 2019-20) Name of State: Uttar Pradesh 3rd SAAP: FY 2017-18 to 2019-20
Amount in Rs Lakhs SN Project Name and Code (List of all projects to achieve universal
coverage)
Priority
Number
FY in which
project proposed to
be implemented
FY in which
project proposed to
be completed
Estimated Cost
1 2 3 4 5 6
Name of City: Gorakhpur
1 Sewerage Scheme, Zone A1, Northern Area Upper part 1 2015-16 2018-19 6431.40
2 Sewerage Scheme, Zone A1, Southern Area Mahadev (Jharkhandi) 1 2016-17 2019-20 9292.71
3 Sewerage Scheme for Gorakhpur City 2 2016-17 2018-19 76.00
4 Sewerage Scheme for Gorakhpur City 3 2017-18 2019-20 4000.00
Name of City: Jhansi
1 Sewerage Scheme for Jhansi 2 2016-17 2018-19 324.00
2 Sewerage Scheme for Jhansi 2 2017-18 2019-20 1500.00
Name of City: Moradabad
1 Sewer House Connection, Moradabad 1 2015-16 2019-20 12729.36
2 Sewerage Scheme for Moradabad City 2 2016-17 2018-19 271.00
3 Sewerage Scheme for Moradabad City 3 2017-18 2019-20 1500.00
Name of City: Saharanpur
1 Sewerage Scheme for Saharanpur 2 2016-17 2018-19 10300.00
2 Sewerage Scheme for Saharanpur 2 2017-18 2019-20 3000.00
Name of City: Amroha
1 Sewerage Scheme for Amroha 2 2017-18 2019-20 1000.00
Name of City: Ayodhya
1 Sewerage Scheme for Ayodhya 2 2017-18 2019-20 3500.00
Name of City: Azamgarh
1 Sewer House Connection Azamgarh City 1 2015-16 2017-18 1614.28

Final 3rd STATE ANNUAL ACTION PLAN (3rd SAAP) FOR FY: 2017-18 to FY 2019-20 OF UTTAR PRADESH UNDER ATAL MISSION FOR
REJUVENATION AND URBAN TRANSFORMATION (AMRUT)
2017
STATE MISSION DIRECTORATE (AMRUT) UTTAR PRADESH, 8TH FLOOR, INDIRA BHAWAN, ASHOK MARG, LUCKNOW-226001 150 | P a g e
Table 2.1: SLIP – Master Plan of all projects to achieve universal coverage of Water Supply and Sewerage &
Septage management during current Mission Period (FY: 2015-16 to 2019-20) Name of State: Uttar Pradesh 3rd SAAP: FY 2017-18 to 2019-20
Amount in Rs Lakhs SN Project Name and Code (List of all projects to achieve universal
coverage)
Priority
Number
FY in which
project proposed to
be implemented
FY in which
project proposed to
be completed
Estimated Cost
1 2 3 4 5 6
2 Sewerage Scheme for Azamgarh City 2 2016-17 2018-19 3536.00
3 Sewerage Scheme for Azamgarh City 3 2017-18 2019-20 500.00
Name of City: Ballia
1 Sewer House Connection Ballia City 1 2015-16 2018-19 3565.76
2 Sewerage Scheme for Ballia City 2 2016-17 2018-19 0.00
3 Sewerage Scheme for Ballia City 3 2017-18 2019-20 1000.00
Name of City: Banda
1 Sewerage Scheme for Banda 2 2016-17 2018-19 3448.00
2 Sewerage Scheme for Banda 2 2017-18 2019-20 1000.00
Name of City: Baraut
1 Sewerage Scheme for Baraut 2 2017-18 2019-20 1000.00
Name of City: Basti
1 Sewerage Scheme for Basti 2 2017-18 2019-20 800.00
Name of City: Budaun
1 Sewerage Scheme for Budaun 2 2017-18 2019-20 1000.00
Name of City: Bulandshahar
1 Sewerage Scheme, Phase 1, Bulandshahar City 1 2015-16 2019-20 14898.08
2 Sewerage Scheme, Phase 2, Bulandshahar City 1 2016-17 2018-19 8749.54
3 Sewerage Scheme for Bulandshahar City 2 2017-18 2019-20 16000.00
Name of City: Chandausi
1 Sewerage Scheme for Chandausi 2 2017-18 2019-20 500.00

Final 3rd STATE ANNUAL ACTION PLAN (3rd SAAP) FOR FY: 2017-18 to FY 2019-20 OF UTTAR PRADESH UNDER ATAL MISSION FOR
REJUVENATION AND URBAN TRANSFORMATION (AMRUT)
2017
STATE MISSION DIRECTORATE (AMRUT) UTTAR PRADESH, 8TH FLOOR, INDIRA BHAWAN, ASHOK MARG, LUCKNOW-226001 151 | P a g e
Table 2.1: SLIP – Master Plan of all projects to achieve universal coverage of Water Supply and Sewerage &
Septage management during current Mission Period (FY: 2015-16 to 2019-20) Name of State: Uttar Pradesh 3rd SAAP: FY 2017-18 to 2019-20
Amount in Rs Lakhs SN Project Name and Code (List of all projects to achieve universal
coverage)
Priority
Number
FY in which
project proposed to
be implemented
FY in which
project proposed to
be completed
Estimated Cost
1 2 3 4 5 6
Name of City: Etah
1 Sewerage Scheme, Phase 1, Etah City 1 2016-17 2019-20 9546.03
2 Sewerage Scheme for Etah City 2 2017-18 2019-20 6800.00
Name of City: Etawah
1 Sewerage Scheme for Etawah 2 2017-18 2019-20 800.00
Name of City: Farrukhabad-cum-Fatehgarh
1 Sewerage Scheme for Farrukhabad-cum-Fatehgarh 2 2017-18 2019-20 700.00
Name of City: Fatehpur
1 Sewerage Scheme for Fatehpur 2 2017-18 2019-20 1500.00
Name of City: Ghazipur
1 Sewerage Scheme for Ghazipur 2 2016-17 2018-19 9000.00
2 Sewerage Scheme for Ghazipur 2 2017-18 2019-20 9000.00
Name of City: Hapur
1 Construction of Boundary Wall for protection of STP land, Hapur City 1 2015-16 2017-18 151.23
2 Sewerage Scheme, Phase 1 Part 1, Hapur City 1 2016-17 2018-19 8080.57
3 Sewerage Scheme for Hapur City 2 2017-18 2019-20 6400.00
Name of City: Hathras
1 Sewerage Scheme for Hathras 2 2017-18 2019-20 700.00
Name of City: Jaunpur
1 Sewerage Scheme for Jaunpur 2 2017-18 2019-20 8746.00
Name of City: Kasganj

Final 3rd STATE ANNUAL ACTION PLAN (3rd SAAP) FOR FY: 2017-18 to FY 2019-20 OF UTTAR PRADESH UNDER ATAL MISSION FOR
REJUVENATION AND URBAN TRANSFORMATION (AMRUT)
2017
STATE MISSION DIRECTORATE (AMRUT) UTTAR PRADESH, 8TH FLOOR, INDIRA BHAWAN, ASHOK MARG, LUCKNOW-226001 152 | P a g e
Table 2.1: SLIP – Master Plan of all projects to achieve universal coverage of Water Supply and Sewerage &
Septage management during current Mission Period (FY: 2015-16 to 2019-20) Name of State: Uttar Pradesh 3rd SAAP: FY 2017-18 to 2019-20
Amount in Rs Lakhs SN Project Name and Code (List of all projects to achieve universal
coverage)
Priority
Number
FY in which
project proposed to
be implemented
FY in which
project proposed to
be completed
Estimated Cost
1 2 3 4 5 6
1 Sewerage Scheme for Kasganj 2 2017-18 2019-20 800.00
Name of City: Khurja
1 Sewerage Scheme for Khurja 2 2017-18 2019-20 1000.00
Name of City: Lalitpur
1 Sewerage Scheme for Lalitpur 2 2017-18 2019-20 1000.00
Name of City: Loni
1 Sewer House Connection in 4 zones (22 wards), Loni City 1 2015-16 2018-19 3460.94
2 Sewerage Scheme for Loni City 2 2016-17 2018-19 1665.00
3 Sewerage Scheme for Loni City 3 2017-18 2019-20 4000.00
Name of City: Mainpuri
1 Sewer House Connection, Mainpuri City 1 2015-16 2017-18 1732.44
2 Sewerage Scheme for Mainpuri City 2 2016-17 2018-19 1367.56
Name of City: Mathura
1 Sewer House Connection in trans Yamuna, Mathura City 1 2015-16 2018-19 4914.36
2 Sewerage Scheme for Mathura City 2 2016-17 2018-19 5286.00
3 Sewerage Scheme for Mathura City 3 2017-18 2019-20 3000.00
Name of City: Maunath
1 Sewerage Scheme for Maunath 2 2017-18 2019-20 1000.00
Name of City: Mirzapur-cum-vindhyachal
1 Sewerage Scheme in Vindhyachal Area, Mirzapur City 1 2015-16 2018-19 5159.52
2 Sewerage Scheme for Mirzapur-cum-vindhyachal City 2 2016-17 2018-19 3840.00

Final 3rd STATE ANNUAL ACTION PLAN (3rd SAAP) FOR FY: 2017-18 to FY 2019-20 OF UTTAR PRADESH UNDER ATAL MISSION FOR
REJUVENATION AND URBAN TRANSFORMATION (AMRUT)
2017
STATE MISSION DIRECTORATE (AMRUT) UTTAR PRADESH, 8TH FLOOR, INDIRA BHAWAN, ASHOK MARG, LUCKNOW-226001 153 | P a g e
Table 2.1: SLIP – Master Plan of all projects to achieve universal coverage of Water Supply and Sewerage &
Septage management during current Mission Period (FY: 2015-16 to 2019-20) Name of State: Uttar Pradesh 3rd SAAP: FY 2017-18 to 2019-20
Amount in Rs Lakhs SN Project Name and Code (List of all projects to achieve universal
coverage)
Priority
Number
FY in which
project proposed to
be implemented
FY in which
project proposed to
be completed
Estimated Cost
1 2 3 4 5 6
3 Sewerage Scheme for Mirzapur-cum-vindhyachal City 3 2017-18 2019-20 1000.00
Name of City: Modinagar
1 Sewerage Scheme, Phase 1, Modinagar City 1 2015-16 2018-19 5751.95
2 Sewerage Scheme, Phase 2 Part 1, Modinagar City 1 2016-17 2019-20 9923.07
3 Sewerage Scheme for Modinagar 3 2016-17 2018-19 4225.00
3 Sewerage Scheme for Modinagar City 2 2017-18 2019-20 10000.00
Name of City: Mughalsarai
1 Sewerage Scheme for Mughalsarai City 1 2016-17 2018-19 1880.00
Name of City: Muzaffarnagar
1 Sewer House Connection in Western Zone, Muzaffarnagar City 1 2015-16 2018-19 2839.83
2 Sewerage Scheme for Muzaffarnagar City 2 2016-17 2018-19 1752.00
3 Sewerage Scheme for Muzaffarnagar City 3 2017-18 2019-20 1000.00
Name of City: Orai
1 Sewerage Scheme for Orai 2 2016-17 2018-19 1000.00
Name of City: Raibareli
1 Sewerage Scheme, Phase 1 Part 1, Raebareily City 1 2015-16 2018-19 4474.00
2 Sewerage Scheme, Phase 2, Raebareily City 1 2016-17 2018-19 5538.39
3 Sewerage Scheme for Raebareilly City 2 2017-18 2019-20 16000.00
Name of City: Rampur
1 Sewer House Connection in Zone 1 and 2, Rampur City 1 2015-16 2017-18 1948.60
2 Sewerage Scheme for Rampur City 2 2016-17 2018-19 9651.00

Final 3rd STATE ANNUAL ACTION PLAN (3rd SAAP) FOR FY: 2017-18 to FY 2019-20 OF UTTAR PRADESH UNDER ATAL MISSION FOR
REJUVENATION AND URBAN TRANSFORMATION (AMRUT)
2017
STATE MISSION DIRECTORATE (AMRUT) UTTAR PRADESH, 8TH FLOOR, INDIRA BHAWAN, ASHOK MARG, LUCKNOW-226001 154 | P a g e
Table 2.1: SLIP – Master Plan of all projects to achieve universal coverage of Water Supply and Sewerage &
Septage management during current Mission Period (FY: 2015-16 to 2019-20) Name of State: Uttar Pradesh 3rd SAAP: FY 2017-18 to 2019-20
Amount in Rs Lakhs SN Project Name and Code (List of all projects to achieve universal
coverage)
Priority
Number
FY in which
project proposed to
be implemented
FY in which
project proposed to
be completed
Estimated Cost
1 2 3 4 5 6
3 Sewerage Scheme for Rampur City 3 2017-18 2019-20 1000.00
Name of City: Sambhal
1 Sewerage Scheme for Sambhal 2 2017-18 2019-20 800.00
Name of City: Shahjahanpur
1 Sewerage Scheme for Shahjahanpur 2 2017-18 2019-20 1000.00
Name of City: Sitapur
1 Sewerage Scheme for Sitapur 2 2017-18 2019-20 800.00
Name of City: Sultanpur
1 Sewerage Scheme for Sultanpur 2 2017-18 2019-20 1000.00
Name of City: Unnao
1 Sewerage Scheme for Unnao 2 2016-17 2018-19 5160.00
2 Sewerage Scheme for Unnao 2 2017-18 2019-20 11000.00
Total (Sewerage & Septage Management): 590106.51
Grand Total (Water Supply + Sewerage & Septage Management): 1173735.10
UP-SAAP_2015-16 (Sewerage & Septage Management) 172087.78
UP-SAAP_2016-17 (Sewerage & Septage Management) 203072.73
UP-SAAP_2017-20 (Sewerage & Septage Management) 214946.00
Total: UP-SAAP_2015-20 (Sewerage & Septage Management) 590106.51
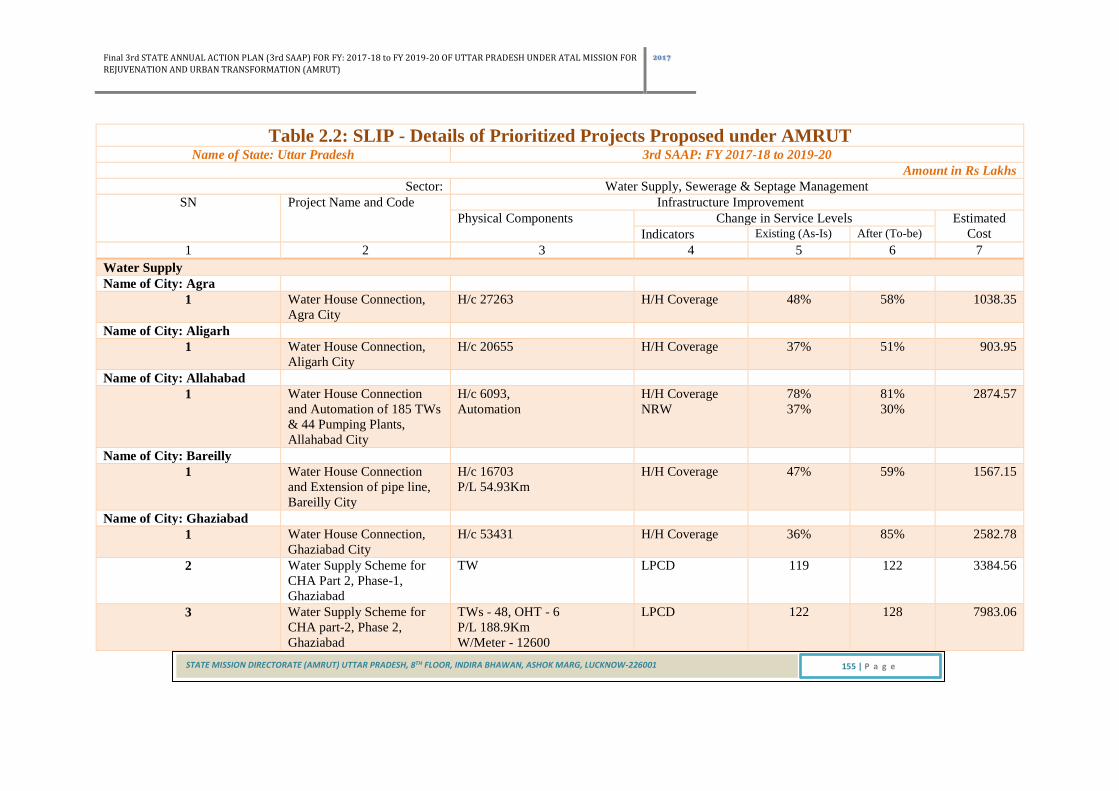
Final 3rd STATE ANNUAL ACTION PLAN (3rd SAAP) FOR FY: 2017-18 to FY 2019-20 OF UTTAR PRADESH UNDER ATAL MISSION FOR
REJUVENATION AND URBAN TRANSFORMATION (AMRUT)
2017
STATE MISSION DIRECTORATE (AMRUT) UTTAR PRADESH, 8TH FLOOR, INDIRA BHAWAN, ASHOK MARG, LUCKNOW-226001 155 | P a g e
Table 2.2: SLIP - Details of Prioritized Projects Proposed under AMRUT Name of State: Uttar Pradesh 3rd SAAP: FY 2017-18 to 2019-20
Amount in Rs Lakhs
Sector: Water Supply, Sewerage & Septage Management
SN Project Name and Code Infrastructure Improvement
Physical Components Change in Service Levels Estimated
Cost Indicators Existing (As-Is) After (To-be)
1 2 3 4 5 6 7
Water Supply
Name of City: Agra
1 Water House Connection,
Agra City
H/c 27263 H/H Coverage 48% 58% 1038.35
Name of City: Aligarh
1 Water House Connection,
Aligarh City
H/c 20655 H/H Coverage 37% 51% 903.95
Name of City: Allahabad
1 Water House Connection
and Automation of 185 TWs
& 44 Pumping Plants,
Allahabad City
H/c 6093,
Automation
H/H Coverage
NRW
78%
37%
81%
30%
2874.57
Name of City: Bareilly
1 Water House Connection
and Extension of pipe line,
Bareilly City
H/c 16703
P/L 54.93Km
H/H Coverage 47% 59% 1567.15
Name of City: Ghaziabad
1 Water House Connection,
Ghaziabad City
H/c 53431 H/H Coverage 36% 85% 2582.78
2 Water Supply Scheme for
CHA Part 2, Phase-1,
Ghaziabad
TW LPCD 119 122 3384.56
3 Water Supply Scheme for
CHA part-2, Phase 2,
Ghaziabad
TWs - 48, OHT - 6
P/L 188.9Km
W/Meter - 12600
LPCD 122 128 7983.06

Final 3rd STATE ANNUAL ACTION PLAN (3rd SAAP) FOR FY: 2017-18 to FY 2019-20 OF UTTAR PRADESH UNDER ATAL MISSION FOR
REJUVENATION AND URBAN TRANSFORMATION (AMRUT)
2017
STATE MISSION DIRECTORATE (AMRUT) UTTAR PRADESH, 8TH FLOOR, INDIRA BHAWAN, ASHOK MARG, LUCKNOW-226001 156 | P a g e
Table 2.2: SLIP - Details of Prioritized Projects Proposed under AMRUT Name of State: Uttar Pradesh 3rd SAAP: FY 2017-18 to 2019-20
Amount in Rs Lakhs
Sector: Water Supply, Sewerage & Septage Management
SN Project Name and Code Infrastructure Improvement
Physical Components Change in Service Levels Estimated
Cost Indicators Existing (As-Is) After (To-be)
1 2 3 4 5 6 7
4 Water Supply Scheme for
THA Part 2, Ghaziabad
Ranney Well - 3 LPCD 128 135 3962.62
Name of City: Gorakhpur
1 Water House Connection,
Gorakhpur City
H/c 7579 H/H Coverage 60% 66% 278.13
2 Automation of TWs
(SCADA), Gorakhpur City
Automation of 52 TW & 21
OHT
NRW Reduction 30% 25% 765.16
Name of City: Jhansi
1 Water Supply
Reorganisation Scheme,
Phase 1, Jhansi City
CWR - 8, OHT - 12
R/M - 6.07Km
Feeder Main - 33.54Km
P/L - 244.45Km
Renovation of Baratha basin,
H/c -26848
H/H Coverage 35% 60% 19599.00
2 Water Supply
Reorganisation of Baratta
Basin HH connection
Scheme Jhansi City
Intakr Well - 1, CPT - 1,
WTP (195MLD) - 1,
R/W G/Main - 19.9 Km
C/W G/Main - 27.05Km
NRW
LPCD
37%
126
25%
135
30710.71
Name of City: Kanpur
1 Water Supply
Reorganisation Scheme,
East Service District, Phase
3 Part 1, Kanpur City
Renovation of OHT
p/L 87km
H/c - 6930
H/H Coverage 52% 54% 5007.24

Final 3rd STATE ANNUAL ACTION PLAN (3rd SAAP) FOR FY: 2017-18 to FY 2019-20 OF UTTAR PRADESH UNDER ATAL MISSION FOR
REJUVENATION AND URBAN TRANSFORMATION (AMRUT)
2017
STATE MISSION DIRECTORATE (AMRUT) UTTAR PRADESH, 8TH FLOOR, INDIRA BHAWAN, ASHOK MARG, LUCKNOW-226001 157 | P a g e
Table 2.2: SLIP - Details of Prioritized Projects Proposed under AMRUT Name of State: Uttar Pradesh 3rd SAAP: FY 2017-18 to 2019-20
Amount in Rs Lakhs
Sector: Water Supply, Sewerage & Septage Management
SN Project Name and Code Infrastructure Improvement
Physical Components Change in Service Levels Estimated
Cost Indicators Existing (As-Is) After (To-be)
1 2 3 4 5 6 7
2 Water Supply
Reorganisation Scheme,
South Service District,
Phase 3 Part 2, Kanpur City
Renovation of OHT
p/L 63km
H/c - 5370
H/H Coverage 54% 55% 5223.93
3 Water Supply
Reorganisation Scheme,
City Service District, Phase
2 Part 3A, Kanpur City
Renovation of OHT
p/L 5.33km
H/c - 453
H/H Coverage 55% 55.2% 2720.00
Name of City: Lucknow
1 Construction of Boundary
Wall for protection of 5th
Water Works land, Lucknow
City
Boundary Wall - 4.60Km Protection of land
for W/Wks
- - 320.79
2 Water House Connection in
District A, Lucknow City
H/c - 58540 H/H Coverage 63% 75% 2781.09
3 Water House Connection in
District B, C, D Lucknow
City
H/c 88594 H/H Coverage 75% 92% 3758.39
4 Construction of Boundary
Wall, CCTV and Watch
Tower for protection of 3rd
Water Works land, Lucknow
City
Boundary Wall Protection of
water bodies
1500.06
Name of City: Meerut

Final 3rd STATE ANNUAL ACTION PLAN (3rd SAAP) FOR FY: 2017-18 to FY 2019-20 OF UTTAR PRADESH UNDER ATAL MISSION FOR
REJUVENATION AND URBAN TRANSFORMATION (AMRUT)
2017
STATE MISSION DIRECTORATE (AMRUT) UTTAR PRADESH, 8TH FLOOR, INDIRA BHAWAN, ASHOK MARG, LUCKNOW-226001 158 | P a g e
Table 2.2: SLIP - Details of Prioritized Projects Proposed under AMRUT Name of State: Uttar Pradesh 3rd SAAP: FY 2017-18 to 2019-20
Amount in Rs Lakhs
Sector: Water Supply, Sewerage & Septage Management
SN Project Name and Code Infrastructure Improvement
Physical Components Change in Service Levels Estimated
Cost Indicators Existing (As-Is) After (To-be)
1 2 3 4 5 6 7
1 Water House Connection in
9 zones, Meerut City
H/c 28000 H/H Coverage 51% 63% 1339.39
2 Automation of 157 TWs & 9
Zonal Pumping Stations
(SCADA), Meerut City
Automation of 157 TWs & 9
Zonal Pumping Stations
NRW 65% 50% 2268.74
3 Water Supply
Reorganisation Scheme,
Meerut City
TW - 7New, 10Rebore
P/L 27.43Km
H/C 7356
H/H Coverage 63% 66% 1647.50
Name of City: Moradabad
1 Water House Connection,
Moradabad City
H/c 49420 H/H Coverage 54% 85% 2437.57
Name of City: Saharanpur
1 Water Supply
Reorganisation Scheme, Part
1, Saharanpur City
TW-7, OHT-4,
P/L-104.48Km,
H/C- 9620
H/H Coverage 32% 40% 2611.70
Name of City: Varanasi
1 Water House Connection in
5 zones, Varanasi City
H/c 50028 H/H Coverage 67% 83% 2643.43
2 Estimate for laying of new
parallel feeder main by
micro tunnelling method in
CIS Varuna Area
Feeder Main 1400 mm -
5.448Km
NRW 58% 40% 10453.05
Name of City: Akbarpur

Final 3rd STATE ANNUAL ACTION PLAN (3rd SAAP) FOR FY: 2017-18 to FY 2019-20 OF UTTAR PRADESH UNDER ATAL MISSION FOR
REJUVENATION AND URBAN TRANSFORMATION (AMRUT)
2017
STATE MISSION DIRECTORATE (AMRUT) UTTAR PRADESH, 8TH FLOOR, INDIRA BHAWAN, ASHOK MARG, LUCKNOW-226001 159 | P a g e
Table 2.2: SLIP - Details of Prioritized Projects Proposed under AMRUT Name of State: Uttar Pradesh 3rd SAAP: FY 2017-18 to 2019-20
Amount in Rs Lakhs
Sector: Water Supply, Sewerage & Septage Management
SN Project Name and Code Infrastructure Improvement
Physical Components Change in Service Levels Estimated
Cost Indicators Existing (As-Is) After (To-be)
1 2 3 4 5 6 7
1 Water House Connection,
Akbarpur City (Ambedkar
Nagar)
H/c 4116 H/H Coverage 23% 41% 190.44
2 Water Supply
Reorganisation Scheme,
Akbarpur City
TW-3, OHT-1, P/L-39.01 Km,
H/C- 2000
H/H Coverage
LPCD
41%
76
50%
105
793.78
Name of City: Amroha
1 Water House Connection in
6 zones, Amroha City
H/c 24281 H/H Coverage 32% 95% 1390.50
Name of City: Azamgarh
1 Water House Connection,
Azamgarh City
H/c 1424 H/H Coverage 50% 58% 54.67
2 Water Supply Scheme in
Belaisa & Hirapatti Area,
Azamgarh City
RW - 2, OHT - 2
P/L 23.456Km
H/C 1670
H/H Coverage 58% 67% 533.08
Name of City: Bahraich
1 Water House Connection,
Bahraich City
H/c 1789 H/H Coverage 52% 58% 82.18
2 Water Supply
Reorganisation Scheme,
Bahraich City
TW-9 New, 05 Rebore
CWR-2, OHT-4 P/L-210.445
Km
H/H Coverage
LPCD
58%
106
65%
135
6607.37
Name of City: Ballia
1 Water House Connection,
Ballia City
H/c 1876P/L 9.075Km H/H Coverage 26% 36% 182.40

Final 3rd STATE ANNUAL ACTION PLAN (3rd SAAP) FOR FY: 2017-18 to FY 2019-20 OF UTTAR PRADESH UNDER ATAL MISSION FOR
REJUVENATION AND URBAN TRANSFORMATION (AMRUT)
2017
STATE MISSION DIRECTORATE (AMRUT) UTTAR PRADESH, 8TH FLOOR, INDIRA BHAWAN, ASHOK MARG, LUCKNOW-226001 160 | P a g e
Table 2.2: SLIP - Details of Prioritized Projects Proposed under AMRUT Name of State: Uttar Pradesh 3rd SAAP: FY 2017-18 to 2019-20
Amount in Rs Lakhs
Sector: Water Supply, Sewerage & Septage Management
SN Project Name and Code Infrastructure Improvement
Physical Components Change in Service Levels Estimated
Cost Indicators Existing (As-Is) After (To-be)
1 2 3 4 5 6 7
2 Automation of TWs, CWRs
& OHTs (SCADA), Ballia
City
Automation of 20 TWs & 1
OHTs
NRW 40% 30% 292.25
Name of City: Banda
1 Water House Connection,
Banda City
H/c 4343 H/H Coverage 66% 84% 190.94
Name of City: Baraut
1 Water House Connection &
Extension of Pipe Line
(Ward 14, Zone 4), Baraut
City
H/c 1853, TW-1 No.,
P/L-7 Km
H/H Coverage 64% 74% 215.94
2 Automation of TWs
(SCADA), Baraut City
Automation of 19 TW NRW 31% 20% 252.63
Name of City: Basti
1 Water House Connection &
Water meter installation,
Basti City
H/c 1826
W/Meter 17213
H/H Coverage 70% 79% 603.25
Name of City: Budaun
1 Water House Connection &
Extension of Pipe Line,
Budaun City
H/c 2669
P/L 12Km
W/Meter 28851
H/H Coverage 38% 47% 1196.34
Name of City: Bulandshahar
1 Water House Connection in
6 zones, Bulandshahar City
H/c 1904 H/H Coverage 33% 37% 100.84

Final 3rd STATE ANNUAL ACTION PLAN (3rd SAAP) FOR FY: 2017-18 to FY 2019-20 OF UTTAR PRADESH UNDER ATAL MISSION FOR
REJUVENATION AND URBAN TRANSFORMATION (AMRUT)
2017
STATE MISSION DIRECTORATE (AMRUT) UTTAR PRADESH, 8TH FLOOR, INDIRA BHAWAN, ASHOK MARG, LUCKNOW-226001 161 | P a g e
Table 2.2: SLIP - Details of Prioritized Projects Proposed under AMRUT Name of State: Uttar Pradesh 3rd SAAP: FY 2017-18 to 2019-20
Amount in Rs Lakhs
Sector: Water Supply, Sewerage & Septage Management
SN Project Name and Code Infrastructure Improvement
Physical Components Change in Service Levels Estimated
Cost Indicators Existing (As-Is) After (To-be)
1 2 3 4 5 6 7
2 Automation of TWs
(SCADA), Bulandshahar
City
Automation of 37 TWs & 11
OHTs
NRW 67% 50% 522.74
Name of City: Chandausi
1 Water House Connection,
Chandausi City
H/c 881 H/H Coverage 40% 44% 44.72
Name of City: Deoria
1 Water House Connection,
Deoria City
H/c 1706
P/L 10Km
W/Meter 19500
H/H Coverage 33% 42% 674.81
Name of City: Etah
1 Water House Connection,
Etah City
H/c 1698 H/H Coverage 34% 42% 76.87
Name of City: Etawah
1 Water House Connection,
Etawah City
H/c 6856
W/Meter 44601
H/H Coverage 60% 75% 1696.98
Name of City: Faizabad
1 Water House Connection,
Faizabad City
H/c 9564 H/H Coverage 70% 98% 426.93
Name of City: Farrukhabad
1 Water House Connection,
Farrukhabad City
H/c 16970 H/H Coverage 47% 80% 674.81
Name of City: Fatehpur

Final 3rd STATE ANNUAL ACTION PLAN (3rd SAAP) FOR FY: 2017-18 to FY 2019-20 OF UTTAR PRADESH UNDER ATAL MISSION FOR
REJUVENATION AND URBAN TRANSFORMATION (AMRUT)
2017
STATE MISSION DIRECTORATE (AMRUT) UTTAR PRADESH, 8TH FLOOR, INDIRA BHAWAN, ASHOK MARG, LUCKNOW-226001 162 | P a g e
Table 2.2: SLIP - Details of Prioritized Projects Proposed under AMRUT Name of State: Uttar Pradesh 3rd SAAP: FY 2017-18 to 2019-20
Amount in Rs Lakhs
Sector: Water Supply, Sewerage & Septage Management
SN Project Name and Code Infrastructure Improvement
Physical Components Change in Service Levels Estimated
Cost Indicators Existing (As-Is) After (To-be)
1 2 3 4 5 6 7
1 Water House Connection,
Fatehpur City
TW - 5, OHT - 5
P/L - 40.24Km
H/c - 2462
H/H Coverage 43% 51% 1250.27
Name of City: Ghazipur
1 Water House Connection,
Ghazipur City
H/c 1419 H/H Coverage 56% 63% 62.76
2 Extension of Distribution
System & Water House
Connection, Ghazipur City
H/c 714
P/L 14.18Km
H/H Coverage 63% 81% 155.56
Name of City: Gonda
1 Extension of Distribution
System, Water House
Connection & Automation
Works, Gonda City
H/c 866P/l Extn
9.3KmAutomation 19TWs
H/H
CoverageNRW
37%65% 42%35% 445.17
Name of City: Hapur
1 Water House Connection in
11 zones, Hapur City
H/c 28967 H/H Coverage 34% 95% 1440.33
2 Automation of TWs
(SCADA), Hapur City
Automation of 38 TWs & 4
ZPS/OHTs
NRW 46% 30% 684.18
Name of City: Hardoi
1 Water House Connection,
Hardoi City
H/c 1806 H/H Coverage 36% 44% 78.66
2 Water Supply
Reorganisation Scheme,
Zone 1, Hardoi City
H/c - 1550
TW - 2, OHT - 1
P/L 9.60Km
H/H Coverage
LPCD
44%
90
50%
104
374.08

Final 3rd STATE ANNUAL ACTION PLAN (3rd SAAP) FOR FY: 2017-18 to FY 2019-20 OF UTTAR PRADESH UNDER ATAL MISSION FOR
REJUVENATION AND URBAN TRANSFORMATION (AMRUT)
2017
STATE MISSION DIRECTORATE (AMRUT) UTTAR PRADESH, 8TH FLOOR, INDIRA BHAWAN, ASHOK MARG, LUCKNOW-226001 163 | P a g e
Table 2.2: SLIP - Details of Prioritized Projects Proposed under AMRUT Name of State: Uttar Pradesh 3rd SAAP: FY 2017-18 to 2019-20
Amount in Rs Lakhs
Sector: Water Supply, Sewerage & Septage Management
SN Project Name and Code Infrastructure Improvement
Physical Components Change in Service Levels Estimated
Cost Indicators Existing (As-Is) After (To-be)
1 2 3 4 5 6 7
3 Water Supply
Reorganisation Scheme,
Zone 5, Hardoi City
H/c - 4486
TW - 5, OHT - 2
P/L 25.8Km
H/H Coverage
LPCD
50%
104
70%
135
1418.85
Name of City: Hathras
1 Water House Connection,
Hathras City
H/c 2749 H/H Coverage 35% 46% 124.82
2 Water Supply
Reorganisation Scheme,
Zone 1, Hathras City
TW - 8, CWR - 2
P/L - 34.46Km
LPCD 100 135 2054.34
Name of City: Jaunpur
1 Water House Connection in
Cis & Trans zones, Jaunpur
City
H/c 16131 H/H Coverage 60% 90% 727.64
2 Water Supply
Reorganisation Scheme,
Zone 2G Phase 1, Jaunpur
City
OHT - 1, P.L - 30.40Km LPCD 112 120 568.56
Name of City: Kasganj
1 Water House Connection,
Kasganj City
H/c 1667 H/H Coverage 45% 54% 77.89
Name of City: Khurja
1 Water House Connection,
Khurja City
H/c 8781 H/H Coverage 50% 95% 442.18
2 Automation of TWs
(SCADA), Khurja City
Automation of 15 TWs & 6
OHTs
NRW 40% 30% 233.33

Final 3rd STATE ANNUAL ACTION PLAN (3rd SAAP) FOR FY: 2017-18 to FY 2019-20 OF UTTAR PRADESH UNDER ATAL MISSION FOR
REJUVENATION AND URBAN TRANSFORMATION (AMRUT)
2017
STATE MISSION DIRECTORATE (AMRUT) UTTAR PRADESH, 8TH FLOOR, INDIRA BHAWAN, ASHOK MARG, LUCKNOW-226001 164 | P a g e
Table 2.2: SLIP - Details of Prioritized Projects Proposed under AMRUT Name of State: Uttar Pradesh 3rd SAAP: FY 2017-18 to 2019-20
Amount in Rs Lakhs
Sector: Water Supply, Sewerage & Septage Management
SN Project Name and Code Infrastructure Improvement
Physical Components Change in Service Levels Estimated
Cost Indicators Existing (As-Is) After (To-be)
1 2 3 4 5 6 7
Name of City: Lakhimpur
1 Water House Connection,
Lakhimpur
H/c 1656 H/H Coverage 49% 55% 69.44
2 Water Supply
Reorganisation Scheme, Part
1, Lakhimpur City
OHT - 3
P/L - 55.50 Km
H/c - 2531
H/H Coverage 55% 64% 2884.00
Name of City: Lalitpur
1 Water House Connection,
Lalitpur City
H/c 4942 H/H Coverage 44% 65% 214.36
2 Water Supply Scheme,
Nehru Nagar Area, Phase 1,
Lalitpur City
CWR - 1,
Feeder Main - 6.5Km
P/L - 15Km
H/H Coverage 65% 77% 1456.88
3 Water Supply Scheme,
Nehru Nagar Area, Phase 2,
Lalitpur City
OHT - 1, P.L - 17 Km 1143.55
Name of City: Loni
1 Water House Connection in
14 zones (45 wards), Loni
City
H/c 57048 H/H Coverage 20% 83% 2082.30
2 Construction of New &
Rebore TWs, Loni City
TW-New-16, Rebore-4, LPCD 88 94 2162.21
Name of City: Mainpuri
1 Water House Connection,
Mainpuri City
H/c 2876 H/H Coverage 32% 42% 125.59
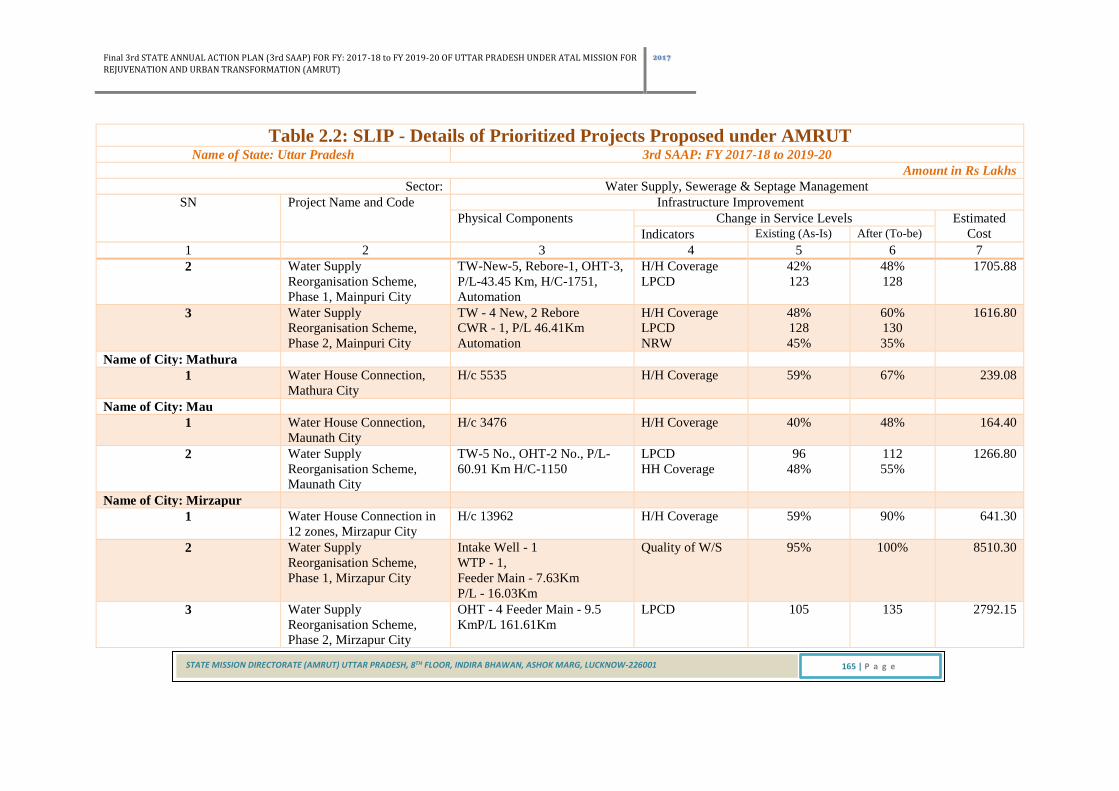
Final 3rd STATE ANNUAL ACTION PLAN (3rd SAAP) FOR FY: 2017-18 to FY 2019-20 OF UTTAR PRADESH UNDER ATAL MISSION FOR
REJUVENATION AND URBAN TRANSFORMATION (AMRUT)
2017
STATE MISSION DIRECTORATE (AMRUT) UTTAR PRADESH, 8TH FLOOR, INDIRA BHAWAN, ASHOK MARG, LUCKNOW-226001 165 | P a g e
Table 2.2: SLIP - Details of Prioritized Projects Proposed under AMRUT Name of State: Uttar Pradesh 3rd SAAP: FY 2017-18 to 2019-20
Amount in Rs Lakhs
Sector: Water Supply, Sewerage & Septage Management
SN Project Name and Code Infrastructure Improvement
Physical Components Change in Service Levels Estimated
Cost Indicators Existing (As-Is) After (To-be)
1 2 3 4 5 6 7
2 Water Supply
Reorganisation Scheme,
Phase 1, Mainpuri City
TW-New-5, Rebore-1, OHT-3,
P/L-43.45 Km, H/C-1751,
Automation
H/H Coverage
LPCD
42%
123
48%
128
1705.88
3 Water Supply
Reorganisation Scheme,
Phase 2, Mainpuri City
TW - 4 New, 2 Rebore
CWR - 1, P/L 46.41Km
Automation
H/H Coverage
LPCD
NRW
48%
128
45%
60%
130
35%
1616.80
Name of City: Mathura
1 Water House Connection,
Mathura City
H/c 5535 H/H Coverage 59% 67% 239.08
Name of City: Mau
1 Water House Connection,
Maunath City
H/c 3476 H/H Coverage 40% 48% 164.40
2 Water Supply
Reorganisation Scheme,
Maunath City
TW-5 No., OHT-2 No., P/L-
60.91 Km H/C-1150
LPCD
HH Coverage
96
48%
112
55%
1266.80
Name of City: Mirzapur
1 Water House Connection in
12 zones, Mirzapur City
H/c 13962 H/H Coverage 59% 90% 641.30
2 Water Supply
Reorganisation Scheme,
Phase 1, Mirzapur City
Intake Well - 1
WTP - 1,
Feeder Main - 7.63Km
P/L - 16.03Km
Quality of W/S 95% 100% 8510.30
3 Water Supply
Reorganisation Scheme,
Phase 2, Mirzapur City
OHT - 4 Feeder Main - 9.5
KmP/L 161.61Km
LPCD 105 135 2792.15

Final 3rd STATE ANNUAL ACTION PLAN (3rd SAAP) FOR FY: 2017-18 to FY 2019-20 OF UTTAR PRADESH UNDER ATAL MISSION FOR
REJUVENATION AND URBAN TRANSFORMATION (AMRUT)
2017
STATE MISSION DIRECTORATE (AMRUT) UTTAR PRADESH, 8TH FLOOR, INDIRA BHAWAN, ASHOK MARG, LUCKNOW-226001 166 | P a g e
Table 2.2: SLIP - Details of Prioritized Projects Proposed under AMRUT Name of State: Uttar Pradesh 3rd SAAP: FY 2017-18 to 2019-20
Amount in Rs Lakhs
Sector: Water Supply, Sewerage & Septage Management
SN Project Name and Code Infrastructure Improvement
Physical Components Change in Service Levels Estimated
Cost Indicators Existing (As-Is) After (To-be)
1 2 3 4 5 6 7
Name of City: Mughalsarai
1 Water House Connection,
Mughalsarai City
H/c 2358 H/H Coverage 23% 34% 100.36
2 Water Supply
Reorganisation Scheme,
Phase 1, Mughalsarai City
TW-6 No., OHT-4 No., P/L-
62.62 Km
LPCD 76 117 1563.91
Name of City: Muzaffarnagar
1 Water Supply
Reorganisation Scheme,
Muzaffarnagar City
H/c 1799
Water Meter 6933
H/H Coverage 66% 68% 2246.37
Name of City: Orai
1 Water House Connection,
Orai City
H/c 2377 H/H Coverage 37% 44% 108.03
Name of City: Pilibhit
1 Water Supply
Reorganisation Scheme,
Zone 2, 4, 5 Piliphit City
H/c 4620
TW-3 New, 1 Rebore
Automation-6 TW
H/H Coverage 51% 88% 1551.86
Name of City: Rampur
1 Extension of Distribution
System, Rampur City
P/L 12.4Km 296.52
2 Automation of TWs &
OHTs (SCADA), Rampur
City
Automation of TWs-41 &
OHTs-22
NRW 62% 50% 625.36
Name of City: Sambhal

Final 3rd STATE ANNUAL ACTION PLAN (3rd SAAP) FOR FY: 2017-18 to FY 2019-20 OF UTTAR PRADESH UNDER ATAL MISSION FOR
REJUVENATION AND URBAN TRANSFORMATION (AMRUT)
2017
STATE MISSION DIRECTORATE (AMRUT) UTTAR PRADESH, 8TH FLOOR, INDIRA BHAWAN, ASHOK MARG, LUCKNOW-226001 167 | P a g e
Table 2.2: SLIP - Details of Prioritized Projects Proposed under AMRUT Name of State: Uttar Pradesh 3rd SAAP: FY 2017-18 to 2019-20
Amount in Rs Lakhs
Sector: Water Supply, Sewerage & Septage Management
SN Project Name and Code Infrastructure Improvement
Physical Components Change in Service Levels Estimated
Cost Indicators Existing (As-Is) After (To-be)
1 2 3 4 5 6 7
1 Water House Connection in
8 zones, Sambhal City
H/c 2600 H/H Coverage 25% 33% 123.30
Name of City: Shahjahanpur
1 Water House Connection,
Shahjahanpur City
H/c 3645 H/H Coverage 58% 65% 157.33
2 Water Supply
Reorganisation Scheme,
Zone 8a 8b Phase 1,
Shahjahanpur City
OHT 2, CWR -1
P/L - 48.103Km
H/c - 7850
H/H Coverage 65% 78% 1546.73
Name of City: Shamli
1 Water House Connection,
Shamli City
H/c 2093
P/L 8.251Km
H/H Coverage 56% 61% 159.28
Name of City: Shikohabad
1 Water House Connection in
10 zones, Shikohabad City
H/c 3203 H/H Coverage 27% 41% 137.33
Name of City: Sitapur
1 Water House Connection,
Sitapur City
H/c 2577 H/H Coverage 38% 48% 112.51
2 Water Supply
Reorganisation Scheme,
Phase 1, Sitapur City
3 OHTs, 66.5Km P/L & 2982
H/c
H/H Coverage 48% 61% 2902.04
Name of City: Sultanpur
1 Water House Connection,
Sultanpur City
H/c 1798 H/H Coverage 53% 61% 84.22
Name of City: Unnao

Final 3rd STATE ANNUAL ACTION PLAN (3rd SAAP) FOR FY: 2017-18 to FY 2019-20 OF UTTAR PRADESH UNDER ATAL MISSION FOR
REJUVENATION AND URBAN TRANSFORMATION (AMRUT)
2017
STATE MISSION DIRECTORATE (AMRUT) UTTAR PRADESH, 8TH FLOOR, INDIRA BHAWAN, ASHOK MARG, LUCKNOW-226001 168 | P a g e
Table 2.2: SLIP - Details of Prioritized Projects Proposed under AMRUT Name of State: Uttar Pradesh 3rd SAAP: FY 2017-18 to 2019-20
Amount in Rs Lakhs
Sector: Water Supply, Sewerage & Septage Management
SN Project Name and Code Infrastructure Improvement
Physical Components Change in Service Levels Estimated
Cost Indicators Existing (As-Is) After (To-be)
1 2 3 4 5 6 7
1 Water Supply Scheme
(Source Development from
Ganga Barrage) for Unnao
& Shuklaganj City
Intake Well - 1 WTP - 1, CWR
- 1, ZPS - 12OHT - 9
LPCD 102 135 22678.35
Total (Water Supply) 208774.55
Sewerage and Septage Management
Name of City: Agra
1 Sewer House Connection,
Agra City, Part 1
H/c - 28079 H/H Coverage 41% 52% 2612.44
2 Sewer House Connection,
Agra City, Part 2
H/c - 11780 H/H Coverage 52% 57% 1421.98
Name of City: Allahabad
1 Sewer House Connection in
District D, Allahabad City
H/c - 48693 H/H Coverage 48% 73% 8176.65
2 Sewerage Scheme District F
(Phaphamau), Allahabad Ph-
1
IPS - 1
Sewer - 33.294Km
Network
Coverage
78% 80% 3332.66
Name of City: Firozabad
1 Sewer House Connection,
Firozabad City
H/c 17820 H/H Coverage 8% 38% 3688.45
Name of City: Ghaziabad
1 Sewer House Connection,
Ghaziabad City
H/c - 9594 H/H Coverage 84% 87% 2841.04
2 Rehabilitation of Dudahera
Sewer, Ghaziabad
Rehabilitation Sewer - 16Km 10673.02

Final 3rd STATE ANNUAL ACTION PLAN (3rd SAAP) FOR FY: 2017-18 to FY 2019-20 OF UTTAR PRADESH UNDER ATAL MISSION FOR
REJUVENATION AND URBAN TRANSFORMATION (AMRUT)
2017
STATE MISSION DIRECTORATE (AMRUT) UTTAR PRADESH, 8TH FLOOR, INDIRA BHAWAN, ASHOK MARG, LUCKNOW-226001 169 | P a g e
Table 2.2: SLIP - Details of Prioritized Projects Proposed under AMRUT Name of State: Uttar Pradesh 3rd SAAP: FY 2017-18 to 2019-20
Amount in Rs Lakhs
Sector: Water Supply, Sewerage & Septage Management
SN Project Name and Code Infrastructure Improvement
Physical Components Change in Service Levels Estimated
Cost Indicators Existing (As-Is) After (To-be)
1 2 3 4 5 6 7
3 Sewerage Scheme,
Ghaziabad
IPS - 2
Sewer - 47Km
H/c - 11290
H/H Coverage
Network
Coverage
87%
91%
91%
92%
13367.88
Name of City: Gorakhpur
1 Sewerage Scheme, Zone A1,
Northern Area Upper part
Sewer - 55.774 Km
H/c - 4695
H/H Coverage 12% 16% 6431.40
2 Sewerage Scheme, Zone A1,
Southern Area Mahadev
(Jharkhandi)
Sewer - 80.27 KmH/c -
9180MPS - 1
H/H Coverage 16% 23% 9292.71
Name of City: Kanpur
1 Sewer House Connection in
4 wards of Kanpur City
H/c - 15300 H/H Coverage 38% 41% 2959.37
2 Extension of Sewer Network
District 4, Kanpur
Sewer - 44.547Km
H/c 13512
H/H Coverage 41% 43% 6916.15
3 Sewerage Scheme District 3
Zone 1 Kanpur
IPS - 3
Sewer - 100.625Km
12273.08
Name of City: Lucknow
1 Sewer House Connection in
Zone 6 District 1, Lucknow
H/c - 20000
Sewer - 10Km
H/H Coverage 39% 43% 6836.47
2 Sewer House Connection in
District 3, Part 2, Lucknow
H/c - 24540
Sewer - 18.85Km
H/H Coverage 43% 48% 7592.36
3 Sewer House Connection in
District 3, Part 1, Lucknow
H/c - 50500
Sewer - 13.73Km
H/H Coverage 48% 58% 13382.57

Final 3rd STATE ANNUAL ACTION PLAN (3rd SAAP) FOR FY: 2017-18 to FY 2019-20 OF UTTAR PRADESH UNDER ATAL MISSION FOR
REJUVENATION AND URBAN TRANSFORMATION (AMRUT)
2017
STATE MISSION DIRECTORATE (AMRUT) UTTAR PRADESH, 8TH FLOOR, INDIRA BHAWAN, ASHOK MARG, LUCKNOW-226001 170 | P a g e
Table 2.2: SLIP - Details of Prioritized Projects Proposed under AMRUT Name of State: Uttar Pradesh 3rd SAAP: FY 2017-18 to 2019-20
Amount in Rs Lakhs
Sector: Water Supply, Sewerage & Septage Management
SN Project Name and Code Infrastructure Improvement
Physical Components Change in Service Levels Estimated
Cost Indicators Existing (As-Is) After (To-be)
1 2 3 4 5 6 7
4 Rising Mains from CGVS to
Kukrail Pumping Station,
Lucknow
Rehabilitation of Rising Mailns
- 1.152 Km
1570.48
5 Smart City Area Sewerage
Scheme, District 4, Zone 1,
Part 2, Phase 1, Lucknow
Sewer - 50Km
Rehab of IPS - 1
MPS - 1 (part)
H/c 12000
H/H Coverage 58% 60% 2233.98
6 Sewerage Scheme, District
4, Zone 4, Phase-1,
Lucknow
H/c - 34681
Sewer - 194.29Km
Network
Coverage
60% 67% 16464.06
Name of City: Meerut
1 Sewer House Connection in
Zones 1 to 6, Meerut City
H/c 14450 H/H Coverage 51% 57% 4082.22
Name of City: Moradabad
1 Sewer House Connection,
Moradabad
H/c - 83853 H/H Coverage 0% 52% 12729.36
Name of City: Varanasi
1 Sewer House Connection in
Trans Varuna Zone,
Varanasi City
H/c - 25132 H/H Coverage 60% 77% 14489.94
2 Rehabilitation of Sewer,
Varanasi City
Rehabilitation of Sewer - 1.152
Km
894.19
Name of City: Azamgarh
1 Sewer House Connection
Azamgarh City
H/c - 6667 H/H Coverage 0% 36% 1614.28
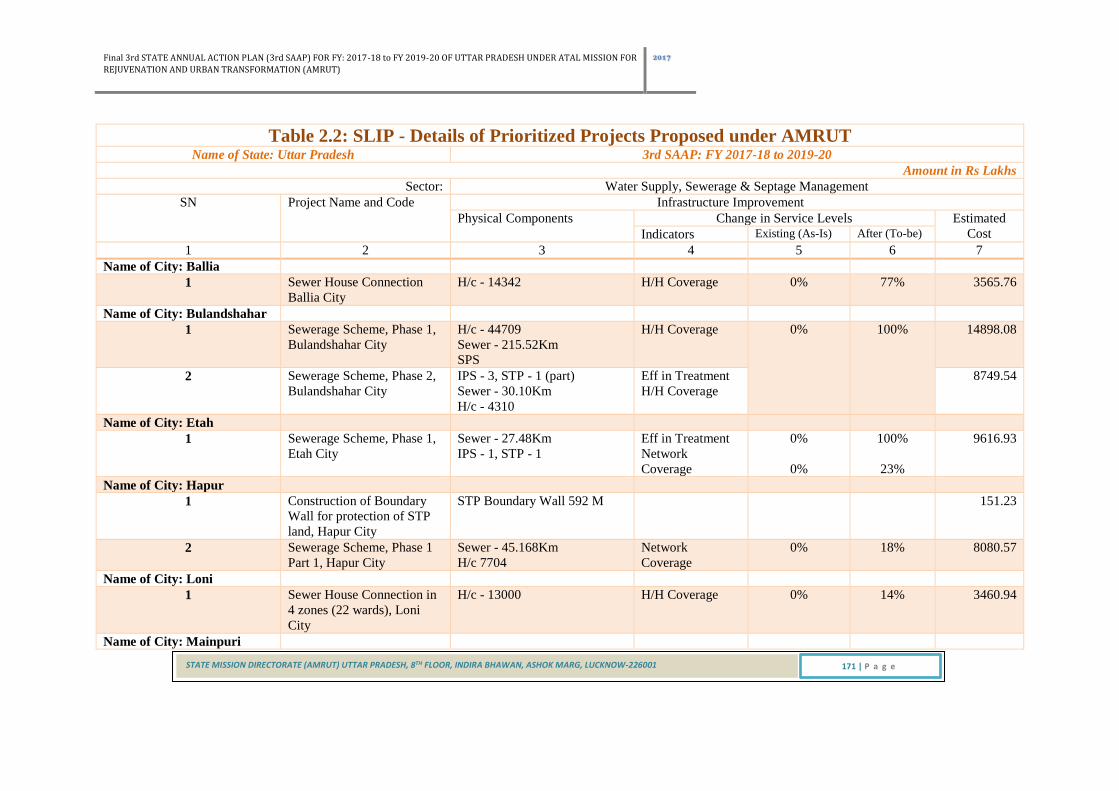
Final 3rd STATE ANNUAL ACTION PLAN (3rd SAAP) FOR FY: 2017-18 to FY 2019-20 OF UTTAR PRADESH UNDER ATAL MISSION FOR
REJUVENATION AND URBAN TRANSFORMATION (AMRUT)
2017
STATE MISSION DIRECTORATE (AMRUT) UTTAR PRADESH, 8TH FLOOR, INDIRA BHAWAN, ASHOK MARG, LUCKNOW-226001 171 | P a g e
Table 2.2: SLIP - Details of Prioritized Projects Proposed under AMRUT Name of State: Uttar Pradesh 3rd SAAP: FY 2017-18 to 2019-20
Amount in Rs Lakhs
Sector: Water Supply, Sewerage & Septage Management
SN Project Name and Code Infrastructure Improvement
Physical Components Change in Service Levels Estimated
Cost Indicators Existing (As-Is) After (To-be)
1 2 3 4 5 6 7
Name of City: Ballia
1 Sewer House Connection
Ballia City
H/c - 14342 H/H Coverage 0% 77% 3565.76
Name of City: Bulandshahar
1 Sewerage Scheme, Phase 1,
Bulandshahar City
H/c - 44709
Sewer - 215.52Km
SPS
H/H Coverage 0% 100% 14898.08
2 Sewerage Scheme, Phase 2,
Bulandshahar City
IPS - 3, STP - 1 (part)
Sewer - 30.10Km
H/c - 4310
Eff in Treatment
H/H Coverage
8749.54
Name of City: Etah
1 Sewerage Scheme, Phase 1,
Etah City
Sewer - 27.48Km
IPS - 1, STP - 1
Eff in Treatment
Network
Coverage
0%
0%
100%
23%
9616.93
Name of City: Hapur
1 Construction of Boundary
Wall for protection of STP
land, Hapur City
STP Boundary Wall 592 M 151.23
2 Sewerage Scheme, Phase 1
Part 1, Hapur City
Sewer - 45.168Km
H/c 7704
Network
Coverage
0% 18% 8080.57
Name of City: Loni
1 Sewer House Connection in
4 zones (22 wards), Loni
City
H/c - 13000 H/H Coverage 0% 14% 3460.94
Name of City: Mainpuri

Final 3rd STATE ANNUAL ACTION PLAN (3rd SAAP) FOR FY: 2017-18 to FY 2019-20 OF UTTAR PRADESH UNDER ATAL MISSION FOR
REJUVENATION AND URBAN TRANSFORMATION (AMRUT)
2017
STATE MISSION DIRECTORATE (AMRUT) UTTAR PRADESH, 8TH FLOOR, INDIRA BHAWAN, ASHOK MARG, LUCKNOW-226001 172 | P a g e
Table 2.2: SLIP - Details of Prioritized Projects Proposed under AMRUT Name of State: Uttar Pradesh 3rd SAAP: FY 2017-18 to 2019-20
Amount in Rs Lakhs
Sector: Water Supply, Sewerage & Septage Management
SN Project Name and Code Infrastructure Improvement
Physical Components Change in Service Levels Estimated
Cost Indicators Existing (As-Is) After (To-be)
1 2 3 4 5 6 7
1 Sewer House Connection,
Mainpuri City
H/c - 8121 H/H Coverage 12% 39% 1732.44
Name of City: Mathura
1 Sewer House Connection in
trans Yamuna, Mathura City
H/c - 21200 H/H Coverage 13% 39% 4914.36
Name of City: Mirzapur
1 Sewerage Scheme in
Vindhyachal Area, Mirzapur
City
Sewer - 25.614Km
IPS - 1, STP - 1
H/c 5206
H/H Coverage 12% 27% 5159.52
Name of City: Modinagar
1 Sewerage Scheme, Phase 1,
Modinagar City
IPS - 1, STP - 1 Eff in Treatment 0% 70% 5751.95
2 Sewerage Scheme, Phase 2
Part 1, Modinagar City
Sewer - 106Km,
H/c 25070
H/H Coverage 0% 100% 9923.07
Name of City: Muzaffarnagar
1 Sewer House Connection in
Western Zone,
Muzaffarnagar City
H/c - 4700 H/H Coverage 0% 7% 2839.83
Name of City: Raebareilly
1 Sewerage Scheme, Phase 1
Part 1, Raebareily City
Sewer - 23.437 Km
MIPS - 1 (40%),
STP - 1 (40%)
H/H Coverage 4474.00
2 Sewerage Scheme, Phase 2,
Raebareily City
Sewer - 15.064 Km
MIPS - 1 (60%),
STP - 1 (60%)
Eff in Treatment 5738.27

Final 3rd STATE ANNUAL ACTION PLAN (3rd SAAP) FOR FY: 2017-18 to FY 2019-20 OF UTTAR PRADESH UNDER ATAL MISSION FOR
REJUVENATION AND URBAN TRANSFORMATION (AMRUT)
2017
STATE MISSION DIRECTORATE (AMRUT) UTTAR PRADESH, 8TH FLOOR, INDIRA BHAWAN, ASHOK MARG, LUCKNOW-226001 173 | P a g e
Table 2.2: SLIP - Details of Prioritized Projects Proposed under AMRUT Name of State: Uttar Pradesh 3rd SAAP: FY 2017-18 to 2019-20
Amount in Rs Lakhs
Sector: Water Supply, Sewerage & Septage Management
SN Project Name and Code Infrastructure Improvement
Physical Components Change in Service Levels Estimated
Cost Indicators Existing (As-Is) After (To-be)
1 2 3 4 5 6 7
Name of City: Rampur
1 Sewer House Connection in
Zone 1 and 2, Rampur City
H/c - 7070 H/H Coverage 0% 12% 1948.60
Total (Sewerage) 256881.83

Final 3rd STATE ANNUAL ACTION PLAN (3rd SAAP) FOR FY: 2017-18 to FY 2019-20 OF UTTAR PRADESH UNDER ATAL MISSION FOR
REJUVENATION AND URBAN TRANSFORMATION (AMRUT)
2017
STATE MISSION DIRECTORATE (AMRUT) UTTAR PRADESH, 8TH FLOOR, INDIRA BHAWAN, ASHOK MARG, LUCKNOW-226001 174 | P a g e
Table 2.3.1: SLIP - Proposed Funding and Sharing Pattern: Sector Wise Name of State Uttar Pradesh 3rd SAAP: FY 2017-18 to 2019-20
Amount in Rs Crore
SN Sector Total
Project Cost
Sharing Pattern
GOI State ULB Total
1 2 3 4 5 6 7
Name of City: Agra
1 Water Supply 80.00 26.66 29.34 24.00 80.00
Sewerage & Septage Management 110.00 36.66 40.34 33.00 110.00
Park & Green Space 5.69 2.85 1.71 1.14 5.69
Total: 195.69 66.17 71.38 58.14 195.69
Name of City: Allahabad
2 Water Supply 80.00 26.66 29.34 24.00 80.00
Sewerage & Septage Management 15.00 5.00 5.50 4.50 15.00
Park & Green Space 4.03 2.02 1.21 0.81 4.03
Total: 99.03 33.68 36.05 29.31 99.03
Name of City: Ghaziabad
3 Water Supply 100.00 33.33 36.67 30.00 100.00
Sewerage & Septage Management 55.00 18.33 20.17 16.50 55.00
Park & Green Space 5.95 2.98 1.79 1.19 5.95
Total: 160.95 54.64 58.62 47.69 160.95
Name of City: Kanpur
4 Water Supply 80.00 26.66 29.34 24.00 80.00
Sewerage & Septage Management 60.00 20.00 22.00 18.00 60.00
Park & Green Space 10.00 5.00 3.00 2.00 10.00
Total: 150.00 51.66 54.34 44.00 150.00
Name of City: Lucknow
5 Water Supply 250.01 83.33 91.68 75.00 250.01
Sewerage & Septage Management 240.00 79.99 88.01 72.00 240.00
Park & Green Space 10.17 5.09 3.05 2.03 10.17
Total: 500.18 168.40 182.74 149.03 500.18
Name of City: Meerut

Final 3rd STATE ANNUAL ACTION PLAN (3rd SAAP) FOR FY: 2017-18 to FY 2019-20 OF UTTAR PRADESH UNDER ATAL MISSION FOR
REJUVENATION AND URBAN TRANSFORMATION (AMRUT)
2017
STATE MISSION DIRECTORATE (AMRUT) UTTAR PRADESH, 8TH FLOOR, INDIRA BHAWAN, ASHOK MARG, LUCKNOW-226001 175 | P a g e
Table 2.3.1: SLIP - Proposed Funding and Sharing Pattern: Sector Wise Name of State Uttar Pradesh 3rd SAAP: FY 2017-18 to 2019-20
Amount in Rs Crore
SN Sector Total
Project Cost
Sharing Pattern
GOI State ULB Total
1 2 3 4 5 6 7
6 Water Supply 25.00 8.33 9.17 7.50 25.00
Sewerage & Septage Management 175.00 58.33 64.17 52.50 175.00
Park & Green Space 4.74 2.37 1.42 0.95 4.74
Total: 204.74 69.03 74.76 60.95 204.74
Name of City: Varanasi
7 Water Supply 100.00 33.33 36.67 30.00 100.00
Sewerage & Septage Management 95.00 31.66 34.84 28.50 95.00
Park & Green Space 4.34 2.17 1.30 0.87 4.34
Total: 199.34 67.16 72.81 59.37 199.34
Name of City: Aligarh
8 Water Supply 40.00 20.00 12.00 8.00 40.00
Sewerage & Septage Management 15.00 7.50 4.50 3.00 15.00
Park & Green Space 3.15 1.58 0.95 0.63 3.15
Total: 58.15 29.08 17.45 11.63 58.15
Name of City: Bareilly
9 Water Supply 15.00 7.50 4.50 3.00 15.00
Sewerage & Septage Management 131.00 65.50 39.30 26.20 131.00
Park & Green Space 3.24 1.62 0.97 0.65 3.24
Total: 149.24 74.62 44.77 29.85 149.24
Name of City: Firozabad
10 Water Supply 0.00 0.00 0.00 0.00 0.00
Sewerage & Septage Management 0.00 0.00 0.00 0.00 0.00
Park & Green Space 2.18 1.09 0.65 0.44 2.18
Total: 2.18 1.09 0.65 0.44 2.18
Name of City: Gorakhpur
11 Water Supply 40.00 20.00 12.00 8.00 40.00
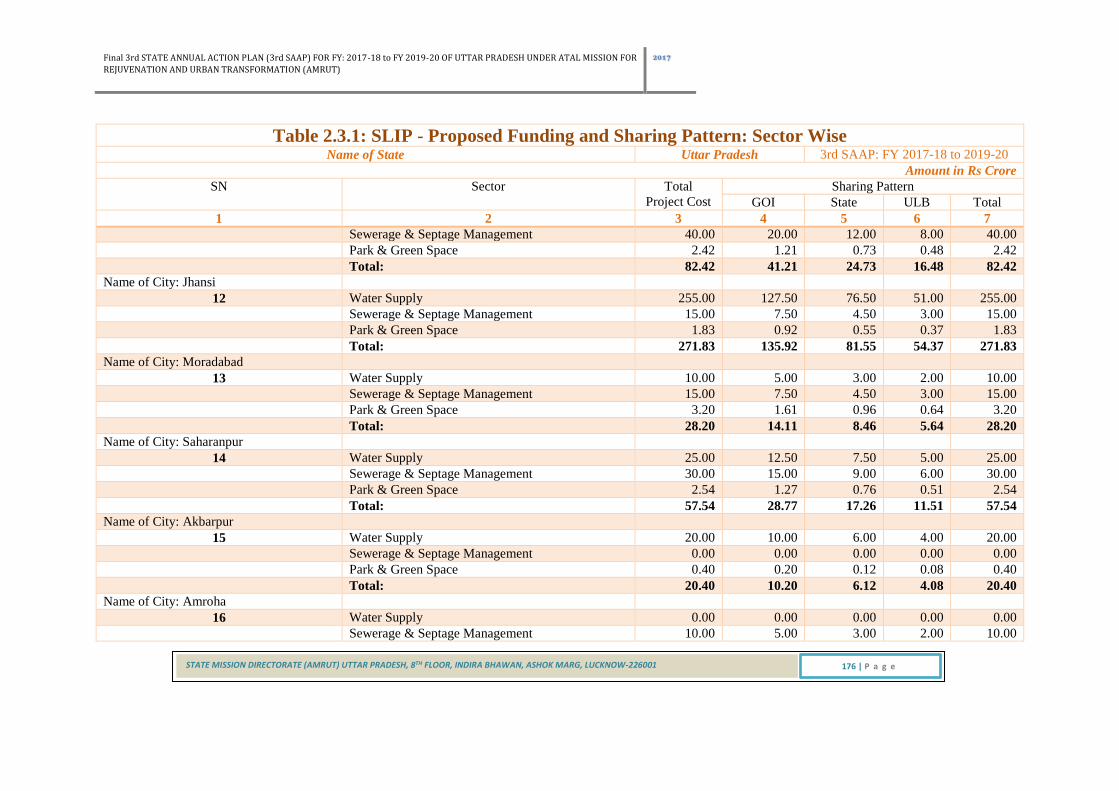
Final 3rd STATE ANNUAL ACTION PLAN (3rd SAAP) FOR FY: 2017-18 to FY 2019-20 OF UTTAR PRADESH UNDER ATAL MISSION FOR
REJUVENATION AND URBAN TRANSFORMATION (AMRUT)
2017
STATE MISSION DIRECTORATE (AMRUT) UTTAR PRADESH, 8TH FLOOR, INDIRA BHAWAN, ASHOK MARG, LUCKNOW-226001 176 | P a g e
Table 2.3.1: SLIP - Proposed Funding and Sharing Pattern: Sector Wise Name of State Uttar Pradesh 3rd SAAP: FY 2017-18 to 2019-20
Amount in Rs Crore
SN Sector Total
Project Cost
Sharing Pattern
GOI State ULB Total
1 2 3 4 5 6 7
Sewerage & Septage Management 40.00 20.00 12.00 8.00 40.00
Park & Green Space 2.42 1.21 0.73 0.48 2.42
Total: 82.42 41.21 24.73 16.48 82.42
Name of City: Jhansi
12 Water Supply 255.00 127.50 76.50 51.00 255.00
Sewerage & Septage Management 15.00 7.50 4.50 3.00 15.00
Park & Green Space 1.83 0.92 0.55 0.37 1.83
Total: 271.83 135.92 81.55 54.37 271.83
Name of City: Moradabad
13 Water Supply 10.00 5.00 3.00 2.00 10.00
Sewerage & Septage Management 15.00 7.50 4.50 3.00 15.00
Park & Green Space 3.20 1.61 0.96 0.64 3.20
Total: 28.20 14.11 8.46 5.64 28.20
Name of City: Saharanpur
14 Water Supply 25.00 12.50 7.50 5.00 25.00
Sewerage & Septage Management 30.00 15.00 9.00 6.00 30.00
Park & Green Space 2.54 1.27 0.76 0.51 2.54
Total: 57.54 28.77 17.26 11.51 57.54
Name of City: Akbarpur
15 Water Supply 20.00 10.00 6.00 4.00 20.00
Sewerage & Septage Management 0.00 0.00 0.00 0.00 0.00
Park & Green Space 0.40 0.20 0.12 0.08 0.40
Total: 20.40 10.20 6.12 4.08 20.40
Name of City: Amroha
16 Water Supply 0.00 0.00 0.00 0.00 0.00
Sewerage & Septage Management 10.00 5.00 3.00 2.00 10.00

Final 3rd STATE ANNUAL ACTION PLAN (3rd SAAP) FOR FY: 2017-18 to FY 2019-20 OF UTTAR PRADESH UNDER ATAL MISSION FOR
REJUVENATION AND URBAN TRANSFORMATION (AMRUT)
2017
STATE MISSION DIRECTORATE (AMRUT) UTTAR PRADESH, 8TH FLOOR, INDIRA BHAWAN, ASHOK MARG, LUCKNOW-226001 177 | P a g e
Table 2.3.1: SLIP - Proposed Funding and Sharing Pattern: Sector Wise Name of State Uttar Pradesh 3rd SAAP: FY 2017-18 to 2019-20
Amount in Rs Crore
SN Sector Total
Project Cost
Sharing Pattern
GOI State ULB Total
1 2 3 4 5 6 7
Park & Green Space 0.70 0.36 0.21 0.14 0.70
Total: 10.70 5.36 3.21 2.14 10.70
Name of City: Ayodhya
17 Water Supply 18.01 9.00 5.40 3.60 18.01
Sewerage & Septage Management 35.00 17.50 10.50 7.00 35.00
Park & Green Space 0.20 0.10 0.06 0.04 0.20
Total: 53.21 26.60 15.96 10.64 53.21
Name of City: Azamgarh
18 Water Supply 10.00 5.00 3.00 2.00 10.00
Sewerage & Septage Management 5.00 2.50 1.50 1.00 5.00
Park & Green Space 0.40 0.20 0.12 0.08 0.40
Total: 15.40 7.70 4.62 3.08 15.40
Name of City: Baharaich
19 Water Supply 0.00 0.00 0.00 0.00 0.00
Sewerage & Septage Management 0.00 0.00 0.00 0.00 0.00
Park & Green Space 0.66 0.34 0.20 0.13 0.66
Total: 0.66 0.34 0.20 0.13 0.66
Name of City: Ballia
20 Water Supply 5.00 2.50 1.50 1.00 5.00
Sewerage & Septage Management 10.00 5.00 3.00 2.00 10.00
Park & Green Space 0.38 0.19 0.11 0.08 0.38
Total: 15.38 7.69 4.61 3.08 15.38
Name of City: Banda
21 Water Supply 250.00 125.00 75.00 50.00 250.00
Sewerage & Septage Management 10.00 5.00 3.00 2.00 10.00
Park & Green Space 0.56 0.28 0.17 0.11 0.56

Final 3rd STATE ANNUAL ACTION PLAN (3rd SAAP) FOR FY: 2017-18 to FY 2019-20 OF UTTAR PRADESH UNDER ATAL MISSION FOR
REJUVENATION AND URBAN TRANSFORMATION (AMRUT)
2017
STATE MISSION DIRECTORATE (AMRUT) UTTAR PRADESH, 8TH FLOOR, INDIRA BHAWAN, ASHOK MARG, LUCKNOW-226001 178 | P a g e
Table 2.3.1: SLIP - Proposed Funding and Sharing Pattern: Sector Wise Name of State Uttar Pradesh 3rd SAAP: FY 2017-18 to 2019-20
Amount in Rs Crore
SN Sector Total
Project Cost
Sharing Pattern
GOI State ULB Total
1 2 3 4 5 6 7
Total: 260.56 130.28 78.17 52.11 260.56
Name of City: Baraut
22 Water Supply 5.00 2.50 1.50 1.00 5.00
Sewerage & Septage Management 10.00 5.00 3.00 2.00 10.00
Park & Green Space 0.36 0.19 0.11 0.07 0.36
Total: 15.36 7.69 4.61 3.07 15.36
Name of City: Basti
23 Water Supply 5.00 2.50 1.50 1.00 5.00
Sewerage & Septage Management 8.00 4.00 2.40 1.60 8.00
Park & Green Space 0.40 0.21 0.12 0.08 0.40
Total: 13.40 6.71 4.02 2.68 13.40
Name of City: Budaun
24 Water Supply 6.00 3.00 1.80 1.20 6.00
Sewerage & Septage Management 10.00 5.00 3.00 2.00 10.00
Park & Green Space 0.58 0.29 0.17 0.12 0.58
Total: 16.58 8.29 4.97 3.32 16.58
Name of City: Bulandshahar
25 Water Supply 0.00 0.00 0.00 0.00 0.00
Sewerage & Septage Management 160.00 80.00 48.00 32.00 160.00
Park & Green Space 0.80 0.40 0.24 0.16 0.80
Total: 160.80 80.40 48.24 32.16 160.80
Name of City: Chandausi
26 Water Supply 30.00 15.00 9.00 6.00 30.00
Sewerage & Septage Management 5.00 2.50 1.50 1.00 5.00
Park & Green Space 0.40 0.21 0.12 0.08 0.40
Total: 35.40 17.71 10.62 7.08 35.40

Final 3rd STATE ANNUAL ACTION PLAN (3rd SAAP) FOR FY: 2017-18 to FY 2019-20 OF UTTAR PRADESH UNDER ATAL MISSION FOR
REJUVENATION AND URBAN TRANSFORMATION (AMRUT)
2017
STATE MISSION DIRECTORATE (AMRUT) UTTAR PRADESH, 8TH FLOOR, INDIRA BHAWAN, ASHOK MARG, LUCKNOW-226001 179 | P a g e
Table 2.3.1: SLIP - Proposed Funding and Sharing Pattern: Sector Wise Name of State Uttar Pradesh 3rd SAAP: FY 2017-18 to 2019-20
Amount in Rs Crore
SN Sector Total
Project Cost
Sharing Pattern
GOI State ULB Total
1 2 3 4 5 6 7
Name of City: Deoria
27 Water Supply 5.00 2.50 1.50 1.00 5.00
Sewerage & Septage Management 0.00 0.00 0.00 0.00 0.00
Park & Green Space 0.46 0.24 0.14 0.09 0.46
Total: 5.46 2.74 1.64 1.09 5.46
Name of City: Etah
28 Water Supply 10.00 5.00 3.00 2.00 10.00
Sewerage & Septage Management 68.00 34.00 20.40 13.60 68.00
Park & Green Space 0.43 0.22 0.13 0.09 0.43
Total: 78.43 39.22 23.53 15.69 78.43
Name of City: Etawah
29 Water Supply 0.00 0.00 0.00 0.00 0.00
Sewerage & Septage Management 8.00 4.00 2.40 1.60 8.00
Park & Green Space 0.93 0.47 0.28 0.19 0.93
Total: 8.93 4.47 2.68 1.79 8.93
Name of City: Faizabad
30 Water Supply 0.00 0.00 0.00 0.00 0.00
Sewerage & Septage Management 0.00 0.00 0.00 0.00 0.00
Park & Green Space 0.60 0.31 0.18 0.12 0.60
Total: 0.60 0.31 0.18 0.12 0.60
Name of City: Farrukhabad-cum-Fatehgarh
31 Water Supply 0.00 0.00 0.00 0.00 0.00
Sewerage & Septage Management 7.00 3.50 2.10 1.40 7.00
Park & Green Space 1.00 0.50 0.30 0.20 1.00
Total: 8.00 4.00 2.40 1.60 8.00
Name of City: Fatehpur

Final 3rd STATE ANNUAL ACTION PLAN (3rd SAAP) FOR FY: 2017-18 to FY 2019-20 OF UTTAR PRADESH UNDER ATAL MISSION FOR
REJUVENATION AND URBAN TRANSFORMATION (AMRUT)
2017
STATE MISSION DIRECTORATE (AMRUT) UTTAR PRADESH, 8TH FLOOR, INDIRA BHAWAN, ASHOK MARG, LUCKNOW-226001 180 | P a g e
Table 2.3.1: SLIP - Proposed Funding and Sharing Pattern: Sector Wise Name of State Uttar Pradesh 3rd SAAP: FY 2017-18 to 2019-20
Amount in Rs Crore
SN Sector Total
Project Cost
Sharing Pattern
GOI State ULB Total
1 2 3 4 5 6 7
32 Water Supply 0.00 0.00 0.00 0.00 0.00
Sewerage & Septage Management 15.00 7.50 4.50 3.00 15.00
Park & Green Space 0.70 0.35 0.21 0.14 0.70
Total: 15.70 7.85 4.71 3.14 15.70
Name of City: Ghazipur
33 Water Supply 7.00 3.50 2.10 1.40 7.00
Sewerage & Septage Management 90.00 45.00 27.00 18.00 90.00
Park & Green Space 0.40 0.20 0.12 0.08 0.40
Total: 97.40 48.70 29.22 19.48 97.40
Name of City: Gonda
34 Water Supply 0.00 0.00 0.00 0.00 0.00
Sewerage & Septage Management 0.00 0.00 0.00 0.00 0.00
Park & Green Space 0.40 0.21 0.12 0.08 0.40
Total: 0.40 0.21 0.12 0.08 0.40
Name of City: Hapur
35 Water Supply 0.00 0.00 0.00 0.00 0.00
Sewerage & Septage Management 64.00 32.00 19.20 12.80 64.00
Park & Green Space 0.96 0.48 0.29 0.19 0.96
Total: 64.96 32.48 19.49 12.99 64.96
Name of City: Hardoi
36 Water Supply 20.00 10.00 6.00 4.00 20.00
Sewerage & Septage Management 0.00 0.00 0.00 0.00 0.00
Park & Green Space 0.46 0.23 0.14 0.09 0.46
Total: 20.46 10.23 6.14 4.09 20.46
Name of City: Hathras
37 Water Supply 20.00 10.00 6.00 4.00 20.00

Final 3rd STATE ANNUAL ACTION PLAN (3rd SAAP) FOR FY: 2017-18 to FY 2019-20 OF UTTAR PRADESH UNDER ATAL MISSION FOR
REJUVENATION AND URBAN TRANSFORMATION (AMRUT)
2017
STATE MISSION DIRECTORATE (AMRUT) UTTAR PRADESH, 8TH FLOOR, INDIRA BHAWAN, ASHOK MARG, LUCKNOW-226001 181 | P a g e
Table 2.3.1: SLIP - Proposed Funding and Sharing Pattern: Sector Wise Name of State Uttar Pradesh 3rd SAAP: FY 2017-18 to 2019-20
Amount in Rs Crore
SN Sector Total
Project Cost
Sharing Pattern
GOI State ULB Total
1 2 3 4 5 6 7
Sewerage & Septage Management 7.00 3.50 2.10 1.40 7.00
Park & Green Space 0.50 0.25 0.15 0.10 0.50
Total: 27.50 13.75 8.25 5.50 27.50
Name of City: Jaunpur
38 Water Supply 10.00 5.00 3.00 2.00 10.00
Sewerage & Septage Management 87.46 43.73 26.24 17.49 87.46
Park & Green Space 0.61 0.31 0.18 0.12 0.61
Total: 98.07 49.04 29.42 19.61 98.07
Name of City: Kasganj
39 Water Supply 15.00 7.50 4.50 3.00 15.00
Sewerage & Septage Management 8.00 4.00 2.40 1.60 8.00
Park & Green Space 0.37 0.19 0.11 0.07 0.37
Total: 23.37 11.69 7.01 4.67 23.37
Name of City: Khurja
40 Water Supply 0.00 0.00 0.00 0.00 0.00
Sewerage & Septage Management 10.00 5.00 3.00 2.00 10.00
Park & Green Space 0.40 0.20 0.12 0.08 0.40
Total: 10.40 5.20 3.12 2.08 10.40
Name of City: Lakhimpur
41 Water Supply 10.00 5.00 3.00 2.00 10.00
Sewerage & Septage Management 0.00 0.00 0.00 0.00 0.00
Park & Green Space 0.56 0.28 0.17 0.11 0.56
Total: 10.56 5.28 3.17 2.11 10.56
Name of City: Lalitpur
42 Water Supply 5.00 2.50 1.50 1.00 5.00
Sewerage & Septage Management 10.00 5.00 3.00 2.00 10.00

Final 3rd STATE ANNUAL ACTION PLAN (3rd SAAP) FOR FY: 2017-18 to FY 2019-20 OF UTTAR PRADESH UNDER ATAL MISSION FOR
REJUVENATION AND URBAN TRANSFORMATION (AMRUT)
2017
STATE MISSION DIRECTORATE (AMRUT) UTTAR PRADESH, 8TH FLOOR, INDIRA BHAWAN, ASHOK MARG, LUCKNOW-226001 182 | P a g e
Table 2.3.1: SLIP - Proposed Funding and Sharing Pattern: Sector Wise Name of State Uttar Pradesh 3rd SAAP: FY 2017-18 to 2019-20
Amount in Rs Crore
SN Sector Total
Project Cost
Sharing Pattern
GOI State ULB Total
1 2 3 4 5 6 7
Park & Green Space 0.48 0.24 0.14 0.10 0.48
Total: 15.48 7.74 4.64 3.10 15.48
Name of City: Loni
43 Water Supply 0.00 0.00 0.00 0.00 0.00
Sewerage & Septage Management 40.00 20.00 12.00 8.00 40.00
Park & Green Space 1.86 0.93 0.56 0.37 1.86
Total: 41.86 20.93 12.56 8.37 41.86
Name of City: Mainpuri
44 Water Supply 5.00 2.50 1.50 1.00 5.00
Sewerage & Septage Management 0.00 0.00 0.00 0.00 0.00
Park & Green Space 0.42 0.21 0.13 0.08 0.42
Total: 5.42 2.71 1.63 1.08 5.42
Name of City: Mathura
45 Water Supply 180.00 90.00 54.00 36.00 180.00
Sewerage & Septage Management 30.00 15.00 9.00 6.00 30.00
Park & Green Space 1.26 0.63 0.38 0.25 1.26
Total: 211.26 105.63 63.38 42.25 211.26
Name of City: Maunath
46 Water Supply 10.00 5.00 3.00 2.00 10.00
Sewerage & Septage Management 10.00 5.00 3.00 2.00 10.00
Park & Green Space 1.01 0.51 0.30 0.20 1.01
Total: 21.01 10.51 6.30 4.20 21.01
Name of City: Mirzapur-cum-vindhyachal
47 Water Supply 15.00 7.50 4.50 3.00 15.00
Sewerage & Septage Management 10.00 5.00 3.00 2.00 10.00
Park & Green Space 0.84 0.42 0.25 0.17 0.84

Final 3rd STATE ANNUAL ACTION PLAN (3rd SAAP) FOR FY: 2017-18 to FY 2019-20 OF UTTAR PRADESH UNDER ATAL MISSION FOR
REJUVENATION AND URBAN TRANSFORMATION (AMRUT)
2017
STATE MISSION DIRECTORATE (AMRUT) UTTAR PRADESH, 8TH FLOOR, INDIRA BHAWAN, ASHOK MARG, LUCKNOW-226001 183 | P a g e
Table 2.3.1: SLIP - Proposed Funding and Sharing Pattern: Sector Wise Name of State Uttar Pradesh 3rd SAAP: FY 2017-18 to 2019-20
Amount in Rs Crore
SN Sector Total
Project Cost
Sharing Pattern
GOI State ULB Total
1 2 3 4 5 6 7
Total: 25.84 12.92 7.75 5.17 25.84
Name of City: Modinagar
48 Water Supply 20.00 10.00 6.00 4.00 20.00
Sewerage & Septage Management 100.00 50.00 30.00 20.00 100.00
Park & Green Space 0.47 0.24 0.14 0.09 0.47
Total: 120.47 60.24 36.14 24.09 120.47
Name of City: Mughalsarai
49 Water Supply 30.00 15.00 9.00 6.00 30.00
Sewerage & Septage Management 0.00 0.00 0.00 0.00 0.00
Park & Green Space 0.40 0.20 0.12 0.08 0.40
Total: 30.40 15.20 9.12 6.08 30.40
Name of City: Muzaffarnagar
50 Water Supply 0.00 0.00 0.00 0.00 0.00
Sewerage & Septage Management 10.00 5.00 3.00 2.00 10.00
Park & Green Space 1.42 0.71 0.43 0.28 1.42
Total: 11.42 5.71 3.43 2.28 11.42
Name of City: Orai
51 Water Supply 20.00 10.00 6.00 4.00 20.00
Sewerage & Septage Management 0.00 0.00 0.00 0.00 0.00
Park & Green Space 0.68 0.34 0.20 0.14 0.68
Total: 20.68 10.34 6.20 4.14 20.68
Name of City: Pilibhit
52 Water Supply 25.00 12.50 7.50 5.00 25.00
Sewerage & Septage Management 0.00 0.00 0.00 0.00 0.00
Park & Green Space 0.47 0.24 0.14 0.09 0.47
Total: 25.47 12.74 7.64 5.09 25.47

Final 3rd STATE ANNUAL ACTION PLAN (3rd SAAP) FOR FY: 2017-18 to FY 2019-20 OF UTTAR PRADESH UNDER ATAL MISSION FOR
REJUVENATION AND URBAN TRANSFORMATION (AMRUT)
2017
STATE MISSION DIRECTORATE (AMRUT) UTTAR PRADESH, 8TH FLOOR, INDIRA BHAWAN, ASHOK MARG, LUCKNOW-226001 184 | P a g e
Table 2.3.1: SLIP - Proposed Funding and Sharing Pattern: Sector Wise Name of State Uttar Pradesh 3rd SAAP: FY 2017-18 to 2019-20
Amount in Rs Crore
SN Sector Total
Project Cost
Sharing Pattern
GOI State ULB Total
1 2 3 4 5 6 7
Name of City: Raibareli
53 Water Supply 0.00 0.00 0.00 0.00 0.00
Sewerage & Septage Management 160.00 80.00 48.00 32.00 160.00
Park & Green Space 0.70 0.35 0.21 0.14 0.70
Total: 160.70 80.35 48.21 32.14 160.70
Name of City: Rampur
54 Water Supply 5.00 2.50 1.50 1.00 5.00
Sewerage & Septage Management 10.00 5.00 3.00 2.00 10.00
Park & Green Space 1.17 0.59 0.35 0.23 1.17
Total: 16.17 8.09 4.85 3.23 16.17
Name of City: Shahjahanpur
55 Water Supply 40.00 20.00 12.00 8.00 40.00
Sewerage & Septage Management 10.00 5.00 3.00 2.00 10.00
Park & Green Space 1.18 0.59 0.35 0.24 1.18
Total: 51.18 25.59 15.35 10.24 51.18
Name of City: Sambhal
56 Water Supply 5.00 2.50 1.50 1.00 5.00
Sewerage & Septage Management 8.00 4.00 2.40 1.60 8.00
Park & Green Space 0.80 0.40 0.24 0.16 0.80
Total: 13.80 6.90 4.14 2.76 13.80
Name of City: Shamli
57 Water Supply 10.00 5.00 3.00 2.00 10.00
Sewerage & Septage Management 0.00 0.00 0.00 0.00 0.00
Park & Green Space 0.40 0.20 0.12 0.08 0.40
Total: 10.40 5.20 3.12 2.08 10.40
Name of City: Shikohabad

Final 3rd STATE ANNUAL ACTION PLAN (3rd SAAP) FOR FY: 2017-18 to FY 2019-20 OF UTTAR PRADESH UNDER ATAL MISSION FOR
REJUVENATION AND URBAN TRANSFORMATION (AMRUT)
2017
STATE MISSION DIRECTORATE (AMRUT) UTTAR PRADESH, 8TH FLOOR, INDIRA BHAWAN, ASHOK MARG, LUCKNOW-226001 185 | P a g e
Table 2.3.1: SLIP - Proposed Funding and Sharing Pattern: Sector Wise Name of State Uttar Pradesh 3rd SAAP: FY 2017-18 to 2019-20
Amount in Rs Crore
SN Sector Total
Project Cost
Sharing Pattern
GOI State ULB Total
1 2 3 4 5 6 7
58 Water Supply 0.00 0.00 0.00 0.00 0.00
Sewerage & Septage Management 0.00 0.00 0.00 0.00 0.00
Park & Green Space 0.40 0.20 0.12 0.08 0.40
Total: 0.40 0.20 0.12 0.08 0.40
Name of City: Sitapur
59 Water Supply 25.00 12.50 7.50 5.00 25.00
Sewerage & Septage Management 8.00 4.00 2.40 1.60 8.00
Park & Green Space 0.64 0.32 0.19 0.13 0.64
Total: 33.64 16.82 10.09 6.73 33.64
Name of City: Sultanpur
60 Water Supply 15.00 7.50 4.50 3.00 15.00
Sewerage & Septage Management 10.00 5.00 3.00 2.00 10.00
Park & Green Space 0.40 0.20 0.12 0.08 0.40
Total: 25.40 12.70 7.62 5.08 25.40
Name of City: Unnao
61 Water Supply 40.00 20.00 12.00 8.00 40.00
Sewerage & Septage Management 110.00 55.00 33.00 22.00 110.00
Park & Green Space 0.66 0.33 0.20 0.13 0.66
Total: 150.66 75.33 45.20 30.13 150.66
Total
Water Supply 1996.02 878.81 646.51 470.70 1996.02
Sewerage & Septage Management 2149.46 949.70 694.87 504.89 2149.46
Park & Green Space 93.76 46.88 28.13 18.75 93.76
Total: 4239.24 1875.39 1369.51 994.34 4239.24

Final 3rd STATE ANNUAL ACTION PLAN (3rd SAAP) FOR FY: 2017-18 to FY 2019-20 OF UTTAR PRADESH UNDER ATAL MISSION FOR
REJUVENATION AND URBAN TRANSFORMATION (AMRUT)
2017
STATE MISSION DIRECTORATE (AMRUT) UTTAR PRADESH, 8TH FLOOR, INDIRA BHAWAN, ASHOK MARG, LUCKNOW-226001 186 | P a g e
Table 2.3.2: SLIP- Source of Funds from GoI /State/ULB (for all sectors and prioritized projects) Name of State: Uttar Pradesh 3rd SAAP: FY 2017-18 to 2019-20
Amount in Rs Crore
SN Sources
of Fund
Sources of Fund Grant
(Central)
Own Fund
(State/ ULB)
14th FC
(State)
Debt (Central/
State/Others)
Others
(Including PPP)
Convergence
(Central/
State/ULB)
Total
1 2 3 4 5 6 7 8 9
Name of City: Agra
1 GOI 66.16
66.16
State
71.39
71.39
ULB
58.14
58.14
Total: 66.16 129.53 - - - - 195.69
Name of City: Allahabad
2 GOI 33.67
33.67
State
36.05
36.05
ULB
29.31
29.31
Total: 33.67 65.36 - - - - 99.03
Name of City: Ghaziabad
3 GOI 54.63
54.63
State
58.63
58.63
ULB
47.69
47.69
Total: 54.63 106.32 - - - - 160.95
Name of City: Kanpur
4 GOI 51.66
51.66
State
54.34
54.34
ULB
44.00
44.00
Total: 51.66 98.34 - - - - 150.00
Name of City: Lucknow
5 GOI 168.41
168.41
State
182.74
182.74
ULB
149.03
149.03
Total: 168.41 331.77 - - - - 500.18

Final 3rd STATE ANNUAL ACTION PLAN (3rd SAAP) FOR FY: 2017-18 to FY 2019-20 OF UTTAR PRADESH UNDER ATAL MISSION FOR
REJUVENATION AND URBAN TRANSFORMATION (AMRUT)
2017
STATE MISSION DIRECTORATE (AMRUT) UTTAR PRADESH, 8TH FLOOR, INDIRA BHAWAN, ASHOK MARG, LUCKNOW-226001 187 | P a g e
Table 2.3.2: SLIP- Source of Funds from GoI /State/ULB (for all sectors and prioritized projects) Name of State: Uttar Pradesh 3rd SAAP: FY 2017-18 to 2019-20
Amount in Rs Crore
SN Sources
of Fund
Sources of Fund Grant
(Central)
Own Fund
(State/ ULB)
14th FC
(State)
Debt (Central/
State/Others)
Others
(Including PPP)
Convergence
(Central/
State/ULB)
Total
1 2 3 4 5 6 7 8 9
Name of City: Meerut
6 GOI 69.03
69.03
State
74.76
74.76
ULB
60.95
60.95
Total: 69.03 135.71 - - - - 204.74
Name of City: Varanasi
7 GOI 67.16
67.16
State
72.81
72.81
ULB
59.37
59.37
Total: 67.16 132.18 - - - - 199.34
Name of City: Aligarh
8 GOI 29.07
29.07
State
17.45
17.45
ULB
11.63
11.63
Total: 29.07 29.08 - - - - 58.15
Name of City: Bareilly
9 GOI 74.62
74.62
State
44.77
44.77
ULB
29.85
29.85
Total: 74.62 74.62 - - - - 149.24
Name of City: Firozabad
10 GOI 1.09
1.09
State
0.65
0.65
ULB
0.44
0.44
Total: 1.09 1.09 - - - - 2.18

Final 3rd STATE ANNUAL ACTION PLAN (3rd SAAP) FOR FY: 2017-18 to FY 2019-20 OF UTTAR PRADESH UNDER ATAL MISSION FOR
REJUVENATION AND URBAN TRANSFORMATION (AMRUT)
2017
STATE MISSION DIRECTORATE (AMRUT) UTTAR PRADESH, 8TH FLOOR, INDIRA BHAWAN, ASHOK MARG, LUCKNOW-226001 188 | P a g e
Table 2.3.2: SLIP- Source of Funds from GoI /State/ULB (for all sectors and prioritized projects) Name of State: Uttar Pradesh 3rd SAAP: FY 2017-18 to 2019-20
Amount in Rs Crore
SN Sources
of Fund
Sources of Fund Grant
(Central)
Own Fund
(State/ ULB)
14th FC
(State)
Debt (Central/
State/Others)
Others
(Including PPP)
Convergence
(Central/
State/ULB)
Total
1 2 3 4 5 6 7 8 9
Name of City: Gorakhpur
11 GOI 41.21
41.21
State
24.73
24.73
ULB
16.48
16.48
Total: 41.21 41.21 - - - - 82.42
Name of City: Jhansi
12 GOI 135.91
135.91
State
81.55
81.55
ULB
54.37
54.37
Total: 135.91 135.92 - - - - 271.83
Name of City: Moradabad
13 GOI 14.10
14.10
State
8.46
8.46
ULB
5.64
5.64
Total: 14.10 14.10 - - - - 28.20
Name of City: Saharanpur
14 GOI 28.77
28.77
State
17.26
17.26
ULB
11.51
11.51
Total: 28.77 28.77 - - - - 57.54
Name of City: Akbarpur
15 GOI 10.20
10.20
State
6.12
6.12
ULB
4.08
4.08
Total: 10.20 10.20 - - - - 20.40
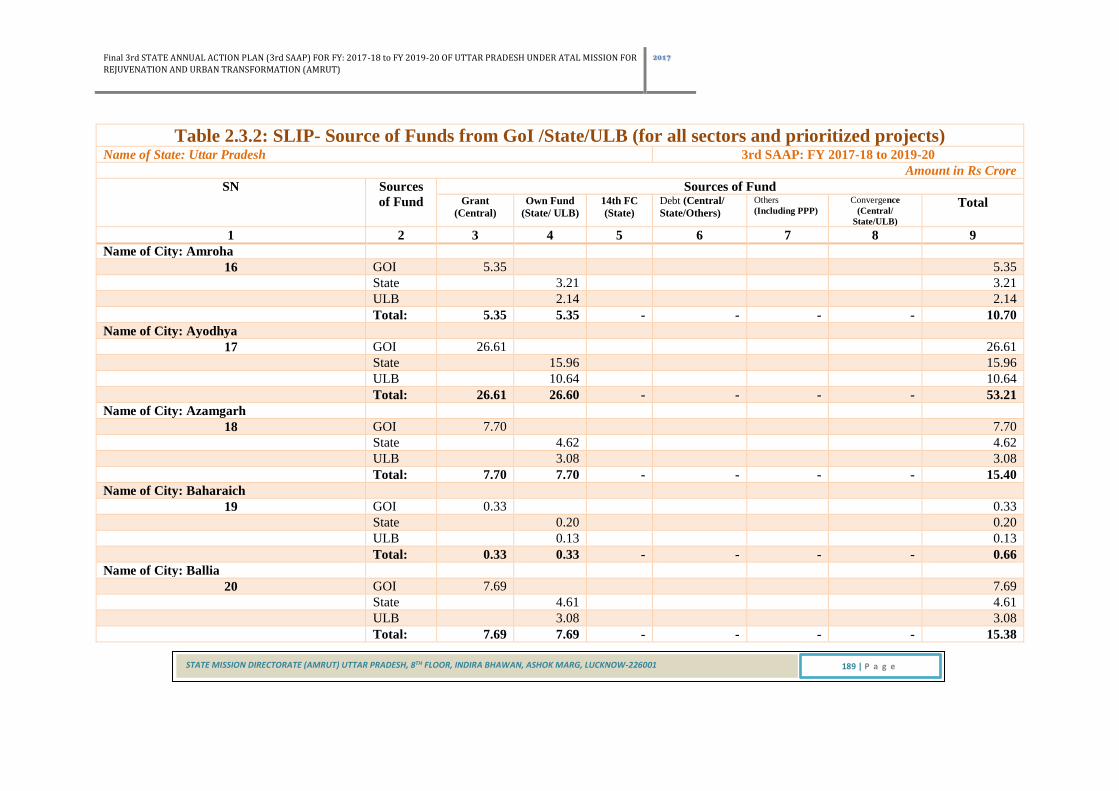
Final 3rd STATE ANNUAL ACTION PLAN (3rd SAAP) FOR FY: 2017-18 to FY 2019-20 OF UTTAR PRADESH UNDER ATAL MISSION FOR
REJUVENATION AND URBAN TRANSFORMATION (AMRUT)
2017
STATE MISSION DIRECTORATE (AMRUT) UTTAR PRADESH, 8TH FLOOR, INDIRA BHAWAN, ASHOK MARG, LUCKNOW-226001 189 | P a g e
Table 2.3.2: SLIP- Source of Funds from GoI /State/ULB (for all sectors and prioritized projects) Name of State: Uttar Pradesh 3rd SAAP: FY 2017-18 to 2019-20
Amount in Rs Crore
SN Sources
of Fund
Sources of Fund Grant
(Central)
Own Fund
(State/ ULB)
14th FC
(State)
Debt (Central/
State/Others)
Others
(Including PPP)
Convergence
(Central/
State/ULB)
Total
1 2 3 4 5 6 7 8 9
Name of City: Amroha
16 GOI 5.35
5.35
State
3.21
3.21
ULB
2.14
2.14
Total: 5.35 5.35 - - - - 10.70
Name of City: Ayodhya
17 GOI 26.61
26.61
State
15.96
15.96
ULB
10.64
10.64
Total: 26.61 26.60 - - - - 53.21
Name of City: Azamgarh
18 GOI 7.70
7.70
State
4.62
4.62
ULB
3.08
3.08
Total: 7.70 7.70 - - - - 15.40
Name of City: Baharaich
19 GOI 0.33
0.33
State
0.20
0.20
ULB
0.13
0.13
Total: 0.33 0.33 - - - - 0.66
Name of City: Ballia
20 GOI 7.69
7.69
State
4.61
4.61
ULB
3.08
3.08
Total: 7.69 7.69 - - - - 15.38

Final 3rd STATE ANNUAL ACTION PLAN (3rd SAAP) FOR FY: 2017-18 to FY 2019-20 OF UTTAR PRADESH UNDER ATAL MISSION FOR
REJUVENATION AND URBAN TRANSFORMATION (AMRUT)
2017
STATE MISSION DIRECTORATE (AMRUT) UTTAR PRADESH, 8TH FLOOR, INDIRA BHAWAN, ASHOK MARG, LUCKNOW-226001 190 | P a g e
Table 2.3.2: SLIP- Source of Funds from GoI /State/ULB (for all sectors and prioritized projects) Name of State: Uttar Pradesh 3rd SAAP: FY 2017-18 to 2019-20
Amount in Rs Crore
SN Sources
of Fund
Sources of Fund Grant
(Central)
Own Fund
(State/ ULB)
14th FC
(State)
Debt (Central/
State/Others)
Others
(Including PPP)
Convergence
(Central/
State/ULB)
Total
1 2 3 4 5 6 7 8 9
Name of City: Banda
21 GOI 130.28
130.28
State
78.17
78.17
ULB
52.11
52.11
Total: 130.28 130.28 - - - - 260.56
Name of City: Baraut
22 GOI 7.68
7.68
State
4.61
4.61
ULB
3.07
3.07
Total: 7.68 7.68 - - - - 15.36
Name of City: Basti
23 GOI 6.70
6.70
State
4.02
4.02
ULB
2.68
2.68
Total: 6.70 6.70 - - - - 13.40
Name of City: Budaun
24 GOI 8.29
8.29
State
4.97
4.97
ULB
3.32
3.32
Total: 8.29 8.29 - - - - 16.58
Name of City: Bulandshahar
25 GOI 80.40
80.40
State
48.24
48.24
ULB
32.16
32.16
Total: 80.40 80.40 - - - - 160.80

Final 3rd STATE ANNUAL ACTION PLAN (3rd SAAP) FOR FY: 2017-18 to FY 2019-20 OF UTTAR PRADESH UNDER ATAL MISSION FOR
REJUVENATION AND URBAN TRANSFORMATION (AMRUT)
2017
STATE MISSION DIRECTORATE (AMRUT) UTTAR PRADESH, 8TH FLOOR, INDIRA BHAWAN, ASHOK MARG, LUCKNOW-226001 191 | P a g e
Table 2.3.2: SLIP- Source of Funds from GoI /State/ULB (for all sectors and prioritized projects) Name of State: Uttar Pradesh 3rd SAAP: FY 2017-18 to 2019-20
Amount in Rs Crore
SN Sources
of Fund
Sources of Fund Grant
(Central)
Own Fund
(State/ ULB)
14th FC
(State)
Debt (Central/
State/Others)
Others
(Including PPP)
Convergence
(Central/
State/ULB)
Total
1 2 3 4 5 6 7 8 9
Name of City: Chandausi
26 GOI 17.70
17.70
State
10.62
10.62
ULB
7.08
7.08
Total: 17.70 17.70 - - - - 35.40
Name of City: Deoria
27 GOI 2.73
2.73
State
1.64
1.64
ULB
1.09
1.09
Total: 2.73 2.73 - - - - 5.46
Name of City: Etah
28 GOI 39.21
39.21
State
23.53
23.53
ULB
15.69
15.69
Total: 39.21 39.22 - - - - 78.43
Name of City: Etawah
29 GOI 4.46
4.46
State
2.68
2.68
ULB
1.79
1.79
Total: 4.46 4.47 - - - - 8.93
Name of City: Faizabad
30 GOI 0.30
0.30
State
0.18
0.18
ULB
0.12
0.12
Total: 0.30 0.30 - - - - 0.60

Final 3rd STATE ANNUAL ACTION PLAN (3rd SAAP) FOR FY: 2017-18 to FY 2019-20 OF UTTAR PRADESH UNDER ATAL MISSION FOR
REJUVENATION AND URBAN TRANSFORMATION (AMRUT)
2017
STATE MISSION DIRECTORATE (AMRUT) UTTAR PRADESH, 8TH FLOOR, INDIRA BHAWAN, ASHOK MARG, LUCKNOW-226001 192 | P a g e
Table 2.3.2: SLIP- Source of Funds from GoI /State/ULB (for all sectors and prioritized projects) Name of State: Uttar Pradesh 3rd SAAP: FY 2017-18 to 2019-20
Amount in Rs Crore
SN Sources
of Fund
Sources of Fund Grant
(Central)
Own Fund
(State/ ULB)
14th FC
(State)
Debt (Central/
State/Others)
Others
(Including PPP)
Convergence
(Central/
State/ULB)
Total
1 2 3 4 5 6 7 8 9
Name of City: Farrukhabad
31 GOI 4.00
4.00
State
2.40
2.40
ULB
1.60
1.60
Total: 4.00 4.00 - - - - 8.00
Name of City: Fatehpur
32 GOI 7.85
7.85
State
4.71
4.71
ULB
3.14
3.14
Total: 7.85 7.85 - - - - 15.70
Name of City: Ghazipur
33 GOI 48.70
48.70
State
29.22
29.22
ULB
19.48
19.48
Total: 48.70 48.70 - - - - 97.40
Name of City: Gonda
34 GOI 0.20
0.20
State
0.12
0.12
ULB
0.08
0.08
Total: 0.20 0.20 - - - - 0.40
Name of City: Hapur
35 GOI 32.48
32.48
State
19.49
19.49
ULB
12.99
12.99
Total: 32.48 32.48 - - - - 64.96

Final 3rd STATE ANNUAL ACTION PLAN (3rd SAAP) FOR FY: 2017-18 to FY 2019-20 OF UTTAR PRADESH UNDER ATAL MISSION FOR
REJUVENATION AND URBAN TRANSFORMATION (AMRUT)
2017
STATE MISSION DIRECTORATE (AMRUT) UTTAR PRADESH, 8TH FLOOR, INDIRA BHAWAN, ASHOK MARG, LUCKNOW-226001 193 | P a g e
Table 2.3.2: SLIP- Source of Funds from GoI /State/ULB (for all sectors and prioritized projects) Name of State: Uttar Pradesh 3rd SAAP: FY 2017-18 to 2019-20
Amount in Rs Crore
SN Sources
of Fund
Sources of Fund Grant
(Central)
Own Fund
(State/ ULB)
14th FC
(State)
Debt (Central/
State/Others)
Others
(Including PPP)
Convergence
(Central/
State/ULB)
Total
1 2 3 4 5 6 7 8 9
Name of City: Hardoi
36 GOI 10.23
10.23
State
6.14
6.14
ULB
4.09
4.09
Total: 10.23 10.23 - - - - 20.46
Name of City: Hathras
37 GOI 13.75
13.75
State
8.25
8.25
ULB
5.50
5.50
Total: 13.75 13.75 - - - - 27.50
Name of City: Jaunpur
38 GOI 49.04
49.04
State
29.42
29.42
ULB
19.61
19.61
Total: 49.04 49.04 - - - - 98.08
Name of City: Kasganj
39 GOI 11.69
11.69
State
7.01
7.01
ULB
4.67
4.67
Total: 11.69 11.68 - - - - 23.37
Name of City: Khurja
40 GOI 5.20
5.20
State
3.12
3.12
ULB
2.08
2.08
Total: 5.20 5.20 - - - - 10.40
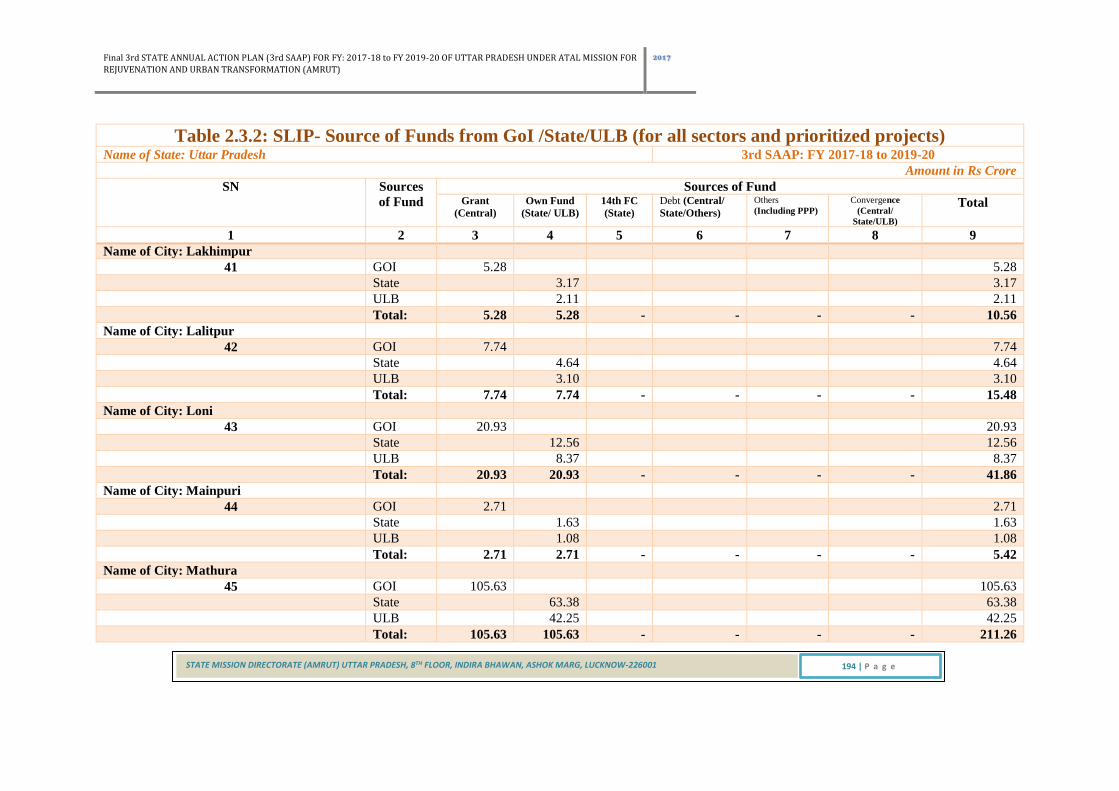
Final 3rd STATE ANNUAL ACTION PLAN (3rd SAAP) FOR FY: 2017-18 to FY 2019-20 OF UTTAR PRADESH UNDER ATAL MISSION FOR
REJUVENATION AND URBAN TRANSFORMATION (AMRUT)
2017
STATE MISSION DIRECTORATE (AMRUT) UTTAR PRADESH, 8TH FLOOR, INDIRA BHAWAN, ASHOK MARG, LUCKNOW-226001 194 | P a g e
Table 2.3.2: SLIP- Source of Funds from GoI /State/ULB (for all sectors and prioritized projects) Name of State: Uttar Pradesh 3rd SAAP: FY 2017-18 to 2019-20
Amount in Rs Crore
SN Sources
of Fund
Sources of Fund Grant
(Central)
Own Fund
(State/ ULB)
14th FC
(State)
Debt (Central/
State/Others)
Others
(Including PPP)
Convergence
(Central/
State/ULB)
Total
1 2 3 4 5 6 7 8 9
Name of City: Lakhimpur
41 GOI 5.28
5.28
State
3.17
3.17
ULB
2.11
2.11
Total: 5.28 5.28 - - - - 10.56
Name of City: Lalitpur
42 GOI 7.74
7.74
State
4.64
4.64
ULB
3.10
3.10
Total: 7.74 7.74 - - - - 15.48
Name of City: Loni
43 GOI 20.93
20.93
State
12.56
12.56
ULB
8.37
8.37
Total: 20.93 20.93 - - - - 41.86
Name of City: Mainpuri
44 GOI 2.71
2.71
State
1.63
1.63
ULB
1.08
1.08
Total: 2.71 2.71 - - - - 5.42
Name of City: Mathura
45 GOI 105.63
105.63
State
63.38
63.38
ULB
42.25
42.25
Total: 105.63 105.63 - - - - 211.26

Final 3rd STATE ANNUAL ACTION PLAN (3rd SAAP) FOR FY: 2017-18 to FY 2019-20 OF UTTAR PRADESH UNDER ATAL MISSION FOR
REJUVENATION AND URBAN TRANSFORMATION (AMRUT)
2017
STATE MISSION DIRECTORATE (AMRUT) UTTAR PRADESH, 8TH FLOOR, INDIRA BHAWAN, ASHOK MARG, LUCKNOW-226001 195 | P a g e
Table 2.3.2: SLIP- Source of Funds from GoI /State/ULB (for all sectors and prioritized projects) Name of State: Uttar Pradesh 3rd SAAP: FY 2017-18 to 2019-20
Amount in Rs Crore
SN Sources
of Fund
Sources of Fund Grant
(Central)
Own Fund
(State/ ULB)
14th FC
(State)
Debt (Central/
State/Others)
Others
(Including PPP)
Convergence
(Central/
State/ULB)
Total
1 2 3 4 5 6 7 8 9
Name of City: Maunath
46 GOI 10.51
10.51
State
6.30
6.30
ULB
4.20
4.20
Total: 10.51 10.50 - - - - 21.01
Name of City: Mirzapur-cum-vindhyachal
47 GOI 12.92
12.92
State
7.75
7.75
ULB
5.17
5.17
Total: 12.92 12.92 - - - - 25.84
Name of City: Modinagar
48 GOI 60.24
60.24
State
36.14
36.14
ULB
24.09
24.09
Total: 60.24 60.23 - - - - 120.47
Name of City: Mughalsarai
49 GOI 15.20
15.20
State
9.12
9.12
ULB
6.08
6.08
Total: 15.20 15.20 - - - - 30.40
Name of City: Muzaffarnagar
50 GOI 5.71
5.71
State
3.43
3.43
ULB
2.28
2.28
Total: 5.71 5.71 - - - - 11.42

Final 3rd STATE ANNUAL ACTION PLAN (3rd SAAP) FOR FY: 2017-18 to FY 2019-20 OF UTTAR PRADESH UNDER ATAL MISSION FOR
REJUVENATION AND URBAN TRANSFORMATION (AMRUT)
2017
STATE MISSION DIRECTORATE (AMRUT) UTTAR PRADESH, 8TH FLOOR, INDIRA BHAWAN, ASHOK MARG, LUCKNOW-226001 196 | P a g e
Table 2.3.2: SLIP- Source of Funds from GoI /State/ULB (for all sectors and prioritized projects) Name of State: Uttar Pradesh 3rd SAAP: FY 2017-18 to 2019-20
Amount in Rs Crore
SN Sources
of Fund
Sources of Fund Grant
(Central)
Own Fund
(State/ ULB)
14th FC
(State)
Debt (Central/
State/Others)
Others
(Including PPP)
Convergence
(Central/
State/ULB)
Total
1 2 3 4 5 6 7 8 9
Name of City: Orai
51 GOI 10.34
10.34
State
6.20
6.20
ULB
4.14
4.14
Total: 10.34 10.34 - - - - 20.68
Name of City: Pilibhit
52 GOI 12.74
12.74
State
7.64
7.64
ULB
5.09
5.09
Total: 12.74 12.73 - - - - 25.47
Name of City: Raibareli
53 GOI 80.35
80.35
State
48.21
48.21
ULB
32.14
32.14
Total: 80.35 80.35 - - - - 160.70
Name of City: Rampur
54 GOI 8.09
8.09
State
4.85
4.85
ULB
3.23
3.23
Total: 8.09 8.08 - - - - 16.17
Name of City: Shahjahanpur
55 GOI 25.59
25.59
State
15.35
15.35
ULB
10.24
10.24
Total: 25.59 25.59 - - - - 51.18

Final 3rd STATE ANNUAL ACTION PLAN (3rd SAAP) FOR FY: 2017-18 to FY 2019-20 OF UTTAR PRADESH UNDER ATAL MISSION FOR
REJUVENATION AND URBAN TRANSFORMATION (AMRUT)
2017
STATE MISSION DIRECTORATE (AMRUT) UTTAR PRADESH, 8TH FLOOR, INDIRA BHAWAN, ASHOK MARG, LUCKNOW-226001 197 | P a g e
Table 2.3.2: SLIP- Source of Funds from GoI /State/ULB (for all sectors and prioritized projects) Name of State: Uttar Pradesh 3rd SAAP: FY 2017-18 to 2019-20
Amount in Rs Crore
SN Sources
of Fund
Sources of Fund Grant
(Central)
Own Fund
(State/ ULB)
14th FC
(State)
Debt (Central/
State/Others)
Others
(Including PPP)
Convergence
(Central/
State/ULB)
Total
1 2 3 4 5 6 7 8 9
Name of City: Sambhal
56 GOI 6.90
6.90
State
4.14
4.14
ULB
2.76
2.76
Total: 6.90 6.90 - - - - 13.80
Name of City: Shamli
57 GOI 5.20
5.20
State
3.12
3.12
ULB
2.08
2.08
Total: 5.20 5.20 - - - - 10.40
Name of City: Shikohabad
58 GOI 0.20
0.20
State
0.12
0.12
ULB
0.08
0.08
Total: 0.20 0.20 - - - - 0.40
Name of City: Sitapur
59 GOI 16.82
16.82
State
10.09
10.09
ULB
6.73
6.73
Total: 16.82 16.82 - - - - 33.64
Name of City: Sultanpur
60 GOI 12.70
12.70
State
7.62
7.62
ULB
5.08
5.08
Total: 12.70 12.70 - - - - 25.40

Final 3rd STATE ANNUAL ACTION PLAN (3rd SAAP) FOR FY: 2017-18 to FY 2019-20 OF UTTAR PRADESH UNDER ATAL MISSION FOR
REJUVENATION AND URBAN TRANSFORMATION (AMRUT)
2017
STATE MISSION DIRECTORATE (AMRUT) UTTAR PRADESH, 8TH FLOOR, INDIRA BHAWAN, ASHOK MARG, LUCKNOW-226001 198 | P a g e
Table 2.3.2: SLIP- Source of Funds from GoI /State/ULB (for all sectors and prioritized projects) Name of State: Uttar Pradesh 3rd SAAP: FY 2017-18 to 2019-20
Amount in Rs Crore
SN Sources
of Fund
Sources of Fund Grant
(Central)
Own Fund
(State/ ULB)
14th FC
(State)
Debt (Central/
State/Others)
Others
(Including PPP)
Convergence
(Central/
State/ULB)
Total
1 2 3 4 5 6 7 8 9
Name of City: Unnao
61 GOI 75.33
75.33
State
45.20
45.20
ULB
30.13
30.13
Total: 75.33 75.33 - - - - 150.66
Grand Total
GOI 1,875.39
1,875.39
State
1,369.51
1,369.51
ULB
994.34
994.34
Total: 1,875.39 2,363.85 - - - - 4,239.24

Final 3rd STATE ANNUAL ACTION PLAN (3rd SAAP) FOR FY: 2017-18 to FY 2019-20 OF UTTAR PRADESH UNDER ATAL MISSION FOR
REJUVENATION AND URBAN TRANSFORMATION (AMRUT)
2017
STATE MISSION DIRECTORATE (AMRUT) UTTAR PRADESH, 8TH FLOOR, INDIRA BHAWAN, ASHOK MARG, LUCKNOW-226001 199 | P a g e
Table 2.4: SLIP - Year Wise Breakup of Investments (For All Sectors & All FYs: 2015-16, 2016-17 & 2017-20) Name of State: Uttar Pradesh 3rd SAAP: FY 2017-18 to 2019-20
Amount in Rs Crore
SN Name of ULB (All Sectors in Mission Period) Sharing Pattern
GOI State ULB Total
1 2 3 4 5 6
Name of City: Agra
1 Total Cost of Projects approved till last Year (a) 94.09 102.74 83.90 280.73
Cost of Project Proposed during the year (b) 66.18 71.38 58.13 195.69
Amount Spent till last Year (c) 0.00 0.00 0.00 0.00
Committed Expenditure (d) =(a+b-c) 160.27 174.12 142.03 476.42
Proposed Spending during Current Financial Year (new & old projects) (e) 18.81 20.55 16.78 56.14
Balance Carry Forward for Next Financial Years (f) = (d-e) 141.46 153.57 125.25 420.28
Name of City: Allahabad
2 Total Cost of Projects approved till last Year (a) 121.86 132.43 108.04 362.33
Cost of Project Proposed during the year (b) 33.68 36.05 29.30 99.03
Amount Spent till last Year (c) 0.00 0.00 0.00 0.00
Committed Expenditure (d) =(a+b-c) 155.54 168.48 137.34 461.36
Proposed Spending during Current Financial Year (new & old projects) (e) 24.37 26.49 21.61 72.47
Balance Carry Forward for Next Financial Years (f) = (d-e) 131.17 141.99 115.73 388.89
Name of City: Ghaziabad
3 Total Cost of Projects approved till last Year (a) 192.69 211.04 172.48 576.21
Cost of Project Proposed during the year (b) 54.64 58.63 47.68 160.95
Amount Spent till last Year (c) 0.00 0.00 0.00 0.00
Committed Expenditure (d) =(a+b-c) 247.33 269.67 220.16 737.16
Proposed Spending during Current Financial Year (new & old projects) (e) 38.55 42.21 34.49 115.25
Balance Carry Forward for Next Financial Years (f) = (d-e) 208.78 227.46 185.67 621.91
Name of City: Kanpur
4 Total Cost of Projects approved till last Year (a) 156.77 169.08 137.70 463.55
Cost of Project Proposed during the year (b) 51.66 54.34 44.00 150.00
Amount Spent till last Year (c) 0.00 0.00 0.00 0.00
Committed Expenditure (d) =(a+b-c) 208.43 223.42 181.70 613.55

Final 3rd STATE ANNUAL ACTION PLAN (3rd SAAP) FOR FY: 2017-18 to FY 2019-20 OF UTTAR PRADESH UNDER ATAL MISSION FOR
REJUVENATION AND URBAN TRANSFORMATION (AMRUT)
2017
STATE MISSION DIRECTORATE (AMRUT) UTTAR PRADESH, 8TH FLOOR, INDIRA BHAWAN, ASHOK MARG, LUCKNOW-226001 200 | P a g e
Table 2.4: SLIP - Year Wise Breakup of Investments (For All Sectors & All FYs: 2015-16, 2016-17 & 2017-20) Name of State: Uttar Pradesh 3rd SAAP: FY 2017-18 to 2019-20
Amount in Rs Crore
SN Name of ULB (All Sectors in Mission Period) Sharing Pattern
GOI State ULB Total
1 2 3 4 5 6
Proposed Spending during Current Financial Year (new & old projects) (e) 31.36 33.81 27.54 92.71
Balance Carry Forward for Next Financial Years (f) = (d-e) 177.07 189.61 154.16 520.84
Name of City: Lucknow
5 Total Cost of Projects approved till last Year (a) 298.51 326.65 266.92 892.08
Cost of Project Proposed during the year (b) 168.41 182.74 149.03 500.18
Amount Spent till last Year (c) 0.00 0.00 0.00 0.00
Committed Expenditure (d) =(a+b-c) 466.92 509.39 415.95 1392.26
Proposed Spending during Current Financial Year (new & old projects) (e) 59.70 65.34 53.38 178.42
Balance Carry Forward for Next Financial Years (f) = (d-e) 407.22 444.05 362.57 1213.84
Name of City: Meerut
6 Total Cost of Projects approved till last Year (a) 88.98 95.49 77.70 262.17
Cost of Project Proposed during the year (b) 69.03 74.76 60.95 204.74
Amount Spent till last Year (c) 0.00 0.00 0.00 0.00
Committed Expenditure (d) =(a+b-c) 158.01 170.25 138.65 466.91
Proposed Spending during Current Financial Year (new & old projects) (e) 17.80 19.11 15.53 52.44
Balance Carry Forward for Next Financial Years (f) = (d-e) 140.21 151.14 123.12 414.47
Name of City: Varanasi
7 Total Cost of Projects approved till last Year (a) 151.47 165.90 135.60 452.97
Cost of Project Proposed during the year (b) 67.16 72.81 59.37 199.34
Amount Spent till last Year (c) 0.00 0.00 0.00 0.00
Committed Expenditure (d) =(a+b-c) 218.63 238.71 194.97 652.31
Proposed Spending during Current Financial Year (new & old projects) (e) 30.30 33.18 27.12 90.60
Balance Carry Forward for Next Financial Years (f) = (d-e) 188.33 205.53 167.85 561.71
Name of City: Aligarh
1 Total Cost of Projects approved till last Year (a) 94.38 56.62 37.75 188.75
Cost of Project Proposed during the year (b) 29.08 17.45 11.62 58.15

Final 3rd STATE ANNUAL ACTION PLAN (3rd SAAP) FOR FY: 2017-18 to FY 2019-20 OF UTTAR PRADESH UNDER ATAL MISSION FOR
REJUVENATION AND URBAN TRANSFORMATION (AMRUT)
2017
STATE MISSION DIRECTORATE (AMRUT) UTTAR PRADESH, 8TH FLOOR, INDIRA BHAWAN, ASHOK MARG, LUCKNOW-226001 201 | P a g e
Table 2.4: SLIP - Year Wise Breakup of Investments (For All Sectors & All FYs: 2015-16, 2016-17 & 2017-20) Name of State: Uttar Pradesh 3rd SAAP: FY 2017-18 to 2019-20
Amount in Rs Crore
SN Name of ULB (All Sectors in Mission Period) Sharing Pattern
GOI State ULB Total
1 2 3 4 5 6
Amount Spent till last Year (c) 0.00 0.00 0.00 0.00
Committed Expenditure (d) =(a+b-c) 123.46 74.07 49.37 246.90
Proposed Spending during Current Financial Year (new & old projects) (e) 18.88 11.32 7.55 37.75
Balance Carry Forward for Next Financial Years (f) = (d-e) 104.58 62.75 41.82 209.15
Name of City: Bareilly
2 Total Cost of Projects approved till last Year (a) 35.54 21.32 14.20 71.06
Cost of Project Proposed during the year (b) 74.62 44.77 29.85 149.24
Amount Spent till last Year (c) 0.00 0.00 0.00 0.00
Committed Expenditure (d) =(a+b-c) 110.16 66.09 44.05 220.30
Proposed Spending during Current Financial Year (new & old projects) (e) 7.11 4.26 2.84 14.21
Balance Carry Forward for Next Financial Years (f) = (d-e) 103.05 61.83 41.21 206.09
Name of City: Firozabad
3 Total Cost of Projects approved till last Year (a) 22.13 13.28 8.85 44.26
Cost of Project Proposed during the year (b) 1.09 0.65 0.44 2.18
Amount Spent till last Year (c) 0.00 0.00 0.00 0.00
Committed Expenditure (d) =(a+b-c) 23.22 13.93 9.29 46.44
Proposed Spending during Current Financial Year (new & old projects) (e) 4.43 2.66 1.76 8.85
Balance Carry Forward for Next Financial Years (f) = (d-e) 18.79 11.27 7.53 37.59
Name of City: Gorakhpur
4 Total Cost of Projects approved till last Year (a) 145.67 87.40 58.27 291.34
Cost of Project Proposed during the year (b) 41.21 24.73 16.48 82.42
Amount Spent till last Year (c) 0.00 0.00 0.00 0.00
Committed Expenditure (d) =(a+b-c) 186.88 112.13 74.75 373.76
Proposed Spending during Current Financial Year (new & old projects) (e) 29.14 17.48 11.65 58.27
Balance Carry Forward for Next Financial Years (f) = (d-e) 157.74 94.65 63.10 315.49
Name of City: Jhansi

Final 3rd STATE ANNUAL ACTION PLAN (3rd SAAP) FOR FY: 2017-18 to FY 2019-20 OF UTTAR PRADESH UNDER ATAL MISSION FOR
REJUVENATION AND URBAN TRANSFORMATION (AMRUT)
2017
STATE MISSION DIRECTORATE (AMRUT) UTTAR PRADESH, 8TH FLOOR, INDIRA BHAWAN, ASHOK MARG, LUCKNOW-226001 202 | P a g e
Table 2.4: SLIP - Year Wise Breakup of Investments (For All Sectors & All FYs: 2015-16, 2016-17 & 2017-20) Name of State: Uttar Pradesh 3rd SAAP: FY 2017-18 to 2019-20
Amount in Rs Crore
SN Name of ULB (All Sectors in Mission Period) Sharing Pattern
GOI State ULB Total
1 2 3 4 5 6
5 Total Cost of Projects approved till last Year (a) 264.43 158.65 105.77 528.85
Cost of Project Proposed during the year (b) 135.92 81.55 54.36 271.83
Amount Spent till last Year (c) 0.00 0.00 0.00 0.00
Committed Expenditure (d) =(a+b-c) 400.35 240.20 160.13 800.68
Proposed Spending during Current Financial Year (new & old projects) (e) 52.89 31.73 21.15 105.77
Balance Carry Forward for Next Financial Years (f) = (d-e) 347.46 208.47 138.98 694.91
Name of City: Moradabad
6 Total Cost of Projects approved till last Year (a) 87.52 52.51 35.01 175.04
Cost of Project Proposed during the year (b) 14.10 8.46 5.64 28.20
Amount Spent till last Year (c) 0.00 0.00 0.00 0.00
Committed Expenditure (d) =(a+b-c) 101.62 60.97 40.65 203.24
Proposed Spending during Current Financial Year (new & old projects) (e) 17.51 10.51 6.99 35.01
Balance Carry Forward for Next Financial Years (f) = (d-e) 84.11 50.46 33.66 168.23
Name of City: Saharanpur
7 Total Cost of Projects approved till last Year (a) 75.39 45.24 30.15 150.78
Cost of Project Proposed during the year (b) 28.77 17.26 11.51 57.54
Amount Spent till last Year (c) 0.00 0.00 0.00 0.00
Committed Expenditure (d) =(a+b-c) 104.16 62.50 41.66 208.32
Proposed Spending during Current Financial Year (new & old projects) (e) 15.08 9.04 6.03 30.15
Balance Carry Forward for Next Financial Years (f) = (d-e) 89.08 53.46 35.63 178.17
Name of City: Akbarpur
8 Total Cost of Projects approved till last Year (a) 6.55 3.93 2.61 13.09
Cost of Project Proposed during the year (b) 10.20 6.12 4.08 20.40
Amount Spent till last Year (c) 0.00 0.00 0.00 0.00
Committed Expenditure (d) =(a+b-c) 16.75 10.05 6.69 33.49
Proposed Spending during Current Financial Year (new & old projects) (e) 1.32 0.79 0.51 2.62

Final 3rd STATE ANNUAL ACTION PLAN (3rd SAAP) FOR FY: 2017-18 to FY 2019-20 OF UTTAR PRADESH UNDER ATAL MISSION FOR
REJUVENATION AND URBAN TRANSFORMATION (AMRUT)
2017
STATE MISSION DIRECTORATE (AMRUT) UTTAR PRADESH, 8TH FLOOR, INDIRA BHAWAN, ASHOK MARG, LUCKNOW-226001 203 | P a g e
Table 2.4: SLIP - Year Wise Breakup of Investments (For All Sectors & All FYs: 2015-16, 2016-17 & 2017-20) Name of State: Uttar Pradesh 3rd SAAP: FY 2017-18 to 2019-20
Amount in Rs Crore
SN Name of ULB (All Sectors in Mission Period) Sharing Pattern
GOI State ULB Total
1 2 3 4 5 6
Balance Carry Forward for Next Financial Years (f) = (d-e) 15.43 9.26 6.18 30.87
Name of City: Amroha
9 Total Cost of Projects approved till last Year (a) 0.68 0.41 0.26 1.35
Cost of Project Proposed during the year (b) 5.35 3.21 2.14 10.70
Amount Spent till last Year (c) 0.00 0.00 0.00 0.00
Committed Expenditure (d) =(a+b-c) 6.03 3.62 2.40 12.05
Proposed Spending during Current Financial Year (new & old projects) (e) 0.14 0.09 0.04 0.27
Balance Carry Forward for Next Financial Years (f) = (d-e) 5.89 3.53 2.36 11.78
Name of City: Ayodhya
10 Total Cost of Projects approved till last Year (a) 0.00 0.00 0.00 0.00
Cost of Project Proposed during the year (b) 26.61 15.96 10.64 53.21
Amount Spent till last Year (c) 0.00 0.00 0.00 0.00
Committed Expenditure (d) =(a+b-c) 26.61 15.96 10.64 53.21
Proposed Spending during Current Financial Year (new & old projects) (e) 0.00 0.00 0.00 0.00
Balance Carry Forward for Next Financial Years (f) = (d-e) 26.61 15.96 10.64 53.21
Name of City: Azamgarh
11 Total Cost of Projects approved till last Year (a) 35.78 21.46 14.32 71.56
Cost of Project Proposed during the year (b) 7.70 4.62 3.08 15.40
Amount Spent till last Year (c) 0.00 0.00 0.00 0.00
Committed Expenditure (d) =(a+b-c) 43.48 26.08 17.40 86.96
Proposed Spending during Current Financial Year (new & old projects) (e) 7.16 4.29 2.87 14.32
Balance Carry Forward for Next Financial Years (f) = (d-e) 36.32 21.79 14.53 72.64
Name of City: Bahraich
12 Total Cost of Projects approved till last Year (a) 25.69 15.42 10.27 51.38
Cost of Project Proposed during the year (b) 0.33 0.20 0.13 0.66
Amount Spent till last Year (c) 0.00 0.00 0.00 0.00

Final 3rd STATE ANNUAL ACTION PLAN (3rd SAAP) FOR FY: 2017-18 to FY 2019-20 OF UTTAR PRADESH UNDER ATAL MISSION FOR
REJUVENATION AND URBAN TRANSFORMATION (AMRUT)
2017
STATE MISSION DIRECTORATE (AMRUT) UTTAR PRADESH, 8TH FLOOR, INDIRA BHAWAN, ASHOK MARG, LUCKNOW-226001 204 | P a g e
Table 2.4: SLIP - Year Wise Breakup of Investments (For All Sectors & All FYs: 2015-16, 2016-17 & 2017-20) Name of State: Uttar Pradesh 3rd SAAP: FY 2017-18 to 2019-20
Amount in Rs Crore
SN Name of ULB (All Sectors in Mission Period) Sharing Pattern
GOI State ULB Total
1 2 3 4 5 6
Committed Expenditure (d) =(a+b-c) 26.02 15.62 10.40 52.04
Proposed Spending during Current Financial Year (new & old projects) (e) 5.14 3.08 2.05 10.27
Balance Carry Forward for Next Financial Years (f) = (d-e) 20.88 12.54 8.35 41.77
Name of City: Ballia
13 Total Cost of Projects approved till last Year (a) 18.57 11.14 7.42 37.13
Cost of Project Proposed during the year (b) 7.69 4.61 3.08 15.38
Amount Spent till last Year (c) 0.00 0.00 0.00 0.00
Committed Expenditure (d) =(a+b-c) 26.26 15.75 10.50 52.51
Proposed Spending during Current Financial Year (new & old projects) (e) 3.72 2.23 1.48 7.43
Balance Carry Forward for Next Financial Years (f) = (d-e) 22.54 13.52 9.02 45.08
Name of City: Banda
14 Total Cost of Projects approved till last Year (a) 29.16 17.49 11.66 58.31
Cost of Project Proposed during the year (b) 130.28 78.17 52.11 260.56
Amount Spent till last Year (c) 0.00 0.00 0.00 0.00
Committed Expenditure (d) =(a+b-c) 159.44 95.66 63.77 318.87
Proposed Spending during Current Financial Year (new & old projects) (e) 5.83 3.49 2.34 11.66
Balance Carry Forward for Next Financial Years (f) = (d-e) 153.61 92.17 61.43 307.21
Name of City: Baraut
15 Total Cost of Projects approved till last Year (a) 4.39 2.63 1.75 8.77
Cost of Project Proposed during the year (b) 7.68 4.61 3.07 15.36
Amount Spent till last Year (c) 0.00 0.00 0.00 0.00
Committed Expenditure (d) =(a+b-c) 12.07 7.24 4.82 24.13
Proposed Spending during Current Financial Year (new & old projects) (e) 0.89 0.53 0.34 1.76
Balance Carry Forward for Next Financial Years (f) = (d-e) 11.18 6.71 4.48 22.37
Name of City: Basti
16 Total Cost of Projects approved till last Year (a) 7.53 4.52 3.01 15.06

Final 3rd STATE ANNUAL ACTION PLAN (3rd SAAP) FOR FY: 2017-18 to FY 2019-20 OF UTTAR PRADESH UNDER ATAL MISSION FOR
REJUVENATION AND URBAN TRANSFORMATION (AMRUT)
2017
STATE MISSION DIRECTORATE (AMRUT) UTTAR PRADESH, 8TH FLOOR, INDIRA BHAWAN, ASHOK MARG, LUCKNOW-226001 205 | P a g e
Table 2.4: SLIP - Year Wise Breakup of Investments (For All Sectors & All FYs: 2015-16, 2016-17 & 2017-20) Name of State: Uttar Pradesh 3rd SAAP: FY 2017-18 to 2019-20
Amount in Rs Crore
SN Name of ULB (All Sectors in Mission Period) Sharing Pattern
GOI State ULB Total
1 2 3 4 5 6
Cost of Project Proposed during the year (b) 6.70 4.02 2.68 13.40
Amount Spent till last Year (c) 0.00 0.00 0.00 0.00
Committed Expenditure (d) =(a+b-c) 14.23 8.54 5.69 28.46
Proposed Spending during Current Financial Year (new & old projects) (e) 1.51 0.91 0.59 3.01
Balance Carry Forward for Next Financial Years (f) = (d-e) 12.72 7.63 5.10 25.45
Name of City: Budaun
17 Total Cost of Projects approved till last Year (a) 2.46 1.47 0.98 4.91
Cost of Project Proposed during the year (b) 8.29 4.97 3.32 16.58
Amount Spent till last Year (c) 0.00 0.00 0.00 0.00
Committed Expenditure (d) =(a+b-c) 10.75 6.44 4.30 21.49
Proposed Spending during Current Financial Year (new & old projects) (e) 0.49 0.29 0.20 0.98
Balance Carry Forward for Next Financial Years (f) = (d-e) 10.26 6.15 4.10 20.51
Name of City: Bulandshahar
18 Total Cost of Projects approved till last Year (a) 95.17 57.10 38.06 190.33
Cost of Project Proposed during the year (b) 80.40 48.24 32.16 160.80
Amount Spent till last Year (c) 0.00 0.00 0.00 0.00
Committed Expenditure (d) =(a+b-c) 175.57 105.34 70.22 351.13
Proposed Spending during Current Financial Year (new & old projects) (e) 19.04 11.42 7.60 38.06
Balance Carry Forward for Next Financial Years (f) = (d-e) 156.53 93.92 62.62 313.07
Name of City: Chandausi
19 Total Cost of Projects approved till last Year (a) 6.63 3.98 2.64 13.25
Cost of Project Proposed during the year (b) 17.70 10.62 7.08 35.40
Amount Spent till last Year (c) 0.00 0.00 0.00 0.00
Committed Expenditure (d) =(a+b-c) 24.33 14.60 9.72 48.65
Proposed Spending during Current Financial Year (new & old projects) (e) 1.33 0.79 0.53 2.65
Balance Carry Forward for Next Financial Years (f) = (d-e) 23.00 13.81 9.19 46.00

Final 3rd STATE ANNUAL ACTION PLAN (3rd SAAP) FOR FY: 2017-18 to FY 2019-20 OF UTTAR PRADESH UNDER ATAL MISSION FOR
REJUVENATION AND URBAN TRANSFORMATION (AMRUT)
2017
STATE MISSION DIRECTORATE (AMRUT) UTTAR PRADESH, 8TH FLOOR, INDIRA BHAWAN, ASHOK MARG, LUCKNOW-226001 206 | P a g e
Table 2.4: SLIP - Year Wise Breakup of Investments (For All Sectors & All FYs: 2015-16, 2016-17 & 2017-20) Name of State: Uttar Pradesh 3rd SAAP: FY 2017-18 to 2019-20
Amount in Rs Crore
SN Name of ULB (All Sectors in Mission Period) Sharing Pattern
GOI State ULB Total
1 2 3 4 5 6
Name of City: Deoria
20 Total Cost of Projects approved till last Year (a) 7.07 4.24 2.83 14.14
Cost of Project Proposed during the year (b) 2.73 1.64 1.09 5.46
Amount Spent till last Year (c) 0.00 0.00 0.00 0.00
Committed Expenditure (d) =(a+b-c) 9.80 5.88 3.92 19.60
Proposed Spending during Current Financial Year (new & old projects) (e) 1.42 0.85 0.56 2.83
Balance Carry Forward for Next Financial Years (f) = (d-e) 8.38 5.03 3.36 16.77
Name of City: Etah
21 Total Cost of Projects approved till last Year (a) 38.73 23.24 15.49 77.46
Cost of Project Proposed during the year (b) 39.22 23.53 15.68 78.43
Amount Spent till last Year (c) 0.00 0.00 0.00 0.00
Committed Expenditure (d) =(a+b-c) 77.95 46.77 31.17 155.89
Proposed Spending during Current Financial Year (new & old projects) (e) 7.75 4.65 3.09 15.49
Balance Carry Forward for Next Financial Years (f) = (d-e) 70.20 42.12 28.08 140.40
Name of City: Etawah
22 Total Cost of Projects approved till last Year (a) 0.40 0.24 0.16 0.80
Cost of Project Proposed during the year (b) 4.47 2.68 1.78 8.93
Amount Spent till last Year (c) 0.00 0.00 0.00 0.00
Committed Expenditure (d) =(a+b-c) 4.87 2.92 1.94 9.73
Proposed Spending during Current Financial Year (new & old projects) (e) 0.08 0.05 0.03 0.16
Balance Carry Forward for Next Financial Years (f) = (d-e) 4.79 2.87 1.91 9.57
Name of City: Faizabad
23 Total Cost of Projects approved till last Year (a) 13.22 7.94 5.28 26.44
Cost of Project Proposed during the year (b) 0.30 0.18 0.12 0.60
Amount Spent till last Year (c) 0.00 0.00 0.00 0.00
Committed Expenditure (d) =(a+b-c) 13.52 8.12 5.40 27.04
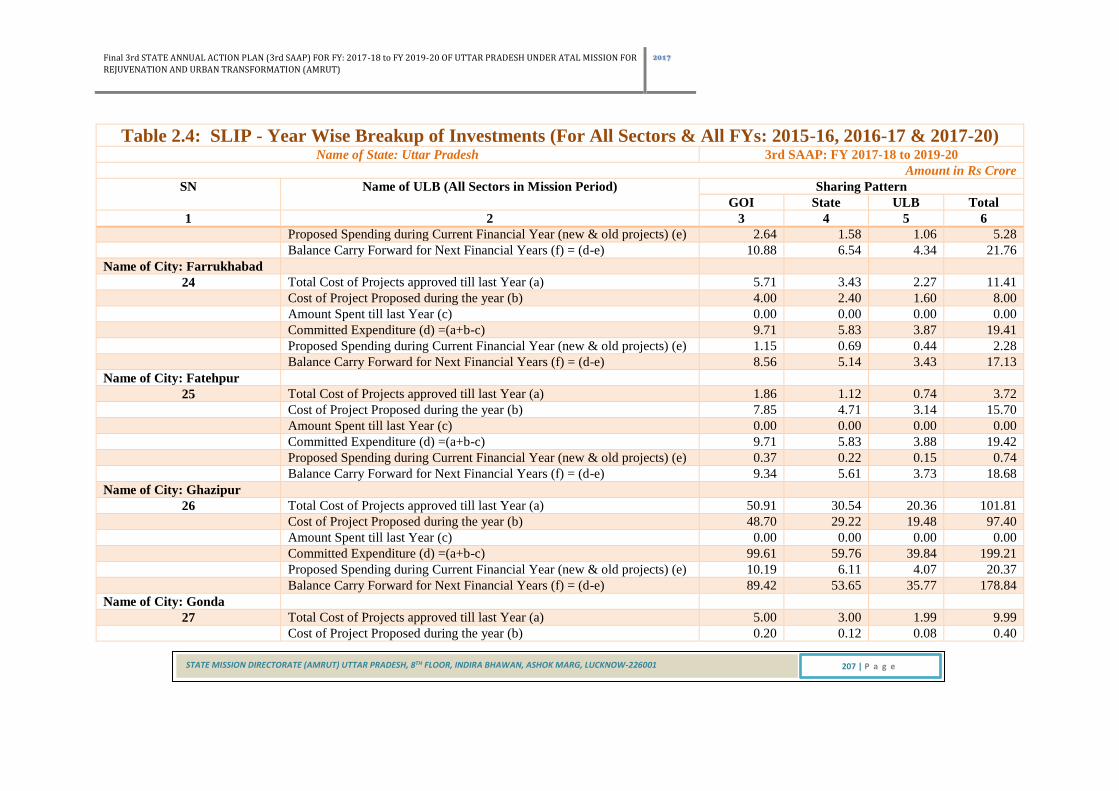
Final 3rd STATE ANNUAL ACTION PLAN (3rd SAAP) FOR FY: 2017-18 to FY 2019-20 OF UTTAR PRADESH UNDER ATAL MISSION FOR
REJUVENATION AND URBAN TRANSFORMATION (AMRUT)
2017
STATE MISSION DIRECTORATE (AMRUT) UTTAR PRADESH, 8TH FLOOR, INDIRA BHAWAN, ASHOK MARG, LUCKNOW-226001 207 | P a g e
Table 2.4: SLIP - Year Wise Breakup of Investments (For All Sectors & All FYs: 2015-16, 2016-17 & 2017-20) Name of State: Uttar Pradesh 3rd SAAP: FY 2017-18 to 2019-20
Amount in Rs Crore
SN Name of ULB (All Sectors in Mission Period) Sharing Pattern
GOI State ULB Total
1 2 3 4 5 6
Proposed Spending during Current Financial Year (new & old projects) (e) 2.64 1.58 1.06 5.28
Balance Carry Forward for Next Financial Years (f) = (d-e) 10.88 6.54 4.34 21.76
Name of City: Farrukhabad
24 Total Cost of Projects approved till last Year (a) 5.71 3.43 2.27 11.41
Cost of Project Proposed during the year (b) 4.00 2.40 1.60 8.00
Amount Spent till last Year (c) 0.00 0.00 0.00 0.00
Committed Expenditure (d) =(a+b-c) 9.71 5.83 3.87 19.41
Proposed Spending during Current Financial Year (new & old projects) (e) 1.15 0.69 0.44 2.28
Balance Carry Forward for Next Financial Years (f) = (d-e) 8.56 5.14 3.43 17.13
Name of City: Fatehpur
25 Total Cost of Projects approved till last Year (a) 1.86 1.12 0.74 3.72
Cost of Project Proposed during the year (b) 7.85 4.71 3.14 15.70
Amount Spent till last Year (c) 0.00 0.00 0.00 0.00
Committed Expenditure (d) =(a+b-c) 9.71 5.83 3.88 19.42
Proposed Spending during Current Financial Year (new & old projects) (e) 0.37 0.22 0.15 0.74
Balance Carry Forward for Next Financial Years (f) = (d-e) 9.34 5.61 3.73 18.68
Name of City: Ghazipur
26 Total Cost of Projects approved till last Year (a) 50.91 30.54 20.36 101.81
Cost of Project Proposed during the year (b) 48.70 29.22 19.48 97.40
Amount Spent till last Year (c) 0.00 0.00 0.00 0.00
Committed Expenditure (d) =(a+b-c) 99.61 59.76 39.84 199.21
Proposed Spending during Current Financial Year (new & old projects) (e) 10.19 6.11 4.07 20.37
Balance Carry Forward for Next Financial Years (f) = (d-e) 89.42 53.65 35.77 178.84
Name of City: Gonda
27 Total Cost of Projects approved till last Year (a) 5.00 3.00 1.99 9.99
Cost of Project Proposed during the year (b) 0.20 0.12 0.08 0.40

Final 3rd STATE ANNUAL ACTION PLAN (3rd SAAP) FOR FY: 2017-18 to FY 2019-20 OF UTTAR PRADESH UNDER ATAL MISSION FOR
REJUVENATION AND URBAN TRANSFORMATION (AMRUT)
2017
STATE MISSION DIRECTORATE (AMRUT) UTTAR PRADESH, 8TH FLOOR, INDIRA BHAWAN, ASHOK MARG, LUCKNOW-226001 208 | P a g e
Table 2.4: SLIP - Year Wise Breakup of Investments (For All Sectors & All FYs: 2015-16, 2016-17 & 2017-20) Name of State: Uttar Pradesh 3rd SAAP: FY 2017-18 to 2019-20
Amount in Rs Crore
SN Name of ULB (All Sectors in Mission Period) Sharing Pattern
GOI State ULB Total
1 2 3 4 5 6
Amount Spent till last Year (c) 0.00 0.00 0.00 0.00
Committed Expenditure (d) =(a+b-c) 5.20 3.12 2.07 10.39
Proposed Spending during Current Financial Year (new & old projects) (e) 1.00 0.60 0.39 1.99
Balance Carry Forward for Next Financial Years (f) = (d-e) 4.20 2.52 1.68 8.40
Name of City: Hapur
28 Total Cost of Projects approved till last Year (a) 42.74 25.65 17.09 85.48
Cost of Project Proposed during the year (b) 32.48 19.49 12.99 64.96
Amount Spent till last Year (c) 0.00 0.00 0.00 0.00
Committed Expenditure (d) =(a+b-c) 75.22 45.14 30.08 150.44
Proposed Spending during Current Financial Year (new & old projects) (e) 8.55 5.13 3.41 17.09
Balance Carry Forward for Next Financial Years (f) = (d-e) 66.67 40.01 26.67 133.35
Name of City: Hardoi
29 Total Cost of Projects approved till last Year (a) 6.26 3.75 2.51 12.52
Cost of Project Proposed during the year (b) 10.23 6.14 4.09 20.46
Amount Spent till last Year (c) 0.00 0.00 0.00 0.00
Committed Expenditure (d) =(a+b-c) 16.49 9.89 6.60 32.98
Proposed Spending during Current Financial Year (new & old projects) (e) 1.26 0.76 0.49 2.51
Balance Carry Forward for Next Financial Years (f) = (d-e) 15.23 9.13 6.11 30.47
Name of City: Hathras
30 Total Cost of Projects approved till last Year (a) 16.83 10.09 6.72 33.64
Cost of Project Proposed during the year (b) 13.75 8.25 5.50 27.50
Amount Spent till last Year (c) 0.00 0.00 0.00 0.00
Committed Expenditure (d) =(a+b-c) 30.58 18.34 12.22 61.14
Proposed Spending during Current Financial Year (new & old projects) (e) 3.37 2.02 1.34 6.73
Balance Carry Forward for Next Financial Years (f) = (d-e) 27.21 16.32 10.88 54.41
Name of City: Jaunpur
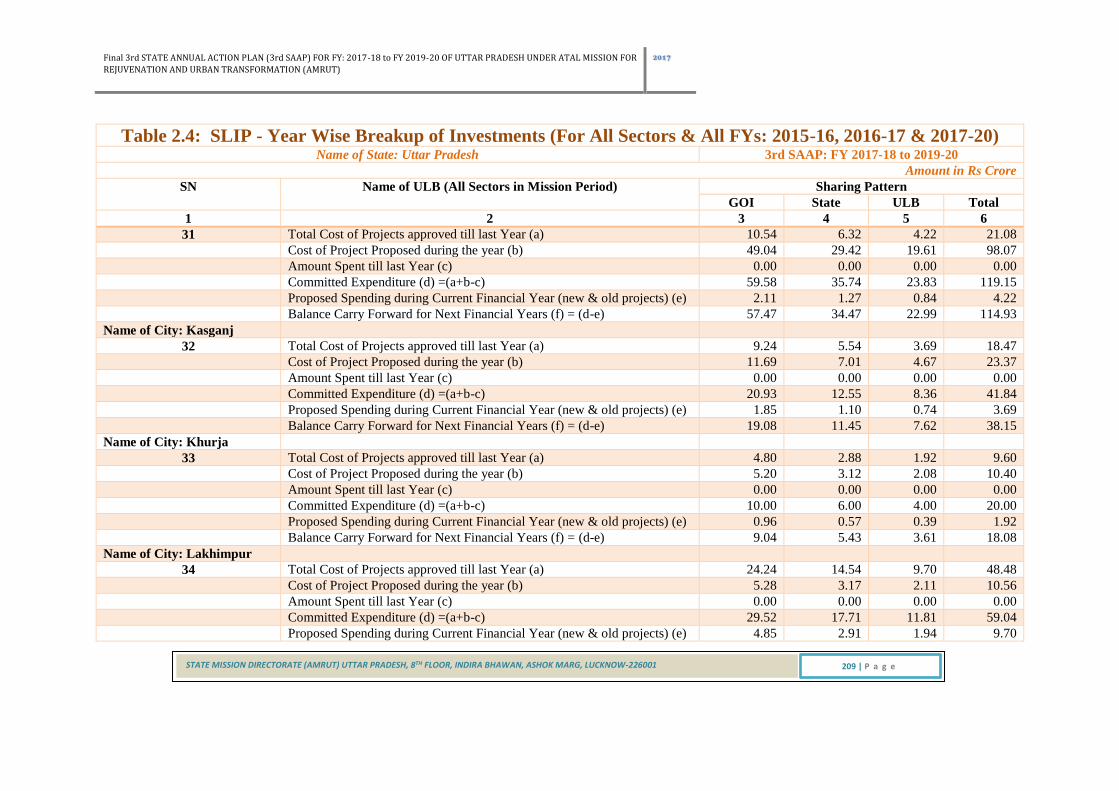
Final 3rd STATE ANNUAL ACTION PLAN (3rd SAAP) FOR FY: 2017-18 to FY 2019-20 OF UTTAR PRADESH UNDER ATAL MISSION FOR
REJUVENATION AND URBAN TRANSFORMATION (AMRUT)
2017
STATE MISSION DIRECTORATE (AMRUT) UTTAR PRADESH, 8TH FLOOR, INDIRA BHAWAN, ASHOK MARG, LUCKNOW-226001 209 | P a g e
Table 2.4: SLIP - Year Wise Breakup of Investments (For All Sectors & All FYs: 2015-16, 2016-17 & 2017-20) Name of State: Uttar Pradesh 3rd SAAP: FY 2017-18 to 2019-20
Amount in Rs Crore
SN Name of ULB (All Sectors in Mission Period) Sharing Pattern
GOI State ULB Total
1 2 3 4 5 6
31 Total Cost of Projects approved till last Year (a) 10.54 6.32 4.22 21.08
Cost of Project Proposed during the year (b) 49.04 29.42 19.61 98.07
Amount Spent till last Year (c) 0.00 0.00 0.00 0.00
Committed Expenditure (d) =(a+b-c) 59.58 35.74 23.83 119.15
Proposed Spending during Current Financial Year (new & old projects) (e) 2.11 1.27 0.84 4.22
Balance Carry Forward for Next Financial Years (f) = (d-e) 57.47 34.47 22.99 114.93
Name of City: Kasganj
32 Total Cost of Projects approved till last Year (a) 9.24 5.54 3.69 18.47
Cost of Project Proposed during the year (b) 11.69 7.01 4.67 23.37
Amount Spent till last Year (c) 0.00 0.00 0.00 0.00
Committed Expenditure (d) =(a+b-c) 20.93 12.55 8.36 41.84
Proposed Spending during Current Financial Year (new & old projects) (e) 1.85 1.10 0.74 3.69
Balance Carry Forward for Next Financial Years (f) = (d-e) 19.08 11.45 7.62 38.15
Name of City: Khurja
33 Total Cost of Projects approved till last Year (a) 4.80 2.88 1.92 9.60
Cost of Project Proposed during the year (b) 5.20 3.12 2.08 10.40
Amount Spent till last Year (c) 0.00 0.00 0.00 0.00
Committed Expenditure (d) =(a+b-c) 10.00 6.00 4.00 20.00
Proposed Spending during Current Financial Year (new & old projects) (e) 0.96 0.57 0.39 1.92
Balance Carry Forward for Next Financial Years (f) = (d-e) 9.04 5.43 3.61 18.08
Name of City: Lakhimpur
34 Total Cost of Projects approved till last Year (a) 24.24 14.54 9.70 48.48
Cost of Project Proposed during the year (b) 5.28 3.17 2.11 10.56
Amount Spent till last Year (c) 0.00 0.00 0.00 0.00
Committed Expenditure (d) =(a+b-c) 29.52 17.71 11.81 59.04
Proposed Spending during Current Financial Year (new & old projects) (e) 4.85 2.91 1.94 9.70

Final 3rd STATE ANNUAL ACTION PLAN (3rd SAAP) FOR FY: 2017-18 to FY 2019-20 OF UTTAR PRADESH UNDER ATAL MISSION FOR
REJUVENATION AND URBAN TRANSFORMATION (AMRUT)
2017
STATE MISSION DIRECTORATE (AMRUT) UTTAR PRADESH, 8TH FLOOR, INDIRA BHAWAN, ASHOK MARG, LUCKNOW-226001 210 | P a g e
Table 2.4: SLIP - Year Wise Breakup of Investments (For All Sectors & All FYs: 2015-16, 2016-17 & 2017-20) Name of State: Uttar Pradesh 3rd SAAP: FY 2017-18 to 2019-20
Amount in Rs Crore
SN Name of ULB (All Sectors in Mission Period) Sharing Pattern
GOI State ULB Total
1 2 3 4 5 6
Balance Carry Forward for Next Financial Years (f) = (d-e) 24.67 14.80 9.87 49.34
Name of City: Lalitpur
35 Total Cost of Projects approved till last Year (a) 9.87 5.92 3.95 19.74
Cost of Project Proposed during the year (b) 7.74 4.64 3.10 15.48
Amount Spent till last Year (c) 0.00 0.00 0.00 0.00
Committed Expenditure (d) =(a+b-c) 17.61 10.56 7.05 35.22
Proposed Spending during Current Financial Year (new & old projects) (e) 1.98 1.19 0.78 3.95
Balance Carry Forward for Next Financial Years (f) = (d-e) 15.63 9.37 6.27 31.27
Name of City: Loni
36 Total Cost of Projects approved till last Year (a) 37.01 22.21 14.80 74.02
Cost of Project Proposed during the year (b) 20.93 12.56 8.37 41.86
Amount Spent till last Year (c) 0.00 0.00 0.00 0.00
Committed Expenditure (d) =(a+b-c) 57.94 34.77 23.17 115.88
Proposed Spending during Current Financial Year (new & old projects) (e) 7.41 4.44 2.95 14.80
Balance Carry Forward for Next Financial Years (f) = (d-e) 50.53 30.33 20.22 101.08
Name of City: Mainpuri
37 Total Cost of Projects approved till last Year (a) 32.28 19.37 12.91 64.56
Cost of Project Proposed during the year (b) 2.71 1.63 1.08 5.42
Amount Spent till last Year (c) 0.00 0.00 0.00 0.00
Committed Expenditure (d) =(a+b-c) 34.99 21.00 13.99 69.98
Proposed Spending during Current Financial Year (new & old projects) (e) 6.46 3.87 2.58 12.91
Balance Carry Forward for Next Financial Years (f) = (d-e) 28.53 17.13 11.41 57.07
Name of City: Mathura
38 Total Cost of Projects approved till last Year (a) 116.07 69.64 46.43 232.14
Cost of Project Proposed during the year (b) 105.63 63.38 42.25 211.26
Amount Spent till last Year (c) 0.00 0.00 0.00 0.00

Final 3rd STATE ANNUAL ACTION PLAN (3rd SAAP) FOR FY: 2017-18 to FY 2019-20 OF UTTAR PRADESH UNDER ATAL MISSION FOR
REJUVENATION AND URBAN TRANSFORMATION (AMRUT)
2017
STATE MISSION DIRECTORATE (AMRUT) UTTAR PRADESH, 8TH FLOOR, INDIRA BHAWAN, ASHOK MARG, LUCKNOW-226001 211 | P a g e
Table 2.4: SLIP - Year Wise Breakup of Investments (For All Sectors & All FYs: 2015-16, 2016-17 & 2017-20) Name of State: Uttar Pradesh 3rd SAAP: FY 2017-18 to 2019-20
Amount in Rs Crore
SN Name of ULB (All Sectors in Mission Period) Sharing Pattern
GOI State ULB Total
1 2 3 4 5 6
Committed Expenditure (d) =(a+b-c) 221.70 133.02 88.68 443.40
Proposed Spending during Current Financial Year (new & old projects) (e) 23.22 13.93 9.28 46.43
Balance Carry Forward for Next Financial Years (f) = (d-e) 198.48 119.09 79.40 396.97
Name of City: Maunath
39 Total Cost of Projects approved till last Year (a) 10.85 6.51 4.34 21.70
Cost of Project Proposed during the year (b) 10.51 6.30 4.20 21.01
Amount Spent till last Year (c) 0.00 0.00 0.00 0.00
Committed Expenditure (d) =(a+b-c) 21.36 12.81 8.54 42.71
Proposed Spending during Current Financial Year (new & old projects) (e) 2.18 1.30 0.86 4.34
Balance Carry Forward for Next Financial Years (f) = (d-e) 19.18 11.51 7.68 38.37
Name of City: Mirzapur
40 Total Cost of Projects approved till last Year (a) 105.69 63.41 42.28 211.38
Cost of Project Proposed during the year (b) 12.92 7.75 5.17 25.84
Amount Spent till last Year (c) 0.00 0.00 0.00 0.00
Committed Expenditure (d) =(a+b-c) 118.61 71.16 47.45 237.22
Proposed Spending during Current Financial Year (new & old projects) (e) 21.14 12.68 8.46 42.28
Balance Carry Forward for Next Financial Years (f) = (d-e) 97.47 58.48 38.99 194.94
Name of City: Modinagar
41 Total Cost of Projects approved till last Year (a) 100.31 60.19 40.12 200.62
Cost of Project Proposed during the year (b) 60.24 36.14 24.09 120.47
Amount Spent till last Year (c) 0.00 0.00 0.00 0.00
Committed Expenditure (d) =(a+b-c) 160.55 96.33 64.21 321.09
Proposed Spending during Current Financial Year (new & old projects) (e) 20.07 12.04 8.01 40.12
Balance Carry Forward for Next Financial Years (f) = (d-e) 140.48 84.29 56.20 280.97
Name of City: Mughalsarai
42 Total Cost of Projects approved till last Year (a) 15.14 9.08 6.05 30.27

Final 3rd STATE ANNUAL ACTION PLAN (3rd SAAP) FOR FY: 2017-18 to FY 2019-20 OF UTTAR PRADESH UNDER ATAL MISSION FOR
REJUVENATION AND URBAN TRANSFORMATION (AMRUT)
2017
STATE MISSION DIRECTORATE (AMRUT) UTTAR PRADESH, 8TH FLOOR, INDIRA BHAWAN, ASHOK MARG, LUCKNOW-226001 212 | P a g e
Table 2.4: SLIP - Year Wise Breakup of Investments (For All Sectors & All FYs: 2015-16, 2016-17 & 2017-20) Name of State: Uttar Pradesh 3rd SAAP: FY 2017-18 to 2019-20
Amount in Rs Crore
SN Name of ULB (All Sectors in Mission Period) Sharing Pattern
GOI State ULB Total
1 2 3 4 5 6
Cost of Project Proposed during the year (b) 15.20 9.12 6.08 30.40
Amount Spent till last Year (c) 0.00 0.00 0.00 0.00
Committed Expenditure (d) =(a+b-c) 30.34 18.20 12.13 60.67
Proposed Spending during Current Financial Year (new & old projects) (e) 3.03 1.82 1.20 6.05
Balance Carry Forward for Next Financial Years (f) = (d-e) 27.31 16.38 10.93 54.62
Name of City: Muzaffarnagar
43 Total Cost of Projects approved till last Year (a) 26.15 15.68 10.46 52.29
Cost of Project Proposed during the year (b) 5.71 3.43 2.28 11.42
Amount Spent till last Year (c) 0.00 0.00 0.00 0.00
Committed Expenditure (d) =(a+b-c) 31.86 19.11 12.74 63.71
Proposed Spending during Current Financial Year (new & old projects) (e) 5.23 3.14 2.09 10.46
Balance Carry Forward for Next Financial Years (f) = (d-e) 26.63 15.97 10.65 53.25
Name of City: Orai
44 Total Cost of Projects approved till last Year (a) 9.15 5.49 3.66 18.30
Cost of Project Proposed during the year (b) 10.34 6.20 4.14 20.68
Amount Spent till last Year (c) 0.00 0.00 0.00 0.00
Committed Expenditure (d) =(a+b-c) 19.49 11.69 7.80 38.98
Proposed Spending during Current Financial Year (new & old projects) (e) 1.84 1.10 0.72 3.66
Balance Carry Forward for Next Financial Years (f) = (d-e) 17.65 10.59 7.08 35.32
Name of City: Pilibhit
45 Total Cost of Projects approved till last Year (a) 9.85 5.91 3.94 19.70
Cost of Project Proposed during the year (b) 12.74 7.64 5.09 25.47
Amount Spent till last Year (c) 0.00 0.00 0.00 0.00
Committed Expenditure (d) =(a+b-c) 22.59 13.55 9.03 45.17
Proposed Spending during Current Financial Year (new & old projects) (e) 1.98 1.19 0.77 3.94
Balance Carry Forward for Next Financial Years (f) = (d-e) 20.61 12.36 8.26 41.23

Final 3rd STATE ANNUAL ACTION PLAN (3rd SAAP) FOR FY: 2017-18 to FY 2019-20 OF UTTAR PRADESH UNDER ATAL MISSION FOR
REJUVENATION AND URBAN TRANSFORMATION (AMRUT)
2017
STATE MISSION DIRECTORATE (AMRUT) UTTAR PRADESH, 8TH FLOOR, INDIRA BHAWAN, ASHOK MARG, LUCKNOW-226001 213 | P a g e
Table 2.4: SLIP - Year Wise Breakup of Investments (For All Sectors & All FYs: 2015-16, 2016-17 & 2017-20) Name of State: Uttar Pradesh 3rd SAAP: FY 2017-18 to 2019-20
Amount in Rs Crore
SN Name of ULB (All Sectors in Mission Period) Sharing Pattern
GOI State ULB Total
1 2 3 4 5 6
Name of City: Raibareli
46 Total Cost of Projects approved till last Year (a) 70.95 42.57 28.38 141.90
Cost of Project Proposed during the year (b) 80.35 48.21 32.14 160.70
Amount Spent till last Year (c) 0.00 0.00 0.00 0.00
Committed Expenditure (d) =(a+b-c) 151.30 90.78 60.52 302.60
Proposed Spending during Current Financial Year (new & old projects) (e) 14.19 8.52 5.67 28.38
Balance Carry Forward for Next Financial Years (f) = (d-e) 137.11 82.26 54.85 274.22
Name of City: Rampur
47 Total Cost of Projects approved till last Year (a) 65.09 39.05 26.04 130.18
Cost of Project Proposed during the year (b) 8.09 4.85 3.23 16.17
Amount Spent till last Year (c) 0.00 0.00 0.00 0.00
Committed Expenditure (d) =(a+b-c) 73.18 43.90 29.27 146.35
Proposed Spending during Current Financial Year (new & old projects) (e) 13.02 7.81 5.21 26.04
Balance Carry Forward for Next Financial Years (f) = (d-e) 60.16 36.09 24.06 120.31
Name of City: Sambhal
48 Total Cost of Projects approved till last Year (a) 2.38 1.42 0.95 4.75
Cost of Project Proposed during the year (b) 6.90 4.14 2.76 13.80
Amount Spent till last Year (c) 0.00 0.00 0.00 0.00
Committed Expenditure (d) =(a+b-c) 9.28 5.56 3.71 18.55
Proposed Spending during Current Financial Year (new & old projects) (e) 0.48 0.29 0.18 0.95
Balance Carry Forward for Next Financial Years (f) = (d-e) 8.80 5.27 3.53 17.60
Name of City: Shahjahanpur
49 Total Cost of Projects approved till last Year (a) 15.59 9.35 6.24 31.18
Cost of Project Proposed during the year (b) 25.59 15.35 10.24 51.18
Amount Spent till last Year (c) 0.00 0.00 0.00 0.00
Committed Expenditure (d) =(a+b-c) 41.18 24.70 16.48 82.36

Final 3rd STATE ANNUAL ACTION PLAN (3rd SAAP) FOR FY: 2017-18 to FY 2019-20 OF UTTAR PRADESH UNDER ATAL MISSION FOR
REJUVENATION AND URBAN TRANSFORMATION (AMRUT)
2017
STATE MISSION DIRECTORATE (AMRUT) UTTAR PRADESH, 8TH FLOOR, INDIRA BHAWAN, ASHOK MARG, LUCKNOW-226001 214 | P a g e
Table 2.4: SLIP - Year Wise Breakup of Investments (For All Sectors & All FYs: 2015-16, 2016-17 & 2017-20) Name of State: Uttar Pradesh 3rd SAAP: FY 2017-18 to 2019-20
Amount in Rs Crore
SN Name of ULB (All Sectors in Mission Period) Sharing Pattern
GOI State ULB Total
1 2 3 4 5 6
Proposed Spending during Current Financial Year (new & old projects) (e) 3.12 1.87 1.25 6.24
Balance Carry Forward for Next Financial Years (f) = (d-e) 38.06 22.83 15.23 76.12
Name of City: Shamli
50 Total Cost of Projects approved till last Year (a) 6.87 4.13 2.74 13.74
Cost of Project Proposed during the year (b) 5.20 3.12 2.08 10.40
Amount Spent till last Year (c) 0.00 0.00 0.00 0.00
Committed Expenditure (d) =(a+b-c) 12.07 7.25 4.82 24.14
Proposed Spending during Current Financial Year (new & old projects) (e) 1.37 0.82 0.55 2.74
Balance Carry Forward for Next Financial Years (f) = (d-e) 10.70 6.43 4.27 21.40
Name of City: Shikohabad
51 Total Cost of Projects approved till last Year (a) 1.33 0.80 0.52 2.65
Cost of Project Proposed during the year (b) 0.20 0.12 0.08 0.40
Amount Spent till last Year (c) 0.00 0.00 0.00 0.00
Committed Expenditure (d) =(a+b-c) 1.53 0.92 0.60 3.05
Proposed Spending during Current Financial Year (new & old projects) (e) 0.27 0.16 0.10 0.53
Balance Carry Forward for Next Financial Years (f) = (d-e) 1.26 0.76 0.50 2.52
Name of City: Sitapur
52 Total Cost of Projects approved till last Year (a) 19.92 11.95 7.95 39.82
Cost of Project Proposed during the year (b) 16.82 10.09 6.73 33.64
Amount Spent till last Year (c) 0.00 0.00 0.00 0.00
Committed Expenditure (d) =(a+b-c) 36.74 22.04 14.68 73.46
Proposed Spending during Current Financial Year (new & old projects) (e) 3.99 2.39 1.59 7.97
Balance Carry Forward for Next Financial Years (f) = (d-e) 32.75 19.65 13.09 65.49
Name of City: Sultanpur
53 Total Cost of Projects approved till last Year (a) 18.06 10.83 7.22 36.11
Cost of Project Proposed during the year (b) 12.70 7.62 5.08 25.40

Final 3rd STATE ANNUAL ACTION PLAN (3rd SAAP) FOR FY: 2017-18 to FY 2019-20 OF UTTAR PRADESH UNDER ATAL MISSION FOR
REJUVENATION AND URBAN TRANSFORMATION (AMRUT)
2017
STATE MISSION DIRECTORATE (AMRUT) UTTAR PRADESH, 8TH FLOOR, INDIRA BHAWAN, ASHOK MARG, LUCKNOW-226001 215 | P a g e
Table 2.4: SLIP - Year Wise Breakup of Investments (For All Sectors & All FYs: 2015-16, 2016-17 & 2017-20) Name of State: Uttar Pradesh 3rd SAAP: FY 2017-18 to 2019-20
Amount in Rs Crore
SN Name of ULB (All Sectors in Mission Period) Sharing Pattern
GOI State ULB Total
1 2 3 4 5 6
Amount Spent till last Year (c) 0.00 0.00 0.00 0.00
Committed Expenditure (d) =(a+b-c) 30.76 18.45 12.30 61.51
Proposed Spending during Current Financial Year (new & old projects) (e) 3.62 2.17 1.43 7.22
Balance Carry Forward for Next Financial Years (f) = (d-e) 27.14 16.28 10.87 54.29
Name of City: Unnao
54 Total Cost of Projects approved till last Year (a) 78.54 47.12 31.42 157.08
Cost of Project Proposed during the year (b) 75.33 45.20 30.13 150.66
Amount Spent till last Year (c) 0.00 0.00 0.00 0.00
Committed Expenditure (d) =(a+b-c) 153.87 92.32 61.55 307.74
Proposed Spending during Current Financial Year (new & old projects) (e) 15.71 9.43 6.28 31.42
Balance Carry Forward for Next Financial Years (f) = (d-e) 138.16 82.89 55.27 276.32
Grand Total:
Total Cost of Projects approved till last Year (a) 3050.69 2371.05 1760.69 7182.43
Cost of Project Proposed during the year (b) 1875.47 1369.50 994.27 4239.24
Amount Spent till last Year (c) 0.00 0.00 0.00 0.00
Committed Expenditure (d) =(a+b-c) 4926.16 3740.55 2754.96 11421.67
Proposed Spending during Current Financial Year (new & old projects) (e) 610.36 474.27 351.87 1436.50
Balance Carry Forward for Next Financial Years (f) = (d-e) 4315.80 3266.28 2403.09 9985.17
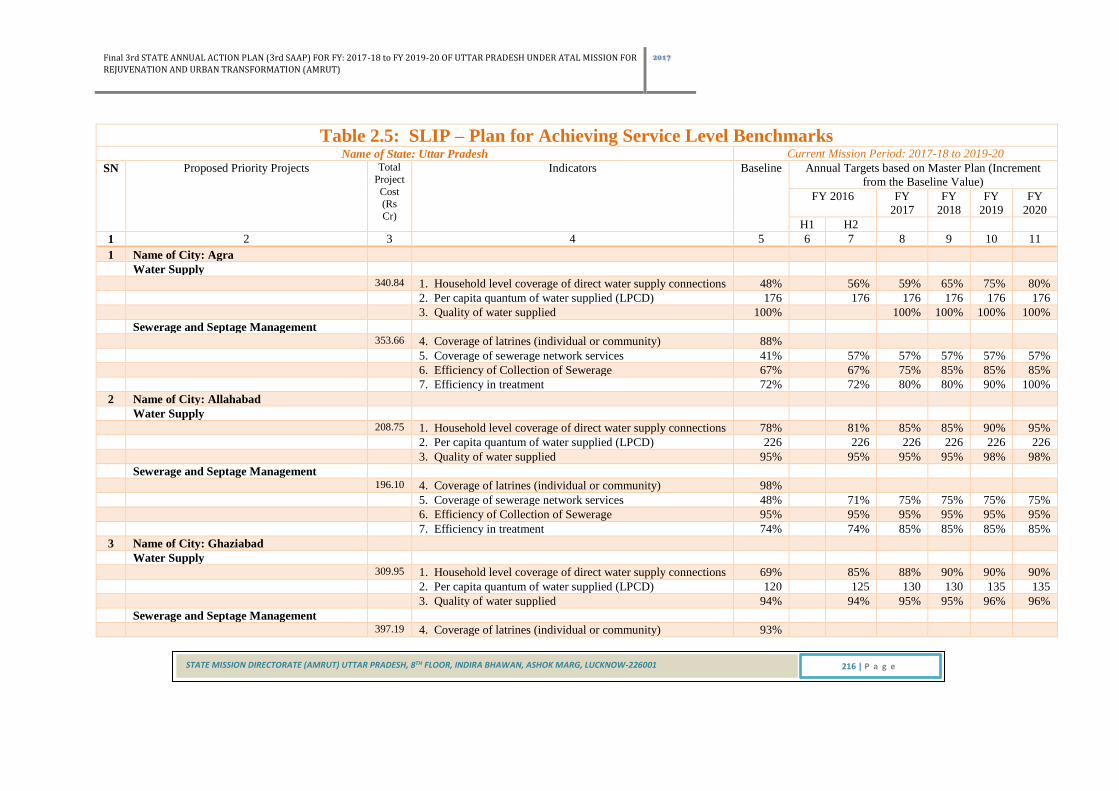
Final 3rd STATE ANNUAL ACTION PLAN (3rd SAAP) FOR FY: 2017-18 to FY 2019-20 OF UTTAR PRADESH UNDER ATAL MISSION FOR
REJUVENATION AND URBAN TRANSFORMATION (AMRUT)
2017
STATE MISSION DIRECTORATE (AMRUT) UTTAR PRADESH, 8TH FLOOR, INDIRA BHAWAN, ASHOK MARG, LUCKNOW-226001 216 | P a g e
Table 2.5: SLIP – Plan for Achieving Service Level Benchmarks Name of State: Uttar Pradesh Current Mission Period: 2017-18 to 2019-20
SN Proposed Priority Projects Total
Project
Cost (Rs
Cr)
Indicators Baseline Annual Targets based on Master Plan (Increment
from the Baseline Value)
FY 2016 FY
2017
FY
2018
FY
2019
FY
2020
H1 H2
1 2 3 4 5 6 7 8 9 10 11
1 Name of City: Agra
Water Supply
340.84 1. Household level coverage of direct water supply connections 48% 56% 59% 65% 75% 80%
2. Per capita quantum of water supplied (LPCD) 176 176 176 176 176 176
3. Quality of water supplied 100% 100% 100% 100% 100%
Sewerage and Septage Management
353.66 4. Coverage of latrines (individual or community) 88%
5. Coverage of sewerage network services 41% 57% 57% 57% 57% 57%
6. Efficiency of Collection of Sewerage 67% 67% 75% 85% 85% 85%
7. Efficiency in treatment 72% 72% 80% 80% 90% 100%
2 Name of City: Allahabad
Water Supply
208.75 1. Household level coverage of direct water supply connections 78% 81% 85% 85% 90% 95%
2. Per capita quantum of water supplied (LPCD) 226 226 226 226 226 226
3. Quality of water supplied 95% 95% 95% 95% 98% 98%
Sewerage and Septage Management
196.10 4. Coverage of latrines (individual or community) 98%
5. Coverage of sewerage network services 48% 71% 75% 75% 75% 75%
6. Efficiency of Collection of Sewerage 95% 95% 95% 95% 95% 95%
7. Efficiency in treatment 74% 74% 85% 85% 85% 85%
3 Name of City: Ghaziabad
Water Supply
309.95 1. Household level coverage of direct water supply connections 69% 85% 88% 90% 90% 90%
2. Per capita quantum of water supplied (LPCD) 120 125 130 130 135 135
3. Quality of water supplied 94% 94% 95% 95% 96% 96%
Sewerage and Septage Management
397.19 4. Coverage of latrines (individual or community) 93%

Final 3rd STATE ANNUAL ACTION PLAN (3rd SAAP) FOR FY: 2017-18 to FY 2019-20 OF UTTAR PRADESH UNDER ATAL MISSION FOR
REJUVENATION AND URBAN TRANSFORMATION (AMRUT)
2017
STATE MISSION DIRECTORATE (AMRUT) UTTAR PRADESH, 8TH FLOOR, INDIRA BHAWAN, ASHOK MARG, LUCKNOW-226001 217 | P a g e
Table 2.5: SLIP – Plan for Achieving Service Level Benchmarks Name of State: Uttar Pradesh Current Mission Period: 2017-18 to 2019-20
SN Proposed Priority Projects Total
Project
Cost (Rs
Cr)
Indicators Baseline Annual Targets based on Master Plan (Increment
from the Baseline Value)
FY 2016 FY
2017
FY
2018
FY
2019
FY
2020
H1 H2
1 2 3 4 5 6 7 8 9 10 11
5. Coverage of sewerage network services 84% 87% 87% 91% 91% 91%
6. Efficiency of Collection of Sewerage 73% 73% 73% 90% 90% 91%
7. Efficiency in treatment 73% 73% 73% 90% 91% 91%
4 Name of City: Kanpur
Water Supply
310.30 1. Household level coverage of direct water supply connections 52% 58% 60% 65% 70% 75%
2. Per capita quantum of water supplied (LPCD) 210 210 210 210 210 210
3. Quality of water supplied 95% 95% 95% 95% 100% 100%
Sewerage and Septage Management
308.75 4. Coverage of latrines (individual or community) 86%
5. Coverage of sewerage network services 38% 41% 44% 50% 50% 50%
6. Efficiency of Collection of Sewerage 38% 41% 44% 50% 65% 70%
7. Efficiency in treatment 82% 82% 82% 82% 82% 82%
5 Name of City: Lucknow
Water Supply
738.88 1. Household level coverage of direct water supply connections 63% 91% 93% 95% 95% 95%
2. Per capita quantum of water supplied (LPCD) 189 189 189 189 189 189
3. Quality of water supplied 95% 95% 95% 96% 98% 98%
Sewerage and Septage Management
722.05 4. Coverage of latrines (individual or community) 90%
5. Coverage of sewerage network services 39% 43% 58% 60% 60% 60% 67%
6. Efficiency of Collection of Sewerage 39% 43% 43% 60% 60% 60% 67%
7. Efficiency in treatment 50% 50% 50% 50% 60% 70% 70%
6 Name of City: Meerut
Water Supply
106.23 1. Household level coverage of direct water supply connections 51% 63% 70% 75% 85% 90%
2. Per capita quantum of water supplied (LPCD) 175 175 175 175 175 175
3. Quality of water supplied 100% 100% 100% 100% 100% 100%

Final 3rd STATE ANNUAL ACTION PLAN (3rd SAAP) FOR FY: 2017-18 to FY 2019-20 OF UTTAR PRADESH UNDER ATAL MISSION FOR
REJUVENATION AND URBAN TRANSFORMATION (AMRUT)
2017
STATE MISSION DIRECTORATE (AMRUT) UTTAR PRADESH, 8TH FLOOR, INDIRA BHAWAN, ASHOK MARG, LUCKNOW-226001 218 | P a g e
Table 2.5: SLIP – Plan for Achieving Service Level Benchmarks Name of State: Uttar Pradesh Current Mission Period: 2017-18 to 2019-20
SN Proposed Priority Projects Total
Project
Cost (Rs
Cr)
Indicators Baseline Annual Targets based on Master Plan (Increment
from the Baseline Value)
FY 2016 FY
2017
FY
2018
FY
2019
FY
2020
H1 H2
1 2 3 4 5 6 7 8 9 10 11
Sewerage and Septage Management
317.60 4. Coverage of latrines (individual or community) 94%
5. Coverage of sewerage network services 51% 57% 57% 57% 57% 65%
6. Efficiency of Collection of Sewerage 25% 25% 35% 35% 40% 55%
7. Efficiency in treatment 20% 41% 41% 55% 55% 55%
7 Name of City: Varanasi
Water Supply
405.96 1. Household level coverage of direct water supply connections 67% 90% 93% 95% 95% 95%
2. Per capita quantum of water supplied (LPCD) 206 206 206 206 206 206
3. Quality of water supplied 96% 96% 96% 100% 100% 100%
Sewerage and Septage Management
334.90 4. Coverage of latrines (individual or community) 98%
5. Coverage of sewerage network services 60% 60% 65% 70% 75% 83%
6. Efficiency of Collection of Sewerage 40% 40% 50% 65% 75% 83%
7. Efficiency in treatment 100% 100% 100% 100% 100% 100%
1 Name of City: Aligarh
Water Supply
149.07 1. Household level coverage of direct water supply connections 37% 51% 62% 68% 70% 70%
2. Per capita quantum of water supplied (LPCD) 116 116 116 125 130 135
3. Quality of water supplied 88% 88% 88% 90% 92% 95%
Sewerage and Septage Management
95.00 4. Coverage of latrines (individual or community) 95%
5. Coverage of sewerage network services 4% 4% 4% 4% 4% 4%
6. Efficiency of Collection of Sewerage 17% 17% 17% 40% 40% 50%
7. Efficiency in treatment 0% 0% 0% 40% 40% 50%
2 Name of City: Bareilly
Water Supply
38.96 1. Household level coverage of direct water supply connections 47% 59% 52% 58% 60% 65%

Final 3rd STATE ANNUAL ACTION PLAN (3rd SAAP) FOR FY: 2017-18 to FY 2019-20 OF UTTAR PRADESH UNDER ATAL MISSION FOR
REJUVENATION AND URBAN TRANSFORMATION (AMRUT)
2017
STATE MISSION DIRECTORATE (AMRUT) UTTAR PRADESH, 8TH FLOOR, INDIRA BHAWAN, ASHOK MARG, LUCKNOW-226001 219 | P a g e
Table 2.5: SLIP – Plan for Achieving Service Level Benchmarks Name of State: Uttar Pradesh Current Mission Period: 2017-18 to 2019-20
SN Proposed Priority Projects Total
Project
Cost (Rs
Cr)
Indicators Baseline Annual Targets based on Master Plan (Increment
from the Baseline Value)
FY 2016 FY
2017
FY
2018
FY
2019
FY
2020
H1 H2
1 2 3 4 5 6 7 8 9 10 11
2. Per capita quantum of water supplied (LPCD) 126 135 135 135 135 135
3. Quality of water supplied 95% 100% 100% 100% 100% 100%
Sewerage and Septage Management
171.00 4. Coverage of latrines (individual or community) 97%
5. Coverage of sewerage network services 41% 41% 41% 50% 55% 60% 60%
6. Efficiency of Collection of Sewerage 0% 0% 0% 60% 60% 70% 70%
7. Efficiency in treatment 0% 0% 0% 0% 50% 50% 50%
3 Name of City: Firozabad
Water Supply
2.00 1. Household level coverage of direct water supply connections 40% 40% 41% 50% 60% 75%
2. Per capita quantum of water supplied (LPCD) 214 214 214 214 214 214
3. Quality of water supplied 90% 90% 95% 100% 100% 100%
Sewerage and Septage Management
76.89 4. Coverage of latrines (individual or community) 83%
5. Coverage of sewerage network services 54% 54% 84% 84% 84% 84%
6. Efficiency of Collection of Sewerage 8% 80% 80% 80% 80% 90%
7. Efficiency in treatment 4% 80% 80% 80% 80% 90%
4 Name of City: Gorakhpur
Water Supply
138.41 1. Household level coverage of direct water supply connections 60% 66% 67% 70% 75% 80%
2. Per capita quantum of water supplied (LPCD) 135 135 135 135 135 135
3. Quality of water supplied 95% 95% 95% 95% 95% 100%
Sewerage and Septage Management
203.78 4. Coverage of latrines (individual or community) 94%
5. Coverage of sewerage network services 12% 16% 23% 23% 30% 30%
6. Efficiency of Collection of Sewerage 12% 16% 23% 23% 35% 35%
7. Efficiency in treatment 30% 30% 30% 30% 35% 35%
5 Name of City: Jhansi

Final 3rd STATE ANNUAL ACTION PLAN (3rd SAAP) FOR FY: 2017-18 to FY 2019-20 OF UTTAR PRADESH UNDER ATAL MISSION FOR
REJUVENATION AND URBAN TRANSFORMATION (AMRUT)
2017
STATE MISSION DIRECTORATE (AMRUT) UTTAR PRADESH, 8TH FLOOR, INDIRA BHAWAN, ASHOK MARG, LUCKNOW-226001 220 | P a g e
Table 2.5: SLIP – Plan for Achieving Service Level Benchmarks Name of State: Uttar Pradesh Current Mission Period: 2017-18 to 2019-20
SN Proposed Priority Projects Total
Project
Cost (Rs
Cr)
Indicators Baseline Annual Targets based on Master Plan (Increment
from the Baseline Value)
FY 2016 FY
2017
FY
2018
FY
2019
FY
2020
H1 H2
1 2 3 4 5 6 7 8 9 10 11
Water Supply
775.00 1. Household level coverage of direct water supply connections 35% 60% 66% 70% 75% 80%
2. Per capita quantum of water supplied (LPCD) 126 126 126 126 135 135
3. Quality of water supplied 100% 100% 100% 100% 100%
Sewerage and Septage Management
18.25 4. Coverage of latrines (individual or community) 85%
5. Coverage of sewerage network services 0% 0% 0% 0% 0% 0%
6. Efficiency of Collection of Sewerage 0% 0% 0% 0% 35% 50%
7. Efficiency in treatment 0% 0% 0% 0% 35% 50%
6 Name of City: Moradabad
Water Supply
45.58 1. Household level coverage of direct water supply connections 54% 57% 58% 60% 62% 65%
2. Per capita quantum of water supplied (LPCD) 186 186 186 186 186 186
3. Quality of water supplied 100% 100% 100% 100% 100% 100%
Sewerage and Septage Management
201.57 4. Coverage of latrines (individual or community) 87%
5. Coverage of sewerage network services 0% 0% 0% 52% 52% 52% 52%
6. Efficiency of Collection of Sewerage 0% 0% 0% 52% 52% 52% 60%
7. Efficiency in treatment 50% 50% 50% 50% 50% 50%
7 Name of City: Saharanpur
Water Supply
71.12 1. Household level coverage of direct water supply connections 32% 51% 55% 60% 62% 65%
2. Per capita quantum of water supplied (LPCD) 134 134 134 135 135 135
3. Quality of water supplied 99.80% 99.80% 99.80% 100% 100% 100%
Sewerage and Septage Management
80.00 4. Coverage of latrines (individual or community) 98%
5. Coverage of sewerage network services 19% 19% 19% 19% 25% 30%
6. Efficiency of Collection of Sewerage 38% 38% 38% 38% 50% 65%

Final 3rd STATE ANNUAL ACTION PLAN (3rd SAAP) FOR FY: 2017-18 to FY 2019-20 OF UTTAR PRADESH UNDER ATAL MISSION FOR
REJUVENATION AND URBAN TRANSFORMATION (AMRUT)
2017
STATE MISSION DIRECTORATE (AMRUT) UTTAR PRADESH, 8TH FLOOR, INDIRA BHAWAN, ASHOK MARG, LUCKNOW-226001 221 | P a g e
Table 2.5: SLIP – Plan for Achieving Service Level Benchmarks Name of State: Uttar Pradesh Current Mission Period: 2017-18 to 2019-20
SN Proposed Priority Projects Total
Project
Cost (Rs
Cr)
Indicators Baseline Annual Targets based on Master Plan (Increment
from the Baseline Value)
FY 2016 FY
2017
FY
2018
FY
2019
FY
2020
H1 H2
1 2 3 4 5 6 7 8 9 10 11
7. Efficiency in treatment 38% 38% 38% 38% 50% 65%
8 Name of City: Akbarpur
Water Supply
32.56 1. Household level coverage of direct water supply connections 23% 41% 45% 65% 80% 95%
2. Per capita quantum of water supplied (LPCD) 76 100 100 120 120 135
3. Quality of water supplied 90% 92% 92% 95% 95% 100%
Sewerage and Septage Management
0.00 4. Coverage of latrines (individual or community) 39%
5. Coverage of sewerage network services 0% 0% 0% 0% 0% 0% 0%
6. Efficiency of Collection of Sewerage 0% 0% 0% 0% 0% 0% 0%
7. Efficiency in treatment 0% 0% 0% 0% 0% 0% 0%
9 Name of City: Amroha
Water Supply
13.91 1. Household level coverage of direct water supply connections 32% 90% 90% 90% 90% 90%
2. Per capita quantum of water supplied (LPCD) 45 45 243 135 135 135
3. Quality of water supplied 80% 80% 100% 100% 100% 100%
Sewerage and Septage Management
10.00 4. Coverage of latrines (individual or community) 91%
5. Coverage of sewerage network services 0% 0% 0% 0% 0% 0%
6. Efficiency of Collection of Sewerage 0% 0% 0% 30% 50% 85%
7. Efficiency in treatment 0% 0% 0% 30% 50% 85%
10 Name of City: Ayodhya
Water Supply
18.00 1. Household level coverage of direct water supply connections 64% 0% 0% 80% 95% 95%
2. Per capita quantum of water supplied (LPCD) 148 148 148 148 148 148
3. Quality of water supplied 93% 93% 93% 93% 95% 100%
Sewerage and Septage Management
35.00 4. Coverage of latrines (individual or community) 83%

Final 3rd STATE ANNUAL ACTION PLAN (3rd SAAP) FOR FY: 2017-18 to FY 2019-20 OF UTTAR PRADESH UNDER ATAL MISSION FOR
REJUVENATION AND URBAN TRANSFORMATION (AMRUT)
2017
STATE MISSION DIRECTORATE (AMRUT) UTTAR PRADESH, 8TH FLOOR, INDIRA BHAWAN, ASHOK MARG, LUCKNOW-226001 222 | P a g e
Table 2.5: SLIP – Plan for Achieving Service Level Benchmarks Name of State: Uttar Pradesh Current Mission Period: 2017-18 to 2019-20
SN Proposed Priority Projects Total
Project
Cost (Rs
Cr)
Indicators Baseline Annual Targets based on Master Plan (Increment
from the Baseline Value)
FY 2016 FY
2017
FY
2018
FY
2019
FY
2020
H1 H2
1 2 3 4 5 6 7 8 9 10 11
5. Coverage of sewerage network services 12% 12% 12% 50% 79% 90%
6. Efficiency of Collection of Sewerage 82% 82% 82% 82% 85% 90%
7. Efficiency in treatment 100% 100% 100% 100% 100% 100%
11 Name of City: Azamgarh
Water Supply
27.66 1. Household level coverage of direct water supply connections 50% 58% 62% 66% 70% 70%
2. Per capita quantum of water supplied (LPCD) 196 196 196 196 196 196
3. Quality of water supplied 50% 50% 55% 80% 95% 100%
Sewerage and Septage Management
34.12 4. Coverage of latrines (individual or community) 90%
5. Coverage of sewerage network services 0% 0% 36% 36% 36% 55%
6. Efficiency of Collection of Sewerage 0% 0% 0% 36% 36% 70%
7. Efficiency in treatment 0% 0% 0% 0% 0% 100%
12 Name of City: Baharaich
Water Supply
74.75 1. Household level coverage of direct water supply connections 52% 58% 60% 70% 70% 70%
2. Per capita quantum of water supplied (LPCD) 106 106 106 115 125 135
3. Quality of water supplied 80% 80% 80% 85% 90% 100%
Sewerage and Septage Management
0.00 4. Coverage of latrines (individual or community) 87%
5. Coverage of sewerage network services 0% 0% 0% 0% 0% 0%
6. Efficiency of Collection of Sewerage 0% 0% 0% 0% 0% 0%
7. Efficiency in treatment 0% 0% 0% 0% 0% 0%
13 Name of City: Ballia
Water Supply
11.44 1. Household level coverage of direct water supply connections 26% 35% 36% 50% 60% 65%
2. Per capita quantum of water supplied (LPCD) 138 138 138 138 138 138
3. Quality of water supplied 100% 100% 100% 100% 100% 100%

Final 3rd STATE ANNUAL ACTION PLAN (3rd SAAP) FOR FY: 2017-18 to FY 2019-20 OF UTTAR PRADESH UNDER ATAL MISSION FOR
REJUVENATION AND URBAN TRANSFORMATION (AMRUT)
2017
STATE MISSION DIRECTORATE (AMRUT) UTTAR PRADESH, 8TH FLOOR, INDIRA BHAWAN, ASHOK MARG, LUCKNOW-226001 223 | P a g e
Table 2.5: SLIP – Plan for Achieving Service Level Benchmarks Name of State: Uttar Pradesh Current Mission Period: 2017-18 to 2019-20
SN Proposed Priority Projects Total
Project
Cost (Rs
Cr)
Indicators Baseline Annual Targets based on Master Plan (Increment
from the Baseline Value)
FY 2016 FY
2017
FY
2018
FY
2019
FY
2020
H1 H2
1 2 3 4 5 6 7 8 9 10 11
Sewerage and Septage Management
60.69 4. Coverage of latrines (individual or community) 88%
5. Coverage of sewerage network services 0% 0% 77% 77% 77% 77%
6. Efficiency of Collection of Sewerage 0% 0% 0% 50% 65% 85%
7. Efficiency in treatment 0% 0% 0% 100% 100% 100%
14 Name of City: Banda
Water Supply
255.41 1. Household level coverage of direct water supply connections 53% 64% 80% 85% 85% 85%
2. Per capita quantum of water supplied (LPCD) 76 76 76 76 135 135
3. Quality of water supplied 50% 50% 50% 50% 100% 100%
Sewerage and Septage Management
31.00 4. Coverage of latrines (individual or community) 58%
5. Coverage of sewerage network services 4% 0% 4% 4% 4% 4% 4%
6. Efficiency of Collection of Sewerage 0% 0% 0% 0% 30% 50% 60%
7. Efficiency in treatment 0% 0% 0% 0% 30% 50% 60%
15 Name of City: Barraut
Water Supply
16.09 1. Household level coverage of direct water supply connections 64% 70% 73% 75% 75% 75%
2. Per capita quantum of water supplied (LPCD) 190 190 190 190 190 190
3. Quality of water supplied 90% 90% 90% 95% 100% 100%
Sewerage and Septage Management
10.00 4. Coverage of latrines (individual or community) 93%
5. Coverage of sewerage network services 6% 6% 6% 6% 6% 6%
6. Efficiency of Collection of Sewerage 0% 0% 0% 0% 35% 65%
7. Efficiency in treatment 0% 0% 0% 0% 35% 65%
16 Name of City: Basti
Water Supply
13.53 1. Household level coverage of direct water supply connections 70% 80% 80% 80% 80% 80%

Final 3rd STATE ANNUAL ACTION PLAN (3rd SAAP) FOR FY: 2017-18 to FY 2019-20 OF UTTAR PRADESH UNDER ATAL MISSION FOR
REJUVENATION AND URBAN TRANSFORMATION (AMRUT)
2017
STATE MISSION DIRECTORATE (AMRUT) UTTAR PRADESH, 8TH FLOOR, INDIRA BHAWAN, ASHOK MARG, LUCKNOW-226001 224 | P a g e
Table 2.5: SLIP – Plan for Achieving Service Level Benchmarks Name of State: Uttar Pradesh Current Mission Period: 2017-18 to 2019-20
SN Proposed Priority Projects Total
Project
Cost (Rs
Cr)
Indicators Baseline Annual Targets based on Master Plan (Increment
from the Baseline Value)
FY 2016 FY
2017
FY
2018
FY
2019
FY
2020
H1 H2
1 2 3 4 5 6 7 8 9 10 11
2. Per capita quantum of water supplied (LPCD) 191 191 191 191 191 191
3. Quality of water supplied 100% 100% 100% 100% 100% 100%
Sewerage and Septage Management
8.00 4. Coverage of latrines (individual or community) 82%
5. Coverage of sewerage network services 0% 0% 0% 0% 0% 0%
6. Efficiency of Collection of Sewerage 0% 0% 0% 30% 50% 82%
7. Efficiency in treatment 0% 0% 0% 30% 50% 82%
17 Name of City: Budaun
Water Supply
18.06 1. Household level coverage of direct water supply connections 38% 60% 64% 70% 75% 75%
2. Per capita quantum of water supplied (LPCD) 216 216 216 216 216 216
3. Quality of water supplied 95% 95% 95% 95% 98% 100%
Sewerage and Septage Management
10.00 4. Coverage of latrines (individual or community) 98%
5. Coverage of sewerage network services 0% 0% 0% 0% 0% 0%
6. Efficiency of Collection of Sewerage 0% 0% 0% 0% 40% 80%
7. Efficiency in treatment 0% 0% 0% 0% 40% 80%
18 Name of City: Bulandshahar
Water Supply
8.91 1. Household level coverage of direct water supply connections 33% 37% 38% 45% 55% 65%
2. Per capita quantum of water supplied (LPCD) 162 162 162 162 162 162
3. Quality of water supplied 100% 100% 100% 100% 100% 100%
Sewerage and Septage Management
392.78 4. Coverage of latrines (individual or community) 99%
5. Coverage of sewerage network services 0% 0% 0% 50% 60% 70%
6. Efficiency of Collection of Sewerage 0% 0% 0% 20% 20% 80%
7. Efficiency in treatment 0% 0% 0% 0% 20% 80%
19 Name of City: Chandausi

Final 3rd STATE ANNUAL ACTION PLAN (3rd SAAP) FOR FY: 2017-18 to FY 2019-20 OF UTTAR PRADESH UNDER ATAL MISSION FOR
REJUVENATION AND URBAN TRANSFORMATION (AMRUT)
2017
STATE MISSION DIRECTORATE (AMRUT) UTTAR PRADESH, 8TH FLOOR, INDIRA BHAWAN, ASHOK MARG, LUCKNOW-226001 225 | P a g e
Table 2.5: SLIP – Plan for Achieving Service Level Benchmarks Name of State: Uttar Pradesh Current Mission Period: 2017-18 to 2019-20
SN Proposed Priority Projects Total
Project
Cost (Rs
Cr)
Indicators Baseline Annual Targets based on Master Plan (Increment
from the Baseline Value)
FY 2016 FY
2017
FY
2018
FY
2019
FY
2020
H1 H2
1 2 3 4 5 6 7 8 9 10 11
Water Supply
38.27 1. Household level coverage of direct water supply connections 40% 44% 46% 50% 55% 60%
2. Per capita quantum of water supplied (LPCD) 100 100 100 120 120 135
3. Quality of water supplied 95% 95% 95% 97% 97% 100%
Sewerage and Septage Management
5.00 4. Coverage of latrines (individual or community) 88%
5. Coverage of sewerage network services 0% 0% 0% 0% 0% 0%
6. Efficiency of Collection of Sewerage 0% 0% 0% 30% 50% 80%
7. Efficiency in treatment 0% 0% 0% 30% 50% 80%
20 Name of City: Deoria
Water Supply
18.83 1. Household level coverage of direct water supply connections 33% 39% 40% 45% 50% 50%
2. Per capita quantum of water supplied (LPCD) 62 62 135 135 135 135
3. Quality of water supplied 95% 62% 100% 100% 100% 100%
Sewerage and Septage Management
0.00 4. Coverage of latrines (individual or community) 99%
5. Coverage of sewerage network services 0% 0% 0% 0% 0% 0%
6. Efficiency of Collection of Sewerage 0% 0% 0% 0% 50% 80%
7. Efficiency in treatment 0% 0% 0% 0% 50% 80%
21 Name of City: Etah
Water Supply
13.35 1. Household level coverage of direct water supply connections 34% 42% 46% 55% 55% 55%
2. Per capita quantum of water supplied (LPCD) 203 203 203 203 203 203
3. Quality of water supplied 90% 90% 90% 90% 95% 100%
Sewerage and Septage Management
164.17 4. Coverage of latrines (individual or community) 93%
5. Coverage of sewerage network services 0% 0% 0% 0% 20% 30% 30%
6. Efficiency of Collection of Sewerage 0% 0% 0% 0% 50% 60% 70%
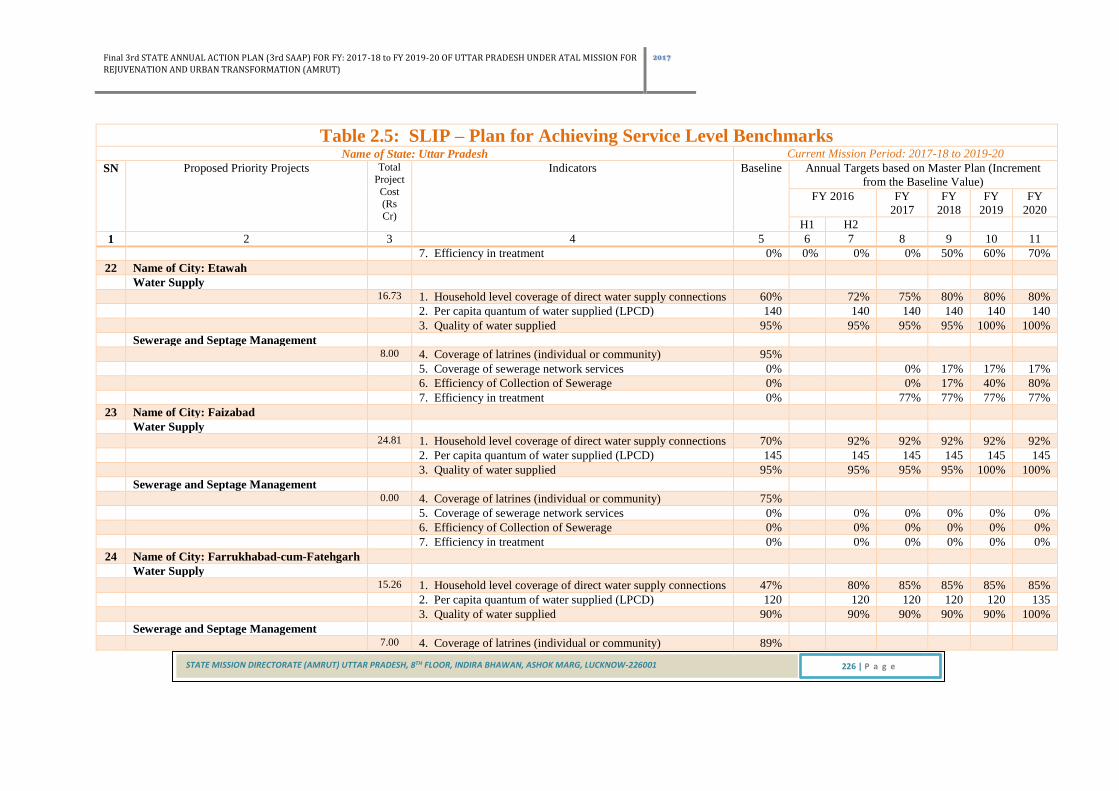
Final 3rd STATE ANNUAL ACTION PLAN (3rd SAAP) FOR FY: 2017-18 to FY 2019-20 OF UTTAR PRADESH UNDER ATAL MISSION FOR
REJUVENATION AND URBAN TRANSFORMATION (AMRUT)
2017
STATE MISSION DIRECTORATE (AMRUT) UTTAR PRADESH, 8TH FLOOR, INDIRA BHAWAN, ASHOK MARG, LUCKNOW-226001 226 | P a g e
Table 2.5: SLIP – Plan for Achieving Service Level Benchmarks Name of State: Uttar Pradesh Current Mission Period: 2017-18 to 2019-20
SN Proposed Priority Projects Total
Project
Cost (Rs
Cr)
Indicators Baseline Annual Targets based on Master Plan (Increment
from the Baseline Value)
FY 2016 FY
2017
FY
2018
FY
2019
FY
2020
H1 H2
1 2 3 4 5 6 7 8 9 10 11
7. Efficiency in treatment 0% 0% 0% 0% 50% 60% 70%
22 Name of City: Etawah
Water Supply
16.73 1. Household level coverage of direct water supply connections 60% 72% 75% 80% 80% 80%
2. Per capita quantum of water supplied (LPCD) 140 140 140 140 140 140
3. Quality of water supplied 95% 95% 95% 95% 100% 100%
Sewerage and Septage Management
8.00 4. Coverage of latrines (individual or community) 95%
5. Coverage of sewerage network services 0% 0% 17% 17% 17%
6. Efficiency of Collection of Sewerage 0% 0% 17% 40% 80%
7. Efficiency in treatment 0% 77% 77% 77% 77%
23 Name of City: Faizabad
Water Supply
24.81 1. Household level coverage of direct water supply connections 70% 92% 92% 92% 92% 92%
2. Per capita quantum of water supplied (LPCD) 145 145 145 145 145 145
3. Quality of water supplied 95% 95% 95% 95% 100% 100%
Sewerage and Septage Management
0.00 4. Coverage of latrines (individual or community) 75%
5. Coverage of sewerage network services 0% 0% 0% 0% 0% 0%
6. Efficiency of Collection of Sewerage 0% 0% 0% 0% 0% 0%
7. Efficiency in treatment 0% 0% 0% 0% 0% 0%
24 Name of City: Farrukhabad-cum-Fatehgarh
Water Supply
15.26 1. Household level coverage of direct water supply connections 47% 80% 85% 85% 85% 85%
2. Per capita quantum of water supplied (LPCD) 120 120 120 120 120 135
3. Quality of water supplied 90% 90% 90% 90% 90% 100%
Sewerage and Septage Management
7.00 4. Coverage of latrines (individual or community) 89%

Final 3rd STATE ANNUAL ACTION PLAN (3rd SAAP) FOR FY: 2017-18 to FY 2019-20 OF UTTAR PRADESH UNDER ATAL MISSION FOR
REJUVENATION AND URBAN TRANSFORMATION (AMRUT)
2017
STATE MISSION DIRECTORATE (AMRUT) UTTAR PRADESH, 8TH FLOOR, INDIRA BHAWAN, ASHOK MARG, LUCKNOW-226001 227 | P a g e
Table 2.5: SLIP – Plan for Achieving Service Level Benchmarks Name of State: Uttar Pradesh Current Mission Period: 2017-18 to 2019-20
SN Proposed Priority Projects Total
Project
Cost (Rs
Cr)
Indicators Baseline Annual Targets based on Master Plan (Increment
from the Baseline Value)
FY 2016 FY
2017
FY
2018
FY
2019
FY
2020
H1 H2
1 2 3 4 5 6 7 8 9 10 11
5. Coverage of sewerage network services 0% 0% 0% 0% 0% 0%
6. Efficiency of Collection of Sewerage 0% 0% 0% 0% 35% 80%
7. Efficiency in treatment 0% 0% 0% 0% 35% 80%
25 Name of City: Fatehpur
Water Supply
14.50 1. Household level coverage of direct water supply connections 43% 45% 46% 65% 75% 75%
2. Per capita quantum of water supplied (LPCD) 143 143 143 143 143 143
3. Quality of water supplied 90%
Sewerage and Septage Management
15.00 4. Coverage of latrines (individual or community) 70%
5. Coverage of sewerage network services 0% 0% 0% 0% 0% 0% 0%
6. Efficiency of Collection of Sewerage 0% 0% 0% 0% 30% 50% 70%
7. Efficiency in treatment 0% 0% 0% 0% 30% 50% 70%
26 Name of City: Ghazipur
Water Supply
15.15 1. Household level coverage of direct water supply connections 56% 63% 67% 75% 80% 80%
2. Per capita quantum of water supplied (LPCD) 300 300 300 300 300 300
3. Quality of water supplied 80% 80% 80% 85% 95% 100%
Sewerage and Septage Management
110.00 4. Coverage of latrines (individual or community) 76%
5. Coverage of sewerage network services 0% 0% 0% 10% 20% 30%
6. Efficiency of Collection of Sewerage 0% 0% 0% 20% 50% 70%
7. Efficiency in treatment 0% 0% 0% 0% 100% 100%
27 Name of City: Gonda
Water Supply
9.95 1. Household level coverage of direct water supply connections 37% 42% 45% 55% 60% 60%
2. Per capita quantum of water supplied (LPCD) 281 281 281 281 281 281
3. Quality of water supplied 95% 95% 95% 95% 100% 100%

Final 3rd STATE ANNUAL ACTION PLAN (3rd SAAP) FOR FY: 2017-18 to FY 2019-20 OF UTTAR PRADESH UNDER ATAL MISSION FOR
REJUVENATION AND URBAN TRANSFORMATION (AMRUT)
2017
STATE MISSION DIRECTORATE (AMRUT) UTTAR PRADESH, 8TH FLOOR, INDIRA BHAWAN, ASHOK MARG, LUCKNOW-226001 228 | P a g e
Table 2.5: SLIP – Plan for Achieving Service Level Benchmarks Name of State: Uttar Pradesh Current Mission Period: 2017-18 to 2019-20
SN Proposed Priority Projects Total
Project
Cost (Rs
Cr)
Indicators Baseline Annual Targets based on Master Plan (Increment
from the Baseline Value)
FY 2016 FY
2017
FY
2018
FY
2019
FY
2020
H1 H2
1 2 3 4 5 6 7 8 9 10 11
Sewerage and Septage Management
0.00 4. Coverage of latrines (individual or community) 90%
5. Coverage of sewerage network services 0% 0% 0% 0% 0% 0%
6. Efficiency of Collection of Sewerage 0% 0% 0% 0% 0% 0%
7. Efficiency in treatment 0% 0% 0% 0% 0% 0%
28 Name of City: Hapur
Water Supply
34.00 1. Household level coverage of direct water supply connections 34% 90% 92% 92% 92% 92%
2. Per capita quantum of water supplied (LPCD) 91 91 91 91 135 135
3. Quality of water supplied 97% 91% 91% 91% 100% 100%
Sewerage and Septage Management
146.32 4. Coverage of latrines (individual or community) 98%
5. Coverage of sewerage network services 0% 0% 0% 18% 18% 25%
6. Efficiency of Collection of Sewerage 0% 0% 0% 28% 40% 60%
7. Efficiency in treatment 0% 0% 0% 28% 40% 60%
29 Name of City: Hardoi
Water Supply
38.72 1. Household level coverage of direct water supply connections 36% 43% 45% 55% 60% 60%
2. Per capita quantum of water supplied (LPCD) 90 90 105 135 135 135
3. Quality of water supplied 90% 90% 93% 100% 100% 100%
Sewerage and Septage Management
0.00 4. Coverage of latrines (individual or community) 84%
5. Coverage of sewerage network services 0% 0% 0% 0% 0% 0%
6. Efficiency of Collection of Sewerage 0% 0% 0% 0% 0% 0%
7. Efficiency in treatment 0% 0% 0% 0% 0% 0%
30 Name of City: Hathras
Water Supply
56.79 1. Household level coverage of direct water supply connections 35% 44% 49% 55% 55% 55%

Final 3rd STATE ANNUAL ACTION PLAN (3rd SAAP) FOR FY: 2017-18 to FY 2019-20 OF UTTAR PRADESH UNDER ATAL MISSION FOR
REJUVENATION AND URBAN TRANSFORMATION (AMRUT)
2017
STATE MISSION DIRECTORATE (AMRUT) UTTAR PRADESH, 8TH FLOOR, INDIRA BHAWAN, ASHOK MARG, LUCKNOW-226001 229 | P a g e
Table 2.5: SLIP – Plan for Achieving Service Level Benchmarks Name of State: Uttar Pradesh Current Mission Period: 2017-18 to 2019-20
SN Proposed Priority Projects Total
Project
Cost (Rs
Cr)
Indicators Baseline Annual Targets based on Master Plan (Increment
from the Baseline Value)
FY 2016 FY
2017
FY
2018
FY
2019
FY
2020
H1 H2
1 2 3 4 5 6 7 8 9 10 11
2. Per capita quantum of water supplied (LPCD) 100 100 100 110 135 135
3. Quality of water supplied 90% 90% 90% 95% 100% 100%
Sewerage and Septage Management
7.00 4. Coverage of latrines (individual or community) 93%
5. Coverage of sewerage network services 10% 10% 10% 10% 10% 10%
6. Efficiency of Collection of Sewerage 44% 44% 44% 44% 65% 80%
7. Efficiency in treatment 0% 0% 0% 0% 50% 80%
31 Name of City: Jaunpur
Water Supply
25.52 1. Household level coverage of direct water supply connections 60% 94% 95% 95% 95% 95%
2. Per capita quantum of water supplied (LPCD) 112 112 112 120 125 135
3. Quality of water supplied 50% 50% 50% 60% 65% 100%
Sewerage and Septage Management
87.46 4. Coverage of latrines (individual or community) 80%
5. Coverage of sewerage network services 0% 0% 0% 0% 15% 25%
6. Efficiency of Collection of Sewerage 0% 0% 0% 20% 50% 80%
7. Efficiency in treatment 0% 0% 0% 20% 50% 80%
32 Name of City: Kasganj
Water Supply
24.28 1. Household level coverage of direct water supply connections 45% 54% 66% 70% 70% 70%
2. Per capita quantum of water supplied (LPCD) 96 96 96 96 120 135
3. Quality of water supplied 90% 90% 90% 90% 95% 100%
Sewerage and Septage Management
8.00 4. Coverage of latrines (individual or community) 87%
5. Coverage of sewerage network services 0% 0% 0% 0% 0% 0%
6. Efficiency of Collection of Sewerage 0% 0% 0% 0% 50% 80%
7. Efficiency in treatment 0% 0% 0% 0% 50% 80%
33 Name of City: Khurja
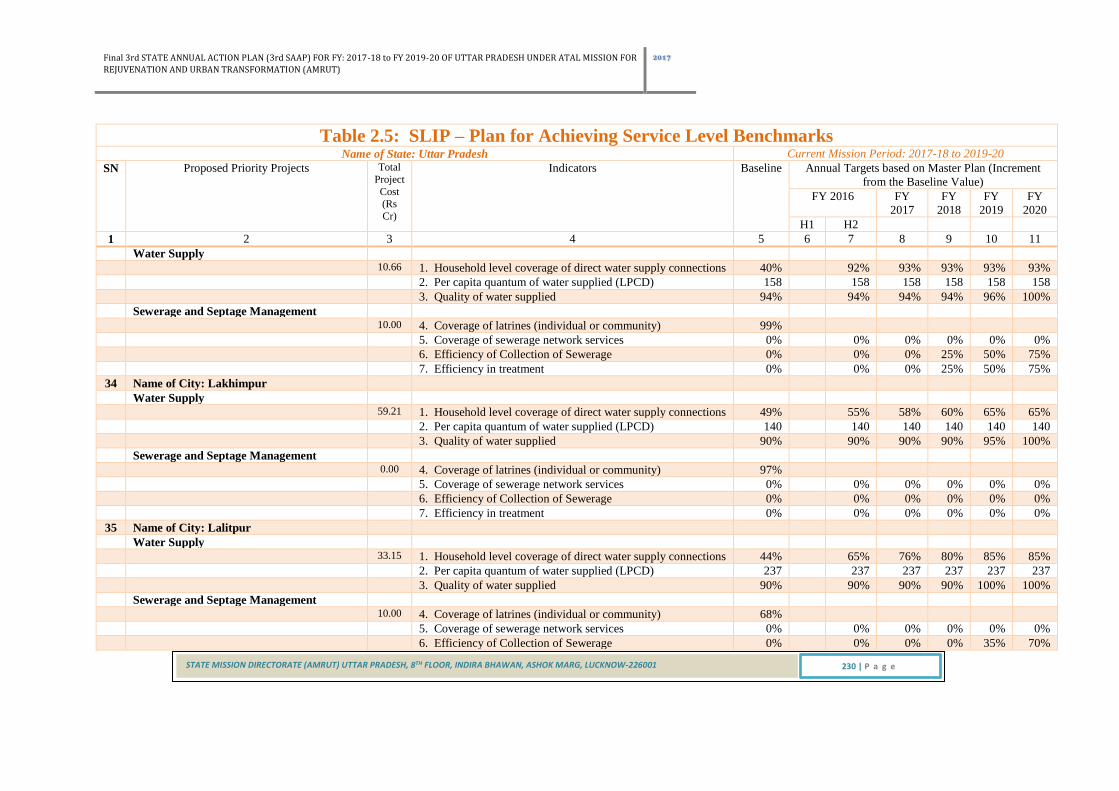
Final 3rd STATE ANNUAL ACTION PLAN (3rd SAAP) FOR FY: 2017-18 to FY 2019-20 OF UTTAR PRADESH UNDER ATAL MISSION FOR
REJUVENATION AND URBAN TRANSFORMATION (AMRUT)
2017
STATE MISSION DIRECTORATE (AMRUT) UTTAR PRADESH, 8TH FLOOR, INDIRA BHAWAN, ASHOK MARG, LUCKNOW-226001 230 | P a g e
Table 2.5: SLIP – Plan for Achieving Service Level Benchmarks Name of State: Uttar Pradesh Current Mission Period: 2017-18 to 2019-20
SN Proposed Priority Projects Total
Project
Cost (Rs
Cr)
Indicators Baseline Annual Targets based on Master Plan (Increment
from the Baseline Value)
FY 2016 FY
2017
FY
2018
FY
2019
FY
2020
H1 H2
1 2 3 4 5 6 7 8 9 10 11
Water Supply
10.66 1. Household level coverage of direct water supply connections 40% 92% 93% 93% 93% 93%
2. Per capita quantum of water supplied (LPCD) 158 158 158 158 158 158
3. Quality of water supplied 94% 94% 94% 94% 96% 100%
Sewerage and Septage Management
10.00 4. Coverage of latrines (individual or community) 99%
5. Coverage of sewerage network services 0% 0% 0% 0% 0% 0%
6. Efficiency of Collection of Sewerage 0% 0% 0% 25% 50% 75%
7. Efficiency in treatment 0% 0% 0% 25% 50% 75%
34 Name of City: Lakhimpur
Water Supply
59.21 1. Household level coverage of direct water supply connections 49% 55% 58% 60% 65% 65%
2. Per capita quantum of water supplied (LPCD) 140 140 140 140 140 140
3. Quality of water supplied 90% 90% 90% 90% 95% 100%
Sewerage and Septage Management
0.00 4. Coverage of latrines (individual or community) 97%
5. Coverage of sewerage network services 0% 0% 0% 0% 0% 0%
6. Efficiency of Collection of Sewerage 0% 0% 0% 0% 0% 0%
7. Efficiency in treatment 0% 0% 0% 0% 0% 0%
35 Name of City: Lalitpur
Water Supply
33.15 1. Household level coverage of direct water supply connections 44% 65% 76% 80% 85% 85%
2. Per capita quantum of water supplied (LPCD) 237 237 237 237 237 237
3. Quality of water supplied 90% 90% 90% 90% 100% 100%
Sewerage and Septage Management
10.00 4. Coverage of latrines (individual or community) 68%
5. Coverage of sewerage network services 0% 0% 0% 0% 0% 0%
6. Efficiency of Collection of Sewerage 0% 0% 0% 0% 35% 70%

Final 3rd STATE ANNUAL ACTION PLAN (3rd SAAP) FOR FY: 2017-18 to FY 2019-20 OF UTTAR PRADESH UNDER ATAL MISSION FOR
REJUVENATION AND URBAN TRANSFORMATION (AMRUT)
2017
STATE MISSION DIRECTORATE (AMRUT) UTTAR PRADESH, 8TH FLOOR, INDIRA BHAWAN, ASHOK MARG, LUCKNOW-226001 231 | P a g e
Table 2.5: SLIP – Plan for Achieving Service Level Benchmarks Name of State: Uttar Pradesh Current Mission Period: 2017-18 to 2019-20
SN Proposed Priority Projects Total
Project
Cost (Rs
Cr)
Indicators Baseline Annual Targets based on Master Plan (Increment
from the Baseline Value)
FY 2016 FY
2017
FY
2018
FY
2019
FY
2020
H1 H2
1 2 3 4 5 6 7 8 9 10 11
7. Efficiency in treatment 0% 0% 0% 0% 35% 70%
36 Name of City: Loni
Water Supply
42.77 1. Household level coverage of direct water supply connections 21% 82% 83% 83% 83% 83%
2. Per capita quantum of water supplied (LPCD) 88 88 100 115 115 135
3. Quality of water supplied 70% 70% 80% 85% 85% 100%
Sewerage and Septage Management
114.26 4. Coverage of latrines (individual or community) 99.9%
5. Coverage of sewerage network services 0% 0% 0% 14% 24% 24%
6. Efficiency of Collection of Sewerage 0% 0% 0% 14% 45% 80%
7. Efficiency in treatment 50% 50% 50% 50% 50% 50%
37 Name of City: Mainpuri
Water Supply
39.49 1. Household level coverage of direct water supply connections 32% 42% 42% 55% 70% 80%
2. Per capita quantum of water supplied (LPCD) 123 123 123 130 135 135
3. Quality of water supplied 75% 75% 75% 85% 100% 100%
Sewerage and Septage Management
27.94 4. Coverage of latrines (individual or community) 95%
5. Coverage of sewerage network services 12% 12% 12% 39% 39% 50%
6. Efficiency of Collection of Sewerage 27% 27% 27% 40% 60% 80%
7. Efficiency in treatment 13% 13% 90% 90% 90% 90%
38 Name of City: Mathura
Water Supply
216.52 1. Household level coverage of direct water supply connections 59% 66% 86% 90% 90% 90%
2. Per capita quantum of water supplied (LPCD) 126 126 126 135 135 135
3. Quality of water supplied 90% 90% 90% 100% 100% 100%
Sewerage and Septage Management
139.14 4. Coverage of latrines (individual or community) 97%

Final 3rd STATE ANNUAL ACTION PLAN (3rd SAAP) FOR FY: 2017-18 to FY 2019-20 OF UTTAR PRADESH UNDER ATAL MISSION FOR
REJUVENATION AND URBAN TRANSFORMATION (AMRUT)
2017
STATE MISSION DIRECTORATE (AMRUT) UTTAR PRADESH, 8TH FLOOR, INDIRA BHAWAN, ASHOK MARG, LUCKNOW-226001 232 | P a g e
Table 2.5: SLIP – Plan for Achieving Service Level Benchmarks Name of State: Uttar Pradesh Current Mission Period: 2017-18 to 2019-20
SN Proposed Priority Projects Total
Project
Cost (Rs
Cr)
Indicators Baseline Annual Targets based on Master Plan (Increment
from the Baseline Value)
FY 2016 FY
2017
FY
2018
FY
2019
FY
2020
H1 H2
1 2 3 4 5 6 7 8 9 10 11
5. Coverage of sewerage network services 13% 13% 30% 39% 39% 39%
6. Efficiency of Collection of Sewerage 13% 13% 30% 39% 60% 90%
7. Efficiency in treatment 80% 80% 80% 80% 85% 90%
39 Name of City: Maunath
Water Supply
37.75 1. Household level coverage of direct water supply connections 40% 48% 50% 55% 55% 55%
2. Per capita quantum of water supplied (LPCD) 96 96 96 110 110 135
3. Quality of water supplied 98% 98% 98% 99% 99% 100%
Sewerage and Septage Management
10.00 4. Coverage of latrines (individual or community) 68%
5. Coverage of sewerage network services 5% 5% 5% 5% 5% 5%
6. Efficiency of Collection of Sewerage 0% 0% 0% 0% 35% 70%
7. Efficiency in treatment 0% 0% 0% 0% 35% 70%
40 Name of City: Mirzapur-cum-vindhyachal
Water Supply
136.83 1. Household level coverage of direct water supply connections 59% 92% 92% 92% 92% 92%
2. Per capita quantum of water supplied (LPCD) 105 105 120 135 135 135
3. Quality of water supplied 95% 95% 97% 100% 100% 100%
Sewerage and Septage Management
101.60 4. Coverage of latrines (individual or community) 51%
5. Coverage of sewerage network services 39% 39% 45% 45% 45% 45%
6. Efficiency of Collection of Sewerage 40% 40% 50% 60% 70% 70%
7. Efficiency in treatment 40% 40% 50% 60% 70% 70%
41 Name of City: Modinagar
Water Supply
20.62 1. Household level coverage of direct water supply connections 72% 73% 73% 75% 75% 75%
2. Per capita quantum of water supplied (LPCD) 191 191 191 191 191 191
3. Quality of water supplied 100% 100% 100% 100% 100% 100%

Final 3rd STATE ANNUAL ACTION PLAN (3rd SAAP) FOR FY: 2017-18 to FY 2019-20 OF UTTAR PRADESH UNDER ATAL MISSION FOR
REJUVENATION AND URBAN TRANSFORMATION (AMRUT)
2017
STATE MISSION DIRECTORATE (AMRUT) UTTAR PRADESH, 8TH FLOOR, INDIRA BHAWAN, ASHOK MARG, LUCKNOW-226001 233 | P a g e
Table 2.5: SLIP – Plan for Achieving Service Level Benchmarks Name of State: Uttar Pradesh Current Mission Period: 2017-18 to 2019-20
SN Proposed Priority Projects Total
Project
Cost (Rs
Cr)
Indicators Baseline Annual Targets based on Master Plan (Increment
from the Baseline Value)
FY 2016 FY
2017
FY
2018
FY
2019
FY
2020
H1 H2
1 2 3 4 5 6 7 8 9 10 11
Sewerage and Septage Management
256.75 4. Coverage of latrines (individual or community) 95%
5. Coverage of sewerage network services 0% 0% 0% 0% 70% 40%
6. Efficiency of Collection of Sewerage 0% 0% 0% 0% 70%
7. Efficiency in treatment 0% 0% 0% 0% 70% 70%
42 Name of City: Mughalsarai
Water Supply
55.55 1. Household level coverage of direct water supply connections 23% 34% 37% 50% 65% 75%
2. Per capita quantum of water supplied (LPCD) 76 76 76 76 76 76
3. Quality of water supplied 90% 0% 90% 90% 95%
Sewerage and Septage Management
0.00 4. Coverage of latrines (individual or community) 78%
5. Coverage of sewerage network services 8% 8% 8% 8% 8% 8%
6. Efficiency of Collection of Sewerage 8% 8% 8% 8% 8% 8%
7. Efficiency in treatment 0% 0% 0% 0% 0% 0%
43 Name of City: Muzaffarnagar
Water Supply
22.97 1. Household level coverage of direct water supply connections 66% 70% 71% 75% 75% 75%
2. Per capita quantum of water supplied (LPCD) 191 191 191 191 191 191
3. Quality of water supplied 90% 90% 90% 90% 95% 100%
Sewerage and Septage Management
76.95 4. Coverage of latrines (individual or community) 93%
5. Coverage of sewerage network services 0.1% 0% 0% 7% 7% 7%
6. Efficiency of Collection of Sewerage 50% 50% 50% 50% 75% 90%
7. Efficiency in treatment 50% 50% 50% 50% 80% 90%
44 Name of City: Orai
Water Supply
23.58 1. Household level coverage of direct water supply connections 37% 40% 43% 55% 60% 65%

Final 3rd STATE ANNUAL ACTION PLAN (3rd SAAP) FOR FY: 2017-18 to FY 2019-20 OF UTTAR PRADESH UNDER ATAL MISSION FOR
REJUVENATION AND URBAN TRANSFORMATION (AMRUT)
2017
STATE MISSION DIRECTORATE (AMRUT) UTTAR PRADESH, 8TH FLOOR, INDIRA BHAWAN, ASHOK MARG, LUCKNOW-226001 234 | P a g e
Table 2.5: SLIP – Plan for Achieving Service Level Benchmarks Name of State: Uttar Pradesh Current Mission Period: 2017-18 to 2019-20
SN Proposed Priority Projects Total
Project
Cost (Rs
Cr)
Indicators Baseline Annual Targets based on Master Plan (Increment
from the Baseline Value)
FY 2016 FY
2017
FY
2018
FY
2019
FY
2020
H1 H2
1 2 3 4 5 6 7 8 9 10 11
2. Per capita quantum of water supplied (LPCD) 157 157 157 157 157 157
3. Quality of water supplied 90% 90% 90% 90% 100% 100%
Sewerage and Septage Management
10.00 4. Coverage of latrines (individual or community) 99%
5. Coverage of sewerage network services 5% 5% 5% 5% 5% 5%
6. Efficiency of Collection of Sewerage 0% 0% 0% 0% 40% 80%
7. Efficiency in treatment 0% 0% 0% 0% 40% 80%
45 Name of City: Pilibhit
Water Supply
42.86 1. Household level coverage of direct water supply connections 51% 56% 92% 92% 92% 92%
2. Per capita quantum of water supplied (LPCD) 117 117 130 130 135 135
3. Quality of water supplied 90% 90% 95% 95% 100% 100%
Sewerage and Septage Management
0.00 4. Coverage of latrines (individual or community) 88%
5. Coverage of sewerage network services 0% 0% 0% 0% 0% 0%
6. Efficiency of Collection of Sewerage 0% 0% 0% 0% 0% 0%
7. Efficiency in treatment 0% 0% 0% 0% 0% 0%
46 Name of City: Raibareli
Water Supply
26.09 1. Household level coverage of direct water supply connections 48% 48% 55% 60% 65% 72%
2. Per capita quantum of water supplied (LPCD) 66 90 120 135 135 135
3. Quality of water supplied 90% 90% 95% 100% 100% 100%
Sewerage and Septage Management
262.12 4. Coverage of latrines (individual or community) 95%
5. Coverage of sewerage network services 26% 26% 36% 44% 70% 70%
6. Efficiency of Collection of Sewerage 26% 0% 30% 45% 70% 70%
7. Efficiency in treatment 0% 0% 0% 100% 100% 100%
47 Name of City: Rampur

Final 3rd STATE ANNUAL ACTION PLAN (3rd SAAP) FOR FY: 2017-18 to FY 2019-20 OF UTTAR PRADESH UNDER ATAL MISSION FOR
REJUVENATION AND URBAN TRANSFORMATION (AMRUT)
2017
STATE MISSION DIRECTORATE (AMRUT) UTTAR PRADESH, 8TH FLOOR, INDIRA BHAWAN, ASHOK MARG, LUCKNOW-226001 235 | P a g e
Table 2.5: SLIP – Plan for Achieving Service Level Benchmarks Name of State: Uttar Pradesh Current Mission Period: 2017-18 to 2019-20
SN Proposed Priority Projects Total
Project
Cost (Rs
Cr)
Indicators Baseline Annual Targets based on Master Plan (Increment
from the Baseline Value)
FY 2016 FY
2017
FY
2018
FY
2019
FY
2020
H1 H2
1 2 3 4 5 6 7 8 9 10 11
Water Supply
25.46 1. Household level coverage of direct water supply connections 18% 25% 27% 42% 42% 42%
2. Per capita quantum of water supplied (LPCD) 135 135 135 135 135 135
3. Quality of water supplied 100% 100% 100% 100% 100% 100%
Sewerage and Septage Management
121.04 4. Coverage of latrines (individual or community) 99%
5. Coverage of sewerage network services 0% 12% 12% 20% 25% 25%
6. Efficiency of Collection of Sewerage 0% 59% 59% 65% 75% 75%
7. Efficiency in treatment 60% 72% 72% 75% 75% 75%
48 Name of City: Shahjahanpur
Water Supply
57.04 1. Household level coverage of direct water supply connections 58% 64% 66% 75% 75% 75%
2. Per capita quantum of water supplied (LPCD) 59 59 79 99 110 135
3. Quality of water supplied 100% 100% 100% 100% 100% 100%
Sewerage and Septage Management
10.00 4. Coverage of latrines (individual or community) 97%
5. Coverage of sewerage network services 0% 0% 0% 0% 0% 0%
6. Efficiency of Collection of Sewerage 0% 0% 0% 30% 50% 70%
7. Efficiency in treatment 0% 0% 0% 30% 50% 70%
49 Name of City: Sambhal
Water Supply
9.17 1. Household level coverage of direct water supply connections 25% 33% 35% 40% 40% 40%
2. Per capita quantum of water supplied (LPCD) 105 135 135 135 135 135
3. Quality of water supplied 95% 100% 100% 100% 100% 100%
Sewerage and Septage Management
8.00 4. Coverage of latrines (individual or community) 99%
5. Coverage of sewerage network services 0% 0% 0% 0% 0% 0%
6. Efficiency of Collection of Sewerage 0% 0% 0% 30% 50% 80%

Final 3rd STATE ANNUAL ACTION PLAN (3rd SAAP) FOR FY: 2017-18 to FY 2019-20 OF UTTAR PRADESH UNDER ATAL MISSION FOR
REJUVENATION AND URBAN TRANSFORMATION (AMRUT)
2017
STATE MISSION DIRECTORATE (AMRUT) UTTAR PRADESH, 8TH FLOOR, INDIRA BHAWAN, ASHOK MARG, LUCKNOW-226001 236 | P a g e
Table 2.5: SLIP – Plan for Achieving Service Level Benchmarks Name of State: Uttar Pradesh Current Mission Period: 2017-18 to 2019-20
SN Proposed Priority Projects Total
Project
Cost (Rs
Cr)
Indicators Baseline Annual Targets based on Master Plan (Increment
from the Baseline Value)
FY 2016 FY
2017
FY
2018
FY
2019
FY
2020
H1 H2
1 2 3 4 5 6 7 8 9 10 11
7. Efficiency in treatment 0% 0% 0% 30% 50% 80%
50 Name of City: Shamli
Water Supply
22.45 1. Household level coverage of direct water supply connections 56% 59% 62% 70% 75% 80%
2. Per capita quantum of water supplied (LPCD) 179 179 179 179 179 179
3. Quality of water supplied 80% 80% 80% 80% 90% 100%
Sewerage and Septage Management
0.00 4. Coverage of latrines (individual or community) 87%
5. Coverage of sewerage network services 0% 0% 0% 0% 0% 0%
6. Efficiency of Collection of Sewerage 0% 0% 0% 0% 0% 0%
7. Efficiency in treatment 0% 0% 0% 0% 0% 0%
51 Name of City: Shikohabad
Water Supply
3.35 1. Household level coverage of direct water supply connections 27% 42% 46% 50% 55% 60%
2. Per capita quantum of water supplied (LPCD) 125 125 125 125 125 125
3. Quality of water supplied 90% 90% 90% 100% 100% 100%
Sewerage and Septage Management
0.00 4. Coverage of latrines (individual or community) 87%
5. Coverage of sewerage network services 0% 0% 0% 0% 0% 0%
6. Efficiency of Collection of Sewerage 0% 0% 0% 0% 0% 0%
7. Efficiency in treatment 0% 0% 0% 0% 0% 0%
52 Name of City: Sitapur
Water Supply
66.27 1. Household level coverage of direct water supply connections 38% 48% 52% 60% 65% 65%
2. Per capita quantum of water supplied (LPCD) 89 89 89 89 89 89
3. Quality of water supplied 80% 80% 80% 88% 88% 100%
Sewerage and Septage Management
8.00 4. Coverage of latrines (individual or community) 88%

Final 3rd STATE ANNUAL ACTION PLAN (3rd SAAP) FOR FY: 2017-18 to FY 2019-20 OF UTTAR PRADESH UNDER ATAL MISSION FOR
REJUVENATION AND URBAN TRANSFORMATION (AMRUT)
2017
STATE MISSION DIRECTORATE (AMRUT) UTTAR PRADESH, 8TH FLOOR, INDIRA BHAWAN, ASHOK MARG, LUCKNOW-226001 237 | P a g e
Table 2.5: SLIP – Plan for Achieving Service Level Benchmarks Name of State: Uttar Pradesh Current Mission Period: 2017-18 to 2019-20
SN Proposed Priority Projects Total
Project
Cost (Rs
Cr)
Indicators Baseline Annual Targets based on Master Plan (Increment
from the Baseline Value)
FY 2016 FY
2017
FY
2018
FY
2019
FY
2020
H1 H2
1 2 3 4 5 6 7 8 9 10 11
5. Coverage of sewerage network services 3% 3% 3% 3% 3% 3%
6. Efficiency of Collection of Sewerage 29% 29% 29% 29% 40% 85%
7. Efficiency in treatment 0% 0% 0% 0% 40% 85%
53 Name of City: Sultanpur
Water Supply
22.24 1. Household level coverage of direct water supply connections 53% 61% 65% 70% 75% 85%
2. Per capita quantum of water supplied (LPCD) 141 141 141 141 141 141
3. Quality of water supplied 90% 90% 90% 100% 100% 100%
Sewerage and Septage Management
10.00 4. Coverage of latrines (individual or community) 85%
5. Coverage of sewerage network services 0% 0% 0% 0% 0% 0%
6. Efficiency of Collection of Sewerage 0% 0% 0% 0% 35% 75%
7. Efficiency in treatment 50% 0% 0% 0% 35% 75%
54 Name of City: Unnao
Water Supply
329.65 1. Household level coverage of direct water supply connections 31% 33% 33% 60% 75% 96%
2. Per capita quantum of water supplied (LPCD) 102 102 102 102 135 135
3. Quality of water supplied 97% 97% 97% 97% 100% 100%
Sewerage and Septage Management
140.00 4. Coverage of latrines (individual or community) 81%
5. Coverage of sewerage network services 6% 6% 6% 15% 25% 30%
6. Efficiency of Collection of Sewerage 0% 0% 0% 15% 45% 80%
7. Efficiency in treatment 0% 0% 0% 0% 50% 80%
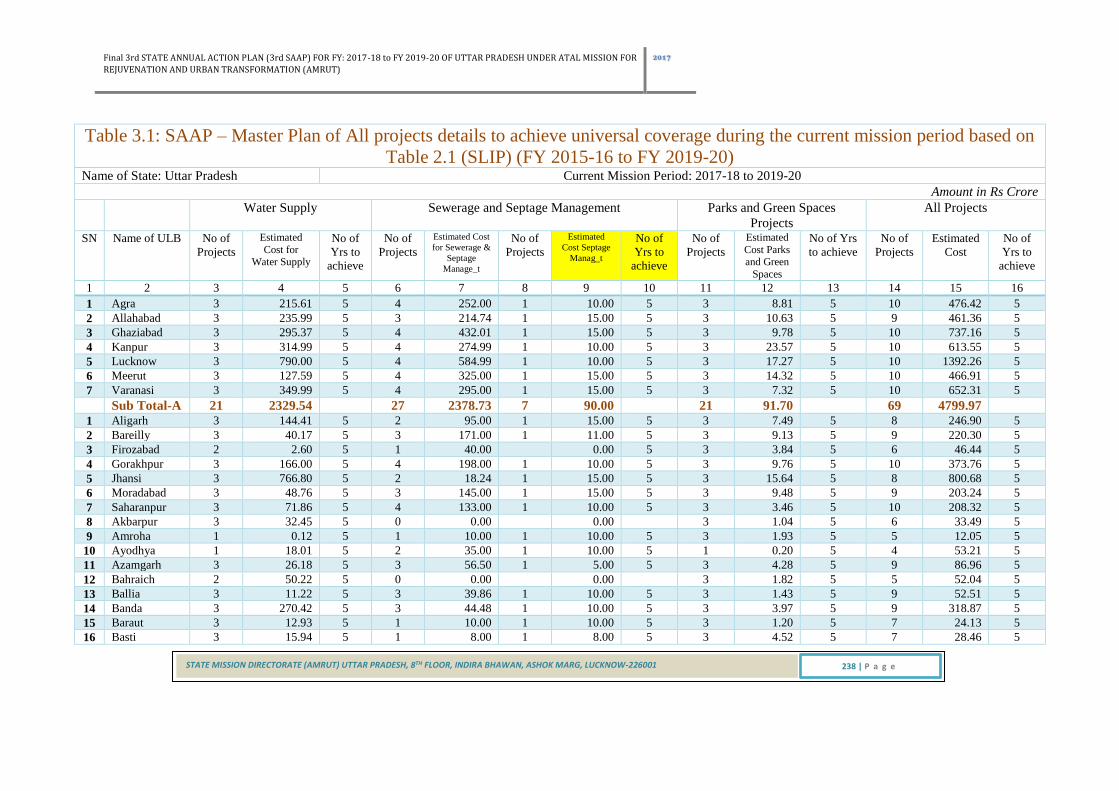
Final 3rd STATE ANNUAL ACTION PLAN (3rd SAAP) FOR FY: 2017-18 to FY 2019-20 OF UTTAR PRADESH UNDER ATAL MISSION FOR
REJUVENATION AND URBAN TRANSFORMATION (AMRUT)
2017
STATE MISSION DIRECTORATE (AMRUT) UTTAR PRADESH, 8TH FLOOR, INDIRA BHAWAN, ASHOK MARG, LUCKNOW-226001 238 | P a g e
Table 3.1: SAAP – Master Plan of All projects details to achieve universal coverage during the current mission period based on
Table 2.1 (SLIP) (FY 2015-16 to FY 2019-20) Name of State: Uttar Pradesh Current Mission Period: 2017-18 to 2019-20
Amount in Rs Crore
Water Supply Sewerage and Septage Management Parks and Green Spaces
Projects
All Projects
SN Name of ULB No of
Projects
Estimated
Cost for Water Supply
No of
Yrs to
achieve
No of
Projects
Estimated Cost
for Sewerage &
Septage
Manage_t
No of
Projects
Estimated
Cost Septage
Manag_t
No of
Yrs to
achieve
No of
Projects
Estimated
Cost Parks and Green
Spaces
No of Yrs
to achieve
No of
Projects
Estimated
Cost
No of
Yrs to
achieve
1 2 3 4 5 6 7 8 9 10 11 12 13 14 15 16
1 Agra 3 215.61 5 4 252.00 1 10.00 5 3 8.81 5 10 476.42 5
2 Allahabad 3 235.99 5 3 214.74 1 15.00 5 3 10.63 5 9 461.36 5
3 Ghaziabad 3 295.37 5 4 432.01 1 15.00 5 3 9.78 5 10 737.16 5
4 Kanpur 3 314.99 5 4 274.99 1 10.00 5 3 23.57 5 10 613.55 5
5 Lucknow 3 790.00 5 4 584.99 1 10.00 5 3 17.27 5 10 1392.26 5
6 Meerut 3 127.59 5 4 325.00 1 15.00 5 3 14.32 5 10 466.91 5
7 Varanasi 3 349.99 5 4 295.00 1 15.00 5 3 7.32 5 10 652.31 5
Sub Total-A 21 2329.54 27 2378.73 7 90.00 21 91.70 69 4799.97
1 Aligarh 3 144.41 5 2 95.00 1 15.00 5 3 7.49 5 8 246.90 5
2 Bareilly 3 40.17 5 3 171.00 1 11.00 5 3 9.13 5 9 220.30 5
3 Firozabad 2 2.60 5 1 40.00 0.00 5 3 3.84 5 6 46.44 5
4 Gorakhpur 3 166.00 5 4 198.00 1 10.00 5 3 9.76 5 10 373.76 5
5 Jhansi 3 766.80 5 2 18.24 1 15.00 5 3 15.64 5 8 800.68 5
6 Moradabad 3 48.76 5 3 145.00 1 15.00 5 3 9.48 5 9 203.24 5
7 Saharanpur 3 71.86 5 4 133.00 1 10.00 5 3 3.46 5 10 208.32 5
8 Akbarpur 3 32.45 5 0 0.00 0.00 3 1.04 5 6 33.49 5
9 Amroha 1 0.12 5 1 10.00 1 10.00 5 3 1.93 5 5 12.05 5
10 Ayodhya 1 18.01 5 2 35.00 1 10.00 5 1 0.20 5 4 53.21 5
11 Azamgarh 3 26.18 5 3 56.50 1 5.00 5 3 4.28 5 9 86.96 5
12 Bahraich 2 50.22 5 0 0.00 0.00 3 1.82 5 5 52.04 5
13 Ballia 3 11.22 5 3 39.86 1 10.00 5 3 1.43 5 9 52.51 5
14 Banda 3 270.42 5 3 44.48 1 10.00 5 3 3.97 5 9 318.87 5
15 Baraut 3 12.93 5 1 10.00 1 10.00 5 3 1.20 5 7 24.13 5
16 Basti 3 15.94 5 1 8.00 1 8.00 5 3 4.52 5 7 28.46 5

Final 3rd STATE ANNUAL ACTION PLAN (3rd SAAP) FOR FY: 2017-18 to FY 2019-20 OF UTTAR PRADESH UNDER ATAL MISSION FOR
REJUVENATION AND URBAN TRANSFORMATION (AMRUT)
2017
STATE MISSION DIRECTORATE (AMRUT) UTTAR PRADESH, 8TH FLOOR, INDIRA BHAWAN, ASHOK MARG, LUCKNOW-226001 239 | P a g e
Table 3.1: SAAP – Master Plan of All projects details to achieve universal coverage during the current mission period based on
Table 2.1 (SLIP) (FY 2015-16 to FY 2019-20) Name of State: Uttar Pradesh Current Mission Period: 2017-18 to 2019-20
Amount in Rs Crore
Water Supply Sewerage and Septage Management Parks and Green Spaces
Projects
All Projects
SN Name of ULB No of
Projects
Estimated
Cost for Water Supply
No of
Yrs to
achieve
No of
Projects
Estimated Cost
for Sewerage &
Septage
Manage_t
No of
Projects
Estimated
Cost Septage
Manag_t
No of
Yrs to
achieve
No of
Projects
Estimated
Cost Parks and Green
Spaces
No of Yrs
to achieve
No of
Projects
Estimated
Cost
No of
Yrs to
achieve
1 2 3 4 5 6 7 8 9 10 11 12 13 14 15 16
17 Budaun 3 10.00 5 1 10.00 1 10.00 5 3 1.49 5 7 21.49 5
18 Bulandshahar 2 8.30 5 4 341.07 1 10.00 5 3 1.76 5 9 351.13 5
19 Chandausi 3 42.36 5 1 5.00 1 5.00 5 3 1.29 5 7 48.65 5
20 Deoria 3 16.80 5 0 0.00 0.00 3 2.80 5 6 19.60 5
21 Etah 3 15.36 5 3 138.00 1 8.00 5 3 2.53 5 9 155.89 5
22 Etawah 0 0.00 5 1 8.00 1 8.00 5 3 1.73 5 4 9.73 5
23 Faizabad 2 25.22 5 0 0.00 0.00 3 1.82 5 5 27.04 5
24 Farrukhabad 2 10.26 5 1 7.00 1 7.00 5 3 2.15 5 6 19.41 5
25 Fatehpur 2 3.00 5 1 15.00 1 15.00 5 3 1.42 5 6 19.42 5
26 Ghazipur 3 17.93 5 4 180.00 1 10.00 5 3 1.28 5 10 199.21 5
27 Gonda 2 9.12 5 0 0.00 0.00 3 1.27 5 5 10.39 5
28 Hapur 2 33.26 5 3 114.00 1 10.00 5 3 3.18 5 8 150.44 5
29 Hardoi 3 32.08 5 0 0.00 0.00 2 0.90 5 5 32.98 5
30 Hathras 3 51.01 5 1 7.00 1 7.00 5 3 3.13 5 7 61.14 5
31 Jaunpur 3 30.00 5 2 87.46 1 10.00 5 3 1.69 5 8 119.15 5
32 Kasganj 3 32.56 5 1 8.00 1 8.00 5 3 1.28 5 7 41.84 5
33 Khurja 2 8.90 5 1 10.00 1 10.00 5 3 1.10 5 6 20.00 5
34 Lakhimpur 3 57.28 5 0 0.00 0.00 3 1.76 5 6 59.04 5
35 Lalitpur 3 23.50 5 1 10.00 1 10.00 5 3 1.72 5 7 35.22 5
36 Loni 2 21.40 5 4 91.26 1 10.00 5 3 3.22 5 9 115.88 5
37 Mainpuri 3 37.14 5 2 31.00 0.00 5 3 1.84 5 8 69.98 5
38 Mathura 3 308.80 5 4 132.00 1 10.00 5 3 2.60 5 10 443.40 5
39 Maunath 3 29.56 5 1 10.00 1 10.00 5 3 3.15 5 7 42.71 5
40 Mirzapur 3 135.70 5 3 100.00 1 10.00 5 3 1.52 5 9 237.22 5

Final 3rd STATE ANNUAL ACTION PLAN (3rd SAAP) FOR FY: 2017-18 to FY 2019-20 OF UTTAR PRADESH UNDER ATAL MISSION FOR
REJUVENATION AND URBAN TRANSFORMATION (AMRUT)
2017
STATE MISSION DIRECTORATE (AMRUT) UTTAR PRADESH, 8TH FLOOR, INDIRA BHAWAN, ASHOK MARG, LUCKNOW-226001 240 | P a g e
Table 3.1: SAAP – Master Plan of All projects details to achieve universal coverage during the current mission period based on
Table 2.1 (SLIP) (FY 2015-16 to FY 2019-20) Name of State: Uttar Pradesh Current Mission Period: 2017-18 to 2019-20
Amount in Rs Crore
Water Supply Sewerage and Septage Management Parks and Green Spaces
Projects
All Projects
SN Name of ULB No of
Projects
Estimated
Cost for Water Supply
No of
Yrs to
achieve
No of
Projects
Estimated Cost
for Sewerage &
Septage
Manage_t
No of
Projects
Estimated
Cost Septage
Manag_t
No of
Yrs to
achieve
No of
Projects
Estimated
Cost Parks and Green
Spaces
No of Yrs
to achieve
No of
Projects
Estimated
Cost
No of
Yrs to
achieve
1 2 3 4 5 6 7 8 9 10 11 12 13 14 15 16
41 Modinagar 3 20.66 5 4 299.00 1 10.00 5 3 1.43 5 10 321.09 5
42 Mughalsarai 3 41.47 5 1 18.80 0.00 5 1 0.40 5 5 60.67 5
43 Muzaffarnagar 2 3.56 5 3 55.92 1 10.00 5 3 4.23 5 8 63.71 5
44 Orai 3 26.94 5 1 10.00 0.00 5 3 2.04 5 7 38.98 5
45 Pilibhit 3 43.74 5 0 0.00 0.00 3 1.43 5 6 45.17 5
46 Raibareli 2 53.10 5 4 248.00 1 10.00 5 3 1.50 5 9 302.60 5
47 Rampur 3 18.38 5 3 126.00 1 10.00 5 3 1.97 5 9 146.35 5
48 Shahjahanpur 3 69.90 5 1 10.00 1 10.00 5 3 2.46 5 7 82.36 5
49 Sambhal 3 8.14 5 1 8.00 1 8.00 5 3 2.41 5 7 18.55 5
50 Shamli 3 23.42 5 0 0.00 0.00 3 0.72 5 6 24.14 5
51 Shikohabad 2 2.12 5 0 0.00 0.00 3 0.93 5 5 3.05 5
52 Sitapur 3 61.19 5 1 8.00 1 8.00 5 3 4.27 5 7 73.46 5
53 Sultanpur 3 48.84 5 1 10.00 1 10.00 5 3 2.67 5 7 61.51 5
54 Unnao 3 144.00 5 4 161.60 1 10.00 5 3 2.14 5 10 307.74 5
Sub Total-B 142 3203.09 96 3264.19 40 393.00 157 154.42 395 6621.70
Grand Total 163 5532.63 123 5642.92 47 483.00 178 246.12 464 11421.67

Final 3rd STATE ANNUAL ACTION PLAN (3rd SAAP) FOR FY: 2017-18 to FY 2019-20 OF UTTAR PRADESH UNDER ATAL MISSION FOR
REJUVENATION AND URBAN TRANSFORMATION (AMRUT)
2017
STATE MISSION DIRECTORATE (AMRUT) UTTAR PRADESH, 8TH FLOOR, INDIRA BHAWAN, ASHOK MARG, LUCKNOW-226001 241 | P a g e
Table 3.2: UP 3rd SAAP - Sector Wise Breakup of Consolidated Investments for all AMRUT ULBs in the State Name of State: Uttar Pradesh
3rd SAAP: FY 2017-18 to 2019-20
Amount in Rs Crore
SN Name of ULB Water
Supply
Sewerage
and Septage
Manag_t
Drainage Urban
Transport
Others
(Parks and
Green
Spaces)
Reforms Total
1 2 3 4 5 6 7 8 9
1 Agra 215.61 252.00 8.82 476.43
2 Allahabad 235.99 214.74 10.63 461.36
3 Ghaziabad 295.37 432.01 9.78 737.16
4 Kanpur 314.99 274.99 23.57 613.55
5 Lucknow 790.00 584.99 17.27 1392.26
6 Meerut 127.59 325.00 14.32 466.91
7 Varanasi 349.99 295.00 7.31 652.30
Sub Total-A 2329.54 2378.73 91.70 4799.97
1 Aligarh 144.41 95.00 7.48 246.89
2 Bareilly 40.17 171.00 9.12 220.29
3 Firozabad 2.60 40.00 3.86 46.46
4 Gorakhpur 166.00 198.00 9.75 373.75
5 Jhansi 766.80 18.24 15.65 800.69
6 Moradabad 48.76 145.00 9.49 203.25
7 Saharanpur 71.86 133.00 3.48 208.34
8 Akbarpur 32.45 0.00 1.05 33.50
9 Amroha 0.12 10.00 1.95 12.07
10 Ayodhya 18.01 35.00 0.20 53.21
11 Azamgarh 26.18 56.50 4.29 86.97
12 Bahraich 50.22 0.00 1.83 52.05

Final 3rd STATE ANNUAL ACTION PLAN (3rd SAAP) FOR FY: 2017-18 to FY 2019-20 OF UTTAR PRADESH UNDER ATAL MISSION FOR
REJUVENATION AND URBAN TRANSFORMATION (AMRUT)
2017
STATE MISSION DIRECTORATE (AMRUT) UTTAR PRADESH, 8TH FLOOR, INDIRA BHAWAN, ASHOK MARG, LUCKNOW-226001 242 | P a g e
Table 3.2: UP 3rd SAAP - Sector Wise Breakup of Consolidated Investments for all AMRUT ULBs in the State Name of State: Uttar Pradesh
3rd SAAP: FY 2017-18 to 2019-20
Amount in Rs Crore
SN Name of ULB Water
Supply
Sewerage
and Septage
Manag_t
Drainage Urban
Transport
Others
(Parks and
Green
Spaces)
Reforms Total
1 2 3 4 5 6 7 8 9
13 Ballia 11.22 39.86 1.44 52.52
14 Banda 270.42 44.48 3.97 318.87
15 Baraut 12.93 10.00 1.20 24.13
16 Basti 15.94 8.00 4.52 28.46
17 Budaun 10.00 10.00 1.50 21.50
18 Bulandshahar 8.30 341.07 1.75 351.12
19 Chandausi 42.36 5.00 1.29 48.65
20 Deoria 16.80 0.00 2.80 19.60
21 Etah 15.36 138.00 2.53 155.89
22 Etawah 0.00 8.00 1.73 9.73
23 Faizabad 25.22 0.00 1.82 27.04
24 Farrukhabad 10.26 7.00 2.14 19.40
25 Fatehpur 3.00 15.00 1.43 19.43
26 Ghazipur 17.93 180.00 1.27 199.20
27 Gonda 9.12 0.00 1.28 10.40
28 Hapur 33.26 114.00 3.19 150.45
29 Hardoi 32.08 0.00 0.89 32.97
30 Hathras 51.01 7.00 3.12 61.13
31 Jaunpur 30.00 87.46 1.69 119.15
32 Kasganj 32.56 8.00 1.28 41.84

Final 3rd STATE ANNUAL ACTION PLAN (3rd SAAP) FOR FY: 2017-18 to FY 2019-20 OF UTTAR PRADESH UNDER ATAL MISSION FOR
REJUVENATION AND URBAN TRANSFORMATION (AMRUT)
2017
STATE MISSION DIRECTORATE (AMRUT) UTTAR PRADESH, 8TH FLOOR, INDIRA BHAWAN, ASHOK MARG, LUCKNOW-226001 243 | P a g e
Table 3.2: UP 3rd SAAP - Sector Wise Breakup of Consolidated Investments for all AMRUT ULBs in the State Name of State: Uttar Pradesh
3rd SAAP: FY 2017-18 to 2019-20
Amount in Rs Crore
SN Name of ULB Water
Supply
Sewerage
and Septage
Manag_t
Drainage Urban
Transport
Others
(Parks and
Green
Spaces)
Reforms Total
1 2 3 4 5 6 7 8 9
33 Khurja 8.90 10.00 1.10 20.00
34 Lakhimpur 57.28 0.00 1.76 59.04
35 Lalitpur 23.50 10.00 1.72 35.22
36 Loni 21.40 91.26 3.22 115.88
37 Mainpuri 37.14 31.00 1.83 69.97
38 Mathura 308.80 132.00 2.59 443.39
39 Maunath 29.56 10.00 3.14 42.70
40 Mirzapur 135.70 100.00 1.51 237.21
41 Modinagar 20.66 299.00 1.43 321.09
42 Mughalsarai 41.47 18.80 0.40 60.67
43 Muzaffarnagar 3.56 55.92 4.23 63.71
44 Orai 26.94 10.00 2.03 38.97
45 Pilibhit 43.74 0.00 1.43 45.17
46 Raibareli 53.10 248.00 1.49 302.59
47 Rampur 18.38 126.00 1.97 146.35
48 Shahjahanpur 69.90 10.00 2.46 82.36
49 Sambhal 8.14 8.00 2.41 18.55
50 Shamli 23.42 0.00 0.71 24.13
51 Shikohabad 2.12 0.00 0.94 3.06
52 Sitapur 61.19 8.00 4.26 73.45

Final 3rd STATE ANNUAL ACTION PLAN (3rd SAAP) FOR FY: 2017-18 to FY 2019-20 OF UTTAR PRADESH UNDER ATAL MISSION FOR
REJUVENATION AND URBAN TRANSFORMATION (AMRUT)
2017
STATE MISSION DIRECTORATE (AMRUT) UTTAR PRADESH, 8TH FLOOR, INDIRA BHAWAN, ASHOK MARG, LUCKNOW-226001 244 | P a g e
Table 3.2: UP 3rd SAAP - Sector Wise Breakup of Consolidated Investments for all AMRUT ULBs in the State Name of State: Uttar Pradesh
3rd SAAP: FY 2017-18 to 2019-20
Amount in Rs Crore
SN Name of ULB Water
Supply
Sewerage
and Septage
Manag_t
Drainage Urban
Transport
Others
(Parks and
Green
Spaces)
Reforms Total
1 2 3 4 5 6 7 8 9
53 Sultanpur 48.84 10.00 2.67 61.51
54 Unnao 144.00 161.60 2.13 307.73
Sub Total-B 3203.09 3264.19 154.42 6621.70
Total: A+B 5532.63 5642.92 246.12 11421.67
Total Project Investments 11421.6700
A&OE 262.99
Grand Total 11684.6600
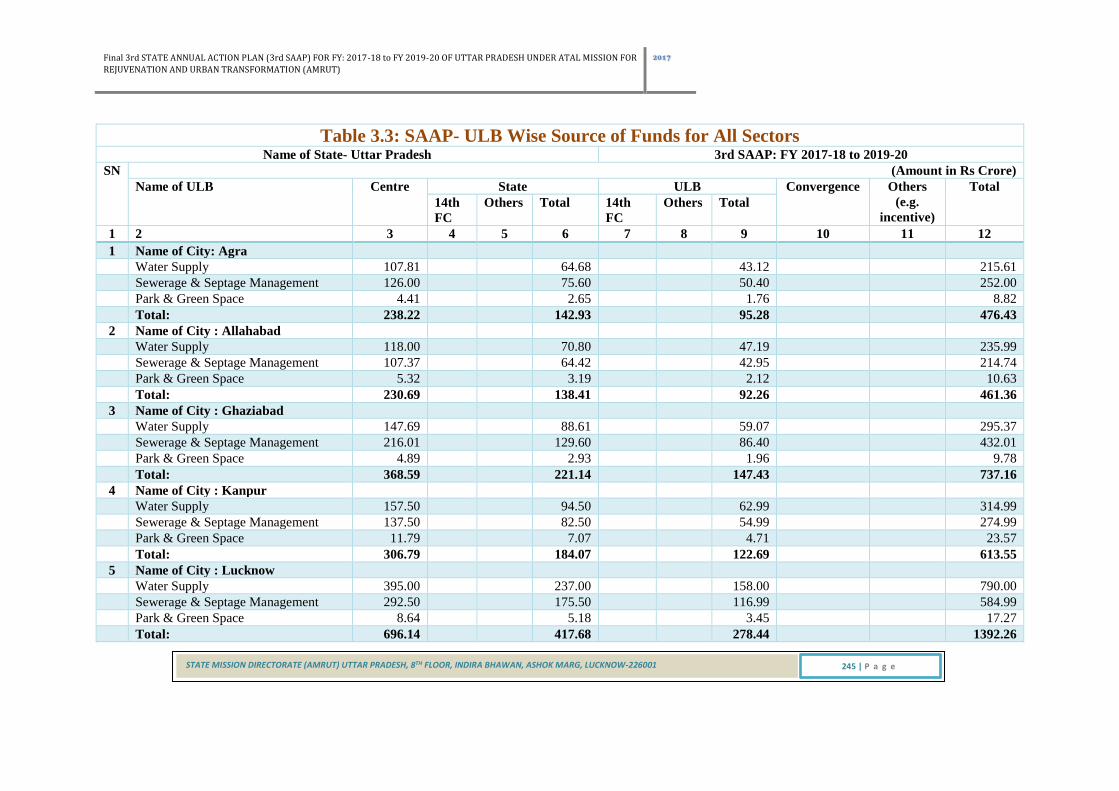
Final 3rd STATE ANNUAL ACTION PLAN (3rd SAAP) FOR FY: 2017-18 to FY 2019-20 OF UTTAR PRADESH UNDER ATAL MISSION FOR
REJUVENATION AND URBAN TRANSFORMATION (AMRUT)
2017
STATE MISSION DIRECTORATE (AMRUT) UTTAR PRADESH, 8TH FLOOR, INDIRA BHAWAN, ASHOK MARG, LUCKNOW-226001 245 | P a g e
Table 3.3: SAAP- ULB Wise Source of Funds for All Sectors Name of State- Uttar Pradesh 3rd SAAP: FY 2017-18 to 2019-20
SN (Amount in Rs Crore)
Name of ULB Centre State ULB Convergence Others
(e.g.
incentive)
Total
14th
FC
Others Total 14th
FC
Others Total
1 2 3 4 5 6 7 8 9 10 11 12
1 Name of City: Agra
Water Supply 107.81 64.68 43.12 215.61
Sewerage & Septage Management 126.00 75.60 50.40 252.00
Park & Green Space 4.41 2.65 1.76 8.82
Total: 238.22 142.93 95.28 476.43
2 Name of City : Allahabad
Water Supply 118.00 70.80 47.19 235.99
Sewerage & Septage Management 107.37 64.42 42.95 214.74
Park & Green Space 5.32 3.19 2.12 10.63
Total: 230.69 138.41 92.26 461.36
3 Name of City : Ghaziabad
Water Supply 147.69 88.61 59.07 295.37
Sewerage & Septage Management 216.01 129.60 86.40 432.01
Park & Green Space 4.89 2.93 1.96 9.78
Total: 368.59 221.14 147.43 737.16
4 Name of City : Kanpur
Water Supply 157.50 94.50 62.99 314.99
Sewerage & Septage Management 137.50 82.50 54.99 274.99
Park & Green Space 11.79 7.07 4.71 23.57
Total: 306.79 184.07 122.69 613.55
5 Name of City : Lucknow
Water Supply 395.00 237.00 158.00 790.00
Sewerage & Septage Management 292.50 175.50 116.99 584.99
Park & Green Space 8.64 5.18 3.45 17.27
Total: 696.14 417.68 278.44 1392.26

Final 3rd STATE ANNUAL ACTION PLAN (3rd SAAP) FOR FY: 2017-18 to FY 2019-20 OF UTTAR PRADESH UNDER ATAL MISSION FOR
REJUVENATION AND URBAN TRANSFORMATION (AMRUT)
2017
STATE MISSION DIRECTORATE (AMRUT) UTTAR PRADESH, 8TH FLOOR, INDIRA BHAWAN, ASHOK MARG, LUCKNOW-226001 246 | P a g e
Table 3.3: SAAP- ULB Wise Source of Funds for All Sectors Name of State- Uttar Pradesh 3rd SAAP: FY 2017-18 to 2019-20
SN (Amount in Rs Crore)
Name of ULB Centre State ULB Convergence Others
(e.g.
incentive)
Total
14th
FC
Others Total 14th
FC
Others Total
1 2 3 4 5 6 7 8 9 10 11 12
6 Name of City : Meerut
Water Supply 63.80 38.28 25.51 127.59
Sewerage & Septage Management 162.50 97.50 65.00 325.00
Park & Green Space 7.16 4.30 2.86 14.32
Total: 233.46 140.08 93.37 466.91
7 Name of City : Varanasi
Water Supply 175.00 105.00 69.99 349.99
Sewerage & Septage Management 147.50 88.50 59.00 295.00
Park & Green Space 3.66 2.19 1.46 7.31
Total: 326.16 195.69 130.45 652.30
Total-A
Water Supply 1164.80 698.87 465.87 2329.54
Sewerage & Septage Management 1189.38 713.62 475.73 2378.73
Park & Green Space 45.87 27.51 18.32 91.70
Total (A) : 2400.05 1440.00 959.92 4799.97
1 Name of City : Aligarh
Water Supply 72.21 43.32 28.88 144.41
Sewerage & Septage Management 47.50 28.50 19.00 95.00
Park & Green Space 3.74 2.24 1.50 7.48
Total: 123.45 74.06 49.38 246.89
2 Name of City : Bareilly
Water Supply 20.09 12.05 8.03 40.17
Sewerage & Septage Management 85.50 51.30 34.20 171.00
Park & Green Space 4.56 2.74 1.82 9.12
Total: 110.15 66.09 44.05 220.29

Final 3rd STATE ANNUAL ACTION PLAN (3rd SAAP) FOR FY: 2017-18 to FY 2019-20 OF UTTAR PRADESH UNDER ATAL MISSION FOR
REJUVENATION AND URBAN TRANSFORMATION (AMRUT)
2017
STATE MISSION DIRECTORATE (AMRUT) UTTAR PRADESH, 8TH FLOOR, INDIRA BHAWAN, ASHOK MARG, LUCKNOW-226001 247 | P a g e
Table 3.3: SAAP- ULB Wise Source of Funds for All Sectors Name of State- Uttar Pradesh 3rd SAAP: FY 2017-18 to 2019-20
SN (Amount in Rs Crore)
Name of ULB Centre State ULB Convergence Others
(e.g.
incentive)
Total
14th
FC
Others Total 14th
FC
Others Total
1 2 3 4 5 6 7 8 9 10 11 12
3 Name of City : Firozabad
Water Supply 1.30 0.78 0.52 2.60
Sewerage & Septage Management 20.00 12.00 8.00 40.00
Park & Green Space 1.93 1.16 0.77 3.86
Total: 23.23 13.94 9.29 46.46
4 Name of City : Gorakhpur
Water Supply 83.00 49.80 33.20 166.00
Sewerage & Septage Management 99.00 59.40 39.60 198.00
Park & Green Space 4.88 2.93 1.94 9.75
Total: 186.88 112.13 74.74 373.75
5 Name of City : Jhansi
Water Supply 383.40 230.04 153.36 766.80
Sewerage & Septage Management 9.12 5.47 3.65 18.24
Park & Green Space 7.83 4.70 3.12 15.65
Total: 400.35 240.21 160.13 800.69
6 Name of City : Moradabad
Water Supply 24.38 14.63 9.75 48.76
Sewerage & Septage Management 72.50 43.50 29.00 145.00
Park & Green Space 4.75 2.85 1.89 9.49
Total: 101.63 60.98 40.64 203.25
7 Name of City : Saharanpur
Water Supply 35.93 21.56 14.37 71.86
Sewerage & Septage Management 66.50 39.90 26.60 133.00
Park & Green Space 1.74 1.04 0.70 3.48
Total: 104.17 62.50 41.67 208.34

Final 3rd STATE ANNUAL ACTION PLAN (3rd SAAP) FOR FY: 2017-18 to FY 2019-20 OF UTTAR PRADESH UNDER ATAL MISSION FOR
REJUVENATION AND URBAN TRANSFORMATION (AMRUT)
2017
STATE MISSION DIRECTORATE (AMRUT) UTTAR PRADESH, 8TH FLOOR, INDIRA BHAWAN, ASHOK MARG, LUCKNOW-226001 248 | P a g e
Table 3.3: SAAP- ULB Wise Source of Funds for All Sectors Name of State- Uttar Pradesh 3rd SAAP: FY 2017-18 to 2019-20
SN (Amount in Rs Crore)
Name of ULB Centre State ULB Convergence Others
(e.g.
incentive)
Total
14th
FC
Others Total 14th
FC
Others Total
1 2 3 4 5 6 7 8 9 10 11 12
8 Name of City : Akbarpur
Water Supply 16.23 9.74 6.48 32.45
Sewerage & Septage Management 0.00 0.00 0.00 0.00
Park & Green Space 0.53 0.32 0.20 1.05
Total: 16.76 10.06 6.68 33.50
9 Name of City : Amroha
Water Supply 0.06 0.04 0.02 0.12
Sewerage & Septage Management 5.00 3.00 2.00 10.00
Park & Green Space 0.98 0.59 0.38 1.95
Total: 6.04 3.63 2.40 12.07
10 Name of City : Ayodhya
Water Supply 9.01 5.40 3.60 18.01
Sewerage & Septage Management 17.50 10.50 7.00 35.00
Park & Green Space 0.10 0.06 0.04 0.20
Total: 26.61 15.96 10.64 53.21
11 Name of City : Azamgarh
Water Supply 13.09 7.85 5.24 26.18
Sewerage & Septage Management 28.25 16.95 11.30 56.50
Park & Green Space 2.15 1.29 0.85 4.29
Total: 43.49 26.09 17.39 86.97
12 Name of City : Bahraich
Water Supply 25.11 15.07 10.04 50.22
Sewerage & Septage Management 0.00 0.00 0.00 0.00
Park & Green Space 0.92 0.55 0.36 1.83
Total: 26.03 15.62 10.40 52.05

Final 3rd STATE ANNUAL ACTION PLAN (3rd SAAP) FOR FY: 2017-18 to FY 2019-20 OF UTTAR PRADESH UNDER ATAL MISSION FOR
REJUVENATION AND URBAN TRANSFORMATION (AMRUT)
2017
STATE MISSION DIRECTORATE (AMRUT) UTTAR PRADESH, 8TH FLOOR, INDIRA BHAWAN, ASHOK MARG, LUCKNOW-226001 249 | P a g e
Table 3.3: SAAP- ULB Wise Source of Funds for All Sectors Name of State- Uttar Pradesh 3rd SAAP: FY 2017-18 to 2019-20
SN (Amount in Rs Crore)
Name of ULB Centre State ULB Convergence Others
(e.g.
incentive)
Total
14th
FC
Others Total 14th
FC
Others Total
1 2 3 4 5 6 7 8 9 10 11 12
13 Name of City : Ballia
Water Supply 5.61 3.37 2.24 11.22
Sewerage & Septage Management 19.93 11.96 7.97 39.86
Park & Green Space 0.72 0.43 0.29 1.44
Total: 26.26 15.76 10.50 52.52
14 Name of City : Banda
Water Supply 135.21 81.13 54.08 270.42
Sewerage & Septage Management 22.24 13.34 8.90 44.48
Park & Green Space 1.99 1.19 0.79 3.97
Total: 159.44 95.66 63.77 318.87
15 Name of City : Baraut
Water Supply 6.47 3.88 2.58 12.93
Sewerage & Septage Management 5.00 3.00 2.00 10.00
Park & Green Space 0.60 0.36 0.24 1.20
Total: 12.07 7.24 4.82 24.13
16 Name of City : Basti
Water Supply 7.97 4.78 3.19 15.94
Sewerage & Septage Management 4.00 2.40 1.60 8.00
Park & Green Space 2.26 1.36 0.90 4.52
Total: 14.23 8.54 5.69 28.46
17 Name of City : Budaun
Water Supply 5.00 3.00 2.00 10.00
Sewerage & Septage Management 5.00 3.00 2.00 10.00
Park & Green Space 0.75 0.45 0.30 1.50
Total: 10.75 6.45 4.30 21.50

Final 3rd STATE ANNUAL ACTION PLAN (3rd SAAP) FOR FY: 2017-18 to FY 2019-20 OF UTTAR PRADESH UNDER ATAL MISSION FOR
REJUVENATION AND URBAN TRANSFORMATION (AMRUT)
2017
STATE MISSION DIRECTORATE (AMRUT) UTTAR PRADESH, 8TH FLOOR, INDIRA BHAWAN, ASHOK MARG, LUCKNOW-226001 250 | P a g e
Table 3.3: SAAP- ULB Wise Source of Funds for All Sectors Name of State- Uttar Pradesh 3rd SAAP: FY 2017-18 to 2019-20
SN (Amount in Rs Crore)
Name of ULB Centre State ULB Convergence Others
(e.g.
incentive)
Total
14th
FC
Others Total 14th
FC
Others Total
1 2 3 4 5 6 7 8 9 10 11 12
18 Name of City : Bulandshahar
Water Supply 4.15 2.49 1.66 8.30
Sewerage & Septage Management 170.54 102.32 68.21 341.07
Park & Green Space 0.88 0.53 0.34 1.75
Total: 175.57 105.34 70.21 351.12
19 Name of City : Chandausi
Water Supply 21.18 12.71 8.47 42.36
Sewerage & Septage Management 2.50 1.50 1.00 5.00
Park & Green Space 0.65 0.39 0.25 1.29
Total: 24.33 14.60 9.72 48.65
20 Name of City : Deoria
Water Supply 8.40 5.04 3.36 16.80
Sewerage & Septage Management 0.00 0.00 0.00 0.00
Park & Green Space 1.40 0.84 0.56 2.80
Total: 9.80 5.88 3.92 19.60
21 Name of City : Etah
Water Supply 7.68 4.61 3.07 15.36
Sewerage & Septage Management 69.00 41.40 27.60 138.00
Park & Green Space 1.27 0.76 0.50 2.53
Total: 77.95 46.77 31.17 155.89
22 Name of City : Etawah
Water Supply 0.00 0.00 0.00 0.00
Sewerage & Septage Management 4.00 2.40 1.60 8.00
Park & Green Space 0.87 0.52 0.34 1.73
Total: 4.87 2.92 1.94 9.73

Final 3rd STATE ANNUAL ACTION PLAN (3rd SAAP) FOR FY: 2017-18 to FY 2019-20 OF UTTAR PRADESH UNDER ATAL MISSION FOR
REJUVENATION AND URBAN TRANSFORMATION (AMRUT)
2017
STATE MISSION DIRECTORATE (AMRUT) UTTAR PRADESH, 8TH FLOOR, INDIRA BHAWAN, ASHOK MARG, LUCKNOW-226001 251 | P a g e
Table 3.3: SAAP- ULB Wise Source of Funds for All Sectors Name of State- Uttar Pradesh 3rd SAAP: FY 2017-18 to 2019-20
SN (Amount in Rs Crore)
Name of ULB Centre State ULB Convergence Others
(e.g.
incentive)
Total
14th
FC
Others Total 14th
FC
Others Total
1 2 3 4 5 6 7 8 9 10 11 12
23 Name of City : Faizabad
Water Supply 12.61 7.57 5.04 25.22
Sewerage & Septage Management 0.00 0.00 0.00 0.00
Park & Green Space 0.91 0.55 0.36 1.82
Total: 13.52 8.12 5.40 27.04
24 Name of City : Farrukhabad
Water Supply 5.13 3.08 2.05 10.26
Sewerage & Septage Management 3.50 2.10 1.40 7.00
Park & Green Space 1.07 0.64 0.43 2.14
Total: 9.70 5.82 3.88 19.40
25 Name of City : Fatehpur
Water Supply 1.50 0.90 0.60 3.00
Sewerage & Septage Management 7.50 4.50 3.00 15.00
Park & Green Space 0.72 0.43 0.28 1.43
Total: 9.72 5.83 3.88 19.43
26 Name of City : Ghazipur
Water Supply 8.97 5.38 3.58 17.93
Sewerage & Septage Management 90.00 54.00 36.00 180.00
Park & Green Space 0.64 0.38 0.25 1.27
Total: 99.61 59.76 39.83 199.20
27 Name of City : Gonda
Water Supply 4.56 2.74 1.82 9.12
Sewerage & Septage Management 0.00 0.00 0.00 0.00
Park & Green Space 0.64 0.38 0.26 1.28
Total: 5.20 3.12 2.08 10.40

Final 3rd STATE ANNUAL ACTION PLAN (3rd SAAP) FOR FY: 2017-18 to FY 2019-20 OF UTTAR PRADESH UNDER ATAL MISSION FOR
REJUVENATION AND URBAN TRANSFORMATION (AMRUT)
2017
STATE MISSION DIRECTORATE (AMRUT) UTTAR PRADESH, 8TH FLOOR, INDIRA BHAWAN, ASHOK MARG, LUCKNOW-226001 252 | P a g e
Table 3.3: SAAP- ULB Wise Source of Funds for All Sectors Name of State- Uttar Pradesh 3rd SAAP: FY 2017-18 to 2019-20
SN (Amount in Rs Crore)
Name of ULB Centre State ULB Convergence Others
(e.g.
incentive)
Total
14th
FC
Others Total 14th
FC
Others Total
1 2 3 4 5 6 7 8 9 10 11 12
28 Name of City : Hapur
Water Supply 16.63 9.98 6.65 33.26
Sewerage & Septage Management 57.00 34.20 22.80 114.00
Park & Green Space 1.60 0.96 0.63 3.19
Total: 75.23 45.14 30.08 150.45
29 Name of City : Hardoi
Water Supply 16.04 9.62 6.42 32.08
Sewerage & Septage Management 0.00 0.00 0.00 0.00
Park & Green Space 0.45 0.27 0.17 0.89
Total: 16.49 9.89 6.59 32.97
30 Name of City : Hathras
Water Supply 25.51 15.30 10.20 51.01
Sewerage & Septage Management 3.50 2.10 1.40 7.00
Park & Green Space 1.56 0.94 0.62 3.12
Total: 30.57 18.34 12.22 61.13
31 Name of City : Jaunpur
Water Supply 15.00 9.00 6.00 30.00
Sewerage & Septage Management 43.73 26.24 17.49 87.46
Park & Green Space 0.85 0.51 0.33 1.69
Total: 59.58 35.75 23.82 119.15
32 Name of City : Kasganj
Water Supply 16.28 9.77 6.51 32.56
Sewerage & Septage Management 4.00 2.40 1.60 8.00
Park & Green Space 0.64 0.38 0.26 1.28
Total: 20.92 12.55 8.37 41.84

Final 3rd STATE ANNUAL ACTION PLAN (3rd SAAP) FOR FY: 2017-18 to FY 2019-20 OF UTTAR PRADESH UNDER ATAL MISSION FOR
REJUVENATION AND URBAN TRANSFORMATION (AMRUT)
2017
STATE MISSION DIRECTORATE (AMRUT) UTTAR PRADESH, 8TH FLOOR, INDIRA BHAWAN, ASHOK MARG, LUCKNOW-226001 253 | P a g e
Table 3.3: SAAP- ULB Wise Source of Funds for All Sectors Name of State- Uttar Pradesh 3rd SAAP: FY 2017-18 to 2019-20
SN (Amount in Rs Crore)
Name of ULB Centre State ULB Convergence Others
(e.g.
incentive)
Total
14th
FC
Others Total 14th
FC
Others Total
1 2 3 4 5 6 7 8 9 10 11 12
33 Name of City : Khurja
Water Supply 4.45 2.67 1.78 8.90
Sewerage & Septage Management 5.00 3.00 2.00 10.00
Park & Green Space 0.55 0.33 0.22 1.10
Total: 10.00 6.00 4.00 20.00
34 Name of City : Lakhimpur
Water Supply 28.64 17.18 11.46 57.28
Sewerage & Septage Management 0.00 0.00 0.00 0.00
Park & Green Space 0.88 0.53 0.35 1.76
Total: 29.52 17.71 11.81 59.04
35 Name of City : Lalitpur
Water Supply 11.75 7.05 4.70 23.50
Sewerage & Septage Management 5.00 3.00 2.00 10.00
Park & Green Space 0.86 0.52 0.34 1.72
Total: 17.61 10.57 7.04 35.22
36 Name of City : Loni
Water Supply 10.70 6.42 4.28 21.40
Sewerage & Septage Management 45.63 27.38 18.25 91.26
Park & Green Space 1.61 0.97 0.64 3.22
Total: 57.94 34.77 23.17 115.88
37 Name of City : Mainpuri
Water Supply 18.57 11.14 7.43 37.14
Sewerage & Septage Management 15.50 9.30 6.20 31.00
Park & Green Space 0.92 0.55 0.36 1.83
Total: 34.99 20.99 13.99 69.97

Final 3rd STATE ANNUAL ACTION PLAN (3rd SAAP) FOR FY: 2017-18 to FY 2019-20 OF UTTAR PRADESH UNDER ATAL MISSION FOR
REJUVENATION AND URBAN TRANSFORMATION (AMRUT)
2017
STATE MISSION DIRECTORATE (AMRUT) UTTAR PRADESH, 8TH FLOOR, INDIRA BHAWAN, ASHOK MARG, LUCKNOW-226001 254 | P a g e
Table 3.3: SAAP- ULB Wise Source of Funds for All Sectors Name of State- Uttar Pradesh 3rd SAAP: FY 2017-18 to 2019-20
SN (Amount in Rs Crore)
Name of ULB Centre State ULB Convergence Others
(e.g.
incentive)
Total
14th
FC
Others Total 14th
FC
Others Total
1 2 3 4 5 6 7 8 9 10 11 12
38 Name of City : Mathura
Water Supply 154.40 92.64 61.76 308.80
Sewerage & Septage Management 66.00 39.60 26.40 132.00
Park & Green Space 1.30 0.78 0.51 2.59
Total: 221.70 133.02 88.67 443.39
39 Name of City : Maunath
Water Supply 14.78 8.87 5.91 29.56
Sewerage & Septage Management 5.00 3.00 2.00 10.00
Park & Green Space 1.57 0.94 0.63 3.14
Total: 21.35 12.81 8.54 42.70
40 Name of City : Mirzapur
Water Supply 67.85 40.71 27.14 135.70
Sewerage & Septage Management 50.00 30.00 20.00 100.00
Park & Green Space 0.76 0.45 0.30 1.51
Total: 118.61 71.16 47.44 237.21
41 Name of City : Modinagar
Water Supply 10.33 6.20 4.13 20.66
Sewerage & Septage Management 149.50 89.70 59.80 299.00
Park & Green Space 0.72 0.43 0.28 1.43
Total: 160.55 96.33 64.21 321.09
42 Name of City : Mughalsarai
Water Supply 20.74 12.44 8.29 41.47
Sewerage & Septage Management 9.40 5.64 3.76 18.80
Park & Green Space 0.20 0.12 0.08 0.40
Total: 30.34 18.20 12.13 60.67

Final 3rd STATE ANNUAL ACTION PLAN (3rd SAAP) FOR FY: 2017-18 to FY 2019-20 OF UTTAR PRADESH UNDER ATAL MISSION FOR
REJUVENATION AND URBAN TRANSFORMATION (AMRUT)
2017
STATE MISSION DIRECTORATE (AMRUT) UTTAR PRADESH, 8TH FLOOR, INDIRA BHAWAN, ASHOK MARG, LUCKNOW-226001 255 | P a g e
Table 3.3: SAAP- ULB Wise Source of Funds for All Sectors Name of State- Uttar Pradesh 3rd SAAP: FY 2017-18 to 2019-20
SN (Amount in Rs Crore)
Name of ULB Centre State ULB Convergence Others
(e.g.
incentive)
Total
14th
FC
Others Total 14th
FC
Others Total
1 2 3 4 5 6 7 8 9 10 11 12
43 Name of City : Muzaffarnagar
Water Supply 1.78 1.07 0.71 3.56
Sewerage & Septage Management 27.96 16.78 11.18 55.92
Park & Green Space 2.12 1.27 0.84 4.23
Total: 31.86 19.12 12.73 63.71
44 Name of City : Orai
Water Supply 13.47 8.08 5.39 26.94
Sewerage & Septage Management 5.00 3.00 2.00 10.00
Park & Green Space 1.02 0.61 0.40 2.03
Total: 19.49 11.69 7.79 38.97
45 Name of City : Pilibhit
Water Supply 21.87 13.12 8.75 43.74
Sewerage & Septage Management 0.00 0.00 0.00 0.00
Park & Green Space 0.72 0.43 0.28 1.43
Total: 22.59 13.55 9.03 45.17
46 Name of City : Raibareli
Water Supply 26.55 15.93 10.62 53.10
Sewerage & Septage Management 124.00 74.40 49.60 248.00
Park & Green Space 0.75 0.45 0.29 1.49
Total: 151.30 90.78 60.51 302.59
47 Name of City : Rampur
Water Supply 9.19 5.51 3.68 18.38
Sewerage & Septage Management 63.00 37.80 25.20 126.00
Park & Green Space 0.99 0.59 0.39 1.97
Total: 73.18 43.90 29.27 146.35
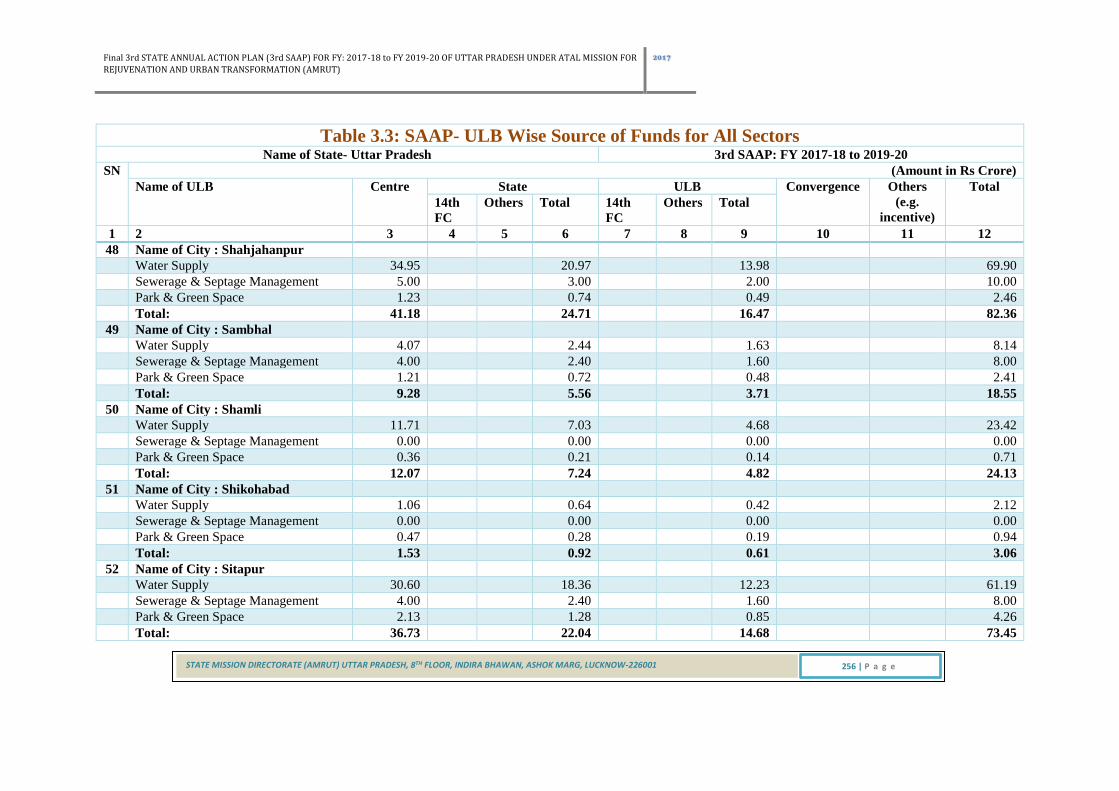
Final 3rd STATE ANNUAL ACTION PLAN (3rd SAAP) FOR FY: 2017-18 to FY 2019-20 OF UTTAR PRADESH UNDER ATAL MISSION FOR
REJUVENATION AND URBAN TRANSFORMATION (AMRUT)
2017
STATE MISSION DIRECTORATE (AMRUT) UTTAR PRADESH, 8TH FLOOR, INDIRA BHAWAN, ASHOK MARG, LUCKNOW-226001 256 | P a g e
Table 3.3: SAAP- ULB Wise Source of Funds for All Sectors Name of State- Uttar Pradesh 3rd SAAP: FY 2017-18 to 2019-20
SN (Amount in Rs Crore)
Name of ULB Centre State ULB Convergence Others
(e.g.
incentive)
Total
14th
FC
Others Total 14th
FC
Others Total
1 2 3 4 5 6 7 8 9 10 11 12
48 Name of City : Shahjahanpur
Water Supply 34.95 20.97 13.98 69.90
Sewerage & Septage Management 5.00 3.00 2.00 10.00
Park & Green Space 1.23 0.74 0.49 2.46
Total: 41.18 24.71 16.47 82.36
49 Name of City : Sambhal
Water Supply 4.07 2.44 1.63 8.14
Sewerage & Septage Management 4.00 2.40 1.60 8.00
Park & Green Space 1.21 0.72 0.48 2.41
Total: 9.28 5.56 3.71 18.55
50 Name of City : Shamli
Water Supply 11.71 7.03 4.68 23.42
Sewerage & Septage Management 0.00 0.00 0.00 0.00
Park & Green Space 0.36 0.21 0.14 0.71
Total: 12.07 7.24 4.82 24.13
51 Name of City : Shikohabad
Water Supply 1.06 0.64 0.42 2.12
Sewerage & Septage Management 0.00 0.00 0.00 0.00
Park & Green Space 0.47 0.28 0.19 0.94
Total: 1.53 0.92 0.61 3.06
52 Name of City : Sitapur
Water Supply 30.60 18.36 12.23 61.19
Sewerage & Septage Management 4.00 2.40 1.60 8.00
Park & Green Space 2.13 1.28 0.85 4.26
Total: 36.73 22.04 14.68 73.45

Final 3rd STATE ANNUAL ACTION PLAN (3rd SAAP) FOR FY: 2017-18 to FY 2019-20 OF UTTAR PRADESH UNDER ATAL MISSION FOR
REJUVENATION AND URBAN TRANSFORMATION (AMRUT)
2017
STATE MISSION DIRECTORATE (AMRUT) UTTAR PRADESH, 8TH FLOOR, INDIRA BHAWAN, ASHOK MARG, LUCKNOW-226001 257 | P a g e
Table 3.3: SAAP- ULB Wise Source of Funds for All Sectors Name of State- Uttar Pradesh 3rd SAAP: FY 2017-18 to 2019-20
SN (Amount in Rs Crore)
Name of ULB Centre State ULB Convergence Others
(e.g.
incentive)
Total
14th
FC
Others Total 14th
FC
Others Total
1 2 3 4 5 6 7 8 9 10 11 12
53 Name of City : Sultanpur
Water Supply 24.42 14.65 9.77 48.84
Sewerage & Septage Management 5.00 3.00 2.00 10.00
Park & Green Space 1.34 0.80 0.53 2.67
Total: 30.76 18.45 12.30 61.51
54 Name of City : Unnao
Water Supply 72.00 43.20 28.80 144.00
Sewerage & Septage Management 80.80 48.48 32.32 161.60
Park & Green Space 1.07 0.64 0.42 2.13
Total: 153.87 92.32 61.54 307.73
Total-B
Water Supply 1601.59 960.95 640.55 3203.09
Sewerage & Septage Management 1632.10 979.26 652.83 3264.19
Park & Green Space 77.36 46.38 30.68 154.42
Total: (B) 3311.05 1986.59 1324.06 6621.70
Total (A+B)
Water Supply 2766.39 1659.82 1106.42 5532.63
Sewerage & Septage Management 2821.48 1692.88 1128.56 5642.92
Park & Green Space 123.23 73.89 49.00 246.12
Grand Total: 5711.10 3426.59 2283.98 11421.67
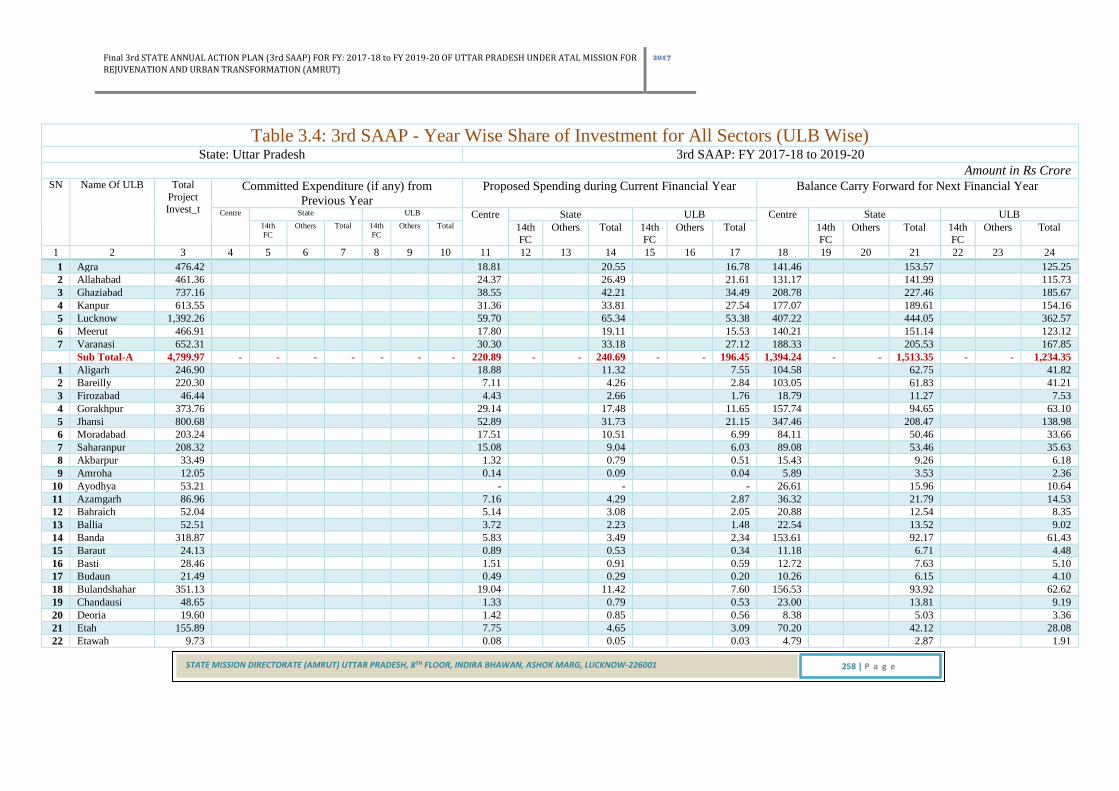
Final 3rd STATE ANNUAL ACTION PLAN (3rd SAAP) FOR FY: 2017-18 to FY 2019-20 OF UTTAR PRADESH UNDER ATAL MISSION FOR
REJUVENATION AND URBAN TRANSFORMATION (AMRUT)
2017
STATE MISSION DIRECTORATE (AMRUT) UTTAR PRADESH, 8TH FLOOR, INDIRA BHAWAN, ASHOK MARG, LUCKNOW-226001 258 | P a g e
Table 3.4: 3rd SAAP - Year Wise Share of Investment for All Sectors (ULB Wise) State: Uttar Pradesh 3rd SAAP: FY 2017-18 to 2019-20
Amount in Rs Crore SN Name Of ULB Total
Project Invest_t
Committed Expenditure (if any) from
Previous Year
Proposed Spending during Current Financial Year Balance Carry Forward for Next Financial Year
Centre State ULB Centre State ULB Centre State ULB 14th
FC
Others Total 14th
FC
Others Total 14th
FC
Others Total 14th
FC
Others Total 14th
FC
Others Total 14th
FC
Others Total
1 2 3 4 5 6 7 8 9 10 11 12 13 14 15 16 17 18 19 20 21 22 23 24
1 Agra 476.42
18.81
20.55
16.78 141.46
153.57
125.25
2 Allahabad 461.36
24.37
26.49
21.61 131.17
141.99
115.73
3 Ghaziabad 737.16
38.55
42.21
34.49 208.78
227.46
185.67
4 Kanpur 613.55
31.36
33.81
27.54 177.07
189.61
154.16
5 Lucknow 1,392.26
59.70
65.34
53.38 407.22
444.05
362.57
6 Meerut 466.91
17.80
19.11
15.53 140.21
151.14
123.12
7 Varanasi 652.31
30.30
33.18
27.12 188.33
205.53
167.85 Sub Total-A 4,799.97 - - - - - - - 220.89 - - 240.69 - - 196.45 1,394.24 - - 1,513.35 - - 1,234.35
1 Aligarh 246.90
18.88
11.32
7.55 104.58
62.75
41.82
2 Bareilly 220.30
7.11
4.26
2.84 103.05
61.83
41.21
3 Firozabad 46.44
4.43
2.66
1.76 18.79
11.27
7.53
4 Gorakhpur 373.76
29.14
17.48
11.65 157.74
94.65
63.10
5 Jhansi 800.68
52.89
31.73
21.15 347.46
208.47
138.98
6 Moradabad 203.24
17.51
10.51
6.99 84.11
50.46
33.66
7 Saharanpur 208.32
15.08
9.04
6.03 89.08
53.46
35.63
8 Akbarpur 33.49
1.32
0.79
0.51 15.43
9.26
6.18
9 Amroha 12.05
0.14
0.09
0.04 5.89
3.53
2.36
10 Ayodhya 53.21
-
-
- 26.61
15.96
10.64
11 Azamgarh 86.96
7.16
4.29
2.87 36.32
21.79
14.53
12 Bahraich 52.04
5.14
3.08
2.05 20.88
12.54
8.35
13 Ballia 52.51
3.72
2.23
1.48 22.54
13.52
9.02
14 Banda 318.87
5.83
3.49
2.34 153.61
92.17
61.43
15 Baraut 24.13
0.89
0.53
0.34 11.18
6.71
4.48
16 Basti 28.46
1.51
0.91
0.59 12.72
7.63
5.10
17 Budaun 21.49
0.49
0.29
0.20 10.26
6.15
4.10
18 Bulandshahar 351.13
19.04
11.42
7.60 156.53
93.92
62.62
19 Chandausi 48.65
1.33
0.79
0.53 23.00
13.81
9.19
20 Deoria 19.60
1.42
0.85
0.56 8.38
5.03
3.36
21 Etah 155.89
7.75
4.65
3.09 70.20
42.12
28.08
22 Etawah 9.73
0.08
0.05
0.03 4.79
2.87
1.91

Final 3rd STATE ANNUAL ACTION PLAN (3rd SAAP) FOR FY: 2017-18 to FY 2019-20 OF UTTAR PRADESH UNDER ATAL MISSION FOR
REJUVENATION AND URBAN TRANSFORMATION (AMRUT)
2017
STATE MISSION DIRECTORATE (AMRUT) UTTAR PRADESH, 8TH FLOOR, INDIRA BHAWAN, ASHOK MARG, LUCKNOW-226001 259 | P a g e
Table 3.4: 3rd SAAP - Year Wise Share of Investment for All Sectors (ULB Wise) State: Uttar Pradesh 3rd SAAP: FY 2017-18 to 2019-20
Amount in Rs Crore SN Name Of ULB Total
Project Invest_t
Committed Expenditure (if any) from
Previous Year
Proposed Spending during Current Financial Year Balance Carry Forward for Next Financial Year
Centre State ULB Centre State ULB Centre State ULB 14th
FC
Others Total 14th
FC
Others Total 14th
FC
Others Total 14th
FC
Others Total 14th
FC
Others Total 14th
FC
Others Total
1 2 3 4 5 6 7 8 9 10 11 12 13 14 15 16 17 18 19 20 21 22 23 24
23 Faizabad 27.04
2.64
1.58
1.06 10.88
6.54
4.34
24 Farrukhabad 19.41
1.15
0.69
0.44 8.56
5.14
3.43
25 Fatehpur 19.42
0.37
0.22
0.15 9.34
5.61
3.73
26 Ghazipur 199.21
10.19
6.11
4.07 89.42
53.65
35.77
27 Gonda 10.39
1.00
0.60
0.39 4.20
2.52
1.68
28 Hapur 150.44
8.55
5.13
3.41 66.67
40.01
26.67
29 Hardoi 32.98
1.26
0.76
0.49 15.23
9.13
6.11
30 Hathras 61.14
3.37
2.02
1.34 27.21
16.32
10.88
31 Jaunpur 119.15
2.11
1.27
0.84 57.47
34.47
22.99
32 Kasganj 41.84
1.85
1.10
0.74 19.08
11.45
7.62
33 Khurja 20.00
0.96
0.57
0.39 9.04
5.43
3.61
34 Lakhimpur 59.04
4.85
2.91
1.94 24.67
14.80
9.87
35 Lalitpur 35.22
1.98
1.19
0.78 15.63
9.37
6.27
36 Loni 115.88
7.41
4.44
2.95 50.53
30.33
20.22
37 Mainpuri 69.98
6.46
3.87
2.58 28.53
17.13
11.41
38 Mathura 443.40
23.22
13.93
9.28 198.48
119.09
79.40
39 Maunath 42.71
2.18
1.30
0.86 19.18
11.51
7.68
40 Mirzapur 237.22
21.14
12.68
8.46 97.47
58.48
38.99
41 Modinagar 321.09
20.07
12.04
8.01 140.48
84.29
56.20
42 Mughalsarai 60.67
3.03
1.82
1.20 27.31
16.38
10.93
43 Muzaffarnagar 63.71
5.23
3.14
2.09 26.63
15.97
10.65
44 Orai 38.98
1.84
1.10
0.72 17.65
10.59
7.08
45 Pilibhit 45.17
1.98
1.19
0.77 20.61
12.36
8.26
46 Raibareli 302.60
14.19
8.52
5.67 137.11
82.26
54.85
47 Rampur 146.35
13.02
7.81
5.21 60.16
36.09
24.06
48 Shahjahanpur 82.36
3.12
1.87
1.25 38.06
22.83
15.23
49 Sambhal 18.55
0.48
0.29
0.18 8.80
5.27
3.53
50 Shamli 24.14
1.37
0.82
0.55 10.70
6.43
4.27
51 Shikohabad 3.05
0.27
0.16
0.10 1.26
0.76
0.50
52 Sitapur 73.46
3.99
2.39
1.59 32.75
19.65
13.09

Final 3rd STATE ANNUAL ACTION PLAN (3rd SAAP) FOR FY: 2017-18 to FY 2019-20 OF UTTAR PRADESH UNDER ATAL MISSION FOR
REJUVENATION AND URBAN TRANSFORMATION (AMRUT)
2017
STATE MISSION DIRECTORATE (AMRUT) UTTAR PRADESH, 8TH FLOOR, INDIRA BHAWAN, ASHOK MARG, LUCKNOW-226001 260 | P a g e
Table 3.4: 3rd SAAP - Year Wise Share of Investment for All Sectors (ULB Wise) State: Uttar Pradesh 3rd SAAP: FY 2017-18 to 2019-20
Amount in Rs Crore SN Name Of ULB Total
Project Invest_t
Committed Expenditure (if any) from
Previous Year
Proposed Spending during Current Financial Year Balance Carry Forward for Next Financial Year
Centre State ULB Centre State ULB Centre State ULB 14th
FC
Others Total 14th
FC
Others Total 14th
FC
Others Total 14th
FC
Others Total 14th
FC
Others Total 14th
FC
Others Total
1 2 3 4 5 6 7 8 9 10 11 12 13 14 15 16 17 18 19 20 21 22 23 24
53 Sultanpur 61.51
3.62
2.17
1.43 27.14
16.28
10.87
54 Unnao 307.74
15.71
9.43
6.28 138.16
82.89
55.27 Sub Total-B 6,621.70 - - - - - - - 389.47 - - 233.58 - - 155.42 2,921.56 - - 1,752.93 - - 1,168.74
Total (A+B) 11,421.67 - - - - - - - 610.36 - - 474.27 - - 351.87 4,315.80 - - 3,266.28 - - 2,403.09

Final 3rd STATE ANNUAL ACTION PLAN (3rd SAAP) FOR FY: 2017-18 to FY 2019-20 OF UTTAR PRADESH UNDER ATAL MISSION FOR
REJUVENATION AND URBAN TRANSFORMATION (AMRUT)
2017
STATE MISSION DIRECTORATE (AMRUT) UTTAR PRADESH, 8TH FLOOR, INDIRA BHAWAN, ASHOK MARG, LUCKNOW-226001 261 | P a g e
Table 3.5: SAAP – State Level Plan for Achieving Service Level Benchmarks in Mission Period: 2015-20 Name of State: Uttar Pradesh Current Mission Period: 2017-18 to 2019-20
SN Proposed
Priority
Projects
Total
Project
Cost (Rs
Cr)
Indicators Baseline Annual Targets based on Master Plan (Increment from the
Baseline Value)
FY 2016 FY 2017 FY 2018 FY 2019 FY 2020
H1 H2
1 2 3 4 5 6 7 8 9 10 11
Water Supply
Water Supply 5532.63 1. Household level coverage of direct water supply connections 46% 59% 62% 69% 73% 76%
2. Per capita quantum of water supplied (LPCD) 142 144 150 151 155 158
3. Quality of water supplied 90% 89% 91% 94% 97% 100%
Sewerage and Septage Management
Sewerage &
Septage Manage_t
5642.92 4. Coverage of latrines (individual or community) 88% 89% 92% 95% 98% 100%
5. Coverage of sewerage network services 10% 12% 16% 20% 24% 25%
Septage Manage_t 483.00 6. Efficiency of Collection of Sewerage 13% 15% 18% 29% 45% 62%
7. Efficiency in treatment 17% 18% 21% 32% 49% 64%
Drainage
8. Coverage of storm water drainage network
Urban Transport
9. Service Coverage of urban transport in the city
10. Availability of urban transport per 1000 population

Final 3rd STATE ANNUAL ACTION PLAN (3rd SAAP) FOR FY: 2017-18 to FY 2019-20 OF UTTAR PRADESH UNDER ATAL MISSION FOR
REJUVENATION AND URBAN TRANSFORMATION (AMRUT)
2017
STATE MISSION DIRECTORATE (AMRUT) UTTAR PRADESH, 8TH FLOOR, INDIRA BHAWAN, ASHOK MARG, LUCKNOW-226001 262 | P a g e
Table 3.6: SAAP – State Leve Plan of Action for Physical and Financial Progress during mission period 2015-20 Name of State: Uttar Pradesh Current Mission Period: 2017-18 to 2019-20
SN Name of ULB Performance Indicator Baseline Mission
Target
Total
Project
Cost
For the FY 2016-17 For the FY 2017-18 For the FY 2018-19 For the FY 2019-20
For Half Year 2 For Half Year 2 For Half Year 2 For Half Year 2 Physical
Progress to
be achieved
Funds
to be
utilized
Physical
Progress
to be
achieved
Funds
to be
utilized
Physical
Progress
to be
achieved
Funds
to be
utilized
Physical
Progress
to be
achieved
Funds to
be utilized
1 2 3 4 5 6 9 10 13 14 17 18 21 22
Sector: Water Supply 1 Agra 1. Household level coverage of direct water supply connections 48% 80% 215.61 20% 52.17 40% 49.03 60% 49.03 100% 65.38
2. Per capita quantum of water supplied (LPCD) 176 176
3. Quality of water supplied 100% 100%
2 Allahabad 1. Household level coverage of direct water supply connections 78% 75% 235.99 20% 56.65 40% 53.80 60% 53.80 100% 71.74
2. Per capita quantum of water supplied (LPCD) 226 226
3. Quality of water supplied 95% 98%
3 Ghaziabad 1. Household level coverage of direct water supply connections 69% 90% 295.37 20% 42.32 40% 75.92 60% 75.92 100% 101.22
2. Per capita quantum of water supplied (LPCD) 120 135
3. Quality of water supplied 94% 96%
4 Kanpur 1. Household level coverage of direct water supply connections 52% 75% 314.99 20% 68.09 40% 74.07 60% 74.07 100% 98.76
2. Per capita quantum of water supplied (LPCD) 210 210
3. Quality of water supplied 95% 100%
5 Lucknow 1. Household level coverage of direct water supply connections 63% 95% 790.00 20% 199.28 40% 177.21 60% 177.21 100% 236.28
2. Per capita quantum of water supplied (LPCD) 189 189
3. Quality of water supplied 95% 95%
6 Meerut 1. Household level coverage of direct water supply connections 51% 90% 127.59 20% 30.52 40% 29.12 60% 29.12 100% 38.83
2. Per capita quantum of water supplied (LPCD) 175 175
3. Quality of water supplied 100% 100%
7 Varanasi 1. Household level coverage of direct water supply connections 67% 95% 349.99 20% 73.80 40% 82.86 60% 82.86 100% 110.48
2. Per capita quantum of water supplied (LPCD) 206 206
3. Quality of water supplied 96% 100%
8 Aligarh 1. Household level coverage of direct water supply connections 37% 75% 144.41 20% 39.96 40% 31.34 60% 31.34 100% 41.78
2. Per capita quantum of water supplied (LPCD) 116 135
3. Quality of water supplied 88% 95%
9 Bareilly 1. Household level coverage of direct water supply connections 47% 65% 40.17 20% 6.93 40% 9.97 60% 9.97 100% 13.30
2. Per capita quantum of water supplied (LPCD) 126 135
3. Quality of water supplied 95% 100%
10 Firozabad 1. Household level coverage of direct water supply connections 40% 75% 2.60 20% 1.04 40% 0.47 60% 0.47 100% 0.62
2. Per capita quantum of water supplied (LPCD) 214 214
3. Quality of water supplied 90% 100%

Final 3rd STATE ANNUAL ACTION PLAN (3rd SAAP) FOR FY: 2017-18 to FY 2019-20 OF UTTAR PRADESH UNDER ATAL MISSION FOR
REJUVENATION AND URBAN TRANSFORMATION (AMRUT)
2017
STATE MISSION DIRECTORATE (AMRUT) UTTAR PRADESH, 8TH FLOOR, INDIRA BHAWAN, ASHOK MARG, LUCKNOW-226001 263 | P a g e
Table 3.6: SAAP – State Leve Plan of Action for Physical and Financial Progress during mission period 2015-20 Name of State: Uttar Pradesh Current Mission Period: 2017-18 to 2019-20
SN Name of ULB Performance Indicator Baseline Mission
Target
Total
Project
Cost
For the FY 2016-17 For the FY 2017-18 For the FY 2018-19 For the FY 2019-20
For Half Year 2 For Half Year 2 For Half Year 2 For Half Year 2 Physical
Progress to
be achieved
Funds
to be
utilized
Physical
Progress
to be
achieved
Funds
to be
utilized
Physical
Progress
to be
achieved
Funds
to be
utilized
Physical
Progress
to be
achieved
Funds to
be utilized
1 2 3 4 5 6 9 10 13 14 17 18 21 22
11 Gorakhpur 1. Household level coverage of direct water supply connections 60% 80% 166.00 20% 48.31 40% 35.31 60% 35.31 100% 47.08
2. Per capita quantum of water supplied (LPCD) 135 135
3. Quality of water supplied 95% 100%
12 Jhansi 1. Household level coverage of direct water supply connections 35% 80% 766.80 20% 104.10 40% 198.81 60% 198.81 100% 265.08
2. Per capita quantum of water supplied (LPCD) 126 135
3. Quality of water supplied 100%
13 Moradabad 1. Household level coverage of direct water supply connections 54% 65% 48.76 20% 10.63 40% 11.44 60% 11.44 100% 15.25
2. Per capita quantum of water supplied (LPCD) 186 186
3. Quality of water supplied 100% 100%
14 Saharanpur 1. Household level coverage of direct water supply connections 32% 65% 71.86 20% 13.52 40% 17.50 60% 17.50 100% 23.34
2. Per capita quantum of water supplied (LPCD) 134 134
3. Quality of water supplied 100% 100%
15 Akbarpur 1. Household level coverage of direct water supply connections 23% 95% 32.45 20% 3.01 40% 8.83 60% 8.83 100% 11.78
2. Per capita quantum of water supplied (LPCD) 76 135
3. Quality of water supplied 90% 100%
16 Amroha 1. Household level coverage of direct water supply connections 32% 90% 0.12 20% 0.02 40% 0.03 60% 0.03 100% 0.04
2. Per capita quantum of water supplied (LPCD) 45 135
3. Quality of water supplied 80% 100%
17 Ayodhya 1. Household level coverage of direct water supply connections 64% 95% 18.01 20% 0.00 40% 5.40 60% 5.40 100% 7.20
2. Per capita quantum of water supplied (LPCD) 148 148
3. Quality of water supplied 93% 93%
18 Azamgarh 1. Household level coverage of direct water supply connections 50% 70% 26.18 20% 5.30 40% 6.26 60% 6.26 100% 8.35
2. Per capita quantum of water supplied (LPCD) 196 196
3. Quality of water supplied 50% 90%
19 Bahraich 1. Household level coverage of direct water supply connections 52% 70% 50.22 20% 10.04 40% 12.05 60% 12.05 100% 16.08
2. Per capita quantum of water supplied (LPCD) 106 135
3. Quality of water supplied 80% 90%
20 Ballia 1. Household level coverage of direct water supply connections 26% 65% 11.22 20% 1.54 40% 2.90 60% 2.90 100% 3.87
2. Per capita quantum of water supplied (LPCD) 138 138
3. Quality of water supplied 100% 100%
21 Banda 1. Household level coverage of direct water supply connections 53% 85% 270.42 20% 7.79 40% 78.79 60% 78.79 100% 105.05

Final 3rd STATE ANNUAL ACTION PLAN (3rd SAAP) FOR FY: 2017-18 to FY 2019-20 OF UTTAR PRADESH UNDER ATAL MISSION FOR
REJUVENATION AND URBAN TRANSFORMATION (AMRUT)
2017
STATE MISSION DIRECTORATE (AMRUT) UTTAR PRADESH, 8TH FLOOR, INDIRA BHAWAN, ASHOK MARG, LUCKNOW-226001 264 | P a g e
Table 3.6: SAAP – State Leve Plan of Action for Physical and Financial Progress during mission period 2015-20 Name of State: Uttar Pradesh Current Mission Period: 2017-18 to 2019-20
SN Name of ULB Performance Indicator Baseline Mission
Target
Total
Project
Cost
For the FY 2016-17 For the FY 2017-18 For the FY 2018-19 For the FY 2019-20
For Half Year 2 For Half Year 2 For Half Year 2 For Half Year 2 Physical
Progress to
be achieved
Funds
to be
utilized
Physical
Progress
to be
achieved
Funds
to be
utilized
Physical
Progress
to be
achieved
Funds
to be
utilized
Physical
Progress
to be
achieved
Funds to
be utilized
1 2 3 4 5 6 9 10 13 14 17 18 21 22
2. Per capita quantum of water supplied (LPCD) 76 135
3. Quality of water supplied 90% 90%
22 Barraut 1. Household level coverage of direct water supply connections 64% 75% 12.93 20% 2.23 40% 3.21 60% 3.21 100% 4.28
2. Per capita quantum of water supplied (LPCD) 190 190
3. Quality of water supplied 90% 100%
23 Basti 1. Household level coverage of direct water supply connections 70% 80% 15.94 20% 3.17 40% 3.83 60% 3.83 100% 5.11
2. Per capita quantum of water supplied (LPCD) 191 191
3. Quality of water supplied 100% 100%
24 Budaun 1. Household level coverage of direct water supply connections 38% 75% 10.00 20% 0.80 40% 2.76 60% 2.76 100% 3.68
2. Per capita quantum of water supplied (LPCD) 216 216
3. Quality of water supplied 95% 95%
25 Bulandshahar 1. Household level coverage of direct water supply connections 33% 65% 8.30 20% 2.07 40% 1.87 60% 1.87 100% 2.49
2. Per capita quantum of water supplied (LPCD) 162 162
3. Quality of water supplied 100% 100%
26 Chandausi 1. Household level coverage of direct water supply connections 40% 60% 42.36 20% 4.85 40% 11.25 60% 11.25 100% 15.00
2. Per capita quantum of water supplied (LPCD) 100 135
3. Quality of water supplied 95% 100%
27 Deoria 1. Household level coverage of direct water supply connections 33% 50% 16.80 20% 3.37 40% 4.03 60% 4.03 100% 5.37
2. Per capita quantum of water supplied (LPCD) 62 135
3. Quality of water supplied 95% 100%
28 Etah 1. Household level coverage of direct water supply connections 34% 55% 15.36 20% 1.99 40% 4.01 60% 4.01 100% 5.35
2. Per capita quantum of water supplied (LPCD) 203
3. Quality of water supplied 90%
29 Etawah 1. Household level coverage of direct water supply connections 60% 80% 0.00 20% 0.00 40% 0.00 60% 0.00 100% 0.00
2. Per capita quantum of water supplied (LPCD) 140
3. Quality of water supplied 95%
30 Faizabad 1. Household level coverage of direct water supply connections 70% 92% 25.22 20% 9.23 40% 4.80 60% 4.80 100% 6.40
2. Per capita quantum of water supplied (LPCD) 145
3. Quality of water supplied 95%
31 Farrukhabad 1. Household level coverage of direct water supply connections 47% 85% 10.26 20% 2.75 40% 2.25 60% 2.25 100% 3.00
2. Per capita quantum of water supplied (LPCD) 120

Final 3rd STATE ANNUAL ACTION PLAN (3rd SAAP) FOR FY: 2017-18 to FY 2019-20 OF UTTAR PRADESH UNDER ATAL MISSION FOR
REJUVENATION AND URBAN TRANSFORMATION (AMRUT)
2017
STATE MISSION DIRECTORATE (AMRUT) UTTAR PRADESH, 8TH FLOOR, INDIRA BHAWAN, ASHOK MARG, LUCKNOW-226001 265 | P a g e
Table 3.6: SAAP – State Leve Plan of Action for Physical and Financial Progress during mission period 2015-20 Name of State: Uttar Pradesh Current Mission Period: 2017-18 to 2019-20
SN Name of ULB Performance Indicator Baseline Mission
Target
Total
Project
Cost
For the FY 2016-17 For the FY 2017-18 For the FY 2018-19 For the FY 2019-20
For Half Year 2 For Half Year 2 For Half Year 2 For Half Year 2 Physical
Progress to
be achieved
Funds
to be
utilized
Physical
Progress
to be
achieved
Funds
to be
utilized
Physical
Progress
to be
achieved
Funds
to be
utilized
Physical
Progress
to be
achieved
Funds to
be utilized
1 2 3 4 5 6 9 10 13 14 17 18 21 22
3. Quality of water supplied 90%
32 Fatehpur 1. Household level coverage of direct water supply connections 43% 75% 3.00 20% 0.60 40% 0.72 60% 0.72 100% 0.96
2. Per capita quantum of water supplied (LPCD) 143 143
3. Quality of water supplied 90%
33 Ghazipur 1. Household level coverage of direct water supply connections 56% 80% 17.93 20% 3.94 40% 4.20 60% 4.20 100% 5.60
2. Per capita quantum of water supplied (LPCD) 300
3. Quality of water supplied 80%
34 Gonda 1. Household level coverage of direct water supply connections 37% 60% 9.12 20% 2.76 40% 1.91 60% 1.91 100% 2.54
2. Per capita quantum of water supplied (LPCD) 281
3. Quality of water supplied 95%
35 Hapur 1. Household level coverage of direct water supply connections 34% 92% 33.26 20% 9.05 40% 7.26 60% 7.26 100% 9.68
2. Per capita quantum of water supplied (LPCD) 91 135
3. Quality of water supplied 97% 100%
36 Hardoi 1. Household level coverage of direct water supply connections 36% 60% 32.08 20% 2.42 40% 8.90 60% 8.90 100% 11.86
2. Per capita quantum of water supplied (LPCD) 90
3. Quality of water supplied 90%
37 Hathras 1. Household level coverage of direct water supply connections 35% 55% 51.01 20% 8.05 40% 12.89 60% 12.89 100% 17.18
2. Per capita quantum of water supplied (LPCD) 100
3. Quality of water supplied 90%
38 Jaunpur 1. Household level coverage of direct water supply connections 60% 95% 30.00 20% 5.41 40% 7.38 60% 7.38 100% 9.84
2. Per capita quantum of water supplied (LPCD) 112
3. Quality of water supplied 50%
39 Kasganj 1. Household level coverage of direct water supply connections 45% 70% 32.56 20% 6.87 40% 7.71 60% 7.71 100% 10.28
2. Per capita quantum of water supplied (LPCD) 96
3. Quality of water supplied 90%
40 Khurja 1. Household level coverage of direct water supply connections 40% 93% 8.90 20% 2.21 40% 2.01 60% 2.01 100% 2.68
2. Per capita quantum of water supplied (LPCD) 158 158
3. Quality of water supplied 94% 100%
41 Lakhimpur 1. Household level coverage of direct water supply connections 49% 65% 57.28 20% 13.01 40% 13.28 60% 13.28 100% 17.71
2. Per capita quantum of water supplied (LPCD) 140
3. Quality of water supplied 90%

Final 3rd STATE ANNUAL ACTION PLAN (3rd SAAP) FOR FY: 2017-18 to FY 2019-20 OF UTTAR PRADESH UNDER ATAL MISSION FOR
REJUVENATION AND URBAN TRANSFORMATION (AMRUT)
2017
STATE MISSION DIRECTORATE (AMRUT) UTTAR PRADESH, 8TH FLOOR, INDIRA BHAWAN, ASHOK MARG, LUCKNOW-226001 266 | P a g e
Table 3.6: SAAP – State Leve Plan of Action for Physical and Financial Progress during mission period 2015-20 Name of State: Uttar Pradesh Current Mission Period: 2017-18 to 2019-20
SN Name of ULB Performance Indicator Baseline Mission
Target
Total
Project
Cost
For the FY 2016-17 For the FY 2017-18 For the FY 2018-19 For the FY 2019-20
For Half Year 2 For Half Year 2 For Half Year 2 For Half Year 2 Physical
Progress to
be achieved
Funds
to be
utilized
Physical
Progress
to be
achieved
Funds
to be
utilized
Physical
Progress
to be
achieved
Funds
to be
utilized
Physical
Progress
to be
achieved
Funds to
be utilized
1 2 3 4 5 6 9 10 13 14 17 18 21 22
42 Lalitpur 1. Household level coverage of direct water supply connections 44% 85% 23.50 20% 3.70 40% 5.94 60% 5.94 100% 7.92
2. Per capita quantum of water supplied (LPCD) 237
3. Quality of water supplied 90%
43 Loni 1. Household level coverage of direct water supply connections 21% 83% 21.40 20% 4.28 40% 5.14 60% 5.14 100% 6.85
2. Per capita quantum of water supplied (LPCD) 88 135
3. Quality of water supplied 70% 100%
44 Mainpuri 1. Household level coverage of direct water supply connections 32% 80% 37.14 20% 6.43 40% 9.21 60% 9.21 100% 12.28
2. Per capita quantum of water supplied (LPCD) 123
3. Quality of water supplied 75%
45 Mathura 1. Household level coverage of direct water supply connections 59% 90% 308.80 20% 51.04 40% 77.33 60% 77.33 100% 103.10
2. Per capita quantum of water supplied (LPCD) 126
3. Quality of water supplied 90%
46 Maunath 1. Household level coverage of direct water supply connections 40% 55% 29.56 20% 4.96 40% 7.38 60% 7.38 100% 9.84
2. Per capita quantum of water supplied (LPCD) 96
3. Quality of water supplied 98%
47 Mirzapur 1. Household level coverage of direct water supply connections 59% 92% 135.70 20% 24.39 40% 33.39 60% 33.39 100% 44.52
2. Per capita quantum of water supplied (LPCD) 105 135
3. Quality of water supplied 95% 100%
48 Modinagar 1. Household level coverage of direct water supply connections 72% 75% 20.66 20% 0.26 40% 6.12 60% 6.12 100% 8.16
2. Per capita quantum of water supplied (LPCD) 191
3. Quality of water supplied 100%
49 Mughalsarai 1. Household level coverage of direct water supply connections 23% 75% 41.47 20% 2.29 40% 11.75 60% 11.75 100% 15.67
2. Per capita quantum of water supplied (LPCD) 76
3. Quality of water supplied 90%
50 Muzaffarnagar 1. Household level coverage of direct water supply connections 66% 75% 3.56 20% 0.71 40% 0.86 60% 0.86 100% 1.14
2. Per capita quantum of water supplied (LPCD) 191
3. Quality of water supplied 90%
51 Orai 1. Household level coverage of direct water supply connections 37% 65% 26.94 20% 2.56 40% 7.31 60% 7.31 100% 9.75
2. Per capita quantum of water supplied (LPCD) 157
3. Quality of water supplied 90%
52 Pilibhit 1. Household level coverage of direct water supply connections 51% 92% 43.74 20% 4.39 40% 11.81 60% 11.81 100% 15.74

Final 3rd STATE ANNUAL ACTION PLAN (3rd SAAP) FOR FY: 2017-18 to FY 2019-20 OF UTTAR PRADESH UNDER ATAL MISSION FOR
REJUVENATION AND URBAN TRANSFORMATION (AMRUT)
2017
STATE MISSION DIRECTORATE (AMRUT) UTTAR PRADESH, 8TH FLOOR, INDIRA BHAWAN, ASHOK MARG, LUCKNOW-226001 267 | P a g e
Table 3.6: SAAP – State Leve Plan of Action for Physical and Financial Progress during mission period 2015-20 Name of State: Uttar Pradesh Current Mission Period: 2017-18 to 2019-20
SN Name of ULB Performance Indicator Baseline Mission
Target
Total
Project
Cost
For the FY 2016-17 For the FY 2017-18 For the FY 2018-19 For the FY 2019-20
For Half Year 2 For Half Year 2 For Half Year 2 For Half Year 2 Physical
Progress to
be achieved
Funds
to be
utilized
Physical
Progress
to be
achieved
Funds
to be
utilized
Physical
Progress
to be
achieved
Funds
to be
utilized
Physical
Progress
to be
achieved
Funds to
be utilized
1 2 3 4 5 6 9 10 13 14 17 18 21 22
2. Per capita quantum of water supplied (LPCD) 117 135
3. Quality of water supplied 90% 100%
53 Raibareli 1. Household level coverage of direct water supply connections 48% 72% 53.10 20% 21.24 40% 9.56 60% 9.56 100% 12.74
2. Per capita quantum of water supplied (LPCD) 66 135
3. Quality of water supplied 90% 100%
54 Rampur 1. Household level coverage of direct water supply connections 18% 42% 18.38 20% 3.51 40% 4.46 60% 4.46 100% 5.95
2. Per capita quantum of water supplied (LPCD) 135 135
3. Quality of water supplied 100% 100%
55 Sambhal 1. Household level coverage of direct water supply connections 25% 40% 8.14 20% 1.01 40% 2.14 60% 2.14 100% 2.85
2. Per capita quantum of water supplied (LPCD) 105 135
3. Quality of water supplied 95% 100%
56 Shahjahanpur 1. Household level coverage of direct water supply connections 58% 75% 69.90 20% 8.55 40% 18.41 60% 18.41 100% 24.54
2. Per capita quantum of water supplied (LPCD) 59
3. Quality of water supplied 100% 100%
57 Shamli 1. Household level coverage of direct water supply connections 56% 80% 23.42 20% 5.05 40% 5.51 60% 5.51 100% 7.35
2. Per capita quantum of water supplied (LPCD) 179
3. Quality of water supplied 80%
58 Shikohabad 1. Household level coverage of direct water supply connections 27% 60% 2.12 20% 0.57 40% 0.47 60% 0.47 100% 0.62
2. Per capita quantum of water supplied (LPCD) 125
3. Quality of water supplied 90%
59 Sitapur 1. Household level coverage of direct water supply connections 38% 65% 61.19 20% 8.45 40% 15.82 60% 15.82 100% 21.10
2. Per capita quantum of water supplied (LPCD) 80
3. Quality of water supplied 80%
60 Sultanpur 1. Household level coverage of direct water supply connections 53% 85% 48.84 20% 13.37 40% 10.64 60% 10.64 100% 14.19
2. Per capita quantum of water supplied (LPCD) 141
3. Quality of water supplied 90%
61 Unnao 1. Household level coverage of direct water supply connections 31% 96% 144.00 20% 20.80 40% 36.96 60% 36.96 100% 49.28
2. Per capita quantum of water supplied (LPCD) 102
3. Quality of water supplied 97%
Sector: Sewerage & Septage Management 1 Agra 4. Coverage of latrines (individual or community) 88% 252.00 20% 48.73 40% 60.98 60% 60.98 100% 81.31

Final 3rd STATE ANNUAL ACTION PLAN (3rd SAAP) FOR FY: 2017-18 to FY 2019-20 OF UTTAR PRADESH UNDER ATAL MISSION FOR
REJUVENATION AND URBAN TRANSFORMATION (AMRUT)
2017
STATE MISSION DIRECTORATE (AMRUT) UTTAR PRADESH, 8TH FLOOR, INDIRA BHAWAN, ASHOK MARG, LUCKNOW-226001 268 | P a g e
Table 3.6: SAAP – State Leve Plan of Action for Physical and Financial Progress during mission period 2015-20 Name of State: Uttar Pradesh Current Mission Period: 2017-18 to 2019-20
SN Name of ULB Performance Indicator Baseline Mission
Target
Total
Project
Cost
For the FY 2016-17 For the FY 2017-18 For the FY 2018-19 For the FY 2019-20
For Half Year 2 For Half Year 2 For Half Year 2 For Half Year 2 Physical
Progress to
be achieved
Funds
to be
utilized
Physical
Progress
to be
achieved
Funds
to be
utilized
Physical
Progress
to be
achieved
Funds
to be
utilized
Physical
Progress
to be
achieved
Funds to
be utilized
1 2 3 4 5 6 9 10 13 14 17 18 21 22
5. Coverage of sewerage network services 41% 57%
6. Efficiency of Collection of Sewerage 67% 85%
7. Efficiency in treatment 72% 100%
2 Aligarh 4. Coverage of latrines (individual or community) 95% 95.00 20% 32.00 40% 18.90 60% 18.90 100% 25.20
5. Coverage of sewerage network services 4% 4%
6. Efficiency of Collection of Sewerage 17% 50%
7. Efficiency in treatment 0% 50%
3 Allahabad 4. Coverage of latrines (individual or community) 98% 214.74 20% 56.88 40% 47.36 60% 47.36 100% 63.14
5. Coverage of sewerage network services 48% 75%
6. Efficiency of Collection of Sewerage 95% 95%
7. Efficiency in treatment 74% 85%
4 Bareilly 4. Coverage of latrines (individual or community) 97% 171.00 20% 16.00 40% 46.50 60% 46.50 100% 62.00
5. Coverage of sewerage network services 41% 60%
6. Efficiency of Collection of Sewerage 0% 70%
7. Efficiency in treatment 0% 50%
5 Firozabad 4. Coverage of latrines (individual or community) 83% 40.00 20% 8.62 40% 9.41 60% 9.41 100% 12.55
5. Coverage of sewerage network services 54% 84%
6. Efficiency of Collection of Sewerage 8% 80%
7. Efficiency in treatment 4% 80%
6 Ghaziabad 4. Coverage of latrines (individual or community) 93% 432.01 20% 97.04 40% 100.49 60% 100.49 100% 133.99
5. Coverage of sewerage network services 84% 91%
6. Efficiency of Collection of Sewerage 73% 91%
7. Efficiency in treatment 73% 90%
7 Gorakhpur 4. Coverage of latrines (individual or community) 94% 198.00 20% 31.75 40% 49.88 60% 49.88 100% 66.50
5. Coverage of sewerage network services 12% 30%
6. Efficiency of Collection of Sewerage 12% 35%
7. Efficiency in treatment 30% 35%
8 Jhansi 4. Coverage of latrines (individual or community) 85% 18.24 20% 1.30 40% 5.08 60% 5.08 100% 6.78
5. Coverage of sewerage network services 0% 0%
6. Efficiency of Collection of Sewerage 0% 50%
7. Efficiency in treatment 0% 50%

Final 3rd STATE ANNUAL ACTION PLAN (3rd SAAP) FOR FY: 2017-18 to FY 2019-20 OF UTTAR PRADESH UNDER ATAL MISSION FOR
REJUVENATION AND URBAN TRANSFORMATION (AMRUT)
2017
STATE MISSION DIRECTORATE (AMRUT) UTTAR PRADESH, 8TH FLOOR, INDIRA BHAWAN, ASHOK MARG, LUCKNOW-226001 269 | P a g e
Table 3.6: SAAP – State Leve Plan of Action for Physical and Financial Progress during mission period 2015-20 Name of State: Uttar Pradesh Current Mission Period: 2017-18 to 2019-20
SN Name of ULB Performance Indicator Baseline Mission
Target
Total
Project
Cost
For the FY 2016-17 For the FY 2017-18 For the FY 2018-19 For the FY 2019-20
For Half Year 2 For Half Year 2 For Half Year 2 For Half Year 2 Physical
Progress to
be achieved
Funds
to be
utilized
Physical
Progress
to be
achieved
Funds
to be
utilized
Physical
Progress
to be
achieved
Funds
to be
utilized
Physical
Progress
to be
achieved
Funds to
be utilized
1 2 3 4 5 6 9 10 13 14 17 18 21 22
9 Kanpur 4. Coverage of latrines (individual or community) 86% 274.99 20% 43.00 40% 69.60 60% 69.60 100% 92.80
5. Coverage of sewerage network services 38% 70%
6. Efficiency of Collection of Sewerage 38% 70%
7. Efficiency in treatment 82% 82%
10 Lucknow 4. Coverage of latrines (individual or community) 90% 584.99 20% 69.00 40% 154.80 60% 154.80 100% 206.40
5. Coverage of sewerage network services 39% 67%
6. Efficiency of Collection of Sewerage 39% 67%
7. Efficiency in treatment 50% 70%
11 Meerut 4. Coverage of latrines (individual or community) 94% 325.00 20% 51.84 40% 81.95 60% 81.95 100% 109.26
5. Coverage of sewerage network services 51% 65%
6. Efficiency of Collection of Sewerage 25% 55%
7. Efficiency in treatment 20% 55%
12 Moradabad 4. Coverage of latrines (individual or community) 87% 145.00 20% 26.54 40% 35.54 60% 35.54 100% 47.38
5. Coverage of sewerage network services 0% 52%
6. Efficiency of Collection of Sewerage 0% 60%
7. Efficiency in treatment 50% 50%
13 Saharanpur 4. Coverage of latrines (individual or community) 98% 133.00 20% 41.20 40% 27.54 60% 27.54 100% 36.72
5. Coverage of sewerage network services 19% 30%
6. Efficiency of Collection of Sewerage 38% 65%
7. Efficiency in treatment 38% 65%
14 Varanasi 4. Coverage of latrines (individual or community) 98% 295.00 20% 49.23 40% 73.73 60% 73.73 100% 98.31
5. Coverage of sewerage network services 60% 77%
6. Efficiency of Collection of Sewerage 40%
7. Efficiency in treatment 100%
15 Akbarpur 4. Coverage of latrines (individual or community) 39% 0.00 20% 0.00 40% 0.00 60% 0.00 100% 0.00
5. Coverage of sewerage network services 0%
6. Efficiency of Collection of Sewerage 0%
7. Efficiency in treatment 0%
16 Amroha 4. Coverage of latrines (individual or community) 91% 10.00 20% 0.00 40% 3.00 60% 3.00 100% 4.00
5. Coverage of sewerage network services 0% 0%
6. Efficiency of Collection of Sewerage 0% 85%

Final 3rd STATE ANNUAL ACTION PLAN (3rd SAAP) FOR FY: 2017-18 to FY 2019-20 OF UTTAR PRADESH UNDER ATAL MISSION FOR
REJUVENATION AND URBAN TRANSFORMATION (AMRUT)
2017
STATE MISSION DIRECTORATE (AMRUT) UTTAR PRADESH, 8TH FLOOR, INDIRA BHAWAN, ASHOK MARG, LUCKNOW-226001 270 | P a g e
Table 3.6: SAAP – State Leve Plan of Action for Physical and Financial Progress during mission period 2015-20 Name of State: Uttar Pradesh Current Mission Period: 2017-18 to 2019-20
SN Name of ULB Performance Indicator Baseline Mission
Target
Total
Project
Cost
For the FY 2016-17 For the FY 2017-18 For the FY 2018-19 For the FY 2019-20
For Half Year 2 For Half Year 2 For Half Year 2 For Half Year 2 Physical
Progress to
be achieved
Funds
to be
utilized
Physical
Progress
to be
achieved
Funds
to be
utilized
Physical
Progress
to be
achieved
Funds
to be
utilized
Physical
Progress
to be
achieved
Funds to
be utilized
1 2 3 4 5 6 9 10 13 14 17 18 21 22
7. Efficiency in treatment 0% 85%
17 Ayodhya 4. Coverage of latrines (individual or community) 83% 35.00 20% 0.00 40% 10.50 60% 10.50 100% 14.00
5. Coverage of sewerage network services 12% 78%
6. Efficiency of Collection of Sewerage 82%
7. Efficiency in treatment 100%
18 Azamgarh 4. Coverage of latrines (individual or community) 90% 56.50 20% 17.37 40% 11.74 60% 11.74 100% 15.65
5. Coverage of sewerage network services 0%
6. Efficiency of Collection of Sewerage 0%
7. Efficiency in treatment 0%
19 Baharaich 4. Coverage of latrines (individual or community) 87% 0.00 20% 0.00 40% 0.00 60% 0.00 100% 0.00
5. Coverage of sewerage network services 0%
6. Efficiency of Collection of Sewerage 0%
7. Efficiency in treatment 0%
20 Ballia 4. Coverage of latrines (individual or community) 88% 39.86 20% 5.97 40% 10.17 60% 10.17 100% 13.56
5. Coverage of sewerage network services 0%
6. Efficiency of Collection of Sewerage 0%
7. Efficiency in treatment 0%
21 Banda 4. Coverage of latrines (individual or community) 58% 44.48 20% 13.79 40% 9.21 60% 9.21 100% 12.28
5. Coverage of sewerage network services 4%
6. Efficiency of Collection of Sewerage 0%
7. Efficiency in treatment 0%
22 Barraut 4. Coverage of latrines (individual or community) 93% 10.00 20% 0.00 40% 3.00 60% 3.00 100% 4.00
5. Coverage of sewerage network services 6% 6%
6. Efficiency of Collection of Sewerage 0% 65%
7. Efficiency in treatment 0% 65%
23 Basti 4. Coverage of latrines (individual or community) 82% 8.00 20% 0.00 40% 2.40 60% 2.40 100% 3.20
5. Coverage of sewerage network services 0% 0%
6. Efficiency of Collection of Sewerage 0% 82%
7. Efficiency in treatment 0% 82%
24 Budaun 4. Coverage of latrines (individual or community) 98% 10.00 20% 0.00 40% 3.00 60% 3.00 100% 4.00
5. Coverage of sewerage network services 0% 0%
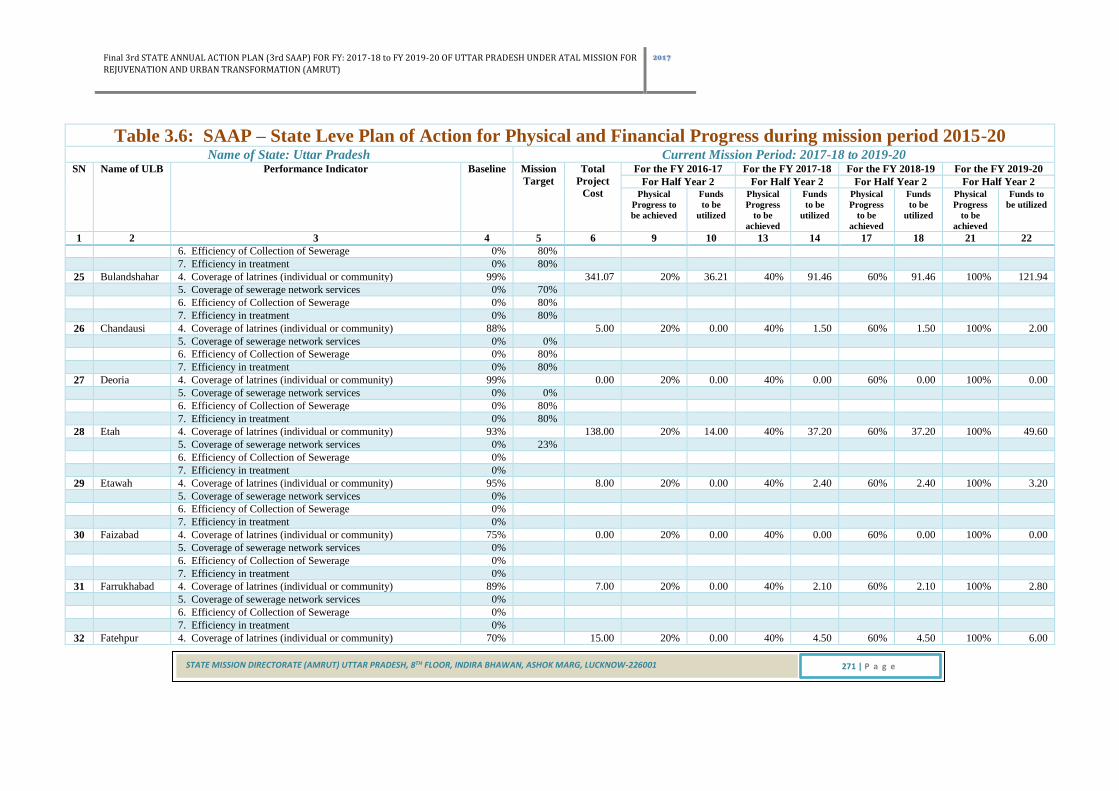
Final 3rd STATE ANNUAL ACTION PLAN (3rd SAAP) FOR FY: 2017-18 to FY 2019-20 OF UTTAR PRADESH UNDER ATAL MISSION FOR
REJUVENATION AND URBAN TRANSFORMATION (AMRUT)
2017
STATE MISSION DIRECTORATE (AMRUT) UTTAR PRADESH, 8TH FLOOR, INDIRA BHAWAN, ASHOK MARG, LUCKNOW-226001 271 | P a g e
Table 3.6: SAAP – State Leve Plan of Action for Physical and Financial Progress during mission period 2015-20 Name of State: Uttar Pradesh Current Mission Period: 2017-18 to 2019-20
SN Name of ULB Performance Indicator Baseline Mission
Target
Total
Project
Cost
For the FY 2016-17 For the FY 2017-18 For the FY 2018-19 For the FY 2019-20
For Half Year 2 For Half Year 2 For Half Year 2 For Half Year 2 Physical
Progress to
be achieved
Funds
to be
utilized
Physical
Progress
to be
achieved
Funds
to be
utilized
Physical
Progress
to be
achieved
Funds
to be
utilized
Physical
Progress
to be
achieved
Funds to
be utilized
1 2 3 4 5 6 9 10 13 14 17 18 21 22
6. Efficiency of Collection of Sewerage 0% 80%
7. Efficiency in treatment 0% 80%
25 Bulandshahar 4. Coverage of latrines (individual or community) 99% 341.07 20% 36.21 40% 91.46 60% 91.46 100% 121.94
5. Coverage of sewerage network services 0% 70%
6. Efficiency of Collection of Sewerage 0% 80%
7. Efficiency in treatment 0% 80%
26 Chandausi 4. Coverage of latrines (individual or community) 88% 5.00 20% 0.00 40% 1.50 60% 1.50 100% 2.00
5. Coverage of sewerage network services 0% 0%
6. Efficiency of Collection of Sewerage 0% 80%
7. Efficiency in treatment 0% 80%
27 Deoria 4. Coverage of latrines (individual or community) 99% 0.00 20% 0.00 40% 0.00 60% 0.00 100% 0.00
5. Coverage of sewerage network services 0% 0%
6. Efficiency of Collection of Sewerage 0% 80%
7. Efficiency in treatment 0% 80%
28 Etah 4. Coverage of latrines (individual or community) 93% 138.00 20% 14.00 40% 37.20 60% 37.20 100% 49.60
5. Coverage of sewerage network services 0% 23%
6. Efficiency of Collection of Sewerage 0%
7. Efficiency in treatment 0%
29 Etawah 4. Coverage of latrines (individual or community) 95% 8.00 20% 0.00 40% 2.40 60% 2.40 100% 3.20
5. Coverage of sewerage network services 0%
6. Efficiency of Collection of Sewerage 0%
7. Efficiency in treatment 0%
30 Faizabad 4. Coverage of latrines (individual or community) 75% 0.00 20% 0.00 40% 0.00 60% 0.00 100% 0.00
5. Coverage of sewerage network services 0%
6. Efficiency of Collection of Sewerage 0%
7. Efficiency in treatment 0%
31 Farrukhabad 4. Coverage of latrines (individual or community) 89% 7.00 20% 0.00 40% 2.10 60% 2.10 100% 2.80
5. Coverage of sewerage network services 0%
6. Efficiency of Collection of Sewerage 0%
7. Efficiency in treatment 0%
32 Fatehpur 4. Coverage of latrines (individual or community) 70% 15.00 20% 0.00 40% 4.50 60% 4.50 100% 6.00

Final 3rd STATE ANNUAL ACTION PLAN (3rd SAAP) FOR FY: 2017-18 to FY 2019-20 OF UTTAR PRADESH UNDER ATAL MISSION FOR
REJUVENATION AND URBAN TRANSFORMATION (AMRUT)
2017
STATE MISSION DIRECTORATE (AMRUT) UTTAR PRADESH, 8TH FLOOR, INDIRA BHAWAN, ASHOK MARG, LUCKNOW-226001 272 | P a g e
Table 3.6: SAAP – State Leve Plan of Action for Physical and Financial Progress during mission period 2015-20 Name of State: Uttar Pradesh Current Mission Period: 2017-18 to 2019-20
SN Name of ULB Performance Indicator Baseline Mission
Target
Total
Project
Cost
For the FY 2016-17 For the FY 2017-18 For the FY 2018-19 For the FY 2019-20
For Half Year 2 For Half Year 2 For Half Year 2 For Half Year 2 Physical
Progress to
be achieved
Funds
to be
utilized
Physical
Progress
to be
achieved
Funds
to be
utilized
Physical
Progress
to be
achieved
Funds
to be
utilized
Physical
Progress
to be
achieved
Funds to
be utilized
1 2 3 4 5 6 9 10 13 14 17 18 21 22
5. Coverage of sewerage network services 0% 0%
6. Efficiency of Collection of Sewerage 0% 70%
7. Efficiency in treatment 0% 70%
33 Ghazipur 4. Coverage of latrines (individual or community) 76% 180.00 20% 36.00 40% 43.20 60% 43.20 100% 57.60
5. Coverage of sewerage network services 0%
6. Efficiency of Collection of Sewerage 0%
7. Efficiency in treatment 0%
34 Gonda 4. Coverage of latrines (individual or community) 90% 0.00 20% 0.00 40% 0.00 60% 0.00 100% 0.00
5. Coverage of sewerage network services 0%
6. Efficiency of Collection of Sewerage 0%
7. Efficiency in treatment 0%
35 Hapur 4. Coverage of latrines (individual or community) 98% 114.00 20% 10.00 40% 31.20 60% 31.20 100% 41.60
5. Coverage of sewerage network services 0% 25%
6. Efficiency of Collection of Sewerage 0% 60%
7. Efficiency in treatment 0% 60%
36 Hardoi 4. Coverage of latrines (individual or community) 84% 0.00 20% 0.00 40% 0.00 60% 0.00 100% 0.00
5. Coverage of sewerage network services 0%
6. Efficiency of Collection of Sewerage 0%
7. Efficiency in treatment 0%
37 Hathras 4. Coverage of latrines (individual or community) 93% 7.00 20% 0.00 40% 2.10 60% 2.10 100% 2.80
5. Coverage of sewerage network services 10%
6. Efficiency of Collection of Sewerage 44%
7. Efficiency in treatment 0%
38 Jaunpur 4. Coverage of latrines (individual or community) 80% 87.46 20% 0.00 40% 26.24 60% 26.24 100% 34.98
5. Coverage of sewerage network services 0%
6. Efficiency of Collection of Sewerage 0%
7. Efficiency in treatment 0%
39 Kasganj 4. Coverage of latrines (individual or community) 87% 8.00 20% 0.00 40% 2.40 60% 2.40 100% 3.20
5. Coverage of sewerage network services 0%
6. Efficiency of Collection of Sewerage 0%
7. Efficiency in treatment 0%

Final 3rd STATE ANNUAL ACTION PLAN (3rd SAAP) FOR FY: 2017-18 to FY 2019-20 OF UTTAR PRADESH UNDER ATAL MISSION FOR
REJUVENATION AND URBAN TRANSFORMATION (AMRUT)
2017
STATE MISSION DIRECTORATE (AMRUT) UTTAR PRADESH, 8TH FLOOR, INDIRA BHAWAN, ASHOK MARG, LUCKNOW-226001 273 | P a g e
Table 3.6: SAAP – State Leve Plan of Action for Physical and Financial Progress during mission period 2015-20 Name of State: Uttar Pradesh Current Mission Period: 2017-18 to 2019-20
SN Name of ULB Performance Indicator Baseline Mission
Target
Total
Project
Cost
For the FY 2016-17 For the FY 2017-18 For the FY 2018-19 For the FY 2019-20
For Half Year 2 For Half Year 2 For Half Year 2 For Half Year 2 Physical
Progress to
be achieved
Funds
to be
utilized
Physical
Progress
to be
achieved
Funds
to be
utilized
Physical
Progress
to be
achieved
Funds
to be
utilized
Physical
Progress
to be
achieved
Funds to
be utilized
1 2 3 4 5 6 9 10 13 14 17 18 21 22
40 Khurja 4. Coverage of latrines (individual or community) 99% 10.00 20% 0.00 40% 3.00 60% 3.00 100% 4.00
5. Coverage of sewerage network services 0% 0%
6. Efficiency of Collection of Sewerage 0% 75%
7. Efficiency in treatment 0% 75%
41 Lakhimpur 4. Coverage of latrines (individual or community) 97% 0.00 20% 0.00 40% 0.00 60% 0.00 100% 0.00
5. Coverage of sewerage network services 0%
6. Efficiency of Collection of Sewerage 0%
7. Efficiency in treatment 0%
42 Lalitpur 4. Coverage of latrines (individual or community) 68% 10.00 20% 0.00 40% 3.00 60% 3.00 100% 4.00
5. Coverage of sewerage network services 0%
6. Efficiency of Collection of Sewerage 0%
7. Efficiency in treatment 0%
43 Loni 4. Coverage of latrines (individual or community) 100% 91.26 20% 13.58 40% 23.30 60% 23.30 100% 31.07
5. Coverage of sewerage network services 0%
6. Efficiency of Collection of Sewerage 0%
7. Efficiency in treatment 50%
44 Mainpuri 4. Coverage of latrines (individual or community) 95% 31.00 20% 8.94 40% 6.62 60% 6.62 100% 8.82
5. Coverage of sewerage network services 12%
6. Efficiency of Collection of Sewerage 27%
7. Efficiency in treatment 13%
45 Mathura 4. Coverage of latrines (individual or community) 97% 132.00 20% 30.97 40% 30.31 60% 30.31 100% 40.41
5. Coverage of sewerage network services 13%
6. Efficiency of Collection of Sewerage 13%
7. Efficiency in treatment 80%
46 Maunath 4. Coverage of latrines (individual or community) 68% 10.00 20% 0.00 40% 3.00 60% 3.00 100% 4.00
5. Coverage of sewerage network services 5%
6. Efficiency of Collection of Sewerage 0%
7. Efficiency in treatment 0%
47 Mirzapur 4. Coverage of latrines (individual or community) 51% 100.00 20% 25.68 40% 22.30 60% 22.30 100% 29.73
5. Coverage of sewerage network services 39% 35%
6. Efficiency of Collection of Sewerage 40% 70%

Final 3rd STATE ANNUAL ACTION PLAN (3rd SAAP) FOR FY: 2017-18 to FY 2019-20 OF UTTAR PRADESH UNDER ATAL MISSION FOR
REJUVENATION AND URBAN TRANSFORMATION (AMRUT)
2017
STATE MISSION DIRECTORATE (AMRUT) UTTAR PRADESH, 8TH FLOOR, INDIRA BHAWAN, ASHOK MARG, LUCKNOW-226001 274 | P a g e
Table 3.6: SAAP – State Leve Plan of Action for Physical and Financial Progress during mission period 2015-20 Name of State: Uttar Pradesh Current Mission Period: 2017-18 to 2019-20
SN Name of ULB Performance Indicator Baseline Mission
Target
Total
Project
Cost
For the FY 2016-17 For the FY 2017-18 For the FY 2018-19 For the FY 2019-20
For Half Year 2 For Half Year 2 For Half Year 2 For Half Year 2 Physical
Progress to
be achieved
Funds
to be
utilized
Physical
Progress
to be
achieved
Funds
to be
utilized
Physical
Progress
to be
achieved
Funds
to be
utilized
Physical
Progress
to be
achieved
Funds to
be utilized
1 2 3 4 5 6 9 10 13 14 17 18 21 22
7. Efficiency in treatment 40% 70%
48 Modinagar 4. Coverage of latrines (individual or community) 95% 299.00 20% 48.25 40% 75.23 60% 75.23 100% 100.30
5. Coverage of sewerage network services 0% 100%
6. Efficiency of Collection of Sewerage 0%
7. Efficiency in treatment 0%
49 Mughalsarai 4. Coverage of latrines (individual or community) 78% 18.80 20% 7.52 40% 3.38 60% 3.38 100% 4.51
5. Coverage of sewerage network services 8%
6. Efficiency of Collection of Sewerage 8%
7. Efficiency in treatment 0%
50 Muzaffarnagar 4. Coverage of latrines (individual or community) 93% 55.92 20% 12.69 40% 12.97 60% 12.97 100% 17.29
5. Coverage of sewerage network services 0%
6. Efficiency of Collection of Sewerage 50%
7. Efficiency in treatment 50%
51 Orai 4. Coverage of latrines (individual or community) 99% 10.00 20% 4.00 40% 1.80 60% 1.80 100% 2.40
5. Coverage of sewerage network services 5%
6. Efficiency of Collection of Sewerage 0%
7. Efficiency in treatment 0%
52 Pilibhit 4. Coverage of latrines (individual or community) 88% 0.00 20% 0.00 40% 0.00 60% 0.00 100% 0.00
5. Coverage of sewerage network services 0% 0%
6. Efficiency of Collection of Sewerage 0% 0%
7. Efficiency in treatment 0% 0%
53 Raibareli 4. Coverage of latrines (individual or community) 95% 248.00 20% 17.60 40% 69.12 60% 69.12 100% 92.16
5. Coverage of sewerage network services 26% 70%
6. Efficiency of Collection of Sewerage 26% 70%
7. Efficiency in treatment 0% 100%
54 Rampur 4. Coverage of latrines (individual or community) 99% 126.00 20% 42.50 40% 25.05 60% 25.05 100% 33.40
5. Coverage of sewerage network services 0% 25%
6. Efficiency of Collection of Sewerage 0% 75%
7. Efficiency in treatment 60% 75%
55 Shahjahanpur 4. Coverage of latrines (individual or community) 97% 10.00 20% 0.00 40% 3.00 60% 3.00 100% 4.00
5. Coverage of sewerage network services 0% 0%

Final 3rd STATE ANNUAL ACTION PLAN (3rd SAAP) FOR FY: 2017-18 to FY 2019-20 OF UTTAR PRADESH UNDER ATAL MISSION FOR
REJUVENATION AND URBAN TRANSFORMATION (AMRUT)
2017
STATE MISSION DIRECTORATE (AMRUT) UTTAR PRADESH, 8TH FLOOR, INDIRA BHAWAN, ASHOK MARG, LUCKNOW-226001 275 | P a g e
Table 3.6: SAAP – State Leve Plan of Action for Physical and Financial Progress during mission period 2015-20 Name of State: Uttar Pradesh Current Mission Period: 2017-18 to 2019-20
SN Name of ULB Performance Indicator Baseline Mission
Target
Total
Project
Cost
For the FY 2016-17 For the FY 2017-18 For the FY 2018-19 For the FY 2019-20
For Half Year 2 For Half Year 2 For Half Year 2 For Half Year 2 Physical
Progress to
be achieved
Funds
to be
utilized
Physical
Progress
to be
achieved
Funds
to be
utilized
Physical
Progress
to be
achieved
Funds
to be
utilized
Physical
Progress
to be
achieved
Funds to
be utilized
1 2 3 4 5 6 9 10 13 14 17 18 21 22
6. Efficiency of Collection of Sewerage 0% 70%
7. Efficiency in treatment 0% 70%
56 Sambhal 4. Coverage of latrines (individual or community) 99% 8.00 20% 0.00 40% 2.40 60% 2.40 100% 3.20
5. Coverage of sewerage network services 0% 0%
6. Efficiency of Collection of Sewerage 0% 80%
7. Efficiency in treatment 0% 80%
57 Shamli 4. Coverage of latrines (individual or community) 90% 0.00 20% 0.00 40% 0.00 60% 0.00 100% 0.00
5. Coverage of sewerage network services 0%
6. Efficiency of Collection of Sewerage 0%
7. Efficiency in treatment 0%
58 Shikohabad 4. Coverage of latrines (individual or community) 86% 0.00 20% 0.00 40% 0.00 60% 0.00 100% 0.00
5. Coverage of sewerage network services 0%
6. Efficiency of Collection of Sewerage 0%
7. Efficiency in treatment 0%
59 Sitapur 4. Coverage of latrines (individual or community) 88% 8.00 20% 0.00 40% 2.40 60% 2.40 100% 3.20
5. Coverage of sewerage network services 3%
6. Efficiency of Collection of Sewerage 29%
7. Efficiency in treatment 0%
60 Sultanpur 4. Coverage of latrines (individual or community) 85% 10.00 20% 0.00 40% 3.00 60% 3.00 100% 4.00
5. Coverage of sewerage network services 0%
6. Efficiency of Collection of Sewerage 0%
7. Efficiency in treatment 50%
61 Unnao 4. Coverage of latrines (individual or community) 81% 161.60 20% 20.64 40% 42.29 60% 42.29 100% 56.38
5. Coverage of sewerage network services 6%
6. Efficiency of Collection of Sewerage 0%
7. Efficiency in treatment 0%

Final 3rd STATE ANNUAL ACTION PLAN (3rd SAAP) FOR FY: 2017-18 to FY 2019-20 OF UTTAR PRADESH UNDER ATAL MISSION FOR
REJUVENATION AND URBAN TRANSFORMATION (AMRUT)
2017
STATE MISSION DIRECTORATE (AMRUT) UTTAR PRADESH, 8TH FLOOR, INDIRA BHAWAN, ASHOK MARG, LUCKNOW-226001 276 | P a g e
Table 4: 3rd SAAP - Broad Proposed Allocations for Administrative and Other Expenses (A&OE) Name of State: Uttar Pradesh FY. 2017-20
Amount Rs. in Crore
SN Items proposed for A&OE Total
Allocation
Committed Expenditure
from previous year (if any)
Proposed
spending for
FY 2017-18
Balance to Carry Forward
2015-16 2016-17 FY 2018-19 FY 2019-20
1 2 3 4 5 6 7 8
1 Preparation of SLIP SAAP and DPR 39.45 15.00 0.00 8.22 8.12 8.12
2 PDMC 26.30 0.00 3.83 4.57 8.95 8.95
3 Procuring Third Party Independent
Review and Monitoring Agency
IRMA
2.63 0.00 0.50 0.75 0.69 0.69
4 Publications (e-Newsletter,
guidelines, brochures etc.)
1.97 0.00 0.50 0.49 0.49 0.49
5 1- Capacity Building and
Training
36.11 0.00 9.02 5.06 11.04 11.04
2- CCBP, if applicable ( Rs 12.49
crore included in above point 5.1)
0.00 0.00 0.00 0.00 0.00 0.00
3- Others 19.35 0.00 4.83 4.83 4.85 4.85
6 Reform implementation 65.75 0.00 11.27 12.59 20.95 20.95
7 Others (SMMU & CMMU and
Supporting Costs)
71.43 0.00 13.73 17.85 19.93 19.93
Total 262.99 15.00 43.68 54.36 75.00 75.00

Final 3rd STATE ANNUAL ACTION PLAN (3rd SAAP) FOR FY: 2017-18 to FY 2019-20 OF UTTAR PRADESH UNDER ATAL MISSION FOR
REJUVENATION AND URBAN TRANSFORMATION (AMRUT)
2017
STATE MISSION DIRECTORATE (AMRUT) UTTAR PRADESH, 8TH FLOOR, INDIRA BHAWAN, ASHOK MARG, LUCKNOW-226001 277 | P a g e
Table 5.2: SAAP-Reforms Type, Steps and Target for AMRUT Cities FY 2016-2017 SN Type Steps Implementation
Timeline
Target to be set by States in SAAP
April to
Sep, 2015
Oct, 2015 to
Mar, 2016
April to
Sep, 2016
Oct, 2016 to
Mar, 2017
1 2 3 4 5 6 7 8
1 E-Governance 1. Coverage with E-MASS (from the date
of hosting the software)
• Registration of Birth, Death and
Marriage.
• Water & Sewerage Charges,
• Grievance Redressal,
• Property Tax,
• Advertisement Tax,
• Issuance of Licenses,
• Building Permissions,
• Mutations,
• Payroll,
• Pension etc.
24 Months
March,
2017
2 Constitution and
professionalization of
municipal cadre
1. Establishment of municipal cadre. 24 Months
March,
2017
2. Cadre linked training.
3 Augmenting double
entry accounting
1. Appointment of internal auditor. 24 Months
March,
2017
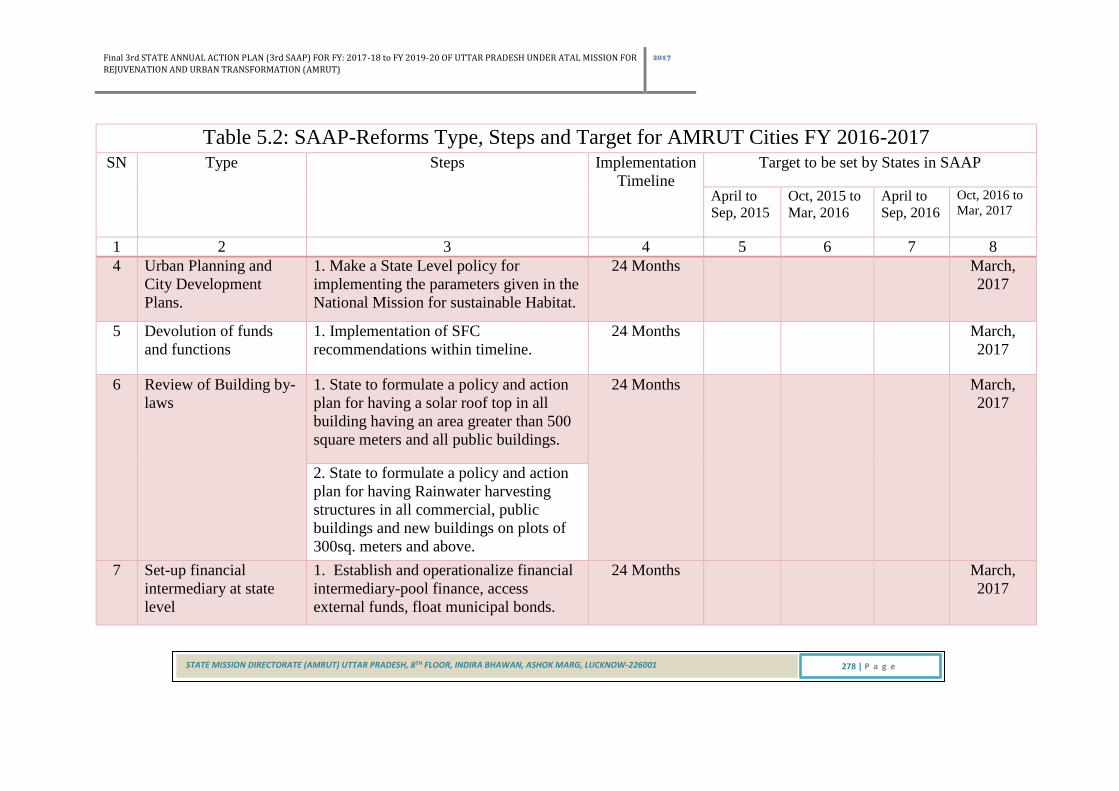
Final 3rd STATE ANNUAL ACTION PLAN (3rd SAAP) FOR FY: 2017-18 to FY 2019-20 OF UTTAR PRADESH UNDER ATAL MISSION FOR
REJUVENATION AND URBAN TRANSFORMATION (AMRUT)
2017
STATE MISSION DIRECTORATE (AMRUT) UTTAR PRADESH, 8TH FLOOR, INDIRA BHAWAN, ASHOK MARG, LUCKNOW-226001 278 | P a g e
Table 5.2: SAAP-Reforms Type, Steps and Target for AMRUT Cities FY 2016-2017 SN Type Steps Implementation
Timeline
Target to be set by States in SAAP
April to
Sep, 2015
Oct, 2015 to
Mar, 2016
April to
Sep, 2016
Oct, 2016 to
Mar, 2017
1 2 3 4 5 6 7 8
4 Urban Planning and
City Development
Plans.
1. Make a State Level policy for
implementing the parameters given in the
National Mission for sustainable Habitat.
24 Months
March,
2017
5 Devolution of funds
and functions
1. Implementation of SFC
recommendations within timeline.
24 Months
March,
2017
6 Review of Building by-
laws
1. State to formulate a policy and action
plan for having a solar roof top in all
building having an area greater than 500
square meters and all public buildings.
24 Months
March,
2017
2. State to formulate a policy and action
plan for having Rainwater harvesting
structures in all commercial, public
buildings and new buildings on plots of
300sq. meters and above.
7 Set-up financial
intermediary at state
level
1. Establish and operationalize financial
intermediary-pool finance, access
external funds, float municipal bonds.
24 Months
March,
2017

Final 3rd STATE ANNUAL ACTION PLAN (3rd SAAP) FOR FY: 2017-18 to FY 2019-20 OF UTTAR PRADESH UNDER ATAL MISSION FOR
REJUVENATION AND URBAN TRANSFORMATION (AMRUT)
2017
STATE MISSION DIRECTORATE (AMRUT) UTTAR PRADESH, 8TH FLOOR, INDIRA BHAWAN, ASHOK MARG, LUCKNOW-226001 279 | P a g e
Table 5.2: SAAP-Reforms Type, Steps and Target for AMRUT Cities FY 2016-2017 SN Type Steps Implementation
Timeline
Target to be set by States in SAAP
April to
Sep, 2015
Oct, 2015 to
Mar, 2016
April to
Sep, 2016
Oct, 2016 to
Mar, 2017
1 2 3 4 5 6 7 8
8 Credit Rating 1. Complete the credit ratings of the
ULBs.
24 Months
March,
2017
9 Energy and Water audit 1. Give incentives for green buildings
(e.g. rebate in property tax or charges
connected to building
permission/development charges.)
24 Months
March,
2017
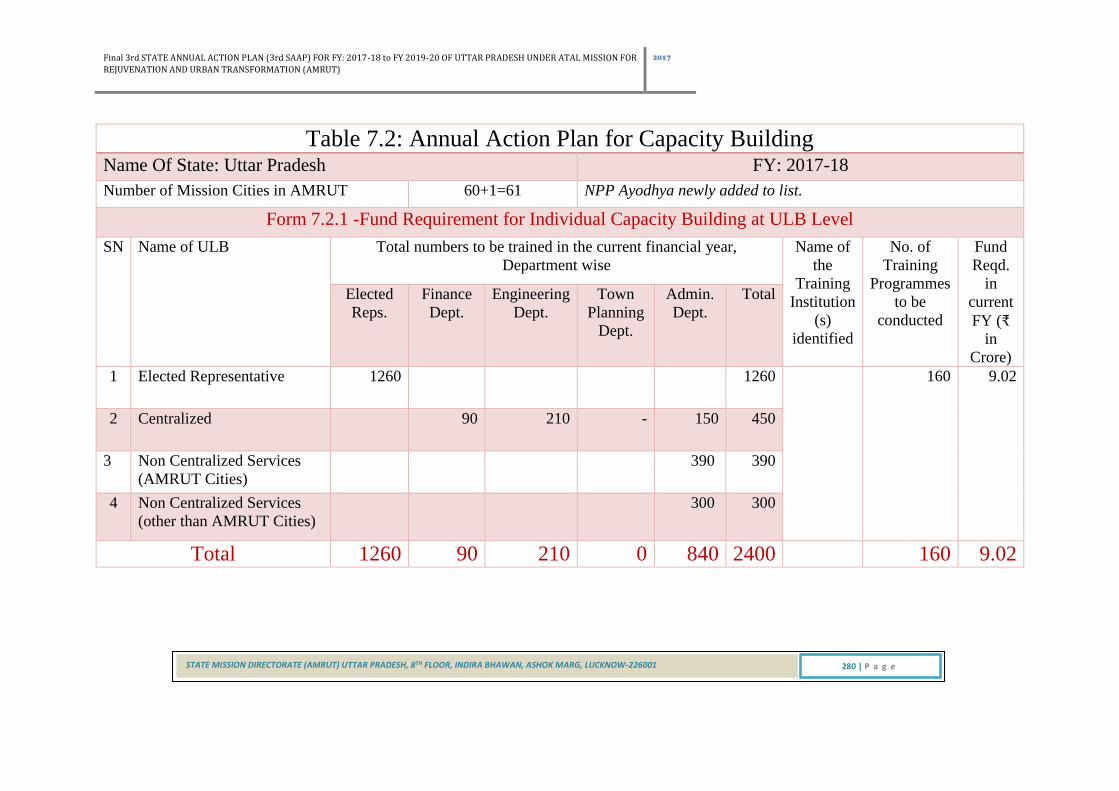
Final 3rd STATE ANNUAL ACTION PLAN (3rd SAAP) FOR FY: 2017-18 to FY 2019-20 OF UTTAR PRADESH UNDER ATAL MISSION FOR
REJUVENATION AND URBAN TRANSFORMATION (AMRUT)
2017
STATE MISSION DIRECTORATE (AMRUT) UTTAR PRADESH, 8TH FLOOR, INDIRA BHAWAN, ASHOK MARG, LUCKNOW-226001 280 | P a g e
Table 7.2: Annual Action Plan for Capacity Building Name Of State: Uttar Pradesh FY: 2017-18
Number of Mission Cities in AMRUT 60+1=61 NPP Ayodhya newly added to list.
Form 7.2.1 -Fund Requirement for Individual Capacity Building at ULB Level
SN Name of ULB Total numbers to be trained in the current financial year,
Department wise
Name of
the
Training
Institution
(s)
identified
No. of
Training
Programmes
to be
conducted
Fund
Reqd.
in
current
FY (₹
in
Crore)
Elected
Reps.
Finance
Dept.
Engineering
Dept.
Town
Planning
Dept.
Admin.
Dept.
Total
1 Elected Representative 1260 1260 160 9.02
2 Centralized 90 210 - 150 450
3 Non Centralized Services
(AMRUT Cities)
390 390
4 Non Centralized Services
(other than AMRUT Cities)
300 300
Total 1260 90 210 0 840 2400 160 9.02

Final 3rd STATE ANNUAL ACTION PLAN (3rd SAAP) FOR FY: 2017-18 to FY 2019-20 OF UTTAR PRADESH UNDER ATAL MISSION FOR
REJUVENATION AND URBAN TRANSFORMATION (AMRUT)
2017
STATE MISSION DIRECTORATE (AMRUT) UTTAR PRADESH, 8TH FLOOR, INDIRA BHAWAN, ASHOK MARG, LUCKNOW-226001 281 | P a g e
Form : 7.2.2 Fund requirement at State Level
Name of State: Uttar Pradesh
FY 2017-18
Figure in Rs Crore
SN State Level activities Total expenditure up to FY:
2016-17
Unspent funds available from
earlier releases
Funds required for the FY
2017-18
1 2 3 4 5
1 RPMC (SMMU) 0.58 8.81 1.85
2 UMC 0.00
3
Others (Workshops,
Seminars, etc.) are approved
by NIUA
1.16
4 DPR/PDMC/IRMA/ E -
Newsletter 14.03
5 Institutional/ Reform 2.59
Total 0.58 8.81 19.63

Final 3rd STATE ANNUAL ACTION PLAN (3rd SAAP) FOR FY: 2017-18 to FY 2019-20 OF UTTAR PRADESH UNDER ATAL MISSION FOR
REJUVENATION AND URBAN TRANSFORMATION (AMRUT)
2017
STATE MISSION DIRECTORATE (AMRUT) UTTAR PRADESH, 8TH FLOOR, INDIRA BHAWAN, ASHOK MARG, LUCKNOW-226001 282 | P a g e
Form : 7.2.3 Total Fund Requirement for Capacity Building
Name of State: Uttar Pradesh
FY 2017-18
SN Fund requirement Individual
(Training &
Workshop)
Institutional/
Reform
CMMU and other
supporting expenses
Others Total (In
Crore)
1
Total release since
start of Mission
(2015) 0.00 0.00 0.00 0.00 0.00
2 Total utilisation-
Central Share 0.00 0.00 0.00 0.00 0.00
3 Balance available-
Central Share 0.00 0.00 0.00 0.00 0.00
4 Amount required-
Central Share 3.90 10.00 16.00 4.83 34.73
5 (4-3) Total fund required for
capacity building in
current FY 2017-18 3.90 10.00 16.00 4.83 34.73

Final 3rd STATE ANNUAL ACTION PLAN (3rd SAAP) FOR FY: 2017-18 to FY 2019-20 OF UTTAR PRADESH UNDER ATAL MISSION FOR
REJUVENATION AND URBAN TRANSFORMATION (AMRUT)
2017
STATE MISSION DIRECTORATE (AMRUT) UTTAR PRADESH, 8TH FLOOR, INDIRA BHAWAN, ASHOK MARG, LUCKNOW-226001 283 | P a g e
Form 7.2.4 Details of Institutional Capacity Building
Q1- Is the State willing to revise their town planning laws and rules to include land pooling?
Response: Yes, Uttar Pradesh state is willing to revise town planning laws and rules to include land pooling.
Q2- List of ULBs willing to have a credit rating done as the first step to issue bonds?
Response: Initially Credit Rating is being done in Cities covered under Smart City Mission thereafter other AMRUT cities to be covered in phased
manner and which proposed to be completed by 31st march 2017.
Q3- Is the State willing to integrate all work done in GIS in order to make GIS useful for decision making in ULBs?
Response: Yes, State of Uttar Pradesh is willing to integrate all work done in GIS to make GIS useful for decision making in ULBs.
Q4- Is the State willing to take assistance for using land as a fiscal tool in ULBs?
Response: In the state of Uttar Pradesh government has already issued a direction to develop vacant land for commercial purpose on public
private partnership basis and also urban local bodies have been directed to dispose of uneconomical land for revenue generation and all earnings
from such land is being pooled as infrastructure fund known has “Awasthapana Nidhi” to be used for infrastructure projects. U.P. Municipal
Corporation Act / Municipalities Act empowers the Urban Local Bodies to impose 2% additional stamp duty as surcharge on transaction of land
in the state and this fund is also used for funding of infrastructure projects in the state. Further both the Act also empowers ULB to impose
Betterment Tax.

Final 3rd STATE ANNUAL ACTION PLAN (3rd SAAP) FOR FY: 2017-18 to FY 2019-20 OF UTTAR PRADESH UNDER ATAL MISSION FOR
REJUVENATION AND URBAN TRANSFORMATION (AMRUT)
2017
STATE MISSION DIRECTORATE (AMRUT) UTTAR PRADESH, 8TH FLOOR, INDIRA BHAWAN, ASHOK MARG, LUCKNOW-226001 284 | P a g e
Q5- Does the State require assistance to professionalize the municipal cadre?
Response: The state of Uttar Pradesh already has 24 different cadre at State Level that is called “Uttar Pradesh Palika Centralized Services”.
These services include Administrative, Engineering, Water Works, Revenue, Tax, Health, Sanitary Services, Veterinary Services, Traffic and
Transportation, Environmental and Office Superintendent.
Q6- Does the State require assistance to reduce non-revenue water in ULBs?
Response: Yes, the State of Uttar Pradesh requires assistance to reduce non-revenue water in ULBs.
Q7- Does the State require assistance to improve property tax assessment and collections in ULBs?
Response: Yes, state requires assistance to improve property tax assessment and collection in ULBs. State government has already constituted
independent Uttar Pradesh Financial Resources Development Board which is assisting ULBs to improve the Property Tax collection and user
charges for enhancing the revenue of the urban local bodies.
Q8- Does the State require assistance to establish a financial intermediary?
Response: Yes, State requires assistance to establish a financial intermediary. State will consider floating of municipal bonds after credit rating
of urban local bodies.

Final 3rd STATE ANNUAL ACTION PLAN (3rd SAAP) FOR FY: 2017-18 to FY 2019-20 OF UTTAR PRADESH UNDER ATAL MISSION FOR
REJUVENATION AND URBAN TRANSFORMATION (AMRUT)
2017
STATE MISSION DIRECTORATE (AMRUT) UTTAR PRADESH, 8TH FLOOR, INDIRA BHAWAN, ASHOK MARG, LUCKNOW-226001 285 | P a g e
Table 7.4: Quarterly Score Cards for States
Financial and physical progress on Capacity Building (State level)
State: Uttar Pradesh FY: 2016-17
Total No of ULBs-61 Quarter ending- December 2016
Number of ULBs
above/below
proportionate
target (from table
7.3 of AMRUT
guideline)
Name of the
department/position
Physical Financial (Rs Crore) Total
number
trained, if
relevant,
upto
quarter
Total funds
utilized
upto
quarter (Rs
Cr)
Total
target in
FY
Proportionate
target upto
quarter
Funds
allocated in
current FY
Proportionate
target upto
quarter
above
Individual training 1500 1500 1.6 1.6 797 0.85
Institutional capacity
building
Below RPMC and UMC
Other- specify
Other-specify

Final 3rd STATE ANNUAL ACTION PLAN (3rd SAAP) FOR FY: 2017-18 to FY 2019-20 OF UTTAR PRADESH UNDER ATAL MISSION FOR
REJUVENATION AND URBAN TRANSFORMATION (AMRUT)
2017
STATE MISSION DIRECTORATE (AMRUT) UTTAR PRADESH, 8TH FLOOR, INDIRA BHAWAN, ASHOK MARG, LUCKNOW-226001 286 | P a g e
Form 7.2.1 - Fund Requirement for Individual Capacity Building at ULB level (ULB wise) Name of State: Uttar Pradesh
FY 2017-18
Sl. No. Name of ULB Total numbers to be trained in the current financial year, department wise Name of the
Training
Institution (s)
identified
No. of
Training
Programmes
to be
conducted
Fund
Reqd. in
current FY
(₹ in
Crore)
Elected
Reps.
Finance
Dept.
Engineering
Dept.
Town
Planning
Dept.
Admin.
Dept.
Total
1 2 3 4 5 6 7 8 9 10 11
1 Achhnera (NPP) 2 1 2 0 3 8
2 Auraiya (NPP) 2 1 2 0 3 8
3 Nanpara (NPP) 2 1 2 0 3 8
4 Rasra (NPP) 2 1 2 0 3 8
5 Atarra (NPP) 2 1 2 0 3 8
6 Dataganj (NPP) 2 1 2 0 3 8
7 Bindki (NPP) 2 1 2 0 3 8
8 Barua Sagar (NPP) 2 1 2 0 3 8
9 Charkhari (NPP) 2 1 2 0 3 8
10 Sardhana (NPP) 2 1 2 0 3 8
11 Ahraura (NPP) 2 1 2 0 3 8
12 Bahjoi (NPP) 2 1 2 0 3 8
13 Bansi (NPP) 2 1 2 0 3 8
14 Ramnagar (NPP) 2 1 2 0 3 8
15 Agra (M Corp.) 2 1 4 0 3 10
16 Bah (NPP) 2 1 0 3 6
17 Etmadpur (NPP) 2 1 0 3 6
18 Fatehpur Sikri (NPP) 2 1 0 3 6
19 Shamsabad (NPP) 2 1 0 3 6
20 Dayalbagh (NP) 2 0 3 5
21 Fatehabad (NP) 2 0 3 5
22 Jagner (NP) 2 0 3 5
23 Kheragarh (NP) 2 0 3 5
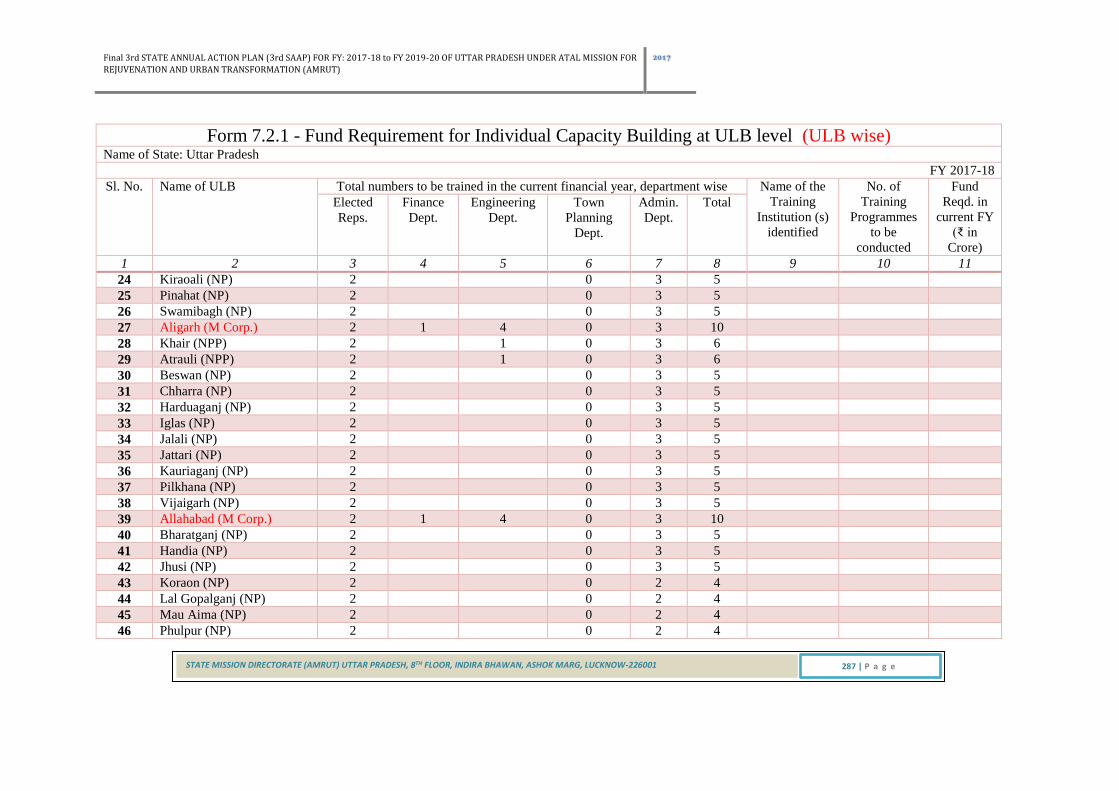
Final 3rd STATE ANNUAL ACTION PLAN (3rd SAAP) FOR FY: 2017-18 to FY 2019-20 OF UTTAR PRADESH UNDER ATAL MISSION FOR
REJUVENATION AND URBAN TRANSFORMATION (AMRUT)
2017
STATE MISSION DIRECTORATE (AMRUT) UTTAR PRADESH, 8TH FLOOR, INDIRA BHAWAN, ASHOK MARG, LUCKNOW-226001 287 | P a g e
Form 7.2.1 - Fund Requirement for Individual Capacity Building at ULB level (ULB wise) Name of State: Uttar Pradesh
FY 2017-18
Sl. No. Name of ULB Total numbers to be trained in the current financial year, department wise Name of the
Training
Institution (s)
identified
No. of
Training
Programmes
to be
conducted
Fund
Reqd. in
current FY
(₹ in
Crore)
Elected
Reps.
Finance
Dept.
Engineering
Dept.
Town
Planning
Dept.
Admin.
Dept.
Total
1 2 3 4 5 6 7 8 9 10 11
24 Kiraoali (NP) 2 0 3 5
25 Pinahat (NP) 2 0 3 5
26 Swamibagh (NP) 2 0 3 5
27 Aligarh (M Corp.) 2 1 4 0 3 10
28 Khair (NPP) 2 1 0 3 6
29 Atrauli (NPP) 2 1 0 3 6
30 Beswan (NP) 2 0 3 5
31 Chharra (NP) 2 0 3 5
32 Harduaganj (NP) 2 0 3 5
33 Iglas (NP) 2 0 3 5
34 Jalali (NP) 2 0 3 5
35 Jattari (NP) 2 0 3 5
36 Kauriaganj (NP) 2 0 3 5
37 Pilkhana (NP) 2 0 3 5
38 Vijaigarh (NP) 2 0 3 5
39 Allahabad (M Corp.) 2 1 4 0 3 10
40 Bharatganj (NP) 2 0 3 5
41 Handia (NP) 2 0 3 5
42 Jhusi (NP) 2 0 3 5
43 Koraon (NP) 2 0 2 4
44 Lal Gopalganj (NP) 2 0 2 4
45 Mau Aima (NP) 2 0 2 4
46 Phulpur (NP) 2 0 2 4

Final 3rd STATE ANNUAL ACTION PLAN (3rd SAAP) FOR FY: 2017-18 to FY 2019-20 OF UTTAR PRADESH UNDER ATAL MISSION FOR
REJUVENATION AND URBAN TRANSFORMATION (AMRUT)
2017
STATE MISSION DIRECTORATE (AMRUT) UTTAR PRADESH, 8TH FLOOR, INDIRA BHAWAN, ASHOK MARG, LUCKNOW-226001 288 | P a g e
Form 7.2.1 - Fund Requirement for Individual Capacity Building at ULB level (ULB wise) Name of State: Uttar Pradesh
FY 2017-18
Sl. No. Name of ULB Total numbers to be trained in the current financial year, department wise Name of the
Training
Institution (s)
identified
No. of
Training
Programmes
to be
conducted
Fund
Reqd. in
current FY
(₹ in
Crore)
Elected
Reps.
Finance
Dept.
Engineering
Dept.
Town
Planning
Dept.
Admin.
Dept.
Total
1 2 3 4 5 6 7 8 9 10 11
47 Shankargarh (NP) 2 0 2 4
48 Sirsa (NP) 2 0 2 4
49 Akbarpur (NPP) 2 1 2 0 3 8
50 Jalalpur (NPP) 2 1 0 2 5
51 Tanda (NPP) 2 1 0 2 5
52 Ashrafpur Kichhauchha (NP) 2 0 2 4
53 Iltifatganj (NP) 2 0 2 4
54 Jais (NPP) 2 1 0 2 5
55 Gauriganj (NPP) 1 0 2 3
56 Amethi (NP) 2 0 2 4
57 Musafirkhana (NP) 2 0 2 4
58 Amroha (NPP) 2 1 2 0 3 8
59 Bachhraon (NPP) 2 0 2 4
60 Dhanaura (NPP) 2 0 2 4
61 Hasanpur (NPP) 2 0 2 4
62 Gajraula (NP) 2 0 3 5
63 Joya (NP) 2 0 2 4
64 Naugawan Sadat (NP) 2 0 2 4
65 Ujhari (NP) 2 0 2 4
66 Achhalda (NP) 2 0 2 4
67 Atasu (NP) 2 0 2 4
68 Babarpur Ajitmal (NP) 2 0 2 4
69 Bidhuna (NP) 2 0 2 4

Final 3rd STATE ANNUAL ACTION PLAN (3rd SAAP) FOR FY: 2017-18 to FY 2019-20 OF UTTAR PRADESH UNDER ATAL MISSION FOR
REJUVENATION AND URBAN TRANSFORMATION (AMRUT)
2017
STATE MISSION DIRECTORATE (AMRUT) UTTAR PRADESH, 8TH FLOOR, INDIRA BHAWAN, ASHOK MARG, LUCKNOW-226001 289 | P a g e
Form 7.2.1 - Fund Requirement for Individual Capacity Building at ULB level (ULB wise) Name of State: Uttar Pradesh
FY 2017-18
Sl. No. Name of ULB Total numbers to be trained in the current financial year, department wise Name of the
Training
Institution (s)
identified
No. of
Training
Programmes
to be
conducted
Fund
Reqd. in
current FY
(₹ in
Crore)
Elected
Reps.
Finance
Dept.
Engineering
Dept.
Town
Planning
Dept.
Admin.
Dept.
Total
1 2 3 4 5 6 7 8 9 10 11
70 Dibiyapur (NP) 2 0 1 3
71 Phaphund (NP) 2 0 1 3
72 Azamgarh (NPP) 2 1 2 0 3 8
73 Mubarakpur (NPP) 2 0 1 3
74 Azmatgarh (NP) 2 0 1 3
75 Atrauliya (NP) 2 0 1 3
76 Bilariaganj (NP) 2 0 1 3
77 Jiyanpur (NP) 2 0 1 3
78 Katghar Lalganj (NP) 2 0 1 3
79 Mahrajganj (NP) 2 0 1 3
80 Mehnagar (NP) 2 0 1 3
81 Nizamabad (NP) 2 0 1 3
82 Phulpur (NP) 2 0 1 3
83 Sarai Mir (NP) 2 0 1 3
84 Mahul 0 1 1
85 Baghpat (NPP) 2 1 2 0 2 7
86 Baraut (NPP) 2 1 2 0 3 8
87 Khekada (NPP) 2 0 1 3
88 Agarwal Mandi (NP) 2 0 1 3
89 Aminagar Sarai (NP) 2 0 1 3
90 Chhaprauli (NP) 2 0 1 3
91 Doghat (NP) 2 0 1 3
92 Tikri (NP) 2 0 1 3

Final 3rd STATE ANNUAL ACTION PLAN (3rd SAAP) FOR FY: 2017-18 to FY 2019-20 OF UTTAR PRADESH UNDER ATAL MISSION FOR
REJUVENATION AND URBAN TRANSFORMATION (AMRUT)
2017
STATE MISSION DIRECTORATE (AMRUT) UTTAR PRADESH, 8TH FLOOR, INDIRA BHAWAN, ASHOK MARG, LUCKNOW-226001 290 | P a g e
Form 7.2.1 - Fund Requirement for Individual Capacity Building at ULB level (ULB wise) Name of State: Uttar Pradesh
FY 2017-18
Sl. No. Name of ULB Total numbers to be trained in the current financial year, department wise Name of the
Training
Institution (s)
identified
No. of
Training
Programmes
to be
conducted
Fund
Reqd. in
current FY
(₹ in
Crore)
Elected
Reps.
Finance
Dept.
Engineering
Dept.
Town
Planning
Dept.
Admin.
Dept.
Total
1 2 3 4 5 6 7 8 9 10 11
93 Bahraich (NPP) 2 1 2 0 3 8
94 Jarwal (NP) 2 0 1 3
95 Risiya (NP) 2 0 1 3
96 Ballia (NPP) 2 1 2 0 3 8
97 Bansdih (NP) 2 0 1 3
98 Belthara Road (NP) 2 0 1 3
99 Chitbara Gaon (NP) 2 0 1 3
100 Maniyar (NP) 2 0 1 3
101 Reoti (NP) 2 0 1 3
102 Sahatwar (NP) 2 0 1 3
103 Sikanderpur (NP) 2 0 1 3
104 Balrampur (NPP) 2 1 2 0 2 7
105 Utraula (NPP) 2 0 1 3
106 Pachperwa (NP) 2 0 1 3
107 Tulsipur (NP) 2 0 1 3
108 Banda (NPP) 2 1 2 0 3 8
109 Baberu (NP) 2 0 1 3
110 Bisanda Buzurg (NP) 2 0 1 3
111 Mataundh (NP) 2 0 1 3
112 Naraini (NP) 2 0 1 3
113 Oran (NP) 2 0 1 3
114 Tindwari (NP) 2 0 1 3
115 Nawabganj (NPP) 2 1 2 0 2 7

Final 3rd STATE ANNUAL ACTION PLAN (3rd SAAP) FOR FY: 2017-18 to FY 2019-20 OF UTTAR PRADESH UNDER ATAL MISSION FOR
REJUVENATION AND URBAN TRANSFORMATION (AMRUT)
2017
STATE MISSION DIRECTORATE (AMRUT) UTTAR PRADESH, 8TH FLOOR, INDIRA BHAWAN, ASHOK MARG, LUCKNOW-226001 291 | P a g e
Form 7.2.1 - Fund Requirement for Individual Capacity Building at ULB level (ULB wise) Name of State: Uttar Pradesh
FY 2017-18
Sl. No. Name of ULB Total numbers to be trained in the current financial year, department wise Name of the
Training
Institution (s)
identified
No. of
Training
Programmes
to be
conducted
Fund
Reqd. in
current FY
(₹ in
Crore)
Elected
Reps.
Finance
Dept.
Engineering
Dept.
Town
Planning
Dept.
Admin.
Dept.
Total
1 2 3 4 5 6 7 8 9 10 11
116 Banki (NP) 2 0 1 3
117 Dariyabad (NP) 2 0 1 3
118 Dewa (NP) 2 0 1 3
119 Fatehpur (NP) 2 0 1 3
120 Haidergarh (NP) 2 0 1 3
121 Zaidpur (NP) 2 0 1 3
122 Ramnagar (NP) 2 0 1 3
123 Satrikh (NP) 2 0 1 3
124 Siddhaur (NP) 2 0 1 3
125 Subeha (NP) 2 0 1 3
126 Tikait Nagar (NP) 2 0 1 3
127 Bareilly (M Corp.) 2 1 4 0 3 10
128 Aonla (NPP) 2 0 1 3
129 Baheri (NPP) 2 0 1 3
130 Faridpur (NPP) 2 0 1 3
131 Nawabganj (NPP) 2 0 1 3
132 Bisharatganj (NP) 2 0 1 3
133 Deoranian (NP) 2 0 1 3
134 Dhaura Tanda (NP) 2 0 1 3
135 Faridpur (NP) 2 0 1 3
136 Fatehganj Purvi (NP) 2 0 1 3
137 Fatehganj Pashchimi (NP) 2 0 1 3
138 Mirganj (NP) 2 0 1 3
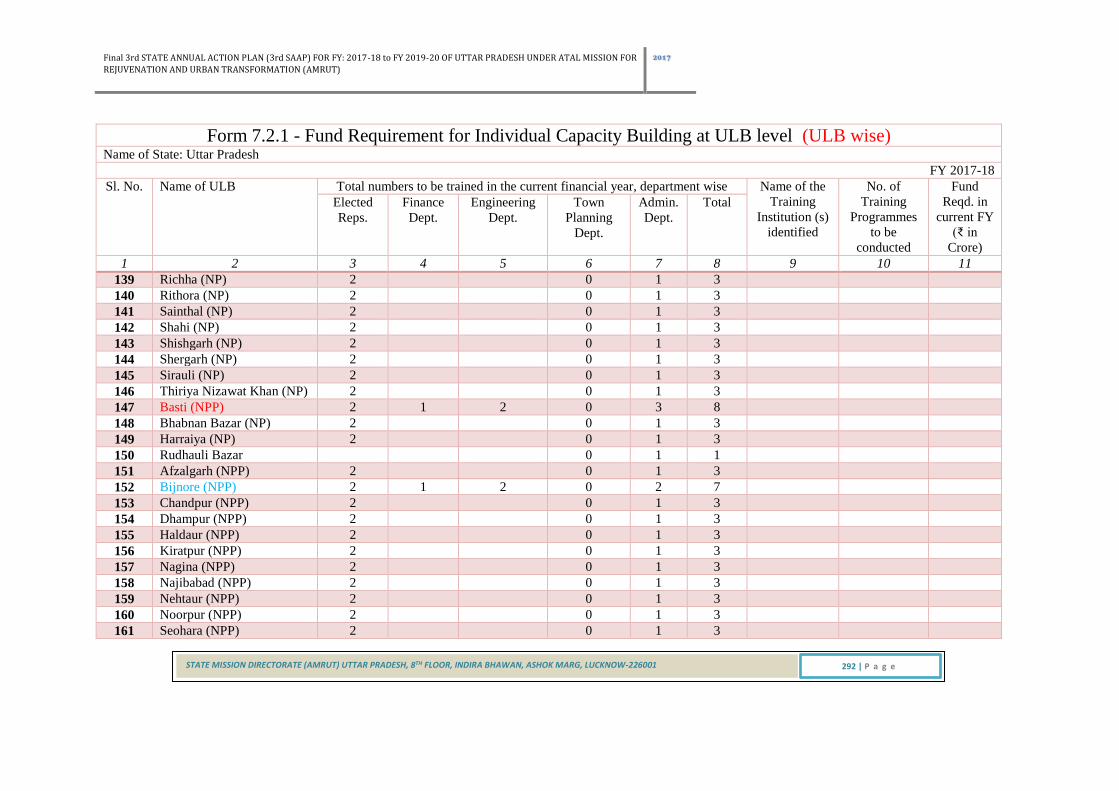
Final 3rd STATE ANNUAL ACTION PLAN (3rd SAAP) FOR FY: 2017-18 to FY 2019-20 OF UTTAR PRADESH UNDER ATAL MISSION FOR
REJUVENATION AND URBAN TRANSFORMATION (AMRUT)
2017
STATE MISSION DIRECTORATE (AMRUT) UTTAR PRADESH, 8TH FLOOR, INDIRA BHAWAN, ASHOK MARG, LUCKNOW-226001 292 | P a g e
Form 7.2.1 - Fund Requirement for Individual Capacity Building at ULB level (ULB wise) Name of State: Uttar Pradesh
FY 2017-18
Sl. No. Name of ULB Total numbers to be trained in the current financial year, department wise Name of the
Training
Institution (s)
identified
No. of
Training
Programmes
to be
conducted
Fund
Reqd. in
current FY
(₹ in
Crore)
Elected
Reps.
Finance
Dept.
Engineering
Dept.
Town
Planning
Dept.
Admin.
Dept.
Total
1 2 3 4 5 6 7 8 9 10 11
139 Richha (NP) 2 0 1 3
140 Rithora (NP) 2 0 1 3
141 Sainthal (NP) 2 0 1 3
142 Shahi (NP) 2 0 1 3
143 Shishgarh (NP) 2 0 1 3
144 Shergarh (NP) 2 0 1 3
145 Sirauli (NP) 2 0 1 3
146 Thiriya Nizawat Khan (NP) 2 0 1 3
147 Basti (NPP) 2 1 2 0 3 8
148 Bhabnan Bazar (NP) 2 0 1 3
149 Harraiya (NP) 2 0 1 3
150 Rudhauli Bazar 0 1 1
151 Afzalgarh (NPP) 2 0 1 3
152 Bijnore (NPP) 2 1 2 0 2 7
153 Chandpur (NPP) 2 0 1 3
154 Dhampur (NPP) 2 0 1 3
155 Haldaur (NPP) 2 0 1 3
156 Kiratpur (NPP) 2 0 1 3
157 Nagina (NPP) 2 0 1 3
158 Najibabad (NPP) 2 0 1 3
159 Nehtaur (NPP) 2 0 1 3
160 Noorpur (NPP) 2 0 1 3
161 Seohara (NPP) 2 0 1 3

Final 3rd STATE ANNUAL ACTION PLAN (3rd SAAP) FOR FY: 2017-18 to FY 2019-20 OF UTTAR PRADESH UNDER ATAL MISSION FOR
REJUVENATION AND URBAN TRANSFORMATION (AMRUT)
2017
STATE MISSION DIRECTORATE (AMRUT) UTTAR PRADESH, 8TH FLOOR, INDIRA BHAWAN, ASHOK MARG, LUCKNOW-226001 293 | P a g e
Form 7.2.1 - Fund Requirement for Individual Capacity Building at ULB level (ULB wise) Name of State: Uttar Pradesh
FY 2017-18
Sl. No. Name of ULB Total numbers to be trained in the current financial year, department wise Name of the
Training
Institution (s)
identified
No. of
Training
Programmes
to be
conducted
Fund
Reqd. in
current FY
(₹ in
Crore)
Elected
Reps.
Finance
Dept.
Engineering
Dept.
Town
Planning
Dept.
Admin.
Dept.
Total
1 2 3 4 5 6 7 8 9 10 11
162 Sherkot (NPP) 2 0 1 3
163 Warhapur (NP) 2 0 1 3
164 Jalalabad (NP) 2 0 1 3
165 Jhalu (NP) 2 0 1 3
166 Mandawar (NP) 2 0 1 3
167 Sahanpur (NP) 2 0 1 3
168 Sahaspur (NP) 2 0 1 3
169 Bilsi (NPP) 2 0 1 3
170 Bisauli (NPP) 2 0 1 3
171 Budaun (NPP) 2 1 2 0 2 7
172 Kakrala (NPP) 2 0 1 3
173 Sahaswan (NPP) 2 0 1 3
174 Ujhani (NPP) 2 0 1 3
175 Allapur (NP) 2 0 1 3
176 Faizganj (NP) 2 0 1 3
177 Gulariya (NP) 2 0 1 3
178 Islamnagar (NP) 2 0 1 3
179 Kachhla (NP) 2 0 1 3
180 Kunwargaon (NP) 2 0 1 3
181 Mundiya (NP) 2 0 1 3
182 Rudayan (NP) 2 0 1 3
183 Saidpur (NP) 2 0 1 3
184 Sakhanu (NP) 2 0 1 3

Final 3rd STATE ANNUAL ACTION PLAN (3rd SAAP) FOR FY: 2017-18 to FY 2019-20 OF UTTAR PRADESH UNDER ATAL MISSION FOR
REJUVENATION AND URBAN TRANSFORMATION (AMRUT)
2017
STATE MISSION DIRECTORATE (AMRUT) UTTAR PRADESH, 8TH FLOOR, INDIRA BHAWAN, ASHOK MARG, LUCKNOW-226001 294 | P a g e
Form 7.2.1 - Fund Requirement for Individual Capacity Building at ULB level (ULB wise) Name of State: Uttar Pradesh
FY 2017-18
Sl. No. Name of ULB Total numbers to be trained in the current financial year, department wise Name of the
Training
Institution (s)
identified
No. of
Training
Programmes
to be
conducted
Fund
Reqd. in
current FY
(₹ in
Crore)
Elected
Reps.
Finance
Dept.
Engineering
Dept.
Town
Planning
Dept.
Admin.
Dept.
Total
1 2 3 4 5 6 7 8 9 10 11
185 Usehat (NP) 2 0 1 3
186 Usawan (NP) 2 0 1 3
187 Wazirganj (NP) 2 0 1 3
188 Anupshahr (NPP) 2 0 1 3
189 Bulandshahr (NPP) 2 1 2 0 3 8
190 Dibai (NPP) 2 0 1 3
191 Gulaoti (NPP) 2 0 1 3
192 Jahangirabad (NPP) 2 0 1 3
193 Khurja (NPP) 2 1 2 0 2 7
194 Sikandrabad (NPP) 2 0 1 3
195 Shikarpur (NPP) 2 0 1 3
196 Siana (NPP) 2 0 1 3
197 Aurangabad (NP) 2 0 1 3
198 Bhawan Bahadurnagar (NP) 2 0 1 3
199 Bugrasi (NP) 2 0 1 3
200 Chhatari (NP) 2 0 1 3
201 Khanpur (NP) 2 0 1 3
202 Naraura (NP) 2 0 1 3
203 Pahasu (NP) 2 0 1 3
204 Kakod (NP) 2 0 1 3
205 Mughalsarai (NPP) 2 1 2 0 2 7
206 Chakia (NP) 2 0 1 3
207 Chandauli (NP) 2 0 1 3

Final 3rd STATE ANNUAL ACTION PLAN (3rd SAAP) FOR FY: 2017-18 to FY 2019-20 OF UTTAR PRADESH UNDER ATAL MISSION FOR
REJUVENATION AND URBAN TRANSFORMATION (AMRUT)
2017
STATE MISSION DIRECTORATE (AMRUT) UTTAR PRADESH, 8TH FLOOR, INDIRA BHAWAN, ASHOK MARG, LUCKNOW-226001 295 | P a g e
Form 7.2.1 - Fund Requirement for Individual Capacity Building at ULB level (ULB wise) Name of State: Uttar Pradesh
FY 2017-18
Sl. No. Name of ULB Total numbers to be trained in the current financial year, department wise Name of the
Training
Institution (s)
identified
No. of
Training
Programmes
to be
conducted
Fund
Reqd. in
current FY
(₹ in
Crore)
Elected
Reps.
Finance
Dept.
Engineering
Dept.
Town
Planning
Dept.
Admin.
Dept.
Total
1 2 3 4 5 6 7 8 9 10 11
208 Saiyad Raza (NP) 2 0 1 3
209 Chitrakootdham Karwi (NPP) 2 1 2 0 2 7
210 Manikpur Sarhat (NP) 2 0 1 3
211 Rajapur (NP) 2 0 1 3
212 Deoria (NPP) 2 1 2 0 2 7
213 Gaura Barhaj (NPP) 2 0 1 3
214 Bhatni Bazar (NP) 2 0 1 3
215 Bhatpar Rani (NP) 2 0 1 3
216 Gauri Bazar (NP) 2 0 1 3
217 Lar (NP) 2 0 1 3
218 Majhauliraj (NP) 2 0 1 3
219 Rampur Karkhana (NP) 2 0 1 3
220 Rudrapur (NP) 2 0 1 3
221 Salempur (NP) 2 0 1 3
222 Aliganj (NPP) 2 0 1 3
223 Jalesar (NPP) 2 0 1 3
224 Marehra (NPP) 2 0 1 3
225 Etah (NPP) 2 1 2 0 2 7
226 Awagarh (NP) 2 0 1 3
227 Nidhauli Kalan (NP) 2 0 1 3
228 Jaithara (NP) 2 0 1 3
229 Raja Ka Rampur (NP) 2 0 1 3
230 Sakit (NP) 2 0 1 3

Final 3rd STATE ANNUAL ACTION PLAN (3rd SAAP) FOR FY: 2017-18 to FY 2019-20 OF UTTAR PRADESH UNDER ATAL MISSION FOR
REJUVENATION AND URBAN TRANSFORMATION (AMRUT)
2017
STATE MISSION DIRECTORATE (AMRUT) UTTAR PRADESH, 8TH FLOOR, INDIRA BHAWAN, ASHOK MARG, LUCKNOW-226001 296 | P a g e
Form 7.2.1 - Fund Requirement for Individual Capacity Building at ULB level (ULB wise) Name of State: Uttar Pradesh
FY 2017-18
Sl. No. Name of ULB Total numbers to be trained in the current financial year, department wise Name of the
Training
Institution (s)
identified
No. of
Training
Programmes
to be
conducted
Fund
Reqd. in
current FY
(₹ in
Crore)
Elected
Reps.
Finance
Dept.
Engineering
Dept.
Town
Planning
Dept.
Admin.
Dept.
Total
1 2 3 4 5 6 7 8 9 10 11
231 Bharthana (NPP) 2 0 1 3
232 Etawah (NPP) 2 1 2 0 2 7
233 Jaswantnagar (NPP) 2 0 1 3
234 Ekdil (NP) 2 0 1 3
235 Lakhna (NP) 2 0 1 3
236 Bakewar (NP) 2 0 1 3
237 Ayodhya (NPP) 2 1 2 0 3 8
238 Faizabad (NPP) 2 1 2 0 2 7
239 Rudauli (NPP) 2 0 1 3
240 Bhadarsa (NP) 2 0 1 3
241 Bikapur (NP) 2 0 1 3
242 Gosainganj (NP) 2 0 1 3
243 Farrukhabad (NPP) 2 1 2 0 2 7
244 Kaimganj (NPP) 2 0 1 3
245 Kamalganj (NP) 2 0 1 3
246 Kampil (NP) 2 0 1 3
247 Mohammadabad (NP) 2 0 1 3
248 Shamsabad (NP) 2 0 1 3
249 Fatehpur (NPP) 2 1 2 0 2 7
250 Bahuwa (NP) 2 0 1 3
251 Hathgaam (NP) 2 0 1 3
252 Khaga (NP) 2 0 1 3
253 Kishunpur (NP) 2 0 1 3

Final 3rd STATE ANNUAL ACTION PLAN (3rd SAAP) FOR FY: 2017-18 to FY 2019-20 OF UTTAR PRADESH UNDER ATAL MISSION FOR
REJUVENATION AND URBAN TRANSFORMATION (AMRUT)
2017
STATE MISSION DIRECTORATE (AMRUT) UTTAR PRADESH, 8TH FLOOR, INDIRA BHAWAN, ASHOK MARG, LUCKNOW-226001 297 | P a g e
Form 7.2.1 - Fund Requirement for Individual Capacity Building at ULB level (ULB wise) Name of State: Uttar Pradesh
FY 2017-18
Sl. No. Name of ULB Total numbers to be trained in the current financial year, department wise Name of the
Training
Institution (s)
identified
No. of
Training
Programmes
to be
conducted
Fund
Reqd. in
current FY
(₹ in
Crore)
Elected
Reps.
Finance
Dept.
Engineering
Dept.
Town
Planning
Dept.
Admin.
Dept.
Total
1 2 3 4 5 6 7 8 9 10 11
254 Kora Jahanabad (NP) 2 0 1 3
255 Firozabad (M Corp.) 2 1 4 0 3 10
256 Shikohabad (NPP) 2 1 2 0 2 7
257 Sirsaganj (NPP) 2 0 1 3
258 Tundla (NPP) 2 0 1 3
259 Jasrana (NP) 2 0 1 3
260 Fariha (NP) 2 0 1 3
261 Dadri (NPP) 2 0 1 3
262 Bilaspur (NP) 2 0 1 3
263 Dankaur (NP) 2 0 1 3
264 Jahangirpur (NP) 2 0 1 3
265 Jewar (NP) 2 0 1 3
266 Rabupura (NP) 2 0 1 3
267 Ghaziabad (M Corp.) 2 1 4 0 3 10
268 Loni (NPP) 2 1 2 0 2 7
269 Modinagar (NPP) 2 1 2 0 2 7
270 Muradnagar (NPP) 2 0 1 3
271 Dasna (NP) 2 0 1 3
272 Faridnagar (NP) 2 0 1 3
273 Niwari (NP) 2 0 1 3
274 Patala (NP) 2 0 1 3
275 Ghazipur (NPP) 2 1 2 0 2 7
276 Zamania (NPP) 2 0 1 3

Final 3rd STATE ANNUAL ACTION PLAN (3rd SAAP) FOR FY: 2017-18 to FY 2019-20 OF UTTAR PRADESH UNDER ATAL MISSION FOR
REJUVENATION AND URBAN TRANSFORMATION (AMRUT)
2017
STATE MISSION DIRECTORATE (AMRUT) UTTAR PRADESH, 8TH FLOOR, INDIRA BHAWAN, ASHOK MARG, LUCKNOW-226001 298 | P a g e
Form 7.2.1 - Fund Requirement for Individual Capacity Building at ULB level (ULB wise) Name of State: Uttar Pradesh
FY 2017-18
Sl. No. Name of ULB Total numbers to be trained in the current financial year, department wise Name of the
Training
Institution (s)
identified
No. of
Training
Programmes
to be
conducted
Fund
Reqd. in
current FY
(₹ in
Crore)
Elected
Reps.
Finance
Dept.
Engineering
Dept.
Town
Planning
Dept.
Admin.
Dept.
Total
1 2 3 4 5 6 7 8 9 10 11
277 Mohammadabad (NPP) 2 0 1 3
278 Bahadurganj (NP) 2 0 1 3
279 Dildarnagar (NP) 2 0 1 3
280 Jangipur (NP) 2 0 1 3
281 Sadat (NP) 2 0 1 3
282 Saidpur (NP) 2 0 1 3
283 Colonelganj (NPP) 2 0 1 3
284 Gonda (NPP) 2 1 2 0 2 7
285 Nawabganj (NPP) 2 0 1 3
286 Khargupur (NP) 2 0 1 3
287 Katra (NP) 2 0 1 3
288 Mankapur (NP) 2 0 1 3
289 Gorakhpur (M Corp.) 2 1 3 0 3 9
290 Barhalganj (NP) 2 0 1 3
291 Bansgaon (NP) 2 0 1 3
292 Gola Bazar (NP) 2 0 1 3
293 Mundera Bazar (NP) 2 0 1 3
294 Pipiganj (NP) 2 0 1 3
295 Pipraich (NP) 2 0 1 3
296 Sahjanwan (NP) 2 0 1 3
297 Hamirpur (NPP) 2 1 2 0 2 7
298 Maudaha (NPP) 2 0 1 3
299 Rath (NPP) 2 0 1 3

Final 3rd STATE ANNUAL ACTION PLAN (3rd SAAP) FOR FY: 2017-18 to FY 2019-20 OF UTTAR PRADESH UNDER ATAL MISSION FOR
REJUVENATION AND URBAN TRANSFORMATION (AMRUT)
2017
STATE MISSION DIRECTORATE (AMRUT) UTTAR PRADESH, 8TH FLOOR, INDIRA BHAWAN, ASHOK MARG, LUCKNOW-226001 299 | P a g e
Form 7.2.1 - Fund Requirement for Individual Capacity Building at ULB level (ULB wise) Name of State: Uttar Pradesh
FY 2017-18
Sl. No. Name of ULB Total numbers to be trained in the current financial year, department wise Name of the
Training
Institution (s)
identified
No. of
Training
Programmes
to be
conducted
Fund
Reqd. in
current FY
(₹ in
Crore)
Elected
Reps.
Finance
Dept.
Engineering
Dept.
Town
Planning
Dept.
Admin.
Dept.
Total
1 2 3 4 5 6 7 8 9 10 11
300 Gohand (NP) 2 0 1 3
301 Kurara (NP) 2 0 1 3
302 Sarila (NP) 2 0 1 3
303 Sumerpur (NP) 2 0 1 3
304 Garhmukhteshwar (NPP) 2 0 1 3
305 Hapur (NPP) 2 1 2 0 2 7
306 Pilkhuwa (NPP) 2 1 2 0 2 7
307 Babugarh (NP) 2 0 1 3
308 Bilgram (NPP) 2 0 1 3
309 Hardoi (NPP) 2 1 2 0 2 7
310 Mallawan (NPP) 2 0 1 3
311 Pihani (NPP) 2 0 1 3
312 Sandi (NPP) 2 0 1 3
313 Sandila (NPP) 2 0 1 3
314 Shahabad (NPP) 2 0 1 3
315 Beniganj (NP) 2 0 1 3
316 Gopamau (NP) 2 0 1 3
317 Kachhauna Patseni (NP) 2 0 1 3
318 Madhoganj (NP) 2 0 1 3
319 Pali (NP) 2 0 1 3
320 Kursath (NP) 2 0 1 3
321 Hathras (NPP) 2 1 2 0 2 7
322 Sikandrarao (NPP) 2 0 1 3

Final 3rd STATE ANNUAL ACTION PLAN (3rd SAAP) FOR FY: 2017-18 to FY 2019-20 OF UTTAR PRADESH UNDER ATAL MISSION FOR
REJUVENATION AND URBAN TRANSFORMATION (AMRUT)
2017
STATE MISSION DIRECTORATE (AMRUT) UTTAR PRADESH, 8TH FLOOR, INDIRA BHAWAN, ASHOK MARG, LUCKNOW-226001 300 | P a g e
Form 7.2.1 - Fund Requirement for Individual Capacity Building at ULB level (ULB wise) Name of State: Uttar Pradesh
FY 2017-18
Sl. No. Name of ULB Total numbers to be trained in the current financial year, department wise Name of the
Training
Institution (s)
identified
No. of
Training
Programmes
to be
conducted
Fund
Reqd. in
current FY
(₹ in
Crore)
Elected
Reps.
Finance
Dept.
Engineering
Dept.
Town
Planning
Dept.
Admin.
Dept.
Total
1 2 3 4 5 6 7 8 9 10 11
323 Hasayan (NP) 2 0 1 3
324 Purdilnagar (NP) 2 0 1 3
325 Mendu (NP) 2 0 1 3
326 Mursan (NP) 2 0 1 3
327 Sadabad (NP) 2 0 1 3
328 Sasni (NP) 2 0 1 3
329 Sahpau (NP) 2 0 1 3
330 Jalaun (NPP) 2 0 1 3
331 Kalpi (NPP) 2 0 1 3
332 Konch (NPP) 2 0 1 3
333 Orai (NPP) 2 1 2 0 2 7
334 Kotra (NP) 2 0 1 3
335 Kadaura (NP) 2 0 1 3
336 Madhogarh (NP) 2 0 1 3
337 Nadigaon (NP) 2 0 1 3
338 Rampura (NP) 2 0 1 3
339 Umri (NP) 2 0 1 3
340 Jaunpur (NPP) 2 1 2 0 2 7
341 Mogra Badshahpur (NPP) 2 0 1 3
342 Shahganj (NPP) 2 0 1 3
343 Jafarabad (NP) 2 0 1 3
344 Kerakat (NP) 2 0 1 3
345 Khetasarai (NP) 2 0 1 3
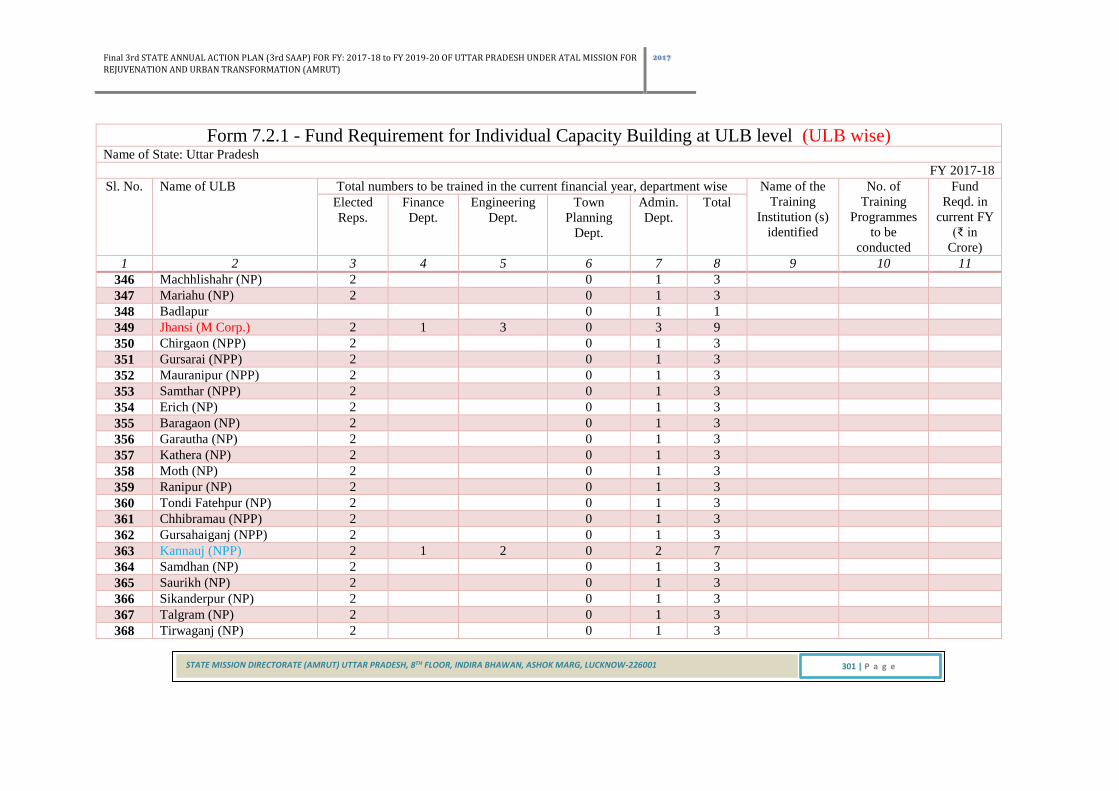
Final 3rd STATE ANNUAL ACTION PLAN (3rd SAAP) FOR FY: 2017-18 to FY 2019-20 OF UTTAR PRADESH UNDER ATAL MISSION FOR
REJUVENATION AND URBAN TRANSFORMATION (AMRUT)
2017
STATE MISSION DIRECTORATE (AMRUT) UTTAR PRADESH, 8TH FLOOR, INDIRA BHAWAN, ASHOK MARG, LUCKNOW-226001 301 | P a g e
Form 7.2.1 - Fund Requirement for Individual Capacity Building at ULB level (ULB wise) Name of State: Uttar Pradesh
FY 2017-18
Sl. No. Name of ULB Total numbers to be trained in the current financial year, department wise Name of the
Training
Institution (s)
identified
No. of
Training
Programmes
to be
conducted
Fund
Reqd. in
current FY
(₹ in
Crore)
Elected
Reps.
Finance
Dept.
Engineering
Dept.
Town
Planning
Dept.
Admin.
Dept.
Total
1 2 3 4 5 6 7 8 9 10 11
346 Machhlishahr (NP) 2 0 1 3
347 Mariahu (NP) 2 0 1 3
348 Badlapur 0 1 1
349 Jhansi (M Corp.) 2 1 3 0 3 9
350 Chirgaon (NPP) 2 0 1 3
351 Gursarai (NPP) 2 0 1 3
352 Mauranipur (NPP) 2 0 1 3
353 Samthar (NPP) 2 0 1 3
354 Erich (NP) 2 0 1 3
355 Baragaon (NP) 2 0 1 3
356 Garautha (NP) 2 0 1 3
357 Kathera (NP) 2 0 1 3
358 Moth (NP) 2 0 1 3
359 Ranipur (NP) 2 0 1 3
360 Tondi Fatehpur (NP) 2 0 1 3
361 Chhibramau (NPP) 2 0 1 3
362 Gursahaiganj (NPP) 2 0 1 3
363 Kannauj (NPP) 2 1 2 0 2 7
364 Samdhan (NP) 2 0 1 3
365 Saurikh (NP) 2 0 1 3
366 Sikanderpur (NP) 2 0 1 3
367 Talgram (NP) 2 0 1 3
368 Tirwaganj (NP) 2 0 1 3

Final 3rd STATE ANNUAL ACTION PLAN (3rd SAAP) FOR FY: 2017-18 to FY 2019-20 OF UTTAR PRADESH UNDER ATAL MISSION FOR
REJUVENATION AND URBAN TRANSFORMATION (AMRUT)
2017
STATE MISSION DIRECTORATE (AMRUT) UTTAR PRADESH, 8TH FLOOR, INDIRA BHAWAN, ASHOK MARG, LUCKNOW-226001 302 | P a g e
Form 7.2.1 - Fund Requirement for Individual Capacity Building at ULB level (ULB wise) Name of State: Uttar Pradesh
FY 2017-18
Sl. No. Name of ULB Total numbers to be trained in the current financial year, department wise Name of the
Training
Institution (s)
identified
No. of
Training
Programmes
to be
conducted
Fund
Reqd. in
current FY
(₹ in
Crore)
Elected
Reps.
Finance
Dept.
Engineering
Dept.
Town
Planning
Dept.
Admin.
Dept.
Total
1 2 3 4 5 6 7 8 9 10 11
369 Pukhrayan (NPP) 2 0 1 3
370 Akbarpur (NP) 2 0 1 3
371 Amraudha (NP) 2 0 1 3
372 Derapur (NP) 2 0 1 3
373 Jhinjhak (NP) 2 0 1 3
374 Rasulabad (NP) 2 0 1 3
375 Rura (NP) 2 0 1 3
376 Shivli (NP) 2 0 1 3
377 Sikandra (NP) 2 0 1 3
378 Kanpur (M Corp.) 2 1 3 0 3 9
379 Bilhaur (NPP) 2 0 1 3
380 Ghatampur (NPP) 2 0 1 3
381 Bithoor (NP) 2 0 1 3
382 Shivrajpur (NP) 2 0 1 3
383 Ganj Dundawara (NPP) 2 0 1 3
384 Kasganj (NPP) 2 1 2 0 2 7
385 Soron (NPP) 2 0 1 3
386 Amapur (NP) 2 0 1 3
387 Bhargain (NP) 2 0 1 3
388 Bilram (NP) 2 0 1 3
389 Mohanpur (NP) 2 0 1 3
390 Patiyali (NP) 2 0 1 3
391 Sahawar (NP) 2 0 1 3

Final 3rd STATE ANNUAL ACTION PLAN (3rd SAAP) FOR FY: 2017-18 to FY 2019-20 OF UTTAR PRADESH UNDER ATAL MISSION FOR
REJUVENATION AND URBAN TRANSFORMATION (AMRUT)
2017
STATE MISSION DIRECTORATE (AMRUT) UTTAR PRADESH, 8TH FLOOR, INDIRA BHAWAN, ASHOK MARG, LUCKNOW-226001 303 | P a g e
Form 7.2.1 - Fund Requirement for Individual Capacity Building at ULB level (ULB wise) Name of State: Uttar Pradesh
FY 2017-18
Sl. No. Name of ULB Total numbers to be trained in the current financial year, department wise Name of the
Training
Institution (s)
identified
No. of
Training
Programmes
to be
conducted
Fund
Reqd. in
current FY
(₹ in
Crore)
Elected
Reps.
Finance
Dept.
Engineering
Dept.
Town
Planning
Dept.
Admin.
Dept.
Total
1 2 3 4 5 6 7 8 9 10 11
392 Sidhpura (NP) 2 0 1 3
393 Ajhuwa (NP) 2 0 1 3
394 Bharwari (NP) 2 0 1 3
395 Chail (NP) 2 0 1 3
396 Karari (NP) 2 0 1 3
397 Manjhanpur (NP) 2 0 1 3
398 Sarai Aquil (NP) 2 0 1 3
399 Sirathu (NP) 2 0 1 3
400 Gola Gokarannath (NPP) 2 0 1 3
401 Lakhimpur (NPP) 2 1 2 0 2 7
402 Mohammadi (NPP) 2 0 1 3
403 Paliya Kalan (NPP) 2 0 1 3
404 Barwar (NP) 2 0 1 3
405 Dhaurehra (NP) 2 0 1 3
406 Kheri (NP) 2 0 1 3
407 Mailani (NP) 2 0 1 3
408 Oel Dhakwa (NP) 2 0 1 3
409 Singahi Bhindaura (NP) 2 0 1 3
410 Padrauna (NPP) 2 1 2 0 2 7
411 Kaptanganj (NP) 2 0 1 3
412 Hata (NP) 2 0 1 3
413 Khadda (NP) 2 0 1 3
414 Kushinagar (NP) 2 0 1 3

Final 3rd STATE ANNUAL ACTION PLAN (3rd SAAP) FOR FY: 2017-18 to FY 2019-20 OF UTTAR PRADESH UNDER ATAL MISSION FOR
REJUVENATION AND URBAN TRANSFORMATION (AMRUT)
2017
STATE MISSION DIRECTORATE (AMRUT) UTTAR PRADESH, 8TH FLOOR, INDIRA BHAWAN, ASHOK MARG, LUCKNOW-226001 304 | P a g e
Form 7.2.1 - Fund Requirement for Individual Capacity Building at ULB level (ULB wise) Name of State: Uttar Pradesh
FY 2017-18
Sl. No. Name of ULB Total numbers to be trained in the current financial year, department wise Name of the
Training
Institution (s)
identified
No. of
Training
Programmes
to be
conducted
Fund
Reqd. in
current FY
(₹ in
Crore)
Elected
Reps.
Finance
Dept.
Engineering
Dept.
Town
Planning
Dept.
Admin.
Dept.
Total
1 2 3 4 5 6 7 8 9 10 11
415 Ramkola (NP) 2 0 1 3
416 Sewarhi (NP) 2 0 1 3
417 Lalitpur (NPP) 2 1 2 0 2 7
418 Mahroni (NP) 2 0 1 3
419 Pali (NP) 2 0 1 3
420 Talbehat (NP) 2 0 1 3
421 Lucknow (M Corp.) 2 1 3 0 3 9
422 Amethi (NP) 2 0 1 3
423 Gosainganj (NP) 2 0 1 3
424 Itaunja (NP) 2 0 1 3
425 Kakori (NP) 2 0 1 3
426 Mahona (NP) 2 0 1 3
427 Malihabad (NP) 2 0 1 3
428 Nagram (NP) 2 0 1 3
429 Bakshi Ka Talab (NP) 2 0 1 3
430 Maharajganj (NPP) 2 1 2 0 2 7
431 Nautanwa (NPP) 2 0 1 3
432 Anandnagar (NP) 2 0 1 3
433 Ghughuli (NP) 2 0 1 3
434 Nichlaul (NP) 2 0 1 3
435 Siswa Bazar (NP) 2 0 1 3
436 Mahoba (NPP) 2 0 1 3
437 Kabrai (NP) 2 0 1 3

Final 3rd STATE ANNUAL ACTION PLAN (3rd SAAP) FOR FY: 2017-18 to FY 2019-20 OF UTTAR PRADESH UNDER ATAL MISSION FOR
REJUVENATION AND URBAN TRANSFORMATION (AMRUT)
2017
STATE MISSION DIRECTORATE (AMRUT) UTTAR PRADESH, 8TH FLOOR, INDIRA BHAWAN, ASHOK MARG, LUCKNOW-226001 305 | P a g e
Form 7.2.1 - Fund Requirement for Individual Capacity Building at ULB level (ULB wise) Name of State: Uttar Pradesh
FY 2017-18
Sl. No. Name of ULB Total numbers to be trained in the current financial year, department wise Name of the
Training
Institution (s)
identified
No. of
Training
Programmes
to be
conducted
Fund
Reqd. in
current FY
(₹ in
Crore)
Elected
Reps.
Finance
Dept.
Engineering
Dept.
Town
Planning
Dept.
Admin.
Dept.
Total
1 2 3 4 5 6 7 8 9 10 11
438 Kharela (NP) 2 0 1 3
439 Kul Pahar (NP) 2 0 1 3
440 Mainpuri (NPP) 2 1 2 0 2 7
441 Bewar (NP) 2 0 1 3
442 Bhogaon (NP) 2 0 1 3
443 Ghiraur (NP) 2 0 1 3
444 Jyoti Khuriya (NP) 2 0 1 3
445 Karhal (NP) 2 0 1 3
446 Kishni (NP) 2 0 1 3
447 Kushmara (NP) 2 0 1 3
448 Kuraoali (NP) 2 0 1 3
449 Mathura (NPP) 2 1 2 0 2 7
450 Kosi Kalan (NPP) 2 0 1 3
451 Vrindavan (NPP) 2 0 1 3
452 Bajna (NP) 2 0 1 3
453 Baldeo (NP) 2 0 1 3
454 Barsana (NP) 2 0 1 3
455 Chhata (NP) 2 0 1 3
456 Chaumuhan (NP) 2 0 1 3
457 Gokul (NP) 2 0 1 3
458 Govardhan (NP) 2 0 1 3
459 Farah (NP) 2 0 1 3
460 Mahavan (NP) 2 0 1 3

Final 3rd STATE ANNUAL ACTION PLAN (3rd SAAP) FOR FY: 2017-18 to FY 2019-20 OF UTTAR PRADESH UNDER ATAL MISSION FOR
REJUVENATION AND URBAN TRANSFORMATION (AMRUT)
2017
STATE MISSION DIRECTORATE (AMRUT) UTTAR PRADESH, 8TH FLOOR, INDIRA BHAWAN, ASHOK MARG, LUCKNOW-226001 306 | P a g e
Form 7.2.1 - Fund Requirement for Individual Capacity Building at ULB level (ULB wise) Name of State: Uttar Pradesh
FY 2017-18
Sl. No. Name of ULB Total numbers to be trained in the current financial year, department wise Name of the
Training
Institution (s)
identified
No. of
Training
Programmes
to be
conducted
Fund
Reqd. in
current FY
(₹ in
Crore)
Elected
Reps.
Finance
Dept.
Engineering
Dept.
Town
Planning
Dept.
Admin.
Dept.
Total
1 2 3 4 5 6 7 8 9 10 11
461 Nandgaon (NP) 2 0 1 3
462 Radhakund (NP) 2 0 1 3
463 Raya (NP) 2 0 1 3
464 Saunkh (NP) 2 0 1 3
465 Maunath Bhanjan (NPP) 2 1 2 0 2 7
466 Adari (NP) 2 0 1 3
467 Amila (NP) 2 0 1 3
468 Dohrighat (NP) 2 0 1 3
469 Ghosi (NP) 2 0 1 3
470 Kopaganj (NP) 2 0 1 3
471 Muhammadabad Gohna (NP) 2 0 1 3
472 Waleedpur 0 1 1
473 Meerut (M Corp.) 2 1 3 0 3 9
474 Mawana (NPP) 2 0 1 3
475 Bahsuma (NP) 2 0 1 3
476 Daurala (NP) 2 0 1 3
477 Hastinapur (NP) 2 0 1 3
478 Karnawal (NP) 2 0 1 3
479 Kharkhauda (NP) 2 0 1 3
480 Kithaur (NP) 2 0 1 3
481 Lawar (NP) 2 0 1 3
482 Parikshitgarh (NP) 2 0 1 3
483 Phalauda (NP) 2 0 1 3

Final 3rd STATE ANNUAL ACTION PLAN (3rd SAAP) FOR FY: 2017-18 to FY 2019-20 OF UTTAR PRADESH UNDER ATAL MISSION FOR
REJUVENATION AND URBAN TRANSFORMATION (AMRUT)
2017
STATE MISSION DIRECTORATE (AMRUT) UTTAR PRADESH, 8TH FLOOR, INDIRA BHAWAN, ASHOK MARG, LUCKNOW-226001 307 | P a g e
Form 7.2.1 - Fund Requirement for Individual Capacity Building at ULB level (ULB wise) Name of State: Uttar Pradesh
FY 2017-18
Sl. No. Name of ULB Total numbers to be trained in the current financial year, department wise Name of the
Training
Institution (s)
identified
No. of
Training
Programmes
to be
conducted
Fund
Reqd. in
current FY
(₹ in
Crore)
Elected
Reps.
Finance
Dept.
Engineering
Dept.
Town
Planning
Dept.
Admin.
Dept.
Total
1 2 3 4 5 6 7 8 9 10 11
484 Siwalkhas (NP) 2 0 1 3
485 Chunar (NPP) 2 0 1 3
486 Mirzapur (NPP) 2 1 2 0 2 7
487 Kachhwa (NP) 2 0 1 3
488 Moradabad (M Corp.) 2 1 3 0 3 9
489 Bilari (NPP) 2 0 1 3
490 Thakurdwara (NPP) 2 0 1 3
491 Bhojpur Dharampur (NP) 2 0 1 3
492 Kanth (NP) 2 0 1 3
493 Kundarki (NP) 2 0 1 3
494 Umri Kalan (NP) 2 0 1 3
495 Khatauli (NPP) 2 0 1 3
496 Muzaffarnagar (NPP) 2 1 2 0 2 7
497 Bhokarhedi (NP) 2 0 1 3
498 Budhana (NP) 2 0 1 3
499 Charthawal (NP) 2 0 1 3
500 Jansath (NP) 2 0 1 3
501 Purquazi (NP) 2 0 1 3
502 Mirapur (NP) 2 0 1 3
503 Shahpur (NP) 2 0 1 3
504 Sisauli (NP) 2 0 1 3
505 Bisalpur (NPP) 2 0 1 3
506 Pilibhit (NPP) 2 1 2 0 2 7
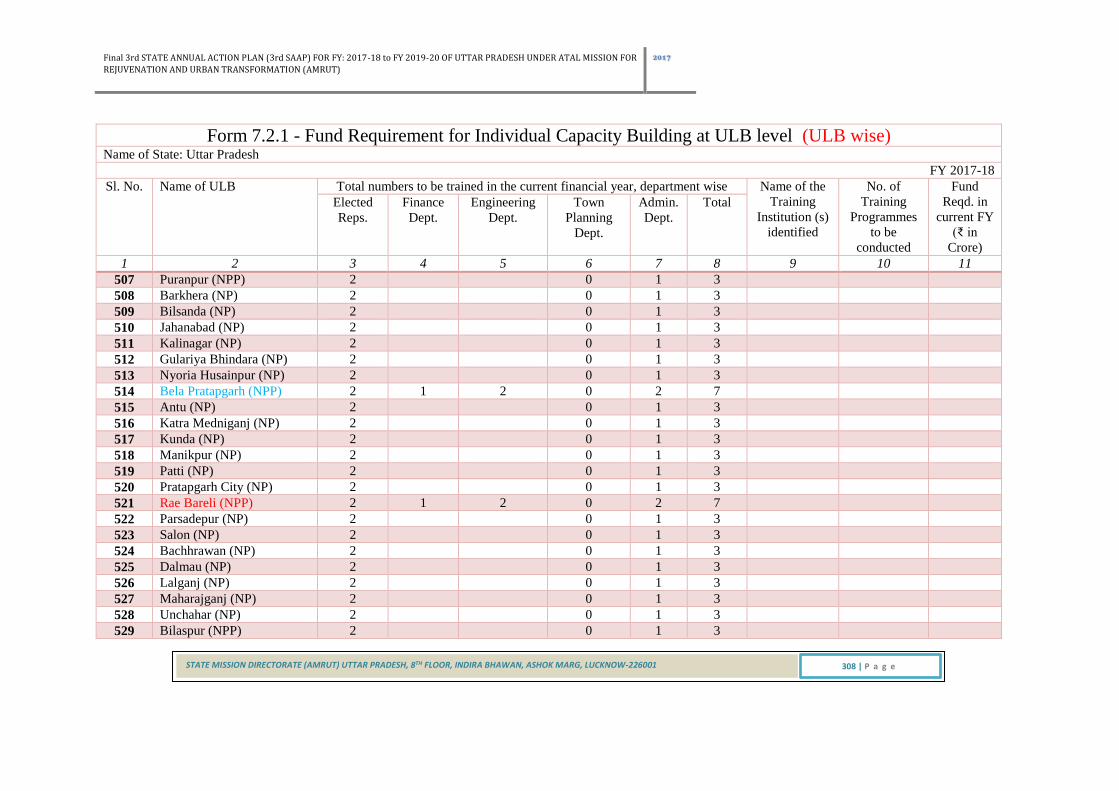
Final 3rd STATE ANNUAL ACTION PLAN (3rd SAAP) FOR FY: 2017-18 to FY 2019-20 OF UTTAR PRADESH UNDER ATAL MISSION FOR
REJUVENATION AND URBAN TRANSFORMATION (AMRUT)
2017
STATE MISSION DIRECTORATE (AMRUT) UTTAR PRADESH, 8TH FLOOR, INDIRA BHAWAN, ASHOK MARG, LUCKNOW-226001 308 | P a g e
Form 7.2.1 - Fund Requirement for Individual Capacity Building at ULB level (ULB wise) Name of State: Uttar Pradesh
FY 2017-18
Sl. No. Name of ULB Total numbers to be trained in the current financial year, department wise Name of the
Training
Institution (s)
identified
No. of
Training
Programmes
to be
conducted
Fund
Reqd. in
current FY
(₹ in
Crore)
Elected
Reps.
Finance
Dept.
Engineering
Dept.
Town
Planning
Dept.
Admin.
Dept.
Total
1 2 3 4 5 6 7 8 9 10 11
507 Puranpur (NPP) 2 0 1 3
508 Barkhera (NP) 2 0 1 3
509 Bilsanda (NP) 2 0 1 3
510 Jahanabad (NP) 2 0 1 3
511 Kalinagar (NP) 2 0 1 3
512 Gulariya Bhindara (NP) 2 0 1 3
513 Nyoria Husainpur (NP) 2 0 1 3
514 Bela Pratapgarh (NPP) 2 1 2 0 2 7
515 Antu (NP) 2 0 1 3
516 Katra Medniganj (NP) 2 0 1 3
517 Kunda (NP) 2 0 1 3
518 Manikpur (NP) 2 0 1 3
519 Patti (NP) 2 0 1 3
520 Pratapgarh City (NP) 2 0 1 3
521 Rae Bareli (NPP) 2 1 2 0 2 7
522 Parsadepur (NP) 2 0 1 3
523 Salon (NP) 2 0 1 3
524 Bachhrawan (NP) 2 0 1 3
525 Dalmau (NP) 2 0 1 3
526 Lalganj (NP) 2 0 1 3
527 Maharajganj (NP) 2 0 1 3
528 Unchahar (NP) 2 0 1 3
529 Bilaspur (NPP) 2 0 1 3

Final 3rd STATE ANNUAL ACTION PLAN (3rd SAAP) FOR FY: 2017-18 to FY 2019-20 OF UTTAR PRADESH UNDER ATAL MISSION FOR
REJUVENATION AND URBAN TRANSFORMATION (AMRUT)
2017
STATE MISSION DIRECTORATE (AMRUT) UTTAR PRADESH, 8TH FLOOR, INDIRA BHAWAN, ASHOK MARG, LUCKNOW-226001 309 | P a g e
Form 7.2.1 - Fund Requirement for Individual Capacity Building at ULB level (ULB wise) Name of State: Uttar Pradesh
FY 2017-18
Sl. No. Name of ULB Total numbers to be trained in the current financial year, department wise Name of the
Training
Institution (s)
identified
No. of
Training
Programmes
to be
conducted
Fund
Reqd. in
current FY
(₹ in
Crore)
Elected
Reps.
Finance
Dept.
Engineering
Dept.
Town
Planning
Dept.
Admin.
Dept.
Total
1 2 3 4 5 6 7 8 9 10 11
530 Milak (NPP) 2 0 1 3
531 Rampur (NPP) 2 1 2 0 2 7
532 Swar (NPP) 2 0 1 3
533 Tanda (NPP) 2 0 1 3
534 Kemri (NP) 2 0 1 3
535 Maswasi (NP) 2 0 1 3
536 Shahabad (NP) 2 0 1 3
537 Saharanpur (M Corp.) 2 1 3 0 3 9
538 Deoband (NPP) 2 0 1 3
539 Gangoh (NPP) 2 0 1 3
540 Nakur (NPP) 2 0 1 3
541 Sarsawa (NPP) 2 0 1 3
542 Ambehta (NP) 2 0 1 3
543 Behat (NP) 2 0 1 3
544 Nanauta (NP) 2 0 1 3
545 Rampur Maniharan (NP) 2 0 1 3
546 Sultanpur Chilkana (NP) 2 0 1 3
547 Titron (NP) 2 0 1 3
548 Chandausi (NPP) 2 1 2 0 3 8
549 Sambhal (NPP) 2 1 2 0 2 7
550 Babrala (NP) 2 0 1 3
551 Gawan (NP) 2 0 1 3
552 Gunnaur (NP) 2 0 1 3
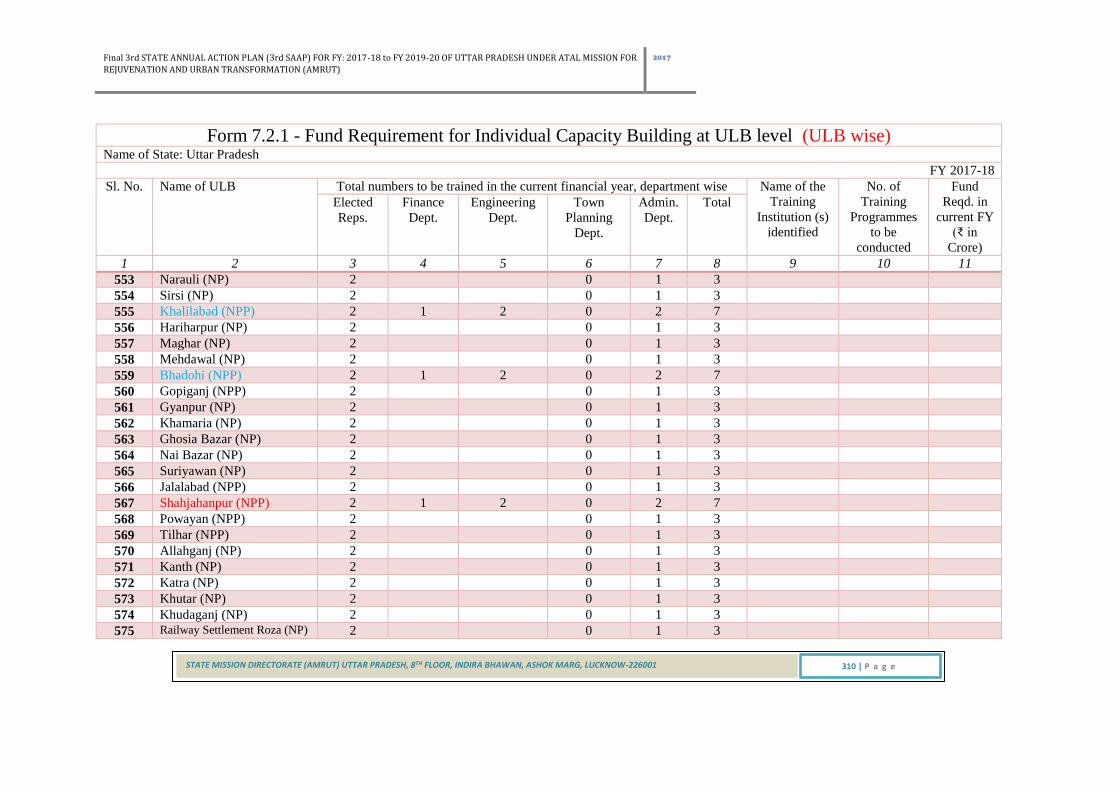
Final 3rd STATE ANNUAL ACTION PLAN (3rd SAAP) FOR FY: 2017-18 to FY 2019-20 OF UTTAR PRADESH UNDER ATAL MISSION FOR
REJUVENATION AND URBAN TRANSFORMATION (AMRUT)
2017
STATE MISSION DIRECTORATE (AMRUT) UTTAR PRADESH, 8TH FLOOR, INDIRA BHAWAN, ASHOK MARG, LUCKNOW-226001 310 | P a g e
Form 7.2.1 - Fund Requirement for Individual Capacity Building at ULB level (ULB wise) Name of State: Uttar Pradesh
FY 2017-18
Sl. No. Name of ULB Total numbers to be trained in the current financial year, department wise Name of the
Training
Institution (s)
identified
No. of
Training
Programmes
to be
conducted
Fund
Reqd. in
current FY
(₹ in
Crore)
Elected
Reps.
Finance
Dept.
Engineering
Dept.
Town
Planning
Dept.
Admin.
Dept.
Total
1 2 3 4 5 6 7 8 9 10 11
553 Narauli (NP) 2 0 1 3
554 Sirsi (NP) 2 0 1 3
555 Khalilabad (NPP) 2 1 2 0 2 7
556 Hariharpur (NP) 2 0 1 3
557 Maghar (NP) 2 0 1 3
558 Mehdawal (NP) 2 0 1 3
559 Bhadohi (NPP) 2 1 2 0 2 7
560 Gopiganj (NPP) 2 0 1 3
561 Gyanpur (NP) 2 0 1 3
562 Khamaria (NP) 2 0 1 3
563 Ghosia Bazar (NP) 2 0 1 3
564 Nai Bazar (NP) 2 0 1 3
565 Suriyawan (NP) 2 0 1 3
566 Jalalabad (NPP) 2 0 1 3
567 Shahjahanpur (NPP) 2 1 2 0 2 7
568 Powayan (NPP) 2 0 1 3
569 Tilhar (NPP) 2 0 1 3
570 Allahganj (NP) 2 0 1 3
571 Kanth (NP) 2 0 1 3
572 Katra (NP) 2 0 1 3
573 Khutar (NP) 2 0 1 3
574 Khudaganj (NP) 2 0 1 3
575 Railway Settlement Roza (NP) 2 0 1 3

Final 3rd STATE ANNUAL ACTION PLAN (3rd SAAP) FOR FY: 2017-18 to FY 2019-20 OF UTTAR PRADESH UNDER ATAL MISSION FOR
REJUVENATION AND URBAN TRANSFORMATION (AMRUT)
2017
STATE MISSION DIRECTORATE (AMRUT) UTTAR PRADESH, 8TH FLOOR, INDIRA BHAWAN, ASHOK MARG, LUCKNOW-226001 311 | P a g e
Form 7.2.1 - Fund Requirement for Individual Capacity Building at ULB level (ULB wise) Name of State: Uttar Pradesh
FY 2017-18
Sl. No. Name of ULB Total numbers to be trained in the current financial year, department wise Name of the
Training
Institution (s)
identified
No. of
Training
Programmes
to be
conducted
Fund
Reqd. in
current FY
(₹ in
Crore)
Elected
Reps.
Finance
Dept.
Engineering
Dept.
Town
Planning
Dept.
Admin.
Dept.
Total
1 2 3 4 5 6 7 8 9 10 11
576 Kairana (NPP) 2 0 1 3
577 Kandhla (NPP) 2 0 1 3
578 Shamli (NPP) 2 1 2 0 1 6
579 Ailam (NP) 2 0 1 3
580 Banat (NP) 2 0 1 3
581 Jalalabad (NP) 2 0 1 3
582 Jhinjhana (NP) 2 0 1 3
583 Garhi Pukhta (NP) 2 0 1 3
584 Thana Bhawan (NP) 2 0 1 3
585 Un (NP) 2 0 1 3
586 Bhinga (NP) 2 0 1 3
587 Ikauna (NP) 2 0 1 3
588 Siddharthnagar (NPP) 2 1 2 0 3 8
589 Barhani Bazar (NP) 2 0 1 3
590 Shohratgarh (NP) 2 0 1 3
591 Domariyaganj (NP) 2 0 1 3
592 Uska Bazar (NP) 2 0 1 3
593 Biswan (NPP) 2 0 1 3
594 Khairabad (NPP) 2 0 1 3
595 Laharpur (NPP) 2 0 1 3
596 Mahmudabad (NPP) 2 0 1 3
597 Misrikh-Naimish (NPP) 2 0 1 3
598 Sitapur (NPP) 2 1 2 0 2 7

Final 3rd STATE ANNUAL ACTION PLAN (3rd SAAP) FOR FY: 2017-18 to FY 2019-20 OF UTTAR PRADESH UNDER ATAL MISSION FOR
REJUVENATION AND URBAN TRANSFORMATION (AMRUT)
2017
STATE MISSION DIRECTORATE (AMRUT) UTTAR PRADESH, 8TH FLOOR, INDIRA BHAWAN, ASHOK MARG, LUCKNOW-226001 312 | P a g e
Form 7.2.1 - Fund Requirement for Individual Capacity Building at ULB level (ULB wise) Name of State: Uttar Pradesh
FY 2017-18
Sl. No. Name of ULB Total numbers to be trained in the current financial year, department wise Name of the
Training
Institution (s)
identified
No. of
Training
Programmes
to be
conducted
Fund
Reqd. in
current FY
(₹ in
Crore)
Elected
Reps.
Finance
Dept.
Engineering
Dept.
Town
Planning
Dept.
Admin.
Dept.
Total
1 2 3 4 5 6 7 8 9 10 11
599 Hargaon (NP) 2 0 1 3
600 Maholi (NP) 2 0 1 3
601 Paintepur (NP) 2 0 1 3
602 Sidhauli (NP) 2 0 1 3
603 Tambaur- Ahamdabad (NP) 2 0 1 3
604 Sonbhadra- Robertsganj (NPP) 2 1 2 0 2 7
605 Chopan (NP) 2 0 1 3
606 Churk Ghurma (NP) 2 0 1 3
607 Dudhi (NP) 2 0 1 3
608 Ghorawal (NP) 2 0 1 3
609 Obra (NP) 2 0 1 3
610 Pipri (NP) 2 0 1 3
611 Renukoot (NP) 2 0 1 3
612 Sultanpur (NPP) 2 1 2 0 2 7
613 Dostpur (NP) 2 0 1 3
614 Kadipur (NP) 2 0 1 3
615 Koeripur (NP) 2 0 1 3
616 Bangarmau (NPP) 2 0 1 3
617 Gangaghat (NPP) 2 0 1 3
618 Unnao (NPP) 2 1 2 0 2 7
619 Auras (NP) 2 0 1 3
620 Bhagwant Nagar (NP) 2 0 1 3
621 Bighapur (NP) 2 0 1 3

Final 3rd STATE ANNUAL ACTION PLAN (3rd SAAP) FOR FY: 2017-18 to FY 2019-20 OF UTTAR PRADESH UNDER ATAL MISSION FOR
REJUVENATION AND URBAN TRANSFORMATION (AMRUT)
2017
STATE MISSION DIRECTORATE (AMRUT) UTTAR PRADESH, 8TH FLOOR, INDIRA BHAWAN, ASHOK MARG, LUCKNOW-226001 313 | P a g e
Form 7.2.1 - Fund Requirement for Individual Capacity Building at ULB level (ULB wise) Name of State: Uttar Pradesh
FY 2017-18
Sl. No. Name of ULB Total numbers to be trained in the current financial year, department wise Name of the
Training
Institution (s)
identified
No. of
Training
Programmes
to be
conducted
Fund
Reqd. in
current FY
(₹ in
Crore)
Elected
Reps.
Finance
Dept.
Engineering
Dept.
Town
Planning
Dept.
Admin.
Dept.
Total
1 2 3 4 5 6 7 8 9 10 11
623 Fatehpur Chaurasi (NP) 2 0 1 3
624 Ganj Muradabad (NP) 2 0 1 3
625 Hyderabad (NP) 2 0 1 3
626 Kursath (NP) 2 0 1 3
627 Maurawan (NP) 2 0 1 3
628 Mohan (NP) 2 0 1 3
629 Nawabganj (NP) 2 0 1 3
630 Nyotini (NP) 2 0 1 3
631 Ugu (NP) 2 0 1 3
632 Purwa (NP) 2 0 1 3
633 Rasulabad (NP) 2 0 1 3
634 Safipur (NP) 2 0 1 3
635 Varanasi (M Corp.) 2 1 3 0 3 9
636 Gangapur (NP) 2 0 1 3
1260 90 210 0 840 2400 0 160 9.02