NCR, Uttar Pradesh and East India
24
Emkay Research is also available on www.emkayglobal.com, Bloomberg EMKAY<GO>, Reuters and DOWJONES. Emkay Global Financial Services Ltd. © Your success is our success Emkay . India Equity Research | Cement February 8, 2016 Emkay Ground Speak Cement- Road Trip NCR, Uttar Pradesh and East India ACC HOLD CMP Target Price 1,271 1,394 Ambuja Cements HOLD CMP Target Price 196 224 UltraTech Cement BUY CMP Target Price 2,843 3,281 Grasim BUY CMP Target Price 3,463 4,302 Shree Cements BUY CMP Target Price 10,350 12,900 Ramco Cements BUY CMP Target Price 382 432 India Cement HOLD CMP Target Price 84 104 JK Lakshmi Cement HOLD CMP Target Price 276 303 JK Cement ACCUMULATE CMP Target Price 465 705 OCL India BUY CMP Target Price 477 671 Orient Cement HOLD CMP Target Price 138 152 Prism Cement HOLD CMP Target Price 72 98 Mangalam Cement BUY CMP Target Price 179 257 Sanjeev Kumar Singh [email protected] +91 22 66121255 Tejashwini Kumari [email protected] +91 22 66121285 We travelled 3,200 kms (primarily by rail & road) across the NCR, Uttar Pradesh and East regions to get a firsthand idea of the logistical issues involved, met up with around 50 industry participants (cement marketing officials, sales promoters/C&F agents & stockists) to - a) Assess the cement demand and pricing situation in NCR, UP (West/Central/East) and East India, and b) Understand market size and behavior of various cement players in these regions Areas covered: NCR- Delhi, Gurgaon, Ghaziabad, Noida (Prices in Noida are kept Rs 5/bag lower than in Ghaziabad, primarily to offset movement from Delhi. The difference, till a year ago, was Rs 3/bag) and Meerut, the most competitive market in West UP (Supply from non- trade to trade segment is rampant); Central UP – Lucknow (the largest consumption centre in the state) & Kanpur; Eastern UP: Varanasi; East India: Bihar (Patna, South Bihar/Muzaffarpur, North Bihar), Jharkhand (Ranchi), Orissa (Bhubaneswar, Cuttack, Durg), West Bengal (Kolkata) and Chhattisgarh (Raipur, Bilaspur) Robust volume growth partially led by better demand; However, inventory stockings have been higher: During December, cement companies in the regions we visited, reported robust volume growth, led by a) slight improvement in demand, and, b) inventory stockings. Most of the people were of the view that empty godowns facilitated inventory pile up and secondary sale remains tepid (except in Bihar, where the feedback was different) Lower prices remain a cause of worry; Companies focus on market share gains: Cement prices remain tepid and this has worried industry. Many of them were of the opinion that this type of worrisome trend has not been witnessed in the last 10years. Most of the people believe that companies are not willing to compromise on market share, which coupled with year-end volume push by Ambuja/ACC/Lafarge, has led to pressure on cement prices North: December despatches at all-time high: In the North, December despatches were 7.2mn tonnes against the normal run-rate of 5.5-5.9mn tonnes/month in the last 4 years. Almost all the companies have registered highest ever despatches. Before Dec’15, highest despatches in the region were 6.5mn tonnes reported in the month of March, when the government led demand is usually very high Maintain Buy on Shree: Based on the cash flow & discussions with equipment suppliers, it is estimated that Shree Cement can add another 10 million tonnes capacity in the next 4 years. Combo mill (capacity: 1.6 million tons) in Aurangabad, Bihar is expected by Q1FY17- end, because as per the existing industrial policy of the state, VAT incentives are valid till June’16. Shree Cement is the first and the only company till date to have set up split location cement GU in Bihar. We believe that one should look beyond near-term concerns and factor in the sharp jump in capacities. We maintain Buy. Company Financials EPS EV/EBITDA (x) P/E (x) Companies FY16e FY17e FY16e FY17e FY16e FY17e ACC 42.6 60.2 15.7 11.5 29.9 21.1 Ambuja Cements 7.0 10.0 15.8 10.8 27.9 19.5 Grasim Industries 224.7 289.0 6.9 5.6 15.2 11.8 India Cements 4.4 10.0 6.9 5.1 19.3 8.4 Madras Cements 17.7 24.3 12.8 10.2 21.6 15.7 Shree Cements 107.8 339.2 26.3 15.0 96.0 30.5 UltraTech Cement 85.2 115.1 17.7 13.7 33.4 24.7 JK Lakshmi Cement 0.8 7.6 18.4 11.7 359.9 36.3 JK Cement 18.3 45.8 11.5 7.1 25.4 10.2 Orient Cement 4.1 6.2 20.3 9.7 33.7 22.1 OCL India 34.7 51.3 5.4 3.8 13.7 9.3 Mangalam Cement 8.7 28.8 9.5 4.9 20.6 6.2 Prism Cement 0.5 4.4 14.3 8.5 154.2 16.2 Source: Company, Emkay Research
-
Upload
khangminh22 -
Category
Documents
-
view
1 -
download
0
Transcript of NCR, Uttar Pradesh and East India

Emkay Research is also available on www.emkayglobal.com, Bloomberg EMKAY<GO>, Reuters and DOWJONES. Emkay Global Financial Services Ltd.
©
Your success is our success
Emkay
.
India Equity Research | Cement
February 8, 2016
Emkay Ground Speak
Cement- Road Trip
NCR, Uttar Pradesh and East India
ACC HOLD
CMP Target Price
1,271 1,394
Ambuja Cements HOLD
CMP Target Price
196 224
UltraTech Cement BUY
CMP Target Price
2,843 3,281
Grasim BUY
CMP Target Price
3,463 4,302
Shree Cements BUY
CMP Target Price
10,350 12,900
Ramco Cements BUY
CMP Target Price
382 432
India Cement HOLD
CMP Target Price
84 104
JK Lakshmi Cement HOLD
CMP Target Price
276 303
JK Cement ACCUMULATE
CMP Target Price
465 705
OCL India BUY
CMP Target Price
477 671
Orient Cement HOLD
CMP Target Price
138 152
Prism Cement HOLD
CMP Target Price
72 98
Mangalam Cement BUY
CMP Target Price
179 257
Sanjeev Kumar Singh [email protected] +91 22 66121255
Tejashwini Kumari [email protected] +91 22 66121285
We travelled 3,200 kms (primarily by rail & road) across the NCR, Uttar Pradesh and East
regions to get a firsthand idea of the logistical issues involved, met up with around 50 industry
participants (cement marketing officials, sales promoters/C&F agents & stockists) to - a)
Assess the cement demand and pricing situation in NCR, UP (West/Central/East) and East
India, and b) Understand market size and behavior of various cement players in these regions
Areas covered: NCR- Delhi, Gurgaon, Ghaziabad, Noida (Prices in Noida are kept Rs 5/bag
lower than in Ghaziabad, primarily to offset movement from Delhi. The difference, till a year
ago, was Rs 3/bag) and Meerut, the most competitive market in West UP (Supply from non-
trade to trade segment is rampant); Central UP – Lucknow (the largest consumption centre
in the state) & Kanpur; Eastern UP: Varanasi; East India: Bihar (Patna, South
Bihar/Muzaffarpur, North Bihar), Jharkhand (Ranchi), Orissa (Bhubaneswar, Cuttack, Durg),
West Bengal (Kolkata) and Chhattisgarh (Raipur, Bilaspur)
Robust volume growth partially led by better demand; However, inventory stockings
have been higher: During December, cement companies in the regions we visited, reported
robust volume growth, led by a) slight improvement in demand, and, b) inventory stockings.
Most of the people were of the view that empty godowns facilitated inventory pile up and
secondary sale remains tepid (except in Bihar, where the feedback was different)
Lower prices remain a cause of worry; Companies focus on market share gains:
Cement prices remain tepid and this has worried industry. Many of them were of the opinion
that this type of worrisome trend has not been witnessed in the last 10years. Most of the
people believe that companies are not willing to compromise on market share, which coupled
with year-end volume push by Ambuja/ACC/Lafarge, has led to pressure on cement prices
North: December despatches at all-time high: In the North, December despatches were
7.2mn tonnes against the normal run-rate of 5.5-5.9mn tonnes/month in the last 4 years.
Almost all the companies have registered highest ever despatches. Before Dec’15, highest
despatches in the region were 6.5mn tonnes reported in the month of March, when the
government led demand is usually very high
Maintain Buy on Shree: Based on the cash flow & discussions with equipment suppliers, it
is estimated that Shree Cement can add another 10 million tonnes capacity in the next 4
years. Combo mill (capacity: 1.6 million tons) in Aurangabad, Bihar is expected by Q1FY17-
end, because as per the existing industrial policy of the state, VAT incentives are valid till
June’16. Shree Cement is the first and the only company till date to have set up split location
cement GU in Bihar. We believe that one should look beyond near-term concerns and factor
in the sharp jump in capacities. We maintain Buy.
Company Financials
EPS EV/EBITDA (x) P/E (x)
Companies FY16e FY17e FY16e FY17e FY16e FY17e
ACC 42.6 60.2 15.7 11.5 29.9 21.1
Ambuja Cements 7.0 10.0 15.8 10.8 27.9 19.5
Grasim Industries 224.7 289.0 6.9 5.6 15.2 11.8
India Cements 4.4 10.0 6.9 5.1 19.3 8.4
Madras Cements 17.7 24.3 12.8 10.2 21.6 15.7
Shree Cements 107.8 339.2 26.3 15.0 96.0 30.5
UltraTech Cement 85.2 115.1 17.7 13.7 33.4 24.7
JK Lakshmi Cement 0.8 7.6 18.4 11.7 359.9 36.3
JK Cement 18.3 45.8 11.5 7.1 25.4 10.2
Orient Cement 4.1 6.2 20.3 9.7 33.7 22.1
OCL India 34.7 51.3 5.4 3.8 13.7 9.3
Mangalam Cement 8.7 28.8 9.5 4.9 20.6 6.2
Prism Cement 0.5 4.4 14.3 8.5 154.2 16.2
Source: Company, Emkay Research
Cement- Road Trip India Equity Research | Emkay Ground Speak
Emkay Research | February 8, 2016 2
Earnings for JKLC to remain impacted, downgrade to Hold: JKLC’s inability to gain a
strong foothold in Jharkhand, West Bengal and Orissa markets, will impact its NCR till the
time Cuttack GU gets commissioned. Cuttack Grinding unit (GU) which was expected to get
commissioned by Q3FY17 earlier is now expected to come by Q3FY18e. Railway siding at
Durg, Chhattisgarh unit has also been delayed and is now expected after 6-9 months.
Minimum time for WHRS to get commissioned at Durg Plant will be 18 months (assuming
company places order in February itself). 80% of Durg plant serves two of the lowest cement
priced markets – Chhattisgarh and Orissa – with proportion of non-trade being higher (50:50
trade: non-trade) in the Orissa market. We believe that East capacity will be a drag for the
company for at least 18 months. Though, the stock has corrected in last 6-7 months, we
believe that the concerns related to East plant will continue to keep the stock under pressure
for some time. We downgrade our rating on the stock to Hold from Buy with revised PT of
Rs303 based on 8x FY18e EV/EBITDA and Rs14/share for its stake in Udaipur Cement
Work.
Key features of markets visited
Bihar
It is an ex (depot/rake point) market. Shree Cement remains the only company to operate
on FoR basis.
The incremental volume growth has been captured almost entirely by Shree
Cement (Shree & Bangur).
Shree Cement (SCL) is the only company to have operational cement unit in the state. The
primary advantage is slag as blending material. The only cement company in the state is
Kalyanpur Cement, which is a BIFR case.
It is primarily a trade market. Lafarge “Concreto” is the highest priced brand. Lafarge is the
price & volume leader in 'A' segment, & Birla Gold (Century Textiles) is the highest priced
'B' grade brand and does the largest volume in the state.
Almost every company has separate brands for PPC & PSC (slag cement) with different
schemes. The market consists of 40+ brands.
For the first time in the last 6 years, January'16 saw no price hike.
Shree Cement has introduced the concept of small sized godowns. As a result, there is no
difference between despatches & sales, as holding capacity of godowns is very limited.
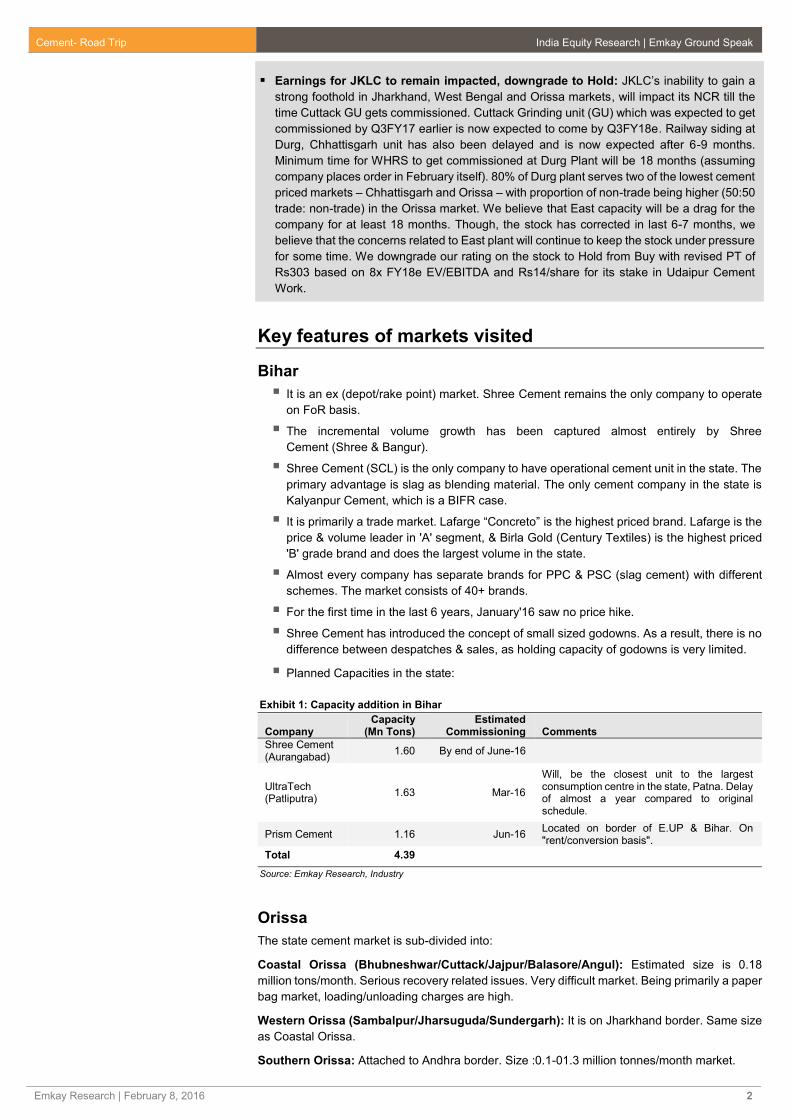
Planned Capacities in the state:
Exhibit 1: Capacity addition in Bihar
Company Capacity
(Mn Tons) Estimated
Commissioning Comments
Shree Cement (Aurangabad)
1.60 By end of June-16
UltraTech (Patliputra)
1.63 Mar-16
Will, be the closest unit to the largest consumption centre in the state, Patna. Delay of almost a year compared to original schedule.
Prism Cement 1.16 Jun-16 Located on border of E.UP & Bihar. On "rent/conversion basis".
Total 4.39
Source: Emkay Research, Industry
Orissa
The state cement market is sub-divided into:
Coastal Orissa (Bhubneshwar/Cuttack/Jajpur/Balasore/Angul): Estimated size is 0.18
million tons/month. Serious recovery related issues. Very difficult market. Being primarily a paper
bag market, loading/unloading charges are high.
Western Orissa (Sambalpur/Jharsuguda/Sundergarh): It is on Jharkhand border. Same size
as Coastal Orissa.
Southern Orissa: Attached to Andhra border. Size :0.1-01.3 million tonnes/month market.

Cement- Road Trip India Equity Research | Emkay Ground Speak
Emkay Research | February 8, 2016 3
Key features:
Very strong transport unions. The ratio of private: union truck is 1:1.
Same district in Coastal Orissa will have multiple billing.
Shree Cement has introduced the concept of paper depots. It effectively results in
secondary freight getting adjusted in primary freight itself.
Uttar Pradesh
Lucknow (Central U.P.)
ACC remains the highest priced brand in Lucknow, the largest consumption center.
Despite having the unit (Kundanganj GU) located closest to border of Lucknow district,
Reliance is not a relevant player in the trade segment.
Kanpur (Central U.P.)
ACC & JP are price & volume leaders respectively.
Reportedly, Reliance remains primarily a non-trade player & that too, the lowest priced
brand in Non-trade segment.
Varanasi (E. UP)
The largest market in E. UP (larger than Allahabad).
Jharkhand
Dalmia (paper bags) is being sold at par with Shree (WSP). It effectively indicates discount of Rs
20/bag compared to Shree Cement.
West Bengal
Extremely local brand conscious market. For any significant presence, cement grinding unit in
the state is a must. It does not have limestone reserves & hence, can’t have clinker capacity
Chhattisgarh
It is F.o.R. market. No Ex-price anywhere in Chhattisgarh. At best, even NTPC gets ex-rake rate.
For rest of non-trade buyers, pricing is F.o.R.
NCR (Delhi, Ghaziabad and Gurgaon): Robust volume growth, but at the cost of
pricing
Volume in the month of December’15 was 7.2 mn tonnes, which was the highest ever
volume recorded in the northern region. Average volume run–rate was 5.5-5.9mt/month in
the last 4 years. Before Dec ’15, highest despatches in the region were 6.5mn tonnes
reported in the month of March, when the government led demand is usually very high
Increase in volume is led by two factors: a) Partly demand push- infrastructure projects
have shown initial signals of pick-up and b) Partly stocking of inventories: Godowns were
empty (only 20-25% of storage capacity was utilized) and hence, inventory was piled up
due to low prices
Every player has done highest ever volume. Chances are that most of the volume increase
is due to stocking of inventories, as in last 10 days of Decemeber, despatches picked up
significantly (3x of normal volume). However, industry view is that if on an average, Jan &
Feb’16 volumes are 10% lower than that of Dec’15, start of demand recovery in the region
can safely be considered.
Secondary sale is lacking and major improvement in demand is still some time away. Boost
in confidence will come only after 3-4 months of consistent demand, as reason for demand
pick up in December is not very clear- actual demand, pent up demand or stocking of
inventory in anticipation of price hikes in January, which did not materialize
Market size of Gurgaon is normally 8-9 lakh tonnes/month. However, December volume
was between 10-11 lakh tonnes. Shree Cement and UltraTech despatches in Gurgaon
should be at 3 lakh tonnes and 2.4-3 lakh tonnes respectively.
Most of the people expect pickup in demand from infra segment from Mar-April, but as of
now, nothing much is happening on ground. There has not been any material procurement
Cement- Road Trip India Equity Research | Emkay Ground Speak
Emkay Research | February 8, 2016 4
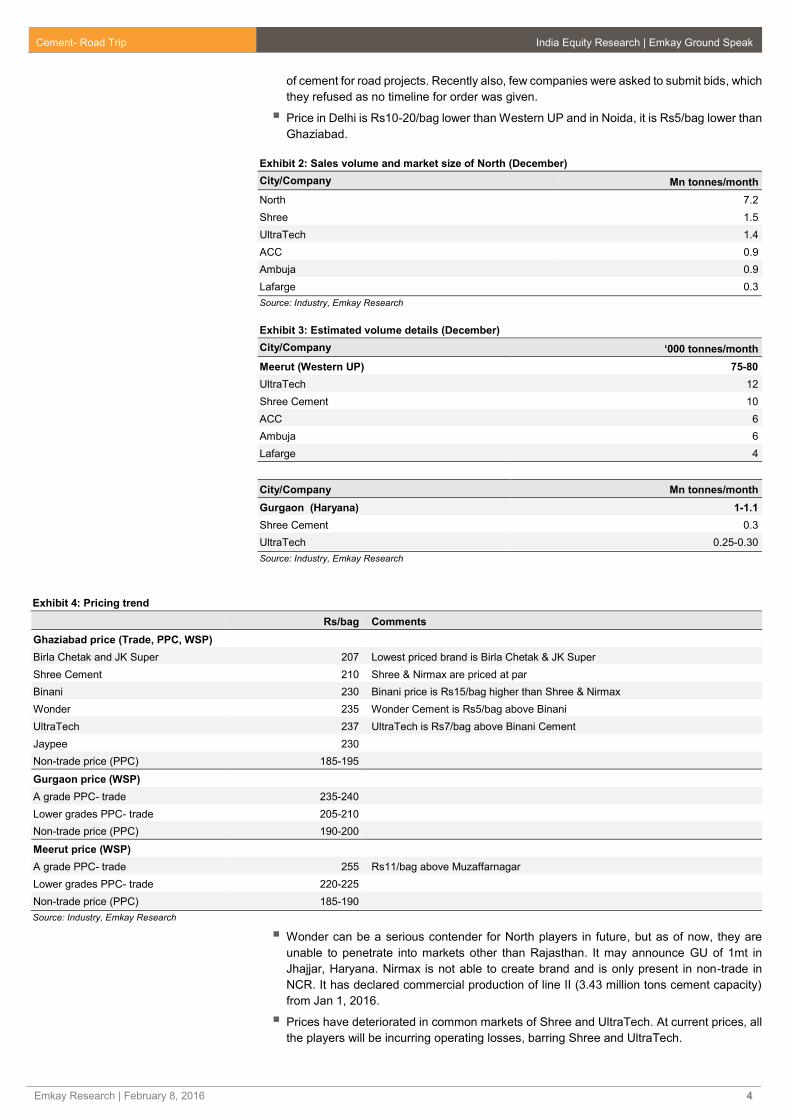
of cement for road projects. Recently also, few companies were asked to submit bids, which
they refused as no timeline for order was given.
Price in Delhi is Rs10-20/bag lower than Western UP and in Noida, it is Rs5/bag lower than
Ghaziabad.
Exhibit 2: Sales volume and market size of North (December)
City/Company Mn tonnes/month
North 7.2
Shree 1.5
UltraTech 1.4
ACC 0.9
Ambuja 0.9
Lafarge 0.3
Source: Industry, Emkay Research
Exhibit 3: Estimated volume details (December)
City/Company ‘000 tonnes/month
Meerut (Western UP) 75-80
UltraTech 12
Shree Cement 10
ACC 6
Ambuja 6
Lafarge 4
City/Company Mn tonnes/month
Gurgaon (Haryana) 1-1.1
Shree Cement 0.3
UltraTech 0.25-0.30
Source: Industry, Emkay Research
Exhibit 4: Pricing trend
Rs/bag Comments
Ghaziabad price (Trade, PPC, WSP)
Birla Chetak and JK Super 207 Lowest priced brand is Birla Chetak & JK Super
Shree Cement 210 Shree & Nirmax are priced at par
Binani 230 Binani price is Rs15/bag higher than Shree & Nirmax
Wonder 235 Wonder Cement is Rs5/bag above Binani
UltraTech 237 UltraTech is Rs7/bag above Binani Cement
Jaypee 230
Non-trade price (PPC) 185-195
Gurgaon price (WSP)
A grade PPC- trade 235-240
Lower grades PPC- trade 205-210
Non-trade price (PPC) 190-200
Meerut price (WSP)
A grade PPC- trade 255 Rs11/bag above Muzaffarnagar
Lower grades PPC- trade 220-225
Non-trade price (PPC) 185-190
Source: Industry, Emkay Research
Wonder can be a serious contender for North players in future, but as of now, they are
unable to penetrate into markets other than Rajasthan. It may announce GU of 1mt in
Jhajjar, Haryana. Nirmax is not able to create brand and is only present in non-trade in
NCR. It has declared commercial production of line II (3.43 million tons cement capacity)
from Jan 1, 2016.
Prices have deteriorated in common markets of Shree and UltraTech. At current prices, all
the players will be incurring operating losses, barring Shree and UltraTech.

Cement- Road Trip India Equity Research | Emkay Ground Speak
Emkay Research | February 8, 2016 5
Uttar Pradesh (Kanpur, Lucknow and Varanasi)
The demand scenario continues to remain weak in Kanpur, due to low demand from real
estate and government projects. Dealers in Lucknow and Varanasi were of the opinion that
government projects are driving cement consumption.
Demand in Lucknow was impacted in Nov-Dec’15 due to ongoing panchayat and municipal
elections. Now, dealers believe that the allocated funds for infrastructure expenditure will
start flowing to the panchayat from the government, which would help cement consumption.
Varanasi is also witnessing good demand from the new projects announced by the
government, which includes construction of National Highways, bypasses, sewage and
other projects.
Overall, the dealers are positive on the demand pick up in the state of UP and believe that
the state elections, which are to be held in 2017 would drive growth in the state. Also, the
MNREGA funds, which were not given since last one and half years, is anticipated to start
flowing in directly to the beneficiaries, which will help improvement in demand in rural areas.
Despite the good demand from government projects, which aided strong volume growth,
prices were low in the region as along with the actual demand, lot of hoarding happened
by the dealers in order to take benefit of full year incentive schemes. Also, the
competitiveness among various players to maintain/gain market share has put pressure on
cement prices. The market can absorb price hikes, but companies are not willing to take
price hikes, leaving prices to remain subdued.
Prices in North region are much lower compared to Central region, even after adjusting for
freight of Rs15-20/bag. Hence, brands like Shree, Bangur, JK Lakshmi Cement and Nirma
are being transported to Central market (other than W. UP) through Agra route. However,
this is not sale by the concerned companies.
In Central U.P., Non-trade material of Prism Cement is being sold into trade and also, much
lower quantity is being supplied in non-trade. The company has same colour of bags for
trade and non-trade. It may be a one-off. However, 40/200 bags of non-trade were also
sold at Rs230/bag (Kanpur and Lucknow).
Location-wise, Reliance cement is best placed to serve Central U.P. However, it is not able
to penetrate the market. It is not able to create much impact in the trade segment, even in
its near-by markets (e.g. Raibareli, Lucknow and Kanpur). Reliance sells 70-80% in non-
trade in Lucknow and Kanpur.
Exhibit 5: Market size and region-wise volume (December)
City/Company ‘000 tn/month
Kanpur 120
ACC 8-10
JP 12-15
Prism 10-12
Mycem 12-15
Birla Corp 12-15
Reliance 8-10
Lafarge 5
Lucknow 200
ACC 34
JP 37-38
Mycem 37-38
Birla Corp 20 -22
Reliance 15
Prism 28
Century 10-12
Varanasi 40
ACC 15-16
JP 7-8
Prism 3.5-4
Source: Industry, Emkay Research
Cement- Road Trip India Equity Research | Emkay Ground Speak
Emkay Research | February 8, 2016 6
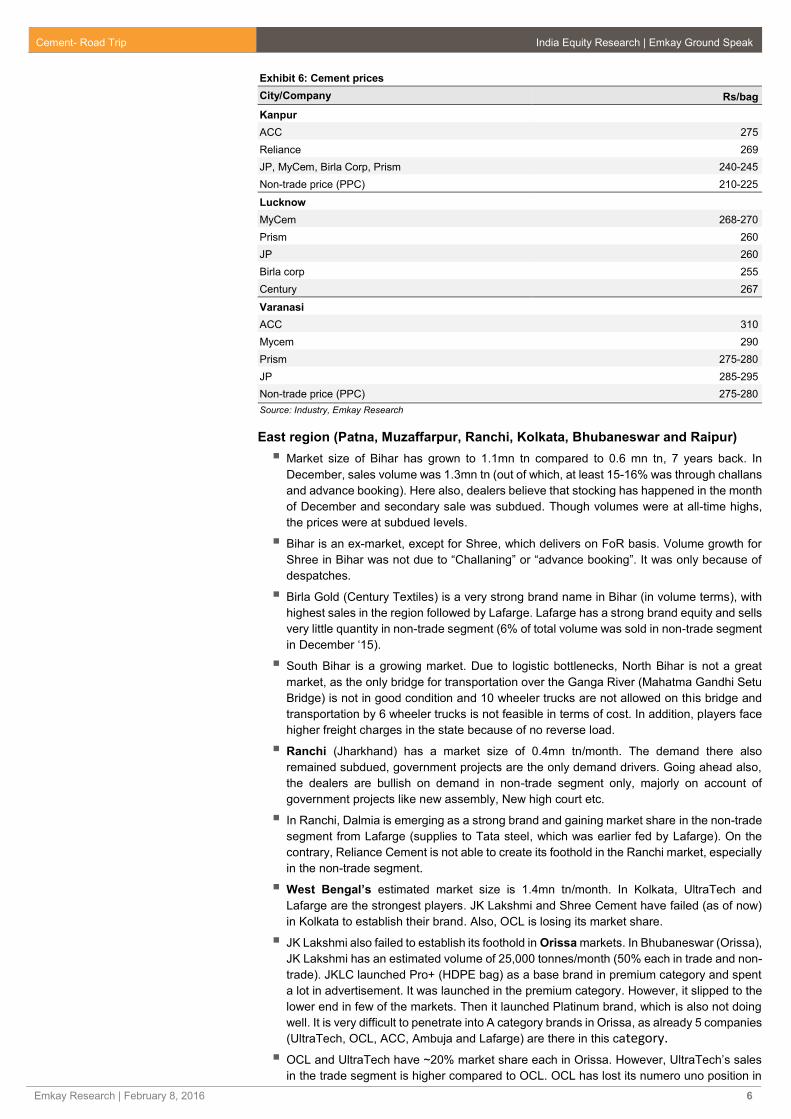
Exhibit 6: Cement prices
City/Company Rs/bag
Kanpur
ACC 275
Reliance 269
JP, MyCem, Birla Corp, Prism 240-245
Non-trade price (PPC) 210-225
Lucknow
MyCem 268-270
Prism 260
JP 260
Birla corp 255
Century 267
Varanasi
ACC 310
Mycem 290
Prism 275-280
JP 285-295
Non-trade price (PPC) 275-280
Source: Industry, Emkay Research
East region (Patna, Muzaffarpur, Ranchi, Kolkata, Bhubaneswar and Raipur)
Market size of Bihar has grown to 1.1mn tn compared to 0.6 mn tn, 7 years back. In
December, sales volume was 1.3mn tn (out of which, at least 15-16% was through challans
and advance booking). Here also, dealers believe that stocking has happened in the month
of December and secondary sale was subdued. Though volumes were at all-time highs,
the prices were at subdued levels.
Bihar is an ex-market, except for Shree, which delivers on FoR basis. Volume growth for
Shree in Bihar was not due to “Challaning” or “advance booking”. It was only because of
despatches.
Birla Gold (Century Textiles) is a very strong brand name in Bihar (in volume terms), with
highest sales in the region followed by Lafarge. Lafarge has a strong brand equity and sells
very little quantity in non-trade segment (6% of total volume was sold in non-trade segment
in December ‘15).
South Bihar is a growing market. Due to logistic bottlenecks, North Bihar is not a great
market, as the only bridge for transportation over the Ganga River (Mahatma Gandhi Setu
Bridge) is not in good condition and 10 wheeler trucks are not allowed on this bridge and
transportation by 6 wheeler trucks is not feasible in terms of cost. In addition, players face
higher freight charges in the state because of no reverse load.
Ranchi (Jharkhand) has a market size of 0.4mn tn/month. The demand there also
remained subdued, government projects are the only demand drivers. Going ahead also,
the dealers are bullish on demand in non-trade segment only, majorly on account of
government projects like new assembly, New high court etc.
In Ranchi, Dalmia is emerging as a strong brand and gaining market share in the non-trade
segment from Lafarge (supplies to Tata steel, which was earlier fed by Lafarge). On the
contrary, Reliance Cement is not able to create its foothold in the Ranchi market, especially
in the non-trade segment.
West Bengal’s estimated market size is 1.4mn tn/month. In Kolkata, UltraTech and
Lafarge are the strongest players. JK Lakshmi and Shree Cement have failed (as of now)
in Kolkata to establish their brand. Also, OCL is losing its market share.
JK Lakshmi also failed to establish its foothold in Orissa markets. In Bhubaneswar (Orissa),
JK Lakshmi has an estimated volume of 25,000 tonnes/month (50% each in trade and non-
trade). JKLC launched Pro+ (HDPE bag) as a base brand in premium category and spent
a lot in advertisement. It was launched in the premium category. However, it slipped to the
lower end in few of the markets. Then it launched Platinum brand, which is also not doing
well. It is very difficult to penetrate into A category brands in Orissa, as already 5 companies
(UltraTech, OCL, ACC, Ambuja and Lafarge) are there in this category.
OCL and UltraTech have ~20% market share each in Orissa. However, UltraTech’s sales
in the trade segment is higher compared to OCL. OCL has lost its numero uno position in

Cement- Road Trip India Equity Research | Emkay Ground Speak
Emkay Research | February 8, 2016 7
the trade segment in the state. Coastal Orissa gets significant “consignment sale” from
Andhra Pradesh based manufacturers. My Home (Brand:Mahashakti) is the key player.
Chhattisgarh remains FoR market and there is no ex-rate applicable in the state. Demand
from infrastructure and government projects is very low in the state. UltraTech has the
strongest brand equity in the region and it is the only brand, which is spread across the
state. JK Lakshmi Cement has capitalized on volume loss of JP Associates and has
become aggressive to gain market share. Lafarge is losing market share in the state and
in trade segment. Now, it is priced at Rs10/bag lower, compared to UltraTech, which was
earlier only Rs5/bag.
Raipur also witnessed lowest pricing in the month of December. Government project
demand remains low coupled with slowdown in the rural demand (due to low rainfall).
Exhibit 7: Company-wise volume details (December)
Company mt/month
Bihar 1.3
Lafarge 0.17
Birla gold 0.2
Shree 0.15
UltraTech 0.09
ACC 0.15
Prism 0.1
Konark 0.1
Birla Corp 0.06
Kalyanpur 0.05
JP 0.09
Samrat 0.06
Ambuja 0.04
Star 0.03
Mycem 0.01
Reliance 0.02
Ranchi 0.4
Lafarge 0.1
UltraTech 0.05
ACC 0.07
Birla Corp 0.02
JP 0.01
Ambuja 0.03
OCL 0.02
Century 0.03
Dalmia 0.05
West Bengal 1.4
Lafarge 0.25
UltraTech 0.3
ACC 0.1
Birla Corp 0.07
Ambuja 0.25
OCL 0.1
Century 0.09
Dalmia 0.03
Ramco 0.09
Source: Industry, Emkay Research

Cement- Road Trip India Equity Research | Emkay Ground Speak
Emkay Research | February 8, 2016 8
Exhibit 8: Company-wise volume details (December)
Company mt/month
Orissa 0.7
Bhubaneshwar 0.08
Cuttack 0.07
Birla gold 0.04
UltraTech 0.12
OCL 0.12
Shree + Bangur 0.03
Chhattisgarh 0.5
Raipur 0.13
Durg 0.05
Bilaspur 0.07
Lafarge 0.1
Shree 0.03
UltraTech 0.16
Century 0.08
JK Lakshmi 0.07
Bangur 0.03
Source: Industry, Emkay Research
Exhibit 9: Pricing trend
Region/Company Trade (Rs/bag) Non-trade (Rs/bag)
Bihar
Lafarge (Duraguard) 320 275-280
Concreto 335-340
UltraTech 298 265
ACC 315 275-280
Birla gold 265 260
Prism 245-250
Konark 290 240-245
Satna 250 240
Shree (PSC) 260
Prism 230-240
Ranchi
Lafarge 275-280
UltraTech 240-245
ACC 240-245
Birla gold 220-230 265
Dalmia 240-250 285
Ambuja 240-245
Birla corp 220-230
Konark 265-270
Kolkata
Lafarge 310-320 280
UltraTech 280-285 280
ACC 290
Birla gold 240-260
Ambuja 305-315
Birla corp 240-260
Raipur
Lafarge 225-226 195
Shree 212 185
JKLC 215-218 185
Bhubaneshwar
Lafarge 280 250
UltraTech 305 250
Ambuja 280 250
Ramco 285
OCL 305 250
Source: Industry, Emkay Research

Cement- Road Trip India Equity Research | Emkay Ground Speak
Emkay Research | February 8, 2016 9
Key Takeaways: Cement Companies
Shree Cement (SCL)
Road distance from Chhattisgarh to Bihar is lesser by almost 300 km as compared to rail.
Shree is the only company to transfer clinker from Chhattisgarh to Bihar (almost entire
quantity) by road. Chhattisgarh players are at a disadvantage compared to Satna players
for supply of cement to Bihar because of lead distance. It is more economical to supply
clinker from Chhattisgarh & use slag as blending material.
As per a large transporter of Bihar, despite no reverse load, freight/ton-km of SCL is lower,
primarily because of competitive bidding & owned fleet.
It had ~11.6% market share in Bihar in December’15. It is supplying only in trade segment.
It does not sell OPC, only PPC & PSC. Bihar is an ex-depot/rake-point market, except for
Shree, which delivers on FoR basis. It may be noted that in North (including W. UP), non-
trade segment accounts for almost 40% of volume sale of Shree.
Volume growth for Shree in Bihar was not due to “Challaning” or “advance booking”. It was
only because of despatches.
West Bengal is a difficult market to enter and non-locals find it difficult to enter there. Shree
Cement’s volume is also negligible in the state. (Non-local means without cement GU in
the state). West Bengal does not have limestone reserves & hence, can’t have clinker
capacity.
Bihar remains the focus market for the company in the East region. It has not been able to
create much impact in Jharkhand too. As per our estimate, Bihar market is more profitable
(on per ton basis) than North. The primary advantage is NOT cost of clinker but slag.
Already operational WHRS & self-sufficiency of captive power for clinker in Chhattisgarh
will improve the profitability.
Despite not having Flue Gas Desulphurisation (FGD) unit, Eastern unit is entirely on pet
coke. FGD is required to handle high sulphur pet coke.
JK Cement
The company need not pay VAT for cement sales in Rajasthan from Mangrol plant. The
VAT is exempted for 7 years.
The company is using road transport for inter-unit clinker transfer from Mangrol, Rajasthan
to Jhajjar, Haryana unit, even though railway siding and wagon tippler is operational on
both sides. This is due to steep increase in rail freight (up 27% yoy) and hence, road
transportation cost is lower than rail transport. The capex for this siding was Rs1.5bn and
the company was expecting savings of Rs200/tn in clinker transportation earlier.
One kiln at the old plant continues to remain shut due to higher operational cost. The
company will operate this kiln only if the demand improves.
It is increasing Wall Putty capacity by 0.2mtpa to 0.7mtpa. Capex cost for the same will be
Rs1.25bn. It is also establishing Dolomite grinding unit, and capex for the same will be
Rs400mn.
UAE unit of the company (Capacity - white cement 0.6mtpa or grey cement 1 mtpa) is
impacted negatively because of lower crude prices, as Saudi Arabia has shelved growth
plans.
In UAE, the grid power is available now, but the company is facing some issues in 2nd
circuit, which needs to be rectified.
There should be a saving of Rs100/tn in energy cost due to recent correction in pet coke
prices.
JK Lakshmi Cement
JKLC has tied up for a grinding unit on Bihar- Uttar Pradesh border. This was a constant
feedback from our meetings in Patna and Muzaffarpur.
The company has not been able to create much impact in Jharkhand. Sales volume of the
company is 3,000 - 4,000 tonnes/month.
In Kolkata too, the feedback was that JK Lakshmi has not been able to create much impact.
Its volume in December was ~9,000 tonnes (2,500 trade and 6,500 non-trade). JK Lakshmi
is mostly supplying OPC in the non-trade market.

Cement- Road Trip India Equity Research | Emkay Ground Speak
Emkay Research | February 8, 2016 10
West Bengal is a market where only those companies have succeeded, who are having
grinding unit in the state. 60% market is with local players and it is on the rise.
JKLC’s quality and packaging is appreciated. Higher distance is a negative. It will take
some time to create an impact in West Bengal markets.
In Bhubaneswar (Orissa), JK Lakshmi does volume of 25,000 tonnes/month (50% each in
trade and non-trade). JKLC launched Pro+ (HDPE bag) as a base brand in premium
category and spent a lot in advertisement. It was launched in the premium category.
However, it slipped to the lower end in few of the markets. Then it launched Platinum brand,
which is also not doing well. It is very difficult to penetrate into A category brands in Orissa
as already 5 companies (UltraTech, OCL, ACC, Ambuja and Lafarge) are present in this
category.
Raipur: JK Lakshmi is very aggressive in non-trade markets and is looking to gain volume
only. Shree and JKLC are the lowest priced brands in the non-trade segment (Rs180-
185/bag). We believe that this is primarily to gain market share as the company has recently
entered Chhattisgarh markets.
In Chhattisgarh, UltraTech is the only company, whose products are spread across the
state (except few specific Naxal affected areas). JKLC too, wants to spread its materials in
each and every corner. For e.g. in places like Bijapur, Dantewada and Sukuma, only
UltraTech and JKLC have presence. It will help the company to gain market share, though
NCR (naked cement realization) is likely to come down.
Prism Cement
In Central U.P, non-trade material is being sold into trade and also, much lower
quantity is being supplied in non-trade. The company has same colour of bags for trade
and non-trade. It may be a one-off. However, reportedly 40/200bags of non-trade were also
sold at Rs230/bag (Kanpur and Lucknow respectively).
The same feedback about selling of non-trade material into trade was received in Patna
(Bihar) too.
The company is taking one grinding unit on rent near Bihar-Uttar Pradesh border (within 10
kms of Eastern UP-Bihar border). Our interaction with equipment suppliers indicates that
the company is taking a GU of capacity of 175 TPH (or 1.16 mn tonnes) on rent from
Kanoria Cement. The unit is estimated to be operational in June’16.
OCL & Dalmia Bharat
OCL is supplying material from Orissa to Bihar. Dalmia Bharat is supplying from Bokaro,
Jharkhand.
Both these players have higher proportion of sales in the non-trade segment. In the non-
trade segment, the price of these brands is on the lower side. For e.g. non-trade price is
Rs240/bag FoR in Patna, compared to Rs235/bag ex-price of Prism and Rs240/bag ex-
price of Birla Corp
OCL had ~8% market share in Bihar, whereas Dalmia had 2.5% market share in Bihar in
December ’15.
OCL & Dalmia combined had ~20% market share in Jharkhand in December’15. Dalmia
Bharat sells 60-65% in non-trade segment in the state.
Dalmia Bharat has become an aggressive player and is fighting for volume share in West
Bengal. OCL has ~7% market share in West Bengal.
OCL and UltraTech have ~20% market share each in Orissa. However, UltraTech’s sales
in the trade segment is higher compared to OCL. OCL has lost its numero uno position in
the trade segment in the state.
Emami Cement
Emami Cement’s grinding unit of 335 TPH (or 2.2mt/year) capacity is expected to get
commissioned in this month. The company is expected to source first rake of clinker from
Reliance Cement to start trial-run of the plant.
Clinkerization plant (9,000 TPD or capacity 2.97 mtpa) will get commissioned only after 6-
7 months and hence, it will have to procure clinker from outside to operate the grinding unit
till clinkerisation unit stabilises.

Cement- Road Trip India Equity Research | Emkay Ground Speak
Emkay Research | February 8, 2016 11
None of the people seemed to be worried about this plant and believe that the company
will find it difficult to create market as the marketing team, C&Fs and dealers are not in
place.
Other two grinding units of the company with similar capacity of 335 TPH (or 2.2 mt/year)
each in Durgapur (West Bengal) and Baigunea (Orissa) will get commissioned by
Q4FY17e.
Emkay Research is also available on www.emkayglobal.com, Bloomberg EMKAY<GO>, Reuters and DOWJONES. Emkay Global Financial Services Ltd.
©
Your success is our success
Emkay
India Equity Research | Cement
February 8, 2016
Company Update
Shree Cements
Look beyond near-term challenges
CMP Target Price
Rs10,350 Rs12,900 (■)
Rating Upside
BUY (■) 24.6 %
Change in Estimates
EPS Chg FY16E/FY17E (%) NA
Target Price change (%) NA
Previous Reco BUY
Emkay vs Consensus
EPS Estimates
FY16E FY17E
Emkay 107.8 339.2
Consensus 171.4 361.3
Mean Consensus TP Rs 10,813
Stock Details
Bloomberg Code SRCM IN
Face Value (Rs) 10
Shares outstanding (mn) 35
52 Week H/L 13,360 / 9,350
M Cap (Rs bn/USD bn) 361 / 5.33
Daily Avg Volume (nos.) 16,258
Daily Avg Turnover (US$ mn) 2.5
Shareholding Pattern Dec '15
Promoters 64.8%
FIIs 13.6%
DIIs 15.4%
Public and Others 6.2%
Price Performance
(%) 1M 3M 6M 12M
Absolute (7) (14) (11) (6)
Rel. to Nifty (3) (8) 2 10
Relative price chart
Source: Bloomberg
Sanjeev Kumar Singh
+91 22 66121255
Tejashwini Kumari
+91 22 66121285
-10
-2
6
14
22
30
9500
10175
10850
11525
12200
12875
Feb-15 Apr-15 Jun-15 Aug-15 Oct-15 Dec-15 Feb-16
%Rs
Shree Cements (LHS) Rel to Nifty (RHS)
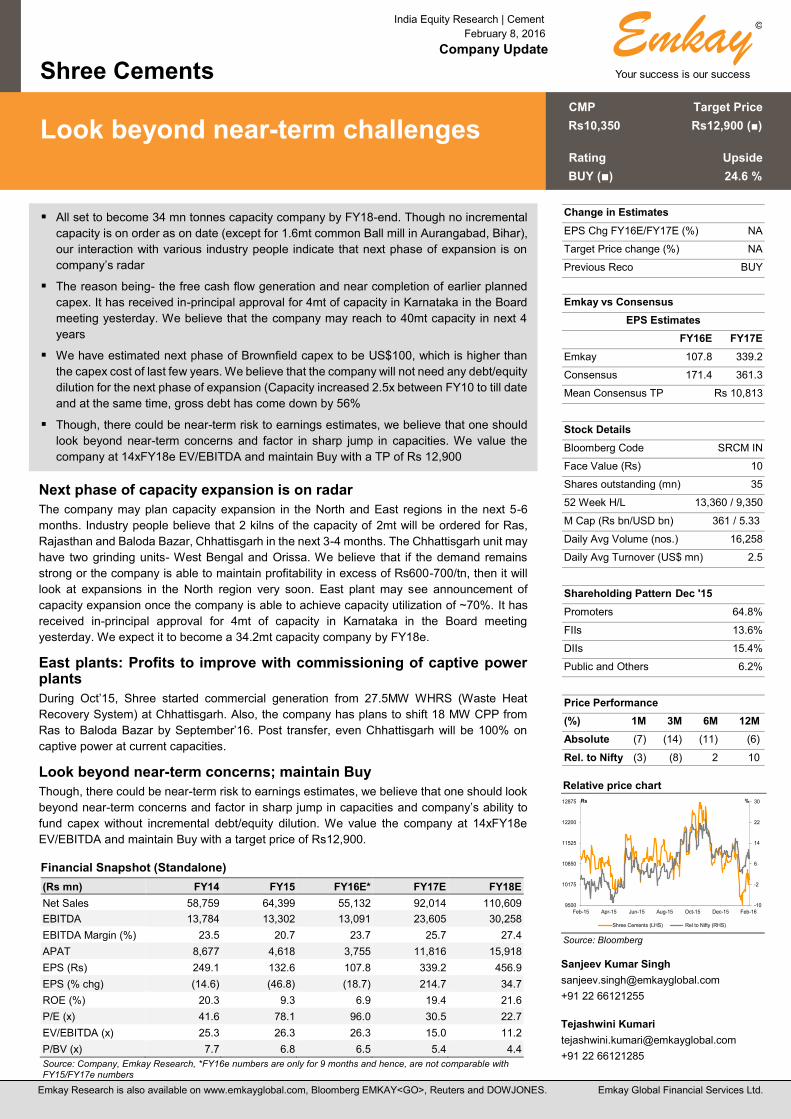
All set to become 34 mn tonnes capacity company by FY18-end. Though no incremental
capacity is on order as on date (except for 1.6mt common Ball mill in Aurangabad, Bihar),
our interaction with various industry people indicate that next phase of expansion is on
company’s radar
The reason being- the free cash flow generation and near completion of earlier planned
capex. It has received in-principal approval for 4mt of capacity in Karnataka in the Board
meeting yesterday. We believe that the company may reach to 40mt capacity in next 4
years
We have estimated next phase of Brownfield capex to be US$100, which is higher than
the capex cost of last few years. We believe that the company will not need any debt/equity
dilution for the next phase of expansion (Capacity increased 2.5x between FY10 to till date
and at the same time, gross debt has come down by 56%
Though, there could be near-term risk to earnings estimates, we believe that one should
look beyond near-term concerns and factor in sharp jump in capacities. We value the
company at 14xFY18e EV/EBITDA and maintain Buy with a TP of Rs 12,900
Next phase of capacity expansion is on radar
The company may plan capacity expansion in the North and East regions in the next 5-6
months. Industry people believe that 2 kilns of the capacity of 2mt will be ordered for Ras,
Rajasthan and Baloda Bazar, Chhattisgarh in the next 3-4 months. The Chhattisgarh unit may
have two grinding units- West Bengal and Orissa. We believe that if the demand remains
strong or the company is able to maintain profitability in excess of Rs600-700/tn, then it will
look at expansions in the North region very soon. East plant may see announcement of
capacity expansion once the company is able to achieve capacity utilization of ~70%. It has
received in-principal approval for 4mt of capacity in Karnataka in the Board meeting
yesterday. We expect it to become a 34.2mt capacity company by FY18e.
East plants: Profits to improve with commissioning of captive power plants
During Oct’15, Shree started commercial generation from 27.5MW WHRS (Waste Heat
Recovery System) at Chhattisgarh. Also, the company has plans to shift 18 MW CPP from
Ras to Baloda Bazar by September’16. Post transfer, even Chhattisgarh will be 100% on
captive power at current capacities.
Look beyond near-term concerns; maintain Buy
Though, there could be near-term risk to earnings estimates, we believe that one should look
beyond near-term concerns and factor in sharp jump in capacities and company’s ability to
fund capex without incremental debt/equity dilution. We value the company at 14xFY18e
EV/EBITDA and maintain Buy with a target price of Rs12,900.
Financial Snapshot (Standalone)
(Rs mn) FY14 FY15 FY16E* FY17E FY18E
Net Sales 58,759 64,399 55,132 92,014 110,609
EBITDA 13,784 13,302 13,091 23,605 30,258
EBITDA Margin (%) 23.5 20.7 23.7 25.7 27.4
APAT 8,677 4,618 3,755 11,816 15,918
EPS (Rs) 249.1 132.6 107.8 339.2 456.9
EPS (% chg) (14.6) (46.8) (18.7) 214.7 34.7
ROE (%) 20.3 9.3 6.9 19.4 21.6
P/E (x) 41.6 78.1 96.0 30.5 22.7
EV/EBITDA (x) 25.3 26.3 26.3 15.0 11.2
P/BV (x) 7.7 6.8 6.5 5.4 4.4
Source: Company, Emkay Research, *FY16e numbers are only for 9 months and hence, are not comparable with
FY15/FY17e numbers
Shree Cements (SRCM IN) India Equity Research | Management Meet Update
Emkay Research | February 2, 2016 13
Next phase of capacity expansion is on radar
Our interaction with various industry participants indicate that the company may plan capacity
expansion in the North and East regions in the next 5-6 months. Industry people believe that 2
kilns of the capacity of 2mt will be order for Ras, Rajasthan and Baloda Bazar, Chhattisgarh in
the next 3-4 months. The Chhattisgarh unit may have two grinding units- West Bengal and
Orissa. We believe that if the demand remains strong or the company is able to maintain
profitability in excess of Rs600-700/tn, then it will look at expansions in the North region very
soon. East plant may see announcement of capacity expansion, once the company is able to
achieve capacity utilization of ~70%. Combo mill in Aurangabad, Bihar is expected by Q1FY17-
end because as per the existing industrial policy of the state VAT incentives are valid till June’16
only. Shree Cement is the first and the only company till date to have set up split location cement
GU in Bihar. In addition, the company’s board has given in principal approval for the new capacity
addition (clinker capacity of 2.4mtpa and cement grinding unit of upto 4mtpa in Gulbarga district)
at Karnataka (details regarding the investment and duration is yet to be announced).
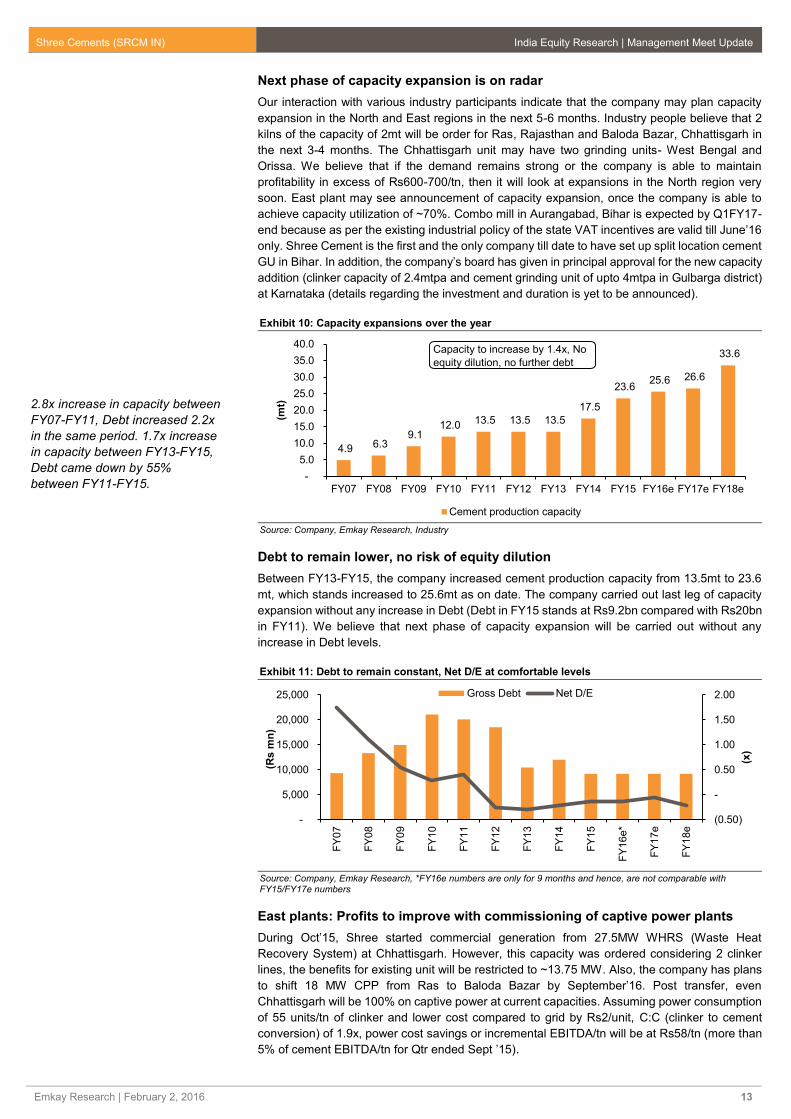
Exhibit 10: Capacity expansions over the year
Source: Company, Emkay Research, Industry
Debt to remain lower, no risk of equity dilution
Between FY13-FY15, the company increased cement production capacity from 13.5mt to 23.6
mt, which stands increased to 25.6mt as on date. The company carried out last leg of capacity
expansion without any increase in Debt (Debt in FY15 stands at Rs9.2bn compared with Rs20bn
in FY11). We believe that next phase of capacity expansion will be carried out without any
increase in Debt levels.
Exhibit 11: Debt to remain constant, Net D/E at comfortable levels
Source: Company, Emkay Research, *FY16e numbers are only for 9 months and hence, are not comparable with
FY15/FY17e numbers
East plants: Profits to improve with commissioning of captive power plants
During Oct’15, Shree started commercial generation from 27.5MW WHRS (Waste Heat
Recovery System) at Chhattisgarh. However, this capacity was ordered considering 2 clinker
lines, the benefits for existing unit will be restricted to ~13.75 MW. Also, the company has plans
to shift 18 MW CPP from Ras to Baloda Bazar by September’16. Post transfer, even
Chhattisgarh will be 100% on captive power at current capacities. Assuming power consumption
of 55 units/tn of clinker and lower cost compared to grid by Rs2/unit, C:C (clinker to cement
conversion) of 1.9x, power cost savings or incremental EBITDA/tn will be at Rs58/tn (more than
5% of cement EBITDA/tn for Qtr ended Sept ’15).
4.9 6.3 9.1
12.0 13.5 13.5 13.5
17.5
23.6 25.6 26.6
33.6
-
5.0
10.0
15.0
20.0
25.0
30.0
35.0
40.0
FY07 FY08 FY09 FY10 FY11 FY12 FY13 FY14 FY15 FY16e FY17e FY18e
(mt)
Cement production capacity
Capacity to increase by 1.4x, No
equity dilution, no further debt
(0.50)
-
0.50
1.00
1.50
2.00
-
5,000
10,000
15,000
20,000
25,000
FY
07
FY
08
FY
09
FY
10
FY
11
FY
12
FY
13
FY
14
FY
15
FY
16e*
FY
17e
FY
18e
(x)
(Rs m
n)
Gross Debt Net D/E
2.8x increase in capacity between
FY07-FY11, Debt increased 2.2x
in the same period. 1.7x increase
in capacity between FY13-FY15,
Debt came down by 55%
between FY11-FY15.
Shree Cements (SRCM IN) India Equity Research | Management Meet Update
Emkay Research | February 2, 2016 14
Bihar: Company has gained double digit market share
Based on our interaction with Cement dealers and industry people, we believe that the company
had ~12% market share in Bihar in Dec ’15 which reflects the company’s ability to establish its
brand in new areas. It is to be noted here that the company started sales in Bihar in June ’14.
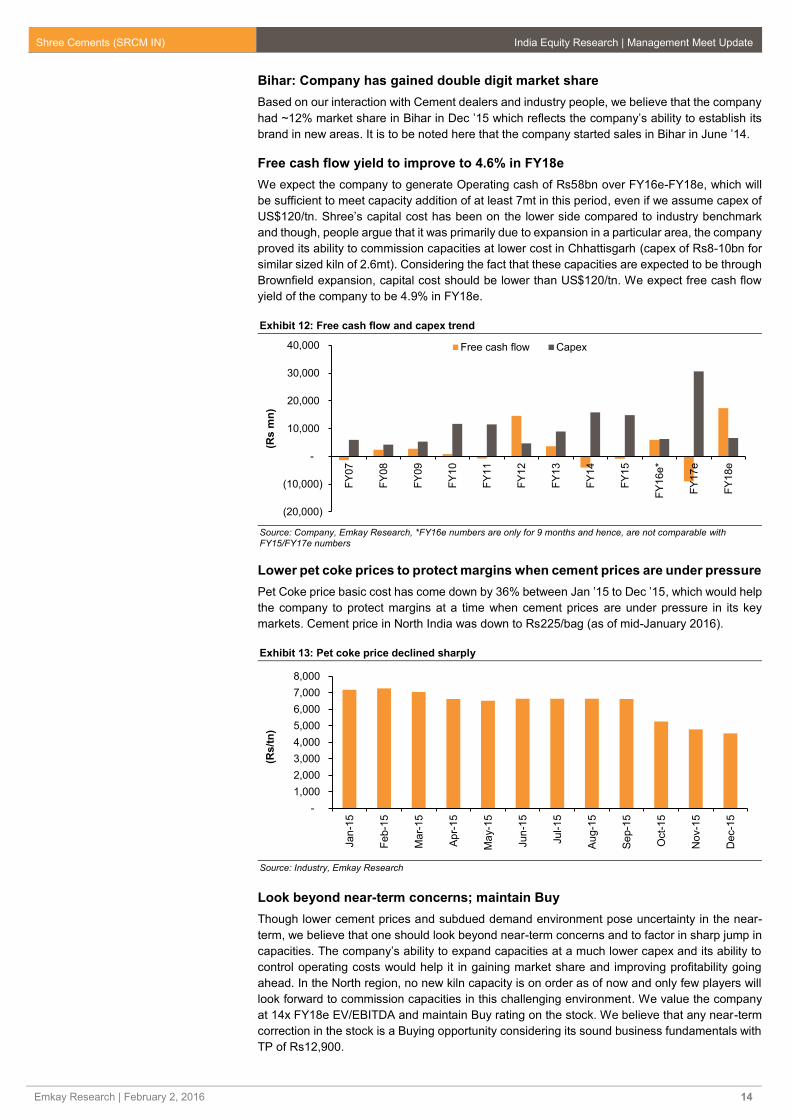
Free cash flow yield to improve to 4.6% in FY18e
We expect the company to generate Operating cash of Rs58bn over FY16e-FY18e, which will
be sufficient to meet capacity addition of at least 7mt in this period, even if we assume capex of
US$120/tn. Shree’s capital cost has been on the lower side compared to industry benchmark
and though, people argue that it was primarily due to expansion in a particular area, the company
proved its ability to commission capacities at lower cost in Chhattisgarh (capex of Rs8-10bn for
similar sized kiln of 2.6mt). Considering the fact that these capacities are expected to be through
Brownfield expansion, capital cost should be lower than US$120/tn. We expect free cash flow
yield of the company to be 4.9% in FY18e.
Exhibit 12: Free cash flow and capex trend
Source: Company, Emkay Research, *FY16e numbers are only for 9 months and hence, are not comparable with
FY15/FY17e numbers
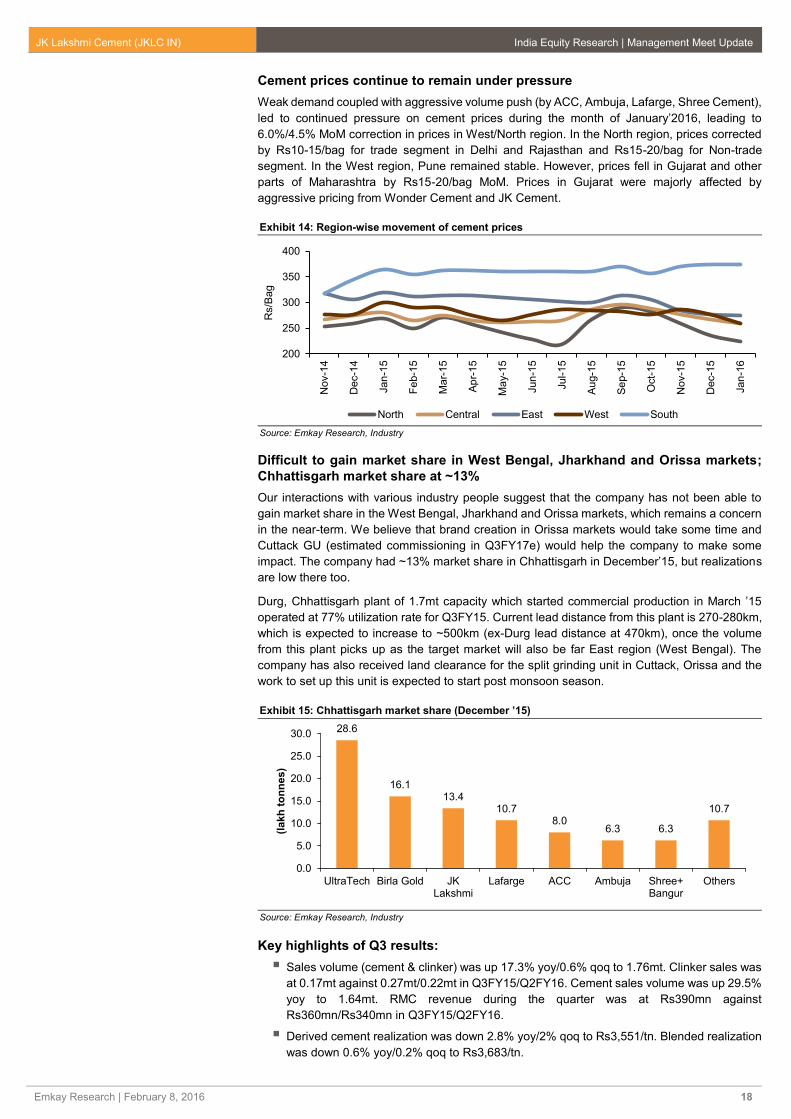
Lower pet coke prices to protect margins when cement prices are under pressure
Pet Coke price basic cost has come down by 36% between Jan ’15 to Dec ’15, which would help
the company to protect margins at a time when cement prices are under pressure in its key
markets. Cement price in North India was down to Rs225/bag (as of mid-January 2016).
Exhibit 13: Pet coke price declined sharply
Source: Industry, Emkay Research
Look beyond near-term concerns; maintain Buy
Though lower cement prices and subdued demand environment pose uncertainty in the near-
term, we believe that one should look beyond near-term concerns and to factor in sharp jump in
capacities. The company’s ability to expand capacities at a much lower capex and its ability to
control operating costs would help it in gaining market share and improving profitability going
ahead. In the North region, no new kiln capacity is on order as of now and only few players will
look forward to commission capacities in this challenging environment. We value the company
at 14x FY18e EV/EBITDA and maintain Buy rating on the stock. We believe that any near-term
correction in the stock is a Buying opportunity considering its sound business fundamentals with
TP of Rs12,900.
(20,000)
(10,000)
-
10,000
20,000
30,000
40,000F
Y07
FY
08
FY
09
FY
10
FY
11
FY
12
FY
13
FY
14
FY
15
FY
16e*
FY
17e
FY
18e
(Rs m
n)
Free cash flow Capex
-
1,000
2,000
3,000
4,000
5,000
6,000
7,000
8,000
Jan
-15
Fe
b-1
5
Ma
r-15
Ap
r-15
Ma
y-1
5
Jun
-15
Jul-1
5
Au
g-1
5
Se
p-1
5
Oct-
15
Nov-1
5
Dec-1
5
(Rs/t
n)

Shree Cements (SRCM IN) India Equity Research | Management Meet Update
Emkay Research | February 2, 2016 15
Key Financials (Standalone)
Income Statement
Y/E Jun (Rs mn) FY14 FY15 FY16E* FY17E FY18E
Net Sales 58,759 64,399 55,132 92,014 110,609
Expenditure 44,975 51,097 42,041 68,410 80,351
EBITDA 13,784 13,302 13,091 23,605 30,258
Depreciation 5,499 9,248 8,840 9,672 11,424
EBIT 8,285 4,054 4,251 13,932 18,834
Other Income 1,964 1,515 1,078 1,778 1,878
Interest expenses 1,292 1,206 750 1,300 1,300
PBT 8,957 4,363 4,579 14,410 19,412
Tax 279 (255) 824 2,594 3,494
Extraordinary Items (805) (355) 0 0 0
Minority Int./Income from Assoc. 0 0 0 0 0
Reported Net Income 7,872 4,263 3,755 11,816 15,918
Adjusted PAT 8,677 4,618 3,755 11,816 15,918
Balance Sheet
Y/E Jun (Rs mn) FY14 FY15 FY16E* FY17E FY18E
Equity share capital 348 348 348 348 348
Reserves & surplus 46,667 52,415 55,279 66,124 80,827
Net worth 47,015 52,764 55,627 66,472 81,175
Minority Interest 0 0 0 0 0
Loan Funds 11,999 9,166 9,166 9,166 9,166
Net deferred tax liability (1,429) (1,952) (1,952) (1,952) (1,952)
Total Liabilities 57,585 59,978 62,842 73,686 88,389
Net block 21,938 30,043 31,046 26,288 45,700
Investment 22,444 16,626 16,626 12,626 26,626
Current Assets 19,888 26,256 31,097 29,048 39,312
Cash & bank balance 1,593 3,075 8,463 2,954 5,711
Other Current Assets 339 163 293 293 293
Current liabilities & Provision 14,269 18,058 17,526 21,575 26,369
Net current assets 5,619 8,198 13,570 7,472 12,943
Misc. exp 0 0 0 0 0
Total Assets 57,586 59,979 62,842 73,686 88,389
Cash Flow
Y/E Jun (Rs mn) FY14 FY15 FY16E* FY17E FY18E
PBT (Ex-Other income) (NI+Dep) 8,152 4,245 4,579 12,632 17,534
Other Non-Cash items (2,980) 1,026 (1,177) 0 0
Chg in working cap 1,187 (229) 16 589 (2,714)
Operating Cashflow 11,796 14,037 12,183 21,600 24,050
Capital expenditure (15,829) (14,886) (6,232) (30,615) (6,656)
Free Cash Flow (4,033) (848) 5,951 (9,015) 17,394
Investments 2,402 4,140 0 4,000 (14,000)
Other Investing Cash Flow 0 0 0 0 0
Investing Cashflow (12,339) (9,969) (5,154) (24,837) (18,778)
Equity Capital Raised 0 0 0 0 0
Loans Taken / (Repaid) (894) (2,832) 0 0 0
Dividend paid (incl tax) (895) (893) (891) (972) (1,215)
Other Financing Cash Flow 1,697 2,387 0 0 0
Financing Cashflow (1,558) (2,586) (1,641) (2,272) (2,515)
Net chg in cash (2,101) 1,483 5,388 (5,509) 2,757
Opening cash position 3,694 1,593 3,075 8,463 2,954
Closing cash position 1,593 3,075 8,463 2,954 5,711

Shree Cements (SRCM IN) India Equity Research | Management Meet Update
Emkay Research | February 2, 2016 16
Key Ratios
Profitability (%) FY14 FY15 FY16E* FY17E FY18E
EBITDA Margin 23.5 20.7 23.7 25.7 27.4
EBIT Margin 14.1 6.3 7.7 15.1 17.0
Effective Tax Rate 3.1 (5.8) 18.0 18.0 18.0
Net Margin 14.8 7.2 6.8 12.8 14.4
ROCE 19.4 9.5 8.7 23.0 25.6
ROE 20.3 9.3 6.9 19.4 21.6
RoIC 38.1 13.3 11.9 41.6 45.0
Per Share Data (Rs) FY14 FY15 FY16E* FY17E FY18E
EPS 249.1 132.6 107.8 339.2 456.9
CEPS 406.9 398.0 361.5 616.8 784.8
BVPS 1,349.6 1,514.6 1,596.8 1,908.1 2,330.1
DPS 22.0 24.0 22.0 24.0 30.0
Valuations (x) FY14 FY15 FY16E* FY17E FY18E
PER 41.6 78.1 96.0 30.5 22.7
P/CEPS 25.4 26.0 28.6 16.8 13.2
P/BV 7.7 6.8 6.5 5.4 4.4
EV / Sales 5.9 5.4 6.3 3.8 3.1
EV / EBITDA 25.3 26.3 26.3 15.0 11.2
Dividend Yield (%) 0.2 0.2 0.2 0.2 0.3
Gearing Ratio (x) FY14 FY15 FY16E* FY17E FY18E
Net Debt/ Equity (0.3) (0.2) (0.3) (0.1) (0.3)
Net Debt/EBIDTA (0.9) (0.8) (1.2) (0.3) (0.8)
Working Cap Cycle (days) 25.0 29.0 33.8 17.9 23.9
Growth (%) FY14 FY15 FY16E* FY17E FY18E
Revenue 5.5 9.6 (14.4) 66.9 20.2
EBITDA (11.1) (3.5) (1.6) 80.3 28.2
EBIT (25.6) (51.1) 4.9 227.7 35.2
PAT (21.6) (45.8) (11.9) 214.7 34.7
Quarterly (Rs mn) Q2FY15 Q3FY15 Q4FY15 Q1FY16 Q2FY16
Revenue 15,419 15,733 17,194 17,235 18,268
EBITDA 3,035 3,375 3,516 4,108 4,240
EBITDA Margin (%) 19.7 21.5 20.4 23.8 23.2
PAT 937 1,197 1,041 1,287 1,029
EPS (Rs) 26.9 34.4 29.9 36.9 29.5
Shareholding Pattern (%) Dec-14 Mar-15 Jun-15 Sep-15 Dec-15
Promoters 64.8 64.8 64.8 64.8 64.8
FIIs 11.3 11.9 13.5 13.6 13.6
DIIs 5.6 5.2 4.7 4.9 15.4
Public and Others 18.3 18.1 17.0 16.7 6.2
*FY16e numbers are only for 9 months and hence, are not comparable with FY15/FY17e numbers

Emkay Research is also available on www.emkayglobal.com, Bloomberg EMKAY<GO>, Reuters and DOWJONES. Emkay Global Financial Services Ltd.
©
Your success is our success
Emkay
India Equity Research | Cement
February 8, 2016
Company Update
JK Lakshmi Cement
East plant to remain under pressure, downgrade to Hold
CMP Target Price
Rs276 Rs303 ()
Rating Upside
HOLD () 9.6 %
Change in Estimates
EPS Chg FY16E/FY17E (%) (89)/(63)
Target Price change (%) (33.2)
Previous Reco BUY
Emkay vs Consensus
EPS Estimates
FY16E FY17E
Emkay 0.8 7.6
Consensus 2.4 16.9
Mean Consensus TP Rs 390
Stock Details
Bloomberg Code JKLC IN
Face Value (Rs) 5
Shares outstanding (mn) 118
52 Week H/L 410 / 258
M Cap (Rs bn/USD bn) 33 / 0.48
Daily Avg Volume (nos.) 62,535
Daily Avg Turnover (US$ mn) 0.3
Shareholding Pattern Sep '15
Promoters 45.9%
FIIs 14.4%
DIIs 18.2%
Public and Others 21.5%
Price Performance
(%) 1M 3M 6M 12M
Absolute (17) (23) (24) (30)
Rel. to Nifty 1 (18) (13) (18)
Relative price chart
Source: Bloomberg
Sanjeev Kumar Singh
+91 22 66121255
Tejashwini Kumari
+91 22 66121285
-20
-14
-8
-2
4
10
250
280
310
340
370
400
Feb-15 Apr-15 Jun-15 Aug-15 Oct-15 Dec-15 Feb-16
%Rs
JK Lakshmi Cement (LHS) Rel to Nifty (RHS)
Continuous pricing pressure in the company’s key markets (North and West regions) and
weakening cement prices in Chhattisgarh markets too, have forced us to downgrade our
realization assumptions. Also, Cuttack grinding unit has been delayed by 12 months and
WHRS has not yet been ordered.
Our interaction with various industry participants suggest that JK Lakshmi (JKLC) has
been unable to create markets in Jharkhand, West Bengal and Orissa, which is a reason
for concern in the near-term
In Chhattisgarh, the company has gained ~13% market share in December ’15 as per our
channel checks. However, the price for JKLC remains on the lower side. We believe that
this could be company’s strategy to gain market share
Based on our channel checks and delay in commissioning of Cuttack GU, railway siding
and WHRS, we have revised FY16e/FY17e/FY18e EBITDA estimates downwards by
24.4%/29.4%/29.1%. Downgrade our rating on the stock to Hold from Buy.
Cement prices under pressure, delay in capex plans
Weak demand coupled with aggressive volume push (by ACC, Ambuja, Lafarge, Shree
Cement), led to continued pressure on cement prices during the month of January’2016,
leading to a 6.0%/4.5% MoM correction in prices in West/North region. Cuttack GU which was
earlier expected to get commissioned by Q3FY17 has now been delayed to Q3FY18e.
Railway siding has also been delayed by 6-9 months and WHRS capacity has not yet been
ordered. These factors will continue to keep the profitability of East plant under pressure at
least for next 18 months.
Difficult to gain market share in West Bengal, Jharkhand and Orissa markets;
Chhattisgarh market share at ~13%
Our interactions with various industry people suggest that the company has not been able to
gain market share in the West Bengal, Jharkhand and Orissa markets, which remains a
concern in the near-term. We believe that brand creation in Orissa markets would take some
time and Cuttack GU (estimated commissioning in Q3FY17e) would help the company to
make some impact. The company had ~13% market share in Chhattisgarh in December ’15,
but realizations are low there too (215-218/bag in Raipur).
Have sharply downgraded estimates owing to weak cement prices & delay in
Cuttack grinding unit
We have revised FY16e/FY17e/FY18e EBITDA estimates downwards by
24.4%/29.4%/29.1%, factoring in a) delay in commissioning of grinding unit at Cuttack, Orissa;
b) pressure on realization in the company’s key markets and c) the difficulty being faced by
the company to establish foothold in the market of Jharkhand and Kolkata. We downgrade
our rating on the stock to Hold from Buy with revised PT of Rs303.
Financial Snapshot (Standalone)
(Rs mn) FY14 FY15 FY16E FY17E FY18E
Net Sales 20,559 23,011 26,378 31,060 35,656
EBITDA 3,013 3,434 2,889 4,314 5,741
EBITDA Margin (%) 14.7 14.9 11.0 13.9 16.1
APAT 1,115 1,587 90 894 2,195
EPS (Rs) 9.5 13.5 0.8 7.6 18.7
EPS (% chg) (41.9) 42.4 (94.3) 890.1 145.5
ROE (%) 8.7 12.1 0.7 6.5 14.8
P/E (x) 29.2 20.5 359.9 36.3 14.8
EV/EBITDA (x) 16.1 15.0 18.4 11.7 8.2
P/BV (x) 2.5 2.4 2.4 2.3 2.1
Source: Company, Emkay Research
JK Lakshmi Cement (JKLC IN) India Equity Research | Management Meet Update
Emkay Research | February 8, 2016 18
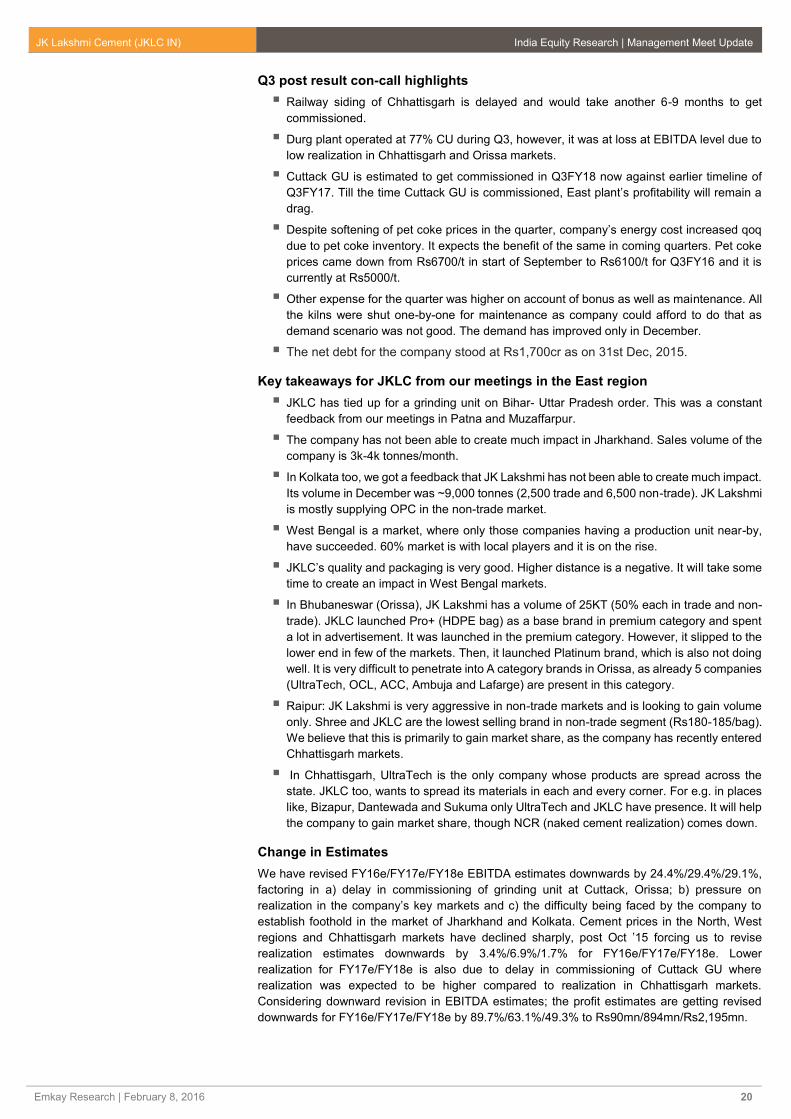
Cement prices continue to remain under pressure
Weak demand coupled with aggressive volume push (by ACC, Ambuja, Lafarge, Shree Cement),
led to continued pressure on cement prices during the month of January’2016, leading to
6.0%/4.5% MoM correction in prices in West/North region. In the North region, prices corrected
by Rs10-15/bag for trade segment in Delhi and Rajasthan and Rs15-20/bag for Non-trade
segment. In the West region, Pune remained stable. However, prices fell in Gujarat and other
parts of Maharashtra by Rs15-20/bag MoM. Prices in Gujarat were majorly affected by
aggressive pricing from Wonder Cement and JK Cement.
Exhibit 14: Region-wise movement of cement prices
Source: Emkay Research, Industry
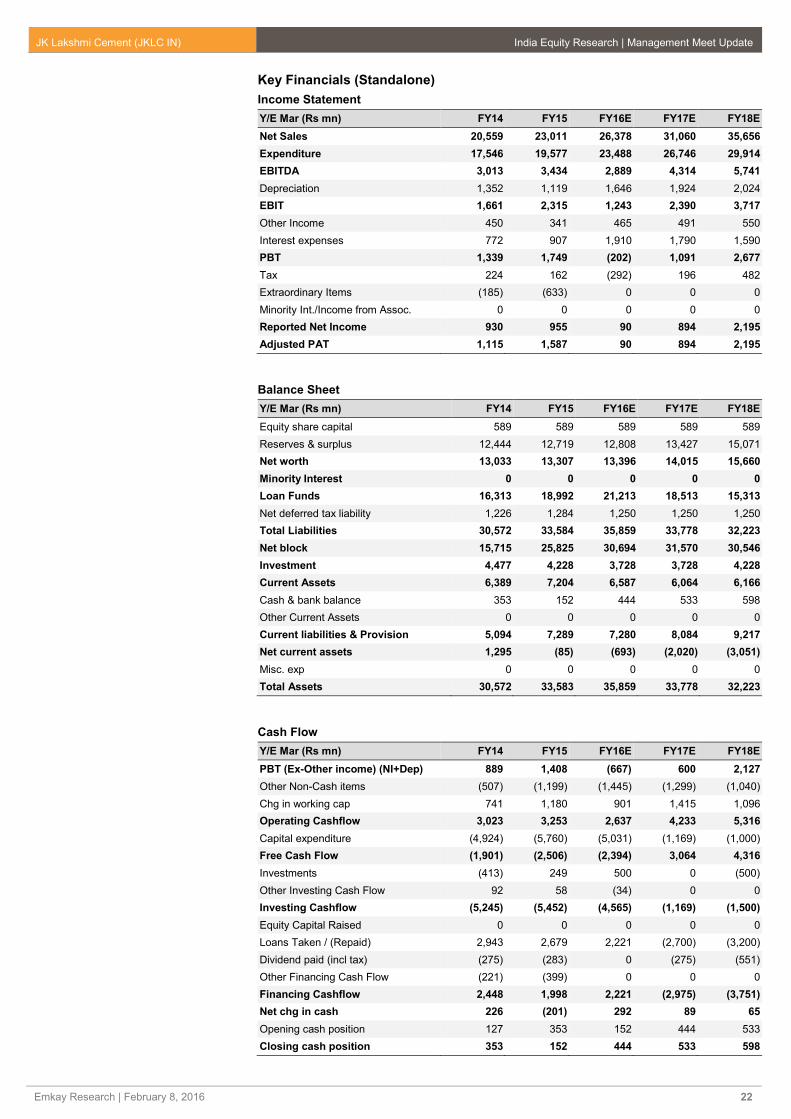
Difficult to gain market share in West Bengal, Jharkhand and Orissa markets;
Chhattisgarh market share at ~13%
Our interactions with various industry people suggest that the company has not been able to
gain market share in the West Bengal, Jharkhand and Orissa markets, which remains a concern
in the near-term. We believe that brand creation in Orissa markets would take some time and
Cuttack GU (estimated commissioning in Q3FY17e) would help the company to make some
impact. The company had ~13% market share in Chhattisgarh in December’15, but realizations
are low there too.
Durg, Chhattisgarh plant of 1.7mt capacity which started commercial production in March ’15
operated at 77% utilization rate for Q3FY15. Current lead distance from this plant is 270-280km,
which is expected to increase to ~500km (ex-Durg lead distance at 470km), once the volume
from this plant picks up as the target market will also be far East region (West Bengal). The
company has also received land clearance for the split grinding unit in Cuttack, Orissa and the
work to set up this unit is expected to start post monsoon season.
Exhibit 15: Chhattisgarh market share (December ’15)
Source: Emkay Research, Industry
Key highlights of Q3 results:
Sales volume (cement & clinker) was up 17.3% yoy/0.6% qoq to 1.76mt. Clinker sales was
at 0.17mt against 0.27mt/0.22mt in Q3FY15/Q2FY16. Cement sales volume was up 29.5%
yoy to 1.64mt. RMC revenue during the quarter was at Rs390mn against
Rs360mn/Rs340mn in Q3FY15/Q2FY16.
Derived cement realization was down 2.8% yoy/2% qoq to Rs3,551/tn. Blended realization
was down 0.6% yoy/0.2% qoq to Rs3,683/tn.
200
250
300
350
400
Nov-1
4
Dec-1
4
Jan
-15
Fe
b-1
5
Ma
r-15
Ap
r-15
Ma
y-1
5
Jun
-15
Jul-1
5
Au
g-1
5
Se
p-1
5
Oct-
15
Nov-1
5
Dec-1
5
Jan
-16
Rs/B
ag
North Central East West South
28.6
16.113.4
10.78.0
6.3 6.3
10.7
0.0
5.0
10.0
15.0
20.0
25.0
30.0
UltraTech Birla Gold JKLakshmi
Lafarge ACC Ambuja Shree+Bangur
Others
(lakh
to
nn
es)

JK Lakshmi Cement (JKLC IN) India Equity Research | Management Meet Update
Emkay Research | February 8, 2016 19
Opex/tn was up 3.2% yoy, but down 0.3% qoq to Rs3,303/tn. Though, energy cost was
down 7.6% yoy, it increased 4.1% qoq despite decline in pet coke prices. The company
was carrying high cost inventory which restricted the benefits in the quarter and the
management expects the benefits to accrue in subsequent quarters. Employee cost/tn was
up 22.3% yoy led by capacity increase at Durg, Chhattisgarh. Freight cost/tn was up 8%
yoy/4.7% qoq to Rs911.
Led by higher cost and decline in realization, EBITDA/tn declined 24.3% yoy to Rs380
during the quarter. EBITDA was down 11.2% yoy to Rs669mn. OPM declined 324bps yoy
to 10.3%.
Depreciation was up 49.3% yoy to Rs419mn and interest cost was up 128% yoy to Rs497
mn primarily due to new capacity additions.
Exhibit 16: Quarterly results
(Y/E Mar, Rs mn) Q3FY15 Q4FY15 Q1FY16 Q2FY16 Q3FY16 YoY (%) QoQ (%) YTD FY16 YTD FY15 YoY (%)
Net Sales 5,559 5,782 5,908 6,457 6,483 16.6 0.4 18,848 17,289 9.0
Expenditure 4,805 5,067 5,401 5,791 5,814 21.0 0.4 17,005 14,509 17.2
as % of sales 86.4% 87.6% 91.4% 89.7% 89.7% 90.2% 83.9%
Consumption of RM 900 817 1,052 1,303 1,145 27.3 -12.1 3,501 2,745 27.5
as % of sales 16.2% 14.1% 17.8% 20.2% 17.7% 18.6% 15.9%
Employee Cost 349 392 489 496 501 43.4 0.9 1,486 1,069 39.1
as % of sales 6.3% 6.8% 8.3% 7.7% 7.7% 7.9% 6.2%
Power, Oil & Fuel 1,268 1,304 1,357 1,312 1,374 8.3 4.8 4,042 3,644 10.9
as % of sales 22.8% 22.5% 23.0% 20.3% 21.2% 21.4% 21.1%
Transportation & Handling 1,267 1,382 1,495 1,522 1,604 26.6 5.4 4,621 3,780 22.2
as % of sales 22.8% 23.9% 25.3% 23.6% 24.7% 24.5% 21.9%
Other expenditure 1,021 1,173 1,008 1,157 1,189 16.5 2.8 3,355 3,271 2.6
as % of sales 18.4% 20.3% 17.1% 17.9% 18.3% 17.8% 18.9%
EBITDA 754 715 507 667 669 -11.2 0.4 1,843 2,780 -33.7
Depreciation 281 270 392 417 419 49.3 0.6 1,228 905 35.7
EBIT 473 445 115 250 250 -47.2 0.0 615 1,875 -67.2
Other Income 67 178 44 60 157 133.8 164.0 260 104 150.0
Interest 218 255.9 453 477.7 497 128.0 4.0 1,428 651 119.3
PBT 322 367 -295 -168 -90 n/m n/m -553 1,328 n/m
Total Tax 37 -12 -114 -72 -53 n/m n/m -239 173 n/m
Adjusted PAT 285 378 -180 -97 -37 n/m n/m -314 1,155 n/m
Extra ordinary items 100 318 55 53 0 107 259
Reported PAT 185 61 -235 -150 -37 n/m n/m -421 896 n/m
Adjusted EPS 2.42 3.21 -1.53 -0.82 -0.31 n/m n/m -2.67 9.81 n/m
Margins (%)
EBIDTA 13.6 12.4 8.6 10.3 10.3 -324 0 9.8 16.1 -630
EBIT 8.5 7.7 1.9 3.9 3.9 -465 -2 3.3 10.8 -759
EBT 5.8 6.3 (5.0) (2.6) (1.4) -718 122 (2.9) 7.7 -1,062
PAT 5.1 6.5 (3.1) (1.5) (0.6) -570 93 (2.2) 5.2 -742
Effective Tax rate 11.5 (3.1) 38.8 42.5 59.2 4,774 1,671 43.3 13.0 3,021
Source: Company, Emkay Research
Exhibit 17: Operating cost on per tonne basis
Per ton costs Q3FY15 Q4FY15 Q1FY16 Q2FY16 Q3FY16 YoY (%) QoQ (%) YTD FY16 YTD FY15 YoY (%)
Cement volumes 1.50 1.55 1.66 1.75 1.76 17.3 0.6 5.16 4.40 17.3
Raw Material 599 527 636 745 651 8.5 -12.7 636 594 6.9
Employee 233 253 295 284 285 22.3 0.3 295 259 14.2
Power and fuel 845 841 820 750 781 -7.6 4.1 820 844 -2.8
Freight 844 891 903 870 911 8.0 4.7 903 873 3.5
Other Expenses 680 756 609 662 676 -0.7 2.1 609 803 -24.1
Net Realisation 3704 3730 3569 3692 3683 -0.6 -0.2 3569 4158 -14.2
Total cost per tonne 3201 3269 3263 3311 3303 3.2 -0.2 3263 3372 -3.2
EBIDTA per tonne 502 461 306 381 380 -24.3 -0.3 306 786 -61.0
Source: Company, Emkay Research
JK Lakshmi Cement (JKLC IN) India Equity Research | Management Meet Update
Emkay Research | February 8, 2016 20
Q3 post result con-call highlights
Railway siding of Chhattisgarh is delayed and would take another 6-9 months to get
commissioned.
Durg plant operated at 77% CU during Q3, however, it was at loss at EBITDA level due to
low realization in Chhattisgarh and Orissa markets.
Cuttack GU is estimated to get commissioned in Q3FY18 now against earlier timeline of
Q3FY17. Till the time Cuttack GU is commissioned, East plant’s profitability will remain a
drag.
Despite softening of pet coke prices in the quarter, company’s energy cost increased qoq
due to pet coke inventory. It expects the benefit of the same in coming quarters. Pet coke
prices came down from Rs6700/t in start of September to Rs6100/t for Q3FY16 and it is
currently at Rs5000/t.
Other expense for the quarter was higher on account of bonus as well as maintenance. All
the kilns were shut one-by-one for maintenance as company could afford to do that as
demand scenario was not good. The demand has improved only in December.
The net debt for the company stood at Rs1,700cr as on 31st Dec, 2015.
Key takeaways for JKLC from our meetings in the East region
JKLC has tied up for a grinding unit on Bihar- Uttar Pradesh order. This was a constant
feedback from our meetings in Patna and Muzaffarpur.
The company has not been able to create much impact in Jharkhand. Sales volume of the
company is 3k-4k tonnes/month.
In Kolkata too, we got a feedback that JK Lakshmi has not been able to create much impact.
Its volume in December was ~9,000 tonnes (2,500 trade and 6,500 non-trade). JK Lakshmi
is mostly supplying OPC in the non-trade market.
West Bengal is a market, where only those companies having a production unit near-by,
have succeeded. 60% market is with local players and it is on the rise.
JKLC’s quality and packaging is very good. Higher distance is a negative. It will take some
time to create an impact in West Bengal markets.
In Bhubaneswar (Orissa), JK Lakshmi has a volume of 25KT (50% each in trade and non-
trade). JKLC launched Pro+ (HDPE bag) as a base brand in premium category and spent
a lot in advertisement. It was launched in the premium category. However, it slipped to the
lower end in few of the markets. Then, it launched Platinum brand, which is also not doing
well. It is very difficult to penetrate into A category brands in Orissa, as already 5 companies
(UltraTech, OCL, ACC, Ambuja and Lafarge) are present in this category.
Raipur: JK Lakshmi is very aggressive in non-trade markets and is looking to gain volume
only. Shree and JKLC are the lowest selling brand in non-trade segment (Rs180-185/bag).
We believe that this is primarily to gain market share, as the company has recently entered
Chhattisgarh markets.
In Chhattisgarh, UltraTech is the only company whose products are spread across the
state. JKLC too, wants to spread its materials in each and every corner. For e.g. in places
like, Bizapur, Dantewada and Sukuma only UltraTech and JKLC have presence. It will help
the company to gain market share, though NCR (naked cement realization) comes down.
Change in Estimates
We have revised FY16e/FY17e/FY18e EBITDA estimates downwards by 24.4%/29.4%/29.1%,
factoring in a) delay in commissioning of grinding unit at Cuttack, Orissa; b) pressure on
realization in the company’s key markets and c) the difficulty being faced by the company to
establish foothold in the market of Jharkhand and Kolkata. Cement prices in the North, West
regions and Chhattisgarh markets have declined sharply, post Oct ’15 forcing us to revise
realization estimates downwards by 3.4%/6.9%/1.7% for FY16e/FY17e/FY18e. Lower
realization for FY17e/FY18e is also due to delay in commissioning of Cuttack GU where
realization was expected to be higher compared to realization in Chhattisgarh markets.
Considering downward revision in EBITDA estimates; the profit estimates are getting revised
downwards for FY16e/FY17e/FY18e by 89.7%/63.1%/49.3% to Rs90mn/894mn/Rs2,195mn.

JK Lakshmi Cement (JKLC IN) India Equity Research | Management Meet Update
Emkay Research | February 8, 2016 21
Exhibit 18: Earnings revision
FY16e FY17e FY18e
Particulars/Rs mn Earlier Revised Chg (%) Earlier Revised Chg (%) Earlier Revised Chg (%)
Sales Volume 7.3 7.2 (1.2) 8.7 8.1 (6.6) 9.5 8.6 (9.2)
Net Realisation 3,854 3,722.9 (3.4) 4,169 3,881.4 (6.9) 4,205 4,133.2 (1.7)
Revenue 27552 26,378 (4.3) 36,031 31,060 (13.8) 40,870 35,656 (12.8)
EBITDA 3822 2,889 (24.4) 6,112 4,314 (29.4) 8,096 5,741 (29.1)
EBITDA m (%) 13.9 11.0 (292) 17.0 13.9 (307) 19.8 16.1 (371)
PAT 873 90 (89.7) 2,426 894 (63.1) 4,331 2,195 (49.3)
EPS (Rs) 7 0.8 (89.7) 20.6 7.6 (63.1) 36.8 18.7 (49.3)
Source: Company, Emkay Research
East plant to continue to strain the financials, downgrade to Hold
Cuttack Grinding unit (GU) which was expected to get commissioned by Q3FY17 earlier is now
expected to come by Q3FY18e. Railway siding at Durg, Chhattisgarh unit has also been delayed
and is now expected after 6-9 months. Minimum time for WHRS to get commissioned at Durg
Plant will be 18 months (assuming company places order in February itself). 80% of Durg
plant serves two of the lowest cement priced markets – Chhattisgarh and Orissa – with
proportion of non-trade being higher (50:50 trade: non-trade) in the Orissa market. We
believe that East capacity will be a drag for the company for at least 18 months. Though, the
stock has corrected in last 6-7 months, we believe that the concerns related to East plant will
continue to keep the stock under pressure for some time. We downgrade our rating on the stock
to Hold from Buy with revised PT of Rs303 based on 8x FY18e EV/EBITDA and Rs14/share for
its stake in Udaipur Cement Work.
JK Lakshmi Cement (JKLC IN) India Equity Research | Management Meet Update
Emkay Research | February 8, 2016 22
Key Financials (Standalone)
Income Statement
Y/E Mar (Rs mn) FY14 FY15 FY16E FY17E FY18E
Net Sales 20,559 23,011 26,378 31,060 35,656
Expenditure 17,546 19,577 23,488 26,746 29,914
EBITDA 3,013 3,434 2,889 4,314 5,741
Depreciation 1,352 1,119 1,646 1,924 2,024
EBIT 1,661 2,315 1,243 2,390 3,717
Other Income 450 341 465 491 550
Interest expenses 772 907 1,910 1,790 1,590
PBT 1,339 1,749 (202) 1,091 2,677
Tax 224 162 (292) 196 482
Extraordinary Items (185) (633) 0 0 0
Minority Int./Income from Assoc. 0 0 0 0 0
Reported Net Income 930 955 90 894 2,195
Adjusted PAT 1,115 1,587 90 894 2,195
Balance Sheet
Y/E Mar (Rs mn) FY14 FY15 FY16E FY17E FY18E
Equity share capital 589 589 589 589 589
Reserves & surplus 12,444 12,719 12,808 13,427 15,071
Net worth 13,033 13,307 13,396 14,015 15,660
Minority Interest 0 0 0 0 0
Loan Funds 16,313 18,992 21,213 18,513 15,313
Net deferred tax liability 1,226 1,284 1,250 1,250 1,250
Total Liabilities 30,572 33,584 35,859 33,778 32,223
Net block 15,715 25,825 30,694 31,570 30,546
Investment 4,477 4,228 3,728 3,728 4,228
Current Assets 6,389 7,204 6,587 6,064 6,166
Cash & bank balance 353 152 444 533 598
Other Current Assets 0 0 0 0 0
Current liabilities & Provision 5,094 7,289 7,280 8,084 9,217
Net current assets 1,295 (85) (693) (2,020) (3,051)
Misc. exp 0 0 0 0 0
Total Assets 30,572 33,583 35,859 33,778 32,223
Cash Flow
Y/E Mar (Rs mn) FY14 FY15 FY16E FY17E FY18E
PBT (Ex-Other income) (NI+Dep) 889 1,408 (667) 600 2,127
Other Non-Cash items (507) (1,199) (1,445) (1,299) (1,040)
Chg in working cap 741 1,180 901 1,415 1,096
Operating Cashflow 3,023 3,253 2,637 4,233 5,316
Capital expenditure (4,924) (5,760) (5,031) (1,169) (1,000)
Free Cash Flow (1,901) (2,506) (2,394) 3,064 4,316
Investments (413) 249 500 0 (500)
Other Investing Cash Flow 92 58 (34) 0 0
Investing Cashflow (5,245) (5,452) (4,565) (1,169) (1,500)
Equity Capital Raised 0 0 0 0 0
Loans Taken / (Repaid) 2,943 2,679 2,221 (2,700) (3,200)
Dividend paid (incl tax) (275) (283) 0 (275) (551)
Other Financing Cash Flow (221) (399) 0 0 0
Financing Cashflow 2,448 1,998 2,221 (2,975) (3,751)
Net chg in cash 226 (201) 292 89 65
Opening cash position 127 353 152 444 533
Closing cash position 353 152 444 533 598
JK Lakshmi Cement (JKLC IN) India Equity Research | Management Meet Update
Emkay Research | February 8, 2016 23
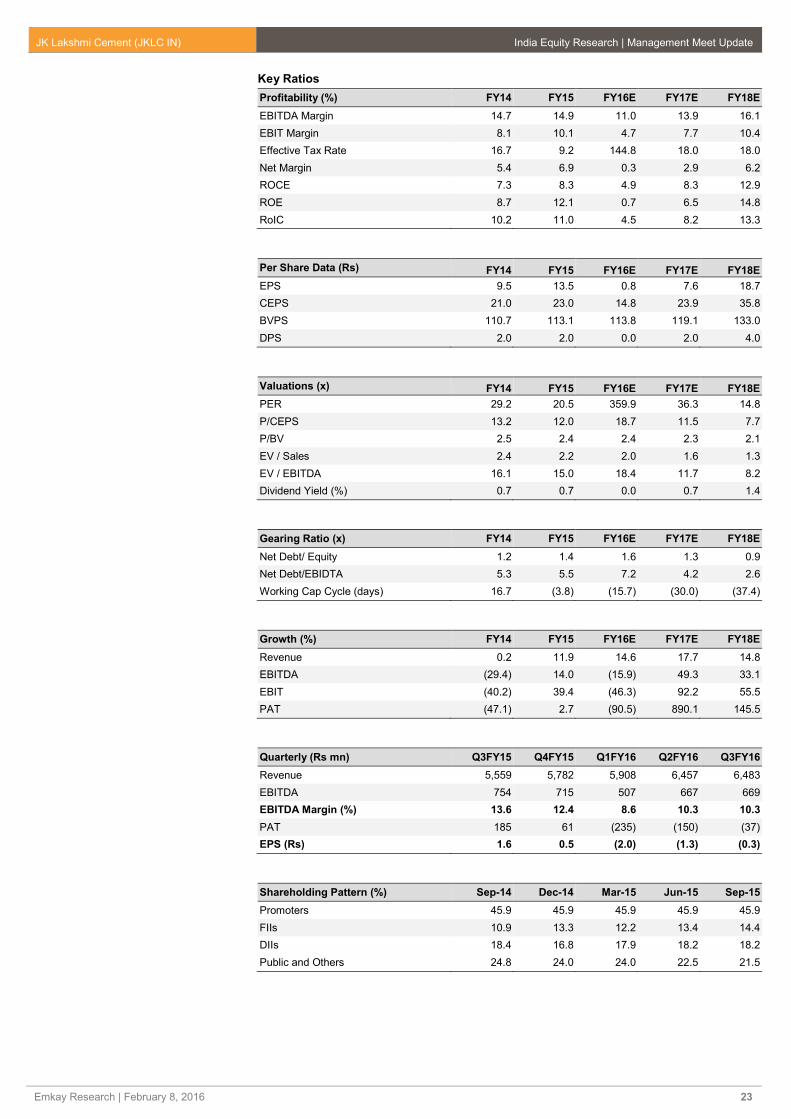
Key Ratios
Profitability (%) FY14 FY15 FY16E FY17E FY18E
EBITDA Margin 14.7 14.9 11.0 13.9 16.1
EBIT Margin 8.1 10.1 4.7 7.7 10.4
Effective Tax Rate 16.7 9.2 144.8 18.0 18.0
Net Margin 5.4 6.9 0.3 2.9 6.2
ROCE 7.3 8.3 4.9 8.3 12.9
ROE 8.7 12.1 0.7 6.5 14.8
RoIC 10.2 11.0 4.5 8.2 13.3
Per Share Data (Rs) FY14 FY15 FY16E FY17E FY18E
EPS 9.5 13.5 0.8 7.6 18.7
CEPS 21.0 23.0 14.8 23.9 35.8
BVPS 110.7 113.1 113.8 119.1 133.0
DPS 2.0 2.0 0.0 2.0 4.0
Valuations (x) FY14 FY15 FY16E FY17E FY18E
PER 29.2 20.5 359.9 36.3 14.8
P/CEPS 13.2 12.0 18.7 11.5 7.7
P/BV 2.5 2.4 2.4 2.3 2.1
EV / Sales 2.4 2.2 2.0 1.6 1.3
EV / EBITDA 16.1 15.0 18.4 11.7 8.2
Dividend Yield (%) 0.7 0.7 0.0 0.7 1.4
Gearing Ratio (x) FY14 FY15 FY16E FY17E FY18E
Net Debt/ Equity 1.2 1.4 1.6 1.3 0.9
Net Debt/EBIDTA 5.3 5.5 7.2 4.2 2.6
Working Cap Cycle (days) 16.7 (3.8) (15.7) (30.0) (37.4)
Growth (%) FY14 FY15 FY16E FY17E FY18E
Revenue 0.2 11.9 14.6 17.7 14.8
EBITDA (29.4) 14.0 (15.9) 49.3 33.1
EBIT (40.2) 39.4 (46.3) 92.2 55.5
PAT (47.1) 2.7 (90.5) 890.1 145.5
Quarterly (Rs mn) Q3FY15 Q4FY15 Q1FY16 Q2FY16 Q3FY16
Revenue 5,559 5,782 5,908 6,457 6,483
EBITDA 754 715 507 667 669
EBITDA Margin (%) 13.6 12.4 8.6 10.3 10.3
PAT 185 61 (235) (150) (37)
EPS (Rs) 1.6 0.5 (2.0) (1.3) (0.3)
Shareholding Pattern (%) Sep-14 Dec-14 Mar-15 Jun-15 Sep-15
Promoters 45.9 45.9 45.9 45.9 45.9
FIIs 10.9 13.3 12.2 13.4 14.4
DIIs 18.4 16.8 17.9 18.2 18.2
Public and Others 24.8 24.0 24.0 22.5 21.5

JK Lakshmi Cement (JKLC IN) India Equity Research | Management Meet Update
Emkay Research | February 8, 2016 25
DISCLAIMERS AND DISCLOSURES: Emkay Global Financial Services Limited (CIN-L67120MH1995PLC084899) and its affiliates are a full-service, brokerage, investment banking, investment
management and financing group. Emkay Global Financial Services Limited (EGFSL) along with its affiliates are participants in virtually all securities trading markets in India. EGFSL was established in
1995 and is one of India's leading brokerage and distribution house.EGFSL is a corporate trading member of Bombay Stock Exchange Limited (BSE), National Stock Exchange of India Limited(NSE),
MCX Stock Exchange Limited (MCX-SX).EGFSL along with its subsidiaries offers the most comprehensive avenues for investments and is engaged in the businesses including stock broking (Institutional
and retail), merchant banking, commodity broking, depository participant, portfolio management, insurance broking and services rendered in connection with distribution of primary market issues and
financial products like mutual funds, fixed deposits. Details of associates are available on our website i.e. www.emkayglobal.com
EGFSL is registered as Research Analyst with SEBI bearing registration Number INH000000354 as per SEBI (Research Analysts) Regulations, 2014. EGFSL hereby declares that it has not defaulted
with any stock exchange nor its activities were suspended by any stock exchange with whom it is registered in last five years, except that NSE had disabled EGFSL from trading on October 05, October
08 and October 09, 2012 for a manifest error resulting into a bonafide erroneous trade on October 05, 2012. However, SEBI and Stock Exchanges have conducted the routine inspection and based on
their observations have issued advice letters or levied minor penalty on EGFSL for certain operational deviations in ordinary/routine course of business. EGFSL has not been debarred from doing business
by any Stock Exchange / SEBI or any other authorities; nor has its certificate of registration been cancelled by SEBI at any point of time.
EGFSL offers research services to clients as well as prospects. The analyst for this report certifies that all of the views expressed in this report accurately reflect his or her personal views about the subject
company or companies and its or their securities, and no part of his or her compensation was, is or will be, directly or indirectly related to specific recommendations or views expressed in this report.
Other disclosures by Emkay Global Financial Services Limited (Research Entity) and its Research Analyst under SEBI (Research Analyst) Regulations, 2014 with reference to the subject
company(s) covered in this report-:
EGFSL or its associates may have financial interest in the subject company.
Research Analyst or his/her relative’s financial interest in the subject company. (NO)
EGFSL or its associates and Research Analyst or his/her relative’s does not have any material conflict of interest in the subject company. The research Analyst or research entity (EGFSL) have not been
engaged in market making activity for the subject company.
EGFSL or its associates may have actual/beneficial ownership of 1% or more securities of the subject company at the end of the month immediately preceding the date of publication of Research Report.
Research Analyst or his/her relatives have actual/beneficial ownership of 1% or more securities of the subject company at the end of the month immediately preceding the date of publication of Research
Report: (NO)
EGFSL or its associates may have received any compensation including for investment banking or merchant banking or brokerage services from the subject company in the past 12 months. EGFSL or its
associates may have received compensation for products or services other than investment banking or merchant banking or brokerage services from the subject company in the past 12 months. EGFSL
or its associates may have received any compensation or other benefits from the Subject Company or third party in connection with the research report. Subject Company may have been client of EGFSL
or its associates during twelve months preceding the date of distribution of the research report and EGFSL may have co-managed public offering of securities for the subject company in the past twelve
months.
The research Analyst has served as officer, director or employee of the subject company: (NO)
EGFSL and/or its affiliates may seek investment banking or other business from the company or companies that are the subject of this material. Our salespeople, traders, and other professionals may
provide oral or written market commentary or trading strategies to our clients that reflect opinions that are contrary to the opinions expressed herein, and our proprietary trading and investing businesses
may make investment decisions that may be inconsistent with the recommendations expressed herein. In reviewing these materials, you should be aware that any or all of the foregoing, among other
things, may give rise to real or potential conflicts of interest including but not limited to those stated herein. Additionally, other important information regarding our relationships with the company or
companies that are the subject of this material is provided herein. This report is not directed to, or intended for distribution to or use by, any person or entity who is a citizen or resident of or located in any
locality, state, country or other jurisdiction where such distribution, publication, availability or use would be contrary to law or regulation or which would subject EGFSL or its group companies to any
registration or licensing requirement within such jurisdiction. Specifically, this document does not constitute an offer to or solicitation to any U.S. person for the purchase or sale of any financial instrument
or as an official confirmation of any transaction to any U.S. person. Unless otherwise stated, this message should not be construed as official confirmation of any transaction. No part of this document may
be distributed in Canada or used by private customers in United Kingdom. All material presented in this report, unless specifically indicated otherwise, is under copyright to Emkay. None of the material,
nor its content, nor any copy of it, may be altered in any way, transmitted to, copied or distributed to any other party, without the prior express written permission of EGFSL . All trademarks, service marks
and logos used in this report are trademarks or registered trademarks of EGFSL or its Group Companies. The information contained herein is not intended for publication or distribution or circulation in
any manner whatsoever and any unauthorized reading, dissemination, distribution or copying of this communication is prohibited unless otherwise expressly authorized. Please ensure that you have read
“Risk Disclosure Document for Capital Market and Derivatives Segments” as prescribed by Securities and Exchange Board of India before investing in Indian Securities Market. In so far as this report
includes current or historic information, it is believed to be reliable, although its accuracy and completeness cannot be guaranteed.
www.emkayglobal.com
Emkay Global Financial Services Ltd.
CIN - L67120MH1995PLC084899
7th Floor, The Ruby, Senapati Bapat Marg, Dadar - West, Mumbai - 400028. India
Tel: +91 22 66121212 Fax: +91 22 66121299 Web: www.emkayglobal.com
Emkay Rating Distribution
BUY Expected total return (%) (Stock price appreciation and dividend yield) of over 25% within the next 12-18 months.
ACCUMULATE Expected total return (%) (Stock price appreciation and dividend yield) of over 10% within the next 12-18 months.
HOLD Expected total return (%) (Stock price appreciation and dividend yield) of upto 10% within the next 12-18 months.
REDUCE Expected total return (%) (Stock price depreciation) of upto (-) 10% within the next 12-18 months.
SELL The stock is believed to underperform the broad market indices or its related universe within the next 12-18 months.