
2015-25 LONG TERM PLAN - Marlborough District Council
334
Page 2 2015-2025 Long Term Plan 2015-25 LONG TERM PLAN
-
Upload
khangminh22 -
Category
Documents
-
view
3 -
download
0
Transcript of 2015-25 LONG TERM PLAN - Marlborough District Council

Page 2 2015-2025 Long Term Plan
2015-25 LONG TERM PLAN

Table of Contents
2015-2025 Long Term Plan Page 1
Our Long Term Plan Explains what Council plans to do over the next decade and how Council activities will contribute to the community outcomes. Here you will find how much Council intends to spend on its activities and services, how this will be funded and the expected impact on rates.
Part 1: Executive Summary Mayors Introduction ................................................. 3
Elected Council Members ....................................... 4
Plan Highlights – Key Issues and Projects .............. 5
Financial Overview ................................................ 13
Long Term Plan Disclosure Statement for the Period Commencing 1 July 2015 ...................................... 17
Community Outcomes ........................................... 21
Consultation .......................................................... 23
Part 2: Our Business Activity Groups and Activities ................................ 25
People ................................................................... 30
Community Facilities ............................................. 59
The Provision of Roads and Footpaths ................. 71
Flood Protection and Control Works ...................... 79
Sewerage Including Treatment and Disposal ........ 86
Stormwater Drainage ............................................ 93
Water Supply ....................................................... 100
Solid Waste Management ................................... 112
Environmental Management ............................... 120
Regulatory ........................................................... 141
Regional Development ........................................ 161
Part 3: Financial and Infrastructure Strategy and Statements
Financial Strategy ............................................... 169
Infrastructure Strategy ......................................... 179
Assumptions, Disclosure and Compliance .......... 215
Forecast Statement of Comprehensive Revenue and Expense ....................................................... 220
Statement of Other Comprehensive Revenue and Expense .............................................................. 221
Statement of Changes in Net Assets/Equity ........ 221
Statement of Financial Position ........................... 222
Statement of Cashflows ...................................... 223
Statement of Accounting Policies ........................ 224
Notes to Financial Statements ............................ 236
Part 4: Funding Impact Statement and Rates
Funding Impact Statement .................................. 251
Rates Movements 2015-25 ................................. 275
Part 5: Policies Revenue and Financing Policy ............................ 285
Rates Remission and Postponement Policies ..... 304
Significance and Engagement Policy .................. 312
Maori Capacity Development Policy .................... 319
Council Controlled Organisations ........................ 320
Part 6: Audit Report Audit Report ........................................................ 322
Appendices Council Committees and Members ..................... 325
Ward Boundaries ................................................ 327
Council Staff Structure ........................................ 328
MDC Directory ..................................................... 329
Glossary of Terms ............................................... 331

Part 1: Executive Summary
Page 2 2015-2025 Long Term Plan
Part 1: Executive Summary
Mayor’s Introduction
Elected Council Members
Plan Highlights – Key Issues and Projects
Financial Overview
Long Term Plan Disclosure Statement for the Period Commencing 1 July 2015
Community Outcomes
Consultation
Enabling social and economic development in
balance with environmental and community needs
Mayor’s Introduction
2015-2025 Long Term Plan Page 3
Mayors Introduction Marlborough is a special region, where we share a good quality of life within a wonderful environment blessed by natural attributes and a strong community. Marlborough District Council plays an important part in protecting the quality of that environment as well as providing the services and facilities that support our everyday lives.
Councillors want to uphold the quality of those services and to ensure the assets managed for the people of Marlborough are well maintained. We also appreciate that there is a responsibility to plan for the future development of the region. This Long Term Plan (LTP) is designed to fulfil those aspirations.
In the preparation of this LTP, the Council publicised its proposals widely, through its Consultation Document, clearly setting out the key issues confronting the region, explaining the Council’s financial and infrastructure strategies and highlighting the implications of Council’s plans.
In reaching the decisions on the LTP, Councillors have recognised the pressure that exists to hold down spending while also acknowledging the signals from Central Government that we must plan for future growth.
Long term planning coupled with prudence in expenditure has driven the decisions. Therefore the LTP concentrates heavily on Council’s primary responsibility; core infrastructure with a big emphasis on our most important resource, water. The particular need for improvements to domestic water supply in three of Marlborough’s townships, Seddon, Havelock and Renwick, has been recognised and long-term work to upgrade supply to each area will has been brought forward.
Underpinning this LTP is Council’s Infrastructure Strategy, looking out 30 years. It takes into account the prospect of an ageing or decreasing population as well as a future which may bring climate change and require higher environmental standards. We think it’s important to anticipate these challenges in our infrastructure planning.
So we have also budgeted for sewerage and stormwater upgrades, some of which are already underway, with other work necessary to replace aging assets and to provide future capacity for urban areas.
At the same time, this Plan allows Council to take further steps to deliver on community infrastructure as set out in Marlborough’s Growth Strategy; allocating funds to help make modest improvements to our smaller towns and to upgrade library and community facilities for Picton. For Blenheim, some of the aspirations in the Growth Strategy will be met by advancing streetscape improvements and advancing the first landscaping stage of a new cultural precinct aimed at reinvigorating an older part of the
town centre. However, Councillors decided that, due to budgetary constraints, a proposal to begin the building of a library and cultural facilities at the centre of this new precinct should be postponed for three years.
The LTP was finalised following a large number of submissions from our community and this feedback was invaluable in helping Councillors decide on the final shape of this Plan. Undoubtedly, we all share the same aim of ensuring that every dollar spent is delivering the best possible value for ratepayers and the best possible future for Marlborough.
Alistair Sowman
Mayor
Elected Council Members
Page 4 2015-2025 Long Term Plan
Elected Council Members
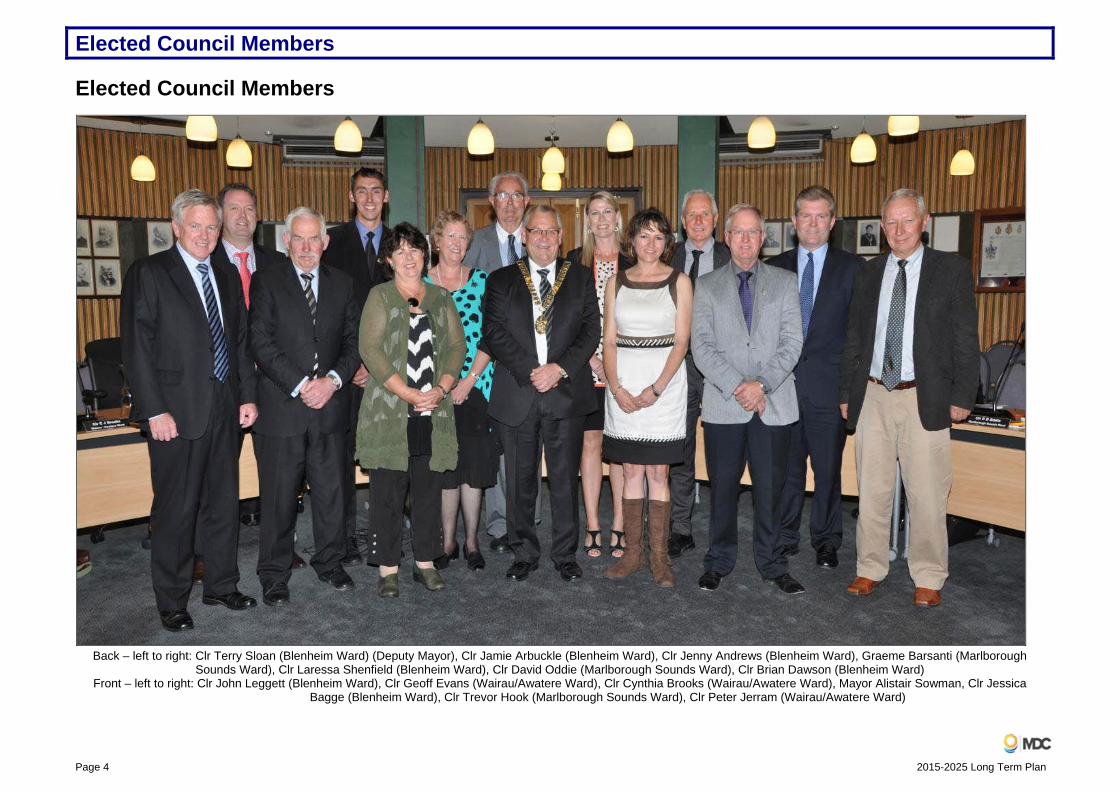
Back – left to right: Clr Terry Sloan (Blenheim Ward) (Deputy Mayor), Clr Jamie Arbuckle (Blenheim Ward), Clr Jenny Andrews (Blenheim Ward), Graeme Barsanti (Marlborough Sounds Ward), Clr Laressa Shenfield (Blenheim Ward), Clr David Oddie (Marlborough Sounds Ward), Clr Brian Dawson (Blenheim Ward)
Front – left to right: Clr John Leggett (Blenheim Ward), Clr Geoff Evans (Wairau/Awatere Ward), Clr Cynthia Brooks (Wairau/Awatere Ward), Mayor Alistair Sowman, Clr Jessica Bagge (Blenheim Ward), Clr Trevor Hook (Marlborough Sounds Ward), Clr Peter Jerram (Wairau/Awatere Ward)

Plan Highlights – Key Issues and Projects
2015-2025 Long Term Plan Page 5
Plan Highlights – Key Issues and Projects Clean and Safe Drinking Water The quantity of available drinking water is an issue in some areas. Each settlement has its own set of challenges that impact on the quantity of water available and can lead to restrictions.
New Zealand’s drinking water standards are designed to improve the quality of drinking water. Blenheim water supply meets the standards and the Picton water supply will meet them soon. The Seddon, Rural Awatere, Renwick, Wairau Valley and Havelock Council water supplies do not.
Renwick, Havelock and Picton also have issues with the amount of water available.
Issued by the Minister of Health, the standards effectively set the maximum allowable levels of contamination from bacteria or protozoa (such as cryptosporidium, campylobacter and giardia) and other contaminants by prescribing treatment standards.
Bringing water supplies up to the standards can be costly. However, Council can take the cost of improving water quality and user affordability into account before deciding what to do.
Council has consulted on this issue in the past. In 2012, the feedback from these smaller communities was that people did not want the treatment upgrades if they had to pay for it.
However, in 2014, submissions were made to Council from across Marlborough calling for Seddon’s water supply to be upgraded and expressing willingness to help pay for it.
Council previously funded water supply upgrades by sharing the costs across all those who use that supply. Blenheim and Picton water users could afford the upgrades as they have sufficient ratepayers to absorb the costs. Smaller places have struggled with affordability as they have fewer ratepayers to share this cost amongst. Council has no proposal to upgrade the Wairau Valley Township water supply due to its expense and unaffordability.
This section sets out what Council proposes to do over the next 10 years for Renwick, Seddon, Rural Awatere, and Havelock.
Seddon Council will start building a new water treatment plant for Seddon in 2015-16.
At present, Seddon water should be boiled before use. The existing MIOX treatment works well at treating bacteria - except during flooding which regularly occurs. MIOX does not treat protozoa, however which requires filtration.
There are few ratepayers in Seddon, so the costs of upgrading the water supply would be an expensive option shared amongst these ratepayers alone. Council has applied for a subsidy from Government to help meet the costs of treatment, providing $1.5 million (50%) from District wide reserves and spreading the operating costs for treatment across all Council water users.
How much will it cost? How will it be funded? Capital Expenditure in financial years 2015-18:
Debt Reserves Government drinking water Subsidy
Total
Capital Expenditure
$0.5 million
$1.5 million $1.0 million $3.0 million
Note 1: Figures are normally adjusted by LGCI to year expected to be expended. LGCI is the Local Government Costs Index. However, in Seddon’s case cost estimates are current, because they are the figures given to the Community as part of the consultation process.
Note 2: Capital and operating expenditure estimates are based on using the proposed highest cost membrane filtration treatment.
Note 3: Should an effective less costly option be identified, the amounts contained in the above table will be reduced.
Debt funding of $0.5 million is required for this project. Actual debt will be a mix of internal and external debt.
Council would consider deferring Seddon water treatment if the actual costs would increase the amount Seddon users have to pay above $240 per user upon completion of the capital works in 2017-18. Other Marlborough ratepayers paying a Council water rate will contribute $8 per annum towards the increased Seddon water operating costs.
Rural Awatere Previous proposals to treat all of the Awatere water supply (Seddon and Rural Awatere) were considered to be unaffordable even though a subsidy was granted.

Plan Highlights – Key Issues and Projects
Page 6 2015-2025 Long Term Plan
Council will consult these rural areas about using point-of-entry (filter type) systems at individual households.
How much will it cost? How will it be funded? Capital Expenditure in financial years 2017-18 - $1.5 million.
Note 1: Figures are not adjusted by LGCI to year expected to be expended.
Debt funding of $0.7 million is required for this project. Actual debt will be a mix of internal and external debt. For the total impact on external debt for all capital projects please see the chart on page 15. The balance of the $1.5 million will be funded from Reserves.
Operating expenditure to be funded by Rural Awatere point of entry water users increase from 2018 to $0.32M, based on all users choosing to join the scheme.
Note 1: Figures are not adjusted by LGCI to year expected to be expended.
Note 2; Opex includes debt servicing and depreciation and operating expenditure.
Note 3: Should the level of uptake for this scheme be less than 100%, the cost per user will increase.
Renwick Council will:
Build a new water reservoir in Renwick in 2016-18 – $2.3M.
Consult with the community to introduce water meters to each household in Renwick in 2016-19 – $0.7M.
Find a new water source for Renwick by 2018-19 – $1.8M.
Build a new water treatment plant for Renwick by 2017-19 – $6.0M.
Renwick experiences regular water restrictions in extended dry weather. Metering and charging for water used is a proven way of reducing water demand. It would reduce the frequency of water restrictions and could postpone the need for the Council to find a new water source depending on the frequency of restrictions the community is prepared to accept. In addition a new water source for the town supply will be secured.
The reservoir would be concrete, hold 1,700 cubic metres of water and be sealed to prevent contamination. It would replace the nine tanks that are old, insecure and require seismic upgrading.
The treatment plant would add filtering to the existing chlorine treatment and meet the Drinking Water Standards. It is currently proposed to use membrane filtration treatment but the specific treatment system would be decided nearer to the time of construction as technologies and standards may change.
There will be significant community consultation on these proposals and options before projects are finalised.
How much will it cost? How will it be funded? Capital Expenditure in financial years 2016-19:
Debt Reserves Total$5.4 million $5.4 million $10.8 million Note 1: Figures are uninflated.
Debt funding of $5.4 million is required for this project. Actual debt will be a mix of internal and external debt.
Operating expenditure will increase by $0.94 million following completion of all capital expenditure. Council will consult via a future Annual Plan on the possibility of all Council water users contributing towards the increased Renwick water operating costs.
Note 2: Operating expenditure includes debt servicing & depreciation.
Havelock Council will:
Consult with the community to introduce water meters to each household in Havelock by 2017-19 – $0.3M.
Build a new steel water reservoir in Havelock by 2017-19. – $0.5M.
Build a new water treatment plant in Havelock by 2017-19– $3.6M.
Find a new water source by 2018-19 - $5.0M.
The Havelock water supply was affected by salinity in late summer and autumn in 2010, 2013, 2014 and this year. The salinity is caused when high demand draws salt water into the aquifer. It can rust pipes and affect the taste of the water.
Plan Highlights – Key Issues and Projects
2015-2025 Long Term Plan Page 7
Water meters are expected to reduce demand for water in Havelock. In addition, a new water source from the Pelorus River will be found to provide a greater security of supply for the community.
An additional reservoir would provide security of supply and extra storage leading to fewer water restrictions in dry periods.
Havelock’s water is treated only with chlorine. It does not comply with the Drinking Water Standards. The water needs to be UV-disinfected or filtered to comply. The site of the existing treatment plant is subject to flooding which increases the cost and complexity of treatment.
How much will it cost? How will it be funded? Capital Expenditure in financial years 2017-19:
Debt Reserves Total$4.7 million $4.7 million $9.4 million
Note 1: Expenditure in financial years 2016-19.
Note 2: Figures are uninflated.
Debt funding of $4.7 million is required for this project. Actual debt will be a mix of internal and external debt.
Operating expenditure will increase by $0.72 million following completion of all capital expenditure. Council will consult via a future Annual Plan on the possibility of all Council water users paying a Council water rate contributing towards the increased Havelock water operating costs.
Note 3: Operating expenditure includes debt servicing and depreciation.
Growing Marlborough – Libraries/Small Towns A Strategy for the Future In March 2013 Council adopted the “Growing Marlborough – a Strategy for the Future”.
The Strategy considered future growth and the development of stronger communities. It focused on the major settlements of Blenheim and Picton, the secondary service roles of Renwick, Havelock and Seddon and on the smaller townships in Marlborough.
Council proposes to implement parts of the Strategy within the next 10 years:
o Creating a new Riverside precinct with a new library at its heart and with links to the Taylor River in Blenheim by 2021-22;
o Upgrades to Blenheim CBD
o Picton revitalisation and new Library and service centre by 2018-19;
o Upgrading amenities in Marlborough’s smaller towns over the next 10 years.
Libraries are a place of inspiration, debate and social interaction. Future libraries will provide facilities that are multi-use for:
Creating and innovating;
Giving things a go;
Relaxing and socialising; or
Simply providing a modern, comfortable and well-equipped place where people can visit and enjoy being part of the community.
Free access to technology is increasingly important to meet the expanding technology needs of the community.
The current library facilities in Blenheim and Picton are no longer adequate to serve the public’s changing expectations. The facilities cannot be further enlarged or renovated to the degree needed to meet current needs and certainly not future requirements.
Picton The Picton revitalisation project includes upgrading existing streetscape and construction of a Council service centre and a library which will include a community use area. The existing Picton library is dual purpose Council service centre and library. The area dedicated to the current library activity is undersized based on library standards and the population of Picton. A new library would need to be considerably larger with a revised layout.
The Picton community is presently providing their views on the pros and cons of a number of different sites.
Strategically the sites should be located to support the visitor economy or the local community.
A budget of $6 million has been allocated to undertake this development (note: this figure has not been adjusted by the Local Government Cost Index).
Plan Highlights – Key Issues and Projects
Page 8 2015-2025 Long Term Plan
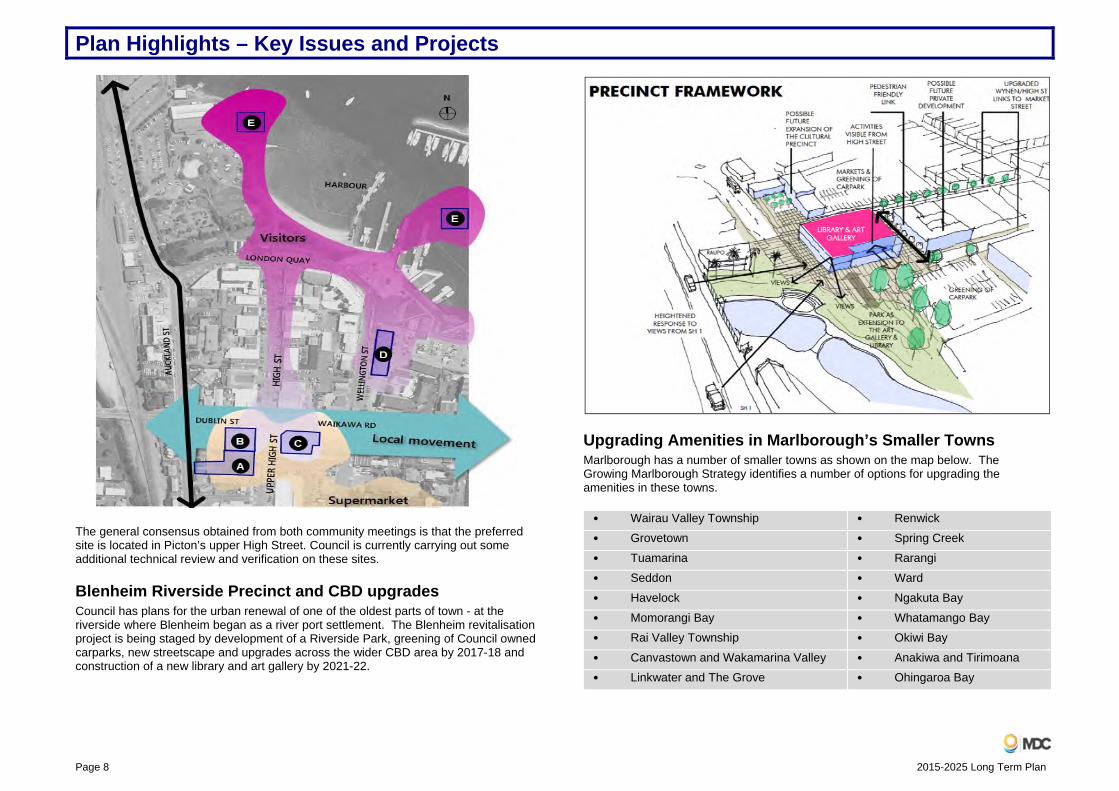
The general consensus obtained from both community meetings is that the preferred site is located in Picton’s upper High Street. Council is currently carrying out some additional technical review and verification on these sites.
Blenheim Riverside Precinct and CBD upgrades Council has plans for the urban renewal of one of the oldest parts of town - at the riverside where Blenheim began as a river port settlement. The Blenheim revitalisation project is being staged by development of a Riverside Park, greening of Council owned carparks, new streetscape and upgrades across the wider CBD area by 2017-18 and construction of a new library and art gallery by 2021-22.
Upgrading Amenities in Marlborough’s Smaller Towns Marlborough has a number of smaller towns as shown on the map below. The Growing Marlborough Strategy identifies a number of options for upgrading the amenities in these towns.
• Wairau Valley Township • Renwick • Grovetown • Spring Creek
• Tuamarina • Rarangi • Seddon • Ward
• Havelock • Ngakuta Bay
• Momorangi Bay • Whatamango Bay • Rai Valley Township • Okiwi Bay
• Canvastown and Wakamarina Valley • Anakiwa and Tirimoana • Linkwater and The Grove • Ohingaroa Bay

Plan Highlights – Key Issues and Projects
2015-2025 Long Term Plan Page 9
The Growing Marlborough project identified that these areas needed future investment to remain attractive and liveable. In particular, quality streetscapes and transport accessibility with safe walking and cycling opportunities were considered. A strongly consultative approach was taken and schedules of future urban amenity improvements developed from this.
The types of projects imagined include:
Providing public toilets;
Improving signage;
Installing footpaths, walkways and cycleways;
Investigating parking restrictions, traffic calming devices and pedestrian refuges;
Planting of new street trees and reserve plantings.
Council will work with communities to implement the Strategy for the smaller Marlborough townships over the next 10 years. A budget of $5 million has been identified to contribute to the project costs.
*This figure has not been adjusted by LGCI to the year(s) expected to be expended. LGCI is the Local Government Costs Index.
Flaxbourne Irrigation Scheme Council has been working with the Flaxbourne community for a number of years. Together, we have been looking at how Flaxbourne can access enough water to improve the productivity of its land. With irrigation available, landowners would have more flexibility in deciding how to get the best out of their land.
The planned Flaxbourne Irrigation Scheme will provide irrigation to 2,250 hectares of land between Grassmere and Ward and allow the owners to develop vineyards and have mixed cropping.
The proposal is for Council to own, operate and fund the Scheme. This is similar to the Southern Valleys’ Irrigation Scheme.
Council’s involvement would be conditional on:
Satisfactory final design, estimates, and funding for the Scheme;
Securing 100% commitment to fund the Scheme;
Consultation and adoption of the proposed Scheme through the LTP process; and
The actual costs of construction of the Scheme (determined through the tender process) being within the funding secured for the Scheme.
At present, approximately the owners of 59% or 1,298 hectares of the total 2,200 hectare Scheme area have committed to the Scheme. Council will work with Crown Irrigation Fund to identify appropriate means of financing the “uncommitted” 41% of the Scheme.
Rates and charges relating to the Scheme would impact only on those who choose to join it. There would be no rating impact on anyone else. The Scheme is estimated to cost $28.2 million ($30.2 million inflated*).
*Amounts are inflated using the LGCI index to the year they are expected to be incurred.
Under the Scheme, water would be taken from the Awatere River and used for irrigation and pumped to storage in a dam on Flaxbourne Station on the south side of Lake Grassmere. Pumping into the dam would occur when water is available and there is no irrigation demand. During the irrigation season, water would be taken for irrigation directly from the Awatere River when flows are sufficient. This demand would be supplemented from the dam, when necessary. When water could not be taken from the Awatere River, due to reduced flows, water for irrigation would be taken from the dam.
The Scheme depends on securing sufficient water for the scheme to proceed. This may prove challenging. Between 200 to 250 litres per second B class water and 200 litres per second C class water is required to provide 97% reliability for the scheme.

Plan Highlights – Key Issues and Projects
Page 10 2015-2025 Long Term Plan
Layout of Scheme
Development Contributions Development Contributions are levied on developers to recover the cost of the growth portion of Council expenditure on Infrastructure assets such as Roads, Reserves, Water, Sewerage and Stormwater. If recovery is not made from developers, then the cost is paid by ratepayers.
Council first introduced its Development Contributions Policy, as enabled by the Local Government Act 2002, as part of its 2009-19 LTP and is required to review its Policy every three years. As a basis for its Policy, a Financial Model was developed that
assessed the growth component of projects in its Capital Expenditure Programme and the projected consumption of capacity in existing assets because of growth. The financial model recommended Development Levies higher than those charged under the previous Resource Management Act 1991 Financial Contributions regime. To ease the transition on developers, Council agreed to transition the increased levies over a three year period, by means of a progressively reducing remission.
When Council reviewed its Policy in 2012, it updated the Financial Model. The model supported an increase in Development Contribution Levies. However, as the District was experiencing the effects of the Global Financial Crisis and low growth, Council decided to retain Levies at the level set in 2009 to encourage growth. In the intervening period between 2009 and 2012 Council also decided to extend the remission period and a 34% remission of the increased levies remained.
Council decisions subsequent to the 2012 review have continued the 34% remission until 30 June 2015, ie; the Levies actually paid by Developers remain below the level set in 2009.
In 2015 the financial model was again updated and supported an increase.
Also in 2015, the economic environment in Marlborough is different to the one that existed in 2012. Marlborough had achieved a 10.3% growth in GDP, third highest of New Zealand’s Regions, compared to the New Zealand average of 6.7%. Another high growth year is forecast for the next year also.
As a result of the outcome of the Financial Model update and the high level of growth being experienced, Council has decided that it should explore means of redresssing the balance of who pays for the growth portion of capital projects, increasing the Development Contribution Levies on developers, and as a result reduce the amount paid by ratepayers.
Revised Levies Council has undertaken modelling to guide determining appropriate development levies. The options considered by Council were:
o Retain the existing charges with Remissions Policy; or
o Retain the existing charges without Remissions Policy; or
o Implement the modelled results; or
o Introduce a midway point between the modelled result and the existing charges with no remissions.

Plan Highlights – Key Issues and Projects
2015-2025 Long Term Plan Page 11
Council included in its Consultation Document (option d). However, following the consultation process Council agreed to adopt (option b), which will mean the retention of existing levies, plus adjustments for increases in the Producer Price Index: and that no remissions would apply. .
A new schedule of capital expenditure apportioned to growth and other funding sources is attached to the Policy.
On a section with a $180,000 land value, total development levies will remain below those set by Tasman District Council, which faces many of the same issues faced by Marlborough.
Is Council Financially Prepared for a Natural Disaster? Council regularly reviews its plans for dealing with potential future damage from a natural disaster, including:
Assessing the risks to people and property from natural disasters;
Reducing hazards by designing infrastructure to better resist damage and managing what can be done on hazard prone land and sound land use planning;
Insuring and self-insuring property for damage from natural events;
Being ready for disasters;
Reviewing how it has responded to disasters in the past;
Making sure Council would be eligible for Central Government funding after a disaster.
Should a major natural disaster occur the District could be faced with significant repair and reconstruction costs. Council has estimated the maximum probable loss (MPL) to Council’s $1.1 billion of assets (excluding land) as a result of a major earthquake, flood or tsunami at approximately $75 million of infrastructure assets.
The arrangements currently in place for infrastructure (underground reticulation, river protection and roading) and other built assets is summarised below:
Infrastructure Other Built AssetsMPL used - Flood $75 million Value insured $276 million MPL funded by: NZTA Roading Subsidies $19 million Premium Cost $763,000
Infrastructure Other Built AssetsLocal Authority Protection Plan (LAPP)
$17 million Current Excess $10,000
Central Government Contribution
$27 million
Dedicated Financial Reserves
$6 million In order to address rapidly increasing insurance costs in 2012 Council introduced a $500,000 threshold for other built assets insurance. This is a form of voluntary excess and introduced the concept of self-insurance above standard policy excess for the first time. The result was that $45 million worth of assets became self-insured, representing a premium saving of around $120,000 per annum.
Repriortising contract works and maintenance (up to three years)
$6 million
$75 million
Under the above scenario, Council effectively has two areas of self-insurance:
$6 million of infrastructure; and
$45 million of other built assets, including assets such as sewerage pumping stations, some community halls, and sports facilities.
There are four key elements to managing the risk associated with the current level of self-insurance:
Recognising that because of the size of the District, all assets are unlikely to be affected by a disaster at the same time;
Acknowledging that initially repairs following a major disaster will only focus on reinstating core servicing to minimal levels, eg; reinstating four wheel drive single lane road access.
Should a major disaster occur, essential assets will need to be prioritised for repair and rebuild. It is anticipated that this will take approximately three years;
The work of Council and associated priorities will not be “business as usual” for a significant time, years, as current contracts and priorities will need to refocus on repair and rebuild activities.
The current strategy sees the period of reprioritisation of mainly improvement projects for approximately three years.
Plan Highlights – Key Issues and Projects
Page 12 2015-2025 Long Term Plan
Apart from the initial emergency works to restore essential services, the strategy also considers that further public consultation will be required in order to decide priorities for community assets repair and rebuilding eg; the community generally may see a need for a community hub to be built in a central area for all to use rather than rebuild separate facilities which may have been under-utilised prior to the disaster event.
Council considered alternative strategies such as taking on more risk by self-insuring more assets or rebuilding in two or four years (instead of three) but based on the results of consultation decided to maintain its current strategy for future financial planning and reduce the level of excess.
Economic Development Council’s vision for Marlborough is:
Over the next decade, Marlborough will become a globally-connected district of progressive, high-value enterprise, known for our economic efficiency, quality lifestyle, desirable location and natural environment. Marlborough will be ‘Smart and Connected’.
The purpose of the vision is to guide everyone’s actions to ensure that we are:
Smart: Think strategically – becoming more efficient, creating new solutions to our problems, leveraging those solutions to create new opportunities;
Connected: Don’t do it alone, get informed, get supported locally, nationally and internationally.
The economy is not a natural phenomenon, it is constructed by people. The challenge for Marlborough is to ensure it is our people making the decisions about our economy - if we don’t, someone else will.
Since 2012, Council has been implementing the Smart and Connected strategy:
Undertaking an Industry and Innovation Stocktake (2013) to identify growth opportunities;
Developing visions and priorities for Industry and Community Groups (2014);
Establishing the Smart Business Marlborough business unit within Council;
Appointing a Regional Events Co-ordinator and an Economic Development Officer;
Setting up a Marlborough-based start-up business advice service under Business Trust Marlborough;
Establishing industry leadership groups to develop Smart and Connected strategies;
Launching The Marlborough Story- including the “Only Marlborough” regional identity (2014).
Council had considered establishing ‘The EDGE’: A new combined agency for economic development, events, tourism and conference promotion however decided to continue its current form of delivery for each of these functions.
An annual budget of $284,000 was agreed, for the Economic Development component of these services. This funding is on an ongoing basis from rates as compared to the one year funding previously provided from Reserves. This change in funding will mean that existing levels of service can be maintained. The proposal for a new agency may be revisited in the future.

Financial Overview
2015-2025 Long Term Plan Page 13
Financial Overview Council must, under the Local Government Act 2002, manage its revenues, expenses, assets, liabilities and general financial dealings prudently and in a manner that sustainably promotes the current and future interests of the community. The Financial Strategy at pages 169 to 178 is an important part of the LTP, providing detailed information about how this will be achieved over the next ten years; an overview of that information is given here. The Financial Strategy demonstrates how Council will:
Ensure the levels of rates and borrowing are financially sustainable and kept within pre-set limits;
Maintain levels of service;
Maintain the assets it owns on behalf of the community;
Provide for growth and changing demand patterns within the District;
Fund improvements to infrastructural and other community facilities;
Manage Council’s investments and liabilities.
In preparing its LTP budget and Financial Strategy Council has considered how to balance:
The levels of service to be provided and the cost of achieving and maintaining them during periods of growth;
The priorities and timing of expenditure across all activities, especially expenditure of a capital nature which is contained in the Infrastructure Strategy and Asset Management Plans;
The proposed levels of rates and charges across the full 10 year period of the LTP and their impact on the community;
The proposed level of borrowing current and future ratepayers will need to service.
Capital Expenditure To maintain and improve levels of service in response to Government, community and growth demands, Council is planning capital expenditure of $421.9 million over the next 10 years.
$120.6 million to meet additional demand (including vested assets) $111.0 million to improve the levels of service $190.2 million to replace existing asset $421.9 million in total
More information on the capital expenditure programme is given in the Activity Sections and the Infrastructure Strategy and is also available in Council’s Asset Management Plans.

Financial Overview
Page 14 2015-2025 Long Term Plan
Over the last four years, including the 2014-15 Annual Plan, Capital expenditure has ranged between $23.9 million and $30.6 million a year, with an average of $28.3 million. As can be seen in the following table Capital expenditure is budgeted to increase by $20 million plus for the 2015-16 to 2017-18 period, before finally settling at more normal levels in 2021-22 to 2024-25 period. This increased level of Capital expenditure has follow on impacts on Interest, depreciation and operating costs and ultimately to Rates.
$million 15-16 16-17 17-18 18-19 19-20 20-21 21-22 22-23 23-24 24-25
Capital Expenditure
52.1 45.1 41.2 62.5 37.3 45.0 36.6 32.7 33.5 35.9
The biggest increases of Capital expenditure in the early years take place in sewerage, roads and water followed by the Libraries/CBD redevelopment in Picton and then Blenheim and the construction of the $28.2 million ($30.2 million inflated) Flaxbourne Irrigation Scheme, commencing in 2015-16 and being completed in 2019-20 and rated for in 2020-21.
Roading remains the area of highest Capital expenditure and remains relatively constant except for the CBD and small township budget increases. There is roading capital expenditure included in the Libraries/CBD redevelopment project in the table above.
Each year Council will review the continued need and timing of Capital expenditure as part of its Annual Planning approach. In previous years, these reviews have resulted in expenditure deferrals, which has in turn, reduced subsequent years rates increases and actual debt levels.
Where Does Council Spend its Money? In addition to the investment in new assets, and the renewal of old, Council spends its money on delivering services under the following broad groupings. As can be seen,
the vast majority of expenditure is made on core infrastructure operation and maintenance plus environmental, regulatory and people (Democracy and Library) related activities. NB Irrigation, Parking and Economic Development are included under Regional development.
Balancing the Budget The Council is required under the Local Government Act 2002 to ensure that each year’s projected operating revenues are set at a level sufficient to meet that year’s projected operating expenses, that is, the Council must demonstrate financial prudence.
In preparing its budgets, Council must make a number of assumptions. These include legislative change, interest rates, inflation, subsidy rates etc and are shown in more detail in Financial Strategy. The Council is forecasting that its Activity expenditure will increase from $82 million in the 2014-15 Annual Plan to $122 million (49%) for the 2024-25 financial year. The increase is primarily due to forecast inflation, 35.2% over 10 years, a larger population to be served and the balance represents the effects of supplying either additional or improved services offset in part by the impact of deferring capital works.
2015-16 2016-17 2017-18 2018-19 2019-20$million $million $million $million $million
Water 6.4 6.0 6.8 19.4 3.3 Sewerage 14.1 17.6 4.8 8.6 1.9 Roading 10.8 10.5 10.7 10.0 10.9 Library Blenheim and Picton 2.5 0.5 4.7 3.1 3.3 Flaxbourne Irrigation Scheme 0.5 2.1 7.7 11.2 8.7
22.4 31 29 28.6 14.8
Activity
People10.0%
Community Facilities9.1%
The Provision of Roads and Footpaths22.4%
Flood Protection and Control Works
4.9%
Sewerage12.4%
Stormwater Drainage2.5%
Water Supply9.8%
Solid Waste Management
7.3%Environmental Management
8.1%Regulatory
6.9%Regional
Development6.6%

Financial Overview
2015-2025 Long Term Plan Page 15
Gross borrowing over the period of the LTP will increase from $50.0 million shown in the 2014-15 Annual Plan to a maximum of $127.8 million to help fund the proposed capital expenditure programme. Projected debt includes an allowance of $28.2 million ($30.2 million inflated) for the development of an irrigation scheme at Flaxbourne.
While existing Reserves, subsidies and Development Contributions are the first sources for funding Capital expenditure, the balance is generally funded by loans. Council usually funds up to 50% of new capital assets from Reserves if available. Loans have a rating impact, but as their repayment is generally spread over 20 years it reduces the burden on current rates and spreads the costs over those future ratepayers who will also benefit from the asset being created. Increased maintenance and operating costs from capital projects are funded primarily by rates.
Debt A significant portion of planned Capital expenditure will be funded by debt. The following table identifies Council’s projected debt at a gross, net of cash and investments and net debt without the Flaxbourne Irrigation Scheme included.
Net debt levels for the 10 years is forecast to peak in 2021-22 at $116.3 million before reducing to $96.8 million by 2025. These amounts are above Council’s $100 million net debt cap. However, these debt figures are based on a conservative approach that includes the full $28.2 million, ($30.2 million inflated) for the separately funded Flaxbourne Irrigation Scheme. For the Scheme to proceed an injection of between $10-12 million is required from the Crown Irrigation Fund, thereby reducing Council’s net debt to just below the debt cap.
Rates Increases and Rates Increase Limit As identified above, increasing debt to spread the cost of Capital expenditure has a rating impact as do increased operating costs. The other major contributor is inflation (35.2% over 10 years). Inflation means change in the costs Council faces, including materials like diesel, bitumen, pipes and other construction costs. As these are not the same as the costs faced by households (eg; food, housing, transportation) and measured by the CPI Council, along with the majority of other Councils in New Zealand, uses inflation projections provided by Business Economic Research Limited (BERL) to inflate budgeted Operating and Capital Expenditure in years two to 10 of the LTP.
Forecast BERL LGCI 15-16 16-17 17-18 18-19 19-20 20-21 21-22 22-23 23-24 24-25
2.24% 2.45% 2.53% 2.61% 2.75% 2.90% 3.04% 3.19% 3.36% 3.53%
Forecast Rates Increases Council has adopted as policy that increases in total rates will not exceed the LGCI movement by more than 2%. The following table shows forecast rates increases compared to Council’s policy.
This table shows that Council has gone outside its policy in the 2016-17, 2017-18, 2018-19 and 2020-21 financial years. The main driver for this is the significant lift in Capital expenditure to meet service level and growth expectations which has been commented on above. However, for affordability reasons Council is committed to remaining within its self-imposed rates limit and reviews its plans and projects annually to confirm their continued need and timing. Projects are deferred where this can be done without compromising maintenance and standards and this reduces the annual rates increases. The outcome of these annual reviews is shown in the following graph, the level of rates for 2015-16 is almost $9M below the level forecast when the 2009-19 Long Term Council Community Plan (LTCCP) was prepared.
15-16 16-17 17-18 18-19 19-20 20-21 21-22 22-23 23-24 24-25Proposed Rates Movements 3.30 4.97 5.26 5.18 4.41 8.57 3.91 2.44 3.14 3.11
Rates Cap (LGCI + 2%) 4.24 4.45 4.53 4.61 4.75 4.9 5.04 5.19 5.36 5.53
Within/(Above) Rates Cap
0.94 (0.52) (0.73) (0.57) 0.34 (3.67) 1.13 2.75 2.22 2.42

Financial Overview
Page 16 2015-2025 Long Term Plan

Long Term Plan Disclosure Statement for the Period Commencing 1 July 2015
2015-2025 Long Term Plan Page 17
Long Term Plan Disclosure Statement for the Period Commencing 1 July 2015 What is the Purpose of this Statement? The purpose of this statement is to disclose the Council’s planned financial performance in relation to various benchmarks to enable the assessment of whether the Council is prudently managing its revenues, expenses, assets, liabilities, and general financial dealings. The Council is required to include this Statement in the Long Term Plan Local Government (Financial Reporting and Prudence) Regulations 2014 (the Regulations). Refer to the Regulations for more information including definitions of some of the terms used in this Statement.
Rates Increases Affordability Benchmark The following graph compares Council's actual rates income with a quantified limit on rates contained in the Financial Strategy included in the Council's Long Term Plan. The quantified limit is that rate increases will not exceed the Local Government Cost Index by more than 2%.
The limit is exceeded in years 2016-17 to 2018-19 due to the investment in the Seddon, Awatere, Havelock and Renwick water improvements. The limit is exceeded in 2020-21 due to the Flaxbourne Irrigation Scheme. This is a targeted rate so only impacts those participating in the scheme.
Rates Affordability Benchmark The following graph compares council's planned rates with a quantified limit on rates contained in the financial strategy included in this long term plan. The quantified limit is a maximum dollar rates of $89.7 million.

Long Term Plan Disclosure Statement for the Period Commencing 1 July 2015
Page 18 2015-2025 Long Term Plan
Debt Affordability Benchmarks The following graph compares Council's proposed borrowing with a quantified limit on borrowing stated in the Financial Strategy included in the Council's Long Term Plan. The quantified limits is proposed earnings before interest and tax at least 2.25 times proposed net interest expense measured as a factor of proposed net interest. A negative number means there was net interest income and this is a favourable result. Positive numbers below 2.25 are an unfavourable result.
The debt affordability is not met in 2018-19 to 2022-23 due to investment in the Flaxbourne Irrigation Scheme.
The following graph compares Council's proposed borrowing with a quantified limit on borrowing stated in the Financial Strategy included in the Council's Long Term Plan. The quantified limit is annual interest expense cannot exceed 12.5% of proposed total operating revenue and is measured as a percentage.

Long Term Plan Disclosure Statement for the Period Commencing 1 July 2015
2015-2025 Long Term Plan Page 19
Operations Control Benchmark The following graph compares council's proposed borrowing with a quantified limit on borrowing stated in the financial strategy included in the Council's Long Term Plan.
The quantified limit is proposed net cash flow from operating activities to exceed proposed gross annual interest expense by at least two times measured as a factor of operating activities cashflow.
Balanced Budget Benchmark The following graph displays the Council's planned revenue (excluding development contributions, financial contributions, vested assets, gains on derivative financial instruments, and revaluations of property, plant or equipment) as a proportion of planned operating expenses (excluding losses on derivatives financial instruments and revaluations of the Council meets this benchmark if its planned revenue equals or is greater than its planned operating expenses.

Long Term Plan Disclosure Statement for the Period Commencing 1 July 2015
Page 20 2015-2025 Long Term Plan
Essential Services Benchmark The following graph displays the Council's planned capital expenditure on network services as a proportion of expected depreciation on network services. The Council meets this benchmark if its planned capital expenditure on network services equals or is greater than expected depreciation on network services.
Debt Servicing Benchmark The following graph displays the Council's borrowing costs as a proportion of planned revenue (excluding development contributions, financial contributions, vested assets, gains on derivative financial instruments, and revaluations of property, plant or equipment). Because Statistics New Zealand projects the Council's population will grow more slowly than the national population growth, it meets the debt servicing benchmark if its borrowing costs are equal or less than 10% of its revenue.
.

Community Outcomes
2015-2025 Long Term Plan Page 21
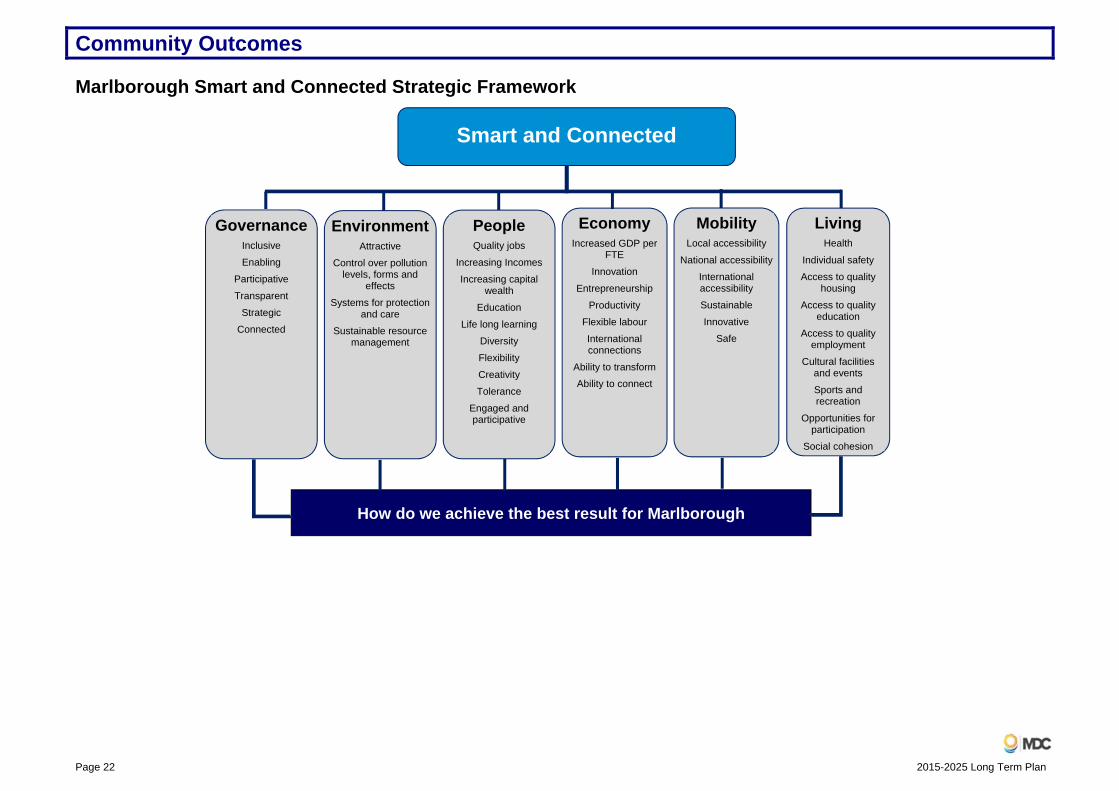
Community Outcomes Community Outcomes are statements that describe the sort of community Marlborough could be in the future, as a result of actions that get taken now and in years to come. The current group of Community Outcomes were written to take into account the Marlborough Smart and Connected vision and strategic framework. Council’s contribution to achieving the community outcomes and the vision is summarised in the table below. A more detailed assessment is included in each activity statement.
Governance Creating an environment in which people can participate, connect with and help shape the community’s future. Providing strong leadership when needed. Inclusive, enabling, participative, transparent, strategic, and connected.
Environment Marlborough’s unique landscape, natural resources, features and wildlife are managed, embraced and valued for preservation and celebration. Attractive, control over pollution levels, forms and effects, systems for protection and care, sustainable resource management.
People A vibrant community that is flourishing, diverse and inclusive for everyone, presenting opportunities for people to succeed.
Quality jobs, increasing incomes, increasing capital wealth, education, life long learning, diversity, flexibility, creativity, tolerance, engaged and participative.
Economy Building a strong economy through strategic, thoughtful and innovative use of local resources. Increasing people’s wealth, innovation, entrepreneurship, productivity, flexible labour, international connections, ability to transform and the ability to connect.
Mobility Where people are able to access and engage in a wide range of recreational, cultural and business activities locally, nationally and internationally. Local accessibility, national accessibility, and international accessibility, sustainable, innovative and safe.
Living A healthy and safe community that thrives on positive relationships between all people, where opportunities for a better life abound. Health, individual safety, access to quality housing, access to quality education and access to quality employment, cultural
facilities and events, sports and recreation, opportunities for participation and social cohesion.
Council Outcomes and Activities Summary Table
Council Activities
Community Outcomes
Gov
erna
nce
Env
ironm
ent
Peop
le
Eco
nom
y
Mob
ility
Livi
ng
Democratic Process Culture and Heritage Community Housing Community Support Library Services Emergency Management Community Facilities The Provision of Roads and Footpaths Flood Protection and Control Works Sewerage Including Treatment and Disposal Stormwater Drainage Water Supply Solid Waste Management Environmental Policy Environmental Science and Monitoring Resource Consents Environmental Protection Biosecurity Building Control Environmental Health Animal Control Harbours Regional Development
Community Outcomes
Page 22 2015-2025 Long Term Plan
Smart and Connected
Governance Inclusive
Enabling
Participative
Transparent
Strategic
Connected
EnvironmentAttractive
Control over pollution levels, forms and
effects
Systems for protection and care
Sustainable resource management
People Quality jobs
Increasing Incomes
Increasing capital wealth
Education
Life long learning
Diversity
Flexibility
Creativity
Tolerance
Engaged and participative
Economy Increased GDP per
FTE
Innovation
Entrepreneurship
Productivity
Flexible labour
International connections
Ability to transform
Ability to connect
Mobility Local accessibility
National accessibility
International accessibility
Sustainable
Innovative
Safe
Living Health
Individual safety
Access to quality housing
Access to quality education
Access to quality employment
Cultural facilities and events
Sports and recreation
Opportunities for participation
Social cohesion
How do we achieve the best result for Marlborough
Marlborough Smart and Connected Strategic Framework

Consultation
2015-2025 Long Term Plan Page 23
Consultation The 2015-25 Long Term Plan Consultation Document was adopted for public consultation on 2 April 2015. The period for submissions was open until 7 May 2015 and a total of 346 submissions were received, a large increase on the previous year.
The topics covered by the submissions included comment on a number of Council-funded activities and proposals as well as funding requests for new and existing projects around the region including:
Drinking water upgrades for smaller communities.
Blenheim CBD Library and Art Gallery upgrade and Picton Library upgrade.
The appropriate level of Development Contributions to be paid by developers and ratepayers, upgraded or new sports and community facilities in various locations across the District.
The future delivery of economic development.
Further upgrades of Kenepuru and French Pass Roads in the Marlborough Sounds.
Submitters were offered the opportunity to speak to Councillors about their submission at hearings on 2, 3 and 4 June 2015. A total of 116 oral submissions were made at the hearings.
Councillors considered all submissions at a meeting held on 8 June 2015. The result of the deliberation was that the rates-take across the district will rise by 3.3%, compared with the 3.19% initially forecast in the Consultation Document.
A number of funding requests or project proposals were referred to Council committees for future consideration. Council made the following decisions in respect of major projects:
To bring forward water treatment in Seddon, Renwick and Havelock.
To proceed with the Picton library proposals and Blenheim Riverside upgrades, but to delay the Blenheim Library Art Gallery redevelopment project.
To proceed with the Small Town Upgrades over the next 10 years.
To invest an additional $2 million in Blenheim CBD upgrades.
To retain existing Development Contribution levies, plus adjustments for increases in the Producer Price Index; and that no remissions would apply.
To continue with the current financial preparedness for a Natural Disaster Policy, but with a reduction in the value of the excess.
To provide continued support for the Flaxbourne Irrigation Scheme.
To not proceed with the proposal to establish a new Economic Development Agency, but to maintain current levels of service and operational delivery arrangements for Economic Development.
Council also considered and supported a number of community proposals including:
Funding towards a combined search and rescue/marine ambulance vessel for Coastguard Marlborough.
Funding for the Marlborough Research Centre Food and Beverage Innovation Cluster.
Providing ongoing funding to maintain Rapaura War Memorial.
Funding to assist operating costs at Giesens Sports Centre in Renwick, Havelock Community Association, and Endeavour Park, Picton.
Funding for the National Whale Centre Development Trust, in Picton.

Part 2: Our Business
Page 24 2015-2025 Long Term Plan
Part 2: Our Business
Activity Groups and Activities
Part 2 describes the activity groups and activities in the Plan. There are 11 activity groups, which are split into 23 activities.

Activity Groups and Activities
2015-2025 Long Term Plan Page 25
Activity Groups and Activities How to Read the Activity Section An explanation of how to read the activity group and activity sections is set out below.
Activity Group Pie Chart: Operating Costs The graph represents the operating costs for the Activity Group in relation to total Council expenditure. Pie Chart: Capital Projects The graph represents the capital expenditure for the Activity Group in relation to total Council expenditure. Rationale for the delivery of the Group of ActivitiesThis text explains why the Activities have been grouped together. Some Activity Groups are mandatory as they are prescribed by the Local Government Act. Changes to Activity Group from the 2014-15 Annual Plan This text summarised any changes to the Activity Group structure from the 2014-15 Annual Plan.
Intended Changes to Levels of Service from the 2014-15 Annual Plan The table describes any intended changes to the levels of service within the Group from the levels of service displayed in the 2014-15 Annual Plan. Significant Negative Effects associated with this Group of Activities This text lists any significant negative effects that may exist through the delivery of the Activities within the Group.
Variation between Long Term Plan and assessment of Water and Sanitary Services (only included in assets related activity statements) This text describes any variations between the adopted assessment of water and sanitary services and this Plan. Variation between Long Term Plan and Waste Management and Minimisation Plan (WMMP) (only included under Solid Waste Management) This text describes any variations between the adopted WMMP and this Plan. Activities Activity nameThis table summarises the percentage of operating costs in relation to total Council expenditure.
How this Activity contributes to related Community Outcomes This table includes how the Activity contributes to each of the Community Outcomes linked to the Smart and Connected vision for Marlborough; i.e. Governance, Environment, People, Economy, Mobility and Living. Refer to the Community Outcomes section under Part 1 of our Long term Plan for more information on the Smart and Connected framework. What is this Activity about? This text describes the services that the activity provides. Asset Description The text and tables describe the assets that Council holds to deliver the activity. It provides a picture of the extent of the network as a whole, and the differing levels of assets between different communities.

Activity Groups and Activities
Page 26 2015-2025 Long Term Plan
Major Budgeted Capital Projects The table outlines the major capital projects and areas of expenditure planned for this Activity over the next 10 years. Although these items are budgeted, in some cases further public consultation will be required with the relevant community before the project is implemented. These projects are also listed under the Capital Expenditure line of the Funding Impact Statement at the end of this activity section. Emerging Issues and Expected ChangesThis text outlines the issues that will affect the Activity during the years of our Long term Plan. This section signals foreseeable changes to the way the Activity will be delivered and explains some of the expenditure that Council is making. Levels of Service This table details the Levels of Service that the Council is proposing to deliver for each Activity and the indicators and targets we will use each year to measure our success. The baseline reflects an average of the three years actual performance prior to 2014, where applicable.

Activity Groups and Activities
2015-2025 Long Term Plan Page 27
Financial Information in this Section
A “Funding Impact Statement” (FIS) is included under each Activity Group and Activity sections. The format of the FIS (down to the ‘Funding balance’ line) is laid down by government regulations which require that non-cash items are excluded from the FIS. This means that the FIS information differs from the information in Council’s financial statements which are prepared in accordance with generally accepted accounting practices (GAAP). The table displays the budget for the 2014-15 Annual Plan (as set in the 2012-22 Long Term Plan now revised) and the budgets for this 2015-25 Long Term Plan.
The “Sources of operating funding” section of the FIS includes revenue to the activity, but note:
Grants and contributions received which are specified for funding capital expenditure are not included, they are included in “Sources of capital funding” - whereas under GAAP they are included in either “Development and financial contributions” or “Other revenue” in the Income Statement.
Any gain from sale of assets is not included, instead the sale proceeds are included in “Sources of capital funding” - whereas under GAAP any such gain is included in “Gains” in the Income Statement.
Internal charges and overheads recovered are shown as a source of operating funding in the FIS – whereas in Council’s Income Statement they are deducted from operating expenditure.
The value of assets vested in (effectively donated to) Council is excluded and is also excluded from capital expenditure - whereas under GAAP this amount is included in “Other revenue” in the Income Statement and added to the value of fixed assets in the Statement of Financial Position. However, for some activities a more detailed breakdown of capital expenditure is provided at the bottom of the FIS and this includes the value of vested assets.
Some of this total may be designated by Council to fund capital expenditure.
The “Applications of operating funding” section includes operating expenditure of the activity, but note:
Depreciation and amortisation expense is excluded as it does not involve a cash payment- whereas under GAAP it is included in Expenditure in the Income Statement. The value of this expense is shown in the reconciliation section.
In Council’s Income Statement internal charges and overheads recovered are deducted from operating expenditure whereas in the FIS they are shown as a source of operating funding.
The “Finance costs” shown are the amount paid by the activity to Council’s Investment unit and so are also an internal cost.
Any loss on sale of assets is not included as it does not involve a cash payment - whereas under GAAP it is included in Expenditure in the Income Statement.
The “Sources of capital funding” section shows direct sources of funding the capital expenditure of the activity, but note:
Grants and contributions received which are specified for funding capital expenditure are included - whereas under GAAP they are included in either “Development and financial contributions” or “Other revenue” in the Income Statement.
Any proceeds from the sale of an asset are included in here - whereas under GAAP only the loss or gain on sale would be included in the Income Statement.
Funding from a reserve is included as a negative value of “Increase (decrease) in reserves” in the “Applications of capital funding” section.
While loans are included here there are some situations in which a loan is used to fund operating expenditure.
Capital expenditure may also be funded from items included as “Sources of operating funding”, e.g. activities with low levels of Capital expenditure often fund it directly from rates.
The “Applications of capital funding” section shows how much funding has been:
used to fund capital expenditure.
Transferred to a reserve, less the amount taken from a reserve to fund capital expenditure.
The Surplus (deficit) of operating funding and capital funding represent funds transferred between these two uses as defined by the FIS, for the reasons outlined here they differs from a surplus which would be calculated under GAAP.
Council’s management and investment units are not included in any activity, their costs and revenues are allocated over all activities, using appropriate allocation bases. For this reason adding the information provided for all activity groups will not agree to Councils financial statements. Similarly adding all “Internal charges and overheads recovered” gives a different answer to adding all “Internal charges and overheads applied” as most recoveries are to the management units. Below each FIS a reconciliation is given of the “Total applications of operating funding” in the FIS and the operating expenditure disclosed for that activity in the Income Statement.

Activity Groups and Activities
Page 28 2015-2025 Long Term Plan
For some activities a further breakdown is given of the operating and capital expenditure, eg; to individual scheme. This operating expenditure breakdown uses information form the Income Statement and is prepared as per GAAP, similarly the capital expenditure includes vested assets as per GAAP.

Activity Group: People
2015-2025 Long Term Plan Page 29
People

Activity Group: People
Page 30 2015-2025 Long Term Plan
People Operating Costs The operating costs for the People Group of Activities represents $112 million of total Council expenditure.
Capital Projects The capital expenditure for the People Group of Activities represents $32 million of total Council expenditure over the next 10 years. Information about the major budgeted capital projects are included under the respective Activities sections.
Rationale for the Delivery of the People Group of Activities The Activities encompass a range of People focused services from support to the youth and elderly, community services, housing and energy efficiency, democratic participation, safety and learning.
Changes to People Activity Group from the 2014-15 Annual Plan Community Support Activity now includes this Community Safety (Safer Communities and Security Activity).
Intended Changes to Levels of Service from the 2014-15 Annual Plan The table describes any intended changes to the levels of service within the group from the levels of service displayed in the 2014-15 Annual Plan. The reasons for the intended changes are also described.
2014-15 Annual Plan 2015-25 LTP Reason for changes Activity: Library - Provide a range of
programmes or training opportunities that meet or exceed customers’ expectations.
Addition of level of service to measure library users views about programmes and training opportunities.
Activity: Community SafetyProvide an overall service that meets or exceeds residents’ expectations.
Merged with Community Support.
Activity is small in terms of overall cost and fits with Community Safety activity remit.
Provide quality service that meets and exceeds the expectations of the funding ministries and thus providing quality service to the community.
Merged with Community Support.
Activity is small in terms of overall cost and fits with Community Safety activity remit.
Provide services relevant to our community.
None. Activity is funded by central government for each of the individual projects and is subject to constant changes.

Activity Group: People
2015-2025 Long Term Plan Page 31
Significant Negative Effects Associated with this Group of Activities There are no significant negative effects that have been identified for this Group of Activities.
Activity Group Funding Impact Statement The following Funding Impact Statement (FIS) is for the Activity Group, throughout this section a separate FIS is included for each Activity and these should be referred to for more detailed information.

Activity Group: People
Page 32 2015-2025 Long Term Plan
Note 1: The increase in cost of service is a result of the budgeted capital works projects for the new Picton and Blenheim libraries and art gallery.
Funding Impact Statement for 2015-25PEOPLE AP 2014.15 2015.16 2016.17 2017.18 2018.19 2019.20 2020.21 2021.22 2022.23 2023.24 2024.25
$000's $000's $000's $000's $000's $000's $000's $000's $000's $000's $000'sSources of operating funding
General rates, uniform annual general charges, rates penalties 6,185 6,531 6,914 7,177 7,405 7,928 8,436 8,927 9,188 9,299 9,460Targeted rates 120 137 162 187 214 232 162 133 100 78 53Subsidies and grants for operating purposes 323 344 353 348 360 385 380 394 423 419 437Fees and charges 21 24 24 25 25 26 27 28 29 30 31Other receipts including fines and infringement fees 1,950 1,987 2,103 2,092 2,116 2,226 2,232 2,303 2,404 2,393 2,437
Total operating funding 8,599 9,023 9,556 9,829 10,120 10,797 11,237 11,785 12,144 12,219 12,418Applications of operating funding
Payments to staff and suppliers 5,154 4,464 4,773 4,869 4,813 5,081 4,997 5,000 5,318 5,296 5,564Finance costs 1 11 39 179 403 619 1,048 1,517 1,546 1,395 1,346Internal charges and overheads applied 2,097 2,793 2,866 2,951 2,997 3,001 3,081 3,122 3,191 3,295 3,367Other operating funding applications 1,154 1,432 1,372 1,329 1,331 1,356 1,334 1,336 1,362 1,340 1,342
Total applications of operating funding 8,406 8,700 9,050 9,328 9,544 10,057 10,460 10,975 11,417 11,326 11,619Surplus (deficit) of operating funding 193 323 506 501 576 740 777 810 727 893 799
Sources of capital fundingSubsidies and grants for capital expenditure - 10 10 10 11 11 11 11 12 12 13Increase (decrease) in debt - 310 3,500 6,299 3,000 3,500 7,000 5,068 - 465 457Gross proceeds from sale of assets - - - - - 23 - - 2,376 - -
Total sources of capital funding - 320 3,510 6,309 3,011 3,534 7,011 5,079 2,388 477 470Applications of capital funding
Capital expenditure to meet additional demand - - 512 3,675 3,072 3,322 6,835 4,695 - - -Capital expenditure to improve the level of service 3,583 172 24 25 27 29 31 33 37 39 42Capital expenditure to replace existing assets 798 1,231 555 380 334 591 2,858 791 862 698 697Increase (decrease) in reserves (4,188) (760) 2,925 2,730 154 332 (1,936) 370 2,216 633 530
Total applications of capital funding 193 643 4,016 6,810 3,587 4,274 7,788 5,889 3,115 1,370 1,269Surplus (deficit) of capital funding (193) (323) (506) (501) (576) (740) (777) (810) (727) (893) (799)
Funding balance - - - - - - - - - - -ReconciliationTotal applications of operating funding 8,406 8,700 9,050 9,328 9,544 10,057 10,460 10,975 11,417 11,326 11,619
plus - Depreciation and amortisation 641 643 687 702 725 1,000 1,050 1,093 1,063 1,095 1,129plus - Loss on sale of fixed assets - - - - - 2 - - 1 - -
Expenditure as per Note 1 9,047 9,343 9,737 10,030 10,269 11,059 11,510 12,068 12,481 12,421 12,748

Activity Group: People
2015-2025 Long Term Plan Page 33
Democratic Process
How this Activity Contributes to Related Community Outcomes This Activity contributes to the Community Outcome of Governance, People, Economy and Living by:
Outcome Sub-outcome Major linkages Secondary linkagesGovernance Inclusive
Enabling Participative Transparent Strategic Connected
Council is the main democratic body for the District. This Activity manages the public interaction with Council, and facilitates public interaction with other public and private organisations.
-
People Engaged and participative
- This Activity promotes the ability for people to be engaged and participative in their community.
Economy Ability to connect - This Activity promotes the ability for industry to engage in their community.
Living Opportunities for participation Social cohesion
- This Activity encourages people to work together to participate in local democracy.
What is this Activity About? The Marlborough District Council is a unitary authority, with the functions, duties and powers of both a regional Council and a territorial authority conferred on it by the Local Government Act 2002. This Act was recently amended and now describes the purpose of local government as being to enable democratic local decision-making and action by and on behalf of communities; and to meet the current and future needs of communities for good quality local infrastructure, local public services and performance of regulatory functions in a way that is most cost effective for households and businesses.
In considering the range and diversity of the communities that are represented in Marlborough, Marlborough District Council recognises the special relationship it has with Tangata Whenua, and acknowledges the specific responsibilities it has to Maori under the Local Government Act 2002 and under the Resource Management Act 1991.
The Marlborough District Council’s Local Governance Statement provides a comprehensive overview of its governance policies and processes. Copies of the Local Governance Statement, and associated polices and documents, can be viewed at Council Service Centres and Libraries, and on the Council’s website.
The Council elections were held successfully in October 2013 (the next election being in October 2016 and every three years thereafter). In the two years prior to the 2016 election Council will be reviewing its election method (currently Single Transferable Vote) and also its representation arrangements (ward structure, etc). This review will again be taken in the two years prior to the 2022 election.
Emerging Issues and Expected Changes The main emerging issue within this Activity is the community’s expectation for more information, consultation and recognition of significant events and people, which increases the cost in these areas.
Activity: Democratic Process Operating costs of this Activity represent approximately 2.9% of total Activity expenditure.

Activity Group: People
Page 34 2015-2025 Long Term Plan
Levels of Service 2015-25: Democratic Process Performance Targets (for the financial year) Level of Service Indicator Baseline 2015-16 2016-17 2017-18 2018-25 Provide an overall level of service that meets or exceeds residents’ expectations.
Resident satisfaction with this service as measured by survey, 10 = “service delivered extremely well”.
6.5 6.6 6.6 6.7 6.7
Provide a service that is timely and responsive to residents’ needs.
Percentage of agendas available to the public, by way of the website and counter enquiry, at least three working days prior to meetings.
100% 100% 100% 100% 100%
Properly managed local elections. Elections and polls will comply with the provision of the Local Electoral Act 2001 with no petitions for enquiry.
No petitions for enquiry.
N/A No petitions for enquiry.
N/A No petitions for enquiry 2019, 2022 and 2025 elections.
Public contribution to decision making process.
% of Council items of business open to the public.
90% 90% 90% 90% 90%

Activity Group: People
2015-2025 Long Term Plan Page 35
Note 1: There are no material cost of service variances.
.
Democratic Process AP 2014.15 2015.16 2016.17 2017.18 2018.19 2019.20 2020.21 2021.22 2022.23 2023.24 2024.25$000's $000's $000's $000's $000's $000's $000's $000's $000's $000's $000's
Sources of operating fundingGeneral rates, uniform annual general charges, rates penalties 2,620 2,563 2,788 2,885 2,848 2,976 3,081 3,055 3,245 3,401 3,515Other receipts 253 254 303 262 248 294 248 236 290 243 242
Total operating funding 2,873 2,817 3,091 3,147 3,096 3,270 3,329 3,291 3,535 3,644 3,757Applications of operating funding
Payments to staff and suppliers 1,578 1,148 1,348 1,345 1,251 1,445 1,446 1,352 1,565 1,572 1,620Internal charges and overheads applied 1,283 1,657 1,725 1,785 1,828 1,829 1,871 1,927 1,985 2,059 2,124Other operating funding applications 6 6 6 6 6 6 6 6 6 6 6
Total applications of operating funding 2,867 2,811 3,079 3,136 3,085 3,280 3,323 3,285 3,556 3,637 3,750Surplus (deficit) of operating funding 6 6 12 11 11 (10) 6 6 (21) 7 7
Sources of capital fundingGross Proceeds from sale of assets - - - - - 23 - - 25 - -
Total sources of capital funding - - - - - 23 - - 25 - -Applications of capital funding
Capital expenditure to replace existing assets - - 41 - - 44 - - 49 - -Increase (decrease) in reserves 6 6 (29) 11 11 (31) 6 6 (45) 7 7
Total applications of capital funding 6 6 12 11 11 13 6 6 4 7 7Surplus (deficit) of capital funding (6) (6) (12) (11) (11) 10 (6) (6) 21 (7) (7)
Funding balance - - - - - - - - - - -ReconciliationTotal applications of operating funding 2,867 2,811 3,079 3,135 3,085 3,279 3,323 3,284 3,556 3,637 3,750
plus - Depreciation and amortisation 6 6 12 12 12 12 7 6 3 7 7Expenditure as per Statement of Financial Performance 2,873 2,817 3,091 3,147 3,097 3,291 3,330 3,290 3,559 3,644 3,757
Funding Impact Statement for 2015-25

Activity Group: People
Page 36 2015-2025 Long Term Plan
Activity: Culture and Heritage
How this Activity Contributes to Related Community Outcomes This Activity contributes to the Community Outcomes of Governance, People, economy and Living by:
Outcome Sub-outcome Major linkages Secondary linkagesGovernance Inclusive
Participative Strategic Connected
The people of Marlborough want to be assured that their community aspirations for arts and heritage services are being supported for professional delivery of services.
Access to funding for services. Understanding the process to access funding. Provision of essential services.
People Education Life long learning Diversity Flexibility Creativity Tolerance Engaged and participative
The people of Marlborough want to be assured that their community aspirations for arts and heritage services are being supported for professional delivery of services.
Capacity of the arts and heritage sector is supported.
Economy Flexible labour Productivity Ability to connect
The heritage and arts sectors provide the opportunity for people to undertake rewarding work that suits their lifestyle.
Employment that reflects the changing demographics of youth, older people and families. Volunteer sector acknowledged as a key component to heritage services.
Living Cultural facilities and events
The heritage and arts sectors supports the cultural richness of the
Enabling arts and heritage services to be accessible to the
Outcome Sub-outcome Major linkages Secondary linkages Opportunities for participation Social cohesion
District. community at large.
What is this Activity About? This Activity involves promoting the Marlborough communities’ cultural wellbeing. Council defines “culture” as encompassing the customs, practices, languages, values and world views that define social groups in Marlborough. Practices such as arts, design, and architecture reflect and create our cultural identity. Likewise, the ways in which we approach and understand our heritage shapes our image of ourselves, and the image we convey to future generations.
The Marlborough culture is unique: nowhere else in the world is there the same combination of people, place and practice. Cultural identity – the sense of connection with other people through a shared culture – can make a strong contribution to a person’s overall wellbeing. Responding to community changes requires a continual balance between the old and the new.
The Council’s Arts and Culture Strategy, and its Heritage Strategy, sets out the roles played by Council in details, and the ways in which it proposes working with the community to achieve outcomes for culture and heritage. These include:
Forming partnerships with organisations and institutions that contribute to cultural wellbeing (eg; Marlborough Museum Past Perfect museums database project);
Supporting projects that reflect and strengthen Marlborough cultural identity.
Managing the cultural and heritage assets and resources in a sustainable manner.
Council also provides annual heritage operating grants and a pool of contestable arts, culture and heritage grant funds.
A total of $75,000 per year is available for heritage and $50,000 for arts and culture project assistance that:
Supports the infrastructure of heritage/arts and culture service providers.
Promote the sustainable use and enjoyment of Marlborough heritage/arts resources.
Activity: Culture and Heritage Operating costs of this Activity represent approximately 0.8% of total Activity expenditure.
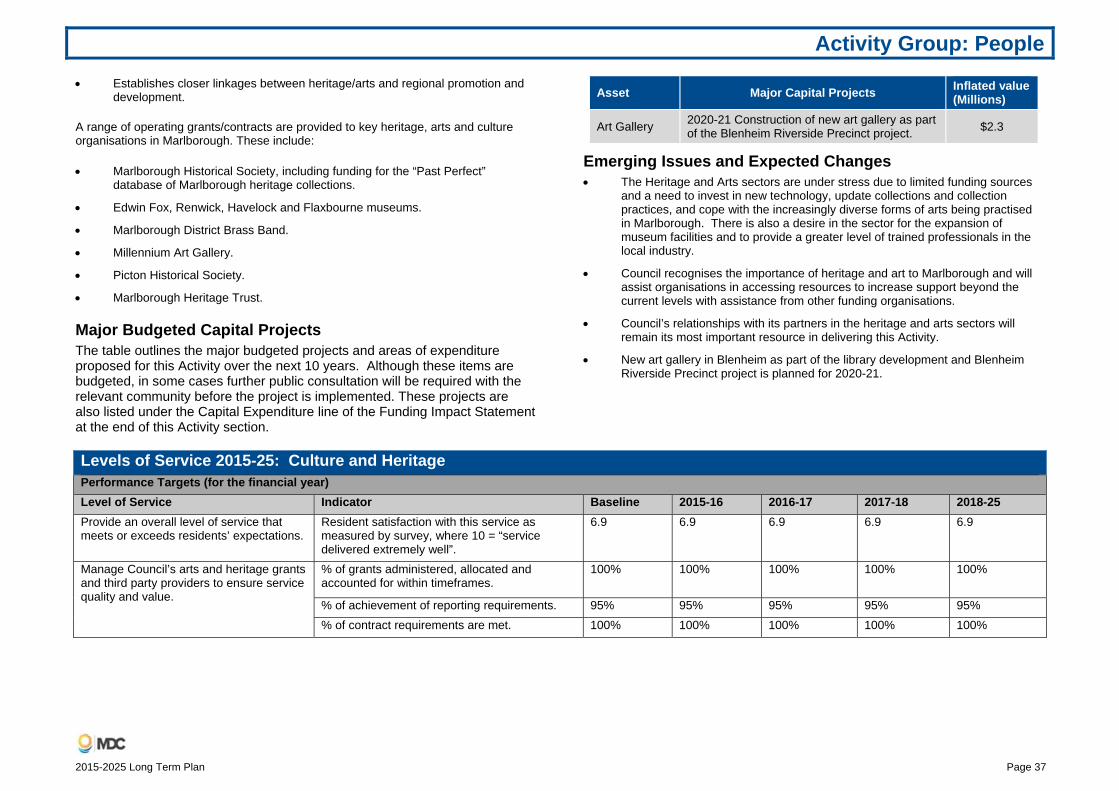
Activity Group: People
2015-2025 Long Term Plan Page 37
Establishes closer linkages between heritage/arts and regional promotion and development.
A range of operating grants/contracts are provided to key heritage, arts and culture organisations in Marlborough. These include:
Marlborough Historical Society, including funding for the “Past Perfect” database of Marlborough heritage collections.
Edwin Fox, Renwick, Havelock and Flaxbourne museums.
Marlborough District Brass Band.
Millennium Art Gallery.
Picton Historical Society.
Marlborough Heritage Trust.
Major Budgeted Capital Projects The table outlines the major budgeted projects and areas of expenditure proposed for this Activity over the next 10 years. Although these items are budgeted, in some cases further public consultation will be required with the relevant community before the project is implemented. These projects are also listed under the Capital Expenditure line of the Funding Impact Statement at the end of this Activity section.
Asset Major Capital Projects Inflated value (Millions)
Art Gallery 2020-21 Construction of new art gallery as part of the Blenheim Riverside Precinct project. $2.3
Emerging Issues and Expected Changes The Heritage and Arts sectors are under stress due to limited funding sources
and a need to invest in new technology, update collections and collection practices, and cope with the increasingly diverse forms of arts being practised in Marlborough. There is also a desire in the sector for the expansion of museum facilities and to provide a greater level of trained professionals in the local industry.
Council recognises the importance of heritage and art to Marlborough and will assist organisations in accessing resources to increase support beyond the current levels with assistance from other funding organisations.
Council’s relationships with its partners in the heritage and arts sectors will remain its most important resource in delivering this Activity.
New art gallery in Blenheim as part of the library development and Blenheim Riverside Precinct project is planned for 2020-21.
Levels of Service 2015-25: Culture and Heritage Performance Targets (for the financial year)Level of Service Indicator Baseline 2015-16 2016-17 2017-18 2018-25 Provide an overall level of service that meets or exceeds residents’ expectations.
Resident satisfaction with this service as measured by survey, where 10 = “service delivered extremely well”.
6.9 6.9 6.9 6.9 6.9
Manage Council’s arts and heritage grants and third party providers to ensure service quality and value.
% of grants administered, allocated and accounted for within timeframes.
100% 100% 100% 100% 100%
% of achievement of reporting requirements. 95% 95% 95% 95% 95% % of contract requirements are met. 100% 100% 100% 100% 100%

Activity Group: People
Page 38 2015-2025 Long Term Plan
Note 1: The increase in cost of service in 2020-21 is due the funding and operating costs from the budgeted project for the new art gallery.
Funding Impact Statement for 2015-25Culture and Heritage AP 2014.15 2015.16 2016.17 2017.18 2018.19 2019.20 2020.21 2021.22 2022.23 2023.24 2024.25
$000's $000's $000's $000's $000's $000's $000's $000's $000's $000's $000'sSources of operating funding
General rates, uniform annual general charges, rates penalties 578 739 808 796 802 816 894 981 982 983 984Other receipts 59 73 75 72 69 68 71 75 72 70 67
Total operating funding 637 812 883 868 871 884 965 1,056 1,054 1,053 1,051Applications of operating funding
Payments to staff and suppliers 25 3 3 3 3 4 4 4 4 4 4Finance costs 1 - - 2 4 4 83 160 156 151 147Internal charges and overheads applied 17 67 69 70 71 72 73 75 76 78 80Other operating funding applications 599 760 806 786 786 786 786 786 786 786 786
Total applications of operating funding 642 830 878 861 864 866 946 1,025 1,022 1,019 1,017Surplus (deficit) of operating funding (5) (18) 5 7 7 18 19 31 32 34 34
Sources of capital fundingIncrease (decrease) in debt - - - 52 - - - - - - -
Total sources of capital funding - - - 52 - - - - - - -Applications of capital funding
Capital expenditure to improve the level of service 50 - - 52 - - - - - - -Capital expenditure to replace existing assets - - 52 - 11 2,278 - - - -Increase (decrease) in reserves (55) (18) 5 (45) 7 7 (2,259) 31 32 34 34
Total applications of capital funding (5) (18) 5 59 7 18 19 31 32 34 34Surplus (deficit) of capital funding 5 18 (5) (7) (7) (18) (19) (31) (32) (34) (34)
Funding balance - - - - - - - - - - -ReconciliationTotal applications of operating funding 642 830 878 861 864 866 946 1,025 1,022 1,019 1,017
plus - Depreciation and amortisation 5 5 6 6 6 7 18 30 31 32 33Expenditure as per Statement of Financial Performance 647 835 884 867 870 873 964 1,055 1,053 1,051 1,050
Operating expenditureArts 250 386 487 488 489 489 581 670 668 666 663Heritage 397 449 396 379 381 382 383 384 384 385 386
Capital expenditure:Arts - - - - - - - - - - -Heritage 50 - - 2,152 - - - - - - -

Activity Group: People
2015-2025 Long Term Plan Page 39
Activity: Community Housing
How this Activity Contributes to Related Community Outcomes This Activity contributes to the Community Outcomes of Governance, People, Mobility and Living by:
Outcome Sub-outcome Major linkages Secondary linkages
Governance Transparent Involvement of community representative on the Housing for the Elderly Sub-Committee.
-
People Diversity Ensuring the provision of affordable housing for older adults within Council policy parameters.
-
Mobility Safe Community housing provides safe environment for elderly residents to live.
-
Living Access to quality housing Individual safety Health
Ensuring Council supplied housing meets the needs of future residents.
Ensuring future tenants meet the criteria of Council requirements.
What is this Activity About? This Activity involves Council considering ways and means by which it can assist the people of Marlborough to have access to housing suitable to their needs. Council considers the most effective means of discharging this responsibility to be providing an option for elderly people to access appropriate and affordable housing, and to advocate and facilitate other housing options.
Council will continue to implement the maintenance plans for the Housing for the Elderly units to ensure a minimum living standard. The age and difficulty in maintaining these units is a long term issue.
Council has an advocacy and facilitation role beyond the current provision of Housing for the Elderly. Council will continue to work closely with Housing New Zealand and the
Marlborough Sustainable Housing Trust to attract more funding and provision of housing options for the Marlborough community.
Policy on Social Housing Council will own and maintain a stock of housing, for the purpose of assisting elderly people to have access to housing they could not otherwise afford.
Principles and Criteria Council resources for the provision of housing assistance are limited, and therefore applications will be assessed according to the following principles and criteria:
1. To prioritise clients according to prevailing demand.
Given the current and projected demographic profile of the District, the prevailing demand for assistance with affordable housing is considered to lie with older people. Priority will therefore be given to people over age 65. Prevailing demand will be reassessed periodically.
2. To focus assistance on those with low incomes.
The threshold for access to Council housing will be reviewed periodically, and will be based on a combined assessment of household income and assets.
3. To provide for needs not met by other providers.
Council considers itself to be the housing option of last resort. Applicants must be able to demonstrate that their housing needs cannot be met from alternative sources.
4. To match applicants with housing suited to their needs.
Within a limited portfolio, the type of housing that may be available at any time may not be suited to the specific needs of an applicant. This may require applicants to be waitlisted until suitable housing becomes available. Suitable housing is housing that is appropriate to household size, is proximate to essential services, and is located within a neighbourhood and community context that will foster integration and participation.
Rents Rents are set at a rate less than market rental value, with annual reviews linked to Consumer Price Index (CPI) and Guaranteed Retirement Income (GRI) adjustments. Rents are also reviewed with major remodelling or new builds.
Governance The Housing Policy will be administered by the Council’s Housing for the Elderly Sub-Committee. Day to day administration of the portfolio, including assessing
Activity: Community Housing Operating costs of this Activity represents approximately 1.3% of total Activity expenditure.

Activity Group: People
Page 40 2015-2025 Long Term Plan
applications, will be provided by the Council’s property managers, according to this policy and to the provisions of the Housing Asset Management Plan.
Major Budgeted Capital Projects The table outlines the major budgeted projects and areas of expenditure proposed for this Activity over the next 10 years. Although these items are budgeted, in some cases further public consultation will be required with the relevant community before the project is implemented. These projects are also listed under the Capital Expenditure line of the Funding Impact Statement at the end of this Activity section.
Asset Major Capital Projects Inflated value (Millions)
Housing 2015-25 Redevelopment and upgrading of a number of Housing for the Elderly units. $2.3
Emerging Issues and Expected Changes The following issues are emerging within this Activity:
Age of units.
Increasing proportion of elderly population in Marlborough.
Fixed incomes of many tenants.
Rents below market levels.
Increasing maintenance costs.
Increase in demand for current units and demand for Council to build more units.
Increase in use of mobility scooters and secure storage of them – to be considered if developing new complexes.
Damage caused by tenants smoking inside or in nearby vicinity- Implementing a full smoking ban inside and outside the units to preserve life of units and decrease costs involved to renovate after smoke damaged.
Currently the housing is of reasonable quality but due to some units being old and some on unstable land there is a need to undertake redevelopment and upgrading of a number of units. Council agreed to a comprehensive budget in the 2014-15 Annual Plan.
1 Urgent unplanned maintenance is for events that would make the unit unliveable if left for an extended period. 2 Non urgent unplanned maintenance is for events that do not pose a risk to the tenant if not dealt with straight away but does need to be dealt with in the near future.
Levels of Service 2015-25: Community Housing Performance Targets (for the financial year) Level of Service Indicator Baseline 2015-16 2016-17 2017-18 2018-25 Provide an overall level of service that meets or exceeds residents’ expectations.
Resident satisfaction with this service as measured by survey, where 10 = “service delivered extremely well”.
7.1 7.1 7.1 7.1 7.1
Tenant satisfaction with this service as measured by survey, where 10 = “service delivered extremely well”.
8 8 8 8 8
Provide up-to-date record of Occupancy levels.
Minimum occupancy in units to be maintained. 98% 98% 98% 98% 98%
Provide community housing reactive maintenance service in two categories.
Urgent Unplanned Maintenance0F
1 – Percentage of unplanned maintenance completed within 24 hours of notification.
98% 98% 98% 98% 98%
Non-Urgent Unplanned Maintenance2 - Percentage of unplanned non-urgent maintenance completed within 20 working days of notification.
90% 90% 90% 90% 90%
Provide an annual checklist of planned maintenance/projects as set out in budget and from Committee meetings.
Percentage of planned maintenance/projects completed in financial year. 70% 70% 72% 74% 75%

Activity Group: People
2015-2025 Long Term Plan Page 41
Note 1: There are no material cost of service variances.
Funding Impact Statement for 2015-25Community Housing AP 2014.15 2015.16 2016.17 2017.18 2018.19 2019.20 2020.21 2021.22 2022.23 2023.24 2024.25
$000's $000's $000's $000's $000's $000's $000's $000's $000's $000's $000'sSources of operating funding
Other receipts including property rentals 1,155 1,126 1,165 1,188 1,211 1,248 1,279 1,331 1,380 1,426 1,473Total operating funding 1,155 1,126 1,165 1,188 1,211 1,248 1,279 1,331 1,380 1,426 1,473
Applications of operating fundingPayments to staff and suppliers 1,113 801 855 879 913 990 891 911 934 829 956Finance costs - - - - - - - - - - -Internal charges and overheads applied 46 150 149 154 157 159 162 167 172 177 182Other operating funding applications 18 13 17 18 18 19 19 20 21 21 22
Total applications of operating funding 1,177 964 1,021 1,051 1,088 1,168 1,072 1,098 1,127 1,027 1,160Surplus (deficit) of operating funding (22) 162 144 137 123 80 207 233 253 399 313
Sources of capital fundingIncrease (decrease) in debt - - - - - - - - - - -Gross proceeds from sale of assets - - - - - - - - - - -
Total sources of capital funding - - - - - - - - - - -Applications of capital funding
Capital expenditure to meet additional demand - - - - - - - - - - -Capital expenditure to improve the level of service - 150 - - - - - - - - -Capital expenditure to replace existing assets 533 533 170 - - - 190 394 407 212 219Increase (decrease) in reserves (555) (521) (26) 137 123 80 17 (161) (154) 187 94
Total applications of capital funding (22) 162 144 137 123 80 207 233 253 399 313Surplus (deficit) of capital funding 22 (162) (144) (137) (123) (80) (207) (233) (253) (399) (313)
Funding balance - - - - - - - - - - -ReconciliationTotal applications of operating funding 1,177 964 1,022 1,051 1,088 1,168 1,073 1,097 1,127 1,027 1,161
plus - Depreciation and amortisation 274 262 289 296 305 315 327 342 359 377 396plus - Loss on sale of fixed assets - - - - - - - - - - -Expenditure as per Statement of Financial Performance 1,451 1,226 1,311 1,347 1,393 1,483 1,400 1,439 1,486 1,404 1,557

Activity Group: People
Page 42 2015-2025 Long Term Plan
Activity: Community Support
How this Activity Contributes to Related Community Outcomes This Activity contributes to the Community Outcomes of Governance, Environment, People, Mobility and Living as follows:
Outcome Sub-outcome Major contribution Secondary contribution
Community Support and Development Governance Inclusive
Enabling Participative Transparent Strategic Connected
The people of Marlborough want to be assured that their community aspirations and essential services are being supported and appropriately responded to. Council’s Youth Council and Older Persons Forum encourage participation of these groups in Council and other agencies.
Access to funding for services. Understanding the process to access funding. Provision of essential services.
People Education Life long learning Diversity Flexibility Creativity Tolerance Engaged and participative
Participation in the Youth Forum and Older Persons Forum supports this cohorts contribution to the community.
Capacity of the volunteer sector is supported.
Outcome Sub-outcome Major contribution Secondary contribution
Community Safety (Safer Communities and Security)Governance Inclusive
Enabling Participative Transparent Strategic Connected
World Health Organisation Safe Communities accreditation has brought multiple agencies together to improve safety for all in Marlborough.
CPTED street intensive programmes encourage residents to become involved in improving their environment and to engage with other groups in the community.
People Education Life long learning Diversity Flexibility Creativity Tolerance Engaged and participative
CPTED street intensive programmes encourage residents to become involved in improving their environment and to engage with other groups in the community. Restorative Justice provides the opportunity for victims to have their say in the justice system. World Health Organisation Safe Communities accreditation has brought multiple agencies together to improve safety for all in Marlborough.
Mobility Safe Improved CCTV in Blenheim and Picton supports safe mobility of people in these towns.
-
Living Health The people of Marlborough want to be
Activity: Community Support Operating costs of this Activity represent approximately 1.4% of total Activity expenditure.

Activity Group: People
2015-2025 Long Term Plan Page 43
Outcome Sub-outcome Major contribution Secondary contribution
Individual safety Cultural facilities and events Sport and recreation Opportunities for participation Social cohesion
assured that the community they live in is safe.
Events ManagementLiving Health
Individual safety Cultural facilities and events Sport and recreation Opportunities for participation Social cohesion
The people of Marlborough want to be assured that events are provided that reflect the diversity of the community and allow access for all. Events that are fun and provide opportunities to celebrate community.
Enabling events that are fun, family friendly, affordable and promote community connection and pride.
Passenger Transport and Mobility Scheme Mobility Local
accessibility Sustainable Safe
Passenger transport is a fundamental service that connects people to services and activities for better quality of life. The Total Mobility scheme assists people with impairments to access appropriate transport to enhance their community participation.
-
Living Opportunities for participation
Energy EfficiencyEnvironment Sustainable
resource management
To encourage the uptake of energy efficient products in the home.
Outcome Sub-outcome Major contribution Secondary contribution
Living Health Helping people to make their homes warm or heat their water whilst using less energy.
What is this Activity About? Community support is provided by Council in a number of ways including via third parties: organisations and agencies working with particular groups within the community, provision of funding, advocacy or addressing specific issues directly through service provision. This Activity combines a number of distinct ways Council are involved in supporting their community:
Community Support and Development Strengthening community cohesion, supporting social networks recognising the value and needs of older people and providing a positive environment for the development of our young people. Council acknowledges the needs of specific sectors in our community including our older people and youth. Council has worked in partnership with key organisations to establish the Positive Ageing Accord to identify the aspirations of this sector and actions to take place to achieve these. Monthly Older Persons Forums and regular Picton Regional Forums are held to give a voice to these sectors and enable issues to be raised and addressed.
Similarly Council has a Youth Policy and Youth Initiatives Plan that works towards achieving a better environment and services for this sector and active input from youth. This includes making progress towards the Mayoral Task Force goal of “that all young people under the age of 25 should be engaged in appropriate education, training, work or other options which will lead to long term economic independence and wellbeing”. Monthly Youth Council meetings are held to provide a voice for youth and to take effect of the Policy and Plan which provides direction for the allocation of Council’s Youth Funding.
The volunteer sector including non-government (NGO) and not-for-profit (NFP) organisations, underpins much of the service delivery of community services in Marlborough.
Advocating the needs of the sector is an ongoing issue particularly given the changes being experienced in the age and ethnicity of the community. Relationships are being made with key organisations to build the capacity of the sector through provision of training and support.
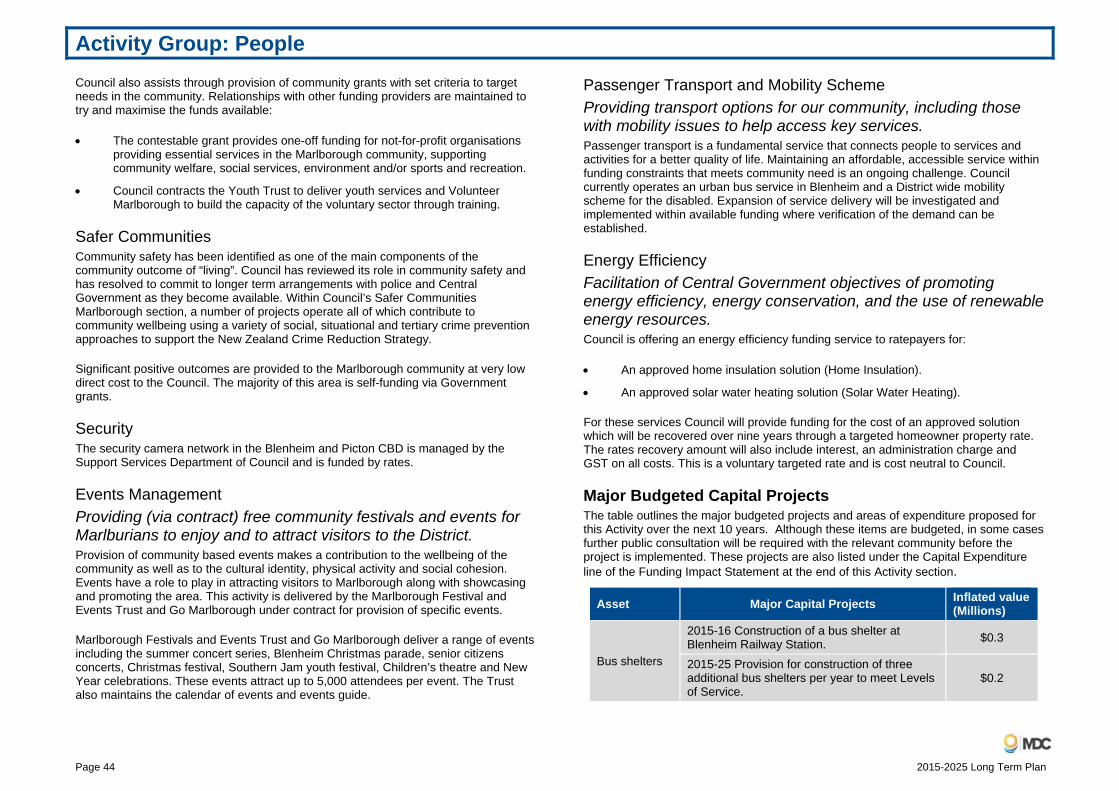
Activity Group: People
Page 44 2015-2025 Long Term Plan
Council also assists through provision of community grants with set criteria to target needs in the community. Relationships with other funding providers are maintained to try and maximise the funds available:
The contestable grant provides one-off funding for not-for-profit organisations providing essential services in the Marlborough community, supporting community welfare, social services, environment and/or sports and recreation.
Council contracts the Youth Trust to deliver youth services and Volunteer Marlborough to build the capacity of the voluntary sector through training.
Safer Communities Community safety has been identified as one of the main components of the community outcome of “living”. Council has reviewed its role in community safety and has resolved to commit to longer term arrangements with police and Central Government as they become available. Within Council’s Safer Communities Marlborough section, a number of projects operate all of which contribute to community wellbeing using a variety of social, situational and tertiary crime prevention approaches to support the New Zealand Crime Reduction Strategy.
Significant positive outcomes are provided to the Marlborough community at very low direct cost to the Council. The majority of this area is self-funding via Government grants.
Security The security camera network in the Blenheim and Picton CBD is managed by the Support Services Department of Council and is funded by rates.
Events Management Providing (via contract) free community festivals and events for Marlburians to enjoy and to attract visitors to the District. Provision of community based events makes a contribution to the wellbeing of the community as well as to the cultural identity, physical activity and social cohesion. Events have a role to play in attracting visitors to Marlborough along with showcasing and promoting the area. This activity is delivered by the Marlborough Festival and Events Trust and Go Marlborough under contract for provision of specific events.
Marlborough Festivals and Events Trust and Go Marlborough deliver a range of events including the summer concert series, Blenheim Christmas parade, senior citizens concerts, Christmas festival, Southern Jam youth festival, Children’s theatre and New Year celebrations. These events attract up to 5,000 attendees per event. The Trust also maintains the calendar of events and events guide.
Passenger Transport and Mobility Scheme Providing transport options for our community, including those with mobility issues to help access key services. Passenger transport is a fundamental service that connects people to services and activities for a better quality of life. Maintaining an affordable, accessible service within funding constraints that meets community need is an ongoing challenge. Council currently operates an urban bus service in Blenheim and a District wide mobility scheme for the disabled. Expansion of service delivery will be investigated and implemented within available funding where verification of the demand can be established.
Energy Efficiency Facilitation of Central Government objectives of promoting energy efficiency, energy conservation, and the use of renewable energy resources. Council is offering an energy efficiency funding service to ratepayers for:
An approved home insulation solution (Home Insulation).
An approved solar water heating solution (Solar Water Heating).
For these services Council will provide funding for the cost of an approved solution which will be recovered over nine years through a targeted homeowner property rate. The rates recovery amount will also include interest, an administration charge and GST on all costs. This is a voluntary targeted rate and is cost neutral to Council.
Major Budgeted Capital Projects The table outlines the major budgeted projects and areas of expenditure proposed for this Activity over the next 10 years. Although these items are budgeted, in some cases further public consultation will be required with the relevant community before the project is implemented. These projects are also listed under the Capital Expenditure line of the Funding Impact Statement at the end of this Activity section.
Asset Major Capital Projects Inflated value (Millions)
Bus shelters
2015-16 Construction of a bus shelter at Blenheim Railway Station. $0.3
2015-25 Provision for construction of three additional bus shelters per year to meet Levels of Service.
$0.2

Activity Group: People
2015-2025 Long Term Plan Page 45
Emerging Issues and Expected Changes The changing age structure of the Marlborough community will pose some challenges for future infrastructure and delivery of services. In the coming years our community is going to be “older” – 2013 Census shows 20.5% of the population was over 65 and expected to increase to almost a third of the population by 2026. The other significant change anticipated is an increase in the ethnic diversity of the Marlborough community. It is already apparent that ethnic and cultural diversity will be an increasingly prominent feature of the population.
These changes to the composition to the community have major implications for planning of Council and non-Council services – they affect, for example, the demand for and delivery of health and education services, along with housing, transport (including passenger transport and mobility) and recreation. They have implications for the labour market, and the demand for a wide range of goods and services. Delivery of community based services is also affected by the changes experienced in the community. Volunteer input is an enormously valuable community resource. Support is needed to build the capacity of the sector to ensure services continue to be provided that reflect the changing needs of the community.
For Energy Efficiency, applications for the Heat Smart programme closed in September 2013 following the Government’s (EECA) programme ceasing grants to the wider community. Council is now offering a Home Insulation programme on a similar basis but without an EECA grant to the ratepayer. In addition Council has recently initiated a Solar Water Heating programme. These are voluntary targeted rates and are cost neutral to Council. The budget assumes providing similar levels of energy efficiency services, however demand may reduce without the EECA grants.
For Events Management, the main challenge is to keep events relevant and interesting in times of changing population demographics. This includes challenges for the providers to achieve funding from other sources to maximise the events at a time when there is significant pressure on these sources from the community sector. Sponsorship is also less available from the business sector.
Safer Communities Marlborough has always operated in an environment of potential change with the majority of funding provided by central government for each of the individual projects.
Levels of Service 2015-25 - Community Support Performance Targets (for the financial year)Level of Service Indicator Baseline 2015-16 2016-17 2017-18 2018-25 Provide an overall level of service that meets or exceeds residents’ expectations (excludes Passenger transport).
Resident satisfaction with this service as measured by survey, where 10 = “service delivered extremely well”.
Community Support. 7.2 7.2 7.2 7.2 7.2
Community Safety 7.3 7.3 7.3 7.3 7.3
Events Management. 7.1 7.1 7.1 7.1 7.1
Manage Council’s community grants and third party providers to ensure service quality and value.
% of grants administered, allocated and accounted for within timeframes.
100% 100% 100% 100% 100%
Achievement of reporting requirements. 95% 95% 95% 95% 95% Contract requirements met. 100% 100% 100% 100% 100%
Manage third party providers to ensure service quality and value of community events.
Achievement of reporting requirements. 100% 100% 100% 100% 100% Participation numbers match targets in contracts. 100% >95% >95% >95% >95%
Implement the Positive Ageing Accord.
Number of Older Persons Forums held annually with attendance exceeding quorum.
10 10 10 10 10
Frequency of Seniors Expo. Biennial Seniors Expo
Senior Expo Held
N/A Senior Expo Held
every two years thereafter

Activity Group: People
Page 46 2015-2025 Long Term Plan
Levels of Service 2015-25 - Community Support Performance Targets (for the financial year)Level of Service Indicator Baseline 2015-16 2016-17 2017-18 2018-25
% of actions in Positive Ageing Accord Plan completed each year.
New measure 95% 95% 95% 95%
Implement Youth Initiatives Plan. Number of Youth Forums held annually with attendance exceeding quorum.
10 10 10 10 10
% of actions in Youth Initiatives Plan completed each year.
95% 95% 95% 95% 95%
Build capacity of the Volunteer Sector through provision of training in partnership with key service providers.
Number of training courses provided per annum where attendance numbers meet targets.
3 3 3 3 3
Provide quality service that meets and exceeds the expectations of the funding ministries and thus providing quality service to the community.
Ensure contract reports are completed within timeframes.
100% 100% 100% 100% 100%
% of compliance with Ministry of Justice contract conditions met.
100% 100% 100% 100% 100%
Monitor and manage services to agreed timeframes and budgets.
100% 100% 100% 100% 100%
Provide a well-used and affordable bus service in Blenheim that is timely and responsive to community needs.
Increase levels of customer patronage by 3% per annum (total patronage for 2013-14 year was 26,498).
26,498 3%> previous year
3%> previous year
3%> previous year
3%> previous year
Complete annual passenger survey and reports results to Council by 30 June each year.
New measure 30 June 30 June 30 June 30 June
Improve infrastructure to support bus service by adding a minimum of three bus shelters per year (as funding allows).
12 shelters 3 extra 3 extra 3 extra 3 extra

Activity Group: People
2015-2025 Long Term Plan Page 47
Note 1: There are no material cost of service variances.
Funding Impact Statement for 2015-25Community Support AP 2014.15 2015.16 2016.17 2017.18 2018.19 2019.20 2020.21 2021.22 2022.23 2023.24 2024.25
$000's $000's $000's $000's $000's $000's $000's $000's $000's $000's $000'sSources of operating funding
General rates, uniform annual general charges, rates penalties 849 886 932 942 959 983 995 1,019 1,043 1,055 1,078Targeted rates 120 137 162 187 214 232 162 133 100 78 53Subsidies and grants for operating purposes 305 326 334 329 341 365 359 373 401 397 414Fees and charges 51 18 18 18 19 19 20 21 21 22 23Other receipts 78 95 123 122 121 121 120 119 120 119 119
Total operating funding 1,403 1,462 1,569 1,598 1,654 1,720 1,656 1,665 1,685 1,671 1,687Applications of operating funding
Payments to staff and suppliers 937 873 881 901 872 839 807 833 855 877 909Internal charges and overheads applied 148 188 193 197 199 198 202 206 211 217 223Finance costs - 11 21 21 20 20 19 18 17 17 16Other operating funding applications 460 582 472 449 450 475 452 453 479 456 458
Total applications of operating funding 1,545 1,654 1,567 1,568 1,541 1,532 1,480 1,510 1,562 1,567 1,606Surplus (deficit) of operating funding (142) (192) 2 30 113 188 176 155 123 104 81
Sources of capital fundingIncrease (decrease) in debt - 310 - - - - - - - - -Subsidies and grants for capital expenditure - 10 10 10 11 11 11 11 12 12 13
Total sources of capital funding - 320 10 10 11 11 11 11 12 12 13Applications of capital funding
Capital expenditure to improve the level of service 12 - - - - - - - - - -Capital expenditure to replace existing assets - 320 20 21 22 22 23 23 24 25 26Increase (decrease) in reserves (154) (192) (8) 19 102 177 164 143 111 91 68
Total applications of capital funding (142) 128 12 40 124 199 187 166 135 116 94Surplus (deficit) of capital funding (142) 192 (2) (30) (113) (188) (176) (155) (123) (104) (81)
Funding balance - - - - - - - - - - -ReconciliationTotal applications of operating funding 1,545 1,654 1,567 1,568 1,541 1,532 1,480 1,510 1,562 1,567 1,606
plus - Depreciation and amortisation 2 4 4 5 5 5 6 6 6 7 7Expenditure as per Statement of Financial Performance 1,547 1,658 1,571 1,573 1,546 1,537 1,486 1,516 1,568 1,574 1,613
Operating expenditureGrants and Donations 511 647 514 516 518 518 520 522 524 528 530Safer Communities 144 150 142 146 149 152 156 160 164 169 174Security 97 97 97 97 98 98 98 98 99 99 100Events Management 174 174 178 182 185 189 193 197 202 207 213Energy Efficiency 206 156 156 156 104 52 2 2 2 2 2Recreation 74 69 70 72 73 74 76 78 80 82 84Passenger transport 341 365 414 404 419 454 441 459 497 487 510
Capital expenditure:Passenger transport 12 320 20 21 22 22 23 23 24 25 26

Activity Group: People
Page 48 2015-2025 Long Term Plan
Activity: Library Services
How this Activity Contributes to Related Community Outcomes This activity contributes to the Community Outcomes of Governance, People, Mobility and Living by:
Outcome Sub-outcome Major linkages Secondary linkagesGovernance Inclusive
Enabling Participative Transparent
- Libraries and library staff assist members of the community to participate in Central and Local Government issues via free internet access to consultation documents/papers, displays and brochures.
Strategic - Marlborough District Libraries are part of the Kotui Library Management System Consortia and the District Libraries Manager is a member of the Association of Public Library Managers. Both of these activities provide access and allow input to national organisations and initiatives.
People Education Life long learning Diversity Creativity
Expertise, resources, (including access to national resources via the Interloan service), developing digital information literacy (eg; Any Questions/Many Answers), Library
-
Outcome Sub-outcome Major linkages Secondary linkages facilities and programmes are available to everyone, of which the majority are free of charge.
Engaged and participative
Library services are free to all residents of Marlborough
Library members, visitors and tourists to the District can use many of the services offer by the libraries
Economy International connections Ability to connect
- Provide internet services for the overseas workforce to keep in touch with family at home.
Mobility Local accessibility
School/Community libraries provided throughout the district.
Living Individual health
Provides a collection of self-help books (SMART) that are promoted by medical practitioners
Displays used to promote topical issues eg; Get Ready Get Through campaign.
Opportunities for participation Social cohesion
Access to the internet, resources, programmes (eg; BookChat) and tutorials (eg; e-Book training, Stepping-Up computer courses)
-
What is this Activity About? This activity involves providing the community with a professional library service. The purpose of the library is to help customers help themselves, by encouraging a joy of reading and the pursuit of knowledge, through the provision of a wide range of current resources in various formats, computers, and educational programmes, in a safe and
Activity: Library Services Operating costs of this Activity represents approximately 2.7% of total Activity expenditure.

Activity Group: People
2015-2025 Long Term Plan Page 49
accessible environment. Library services are consistently rated one of the highest Council provided service in the annual Resident’s Satisfaction Survey.
The Council provides library services to all Marlborough residents through a network of library facilities. These comprise a District Library in Blenheim and a Branch Library in Picton (a combined Library and Council Service Centre) which are open seven days. Council also supports school based community libraries in Ward, Havelock, Rai Valley and Waitaria Bay, along with a community library in Renwick.
All age groups are catered for - from birth (through the "Bookstart" programme offered to every mother with a new baby born in Marlborough) to senior citizens (some of whom are confined to their own home and make use of the housebound service).
The promotion of books, literature and literacy is the main focus of library services to children across the District. Programmes include the Summer and Winter Reading Programmes, along with Picton’s project ‘Library on Wheels’, which aims to take the library into the community by regular visiting local schools and preschools.
As well as providing comprehensive book collections for informational and recreational use, assistance and support is available for those seeking information or needing access to, or help with, computer hardware, software (eg. MS Office), electronic resources or the World Wide Web. Free internet and Wi-fi access is provided to all library visitors through the Aotearoa People’s Network Kaharoa with a maximum 25% contribution from Council.
Asset Description To undertake this Activity, the following assets are held:
Marlborough District Library, Blenheim The Marlborough District Library was opened in 1989. Since that time, the library has seen patronage and issues increase. The library requires extra space that the current building cannot provide. It is proposed that a new library be built by 2022.
In 2013-14 408,115 items were issued. Its central location has proven popular as a central meeting place for those visiting the CBD. As the collection has expanded, free space has become a premium.
Picton Library and Service Centre The Picton Library and Service Centre became a combined facility in 1998. It is located in part of a Council owned building built in the 1970’s. As a combined facility it provides access to library resources, as well as Council information and services. There is a severe shortage of space at Picton Library and Service Centre and Council is proposing that a new facility be built by 2019.
In 2013-14, 59,361 items were issued. As a combined Council facility there is little space available to encourage class visits, children’s holiday activities and groups of adults to meet within the library.
Collections The libraries’ collection consists of over 123,000 physical items with a current value estimated at $3.9 million, covering a wide range of general interest and popular titles, both fiction and non-fiction, pre-school and children's titles, large print, local history, bicultural, along with non-book resources. The Collection Development Policy identifies how the collections will be maintained and developed to meet the needs of a growing and diverse population.
The comprehensive book collections are complimented by providing access to authoritative electronic databases, national online catalogues and websites, including access to national and international newspapers, along with the World Wide Web.
The Marlborough District Libraries' catalogue is also available on-line, providing 24/7 access to the libraries holdings. Non-book resources include music CDs, sheet music, DVDs, talking books in various formats, magazines and jigsaw puzzles.
In addition, downloadable e-Books and e-audio books are also available to library members. This service is now offered through two consortia - OverDrive Digital Library and Bolinda BorrowBox. These companies allow library customers to download e-Books and audio books. Titles include fiction and non-fiction items for adults, young adults and children, with regular additions of new material.
IT The library management and searching system (catalogue) is part of a New Zealand wide Public Library Consortium called Kotui.
The Library management system provides the day to day control of the collection. The on-line catalogue can be accessed 24/7 and allows members to self-manage the items they have out on loan and reserve items they wish to borrow. Members with email addresses receive a reminder email three days prior to their items being due.
The Aotearoa Peoples Network Kaharoa is a managed network separate from Council and provided by the National Library of New Zealand. The new Library Management System, Kotui, is supported through this same framework.
Systems Thinking The library service has adopted the Vanguard Method of systems thinking to find out what matters to the customers and improve the services delivered to them.
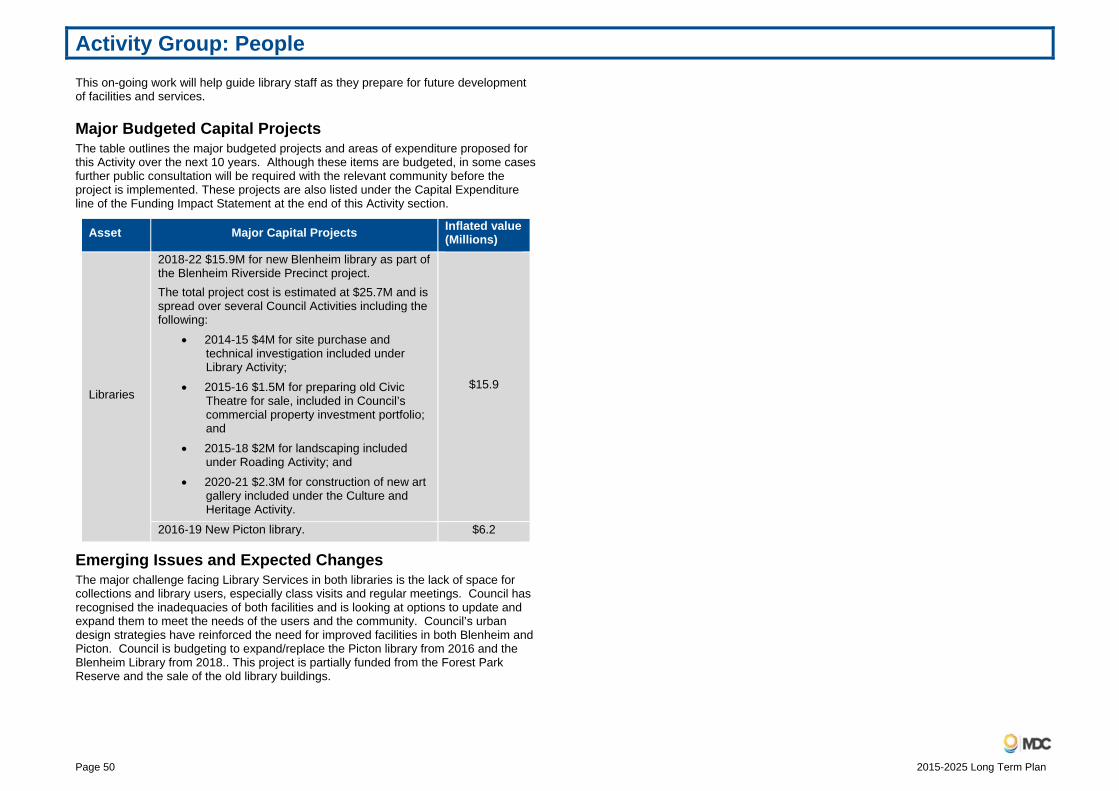
Activity Group: People
Page 50 2015-2025 Long Term Plan
This on-going work will help guide library staff as they prepare for future development of facilities and services.
Major Budgeted Capital Projects The table outlines the major budgeted projects and areas of expenditure proposed for this Activity over the next 10 years. Although these items are budgeted, in some cases further public consultation will be required with the relevant community before the project is implemented. These projects are also listed under the Capital Expenditure line of the Funding Impact Statement at the end of this Activity section.
Asset Major Capital Projects Inflated value (Millions)
Libraries
2018-22 $15.9M for new Blenheim library as part of the Blenheim Riverside Precinct project. The total project cost is estimated at $25.7M and is spread over several Council Activities including the following:
2014-15 $4M for site purchase and technical investigation included under Library Activity;
2015-16 $1.5M for preparing old Civic Theatre for sale, included in Council’s commercial property investment portfolio; and
2015-18 $2M for landscaping included under Roading Activity; and
2020-21 $2.3M for construction of new art gallery included under the Culture and Heritage Activity.
$15.9
2016-19 New Picton library. $6.2
Emerging Issues and Expected Changes The major challenge facing Library Services in both libraries is the lack of space for collections and library users, especially class visits and regular meetings. Council has recognised the inadequacies of both facilities and is looking at options to update and expand them to meet the needs of the users and the community. Council’s urban design strategies have reinforced the need for improved facilities in both Blenheim and Picton. Council is budgeting to expand/replace the Picton library from 2016 and the Blenheim Library from 2018.. This project is partially funded from the Forest Park Reserve and the sale of the old library buildings.

Activity Group: People
2015-2025 Long Term Plan Page 51
Levels of Service 2015-25: Library Services Performance Targets (for the financial year)Level of Service Indicator Baseline 2015-16 2016-17 2017-18 2018-25 Provide an overall level of service that meets or exceeds residents’ expectations.
Resident satisfaction with this service as measured by survey, where 10 = “service delivered extremely well”.
8.1 8.1 8.1 8.1 8.1
Provide a range of current resources supporting the tastes, interests and reading levels of users.
Average age of resources. 10 years or less <10 years <10 years <10 years <10 years Frequency of items being taken out (turnover rate).
4 times per year 4 times per year 4 times per year 4 times per year 4 times per year
Average number of overdue items not returned 28 days after the due date each month.
185 items <185 items <185 items <185 items <185 items
Provide a range of programmes or training opportunities that meet or exceed customers’ expectations.
Evaluate the satisfaction of courses and programmes offered by the libraries by survey, where 1=Unsatisfactory, 3=Good, and 5=Excellent.
>3 >3 >3 >3 >3
Provide access to information electronically.
Number of e-book and e-audio loaned. 6,600 items 10% increase on baseline
10% increase on baseline
10% increase on baseline
10% increase on baseline

Activity Group: People
Page 52 2015-2025 Long Term Plan
Note 1: The increase in cost of service is a result of the budgeted capital works projects for the new Picton and Blenheim libraries.
Funding Impact Statement for 2015-25Library Services AP 2014.15 2015.16 2016.17 2017.18 2018.19 2019.20 2020.21 2021.22 2022.23 2023.24 2024.25
$000's $000's $000's $000's $000's $000's $000's $000's $000's $000's $000'sSources of operating funding
General rates, uniform annual general charges, rates penalties 1,499 1,623 1,642 1,766 2,010 2,361 2,630 3,045 3,074 2,981 2,991Fees and charges 6 6 6 6 6 7 7 7 7 8 8Other receipts including fines and infringement fees 272 313 310 320 339 367 385 413 413 404 404
Total operating funding 1,777 1,942 1,958 2,092 2,355 2,735 3,022 3,465 3,494 3,393 3,403Applications of operating funding
Payments to staff and suppliers 1,065 1,122 1,150 1,176 1,208 1,233 1,264 1,298 1,339 1,374 1,413Finance costs - - 18 157 379 596 946 1,339 1,373 1,228 1,184Internal charges and overheads applied 393 490 490 490 490 490 490 490 490 490 490
Total applications of operating funding 1,458 1,612 1,658 1,823 2,077 2,319 2,700 3,127 3,202 3,092 3,087Surplus (deficit) of operating funding 319 330 300 269 278 416 322 338 292 301 316
Sources of capital fundingIncrease (decrease) in debt - - 3,500 6,299 3,000 3,500 7,000 5,068 - 465 457Gross proceeds from sale of assets - - - - - - - - 2,350 - -
Total sources of capital funding - - 3,500 6,299 3,000 3,500 7,000 5,068 2,350 465 457Applications of capital funding
Capital expenditure to meet additional demand - 22 24 25 27 29 31 33 37 39 42Capital expenditure to improve the level of service 3,521 - 512 3,675 3,072 3,322 6,835 4,695 - - -Capital expenditure to replace existing assets 238 350 276 277 282 460 336 340 348 426 415Increase (decrease) in reserves (3,440) (42) 2,988 2,591 (103) 105 120 338 2,257 303 315
Total applications of capital funding 319 330 3,800 6,568 3,278 3,916 7,322 5,406 2,642 768 772Surplus (deficit) of capital funding (319) (330) (300) (269) (278) (416) (322) (338) (292) (303) (315)
Funding balance - - - - - - - - - (2) 1ReconciliationTotal applications of operating funding 1,458 1,612 1,656 1,822 2,077 2,318 2,699 3,127 3,202 3,091 3,087
plus - Depreciation and amortisation 317 329 335 339 352 616 646 662 616 625 638Expenditure as per Statement of Financial Performance 1,775 1,941 1,991 2,161 2,429 2,934 3,345 3,789 3,818 3,716 3,725

Activity Group: People
2015-2025 Long Term Plan Page 53
Activity: Emergency Management
How this Activity Contributes to Related Community Outcomes This Activity contributes to the Community Outcomes of Governance, Environment, People, Economy and Living by:
Column Sub-attribute Major linkages Secondary linkages
Governance Strategic Supports the MKRFA as the governance body for rural fire. Support CDEM for civil defence.
Environment Systems of protection and care
Supports the MKRFA to protect the environment from risk of fire.
Input into the Marlborough Resource Management Plans
People Education People of Marlborough want to be assured that their community is able to respond and recover from emergency events.
Engaging with community groups encouraging general preparedness required to build community resilience.
Economy Productivity Business continuity planning is essential for all businesses for their own economic survival and that of their employees.
Engage with business groups to encourage Business continuity planning.
Column Sub-attribute Major linkages Secondary linkages
Living Access to services Health Social cohesion Individual safety
The people of Marlborough want to be assured that in times of adversity systems are in place for a coordinated and timely response.
Continued coordination of Welfare Recovery Group and Readiness and Response Group. Through public education, community will be encouraged to build their own community resilience through being prepared at home and work, supported by CDEM.
What is this Activity About? Council is a key member of the Marlborough Civil Defence Emergency Management Group (CDEM) with responsibility for the administration and implementation of a Civil Defence Emergency Management Group Plan.
Council is also a key stake holder within the Marlborough Kaikoura Rural Fire Authority (MKRFA) enlarged rural fire district with representation on the MKRFA Board and responsibility for providing operational support for readiness and response for Council’s rural fire administration zone.
Amongst other requirements the Plan describes:
Emergency Management policies and procedures in place to manage the hazards and risks.
Arrangements for declaring a state of emergency in the area.
Arrangements for cooperation and coordination with all other Civil Defence Emergency Management Groups.
The risk profile has been rated identifying hazards, likelihood, consequence and risk rating to be managed by the Group and are prioritised according to risk. The eight most major risks include:
Earthquake.
Activity: Emergency Management Operating costs of this Activity represent approximately 0.9% of total Activity expenditure.

Activity Group: People
Page 54 2015-2025 Long Term Plan
Human disease epidemic.
Biological pests and new organisms.
Flooding.
Wildfire/rural fire.
Dam failure.
Drought.
Electricity failure.
Marlborough may need to deal with a number of other hazards not mentioned here. The vision and goals of the Marlborough CDEM Plan are:
Vision Improve the resilience of the region to all foreseeable emergency events through active engagement of communities and the effective integration of support agencies.
Goals Goal 1. To coordinate efforts to reduce the risk posed by hazards that threaten the
life, wellbeing, infrastructure, economic fabric and ecological systems that support the lifestyle of the area.
Goal 2. To improve an awareness of the remaining risks faced by residents and visitors to the region in order to be better prepared for the risks of known hazards.
Goal 3. To enhance the efficiency and effectiveness of all agencies and the community in their response to an emergency through integrated and coordinated effort.
Goal 4. Improve the process of recovery after an event in order to return to normal life as quickly as possible with a minimum of loss and disruption.
Rural Fire The Council from 2012 surrendered its role as a Rural Fire Authority to the MKRFA which has set policy and ensures fire protection is provided for in the wider Marlborough and Kaikoura District Council areas.
The preparation of fire plans, business plans and all high level administration is the responsibility of the Principal Rural Fire Officer and the MKRFA Committee.
Council provides a member of the Committee alongside representatives of the Department of Conservation, Federated Farmers, Kaikoura District Council, New Zealand Fire Service and an independent. It continues to provide rural fire readiness and response services within the Marlborough South zone.
Preparedness for Major Hazards and Events The Marlborough CDEM, of which the Council is a key member, is prepared
and capable to respond and recover from a major event such as earthquake and floods. It should be noted that the Council is only one of the organisations that has emergency management responsibilities (others include: DHB, Police, Fire Service, St Johns).
Response is carried out for the Marlborough District Council by the Emergency Management Group (Group). The Group is well prepared and ready to respond to an event. Exercises are carried out regularly and the Group is actively involved in the Ministry of Civil Defence and Emergency Management 10 year training programme. Our current contact list has been reviewed and updated by the Emergency Management Office.
An engineering lifeline group has been established to ensure that lifelines in Marlborough are planned to withstand a major event and to ensure that damaged lifelines during an event are repaired as soon as possible.
Community awareness campaigns are given high priority within the allocated budget provided. The Group has visited many groups and organisations talking about the risk to Marlborough and how to prepare for large emergency events.
The Emergency Management Office received numerous weather warnings throughout the year 24/7 and staff responded to these appropriately.
The Group has established a recovery group incorporating Council, Work and Income NZ, Child Youth and Family, Insurance Industry, Chamber of Commerce and Health inspectors to help with planning for the recovery phase of a major emergency event.
The Group’s Civil Defence/Welfare centres are well resourced. The training of volunteers is given high priority.
A programme is underway to train Council staff to work in an incident control structure and to increase training for welfare and sector groups.
Buildings below the earthquake standard have been identified and building owners have been advised.
A new building evaluation plan has been formulated incorporating the lessons learned from the Christchurch event.
The Council is well prepared for an emergency, however many of our communities still believe it will not happen here. Our Group supports the
Activity Group: People
2015-2025 Long Term Plan Page 55
national awareness campaign and the Group spends considerable resources each year encouraging residents to prepare for disaster.
Readiness and Response A training needs analysis was distributed to all stakeholders including Council
staff last financial year. The outcome will be to provide sufficient funding and target the training of individuals most in need and to standards acceptable to the industry.
Continue running both level 2 and level 4 Coordinated Incident Management System (CIMS) courses.
Continue to train both Council staff and volunteers at all levels in line with the Integrated Training Framework (ITF).
Provide public awareness to the residents of Marlborough.
Continue to integrate the Emergency Management Information System (EMIS) and train both volunteers and Council staff on its application.
The Group will take an active part in the national exercise training programme.
The Group will also take an active role in the Get Ready Get Through campaign.
The Readiness and Response Working Group will meet quarterly.
Emerging Issues and Expected Changes Possibility of legislative changes following the Canterbury earthquakes may have impacts upon Civil Defence.
The Seddon earthquakes in 2013 proved to be challenging to CDEM in providing vital information into impacted communities. Conventional media sources such as radio proved to be problematic as with a lot of our more remote areas radio coverage is not good. New products are being developed by private companies that on the face of it will go a long way towards rectifying this issue by using satellite technologies alongside and in conjunction with conventional media. With all new emerging technology comes a cost to the end user along with the ongoing cost with providing the service, which will fall on local CDEM. This will be an issue that will need to be addressed as technology comes on-line.
Marlborough’s ever increasing ethnic diversity and fluid transient population proves to be a difficult sector to provide adequate understanding around being prepared for any disaster. Many immigrants are coming from cultures that don’t have a CDEM organisational structure. Greater emphasis will be placed on the integration of these minority groups along with the Recognised Seasonal Employment programme onto our local welfare community which will act as the conduit for information to these groups.
Marlborough CDEM in conjunction with Police has taken on the administration role of Marlborough Neighbourhood Support (MNS). Over time the intention is to have MNS entwined into the very fabric of our communities’ resilience with neighbour supporting neighbour not just in time of emergencies.
This organisation continues to grow with new street coordinators appearing at regular intervals. It is pleasing to see streets taking on the challenge to create safer communities they live in. A regular newsletter is circulated to all members of the MNS which has updates from the individual sectors on what they are doing in their areas.
Greater integration is now occurring with CDEM, Police and Fire speaking to groups who wish to set up a network in their area.
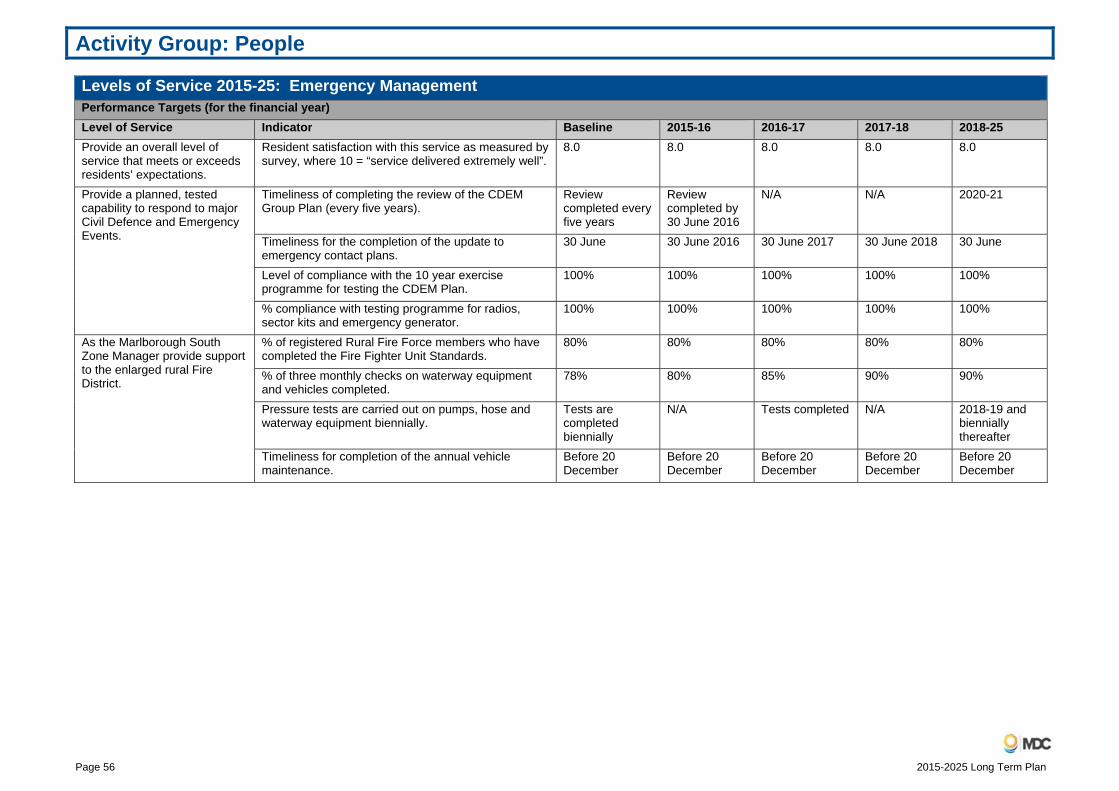
Activity Group: People
Page 56 2015-2025 Long Term Plan
Levels of Service 2015-25: Emergency Management Performance Targets (for the financial year)Level of Service Indicator Baseline 2015-16 2016-17 2017-18 2018-25 Provide an overall level of service that meets or exceeds residents’ expectations.
Resident satisfaction with this service as measured by survey, where 10 = “service delivered extremely well”.
8.0 8.0 8.0 8.0 8.0
Provide a planned, tested capability to respond to major Civil Defence and Emergency Events.
Timeliness of completing the review of the CDEM Group Plan (every five years).
Review completed every five years
Review completed by 30 June 2016
N/A N/A 2020-21
Timeliness for the completion of the update to emergency contact plans.
30 June 30 June 2016 30 June 2017 30 June 2018 30 June
Level of compliance with the 10 year exercise programme for testing the CDEM Plan.
100% 100% 100% 100% 100%
% compliance with testing programme for radios, sector kits and emergency generator.
100% 100% 100% 100% 100%
As the Marlborough South Zone Manager provide support to the enlarged rural Fire District.
% of registered Rural Fire Force members who have completed the Fire Fighter Unit Standards.
80% 80% 80% 80% 80%
% of three monthly checks on waterway equipment and vehicles completed.
78% 80% 85% 90% 90%
Pressure tests are carried out on pumps, hose and waterway equipment biennially.
Tests are completed biennially
N/A Tests completed N/A 2018-19 and biennially thereafter
Timeliness for completion of the annual vehicle maintenance.
Before 20 December
Before 20 December
Before 20 December
Before 20 December
Before 20 December

Activity Group: People
2015-2025 Long Term Plan Page 57
Note 1: There are no material cost of service variances.
Funding Impact Statement for 2015-25Emergency Management AP 2014.15 2015.16 2016.17 2017.18 2018.19 2019.20 2020.21 2021.22 2022.23 2023.24 2024.25
$000's $000's $000's $000's $000's $000's $000's $000's $000's $000's $000'sSources of operating funding
General rates, uniform annual general charges, rates penalties 639 721 744 788 785 791 835 828 844 878 893Subsidies and grants for operating purposes 18 18 18 19 19 20 21 21 22 23 24Other receipts 97 126 126 129 128 127 130 128 129 132 133
Total operating funding 754 865 888 936 932 938 986 977 995 1,033 1,050Applications of operating funding
Payments to staff and suppliers 436 516 536 565 565 570 586 603 621 641 662Internal charges and overheads applied 210 241 240 256 252 253 282 257 257 274 268Other operating funding applications 71 71 71 71 71 71 71 71 71 71 71
Total applications of operating funding 717 828 847 892 888 894 939 931 949 986 1,001Surplus (deficit) of operating funding 37 37 41 44 44 44 47 46 46 47 49
Sources of capital fundingTotal sources of capital funding - - - - - - - - - - -
Applications of capital fundingCapital expenditure to replace existing assets 28 28 47 29 30 53 32 33 34 35 37Increase (decrease) in reserves 9 9 (6) 15 14 (9) 15 13 12 12 12
Total applications of capital funding 37 37 41 44 44 44 47 46 46 47 49Surplus (deficit) of capital funding (37) (37) (41) (44) (44) (44) (47) (46) (46) (47) (49)
Funding balance - - - - - - - - - - -ReconciliationTotal applications of operating funding 717 828 847 892 888 894 939 931 950 986 1,001
plus - Depreciation and amortisation 37 37 41 44 44 44 47 47 46 47 48Expenditure as per Statement of Financial Performance 754 865 888 936 932 938 986 978 996 1,033 1,049

Activity Group: Community Facilities
Page 58 2015-2025 Long Term Plan
Community Facilities

Activity Group: Community Facilities
2015-2025 Long Term Plan Page 59
Community Facilities Operating Costs The operating costs for the Community Facilities Group of Activities represents $102 million of total Council expenditure.
Capital Projects The capital expenditure for the Community Facilities Group of Activities represents $38 million of total Council expenditure over the next 10 years. Information about the major budgeted capital projects are included under the respective Activities sections.
Rationale for the Delivery of the Community Facilities Group of Activities This Activity is a grouping of several types of community facilities that are mostly delivered within the Reserves and Amenities Department.
Changes to Community Facilities Activity Group from the 2014-15 Annual Plan There are no changes to this Activities Group.
Intended Changes to Levels of Service from the 2014-15 Annual Plan The table describes any intended changes to the levels of service within the group from the levels of service displayed in the 2014-15 Annual Plan. The reasons for the intended changes are also described.
2014-15 Annual Plan 2015-25 LTP Reason for changes Activity: Community FacilitiesAccess to informationProvide up to date and relevant information to residents and visitors.
None. Levels of service reviewed to reflect New Zealand Recreation Association (NZRA). This level of service is not consistent with NZRA measures.
Access to facilitiesProvide reserves and amenities that are equitably distributed to all.
Neighbourhood ParksProvision of Neighbourhood Parks in urban area within walking distance of home, providing play opportunities for all ages, open space and amenity values.
Very similar but to come in line with NZRA national guidelines.
None. Public GardensProvision of high quality public gardens in key locations that provide opportunities for amenity horticultural displays, education and contemplative leisure experiences.
To come in line with NZRA national guidelines.

Activity Group: Community Facilities
Page 60 2015-2025 Long Term Plan
2014-15 Annual Plan 2015-25 LTP Reason for changesActivity: Community Facilities Access to facilitiesProvide reserves and amenities that are equitably distributed to all.
Cultural Heritage The protection of specific cultural heritage sites and opportunities to experience and learn about our history.
To come in line with NZRA national guidelines.
None. Outdoor AdventureRecreation activities and built facilities, requiring a large scale non-urban environment.
To come in line with NZRA national guidelines.
None. Civic Space Provision of open space within business/retail areas, with a high level of amenity development and maintenance designed to attract and cater for periodic high levels of use.
To come in line with NZRA national guidelines.
Access to facilitiesProvide reserves and amenities that are equitably distributed to all.
Sport & RecreationTo provide and maintain sports field capacity to meet reasonable demand.
To come in line with NZRA national guidelines.
Variation Between Long Term Plan and the Assessment of Water and Sanitary Services There is no significant variation between the adopted assessment of water and sanitary services (i.e. cemeteries and public conveniences) and this Plan.
Significant Negative Effects Associated with this Group of Activities This Activity group may involve the operation of noisy machinery, earthmoving or construction works, which may impact on the environment and can result in temporary disruptions to daily life. Where resource consents are required for these Activities, controls are imposed as appropriate.

Activity Group: Community Facilities
2015-2025 Long Term Plan Page 61
Activity: Community Facilities
How this Activity Contributes to Related Community Outcomes This Activity contributes to the Community Outcomes of Governance, Environment, People, Living and Mobility as follows:
Outcome Sub-outcome Major contribution Secondary contribution
Cemeteries Living Health
Cultural facilities and events
Cemeteries are provided for many reasons including cultural, religious, coping with grief. People have a respectful and comforting environment to remember those they have lost.
-
Memorials Living Cultural facilities
and events Society values past history. Contributes towards the commemorative needs of the community.
-
Street Trees and PlotsEnvironment Attractive Trees are valued
aesthetically and for their air quality benefits.
- Control over pollution levels, forms and effect
Halls Governance Enabling Community halls enable
local governance to take place in communities across Marlborough
-
Outcome Sub-outcome Major contribution Secondary contribution
People Engaged and participative
Meeting places for community groups.
Living Cultural facilities and events Sports and recreation Opportunities for participation Social cohesion
Meeting places for community groups.
Public ConveniencesEnvironment Control over
pollution Public toilets help prevent environmental pollution and benefit public health and comfort. They assist and encourage people to get out and about.
-
Living Health
Mobility Individual safety Local accessibility
Reserves and Swimming PoolsEnvironment Attractive Reserves, recreation
facilities, sports grounds and open spaces all provide opportunities for recreation, relaxation and physical activity. There are also responsibilities to sustain natural and physical resources and manage the environment.
- Sustainable resource management
Living Health Cultural facilities and events Sports and recreation Opportunities for participation
What is this Activity About? The Council provides, maintains and protects reserves, gardens, trees, lawns, playgrounds other open spaces and amenity facilities that meet the community needs while enhancing people’s appreciation of the environment and encouraging active lifestyles.
Community facilities can be categorised as follows:
Activity: Community Facilities Operating costs of this Activity represent approximately 9.1% of total Activity expenditure.
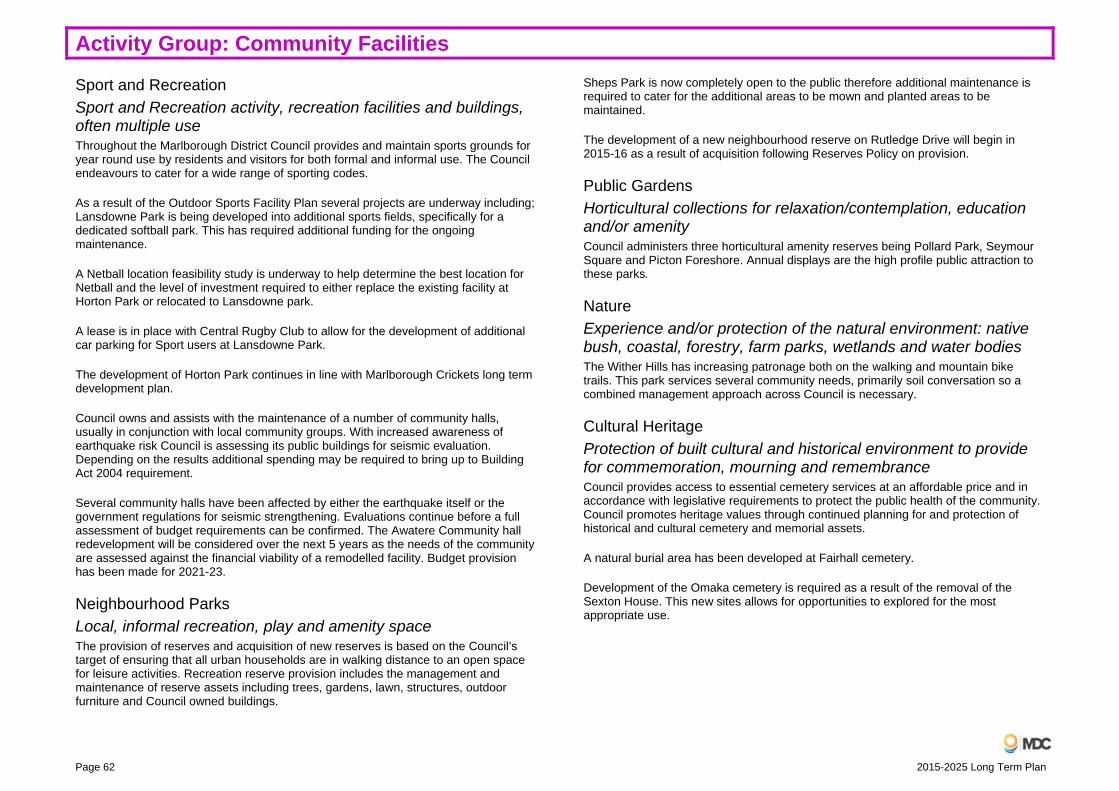
Activity Group: Community Facilities
Page 62 2015-2025 Long Term Plan
Sport and Recreation Sport and Recreation activity, recreation facilities and buildings, often multiple use Throughout the Marlborough District Council provides and maintain sports grounds for year round use by residents and visitors for both formal and informal use. The Council endeavours to cater for a wide range of sporting codes.
As a result of the Outdoor Sports Facility Plan several projects are underway including; Lansdowne Park is being developed into additional sports fields, specifically for a dedicated softball park. This has required additional funding for the ongoing maintenance.
A Netball location feasibility study is underway to help determine the best location for Netball and the level of investment required to either replace the existing facility at Horton Park or relocated to Lansdowne park.
A lease is in place with Central Rugby Club to allow for the development of additional car parking for Sport users at Lansdowne Park.
The development of Horton Park continues in line with Marlborough Crickets long term development plan.
Council owns and assists with the maintenance of a number of community halls, usually in conjunction with local community groups. With increased awareness of earthquake risk Council is assessing its public buildings for seismic evaluation. Depending on the results additional spending may be required to bring up to Building Act 2004 requirement.
Several community halls have been affected by either the earthquake itself or the government regulations for seismic strengthening. Evaluations continue before a full assessment of budget requirements can be confirmed. The Awatere Community hall redevelopment will be considered over the next 5 years as the needs of the community are assessed against the financial viability of a remodelled facility. Budget provision has been made for 2021-23.
Neighbourhood Parks Local, informal recreation, play and amenity space The provision of reserves and acquisition of new reserves is based on the Council’s target of ensuring that all urban households are in walking distance to an open space for leisure activities. Recreation reserve provision includes the management and maintenance of reserve assets including trees, gardens, lawn, structures, outdoor furniture and Council owned buildings.
Sheps Park is now completely open to the public therefore additional maintenance is required to cater for the additional areas to be mown and planted areas to be maintained.
The development of a new neighbourhood reserve on Rutledge Drive will begin in 2015-16 as a result of acquisition following Reserves Policy on provision.
Public Gardens Horticultural collections for relaxation/contemplation, education and/or amenity Council administers three horticultural amenity reserves being Pollard Park, Seymour Square and Picton Foreshore. Annual displays are the high profile public attraction to these parks.
Nature Experience and/or protection of the natural environment: native bush, coastal, forestry, farm parks, wetlands and water bodies The Wither Hills has increasing patronage both on the walking and mountain bike trails. This park services several community needs, primarily soil conversation so a combined management approach across Council is necessary.
Cultural Heritage Protection of built cultural and historical environment to provide for commemoration, mourning and remembrance Council provides access to essential cemetery services at an affordable price and in accordance with legislative requirements to protect the public health of the community. Council promotes heritage values through continued planning for and protection of historical and cultural cemetery and memorial assets.
A natural burial area has been developed at Fairhall cemetery.
Development of the Omaka cemetery is required as a result of the removal of the Sexton House. This new sites allows for opportunities to explored for the most appropriate use.
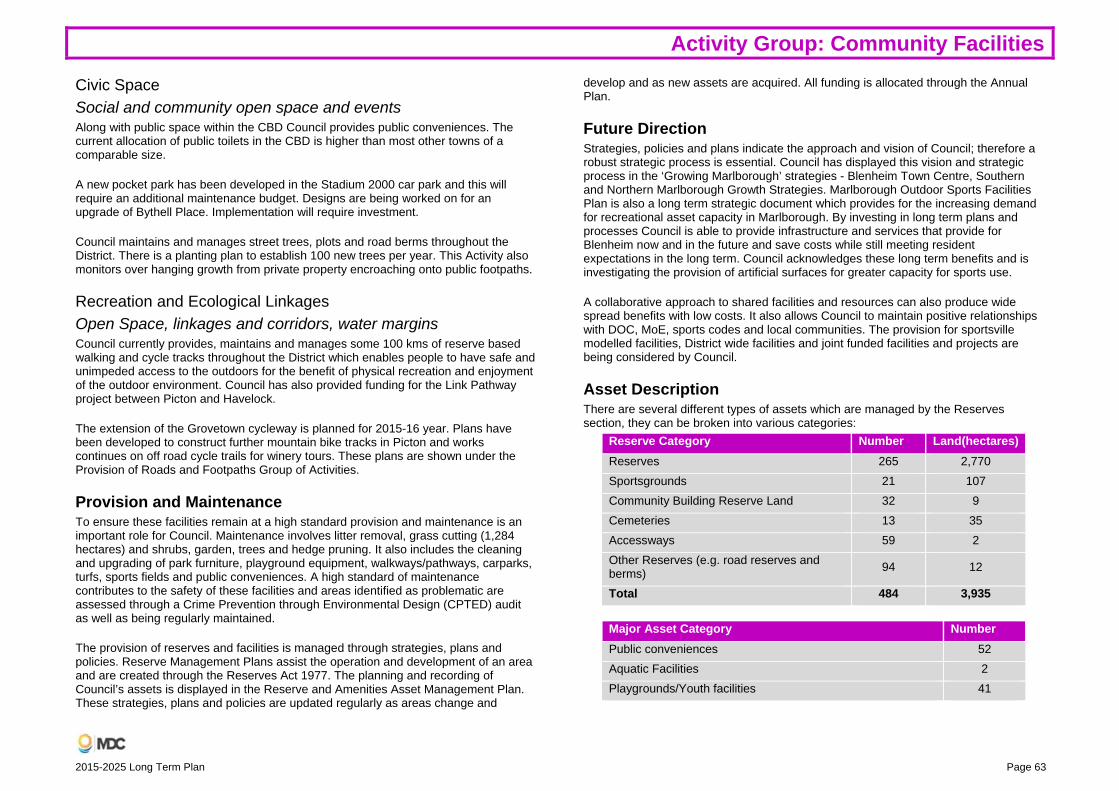
Activity Group: Community Facilities
2015-2025 Long Term Plan Page 63
Civic Space Social and community open space and events Along with public space within the CBD Council provides public conveniences. The current allocation of public toilets in the CBD is higher than most other towns of a comparable size.
A new pocket park has been developed in the Stadium 2000 car park and this will require an additional maintenance budget. Designs are being worked on for an upgrade of Bythell Place. Implementation will require investment.
Council maintains and manages street trees, plots and road berms throughout the District. There is a planting plan to establish 100 new trees per year. This Activity also monitors over hanging growth from private property encroaching onto public footpaths.
Recreation and Ecological Linkages Open Space, linkages and corridors, water margins Council currently provides, maintains and manages some 100 kms of reserve based walking and cycle tracks throughout the District which enables people to have safe and unimpeded access to the outdoors for the benefit of physical recreation and enjoyment of the outdoor environment. Council has also provided funding for the Link Pathway project between Picton and Havelock.
The extension of the Grovetown cycleway is planned for 2015-16 year. Plans have been developed to construct further mountain bike tracks in Picton and works continues on off road cycle trails for winery tours. These plans are shown under the Provision of Roads and Footpaths Group of Activities.
Provision and Maintenance To ensure these facilities remain at a high standard provision and maintenance is an important role for Council. Maintenance involves litter removal, grass cutting (1,284 hectares) and shrubs, garden, trees and hedge pruning. It also includes the cleaning and upgrading of park furniture, playground equipment, walkways/pathways, carparks, turfs, sports fields and public conveniences. A high standard of maintenance contributes to the safety of these facilities and areas identified as problematic are assessed through a Crime Prevention through Environmental Design (CPTED) audit as well as being regularly maintained.
The provision of reserves and facilities is managed through strategies, plans and policies. Reserve Management Plans assist the operation and development of an area and are created through the Reserves Act 1977. The planning and recording of Council’s assets is displayed in the Reserve and Amenities Asset Management Plan. These strategies, plans and policies are updated regularly as areas change and
develop and as new assets are acquired. All funding is allocated through the Annual Plan.
Future Direction Strategies, policies and plans indicate the approach and vision of Council; therefore a robust strategic process is essential. Council has displayed this vision and strategic process in the ‘Growing Marlborough’ strategies - Blenheim Town Centre, Southern and Northern Marlborough Growth Strategies. Marlborough Outdoor Sports Facilities Plan is also a long term strategic document which provides for the increasing demand for recreational asset capacity in Marlborough. By investing in long term plans and processes Council is able to provide infrastructure and services that provide for Blenheim now and in the future and save costs while still meeting resident expectations in the long term. Council acknowledges these long term benefits and is investigating the provision of artificial surfaces for greater capacity for sports use.
A collaborative approach to shared facilities and resources can also produce wide spread benefits with low costs. It also allows Council to maintain positive relationships with DOC, MoE, sports codes and local communities. The provision for sportsville modelled facilities, District wide facilities and joint funded facilities and projects are being considered by Council.
Asset Description There are several different types of assets which are managed by the Reserves section, they can be broken into various categories:
Reserve Category Number Land(hectares) Reserves 265 2,770 Sportsgrounds 21 107 Community Building Reserve Land 32 9 Cemeteries 13 35 Accessways 59 2 Other Reserves (e.g. road reserves and berms) 94 12
Total 484 3,935
Major Asset Category Number Public conveniences 52 Aquatic Facilities 2 Playgrounds/Youth facilities 41

Activity Group: Community Facilities
Page 64 2015-2025 Long Term Plan
Major Asset Category Number Sports Facilities 571 Bridges, Boardwalks, Structures 1,931 Carpark/roading 148 Walkways and Cycle Routes 215 routes Park Fixtures 661 Street Trees and Garden Plots 7500
The total asset value for the Community Facilities Activity as at 30 June 2014 is $88.1 million.
Major Budgeted Capital Projects The table outlines the major budgeted projects and areas of expenditure proposed for this Activity over the next 10 years. Although these items are budgeted, in some cases further public consultation will be required with the relevant community before the project is implemented. These projects are also listed under the Capital Expenditure line of the Funding Impact Statement at the end of this Activity section.
Sub-Activity Major Capital Projects Inflated value (Millions)
Cemeteries 2015-19 Restoration of Picton historic cemetery and ashes retaining wall. $0.3
Public Conveniences
2015-16 Seymour Square upgrade and disabled accessible. $0.4
2017-18 New facility on Seddon Domain. $0.1 2015-25 Renewals of public conveniences in Blenheim, Havelock, Picton, Marlborough Sounds, Rai Valley and other rural areas.
$2.0
Halls 2023-24 New Blenheim Youth Centre. $2.5 2021-23 Upgrades to Awatere Community Hall. $3.6
Reserves
2018-19 Cricket nets and wickets for Horton Park. $0.4
2019-20 A&P Park new grandstand and administration complex. $1.7
Sub-Activity Major Capital Projects Inflated value (Millions)
2015-24 redevelopment of Lansdowne Park into a multisport facility, including parking development and stormwater control, field lighting, artificial turf field and relocation of netball courts.
$4.8
2015-25 New and improved reserves across Marlborough, subject to Land Subdivision reserve contributions.
$19.2
Swimming Pools
2015-16 Structural strengthening of Stadium 2000 facility. $1.3
Emerging Issues and Expected Changes o Ongoing assessment and evaluation of community facilities that require seismic
strengthening will be required. Funding will be required for a decision on the facility; either improvement or replacement in consultation with user groups - Athletic Park Grandstand, A&P Park Grand Stand, Awatere Community Hall, Stadium 2000.
o Significantly reduced revenue from the Land Subdivision Account (financial contributions from developers of subdivisions) which funds the Reserves capital works programme, including those resulting from Annual Plan submissions, potential projects from the sports facility plan and urban design projects and community grants.
o Government’s legislation enabling development contributions has changed and could result in less contributions being collected.
o Prioritising, budgeting and implementation of the Growing Marlborough Strategy will be challenging. Council is now considering more detailed plans for Picton lower High Street redevelopment.
o Port Marlborough Pavilion at Endeavour Park and Renwick Pavilion will require ongoing operational grants to ensure their sustainability in the community.
o The Freedom Camping Bylaw review may result in changes to administration of the activity. Public education is an important aspect to control the negative effects associated with the freedom camping. As the Activity and its profile are increasing nationally, Marlborough will need to put more resources into its management.
o Picton proposed indoor swimming pool - while this project is currently viewed as “unaffordable’ for the community it will be important for achieving community outcomes to ensure the Queen Charlotte College community pool is accessible

Activity Group: Community Facilities
2015-2025 Long Term Plan Page 65
and maintained to a standard that caters to the community. This will require continued investment in the current facility.
o Lansdowne Park redevelopment in to a multisport facility will be a complex process. Early planning in consultation with existing and potential users will be required as will be staged approach to the development. Funding of developments will be reliant on revenue to the Land Subdivision Account which may delay progress thereby putting pressure on sports that are expanding at a greater rate than Council can provide facilities for. Other Councils in the country are providing increasingly higher levels of sport field provision. Marlborough is at the risk of falling behind the national provision of sport fields.
o Asset Management Systems and data collection will be enhanced enabling a more planned approach to maintenance renewals and future planning although resourcing the transition will be challenging.
o As part of the Marlborough Outdoor Sports Facility Plan a review of the long term use of Athletic Park will be required. Funding for the repair of the velodrome has been provided.
o The need for a Youth Development Hub has been identified by the Marlborough Youth Trust (MYT) through research undertaken in 2014. MYT are continuing to progress this and see Council as a partner in the development of this facility. Finding the right location and supporting funding will be critical to the success of this project.

Activity Group: Community Facilities
Page 66 2015-2025 Long Term Plan
Levels of Service 2015-25: Community Facilities Performance Targets (for the financial year)Level of Service Indicator Baseline 2015-16 2016-17 2017-18 2018-25 Provide an overall level of service that meets or exceeds residents’ expectations.
Resident satisfaction with this service as measured by survey, where 10 = “service delivered extremely well”.
7.7 7.7 7.7 7.7 7.7
Neighbourhood Parks Provision of neighbourhood parks in urban area within walking distance of home, providing play opportunities for all ages, open space and amenity values.
That within the urban environment 98% of the area is provided with a Neighbourhood Park which is either 500 metres approximately or ten minutes’ walk.
98% 98% 98% 98% 98%
Public GardensProvision of high quality public gardens in key locations that provide opportunities for amenity horticultural displays, education and contemplative leisure experiences.
Three prime areas are allocated and maintained to high horticultural amenity standard. Offering at least five various displays, educational opportunities for the community and contemplative leisure experiences.
Five educational sessions are offered.
5 5 5 5
Cultural HeritageThe protection of specific cultural heritage sites and opportunities to experience and learn about our history.
War Memorial sites are protected, maintained and made available for memorial services.
Sites are available for at least 12 services.
12 12 12 12
Provision of cemeteries will meet the future interment of the community to provide accessible and appropriate sites for burial.
300 burial sites are available.
300 350 400 450
Outdoor AdventureRecreation activities and built facilities, requiring a large scale non-urban environment.
Provision of opportunities for outdoor adventure based Recreation activities such as walking tracks and mountain bike tracks.
158 kms 158 kms 168 kms 168 kms 178 kms
Civic Space Provision of open space within business/retail areas, with a high level of amenity development and maintenance designed to attract and cater for periodic high levels of use.
Provision and maintenance of central areas eg; Liz Davidson Place, Bythell Place, Stadium 2000 Pocket Park, Riverside Park and London Quay.
At least 12 areas are provided and maintained.
12 12 12 12
Events are held at the Parks. Five or more events are held.
5 5 5 5
Identification and acquisition of identified sites eg; Taylor River, Spring Creek walk way. Esplanade acquisition.
At least four new identified sites were acquired each year.
4 4 4 4

Activity Group: Community Facilities
2015-2025 Long Term Plan Page 67
Levels of Service 2015-25: Community Facilities Performance Targets (for the financial year)Level of Service Indicator Baseline 2015-16 2016-17 2017-18 2018-25 Sport and RecreationTo provide and maintain sports field capacity to meet reasonable demand. Recreation facilities will be managed to meet the recreation needs of the community or sport code.
Provision of sports facilities meet reasonable demand.
New Measure 85% 85% 85% 85%
Delivery will achieve at least 85% resident satisfaction.
New Measure 90% 90% 90% 90%

Activity Group: Community Facilities
Page 68 2015-2025 Long Term Plan
Community Facilities AP 2014.15 2015.16 2016.17 2017.18 2018.19 2019.20 2020.21 2021.22 2022.23 2023.24 2024.25$000's $000's $000's $000's $000's $000's $000's $000's $000's $000's $000's
Sources of operating fundingGeneral rates, uniform annual general charges, rates penalties 6,879 7,398 7,614 7,916 8,203 8,569 9,031 9,547 9,958 10,631 11,155Subsidies and grants for operating purposes 40 45 11 11 11 11 12 12 13 13 13Fees and charges 143 143 146 150 154 159 163 168 174 180 187Other receipts 718 767 750 752 751 756 763 774 779 799 808
Total operating funding 7,780 8,353 8,521 8,829 9,119 9,495 9,969 10,501 10,924 11,623 12,163Total operating funding
Payments to staff and suppliers 6,000 5,706 5,463 5,596 5,704 5,859 6,093 6,307 6,308 6,508 6,653Finance costs 598 1,573 1,595 1,628 1,657 1,673 1,703 1,739 1,777 1,822 1,865Internal charges and overheads applied 672 642 709 772 829 917 1,000 1,129 1,320 1,554 1,692Other operating funding applications 191 351 212 212 137 137 137 137 137 137 137
Total applications of operating funding 7,461 8,272 7,979 8,208 8,327 8,586 8,933 9,312 9,542 10,021 10,347Surplus (deficit) of operating funding 319 81 542 621 792 909 1,036 1,189 1,382 1,602 1,816
Sources of capital fundingDevelopment and financial contributions 1,102 885 942 1,064 1,216 1,389 1,127 1,336 1,575 1,851 2,166Increase (decrease) in debt 125 - - - - - - - - - -
Total sources of capital funding 1,227 885 942 1,064 1,216 1,389 1,127 1,336 1,575 1,851 2,166Applications of capital funding
Capital expenditure to meet additional demand 568 842 415 388 592 1,021 1,123 1,278 1,461 1,655 1,885Capital expenditure to improve the level of service 1,238 2,291 412 468 458 627 596 689 830 841 944Capital expenditure to replace existing assets 325 574 1,232 1,260 1,319 2,195 964 3,299 2,944 4,777 703Increase (decrease) in reserves (585) (2,741) (575) (431) (361) (1,545) (520) (2,741) (2,278) (3,820) 450
Total applications of capital funding 1,546 966 1,484 1,685 2,008 2,298 2,163 2,525 2,957 3,453 3,982Surplus (deficit) of capital funding (319) (81) (542) (621) (792) (909) (1,036) (1,189) (1,382) (1,602) (1,816)
Funding balance - - - - - - - - - - -ReconciliationTotal applications of operating funding 7,461 8,272 7,979 8,208 8,327 8,586 8,933 9,312 9,542 10,021 10,347
plus - Depreciation and amortisation 970 990 1,076 1,117 1,162 1,220 1,283 1,360 1,443 1,552 1,657Expenditure as per Statement of Financial Performance 8,431 9,262 9,055 9,325 9,489 9,806 10,216 10,672 10,985 11,573 12,004
Operating expenditureCemeteries 482 528 543 557 574 589 598 608 618 629 640Memorials 95 94 98 100 103 107 110 115 121 124 130Street berms, trees and plots 526 547 570 583 596 610 626 642 660 678 698Halls 252 344 304 311 319 326 335 393 535 738 841Public Conveniences 779 829 877 909 942 969 989 1,010 1,034 1,066 1,098Reserves 4,606 5,150 4,902 5,086 5,151 5,374 5,720 6,001 6,079 6,359 6,606Swimming Pools 1,691 1,772 1,763 1,783 1,807 1,835 1,842 1,908 1,944 1,984 1,996
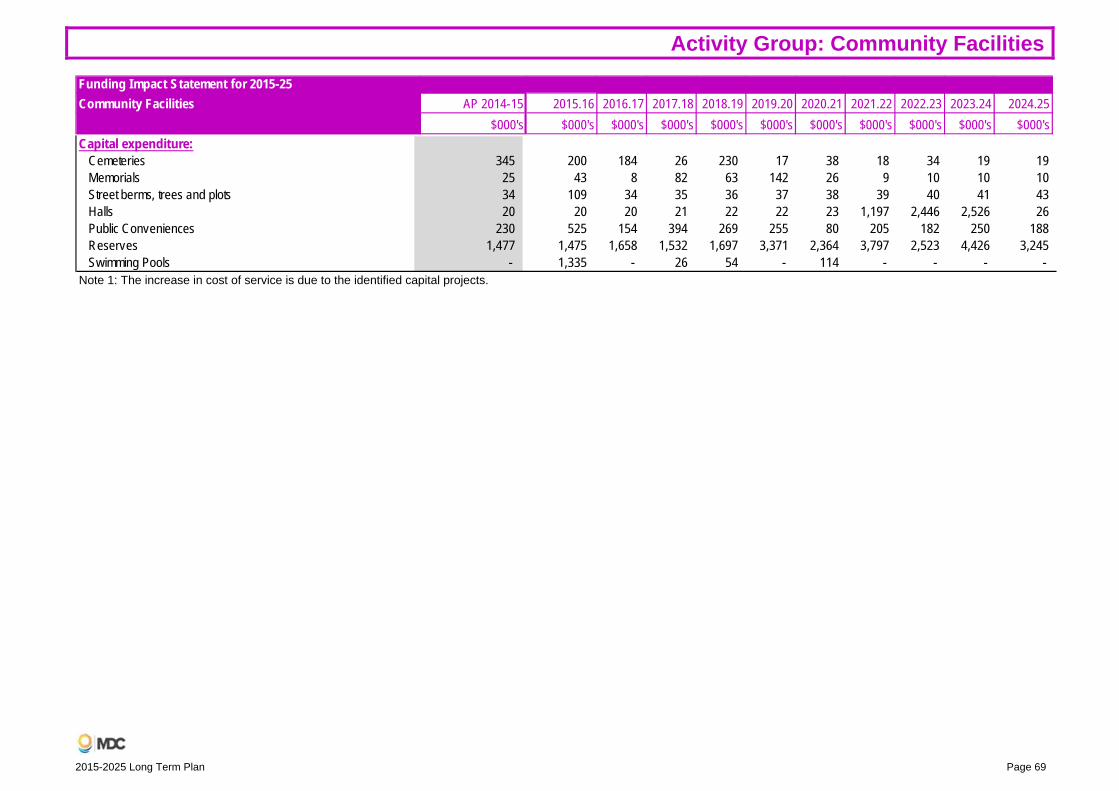
Activity Group: Community Facilities
2015-2025 Long Term Plan Page 69
Note 1: The increase in cost of service is due to the identified capital projects.
Funding Impact Statement for 2015-25Community Facilities AP 2014-15 2015.16 2016.17 2017.18 2018.19 2019.20 2020.21 2021.22 2022.23 2023.24 2024.25
$000's $000's $000's $000's $000's $000's $000's $000's $000's $000's $000'sCapital expenditure:
Cemeteries 345 200 184 26 230 17 38 18 34 19 19Memorials 25 43 8 82 63 142 26 9 10 10 10Street berms, trees and plots 34 109 34 35 36 37 38 39 40 41 43Halls 20 20 20 21 22 22 23 1,197 2,446 2,526 26Public Conveniences 230 525 154 394 269 255 80 205 182 250 188Reserves 1,477 1,475 1,658 1,532 1,697 3,371 2,364 3,797 2,523 4,426 3,245Swimming Pools - 1,335 - 26 54 - 114 - - - -
Activity Group: The Provision of Roads and Footpaths
Page 70 2015-2025 Long Term Plan
The Provision of Roads and Footpaths

Activity Group: The Provision of Roads and Footpaths
2015-2025 Long Term Plan Page 71
The Provision of Roads and Footpaths Operating Costs The operating costs for The Provision of Roads and Footpaths Group of Activities represents $251 million of total Council expenditure.
Capital Projects The capital expenditure for The Provision of Roads and Footpaths Group of Activities represents $115 million of total Council expenditure over the next 10 years. Information about the major budgeted capital projects are included under the respective Activities sections.
Rationale for the Delivery of the Provision of Roads and Footpaths Group of Activities It is mandatory that the provision of roads and footpaths is an Activity Group.
Changes to the Provision of Roads and Footpaths Activity Group from the 2014-15 Annual Plan There are no changes to this Activity Group.
Intended Changes to Levels of Service from the 2014-15 Annual Plan The table describes any intended changes to the levels of service within the Group from the levels of service displayed in the 2014-15 Annual Plan. The reasons for the intended changes are also described.
2014-15 Annual Plan 2015-25 LTP Reason for changes Activity: Roads and FootpathsNone. Respond to service
requests. To reflect new national mandatory performance measure.
Significant Negative Effects Associated with this Group of Activities This Activity Group may involve the potential for environmental impact or the operation of noisy machinery, earthmoving or construction works, which may impact on the environment and can result in temporary disruptions to daily life. Where resource consents are required for these activities, controls are imposed as appropriate. Vehicle emissions is another potential negative effect associated with this Group of Activities.
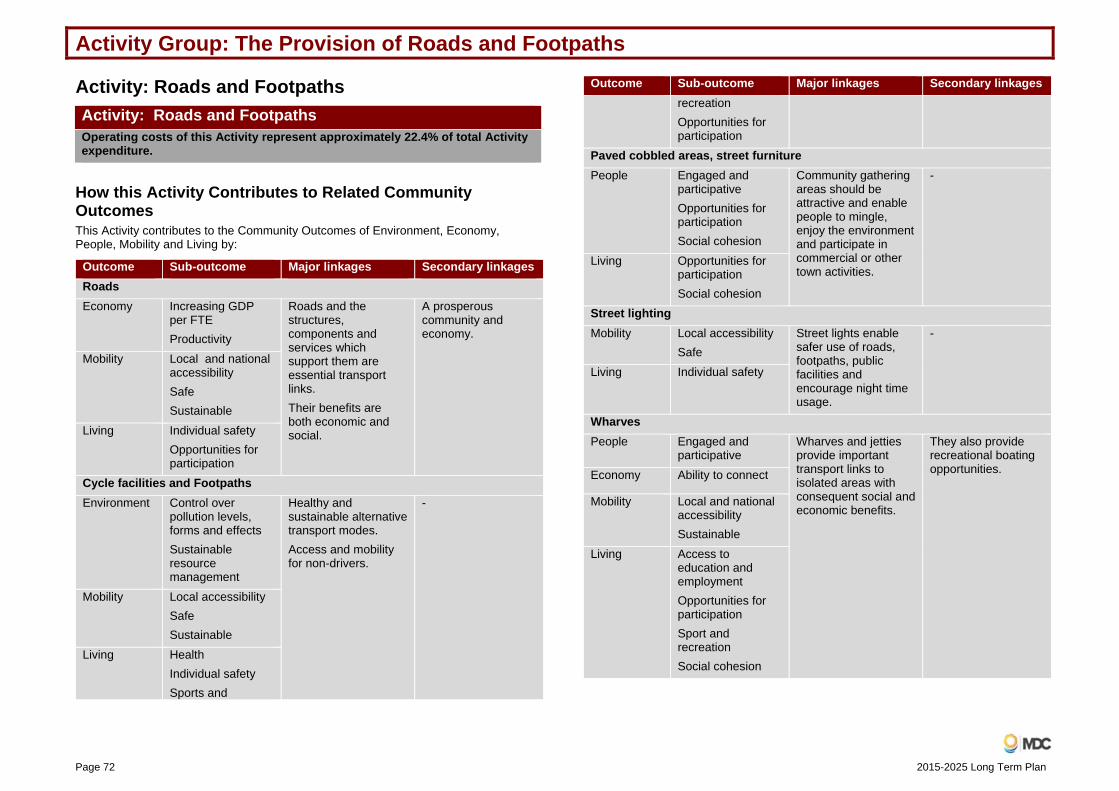
Activity Group: The Provision of Roads and Footpaths
Page 72 2015-2025 Long Term Plan
Activity: Roads and Footpaths
How this Activity Contributes to Related Community Outcomes This Activity contributes to the Community Outcomes of Environment, Economy, People, Mobility and Living by:
Outcome Sub-outcome Major linkages Secondary linkagesRoads Economy Increasing GDP
per FTE Productivity
Roads and the structures, components and services which support them are essential transport links. Their benefits are both economic and social.
A prosperous community and economy.
Mobility Local and national accessibility Safe Sustainable
Living Individual safety Opportunities for participation
Cycle facilities and Footpaths Environment Control over
pollution levels, forms and effects Sustainable resource management
Healthy and sustainable alternative transport modes. Access and mobility for non-drivers.
-
Mobility Local accessibility Safe Sustainable
Living Health Individual safety Sports and
Outcome Sub-outcome Major linkages Secondary linkages recreation Opportunities for participation
Paved cobbled areas, street furniturePeople Engaged and
participative Opportunities for participation Social cohesion
Community gathering areas should be attractive and enable people to mingle, enjoy the environment and participate in commercial or other town activities.
-
Living Opportunities for participation Social cohesion
Street lightingMobility Local accessibility
Safe Street lights enable safer use of roads, footpaths, public facilities and encourage night time usage.
-
Living Individual safety
Wharves People Engaged and
participative Wharves and jetties provide important transport links to isolated areas with consequent social and economic benefits.
They also provide recreational boating opportunities. Economy Ability to connect
Mobility Local and national accessibility Sustainable
Living Access to education and employment Opportunities for participation Sport and recreation Social cohesion
Activity: Roads and Footpaths Operating costs of this Activity represent approximately 22.4% of total Activity expenditure.

Activity Group: The Provision of Roads and Footpaths
2015-2025 Long Term Plan Page 73
What is this Activity About? This Activity is carried out to provide our Community with an efficient, safe and resilient road network.
As owner of the local roading network Council provides and maintains roads to standards that achieve an acceptable balance between user levels of service and cost. In addition Council is responsible for all roading related assets - footpaths, kerb and channelling, street lighting and carparks. Some wharves are also owned and maintained by Council. There has recently been an increased emphasis on alternative modes such as walking and cycling. In particular provision of high quality pedestrian facilities for an ageing population is increasing demand.
Separate Roles Council is responsible for all roads in Marlborough except the State Highways, which are the responsibility of the New Zealand Transport Agency (Transport Agency).
Marlborough District Council has developed a contract with the Transport Agency’s Marlborough Roads office to manage Council’s roads on its behalf. This is achieved through a formal contract and a close management relationship between Council and Marlborough Roads.
The Transport Agency is a key partner in Council’s land transport management. The State Highway network is of significant strategic importance in achieving community outcomes.
Council also works closely with the New Zealand Police on road safety issues and maintains and annually reviews a Road Safety Action Plan for the District.
The Road System Council has 242 kms of footpaths, 886 kms of sealed road and 640 kms of unsealed roads. Council operates 363 bridges. The network is absolutely essential enabling freight and passenger travel over land and across waterways within Marlborough.
Meeting Standards The key tool for management of the network is the Road Infrastructure Activity Management Plan (AMP) which determines levels of service to be provided for the next 10 years. Detailed programmes are included in the Transport Agency’s three year programme for which Council receives Funding Assistance. Funding Assistance will be 50% for 2015-16 moving to 51% from 2016-17.
Council in its AMP identifies standards and guidelines for all activities undertaken to manage the road infrastructure. Council has adopted a best practice approach
common to Road Controlling Authorities throughout New Zealand and in doing so ensures compliance with Transport Agency requirements. The standards and guidelines identified are predominantly those developed or adopted by the Transport Agency and are consistently applied across the Marlborough District's road network.
The Transport Agency has introduced the One Network Road Classification (ONRC) system. This ONRC system classifies all roads across the country. Roads of a similar form and function will have the same classification and have consistent levels of service across the nation. Councils are required to implement the ONRC by 1 July 2018 and adopt a ONRC transition plan within the AMP.
Road Safety Marlborough Roads constantly reviews road crashes in the Marlborough District and annually prioritises the budgets available to improve safety where the road infrastructure is considered to be causing the most serious accidents. Reports are presented to the quarterly Road Safety Action Plan meetings which focuses on developing strategies with Police, ACC and road safety coordinators to address safety issues. Safety reports are also presented quarterly to the Regional Land Transport Committee which review the latest regional local road and state highway safety performance.
Nationally there has been a continual reduction in road fatalities in recent years and this is reflected in the Marlborough statistics which shows a trending down of serious casualties on local roads from 10 in 2005-06 to two in 2013-14.
A significant focus is in place to ensure safety is maintained through good quality pavements that are free of large potholes, edge breaks and other defects that may compromise safety. Management of icy road conditions has been a winter focus with no injury crashes reported in the last year.
Council also undertakes a road safety programme which provides educational advice to road users.
Road Quality Council maintains the quality of its roads by monitoring trends in pavement condition, the age of surfacings, and undertakes structural inspections and repairs. Marlborough Roads schedules a renewals programme to optimise total costs by ensuring maintenance costs do not become excessive. The proposed standards and forward programme of work are reviewed by the Transport Agency. The Transport Agency undertakes technical and procedural audits on a three yearly cycle.
The renewals are determined from approved pavement modelling systems verified by physical inspection by experienced engineers. The pavement modelling system dTIMS (Deighton Total Infrastructure Modelling System) confirms that the planned quantities
Activity Group: The Provision of Roads and Footpaths
Page 74 2015-2025 Long Term Plan
are those required to maintain the asset. A regime of planned inspections determines standards are being maintained, programmed and delivered.
Marlborough Roads also monitor unsealed roads. They are challenging to manage, can deteriorate rapidly and are influenced by climatic and traffic variables. Marlborough Roads now have the capability to measure roughness to assist with determining the need for intervention treatments eg; grading, roughness management.
Marlborough's road pavement indicators compare favourably with peer agencies and the Transport Agency’s requirements.
The draft 2015-18 Government Policy Statement (GPS) signals a continuation of funding levels advised in the 2012-15 GPS. Council’s budgets align with the GPS funding signals. Further efficiencies are sought through “flat line” budgeting.
The Network Outcomes Contract continues to deliver optimal costs and ongoing savings. This has enabled all maintenance and renewals to be delivered within the tensioned budgets that were set by the Transport Agency.
Funding may be moderated over the next three years to ensure that levels of service over time will meet ONRC requirements. The AMP has been updated to reflect the real reduction in funding. Renewal programmes have been tensioned with renewals only being undertaken where they are economically justified.
Footpaths and Street Parking A formal monitoring system is now established to assess footpath condition in urban areas. A full footpath rating is undertaken on a three yearly basis.
Council provides parking on urban streets where it is practicable and safe to do so. Within areas kerbside parking is either metered or time restricted in high use areas to ensure a good turn-over of usage to encourage a vibrant retail environment. Off-street parking and the parking building is managed by Marlborough Roads (via a sub-contractor). This is part of the Regional Development Activity Group elsewhere in the Plan.
Growing Marlborough Strategy The Growing Marlborough Strategy identified a number of options for upgrading the amenities of smaller towns and to keep them attractive and liveable. A strongly consultative approach was taken and schedules of future urban amenity improvements were developed from this. A budget of $5.5 million has been created to carry out these improvements in consultation with these small communities.
Funding for the upgrade of Blenheim’s CBD has been provided over the next three years. This includes works relating to the area proposed for the library redevelopment.
Asset Description The table below provides an overview of Council’s roading assets:
Asset Length / QuantityRoad Length 1,526 kms (886 kms sealed, 640 kms unsealed) Bridges 363 Jetties 13
Urban Footpaths 242 kms (146 kms concrete; 75 kms asphalt; 9 kms sealed; other 12 kms)
The total asset value for the Roads and Footpaths Activity as at 30 June 2014 is $631.5 million.
Major Budgeted Capital Projects The table outlines the major budgeted projects and areas of expenditure proposed for this Activity over the next 10 years. Although these items are budgeted, in some cases further public consultation will be required with the relevant community before the project is implemented. These projects are also listed under the Capital Expenditure line of the Funding Impact Statement at the end of this Activity section.
Sub-Activity Major Capital Projects Inflated value (Millions)
General roading
2015-17 Major rehabilitation of Waihopai high productivity motor vehicles (HPMVs) route. $0.8
2015-17 Major rehabilitation of Northbank HPMV route. $4.8
2016-17 French Pass Road sealed pavement. $0.7 2017-18 Northbank Road staircase seal extension. $1.2 2017-24 Kenepuru Road sealed pavement. $0.8 2015-25 Renewal of existing infrastructure (eg; resealing, rehabilitation, seal widening, metalling etc).
$64.3
Bridges 2015-16 Replacement of Tyntesfield Road bridge. $0.9 Signs, footpaths, cycle facilities, kerb and channel
2015-24 Small Township Upgrade project, including quality streetscapes and transport accessibility with safe walking and cycling opportunities.
$5.5
2015-16 Picton and Blenheim town entry signage. $0.5

Activity Group: The Provision of Roads and Footpaths
2015-2025 Long Term Plan Page 75
Sub-Activity Major Capital Projects Inflated value (Millions)
2015-25 Renewals and additions of kerb and channels, footpaths, cycle facilities and non-subsidised seal extensions.
$15.4
Blenheim CBD upgrades
2015-17 Revitalisation of town centre. $2.0
2015-16 and 2017-18 Landscaping project leading to the development of new Blenheim library. $2.0
2015-25 Surface treatment, lighting and street furniture. $5.5
Wharves 2015-25 Renewals of existing infrastructure (jetties). $1.2
Subdivisional works
2015-25 Seal extensions, widening, kerb and channelling as required by subdivisional works. $1.7
Emerging Issues and Expected Changes Increasing Forest Harvests Marlborough’s main forests were planted in the late 1970’s and 1980’s. Increasing harvest volumes are anticipated as these forests fully mature and market demand improves. The effects on roading such as dust, noise, damage and safety are increasing.
Pressure on Budgets for Increasing Storm Damage Costs Climate change is expected to increase the frequency of heavy rainfall events with consequent road damage. Changes to the Transport Agencies’ funding assistance rate for repairs could also impact on Council’s budgets.
Urban Growth Effects Proposed new zone developments need to follow planned roading layouts and services plans to ensure good community outcomes and equitable cost sharing. Capital costs are expected to be met by developers with road costs included in Council zone levies.
Capital Bridge Programme Council has 18 bridges that have been identified as having less than or equal to two years remaining life. As many bridges as funding permits will be replaced during the LTP.
Ageing Population The ageing demographic of the Marlborough population is likely to increase demand for better standards of footpath including increased levels of service for mobility scooter users.

Activity Group: The Provision of Roads and Footpaths
Page 76 2015-2025 Long Term Plan
Levels of Service 2015-25: Roads and footpaths Performance Targets (for the financial year) Level of Service Indicator Baseline 2015-16 2016-17 2017-18 2018-25 Provide an overall level of service that meets or exceeds residents’ expectations.
Resident satisfaction with this service as measured by survey, where 10 = “service delivered extremely well”.
6.5 6.5 6.5 6.5 6.5
Road safety Provide a safe transport infrastructure.
The change from the previous financial year in the number of fatalities and serious injury crashes on the local road network, expressed as a number.
8 (previous 10 year average)
Target for reducing the number of serious injuries and fatalities = Nil
Target for reducing the number of serious injuries and fatalities = 1
Target for reducing the number of serious injuries and fatalities = Nil
Target for reducing the number of serious injuries and fatalities = 1
Road condition Provide a quality transport infrastructure.
Average quality of ride on a sealed local road network measured by Smooth Travel Exposure3 for:
Urban roads ≥ 85% ≥ 84% ≥ 84% ≥ 83% ≥ 83% Rural roads ≥ 92% ≥ 92% ≥ 92% ≥ 92% ≥ 91% Condition Index4. ≤ 6.5 < 6.1 < 6.2 < 6.3 ≤ 6.5 Average road roughness standards for: Urban sealed roads < 110 < 115 < 115 < 115 < 115 Rural sealed roads NB: a newly sealed road has an average roughness of 50 – 70. A very rough gravel rough will have a roughness value higher than 300.
< 98 < 100 < 100 < 100 < 100
Road maintenance Provide a sustainable land transport infrastructure.
The percentage of sealed road network that is resurfaced annually. Total sealed area is 7,995m2 as 2014-15.
4.2% 4.2% 4.2% 4.2% 5.6%
Footpaths To provide footpaths that meet the needs of an ageing community.
Length of footpath that meets the Asset Management Plan rating of better than 4.
94% 94.4% 94.7% 94.9% 94.9%
Respond to Service Requests % of customer services requests relating to roads and footpaths to which the territorial authority responds within 15 days.
New measure ≥ 90% ≥ 90% ≥ 90% ≥ 90%
3 Smooth Travel Exposure is the percentage of vehicle kms travelled on roads meeting a certain roughness standard. This indicator shows the extent to which Council has maintained the road asset. It records travel on the roading network which meets the roughness benchmarks therefore providing a measure of delivery of a safe and comfortable ride. Well maintained roads contribute to lower operating costs for road users. The Marlborough values compare favourably with peer agencies. 4 Condition Index is an addition of weighted percentages of defects like alligator cracking, scabbing, potholes, pothole patches and flushing. It does not include age of the surfacing treatment. Lower values indicate a higher standard, where the maximum score is 100 and a lower score such as five is a very good outcome. Because of short term pressures with funding reducing an allowance was made for some increase in the Condition Index reflecting less renewal and more maintenance.
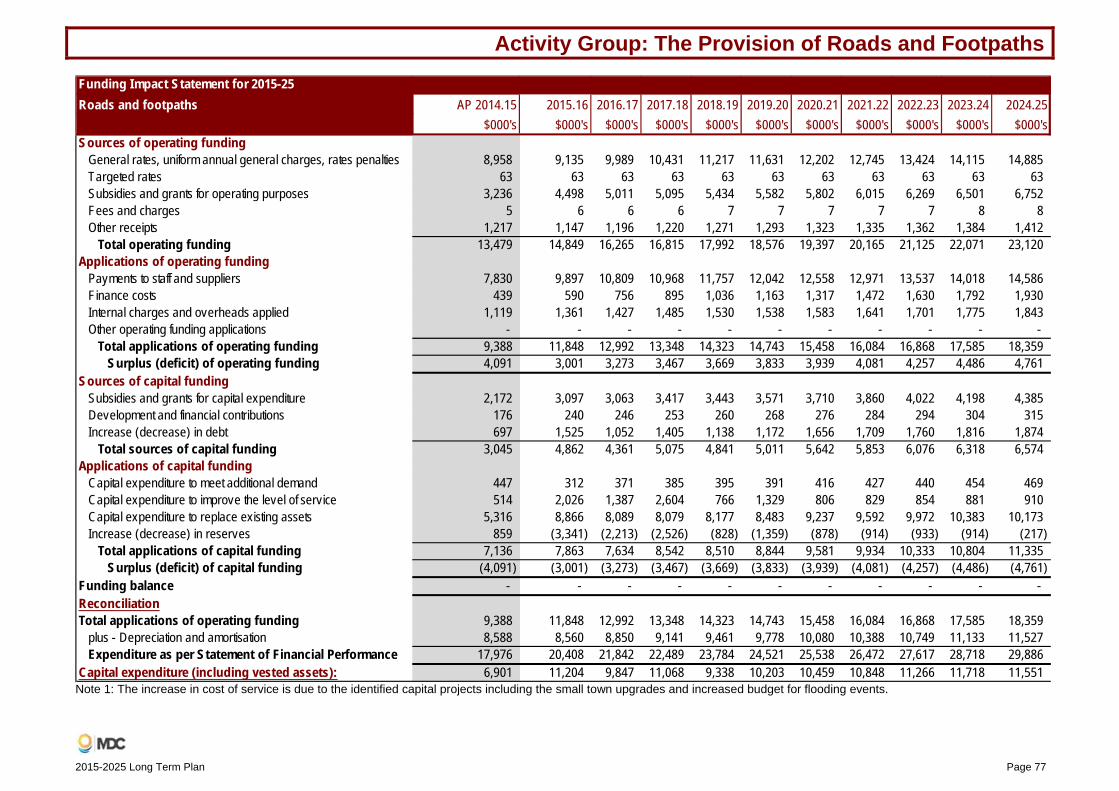
Activity Group: The Provision of Roads and Footpaths
2015-2025 Long Term Plan Page 77
Note 1: The increase in cost of service is due to the identified capital projects including the small town upgrades and increased budget for flooding events.
Funding Impact Statement for 2015-25Roads and footpaths AP 2014.15 2015.16 2016.17 2017.18 2018.19 2019.20 2020.21 2021.22 2022.23 2023.24 2024.25
$000's $000's $000's $000's $000's $000's $000's $000's $000's $000's $000'sSources of operating funding
General rates, uniform annual general charges, rates penalties 8,958 9,135 9,989 10,431 11,217 11,631 12,202 12,745 13,424 14,115 14,885Targeted rates 63 63 63 63 63 63 63 63 63 63 63Subsidies and grants for operating purposes 3,236 4,498 5,011 5,095 5,434 5,582 5,802 6,015 6,269 6,501 6,752Fees and charges 5 6 6 6 7 7 7 7 7 8 8Other receipts 1,217 1,147 1,196 1,220 1,271 1,293 1,323 1,335 1,362 1,384 1,412
Total operating funding 13,479 14,849 16,265 16,815 17,992 18,576 19,397 20,165 21,125 22,071 23,120Applications of operating funding
Payments to staff and suppliers 7,830 9,897 10,809 10,968 11,757 12,042 12,558 12,971 13,537 14,018 14,586Finance costs 439 590 756 895 1,036 1,163 1,317 1,472 1,630 1,792 1,930Internal charges and overheads applied 1,119 1,361 1,427 1,485 1,530 1,538 1,583 1,641 1,701 1,775 1,843Other operating funding applications - - - - - - - - - - -
Total applications of operating funding 9,388 11,848 12,992 13,348 14,323 14,743 15,458 16,084 16,868 17,585 18,359Surplus (deficit) of operating funding 4,091 3,001 3,273 3,467 3,669 3,833 3,939 4,081 4,257 4,486 4,761
Sources of capital fundingSubsidies and grants for capital expenditure 2,172 3,097 3,063 3,417 3,443 3,571 3,710 3,860 4,022 4,198 4,385Development and financial contributions 176 240 246 253 260 268 276 284 294 304 315Increase (decrease) in debt 697 1,525 1,052 1,405 1,138 1,172 1,656 1,709 1,760 1,816 1,874
Total sources of capital funding 3,045 4,862 4,361 5,075 4,841 5,011 5,642 5,853 6,076 6,318 6,574Applications of capital funding
Capital expenditure to meet additional demand 447 312 371 385 395 391 416 427 440 454 469Capital expenditure to improve the level of service 514 2,026 1,387 2,604 766 1,329 806 829 854 881 910Capital expenditure to replace existing assets 5,316 8,866 8,089 8,079 8,177 8,483 9,237 9,592 9,972 10,383 10,173Increase (decrease) in reserves 859 (3,341) (2,213) (2,526) (828) (1,359) (878) (914) (933) (914) (217)
Total applications of capital funding 7,136 7,863 7,634 8,542 8,510 8,844 9,581 9,934 10,333 10,804 11,335Surplus (deficit) of capital funding (4,091) (3,001) (3,273) (3,467) (3,669) (3,833) (3,939) (4,081) (4,257) (4,486) (4,761)
Funding balance - - - - - - - - - - -ReconciliationTotal applications of operating funding 9,388 11,848 12,992 13,348 14,323 14,743 15,458 16,084 16,868 17,585 18,359
plus - Depreciation and amortisation 8,588 8,560 8,850 9,141 9,461 9,778 10,080 10,388 10,749 11,133 11,527Expenditure as per Statement of Financial Performance 17,976 20,408 21,842 22,489 23,784 24,521 25,538 26,472 27,617 28,718 29,886
Capital expenditure (including vested assets): 6,901 11,204 9,847 11,068 9,338 10,203 10,459 10,848 11,266 11,718 11,551

Activity Group: Flood Protection and Control Works
Page 78 2015-2025 Long Term Plan
Flood Protection and Control Works

Activity Group: Flood Protection and Control Works
2015-2025 Long Term Plan Page 79
Flood Protection and Control Works Operating Costs The operating costs for the Flood Protection and Control Works Group of Activities represents $55 million of total Council expenditure.
Capital Projects The capital expenditure for the Flood Protection and Control Works Group of Activities represents $13 million of total Council expenditure over the next 10 years. Information about the major budgeted capital projects are included under the respective Activities sections.
Rationale for the Delivery of Flood Protection and Control Works Group of Activities It is mandatory that Flood Protection and Control Works is an Activity Group.
Changes to Flood Protection and Control Works Activity Group from the 2014-15 Annual Plan There are no changes for this Activity Group.
Intended Changes to Levels of Service from the 2014-15 Annual Plan The table describes any intended changes to the levels of service within the group from the levels of service displayed in the 2014-15 Annual Plan. The reasons for the intended changes are also described.
2014-15 Annual Plan 2015-25 LTP Reason for changes Activity: Flood Protection and Control WorksMonitor, maintain and upgrade floodways to provide a capacity for a flood size of up to 1 in 100 year return period event for the lower Wairau Plain, and 1 in 50 year return period event for Blenheim stormwater outfalls, and Waitohi and Waikawa Rivers, Picton.
Wairau River scheme -system and adequacy These major flood protection and control works are maintained, repaired and renewed to the standards defined in Rivers and Drainage Asset Management Plan (AMP).
To reflect new national mandatory performance measure which relates to ‘major flood protection and control works’. In Marlborough, only the Wairau scheme meets the criteria for ‘major’ works.
Monitor, maintain and upgrade key Picton floodways (Waitohi and Waikawa Rivers) to provide for a 1 in 50 year return period flood event.
Level of service that relates to the Waitohi and Waikawa schemes in Picton.
Upgrade and maintain key Blenheim stormwater outfalls (channels and pump stations) including the Town Branch Caseys, Fulton and Murphys Creeks to provide for a 1 in 50 year return period storm event runoff including both infill and greenfield development.
Level of service that relates to storm water outfalls in Blenheim.
Significant Negative Effects Associated with this Group of Activities This Activity Group may involve the potential for environmental impact or the operation of noisy machinery, earthmoving or construction works, which may impact on the environment and can result in temporary disruptions to daily life. Where resource consents are required for these activities, controls are imposed as appropriate.

Activity Group: Flood Protection and Control Works
Page 80 2015-2025 Long Term Plan
Activity: Flood Protection and Control Works Activity: Flood Protection and Control Works
Operating costs of this Activity represents approximately 4.9% of total Activity expenditure.
How this Activity Contributes to Related Community Outcomes This Activity contributes primarily to the Community Outcomes of Environment, People, Economy, Mobility and Living by:
Outcome Sub-outcome Major linkages Secondary linkagesEnvironment Systems for
protection and care Sustainable resource management
Flood control and drainage management provide major environmental, economic and social benefits. Residents and their property are safeguarded from the risks of river and stream flooding and erosion. Agricultural drainage of the lower Wairau plains is provided, improving the productivity of drainage impaired soils. Soil conservation is managed in the Wither Hills Farm Park to prevent sediment from depositing into the watercourses at the base of the hills. Gravel extraction from river channels is managed in a sustainable manner and provides a valuable economic resource. Environmental sustainability is managed.
Council owned floodway land can have secondary uses of public access and recreation, ecological/amenity plantings or for economic gain through forestry or pastoral leasing as appropriate.
People Quality jobs Increasing incomes Increasing capital wealth
Economy Increasing GDP per FTE Productivity
Mobility Accessibility Sustainable
Living Health Individual safety Access to housing Sport and recreation
What is this Activity About? The Activity is primarily about managing flood hazard and drainage focused on the more developed areas of Marlborough. Requirements in different areas have developed according to the history of flood risks and development of drainage improvements or from more recent assessment of flood risks as land uses have changed and development occurred. The areas of activity can be summarised as follows:
Lower Wairau Flood Protection To maintain and upgrade the main Wairau floodplain floodways below the Waihopai confluence to provide a capacity for flood sizes up to a one in 100 year return period. These floodways include the Wairau (below Waihopai), the Wairau Diversion, and tributaries including the Opawa, Taylor and Omaka Rivers and the Riverlands Co-op Floodway.
Wairau Floodplain Tributaries To keep key Wairau River tributary (including the Wairau above the Waihopai confluence) channels clear of trees and debris as economically practical, to maintain flood capacity and minimise the risk of changes to channel alignment.
Sounds Watercourses Flood Management To develop and maintain a river capacity and standard of protection for flood sizes of up to one in 50 years return period for the Waitohi, Waikawa and their tributaries flowing through the urban areas of Picton and Waikawa. Similarly to consider waterway improvements in other built up Sounds areas including Havelock to protect houses.
Blenheim, Riverlands and Renwick Stormwater Outfalls To ensure the system of drains, natural watercourses, pumping stations and floodgates adequately provides for the disposal of urban stormwater from the pipe networks operated by Council’s Services section. The desired level of service is to provide for a one in 50 years return period event.
Lower Wairau Floodplain Drainage To provide agricultural drainage for the Wairau floodplain land generally to the east of Blenheim and O’Dwyers Road. This involves controlling weed and sediment for some 280 kms of excavated drains or natural watercourses, maintaining floodgated culverts into the major rivers, and providing pumping stations generally with a capacity of removing 15 mm of rainfall in 24 hours. The riparian margins of selected channels are managed in an aesthetic and ecologically sensitive manner.

Activity Group: Flood Protection and Control Works
2015-2025 Long Term Plan Page 81
Gravel Extraction To manage gravel extraction from river channels throughout Marlborough to ensure that the extraction of this valuable economic resource is managed in a sustainable manner consistent with good river management. This requires limiting gravel extraction to specific amounts and locations.
Gibsons Creek Rewatering To supply water from the Wairau and Waihopai rivers into Gibsons Creek to meet the requirements of the Southern Valleys’ Irrigation Scheme and to provide further water to ensure a continuous flow in the Gibsons Creek/Opawa system for environmental objectives including groundwater recharge.
Soil Conservation To manage the Wither Hills Farm Park so that little or no sediment is deposited into the watercourses at the base of the hills.
Council River Control Floodway Reserve Land To allow Council owned floodway land to have secondary uses of public access/recreation, ecological/amenity plantings, or for economic gain by forestry or pastoral leasing as appropriate.
Flood Hazard and River Management Advice To provide flood hazard advice to other sections of Council for LIMS and PIMS documents, for resource consents, building consents and Resource Management Plans. The section also provides direct advice to landowners on flooding and erosion risks, and mitigation options, throughout the District.
Flood Response To monitor key river systems during a flood event, provide advice and undertake emergency repairs as appropriate. Advice of potential flood danger is directed at the public and public agencies such as police, Civil Defence etc.
Asset Description The table below provides an overview of Council’s Flood Protection and Control Works assets:
Asset Length /QuantityStopbanks, training banks, the Taylor Dam, and other minor dams in total comprising 4.8 million cubic metres volume of earthworks.
180 kms
Large rock rip rap for river bank erosion protection purpose. 585,000 m³
Asset Length /Quantity Manage tree plantings (willows, poplars etc) for riverbank erosion protection purposes 55 hectares
Excavated minor water courses for agricultural drainage and urban stormwater disposal purposes. 160 kms
Major river diversions. 4
Pumping stations for agricultural drainage purposes. 19
Pumping stations for urban stormwater disposal purposes. 11
Culverts under stopbanks etc of various sizes and lengths, usually floodgated. 290
Control gates or weirs. 20
Floodway land. 3,000 hectares
The total asset value for the Flood Protection and Control Works Activity as at 30 June 2014 is $176.9 million.
Major Budgeted Capital Projects The table outlines the major budgeted projects and areas of expenditure proposed for this Activity over the next 10 years. Although these items are budgeted, in some cases further public consultation will be required with the relevant community before the project is implemented. These projects are also listed under the Capital Expenditure line of the Funding Impact Statement at the end of this Activity section.
Areas Major Capital Projects Inflated value (Millions)
Wairau floodplain to the Waihopai confluence
2015-25 Flood protection and control works. $9.2
Wairau floodplain
2015-25 Pump station and drainage network upgrades. $3.3
Picton and Waikawa minor streams
2015-25 Rock and gabion protection. $0.2
Emerging Issues and Expected Changes This plan provides for progress on a number of some issues identified over last couple of years that need to be addressed in this plan. These issues are summarised as follows:

Activity Group: Flood Protection and Control Works
Page 82 2015-2025 Long Term Plan
Taylor Dam Upgrades to meet new Dam Safety Regulations The Taylor flood detention dam is a very important part of the flood protection system that protects Blenheim. The dam is now close to 50 years old and generally in very good order. Dam safety regulations now require dams like the Taylor to be regularly inspected and assessed for safety.
A comprehensive safety review was completed earlier this year and has identified a number of matters for Council to attend to including a minor capacity upgrade to the auxiliary spillway, installation of additional drainage and crest level monitoring points and resealing of the main outlet culvert joints. Provision in the plan has been made for this work.
Similar refurbishment work is also required to a number of other flow control/outlet structures of a similar age including the Gibsons Creek Waihopai intake and the upper Opawa loop inlet control gate.
Maintaining the Wairau River Alignment and Stopbank Security The stop banked reach of the Wairau River from the Waihopai confluence downstream has very powerful and erosive river flows. Bank protection in the form or rock rip-rap armouring and tree planting is required to protect the stopbanks from erosion, especially as a result of floods.
Regular asset inspections have confirmed the need for continued investment in new works and regular maintenance of existing works to ensure a robust flood protection system. The main change for this plan is that new rock work has been identified as being required in both the lower Wairau and Diversion reaches. Provision has been made for this work.
The flood events of April and June 2014 also caused significant bank edge damage in the lower Tuamarina River immediately upstream from the Wairau confluence, and in the stopbank section of the Omaka River. Budget provision has been included to repair the damage and secure the adjacent stopbanks with new heavy rock linings or planting as appropriate.
Implementing Agreed Improvements to the Lower Wairau Drainage Network The review of the current drainage network is complete and ready for consultation with benefitting landowners. Final changes to the network will only be adopted once we have landowner feedback.
Provision has been included in the plan to upgrade and then maintain an additional 15.5 kms of drain.
Blenheim Stormwater Outfall Upgrades Ongoing development of Blenheim including infill housing and expansion into the recently rezoned areas to the north and west requires upgrade of the stormwater system, including the outfall channels and pump stations.
Considerable work is underway to determine and design necessary upgrades for the Redwood Street catchment (Town Branch drain and Redwood Street and Abattoir pumping), Blenheim north rezone area (Caseys Creek and pump station) and Blenheim west (Murphys Creek capacity and environmental issues). Some budget provision has been included for new/upgraded pump stations and channel upgrades.
Pukaka Quarry Extension The Council owned Pukaka Quarry is a key source of rock rip-rap for river protection works on the Wairau River and tributaries. The quarry also supplies a variety of aggregates to the contracting market as a by-product of the rock production.
The rock resource within the existing land boundary is now limited and further land will be required if the quarry is going to continue for a further 50 years.
Investigations are underway to determine the feasibility of extending the quarry to the north including the land area required, and infrastructure requirements including a new haul road, floor extension and building requirements. Once complete we will then approach the adjacent landowner regarding purchase of the additional land.
No specific capital budget is provided for in this plan. However the Pukaka Quarry is self-funding and capital requirements for any extension are proposed to be serviced from operating revenue.
Planning Input Much of the sections work is required to be authorised by way of plan rules or resource consent. Similarly implementation of the Marlborough Growth Strategy can have a significant impact on investigation and capital expenditure programmes. These include Blenheim north and the lower terrace at Renwick.
Ongoing staff resource will continue to be made available to provide appropriate input into the proposed Regional Policy Statement/Resource Management Plan, and to ensure that adequate technical expertise is applied to assess and facilitate areas of growth in the District.
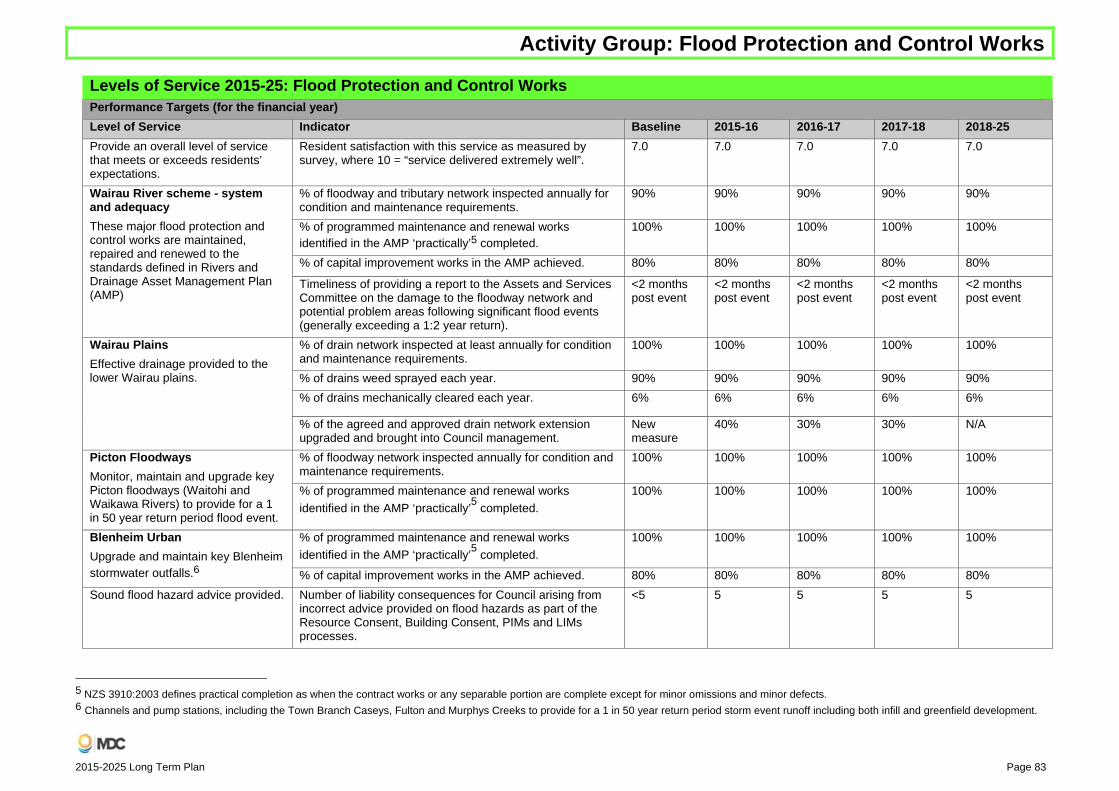
Activity Group: Flood Protection and Control Works
2015-2025 Long Term Plan Page 83
Levels of Service 2015-25: Flood Protection and Control Works
Performance Targets (for the financial year)Level of Service Indicator Baseline 2015-16 2016-17 2017-18 2018-25 Provide an overall level of service that meets or exceeds residents’ expectations.
Resident satisfaction with this service as measured by survey, where 10 = “service delivered extremely well”.
7.0 7.0 7.0 7.0 7.0
Wairau River scheme - system and adequacy These major flood protection and control works are maintained, repaired and renewed to the standards defined in Rivers and Drainage Asset Management Plan (AMP)
% of floodway and tributary network inspected annually for condition and maintenance requirements.
90% 90% 90% 90% 90%
% of programmed maintenance and renewal works identified in the AMP ‘practically’5 completed.
100% 100% 100% 100% 100%
% of capital improvement works in the AMP achieved. 80% 80% 80% 80% 80%
Timeliness of providing a report to the Assets and Services Committee on the damage to the floodway network and potential problem areas following significant flood events (generally exceeding a 1:2 year return).
<2 months post event
<2 months post event
<2 months post event
<2 months post event
<2 months post event
Wairau PlainsEffective drainage provided to the lower Wairau plains.
% of drain network inspected at least annually for condition and maintenance requirements.
100% 100% 100% 100% 100%
% of drains weed sprayed each year. 90% 90% 90% 90% 90%
% of drains mechanically cleared each year. 6% 6% 6% 6% 6%
% of the agreed and approved drain network extension upgraded and brought into Council management.
New measure
40% 30% 30% N/A
Picton FloodwaysMonitor, maintain and upgrade key Picton floodways (Waitohi and Waikawa Rivers) to provide for a 1 in 50 year return period flood event.
% of floodway network inspected annually for condition and maintenance requirements.
100% 100% 100% 100% 100%
% of programmed maintenance and renewal works identified in the AMP ‘practically’5 completed.
100% 100% 100% 100% 100%
Blenheim UrbanUpgrade and maintain key Blenheim stormwater outfalls.6
% of programmed maintenance and renewal works identified in the AMP ‘practically’5 completed.
100% 100% 100% 100% 100%
% of capital improvement works in the AMP achieved. 80% 80% 80% 80% 80%
Sound flood hazard advice provided. Number of liability consequences for Council arising from incorrect advice provided on flood hazards as part of the Resource Consent, Building Consent, PIMs and LIMs processes.
<5 5 5 5 5
5 NZS 3910:2003 defines practical completion as when the contract works or any separable portion are complete except for minor omissions and minor defects. 6 Channels and pump stations, including the Town Branch Caseys, Fulton and Murphys Creeks to provide for a 1 in 50 year return period storm event runoff including both infill and greenfield development.
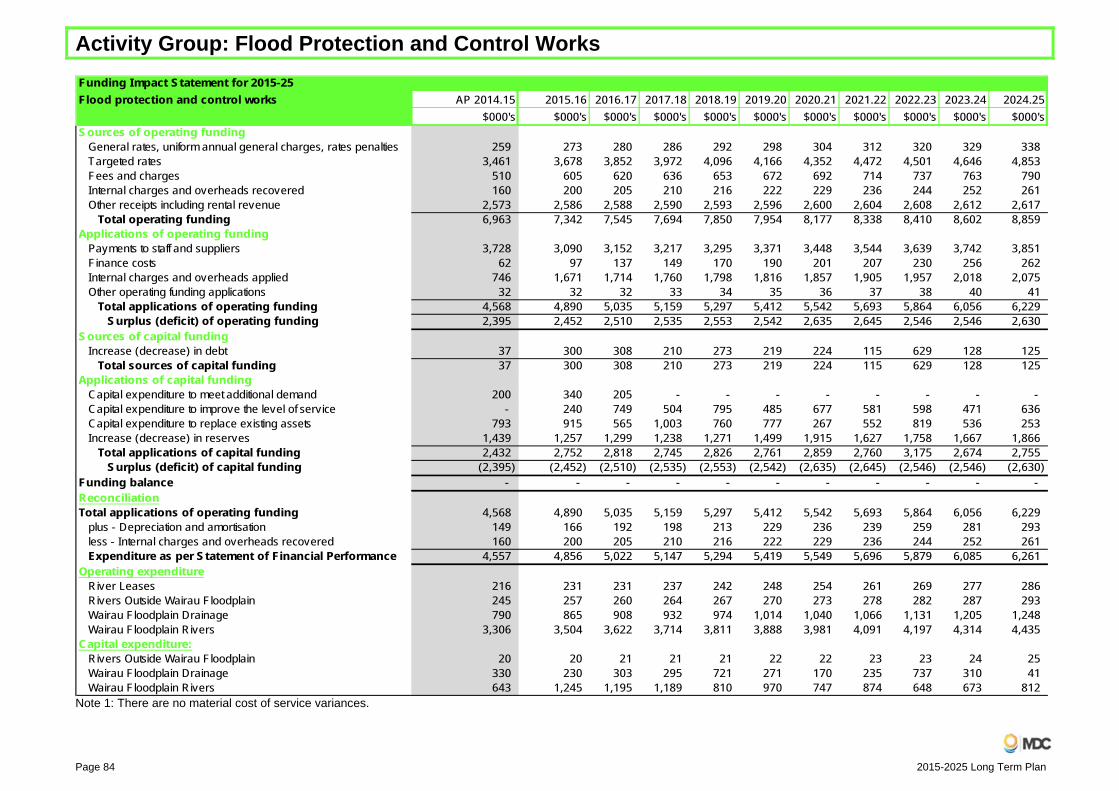
Activity Group: Flood Protection and Control Works
Page 84 2015-2025 Long Term Plan
Note 1: There are no material cost of service variances.
Funding Impact Statement for 2015-25Flood protection and control works AP 2014.15 2015.16 2016.17 2017.18 2018.19 2019.20 2020.21 2021.22 2022.23 2023.24 2024.25
$000's $000's $000's $000's $000's $000's $000's $000's $000's $000's $000'sSources of operating funding
General rates, uniform annual general charges, rates penalties 259 273 280 286 292 298 304 312 320 329 338Targeted rates 3,461 3,678 3,852 3,972 4,096 4,166 4,352 4,472 4,501 4,646 4,853Fees and charges 510 605 620 636 653 672 692 714 737 763 790Internal charges and overheads recovered 160 200 205 210 216 222 229 236 244 252 261Other receipts including rental revenue 2,573 2,586 2,588 2,590 2,593 2,596 2,600 2,604 2,608 2,612 2,617
Total operating funding 6,963 7,342 7,545 7,694 7,850 7,954 8,177 8,338 8,410 8,602 8,859Applications of operating funding
Payments to staff and suppliers 3,728 3,090 3,152 3,217 3,295 3,371 3,448 3,544 3,639 3,742 3,851Finance costs 62 97 137 149 170 190 201 207 230 256 262Internal charges and overheads applied 746 1,671 1,714 1,760 1,798 1,816 1,857 1,905 1,957 2,018 2,075Other operating funding applications 32 32 32 33 34 35 36 37 38 40 41
Total applications of operating funding 4,568 4,890 5,035 5,159 5,297 5,412 5,542 5,693 5,864 6,056 6,229Surplus (deficit) of operating funding 2,395 2,452 2,510 2,535 2,553 2,542 2,635 2,645 2,546 2,546 2,630
Sources of capital fundingIncrease (decrease) in debt 37 300 308 210 273 219 224 115 629 128 125
Total sources of capital funding 37 300 308 210 273 219 224 115 629 128 125Applications of capital funding
Capital expenditure to meet additional demand 200 340 205 - - - - - - - -Capital expenditure to improve the level of service - 240 749 504 795 485 677 581 598 471 636Capital expenditure to replace existing assets 793 915 565 1,003 760 777 267 552 819 536 253Increase (decrease) in reserves 1,439 1,257 1,299 1,238 1,271 1,499 1,915 1,627 1,758 1,667 1,866
Total applications of capital funding 2,432 2,752 2,818 2,745 2,826 2,761 2,859 2,760 3,175 2,674 2,755Surplus (deficit) of capital funding (2,395) (2,452) (2,510) (2,535) (2,553) (2,542) (2,635) (2,645) (2,546) (2,546) (2,630)
Funding balance - - - - - - - - - - -ReconciliationTotal applications of operating funding 4,568 4,890 5,035 5,159 5,297 5,412 5,542 5,693 5,864 6,056 6,229
plus - Depreciation and amortisation 149 166 192 198 213 229 236 239 259 281 293less - Internal charges and overheads recovered 160 200 205 210 216 222 229 236 244 252 261Expenditure as per Statement of Financial Performance 4,557 4,856 5,022 5,147 5,294 5,419 5,549 5,696 5,879 6,085 6,261
Operating expenditureRiver Leases 216 231 231 237 242 248 254 261 269 277 286Rivers Outside Wairau Floodplain 245 257 260 264 267 270 273 278 282 287 293Wairau Floodplain Drainage 790 865 908 932 974 1,014 1,040 1,066 1,131 1,205 1,248Wairau Floodplain Rivers 3,306 3,504 3,622 3,714 3,811 3,888 3,981 4,091 4,197 4,314 4,435
Capital expenditure:Rivers Outside Wairau Floodplain 20 20 21 21 21 22 22 23 23 24 25Wairau Floodplain Drainage 330 230 303 295 721 271 170 235 737 310 41Wairau Floodplain Rivers 643 1,245 1,195 1,189 810 970 747 874 648 673 812

Activity Group: Sewerage Including Treatment and Disposal
2015-2025 Long Term Plan Page 85
Sewerage Including Treatment and Disposal

Activity Group: Sewerage Including Treatment and Disposal
Page 86 2015-2025 Long Term Plan
Sewerage Including Treatment and Disposal Operating Costs The operating costs for the Sewerage Group of Activities represents $139 million of total Council expenditure.
Capital Projects The capital expenditure for the Sewerage Group of Activities represents $75 million of total Council expenditure over the next 10 years. Information about the major budgeted capital projects are included under the respective Activities sections.
Rationale for the Delivery of Sewerage Including Treatment and Disposal Group of Activities It is mandatory that Sewerage including Treatment and Disposal is an Activity Group.
Changes to Sewerage Including Treatment and Disposal Activity Group from the 2014-15 Annual Plan There are no changes to this Activity Group.
Intended Changes to Levels of Service from the 2014-15 Annual Plan The table describes any intended changes to the levels of service within the group from the levels of service displayed in the 2014-15 Annual Plan. The reasons for the intended changes are also described.
2014-15 Annual Plan 2015-25 LTP Reason for changesActivity: Sewerage Including Treatment and DisposalProvide a level of service quality that minimises environmental risks.
System and adequacy.
To reflect new national mandatory performance measure.
Provide a reliable wastewater service with adequate system capacity and performance.
Discharge compliance.
To reflect new national mandatory performance measure.
Provide a service that is timely and responsive to customer needs.
Fault response times.
To reflect new national mandatory performance measure.
Provide a sustainable wastewater service.
None. Level of service to be maintained, but reporting to be covered by new ‘Essential Services Benchmark’ as per the Local Government (Financial Reporting and Prudence) Regulations 2014, section 10d.
Variation Between Long Term Plan and the Assessment of Water and Sanitary Services There is no significant variation between the adopted assessment of water and sanitary services and this Plan.
Significant Negative Effects Associated with this Group of Activities This Activity Group may involve the potential for environmental impact or the operation of noisy machinery, earthmoving or construction works, which may impact on the environment and can result in temporary disruptions to daily life. Where resource consents are required for these activities, controls are imposed as appropriate.

Activity Group: Sewerage Including Treatment and Disposal
2015-2025 Long Term Plan Page 87
Activity: Sewerage Including Treatment and Disposal Activity: Sewerage Including Treatment and Disposal Operating costs of this Activity represents approximately 12.4% of total Activity expenditure.
How this Activity Contributes to Related Community Outcomes This Activity contributes to the Community Outcomes of Environment, Economy and Living by:
Outcome Sub-outcome Major linkages Secondary linkagesEnvironment Attractive
Control over pollution levels, forms and effects Systems for protection and care Sustainable resource management
Collection treatment and disposal of wastewater to provide sanitary living conditions, protect public health and minimise damaging discharges to the environment is an essential service.
Environmental sustainability.
Economy Increasing GDP per FTE Ability to transform
Good effluent management enables industry.
Industrial and residential development. A prosperous community and economy for all Marlburians.
Living Health Access to quality housing
Sewage management and treatment is a highly significant benefit to health and also enables more intensive housing.
What is this Activity about? Collection, treatment and disposal of wastewater to provide sanitary living conditions, protect the public health and minimise damaging discharges to the environment is an essential service that contributes to:
The health of communities.
Minimising adverse environmental effects.
Industrial and residential development.
What We Do and Where We Do It Council operates four wastewater schemes in Blenheim, Picton, Havelock and Seddon. The reticulation networks at Blenheim, Renwick, Grovetown, Spring Creek, Riverlands, Cloudy Bay, Marlborough Ridge and Woodbourne drain to the sewage treatment facility at Hardings Road, Blenheim.
The plant has evolved over many years. The original aeration ponds have been augmented with the treatment ponds that formerly served the PPCS meat processing plant. There have been major upgrades to the plant in recent years to meet the rapidly growing demands of the wine industry. Work has recently been completed on the construction of a major new wetland, tertiary treatment and outfall that will deliver improved effluent quality and facilitate irrigation to land. A new outfall pipeline has been constructed into the Wairau River estuary.
Picton and Waikawa are served by an extended aeration treatment plant, completed in 1999. The plant performs very well and produces an effluent of consistent high quality. The old outfall pipeline that used to be conspicuous along the shore of Kaipupu Point has now been replaced by a new and improved under water pipe, and the old pipeline has been removed. Traditional oxidation ponds are used to treat effluent at Havelock and Seddon.
The cost of providing wastewater infrastructure is high and becomes increasingly expensive as larger and more complex equipment is installed to meet the higher standards of discharge quality and reliability demanded by modern society. It is common policy for the costs of the scheme to be borne only by the beneficiaries.
Subsequently the installation and maintenance of wastewater infrastructure becomes tenable only for reasonably large and concentrated population centres.
Around 85% of Marlborough’s population is on the reticulated wastewater system. Rural locations rely on individual on-site treatment/disposal systems or small community based reticulation and treatment. The initial cost of on-site treatment is often more affordable for small and dispersed settlements but require suitable ground conditions for percolation of supernatant liquors and an on-going monitoring and maintenance commitment. Permeable soils, a low residual water table and a reasonably flat topography are good attributes for an efficient on-site treatment system.
There are many areas of Marlborough where on-site sewage disposal are operated in difficult conditions. For example, further growth in many areas of the Marlborough

Activity Group: Sewerage Including Treatment and Disposal
Page 88 2015-2025 Long Term Plan
Sounds is inhibited by the lack of sewage disposal options. Failing treatment systems cause insanitary conditions and pollution of local water courses and groundwater with a subsequent deterioration to the ecological, recreational and living environment. In these circumstances, a community wide treatment scheme may become more attractive to residents of small communities.
Reticulation has recently been installed in Grovetown, St Andrews, and the David/Severne Street areas of Blenheim. Installation costs were reduced by using a modern grinder pump system but connection costs were still considered high by some residents.
Why we Provide the Service we do The levels of service for the wastewater service have been determined by the features of the Activity most valued by our customers.
Environmental Risks – the marine and riverine environments are important commercial, recreational and cultural environments. Fisheries, aquaculture, tourism, water sports and leisure activities depend on good quality water. Iwi have a deep cultural relationship with the natural environment. Effluent quality from the treatment plants is strictly controlled by resource consent. Sampling routines have been imposed to check the quality of the outfall discharge of each of the plants and on the shellfish ecology in the vicinity of two of the plants.
Treatment plants can become overloaded by highly concentrated wastewater. Vigilance is required to monitor trade wastes discharging into the networks particularly of the smaller treatment plants.
Excessive wastewater volumes can lead to inadequate treatment at the plants and overflows from the reticulation. Most surcharging in the system is derived from rainwater entering the reticulation through inflow and infiltration during storms. There is a continuous programme to identify and remedy sources of leakage into the system. There is a formal process for Assets and Services Department to advise Council’s Regulatory Department, Public Health and major stakeholders if an overflow occurs, so that a recovery plan can be agreed and monitored.
Reliability and capacity - Blockages and pump breakdowns can cause occasional problems. They need rapid detection and response to prevent wastewater build-up and overflow into the environment. Repeated breakdowns in the system may be of considerable inconvenience to customers who are unable to drain wastewater from their property and may also be an indication to Council of a deteriorating asset or inadequate operational maintenance.
Timely and responsive service – A constant and reliable wastewater service is often taken for granted, however all systems are likely to breakdown or fail from time to time.
The Council cannot guarantee a 24/7 wastewater drainage but do endeavour to remedy faults as quickly as possible.
Many blockages occur on laterals (the smaller pipes connecting the property to the mains in the road). Customer Service staff are trained to question customers reporting blockages to try to establish whether the problem is on the customers pipe within the property or is the responsibility of the Council. Sewers maybe partially blocked causing them to drain slowly and restricting the service. More severely blocked sewers will quickly back-up and be at risk of overflowing. Service requests are prioritised based on the severity and the number of customers affected.
Council aims to restore toilet facilities to customers within six hours of the notification of a breakdown, either by repairing the fault or by providing temporary toilet facilities where significant repairs are required.
Sustainable Service - Responsible stewardship of major infrastructure requires the Council to repair, renew and upgrade the assets in a timely fashion and avoid accumulating a legacy of decrepit assets. Decisions have to be made as to when it is cost effective to replace failing assets rather than to continue to repair them. Routine maintenance is important for wastewater systems to ensure assets are clean and functioning correctly and plant is serviced to prevent premature failure.
Asset Description The table provides an overview of the extent of Council’s sewerage reticulation network:
Area Sub Area Pipeline Length (kms)
Number of Connections
Blenheim
Blenheim 202 12,106Renwick 13.9 Included in Blenheim
Spring Creek 3.9 Included in Blenheim
Riverlands 4.0 Included in Blenheim
Grovetown 16.9 Included in Blenheim
Picton 48.8 2,497Havelock 10.2 287Seddon 7.4 224Total 304.7 15,114
There are four treatment plants at Blenheim (Hardings Road), Havelock, Picton, Seddon; (Spring Creek decommissioned); 59 sewer pump stations and 150 sewer grinder pumps. The asset base has grown considerably over the last 10 years to meet

Activity Group: Sewerage Including Treatment and Disposal
2015-2025 Long Term Plan Page 89
the growth in wastewater (domestic and industrial) and the higher standards imposed by an increasingly environmentally conscious population.
The total asset value for the Sewerage Activity as at 30 June 2014 is $149.2 million. Detailed information on these assets is provided in the Wastewater Asset Management Plans.
Major Budgeted Capital Projects The table outlines the major budgeted projects and areas of expenditure proposed for this Activity over the next 10 years. Although these items are budgeted, in some cases further public consultation will be required with the relevant community before the project is implemented. These projects are also listed under the Capital Expenditure line of the Funding Impact Statement at the end of this Activity section.
Areas Major Capital Projects Inflated value (Millions)
Blenheim
2015-21 Reticulation upgrades to provide capacity for growth, particularly new residential zones in the northwest.
$8.4
2019-21 Reticulation upgrades and pump station for Burleigh area. $2.8
2019-21 Seismic strengthening of Main Outfall Pump Station in Alabama Road. $7.3
2021-24 Pump station upgrade at Nelson Street. $2.2
2024-25 Pump station upgrade at Battys Road. $5.8
Picton
2015-19 Pump station upgrades and trunk sewer. $20.4
2015-17 New treatment plant at Dublin Street. $2.4 2017-18 Aeration upgrade. $0.7
Riverlands 2016-17 Sewerage treatment for industrial capacity upgrade. $1.9
Seddon 2015-22 Sewerage treatment upgrade. $1.3
St Andrews 2017-18 New reticulation of sewerage system and connection to Blenheim. $1.1
Havelock 2015-17 Sewerage treatment upgrade. $0.8
Emerging Issues and Expected Changes The upgrade of Blenheim Sewage Treatment Plant has been completed. The
discharge to the Opawa River has been discontinued. The use of the new wetland, operation of the upgraded outfall to Wairau River mouth adjacent to the Wairau Bar and irrigating treated effluent to land has commenced.
Increasing treatment capacity at BSTP to meet continuing growth in trade waste.
Significant upgrades of the sewerage reticulation network are planned for Blenheim and Picton over the next 10 years to reduce and control overflows.
Consideration for upgrading Havelock’s oxidation pond system to allow for industrial growth.
The management and control of rainfall derived inflow and ground water infiltration into the wastewater reticulation.
Infrastructure renewal is becoming necessary across all networks as pipelines near the end of their useful life, in particular in Picton.
Failure of on-site wastewater treatment systems in unsewered townships and rural residential areas.
The Main Outfall Pump Station (MOPS) at Riverlands will require major upgrade works to improve its earthquake resistance. It was decided by Council that it would be more economically viable to rebuild the pump station in 2017.
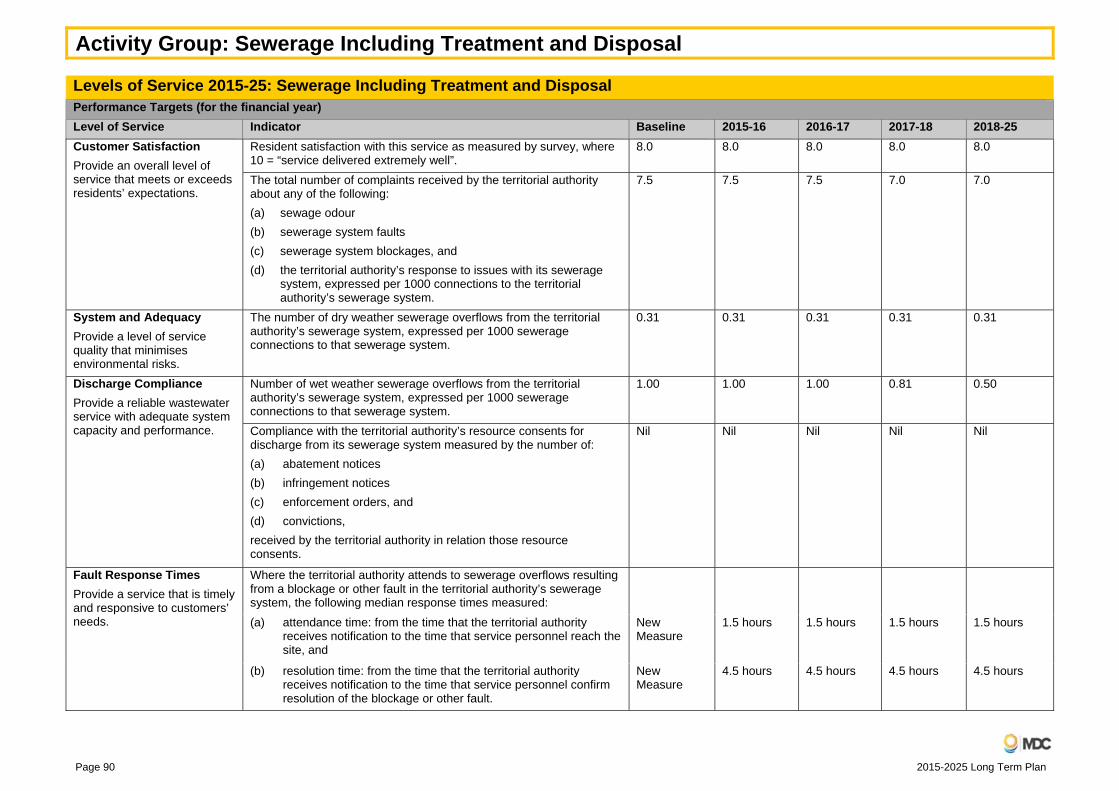
Activity Group: Sewerage Including Treatment and Disposal
Page 90 2015-2025 Long Term Plan
Levels of Service 2015-25: Sewerage Including Treatment and Disposal Performance Targets (for the financial year) Level of Service Indicator Baseline 2015-16 2016-17 2017-18 2018-25 Customer Satisfaction Provide an overall level of service that meets or exceeds residents’ expectations.
Resident satisfaction with this service as measured by survey, where 10 = “service delivered extremely well”.
8.0 8.0 8.0 8.0 8.0
The total number of complaints received by the territorial authority about any of the following: (a) sewage odour (b) sewerage system faults (c) sewerage system blockages, and (d) the territorial authority’s response to issues with its sewerage
system, expressed per 1000 connections to the territorial authority’s sewerage system.
7.5 7.5 7.5 7.0 7.0
System and Adequacy Provide a level of service quality that minimises environmental risks.
The number of dry weather sewerage overflows from the territorial authority’s sewerage system, expressed per 1000 sewerage connections to that sewerage system.
0.31 0.31 0.31 0.31 0.31
Discharge ComplianceProvide a reliable wastewater service with adequate system capacity and performance.
Number of wet weather sewerage overflows from the territorial authority’s sewerage system, expressed per 1000 sewerage connections to that sewerage system.
1.00 1.00 1.00 0.81 0.50
Compliance with the territorial authority’s resource consents for discharge from its sewerage system measured by the number of: (a) abatement notices (b) infringement notices (c) enforcement orders, and (d) convictions, received by the territorial authority in relation those resource consents.
Nil Nil Nil Nil Nil
Fault Response TimesProvide a service that is timely and responsive to customers’ needs.
Where the territorial authority attends to sewerage overflows resulting from a blockage or other fault in the territorial authority’s sewerage system, the following median response times measured:
(a) attendance time: from the time that the territorial authority receives notification to the time that service personnel reach the site, and
New Measure
1.5 hours 1.5 hours 1.5 hours 1.5 hours
(b) resolution time: from the time that the territorial authority receives notification to the time that service personnel confirm resolution of the blockage or other fault.
New Measure
4.5 hours 4.5 hours 4.5 hours 4.5 hours

Activity Group: Sewerage Including Treatment and Disposal
2015-2025 Long Term Plan Page 91
Note 1: The increase in cost of service is due to the identified capital works and projects.
Funding Impact Statement for 2015-25Sewerage AP 2014.15 2015.16 2016.17 2017.18 2018.19 2019.20 2020.21 2021.22 2022.23 2023.24 2024.25
$000's $000's $000's $000's $000's $000's $000's $000's $000's $000's $000'sSources of operating funding
Targeted rates 7,753 7,898 8,321 9,473 9,985 10,486 10,981 11,530 11,626 11,830 11,994Fees and charges 62 62 64 65 67 69 71 73 76 78 81Other receipts 1,856 1,936 1,943 2,213 2,286 2,362 2,443 2,531 2,623 2,723 2,780
Total operating funding 9,671 9,896 10,328 11,751 12,338 12,917 13,495 14,134 14,325 14,631 14,855Applications of operating funding
Payments to staff and suppliers 3,553 2,802 2,934 2,920 3,121 3,181 3,335 3,547 3,607 3,760 3,928Finance costs 2,661 3,032 3,779 4,167 4,261 4,288 4,340 4,372 4,157 3,935 3,554Internal charges and overheads applied 1,129 1,863 1,931 1,996 2,026 2,053 2,099 2,154 2,209 2,277 2,341
Total applications of operating funding 7,343 7,697 8,644 9,083 9,408 9,522 9,774 10,073 9,973 9,972 9,823Surplus (deficit) of operating funding 2,328 2,199 1,684 2,668 2,930 3,395 3,721 4,061 4,352 4,659 5,032
Sources of capital fundingDevelopment and financial contributions 140 462 458 496 515 529 545 562 581 601 622Increase (decrease) in debt (400) 11,370 12,458 1,142 8,177 588 11,422 254 262 271 7,435
Total sources of capital funding (260) 11,832 12,916 1,638 8,692 1,117 11,967 816 843 872 8,057Applications of capital funding
Capital expenditure to meet additional demand 1,035 5,787 7,189 1,937 3,334 412 3,202 707 197 533 5,177Capital expenditure to improve the level of service 1,700 4,248 5,417 2,233 2,783 739 5,501 1,275 424 1,330 1,679Capital expenditure to replace existing assets 560 4,013 4,869 548 2,317 630 3,023 1,051 601 1,213 994Increase (decrease) in reserves (1,227) (17) (2,875) (412) 3,188 2,731 3,962 1,844 3,973 2,455 5,239
Total applications of capital funding 2,068 14,031 14,600 4,306 11,622 4,512 15,688 4,877 5,195 5,531 13,089Surplus (deficit) of capital funding (2,328) (2,199) (1,684) (2,668) (2,930) (3,395) (3,721) (4,061) (4,352) (4,659) (5,032)
Funding balance - - - - - - - - - - -ReconciliationTotal applications of operating funding 7,343 7,697 8,644 9,083 9,408 9,522 9,774 10,073 9,973 9,972 9,823
plus - Depreciation and amortisation 2,880 2,861 3,283 3,994 4,150 4,450 4,734 5,042 5,243 5,454 5,710Expenditure as per Statement of Financial Performance 10,223 10,558 11,927 13,077 13,558 13,972 14,508 15,115 15,216 15,426 15,533
Operating expenditureCombined scheme 8,155 8,522 9,784 10,797 11,202 11,592 12,102 12,676 12,743 12,916 13,135Riverlands Industrial 1,898 1,887 1,998 2,090 2,119 2,151 2,187 2,225 2,268 2,315 2,212St Andrews (new) 21 7 7 60 111 108 106 104 102 99 96Loan units (no-lump sum) 149 142 136 130 126 122 115 109 104 97 90
Capital expenditure (including vested assets):Combined scheme 3,227 14,093 15,667 3,699 8,559 1,879 11,643 2,968 1,335 3,119 7,897Riverlands Industrial 128 51 737 6 6 6 6 7 7 7 7Tuamarina (new) - - - - - - - - - - -St Andrews (new) - - - 1,142 - - - 199 - - -

Activity Group: Stormwater Drainage
Page 92 2015-2025 Long Term Plan
Stormwater Drainage

Activity Group: Stormwater Drainage
2015-2025 Long Term Plan Page 93
Stormwater Drainage Operating Costs The operating costs for the Stormwater Drainage Group of Activities represents $28 million of total Council expenditure.
Capital Projects The capital expenditure for the Stormwater Drainage Group of Activities represents $20 million of total Council expenditure over the next 10 years. Information about the major budgeted capital projects are included under the respective Activities sections.
Rationale for the Delivery of Stormwater Drainage Group of Activities It is mandatory that Stormwater Drainage is an Activity Group.
Changes to Stormwater Drainage Activity Group from the 2014-15 Annual Plan There are no changes to the levels of service for this Activity Group.
Intended Changes to Levels of Service from the 2014-15 Annual Plan The table describes any intended changes to the levels of service within the group from the levels of service displayed in the 2014-15 Annual Plan. The reasons for the intended changes are also described.
2014-15 Annual Plan 2015-25 LTP Reason for changesActivity: Stormwater DrainageMinimise the environmental risks of stormwater discharge.
Discharge compliance.
To reflect new national mandatory performance measure.
Provide a reliable stormwater service.
System adequacy. To reflect new national mandatory performance measure.
Provide a service that is timely and responsive to current needs.
Response times. To reflect new national mandatory performance measure.
Provide a stormwater service that is sustainable.
None. Level of service to be maintained, but reporting to be covered by new ‘Essential Services Benchmark’ as per the Local Government (Financial Reporting and Prudence) Regulations 2014, section 10d.
Variation Between Long Term Plan and the Assessment of Water and Sanitary Services There is no significant variation between the adopted assessment of water and sanitary services and this Plan.
Significant Negative Effects Associated with this Group of Activities This Activity Group may involve the potential for environmental impact or the operation of noisy machinery, earthmoving or construction works, which may impact on the environment and can result in temporary disruptions to daily life. Where resource consents are required for these activities, controls are imposed as appropriate.

Activity Group: Stormwater Drainage
Page 94 2015-2025 Long Term Plan
Activity: Stormwater Drainage Activity: Stormwater Drainage
Operating costs of this Activity represents approximately 2.5% of total Activity expenditure.
How this Activity Contributes to Related Community Outcomes This activity contributes to the Community Outcomes of Environment, Economy and People by:
Outcome Sub-outcome Major linkages Secondary linkagesEnvironment Systems for
protection and care Sustainable resource management
Stormwater control and drainage management provide major environmental, economic and social benefits. Residents and their property are safeguarded from the risks of stormwater flooding. Flood-free land facilitates commercial and residential development. Environmental sustainability is managed through quality of urban stormwater run-off.
Council owned floodway land can have secondary uses of public access and recreation or, ecological and amenity plantings.
People Quality jobs Increasing incomes Increasing capital wealth
Economy Increasing GDP per FTE Productivity
What is this Activity About? Council provides a stormwater drainage system to manage stormwater run-off from urban catchments. Collection and disposal of stormwater contributes to:
Safety of the community by minimising the incidence of flooding.
Minimising damage to properties from flooding.
Reduced erosion.
Facilitating commercial and residential development.
The aquatic environment through the management of water quality from urban stormwater runoff.
What we do and Where we do It The cost of providing stormwater infrastructure is high and rapidly increases as larger capacity is provided to meet higher standards of drainage and flood protection. It is policy for only the beneficiaries of a scheme to bear the associated costs. Therefore the construction and maintenance of stormwater infrastructure only becomes tenable for reasonably large and concentrated population centres. Rural locations frequently rely on natural channels and local experience to avoid flooding of dwellings and out-buildings. In some areas, flood protection works are undertaken by Council’s Rivers and Land Drainage Department that provides a wider protection to rural land and properties.
The urban stormwater systems can be categorised into two parts: The natural components comprise waterways and ponding areas, whilst the constructed system consists of stormwater mains, manholes, inlet sumps, pump stations, retention areas, secondary flow paths and soak holes. Picton and Blenheim account for over 90% of the stormwater reticulation (see table below).
The flat terrain on which much of Blenheim is sited means that the stormwater reticulation is laid at very flat grades. The reticulation drains to either the natural water courses or man-made drains were constructed primarily for agricultural drainage purposes. Accommodating growth into the existing infrastructure whilst maintaining standards is proving challenging.
The settlements at Picton/Waikawa lie at the base of a number of steep natural catchments that quickly accumulate and concentrate stormwater into managed watercourses that run through the urban area.
Why we Provide the Service we do The levels of service have been determined on the features of the Activity that are most valued by our customers:
Environmental Risks - Rainwater falling on urban areas pick-up and carry all-sorts of materials and also dissolve harmful substances into solution. The stormwater is then discharged into natural watercourses. Council owned stormwater systems must take reasonable care to prevent the conveyance of pollutants into the natural environment. Pro-active measures to prevent the deliberate and reckless tipping of contaminants into the stormwater system is undertaken by education and regulation. High risk activities are required to install interceptors into their drains and cover impermeable

Activity Group: Stormwater Drainage
2015-2025 Long Term Plan Page 95
areas from rain. If a pollution event occurs Council will respond to mitigate the effects and investigate the cause.
The quality of stormwater outfalls are regulated through resource consents. There is a legacy of many old and out-dated consents throughout Marlborough. A major project to consolidate, rationalise and update the legal framework is currently underway through the Blenheim Stormwater Strategy and is likely to be extended to other areas once it has been successfully implemented.
Reliable stormwater system - The efficacy of stormwater drainage can be difficult to assess as it is only required to perform at optimum capacity during relatively rare storm events. Mathematical models are used to model storms and their outcomes.
The design of the stormwater infrastructure is based on the study of historical rainfall events and the resultant flood levels to help predict the frequency that similar events will occur in the future – the average return interval (ARI). Pipes, channels, pump stations, etc are then sized to provide a level of flood protection to the community based on a chosen ARI. However, each storm event has a unique set of characteristics – the intensity and duration of the rain storm, the area over which the storm occurs, the rainfall patterns preceding the storm and changes to permeability as a result of urban infill, etc. The historical record is relatively short and it can therefore be difficult to categorise a storm by its annual return interval or accurately predict the impact it will have.
The outcome of rainfall events is also complicated by changing land use patterns and run-off characteristics from the land, weather patterns and the changing expectations and living standards of the public.
Provide a timely response - During severe storm events when flooding is predicted the Council will mobilise an Incident Management Centre to coordinate the response to emergency calls. All calls are assessed and prioritised. Those areas where there is a possibility of water entering houses or commercial buildings are given the highest priority. Second priority is given to areas where there is a possibility of water entering garages or outbuildings, followed by areas where water may pond on garden areas and roads. In the worst storms there may be little Council can do to manage the flood water as the infrastructure and natural waterways are overloaded. In these circumstances the response is to do whatever is possible to save life and reduce the damage to property.
Providing and maintaining an accurate log of responses during an emergency event can be challenging and the Council continue to refine their recording systems.
Sustainable stormwater - Responsible stewardship of major infrastructure requires the Council to repair, renew and upgrade the assets in a timely fashion and avoid accumulating a legacy of decrepit assets. Decisions have to be made as to when it is no longer cost effective to continue to repair failing assets and to replace them instead. The decision making process is influenced by the need for additional capacity, higher quality and rising standards.
Asset Description The table below provides a summary of stormwater reticulation lengths by area:
Area Reticulation length (Kms)
Blenheim 122.7
Picton/Waikawa 28.6
Renwick 4.9
Okiwi Bay 0.8
Riverlands 5.5
Spring Creek 3.4
Seddon/Grovetown/Anakiwa 1.3
Rai Valley 0.3
Havelock 1.4
Total 169.1
The total asset value for the Stormwater Drainage Activity at 30 June 2014 is $69.1 million. Detailed information on these assets, including information on levels of service performance is provided in the Stormwater Asset Management Plan.
Urban populations are required to site their building platforms at an elevation that provides them with a level of flood protection whilst the stormwater infrastructure is designed and sized to drain the water to natural or man-made water courses. Buried pipes and open channels are expensive to build and maintain and it is often expedient to use a combination of reticulation and road surfaces as secondary flow paths to channel away high rain flows.
The stormwater system is managed in close cooperation with Rivers and Drainage networks. Planning of future stormwater infrastructure must ensure the downstream water course has sufficient capacity for the proposed development.

Activity Group: Stormwater Drainage
Page 96 2015-2025 Long Term Plan
Major Budgeted Capital Projects The table outlines the major budgeted projects and areas of expenditure proposed for this Activity over the next 10 years. Although these items are budgeted, in some cases further public consultation will be required with the relevant community before the project is implemented. These projects are also listed under the Capital Expenditure line of the Funding Impact Statement at the end of this Activity section.
Areas Major Capital Projects Inflated value (Millions)
Blenheim 2016-25 Stormwater catchment upgrades. $12.0 2022-24 Pipelines at Murphys Creek. $2.9
Emerging Issues and Expected Changes Stormwater management in Blenheim is a challenge for the town, both currently and in the future. Many challenges are created by the flat topography and unique and sensitive receiving environments. Council has approved a stormwater strategy which provides clear direction and an integrated approach in managing Blenheim's stormwater into the future. This strategy sets out a 10 year plan of Activity and provides a comprehensive framework to manage both the quality and quantity of stormwater. It also provides for an overhaul of the resource consent structure for Blenheim’s stormwater. The strategy requires clear responsibility, improved integration, rigorous monitoring and a more modern approach to regulation. Ongoing investment in the stormwater strategy is expected to return a much improved infrastructure operating in harmony with Blenheim's sensitive receiving environments. Stormwater management is a significant factor in the identification and planning of new urban development pockets as part of the Urban Development Strategy.
The impact of climate change is also a factor that is becoming increasingly important in future planning. The current indications are that extreme weather events will become more frequent and more intense. Existing design standards and infrastructure will be severely tested by changing weather patterns.
The following issues are emerging within this Activity:
Improvement of urban stormwater systems and associated river drainage in Blenheim and Picton.
Lack of stormwater reticulation systems in rural towns.
Review of stormwater discharge consents.
Urban growth.
Climate change.
Increasing public expectations on the performance of stormwater networks to remove flood water more quickly on or close to properties.
Increasing public expectations for the quality of waterways into which urban stormwater is discharged.

Activity Group: Stormwater Drainage
2015-2025 Long Term Plan Page 97
Levels of Service 2015-25: Stormwater Drainage
Performance Targets (for the financial year)Level of Service Indicator Baseline 2015-16 2016-17 2017-18 2018-25 Customer satisfactionProvide an overall level of service that meets or exceeds residents’ expectations.
Resident satisfaction with this service as measured by survey, where 10 = “service delivered extremely well”.
6.6 6.7 6.7 6.7 6.8
The number of complaints received by a territorial authority about the performance of its stormwater system, expressed per 1000 properties connected to the territorial authority’s stormwater system.
2 2 2 2 1.8
System adequacy Provide a reliable stormwater service.
The number of flooding events that occur in a territorial authority district.
Actual number to be reported
Actual number to be reported
Actual number to be reported
Actual number to be reported
Actual number to be reported
For each flooding event, the number of habitable floors affected, expressed per 1000 properties connected to the territorial authority’s stormwater system.
3 3 3 3 2.8
Discharge complianceMinimise the environmental risks of stormwater discharge.
Compliance with the territorial authority’s resource consents for discharge from its stormwater system, measured by the number of: (a) abatement notices (b) infringement notices (c) enforcement orders, and (d) convictions, received by the territorial authority in relation those resource consents.
Nil Nil Nil Nil Nil
Response timesProvide a service that is timely and responsive to customers’ needs.
The median response time to attend a flooding event, measured from the time that the territorial authority receives notification to the time that service personnel reach the site.
1 hour 1 hour 1 hour 1 hour 1 hour
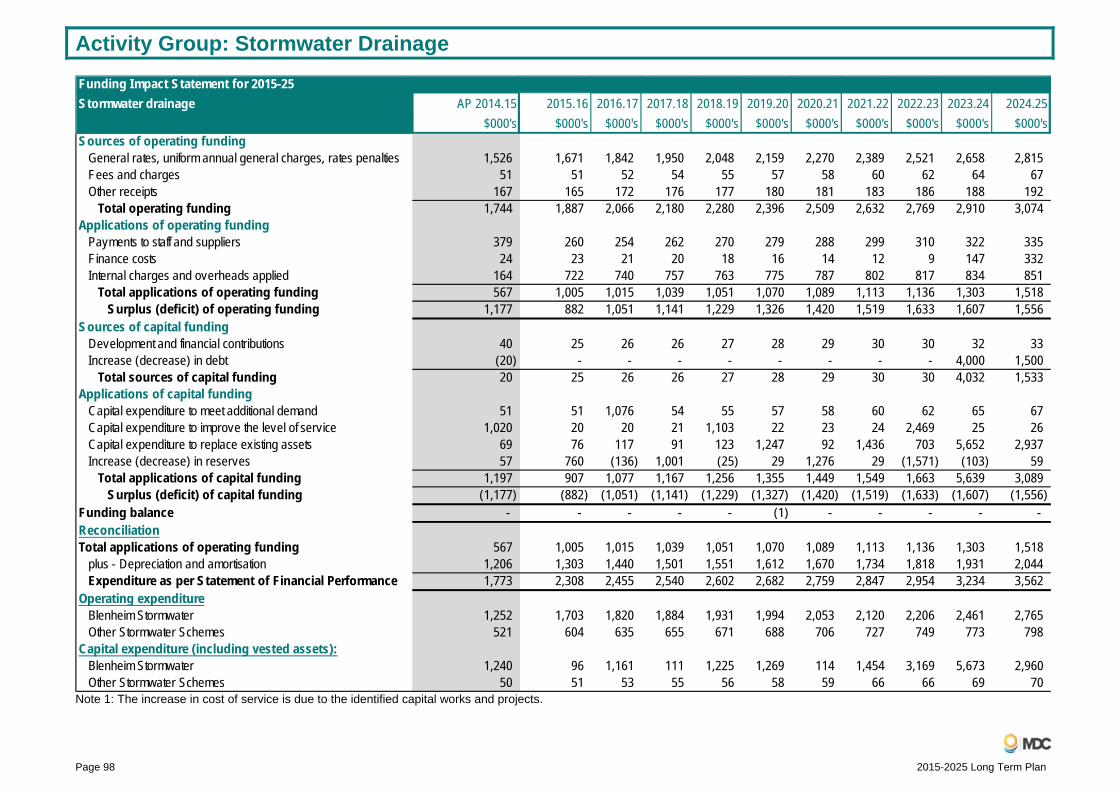
Activity Group: Stormwater Drainage
Page 98 2015-2025 Long Term Plan
Note 1: The increase in cost of service is due to the identified capital works and projects.
Funding Impact Statement for 2015-25Stormwater drainage AP 2014.15 2015.16 2016.17 2017.18 2018.19 2019.20 2020.21 2021.22 2022.23 2023.24 2024.25
$000's $000's $000's $000's $000's $000's $000's $000's $000's $000's $000'sSources of operating funding
General rates, uniform annual general charges, rates penalties 1,526 1,671 1,842 1,950 2,048 2,159 2,270 2,389 2,521 2,658 2,815Fees and charges 51 51 52 54 55 57 58 60 62 64 67Other receipts 167 165 172 176 177 180 181 183 186 188 192
Total operating funding 1,744 1,887 2,066 2,180 2,280 2,396 2,509 2,632 2,769 2,910 3,074Applications of operating funding
Payments to staff and suppliers 379 260 254 262 270 279 288 299 310 322 335Finance costs 24 23 21 20 18 16 14 12 9 147 332Internal charges and overheads applied 164 722 740 757 763 775 787 802 817 834 851
Total applications of operating funding 567 1,005 1,015 1,039 1,051 1,070 1,089 1,113 1,136 1,303 1,518Surplus (deficit) of operating funding 1,177 882 1,051 1,141 1,229 1,326 1,420 1,519 1,633 1,607 1,556
Sources of capital fundingDevelopment and financial contributions 40 25 26 26 27 28 29 30 30 32 33Increase (decrease) in debt (20) - - - - - - - - 4,000 1,500
Total sources of capital funding 20 25 26 26 27 28 29 30 30 4,032 1,533Applications of capital funding
Capital expenditure to meet additional demand 51 51 1,076 54 55 57 58 60 62 65 67Capital expenditure to improve the level of service 1,020 20 20 21 1,103 22 23 24 2,469 25 26Capital expenditure to replace existing assets 69 76 117 91 123 1,247 92 1,436 703 5,652 2,937Increase (decrease) in reserves 57 760 (136) 1,001 (25) 29 1,276 29 (1,571) (103) 59
Total applications of capital funding 1,197 907 1,077 1,167 1,256 1,355 1,449 1,549 1,663 5,639 3,089Surplus (deficit) of capital funding (1,177) (882) (1,051) (1,141) (1,229) (1,327) (1,420) (1,519) (1,633) (1,607) (1,556)
Funding balance - - - - - (1) - - - - -ReconciliationTotal applications of operating funding 567 1,005 1,015 1,039 1,051 1,070 1,089 1,113 1,136 1,303 1,518
plus - Depreciation and amortisation 1,206 1,303 1,440 1,501 1,551 1,612 1,670 1,734 1,818 1,931 2,044Expenditure as per Statement of Financial Performance 1,773 2,308 2,455 2,540 2,602 2,682 2,759 2,847 2,954 3,234 3,562
Operating expenditureBlenheim Stormwater 1,252 1,703 1,820 1,884 1,931 1,994 2,053 2,120 2,206 2,461 2,765Other Stormwater Schemes 521 604 635 655 671 688 706 727 749 773 798
Capital expenditure (including vested assets):Blenheim Stormwater 1,240 96 1,161 111 1,225 1,269 114 1,454 3,169 5,673 2,960Other Stormwater Schemes 50 51 53 55 56 58 59 66 66 69 70

Activity Group: Water Supply
2015-2025 Long Term Plan Page 99
Water Supply

Activity Group: Water Supply
Page 100 2015-2025 Long Term Plan
Water Supply Operating Costs The operating costs for the Water Supply Group of Activities represents $109 million of total Council expenditure.
Capital Projects The capital expenditure for the Water Supply Group of Activities represents $52 million of total Council expenditure over the next 10 years. Information about the major budgeted capital projects are included under the respective Activities sections.
Rationale for the Delivery of Water Supply Group of Activities It is mandatory that Water Supply is an Activity Group.
Changes to Water Supply Activity Group from the 2014-15 Annual Plan There are no changes to this Activity Group.
Intended Changes to Levels of Service from the 2014-15 Annual Plan The table describes any intended changes to the levels of service within the group from the levels of service displayed in the 2014-15 Annual Plan. The reasons for the intended changes are also described.
2014-15 Annual Plan 2015-25 LTP Reason for changes Activity: Water SupplyProvide a level of water quality that meets community needs and is appropriate to the degree of public health risk.
Safety of drinking water.
To reflect new national mandatory performance measure.
None. Maintenance of the reticulation network.
To reflect new national mandatory performance measure.
None. Fault response times.
Provide a service that is timely and responsive to customers’ needs.
None. Customer satisfaction.
Provide a service that is timely and responsive to customers’ needs.
None. Demand management.
Provide a service that is timely and responsive to customers’ needs.
Provide a sustainable water supply.
None. Level of service to be maintained, but reporting to be covered by new ‘Essential Services Benchmark’ as per the Local Government (Financial Reporting and Prudence) Regulations 2014, section 10d.

Activity Group: Water Supply
2015-2025 Long Term Plan Page 101
Variation Between Long Term Plan and the Assessment of Water and Sanitary Services There is no significant variation between the adopted assessment of water and sanitary services and this Plan.
Significant Negative Effects Associated with this Group of Activities This Activity Group may involve the potential for environmental impact or the operation of noisy machinery, earthmoving or construction works, which may impact on the environment and can result in temporary disruptions to daily life. Where resource consents are required for these activities, controls are imposed as appropriate.

Activity Group: Water Supply
Page 102 2015-2025 Long Term Plan
Activity: Water Supply Activity: Water Supply
Operating costs of this Activity represents approximately 9.8% of total Activity expenditure.
How this Activity Contributes to Related Community Outcomes This Activity contributes to the Community Outcomes of Environment, Economy and Living by:
Outcome Sub-outcome Major linkages Secondary linkagesEnvironment Sustainable
resource management Control over pollution levels, forms and effects Systems for protection and care
Planned, efficient water reticulation helps ensure a scarce resource can be sustainably managed. Water is essential for much of Marlborough’s economy. Water supply is a key factor in housing location. Drinking water can present very serious health risks if not of good quality.
The health of the community. Community safety through the firefighting capability of the water supply system. Industrial and residential development.
Economy Increasing GDP per FTE Ability to transform Productivity
Living Health Access to quality housing
What is this Activity About? Council drinking water supplies are necessary so that larger communities can receive an adequate supply of potable, ie; drinkable water thereby contributing cost effectively to:
The health of the community.
Minimising adverse environmental effects.
Community safety through the fire fighting capability of the water supply system.
Industrial and residential development.
What we do and Where we do It Council operates seven drinking water supply schemes in Blenheim, Picton, Havelock, Renwick, Riverlands, Wairau Valley and Awatere (including Seddon). Council also operates a piped irrigation scheme for the Southern Valleys’ area (see Regional Development Activity Group) of the Wairau Plains and provides a small irrigation supply to the Riverlands area. Providing reticulated irrigation supply enables a wider range of land uses contributing to the economic wellbeing of the community.
Around 82% of the population of Marlborough are supplied from Council reticulated supplies. Underground water reticulation systems are expensive to install and maintain and are only cost effective at a certain level of population density. The Awatere water supply scheme for example was initiated as rural water scheme predominantly to provide water for stock. It has a similar length of reticulation as Blenheim but only 7% of the population. Funding depreciation and upgrades (particularly to meet drinking water standards) is an ongoing issue for schemes of this sort.
Many of the smaller Marlborough settlements have individual private boreholes, springs, surface water abstraction, rainwater harvesting or are part of a small community run scheme.
Drin
king
W
ater
Sour
ce
Ret
icul
atio
n Le
ngth
(km
s)
Serv
ice
conn
ectio
ns
Cur
rent
Tr
eatm
ent
Cur
rent
C
ompl
ianc
e w
ith
DW
SNZ6F
Awatere (including Seddon)
Black Birch Stream 153 748
MIOX (chlorine) disinfection meeting compliance for bacteriological section of Drinking Water Standards.
No.7
7 Protozoal compliance not met. An application for Drinking Water CAP funding is being made to Ministry of Health for the 2015 subsidy round to assist funding for treatment of water to Seddon.
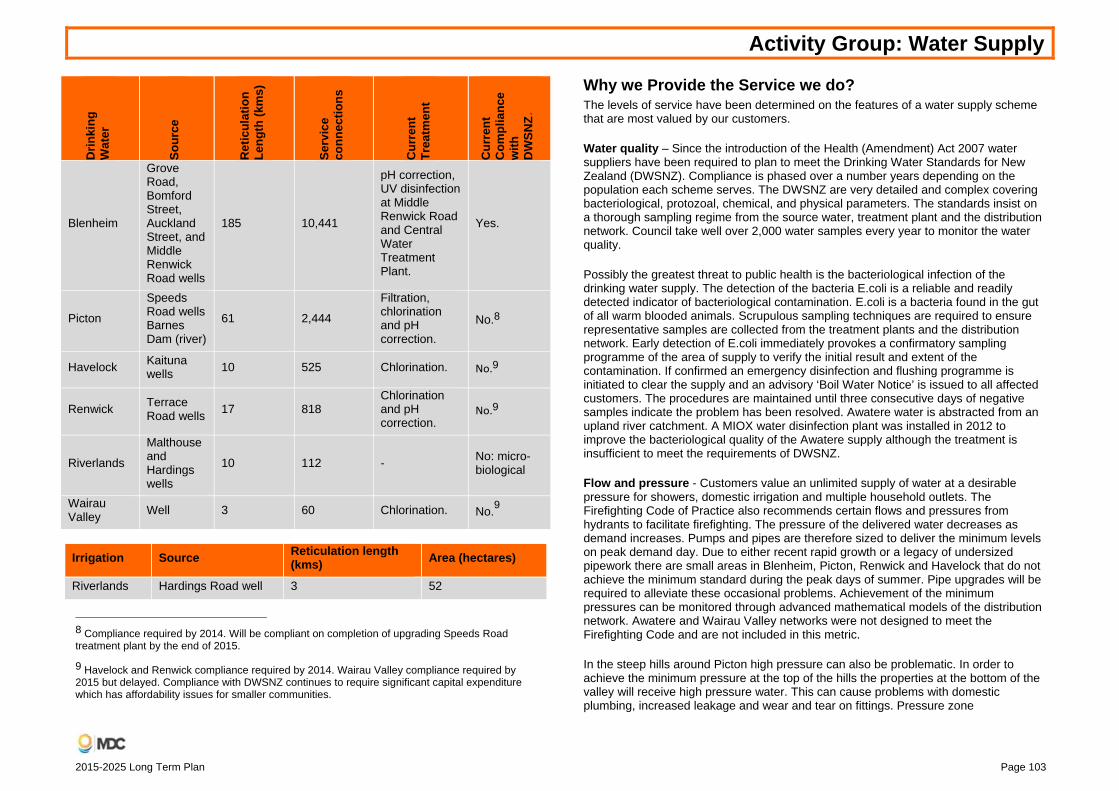
Activity Group: Water Supply
2015-2025 Long Term Plan Page 103
Drin
king
W
ater
Sour
ce
Ret
icul
atio
n Le
ngth
(km
s)
Serv
ice
conn
ectio
ns
Cur
rent
Tr
eatm
ent
Cur
rent
C
ompl
ianc
e w
ith
DW
SNZ6F
Blenheim
Grove Road, Bomford Street, Auckland Street, and Middle Renwick Road wells
185 10,441
pH correction, UV disinfection at Middle Renwick Road and Central Water Treatment Plant.
Yes.
Picton
Speeds Road wells Barnes Dam (river)
61 2,444
Filtration, chlorination and pH correction.
No.8
Havelock Kaituna wells 10 525 Chlorination. No.9
Renwick Terrace Road wells 17 818
Chlorination and pH correction.
No.9
Riverlands
Malthouse and Hardings wells
10 112 - No: micro-biological
Wairau Valley Well 3 60 Chlorination. No.9
Irrigation Source Reticulation length (kms) Area (hectares)
Riverlands Hardings Road well 3 52
8 Compliance required by 2014. Will be compliant on completion of upgrading Speeds Road treatment plant by the end of 2015.
9 Havelock and Renwick compliance required by 2014. Wairau Valley compliance required by 2015 but delayed. Compliance with DWSNZ continues to require significant capital expenditure which has affordability issues for smaller communities.
Why we Provide the Service we do? The levels of service have been determined on the features of a water supply scheme that are most valued by our customers.
Water quality – Since the introduction of the Health (Amendment) Act 2007 water suppliers have been required to plan to meet the Drinking Water Standards for New Zealand (DWSNZ). Compliance is phased over a number years depending on the population each scheme serves. The DWSNZ are very detailed and complex covering bacteriological, protozoal, chemical, and physical parameters. The standards insist on a thorough sampling regime from the source water, treatment plant and the distribution network. Council take well over 2,000 water samples every year to monitor the water quality.
Possibly the greatest threat to public health is the bacteriological infection of the drinking water supply. The detection of the bacteria E.coli is a reliable and readily detected indicator of bacteriological contamination. E.coli is a bacteria found in the gut of all warm blooded animals. Scrupulous sampling techniques are required to ensure representative samples are collected from the treatment plants and the distribution network. Early detection of E.coli immediately provokes a confirmatory sampling programme of the area of supply to verify the initial result and extent of the contamination. If confirmed an emergency disinfection and flushing programme is initiated to clear the supply and an advisory ‘Boil Water Notice’ is issued to all affected customers. The procedures are maintained until three consecutive days of negative samples indicate the problem has been resolved. Awatere water is abstracted from an upland river catchment. A MIOX water disinfection plant was installed in 2012 to improve the bacteriological quality of the Awatere supply although the treatment is insufficient to meet the requirements of DWSNZ.
Flow and pressure - Customers value an unlimited supply of water at a desirable pressure for showers, domestic irrigation and multiple household outlets. The Firefighting Code of Practice also recommends certain flows and pressures from hydrants to facilitate firefighting. The pressure of the delivered water decreases as demand increases. Pumps and pipes are therefore sized to deliver the minimum levels on peak demand day. Due to either recent rapid growth or a legacy of undersized pipework there are small areas in Blenheim, Picton, Renwick and Havelock that do not achieve the minimum standard during the peak days of summer. Pipe upgrades will be required to alleviate these occasional problems. Achievement of the minimum pressures can be monitored through advanced mathematical models of the distribution network. Awatere and Wairau Valley networks were not designed to meet the Firefighting Code and are not included in this metric.
In the steep hills around Picton high pressure can also be problematic. In order to achieve the minimum pressure at the top of the hills the properties at the bottom of the valley will receive high pressure water. This can cause problems with domestic plumbing, increased leakage and wear and tear on fittings. Pressure zone

Activity Group: Water Supply
Page 104 2015-2025 Long Term Plan
management is one of the options considered for water demand management.
Continuity and reliability – A constant and reliable water supply is often taken for granted, however all systems are likely to breakdown or fail from time to time. The Council cannot guarantee a 24/7 water supply but do endeavour to remedy faults as quickly as possible. All requests for service are prioritised based on the severity and impact.
Customers occasionally suffer from leaks inside their property and rely on the Council toby to turn-off the water. The Council do not routinely maintain tobies and cannot guarantee their serviceability. Customers should have a control valve fitted at the point of entry into the property for such emergencies, however Council makes best endeavours when such calls are received.
Sustainable asset management – Responsible stewardship of major infrastructure requires the Council to repair, renew and upgrade the assets in a timely fashion to avoid accumulating a legacy of decrepit assets. Decisions have to be made as to when it is no longer cost effective to repair failing assets and to replace them instead. The decision making process is influenced by the need for additional capacity, higher quality or greater security.
Asset Description The asset base has grown considerably over the last 10 years partly to meet the growth in demand (domestic and industrial) and more recently to meet the drinking water standards required by Health (Drinking Water) Amendment Act 2007. Total asset value on 30 June 2014 was assessed as $108.9 million and is depreciating at a rate of more than $2.9 million/year, a sum collected through the rating system.
Our pipe and service connection assets are identified in the preceding tables and our other assets are identified in the following tables:
Number of assets
per location
Asset description
Ble
nhei
m
Pict
on
Ren
wic
k
Hav
eloc
k
Aw
ater
e
Riv
erla
nds
Wai
rau
Valle
y
Riv
erla
nds
Irrig
atio
n
Borehole 9 3 3 2 0 3 1 0
Bore Pumps 9 3 3 2 0 3 1 0
Abstraction Gallery 0 0 0 0 1 0 0 0
Number of assets
per location
Asset description
Ble
nhei
m
Pict
on
Ren
wic
k
Hav
eloc
k
Aw
ater
e
Riv
erla
nds
Wai
rau
Valle
y
Riv
erla
nds
Irrig
atio
n
Impounding Dam 0 1 0 0 0 0 0 0
Treatment Works 2 2 1 1 1 1 1 0
Distribution Pumps 7 1 2 0 0 2 2 0
Storage Tanks 20 31 10 2 19 2 0 0
Booster Pumps 5 6 0 0 5 0 0 0
Valves 1,049 367 81 74 194 38 9 0
Hydrants 1,002 249 72 32 48 35 4 0
Meters 314 138 34 24 748 103 51 9
Major Budgeted Capital Projects The table outlines the major budgeted projects and areas of expenditure proposed for this Activity over the next 10 years. Although these items are budgeted, in some cases further public consultation will be required with the relevant community before the project is implemented. These projects are also listed under the Capital Expenditure line of the Funding Impact Statement at the end of this Activity section.
Areas Major Capital Projects Inflated value (Millions)
Blenheim
2015-16 New reservoir at high Taylor Pass area. $2.6
2015-25 Fire capacity pipeline upgrades. $2.5 2015-17 Strengthen of Wither reservoir. $1.5
Havelock 2018-19 New Pelorus water source. $5.4 2017-19 New treatment plant. $3.3 2017-19 Construction of additional reservoir. $0.6
Picton 2015-16 New pump station, reservoir, pipelines and treatment plant at Speeds Road. $2.0
2016-23 Universal water meters. $2.8
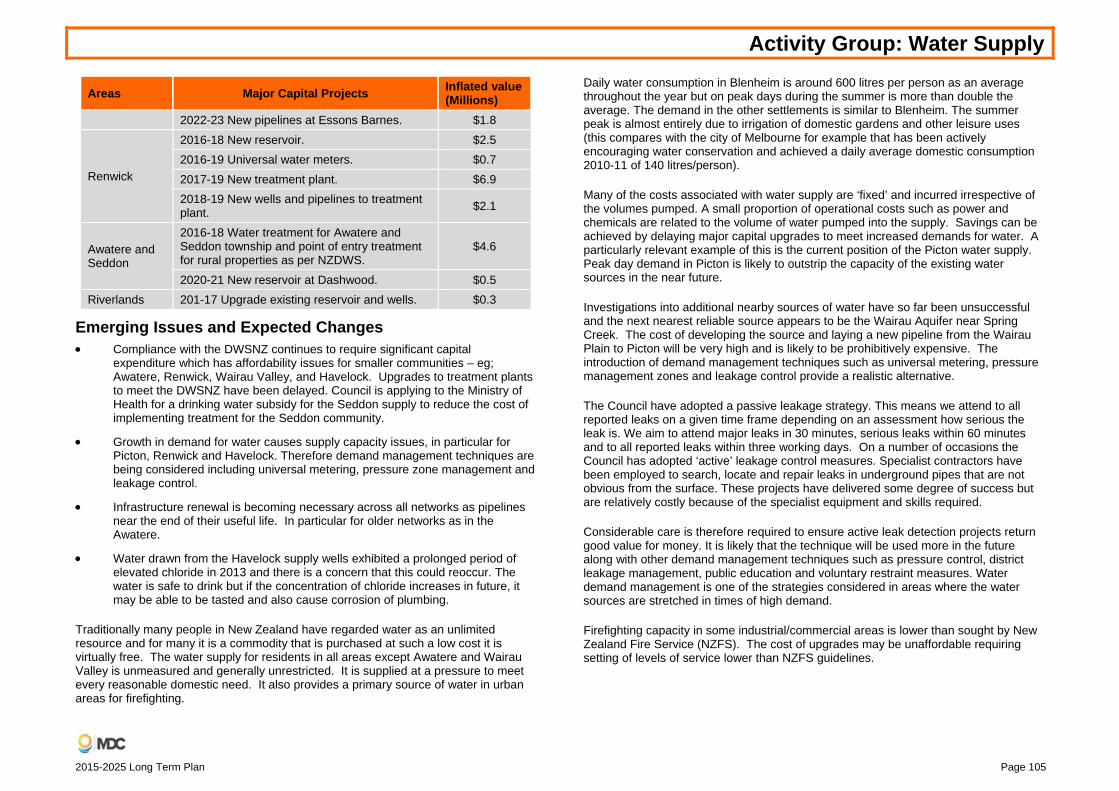
Activity Group: Water Supply
2015-2025 Long Term Plan Page 105
Areas Major Capital Projects Inflated value (Millions)
2022-23 New pipelines at Essons Barnes. $1.8
Renwick
2016-18 New reservoir. $2.5 2016-19 Universal water meters. $0.7 2017-19 New treatment plant. $6.9 2018-19 New wells and pipelines to treatment plant. $2.1
Awatere and Seddon
2016-18 Water treatment for Awatere and Seddon township and point of entry treatment for rural properties as per NZDWS.
$4.6
2020-21 New reservoir at Dashwood. $0.5 Riverlands 201-17 Upgrade existing reservoir and wells. $0.3
Emerging Issues and Expected Changes Compliance with the DWSNZ continues to require significant capital
expenditure which has affordability issues for smaller communities – eg; Awatere, Renwick, Wairau Valley, and Havelock. Upgrades to treatment plants to meet the DWSNZ have been delayed. Council is applying to the Ministry of Health for a drinking water subsidy for the Seddon supply to reduce the cost of implementing treatment for the Seddon community.
Growth in demand for water causes supply capacity issues, in particular for Picton, Renwick and Havelock. Therefore demand management techniques are being considered including universal metering, pressure zone management and leakage control.
Infrastructure renewal is becoming necessary across all networks as pipelines near the end of their useful life. In particular for older networks as in the Awatere.
Water drawn from the Havelock supply wells exhibited a prolonged period of elevated chloride in 2013 and there is a concern that this could reoccur. The water is safe to drink but if the concentration of chloride increases in future, it may be able to be tasted and also cause corrosion of plumbing.
Traditionally many people in New Zealand have regarded water as an unlimited resource and for many it is a commodity that is purchased at such a low cost it is virtually free. The water supply for residents in all areas except Awatere and Wairau Valley is unmeasured and generally unrestricted. It is supplied at a pressure to meet every reasonable domestic need. It also provides a primary source of water in urban areas for firefighting.
Daily water consumption in Blenheim is around 600 litres per person as an average throughout the year but on peak days during the summer is more than double the average. The demand in the other settlements is similar to Blenheim. The summer peak is almost entirely due to irrigation of domestic gardens and other leisure uses (this compares with the city of Melbourne for example that has been actively encouraging water conservation and achieved a daily average domestic consumption 2010-11 of 140 litres/person).
Many of the costs associated with water supply are ‘fixed’ and incurred irrespective of the volumes pumped. A small proportion of operational costs such as power and chemicals are related to the volume of water pumped into the supply. Savings can be achieved by delaying major capital upgrades to meet increased demands for water. A particularly relevant example of this is the current position of the Picton water supply. Peak day demand in Picton is likely to outstrip the capacity of the existing water sources in the near future.
Investigations into additional nearby sources of water have so far been unsuccessful and the next nearest reliable source appears to be the Wairau Aquifer near Spring Creek. The cost of developing the source and laying a new pipeline from the Wairau Plain to Picton will be very high and is likely to be prohibitively expensive. The introduction of demand management techniques such as universal metering, pressure management zones and leakage control provide a realistic alternative.
The Council have adopted a passive leakage strategy. This means we attend to all reported leaks on a given time frame depending on an assessment how serious the leak is. We aim to attend major leaks in 30 minutes, serious leaks within 60 minutes and to all reported leaks within three working days. On a number of occasions the Council has adopted ‘active’ leakage control measures. Specialist contractors have been employed to search, locate and repair leaks in underground pipes that are not obvious from the surface. These projects have delivered some degree of success but are relatively costly because of the specialist equipment and skills required.
Considerable care is therefore required to ensure active leak detection projects return good value for money. It is likely that the technique will be used more in the future along with other demand management techniques such as pressure control, district leakage management, public education and voluntary restraint measures. Water demand management is one of the strategies considered in areas where the water sources are stretched in times of high demand.
Firefighting capacity in some industrial/commercial areas is lower than sought by New Zealand Fire Service (NZFS). The cost of upgrades may be unaffordable requiring setting of levels of service lower than NZFS guidelines.
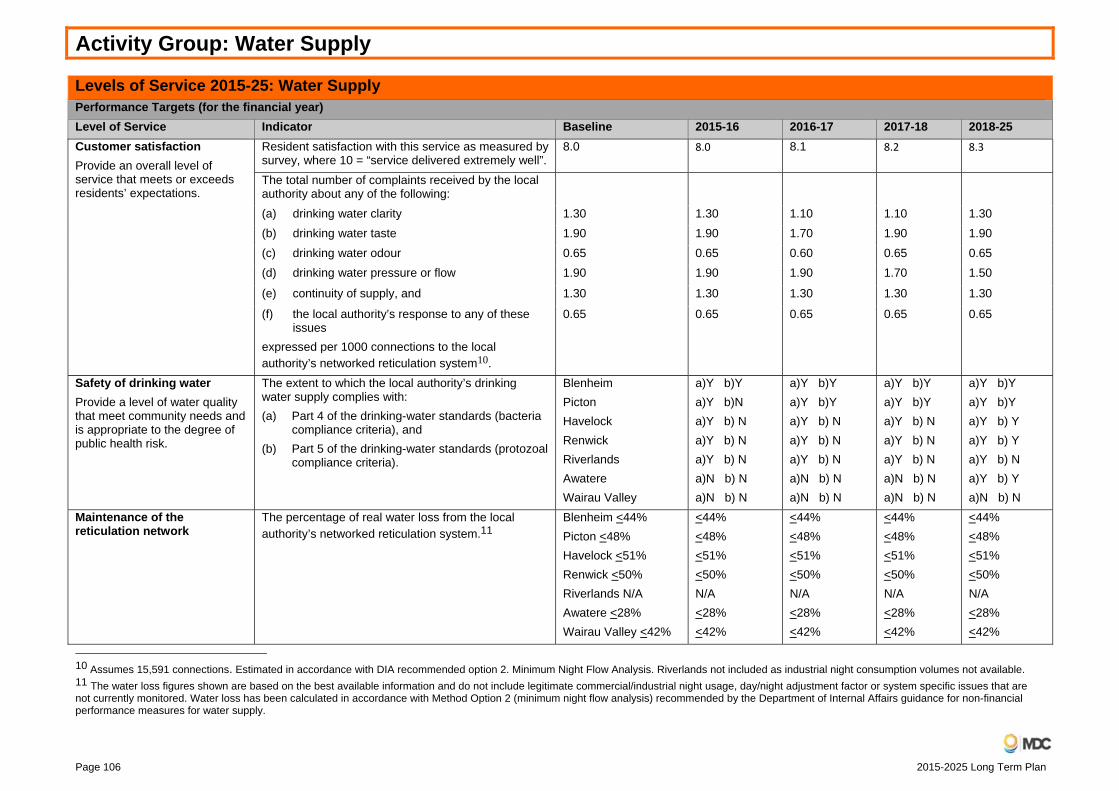
Activity Group: Water Supply
Page 106 2015-2025 Long Term Plan
Levels of Service 2015-25: Water Supply
Performance Targets (for the financial year) Level of Service Indicator Baseline 2015-16 2016-17 2017-18 2018-25 Customer satisfaction Provide an overall level of service that meets or exceeds residents’ expectations.
Resident satisfaction with this service as measured by survey, where 10 = “service delivered extremely well”.
8.0 8.0 8.1 8.2 8.3
The total number of complaints received by the local authority about any of the following: (a) drinking water clarity 1.30 1.30 1.10 1.10 1.30 (b) drinking water taste 1.90 1.90 1.70 1.90 1.90 (c) drinking water odour 0.65 0.65 0.60 0.65 0.65 (d) drinking water pressure or flow 1.90 1.90 1.90 1.70 1.50
(e) continuity of supply, and 1.30 1.30 1.30 1.30 1.30
(f) the local authority’s response to any of these issues
expressed per 1000 connections to the local authority’s networked reticulation system10.
0.65 0.65 0.65 0.65 0.65
Safety of drinking waterProvide a level of water quality that meet community needs and is appropriate to the degree of public health risk.
The extent to which the local authority’s drinking water supply complies with: (a) Part 4 of the drinking-water standards (bacteria
compliance criteria), and (b) Part 5 of the drinking-water standards (protozoal
compliance criteria).
Blenheim Picton Havelock Renwick Riverlands Awatere Wairau Valley
a)Y b)Y a)Y b)N a)Y b) N a)Y b) N a)Y b) N a)N b) N a)N b) N
a)Y b)Y a)Y b)Y a)Y b) N a)Y b) N a)Y b) N a)N b) N a)N b) N
a)Y b)Y a)Y b)Y a)Y b) N a)Y b) N a)Y b) N a)N b) N a)N b) N
a)Y b)Y a)Y b)Y a)Y b) Y a)Y b) Y a)Y b) N a)Y b) Y a)N b) N
Maintenance of the reticulation network
The percentage of real water loss from the local authority’s networked reticulation system.11
Blenheim <44% Picton <48% Havelock <51% Renwick <50% Riverlands N/A Awatere <28% Wairau Valley <42%
<44% <48% <51% <50% N/A <28% <42%
<44% <48% <51% <50% N/A <28% <42%
<44% <48% <51% <50% N/A <28% <42%
<44% <48% <51% <50% N/A <28% <42%
10 Assumes 15,591 connections. Estimated in accordance with DIA recommended option 2. Minimum Night Flow Analysis. Riverlands not included as industrial night consumption volumes not available. 11 The water loss figures shown are based on the best available information and do not include legitimate commercial/industrial night usage, day/night adjustment factor or system specific issues that are not currently monitored. Water loss has been calculated in accordance with Method Option 2 (minimum night flow analysis) recommended by the Department of Internal Affairs guidance for non-financial performance measures for water supply.

Activity Group: Water Supply
2015-2025 Long Term Plan Page 107
Levels of Service 2015-25: Water Supply
Performance Targets (for the financial year) Level of Service Indicator Baseline 2015-16 2016-17 2017-18 2018-25 Fault response timesProvide a service that is timely and responsive to customers’ needs.
Where Council attends a call-out in response to a fault or unplanned interruption to its networked reticulation system, the following median response times measured:
1. attendance for urgent call-outs: from the time that the local authority receives notification to the time that service personnel reach the site, and
30 minutes 30 minutes 30mins 30 minutes 30 minutes
2. resolution of urgent call-outs: from the time that the local authority receives notification to the time that service personnel confirm resolution of the fault or interruption.
3 hours 3 hours 3 hours 3 hours 3 hours
3. attendance for non-urgent call-outs: from the time that the local authority receives notification to the time that service personnel reach the site, and
8 hours 8 hours 8 hours 8 hours 8 hours
(d) resolution of non-urgent call-outs: from the time that the local authority receives notification to the time that service personnel confirm resolution of the fault or interruption.
13 hours 13 hours 13 hours 13 hours 13 hours
Demand managementProvide a reliable water supply service.
The average consumption of drinking water per day per resident within the territorial authority district.
800 litres 800 litres 800 litres 800 litres 750 litres
% of properties that receive a minimum water pressure of 300kPa at the property boundary (except in the Awatere Valley and Wairau Valley township). Blenheim 99% 99% 99% 99% 99% Picton 99% 99% 99% 99% 99% Havelock 100% 100% 100% 100% 100%
Renwick 69% 69% 69% 69% 69% % of system where fire flows are equal to greater 25 litres/sec. Blenheim 55% 55% 55% 55% 55%
Picton 85% 85% 85% 88% 92% Havelock 87% 87% 87% 87% 87% Renwick 100% 100% 100% 100% 100%
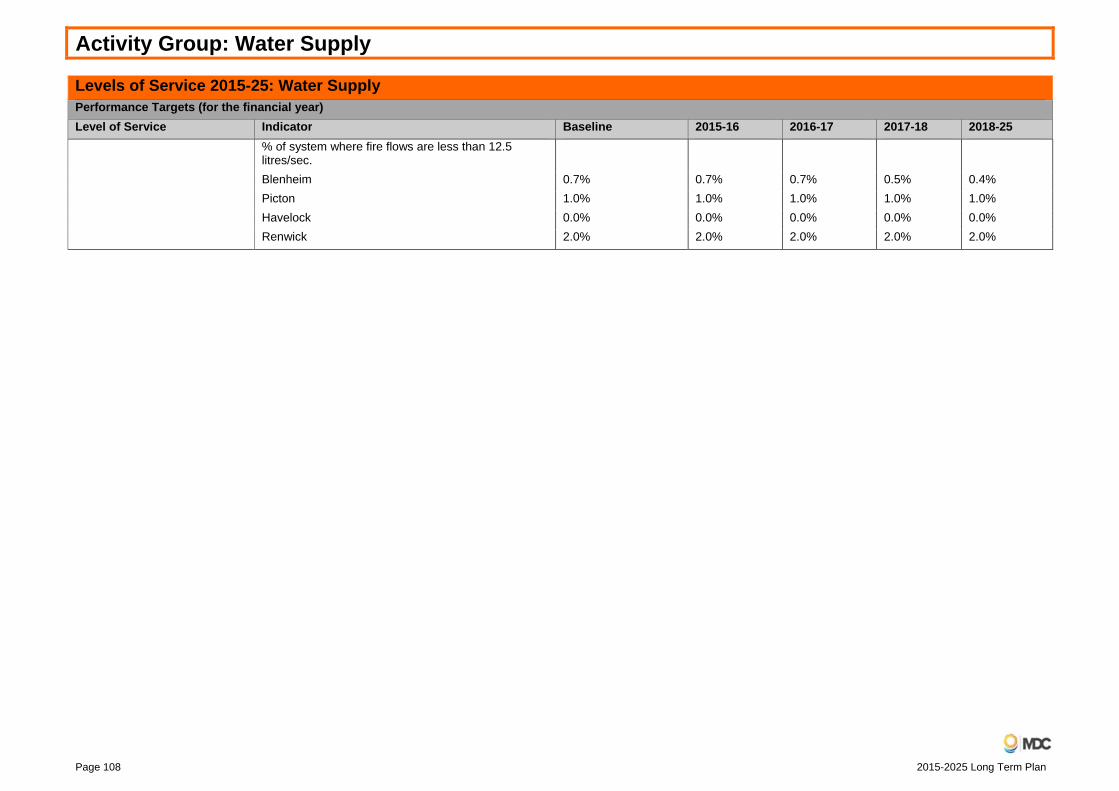
Activity Group: Water Supply
Page 108 2015-2025 Long Term Plan
Levels of Service 2015-25: Water Supply
Performance Targets (for the financial year) Level of Service Indicator Baseline 2015-16 2016-17 2017-18 2018-25
% of system where fire flows are less than 12.5 litres/sec. Blenheim 0.7% 0.7% 0.7% 0.5% 0.4% Picton 1.0% 1.0% 1.0% 1.0% 1.0% Havelock 0.0% 0.0% 0.0% 0.0% 0.0% Renwick 2.0% 2.0% 2.0% 2.0% 2.0%

Activity Group: Water Supply
2015-2025 Long Term Plan Page 109
Funding Impact Statement for 2015-25Water Supply AP 2014.15 2015.16 2016.17 2017.18 2018.19 2019.20 2020.21 2021.22 2022.23 2023.24 2024.25
$000's $000's $000's $000's $000's $000's $000's $000's $000's $000's $000'sSources of operating funding
Targeted rates (other than for water supply) 6,055 6,085 6,246 6,621 7,394 7,978 8,093 8,243 8,256 8,389 8,541Fees, charges and targeted rates for water supply 2,790 2,853 2,941 3,095 3,404 3,641 3,702 3,771 3,788 3,853 3,927
Total operating funding 8,845 8,938 9,187 9,716 10,798 11,619 11,795 12,014 12,044 12,242 12,468Applications of operating funding
Payments to staff and suppliers 3,031 2,300 2,419 2,725 3,170 3,544 3,721 3,861 3,951 4,135 4,311Finance costs 1,547 1,734 1,735 1,763 2,098 2,336 2,254 2,142 2,049 1,948 1,805Internal charges and overheads applied 998 1,612 1,663 1,712 1,735 1,759 1,794 1,836 1,879 1,930 1,979
Total applications of operating funding 5,576 5,646 5,817 6,200 7,003 7,639 7,769 7,839 7,879 8,013 8,095Surplus (deficit) of operating funding 3,269 3,292 3,370 3,516 3,795 3,980 4,026 4,175 4,165 4,229 4,373
Sources of capital fundingDevelopment and financial contributions 155 285 292 300 308 317 326 336 347 359 372Subsidies and grants for capital expenditure - - 1,014 - - - - - - - -Increase (decrease) in debt 3,125 1,700 187 3,141 4,918 650 6,736 1,500 3,107 - 751
Total sources of capital funding 3,280 1,985 1,493 3,441 5,226 967 7,062 1,836 3,454 359 1,123Applications of capital funding
Capital expenditure to meet additional demand 1,022 2,861 309 365 327 140 362 146 89 155 161Capital expenditure to improve the level of service 5,212 2,915 4,177 5,023 17,342 1,610 1,289 - 2,060 - 90Capital expenditure to replace existing assets 281 423 1,336 1,198 1,569 1,316 910 1,265 1,035 387 953Increase (decrease) in reserves 34 (922) (959) 371 (10,217) 1,881 8,527 4,600 4,435 4,046 4,292
Total applications of capital funding 6,549 5,277 4,863 6,957 9,021 4,947 11,088 6,011 7,619 4,588 5,496Surplus (deficit) of capital funding (3,269) (3,292) (3,370) (3,516) (3,795) (3,980) (4,026) (4,175) (4,165) (4,229) (4,373)
Funding balance - - - - - - - - - - -ReconciliationTotal applications of operating funding 5,576 5,646 5,817 6,200 7,003 7,639 7,769 7,839 7,879 8,013 8,095
plus - Depreciation and amortisation 2,640 2,792 3,123 3,265 3,616 3,806 3,945 4,089 4,154 4,242 4,349Expenditure as per Statement of Financial Performance 8,216 8,438 8,940 9,465 10,619 11,445 11,714 11,928 12,033 12,255 12,444

Activity Group: Water Supply
Page 110 2015-2025 Long Term Plan
Note 1: The increase in cost of service is due to the identified capital works and projects.
Funding Impact Statement for 2015-25Water Supply AP 2014.15 2015.16 2016.17 2017.18 2018.19 2019.20 2020.21 2021.22 2022.23 2023.24 2024.25
$000's $000's $000's $000's $000's $000's $000's $000's $000's $000's $000'sOperating expenditure
Awatere Water 631 4,452 4,705 4,780 4,809 4,831 4,909 5,004 5,119 5,221 5,323Blenheim Water 4,522 249 260 289 602 904 910 918 929 940 949Havelock Water 256 2,101 2,243 2,274 2,294 2,403 2,515 2,548 2,554 2,628 2,631Picton Water 1,962 464 488 557 1,037 1,418 1,449 1,484 1,510 1,537 1,565Renwick Water 464 736 793 1,101 1,388 1,418 1,456 1,495 1,437 1,413 1,450Riverlands Water 342 400 413 425 449 430 432 435 438 469 477Wairau Valley Water 37 36 38 39 40 41 43 44 46 47 49Rarangi Water - - - - - - - - - - -
Capital expenditure (including vested assets):Awatere Water 109 575 2,526 2,354 74 35 866 13 13 38 14Blenheim Water 949 3,173 2,211 431 913 745 1,070 1,298 847 538 1,221Havelock Water 78 26 56 443 9,840 6 6 26 365 7 88Picton Water 3,986 2,473 700 152 254 2,459 509 102 2,171 179 109Renwick Water 186 20 350 3,298 8,366 37 333 200 24 25 25Riverlands Water 1,399 123 173 114 1 1 1 1 1 1 1Wairau Valley Water 3 3 6 - - - - - - - -Rarangi Water - - - - - - - - - - -

Activity Group: Solid Waste Management
2015-2025 Long Term Plan Page 111
Solid Waste Management

Activity Group: Solid Waste Management
Page 112 2015-2025 Long Term Plan
Solid Waste Management Operating Costs The operating costs for the Solid Waste Management Group of Activities represents $82 million of total Council expenditure.
Capital Projects The capital expenditure for the Solid Waste Management Group of Activities represents $11 million of total Council expenditure over the next 10 years. Information about the major budgeted capital projects are included under the respective Activities sections.
Rationale for the Delivery of Solid Waste Management Group of Activities Solid Waste Management comprises of the full range of activities to manage solid waste, and is of sufficient size to be an Activity Group.
Changes to Solid Waste Management Activity Group from the 2011-12 Annual Plan There are no changes to this Activity Group.
Intended Changes to Levels of Service from the 2014-15 Annual Plan The table describes any intended changes to the levels of service within the Group from the levels of service displayed in the 2014-15 Annual Plan. The reasons for the intended changes are also described.
2014-15 Annual Plan 2015-25 LTP Reason for changes Activity: Solid Waste ManagementNo changes. ‐ ‐
Variation Between Long Term Plan and the Waste Management and Minimisation Plan (WMMP) The draft WMMP 2015-21 is out for publication and the time of writing this Plan. Funding for the proposals contained within this Draft Plan is not included in this Statement of Proposal.
There is no significant variation from the adopted Waste Management and Minimisation Plan.
Significant Negative Effects Associated with this Group of Activities This Activity Group may involve the potential for environmental impact or the operation of noisy machinery, earthmoving or construction works, which may impact on the environment and can result in temporary disruptions to daily life. Where resource consents are required for these activities, controls are imposed as appropriate.

Activity Group: Solid Waste Management
2015-2025 Long Term Plan Page 113
Activity: Solid Waste Management Activity: Solid Waste Management Operating costs of this Activity represent approximately 7.3% of total Activity expenditure.
How this Activity Contributes to Related Community Outcomes This Activity contributes to the Community Outcomes of Environment, People and Living by:
Outcome Sub-outcome Major linkages Secondary linkages
Environment Control over pollution levels, forms and effects Systems for protection and care Sustainable resource management
Efficient effective landfills enable environmentally safe disposal of waste. Waste education programmes play an important role in engaging the community to reduce waste outputs. Effective and accessible reuse and recycling facilities encourages and improves waste diversion.
Reduced public and environmental health risks.
People Education Engaged and participative
Living Health
What is this Activity About? Marlborough District Council is bound by legislation to ensure that our solid waste is managed in a safe and sanitary manner reducing any potential environmental impact and protecting the public health. Council is the main provider of waste management infrastructure for the region, providing a network of seven transfer stations, central landfill, resource recovery centre, reuse centre, e-waste collection facility, hazardous waste storage facility and salvage yard, all operated under contract to Council.
These facilities are designed and operated to ensure the minimum impact on people’s amenity and the environment. By promoting the reduction, reuse and recycling of waste we will reduce our reliance on landfill for disposal and also have the ability to influence the direction that our waste management and minimisation plan heads.
Council also collects, through a contract, refuse and recyclables from the kerbside in Blenheim and Picton.
The Waste Situation The region currently produces up to 55,000 tonnes of waste per annum. Of this up to 15,000 tonnes (27%) is recycled and 40,000 tonnes (73%) is sent to the Regional (Bluegums) Landfill. A breakdown of the annual diverted tonnage in the region follows:
Total Recycling: 6,500 tonnes (43%) Composting Operation: 8,500 tonnes (57%)
The transfer stations and the resource recovery centre provide the opportunity for source segregation of recyclables by the public.
The Bluegums landfill site is an engineered containment facility for the depositing of waste residues. It has an estimated lifespan of 53 years based on current waste inputs. It is likely that the lifespan will be further extended if the projects outlined below proceed.
A composting facility is operating on leased Council land adjacent to the Blenheim transfer station and currently takes green waste deliveries from the public and private contractors. The operation of this facility was tendered during 2014 and a new contract starts on 1 January 2016. The intention is to stop actual composting at this site. Instead, greenwaste material will be received and transported to an alternative location for processing. Compost products will still be made available for resale to the public from this location.
Hazardous waste materials, such as oils, paints, and solvents can be dropped at each of the transfer stations. These materials are then collected and returned to a storage facility adjacent to the Blenheim transfer station pending onward movement for disposal or recycling.
The region has a number of clean fill sites for the disposal of materials such as brick, concrete, rubble and non-contaminated soils. In addition the region has a number of scrap yards for the receipt of ferrous and non-ferrous metals as well as scrap vehicles. These sites are operated by private contractors.
Waste Management and Minimisation Plan (WMMP) The Council is the territorial authority for the Marlborough District and as such is required to develop, adopt, maintain and review a WMMP. This document has been reviewed and updated during 2014-15 and sets out the strategy for managing and minimising the District’s waste for the period 2015 to 2021.

Activity Group: Solid Waste Management
Page 114 2015-2025 Long Term Plan
The WMMP sets out a number of options/goals to be worked on over the next three year period. The major options/goals are listed in the following table.
Option Comment
4 Convert the Blenheim transfer station into a commercial industrial sorting facility (CIF) by 2016.
11 Work with the private sector to maximise the throughput and diversion levels at the CIF.
13 Review existing methods of communication with the community.15 Continue to work with industry sectors on the development of sustainable
solutions for forest skid sites, mussel shells and grape marc.
The Waste Levy The Waste Minimisation Act 2008 introduced a waste levy to all disposal sites. The current rate is $10 per tonne of waste sent to the landfill. This charge is paid for by the depositor of the waste who could be a private contractor, business or Council on behalf of the ratepayer. The collection of this charge is administered by the Ministry for the Environment. The effectiveness of the waste disposal levy is also reviewed by the Ministry every three years. The latest review took place in 2014. An extract from the Ministry website summarises their finding:
“The 2014 review of the effectiveness of the waste disposal levy was completed on 1 July 2014.
The review focused on whether the levy is being applied fairly and correctly, and how to ensure a level playing field for those paying the levy.
Another priority was to assess the impact that levy funding is having. At the current rate of $10 per tonne (plus GST) the levy generates about $25 million each year. Half of this money is distributed to territorial authorities for waste minimisation initiatives. The rest (minus administration costs) is allocated to projects through the Waste Minimisation Fund.
Review findings The review found:
more and better data is needed to measure the impact the levy is having on waste minimisation.
data that is available indicates that the levy is currently only applied to an estimated 30 per cent of total waste disposed of to land.
changes should be investigated to ensure the levy is applied to a greater proportion of waste being disposed of to land and to ensure that issues of interpretation are clarified. Such changes will ensure a level playing field for
those paying the levy.
the processes around collecting and distributing levy revenue appear to be effective.
levy funding has supported a broad range of waste minimisation initiatives. More could be done to ensure funding is directed towards strategic priorities and that funding outcomes are being effectively measured and monitored.
Review Recommendations The review made 11 recommendations to:
improve the quality and quantity of waste data.
ensure the levy is applied consistently by disposal facility operators.
improve the coverage of the levy.
better measure and evaluate the outcomes of levy funding.
ensure funding is available for New Zealand’s strategic waste priorities.
improve our understanding of the incentives for waste minimisation.
promote user-pays pricing systems for waste disposal”.
Whilst no increase in the Waste Disposal Levy was signalled at present there is a possibility that the $10 per tonne rate could increase in the years ahead. In order to protect the region from legislative increases in disposal costs and our reliance on landfill, Council are proposing the introduction of a Commercial and Industrial Sorting Facility (CIF).
Commercial Industrial Sorting Facility (CIF) Reducing our reliance on landfill as a means of managing our waste will be the immediate challenge for the region over the next few years. Whilst our current infrastructure provides a sustainable solution for domestic recycling we do not have an alternative to landfill for commercial and industrial waste. Whether the government is to increase the waste disposal levy or the carbon price, these costs would fall direct to the community. Council is therefore proposing the establishment of a Commercial and Industrial Sorting Facility (CIF) that would allow us to divert up to 8,000 tonnes of material away from the landfill and provide some cost certainty for the future. These diverted materials would include brick, soil rubble, plastics, glass, cardboard, wood, metal, GIB, and clothing. The CIF will be paid for through a user pays gate fee and is included in the 2015-25 Long Term Plan.
Emissions Trading Scheme (ETS) The landfill generates and emits gas as a by-product of the decomposition of the waste. Under the Climate Change Regulations (2002) the emissions are now subject

Activity Group: Solid Waste Management
2015-2025 Long Term Plan Page 115
to a surrender obligation where carbon credits are traded against the tonnage of emissions. The landfill has a flare and associated collection system which burns the gas on site. The efficiency of this system along with the percentage of biodegradable material within the incoming waste has been assessed and is used to allow the site to define its Unique Emissions Factor (UEF). This UEF has allowed the site to reduce its liability for carbon credits from a default of 49,400 tonnes to a surrender value of 13,740 tonnes. This value is further reduced to an actual surrender value of 6,870 tonnes based on the current two for one option which is due to expire in December 2015.
Asset Description The Council’s principal assets supporting this Activity are the regional landfill facility, the network of transfer stations and the Resource Recovery Centre/Re-Use shop facility. The CIF, if approved, will also form part of the assets.
Major Budgeted Capital Projects The table outlines the major budgeted projects and areas of expenditure proposed for this Activity over the next 10 years. Although these items are budgeted, in some cases further public consultation will be required with the relevant community before the project is implemented. These projects are also listed under the Capital Expenditure line of the Funding Impact Statement at the end of this Activity section.
Areas Major Capital Projects Inflated value (Millions)
Blenheim
2015-16 Construction of new Commercial Industrial Sorting Facility (CIF). $3.0
2015-16 Completion of stage 7 of Regional Landfill. $2.2 2019-22 Completion of stage 8 of Regional Landfill. $5.0
Emerging Issues and Expected Changes The introduction of the CIF will reduce our reliance on landfill as a means for handling our waste and boost our diversion levels from 27% to 42% by June 2017.
The change in operational practice at the compost site, from 2016 onwards, will provide an opportunity to expand the volume of greenwaste processed in the region.
The bag contents from the kerbside collection of refuse have been assessed on a number of occasions. Results consistently show that up to 25% of weight of the bag contents are food waste. Council intend to investigate the reduction of this waste through a combination of community trials, home composting and education awareness programmes.
The introduction of recycling services to the areas of Renwick, Grovetown, Spring Creek, Tua Marina, Rapaura and Rarangi has also been trialed during 2014 through the provision of recycling containers for the collection of cardboard/paper, cans, glass and plastics. A proposal to make this service permanent will be included in the 2015-25 Long Term Plan. If accepted the new system would be rolled out on 1 July 2015 and would be paid for through general rates. This service will divert over 300 tonnes of material per year.

Activity Group: Solid Waste Management
Page 116 2015-2025 Long Term Plan
Levels of Service 2015-25: Solid Waste Management Performance Targets (for the financial year)Level of Service Indicator Baseline 2015-16 2016-17 2017-18 2018-25 Provide an overall level of service that meets or exceeds residents’ expectations.
Resident satisfaction with this service as measured by survey, where 10 = “service delivered extremely well”.
7.6 7.6 7.6 7.6 7.6
Reduce the amount of waste sent to the landfill.
% growth in diverted material throughput at the Resource Recovery Centre (RRC).
4,425 tonnes 2.5% growth from 2014-15
5% growth from 2014-15
10% growth from 2014-15
2.5% growth year on year
% growth in sales at the Reuse Shop. $100k (incl GST) 2.5% growth from 2014-15
5% growth from 2014-15
7.5% growth from 2014-15
2.5% growth year on year
% growth in tonnage diversion from the Commercial Industrial Sorting facility (CIF). (Note this facility will not open until July 2016)
New measure 0 0 8,000 diverted after year 1 of operation
2.5% growth year on year
Amount of organic material composted. 14,000 2.5% on 2014-15 baseline
5% on 2014-15 baseline
7.5% on 2014-15 baseline
2.5% growth year on year
Effective operation of waste management and minimisation services.
Number of resident’s complaints in regards to Bluegums Landfill operations.
12 per annum <11 <10 <9 <8 year on year
% of Kerbside Refuse and Recycling Collection Service complaints/missed lifts.
13,200 households
< 1% of 2014-15 < 1% of 2014-15 < 1% of 2014-15 < 1% of 2014-15
Number of resident’s complaints in regards to Compost operation
12 per annum <11 <10 <9 <8 year on year
Number of resident’s complaints in regards to the transfer stations, Reuse Centre, Resource Centre, ewaste facility, coin skips and salvage yard.
24 per annum <20 <18 <16 <14 year on year
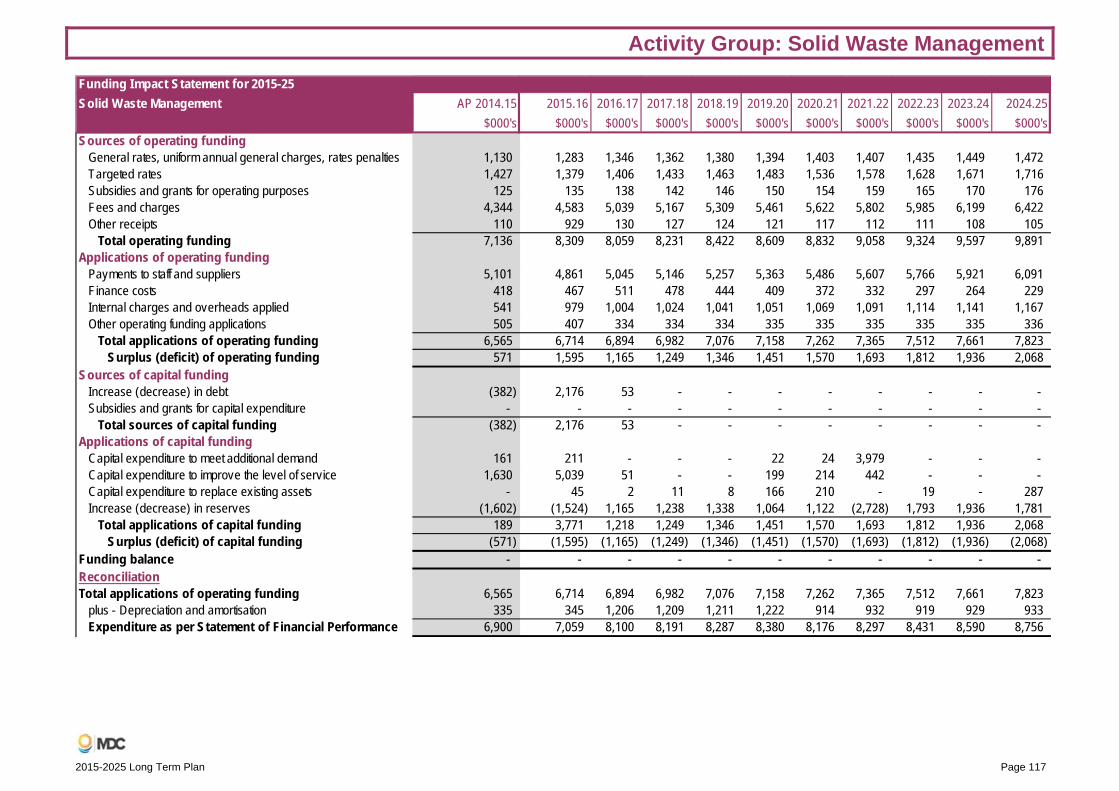
Activity Group: Solid Waste Management
2015-2025 Long Term Plan Page 117
Funding Impact Statement for 2015-25Solid Waste Management AP 2014.15 2015.16 2016.17 2017.18 2018.19 2019.20 2020.21 2021.22 2022.23 2023.24 2024.25
$000's $000's $000's $000's $000's $000's $000's $000's $000's $000's $000'sSources of operating funding
General rates, uniform annual general charges, rates penalties 1,130 1,283 1,346 1,362 1,380 1,394 1,403 1,407 1,435 1,449 1,472Targeted rates 1,427 1,379 1,406 1,433 1,463 1,483 1,536 1,578 1,628 1,671 1,716Subsidies and grants for operating purposes 125 135 138 142 146 150 154 159 165 170 176Fees and charges 4,344 4,583 5,039 5,167 5,309 5,461 5,622 5,802 5,985 6,199 6,422Other receipts 110 929 130 127 124 121 117 112 111 108 105
Total operating funding 7,136 8,309 8,059 8,231 8,422 8,609 8,832 9,058 9,324 9,597 9,891Applications of operating funding
Payments to staff and suppliers 5,101 4,861 5,045 5,146 5,257 5,363 5,486 5,607 5,766 5,921 6,091Finance costs 418 467 511 478 444 409 372 332 297 264 229Internal charges and overheads applied 541 979 1,004 1,024 1,041 1,051 1,069 1,091 1,114 1,141 1,167Other operating funding applications 505 407 334 334 334 335 335 335 335 335 336
Total applications of operating funding 6,565 6,714 6,894 6,982 7,076 7,158 7,262 7,365 7,512 7,661 7,823Surplus (deficit) of operating funding 571 1,595 1,165 1,249 1,346 1,451 1,570 1,693 1,812 1,936 2,068
Sources of capital fundingIncrease (decrease) in debt (382) 2,176 53 - - - - - - - -Subsidies and grants for capital expenditure - - - - - - - - - - -
Total sources of capital funding (382) 2,176 53 - - - - - - - -Applications of capital funding
Capital expenditure to meet additional demand 161 211 - - - 22 24 3,979 - - -Capital expenditure to improve the level of service 1,630 5,039 51 - - 199 214 442 - - -Capital expenditure to replace existing assets - 45 2 11 8 166 210 - 19 - 287Increase (decrease) in reserves (1,602) (1,524) 1,165 1,238 1,338 1,064 1,122 (2,728) 1,793 1,936 1,781
Total applications of capital funding 189 3,771 1,218 1,249 1,346 1,451 1,570 1,693 1,812 1,936 2,068Surplus (deficit) of capital funding (571) (1,595) (1,165) (1,249) (1,346) (1,451) (1,570) (1,693) (1,812) (1,936) (2,068)
Funding balance - - - - - - - - - - -ReconciliationTotal applications of operating funding 6,565 6,714 6,894 6,982 7,076 7,158 7,262 7,365 7,512 7,661 7,823
plus - Depreciation and amortisation 335 345 1,206 1,209 1,211 1,222 914 932 919 929 933Expenditure as per Statement of Financial Performance 6,900 7,059 8,100 8,191 8,287 8,380 8,176 8,297 8,431 8,590 8,756

Activity Group: Solid Waste Management
Page 118 2015-2025 Long Term Plan
Note 1: There are no material cost of service variances.
Funding Impact Statement for 2015-25Solid Waste Management AP 2014-15 2015.16 2016.17 2017.18 2018.19 2019.20 2020.21 2021.22 2022.23 2023.24 2024.25
$000's $000's $000's $000's $000's $000's $000's $000's $000's $000's $000'sOperating expenditure
Landfills 2,888 2,804 3,487 3,504 3,519 3,541 3,227 3,246 3,275 3,320 3,365Refuse Collections 1,633 1,552 1,581 1,612 1,646 1,670 1,727 1,775 1,830 1,878 1,930Transfer Stations 1,385 1,515 1,835 1,862 1,892 1,923 1,958 1,995 2,034 2,076 2,120Waste Minimisation 994 1,188 1,197 1,213 1,230 1,246 1,264 1,281 1,292 1,316 1,341
Capital expenditure:Landfills 1,669 2,253 53 11 8 388 238 4,421 19 - 287Refuse Collections 122 - - - - - 210 - - - -Transfer Stations - 2,952 - - - - - - - - -Waste Minimisation - 90 - - - - - - - - -

Activity Group: Environmental Management
2015-2025 Long Term Plan Page 119
Environmental Management
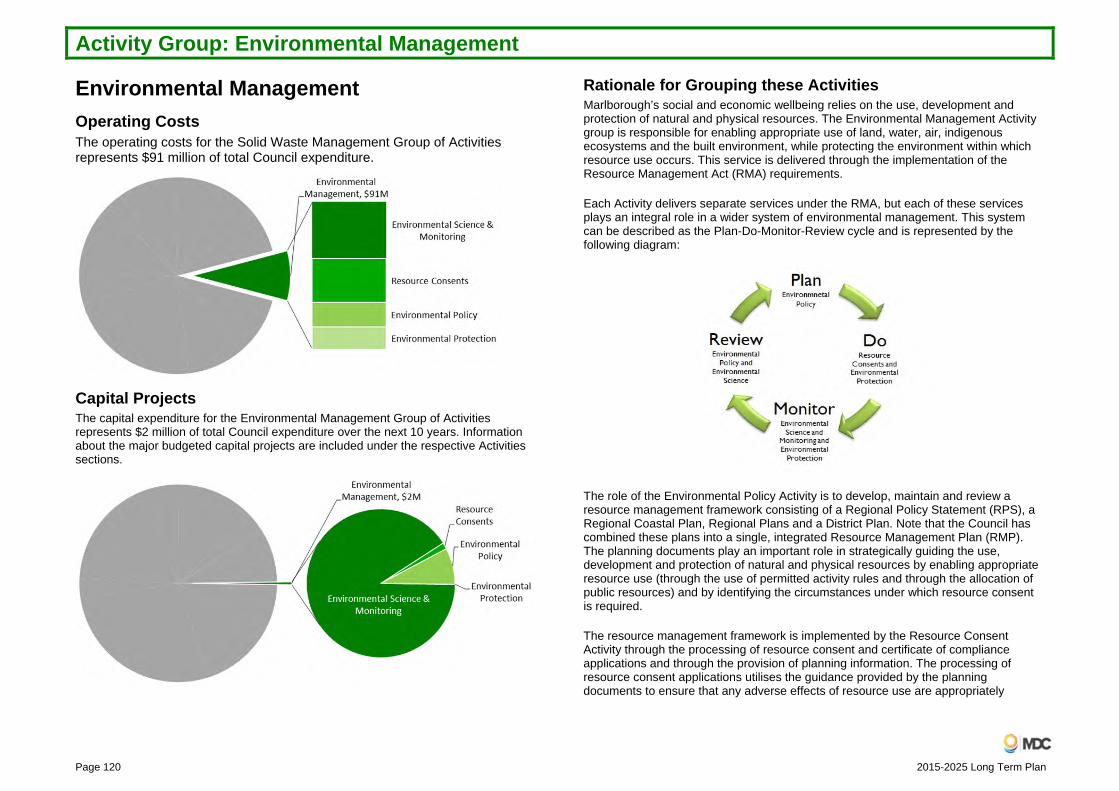
Activity Group: Environmental Management
Page 120 2015-2025 Long Term Plan
Environmental Management Operating Costs The operating costs for the Solid Waste Management Group of Activities represents $91 million of total Council expenditure.
Capital Projects The capital expenditure for the Environmental Management Group of Activities represents $2 million of total Council expenditure over the next 10 years. Information about the major budgeted capital projects are included under the respective Activities sections.
Rationale for Grouping these Activities Marlborough’s social and economic wellbeing relies on the use, development and protection of natural and physical resources. The Environmental Management Activity group is responsible for enabling appropriate use of land, water, air, indigenous ecosystems and the built environment, while protecting the environment within which resource use occurs. This service is delivered through the implementation of the Resource Management Act (RMA) requirements.
Each Activity delivers separate services under the RMA, but each of these services plays an integral role in a wider system of environmental management. This system can be described as the Plan-Do-Monitor-Review cycle and is represented by the following diagram:
The role of the Environmental Policy Activity is to develop, maintain and review a resource management framework consisting of a Regional Policy Statement (RPS), a Regional Coastal Plan, Regional Plans and a District Plan. Note that the Council has combined these plans into a single, integrated Resource Management Plan (RMP). The planning documents play an important role in strategically guiding the use, development and protection of natural and physical resources by enabling appropriate resource use (through the use of permitted activity rules and through the allocation of public resources) and by identifying the circumstances under which resource consent is required.
The resource management framework is implemented by the Resource Consent Activity through the processing of resource consent and certificate of compliance applications and through the provision of planning information. The processing of resource consent applications utilises the guidance provided by the planning documents to ensure that any adverse effects of resource use are appropriately

Activity Group: Environmental Management
2015-2025 Long Term Plan Page 121
managed. Non regulatory methods specified in the planning documents are also being implemented by various parts of the Council. This is the “Do” part of the cycle.
The Council monitors the effect of implementing regulatory and non-regulatory methods by monitoring compliance with the conditions of permitted activity rules and resource consents, and by monitoring the state of the Marlborough environment. This monitoring is undertaken by the Environmental Protection and the Environmental Science and Monitoring Activities respectively. The results of the monitoring allow conclusions to be drawn about the efficiency and effectiveness of the resource management framework. This is the “Review” part of the cycle.
If the objectives established in the planning documents are not being achieved, then this signals the need to adjust or change the planning provisions through further planning, completing the Plan-Do-Monitor-Review cycle.
It is important to note that as a unitary authority, the Council has the functions of both a regional Council and a territorial authority. This influences the way in which the Environmental Management Activity group delivers its services. It means that the full suite of planning documents required under the RMA must be prepared and that all resource consents required under the planning documents are processed by one consent authority. This allows the Group to integrate the management of land use (for which territorial authorities are generally responsible for) with the management of other natural resources (for which regional councils are responsible for), leading to reduced costs to resource users and improved environmental outcomes.
Review Processes It is important to note that the Council is currently reviewing its operative resource management framework. A new regional policy statement and resource management plan will be notified in 2015. These documents will commence to have effect from notification, which will influence the way in which activities in the Environment Management Group deliver their services. In some cases, there may be substantial changes to the services or the way in which they are delivered. The nature of these changes cannot be confirmed until the new planning documents are made operative.
National Policy Statement: Freshwater Management 2014 The Council is required to give effect to the National Policy Statement: Freshwater Management 2014 (NPSFW) through its own resource management documents by December 2015. The overall aim of the NPSFW is for limits to be set for the use of freshwater resources, from both a water quantity and water quality perspective, and to involve iwi in that planning process. The water quantity aspects are to be given effect to through the current review of the Council’s operative resource management framework, with a new RPS/RMP to be publicly notified in July 2015. With respect to water quality aspects, the Council has adopted and publicly notified a staged implementation programme to establish freshwater quality limits. The requirement to
account for all contaminant discharges by 2017, and to set cumulative limits for those discharges by 2025, are significant new activities for this Group. The development of a work programme for these activities is currently being scoped but has not advanced to a point where the costs of technical investigations, community and iwi engagement, planning processes and implementation plans are able to be established. The budget implications of this mandatory work will be identified through either changes to this LTP or through the annual planning process, depending on the significance of the budget.
Measuring Success Monitoring the state of the Marlborough environment is a statutory requirement under the RMA. The data the Council collects is reported on an annual basis.
The data is also used to monitor the effectiveness and efficiency of the policies and methods included in the resource management framework. Again, this monitoring is a statutory requirement under the RMA. The planning documents set environmental results anticipated as a result of the implementation of the policies and methods.
The State of the Environment Report data is used to assess whether the specified results have been achieved and, as a result, whether the provisions are effective or efficient in resolving or managing the environmental issue they are addressing. The results of this monitoring must be reported at intervals of not more than five years.
Increasingly, monitoring is having to be undertaken to meet national requirements as part of the Government’s national State of the Environment reporting system.
A comprehensive set of anticipated environmental results has been developed for inclusion in the new RPS. A measurable indicator has been specified for each result. Given this process, which is a statutory requirement, it is not necessary to set environmental performance indicators in the Long Term Plan.
Changes to Environmental Management Activity Group from the 2014-15 Annual Plan There are no changes to this Activity Group.
Intended Changes to Levels of Service from the 2014-15 Annual Plan The table describes any intended changes to the levels of service within the group from the levels of service displayed in the 2014-15 Annual Plan. The reasons for the intended changes are also described.

Activity Group: Environmental Management
Page 122 2015-2025 Long Term Plan
2014-15 Annual Plan 2015-25 LTP Reason for changesActivity: Environmental Policy None. Freshwater quality limits
are set for all water management units.
New level of service due to requirements of National Policy Statement Freshwater Management 2014.
Activity: Environmental Science and MonitoringEffective environmental monitoring network is operated.
Effective real time environmental monitoring network is operated.
Minor wording change to reflect new Level of Service.
Significant Negative Effects in this Group Potential negative effects in terms of sustainable management of our physical and natural resources may result through ineffective monitoring of the environment and/or inadequate resource management policy with potential flow-on social and economic impacts on the community.
Activity Group Funding Impact Statement The following Funding Impact Statement (FIS) is for the Activity Group, throughout this section a separate FIS is included for each Activity and these should be referred to for more detailed information.

Activity Group: Environmental Management
2015-2025 Long Term Plan Page 123
Note 1: There are no material cost of service variances.
Funding Impact Statement for 2015-25ENVIRONMENTAL MANAGEMENT AP 2014.15 2015.16 2016.17 2017.18 2018.19 2019.20 2020.21 2021.22 2022.23 2023.24 2024.25
$000's $000's $000's $000's $000's $000's $000's $000's $000's $000's $000'sSources of operating funding
General rates, uniform annual general charges, rates penalties 5,967 6,017 6,221 6,401 6,557 6,673 6,847 7,034 7,183 7,433 7,653Fees and charges 1,401 1,495 1,538 1,577 1,620 1,672 1,721 1,782 1,840 1,910 1,979Internal charges and overheads recovered 88 88 88 88 88 88 88 88 88 88 88Other receipts including fines 715 670 584 579 571 560 550 543 536 533 528
Total operating funding 8,171 8,270 8,431 8,645 8,836 8,993 9,206 9,447 9,647 9,964 10,248Applications of operating funding
Payments to staff and suppliers 6,207 5,855 6,024 6,151 6,286 6,429 6,583 6,751 6,930 7,142 7,345Finance costs - 10 15 20 25 30 29 28 30 32 30Internal charges and overheads applied 1,961 2,206 2,289 2,361 2,412 2,412 2,462 2,528 2,598 2,687 2,765Other operating funding applications 15 15 - - - - - - - - -
Total applications of operating funding 8,183 8,086 8,328 8,532 8,723 8,871 9,074 9,307 9,558 9,861 10,140Surplus (deficit) of operating funding (12) 184 103 113 113 122 132 140 89 103 108
Sources of capital fundingIncrease (decrease) in debt - - 154 - 162 - - - 83 - -
Total sources of capital funding - - 154 - 162 - - - 83 - -Applications of capital funding
Capital expenditure to meet additional demand - - - - - - - - - - -Capital expenditure to improve the level of service 3 153 3 3 3 3 3 4 4 - -Capital expenditure to replace existing assets 150 150 154 158 162 167 172 177 183 189 196Increase (decrease) in reserves (165) (118) 100 (47) 110 (48) (42) (40) (15) (86) (88)
Total applications of capital funding (12) 185 257 114 275 122 133 141 172 103 108Surplus (deficit) of capital funding 12 (185) (103) (114) (113) (122) (133) (141) (89) (103) (108)
Funding balance - (1) - (1) - - (1) (1) - - -ReconciliationTotal applications of operating funding 8,183 8,086 8,328 8,532 8,723 8,871 9,074 9,307 9,558 9,861 10,140
plus - Depreciation and amortisation 93 100 168 177 176 184 195 203 152 166 172less - Internal charges and overheads recovered 88 88 88 88 88 88 88 88 88 88 88
Expenditure as per Note 1 8,188 8,098 8,408 8,621 8,811 8,967 9,181 9,422 9,622 9,939 10,224
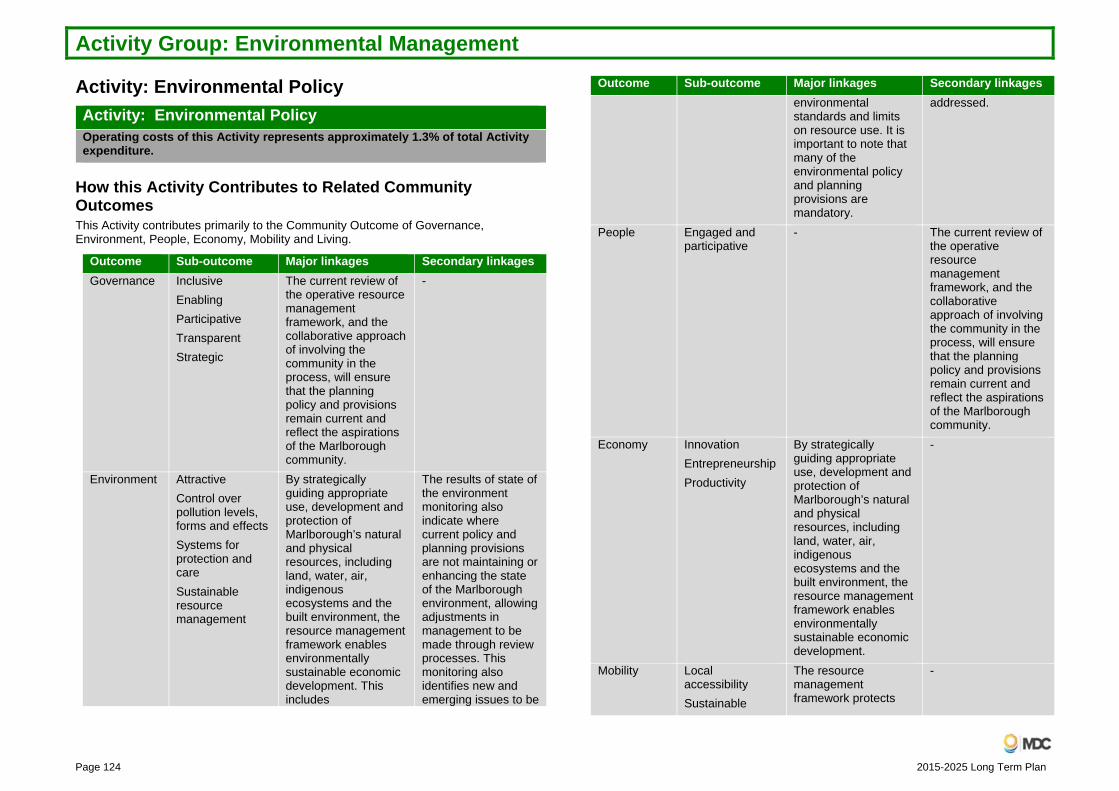
Activity Group: Environmental Management
Page 124 2015-2025 Long Term Plan
Activity: Environmental Policy Activity: Environmental Policy
Operating costs of this Activity represents approximately 1.3% of total Activity expenditure.
How this Activity Contributes to Related Community Outcomes This Activity contributes primarily to the Community Outcome of Governance, Environment, People, Economy, Mobility and Living.
Outcome Sub-outcome Major linkages Secondary linkagesGovernance Inclusive
Enabling Participative Transparent Strategic
The current review of the operative resource management framework, and the collaborative approach of involving the community in the process, will ensure that the planning policy and provisions remain current and reflect the aspirations of the Marlborough community.
-
Environment Attractive Control over pollution levels, forms and effects Systems for protection and care Sustainable resource management
By strategically guiding appropriate use, development and protection of Marlborough’s natural and physical resources, including land, water, air, indigenous ecosystems and the built environment, the resource management framework enables environmentally sustainable economic development. This includes
The results of state of the environment monitoring also indicate where current policy and planning provisions are not maintaining or enhancing the state of the Marlborough environment, allowing adjustments in management to be made through review processes. This monitoring also identifies new and emerging issues to be
Outcome Sub-outcome Major linkages Secondary linkages environmental standards and limits on resource use. It is important to note that many of the environmental policy and planning provisions are mandatory.
addressed.
People Engaged and participative
- The current review of the operative resource management framework, and the collaborative approach of involving the community in the process, will ensure that the planning policy and provisions remain current and reflect the aspirations of the Marlborough community.
Economy Innovation Entrepreneurship Productivity
By strategically guiding appropriate use, development and protection of Marlborough’s natural and physical resources, including land, water, air, indigenous ecosystems and the built environment, the resource management framework enables environmentally sustainable economic development.
-
Mobility Local accessibility Sustainable
The resource management framework protects
-

Activity Group: Environmental Management
2015-2025 Long Term Plan Page 125
Outcome Sub-outcome Major linkages Secondary linkagesSafe transportation
infrastructure from the adverse effects of other activities and enables the efficient and effective operation of the infrastructure.
Living Access to quality housing
The resource management framework makes provision for housing, employment and recreation in the district.
The provision of recreational space and guidelines for the form of residential development encourages social cohesion.
Access to quality employment Cultural facilities and events Sports and recreation Social cohesion
What is this Activity About? This Activity involves the development and review of environmental policy and planning provisions under the Resource Management Act (RMA) in response to resource management issues for Marlborough. These provisions are aimed at the sustainable use, development and protection of Marlborough’s natural and physical resources, including land, water, air, indigenous ecosystems and the built environment. Many of the provisions are mandatory. The Council is required to prepare a Regional Policy Statement, a Regional Coastal Plan and a District Plan under the RMA. It may also develop other regional plans, as necessary.
The Council has an existing resource management policy framework, which is described below. Significant effort has gone into getting this framework to an operative status in the past to provide greater certainty to resource users and the wider community.
The Marlborough Regional Policy Statement (RPS) This is an operative document that provides a community-based vision and direction for managing the natural and physical resources of Marlborough. It identifies regionally significant issues for Marlborough and how they are to be addressed.
The Marlborough Sounds Resource Management Plan (MSRMP) This is an operative combined Regional Plan, Regional Coastal Plan and District Plan
that provides the framework by which the natural and physical resources of the Marlborough Sounds area are to be managed.
The Wairau/Awatere Resource Management Plan (WARMP) This is an operative combined Regional Plan, Regional Coastal Plan and District Plan that provides the framework by which the natural and physical resources of the Wairau and Awatere areas of Marlborough are to be managed.
The RPS and the RMP identify resource management issues, establish objectives for addressing these issues, provide policies for achieving the objectives and identify regulatory and non-regulatory methods for implementing the policies. The provisions collectively seek to enable resource use, but in a manner that ensures any adverse effects arising from that use are avoided, remedied or sufficiently mitigated.
Marlborough’s social and economic wellbeing relies on the use, development and protection of natural and physical resource. The framework described above plays an important role in strategically guiding this use, development and protection. In particular, provisions in this document enable appropriate resource use through the use of permitted activity rules and through the allocation of public resources (such as water and coastal space).
Asset Description Although not an asset in the conventional sense, the RPS, MSRMP and WARMP are assets in that Council and the community rely upon these planning documents. The planning documents guide development within Marlborough as they determine the status of resource use activities occurring within the environment (ie; whether an activity requires a resource consent), allocate public resources (such as water and coastal space) and contain policies to guide the determination of resource consent applications.
Given the above, it is important that the currency and accuracy of the RPS, MSRMP and WARMP are maintained at all times. The Environmental Policy Team has a Quality Management System to ensure that the correct version of the plans are being used internally and are available externally.
Major Budgeted Capital Projects The table outlines the major budgeted projects and areas of expenditure proposed for this Activity over the next 10 years. Although these items are budgeted, in some cases further public consultation will be required with the relevant community before the project is implemented. These projects are also listed under the Capital Expenditure line of the Funding Impact Statement at the end of this Activity section.

Activity Group: Environmental Management
Page 126 2015-2025 Long Term Plan
Asset Major Capital Projects Inflated value (Millions)
Development of E-Planning capabilities for water management.
2015-16 The costs represent 50% of the total project cost, with the remainder being funded by Central Government via the Community Environment Fund.
$0.2
Emerging Issues and Expected Changes The Council has committed to a rebuild of its resource management framework. This has been a significant undertaking for Council and the Marlborough community. As part of this review process, the Council has decided to take the opportunity provided by Section 80 of the RMA to combine the objectives, policies and methods of the two operative resource management plans with the RPS to provide a single strategic direction for the integrated management of Marlborough’s natural and physical resources.
The rules contained in the two existing resource management plans will be recast into one integrated plan for the District. This combined plan will provide the regulatory framework to be applied to the subdivision, use and development of land, air, coastal resources and water resources. This framework will utilise fewer rule categories than is currently the case and will provide clear triggers for the need for resource consent. This simplified and streamlined structure will be easier to use and will provide greater certainty to resource users and the wider community.
A draft combined RPS and RMP is to be completed in 2015. The planning documents will then be publicly notified for submissions and further submissions in accordance with the First Schedule of the RMA. The main task for the Environmental Policy team from that point will be processing submissions on the notified provisions and supporting the hearing of those submissions (through the provision of Section 42A reports and attendance at hearings amongst other things). Decisions on submissions will be made by an appointed hearings panel made up of accredited commissioners.
There are many variables that affect the nature, scope and timing of this environmental policy work programme. In the short term, this will depend on the timing of the notification of the RPS/RMP and the nature and number of submissions received on the proposed RPS/RMP. The greater the number and complexity of submissions, the more resource required to process the submissions. The content of submissions will also influence whether further external assistance is required.
Government initiatives (such as legislative change or the introduction of national policy statements or national environmental standards) can influence the nature, scope and timing of the environmental policy work programme. In particular, the Council is required to give effect to the provisions of national policy statements. There are
currently four national policy statements and in most cases these will be given effect to through the current review of the resource management framework.
In the case of the National Policy Statement (NPS) Freshwater Management 2014, the Council has adopted a staged implementation programme to establish freshwater quality limits through to 2024. This programme sets out the various actions that will be taken by the Council to establish those limits, including technical investigations, community consultation and planning. The budget implications of this work will be highlighted through future annual planning processes. Note that there are ongoing changes to the NPS proposed by Central Government and these changes could have additional implications for the staged implementation programme.
Leading up to and following notification of the reviewed RPS/RMP, the operative resource management framework still has legal status and therefore requires maintenance. Two plan changes and one plan change request were being processed at the time of preparing this Long Term Plan.
Plan change requests by members of the public, which cannot be anticipated, have a similar effect on the environmental policy work programme as central government initiatives. Any new plan change request has to be processed in accordance with statutory processes and timeframes. The costs of plan change requests are borne by the person who has made the request (unless the Council adopts the plan change as its own).
The additional workload generated by plan changes are managed through the use of external planning assistance. This minimises the disruption to the review of the resource management framework.
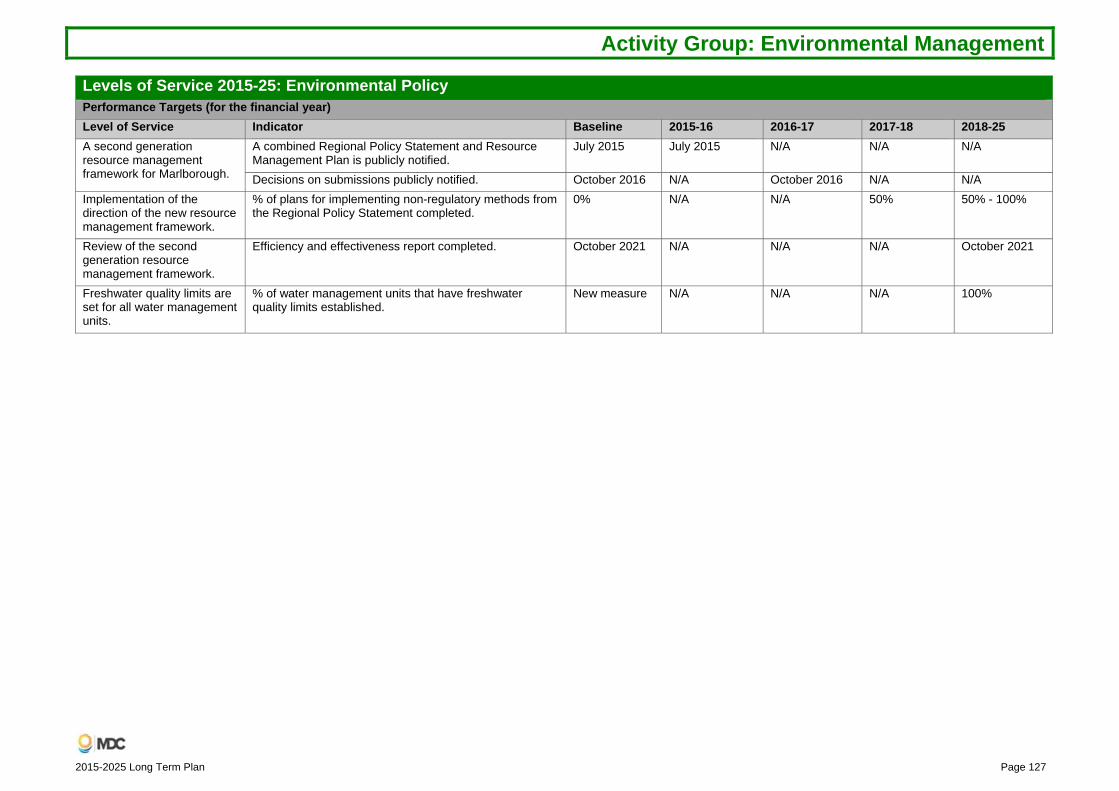
Activity Group: Environmental Management
2015-2025 Long Term Plan Page 127
Levels of Service 2015-25: Environmental Policy
Performance Targets (for the financial year)Level of Service Indicator Baseline 2015-16 2016-17 2017-18 2018-25 A second generation resource management framework for Marlborough.
A combined Regional Policy Statement and Resource Management Plan is publicly notified.
July 2015 July 2015 N/A N/A N/A
Decisions on submissions publicly notified. October 2016 N/A October 2016 N/A N/A Implementation of the direction of the new resource management framework.
% of plans for implementing non-regulatory methods from the Regional Policy Statement completed.
0% N/A N/A 50% 50% - 100%
Review of the second generation resource management framework.
Efficiency and effectiveness report completed. October 2021 N/A N/A N/A October 2021
Freshwater quality limits are set for all water management units.
% of water management units that have freshwater quality limits established.
New measure N/A N/A N/A 100%

Activity Group: Environmental Management
Page 128 2015-2025 Long Term Plan
Note 1: There are no material cost of service variances.
Funding Impact Statement for 2015-25Environmental Policy AP 2014.15 2015.16 2016.17 2017.18 2018.19 2019.20 2020.21 2021.22 2022.23 2023.24 2024.25
$000's $000's $000's $000's $000's $000's $000's $000's $000's $000's $000'sSources of operating funding
General rates, uniform annual general charges, rates penalties 1,220 1,296 1,292 1,326 1,358 1,383 1,419 1,460 1,446 1,493 1,540Other receipts 130 203 121 120 118 115 113 112 107 106 105
Total operating funding 1,350 1,499 1,413 1,446 1,476 1,498 1,532 1,572 1,553 1,599 1,645Applications of operating funding
Payments to staff and suppliers 1,133 1,051 1,056 1,077 1,099 1,122 1,148 1,177 1,207 1,239 1,272Internal charges and overheads applied 202 283 297 309 317 316 324 335 346 360 373Other operating funding applications 15 15 - - - - - - - - -
Total applications of operating funding 1,350 1,349 1,353 1,386 1,416 1,438 1,472 1,512 1,553 1,599 1,645Surplus (deficit) of operating funding - 150 60 60 60 60 60 60 - - -
Sources of capital fundingIncrease (decrease) in debt - - - - - - - - - - -
Total sources of capital funding - - - - - - - - - - -Applications of capital funding
Capital expenditure to improve the level of service - 150 - - - - - - - - -Increase (decrease) in reserves - - 60 60 60 60 60 60 - - -
Total applications of capital funding 189 150 60 60 60 60 60 60 - - -Surplus (deficit) of capital funding (571) (150) (60) (60) (60) (60) (60) (60) - - -
Funding balance - - - - - - - - - - -ReconciliationTotal applications of operating funding 1,350 1,349 1,353 1,386 1,416 1,438 1,472 1,512 1,553 1,599 1,645
plus - Depreciation and amortisation - 60 60 60 60 60 60 - - -Expenditure as per Statement of Financial Performance 1,350 1,349 1,413 1,446 1,476 1,498 1,532 1,572 1,553 1,599 1,645

Activity Group: Environmental Management
2015-2025 Long Term Plan Page 129
Activity: Environmental Science and Monitoring Activity: Environmental Science and Monitoring
Operating costs of this Activity represents approximately 3.1% of total Activity expenditure.
How this Activity Contributes to Related Community Outcomes This Activity contributes primarily to the Community Outcomes of Governance, Environment, Economy, People and Living by:
Outcome Sub-outcome Major linkages Secondary linkagesEnvironment Attractive
Control over pollution levels, forms and effects Systems for protection and care Sustainable resource management
The services are a statutory function that provide for monitoring of the state and condition of our natural resources, investigation of environmental issues, help to create solutions and implementation of programmes to protect our resources (fresh water, land, coastal and air).
Economy Productivity The services provide for monitoring and research of natural resources to help with the allocation and informed use of resources to enable productivity within set environmental bottom lines.
People Education Engaged and participative
The services help the community and resource users better understand our natural resources through participative processes, and the provision of
Outcome Sub-outcome Major linkages Secondary linkages environmental information.
Living Health The community require assurance that our natural resources and special places are protected and in a condition suitable to maintain our lifestyle and general wellbeing eg; recreating and gathering food from our rivers and coastal waters.
Governance Transparent Enabling Participate Strategic
Understanding environmental issues and the condition of our natural resources to enable strategic and transparent decision making.
What is this Activity About? The Activity involves establishing and maintaining an efficient environmental resource information base to allow Council to properly discharge its resource management functions and to provide advice to the community on environmental resources and on issues affecting the resources of the District. The Activity includes the investigation, monitoring and analysis of the District’s natural and physical resources (e.g. land, air, water and coastal).
The monitoring of natural and physical resources is effectively carried out to:
Obtain information about the condition of the environment and raise awareness of environment issues.
Assist in identifying areas where there is a need to improve the quality of the environment and enable Council to support a range of methods that can be applied to address specific issues.
Allow Council to assess the effectiveness of its policies and methods contained in the RMA policy and planning documents.
To support the sustainable use and allocation of our natural resources.

Activity Group: Environmental Management
Page 130 2015-2025 Long Term Plan
This Activity is also responsible for implementing a range of non-regulatory resource management methods to effectively promote the sustainable management of our natural and physical resources. This also includes education and advocacy of resource users and the wider community and provides support for flood and other environmental emergency responses.
Emphasis has been placed on the monitoring and development of sustainable programmes associated with fresh water resources and this is expected to continue into the future. This reflects the value of water to the community and its overall vulnerability to over use and contamination. There are other important programmes associated with measuring the health and integrity of our marine ecosystems, air quality, land resources and the protection of biodiversity.
Asset Description Council operates 89 automated real time monitoring stations that measure a number of environmental parameters to support a range of resource management programmes and emergency response (eg; flooding).
Environmental parameters (automated)
Number of parameters monitored
Rainfall 27Surface Water level 31River Flow 24Groundwater Level 33Groundwater Temperature 11Groundwater Conductivity 7Air Quality (PM10) 2River Water Quality 3Total 138
Major Budgeted Capital Projects The table outlines the major budgeted projects and areas of expenditure proposed for this Activity over the next 10 years. Although these items are budgeted, in some cases further public consultation will be required with the relevant community before the project is implemented. These projects are also listed under the Capital Expenditure line of the Funding Impact Statement at the end of this Activity section.
Asset Major Capital Projects Inflated value (Millions)
Field equipment 2015-25 Telemetry field equipment. $1.7
Emerging Issues and Expected Changes The second generation Resource Management Plan for Marlborough is expected to be notified and become operative during the period of this Long Term Plan (LTP). This LTP will be instrumental in setting the future direction and resourcing of State of Environment (SoE) monitoring and investigation programmes.
Diffuse pollution and sediment runoff as a consequence of intensive urban and rural land use, will remain as the main human induced threat to water quality in the District. The extraction of fresh water for irrigation and consumptive use requires careful management to balance community aspirations of economic growth while ensuring environmental sustainability is not compromised. Other integrated monitoring programmes associated with our marine environment and biodiversity will continue to evolve to meet the changing environment and community expectations.
The government is increasingly directing Council services through legislative change. The National Policy Statement for freshwater is expected to impact on the levels of service for setting of catchment based limits, monitoring and contaminate accounting systems.
There is also an increasing expectation from government and the regional sector for resource information to be readily available for national environmental reporting and the community in an open digital format. Management of resource information and ensuring data is of a high quality standard will continue to impact on resourcing.
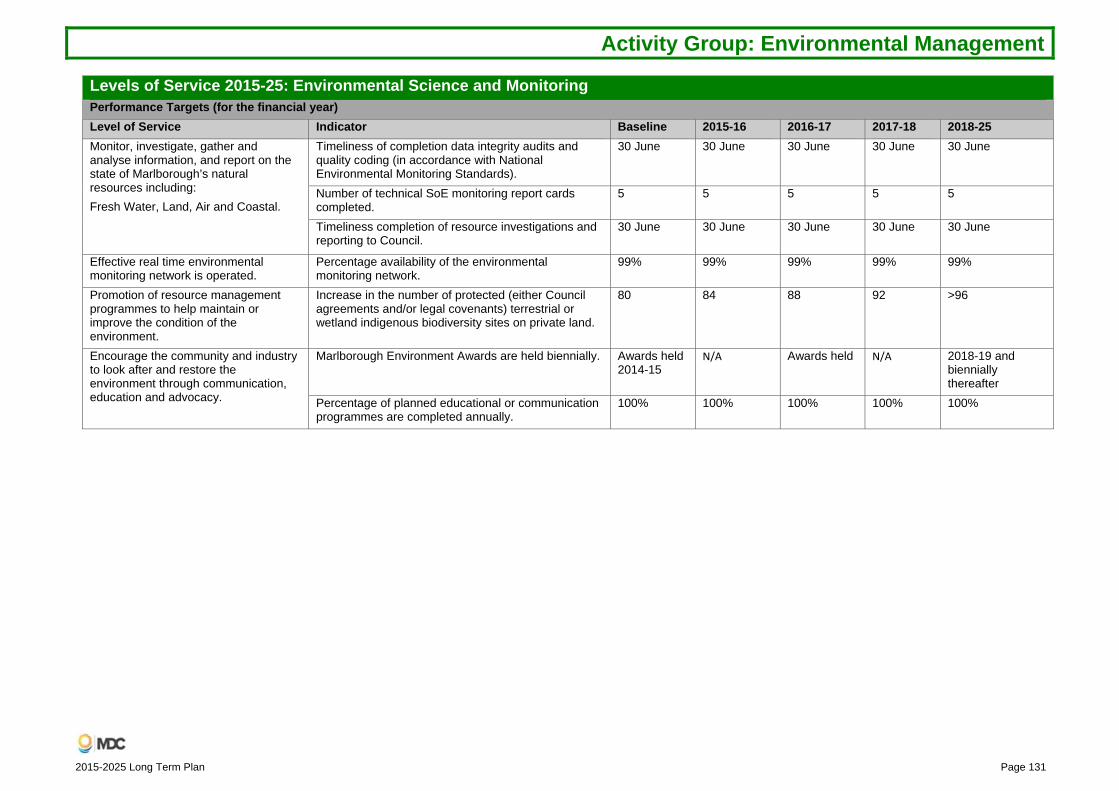
Activity Group: Environmental Management
2015-2025 Long Term Plan Page 131
Levels of Service 2015-25: Environmental Science and Monitoring
Performance Targets (for the financial year)Level of Service Indicator Baseline 2015-16 2016-17 2017-18 2018-25 Monitor, investigate, gather and analyse information, and report on the state of Marlborough’s natural resources including: Fresh Water, Land, Air and Coastal.
Timeliness of completion data integrity audits and quality coding (in accordance with National Environmental Monitoring Standards).
30 June 30 June 30 June 30 June 30 June
Number of technical SoE monitoring report cards completed.
5 5 5 5 5
Timeliness completion of resource investigations and reporting to Council.
30 June 30 June 30 June 30 June 30 June
Effective real time environmental monitoring network is operated.
Percentage availability of the environmental monitoring network.
99% 99% 99% 99% 99%
Promotion of resource management programmes to help maintain or improve the condition of the environment.
Increase in the number of protected (either Council agreements and/or legal covenants) terrestrial or wetland indigenous biodiversity sites on private land.
80 84 88 92 >96
Encourage the community and industry to look after and restore the environment through communication, education and advocacy.
Marlborough Environment Awards are held biennially. Awards held 2014-15
N/A Awards held N/A 2018-19 and biennially thereafter
Percentage of planned educational or communication programmes are completed annually.
100% 100% 100% 100% 100%

Activity Group: Environmental Management
Page 132 2015-2025 Long Term Plan
Note 1: There are no material cost of service variances.
Funding Impact Statement for 2015-25Environmental Science and Monitoring AP 2014.15 2015.16 2016.17 2017.18 2018.19 2019.20 2020.21 2021.22 2022.23 2023.24 2024.25
$000's $000's $000's $000's $000's $000's $000's $000's $000's $000's $000'sSources of operating funding
General rates, uniform annual general charges, rates penalties 2,742 2,733 2,876 2,958 3,032 3,109 3,194 3,285 3,383 3,496 3,599Subsidies and grants for operating purposes 73 - - - - - - - - - -Fees and charges 78 5 5 5 5 6 6 6 6 6 7Internal charges and overheads recovered 65 65 65 65 65 65 65 65 65 65 65Other receipts 293 269 269 267 263 259 255 251 249 248 245
Total operating funding 3,251 3,072 3,215 3,295 3,365 3,439 3,520 3,607 3,703 3,815 3,916Applications of operating funding
Payments to staff and suppliers 2,655 2,262 2,376 2,427 2,481 2,538 2,600 2,667 2,739 2,816 2,897Finance Costs - 10 15 20 25 30 29 28 30 32 30Internal charges and overheads applied 606 767 782 796 806 809 820 833 848 865 882
Total applications of operating funding 3,261 3,039 3,173 3,243 3,312 3,377 3,449 3,528 3,617 3,713 3,809Surplus (deficit) of operating funding (10) 33 42 52 53 62 71 79 86 102 107
Sources of capital fundingIncrease (decrease) in debt - - 154 - 162 - - - 83 - -
Total sources of capital funding - - 154 - 162 - - - 83 - -Applications of capital funding
Capital expenditure to meet additional demand - - - - - - - - - - -Capital expenditure to improve the level of service - - - - - - - - - - -Capital expenditure to replace existing assets 150 150 154 158 162 167 172 177 183 189 196Increase (decrease) in reserves (160) (117) 42 (106) 53 (105) (101) (98) (14) (87) (89)
Total applications of capital funding (10) 33 196 52 215 62 71 79 169 102 107Surplus (deficit) of capital funding 10 (33) (42) (52) (53) (62) (71) (79) (86) (102) (107)
Funding balance - - - - - - - - - - -ReconciliationTotal applications of operating funding 3,261 3,039 3,173 3,243 3,312 3,377 3,449 3,528 3,617 3,713 3,809
plus - Depreciation and amortisation 90 99 107 117 115 123 134 142 151 165 170less - Internal charges and overheads recovered 65 65 65 65 65 65 65 65 65 65 65Expenditure as per Statement of Financial Performance 3,286 3,073 3,215 3,295 3,362 3,435 3,518 3,605 3,703 3,813 3,914

Activity Group: Environmental Management
2015-2025 Long Term Plan Page 133
Activity: Resource Consents Activity: Resource Consents
Operating costs of this Activity represents approximately 2.4% of total Activity expenditure.
How this Activity Contributes to Related Community Outcomes This Activity primarily contributes to the Community Outcomes of Governance, Environment, Economy, Living.
Outcome Sub-outcome Major linkages Secondary linkagesGovernance Enabling
Transparent To ensure that Council meets its statutory obligations under the Resource Management Act 1991 (RMA).
Understanding of the requirements and process of the RMA to assist development.
Environment Sustainable resource management
Promoting the sustainable management of natural and physical resources in Marlborough through an effective resource consenting regime.
-
Economy Education To educate applicants, submitters and other interested parties on the Resource Management Act and the resource consent and approval process to assist development
Understanding of the requirements and process of the Resource Management Act to assist development. Providing information to potential applicants, interest groups and the general public on all resource management matters.
Living Access to quality housing
To manage the physical and built environment through the administration of the resource consenting process in a manner that
Processing and determining applications for resource consent in a manner that ensures the promotion of
Access to quality employment
Outcome Sub-outcome Major linkages Secondary linkages Social cohesion
contributes towards the community outcomes of environmental sustainability and prosperity.
sustainable management of natural and physical resources.
HealthOpportunities for participation Sports and recreation Cultural facilities and events
What is this Activity About? This Activity involves discharging Council’s statutory obligations under the Resource Management Act 1991 (RMA). The RMA sets out a range of powers, duties and functions and the statutory processes that must be followed when processing and determining applications for resource consent. The RMA’s purpose is to promote sustainable management of natural and physical resources. This Activity is about the promotion of the sustainable management of natural and physical resources and the administration of the Marlborough Sounds and the Wairau/Awatere Resource Management Plans.
Specifically this Activity processes five different types of resource consents:
1. Land Use Consents.
2. Water Permits.
3. Discharge Permits.
4. Subdivision Consents.
5. Coastal Permits.
The Resource Consent Activity provides information to potential applicants, interest groups and the general public on all resource management matters. The Activity maintains and manages a consents data base that is responsive to the needs and requirements of central government, applicants, submitters and the general public. The Activity also manages objections and appeals to the Environment Court on resource consent decisions and conditions.
Activity Levels The Activity level of the group varies from year to year. The graph below shows there

Activity Group: Environmental Management
Page 134 2015-2025 Long Term Plan
has been an increase in numbers since last year. Within each year there are also daily, weekly and monthly fluctuations in the number and types of application.
Emerging Issues and Expected Changes The challenges for this Activity are centred on the need to adequately respond to legislative and other changes whilst meeting statutory timeframes for the processing of consents and providing a fair, cost effective and consistent service to the community. Council as a large unitary is faced with processing a constantly fluctuating work flow including a number of applications of a complicated nature, particularly those involving the allocation of water and coastal space. Council constantly reviews its processes and procedures to ensure adherence to current best practices.
The Resource Management Amendment Act 2013 introduced new provisions in March 2015. The new provisions relate to the required content of resource consent applications under section 88 and Schedule 4. The new provisions require significantly more information at lodgment stage for applications to be accepted under section 88 and if the application does not provide this information it “must” be rejected. The current provisions provide the Council discretion over the rejection of applications under section 88. After 3 March 2015 this discretion was removed and consequently it is expected that this will lead to an increase in the number of incomplete applications that will be rejected in future years.
Levels of Service 2015-25: Resource Consents
Performance Targets (for the financial year)Level of Service Indicator Baseline 2015-16 2016-17 2017-18 2018-25 Provide an overall level of service that meets or exceeds residents’ expectations.
Resident satisfaction with this service as measured by survey, where 10 = “service delivered extremely well”.
6.0 6.0 6.0 6.0 6.0
Provide a consent service that is fair, consistent, cost effective, timely and responsive to customers’ needs.
% of resource consent applications processed within statutory timeframes.
99.7% 99% 99% 99% 99%
% of objections under section 357(b) compared to total number of applications processed.12
<0.2 <0.5% <0.5% <0.5% <0.5%
Provide consistent, appropriate and timely information to applicants and the public on the RMA, resource consent and approval process.
% of incomplete applications rejected under the requirements of RMA - section 88.
<1.7% <15% <15% <15% <15%
12 RMA, Section 357(b) – Right of objection in relation to imposition of additional charges and recovery costs.

Activity Group: Environmental Management
2015-2025 Long Term Plan Page 135
Note 1: There are no material cost of service variances.
Funding Impact Statement for 2015-25Resource Consents AP 2014.15 2015.16 2016.17 2017.18 2018.19 2019.20 2020.21 2021.22 2022.23 2023.24 2024.25
$000's $000's $000's $000's $000's $000's $000's $000's $000's $000's $000'sSources of operating funding
General rates, uniform annual general charges, rates penalties 999 884 917 946 966 964 984 1,008 1,034 1,066 1,092Fees and charges 1,288 1,455 1,491 1,529 1,571 1,616 1,664 1,717 1,773 1,835 1,901Internal charges and overheads recovered 22 23 23 23 23 23 23 23 23 23 23Other receipts 107 87 86 85 84 80 79 77 76 76 74
Total operating funding 2,416 2,449 2,517 2,583 2,644 2,683 2,750 2,825 2,906 3,000 3,090Applications of operating funding
Payments to staff and suppliers 1,661 1,685 1,719 1,756 1,795 1,836 1,880 1,929 1,981 2,037 2,095Internal charges and overheads applied 759 762 797 828 849 847 868 895 924 961 993
Total applications of operating funding 2,420 2,447 2,516 2,584 2,644 2,683 2,748 2,824 2,905 2,998 3,088Surplus (deficit) of operating funding (4) 2 1 (1) - - 2 1 1 2 2
Sources of capital fundingTotal sources of capital funding - - - - - - - - - - -
Applications of capital fundingCapital expenditure to improve the level of service 3 3 3 3 3 3 - - - - -Capital expenditure to replace existing assets - - - - - 3 4 4 - -Increase (decrease) in reserves (7) (1) (2) (4) (3) (3) (1) (3) (3) 2 2
Total applications of capital funding (4) 2 1 (1) - - 2 1 1 2 2Surplus (deficit) of capital funding 4 (2) (1) 1 - - (2) (1) (1) (2) (2)
Funding balance - - - - - - - - - - -ReconciliationTotal applications of operating funding 2,420 2,447 2,516 2,584 2,644 2,683 2,748 2,824 2,905 2,998 3,088
plus - Depreciation and amortisation - 1 1 1 1 1 1 1 1 1 1less - Internal charges and overheads recovered 22 23 23 23 23 23 23 23 23 23 23Expenditure as per Statement of Financial Performance 2,398 2,425 2,494 2,562 2,622 2,661 2,726 2,802 2,883 2,976 3,066

Activity Group: Environmental Management
Page 136 2015-2025 Long Term Plan
Activity: Environmental Protection Activity: Environmental Protection
Operating costs of this Activity represent approximately 1.3% of total Activity expenditure.
How this Activity Contributes to Related Community Outcomes This Activity primarily contributes to the Community Outcomes of Governance, Environment, People and Economy by:
Outcome Sub-outcome Major linkages Secondary linkagesGovernance Enabling Internal user groups.
Industry groups. External special interest groups.
Understanding of the requirements processes of the Resource Management Act (RMA) and Council’s resource management framework.
Environment Control over pollution levels, forms and effects Systems for protection and care
Consent holders and the public.
Council has responsibility pursuant to s35 of the Resource Management Act to provide an active compliance monitoring and enforcement regime to sustainably manage Marlborough’s natural physical resources and to provide feedback to the policy, Resource Consents and Science and Monitoring groups.
People Education Holders of consents and people undertaking permitted activities and the public.
-
Outcome Sub-outcome Major linkages Secondary linkages Economy Sustainability Providing an active
compliance monitoring and enforcement regime to sustainably manage Marlborough’s natural and physical resources.
What is this Activity About? Council monitors the effect of implementing its Resource Management Plans (RMP) by monitoring compliance with the conditions of resource consent conditions and permitted activity standards.
The main activities of the Environmental Protection section are:
Monitoring – Proactively monitor activities that have either a greater environmental impact warranting special consideration, generate community concern or are related to trends highlighted through the State of the Environment Report.
Policy – Provide feedback to the policy, resource consents and science and monitoring groups to measure the effectiveness and efficiency of the district resource management plan.
Complaint Response - Investigate alleged breaches of the RMA, RMP and consents. Council receives over 1,500 complaints on an annual basis in regard to alleged breaches of the RMA or resource consent conditions, all of which require investigation. The follow up involved in resolving a complaint can vary from a relatively simplistic desk top exercise to a complex investigation and Court action. As any complaint could escalate, a high level of data recording is essential.
Emergency Response – Respond to emergencies that have the potential to affect the environment (eg; spillages, discharges).
Education - Good education leads to the community understanding and taking ownership of an issue and its resolution. It is an effective way of bringing about a long-term change in environmental behaviour and also allows Council and the community to foster good relationships and deal with issues in a proactive as opposed to a regulatory manner.
Activity Levels During 2013-14, Council received 1,848 complaints (2012-13: 1,650). Noise complaints are the most common complaints received. The types of complaints that have increased are, noise, land use, discharges to air and coastal:
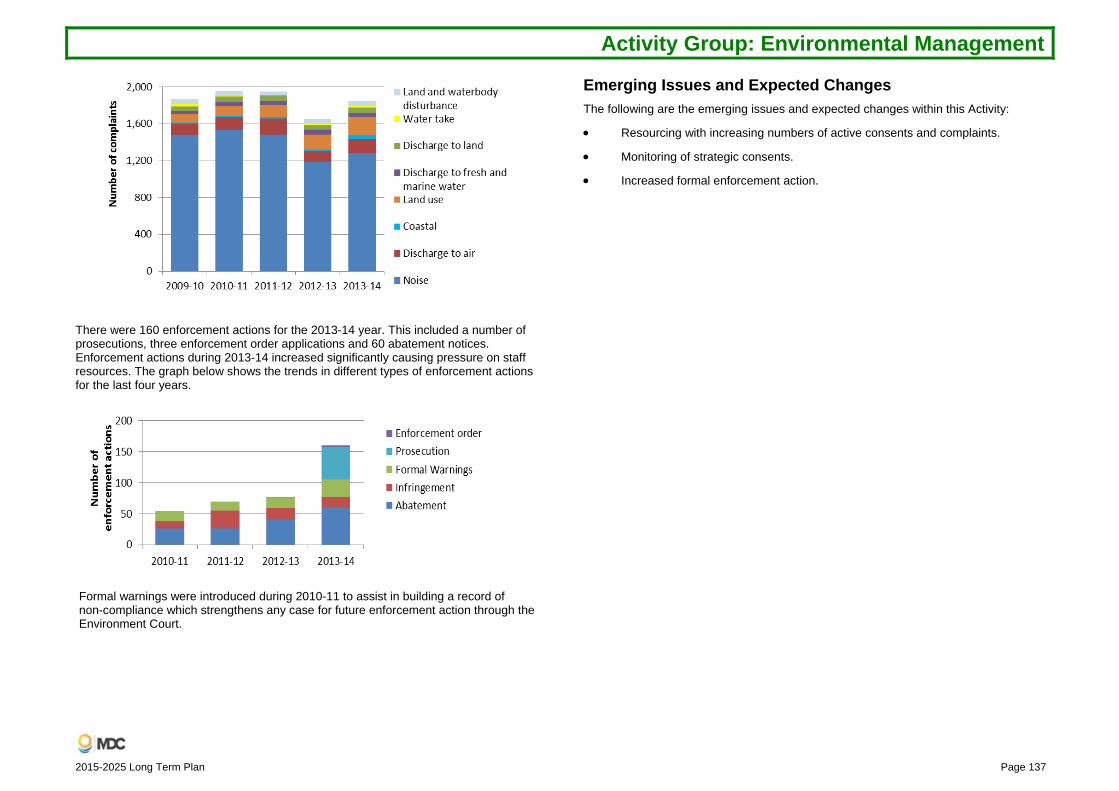
Activity Group: Environmental Management
2015-2025 Long Term Plan Page 137
There were 160 enforcement actions for the 2013-14 year. This included a number of prosecutions, three enforcement order applications and 60 abatement notices. Enforcement actions during 2013-14 increased significantly causing pressure on staff resources. The graph below shows the trends in different types of enforcement actions for the last four years.
Formal warnings were introduced during 2010-11 to assist in building a record of non-compliance which strengthens any case for future enforcement action through the Environment Court.
Emerging Issues and Expected Changes The following are the emerging issues and expected changes within this Activity:
Resourcing with increasing numbers of active consents and complaints.
Monitoring of strategic consents.
Increased formal enforcement action.

Activity Group: Environmental Management
Page 138 2015-2025 Long Term Plan
Levels of Service 2015-25: Environmental Protection
Performance Targets (for the financial year)Level of Service Indicator Baseline 2015-16 2016-17 2017-18 2018-25 Provide an overall level of service that meets or exceeds residents’ expectations.
Resident satisfaction with this service as measured by survey, where 10 = “service delivered extremely well”.
6.5 6.5 6.5 6.5 6.5
Monitor activities that have either a greater environmental impact warranting special consideration, or are activities that generate community concern or are related to trends highlighted through the State of the Environment Report.
Report on dairy farm effluent systems and stream crossings for compliance with permitted activity standards or RMP and consents.
N/A 31 August 31 August 31 August 31 August New Measure
Improved or unchanged compliance level
Improved or unchanged compliance level
Improved or unchanged compliance level
Improved or unchanged compliance level
Report on waste from wineries for compliance with resource consent conditions (waste water and grape marc).
N/A 30 November 30 November 30 November 30 November New Measure
Improved or unchanged compliance level
Improved or unchanged compliance level
Improved or unchanged compliance level
Improved or unchanged compliance level
Report on resource consents for the discharge of sewage from commercial operators to Marlborough Sounds’ land or coastal waters.
N/A 31 July 31 July 31 July 31 July New
Measure Improved or unchanged compliance level
Improved or unchanged compliance level
Improved or unchanged compliance level
Improved or unchanged compliance level
Monitor and investigate alleged breaches of the RMA, RMP and Consents.
% of complaints assessed within one working day.
80% 80% 80% 80% 80%
% of complaints, either resolved or had a resolution strategy, developed within 90 days of receipt.
99% 99% 99% 99% 99%

Activity Group: Environmental Management
2015-2025 Long Term Plan Page 139
Note 1: There are no material cost of service variances.
Funding Impact Statement for 2015-25Environmental Protection AP 2014.15 2015.16 2016.17 2017.18 2018.19 2019.20 2020.21 2021.22 2022.23 2023.24 2024.25
$000's $000's $000's $000's $000's $000's $000's $000's $000's $000's $000'sSources of operating funding
General rates, uniform annual general charges, rates penalties 1,007 1,105 1,137 1,171 1,201 1,217 1,250 1,282 1,320 1,378 1,423Fees and charges 35 35 41 42 43 50 51 59 61 69 72Other receipts including fines 112 111 109 108 107 105 104 103 103 104 103
Total operating funding 1,154 1,251 1,287 1,321 1,351 1,372 1,405 1,444 1,484 1,551 1,598Applications of operating funding
Payments to staff and suppliers 758 857 874 892 911 932 955 979 1,004 1,051 1,081Internal charges and overheads applied 395 394 413 429 440 440 450 465 480 500 517
Total applications of operating funding 1,153 1,251 1,287 1,321 1,351 1,372 1,405 1,444 1,484 1,551 1,598Surplus (deficit) of operating funding 1 - - - - - - - - - -
Sources of capital fundingTotal sources of capital funding - - - - - - - - - - -
Applications of capital fundingIncrease (decrease) in reserves 1 - - - - - - - - - -
Total applications of capital funding 1 - - - - - - - - - -Surplus (deficit) of capital funding (1) - - - - - - - - - -
Funding balance - - - - - - - - - - -ReconciliationTotal applications of operating funding 1,153 1,251 1,287 1,321 1,351 1,372 1,405 1,444 1,484 1,551 1,598
plus - Depreciation and amortisation 1 - - - - - - - - - -Expenditure as per Statement of Financial Performance 1,154 1,251 1,287 1,321 1,351 1,372 1,405 1,444 1,484 1,551 1,598

Activity Group: Regulatory
Page 140 2015-2025 Long Term Plan
Regulatory

Activity Group: Regulatory
2015-2025 Long Term Plan Page 141
Regulatory Operating Costs The operating costs for the Regulatory Group of Activities represents $77 million of total Council expenditure.
Capital Projects The capital expenditure for the Regulatory Group of Activities represents $2 million of total Council expenditure over the next 10 years. Information about the major budgeted capital projects are included under the respective Activities sections.
Rationale for Activities in this Group Council is charged with carrying out a number of statutory functions, on behalf of Central Government. These responsibilities are denoted down to Local Government by statute. This grouping contains activities driven by various statutes which have nothing in common and no real interrelationships.
The responsibility for managing this Group of Activities has been given to the Regulatory Group to manage.
Changes to Regulatory Activity Group from the 2014-15 Annual Plan There are no changes to this Activity Group.
Intended Changes to Levels of Service from the 2014-15 Annual Plan The table describes any intended changes to the levels of service within the group from the levels of service displayed in the 2014-15 Annual Plan. The reasons for the intended changes are also described.
2014-15 Annual Plan 2015-25 LTP Reason for changes Activity: Environmental HealthNone. Administer Food Control Plans
under the Food Act 2014. New level of service due to requirements of Food Act 2014.
Significant Negative Effects Associated with this Group of Activities No negative effects are considered to be associated with this Group of Activities.
Activity Group Funding Impact Statement The following Funding Impact Statement (FIS) is for the Activity Group, throughout this section a separate FIS is included for each Activity and these should be referred to for more detailed information.

Activity Group: Regulatory
Page 142 2015-2025 Long Term Plan
Note 1: There are no material cost of service variances.
Funding Impact Statement for 2015-25REGULATORY AP 2014.15 2015.16 2016.17 2017.18 2018.19 2019.20 2020.21 2021.22 2022.23 2023.24 2024.25
$000's $000's $000's $000's $000's $000's $000's $000's $000's $000's $000'sGeneral rates, uniform annual general charges, rates penalties 2,485 2,800 2,930 3,025 3,049 3,084 3,157 3,219 3,299 3,393 3,502Fees and charges 3,059 3,367 3,449 3,535 3,628 3,726 3,831 3,947 4,072 4,201 4,336Other receipts 981 765 784 795 801 810 821 833 849 868 888
Total operating funding 6,525 6,932 7,163 7,355 7,478 7,620 7,809 7,999 8,220 8,462 8,726Applications of operating funding
Payments to staff and suppliers 4,764 4,998 5,119 5,244 5,319 5,474 5,603 5,711 5,864 6,027 6,198Finance Costs - 34 42 41 40 38 37 35 34 32 30Internal charges and overheads applied 1,542 1,659 1,729 1,788 1,831 1,829 1,870 1,925 1,982 2,057 2,121Other operating funding applications 38 30 31 31 32 33 34 35 35 37 38
Total applications of operating funding 6,344 6,721 6,921 7,104 7,222 7,374 7,544 7,706 7,915 8,153 8,387Surplus (deficit) of operating funding 181 211 242 251 256 246 265 293 305 309 339
Sources of capital fundingGross proceeds from sale of assets - - - - - - - - - - -Increase (decrease) in debt - 247 - - - - - - - - -
Total sources of capital funding - 247 - - - - - - - - -Applications of capital funding
Capital expenditure to meet additional demand - - - - - - - - - - -Capital expenditure to improve the level of service 102 320 - 74 - - 80 - - - 91Capital expenditure to replace existing assets 32 74 110 140 244 73 332 40 177 42 321Increase (decrease) in reserves 47 64 132 37 12 173 (147) 253 128 267 (73)
Total applications of capital funding 181 458 242 251 256 246 265 293 305 309 339Surplus (deficit) of capital funding (181) (211) (242) (251) (256) (246) (265) (293) (305) (309) (339)
Funding balance - - - - - - - - - - -ReconciliationTotal applications of operating funding 6,344 6,721 6,921 7,104 7,222 7,374 7,544 7,706 7,915 8,153 8,387
plus - Depreciation and amortisation 145 161 184 188 192 179 189 209 213 217 232Expenditure as per Note 1 6,489 6,882 7,105 7,292 7,414 7,553 7,733 7,915 8,128 8,370 8,619
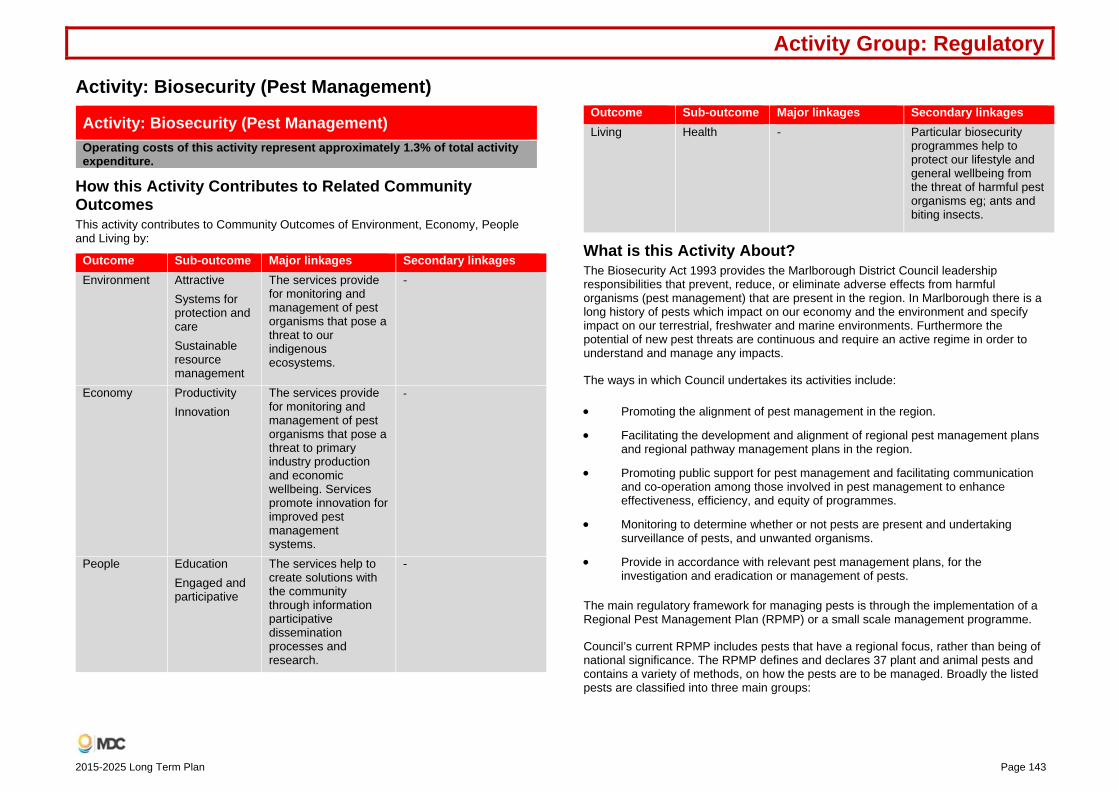
Activity Group: Regulatory
2015-2025 Long Term Plan Page 143
Activity: Biosecurity (Pest Management)
Activity: Biosecurity (Pest Management) Operating costs of this activity represent approximately 1.3% of total activity expenditure.
How this Activity Contributes to Related Community Outcomes This activity contributes to Community Outcomes of Environment, Economy, People and Living by:
Outcome Sub-outcome Major linkages Secondary linkagesEnvironment Attractive
Systems for protection and care Sustainable resource management
The services provide for monitoring and management of pest organisms that pose a threat to our indigenous ecosystems.
-
Economy Productivity Innovation
The services provide for monitoring and management of pest organisms that pose a threat to primary industry production and economic wellbeing. Services promote innovation for improved pest management systems.
‐
People Education Engaged and participative
The services help to create solutions with the community through information participative dissemination processes and research.
-
Outcome Sub-outcome Major linkages Secondary linkages Living Health - Particular biosecurity
programmes help to protect our lifestyle and general wellbeing from the threat of harmful pest organisms eg; ants and biting insects.
What is this Activity About? The Biosecurity Act 1993 provides the Marlborough District Council leadership responsibilities that prevent, reduce, or eliminate adverse effects from harmful organisms (pest management) that are present in the region. In Marlborough there is a long history of pests which impact on our economy and the environment and specify impact on our terrestrial, freshwater and marine environments. Furthermore the potential of new pest threats are continuous and require an active regime in order to understand and manage any impacts.
The ways in which Council undertakes its activities include:
Promoting the alignment of pest management in the region.
Facilitating the development and alignment of regional pest management plans and regional pathway management plans in the region.
Promoting public support for pest management and facilitating communication and co-operation among those involved in pest management to enhance effectiveness, efficiency, and equity of programmes.
Monitoring to determine whether or not pests are present and undertaking surveillance of pests, and unwanted organisms.
Provide in accordance with relevant pest management plans, for the investigation and eradication or management of pests.
The main regulatory framework for managing pests is through the implementation of a Regional Pest Management Plan (RPMP) or a small scale management programme.
Council’s current RPMP includes pests that have a regional focus, rather than being of national significance. The RPMP defines and declares 37 plant and animal pests and contains a variety of methods, on how the pests are to be managed. Broadly the listed pests are classified into three main groups:

Activity Group: Regulatory
Page 144 2015-2025 Long Term Plan
Total Control Pests – pests of limited distribution which potentially would have a high impact if left unmanaged. The objective is to eradicate these species throughout the region. The onus for pest control is shared between the land occupiers, Council and in particular circumstances, the Department of Conservation.
Containment Pests - pests that are more widespread in nature which have a high impact on the environment and require control to prevent spread and to reduce overall pest density levels over time. The control of these pests is primarily the responsibility of the land occupier.
Surveillance Pests - pests which have significance and require further information gathering. The only management intervention is the banning of sale, propagation and distribution.
The Council also provides a range of non-regulatory pest management services through the provision of community partnerships and funding to the Tb Free programme controlling wildlife vectors, pursuant to the National Pest Management Strategy for Bovine Tb.
Emerging Issues and Expected Changes Over the next few years our focus is centred on the need to adequately respond to:
The statutory review of the RPMP is required to be completed by 2017. The process is expected to review the existing pest programmes and provide for new approaches to pest management, while ensuring alignment of the Plan to the requirements of the National policy direction.
Incorporated with this review is the potential to prepare a non-regulatory Biosecurity Strategy incorporating a framework for all Council based approaches to pest management.
The spread of Chilean needle grass and Wilding conifers continues to be a threat to the community. A joint agency and community partnership and the development of a non-regulatory approach to the management of these pests, coupled with other regulatory tools are expected to be developed.
The National Bovine Tb Strategy and funding implications are likely to be reviewed during the term of this Plan.
Levels of Service 2015-25: Biosecurity (Pest Management) Performance Targets (for the financial year)Level of Service Indicator Baseline 2015-16 2016-17 2017-18 2018-25 Provide an overall level of service that meets or exceeds residents’ expectations.
Resident satisfaction with this service as measured by survey, where 10 = “service delivered extremely well”.
6.3 6.3 6.3 6.3 6.4
Monitoring and controlling the spread and impacts of animal and plant pests.
Percentage of ‘high priority’ sites (land occupier obligations) inspected or audited to confirm compliance.
95% 95% 95% 95% 95%
Percentage of ‘active’ pest sites managed annually through a service delivery programme.
95% 95% 95% 95% 95%
The number of hours spent searching (surveillance) for pests outside known areas.
500 hours >500 hours >500 hours >500 hours >500 hours
Prepare, publish, and implement the RPMS operational plan.
Timeliness completion of annual plan to the Environment Committee.
30 October 30 October 30 October 30 October 30 October

Activity Group: Regulatory
2015-2025 Long Term Plan Page 145
Note 1: There are no material cost of service variances.
Funding Impact Statement for 2015-25Biosecurity (Pest Management) AP 2014.15 2015.16 2016.17 2017.18 2018.19 2019.20 2020.21 2021.22 2022.23 2023.24 2024.25
$000's $000's $000's $000's $000's $000's $000's $000's $000's $000's $000'sSources of operating funding
General rates, uniform annual general charges, rates penalties 1,134 1,140 1,193 1,246 1,244 1,300 1,336 1,345 1,387 1,434 1,481Fees and charges - 20 21 21 22 22 23 24 24 25 26Other receipts 156 124 124 125 121 122 120 117 117 117 117
Total operating funding 1,290 1,284 1,338 1,392 1,387 1,444 1,479 1,486 1,528 1,576 1,624Applications of operating funding
Payments to staff and suppliers 1,015 963 1,004 1,046 1,033 1,089 1,116 1,112 1,142 1,174 1,210Internal charges and overheads applied 274 320 333 345 354 355 363 374 386 401 414
Total applications of operating funding 1,289 1,283 1,337 1,391 1,387 1,444 1,479 1,486 1,528 1,575 1,624Surplus (deficit) of operating funding 1 1 1 1 - - - - - 1 -
Sources of capital fundingTotal sources of capital funding - - - - - - - - - - -
Applications of capital fundingIncrease (decrease) in reserves 1 - - - - - - - - - -
Total applications of capital funding 1 - - - - - - - - - -Surplus (deficit) of capital funding (1) - - - - - - - - - -
Funding balance - 1 1 1 - - - - - 1 -ReconciliationTotal applications of operating funding 1,289 1,283 1,337 1,391 1,387 1,444 1,479 1,486 1,528 1,575 1,624
plus - Depreciation and amortisation 1 - - - - - - - - - -Expenditure as per Statement of Financial Performance 1,290 1,283 1,337 1,391 1,387 1,444 1,479 1,486 1,528 1,575 1,624

Activity Group: Regulatory
Page 146 2015-2025 Long Term Plan
Activity: Building Control Activity: Building Control Operating costs of this Activity represents approximately 2.9% of total Activity expenditure.
How this Activity Contributes to Related Community and Council Outcomes This activity contributes to the Community Outcomes of Environment, Economy and Living by:
Outcome Sub-outcome Major linkages Secondary linkagesEnvironment System for
protection and care
The people of Marlborough want to be assured that the buildings they live and work in comply with the Building Code, are structurally sound, weather-tight and meet fire protection requirements.
-
Economy Education - Understanding of the requirements and process of the Building Code to assist development.
Living Access to quality housing
The people of Marlborough want to be assured that the buildings they live and work in comply with Building Code, are structurally sound, weather-tight and meet fire protection requirements.
Enabling events to take place with an effective inspection regime to ensure safety.
What is this Activity About? This Activity is important for safety and health of the residents, workers and visitors to the Marlborough District because the main thrust of the Building Act and Regulations is the health and safety of building users. The efficient processing of Building Consents is a key focus of this Activity to ensure we are responsive to customer needs.
This Activity involves giving effect to the Building Act 2004. This Act charges Council with several responsibilities which are set out in two separate categories: Territorial Authority (TA) and Building Consent Authority (BCA). The Council’s role is to ensure compliance and to meet the relevant Acts and Regulations. The most significant component of this Activity is to receive, process, grant, and issue Building Consent applications, followed by inspecting work for compliance and issuing a Code Compliance Certificate. The standard of compliance required is set out in the Building Regulations and it’s compliance with the New Zealand Building Code.
This Activity also involves other functions under separate legislation including:
Monitoring swimming pool fencing under the Fencing of Swimming Pools Act 1987.
Investigating building related complaints under the Local Government Act and the Building Act 2002.
The Council is required to have an accredited Building Consent Authority.
Land Information Memoranda The issuing of a Land Information Memorandum (LIM) involves the timely, accurate and complete supply of information Council either holds, or has been statutorily advised of, by means of a memorandum to the applicant. Council is required to hold LIM pursuant to section 44A of the Local Government Information and Meetings Act 1987. Council is also required to process all LIM requests within statutory timeframes.
Activity Levels The Activity level varies from year to year. The following table lists the numbers of Building Consents handled during the last three years:
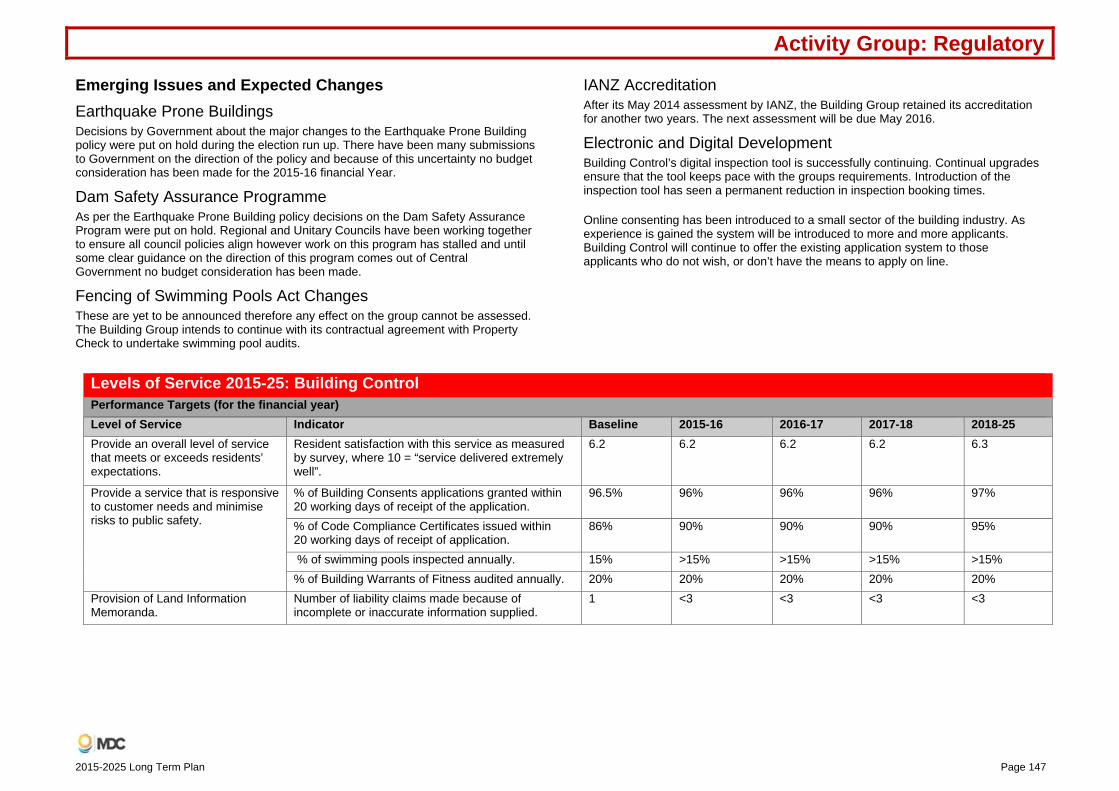
Activity Group: Regulatory
2015-2025 Long Term Plan Page 147
Emerging Issues and Expected Changes Earthquake Prone Buildings Decisions by Government about the major changes to the Earthquake Prone Building policy were put on hold during the election run up. There have been many submissions to Government on the direction of the policy and because of this uncertainty no budget consideration has been made for the 2015-16 financial Year.
Dam Safety Assurance Programme As per the Earthquake Prone Building policy decisions on the Dam Safety Assurance Program were put on hold. Regional and Unitary Councils have been working together to ensure all council policies align however work on this program has stalled and until some clear guidance on the direction of this program comes out of Central Government no budget consideration has been made.
Fencing of Swimming Pools Act Changes These are yet to be announced therefore any effect on the group cannot be assessed. The Building Group intends to continue with its contractual agreement with Property Check to undertake swimming pool audits.
IANZ Accreditation After its May 2014 assessment by IANZ, the Building Group retained its accreditation for another two years. The next assessment will be due May 2016.
Electronic and Digital Development Building Control’s digital inspection tool is successfully continuing. Continual upgrades ensure that the tool keeps pace with the groups requirements. Introduction of the inspection tool has seen a permanent reduction in inspection booking times.
Online consenting has been introduced to a small sector of the building industry. As experience is gained the system will be introduced to more and more applicants. Building Control will continue to offer the existing application system to those applicants who do not wish, or don’t have the means to apply on line.
Levels of Service 2015-25: Building Control Performance Targets (for the financial year)Level of Service Indicator Baseline 2015-16 2016-17 2017-18 2018-25 Provide an overall level of service that meets or exceeds residents’ expectations.
Resident satisfaction with this service as measured by survey, where 10 = “service delivered extremely well”.
6.2 6.2 6.2 6.2 6.3
Provide a service that is responsive to customer needs and minimise risks to public safety.
% of Building Consents applications granted within 20 working days of receipt of the application.
96.5% 96% 96% 96% 97%
% of Code Compliance Certificates issued within 20 working days of receipt of application.
86% 90% 90% 90% 95%
% of swimming pools inspected annually. 15% >15% >15% >15% >15%
% of Building Warrants of Fitness audited annually. 20% 20% 20% 20% 20%
Provision of Land Information Memoranda.
Number of liability claims made because of incomplete or inaccurate information supplied.
1 <3 <3 <3 <3

Activity Group: Regulatory
Page 148 2015-2025 Long Term Plan
Note 1: There are no material cost of service variances.
Funding Impact Statement for 2015-25Building Control AP 2014.15 2015.16 2016.17 2017.18 2018.19 2019.20 2020.21 2021.22 2022.23 2023.24 2024.25
$000's $000's $000's $000's $000's $000's $000's $000's $000's $000's $000'sSources of operating funding
General rates, uniform annual general charges, rates penalties 403 464 483 500 503 480 480 483 487 495 495Fees and charges 2,338 2,344 2,403 2,464 2,531 2,604 2,680 2,766 2,856 2,956 3,062Other receipts 83 136 137 140 141 140 141 143 146 149 151
Total operating funding 2,824 2,944 3,023 3,104 3,175 3,224 3,301 3,392 3,489 3,600 3,708Applications of operating funding
Payments to staff and suppliers 1,839 1,975 2,011 2,052 2,096 2,142 2,191 2,245 2,303 2,365 2,429Internal charges and overheads applied 931 936 980 1,018 1,045 1,043 1,068 1,103 1,139 1,186 1,227Other operating funding applications 25 20 21 21 22 22 23 24 24 25 26
Total applications of operating funding 2,795 2,931 3,012 3,091 3,163 3,207 3,282 3,372 3,466 3,576 3,682Surplus (deficit) of operating funding 29 13 11 13 12 17 19 20 23 24 26
Sources of capital fundingTotal sources of capital funding - - - - - - - - - - -
Applications of capital fundingCapital expenditure to replace existing assets - - - - - - - - - - -Increase (decrease) in reserves 29 13 12 12 13 17 19 20 22 24 26
Total applications of capital funding 29 13 12 12 13 17 19 20 22 24 26Surplus (deficit) of capital funding (29) (13) (12) (12) (13) (17) (19) (20) (22) (24) (26)
Funding balance - - (1) 1 (1) - - - 1 - -ReconciliationTotal applications of operating funding 2,795 2,931 3,012 3,091 3,163 3,207 3,282 3,372 3,466 3,576 3,682
plus - Depreciation and amortisation - - - - - - - - - - -Expenditure as per Statement of Financial Performance 2,795 2,931 3,012 3,091 3,163 3,207 3,282 3,372 3,466 3,576 3,682
Operating expenditureBuilding Control 2,618 2,754 2,829 2,903 2,971 3,013 3,083 3,168 3,257 3,360 3,460LIMs 178 177 183 188 192 194 199 204 209 216 222
Capital expenditure:Building Control - - - - - - - - - - -
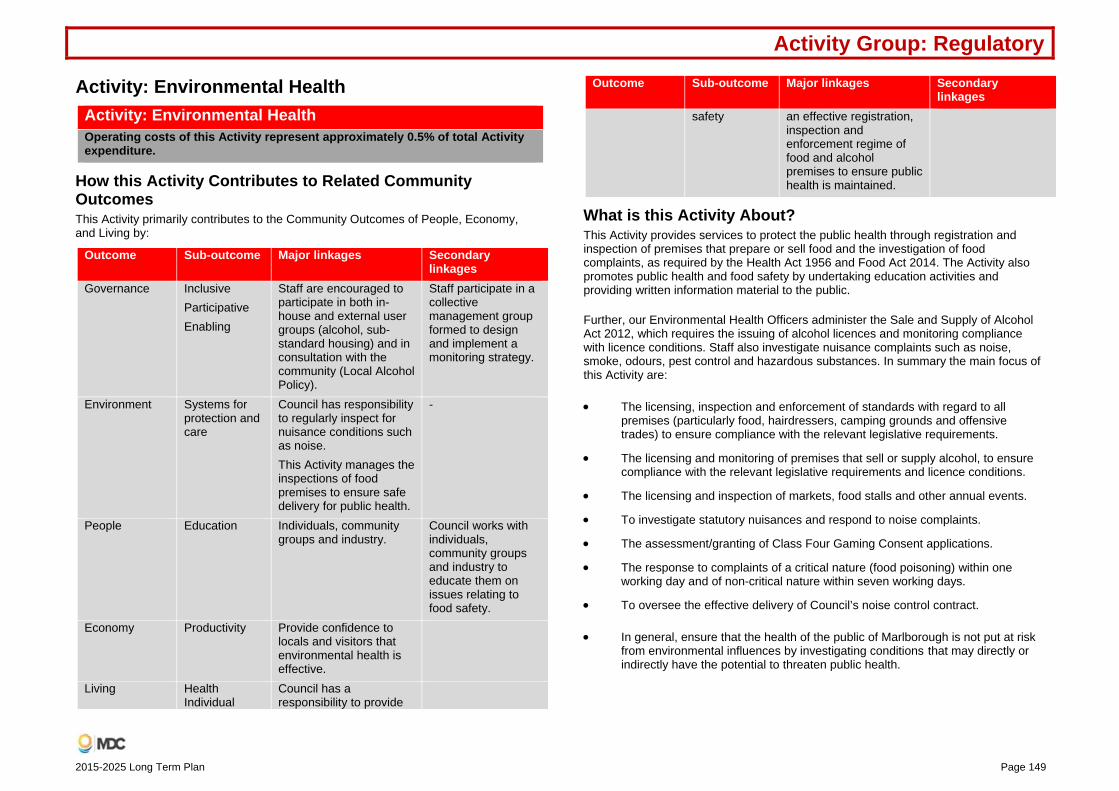
Activity Group: Regulatory
2015-2025 Long Term Plan Page 149
Activity: Environmental Health Activity: Environmental Health
Operating costs of this Activity represent approximately 0.5% of total Activity expenditure.
How this Activity Contributes to Related Community Outcomes This Activity primarily contributes to the Community Outcomes of People, Economy, and Living by:
Outcome Sub-outcome Major linkages Secondary linkages
Governance Inclusive Participative Enabling
Staff are encouraged to participate in both in-house and external user groups (alcohol, sub-standard housing) and in consultation with the community (Local Alcohol Policy).
Staff participate in a collective management group formed to design and implement a monitoring strategy.
Environment Systems for protection and care
Council has responsibility to regularly inspect for nuisance conditions such as noise. This Activity manages the inspections of food premises to ensure safe delivery for public health.
-
People Education Individuals, community groups and industry.
Council works with individuals, community groups and industry to educate them on issues relating to food safety.
Economy Productivity Provide confidence to locals and visitors that environmental health is effective.
Living Health Individual
Council has a responsibility to provide
Outcome Sub-outcome Major linkages Secondary linkages
safety an effective registration, inspection and enforcement regime of food and alcohol premises to ensure public health is maintained.
What is this Activity About? This Activity provides services to protect the public health through registration and inspection of premises that prepare or sell food and the investigation of food complaints, as required by the Health Act 1956 and Food Act 2014. The Activity also promotes public health and food safety by undertaking education activities and providing written information material to the public.
Further, our Environmental Health Officers administer the Sale and Supply of Alcohol Act 2012, which requires the issuing of alcohol licences and monitoring compliance with licence conditions. Staff also investigate nuisance complaints such as noise, smoke, odours, pest control and hazardous substances. In summary the main focus of this Activity are:
The licensing, inspection and enforcement of standards with regard to all premises (particularly food, hairdressers, camping grounds and offensive trades) to ensure compliance with the relevant legislative requirements.
The licensing and monitoring of premises that sell or supply alcohol, to ensure compliance with the relevant legislative requirements and licence conditions.
The licensing and inspection of markets, food stalls and other annual events.
To investigate statutory nuisances and respond to noise complaints.
The assessment/granting of Class Four Gaming Consent applications.
The response to complaints of a critical nature (food poisoning) within one working day and of non-critical nature within seven working days.
To oversee the effective delivery of Council’s noise control contract.
In general, ensure that the health of the public of Marlborough is not put at risk from environmental influences by investigating conditions 10F that may directly or indirectly have the potential to threaten public health.

Activity Group: Regulatory
Page 150 2015-2025 Long Term Plan
Emerging Issues and Expected Changes The following are the emerging issues and expected changes within this Activity:
Implementation of the new Food Act 2014 that places additional responsibilities and functions on Councils.
Monitoring and enforcement of existing frost fans.
The enactment of the Sale and Supply of Alcohol Act 2012. The Act expands the role of local Councils with the major change being a shift in licence decision making to the local level.
Levels of Service 2015-25: Environmental Health
Performance Targets (for the financial year)Level of Service Indicator Baseline 2015-16 2016-17 2017-18 2018-25 Ensure the residents of Marlborough and visitors to the District have confidence that they live and stay in an environment that is safe.
% of registered premises inspected once a year. 100% 100% 100% 100% 100%
Number of annual inspections of markets and events with 10 or more food stalls.
>12 >12 >12 >12 >12
% of complaints of critical nature (food poisoning) actioned within one working day.
100% 100% 100% 100% 100%
% of complaints of a non-critical nature assessed within seven working days.
100% 100% 100% 100% 100%
Administer the voluntary implementation of Food Control Plans.
Undertake annual audit of all existing food businesses with registered exemptions to ensure compliance with the Food Control Plans.
100% 100% 100% 100% 100%
Undertake an initial audit of newly registered Food Control Plans under the voluntary implementation programme within three months of registration.
100% 100% 100% 100% 100%
Administer Food Control Plans under the Food Act 2014.
Register businesses required under Food Act 2014 in Food Control Plans and National Programmes.
New Measure 100% 100% 100% 100%
Audit registered business as scheduled in the Food Act 2014 and Regulations.
New Measure 100% 100% 100% 100%
Carryout the functions of Licensing Inspector controlling the sale and supply of alcohol to the public with the aim of contributing to the reduction of alcohol abuse.
% of ‘On-Licences’ 11F
inspected once a year13. 90% 90% 90% 90% 90%
Provide a service for investigation of noise complaints.
Report on performance of noise control contract. New Measure 30 September 30 September 30 September 30 September Assess complaints concerning unreasonable noise within one working day.
89% 89% 89% 90% 90%
13 An ‘On-Licence’ allows the sale or supply of liquor to any person present on the premises for the consumption on the premises.

Activity Group: Regulatory
2015-2025 Long Term Plan Page 151
Note 1: There are no material cost of service variances.
Funding Impact Statement for 2015-25Environmental Health AP 2014.15 2015.16 2016.17 2017.18 2018.19 2019.20 2020.21 2021.22 2022.23 2023.24 2024.25
$000's $000's $000's $000's $000's $000's $000's $000's $000's $000's $000'sSources of operating funding
General rates, uniform annual general charges, rates penalties 147 126 130 137 135 135 139 143 147 152 155Fees and charges 10 10 10 11 11 11 11 12 12 6 6Other receipts 310 322 337 346 354 364 374 385 397 411 425
Total operating funding 467 458 477 494 500 510 524 540 556 569 586Applications of operating funding
Payments to staff and suppliers 311 312 317 326 330 340 345 356 365 376 385Internal charges and overheads applied 153 151 158 164 169 168 173 178 184 192 198
Total applications of operating funding 464 463 475 490 499 508 518 534 549 568 583Surplus (deficit) of operating funding 3 (5) 2 4 1 2 6 6 7 1 3
Sources of capital fundingTotal sources of capital funding - - - - - - - - - - -
Applications of capital fundingCapital expenditure to improve the level of service 2 - - - - - - - - - -Capital expenditure to replace existing assets 2 4 4 4 4 4 4 4 4 4 5Increase (decrease) in reserves (1) (9) (2) - (3) (2) 2 2 4 (3) (3)
Total applications of capital funding 3 (5) 2 4 1 2 6 6 8 1 2Surplus (deficit) of capital funding (3) 5 (2) (4) (1) (2) (6) (6) (8) (1) (2)
Funding balance - - - - - - - - (1) - 1ReconciliationTotal applications of operating funding 464 463 475 490 499 508 518 534 549 568 583
plus - Depreciation and amortisation 3 3 3 3 1 1 1 1 2 2 2Expenditure as per Statement of Financial Performance 467 466 478 493 500 509 519 535 551 570 585

Activity Group: Regulatory
Page 152 2015-2025 Long Term Plan
Activity: Animal Control Activity: Animal Control Operating costs of this Activity represents approximately 0.7% of total Activity expenditure.
How this Activity Contributes to Related Community Outcomes This Activity contributes primarily to the Community Outcomes of Environment, People, Mobility and Living by:
Outcome Sub-outcome Major linkages Secondary linkagesEnvironment Systems for
protection and care
Council’s Dog Control Policy and Bylaw provides for dog exercise and restricted access areas in the district to provide an environment for dog owners and the public.
-
People Education Individuals, schools, community groups and industry.
Council works with individuals, schools, community groups and the industry to educate them on the issues relating to animal control.
Mobility Safe - Council’s contractor has the responsibility to ensure that our public roads and public places are kept safe by removing wandering livestock. Investigate complaints of dog attacks and take the appropriate enforcement action.
Outcome Sub-outcome Major linkages Secondary linkages Living Health
Individual safety Sports and recreation
This Activity supports the public to safely participate in sports and recreation in areas where there are dog friendly or restricted areas.
-
What is this Activity About? The Activity involves the promotion of responsible dog ownership and protection of the community from danger, distress and nuisance caused by dogs. It is also responsible for providing services in relation to wandering livestock on public land and roads.
The Dog Control Act (DCA) is the primary legislative tool used in this Activity, carrying out the majority of its functions together with related regulations; Impounding Act 1955 and Council Bylaws. Council oversees the effective delivery of this service, which is delivered on a day-to-day basis under contract.
The contract contains detailed performance measures on registrations, complaints, operation of the dog pound, education, enforcement, impounding, livestock, training and qualification.
Emerging Issues and Expected Changes The cost of maintaining the levels of service.
Number of dogs that have not been microchipped.
Increasing numbers of callouts for wandering stock.

Activity Group: Regulatory
2015-2025 Long Term Plan Page 153
Levels of Service 2015-25: Animal Control Performance Targets (for the financial year) Level of Service Indicator Baseline 2015-16 2016-17 2017-18 2018-25 Provide an overall level of service that meets or exceeds residents’ expectations.
Resident satisfaction with this service as measured by survey, where 10 = “service delivered extremely well”
7.2 7.2 7.2 7.2 7.2
To provide an effective dog control service including registration that is in accordance with the Dog Control Act 1996 (DCA).
% of compliance with the service specifications in the Animal Control contract. The key service specifications relate to Education, Unaccounted for Dogs and Complaints.
100% 100% 100% 100% 100%
Report on contract performance. New measure 30 September 30 September 30 September 30 September
Compliance with DCA requirements by:
Reviewing policies and bylaws; and 2012-13 review 2015-16 review N/A N/A 2018-19 review and three years thereafter
Preparing and publicising a report annually. 30 September 30 September 30 September 30 September 30 September

Activity Group: Regulatory
Page 154 2015-2025 Long Term Plan
Note 1: There are no material cost of service variances.
Funding Impact Statement for 2015-25Animal Control AP 2014.15 2015.16 2016.17 2017.18 2018.19 2019.20 2020.21 2021.22 2022.23 2023.24 2024.25
$000's $000's $000's $000's $000's $000's $000's $000's $000's $000's $000'sSources of operating funding
General rates, uniform annual general charges, rates penalties 40 131 134 137 140 143 147 153 156 161 175Fees and charges 560 561 573 586 598 610 623 636 652 669 678Other receipts 13 26 26 26 26 27 27 27 28 28 29
Total operating funding 613 718 733 749 764 780 797 816 836 858 882Applications of operating funding
Payments to staff and suppliers 532 644 656 669 682 699 713 730 747 766 787Internal charges and overheads applied 62 62 65 68 70 69 71 73 76 79 81Other operating funding applications 9 9 9 9 9 9 10 10 10 10 10
Total applications of operating funding 603 715 730 746 761 777 794 813 833 855 878Surplus (deficit) of operating funding 10 3 3 3 3 3 3 3 3 3 4
Sources of capital fundingTotal sources of capital funding - - - - - - - - - - -
Applications of capital fundingIncrease (decrease) in reserves 10 3 3 3 3 3 3 3 3 3 4
Total applications of capital funding 10 3 3 3 3 3 3 3 3 3 4Surplus (deficit) of capital funding (10) (3) (3) (3) (3) (3) (3) (3) (3) (3) (4)
Funding balance - - - - - - - - - - -ReconciliationTotal applications of operating funding 603 715 730 746 761 777 794 813 833 855 878
plus - Depreciation and amortisation 6 3 3 3 3 3 3 3 3 3 4Expenditure as per Statement of Financial Performance 609 718 733 749 764 780 797 816 836 858 882
Operating expenditureDog Control 557 632 646 659 673 686 702 719 737 757 777Other Animal Control 52 86 88 89 91 93 95 97 99 102 105

Activity Group: Regulatory
2015-2025 Long Term Plan Page 155
Activity: Harbours Activity: Harbours
Operating costs of this Activity represents approximately 1.5% of all the Activity expenditure
How this Activity Contributes to Related Community Outcomes This Activity contributes to the Community Outcomes of Governance, Environment, Economy, People, Mobility and Living by:
Outcome Sub-outcome Major linkages Secondary linkages Governance Transparent
Enabling participative
Maritime legislation, Navigation Bylaws. Availability of service 24/7, 365 days a year. Maritime safety management. Stakeholder liaison.
Education.
Environment Systems for protection and care Control over pollution, levels, forms and effects
Risk Assessment and Safety Management System. Harbour Patrols. Increased pressure on commercial use on Sounds. Expectation of Sounds residents and users that effects of marine oil spills will be mitigated and the environment protected against the impacts.
Implementation of risk control measures. Planned response in accordance with the approved Marine Oil Spill Contingency Plan.
Outcome Sub-outcome Major linkages Secondary linkages Economy International
connections Productivity
Use of the Sounds by internationally operating passenger and cargo vessels; pre-arrival processes. Increased use of Sounds waters by oil exploration industry for delivery and export of oil drilling rigs. Enabling commerce within the Sounds waterways, carriage of logs, marine/salmon farming.
Passive monitoring of vessel movements.
People Engaged and participative
Stakeholder liaison. Increased expectation of on-water patrols.
Mobility National accessibility Local accessibility Safe
Interisland ferry traffic. Transport route for Sounds residents. Providing well marked navigable channels and known dangers. Increased management due to increased use.
Tory Channel, Inner Queen Charlotte Sound an extension of State Highway 1. No road access in many parts of the Sounds.
Living Individual safety Sport and Recreation Cultural facilities and events
Safe environment. Recreational use of the coast and Sounds. Events.
Enabling events to take place in a safe and attractive environment.
What is this Activity About? This Activity involves ensuring safety in Marlborough’s extensive marine waterways. The Marlborough Sounds comprises approximately 1,800 kms of coastline (which is 18% of New Zealand’s entire coastline) and 4,136 kms² of water area. The Sounds is used extensively for recreational purposes, commercial shipping, fishing and other aquaculture industries.

Activity Group: Regulatory
Page 156 2015-2025 Long Term Plan
The purpose of the Harbours Activity is to ensure that the Council’s statutory functions, duties and powers as a Harbour Authority are discharged in an accountable way and, where appropriate, educate the users of the Sounds waterways so that non-compliance with statutes and bylaws and, potentially, enforcement action through legal processes are minimised.
The Activity also performs pollution response functions and duties as set out in the Maritime Transport Act 1994 and associated maritime rules.
More generally, the purpose of the Harbours Activity is to:
In addition to having a qualified Harbour Master available at all times, provide a 24/7 Duty Officer capability, with a rostered system for after-hour call-outs.
Provide the infrastructure and systems that allows all users to travel safely within the region. This includes the provision of all regional Aids to Navigation, maritime information and Vessel Traffic Monitoring Services.
Monitor and manage compliance using statutes, bylaws and regulations that directly affects the Marlborough Sounds.
Manage emergencies and risks that threaten people, the environment, property or economic benefits from the coastal regions of Marlborough.
Protect Marlborough’s coastal environment for this and future generations from pollution through the ability to respond and deal with oil spills or other maritime risks.
Educate maritime users in particular and the whole community in general, on the safe and sustained use of Marlborough’s marine environment.
Provide support to Council on maritime safety decisions and policy provisions related to the region’s Harbour management area.
Assist Central Government agencies and other Council Activities in meeting their responsibilities within Marlborough’s Harbour area.
Promote the public image of Council in the management of its maritime safety responsibilities.
Activity Level The Marlborough Sounds Harbour is a busy waterway, particularly during the summer months. A variety of use the Sounds throughout the year:
Recreational Vessels Recreational use is important in the Sounds, both in terms of access to property and for leisure uses. Currently there are 1,158 berths in the Port Marlborough marinas of
which over 85.6% (Nov 2014) are occupied. In addition, there are in excess of 3,000 moorings in the Sounds and it is estimated that 50% are occupied on a continuous basis. Further, during the summer season, it is estimated that up to 10,000 additional recreational vessels make use of the Sounds.
Commercial Vessels The Marlborough Sounds Harbour is important for commercial use. There were almost 7,000 ferry movements, which according to the New Zealand Standards demonstrates that the area is the second busiest harbour after Wellington. In addition there are over 120 movements of passenger and log ships within the Sounds, the majority of these calling at Picton. Cruise ship calls are set to increase significantly during the next three years.
An important aspect of Council as a Harbour Authority is to patrol these busy waters to ensure safety and to provide education. Patrols are regularly undertaken with a particular emphasis on the summer months. Records are kept of patrols with observed incidents being recorded, reported on and followed up on.
Oil Spill Response Specialist oil spill response equipment is on permanent loan to the District from the national stock-pile held by Maritime NZ (MNZ). As part of the loan agreement, Harbours staff are responsible for the ongoing maintenance required to maintain the equipment in an immediate state of readiness.
Emerging Issues and Expected Changes Over the course of the last decade, commercial vessel movements have increased significantly, particularly in the log and passenger vessel calls being recorded. Additionally, the increase in recreational craft use of Marlborough’s maritime waterways has increased and brings with it the potential for conflict between the various water user groups to increase.
With the increase in timber exports, more vessels are expected to call at Picton and the overlap between vessel arrivals requires a more pro-active vessel movement management regime to be established. This is currently being managed through an electronic pre-arrival process to ensure that as much relevant information regarding the vessel, her crew, cargo and pollutants carried is known. The level of monitoring required is an emerging issue and is further discussed in that area. Additional anchorage areas have been defined both within the inner Sounds two being located close to Picton, one north-east of the Wedge the other north of Allports Island, one at the Northern Entrance, which is subject to specific permission protocols and one in Cloudy Bay.
Aids to Navigation (AtoNs) form a critical component of the Harbour Safety Management System and their operation complies with international standards as set

Activity Group: Regulatory
2015-2025 Long Term Plan Page 157
by the International Light House Authority (IALA). Requirements include minimum response times to rectify light failures, prescribed inspection routines and the establishment of an accurate performance data recording programme. Servicing and maintenance of AtoNs has been undertaken by the Harbour Master Group for the past two years. The processes and systems put in place ensure a robust regime is in place to achieve the IALA standard. Harbours’ vessel Astrolabe, is used to undertake this on-water work and in addition to this work, continues to be used to provide concurrent patrol work in the Pelorus Sound area during the busy summer period. Harbours’ ‘older’ patrol vessel Discovery (Protector 8.5 m) and the current towing vehicle (Toyota Land Cruiser) are scheduled for replacement in the 2015-16 financial year. After due consideration, it has been determined that Discovery will be replaced during the 2015-16 financial year but the replacement of the towing vehicle will be deferred and reviewed during the 2016/17 budget preparation.
Other issues emerging within the Activity are:
Ongoing review of the Harbour Risk Assessment with a complete review every three to four years, the consequential impacts of risk control measures, either adjustment of current measures or implementation of new risk control measures. The next formal review of the Risk Assessment is due in 2016/17. Between the formal risk reviews, individual risks are reviewed in accordance with the parameters below:
o Risks with a score of 5.5 or higher are reviewed every 12 months.
o Risks with a score of between 4.0 and 5.5 over a two year period.
o Risks with a score lower than 4.4 over a three year period.
The Safety Management System has been subject to Maritime New Zealand review and implementation of the policies and procedures remain ongoing.
Impact of oil exploration within New Zealand in relation to Admiralty Bay and the additional pressures these places on the Harbour Master Group resources.
Potential for log exports from Port Underwood has been raised on a number of occasions and again more recently and will require careful consideration prior to this taking place.
The need to review the levels of service with respect to the service provided by Picton Harbour Radio as the number of shipping movements increase, particularly the cruise ship sector, and whether there is a need to introduce a more direct vessel movement management/monitoring system.
Continue to keep the adequacy of the AtoNs network under review to ensure that changes in waterway use are incorporated in establishment of additional AtoNs.
Encouraging use of on-line interaction with stakeholders through electronic reporting of accidents and incidents, lodging of complaints and making suggestions on improvement of the services provided by the Harbour Master Group.
Ongoing public boating education campaign and identifying and developing synergies with other regions and central authorities.
Ongoing statutory responsibilities for preparedness and response to marine oil spill.
Implementation of regular stakeholder liaison strategies.
Introduction of new interactive technology that enables stakeholders to maintain access to their individual information data sets held by Council.
Implementation of Plan Change 21- Moorings Management Area in Waikawa Bay. Additional resources in terms of personnel, systems and finance may be required to effect implementation.
Implementation of the Rena report recommendations and introduction of the Marine Oil Spill Strategy 2015 identifies the need to increase stock piles of response equipment in strategic regions throughout New Zealand. It is anticipated that stock piles will be augmented during the 2016-17 financial year as Marlborough has been identified as one of the regions where an increase in the stock pile will occur. This will require additional storage capacity being identified. Costs associated with the increase in storage requirements are met from the Oil Pollution Fund, a fund administered by MNZ.

Activity Group: Regulatory
Page 158 2015-2025 Long Term Plan
Levels of Service 2015-25: Harbours
Performance Targets (for the financial year) Level of Service Indicator Baseline 2015-16 2016-17 2017-18 2018-25 Provide an overall level of service that meets or exceeds residents’ expectations.
Resident satisfaction with this service as measured by survey, where 10 = “service delivered extremely well”.
7.4 7.4 7.4 7.4 7.4
Provide a safe environment for all users through effective public education.
Safe Sounds Boating brochure reviewed, printed and ready for distribution annually.
Labour weekend
Labour weekend
Labour weekend
Labour weekend
Labour weekend
Number of weekends in period commencing at Labour Weekend through to end of Easter of the following year where patrols undertaken.
>20 >20 >20 >20 >20
Number of weekday patrols undertaken from mid-December through to end of January of the following year.
35 35 35 35 35
% of navigation warnings issued within two hours of a reported event that may impact on navigation safety.
100% 100% 100% 100% 100%
Ensure that Port and Harbour Safety Code requirements are met.
Full review of the Harbour Risk Assessment. Triennially N/A Review completed
N/A 2018-19 review completed
% of funded mitigation measures completed. 80% 80% 80% 80% 80%
Ensure navigation safety and bylaw requirements in the Marlborough Sounds area are adhered to.
Number of random light inspections of marine farms undertaken.
>200 >200 >200 >200 >200
Information regarding accidents and incidents is received and, where relevant, passed onto MNZ within five days.
100% 100% 100% 100% 100%
Ensure that navigation aids, swimming and water-ski lanes are maintained effectively.
% of time aids to navigation are working in compliance with the IALA standards.
Cat 1 = 99.8% 100% 100% 100% 100%
Cat 2 = 99.0% 100% 100% 100% 100%
Cat 3 = 97.0% 100% 100% 100% 100%
% of pre summer season inspections of swimming and water-ski lanes undertaken.
100% 100% 100% 100% 100%
Number of inspections of swimming and water-ski lanes undertaken during the summer season.
4 4 4 4 4

Activity Group: Regulatory
2015-2025 Long Term Plan Page 159
Note 1: There are no material cost of service variances.
Funding Impact Statement for 2015-25Harbours AP 2014.15 2015.16 2016.17 2017.18 2018.19 2019.20 2020.21 2021.22 2022.23 2023.24 2024.25
$000's $000's $000's $000's $000's $000's $000's $000's $000's $000's $000'sGeneral rates, uniform annual general charges, rates penalties 773 940 990 1,006 1,026 1,027 1,056 1,096 1,122 1,151 1,196Fees and charges 151 432 443 454 467 480 494 510 526 545 564Other receipts 407 158 159 159 159 158 159 161 162 164 166
Total operating funding 1,331 1,530 1,592 1,619 1,652 1,665 1,709 1,767 1,810 1,860 1,926Applications of operating funding
Payments to staff and suppliers 1,067 1,103 1,131 1,151 1,178 1,208 1,239 1,273 1,306 1,348 1,387Finance Costs - 34 42 41 40 38 37 35 34 32 30Internal charges and overheads applied 122 191 192 193 194 194 195 196 197 199 200Other operating funding applications 4 1 1 1 1 1 1 1 1 1 1
Total applications of operating funding 1,193 1,329 1,366 1,386 1,413 1,441 1,472 1,505 1,538 1,580 1,618Surplus (deficit) of operating funding 138 201 226 233 239 224 237 262 272 280 308
Sources of capital fundingGross proceeds from sale of assets - - - - - - - - - - -Increase (decrease) in debt - - - - - - - - - - -
Total sources of capital funding - - - - - - - - - - -Applications of capital funding
Capital expenditure to meet additional demand - - - - - - - - - - -Capital expenditure to improve the level of service 100 320 43 179 121 - 208 - 136 - -Capital expenditure to replace existing assets 30 70 64 32 119 69 200 35 37 38 408Increase (decrease) in reserves 8 (189) 119 22 (1) 155 (171) 227 99 242 (100)
Total applications of capital funding 138 201 226 233 239 224 237 262 272 280 308Surplus (deficit) of capital funding (138) (201) (226) (233) (239) (224) (237) (262) (272) (280) (308)
Funding balance - - - - - - - - - - -ReconciliationTotal applications of operating funding 1,193 1,329 1,366 1,386 1,413 1,441 1,472 1,505 1,538 1,580 1,618
plus - Depreciation and amortisation 134 155 177 181 188 175 185 205 208 211 227Expenditure as per Statement of Financial Performance 1,327 1,484 1,543 1,567 1,601 1,616 1,657 1,710 1,746 1,791 1,845

Activity Group: Regional Development
Page 160 2015-2025 Long Term Plan
Regional Development
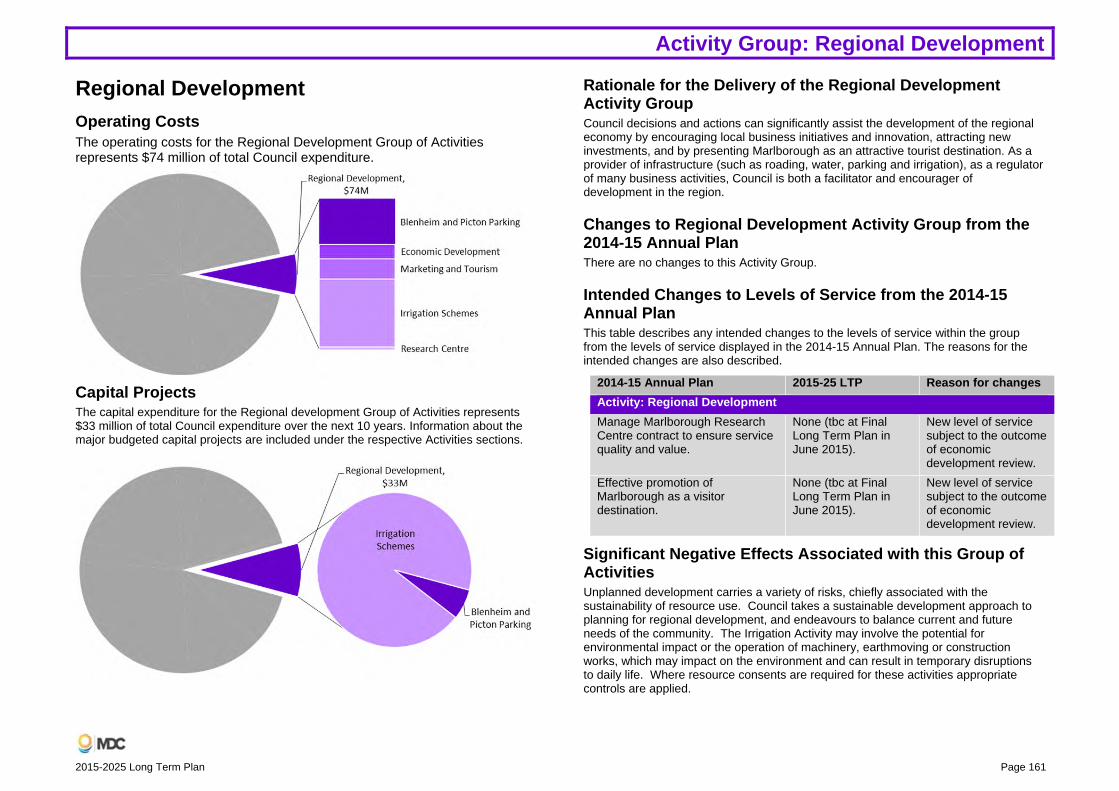
Activity Group: Regional Development
2015-2025 Long Term Plan Page 161
Regional Development Operating Costs The operating costs for the Regional Development Group of Activities represents $74 million of total Council expenditure.
Capital Projects The capital expenditure for the Regional development Group of Activities represents $33 million of total Council expenditure over the next 10 years. Information about the major budgeted capital projects are included under the respective Activities sections.
Rationale for the Delivery of the Regional Development Activity Group Council decisions and actions can significantly assist the development of the regional economy by encouraging local business initiatives and innovation, attracting new investments, and by presenting Marlborough as an attractive tourist destination. As a provider of infrastructure (such as roading, water, parking and irrigation), as a regulator of many business activities, Council is both a facilitator and encourager of development in the region.
Changes to Regional Development Activity Group from the 2014-15 Annual Plan There are no changes to this Activity Group.
Intended Changes to Levels of Service from the 2014-15 Annual Plan This table describes any intended changes to the levels of service within the group from the levels of service displayed in the 2014-15 Annual Plan. The reasons for the intended changes are also described.
2014-15 Annual Plan 2015-25 LTP Reason for changes Activity: Regional DevelopmentManage Marlborough Research Centre contract to ensure service quality and value.
None (tbc at Final Long Term Plan in June 2015).
New level of service subject to the outcome of economic development review.
Effective promotion of Marlborough as a visitor destination.
None (tbc at Final Long Term Plan in June 2015).
New level of service subject to the outcome of economic development review.
Significant Negative Effects Associated with this Group of Activities Unplanned development carries a variety of risks, chiefly associated with the sustainability of resource use. Council takes a sustainable development approach to planning for regional development, and endeavours to balance current and future needs of the community. The Irrigation Activity may involve the potential for environmental impact or the operation of machinery, earthmoving or construction works, which may impact on the environment and can result in temporary disruptions to daily life. Where resource consents are required for these activities appropriate controls are applied.

Activity Group: Regional Development
Page 162 2015-2025 Long Term Plan
Activity: Regional Development Activity: Regional Development Operating costs of this Activity represents approximately 6.6% of total Activity expenditure.
How this Activity Contributes to Related Community Outcomes This Activity contributes to the Community Outcomes of Governance, Environment, People, Economy, Mobility and Living by:
Outcome Sub-outcome Major linkages Secondary linkagesGovernance Enabling
Participative Strategic Connected
The focus of the Smart and Connected programme is to enable and encourage industry groups and the community to develop and implement strategies. Discussions are underway with the Flaxbourne community to explore a community irrigation scheme.
Marlborough Research Centre (MRC) via the Food and Beverage Innovation Cluster are encouraging connectivity between Marlborough businesses and national and international science and markets.
Environment Attractive ‐ Tourism promotes the beauty of the Marlborough’s District and Destination Marlborough’s plans to recognise the tourism’s role in environmental protection through sustainable use.
People Quality jobs Increasing incomes Increasing capital wealth Engaged and participative
The focus of the Smart and Connected programme is to enable and encourage industry groups and the community to develop and implement strategies. MRC via the Food and Beverage Innovation Cluster are encouraging
Discussions are underway with the Flaxbourne community to explore a community irrigation scheme. This is a participative approach that if implemented will
Outcome Sub-outcome Major linkages Secondary linkages connectivity between Marlborough businesses and national and international science and markets. Business Trust Marlborough provides advice to support people starting and growing businesses.
create employment and increase the capital value of properties in that area.
Economy Productivity Innovation Entrepreneurship International connections Ability to transform Ability to connect
The focus of the Smart and Connected programme is to enable and encourage industry groups and the community to develop and implement strategies. MRC via the Food and Beverage Innovation Cluster are encouraging connectivity between Marlborough businesses and national and international science and markets. Business Trust Marlborough provides advice to support people starting and growing businesses Information and advice resources are available to businesses to aid decision making Council provides parking in towns for locals and visitors to shop, work and access the many services located in the CBD.
Discussions are underway with the Flaxbourne community to explore a community irrigation scheme. This is a participative approach that if implemented will create employment and increase the capital value of properties in that area.
Mobility Local accessibility National accessibility Safe
Council provides parking in towns for locals and visitors to shop, work and access the many services located in the CBD.
-

Activity Group: Regional Development
2015-2025 Long Term Plan Page 163
Outcome Sub-outcome Major linkages Secondary linkagesLiving Cultural
facilities and events Opportunities for participation Social cohesion
The focus of the Smart and Connected programme is to enable and the community to develop and implement strategies. Council supports commercial events via the implementation of the Regional Events Strategy, and community events via funding. Event organisation and participation offers opportunities for people to participate and work with others in the community.
-
What is this Activity About? This Activity is aimed at developing the regional economy to achieve long term economic growth to the benefit of the Marlborough community. It is about identifying where the direction of growth needs to be, how we will get there and what needs to be done. It is important to recognise that regional development is not just supporting businesses, but also about ensuring our community and workforce have the health, skills and knowledge to play their part in the development of Marlborough’s economy and to benefit from the wealth created.
Some services are provided by Council specifically for the benefit of the regional economy:
Economic development, marketing and tourism.
Marlborough Research Centre.
Parking.
Irrigation.
Economic Development In 2011, Council identified the need to set a new direction for economic development in Marlborough. An analysis of Marlborough’s economy was undertaken and this was followed up by the development of the Smart and Connected vision and strategic framework in 2012.
Since 2012, Council has begun the implementation of Smart and Connected both
within and outside Council. Internally, Council has begun to integrate the vision and framework in its key strategic planning documents such as the Long Term Plan and the emerging Resource Management Plans. Externally, a number of industry and community groups have been established and each has developed strategic plans for their industry/community. Council’s role has been to facilitate the establishment of the groups and to support their ongoing development via administrative support and as a participant in the discussions.
In addition Council undertakes a range of specific economic development initiatives to support local businesses:
Smart Business Marlborough – a service to assist development related business proposals through Council processes – such as resource consent, building consent, liquor licensing, food health, infrastructure requirements etc.
Marlborough Food and Beverage Innovation Cluster – this cluster is led by MRC. Marlborough produces high quality food and beverages and there is an opportunity to develop additional new products of high value in international markets. The aim is to support innovation and collaboration between local food and beverage companies and with the ‘national grid’ of food and beverage research and development. The cluster supports development of new products and ingredients, production and process improvements, and generating value from waste streams.
Business Trust Marlborough – this Trust manages the provision of advice to start-up and growing businesses, and access to mentors from Business Mentors New Zealand.
Only Marlborough – Council is a partner in the development of this regional brand and positioning statement. A range of free resources are available for businesses and individuals to communicate a consistent and positive message about the region. Only Marlborough has been designed to be applied across all industries who sell products and services outside the region, to visitors, to locals and to people considering relocating to Marlborough.
Information resources – Council provides access to a range of economic and demographic information via its website.
The Council also plays a key role in the local economy through its core services of roading and water infrastructure and regulatory activity, and through its investment in community infrastructure such as libraries and leisure facilities.
Regional Events Strategy Council has developed a Regional Events Strategy with the support of the industry to identify opportunities for growing events in the region and increasing the commercial

Activity Group: Regional Development
Page 164 2015-2025 Long Term Plan
return to local businesses. A Regional Events Co-Ordinator is employed to help to deliver the strategy and to support the events industry.
A key focus of the role is to assist communication within the events sector, and to help promote the many events offered in the region to locals and visitors alike. The Follow ME* website is the primary tool that has been developed to help communication, as well as targeted promotional documents such as the Summer Events Guide and Marlborough Arts Month.
A Commercial Events Fund has been established to help the development of existing and new events to grow the economic and other benefits of hosting events in the region.
Marketing and Tourism Destination marketing services are undertaken on Council’s behalf by Destination Marlborough Trust Inc. Destination Marlborough exists to grow and support a sustainable visitor economy that contributes to achieving a Smart and Connected economy for Marlborough. It is funded through a combination of Council and private sector investment. The organisation’s core marketing priorities are to position Marlborough as a compelling destination to visit, to prioritise effort on smoothing seasonality and to deliver a single collaborative voice to grow visitor spend in the region.
Marlborough Research Centre (MRC) This Activity is delivered by the Marlborough Research Centre Trust, and provides support for public good research, regional prosperity and environmental sustainability in support of Marlborough’s primary industries.
MRC is owned and managed by the Marlborough Research Centre Trust. The Trust was set up in 1984 to ensure the Marlborough region makes the best use of its natural resources, by assisting innovative research and technical development in agricultural, pastoral, horticultural and viticultural matters. MRC are a key partner in the implementation of the Smart and Connected vision.
As mentioned previously MRC (in partnership with Council, Riddet Institute and Massey University) are working jointly to implement a Food and Beverage Strategy for Marlborough via the Food and Beverage Innovation Cluster.
Parking A large number of our businesses are located in or close to our main town centres of Blenheim and Picton. The ability for customers, staff and visitors to access these businesses are supported by the provision of convenient and affordable car parks, as well as support for other modes such as public transport, biking and walking. Council
provides, operates and maintains over 2,000 on and off-street parks in Blenheim and Picton. This service is contracted to Marlborough Roads, which currently sub-contracts parking enforcement to ADT Armourguard and the Cash Collection contract, which is held by Gary Ching Ltd.
This provision of car parking in Blenheim and Picton town centres is guided by parking strategies for each town. Blenheim and Picton’s parking strategies were updated in 2014. Measurement of parking occupancy levels in Blenheim is carried out by contract, and will possibly extend to Picton following the adoption of the Picton Parking Strategy during 2014. The table below provides a summary of Blenheim and Picton kerbside and off-street parking numbers:
Parking Length / Quantity
Blenheim Car Parks 357 kerbside metered; 1,331 off-street metered (includes 348 car park building); 130 off-street leased; 227 off-street time restricted.
Picton Car Parks 201 off-street metered; 65 off-street time restricted.
Irrigation Sourcing water for irrigation is of critical importance to our primary industries, particularly in areas of shortage such as south Marlborough. Council has significant expertise and experience in providing water infrastructure in Marlborough, and has developed an irrigation scheme for the Southern Valleys (SVIS) for horticultural, farming and rural residential properties over an area of approximately 4,500 ha to the south of Renwick. The scheme is operated during the drier months of the year providing there is sufficient water available in the Wairau River.
A proposed irrigation scheme for the Flaxbourne area, estimated to cost up to $30.2m, is under development. It would provide similar benefits to the Southern Valley scheme in supporting the development of productive agricultural land and be paid through a targeted rate by the beneficiaries. Council has agreed to support the development of this scheme subject to a number of conditions:
Securing sufficient water.
Satisfactory final design, estimates and funding.
Securing 100% commitment to fund the scheme from landowners and/or the Crown Irrigation Fund.
The actual cost of construction being within the funding secured.
Council supports in principle other community irrigation schemes if environmental effects can be managed and mitigated. The table below provides a summary of the SVIS assets:

Activity Group: Regional Development
2015-2025 Long Term Plan Page 165
Southern Valleys’ Irrigation Scheme (SVIS) Length/QuantityReticulation length 57 kmsService connections 4,500 hectaresAbstraction Gallery 2Distribution Pumps 6Booster Pumps 8Meters 261
Emerging Issues and Expected Changes The following are the emerging issues and expected changes within this Activity:
Council may revisit the investigation of the most appropriate method of delivery for Economic Development, tourism events and conferences in the future.
Indicators are that New Zealand, and along with it, Marlborough are returning to a period of growth in visitor spend. The Marlborough region is targeting to at least grow visitor spend annually by 4.7% to align with Tourism 2025 national targets.
The global economic balance of power is shifting and this is affecting where New Zealand’s visitors come from. Visitors from Asian countries are increasing; over time this will change the mix of travellers visiting Marlborough. The region’s tourism and hospitality businesses will need to consider adapting their service delivery to respond to these changes.
Council support for the Flaxbourne Irrigation Scheme is subject to a number of conditions including Government assistance, resource consents and take up by landowners. Council will continue to work with the community and Government on these issues.

Activity Group: Regional Development
Page 166 2015-2025 Long Term Plan
Levels of Service 2015-25: Regional Development Performance Targets (for the financial year)Level of Service Indicator Baseline 2015-16 2016-17 2017-18 2018-25 Provide an overall level of service that meets or exceeds residents’ expectations.
Resident satisfaction with this service as measured by survey where 10 = “service delivered extremely well”.
Economic Development – 6.4 Tourism – 7.2 MRC – 6.8 Parking – 6.8 Irrigation – 6.9
6.4 7.2 6.8 6.8 6.9
6.4 7.2 6.8 6.8 6.9
6.4 7.2 6.8 6.8 6.9
6.5 7.3 6.9 6.9 7.0
Undertaking strategic interventions to achieve long term sustainable economic growth for Marlborough.
Develop a three year Economic Development Action Plan
New measure December 2015 - - December 2018 and every three years thereafter
% of funded Action Plan targets achieved New measure 80% 80% 80% 80%
Manage Marlborough Research Centre contract to ensure service quality and value
Number of published research papers 98 papers 100 papers 100 papers 100 papers 100 papers
Effective promotion of Marlborough as a visitor destination
% change in visitor nights in Marlborough compared to national trends.
% change in visitor nights equal or better than national trends
% change in visitor nights equal or better than national trends
% change in visitor nights equal or better than national trends
% change in visitor nights equal or better than national trends
% change in visitor nights equal or better than national trends
% achievement of Destination Marlborough Business Plan Key Performance measures
80% 80% 80% 80% 80%
Provision of convenient and affordable car parks to support CBD businesses.
Regularly review the parking strategies for Blenheim and Picton (five yearly).
2014-15 N/A N/A N/A 2019-20 and 2024-25
Occupancy rates of off-street car parks in Blenheim.
Kerbside – 65% <70% <70% <70% <70%
Off-street – 76% (Queen St and Clubs only)
<85% <85% <85% <85%
Parking building – 30% 30% 30% 30% 50%
Support for land based industries through the supply of irrigation water.
Number of events that cause a loss of supply during the season for more than 48 hours due to infrastructure breakdown.
< 1 event per annum < 1 event per annum
< 1 event per annum
< 1 event per annum
< 1 event per annum

Activity Group: Regional Development
2015-2025 Long Term Plan Page 167
Note 1: Irrigation operating expenditure includes finance costs and depreciation for the proposed $28.2 million ($30.2 million inflated) Flaxbourne Irrigation scheme capital expenditure. This is funded from a targeted rate for those landowners within the Scheme area who choose to join the Scheme, from the 2021-22 rating year.
Funding Impact Statement for 2015-25Regional Development AP 2014.15 2015.16 2016.17 2017.18 2018.19 2019.20 2020.21 2021.22 2022.23 2023.24 2024.25
$000's $000's $000's $000's $000's $000's $000's $000's $000's $000's $000'sSources of operating funding
General rates, uniform annual general charges, rates penalties 1,243 1,530 1,521 1,549 1,580 1,608 1,640 1,665 1,690 1,726 1,764Targeted rates 1,237 1,537 1,609 1,640 1,679 1,722 5,196 5,446 5,513 5,585 5,662Fees and charges 2,065 1,812 1,857 1,904 1,957 2,013 2,072 2,138 2,208 2,285 2,367Other receipts 211 238 232 232 231 231 231 231 231 233 235
Total operating funding 4,756 5,117 5,219 5,325 5,447 5,574 9,139 9,480 9,642 9,829 10,028Applications of operating funding
Payments to staff and suppliers 2,516 2,243 2,277 2,336 2,390 2,509 2,921 3,002 3,096 3,229 3,339Finance costs 1,403 1,370 1,414 1,708 2,299 2,890 3,228 3,247 3,091 2,924 2,745Internal charges and overheads applied 311 524 537 549 559 562 572 585 598 614 629Other operating funding applications 508 1,982 371 375 379 383 387 391 395 400 404
Total applications of operating funding 4,738 6,119 4,599 4,968 5,627 6,344 7,108 7,225 7,180 7,167 7,117Surplus (deficit) of operating funding 18 (1,002) 620 357 (180) (770) 2,031 2,255 2,462 2,662 2,911
Sources of capital fundingIncrease (decrease) in debt (854) 510 2,118 7,744 11,171 8,668 4,811 117 1,635 124 128
Total sources of capital funding (854) 510 2,118 7,744 11,171 8,668 4,811 117 1,635 124 128Applications of capital funding
Capital expenditure to meet additional demand 85 590 2,199 7,827 11,256 8,755 89 92 95 98 101Capital expenditure to improve the level of service 53 60 176 - - - - - - - -Capital expenditure to replace existing assets 6 267 290 279 152 37 24 25 40 26 27Increase (decrease) in reserves (980) (1,409) 73 (5) (417) (894) 6,729 2,255 3,962 2,662 2,911
Total applications of capital funding (836) (492) 2,738 8,101 10,991 7,898 6,842 2,372 4,097 2,786 3,039Surplus (deficit) of capital funding (18) 1,002 (620) (357) 180 770 (2,031) (2,255) (2,462) (2,662) (2,911)
Funding balance - - - - - - - - - - -ReconciliationTotal applications of operating funding 4,738 6,119 4,599 4,968 5,627 6,344 7,108 7,225 7,180 7,167 7,117
plus - Depreciation and amortisation 642 672 738 799 935 1,055 1,122 1,151 1,158 1,193 1,228Expenditure as per Statement of Financial Performance 5,380 6,791 5,337 5,767 6,562 7,399 8,230 8,376 8,338 8,360 8,345
Operating expenditureEconomic Development 570 1,987 489 497 509 519 535 548 563 577 596Marketing and Tourism 1,070 975 946 958 969 980 991 1,002 1,014 1,026 1,038Research Centre 211 211 136 137 137 137 137 137 137 138 138Irrigation 1,393 1,473 1,599 1,990 2,725 3,479 4,329 4,445 4,394 4,341 4,282Parking 2,136 2,145 2,167 2,185 2,222 2,284 2,238 2,244 2,230 2,278 2,291
Capital expenditure:Irrigation 53 571 2,300 7,744 11,171 8,668 - - - - -Parking 91 346 366 362 237 124 113 117 135 124 128
Part 3: Financial and Infrastructure Strategy and Statements
Page 168 2015-2025 Long Term Plan
Part 3: Financial and Infrastructure Strategy and Statements
Financial Strategy
Infrastructure Strategy
Assumptions, Disclosures and Compliance
Forecast Statement of Comprehensive Revenue and Expense
Statement of Other Comprehensive Revenue and Expense
Statement of Changes in Net Assets/Equity
Statement of Financial Position
Statement of Cashflows
Statement of Accounting Policies
Notes to Financial Statements

Part 3: Financial and Infrastructure Strategy and Statements
2015-2025 Long Term Plan Page 169
Financial Strategy Introduction Council must, under the Local Government Act 2002, manage its revenues, expenses, assets, liabilities and general financial dealings prudently and in a manner that sustainably promotes the current and future interests of the community.
The Financial Strategy is an important component of the Long Term Plan that demonstrates how Council will:
Ensure that the levels of rates and borrowing are financially sustainable and kept within pre-set limits.
Maintain levels of service.
Maintain the assets it owns on behalf of the community.
Provide for growth and changing demand patterns within the District.
Fund improvements to infrastructural and other community facilities.
Manage Council’s investments and liabilities.
In preparing the Draft Long Term Plan and this Financial Strategy Council has considered how to balance:
The levels of service to be provided and the cost of achieving and maintaining them during periods of growth.
The priorities and timing of expenditure across all activities, especially expenditure of a capital nature.
The proposed levels of rates and charges across the full 10 year period of the Long Term Plan and their impact on the community.
The proposed level of borrowing that current and future ratepayers will need to service.
Overall Council considers that it has successfully balanced these four key elements in preparing the Draft Long Term Plan, but welcomes the community’s input on how the current result contained in this Draft Long Term Plan can be improved.
Strategic Direction of Council Council’s Mission Statement is set out on page 2 and Community Outcomes are set out on page 21 of this Plan. Each Activity in this Long Term Plan identifies the outcomes that it contributes to.
Outline of Factors that are Expected to have a Significant Impact on the Long Term Plan 1. Environment
Marlborough provides a unique lifestyle opportunity for residents and visitors with the full range of geological features from mountains to fertile plains, rivers and the magnificent Marlborough Sounds, coupled with high sunshine hours and available water. These features support a wide range of business and leisure opportunities. Business opportunities have predominantly centred on “land” based activities ie; viticulture, forestry, horticulture, pastoral farming, aquaculture, tourism and the servicing sectors. The common thread for almost all these activities is having a quality environment and maintaining it. Availability of quality water is also a key factor.
2. Global Financial Crisis and Markets The major industries identified above rely upon favourable international markets to provide a strong economic foundation for the District. The current international situation and the relatively high New Zealand dollar are having a significant impact on the District’s ability to obtain good returns for its products and the ability to attract international visitors. However, the high New Zealand dollar does have some advantages for Council as it helps reduce the cost of petroleum products, diesel and bitumen in particular, which are major components of our roading and contracting costs.
The global financial crisis (GFC) is ongoing. While there are signs of improvement, a number of countries, particularly in Europe and Japan, are still planning major interventions to address their economic issues. As it has in the past, the continuing GFC has the potential to impact upon the cost of borrowing by New Zealand, the four major banks, Local Government Funding Agency (LGFA) and ultimately Council.
Council in its interest rate assumption has taken a conservative position when compared with historically low current market rates. However, the Reserve Bank and other economic commentators continue to forecast interest rate increases, it is just the timing that varies. By adopting the approach that it has, Council is optimistic that it can avoid future interest rate driven rates increases.

Part 3: Financial and Infrastructure Strategy and Statements
Page 170 2015-2025 Long Term Plan
Unfortunately because of Council’s good financial position it has a reduced ability to lock in long term interest rates for its borrowings. Other Councils, with higher base levels of debt, can lock in large portions of the debt levels they are forecasting over the next 10 years. Council will be exposed to prevailing interest rates when it increases debt.
3. Inflation Projections Council, along with the majority of other Councils in New Zealand, uses inflation projections provided by Business Economic Research Limited (BERL). These projections are used to inflate Council’s forecast operating and capital expenditure in years two to 10 of the Long Term Plan.
BERL prepares projections for road, property, water, energy, staff, earth-moving, pipe lines and private sector wages. These are consolidated into an overall Local Government Cost Index (LGCI). To generate its forecasts, BERL estimates relationships based on historic data between price indices and a set of driver economic variables (e.g. GDP, employment, oil prices, construction, investment and CPI).
Currently BERL are forecasting the following combined increases in its LGCI:
Forecast BERL LGCI 15-16 16-17 17-18 18-19 19-20 20-21 21-22 22-23 23-24 24-252.24 2.45 2.53 2.61 2.75 2.90 3.04 3.19 3.36 3.53
These increases make up a significant portion of the proposed rates increase over 10 years of the Long Term Plan contained on page 172 of this Strategy.
4. Growth The number of people in the District, (both permanent residents and visitors), where they choose to live and the growth in economic activity directly affects the demand for land for development, infrastructure and other services the Council provides. This growth underpins land use planning, infrastructure developments, where and when new services and facilities are required and their cost.
Census information on population growth has been analysed from 1991 to 2006, updated for the 2011 Department of Statistics Projections and aligned to the 2013 Census. During this period overall growth in Marlborough was approaching 2% per annum although with some significant variations. The Waikawa area saw population rise by an average of 5.5% whilst the usual resident population of Seddon decreased by 0.8%.
Internal population growth in the region is fairly low for a number of demographic reasons. Growth is therefore more dependent upon migration into and out of the area which in turn is influenced by prevailing economic and political factors. These are difficult to predict with any degree of certainty. Major factors such as the international market demand for Marlborough wines, the future rebuild of Canterbury following the earthquakes and the redevelopment of Port Marlborough following Government’s decision to retain the ferry terminal in Picton are compounded by decisions of multi-nationals, small businesses and individual traders.
For the purpose of long term planning, the sum total of all the influencing factors have been aggregated to high, medium or low growth projections. A simplified version of a growth prediction graph of population in the District is shown below in the graph “Marlborough Usually Resident Population”.
Graphing the past population trends helps projections to be made of future growth. In addition, the census information has provided intelligence on the number of properties, household size, occupancy rates and an estimation of transient visitors.

Part 3: Financial and Infrastructure Strategy and Statements
2015-2025 Long Term Plan Page 171
Since the last (2006) Census, population growth has slowed dramatically (see above graph). The Census results also show that the average number of occupiers per dwelling continues to decrease. The result is that the rate of growth in dwellings is higher than population growth.
For planning purposes a growth rate at or slightly above the medium growth scenario has been adopted. The reasons for taking this position are twofold:
1. To take account of historic levels of growth which are almost double the current projections; and
2. To allow a contingency in infrastructure construction planning. It is comparatively easy to slow a major infrastructure project if the demand is below forecast levels. However, it is virtually impossible to accelerate a significant capital project because of the consultation, land access, regulatory, design and tendering requirements that must be worked through before construction can start.
Council believes that, as development increases the consumption of its current infrastructure capacity and accelerates the requirement for new infrastructure, developers should bear the cost of this increased demand.
Through the application of its Development Contributions and Financial Contributions Policies Council is seeking to fund the cost of this additional infrastructure and reduce the potential for additional burden on the ratepayer.
Undertaking development in a planned, co-ordinated manner can reduce costs as infrastructure development is not responding to “adhoc requests” for isolated, scattered, piecemeal development. Responding to adhoc development can mean that parts of the infrastructure networks are replaced earlier in their life than optimum while allowing other parts of the network to remain comparatively underutilised.
Population projections were used to inform a major consultative process with both the public and Council staff to investigate land areas that have the potential to be developed into urban growth pockets. Recent Plan changes have resulted in the zoning of additional land in the north western and south western peripheries of Blenheim as the areas most capable of accommodating future urban growth. When looking at growth it is also important to look at the demographics that make it up. As identified in the “Key Issues Facing Council” section of the Long Term Plan the percentage of the population aged over 65 is projected to double from around 15% to 30% of the District’s population by 2031. Over time, it is likely that this will alter the demands for particular Council services and raise affordability issues as a large percentage of this group are on relatively fixed incomes.
Balancing the Budget The Council is required under the Local Government Act 2002 to ensure that each year’s projected operating revenues are set at a level sufficient to meet that year’s projected operating expenses ie: Council must demonstrate financial prudence.
In assessing financial prudence consideration is to be given to:
The estimated expenses of achieving and maintaining the predicted levels of service provision set out in the Long Term Plan, including the estimated expenses associated with maintaining the service capacity and integrity of the assets throughout their useful life;
The projected revenue available to fund the estimated expenses associated with maintaining the service capacity and integrity of assets throughout their useful life;
The equitable allocation of responsibility for funding the provision and maintenance of assets and facilities throughout their useful life;
The funding and financial policies.
During the development of the 2015-25 Long Term Plan, the Council considered how to maintain its current levels of service, operating expenditure and capital expenditure needed to replace existing assets and provide new infrastructure and facilities to meet the levels of growth that are forecast within the ten years of the Long Term Plan. The Long Term Plan as presented should, for the majority of activities, enable Council to maintain current levels of service.
The Council is forecasting that its Activity expenditure will increase from $82 million in the 2014-15 Annual Plan to $122 million (49.4%) for the 2024-25 financial year. The increase is due to a larger population that has to be serviced and the balance represents inflation and the effects of supplying either additional or improved services offset in part by the impact of deferring capital works.
Borrowing over the period of the Long Term Plan will increase from $50 million shown in the 2014-15 Annual Plan to $128 million (gross) to help fund the proposed capital expenditure programme. Projected debt includes an allowance of $28.2M (30.2M inflated) for the development of an irrigation scheme in Flaxbourne. It is intended that the debt servicing costs for the Flaxbourne Scheme will be met by a targeted rate on the subscribers to the Scheme, with no rating impact on other rate payers.
Development contributions have been reviewed accordingly to fund growth related expenditure. The “Financial Trends and Summaries” section of the report below provides the extent of capital works and the funding sources.

Part 3: Financial and Infrastructure Strategy and Statements
Page 172 2015-2025 Long Term Plan
Under section 101 of the Local Government Act 2002, Council considered its financial management responsibilities where it must manage revenues, expenses, assets, liabilities, investments and general financial dealings prudently and in a manner that promotes the current and future interests of the community. The Council also considered whether it was sustainable to undertake the level of capital expenditure proposed in the Long Term Plan together with increased operating costs associated with the higher debt level. If the Council has too much debt then future ratepayers will subsidise current ratepayers. If population growth, which is expected to fund the growth portion of assets incorporated into the capital expenditure programme, does not occur or occurs at a slower rate this may either increase rates or slow the delivery of capital projects.
The policy of fully funding depreciation has been continued in the Long Term Plan and is considered an appropriate measure to ensure the concept of intergenerational equity is maintained. That is, current ratepayers will pay for its use and a share of its replacement cost in relation to the assets provided.
In summary, the rate movements have been affected as a result of:
Price increases – cost adjustors (inflation) that have been applied to the estimates within the Long Term Plan.
Growth – while development contributions fund much of the growth related capital expenditure, additional developed land and services need to be maintained and add to the Councils operational expenditure. Generally the additional costs are met by the rates recovered from the extra ratepayers.
Service levels increases – for some services, such as water supply and sewerage, a greater total rate take will be required.
Depreciation and interest payments – the increased capital expenditure programme will mean that there will be a corresponding increase in depreciation and debt servicing costs.
Given there is a need to raise a larger amount of debt funding, this will be reflected in higher interest costs that will be required to be met through fees and charges and rates.
Rates, Rates Increases and Rate Increase Limit Council is very conscious of the impacts of rates increases in the community, the community’s wish to maintain or enhance current levels of service and the underlying cost drivers that Council has limited ability to control. The underlying cost drivers particularly relate to the materials that go into building and maintaining infrastructural assets ie: diesel, bitumen, pipes and other construction materials and the remainder of the Capital Expenditure Programme. Council has reviewed the Capital Expenditure
Programme and looked to defer projects where possible without significantly affecting levels of service.
Existing Reserves and Development Contributions are the first sources for funding Capital Expenditure. The balance is generally funded by loans, predominantly on a 20 year table mortgage basis. Loans have a rating impact, but as their repayment is spread they reduce the burden on current rates and spread the costs over those future ratepayers who will also benefit from the asset being created. Increased operating and in the longer term maintenance costs also result.
Because Council’s costs are not the same as the costs faced by households eg; food, housing, transportation etc as measured by the CPI, Council has decided to use the specifically developed Local Government Cost Index as its benchmark. It has further decided that increases in total rates will not exceed the LGCI movement by more than 2%. The following table shows forecast rates increases, LGCI movements and the difference between the two showing that Council has not exceeded the 2% stated above.
15-16 16-17 17-18 18-19 19-20 20-21 21-22 22-23 23-24 24-25
Proposed Rates Movements
3.19 4.85 5.50 4.65 3.22 8.67 4.09 2.71 3.60 3.13
Rates Cap (LGCI + 2%)
4.24 4.45 4.53 4.61 4.75 4.90 5.04 5.19 5.36 5.53
Within/ (Above) Rates Cap
1.05 -0.40 -0.97 -0.04 1.58 -3.77 0.95 2.48 1.76 2.40
The amounts shown above are the total rates increases throughout the Long Term Plan and include the impact of levels of service improvements, growth and the Flaxbourne Irrigation Scheme. There will be properties that will pay less and others that will pay more, depending on the services that they receive. Samples for areas across the District are provided within the Long Term Plan, “Rates Movements” section. The other point to note is that while this document sets outs Council’s plans for the next 10 years, each year it reviews its priorities and need to undertake capital projects with the objective of reducing rates. As a result, the Council’s limit on total rates equates to $89.7 million, the value of rates budgeted for 2024-25. Council has established a track record of having future years’ rates increases being less than the amounts signalled in this plan. The outcome of these reviews is shown in the graph below. The graph on the next page clearly shows the level of rates for 2015-16 is almost $9M below the level forecast when the 2009-19 Long Term Council Community Plan was prepared.
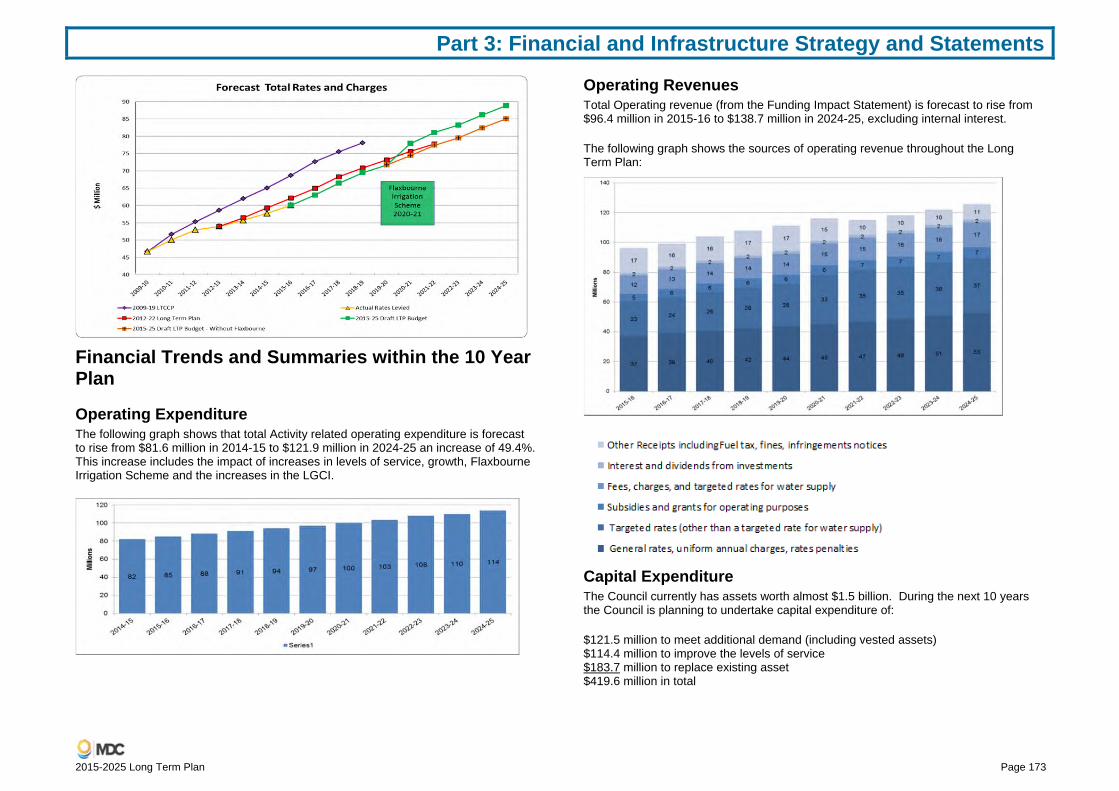
Part 3: Financial and Infrastructure Strategy and Statements
2015-2025 Long Term Plan Page 173
Financial Trends and Summaries within the 10 Year Plan
Operating Expenditure The following graph shows that total Activity related operating expenditure is forecast to rise from $81.6 million in 2014-15 to $121.9 million in 2024-25 an increase of 49.4%. This increase includes the impact of increases in levels of service, growth, Flaxbourne Irrigation Scheme and the increases in the LGCI.
Operating Revenues Total Operating revenue (from the Funding Impact Statement) is forecast to rise from $96.4 million in 2015-16 to $138.7 million in 2024-25, excluding internal interest.
The following graph shows the sources of operating revenue throughout the Long Term Plan:
Capital Expenditure The Council currently has assets worth almost $1.5 billion. During the next 10 years the Council is planning to undertake capital expenditure of:
$121.5 million to meet additional demand (including vested assets) $114.4 million to improve the levels of service $183.7 million to replace existing asset $419.6 million in total

Part 3: Financial and Infrastructure Strategy and Statements
Page 174 2015-2025 Long Term Plan
The graph below shows the amounts being spent on each capital expenditure category to meet community expectations (levels of service), replacement of existing assets and growth over the Long Term Plan.
Capital Projects In each Activity section there is a list of major capital projects planned over the 10 years of the Long Term Plan. A number of these projects have been spread out to coincide with growth, need and/or affordability.
Capital Funding Sources The following graph shows the capital funding sources planned to fund the capital expenditure.
External Debt External debt is only raised after development contributions, reserves and other funding sources have been used. Despite using external debt as a last resort, gross borrowing is proposed to increase from the $42.1 million shown in the 2014-15 Annual Plan to $127.8 million in the 2020-21 year, before decreasing to $108.5 million in 2024-25 year, to fund a $419.6 million capital program. The biggest single contributor at $28.2 ($30.2 inflated) million to this debt increase is the possible financing of the proposed Flaxbourne Irrigation Scheme.
Note these values are Gross Debt, as Council plans to continue to hold at least $11 million of investments as part of its disaster recovery planning.
The graph below shows the trend over the Long Term Plan for each year’s rates, borrowings and capital expenditure. This graph includes an allowance for price movements based on the BERL forecasts. Associated with the capital expenditure programme is a corresponding movement in loans required to fund this work.

Part 3: Financial and Infrastructure Strategy and Statements
2015-2025 Long Term Plan Page 175
Debt Levels and Interest Costs The Council Treasury Policy includes the Investment and Liability Management Policies. The Council has determined maximum amounts and limits of debt. The table below shows a comparison of the limits in the policy compared to those proposed within the 10 Year Plan. The policy limits were determined in association with the Council’s Treasury Advisor.
Also included are the Local Government Funding Agency’s Covenants and how Council compares against each covenant.

Part 3: Financial and Infrastructure Strategy and Statements
Page 176 2015-2025 Long Term Plan
Policy Parameters and Covenants 2015-16 2016-17 2017-18 2018-19 2019-20 2020-21 2021-22 2022-23 2023-24 2024-25 Council Treasury Management Policy Parameters
Earnings before interest and tax has to be at least 2.25 (225%) times net interest
340.6% 274.7% 229.3% 199.2% 178.5% 211.3% 199.4% 212.8% 228.1% 253.4%
Gross interest paid will not exceed 12.5% of total operating revenue
3.5% 4.4% 4.9% 5.8% 6.6% 6.9% 7.2% 6.9% 6.4% 5.8%
Net cash inflow from operating activities exceeds gross annual interest expense by at least two times (200%)
601.4% 537.2% 491.1% 415.2% 358.3% 377.6% 367.9% 383.9% 431.8% 484.1%
Local Government Funding Agency Covenants
Net Debt < 175% of total revenue 50.8% 59.7% 66.8% 84.4% 91.4% 92.6% 95.8% 88.2% 80.8% 73.3%
Net interest < 20% of total revenue 2.6% 3.6% 4.2% 5.0% 5.9% 6.1% 6.4% 6.2% 5.7% 5.2%
Net interest < 25% of rates revenue 4.5% 6.3% 7.1% 8.5% 9.8% 9.9% 9.9% 9.5% 8.7% 8.0%
Liquidity > 110% 138.3% 131.8% 128.3% 121.9% 119.4% 118.6% 118.0% 118.9% 120.3% 121.5%
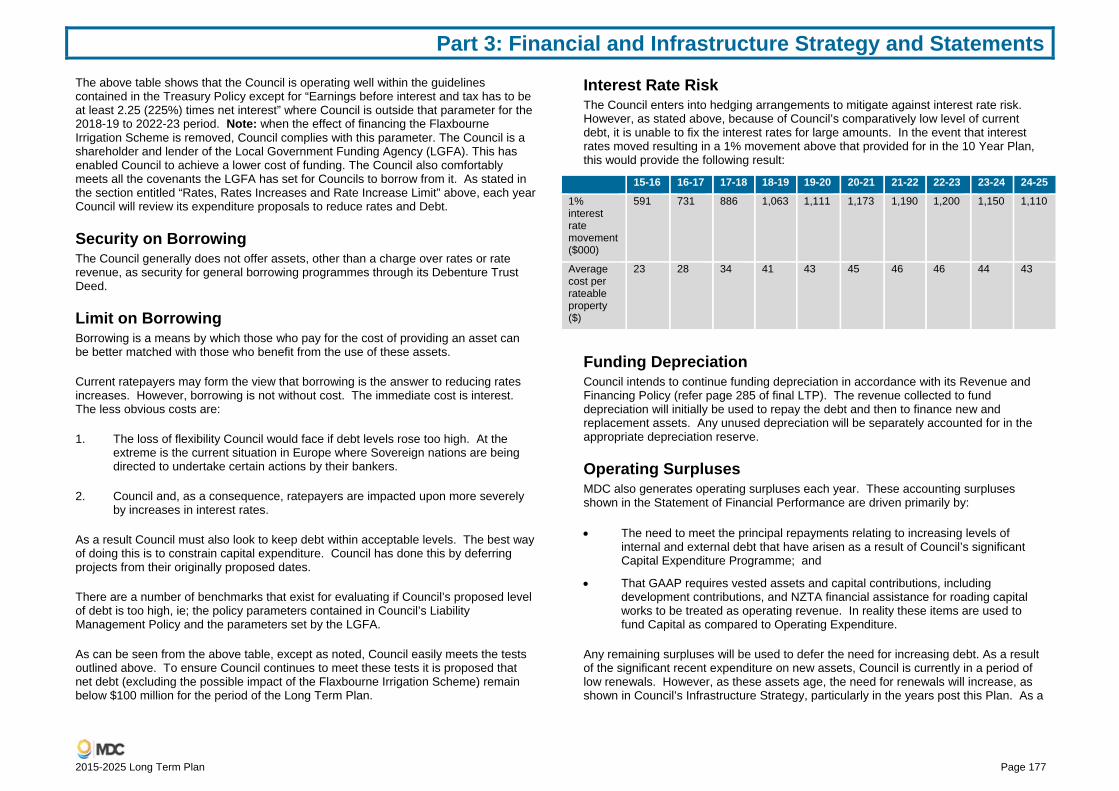
Part 3: Financial and Infrastructure Strategy and Statements
2015-2025 Long Term Plan Page 177
The above table shows that the Council is operating well within the guidelines contained in the Treasury Policy except for “Earnings before interest and tax has to be at least 2.25 (225%) times net interest” where Council is outside that parameter for the 2018-19 to 2022-23 period. Note: when the effect of financing the Flaxbourne Irrigation Scheme is removed, Council complies with this parameter. The Council is a shareholder and lender of the Local Government Funding Agency (LGFA). This has enabled Council to achieve a lower cost of funding. The Council also comfortably meets all the covenants the LGFA has set for Councils to borrow from it. As stated in the section entitled “Rates, Rates Increases and Rate Increase Limit” above, each year Council will review its expenditure proposals to reduce rates and Debt.
Security on Borrowing The Council generally does not offer assets, other than a charge over rates or rate revenue, as security for general borrowing programmes through its Debenture Trust Deed.
Limit on Borrowing Borrowing is a means by which those who pay for the cost of providing an asset can be better matched with those who benefit from the use of these assets.
Current ratepayers may form the view that borrowing is the answer to reducing rates increases. However, borrowing is not without cost. The immediate cost is interest. The less obvious costs are:
1. The loss of flexibility Council would face if debt levels rose too high. At the extreme is the current situation in Europe where Sovereign nations are being directed to undertake certain actions by their bankers.
2. Council and, as a consequence, ratepayers are impacted upon more severely by increases in interest rates.
As a result Council must also look to keep debt within acceptable levels. The best way of doing this is to constrain capital expenditure. Council has done this by deferring projects from their originally proposed dates.
There are a number of benchmarks that exist for evaluating if Council’s proposed level of debt is too high, ie; the policy parameters contained in Council’s Liability Management Policy and the parameters set by the LGFA.
As can be seen from the above table, except as noted, Council easily meets the tests outlined above. To ensure Council continues to meet these tests it is proposed that net debt (excluding the possible impact of the Flaxbourne Irrigation Scheme) remain below $100 million for the period of the Long Term Plan.
Interest Rate Risk The Council enters into hedging arrangements to mitigate against interest rate risk. However, as stated above, because of Council’s comparatively low level of current debt, it is unable to fix the interest rates for large amounts. In the event that interest rates moved resulting in a 1% movement above that provided for in the 10 Year Plan, this would provide the following result:
15-16 16-17 17-18 18-19 19-20 20-21 21-22 22-23 23-24 24-25
1% interest rate movement ($000)
591 731 886 1,063 1,111 1,173 1,190 1,200 1,150 1,110
Average cost per rateable property ($)
23 28 34 41 43 45 46 46 44 43
Funding Depreciation Council intends to continue funding depreciation in accordance with its Revenue and Financing Policy (refer page 285 of final LTP). The revenue collected to fund depreciation will initially be used to repay the debt and then to finance new and replacement assets. Any unused depreciation will be separately accounted for in the appropriate depreciation reserve.
Operating Surpluses MDC also generates operating surpluses each year. These accounting surpluses shown in the Statement of Financial Performance are driven primarily by:
The need to meet the principal repayments relating to increasing levels of internal and external debt that have arisen as a result of Council’s significant Capital Expenditure Programme; and
That GAAP requires vested assets and capital contributions, including development contributions, and NZTA financial assistance for roading capital works to be treated as operating revenue. In reality these items are used to fund Capital as compared to Operating Expenditure.
Any remaining surpluses will be used to defer the need for increasing debt. As a result of the significant recent expenditure on new assets, Council is currently in a period of low renewals. However, as these assets age, the need for renewals will increase, as shown in Council’s Infrastructure Strategy, particularly in the years post this Plan. As a
Part 3: Financial and Infrastructure Strategy and Statements
Page 178 2015-2025 Long Term Plan
result, it is important for Council to retain a strong balance sheet and continue to fund depreciation.
Equity Investments and Other Interests Council holds investments in:
MDC Holdings Limited and its subsidiaries.
Marlborough Regional Forestry.
Investment Bonds and Term Deposits.
for a variety of reasons.
MDC Holdings Limited MDC Holdings Limited was established to:
Separate Council’s commercial trading activities from the other functions it carries out;
Bring Council’s main trading activities into one structure; and
Obtain commercial borrowing facilities at the most attractive rates possible.
For the most part MDC Holdings Limited is charged with operating in a completely commercial manner. As such the only significant target is to generate a tax paid return on opening shareholder’s funds of at least 7.0%. This target is reviewed annually when Council considers the Company’s Statement of Intent.
In addition to the commercial returns received, Council through MDC Holdings Limited’s subsidiaries (Port Marlborough NZ Limited and Marlborough Airport Limited) promotes Regional Economic Development as it provides means for the arrival and departure of visitors and the import and export of goods.
Marlborough Regional Forestry The Council has an 88.5% ownership interest in Marlborough Regional Forestry (MRF), with Kaikoura District Council owning the remaining 11.5%. MRF, a Joint Operating Committee of both Councils, has approximately 5,000 hectares of commercial forest with 4,321 hectares owned and the balance in predominantly leasehold title. This forest is managed on a rotation period of approximately 30 years with minor variations in this period based on market conditions. The forest had a value of $16.3 million as at 30 June 2014. As a result of this holding Council is entitled to approximately 180,000 Emission Trading Units almost entirely from pre 1990 forest. The current intention is to replant the forest following harvest. Providing the replanting
policy is maintained MRF should not be required to surrender Emission Trading Units to meet the obligations imposed by the Emissions Trading Scheme on harvest. As a result, Council may elect to sell its Units to assist in meeting a future funding need.
Council is expecting to generate average cash proceeds of $1.5M per annum from its investment in MRF until the 2021 year. Actual returns will vary depending on an internationally determined market price which Council has little control over. In the 2022 financial year no return is expected because if harvesting has gone to plan in earlier years, there will be no mature trees available to harvest.
Council also has significantly smaller holdings of trees in its own right, but these are held predominantly for river protection and not for financial return.
Investment Bonds and Term Deposits Council holds approximately $11 million of investment bonds and term deposits as part of its Disaster Recovery Planning. It is expected that the rate of return received should be similar to the cost of Council’s external debt.
Local Government Funding Agency (LGFA) The Council is a shareholder/member of the LGFA. The LGFA is a Council Controlled Trading Organisation (“CCTO”) set up by specific legislation. A key objective of the LGFA is to provide a funding vehicle that would enable local authorities to borrow at lower interest margins than would otherwise be available.
The LGFA is ‘AA+’ rated from Standard and Poor’s. This is the same as the New Zealand government’s domestic rating.
All local authorities (but not Council Controlled Trading Organisations or Council Controlled Organisations) are able to borrow from the LGFA. As at 30 June 2014 the LGFA had advanced $3.75B to local authorities, generating an estimated saving of approximately 0.2% in interest costs. The amount currently advanced is now in excess of $4.75B.
The LGFA’s policy is to pay a dividend that provides an annual rate of return to Shareholders equal to LGFA cost of funds plus 2.00% over the medium term. The latest dividend was 7%.

Part 3: Financial and Infrastructure Strategy and Statements
2015-2025 Long Term Plan Page 179
Infrastructure Strategy 1. Chairman’s Summary
Marlborough celebrates 156 years as a district this year and during that time it has grown from small settlements of farmers, whalers, gold-miners and forestry to become a thriving rural services district and world-class winegrowing region.
The Marlborough District Council covers an area of 17,517 sq km at the top of the South Island. Across the region there is a considerable variety of topography, climate, geology and human geographic features which provide consequences for planning the provision of services and infrastructure.
Key among that infrastructure are the flood protection works on the Wairau River which has become the most heavily engineered river in New Zealand. There are 1,526 km (886 km sealed) of roads, over 300 kms of water and sewer mains and around 200 kms of urban stormwater pipes and channels.
Infrastructure assets, the capital assets that the Council builds, operates and maintains on behalf of the community, are a vital part of society as they provide clean drinking water, reticulated wastewater and treatment, limit damage and loss due to flooding, enable people and goods to move around safely and efficiently and provide recreation and open spaces that enable an active lifestyle. This strategy considers the high capital investment assets of drinking water, stormwater, wastewater, flood protection and roading.
Infrastructure assets also prevent or mitigate adverse effects on the environment and allow economic growth, which leads to a prosperous community. The challenge is always to put the right asset, in the right place, at the right time, at the right cost.
The Council has prepared an infrastructure strategy, with a 30-year view of significant infrastructure issues, which is produced alongside the Long Term Plan and Asset Management Plans.
The Strategy sets out the principal long-term (30 year) infrastructure requirements of the district, to help ensure there are ‘no surprises’ in the future with regard to infrastructure asset planning, capital investment and/or delivery.
As part of that, there are 10 particularly significant infrastructure projects the Marlborough District Council has planned within the next 10 years to maintain, replace, and in some cases extend the infrastructure owned by the district. These are:
Drinking water treatment projects in Seddon, rural Awatere, Renwick and Havelock.
Management of drinking water capacity limitations in Renwick, Havelock and Picton.
Sewage overflow projects in Picton and Blenheim.
Stormwater overflow in Blenheim.
The Strategy has identified potentially challenging issues that could impact on the Council’s work in the next 30 years: negative population growth and ageing demographic; rising environmental standards and climate change.
Within a generation, most developed (including New Zealand) and many developing countries in the world will be experiencing negative population growth.
The composition of the population of Marlborough will be predominantly older people.
There are two consequences for Council infrastructure that need to be highlighted.
1. Councils can no longer simply design infrastructure for significant growth secure in the knowledge that at some time in the future the capacity will be required.
2. A greater portion of the population will be on fixed incomes so people will have a limited capacity to handle increased costs.
As well, the changes in population are not occurring uniformly through the region or uniformly through settlements. Generally the rural population is experiencing a more rapid slow-down in growth than the urban populations but there is also a shift in the ‘centre of gravity’ of the Blenheim-Renwick and the Picton-Waikawa urban areas.
Growth is proposed for green-field sites on the periphery of existing urban areas. This has a significant impact on service design as relatively greater capital investment will be required on the ends of the existing networks. The number of inhabitants per dwelling is also falling. This means the demand for

Part 3: Financial and Infrastructure Strategy and Statements
Page 180 2015-2025 Long Term Plan
housing will decline at a slower rate than the fall in population. However, it may also mean that the wealth per household declines at a higher rate.
However, population growth alone is a poor indicator of demand for infrastructural services. Other underlying factors such as climate change, environmental standards, national legislation, major hazard resilience, levels of service and other social aspects often have a far greater impact either alone or in combination. There is less empirical data to support assumptions relating to these factors. However it is important these are also placed on a common footing and a consistent approach underlies medium term strategy development.
Council will manage its response to growth by monitoring these demographic changes carefully, working closely with developers and responding to estimated market demand by building “just in time”. Development contributions will continue to be an important way of funding growth.
There is a general trend towards stronger environmental controls as the human impacts on natural ecosystems are better understood. Infrastructure planning needs to anticipate the improvements.
TERRY SLOAN CHAIRMAN – ASSETS & SERVICES COMMITTEE
2. Executive Summary 2.1 Why have a Strategy?
Requirement of Local Government Act 2002 (amended in 2014).
Provides a long-term view of core infrastructure issues, options and future costs.
Support Council’s Community Outcomes.
2.2 Which assets? Water supply
Wastewater
Stormwater
Rivers and Drainage
Roading
2.3 Significant issues affecting all services: Slowing population growth
Council’s Response: Close monitoring of growth “just in time” design and construction.
Ageing population
Impacts on infrastructure needs
Council’s response: Elderly needs can be different (eg; use of footpaths for mobility scooters).
Acknowledge that a higher proportion of population will be on fixed incomes.
Climate change
- warmer, wetter, rising sea level, windier
- Increased flooding, drainage and road damage
Council’s response: Increased stormwater and river control investment.
Provide much greater road storm damage budgets.
Stronger environmental and health standards
Council’s response: Provide water treatment where affordable.
(eg; Seddon is being given immediate priority with Council district-wide assistance proposed).
Reduce sewage overflows in Picton and Blenheim.
Improve stormwater discharge management in Blenheim.

Part 3: Financial and Infrastructure Strategy and Statements
2015-2025 Long Term Plan Page 181
2.4 Key issues for each service (a) 3 Waters and Roading
Urban growth- infrastructure pressures
Council’s response: Close monitoring of growth and land development markets. “just in time” infrastructure design and construction.
Use of development contributions to reduce ratepayer impacts.
(b) 3 Waters Renewal funding
Council’s response: Improve asset information to accurately time renewals.
Continue to fully fund depreciation.
(c) Water Supply Water treatment requirements of NZ Drinking Water
Standards
Council’s response: Treat where it can be made affordable to the communities affected.
Seddon has been given priority and district-wide assistance is proposed with rural Awatere, Renwick and Havelock to follow).
Demand management Short term – Picton, Havelock, Renwick
Long term – Blenheim.
To defer very expensive provision of new water supplies.
Council’s response:
Introduce demand management programmes in close consultation with affected communities.
Leakage and pressure reduction, conservation education, water metering.
Keep investigating longer term supply options (high level) (eg; will desalination become economic for Picton?)
(d) Wastewater Sewerage reticulation upgrades to manage overflows
Council’s Response: Major investments budgeted for Picton and Blenheim reticulation networks to reduce and control overflows.
Blenheim Sewage Treatment Plant Upgrades to meet possible consent renewal requirements (2028)
Council’s response: Ensure effects of existing discharges are properly understood.
Design options to improve if necessary.
Consult effectively.
Blenheim Sewer Pump Station Seismic Upgrades
Council’s response: Budgets have been provided in the Long Term Plan.
(e) Stormwater Obtain comprehensive stormwater discharge consents
for Blenheim stormwater management areas
Council’s Response: Ensure effects of existing and proposed discharges are properly understood.
Design options to improve if necessary.
Consult effectively.
Meet improved levels of service expectations

Part 3: Financial and Infrastructure Strategy and Statements
Page 182 2015-2025 Long Term Plan
Council’s Response: Capacity and environmental
Environmental - as for the preceding issue.
Budgets provide for a significant increase in stormwater capital spend.
Projects will be prioritised based on need.
Design options will be identified.
Consultation will need to be effective.
(f) River Control Climate change impacts assessment needed to guide
longer term design and upgrades
Council’s Response:
Improve understanding of climate change and sea level rise projections.
Use models to consider options to maintain current levels of service or accept reduced levels.
Lift maintenance and renewal levels to ensure levels of service are sustained (short term).
Council’s Response: LTP budgets include increased expenditure (short term).
(g) Roading Future congestion at Blenheim ring road intersections
and linkages to State Highways (long term)
Council’s Response: Fund $1.5 million intersection upgrades – estimated required 2029-31.
Climate change and increased frequency of storms
o Gradual increase in intensity and frequency of storms
o In steeper terrain significant damage
Council’s Response:
The LTP provides for an annual budget increase of $2 million per annum for emergency reinstatement from 2015.
Increase the capacity of drainage assets.
(h) Upgrade and renewal of forestry routes for HPMVs Council’s response: The LTP provides for $1.15 million in 2016/17 (Northbank) and $600,000 per annum thereafter for HPMV pavement rehabilitation.
2.5 Financial impacts (a) LTP – 2015 to 2025
The most significant increases in operating costs are a result of:
(i) Water and wastewater capital expenditure pushing up subsequent interest and depreciation charges.
(ii) A $2 million per annum increase in roading and flood damage provision.
Overall Council’s projected rates and charges increases across the draft LTP decade reaches a high of 5.26% increase 2017/18 (excepting when the Flaxbourne irrigation targeted rate and charge occurs) and a low of 2.44% in 2022/23.
BERL Local Government cost index ranges from 2.24% to 3.53% across this same period.
(b) Infrastructure Strategy – 2025 to 2045 Considering the uninflated total operating cost projections for this period a .7% per annum increase is required.

Part 3: Financial and Infrastructure Strategy and Statements
2015-2025 Long Term Plan Page 183
The largest increase is in the rivers area, reflecting the additional upgrades assumed necessary to meet climate change impacts.
Considering the significant increase in 3 waters pipeline renewals estimated this is considered sustainable although putting some pressure on a higher proportion of older fixed income ratepayers.
3. Purpose and Scope of Infrastructure Strategy (IS) Infrastructure assets refer to existing or proposed capital assets that the Council build, operate and maintain on behalf of the community. Infrastructure assets are a vital part of society as they provide clean drinking water, reticulated wastewater and treatment, limit damage and loss due to flooding, enable people and goods to move around safely and efficiently and provide recreation and open spaces that enable an active lifestyle. Infrastructure assets also prevent or mitigate adverse effects on the environment and allow economic growth, which leads to a prosperous community. The challenge is always to put the right asset, in the right place, at the right time, at the right cost.
Assets covered in this strategy relate to the provision of water, wastewater, stormwater, flood protection, and roading as required by Local Government Act. It is considered these assets have more significant investment implications than Council’s other infrastructural assets. This Strategy does not cover State Highways which are the responsibility of the New Zealand Transport Agency. However Council will continue to monitor and provide input to NZTA on State Highway issues and options (eg; future bypass).
The assets covered contribute significantly to Council’s community outcomes as follows:
3.1 “Smart and Connected” – community outcomes Council has adopted community outcomes based on its “Smart and Connected” framework.
Mobility Where people are able to access and engage in a wide range of recreational, cultural and business activities locally, nationally and internationally.
Local accessibility, national accessibility, and international accessibility, sustainable, innovative and safe.
Living A healthy and safe community that thrives on positive relationships between all people, where opportunities for a better life abound.
Health, individual safety, access to quality housing, access to quality education and access to quality employment, cultural facilities and events, sports and recreation, opportunities for participation and social cohesion.
Governance Creating an environment in which people can participate, connect with and help shape the community’s future.
Providing strong leadership when needed. Inclusive, enabling, participative, transparent, strategic and connected.
Environment Marlborough’s unique landscape, natural resources, features and wildlife are managed, embraced and valued for preservation and celebration.
Attractive, control over pollution levels, forms and effects, systems for protection and care, sustainable resource management.
People A vibrant community that is flourishing, diverse and inclusive for everyone, presenting opportunities for people to succeed.
Quality jobs, increasing incomes, increasing capital wealth, education, lifelong learning, diversity, flexibility, creativity, tolerance, engaged and participative.
Economy Building a strong economy through strategic, thoughtful and innovative use of local resources.
Increasing people’s wealth, innovation, entrepreneurship, productivity, flexible labour, international connections, ability to transform and the ability to connect.
3.2 Why have a strategy? The Local Government Act 2002 as amended in 2014 contains a new section 101B that requires the Council to adopt a 30 year IS, as part of the Long Term Plan (LTP). This IS identifies significant infrastructure issues for the Council

Part 3: Financial and Infrastructure Strategy and Statements
Page 184 2015-2025 Long Term Plan
and the key decisions that will be required, the timing of those decisions, the principal options, approximate costs, and the implications of those options.
The IS forms a long-term view of infrastructure issues and attempts to plan for and therefore alleviate unexpected expenditure.
3.3 Scope of the infrastructure strategy The IS is required to have a 30 year view of significant infrastructure issues and is produced alongside the LTP and Asset Management Plans (AMPs). The intention is not to produce a summary of those documents nor delve into the detail of what is already covered in them. The IS is purposefully a high level document that gives a snapshot of the future and avoids the detail of today.
3.4 Infrastructure strategy objectives The main objective of the IS is to set out principal long-term (30 year) infrastructure requirements of the district. Its purpose is to help ensure there are ‘no surprises’ in the future with regard to infrastructure asset planning, capital investment and/or delivery. The IS is not a 30 year budget of Council activities and only identifies substantial infrastructure projects over the next 30 years.
To achieve its objective, the IS must identify and forecast infrastructure issues, the likely timing of such issues, recommend options and the preferred solution, highlight significant capital and operational expenditure, and draw attention to any demand or levels of service opportunities or challenges.
In some cases Council has insufficient information to quantify with any accuracy mitigation of issues identified (eg; climate change effects).
We will work on this between LTPs taking into account the cost of that analysis.
4. Marlborough Context 4.1 Historical Settlement Development
In 2009 Marlborough celebrated its 150 year anniversary. During most of that period the district consisted of a number of small settlements of farmers, whalers, gold-miners and forestry. During the inter-war period some of the settlements began to develop infrastructure to serve and protect the communities. Since then the Wairau has become the most heavily engineered river in New Zealand, there are 1,526 km (886 km sealed) of roads, over 300 kms of water and sewer mains and around 200 kms of urban stormwater pipes and channels.
Marlborough DC was formed in 1989 and became a unitary authority in 1992 following the dis-solution of the Nelson/Marlborough Regional Council. The council covers an area of 17,517 sq km at the top of the South Island. Across the region there is a considerable variety of topography, climate, geology and human geographic features which provides consequences for planning and provision of services.
4.2 Climate While Marlborough enjoys a reputation for being one of the sunniest places in New Zealand, it is also a very diverse area climatically. East coast areas, including Blenheim and the Wairau Plain experience long sunshine hours and a relatively low rainfall of 500 to 700 millimetres per year. However, just 50 kilometres north of Blenheim, parts of the northern Marlborough Sounds record rainfall averages of over 2,500 millimetres per year. Further inland the headwaters of the Wairau River have even higher rainfall as well as permanent snow cover in winter. The upper reaches of the Awatere Valley are very cold and dry with around 750 millimetres of rain and over 200 ground frosts per year.
4.3 Land Resources Marlborough’s land resource covers 10,321 square kilometres. This extremely diverse area includes high mountain ranges, river valleys, lowlands and the islands of the Marlborough Sounds. The mountain ranges and river valleys were formed some 25 million years ago by the collision of the Pacific and Indo-Australian tectonic plates. The result of this has been two quite different geographical areas: the Marlborough Sounds to the north; and the major river valleys of the Wairau and the Awatere in the south.
The flat land and alluvial soils of the Wairau Plain around Blenheim lead them to be the most intensively developed rural area of Marlborough. The environment here is highly modified being the subject of an extensive flood management and drainage system, which benefits some 10,000 hectares of productive land. Favoured by mild climatic conditions, close to centres of population and water resources, a wide range of land uses have historically

Part 3: Financial and Infrastructure Strategy and Statements
2015-2025 Long Term Plan Page 185
developed on the Wairau Plain. Today the main land uses include viticulture and horticulture, and to a limited extent, mixed farming, cereal production, small seed production, the production of crops for food processing, dairy farming, and intensive cropping (eg; garlic). There are also many people living in this area on small rural lifestyle blocks.
Further south, the Awatere Valley and Ward areas have historically had a strong pastoral farming focus. However, in more recent times this area has been distinguished by contrasting land use pressures. On the one hand, these areas are vast and relatively isolated from major centres of population, with the dominant and traditional land use being pastoral farming, producing wool and meat. On the other hand, there are some areas where pastoralism is experiencing continuing pressures to change to forestry, viticulture and other horticultural activities. There have also been pressures for rural lifestyle living as people seek alternative ways to provide for their economic and social well-being.
Viticulture is the most prominent of the intensive land use changes that have occurred in Marlborough’s rural areas, with a rapid expansion of vineyards. Some of the drier parts of south Marlborough have been helped in this expansion by the development of community based irrigation schemes and onsite storage of water for irrigation. In Marlborough’s high country (the area above 1000 metres) extensive pastoralism, was historically the predominant land use activity and in many cases still is. The relative isolation and topographical and climatic limitations of these hill country areas means that pastoralism is likely to remain the major land use activity well into the future. Much of the land is Crown-owned and is in pastoral lease subject to private management.
4.4 Marlborough’s Rivers and Coast The Wairau River is the largest of Marlborough’s rivers being approximately 145 kilometres long with a catchment that covers 3,825 square kilometres. It flows in a north easterly direction from its source to the Pacific Ocean at Cloudy Bay. It is essentially a braided river, except in its lower reaches where it flows as a single meandering channel. The Wairau also has a number of significant tributaries. The Branch, Wye and Waihopai flow into the Wairau on its south bank. One of the most significant features of the Wairau and its tributaries is its long history of modification to its channels. From 1861 a succession of river control works were carried out for the purpose of draining swamps and wetlands for conversion to pasture and to reduce the incidence of flooding in Blenheim and the surrounding floodplains. This work has been very successful and has enabled Blenheim to grow and much of the surrounding floodplain to be developed for intensive viticulture, fruit crop and process vegetables, and industrial development including at Riverlands and Cloudy Bay.
4.5 Economic Activity in Marlborough The economy has diversity and is not reliant on one single sector, however many of the industrial, construction, retail and administrative businesses are reliant on the fortunes of the core resource-based industries.
Marlborough’s prosperity has been, and continues to be, dependent on the value of production from its rural and marine areas. These core primary industries are viticulture, agriculture, marine farming, horticulture and forestry.
The consequences for Council services of the major boom in viticulture in the region have been providing for increases in seasonal employment, liquid and solid trade waste production, protection of the value of crop within flood protection zones and the value of the Southern Valley’s Irrigation Scheme.

Part 3: Financial and Infrastructure Strategy and Statements
Page 186 2015-2025 Long Term Plan
5. Significant Issues affecting all services There are a number of significant issues that are likely to impact all services over the 30 year span of the strategy. There is considerable uncertainty as to the extent, timing or even the existence of some of these factors. It is therefore important to define the current understanding and assumptions that underpin today’s planning for the future.
5.1 Population growth/decline and demographics There are two major trends in the demographics of developed countries that are unprecedented: Within a generation most developed (including New Zealand) and many
developing countries in the world will be experiencing negative population growth.
The composition of the population will be predominantly older people.
src: Institute of Demograhic & Economic Analysis (Waikato Univ) 2012)
Simplistically there are two consequences for council infrastructure that need to be highlighted.
1. Councils can no longer simply design infrastructure for significant growth secure in the knowledge that at some time in the future the capacity will be required.
2. A greater portion of the population will be on fixed incomes so people will have a limited capacity to handle increased costs.
Marlborough In October 2013 the early findings from the 2013 census were published. Further data will continue to be released as it becomes available. Detailed analysis and future population projections have not yet been issued so, at this point in time, we must use the basic 2013 census results and couple these with the early 2006/2011 projections.
Council has access to the regional population projections made by Statistics NZ in 2011 based on the previous census (2006.) In addition, two reports of the

Part 3: Financial and Infrastructure Strategy and Statements
2015-2025 Long Term Plan Page 187
Institute of Demographic & Economic Analysis (University of Waikato) 2012 provided further detailed analysis and population projections for the region and use Infometrics economic data.
Both sources make projections on high, medium and low scenarios. The trends are broadly similar although the Waikato projections are generally lower and over a narrower range within the Statistics NZ range. The Institutes work, while only for Marlborough as a whole, looked further into the future, and projected that the population will, for ALL scenarios, peak then decline. The timing of the peak ranged from as early as 2017 for the low projection to as late as 2061 for the high projection. The release of the 2013 Usual Resident show the actual population for Blenheim to be very similar to the medium projection scenario of Statistics NZ.
Blenheim 2013 Some others were lower, and Marlborough as a whole, tracked slightly below the Low projections (from both Statistics NZ and Waikato).
The methodology used for an infrastructure planning framework therefore uses the 2011 projections but adjusted to the 2013 census population. For the purpose of planning Council services it is suggested that the Statistics NZ Medium scenario is used as a base projection. Adjustments may be required depending on the service and the area within the region.
Over the next 35 years there will be a slowing down of population increase, followed by a period of no growth and eventual negative growth.
The changes in population are not occurring uniformly through the region or uniformly through settlements. Generally the rural population is experiencing a more rapid slow-down in growth than the urban populations but there is
also a shift in the “centre of gravity” of the Blenheim-Renwick and the Picton-Waikawa urban areas.
The main urban growth areas are the green-field sites on the periphery of existing urban areas. This has a significant impact on service design as relatively greater capacity will be required on the ends of the existing networks. This is particularly noticeable in Picton where the treatment plants are to the south and west whereas the growth areas are the green-field sites at the extreme of Waikawa to the north-east
The number of inhabitants per dwelling is also falling. This means the demand for housing will decline at a slower rate than the fall in population. However, it may also mean that the wealth per household declines at a higher rate.
When planning services with a long lead time the increase in demand needs to be anticipated with a margin of error. A ‘just in time’ approach is prudent both from the point of view of cash flow and the uncertainty of the rapidly changing environment. Conversely, from a financial planning prospective it is prudent to anticipate a slower growth in the rateable property base and development contributions and a subsequent delay or reduction in revenue.
On the other hand, many infrastructure assets have a planned life in excess of 80 years and the large proportion of the total costs is in the initial construction and it would be very expensive to under-estimate demand in the long term. Thus; we should err on the high side for such long life components, use the medium scenario for shorter life components, and for all; build “Just in Time”.
Further Population growth is probably the most obvious and ubiquitous influencing factor for the projection of future services. However population growth alone is a poor indicator of demand for infrastructural services. Other underlying factors such as climate change, environmental standards, national legislation, major hazard resilience, levels of service and other social aspects often have a far greater impact either alone or in combination. There is less empirical data to support assumptions relating to these factors. However it is important these are also placed on a common footing and a consistent approach underlies medium term strategy development.
5.2 Climate change The Ministry for the Environment is coordinating and interpreting the international and regional research on climate change. Their advice is regularly
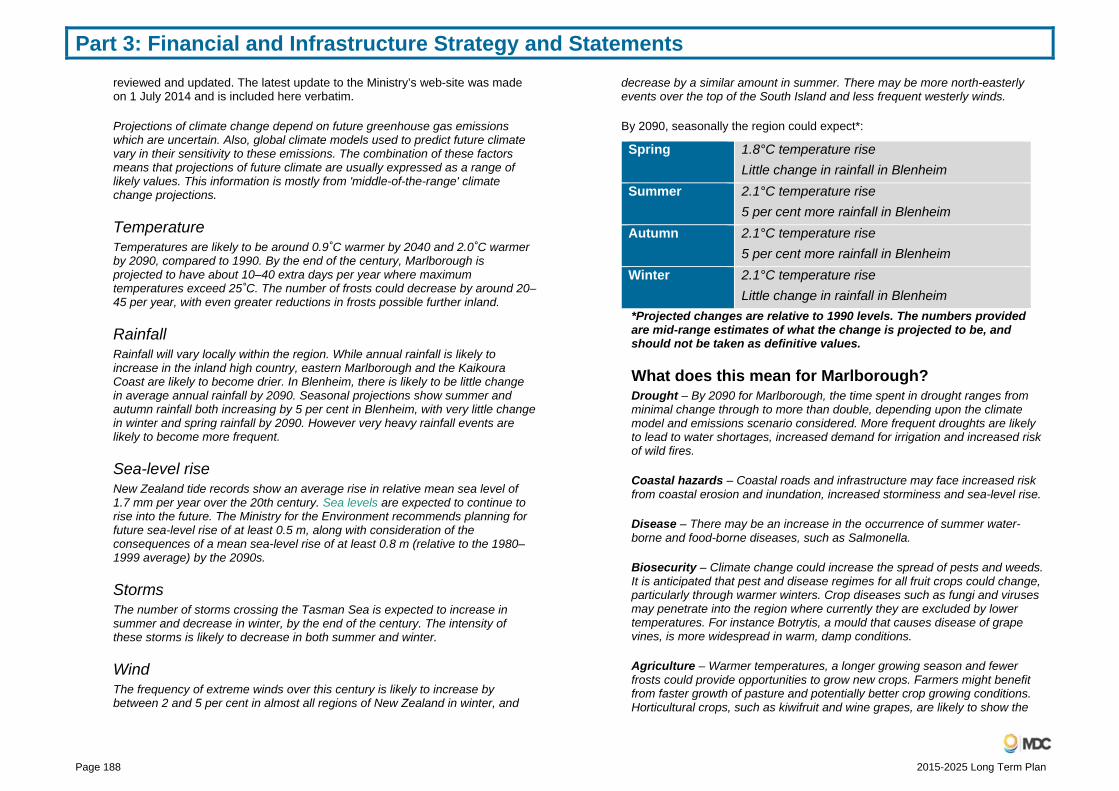
Part 3: Financial and Infrastructure Strategy and Statements
Page 188 2015-2025 Long Term Plan
reviewed and updated. The latest update to the Ministry’s web-site was made on 1 July 2014 and is included here verbatim.
Projections of climate change depend on future greenhouse gas emissions which are uncertain. Also, global climate models used to predict future climate vary in their sensitivity to these emissions. The combination of these factors means that projections of future climate are usually expressed as a range of likely values. This information is mostly from 'middle-of-the-range' climate change projections.
Temperature Temperatures are likely to be around 0.9˚C warmer by 2040 and 2.0˚C warmer by 2090, compared to 1990. By the end of the century, Marlborough is projected to have about 10–40 extra days per year where maximum temperatures exceed 25˚C. The number of frosts could decrease by around 20–45 per year, with even greater reductions in frosts possible further inland.
Rainfall Rainfall will vary locally within the region. While annual rainfall is likely to increase in the inland high country, eastern Marlborough and the Kaikoura Coast are likely to become drier. In Blenheim, there is likely to be little change in average annual rainfall by 2090. Seasonal projections show summer and autumn rainfall both increasing by 5 per cent in Blenheim, with very little change in winter and spring rainfall by 2090. However very heavy rainfall events are likely to become more frequent.
Sea-level rise New Zealand tide records show an average rise in relative mean sea level of 1.7 mm per year over the 20th century. Sea levels are expected to continue to rise into the future. The Ministry for the Environment recommends planning for future sea-level rise of at least 0.5 m, along with consideration of the consequences of a mean sea-level rise of at least 0.8 m (relative to the 1980–1999 average) by the 2090s.
Storms The number of storms crossing the Tasman Sea is expected to increase in summer and decrease in winter, by the end of the century. The intensity of these storms is likely to decrease in both summer and winter.
Wind The frequency of extreme winds over this century is likely to increase by between 2 and 5 per cent in almost all regions of New Zealand in winter, and
decrease by a similar amount in summer. There may be more north-easterly events over the top of the South Island and less frequent westerly winds.
By 2090, seasonally the region could expect*:
Spring 1.8°C temperature rise Little change in rainfall in Blenheim
Summer 2.1°C temperature rise 5 per cent more rainfall in Blenheim
Autumn 2.1°C temperature rise 5 per cent more rainfall in Blenheim
Winter 2.1°C temperature rise Little change in rainfall in Blenheim
*Projected changes are relative to 1990 levels. The numbers provided are mid-range estimates of what the change is projected to be, and should not be taken as definitive values.
What does this mean for Marlborough? Drought – By 2090 for Marlborough, the time spent in drought ranges from minimal change through to more than double, depending upon the climate model and emissions scenario considered. More frequent droughts are likely to lead to water shortages, increased demand for irrigation and increased risk of wild fires.
Coastal hazards – Coastal roads and infrastructure may face increased risk from coastal erosion and inundation, increased storminess and sea-level rise.
Disease – There may be an increase in the occurrence of summer water-borne and food-borne diseases, such as Salmonella.
Biosecurity – Climate change could increase the spread of pests and weeds. It is anticipated that pest and disease regimes for all fruit crops could change, particularly through warmer winters. Crop diseases such as fungi and viruses may penetrate into the region where currently they are excluded by lower temperatures. For instance Botrytis, a mould that causes disease of grape vines, is more widespread in warm, damp conditions.
Agriculture – Warmer temperatures, a longer growing season and fewer frosts could provide opportunities to grow new crops. Farmers might benefit from faster growth of pasture and potentially better crop growing conditions. Horticultural crops, such as kiwifruit and wine grapes, are likely to show the

Part 3: Financial and Infrastructure Strategy and Statements
2015-2025 Long Term Plan Page 189
greatest gains, benefiting from higher average temperatures. However, these benefits may be limited by negative effects of climate change such as prolonged drought or greater frequency and intensity of storms. The Ministry for Primary Industries [MPI website] has more information on the regional impacts of climate change on agriculture.
The five infrastructural asset groups – water, wastewater, stormwater, flood defence and roading use this information specific to individual projects. The influence of climate change will be dependent on location, criticality and life expectancy of new and existing infrastructure. For example the projection of increased rainfall in the western parts of the region is important to Rivers and Roading but is unlikely to have much influence on the water supply network that serves the townships in the east of the region. Likewise the rise in sea level will have significant consequences for coastal infrastructure but less so for roading renewal in the upper Wairau Valley.
Some of the projections are region-wide and have a significant impact on all services. The increase in the incidence of extreme in events, for instance, will impact all services and is already being built into the planning and design of long-life infrastructure.
These impacts will not be significant over the 30 year term of this Plan but need to be considered in the design and capacity of long life assets.
5.3 Environmental standards and sustainability There is a general trend towards stronger environmental controls as the human impact on natural eco-systems are better understood. Generally thinking on ‘sustainability’ recognises the reliance of human activity on fragile eco-systems.
It is likely that compliance with environmental standards will become increasingly demanding over the next thirty years and infrastructure planning needs to anticipate the improvements.
The recently built Picton Sewage Treatment Plant and the upgraded Blenheim STP have been designed to meet high effluent quality levels. Further work is likely to be required to the Havelock and Seddon facultative treatment ponds when their resource consents are due to be renewed in May 2018 and July 2017 respectively.
Further expenditure is certain to be required to protect the environment and public health from un-consented sewer overflows. The wastewater system is designed to convey sewage only. However leaking pipe joints, joints in manholes, submerged manhole covers and erroneous connections of
stormwater pipes results in rain derived inflow and infiltration (RDII) into the sewerage system. As the age of the system increases RDII increases and in storm conditions the pipes surcharge and overflow into the environment. The solutions to this are either to upgrade the sewer network to cope with the increased flows or to try and detect and prevent the inflow/infiltration. In practice it is likely that the current strategy of using a combination of both techniques will continue. Costs will increase as environmental standards tighten and the infrastructure ages.
Sustainability is also an issue for water supply. For a number of settlements, if the demand for water continues to rise as it has done in recent years then demand will out-strip the capacity of the water sources. Picton, Renwick and Havelock can anticipate capacity issues with their current water sources with few or very expensive options for alternate supply. A remaining option already being implemented in some areas of Marlborough is to control demand through a water demand management strategy. The most reliable and effective control is the installation of universal customer metering. Active leak detection, pressure management, grey-water recycling, plumbing management, education, voluntary restrictions may all be deployed with various levels of efficacy and costs. The current strategy includes metering, leak detection, the introduction of pressure management zones and education on efficient water use.
The use of fuel and carbon emissions could become much more significant in the next 30 years as NZ balances commercial competitiveness, economic development and environmental protection. Water infrastructure planning includes careful hydraulic modelling to maximise pump efficiencies, electrical tariff management and energy harvesting through service reservoirs. Further developments may become apparent.
The use of herbicides to control aquatic weeds in the lower Wairau drainage network and a number of natural waterways including Spring Creek, a prime trout fishery, is controlled by a resource consent that expires in February 2019. The renewal of this important resource consent is likely to be contested by sectors of the community concerned about the impact on fishery and native ecology, and possible spray residues remaining in the environment. It is important that we keep up with best practice for the use of these herbicides and undertake appropriate monitoring to show that the effects are as understood.
5.4 Renewal of ageing infrastructure All infrastructural assets, with the exception of some simple structures, have a useful life, after which it is no longer viable to continue to repair them and they need to be replaced. Much of the reticulation has a nominal life expectancy of around 80-100 years. As a consequence of the historic development of

Part 3: Financial and Infrastructure Strategy and Statements
Page 190 2015-2025 Long Term Plan
Marlborough settlements it is likely a significant portion of original piped infrastructure will reach the end of its useful life within the next 30 years.
The projections are based on the age of the pipelines and the life expectancy of pipes installed. There are many factors that affect the useful life of pipeline assets – material quality, working pressures, quality of workmanship during installation, maintenance practices, groundwater levels, surface traffic, depth of installation, chemical composition of the fluid conveyed, proximity of other utilities, ground movement, etc. There may be a dominant factor or a combination of factors affecting the overall life expectancy. Experience has shown that generally buried pipelines will have a useful life of between 80 and 100 years.
The useful life is also influenced by non-physical factors such as the criticality of the pipe to population served and under-capacity problems caused by growth in demand. Industry standard life expectation projections for different materials can be refined by pipe sampling, condition inspection programmes and closed-circuit tv surveying of sewer and stormwater mains. Because of the multitude of factors that affect the deterioration of pipes it can be difficult to recognise trends that can be applied throughout the reticulation. It is therefore usual to develop a systematic strategic approach to pipe condition monitoring in order to inform better renewal projections.
Currently throughout Marlborough’s reticulated systems there is a relatively young age profile to the pipeline networks. There is a concomitant level of repair and maintenance works on the underground assets. Pipe samples have been removed and analysed or inspected in the ground and supports the expectations of the engineers. As a consequence a tactical approach to non-critical mains renewals has evolved to replace pipes that are causing unacceptable interruptions through repeated failure. However a more strategic approach is being developed in preparation of the renewals ‘hump’ in 30 to 40 years’ time. The foundation of the strategy will be a more systematic approach to condition assessment in order to better predict the remaining life of the mains.
Whilst a ‘just in time’ approach has benefits in terms of cash flow and certainty of need it can lead to unacceptable deterioration in the service, disruptive construction and difficulties with securing adequate resources for construction, design and supervision. Improved condition grade data will allow a programmed approach to smooth out the peak of renewal activity over a 30 to 40 year period.

Part 3: Financial and Infrastructure Strategy and Statements
2015-2025 Long Term Plan Page 191
5.5 Resilience Following the Canterbury and Seddon earthquakes further data has become available on the vulnerability of utility services and additional strengthening works have been identified as a result.
The main concrete water reservoirs have been assessed against the most recent building standards for critical infrastructure. The reservoirs at the Elevation, Picton and Cloudy Bay Business Park have been identified for upgrade works
Vulnerable sewer pump stations serving Blenheim have been investigated for resistance to earthquake shaking and liquefaction. Ten stations will require engineering works to improve their earthquake resistance. The work has been programmed.
The Main Outfall Pump Station (MOPS) at Riverlands will require major upgrade works to improve its earthquake resistance. It was decided by Council that it would be more economically viable to rebuild the pump station in 2017.
5.6 Legislation Health (Drinking Water) Amendment Act (2007) For water services the most significant change in legislation over recent years was the introduction of the Health (Drinking Water) Amendment Act (2007.) Part 69A.2(c)
“…….imposes a range of duties on drinking-water suppliers, including duties to-
(i) Monitor drinking water; and
(ii) Take all practicable steps to comply with the drinking-water standards; and…..”
Two water treatment plants in Blenheim and one in Picton have been completed to meet the drinking water standards. Considerable progress has been made on the design of the Speeds Road WTP serving Picton. Blenheim and Picton are Marlborough’s most populated towns (servicing approximately 75% of the population).
There remains significant investment required to upgrade the supplies to Renwick, Awatere, Havelock and Wairau Valley to meet the standards. The costs of the necessary treatment plant can be prohibitively expensive for small communities. Central government has a subsidy scheme to provide financial assistance. However the distribution of the funds is by competitive application and the award is uncertain. The total value of the funds to be distributed is relatively small and unlikely to make a significant impact on the cost to the community. The assistance scheme will cease in 2015. Council is or will be working with each of the communities to find a satisfactory solution. It is applying for subsidy to treat Seddon’s water. District-wide funding assistance is also proposed for these smaller schemes.
Dam Safety Regulation The Taylor flood detention dam is now required to meet new Dam Safety Regulations in effect from July 2014. These regulations set minimum standards for monitoring and inspection, and ensuring earth dams in particular have an adequate flood spillway. Following the Seddon earthquake it was decided to complete the five yearly comprehensive safety review a year earlier than required.
The dam safety review has found that the dam is well designed for its age and is generally in very good condition. However some upgrade to the flood spillway (capacity and safe operation), and installation of crest and seepage monitoring is required to ensure continuing safe operation of this key asset.
Soil Conservation and Rivers Control Act 1941 At various times there have been suggestions to abolish key enabling legislation including the Soil Conservation and Rivers Control Act 1941. However this has been opposed by nearly all river managers through New Zealand as it is the founding legislation under which nearly all major flood schemes around NZ have been built.
Part 3: Financial and Infrastructure Strategy and Statements
Page 192 2015-2025 Long Term Plan
Government Policy Statement on Land Transport Funding 2015-16 – 2024-25 Every three years the Government releases its policy statement on Land Transport funding.
The policy sets national objectives and the funding available for different types of activity. There are three main priorities:
Economic growth and productivity
Road safety
Value for money
5.7 National Workstreams (a) Roading Efficiency Group (REG)
There has been much emphasis on the effectiveness of local government road asset management and a Roading Efficiency Group comprising road controlling authorities (including local authorities and NZTA) has been formed to implement recommendations made by a Road Efficiency Taskforce.
REG focuses on three key areas:
A One Network Road Classification (ONRC) to standardise data and create a classification system which identifies the level of service, function and use of road networks and state highways
Best Practice Asset Management to share best practice planning and advice with road controlling authorities
Collaboration with the industry and between road controlling authorities to share information, staff and management practices
The work is expected to create a number of benefits:
Improve the performance of suppliers and the industry
Encourage better collaboration and flexibility between road controlling authorities
Reduce costs by saving money in the right areas
Prioritise investment on the roads that need it most
Encourage best practice for the future from suppliers, industry and road controlling authorities
Provide a more holistic, collective way of maintaining and operating state highways and local roads in the regions.
(b) Local Government 3 Waters Project Local Government NZ is undertaking a comprehensive review of
the challenges facing 3 Waters planning nationally.
A significant survey has been completed and interpreted by the sector and independent consultants.
A draft report outlining options for improving the delivery of New Zealand’s Water, Wastewater and Stormwater is expected in the near future.
This work is in response to Government interest in the future capability and structure of the 3 Waters infrastructure sector.

Part 3: Financial and Infrastructure Strategy and Statements
2015-2025 Long Term Plan Page 193
6. Significant Infrastructure Issues – Water Issue Options Implications Drinking Water Standards Picton: Upgrade Speeds Road WTP to meet DWSNZ
Project approved for installation of UV treatment.
Construct WTP at Speeds Road planned for 2015 - estimated capital cost of $4,835,000.
Renwick: Drinking Water Standards
Occasional turbidity from the wells requires additional filtration to raw water at significant extra cost per household. Alternative sources have been sought but are expensive.
or Reticulation from
Blenheim.
Upgrade Boyce Street WTP membrane filtration and more secure bore supply. New WTP estimated at outline budget cost of $6M in 2018/19.
Estimated capital cost $8M. This option also negates future demand issues in Renwick but does use future Blenheim capacity.
Havelock: Upgrade Water Treatment Plant to meet DWSNZ
Construct water treatment plant 2018/19.
Estimated budget cost $3.6M in 2018/19.
Awatere: DWSNZ A number of options have been presented to the community. A recent community meeting agreed to apply for a MoH subsidy based on a membrane filtration treatment process. Unit costs per property of treatment to meet the DWSNZ are high so district wide support is also proposed.
The current proposal is to provide a Lamella clarifier and pressure filter treatment to Seddon township and point of entry treatment to rural Awatere properties. Outline budget cost is $3,000,000 for Seddon. A design/build process is proposed.
Wairau Valley: DWSNZ
Supply is from a well within the Wairau floodplain. Membrane
2006 estimate was $295,000. It is considered uneconomic to treat this supply servicing only 51 properties.
Issue Options Implications filtration will be required but is very expensive.
Demand Management Renwick – restrictions are required at periods of peak demand due to dropping water levels in the aquifers.
Integrated demand management strategy including leakage control and universal metering.
Installation of universal meters. Capital cost = $700k (2017/18). Additional operational costs for reading, maintenance, billing and replacement.
Connect alternative source wells at Conders Bend.
New pipeline, pumps, etc to connect recently constructed wells. Estimated capital cost of $1.8M in 2017/18.
Provide additional supply from Blenheim
Reticulation from Blenheim approximately $8M but resolves treatment issue also.
Voluntary community restrictions
Education
Havelock – increased chloride levels at peak demand suggest salt water intrusion to the fresh water aquifer
Alternative bore sources have been sought but there appear to be no alternative aquifer sources in reasonable distance. Re-commissioning the Takorika Dam would present major water quality issues with a relatively small yield. Water management strategy to reduce consumption to include universal metering.
Failure to manage increasing water demand could result in further saltwater intrusion and reduction in the capacity of the aquifer. Universal metering budget cost $294,000 (2017-18). A new water source from the Pelorus River is estimated to cost up to $5M (2018/19). Investigation of other less expensive options is planned.
Picton Reduced Pressure Zones, Leak detection, universal metering, etc
Implement water conservation strategy (2016-23). Alternative sources are very expensive to
Budget estimate of $2,853,000 for universal metering and establishing pressure reduction zones and leakage management zones. This will defer reticulation of water

Part 3: Financial and Infrastructure Strategy and Statements
Page 194 2015-2025 Long Term Plan
Issue Options Implications reticulate to Picton as no reliable groundwater found locally.
from the Wairau River (>$15 million). Consent to abstract will also be challenging.
Growth The urban growth strategy identified areas of urban growth for Marlborough over the next 30 years. Development pockets to the north and west of the town have been rezoned accordingly. Work has started to model and plan for the outline infrastructure (See Appendix 1.) Plans may need to be adjusted to account for changes to population predictions
Spend profile is dependent upon developer demand and number of simultaneous developments. Sequencing of pocket development will be responsive to market and developer demand which requires a flexible approach. Costs re off-site upgrades paid through Development Contributions.
Council provides the downstream infrastructure necessary to accommodate new residential lots recovered from development contributions. Zone levies are also paid to achieve economic and quality development where multiple landowners are involved. Council is the ‘banker’ to enable this.
Blenheim: increase storage for security of supply, firefighting and reduce pumping costs
Construct new 2000 m3 Taylor High Level Reservoir (2015-16) to supply southern part of Blenheim and allow the existing Weld Street reservoir to be drained for maintenance (2016-17).
Estimated capital costs $2,740,000.
Resilience Picton: Elevation Reservoir strengthening
Options prepared and presented to Council. New reservoir to provide resilience (2014-15). Existing reservoir retained with minimum
New reservoir at an estimated cost of $1,600,000.
Issue Options Implications maintenance.
Havelock: additional storage to firefighting standard and security of supply
Install second steel reservoir. Accept risk to supply from power or pipe failure.
Estimated capital cost of second reservoir $450,000 (2018-19).
Riverlands: Cloudy Bay Business Park Reservoir strengthening.
Strengthen reservoir to meet current seismic design standards. Accept risk of reservoir failure and possible disruption to industrial processes at the business park.
Budget cost of $1,420,000. Work planned in 2015-16. Not favoured
Renewals All areas. General reticulation renewals. Most reticulation pipework is designed for a 100 year life expectancy. Asbestos cement has been found to deteriorate at more rapid rate as the local groundwater is aggressive to the cement. Ground movement, high working pressures and evidence of poor installation and historic maintenance techniques may contribute to revision of ‘actual working life’ in some reticulation areas.
Information abstracted from existing valuation data. Critical water mains are subject to proactive replacement planning to avoid main failures Non-critical water mains to be replaced when costs of repair or inconvenience of repeated service interruption becomes untenable. Nominal life expectancies to be corrected from site observation and pipe sampling.
See renewal graphs.
Wither Road Booster pumps
Renew existing pumps (2026-27).
Outline budget cost - $1.2M.
Essons Valley Raw Renew main (2022-23). Budgeting on main renewal at an

Part 3: Financial and Infrastructure Strategy and Statements
2015-2025 Long Term Plan Page 195
Issue Options Implications Waterman Existing steel water main from Barnes Dam suffers repeated failures through corrosion
Reline existing main with structural liner. Abandon source and develop new source.
outline budget cost of $1,450,000.
Renwick: Renew existing tank farm of 10 concrete tanks in poor condition. This is also a resilience issue as the reservoirs have poor resistance to seismic loading.
Improved storage required for the purposes of firefighting, treatment and security of supply.
New storage capacity of 17,000 m3 (2016-17) at an estimated capital cost of $2.5M.
Levels of ServiceBlenheim: Flow and Pressure
Mathematical modelling has exposed areas where the water supplies do not meet the current firefighting code of practice for flow and pressure. Alternative designs have been assessed as there is evidence that new firefighting techniques are more effective and require smaller volume of water. Approval to work to a lower level of service is required from local fire service. Pipeline upgrades are required to provide additional flow and pressure.
Budget costs are: 2016-17 - $431,120 2018-19 - $477,754 2020-21 - $481,833 2022-23 - $303,382 2024-25 - $478,744 2026-27 - $447,932
7. Significant Infrastructure Issues - Wastewater Issue Options Implications EnvironmentalBlenheim: Expectation of increased resource consent conditions for Blenheim STP when current consent expires
Further reduction in faecal coliform and ammoniacal nitrogen likely to require advanced tertiary treatment when current resource consent expires (2023-28).
Install UV disinfection and dissolved air flotation unit on effluent outfall at an outline budget cost of $8,750,000.
Blenheim: Upgrades required to avoid unconsented discharges from sewer overflows
Increased frequency of overflows due to increasing inflow and infiltration from ageing reticulation, growth and increased storm intensity from climate change. Upgrade existing infrastructure capacity to cope with additional flow. Reduce inflow and infiltration through active detection and rehabilitation. This may be very difficult to detect as inflow and infiltration is most apparent during storm conditions when high flows can make It difficult to detect. There is a high degree of uncertainty as to the outcome from rehabilitation. A proportion of I & I will be from private sewer pipes.
Nelson Street Pump Station upgrade outline budget estimate - $2-4M (2021-24). $9M budgeted (2015-16) for new sewer mains (to include Dillons Point Road, Budge Street west, Hutcheson Street, Parker Street and McLauchlan Street) and two pump station upgrades in Blenheim northeast. These new mains also provide for growth from recently approved residential zoning in the northwest. Ongoing significant reticulation upgrades are budgeted.

Part 3: Financial and Infrastructure Strategy and Statements
Page 196 2015-2025 Long Term Plan
Issue Options Implications Picton: Unconsented Sewer Overflows particularly on the Waikawa to Picton trunk main system.
Build bigger sewers Fix inflow and infiltration Obtain consent for managed but infrequent overflows All the above in (2014-19). Sizing the infrastructure to avoid all overflows would be prohibitively expensive.
A cohesive strategy has been devised that includes elements of all of the options. A new trunk main has been carefully designed using hydraulic modelling. During intense storms inflow into sewers may still cause surcharging but incidence will be significantly reduced from the current situation. Overflows have been incorporated and disinfection equipment installed to reduce the public health risk. Estimated capital cost $23M including a new outfall pipe (installed) with $15 million budgeted 2015-16 and continuing further investment through the 11 year period to 2026-27 totalling $17.1M.
Growth Blenheim STP Industrial: Increased industrial loading
Permit continued growth of industrial Tradewaste from wine production.
Outline budget cost 2016-17 - $1.8M.
Blenheim Urban Growth
As for water supply. As for water supply.
St Andrews reticulation extension
Connect additional properties to existing pumped pipeline.
Failure of onsite treatment and disposal systems may increase public health risks. Outline budget costs of $1,032,000.
Burleigh reticulation extension
Connect existing properties in proximity to urban development zones.
Estimated capital cost of $1,950,00.
Renwick: Upgrade for expected settlement growth
Additional storage at Renwick sewer pump station will permit balancing of sewer flows and provide a cost-effective additional capacity for population growth (2026-27).
Outline budget cost of $1,195,000.
Issue Options Implications Resilience Blenheim: Seismic strengthening of Main Operating Pump Station (MOPS)
Options include retrofitting seismic strengthening to the foundations of the existing MOPS building or replacing the existing facility closer to the end of its useful life. Decision to replace in 2020-21.
Estimated budget cost of $6,250,000.
Blenheim: Seismic strengthening of other pump stations
Retrofitting seismic strengthening to pump stations is difficult and expensive. Proposed to replace pump stations over time with new structures.
Outline budget cost $900,000
Renewals All areas: Wastewater reticulation renewals
Sewer renewals based on life expectations adjusted with condition grade where known. Replace non-critical sewers only when condition grade >4 (where 5 is extremely poor needing urgent replacement) after extensive cctv survey. Replace non-critical sewers only when detected breakages greater than 3/km. Replace sewers on a programme based on nominal life expectancy (+ 10 years, - 5 years).
See renewals graphs.
All Areas – Sewage Pump Station Renewals
The assets of the sewer pump stations have been allocated
Renewal expenditure is likely to be as follows: <10 years - $1.8M

Part 3: Financial and Infrastructure Strategy and Statements
2015-2025 Long Term Plan Page 197
Issue Options Implications the following nominal life expectancies: Electrical – 25 years Civil – 100 years Mechanical – 40 years
10-19 years - $3.4M 20-30 years - $2.7M
All Areas – Sewage Treatment Plants
Renewals of major plant are allocated the same life expectancy as the pump station plant.
Renewal expenditure is likely to be as follows: <10 years - $0.2M 10-19 years - $2.0M 20-30 years - $4.9M
8. Significant Infrastructure Issues - Stormwater Issue Options Implications Environmental New resource consents are to be sought for different Blenheim stormwater management areas (SMAPs)
Seek an interim comprehensive consent for all stormwater discharges in Blenheim to be superseded as each SMAP is introduced.
Consolidation of current large numbers of point source discharges. Reflect current and future environmental expectations and standards.
Resilience Additional capacity for climate change effects is being built into stormwater modelling
Current upgrades are being designed for Redwood/Town Branch and Caseys Creek networks and include estimated climate change impacts (rainfall).
Provision of additional reticulation and pumping capacity.
Older pipelines are often made of the more brittle materials – earthenware, asbestos cement, vitreous clay, etc.
Include resilience assessment in condition grading and renewal strategy.
More proactive renewal planning.
Growth Blenheim Urban Growth Strategy
A number of options are being explored
Costs are to be evaluated for each of the options as detailed site data
Issue Options Implications including upgrade of infrastructure downstream, increased soakage onsite and designed detention areas within the urban zones.
is collected. They are recovered by zone levies where Council acts as ‘banker’ and multiple landowners are involved.
Renewals Reticulation Renewals
Stormwater renewals based on life expectations adjusted with condition grade where known. Renewal strategies may be based on one of the following options:
See renewals graphs.
Replace non-critical storm drains only when condition grade >4 (where 5 is extremely poor needing urgent replacement) after extensive cctv survey
Replace non-critical storm drains only when detected breakages greater than 3/km
Replace SW drains on a programme based on nominal life expectancy (+10 years, -5 years).
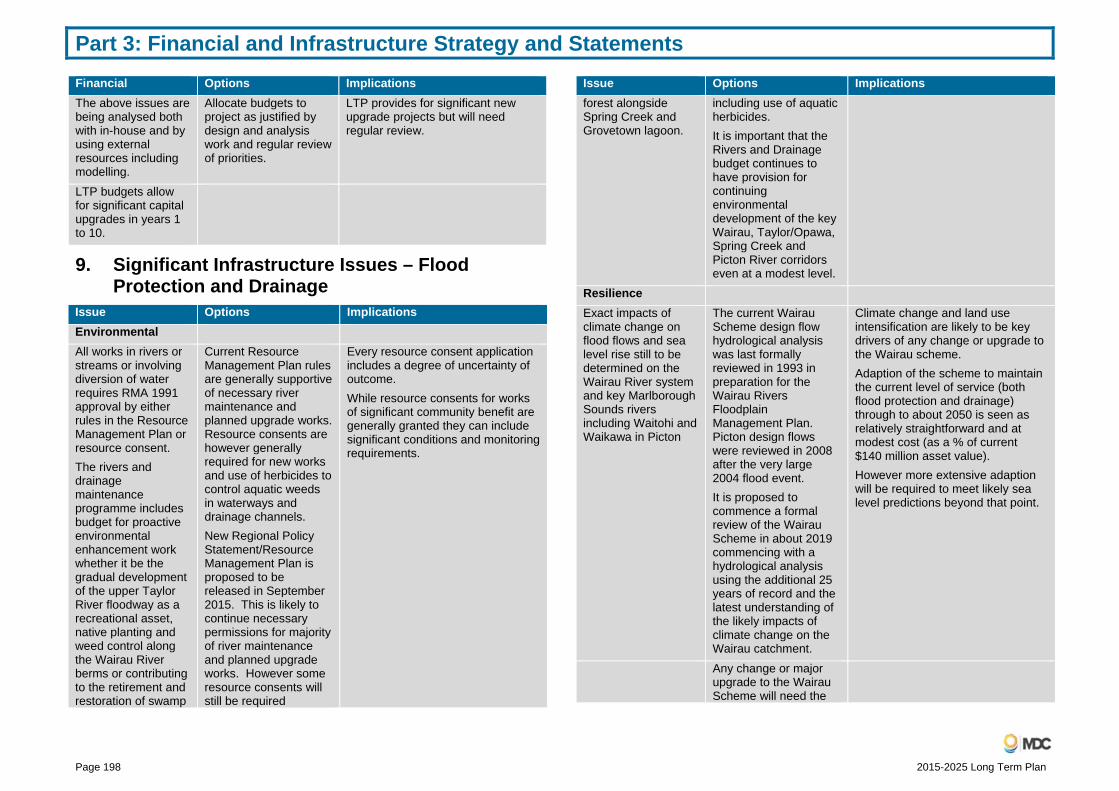
Part 3: Financial and Infrastructure Strategy and Statements
Page 198 2015-2025 Long Term Plan
Financial Options ImplicationsThe above issues are being analysed both with in-house and by using external resources including modelling.
Allocate budgets to project as justified by design and analysis work and regular review of priorities.
LTP provides for significant new upgrade projects but will need regular review.
LTP budgets allow for significant capital upgrades in years 1 to 10.
9. Significant Infrastructure Issues – Flood Protection and Drainage
Issue Options ImplicationsEnvironmental All works in rivers or streams or involving diversion of water requires RMA 1991 approval by either rules in the Resource Management Plan or resource consent. The rivers and drainage maintenance programme includes budget for proactive environmental enhancement work whether it be the gradual development of the upper Taylor River floodway as a recreational asset, native planting and weed control along the Wairau River berms or contributing to the retirement and restoration of swamp
Current Resource Management Plan rules are generally supportive of necessary river maintenance and planned upgrade works. Resource consents are however generally required for new works and use of herbicides to control aquatic weeds in waterways and drainage channels. New Regional Policy Statement/Resource Management Plan is proposed to be released in September 2015. This is likely to continue necessary permissions for majority of river maintenance and planned upgrade works. However some resource consents will still be required
Every resource consent application includes a degree of uncertainty of outcome. While resource consents for works of significant community benefit are generally granted they can include significant conditions and monitoring requirements.
Issue Options Implicationsforest alongside Spring Creek and Grovetown lagoon.
including use of aquatic herbicides. It is important that the Rivers and Drainage budget continues to have provision for continuing environmental development of the key Wairau, Taylor/Opawa, Spring Creek and Picton River corridors even at a modest level.
Resilience Exact impacts of climate change on flood flows and sea level rise still to be determined on the Wairau River system and key Marlborough Sounds rivers including Waitohi and Waikawa in Picton
The current Wairau Scheme design flow hydrological analysis was last formally reviewed in 1993 in preparation for the Wairau Rivers Floodplain Management Plan. Picton design flows were reviewed in 2008 after the very large 2004 flood event. It is proposed to commence a formal review of the Wairau Scheme in about 2019 commencing with a hydrological analysis using the additional 25 years of record and the latest understanding of the likely impacts of climate change on the Wairau catchment.
Climate change and land use intensification are likely to be key drivers of any change or upgrade to the Wairau scheme. Adaption of the scheme to maintain the current level of service (both flood protection and drainage) through to about 2050 is seen as relatively straightforward and at modest cost (as a % of current $140 million asset value). However more extensive adaption will be required to meet likely sea level predictions beyond that point.
Any change or major upgrade to the Wairau Scheme will need the
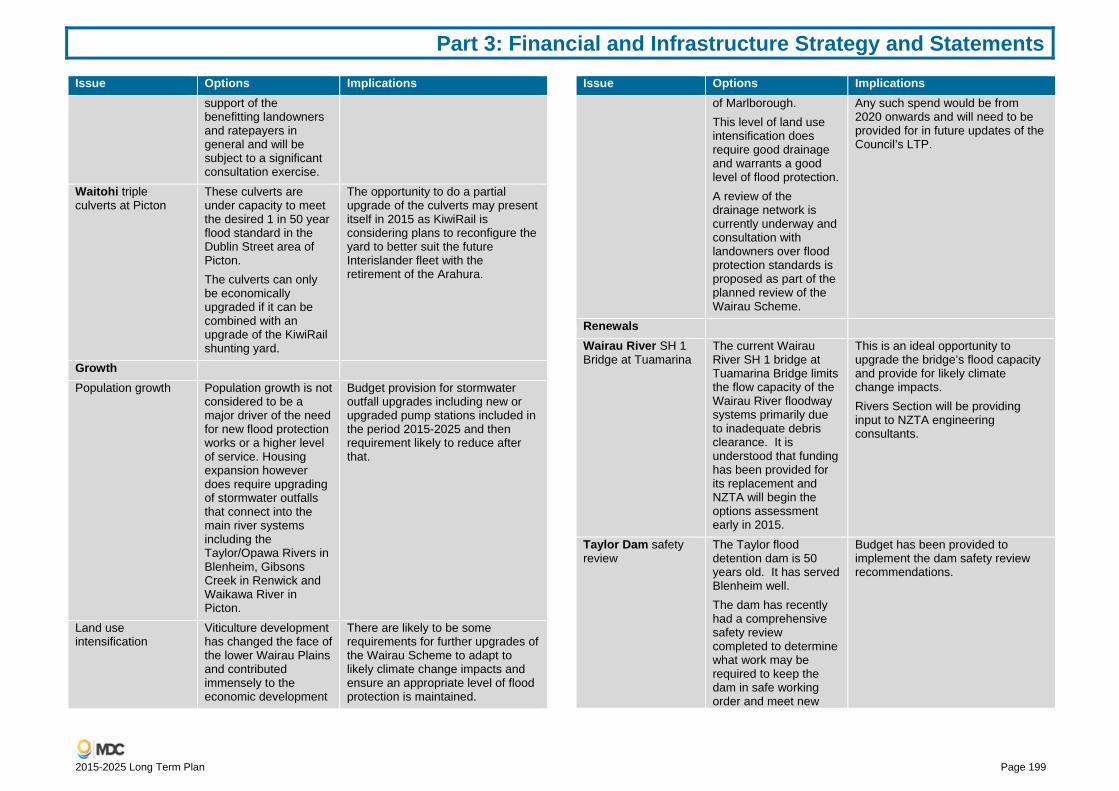
Part 3: Financial and Infrastructure Strategy and Statements
2015-2025 Long Term Plan Page 199
Issue Options Implicationssupport of the benefitting landowners and ratepayers in general and will be subject to a significant consultation exercise.
Waitohi triple culverts at Picton
These culverts are under capacity to meet the desired 1 in 50 year flood standard in the Dublin Street area of Picton. The culverts can only be economically upgraded if it can be combined with an upgrade of the KiwiRail shunting yard.
The opportunity to do a partial upgrade of the culverts may present itself in 2015 as KiwiRail is considering plans to reconfigure the yard to better suit the future Interislander fleet with the retirement of the Arahura.
Growth Population growth Population growth is not
considered to be a major driver of the need for new flood protection works or a higher level of service. Housing expansion however does require upgrading of stormwater outfalls that connect into the main river systems including the Taylor/Opawa Rivers in Blenheim, Gibsons Creek in Renwick and Waikawa River in Picton.
Budget provision for stormwater outfall upgrades including new or upgraded pump stations included in the period 2015-2025 and then requirement likely to reduce after that.
Land use intensification
Viticulture development has changed the face of the lower Wairau Plains and contributed immensely to the economic development
There are likely to be some requirements for further upgrades of the Wairau Scheme to adapt to likely climate change impacts and ensure an appropriate level of flood protection is maintained.
Issue Options Implicationsof Marlborough. This level of land use intensification does require good drainage and warrants a good level of flood protection. A review of the drainage network is currently underway and consultation with landowners over flood protection standards is proposed as part of the planned review of the Wairau Scheme.
Any such spend would be from 2020 onwards and will need to be provided for in future updates of the Council’s LTP.
Renewals Wairau River SH 1 Bridge at Tuamarina
The current Wairau River SH 1 bridge at Tuamarina Bridge limits the flow capacity of the Wairau River floodway systems primarily due to inadequate debris clearance. It is understood that funding has been provided for its replacement and NZTA will begin the options assessment early in 2015.
This is an ideal opportunity to upgrade the bridge’s flood capacity and provide for likely climate change impacts. Rivers Section will be providing input to NZTA engineering consultants.
Taylor Dam safety review
The Taylor flood detention dam is 50 years old. It has served Blenheim well. The dam has recently had a comprehensive safety review completed to determine what work may be required to keep the dam in safe working order and meet new
Budget has been provided to implement the dam safety review recommendations.

Part 3: Financial and Infrastructure Strategy and Statements
Page 200 2015-2025 Long Term Plan
Issue Options Implicationssafety regulations. The outcome of the review is that the dam is generally in good order and well designed for its era but some work is required. This includes a minor increase to spillway capacity, implementation of dam crest and seepage monitoring and some maintenance of the outlet culvert.
Asset renewal in general
The Wairau Scheme as we know it today has been in place for 50 years, and some parts of the scheme including stopbanks along Roses Overflow and the lower Opawa River are close to 100 years old. A continuing programme of robust maintenance, minor asset upgrades and periodic renewals is required to ensure these assets continue to perform to expectation in any future design flood.
Council has recently invested in a new asset management information system (AMIS). The flood protection asset database will be transferred into this system in the next 12-24 months and once up and running should assist in storing and making available monitoring data and enabling renewal requirements to be more easily forecast. Some increase in expenditure is planned to ensure that the system as a whole does not deteriorate and necessary repairs and renewals are undertaken in a timely manner.
Flood damage Assets such as bank protection works, training banks and planted willow buffer zones are vulnerable to flood damage. Flood damage can significantly impact on work programmes and budget requirements in
It is important that adequate annual reserve contributions are made to meet likely annual average flood damage requirements and that disaster damage insurance (via the LAPP scheme) is in place to enable timely flood damage repairs following major flood events (generally in excess of 20 year return period).
Issue Options Implicationsany one year. Council operates a flood reserve and is insured through the LAPP scheme to help smooth these impacts. The Government also provides disaster damage emergency assistance following major flood events.
10. Significant Infrastructure Issues – Roading 10.1 Increase in roads and streets
The AMP forecasts the following changes to the transportation network:
An increase in Sealed Rural Roads of 1.5% per annum. Sealed road total lengths increased from 565 km in 1992 to 685 km in 2008 as a result of seal extension and new subdivisions.
An increase in Urban Streets of 1.5% per annum. Subdivision demand has remained steady.
These sealed road increments exceed forecast population growth projections due to:
(a) disproportionate urban growth
(b) greater HPMV movements
(c) increased user expectations
The total length of the Marlborough District Council roads is increasing at a rate of 0.8% per annum as a result of new road and street creation by subdivision.
From time to time new roads are formed (such as Te Hoiere Road) to improve access, not always funded by Council, but added to the Council network.
The sealed road increases reflect disproportionate effects of increased heavy traffic movements and urban growth when compared to population projections. User expectations are also increasing.

Part 3: Financial and Infrastructure Strategy and Statements
2015-2025 Long Term Plan Page 201
10.2 Budgets
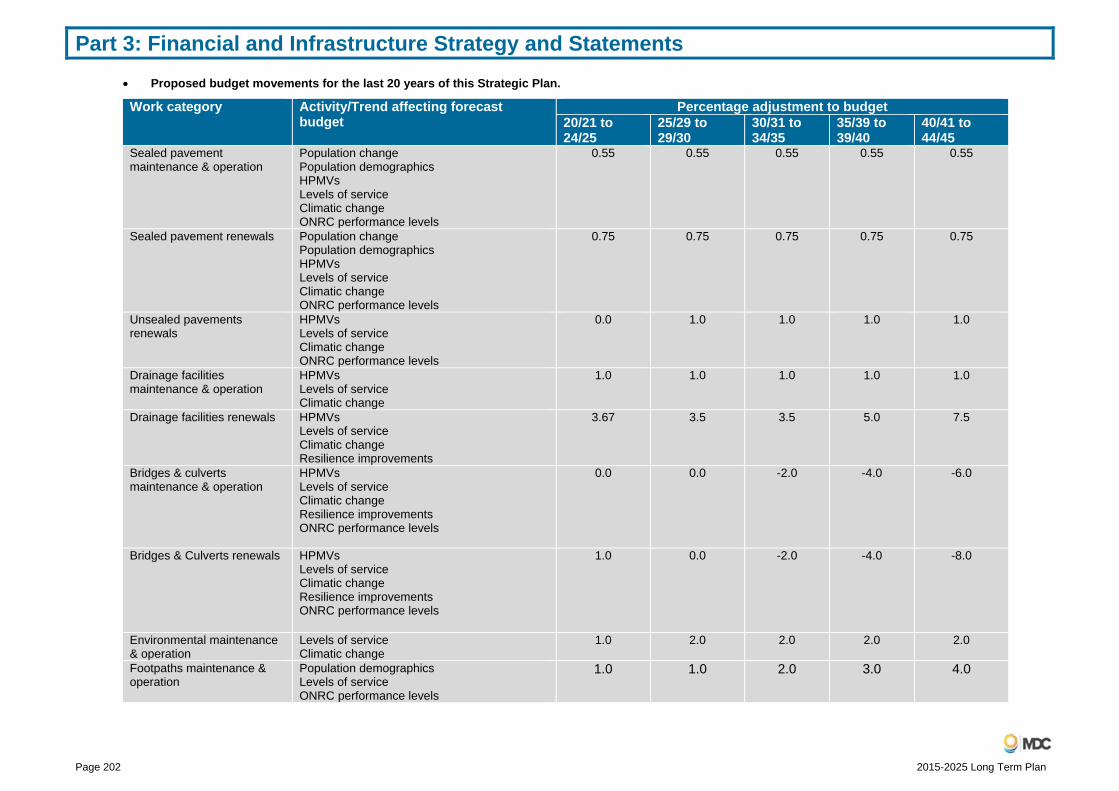
Part 3: Financial and Infrastructure Strategy and Statements
Page 202 2015-2025 Long Term Plan
Proposed budget movements for the last 20 years of this Strategic Plan.
Work category Activity/Trend affecting forecast budget
Percentage adjustment to budget 20/21 to 24/25
25/29 to 29/30
30/31 to 34/35
35/39 to 39/40
40/41 to 44/45
Sealed pavement maintenance & operation
Population change Population demographics HPMVs Levels of service Climatic change ONRC performance levels
0.55 0.55 0.55 0.55 0.55
Sealed pavement renewals Population change Population demographics HPMVs Levels of service Climatic change ONRC performance levels
0.75 0.75 0.75 0.75 0.75
Unsealed pavements renewals
HPMVs Levels of service Climatic change ONRC performance levels
0.0 1.0 1.0 1.0 1.0
Drainage facilities maintenance & operation
HPMVs Levels of service Climatic change
1.0 1.0 1.0 1.0 1.0
Drainage facilities renewals HPMVs Levels of service Climatic change Resilience improvements
3.67 3.5 3.5 5.0 7.5
Bridges & culverts maintenance & operation
HPMVs Levels of service Climatic change Resilience improvements ONRC performance levels
0.0 0.0 -2.0 -4.0 -6.0
Bridges & Culverts renewals HPMVs Levels of service Climatic change Resilience improvements ONRC performance levels
1.0 0.0 -2.0 -4.0 -8.0
Environmental maintenance & operation
Levels of service Climatic change
1.0 2.0 2.0 2.0 2.0
Footpaths maintenance & operation
Population demographics Levels of service ONRC performance levels
1.0 1.0 2.0 3.0 4.0
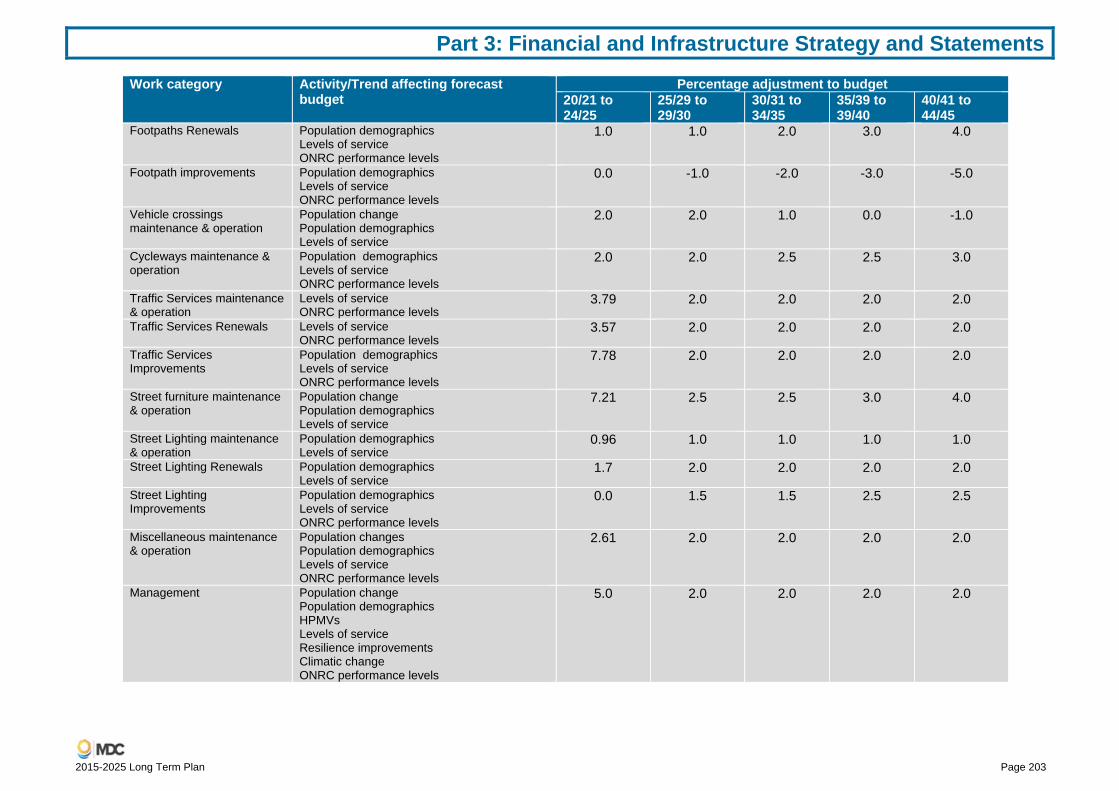
Part 3: Financial and Infrastructure Strategy and Statements
2015-2025 Long Term Plan Page 203
Work category Activity/Trend affecting forecast budget
Percentage adjustment to budget 20/21 to 24/25
25/29 to 29/30
30/31 to 34/35
35/39 to 39/40
40/41 to 44/45
Footpaths Renewals Population demographics Levels of service ONRC performance levels
1.0 1.0 2.0 3.0 4.0
Footpath improvements Population demographics Levels of service ONRC performance levels
0.0 -1.0 -2.0 -3.0 -5.0
Vehicle crossings maintenance & operation
Population change Population demographics Levels of service
2.0 2.0 1.0 0.0 -1.0
Cycleways maintenance & operation
Population demographics Levels of service ONRC performance levels
2.0 2.0 2.5 2.5 3.0
Traffic Services maintenance & operation
Levels of service ONRC performance levels
3.79 2.0 2.0 2.0 2.0
Traffic Services Renewals Levels of service ONRC performance levels
3.57 2.0 2.0 2.0 2.0
Traffic Services Improvements
Population demographics Levels of service ONRC performance levels
7.78 2.0 2.0 2.0 2.0
Street furniture maintenance & operation
Population change Population demographics Levels of service
7.21 2.5 2.5 3.0 4.0
Street Lighting maintenance & operation
Population demographics Levels of service
0.96 1.0 1.0 1.0 1.0
Street Lighting Renewals Population demographics Levels of service
1.7 2.0 2.0 2.0 2.0
Street Lighting Improvements
Population demographics Levels of service ONRC performance levels
0.0 1.5 1.5 2.5 2.5
Miscellaneous maintenance & operation
Population changes Population demographics Levels of service ONRC performance levels
2.61 2.0 2.0 2.0 2.0
Management Population change Population demographics HPMVs Levels of service Resilience improvements Climatic change ONRC performance levels
5.0 2.0 2.0 2.0 2.0

Part 3: Financial and Infrastructure Strategy and Statements
Page 204 2015-2025 Long Term Plan
Summary - Significant Infrastructure Issues - Roading Issue Options Implications Changes to national and district roading standards and requirements Road user expectations
Road users expect to reliably use the roads safely and efficiently
Required performance of roads may change upward to accommodate changed expectations, with appropriate cost implications.
Changes to vehicle standards
New weight and length limits for heavy motor vehicles (50MAX and HPMVs) have been recently introduced. Such changes may happen again at any time over the next 30 years.
Some assets, such as bridges, are understrength, especially old timber bridges, which makes asset replacement an essential activity. Re-aligning bends on MDC remote roads will also be required.
Variations to the Asset Management Plan
The AMP is expected to match the level of service provided by the infrastructure to the expectations of our customers.
As and when expectations change, which they are likely to do gradually over time, the AMP will need to be reviewed in order to accommodate these change.
Speed limit changes
Speed limit changes are seen by users as an improvement to the level of safety of the network.
Review of the speed limits involves significant design and consultation, along with implementation costs when approved. This activity will be on-going to maintain safety levels. A special management plan will be required.
Changes to road user legislation
Changes to current legislation, and introduction of new acts & regulations is an on-going issue with sometimes significant cost issues
Roading budgets will provide funds for future changes in order to meet the cost implications.
Issue Options Implications Demand Management Access by heavy motor service vehicles
The HMV is an essential road user to maintain the drive to make the moving of freight more efficient and using fewer vehicles. This has been achieved recently by amending permitted weights and lengths of such vehicles to provide this efficiency.
Heavier vehicles on roads increases the rate of deterioration of these assets, with the consequence of increased maintenance costs, and earlier renewals. The upgrading/renewal of bridges to carry heavier vehicles is also a major cost. Longer vehicles will require roading alignments to be improved
Traffic congestion Congestion is normally restricted to urban roads at town centres. Minor delays occur in Blenheim, but these do not yet meet “congestion” thresholds. Future road users may require even short delays to be addressed.
Recent works on SH 6 to improve peak hour traffic flow have been completed, with positive results. Future changes to transport modes, with development of a more suitable public transport system may be required. Increasing delays can be expected. Ring road improvements are anticipated and will be demand driven.
Access for tourism vehicles
A major economic activity for this region is tourism, and it is important to ensure the network provides for safe and efficient journeys for these users, especially overseas visitors.
Some of our narrow windy roads are located in the most scenic areas (eg; The sounds) and are being driven on by tourists who are not experienced driving on such roads to NZ road rules. Improvements to alignments and special attention to higher risk sections of these roads will be an on-going necessity.
Access for special events
There may be special events planned to be held which require special management, and particularly traffic control.
MDC will need to retain or have access to experienced staff and contractors to manage these events
Parking Provision of car parking in all areas of towns is a Council responsibility, and
Car parking areas currently developed will need to be monitored to determine when the

Part 3: Financial and Infrastructure Strategy and Statements
2015-2025 Long Term Plan Page 205
Issue Options Implications ensures efficient use is made of these areas,
use of these is approaching full capacity, and plan for additional parking. However other factors that can be promoted (such as greater use of public transport) may affect future parking needs.
Access to remote areas
There are numerous roads in the district which provide access to remote areas and these are often the only access, eg; the sounds and remote valleys. Access must be maintained.
Traffic flows in these areas are low, but the network provides an essential access to the various agriculture activities in these areas. Access maintained to reasonable standards for a wide range of vehicles must be provided.
Service the rural sector
Some of the rural roads provide access to limited numbers of properties, and maintaining these becomes a high cost per capita issue.
Some low use rural roads may be better closed and the adjacent land owner permitted to “farm” these areas. However, the fact that these are legal roads that may be accessed by the general public cannot be ignored and will make closure challenging.
Servicing the residential sector
These roads provide access for a wide range of road users from drivers and pedestrians (of a wide range of mobility), so these must therefore be constructed and maintained in a suitable manner for all these users.
Road surfacing on high volume roads will reduce traffic noise. Service vehicle access to residential communities must be provided.
Servicing the industrial sector
There is a need to provide for much larger vehicles on these roads, hence space is an essential consideration. Vehicle weights are also a pavement design issue.
Roads need to cater for heavy commercial vehicle trucking. Crossings and structures are to be designed to withstand heavier loadings, and surfaces able to withstand turning movements.
Outcomes from deterioration modelling of the roading network
Use the mathematical modelling from the Deighton dTIMS, which works to a range of
The optimal level of spending on the network can be determined by running a series of models which will maintain the road at different
Issue Options Implications (dTIMS) predetermined known
standards, and can identify the work requirements for the network over the district over a specified time.
levels of performance at different rates of funding. From this modelling, the optimum level of expenditure can be determined.
Improvements to reduce conflicts of all road users to enhance safety, and minimise harm
Improving safety on the roads to all users is an essential activity. Significant pressure needs to be directed at this activity to continually drive down the level of harm occurring on district roads.
The funding of all activities which will lead to reduced conflicts between users is an essential part of the roading budget. Work that can be carried out from these budgets is expected to contribute to our “safe system” approach.
Growth Necessary response to manage growth
District planning identifies infrastructure demands to service communities.
Existing infrastructure may need to be upgraded or expanded to meet the needs arising from growth of population, or activity in various sectors of the community. Provision needs to be available to enable any suitable work required to proceed with minimal hindrance or delay.
Restricting parameters arising from growth
Recognising that growth (whether by quantity or activity) needs to allow the existing community to continue with its present level of activity, and with minimal interference.
Provide for these issues with adequate funding for solutions which will alleviate the issues arising
Outside factors arising from growth
Demand of more land for residential or industrial development may require private land owners to enter into a land development phase
Allow private development plans to be accommodated into the existing infrastructure

Part 3: Financial and Infrastructure Strategy and Statements
Page 206 2015-2025 Long Term Plan
Issue Options Implications Growth of transport modes
There may be a growth of new transport modes for which the current infrastructure does not provide a safe and efficient environment
Be prepared to amend existing infrastructure to accommodate new modes of transport.
Public transport development
Look to expand existing public transport usage, or to introduce new options for public transport.
Existing infrastructure needs to be suitable to accommodate vehicles providing public transport. Be prepared to amend assets as needed.
Effects of growth on the risk of harm of any sort to road users
Growth will increase exposure to risks on roads.
Any reduced levels of safety must be continually monitored, and existing infrastructure improved to maintain or enhance levels of safety. This may require new activities to enhance the safety of all road users. An example is provision of cycle lanes on existing road carriageways.
Resilience Ability of the network to provide reliable journeys
The transport network is a vital asset to allow all users to maintain access to the district as and when they require. On occasions the networks free flow is impaired by events beyond the control of the RCA, and access is denied to road users. These can be caused by serious climate events, serious traffic incidents, and the like.
Council needs to have provision for managing these events, in procedures for contracted service providers to follow, and the ability to fund such work. These events are unpredictable as to when they occur, and can have significant effects on local communities, as well as being potentially quite dangerous. Planning for readiness to manage these events when they occur is essential for the community.
Low volume road access
These were discussed above. Access by residents along such routes must be protected
Removing access may put remote land owners in a hazardous position. There needs to be a procedure developed which will help minimise the overall effect of any loss of access.
Funding Sources of funding need to be clearly identified for all
Sources of funding currently used to provide the roading activities
Issue Options Implications roading activities. These are several -fold for the day to day roading activity, but special events may have special funding procedures. The LTP provides a 10 year look ahead for such activity, and this document views probable funding needs for the ensuing 20 years.
may become threatened or unmanageable in the future.
Climate changes effects and mitigation
Climatic changes arising from rising temperatures around the globe will have effect on roading infrastructure. Areas prone to slippage from heavy rain events, managements of stormwater flooding, and potential sea flooding of low lying infrastructure need to be identified.
Extreme rain events cause major damage to roads in the Sounds and other steep country areas, and flooding of infrastructure by rising seas or severe storms are all part of the anticipated outcomes from climate changes. While it is difficult to plan for specific works, trends need to be watched closely so infrastructure protection can be planned and funded for.
Emergency management
Severe natural or unnatural events can occur at any time (e.g. earthquakes), with sometimes very severe effects on existing infrastructure
Ensuring that existing infrastructure can withstand the impacts arising from such events can be managed to some degree, but it is not possible to completely protect the asset from being damaged, and becoming unusable. The long ribbon nature of access roads in the district means the potential of communities being isolated is an issue. Procedures must be in place to manage these events as best as possible.
Safety Addressing vehicle crash hot-spots
Incident hot-spots where numerous traffic collisions have occurred must be identified and the cause of these collisions removed or
Investigation into the cause of such incidents needs to be carried out to determine solutions that will prevent further such incidents. Funding must be available for this

Part 3: Financial and Infrastructure Strategy and Statements
2015-2025 Long Term Plan Page 207
Issue Options Implications isolated. work.
Reduction of fatal and serious road crashes
The need to reduce the numbers of crashes resulting in fatal and/or serious injury to road users
Adopt and follow national processes which will address this major issue.
Providing safe access to wide range of road users
Allow the road network to be used and shared between vehicles and active road users
Adjustment to the road structure will be required to allow all users to share the network
Road hazards and adequate sight lines
Warning all roads users about potential hazards, and maintaining safe sight distances.
Seek out and isolate or remove hazards to road users. Develop safe sightlines for both day and night time use of all roads.
Promoting safe road use
Improve skill, competence and knowledge of road users
Provide guidance and on-going education to road users to reduce harm.
Total budgets each decade
Funding requirements for 10 year periods
Maintenance and operation
All works 10 years end 24-25 $72,030.8M 10 Years end 34-35 $82,032.5M 10 Years end 44-45 $92,822.0M Total for 30 years $246,885.3M
Renewals All works 10 years end 24-25 $65,428.1M 10 Years end 34-35 $75,789.8M 10 Years end 44-45 $85,257.6M Total for 30 years $226,475.5M
Improvements (new works)
All works 10 years end 24-25 $26,173.5M 10 Years end 34-35 $28,254.8M 10 Years end 44-45 $31,797.7M Total for 30 years $86,226.0M
Maintenance and Operations
Funding requirements at year end of decade
All categories All maintenance operations on infrastructure, on operation costs
2024-25 $7,666,700 2034-35 $8,661,700 2044-45 $9,788,300
Issue Options Implications Renewals Funding requirements at year
end of decade Resurfacing of existing pavements
All paved surfaces deteriorate at different rates. Life expectances are as follows: Asphaltic Pavement 25-30 years Chip seals 12-20 years (depending on traffic and chip size)
2024-25 $4,247,500 2034-35 $4,809,300 2044-45 $5,445,400
Maintaining unsealed surfaces of roads
Replacement of existing basecourse layer. (allow for 1.5% of unsealed roads to be sealed each year)
2024-25 $600,000 2034-35 $679,400 2044-45 $769,200
Upgrading stormwater management facilities
Replacing of old or damaged culverts and water channels, and replacing K & C no longer effectively removing stormwater.
2024-25 $836,100 2034-35 $946,700 2044-45 $1,071,900
Bridge renewal Replacing of existing bridges as they come to the end of their useful life, or limit access by heavy vehicles along these roads.
2024-25 $325,000 2034-35 $325,000 2044-45 $325,000
Retaining wall replacement
Replace or renew existing Retaining walls which are no longer effective
2024-25 $20,000 2034-35 $20,000 2044-45 $20,000
Footpath and crossing renewal
Replacing footpaths and crossing damaged beyond repair sufficiently to cause a hazard to users
2024-25 $544,000 2034-35 $616,000 2044-45 $697,000
Traffic services renewal
Replacement of and upgrade of traffic signs and features used to control and direct traffic flow, and maintain safety.
2024-25 $241,500 2034-35 $273,400 2044-45 $309,600
Street furniture and Replacement of existing 2024-25 $164,000
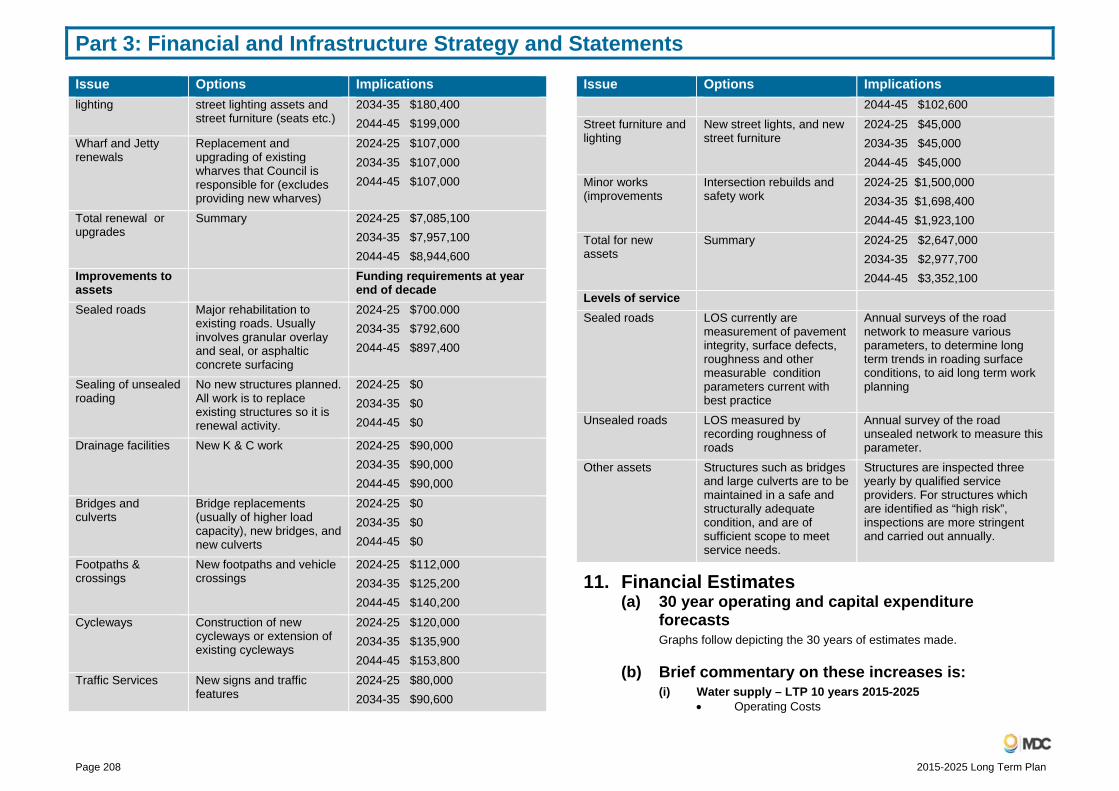
Part 3: Financial and Infrastructure Strategy and Statements
Page 208 2015-2025 Long Term Plan
Issue Options Implications lighting street lighting assets and
street furniture (seats etc.) 2034-35 $180,400 2044-45 $199,000
Wharf and Jetty renewals
Replacement and upgrading of existing wharves that Council is responsible for (excludes providing new wharves)
2024-25 $107,000 2034-35 $107,000 2044-45 $107,000
Total renewal or upgrades
Summary 2024-25 $7,085,100 2034-35 $7,957,100 2044-45 $8,944,600
Improvements to assets
Funding requirements at year end of decade
Sealed roads Major rehabilitation to existing roads. Usually involves granular overlay and seal, or asphaltic concrete surfacing
2024-25 $700.000 2034-35 $792,600 2044-45 $897,400
Sealing of unsealed roading
No new structures planned. All work is to replace existing structures so it is renewal activity.
2024-25 $0 2034-35 $0 2044-45 $0
Drainage facilities New K & C work 2024-25 $90,000 2034-35 $90,000 2044-45 $90,000
Bridges and culverts
Bridge replacements (usually of higher load capacity), new bridges, and new culverts
2024-25 $0 2034-35 $0 2044-45 $0
Footpaths & crossings
New footpaths and vehicle crossings
2024-25 $112,000 2034-35 $125,200 2044-45 $140,200
Cycleways Construction of new cycleways or extension of existing cycleways
2024-25 $120,000 2034-35 $135,900 2044-45 $153,800
Traffic Services New signs and traffic features
2024-25 $80,000 2034-35 $90,600
Issue Options Implications 2044-45 $102,600
Street furniture and lighting
New street lights, and new street furniture
2024-25 $45,000 2034-35 $45,000 2044-45 $45,000
Minor works (improvements
Intersection rebuilds and safety work
2024-25 $1,500,000 2034-35 $1,698,400 2044-45 $1,923,100
Total for new assets
Summary 2024-25 $2,647,000 2034-35 $2,977,700 2044-45 $3,352,100
Levels of serviceSealed roads LOS currently are
measurement of pavement integrity, surface defects, roughness and other measurable condition parameters current with best practice
Annual surveys of the road network to measure various parameters, to determine long term trends in roading surface conditions, to aid long term work planning
Unsealed roads LOS measured by recording roughness of roads
Annual survey of the road unsealed network to measure this parameter.
Other assets Structures such as bridges and large culverts are to be maintained in a safe and structurally adequate condition, and are of sufficient scope to meet service needs.
Structures are inspected three yearly by qualified service providers. For structures which are identified as “high risk”, inspections are more stringent and carried out annually.
11. Financial Estimates (a) 30 year operating and capital expenditure
forecasts Graphs follow depicting the 30 years of estimates made.
(b) Brief commentary on these increases is: (i) Water supply – LTP 10 years 2015-2025
Operating Costs

Part 3: Financial and Infrastructure Strategy and Statements
2015-2025 Long Term Plan Page 209
Average increase 2016 to 2025 = 3.3% per annum
The major causes of this increase are:
Water treatment costs
Interest and depreciation on new assets
These costs are driven by new capital expenditure – predominantly on water treatment and reservoirs to improve levels of service
(ii) Water Supply 2025-2045 Operating costs are projected to be stable for this 20 year
period.
There is an overall decline in capital expenditure even though renewals increase in five years blocks commencing 2025 and then 2040.
The significant investment over the period of the next LTP puts water supply infrastructure in a strong state.
Picton’s supply could be under pressure if demand management methods are outstripped by growth. Supply from the Wairau aquifer is very expensive. Other options will be reviewed eg; desalination.
(iii) Wastewater – LTP 10 years 2015-2025 Operating costs
This is a very similar pattern to water supply.
Total operating costs increase an average of 2.4%/ over the 10 year LTP period.
As for water the increases are driven by capital expenditure and in particular the major upgrades of Blenheim and Picton sewer reticulation networks to reduce overflows and cope with new development.
(iv) Wastewater – 2025-2045 Operating costs continue to increase from 2025 to 2030
as depreciation and interest charges arising from the prior decades major capital investment come through fully.
From 2030 operating costs stabilise as capital investment drops off considerably reflecting the very strong state of the sewerage infrastructure after the LTP period.
(v) Stormwater – LTP 10 years 2015-2025 Operating Costs
Significant investment in Blenheim stormwater upgrades in response to growth and level of service needs (including environmental drivers) pushes operating costs up by approximately $600,000 per annum.
Interest, depreciation and overheads charged to capital expenditure are the major contributors.
(vi) Stormwater 2025-2045 The increases from the LTP decade continue to impact
until 2030 when capital investment has declined.
Renewals then start to impact particularly in 2040-45 when they reach a 30 year high.
(vii) Rivers – LTP 2015-2025 Operating costs increase by 1.5% per annum on average
through this period.
The increases are required to lift flood protection system standards back to where they should be – repairs, renewals and some upgrades drive the costs.
(viii) Rivers – 2025-2045 Our estimates for the 2025-2045 period include provision
for upgrades driven by climate change. Accurate estimates require significant investigation at very high cost and have not been undertaken.
The impacts of climate change will be reviewed periodically.
(ix) Roading – LTP 2015-2025 Operating costs increase by approximately $.5 million per
annum in total – an average per annum increase of 1.5%.
The most significant individual contributor to the increased costs is the $2 million per annum increase provided for emergency works (storm damage).
There are also larger capital investments required for Blenheim CBD works (paving and landscaping).
(x) Roading – 2025-2045 Capital costs decline from 2025 and stabilise at the lower
level.
Operating costs reflecting increased depreciation continue to lift through to 2030 but stabilise thereafter.
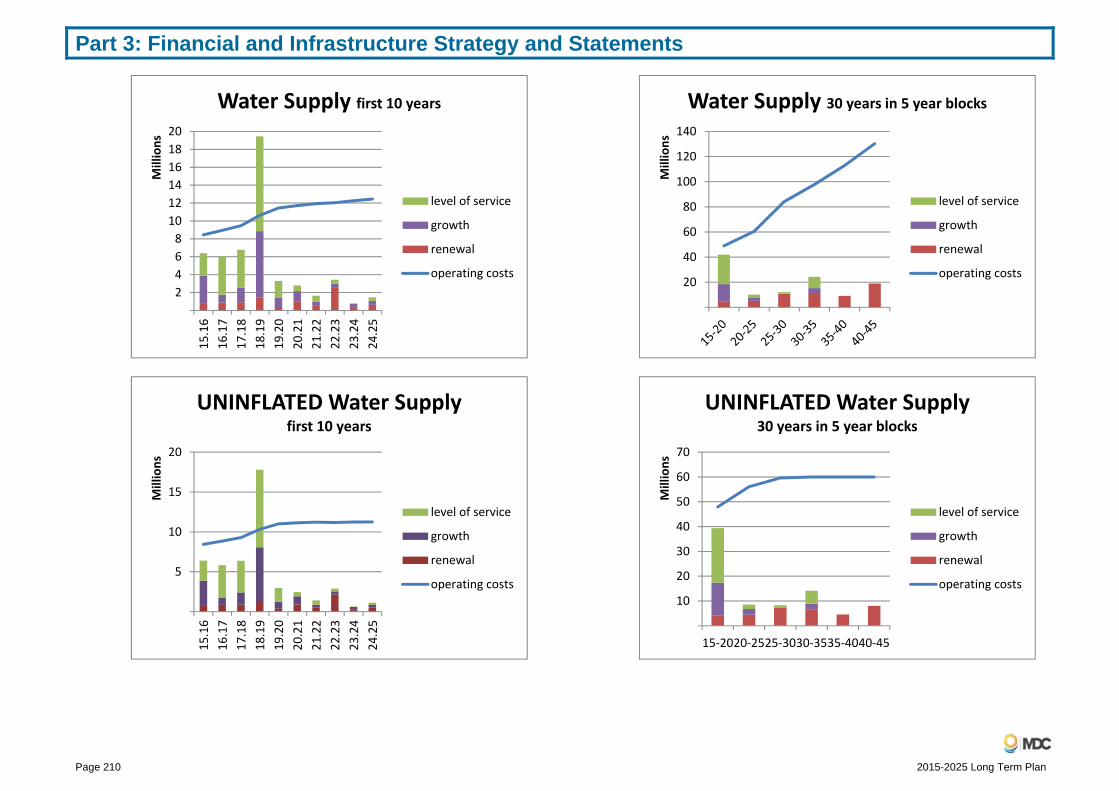
Part 3: Financial and Infrastructure Strategy and Statements
Page 210 2015-2025 Long Term Plan
2468101214161820
15.16
16.17
17.18
18.19
19.20
20.21
21.22
22.23
23.24
24.25
Millions
Water Supply first 10 years
level of service
growth
renewal
operating costs
5
10
15
20
15.16
16.17
17.18
18.19
19.20
20.21
21.22
22.23
23.24
24.25
Millions
UNINFLATED Water Supplyfirst 10 years
level of service
growth
renewal
operating costs
20
40
60
80
100
120
140
Millions
Water Supply 30 years in 5 year blocks
level of service
growth
renewal
operating costs
10
20
30
40
50
60
70
15‐2020‐2525‐3030‐3535‐4040‐45
Millions
UNINFLATED Water Supply30 years in 5 year blocks
level of service
growth
renewal
operating costs

Part 3: Financial and Infrastructure Strategy and Statements
2015-2025 Long Term Plan Page 211
2
4
6
8
10
12
14
16
18
20
Million
s
Wastewater first 10 years
level of service
growth
renewal
operating costs
2
4
6
8
10
12
14
16
18
15.1616.1717.1818.1919.2020.2121.2222.2323.2424.25
Million
s
UNINFLATED Wastewaterfirst 10 years
level of service
growth
renewal
operating costs
20
40
60
80
100
120
140
160
180
15‐20 20‐25 25‐30 30‐35 35‐40 40‐45
Million
s
Wastewater 30 years in 5 year intervals
level of service
growth
renewal
operating costs
‐
10
20
30
40
50
60
70
80
15‐20 20‐25 25‐30 30‐35 35‐40 40‐45
Million
s
UNINFLATED Wastewater30 years in 5 year intervals
level of service
growth
renewal
operating costs

Part 3: Financial and Infrastructure Strategy and Statements
Page 212 2015-2025 Long Term Plan
‐
1
2
3
4
5
6
Million
s
Stormwater first 10 years
level of service
growth
renewal
operating costs
‐
1
2
3
4
5
6
Million
s
UNINFLATED Stormwaterfirst 10 years
level of service
growth
renewal
operating costs
‐
5
10
15
20
25
30
35
40
15‐20 20‐25 25‐30 30‐35 35‐40 40‐45
Millions
Stormwater 30 years in 5 year intervals
level of service
growth
renewal
operating costs
‐
2
4
6
8
10
12
14
16
18
15‐20 20‐25 25‐30 30‐35 35‐40 40‐45Millions
UNINFLATED Stormwater30 years in 5 year intervals
level of service
growth
renewal
operating costs

Part 3: Financial and Infrastructure Strategy and Statements
2015-2025 Long Term Plan Page 213
‐
5
10
15
20
25
Millions
ROADING first ten years
other
‐
5
10
15
20
25
Millions
UNINFLATED Roading first ten years
other
‐
50
100
150
200
250
300
15‐20 20‐25 25‐30 30‐35 35‐40 40‐45
Millions
ROADING 30 years in 5 year blocks
othercapex
‐
20
40
60
80
100
120
140
15‐20 20‐25 25‐30 30‐35 35‐40 40‐45Millions
UNINFLATED Roading 30 years in 5 year blocks
othercapex

Part 3: Financial and Infrastructure Strategy and Statements
Page 214 2015-2025 Long Term Plan
‐
1.0
2.0
3.0
4.0
5.0
6.0
7.0
‐
0.2
0.4
0.6
0.8
1.0
1.2
1.4
1.6
1.8
15.1616.1717.1818.1919.2020.2121.2222.2323.2424.25
opex in
Millions
Cape
x in Millions
UNINFLATED Rivers ‐ first 10 years
renewal growth level of service operating costs ‐
5
10
15
20
25
30
35
‐
1
2
3
4
5
6
7
8
15‐20 20‐25 25‐30 30‐35 35‐40 40‐45
opex in
Million
s
Cape
x in Million
s
UNINFLATED Rivers30 years in 5 year blocks
total capex
level of service
growth
renewal
operating costs
‐
10
20
30
40
50
60
70
‐
2
4
6
8
10
12
14
15‐20 20‐25 25‐30 30‐35 35‐40 40‐45
opex in
Million
s
Cape
x in Million
s
Rivers 30 years in 5 year blocks
total capex
level of service
growth
renewal
operating costs
‐
1
2
3
4
5
6
7
‐
0.2
0.4
0.6
0.8
1.0
1.2
1.4
1.6
1.8
15.1616.1717.1818.1919.2020.2121.2222.2323.2424.25
opex in
Million
s
Cape
x in Million
s
Rivers ‐ first 10 years
renewal growth level of service operating costs

Part 3: Financial and Infrastructure Strategy and Statements
2015-2025 Long Term Plan Page 215
Assumptions, Disclosure and Compliance Assumptions With any financial forecasting, a number of assumptions must be made. The following assumptions have been made in the preparation of this document. Also presented for each assumption is the “Level of uncertainty”, “Risk” and “Financial Impact” for each.
Legislative Assumption Local Government may be significantly affected by changes in legislation. It is assumed that legislative and Government Policy changes will not significantly impact upon Council’s current responsibilities and activities.
Level of Uncertainty Medium to high.
Risk Government has signalled that it wishes to continue its reform agenda for Local Government including the Resource Management Act 1991 and the delivery of core services. It has also issued a National Policy Statement for Water and Food Hygiene and almost completed a major review of the Health and Safety in Employment Act. All of these changes and others that are likely to occur over the period of the Plan will potentially have a significant impact on Council.
Financial Impact To date Government’s reforms have not reduced legislative obligations, costs or the impact on the ratepayer. It is too early to assess the financial impact of the Government’s signalled policy announcements.
Inflation Assumption The costs, revenues and asset values reflected in this plan reflect the following “Forecasts of Price Level Change Adjustors to 2025” produced by Business Economic Research Limited (BERL) in September 2014 for the Society of Local Government Managers.
BERL also consolidates the above adjustors into a consolidated Local Government Cost Index (LGCI) which is further split between operating and capital expenditure.
Year ending LGCI (annual average % change)LGCI OPEX CAPEX
June 2014 1.13 1.72 0.37 June 2015 2.00 1.95 2.08 June 2016 2.04 1.81 2.34 June 2017 2.46 2.34 2.61 June 2018 2.53 2.44 2.64 June 2019 2.61 2.57 2.67 June 2020 2.75 2.71 2.80 June 2021 2.90 2.85 2.96 June 2022 3.04 2.99 3.11 June 2023 3.19 3.13 3.27 June 2024 3.36 3.27 3.48 June 2025 3.53 3.42 3.67
Level of Uncertainty Medium to high.
Adjustors: % per annum change
Year
end
ing
June
Roa
d
Prop
erty
Wat
er
Ener
gy
Staf
f
Oth
er
Eart
h-m
ovin
g
Pipe
lines
Priv
ate
Sect
or
Wag
es
% pa change2015 0.4 1.9 4.7 4.2 1.6 1.5 1.7 1.8 1.7 2016 1.2 2.2 5.2 3.5 1.1 2.3 1.8 2.1 1.0 2017 1.4 2.4 3.8 3.8 1.9 2.5 2.6 2.5 1.8 2018 2.2 2.5 3.0 3.9 2.0 2.6 2.4 2.6 1.9 2019 2.4 2.6 3.2 4.1 2.1 2.7 2.0 2.8 2.0 2020 2.5 2.8 3.3 4.3 2.2 2.9 2.1 2.9 2.1 2021 2.7 2.9 3.5 4.5 2.3 3.0 2.3 3.1 2.1 2022 2.8 3.0 3.7 4.7 2.4 3.1 2.4 3.2 2.2 2023 3.0 3.2 3.8 4.9 2.5 3.3 2.5 3.4 2.3 2024 3.1 3.3 4.0 5.1 2.6 3.4 2.9 3.5 2.4 2025 3.3 3.4 4.2 5.3 2.7 3.6 3.1 3.6 2.5
Part 3: Financial and Infrastructure Strategy and Statements
Page 216 2015-2025 Long Term Plan
NB: The forecast increases for Capital Expenditure are generally higher than operating cost increases and it is the Capital Expenditure that has historically driven rates increases.
Risk There is a risk that the local inflation rates may be higher or lower than the national averages forecast by BERL.
Financial Impact Should local inflation exceed the national average, this could result in either an increase in rates and debt servicing or deferral of capital projects which may impact upon the level of service that can be provided.
Interest Rate on Council Borrowings Assumption Council has assumed a long term interest rate on loans of 7% for the entire 10 years covered by the Long Term Plan.
Level of Uncertainty Medium.
Risk As a result of the continuing impact of the Global Financial Crisis and the expectation of increased interest rates in the future, Council has adopted a conservative position compared to current market rates to mitigate the risk associated with interest rate movements. Council has adopted this approach as interest rates can increase significantly within short timeframes, as has happened in the past. Council will attempt to mitigate the impact of interest rate rises with a prudent hedging programme that operates in accordance with its Treasury Policy. However, because of Council’s current low debt level, its ability to hedge significant amounts of its forecast debt is limited.
Financial Impact Increases in interest rates above 7% will result in higher debt servicing costs and rates funding requirements. Currently Council’s forecast maximum gross debt is $120.0 million. As a result a 1% increase in interest rates above the 7% forecast would result in increased interest costs of $1.2 million.
Population Growth Assumption In preparing the Long Term Plan Council has assumed population growth will occur at slightly above the Department of Statistics medium population growth projection. Population growth is further discussed in the Key Issues and Financial Strategy sections of the Long Term Plan
Level of Uncertainty Low.
Risks Population growth occurs at rates above or below the level forecast with corresponding impacts on the revenue received from rates and development contributions.
Financial Impact If population growth occurs at a slower rate than forecast, then the level of development contributions received will be lower than expected. However, there is the opportunity to mitigate the financial impact by slowing the Capital Expenditure programme. It is not expected that levels of service will be impacted upon significantly.
Economic Life Assumption Council has made a number of assumptions about the useful lives of its assets. The detail for each asset category is shown in the Statement of Accounting Policies. The useful lives are consistent with Council’s experience with respect to its ongoing replacement programme.
Level of Uncertainty Low.
Risk Assets wear out and need to be replaced earlier than anticipated.
Financial Impact Depreciation and borrowing costs would increase if replacement Capital Expenditure was required earlier than anticipated. However, these impacts could be mitigated in part by reprioritising the Capital Expenditure programme. There may also be an

Part 3: Financial and Infrastructure Strategy and Statements
2015-2025 Long Term Plan Page 217
increase in maintenance costs to keep the asset operational until it is decided to proceed with replacement.
Subsidy Rates Assumption The New Zealand Transport Agency (NZTA) has recently reviewed its financial assistance policy and it is assumed that Council will retain, for the period of the Plan, its newly established subsidy rate of 51% for road maintenance and construction works.
Level of Uncertainty Low.
Risk NZTA will either reduce the subsidy rate and/or toughen the criteria for the inclusion of works in the qualifying programme.
Financial Impact If the subsidy rate is reduced, either a reduction in the level of service or an increase in rates would be required. Council is already receiving very good pricing for road maintenance compared to other Local Authorities, through its collaboration with NZTA in the form of Marlborough Roads.
Natural Disasters Assumption Should a major natural disaster occur the District could be faced with significant repair and reconstruction costs. Council has estimated the maximum probable loss (MPL)/cost as a result of a major earthquake, flood or tsunami at approximately $75 million. It is assumed that this forecast is accurate. It is also assumed that:
The forecast contributions from the Local Authority Protection Programme (LAPP), insurance, Government and the NZTA will be received.
Through a combination of Council’s reserves, investment realisation, credit facilities and rescheduling capital and other works, Council can meet the remaining costs associated with a major disaster.
The LAPP fund is a mutual pool set up to assist Councils cover their share of damage to “below ground” and river protection assets resulting from a significant natural event. At the time the fund was formed commercial insurance alternatives for these assets
was not available. There was also a clear requirement from Central Government that any assistance given to rebuild infrastructure following a disaster will only be made available if Council has made adequate financial provisions to cover its own repair obligations.
Above ground assets are insured through commercial insurance. These costs are in addition to LAPP contributions and have more than doubled over recent years as a direct result of national and international disasters. This has led Council to consider self-financing an agreed level of risk in exchange for premium savings. This process involves balancing savings against risk, together with an acknowledgement that not all current assets would be replaced immediately, if at all, following a significant disaster. This generally means that above ground assets with a value of less than $500,000 will be self-insured. While there has been some softening in the insurance market, premium reductions have been offset by increases in the value of assets insured. It is unlikely that insurance premiums will return to previous levels in the near future.
Level of Uncertainty Low.
Risks The actual costs of recovery from a major natural disaster are higher than the forecast MPL of approximately $75 million.
Financial Impact Should Council’s current estimate of MPL and existing arrangements prove inadequate, either an increase in debt and corresponding increase in rates or a slowing in the rebuild would need to occur.
Taxation Framework Assumption Council has assumed that existing taxation framework for the Marlborough District Council group will continue for the period of the Long Term Plan.
Level of Uncertainty Low.
Risk That the Inland Revenue Department (IRD) takes a view that Council’s Holding Company structure is inconsistent with taxation legislation resulting in an increase in associated tax costs.

Part 3: Financial and Infrastructure Strategy and Statements
Page 218 2015-2025 Long Term Plan
Financial Impact Council has mitigated the potential for this to happen by obtaining independent legal advice and a “Binding Ruling” from the IRD on the establishment of MDC Holdings Ltd. Council has not deviated from the principles determined at establishment, so the risk and financial impacts should be low.
Asset Ownership and Valuation In the preparation of the Long Term Plan it has been assumed that Council will retain:
Ownership of MDC Holdings Limited and its subsidiaries:
Its ownership share (88.5%) in Marlborough Regional Forestry, with Kaikoura District Council owning the remaining 11.5%.
Ownership of all substantial assets currently owned.
It has also been assumed that Council will revalue its major assets annually.
Level of Uncertainty Low.
Risk The asset values shown in the Long Term Plan have been adjusted based on the BERL indices. The risk is that the results of actual revaluations may be higher or lower than those disclosed in the Long Term Plan.
Financial Impact If asset revaluations are higher than forecast, this will increase the resulting depreciation cost and rates as Council moves to provide for asset replacement.
Sources of Funds for Capital Expenditure Page174 of the Financial Strategy identifies the expected sources of funds for Council’s Capital Expenditure programme. It has been assumed that the funds identified for each of these sources will be received.
Level of Uncertainty Low.
Risk That the forecast funding will not be received as forecast.
Financial Impact As it is proposed to fund Capital Expenditure from a range of sources it should be possible to compensate a funding shortfall from one source with funding from another ie; borrowing. If it is decided to increase borrowing a debt servicing cost and a corresponding increase in rates will arise. The alternative is to slow Capital Expenditure especially if the project is growth related and the funding shortfall relates to Development Contributions.
Climate Change Council has assumed that the climate changes in relation to rainfall, temperature and sea level will occur as predicted. It has been further assumed that climate change will have minimal impact over the period of the Long Term Plan.
Level of Uncertainty Low.
Risk That asset and hazard planning has not adequately assessed climate change.
Financial Impact For the period of the Long Term Plan, the financial impact is assessed as low as climate change on the whole is occurring very slowly, providing extended lead times for mitigation measures if required.
Emissions Trading Scheme (ETS) Any direct impacts of the ETS through potential price increases are assumed to be covered by Council’s inflation assumptions and thus factored into the forecasts.
Specific ETS costs relating to waste and landfill have been incorporated into those estimates, together with the increased revenue that will be received.
Pre 1990 forestry has been registered. Any costs associated with ETS will be minimal given Council’s rotation and replanting policy.
Level of Uncertainty Low.
Risk The impact and scope of the ETS may be more than assumed.

Part 3: Financial and Infrastructure Strategy and Statements
2015-2025 Long Term Plan Page 219
Financial Impact The Council will face increased compliance and operating costs, which if significant enough, may require higher fees and charges or increased rating requirements to fund them. However, Council had already taken steps to reduce the landfill liability and fix the price of the Emission Trading Units that will be required to be surrendered for the first three years of the Scheme’s operation.
Resource Consents Council has assumed that it will continue to hold and comply with appropriate resource consents to enable it to continue its activities, especially in relation to sewerage and stormwater.
Level of Uncertainty Low.
Risk Appropriate consents are either not renewed or require improvements in level of service before being granted.
Financial Impact The main financial impact could occur if levels of service require improvement before a resource consent renewal is granted. The resulting increase in costs will require an increase in borrowing which in turn will impact on rates.
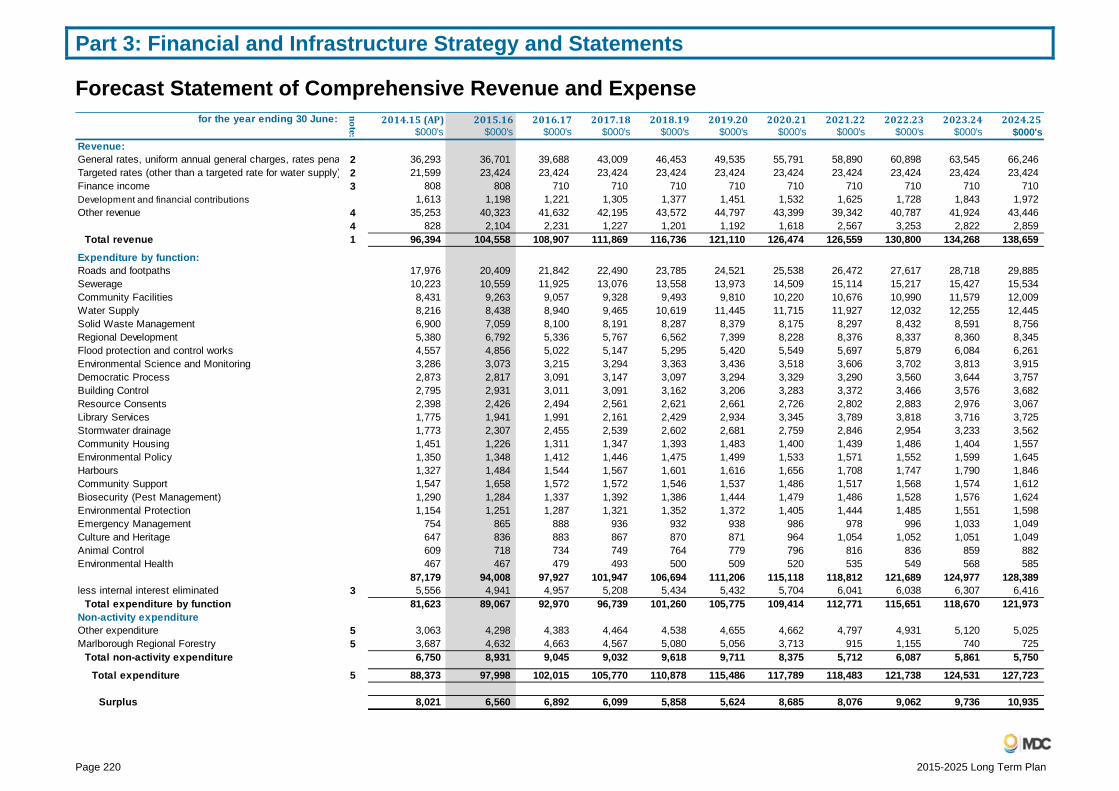
Part 3: Financial and Infrastructure Strategy and Statements
Page 220 2015-2025 Long Term Plan
Forecast Statement of Comprehensive Revenue and Expense
for the year ending 30 June: 2014.15(AP) 2015.16 2016.17 2017.18 2018.19 2019.20 2020.21 2021.22 2022.23 2023.24 2024.25$000's $000's $000's $000's $000's $000's $000's $000's $000's $000's $000's
Revenue:General rates, uniform annual general charges, rates pena 2 36,293 36,701 39,688 43,009 46,453 49,535 55,791 58,890 60,898 63,545 66,246Targeted rates (other than a targeted rate for water supply) 2 21,599 23,424 23,424 23,424 23,424 23,424 23,424 23,424 23,424 23,424 23,424Finance income 3 808 808 710 710 710 710 710 710 710 710 710Development and financial contributions 1,613 1,198 1,221 1,305 1,377 1,451 1,532 1,625 1,728 1,843 1,972Other revenue 4 35,253 40,323 41,632 42,195 43,572 44,797 43,399 39,342 40,787 41,924 43,446 4 828 2,104 2,231 1,227 1,201 1,192 1,618 2,567 3,253 2,822 2,859
Total revenue 1 96,394 104,558 108,907 111,869 116,736 121,110 126,474 126,559 130,800 134,268 138,659
Expenditure by function:Roads and footpaths 17,976 20,409 21,842 22,490 23,785 24,521 25,538 26,472 27,617 28,718 29,885Sewerage 10,223 10,559 11,925 13,076 13,558 13,973 14,509 15,114 15,217 15,427 15,534Community Facilities 8,431 9,263 9,057 9,328 9,493 9,810 10,220 10,676 10,990 11,579 12,009Water Supply 8,216 8,438 8,940 9,465 10,619 11,445 11,715 11,927 12,032 12,255 12,445Solid Waste Management 6,900 7,059 8,100 8,191 8,287 8,379 8,175 8,297 8,432 8,591 8,756Regional Development 5,380 6,792 5,336 5,767 6,562 7,399 8,228 8,376 8,337 8,360 8,345Flood protection and control works 4,557 4,856 5,022 5,147 5,295 5,420 5,549 5,697 5,879 6,084 6,261Environmental Science and Monitoring 3,286 3,073 3,215 3,294 3,363 3,436 3,518 3,606 3,702 3,813 3,915Democratic Process 2,873 2,817 3,091 3,147 3,097 3,294 3,329 3,290 3,560 3,644 3,757Building Control 2,795 2,931 3,011 3,091 3,162 3,206 3,283 3,372 3,466 3,576 3,682Resource Consents 2,398 2,426 2,494 2,561 2,621 2,661 2,726 2,802 2,883 2,976 3,067Library Services 1,775 1,941 1,991 2,161 2,429 2,934 3,345 3,789 3,818 3,716 3,725Stormwater drainage 1,773 2,307 2,455 2,539 2,602 2,681 2,759 2,846 2,954 3,233 3,562Community Housing 1,451 1,226 1,311 1,347 1,393 1,483 1,400 1,439 1,486 1,404 1,557Environmental Policy 1,350 1,348 1,412 1,446 1,475 1,499 1,533 1,571 1,552 1,599 1,645Harbours 1,327 1,484 1,544 1,567 1,601 1,616 1,656 1,708 1,747 1,790 1,846Community Support 1,547 1,658 1,572 1,572 1,546 1,537 1,486 1,517 1,568 1,574 1,612Biosecurity (Pest Management) 1,290 1,284 1,337 1,392 1,386 1,444 1,479 1,486 1,528 1,576 1,624Environmental Protection 1,154 1,251 1,287 1,321 1,352 1,372 1,405 1,444 1,485 1,551 1,598Emergency Management 754 865 888 936 932 938 986 978 996 1,033 1,049Culture and Heritage 647 836 883 867 870 871 964 1,054 1,052 1,051 1,049Animal Control 609 718 734 749 764 779 796 816 836 859 882Environmental Health 467 467 479 493 500 509 520 535 549 568 585
87,179 94,008 97,927 101,947 106,694 111,206 115,118 118,812 121,689 124,977 128,389less internal interest eliminated 3 5,556 4,941 4,957 5,208 5,434 5,432 5,704 6,041 6,038 6,307 6,416
Total expenditure by function 81,623 89,067 92,970 96,739 101,260 105,775 109,414 112,771 115,651 118,670 121,973Non-activity expenditureOther expenditure 5 3,063 4,298 4,383 4,464 4,538 4,655 4,662 4,797 4,931 5,120 5,025Marlborough Regional Forestry 5 3,687 4,632 4,663 4,567 5,080 5,056 3,713 915 1,155 740 725
Total non-activity expenditure 6,750 8,931 9,045 9,032 9,618 9,711 8,375 5,712 6,087 5,861 5,750
Total expenditure 5 88,373 97,998 102,015 105,770 110,878 115,486 117,789 118,483 121,738 124,531 127,723
Surplus 8,021 6,560 6,892 6,099 5,858 5,624 8,685 8,076 9,062 9,736 10,935
note:
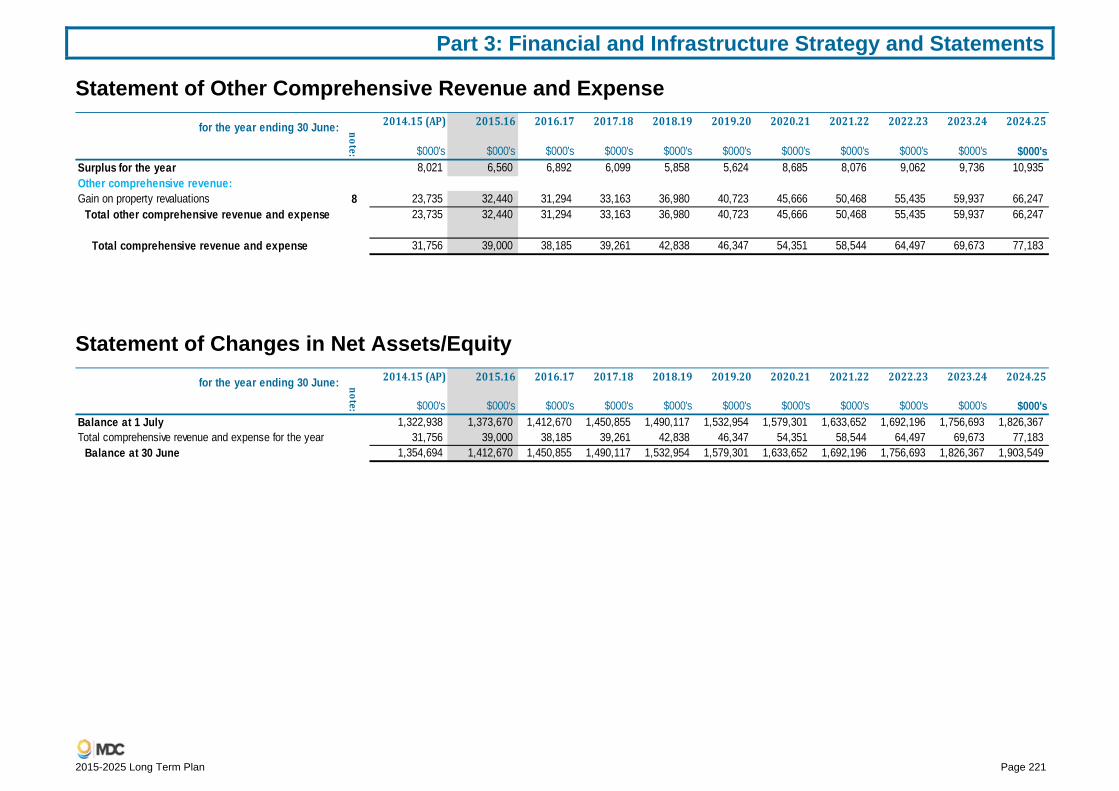
Part 3: Financial and Infrastructure Strategy and Statements
2015-2025 Long Term Plan Page 221
Statement of Other Comprehensive Revenue and Expense
Statement of Changes in Net Assets/Equity
for the year ending 30 June: 2014.15(AP) 2015.16 2016.17 2017.18 2018.19 2019.20 2020.21 2021.22 2022.23 2023.24 2024.25
$000's $000's $000's $000's $000's $000's $000's $000's $000's $000's $000'sSurplus for the year 8,021 6,560 6,892 6,099 5,858 5,624 8,685 8,076 9,062 9,736 10,935Other comprehensive revenue:Gain on property revaluations 8 23,735 32,440 31,294 33,163 36,980 40,723 45,666 50,468 55,435 59,937 66,247
Total other comprehensive revenue and expense 23,735 32,440 31,294 33,163 36,980 40,723 45,666 50,468 55,435 59,937 66,247
Total comprehensive revenue and expense 31,756 39,000 38,185 39,261 42,838 46,347 54,351 58,544 64,497 69,673 77,183
note:
for the year ending 30 June: 2014.15(AP) 2015.16 2016.17 2017.18 2018.19 2019.20 2020.21 2021.22 2022.23 2023.24 2024.25
$000's $000's $000's $000's $000's $000's $000's $000's $000's $000's $000'sBalance at 1 July 1,322,938 1,373,670 1,412,670 1,450,855 1,490,117 1,532,954 1,579,301 1,633,652 1,692,196 1,756,693 1,826,367Total comprehensive revenue and expense for the year 31,756 39,000 38,185 39,261 42,838 46,347 54,351 58,544 64,497 69,673 77,183
Balance at 30 June 1,354,694 1,412,670 1,450,855 1,490,117 1,532,954 1,579,301 1,633,652 1,692,196 1,756,693 1,826,367 1,903,549
note:

Part 3: Financial and Infrastructure Strategy and Statements
Page 222 2015-2025 Long Term Plan
Statement of Financial Position
as at 30 June: 2014.15(AP) 2015.16 2016.17 2017.18 2018.19 2019.20 2020.21 2021.22 2022.23 2023.24 2024.25$000's $000's $000's $000's $000's $000's $000's $000's $000's $000's $000's
Assets:Current assets:Cash and cash equivalents 4,711 642 547 853 789 492 677 437 525 902 750Debtors and other receivables 6 9,709 7,474 7,657 7,851 8,056 8,278 8,518 8,777 9,057 9,361 9,691
Other financial assets 7 3,582 6,528 6,528 6,528 6,528 6,528 6,528 6,528 6,528 6,528 6,528
Inventory (including non-current assets held for sale) 1,160 2,445 2,455 2,464 2,475 2,486 2,499 2,512 2,526 2,542 2,559
Total current assets 19,162 17,089 17,187 17,696 17,847 17,783 18,220 18,253 18,635 19,332 19,528
Non-current assets:Other financial assets 7 14,300 12,348 12,348 12,348 12,348 12,348 12,348 12,348 12,348 12,348 12,348
Intangible assets 556 561 585 605 625 652 676 701 725 749 774
Biological assets 14,901 14,612 13,998 13,333 12,587 11,773 11,330 11,768 12,217 12,712 13,220
Property, plant and equipment 8 1,373,532 1,444,180 1,495,205 1,544,970 1,612,772 1,672,391 1,733,415 1,794,939 1,853,344 1,915,861 1,985,920
Total non-current assets 1,403,289 1,471,701 1,522,136 1,571,256 1,638,332 1,697,164 1,757,769 1,819,755 1,878,635 1,941,669 2,012,262
Total assets 1,422,451 1,488,790 1,539,323 1,588,952 1,656,180 1,714,947 1,775,990 1,838,009 1,897,270 1,961,001 2,031,790
Liabilities:Current liabilities:Creditors and other payables 9 13,475 11,287 11,563 11,856 12,165 12,500 12,862 13,253 13,676 14,135 14,634
Employee entitlements 1,476 1,689 1,730 1,774 1,820 1,870 1,925 1,983 2,046 2,115 2,190
Total current liabilities 14,951 12,976 13,293 13,630 13,985 14,370 14,787 15,236 15,722 16,250 16,824
Non-current liabilities:Borrowings 10 50,039 60,500 72,500 82,500 106,500 118,500 124,750 127,750 122,000 115,500 108,500Provisions 2,420 2,156 2,174 2,193 2,214 2,235 2,244 2,253 2,263 2,273 2,283Employee entitlements 347 488 500 513 526 541 557 573 592 612 633
52,806 63,144 75,174 85,206 109,240 121,276 127,550 130,576 124,855 118,384 111,416
Total liabilities 67,757 76,120 88,468 98,836 123,225 135,646 142,337 145,813 140,577 134,635 128,240
Net assets 1,354,694 1,412,670 1,450,855 1,490,117 1,532,954 1,579,301 1,633,652 1,692,196 1,756,693 1,826,367 1,903,549
Equity:Accumulated funds 12 571,894 570,532 574,293 575,263 584,076 583,510 582,866 585,891 587,869 586,541 593,770
Other reserves 12 782,800 842,138 876,562 914,854 948,879 995,791 1,050,786 1,106,305 1,168,825 1,239,826 1,309,779Total equity 1,354,694 1,412,670 1,450,855 1,490,117 1,532,954 1,579,301 1,633,652 1,692,196 1,756,693 1,826,367 1,903,549
Total non-current liabilities
note:

Part 3: Financial and Infrastructure Strategy and Statements
2015-2025 Long Term Plan Page 223
Statement of Cashflows
for year ending 30 June: 2014.15(AP) 2015.16 2016.17 2017.18 2018.19 2019.20 2020.21 2021.22 2022.23 2023.24 2024.25$000's $000's $000's $000's $000's $000's $000's $000's $000's $000's $000's
Cash flows from operating activities:Receipts from rates revenue 57,892 60,125 63,112 66,433 69,877 72,959 79,215 82,314 84,322 86,969 89,670Interest received 808 808 710 710 710 710 710 710 710 710 710Dividends received 764 222 850 900 950 1,000 1,000 1,000 1,000 1,000 1,000User charges and other revenues 36,113 37,458 39,880 40,489 41,726 42,871 42,328 39,671 40,294 41,590 43,105
(65,607) (73,678) (74,750) (76,320) (79,026) (81,290) (82,426) (82,178) (83,852) (85,883) (88,501)Interest paid (2,337) (3,674) (4,797) (5,571) (6,765) (8,029) (8,672) (9,002) (8,910) (8,487) (8,022)
27,633 21,260 25,005 26,640 27,473 28,221 32,155 32,515 33,564 35,899 37,962
Cash flows from investing activities:Sale of assets 852 3,377 10,345 1,896 2,838 2,020 3,003 2,129 6,182 2,299 3,420Movements in investments (4,982) 7,411 - - - (0) - (0) 0 (0) -Purchase of fixed assets (28,123) (52,360) (47,445) (38,230) (54,375) (42,538) (41,223) (37,883) (33,908) (31,322) (34,533)
(32,253) (41,572) (37,100) (36,334) (51,537) (40,518) (38,220) (35,754) (27,726) (29,023) (31,113)
Cash flows from financing activities:8,457 20,000 12,000 10,000 24,000 12,000 6,250 3,000 (5,750) (6,500) (7,000)
3,837 (312) (95) 306 (64) (297) 185 (239) 88 377 (151)
Cash and cash equivalents:at the beginning of the year 874 954 642 548 854 789 492 677 438 525 902at the end of the year 4,711 642 548 854 789 492 677 438 525 902 751
Movement in borrowings (external)
Net increase/(decrease) in cash
note:
Payments to suppliers and employees
Net cash flows from operating activities
Net cash flows from investing activities

Part 3: Financial and Infrastructure Strategy and Statements
Page 224 2015-2025 Long Term Plan
Statement of Accounting PoliciesThese prospective financial statements of Marlborough District Council (MDC) are for the years commencing 1 July 2015 and ending on 30 June 2025.
These prospective financial statements were authorised for issue by Council on 25 June 2015.
These prospective financial statements are prepared to meet the requirements of the Local Government Act 2002, which requires compliance with generally accepted accounting practice in New Zealand (“NZ GAPP”) and the information provided may not be appropriate for other purposes.
1. Reporting Entity Marlborough District Council is a unitary authority located in New Zealand that is governed by the Local Government Act 2002.
MDC is not presenting group prospective financial statements as the Council believes that parent statements are more relevant to users. The main purpose of these statements is to provide users with information about the core services that the Council intends to provide to ratepayers, the expected cost of those services and the consequent requirement for rate funding. The level of rate funding required is not affected by subsidiaries except to the extent that the Council obtains distributions from, or further invests in, those subsidiaries and such effects are included in these parent prospective financial statements.
These prospective financial statements therefore reflect the activities and position of MDC plus the Council’s 88.5% share in the joint committee Marlborough Regional Forestry, which is also domiciled in New Zealand.
The primary objective of MDC is to provide goods and services for the community or social benefit rather than making a financial return. Accordingly, Council has designated itself as public benefit entities (PBE) for the purposes of New Zealand equivalents to Internal Financial Reporting Standards (NZIFRS).
2. Basis of Preparation These prospective financial statements have been prepared in accordance with Tier 1 PBE standards. As a result of applying the new accounting standards, there have been no significant changes in the Council’s accounting policies.
(i) Statement of Compliance The prospective financial statements of the Council have been prepared in accordance with the requirements of the Local Government Act 2002: sections 95, 100, 101, 111 and Part 2 of Schedule 10 which includes the requirement to comply with Generally Accepted Accounting Practice in New Zealand (NZ GAAP).
(ii) Prospective financial statements The prospective financial statements comply with Tier 1 PBE Accounting Standards (including PBE FRS 42 – Prospective Financial Statements and PBE FRS 46 – First Time Adoption of PBE Standards by Entities Previously Applying NZ IFRSs). The prospective financial statements have been prepared using the best information available at the time they were prepared.
(iii) Measurement Base The prospective financial statements have been prepared on a historical cost basis, modified by the revaluation of certain assets.
(iv) Functional and Presentational Currency The prospective financial statements are presented in New Zealand dollars and all values are rounded to the nearest thousand dollars ($000’s). The functional currency of MDC is New Zealand dollars.
(v) Changes in Accounting Policies There have been no significant changes in the accounting policies and accounting policies have been applied consistently to the prospective financial statements in MDC’s 2014-15 Annual Plan; to the financial statements for the year ended 30 June 2014; and to these prospective financial statements.
(vi) Accounting Estimates and Assumptions and Critical Judgments in Applying Accounting Policies In preparing these prospective financial statements MDC has made estimates and assumptions concerning the future. These estimates and assumptions may differ from the subsequent actual results. Estimates and assumption are continually evaluated and are based on historical experience and various other factors that are believed to be reasonable under the circumstances.
Part 3: Financial and Infrastructure Strategy and Statements
2015-2025 Long Term Plan Page 225
The actual results achieved are likely to vary from the information presented and the variations may be material.
3. Significant Accounting Policies (i) Investments in Subsidiaries
Investments in subsidiaries are recorded in the parent entity’s financial statements at cost less any subsequent accumulated impairment losses.
(ii) Interests in Joint Committees There is a contractual arrangement whereby Council and Kaikoura District Council (KDC) undertake an activity that is subject to joint control.
The Council’s share of jointly controlled assets and any liabilities incurred jointly with KDC are recognised in the Council’s financial statements on a proportionate basis and classified according to their nature. Liabilities and expenses incurred directly in respect of interests in jointly controlled assets are accounted for on an accrual basis. Revenue from the sale or use of Council’s share of the output of jointly controlled assets, and its share of the joint committee expenses, are recognised when it is probable that the economic benefits associated with the transactions will flow to/from the Council and their amount can be measured reliably.
Where Council transacts with the joint committee, unrealised profits and losses are eliminated to the extent of Council’s share in the joint venture, except to the extent that unrealised losses provide evidence of impairment of the asset.
(iii) Revenue Most of the Council’s revenue is from non-exchange transactions accounted for under PBE IPSAS 23.Exchange transactions are recognised under PBE IPSAS 9 . Professional judgement is exercised to determine whether the substance of a transaction is non-exchange or exchange.
For non-exchange revenue there is a recognition of a liability to the extent of unfulfilled conditions.
Revenue from Non-Exchange Transactions Rates Revenue Rates are set annually by a resolution of Council and relate to a financial year. All ratepayers are invoiced within the financial year for which the
rates have been set. Revenue is measured at the fair value of consideration received or receivable. Rates revenue is recognised by Council as being revenue when the Council has struck the rates and provided the rates assessment. It is a non-exchange revenue.
Government Grants NZTA roading subsidies (received in respect of maintaining the roading infrastructure) and other government grants/subsidies are recognised as revenue upon entitlement ie; when conditions pertaining to eligible expenditure have been fulfilled. This revenue is reflected in the financial statements as subsidy revenue. Other Government assistance received includes contributions towards the upkeep of Returned Servicemen Association cemetery plots, community housing, community safety and environmental control.
Provision of Services partial cost recovery/subsidised Revenue from a subsidised sale of services is recognised as non-exchange revenue. Revenue from a contract to provide services is recognised by reference to the stage of completion of the contract at reporting date.
Vested Assets Assets vested in Council, with or without conditions, are recognised as revenue when control over the assets is obtained.
Financial/Development Contributions Financial/Development contributions are recognised as revenue when the Council provides, or is able to provide, the service for which the contribution was charged. Otherwise Financial/Development contributions received are recognised as liabilities until such time the Council provides, or is able to provide, the service. Development contributions are classified as part of “Other revenue”.
Revenue from Exchange Transactions Water billing Revenue Water Billing is recognised on an accrual basis.
Provision of Services full Cost Recovery Significant revenue from full cost recovery sale of services is recognised as exchange revenue. Revenue from a contract to provide services is recognised by reference to the stage of completion of the contract at reporting date.
Part 3: Financial and Infrastructure Strategy and Statements
Page 226 2015-2025 Long Term Plan
Sales of Goods Sales of goods are recognised when goods are delivered and title has passed.
Interest and Dividends Interest revenue is accrued on a time basis, by reference to the principal outstanding and at the effective interest rate applicable. Dividend revenue from investments is recognised when the shareholders’ rights to receive payment have been established.
(iv) Borrowing Costs All borrowing costs are recognised as an expense in the period in which they are incurred and are calculated using effective interest method.
(v) Grant Expenditure Non-discretionary grants are those grants that are awarded if the grant application meets the specified criteria and are recognised as expenditure when an application that meets the specified criteria for the grant has been received. Discretionary grants are those grants where the Council has no obligation to award on receipt of the grant application and are recognised as expenditure when a successful applicant has been notified of the Council’s decision.
(vi) Leases Leases are classified as finance leases whenever the terms of the lease transfer substantially all the risks and rewards of ownership to the lessee. All other leases are classified as operating leases.
Operating Leases Rental revenue from operating leases is recognised on a straight-line basis over the term of the relevant lease. All operating lease contracts contain review clauses in the event that MDC exercises its option to renew. The lessee does not have an option to purchase the property at expiry of the lease period.
Rentals payable under operating leases are charged to revenue on a straight-line basis over the term of the relevant lease.
(vii) Cash and Cash Equivalents Cash and cash equivalents comprise cash on hand, demand deposits, and other short-term highly liquid investments that are readily convertible to a known amount of cash and are subject to an insignificant risk of changes in value. Bank overdrafts are shown within borrowings in current liabilities in the Statement of Financial Position.
Trade and other Receivables Trade receivables are initially measured at fair value, and are subsequently measured at amortised cost using the effective interest rate method. Appropriate allowances for estimated irrecoverable amounts are recognised in the Forecast Statement of Comprehensive Revenue and Expense where there is objective evidence that the asset is impaired. The allowance recognised is measured as the difference between the asset’s carrying amount and the present value of estimated future cash flows discounted at the effective interest rate computed at initial recognition. Receivables are recognised as exchange or non-exchange transactions under PBE IPSAS 23 and PBE IPSAS 9.
Derivative Financial Instruments and Hedge Accounting MDC enters into interest rate swaps to manage interest rate risk and, from time to time, foreign currency forward contracts to manage foreign currency rate fluctuation risk. The Council does not use derivative financial instruments for speculative purposes.
Derivative financial instruments fall into the “fair value through surplus or deficit” category.
Derivatives are initially recognised at fair value on the date a derivative contract is entered into and are subsequently re-measured to their fair value. Derivative instruments entered into by MDC do not qualify for hedge accounting. Changes in the fair value of any derivative financial instrument that does not qualify for hedge accounting are recognised in the surplus or deficit.
(viii) Other Financial Assets Financial assets are initially recognised at fair value plus transaction costs unless they are carried at fair value through surplus or deficit in which case the transaction costs are recognised in the surplus or deficit. Purchases and sales of financial assets are recognised on trade-date, the date on which MDC commits to purchase or sell the asset. Financial assets are derecognised when the rights to receive cash flows from the financial assets have expired or have been transferred and MDC has transferred substantially all the risks and rewards of ownership.
Financial assets are classified into the following categories for the purpose of measurement:
fair value through surplus or deficit as below:
loans and receivables;

Part 3: Financial and Infrastructure Strategy and Statements
2015-2025 Long Term Plan Page 227
held-to-maturity investments; and
fair value through other comprehensive revenue.
The classification of a financial asset depends on the purpose for which the instrument was acquired.
Financial assets at fair value through surplus or deficit Financial assets at fair value through surplus or deficit include financial assets held for trading and those designated at fair value through surplus or deficit at initial recognition. A financial asset is classified in this category if acquired principally for the purpose of selling in the short-term or it is part of a portfolio of identified financial instruments that are managed together and for which there is evidence of short-term profit-taking. Derivatives are also categorised as held for trading unless they are designated into hedge accounting relationship for which hedge accounting is applied.
Financial assets acquired principally for the purpose of selling in the short-term or part of a portfolio classified as held for trading are classified as a current asset. The current/non-current classification of derivatives is explained in the derivatives accounting policy above.
After initial recognition, financial assets in this category are measured at their fair values with gains or losses on re-measurement recognised in the surplus or deficit.
Loans and receivables Loans and receivables are non-derivative financial assets with fixed or determinable payments that are not quoted in an active market. They are included in current assets, except for maturities greater than 12 months after the balance date, which are included in non-current assets.
After initial recognition, they are measured at amortised cost, using the effective interest method, less impairment. Gains and losses when the asset is impaired or derecognised are recognised in the surplus or deficit.
Loans to community organisations made at nil or below-market interest rates are initially recognised at the present value of their expected future cash flows, discounted at the current market rate of return for a similar financial instrument. The loans are subsequently measured at amortised cost using the effective interest method. The difference between the face value and present value of the expected future cash flows of the loan is recognised in the surplus or deficit as a grant.
Held-to-maturity investments Held to maturity investments are non-derivative financial assets with fixed or determinable payments and fixed maturities where there is a positive intention and ability to hold to maturity. They are included in current assets, except for maturities greater than 12 months after balance date, which are included in non-current assets.
After initial recognition they are measured at amortised cost, using the effective interest method, less impairment. Gains and losses when the asset is impaired or derecognised are recognised in the surplus or deficit.
Fair value through other comprehensive revenue and expense Financial assets at fair value through other comprehensive revenue and expense are those that are designated into the category at initial recognition or are not classified in any of the other categories above. They are included in non-current assets unless management intends to dispose of the share investment within 12 months of balance date or if the debt instrument is not expected to be realised within 12 months of balance date. The Council includes in this category:
investments that it intends to hold long-term but which may be realised before maturity; and
shareholdings that it holds for strategic purposes.
These investments are measured at their fair value, with gains and losses recognised in other comprehensive revenue and expense, except for impairment losses, which are recognised in the surplus or deficit.
On de-recognition, the cumulative gain or loss previously recognised in other comprehensive revenue and expense is reclassified from equity to the surplus or deficit.
(ix) Impairment of Financial Assets Financial assets are assessed for objective evidence of impairment at each balance date. Impairment losses are recognised in the surplus or deficit.
Loans and other receivables, and held-to-maturity investments Impairment is established when there is objective evidence that MDC will not be able to collect amounts due according to the original terms of the debt. Significant financial difficulties of the debtor, probability that the debtor will enter into bankruptcy, and default in payments are considered indicators that the asset is impaired. The amount of the

Part 3: Financial and Infrastructure Strategy and Statements
Page 228 2015-2025 Long Term Plan
impairment is the difference between the asset’s carrying amount and the present value of estimated future cash flows, discounted using the original effective interest rate. For debtors and other receivables, the carrying amount of the asset is reduced through the use of an allowance account, and the amount of the loss is recognised in the surplus or deficit. When the receivable is uncollectible, it is written-off against the allowance account. Overdue receivables that have been renegotiated are reclassified as current (that is, not past due). Impairment in term deposits, local authority stock, government stock, and community loans, are recognised directly against the instrument’s carrying amount.
Financial assets at fair value through other comprehensive revenue and expense For equity investments, a significant or prolonged decline in the fair value of the investment below its cost is considered objective evidence of impairment.
For debt investments, significant financial difficulties of the debtor, probability that the debtor will enter into bankruptcy, and default in payments are considered objective indicators that the asset is impaired.
If impairment evidence exists for investments at fair value through other comprehensive revenue and expense,, the cumulative loss (measured as the difference between the acquisition cost and the current fair value, less any impairment loss on that financial asset previously recognised in the surplus or deficit) recognised in other comprehensive revenue and expense is reclassified from equity to the surplus or deficit.
Equity instrument impairment losses recognised in the surplus or deficit are not reversed through the surplus or deficit.
If in a subsequent period the fair value of a debt instrument increases and the increase can be objectively related to an event occurring after the impairment loss was recognised, the impairment loss is reversed in the surplus or deficit.
(x) Inventories Inventories are stated at the lower of cost and net realisable value. Cost comprises direct materials, and, where applicable, direct labour costs and those overheads that have been incurred in bringing the inventories to their present location and condition. Cost is calculated using the weighted average cost method.
Net realisable value represents the estimated selling price less all estimated costs of completion and costs to be incurred in marketing, selling and distribution.
Provision has been made for obsolescence for inventories held for maintenance purposes, where applicable.
(xi) Non-current Assets Held for Sale Non-current assets (or disposal groups) classified as held for sale are stated at the lower of their carrying amount and fair value less costs to sell if their carrying amount will be recovered principally through a sale transaction rather than through continuing use. The valuation of net realisable value was carried out by Alexander Hayward Limited and Abel Properties Limited.
An impairment loss is recognised for any initial or subsequent write down of the asset (or disposal group) to fair value less costs to sell. A gain is recognised for any subsequent increase in fair value less costs to sell of an asset (or disposal group), but not in excess of any cumulative impairment loss previously recognised. A gain or loss not previously recognised by the date of the sale of the non-current asset (or disposal group) is recognised at the date of de-recognition.
Non-current assets (including those that are part of a disposal group) are not depreciated or amortised while they are classified as held for sale. Interest and other expenses attributable to the liabilities of a disposal group classified as held for sale continue to be recognised.
Non-current assets classified as held for sale and the assets of a disposal group classified as held for sale are presented separately from the other assets in the Statement of Financial Position. The liabilities of a disposal group classified as held for sale are presented separately from other liabilities in the Statement of Financial Position.
(xii) Property, Plant and Equipment MDC has the following classes of property, plant and equipment:

Part 3: Financial and Infrastructure Strategy and Statements
2015-2025 Long Term Plan Page 229
Land and buildings.
Improvements on land.
Library books and parking meters.
Infrastructural assets.
Other.
Property, plant and equipment is shown at cost or valuation, less accumulated depreciation and any impairment losses.
Revaluation Land and buildings and infrastructural assets are revalued with sufficient regularity that the carrying amount does not differ materially from that which would be determined using fair values at balance date, generally every year.
Revaluation increments and decrements are credited or debited to the asset revaluation reserve for that class of asset. Where this results in a debit balance in the asset revaluation reserve this balance is expensed in the Revenue Statement. Any subsequent increase on revaluation that offsets a previous decrease in value recognised in the Revenue Statement will be recognised first in the Revenue Statement up to the amount previously expensed, and then credited to the revaluation reserve for that class of asset.
Additions Additions between valuations are recorded at cost, except for vested assets. Cost represents the value of the consideration given to acquire the assets and the value of other directly attributable costs that have been incurred in bringing the assets to the location and condition necessary for their intended use. Certain infrastructural assets and land have been vested in the Council as part of the subdivisional consent process. The vested reserve land has been initially recognised at the most recent appropriately certified government valuation which is their deemed cost. Vested infrastructural assets are initially valued based on the actual quantities of infrastructural components vested and the current “in the ground” cost of providing identical services and this is their deemed cost.
Depreciation Depreciation is provided on a straight line basis on all property, plant and equipment other than land, at rates which will write off the cost (or valuation) of the assets to their estimated residual values over their
useful lives. Depreciation of these assets commences when the assets are ready for their intended use.
Depreciation on revalued assets is charged to the Revenue Statement.
The useful lives and associated depreciation rates of major classes of assets have been estimated as follows:
Asset Life Rate Roads, Streets and Bridges
- Land under roads and pavement formation
Not depreciated
- Pavement layers 55 - 100 years
1 - 1.82%
- Pavement surface 8.25 years 4 – 12.5%
- Unsealed roads 10 years 10% - Culverts 50 years 2% - Kerb and channel 70 years 1.43% - Concrete stormwater channels
50 years 2%
- Earth water channels Not depreciated
- Footpaths 20 - 70 years 1.43- 5% - Bridges 50 - 100
years 1- 2%
- Footbridges 80 years 1.25% - Retaining walls 50 - 80 years 1.25 - 2% - Street berms Not
depreciated
- Traffic signs 10 years 10% - Street lighting 4 - 50 years 2 - 25% - Traffic islands 50 years 2% - Street trees 80 years 1.5% - Street furniture 25 years 4% - Paved and cobbled areas
30 years 3.33%
- Council wharves 40 - 60 years 1.67 -
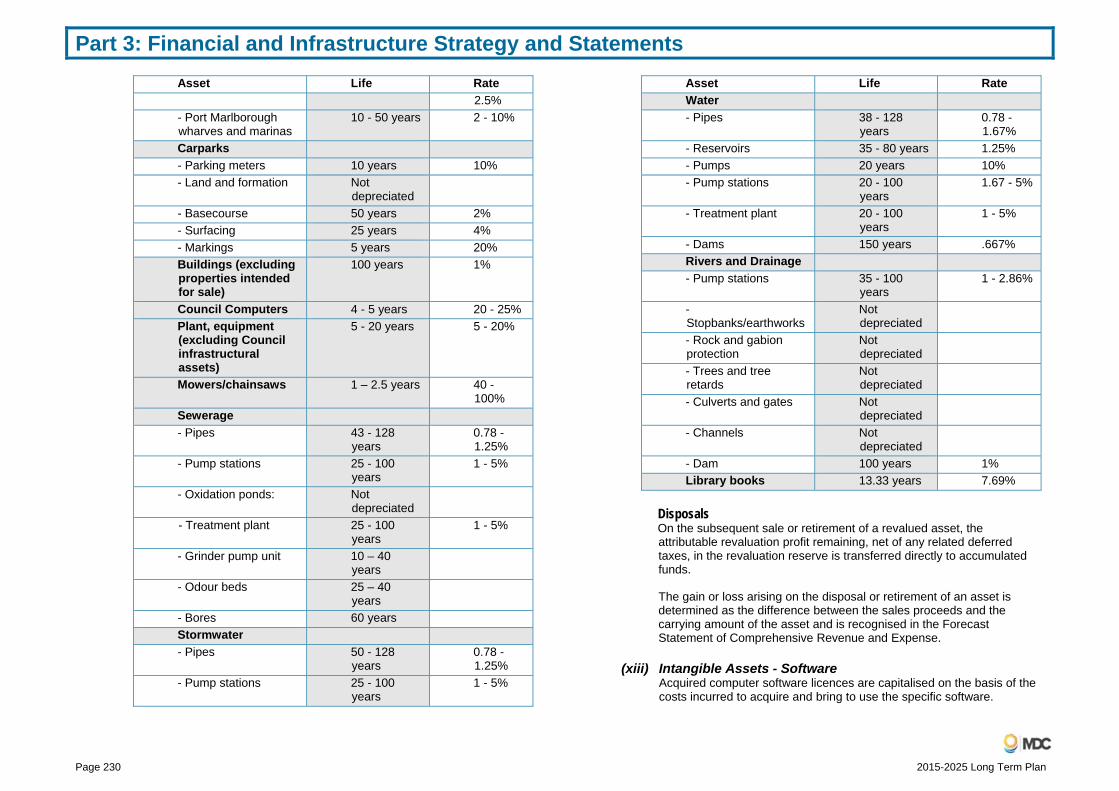
Part 3: Financial and Infrastructure Strategy and Statements
Page 230 2015-2025 Long Term Plan
Asset Life Rate2.5%
- Port Marlborough wharves and marinas
10 - 50 years 2 - 10%
Carparks - Parking meters 10 years 10% - Land and formation Not
depreciated
- Basecourse 50 years 2% - Surfacing 25 years 4% - Markings 5 years 20% Buildings (excluding properties intended for sale)
100 years 1%
Council Computers 4 - 5 years 20 - 25% Plant, equipment (excluding Council infrastructural assets)
5 - 20 years 5 - 20%
Mowers/chainsaws 1 – 2.5 years 40 - 100%
Sewerage - Pipes 43 - 128
years 0.78 - 1.25%
- Pump stations 25 - 100 years
1 - 5%
- Oxidation ponds: Not depreciated
- Treatment plant 25 - 100 years
1 - 5%
- Grinder pump unit 10 – 40 years
- Odour beds 25 – 40 years
- Bores 60 years Stormwater - Pipes 50 - 128
years 0.78 - 1.25%
- Pump stations 25 - 100 years
1 - 5%
Asset Life Rate Water - Pipes 38 - 128
years 0.78 - 1.67%
- Reservoirs 35 - 80 years 1.25% - Pumps 20 years 10% - Pump stations 20 - 100
years 1.67 - 5%
- Treatment plant 20 - 100 years
1 - 5%
- Dams 150 years .667% Rivers and Drainage - Pump stations 35 - 100
years 1 - 2.86%
- Stopbanks/earthworks
Not depreciated
- Rock and gabion protection
Not depreciated
- Trees and tree retards
Not depreciated
- Culverts and gates Not depreciated
- Channels Not depreciated
- Dam 100 years 1% Library books 13.33 years 7.69%
Disposals On the subsequent sale or retirement of a revalued asset, the attributable revaluation profit remaining, net of any related deferred taxes, in the revaluation reserve is transferred directly to accumulated funds.
The gain or loss arising on the disposal or retirement of an asset is determined as the difference between the sales proceeds and the carrying amount of the asset and is recognised in the Forecast Statement of Comprehensive Revenue and Expense.
(xiii) Intangible Assets - Software Acquired computer software licences are capitalised on the basis of the costs incurred to acquire and bring to use the specific software.

Part 3: Financial and Infrastructure Strategy and Statements
2015-2025 Long Term Plan Page 231
Costs associated with maintaining computer software are recognised as an expense when incurred. Costs that are directly associated with the development of software for internal use by MDC are recognised as an intangible asset. Direct costs include the software development employee costs and an appropriate portion of relevant overhead costs.
The computer software has a finite life of four to five years. Amortisation is included in the Revenue Statement.
(xiv) Impairment of Property, Plant and Equipment and Intangible Assets At each balance sheet date MDC reviews the carrying amounts of its tangible and intangible assets to determine whether there is any indication that those assets have suffered an impairment loss. If any such indication exists and for indefinite life intangibles, the recoverable amount of the asset is estimated in order to determine the extent of the impairment loss (if any). Where it is not possible to estimate the recoverable amount of an individual asset MDC estimates the recoverable amount of the cash generating unit to which the asset belongs.
Recoverable amount is the greater of market value less costs to sell and value in use.
For assessing value in use the estimated future cash flows are discounted to their present value using a pre-tax discount rate that reflects current market assessments of the time value of money and the risks specific to the asset. Value in use is depreciated replacement cost for an asset where the future economic benefits or service potential of the asset are not primarily dependent on the assets ability to generate net cash inflows and where the entity would, if deprived of the asset, replace its remaining future economic benefits or service potential.
The value in use for cash-generating assets is the present value of expected future cash flows.
If the recoverable amount of an asset (or cash-generating unit) is estimated to be less than its carrying amount the carrying amount of the asset (or cash-generating unit) is reduced to its recoverable amount.
For non-revalued assets impairment losses are recognised as an expense immediately.
For revalued assets, other than investment property, the impairment loss is treated as a revaluation decrease to the extent it reverses previous accumulated revaluation increments for that asset class.
Where an impairment loss subsequently reverses the carrying amount of the asset (or cash-generating unit) is increased to the revised estimate of its recoverable amount, but so that the increased carrying amount does not exceed the carrying amount that would have been determined had no impairment loss been recognised for the asset (or cash-generating unit) in prior years. A reversal of an impairment loss is recognised as revenue immediately unless the relevant asset is carried at a revalued amount, in which case the reversal of the impairment loss is treated as a revaluation increase to the extent that any impairment loss had been previously charged to equity.
Forestry Assets Forestry assets are owned and managed by Marlborough Regional Forestry. They are stated at fair value less estimated point-of-sale costs, with any resultant gain or loss recognised in the Revenue Statement. Point-of-sale costs include all costs that would be necessary to sell the assets, excluding costs necessary to get the assets to market.
The fair value of all trees is based on estate based Net Present Value (NPV) method, using the present value of future cash flows discounted at a pre-tax market determined rate.
Marlborough District Council own and manage some trees for soil conservation purposes. These are revalued as per Council’s policy on property, plant and equipment.
(xv) Investment Property The classification of property is a matter of professional judgement that requires analysis of the substance of the circumstances surrounding its occupation. The decision as to whether a property or part of a property is classified as ‘Investment Property’ is based on the criteria in PBE IPSAS 16, Investment Property and recognising the following:
Properties leased to third parties under operating leases will generally be classified as ‘Investment Property’ unless:
The occupants provide services that are integral to the operation of the owner’s business and/or these services could not be provided efficiently and effectively by the lessee in another location.

Part 3: Financial and Infrastructure Strategy and Statements
Page 232 2015-2025 Long Term Plan
The owner of the property is a public benefit entity, and the property is held to meet service delivery objectives, rather than to earn rentals or for capital appreciation.
The property is being held for future delivery of services.
If the lessor uses services of the owner and those services are integral to the reasons for their occupancy of the property.
Investment property is measured initially at its cost, including transaction costs. Investment property is then restated to fair value at balance date, based on an independent valuation.
Gains or losses arising from changes in the fair value of investment property are included in the surplus or deficit for the period in which they arise.
(xvi) Trade and Other Payables Trade payables are initially measured at fair value, and subsequently measured at amortised cost, using the effective interest rate method.
(xvii) Borrowings All loans and borrowings are initially recognised at cost, being the fair value of the consideration received net of issue costs associated with the borrowing. After initial recognition, these loans and borrowings are subsequently measured at amortised cost using the effective interest rate method which allocates the cost through the expected life of the loan or borrowing. Amortised cost is calculated taking into account any issue costs, and any discount or premium on drawdown.
Bank loans are classified as current liabilities (either advances or current portion of term debt) unless MDC has an unconditional right to defer settlement of the liability for at least 12 months after the balance sheet date.
(xviii) Employee Entitlements Provision is made in respect of the MDC’s liability for retiring gratuity allowances, annual and long service leave, and sick leave.
The retiring gratuity liability and long service leave liability are assessed on an actuarial basis using current rates of pay taking into account years of service, years to entitlement and the likelihood staff will reach the point of entitlement. These estimated amounts are discounted to their present value using an interpolated 10 year government bond rate.
Liabilities for accumulating short-term compensated absences (eg; annual and sick leave) are measured as the additional amount of unused entitlement accumulated at the balance sheet date. Sick leave, annual leave, vested long service leave and non-vested long service leave and retirement gratuities expected to be settled within 12 months of balance date, are classified as a current liability. All other employee entitlements are classified as a non-current liability.
(xix) Superannuation Schemes Defined contribution schemes Obligations for contributions to defined contribution superannuation schemes are recognised as an expense in the surplus or deficit as incurred.
Defined benefit schemes The Council belongs to the Defined Benefit Plan Contributors Scheme (the scheme), which is managed by the Board of Trustees of the National Provident Fund. The scheme is a multi-employer defined benefit scheme.
Insufficient information is available to use defined benefit plan accounting, as it is not possible to determine from the terms of the scheme the extent to which the scheme’s surplus or deficit will affect future contributions by individual employers, as there is no prescribed basis for allocation. The scheme is therefore accounted for as a defined contribution scheme.
(xx) Provisions Provisions are recognised when MDC has a present obligation as a result of a past event, a reliable estimate can be made for the amount of the obligation and it is probable that MDC will be required to settle that obligation. Provisions are measured at management’s best estimate of the expenditure required to settle the obligation at balance date and are discounted to present value where the effect is material.
Council has a legal obligation to provide ongoing maintenance and monitoring services at the Blenheim landfill site after closure. To provide for these estimated costs of aftercare, a charge is made each year based on the net present value of the after care cost which it is estimated will be incurred following the closure of the landfill.
Part 3: Financial and Infrastructure Strategy and Statements
2015-2025 Long Term Plan Page 233
Financial guarantee contracts A financial guarantee contract is a contract that requires MDC to make specified payments to reimburse the holder of the contract for a loss it incurs because a specified debtor fails to make payment when due.
Financial guarantee contracts are initially recognised at fair value, even if a payment under the guarantee is not considered probable. If a financial guarantee contract was issued in a stand-alone arms-length transaction to an unrelated party, its fair value at inception is equal to the consideration received. When no consideration is received, a liability is recognised based on the probability that the Council will be required to reimburse a holder for a loss incurred discounted to present value. The portion of the guarantee that remains unrecognised, prior to discounting to fair value, is disclosed as a contingent liability.
Financial guarantees are subsequently measured at the initial recognition amount less any amortisation.
However, if it is probable that expenditure will be required to settle a guarantee, then the provision for the guarantee is measured at the present value of the future expenditure.
(xxi) Equity Equity is the community’s interest in MDC and is measured as the difference between total assets and total liabilities. Public equity is disaggregated and classified into a number of reserves to enable clearer identification of the special uses that MDC intends to make of its accumulated profits. These components of equity are:
Accumulated Funds.
Ordinary revenues.
Property Revaluation reserves.
Restricted Reserves.
Special reserves are a component of equity generally representing a particular use to which various parts of equity have been assigned. Reserves may be legally restricted or created by Council.
Restricted reserves are those reserves subject to specific conditions accepted as binding by the Council and which may not be revised by Council without reference to the Courts or a third party. Transfer from
these reserves can be made by certain specified purposes or when certain specified conditions are met.
Council created reserves are reserves established by Council decision. The Council may alter the purpose of the reserve without reference to any third party or the Courts. Transfer to and from these reserves is at the discretion of Council.
Property revaluation reserves relate to the revaluation of property, plant and equipment to fair value.
(xxii) Goods and Services Tax All items in the financial statements are stated exclusive of goods and services tax (GST), except for debtors and other receivables and creditors and other payables, which are presented on a GST-inclusive basis. GST not recoverable as input tax is recognised as part of the related asset or expense.
The net amount of GST recoverable from, or payable to, the Inland Revenue Department (IRD) is included as part of receivables or payables in the Statement of Financial Position.
The net GST paid to, or received from the IRD, including the GST relating to investing and financing activities, is classified as an operating cash flow in the Statement of Cash Flows.
Commitments and contingencies are disclosed exclusive of GST.
(xxiii) Cost Allocation The cost of providing support services for the Council are accumulated and are allocated to each activity using appropriate allocation bases which reflect the usage and /or capacity for each significant activity.
(xxiv) Foreign Currencies Transactions in foreign currencies are initially recorded at the rates of exchange prevailing on the dates of the transactions or rates that approximate those rates. Monetary assets and liabilities denominated in such currencies are retranslated at the rates prevailing on the balance sheet date. Profits and losses arising on exchange are included in the surplus or deficit for the period.
In order to hedge its exposure to certain foreign exchange risks, MDC enters into forward contracts in accordance with the Council treasury
Part 3: Financial and Infrastructure Strategy and Statements
Page 234 2015-2025 Long Term Plan
policies (see above for details of MDC’s accounting policies in respect of such derivative financial instruments).
(xxv) Annual Plan Figures The comparative 2014-15 figures are those approved by the Council in its 2014-15 Annual Plan. They have been prepared in accordance with NZ GAAP, using accounting policies that are consistent with those adopted in preparing these financial statements.
(xxvi) Emissions Trading Scheme (ETS) Marlborough Regional Forestry (MRF) is a participant in the ETS with regard to both its significant holdings of “pre 1990” forests and currently minor holding of “post 1989” forests.
Pre 1990 emission units (NZU’s) received are recognised at fair value and subsequently measured at cost subject to impairment. It is not anticipated that MRF will have any future liabilities or obligations with regard to its pre 1990 forests.
Post 1989 NZU’s received are recognised at cost ($nil) and subsequently measured at cost subject to impairment. Where there is an obligation to return units the expense and liability are recognised and are measured at the carrying value of units on hand plus the fair value of any additional units required. If operations proceed as planned there will always be post 1989 units on hand equal to any liability.
Any future cash flows associated with units receivable/payable will be taken into consideration in determining the valuation of the forest estate.
Council’s regional landfill has entered the ETS and has incurred liabilities from 1 January 2013. NZU’s purchased to meet these liabilities are recognised at cost and subsequently recognised at cost subject to impairment. Where there is an obligation to return units the expense and liability are recognised and are measured at the carrying value of units on hand plus the fair value of any additional units required.
Funding Impact Statement Accounting Policies The format of the FIS (down to the “Funding balance” line) is laid down by government regulations which require that non-cash items are excluded from the FIS. This means that the information on the FIS differs from the information in Council’s financial statements which are prepared in accordance with generally accepted accounting principles (GAAP).
The “Sources of operating funding” section of the FIS includes revenue to the activity, but note:
Grants and contributions received which are specified for funding capital expenditure are not included, they are included in “Sources of capital funding” - whereas under GAAP they are included in either “Development and financial contributions” or “Other revenue” in the Forecast Statement of Comprehensive Revenue and Expense.
Any gain from sale of assets is not included, instead the sale proceeds are included in “Sources of capital funding” - whereas under GAAP any such gain is included in “Gains” in the Forecast Statement of Comprehensive Revenue and Expense.
Internal charges and overheads recovered are shown as a source of operating funding in the FIS – whereas in Council’s Forecast Statement of Comprehensive Revenue and Expense they are deducted from operating expenditure.
The value of assets vested in (effectively donated to) Council is excluded and is also excluded from capital expenditure - whereas under GAAP this amount is included in “Other revenue” in the Forecast Statement of Comprehensive Revenue and Expense and added to the value of fixed assets in the Statement of Financial Position. However, for some activities a more detailed breakdown of capital expenditure is provided at the bottom of the FIS and this includes the value of vested assets.
Some of this total may be designated by Council to fund capital expenditure.
The “Applications of operating funding” section includes operating expenditure of the activity, but note:
Depreciation and amortisation expense is excluded as it does not involve a cash payment- whereas under GAAP it is included in Expenditure in the Revenue Statement. The value of this expense is shown in the reconciliation section.
In Council’s Revenue Statement internal charges and overheads recovered are deducted from operating expenditure whereas in the FIS they are shown as a source of operating funding.
The “Finance costs” shown are the amount paid by the activity to Council’s Investment unit and so are also an internal cost.
Any loss on sale of assets is not included as it does not involve a cash payment - whereas under GAAP it is included in Expenditure in the Forecast Statement of Comprehensive Revenue and Expense.

Part 3: Financial and Infrastructure Strategy and Statements
2015-2025 Long Term Plan Page 235
The “Sources of capital funding” section shows direct sources of funding the capital expenditure of the activity, but note:
Grants and contributions received which are specified for funding capital expenditure are included - whereas under GAAP they are included in either “Development and financial contributions” or “Other revenue” in the Revenue Statement.
Any proceeds from the sale of an asset are included in here - whereas under GAAP only the loss or gain on sale would be included in the Revenue Statement.
Funding from a reserve is included as a negative value of “Increase (decrease) in reserves” in the “Applications of capital funding” section.
While loans are included here there are some special situations in which a loan is used to fund operating expenditure.
Capital expenditure may also be funded from items included as “Sources of operating funding”, eg; activities with low levels of Capital expenditure often fund it directly from rates.
The “Applications of capital funding” section shows how much funding has been:
used to fund capital expenditure.
Transferred to a reserve, less the amount taken from a reserve to fund capital expenditure.
The Surplus (deficit) of operating funding and capital funding represent funds transferred between these two uses as defined by the FIS, for the reasons outlined here they differs from a surplus which would be calculated under GAAP.
Council’s management and investment units are not included in any activity, their costs and revenues are allocated over all activities, using appropriate allocation bases. For this reason adding the information provided for all activity groups will not agree to Councils financial statements. Similarly adding all “Internal charges and overheads recovered” gives a different answer to adding all “Internal charges and overheads applied” as most recoveries are to the management units.
Below each FIS a reconciliation is given of the “Total applications of operating funding” in the FIS and the operating expenditure disclosed for that activity in the Revenue Statement.
For some activities a further breakdown is given of the operating and capital expenditure, eg: to individual scheme. This operating expenditure breakdown uses information form the Revenue Statement and is prepared as per GAAP, similarly the capital expenditure includes vested assets as per GAAP.

Part 3: Financial and Infrastructure Strategy and Statements
Page 236 2015-2025 Long Term Plan
Notes to Financial Statements
for the year ending 30 June: 2014.15(AP) 2015.16 2016.17 2017.18 2018.19 2019.20 2020.21 2021.22 2022.23 2023.24 2024.25$000's $000's $000's $000's $000's $000's $000's $000's $000's $000's $000's
Revenue:People 8,600 9,032 9,566 9,840 10,131 10,808 11,248 11,796 12,763 12,231 12,432Community Facilities 8,882 9,238 9,463 9,893 10,336 10,883 11,095 11,839 12,499 13,474 14,329Roads and footpaths 16,451 18,810 20,214 21,142 22,369 23,107 24,098 25,046 26,201 27,359 28,634Flood protection and control works 6,803 7,142 7,340 7,485 7,635 7,732 7,948 8,102 8,167 8,350 8,599Sewerage 9,871 10,418 10,908 12,374 12,982 13,580 14,178 14,838 15,052 15,384 15,634Stormwater drainage 1,934 2,112 2,297 2,415 2,524 2,646 2,767 2,897 3,043 3,194 3,368Water Supply 9,195 9,418 10,693 10,220 11,316 12,152 12,344 12,580 12,629 12,848 13,095Solid Waste Management 7,136 8,309 8,060 8,231 8,422 8,609 8,832 9,059 9,324 9,596 9,892Environmental Management 8,083 8,182 8,343 8,557 8,748 8,905 9,118 9,359 9,559 9,876 10,160Regulatory 6,525 6,933 7,164 7,355 7,479 7,620 7,809 7,999 8,220 8,462 8,726Regional Development 4,756 5,117 5,219 5,325 5,447 5,574 9,139 9,479 9,641 9,829 10,028Total activity revenue 88,236 94,711 99,267 102,837 107,389 111,616 118,576 122,994 127,098 130,603 134,897Plus other revenue (including forestry) 16,225 18,323 19,252 19,665 21,396 22,801 22,133 18,435 18,455 18,285 18,036Less internal revenue (8,067) (8,476) (9,612) (10,633) (12,049) (13,307) (14,235) (14,870) (14,753) (14,620) (14,274)
Total revenue 96,394 104,558 108,907 111,869 116,736 121,110 126,474 126,559 130,800 134,268 138,659Expenditure:People 9,047 9,343 9,736 10,030 10,268 11,058 11,510 12,067 12,481 12,422 12,749Community Facilities 8,431 9,263 9,057 9,328 9,493 9,810 10,220 10,676 10,990 11,579 12,009Roads and footpaths 17,976 20,409 21,842 22,490 23,785 24,521 25,538 26,472 27,617 28,718 29,885Flood protection and control works 4,557 4,856 5,022 5,147 5,295 5,420 5,549 5,697 5,879 6,084 6,261Sewerage 10,223 10,559 11,925 13,076 13,558 13,973 14,509 15,114 15,217 15,427 15,534Stormwater drainage 1,773 2,307 2,455 2,539 2,602 2,681 2,759 2,846 2,954 3,233 3,562Water Supply 8,216 8,438 8,940 9,465 10,619 11,445 11,715 11,927 12,032 12,255 12,445Solid Waste Management 6,900 7,059 8,100 8,191 8,287 8,379 8,175 8,297 8,432 8,591 8,756Environmental Management 8,188 8,099 8,408 8,622 8,812 8,967 9,181 9,423 9,622 9,939 10,224Regulatory 6,489 6,884 7,105 7,292 7,414 7,553 7,734 7,917 8,127 8,369 8,619Regional Development 5,380 6,792 5,336 5,767 6,562 7,399 8,228 8,376 8,337 8,360 8,345Total activity expenditure 87,180 94,009 97,926 101,947 106,695 111,206 115,118 118,812 121,688 124,977 128,389
Plus other expenditure (including forestry) 9,261 12,466 13,701 14,456 16,232 17,587 16,906 14,541 14,803 14,174 13,608less internal interest eliminated (8,067) (8,476) (9,612) (10,633) (12,049) (13,307) (14,235) (14,870) (14,753) (14,620) (14,274)
Total operating expenditure 88,373 97,999 102,015 105,770 110,878 115,486 117,789 118,483 121,738 124,531 127,723
1. Summary cost of services

Part 3: Financial and Infrastructure Strategy and Statements
2015-2025 Long Term Plan Page 237
for the year ending 30 June: 2014.15(AP) 2015.16 2016.17 2017.18 2018.19 2019.20 2020.21 2021.22 2022.23 2023.24 2024.25$000's $000's $000's $000's $000's $000's $000's $000's $000's $000's $000's
People 6,305 6,668 7,076 7,364 7,619 8,160 8,598 9,060 9,289 9,377 9,514Community Facilities 6,879 7,398 7,614 7,916 8,203 8,569 9,031 9,547 9,958 10,631 11,155Roads and footpaths 9,021 9,198 10,052 10,494 11,280 11,694 12,265 12,808 13,487 14,178 14,948Flood protection and control works 3,720 3,951 4,132 4,258 4,388 4,464 4,656 4,784 4,821 4,975 5,191Sewerage 7,753 7,898 8,321 9,473 9,985 10,486 10,981 11,530 11,626 11,830 11,994Stormwater drainage 1,526 1,671 1,842 1,950 2,048 2,159 2,270 2,389 2,521 2,658 2,815Water Supply 8,705 8,793 9,040 9,566 10,644 11,460 11,633 11,846 11,870 12,062 12,281Solid Waste Management 2,557 2,662 2,752 2,795 2,843 2,877 2,939 2,985 3,064 3,119 3,188Environmental Management 5,967 6,017 6,221 6,401 6,557 6,673 6,847 7,034 7,183 7,433 7,653Regulatory 2,485 2,800 2,930 3,025 3,049 3,084 3,157 3,219 3,299 3,393 3,502Regional Development 2,973 3,067 3,130 3,189 3,259 3,331 6,836 7,110 7,202 7,311 7,427Total activity rates 57,891 60,123 63,110 66,431 69,875 72,957 79,213 82,312 84,320 86,967 89,668Non-activity rates 1 2 2 2 2 2 2 2 2 2 2Total gross rates revenue 57,892 60,125 63,112 66,433 69,877 72,959 79,215 82,314 84,322 86,969 89,670Rates remissions 462 530 543 557 572 588 605 624 644 666 689
Rates revenue net of remissions 57,430 59,595 62,569 65,876 69,305 72,371 78,610 81,690 83,678 86,303 88,981
2. Rates revenue
for the year ending 30 June: 2014.15(AP) 2015.16 2016.17 2017.18 2018.19 2019.20 2020.21 2021.22 2022.23 2023.24 2024.25$000's $000's $000's $000's $000's $000's $000's $000's $000's $000's $000's
Finance revenue - interest revenueTerm deposits 710 710 710 710 710 710 710 710 710 710 710Community loans 98 98 - - - - - - - - -Total finance revenue 808 808 710 710 710 710 710 710 710 710 710
Finance costs - interest expenseTotal internal interest expense 7,982 8,476 9,612 10,633 12,049 13,307 14,235 14,870 14,753 14,620 14,274Bank charges on borrowings 90 139 142 146 150 154 159 164 169 175 182less internal interest eliminated (5,556) (4,941) (4,957) (5,208) (5,434) (5,432) (5,704) (6,041) (6,038) (6,307) (6,416)Total finance costs 2,516 3,674 4,797 5,571 6,765 8,029 8,690 8,993 8,884 8,488 8,040
Net finance costs 1,708 2,866 4,087 4,861 6,055 7,319 7,980 8,283 8,174 7,778 7,330
3. Finance revenue and finance costs

Part 3: Financial and Infrastructure Strategy and Statements
Page 238 2015-2025 Long Term Plan
for the year ending 30 June: 2014.15(AP) 2015.16 2016.17 2017.18 2018.19 2019.20 2020.21 2021.22 2022.23 2023.24 2024.25$000's $000's $000's $000's $000's $000's $000's $000's $000's $000's $000's
NZTA Roading Subsidy 5,547 4,646 5,175 5,251 5,597 5,765 5,976 6,197 6,475 6,696 6,958Fees and Charges 6,405 7,813 8,359 8,569 8,801 9,047 9,308 9,600 9,902 10,248 10,600Marlborough Regional Forestry 6,542 6,660 6,891 7,202 7,453 7,568 5,501 172 178 - -Regulatory revenues 4,460 4,039 4,145 4,251 4,367 4,498 4,630 4,784 4,940 5,112 5,295Rental revenues 5,081 5,137 4,686 4,710 4,737 4,775 4,810 4,862 4,914 4,873 4,922Contributions 1,259 1,807 994 1,104 1,239 1,393 1,110 1,275 1,462 1,678 1,924Vested Assets 1,029 1,079 1,167 1,197 1,230 1,265 1,302 1,344 1,388 1,436 1,488Trade Waste - Operating Charges 1,096 1,125 1,141 1,190 1,243 1,300 1,362 1,429 1,501 1,580 1,637Infringements and fines 625 632 648 664 683 702 723 746 770 797 826Dividends received 764 850 900 950 1,000 1,000 1,000 1,000 1,000 1,000 1,000Subsidies & Grants 423 3,484 4,424 3,773 3,808 3,945 4,094 4,255 4,429 4,618 4,818Petroleum Tax 367 367 376 386 396 408 420 433 447 463 479Penalties - Rates 345 345 354 363 373 383 395 407 420 435 451Trade Waste - Capital Charges 761 812 802 1,024 1,043 1,062 1,082 1,102 1,122 1,143 1,143Licence revenue 307 306 322 330 339 349 359 371 383 396 410Rental revenue from investment properties 161 161 161 161 161 161 161 161 161 161 161Disbursement recoveries 289 470 411 421 433 445 459 473 489 506 524Legal Fees Recovered Revenue 76 89 91 94 97 99 103 107 112 115 120Wharfage 1 1 1 1 1 1 1 1 1 1 1Photocopying / Typing 18 17 18 18 19 19 20 20 21 22 22Refunds (other than rates) 32 30 72 32 32 78 34 35 85 38 39Requests for books etc 8 13 13 14 14 14 15 15 16 16 17Miscellaneous Revenue 672 282 317 325 334 344 354 365 377 390 405Non Property rentals - 143 147 151 155 159 164 169 175 181 187MFC distribution eliminated (1,770) - - - - - - - - - -MFC distribution 1,770 - - - - - - - - - -Interest - General Funds - - - - - - - - - - -Commissions 16 16 16 16 17 17 18 18 19 20 20rounding (2)Other revenue 81 1,060 1,086 1,070 1,103 1,177 1,165 1,204 1,295 1,288 1,335Gain on Sale of Fixed Assets 828 2,104 2,231 1,227 1,201 1,192 1,618 2,567 3,253 2,822 2,859Total Other revenue and Gains 36,081 42,427 43,862 43,422 44,774 45,990 45,016 41,909 44,040 44,746 46,306
4. Other revenue including gains

Part 3: Financial and Infrastructure Strategy and Statements
2015-2025 Long Term Plan Page 239
for the year ending 30 June: 2014.15(AP) 2015.16 2016.17 2017.18 2018.19 2019.20 2020.21 2021.22 2022.23 2023.24 2024.25$000's $000's $000's $000's $000's $000's $000's $000's $000's $000's $000's
Other non-activity expenditure
Insurance 453 1,175 1,169 1,199 1,232 1,267 1,304 1,346 1,390 1,438 1,490Property costs 1,822 1,427 1,375 1,387 1,402 1,448 1,384 1,396 1,415 1,419 1,451Rate remissions as note 2 462 260 266 273 280 288 296 305 315 325 336Digitisation project 101 - - - - - - - - - -Other (inc Marlborough Regional Forestry) 225 6,069 6,235 6,173 6,704 6,709 5,391 2,665 2,967 2,678 2,473
Total other expenditure 3,063 8,931 9,045 9,032 9,618 9,712 8,375 5,712 6,087 5,860 5,750Expenditure disclosures
Depreciation and amortisation expense 20,058 20,350 22,980 24,470 25,628 26,697 27,307 28,396 29,160 30,345 31,303Personnel costs 18,224 19,554 19,820 20,192 20,605 21,053 21,507 22,014 22,576 23,140 23,741Finance costs as note 3 2,516 3,674 4,797 5,571 6,765 8,029 8,672 9,002 8,910 8,487 8,022Grants 1,581 4,277 2,561 2,535 2,479 2,523 2,519 2,541 2,587 2,587 2,613Insurance premiums 1,773 1,778 1,784 1,830 1,883 1,933 1,991 2,057 2,121 2,195 2,274Councillors remuneration 694 634 646 659 672 686 702 719 736 756 775Payments under operating leases 305 313 443 452 462 473 484 497 511 525 541Fees to principal auditor:
audit fees for financial statement audit 122 124 126 128 131 133 136 139 143 146 150audit fees for LTP 93 - - 96 - - 103 - - 110 113
Property plant and equipment loss on disposal - - - 6 - 2 24 - 1 38 -Other operating expenses 39,320 42,662 44,195 45,264 47,173 48,901 50,631 52,203 53,838 55,462 57,466Marlborough Regional Forestry 3,687 4,632 4,663 4,567 5,080 5,056 3,713 915 1,155 740 725
Total expenditure 88,373 97,998 102,015 105,770 110,878 115,486 117,789 118,483 121,738 124,531 127,723
Non-activity expenditure in the Statement of comprehensive revenue and expense is made up of:
Total expenditure in the Statement of Comprehensive revenue and expense includes the following amounts which are required to be disclosed separately:
5. Expenditure
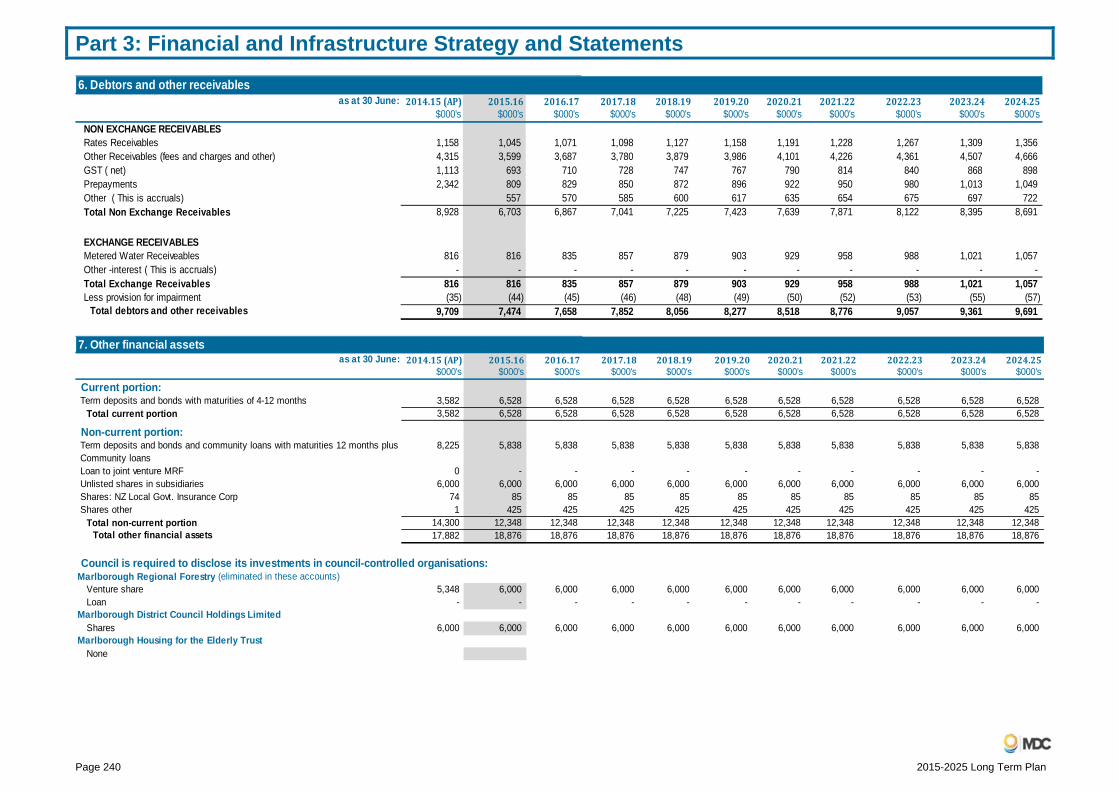
Part 3: Financial and Infrastructure Strategy and Statements
Page 240 2015-2025 Long Term Plan
as at 30 June: 2014.15(AP) 2015.16 2016.17 2017.18 2018.19 2019.20 2020.21 2021.22 2022.23 2023.24 2024.25$000's $000's $000's $000's $000's $000's $000's $000's $000's $000's $000's
NON EXCHANGE RECEIVABLESRates Receivables 1,158 1,045 1,071 1,098 1,127 1,158 1,191 1,228 1,267 1,309 1,356Other Receivables (fees and charges and other) 4,315 3,599 3,687 3,780 3,879 3,986 4,101 4,226 4,361 4,507 4,666GST ( net) 1,113 693 710 728 747 767 790 814 840 868 898Prepayments 2,342 809 829 850 872 896 922 950 980 1,013 1,049Other ( This is accruals) 557 570 585 600 617 635 654 675 697 722Total Non Exchange Receivables 8,928 6,703 6,867 7,041 7,225 7,423 7,639 7,871 8,122 8,395 8,691
EXCHANGE RECEIVABLESMetered Water Receiveables 816 816 835 857 879 903 929 958 988 1,021 1,057Other -interest ( This is accruals) - - - - - - - - - - -Total Exchange Receivables 816 816 835 857 879 903 929 958 988 1,021 1,057Less provision for impairment (35) (44) (45) (46) (48) (49) (50) (52) (53) (55) (57)
Total debtors and other receivables 9,709 7,474 7,658 7,852 8,056 8,277 8,518 8,776 9,057 9,361 9,691
6. Debtors and other receivables
as at 30 June: 2014.15(AP) 2015.16 2016.17 2017.18 2018.19 2019.20 2020.21 2021.22 2022.23 2023.24 2024.25$000's $000's $000's $000's $000's $000's $000's $000's $000's $000's $000's
Current portion: Term deposits and bonds with maturities of 4-12 months 3,582 6,528 6,528 6,528 6,528 6,528 6,528 6,528 6,528 6,528 6,528
Total current portion 3,582 6,528 6,528 6,528 6,528 6,528 6,528 6,528 6,528 6,528 6,528
Non-current portion: Term deposits and bonds and community loans with maturities 12 months plus 8,225 5,838 5,838 5,838 5,838 5,838 5,838 5,838 5,838 5,838 5,838 Community loans Loan to joint venture MRF 0 - - - - - - - - - - Unlisted shares in subsidiaries 6,000 6,000 6,000 6,000 6,000 6,000 6,000 6,000 6,000 6,000 6,000 Shares: NZ Local Govt. Insurance Corp 74 85 85 85 85 85 85 85 85 85 85 Shares other 1 425 425 425 425 425 425 425 425 425 425
Total non-current portion 14,300 12,348 12,348 12,348 12,348 12,348 12,348 12,348 12,348 12,348 12,348 Total other financial assets 17,882 18,876 18,876 18,876 18,876 18,876 18,876 18,876 18,876 18,876 18,876
Council is required to disclose its investments in council-controlled organisations:
Venture share 5,348 6,000 6,000 6,000 6,000 6,000 6,000 6,000 6,000 6,000 6,000Loan - - - - - - - - - - -
Shares 6,000 6,000 6,000 6,000 6,000 6,000 6,000 6,000 6,000 6,000 6,000
None
7. Other financial assets
Marlborough Regional Forestry (eliminated in these accounts)
Marlborough District Council Holdings Limited
Marlborough Housing for the Elderly Trust

Part 3: Financial and Infrastructure Strategy and Statements
2015-2025 Long Term Plan Page 241
as at 30 June: 2014.15(AP) 2015.16 2016.17 2017.18 2018.19 2019.20 2020.21 2021.22 2022.23 2023.24 2024.25$000's $000's $000's $000's $000's $000's $000's $000's $000's $000's $000's
Opening value 1,339,901 1,384,824 1,444,741 1,495,790 1,545,575 1,613,397 1,673,043 1,734,092 1,795,640 1,854,070 1,916,609Capital additions by activityDemocratic Process - - 41 - - 44 - - 49 - -Culture and Heritage 50 - - 52 - 11 2,278 - - - -Community Housing. 533 683 170 - - - 190 394 407 212 219Community Support 12 320 20 21 22 22 23 23 24 25 26Library Services 3,759 372 812 3,977 3,381 3,811 7,201 5,068 384 465 457Emergency Management 28 47 29 30 53 32 33 34 35 37
People 4,382 1,403 1,090 4,079 3,433 3,941 9,724 5,518 898 737 739Community Facilities 2,131 3,707 2,059 2,116 2,370 3,844 2,682 5,266 5,235 7,273 3,532Roads and footpaths 6,899 11,828 10,486 11,724 10,012 10,896 11,172 11,585 12,027 12,505 12,366Flood protection and control works 993 1,495 1,518 1,505 1,553 1,262 939 1,132 1,409 1,007 878Sewerage 3,355 14,148 17,598 4,845 8,564 1,914 11,863 3,175 1,368 3,227 8,007Stormwater drainage 1,290 347 1,419 376 1,497 1,549 402 1,756 3,478 5,994 3,291Water Supply 6,711 6,394 6,022 6,793 19,446 3,283 2,786 1,640 3,420 790 1,459Solid Waste Management 1,792 5,295 53 11 8 388 448 4,421 19 - 287
Environmental Science and Monitoring 150 150 - - - - - - - - -Environmental Policy and Protection - 150 154 158 162 167 172 177 183 189 196Resource Consents 3 3 3 3 3 3 3 4 4 - -
Environmental Management 153 303 157 161 165 170 175 181 187 189 196Building Control - - - - - - - - - - -Environmental Health 4 4 4 4 4 4 4 4 4 5Biosecurity - - - - - - - - - -Animal Control 4 - - - - - - - - - -Harbours 130 390 107 210 240 69 408 35 173 38 408
Regulatory 134 394 111 214 244 73 412 39 177 42 413Regional Development 144 917 2,666 8,106 11,408 8,792 113 117 135 124 128Forest Park Development 140 2,760 - - 2,624 - 2,776 - 2,956 - 3,165Information Services 1,162 884 1,432 748 769 791 986 1,510 929 961 995Commercial Property - 1,500 - - - - - - - - -Plant Operations 610 389 402 366 287 319 385 94 284 559 323Office Services 140 245 102 105 108 111 114 118 146 125 130Asset Services Management - 120 - - - - - - - - -
Total capital expenditure 30,036 52,129 45,115 41,149 62,488 37,333 44,977 36,552 32,668 33,533 35,909Disposals (82) (808) (7,500) (10) (891) (16) (966) - (3,379) (11) (1,069)Less carryovers movement - (3,510) 4,112 (1,057) (6,137) 7,284 (2,008) 2,237 2,179 (1,270) (395)Depreciation (20,058) (20,334) (21,971) (23,460) (24,617) (25,678) (26,621) (27,709) (28,473) (29,650) (30,607)Revaluation 23,735 32,440 31,294 33,163 36,980 40,723 45,666 50,468 55,435 59,937 66,247
Closing value including intangibles 1,373,532 1,444,741 1,495,790 1,545,575 1,613,397 1,673,043 1,734,092 1,795,640 1,854,070 1,916,609 1,986,694
8. Property, plant and equipment

Part 3: Financial and Infrastructure Strategy and Statements
Page 242 2015-2025 Long Term Plan
as at 30 June: 2014.15(AP) 2015.16 2016.17 2017.18 2018.19 2019.20 2020.21 2021.22 2022.23 2023.24 2024.25$000's $000's $000's $000's $000's $000's $000's $000's $000's $000's $000's
Trade payables 7,682 5,043 5,167 5,297 5,437 5,584 5,747 5,920 6,110 6,316 6,539Accrued expenses 2,089 2,670 2,735 2,804 2,877 2,957 3,042 3,135 3,235 3,344 3,462Revenue in advance 944 1,685 1,726 1,770 1,816 1,866 1,920 1,979 2,042 2,110 2,185Deposits 1,417 1,494 1,530 1,569 1,610 1,654 1,702 1,754 1,810 1,870 1,936Agency account 113 108 111 114 116 120 123 127 131 135 140Trust funds 250 283 290 298 305 314 323 333 343 355 367Amounts due to related parties 980 4 4 4 4 5 5 5 5 5 5
Total creditors and other payables 13,475 11,287 11,563 11,856 12,165 12,500 12,862 13,253 13,676 14,135 14,634
9. Creditors and other payables
as at 30 June: 2014.15(AP) 2015.16 2016.17 2017.18 2018.19 2019.20 2020.21 2021.22 2022.23 2023.24 2024.25$000's $000's $000's $000's $000's $000's $000's $000's $000's $000's $000's
Culture and Heritage 9 - - 2,127 2,073 2,016 1,954 1,888 1,817 1,741 1,660Community Housing - 306 298 290 281 272 262 251 239 226 213Library Services - - 3,459 9,596 11,476 8,233 7,962 7,672 7,361 7,488 7,571
People 9 306 3,757 12,013 13,830 10,521 10,178 9,811 9,417 9,455 9,444Community Facilities 8,513 10,199 11,677 12,950 14,280 16,939 18,097 21,500 24,408 28,986 29,847Roads and footpaths 6,522 9,152 9,858 11,928 12,882 14,607 16,316 18,079 19,887 21,706 23,494Flood protection and control works 898 1,372 1,877 2,175 2,633 2,754 2,923 2,914 3,576 3,659 3,724Sewerage 37,105 47,305 58,910 57,717 60,800 58,010 61,751 58,671 55,326 51,890 48,440Stormwater drainage 331 309 286 261 234 205 174 141 106 4,021 5,365Water Supply 23,331 25,082 24,020 27,400 26,642 25,906 31,070 30,989 33,143 31,036 28,784Solid Waste Management 5,653 7,412 6,957 6,469 5,970 5,447 4,887 4,364 3,893 3,401 2,926Environmental Management - 144 292 284 435 422 408 393 458 438 417Regulatory - 605 589 572 553 533 512 489 465 439 411Regional Development 19,377 19,228 20,630 27,507 37,332 44,233 46,868 44,603 43,676 41,043 38,224Commercial Property 10,885 5,780 5,620 5,448 5,264 5,067 4,856 4,630 4,388 4,129 3,851Works Depot 732 736 714 690 664 636 606 574 540 504 465Marlborough Regional Forestry - - - - - - - - - - -Total Loans 113,356 127,630 145,187 165,414 181,519 185,280 198,646 197,158 199,283 200,707 195,392Less internal loans 63,317 67,130 72,687 82,914 75,019 66,780 73,896 69,408 77,283 85,207 86,892Borrowings (external loans) 50,039 60,500 72,500 82,500 106,500 118,500 124,750 127,750 122,000 115,500 108,500
10. Borrowings

Part 3: Financial and Infrastructure Strategy and Statements
2015-2025 Long Term Plan Page 243
for the year ending 30 June: 2014.15(AP) 2015.16 2016.17 2017.18 2018.19 2019.20 2020.21 2021.22 2022.23 2023.24 2024.25$000's $000's $000's $000's $000's $000's $000's $000's $000's $000's $000's
Non exchange revenueGeneral rates and charges 55,102 57,272 60,171 63,338 66,474 69,318 75,513 78,543 80,534 83,115 85,744Donations, Subsidies and Grants 5,970 8,130 9,600 9,024 9,405 9,710 10,070 10,452 10,904 11,313 11,776Fees and Charges 11,460 12,458 13,125 13,456 13,823 14,217 14,631 15,099 15,580 16,123 16,686Other Revenue 7,716 10,086 9,575 9,073 9,416 9,851 10,212 11,620 12,856 12,938 13,547
Total non exchange revenue 80,248 87,945 92,471 94,891 99,117 103,096 110,426 115,714 119,874 123,489 127,752
Exchange revenueMetered water 2,790 2,853 2,941 3,095 3,404 3,641 3,702 3,771 3,788 3,853 3,927Rentals and Leases 5,242 5,441 4,994 5,022 5,053 5,095 5,135 5,192 5,250 5,215 5,270Marlborough Regional Forestry 6,542 6,660 6,891 7,202 7,453 7,568 5,501 172 178 - -Interest and Dividends 1,572 1,658 1,610 1,660 1,710 1,710 1,710 1,710 1,710 1,710 1,710
Total exchange revenue 16,146 16,613 16,436 16,978 17,619 18,014 16,048 10,845 10,926 10,778 10,907
Total Revenue 96,394 104,558 108,907 111,869 116,736 121,110 126,474 126,559 130,800 134,268 138,659
11. Exchange/Non Exchange Revenue

Part 3: Financial and Infrastructure Strategy and Statements
Page 244 2015-2025 Long Term Plan
12. Reservesas at 30 June: 2015 2016 2017 2018 2019 2020 2021 2022 2023 2024 2025
$000's $000's $000's $000's $000's $000's $000's $000's $000's $000's $000's
Opening balance 7,425 6,540 5,769 6,261 7,027 8,058 9,010 10,224 11,661 12,964 14,451Transfer to reserve 2,188 2,129 2,115 2,425 2,730 2,770 3,002 3,295 3,207 3,425 3,504Transfer from reserve (1,837) (1,600) (1,622) (1,658) (1,698) (1,740) (1,787) (1,838) (1,893) (1,952) (2,016)Capex transfer from reserve (1,216) (1,300) (1) (1) (1) (78) (2) (19) (12) 15 14
Closing balance 6,560 5,769 6,261 7,027 8,058 9,010 10,224 11,661 12,964 14,451 15,954
Opening balance 3,831 (1,492) (5,486) (1,928) (1,797) (5,708) (3,884) (3,833) (1,877) (1,805) 300Transfer to reserve 2,488 2,484 4,636 1,799 1,848 1,903 1,960 2,022 2,088 2,160 2,238Transfer from reserve (1,443) (2,026) - (40) (86) (80) (73) (67) (61) (55) (48)Capex transfer from reserve (6,368) (4,452) (1,077) (1,627) (5,673) - (1,835) - (1,955) - (2,096)
Closing balance (1,492) (5,486) (1,928) (1,797) (5,708) (3,884) (3,833) (1,877) (1,805) 300 394
Opening balance 3,104 2,366 3,436 3,672 4,315 621 1,876 2,162 1,942 1,722 1,502Transfer to reserve 2,478 1,770 1,814 1,860 1,434 1,475 506 - - - -Transfer from reserve (2,648) (405) (1,358) (785) - - - - - - -Capex transfer from reserve (569) (295) (220) (432) (5,128) (220) (220) (220) (220) (220) (220)
Closing balance 2,366 3,436 3,672 4,315 621 1,876 2,162 1,942 1,722 1,502 1,282
Opening balance 6,107 6,175 6,518 6,339 6,227 6,164 5,938 5,617 5,326 5,053 4,780Transfer to reserve 1,907 2,535 2,330 2,397 2,447 2,447 2,517 2,547 2,564 2,564 2,564Transfer from reserve (416) (396) (376) (376) (376) (376) (376) (376) (376) (376) (376)Capex transfer from reserve (1,423) (1,796) (2,134) (2,134) (2,134) (2,298) (2,462) (2,462) (2,462) (2,462) (2,462)
Closing balance 6,175 6,518 6,339 6,227 6,164 5,938 5,617 5,326 5,053 4,780 4,506
Opening balance 579 464 45 47 46 46 46 45 44 43 41Transfer to reserve 1,127 1,035 1,096 1,222 1,378 1,555 1,298 1,513 1,758 2,040 2,362Capex transfer from reserve (1,242) (1,454) (1,095) (1,222) (1,379) (1,556) (1,299) (1,514) (1,759) (2,041) (2,364)
Closing balance 464 45 47 46 46 46 45 44 43 41 39
Activities to which it relates: Any Activity approved by Council.
Land Subdivision reserve
Purpose: Receives revenue from Marlborough Regional Forestry and from the sale of non-activity assets for funding any projects approved by Council.
Purpose: To be used for essential infrastructure; to assist funding of new assets (up to a maximum of 50% ), and to assist the funding of significant capital upgrades which will increase the targeted level of service supplied to the community.
12.1 Reserve funds - Council wideEmergency Events reservesPurpose: Council’s Emergency events reserve, which is part of Council’s risk management strategy, exists to: - protect Council's infrastructural assets; - make a provision for restoration of Council's roading network in the event of extraordinary flood damage; - provide for the restoration of Council's Wairau floodplain river protection assets.
Forest Park reservePurpose: This reserve was set up to receive surpluses from the Solar Heights and Forest Hills Land Development Accounts, and for the proceeds to fund projects as determined by Council. Traditionally this reserve funded Community Infrastructure, (as opposed to Core Infrastructure such as Water and Sewerage etc which are funded from other reserves).
Forestry and Asset Sales reserve
Activities to which it relates: Infrastructural Assets including the roading network and rivers.
Activities to which it relates: Various.
Capex transfers are for upgrading of buildings and other structures with seismic issues
Infrastructure Upgrade reserve
Activities to which it relates: Community facilities including: Reserves, Halls, Swimming Pools.Purpose: To provide for Development Contributions and their utilisation in accordance with the provisions of the Local Government Act 2002.
Activities to which it relates: Infrastructure such as Water and Sewerage etc, and Other Activities as determined by Council from time to time.

Part 3: Financial and Infrastructure Strategy and Statements
2015-2025 Long Term Plan Page 245
Reserves as at 30 June: 2015 2016 2017 2018 2019 2020 2021 2022 2023 2024 2025$000's $000's $000's $000's $000's $000's $000's $000's $000's $000's $000's
Activities to which it relates: Various.Opening balance 4,313 4,313 4,313 4,313 4,313 4,313 4,313 4,313 4,313 4,313 4,313Transfer to reserve - - - - - - - - - - -Transfer from reserve - - - - - - - - - - -
Closing balance 4,313 4,313 4,313 4,313 4,313 4,313 4,313 4,313 4,313 4,313 4,313
Opening balance 3,211 1,922 1,520 1,403 1,094 1,049 864 992 734 729 536Transfer to reserve 694 649 886 869 931 859 936 766 743 756 758Transfer from reserve (538) (286) (287) (289) (290) (292) (293) (295) (297) (299) (301)Capex transfer from reserve (1,446) (765) (716) (889) (685) (752) (514) (729) (451) (650) (468)
Closing balance 1,922 1,520 1,403 1,094 1,049 864 992 734 729 536 525
Activities to which it relates: All.Opening balance 544,965 558,506 570,532 574,293 575,263 584,076 583,510 582,866 585,891 587,869 586,541Surplus from Operations 8,021 6,560 6,892 6,099 5,858 5,624 8,685 8,076 9,062 9,736 10,935Transfer from (to) General Reserves 998 2,114 890 (3,018) (2,676) (2,329) (7,696) (1,499) (4,857) (6,974) (1,475)Transfer from (to) Corporate Reserves 4,522 3,351 (4,020) (2,111) 5,631 (3,859) (1,634) (3,551) (2,228) (4,089) (2,231)
Closing balance 558,506 570,532 574,293 575,263 584,076 583,510 582,866 585,891 587,869 586,541 593,770
Total of low balance reserves not separately disclosedOpening balance (162) (419) 581 1,192 2,254 2,873 2,603 3,716 3,817 4,373Transfer to reserve 445 1,664 1,250 1,769 1,338 575 1,821 707 1,333 1,167Transfer from reserve (702) (664) (639) (675) (719) (845) (708) (606) (776) (807)Capex transfer from reserve - - - (32) - - - - - -
Closing balance (162) (419) 581 1,192 2,254 2,873 2,603 3,716 3,817 4,373 4,733Community Housing General and Depreciation reservesOpening balance (839) (948) (1,571) (1,706) (1,677) (1,664) (1,692) (1,784) (2,054) (2,316) (2,230)Transfer to reserve 259 262 289 296 305 315 327 342 359 499 430Transfer from reserve (367) (202) (254) (268) (291) (343) (229) (217) (215) (201) (215)Capex transfer from reserve - (683) (170) - - - (190) (394) (407) (212) (219)
Closing balance (948) (1,571) (1,706) (1,677) (1,664) (1,692) (1,784) (2,054) (2,316) (2,230) (2,234)Energy Efficiency General reserveOpening balance (651) (742) (814) (867) (898) (853) (734) (627) (538) (472) (420)Transfer to reserve 112 84 103 125 149 171 159 141 118 104 79Transfer from reserve (203) (156) (156) (156) (104) (52) (52) (52) (52) (52) (52)
Closing balance (742) (814) (867) (898) (853) (734) (627) (538) (472) (420) (393)
Purpose: technical accounting reserve to accumulate Council surplus's, amounts transferred to/from other reserves are deducted-from/added-to this balance.
General reserve: to accumulate targeted rates or other revenue for use in subsequent years.These reserves are "owned" by a specific activity or individual scheme etc and exist for the following purposes:
Landfill aftercare reserve: to accumulate "dump fees" charged from the operation of the landfill (or of a stage) required to fund its closure and management once it is fully utilised.
12.3 Reserve funds - Activity specific
Depreciation reserve: to accumulate rates levied to fund depreciation expense, may be used to fund capital expenditure or repayment of debt raised to fund capital expenditure.
Port Marlborough NZ Ltd Special Dividend reservePurpose: Defined amounts to be available to the Blenheim Vicinity, Picton Vicinity and General Rural geographic rating areas, or the interest on any unspent balance to be used to subsidise General rates in those areas.
Development contribution reserve: to accumulate development and financial contributions to fund qualifying capital expenditure.
Wairau Rivers reserve
12.2 Accumulated funds
Purpose: Accumulates each year-end surplus or deficit from the Wairau Valley River Works rates.Activities to which it relates: Rivers and Land Drainage on the Wairau Plain.

Part 3: Financial and Infrastructure Strategy and Statements
Page 246 2015-2025 Long Term Plan
Reserves as at 30 June: 2015 2016 2017 2018 2019 2020 2021 2022 2023 2024 2025$000's $000's $000's $000's $000's $000's $000's $000's $000's $000's $000's
Library Services Depreciation and general reservesOpening balance 439 381 341 327 68 (168) (119) (33) 100 (262) (703)Transfer to reserve 315 331 337 341 354 619 649 665 619 628 641Capex transfer from reserve - - (38) (122) (209) (259) (360) (532) (597) (604) (647)
Closing balance 753 713 639 546 213 192 169 100 122 (238) (708)Emergency Management General and Depreciation reservesOpening balance 243 243 252 246 261 275 265 280 294 306 318Transfer to reserve 32 37 41 44 44 44 47 47 46 47 48Transfer from reserve - - - - - - - - - - -Capex transfer from reserve (31) (28) (47) (29) (30) (53) (32) (33) (34) (35) (37)
Closing balance 243 252 246 261 275 265 280 294 306 318 330Swimming Pools General and Depreciation reservesOpening balance 368 720 1,079 1,487 1,913 2,370 2,881 3,411 3,962 4,536 5,136Transfer to reserve 408 421 465 479 494 511 530 551 574 600 629Transfer from reserve (57) (61) (57) (53) (27) - - - - - -
Closing balance 720 1,079 1,487 1,913 2,380 2,881 3,411 3,962 4,536 5,136 5,765Roading General and Depreciation reservesOpening balance 3,392 2,508 3,409 3,824 3,933 4,887 6,051 7,217 8,366 9,511 10,652Transfer to reserve 4,377 4,530 4,732 4,934 5,092 5,278 5,473 5,672 5,898 6,139 6,386Transfer from reserve (445) (682) (668) (783) (870) (936) (1,019) (1,099) (1,183) (1,269) (1,355)Capex transfer from reserve (4,816) (2,948) (3,649) (4,043) (3,267) (3,179) (3,289) (3,423) (3,570) (3,729) (3,897)
Closing balance 2,508 3,409 3,824 3,933 4,887 6,051 7,217 8,366 9,511 10,652 11,786Roading Development Contributions reserve (Northwest Periphery)Opening balance (749) (599) (449) (295) (136) 27 199 382 571 766 968Transfer to reserve 160 160 164 168 173 178 183 189 195 202 209Transfer from reserve (10) (10) (10) (10) (10) (5) - - - - -
Closing balance (599) (449) (295) (136) 27 199 382 571 766 968 1,177Wairau Floodplain Rivers and Drainage Depreciation reservesOpening balance 62 73 178 306 438 418 475 605 734 877 1,037Transfer to reserve 108 135 159 165 178 193 200 203 221 242 254Transfer from reserve - - - - (15) (32) (35) (37) (40) (42) (45)Capex transfer from reserve (98) (30) (31) (32) (183) (104) (35) (37) (38) (40) (41)
Closing balance 73 178 306 438 418 475 605 734 877 1,037 1,204Combined Sewerage General and Depreciation reservesOpening balance 2,387 2,091 2,268 1,331 503 484 1,721 (148) 145 2,282 2,834Transfer to reserve 3,105 3,010 2,978 3,661 3,776 4,089 4,356 4,652 4,841 5,037 5,277Transfer from reserve (973) (1,083) (1,570) (1,703) (1,796) (1,946) (2,226) (2,423) (2,435) (2,469) (2,509)Capex transfer from reserve (2,428) (1,750) (2,345) (2,786) (2,000) (907) (4,000) (1,935) (268) (2,016) (6,754)
Closing balance 2,091 2,268 1,331 503 484 1,721 (148) 145 2,282 2,834 (1,152)Riverlands Industrial Wastewater: General and Depreciation reservesOpening balance (816) (1,076) (1,264) (2,131) (2,127) (2,089) (2,049) (1,975) (1,836) (1,685) (1,569)Transfer to reserve 264 271 317 347 356 367 378 418 474 534 702Transfer from reserve (392) (404) (484) (338) (314) (291) (268) (271) (290) (311) (333)Capex transfer from reserve (133) (55) (700) (5) (5) (36) (37) (8) (33) (108) (110)
Closing balance (1,076) (1,264) (2,131) (2,127) (2,089) (2,049) (1,975) (1,836) (1,685) (1,569) (1,310)

Part 3: Financial and Infrastructure Strategy and Statements
2015-2025 Long Term Plan Page 247
Reserves as at 30 June: 2015 2016 2017 2018 2019 2020 2021 2022 2023 2024 2025$000's $000's $000's $000's $000's $000's $000's $000's $000's $000's $000's
Blenheim Stormwater: Depreciation and general reservesOpening balance 2,230 1,384 2,111 1,948 2,916 2,849 2,828 4,045 4,013 2,370 2,139Transfer to reserve 896 908 1,006 1,051 1,088 1,175 1,257 1,345 1,482 1,471 1,480Transfer from reserve - (150) (75) (40) - - - - (35) (110) (255)Capex transfer from reserve (1,743) (31) (1,094) (42) (1,155) (1,196) (40) (1,378) (3,089) (1,591) (1,375)
Closing balance 1,384 2,111 1,948 2,916 2,849 2,828 4,045 4,013 2,370 2,139 1,990Blenheim Stormwater: Development contribution reserveOpening balance - - - - - - - - - - -Transfer to reserve - - - - - - - - - - -
Closing balance - - - - - - - - - - -Other Stormwater: Depreciation reserveOpening balance 774 1,055 1,387 1,757 2,138 2,531 2,934 3,349 3,772 4,210 4,662Transfer to reserve 393 394 434 450 463 477 492 508 526 545 564Transfer from reserve (20) (22) (23) (25) (27) (29) (31) (33) (35) (38) (39)Capex transfer from reserve (92) (40) (42) (44) (44) (46) (47) (53) (52) (55) (56)
Closing balance 1,055 1,387 1,757 2,138 2,531 2,934 3,349 3,772 4,210 4,662 5,132Awatere Water: Depreciation and general reservesOpening balance 32 32 32 32 32 32 32 32 32 32 32Transfer to reserve - - - - - - - - - - -Transfer from reserve - - - - - - - - - - -Capex transfer from reserve - - - - - - - - - - -
Closing balance 32 32 32 32 32 32 32 32 32 32 32Blenheim Water: General and Depreciation reservesOpening balance 749 1,536 994 401 1,697 2,571 3,625 4,274 4,672 5,559 6,786Transfer to reserve 2,083 2,112 2,063 2,048 2,023 2,017 1,974 1,990 2,070 2,145 2,220Transfer from reserve (871) (940) (917) (804) (733) (729) (781) (836) (896) (960) (1,028)Capex transfer from reserve (425) (1,713) (1,740) 52 (417) (234) (544) (755) (287) 42 (621)
Closing balance 1,536 994 401 1,697 2,571 3,625 4,274 4,672 5,559 6,786 7,358Havelock Water: General and Depreciation reservesOpening balance 343 293 325 344 387 487 591 691 800 496 549Transfer to reserve 106 99 116 124 190 253 260 299 238 249 258Transfer from reserve (61) (44) (44) (19) (80) (146) (157) (168) (180) (192) (206)Capex transfer from reserve (96) (23) (52) (62) (10) (3) (3) (23) (362) (3) (84)
Closing balance 293 325 344 387 487 591 691 800 496 549 517Picton Water: General and Depreciation reservesOpening balance 1,492 1,059 721 672 1,210 1,671 582 800 1,452 1,028 1,585Transfer to reserve 869 744 842 869 897 951 1,009 1,052 1,118 1,184 1,204Transfer from reserve (84) (144) (227) (216) (219) (270) (323) (338) (414) (492) (513)Capex transfer from reserve (1,218) (938) (664) (115) (216) (1,770) (469) (60) (1,129) (135) (63)
Closing balance 1,059 721 672 1,210 1,671 582 800 1,452 1,028 1,585 2,213Renwick Water: General and Depreciation reservesOpening balance 730 547 625 444 434 314 480 556 570 763 956Transfer to reserve 145 118 137 146 264 316 330 346 360 373 387Transfer from reserve (70) (50) (61) (18) (90) (147) (155) (168) (180) (193) (207)Capex transfer from reserve (258) 10 (256) (139) (294) (3) (98) (165) 13 13 14
Closing balance 547 625 444 434 314 480 556 570 763 956 1,150
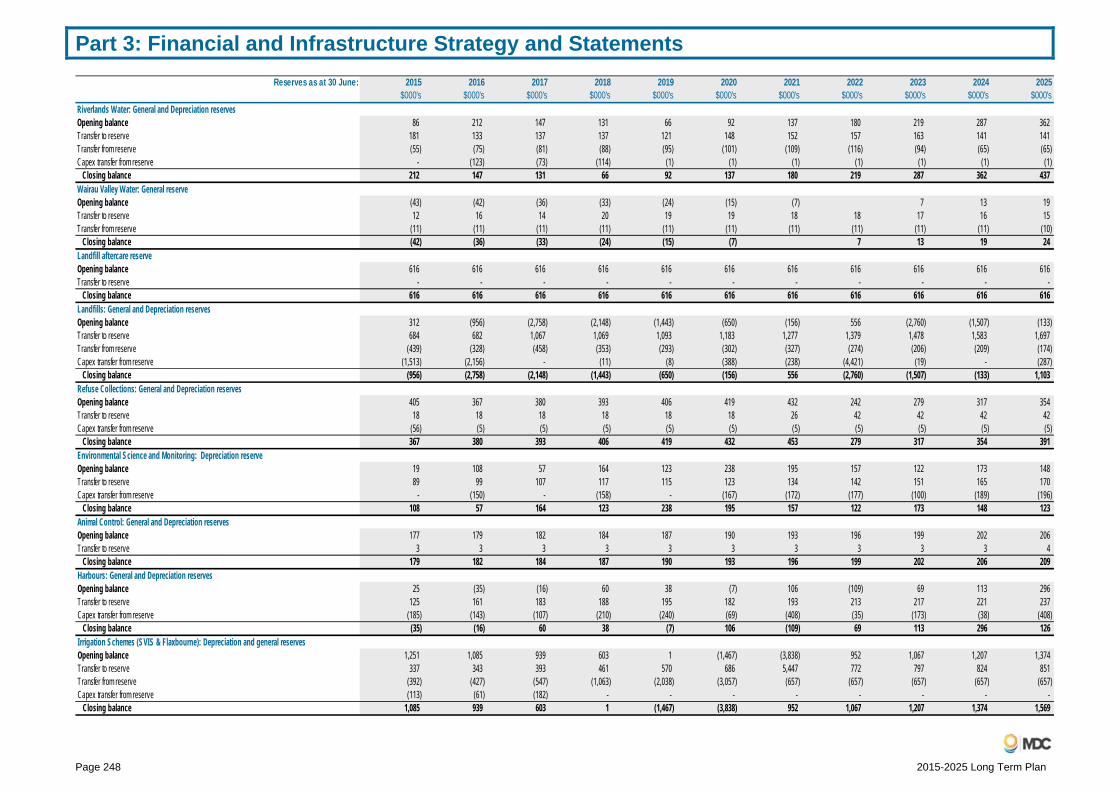
Part 3: Financial and Infrastructure Strategy and Statements
Page 248 2015-2025 Long Term Plan
Reserves as at 30 June: 2015 2016 2017 2018 2019 2020 2021 2022 2023 2024 2025$000's $000's $000's $000's $000's $000's $000's $000's $000's $000's $000's
Riverlands Water: General and Depreciation reservesOpening balance 86 212 147 131 66 92 137 180 219 287 362Transfer to reserve 181 133 137 137 121 148 152 157 163 141 141Transfer from reserve (55) (75) (81) (88) (95) (101) (109) (116) (94) (65) (65)Capex transfer from reserve - (123) (73) (114) (1) (1) (1) (1) (1) (1) (1)
Closing balance 212 147 131 66 92 137 180 219 287 362 437Wairau Valley Water: General reserveOpening balance (43) (42) (36) (33) (24) (15) (7) 7 13 19Transfer to reserve 12 16 14 20 19 19 18 18 17 16 15Transfer from reserve (11) (11) (11) (11) (11) (11) (11) (11) (11) (11) (10)
Closing balance (42) (36) (33) (24) (15) (7) 7 13 19 24Landfill aftercare reserveOpening balance 616 616 616 616 616 616 616 616 616 616 616Transfer to reserve - - - - - - - - - - -
Closing balance 616 616 616 616 616 616 616 616 616 616 616Landfills: General and Depreciation reservesOpening balance 312 (956) (2,758) (2,148) (1,443) (650) (156) 556 (2,760) (1,507) (133)Transfer to reserve 684 682 1,067 1,069 1,093 1,183 1,277 1,379 1,478 1,583 1,697Transfer from reserve (439) (328) (458) (353) (293) (302) (327) (274) (206) (209) (174)Capex transfer from reserve (1,513) (2,156) - (11) (8) (388) (238) (4,421) (19) - (287)
Closing balance (956) (2,758) (2,148) (1,443) (650) (156) 556 (2,760) (1,507) (133) 1,103Refuse Collections: General and Depreciation reservesOpening balance 405 367 380 393 406 419 432 242 279 317 354Transfer to reserve 18 18 18 18 18 18 26 42 42 42 42Capex transfer from reserve (56) (5) (5) (5) (5) (5) (5) (5) (5) (5) (5)
Closing balance 367 380 393 406 419 432 453 279 317 354 391Environmental Science and Monitoring: Depreciation reserveOpening balance 19 108 57 164 123 238 195 157 122 173 148Transfer to reserve 89 99 107 117 115 123 134 142 151 165 170Capex transfer from reserve - (150) - (158) - (167) (172) (177) (100) (189) (196)
Closing balance 108 57 164 123 238 195 157 122 173 148 123Animal Control: General and Depreciation reservesOpening balance 177 179 182 184 187 190 193 196 199 202 206Transfer to reserve 3 3 3 3 3 3 3 3 3 3 4
Closing balance 179 182 184 187 190 193 196 199 202 206 209Harbours: General and Depreciation reservesOpening balance 25 (35) (16) 60 38 (7) 106 (109) 69 113 296Transfer to reserve 125 161 183 188 195 182 193 213 217 221 237Capex transfer from reserve (185) (143) (107) (210) (240) (69) (408) (35) (173) (38) (408)
Closing balance (35) (16) 60 38 (7) 106 (109) 69 113 296 126Irrigation Schemes (SVIS & Flaxbourne): Depreciation and general reservesOpening balance 1,251 1,085 939 603 1 (1,467) (3,838) 952 1,067 1,207 1,374Transfer to reserve 337 343 393 461 570 686 5,447 772 797 824 851Transfer from reserve (392) (427) (547) (1,063) (2,038) (3,057) (657) (657) (657) (657) (657)Capex transfer from reserve (113) (61) (182) - - - - - - - -
Closing balance 1,085 939 603 1 (1,467) (3,838) 952 1,067 1,207 1,374 1,569
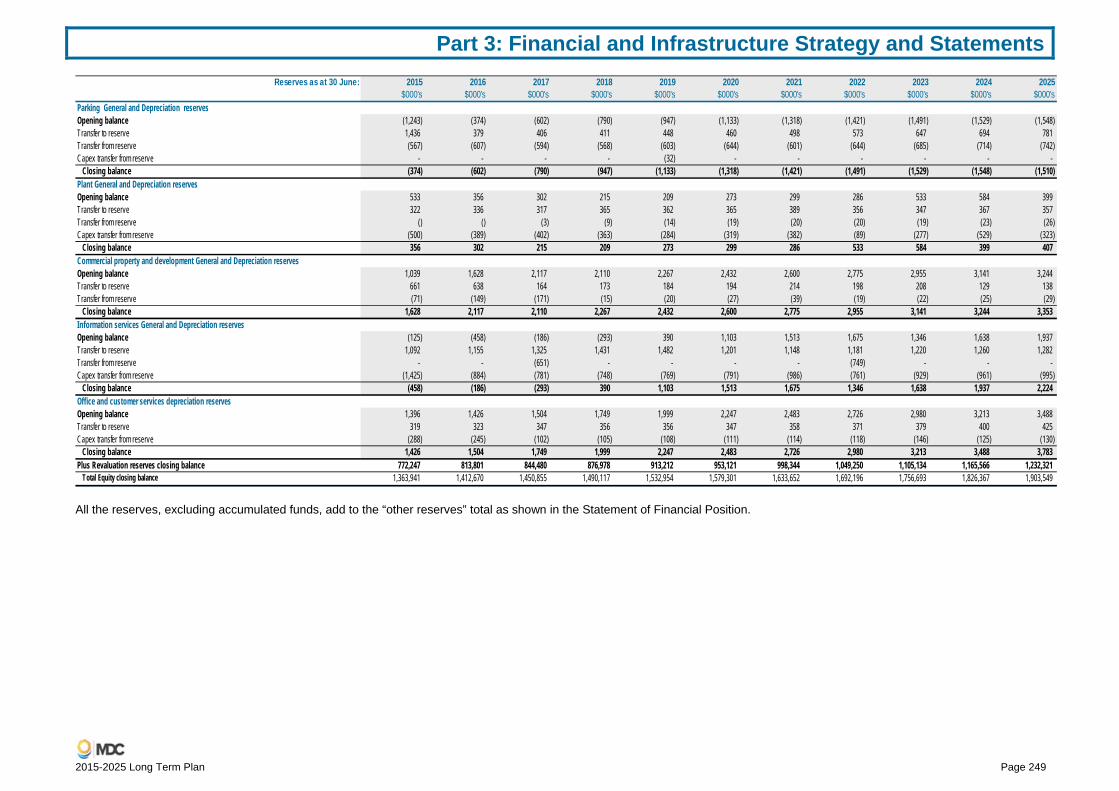
Part 3: Financial and Infrastructure Strategy and Statements
2015-2025 Long Term Plan Page 249
All the reserves, excluding accumulated funds, add to the “other reserves” total as shown in the Statement of Financial Position.
Reserves as at 30 June: 2015 2016 2017 2018 2019 2020 2021 2022 2023 2024 2025$000's $000's $000's $000's $000's $000's $000's $000's $000's $000's $000's
Parking General and Depreciation reservesOpening balance (1,243) (374) (602) (790) (947) (1,133) (1,318) (1,421) (1,491) (1,529) (1,548)Transfer to reserve 1,436 379 406 411 448 460 498 573 647 694 781Transfer from reserve (567) (607) (594) (568) (603) (644) (601) (644) (685) (714) (742)Capex transfer from reserve - - - - (32) - - - - - -
Closing balance (374) (602) (790) (947) (1,133) (1,318) (1,421) (1,491) (1,529) (1,548) (1,510)Plant General and Depreciation reservesOpening balance 533 356 302 215 209 273 299 286 533 584 399Transfer to reserve 322 336 317 365 362 365 389 356 347 367 357Transfer from reserve () () (3) (9) (14) (19) (20) (20) (19) (23) (26)Capex transfer from reserve (500) (389) (402) (363) (284) (319) (382) (89) (277) (529) (323)
Closing balance 356 302 215 209 273 299 286 533 584 399 407Commercial property and development General and Depreciation reservesOpening balance 1,039 1,628 2,117 2,110 2,267 2,432 2,600 2,775 2,955 3,141 3,244Transfer to reserve 661 638 164 173 184 194 214 198 208 129 138Transfer from reserve (71) (149) (171) (15) (20) (27) (39) (19) (22) (25) (29)
Closing balance 1,628 2,117 2,110 2,267 2,432 2,600 2,775 2,955 3,141 3,244 3,353Information services General and Depreciation reservesOpening balance (125) (458) (186) (293) 390 1,103 1,513 1,675 1,346 1,638 1,937Transfer to reserve 1,092 1,155 1,325 1,431 1,482 1,201 1,148 1,181 1,220 1,260 1,282Transfer from reserve - - (651) - - - - (749) - - -Capex transfer from reserve (1,425) (884) (781) (748) (769) (791) (986) (761) (929) (961) (995)
Closing balance (458) (186) (293) 390 1,103 1,513 1,675 1,346 1,638 1,937 2,224Office and customer services depreciation reservesOpening balance 1,396 1,426 1,504 1,749 1,999 2,247 2,483 2,726 2,980 3,213 3,488Transfer to reserve 319 323 347 356 356 347 358 371 379 400 425Capex transfer from reserve (288) (245) (102) (105) (108) (111) (114) (118) (146) (125) (130)
Closing balance 1,426 1,504 1,749 1,999 2,247 2,483 2,726 2,980 3,213 3,488 3,783Plus Revaluation reserves closing balance 772,247 813,801 844,480 876,978 913,212 953,121 998,344 1,049,250 1,105,134 1,165,566 1,232,321
Total Equity closing balance 1,363,941 1,412,670 1,450,855 1,490,117 1,532,954 1,579,301 1,633,652 1,692,196 1,756,693 1,826,367 1,903,549

Part 4: Funding Impact Statement and Rates
Page 250 2015-2025 Long Term Plan
Part 4: Funding Impact Statement and Rates
Funding Impact Statement
Rates Movements 2015-25

Funding Impact Statement
2015-2025 Long Term Plan Page 251
Funding Impact Statement The Funding Impact Statement provides the following information:
A Funding Impact Statement for 2015-16.
Detailed explanations of the types of rates that are to be set, their purpose, and the basis on which they are calculated.
A narrative description of the geographic areas that are used for Targeted General-type Rates and Charges.
General Information in respect of rates instalment dates and penalties for late payment.
Revaluation Movements Information.
The GST inclusive (incl) amounts shown in this Statement have been calculated using GST at 15%.
AP 2014.15 2015.16 2016.17 2017.18 2018.19 2019.20 2020.21 2021.22 2022.23 2023.24 2024.25$000's $000's $000's $000's $000's $000's $000's $000's $000's $000's $000's
Sources of operating fundingGeneral rates, uniform annual general charges, rates penalties 34,977 37,046 39,074 40,522 42,168 43,789 45,749 47,716 49,501 51,530 53,559Targeted rates (other than a targeted rate for water supply) 21,599 20,571 21,451 23,178 24,678 25,912 30,159 31,235 31,453 32,021 32,636Subsidies and grants for operating purposes 3,798 5,022 5,513 5,597 5,951 6,128 6,348 6,580 6,870 7,103 7,379Fees, charges, and targeted rates for water supply 13,122 15,311 16,067 16,551 17,226 17,858 18,333 18,869 19,369 19,976 20,612Interest and dividends from investments 1,572 1,658 1,610 1,660 1,710 1,710 1,710 1,710 1,710 1,710 1,710Other receipts including fuel tax, fines and infringement fees 16,512 16,763 15,744 16,370 16,793 17,143 15,232 10,117 10,395 10,314 10,511
Total operating funding 91,580 96,371 99,458 103,879 108,526 112,541 117,530 116,227 119,298 122,653 126,406Applications of operating funding
Payments to staff and suppliers 59,200 69,066 72,205 73,714 76,529 78,760 79,454 78,727 81,255 83,250 85,954Finance costs 2,337 3,674 4,797 5,571 6,765 8,029 8,672 9,002 8,910 8,487 8,022Other operating funding applications 6,726 4,924 3,042 3,019 2,967 3,017 3,017 3,046 3,099 3,106 3,140
Total applications of operating funding 68,263 77,664 80,044 82,304 86,261 89,806 91,143 90,775 93,264 94,842 97,116Surplus of operating funding 23,317 18,708 19,414 21,575 22,264 22,734 26,387 25,453 26,034 27,811 29,290
Sources of capital fundingSubsidies and grants for capital expenditure (4,828) 3,107 4,087 3,427 3,454 3,582 3,722 3,871 4,034 4,210 4,397Development and financial contributions 1,613 1,198 1,221 1,305 1,377 1,451 1,532 1,625 1,728 1,843 1,972Increase in debt 8,457 20,000 12,000 10,000 24,000 12,000 6,250 3,000 (5,750) (6,500) (7,000)Gross proceeds from sale of assets 24 2,608 9,345 1,901 2,835 2,016 3,025 2,124 5,573 2,281 3,420
Total sources of capital funding 5,266 26,913 26,653 16,633 31,665 19,048 14,529 10,621 5,584 1,835 2,790
Marlborough District CouncilFunding Impact Statement (excluding GST)
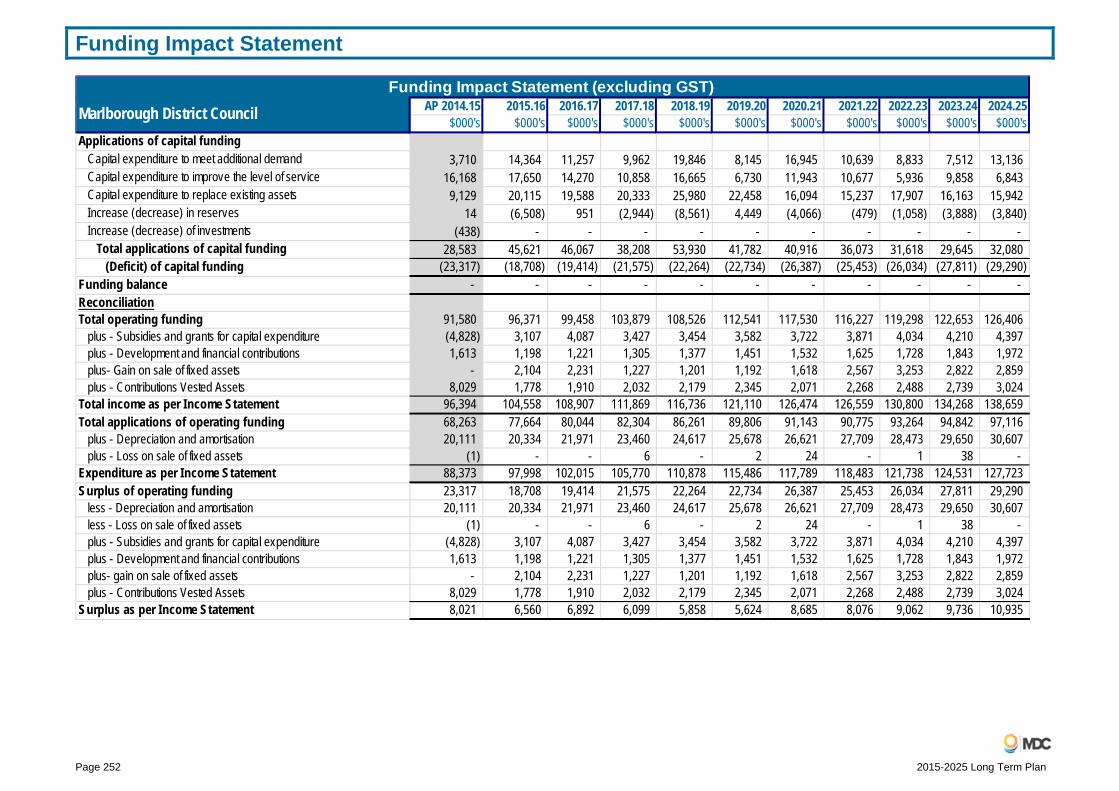
Funding Impact Statement
Page 252 2015-2025 Long Term Plan
AP 2014.15 2015.16 2016.17 2017.18 2018.19 2019.20 2020.21 2021.22 2022.23 2023.24 2024.25$000's $000's $000's $000's $000's $000's $000's $000's $000's $000's $000's
Applications of capital fundingCapital expenditure to meet additional demand 3,710 14,364 11,257 9,962 19,846 8,145 16,945 10,639 8,833 7,512 13,136Capital expenditure to improve the level of service 16,168 17,650 14,270 10,858 16,665 6,730 11,943 10,677 5,936 9,858 6,843Capital expenditure to replace existing assets 9,129 20,115 19,588 20,333 25,980 22,458 16,094 15,237 17,907 16,163 15,942Increase (decrease) in reserves 14 (6,508) 951 (2,944) (8,561) 4,449 (4,066) (479) (1,058) (3,888) (3,840)Increase (decrease) of investments (438) - - - - - - - - - -
Total applications of capital funding 28,583 45,621 46,067 38,208 53,930 41,782 40,916 36,073 31,618 29,645 32,080(Deficit) of capital funding (23,317) (18,708) (19,414) (21,575) (22,264) (22,734) (26,387) (25,453) (26,034) (27,811) (29,290)
Funding balance - - - - - - - - - - -ReconciliationTotal operating funding 91,580 96,371 99,458 103,879 108,526 112,541 117,530 116,227 119,298 122,653 126,406
plus - Subsidies and grants for capital expenditure (4,828) 3,107 4,087 3,427 3,454 3,582 3,722 3,871 4,034 4,210 4,397plus - Development and financial contributions 1,613 1,198 1,221 1,305 1,377 1,451 1,532 1,625 1,728 1,843 1,972plus- Gain on sale of fixed assets - 2,104 2,231 1,227 1,201 1,192 1,618 2,567 3,253 2,822 2,859plus - Contributions Vested Assets 8,029 1,778 1,910 2,032 2,179 2,345 2,071 2,268 2,488 2,739 3,024
Total income as per Income Statement 96,394 104,558 108,907 111,869 116,736 121,110 126,474 126,559 130,800 134,268 138,659Total applications of operating funding 68,263 77,664 80,044 82,304 86,261 89,806 91,143 90,775 93,264 94,842 97,116
plus - Depreciation and amortisation 20,111 20,334 21,971 23,460 24,617 25,678 26,621 27,709 28,473 29,650 30,607plus - Loss on sale of fixed assets (1) - - 6 - 2 24 - 1 38 -
Expenditure as per Income Statement 88,373 97,998 102,015 105,770 110,878 115,486 117,789 118,483 121,738 124,531 127,723Surplus of operating funding 23,317 18,708 19,414 21,575 22,264 22,734 26,387 25,453 26,034 27,811 29,290
less - Depreciation and amortisation 20,111 20,334 21,971 23,460 24,617 25,678 26,621 27,709 28,473 29,650 30,607less - Loss on sale of fixed assets (1) - - 6 - 2 24 - 1 38 -plus - Subsidies and grants for capital expenditure (4,828) 3,107 4,087 3,427 3,454 3,582 3,722 3,871 4,034 4,210 4,397plus - Development and financial contributions 1,613 1,198 1,221 1,305 1,377 1,451 1,532 1,625 1,728 1,843 1,972plus- gain on sale of fixed assets - 2,104 2,231 1,227 1,201 1,192 1,618 2,567 3,253 2,822 2,859plus - Contributions Vested Assets 8,029 1,778 1,910 2,032 2,179 2,345 2,071 2,268 2,488 2,739 3,024
Surplus as per Income Statement 8,021 6,560 6,892 6,099 5,858 5,624 8,685 8,076 9,062 9,736 10,935
Funding Impact Statement (excluding GST) Marlborough District Council

Funding Impact Statement
2015-2025 Long Term Plan Page 253
Terminology Unless otherwise specified:
The terms land values, capital values or rating units refer to rateable land values, rateable capital values or rateable rating units as the case may be.
Uniform Annual Charge (UAC) or Charge refers to a targeted rate of a uniform amount calculated on each separately used or inhabited part of every rating unit; or for some charges, on every rating unit.
General Type Targeted Rates are rates that are targeted to a particular geographic rating area or a differential rating area group. (These rates are based on the land value of each property).
General Type Targeted Charges are charges that are targeted to a particular geographic rating area. (These charges are set differentially for the six geographic areas as a fixed amount on every separately used or inhabited part of a rating unit).
Separate Targeted Rates and Charges are rates or charges that are targeted to a particular area of benefit, eg: Water, Sewerage. (Separate targeted rates are based on the land value of each property other than Wairau Valley River Works rates and the Kenepuru Road rate, which are levied on capital value, the Southern Valleys’ Irrigation Loan rate which is based on irrigable hectares; or the Energy Efficiency rates which are based on the service amount).
LTP refers to Council’s Long Term Plan which was adopted on 25 June 2015.
Council has the following policies to determine what constitutes a “separately used or inhabited part of a rating unit”:
o That in situations where a rating unit contains both a commercial or industrial type use, and a residential or rural type use, they will be treated as two separate uses and be assessed two sets of charges, except for those predominantly residential properties where the owner of the commercial/industrial operation resides on the same rating unit.
o For those predominantly residential rating units where the owner of the rating unit resides and operates a business or businesses (including a homestay or farmstay activity) from the same rating unit, they will be assessed only one uniform targeted charge for geographic area general-type works.
o Where services such as water, sewerage and refuse and kerbside recycling collection are supplied, separate charges will be assessed on the separately used or inhabited portions, except for those predominantly residential properties where the owner of the commercial/industrial operation or a homestay or farmstay activity resides on the same rating unit.
o Where a number of different businesses are located on one rating unit, each separate business will be assessed uniform charges. An exception is made for motels, hotels and dwellings used for commercial rental – they are treated as one business use even if each accommodation unit may be capable of separate habitation.
o Where rating units contain separate residential habitable dwellings that are capable of independent habitation (i.e. they have all the facilities such as bathroom, toilets, kitchens, separate entrance ways etc), uniform charges will be assessed on each dwelling.
o If a rating unit contains a dwelling and a flat (as shown as a “nature of improvements” on the Council valuation roll) and the flat contains a kitchen; uniform charges will be assessed on the dwelling and flat.
GST inclusive (incl) amounts are used to indicate the Levy Totals and the Benchmark Property Levy Amounts affecting Ratepayers. The GST rate used in these calculations is 15%.
GST exclusive (excl) amounts are used to indicate Rate Revenue Movements affecting the Council.
The projected number of rating units within the District for each of the preceding financial years of the Long Term Plan is 26,200.
The Council has adopted the following differential rating categories for general-type rates:
Residential or Rural All land used for a private residence and all land used for rural purposes. "Private residence" excludes rest homes and residential establishments that provide residential care. It also excludes all forms of commercial accommodation.
“Rural purposes” means any agricultural, horticultural or pastoral purpose and includes the keeping of bees, poultry or livestock. This group will include all rating units not otherwise categorised within a specified differential category.
Forestry is included in this category for the purposes of the General Works and Services Rate.
Commercial or Industrial All land used for a commercial or industrial purpose. "Commercial purposes" includes but is not limited to, any trade or service or activity undertaken or provision of facilities, by any person with a view to making a profit or charging any fee or deriving any other consideration in relation to the trade or service or activity or provision. "Industrial"

Funding Impact Statement
Page 254 2015-2025 Long Term Plan
includes a business, manufacturer, undertaking, or service associated with the production of any type of goods. For the purposes of the General Works and Services Rate, this differential category includes residential rest homes and residential establishments that provide residential care and all forms of commercial accommodation as well as rating units otherwise assessed as "utilities".
Commercial accommodation includes but is not limited to the provision of accommodation for a fee or other consideration with the exemption of:
Properties where the principal purpose is the provision of longstay accommodation ie: 28 days or more.
Properties that provide accommodation for five or less people.
Properties that were originally constructed as residential properties that provide accommodation for six or more, which are included in the homestay or farmstay category.
Homestay or Farmstay Includes all rating units that are used for a homestay or farmstay activity on land predominantly used for residential or rural purposes, where a Building Act or Resource Consent was required for such a use.
Utilities Land used for an essential service such as water, electricity, gas, telecommunications or sewerage.
Multiple Land Uses The Council will partition a rating unit where there are two or more land uses that fit into different differential rating categories except for predominantly residential properties where the owner of the commercial/industrial operation resides on the same rating unit.
Targeted General Type Rates and Charges $36,445,700 GST excl
($41,912,555 GST incl) Although general-type rates and charges have increased overall by 4.70% ($1,636,257 GST excl), there are varying percentage movements (both up and down) in the different rates and charges. These variations are the result of expenditure movements not uniformly impacting on geographic areas and valuation movements in the differential areas.
Geographic Area General Works and Services Rates $23,026,795 GST excl
($26,480,814 GST incl) General Works and Services Rates are set differentially for six geographic areas, depending on where the land is situated.

Funding Impact Statement
2015-2025 Long Term Plan Page 255
Geographic Rating Areas

Funding Impact Statement
Page 256 2015-2025 Long Term Plan
Within each geographic area, the rating units are further differentiated into categories of rateable land in accordance with the use to which the land is put in one or more of the following categories of rateable land:
Residential or rural.
Commercial or industrial.
Homestay or farmstay.
For these rates Utilities will be treated as falling within the commercial or industrial differential category.
These rates (which are funded on a land value basis) fund the Geographic Area’s share of the Net Cost of Operations, Capital Expenditure and Debt Servicing Cost charges, after making provision for other targeted rates and charges, general revenue and utilisation of various reserves.
Overall, these rates will increase by $1,029,193 (4.68%) GST excl; however there are varying impacts on the geographic areas and their differential rates.
General Works and Services rate amounts (GST incl) set in each geographic area are as follows:
Geographic Area Differential Rating Categories
Levy(GST excl)
Levy (GST incl)
Cents in $ (GST incl)
Blenheim Res/Rural 5,325,736 6,124,598 0.373919 Com/Ind 3,470,138 3,990,659 1.242995 Hsty/Fsty 1,863 2,142 0.591282
Blenheim Vicinity Res/Rural 4,917,893 5,655,577 0.272681 Com/Ind 258,948 297,790 0.527388 Hsty/Fsty 13,661 15,710 0.336919
Picton Res/Rural 1,455,745 1,674,106 0.536920 Com/Ind 751,837 864,613 1.150003 Hsty/Fsty 5,072 5,833 0.691517
Picton Vicinity Res/Rural 208,411 239,672 0.157913 Com/Ind 18,667 21,467 0.419694 Hsty/Fsty 365 420 0.223153
General Rural Res/Rural 5,837,961 6,713,655 0.290208 Com/Ind 132,777 152,693 0.466520
Hsty/Fsty 3,273 3,764 0.334387 Sounds Admin Res/Rural 600,671 690,771 0.193242

Funding Impact Statement
2015-2025 Long Term Plan Page 257
Geographic Area Differential Rating Categories
Levy(GST excl)
Levy (GST incl)
Cents in $(GST incl)
Rural Com/Ind 23,324 26,823 0.317259 Hsty/Fsty 453 521 0.223921
Geographic Area General Works and Services Charges $13,418,905 GST excl
($15,431,741 GST incl) A targeted Geographic General Area Works and Services rate on the basis of a fixed amount on every separately used or inhabited part of a rating unit ensures that rating units contribute on a uniform basis to fund the respective area’s share of the Net Cost of Operations, Capital Expenditure and Debt Servicing Cost costs, after making provision for targeted rates and charges, general revenue and utilisation of various reserves.
These charges are set differentially for six geographic areas, depending on where the land is situated; on the same basis as for the Geographic Area General Works and Services Rates. There is also a differential charge for Utilities.
Overall, these charges will increase by $607,064 (4.74%) GST excl, but there are varying impacts on the geographic areas and their differential charges.
Total Revenue sought from General Works and Services Charges in each geographic area (including Utilities) will be as follows:
Geographic Area Levy (GST excl)
Levy(GST incl)
Unit Charge(GST incl)
Blenheim 6,911,076 7,947,737 647 Blenheim Vicinity 2,102,131 2,417,451 581 Picton 1,693,899 1,947,984 693 Picton Vicinity 239,202 275,082 599 General Rural 2,006,244 2,307,181 429
Sounds Admin Rural 448,619 515,912 360
Utilities 17,734 20,394 552
Debt Servicing Rates and Charges $1,240,631 GST excl ($1,426,726 GST incl)
Grovetown Sewerage Loan Rate $98,272 GST excl ($113,012 GST incl)
The Grovetown Sewerage Loan Rate is calculated on the land value of every rating unit in the Grovetown Sewerage Special Rating Area in respect of which no contribution to the lump sum scheme was chosen to fund debt servicing costs on an interest only basis for the first year and progressively moving to a table mortgage basis over the ensuing nine years by increasing the rate payable by CPI each year. The loan rate will continue until 30 June 2039.
A 2% CPI related increase has been applied to move towards the amount required to service the future table mortgage requirements.
On a rating unit whose land value increases from $160,000 to $175,000 the sewerage loan rate will increase from $1,017.81 to $1,041.23 GST excl. The new cents in the dollar rate is 0.594987 cents GST incl.
Picton Sewerage Treatment Loan Rate $60,692 GST excl ($69,796 GST incl)
The Picton Sewerage Treatment Loan Rate is calculated on the land value of every rating unit in the Picton Sewerage Special Rating Area in respect of which no contribution to the lump sum scheme was chosen to fund debt servicing costs. The loan rate will continue until 30 June 2018.
No increase has occurred.
On a rating unit whose land value remains at $105,000, the Picton Sewerage Treatment Loan rate will increase from $52.04 to $52.39 GST incl.
The new cents in the dollar rate is 0.049892 GST incl.
Renwick Sewerage Loan Rate $32,118 GST excl ($36,936 GST incl)
The Renwick Sewerage Loan Rate is calculated on the land value of every rating unit in the Renwick Sewerage Special Rating Area in respect of which no contribution to the lump sum scheme was chosen to fund debt servicing costs. The loan rate will continue until 30 June 2026.
No increase has occurred.

Funding Impact Statement
Page 258 2015-2025 Long Term Plan
On a rating unit whose land value increases from $128,000 to $131,000, the loan rate reduces from $86.68 to $85.07 and the new cents in the dollar rate is 0.064938 GST incl.
Southern Valleys’ Irrigation Loan Rate $1,049,549 GST excl ($1,206,982 GST incl)
This rate is assessed on the basis of a fixed amount per hectare on all irrigable land on every rating unit in the Southern Valleys’ Special Rating Area in respect of which no contribution to the lump sum scheme was chosen to fund debt servicing costs on capital expenditure. The loan rate will continue until 30 June 2027.
No increase has occurred.
The targeted loan rate remains at $324.75 GST incl.
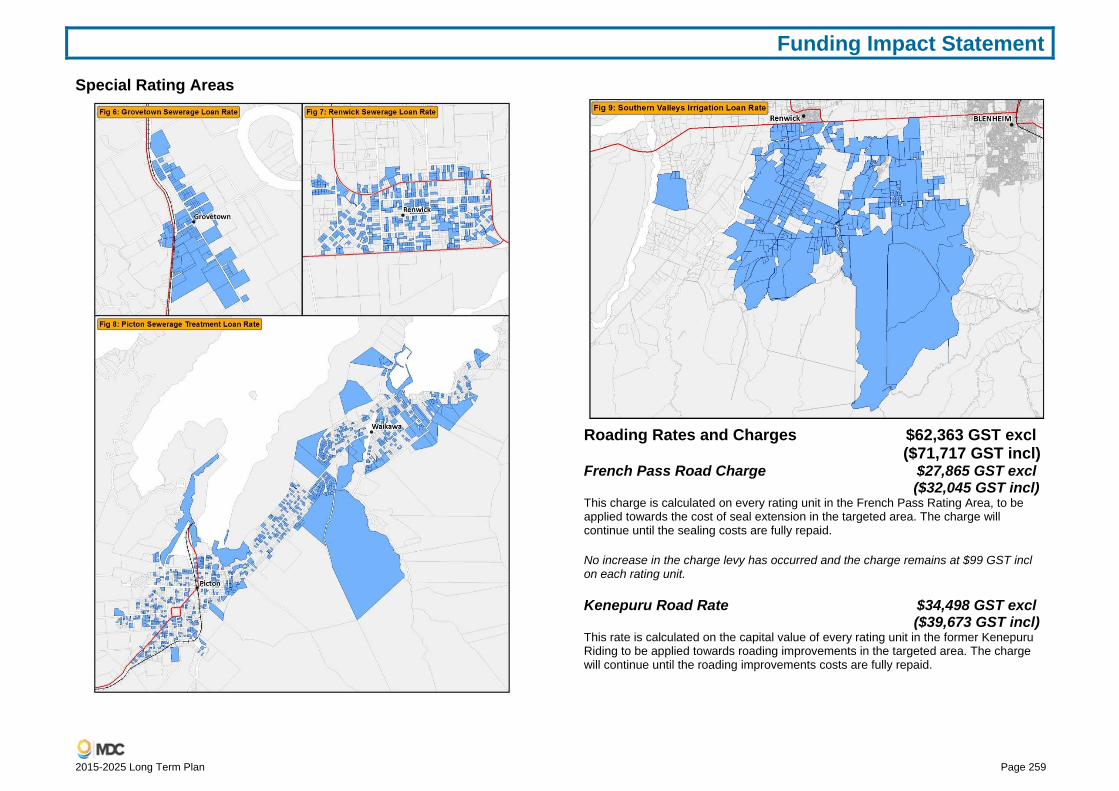
Funding Impact Statement
2015-2025 Long Term Plan Page 259
Special Rating Areas
Roading Rates and Charges $62,363 GST excl
($71,717 GST incl) French Pass Road Charge $27,865 GST excl
($32,045 GST incl) This charge is calculated on every rating unit in the French Pass Rating Area, to be applied towards the cost of seal extension in the targeted area. The charge will continue until the sealing costs are fully repaid.
No increase in the charge levy has occurred and the charge remains at $99 GST incl on each rating unit.
Kenepuru Road Rate $34,498 GST excl ($39,673 GST incl)
This rate is calculated on the capital value of every rating unit in the former Kenepuru Riding to be applied towards roading improvements in the targeted area. The charge will continue until the roading improvements costs are fully repaid.

Funding Impact Statement
Page 260 2015-2025 Long Term Plan
No increase in the rate levy has occurred and the new rate in the dollar based on capital value is 0.013873 cents GST incl.
Wairau Valley River Works Rate $3,677,777 GST excl
($4,229,444 GST incl) This differential rate covers the costs of river planning, control and flood protection in the Wairau Valley Rivers Rating Area and is calculated on a Capital Value basis on every rating unit in the Wairau Catchment. The differentials reflect the benefits derived by each group.
The funding requirements from each area are as follows:
Blenheim Vicinity 47.57% Blenheim Urban 47.84% Other Urban 4.59%
A 6.06% increase ($210,158 GST excl) in the overall rates levy has occurred.
The following is a schedule of the cents in the dollar to be set and assessed on the capital values in each group. (In brackets is the levy amount for each $10,000 of Capital Value).
Rating Areas Levy (GSTexcl)
Levy (GST incl)
Cents in the $ (GST
incl)
Levy Amount*
Rural A Rating Units 494,982 569,228 0.071997 (7.20) Rural B Rating Units 931,772 1,071,538 0.066957 (6.70) Rural C Rating Units 149,733 172,194 0.043198 (4.32) Rural D Rating Units 173,032 198,987 0.007920 (0.79) Blenheim Urban 1 Rating Units 1,128,637 1,297,933 0.060960 (6.10) Blenheim Urban 2 Rating Units 522,266 600,606 0.042672 (4.27) Blenheim Urban 3 Rating Units 61,267 70,457 0.029126 (2.91) Blenheim Urban 4 Rating Units 47,278 54,370 0.023030 (2.30) Other Urban 1 Rating Units in Wairau Catchment
87,490 100,613 0.054438 (5.44)
Other Urban 2 Rating Units in Wairau Catchment
81,320 93,518 0.034996 (3.50)
* Levy amount for each $10,000 of Capital Value.

Funding Impact Statement
2015-2025 Long Term Plan Page 261
Wairau Valley Rivers Rating Area
Combined Sewerage Scheme Rates and Charges $7,706,860 GST excl
($8,862,890 GST incl) An overall increase of $72,864 (GST excl) will occur (0.95%).
Combined Sewerage Scheme Capital Works Rate $2,629,317 GST excl
($3,023,715 GST incl) This rate is assessed on the land value of every rating unit in the Combined Sewerage Rating Area on a differential basis and funds the Capital Expenditure and Debt Servicing costs of the combined sewerage scheme.
There is a 1.45% ($37,482 GST excl) increase in this rate.
On a Blenheim rating unit in the Blenheim Group area whose land value increases from $160,000 to $175,000 the rate will increase from $186.24 to $194.63 - a rate in the dollar of 0.111216 cents GST incl.
On a Havelock rating unit whose land value decreases from $170,000 to $155,000 the rate will decrease from $176.41 to $153.42 - a rate in the dollar of 0.098982 cents GST incl.
On a Picton rating unit whose land value decreases from $160,000 to $155,000 the rate will decrease from $219.82 to $203.41 - a rate in the dollar of 0.131235 cents GST incl.
On a Seddon rating unit whose land value decreases from $86,000 to $62,000 the rate will decrease from $168.47 to $115.84 - a rate in the dollar of 0.186843 cents GST incl.

Funding Impact Statement
Page 262 2015-2025 Long Term Plan
Combined Sewerage Rating Areas
Combined Sewerage Scheme Charge $5,077,543 GST excl ($5,839,175 GST incl)
This uniform charge funds operating costs of the combined sewerage scheme including treatment, reticulation, depreciation and other costs associated with the combined sewerage scheme improvements. Blenheim and Picton rating units with sewerage discharges where the quantity or the strength of the effluent is greater than the average domestic rating unit, will be levied an additional trade waste charge.
There is a 0.70% ($35,382 GST excl) increase in this charge.
The charge will increase from $350 to $352 GST incl on every separately used or inhabited part of every serviced rating unit connected to the combined sewerage scheme; and from $175 to $176 GST incl on every separately used or inhabited part of every serviceable rating unit.
Water Supply Rates and Charges $9,280,478 GST excl ($10,672,550 GST incl)
Awatere Water Supply $714,151 GST excl ($821,273 GST incl)
No increase has occurred.
The following charges fund the net cost of operations, Capital Expenditure and Debt Servicing costs.
Awatere Water Charge $239,098 GST excl ($274,962 GST incl)
The uniform charge reduces from $427 to $421 GST incl on every separately used or inhabited part of a rating unit within the Awatere Water Supply Area and any new lots created by subdivision of such rating units whether connected or not.
Awatere Metered Water Charge $475,053 GST excl ($546,311 GST incl)
This charge is assessed on the basis of the volume of water supplied to metered rating units where consumption exceeds 275 cubic metres per annum.
The metered charge increases from $1.88 to $1.93 GST incl per cubic metre for all usage in excess of 275 cubic metres, for all consumers on the Awatere Water Supply.
Blenheim Water Supply $4,965,329 GST excl ($5,710,128 GST incl)
An overall rates increase of $8,279 will occur (0.17%).
Funding Impact Statement
2015-2025 Long Term Plan Page 263
Blenheim Water Capital Works Rate $2,068,761 GST excl ($2,379,075 GST incl)
This rate is assessed on the land value of every rating unit in the Blenheim Water Supply Area and funds Capital Expenditure and Debt Servicing costs.
No increase has occurred.
The rate levy for a property whose land value increases from $160,000 to $175,000 will decrease from $212.03 to $210.91. The new rate in the dollar will be 0.120522 cents GST incl.
The following charges fund the balance of expenditure other than Capital and Debt Servicing costs.
Metered and Uniform Charges $2,896,568 GST excl ($3,331,053 GST incl)
An increase of $8,279 (GST excl) has occurred (0.29%).
Blenheim Metered Water Charge $340,932 GST excl ($392,072 GST incl)
This charge is assessed on the basis of the volume of water supplied to metered rating units (excluding the Burleigh Extension), subject to a minimum quarterly charge.
Metered water charges are as follows:
The minimum quarterly charge will increase from $62.75 to $63.50 GST incl and it will now provide for the volume of water supplied between 0 m³ and 84.67 m³ instead of the volume of water supplied between 0 m3 and 78.44 m3.
The metered charge for the volume of water supplied in excess of the minimum charge volume will reduce from $0.80 to $0.75 GST incl per cubic metre.
Blenheim Water Charges $2,548,980 GST excl ($2,931,327 GST incl)
These rates are calculated as a fixed amount on every non-metered separately used or inhabited part of a serviced rating unit in the Blenheim Water Supply Area (including the Burleigh Extension); and half that amount for each non metered separately used or inhabited part of every serviceable rating unit in the same area.
The charges will increase from $251 to $254 on every part of a serviced rating unit and from $125.50 to $127 on every part of a serviceable rating unit GST incl.
Burleigh Extension Metered Water Charge $6,656 GST excl ($7,654 GST incl)
This charge is assessed on the basis of the volume of water supplied to metered rating units (excluding residential connections) in the Burleigh Extension, subject to a minimum quarterly charge.
Metered water charges are as follows:
The minimum quarterly charge will increase from $62.75 to $63.50 GST incl and it will now provide for the volume of water supplied between 0 m³ and 84.67m³ instead of the volume of water supplied between 0 m³ and 78.44m³.
The metered charge for the volume of water supplied in excess of the minimum charge volume will reduce from $0.80 to $0.75 GST incl per cubic metre.
Havelock Water Supply $275,463 GST excl ($316,782 GST incl)
An overall rates decrease of $1,593 (GST excl) will occur (0.57%).
Havelock Water Capital Works Rate $96,359 GST excl ($110,813 GST incl)
This targeted rate is calculated on the land value of every rating unit in the Havelock Water Supply Area and funds Capital Expenditure and Debt Servicing costs.
A decrease of $1,305 (GST excl) will occur (1.34%).
For a rating unit whose land value decreases from $170,000 to $155,000 the rate will increase from $288.31 to $288.71. The new rate in the dollar will be 0.186264 cents GST incl.
The following charges fund the balance of expenditure other than Capital and Debt Servicing costs.
Metered and Uniform Charges $179,104 GST excl ($205,969 GST incl)
A decrease of $288 (GST excl) will occur (0.16%).
Havelock Metered Water Charge $46,209 GST excl ($53,140 GST incl)
This charge is assessed on the basis of the volume of water supplied to metered rating units, subject to a minimum quarterly charge.
Metered water charges are as follows:
The minimum quarterly charge remains at $110 GST incl and it will provide for the volume of water supplied between 0 m³ and 55.28 m³.

Funding Impact Statement
Page 264 2015-2025 Long Term Plan
The metered charge for the volume of water supplied in excess of the minimum charge volume remains at $1.99 GST incl per cubic metre.
Havelock Water Charges $132,895 GST excl ($152,829 GST incl)
This targeted rate is calculated as a fixed amount for every non-metered separately used or inhabited part of a serviced rating unit in the Havelock Water Supply Area; and half that amount for every non-metered separately used or inhabited part of a non metered serviceable rating unit.
These charges fund the balance of expenditure not met from meter charges and remain at $440 on every part of a serviced rating unit and $220 on every part of a serviceable rating unit GST incl.
Picton Water Supply $1,957,653 GST excl ($2,251,301 GST incl)
An overall increase of $26,772 (GST excl) will occur (1.39%).
Picton Water Capital Works Rates $422,667 GST excl ($486,067 GST incl)
These rates are assessed on the land value of every rating unit in the Picton Water Supply Area.
They fund Capital Expenditure and Debt Servicing costs and are set differentially for each of the following two areas:
On Koromiko rating units subject to the special pipeline agreement.
On all other rating units in the balance of the Picton Water Supply Area.
A decrease in the Capital Works Rate of $59,340 (GST excl) will occur (12.31%).
For a rating unit whose land value decreases from $160,000 to $155,000 the rate will decrease from $218.42 to $189.94. The new rate in the dollar for rating units subject to the special pipeline agreement will be 0.098033 cents in the dollar and for all other rating units will be 0.122541 cents in the dollar GST incl.
The following charges fund the balance of expenditure other than Capital and Debt Servicing costs.
Metered and Uniform Charges $1,534,986 GST excl ($1,765,234 GST incl)
An increase of $86,112 (GST excl) will occur (5.94%) to meet increased operating costs.
Picton Metered Water Charges $313,137 GST excl ($360,108 GST incl)
Ordinary Charge A Picton Metered Water Ordinary Charge is assessed on the basis of the volume of water supplied to metered rating units, subject to a minimum quarterly charge.
The minimum quarterly charge will increase from $128.50 to $136.50 GST incl and it will now provide for the volume of water supplied between 0 m³ and 62.41m³ instead of the volume of water supplied between 0 m³ and 60.83m³.
The metered charge for the volume of water supplied in excess of the minimum charge volume will increase from $2.1124 to $2.1872 GST incl per cubic metre.
Koromiko Charge A Picton Metered Water Koromiko Charge is assessed on the basis of the volume of water supplied to metered rating units.
Water for Koromiko Special Agreement consumers will increase from $1.6899 to $1.7498 GST incl per cubic metre.
Onsold Charge A Picton Metered Water Onsold Charge is assessed on the basis of the volume of water supplied to metered rating units that is subsequently onsold, subject to a minimum quarterly charge.
Metered water charges for consumers onselling are as follows:
The minimum quarterly charge will increase from $128.50 to $136.50 GST incl and it will now provide for the volume of water supplied between 0 m³ and 56.25 m³ instead of the volume of water supplied between 0 m³ and 54.83m³.
The metered charge for the volume of water supplied in excess of the minimum charge volume will increase from $2.3435 to $2.4265 GST incl per cubic metre.
Picton Water Charge $1,221,849 GST excl ($1,405,126 GST incl)
This targeted charge is calculated as a fixed amount on every non-metered separately used or inhabited part of a serviced rating unit in the Picton Water Supply Area and half that amount on every non-metered separately used or inhabited part of a serviceable rating unit.
These charges fund the balance of expenditure not met from meter charges and will increase from $514 to $546 on every part of a serviced rating unit and increase from $257 to $273 on every part of a serviceable rating unit GST incl.

Funding Impact Statement
2015-2025 Long Term Plan Page 265
Renwick Water Supply $420,500 GST excl ($483,577 GST incl)
An overall decrease of $202 (GST excl) will occur (0.05%).
Renwick Water Capital Works Rate $7,677 GST excl ($8,828 GST incl)
This rate is calculated on the land value of every rating unit in the Renwick Water Supply Area and funds Capital Expenditure and Debt Servicing costs.
A decrease of $202 (GST excl) will occur (0.05%).
For a rating unit whose land value increases from $133,000 to $136,000 the rate levy will decrease from $9.12 to $8.87. The new rate in the dollar is 0.006523 cents GST incl.
Metered and Uniform Charges $412,823 GST excl ($474,749 GST incl)
No increase has occurred.
Renwick Metered Water Charges $43,347 GST excl ($49,848 GST incl)
This charge is assessed on the basis of the volume of water supplied to metered rating units, subject to a minimum quarterly charge.
Metered water charges are as follows:
The minimum quarterly charge will remain unchanged at $116.75 GST incl and it will continue to provide for the volume of water supplied between 0 m³ and 65.96 m³.
The metered charge for the volume of water supplied in excess of the minimum charge volume will remain at $1.77 GST incl per cubic metre.
Renwick Water Charge $369,476 GST excl ($424,900 GST incl)
This targeted charge is calculated as a fixed amount for every non-metered separately used or inhabited part of a serviced rating unit in the Renwick Water Supply Area; and half that amount for every non-metered separately used or inhabited part of a serviceable rating unit.
These charges fund the balance of expenditure and will remain unchanged at $467 on every part of a serviced rating unit and $233.50 on every part of a serviceable rating unit GST incl.
Riverlands Water Supply $426,524 GST excl ($490,503 GST incl)
A metered charge is assessed on the basis of the volume of water supplied to metered rating units, subject to a minimum quarterly charge. It funds the cost of operations, capital expenditure and debt servicing costs.
No increase has occurred.
The minimum quarterly charge will remain unchanged at $41 GST incl and it will provide for the volume of water supplied between 0 m³ and 39.81 m³.
The metered charge for the volume of water supplied in excess of the minimum charge volume will remain at $1.03 GST incl per cubic metre.
Southern Valleys’ Irrigation Scheme $487,264 GST excl ($560,353 GST incl)
Operating costs have decreased by $5,327 GST excl (1.08%).
A metered charge is assessed on the basis of the volume of water supplied to metered connections. This charge funds the net operating costs of the Southern Valleys’ Irrigation Scheme.
The metered charge will reduce from $0.25566 to $0.25241 GST incl per cubic metre.
Wairau Valley Water Supply $33,594 GST excl ($38,633 GST incl)
A decrease of $5,039 (GST excl) will occur (8.04%).
Since the introduction of water metering in Wairau Valley consumption has continued to reduce. It appears to have now stabilised at a total annual demand of approximately 20,000 cubic metres per year. This is down from demand of 53,000 cubic metres per year prior to water metering. Funding formulas to date have overestimated demand with the result that there has been a shortfall between income and operating expenses. The shortfall has been funded from reserves to date. The water charging formula will need to be reviewed for the 2016-17 Annual Plan.
The following charges fund the net cost of operations, Capital Expenditure and Debt Servicing costs.
Wairau Valley Water Charge $21,920 GST excl ($25,208 GST incl)
The uniform charge will increase from $450 to $458 GST incl for each water meter connected to a rating unit within the Wairau Valley Water Supply Area.

Funding Impact Statement
Page 266 2015-2025 Long Term Plan
Wairau Valley Metered Water Charge $11,674 GST excl ($13,425 GST incl)
This charge is assessed on the basis of the volume of water supplied to each water meter connected to a rating unit within the Wairau Valley Water Supply Area where consumption exceeds 350 cubic metres per annum.
The metered charge will remain at $2.61 GST incl per cubic metre for all usage in excess of 350 cubic metres for all consumers on the Wairau Valley water supply.

Funding Impact Statement
2015-2025 Long Term Plan Page 267
Water Supply Areas
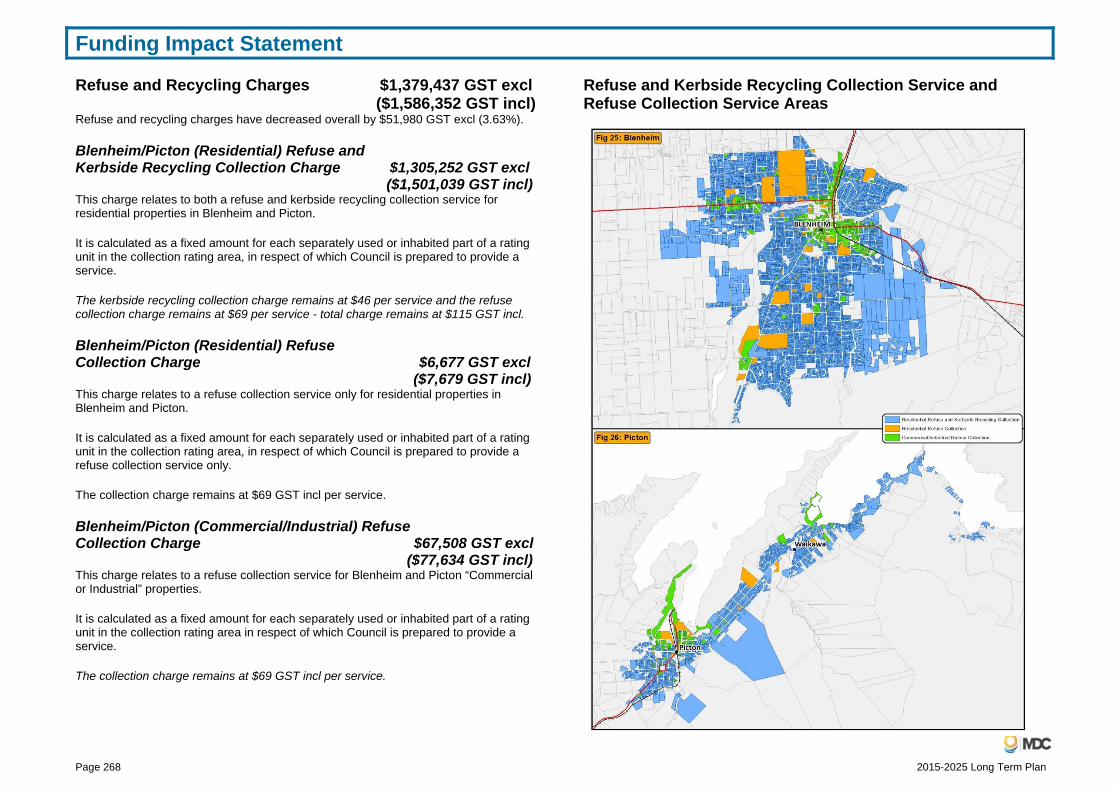
Funding Impact Statement
Page 268 2015-2025 Long Term Plan
Refuse and Recycling Charges $1,379,437 GST excl ($1,586,352 GST incl)
Refuse and recycling charges have decreased overall by $51,980 GST excl (3.63%).
Blenheim/Picton (Residential) Refuse and Kerbside Recycling Collection Charge $1,305,252 GST excl
($1,501,039 GST incl) This charge relates to both a refuse and kerbside recycling collection service for residential properties in Blenheim and Picton.
It is calculated as a fixed amount for each separately used or inhabited part of a rating unit in the collection rating area, in respect of which Council is prepared to provide a service.
The kerbside recycling collection charge remains at $46 per service and the refuse collection charge remains at $69 per service - total charge remains at $115 GST incl.
Blenheim/Picton (Residential) Refuse Collection Charge $6,677 GST excl
($7,679 GST incl) This charge relates to a refuse collection service only for residential properties in Blenheim and Picton.
It is calculated as a fixed amount for each separately used or inhabited part of a rating unit in the collection rating area, in respect of which Council is prepared to provide a refuse collection service only.
The collection charge remains at $69 GST incl per service.
Blenheim/Picton (Commercial/Industrial) Refuse Collection Charge $67,508 GST excl
($77,634 GST incl) This charge relates to a refuse collection service for Blenheim and Picton “Commercial or Industrial” properties.
It is calculated as a fixed amount for each separately used or inhabited part of a rating unit in the collection rating area in respect of which Council is prepared to provide a service.
The collection charge remains at $69 GST incl per service.
Refuse and Kerbside Recycling Collection Service and Refuse Collection Service Areas

Funding Impact Statement
2015-2025 Long Term Plan Page 269
Energy Efficiency Rates $137,342 GST excl ($157,943 GST incl)
These targeted rates are calculated on the extent of energy efficiency services provided to rating units and are calculated as a percentage of the service amount (inclusive of associated costs), until the service amount is recovered. Energy Efficiency is included under the Community Support Activity.
The energy efficiency rate, for nine years, covers both interest and principal and is calculated as a percentage of the service provided as follows:
% GST incl First Rating Year
Final Rating Year
Energy Efficiency Rate 1 17.330531 2011-12 2019-20 Energy Efficiency Rate 2 17.330531 2012-13 2020-21 Energy Efficiency Rate 3 17.330531 2013-14 2021-22 Energy Efficiency Rate 4 17.330531 2014-15 2022-23 Energy Efficiency Rate 5 17.330531 2015-16 2023-24
Picton Forum Charge $5,000 GST excl ($5,750 GST incl)
A targeted Picton Forum rate is calculated on the basis of a fixed amount of $1.20 GST incl on every separately used or inhabited part of any rating unit in the former Picton Electoral Ward. The rate will be used to fund a grant to the Picton Forum. Funding of the Picton Forum is included under the Community Support Activity.
The charge will decrease from $1.24 to $1.20.
Tourism Charges $186,015 GST excl ($213,917 GST incl)
A targeted tourism rate is calculated on the basis of a fixed amount on every separately used or inhabited part of a rating unit set differentially for the following land uses to enable Destination Marlborough to market Marlborough. A CPI adjustment of 2% has been applied to the previous charges. Marketing and Tourism is included under the Regional Development Activity.
Properties used for residential baches or other dwelling units that are advertised for short term rental accommodation and properties used for commercial rental accommodation where less than 30 people can be accommodated - $203 GST incl.
Properties used for commercial rental accommodation where 30 or more people can be accommodated - $312 GST incl.
Properties used for tourism activities (excluding the two groups above) - $227 GST incl.
Landscape Charges $1,620 GST excl ($1,863 GST incl)
A targeted landscape charge on new subdivisions (and existing subdivisions following consultation) is levied where higher landscaping standards result in additional maintenance costs and is calculated as a fixed amount on every separately used or inhabited part of a rating unit set differentially on the following basis:
Properties with Urban level 1 landscaping standards - $37 GST incl Properties with Urban level 2 landscaping standards - $48 GST incl Properties with Rural level 1 landscaping standards - $53 GST incl Properties with Rural level 2 landscaping standards - $162 GST incl
Street berms, trees and plots are included under the Community Facilities Activity.
Agency Rates and Charges $1,594 GST excl ($1,833 GST incl)
Tuamarina/Waikakaho Hall Charge $1,594 GST excl ($1,833 GST incl)
This charge is calculated as a fixed amount of $12.30 GST incl on every rating unit in the Tuamarina/Waikakaho Special Rating Area, such charge to be applied to the Tuamarina/Waikakaho Hall. Community halls are included in the Community Facilities Activity.
No increase has occurred.

Funding Impact Statement
Page 270 2015-2025 Long Term Plan
Residential Rates Postponement Scheme To cover costs for this scheme, the following fees and charges are set for the 2015-16 rating year. All fees and charges will be added as either a one-off or annual charge as the case may be, to the approved applicant’s rate account.
Initial Charges – One off Charging Unit Fees and Charges (GST Inclusive)
Application fee One-off $50.00 Contribution to the decision facilitation
One-off $300.00
Annual Interest ChargesInterest calculated at Council’s borrowing rate on all amounts outstanding Annual Charges – One-off Annual fee Annual $50.00 Management fee Annual 1.00% Reserve fund fee Annual 0.25%
Property insurance: a ratepayer must submit a current certificate annually.
General Revenue Sources There are some revenue sources which are not directly linked to an activity but are utilised by Council to assist in funding a number of Council activities either directly or indirectly.
These include:
Dividends and Interest from Investments ($10,202,866) The $10,202,866 total amount is comprised of Internal Loans Interest ($8,529,866), Interest on General Funds ($75,000), Interest on External Loans to The New Zealand Aviation Museum Trust – Omaka Heritage Centre ($98,000), Interest on Investments ($650,000) and Dividends ($850,000).
Funded to specified Reserves for particular purposes or events (eg: Emergency Events Reserve).
Used to subsidise general type rates and charges by way of general revenue allocation.
Used to fund interest and funding costs on external borrowings.
Petroleum Tax ($367,000) Used to subsidise general type rates and charges by way of general revenue allocation.
Asset Sale Proceeds (not budgeted) In general, 25% of all asset proceeds are used to build up the emergency events reserve in case of a major emergency eg: earthquake.
The remaining 75% of all asset sales proceeds are used to fund the forestry and asset sales reserve.
Contributions Received from Development and Subdivision ($1,896,698) Are applied towards the cost of infrastructure related to the development and community facilities.
Forestry Income ($1,770,000) Currently used to fund the forestry and asset sales reserve which is used to fund infrastructural development.

Funding Impact Statement
2015-2025 Long Term Plan Page 271
The Following is for Information only and Does Not Form Part of the Funding Impact Statement General Information All estimated rates and charges are shown inclusive of goods and services tax unless otherwise stated.
For the purposes of the foregoing:
“Residential use” excludes rest homes and residential establishments that provide residential care.
Where commercial accommodation is the predominant purpose of a property, it will be included on the same basis as a motel or hotel in the “commercial or industrial land use” category.
Subject to the right of objection set out in section 29 of the Local Government (Rating) Act 2002, it shall be at the sole discretion of the Council to determine the use or predominant use of any property in the District.
The geographic areas can generally be described as follows:
Blenheim Area (BM) (Fig 3) All of that area encompassed by the former Blenheim Borough Council together with those properties within a 1.5 km radius of that area which have a zoning of Residential or Industrial in the Wairau/Awatere Resource Management Plan (eg: includes, Burleigh, Hammerichs Road, Riverlands and Waipuna Street); as well as any properties that are connected to (or are able to be connected to) either the Blenheim Water or Blenheim Group Sewerage Schemes, but excluding properties in the Renwick, Spring Creek and Grovetown Sewerage Rating Areas and residential/rural properties and properties in the Riverlands Industrial Estate and Cloudy Bay Business Park that have an area of greater than one hectare.
Also included in the Blenheim area are a number of properties where it was an express condition of subdivisional resource consent.
Growth pockets and other growth areas rezoned Residential or Urban Residential 2 Greenfields following notification of the new Marlborough Resource Management Plan will be excluded from the Blenheim Area until granting of subdivision title.
Blenheim Vicinity Area (BV) (Fig 2) All of that area encompassed within the following general description, but excluding the Blenheim areas described above:
From just north of the Rarangi Settlement following around the foothills in a south-westerly direction; taking in the Tuamarina Settlement; to the south bank of the Wairau River and then up the Wairau south bank to the Waihopai River; up the east bank of the Waihopai River to just north of Omaka Downs; and then generally following the base of the foothills; around to include the Taylors Pass in a south easterly direction as far as the Branch River; following the boundaries of properties on the south east side of the Taylor River; then around the base of the foothills to include land between SH 1 and both sides of Redwood Pass Road to and including 393 Redwood Pass Road; then to the coast on the south of the Vernon Lagoons.
Picton Area (PN) (Fig 4) All of that area encompassed by the former Picton Borough Council; together with the area of those properties serviced by the Picton Water or Sewerage Schemes (excluding those properties listed in the schedule below).
Schedule Pt Lot 1 DP 6881, Pt DP 467 Waitohi Valley Blk XI Linkwater SD, Lot 1 DP 303616 Lot 1 DP 8240, Pt Sec 41 District of Waitohi, Lot 2 DP 3716, Lot 1 DP 3716, Lot 1 DP 9175, Lot 2 DP 9175, Lot 1 DP 10989, Lot 2 DP 10989, Lots 1 2 DP 1353 Lot 1 DP 1148 Pt Sec 37 Waitohi Reg Dist, Lots 2 5 DP 3183, Pt Sec 103 Waitohi Valley District Blk XV Linkwater SD, Lot 1 DP 402932 Lot 1 DP 5595 Lot 2 DP 5660 Sec 38 Pt Sec 37 Waitohi Dist, Lot 1 DP 9268, Pt Lot 1 DP 7160 , Lot 1 DP 12294, Lot 2 DP 10225 Lot 1 DP 10476, Lot 1 DP 10882, Lot 2 DP 434941 Pt DP 747 Pt Sec 25 Wairau Dist Pt Lots 1-3 DP 693 Pt Sec 12 Pt Sec 13 Blk XV Linkwater SD, Secs 105 106 Pts Sec 36 104 Waitohi Valley Dist, Lot 1 DP 6397, Lots 1 2 DP 303945, Lots 3 4 DP 303945 Sec 129 Pt 159 Picton Subn Sec 18 Blk XV Linkwater SD, Lot 1 DP 302741, Lot 1 DP 10871, Lot 1 DP 6129, Lot 1 DP 759 Lot 2 Pt Lot 1 DP 1594, Pt Sec 63-65 Picton Subn. Lots 1-9 12 DP 1086, Sec 1 SO 429571 Lot 10 DP 1086, Lot 11 DP 1086, Lot 13 DP 1086, Lot 14 DP 1086, Lot 2 DP 3080, Sec 1 SO 416848 Lot 1 DP 3080, Sec 2 SO 416848 Lot 16 DP 1086, Lot 18 DP 1086, Pt Waikawa 2C2, Lot 4 DP 11736, Lot 1 DP 335692, Lot 2 DP 344933, Lot 3 DP 11736, Lot 1 DP 11736, Lot 1 DP 344933, Lot 2 DP 404985, Lot 1 DP 424360, Lot 2 DP 424360, Lot 3 DP 424360, Lot 4 DP 424360, Lot 5 DP 424360, Waikawa 3B Blk XII Linkwater SD Blk XI Arapawa SD, Lot 1 DP 9994, Lot 1 DP 10354, Waikawa Sec A2 Waikawa West Blk XII Linkwater SD Blk XI Arapawa SD, Waikawa Sec 4B2 Waikawa West Blk XII Linkwater SD Blk XI Arapawa SD, Lot 2 DP 7961 Pts Sec 10 & Pt Sec 11 Waitohi Dist Pts Sec 100 Waitohi Dist, lot 3 DP 8884.
Also included in the Picton area are a number of properties where it was an express condition of subdivisional resource consent.
Picton Vicinity Area (PV) (Fig 4) All of that area from the western point of Ngakuta Bay to the former Picton Borough boundary; plus all of that area from the eastern point of Waikawa Bay to Whatamango

Funding Impact Statement
Page 272 2015-2025 Long Term Plan
Bay; plus a corridor area from the southern boundary of the former Picton Borough to Speeds Road; excluding properties serviced by the Picton Water or Sewerage Schemes, but including the properties listed in the Schedule above.
General Rural Area (GR) (Fig 1) All of that area administered by the former Marlborough County and excluding that part of the former County’s area which has been included in either the Blenheim, Blenheim Vicinity, Picton, Picton Vicinity or Sounds Admin Rural areas.
Sounds Admin Rural (AR) (Fig 5) All of that area with basically sea access only, which was subject to the former Marlborough County Council Empowering Act 1965.
The above rates and charges are for the period 1 July 2015 to 30 June 2016 and will become due and payable by four instalments as follows:
Last Date for Payment Before Penalty is Added
Instalment One 10 September 2015
Instalment Two 10 December 2015
Instalment Three 10 March 2016
Instalment Four 10 June 2016
Each instalment is one quarter of the annual rates for the current year.
Penalty Provisions (Additional Charges on Unpaid Rates) A penalty, equivalent in amount to 10% of the instalment amount remaining unpaid at the close of day on the “Last Date for Payment”, shall on the next day be added to that amount of unpaid rates.
Pursuant to sections 57/58 of the Local Government (Rating) Act 2002, a further penalty of 10% will be added to all rates and charges that remain unpaid on 30 June 2016.
Payments are applied to the oldest debt first. All payments are allocated to the oldest debt first so if the instalment is not paid in full by the date shown a 10% penalty is added to any amount of the instalment still outstanding. All penalty charges are exempt from GST.
Penalty Provisions (Unpaid Metered Water) A penalty, equivalent in amount to 10% of the metered water amount remaining unpaid two months after the initial invoice date, shall be added to that amount which remains unpaid.
Triennial Revaluation Movements The Marlborough District was revalued by Quotable Value Ltd on 1 July 2014. The new values apply from the 2015-16 rating year, as from 1 July 2015.
With the exception of the Wairau Valley River Rates and the Kenepuru Road Rate, all other rates levied on property values are based on Land Value (LV).
Land Value percentage (decrease) increase movements for the six geographic rating areas, the district at large and their differential rating groups for the triennial revaluation on 1 July 2014 were:
(The previous revaluation movements as at 1 July 2011 and 1 July 2008 are shown alongside).
1.07.14 1.07.11 1.07.08 Blenheim - Residential/Rural 9.62% (14.24%) 34.44% Blenheim - Commercial/Industrial 7.73% (8.51%) 55.98% Blenheim – Homestay/Farmstay 9.58% - - Blenheim - Total 9.31% (13.33%) 37.45% Blenheim Vicinity - Residential/Rural 16.45% (33.53%) 37.64% Blenheim Vicinity - Commercial/Industrial 6.12% (16.31%) 42.17% Blenheim Vicinity – Homestay/Farmstay 14.13% - - Blenheim Vicinity - Total 16.15% (33.15%) 37.74% Picton - Residential/Rural (3.21%) (16.31%) 21.19% Picton - Commercial/Industrial 2.62% (11.53%) 31.44% Picton – Homestay/Farmstay (3.73%) - - Picton - Total (2.13%) (15.44%) 22.91% Picton Vicinity - Residential/Rural (8.58%) (12.95%) 19.71% Picton Vicinity - Commercial/Industrial (1.06%) (21.70%) 166.67% Picton Vicinity – Homestay/Farmstay (0.00%) - - Picton Vicinity - Total (8.34%) (13.24%) 21.97% General Rural - Residential/Rural 2.63% (18.08%) 38.87%

Funding Impact Statement
2015-2025 Long Term Plan Page 273
1.07.14 1.07.11 1.07.08General Rural - Commercial/Industrial (10.72%) (21.12%) 46.67% General Rural – Homestay/Farmstay (11.66%) - - General Rural - Total 2.40% (18.13%) 38.99% Sounds Admin Rural - Residential/Rural (16.23%) (21.97%) 25.64% Sounds Admin Rural - Commercial/Industrial
(16.14%) (23.55%) 33.48%
Sounds Admin Rural – Homestay/Farmstay
(25.40%) - -
Sounds Admin Rural - Total (16.24%) (22.01%) 25.82% District-wide - Residential/Rural 6.24% (22.30%) 35.20% District-wide - Commercial/Industrial 4.72% (11.49%) 49.14% District-wide – Homestay/Farmstay 4.93% - - District-wide - Total 6.13% (21.64%) 35.97% The following is a summary of the valuation movements for each of Council's geographic and differential rating areas:
Rating Area Average LV Mvt
LV Mvt Range Average CV Mvt
CV Mvt Range
Blenheim R/R 9.62% 183.33% - (49.37%) 4/08% 266.07% - (49.37%) Blenheim C/I 7.73% 104.08% - (24.72%) 4.73% 94.89% - (36.44%) Blen Vic R/R 16.45% 223.81% - (34.91%) 23.86% 268.42% - (34.09%) Blen Vic C/I 6.12% 2636.84% - (48.24%) 9.20% 492.31% - (24.68%) Picton R/R (3.21%) 297.06% - (65.05%) (1.35%) 297.06% - (85.95%) Picton C/I 2.62% 59.90% - (68.44%) 15.49% 93.50% - (90.75%) Picton Vic R/R (8.58%) 233.33% - (33.33%) (1.14%) 158.20% - (33.33%) Picton Vic C/I 1.06% 10.67% - (2.35%) (12.54%) 148.84% - (20.87%) Gen Rural R/R 2.63% 426.32% - (89.90%) 7.20% 478.95% - (58.88%) Gen Rural C/I (10.72%) 50.00% - (43.81%) 1.68% 84.21% - (45.37%) Sounds Admin Rural R/R
(16.23%) 133.33% - (64.95%) (10.16%) 133.33% - (50.00%)
Sounds Admin Rural C/I
(16.14%) (14.44%) - (30.00%) (10.82%) (2.11%) – (16.52%)
R/R Relates to Residential and Rural properties C/I Relates to Commercial and Industrial properties
The Capital Value (CV) for the district at large increased by 9.61% as a result of the triennial revaluation on 1 July 2014. (The previous revaluation movement as at 1 July 2011 was (18.26%) and 28.59% as at 1 July 2008).
The following is a summary of the Capital Value percentage increase (decrease) movements for each of the Wairau Valley River and Kenepuru Road rating areas:
1.07.14 1.07.11 1.07.08 Wairau Valley River Class A Rate 23.28% (27.41%) 34.56% Wairau Valley River Class B Rate 23.37% (34.86%) 27.73% Wairau Valley River Class C Rate 18.76% (28.57%) 29.05% Wairau Valley River Class D Rate 21.69% (22.69%) 32.10% Wairau Valley River Rural Urban 1 Rate 3.07% (7.27%) 31.36% Wairau Valley River Rural Urban 2 Rate 3.36% (10.80%) 30.33% Wairau Valley River Blenheim Urban 1 Rate 4.42% (9.47%) 26.50% Wairau Valley River Blenheim Urban 2 Rate 4.15% (10.70%) 21.77% Wairau Valley River Blenheim Urban 3 Rate 3.99% (11.33%) 17.94% Wairau Valley River Blenheim Urban 4 Rate 3.45% (11.77%) 16.69%
Kenepuru Road Rate (12.02%) (9.07%) 6.16% The next revaluation of the District will be released in September 2017.
Valuation changes prior to 2017 will only relate to property subdivisions, new improvements, and any alterations to the 1 July 2014 revaluation which are approved by Quotable Value Ltd or the Land Valuation Tribunal (as a result of revaluation objections lodged prior to 31 October 2014).
With a district-wide revaluation there is no direct relationship between valuation movements and rates movements.
A revaluation of the District does not increase Council’s rating income, but it does redistribute the incidence of valuation based rates between individual ratepayers. This means that even if Council were to levy the same amount in total for the year following a revaluation, some ratepayers will have rate increases, while others will have rate decreases.
Rates levied on a uniform charge basis (eg; refuse and recycling charges) are unaffected by a district-wide revaluation. The only factors responsible for increasing rates on an individual property are:

Funding Impact Statement
Page 274 2015-2025 Long Term Plan
If an individual’s property value increases by more than the average increase for their geographic rating area.
If an individual’s property value decreases by less than the average decrease for their geographic rating area.
If an individual’s property value alters as a result of new improvements being added (only affects rates levied on a capital value basis).
If the property changes its eligibility for separate service rates/charges (eg; it now qualifies for sewerage, refuse and recycling etc).
If Council amends its Revenue and Financing Policy.
If Council increases its rating income requirement through the Annual Plan process.
Note: This revaluation the geographic rating area revaluation movements include both increases and decreases. Last revaluation the revaluation movements were mainly decreases.

Rates Movements 2015-25
2015-2025 Long Term Plan Page 275
Rates Movements 2015-25 Total Rates and Charges for 2015-16 are estimated at $60,124,817 (GST exclusive). This represents an increase of $1,918,231 (3.30%) on last year’s levy.
The rating effect will be different for individual properties because of the varying effects of the recent District-wide revaluation; movements in general-type rates not impacting uniformly on all geographic rating areas; and movements in targeted separate rates (such as Sewerage and Water etc) affecting only those properties able to receive these services.
Significant contributors to the overall rates increase are as follows:
General Rates and Charges
Reserves $225,895 Increased debt servicing costs and increased overhead allocation costs.
Harbours $171,821 As a result of the increased number of permanent staff in the Harbours team, as compared to casuals, this activity attracts a larger share of overhead costs.
Stormwater $137,508 Increased Picton depreciation, pump stations and reticulation costs and Blenheim depreciation, monitoring and reticulation costs.
Arts $135,450 Includes $100,000 Civic Theatre operating grant for six months as it is anticipated that the Theatre will be finished by December 2015.
Libraries $127,764 Increased personnel costs which has in turn attracted a greater share of overhead costs, offset by an increase in library fees and charges.
Solid Waste Management $109,573 Previously surpluses from the Regional Waste Landfill have been used to assist the funding of “rate funded” solid waste activities. These contributions are being progressively phased out and will finish in 2016-17. There has also been a correction of the budgeted cost of the Re-use Centre’s operation.
Regional Development $104,267 The increase in rates for the Economic Development component is as a result of Council funding it, on an ongoing basis, from rates as compared to the one year funding previously provided from Reserves. This change in funding will mean that existing levels of service can
Significant contributors to the overall rates increase are as follows:
be maintained.
Blenheim parking account, a $153,600 reduction.
Animal Control $99,618 Council decision to amend Revenue and Financing Policy to 20% funding from general rates and the increase in the Animal Control contract to address Health and Safety issues.
Targeted Rates and Charges Wairau Valley River Works Targeted Rates
$221,700 There are four main contributors: Increased Blenheim drainage pump station depreciation and debt servicing costs; Rural Zone A drains depreciation and contract costs; Debt servicing costs for the commencement of $750,000 Capital Expenditure over three years for berm reinstatement and new rock armouring to secure the main Wairau River Stopbank at Tuamarina; and Additional $35,000 edge protection maintenance for State Highway 1 to Waihopai Wairau River reach to maintain stopbank security during a large flood.
Combined Sewerage Targeted Rates and Charges
$72,193 Increased depreciation and interest costs.
Additional information in support of the summarised rate movements is included in the Rates Movement section and Funding Impact Statement of this Long Term Plan.

Funding Impact Statement
Page 276 2015-2025 Long Term Plan
2016-17 (Inflation adjusted using BERL indices)
2017-18 (Inflation adjusted using BERL indices)
Total rates and charges are estimated at $63,112,460 (GST exclusive). Principal changes include:
Total rates and charges are estimated at $66,432,718 (GST exclusive). Principal changes include:
General-type activities $2,009,907 General-type activities $1,429,760Combined Sewerage Scheme
$423,380 Combined Sewerage Scheme
$1,152,171
Awatere Water $79,345 Awatere Water $298,829Blenheim Water $21,837 Blenheim Water ($12,461)Havelock Water $13,312 Havelock Water $57,274
Picton Water $109,470 Picton Water $53,874
Renwick Water $13,347 Renwick Water $123,639Riverlands Water $8,385 Riverlands Water $3,662Southern Valleys’ Irrigation
$72,241 Southern Valleys’ Irrigation
$30,984
Wairau Valley Water $1,792 Wairau Valley Water $418Wairau Valley River Works
$179,893 Wairau Valley River Works
$126,205
Bln/Ptn Refuse and Recycling Collection
$26,161 Bln/Ptn Refuse Collection and Recycling
$27,222
Energy Efficiency Rate $24,851 Energy Efficiency Rate $24,886Tourism Charges $3,720 Tourism Charges $3,795
The following rates and charges are estimated for 2018-2025 (Inflation adjusted using BERL indices):
2018-2019 2019-2020 2020-2021 2021-2022 2022-2023 2023-2024 2024-202568,877,029 72,959,300 79,214,606 82,314,023 84,322,171 86,968,713 89,670,473
Indicative Impact on Benchmark Properties Council uses Benchmark Properties in different geographic areas to illustrate the effect of its rating proposals.
The rating effect on individual properties varies because movements in general-type rates do not impact uniformly on Council’s geographic rating areas, and movements in targeted separate rates (such as Sewerage and Water) affect only properties in those rating areas.

Rates Movements 2015-25
2015-2025 Long Term Plan Page 277
Rate and Charges by Rate type The following Rates and Charges report illustrates the estimated rate movements for the 10 year period by Rate type: (inflation adjusted using Business and Economic Research Ltd’s indices).
2015.16 ‐ Yr1
2016.17 ‐ Yr2 2017.18 ‐ Yr3 2018.19 ‐ Yr4 2019.20 ‐ Yr5 2020.21 ‐ Yr6 2021.22 ‐ Yr7 2022.23 ‐ Yr8 2023.24 ‐ Yr9 2024.25 ‐ Yr10
Gen Type Rates / ChargesBlenheim Res/Rural 5,328 5,668 5,870 6,129 6,313 6,579 6,830 7,098 7,398 7,721 Blenheim Com/Ind 3,470 3,768 3,985 4,263 4,419 4,624 4,802 5,048 5,308 5,629 Blenheim UAC 6,929 7,272 7,574 7,868 8,325 8,822 9,329 9,650 9,963 10,327 Blenheim Geo Area 15,727 16,709 17,429 18,261 19,057 20,025 20,961 21,796 22,670 23,676
Blenheim Vicinity Res/Rural 4,932 5,222 5,394 5,621 5,783 6,013 6,236 6,462 6,725 6,982 Blenheim Vicinity Com/Ind 259 266 273 282 289 298 307 316 327 338 Blenheim Vicinity UAC 2,102 2,203 2,283 2,360 2,492 2,620 2,749 2,825 2,887 2,962 Blenheim Vicinity Geo Area 7,293 7,691 7,950 8,262 8,564 8,930 9,292 9,603 9,939 10,282
Picton Res/Rural 1,461 1,525 1,571 1,634 1,684 1,733 1,795 1,858 1,929 2,003 Picton Com/Ind 752 768 790 821 815 816 845 877 911 950 Picton UAC 1,694 1,728 1,784 1,838 1,932 2,041 2,148 2,141 2,190 2,215 Picton Geo Area 3,907 4,021 4,145 4,293 4,430 4,591 4,788 4,876 5,030 5,168
Picton Vicinity Res/Rural 209 216 222 228 232 239 247 253 261 270 Picton Vicinity Com/Ind 19 19 19 20 20 21 21 22 22 23 Picton Vicinity UAC 239 244 252 261 275 293 310 310 316 320 Picton Vicinity Geo Area 467 479 494 508 527 553 578 584 600 612
General Rural Res/Rural 5,841 6,161 6,368 6,595 6,797 7,053 7,336 7,743 8,253 8,641 General Rural Com/Ind 133 137 141 145 149 154 159 166 175 182 General Rural UAC 2,006 2,135 2,208 2,266 2,374 2,490 2,591 2,662 2,730 2,800 General Rural Geo Area 7,980 8,433 8,717 9,006 9,320 9,698 10,086 10,572 11,157 11,623
Sounds Admin Rural Res/Rural 601 631 648 674 691 714 740 763 791 820 Sounds Admin Rural Com/Ind 23 24 25 25 26 27 28 28 29 30 Sounds Admin Rural UAC 449 474 488 497 518 539 554 571 587 602 Sounds Admin Rural Geo Area 1,073 1,129 1,161 1,196 1,235 1,279 1,321 1,362 1,407 1,451
Gen Type Rates / Charges 36,446 38,461 39,896 41,527 43,133 45,076 47,027 48,794 50,803 52,812

Rates Movements 2015-25
Page 278 2015-2025 Long Term Plan
Targeted Roading Rates / ChargesFrench Pass 28 28 28 28 28 28 28 28 28 28 Keneperu 34 34 34 35 35 35 35 35 35 35 Targeted Roading Rates / Charges 62 62 62 63 63 63 63 63 63 63
Wairau Valley River Works RatesWairau Valley River Works Rates 3,678 3,852 3,972 4,096 4,166 4,352 4,472 4,501 4,646 4,853
Sewerage Rates / ChargesCombined Sewerage Scheme Rates & Charges 7,707 8,132 9,249 9,723 10,222 10,710 11,258 11,354 11,557 11,721 Groveton Sewerage 98 100 102 104 106 113 113 113 113 113 Renwick Sewerage 32 32 32 32 32 32 32 32 32 32 Picton Sewerage 61 57 27 ‐ ‐ ‐ ‐ ‐ ‐ ‐ St Andrews Sewerage ‐ ‐ 63 126 126 126 127 127 128 128 Sewerage Rates / Charges 7,898 8,321 9,473 9,985 10,486 10,981 11,530 11,626 11,830 11,994
Targeted Water Rates / ChargesAwatere Water 714 793 1,092 1,370 1,399 1,436 1,473 1,414 1,388 1,423 Blenheim Water 4,965 4,987 4,975 4,948 4,948 4,920 4,956 5,069 5,170 5,272 Flaxbourne Irrigation 0‐ 0‐ 0‐ 0 0‐ 3,425 3,639 3,667 3,697 3,729 Havelock Water 275 289 346 651 945 951 990 929 940 949 Picton Water 1,958 2,067 2,121 2,164 2,274 2,391 2,453 2,455 2,528 2,569 Renwick Water 421 434 557 1,033 1,413 1,449 1,484 1,510 1,537 1,565 Riverlands Water 427 435 439 442 445 448 452 456 461 465 Southern Valleys' Irrigation 1,537 1,609 1,640 1,679 1,722 1,770 1,806 1,846 1,889 1,934 Wairau Valley Water 34 35 36 36 37 37 37 38 38 39 Targeted Water Rates / Charges 10,330 10,650 11,206 12,323 13,183 16,828 17,291 17,383 17,648 17,945
Refuse & Kerbside Recycling Collection ChargesRefuse & Kerbside Recycling Collection Charges 1,379 1,406 1,433 1,463 1,483 1,536 1,578 1,628 1,671 1,716
Miscellaneous Targeted RatesTourism Charge 186 190 194 197 201 205 209 214 218 222 Energy Efficiency Rate 137 162 187 214 232 162 133 100 78 53 Landscape 2 2 3 3 4 5 5 5 5 6 Picton Forum 5 5 5 5 5 5 5 5 5 5 Tua Marina Hall/Waikakaho Charge 2 2 2 2 2 2 2 2 2 2 Miscellaneous Targeted Rates 332 361 390 421 444 379 353 326 308 288
TOTAL RATES & CHARGES 60,125 63,113 66,433 69,877 72,959 79,215 82,314 84,322 86,969 89,671
2015.16 ‐ Yr1
2016.17 ‐ Yr2 2017.18 ‐ Yr3 2018.19 ‐ Yr4 2019.20 ‐ Yr5 2020.21 ‐ Yr6 2021.22 ‐ Yr7 2022.23 ‐ Yr8 2023.24 ‐ Yr9 2024.25 ‐ Yr10

Rates Movements 2015-25
2015-2025 Long Term Plan Page 279
Rates and Charges – By Activity The following Rates and Charges report illustrates the estimated rate movements for the 10 year period by Activity: (inflation adjusted using Business and Economic Research Ltd’s indices).
Rates and Charges by Activity Group ($000's) Group 2015-16 2016-17 2017-18 2018-19 2019-20 2020-21 2021-22 2022-23 2023-24 2024-25
Peop
le
Democratic Process 2,562 2,787 2,885 2,849 2,976 3,078 3,049 3,240 3,398 3,512
Arts 352 446 538 631 634 637 639 643 646 650
Heritage 359 362 348 352 364 356 357 359 361 363
Community Safety 75 72 75 76 81 86 91 91 92 93
Grants and Donations 438 442 445 448 450 453 455 459 462 466
Events Management 159 163 166 171 174 178 183 188 194 199
Energy Efficiency 137 162 187 214 232 162 133 100 78 53
Recreation 62 64 66 67 69 70 72 74 77 79
Passenger Transport 126 163 161 168 181 178 187 200 200 211
Library Services 1,622 1,671 1,902 2,196 2,326 2,242 2,272 2,310 2,348 2,407
Emergency Management 721 744 788 786 791 835 827 843 877 892
Com
mun
ity F
acili
ties Cemeteries 372 380 390 408 424 433 443 453 465 476
Memorials 118 90 92 96 99 102 107 113 117 122
Street berms, trees and plots 547 571 586 602 618 635 654 674 695 717
Halls 252 212 217 222 228 234 291 455 679 797
Public Conveniences 793 829 859 900 932 956 979 1,003 1,033 1,066
Reserves 3,928 4,142 4,395 4,613 4,934 5,381 5,751 5,939 6,323 6,712
Swimming Pools 1,378 1,380 1,409 1,445 1,481 1,501 1,575 1,622 1,673 1,699
Roads and footpaths 9,132 9,892 10,274 11,015 11,375 11,886 12,367 12,991 13,629 14,370
Floo
d pr
otec
tion River Leases (147) (147) (147) (147) (147) (147) (147) (147) (147) (147)
Rivers Outside Wairau Floodplain 273 280 286 292 298 304 312 320 329 338
Wairau Floodplain Drainage 872 915 939 970 997 1,022 1,047 1,118 1,200 1,244
Wairau Floodplain Rivers 2,953 3,084 3,180 3,273 3,360 3,476 3,618 3,531 3,641 3,756
Combined Wastewater 7,890 8,299 9,436 9,932 10,419 10,899 11,433 11,514 11,703 11,853
Stor
m
wat
er
Blenheim 1,121 1,262 1,349 1,432 1,525 1,615 1,711 1,821 1,934 2,067
Other 550 580 601 617 635 653 674 696 721 746

Rates Movements 2015-25
Page 280 2015-2025 Long Term Plan
Rates and Charges by Activity Group ($000's) Group 2015-16 2016-17 2017-18 2018-19 2019-20 2020-21 2021-22 2022-23 2023-24 2024-25
Wat
er
Awatere 714 796 1,229 1,447 1,476 1,512 1,548 1,489 1,462 1,497
Blenheim 4,965 4,987 4,975 4,948 4,948 4,920 4,956 5,069 5,170 5,272
Havelock 275 289 339 374 395 401 448 535 682 688
Picton 1,958 2,067 2,121 2,164 2,274 2,391 2,453 2,455 2,528 2,569
Renwick 421 434 589 737 748 1,244 1,814 1,900 1,920 1,941
Riverlands 427 435 439 442 445 448 452 456 461 465
Wairau Valley 34 35 36 36 37 37 37 38 38 39
Was
te
Landfills 30 92 97 99 102 104 107 111 114 123
Refuse Collections 1,379 1,406 1,433 1,463 1,483 1,536 1,578 1,628 1,671 1,716
Transfer Stations 544 542 545 543 543 536 527 533 527 526
Waste Minimisation 711 715 722 729 734 741 745 742 750 759
Envi
ronm
ent
al
Man
agem
ent
Environmental Policy 1,282 1,291 1,326 1,358 1,383 1,418 1,457 1,444 1,492 1,539
Environmental Science and Monitoring 2,732 2,875 2,957 3,033 3,109 3,192 3,280 3,379 3,492 3,596
Environmental Protection 1,105 1,136 1,171 1,202 1,217 1,249 1,280 1,319 1,377 1,421
Resource Consents 884 917 946 967 964 983 1,007 1,032 1,065 1,091
Reg
ulat
ory
Building Control 464 483 326 504 480 479 482 486 495 494
Environmental Health 126 130 137 135 135 139 143 147 152 154
Biosecurity (Pest Management) 1,139 1,192 1,245 1,245 1,300 1,335 1,343 1,385 1,433 1,480
Dog Control 63 65 67 68 69 72 75 77 80 92
Other Animal Control 67 69 70 72 73 75 77 79 81 83
Harbours 939 990 1,005 1,027 1,027 1,055 1,094 1,121 1,150 1,195
Reg
iona
l D
evel
opm
ent Economic Development 278 209 213 218 223 228 234 305 377 385
Marketing and Tourism 1,187 1,216 1,235 1,254 1,271 1,290 1,309 1,329 1,350 1,359
Research Centre 124 125 125 126 126 127 127 128 128 129
Irrigation Schemes 1,537 1,609 1,640 1,679 1,722 5,227 5,509 5,576 5,649 5,726
Parking 31 30 30 31 29 29 19 10 9 9
Total Activity Rates 60,064 62,978 66,442 69,529 71,768 77,993 81,180 83,383 86,382 89,088

Rates Movements 2015-25
2015-2025 Long Term Plan Page 281
Indicative Rating Impact on Benchmark Properties
Benchmark PropertiesCapital Value
Land Value
2014.15 Actual
Rate Levy 2015.16 2016.17 2017.18 2018.19 2019.20 2020.21 2021.22 2022.23 2023.24 2024.25
01‐Blenheim Residential 320,000 175,000 2,478 2,502 2,605 2,741 2,836 2,939 3,058 3,183 3,266 3,361 3,461 23 103 136 96 103 119 125 83 94 101
0.95% 4.13% 5.20% 3.50% 3.63% 4.05% 4.09% 2.62% 2.89% 2.99%02‐Blenheim Residential 310,000 160,000 2,440 2,469 2,572 2,704 2,798 2,898 3,016 3,139 3,221 3,315 3,417
29 103 132 93 100 118 123 82 94 102 1.19% 4.17% 5.13% 3.45% 3.59% 4.07% 4.09% 2.61% 2.93% 3.07%
03‐Blenheim Residential 410,000 195,000 2,600 2,643 2,752 2,896 2,998 3,106 3,232 3,362 3,448 3,546 3,651 43 109 144 102 108 125 131 86 98 105
1.65% 4.11% 5.22% 3.53% 3.60% 4.04% 4.04% 2.56% 2.85% 2.95%04‐Blenheim Residential 520,000 195,000 2,941 2,866 2,985 3,136 3,246 3,358 3,495 3,633 3,721 3,828 3,945
75‐ 119 151 110 112 137 138 88 107 117 ‐2.54% 4.16% 5.05% 3.50% 3.46% 4.07% 3.94% 2.42% 2.88% 3.06%
05‐Blenheim Residential 435,000 170,000 2,554 2,583 2,691 2,828 2,926 3,030 3,153 3,281 3,364 3,462 3,569 30 108 137 98 104 123 127 84 98 106
1.16% 4.17% 5.11% 3.47% 3.55% 4.07% 4.04% 2.55% 2.91% 3.07%06‐Blenheim Vacant Section 165,000 165,000 1,990 2,020 2,107 2,217 2,302 2,392 2,496 2,600 2,665 2,739 2,817
30 87 110 84 91 104 104 65 74 78 1.52% 4.32% 5.23% 3.81% 3.94% 4.33% 4.17% 2.50% 2.77% 2.86%
07‐Blenheim Commercial 480,000 122,000 3,090 3,414 3,612 3,812 3,998 4,143 4,325 4,499 4,661 4,842 5,059 323 198 200 186 146 181 175 161 181 217
10.47% 5.80% 5.54% 4.88% 3.65% 4.38% 4.03% 3.58% 3.89% 4.47%08‐Blenheim Commercial 990,000 385,000 7,336 7,576 8,056 8,529 9,016 9,342 9,753 10,120 10,494 10,916 11,426
241 480 473 488 325 411 367 375 422 510 3.28% 6.33% 5.87% 5.72% 3.61% 4.40% 3.76% 3.70% 4.02% 4.68%
09‐Picton Residential * 1 340,000 105,000 2,476 2,590 2,687 2,789 2,857 2,984 3,121 3,247 3,283 3,375 3,447 113 97 102 68 127 138 126 35 93 71
4.58% 3.76% 3.78% 2.44% 4.44% 4.62% 4.04% 1.08% 2.83% 2.11%10‐Picton Residential * 2 320,000 155,000 2,842 2,933 3,048 3,200 3,312 3,457 3,613 3,756 3,799 3,902 3,982
90 116 152 112 145 155 143 43 103 80 3.18% 3.94% 4.99% 3.50% 4.37% 4.50% 3.97% 1.15% 2.71% 2.04%
11‐Picton Vacant Section * 1 100,000 100,000 1,921 1,984 2,054 2,126 2,179 2,278 2,384 2,483 2,505 2,569 2,616 62 70 72 53 99 106 99 22 64 47
3.25% 3.53% 3.50% 2.50% 4.53% 4.66% 4.16% 0.88% 2.57% 1.82%12‐Picton Commercial * 1 395,000 280,000 5,787 5,958 6,107 6,302 6,475 6,591 6,748 6,997 7,135 7,340 7,538
171 149 195 173 116 157 249 138 205 199 2.96% 2.49% 3.19% 2.75% 1.79% 2.38% 3.69% 1.97% 2.87% 2.71%
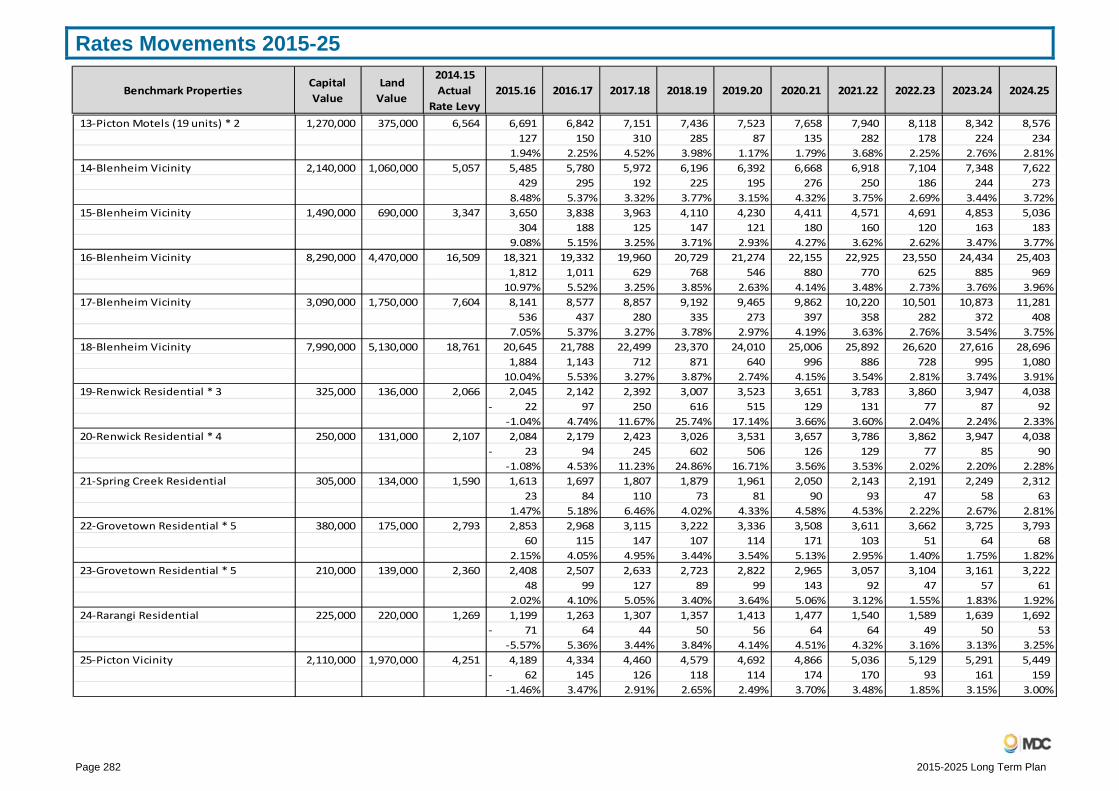
Rates Movements 2015-25
Page 282 2015-2025 Long Term Plan
13‐Picton Motels (19 units) * 2 1,270,000 375,000 6,564 6,691 6,842 7,151 7,436 7,523 7,658 7,940 8,118 8,342 8,576 127 150 310 285 87 135 282 178 224 234
1.94% 2.25% 4.52% 3.98% 1.17% 1.79% 3.68% 2.25% 2.76% 2.81%14‐Blenheim Vicinity 2,140,000 1,060,000 5,057 5,485 5,780 5,972 6,196 6,392 6,668 6,918 7,104 7,348 7,622
429 295 192 225 195 276 250 186 244 273 8.48% 5.37% 3.32% 3.77% 3.15% 4.32% 3.75% 2.69% 3.44% 3.72%
15‐Blenheim Vicinity 1,490,000 690,000 3,347 3,650 3,838 3,963 4,110 4,230 4,411 4,571 4,691 4,853 5,036 304 188 125 147 121 180 160 120 163 183
9.08% 5.15% 3.25% 3.71% 2.93% 4.27% 3.62% 2.62% 3.47% 3.77%16‐Blenheim Vicinity 8,290,000 4,470,000 16,509 18,321 19,332 19,960 20,729 21,274 22,155 22,925 23,550 24,434 25,403
1,812 1,011 629 768 546 880 770 625 885 969 10.97% 5.52% 3.25% 3.85% 2.63% 4.14% 3.48% 2.73% 3.76% 3.96%
17‐Blenheim Vicinity 3,090,000 1,750,000 7,604 8,141 8,577 8,857 9,192 9,465 9,862 10,220 10,501 10,873 11,281 536 437 280 335 273 397 358 282 372 408
7.05% 5.37% 3.27% 3.78% 2.97% 4.19% 3.63% 2.76% 3.54% 3.75%18‐Blenheim Vicinity 7,990,000 5,130,000 18,761 20,645 21,788 22,499 23,370 24,010 25,006 25,892 26,620 27,616 28,696
1,884 1,143 712 871 640 996 886 728 995 1,080 10.04% 5.53% 3.27% 3.87% 2.74% 4.15% 3.54% 2.81% 3.74% 3.91%
19‐Renwick Residential * 3 325,000 136,000 2,066 2,045 2,142 2,392 3,007 3,523 3,651 3,783 3,860 3,947 4,038 22‐ 97 250 616 515 129 131 77 87 92
‐1.04% 4.74% 11.67% 25.74% 17.14% 3.66% 3.60% 2.04% 2.24% 2.33%20‐Renwick Residential * 4 250,000 131,000 2,107 2,084 2,179 2,423 3,026 3,531 3,657 3,786 3,862 3,947 4,038
23‐ 94 245 602 506 126 129 77 85 90 ‐1.08% 4.53% 11.23% 24.86% 16.71% 3.56% 3.53% 2.02% 2.20% 2.28%
21‐Spring Creek Residential 305,000 134,000 1,590 1,613 1,697 1,807 1,879 1,961 2,050 2,143 2,191 2,249 2,312 23 84 110 73 81 90 93 47 58 63
1.47% 5.18% 6.46% 4.02% 4.33% 4.58% 4.53% 2.22% 2.67% 2.81%22‐Grovetown Residential * 5 380,000 175,000 2,793 2,853 2,968 3,115 3,222 3,336 3,508 3,611 3,662 3,725 3,793
60 115 147 107 114 171 103 51 64 68 2.15% 4.05% 4.95% 3.44% 3.54% 5.13% 2.95% 1.40% 1.75% 1.82%
23‐Grovetown Residential * 5 210,000 139,000 2,360 2,408 2,507 2,633 2,723 2,822 2,965 3,057 3,104 3,161 3,222 48 99 127 89 99 143 92 47 57 61
2.02% 4.10% 5.05% 3.40% 3.64% 5.06% 3.12% 1.55% 1.83% 1.92%24‐Rarangi Residential 225,000 220,000 1,269 1,199 1,263 1,307 1,357 1,413 1,477 1,540 1,589 1,639 1,692
71‐ 64 44 50 56 64 64 49 50 53 ‐5.57% 5.36% 3.44% 3.84% 4.14% 4.51% 4.32% 3.16% 3.13% 3.25%
25‐Picton Vicinity 2,110,000 1,970,000 4,251 4,189 4,334 4,460 4,579 4,692 4,866 5,036 5,129 5,291 5,449 62‐ 145 126 118 114 174 170 93 161 159
‐1.46% 3.47% 2.91% 2.65% 2.49% 3.70% 3.48% 1.85% 3.15% 3.00%
Benchmark PropertiesCapital Value
Land Value
2014.15 Actual
Rate Levy 2015.16 2016.17 2017.18 2018.19 2019.20 2020.21 2021.22 2022.23 2023.24 2024.25

Rates Movements 2015-25
2015-2025 Long Term Plan Page 283
26‐Ngakuta Bay ‐ bach 410,000 155,000 831 845 867 894 921 963 1,015 1,067 1,074 1,100 1,118 14 22 27 27 41 52 52 7 26 19
1.67% 2.56% 3.13% 3.06% 4.50% 5.44% 5.10% 0.66% 2.42% 1.70%27‐General Rural ‐ French Pass 2,020,000 1,450,000 7,605 5,166 5,429 5,602 5,787 5,965 6,184 6,419 6,737 7,128 7,433
2,439‐ 263 173 185 178 219 234 318 392 305 ‐32.07% 5.09% 3.20% 3.30% 3.07% 3.68% 3.79% 4.95% 5.82% 4.28%
28‐General Rural ‐ Manaroa 4,610,000 3,710,000 12,931 12,467 13,092 13,509 13,974 14,397 14,924 15,493 16,277 17,251 18,002 464‐ 624 417 465 423 528 568 785 974 751
‐3.59% 5.01% 3.19% 3.44% 3.02% 3.67% 3.81% 5.07% 5.98% 4.35%29‐General Rural ‐ Opouri Valley 3,300,000 2,660,000 6,509 8,149 8,598 8,887 9,199 9,489 9,854 10,249 10,802 11,490 12,018
1,640 449 290 312 290 364 395 553 688 528 25.19% 5.51% 3.37% 3.51% 3.15% 3.84% 4.01% 5.39% 6.37% 4.60%
30‐General Rural ‐ on Awatere Water 2,080,000 1,580,000 4,335 5,435 5,759 6,113 6,467 6,666 6,915 7,179 7,479 7,879 8,219 1,101 324 354 354 199 248 265 300 400 341 25.39% 5.96% 6.15% 5.79% 3.07% 3.73% 3.83% 4.17% 5.34% 4.33%
31‐Havelock Residential 360,000 155,000 2,117 2,113 2,309 2,578 3,544 4,487 4,580 4,773 4,643 4,747 4,831 4‐ 196 268 966 943 93 193 130‐ 103 84
‐0.20% 9.30% 11.62% 37.48% 26.62% 2.07% 4.22% ‐2.72% 2.22% 1.77%32‐Seddon Residential 235,000 62,000 1,588 1,498 1,605 1,864 2,071 2,143 2,223 2,306 2,309 2,341 2,405
91‐ 107 259 207 72 80 83 3 32 64 ‐5.70% 7.16% 16.12% 11.12% 3.47% 3.73% 3.75% 0.13% 1.40% 2.74%
33‐Wairau Valley Township Residential 445,000 134,000 2,096 2,169 2,298 2,364 2,423 2,511 2,611 2,699 2,778 2,865 2,945 74 129 66 60 88 99 89 79 87 80
3.51% 5.93% 2.86% 2.53% 3.64% 3.95% 3.40% 2.91% 3.13% 2.79%34‐Sounds Admin Rural ‐ farm 5,500,000 4,710,000 10,038 10,025 10,525 10,810 11,212 11,513 11,896 12,314 12,705 13,158 13,618
13‐ 500 285 402 301 383 418 391 453 461 ‐0.13% 4.99% 2.71% 3.72% 2.68% 3.33% 3.52% 3.17% 3.56% 3.50%
35‐Sounds Admin Rural ‐ bach 325,000 165,000 582 680 716 737 757 783 812 837 864 892 919 98 36 21 20 25 29 26 27 28 27
16.88% 5.29% 2.93% 2.77% 3.33% 3.72% 3.16% 3.17% 3.22% 3.04%36‐Sounds Admin Rural ‐ bach 465,000 270,000 731 883 929 956 985 1,016 1,053 1,087 1,122 1,159 1,196
152 46 27 29 31 37 34 35 37 37 20.80% 5.23% 2.88% 3.03% 3.16% 3.62% 3.26% 3.18% 3.32% 3.17%
Benchmark PropertiesCapital Value
Land Value
2014.15 Actual
Rate Levy 2015.16 2016.17 2017.18 2018.19 2019.20 2020.21 2021.22 2022.23 2023.24 2024.25
*1 These properties pay the sewer treatment loan rate because they did not make a lump sum payment. *2 These properties opted to make sewer treatment lump sum payments. *3 This property opted to make sewer lump sum payments.
*4 This property opted to make sewer loan repayments over a 20 year term, in lieu of lump sum payments. *5 These properties pay the sewerage loan rate because they did not make a lump sum payment.
Part 5: Policies
Page 284 2015-2025 Long Term Plan
Part 5: Policies
Revenue and Financing Policy
Rates Remission and Postponement Policies
Significance and Engagement Policy
Maori Capacity Development Policy
Council Controlled Organisations

Revenue and Financing Policy
2015-2025 Long Term Plan Page 285
Revenue and Financing Policy1. The Revenue and Financing Policy provides a summary of Council’s funding
policies in respect of both operating expenses and capital expenditures. Council reviews its funding policy at least every three years. The last review was completed prior to the initiation of the 2015-25 Long Term Plan (LTP), and changes adopted are detailed in paragraph 12.
2. Sources of funds available to Council are as follows:
General rates.
Targeted rates.
Lump sum contributions.
Fees and charges.
Interest and dividends from investments.
Borrowing.
Proceeds from asset sales.
Development contributions.
Financial contributions.
Grants and subsidies.
Other sources permitted by statute.
3. Council’s Revenue and Expenditure Policy deals with the revenue and financing mechanisms at a “Sub-Activity” level. Sub-Activities are a sub-set of “Activities”, which in turn are a sub-set of “Activity Groups” using two examples:
1. One of Council’s Activity Groups is “People”.
One of People’s Activities is “Community Support”.
One of Community Support’s Sub-Activities is “Recreation”.
2. One of Council’s Activity Groups is “Environmental Management”.
One of Environmental Management’s Activities is “Environmental Science and Monitoring”.
One of Environmental Science and Monitoring’s Sub-Activities is “Monitoring Groundwater Quantity and Quality”.
4. In determining which funding sources were appropriate, Council gave consideration to the following matters in relation to each activity to be funded:
The community outcomes to which the activity primarily contributes;
The distribution of benefits between the community as a whole, any identifiable part of the community, and individuals; and
The period in or over which those benefits are expected to occur; and
The extent to which the actions or inaction of particular individuals or a group contribute to the need to undertake the activity; and
The costs and benefits, including consequences for transparency and accountability, of funding the activity distinctly from other activities; and
The overall impact of any allocation of liability for revenue needs on the current and future social, economic, environmental, and cultural well-being of the community.
5. Prior to determining the “Residual amount to be funded by General-type Rates”, Council identified all other funding sources appropriate to each activity. These other sources, and the approach taken by Council are listed in the paragraph 9 table, which highlights the funding sources for every Council activity and any sub-activity which may exist. The table shows the rating tools which Council has determined to be fair and equitable for each activity.
Fees and Charges These have been set at a level to recover private benefits where it is practical and economic to do so, unless there have been determinations arising from previous funding reviews to fund all or part of such benefits from rates.
Grants and Subsidies These are sought and applied for whenever they are available.
General Revenues These are allocated to geographic rating areas in proportion to the gross general-type rates and charges.
General-Type Targeted Rates and Charges The proportion of each activity’s costs to be met from general-type targeted rates and charges is detailed in Table 9. The allocations in that table reflect Council’s assessment of the benefits which should be funded by property value

Revenue and Financing Policy
Page 286 2015-2025 Long Term Plan
rates, and the benefits which should be funded by uniform annual charge. In these instances Council believe separate general targeted rates and charges are the most equitable funding mechanism based of the benefits assessed for each targeted geographic area.
Separate differential categories are utilised for general-type rates and charges, and these are specified in each year’s Funding Impact Statement. Council currently has six geographic areas and three categories of land use for each of these areas.
Separate Targeted Rates Targeted rates are levied to meet the full cost of separate water schemes, refuse and recycling collections, defined roading improvements, defined marketing and tourism activities, and for other services where Council has been requested to levy such rates. In these instances Council believe separate targeted rates are the most equitable funding mechanism based of the benefits assessed for the targeted area.
Council has adopted differential land value rates to fund the debt servicing requirement of all sewerage schemes, which takes account of the median land values for each scheme; and of funding operating costs by way of a common uniform annual charge. The most significant benefits derived from this combined single sewerage funding scheme are a smoothing of rating spikes in smaller schemes and better cash flow management through the timing of capital works.
Note: The combined sewerage rates and charges do not include the initial debt servicing requirements for any new schemes not paid by lump sum contributions.
6. The following explanations will give readers an understanding of terminology used in this policy statement. Unless otherwise specified, the term:
Uniform Annual Charge (UAC) or Charge refers to a targeted rate of a uniform amount calculated on each separately used or inhabited part of every rating unit; or for some charges, on every rating unit.
General-type targeted Rates are rates that are targeted to a particular geographic rating area or a differential rating area group. (These rates are based on the land value of each property).
General-type targeted Charges are charges that are targeted to a particular geographic rating area. (These charges are set differentially for the six geographic areas as a fixed amount on every separately used or inhabited part of a rating unit).
Separate targeted Rates are rates that are targeted to a particular area of benefit. e.g. Water, Sewerage. (Separate targeted rates are based on the land value of each property other than Wairau Valley River Works Rates and the Kenepuru Road Rate which are levied on capital value, or the Southern Valleys’ Irrigation Loan Rate which is based on irrigable hectares) or the Energy Efficiency rates which are based on the service amount.
Separate targeted Charges are charges that are targeted to a particular area of benefit e.g. Water, Sewerage.
Land values, capital values or rating units refers to rateable land values, rateable capital values or rateable rating units as the case may be.
Residual Rate Funding Percentages refer to the residual amount to be funded, after allowance for sources of funds other than rates.
Funding relationship weightings refer to a methodology for allocating the various general-type rates and charges where the highest weighting is always expressed as 100.
(Where a weighting shows as zero, there is no contribution from that area, but where a weighting shows as a number between zero and 100 (e.g. 85), that area will pay a rate or uniform charge (as the case may be) of 85% of any area that has a weighting of 100.
If all areas have a weighting of 100, the rate in the dollar or uniform charge (as the case may be) will be the same for all areas).
Council has the following policies to determine what constitutes a “separately used or inhabited part of a rating unit”:
o That in situations where a rating unit contains both a commercial or industrial type use, and a residential or rural type use, they will be treated as two separate uses and be assessed two sets of charges, except for those predominantly residential properties where the owner of the commercial/industrial operation resides on the same rating unit.
o For those predominantly residential rating units where the owner of the rating unit resides and operates a business or businesses (including a homestay or farmstay activity) from the same rating unit, they will be assessed only one uniform targeted charge for geographic area general-type works.
o Where services such as water, sewerage and refuse and kerbside recycling collection are supplied, separate charges will be assessed on the separately used or inhabited portions, except for those predominantly residential properties where the owner of

Revenue and Financing Policy
2015-2025 Long Term Plan Page 287
the commercial/industrial operation or a homestay or farmstay activity resides on the same rating unit.
o Where a number of different businesses are located on one rating unit, each separate business will be assessed uniform charges. An exception is made for motels, hotels and dwellings used for commercial rental – they are treated as one business use even if each accommodation unit may be capable of separate habitation.
o Where rating units contain separate residential habitable dwellings that are capable of independent habitation (i.e. they have all the facilities such as bathroom, toilets, kitchens, separate entrance ways etc), uniform charges will be assessed on each dwelling.
o If a rating unit contains a dwelling and a flat (as shown as a “nature of improvements” on the Council valuation roll) and the flat contains a kitchen; uniform charges will be assessed on the dwelling and flat.
The Council has adopted the following differential rating categories for general-type rates:
Residential or Rural All land used for a private residence and all land used for rural purposes. "Private residence" excludes rest homes and residential establishments that provide residential care. It also excludes all forms of commercial accommodation.
"Rural purposes" means any agricultural, horticultural or pastoral purpose and includes the keeping of bees, poultry or livestock. This group will include all rating units not otherwise categorised within a specified differential category.
Forestry is included in this category for the purposes of the General Works and Services Rate.
Commercial or Industrial All land used for a commercial or industrial purpose. "Commercial purposes" includes but is not limited to, any trade or service or activity undertaken or provision of facilities, by any person with a view to making a profit or charging any fee or deriving any other consideration in relation to the trade or service or activity or provision. "Industrial" includes a business, manufacturer, undertaking, or service associated with the production of any type of goods. For the purposes of the General Works and Services Rate, this differential category includes residential rest homes and residential establishments that
provide residential care and all forms of commercial accommodation as well as rating units otherwise assessed as "utilities".
Commercial accommodation includes but is not limited to the provision of accommodation for a fee or other consideration with the exemption of:
Properties where the principal purpose is the provision of longstay accommodation ie: 28 days or more.
Properties that provide accommodation for five or less people.
Properties that were originally constructed as residential properties that provide accommodation for six or more, which are included in the homestay or farmstay category.
Homestay or Farmstay Includes all rating units that are used for a homestay or farmstay activity on land predominantly used for residential or rural purposes, where a Building Act or Resource Consent was required for such a use.
Utilities Land used for an essential service such as water, electricity, gas, telecommunications or sewerage.
Multiple Land Uses The Council will partition a rating unit where there are two or more land uses that fit into different differential rating categories except for predominantly residential properties where the owner of the commercial/industrial operation resides on the same rating unit.
Property Valuation System 7. Independent property valuations are provided to Council, under contract, by
Quotable Value Ltd. The Marlborough District was last revalued on 1 July 2014 and the new values apply from the 2015-16 rating year.
Compliance with Financial Management Requirements 8. The “Activities” that comprise the eleven “Activity Groups” of People,
Community Facilities, Roads and Footpaths, Flood Protection and Control, Sewerage, Stormwater Drainage, Water Supply, Solid Waste Management, Environmental Management, Regulatory and Regional Development, are listed in the following tables together with a summary of Council’s consideration outcomes:

Revenue and Financing Policy
Page 288 2015-2025 Long Term Plan
8.1 Operating Expenses Funding Policy The following table summarises Council’s possible Operating Expenses Funding Policy at an Activity level:
Group Activities Targeted Rates
Fees and Charges
Interest and Dividends
from Investments
Borrowing Proceeds from Asset
Sales
Development Contributions
and/or Financial
Grants and Subsidies
Other Sources
Peop
le
Democratic Process Yes No Yes No No No No Yes
Culture and Heritage Yes No Yes No No No Yes Yes
Community Housing No Yes No No No No Yes No
Community Safety Yes No Yes No No No Yes Yes
Community Support Yes Yes Yes No No No Yes Yes
Library Services Yes Yes Yes No No No Yes Yes
Emergency Management Yes No Yes No No No Yes Yes
Community Facilities Yes Yes Yes No No No Yes No
Roads and Footpaths Yes Yes Yes No No No Yes Yes
Flood Protection and Control Yes Yes Yes No No No Yes No
Sewerage Yes Yes No No No No Yes Yes
Stormwater Drainage Yes Yes Yes No No No Yes No
Water Supply Yes Yes No No No No Yes No
Solid Waste Management Yes Yes Yes No No No Yes No
Env
ironm
enta
l M
anag
emen
t Environmental Policy Yes No Yes No No No No No
Environmental Science and Monitoring Yes Yes Yes No No No Yes No
Resource Consents Yes Yes Yes No No No No No
Environmental Protection Yes Yes Yes No No No No No
Reg
ulat
ory
Biosecurity (Pest Management) Yes Yes Yes No No No Yes No
Building Control Yes Yes Yes No No No No No
Environmental Health Yes Yes Yes No No No No No
Animal Control Yes Yes Yes No No No No No
Harbours Yes Yes Yes No No No No Yes
Regional Development Yes Yes Yes No No No Yes Yes

Revenue and Financing Policy
2015-2025 Long Term Plan Page 289
8.2 Capital Expenditure Funding Policy The following table summarises Council’s possible Capital Expenditure Funding Policy at an Activity level: The utilisation order of the various funding sources is detailed in paragraph 10 Funding of Capital Requirements.
Group Activity Targeted Rates
Fees and Charges
Interest and Dividends from Investments
Borrowing Proceeds from Asset Sales
Development Contributions and/or Financial
Grants and Subsidies
Other Sources
Peop
le
Democratic Process Yes No Yes Yes Yes No No Yes
Culture and Heritage Yes No Yes Yes No No Yes Yes
Community Housing No No No Yes Yes No Yes Yes
Community Safety Yes No Yes Yes No No Yes Yes
Community Support Yes No Yes No No No Yes Yes
Library Services Yes Yes Yes Yes Yes No Yes Yes
Emergency Management Yes No Yes Yes Yes No Yes Yes
Community Facilities Yes Yes Yes Yes Yes Yes Yes Yes
Roads and Footpaths Yes Yes Yes Yes No Yes Yes Yes
Flood Protection and Control Yes Yes Yes Yes No No Yes Yes
Sewerage Yes Yes No Yes No Yes Yes Yes
Stormwater Drainage Yes Yes Yes Yes No Yes Yes Yes
Water Supply Yes Yes No Yes No Yes Yes Yes
Solid Waste Management Yes Yes Yes Yes No No Yes Yes
Env
ironm
enta
l M
anag
emen
t
Environmental Policy Yes No Yes No No No No No
Environmental Science and Monitoring
Yes No Yes No No No No Yes
Resource Consents Yes No Yes No No No No Yes
Environmental Protection Yes No Yes No No No Yes No
Reg
ulat
ory
Biosecurity (Pest Management) Yes No Yes No No No Yes No
Building Control Yes No Yes No No No No No
Environmental Health Yes No Yes No No No No Yes
Animal Control Yes Yes Yes Yes No No No No
Harbours Yes Yes Yes Yes Yes No Yes Yes
Regional Development Yes No Yes Yes No No No Yes

Revenue and Financing Policy
Page 290 2015-2025 Long Term Plan
8.3 Prior to determining the funding basis for each activity, Council gave consideration to the following matters which are summarised below at an Activity level: (Table 9 on page 296 further identifies the rate funding basis at a Sub-Activity level). Community Outcomes to which Activities Contribute:
Council Activities
Community Outcomes
Gov
erna
nce
Env
ironm
ent
Peop
le
Eco
nom
y
Mob
ility
Livi
ng
Democratic Process Culture and Heritage Community Housing Community Support Library Services Emergency Management Community Facilities The Provision of Roads and Footpaths Flood Protection and Control Works Sewerage Including Treatment and Disposal Stormwater Drainage Water Supply Solid Waste Management Environmental Policy Environmental Science and Monitoring Resource Consents Environmental Protection Biosecurity Building Control Environmental Health Animal Control Harbours Regional Development

Revenue and Financing Policy
2015-2025 Long Term Plan Page 291
Extent to which the Actions or Inaction of Particular Individuals or a Group Contribute to the Need to Undertake the Activity.
Democratic Process
The democratic process is a public benefit available to the community at large.
Culture and Heritage
The Council contributes towards these activities for the benefit of all, as it views arts and culture as essential to the health and well-being of society. It believes that a strong community is knowledgeable of its heritage and also preserves and respects the achievements of the past.
Community Housing
The social and economic position of individuals creates the need for community housing.
Community Safety
Individuals and businesses desire to be safe and protect personal assets.
Community Support
The Council supports the community by ensuring that the public has access to a broad range of recreational, arts, cultural, social opportunities and Passenger Transport including Total Mobility. Council service costs for energy efficiency projects will be recovered over a number of years by a targeted rate on properties that obtain a service.
Library Services
This activity is potentially beneficial to all as it provides individuals with the opportunity to develop a lifestyle that enhances learning and creates recreational, cultural and social opportunities.
Emergency Management
Individual users of hazard information benefit from knowledge of hazards that directly affect them and learning how to mitigate the effects. Regional and national communities benefit directly from the maintenance of a response capability; knowledge of hazards; and measures to mitigate and contain harmful effects.
Community Facilities
The Council provides community facilities to allow residents to enjoy access to a wide range of recreational, cultural and social activities.
Roads and Footpaths
Users of the roading network create the need for maintenance from the number of trips that are made and the type of vehicle is used. The subsidies that the Council receives from New Zealand Transport Agency are funded through petrol taxes and road user charges that reflect the volume of use by each road user. The level of subsidies received does not, however equate to the Council’s view of the public/private benefit split. Hence the balance must be rate funded. ‘Areas of benefit’ will be established for the purpose of funding seal extensions. The ‘area of benefit’ will fund the cost of seal extension.
Flood Protection and Control
The Council plans flood protection to best to protect life and property in the floodplain and to preserve or enhance the environment and amenity values of river corridors. The ratepayers in the floodplain (residents and businesses) in the area directly affected by the planning and subsequent works benefit directly through avoiding the risk of floods and potentially through increased property value. Owners and providers of infrastructure (telephone, roads, rails etc) also benefit directly by avoiding damage to their assets. Ratepayers in the surrounding economic ‘catchment’ adjacent to the floodplain benefit indirectly through their integration with the area affected by the flood protection scheme. The regional community also benefits indirectly through protection of their means of access around the region.
Sewerage People who are connected to the sewer schemes are creating the need for the Council to undertake work to minimise the damage to the District’s waterways. It is considered appropriate for these people to fund the work through targeted rates. Developers who are adding to the demands placed on schemes which require the Council to undertake new capital works related to growth will also contribute to these costs.
Stormwater Drainage
Owners of developed properties require that there are systems for the collection and disposal of stormwater. Developers who are adding to the demands placed on schemes which require the Council to undertake new capital works related to growth will also contribute to these costs.
Water Supply Ratepayers who are connected to the water schemes are creating the need for the Council to undertake work relating to the availability of potable water. It is considered appropriate for these people to fund the work through targeted rates. Developers who are adding to the demands placed on schemes which require the Council to undertake new capital works related to growth will also contribute to these costs.
Solid Waste Management
Council provides waste management services for public health reasons and to protect the environment. Benefits apply directly to those who are in an area which has a kerbside refuse collection service. The Council considers that properties that receive, or will receive, a waste collection service should be responsible for funding expenditure relating to collection and those that dispose of refuse at the transfer stations should pay a disposal fee.
Revenue and Financing Policy
Page 292 2015-2025 Long Term Plan
Environmental Policy
People and organisations benefit in the District community from sound policy development, reviews and planning to enable the sustainable management of the region’s resources.
Environmental Science and Monitoring
The District community is the primary beneficiary of this activity as the information collected provides the basis for monitoring and reporting, sound policy development, reviews and planning. It should be noted that an increasing proportion of this activity is undertaken for national benefit.
Resource Consents
Persons or organisations applying for services require the Council to undertake work and this is reflected in user charges.
Environmental Protection
Environmental health compliance benefits all through having a clean, healthy environment.
Biosecurity (Pest Management)
The management of pests is essential for the District’s continued prosperity, environmental sustainability and health.
Building Control
Persons or organisations applying for services require the Council to undertake work and this is reflected in user charges.
Environmental Health
Environmental health compliance benefits all through having a clean, healthy environment.
Animal Control The activity protects the public from aggressive or straying animals.
Harbours Recreational harbour users benefit directly by avoiding natural and other hazards e.g. collisions. They benefit directly from a clean marine environment and shorter duration of pollution. Swimmers and other recreational harbour users benefit directly from effective management of the harbour and marine environment by enjoying safe, less congested waterways and by avoiding other hazards. Commercial shipping and commercial fishing owners and operators benefit directly by avoiding natural and other hazards e.g. collisions; they also enjoy a direct commercial benefit. They also benefit directly from a clean marine environment and through shorter duration of pollution, thus avoiding delays and loss of business.
Regional Development
Part of this activity is undertaken by Destination Marlborough and the Marlborough Research Centre Trust. Both of these organisations are Trusts to which Council makes contributions. They are important partners for the Council in assisting the District to achieve economic development outcomes, in particular attracting visitors, residents and investment to Marlborough, adding value to Marlborough enterprises and enriching the quality of life for Marlborough residents. The remainder of this activity (Economic Development, Parking and Irrigation) is provided by Council to support economic activity in the District.
Costs and Benefits of Funding the Activity Distinctly from Other
Activities:
Democratic Process
Costs associated with Democracy have been separated for reasons of transparency and accountability.
Culture and Heritage
Council funding is provided from general-type rates and charges as it is considered that all residents benefit from the well-being gained from creative pursuits and it is believed that it is beneficial to have a strong community which is knowledgeable of its heritage, and preserves and respects the achievements of the past.
Community Housing
Appropriate rentals are set to recover the costs associated with providing community housing.
Community Safety The costs associated with community safety have been separated for reasons of transparency and accountability.
Community Support Council provides grants and donations for social and community development groups and assists community groups to access funds for other (non-Council) sources. It works with specific sectors of the community including youth, and the older community, helps to provide liaison between community organisations and develops partnerships with and between central government and non-governmental organisations for the benefit and well-being of Marlborough residents. Council service costs for energy efficiency projects will be recovered over a number of years by a targeted rate on properties that obtain a service. The benefit of identifying passenger transport and total mobility distinctly is that it enables appropriate user charges to be calculated for this service. The Council accepts, however that user charges cannot fully fund the actual costs of the upkeep of the facilities and the shortfall is funded by way of general-type rates and charges and other external revenue.
Revenue and Financing Policy
2015-2025 Long Term Plan Page 293
Library Services There is private benefit for those that use the library services, however, the Council considers that there are wide community benefits from ensuring only minimal charges are imposed.
Emergency Management
The significance of ratepayers funding this activity is an assurance of having a safer and secure community which benefits all.
Community Facilities
The benefit of identifying community facilities distinctly is that it enables appropriate user charges to be calculated for applicable facilities. The Council accepts, however that user charges cannot fully fund the actual costs of the upkeep of the facilities and the shortfall is funded by way of general-type rates and charges.
Roads and Footpaths
. This activity benefits the whole community either directly or indirectly through the transport of people and/or goods.
Flood Protection and Control
The activity, being an essential service to the District, benefits all, although some more than others. Therefore varying rates apply across the District that take account of benefits provided. Gravel extraction and quarry operations are 100% funded from user charges.
Sewerage The benefit of funding sewerage distinctly is that only those in the area of benefit will contribute to the funding.
Stormwater Drainage
The benefit of funding drainage distinctly is that only those within urban drainage areas will contribute to their funding and rural drainage systems will be funded by rural areas.
Water Supply Water supplies are funded distinctly from other activities because only those within the supply area fund the scheme costs.
Solid Waste Management
Where benefits are identified to specific users it is appropriate that user charges and targeted rates are set to match the private benefit received.
Environmental Policy
The benefit is the knowledge that the environment is being managed appropriately and concerns are being addressed. The community benefits through the sustainable management of the region’s resources with some parts of the community benefiting from particular activities. As a result while the majority is funded by general type rates and charges, particular areas of benefit/individuals may be separately charged.
Environmental Science and Monitoring
The benefit is the knowledge that the environment is being monitored appropriately and concerns are being addressed. The community benefits through the sustainable management of the region’s resources with some parts of the community benefiting from particular activities. As a result while the majority is funded by general type rates and charges, particular areas of benefit/individuals may be separately charged.
Resource Consents Charges can be administered cost effectively. Funding is partly user charges and the remainder, rate funded. There is no alternative funding mechanism that would be a reasonable substitute.
Environmental Protection
Charges can be administered cost effectively. Funding is partly user charges and the remainder, rate funded.
Biosecurity (Pest Management)
The benefit is the knowledge that Biosecurity issues are being managed appropriately and concerns are being addressed.
Building Control Charges can be administered cost effectively. Funding is partly user charges and the remainder, rate funded. There is no alternative funding mechanism that would be a reasonable substitute.
Environmental Health
Charges can be administered cost effectively. Funding is partly user charges and the remainder, rate funded. There is no alternative funding mechanism that would be a reasonable substitute.
Animal Control Animal Control is required as a result of dog and animal ownership. In the main the activity is funded by owners.
Harbours Recreational harbour users, commercial shipping and commercial fishing owners and operators benefit directly by this activity. As Port Marlborough users benefit from the activity, it is levied a charge. The balance is funded predominantly from general type rates and charges.
Regional Development
The benefit of these activities is to promote the continued economic development of the District as a whole. Irrigation supply is funded distinctly from other activities because only those within the supply area fund the scheme costs.
Overall Impact on Current/Future Social, Economic, Environmental and
Cultural Well- Being of the Community:

Revenue and Financing Policy
Page 294 2015-2025 Long Term Plan
Democratic Process Significant impact on the social, economic, cultural and environmental well-being of the community in terms of providing effective decision making and leadership for the community, and through effective public information.
Culture and Heritage
The overall impact is significant in terms of promoting cultural enrichment, and giving residents the opportunity to gain valuable knowledge of their heritage.
Community Housing
Significant impact on the social well-being of the community.
Community Safety Safety and security have a significant impact on the social, economic, cultural and environmental well being of the community.
Community Support Significant impact on the social, economic and cultural well-being of the community in terms of promoting cultural enrichment and opportunities for residents to participate in community life. The health and wellbeing of the community benefits from energy efficiency initiatives.
Library Services The provision of libraries contributes to the economic, social and cultural well-being of the community by providing individuals with the opportunity to enhance learning and contributes to the well being of the community.
Emergency Management
Significant impact on the social, economic, cultural and environmental well-being of the community through maintaining readiness to respond to adverse events, and assisting with the health, safety and well-being of the community.
Community Facilities
Significant impact on the social, economic and cultural well-being of the community, in terms of promoting cultural enrichment and opportunities for residents to be involved in community life.
Roads and Footpaths
An efficient road transport network has a significant impact on the social, economic and environmental well-being of the community.
Flood Protection and Control
Adequate river protection has a significant impact on the social, economic and environmental well being of the community.
Sewerage Significant positive impact on the social, economic and environmental well being of the community. Treatment and disposal will protect the health of the community and the environment from adverse effects of untreated or uncontrolled effluent disposal.
Stormwater Drainage
An adequate drainage system has a significant impact on the social, economic and environmental well-being of the community.
Water Supply Water is a necessity of life and the supply of water has a significant impact on the social, economic and environmental well-being of the community.
Solid Waste Management
An adequate refuse collection and disposal system has a significant impact on the social, economic and environmental well-being of the community.
Environmental Policy
Significant impact on the social, economic and environmental well being of the community through protecting the sustainability of the community.
Environmental Science and Monitoring
Significant impact on the social, economic and environmental well being of the community through protecting the sustainability of the community.
Resource Consents Significant impact on the social, economic, cultural and environmental well-being of the community in terms of providing effective public information and applying due diligence in processing and maintaining compliance.
Environmental Protection
Significant impact on the social, economic, cultural and environmental well-being of the community in terms of providing effective public information and applying due diligence in processing and maintaining compliance.
Biosecurity (Pest Management)
Significant impact on the social, economic and environmental well being of the community through protecting the sustainability of the community.
Building Control Significant impact on the social, economic, cultural and environmental well-being of the community in terms of providing effective public information and applying due diligence in processing and maintaining compliance.
Environmental Health
Significant impact on the social, economic, cultural and environmental well-being of the community in terms of providing effective public information and applying due diligence in processing and maintaining compliance.
Animal Control The diligent policing of this activity has a significant impact on the social, economic, cultural and environmental well-being of the community.
Harbours Significant impact on the social, economic and environmental well being of users of the waterways.
Regional Development
Significant impact on the social, economic, cultural and environmental well being of the community.

Revenue and Financing Policy
2015-2025 Long Term Plan Page 295
Distribution of Benefits
Group Activity District-wide
Targeted area
Individuals
Peop
le
Democratic Process 100% Culture and Heritage 100% Community Housing 100% Community Safety 10% 90% Community Support 100% Library Services 20% 80% Emergency Management 100%
Community Facilities 50% 50% Roads and Footpaths 80% 20% Flood Protection and Control 20% 80% Sewerage 100% Stormwater Drainage 100% Water Supply 100% Solid Waste Management 10% 90%
Env
ironm
enta
l M
anag
emen
t Environmental Policy 60% 20% 20% Environmental Science and Monitoring
60% 20% 20%
Resource Consents 40% 60% Environmental Protection 40% 60%
Reg
ulat
ory
Biosecurity (Pest Management) 80% 20% Building Control 20% 80% Environmental Health 40% 60% Animal Control 20% 80% Harbours 10% 50% 40%
Reg
iona
l Dev
elop
men
t Regional Development (Economic Development, Marketing and Tourism and Research Centre)
80% 20%
Business Improvement District 100% Regional Development (Parking)
20% 80%
Regional Development (Irrigation)
100%
NOTE: Benefits are expected to occur for at least the duration of the 10 year Plan, however, many extend to the life of the applicable assets or the service provided.

Revenue and Financing Policy
Page 296 2015-2025 Long Term Plan
9. Funding of Expenditure by Activity The following table illustrates how the Residual Rate funding requirement for each activity/sub-activity is proposed to be met, after provision has been made for any applicable Fees, Charges, Grants, and Subsidies; or other Direct Revenue that relates to the activity/sub-activity; and having given consideration to the matters in paragraph 8.
A separate supplementary report outlining “Relationship determinations, Area Funding %’s, and Geo-type Rates in $, (or) Uniform Charge Amounts” is available on request, which provides a detailed analysis of the Geographic Rating Areas contribution to the General-type Targeted Rates and Charges; as well as the Relationship between the general-type rates and charges in those areas.
Table 9 Residual Rate Funding Basis
Group Activities/ Sub-
activities
Allocation of costs to geographic areas, land use categories and other
targeted rates
Fees and Charges (*)
where applic.
Grants and Subsidies (*) where applic.
General-type Targeted
"Rates" %
General-type Targeted Charges
"UACs %"
Separate Targeted Rates %
Separate Targeted Charges
"UAC's" %
Peop
le
Democratic Process
Democratic Process (excluding Boards/Forums) 0 100 0 0
Community Boards (as determined) 0 0 100 0 Community Boards (as determined) 0 0 0 100 Picton Forum 0 0 0 100
Culture and Heritage
Arts: Marlborough Art Gallery Grants 40 60 0 0 Arts: Other Grants 40 60 0 0 Heritage: Marlborough Historical Society Grants 40 60 0 0
Heritage: Other Grants 40 60 0 0 Museums – Picton 100 0 0 0 Museums: Renwick 100 0 0 0 Museums – Rural 100 0 0 0
Community Housing * 0 0 0 0 Community Safety
Community: Safer Community * * 40 60 0 0 Community: Security Cameras [Blenheim CBD] 100 0 0 0
Community Support
Community: Grants and Donations 40 60 0 0 Community: Recreation 0 100 0 0 Energy Efficiency Initiatives 0 0 100 0 Events Management 0 100 0 0 Passenger Transport 100 0 0 0
Library Services * 0 100 0 0 Emergency Management
Fire Protection * * 100 0 0 0 Emergency Management * 40 60 0 0

Revenue and Financing Policy
2015-2025 Long Term Plan Page 297
Com
mun
ity
Faci
litie
s
Cemeteries * * 0 100 0 0 Halls Group 1 - Awarua Park 100 0 0 0
Group 2 - Waitaria 100 0 0 0 Group 3 - Gen Rural Halls 100 0 0 0 Group 4 - Stadium 100 0 0 0 Group 5 - Fairhall Hall 100 0 0 0
Com
mun
ity F
acilit
ies
Group 6 - Koromiko Hall 100 0 0 0 Group 7 - Wairau Road C/Centre 100 0 0 0 Group 8 – Queen Charlotte College 100 0 0 0 Group 9 - B/Vic. Halls 100 0 0 0
Memorials Cleghorn Rotunda 100 0 0 0 Picton 100 0 0 0 Seymour Square 100 0 0 0 Town Centre Clock 100 0 0 0 Other 100 0 0 0
Public Conveniences 0 100 0 0 Reserves Group 1a - Bln Neighbourhood * 1 99 0 0
Group 1b - B/V Neighbourhood * 1 99 0 0 Group 2a - Ptn Neighbourhood * 1 99 0 0 Group 2b - P/V Neighbourhood 1 99 0 0 Group 3 - WV Domain 1 99 0 0 Group 4 - Bln Vicinity Domains * 4 96 0 0 Group 5 - Endeavour Park/Waitohi Domain
* 4 96 0 0
Group 6 - A&P/Horton Park * 10 90 0 0 Group 7 - Athletic Park/Oliver Park * 10 90 0 0 Group 8 - Bobs Bay/Picton Foreshore etc * 40 60 0 0 Group 9 - Churchward Park 28 72 0 0 Group 10 - Rural Domains * 4 96 0 0 Group 11 - Nelson Square 28 72 0 0 Group 12 - Pollard/Seymour/Riverside * 40 60 0 0 Group 13 - Wither Walkway etc 40 60 0 0 Group 14 - Rural Reserves 100 0 0 0 Group 15 - Misc Leased Reserves * 100 0 0 0
Street Trees, Berms and Plots 100 0 0 0 Swimming Pools
Aquatic Centre * 3 97 0 0 Awatere * 3 97 0 0 Picton * 3 97 0 0
Group Activities/Sub-
activities
Allocation of costs to geographic areas, land use categories and other
targeted rates
Fees and Charges (*)
where applic.
Grants and Subsidies (*) where applic.
General-type Targeted
"Rates" %
General-type Targeted Charges
"UACs %"
Separate Targeted Rates %
Separate Targeted Charges
"UAC's" %

Revenue and Financing Policy
Page 298 2015-2025 Long Term Plan
Group Activities/Sub-
activities
Allocation of costs to geographic areas, land use categories and other
targeted rates
Fees and Charges (*)
where applic.
Grants and Subsidies (*) where applic.
General-type Targeted
"Rates" %
General-type Targeted Charges
"UACs %"
Separate Targeted Rates %
Separate Targeted Charges
"UAC's" % R
oads
And
Foo
tpat
hs
Subdivisional Works * 100 0 0 0 Roading Network * * 100 0 0 0 Roading Related Works * 100 0 0 0 CBD Works Blenheim * 100 0 0 0
Picton * 100 0 0 0 Targeted French Pass Road 0 0 0 100
Kenepuru Road 0 0 100 0 Other Roads (as approved) 0 0 0 100 Other Roads (as approved) 0 0 100 0 Landscaping (Urban 1) 0 0 0 100 Landscaping (Urban 2) 0 0 0 100 Landscaping (Rural 1) 0 0 0 100 Landscaping (Rural 2) 0 0 0 100
Flood Protection and Control
Rivers in Wairau Valley District - (Separate Targeted Rate) * 0 0 100 0
Rivers outside WV Rating District * 100 0 0 0
Sew
erag
e -
(Tar
gete
d
Rat
es )
Combined Sewerage Group
Capital (includes Blenheim, Grovetown, Renwick, Spring Creek, Picton, Seddon and Havelock)
* * 0 0 100 0
Operating (includes Blenheim, Grovetown, Renwick, Spring Creek, Picton, Seddon and Havelock)
0 0 0 100
Loans – No Lump Sum
Grovetown Sewerage 0 0 100 0 Picton Sewerage 0 0 100 0 Renwick Sewerage 0 0 100 0 St Andrews Sewerage 0 0 100 0 Tuamarina Sewerage 0 0 100 0

Revenue and Financing Policy
2015-2025 Long Term Plan Page 299
Group Activities/Sub-
activities
Allocation of costs to geographic areas, land use
categories and other targeted rates
Fees and Charges (*)
where applic.
Grants and Subsidies (*) where applic.
General-type Targeted
"Rates" %
General-type Targeted Charges
"UACs %"
Separate Targeted Rates %
Separate Targeted Charges
"UAC's" %
Wat
er S
uppl
y (S
epar
ate
Targ
eted
Rat
es)
Awatere Water
Capital * * 0 0 100 0 Metered 0 0 100 0 UAC 0 0 0 100
Blenheim Water (2016-17)
Capital * * 0 0 100 0 Metered 0 0 100 0 UAC 0 0 0 100
Havelock Water (2016-17)
Capital * * 0 0 100 0 Metered 0 0 100 0 UAC 0 0 0 100
Picton Water (2016-17)
Capital * * 0 0 100 0 Metered 0 0 100 0 UAC 0 0 0 100
Rarangi Water
Capital * * 0 0 100 0 Metered 0 0 100 0 UAC 0 0 0 100
Renwick Water (2016-17)
Capital * * 0 0 100 0 Metered 0 0 100 0 UAC 0 0 0 100
Riverlands Water
Riverlands Water * 0 0 100 0 UAC 0 0 0 100
Wairau Valley Water (2016-17)
Metered * * 0 0 100 0 UAC 0 0 0 100 Loan - No Lump Sum 0 0 0 100
Wat
er -
(T
arge
ted
R
ates
)
Combined Water Group (from 2017-18)
Capital (includes Blenheim, Havelock, Picton, Renwick, Seddon and Wairau Valley)
* * 0 0 100 0
Operating (includes Blenheim, Havelock, Picton, Renwick, Seddon and Wairau Valley)
0 0 0 100

Revenue and Financing Policy
Page 300 2015-2025 Long Term Plan
Group Activities/Sub-
activities
Allocation of costs to geographic areas, land use
categories and other targeted rates
Fees and Charges (*)
where applic.
Grants and Subsidies (*) where applic.
General-type Targeted
"Rates" %
General-type Targeted Charges
"UACs %"
Separate Targeted Rates %
Separate Targeted Charges
"UAC's" %
Solid Waste Management
Blenheim/Picton (Residential) Refuse and Kerbside Recycling Collection (Separate targeted rates) and any additional areas for which the service is offered.
0 0 0 100
Blenheim/Picton (Residential) and Commercial/Industrial) Refuse Collection (Separate targeted rates)
0 0 0 100
Sounds Area Waste Projects 0 100 0 0 Landfills, Transfer Stations, Waste Minimisation * 0 100 0 0
Env
ironm
enta
l M
anag
emen
t Environment Policy 80 20 0 0 Environment Science and Monitoring * * 80 20 0 0 Resource Consents
Resource Consents * 100 0 0 0 Hearings * 0 100 0 0 Legal Section 100 0 0 0
Environmental Protection * 100 0 0 0
Reg
ulat
ory
Biosecurity (Pest Management)
Biosecurity: Regional Pest Control * * 100 0 0 0
Bovine TB Control * * 100 0 0 0
Building Control
Building Control * 100 0 0 0 LIM Section * 100 0 0 0
Environmental Health * 0 100 0 0 Animal Control
Dog Control * 100 0 0 0 Other Animal Control * 100 0 0 0
Harbours * 100 0 0 0
Reg
iona
l Dev
elop
men
t
Parking Blenheim * 100 0 0 0 Blenheim Other * 100 0 0 0 Picton * 0 100 0 0 Picton Other * 0 100 0 0
Economic Development 100 0 0 0 Business Improvement District 0 0 100* 100** Southern Valleys
Capital – No Lump Sum * 0 0 100 0 Metered * 0 0 100 0
Marketing and Tourism 100 0 0 0 Tourism (separate targeted rates) 0 0 0 100 Research Centre 100 0 0 0 Flaxbourne Capital – No Lump Sum * 0 0 100 0
Metered * 0 0 100 0 Other Developments 100 0 0 0
** Final % between separate targeted rate and separate targeted Uniform Annual Charge (UAC) will be determined following the approval of a Business Improvement District (BID) Policy by Council and the subsequent referendum by affected ratepayers in each possible BID area. The sum percentage of targeted rate plus UAC will not exceed 100%.

Revenue and Financing Policy
2015-2025 Long Term Plan Page 301
Allocation of costs to geographic areas, land use categories and other targeted rates
Non-Group Activities
Fees and Charges (*)
where applic.
Grants and Subsidies (*) where applic.
General-type Targeted
"Rates" %
General-type Targeted Charges
"UACs %"
Separate Targeted Rates %
Separate Targeted Charges
"UAC's" %
Forestry * 100 0 0 0 Land Development * 100 0 0 0 Rental Housing * 100 0 0 0 Commercial Leases * 100 0 0 0 River Leases * 100 0 0 0 MDC Holdings 100 0 0 0 Land Subdivision Reserve Grants * 0 0 0 0 Agencies 0 0 0 100 Special Revenues 100 0 0 0 General Revenues (allocated on the basis of gross general-type rates and charges) * variable variable 0 0

Revenue and Financing Policy
Page 302 2015-2025 Long Term Plan
10. Funding of Capital Requirements In general, the sources of funds for capital expenditure will be utilised in the following order:
Development and financial contributions.
Capital grants and subsidies (where available).
User charges.
General revenue sources [see below].
Council financial reserves, including Depreciation Reserves.
Loan raising [which will impact on rates in the form of loan servicing charges].
Targeted rates [directly charged].
11. General Revenue Sources There are some revenue sources which are not directly linked to an activity but are utilised by Council to assist in funding a number of Council activities either directly or indirectly.
These include:
Dividends and Interest from Investments Funded to specified Reserves for particular purposes or events (eg:
Emergency Events Reserve).
Used to subsidise general-type rates and charges by way of general revenue allocation.
Used to fund interest and funding costs on external borrowings.
Petroleum Tax Used to subsidise general-type rates and charges by way of general
revenue allocation.
Asset Sale Proceeds In general, 25% of all asset sales are used to build up the emergency
events reserve in case of a major emergency eg; earthquake.
The remaining 75% of all asset sales proceeds are used to fund the forestry and asset sales reserve.
Development and Financial Contributions Contributions received from developments and subdivisions are applied
towards the cost of infrastructure to mitigate the effects of growth. (Where capital expenditure can be funded from these contributions, Council will generally use these sources of funding to meet the cost of growth of the District in preference to other services).
Forestry Income Currently used to fund the forestry and asset sales reserve which is
used to fund infrastructural development.
12. Changes to Existing Funding Policy 12.1 Following an in-depth review of its Revenue and Financing Policy, Council
initiated a number of funding changes that will take effect from 1 July 2015.
The review included the following issues:
Consideration of the background to the existing funding policies.
A review of user charges.
An examination of the provisions of the Local Government (Rating) Act 2002.
The appropriateness of the existing geographic areas for levying general-type rates and charges.
The advantages and disadvantages of using either Land Value or Capital Value for levying general-type rates. (The current system is based on property land values).
Review of the “funding relationship weightings system” (see explanation of this in Terminology), to ensure that appropriate funding allocations are made to take account of the Financial Management considerations outlined in section 101 of the Local Government Act 2002.
The effect of collecting more revenue from “uniform annual charges” instead of from “rates levied on property values”, having regard to the legislative constraints of the Local Government (Rating) Act 2002, and the regressive impact on low value properties.
12.2 In this Plan Council has funded Depreciation and Debt Servicing Costs on the following basis:
(i) Depreciation has been fully funded for all assets with the following exceptions:

Revenue and Financing Policy
2015-2025 Long Term Plan Page 303
Roads, where funding has been adjusted to take account of NZ Transport Agency financial contributions.
Halls, Convention Centre, reserves, drains, river channels, retards and Taylor Dam as it is planned that these assets are either maintained in perpetuity, or their replacement is not certain because of changing community needs.
Wairau Valley Water and Southern Valleys’ Irrigation Schemes, where funding is capped at current levels in accordance with practice established following community consultation.
Activities with loans as well as a high value of non-depreciable assets, as below.
(ii) Debt Servicing Costs have been funded from depreciation reserves with the following exceptions:
In activities with loans as well as a high value of non-depreciable assets debt servicing costs are fully funded from revenues and/or reserves and depreciation is not funded.
Where there is a specific rate or dedicated part of any rate to meet debt servicing costs.
12.3 The Geographic Areas are described in Part 4 - Funding Impact Statement on pages 271 to 272 .
Changes 12.4 A review of the Wairau Valley River Works Rates. Council has modified the
weightings of the various Wairau Valley Rivers’ groups to adjust for disproportionate valuation movements arising from the 2014 District wide revaluation.
This means that the various differential groups will have similar levies (in total) on the new capital values, as for the former valuation.
12.5 Council may from time to time introduce a Business Improvement District (BID) rate where a BID has been formed in accordance with the Council BID Policy, and the Council accepts (through consultation with affected parties) that it is appropriate to fund the activity by targeted rates.

Rates Remission and Postponement Policies
Page 304 2015-2025 Long Term Plan
Rates Remission and Postponement Policies Rates Remission Policy This policy was prepared pursuant to sections 102 and 109 of the Local Government Act 2002 for consultation using the special consultative procedure detailed in the same Act.
The changes to the existing policy are for limitation of general-type uniform annual charges and targeted charges in certain circumstances, subdivisions that create four to nine rating units, subdivisions that create ten or more rating units, water losses and extreme financial hardship.
Community, Sporting and Other Organisations Objective of the Policy To facilitate the ongoing provision of community services or recreational opportunities for the residents of the Marlborough District Council where there is no statutory provision in Schedule 1 Part 2 of the Local Government (Rating) Act 2002.
The purpose of granting rates remission to an organisation is to:
Assist the organisation’s survival; and
Make membership of the organisation more accessible to the general public, particularly children, youth, young families, aged people, and economically disadvantaged people.
Conditions and Criteria The land must be owned by the Council or owned, occupied or leased by an organisation (with liability for rates), which is used exclusively or principally for sporting, recreation, or community purposes.
The organisation must not operate for private pecuniary profit.
Applications received during a rating year will be applicable from the commencement of the following rating year. All applications must be on the prescribed form and will not be backdated.
Organisations making application should include the following documents in support of their application:
Statement of Objectives;
Most recent financial accounts (preferably audited);
Details of any leases (where applicable);
Information on activities and programmes;
Details of membership or clients.
Application Generally, the Policy will not apply to groups or organisations whose primary purpose is to address the needs of adult members (over 18 years) for entertainment or social interaction, or who engage in recreational, sporting, or community services as a secondary purpose only.
The Policy shall apply to such organisations as approved by the Council (or Council Officers with delegated authority) as meeting the relevant criteria.
Remissions to any qualifying organisation shall be on the basis of a 50% reduction in rates and charges except that no remission will be granted on targeted rates/charges for water supply, sewerage disposal or refuse collection, or areas used for bars.
Land Protected for Natural, Historic or Cultural Conservation Purposes Objective of the Policy To preserve and promote natural resources and heritage, to encourage the protection of land for natural, historic or cultural purposes.
Conditions and Criteria Ratepayers with rating units which have some feature of cultural, natural or historic heritage which is voluntarily protected may qualify for remission of rates under this part of the Policy.
Land that is non-rateable under section 8 of the Local Government (Rating) Act 2002 and is liable only for targeted rates covering water supply, sewage disposal or refuse collection will not qualify for remission under this part of the Policy.
Applications received during a rating year will be applicable from the commencement of the following rating year. All applications must be on the prescribed form and will not be backdated.
Rates Remission and Postponement Policies
2015-2025 Long Term Plan Page 305
Applications should be supported by documentary evidence of the protected status of the rating unit eg; a copy of the Covenant or other legal mechanism.
In considering any application for remission of rates under this part of the policy the Council will consider the following criteria:
The extent to which the preservation of natural, cultural or historic heritage will be promoted by granting remission of rates on the rating unit.
The degree to which features of natural, cultural or historic heritage are present on the land.
The degree to which features of natural, cultural or historic heritage inhibit the economic utilisation of the land.
Application The extent of any remission shall be determined by the Council or its delegated officer[s] on a case by case basis.
In granting remissions under this part of the Policy, the Council may specify certain conditions before remission will be granted. Applicants will be required to agree in writing to these conditions and to pay any remitted rates if the conditions are violated.
Residential Land in Commercial or Industrial Areas Objective To ensure that owners of residential rating units situated in commercial or industrial areas are not unduly penalised by the zoning decisions of this Council and the former authorities.
Conditions and Criteria To qualify for remission under this part of the Policy, the rating unit must:
Be situated within an area of land that has been zoned for commercial or industrial use. (Ratepayers can determine how their property has been zoned by inspecting the Marlborough Sounds Resource Management Plan and the Wairau/Awatere Resource Management Plan, copies of which are available from either the District Administration Office, the Picton Service Delivery Centre, or on Council’s website www.marlborough.govt.nz).
Be listed as a “residential” property for differential rating purposes. Ratepayers wishing to ascertain whether their property is treated as a residential property may inspect the Council’s rating information database at the District
Administration Office, or obtain that information from the rate records on Council’s website www.marlborough.govt.nz.
Application Following triennial revaluation Council will direct its valuation service provider to prepare a valuation that will treat the rating unit as if it were a comparable rating unit elsewhere in the District. Ratepayers should note that the valuation service provider’s decision is final as there are no statutory rights of objection or appeal, for valuations of this nature.
The extent of any remission shall be determined by the Council or its delegated officer(s) and will be based on valuations supplied by its valuation service provider.
Land Affected by Natural Disaster Residential Land Affected by Natural Disaster Objective of the Policy To enable rate relief to be provided where the use that may be made of any land used for a private residence has been detrimentally affected by natural disaster.
Conditions and Criteria Council may remit wholly or in part, any rate or charge made and levied in respect of the land, where it considers it to be fair and reasonable to do so.
All applications must be on the prescribed form.
Application The extent of any remission shall be determined by the Council or its delegated officer[s].
General -Type Uniform Annual Charges and Targeted Charges on Non-Contiguous Pastoral Rating Units Objective of the Policy To provide relief from General-type Uniform Charges and Targeted Charges on rural pastoral land which is non-contiguous, provided it is farmed as a single entity.
Conditions and Criteria Non-contiguous pastoral units may qualify for a remission of uniform annual general charges and targeted rates calculated as a fixed amount per rating unit where Council

Rates Remission and Postponement Policies
Page 306 2015-2025 Long Term Plan
agrees that the economics of each farm property are inter-dependent on the other. The ratepayer will remain liable for at least one uniform annual general charge and one set of each type of targeted rate calculated as a fixed amount per rating unit.
Only one residential unit can exist on the qualifying rating units except where the farm contains accommodation on a rent free basis for the owner or staff associated with the farm.
Applications received during a rating year will be applicable from the commencement of the following rating year. All applications must be on the prescribed form and will not be backdated.
Application Council or its delegated officer[s] shall determine whether the criteria are met.
General -Type Uniform Annual Charges and Targeted Charges on Contiguous Rating Units in Separate Ownership, Used Jointly as a Single Entity Objective of the Policy To limit the incidence of multiple charges where a farming or other business entity consists of a number of contiguous rating units with different owners.
Conditions and Criteria Each rating unit must be leased to the operator for a term not less than five years.
The operator must provide Council with a statutory declaration confirming that each unit will be operated as part of the entity.
The ratepayer will remain liable for at least one uniform annual general charge-type and one set of each type of targeted rate calculated as a fixed amount per rating unit.
Applications received during a rating year will be applicable from the commencement of the following rating year. All applications must be on the prescribed form and will not be backdated.
Application The extent of any remission shall be determined by the Council or its delegated officer[s].
Limitation of General-Type Uniform Annual Charges and Targeted Charges in Certain Circumstances Purpose of Policy To limit the incidence of General-Type Uniform Annual Charges and targeted rates calculated as a fixed amount per rating unit in certain circumstances.
Conditions and Criteria Council will assess the General-Type Uniform Annual Charges and targeted rates [calculated as a fixed amount per rating unit] on the basis of every separately used or inhabited part of a rating unit but, the following situations will be deemed not to create a separately used or inhabited part of a rating unit:
In the case of a farm, orchard, other horticultural type property, or business:
Where the farm, orchard, horticultural operation, or business contains additional accommodation on a rent free basis for the owner, or staff associated with the farm, orchard, horticultural operation or business.
In the case of a rating unit that contains one additional separately inhabited unit or dwelling, occupied by family members:
Where members of the owner’s family inhabit the separate part of the property on a rent free basis.
Applications received during a rating year will be applicable from the commencement of the following rating year. All applications must be on the prescribed form and will not be backdated.
Application Council will remit any rates in excess of those payable under this policy.
Urban Residential 2 Greenfields Land in Rural Areas Objective To ensure that owners of residential rating units situated in rural areas are not unduly penalised by the zoning decisions of Council.
Conditions and Criteria To qualify for remission under this part of the Policy, the rating unit must:

Rates Remission and Postponement Policies
2015-2025 Long Term Plan Page 307
Be situated within an area of land that has been zoned ‘Urban Residential 2 Greenfield Zone’ in the Wairau-Awatere Resource Management Plan (Ratepayers can determine how their property has been zoned by inspecting the Wairau/Awatere Resource Management Plan, copies of which are available from either the District Administration Office or on Council’s website www.marlborough.govt.nz).
Remain unsubdivided ie; subdivision title has not been granted.
Continue, for any remaining unsubdivided area, to have a land use that’s consistent with the rural character that existed on approval of the new zone on 18 September 2014.
Application All rating units located within the ‘Urban Residential 2 Greenfield Zone’ will be rated on the basis of the underlying land being zoned Rural 3. Following triennial revaluation Council will direct its valuation service provider to prepare a valuation that will treat the rating unit as if it were a comparable rating unit in zoned Rural 3. Ratepayers should note that the valuation service provider’s decision is final as there are no statutory rights of objection or appeal, for valuations of this nature. The extent of any remission shall be determined by the Council or its delegated officer(s) and will be based on valuations supplied by its valuation service provider.
Subdivisions That Create Four or More but Less than Ten Rating Units Objective of the Policy To provide a positive development incentive to commercial subdividers by remitting general-type uniform charges on unsold subdivided land without an occupied dwelling or commercial building, for a maximum period of three years.
Conditions and Criteria To qualify for remission under this part of the Policy, the rating unit must remain in the subdivider’s name.
Remission will not apply to water, sewerage or other targeted rates calculated as a fixed amount per rating unit.
Remission will cease on those rating units which are sold. Remission will also cease on rating units which remain unsold after three years of the lots being created.
The ratepayer will remain liable for at least one uniform annual general-type charge and one set of each type of targeted rate calculated as a fixed amount per rating unit.
Application Council or its delegated officer[s] shall determine whether the criteria are met.
Subdivisions That Create Ten or More Rating Units Objective of the Policy To provide a positive development incentive to commercial subdividers by remitting general-type rates and uniform charges on all unsold subdivided land without an occupied dwelling or commercial building (other than any balance of land) for a maximum period of five years. This policy only applies to subdivisions that are deposited after 1 July 2009.
Conditions and Criteria To qualify for remission under this part of the Policy, the rating unit must remain in the subdivider’s name.
Remission will not apply to water, sewerage or other targeted rates calculated as a fixed amount per rating unit.
Remission will cease on those rating units which are sold. Remission will also cease on rating units which remain unsold after five years of the lots being created.
The ratepayer will remain liable for all rates and charges on the unsubdivided lot (balance of land).
Application Council or its delegated officer[s] shall determine whether the criteria are met.
Rate Penalties Objective of the Policy To enable Council to remit penalties where:
payment has not been received by the penalty date, due to circumstances outside the ratepayer’s control; or
it is deemed equitable to remit the penalty for other reasons.
Conditions and Criteria Each application will be considered on its merits and remission may be granted where it is considered just and equitable to do so.

Rates Remission and Postponement Policies
Page 308 2015-2025 Long Term Plan
The Council will consider remission of rate penalties where an application is made and meets any of the following criteria:
payment has been late due to significant family disruption. [Significant family disruption would include death, illness, or accident of a family member]; or
the ratepayer is able to provide evidence that their payment has gone astray in the post, or the late payment has otherwise resulted from matters outside their control; or
penalties have arisen through processing errors in Council’s records or an outstanding balance has arisen as a result of a shortfall caused by the operation of an agreed payment plan; or
the ratepayer provides a reasonable explanation of the circumstances which caused the late payment, and this is the first occasion on which late payment has occurred.
Application The extent of any remission will be determined by the Council or its delegated officer[s].
Water Losses Objective of the Policy To provide ratepayers with a measure of relief, by way of partial rates remission where, as a result of the existence of a water leak on the property which they occupy, the payment of full water rates is inequitable.
Conditions and Criteria This Remission Policy does not apply to Council’s irrigation water supplies (Southern Valleys’ Irrigation Scheme and Riverlands Irrigation Scheme). There will be no refunds for water losses for irrigation supplies.
The existence of a significant leak on the occupied property has been established and there is evidence that steps have been taken to repair the leak as soon as possible after its detection.
Application Council will calculate the volume of water lost based on average water consumptions during similar periods of previous years.
When an application for water rates remission is approved pursuant to this policy, the amount of the remission will depend on when the leak is repaired.
If the leak is repaired before the following scheduled reading interval, the remission will be equivalent to the assessed volume of water that has been lost through the leak, since the scheduled reading interval prior to the leak being discovered; or
If the leak is not repaired before the following scheduled reading interval, the remission calculation will be assessed on the next scheduled reading interval; or
Where there are extenuating circumstances, Council or its delegated officer[s] may extend the period for a re-assessment of the water rate.
A property displaying ongoing leakage showing likely system failure of the pipe network within the property will be provided with no more than three remissions for water loss.
The maximum remission for any one water loss will be $3,000 unless there are extenuating circumstances verified by the Operations and Maintenance Engineer.
Council or its delegated officer[s] shall determine whether the criteria are met.
Extreme Financial Hardship Objective of the Policy To enable Council to grant remission, for cases of extreme financial hardship, on a case by case basis, of all or part of the rates.
Conditions and Criteria Council may remit rates in accordance with the policy where the application meets all of the following criteria:
The ratepayer(s) must be the current occupier(s) of the rating unit which must be solely used for their personal residential purposes.
The Council must be satisfied that extreme financial hardship exists or would be caused by requiring payment of the whole or part of the rates.
The ratepayer[s] must provide any evidence that Council deems appropriate to support the claim of extreme financial hardship.
The ratepayer[s] must make acceptable arrangements for payment of future rates, for example by setting up a system for regular payments.
Applications received during a rating year will be applicable from the commencement of the following rating year. All applications must be on the prescribed form and will not be backdated.

Rates Remission and Postponement Policies
2015-2025 Long Term Plan Page 309
Application Applications for remissions shall be considered by the Council or its delegated officer[s].
Sundry Remissions Objective of the Policy To remit rates and charges that are the result of fundamental errors; or where the balance owing is considered uneconomic to recover; or where the amount levied is unable to be recovered pursuant to sections 67-76 of the Local Government (Rating) Act 2002, or where Council or its delegated officer(s) consider the levy impractical to recover; or where Council considers it equitable in the particular circumstances to remit rates.
Conditions and Criteria The extent of any remission shall be determined by the Council or its delegated officer[s].
Rates Postponement Policies Extreme Financial Hardship Objective of the Policy To assist ratepayers experiencing extreme financial hardship.
Conditions and Criteria All applications must be on the prescribed form.
When considering whether extreme financial circumstances exist, all of the ratepayer[s] personal circumstances will be relevant.
The Council must postpone rates in accordance with the Policy where the application meets all of the following criteria:
The ratepayer[s] must be the current occupier[s] of the rating unit which must be solely used for their personal residential purposes.
The Council must be satisfied that the ratepayer[s] is/are unlikely to have sufficient funds left over after the payment of rates, for normal health care, appropriate provision for maintenance of his/her home and chattels at an adequate standard, as well as making provision for normal day to day living expenses.
The ratepayer[s] must not own any other rating units or investment properties or other realisable assets.
The ratepayer[s] must make acceptable arrangements for payment of future rates, for example by setting up a system for regular payments.
Even if rates are postponed, as a general rule the ratepayer[s] will be required to pay the first $645 of the annual rate levy.
The Council may add a postponement fee to the postponed rates for the period between the due date and the date they are paid. This fee will not exceed an amount which covers the Council’s administration and financial costs.
The policy will apply from the beginning of the rating year in which the application is made although the Council may consider backdating past the rating year in which the application is made depending on the circumstances.
Any postponed rates will be postponed until:
The death of the ratepayer[s]; or
The ratepayer[s] ceases to be the owner or occupier of the rating unit; or
The ratepayer[s] ceases to use the property as his/her residence; or
A date determined by the Council in any particular case.
At any time, the applicant may elect to postpone the payment of a lesser sum than that which they would be entitled to have postponed pursuant to this Policy by paying the postponed rates or any part thereof.
Application Postponed rates will be registered as a Statutory Land Charge on the rating unit’s title.
Applications for rate postponements shall be considered by the Council or its delegated officer[s].
Residential Ratepayers aged 65 and over Objective of the Policy To offer ratepayers aged 65 years and over a facility to unlock the equity in their residential property by postponing all or part of their rates to a future date, at no cost or risk to Council.

Rates Remission and Postponement Policies
Page 310 2015-2025 Long Term Plan
Conditions and Criteria All applications must be on the prescribed form.
Rates postponement is available on properties that are occupied by the ratepayer applicant(s) as their principal place of residence. Holiday homes are not eligible.
Property that is Maori freehold land is not eligible for postponement as councils do not have adequate rights to recover postponed or overdue rates on Maori freehold land.
Postponement is available to applicant(s) who are the legal owners of their property or who live in a property owned by a family trust. Units in retirement villages held under licences to occupy and any other arrangement where the applicant is not the registered owner are only eligible for postponement if the amount of the rates for the unit/dwelling that is lived in is clearly identified for rating purposes (i.e. separately rated), and that the full benefit of the postponement is passed on to the resident.
Postponement is available only for ratepayers age 65 or over. In the case of the couple, at least one applicant must be of that age.
Applicants must have at least one “decision facilitation” interview with a decision facilitator engaged by Council, to ensure that independent advice has been provided on the implications of the postponement offer.
The application will require any mortgagee’s consents and a decision facilitator completion certificate before a formal postponement offer is made by Council.
Rates may be postponed until:
The death of the ratepayer(s) (the Council will allow up to 12 months for any resolution of estate or trust affairs required to enable repayment); or
The ratepayer(s) ceases to be the owner of the rating unit; or
The rating unit ceases to be the principal place of residence of the ratepayer(s) – this means that if the ratepayer(s) moves out of the home into residential care, technically the postponed rates become due and payable. In practice, if the council is satisfied that the principal reason for moving out is to go into care, the postponement will remain in place.
The Council will offer full postponement unless testing the expected outcome through the council’s actuarial model suggests that equity on expected repayment (the death of the applicant or the survivor of joint applicants) would be less than 20%. If that is the case, then postponement entitlement will be based on the maximum proportion projected to leave a minimum of 20% equity available at the end of the postponement period.
The property must be kept insured to its full value and evidence of this produced annually.
Postponed rates and any part thereof may be paid at any time. Applicants may elect to postpone a lesser amount than the maximum they would be entitled to under the council’s policy.
If accrued rates and charges reach 80% of the value of the property, the Council will not postpone any further rates but instead require that all further rates are paid as they fall due. Accrued rates and charges will remain payable only on an event of repayment (eg; death, sale) and will continue to accrue interest and other annual charges.
One-off costs to the ratepayer will relate to the initial postponement application fee, a contribution to the facilitation process, and any other incidental fees and charges relevant to the particular application.
Other costs to the ratepayer (or their estate) will be the amount of the postponed rates and charges, interest on the accumulated postponement amount, an annual administration fee to cover external management and the scheme’s operating costs, and a reserve fund levy to meet unsecured postponements.
All of the above fees and charges will be added to the postponed rates.
Legal Fees – if an applicant wishes to consult a lawyer, the applicant will need to meet the costs of doing so.
Application Postponed rates will be registered as a Statutory Land Charge on the rating unit’s title.
Applications will be considered by delegated officers in accordance with the scheme’s criteria.
Maori Freehold Land Remission and Postponement of Rates on Maori Freehold Land Objectives of the Policy Section 102(2)(e) of the Local Government Act 2002 requires Council to adopt a policy on the remission and postponement of rates on Maori freehold land; section 108 and Schedule 11 set out the matters to be considered.

Rates Remission and Postponement Policies
2015-2025 Long Term Plan Page 311
Conditions and Criteria Council has reviewed the matters set out in section 108 and Schedule 11 and has decided that the appropriate policy is to consider applications for remission or postponement of rates on Maori freehold land in terms of the policies adopted by Council regarding remissions and postponements of rates on other land.

Significance and Engagement Policy
Page 312 2015-2025 Long Term Plan
Significance and Engagement Policy Purpose The purpose of this policy is to let the community know how and when they can expect to be engaged (informed/consulted) in Council’s decision-making processes. This policy will tell you:
What decisions Council and the community think are particularly significant (important);
How Council will assess the significance (importance) of the decisions;
How the community can expect to be engaged (consulted) with;
When the community can expect to be engaged (consulted) with.
Introduction Community engagement helps to strengthen the legitimacy of decisions. It enables communities to influence decisions and it increases the accountability of Council.
It ensures the community are aware and can respond to Council proposals based on a range of knowledge, views and values.
When Council has a proposal, it needs to decide whether and how to consult or engage with the community, individuals or particular interest groups.
Council has to apply the principles of consultation set out in the Local Government Act 2002 when deciding what process to follow when consulting on a particular proposal. Council will use this policy when deciding how to consult or engage.
This policy is in six parts:
Section One ‘Significance’ describes how Council decides if a proposal is significant (important). The level of significance (together with other factors set out in this policy) then determines what level of engagement is required;
Section Two ‘Engagement’ describes how Council will respond to community preferences about engagement on proposals including the form of consultation that may be desirable;
Section Three details the Engagement Levels and Methods Matrix;
Section Four contains examples of existing community and interest groups engaging with Council;
Section Five has a brief description of the Special Consultative Procedure; and
Section Six sets out the Principles of Consultation as set out in section 82 of the Local Government Act 2002.
Glossary Community A group of people living in the same place or having a
particular characteristic in common and living or owning property in the Marlborough District. It includes interested parties, affected people and key stakeholders
Decisions Refers to all the decisions made by or on behalf of Council including those made by officers under delegation. (Management decisions made by officers under delegation during the implementation of council decisions will not be considered significant).
Engagement Is a term used to describe the process of involving the community in decision-making. There is a continuum of engagement.
Proposal means a decision to be made by Council on a specific issue, asset or activity
Significance As defined in Section 5 of the LGA2002 “in relation to any issue, proposal, decision, or other matter that concerns or is before a local authority, means the degree of importance of the issue, proposal, decision, or matter, as assessed by the local authority, in terms of its likely impact on, and likely consequences for,—
(a) the district or region:
(b) any persons who are likely to be particularly affected by, or interested in, the issue, proposal, decision, or matter:
(c) the capacity of the local authority to perform its role, and the financial and other costs of doing so
Strategic asset As defined in Section 5 of the LGA2002 “in relation to the assets held by a local authority, means an asset or group

Significance and Engagement Policy
2015-2025 Long Term Plan Page 313
of assets that the local authority needs to retain if the local authority is to maintain the local authority's capacity to achieve or promote any outcome that the local authority determines to be important to the current or future well-being of the community; and includes—
any asset or group of assets listed in accordance with section 76AA(3) by the local authority; and
any land or building owned by the local authority and required to maintain the local authority's capacity to provide affordable housing as part of its social policy; and
any equity securities held by the local authority in—
a port company within the meaning of the Port Companies Act 1988:
an airport company within the meaning of the Airport Authorities Act 1966”
Policy Term and Review Council is required to review this policy every three years. Council will start the next review in 2015.
Section One: Significance 1. This part of the Policy describes:
(a) The approach Council will take to determining the significance of proposals and decisions. How significant a proposal or decision is has a direct impact on the level of consultation required.
(b) The criteria or procedures Council will use to assess significance.
(c) Those assets considered to be strategic assets. These are detailed because major decisions about strategic assets are considered significant.
General Approach 2. The Marlborough District Council will determine the significance of proposals
and decisions in relation to issues, assets, or other matters by considering the likely impact of the proposal or decision on, and likely consequences for:
The Marlborough District generally.
Council’s achievement of its community outcomes.
Any persons who are likely to be particularly affected by the issue, proposal, decision, or matter.
The capacity of Council to perform its role and carry out its activities, now and in the future.
The financial costs and other resource requirements of the issue.
Thresholds 3. Marlborough District Council will consider any decisions concerning the
following as significant:
Expenditure on issues, assets, or other matters (not including strategic assets) that represent more than 10% of Council’s total budgeted annual income.
Any transfer of ownership or control to or from the Council, or the construction, replacement or abandonment, of a strategic asset as defined by the Act or listed in this policy.
Reducing Council’s shareholding in any Council Controlled Organisation and Joint Operating Committee below 100% of the shareholding held as at 30 June 2012.
Entry into any partnership with the private sector to carry out a significant activity.
Criteria 4. Degrees of significance will be determined after consideration of the following
criteria:
Whether an affected asset is a strategic asset within the meaning of the Act or listed in this policy.
The extent to which there is, or is likely to be, a change in the level of service in carrying out any significant activity.
The extent to which there is, or is likely to be, a change in the capacity of the Council to provide any significant service or carry out any significant activity.
Procedure for Determining Significance 5. Decisions on significance will be made according to council standing orders,
and applying the general approach to significance set out in this policy.
Significance and Engagement Policy
Page 314 2015-2025 Long Term Plan
Strategic Assets 6. The assets and groups of assets in terms of s.90(2) that Marlborough District
Council considers to be strategic are:
The local roading network as a whole.
District stormwater networks.
District water supply networks.
District sewerage networks.
River control assets.
Shares in MDC Holdings Ltd.
Commercial forestry known as Marlborough Regional Forestry.
Section Two: Engagement and Consultation 7. Council is committed to effective engagement with Marlborough’s communities
on what matters to them. In return people expect to have the opportunity to be involved and have their say.
8. This part of the policy describes:
(a) How Council will respond to community preferences about engagement on decisions including the form of consultation that may be desirable.
(b) How Council will engage with communities on other matters.
Engagement with Maori 9. Council has a current policy on engagement with Maori, the Maori Capacity
Development Policy, made under section 81 of the Local Government Act 2002. Council will continue to engage with Maori under that Policy. Council will review the Maori Capacity Development Policy at the same time as the next review of this Significance and Engagement Policy.
When Council will Consult 10. When legislation requires that consultation be undertaken.
Council will consult where it has a legislative requirement to do so (for example, under the Local Government Act 2002, the Resource Management Act 1991, and the Reserves Act 1977).
Council will undertake the consultation in accordance with the legislative requirements; this may include use of the special consultative procedure under the Local Government Act 2002 (Section Six of this Policy).
When a significant proposal is being considered 11. Council will consult on significant proposals. Council will use this policy to
decide what form of consultation to undertake and who will be consulted.
When a proposal or decision is not significant, but consultation is considered to be appropriate 12. Unless consultation is required by statute, it is open to Council to decide
whether consultation is required in order to determine community views, and if so, the nature and extent of consultation.
When Council will not Consult 13. There are times when it is not necessary, appropriate or possible to consult with
the community on a proposal or decision.
14. Council will not consult or engage with the community on decisions to take (or not take) enforcement action in a particular case (even where the matter may be highly significant under this Policy (for example, where the matter has high public interest)). Council will not consult in emergency situations where an immediate response is necessary. Council will not consult on administrative matters (for example, tendering and contracting, delegations, appointments (staff, commissioners, directors, and trustees), insurance and risk management).
How will Council Decide Whether or not to Consult? 15. Council will decide whether or not to consult depending on:
How significant the matter is (including whether the matter is not of a nature or significance that requires consultation);
Who is affected by, interested in, or likely to have a view on the issue;
Whether Council already has a sound understanding of the views of those affected by or interested in the proposed decision;
Whether the matter has already been addressed in Council’s Policies or Plans, which have previously been consulted on;
The need for confidentiality or where the matter is commercially sensitive;
Significance and Engagement Policy
2015-2025 Long Term Plan Page 315
The urgency of the decision;
Any applicable principles of consultation and requirements of decision-making (for example, under the Local Government Act 2002—see Section Six);
Any statutory or other legal requirements for engagement or consultation on the matter.
What Methods will Council use to Consult? 16. Council will use a variety of methods of consultation. The methods will vary
greatly in accordance with the significance of the decision to be made.
17. Council will choose how it will consult in a particular instance according to the above criteria. The engagement levels and methods Council may use for consultation or engagement are set out in the matrix in Section Three.
Feedback on Decisions Made 18. Council will make sure that the public is told what choices and decisions were
made and why. Council will endeavour to directly contact everyone who had input or made a submission. Council may use the media or the Council website to let people know.
Community Preferences for Engagement 19. Many interest groups and communities already effectively engage with Council
on an on-going basis. Council will continue to support existing community and interest groups in engaging with Council. A list of some of these groups is set out in Section Four.
20. Council has established the “Smart and Connected” programme which brings together industries and interest groups to better manage their futures. The Smart and Connected economic strategy aims to create a partnership between Council and the community to promote the vision for Marlborough.
21. Council will look for other opportunities for communities and interest groups to engage with Council in this way. These opportunities may be single-issue or ongoing. They may involve establishing forums for communities and new Smart and Connected Cluster groups. These forums and groups allow people to express their views to Council on matters affecting them, allows Council to provide information of interest to them, and Council can assist them to make decisions for their future development.
22. When engaging with the community, Council will:
Undertake the engagement with an open mind. (Council expects other people involved in the engagement to also have an open mind)
Be fair, informal and not too bureaucratic.
Seek the views of interested and affected people.
Seek the views of the people who it does not normally hear from.
Give people relevant and easily understood information in a way that suits them.
Use plain language.
Make it easy for people to give their views to the Council.
Engage in the community by going to where people are and not always expecting them to come to the Council.
Involve people right through the decision making process.
Give people time to think about the issues and respond to them.
Be clear about the process being used and the levels of influence that people have.
Be receptive to new ideas.
Give people involved in the engagement a response to the issues they raise.
Undertake the engagement in a cost effective way.
23. Council will look for other ways to engage with the community over the term of this Policy.

Significance and Engagement Policy
Page 316 2015-2025 Long Term Plan
Section Three: Engagement Levels and Methods Matrix Level Inform Consult Involve Collaborate Empower
What does it involve
One-way communication providing balanced and objective information to assist understanding about something that is going to happen or has happened
Two-way communications designed to obtain public feedback about ideas on rationale, alternatives and proposals to inform decision making
Participatory process designed to help identify issues and views to ensure that concerns and aspirations are understood and considered prior to decision-making
Working together to develop understanding of all issues and interests to work out alternatives and identify preferred solutions
The final decision making is in the hands of the public. Under the LGA 2002, the Mayor and Councillors are elected to make decisions on behalf of their constituents
Types of issues that we might use this for
Water restrictions Rates review Smart & Connected Leadership Groups
Resource Management Plan Review
Election voting systems (MMP, STV or first past the post)
Tools Council might use
Websites Social media Information flyer Public notices Public meetings
*Formal submissions and hearings, focus groups, surveys (for example, phone and web—based surveys)
*Workshops Focus groups
*External or joint working groups (involving community experts or stakeholders)
*Binding referendum Local body elections
When the community can expect to be involved
Council would generally advise the community once a decision is made
Council would advise the community once a proposal is determined by Council and would generally provide the community with at least 4 weeks to participate and respond
Council would generally provide the community with a greater lead in time to allow them time to be involved in the process
Council would generally involve the community at the start to scope the issue, again after information has been collected and again when options are being considered
Council would generally provide the community with a greater lead in time to allow them time to be fully involved in the process

Significance and Engagement Policy
2015-2025 Long Term Plan Page 317
Section Four: Examples of Existing Community and Interest Groups Engaging with Council NB: This list is not exhaustive.
Access and Mobility Forum Arts Forum Awatere Water Group Awatere Community Trust Council Youth Forum Funders Forum Heritage Forum Iwi Marlborough Landscape Group Picton Regional Forum Older Persons Forum Ratepayer Associations Residents Associations Sounds Advisory Group Youth Talking Heads
Section Five: Brief Description of the Special Consultative Procedure The special consultative procedure is an open invitation to the public to be involved in decision-making. It is used when the issue to be decided on affects the whole of Marlborough or all ratepayers and residents in Marlborough are likely to be interested in the decision to be made.
It is a formal process that is set out in the Local Government Act 2002. The main steps in the process are:
Council issues a statement of proposal which is open for the community to provide views. It remains open for at least a month. The community can make a submission on the proposal.
Council will hold a hearing if the community want to present their views in person.
Council makes a decision on the proposal taking into account the views expressed.
The process can take four to six months (or even longer) to complete.
Council will provide an opportunity for people to present their views in a manner that enables spoken (or NZ sign language) interaction between the person and Council, if requested.
Council may allow a person to present their views by audio or audio-visual link, if requested.
Council will ensure that the consultation documents are accessible to the public and that the fact the proposal is open for consultation widely known (for example, on Council’s website).
Section Six: Principles of Consultation (s82 Local Government Act 2002) Some or all of the following principles (as considered by Council, in its discretion, to be appropriate in any particular instance) will be observed by Council—
Those who are affected by, or have an interest in, the decision or matter should be provided by Council with reasonable access to relevant information in a manner and format that is appropriate to the preferences and needs of those persons:
Those who are affected by, or have an interest in, the decision or matter should be encouraged by Council to present their views to Council:
Those who are invited or encouraged to present their views to Council should be given clear information by Council on the purpose of the consultation and the scope of the decisions to be taken following the consideration of views presented:
Those who wish to have their views on the decision or matter considered by Council should be provided by Council with a reasonable opportunity to present those views to Council in a manner and format that is appropriate to the preferences and need of those persons:
That the views presented to Council should be received by Council with an open mind and should be given due consideration by Council in making the decision:
That persons who present views to Council should have access to a clear record or description of relevant decisions made by Council and explanatory material relating to those decisions, which may include, for example, reports relating to the matters that were considered before the decisions were made.
In deciding which principles are appropriate in a particular instance, Council must have regard to—
The requirement to give consideration to the views and preferences of persons likely to be affected by, or to have an interest in, the matter; and
The extent to which the current views and preferences of persons who are affected by, or have an interest in, the decision or matter are known to Council; and

Significance and Engagement Policy
Page 318 2015-2025 Long Term Plan
The nature and significance of the decision or matter, including its likely impact from the perspective of the persons who are affected or interested in the decision or matter; and
The provisions of Part 1 of the Local Government Official Information and Meetings Act 1987 (which Part, among other things, sets out the circumstances in which there is good reason for withholding local authority information); and
The costs and benefits of any consultation process or procedure.
These principles do not have to be followed in any statutory consultation process to the extent that these principles are inconsistent with that process.
Information Requirements for Consultation Council must make publicly available:
The proposal and the reasons for the proposal;
An analysis of the reasonably practicable options, including the proposal; and
If a plan or policy or similar document is proposed to be adopted or amended, a draft of the proposed plan, policy or other document.

Maori Capacity Development Policy
2015-2025 Long Term Plan Page 319
Maori Capacity Development Policy Council currently engages with the eight Tangata Whenua Iwi within the Marlborough District: Ngati Apa, Ngati Koata, Ngati Kuia, Ngati Rarua, Ngati Toa, Rangitane, Ngai Tahu, Te Atiawa and also Marlborough Maataa Waka. Marlborough Iwi and Marlborough Maataa Waka make an important contribution to community wellbeing for Maori and the wider community. Progressing Treaty of Waitangi settlements with the Crown has been a principal objective for Marlborough Iwi with Council providing considerable assistance in this endeavour.
At a strategic level Iwi provides input by means of:
An appointed representative on each of Council’s main Standing Committees. On these Committees the representative has both speaking and voting rights.
An eight member Iwi working party on the Regional Policy Statement Review, including identification of resource management issues of significance to Marlborough’s Tangata Whenua Iwi.
At an operational level, advice continues to be sought from Iwi in respect of Environmental Planning and Policy projects, resource consent applications and major Assets and Services projects where Iwi are known or deemed to have an interest.
A heightened mutual awareness and understanding of both Council’s and Iwi’s respective positions (by both parties) is opening pathways for communication which is positively influencing decision making on final project designs and the manner in which they are implemented.

Council Controlled Organisations
Page 320 2015-2025 Long Term Plan
Council Controlled Organisations Marlborough District Council operates the following Council Controlled Organisations (CCO’s):
MDC Holdings Limited.
Marlborough Housing for the Elderly Trust would be a CCO but Council has exempted it under section 7(3-6) of the Local Government Act 2002.
The Local Government Act 2002 (Schedule 10 section 7) requires the Council to include in the Long Term Plan information on CCO’s, including:
The nature and scope of the activities to be provided by the CCO;
The Council’s significant policies and objectives in relation to the ownership and control of the organisation; and
The key performance targets and other measures by which performance is to be judged.
MDC Holdings Limited MDC Holdings Limited is 100% owned by Marlborough District Council. Council established MDC Holdings Limited for the purposes of:
Separating commercial trading activities from the other functions it carries out;
Bringing Council’s main trading activities into one structure; and
Obtaining commercial borrowing facilities at the most attractive rate attainable.
MDC Holdings Limited wholly owns the subsidiaries Port Marlborough New Zealand Limited and Marlborough Airport Limited.
Port Marlborough New Zealand Limited undertakes all the activities typically associated with a port and also wholly owns subsidiaries PMNZ Marina Holdings Limited, Marlborough Sounds Maritime Pilots Limited and Waikawa Marina Trustee Limited.
Marlborough Airport Limited is responsible for the maintenance of the runways and taxiways used by civil aircraft by means of an operating lease from the New Zealand
Defence Force. It is also responsible for the provision of a terminal facility and associated minor freight handling.
The significant polices in place for MDC Holdings Limited are:
That it operate in a commercial manner.
Decisions to:
o Acquire assets, the value of which is more than 10% of the value of the company’s assets before acquisition
o Dispose of any shares in Port Marlborough New Zealand Limited and Marlborough Airport Limited
require the prior written approval of Council as the major shareholder.
That it distribute by way of dividend, subject to solvency requirements, all the net tax paid profit available.
Consistent with an entity operating in a commercial manner, there is only one significant target which is to generate a long-term tax paid return on opening shareholder funds at 7.0%. This target is reviewed at the beginning of each year when MDC Holdings Limited’s Statement of Corporate Intent is considered.
Marlborough Housing for the Elderly Trust Marlborough Housing for the Elderly Trust is a charitable trust that assists in the provision of adequate housing for the elderly people of Marlborough and other members of the community.

Part 6: Audit Report
2015-2025 Long Term Plan Page 321
Part 6: Audit Report
Audit Report
Part 6: Audit Report
Page 322 2015-2025 Long Term Plan
Audit Report
Marlborough District Council’s 2015-25 Long-Term Plan
Independent auditor’s report I am the Auditor-General’s appointed auditor for Marlborough District Council (the Council). Section 94 of the Local Government Act 2002 (the Act) requires an audit report on the Council’s Long-Term Plan (the plan). I have carried out this audit using the staff and resources of Audit New Zealand. We completed the audit on 25 June 2015.
Opinion In my opinion:
• the plan provides a reasonable basis for:
o long-term, integrated decision-making and coordination of the Council’s resources; and
o accountability of the Council to the community;
• the information and assumptions underlying the forecast information in the plan are reasonable; and
• the disclosures on pages 17 to 20 represent a complete list of the disclosures required by Part 2 of the Local Government (Financial Reporting and Prudence) Regulations 2014 and accurately reflect the information drawn from the Council’s audited information.
This opinion does not provide assurance that the forecasts in the plan will be achieved, because events do not always occur as expected and variations may be material. Nor does it guarantee complete accuracy of the information in the plan.
Basis of Opinion We carried out our work in accordance with the Auditor-General’s Auditing Standards, relevant international standards and the ethical requirements in those standards.
1
We assessed the evidence the Council has to support the information and disclosures in the plan and the application of its policies and strategies to the forecast information in the plan. To select appropriate audit procedures, we assessed the risk of material misstatement and the Council’s systems and processes applying to the preparation of the plan.
Our audit procedures included assessing whether:
the Council’s financial strategy, and the associated financial policies, support prudent financial management by the Council;
the Council’s infrastructure strategy identifies the significant infrastructure issues that the Council is likely to face over the next 30 years;
the information in the plan is based on materially complete and reliable asset and activity information;
the Council’s key plans and policies have been consistently applied in the development of the forecast information;
the assumptions set out within the plan are based on the best information currently available to the Council and provide a reasonable and supportable basis for the preparation of the forecast information;
the forecast financial information has been properly prepared on the basis of the underlying information and the assumptions adopted and complies with generally accepted accounting practice in New Zealand;
the rationale for the Council’s activities is clearly presented and agreed levels of service are reflected throughout the plan;
the levels of service and performance measures are reasonable estimates and reflect the main aspects of the Council’s intended service delivery and performance; and
the relationship between the levels of service, performance measures and forecast financial information has been adequately explained within the plan.
We did not evaluate the security and controls over the electronic publication of the plan.
1 The International Standard on Assurance Engagements (New Zealand) 3000 (Revised): Assurance Engagements Other Than Audits or Reviews of Historical Financial Information and The International Standard on Assurance Engagements 3400: The Examination of Prospective Financial Information.

Part 6: Audit Report
2015-2025 Long Term Plan Page 323
Responsibilities of the Council and auditor The Council is responsible for:
• meeting all legal requirements affecting its procedures, decisions, consultation, disclosures and other actions relating to the preparation of the plan;
• presenting forecast financial information in accordance with generally accepted accounting practice in New Zealand; and
• having systems and processes in place to enable the preparation of a plan that is free from material misstatement.
I am responsible for expressing an independent opinion on aspects of the plan, as required by sections 94 and 259C of the Act. I do not express an opinion on the merits of the plan’s policy content.
Independence We have followed the independence requirements of the Auditor-General, which incorporate those of the External Reporting Board. Other than our work in carrying out all legally required external audits and issuing a report to the Council’s debenture trustee, we have no relationship with or interests in the Council or its subsidiaries.
Andy Burns, Audit New Zealand On behalf of the Auditor-General, Christchurch, New Zealand
Appendices
Page 324 2015-2025 Long Term Plan
Appendices
Council Committees and Members
Ward Boundaries
Council Staff Structure
MDC Directory
Glossary of Terms

Council Committee and Members
2015-2025 Long Term Plan Page 325
Council Committees and Members For the new term of Council, the following Committee structure (and membership) was put into place on 31 October 2013. It has five standing committees, a joint committee with Kaikoura District Council, three statutory committees and six sub-committees. Pursuant to section 41A(5) of the Local Government Act 2002 the Mayor is a member of each Committee of Council.
ASSETS & SERVICES COMMITTEE This Committee is responsible for all infrastructure including roads; road safety (including walking and cycling strategies); sewerage; water; stormwater; rivers and drainage, waste management (including recycling); reserves; halls; cemeteries; public conveniences; and civil defence and emergency (including rural fire). Clr Terry Sloan – Chairperson Clr Geoff Evans – Deputy Clr Jenny Andrews Clr Jessica Bagge Clr Brian Dawson Clr Trevor Hook Clr John Leggett Iwi representative – Richard Hunter
Civil Defence Emergency Management Group (Statutory Committee) The delegation to act as this Group (formed in accordance with the Civil Defence and Emergency Management Act 2002) is given to the Assets and Services Committee. The Assets and Services Committee (acting as the Group) is responsible for overseeing the development, maintenance, monitoring and evaluation, and implementation of the Group Plan required by section 17(1)(i) of the Civil Defence and Emergency Management Act 2002. Clr Terry Sloan – Chairperson Clr Geoff Evans – Deputy Clr Jenny Andrews Clr Jessica Bagge Clr Brian Dawson Clr Trevor Hook Clr John Leggett Iwi representative – Richard Hunter
Regional Transport Committee (Statutory Committee) This Committee prepares for approval by Council the Regional Land Transport Plan (the Plan), or any variations to the Plan and provides Council with any advice and assistance in relation to its transport responsibilities.. The Committee must adopt a policy that determines significance in respect of variations made to the Plan (under section 18D of the Land Transport Management Act 2003 (the Act) and the activities that are included in the Plan (under Section 16 of the Act). Membership of the Committee (refer Section 105 of the Act) is limited to four persons representing Council and one person representing the New Zealand Transport Agency. Clr Terry Sloan – Chairperson Clr Geoff Evans – Deputy Clr Brian Dawson Clr John Leggett New Zealand Transport Agency representative
COMMUNITY AND FINANCE COMMITTEE This Committee is responsible for community and social issues, youth, elderly and access issues, culture and heritage, social policies (ie; gaming and psychoactive substances policies), grants and donations, sister cities, libraries, customer services, democratic process, parking, Long Term Plan, Annual Plan, Annual Report, general administration, audit issues, property management, Council Subsidiaries, risk management, health and safety.
Clr John Leggett – Chairperson Clr Jamie Arbuckle – Deputy Clr Jenny Andrews Clr Jessica Bagge Clr Graeme Barsanti Clr Cynthia Brooks Clr Brian Dawson Clr David Oddie Clr Laressa Shenfield Clr Terry Sloan Iwi representative – to be confirmed
Audit Sub-Committee The focus of this Sub-Committee is to oversee the audit of Council’s Annual Report and Annual/Long Term Plan and consider and report as necessary on the findings of any audit management report.
Clr John Leggett - Chairperson Clr Jamie Arbuckle Mayor Alistair Sowman Ian Marshall
Grants Sub-Committee This Sub-Committee carries out Council's partnership with Creative New Zealand and SPARC (Sport and Recreation New Zealand) to ensure local arts funding and rural travel funding are available to the Marlborough area. The Sub-Committee has delegated authority for the allocation of funds under both schemes. In addition the Sub-Committee has delegated authority for consideration of Marlborough District Council Community Grants and Council’s Arts and Heritage Grants, with recommendations being made to Council for consideration.
Clr Jenny Andrews – Chairperson Clr Cynthia Brooks Sports Trust appointee – Karen Hartshorne
Arts Sector appointee – Kate Parker
Community representatives – Patricia Clay, Graeme Duncan, Graeme Haymes, Lisa Ivamy, Two iwi representatives (to be confirmed)

Council Committee and Members
Page 326 2015-2025 Long Term Plan
Housing for the Elderly Sub-Committee The focus of this Sub-Committee is Council’s Housing for the Elderly portfolio.
Clr Jenny Andrews – Chairperson Clr Cynthia Brooks Clr Terry Sloan GreyPower Marlborough representative
(Mr Russell Hopkins)
Sister City Sub-Committee This Sub-Committee manages Council's Sister City activities and strives to involve greater community participation and sponsorship in the programme.
Clr Graeme Barsanti – Chairperson Clr Jamie Arbuckle Mayor – Alistair Sowman Community representatives (at least five)
Youth Sub-Committee The focus of this Sub-Committee is issues related to youth in the community.
Mayor Alistair Sowman – Chairperson Clr Jenny Andrews Clr Laressa Shenfield
REGIONAL PLANNING AND DEVELOPMENT COMMITTEE This Committee is responsible for development, maintenance and review of the Regional Policy Statement and Resource Management Plan and implementation of Growing Marlborough and “Smart and Connected” Economic Development strategies, CBD and Small Township Revitalisation programmes, Destination Marlborough, Picton Forum, Sounds Advisory Group.
Clr Trevor Hook - Chairperson Mayor Alistair Sowman - Deputy Clr Geoff Evans Clr Peter Jerram Clr John Leggett Clr David Oddie Clr Terry Sloan Iwi representative (to be confirmed)
ENVIRONMENT COMMITTEE This Committee is responsible for environmental science and monitoring, monitoring of consents, enforcement and prosecution policies, biosecurity, animal control, building control, resource consent processing, dangerous goods, fencing of swimming pools, food and health monitoring, harbour management and landscape group.
Clr Peter Jerram – Chairperson Clr David Oddie – Deputy Clr Jamie Arbuckle Clr Graeme Barsanti Clr Cynthia Brooks Clr Laressa Shenfield Iwi representative – Mr Raymond Smith
Animal Control Sub-Committee This Sub-Committee has responsibility for animal control including administration and dealing with any right of objection to the Council in terms of the Dog Control Act 1996.
Clr Jamie Arbuckle – Chairperson Clr Graeme Barsanti Clr Peter Jerram
HEARING COMMITTEE This committee makes decisions on applications for resource consents (each consent is heard by a committee made up of a chairperson and two members).
Clr David Oddie – Chairperson Clr Jamie Arbuckle Clr Graeme Barsanti Clr Cynthia Brooks Clr Laressa Shenfield
District Licensing Committee (Statutory Committee) This Committee considers and determines applications, pursuant to the Sale and Supply of Alcohol Act 2012 (the Act) for licences and manager’s certificate; temporary authorities to carry on the sale and supply of alcohol in accordance with s136 of the Act; the variation, suspension, or cancellation of special licences; the variation of licences (other than special licences) unless the application is brought under s280 of the Act; with the leave of the Chairperson for the licensing authority, to refer applications to the licensing authority and conduct inquiries and to make reports as may be required of it by the licensing authority under s175 of the Act. This Committee is also responsible for hearing and deciding on applications to Council’s Gambling Venue Policy pursuant to the Gambling Act 2003.
Clr John Leggett – Chairperson Clr Graeme Barsanti – Deputy Chairperson
Two members appointed by the Chairperson from the following: Clr Graeme Barsanti (Deputy Chairperson)
Mr Hamish Beard
Ms Liz Hawthorne Mr John Hill Ms Norma Livingstone Ms Margaret McHugh
APPOINTMENT OF COUNCILLORS AND STAFF TO SUBSIDIARIES MDC Holdings Limited and Marlborough Airport Limited.
Mayor Alistair Sowman (Director) Chief Executive - Andrew Besley (Director) Chair of Community and Finance Committee – Clr John Leggett (Director)
Port Marlborough NZ Limited Manager, Corporate Finance - Martin Fletcher (Director)
Marlborough Regional Forestry Marlborough Regional Forestry is a joint committee of Marlborough District Council and the Kaikoura District Council. Council owns 88.62% of the forestry estate and Kaikoura District Council owns the remaining 11.38%. The primary aim of production forest management is to create a resource that will maximise utilisation and provide the best financial return from the predominantly radiata pine forests.
Clr Peter Jerram - Chairperson Mayor Alistair Sowman Kaikoura District Council representative Forestry representative – Leo Jelinek

Ward Boundaries
2015-2025 Long Term Plan Page 327
Ward Boundaries

Council Staff Structure
Page 328 2015-2025 Long Term Plan
Council Staff Structure
CHIEF EXECUTIVEAndrew Besley
Manager Assets & Services
Department Mark Wheeler
Manager Corporate Finance
Department Martin Fletcher
Manager Regulatory Department
Hans Versteegh
Cemeteries
Central Business District
Civil Defence and Emergency
Management
Halls and Museums
Land Transport (including road safety)
Public Conveniences
Recycling
Reserves
Rivers and Drainage
Rural Fire
Sewerage
Stormwater
Swimming Pools
Waste Management
Water
Destination Marlborough
Finance & Accounting
Financial Performance (overall)
Functional Reviews
Funding Policy
Policy Issues
Rating Issues
Strategic Planning
Subsidiaries
Treasury Management
Economic Development
Regional Events
Animal Control
Biosecurity (Animal & Plant Pests)
Building Control
Environmental Monitoring
Environmental Policy
Flood Forecasting
Harbours
Hazardous Substances and New Organisms
Health
Liquor Licensing
Pollution Response
Resource Consents
Water Allocation
Manager Support Services
Department Dean Heiford
Arts and Cultural Matters
Community Development
Contracts Management
Corporate Issues
Customer Service Centre
Democratic Process
General Administration
Grants and Donations
Human Resources
Legal Constitutional
Libraries
Marlborough Award
Office Services
Property Development
Recreation Promotions
Sister Cities
Parking

MDC Directory
2015-2025 Long Term Plan Page 329
MDC Directory Contact Details PO Box 443, Blenheim 7240
Telephone: (03) 520 7400
Facsimile: (03) 520 7496
Email: [email protected]
Web: www.marlborough.govt.nz
Addresses District Administration Building
15 Seymour Street, Blenheim 7201
Picton Service Delivery Centre (includes Library) 67 High Street, Picton
Harbour Control Mariner’s Mall, Picton
Marlborough Library Corner Arthur and Seymour Streets, Blenheim
Works and Operations Depot Wither Road, Blenheim
Reserves Depot Pollard Park, Blenheim
Solicitor P J Radich of Radich Law, Blenheim
Bankers Bank of New Zealand, Blenheim
Westpac, Blenheim
Auditor Auditor General, Audit New Zealand, Christchurch
General Statistics Population (Census count March 2013) 46,302
Population (Usually Resident March 2013) 43,416
Inter-Census Population Movement (+) 2.0%
District Area 17,517 square kilometres
as at 30 June 2014
Rateable Land Value $7,033,395,150
Rateable Capital Value $13,691,761,250
Number of Rate Assessments 26,095

Glossary of Terms
2015-2025 Long Term Plan Page 331
Glossary of Terms Accruals These are similar to accounts payable in that they are expenses incurred during the current year for which payment has not been made and
invoices have not yet been recovered.
Activity Means a good or service provided by, or on behalf of, a local authority or a Council-controlled organisation eg: water supply, transport networks.
Allotment Has the meaning given to it in S218(2) of the Resource Management Act 1991. Allotment Area Is the total land area of an allotment. Applicant Is the person/persons that apply for resource consent, building consent or service connection. Asset Management Plan Means Council documents outlining how each main asset class will be managed, upgraded and expanded as required.
Asset Sales Refers to the sale of MDC assets eg: cars, property.
Borrowings This is the amount of external loans.
Capital Expenditure Means the cost of capital works for network infrastructure, reserves and community infrastructure. Catchment Means the area served by a particular infrastructure investment.
Charge These are referred to in the Local Government (Rating) Act 2002 as targeted rates and are calculated as a fixed amount per rating unit.
Commercial Means any activity involving commercial transactions, or providing commercial or administrative services, and includes, non-school activities, offices and banks; but excludes premises or activities involving industrial manufacture or production and retail trade.
Community Facilities Means reserves, network infrastructure, or community infrastructure for which development contributions may be required in accordance with S199 of the Local Government Act 2002.
Community Infrastructure Means the following assets when owned, operated or controlled by a territorial authority:
(a) Community centres or halls for the use of a local community or neighbourhood and the land on which they are or will be situated;
(b) Play equipment that is located on a neighbourhood reserve:
(c) Toilets for use by the public. Community Outcomes Means the outcomes that a local authority aims to achieve in meeting the current and future needs of communities for good quality local
infrastructure, local public services and performance of regulatory functions.
CV Capital Value.
Departmental Management Allocation of Departmental Manager costs to activities. Development Means:
(a) Any subdivision, building (as defined in section 8 of the Building Act 2004), land use, or work that generates a demand for reserves, network infrastructure, or community infrastructure; but
(b) Does not include the pipes or lines of a network utility operator. Development Contribution Means a contribution:
(a) Provided for in a development contributions policy included in the Long Term Plan of a territorial authority; and

Glossary of Terms
Page 332 2015-2025 Long Term Plan
(b) Calculated in accordance with the methodology; and Comprising- (i) Money; or
(ii) Land, including a reserve or esplanade reserve (other than in relation to a subdivision consent), but excluding Maori land within the meaning of Te Ture Whenua Maori Act 1993, unless that Act provides otherwise; or
(iii) Both. Development Contributions Policy Means the policy on development contributions adopted under section 102(1). District Means the District of a territorial authority.
District Wide Applies to every property in the District.
Equity Represents the net worth of the MDC if all assets were sold for the values recorded and the liabilities were extinguished.
Financial Contributions Has the same meaning as financial contributions in S108(9)(a)-(c) of the Resource Management Act 1991.
Financial Strategy Means Council’s Financial Strategy included in the Long Term Plan.
General Revenues Applied Share of revenues generated by Council as a whole as compared to a specific activity eg: interest and dividends.
Geographic Areas The District is divided up into six geographic areas for the purpose of funding general works and services. The geographic areas are Blenheim, Blenheim Vicinity, Picton, Picton Vicinity, General Rural and Sounds Admin Rural.
Goods and Services Tax (GST) Means goods and services tax under the Goods and Services Tax Act 1985. Greenfields Area Are defined as those areas where building capacity exists on the perimeter of the city. Gross Floor Area (GFA) Means, for the purposes of development contributions, the sum of the area of all floors of all buildings on any site measured from the exterior
faces of the exterior walls, or from the centre lines of walls separating two abutting buildings but excluding:
Carparking.
Loading docks.
Vehicle access and manoeuvring areas/ramps.
Plant and equipment enclosures on the roof.
Service station canopies.
Pedestrian circulation space in an enclosed retail shopping centre.
Any foyer/Lobby or a primary means of access to an enclosed retail shopping centre, which is accessed directly from a public place. Household Equivalent Unit (HEU) Means an average residential dwelling occupied by a household of average size. Impervious Surface Area For the purpose of development contribution Impervious Surface Area (ISA) means the area of any site which is not capable of absorbing
water and includes any area which:
Falls within the definition of coverage.
Is covered by decks.

Glossary of Terms
2015-2025 Long Term Plan Page 333
Is occupied by swimming pools.
Is used for parking, manoeuvring or loading of motor vehicles.
Is paved with a continuous surface with a run-off coefficient of greater than 0.45.
Increase (Decrease) in Reserves Increase in reserves are generally surpluses on operations. Decrease from reserves assist to fund capital expenditure.
Industrial Means:
(a) Any premises used for any industrial or trade purposes; or
(b) Any premises used for the storage, transfer, treatment, or disposal of waste materials or for other waste-management purposes, or used for composting organic materials: or
(c) Any other premises from which containment is discharged in connection with any other industrial or trade process.
(d) Any activity where people use materials and physical effort to:
Extract or convert natural resources.
Produce goods or energy from natural or converted resources.
Repair goods.
Store goods. (ensuing from an industrial process)
Infrastructural Assets These are the fixed assets that are not generally regarded as tradable and which provide a continuing service to the community - such as reserves and parks, toilets, memorials, roads, bridges and wharves, water and sewerage schemes.
Infrastructure Strategy Means Council’s Strategy setting out the principal long term (30 years) infrastructure requirements of the District. LGA Means the Local Government Act 2002.
Loans/Debt Refers to the raising of internal loans for capital items, such as a sewerage or water scheme.
Local Authority Means a regional Council or territorial authority.
LTP Means 2015-2025 Long Term Plan.
LTP 2015-16 These are the $ values budgeted for 2015-16 in the LTP.
LV Land Value.
Network Infrastructure Means the provision of roads and other transport, water, wastewater, and stormwater collection and management. Network Utility Operator Has the meaning given to it by section 166 of the RMA Non-Residential Development Means any activity in a non-residentially zoned area, excluding rural areas, or where the predominant activity is not residential or rural.
Operational Assets These are tangible assets that are generally regarded as tradable, such as buildings and improvements, library books, office equipment, plant and machinery, land and forestry crops.
Other Revenue Revenue specifically generated by the activity.
Overhead Allocation The allocation of Customer Services, Office Services, Human Resources, General Management, Information Management Services and Corporate Finance net costs.

Glossary of Terms
Page 334 2015-2025 Long Term Plan
Prepayments Amounts paid to creditors by the MDC in the current year that relate to future years.
Property Value For rating purposes this refers to either the “land” or “capital” value of a property.
Rate/Rates The Local Government (Rating) Act 2002 defines Rate –
(a) means a general rate, a targeted rate, or a uniform annual general charge that is set in accordance with subpart 2 of Part 1; and
(b) includes a penalty added to a rate in accordance with section 58; but
(c) does not include a lump sum contribution.
Residential Development Means any activity in a residentially zoned area or where the predominant activity is not non-residential or rural. RMA Means the Resource Management Act 1991. Resource Management Plan Means the Wairau/Awatere Resource Management Plan and the Marlborough Sounds Resource Management Plan. Section Management Allocation of Section Manager costs when they are responsible for more than one activity. Service Catchment Means the same as catchment. Service Connection Means a physical connection to a service provided by, or on behalf of, a territorial authority.
Statement of Cashflows This describes the cash effect of transactions and is broken down into three components: operating, investing and financing activities.
Statement of Financial Performance
This can also be referred to as the Income Statement, Profit and Loss Statement, or the Operating Statement. It shows the financial results of various MDC activities at the end of each period as either a surplus or deficit. It does not include asset purchases or disposals.
Statement of Financial Position This shows the financial state of affairs at the end of each period. It can also be referred to as the Balance Sheet.
Subdivision Has the same meaning as section 218 of the Resource Management Act 1991.
Subsidies Amounts received from other agencies for the provision of services eg: NZTA roading subsidies.
Third Party Funds Means funding or subsidy, either in full or in part, from a third party eg: subsidies for the roading network. Unit of Demand Means the measure of demand for community facilities.
User Charges The charges levied for use of MDC services eg: building consent fees, health inspections.
Working Capital This is the remainder left when the value of current liabilities is deducted from the value of current assets. It is a measure used to indicate the short-term solvency of an entity.