2009Jo Gdyn Local and global hydrological contributions to gravity variations observed in Strasbourg
6
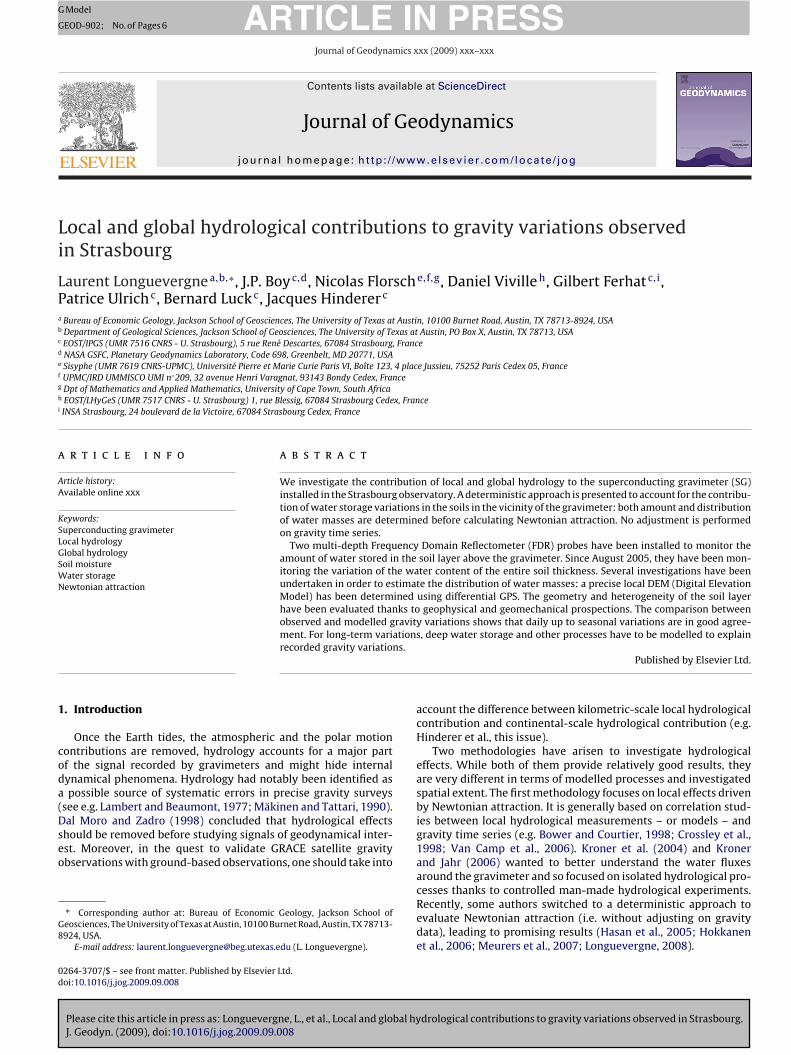
Please cite this article in press as: Longuevergne, L., et al., Local and global hydrological contributions to gravity variations observed in Strasbourg. J. Geodyn. (2009), doi:10.1016/j.jog.2009.09.008 ARTICLE IN PRESS G Model GEOD-902; No. of Pages 6 Journal of Geodynamics xxx (2009) xxx–xxx Contents lists available at ScienceDirect Journal of Geodynamics journal homepage: http://www.elsevier.com/locate/jog Local and global hydrological contributions to gravity variations observed in Strasbourg Laurent Longuevergne a,b,∗ , J.P. Boy c,d , Nicolas Florsch e,f,g , Daniel Viville h , Gilbert Ferhat c,i , Patrice Ulrich c , Bernard Luck c , Jacques Hinderer c a Bureau of Economic Geology, Jackson School of Geosciences, The University of Texas at Austin, 10100 Burnet Road, Austin, TX 78713-8924, USA b Department of Geological Sciences, Jackson School of Geosciences, The University of Texas at Austin, PO Box X, Austin, TX 78713, USA c EOST/IPGS (UMR 7516 CNRS - U. Strasbourg), 5 rue René Descartes, 67084 Strasbourg, France d NASA GSFC, Planetary Geodynamics Laboratory, Code 698, Greenbelt, MD 20771, USA e Sisyphe (UMR 7619 CNRS-UPMC), Université Pierre et Marie Curie Paris VI, Boîte 123, 4 place Jussieu, 75252 Paris Cedex 05, France f UPMC/IRD UMMISCO UMI n ◦ 209, 32 avenue Henri Varagnat, 93143 Bondy Cedex, France g Dpt of Mathematics and Applied Mathematics, University of Cape Town, South Africa h EOST/LHyGeS (UMR 7517 CNRS - U. Strasbourg) 1, rue Blessig, 67084 Strasbourg Cedex, France i INSA Strasbourg, 24 boulevard de la Victoire, 67084 Strasbourg Cedex, France article info Article history: Available online xxx Keywords: Superconducting gravimeter Local hydrology Global hydrology Soil moisture Water storage Newtonian attraction abstract We investigate the contribution of local and global hydrology to the superconducting gravimeter (SG) installed in the Strasbourg observatory. A deterministic approach is presented to account for the contribu- tion of water storage variations in the soils in the vicinity of the gravimeter: both amount and distribution of water masses are determined before calculating Newtonian attraction. No adjustment is performed on gravity time series. Two multi-depth Frequency Domain Reflectometer (FDR) probes have been installed to monitor the amount of water stored in the soil layer above the gravimeter. Since August 2005, they have been mon- itoring the variation of the water content of the entire soil thickness. Several investigations have been undertaken in order to estimate the distribution of water masses: a precise local DEM (Digital Elevation Model) has been determined using differential GPS. The geometry and heterogeneity of the soil layer have been evaluated thanks to geophysical and geomechanical prospections. The comparison between observed and modelled gravity variations shows that daily up to seasonal variations are in good agree- ment. For long-term variations, deep water storage and other processes have to be modelled to explain recorded gravity variations. Published by Elsevier Ltd. 1. Introduction Once the Earth tides, the atmospheric and the polar motion contributions are removed, hydrology accounts for a major part of the signal recorded by gravimeters and might hide internal dynamical phenomena. Hydrology had notably been identified as a possible source of systematic errors in precise gravity surveys (see e.g. Lambert and Beaumont, 1977; Mäkinen and Tattari, 1990). Dal Moro and Zadro (1998) concluded that hydrological effects should be removed before studying signals of geodynamical inter- est. Moreover, in the quest to validate GRACE satellite gravity observations with ground-based observations, one should take into ∗ Corresponding author at: Bureau of Economic Geology, Jackson School of Geosciences, The University of Texas at Austin, 10100 Burnet Road, Austin, TX 78713- 8924, USA. E-mail address: [email protected] (L. Longuevergne). account the difference between kilometric-scale local hydrological contribution and continental-scale hydrological contribution (e.g. Hinderer et al., this issue). Two methodologies have arisen to investigate hydrological effects. While both of them provide relatively good results, they are very different in terms of modelled processes and investigated spatial extent. The first methodology focuses on local effects driven by Newtonian attraction. It is generally based on correlation stud- ies between local hydrological measurements – or models – and gravity time series (e.g. Bower and Courtier, 1998; Crossley et al., 1998; Van Camp et al., 2006). Kroner et al. (2004) and Kroner and Jahr (2006) wanted to better understand the water fluxes around the gravimeter and so focused on isolated hydrological pro- cesses thanks to controlled man-made hydrological experiments. Recently, some authors switched to a deterministic approach to evaluate Newtonian attraction (i.e. without adjusting on gravity data), leading to promising results (Hasan et al., 2005; Hokkanen et al., 2006; Meurers et al., 2007; Longuevergne, 2008). 0264-3707/$ – see front matter. Published by Elsevier Ltd. doi:10.1016/j.jog.2009.09.008
-
Upload
univ-rennes1 -
Category
Documents
-
view
0 -
download
0
Transcript of 2009Jo Gdyn Local and global hydrological contributions to gravity variations observed in Strasbourg
G
G
Li
LPa
b
c
d
e
f
g
h
i
a
AA
KSLGSWN
1
coda(Dseo
G8
0d
ARTICLE IN PRESSModel
EOD-902; No. of Pages 6
Journal of Geodynamics xxx (2009) xxx–xxx
Contents lists available at ScienceDirect
Journal of Geodynamics
journa l homepage: ht tp : / /www.e lsev ier .com/ locate / jog
ocal and global hydrological contributions to gravity variations observedn Strasbourg
aurent Longuevergnea,b,∗, J.P. Boyc,d, Nicolas Florsche,f,g, Daniel Vivilleh, Gilbert Ferhatc,i,atrice Ulrichc, Bernard Luckc, Jacques Hindererc
Bureau of Economic Geology, Jackson School of Geosciences, The University of Texas at Austin, 10100 Burnet Road, Austin, TX 78713-8924, USADepartment of Geological Sciences, Jackson School of Geosciences, The University of Texas at Austin, PO Box X, Austin, TX 78713, USAEOST/IPGS (UMR 7516 CNRS - U. Strasbourg), 5 rue René Descartes, 67084 Strasbourg, FranceNASA GSFC, Planetary Geodynamics Laboratory, Code 698, Greenbelt, MD 20771, USASisyphe (UMR 7619 CNRS-UPMC), Université Pierre et Marie Curie Paris VI, Boîte 123, 4 place Jussieu, 75252 Paris Cedex 05, FranceUPMC/IRD UMMISCO UMI n◦209, 32 avenue Henri Varagnat, 93143 Bondy Cedex, FranceDpt of Mathematics and Applied Mathematics, University of Cape Town, South AfricaEOST/LHyGeS (UMR 7517 CNRS - U. Strasbourg) 1, rue Blessig, 67084 Strasbourg Cedex, FranceINSA Strasbourg, 24 boulevard de la Victoire, 67084 Strasbourg Cedex, France
r t i c l e i n f o
rticle history:vailable online xxx
eywords:uperconducting gravimeterocal hydrologylobal hydrologyoil moisture
a b s t r a c t
We investigate the contribution of local and global hydrology to the superconducting gravimeter (SG)installed in the Strasbourg observatory. A deterministic approach is presented to account for the contribu-tion of water storage variations in the soils in the vicinity of the gravimeter: both amount and distributionof water masses are determined before calculating Newtonian attraction. No adjustment is performedon gravity time series.
Two multi-depth Frequency Domain Reflectometer (FDR) probes have been installed to monitor theamount of water stored in the soil layer above the gravimeter. Since August 2005, they have been mon-
ater storageewtonian attraction
itoring the variation of the water content of the entire soil thickness. Several investigations have beenundertaken in order to estimate the distribution of water masses: a precise local DEM (Digital ElevationModel) has been determined using differential GPS. The geometry and heterogeneity of the soil layerhave been evaluated thanks to geophysical and geomechanical prospections. The comparison betweenobserved and modelled gravity variations shows that daily up to seasonal variations are in good agree-ment. For long-term variations, deep water storage and other processes have to be modelled to explain
ns.
recorded gravity variatio. Introduction
Once the Earth tides, the atmospheric and the polar motionontributions are removed, hydrology accounts for a major partf the signal recorded by gravimeters and might hide internalynamical phenomena. Hydrology had notably been identified aspossible source of systematic errors in precise gravity surveys
Please cite this article in press as: Longuevergne, L., et al., Local and global hyJ. Geodyn. (2009), doi:10.1016/j.jog.2009.09.008
see e.g. Lambert and Beaumont, 1977; Mäkinen and Tattari, 1990).al Moro and Zadro (1998) concluded that hydrological effects
hould be removed before studying signals of geodynamical inter-st. Moreover, in the quest to validate GRACE satellite gravitybservations with ground-based observations, one should take into
∗ Corresponding author at: Bureau of Economic Geology, Jackson School ofeosciences, The University of Texas at Austin, 10100 Burnet Road, Austin, TX 78713-924, USA.
E-mail address: [email protected] (L. Longuevergne).
264-3707/$ – see front matter. Published by Elsevier Ltd.oi:10.1016/j.jog.2009.09.008
Published by Elsevier Ltd.
account the difference between kilometric-scale local hydrologicalcontribution and continental-scale hydrological contribution (e.g.Hinderer et al., this issue).
Two methodologies have arisen to investigate hydrologicaleffects. While both of them provide relatively good results, theyare very different in terms of modelled processes and investigatedspatial extent. The first methodology focuses on local effects drivenby Newtonian attraction. It is generally based on correlation stud-ies between local hydrological measurements – or models – andgravity time series (e.g. Bower and Courtier, 1998; Crossley et al.,1998; Van Camp et al., 2006). Kroner et al. (2004) and Kronerand Jahr (2006) wanted to better understand the water fluxesaround the gravimeter and so focused on isolated hydrological pro-
drological contributions to gravity variations observed in Strasbourg.
cesses thanks to controlled man-made hydrological experiments.Recently, some authors switched to a deterministic approach toevaluate Newtonian attraction (i.e. without adjusting on gravitydata), leading to promising results (Hasan et al., 2005; Hokkanenet al., 2006; Meurers et al., 2007; Longuevergne, 2008).
ING
G
2 of Geo
tcNiplbaht
ardtwfitb
2
2
lNthcNw
pGcwsFwsahi
Fto
ARTICLEModel
EOD-902; No. of Pages 6
L. Longuevergne et al. / Journal
The second methodology, a somewhat different determinis-ic approach considers the physical modelling of the hydrologicalontribution (Boy and Hinderer, 2006). Both surface loading andewtonian attraction effects are calculated using global hydrolog-
cal models (e.g. GLDAS (Rodell et al., 2004)). No adjustment iserformed on gravity data, so this process-oriented approach is
ikely to be more robust. However, this methodology is limitedy the spatial sampling of global models (at best 0.25◦) as wells their temporal resolution (3 h). Note that Virtanen et al. (2006)ave set up hydrological models of several spatial extents in ordero improve this approach.
This work follows Boy and Hinderer (2006). We have set uplocal hydrological monitoring system to better estimate water
edistribution in the unsaturated zone at the scale of several hun-red of meters around the gravimeter. Two main questions needo be answered before calculating the Newtonian attraction effect:hat is the amount of water and where are these water masses? Therst question will be tackled using soil moisture measurements. Forhe second question, the sensitive test mass of the gravimeter haseen precisely localized inside its environment.
. Methodological approach
.1. Local hydrology vs. global hydrology
Two processes forced by local and remote hydrological surfaceoads generate a measurable gravity effect (see Llubes et al., 2004):ewtonian attraction and surface loading, i.e. the elastic deforma-
ion of the earth crust due to the weight of water. Traditionally, theydrological problem has been separated into a ‘local’ and a ‘global’ontribution. This separation is more pragmatic than physical sinceewtonian attraction has to be modelled for both local and globalater distributions.
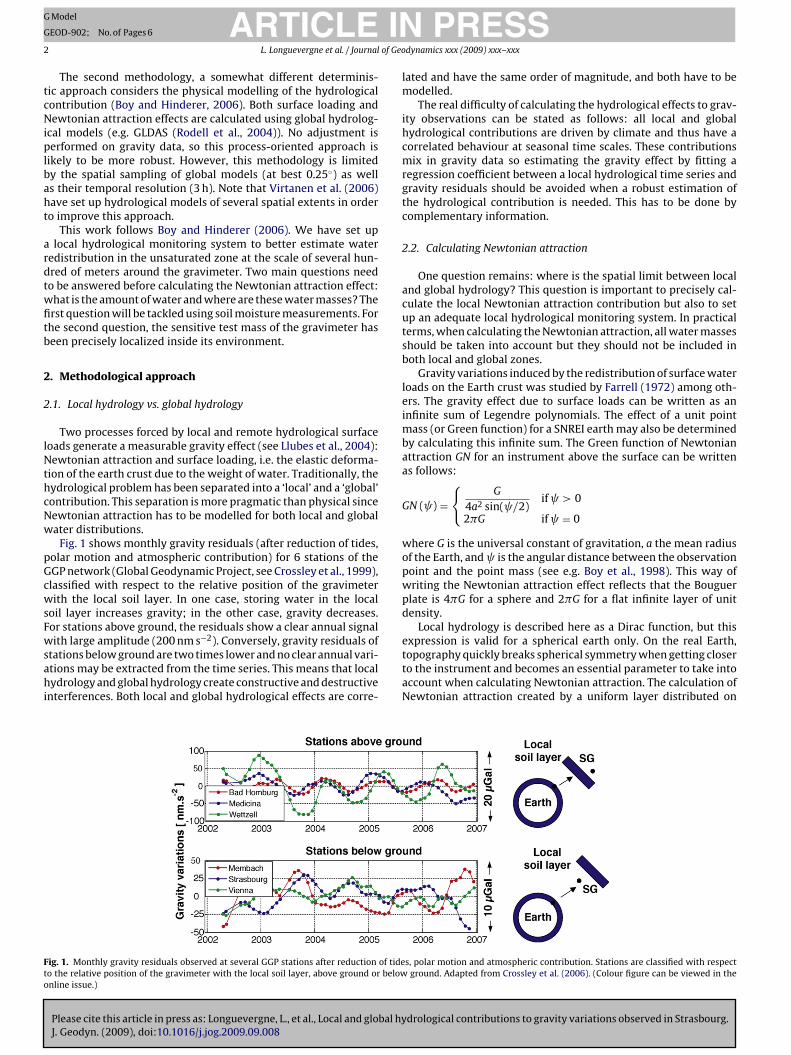
Fig. 1 shows monthly gravity residuals (after reduction of tides,olar motion and atmospheric contribution) for 6 stations of theGP network (Global Geodynamic Project, see Crossley et al., 1999),lassified with respect to the relative position of the gravimeterith the local soil layer. In one case, storing water in the local
oil layer increases gravity; in the other case, gravity decreases.or stations above ground, the residuals show a clear annual signal
Please cite this article in press as: Longuevergne, L., et al., Local and global hyJ. Geodyn. (2009), doi:10.1016/j.jog.2009.09.008
ith large amplitude (200 nm s−2). Conversely, gravity residuals oftations below ground are two times lower and no clear annual vari-tions may be extracted from the time series. This means that localydrology and global hydrology create constructive and destructive
nterferences. Both local and global hydrological effects are corre-
ig. 1. Monthly gravity residuals observed at several GGP stations after reduction of tideo the relative position of the gravimeter with the local soil layer, above ground or belownline issue.)
PRESSdynamics xxx (2009) xxx–xxx
lated and have the same order of magnitude, and both have to bemodelled.
The real difficulty of calculating the hydrological effects to grav-ity observations can be stated as follows: all local and globalhydrological contributions are driven by climate and thus have acorrelated behaviour at seasonal time scales. These contributionsmix in gravity data so estimating the gravity effect by fitting aregression coefficient between a local hydrological time series andgravity residuals should be avoided when a robust estimation ofthe hydrological contribution is needed. This has to be done bycomplementary information.
2.2. Calculating Newtonian attraction
One question remains: where is the spatial limit between localand global hydrology? This question is important to precisely cal-culate the local Newtonian attraction contribution but also to setup an adequate local hydrological monitoring system. In practicalterms, when calculating the Newtonian attraction, all water massesshould be taken into account but they should not be included inboth local and global zones.
Gravity variations induced by the redistribution of surface waterloads on the Earth crust was studied by Farrell (1972) among oth-ers. The gravity effect due to surface loads can be written as aninfinite sum of Legendre polynomials. The effect of a unit pointmass (or Green function) for a SNREI earth may also be determinedby calculating this infinite sum. The Green function of Newtonianattraction GN for an instrument above the surface can be writtenas follows:
GN ( ) ={
G
4a2 sin( /2)if > 0
2�G if = 0
where G is the universal constant of gravitation, a the mean radiusof the Earth, and is the angular distance between the observationpoint and the point mass (see e.g. Boy et al., 1998). This way ofwriting the Newtonian attraction effect reflects that the Bouguerplate is 4�G for a sphere and 2�G for a flat infinite layer of unitdensity.
Local hydrology is described here as a Dirac function, but this
drological contributions to gravity variations observed in Strasbourg.
expression is valid for a spherical earth only. On the real Earth,topography quickly breaks spherical symmetry when getting closerto the instrument and becomes an essential parameter to take intoaccount when calculating Newtonian attraction. The calculation ofNewtonian attraction created by a uniform layer distributed on
s, polar motion and atmospheric contribution. Stations are classified with respectground. Adapted from Crossley et al. (2006). (Colour figure can be viewed in the
IN PRESSG
G
of Geodynamics xxx (2009) xxx–xxx 3
tltmb
3
isT
•
•
Ataltilfib
3
ist(oatchsmdoWgmi
hobt
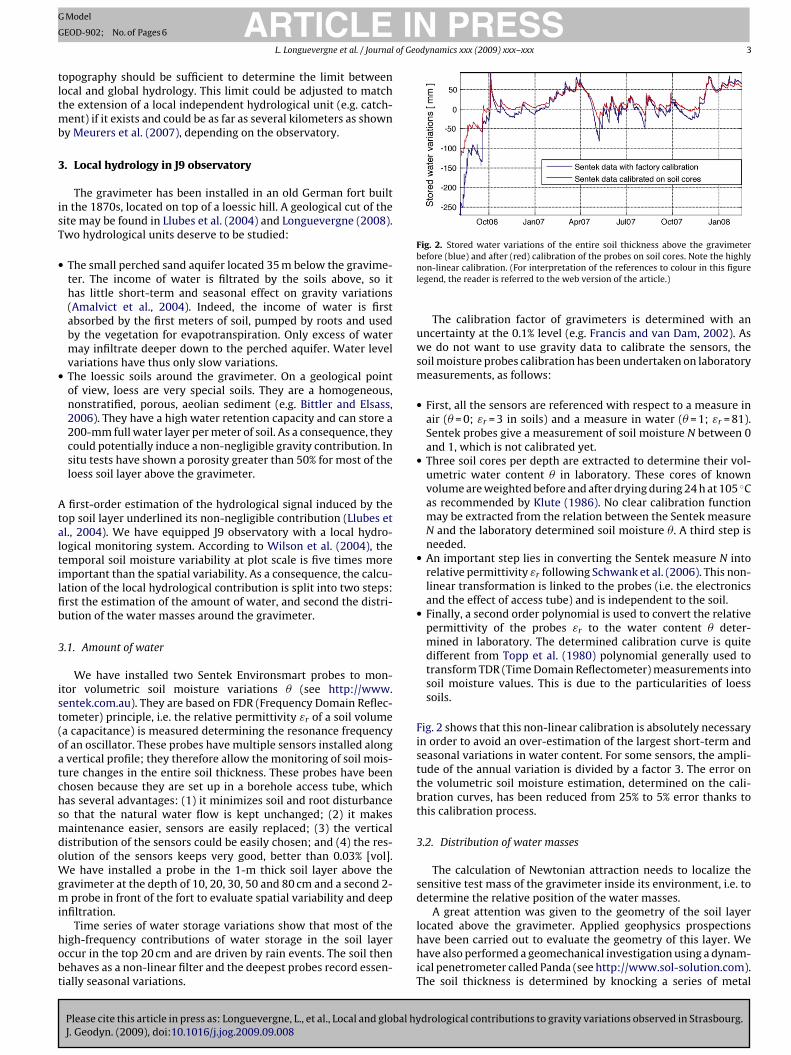
Fig. 2. Stored water variations of the entire soil thickness above the gravimeter
ARTICLEModel
EOD-902; No. of Pages 6
L. Longuevergne et al. / Journal
opography should be sufficient to determine the limit betweenocal and global hydrology. This limit could be adjusted to matchhe extension of a local independent hydrological unit (e.g. catch-
ent) if it exists and could be as far as several kilometers as showny Meurers et al. (2007), depending on the observatory.
. Local hydrology in J9 observatory
The gravimeter has been installed in an old German fort builtn the 1870s, located on top of a loessic hill. A geological cut of theite may be found in Llubes et al. (2004) and Longuevergne (2008).wo hydrological units deserve to be studied:
The small perched sand aquifer located 35 m below the gravime-ter. The income of water is filtrated by the soils above, so ithas little short-term and seasonal effect on gravity variations(Amalvict et al., 2004). Indeed, the income of water is firstabsorbed by the first meters of soil, pumped by roots and usedby the vegetation for evapotranspiration. Only excess of watermay infiltrate deeper down to the perched aquifer. Water levelvariations have thus only slow variations.The loessic soils around the gravimeter. On a geological pointof view, loess are very special soils. They are a homogeneous,nonstratified, porous, aeolian sediment (e.g. Bittler and Elsass,2006). They have a high water retention capacity and can store a200-mm full water layer per meter of soil. As a consequence, theycould potentially induce a non-negligible gravity contribution. Insitu tests have shown a porosity greater than 50% for most of theloess soil layer above the gravimeter.
first-order estimation of the hydrological signal induced by theop soil layer underlined its non-negligible contribution (Llubes etl., 2004). We have equipped J9 observatory with a local hydro-ogical monitoring system. According to Wilson et al. (2004), theemporal soil moisture variability at plot scale is five times moremportant than the spatial variability. As a consequence, the calcu-ation of the local hydrological contribution is split into two steps:rst the estimation of the amount of water, and second the distri-ution of the water masses around the gravimeter.
.1. Amount of water
We have installed two Sentek Environsmart probes to mon-tor volumetric soil moisture variations � (see http://www.entek.com.au). They are based on FDR (Frequency Domain Reflec-ometer) principle, i.e. the relative permittivity εr of a soil volumea capacitance) is measured determining the resonance frequencyf an oscillator. These probes have multiple sensors installed alongvertical profile; they therefore allow the monitoring of soil mois-
ure changes in the entire soil thickness. These probes have beenhosen because they are set up in a borehole access tube, whichas several advantages: (1) it minimizes soil and root disturbanceo that the natural water flow is kept unchanged; (2) it makesaintenance easier, sensors are easily replaced; (3) the vertical
istribution of the sensors could be easily chosen; and (4) the res-lution of the sensors keeps very good, better than 0.03% [vol].e have installed a probe in the 1-m thick soil layer above the
ravimeter at the depth of 10, 20, 30, 50 and 80 cm and a second 2-probe in front of the fort to evaluate spatial variability and deep
nfiltration.
Please cite this article in press as: Longuevergne, L., et al., Local and global hyJ. Geodyn. (2009), doi:10.1016/j.jog.2009.09.008
Time series of water storage variations show that most of theigh-frequency contributions of water storage in the soil layerccur in the top 20 cm and are driven by rain events. The soil thenehaves as a non-linear filter and the deepest probes record essen-ially seasonal variations.
before (blue) and after (red) calibration of the probes on soil cores. Note the highlynon-linear calibration. (For interpretation of the references to colour in this figurelegend, the reader is referred to the web version of the article.)
The calibration factor of gravimeters is determined with anuncertainty at the 0.1% level (e.g. Francis and van Dam, 2002). Aswe do not want to use gravity data to calibrate the sensors, thesoil moisture probes calibration has been undertaken on laboratorymeasurements, as follows:
• First, all the sensors are referenced with respect to a measure inair (� = 0; εr = 3 in soils) and a measure in water (� = 1; εr = 81).Sentek probes give a measurement of soil moisture N between 0and 1, which is not calibrated yet.
• Three soil cores per depth are extracted to determine their vol-umetric water content � in laboratory. These cores of knownvolume are weighted before and after drying during 24 h at 105 ◦Cas recommended by Klute (1986). No clear calibration functionmay be extracted from the relation between the Sentek measureN and the laboratory determined soil moisture �. A third step isneeded.
• An important step lies in converting the Sentek measure N intorelative permittivity εr following Schwank et al. (2006). This non-linear transformation is linked to the probes (i.e. the electronicsand the effect of access tube) and is independent to the soil.
• Finally, a second order polynomial is used to convert the relativepermittivity of the probes εr to the water content � deter-mined in laboratory. The determined calibration curve is quitedifferent from Topp et al. (1980) polynomial generally used totransform TDR (Time Domain Reflectometer) measurements intosoil moisture values. This is due to the particularities of loesssoils.
Fig. 2 shows that this non-linear calibration is absolutely necessaryin order to avoid an over-estimation of the largest short-term andseasonal variations in water content. For some sensors, the ampli-tude of the annual variation is divided by a factor 3. The error onthe volumetric soil moisture estimation, determined on the cali-bration curves, has been reduced from 25% to 5% error thanks tothis calibration process.
3.2. Distribution of water masses
The calculation of Newtonian attraction needs to localize thesensitive test mass of the gravimeter inside its environment, i.e. todetermine the relative position of the water masses.
A great attention was given to the geometry of the soil layer
drological contributions to gravity variations observed in Strasbourg.
located above the gravimeter. Applied geophysics prospectionshave been carried out to evaluate the geometry of this layer. Wehave also performed a geomechanical investigation using a dynam-ical penetrometer called Panda (see http://www.sol-solution.com).The soil thickness is determined by knocking a series of metal

ARTICLE IN PRESSG Model
GEOD-902; No. of Pages 6
4 L. Longuevergne et al. / Journal of Geodynamics xxx (2009) xxx–xxx
Fig. 3. (a) Fort and top soil layer geometry around the gravimeter mass test. The colours indicate the soil stiffness determined by the geomechanical prospection. In grey,t fount ees. (cd orderr f the
rubutch
avotat
tatoI(−tttw
4
g
he geometry of the fort. A more extended topographic and geologic map may behe gravimeter. Altitudes are indicated in meters, latitudes and longitudes in degristributed on the topography. The integration radius of the gravimeter is of theeferences to colour in this figure legend, the reader is referred to the web version o
ods. Moreover, the qualitative interpretation of the soil stiffness issed to evaluate the heterogeneities of the soil. The relative heightetween the gravimeter and the soil layer is finally determinedsing a topographic survey, evidencing the 3-m concrete roof onop of the fort (see Fig. 3a). Note that this roof is a zero flux limitondition for water that cannot be taken into account by globalydrological models.
A 25-cm vertical precision DEM (Digital Elevation Model) haslso been determined thanks to a RTK (Real-Time Kinematic) sur-ey. Note that the precision is estimated thanks to the nugget effectf the variogram (see Wackernagel, 1995). It has been connectedo a regional DEM from the French Mapping Agency (IGN) to map2-km area around the gravimeter. The topographic map around
he gravimeter is plotted in Fig. 3b.We calculate a linear coefficient for the hydrological effect and
he integration radius of the gravimeter by distributing uniformly1-mm water layer on the topography. Note that the integra-
ion radius and the calculated admittance are highly dependentn the topography around the gravimeter (Meurers et al., 2007).n J9 observatory, this integration radius is of the order of 100 msee Fig. 3c). The final gravity effect of a 1-mm water layer is0.305 nm s−2 mm−1. This admittance only varies by 1.5% when
he soil layer is shifted vertically by 1 m. This is due to the fact thathe distribution of the soil reservoir around the gravimeter is closeo a half-plane. As a consequence, a single coefficient is used for thehole soil thickness.
Please cite this article in press as: Longuevergne, L., et al., Local and global hyJ. Geodyn. (2009), doi:10.1016/j.jog.2009.09.008
. Results
The SG data processing is conducted as follows: minute rawravity and pressure data are first corrected from major pertur-
d in Llubes et al. (2004). (b) Local DEM determined with RTK prospection around) Determination of the gravity effect generated by a 1-mm water layer uniformlyof 100 m, the final admittance is −0.305 nm s−2 mm−1. (For interpretation of the
article.)
bations (Crossley et al., 1998) and then filtered to hourly samples.Gravity data are then corrected from polar motion and length-of-day induced effects (Wahr, 1985), using EOPC04 series from theInternational Earth Rotation Service (IERS), assuming an elasticEarth and an equilibrium pole tide, including self-attraction andloading terms (Agnew and Farrell, 1978). The SG instrumental drifthas been determined using repeated absolute gravity measure-ments (AG), as explained in Rosat et al. (this issue). The observed AGdrift has been removed to better focus on short-term and seasonalvariations.
Atmospheric and induced non-tidal oceanic loading have beenmodelled using global surface pressure field provided by ECMWF(European Centre for Medium-range Weather Forecasts) and seasurface height variations from the HUGO-m (Carrère and Lyard,2003) batropic ocean model, following Boy et al. (2002), Boy andLyard (2008) and Boy et al. (this issue). The loading time serieswill also contain some atmospheric residuals since the full 3Datmospheric structure is not taken into account. This may leadto remaining effects at short-term periods (especially linked tofront movements) and a potential annual effect, below 10 nm s−2
for gravity (Neumeyer et al., 2004). Finally, tidal analyses are per-formed using the ETERNA package (Wenzel, 1997).
The 5-min soil moisture measurements above the gravimeterare summed using weights representing the thickness repre-sentativeness of each sensor. These soil moisture variations,representative of the whole soil thickness are multiplied by thedetermined −0.305 nm s−2 mm−1 coefficient. The results are finally
drological contributions to gravity variations observed in Strasbourg.
decimated to hourly values.The redistribution of water masses at continental scale is deter-
mined using GLDAS/Noah (Global Land Data Assimilation System)(Rodell et al., 2004), which is available on a 0.25◦ grid with a 3 htemporal resolution. Green’s function formalism (Farrell, 1972) is

ARTICLE IN PRESSG Model
GEOD-902; No. of Pages 6
L. Longuevergne et al. / Journal of Geodynamics xxx (2009) xxx–xxx 5
F rologia ydrolG d estimi
ue
etObwbfivealg
bbartlt
oiavoiw
FGfi
ig. 4. 1-Year comparison between observed gravity variation and the modelled hydnd modelled local contribution (red). (b) Gravity residuals corrected from global hravity residuals after correction of global and local hydrological signals (black) an
n this figure legend, the reader is referred to the web version of the article.)
sed to convolve water loads and calculate the associated gravityffect, assuming a SNREI earth.
Finally, a “deep hydrological contribution” is calculated. Thisffect includes both storage variations in the groundwater and inhe 30-m thick unsaturated layer situated below the gravimeter.ne difficulty is that a water mass located in the unsaturated zoneelow the gravimeter and infiltrating down to the local ground-ater creates a gravity effect before reaching the aquifer 35 m
elow ground and being recorded as a water level variation. As arst-order estimation, we have here multiplied the observed wellariations by a 0.2 nm s−2 mm−1 coefficient calculated by Llubest al. (2004) using a realistic geometry and porosity of the sandquifer. This estimation is not exact but gives the shape of theong-term variations induced by deep water storage below theravimeter.
The comparison between the modelled hydrological contri-utions and gravity observations is plotted in Fig. 4a. It shoulde noted that the global and local hydrological contributionsre anti-correlated, as determined previously. As a consequence,educing gravity variations from the global hydrological contribu-ion increases the variability of the residuals. The amplitude of theocal hydrological signal is twice as important as the amplitude ofhe global hydrological effect in Strasbourg.
In Fig. 4b, gravity residuals are corrected from global hydrol-gy to better evaluate the quality of the local soil contribution. Onenteresting event happened in April 2007. This period was warm
Please cite this article in press as: Longuevergne, L., et al., Local and global hyJ. Geodyn. (2009), doi:10.1016/j.jog.2009.09.008
nd dry is Strasbourg, which enabled a quick development of theegetation and thus, the root pumping of a non-negligible amountf water. The agreement for this 1-month event is very encourag-ng and allows us to validate our approach. Note that this period
as warm and dry for the Europe as a whole. As a consequence,
ig. 5. 6-Year comparison between the global hydrological contribution, the estimated “dravity residuals are reduced from global hydrological contribution to better show the cgure can be viewed in the online issue.)
cal contributions. (a) Gravity residuals (blue), modelled global contribution (green),ogy (blue) superimposed with modelled local soil moisture contribution (red). (c)
ated deep contribution (magenta). (For interpretation of the references to colour
the global and local hydrological contributions are anti-correlated,even at a monthly time scale.
The gravity time series reduced from both global and localhydrological signals are plotted in Fig. 4c, the estimated “deep”contribution is also superimposed. We confirm here that the watermass variations below the gravimeter only generate long-termvariations. The estimated deep contribution partly explains theresiduals; however, as stated previously, more work is neededto better constrain the vertical fluxes before water can reach thesand aquifer and better evaluate this “deep” contribution. Shortperiod variations are especially due to remaining imprecision inthe hydrological corrections and to unmodelled 3D atmosphericeffects.
Several uncertainties must be underlined. Every rainfall eventgenerates a gravity effect; their amplitude is unfortunately notalways correctly predicted by the Sentek probes (see Fig. 4c). Thenon-linear calibration of the probes maybe not perfect and moresoil cores should be used to adjust the calibration curve. The mainuncertainty is surely related to the spatial sensitivity of the probes(5 cm) compared to the spatial sensitivity of the gravimeter (100 m).
Fig. 5 summarizes the three investigated hydrological con-tributions on a 6-year time period and underlines the complexinteractions and compensations between the identified units.Estimated “deep” and global contributions could be calculatedsince 2002, whereas the local soil moisture contribution, relyingon installed probes, is only available for the last 1.5-year time
drological contributions to gravity variations observed in Strasbourg.
period. Global hydrology contains especially seasonal variations;continental-scale dry period (April 2007) or wet period (January2004) could however induce non-negligible short-term gravityvariations. The “deep” contribution is not as regular. If the sea-sonal amplitude is reduced to 10 nm s−2, exceptional years such
eep” contribution and 1-year and a half measured local soil moisture contribution.ontribution of the local soil moisture and deep hydrological contributions. (Colour
ING
G
6 of Geo
aisgte
qt“toiefih
5
twtwgcoilwgvh
A
hwGbSlwetm
R
A
A
B
B
B
B
B
B
ARTICLEModel
EOD-902; No. of Pages 6
L. Longuevergne et al. / Journal
s 2002 and 2007 wet summers have induced a 50 nm s−2 grav-ty contribution. This is due to the non-linear behaviour of theoils which become very permeable when their water contentset closer to saturation. Finally, the local hydrological unit, athe soil moisture interface, generates most of the high-frequencyvents.
The deterministic approach is necessary to identify and firstuantify the main hydrological units to model, as all these con-ributions are correlated. Deterministic approach does not meanwithout a-priori”, actually a priori is needed to evaluate the con-ribution of the less-known hydrological units (the deepest inur case). However, when independent information is available,t should be used to validate the approach or calibrate the mod-ls/measurements. Adjustment on gravity data could be seen as anal step to reduce the variance of the gravity time series, when allydrological contributions are determined.
. Conclusion
In this work, we have modelled the different hydrological con-ributions in J9 observatory using a deterministic approach, i.e.ithout adjustment on gravity data. Both water redistribution at
he scale of several hundreds of meters around the gravimeter andater redistribution at continental scale induce a non-negligible
ravity effect of several microgals. Moreover, both are driven bylimate and so are anti-correlated and partly compensate eachther at seasonal time scales in J9 observatory. This last remarks an a posteriori justification of the necessity to model the hydro-ogical effect with a deterministic approach. Future improvement
ill focus on the estimation of stored water variations below theravimeter. This deep contribution induces especially long-termariations and cannot be simply constrained using piezometricead time series alone.
cknowledgments
The authors gratefully thank the two anonymous reviewers toelp improving this manuscript. This study has been carried outithin the framework of the ECCO/PNRH Project “Hydrology andeodesy” funded by the French research agency under the num-er ANR-05-009. Jean-Paul Boy is currently visiting NASA Goddardpace Flight Center, with a Marie Curie International Outgoing Fel-owship (N◦ PIOF-GA-2008-221753). Nicolas Florsch is currently
elcomed at the Department of Mathematics and Applied Math-matics at Cape Town University, South Africa, and is granted byhe French Organization “Institut de Recherche pour le Développe-
ent”.
eferences
gnew, D.C., Farrell, W.E., 1978. Self-consistent equilibrium ocean tides. Geophys. J.R. Astron. Soc. 55, 171–181.
malvict, M., Hinderer, J., Mäkinen, J., Rosat, S., Rogister, Y., 2004. Long-term andseasonal gravity changes at the Strasbourg station and their relation to crustaldeformation and hydrology. J. Geodyn. 38, 343–353.
ittler, C., Elsass, P., 2006. Banque régionale de l’aquifère rhénan - programme2003–2006, rapport brgm/rp-5876-fr. Technical report.
ower, D, Courtier, N., 1998. Precipitation effects on gravity measurements at theCanadian absolute gravity site. Phys. Earth Planet. Inter. 106 (3–4), 353–369.
oy, J.-P., Hinderer, J., Gegout, P., 1998. Global atmospheric loading and gravity. Phys.Earth Planet. Inter., 161–177.
Please cite this article in press as: Longuevergne, L., et al., Local and global hyJ. Geodyn. (2009), doi:10.1016/j.jog.2009.09.008
oy, J.-P., Gégout, P., Hinderer, J., 2002. Reduction of surface gravity data from globalatmospheric pressure loading. Geophys. J. Int. 149, 534–545.
oy, J., Hinderer, J., 2006. Study of the seasonal gravity signal in superconductinggravimeter data. J. Geodyn. 41, 227–233.
oy, J.-P., Lyard, F., 2008. High-frequency non-tidal ocean loading effects on surfacegravity measurements. Geophys. J. Int. 175, 35–45.
PRESSdynamics xxx (2009) xxx–xxx
Boy, J.P., Longuevergne, L., Boudin, F., Jacob, T., Lyard, F., Llubes, M., Florsch, N., thisissue. Modelling atmospheric and induced non-tidal oceanic loading contribu-tions to surface gravity and tilt measurements. J. Geodyn.
Carrère, C., Lyard, F., 2003. Modeling the barotropic response of the global ocean toatmospheric wind and pressure forcing—comparisons with observations. Geo-phys. Res. Lett. 30 (6), 1275, doi:10.1029/2002GL016473.
Crossley, D.J., Hinderer, J., Jensen, O., Xu, H., 1998. A slewrate detection criterionapplied to SG data processing. Bulletin d’Information des Marées Terrestres 117,8675–8704.
Crossley, D., Hinderer, J., Casula, G., Francis, O., Hsu, H.-T., Imanishi, Y., Jentzsch,G., Kaarianen, J., Merriam, J., Meurers, B., Neumeyer, J., Richter, B., Shibuya, K.,Sato, T., van Dam, T., 1999. Network of superconducting gravimeters benefits anumber of disciplines. EOS Trans. 80 (11), 125–126.
Crossley, D., Hinderer, J., Boy, J.-P., De Linage, C., 2006. Status of the GGP satelliteproject. Bulletin d’Information des Marées Terrestres 142, 11423–11432.
Dal Moro, G., Zadro, M., 1998. Subsurface deformations induced by rainfall atmo-spheric pressure: tilt/strain measurements in the NE Italy seismic area. EarthPlanet. Sci. Lett. 164, 193–203.
Farrell, W., 1972. Deformation of the Earth by surface load. Rev. Geophys. SpacePhys. 10 (3), 761–797.
Francis, O., van Dam, T., 2002. Evaluation of the precision of using absolute gravime-ters to calibrate superconducting gravimeters. Metrologia 39, 485–488.
Hasan, S., Troch, P., Boll, J., Kroner, C., 2005. Modeling the hydrological effect on localgravity at Moxa, Germany. J. Hydrometeorol. 7, 346–354.
Hokkanen, T., Korhonen, K., Virtanen, H., 2006. Hydrogeological effects on super-conducting gravimeter measurements at Metsähovi in Finland. J. Environ. Eng.Geophys. 11, 261–267.
Klute, A., 1986. Methods of Soil Analysis. Part 1. Physical and Mineralogical Methods.American Society of Agronomy, Soil Science Society of America, Madison, WI,USA, 1772 pp.
Kroner, C., Jahr, T., Jentzsch, G., 2004. Result from 44 months of observations with asuperconducting gravimeter at Moxa/Germany. J. Geodyn. 38, 263–280.
Kroner, C., Jahr, T., 2006. Hydrological experiments around the supercon-ducting gravimeter at Moxa observatory. J. Geodyn. 41 (1–3), 242–252,doi:10.1016/j.jog.2005.08.012.
Lambert, A., Beaumont, C., 1977. Nano variations in gravity due to seasonal ground-water movements: implications for the gravitational detection of tectonicmovements. J. Geophys. Res. 82, 297–306.
Llubes, M., Florsch, N., Hinderer, J., Longuevergne, L., Amalvict, M., 2004. Localhydrology, the global geodynamics project CHAMP/GRACE perspective: somecase studies. J. Geodyn. 38, 355–374.
Mäkinen, Tattari, 1990. The influence of variation in subsurface water storageon observed gravity. In: Kakkuri, J. (Ed.), Proceedings of the 11th Interna-tional Symposium: Earth Tides. Schweitzerbart, Stuttgart, Germany, pp. 457–471.
Longuevergne, L., 2008. Contribution a l’Hydrogéodésie, Ph.D. thesis, 300 pp.,Université Pierre et Marie Curie. Can be downloaded at: http://tel.archives-ouvertes.fr/docs/00/31/92/05/PDF/these longuevergne.pdf.
Meurers, B., Van Camp, M., Petermans, T., 2007. Correcting superconducting gravitytime-series using rainfall modelling at the Vienna and Membach station andapplication to earth tide analysis. J. Geodesy 81 (11), 703–712.
Neumeyer, J., Hagedoorn, J., Leitloff, J., Schmidt, T., 2004. Gravity reduction withthree-dimensional atmospheric pressure data for precise ground gravity mea-surements. J. Geodyn. 38 (3–5), 437–450.
Rosat, S., Boy, J.-P., Ferhat, G., Hinderer, J., Amalvict, M., Gegout, M., Luck, B., this issue.Analysis of a ten-year (1997–2007) record of time-varying gravity in Strasbourgusing absolute and superconducting gravimeters: new results on the calibrationand comparison with GPS height changes and hydrology.
Rodell, M., Houser, P.R., Jambor, U., Gottschalck, J., Mitchell, K., Meng, C.-J., Arsenault,K., Cosgrove, B., Radakovich, J., Bosilovich, M., Entin, J.K., Walker, J.P., Lohmann,D., Toll, D., 2004. The global land data assimilation system. Bull. Am. Meteor. Soc.85, 381–394.
Schwank, M., Green, T., Mätzlerc, C., Benedickterd, H., Flühlere, H., 2006. Laboratorycharacterization of a commercial capacitance sensor for estimating permittivityand inferring soil water content. Vadose Zone J. 5, 1048–1064.
Topp, G., Davis, J.L., Annan, A.P., 1980. Electromagnetic determination of soil watercontent: measurements in coaxial transmission lines. Water Resour. Res. 16,574–582.
Van Camp, M., Vanclooster, M., Crommen, O., Petermans, T., Verbeeck, K., Meurers,B., Van Dam, T., Dassargues, A., 2006. Hydrogeological investigation at the Mem-bach station, Belgium, application to correct long periodic gravity variations. J.Geophys. Res. 111, B10403.
Virtanen, H., Tervo, M., Bilker-Koivula, M., 2006. Comparison of superconductinggravimeter observations with hydrological models of various spatial extents.Bulletin d’Information des Marées Terrestres 142, 11361–11368.
Wackernagel, H., 1995. Multivariate Geostatistics. Springer, New York, 256 pp.Wahr, J.M., 1985. Deformation induced by polar motion. J. Geophys. Res. 90 (B11),
drological contributions to gravity variations observed in Strasbourg.
9363–9368.Wenzel, H.G., 1997. The nanogal software: Earth tide data processing package
ETERNA 3.30. Bulletin d’Information des Marées Terrestres 124, 9425–9439.Wilson, D., Western, A., Grayson, R., 2004. Identifying and quantifying sources of
variability in temporal and spatial soil moisture observations. Water Resour.Res. 40, W02507.