2001 mbia annual report capital strength. triple-a performance ...
65
Hasitha Abeygunawardena, Christy Abraham-John, Patricia Abt, Connie Accordino, Angelique Allen, James Allen, Michael Alter, Doreen Amado, Nicole Amador, Eric Anderson, Panayiotis Andreou, Gina Antonelli, Michael Antonicelli, Brian Arcese, Ana Areal, John Ariola, Craig Armstrong, Errol Arne, Daniel Avitabile, Judith Baiocco, Michael Ballinger, Frances Banuelos, Ricardo Banuelos, Anna Barbara, Mary Barbara, Lorraine Barg, Steve Barney, Philip Baudinet, Barry Baughier, Marguerite Beirne, Ahmed Belal, Richard Bell II, Thomas Bell, Dinah Bellis, Regina Bello, Anna Bencrowsky, Arlene Bent-Mutz, James Berger, Adam Bergonzi, Beth Berman, Nancy Bermudez, Paul Bernier, Gerry Berrigan, Michael Biemer, Dennis Bird, Cheri Bivings, Carol Blair, Robert Blair, Robert Blake, Elizabeth Blasius, Neal Blum, Kim Boeheim, David Boisselle, Edward Bonner, Amy Borst, C. Terry Bowens, Michelle Bracamonte, David Brancale, Martin Braunstein, Yaquelin Brea, Helen Brennan, Melissa Brice-Johnson, Nelly Briggs, Grant Brimhall, Patricia Brosnan, Carol Broughton, Jay Brown, Kevin Brown, W. Thacher Brown, Lise Bruun, Karen Brylle, Neil Budnick, Mark Bunyea, Joseph Buonadonna, Danny Burdiez, Kathelene Burns, Paul Burns, Derrick Burr, Audrey Calogero, Michael Cambridge, Jason Cameron, Patricia Campbell, Lori Candarelli, Nicholas Canuso, Jack Caouette, Lisa Carinha, Linda Carpenter, William Carson, Adam Carta, William Carta, Sal Carvo, Fred Casadei, Judith Casey, Christopher Cassel, Robert Castillo, Michael Castracan, Judith Cavino, Jason Celente, Kevin Cerutti, Chris Chafizadeh, Stephen Chaloux, David Chappell, Charlotte Cheong, Sammy Cheung, Manuel Chevalier, Lina Chew, Sze- Loon Chew, Andrew Chintz, Siew-Li Chong, Richard Choyke, David Christiansen, Rebecca Christoforou, Leonard Chubinsky, Lori Church, Joanne Ciralli, Steven Citron, Robert Claiborne, John Clancy, Joyce Clark, Michael Clarke, Robyn Clarke, Geoffrey Clarkson, Miriam Cleary, Thomas Cochran, William Cody, William Coleman Jr., Rosemaria Collorafi, Steven Cooke, Brian Cooney, Christie Corbett, Maryann Corse, Tim Corsi, Clifford Corso, Jonathan Costello, Kenneth Couch, Thomas Cousins, David Craparo, Celinda Creighton, James Cronin, David Crowle, Jacquelyn Cruz, Pauline Cullen, Derrin Culp, Celia Culpan, Terry Cundiff II, Melissa Currie, Salvatore D’Addio, Ron Dadina, Jennifer Dalton, Valerie Damon, John Danaher, Kathryn D’Angio, Jeffrey Daniels, John Dare, Stephen Dartley, Paul David, Gary Davis, Joshua Davis, Leslie Davis, Suzanne Davis, Karen Decter, Kenneth Degen, Joanne DeGennaro, Sandra DeKoubia, Lynne DeLaurentis, Laura DeLena, Maria DeMilia, Nils Demme, Michael DeNigris, Debra Descloux, Lauren Desharnais, William DeVane, Edward DeVito, Greg Diamond, James DiChiaro, Kimberly Dilly, Lauren Dimartino, Anthony Dimino, Wendy Dinsmore, Jamie Di Orio, Frederic Dittmann, Christie Dixon, Stephen Dixon, Kerry Dolan, Everlena Dolman, John Donaldson, Michelle Donaldson, Pallavi Donde, Mary Donovan, Janine Doran, Gloria D’Ottavio, Edward Dougherty, Stephanie Dougherty, Shawn Dowdy, Joseph Doyle Jr., Randy Dryden, David Dubin, Geoffrey Dudick, Maureen Duffy, Mohinder Dugal, Matthew Dugan, Rita Duggan, Gary Dunton, Utressa Earl, Pamela Eccles, Scott Eckman, Teri Eckman, Audra Edele, Barbara Edelmann, Gay Eichhoff, Bruce Ely, Ira Epstein, Richard Erickson, Jeff Esraelian, Lori Evangel, Felicia Fanelli, Matthew Fanelli, Marisa Farrell, Robert Faulkner, Carl Favelukes, Sharon Fera, Gregg Ferguson, Robert Fernald, Pamela Fernandes, Maria Ferrante, Nicholas Ferreri, Denise Feulner, Peter Fiala, Sara Fischer, Anna Fischetti, Minnie Fitchben, Catherine Geddes, Stephen Gibson, Donna Flack, Rosanne Fleury, Barbara Flickinger, Mary Flynn, Jesse Fogarty, Glenn Fox, David Frascella, Daniel Frisch, Ileana Fuentes, Max 2001 MBIA ANNUAL REPORT CAPITAL STRENGTH. TRIPLE-A PERFORMANCE. RISK MANAGEMENT TOTAL COMMITMENT RESULTS CERTAINTY OF EXECUTION
-
Upload
khangminh22 -
Category
Documents
-
view
1 -
download
0
Transcript of 2001 mbia annual report capital strength. triple-a performance ...
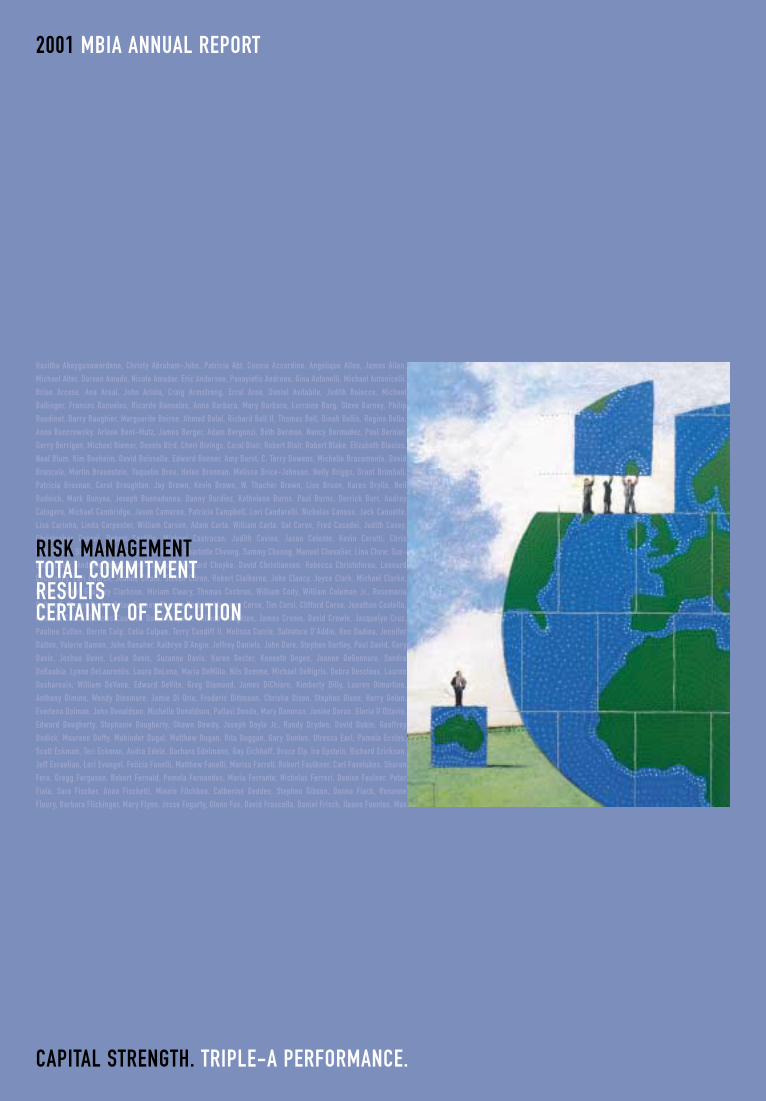
Hasitha Abeygunawardena, Christy Abraham-John, Patricia Abt, Connie Accordino, Angelique Allen, James Allen,Michael Alter, Doreen Amado, Nicole Amador, Eric Anderson, Panayiotis Andreou, Gina Antonelli, Michael Antonicelli,Brian Arcese, Ana Areal, John Ariola, Craig Armstrong, Errol Arne, Daniel Avitabile, Judith Baiocco, MichaelBallinger, Frances Banuelos, Ricardo Banuelos, Anna Barbara, Mary Barbara, Lorraine Barg, Steve Barney, PhilipBaudinet, Barry Baughier, Marguerite Beirne, Ahmed Belal, Richard Bell II, Thomas Bell, Dinah Bellis, Regina Bello,Anna Bencrowsky, Arlene Bent-Mutz, James Berger, Adam Bergonzi, Beth Berman, Nancy Bermudez, Paul Bernier,Gerry Berrigan, Michael Biemer, Dennis Bird, Cheri Bivings, Carol Blair, Robert Blair, Robert Blake, Elizabeth Blasius,Neal Blum, Kim Boeheim, David Boisselle, Edward Bonner, Amy Borst, C. Terry Bowens, Michelle Bracamonte, DavidBrancale, Martin Braunstein, Yaquelin Brea, Helen Brennan, Melissa Brice-Johnson, Nelly Briggs, Grant Brimhall,Patricia Brosnan, Carol Broughton, Jay Brown, Kevin Brown, W. Thacher Brown, Lise Bruun, Karen Brylle, NeilBudnick, Mark Bunyea, Joseph Buonadonna, Danny Burdiez, Kathelene Burns, Paul Burns, Derrick Burr, AudreyCalogero, Michael Cambridge, Jason Cameron, Patricia Campbell, Lori Candarelli, Nicholas Canuso, Jack Caouette,Lisa Carinha, Linda Carpenter, William Carson, Adam Carta, William Carta, Sal Carvo, Fred Casadei, Judith Casey,Christopher Cassel, Robert Castillo, Michael Castracan, Judith Cavino, Jason Celente, Kevin Cerutti, ChrisChafizadeh, Stephen Chaloux, David Chappell, Charlotte Cheong, Sammy Cheung, Manuel Chevalier, Lina Chew, Sze-Loon Chew, Andrew Chintz, Siew-Li Chong, Richard Choyke, David Christiansen, Rebecca Christoforou, LeonardChubinsky, Lori Church, Joanne Ciralli, Steven Citron, Robert Claiborne, John Clancy, Joyce Clark, Michael Clarke,Robyn Clarke, Geoffrey Clarkson, Miriam Cleary, Thomas Cochran, William Cody, William Coleman Jr., RosemariaCollorafi, Steven Cooke, Brian Cooney, Christie Corbett, Maryann Corse, Tim Corsi, Clifford Corso, Jonathan Costello,Kenneth Couch, Thomas Cousins, David Craparo, Celinda Creighton, James Cronin, David Crowle, Jacquelyn Cruz,Pauline Cullen, Derrin Culp, Celia Culpan, Terry Cundiff II, Melissa Currie, Salvatore D’Addio, Ron Dadina, JenniferDalton, Valerie Damon, John Danaher, Kathryn D’Angio, Jeffrey Daniels, John Dare, Stephen Dartley, Paul David, GaryDavis, Joshua Davis, Leslie Davis, Suzanne Davis, Karen Decter, Kenneth Degen, Joanne DeGennaro, SandraDeKoubia, Lynne DeLaurentis, Laura DeLena, Maria DeMilia, Nils Demme, Michael DeNigris, Debra Descloux, LaurenDesharnais, William DeVane, Edward DeVito, Greg Diamond, James DiChiaro, Kimberly Dilly, Lauren Dimartino,Anthony Dimino, Wendy Dinsmore, Jamie Di Orio, Frederic Dittmann, Christie Dixon, Stephen Dixon, Kerry Dolan,Everlena Dolman, John Donaldson, Michelle Donaldson, Pallavi Donde, Mary Donovan, Janine Doran, Gloria D’Ottavio,Edward Dougherty, Stephanie Dougherty, Shawn Dowdy, Joseph Doyle Jr., Randy Dryden, David Dubin, GeoffreyDudick, Maureen Duffy, Mohinder Dugal, Matthew Dugan, Rita Duggan, Gary Dunton, Utressa Earl, Pamela Eccles,Scott Eckman, Teri Eckman, Audra Edele, Barbara Edelmann, Gay Eichhoff, Bruce Ely, Ira Epstein, Richard Erickson,Jeff Esraelian, Lori Evangel, Felicia Fanelli, Matthew Fanelli, Marisa Farrell, Robert Faulkner, Carl Favelukes, SharonFera, Gregg Ferguson, Robert Fernald, Pamela Fernandes, Maria Ferrante, Nicholas Ferreri, Denise Feulner, PeterFiala, Sara Fischer, Anna Fischetti, Minnie Fitchben, Catherine Geddes, Stephen Gibson, Donna Flack, RosanneFleury, Barbara Flickinger, Mary Flynn, Jesse Fogarty, Glenn Fox, David Frascella, Daniel Frisch, Ileana Fuentes, Max
2001 MBIA ANNUAL REPORT
CAPITAL STRENGTH. TRIPLE-A PERFORMANCE.
RISK MANAGEMENTTOTAL COMMITMENTRESULTSCERTAINTY OF EXECUTION

Financial Highlights. 2
Letter to Shareholders. 3
Interview with Gary Dunton. 10
Review of Operations. 16
Human Capital. 22
Financial Review. 25
Board of Directors and Senior Officers. 61
Shareholder Information. 62
MBIA Inc., through its subsidiaries, is the world’s leading provider of credit enhancement services and a leader in asset management. MBIA’sTriple-A pledge on municipal bonds and structured finance transactions around the world guarantees timely payment of principal andinterest for investors and lowers the cost of capital for the issuing entity. With 77,700 issues insured, MBIA has saved issuers nearly $14 billionin interest costs since inception 27 years ago.
With over $39 billion in assets under management, MBIA offers a number of flexible investment management options for state and local governments, school districts, pension funds, endowments, institutional investors and high-net-worth individuals. MBIA InsuranceCorporation is rated Triple-A by Moody’s Investors Service, Standard and Poor’s Rating Services, Fitch Ratings, and Rating and InvestmentInformation, Inc.
If you could see the world through our eyes, you’d see that the capital markets aresubject to unforeseen risks. Identifying and mitigating these risks are our corecompetencies, and they are also fundamentalto our business. They help protect our strong capital base and Triple-A ratings.
In fact, our commitment to no-lossunderwriting is the cornerstone of oursuccess. Put simply, it drives everything wedo. From the consistency and discipline inour risk management processes … to theflow of intellectual assets within our teamapproach … to our conservativemanagement of institutional assets … weare committed to managing and mitigatingrisk to a no-loss standard.
With our adherence to strict credit quality,MBIA has provided clients with Triple-A-ratedfinancial guarantees since 1974, so thatissuers of debt can benefit from lowerinterest rates, better access to capitalmarkets, and securities that are highlyattractive to investors. MBIA’s financialstrength and risk management expertise arethe foundation of our Triple-A ratings.
So whether we’re insuring bonds to financethe Eurotunnel railway system or the U. S.Patent and Trademark Office in Alexandria,Virginia, one thing is clear: MBIA’s riskculture drives every decision made in everysector of our business. In this way, wesafeguard our capital, our industry leadingfranchise and our Triple-A ratings, and buildshareholder value for our owners every day.
2 M B I A A N N U A L R E P O R T
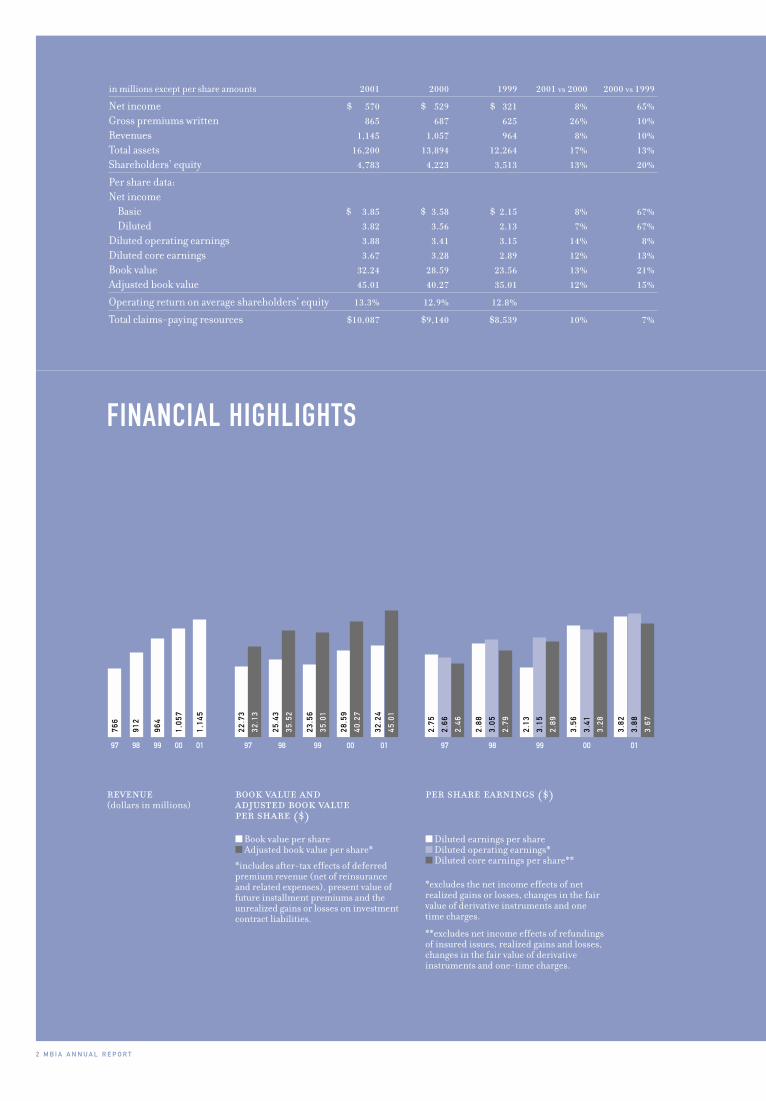
FINANCIAL HIGHLIGHTS
revenue (dollars in millions)
per share earnings ($)
■ Diluted earnings per share■ Diluted operating earnings*■ Diluted core earnings per share**
*excludes the net income effects of net realized gains or losses, changes in the fair value of derivative instruments and one time charges.
**excludes net income effects of refundings of insured issues, realized gains and losses, changes in the fair value of derivative instruments and one-time charges.
766
2.66
912
964
00
1,05
7
1,14
5
3.41
3.56
00
3.28
3.05
2.79
98
2.88
3.88
3.82
01
3.67
3.15
2.89
99
2.13
97
22.7
3
32.1
3
23.5
6
99
35.0
1
25.4
3
35.5
2
98
32.2
4
01
45.0
1
28.5
9
40.2
7
00
book value and adjusted book value per share ($)
■ Book value per share■ Adjusted book value per share*
*includes after-tax effects of deferred premium revenue (net of reinsuranceand related expenses), present value offuture installment premiums and theunrealized gains or losses on investmentcontract liabilities.
in millions except per share amounts 2001 2000 1999 2001 vs 2000 2000 vs 1999
Net income $ 570 $ 529 $ 321 8% 65%
Gross premiums written 865 687 625 26% 10%
Revenues 1,145 1,057 964 8% 10%
Total assets 16,200 13,894 12,264 17% 13%
Shareholders’ equity 4,783 4,223 3,513 13% 20%
Per share data:Net income
Basic $ 3.85 $ 3.58 $ 2.15 8% 67%
Diluted 3.82 3.56 2.13 7% 67%
Diluted operating earnings 3.88 3.41 3.15 14% 8%
Diluted core earnings 3.67 3.28 2.89 12% 13%
Book value 32.24 28.59 23.56 13% 21%
Adjusted book value 45.01 40.27 35.01 12% 15%
Operating return on average shareholders’ equity 13.3% 12.9% 12.8%
Total claims-paying resources $10,087 $9,140 $8,539 10% 7%
2.75
97
2.46
97 98 99 01

M B I A A N N U A L R E P O R T 3
domestic and global credit and investment mar-
kets provide a vivid backdrop to the position of
your company as the year closed. In the confusion
of this volatile environment, I believe we had a very
satisfactory year, again demonstrating the value of
our insurance products. I continue to be pleased
with the quality of our outstanding credit book in
the midst of the anticipated global recession.
Starting with our global credit enhancement
business, the secular trends, which we identified
a few years back, were very evident across all sec-
tors. We continued to experience very strong pric-
ing for our transactions as credit concerns kept
demand for the highest quality enhancement at
peak levels. Driven by the strong expansion of the
fixed-income capital markets outside the United
States, aggregate production grew just over 25%,
comfortably above our mid-term trend line of
mid-teens growth. Global public infrastructure
was the dominant theme for the year. Several
transactions in the United Kingdom put together
by Jack Caouette and his team helped to elevate
our adjusted direct premium revenues above one
billion dollars for the first time. In the United
States, a very strong second half surge in insured
municipal issuance helped overcome a fair
amount of price competition from some competi-
ALTHOUGH WE HAVE CLOSED our financial books
for the year 2001, it will be many years in the
future, if ever, before the anguished memories of
the past year begin to fade from our thoughts.
While the MBIA family was fortunate to have suf-
fered no direct human or financial loss, our busi-
ness and personal communities were deeply
impacted and our common understanding of risk
was forever altered. The shocking events of
September 11 and their tumultuous impact on
TO OUR OWNERS,
THE RUNG OF A LADDER WAS NEVER MEANT TO REST UPON, BUT ONLY TO HOLD A MAN'S FOOT LONG ENOUGH TO ENABLE HIM TO PUT THE OTHER SOMEWHAT HIGHER.THOMAS H. HUXLEY (1825-1895)
Jay Brown
4 M B I A A N N U A L R E P O R T
smashed my short-term goal of getting our statu-
tory expense ratio below 20%. We recorded a
13.4% ratio compared to the 22.1% we saw in
2000 and the 23.6% in 1999. While the strong
production obviously drove this ratio, the modest
$3 million increase in cash expenses to $181 mil-
lion was an equally significant factor. Three
straight years of belt tightening have paid off as we
have now moved back to world-class levels.
Continuous improvement in process, skill
enhancements and strong controls will keep this
performance in place. The impact on our reported
results will be seen in the next few years as GAAP
accounting catches up with cash expenditures.
Although we have been vigilant in keeping
the number of staff under control, we made nice
strides in increasing both job rotations and the
amount of training provided to each employee.
During the year, we reassigned a long-term
employee to a new role of Chief Learning Officer
with full time responsibilities for all formal train-
ing and knowledge transfer within the organiza-
tion. We are well along on our journey to provide
employees with a minimum of two weeks of job-
specific training each year. While this is an ambi-
tious structural goal, the essence of MBIA is the
shared knowledge base of our professional
tors. In the domestic structured market we never
really regained the momentum that was in place
prior to September.
Credit quality on the new book was solid
with approximately 80% of the business written
in 2001 rated A or above. This continued the trend
of the past three years which has raised the
A-rated or above component to 75% on the
inforce book of business. I will come back later for
some additional comments on the balance sheet
but we feel very good with how the book is per-
forming in the middle stages of the recession…so
far no big surprises to report!
With good volume of acceptable business at
very good prices, we had split results on the other
two economic drivers of our credit enhancement
profitability—investment income and expenses.
While cash flow was strong at around an 8%
change in invested assets, the strong actions of the
Federal Reserve in cutting interest rates resulted
in an anemic 6.5% growth in pretax investment
income. We resisted the urge to stretch out dura-
tion or go down market in risk appetite keeping
our powder relatively dry for a different investing
environment in the years ahead.
On a much brighter note, the entire com-
pany’s continued focus on expense management
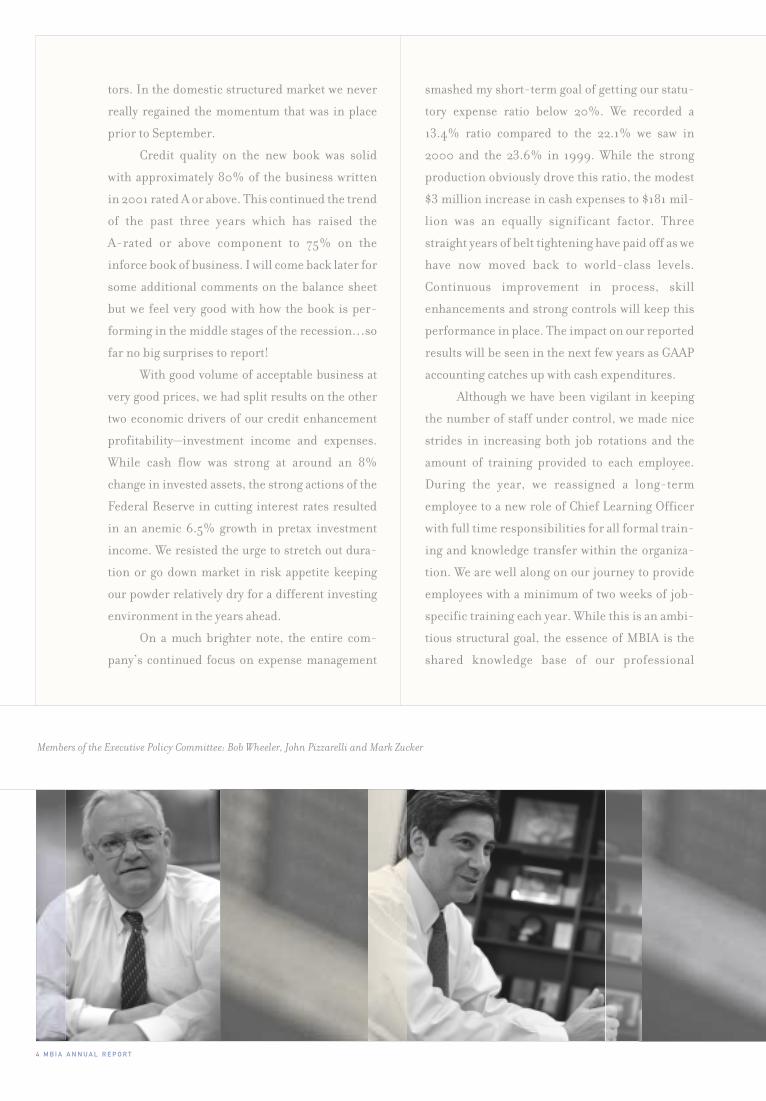
Members of the Executive Policy Committee: Bob Wheeler, John Pizzarelli and Mark Zucker

M B I A A N N U A L R E P O R T 5
employees. This is one investment in the future
that must survive the budget knives if we are to
prosper in the years ahead.
After three years of torrid growth, our asset
management business cooled down a bit in 2001,
recording a 6% growth in revenues and “only” a
12% growth in operating profits. As you might
expect, our equity management results suffered
along with the market and we saw our assets under
management at 1838 Investment Advisors fall by
17% to $11.9 billion at the close of the year.
Although cash inflows were modestly positive, it
was a tough year for that team. On a much brighter
note, Francie Heller’s group led our three fixed-
income teams in Armonk, registering a 34%
growth in assets under management and breaking
through the $10 billion mark in the third quarter.
This led to an impressive 50%+ growth in profits
from our short-term money management team.
Very solid results in the remainder of the fixed-
income operation offset the drop in equity assets
under management, leaving us just shy of $40 bil-
lion at year-end 2001. Given the tough compar-
isons, we expect to fall short of our long-term 14%
to 17% growth targets for our asset management
operation in 2002, but see no reason why we
shouldn’t pick up momentum in 2003 and beyond.
MuniServices had a very disappointing year,
recording a loss of $3 million from our revenue
enhancement operations following the modest
profit reported in 2000. This was well below our
expectations when the year began. Having faced up
to the problems early in the year, the management
team made a course correction to significantly
narrow the geographic focus to a handful of states.
This resulted in a sharp reduction in anticipated
revenues, which forced an immediate staff reduc-
tion. Management’s quick attention to the details
allowed us to remain cash flow positive for the
year, but we have lowered our own expectations for
significant contributions from this business unit
in the near future. While we expect to continue to
generate cash and report a modest profit in 2002,
our forecasting track record here has not been
good. In any event, given the book value of $20
million – $8 million of which is goodwill – this
operation will not have any material impact on the
company in the near term.
During the past several months, there has
been a fair amount of public debate on issues such
as balance sheet transparency, special purpose
vehicles, risk management, accounting conflicts
and quality of earnings. As you might expect, we
have spent some time staring in the mirror, com-

Ram Wertheim, Ruth Whaley and Kevin Silva
6 M B I A A N N U A L R E P O R T
paring our own practices against others and trying
to ascertain if we are doing a good job of explain-
ing the risks in our business model and present-
ing a fair picture of past operating performance
and the challenges we face in ensuing time peri-
ods. Along these lines, you may have noticed that
we have expanded the disclosures related to our
activities in two areas: credit derivatives and spe-
cial purpose vehicles. While neither area has had
a material impact on any past period results, it
seems useful to provide some additional material
to assist your understanding of these activities.
Our two main business areas, credit enhance-
ment and asset management, are relatively easy
business models to explain, but very difficult to do
well. Turning first to our third party asset manage-
ment business, our activities are dispersed by type
of asset, geography and client, thereby minimizing
any short-term adverse surprises. Our largest client
represents less than 3% of annual revenue. Again,
our major expense is staff with relatively constant
margins from period to period given variable bonus
plans. While this business can hopefully grow sig-
nificantly over time, the real risk is lack of perform-
ance for our clients, which would cause a gradual
reduction in revenue and profits over time.
In the credit enhancement area, we review
and analyze several thousand public and private
transactions each year. For each transaction we
approve and receive an order for, a premium is
charged which is then earned over the life of the
exposure, sometimes as long as 40 years. The
expenses that we incur in putting the transaction
together are also accounted for over the life of the
transaction. As you might expect, we keep an eye
on the relationship between deferred revenue and
deferred expenses to minimize any impacts on
any accounting period. Our actual expense is
dominated by employee costs and we disclose all
cash expenditures and net incurred numbers each
quarter which provides pretty clear transparency
for this item.
The other major component of insurance rev-
enues is investment income. You will note in our
financial statements that our current portfolio is
virtually 100% investment grade fixed-income
securities managed by our asset management folks
for long-term total return. While asset values will
move significantly with interest rate changes, we
have traditionally incurred only modest capital
gains/losses in response to market opportunities.
In addition to operating expenses, the two
other significant areas of expense are loss reserves

M B I A A N N U A L R E P O R T 7
and taxes. As to the latter, as a United States domi-
ciled insurance company our taxes are substantial
and audited every year by the IRS and other taxing
authorities. (We do think about Bermuda and other
tax havens from time to time but we just don't think
there is really that much financial guarantee insur-
ance needed on the islands.) Our marginal rate is
pretty consistent as there is not much variation
beyond business and invested asset mix from year
to year. I think shareholders should feel comfort-
able that these figures will contain no surprises.
Obviously, insurance company loss reserves
are an area that causes all investors in the busi-
ness to pause, given the historical reference
points and the underlying degree of difficulty in
getting it right. While financial guarantee has had
neither the actual loss level volatility nor the
reserve difficulties of the property casualty insur-
ance segment, it does contain similar challenges.
The approach we have followed at MBIA for our
formula provisions the past three years has been
to reserve four basis points (0.04%) of the new
net incurred debt service written each period.
There were two flaws with this approach. First,
our actual amount of new debt service written
each quarter actually fluctuates quite a bit,
although the relevant premium revenue is earned
smoothly over the life of the transactions. Second,
during the quarter business is written, virtually all
of the revenue is deferred in unearned premium
and we are therefore actually incurring loss
reserve charges in advance of the associated rev-
enues. Since the goal of a formula approach is to
provide a reasonable estimate in each accounting
period, we have decided to alter our formula to
reserve at a rate of approximately 12% of regular
earned premium. This formula will be reviewed at
a minimum once a year but should allow us to keep
our reserve margin at adequate levels and reduce
some volatility from quarter to quarter.
In terms of our own experience, you will
note in our financial statements that we have
reserved $154 million in formula reserves over
the past three years, which is about 12% of the
$1.26 billion in regular earned premium (exclud-
ing the individual charge of $153 million in
1999). During that same time period we opened
23 new case files and incurred $116 million in case
incurred losses across 48 cases. This resulted in a
$38 million increase in our unallocated reserve to
$272 million during the three-year period.
While virtually every case had some activity
during the time period, the bulk of the dollars
were associated with AHERF, the hospital loss we

8 M B I A A N N U A L R E P O R T
experienced in 1998, and four tax lien transac-
tions which are in run-off. The AHERF losses are
a combination of reserve discount accretion and
adjustments for salvage estimates, and the tax
liens are reserve developments consistent with
individual tax lien write-offs. These two classes
represent 74% of the case incurred activity of $116
million during the three-year period and represent
76% of our all-time gross case loss activity. While
we continue to participate in the health care sector
with adjusted underwriting criteria, our decision to
exit the tax lien business remains a firm position.
Given the above, I remain convinced that
the real investment risk to our shareholders is the
obvious one, a series of bad selections on individ-
ual credits. Although we only insure investment
grade transactions (each one reviewed by one or
more rating agencies), there can be no assurances
that the past track record of the industry in gener-
al or MBIA in particular will continue into the
future. Given our track record and current condi-
tions, we continue to feel very comfortable
deploying our capital going forward.
In looking at the key numbers we reported
for the year, I looked back at our 1991 annual
report to incorporate a reference against the
longer term. (I tried to get the team to use my
photo from that 1991 report but they clearly felt
this was a year where more transparency was need-
ed.) The following table captures the trends nicely:
1991 2001 Growth Per Annum
Adjusted Direct Premium $269 million $1.04 billion 14%
Net Income $145 million $570 million 15%
Claims-Paying Resources $2.7 billion $10.1 billion 14%
Net Debt Service Outstanding $185 billion $722 billion 15%
Shareholders’ Equity $1.1 billion $4.8 billion 16%
Book Value Per Share $9.19 $32.24 13%
Annual Dividend $.20 $.60 12%
Share Price $16.08 $53.63 13%
Neil Budnick, Jack Caouette and Dick Weill

M B I A A N N U A L R E P O R T 9
Our 2001 operating ROE of 13.3% fell short
of the fine 14.5% which we reported in 1991, but in
each of the other categories listed we saw ten-year
compound growth consistent with our objectives of
12% to 15% per annum future growth. In addition,
you have received total returns toward the high end
of this range. MBIA’s ten-year total returns, at
14.5%, outperformed the S&P 500 average of
12.9%. My predecessors have done a fine job of
establishing an excellent track record, which we
have made a nice start in matching the last three
years. I remain confident that our stated growth
goals for the next several years are within reach.
Due to the strong growth we experienced
during the year and the volatility we observed in
the credit markets, we made only a modest share
repurchase of two hundred thousand shares dur-
ing the year. Our dividend per share increased
10% to $.60 per share and a total of $87 million
was paid for the year. I expect that we will be rec-
ommending a modest increase in the dividend in
2002 and be more aggressive in our share pur-
chases during the coming year.
Your board was very involved during the
course of 2001 including a two-day strategic
review in August in New York City. One important
step they took was to develop and adopt a formal
set of guiding principles for corporate governance
which is available on our Web site. I would like to
thank all of your board for their advice and sup-
port and would sadly note that this will be David
Elliott's final year on your board. No amount of
words can cover all of David’s contributions since
the first days of MBIA.... On behalf of all of us, I
just want to say thank you, David.
The first year of the new decade was a suc-
cessful one for your company albeit a serious test
for the resiliency of our industry. Our balance
sheet remains strong and the caliber and energy
of my associates continues to position us well for
the future. It was another very satisfactory year
and I continue to thoroughly enjoy leading this
team with my partner Gary Dunton. We are both
looking forward to 2002 with great enthusiasm!
Joseph W. Brown
Chairman and Chief Executive Officer
February 19, 2002

1 0 M B I A A N N U A L R E P O R T
QUESTION 1: GARY, AT MY FIRM, THE CORPORATE CUL-
TURE IS VERY IMPORTANT. I ’M WONDERING WHAT THE
CULTURE IS LIKE AT MBIA, AND HOW DO YOU STRENGTHEN
AND PERPETUATE IT?
GARY: Three years ago, when Jay came in as CEO,he and I and the other senior managers gottogether and addressed these very questions. Wewanted to know whether our current culture couldsupport the kind of organization we needed tobecome in an increasingly competitive world.
We spent a few days off site at meetings where we developed what we call our “PeoplePrinciples.” I won’t go through them all, but I willhighlight five that we talk about on a pretty regularbasis in our leadership training programs.
The first is honesty. In a business that isinformation-based and tied so much to ouremployees’ expertise and knowledge, we have gotto be open and frank with each other. If you don’tlike something about a deal, or if you think youhave a perspective that no one else is hearing, it isyour responsibility to come forward.
So we encourage our people to tell us whatthey think. And all of us are, therefore, required tohave pretty thick skin.
The second element that we stress in termsof culture is the notion of ownership. You can call itwork ethic, but whatever you call it, it is the ideathat everybody owns the results. Our view is thateveryone is important to our success and eachemployee is therefore expected and encouraged tomake a difference every day they come to work.
The third principle is, for lack of a betterterm, attitude – the spirit and character youdemonstrate in your job. There are two keydimensions to most folk – aptitude and attitude.Our business is too real time and too tough to putup with anything but the right attitude – or whatwe call “in spite of” behavior. In spite of the factthat the world isn’t perfect, I kept my commit-ment – that sort of thing. And every year, extraor-dinary employees who embody this and the other
INTERVIEW WITH GARY DUNTON
TWO MAJOR INSTITUTIONALINVESTORS, REPRESENTING BOTHFIXED-INCOME AND EQUITY AUDIENCES, SAT DOWN WITHGARY DUNTON IN FEBRUARY 2002TO DISCUSS ISSUES OF IMPORTANCE TO THEM AND TO THEIR CLIENTS.

key traits are recognized with a formal awardsprogram – the Chairman’s Award.
The fourth principle is teamwork. I knowmost organizations talk about teamwork, but inour business we really do practice it. When youthink about our business model, it is one of per-fection: a zero-loss underwriting standard. Tohave zero losses, you have to be perfect. How easyis it for anyone to be perfect by him or herself?We’re getting our people to understand that ask-ing for help isn’t a sign of weakness or a sign ofindecision; it is a sign of strength.
The fifth principle is our commitment togrowth and development. Three or four years ago,we had no in-house training. We didn’t reallyhave a lot of performance management, and wehad low turnover. We were in a relatively benignenvironment. Now we recognize that if we sitstill, we’re dead.
We had 307 training days in 2000, 553 in2001, and in 2002 we are going to have 1470 train-ing days. Our professionals get away from the day-to-day activities anywhere from four to sevenbusiness days a year for professional training. Inaddition, out of 423 employees in our insurancedivision almost 100 of them rotated jobs in thelast year to further build organizational strength.You can't build bench strength if you use the samemuscles day in and day out.
Creating the right corporate culture is veryimportant to us because we don’t want our companyto be the image of Jay or me, or Neil Budnick, or
anybody else. Too many companies are run byrock stars, and when they leave, the whole placefalls apart. We don’t want that. We want to pro-mote from within and have a very tangible culturewith consistent capabilities and knowledge thatcross over disciplines. And we think this differ-entiates us from our competition.
QUESTION 2: AS A FIXED-INCOME INVESTOR, MY PRI-
MARY CONCERN IS THE QUALITY OF YOUR PORTFOLIO
AND THE STABILITY OF YOUR RATINGS. HOW DO YOU
BALANCE THE SOMETIMES CONFLICTING DEMANDS OF
GROWTH, QUALITY AND RETURNS?
GARY: I almost hate to say this in front of an equityholder, but our number one priority at MBIA isquality underwriting – day in and day out, year afteryear. There is no substitute for a long-term buyerand holder of risk. It is the number one and onlycommon factor for successful insurance companies,not claims handling, investment management,expense management or product development. It ishow well we select risk and underwrite it. If we arebringing quality business in the door, we havealready got 80% of the equation right.
Consistent with that mentality is our com-mitment to our Triple-A rating. In our minds, ourfranchise is the ultimate money-back guarantee,the “Good Housekeeping” seal of approval. So thequality of the individual transaction on one hand,combined with the quality of our balance sheet onthe other, means that our Triple-A is secure.
M B I A A N N U A L R E P O R T 1 1

A
BC
A . Global Credit Enhancement 85%B . Asset Management 11%C . Other 4%
INTERVIEW WITH GARY DUNTON
1 2 M B I A A N N U A L R E P O R T
Right after quality comes pricing. Are wepricing based on the value we bring? Are we pric-ing to a 15% or higher rate of return? The answerswere not always positive, so over the last few yearswe increased prices. We were and still are themarket leader in volume – and so it should be thesame with price. We may or may not get to ourlong-term goal of 15% ROE, but if we don’t priceeach new transaction at that level or higher, wedefinitely won’t get there.
Only after those two issues are adequatelyaddressed can we rightly focus on the growth ele-ment of our business – top line and bottom line.Our view is very straightforward: if the marketsare healthy and pricing is rational, we will be avery aggressive competitor. If the markets don’tpresent us with good underwriting opportunitiesor competition is driving prices to inadequatelevels, we will pick up our marbles, go home andwait for a better day.
QUESTION 3: WHAT DRIVES THE PRICING? DOES VOLUME
HAVE A LOT TO DO WITH IT?
GARY: On any given day our competitors may havedifferent motives – the two extremes are puregrowth and pure profitability. As a public company,we have to operate with a balance – growth and
profitability – and there is a tradeoff between thetwo. Our view is that pricing is the fastest and eas-iest way to grow the organization. We have lostdeals where bankers or issuers that we’ve had
relationships with for years come to us and say,“Company Y just bid 50 and you’re at 90. Can youdo any better?” We might shave a few basis points,but we can’t do 50. That is just not sustainable.Company Y is trying to build a book. We are tryingto run a business.
So we let it go. And then, we hear that theexecution by Company Y wasn’t good. The marketdidn’t accept it because the spread wasn’t as goodas they thought it would be. And, we win the nextbid, back at our price. It proves that we don't haveto sacrifice our pricing discipline. More timesthan not, we preserve our capacity to do the nextdeal on our terms at a later date.
QUESTION 4: HOW MUCH GROWTH DO YOU SEE IN YOUR
ASSET-BACKED BUSINESS? AND HOW DO YOU ASSESS
THE RISK? AND HOW DO YOU EDUCATE THOSE OF US ON
THE MUNICIPAL SIDE, WHO MIGHT BE A LITTLE UNEASY
WHEN THEY HEAR OF SOME INTERNATIONAL AUTO
FINANCING DEAL? IT SOUNDS A LITTLE MORE COMPLI-
CATED THAN A WATER/SEWER DEAL.
GARY: You know what’s funny – fixed-incomeinvestors of our insured asset-backed paper saythe same thing about public finance deals!
On the asset-backed side, you are not look-ing at issuer credit as much as you are looking atassets – typically homogeneous pools of assetslike leases, auto loans, credit card receivables orhome equity loans.
We structure these deals so we have control
REVENUE SOURCES 2001

AB
2000 A . Global Public Finance 48%B . Global Structured Finance 52%
2001 A . Global Public Finance 63%B . Global Structured Finance 37%
A
B
M B I A A N N U A L R E P O R T 1 3
of the underlying assets in case of portfolio stress.These deals have attractive structural componentslike over collateralization. So let’s say an assetclass has historical losses at the 2% level andworst-experience losses over some time period orin some part of the portfolio of 4%, we might usethe 4% as the basic scenario and underwrite(structure) the over collateralization at 8%.
If there are subsequent problems with thedeal and the over collateralization starts to shrink,warning signals will be triggered and we will startto capture the excess spread. If we catch it soonenough, we can replenish whatever shortfall thereis in the over collateralization.
In addition, if the servicing is not beingperformed correctly, we can change the servicer.As a result of this right, many servicers will doother things like buy back slow-paying loans outof the pool and replace them with performingloans, because they want to keep their servicingincome. Plus, they don’t want to be known assomebody that MBIA won’t do business with.
So, the first level of defense is the quality ofthe assets. Then the strength of the structure, andnext is the operating goodness of the servicer. Thefinal level of defense is the financial strength ofthe servicer. In our deals we satisify ourselves onall four elements, but we do put the most weighton the first two elements.
FINANCIAL GUARANTEE PREMIUM SOURCES 2000/2001
QUESTION 5: DO YOU EXPECT THE CAPITAL MARKETS IN
THE U.K. , EUROPE AND ASIA TO DEVELOP ALONG THE
LINES OF THE U.S. MODEL? HOW LARGE AN OPPORTUNI-
TY IS THAT FOR MBIA? DO ALL YOUR RESOURCES STAND
BEHIND THE GLOBAL EFFORT?
GARY: Excellent question. We believe there is a bigstory to be told about the opportunities overseas.These days, two-thirds of the world’s GDP is out-side of the U.S. If we can write $700 or $800 mil-lion of premiums in the U.S. this year, we canwrite that much overseas in a few years.
Our view is that there will be gradualglobalization of the capital markets around theworld. Already there are a number of trends thatsupport this perspective.
We see banks in Europe, Australia and Asiagoing through the same disintermediationprocess that our banks went through in the 1940s,50s and 60s. That’s where the capital marketssupplanted the banks to a large extent with capi-tal formation.
We’re also seeing a lot of privatization goingon in the U.K., France, Italy, Spain and Portugal.Governments are recognizing that private sectorscan do as good a job or even a better job managingcertain things like roads, subways, museums andhealth care. So these organizations are accessingfunds from the capital markets as opposed to get-ting capital from their governments.
And lastly, pension reform is going on inEurope. It used to be a pay-as-you-go system. But
1 4 M B I A A N N U A L R E P O R T
INTERVIEW WITH GARY DUNTON
with the aging of the European population, theyhave to start funding their pension programs.They probably aren’t going to start funding themwith equities. Americans love equities, butEuropeans really haven’t gotten into the equitygame as much. So they are probably going to startwith high-quality fixed-income securities.
We benefit from all of these trends as ourproduct – Triple-A credit enhancement – facili-tates the development of capital markets. Again,it’s the concept of the “Good Housekeeping” sealof approval, with a money-back guarantee. Ifthings go wrong, we pay – not the investor.
MBIA is well positioned to take advantage ofthese opportunities. Two years ago, we and Ambacdissolved our international joint venture. It hadbeen very successful, but both companies wereready to go out on their own. The growth opportu-nities were tremendous, but we were tripping overeach other. By the way, both of us are actuallydoing a better job now stimulating primarydemand by competing in the markets.
Since then, we’ve been making sure that wehave the right people in the right places. Some ofour overseas staff are seasoned MBIA professionalsthat we moved overseas, and others were very care-fully selected from cities where we have offices.
The trick is to approach the business from aglobal point of view. We can’t afford to have utilityexperts in Sydney, Paris, London, San Franciscoand New York. So we operate as a virtual organiza-tion with a matrix reporting structure – product
specialties with a geographic overlay.The structure compels us to work together
and share resources. The teamwork has actuallybeen phenomenally successful. We had a wonder-ful year in our international business, because wewere able to deliver our expertise where and whenit was needed by our customers.
QUESTION 6: IN YOUR OPINION, WHAT KEY FACTORS
SHOULD INVESTORS CONSIDER IN VALUING MBIA?
GARY: The most important things to Jay and to meand to the board are the Triple-A balance sheetand business model. As they say, the best defenseis a good offense. That really is our franchise.
In 1998, we started to look at our credits on amore broad ranging portfolio basis. We assigneddefault probabilities, severity tests and defaultvolatilities to each credit. We looked at the correla-tions among all of the sectors, and we ran all thisdata on a simulation model to see what our distri-bution of losses would be all the way up to a 99.99%confidence level.
As it turns out, Moody’s was going through avery similar exercise for the industry and estab-lished a portfolio simulation model as a critical ele-ment of its ratings approach to financial guarantors.Moody’s uses two different confidence levels,99.9% and 99.99% as part of its capital adequacyratios. The likelihood of default for 99.9% is one inone thousand while 99.99% is one in ten thousand.
Fundamentally, MBIA uses its own portfolio
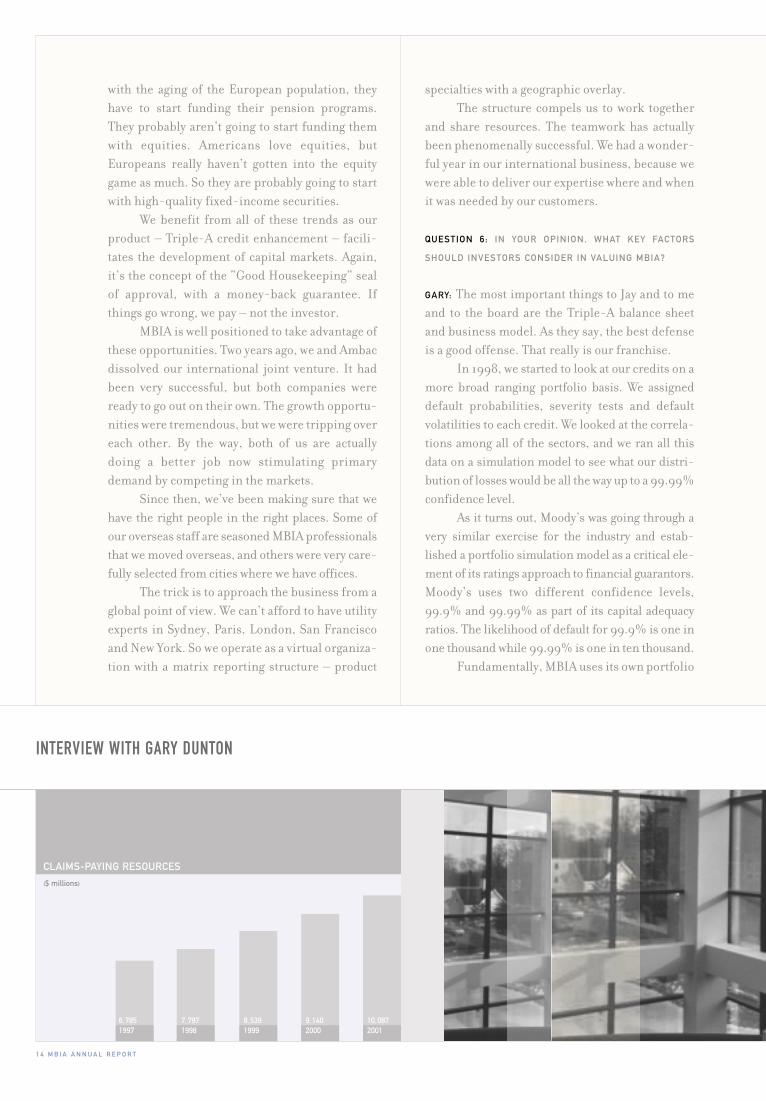
CLAIMS-PAYING RESOURCES
($ millions)
6,785 7,797 8,539 9,140 10,087 1997 1998 1999 2000 2001

M B I A A N N U A L R E P O R T 1 5
model to assist in the management of our busi-ness. It helps us gain perspective on total capitalneeds and capital we use on a deal by deal basis. Ithelps us price each transaction, and it assists us inour reinsurance strategy. We believe we have themost sophisticated day-to-day risk managementcapabilities in the industry.
So from a valuation perspective, the realquestion is – how secure is the MBIA franchisevalue? We are comfortable that our Triple-A fran-chise is very strong, and that we are well posi-tioned in the industry. Then we step back and say,okay, let’s consider the other elements of tradi-tional equity valuation. How necessary is theproduct? What is competition like? Are the mar-kets for the product growing? The answers tothese questions are all positive for MBIA.
We are inextricably linked to the global cap-ital markets, and they are growing. We provide anessential service that actually facilitates the growthand expansion of those markets. We are the globalleader, and we operate in an industry with a limit-ed number of largely responsible competitors.
MBIA has a track record that goes back over25 years. Since we went public in 1987 our returnsto shareholders have exceeded those of the S&P500. If we mind our Ps and Qs in terms of riskmanagement, and don’t overly focus on the topline in any particular period of time, I believe wewill continue to outperform the S&P 500.
RETURN ON INVESTMENT
Calculated based on a start date of 7/31/1987. Percentage represents compound annual return.
12.01% 17.36%S&P 500 MBIA Inc.Index
MBIA HAS A TRACK RECORD THAT GOES BACK OVER 25 YEARS. SINCE WE WENT PUBLIC IN 1987 OUR RETURNS TO SHAREHOLDERS HAVE EXCEEDED THOSE OF THE S&P 500.
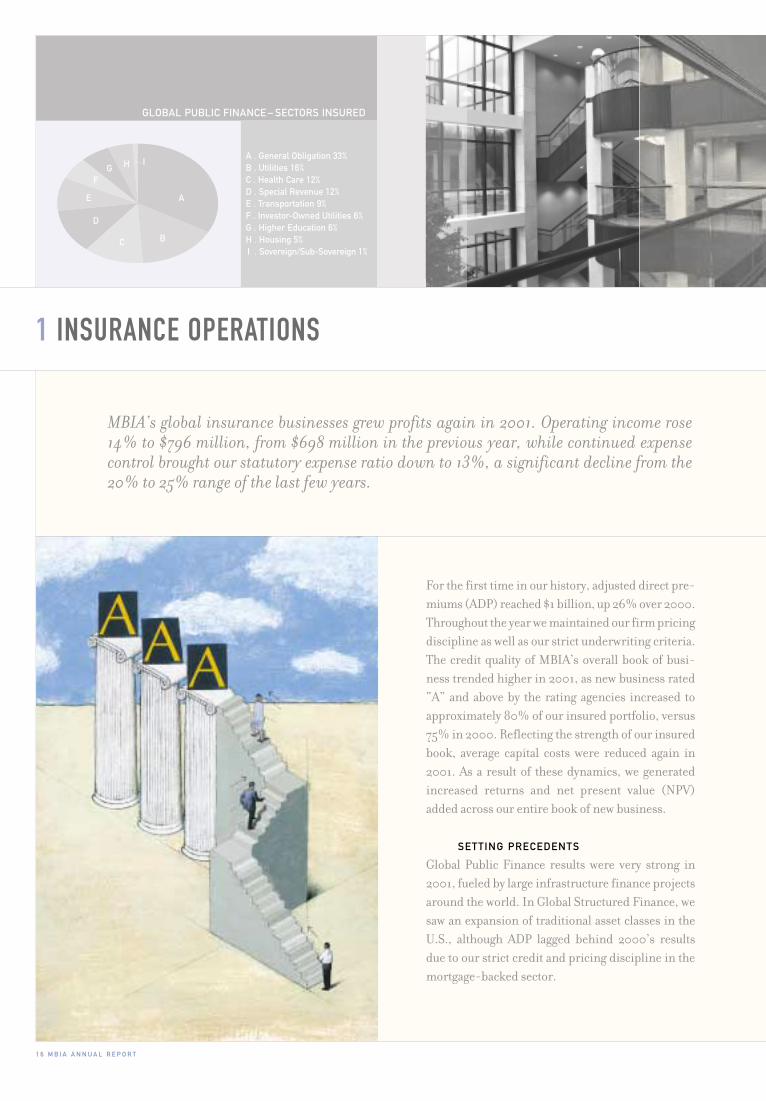
GLOBAL PUBLIC FINANCE – SECTORS INSURED
A
BC
D
E
FG H I
A . General Obligation 33% B . Utilities 16% C . Health Care 12% D . Special Revenue 12% E . Transportation 9% F . Investor-Owned Utilities 6% G . Higher Education 6% H . Housing 5% I . Sovereign/Sub-Sovereign 1%
For the first time in our history, adjusted direct pre-miums (ADP) reached $1 billion, up 26% over 2000.Throughout the year we maintained our firm pricingdiscipline as well as our strict underwriting criteria.The credit quality of MBIA’s overall book of busi-ness trended higher in 2001, as new business rated“A” and above by the rating agencies increased toapproximately 80% of our insured portfolio, versus75% in 2000. Reflecting the strength of our insuredbook, average capital costs were reduced again in2001. As a result of these dynamics, we generatedincreased returns and net present value (NPV)added across our entire book of new business.
SETTING PRECEDENTS
Global Public Finance results were very strong in2001, fueled by large infrastructure finance projectsaround the world. In Global Structured Finance, wesaw an expansion of traditional asset classes in theU.S., although ADP lagged behind 2000’s resultsdue to our strict credit and pricing discipline in themortgage-backed sector.
1 6 M B I A A N N U A L R E P O R T
MBIA’s global insurance businesses grew profits again in 2001. Operating income rose14% to $796 million, from $698 million in the previous year, while continued expensecontrol brought our statutory expense ratio down to 13%, a significant decline from the20% to 25% range of the last few years.
1 INSURANCE OPERATIONS

M B I A A N N U A L R E P O R T 1 7
Water is a regulated provider of clean water and wastewater services to over three million customers inWales and England. MBIA’s analysis of the issuerevolved around historical and projected financialperformance, operating performance, technicalcharacteristics of the system, as well as a thoroughexamination of the regulatory environment,including how it may alter over time. A not-for-profit company acquired Welsh Water through aGBP 1.9 billion bond issue, over half of which wasguaranteed by MBIA.
MBIA closed a number of large, complex pub-lic finance deals in the U.S. as well. One notabletransaction was the United States Patent andTrademark Office (PTO) project financing. MBIAguaranteed $761 million of bonds issued to fund theconstruction of a new headquarters complex for thePTO in Alexandria, Virginia. Analysis of the credit,which consists of five buildings in a campus-likesetting, included the essentiality of the project, con-struction risk and accessibility to the suburbs andcity of Washington D.C. By applying MBIA’s struc-turing abilities, the deal itself became stronger. Theresult: a successfully underwritten low risk deal.
GLOBAL STRUCTURED FINANCE
In addition to enhancing large public infrastruc-ture finance transactions around the world, wealso apply our value-added structuring expertiseand risk management skills to the global struc-tured finance industry.
Our traditional “flow” business – the securiti-
Both Global Public Finance and GlobalStructured Finance divisions executed many highlycomplex, unique transactions throughout the year. Ininternational markets, ongoing developments led toexcellent opportunities for insured financial prod-ucts. For example, privatization initiatives in Europeand Australia and continued disintermediation ofEuropean banks increased demand for MBIA’s guar-antee. To support growth in these markets, we addedSecondary Market and Risk Management functionsin our London office this past year.
In the U.S., a series of turbulent events – fromthe California energy crisis to the terrorist attacksof September 11 – drove a flight to quality amonginvestors as uncertainty and fear prevailed.
GLOBAL PUBLIC FINANCE
Analyzing risk in the global marketplace allowsMBIA to demonstrate its ability to not only handlecomplex transactions, but to improve them with ourstructuring expertise. One such example is theEurotunnel deal. Comprised of three tunnels run-ning below the English Channel seabed, Eurotunnelis the rail system between the U.K. and France. In amove to strengthen its balance sheet, the issuingentity repackaged its debt by offering GBP 232 mil-lion and Euro 365 million notes wrapped withMBIA’s guarantee. MBIA’s credit analysts took ahighly complex transaction, and after performing anin-depth review, structured it successfully.
The same rigorous approach to underwritingwas applied to the Welsh Water transaction. Welsh
Beth Smayda, Insured Portfolio Management (IPM); Michael Antonicelli and Lauren Desharnais, Structured Finance;
Pat Brosnan, Jeremy Reifsnyder and Aeneas Griffin, Structured Finance
1 8 M B I A A N N U A L R E P O R T
The transaction is designed to allow the clientto deploy capital into other business activities andfinance its lease portfolio separately. The portfolioconsists of 353 regional jet and turboprop aircraftthat are on sublease to airlines around the world.After thorough analysis, MBIA determined thatBAE’s market leadership position and financialstrength, the quality of the collateral package andthe sound structural elements that provide severalrepayment sources, ensured adequate cash flows toservice the debt.
MBIA also provided capital relief to selectclients through synthetic CDO structures at anunderlying Triple-A level, as the company guaran-teed a record number of CDO transactions in theU.S. and abroad.
MBIA’S CREDIT CULTURE
All of these deals were underwritten to a no-lossstandard, the hallmark of MBIA’s credit culture thathas served both the industry and our investors sowell. For a transaction to meet our strict no-lossstandard, it must withstand all types of stress scenar-ios. We analyze each deal using historical data, we testall assumptions, and we must demonstrate full col-lection of cash under very adverse scenarios.
Central to our underwriting success is ourmatrixed team approach to decision making,which distinguishes the company’s risk manage-ment process. This team approach providesimproved deal analysis among New Business, Risk
zation of assets such as home equity mortgages, autoloans, credit cards and auto rental fleets – was char-acterized both by repeat business from long-stand-ing customers and the addition of new valuedrelationships. Using the same no-loss risk stan-dard, we transferred our structuring expertise tonew asset classes during the year, such as timber andmarine cargo containers.
A transaction with the global containerleasing company, Textainer Limited, enabledMBIA to expand its growing operating lease fran-chise, which currently includes railcars and chas-sis. MBIA guaranteed timely payment of interestand principal on $300 million of floating ratenotes issued by a special-purpose subsidiary ofTextainer that was formed to finance and ownmarine cargo containers.
This size of the transaction was based on thevalue of a pool of marine cargo containers, but willbe repaid from the current and future expected cashflows associated with leasing the containers to adiversified pool of global shipping companies.
Our expansion into global markets continuedwith securitizations of future flows, collateralizeddebt obligations (CDOs) and operating assets.
In a key operating asset securitization, MBIAguaranteed $1.2 billion of fixed-rate Class ACertificates issued for BAE Systems, PLC (BAE),formerly British Aerospace, the dominant aero-space and defense contractor in Europe and thirdlargest worldwide.
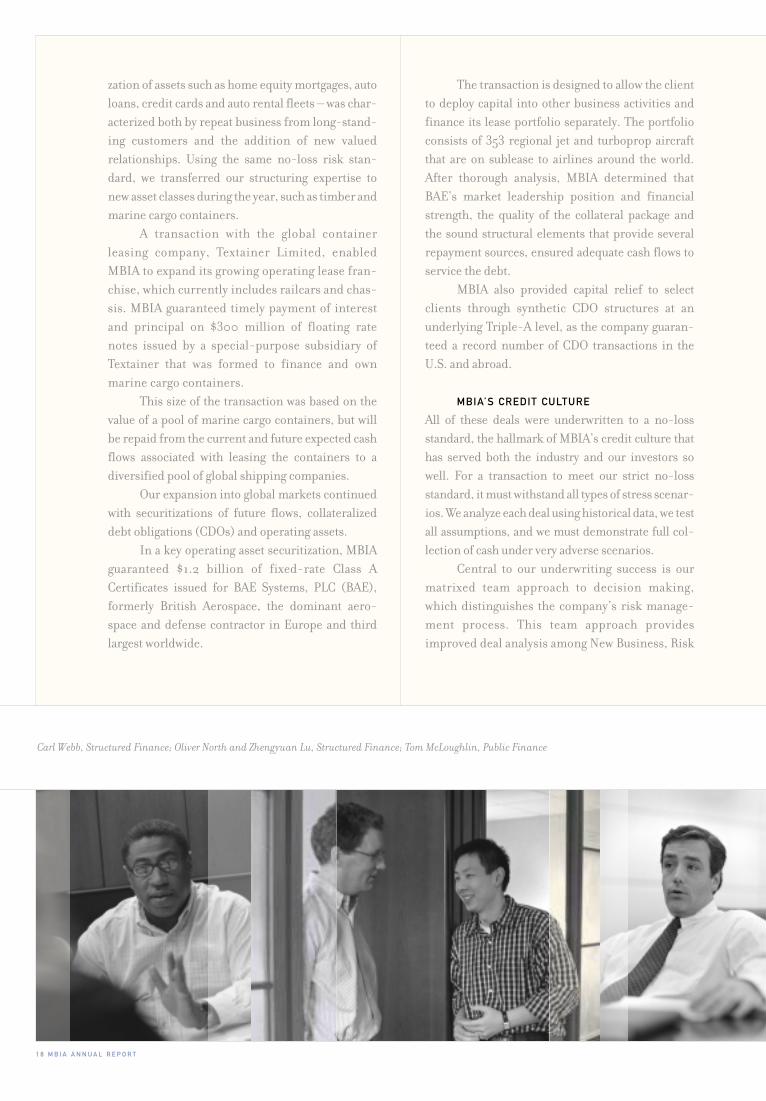
Carl Webb, Structured Finance; Oliver North and Zhengyuan Lu, Structured Finance; Tom McLoughlin, Public Finance

M B I A A N N U A L R E P O R T 1 9
Management, and Insured Portfolio Management,as well as across product lines. By including so manyperspectives in the underwriting process, we bene-fit from our collective knowledge and experience.
Our record of success confirms the merit ofour team approach. Since our inception 27 yearsago, the historical performance of our portfolio hasbeen far superior to comparable, uninsured invest-ment-grade portfolios. We have insured nearly 78thousand issues representing $1.35 trillion in netdebt service, but we have only incurred 3 bps ofaggregate losses on 48 of these issues.
LOOKING AHEAD
In 2001, MBIA expanded its franchise as it contin-ued to strengthen its international platform toapproach the size and depth of its domestic opera-tions. We expect to see growth long-term as MBIAcontinues its active participation in the developingglobal capital markets.
Additionally, as investors strive for securityand safety in their portfolios, we expect the flight-to-quality among investors to continue throughout2002, increasing insurance penetration throughoutthe world.
More than ever before, our team of experts,coupled with MBIA’s superior financial strength,continue to position us as the insurer of choice inthe global capital markets.
Chris Chafizadeh, Karleen Strayer, Public Finance
GLOBAL STRUCTURED FINANCE – ASSET CLASSES
A
BC
D
E
FG H I
A . Pooled Corporate Obligations & Other 36%
B . Home Equity 17% C . Auto 11% D . Credit Cards 10% E . Other Mortgage-Backed 7% F . First Mortgage 7% G . Other Asset-Backed 4% H . Financial Risk 4% I . Leasing 4%
ANALYZING RISK IN THE GLOBAL MARKETPLACEALLOWS MBIA TO DEMONSTRATE ITS ABILITYTO NOT ONLY HANDLE COMPLEX TRANSACTIONS,BUT TO IMPROVE THEM WITH OUR STRUCTURING EXPERTISE.

GROWTH IN ASSETS UNDER MANAGEMENT
($ millions)
2 0 M B I A A N N U A L R E P O R T
13 ,404
1997
24 ,185
1998
30 ,078
1999
36 ,580
2000
MBIA’s asset management businesses bring together not only conservative investmentstrategies, but also sophisticated risk management tools to guide every investment decision,with the goal of meeting clients’ objectives for safety, liquidity and returns. The value of theirconservative approach was evidenced in 2001. In a year rife with market volatility andintense competition, the asset management businesses turned in a fine performance overall,reflecting healthy diversification and sound strategy within this business.
2 ASSET MANAGEMENT
INVESTMENT SERVICES
MBIA Asset Management’s four business unitsoffer specialized investment management servicesto fixed-income and equity clients such as munici-palities, school districts, corporations, banks, pen-sion funds, foundations and other not-for-profitinstitutions and high-net-worth individuals. Forthe year, overall operating income was up 12% to$63 million from $56 million. And importantly, ourexpense control efforts resulted in a modestincrease in margins. At year-end, the group had$39.2 billion in assets under management, a 7%increase over 2000. Over the last three years, MBIAAsset Management profits have grown 117% andassets under management have risen 62%. A weakequity market, lower interest rates and narrowingspreads resulted in a slowdown in long-term growthfor the year, and we anticipate that slower growthwill continue over the coming year.
In line with the U. S. equity market’s decline,1838 Investment Advisors, LLC (1838), one of the
39 ,248
2001
M B I A A N N U A L R E P O R T 2 1
ble repurchase agreements, put agreements andforward delivery agreements for bond proceeds andother funds. IMC’s products are backed by MBIA’sTriple-A, and clients can minimize market riskwhile generating attractive returns until the fundsare needed for purposes such as capital projects,loan origination or debt service payments. In 2001,IMC successfully expanded its marketing to includeinternational and structured finance clients. Overall,IMC had $6.6 billion outstanding in municipalinvestment and repurchase agreements and securi-ties sold under agreements to repurchase, repre-senting an increase of 25% over the prior year.
MBIA Capital Management Corp. (CMC), anSEC-registered investment adviser and NASDmember firm, manages several fixed-income insti-tutional funds, including MBIA’s insurance-relatedinvestment portfolio, as well as those held by stateand local government entities, school districts,municipalities, insurance companies, unions andcorporations. CMC also invests the fixed-incomeassets of 1838, MBIA-MISC and IMC. CMC record-ed another strong year of profitability as assets undermanagement increased 22% to $21.8 billion at year-end 2001, compared with $17.8 billion in 2000.
Diversification, strict adherence to riskguidelines and a conservative approach should helpdampen the effects of any continuing volatility inthe equity markets. With the broad range of equityand fixed-income product offerings, MBIA’s assetmanagement businesses should continue to bepositive contributors to our bottom line.
group’s business units, was impacted by the weak-ness in the U.S. economy. This full-service assetmanagement firm based in King of Prussia,Pennsylvania, manages large-cap and internationalequities, as well as fixed-income and balancedaccount portfolios for its clients. By year-end 2001,1838’s assets under management fell to $11.9 billionfrom $14.3 billion in 2000. 1838’s TaxSmart system,a personalized investment management tool thatenhances clients’ after-tax rates of return, and1838’s extensive network of financial intermedi-aries saw positive growth during the year.
While the equity markets were soft, the AssetManagement Group’s fixed-income business unitsflourished. MBIA Municipal Investors Service
Corporation (MBIA-MISC), an SEC-registeredinvestment adviser which offers a range of liquidcash management and longer-term investmentprograms, saw assets under management increase34%, to $10.6 billion from $7.9 billion in 2000.MBIA-MISC offers a number of investment optionsfor its client base, such as CLASS®, which enablesschool districts and municipalities to pool fundswith other units of government to obtain safety ofprincipal, liquidity and competitive rates on theirshort-term investments. Another offering is CAM,an individualized asset management program that iscompletely customized to meet the unique needs ofeach public sector entity.
Another solid performance was turned in byMBIA Investment Management Corp. (IMC), whichprovides guaranteed investment agreements, flexi-
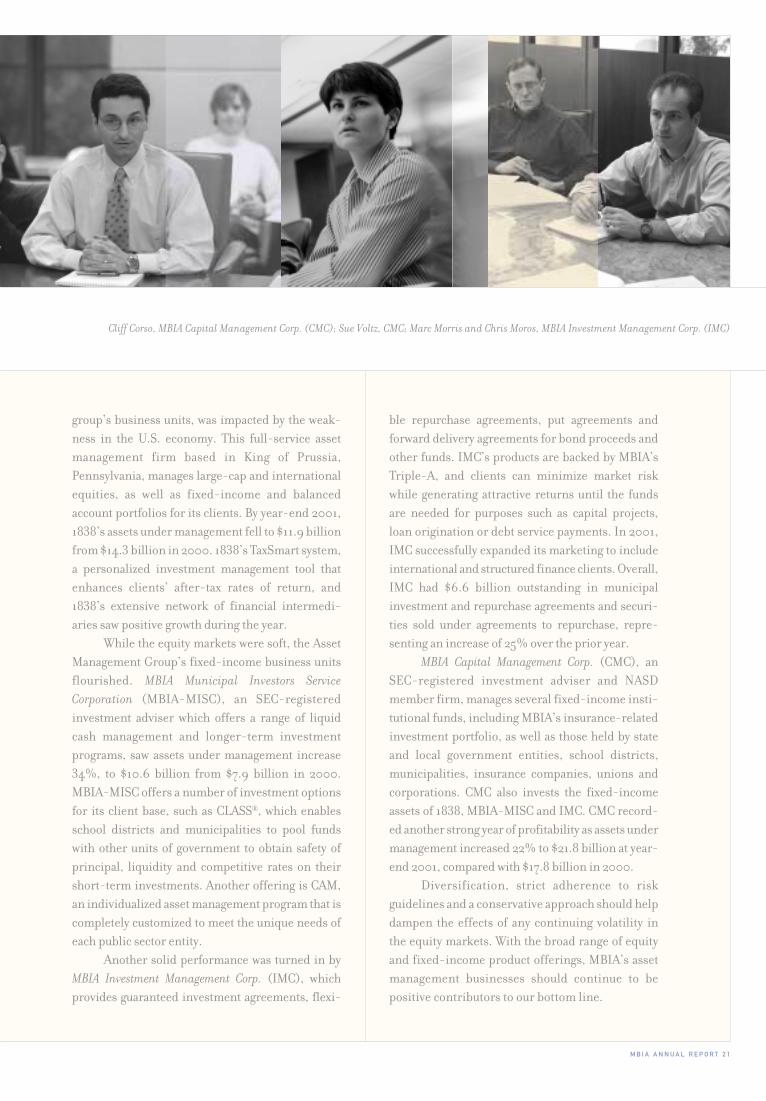
Cliff Corso, MBIA Capital Management Corp. (CMC); Sue Voltz, CMC; Marc Morris and Chris Moros, MBIA Investment Management Corp. (IMC)

2 2 M B I A A N N U A L R E P O R T
MBIA’s capital strength can be measured two ways: by the strength of our balance sheetand by the strength of our human capital. Our unwavering commitment to manageexpertise in our credit culture and develop diverse talent in our employees is the catalystfor the company’s financial success.
3 HUMAN CAPITAL
This past year, MBIA continued a series of key
strategies to strengthen the organization. Our
knowledge management effort expanded training
and development, while a focus on teamwork and
job rotation improved communication across
product lines. Our commitment to a diversified
workforce continued throughout the year. The
implementation of a performance management
program and a management organization review
insured that each employee had a personal devel-
opment plan and received clear feedback on their
roles and performance. Finally, we created a formal
structure for supporting our communities with
charitable contributions.
A Chief Learning Officer was appointed in
2001 to formalize the management and transfer of
knowledge within our organization. This function
allows us to retain and share knowledge gained
from nearly three decades of managing risk and
solving problems for our customers. Through
workshops and training programs, employees will
continually improve proficiency in MBIA’s risk

M B I A A N N U A L R E P O R T 2 3
MBIA embraces diversity because it brings to
the workplace the widest range of experience, ideas
and skills. Collectively, it allows us to make the
strongest business decisions for clients and share-
holders. The goal of this effort is to recruit, retain,
compensate and grow diverse talent within the
organization.
Community involvement and charitable giv-
ing have always been an important part of the MBIA
culture. This past year, the MBIA Foundation was
established so that the company could reach its goal
of providing charitable gifts on a more consistent
basis. In response to the tragic events of September
11, the MBIA Foundation created a special match-
ing gift program for employees that raised almost
$2 million for relief organizations.
We will continue to strengthen the foremost
team of risk experts in the industry in the coming
year. In 2002, we will expand training programs
and knowledge exchange throughout the company,
further refine our recruiting programs and pro-
mote an environment which values diversity as well
as teamwork and prudent risk management. At
MBIA, each employee has the opportunity and
obligation to grow, and each plays a vital role in
building profitability and shareholder value. MBIA
is committed to investing in and developing our
human capital in the year ahead and beyond.
management culture and practices.
Monitoring and assessing the skills of the
workforce is a key aspect of employee development.
Completing the initial phase of the Management
Organization Review, which provides a detailed
analysis of each employee’s business-specific skills
and developmental needs, led to individual devel-
opment plans.
To further develop in-house expertise this
past year, a number of employees were given the
opportunity to broaden their skills by rotating
positions. These employees gain knowledge in
related business disciplines and apply their rec-
ognized management skills in different parts of
the business.
The risk management culture at MBIA is
supported by a matrixed team approach to deci-
sion making. This team process provides front-
end analysis by our entire risk management team,
which includes many perspectives in each under-
writing decision, and allows the company to turn
transactions around quickly with superior service.
We have also improved teamwork between busi-
ness units. Credit enhancement and asset man-
agement are cross-marketing their products so
that clients have end-to-end service. MBIA
insures the bonds and then provides investment
opportunities to minimize market risk through
structured withdrawals, while investing to gener-
ate attractive returns until the funds are needed.
Melissa Brice-Johnson, Business Analysis; Doug Hamilton, Controller’s Group; Eva Thein, IPM; Pauline Cullen, Legal; Roger Harris, Information Technology

2 4 M B I A A N N U A L R E P O R T
LOCATIONS Manuel Chevalier and Phil Sullivan, Poh Choo Lee, Dave Dubin, International
corporate headquartersMBIA Inc.
113 King Street
Armonk, NY 10504
1-914-273-4545
www.mbia.com
financial guarantee business officesMBIA Insurance Corporation
113 King Street
Armonk, NY 10504
1-914-273-4545
1 Great St. Helen’s
London, EC3A6HX
England
44-20-7920-6363
Serrano, 20-2º Dcha
28001 Madrid, Spain
34-91-435-10 43
650 Fifth Avenue, 7th Floor
New York, NY 10019
1-212-713-6400
112, avenue Kléber
75116 Paris, France
33-1-5370-4343
The TransAmerica Pyramid
600 Montgomery Street
Suite 4400
San Francisco, CA 94111
1-415-352-3050
9 Temasek Boulevard
#38-01 Suntec Tower Two
Singapore 038989
65-6334-2555
Level 29, The Chifley Tower
2 Chifley Square
Sydney NSW 2000
Australia
61-2-9375-2105
Shiroyama Hills, Level 16
4-3-1 Toranomon
Minato-ku, Tokyo 105-6016
Japan
81-3-5403-4774
investment managementofficesMBIA Investment Management Corp.
(investment agreements)MBIA Capital Management Corp.
(fixed-income asset management)MBIA Municipal Investors Service
Corporation (CLASS®, CAM)113 King Street
Armonk, NY 10504
1-914-273-4545
MBIA Municipal Investors Service
Corporation (CAM)
1700 Broadway, Suite 2050
Denver, CO 80290
1-303-860-1100
1838 Investment Advisors, LLC
2701 Renaissance Boulevard
Fourth Floor
King of Prussia, PA 19406
1-484-322-4300
mbia muniservices (specialized financial services for thepublic sector) 3433 W. Shaw Avenue
Fresno, CA 93711
1-800-800-8181

M B I A A N N U A L R E P O R T 2 5
FINANCIAL REVIEW
26
28
38
39
40
41
42
43
Selected financial and statistical data
Management’s discussion & analysis of financial condition & results of operations
Report on management’s responsibility & report of independent accountants
Consolidated balance sheets
Consolidated statements of income
Consolidated statements of changes in shareholders’ equity
Consolidated statements of cash flows
Notes to consolidated financial statements
2 6 M B I A A N N U A L R E P O R T
SELECTED FINANCIAL AND STATISTICAL DATA
MBIA Inc. & SubsidiariesMBIA Inc. & Subsidiaries
Premiums Earned (dollars in millions)
Net Investment Income(dollars in millions)
Net Income per Common Share: Diluted(dollars)
019998979695949392 00
524
169
249
241
244
294
351
425
443
446
92 0099989796959493 01
1.47
1.97
1.97
2.10
2.41
2.75
2.88
2.13
3.56
3.82
92 0099989796959493 01
155
189
204
233
265
302
332
359
394
413
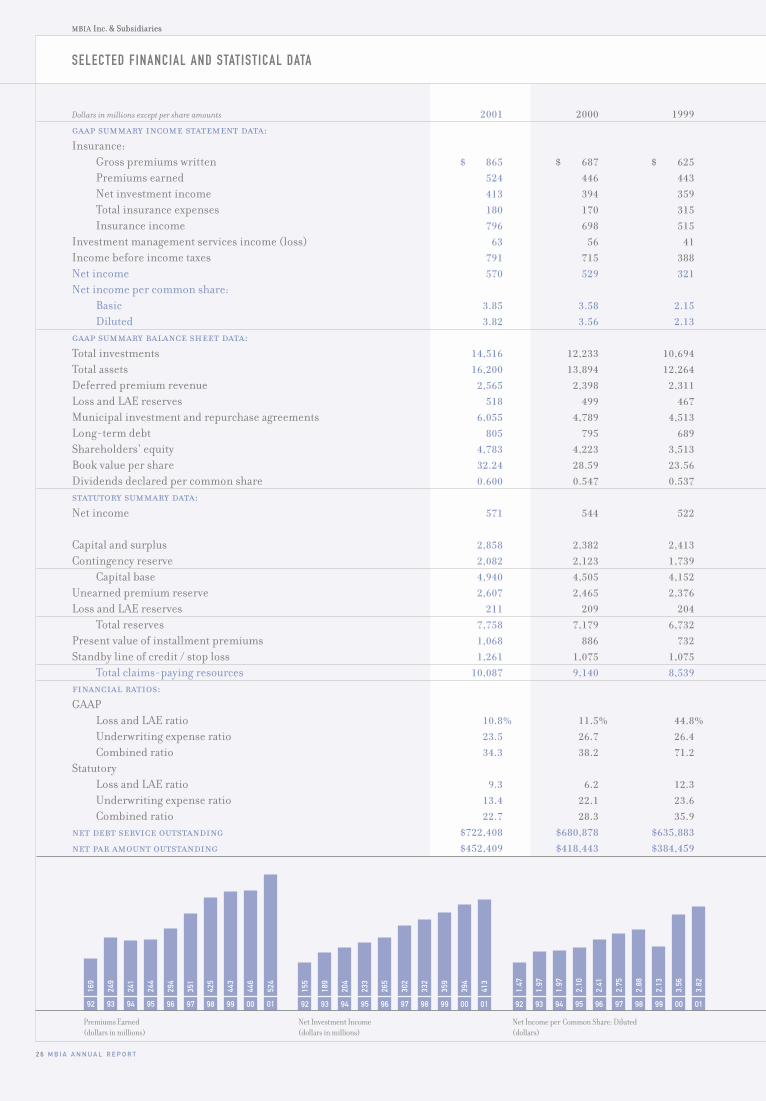
Dollars in millions except per share amounts 2001 2000 1999gaap summary income statement data:Insurance:
Gross premiums written $ 865 $ 687 $ 625Premiums earned 524 446 443 Net investment income 413 394 359 Total insurance expenses 180 170 315 Insurance income 796 698 515
Investment management services income (loss) 63 56 41 Income before income taxes 791 715 388 Net income 570 529 321 Net income per common share:
Basic 3.85 3.58 2.15 Diluted 3.82 3.56 2.13
gaap summary balance sheet data:Total investments 14,516 12,233 10,694Total assets 16,200 13,894 12,264 Deferred premium revenue 2,565 2,398 2,311 Loss and LAE reserves 518 499 467 Municipal investment and repurchase agreements 6,055 4,789 4,513 Long-term debt 805 795 689 Shareholders’ equity 4,783 4,223 3,513 Book value per share 32.24 28.59 23.56 Dividends declared per common share 0.600 0.547 0.537 statutory summary data:Net income 571 544 522
Capital and surplus 2,858 2,382 2,413 Contingency reserve 2,082 2,123 1,739
Capital base 4,940 4,505 4,152 Unearned premium reserve 2,607 2,465 2,376 Loss and LAE reserves 211 209 204
Total reserves 7,758 7,179 6,732 Present value of installment premiums 1,068 886 732 Standby line of credit / stop loss 1,261 1,075 1,075
Total claims-paying resources 10,087 9,140 8,539 financial ratios:GAAP
Loss and LAE ratio 10.8% 11.5% 44.8%Underwriting expense ratio 23.5 26.7 26.4 Combined ratio 34.3 38.2 71.2
StatutoryLoss and LAE ratio 9.3 6.2 12.3 Underwriting expense ratio 13.4 22.1 23.6 Combined ratio 22.7 28.3 35.9
net debt service outstanding $722,408 $680,878 $635,883 net par amount outstanding $452,409 $418,443 $384,459
M B I A A N N U A L R E P O R T 2 7
Total Assets(dollars in millions)
Book Value per Share(dollars)
Total Claims-paying Resources(dollars in millions)
92 0099989796959493 01
3,23
4
4,32
0
5,71
2
7,67
1
9,03
3
10,3
87
11,8
26
12,2
64
13,8
94
16,2
00
92 0099989796959493 01
3,48
6
4,03
6
4,46
3
5,07
9
5,81
9
6,78
5
7,79
7
8,53
9
9,14
0
10,0
87
92 0099989796959493 01
11.4
6
13.1
8
13.9
5
18.0
1
19.3
2
22.7
3
25.4
3
23.5
6
28.5
9
32.2
4
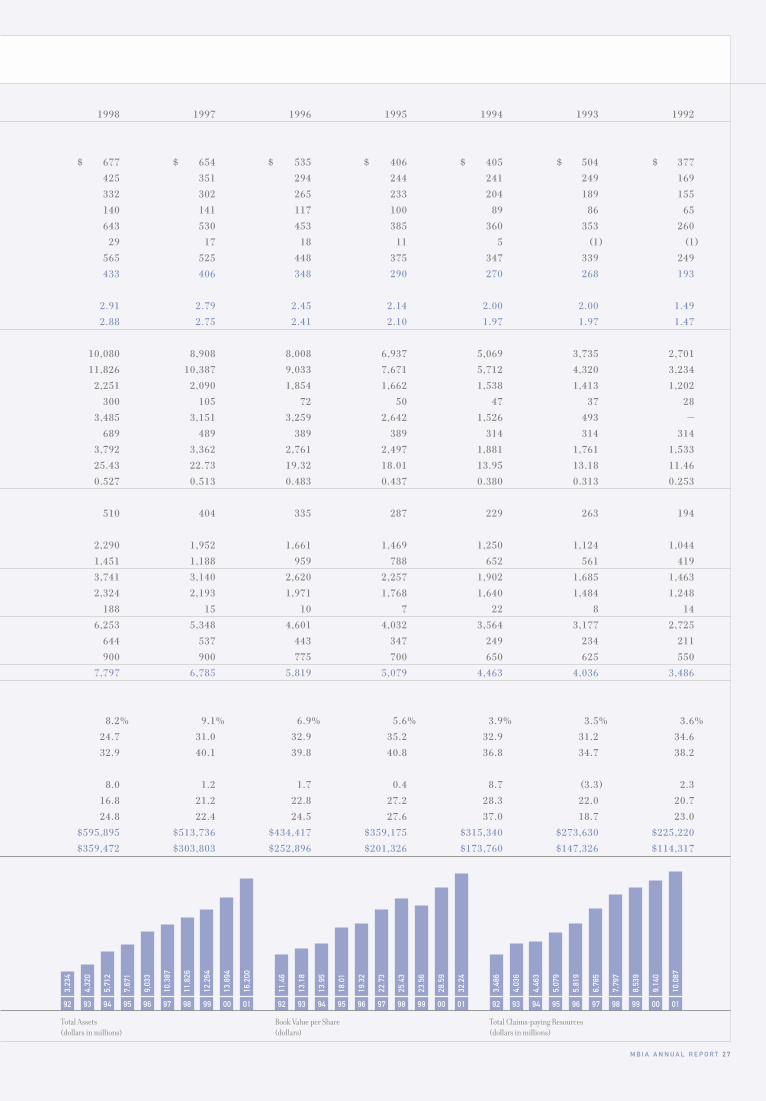
1998 1997 1996 1995 1994 1993 1992
$ 677 $ 654 $ 535 $ 406 $ 405 $ 504 $ 377425 351 294 244 241 249 169 332 302 265 233 204 189 155 140 141 117 100 89 86 65 643 530 453 385 360 353 260
29 17 18 11 5 (1) (1)565 525 448 375 347 339 249 433 406 348 290 270 268 193
2.91 2.79 2.45 2.14 2.00 2.00 1.492.88 2.75 2.41 2.10 1.97 1.97 1.47
10,080 8,908 8,008 6,937 5,069 3,735 2,70111,826 10,387 9,033 7,671 5,712 4,320 3,234
2,251 2,090 1,854 1,662 1,538 1,413 1,202 300 105 72 50 47 37 28
3,485 3,151 3,259 2,642 1,526 493 — 689 489 389 389 314 314 314
3,792 3,362 2,761 2,497 1,881 1,761 1,533 25.43 22.73 19.32 18.01 13.95 13.18 11.46 0.527 0.513 0.483 0.437 0.380 0.313 0.253
510 404 335 287 229 263 194
2,290 1,952 1,661 1,469 1,250 1,124 1,044 1,451 1,188 959 788 652 561 419 3,741 3,140 2,620 2,257 1,902 1,685 1,463 2,324 2,193 1,971 1,768 1,640 1,484 1,248
188 15 10 7 22 8 14 6,253 5,348 4,601 4,032 3,564 3,177 2,725
644 537 443 347 249 234 211 900 900 775 700 650 625 550
7,797 6,785 5,819 5,079 4,463 4,036 3,486
8.2% 9.1% 6.9% 5.6% 3.9% 3.5% 3.6%24.7 31.0 32.9 35.2 32.9 31.2 34.6 32.9 40.1 39.8 40.8 36.8 34.7 38.2
8.0 1.2 1.7 0.4 8.7 (3.3) 2.3 16.8 21.2 22.8 27.2 28.3 22.0 20.7 24.8 22.4 24.5 27.6 37.0 18.7 23.0
$595,895 $513,736 $434,417 $359,175 $315,340 $273,630 $225,220$359,472 $303,803 $252,896 $201,326 $173,760 $147,326 $114,317
2 8 M B I A A N N U A L R E P O R T
overviewMBIA Inc. (MBIA or the Company) is engaged in providing financial
guarantee insurance, investment management services and municipal
services to public finance clients and financial institutions on a global
basis. The Company turned in a solid year as we continued to focus on
our Triple-A ratings, no-loss underwriting standards, and building of
shareholder value. Our insurance operations posted strong par insured
growth in both the global public finance and global structured finance
markets, with especially strong growth in our non-United States public
finance business. Our investment management operations had a
record year in ending assets under management and operating earn-
ings. Looking forward, the Company believes it is well positioned to take
advantage of very favorable growth prospects both inside and outside of
the United States (U.S.) across all of our business lines.
forward-looking and cautionary statementsStatements included in this annual report which are not historical or
current facts are “forward-looking statements” made pursuant to the
safe harbor provisions of the Private Securities Litigation Reform Act of
1998. The words “believe,” “anticipate,” “project,” “plan,” “expect,”
“intend,” “will likely result,” “looking forward” or “will continue,” and
similar expressions identify forward-looking statements. These state-
ments are subject to certain risks and uncertainties that could cause
actual results to differ materially from historical earnings and those
presently anticipated or projected. We wish to caution readers not to
place undue reliance on any such forward-looking statements, which
speak only to their respective dates. The following are some of the fac-
tors that could affect our financial performance or could cause actual
results to differ materially from estimates contained in or underlying
the Company’s forward-looking statements:
1 fluctuations in the economic, credit or interest rate environment in
the United States and abroad;
1 the level of activity within the national and international credit markets;
1 competitive conditions and pricing levels;
1 legislative and regulatory developments;
1 technological developments;
1 changes in tax laws;
1 the effects of mergers, acquisitions and divestitures; and
1 uncertainties that have not been identified at this time.
The Company undertakes no obligation to publicly correct or
update any forward-looking statement if we later become aware that
such results are not likely to be achieved.
critical accounting policiesThe following accounting policies are viewed by management to be crit-
ical accounting policies because they require significant judgement on
the part of management. Financial results could be materially different
if alternate methodologies were used.
premium revenue recognition Upfront premiums are
earned in proportion to the expiration of the related risk. Therefore,
premium earnings are greater in the earlier periods of an upfront trans-
action when there is a higher amount of exposure outstanding. The pre-
miums are apportioned to individual sinking fund payments of a bond
issue according to an amortization schedule. After the premiums are
MANAGEMENT’S DISCUSSION AND ANALYSIS OF FINANCIAL CONDITION AND RESULTS OF OPERATIONS
MBIA Inc. & Subsidiaries
allocated to each scheduled sinking fund payment, they are earned on a
straight-line basis over the period of that sinking fund payment. When
an insured issue is retired early, is called by the issuer, or is in sub-
stance paid in advance through a refunding accomplished by placing
U.S. Government securities in escrow, the remaining deferred premi-
um revenue is earned at that time, since there is no longer risk to the
Company. Accordingly, deferred premium revenue represents the por-
tion of premiums written that is applicable to the unexpired risk of
insured bonds and notes. Installment premiums are earned over each
installment period, generally one year or less.
The effect of the Company’s policy is to recognize greater levels
of upfront premium in the earlier years of each policy insured, thus
matching revenue recognition with the underlying risk. Recognizing
premium revenue on a straight-line basis over the life of each policy
would materially affect the Company’s financial results. Premium earn-
ings would be more evenly recorded as revenue throughout the period
of risk than under the current method. However, the Company does not
believe that the straight-line method would appropriately match pre-
miums earned to the underlying risk. Therefore, the Company believes
its upfront premium earnings methodology is the most appropriate
method to recognize its upfront premiums as revenue.
losses and loss adjustment expenses Loss and loss
adjustment expense (LAE) reserves are established in an amount
equal to the Company’s estimate of identified or case basis reserves
and unallocated losses, including costs of settlement, on the obliga-
tions it has insured.
The unallocated reserve is calculated by applying a loss factor to
net debt service written. Management determines this factor based on
an independent research agency study of bond defaults, which manage-
ment feels is a reliable source of bond default data. Case basis reserves
are established when specific insured issues are identified as currently
or likely to be in default. Such a reserve is based on the present value of
the expected loss and LAE payments, net of expected recoveries under
salvage and subrogation rights and reinsurance, based on a discount
rate of 5.86%. The discount rate is based on the estimated yield of our
fixed-income investment portfolio. When a case basis reserve is record-
ed, a corresponding reduction is made to the unallocated reserve.
Management of the Company periodically reevaluates its esti-
mates for losses and LAE, and any resulting adjustments are reflected in
current earnings. Management believes that the reserves are adequate
to cover the ultimate net cost of claims; however, because the reserves
are based on estimates, there can be no assurance that the ultimate lia-
bility will not exceed such estimates.
Beginning in 2002, the Company has decided to change the
methodology it uses to determine the amount of loss and loss adjust-
ment expenses. The Company will start accruing loss and loss adjust-
ment expenses based upon a percentage of earned premiums instead of
a percentage of net debt service written. There are two reasons for the
change in the methodology. First, the amount of net debt service writ-
ten can significantly fluctuate from quarter to quarter while the related
premium is earned more consistently over the life of the transaction.
Second, during the quarter the premiums are written, the loss and loss
adjustment charge is recognized in advance of the related earned pre-
mium because this revenue is essentially all deferred in the quarter that
it is written. The intent of the change is to better match the recognition
M B I A A N N U A L R E P O R T 2 9
special purpose vehiclesThe Company provides structured funding and credit enhancement
services to global structured finance clients through the use of MBIA-
administered, bankruptcy-remote special purpose vehicles (SPVs). The
purpose of these SPVs is to provide our clients with an efficient source of
funding, which may offer MBIA the opportunity to issue financial guar-
antee insurance policies. The SPVs purchase various types of financial
instruments, such as debt securities, loans, lease and trade receivables,
and funds these purchases through the issuance of asset-backed short-
term commercial paper or medium-term notes. The assets and liabilities
within the medium-term note programs are managed primarily on a
match-funded basis and may include the use of derivative hedges, such
as interest rate and foreign currency swaps. By match-funding, the SPVs
eliminate the risks associated with fluctuations in interest and foreign
currency rates, indices and liquidity. Typically, programs involve the use
of rating agencies in assessing the quality of asset purchases and in
assigning ratings to the various programs. In general, asset purchases at
the inception of a program are required to be at least investment grade by
at least one major rating agency. The primary SPVs administered by
MBIA are Triple-A One Funding Corporation (Triple-A), Hemispheres
Funding Corporation (Hemispheres), Meridian Funding Company, LLC
(Meridian), Polaris Funding Company, LLC (Polaris) and 885
Warehouse, LLC (885 Warehouse).
Incorporated in September 1993, Triple-A is wholly owned by
an unaffiliated party and was formed to provide secured loans to bor-
rowers, purchase participations in pools of retail, trade and other
receivables and purchase investment grade securities at the time of
issuance or in the secondary market. Triple-A may fund its purchases of
such assets through the issuance of commercial paper or other securi-
ties. For the years ending December 31, 2001 and 2000, assets funded
by Triple-A primarily consisted of secured loans to qualified borrowers,
participations in short-term and long-term interest and non-interest
bearing receivable pools and investment grade asset-backed securities.
Debt issued for the same periods substantially consisted of commercial
paper. Triple-A enters into 364-day or shorter term credit facilities with
multiple independent third-party credit support providers as a source
of liquidity in the event of a commercial paper market disruption.
Hemispheres was incorporated in January 1994 and is wholly
owned by an unaffiliated party. Through its articles of incorporation,
Hemispheres is permitted to issue medium-term notes in an unlimited
number of series of undetermined amounts not to exceed an aggregate
principal amount of $5 billion. Proceeds from the issuance of such
notes are used to fund the purchase of permitted investments. For the
years ending December 31, 2001 and 2000, such investments consist-
ed of loans and lease receivables. Currently, these loans are denominat-
ed in a foreign currency and carry a variable interest rate linked to a
foreign interest rate index. Hemispheres has entered into various for-
eign currency and interest rate swap agreements relating to such loans
designed to hedge its exposures to foreign exchange and interest rate
fluctuations. Hemispheres uses such derivative agreements for non-
trading purposes. In addition to a nominal amount of common stock,
Hemispheres has issued and outstanding 5,138 shares of mandatory
redeemable cumulative preferred stock totaling $5.1 million for 2001
and 10,900 shares totaling $10.9 million for 2000.
MANAGEMENT’S DISCUSSION AND ANALYSIS OF FINANCIAL CONDITION AND RESULTS OF OPERATIONS
MBIA Inc. & Subsidiaries
of incurred losses with the related revenue. If the new methodology was
applied in 2001, 2000 and 1999, excluding the loss reserve strength-
ening in 1999, the Company would have reserved essentially the same
amount as it did under the current approach.
recent accounting pronouncementssfas 133Effective January 1, 2001 the Company adopted Statement of Financial
Accounting Standards (SFAS) 133, “Accounting for Derivative
Instruments and Hedging Activities.” SFAS 133 requires that all deriva-
tive instruments are recorded on the balance sheet at their fair value.
Changes in the fair value of derivatives are recorded each period in cur-
rent earnings or other comprehensive income, depending on whether a
derivative is designated as a hedge, and if so designated, the type of
hedge. The Company will continue to enter into derivative transactions
in the future that meet the underwriting, risk management and strate-
gic objectives of the Company. For further information see Note 5 in the
Notes to Consolidated Financial Statements.
sfas 140In September 2000, the Financial Accounting Standards Board (FASB)
issued SFAS 140, “Accounting for Transfers and Servicing of Financial
Assets and Extinguishments of Liabilities,” having certain requirements
effective as of April 1, 2001. In accordance with SFAS 140, the Company
no longer reflects on its balance sheet financial assets involving the bor-
rowing of securities that meet specific criteria. See Note 6 in the Notes to
Consolidated Financial Statements for further discussion of the impact of
the adoption of this statement on the financial statements of the Company.
sfas 141 and 142In June 2001, the FASB issued SFAS 141, “Business Combinations” and
SFAS 142, “Goodwill and Other Intangible Assets,” which are effective
for fiscal years beginning after December 15, 2001. SFAS 141, which
supercedes Accounting Principles Board Opinion (APB) 16, “Business
Combinations,” requires that the purchase method of accounting be
used for all business combinations initiated after June 30, 2001 and
provides specific criteria for initial recognition of intangible assets
apart from goodwill. SFAS 142 supercedes APB 17, “Intangible Assets,”
and requires that goodwill and intangible assets with indefinite lives no
longer be amortized but be subject to annual impairment tests in
accordance with the Statement. The Statement includes a two-step
process aimed at determining the amount, if any, by which the carrying
value of a reporting unit exceeds its fair value. Other intangible assets
will continue to be amortized over their useful lives.
The Company will apply the new rules on accounting for goodwill
and other intangible assets beginning in the first quarter of 2002 and is
making determinations as to what its reporting units are and what
amounts of goodwill, intangible assets, other assets and liabilities should
be allocated to those reporting units. As a result of the application of the
nonamortization provision of the Statement, the Company will no longer
incur approximately $6.5 million of annual goodwill amortization
expense. During 2002 the Company will perform the first of the required
impairment tests of goodwill and indefinite lived intangible assets as of
January 1, 2002 and has not yet determined what the effect of these tests
will be on earnings and the financial position of the Company.

3 0 M B I A A N N U A L R E P O R T
Meridian, formed in July 1997, is a limited liability company of
which MBIA is a non-controlling 1% member. Meridian may issue
medium-term notes in an unlimited number of series of undetermined
amounts not to exceed an aggregate principal amount of $5 billion.
Proceeds from the issuance of such notes are used to fund the purchase
of permitted investments. For the years ending December 31, 2001 and
2000, such investments primarily consisted of asset-backed loans and
securities issued by major global structured finance clients. Meridian
may enter into various types of derivative agreements for non-trading
purposes designed to hedge its exposure to interest rate and foreign
currency fluctuations.
Polaris, formed in November 1997, is a limited liability compa-
ny of which MBIA is a non-controlling 1% member. Polaris may issue
medium-term notes in an unlimited number of series of undeter-
mined amounts not to exceed an aggregate principal amount of $5 bil-
lion. Proceeds from the issuance of such notes are used to fund the
purchase of permitted investments. For the years ending December 31,
2001 and 2000, such investments primarily consisted of debt instru-
ments and loans issued by major national and international corpora-
tions. Polaris may enter into various types of derivative agreements for
non-trading purposes designed to hedge its exposure to interest rate and
foreign currency fluctuations on its assets and liabilities.
885 Warehouse, incorporated in December 1997 and converted
to a limited liability company in December 1998, is wholly owned by an
unaffiliated party. 885 Warehouse was formed in connection with a sin-
gle structured finance transaction and is not actively used as part of
MBIA’s ongoing structured funding programs. For the years ending
December 31, 2001 and 2000, assets consisted solely of asset-backed
structured notes funded through a loan agreement with an unaffiliated
loan provider. The notes purchased and the loan payable are due to
mature by January 2003.
Pursuant to insurance policies issued by MBIA, all of the invest-
ments of Triple-A are unconditionally and irrevocably guaranteed as to
principal and interest when due. In addition, full amounts due to liquid-
ity providers under various agreements are unconditionally and irrevo-
cably guaranteed. Pursuant to facility agreements between MBIA and the
medium-term note SPVs, all series of notes are unconditionally and
irrevocably guaranteed as to scheduled payments of principal, interest
and other amounts payable with respect to such series. Since MBIA’s
exposure to these SPVs is primarily through the guarantee of the assets
purchased and debt issued, such exposure is reported as part of MBIA’s
net insurance in force. The following table details amounts relating to
MBIA’s guarantee of SPV obligations for SPVs administered by MBIA:
MBIA, as administrative agent, provides administrative and
operational services to the SPVs and receives administrative, structur-
ing and advisory fees for such services. Premiums and fees received
from SPV transactions are reported within the insurance segment of
the Consolidated Statements of Income.
The risks associated with SPV transactions are the same as
those inherent in other structured asset-backed transactions, whereby
the repayment of the SPV’s debt is dependent on the performance of the
assets funded. Therefore, all transactions are reviewed to ensure com-
pliance with the Company’s underwriting standards.
Under current accounting guidelines, MBIA does not include
the accounts of the SPVs in the consolidation of the MBIA group. When
a SPV does not meet the formal definition of a qualifying special pur-
pose vehicle under SFAS 140, the decision as to whether or not to con-
solidate depends on the applicable accounting principles for
non-qualifying SPVs. Consideration is given to, for example, whether a
third-party has made a substantive equity investment in the SPV; which
party has voting rights, if any; who makes decisions about assets in the
SPV; and who is at risk of loss. The SPVs would be consolidated if MBIA
were to retain or acquire control over the risks and rewards of the assets
in the SPVs. The Company is presently considering changes that would
result in the consolidation of the SPVs in 2002. Consolidation of the
SPVs into MBIA would require the Company to include gross assets and
liabilities of the SPVs, primarily consisting of investments and debt, on
its balance sheet. However, given the inconsequential level of residual
profits of these entities, the consolidated net income of the Company
would not materially change.
effect of september 11In addition to the tragic loss of life, the terrorist attacks in New York
City and Washington, D.C. on September 11, 2001 disrupted and are
expected to continue to disrupt commerce worldwide. These events
have had a direct material adverse impact on certain industries and on
general economic activity.
The Company has exposure in certain sectors that will suffer
increased stress as a direct result of these events. The Company’s expo-
sure to New York City and New York State and their respective agencies,
to domestic airports and to domestic enhanced equipment trust certifi-
cate aircraft securitizations have experienced increased stress as a
result of these events, including a downgrading of the ratings of some of
the underlying issuers. Other exposures that depend on revenues from
business and personal travel, such as bonds backed by hotel taxes and
car rental fleet securitizations, are also likely to see direct increased
Net DebtIn millions Assets Liabilities Service OutstandingSpecial Purpose Vehicle Funding Type 2001 2000 2001 2000 2001 2000Meridian Funding Company, LLC Medium-Term Notes $4,254 $3,603 $4,218 $3,603 $2,962 $3,108Triple-A One Funding Corp. Commercial Paper 2,762 3,244 2,762 3,244 2,691 2,789Hemispheres Funding Corp. Medium-Term Notes 391 875 384 862 146 327Polaris Funding Company, LLC Medium-Term Notes 313 457 327 457 150 248885 Warehouse, LLC Medium-Term Notes 59 59 59 58 4 4Total $7,779 $8,238 $7,750 $8,224 $5,953 $6,476
MANAGEMENT’S DISCUSSION AND ANALYSIS OF FINANCIAL CONDITION AND RESULTS OF OPERATIONS
MBIA Inc. & Subsidiaries

M B I A A N N U A L R E P O R T 3 1
stress as a result of these events. In addition, certain other sectors in
which the Company has insured exposure such as consumer loan secu-
ritizations (e.g., home equity, auto loan and credit card transactions)
and certain collateralized debt obligations (CDO) backed by high yield
bonds have seen increased delinquencies and defaults in the underly-
ing pools of loans.
In accordance with the Company’s underwriting criteria,
transactions insured by the Company are structured to endure signifi-
cant stress under various stress assumptions, including an assumed
economic recession. The Company has assessed each of its related
portfolio exposures and, based on the transaction structures and on
the Company’s evaluation of the likely effects and impact of these
events, the Company believes at this time that it will not incur any
material losses due to these events. There can be no assurance, how-
ever, that the Company will not incur material losses due to these
exposures if the economic stress caused by these events in certain sec-
tors are more severe than the Company currently foresees and had
assumed in underwriting its exposures.
results of operationssummaryThe Company uses various measures of profitability and intrinsic value
in addition to our reported net income and earnings per share, namely,
“operating earnings,” “core earnings,” “adjusted book value” (ABV) and
“adjusted direct premium” (ADP), which are not in accordance with
accounting principles generally accepted in the United States of
America. Operating earnings exclude the effect of realized gains and
losses from activity in our investment portfolio, changes in fair value of
derivative instruments and non-recurring charges by subtracting these
items from our reported net income. Core earnings represent the
stricter measurement of our business by stripping out all non-operating
and non-recurring items. It is calculated by subtracting the net income
effect of premiums earned from refundings from our operating earnings.
ADP includes our upfront direct premiums as well as the esti-
mated present value of current and future direct premiums from
installment-based insurance policies issued during the period and does
not include any premiums assumed or ceded.
ABV is defined as book value plus the after-tax effects of net
deferred premium revenue net of deferred acquisition costs, the pres-
ent value of unrecorded future installment premiums, and the unreal-
ized gains or losses on investment contract liabilities. We view these
measures as a meaningful way to assess our performance and the intrin-
sic value of the Company.
The following chart presents highlights of our consolidated
financial results for 2001, 2000 and 1999.
* All earnings per share calculations are diluted.
Our 2001 reported net income increased by 8%, or by 7% on a
per share basis. Excluding the effect of the accounting change for the
adoption of SFAS 133, net income and earnings per share increased by
10% as a result of a 14% growth in pre-tax income from insurance oper-
ations and a 12% increase in pre-tax income from investment manage-
ment services. These increases in pre-tax income were partially offset
by the loss in our municipal services segment and a decrease in net real-
ized gains. The effect of the 71% decrease in after-tax net realized gains
can be seen in the 14% increase in our operating earnings. When we
remove the effect of the 57% increase in refundings, we arrive at our
core earnings per share, which increased 12% over 2000.
In 2000 net income increased by 8% over 1999, excluding one-
time charges in 1999, which resulted in a 9% per share increase. These
increases were due primarily to the 38% increase in pre-tax income from
our investment management services segment. Reported net income
increased by 65% in 2000 over 1999, due to one-time charges incurred
in 1999. The increases in operating earnings per share were consistent
throughout 2001 and 2000, highlighting the predictable earnings pat-
tern of the Company. Core earnings showed a 13% increase in 2000 over
1999. The 2000 growth in core earnings per share was also the result of
the 38% increase in investment management services income.
Our book value at year-end 2001 was $32.24 per share, up 13%
from $28.59 at year-end 2000. The increase was due primarily to
income from operations and the increase in the market value of our
investment portfolio. Our adjusted book value per share was $45.01 at
year-end 2001, a 12% increase from year-end 2000. The lower growth
rate in adjusted book value per share was caused by a decrease in the
unrealized gain on our investment contract liabilities.
The following table presents the components of our adjusted
book value per share:
Percent Change
2001 2000vs. vs.
2001 2000 1999 2000 1999
Net income (in millions):
As reported $570 $529 $321 8% 65%
Excluding one-time charges
and accounting changes $583 $529 $490 10% 8%
Per share data: *
Net income:
As reported $ 3.82 $ 3.56 $ 2.13 7% 67%
Excluding one-time charges
and accounting changes $ 3.91 $ 3.56 $ 3.26 10% 9%
Operating earnings $ 3.88 $ 3.41 $ 3.15 14% 8%
Core earnings $ 3.67 $ 3.28 $ 2.89 12% 13%
Book value $ 32.24 $28.59 $23.56 13% 21%
Adjusted book value $ 45.01 $40.27 $35.01 12% 15%
MANAGEMENT’S DISCUSSION AND ANALYSIS OF FINANCIAL CONDITION AND RESULTS OF OPERATIONS
MBIA Inc. & Subsidiaries
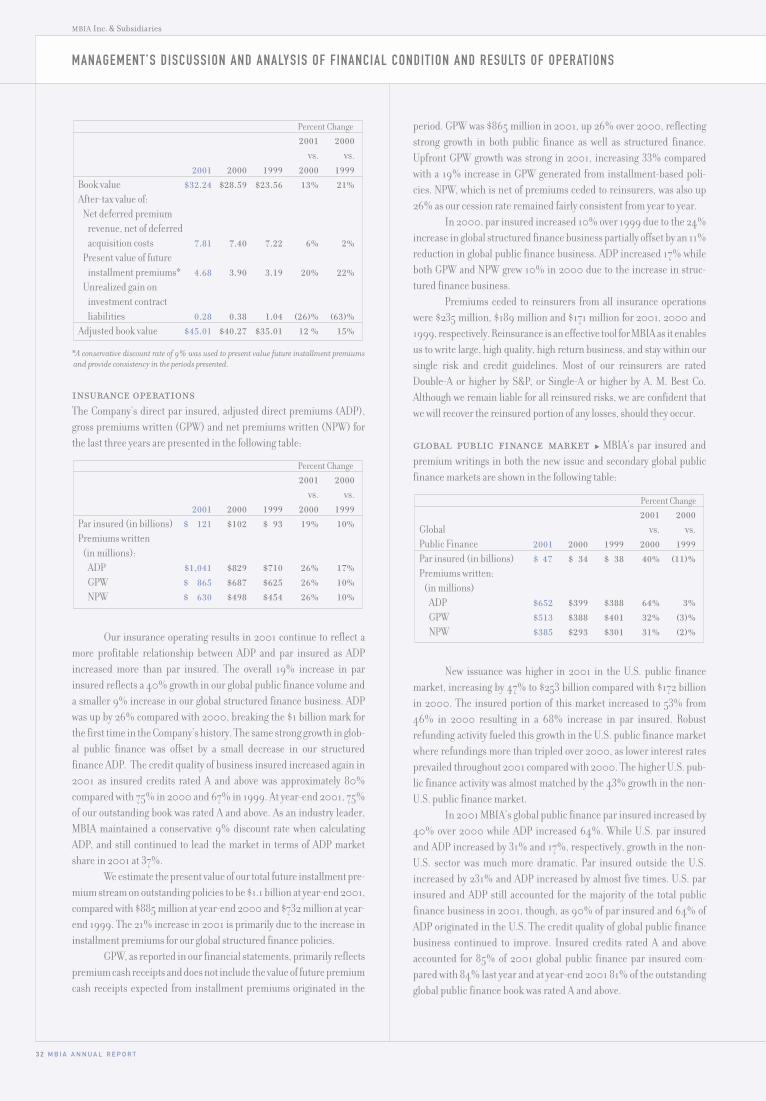
3 2 M B I A A N N U A L R E P O R T
*A conservative discount rate of 9% was used to present value future installment premiumsand provide consistency in the periods presented.
insurance operationsThe Company’s direct par insured, adjusted direct premiums (ADP),
gross premiums written (GPW) and net premiums written (NPW) for
the last three years are presented in the following table:
Our insurance operating results in 2001 continue to reflect a
more profitable relationship between ADP and par insured as ADP
increased more than par insured. The overall 19% increase in par
insured reflects a 40% growth in our global public finance volume and
a smaller 9% increase in our global structured finance business. ADP
was up by 26% compared with 2000, breaking the $1 billion mark for
the first time in the Company’s history. The same strong growth in glob-
al public finance was offset by a small decrease in our structured
finance ADP. The credit quality of business insured increased again in
2001 as insured credits rated A and above was approximately 80%
compared with 75% in 2000 and 67% in 1999. At year-end 2001, 75%
of our outstanding book was rated A and above. As an industry leader,
MBIA maintained a conservative 9% discount rate when calculating
ADP, and still continued to lead the market in terms of ADP market
share in 2001 at 37%.
We estimate the present value of our total future installment pre-
mium stream on outstanding policies to be $1.1 billion at year-end 2001,
compared with $885 million at year-end 2000 and $732 million at year-
end 1999. The 21% increase in 2001 is primarily due to the increase in
installment premiums for our global structured finance policies.
GPW, as reported in our financial statements, primarily reflects
premium cash receipts and does not include the value of future premium
cash receipts expected from installment premiums originated in the
Percent Change
2001 2000
vs. vs.
2001 2000 1999 2000 1999
Par insured (in billions) $ 121 $102 $ 93 19% 10%
Premiums written
(in millions):
ADP $1,041 $829 $710 26% 17%
GPW $ 865 $687 $625 26% 10%
NPW $ 630 $498 $454 26% 10%
Percent Change
2001 2000
vs. vs.
2001 2000 1999 2000 1999
Book value $32.24 $28.59 $23.56 13% 21%
After-tax value of:
Net deferred premium
revenue, net of deferred
acquisition costs 7.81 7.40 7.22 6% 2%
Present value of future
installment premiums* 4.68 3.90 3.19 20% 22%
Unrealized gain on
investment contract
liabilities 0.28 0.38 1.04 (26)% (63)%
Adjusted book value $45.01 $40.27 $35.01 12 % 15%
period. GPW was $865 million in 2001, up 26% over 2000, reflecting
strong growth in both public finance as well as structured finance.
Upfront GPW growth was strong in 2001, increasing 33% compared
with a 19% increase in GPW generated from installment-based poli-
cies. NPW, which is net of premiums ceded to reinsurers, was also up
26% as our cession rate remained fairly consistent from year to year.
In 2000, par insured increased 10% over 1999 due to the 24%
increase in global structured finance business partially offset by an 11%
reduction in global public finance business. ADP increased 17% while
both GPW and NPW grew 10% in 2000 due to the increase in struc-
tured finance business.
Premiums ceded to reinsurers from all insurance operations
were $235 million, $189 million and $171 million for 2001, 2000 and
1999, respectively. Reinsurance is an effective tool for MBIA as it enables
us to write large, high quality, high return business, and stay within our
single risk and credit guidelines. Most of our reinsurers are rated
Double-A or higher by S&P, or Single-A or higher by A. M. Best Co.
Although we remain liable for all reinsured risks, we are confident that
we will recover the reinsured portion of any losses, should they occur.
global public finance market MBIA’s par insured and
premium writings in both the new issue and secondary global public
finance markets are shown in the following table:
New issuance was higher in 2001 in the U.S. public finance
market, increasing by 47% to $253 billion compared with $172 billion
in 2000. The insured portion of this market increased to 53% from
46% in 2000 resulting in a 68% increase in par insured. Robust
refunding activity fueled this growth in the U.S. public finance market
where refundings more than tripled over 2000, as lower interest rates
prevailed throughout 2001 compared with 2000. The higher U.S. pub-
lic finance activity was almost matched by the 43% growth in the non-
U.S. public finance market.
In 2001 MBIA’s global public finance par insured increased by
40% over 2000 while ADP increased 64%. While U.S. par insured
and ADP increased by 31% and 17%, respectively, growth in the non-
U.S. sector was much more dramatic. Par insured outside the U.S.
increased by 231% and ADP increased by almost five times. U.S. par
insured and ADP still accounted for the majority of the total public
finance business in 2001, though, as 90% of par insured and 64% of
ADP originated in the U.S. The credit quality of global public finance
business continued to improve. Insured credits rated A and above
accounted for 85% of 2001 global public finance par insured com-
pared with 84% last year and at year-end 2001 81% of the outstanding
global public finance book was rated A and above.
Percent Change
2001 2000
Global vs. vs.
Public Finance 2001 2000 1999 2000 1999
Par insured (in billions) $ 47 $ 34 $ 38 40% (11)%
Premiums written:
(in millions)
ADP $652 $399 $388 64% 3%
GPW $513 $388 $401 32% (3)%
NPW $385 $293 $301 31% (2)%
MANAGEMENT’S DISCUSSION AND ANALYSIS OF FINANCIAL CONDITION AND RESULTS OF OPERATIONS
MBIA Inc. & Subsidiaries

M B I A A N N U A L R E P O R T 3 3
Global public finance GPW increased by 32% over 2000. This
increase was driven by a 148% increase in business written outside the
U.S., partially offset by a smaller 13% increase in U.S. public finance
business. Ceded premiums as a percent of gross premiums increased
slightly from 24% in 2000 to 25% in 2001, the result of higher cession
rates on deals insured outside the U.S. NPW was up 31% representing
increases in both U.S. and non-U.S. business.
In 2000, global public finance par insured decreased 11% while
ADP increased 3% over 1999, reflecting our increased pricing strategy.
GPW and NPW decreased 3% and 2%, respectively. These results were
driven by increased business volume outside the U.S offset by lower
U.S. business. MBIA continued to lead the market in terms of global
public finance ADP market share in 2001 at 43%, despite using an
industry high 9% discount rate when calculating ADP.
global structured finance market Details regarding
MBIA’s par insured and premium writings in both the new issue and sec-
ondary global structured finance markets are shown in the following table:
Issuance in the domestic public asset-backed market increased
26% over 2000. MBIA insured $74 billion of par in 2001, up 9% from
$68 billion in 2000. ADP was down 9% in 2001 resulting from lower
business written outside the U.S. The increase in the ratio of global
structured finance par insured to ADP primarily reflects the sharp
improvement in the credit quality of the business we wrote. We contin-
ue to be active in the high-quality secondary market and to insure a sig-
nificant number of synthetic CDO deals at the Triple-A credit quality
level. These transactions produce large amounts of par insured, and
have smaller premiums on an absolute basis than lower rated credits,
but are extremely profitable, high-quality transactions. Overall, global
structured finance insured business rated A and above totaled 75% in
2001, up sharply from 67% last year. At year-end 2001, 63% of our
global structured finance book was rated A and above, up from 59% at
year-end 2000.
Global structured finance GPW increased 18% in 2001, to $352
million from $299 million last year. In 2001, installments received
from business written in prior periods remained very strong. Business
within the U.S. increased by 25% while non-U.S. business increased by
only 4%. The cession rate on global structured finance business
decreased from 32% last year to 30% this year, resulting in an increase
in NPW of 20%. This higher growth in NPW when compared with GPW
reflects the decreased cession rate outside the U.S.
In 2000, global structured finance par insured and ADP
increased 24% and 34%, respectively, over 1999 due primarily to the
increase in non-U.S. business. In 2000, both GPW and NPW increased
34% due to the strong subsequent installments collected during the year.
Percent Change
2001 2000
Global vs. vs.
Structured Finance 2001 2000 1999 2000 1999
Par insured (in billions) $ 74 $ 68 $ 55 9% 24%
Premiums written
(in millions):
ADP $389 $430 $322 (9)% 34%
GPW $352 $299 $224 18% 34%
NPW $245 $205 $153 20% 34%
premiums earned The composition of MBIA’s premiums earned in
terms of its scheduled and refunded components is illustrated as follows:
In 2001, premiums earned from scheduled amortization
increased by 14%, after a 9% increase in 2000, indicating that the ben-
efits of the increased pricing strategy established in early 1999 are pro-
ducing solid growth in premium earnings. Global structured finance
premiums earned drove this result, increasing 21% over 2000. Total
premiums earned in 2000 grew by only 1% over 1999 due to the 47%
decrease in refunding premiums earned.
Refunded premiums earned increased significantly this year
compared with last year, reflecting the lower interest rate environment.
When an MBIA-insured bond issue is refunded or retired early, the
related deferred premium revenue is earned immediately. The level of
bond refundings and calls is influenced by a variety of factors such as
prevailing interest rates, the coupon rates of the bond issue, the issuer’s
desire or ability to modify bond covenants and applicable regulations
under the Internal Revenue Code.
investment income Our insurance-related investment income
(exclusive of net realized gains) increased 5% to $413 million in 2001,
up from $394 million in 2000. In 2000, investment income was up
10% over 1999. The lower growth in 2001 was primarily due to a con-
tinuing decline in interest rates as well as a shift in the investment port-
folio from taxable to tax-exempt investments.
advisory fees The Company collects various advisory fees in con-
nection with certain transactions. The Company also earns advisory
fees in connection with its administration of certain third-party-owned
special purpose vehicles. Depending upon the type of fee received, the
fee is either earned when it is due or deferred and earned over the life
of the related transaction. Work, waiver and consent, termination,
administrative and management fees are earned when due.
Structuring and commitment fees are earned on a straight-line basis
over the life of the related insured transaction. In 2001, advisory fee
revenues increased 39% to $39 million, up from $28 million in 2000
and $27 million in 1999. These increases were primarily due to one-
time, non-deferrable fees recognized in 2001 and 2000. Due to the
one-time nature of advisory fees, there can be no assurance that the
level of advisory fees will stay the same and not decline.
losses and loss adjustment expenses (lae) We main-
tain a loss and LAE reserve based on our estimate of identified and unal-
located losses from our insured obligations. In 2001 and 2000, we
reviewed our loss reserving methodology. Each review included an
analysis of loss-reserve factors based on the latest available industry
Percent Change
2001 2000
vs. vs.
In millions 2001 2000 1999 2000 1999
Premiums earned:
Scheduled $469 $412 $379 14% 9%
Refunded 55 34 64 61% (47)%
Total $524 $446 $443 17% 1%
MANAGEMENT’S DISCUSSION AND ANALYSIS OF FINANCIAL CONDITION AND RESULTS OF OPERATIONS
MBIA Inc. & Subsidiaries
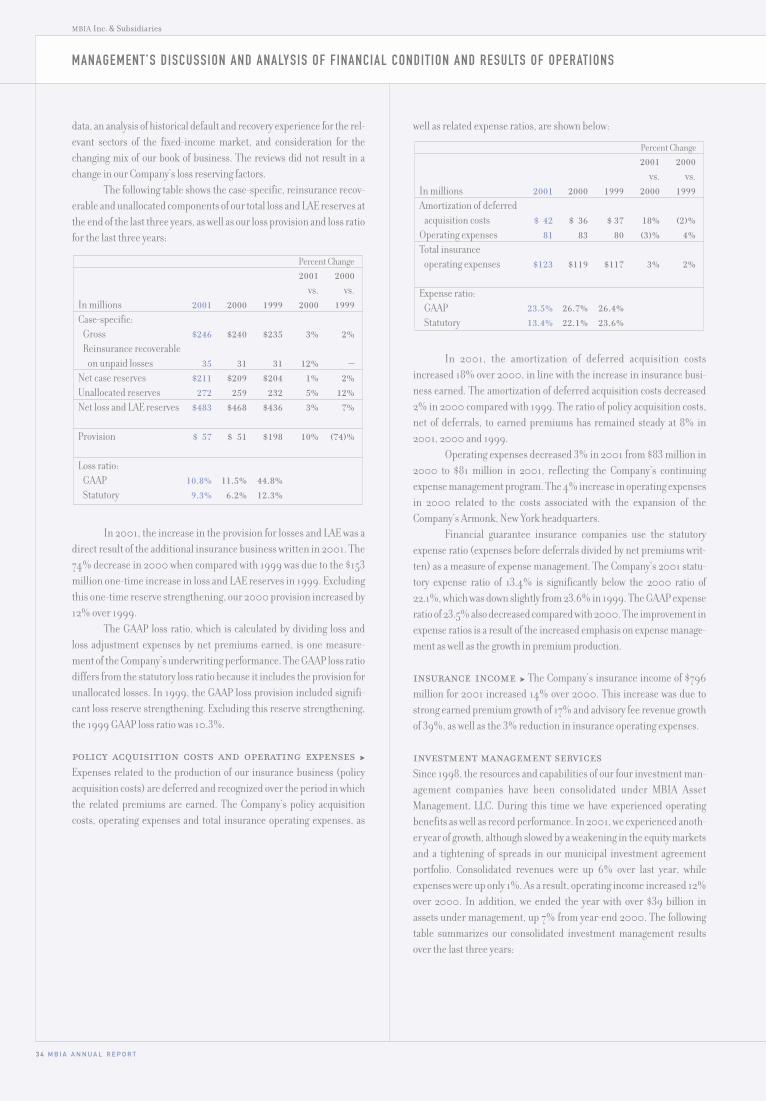
3 4 M B I A A N N U A L R E P O R T
data, an analysis of historical default and recovery experience for the rel-
evant sectors of the fixed-income market, and consideration for the
changing mix of our book of business. The reviews did not result in a
change in our Company’s loss reserving factors.
The following table shows the case-specific, reinsurance recov-
erable and unallocated components of our total loss and LAE reserves at
the end of the last three years, as well as our loss provision and loss ratio
for the last three years:
In 2001, the increase in the provision for losses and LAE was a
direct result of the additional insurance business written in 2001. The
74% decrease in 2000 when compared with 1999 was due to the $153
million one-time increase in loss and LAE reserves in 1999. Excluding
this one-time reserve strengthening, our 2000 provision increased by
12% over 1999.
The GAAP loss ratio, which is calculated by dividing loss and
loss adjustment expenses by net premiums earned, is one measure-
ment of the Company’s underwriting performance. The GAAP loss ratio
differs from the statutory loss ratio because it includes the provision for
unallocated losses. In 1999, the GAAP loss provision included signifi-
cant loss reserve strengthening. Excluding this reserve strengthening,
the 1999 GAAP loss ratio was 10.3%.
policy acquisition costs and operating expenses Expenses related to the production of our insurance business (policy
acquisition costs) are deferred and recognized over the period in which
the related premiums are earned. The Company’s policy acquisition
costs, operating expenses and total insurance operating expenses, as
Percent Change
2001 2000
vs. vs.
In millions 2001 2000 1999 2000 1999
Case-specific:
Gross $246 $240 $235 3% 2%
Reinsurance recoverable
on unpaid losses 35 31 31 12% —
Net case reserves $211 $209 $204 1% 2%
Unallocated reserves 272 259 232 5% 12%
Net loss and LAE reserves $483 $468 $436 3% 7%
Provision $ 57 $ 51 $198 10% (74)%
Loss ratio:
GAAP 10.8% 11.5% 44.8%
Statutory 9.3% 6.2% 12.3%
well as related expense ratios, are shown below:
In 2001, the amortization of deferred acquisition costs
increased 18% over 2000, in line with the increase in insurance busi-
ness earned. The amortization of deferred acquisition costs decreased
2% in 2000 compared with 1999. The ratio of policy acquisition costs,
net of deferrals, to earned premiums has remained steady at 8% in
2001, 2000 and 1999.
Operating expenses decreased 3% in 2001 from $83 million in
2000 to $81 million in 2001, reflecting the Company’s continuing
expense management program. The 4% increase in operating expenses
in 2000 related to the costs associated with the expansion of the
Company’s Armonk, New York headquarters.
Financial guarantee insurance companies use the statutory
expense ratio (expenses before deferrals divided by net premiums writ-
ten) as a measure of expense management. The Company’s 2001 statu-
tory expense ratio of 13.4% is significantly below the 2000 ratio of
22.1%, which was down slightly from 23.6% in 1999. The GAAP expense
ratio of 23.5% also decreased compared with 2000. The improvement in
expense ratios is a result of the increased emphasis on expense manage-
ment as well as the growth in premium production.
insurance income The Company’s insurance income of $796
million for 2001 increased 14% over 2000. This increase was due to
strong earned premium growth of 17% and advisory fee revenue growth
of 39%, as well as the 3% reduction in insurance operating expenses.
investment management servicesSince 1998, the resources and capabilities of our four investment man-
agement companies have been consolidated under MBIA Asset
Management, LLC. During this time we have experienced operating
benefits as well as record performance. In 2001, we experienced anoth-
er year of growth, although slowed by a weakening in the equity markets
and a tightening of spreads in our municipal investment agreement
portfolio. Consolidated revenues were up 6% over last year, while
expenses were up only 1%. As a result, operating income increased 12%
over 2000. In addition, we ended the year with over $39 billion in
assets under management, up 7% from year-end 2000. The following
table summarizes our consolidated investment management results
over the last three years:
Percent Change
2001 2000
vs. vs.
In millions 2001 2000 1999 2000 1999
Amortization of deferred
acquisition costs $ 42 $ 36 $ 37 18% (2)%
Operating expenses 81 83 80 (3)% 4%
Total insurance
operating expenses $123 $119 $117 3% 2%
Expense ratio:
GAAP 23.5% 26.7% 26.4%
Statutory 13.4% 22.1% 23.6%
MANAGEMENT’S DISCUSSION AND ANALYSIS OF FINANCIAL CONDITION AND RESULTS OF OPERATIONS
MBIA Inc. & Subsidiaries
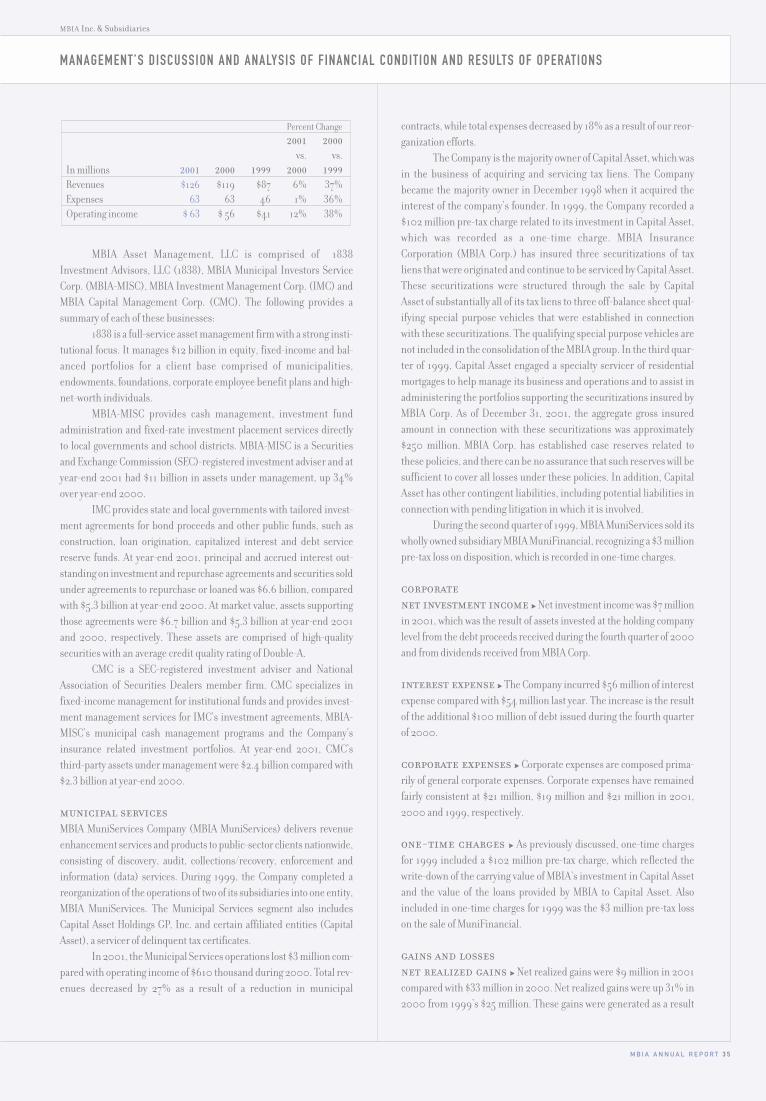
M B I A A N N U A L R E P O R T 3 5
MBIA Asset Management, LLC is comprised of 1838
Investment Advisors, LLC (1838), MBIA Municipal Investors Service
Corp. (MBIA-MISC), MBIA Investment Management Corp. (IMC) and
MBIA Capital Management Corp. (CMC). The following provides a
summary of each of these businesses:
1838 is a full-service asset management firm with a strong insti-
tutional focus. It manages $12 billion in equity, fixed-income and bal-
anced portfolios for a client base comprised of municipalities,
endowments, foundations, corporate employee benefit plans and high-
net-worth individuals.
MBIA-MISC provides cash management, investment fund
administration and fixed-rate investment placement services directly
to local governments and school districts. MBIA-MISC is a Securities
and Exchange Commission (SEC)-registered investment adviser and at
year-end 2001 had $11 billion in assets under management, up 34%
over year-end 2000.
IMC provides state and local governments with tailored invest-
ment agreements for bond proceeds and other public funds, such as
construction, loan origination, capitalized interest and debt service
reserve funds. At year-end 2001, principal and accrued interest out-
standing on investment and repurchase agreements and securities sold
under agreements to repurchase or loaned was $6.6 billion, compared
with $5.3 billion at year-end 2000. At market value, assets supporting
those agreements were $6.7 billion and $5.3 billion at year-end 2001
and 2000, respectively. These assets are comprised of high-quality
securities with an average credit quality rating of Double-A.
CMC is a SEC-registered investment adviser and National
Association of Securities Dealers member firm. CMC specializes in
fixed-income management for institutional funds and provides invest-
ment management services for IMC’s investment agreements, MBIA-
MISC’s municipal cash management programs and the Company’s
insurance related investment portfolios. At year-end 2001, CMC’s
third-party assets under management were $2.4 billion compared with
$2.3 billion at year-end 2000.
municipal servicesMBIA MuniServices Company (MBIA MuniServices) delivers revenue
enhancement services and products to public-sector clients nationwide,
consisting of discovery, audit, collections/recovery, enforcement and
information (data) services. During 1999, the Company completed a
reorganization of the operations of two of its subsidiaries into one entity,
MBIA MuniServices. The Municipal Services segment also includes
Capital Asset Holdings GP, Inc. and certain affiliated entities (Capital
Asset), a servicer of delinquent tax certificates.
In 2001, the Municipal Services operations lost $3 million com-
pared with operating income of $610 thousand during 2000. Total rev-
enues decreased by 27% as a result of a reduction in municipal
Percent Change
2001 2000
vs. vs.
In millions 2001 2000 1999 2000 1999
Revenues $126 $119 $87 6% 37%
Expenses 63 63 46 1% 36%
Operating income $ 63 $ 56 $41 12% 38%
contracts, while total expenses decreased by 18% as a result of our reor-
ganization efforts.
The Company is the majority owner of Capital Asset, which was
in the business of acquiring and servicing tax liens. The Company
became the majority owner in December 1998 when it acquired the
interest of the company’s founder. In 1999, the Company recorded a
$102 million pre-tax charge related to its investment in Capital Asset,
which was recorded as a one-time charge. MBIA Insurance
Corporation (MBIA Corp.) has insured three securitizations of tax
liens that were originated and continue to be serviced by Capital Asset.
These securitizations were structured through the sale by Capital
Asset of substantially all of its tax liens to three off-balance sheet qual-
ifying special purpose vehicles that were established in connection
with these securitizations. The qualifying special purpose vehicles are
not included in the consolidation of the MBIA group. In the third quar-
ter of 1999, Capital Asset engaged a specialty servicer of residential
mortgages to help manage its business and operations and to assist in
administering the portfolios supporting the securitizations insured by
MBIA Corp. As of December 31, 2001, the aggregate gross insured
amount in connection with these securitizations was approximately
$250 million. MBIA Corp. has established case reserves related to
these policies, and there can be no assurance that such reserves will be
sufficient to cover all losses under these policies. In addition, Capital
Asset has other contingent liabilities, including potential liabilities in
connection with pending litigation in which it is involved.
During the second quarter of 1999, MBIA MuniServices sold its
wholly owned subsidiary MBIA MuniFinancial, recognizing a $3 million
pre-tax loss on disposition, which is recorded in one-time charges.
corporatenet investment income Net investment income was $7 million
in 2001, which was the result of assets invested at the holding company
level from the debt proceeds received during the fourth quarter of 2000
and from dividends received from MBIA Corp.
interest expense The Company incurred $56 million of interest
expense compared with $54 million last year. The increase is the result
of the additional $100 million of debt issued during the fourth quarter
of 2000.
corporate expenses Corporate expenses are composed prima-
rily of general corporate expenses. Corporate expenses have remained
fairly consistent at $21 million, $19 million and $21 million in 2001,
2000 and 1999, respectively.
one-time charges As previously discussed, one-time charges
for 1999 included a $102 million pre-tax charge, which reflected the
write-down of the carrying value of MBIA’s investment in Capital Asset
and the value of the loans provided by MBIA to Capital Asset. Also
included in one-time charges for 1999 was the $3 million pre-tax loss
on the sale of MuniFinancial.
gains and lossesnet realized gains Net realized gains were $9 million in 2001
compared with $33 million in 2000. Net realized gains were up 31% in
2000 from 1999’s $25 million. These gains were generated as a result
MANAGEMENT’S DISCUSSION AND ANALYSIS OF FINANCIAL CONDITION AND RESULTS OF OPERATIONS
MBIA Inc. & Subsidiaries
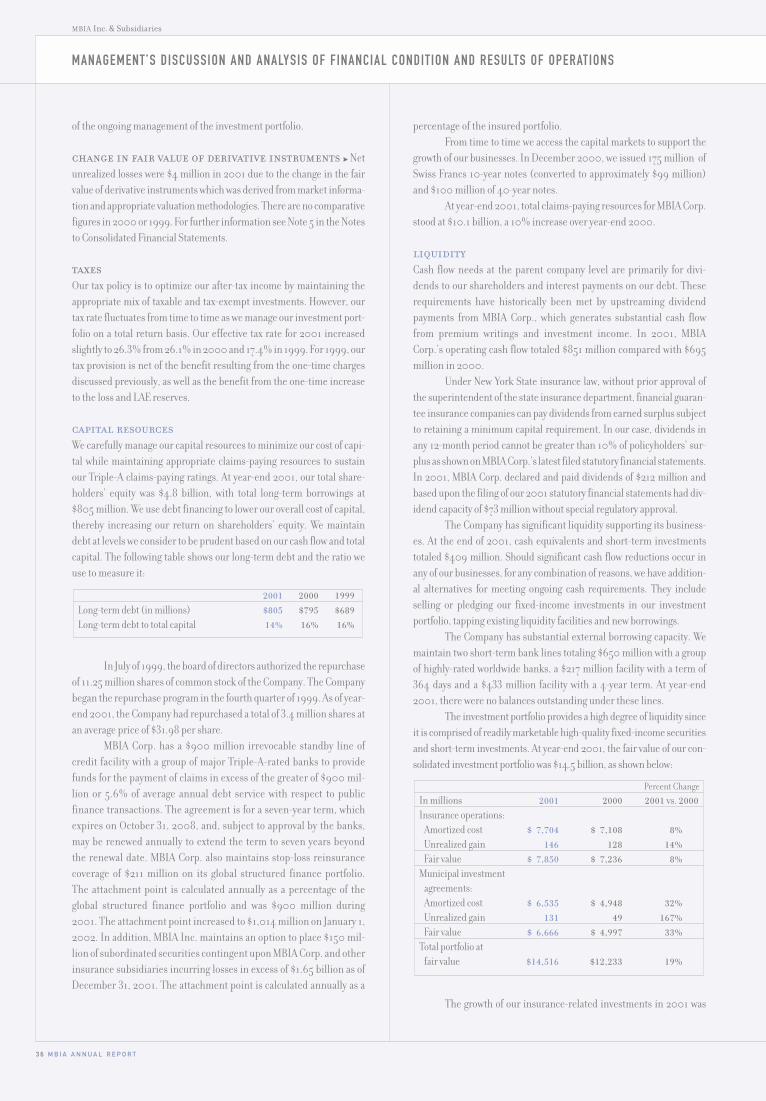
3 6 M B I A A N N U A L R E P O R T
MANAGEMENT’S DISCUSSION AND ANALYSIS OF FINANCIAL CONDITION AND RESULTS OF OPERATIONS
MBIA Inc. & Subsidiaries
of the ongoing management of the investment portfolio.
change in fair value of derivative instruments Net
unrealized losses were $4 million in 2001 due to the change in the fair
value of derivative instruments which was derived from market informa-
tion and appropriate valuation methodologies. There are no comparative
figures in 2000 or 1999. For further information see Note 5 in the Notes
to Consolidated Financial Statements.
taxesOur tax policy is to optimize our after-tax income by maintaining the
appropriate mix of taxable and tax-exempt investments. However, our
tax rate fluctuates from time to time as we manage our investment port-
folio on a total return basis. Our effective tax rate for 2001 increased
slightly to 26.3% from 26.1% in 2000 and 17.4% in 1999. For 1999, our
tax provision is net of the benefit resulting from the one-time charges
discussed previously, as well as the benefit from the one-time increase
to the loss and LAE reserves.
capital resourcesWe carefully manage our capital resources to minimize our cost of capi-
tal while maintaining appropriate claims-paying resources to sustain
our Triple-A claims-paying ratings. At year-end 2001, our total share-
holders’ equity was $4.8 billion, with total long-term borrowings at
$805 million. We use debt financing to lower our overall cost of capital,
thereby increasing our return on shareholders’ equity. We maintain
debt at levels we consider to be prudent based on our cash flow and total
capital. The following table shows our long-term debt and the ratio we
use to measure it:
In July of 1999, the board of directors authorized the repurchase
of 11.25 million shares of common stock of the Company. The Company
began the repurchase program in the fourth quarter of 1999. As of year-
end 2001, the Company had repurchased a total of 3.4 million shares at
an average price of $31.98 per share.
MBIA Corp. has a $900 million irrevocable standby line of
credit facility with a group of major Triple-A-rated banks to provide
funds for the payment of claims in excess of the greater of $900 mil-
lion or 5.6% of average annual debt service with respect to public
finance transactions. The agreement is for a seven-year term, which
expires on October 31, 2008, and, subject to approval by the banks,
may be renewed annually to extend the term to seven years beyond
the renewal date. MBIA Corp. also maintains stop-loss reinsurance
coverage of $211 million on its global structured finance portfolio.
The attachment point is calculated annually as a percentage of the
global structured finance portfolio and was $900 million during
2001. The attachment point increased to $1,014 million on January 1,
2002. In addition, MBIA Inc. maintains an option to place $150 mil-
lion of subordinated securities contingent upon MBIA Corp. and other
insurance subsidiaries incurring losses in excess of $1.65 billion as of
December 31, 2001. The attachment point is calculated annually as a
2001 2000 1999
Long-term debt (in millions) $805 $795 $689
Long-term debt to total capital 14% 16% 16%
percentage of the insured portfolio.
From time to time we access the capital markets to support the
growth of our businesses. In December 2000, we issued 175 million of
Swiss Francs 10-year notes (converted to approximately $99 million)
and $100 million of 40-year notes.
At year-end 2001, total claims-paying resources for MBIA Corp.
stood at $10.1 billion, a 10% increase over year-end 2000.
liquidityCash flow needs at the parent company level are primarily for divi-
dends to our shareholders and interest payments on our debt. These
requirements have historically been met by upstreaming dividend
payments from MBIA Corp., which generates substantial cash flow
from premium writings and investment income. In 2001, MBIA
Corp.’s operating cash flow totaled $851 million compared with $695
million in 2000.
Under New York State insurance law, without prior approval of
the superintendent of the state insurance department, financial guaran-
tee insurance companies can pay dividends from earned surplus subject
to retaining a minimum capital requirement. In our case, dividends in
any 12-month period cannot be greater than 10% of policyholders’ sur-
plus as shown on MBIA Corp.’s latest filed statutory financial statements.
In 2001, MBIA Corp. declared and paid dividends of $212 million and
based upon the filing of our 2001 statutory financial statements had div-
idend capacity of $73 million without special regulatory approval.
The Company has significant liquidity supporting its business-
es. At the end of 2001, cash equivalents and short-term investments
totaled $409 million. Should significant cash flow reductions occur in
any of our businesses, for any combination of reasons, we have addition-
al alternatives for meeting ongoing cash requirements. They include
selling or pledging our fixed-income investments in our investment
portfolio, tapping existing liquidity facilities and new borrowings.
The Company has substantial external borrowing capacity. We
maintain two short-term bank lines totaling $650 million with a group
of highly-rated worldwide banks, a $217 million facility with a term of
364 days and a $433 million facility with a 4-year term. At year-end
2001, there were no balances outstanding under these lines.
The investment portfolio provides a high degree of liquidity since
it is comprised of readily marketable high-quality fixed-income securities
and short-term investments. At year-end 2001, the fair value of our con-
solidated investment portfolio was $14.5 billion, as shown below:
The growth of our insurance-related investments in 2001 was
Percent Change
In millions 2001 2000 2001 vs. 2000
Insurance operations:
Amortized cost $ 7,704 $ 7,108 8%
Unrealized gain 146 128 14%
Fair value $ 7,850 $ 7,236 8%
Municipal investment
agreements:
Amortized cost $ 6,535 $ 4,948 32%
Unrealized gain 131 49 167%
Fair value $ 6,666 $ 4,997 33%
Total portfolio at
fair value $14,516 $12,233 19%
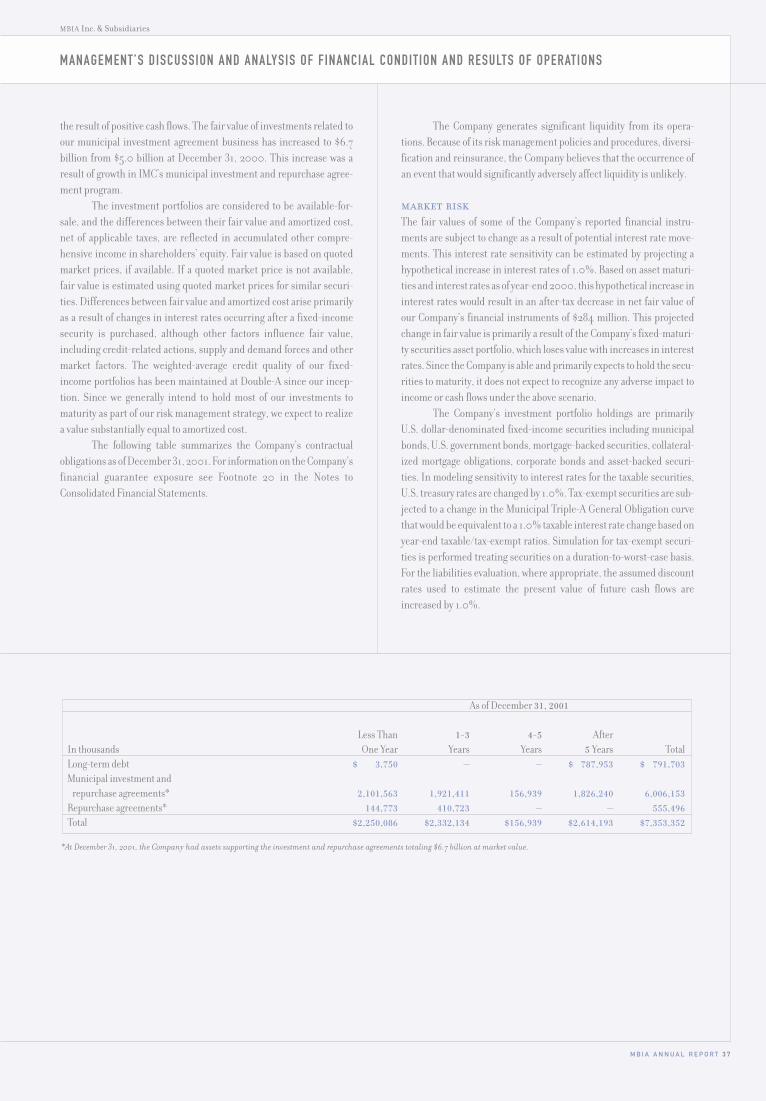
M B I A A N N U A L R E P O R T 3 7
the result of positive cash flows. The fair value of investments related to
our municipal investment agreement business has increased to $6.7
billion from $5.0 billion at December 31, 2000. This increase was a
result of growth in IMC’s municipal investment and repurchase agree-
ment program.
The investment portfolios are considered to be available-for-
sale, and the differences between their fair value and amortized cost,
net of applicable taxes, are reflected in accumulated other compre-
hensive income in shareholders’ equity. Fair value is based on quoted
market prices, if available. If a quoted market price is not available,
fair value is estimated using quoted market prices for similar securi-
ties. Differences between fair value and amortized cost arise primarily
as a result of changes in interest rates occurring after a fixed-income
security is purchased, although other factors influence fair value,
including credit-related actions, supply and demand forces and other
market factors. The weighted-average credit quality of our fixed-
income portfolios has been maintained at Double-A since our incep-
tion. Since we generally intend to hold most of our investments to
maturity as part of our risk management strategy, we expect to realize
a value substantially equal to amortized cost.
The following table summarizes the Company’s contractual
obligations as of December 31, 2001. For information on the Company’s
financial guarantee exposure see Footnote 20 in the Notes to
Consolidated Financial Statements.
The Company generates significant liquidity from its opera-
tions. Because of its risk management policies and procedures, diversi-
fication and reinsurance, the Company believes that the occurrence of
an event that would significantly adversely affect liquidity is unlikely.
market riskThe fair values of some of the Company’s reported financial instru-
ments are subject to change as a result of potential interest rate move-
ments. This interest rate sensitivity can be estimated by projecting a
hypothetical increase in interest rates of 1.0%. Based on asset maturi-
ties and interest rates as of year-end 2000, this hypothetical increase in
interest rates would result in an after-tax decrease in net fair value of
our Company’s financial instruments of $284 million. This projected
change in fair value is primarily a result of the Company’s fixed-maturi-
ty securities asset portfolio, which loses value with increases in interest
rates. Since the Company is able and primarily expects to hold the secu-
rities to maturity, it does not expect to recognize any adverse impact to
income or cash flows under the above scenario.
The Company’s investment portfolio holdings are primarily
U.S. dollar-denominated fixed-income securities including municipal
bonds, U.S. government bonds, mortgage-backed securities, collateral-
ized mortgage obligations, corporate bonds and asset-backed securi-
ties. In modeling sensitivity to interest rates for the taxable securities,
U.S. treasury rates are changed by 1.0%. Tax-exempt securities are sub-
jected to a change in the Municipal Triple-A General Obligation curve
that would be equivalent to a 1.0% taxable interest rate change based on
year-end taxable/tax-exempt ratios. Simulation for tax-exempt securi-
ties is performed treating securities on a duration-to-worst-case basis.
For the liabilities evaluation, where appropriate, the assumed discount
rates used to estimate the present value of future cash flows are
increased by 1.0%.
MANAGEMENT’S DISCUSSION AND ANALYSIS OF FINANCIAL CONDITION AND RESULTS OF OPERATIONS
MBIA Inc. & Subsidiaries
*At December 31, 2001, the Company had assets supporting the investment and repurchase agreements totaling $6.7 billion at market value.
As of December 31, 2001
Less Than 1-3 4-5 After
In thousands One Year Years Years 5 Years Total
Long-term debt $ 3,750 — — $ 787,953 $ 791,703
Municipal investment and
repurchase agreements* 2,101,563 1,921,411 156,939 1,826,240 6,006,153
Repurchase agreements* 144,773 410,723 — — 555,496
Total $2,250,086 $2,332,134 $156,939 $2,614,193 $7,353,352
3 8 M B I A A N N U A L R E P O R T
MBIA Inc. & SubsidiariesMBIA Inc. & Subsidiaries
report on management’s responsibility
Management is responsible for the preparation, integrity and objectiv-
ity of the consolidated financial statements and other financial infor-
mation presented in this annual report. The accompanying
consolidated financial statements were prepared in accordance with
accounting principles generally accepted in the United States of
America, applying certain estimates and judgments as required.
MBIA’s internal controls are designed to provide reasonable
assurance as to the integrity and reliability of the financial statements
and to adequately safeguard, verify and maintain accountability of
assets. Such controls are based on established written policies and pro-
cedures and are implemented by trained, skilled personnel with an
appropriate segregation of duties. These policies and procedures pre-
scribe that MBIA and all its employees are to maintain the highest eth-
ical standards and that its business practices are to be conducted in a
manner that is above reproach.
PricewaterhouseCoopers LLP, independent accountants, is
retained to audit the Company’s financial statements. Their accompa-
nying report is based on audits conducted in accordance with auditing
standards generally accepted in the United States of America, which
include consideration of the company’s internal controls to establish a
basis for reliance thereon in determining the nature, timing and extent
of audit tests to be applied.
The board of directors exercises its responsibility for these
financial statements through its Audit Committee, which consists
entirely of independent non-management board members. The Audit
Committee meets periodically with the independent accountants, both
privately and with management present, to review accounting, audit-
ing, internal controls and financial reporting matters.
Joseph W. Brown
Chairman and Chief Executive Officer
Neil G. Budnick
Chief Financial Officer
report of independent accountantsto the board of directors and shareholders of mbia inc.:
In our opinion, the accompanying consolidated balance sheets and the
related consolidated statements of income and changes in sharehold-
ers’ equity and cash flows present fairly, in all material respects, the
financial position of MBIA Inc. and its subsidiaries at December 31,
2001 and 2000, and the results of their operations and their cash flows
for each of the three years in the period ended December 31, 2001, in
conformity with accounting principles generally accepted in the United
States of America. These financial statements are the responsibility of
the Company’s management; our responsibility is to express an opinion
on these financial statements based on our audits. We conducted our
audits of these statements in accordance with auditing standards gen-
erally accepted in the United States of America, which require that we
plan and perform the audit to obtain reasonable assurance about
whether the financial statements are free of material misstatement. An
audit includes examining, on a test basis, evidence supporting the
amounts and disclosures in the financial statements, assessing the
accounting principles used and significant estimates made by manage-
ment, and evaluating the overall financial statement presentation. We
believe that our audits provide a reasonable basis for our opinion.
As discussed in Note 5 to the financial statements, the Company
changed its method of accounting for derivative instruments in 2001.
New York, New York
February 1, 2002
REPORT ON MANAGEMENT’S RESPONSIBILITY AND REPORT OF INDEPENDENT ACCOUNTANTS
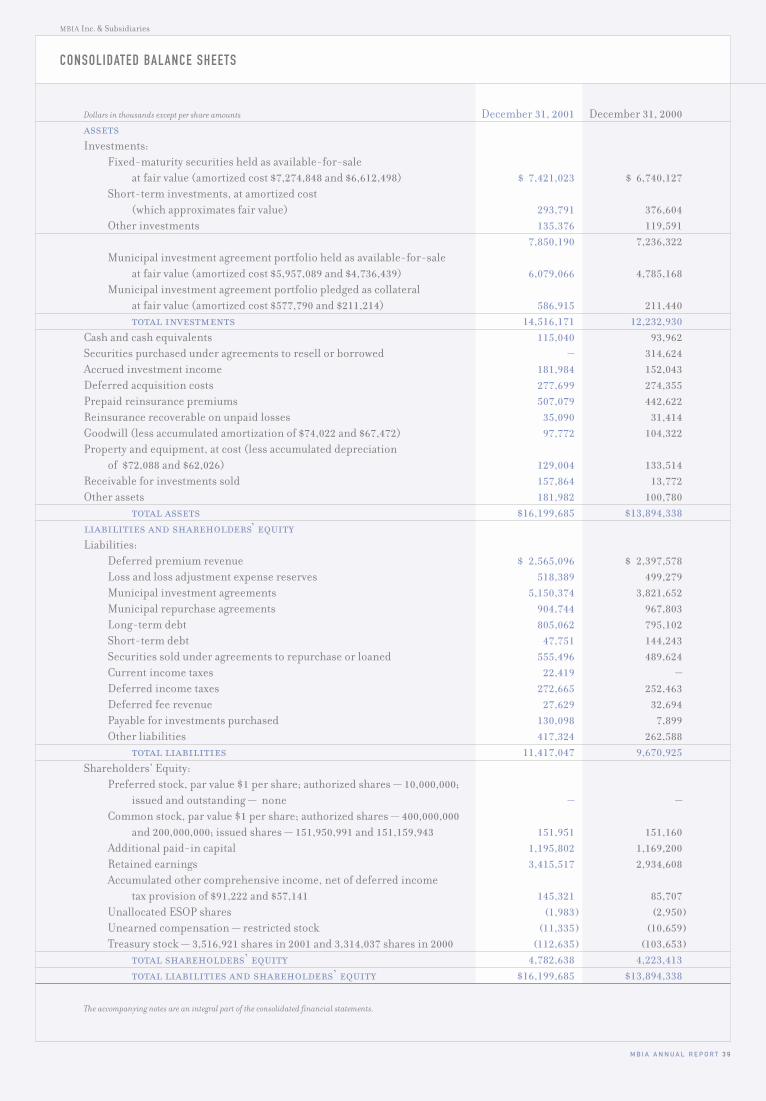
M B I A A N N U A L R E P O R T 3 9
MBIA Inc. & Subsidiaries
CONSOLIDATED BALANCE SHEETS
Dollars in thousands except per share amounts December 31, 2001 December 31, 2000assetsInvestments:
Fixed-maturity securities held as available-for-saleat fair value (amortized cost $7,274,848 and $6,612,498) $ 7,421,023 $ 6,740,127
Short-term investments, at amortized cost(which approximates fair value) 293,791 376,604
Other investments 135,376 119,591 7,850,190 7,236,322
Municipal investment agreement portfolio held as available-for-saleat fair value (amortized cost $5,957,089 and $4,736,439) 6,079,066 4,785,168
Municipal investment agreement portfolio pledged as collateralat fair value (amortized cost $577,790 and $211,214) 586,915 211,440 total investments 14,516,171 12,232,930
Cash and cash equivalents 115,040 93,962 Securities purchased under agreements to resell or borrowed — 314,624 Accrued investment income 181,984 152,043 Deferred acquisition costs 277,699 274,355 Prepaid reinsurance premiums 507,079 442,622 Reinsurance recoverable on unpaid losses 35,090 31,414 Goodwill (less accumulated amortization of $74,022 and $67,472) 97,772 104,322Property and equipment, at cost (less accumulated depreciation
of $72,088 and $62,026) 129,004 133,514 Receivable for investments sold 157,864 13,772 Other assets 181,982 100,780
total assets $16,199,685 $13,894,338 liabilities and shareholders’ equityLiabilities:
Deferred premium revenue $ 2,565,096 $ 2,397,578 Loss and loss adjustment expense reserves 518,389 499,279 Municipal investment agreements 5,150,374 3,821,652Municipal repurchase agreements 904,744 967,803 Long-term debt 805,062 795,102 Short-term debt 47,751 144,243 Securities sold under agreements to repurchase or loaned 555,496 489,624 Current income taxes 22,419 —Deferred income taxes 272,665 252,463 Deferred fee revenue 27,629 32,694 Payable for investments purchased 130,098 7,899 Other liabilities 417,324 262,588
total liabilities 11,417,047 9,670,925 Shareholders’ Equity:
Preferred stock, par value $1 per share; authorized shares — 10,000,000;issued and outstanding — none — —
Common stock, par value $1 per share; authorized shares — 400,000,000and 200,000,000; issued shares — 151,950,991 and 151,159,943 151,951 151,160
Additional paid-in capital 1,195,802 1,169,200 Retained earnings 3,415,517 2,934,608 Accumulated other comprehensive income, net of deferred income
tax provision of $91,222 and $57,141 145,321 85,707 Unallocated ESOP shares (1,983) (2,950)Unearned compensation — restricted stock (11,335) (10,659)Treasury stock — 3,516,921 shares in 2001 and 3,314,037 shares in 2000 (112,635) (103,653)
total shareholders’ equity 4,782,638 4,223,413 total liabilities and shareholders’ equity $16,199,685 $13,894,338
The accompanying notes are an integral part of the consolidated financial statements.
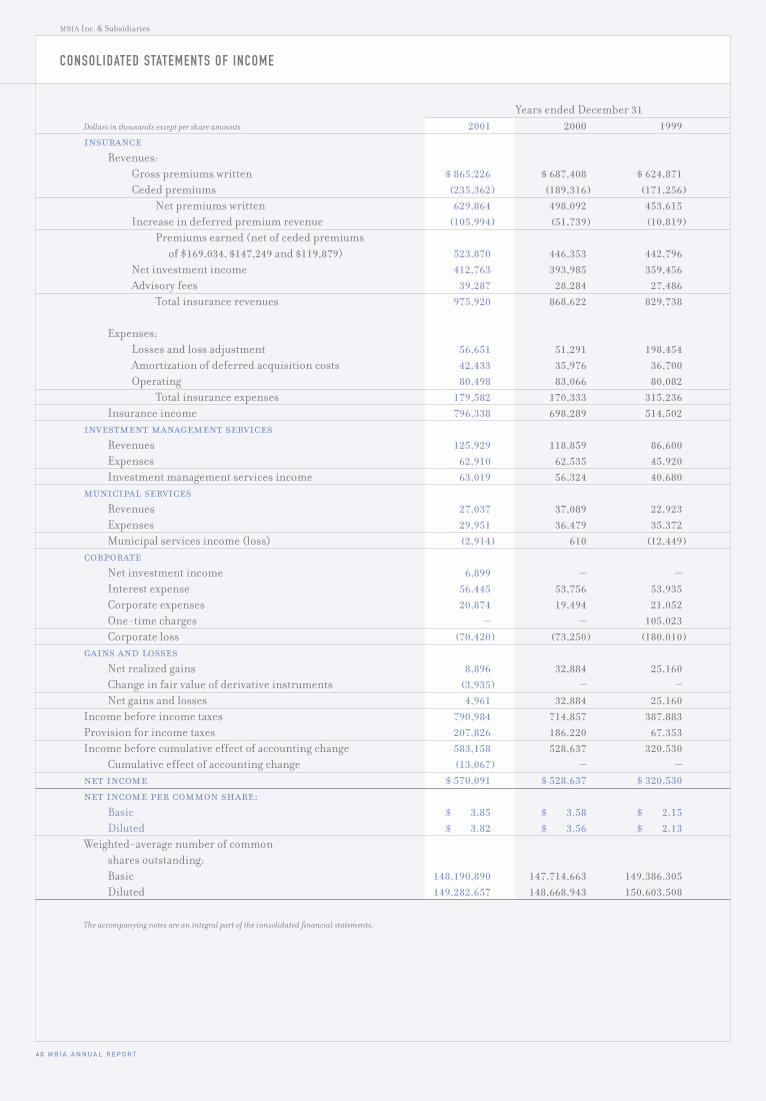
4 0 M B I A A N N U A L R E P O R T
MBIA Inc. & Subsidiaries
CONSOLIDATED STATEMENTS OF INCOME
Dollars in thousands except per share amounts 2001 2000 1999insurance
Revenues:Gross premiums written $ 865,226 $ 687,408 $ 624,871 Ceded premiums (235,362) (189,316) (171,256)
Net premiums written 629,864 498,092 453,615 Increase in deferred premium revenue (105,994) (51,739) (10,819)
Premiums earned (net of ceded premiumsof $169,034, $147,249 and $119,879) 523,870 446,353 442,796
Net investment income 412,763 393,985 359,456 Advisory fees 39,287 28,284 27,486
Total insurance revenues 975,920 868,622 829,738
Expenses:Losses and loss adjustment 56,651 51,291 198,454 Amortization of deferred acquisition costs 42,433 35,976 36,700Operating 80,498 83,066 80,082
Total insurance expenses 179,582 170,333 315,236Insurance income 796,338 698,289 514,502
investment management servicesRevenues 125,929 118,859 86,600Expenses 62,910 62,535 45,920Investment management services income 63,019 56,324 40,680
municipal servicesRevenues 27,037 37,089 22,923Expenses 29,951 36,479 35,372Municipal services income (loss) (2,914) 610 (12,449)
corporateNet investment income 6,899 — —Interest expense 56,445 53,756 53,935Corporate expenses 20,874 19,494 21,052 One-time charges — — 105,023 Corporate loss (70,420) (73,250) (180,010)
gains and lossesNet realized gains 8,896 32,884 25,160Change in fair value of derivative instruments (3,935) — — Net gains and losses 4,961 32,884 25,160
Income before income taxes 790,984 714,857 387,883 Provision for income taxes 207,826 186,220 67,353 Income before cumulative effect of accounting change 583,158 528,637 320,530
Cumulative effect of accounting change (13,067) — — net income $ 570,091 $ 528,637 $ 320,530 net income per common share:
Basic $ 3.85 $ 3.58 $ 2.15 Diluted $ 3.82 $ 3.56 $ 2.13
Weighted-average number of commonshares outstanding:Basic 148,190,890 147,714,663 149,386,305 Diluted 149,282,657 148,668,943 150,603,508
The accompanying notes are an integral part of the consolidated financial statements,
Years ended December 31
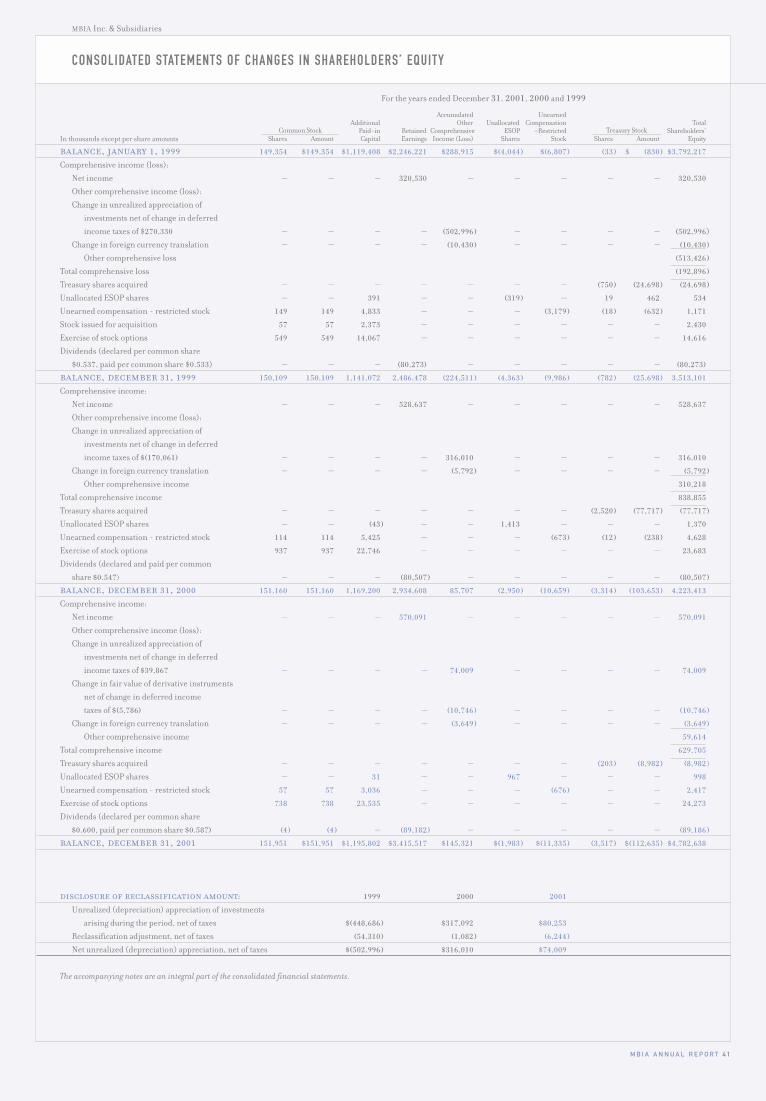
M B I A A N N U A L R E P O R T 4 1
MBIA Inc. & Subsidiaries
CONSOLIDATED STATEMENTS OF CHANGES IN SHAREHOLDERS’ EQUITY
For the years ended December 31, 2001, 2000 and 1999
In thousands except per share amounts
Accumulated UnearnedAdditional Other Unallocated Compensation Total
Paid-in Retained Comprehensive ESOP –Restricted Shareholders’Shares Amount Capital Earnings Income (Loss) Shares Stock Shares Amount Equity
balance, january 1, 1999 149,354 $149,354 $1,119,408 $2,246,221 $288,915 $(4,044) $(6,807) (33) $ (830) $3,792,217
Comprehensive income (loss):
Net income — — — 320,530 — — — — — 320,530
Other comprehensive income (loss):
Change in unrealized appreciation of
investments net of change in deferred
income taxes of $270,330 — — — — (502,996) — — — — (502,996)
Change in foreign currency translation — — — — (10,430) — — — — (10,430)
Other comprehensive loss (513,426)
Total comprehensive loss (192,896)
Treasury shares acquired — — — — — — — (750) (24,698) (24,698)
Unallocated ESOP shares — — 391 — — (319) — 19 462 534
Unearned compensation - restricted stock 149 149 4,833 — — — (3,179) (18) (632) 1,171
Stock issued for acquisition 57 57 2,373 — — — — — — 2,430
Exercise of stock options 549 549 14,067 — — — — — — 14,616
Dividends (declared per common share
$0.537, paid per common share $0.533) — — — (80,273) — — — — — (80,273)
balance, december 31, 1999 150,109 150,109 1,141,072 2,486,478 (224,511) (4,363) (9,986) (782) (25,698) 3,513,101
Comprehensive income:
Net income — — — 528,637 — — — — — 528,637
Other comprehensive income (loss):
Change in unrealized appreciation of
investments net of change in deferred
income taxes of $(170,061) — — — — 316,010 — — — — 316,010
Change in foreign currency translation — — — — (5,792) — — — — (5,792)
Other comprehensive income 310,218
Total comprehensive income 838,855
Treasury shares acquired — — — — — — — (2,520) (77,717) (77,717)
Unallocated ESOP shares — — (43) — — 1,413 — — — 1,370
Unearned compensation - restricted stock 114 114 5,425 — — — (673) (12) (238) 4,628
Exercise of stock options 937 937 22,746 — — — — — — 23,683
Dividends (declared and paid per common
share $0.547) — — — (80,507) — — — — — (80,507)
balance, december 31, 2000 151,160 151,160 1,169,200 2,934,608 85,707 (2,950) (10,659) (3,314) (103,653) 4,223,413
Comprehensive income:
Net income — — — 570,091 — — — — — 570,091
Other comprehensive income (loss):
Change in unrealized appreciation of
investments net of change in deferred
income taxes of $39,867 — — — — 74,009 — — — — 74,009
Change in fair value of derivative instruments
net of change in deferred income
taxes of $(5,786) — — — — (10,746) — — — — (10,746)
Change in foreign currency translation — — — — (3,649) — — — — (3,649)
Other comprehensive income 59,614
Total comprehensive income 629,705
Treasury shares acquired — — — — — — — (203) (8,982) (8,982)
Unallocated ESOP shares — — 31 — — 967 — — — 998
Unearned compensation - restricted stock 57 57 3,036 — — — (676) — — 2,417
Exercise of stock options 738 738 23,535 — — — — — — 24,273
Dividends (declared per common share
$0.600, paid per common share $0.587) (4) (4) — (89,182) — — — — — (89,186)
balance, december 31, 2001 151,951 $151,951 $1,195,802 $3,415,517 $145,321 $(1,983) $(11,335) (3,517) $(112,635) $4,782,638
disclosure of reclassification amount: 1999 2000 2001
Unrealized (depreciation) appreciation of investments
arising during the period, net of taxes $(448,686) $317,092 $80,253
Reclassification adjustment, net of taxes (54,310) (1,082) (6,244)
Net unrealized (depreciation) appreciation, net of taxes $(502,996) $316,010 $74,009
The accompanying notes are an integral part of the consolidated financial statements.
Common Stock Treasury Stock
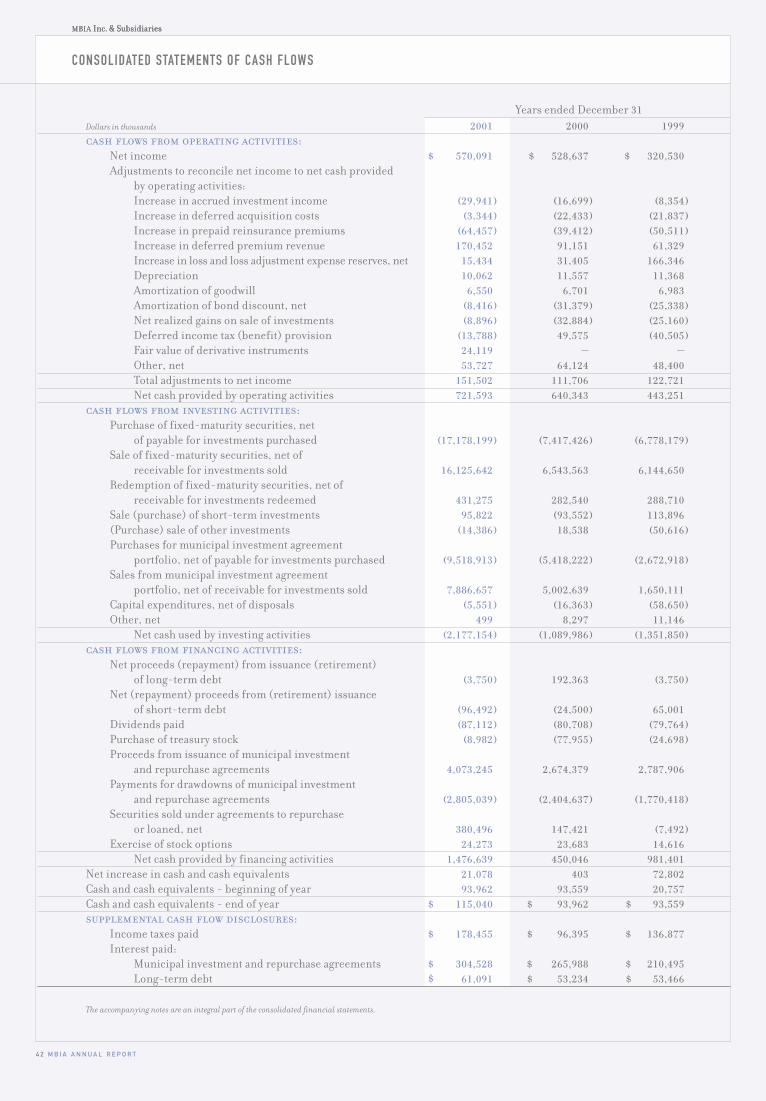
4 2 M B I A A N N U A L R E P O R T
MBIA Inc. & SubsidiariesMBIA Inc. & Subsidiaries
CONSOLIDATED STATEMENTS OF CASH FLOWS
MBIA Inc. & Subsidiaries
Dollars in thousands 2001 2000 1999cash flows from operating activities:
Net income $ 570,091 $ 528,637 $ 320,530 Adjustments to reconcile net income to net cash provided
by operating activities:Increase in accrued investment income (29,941) (16,699) (8,354)Increase in deferred acquisition costs (3,344) (22,433) (21,837)Increase in prepaid reinsurance premiums (64,457) (39,412) (50,511)Increase in deferred premium revenue 170,452 91,151 61,329 Increase in loss and loss adjustment expense reserves, net 15,434 31,405 166,346Depreciation 10,062 11,557 11,368Amortization of goodwill 6,550 6,701 6,983Amortization of bond discount, net (8,416) (31,379) (25,338)Net realized gains on sale of investments (8,896) (32,884) (25,160)Deferred income tax (benefit) provision (13,788) 49,575 (40,505)Fair value of derivative instruments 24,119 — — Other, net 53,727 64,124 48,400 Total adjustments to net income 151,502 111,706 122,721 Net cash provided by operating activities 721,593 640,343 443,251
cash flows from investing activities:Purchase of fixed-maturity securities, net
of payable for investments purchased (17,178,199) (7,417,426) (6,778,179)Sale of fixed-maturity securities, net of
receivable for investments sold 16,125,642 6,543,563 6,144,650Redemption of fixed-maturity securities, net of
receivable for investments redeemed 431,275 282,540 288,710 Sale (purchase) of short-term investments 95,822 (93,552) 113,896 (Purchase) sale of other investments (14,386) 18,538 (50,616)Purchases for municipal investment agreement
portfolio, net of payable for investments purchased (9,518,913) (5,418,222) (2,672,918)Sales from municipal investment agreement
portfolio, net of receivable for investments sold 7,886,657 5,002,639 1,650,111Capital expenditures, net of disposals (5,551) (16,363) (58,650)Other, net 499 8,297 11,146
Net cash used by investing activities (2,177,154) (1,089,986) (1,351,850)cash flows from financing activities:
Net proceeds (repayment) from issuance (retirement)of long-term debt (3,750) 192,363 (3,750)
Net (repayment) proceeds from (retirement) issuanceof short-term debt (96,492) (24,500) 65,001
Dividends paid (87,112) (80,708) (79,764)Purchase of treasury stock (8,982) (77,955) (24,698)Proceeds from issuance of municipal investment
and repurchase agreements 4,073,245 2,674,379 2,787,906 Payments for drawdowns of municipal investment
and repurchase agreements (2,805,039) (2,404,637) (1,770,418)Securities sold under agreements to repurchase
or loaned, net 380,496 147,421 (7,492)Exercise of stock options 24,273 23,683 14,616
Net cash provided by financing activities 1,476,639 450,046 981,401Net increase in cash and cash equivalents 21,078 403 72,802 Cash and cash equivalents - beginning of year 93,962 93,559 20,757 Cash and cash equivalents - end of year $ 115,040 $ 93,962 $ 93,559 supplemental cash flow disclosures:
Income taxes paid $ 178,455 $ 96,395 $ 136,877 Interest paid:
Municipal investment and repurchase agreements $ 304,528 $ 265,988 $ 210,495Long-term debt $ 61,091 $ 53,234 $ 53,466
The accompanying notes are an integral part of the consolidated financial statements.
Years ended December 31
M B I A A N N U A L R E P O R T 4 3
MBIA Inc. & Subsidiaries
note 1: business and organizationMBIA Inc. (MBIA or the Company) was incorporated in the state of
Connecticut on November 12, 1986 as a licensed insurer and, through a
series of transactions during December 1986, became the successor to
the business of the Municipal Bond Insurance Association (the
Association), a voluntary unincorporated association of insurers writ-
ing municipal bond and note insurance as agent for the member insur-
ance companies. The Company operates its insurance business
primarily through its wholly owned subsidiary, MBIA Insurance
Corporation (MBIA Corp.) and its wholly owned French subsidiary
MBIA Assurance, S.A. (MBIA Assurance). MBIA Assurance writes
financial guarantee insurance in the international market, and pur-
suant to a reinsurance agreement with MBIA Corp., a substantial
amount of the risks insured by MBIA Assurance is reinsured by MBIA
Corp. In addition, the Company manages books of business through two
other subsidiaries, MBIA Insurance Corp. of Illinois (MBIA Illinois),
acquired in December 1989, and Capital Markets Assurance
Corporation (CMAC), acquired in February 1998 when the Company
merged with CapMAC Holdings, Inc. (CapMAC). The net book of busi-
ness of these two subsidiaries is 100% reinsured by MBIA Corp.
The Company also provides investment services through
several of its subsidiaries which are wholly owned by MBIA Asset
Management, LLC (MBIA-AMC), which was formed in 1998 and con-
verted to a limited liability corporation in December 2000. MBIA
Municipal Investors Services Corporation (MBIA-MISC) operates
cooperative cash management programs for school districts and munic-
ipalities. In May 2000, MBIA-MISC merged with another subsidiary,
American Money Management Associates, Inc. (AMMA), which provid-
ed investment and treasury management consulting services to munic-
ipal and quasi public-sector clients. This merger combined the
investment expertise into a consolidated investment management
business. MBIA Investment Management Corp. (IMC) provides guar-
anteed investment agreements to states, municipalities and municipal
authorities. MBIA Capital Management Corp. (CMC) provides fixed-
income investment management services for the Company, its affiliates
and third-party institutional clients. 1838 Investment Advisors, LLC
(1838), a limited liability corporation, manages domestic and interna-
tional equity, fixed-income and balanced portfolios for high-net-worth
individuals, mutual funds, endowments, foundations and employee
benefit plans.
The Company also provides municipal services through its
municipal services operations subsidiaries, which are wholly owned by
MBIA MuniServices Company (MBIA MuniServices), formed in 1996.
Municipal Tax Collection Bureau Inc. (MTB) is a provider of tax compli-
ance services to state and local governments. Municipal Resources
Consultants (MRC) is a revenue audit and information services firm.
Capital Asset Holdings, Inc. (Capital Asset) services and manages
delinquent municipal tax liens. In July 1997 the Company acquired
MuniFinancial, a public finance consulting firm specializing in munic-
ipal debt administration, which it sold in September 1999.
TRS Funding Corporation (TRS) was formed in September 1997
to provide clients with structured financing solutions involving the use
of total return swaps and credit derivatives. While MBIA does not have
a direct ownership interest in TRS, it is consolidated in the financial
statements of the Company on the basis that substantially all rewards
and risks are borne by MBIA.
LaCrosse Financial Products, LLC (LaCrosse), formerly King
Street Financial Products, LLC, was created in December 1999 to offer
clients structured derivative products, such as credit default, interest
rate and currency swaps. While MBIA does not have a direct ownership
interest in LaCrosse, it is consolidated in the financial statements of the
Company on the basis that substantially all rewards and risks are borne
by MBIA.
note 2: significant accounting policiesThe consolidated financial statements have been prepared on the basis
of accounting principles generally accepted in the United States of
America (GAAP). The preparation of financial statements in conformity
with GAAP requires management to make estimates and assumptions
that affect the reported amounts of assets and liabilities and disclosures
of contingent assets and liabilities at the date of the financial statements,
and the reported amounts of revenues and expenses during the report-
ing period. As additional information becomes available or actual
amounts become determinable, the recorded estimates are revised and
reflected in operating results. Actual results could differ from those esti-
mates. Significant accounting policies are as follows:
consolidation The consolidated financial statements include
the accounts of the Company, its significant subsidiaries, entities under
its control and entities for which the Company retains substantially all
the risks and rewards. All significant intercompany balances have been
eliminated. Certain amounts have been reclassified in prior years’
financial statements to conform to the current presentation.
investments The Company’s entire investment portfolio is con-
sidered available-for-sale and is reported in the financial statements at
fair value, with unrealized gains and losses, net of deferred taxes, reflect-
ed in accumulated other comprehensive income in shareholders’ equity.
Bond discounts and premiums are amortized using the effec-
tive-yield method over the remaining term of the securities. For pre-
refunded bonds, the remaining term is determined based on the
contractual refunding date. Short-term investments are carried at
amortized cost, which approximates fair value, and include all fixed-
maturity securities, other than those held in the municipal investment
agreement portfolio, with a remaining effective term to maturity of less
than one year. Investment income is recorded as earned. Realized gains
or losses on the sale of investments are determined by specific identifi-
cation and are included as a separate component of revenues.
Investment income from the municipal investment agreement
portfolio is recorded as a component of investment management services
revenues. Municipal investment agreement portfolio accrued interest
income, receivables for investments sold, and payables for investments
purchased are included in the respective consolidated accounts.
Other investments include the Company’s interest in equity-
oriented and equity-method investments. The Company records its
share of the unrealized gains and losses on equity-oriented invest-
ments, net of applicable deferred income taxes, in accumulated other
comprehensive income in shareholders’ equity.
NOTES TO CONSOLIDATED FINANCIAL STATEMENTS
4 4 M B I A A N N U A L R E P O R T
MBIA Inc. & Subsidiaries
cash and cash equivalents Cash and cash equivalents
include cash on hand and demand deposits with banks.
securities purchased under agreements to resellor borrowed and securities sold under agreementsto repurchase or loaned Securities purchased under agree-
ments to resell or borrowed and securities sold under agreements to
repurchase or loaned are accounted for as collateralized transactions
and are recorded at principal or contract value. It is the Company’s pol-
icy to take possession of securities borrowed or purchased under agree-
ments to resell. These contracts are primarily entered into to obtain
securities that are repledged as part of MBIA’s collateralized municipal
investment and repurchase agreement activity and are only transacted
with high-quality dealer firms.
The Company minimizes the credit risk that counterparties to
transactions might be unable to fulfill their contractual obligations by
monitoring customer credit exposure and collateral value and requir-
ing additional collateral to be deposited with the Company when
deemed necessary.
policy acquisition costs Policy acquisition costs include
only those expenses that relate primarily to, and vary with, premium
production. The Company periodically conducts a study to determine
which operating costs vary with, and are primarily related to, the acqui-
sition of new insurance business and qualify for deferral. For business
produced directly by MBIA Corp., such costs include compensation of
employees involved in underwriting and policy issuance functions, cer-
tain rating agency fees, state premium taxes and certain other under-
writing expenses, reduced by ceding commission income on premiums
ceded to reinsurers. Policy acquisition costs are deferred and amortized
over the period in which the related premiums are earned.
premium revenue recognition Upfront premiums are
earned in proportion to the expiration of the related risk. Therefore,
premium earnings are greater in the earlier periods of an upfront trans-
action when there is a higher amount of exposure outstanding. The pre-
miums are apportioned to individual sinking fund payments of a bond
issue according to an amortization schedule. After the premiums are
allocated to each scheduled sinking fund payment, they are earned on a
straight-line basis over the period of that sinking fund payment. When
an insured issue is retired early, is called by the issuer, or is in sub-
stance paid in advance through a refunding accomplished by placing
U.S. Government securities in escrow, the remaining deferred premi-
um revenue is earned at that time, since there is no longer risk to the
Company. Accordingly, deferred premium revenue represents the por-
tion of premiums written that is applicable to the unexpired risk of
insured bonds and notes. Installment premiums are earned over each
installment period, generally one year or less.
advisory fee revenue recognition The Company collects
various advisory fees in connection with certain transactions. The
Company also earns advisory fees in connection with its administration
of certain third-party-owned special purpose vehicles. Depending upon
the type of fee received, the fee is either earned when it is due or
deferred and earned over the life of the related transaction. Work, waiv-
er and consent, termination, administrative and management fees are
earned when due. Structuring and commitment fees are earned on a
straight-line basis over the life of the related insured transaction.
goodwill Goodwill represents the excess of the cost of acquisitions
over the fair value of the net assets acquired. Goodwill attributed to the
acquisition of MBIA Corp. and MBIA-MISC is amortized by the straight-
line method over 25 years. Goodwill attributed to the acquisition of
MBIA Illinois is amortized according to the recognition of future profits
from its deferred premium revenue and installment premiums, except
for a minor portion attributed to state licenses, which is amortized by
the straight-line method over 25 years. Goodwill attributed to the acqui-
sition of all other subsidiaries is amortized by the straight-line method
over 15 years.
Effective January 1, 2002 the Company will adopt Statement of
Financial Accounting Standards (SFAS) 142, “Goodwill and Other
Intangible Assets.” See Note 4 for an explanation of the impact the adop-
tion of this Statement will have on the Company’s financial statements.
property and equipment Property and equipment consist of
the Company’s headquarters, furniture, fixtures and equipment, which
are recorded at cost and are depreciated using the straight-line method
over their estimated service lives ranging from 3 to 31 years.
Maintenance and repairs are charged to current earnings as incurred.
loss and loss adjustment expenses Loss and loss adjust-
ment expense (LAE) reserves are established in an amount equal to the
Company’s estimate of identified or case basis reserves and unallocated
losses, including costs of settlement, on the obligations it has insured.
The unallocated reserve is calculated by applying a loss factor to
net debt service written. Management determines this factor based on
an independent research agency study of bond defaults, which manage-
ment feels is a reliable source of bond default data. Case basis reserves
are established when specific insured issues are identified as currently
or likely to be in default. Such a reserve is based on the present value of
the expected loss and LAE payments, net of expected recoveries under
salvage and subrogation rights and reinsurance, based on a discount
rate of 5.86%. The discount rate is based on the estimated yield of our
fixed-income investment portfolio. When a case basis reserve is record-
ed, a corresponding reduction is made to the unallocated reserve.
Management of the Company periodically reevaluates its esti-
mates for losses and LAE, and any resulting adjustments are reflected in
current earnings. Management believes that the reserves are adequate
to cover the ultimate net cost of claims; however, because the reserves
are based on estimates, there can be no assurance that the ultimate lia-
bility will not exceed such estimates.
In 2001 and 2000, the Company reviewed its loss reserving
methodology. The reviews included an analysis of loss reserve factors
based on the latest industry data. Historical bond default and recovery
experience for the relevant sectors of the fixed-income market were
included in the analysis as was the Company’s changing mix of busi-
ness. These reviews did not result in a change to the Company’s loss and
LAE reserving factor.
NOTES TO CONSOLIDATED FINANCIAL STATEMENTS
M B I A A N N U A L R E P O R T 4 5
MBIA Inc. & Subsidiaries
Beginning in 2002, the Company has decided to change the
methodology it uses to determine the amount of loss and loss adjust-
ment expenses. The Company will start accruing loss and loss adjust-
ment expenses based upon a percentage of earned premiums instead of
a percentage of net debt service written. There are two reasons for the
change in the methodology. First, the amount of net debt service writ-
ten can significantly fluctuate from quarter to quarter while the related
premium is earned more consistently over the life of the transaction.
Second, during the quarter the premiums are written, the loss and loss
adjustment charge is recognized in advance of the related earned pre-
mium because this revenue is essentially all deferred in the quarter that
it is written. The intent of the change is to better match the recognition
of incurred losses with the related revenue. If the new methodology was
used during 2001, 2000 and 1999, excluding the loss reserve strength-
ening in 1999, the Company would have reserved essentially the same
amount as it did under the current approach.
municipal investment agreements and municipalrepurchase agreements Municipal investment agreements
and municipal repurchase agreements are recorded as liabilities on the
balance sheet at the time such agreements are executed. The liabilities
for municipal investment and repurchase agreements are carried at the
face value of the agreements plus accrued interest, whereas the related
assets are recorded at fair value. Investment management services rev-
enues include investment income on the assets underlying the munic-
ipal investment agreement portfolio, net of interest expense at rates
specified in the agreements, computed daily based upon the outstand-
ing balances.
derivatives The Financial Accounting Standards Board (FASB)
issued, then subsequently amended, SFAS 133, “Accounting for
Derivative Instruments and Hedging Activities,” which became effec-
tive for the Company on January 1, 2001. Under SFAS 133, as amended,
all derivative instruments are recognized on the balance sheet at their
fair values and changes in fair value are recognized immediately in
earnings, unless the derivatives qualify as hedges. If the derivatives
qualify as hedges, depending on the nature of the hedge, changes in the
fair value of the derivatives are either offset against the change in fair
value of assets, liabilities, or firm commitments through earnings or
recognized in accumulated other comprehensive income until the
hedged item is recognized in earnings. Any ineffective portion of a
derivative’s change in fair value is recognized immediately in earnings.
The nature of the Company’s business activities requires the
management of various financial and market risks, including those
related to changes in interest rates and currency exchange rates. As dis-
cussed more fully in Note 5, the Company uses derivative financial
instruments to mitigate or eliminate certain of those risks. See Note 5
for further discussion of the impact of the adoption of this statement on
the financial statements.
investment management services operations Invest-
ment management services results are comprised of the net investment
income, operating revenues, and expenses of MBIA-AMC, MBIA-MISC,
IMC, CMC and 1838.
municipal services operations Municipal services results
are comprised of the net investment income, operating revenues and
expenses of MBIA MuniServices, MTB, MRC and Capital Asset, and for
1999 only, MuniFinancial.
corporate Corporate consists of net investment income, interest
expense, general corporate expenses and one-time charges.
gains and losses Net realized gains and losses are generated as a
result of the ongoing management of the investment portfolio. The
change in fair value of derivative instruments is a result of the mark-to-
market of derivative assets and liabilities reported on the balance sheet.
income taxes Deferred income taxes are provided with respect to
the temporary differences between the tax bases of assets and liabilities
and the reported amounts in the financial statements that will result in
deductible or taxable amounts in future years when the reported
amount of the asset or liability is recovered or settled. Such temporary
differences relate principally to premium revenue recognition,
deferred acquisition costs, unrealized appreciation or depreciation of
investments and the contingency reserve.
The Internal Revenue Code permits companies writing finan-
cial guarantee insurance to deduct from taxable income amounts added
to the statutory contingency reserve, subject to certain limitations. The
tax benefits obtained from such deductions must be invested in non-
interest-bearing U.S. Government tax and loss bonds. The Company
records purchases of tax and loss bonds as payments of federal income
taxes. The amounts deducted must be restored to taxable income when
the contingency reserve is released, at which time the Company may
present the tax and loss bonds for redemption to satisfy the additional
tax liability.
foreign currency translation Assets and liabilities
denominated in foreign currencies are translated at year-end exchange
rates. Operating results are translated at average rates of exchange pre-
vailing during the year. Unrealized gains or losses resulting from trans-
lation are included in accumulated other comprehensive income in
shareholders’ equity. Gains and losses resulting from transactions in
foreign currencies are recorded in current income.
net income per common share Basic earnings per share
excludes dilution and is computed by dividing income available to com-
mon shareholders by the weighted average number of common shares
outstanding during the period. Diluted earnings per share gives the
dilutive effect of all stock options and other items outstanding during
the period that could potentially result in the issuance of common
stock. As of December 31, 2001, 2000 and 1999 there were 4,035,843,
4,993,542 and 3,905,846 stock options, respectively, that were not
included in the diluted earnings per share calculation because they
were antidilutive. A reconciliation of the denominators of the basic and
NOTES TO CONSOLIDATED FINANCIAL STATEMENTS

4 6 M B I A A N N U A L R E P O R T
NOTES TO CONSOLIDATED FINANCIAL STATEMENTS
MBIA Inc. & Subsidiaries
diluted earnings per share for the years ended December 31, 2001,
2000 and 1999 is as follows:
note 3: special purpose vehiclesThe Company provides structured funding and credit enhancement
services to global structured finance clients through the use of MBIA-
administered, bankruptcy-remote special purpose vehicles (SPVs).
The purpose of these SPVs is to provide our clients with an efficient
source of funding, which may offer MBIA the opportunity to issue
financial guarantee insurance policies. The SPVs purchase various
types of financial instruments, such as debt securities, loans, lease and
trade receivables, and funds these purchases through the issuance of
asset-backed short-term commercial paper or medium-term notes.
The assets and liabilities within the medium-term note programs are
managed primarily on a match-funded basis and may include the use
of derivative hedges, such as interest rate and foreign currency swaps.
By match-funding, the SPVs eliminate the risks associated with fluctu-
ations in interest and foreign currency rates, indices and liquidity.
Typically, programs involve the use of rating agencies in assessing the
quality of asset purchases and in assigning ratings to the various pro-
grams. In general, asset purchases at the inception of the program are
required to be at least investment grade by at least one major rating
agency. The primary SPVs administered by MBIA are Triple-A One
Funding Corporation (Triple-A), Hemispheres Funding Corporation
(Hemispheres), Meridian Funding Company, LLC (Meridian), Polaris
Funding Company, LLC (Polaris) and 885 Warehouse, LLC (885
Warehouse).
Incorporated in September 1993, Triple-A is wholly owned by
an unaffiliated party and was formed to provide secured loans to bor-
rowers, purchase participations in pools of retail, trade and other
receivables and purchase investment grade securities at the time of
issuance or in the secondary market. Triple-A may fund its purchases of
such assets through the issuance of commercial paper or other securi-
ties. For the years ending December 31, 2001 and 2000, assets funded
by Triple-A primarily consisted of secured loans to qualified borrowers,
participations in short-term and long-term interest and non-interest
bearing receivable pools and investment grade asset-backed securities.
Debt issued for the same periods substantially consisted of commercial
paper. Triple-A enters into 364-day or shorter term credit facilities with
multiple independent third-party credit support providers as a source
of liquidity in the event of a commercial paper market disruption.
Hemispheres was incorporated in January 1994 and is wholly
owned by an unaffiliated party. Through its articles of incorporation,
Hemispheres is permitted to issue medium-term notes in an unlimited
number of series of undetermined amounts not to exceed an aggregate
Years ended December 31
2001 2000 1999
Net income (in thousands) $570,091 $528,637 $320,530
Basic weighted
average shares 148,190,890 147,714,663 149,386,305
Stock options 998,253 815,155 1,011,442
Unallocated ESOP shares 93,514 139,125 205,761
Diluted weighted
average shares 149,282,657 148,668,943 150,603,508
Basic EPS $3.85 $3.58 $2.15
Diluted EPS $3.82 $3.56 $2.13
principal amount of $5 billion. Proceeds from the issuance of such
notes are used to fund the purchase of permitted investments. For the
years ending December 31, 2001 and 2000, such investments consist-
ed of loans and lease receivables. Currently, these loans are denominat-
ed in a foreign currency and carry a variable interest rate linked to a
foreign interest rate index. Hemispheres has entered into various for-
eign currency and interest rate swap agreements relating to such loans
designed to hedge its exposures to foreign exchange and interest rate
fluctuations. Hemispheres uses such derivative agreements for non-
trading purposes. In addition to a nominal amount of common stock,
Hemispheres has issued and outstanding 5,138 shares of mandatory
redeemable cumulative preferred stock totaling $5.1 million for 2001
and 10,900 shares totaling $10.9 million for 2000.
Meridian, formed in July 1997, is a limited liability company of
which MBIA is a non-controlling 1% member. Meridian may issue
medium-term notes in an unlimited number of series of undetermined
amounts not to exceed an aggregate principal amount of $5 billion.
Proceeds from the issuance of such notes are used to fund the purchase
of permitted investments. For the years ending December 31, 2001 and
2000, such investments primarily consisted of asset-backed loans and
securities issued by major global structured finance clients. Meridian
may enter into various types of derivative agreements for non-trading
purposes designed to hedge its exposure to interest rate and foreign
currency fluctuations.
Polaris, formed in November 1997, is a limited liability compa-
ny of which MBIA is a non-controlling 1% member. Polaris may issue
medium-term notes in an unlimited number of series of undeter-
mined amounts not to exceed an aggregate principal amount of $5 bil-
lion. Proceeds from the issuance of such notes are used to fund the
purchase of permitted investments. For the years ending December 31,
2001 and 2000, such investments primarily consisted of debt instru-
ments and loans issued by major national and international corpora-
tions. Polaris may enter into various types of derivative agreements for
non-trading purposes designed to hedge its exposure to interest rate and
foreign currency fluctuations on its assets and liabilities.
885 Warehouse, incorporated in December 1997 and converted
to a limited liability company in December 1998, is wholly owned by an
unaffiliated party. 885 Warehouse was formed in connection with a sin-
gle structured finance transaction and is not actively used as part of
MBIA’s ongoing structured funding programs. For the years ending
December 31, 2001 and 2000, assets consisted solely of asset-backed
structured notes funded through a loan agreement with an unaffiliated
loan provider. The notes purchased and the loan payable are due to
mature by January 2003.
Pursuant to insurance policies issued by MBIA, all of the invest-
ments of Triple-A are unconditionally and irrevocably guaranteed as to
principal and interest when due. In addition, full amounts due to liquid-
ity providers under various agreements are unconditionally and irrevo-
cably guaranteed. Pursuant to facility agreements between MBIA and the
medium-term note SPVs, all series of notes are unconditionally and
irrevocably guaranteed as to scheduled payments of principal, interest
and other amounts payable with respect to such series. Since MBIA’s
exposure to these SPVs is primarily through the guarantee of the assets
purchased and debt issued, such exposure is reported within MBIA’s net
insurance in force. The following table details amounts relating to
MBIA’s guarantee of SPV obligations for SPVs administered by MBIA:
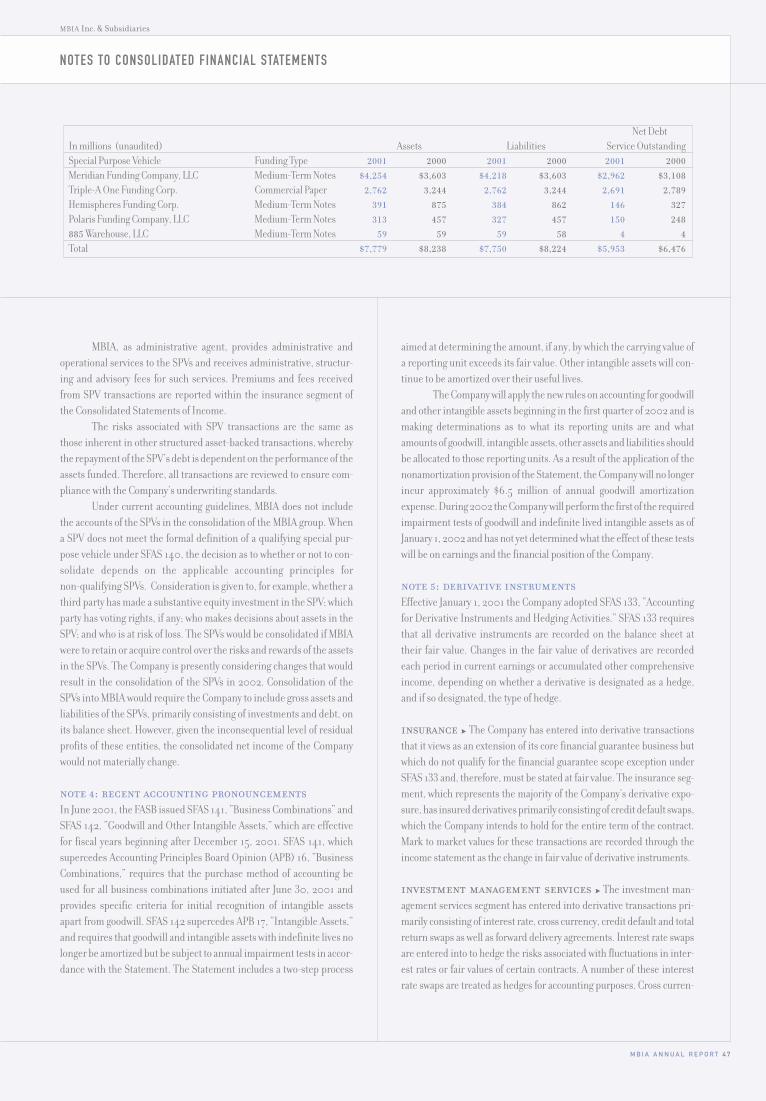
M B I A A N N U A L R E P O R T 4 7
NOTES TO CONSOLIDATED FINANCIAL STATEMENTS
MBIA Inc. & Subsidiaries
MBIA, as administrative agent, provides administrative and
operational services to the SPVs and receives administrative, structur-
ing and advisory fees for such services. Premiums and fees received
from SPV transactions are reported within the insurance segment of
the Consolidated Statements of Income.
The risks associated with SPV transactions are the same as
those inherent in other structured asset-backed transactions, whereby
the repayment of the SPV’s debt is dependent on the performance of the
assets funded. Therefore, all transactions are reviewed to ensure com-
pliance with the Company’s underwriting standards.
Under current accounting guidelines, MBIA does not include
the accounts of the SPVs in the consolidation of the MBIA group. When
a SPV does not meet the formal definition of a qualifying special pur-
pose vehicle under SFAS 140, the decision as to whether or not to con-
solidate depends on the applicable accounting principles for
non-qualifying SPVs. Consideration is given to, for example, whether a
third party has made a substantive equity investment in the SPV; which
party has voting rights, if any; who makes decisions about assets in the
SPV; and who is at risk of loss. The SPVs would be consolidated if MBIA
were to retain or acquire control over the risks and rewards of the assets
in the SPVs. The Company is presently considering changes that would
result in the consolidation of the SPVs in 2002. Consolidation of the
SPVs into MBIA would require the Company to include gross assets and
liabilities of the SPVs, primarily consisting of investments and debt, on
its balance sheet. However, given the inconsequential level of residual
profits of these entities, the consolidated net income of the Company
would not materially change.
note 4: recent accounting pronouncementsIn June 2001, the FASB issued SFAS 141, “Business Combinations” and
SFAS 142, “Goodwill and Other Intangible Assets,” which are effective
for fiscal years beginning after December 15, 2001. SFAS 141, which
supercedes Accounting Principles Board Opinion (APB) 16, “Business
Combinations,” requires that the purchase method of accounting be
used for all business combinations initiated after June 30, 2001 and
provides specific criteria for initial recognition of intangible assets
apart from goodwill. SFAS 142 supercedes APB 17, “Intangible Assets,”
and requires that goodwill and intangible assets with indefinite lives no
longer be amortized but be subject to annual impairment tests in accor-
dance with the Statement. The Statement includes a two-step process
aimed at determining the amount, if any, by which the carrying value of
a reporting unit exceeds its fair value. Other intangible assets will con-
tinue to be amortized over their useful lives.
The Company will apply the new rules on accounting for goodwill
and other intangible assets beginning in the first quarter of 2002 and is
making determinations as to what its reporting units are and what
amounts of goodwill, intangible assets, other assets and liabilities should
be allocated to those reporting units. As a result of the application of the
nonamortization provision of the Statement, the Company will no longer
incur approximately $6.5 million of annual goodwill amortization
expense. During 2002 the Company will perform the first of the required
impairment tests of goodwill and indefinite lived intangible assets as of
January 1, 2002 and has not yet determined what the effect of these tests
will be on earnings and the financial position of the Company.
note 5: derivative instrumentsEffective January 1, 2001 the Company adopted SFAS 133, “Accounting
for Derivative Instruments and Hedging Activities.” SFAS 133 requires
that all derivative instruments are recorded on the balance sheet at
their fair value. Changes in the fair value of derivatives are recorded
each period in current earnings or accumulated other comprehensive
income, depending on whether a derivative is designated as a hedge,
and if so designated, the type of hedge.
insurance The Company has entered into derivative transactions
that it views as an extension of its core financial guarantee business but
which do not qualify for the financial guarantee scope exception under
SFAS 133 and, therefore, must be stated at fair value. The insurance seg-
ment, which represents the majority of the Company’s derivative expo-
sure, has insured derivatives primarily consisting of credit default swaps,
which the Company intends to hold for the entire term of the contract.
Mark to market values for these transactions are recorded through the
income statement as the change in fair value of derivative instruments.
investment management services The investment man-
agement services segment has entered into derivative transactions pri-
marily consisting of interest rate, cross currency, credit default and total
return swaps as well as forward delivery agreements. Interest rate swaps
are entered into to hedge the risks associated with fluctuations in inter-
est rates or fair values of certain contracts. A number of these interest
rate swaps are treated as hedges for accounting purposes. Cross curren-
Net Debt
In millions (unaudited) Assets Liabilities Service Outstanding
Special Purpose Vehicle Funding Type 2001 2000 2001 2000 2001 2000
Meridian Funding Company, LLC Medium-Term Notes $4,254 $3,603 $4,218 $3,603 $2,962 $3,108
Triple-A One Funding Corp. Commercial Paper 2,762 3,244 2,762 3,244 2,691 2,789
Hemispheres Funding Corp. Medium-Term Notes 391 875 384 862 146 327
Polaris Funding Company, LLC Medium-Term Notes 313 457 327 457 150 248
885 Warehouse, LLC Medium-Term Notes 59 59 59 58 4 4
Total $7,779 $8,238 $7,750 $8,224 $5,953 $6,476
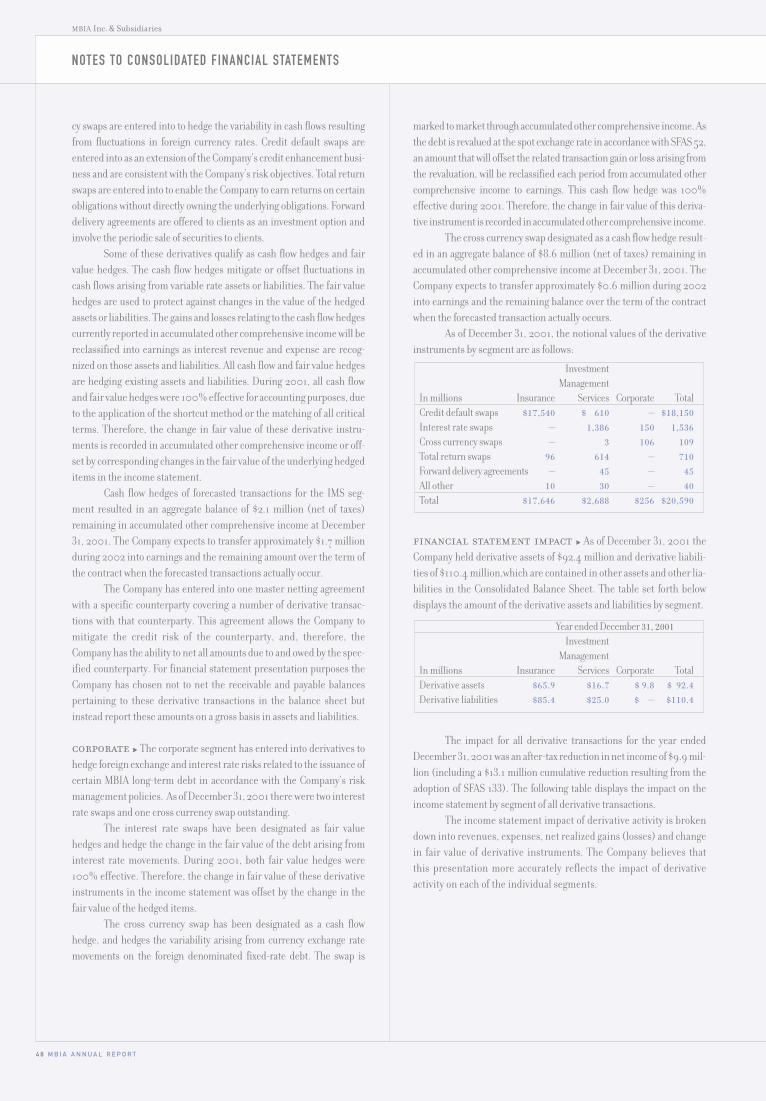
4 8 M B I A A N N U A L R E P O R T
MBIA Inc. & Subsidiaries
cy swaps are entered into to hedge the variability in cash flows resulting
from fluctuations in foreign currency rates. Credit default swaps are
entered into as an extension of the Company’s credit enhancement busi-
ness and are consistent with the Company’s risk objectives. Total return
swaps are entered into to enable the Company to earn returns on certain
obligations without directly owning the underlying obligations. Forward
delivery agreements are offered to clients as an investment option and
involve the periodic sale of securities to clients.
Some of these derivatives qualify as cash flow hedges and fair
value hedges. The cash flow hedges mitigate or offset fluctuations in
cash flows arising from variable rate assets or liabilities. The fair value
hedges are used to protect against changes in the value of the hedged
assets or liabilities. The gains and losses relating to the cash flow hedges
currently reported in accumulated other comprehensive income will be
reclassified into earnings as interest revenue and expense are recog-
nized on those assets and liabilities. All cash flow and fair value hedges
are hedging existing assets and liabilities. During 2001, all cash flow
and fair value hedges were 100% effective for accounting purposes, due
to the application of the shortcut method or the matching of all critical
terms. Therefore, the change in fair value of these derivative instru-
ments is recorded in accumulated other comprehensive income or off-
set by corresponding changes in the fair value of the underlying hedged
items in the income statement.
Cash flow hedges of forecasted transactions for the IMS seg-
ment resulted in an aggregate balance of $2.1 million (net of taxes)
remaining in accumulated other comprehensive income at December
31, 2001. The Company expects to transfer approximately $1.7 million
during 2002 into earnings and the remaining amount over the term of
the contract when the forecasted transactions actually occur.
The Company has entered into one master netting agreement
with a specific counterparty covering a number of derivative transac-
tions with that counterparty. This agreement allows the Company to
mitigate the credit risk of the counterparty, and, therefore, the
Company has the ability to net all amounts due to and owed by the spec-
ified counterparty. For financial statement presentation purposes the
Company has chosen not to net the receivable and payable balances
pertaining to these derivative transactions in the balance sheet but
instead report these amounts on a gross basis in assets and liabilities.
corporate The corporate segment has entered into derivatives to
hedge foreign exchange and interest rate risks related to the issuance of
certain MBIA long-term debt in accordance with the Company’s risk
management policies. As of December 31, 2001 there were two interest
rate swaps and one cross currency swap outstanding.
The interest rate swaps have been designated as fair value
hedges and hedge the change in the fair value of the debt arising from
interest rate movements. During 2001, both fair value hedges were
100% effective. Therefore, the change in fair value of these derivative
instruments in the income statement was offset by the change in the
fair value of the hedged items.
The cross currency swap has been designated as a cash flow
hedge, and hedges the variability arising from currency exchange rate
movements on the foreign denominated fixed-rate debt. The swap is
marked to market through accumulated other comprehensive income. As
the debt is revalued at the spot exchange rate in accordance with SFAS 52,
an amount that will offset the related transaction gain or loss arising from
the revaluation, will be reclassified each period from accumulated other
comprehensive income to earnings. This cash flow hedge was 100%
effective during 2001. Therefore, the change in fair value of this deriva-
tive instrument is recorded in accumulated other comprehensive income.
The cross currency swap designated as a cash flow hedge result-
ed in an aggregate balance of $8.6 million (net of taxes) remaining in
accumulated other comprehensive income at December 31, 2001. The
Company expects to transfer approximately $0.6 million during 2002
into earnings and the remaining balance over the term of the contract
when the forecasted transaction actually occurs.
As of December 31, 2001, the notional values of the derivative
instruments by segment are as follows:
financial statement impact As of December 31, 2001 the
Company held derivative assets of $92.4 million and derivative liabili-
ties of $110.4 million,which are contained in other assets and other lia-
bilities in the Consolidated Balance Sheet. The table set forth below
displays the amount of the derivative assets and liabilities by segment.
The impact for all derivative transactions for the year ended
December 31, 2001 was an after-tax reduction in net income of $9.9 mil-
lion (including a $13.1 million cumulative reduction resulting from the
adoption of SFAS 133). The following table displays the impact on the
income statement by segment of all derivative transactions.
The income statement impact of derivative activity is broken
down into revenues, expenses, net realized gains (losses) and change
in fair value of derivative instruments. The Company believes that
this presentation more accurately reflects the impact of derivative
activity on each of the individual segments.
Year ended December 31, 2001
Investment
Management
In millions Insurance Services Corporate Total
Derivative assets $65.9 $16.7 $ 9.8 $ 92.4
Derivative liabilities $85.4 $25.0 $ — $110.4
Investment
Management
In millions Insurance Services Corporate Total
Credit default swaps $17,540 $ 610 — $18,150
Interest rate swaps — 1,386 150 1,536
Cross currency swaps — 3 106 109
Total return swaps 96 614 — 710
Forward delivery agreements — 45 — 45
All other 10 30 — 40
Total $17,646 $2,688 $256 $20,590
NOTES TO CONSOLIDATED FINANCIAL STATEMENTS
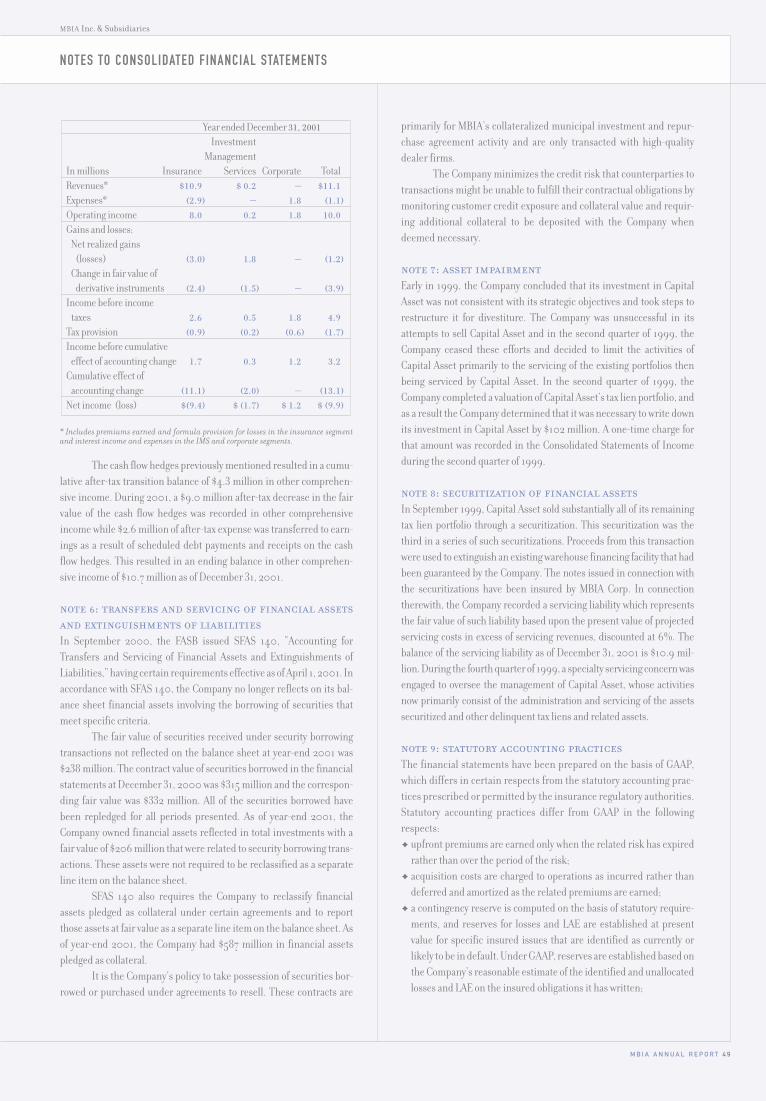
M B I A A N N U A L R E P O R T 4 9
MBIA Inc. & Subsidiaries
* Includes premiums earned and formula provision for losses in the insurance segmentand interest income and expenses in the IMS and corporate segments.
The cash flow hedges previously mentioned resulted in a cumu-
lative after-tax transition balance of $4.3 million in other comprehen-
sive income. During 2001, a $9.0 million after-tax decrease in the fair
value of the cash flow hedges was recorded in other comprehensive
income while $2.6 million of after-tax expense was transferred to earn-
ings as a result of scheduled debt payments and receipts on the cash
flow hedges. This resulted in an ending balance in other comprehen-
sive income of $10.7 million as of December 31, 2001.
note 6: transfers and servicing of financial assetsand extinguishments of liabilitiesIn September 2000, the FASB issued SFAS 140, “Accounting for
Transfers and Servicing of Financial Assets and Extinguishments of
Liabilities,” having certain requirements effective as of April 1, 2001. In
accordance with SFAS 140, the Company no longer reflects on its bal-
ance sheet financial assets involving the borrowing of securities that
meet specific criteria.
The fair value of securities received under security borrowing
transactions not reflected on the balance sheet at year-end 2001 was
$238 million. The contract value of securities borrowed in the financial
statements at December 31, 2000 was $315 million and the correspon-
ding fair value was $332 million. All of the securities borrowed have
been repledged for all periods presented. As of year-end 2001, the
Company owned financial assets reflected in total investments with a
fair value of $206 million that were related to security borrowing trans-
actions. These assets were not required to be reclassified as a separate
line item on the balance sheet.
SFAS 140 also requires the Company to reclassify financial
assets pledged as collateral under certain agreements and to report
those assets at fair value as a separate line item on the balance sheet. As
of year-end 2001, the Company had $587 million in financial assets
pledged as collateral.
It is the Company’s policy to take possession of securities bor-
rowed or purchased under agreements to resell. These contracts are
Year ended December 31, 2001
Investment
Management
In millions Insurance Services Corporate Total
Revenues* $10.9 $ 0.2 — $11.1
Expenses* (2.9) — 1.8 (1.1)
Operating income 8.0 0.2 1.8 10.0
Gains and losses:
Net realized gains
(losses) (3.0) 1.8 — (1.2)
Change in fair value of
derivative instruments (2.4) (1.5) — (3.9)
Income before income
taxes 2.6 0.5 1.8 4.9
Tax provision (0.9) (0.2) (0.6) (1.7)
Income before cumulative
effect of accounting change 1.7 0.3 1.2 3.2
Cumulative effect of
accounting change (11.1) (2.0) — (13.1)
Net income (loss) $(9.4) $ (1.7) $ 1.2 $ (9.9)
primarily for MBIA’s collateralized municipal investment and repur-
chase agreement activity and are only transacted with high-quality
dealer firms.
The Company minimizes the credit risk that counterparties to
transactions might be unable to fulfill their contractual obligations by
monitoring customer credit exposure and collateral value and requir-
ing additional collateral to be deposited with the Company when
deemed necessary.
note 7: asset impairmentEarly in 1999, the Company concluded that its investment in Capital
Asset was not consistent with its strategic objectives and took steps to
restructure it for divestiture. The Company was unsuccessful in its
attempts to sell Capital Asset and in the second quarter of 1999, the
Company ceased these efforts and decided to limit the activities of
Capital Asset primarily to the servicing of the existing portfolios then
being serviced by Capital Asset. In the second quarter of 1999, the
Company completed a valuation of Capital Asset’s tax lien portfolio, and
as a result the Company determined that it was necessary to write down
its investment in Capital Asset by $102 million. A one-time charge for
that amount was recorded in the Consolidated Statements of Income
during the second quarter of 1999.
note 8: securitization of financial assetsIn September 1999, Capital Asset sold substantially all of its remaining
tax lien portfolio through a securitization. This securitization was the
third in a series of such securitizations. Proceeds from this transaction
were used to extinguish an existing warehouse financing facility that had
been guaranteed by the Company. The notes issued in connection with
the securitizations have been insured by MBIA Corp. In connection
therewith, the Company recorded a servicing liability which represents
the fair value of such liability based upon the present value of projected
servicing costs in excess of servicing revenues, discounted at 6%. The
balance of the servicing liability as of December 31, 2001 is $10.9 mil-
lion. During the fourth quarter of 1999, a specialty servicing concern was
engaged to oversee the management of Capital Asset, whose activities
now primarily consist of the administration and servicing of the assets
securitized and other delinquent tax liens and related assets.
note 9: statutory accounting practicesThe financial statements have been prepared on the basis of GAAP,
which differs in certain respects from the statutory accounting prac-
tices prescribed or permitted by the insurance regulatory authorities.
Statutory accounting practices differ from GAAP in the following
respects:
1 upfront premiums are earned only when the related risk has expired
rather than over the period of the risk;
1 acquisition costs are charged to operations as incurred rather than
deferred and amortized as the related premiums are earned;
1 a contingency reserve is computed on the basis of statutory require-
ments, and reserves for losses and LAE are established at present
value for specific insured issues that are identified as currently or
likely to be in default. Under GAAP, reserves are established based on
the Company’s reasonable estimate of the identified and unallocated
losses and LAE on the insured obligations it has written;
NOTES TO CONSOLIDATED FINANCIAL STATEMENTS
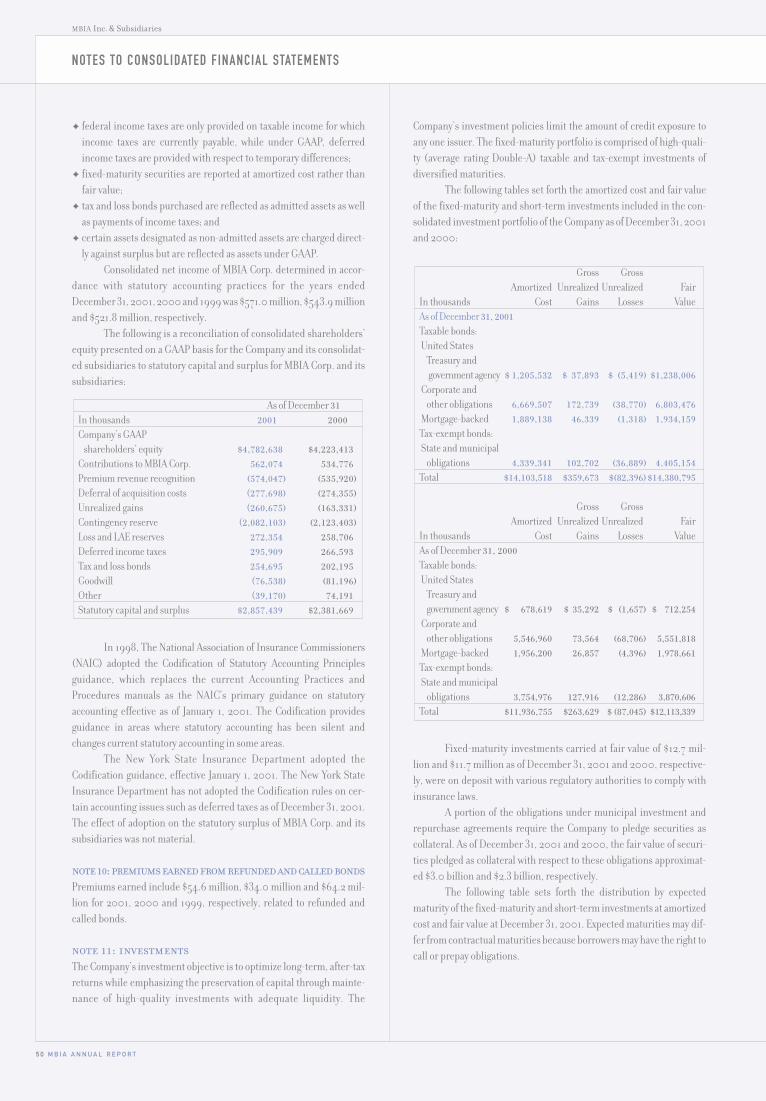
5 0 M B I A A N N U A L R E P O R T
MBIA Inc. & Subsidiaries
1 federal income taxes are only provided on taxable income for which
income taxes are currently payable, while under GAAP, deferred
income taxes are provided with respect to temporary differences;
1 fixed-maturity securities are reported at amortized cost rather than
fair value;
1 tax and loss bonds purchased are reflected as admitted assets as well
as payments of income taxes; and
1 certain assets designated as non-admitted assets are charged direct-
ly against surplus but are reflected as assets under GAAP.
Consolidated net income of MBIA Corp. determined in accor-
dance with statutory accounting practices for the years ended
December 31, 2001, 2000 and 1999 was $571.0 million, $543.9 million
and $521.8 million, respectively.
The following is a reconciliation of consolidated shareholders’
equity presented on a GAAP basis for the Company and its consolidat-
ed subsidiaries to statutory capital and surplus for MBIA Corp. and its
subsidiaries:
In 1998, The National Association of Insurance Commissioners
(NAIC) adopted the Codification of Statutory Accounting Principles
guidance, which replaces the current Accounting Practices and
Procedures manuals as the NAIC’s primary guidance on statutory
accounting effective as of January 1, 2001. The Codification provides
guidance in areas where statutory accounting has been silent and
changes current statutory accounting in some areas.
The New York State Insurance Department adopted the
Codification guidance, effective January 1, 2001. The New York State
Insurance Department has not adopted the Codification rules on cer-
tain accounting issues such as deferred taxes as of December 31, 2001.
The effect of adoption on the statutory surplus of MBIA Corp. and its
subsidiaries was not material.
note 10: premiums earned from refunded and called bondsPremiums earned include $54.6 million, $34.0 million and $64.2 mil-
lion for 2001, 2000 and 1999, respectively, related to refunded and
called bonds.
note 11: investmentsThe Company’s investment objective is to optimize long-term, after-tax
returns while emphasizing the preservation of capital through mainte-
nance of high-quality investments with adequate liquidity. The
As of December 31
In thousands 2001 2000
Company’s GAAP
shareholders’ equity $4,782,638 $4,223,413
Contributions to MBIA Corp. 562,074 534,776
Premium revenue recognition (574,047) (535,920)
Deferral of acquisition costs (277,698) (274,355)
Unrealized gains (260,675) (163,331)
Contingency reserve (2,082,103) (2,123,403)
Loss and LAE reserves 272,354 258,706
Deferred income taxes 295,909 266,593
Tax and loss bonds 254,695 202,195
Goodwill (76,538) (81,196)
Other (39,170) 74,191
Statutory capital and surplus $2,857,439 $2,381,669
Company’s investment policies limit the amount of credit exposure to
any one issuer. The fixed-maturity portfolio is comprised of high-quali-
ty (average rating Double-A) taxable and tax-exempt investments of
diversified maturities.
The following tables set forth the amortized cost and fair value
of the fixed-maturity and short-term investments included in the con-
solidated investment portfolio of the Company as of December 31, 2001
and 2000:
Fixed-maturity investments carried at fair value of $12.7 mil-
lion and $11.7 million as of December 31, 2001 and 2000, respective-
ly, were on deposit with various regulatory authorities to comply with
insurance laws.
A portion of the obligations under municipal investment and
repurchase agreements require the Company to pledge securities as
collateral. As of December 31, 2001 and 2000, the fair value of securi-
ties pledged as collateral with respect to these obligations approximat-
ed $3.0 billion and $2.3 billion, respectively.
The following table sets forth the distribution by expected
maturity of the fixed-maturity and short-term investments at amortized
cost and fair value at December 31, 2001. Expected maturities may dif-
fer from contractual maturities because borrowers may have the right to
call or prepay obligations.
Gross Gross
Amortized Unrealized Unrealized Fair
In thousands Cost Gains Losses Value
As of December 31, 2001
Taxable bonds:
United States
Treasury and
government agency $ 1,205,532 $ 37,893 $ (5,419) $1,238,006
Corporate and
other obligations 6,669,507 172,739 (38,770) 6,803,476
Mortgage-backed 1,889,138 46,339 (1,318) 1,934,159
Tax-exempt bonds:
State and municipal
obligations 4,339,341 102,702 (36,889) 4,405,154
Total $14,103,518 $359,673 $(82,396) $14,380,795
Gross Gross
Amortized Unrealized Unrealized Fair
In thousands Cost Gains Losses Value
As of December 31, 2000
Taxable bonds:
United States
Treasury and
government agency $ 678,619 $ 35,292 $ (1,657) $ 712,254
Corporate and
other obligations 5,546,960 73,564 (68,706) 5,551,818
Mortgage-backed 1,956,200 26,857 (4,396) 1,978,661
Tax-exempt bonds:
State and municipal
obligations 3,754,976 127,916 (12,286) 3,870,606
Total $11,936,755 $263,629 $ (87,045) $12,113,339
NOTES TO CONSOLIDATED FINANCIAL STATEMENTS
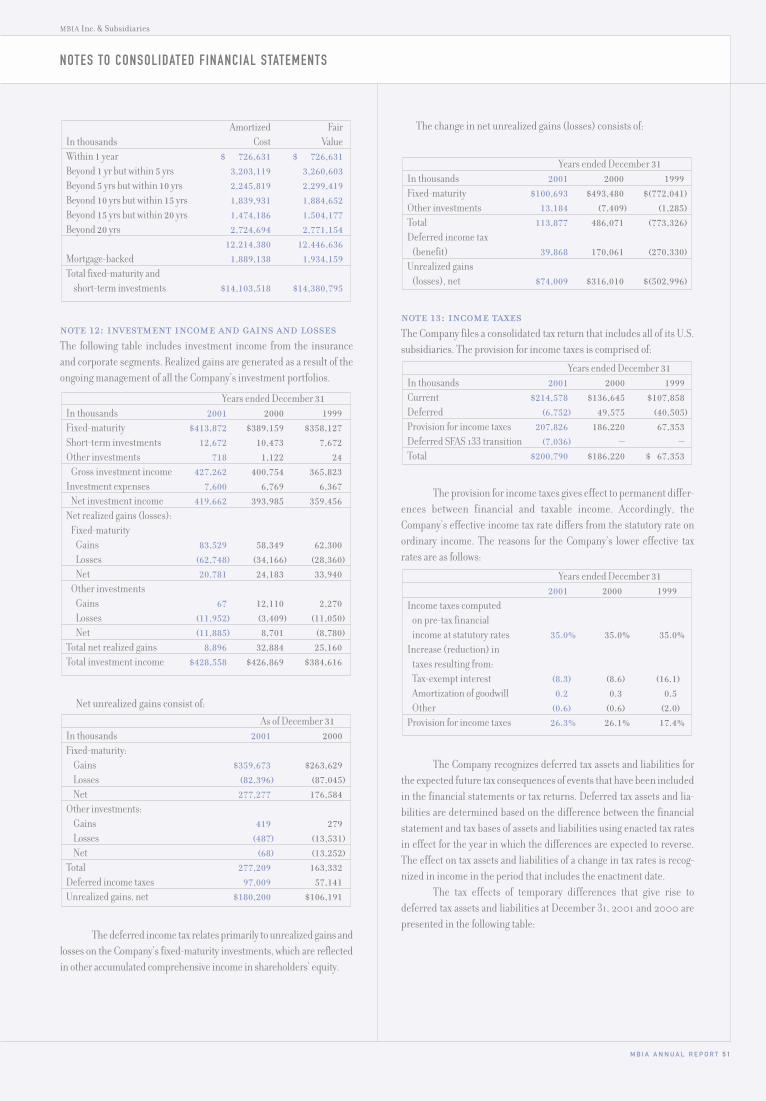
M B I A A N N U A L R E P O R T 5 1
MBIA Inc. & Subsidiaries
note 12: investment income and gains and lossesThe following table includes investment income from the insurance
and corporate segments. Realized gains are generated as a result of the
ongoing management of all the Company’s investment portfolios.
Net unrealized gains consist of:
The deferred income tax relates primarily to unrealized gains and
losses on the Company’s fixed-maturity investments, which are reflected
in other accumulated comprehensive income in shareholders’ equity.
As of December 31
In thousands 2001 2000
Fixed-maturity:
Gains $359,673 $263,629
Losses (82,396) (87,045)
Net 277,277 176,584
Other investments:
Gains 419 279
Losses (487) (13,531)
Net (68) (13,252)
Total 277,209 163,332
Deferred income taxes 97,009 57,141
Unrealized gains, net $180,200 $106,191
Years ended December 31
In thousands 2001 2000 1999
Fixed-maturity $413,872 $389,159 $358,127
Short-term investments 12,672 10,473 7,672
Other investments 718 1,122 24
Gross investment income 427,262 400,754 365,823
Investment expenses 7,600 6,769 6,367
Net investment income 419,662 393,985 359,456
Net realized gains (losses):
Fixed-maturity
Gains 83,529 58,349 62,300
Losses (62,748) (34,166) (28,360)
Net 20,781 24,183 33,940
Other investments
Gains 67 12,110 2,270
Losses (11,952) (3,409) (11,050)
Net (11,885) 8,701 (8,780)
Total net realized gains 8,896 32,884 25,160
Total investment income $428,558 $426,869 $384,616
Amortized Fair
In thousands Cost Value
Within 1 year $ 726,631 $ 726,631
Beyond 1 yr but within 5 yrs 3,203,119 3,260,603
Beyond 5 yrs but within 10 yrs 2,245,819 2,299,419
Beyond 10 yrs but within 15 yrs 1,839,931 1,884,652
Beyond 15 yrs but within 20 yrs 1,474,186 1,504,177
Beyond 20 yrs 2,724,694 2,771,154
12,214,380 12,446,636
Mortgage-backed 1,889,138 1,934,159
Total fixed-maturity and
short-term investments $14,103,518 $14,380,795
The change in net unrealized gains (losses) consists of:
note 13: income taxesThe Company files a consolidated tax return that includes all of its U.S.
subsidiaries. The provision for income taxes is comprised of:
The provision for income taxes gives effect to permanent differ-
ences between financial and taxable income. Accordingly, the
Company’s effective income tax rate differs from the statutory rate on
ordinary income. The reasons for the Company’s lower effective tax
rates are as follows:
The Company recognizes deferred tax assets and liabilities for
the expected future tax consequences of events that have been included
in the financial statements or tax returns. Deferred tax assets and lia-
bilities are determined based on the difference between the financial
statement and tax bases of assets and liabilities using enacted tax rates
in effect for the year in which the differences are expected to reverse.
The effect on tax assets and liabilities of a change in tax rates is recog-
nized in income in the period that includes the enactment date.
The tax effects of temporary differences that give rise to
deferred tax assets and liabilities at December 31, 2001 and 2000 are
presented in the following table:
Years ended December 31
2001 2000 1999
Income taxes computed
on pre-tax financial
income at statutory rates 35.0% 35.0% 35.0%
Increase (reduction) in
taxes resulting from:
Tax-exempt interest (8.3) (8.6) (16.1)
Amortization of goodwill 0.2 0.3 0.5
Other (0.6) (0.6) (2.0)
Provision for income taxes 26.3% 26.1% 17.4%
Years ended December 31
In thousands 2001 2000 1999
Current $214,578 $136,645 $107,858
Deferred (6,752) 49,575 (40,505)
Provision for income taxes 207,826 186,220 67,353
Deferred SFAS 133 transition (7,036) — —
Total $200,790 $186,220 $ 67,353
Years ended December 31
In thousands 2001 2000 1999
Fixed-maturity $100,693 $493,480 $(772,041)
Other investments 13,184 (7,409) (1,285)
Total 113,877 486,071 (773,326)
Deferred income tax
(benefit) 39,868 170,061 (270,330)
Unrealized gains
(losses), net $74,009 $316,010 $(502,996)
NOTES TO CONSOLIDATED FINANCIAL STATEMENTS
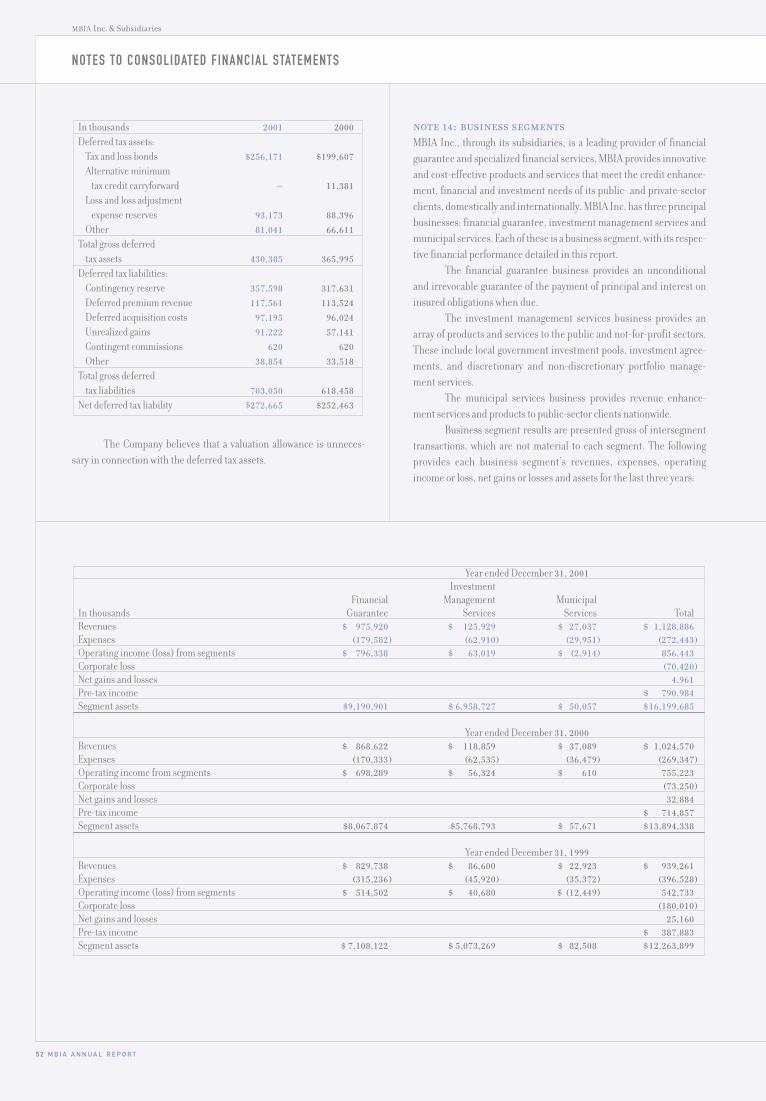
5 2 M B I A A N N U A L R E P O R T
MBIA Inc. & Subsidiaries
NOTES TO CONSOLIDATED FINANCIAL STATEMENTS
The Company believes that a valuation allowance is unneces-
sary in connection with the deferred tax assets.
In thousands 2001 2000
Deferred tax assets:
Tax and loss bonds $256,171 $199,607
Alternative minimum
tax credit carryforward — 11,381
Loss and loss adjustment
expense reserves 93,173 88,396
Other 81,041 66,611
Total gross deferred
tax assets 430,385 365,995
Deferred tax liabilities:
Contingency reserve 357,598 317,631
Deferred premium revenue 117,561 113,524
Deferred acquisition costs 97,195 96,024
Unrealized gains 91,222 57,141
Contingent commissions 620 620
Other 38,854 33,518
Total gross deferred
tax liabilities 703,050 618,458
Net deferred tax liability $272,665 $252,463
Year ended December 31, 2001Investment
Financial Management MunicipalIn thousands Guarantee Services Services TotalRevenues $ 975,920 $ 125,929 $ 27,037 $ 1,128,886Expenses (179,582) (62,910) (29,951) (272,443)Operating income (loss) from segments $ 796,338 $ 63,019 $ (2,914) 856,443Corporate loss (70,420)Net gains and losses 4,961Pre-tax income $ 790,984Segment assets $9,190,901 $ 6,958,727 $ 50,057 $16,199,685
Year ended December 31, 2000Revenues $ 868,622 $ 118,859 $ 37,089 $ 1,024,570Expenses (170,333) (62,535) (36,479) (269,347)Operating income from segments $ 698,289 $ 56,324 $ 610 755,223Corporate loss (73,250)Net gains and losses 32,884Pre-tax income $ 714,857Segment assets $8,067,874 $5,768,793 $ 57,671 $13,894,338
Year ended December 31, 1999Revenues $ 829,738 $ 86,600 $ 22,923 $ 939,261Expenses (315,236) (45,920) (35,372) (396,528)Operating income (loss) from segments $ 514,502 $ 40,680 $ (12,449) 542,733Corporate loss (180,010)Net gains and losses 25,160Pre-tax income $ 387,883Segment assets $ 7,108,122 $ 5,073,269 $ 82,508 $12,263,899
note 14: business segmentsMBIA Inc., through its subsidiaries, is a leading provider of financial
guarantee and specialized financial services. MBIA provides innovative
and cost-effective products and services that meet the credit enhance-
ment, financial and investment needs of its public- and private-sector
clients, domestically and internationally. MBIA Inc. has three principal
businesses: financial guarantee, investment management services and
municipal services. Each of these is a business segment, with its respec-
tive financial performance detailed in this report.
The financial guarantee business provides an unconditional
and irrevocable guarantee of the payment of principal and interest on
insured obligations when due.
The investment management services business provides an
array of products and services to the public and not-for-profit sectors.
These include local government investment pools, investment agree-
ments, and discretionary and non-discretionary portfolio manage-
ment services.
The municipal services business provides revenue enhance-
ment services and products to public-sector clients nationwide.
Business segment results are presented gross of intersegment
transactions, which are not material to each segment. The following
provides each business segment’s revenues, expenses, operating
income or loss, net gains or losses and assets for the last three years:

M B I A A N N U A L R E P O R T 5 3
MBIA Inc. & Subsidiaries
For 2001, 2000 and 1999 premiums earned in the United
States were $443 million, $380 million and $391 million, respectively.
For 2001, 2000, and 1999 premiums earned outside the United States
were $81 million, $66 million, and $52 million, respectively.
note 15: stock splitOn March 15, 2001 the Company’s board of directors approved a three-
for-two stock split by means of a stock dividend. The three-for-two stock
split was accomplished through a stock dividend distributed on April 20,
2001 to shareholders of record on April 2, 2001. All references to the
number of common shares, except shares authorized, and to the per
share information in the consolidated financial statements and related
notes, have been adjusted to reflect the stock split on a retroactive basis.
note 16: dividends and capital requirementsUnder New York State insurance law, without prior approval of the
superintendent of the state insurance department, financial guarantee
insurance companies can pay dividends from earned surplus subject to
retaining a minimum capital requirement. In the Company’s case, div-
idends in any 12-month period cannot be greater than 10% of policy-
holders’ surplus as shown on MBIA Corp.’s latest filed statutory
financial statements. In 2001, MBIA Corp. declared and paid dividends
of $212 million and based upon the filing of our 2001 statutory financial
statements had dividend capacity of $73 million without special regula-
tory approval.
The insurance departments of New York State and certain other
statutory insurance regulatory authorities, and the agencies that rate
the bonds insured by MBIA Corp. and its subsidiaries, have various
requirements relating to the maintenance of certain minimum ratios of
statutory capital and reserves to net insurance in force. MBIA Corp. and
its subsidiaries were in compliance with these requirements as of
December 31, 2001.
note 17: stock repurchase planIn the third quarter of 1999, the Company began acquiring shares of its
common stock in connection with its stock repurchase plan announced
in August 1999. The plan authorizes the Company to repurchase up to
11.25 million of its outstanding common shares. During 2001, 2000
and 1999, the Company purchased 0.2 million, 2.5 million and 0.7 mil-
lion shares of common stock at an aggregate cost of $7.8 million, $77.7
million and $24.7 million, respectively. The Company will only repur-
chase shares under this program when it is economically attractive and
within rating agency constraints, including the Triple-A claims-paying
ratings of MBIA Corp.
note 18: long-term debt and lines of creditLong-term debt consists of:
* These notes bear interest at three-month LIBOR plus a fixed spread. The current interestrate in effect is 2.850%
** Callable 10/2002 @ 103.99*** Callable 11/2003 @ 100.00**** Callable 12/2005 @100.00
The Company’s long-term debt is subject to certain covenants,
none of which significantly restricts the Company’s operating activities
or dividend-paying ability.
In December 2000, MBIA issued unsecured bonds denomi-
nated in Swiss Francs. The principal amount of 175 million Swiss
Francs is due June 15, 2010 and accrues interest at a rate of 4.50%,
which is paid annually. These bonds are not redeemable prior to matu-
rity, except in the event of certain changes involving taxation in the
United States or the imposition of certain certification, identification
or reporting requirements.
Simultaneous with the issuance of this debt, MBIA entered into
a swap transaction, which has met the criteria for cash flow hedge
accounting and effectively converts the interest rate from the fixed
Swiss Franc debt rate of 4.5 % to a fixed U.S. dollar rate of 7.56%, and
converts the principal obligation to a U.S. dollar liability at maturity of
approximately $99.3 million.
In May 2000 MBIA entered into a swap transaction that is des-
ignated as a fair value hedge of its 8.2% Debentures due 2022. Through
this transaction, MBIA effectively swapped fixed-rate debt to variable-
rate debt. This transaction can be cancelled at the option of the coun-
terparty on or after October 2002. In May of 2001 MBIA entered into a
similar swap transaction that has been designated as a fair value hedge
of its 6.95% Senior Quarterly Income Debt Securities (QUIDs) due
2038. This transaction can be cancelled at the option of the counter-
party on or after November 2003.
Aggregate maturities of long-term obligations as of December
31, 2001 for each of the next five years commencing in 2002 are:
After
In thousands 2002 2003 2004 2005 2006 Total
$3,750 — — — $787,953 $791,703
As of December 31
In thousands 2001 2000
7.520% Notes due 2001-2002 $ 3,750 $ 7,500
9.000% Notes due 2001 — 100,000
2.850% Notes due 2008* 7,550 7,550
9.375% Notes due 2011 100,000 100,000
8.200% Debentures due 2022** 100,000 100,000
7.000% Debentures due 2025 75,000 75,000
7.150% Debentures due 2027 100,000 100,000
6.625% Debentures due 2028 150,000 150,000
6.950% Notes due 2038*** 50,000 50,000
7.560% Notes due 2010 105,403 108,648
8.000% Notes due 2040**** 100,000 100,000
791,703 898,698
Less current portion 3,750 103,750
Less unamortized discount 707 760
Plus unamortized premium 913 914
Plus fair value adjustment 16,903 —
Total $805,062 $795,102
NOTES TO CONSOLIDATED FINANCIAL STATEMENTS
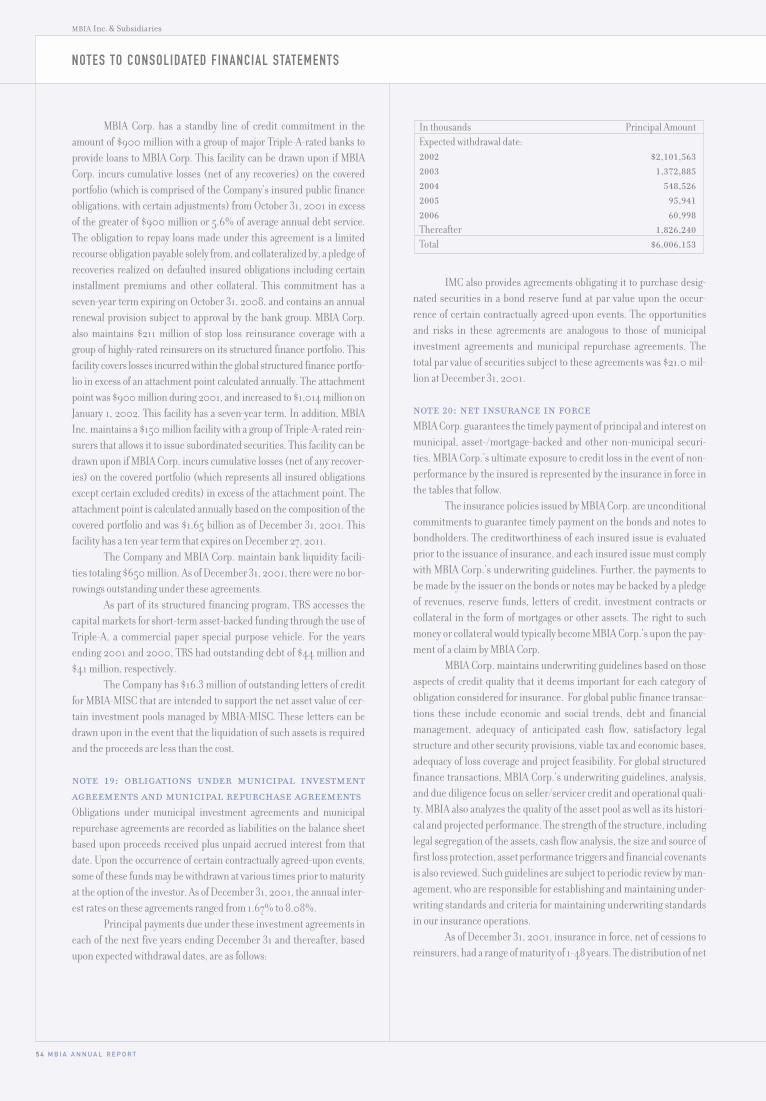
5 4 M B I A A N N U A L R E P O R T
MBIA Inc. & Subsidiaries
MBIA Corp. has a standby line of credit commitment in the
amount of $900 million with a group of major Triple-A-rated banks to
provide loans to MBIA Corp. This facility can be drawn upon if MBIA
Corp. incurs cumulative losses (net of any recoveries) on the covered
portfolio (which is comprised of the Company’s insured public finance
obligations, with certain adjustments) from October 31, 2001 in excess
of the greater of $900 million or 5.6% of average annual debt service.
The obligation to repay loans made under this agreement is a limited
recourse obligation payable solely from, and collateralized by, a pledge of
recoveries realized on defaulted insured obligations including certain
installment premiums and other collateral. This commitment has a
seven-year term expiring on October 31, 2008, and contains an annual
renewal provision subject to approval by the bank group. MBIA Corp.
also maintains $211 million of stop loss reinsurance coverage with a
group of highly-rated reinsurers on its structured finance portfolio. This
facility covers losses incurred within the global structured finance portfo-
lio in excess of an attachment point calculated annually. The attachment
point was $900 million during 2001, and increased to $1,014 million on
January 1, 2002. This facility has a seven-year term. In addition, MBIA
Inc. maintains a $150 million facility with a group of Triple-A-rated rein-
surers that allows it to issue subordinated securities. This facility can be
drawn upon if MBIA Corp. incurs cumulative losses (net of any recover-
ies) on the covered portfolio (which represents all insured obligations
except certain excluded credits) in excess of the attachment point. The
attachment point is calculated annually based on the composition of the
covered portfolio and was $1.65 billion as of December 31, 2001. This
facility has a ten-year term that expires on December 27, 2011.
The Company and MBIA Corp. maintain bank liquidity facili-
ties totaling $650 million. As of December 31, 2001, there were no bor-
rowings outstanding under these agreements.
As part of its structured financing program, TRS accesses the
capital markets for short-term asset-backed funding through the use of
Triple-A, a commercial paper special purpose vehicle. For the years
ending 2001 and 2000, TRS had outstanding debt of $44 million and
$41 million, respectively.
The Company has $16.3 million of outstanding letters of credit
for MBIA-MISC that are intended to support the net asset value of cer-
tain investment pools managed by MBIA-MISC. These letters can be
drawn upon in the event that the liquidation of such assets is required
and the proceeds are less than the cost.
note 19: obligations under municipal investmentagreements and municipal repurchase agreementsObligations under municipal investment agreements and municipal
repurchase agreements are recorded as liabilities on the balance sheet
based upon proceeds received plus unpaid accrued interest from that
date. Upon the occurrence of certain contractually agreed-upon events,
some of these funds may be withdrawn at various times prior to maturity
at the option of the investor. As of December 31, 2001, the annual inter-
est rates on these agreements ranged from 1.67% to 8.08%.
Principal payments due under these investment agreements in
each of the next five years ending December 31 and thereafter, based
upon expected withdrawal dates, are as follows:
IMC also provides agreements obligating it to purchase desig-
nated securities in a bond reserve fund at par value upon the occur-
rence of certain contractually agreed-upon events. The opportunities
and risks in these agreements are analogous to those of municipal
investment agreements and municipal repurchase agreements. The
total par value of securities subject to these agreements was $21.0 mil-
lion at December 31, 2001.
note 20: net insurance in forceMBIA Corp. guarantees the timely payment of principal and interest on
municipal, asset-/mortgage-backed and other non-municipal securi-
ties. MBIA Corp.’s ultimate exposure to credit loss in the event of non-
performance by the insured is represented by the insurance in force in
the tables that follow.
The insurance policies issued by MBIA Corp. are unconditional
commitments to guarantee timely payment on the bonds and notes to
bondholders. The creditworthiness of each insured issue is evaluated
prior to the issuance of insurance, and each insured issue must comply
with MBIA Corp.’s underwriting guidelines. Further, the payments to
be made by the issuer on the bonds or notes may be backed by a pledge
of revenues, reserve funds, letters of credit, investment contracts or
collateral in the form of mortgages or other assets. The right to such
money or collateral would typically become MBIA Corp.’s upon the pay-
ment of a claim by MBIA Corp.
MBIA Corp. maintains underwriting guidelines based on those
aspects of credit quality that it deems important for each category of
obligation considered for insurance. For global public finance transac-
tions these include economic and social trends, debt and financial
management, adequacy of anticipated cash flow, satisfactory legal
structure and other security provisions, viable tax and economic bases,
adequacy of loss coverage and project feasibility. For global structured
finance transactions, MBIA Corp.’s underwriting guidelines, analysis,
and due diligence focus on seller/servicer credit and operational quali-
ty. MBIA also analyzes the quality of the asset pool as well as its histori-
cal and projected performance. The strength of the structure, including
legal segregation of the assets, cash flow analysis, the size and source of
first loss protection, asset performance triggers and financial covenants
is also reviewed. Such guidelines are subject to periodic review by man-
agement, who are responsible for establishing and maintaining under-
writing standards and criteria for maintaining underwriting standards
in our insurance operations.
As of December 31, 2001, insurance in force, net of cessions to
reinsurers, had a range of maturity of 1-48 years. The distribution of net
In thousands Principal Amount
Expected withdrawal date:
2002 $2,101,563
2003 1,372,885
2004 548,526
2005 95,941
2006 60,998
Thereafter 1,826,240
Total $6,006,153
NOTES TO CONSOLIDATED FINANCIAL STATEMENTS

M B I A A N N U A L R E P O R T 5 5
MBIA Inc. & Subsidiaries
insurance in force by geographic location, excluding $6.7 billion and
$5.4 billion relating to IMC municipal investment agreements guaran-
teed by MBIA Corp. in 2001 and 2000, respectively, is set forth in the
following table:
The net insurance in force by type of bond is set forth in the table below.
As of December 31
2001 2000
Net % of Net Net % of Net
In billions Insurance Insurance Insurance Insurance
Bond Type In Force In Force In Force In Force
Global Public Finance:
United States
General obligation $165.3 22.9% $152.5 22.4%
Utilities 84.2 11.7 79.0 11.6
Special revenue 67.0 9.3 61.4 9.0
Health care 64.7 8.9 68.3 10.0
Transportation 47.4 6.6 48.7 7.2
Investor-owned utilities 36.9 5.1 36.1 5.3
Higher education 31.3 4.3 29.0 4.3
Housing 27.7 3.8 24.4 3.6
Total United States 524.5 72.6 499.4 73.4
Non-United States
Investor-owned utilities 3.8 0.5 2.8 0.4
Utilities 3.5 0.5 1.1 0.2
Sovereign 3.1 0.4 2.7 0.4
Transportation 2.4 0.3 1.6 0.2
Sub-sovereign 1.1 0.2 1.0 0.1
Health care 0.8 0.1 0.6 0.1
Housing 0.6 0.1 0.7 0.1
Higher education 0.1 — 0.1 —
Total Non-United States 15.4 2.1 10.6 1.5
Total Global
Public Finance 539.9 74.7 510.0 74.9
As of December 31
2001 2000
Net % of Net Net % of Net
In billions Insurance Insurance Insurance Insurance
Geographic Location In Force In Force In Force In Force
California $ 86.0 11.9% $ 80.0 11.8%
New York 68.6 9.5 71.1 10.4
Florida 36.1 5.0 35.7 5.3
Texas 30.1 4.2 26.7 3.9
New Jersey 26.9 3.7 26.0 3.8
Illinois 23.9 3.3 22.6 3.3
Pennsylvania 23.0 3.2 24.5 3.6
Massachusetts 21.8 3.0 20.5 3.0
Michigan 16.0 2.2 14.8 2.2
Ohio 13.9 1.9 13.5 2.0
Subtotal 346.3 47.9 335.4 49.3
Nationally diversified 128.2 17.8 117.2 17.2
Other states 190.1 26.3 180.4 26.5
Total United States 664.6 92.0 633.0 93.0
Internationally
diversified 25.2 3.5 20.7 3.0
Country specific 32.6 4.5 27.2 4.0
Total Non-United States 57.8 8.0 47.9 7.0
Total $722.4 100.0% $680.9 100.0%
(continued)
note 21: reinsuranceMBIA Corp. reinsures exposure to other insurance companies under
various treaty and facultative reinsurance contracts, both on a pro rata
and non-proportional basis. In the event that any or all of the reinsurers
were unable to meet their obligations, MBIA Corp. would be liable for
such defaulted amounts.
Amounts deducted from gross insurance in force for reinsur-
ance ceded by MBIA Corp. and its subsidiaries were $153.9 billion and
$143.3 billion at December 31, 2001 and 2000, respectively. The dis-
tribution of ceded insurance in force by geographic location and type of
bond is set forth in the following tables:
As of December 31
2001 2000
Net % of Net Net % of Net
In billions Insurance Insurance Insurance Insurance
Bond Type In Force In Force In Force In Force
Global Structured Finance:
United States
Mortgage-backed:
Home equity 29.6 4.1 37.3 5.5
Other 13.0 1.8 20.1 3.0
First mortgage 9.0 1.3 8.0 1.2
Asset-backed:
Credit cards 18.7 2.6 17.3 2.5
Auto 18.1 2.5 14.5 2.1
Other 7.5 1.0 7.0 1.0
Leasing 7.0 1.0 5.5 0.8
Corporate debt
obligations 21.1 2.9 11.8 1.7
Pooled Corp. obligations
& other 11.6 1.6 8.5 1.3
Financial risk 4.5 0.6 5.0 0.7
Total United States 140.1 19.4 135.0 19.8
Non-United States
Corporate debt
obligations 22.9 3.2 20.7 3.0
Pooled Corp. obligations
& other 9.1 1.3 5.7 0.8
Mortgage-backed:
First mortgage 4.6 0.6 3.8 0.6
Other 0.7 0.1 0.2 —
Home equity 0.5 0.1 0.4 0.1
Financial risk 3.1 0.4 3.4 0.5
Asset-backed 1.5 0.2 1.7 0.3
Total Non-United States 42.4 5.9 35.9 5.3
Total Global
Structured Finance 182.5 25.3 170.9 25.1
Total $722.4 100.0% $680.9 100.0%
NOTES TO CONSOLIDATED FINANCIAL STATEMENTS
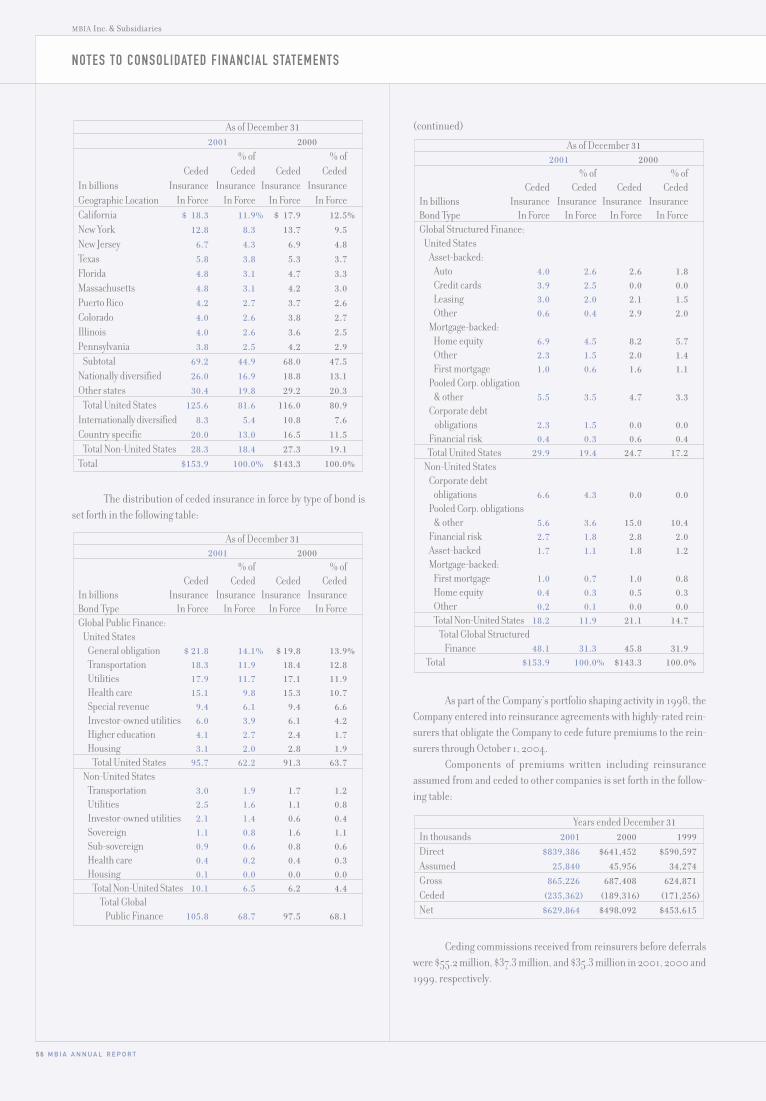
5 6 M B I A A N N U A L R E P O R T
MBIA Inc. & Subsidiaries
The distribution of ceded insurance in force by type of bond is
set forth in the following table:
As of December 312001 2000
% of % ofCeded Ceded Ceded Ceded
In billions Insurance Insurance Insurance InsuranceBond Type In Force In Force In Force In ForceGlobal Public Finance:
United StatesGeneral obligation $ 21.8 14.1% $ 19.8 13.9%Transportation 18.3 11.9 18.4 12.8Utilities 17.9 11.7 17.1 11.9Health care 15.1 9.8 15.3 10.7Special revenue 9.4 6.1 9.4 6.6Investor-owned utilities 6.0 3.9 6.1 4.2Higher education 4.1 2.7 2.4 1.7Housing 3.1 2.0 2.8 1.9
Total United States 95.7 62.2 91.3 63.7Non-United States
Transportation 3.0 1.9 1.7 1.2Utilities 2.5 1.6 1.1 0.8Investor-owned utilities 2.1 1.4 0.6 0.4Sovereign 1.1 0.8 1.6 1.1Sub-sovereign 0.9 0.6 0.8 0.6Health care 0.4 0.2 0.4 0.3Housing 0.1 0.0 0.0 0.0
Total Non-United States 10.1 6.5 6.2 4.4Total Global
Public Finance 105.8 68.7 97.5 68.1
As of December 31
2001 2000
% of % of
Ceded Ceded Ceded Ceded
In billions Insurance Insurance Insurance Insurance
Geographic Location In Force In Force In Force In Force
California $ 18.3 11.9% $ 17.9 12.5%
New York 12.8 8.3 13.7 9.5
New Jersey 6.7 4.3 6.9 4.8
Texas 5.8 3.8 5.3 3.7
Florida 4.8 3.1 4.7 3.3
Massachusetts 4.8 3.1 4.2 3.0
Puerto Rico 4.2 2.7 3.7 2.6
Colorado 4.0 2.6 3.8 2.7
Illinois 4.0 2.6 3.6 2.5
Pennsylvania 3.8 2.5 4.2 2.9
Subtotal 69.2 44.9 68.0 47.5
Nationally diversified 26.0 16.9 18.8 13.1
Other states 30.4 19.8 29.2 20.3
Total United States 125.6 81.6 116.0 80.9
Internationally diversified 8.3 5.4 10.8 7.6
Country specific 20.0 13.0 16.5 11.5
Total Non-United States 28.3 18.4 27.3 19.1
Total $153.9 100.0% $143.3 100.0%
(continued)
As part of the Company’s portfolio shaping activity in 1998, the
Company entered into reinsurance agreements with highly-rated rein-
surers that obligate the Company to cede future premiums to the rein-
surers through October 1, 2004.
Components of premiums written including reinsurance
assumed from and ceded to other companies is set forth in the follow-
ing table:
Ceding commissions received from reinsurers before deferrals
were $55.2 million, $37.3 million, and $35.3 million in 2001, 2000 and
1999, respectively.
Years ended December 31
In thousands 2001 2000 1999
Direct $839,386 $641,452 $590,597
Assumed 25,840 45,956 34,274
Gross 865,226 687,408 624,871
Ceded (235,362) (189,316) (171,256)
Net $629,864 $498,092 $453,615
As of December 312001 2000
% of % ofCeded Ceded Ceded Ceded
In billions Insurance Insurance Insurance InsuranceBond Type In Force In Force In Force In ForceGlobal Structured Finance:
United StatesAsset-backed:
Auto 4.0 2.6 2.6 1.8Credit cards 3.9 2.5 0.0 0.0Leasing 3.0 2.0 2.1 1.5Other 0.6 0.4 2.9 2.0
Mortgage-backed:Home equity 6.9 4.5 8.2 5.7Other 2.3 1.5 2.0 1.4First mortgage 1.0 0.6 1.6 1.1
Pooled Corp. obligation & other 5.5 3.5 4.7 3.3
Corporate debt obligations 2.3 1.5 0.0 0.0
Financial risk 0.4 0.3 0.6 0.4Total United States 29.9 19.4 24.7 17.2
Non-United StatesCorporate debt
obligations 6.6 4.3 0.0 0.0Pooled Corp. obligations
& other 5.6 3.6 15.0 10.4Financial risk 2.7 1.8 2.8 2.0Asset-backed 1.7 1.1 1.8 1.2Mortgage-backed:
First mortgage 1.0 0.7 1.0 0.8Home equity 0.4 0.3 0.5 0.3Other 0.2 0.1 0.0 0.0Total Non-United States 18.2 11.9 21.1 14.7
Total Global StructuredFinance 48.1 31.3 45.8 31.9
Total $153.9 100.0% $143.3 100.0%
NOTES TO CONSOLIDATED FINANCIAL STATEMENTS
M B I A A N N U A L R E P O R T 5 7
MBIA Inc. & Subsidiaries
note 22: pension and profit-sharing plansThe Company has a non-contributory, defined contribution pension
plan to which the Company contributes 10% of each eligible employee’s
annual total compensation. Pension contributions vest over a five-year
period with 60% vesting after three years and 20% in years four and
five. Pension expense for the years ended December 31, 2001, 2000
and 1999 was $7.4 million, $7.8 million and $7.8 million, respectively.
The Company also has a profit-sharing/401(k) plan. The plan
is a voluntary contributory plan that allows eligible employees to defer
compensation for federal income tax purposes under Section 401(k)
of the Internal Revenue Code of 1986, as amended. Employees may
contribute through payroll deductions up to 10% of eligible compen-
sation. The Company matches employee contributions up to the first
5% of total compensation with MBIA common stock. The Company’s
contributions vest over five years with 60% vesting after three years
and then 20% in years four and five. Generally, a participating
employee is entitled to distributions from the plan upon termination
of employment, retirement, death or disability. Participants who qual-
ify for distribution may receive a single lump sum, transfer the assets
to another qualified plan or individual retirement account, or receive
a series of specified installment payments. Company contributions to
the profit-sharing/401(k) plan aggregated $3.1 million, $2.8 million
and $4.2 million for the years ended December 31, 2001, 2000 and
1999, respectively.
Amounts relating to the above plans that exceed limitations
established by federal regulations are contributed to a non-qualified
deferred compensation plan. These non-qualified contributions are
included in the above stated pension and profit-sharing/401(k) match
amounts and totaled $3.0 million, $2.6 million and $2.5 million for the
pension plan, and $1.8 million, $1.5 million and $1.7 million for the profit-
sharing/401(k) plan for the years ending December 31, 2001, 2000 and
1999, respectively. Starting in 1999 former CapMAC and 1838 employees
were covered under the Company’s pension and profit-sharing plans.
note 23: long-term incentive plansOn May 11, 2000, the Company’s shareholders approved the 2000
Stock Option Plan (the 2000 plan). The 2000 plan superceded the
Company’s 1987 plan, and shares available for grant under the 1987
plan were cancelled and are no longer available for grant. Options pre-
viously granted under the 1987 plan will remain outstanding in accor-
dance with their terms and with the terms of the plan. The 2000 plan
enables key employees of the Company and its subsidiaries to acquire
shares of common stock of the Company or to benefit from appreciation
in the price of the common stock of the Company. Options granted will
either be Incentive Stock Options (ISOs), where they qualify under
Section 422(a) of the Internal Revenue Code, or Non-Qualified Stock
Options (NQSOs).
ISOs and NQSOs are granted at a price not less than 100% of
the fair value, defined as closing price, of the Company’s common stock
as determined on the date granted. Options are exercisable as specified
at the time of grant and expire ten years from the date of grant (or short-
er if specified or following termination of employment).
The board of directors of the Company has authorized a maxi-
mum of 7,350,000 shares of the Company’s common stock to be grant-
ed as options under the 2000 plan. As of December 31, 2001, 1,892,758
options had been granted under the 2000 plan, net of expirations and
cancellations, leaving the total available for future grants at 5,457,242.
The stock option grants, which may continue to be awarded
every year, provide the right to purchase shares of common stock at the
fair value of the stock on the date of the grant. In 2001, 1,265,374
options were awarded under the 2000 plan. These options vest over
four or five years depending on the level of the recipient. Prior option
grants are not taken into account in determining the number of options
granted in any year.
In December 1995, the MBIA Inc. Board of Directors approved
the “MBIA Long-Term Incentive Program” (the incentive program).
The incentive program includes a stock option component and a com-
pensation component linked to the growth in book value per share,
including certain adjustments, of the Company’s stock (modified book
value) over a three-year period following the grant date. Target levels for
the incentive program awards are established as a percentage of total
salary and bonus, based upon the recipient’s position. Awards under
the incentive program typically are granted from the vice president
level up to and including the Chairman and Chief Executive Officer.
Actual amounts to be paid are adjusted upward or downward depending
on the growth of modified book value versus a baseline target, with a
minimum growth of 8% necessary to receive any payment and an 18%
growth necessary to receive the maximum payment. Awards under the
incentive program are divided equally between the two components,
with 50% of the award to be given in stock options and 50% of the
award to be paid in cash or shares of Company stock. Payments are
made at the end of each three-year measurement period. During 2001,
2000 and 1999, $17.0 million, $13.6 million and $8.5 million, respec-
tively, were recorded as a charge related to these awards.
In December 1995, the Company adopted a restricted stock
program whereby key executive officers are granted restricted shares of
the Company’s common stock. These stock awards may only be sold
three, four or five years from the date of grant, at which time the awards
fully vest.
In 2001 and 2000, respectively, 57,410 and 114,768 restricted
shares (net of canceled shares) of the Company’s common stock were
granted to certain officers of the Company. The fair value of the shares
awarded (net of cancellations) in 2001 and 2000, determined on the
grant date, was $3.1 million and $5.3 million, respectively, which has
been recorded as “Unearned compensation-restricted stock” and is
shown as a separate component of shareholders’ equity. Unearned
compensation is amortized to expense over the appropriate three- to
five-year vesting period. Compensation expense related to the restrict-
ed stock was $2.9 million, $4.2 million, and $1.9 million for the years
ended December 31, 2001, 2000 and 1999, respectively.
In 1992, CapMAC adopted an Employee Stock Ownership Plan
(ESOP) to provide its employees the opportunity to obtain beneficial
interests in the stock of CapMAC through a trust (the ESOP Trust). The
ESOP Trust purchased 525,938 shares of the Company’s stock. The
ESOP Trust financed its purchase of common stock with a loan from the
Company in the amount of $10 million. An amount representing
unearned employee compensation, equivalent in value to the unpaid
balance of the ESOP loan, is recorded as “Unallocated ESOP shares” and
is shown as a separate component of shareholders’ equity.
NOTES TO CONSOLIDATED FINANCIAL STATEMENTS
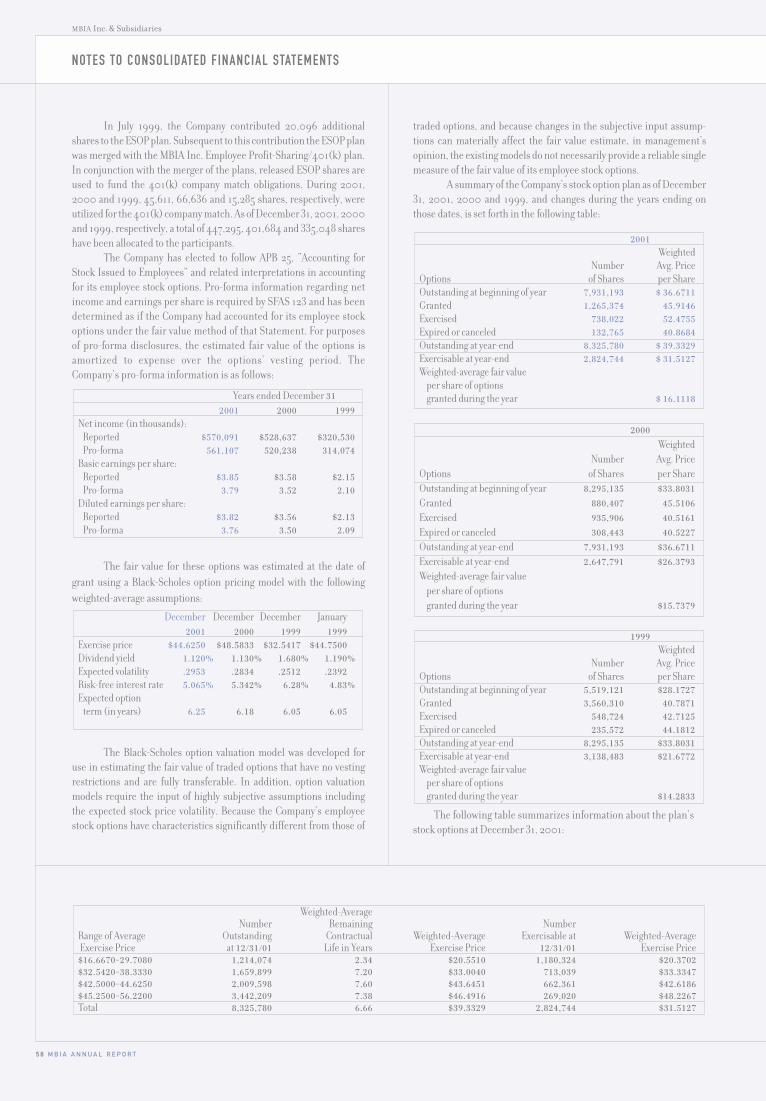
5 8 M B I A A N N U A L R E P O R T
MBIA Inc. & Subsidiaries
In July 1999, the Company contributed 20,096 additionalshares to the ESOP plan. Subsequent to this contribution the ESOP planwas merged with the MBIA Inc. Employee Profit-Sharing/401(k) plan.In conjunction with the merger of the plans, released ESOP shares areused to fund the 401(k) company match obligations. During 2001,2000 and 1999, 45,611, 66,636 and 15,285 shares, respectively, wereutilized for the 401(k) company match. As of December 31, 2001, 2000and 1999, respectively, a total of 447,295, 401,684 and 335,048 shareshave been allocated to the participants.
The Company has elected to follow APB 25, “Accounting forStock Issued to Employees” and related interpretations in accountingfor its employee stock options. Pro-forma information regarding netincome and earnings per share is required by SFAS 123 and has beendetermined as if the Company had accounted for its employee stockoptions under the fair value method of that Statement. For purposesof pro-forma disclosures, the estimated fair value of the options isamortized to expense over the options’ vesting period. TheCompany’s pro-forma information is as follows:
The fair value for these options was estimated at the date of
grant using a Black-Scholes option pricing model with the following
weighted-average assumptions:
The Black-Scholes option valuation model was developed foruse in estimating the fair value of traded options that have no vestingrestrictions and are fully transferable. In addition, option valuationmodels require the input of highly subjective assumptions includingthe expected stock price volatility. Because the Company’s employeestock options have characteristics significantly different from those of
December December December January
2001 2000 1999 1999Exercise price $44.6250 $48.5833 $32.5417 $44.7500Dividend yield 1.120% 1.130% 1.680% 1.190%Expected volatility .2953 .2834 .2512 .2392Risk-free interest rate 5.065% 5.342% 6.28% 4.83%Expected option
term (in years) 6.25 6.18 6.05 6.05
Years ended December 31
2001 2000 1999Net income (in thousands):
Reported $570,091 $528,637 $320,530Pro-forma 561,107 520,238 314,074
Basic earnings per share:Reported $3.85 $3.58 $2.15Pro-forma 3.79 3.52 2.10
Diluted earnings per share:Reported $3.82 $3.56 $2.13Pro-forma 3.76 3.50 2.09
traded options, and because changes in the subjective input assump-tions can materially affect the fair value estimate, in management’sopinion, the existing models do not necessarily provide a reliable singlemeasure of the fair value of its employee stock options.
A summary of the Company’s stock option plan as of December31, 2001, 2000 and 1999, and changes during the years ending onthose dates, is set forth in the following table:
The following table summarizes information about the plan’sstock options at December 31, 2001:
1999Weighted
Number Avg. PriceOptions of Shares per ShareOutstanding at beginning of year 5,519,121 $28.1727Granted 3,560,310 40.7871Exercised 548,724 42.7125Expired or canceled 235,572 44.1812Outstanding at year-end 8,295,135 $33.8031Exercisable at year-end 3,138,483 $21.6772Weighted-average fair value
per share of optionsgranted during the year $14.2833
2000
Weighted
Number Avg. Price
Options of Shares per Share
Outstanding at beginning of year 8,295,135 $33.8031
Granted 880,407 45.5106
Exercised 935,906 40.5161
Expired or canceled 308,443 40.5227
Outstanding at year-end 7,931,193 $36.6711
Exercisable at year-end 2,647,791 $26.3793
Weighted-average fair value
per share of options
granted during the year $15.7379
2001Weighted
Number Avg. PriceOptions of Shares per ShareOutstanding at beginning of year 7,931,193 $ 36.6711Granted 1,265,374 45.9146Exercised 738,022 52.4755Expired or canceled 132,765 40.8684Outstanding at year-end 8,325,780 $ 39.3329Exercisable at year-end 2,824,744 $ 31.5127Weighted-average fair value
per share of optionsgranted during the year $ 16.1118
Weighted-AverageNumber Remaining Number
Range of Average Outstanding Contractual Weighted-Average Exercisable at Weighted-AverageExercise Price at 12/31/01 Life in Years Exercise Price 12/31/01 Exercise Price$16.6670-29.7080 1,214,074 2.34 $20.5510 1,180,324 $20.3702$32.5420-38.3330 1,659,899 7.20 $33.0040 713,039 $33.3347$42.5000-44.6250 2,009,598 7.60 $43.6451 662,361 $42.6186$45.2500-56.2200 3,442,209 7.38 $46.4916 269,020 $48.2267Total 8,325,780 6.66 $39.3329 2,824,744 $31.5127
NOTES TO CONSOLIDATED FINANCIAL STATEMENTS

M B I A A N N U A L R E P O R T 5 9
MBIA Inc. & Subsidiaries
note 24: shareholders’ rights planIn December 1991, the board of directors of the Company declared a
dividend distribution of one preferred share purchase right (a Right)
for each outstanding share of the Company’s common stock. Each Right
entitled its holder to purchase from the Company one one-hundredth
of a share of the Company’s Junior Participating Cumulative Preferred
Shares at a price of $160, subject to certain adjustments. Initially, the
Rights were attached to the common stock and were not transferable
separately nor exercisable until the earlier of (i) ten business days fol-
lowing the date of the public announcement by the Company (the
Shares Acquisition Date) that a person or group of persons has acquired
or obtained the right to acquire beneficial ownership of 10% or more of
the outstanding shares of the Company’s common stock, and (ii) ten
business days (or later as may be determined by the board of directors)
after the announcement or commencement of a tender offer or
exchange offer which, if successful, would result in the bidder owning
10% or more of the outstanding shares of the Company’s common
stock. The Shareholders’ Rights Plan expired on December 12, 2001 and
was not renewed by the board. No Rights were exercised under the plan.
note 25: related party transactionsSince 1989, MBIA Corp. has executed five surety bonds to guarantee the
payment obligations of the members of the Association which had their
S&P claims-paying rating downgraded from Triple-A on their previously
issued Association policies. In the event that they do not meet their
Association policy payment obligations, MBIA Corp. will pay the required
amounts directly to the paying agent. The aggregate outstanding exposure
on these surety bonds as of December 31, 2001 is $340 million.
note 26: fair value of financial instrumentsThe estimated fair value amounts of financial instruments shown in the
following table have been determined by the Company using available
market information and appropriate valuation methodologies. However,
in certain cases considerable judgement has been necessarily required
to interpret market data to develop estimates of fair value. Accordingly,
the estimates presented herein are not necessarily indicative of the
amount the Company could realize in a current market exchange. The
use of different market assumptions and/or estimation methodologies
may have a material effect on the estimated fair value amounts.
fixed-maturity securities The fair value of fixed-maturity
securities available-for-sale is based upon quoted market prices, if
available. If a quoted market price is not available, fair value is estimat-
ed using quoted market prices for similar securities.
short-term investments Short-term investments are car-
ried at amortized cost, which approximates fair value.
other investments Other investments include the Company’s
interest in equity-oriented and equity-method investments. The fair
value of these investments is based on quoted market prices.
municipal investment agreement portfolio The munic-
ipal investment agreement portfolio is comprised of fixed-maturity secu-
rities and short-term investments. Its fair value equals the quoted
market prices, if available, of its fixed-maturity securities plus the
amortized cost of its short-term investments which, because of their
short duration, is a reasonable estimate of fair value. If a quoted market
price is not available for a fixed-maturity security, fair value is estimat-
ed using quoted market prices for similar securities.
cash and cash equivalents, receivable for invest-ments sold, short-term debt, and payable forinvestments purchased The carrying amounts of these items
are a reasonable estimate of their fair value.
securities purchased under agreements to resellor borrowed The fair value is estimated based upon the quoted
market prices of the transactions’ underlying collateral.
prepaid reinsurance premiums The fair value of the
Company’s prepaid reinsurance premiums is based on the estimated
cost of entering into an assumption of the entire portfolio with third-
party reinsurers under current market conditions.
deferred premium revenue The fair value of the Company’s
deferred premium revenue is based on the estimated cost of entering
into a cession of the entire portfolio with third-party reinsurers under
current market conditions.
loss and loss adjustment expense reserves The carry-
ing amount is composed of the present value of the expected cash flows
for specifically identified claims combined with an estimate for uniden-
tified claims. Therefore, the carrying amount is a reasonable estimate
of the fair value of the reserve.
long-term debt The fair value is estimated based on the quoted
market prices for the same or similar securities.
municipal investment agreements and municipalrepurchase agreements The fair values of municipal invest-
ment agreements and municipal repurchase agreements are estimated
using discounted cash flow calculations based upon interest rates cur-
rently being offered for similar agreements with maturities consistent
with those remaining for the agreements being valued.
securities sold under agreements to repurchase orloaned The fair value is estimated based upon the quoted market
prices of the transactions’ underlying collateral.
installment premiums The fair value is derived by calculat-
ing the present value of the estimated future cash flow stream dis-
counted at 9%.
derivatives The fair value derived from market information and
appropriate valuation methodologies reflects the estimated amounts
that the Company would receive or pay to terminate the transaction at
the reporting date.
NOTES TO CONSOLIDATED FINANCIAL STATEMENTS
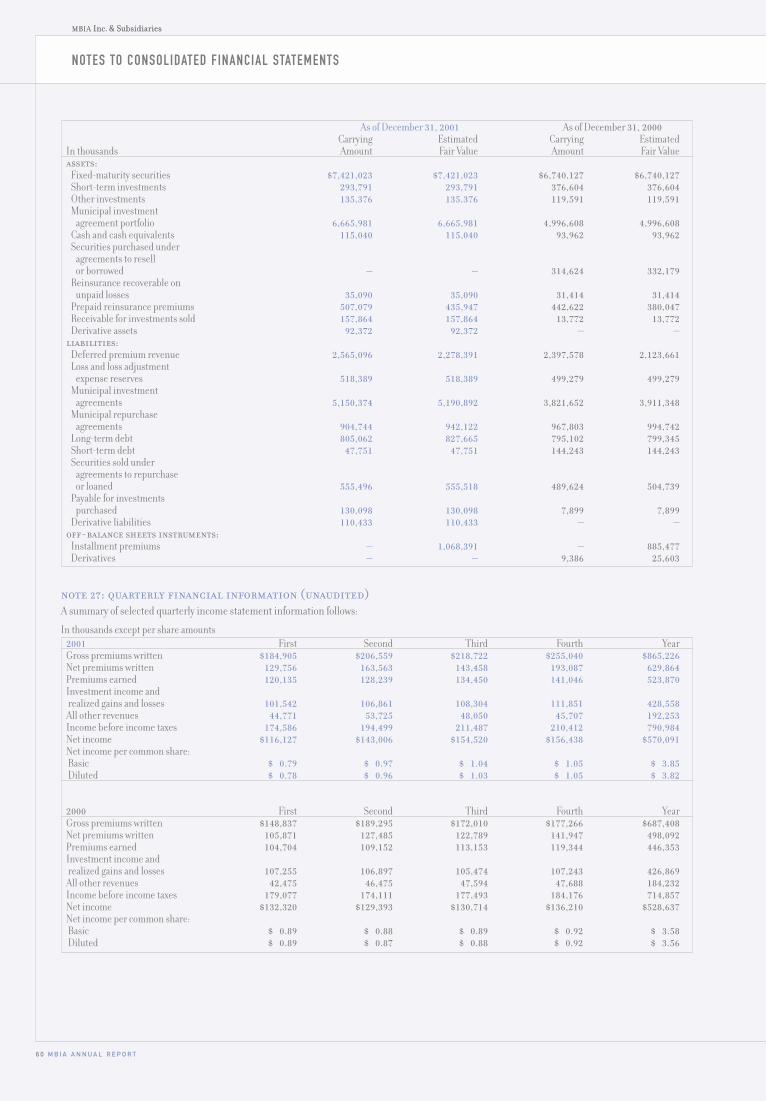
6 0 M B I A A N N U A L R E P O R T
MBIA Inc. & Subsidiaries
note 27: quarterly financial information (unaudited)A summary of selected quarterly income statement information follows:
In thousands except per share amounts2001 First Second Third Fourth YearGross premiums written $184,905 $206,559 $218,722 $255,040 $865,226Net premiums written 129,756 163,563 143,458 193,087 629,864Premiums earned 120,135 128,239 134,450 141,046 523,870Investment income andrealized gains and losses 101,542 106,861 108,304 111,851 428,558
All other revenues 44,771 53,725 48,050 45,707 192,253Income before income taxes 174,586 194,499 211,487 210,412 790,984Net income $116,127 $143,006 $154,520 $156,438 $570,091Net income per common share:Basic $ 0.79 $ 0.97 $ 1.04 $ 1.05 $ 3.85Diluted $ 0.78 $ 0.96 $ 1.03 $ 1.05 $ 3.82
2000 First Second Third Fourth YearGross premiums written $148,837 $189,295 $172,010 $177,266 $687,408Net premiums written 105,871 127,485 122,789 141,947 498,092Premiums earned 104,704 109,152 113,153 119,344 446,353Investment income andrealized gains and losses 107,255 106,897 105,474 107,243 426,869
All other revenues 42,475 46,475 47,594 47,688 184,232Income before income taxes 179,077 174,111 177,493 184,176 714,857Net income $132,320 $129,393 $130,714 $136,210 $528,637Net income per common share:Basic $ 0.89 $ 0.88 $ 0.89 $ 0.92 $ 3.58Diluted $ 0.89 $ 0.87 $ 0.88 $ 0.92 $ 3.56
As of December 31, 2001 As of December 31, 2000Carrying Estimated Carrying Estimated
In thousands Amount Fair Value Amount Fair Valueassets:
Fixed-maturity securities $7,421,023 $7,421,023 $6,740,127 $6,740,127Short-term investments 293,791 293,791 376,604 376,604Other investments 135,376 135,376 119,591 119,591Municipal investment
agreement portfolio 6,665,981 6,665,981 4,996,608 4,996,608Cash and cash equivalents 115,040 115,040 93,962 93,962Securities purchased under
agreements to resellor borrowed — — 314,624 332,179
Reinsurance recoverable onunpaid losses 35,090 35,090 31,414 31,414
Prepaid reinsurance premiums 507,079 435,947 442,622 380,047Receivable for investments sold 157,864 157,864 13,772 13,772Derivative assets 92,372 92,372 — —
liabilities:Deferred premium revenue 2,565,096 2,278,391 2,397,578 2,123,661Loss and loss adjustment
expense reserves 518,389 518,389 499,279 499,279Municipal investment
agreements 5,150,374 5,190,892 3,821,652 3,911,348Municipal repurchase
agreements 904,744 942,122 967,803 994,742Long-term debt 805,062 827,665 795,102 799,345Short-term debt 47,751 47,751 144,243 144,243Securities sold under
agreements to repurchaseor loaned 555,496 555,518 489,624 504,739
Payable for investmentspurchased 130,098 130,098 7,899 7,899
Derivative liabilities 110,433 110,433 — —off-balance sheets instruments:
Installment premiums — 1,068,391 — 885,477Derivatives — — 9,386 25,603
NOTES TO CONSOLIDATED FINANCIAL STATEMENTS
MBIA Inc. & Subsidiaries

M B I A A N N U A L R E P O R T 6 1
board of directors ages as of 12/31/01
Joseph W. Brown [4]ChairmanChief Executive OfficerMBIA Inc. Armonk, New YorkAge 52
David C. Clapp [3,5,6]Senior DirectorGoldman, Sachs & Co., Inc.New York, New YorkAge 64
Gary C. Dunton [5,6]PresidentMBIA Inc.Armonk, New YorkAge 46
David H. Elliott [5,6]retired Chairman MBIA Inc. Armonk, New YorkAge 60
Claire L. Gaudiani [2,3]Senior Research ScholarYale Law SchoolNew Haven, ConnecticutAge 57
William H. Gray, III [1,2]PresidentChief Executive OfficerUnited Negro College Fund, Inc. Fairfax, VirginiaAge 60
Freda S. Johnson [1,2]PresidentGovernment FinanceAssociates, Inc.New York, New YorkAge 54
Daniel P. Kearney [3,4,6]Private InvestorMarblehead, Massachusetts Age 62
James A. Lebenthal [1]Chairman EmeritusLebenthal & Co., Inc.New York, New YorkAge 73
John A. Rolls [1,3,4,5]President Thermion SystemsInternationalStamford, ConnecticutAge 60
Board Committees1. Audit2. Committee on Directors3. Compensation and
Organization4. Executive 5. Finance6. Risk Oversight
senior officersmbia inc.
Joseph W. Brown*ChairmanChief Executive Officer
Neil G. Budnick*Vice President Chief Financial Officer
John B. Caouette* Vice PresidentHead of International
Gary C. Dunton*PresidentChief Operating Officer
Douglas C. HamiltonVice PresidentController
John S. Pizzarelli*Vice PresidentHead of Public Finance
Joseph L. SevelyVice PresidentTreasurer
Kevin D. Silva*Vice President Chief Administrative Officer
Richard L. Weill*Vice PresidentSecretary
Ram D. Wertheim*Vice PresidentGeneral Counsel
Ruth M. Whaley*Vice President Chief Risk Officer
Robert T. Wheeler*Vice PresidentChief Technology Officer
Mark S. Zucker*Vice PresidentHead of Structured Finance
* members of the executive policy committee
senior officers mbia insurance corp.
Dinah E. BellisManaging Director
Beth E. BermanManaging Director
Joseph W. BrownChairman
Neil G. Budnick Vice Chairman
John B. Caouette Vice Chairman
Steven C. H. CitronManaging Director
Steven S. CookeManaging Director
Clifford D. CorsoManaging DirectorChief Investment Officer
John D. Dare Managing Director
Kenneth L. DegenManaging Director
David H. DubinManaging Director
Gary C. Dunton President
Lori M. EvangelManaging Director
Carl E. FavelukesManaging Director
Nicholas FerreriManaging Director
Barbara J. FlickingerManaging Director
Margaret D. GarfunkelManaging Director
Sanford M. GoldsteinManaging Director
Stephen C. HalpertManaging Director
Douglas C. HamiltonManaging Director
Drew D. HoffmanManaging Director
Christopher JumperManaging Director
Una M. KearnsManaging Director
Jane K. KlemmerManaging Director
Louis G. LenziManaging Director
Lawrence E. LevitzManaging Director
Amy E. Mauer LitosManaging Director
John D. LohrsManaging Director
Michael J. Maguire Managing Director
J. Paul MansourManaging Director
Timothy J. McKeonManaging Director
Thomas G. McLoughlinManaging Director
Franklin MinervaManaging Director
Robert L. Nevin, Jr.Managing Director
John S. Pizzarelli Managing Director
Judith C. RadaschManaging Director
Andrea E. RandolphManaging Director
Jeremy E. ReifsnyderManaging Director
Emmeline Rocha-Sinha Managing Director
Eric J. RosensweigManaging Director
Edward T. RuddockManaging Director
Thomas O. SchererManaging Director
Joseph L. SevelyManaging Director
Roger ShieldsManaging Director
MBIA INC. BOARD OF DIRECTORS AND SENIOR OFFICERS

6 2 M B I A A N N U A L R E P O R T
Kevin D. Silva Managing Director
Deborah Z. SilvermanManaging Director
Nicholas SourbisManaging Director
Karleen C. StrayerManaging Director
Elizabeth B. SullivanManaging Director
Philip C. SullivanManaging Director
Carolyn TainManaging Director
Christopher W. TilleyManaging Director
Carl WebbManaging Director
Christopher H. WeeksManaging Director
Richard L. Weill Vice Chairman
Ram D. WertheimManaging Director
Ruth M. Whaley Managing Director
Robert T. WheelerManaging Director
David WhiteManaging Director
Charles E. WilliamsManaging Director
Eric C. WilliamsonManaging Director
Mark S. ZuckerManaging Director
senior officers mbia inc. subsidiaries
W. Thacher BrownPresidentMBIA Asset Management, LLC
Carol K. BlairManaging DirectorMBIA Capital Management Corp.
Clifford D. CorsoPresident MBIA Capital Management Corp.
Joseph T. Doyle, Jr.Managing Director1838 Investment Advisors, LLC
George W. Gephart, Jr.Managing DirectorHead of Equity Management1838 Investment Advisors, LLC
Robert C. HancockManaging Director1838 Investment Advisors, LLC
Francie Heller PresidentMBIA Municipal Investors ServiceCorporation
Robert W. HerzManaging Director1838 Investment Advisors, LLC
Thomas D. JordanManaging DirectorMBIA Municipal Investors ServiceCorporation
Marc D. MorrisPresidentMBIA Investment ManagementCorp.
John H. SpringroseManaging DirectorHead of Marketing1838 Investment Advisors, LLC
Hans van den BergManaging Director1838 Investment Advisors, LLC
stock exchange listingMBIA Inc. common stock islisted on the New York StockExchange (symbol: MBI). The approximate number ofshareholders of record ofMBIA’s common stock was 1,075 as of December 31, 2001.
annual meetingAll shareholders are cordiallyinvited to attend the annualshareholders’ meeting, whichwill be held Thursday, May 9,2002 at MBIA Inc. in Armonk,New York. A formal notice of the meeting, together with a proxy statement and proxyform, will be mailed to allshareholders.
financial and other informationQuarterly earnings, annualreports, Form 10-K, corporatenews and other companyinformation is available onMBIA’s Web site:www.mbia.com. Copies ofMBIA’s corporate financialinformation can also beobtained by writing to Share-holder Information at MBIA.
Members of the financial community seeking additionalinformation about MBIAshould contact:
Neil G. BudnickVice Chairman, Chief Financial Officer [email protected]
Judith C. RadaschManaging Director, Investor [email protected]
Charles E. WilliamsManaging Director, Fixed-Income Investor [email protected]
2002 key financial datesPayment of future dividends is dependent upon results ofMBIA’s operations, financialcondition and other businessconsiderations.
Dividend DeclarationsMarch 15, 2002June 13, 2002September 13, 2002December 6, 2002
Record DatesMarch 26 , 2002June 25, 2002September 24, 2002December 19, 2002
Dividend Payment DatesApril 15, 2002July 15, 2002October 15, 2002January 15, 2003
transfer agent,registrar and dividenddisbursing agentMellon Investor Services, LLC85 Challenger RoadOverpeck CentreRidgefield Park, New Jersey 076601-800-288-9541
auditors PricewaterhouseCoopers LLP,New York, New York
trademarks The MBIA logo, MBIAInsurance Corporation andCLASS are trademarks ofMBIA.
SHAREHOLDER INFORMATION
DES
IGN
: TH
E B
AR
NET
T G
RO
UP/
NY
PH
OTO
GR
APH
Y: T
HEO
AN
DER
SONcommon stock data
Dividends Paid Market Price*Per Share High Low Close
2001
1st Quarter $0.137 54.067 40.042 53.787
2nd Quarter 0.150 56.700 46.180 55.680
3rd Quarter 0.150 57.490 36.000 50.000
4th Quarter 0.150 54.280 43.500 53.630
2000
1st Quarter $0.137 34.709 24.417 34.709
2nd Quarter 0.137 39.459 32.125 32.125
3rd Quarter 0.137 47.417 32.959 47.417
4th Quarter 0.137 49.959 42.959 49.417
*Based on New York Stock Exchange trading data

Angeles Community College District, Los Gatos-Saratoga Joint Union High School Dist., Los Lunas SD No. 1, Louisiana Public Facilities Auth, Louisville & Jefferson Co Metro. Sewer Dist., Lower Cape May Regional SD,Lower Colorado River Auth, Lower Dauphin SD, Loyalsock Township SD, Luzerne Co, Lycoming Co, Lyon Charter Township, Lyon Co, Lyons Central SD, Mahanoy Area SD, Mahwah Township, Maine Governmental FacilitiesAuth, Mammoth Unified SD, Manheim SD #83, Manitou Springs Public Schools No. 14, Manteca Unified School Dist. Community Facilities, Manteca Unified SD, Marion Central SD, Marion Co Convention and RecreationalFac Auth, Marion Co School Board, Marshall Co Health Care Auth, Maryland Dept. of Housing & Community Development, Marysville Exempted Village SD, Massachusetts Development Finance Agency, MassachusettsHealth & Educational Facilities Auth, Massachusetts Municipal Wholesale Electric Co., Massachusetts Turnpike Auth, Mayfield Central SD, Mayville SD, McHenry Community Consolidated SD 15, Mendocino Co,Menominee Co, Merced Irrigation District, Merrillville Community School Corporation, Merrillville Town, Metropolitan Sewerage District of Buncombe Co, Metropolitan Washington Airports Auth, Mexico Central SD,Miami-Dade Co, Miami-Dade Co School Board, Michigan State Housing Development Auth, Middlebury Elementary School Building Corporation, Middlesex Borough, Middlesex Co, Middleton-Cross Plains Area SD,Middletown Area SD, Middletown City SD, Milan Special SD, Minnesota Housing Finance Agency, Mississippi Co Public Facilities Auth, Mississippi Department of Finance and Admin., Mississippi Department of MentalHealth, Mississippi Development Bank, Mississippi State BOT Inst of Higher Learning, Missouri Association of Rural Education, Missouri Development Finance Board, Missouri Health & Educational Facilities Auth,Missouri State Public Building, Monmouth Beach Board of Education, Monroe Co, Monroe Co Industrial Development Agency, Monroe Public Schools, Montgomery Co, Montgomery Township Board of Education,Monticello Community Unit SD No. 25, Moon Township, Morehead State University, Moreno Valley Unified SD, Morrisville-Eaton Central SD, Mounds View Independent SD No. 621, Mount Joy Borough Auth, Mount VernonCity SD, Mount Vernon SD No. 320, Mountain View SD, Mountain View SD Community Facilities Dist No.1, Mountain View Shoreline Regional Park Community, Mountain Village Metropolitan District, M-S-R Public PowerAgency, Municipal Auth of the Borough of Lewistown, Municipal Sanit Auth of the City of New Kensington, Murray Co, Murrieta Valley Unified SD, Muscle Shoals City, Napa Co Board of Education, Nassau Co, Nassau CoSchool Board, National Educational Loan Network, Inc., Necedah Area SD, NELnet Inc., Nevada Co, New Albany SD, New Caney Municipal Utility District, New Castle Area SD, New Durham Township Metropolitan SD,New Hampshire Municipal Bond Bank, New Jersey Economic Development Auth, New Jersey Education Facilities Auth, New Jersey Environmental Infrastructure Trust, New Jersey Higher Education Assistance Auth,New Jersey Transportation Trust Fund Auth, New Mexico Finance Auth, New York City Transitional Finance Auth, New York State Thruway Auth, Newberry Co, Newport-Mesa Unified SD, Niles Township Community HighSD #219, Nogales Municipal Development Auth, Inc., Norco Redevelopment Agency, North Dakota Building Auth, North Harris Montgomery Community College District, North Hudson Sewerage Auth, North Kent SewerAuth, North Lamar Independent SD, North Park Public Water District, North Polk Community SD, North Sacramento SD, North Scott Community SD, North Shore Central SD, North Syracuse Central SD, North TexasMunicipal Water District, Northampton Area SD, Northbrook-Glenview SD #30, Northeast Alabama Water, Sewer & Fire Prot. Dist., Northeastern University, Northern York Co SD, Northwest Improvement Projects JointPowers Board, Norwalk Community SD, Norwin SD, Oblong Community Unit SD #4, Ocean Co Central Regional High SD, Oceanside Unified SD, Oconomowoc Area SD, Oconto Co, O'Fallon Public Facilities Auth, Ohio WaterDevelopment Auth, Ojai Unified SD, Old Forge SD, Oneonta City SD, Onyx Acceptance Owner Trust 2001, Orange Co Development Agency, Orange Co Fire Auth, Osceola Co Industrial Development Auth, Otero Co, OttovilleLocal SD, Outagamie Co, Owensboro Mercy Health System, Oxnard SD, Oxnard Union High SD, PA Higher Ed Facilities Auth, PA State Public School Building Auth, Pacific Co Public Utility District No. 2, Palm Beach CoDepartment of Airport, Palm Desert Financing Auth, Palm Springs Unified SD, Palmyra-Macedon Central SD, Palo Pinto Co Municipal Water District No. 1, Payne Co Facilities Auth, Paynesville Independent SD No. 741,Pecos Higher Education Auth, Peninsula SD No. 401, Petaluma Community Development Agency, Petrobras Brasileiro SA, Petrotrin, Pickens Co Water Auth, Pitt Co, Pittsburgh International Airport, Plainfield ElementarySchool Building Corporation, Platte Co Reorganized SD No. R-3, Pleasant Valley SD, Polk Co, Pomona Public Financing Auth, Pomona Unified SD, Port Beaumont Navigation District, Port Chester-Rye Union Free Schools,Port of Olympia, Portage Public Schools, Portola Valley SD, Pottsgrove SD, Prince Georges Co, Princeton SD, Providence Public Buildings Auth, Providian Gateway Master Trust Series 2001, Public Building Auth of CoffeeCo, Puerto Rico Electric Power Auth, Puerto Rico Public Finance Corporation, Putnam Co, Ramapo Indian Hills Regional High SD, Rancho Mirage Redevelopment Agency, Rapid City Regional Hospital, Raven Hills HigherEducation Corporation, Red Hook Central SD, Redding Redevelopment Agency, Redevelopment Agency of the City of Livermore, Reed City Area Public Schools, Rhea Co, Rhode Island Convention Center Auth, RhodeIsland Health and Educational Building Corp., Riley Co Unified SD No. 383, River Trails Park District, Riverside Co, Riverside Elementary SD No. 2, Robbinsdale Independent SD No. 281, Robinson Community Unit SD #2,Rochelle Township High SD #212, Rockland Co, Rocklin Unified Sch Dist Community Fac. Dist No. 1, Rogers Co Criminal Justice Auth, Ronan/Pablo Elementary SD #30, Rosemead SD, Royal Oak Building Auth, RuralEnterprises of Oklahoma Inc., Russia Local SD, Rutherford Co, Sacramento City Unified SD, Sacramento Municipal Utility District, Saginaw Valley State University, Saint Johns Co Industrial Development Auth., SaintJohn's University, San Bernardino Co Financing Auth, San Diego Family Housing Privitization, San Diego Unified SD, San Francisco City and Co, San Francisco State University Foundation, Inc., San Jose Financing Auth,San Jose Unified SD, San Marcos Public Finance Auth, San Ysidro School Disctrict, Santa Clara Valley Transportation Auth, Santa Clarita Community College District, Santa Fe Co, Santa Fe Springs CommunityDevelopment Commission, Santa Monica-Malibu Unified SD, Sarah Lawrence College, Saratoga Springs City SD, Sauquoit Valley CSD, Schenectady Co, SD of Superior, Scott Co, Scottish Power UK PLC, Scranton SD,Scurry Co, Seattle SD No. 1, Seneca Valley SD, SFC Owner Trust 2001-1, Shakopee Independent SD No. 720, Shakopee Public Utilities Commission, Signal Hill Redevelopment Agency, Sioux Center Community SD,Snohomish Co, Solano Co, Sonoma Public Financing Auth, Souderton Area SD, South Bend Redevelopment Auth, South Carolina Jobs-Economic Development Auth, South Glens Falls Central School, South Harrison SchoolCorporation, South Huntington Union Free SD, South Lake Tahoe Recreation Fac Joint Powers Auth, South Suburban Park & Recreation District, South Texas Higher Education Auth, Inc., Southeast Missouri StateUniversity, Southeast Morris Co Municipal Utility Auth., Southeast Wisconsin Baseball Park District, Southern California Public Power Auth, Southern Door SD, Spackenkill Union Free SD, Spokane Public FacilitiesDistrict, St John's Co Industrial Development Auth, St Lawrence Co Industrial Development Auth., St. Marys Municipal Auth, State of Arizona, State of Arizona Department of Transportation, State of California Treasurer'sOffice, State of Connecticut Health and Ed Fac Auth, State of Florida Correctional Privatization Comm., State of Illinois, State of Iowa, State of Michigan, State of New York Dormitory Auth, State of Rhode Island, Stateof Washington, State of Wisconsin, State Public School Building Auth, Stillwater Central SD, Stormont-Vail Regional Medical Center, Student Finance Corporation, Suffolk Co, Sumner Co Unified SD No. 360, SusquehannaValley Central SD, Sussex Co, Sussex Co Municipal Utilities Auth., Sweetwater Union High SD, Taft City Elementary SD, Tahoe-Truckee Unified Schl Dist Improv Dist No. 1, Tahoe-Truckee Unified Schl Dist Improv DistNo. 2, Tamalpais Union High SD, Tarrant Co Housing Finance Commission, Tax Increment Fin Auth of City of Dearborn Heights, Teaneck Township Board of Education, Tenafly Borough, Teton Co/Teton Co SD#1 Public FacilJt Pwrs Board, Tewskbury Township Board of Education, Texas Medical Center, Texas State Affordable Housing Auth, Texas Student Housing Corporation, The Board of Education of the Twnshp of Deerfield, The Board ofGovernors of Univ of North Carolina, The Mayor and Aldermen of the City of Vicksburg, Thorp SD, Thurston Co SD No. 16, Tiffin Central SD, Town Ipswich Massachusetts, Town of Amherst, Town of Arlington, Town ofBasalt, Town of Billerica, Town of Branford, Town of Bristol, Town of Caledonia, Town of Carmel, Town of Cheektowaga, Town of Clinton, Town of Colonie, Town of Columbia, Town of Fountain Hills, Town of Freedom, Townof Freeport, Town of Grand Chute, Town of Griswold, Town of Halfmoon, Town of Hamden, Town of Hartland, Town of Hempstead, Town of Henrietta, Town of Herndon, Town of Holbrook, Town of Lexington, Town of Menasha,Town of Millbury, Town of Millis, Town of North Hempstead, Town of Oconomowoc, Town of Old Saybrook, Town of Plainfield, Town of Plymouth, Town of Pomfret, Connecticut, Town of Raynham, Town of Richmond, Townof Sandwich, MA, Town of Seymour, Town of Speedway, Town of Stoneham, Town of Suffield, Town of Wappinger, Town of Warwick, Town of Wellfleet, Town of West Seneca, Town of Westfield Board of Education, Townshipof Alexandria, Township of Berkeley, Township of Cheltenham, Township of Evesham, Township of Haddon, Township of Hope Board of Education, Township of Howell, Township of Kennedy, Township of Lafayette Boardof Education, Township of Lawrence, Township of Little Falls, Township of Livingston, Township of Lyndhurst, Township of Manchester, Township of Montgomery Board of Education, Township of Pemberton Board ofEducation, Township of South Brunswick, Township of Southhampton, Township of Washington, Township of West Amwell Board of Education, Troy City GO, Troy State University, Trumbull Co, Truth or ConsequencesMunicipal School Dist #6, Twin Lakes SD #4, Twinsburg City SD, UACSC Auto Trust 2001-C, Unified Government of Wyandotte Co/Kansas City, Union Acceptance Corporation 2001A Class A1-A4, Union Financial Services,Union Township, United Networks Limited, University Area Joint Auth, University Corp for Atmospheric Research, University of Alabama in Huntsville, University of Medicine and Dentistry of New Jersey, University ofNew Mexico, University of Washington, Upper Dauphin Area SD, Upper Moreland Township, Utah State Board of Regents, Valley Local SD, Van Buren Co, Ventura Unified SD, Vermont Municipal Bond Bank, VersaillesCity Water & Sewer, Village Center Community Development District, Village of Algonquin, Village of Arlington Heights, Village of Bloomingdale, Village of Brown Deer, Village of Channahon, Village of Forest Park,Village of Fredonia, Village of Germantown, Village of Hales Corners, Village of Irvington, Village of Lindenhurst, Village of Los Lunas, Village of Maryville, Village of Mount Kisco, Village of Obetz, Village of Oregon,Village of Orland Hills, Village of Osceola, Village of Ossining, Village of Round Lake Beach, Village of Royal Palm Beach, Village of Shorewood, Village of Sleepy Hollow, Village of Stickney, Village of Sugar Grove,Village of Vernon Hills, Virginia Housing Development Auth, Virginia Resources Auth, Volusia Co, Wadena-Deer Creek ISD 2155, Walker-Hackensack-Akeley Independent SD No. 113, Warren Community Unit SD No. 205,Warren Co, Washington Health Care Facilities Auth, Washington Union SD, Washtenaw Co Department of Public Works, Water Works Board of the City of Attalla, Waterford Joint SD #1, Watertown City SD, WaukeeCommunity SD, Webster SD, Weld Co SD No. RE-4, West Bloomfield SD, West Chicago SD No. 33, West Contra Costa Unified SD, West Harvey-Dixmoor Public SD #147, West Lafayette Redevelopment Auth, West ValleyCity, Western School Building Corporation, Western Townships Utilities Auth, Westmoreland Co, Westmoreland Co Municipal Auth, Wharton Co Junior College District, Whittier Union High SD, Wichita Co, Will Co, WilliamBeaumont Hospital, William Floyd Union Free SD, Williamsport Area SD, Wilson Co, Windsor-Severance Fire Building Auth, Winnisquam Regional SD, Winters Joint Unified SD, Wisconsin Department of Transportation,Wisconsin Housing & Economic Development Auth, Wright Co, Yakima Co, Yonkers Industrial Development Agency, York Co Hospital Auth, Yorkshire-Pioneer Central SD, Yorktown Central SD, Yucaipa-Calimesa UnifiedSD, Yuma Co, Adams Co SD No. 12, Adrian Independent SD No. 511, AESOP Funding II LLC 2001-1, Akbank T.A.S., Alabama State Port Auth, Alameda Co, Alameda Power and Telecom, Alaska Housing Finance Corporation,Alaska Municipal Bond Bank Auth, Albion Central SD, Alderwood Water District, Allegheny Co Sanitary Auth, Altmar-Parish-Williamstown Central SD, American Business Credit Inc., American Business FinancialServices, Inc., American Campus Communities, LLP, American Municipal Power-Ohio, Inc., AmeriCredit MTN Receivables Trust 2001-A, Anderson Union High SD, Anoka Co, ANRC Auto Owner Trust 2001-A, Antioch AreaPublic Facilities Financing Agency, Arab Water Works, Arapahoe Co E-470 Public Highway Auth, Archer Co, Area Education Agency 7, ARG Funding Corporation Series 1999, 2000, 2001, Arkansas Development FinanceAuth, Armstrong Co, Arrowhead Metropolitan District, Arvada Urban Renewal Auth, Ashby Independent SD No. 261, Asotin Co, Atlanta Development Auth, Auburn University, Aurora Public Schools, Australian PacificAirports Melbourne Pty. Ltd., Autauga Co Public Building Auth, Autopista de Maipo Sociedad Concesionaria S.A., Autopistas de leon S.A. (AULESA), Avon Central SD, Avon Metropolitan District, Baraboo SD, Baytown AreaWater Auth, Beacon SD, Bear Valley, Beauregard Parish SD, Beaver Falls City, Belfast Central SD, Bell Co Health Facilities Development Corp., Belmont Joint Powers Financing Auth, Belvidere Community Unified SD No.100, Bemus Point Central SD, Benton Co, Berkeley Unified SD, Bernalillo Co, Berwick Area Joint Sewer Auth, Bethel SD No. 403, Bethlehem Area Vocational-Technical School Auth., Bethlehem Auth, Bethpage Fire District,Bexar Co Housing Finance Corp, Big Horn Co, Biloxi SD, Bingham Co SD No. 59, Blackfoot SD No. 55, Blind Brook Rye Union Free School Dist., Bloomfield SD No. 6, Blue Point Fire District, Board of Governors of theUniv. of North Carolina, Board of Regents of Borger Junior College District, Board of Regents of the University of Oklahoma, Bonneville Power Administration, Boone Co Water District, Borough of Barrington, Boroughof Montvale, Borough of North Slope, Borough of Park Ridge Board of Education, Borough of Prospect Park Board of Education, Borough of Quakertown, Borough of Sayreville, Borough of Stroudsburg, Borough ofWalnutport, Brandywine Heights Area SD, Brazos Higher Education Auth, Inc., Brentwood Union Elementary SD, Brevard Co Health Facilities Auth, Bridgewater-Raritan Regional SD, Brighton SD No. 27J, Brockport

Gabriel, Theodore Galgano Jr., Brendan Gallagher, Maureen Gallagher, Michele Galligan, Richard Garay, Leigh Garcia, Lisa Garcia, PeggyGarfunkel, Andrea Gavaller, Wayne Gee, Ethel Geisinger, George Gephart Jr., MaryEllen Gilroy, Patri Ginas, Richard Giuffra, Patricia Goldrick, Sanford Goldstein, Amy Gonch, Esther Gonzalez, Melysa Gonzalez, RobertoGonzalez, Andrew Goodale, Jennette Gosselin, Richard Greenwood, Kelli Greene, Robert Greene, Aeneas Griffin, Lisa Grozio, Amy Gullotta, Marsha Gumbs, John Hall, Traci Hall, Stephen Halpert, Dorothy Hamill, DouglasHamilton, Jacquelyn Hamme, Christine Hammond, Robert Hancock, Nancy Harris, Roger Harris, Marcy Harris, Donald Harrison, Dana Hartman, Emete Hassan, Katina Hawe, Selena Hay, Oddette Haynes, Venetia Heintz,Francie Heller, Robert Heller, Ken Helwig, Jennifer Hendrix, Marc Herman, Ana Hernandez, Robert Herz, Rick Hess, Sandra Heuer, Leslie Hickey, Marshall Hite, David Hoak, Hai Hoang, Drew Hoffman, Ed Holden, StephenHolliday, Denise Horbach, David Hufnagel, Scott Hughes, Roslyn Hume, Travis Humphries, Timothy Hunt, David Huntley, Francesca Hurd, Brian Hynes, Paul Iannone, Rosalie Jackson, Lynn Jacobs, Michael Jacobson,Elizabeth James, Edward Janson, Sean Jencik, Paul Jennings, Douglas Jensen, Corey Johnson, Janet Johnson, Lisa Johnson, Kimberly Johnson-Cole, Joanne Jontz, Michael Joos, Thomas Jordan, Deirdre Jordan-Coleman, Christopher Jumper, Esther Kain, Maria Kang, Jasvinder Kaur, Una Kearns, Monica Keller, John Kelley, Rosemary Kelley, Brian Kelly, James Kelly, Patrick Kelly, Stephen Kepes, Jennifer Khoury, Amy Killeen,Henry Kim, Sang Kim, Danny King, Howard King, Kathy Kinney, Jason Kissane, Douglas Kitchen, Jane Klemmer, Richard Knight III, Jeffrey Knight, Megan Korson, Amy Kramer, John Krick, Kathleen Kruse, NicholasKrzemienski, Edward Kushma II, Arthur Kuypers, Todd LaChance, Linda Labelle, Matthew Lagana, Gina Landi, Richard Langberg, Sean Langley, Cara Lapicola, Cheryl Larkin, Mary Larson, Andrew Laterza, Linda Latta,Jay Leborgne Jr., Chong Lee, David Lee, Jacqueline Lee, Poh-Choo Lee, Andrew Leggio, James Lennon, Louis Lenzi, Lynn Leone, Lawrence Levitz, Clifton Lewis, Amy Lieb, Sonya Linder Silidjian, Linda Lindh, EleanorLipsey, Gregory Lirot, Sandra Lisanti, John Lisle Jr., Georgina Lo, Susan Lockwood, Kevin Loescher, John Lohrs, Siobhan Lombard, Denise Lorine, Zhengyuan Lu, John Lucas, Christa Luckenbach, Bertha Lui-McKee,Robert Lupoli, Mary Lynn, Frank MacDonald, Scott Madden, Michael Maguire, James Maitland, Janelle Major, Efrain Maldonado, Fran Mancia, Joanne Mancuso, Katherine Manion, Denise Mann, Paul J. Mansour, GabrielMarcovecchio, Jaime Mariategui, Sabina Marino, Anel Martinez, Maryann Martini, Patricia Martins, Anne Marquart, Angel Martin, Amy Mauer Litos, Cheryl May, Irene Mayorga, Lisa McCall, Shaun McClelland, JohnMcDonnell Sr., Denise McGee, Frank McGothigan, James McGrane Jr, Timothy McKeon, Anthony McKiernan, Lisa McLaughlin, Thomas McLoughlin, Linda McManus, Sadie McSwain, William McWilliams, Ani Mensuroglu,Michael Messer, Joyce Michaux, Marsha Miclat, Helen Miksits, Timothy Miles, Howard Miller, Kevin Miller, Michelle Miller, Carrie Milligan, Franklin Minerva, Jairo Molina, Sadhana Moondra, James Moore, Paola Moreno,Janet Morley, Chris Moros, John Morris, Marc Morris, Kristin Mosca, Michael Muldoon, James Munekawa, Jesse Murphy, Cathleen Murray, Gerard Murray, Stephen Murray, Theresa Murray, Fred Murrell, Michael Murtagh,Joan Musselbrook, Brenda Narayan, Salvatore Narciso, Daniel Nash, Todd Navin, Eric Neglia, Robert Nevin Jr., Deborah Nickel, Ann Nicoletti, Petya Nikolova, Michael Norris, Oliver North, Michael O’Brien, Frances Ochoa,Meghan O’Donnell, Kathleen Okenica, Patricia Olin, Alexis Ong, Stephanie Ontiveros, Kimberly Osgood, Ashwin Palekar, Laura Palmieri, Randy Palomba, Kimbra Pannett, Brett Parker, Kelli Parker, Christine Parks, EricParsons, Fred Pastore, Nicole Paszkiewicz, David Patashnik, Nancy Paulercio, Giri Pawar, Alan Pearlman, Gerald Peeler, Arthur Perlowitz, Ian Petrillo, Eileen Pettineo, Amelito Pilande, Pascale Pinte, John Pizzarelli, EricPopejoy, Scot Post, Peter Potenziani, Cynthia Praschnik, Andrea Preftes, Armand Principato, James Pugh, Wendy Quartuccio, Cindia Quintana, Judith Radasch, Jane Radocchio, Kerrie Radoor, Beverly Raine, EdwardRajsteter, Veda Ramsay-Stamps, Andrea Randolph, Kathleen Reagan, Kevin Regan, Jeremy Reifsnyder, Pamela Reifsnyder, Charles Reilly, Robert Reilly, Susan Reilly, Jeffrey Relkin, David Rey, Joshua Rezak, JamesRichardson, Margaret Ritter, Angel Rivera, Loretta Rivera, Stephanie Rivera, Pascual Rizzo, Sheryl Robbins, Emmeline Rocha-Sinha, Lisa Rodia, Omar Rodriguez, Leo Roland, Doreen Romans, Eric Rosensweig, KathrynRothberg, Gail Roux, Edward Ruddock, Maria Rundbaken, Kelly-Ann Rush, Stacey Russell, Steven Ruterman, Deirdre Ryan, William Ryff, Thomas Saccardi, Sharon Sacks, Nazima Saleem, D. Kristine Sandvik, RidwanSasmita, Jessica Sato, Eric Savino, Colleen Scaglione, Stephen Scanlan, Joseph Schachinger, Constanze Scheidl, Thomas Scherer, Ellen Schmall, Laura Schneider, Larry Scott, Linda Scott, Patrick Scott, Louie Sedano,Lawrence Selik, Joell Selmon, Joseph Sevely, Bijal Shah, Robert Sheahan, Steven Sherman, Roger Shields, Linda Shikitino, Cheryl Sholl, John Shope, Keith Shuron, Carol Siefermann, Kara Silva, Kevin Silva, DeborahSilverman, Don Simon, Evangeline Simpson, Veronica Sin, Katherine Sincerbeaux, Adithi Singh, Arvind Singh, Erika Singh, Joanne Sinopoli, Susanne Slavin, Marina Sloan, Beth Smayda, James Smiles, Deborah Smith,Peter Smith, Mario Soberal, Fran Sofo, Ursula Solimine, Lori Soper, Victor Soto, Nicholas Sourbis, Lisa Spano, Rachael Spisak, John Springrose, Stephen Starnes, Julie Steincamp, Cynthia Stelter, Robin Steward, JudithStone, Eric Storch, Karleen Strayer, David Sugimoto, Elizabeth Sullivan, Heather Sullivan, Philip Sullivan, Jill Swanger, Donna-Sue Swanson, David Sweet, Carolyn Tain, Maria Tallent, Yong-Khim Tan, Michael Tarquinio,Stephen Tartaglia, Patricia Taxter, Joanne Taylor, Stephanie Taylor, Eva Thein, Susan Thomas, Laura Thorne-Trawinski, James Tilkes, Christopher Tilley, Laura Tirado, Donald Tomlin Jr., Melanie Tomlin, Carrie Toomey,Rosanna Traina, Daniel Trainor, Matthew Trapp, Carol Trottier, Donna Turner, Anton Unger III, Susan Valenti, Frederic Vallon, Hans van den Berg, Thomas Vandermark, Lisa Varalli, Janis Varney, Robert Velins, Frank Venuti,Maria Vero-Magnan, Joan Vita, Kirk Viviano, Jacqueline Vlymen, Susan Voltz, Karen Wagner, Todd Wall, Maggie Walsh, Richard Walz, Jing Wang, Mary Warde, Randolph Warman, Patricia Warnke, Elizabeth Watkins,Antoinette Watson, Othneil Waud, Carl Webb, Christopher Weeks, Debra Weeks, Irene Weidelman, Richard Weill, Nancy Weiss, Ram Wertheim, Rebecca Werther, Linda Wessel, Ellen West, Ruth Whaley, Robert Wheeler,Ashling Whelan, David White, Denise White, Lori White, James Whitford Jr., Charles Williams, Noni-Kai Williams, Eric Williamson, David Wilson, Henry Wilson, Lisa Wilson, David Witthohn, Eunice Wong, Edmund Woods,Raymond Wosinski, Greg Wright, Melissa Wright, Jamie Xiong, Diana York, Christopher Young, Suzanne Zelov, Richard Zogheb, Kimberly Zottola, Gail Zubradt, Mark Zucker, Deborah Zurkow, Hasitha Abeygunawardena,Christy Abraham-John, Patricia Abt, Connie Accordino, Angelique Allen, James Allen, Michael Alter, Doreen Amado, Nicole Amador, Eric Anderson, Panayiotis Andreou, Gina Antonelli, Michael Antonicelli, Brian Arcese,Ana Areal, John Ariola, Craig Armstrong, Errol Arne, Daniel Avitabile, Judith Baiocco, Michael Ballinger, Frances Banuelos, Ricardo Banuelos, Anna Barbara, Mary Barbara, Lorraine Barg, Steve Barney, Philip Baudinet,Barry Baughier, Marguerite Beirne, Ahmed Belal, Richard Bell II, Thomas Bell, Dinah Bellis, Regina Bello, Anna Bencrowsky, Arlene Bent-Mutz, James Berger, Adam Bergonzi, Beth Berman, Nancy Bermudez, Paul Bernier,Gerry Berrigan, Michael Biemer, Dennis Bird, Cheri Bivings, Carol Blair, Robert Blair, Robert Blake, Elizabeth Blasius, Neal Blum, Kim Boeheim, David Boisselle, Edward Bonner, Amy Borst, C. Terry Bowens, MichelleBracamonte, David Brancale, Martin Braunstein, Yaquelin Brea, Helen Brennan, Melissa Brice-Johnson, Nelly Briggs, Grant Brimhall, Patricia Brosnan, Carol Broughton, Jay Brown, Kevin Brown, W. Thacher Brown, LiseBruun, Karen Brylle, Neil Budnick, Mark Bunyea, Joseph Buonadonna, Danny Burdiez, Kathelene Burns, Paul Burns, Derrick Burr, Audrey Calogero, Michael Cambridge, Jason Cameron, Patricia Campbell, Lori Candarelli,Nicholas Canuso, Jack Caouette, Lisa Carinha, Linda Carpenter, William Carson, Adam Carta, William Carta, Sal Carvo, Fred Casadei, Judith Casey, Christopher Cassel, Robert Castillo, Michael Castracan, Judith Cavino,Jason Celente, Kevin Cerutti, Chris Chafizadeh, Stephen Chaloux, David Chappell, Charlotte Cheong, Sammy Cheung, Manuel Chevalier, Lina Chew, Sze-Loon Chew, Andrew Chintz, Siew-Li Chong, Richard Choyke, DavidChristiansen, Rebecca Christoforou, Leonard Chubinsky, Lori Church, Joanne Ciralli, Steven Citron, Robert Claiborne, John Clancy, Joyce Clark, Michael Clarke, Robyn Clarke, Geoffrey Clarkson, Miriam Cleary, ThomasCochran, William Cody, William Coleman Jr., Rosemaria Collorafi, Steven Cooke, Brian Cooney, Christie Corbett, Maryann Corse, Tim Corsi, Clifford Corso, Jonathan Costello, Kenneth Couch, Thomas Cousins, DavidCraparo, Celinda Creighton, James Cronin, David Crowle, Jacquelyn Cruz, Pauline Cullen, Derrin Culp, Celia Culpan, Terry Cundiff II, Melissa Currie, Salvatore D’Addio, Ron Dadina, Jennifer Dalton, Valerie Damon, JohnDanaher, Kathryn D’Angio, Jeffrey Daniels, John Dare, Stephen Dartley, Paul David, Gary Davis, Joshua Davis, Leslie Davis, Suzanne Davis, Karen Decter, Kenneth Degen, Joanne DeGennaro, Sandra DeKoubia, LynneDeLaurentis, Laura DeLena, Maria DeMilia, Nils Demme, Michael DeNigris, Debra Descloux, Lauren Desharnais, William DeVane, Edward DeVito, Greg Diamond, James DiChiaro, Kimberly Dilly, Lauren Dimartino, AnthonyDimino, Wendy Dinsmore, Jamie Di Orio, Frederic Dittmann, Christie Dixon, Stephen Dixon, Kerry Dolan, Everlena Dolman, John Donaldson, Michelle Donaldson, Pallavi Donde, Mary Donovan, Janine Doran, GloriaD’Ottavio, Edward Dougherty, Stephanie Dougherty, Shawn Dowdy, Joseph Doyle Jr., Randy Dryden, David Dubin, Geoffrey Dudick, Maureen Duffy, Mohinder Dugal, Matthew Dugan, Rita Duggan, Gary Dunton, UtressaEarl, Pamela Eccles, Scott Eckman, Teri Eckman, Audra Edele, Barbara Edelmann, Gay Eichhoff, Bruce Ely, Ira Epstein, Richard Erickson, Jeff Esraelian, Lori Evangel, Felicia Fanelli, Matthew Fanelli, Marisa Farrell,Robert Faulkner, Carl Favelukes, Sharon Fera, Gregg Ferguson, Robert Fernald, Pamela Fernandes, Maria Ferrante, Nicholas Ferreri, Denise Feulner, Peter Fiala, Sara Fischer, Anna Fischetti, Minnie Fitchben, CatherineGeddes, Stephen Gibson, Donna Flack, Rosanne Fleury, Barbara Flickinger, Mary Flynn, Jesse Fogarty, Glenn Fox, David Frascella, Daniel Frisch, Ileana Fuentes, Max Gabriel, Theodore Galgano Jr., Brendan Gallagher,Maureen Gallagher, Michele Galligan, Richard Garay, Leigh Garcia, Lisa Garcia, Peggy Garfunkel, Andrea Gavaller, Wayne Gee, Ethel Geisinger, George Gephart Jr., MaryEllen Gilroy, Patri Ginas, Richard Giuffra, PatriciaGoldrick, Sanford Goldstein, Amy Gonch, Esther Gonzalez, Melysa Gonzalez, Roberto Gonzalez, Andrew Goodale, Jennette Gosselin, Richard Greenwood, Kelli Greene, Robert Greene, Aeneas Griffin, Lisa Grozio, AmyGullotta, Marsha Gumbs, John Hall, Traci Hall, Stephen Halpert, Dorothy Hamill, Douglas Hamilton, Jacquelyn Hamme, Christine Hammond, Robert Hancock, Nancy Harris, Roger Harris, Marcy Harris, Donald Harrison,Dana Hartman, Emete Hassan, Katina Hawe, Selena Hay, Oddette Haynes, Venetia Heintz, Francie Heller, Robert Heller, Ken Helwig, Jennifer Hendrix, Marc Herman, Ana Hernandez, Robert Herz, Rick Hess, Sandra Heuer,Leslie Hickey, Marshall Hite, David Hoak, Hai Hoang, Drew Hoffman, Ed Holden, Stephen Holliday, Denise Horbach, David Hufnagel, Scott Hughes, Roslyn Hume, Travis Humphries, Timothy Hunt, David Huntley, FrancescaHurd, Brian Hynes, Paul Iannone, Rosalie Jackson, Lynn Jacobs, Michael Jacobson, Elizabeth James, Edward Janson, Sean Jencik, Paul Jennings, Douglas Jensen, Corey Johnson, Janet Johnson, Lisa Johnson, KimberlyJohnson-Cole, Joanne Jontz, Michael Joos, Thomas Jordan, Deirdre Jordan-Coleman, Christopher Jumper, Esther Kain, Maria Kang, Jasvinder Kaur, Una Kearns, Monica Keller, John Kelley, Rosemary Kelley, Brian Kelly,James Kelly, Patrick Kelly, Stephen Kepes, Jennifer Khoury, Amy Killeen, Henry Kim, Sang Kim, Danny King, Howard King, Kathy Kinney, Jason Kissane, Douglas Kitchen, Jane Klemmer, Richard Knight III, Jeffrey Knight,Megan Korson, Amy Kramer, John Krick, Kathleen Kruse, Nicholas Krzemienski, Edward Kushma II, Arthur Kuypers, Todd LaChance, Linda Labelle, Matthew Lagana, Gina Landi, Richard Langberg, Sean Langley, CaraLapicola, Cheryl Larkin, Mary Larson, Andrew Laterza, Linda Latta, Jay Leborgne Jr., Chong Lee, David Lee, Jacqueline Lee, Poh-Choo Lee, Andrew Leggio, James Lennon, Louis Lenzi, Lynn Leone, Lawrence Levitz,Clifton Lewis, Amy Lieb, Sonya Linder Silidjian, Linda Lindh, Eleanor Lipsey, Gregory Lirot, Sandra Lisanti, John Lisle Jr., Georgina Lo, Susan Lockwood, Kevin Loescher, John Lohrs, Siobhan Lombard, Denise Lorine,Zhengyuan Lu, John Lucas, Christa Luckenbach, Bertha Lui-McKee, Robert Lupoli, Mary Lynn, Frank MacDonald, Scott Madden, Michael Maguire, James Maitland, Janelle Major, Efrain Maldonado, Fran Mancia, JoanneMancuso, Katherine Manion, Denise Mann, Paul J. Mansour, Gabriel Marcovecchio, Jaime Mariategui, Sabina Marino, Anel Martinez, Maryann Martini, Patricia Martins, Anne Marquart, Angel Martin, Amy Mauer Litos,Cheryl May, Irene Mayorga, Lisa McCall, Shaun McClelland, John McDonnell Sr., Denise McGee, Frank McGothigan, James McGrane Jr, Timothy McKeon, Anthony McKiernan, Lisa McLaughlin, Thomas McLoughlin, LindaMcManus, Sadie McSwain, William McWilliams, Ani Mensuroglu, Michael Messer, Joyce Michaux, Marsha Miclat, Helen Miksits, Timothy Miles, Howard Miller, Kevin Miller, Michelle Miller, Carrie Milligan, FranklinMinerva, Jairo Molina, Sadhana Moondra, James Moore, Paola Moreno, Janet Morley, Chris Moros, John Morris, Marc Morris, Kristin Mosca, Michael Muldoon, James Munekawa, Jesse Murphy, Cathleen Murray, GerardMurray, Stephen Murray, Theresa Murray, Fred Murrell, Michael Murtagh, Joan Musselbrook, Brenda Narayan, Salvatore Narciso, Daniel Nash, Todd Navin, Eric Neglia, Robert Nevin Jr., Deborah Nickel, Ann Nicoletti,Petya Nikolova, Michael Norris, Oliver North, Michael O’Brien, Frances Ochoa, Meghan O’Donnell, Kathleen Okenica, Patricia Olin, Alexis Ong, Stephanie Ontiveros, Kimberly Osgood, Ashwin Palekar, Laura Palmieri,Randy Palomba, Kimbra Pannett, Brett Parker, Kelli Parker, Christine Parks, Eric Parsons, Fred Pastore, Nicole Paszkiewicz, David Patashnik, Nancy Paulercio, Giri Pawar, Alan Pearlman, Gerald Peeler, Arthur Perlowitz,Ian Petrillo, Eileen Pettineo, Amelito Pilande, Pascale Pinte, John Pizzarelli, Eric Popejoy, Scot Post, Peter Potenziani, Cynthia Praschnik, Andrea Preftes, Armand Principato, James Pugh, Wendy Quartuccio, CindiaQuintana, Judith Radasch, Jane Radocchio, Kerrie Radoor, Beverly Raine, Edward Rajsteter, Veda Ramsay-Stamps, Andrea Randolph, Kathleen Reagan, Kevin Regan, Jeremy Reifsnyder, Pamela Reifsnyder, Charles Reilly,Robert Reilly, Susan Reilly, Jeffrey Relkin, David Rey, Joshua Rezak, James Richardson, Margaret Ritter, Angel Rivera, Loretta Rivera, Stephanie Rivera, Pascual Rizzo, Sheryl Robbins, Emmeline Rocha-Sinha, Lisa Rodia,Omar Rodriguez, Leo Roland, Doreen Romans, Eric Rosensweig, Kathryn Rothberg, Gail Roux, Edward Ruddock, Maria Rundbaken, Kelly-Ann Rush, Stacey Russell, Steven Ruterman, Deirdre Ryan, William Ryff, ThomasSaccardi, Sharon Sacks, Nazima Saleem, D. Kristine Sandvik, Ridwan Sasmita, Jessica Sato, Eric Savino, Colleen Scaglione, Stephen Scanlan, Joseph Schachinger, ConstanzeScheidl, Thomas Scherer, Ellen Schmall, Laura Schneider, Larry Scott, Linda Scott, Patrick Scott, Louie Sedano, Lawrence Selik, Joell Selmon, Joseph Sevely, Bijal Shah, Robert
MBIA Inc. 113 King Street Armonk New York 10504