Determinants of Triple Bottom Line Reporting
36
What drives TBL reporting: Good governance or threat to legitimacy? Author Kent, Pamela, Monem, Reza Published 2008 Journal Title Australian Accounting Review DOI https://doi.org/10.1111/j.1835-2561.2008.0036.x Copyright Statement © 2008 Blackwell Publishing. This is the author-manuscript version of the paper. Reproduced in accordance with the copyright policy of the publisher. The definitive version is available at www.interscience.wiley.com Downloaded from http://hdl.handle.net/10072/22083 Link to published version https://onlinelibrary.wiley.com/doi/10.1111/j.1835-2561.2008.0036.x Griffith Research Online https://research-repository.griffith.edu.au
-
Upload
khangminh22 -
Category
Documents
-
view
0 -
download
0
Transcript of Determinants of Triple Bottom Line Reporting
What drives TBL reporting: Good governance or threat tolegitimacy?
Author
Kent, Pamela, Monem, Reza
Published
2008
Journal Title
Australian Accounting Review
DOI
https://doi.org/10.1111/j.1835-2561.2008.0036.x
Copyright Statement
© 2008 Blackwell Publishing. This is the author-manuscript version of the paper. Reproducedin accordance with the copyright policy of the publisher. The definitive version is available atwww.interscience.wiley.com
Downloaded from
http://hdl.handle.net/10072/22083
Link to published version
https://onlinelibrary.wiley.com/doi/10.1111/j.1835-2561.2008.0036.x
Griffith Research Online
https://research-repository.griffith.edu.au

What Drives TBL Reporting: Good Governance or Threat to Legitimacy?
Pamela Kent and Reza Monem
Abstract
This paper provides two complementary explanations for the adoption of triple bottom
line (TBL) reporting by Australian companies. The first explanation is that companies
adopt TBL reporting to legitimise their relationship with society because of adverse
publicity from the media. The second explanation is that TBL reporting is adopted
because of the company’s desire to achieve high-quality reporting and transparency
inferred by strong corporate governance. Companies with TBL reporting had significantly
more adverse media coverage before implementing TBL reporting than non-TBL
companies. TBL reporting is also significantly and positively related to the existence of
an environmental or sustainable development committee and the frequency of meetings of
the audit committee.
Correspondence Pamela Kent, Faculty of Business, Technology & Sustainable Development, Bond University, Robina, Qld, 4226, Australia. Tel: +61 7 5595 2279; fax: +61 7 5595 1160; email: [email protected]
Classification codes: M41, M48
Corporations report on their performance in protecting and conserving the natural
environment, promoting social justice and enhancing economic developments under a
triple bottom line (TBL) reporting framework (Deegan 2005). The global community is
increasingly aware that economic and business activities are causing degradation both in
the natural (for example, global warming and greenhouse gas emissions, and
deforestation) and social environments (for example, the widening gap between rich and
poor, and increased poverty in developing countries). In recent decades, companies have
come under increased pressure to justify the nature and scale of their consumption
because they are among the largest consumers of natural and social resources.
The Australian government commissioned the report, Corporate Responsibility:
Managing Risk and Creating Value (Parliamentary Joint Committee on Corporations and
Financial Services 2006) to determine whether greater regulation was required to mandate
corporate responsibility and TBL reporting for Australian companies. This inquiry
involved an invitation for submissions from the public that were then evaluated before a
final report was released. Companies, industry associations, accounting firms and
accounting bodies provided submissions in favour of a free market approach where
companies decide on their level of corporate responsibility and TBL reporting.
Conversely, social and environmental non-government organisations, consumer
associations, employee groups and individuals were in favour of legislation that required
companies to report on their social responsibilities to protect interested stakeholders. In
response, the committee decided that it was not in favour of adopting legislation requiring
corporate responsibility and TBL reporting (Deegan and Shelly 2006).
This means that the adoption of TBL reporting in Australia is currently voluntary
and likely to continue this way in the foreseeable future. In 2002, an international
benchmark survey by the United Nations Environment Programme (UNEP) and
2
SustainAbility (a London-based research group) reported a total of 235 corporate
sustainability reports around the world (UNEP/SustainAbility 2002). Further, survey
research commissioned by CPA Australia in 2003 suggests that TBL reporting has been
adopted recently by some 160 companies spread over Australia, the United Kingdom,
other European countries, and Japan (CPA Australia 2004).
Demands for social and environmental information are likely to vary across
countries because of differences in environmental awareness in society, volatility in the
natural environment and cultural differences (Chan and Kent 2003). The aim of this paper
is to identify the factors that determine the implementation of TBL reporting by
Australian companies. Two key complementary explanations are proposed for the
adoption of TBL reporting by Australian companies. The first explanation is that
companies adopt TBL reporting in response to adverse publicity from the media to
legitimise their relationship with society. The second explanation is companies want to be
more transparent and accountable to society by reporting the social and environmental
impact of their operations by adopting TBL reporting. This desire to be more accountable
and transparent is implied by strong corporate governance practices. We know of no other
Australian study that links TBL reporting with corporate governance practices.
To test our propositions, we identified a sample of 22 Australian companies that
were listed in the 2003 CPA Australia survey of companies adopting TBL reporting. We
also identified a control sample of 50 companies matched by total assets (as a proxy for
company size) and industry classification. Results of a binary logistic regression provide
support for a strong positive relation between the number of adverse newspaper articles
and adoption of TBL reporting. Corporate governance variables that have significant
influence on the adoption of TBL reporting are frequency of meetings of the audit
committee and the existence of an environmental or sustainable development committee
3
in the company. Thus, empirical evidence in this paper provides support for both
legitimacy theory and good corporate governance structure as plausible explanations for
the adoption of TBL reporting by Australian companies.
Background and Development of Hypotheses
Legitimacy Theory and TBL
TBL reporting is defined as providing information about the economic, social and
environmental performance of an entity (Elkington 1997). It is a departure from the
traditional focus of companies in maximising their economic or financial bottom-line,
commonly known as profits. TBL reporting is directly tied to the concept of sustainable
development (O’Donovan 2002), which is defined as ‘development that meets the needs
of the present world without compromising the ability of future generations to meet their
own needs’ (World Commission on Environment and Development 1987, p. 43).
Our first explanation for a company’s voluntary disclosure of environmental and
social responsibility reporting (in addition to mandatory financial reporting) is based on
legitimacy theory (see O’Donovan 2002; Deegan 2000 for a comprehensive review of
legitimacy theory). Legitimacy theory posits that the legitimacy of a business entity to
operate in society depends on an implicit social contract between the business entity and
society. Companies lose their license to operate in society by breaching society’s norms
and expectations. Accordingly, legitimacy theory predicts that companies adopt
environmental and social responsibility reporting (in addition to mandatory financial
reporting) to legitimise their operations when society’s norms and expectations of the
business entities change or the business entities perceive themselves in breach of existing
norms and expectations of society (Deegan and Blomquist 2006).
4
Previous research has attributed increased social and environmental disclosures of
companies to adverse media attention in general, unfavourable publicity due to a
significant environmental or social event, and adverse attention for the company due to
union criticism. Media agenda-setting theory posits a positive relation between the
relative emphasis given by the media to various topics, and the degree of importance
these topics have for the general public (Ader 1993). Thus, a firm that comes under
adverse media publicity because of its ‘socially unacceptable’ behaviour is considered to
have lost its social legitimacy. This is a logical conclusion because media organisations
themselves face litigation risk and the risk of reputation damage if their publicity is based
on false evidence. Thus, heightened, adverse media publicity is likely to force a company
to make specific and targeted disclosures to negate the impacts of unfavourable
information available to the public. More importantly, a perceived socially undesirable
company is likely to portray an image of ‘coming clean’ and playing a good corporate
citizen by producing TBL reports. Production of TBL reports to create a positive image
appears to be an appropriate strategy because there has been ever-increasing public
awareness around the world of the adverse social and environmental impacts of business
operations.
Major oil spills, loss of life due to poor working conditions and job losses have a
direct impact on a company’s social responsibility records and disclosure polices.
Companies with recent environmental or social incidents have legitimacy problems for
the industry, and managers use disclosure strategies to reinstate damaged legitimacy (as
inferred by increasing disclosures around the time of the events). This is viewed as
repairing legitimacy threats and is a reactive rather than a proactive strategy (O’Donovan
2002).
5
Patten (1992) provides evidence that there were increased environmental
disclosures by petroleum companies in the post-1989 period after the Exxon Valdez
incident in 1989. Similarly, in Australia, Brown and Deegan (1998) document that higher
levels of media attention are significantly associated with higher levels of annual report
environmental disclosures. An increase in positive self-laudatory disclosures has also
been observed around the time that an event depicted the organisation in an unfavourable
way (Patten 1992; Deegan and Rankin 1996; Deegan et al. 2002). Deegan, Rankin and
Tobin (2002) extended previous research to show that the higher the unfavourable print
media, the higher the positive social and environmental disclosures made in annual
reports.
It has also been shown in Australia that companies do not respond positively to
adverse events unless there is widespread adverse publicity (Jantadej and Kent 1999). In
1994, landowners and villagers in Papua New Guinea issued writs against the Broken Hill
Proprietary Company Limited (BHP), claiming unspecified damages caused by the
discharge of tailings and other releases from a mine owned by BHP into the Ok Tedi
River. Environmental organisations and international authorities were concerned with the
pollution of the river prior to 1994. Pollution of the Ok Tedi River was not referred to in
the annual reports before 1994. However, 1994 was identified as the event year because
BHP became subject to major public scrutiny in the Australian media. BHP greatly
increased their environmental disclosures from 1994 to 1996, compared with the previous
two years, to counteract adverse publicity (Jantadej and Kent 1999).
Criticism by unions on health, safety, environmental and social issues are likely to
encourage management to adopt TBL reporting because unions provide an oversight role
on management behaviour. Deegan et al. (2002) found that unfavourable media releases
6
involving health and safety were followed by increased disclosures of health and safety
issues.
Companies providing TBL reporting are signalling that they are socially
responsible because a review of TBL reports indicates that companies provide mostly
positive information about the social and environmental impact of their operations in
these reports. The implementation of TBL reporting is one potential way of reinstating
damaged legitimacy following adverse media coverage about negative activities and
events. This leads to the following hypothesis:
H1: Adverse media publicity encourages companies to adopt TBL reporting.
Corporate Governance and TBL Reporting
The role of corporate governance in the past has focused on protecting and promoting the
interests of the suppliers of capital to the firm (Shleifer and Vishny 1997). In recent years
emphasis has been placed on a growing demand to link financial performance with
sustainability. For example, all large and medium-sized European companies are required
to produce a business review that provides key information on performance and
development (Financial Times, 26 May 2006, p. 5). Auditors have to state in their audit
report whether the review’s contents are consistent with the financial statements.
Auditors’ new role on sustainability places increasing emphasis on the audit committee
and internal audit (Financial Times, 26 May 2006, p. 5)
The adoption of TBL reporting is likely to be linked to a company’s desire to
achieve general high-quality reporting that is transparent and accountable. TBL reporting
is closely associated with disclosure transparency and transparency is related to strong
corporate governance (Beekes and Brown 2006). A company with a weak corporate
7
governance structure is unlikely to adopt TBL reporting, because management of these
companies withhold information from stakeholders.
Australia introduced the Principles of Good Corporate Governance and Best
Practice Recommendations (Australian Securities Exchange Corporate Governance
Council 2003) in March 2003. The following are the ten principles recommended in the
first ASX Corporate Governance Council report in 2003: lay solid foundations for
management and oversight; structure the board to add value; promote ethical and
responsible decision-making; safeguard integrity in financial reporting; make timely and
balanced disclosure; respect the rights of shareholders; recognise and manage risk;
encourage enhanced performance; remunerate fairly and responsibly; and recognise the
legitimate interests of stakeholders. The principles likely to be associated with the
implementation of TBL are: lay solid foundations for management and oversight;
promote ethical and responsible decision-making; make balanced disclosure; recognise
and manage risk; and recognise the legitimate interests of stakeholders.
The Council also made 28 recommendations for implementing these principles.
Specific recommendations are made about the structure of the board of directors and
establishment and content of an audit committee. It is also recommended that nomination,
remuneration, risk oversight and management committees are established, and that the
external auditor attends the annual general meeting. The committees with relevance to
TBL reporting are risk oversight and management committees. Otherwise the
recommendations are subjective and open to alternative interpretations (Australian
Securities Exchange Corporate Governance Council 2003).
Recommendation 1.1 suggests that the functions of the board of directors and
functions delegated to management should be formally disclosed. The board of directors
generally delegates financial reporting and risk management responsibilities to the audit
8
committee (Davidson et al. 2005; Kent and Stewart 2008), and management committees
such as environmental and/or sustainable development committees are expected to
interact with the audit committee in providing TBL reporting. The board of directors and
the audit committee are instrumental in recommending an external auditor to
communicate to shareholders (Goodwin-Stewart and Kent 2006).
Many companies in Australia require that their audit committee accept
responsibility for overall business risk and ethical standards in addition to financial
reporting responsibilities (OneSteel 2003; Ticor Limited 2003; Lynas Corporation
Limited 2003; United Group Limited 2003). One company explains that the audit
committee is required to report and advise the Board about business risk. It is stated that
‘Risk management policies cover areas such as environment, occupational health and
safety, financial reporting and internal controls’ (OneSteel Limited 2003, p. 33). Another
company reports that the charter of the audit and risk management committee is to assist
the Board in establishing and maintaining ethical standards (Sons of Gwalia Limited
2003).
We expect that audit committees encourage companies to adopt TBL reporting to
demonstrate greater accountability of business activities and transparency in disclosure.
As audit committees were not mandatory for Australian companies (except for the top
500), the existence of an audit committee is indicative of a company’s commitment to
strong corporate governance (Goodwin-Stewart and Kent 2006). All companies in our
sample had audit committees so that this variable is not a suitable discriminator for our
study. We therefore, focus on indicators of the effectiveness of the audit committees for
our sample of companies. The effectiveness of an audit committee partly depends on the
independence and expertise of its members (Menon and Williams 1994; Blue Ribbon
9
Committee 1999), the frequency of its meetings (McMullen and Raghunandan 1996) and
its size (Cadbury Committee 1992).
Researchers and regulators maintain that audit committees should be independent
and consist exclusively of non-executive or independent directors (for example, Blue
Ribbon Committee 1999; Abbott et al. 2004; Carcello and Neal 2000; Dechow et al.
1996; McMullen and Raghunandan 1996; Menon and Williams 1994, ASX 2007).
Researchers find a relation between independence of the audit committee and a lower
incidence of financial statement fraud (Jiambalvo 1996; McMullen and Raghunandan
1996). A more independent audit committee could extend financial reporting quality by
requiring TBL reporting.
Regulators recommend that all committee members be financially literate and that
at least one member has accounting or financial expertise (Blue Ribbon Committee 1999;
ASX 2007; DeZoort and Salterio 2001). External auditors are more likely to rely on
information supplied by audit committees with members possessing financial expertise.
Furthermore, auditors are more likely to refer a complex accounting issue to an audit
committee that is perceived as having expertise about technical financial reporting issues
(Knapp 1987; Cohen et al. 2002). Financial expertise of audit committee members is
more appropriate to financial accounting than TBL reporting and is not included in this
study.
Audit committee size is another attribute considered pertinent to the successful
discharge of its reporting duties (Cadbury Committee 1992; CIMA 2000). Some
corporate governance reports have recommended that an audit committee should have at
least three members (Australian Securities Exchange 2007; New York Stock Exchange
2002; Blue Ribbon Committee 1999). Larger audit committees are perceived as having
increased organisational status and authority (Kalbers and Fogarty 1993; Braiotta 2000).
10
It is also possible that an audit committee can become too large to effectively carry out its
duties because of process losses and diffusion of responsibility (Karamanou and Vafeas
2005). Therefore, audit committees require sufficient members to generate a critical mass,
but become ineffective if they are too large. Kent and Stewart (2008) found that required
disclosures relating to the introduction of international accounting standards were higher
for companies with smaller audit committees. Karamanou and Vafeas (2005) found
support for the efficiency of smaller committees when they showed that companies with
smaller audit committees were more likely to make earnings forecasts than those with
larger committees. Thus, companies with smaller audit committees are more likely to
adopt TBL reporting.
A management committee created by the board of directors specific to social and
environmental disclosures is an environmental and/or sustainable development
committee. This constitutes a formal recognition of the social and environmental impact
of the activities of the company and demonstrates a commitment to consider wider
environmental and social issues within the decision-making framework of the company. It
also implies a company’s commitment to good corporate governance, and social and
environmental disclosures are likely to lead to the implementation of TBL reporting
(Chan and Kent 2003).
The above discussion leads to the following hypothesis:
H2: Good corporate governance structures associated with the audit committee and
existence of an environmental and/or sustainable development committee are positively
related to the adoption of TBL reporting.
Other Corporate Governance and Control Variables
11

The board of directors is the most important internal control mechanism available to
monitor the actions of management (Fama and Jensen 1983). The board of directors as
the highest committee in the company is likely to influence reporting and disclosure
decisions by directly making decisions within the board and indirectly through the audit
committee, and environmental and/or sustainable development committee, the external
auditor and internal auditors. Characteristics of the board of directors indicating sound
corporate governance practice are therefore relevant and measured in the study.
Factors that determine good corporate governance with respect to the board of
directors include the independence of the board members, separation between chief
executive officer (CEO) and the chair of the board, frequency of board meetings, and the
size of the board. The ability of board members to act as an effective monitoring
mechanism depends on their independence from management (Beasley 1996; Dechow et
al. 1996). Independence of the board depends on the number of independent, non-
executive directors on the board. Beasley (1996) finds that the inclusion of independent
directors on the board reduces the likelihood of financial statement fraud, while Dechow
et al. (1996) provide evidence that companies with a greater proportion of non-executive
directors are less likely to be subject to SEC enforcement actions for violating generally
accepted accounting principles.
Another important characteristic of the board of directors from an agency
perspective is whether there is a separation of the roles between the board chair and the
chief executive officer (CEO). This is important in that a board’s ability to perform its
monitoring role is weakened when the CEO is also the chair of the board (for example,
Jensen 1993; Cadbury Committee 1992).
Board size is also related to the directors’ ability to monitor and control managers.
Difficulties in organising and coordinating large groups of directors suggest that board
12
size is negatively related to the board’s ability to advise and engage in long-term strategic
plans (Yatim et al. 2006; Jensen, 1993, Lipton and Lorsch 1992). Further, research
indicates the likelihood of financial statement fraud increases with board size (Beasley
1996); that is, smaller boards are more efficient and effective than larger boards. If
adoption of TBL reporting is considered as a company’s commitment to transparency and
accountability, then it can be argued that board size is negatively related to the adoption
of TBL reporting.
Boards that meet more frequently are expected to be more effective in their
oversight functions (Lipton and Lorsch 1992; Conger et al. 1998, Vafeas 1999). Recent
research on mandated disclosures relating to the introduction of international accounting
standards indicates that more transparent disclosures are positively related to the
frequency of board meetings (Kent and Stewart 2008). Again, if adoption of TBL
reporting is considered as a company’s commitment to transparency and accountability,
then it can be argued that frequency of board meetings is likely to be positively related to
the adoption of TBL reporting. Arguably, meetings of smaller boards can be organised
more efficiently and frequently relative to larger boards.
Past studies of voluntary disclosures have consistently found that larger
companies are more likely to disclose non-mandated information (Ball and Foster 1982;
Kent and Molesworth 2006). Therefore, larger companies are more likely to adopt TBL
reporting. Although control companies have been matched on company size, the effect of
company size on TBL reporting may not have been removed completely due to the non-
availability of perfectly matched companies (that is, companies of equal size). Thus, we
measure and control for company size in our tests.
Firms more successful economically are more likely to adopt TBL reporting than
others. This is for two reasons. First, the adoption of TBL reporting involves additional
13
reporting costs and only economically successful firms have the financial capability to
undertake costly social responsibility activities, which are the subject of social
disclosures. Further, firms with depressed economic performance are more likely to give
priority to economic survival over social demands of being socially and environmentally
responsible (Roberts 1992; Chan and Kent 2003). Second, economically successful firms
have incentives for not being viewed as socially and environmentally irresponsible
through media and public scrutiny. Thus, companies with higher economic performance
are more likely to adopt TBL reporting and economic performance is used as a control
variable.
Companies are likely to use TBL reporting to provide information to their
creditors and reduce their agency costs of debt (Chan and Kent 2003). Creditors want to
ensure that companies do not invest in activities that reduce the value of creditors’ claims
on the company. Companies that conduct their business activities in an environmentally
and socially irresponsible manner increase their default risk on debts because these
activities attract sanctions (Cornell and Shapiro 1987; Chan and Kent 2003). Sanctions
applied to socially undesirable corporate activities include monetary penalties under
legislative enactment and regulations (Deegan and Rankin 1996), adverse judicial
decisions and consumer retaliation (Spicer 1978). Fines imposed on companies are
typically not material in financial terms, but do impose costs by damaging the reputation
of the company. Creditors are able to exercise their economic power by increasing the
cost of capital or withdrawing their investments (Chan and Kent 2003). The influence of
the creditors to a company is likely to be positively related to the degree to which the
company relies on debt financing for its operations (Roberts 1992). A control variable is
therefore included to measure financial leverage of the companies.
14
Research Method
Sample selection
Deegan, Cooper and Shelley (2006a; 2006b) constructed a database in 2003 on behalf of
CPA Australia. The database identifies 170 organisations, internationally, as of 2003 that
produced TBL reports with an accompanying assurance statement. Of these, 33
organisations were identified as Australian. Our initial sample consists of these 33
Australian organisations. Because our research design requires control for firm size and
industry membership, we were unable to find suitable matching for 11 companies in the
TBL database. Hence, 22 TBL reporting companies were then matched with up to four
companies where available by firm size (measured by total assets) and global industry
classification standard (GICS). Due to substantial size differences between TBL
companies and their industry peers, the control companies ranged between 50% and
150% in terms of total assets of the respective TBL companies. This resulted in an overall
sample of 72 companies with 22 TBL companies and 50 control companies. We collected
data for all our companies from the annual reports available on Connect 4 database.
Model
The following logistic regression model is estimated for testing the hypotheses:
TBLi = b0 + b1ADVERSEi + b2INDEPENDENTi + b3FREQi + + b4SIZEi + b5ENVIRONi + b6INDEPENDENTBi + b7CHAIRi + b8FREQBi + b9 SIZEBi + b10ASSETSi + b11ROAi
+ b12DEBTi + ei (1) where TBLi is a dummy variable that takes a value of 1 if company i has adopted TBL
reporting and 0 otherwise; ADVERSEi is the number of adverse publicity articles about
the company reported in major newspapers in the past three years; INDEPENDENTi is the
proportion of audit committee members identified as independent in the annual report;
15
FREQCi is the number of meetings held by the audit committee in the past 12 months;
SIZECi is the number of members on the audit committee; ENVIRONi is a dummy
variable that takes a value of one if the company has an environmental or sustainable
development committee; INDEPENDENTBi is the proportion of non-executive directors
on the board of directors and CHAIRi is a dummy variable taking a value of 1 if the CEO
is also the chair of the board and 0 otherwise; FREQBi is the number of meetings held in
2003 by the board of directors; SIZEBi is the number of directors on the board of
directors; ASSETSi is total assets of firm i at the end of its fiscal year in 2003; ROAi is net
profit after tax divided by total assets at the end of 2003; DEBTi is total liabilities divided
by total assets; and ei is the error term.
Measurement of the Variables
The dependant variable is measured as a dichotomous variable taking a value of 1 for a
TBL reporting company and 0 otherwise. We relied on the CPA survey to identify the
companies that adopted TBL reporting. This provided 19 companies with available
annual reports and we were able to identify three other companies not on the database that
reported TBL in a similar manner to those listed with the CPA.
When a company perceives that its social legitimacy has been threatened by
adverse publicity, it is likely to adopt TBL reporting to repair the damage caused by the
adverse publicity. The adoption of TBL reporting requires investments in information
systems. It also requires companies to ensure that TBL does not further damage their
image with the public. This is likely to involve the company in ensuring that some levels
of social and environmental performance programs are implemented by the company
because TBL reporting adds attention to their actual performance. For these reasons, the
16
adoption of TBL reporting is unlikely to be implemented in a year or two. Thus, we allow
a company up to three years to adopt TBL reporting subsequent to adverse publicity.
A senior research assistant with an Honours degree in commerce (accounting
major) searched the Factiva database for each sample company for published news items
over the years 2001 to 2003. This database records articles from all major newspapers in
Australia and New Zealand. The research assistant and the researchers then read the news
items and determined whether they constituted adverse publicity based on the nature and
content of the news items. A negative social or environmental event or union criticism
usually leads to adverse publicity; hence, these three items were counted to provide the
number of newspaper articles representing the variable, ADVERSEi. The search for
adverse publicity was confined to the print media, although most adverse publicity is
duplicated in the electronic media.
Independence of the audit committee, INDEPENDENTi, is measured by the
proportion of audit committee members identified as independent in the annual report.
Most companies specify that directors are independent and non-executive. We assume
that non-executive directors are not independent unless specified as so. We also perform
sensitivity analysis by treating all the non-executive directors as independent.
Effectiveness or diligence of the audit committee is measured by the number of
meetings (FREQCi) each year. Prior research finds that an audit committee which meets
frequently can reduce the incidence of financial reporting problems (Farber 2005; Collier
1993; Hughes 1999; McMullen and Raghunandan 1996). Size of the audit committee,
SIZECi, is measured as the number of members on the audit committee.
ENVIRONi is a dummy variable that takes a value of 1 if the company has an
environmental or sustainable development committee and 0 otherwise. This variable was
collected from the Director’s report, Corporate Governance Statement or the notes to
17
accounts of the annual report. INDEPENDENTBi is the proportion of the non-executive
directors on the board of directors. CHAIR, a dummy variable, takes a value of 1 if the
CEO is also the chair of the board and otherwise 0. FREQBi is the number of meetings
held in 2003 by the board of directors. SIZEBi is the number of directors on the board of
directors. ASSETS is the unscaled total assets of the company at the end of the year.
Economic performance can be measured by accounting or market-based
constructs. Accounting-based measures provide an advantage over market-based
measures because market-based measures convey investors’ predictions of companies’
future performance, whereas a more appropriate measure is an estimate of past or current
performance (Ullman 1985). Market-based measures have the limitation that the
information content of disclosure potentially influences the market price of the company
and that confounding events make measurement of market-based returns unreliable.
Accounting-based measures also have limitations because management frequently
manipulates earnings and this reduces the reliability of reported performance (Holthausen
1990). Accounting-based measures are also subject to estimates such as provision
accounts and different interpretations of reporting standards. This study uses returns on
assets, ROAi, for 2003 as a measure of economic performance. ROAi is net profit after tax
divided by total assets at the end of 2003.
Finally, recall that highly leveraged companies have incentives to reduce their cost
of capital by improving their disclosure levels. DEBTi is measured as total liabilities
divided by total assets.
Results
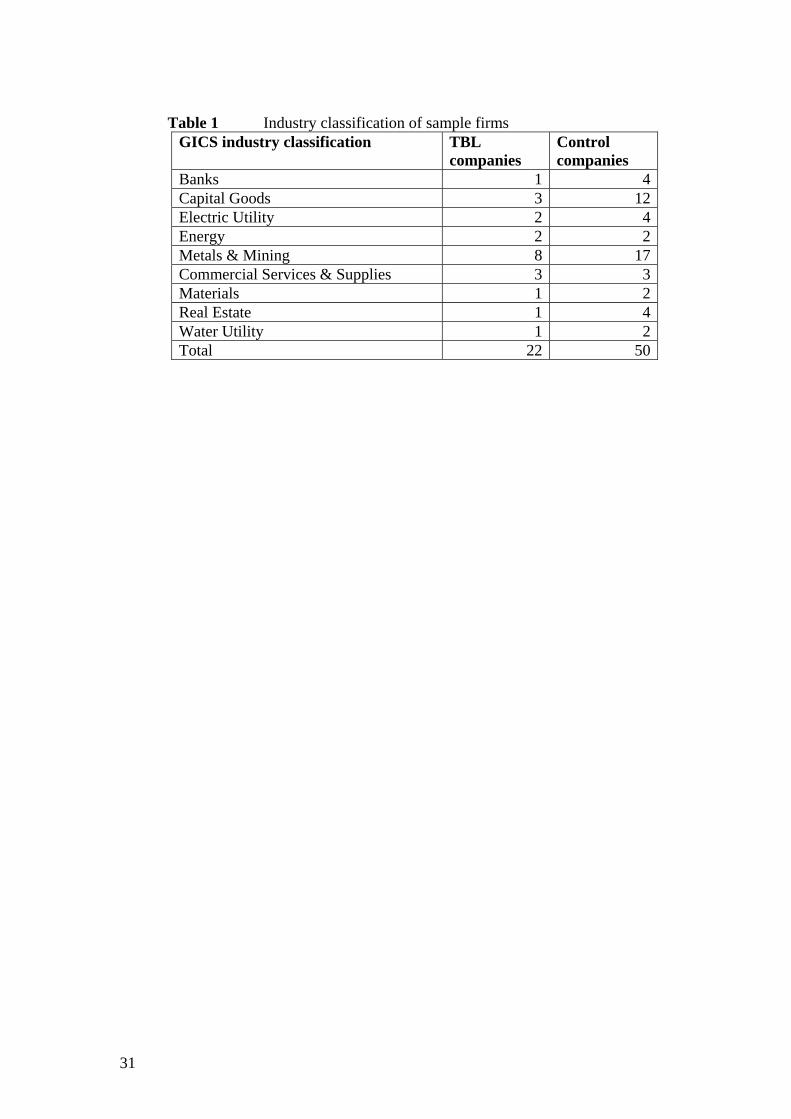
Table 1 shows the industry classification of 72 sample companies as per GICS industry
classification. The largest representation is from the metals and mining industry with
18
eight TBL companies and 17 control companies. This is not surprising given that metals
and mining companies directly affect the natural environment of the surrounding areas in
which they operate and mining operations are susceptible to accidents.
Take in Table 1
Table 2 provides descriptive statistics of the variables of interest and indicates
that 33% of the companies had adverse publicity in major Australian and New Zealand
newspapers. This publicity was found in the following: The Western Australian, The
Australian, Sydney Morning Herald, New Zealand Herald, Daily Telegraph, Adelaide
Adviser, Courier Mail, The Age, Canberra Times, Advertiser (Adelaide), Hobart
Mercury, New Zealand and Herald Standard & Poor’s rating services. The average
number of adverse newspaper articles for companies with adverse publicity was 13.25
articles with a range of 3 to 41 (not tabulated). The average was 4.81 with a range of 2 to
41 when all companies were included in calculating descriptive statistics. BHP Billiton
had adverse publicity in excess of other companies and was truncated to the next highest
number of articles at 41 (Boral Limited), so that one company did not create undue
influence on the results.
The mean (median) board of directors comprised of 7.67 (7.00) members. The
mean (median) ratio of non-executive directors was 78% (83%). The sample companies
had 10.75 meetings in the year 2003 on average with a median of 11 meetings. An
average of 87% (median = 100) of audit committee members were declared independent.
The audit committee met on average 4.63 (median = 4) times a year, while the mean
(median) size of the audit committee was 3.37 (3) members. Among other corporate
governance attributes, 97% of the companies had an audit committee and the CEO had a
dual role as Chair in 11% of the companies.
19
Some 25% of the companies had an environmental or sustainable development
committee. Environmental or sustainable development committees had a range of names
including Health, Safety and Environment; Sustainability; Social Responsibility; Safety
Environment; and Security and Health, Environment and Community. All companies
except one stated that the committee was responsible to the board of directors and
reported the number of meetings and number of directors attending the committee for the
year. The company not reporting the number of directors or meetings was a non-TBL
reporting company (that is, a control company). The environmental or sustainability
committee met on average 3.25 (median = 3) times a year, while the mean (median) size
of the committee was 4.25 (4) members.
The sample companies differed substantially in terms of total assets with mean
total assets of $19 billion and median total assets of $2 billion. Similarly, the sample
companies had varied debt levels; the mean and median ratios were 52%, while the
minimum was 1% and the maximum leverage ratio was 94%. The mean return on assets
was 2% with the median 6%.
Take in Table 2
Table 3 provides detailed analysis of adverse publicity. Panel A shows that 77%
of 22 TBL companies faced adverse publicity compared with only 14% of the 50 control
companies. The only industry that did not have any adverse publicity was the real estate
industry (five sample companies). Panel B lists the different types of adverse publicity
reported for the sample companies. It must be noted that different industries attract
adverse publicity for different reasons. For example, while banks are criticised for record
profits, branch closures and high bank fees, mining companies are likely to receive
adverse publicity due to mining accidents, environmental pollution, and health and safety
20
standards.
Take in Table 3
Table 4 reports Pearson’s bi-variate correlation matrix for all the variables. The
variables ADVERSE (number of adverse publicity newspaper articles) and FREQC
(frequency of meetings of the audit committee) are positively, significantly correlated to
the dependent variable TBL at the 1% and 5% level of significance (two-tailed),
respectively. FREQC is also positively, significantly related to the variables ADVERSE
and INDEPENDENT (proportion of independent audit committee members) at a 5%
level of significance (two-tailed). Table 4 also reveals that the independence of the audit
committee (INDEPENDENT) and size of the audit committee (SIZEC) are significantly,
positively related at 1%.
Take in Table 4
Table 5 provides the results of a binary logistic regression estimated on a sample
of 70 companies comprising 22 TBL companies and 48 control companies. All variables
were not available for two companies and these were excluded from the analysis. Non-
significant control variables relating to the board of directors were excluded from the
reported analysis for brevity. The model correctly classifies 91% of the TBL and non-
TBL companies, and is significant at p<0.001.
The coefficient of the variable ADVERSE is positive as expected and statistically
significant with a Wald statistic of 11.53 (p-value <0.001). This result is consistent with
hypothesis 1 in that adverse publicity encourages companies to adopt TBL reporting.
The variable FREQC (frequency of meetings of the audit committee) has the
expected positive sign and is statistically significant with a Wald statistic of 4.36 (p-
21
value = 0.02). Furthermore, the existence of an environmental or sustainable
development committee helps explain the adoption of TBL reporting. The variable
ENVIRON (the existence of an environmental or sustainable development committee) is
statistically significant with a Wald statistic of 2.49 (p-value = 0.06). Thus, to the extent
that the frequency of audit committee meetings reflects the effectiveness of the audit
committee in improving the reporting and disclosure quality of companies, it appears that
audit committees influence companies’ disclosure and social accountability choice.
Similarly, the existence of an environmental or sustainable development committee
could reflect a company’s strong commitment to improving its social accountability.
Thus, the variable FREQC and ENVIRON provide support for hypothesis 2 in that
companies with good corporate governance structures associated with the audit
committee and existence of an environmental and/or sustainable development committee
adopt TBL reporting.
Take in Table 5
None of the control variables except ASSETS (total assets) is significant in
explaining the adoption of TBL reporting. The treatment and control companies were
matched on total assets as a proxy for company size. Yet the variable ASSETS is
statistically significant with a Wald statistic of 5.86 (p-value = 0.01). This implies that
difference in company size between the TBL and non-TBL companies was still
significant even after matching by company size. That is, TBL reporting is also
potentially linked to political sensitivity of companies to the extent that company size
captures political sensitivity. We also matched treatment companies against control
companies on the basis of industry classification and found that industry membership
was effectively controlled for in our research design.
22
All TBL reporting companies and most non-TBL companies (97% of the control
companies) had an audit committee. All the companies in the sample used either a Big 4
auditor or the government auditor. Therefore, variables representing the Big 4 auditors
and the existence of an audit committee were not tested in equation (1). This lack of
variation is not representative of all listed companies in Australia. A recent study by
Kent and Stewart (2008) found that 58% of all listed companies with a 30 June balance
date used the Big 4 auditors while 81% had an audit committee.
In the sample, BHP Billiton was matched on industry, but it was not possible to
find a close match on size of assets. Equation (1) was re-estimated after excluding BHP
Billiton from the sample without any qualitative change to the results. Similarly,
regression estimates using alternative measures of variables discussed in the
‘measurement of variables’ section produced qualitatively similar results.
Conclusion
We investigate explanations for companies adopting TBL reporting in this paper. We
proposed two explanations for the adoption of TBL reporting in Australia. On the
premise of legitimacy theory, first we hypothesised that adverse publicity against a
company encourages adoption of TBL reporting. Second, we proposed that companies
with good corporate governance structures adopt TBL reporting.
Binary logistic regression estimates provided support for our hypotheses. The
good corporate governance practices that were positively associated with TBL reporting
are the frequency of meetings of the audit committee and the existence of an
environmental or sustainable development committee. This indicates that audit
committees play a role in assuring high-quality financial reporting and improving
disclosure and accountability of the company to society. Similarly, the presence of an
23
environmental or sustainable development committee reflects a company’s commitment
to sustainable development. Such a committee is likely to exist when the company is
committed to social accountability and transparency. These company attributes signal
good corporate governance practice. Thus, threat to legitimacy and good corporate
governance practice both have contributed to the adoption of TBL reporting in Australia.
The findings of this paper have policy implications. Given that there is consistent
and strong evidence of global warming and threat to bio-diversity, corporations as the
largest consumers of natural resources need to be more responsive to the impacts of their
activities on the environment and society. If society desires greater accountability and
transparency for corporate activities, then the findings of this paper suggest that large-
scale adoption of TBL reporting can be ensured in two ways: making TBL reporting
mandatory at least for the largest companies in our economy or taking initiatives in
improving corporate governance practice at the company level. However, embracing
TBL reporting via good governance practice is likely to be slow and it is unlikely to
bring significant changes in corporate behaviour. Our findings are consistent with
Deegan and Ranking (1996) confirming that TBL reporting will mainly remain sporadic
and self-laudatory without legislation.
There are at least two limitations in this study. First, the analysis is based on a
single year and on a small sample. Thus, it may have limited external validity. Second,
because environmental awareness is likely to vary across countries because of social and
cultural differences, it is indeterminate whether the explanations provided in this paper
still hold in other cultures and societies. Thus, future research investigating TBL
reporting could focus on cultures and societies very different from Australia. Future
research could also investigate the association between the level of voluntary financial
reporting and the adoption of TBL reporting.
24
Pamela Kent is at Bond University and Reza Monem is at Griffith University. The authors are grateful to Jacqui Christensen, Ryan Davidson, Janice Hollindale, Edward Leow, Eduardo Roca, Jenny Stewart, Nava Subramaniam, COGAP seminar participants at Griffith University and workshop participants at the Annual Conference of the European Accounting Association, Lisbon, April, 2007; Annual Conference of the Accounting and Finance Association of Australia and New Zealand, Gold Coast, July 2007.
25

References
Abbott, L.J., S. Parker and G.F. Peters 2004, ‘Audit Committee Characteristics and Restatements’, Auditing: A Journal of Practice & Theory, 23, 1: 69–87.
Ader, C.R. 1993, ‘A Longitudinal Study of Agenda Setting for the Issues of Environmental Pollution’, Journalism and Mass Communication Quarterly, 72, 2: 300–11. Australian Securities Exchange (ASX) Corporate Governance Council 2003, Corporate Governance Principles and Recommendations, 1st edition, ASX, Sydney. Ball, R. and G. Foster 1982, ‘Corporate Financial Reporting: A Methodological Review of Empirical Research’, Journal of Accounting Research, 20, Supplement: 161–234. Beasley, M.S. 1996, ‘An Empirical Analysis of the Relation between the Board of Director Composition and Financial Statement Fraud’, The Accounting Review, 71, 4: 443–65. Beekes, W. and P. Brown 2006, ‘Do Better-governed Australian Firms Make More Informative Disclosures?’, Journal of Business Finance & Accounting, 33, 3 and 4: 422–50. Blue Ribbon Committee 1999, Report and Recommendations of the Blue Ribbon Committee on Improving the Effectiveness of Corporate Audit Committees, New York Stock Exchange & National Association of Securities Dealers, New York. Braiotta, L. 2000, The Audit Committee Handbook, John Wiley & Sons, New York. Brown, N. and C.M. Deegan 1998, ‘The Public Disclosure of Environmental Performance Information – A Dual Test of Media Agenda Setting Theory and Legitimacy Theory’, Accounting and Business Research, 19, 1: 21–41. Cadbury Committee 1992, Report of the Committee on the Financial Aspects of Corporate Governance (Sir Adrian Cadbury, chair), Gee and Company Ltd, London. Carcello, J.V. and T.L. Neal 2000, ‘Audit Committee Composition and Auditor Reporting’, The Accounting Review, 75, 4: 453–67. Chan, C. and P. Kent 2003, ‘Application of Stakeholder Theory to the Quantity and Quality of Australian Voluntary Corporate Environmental Disclosures’, Annual Conference of the Accounting and Finance Association of Australia and New Zealand, Brisbane. Chartered Institute of Management Accountants (CIMA) 2000, Corporate Governance – History, Practice and Future, CIMA, London. Cohen, J., G. Krishnamoorthy and A. Wright 2002, ‘Corporate Governance and the Audit Process’, Contemporary Accounting Research, 19, 4: 573–92.
26
Collier, P.A. 1993, ‘Audit Committees in Major U.K. Companies’, Managerial Auditing Journal, 8, 3: 25–30. Conger, J.A., D. Finegold, D. and E.E. Lawler, III, 1998, ‘Appraising Boardroom Performance’, Harvard Business Review, 76 January–February: 136–48. Cornell. B. and A. Shapiro 1987, ‘Corporate Stakeholders and Corporate Finance’, Financial Management, 16: 5–14. CPA Australia 2004, Triple Bottom Line: A Study of Assurance Statements Worldwide, Melbourne, Australia. Davidson, R., J. Goodwin and P. Kent 2005, ‘Internal Governance Structures and Earnings Management’, Accounting and Finance, 45, 2: 241–67. Dechow, P.M., R.G. Sloan and A.P. Sweeney 1996, ‘Causes and Consequences of Earnings Manipulation: An Analysis of Firms Subject to Enforcement by the SEC’, Contemporary Accounting Research, 13, 1: 1–36. Deegan, C. 2000, ‘Financial Accounting Theory’, McGraw Hill, Sydney. Deegan, C. 2005, ‘Australian Financial Accounting’, 4th edn, McGraw Hill, Sydney. Deegan, C. and C. Blomquist 2006, ‘Stakeholder Influence on Corporate Reporting: An Exploration of the Interaction between the World Wide Fund for Nature and the Australian Minerals Industry’, Accounting, Organizations, and Society, 31, 4–5: 343–72. Deegan, C., B. Cooper and M. Shelley 2006a, ‘An Investigation of TBL Report Assurance Statements: Australian Evidence’, Australian Accounting Review, 16, 2: 2–18. Deegan, C., B. Cooper and M. Shelley 2006b, ‘An Investigation of TBL Report Assurance Statements: UK and European Evidence’, Managerial Auditing Journal, 21, 4: 329–71. Deegan, C.M. and M. Rankin 1996, ‘Do Australian Companies Report Environmental News Objectively? An Analysis of Environmental Disclosures by Firms Prosecuted Successfully by the Environmental Protection Authority’, Accounting, Auditing & Accountability Journal, 9, 2: 50–67. Deegan C.M., M. Rankin M. and J. Tobin 2002, ‘An Examination of the Corporate Social and Environmental Disclosures of BHP from 1983–1997 – A Test of Legitimacy Theory’, Accounting, Auditing & Accountability Journal, 15, 3: 312–43. Deegan, C. and M. Shelly 2006, ‘Stakeholder Perceptions about Corporate Social Responsibilities: To Regulate or Not to Regulate’, working paper, RMIT, Melbourne. DeZoort, F.T. and S. Salterio 2001 , ‘The Effects of Corporate Governance Experience, Financial Reporting and Audit Knowledge on Audit Committee Members’ Judgments’, Auditing: A Journal of Practice & Theory, 20, 2: 31–47.
27

Elkington, J. 1997, Cannibals with Forks: The Triple Bottom Line of 21st Century Business, Capstone, Oxford. Fama, E.F. and M. Jensen 1983, ‘Agency Problems and Residual Claims’, Journal of Law and Economics, 26, 2: 327–49. Farber, D. 2005, ‘Restoring Trust after Fraud: Does Corporate Governance Matter?’ The Accounting Review, 80, 539–61. Financial Times 2006, ‘Management of Companies and Enterprises’, 26 May, p. 5. London (UK). Goodwin-Stewart, J. and P. Kent 2006, ‘Factors Affecting the Voluntary Use of Internal Audit’, Managerial Auditing Journal, 21, 1: 81–101. Holthausen, R. 1990, ‘Accounting Method Choice: Opportunistic Behaviour, Efficient Contracting and Information Perspectives’, Journal of Accounting and Economics, 12, 1–3: 207–18. Hughes, R. 1999, ‘The Rise and Rise of the Audit Committee’, Accountancy, 123, 1266: 59. Jantadej, P. and P. Kent 1999, ‘Corporate Environmental Disclosures in Response to Public Awareness of the Ok Tedi Copper Mine Disaster: A Legitimacy Theory Perspective’, Accounting Research Journal, 12, 1: 72–88. Jiambalvo, J. 1996, ‘Discussion of Causes and Consequences of Earnings Manipulation: An Analysis of Firms Subject to Enforcement by the SEC’, Contemporary Accounting Research, 13, 1: 37–47. Jensen, M.C. 1993, ‘The Modern Industrial Revolution, Exit, and the Failure of Internal Control Systems’, The Journal of Finance, 48, 3: 831–80. Kalbers, L.P. and T.J. Fogarty 1993, ‘Audit Committee Effectiveness: An Empirical Investigation of the Contribution of Power’, Auditing: A Journal of Practice & Theory, 12, 1: 24–49. Karamanou, I. and N. Vafeas 2005, ‘The Association between Corporate Boards, Audit Committees, and Management Earnings Forecasts; An Empirical Analysis’, Journal of Accounting Research, 43, 3: 453–86. Knapp, M. 1987, ‘An Empirical Study of Audit Committee Support for Auditors Involved in Technical Disputes with Client Management’, The Accounting Review, 62, 3: 578–88. Kent, P. and M. Molesworth 2006, ‘Incidence and Incentives for the Voluntary Disclosure of Employee Entitlement Information Encouraged under AASB1028’, Corporate Ownership and Control, 3, 4: 82–9.
28
Kent, P. and J. Stewart 2008, ‘Corporate Governance and Disclosures on the Transition to International Financial Reporting Standards’, forthcoming, Accounting and Finance. Lipton, M. and J. Lorsch 1992, ‘A Modest Proposal for Improved Corporate Governance’, The Business Lawyer, 48, 1: 59–77. Lynas Corporation Limited 2003, Annual Reports Online, Aspecthuntley. McMullen, D.A. and K. Raghunandan, K. 1996, ‘Enhancing Audit Committee Effectiveness’, Journal of Accountancy, 182: 79–81. Menon, K. and J.D. Williams 1994, ‘The Use of Audit Committees for Monitoring’, Journal of Accounting and Public Policy, 13, 2: 121–39. O’Donovan, G. 2002, ‘Environmental Disclosures in the Annual Report – Extending the Applicability and Predictive Power of Legitimacy Theory’, Accounting, Auditing & Accountability, 15, 3: 344–71. OneSteel Limited 2003, Annual Reports Online, Aspecthuntley. Parliamentary Joint Committee on Corporations and Financial Services, 2006, ‘Corporate Responsibility: Managing Risk and Creating Value’, Commonwealth of Australia, Canberra. Patten, D.M. 1992, ‘Intra-industry Environmental Disclosures in Response to the Alaskan Oil Spill: A Note on Legitimacy Theory’, Accounting, Organisations and Society, 17, 5: 471–5. Roberts, R. 1992, ‘Determinants of Corporate Social Responsibility Disclosure: An Application of Stakeholder Theory’, Accounting, Organizations and Society, 17, 7: 595–612. Shleifer, A. and R.W. Vishney 1997, ‘A Survey of Corporate Governance’, The Journal of Finance, 52, 2: 737–83. Sons of Gwalia Limited 2003, Annual Reports Online, Aspecthuntley. Spicer, B. 1978, ‘Investors, Corporate Social Performance and Information Disclosure: An Empirical Study’, The Accounting Review, January: 94–111. Ticor Limited 2003, Annual Reports Online, Aspecthuntley. Treadway, J.C. 1987, Report of the National Commission of Fraudulent Financial Reporting, National Commission of Fraudulent Financial Reporting, Washington, DC. UNEP/SustainAbility 2002, Trust Us: The Global Reporters 2002 Survey of Corporate Sustainability Reporting, UNEP/SustainAblity, New York and London.
29
Ullman, A. 1985, ‘Data in Search of a Theory: A Critical Examination of the Relationships Among Social Performance, Social Disclosure and Economic Performance of US Firms’, Academy of Management Review, 10, 3: 540–77. United Group Limited 2003, Annual Reports Online, Aspecthuntley. New York Stock Exchange (NYSE) Corporate Accountability and Listing Standards Committee 2002, available at <http://www.nyse.com>. Vafeas, N. 1999, ‘Board Meeting Frequency and Firm Performance’, Journal of Financial Economics, 53, July: 113–42. World Commission on Environment and Development 1987, Our Common Future (The Brundtland Report), Oxford University Press, Oxford, U.K. Yatim, P., P. Kent and P. Clarkson 2006, ‘Governance Structures, Ethnicity, and Audit Fees of Malaysian-listed Firms’, Managerial Auditing Journal, 21, 7: 757–82.
30
31
Table 1 Industry classification of sample firms
GICS industry classification TBL companies
Control companies
Banks 1 4 Capital Goods 3 12 Electric Utility 2 4 Energy 2 2 Metals & Mining 8 17 Commercial Services & Supplies 3 3 Materials 1 2 Real Estate 1 4 Water Utility 1 2 Total 22 50

Table 2 Descriptive statistics Panel A: Continuous variables Variable Mean Median Std Dev. Minimum Maximum Number of adverse newspaper articles
4.81 0 9.74 2 41
Ratio of independent members on the audit committee
0.87 1 0.24 0 1
Frequency of audit committee meetings
4.63 4 2.16 3 1
Size of the audit committee 3.37 3.00 0.75 2 5Frequency of environment committee meetings
3.25 3.00 0.87 2 4
Size of the environment committee
4.25 4.00 1.83 2 7
Ratio of independent directors 0.78 0.83 0.15 0 1Number of directors 7.67 7.00 2.10 3 13Number of board meetings 10.75 11.00 4.88 1 27Total assets $19 000m. $2000m. $65 000m. $18m. $400 000m.Return on assets 0.02 0.06 0.15 –0.89 0.24Debt to total assets 0.52 0.52 0.20 0.01 0.94Descriptive statistics Panel B: Binary variables Variable ProportionDuality of Chair 0.11 Existence of an audit committee 0.97 Presence of environment committee 0.25 Adverse publicity 0.33
Note: Total TBL companies = 22, Control companies = 50.
32
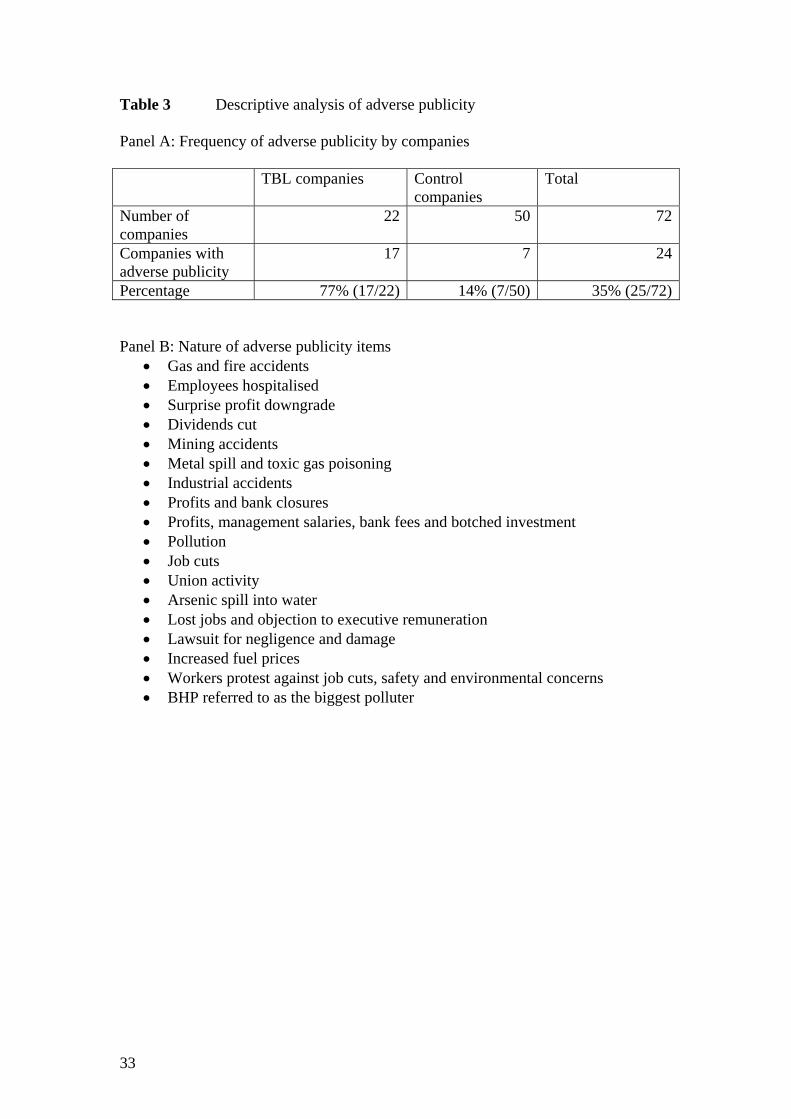
Table 3 Descriptive analysis of adverse publicity Panel A: Frequency of adverse publicity by companies TBL companies Control
companies Total
Number of companies
22 50 72
Companies with adverse publicity
17 7 24
Percentage 77% (17/22) 14% (7/50) 35% (25/72) Panel B: Nature of adverse publicity items
Gas and fire accidents Employees hospitalised Surprise profit downgrade Dividends cut Mining accidents Metal spill and toxic gas poisoning Industrial accidents Profits and bank closures Profits, management salaries, bank fees and botched investment Pollution Job cuts Union activity Arsenic spill into water Lost jobs and objection to executive remuneration Lawsuit for negligence and damage Increased fuel prices Workers protest against job cuts, safety and environmental concerns BHP referred to as the biggest polluter
33
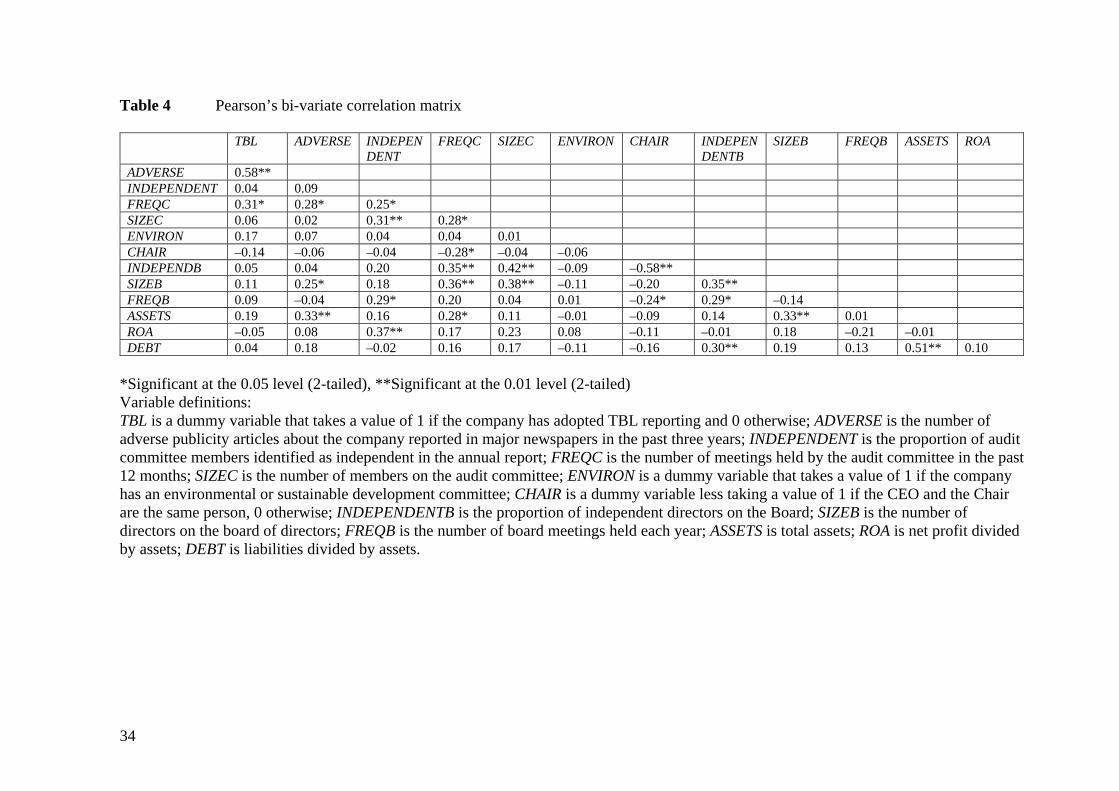
Table 4 Pearson’s bi-variate correlation matrix
TBL ADVERSE INDEPENDENT
FREQC SIZEC ENVIRON CHAIR INDEPENDENTB
SIZEB FREQB ASSETS ROA
ADVERSE 0. 58 ** INDEPENDENT 0.04 0.09 FREQC 0.31* 0.28* 0.25* SIZEC 0.06 0.02 0.31** 0.28* ENVIRON 0.17 0.07 0.04 0.04 0.01 CHAIR –0.14 –0.06 –0.04 –0.28* –0.04 –0.06 INDEPENDB 0.05 0.04 0.20 0.35** 0.42** –0.09 –0.58** SIZEB 0.11 0.25* 0.18 0.36** 0.38** –0.11 –0.20 0.35** FREQB 0.09 –0.04 0.29* 0.20 0.04 0.01 –0.24* 0.29* –0.14 ASSETS 0.19 0.33** 0.16 0.28* 0.11 –0.01 –0.09 0.14 0.33** 0.01 ROA –0.05 0.08 0.37** 0.17 0.23 0.08 –0.11 –0.01 0.18 –0.21 –0.01 DEBT 0.04 0.18 –0.02 0.16 0.17 –0.11 –0.16 0.30** 0.19 0.13 0.51** 0.10
*Significant at the 0.05 level (2-tailed), **Significant at the 0.01 level (2-tailed) Variable definitions: TBL is a dummy variable that takes a value of 1 if the company has adopted TBL reporting and 0 otherwise; ADVERSE is the number of adverse publicity articles about the company reported in major newspapers in the past three years; INDEPENDENT is the proportion of audit committee members identified as independent in the annual report; FREQC is the number of meetings held by the audit committee in the past 12 months; SIZEC is the number of members on the audit committee; ENVIRON is a dummy variable that takes a value of 1 if the company has an environmental or sustainable development committee; CHAIR is a dummy variable less taking a value of 1 if the CEO and the Chair are the same person, 0 otherwise; INDEPENDENTB is the proportion of independent directors on the Board; SIZEB is the number of directors on the board of directors; FREQB is the number of board meetings held each year; ASSETS is total assets; ROA is net profit divided by assets; DEBT is liabilities divided by assets.
34
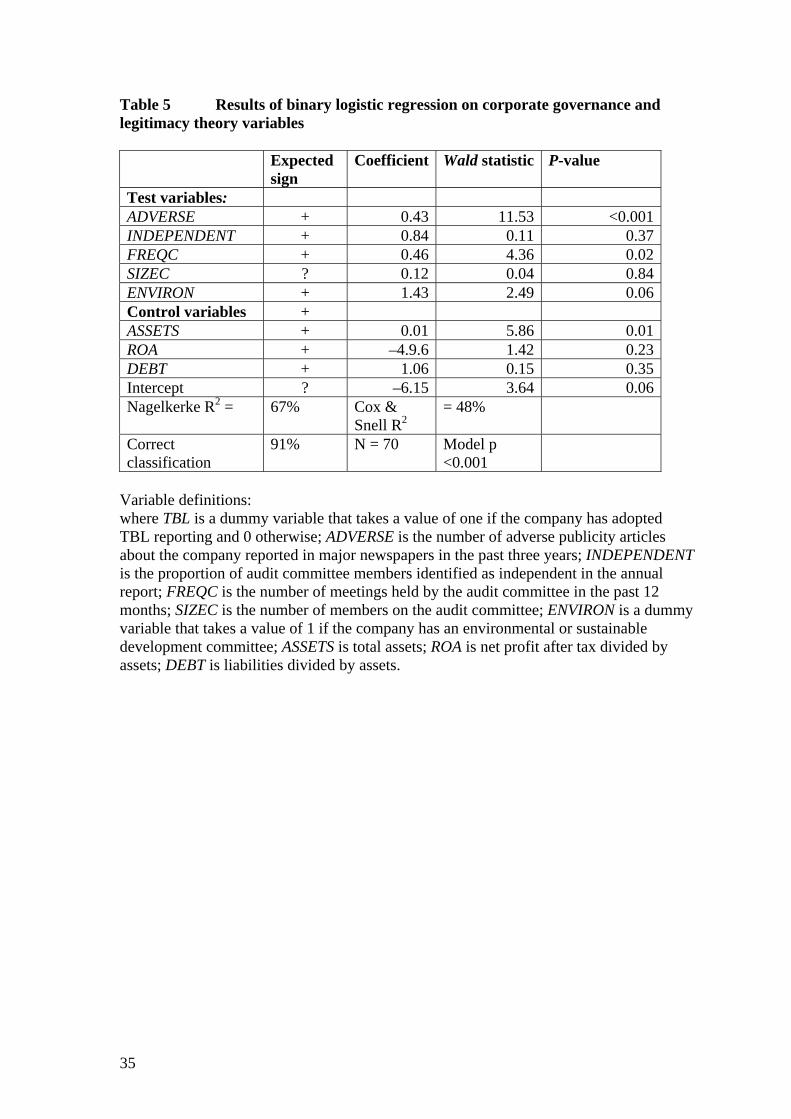
Table 5 Results of binary logistic regression on corporate governance and legitimacy theory variables Expected
sign Coefficient Wald statistic P-value
Test variables: ADVERSE + 0.43 11.53 <0.001INDEPENDENT + 0.84 0.11 0.37FREQC + 0.46 4.36 0.02SIZEC ? 0.12 0.04 0.84ENVIRON + 1.43 2.49 0.06Control variables + ASSETS + 0.01 5.86 0.01ROA + –4.9.6 1.42 0.23DEBT + 1.06 0.15 0.35Intercept ? –6.15 3.64 0.06Nagelkerke R2 = 67% Cox &
Snell R2 = 48%
Correct classification
91% N = 70 Model p <0.001
Variable definitions: where TBL is a dummy variable that takes a value of one if the company has adopted TBL reporting and 0 otherwise; ADVERSE is the number of adverse publicity articles about the company reported in major newspapers in the past three years; INDEPENDENT is the proportion of audit committee members identified as independent in the annual report; FREQC is the number of meetings held by the audit committee in the past 12 months; SIZEC is the number of members on the audit committee; ENVIRON is a dummy variable that takes a value of 1 if the company has an environmental or sustainable development committee; ASSETS is total assets; ROA is net profit after tax divided by assets; DEBT is liabilities divided by assets.
35