2 3 1.3 THE STRUCTURE OF THIS C-DAP - Department of ...
416
Sr.No Subject Page No 1 1.1OBJECTIVES : 1 2 1.2 GOVERNMENT OF INDIA’S INITIATIVES : 2 3 1.3 THE STRUCTURE OF THIS C-DAP : 4 4 APPENDIX-II 4 5 1.5 GAP ANALYSIS : 5 6 1.6 Estimation of trend growth rates : 5 7 2.1WHY COMPREHENSIVE-DISTRICT AGRICULTURE DEVELOPMENT PLAN (C-DAP) 6 8 2.2 GROWTH TARGETS : 6 9 2.3 LOCATION AND GEOGRAPHICAL CHARACTERISTICS : 7 10 2.4 NATURAL RESOURCES : 7 11 2.5 RIVER SYSTEM : 7 12 2.6 CLIMATE AND RAINFALL : 7 13 2.7 DEMOGRAPHIC PROFILE : 8 14 2.8 SC & ST POPULATION : 8 15 2.9 DENSITY OF POPULATION : 8 16 2.10 AGE COMPOSITION : 8 17 2.11 GENERAL INFORMATION 8 18 2.12 1.LAND CAPABILITY CLASSES : 8 19 2.13 2.SOIL FERTILITY : 9 20 2.14 IRRIGATION AND GROUND WATER : 9 21 2.15 2.GROUND WATER : 9 22 2.16 LAND UTILIZATION STATISTICS (PRECEDING 3 YEARS) 10 23 2.17 Forest area : 10 24 2.18 CURRENT AND OTHER FALLOW LANDS : 11 25 2.19 NET AND GROSS CROPPED AREA : 11 26 2.20 CROPPING INTENSITY : 11 27 Table 2.4 Employment/Unemployment (District) 12 28 2.21 RATE OF UNEMPLOYMENT : 13 29 2.22 LAND HOLDING PATTERN : 13 30 2.23 PER CAPITA INCOME : 14 31 2.24 HUMAN DEVELOPMENT INDEX : 14 32 2.25 OUR TEN YEAR VISION FOR THE FARMERS OF THE DISTRICT 15 33 2.26 OUR TEN YEARS VISION SPECIALLY FOR THE ASSET POOR AND ASSET LESS FARMERS 16 34 3.1 INTRODUCTION : 18 35 3.2 SECTION -2 : 19 36 3.2 WATER RESOURCES 19 37 LAND DEVELOPMENT 20 38 II Assessment of credit Potential for 2015-16 21 39 FARM MECHANISATION 22 40 Actions Points Government Departments 23 41 Assessment of credit Potential for 2015-16 24 42 Forestry and Wasteland Development 25 43 ANIMAL HUSBANDRY-DAIRY DEVELOPMENT INTRODUCTION 26 44 ANIMAL HUSBANDRY-POULTRY DEVELOPMENT 28 45 Action points / issues 29 46 Animal Husbandry-Sheep, Goat and Piggery 30 47 STORAGE GODOWNS/MARKET YARDS INTRODUCTION 31 48 FOOD AND AGRO PROCESSING INTRODUCTION 34 49 WORKING CAPITAL REQUIRMENT FOR NFS ACTIVITIES 36 50 INFRASTRUCTURE AND LINKAGE SUPPORT INTRODUCTION 37 51 AREA BASED SCHEME –SHED NET INTRODUCTION / BACKGROUND 39 52 STRENGTHS : 43 53 3.3 SECTION -3 WEAKNESSES: 44 54 3.4 SOCIAL WEAKNESS : 44 55 3.5 POOR LITERACY : 44 56 3.6 Poor Health Services : 44 INDEX
-
Upload
khangminh22 -
Category
Documents
-
view
1 -
download
0
Transcript of 2 3 1.3 THE STRUCTURE OF THIS C-DAP - Department of ...

Sr.No Subject Page No
1 1.1OBJECTIVES : 1
2 1.2 GOVERNMENT OF INDIA’S INITIATIVES : 2
3 1.3 THE STRUCTURE OF THIS C-DAP : 4
4 APPENDIX-II 4
5 1.5 GAP ANALYSIS : 5
6 1.6 Estimation of trend growth rates : 5
7 2.1WHY COMPREHENSIVE-DISTRICT AGRICULTURE DEVELOPMENT PLAN (C-DAP) 6
8 2.2 GROWTH TARGETS : 6
9 2.3 LOCATION AND GEOGRAPHICAL CHARACTERISTICS : 7
10 2.4 NATURAL RESOURCES : 7
11 2.5 RIVER SYSTEM : 7
12 2.6 CLIMATE AND RAINFALL : 7
13 2.7 DEMOGRAPHIC PROFILE : 8
14 2.8 SC & ST POPULATION : 8
15 2.9 DENSITY OF POPULATION : 8
16 2.10 AGE COMPOSITION : 8
17 2.11 GENERAL INFORMATION 8
18 2.12 1.LAND CAPABILITY CLASSES : 8
19 2.13 2.SOIL FERTILITY : 9
20 2.14 IRRIGATION AND GROUND WATER : 9
21 2.15 2.GROUND WATER : 9
22 2.16 LAND UTILIZATION STATISTICS (PRECEDING 3 YEARS) 10
23 2.17 Forest area : 10
24 2.18 CURRENT AND OTHER FALLOW LANDS : 11
25 2.19 NET AND GROSS CROPPED AREA : 11
26 2.20 CROPPING INTENSITY : 11
27 Table 2.4 Employment/Unemployment (District) 12
28 2.21 RATE OF UNEMPLOYMENT : 13
29 2.22 LAND HOLDING PATTERN : 13
30 2.23 PER CAPITA INCOME : 14
31 2.24 HUMAN DEVELOPMENT INDEX : 14
32 2.25 OUR TEN YEAR VISION FOR THE FARMERS OF THE DISTRICT 15
33 2.26 OUR TEN YEARS VISION SPECIALLY FOR THE ASSET POOR AND ASSET LESS FARMERS 16
34 3.1 INTRODUCTION : 18
35 3.2 SECTION -2 : 19
36 3.2 WATER RESOURCES 19
37 LAND DEVELOPMENT 20
38 II Assessment of credit Potential for 2015-16 21
39 FARM MECHANISATION 22
40 Actions Points Government Departments 23
41 Assessment of credit Potential for 2015-16 24
42 Forestry and Wasteland Development 25
43 ANIMAL HUSBANDRY-DAIRY DEVELOPMENT INTRODUCTION 26
44 ANIMAL HUSBANDRY-POULTRY DEVELOPMENT 28
45 Action points / issues 29
46 Animal Husbandry-Sheep, Goat and Piggery 30
47 STORAGE GODOWNS/MARKET YARDS INTRODUCTION 31
48 FOOD AND AGRO PROCESSING INTRODUCTION 34
49 WORKING CAPITAL REQUIRMENT FOR NFS ACTIVITIES 36
50 INFRASTRUCTURE AND LINKAGE SUPPORT INTRODUCTION 37
51 AREA BASED SCHEME –SHED NET INTRODUCTION / BACKGROUND 39
52 STRENGTHS : 43
53 3.3 SECTION -3 WEAKNESSES: 44
54 3.4 SOCIAL WEAKNESS : 44
55 3.5 POOR LITERACY : 44
56 3.6 Poor Health Services : 44
INDEX

INDEX57 3.7 INFRASTRUCTURAL GAP 44
58 3.8 ECONOMIC NON AGRICULTURAL WEAKNESSES. : 45
59 3.9 ECONOMIC-AGRICULUTURAL WEAKNESSES: 46
60 3.10 IRRIGATION 46
61 3.11 Crops : 47
62 3.12 MECHANISATION : 47
63 3.13 ACTIVITY IN ALL ALLIED SECTORS : 47
64 3.14 GOVERNANCE : 48
65 3.15 SECTION (4) : OPPORTUNITIES : 48
66 3.16 The RKVY : 49
67 4.1 INTRODUCTION 50
68 4.2 LAND USE : 50
69 4.3 SOIL HEALTH 50
70 4.4 CONSTRAINTS : 50
71 4.5 POTENTIALS : 51
72 4.6 LAND MANAGEMENT STRATEGIES : 51
73 Table 8 Land utilization statistics of Maharashtra (Latest Year) 52
74 4.7 WATER RESOURCES AND MANAGEMENT : 53
75 4.8 MAJOR CROPS IN THE DISTRICT : 55
76 Table No. 9 Area production and productivity of crops 56
77 Table No. 10 Distribution of area under different crops 58
78 Table No. 11 plant Protection Chemicals Requirement 60
79 Table No. 12 Farm Machinery Status and Projection 61
80 Table No. 13 Yield gaps (%) analysis 62
81 4.9 IRRIGATED AREA : 62
82 4.10 CROPS AND CROPPING SYSTEM IN IRRIGATED AREA 63
83 Table 16 Irrigated crops 64
84 4.11 INPUT MANAGEMENT : 65
85 4.12 SEEDS : 65
86 4.13 ORGANIC MANURES : 66
87 4.14 FERTILIZERS : 66
88 4.15 CHEMICALS : 66
89 4.16 LABOURS : 66
90 Table No. 18 Planning of Agriculture Inputs in the District - Seed 2012-13 67
91 4.17 FARM MECHANIZATION / FARM EQUIPMENTS 68
92 4.18 SPECIAL PROJECT / PROGRAMMES ON-GOING IN THE DISTRICT : 69
93 4.19 CONSTRAINT ANALYSIS : 71
94 4.19.2 EXTENSION & ADOPTING GAPS/LIMITATIONS: 72
95 4.19 3 LIMITATIONS OF PUBLIC EXTENSION SYSTEM : 72
96 4.19.4 EXISTING INSTITUTIONAL MECHANISM IN THE GOVT. 73
97 4.20 EVOLUTION OF PUBLIC EXTENSION SYSTEM IN STATE : 74
98 4.21 PRESENT EXTENSION SERVICES 75
99 4.22 CORPORATE/PRIVATE/ NGOs SECTOR 76
100 4.23 INNOVATIONS IN TECHNOLOGY DISSEMINATION: 76
101 5.1 Introduction : 78
102 5.3 Development of fruit crops : 79
103 5.4 Nursary Activities : 80
104 6.1 Strategy for achieving XII Year plan projections 83
105 6.2 Sect oral / Regional Growth Drivers of the districts: 84
106 6.3 Seed processing for seed village programme 85
107 6.4 Encouraging the production & processing marketing of spices Chilly & Turmeric 87
108 6.5 improved technology dissemination co-ordination of teaching, research and extension institutions rationale:88
109 6.6 Implementing C-DAP 91
110 I Raising Productivity and Production 91
111 II.SHGs of Asset poor and Asset less Farmers: 92
112 III. Association For Progressive Farming 92
113 IV.Strengthening of the existing organization structures: 94

1 | P a g e
CHAPTER -1
INTRODUCTION
1.1 OBJECTIVES : This comprehensive District Agricultural Plan (C-DAP) describes what the
district can achieve over a medium term of five years and how it should work to achieve it. The C-DAP has been repaired with the following objectives:-
To continuously raise productivity, production, employment and income in agriculture and allied activities through optimal utilization of natural and human resources;
To strengthen, reorganize or newly build up physical infrastructure and institutions to effectively help adopt and operate modern technologies and practices to provide further impetus to agricultural growth and rural Development;
To provide food security and to eliminate hunger; To focus all activities in support of small and marginal farmers, poor and
disadvantaged people with a view to secure social justice and to reduce poverty and distress;
To continuously improve economic well being and quality of life of all stake holders in the district; and
To help the district to take off on a faster track of growth and sustainable development.
Along with crops and their productivities the C-DAP deals with all the infrastructural and allied activities like soil health and conservation optimal utilization of land and water resources, adequacy and purity of inputs, credit, marketing, livestock, dairying, poultry, fisheries, sericulture, agro-processing, agro services and strengthening of research, education and extension services, for continuing technological up gradation of the entire farming system.

2 | P a g e
These goals and the strategies (meaning courses of action) to achieve them have been discussed in the following chapters on different sectors and services supporting them. All the strategies are designed to continuously raise productivity.
The C-DAP proposals will provide employment to thousands of employed or partly employed people, raise standards of living in rural areas, reduce poverty and distress, and specially reach the benefits of growth and development to the thousands of small and marginal farmers who are mostly in distress today because of the non-viability of their farms and several other consequential handicaps; Naturally, this last group of small and marginal farmers and their handicaps are the focus of attention of many C-DAP proposals.
The most important aspect of C-DAP is the implementation of strategies. For doing it effectively we have to strengthen, reorganize or newly build up physical infrastructure and institution to effectively help adopt and operate modern technologies and practices and to provide farther impetus to agricultural growth and rural development.
Earnest implementation of all C-DAP projects, schemes and programmes will result in simultaneous increments in productivity of each crop and each of the allied activities, in each farm in each village, and in each block in the district. Combined with improvements in credit, marketing, employment and other infrastructure, the overall growth in bound to have a multiplier effect. It should be certainly possible to raise farm production and farmer incomes at least by 50% over a medium terra of five years. That should mean the beginning of the Second Green Revolution. The momentum generated, the self confidence gained in reprocess and the continuing upgrading of agro-technologies will continue to lift the district economy to higher and higher levels in future. Outcomes of all the efforts will remain in the farmer’s hands. No one else will claim any share or tax from there. Even the access to credit will be much easier and cheaper than what it has been during the past several decades.

3 | P a g e
Accomplishment of this C-DAP will thus lead to the most desired well-being of the people of the district.
1.2 GOVERNMENT OF INDIA’S INITIATIVES :
The Government of India has taken several significant initiatives during the last 3/4 years. A few of them may be mentioned :
The task force on revival of co-operative credit institutions (vaidayanath committee) constituted in 2004,It reported in December 2004.
Launching of the National Rural Employment Guarantee scheme in 2004 Constitution of an Expert Group on Ground water Management and
ownership 2005
National Farmers Commission 2006 It submitted five reports. Declaration of National Policy on Farmers 2007
Launching of Food Security Mission 2007
Establishment of National Rainfed Areas Authority 2007
Launching of Rashtriya Krishi Vikas Yojana (RKVY) 2007
Watershed Development and micro irrigation programmes;
The Loan waiver scheme for 2008
The Planning Commission’s approach paper to the 12th five year plan also reflects the national concern for inclusive growth. In fact, that paper is titled “Towards a faster and more inclusive growth. The pro poor inclusiveness is bound to the future strategy of development. It shall be operative in two ways. First is that sector line agriculture which had been neglected in the earlier decade would again be contributing to the vibrant economy. Second is that the

4 | P a g e
poor sections of the population whom the earlier growth process had bypassed shall be enabled to fully engage themselves with the development process.
The core purposes behind all the above initiatives are Rejuvenation of Agriculture and reversal of the downward trend in agricultural productions;
Acceleration of growth of agricultural production;
Optimal utilization of land and water resources;
Creation of additional employment;
Reduction of poverty;
Immediate relief to indebted farmers;
Decentralized development planning with reference to location specific, potential, needs and problems Special attention to and focus generally upon poor and especially upon small and marginal farmers whose farm holding are not viable and who for this and several other handicaps live in poverty and distress.
Looking to the above initiatives and the core purpose underlying them generally, and especially to the RKVY with its assertive precondition of decentralized comprehensive District Agriculture Plans (C-DAP) based upon agro climatic variation, location specific potential, needs and problems, one can confidently say that the bas days of neglect and indifference towards this district, its development potential, its needs and its problems are at last gone. In their place a new era has dawned in which well organized and determined efforts of each and every farmer will be enthusiastically and actively supported by Gram Panchayat, NGO’s. Local Technology Support groups, Banks, and higher entities in the Agricultural Department. District Administration. KVKs and the Agricultural University. The GP,NGOs and the village TSG will together ensure that no farmer or no farm remains out of the campaign or remains

5 | P a g e
unsupported. Generally, the farmers will need technological advice on soil health, soil nutrients, fertilizers, adequate and pure seeds and harvesting or marketing. The poor small and marginal farmers would, in addition, need support of agro-services, bulloks, tools implements etc, and a sort of small working capital loan for payment of those services. A tripartite arrangement may have to be made between a Bank, GP and the individual small farmer or a self help group formed by a group of small farmers for meeting expenses up to harvesting time.
1.3 THE STRUCTURE OF THIS C-DAP :
This C-DAP has been prepared in accordance with the RKVY guidelines and Planning Commission’s Manual. The scheme of six chapters and their sections follows the manual , paragraphs in each section have been numbered separately.
The Manual scheme does not have separate chapters or sections for a new important topics like extension, research, implementation of C-DAP etc. In such cases, we have incorporated our proposals in the sections dealing with constraints or interventions. Our proposals on plan implementation are included in chapter 6’towards the end of the section on C-DAP.
In accordance with the Manual, we have an Executive Summary’of the C-DAP at its beginning used in this C-DAP.
A list of maps and figures is presented after the contents indicating their location as pages containing those maps or figures.
APPENDIX-II
1.4 Structure of C-Dap METHODOLOGY – TECHNICAL NOTE :
6 | P a g e
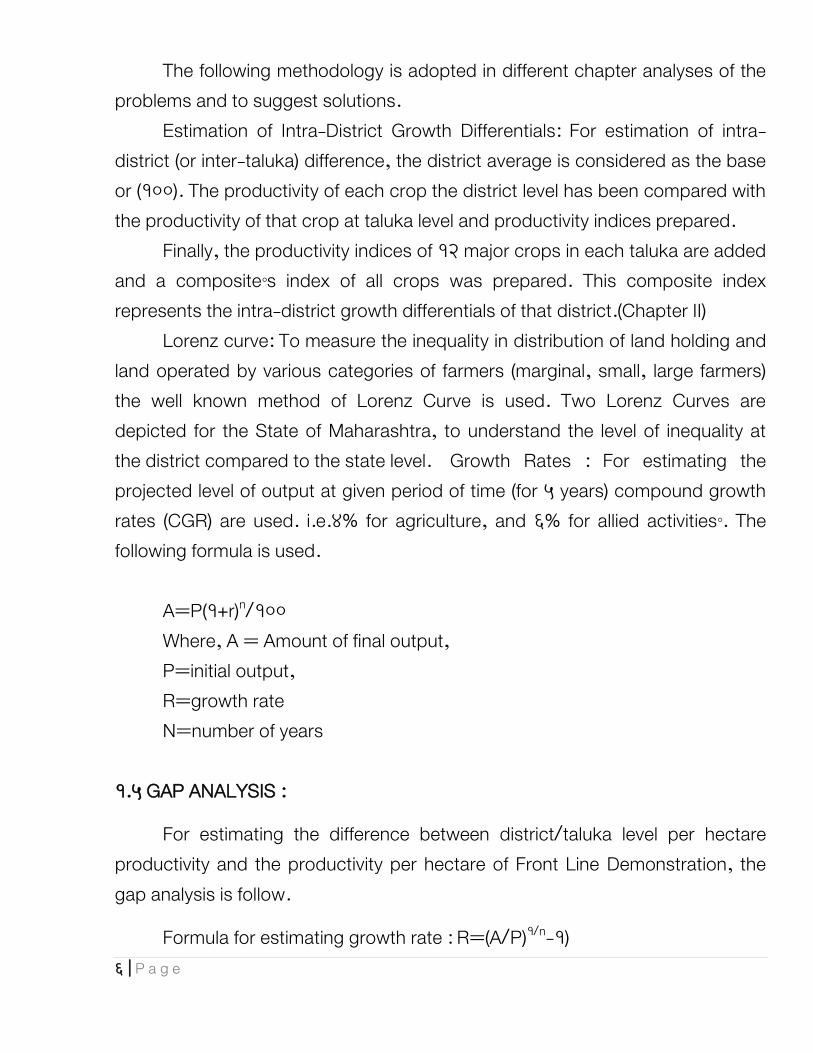
The following methodology is adopted in different chapter analyses of the problems and to suggest solutions. Estimation of Intra-District Growth Differentials: For estimation of intra-district (or inter-taluka) difference, the district average is considered as the base or (100). The productivity of each crop the district level has been compared with the productivity of that crop at taluka level and productivity indices prepared. Finally, the productivity indices of 12 major crops in each taluka are added and a composite’s index of all crops was prepared. This composite index represents the intra-district growth differentials of that district.(Chapter II) Lorenz curve: To measure the inequality in distribution of land holding and land operated by various categories of farmers (marginal, small, large farmers) the well known method of Lorenz Curve is used. Two Lorenz Curves are depicted for the State of Maharashtra, to understand the level of inequality at the district compared to the state level. Growth Rates : For estimating the projected level of output at given period of time (for 5 years) compound growth rates (CGR) are used. i.e.4% for agriculture, and 6% for allied activities’. The following formula is used. A=P(1+r)n/100 Where, A = Amount of final output, P=initial output, R=growth rate N=number of years 1.5 GAP ANALYSIS :
For estimating the difference between district/taluka level per hectare productivity and the productivity per hectare of Front Line Demonstration, the gap analysis is follow.
Formula for estimating growth rate : R=(A/P)1/n-1)

7 | P a g e
1.6 Estimation of trend growth rates :
For estimating the long-term growth rates of the past 8-10 years of each crop (i.e.2013-14 to 2014-15) the method of Least square is followed :
Yc = a + bx ....................(i) for estimating trend growth rate Usefulness of the method : Generally productivity / production of crops differs form year to year, may by due to climate conditions scanty & irregular rainfall, disease, etc. the least square method eliminates such fluctuations and a trend growth rate over a period can be obtained. This trend growth rate can be used for projections during the 5 year period. Estimation of Gross Value Added of District : For estimating the Gross Value of output of agriculture, horticulture, floriculture, milk, meat, eggs, fish etc. we have used 1999-2000 prices (constant prices) so as to understand the real changes in the value of output. The prices have been obtained from the respective APMC offices, of the district. Estimation of income of carious categories of farmers; after estimating the Gross Values of output of each district, this total value of output has been allocated to each category of cultivators in their proportion. i.e. proportion of marginal farmers; small farmers, medium and large farmers, etc. This allocated proportion is divided by the total number of farmers in each category so as to obtain average income of the cultivator in each category.
This kind of estimation is made at two points of time, i.e. base year ( )and final year-------.This will enable us to find out the changes in level of incomes of the cultivators at two points of time.
The compound Growth Rate of incomes of cultivators are also estimated at two points of time.
CHAPTER – II
GENERAL DESCRIPTION OF NANDED DISTRICT

8 | P a g e
INTRODUCTION:
The XII five year plan aims at the improvement of the farming community in particular and the rural masses in general through investment in agriculture and allied sectors of the Indian economy. To achieve this broader objective the Govt. of India has initiated a number of projects/ programmes/ schemes during the XII Plan period,2013-2017.
2.1WHY COMPREHENSIVE-DISTRICT AGRICULTURE DEVELOPMENT PLAN (C-DAP)
To raise productivity, production employment and income in agriculture & allied sectors. To achieve optimal utilization of natural and human resources. To strengthen, recognize and build up physical infrastructure and institutions. To ensure higher adoption or modern technologies. To provide further impetus to agricultural growth and rural development Provide food security and eliminate hunger. To secure social social justice by focusing all activities / programme in support of small and marginal farmers, poor & disadvantaged people. Top reduce poverty and ditress. To continuously improve economic well being and quality of life of all stake holders in the district. To help the district to take off on a faster track of growth and sustainable development.
2.2 GROWTH TARGETS :

9 | P a g e
The Eleventh Five year Plan (2013-2017) has per the 4% growth target for agricultural sector, and, II) 6% for the allied sectors, like, animal husbandry and horticulture, sericulture, fisheries, etc. per annum.
INTRODUCTION
Nanded district is known as one of the district in mahatashtra, with historical background. Guru Govindsingh has laid down his life in Nanded. It is located on the banks of the Godavari River.
2.3 LOCATION AND GEOGRAPHICAL CHARACTERISTICS :
Nanded district is one of the eight district of the Marathwada region. It is locate between 18.150
to 19.550 North latitude and between 77.70 to 78.150
East longitude. The district is bounded by Hingoli and Yavatmal districts to the North; by Parbhani district to the West; by Adilabad and Nizamabad districts (of Andhra Pradesh) to the East; and by Bidar district (of Karnataka) to the South.
AREA : The total geographical area of the Nanded district is 1033100 ha. which forms 3.35% of the total geographical area of Mahrashtra state. Out of this area 211.1 sqkms (2.01%) is urban are while the remaining 10290.9 sqkms (or 97.99% ) is rural area.
Of the total geographical area of the district about 8.97% area is forest area; 52% of forest area is concentrated in Kinwat Taluka alone. The southern part of the district is hilly and has light soils; while the North-Eastern part is hilly

10 | P a g e
and not very useful for cultivation. The rest of the land of district is very fertile and black soil.
2.4 NATURAL RESOURCES :
The district does not have much natural resources like mines etc. However, in some part of Kinwat Taluka low quality calcium is available. Soils, useful for brick making is available in the district.
2.5 RIVER SYSTEM :
The Godavari is the main river which flows through Nanded district. The other rivers in the district are, Saraswati, Painganga, Asana, Seeta, Lendi etc. Godavari, Manjra, Maniad and Painganga are rivers with perennial flow.
2.6 CLIMATE AND RAINFALL :
The district experience three climatic seasons, namely i) Rainy season during June to September ii) Winter season, during October to February and iii) Summer season during March to May.
In 2005,the maximum rain fall was recorded in Himayatnagar Tehsil (i.e.2081 mm) while minimum was recorded in Nanded tahsil (795mm ) The district comes under Assured Rainfall Zone.
2.7 DEMOGRAPHIC PROFILE :
Population : According to the population census of 2011 Nanded district has a total population of 33.56 lakhs,of which 27.18 lakhs is rural 80.98% while 6.38 lakhs is urban population (or 19.02%) The male and female population of the district is 17.32 lakh and 16.23 lakh respectively. The sex ratio is 937 as against the state average of 897 per 1000 males
2.8 SC & ST POPULATION :

11 | P a g e
The schedule caste population of the district is 640483 (or 19.07%) and the scheduled Tribes population is 281665 (or 8.37% ) of the total population.
2.9 DENSITY OF POPULATION :
The density of population in Nanded district is 319 persons per sqkm of area as against the state average of 365 persons.
2.10 AGE COMPOSITION :
The age composition of population in Nanded district is as follow : (in %)
BPL families 148016
Total Rural families = 2447394
Total BPL families = 148016
% of BPL families = 6.04
2.11 GENERAL INFORMATION
Table 1 show the general information of Nanded district. These are a total no. of 16 talukas in Nanded district, with a total no of 1575 revenue villages. There are a total no of 1309 Gram Panchayat in the district. This table also incites, total male and female population as well as scheduled caste and Scheduled Tribes population of Nanded district.
2.12 1.LAND CAPABILITY CLASSES :
There is no capability class I land in Nanded District, this means that the land without any limitation for crop production does not occur. However the land of class II and class III occupy nearly 3.62 lakh ha area. With proper management these soils have good potential for crop production class four areas is 1.9 lakh ha. This is not productive. This area is in to steep slopes indicating the need for watershed development programme.

12 | P a g e
2.13 2.SOIL FERTILITY :
The data PH, EC, organic, carbon, available NP, and have been presented in tables. The sample soil is too small to arrive at any conclusion. However, the soil health is poor. Pure is depletion of nutrients with high yielding variation group over a long period. The nutrients imbalance has been indicate. There is a velocity to adopt integrated nutrient the soil use sufficient in copper and manganese while they are deficient in available iron and zinc.
2.14 IRRIGATION AND GROUND WATER :
SURFACE IRRIGATION :
The total cultivable area in the district is of the order of 8,73,300 ha ie. 82.92% of the Geographical area of 1053100 ha. The total surface irrigation potential is of the order of 97332 ha after completion of the following projects.
Major projects 31800 ha Medium projects 7486 ha Minor projects (state & local sector) 3150 ha K.T. wears (state & local sector) 20828 Total : 63264
Average rainfall in the district 875 to 900 mms. A potential of about 1,60,979 ha. has been created up to June 2014 irrigation 18.43%
2.15 2.GROUND WATER :
The total no of watershed in the district is 88. As per latest Ground water survey, the total recharge available from ground water is of the order of 144,957 ha. The no of existing wells is 97809. Thus there is potential for digging additional 1,13,478 wells. Presently actual irrigation from existing open and tube wells is of the order of 85120 as per table 10, furnished by Agriculture Department.
13 | P a g e
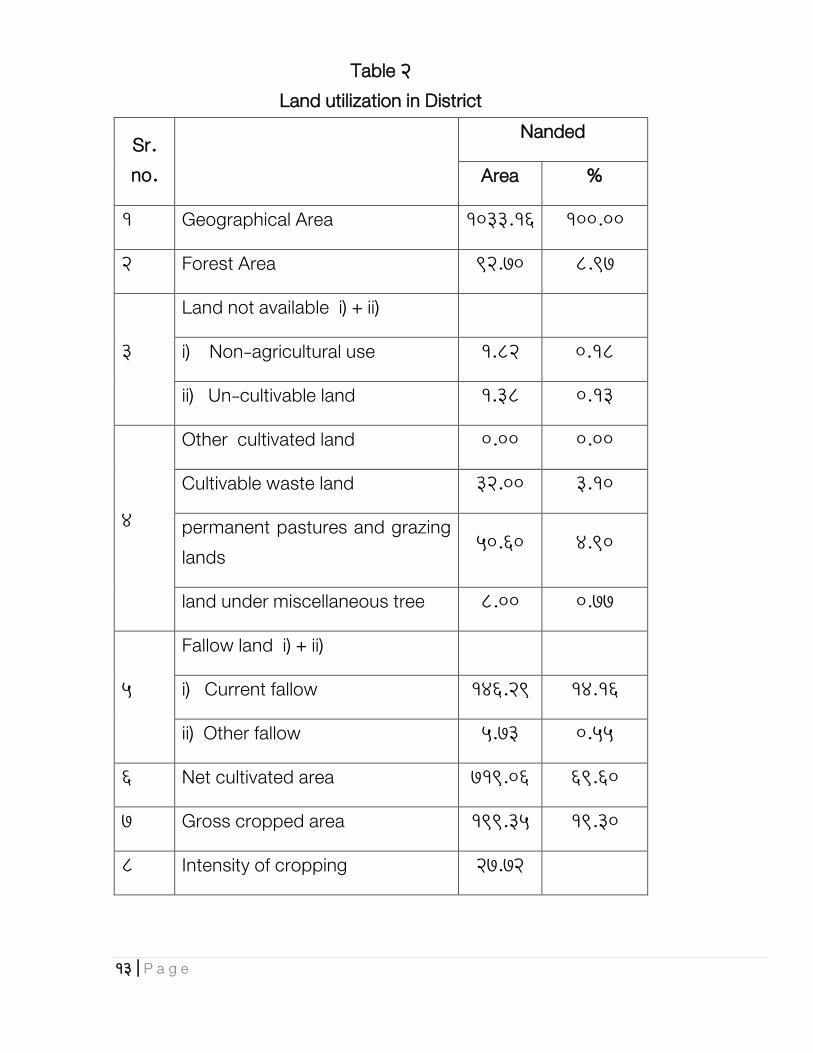
Table 2 Land utilization in District
Sr. no.
Nanded
Area %
1 Geographical Area 1033.16 100.00
2 Forest Area 92.70 8.97
3
Land not available i) + ii)
i) Non-agricultural use 1.82 0.18
ii) Un-cultivable land 1.38 0.13
4
Other cultivated land 0.00 0.00
Cultivable waste land 32.00 3.10
permanent pastures and grazing lands
50.60 4.90
land under miscellaneous tree 8.00 0.77
5
Fallow land i) + ii)
i) Current fallow 146.29 14.16
ii) Other fallow 5.73 0.55
6 Net cultivated area 719.06 69.60
7 Gross cropped area 199.35 19.30
8 Intensity of cropping 27.72

14 | P a g e
2.16 LAND UTILIZATION STATISTICS (PRECEDING 3 YEARS)
The land utilization statics of a district explains the use of the land resources for various proposes. Table -13 indicate the land utilization statistics of Nanded district, which is the average of the last 3 years.
2.17 Forest area :
At the district level, the total area under forest is only 92700 of the total geographical area of the district. At the taluka level lowest the percentage of forest area is only (0.28%) in Dharmabad. While lightest in Mahoor,(21.23%) taluka. The proportion of the Taluka to the state level is about 17% Hence, from the point of view of maintaining of ecological or environmental balance,the area under forest in Nanded district needs to improved with priority through the social forestry programmes in the district.
2.18 CURRENT AND OTHER FALLOW LANDS :
At the district level, the current fallows form 14.16% and other fallows from 0.55% of total geographical area of the district. Taluka - wise proportions of fallow land are shown in table no 2.
2.19 NET AND GROSS CROPPED AREA :
At the district level, the total cultivable area is 858300 hectares forming about 83.08% of the total geographical area of the district; at the physical area of the district; at the Taluka level the proportion of net sown area to total geographical area of each Taluka is shown in table No 1.
2.20 CROPPING INTENSITY :
15 | P a g e
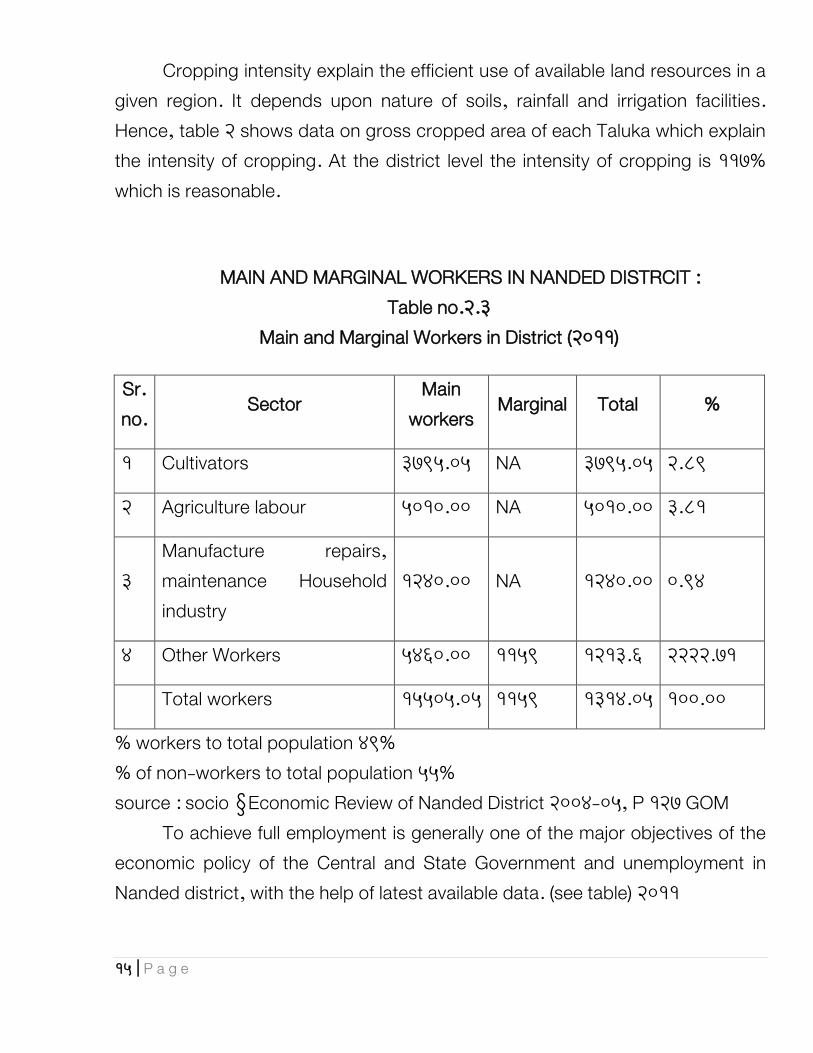
Cropping intensity explain the efficient use of available land resources in a given region. It depends upon nature of soils, rainfall and irrigation facilities. Hence, table 2 shows data on gross cropped area of each Taluka which explain the intensity of cropping. At the district level the intensity of cropping is 117% which is reasonable.
MAIN AND MARGINAL WORKERS IN NANDED DISTRCIT : Table no.2.3
Main and Marginal Workers in District (2011)
Sr. no.
Sector Main
workers Marginal Total %
1 Cultivators 3795.05 NA 3795.05 2.89
2 Agriculture labour 5010.00 NA 5010.00 3.81
3 Manufacture repairs, maintenance Household industry
1240.00 NA 1240.00 0.94
4 Other Workers 5460.00 1159 1213.6 2222.71
Total workers 15505.05 1159 1314.05 100.00
% workers to total population 49% % of non-workers to total population 55% source : socio –Economic Review of Nanded District 2004-05, P 127 GOM
To achieve full employment is generally one of the major objectives of the economic policy of the Central and State Government and unemployment in Nanded district, with the help of latest available data. (see table) 2011

16 | P a g e
There are a total no. of 1042500 workers in Nanded district as in 2001; of which 88.9% (or 926600) workers are main workers, while the remaining 11.1% (or 115900) workers are Marginal workers.
Of the total workers,32.7% are cultivators, while another 36.8% are agricultural labour. In this way the cultivators and agricultural workers, together constitute 69.5% of the total workers.
The secondary sector (manufacturing, household industry) employs hardly 1.2% of total work force, indicating a very weak industrial base.
The service sector (other workers) employs 29.3% of total workers. It may be concluded from the above data that there is huge burden of workers on agriculture sector, which needs to be shifted to the non farm sector, by the expansion of industrial sector during XII plan.
Table 2.4 Employment/Unemployment (District)
No. of posts declared vacant 343
Employers using Employment Exchange for recruitment 73
Total unemployed persons on the register last year 116370
No. of new persons registered in current year 21640
No. of persons obtaining Jobs 56
No. of persons unemployed at the end of the year 120500
(source : IBid Nanded)
Rate of unemployment :
i) Labour force = workforce + No. of employed
1163000 = 1042500+120500

17 | P a g e
Rate of Unemployment 10.36%
2.21 RATE OF UNEMPLOYMENT :
Table 15 shows the no. of unemployed in Nanded district at the end of the year 2004,as recorded by the District employment Exchange & Guidance centre. There a total no. of 120500 persons in Nanded district seeking employment at the end of 2004.
The rate of unemployment is quite serious at 10.36% of the total labour force in the district. Most of these unemployed persons are unskilled as well as educated; but they are unemployable due to lack of any skills. Therefore, to make them employable, a large no of vocational schools, ITI s, and job oriented courses need to be introduced on large scale in the district there has to be a linkage between Universities/ Colleges and the industrial sector, so that suitable courses needed by the industrial sector could be introduced in the syllabus of Universities / Colleges.
2.22 LAND HOLDING PATTERN :
The following table show the land holding pattern in Nanded district
Table No 2.5
Land holding pattern in Nanded district (1991)
Sr. no. Size of land Holding (ha)
No. of Holders
Land Operated
(ha)
% of Land
Holders
% of Area
operated

18 | P a g e
(100)
1 0.0 to 1.00 100489 61275 26.48 7.62
2 1.0 to 2.00 132988 195186 35.04 24.29
3 2.0 to 5.00 119740 358063 31.55 44.56
4 5.0 to 10.00 23672 154799 6.24 19.26
5 10.00 to 20.00 2488 30819 0.66 3.84
6 20.00 to above 128 3465 0.03 0.43
Total 379505 803607 100 100
source:
Agricultural Census 2010-11
There are 379505 cultivators in Nanded district cultivating a total land area of 802607 hectares, or an average of 2.11 hect per cultivator. The marginal farmer’s group formed 26.5% of total, but they operated only 7.6% of total land; another group of small farmers (1.00 to 2.00) formed 35.04% of total land holders while they operated 24.29% of land. While other groups formed lower percentage of land holders but they operated high percentage of land. Hence, it may be concluded that land distribution in Nanded district is skewed in favor of large farmers, which is also depicted by the Lorenz Curve shown here. More land reform measures as well as consolidation of land holding is necessary to make farming a viable proposition. 2.23 PER CAPITA INCOME :
The per capita income of a region reflects upon the standard of living of the common people residing in that region. The per capita income of Nanded district,in 2010-11, at constant prices, was observed to be Rs. 44978/- as

19 | P a g e
against the state average of Rs.46492/- In other words, the per capita income of Nanded district is about 96.74% of state per capita income, indicating a low standard of living of the masses in Nanded district (See diagram) 2.24 HUMAN DEVELOPMENT INDEX :
Recently, the United Nations Development Index (HDI) , which is much more comprehensive than the per capita income. The HDI is the average value of three major variable , viz (1) per capita income ii) Education and iii) Health
Table no. 6 Gross District Domestic Product, of District
at constant Prices (latest 2011-12Year) Rs. Lakhs
Sr. No
Sector Amount % to total State
GSDP% 1 Primary sector 38.97 74.58 - 2 Secondary sector 2.42 4.63 - 3 Tertiary sector 10.86 20.78 - Total GDDP 52.25 100.00 - 4 Per capita District Income Rs. 52.58 55.15 - 5 Per Capita State Income Rs. 95.33 100.00 -
6 Dist. Per capita income as % of State per capita Income 1.58 1.65 -
7 Human Development Index (HDI) 0.37 0.38 - 8 Human Poverty Index (HPI) 23.39 2453 -
source Socio economic review of Nanded District year 2011-12
VISION :
I-OUR VISION OF THE DISTRICT IS THAT IN THE NEXT TEN YEARS :
It should be doubling its production from agriculture and allied activities;

20 | P a g e
It should have ------
\Modern physical infrastructure;
Modern social and institutional infrastructure;
Healthy and sustainable environment; and
Full employment; and
It should be free of
Poverty;
Illiteracy and ignorace;
Social disparties;and
Gender disparities
2.25 OUR TEN YEAR VISION FOR THE FARMERS OF THE DISTRICT IS THAT ALL OF THEM SHOULD
Have adopted modern farming technologies and best practices and should be reaching achievement of maximum yields and optimum agriculture production from their farms, water and other resources;
Have at least one well or one farm pond each fitted with micro irrigation system and should be optimally utilizing their rain water and ground water resources;
Have had soils testing of their lands done and received and acted upon scientific advice from experts and used inputs for preservation and enrichment of their soils;
Be getting adequate, timely, and quality pure supplies of seeds, fertilizers, pesticides and other inputs;

21 | P a g e
Have taken to using modernized tools and implements, reduced drudgery of manual work and have taken to farm mechanization to overcome shortage of hired labour;
Have taken to growing higher value crops and specially to irrigated or rainfaid horticulture;
Have good credit and marketing facilities and supporting infrastructure like all weather connectivity, transport and market intelligence; and
Have caring and technologically competent extension workers willing to rush advice and help at the shortest notice of needs,
We also envision formation of an Associations For Progressive Fanning (AFPFS) separetly for each block with village wise branches and a federation for the district to positively support spreading of modern implementation of CDAP programmes at the Panchayat Samiti and Gram Panchayat levels. PPFs will take special care to ensure total coverage of all the farmers and that no farmer is left out.
2.26 OUR TEN YEARS VISION SPECIALLY FOR THE ASSET POOR AND ASSET LESS FARMERS IS THAT ALL OF THEM :
Have joined self help groups (SHGs) specially promoted for them; Through those SHGs and with training, financial and backup promotional
support from DRDA, Z.P. Gram Panchayat, Panchayat Samiti, Progressive Farming Society, Banks and the Agriculture department get themselves transformed into capable providers of critical service to agriculture of the village;
With those critical agro services they have started contributing to the rejuvenation of agriculture of the village including their own presently non-viable small farms,

22 | P a g e
With their non-viable farms back in progressive production line and with the additional employment and incomes they get from the agro services they are providing, most of them have come out of poverty; At least 20% out of them have made more progress and have setup their own micro-agro enterprises; and
All of them have gained self confidence for making more progress in future and are all living with dignity and in well being.
For actualizing this vision, the C-DAP attempts to explore possible ways of better utilization of natural, physical and human resources. It attempts to discover and locate laten potentials of growth and development and is making proposals for activating human energies and social organizations for their full utilization.
C-DAP proposals for reforms and strengthening of the extension agencies should help inform the farmers of the latest technologies and adequately motivate them to diligently work for their own advancement.
The reforms and strengthening of the implementation agencies in the district are of crucial importance. The best policies and programmes fail because of poor governance and shortcoming in implementation. An innovative re-organization to provide missing coordination links within the different wings and departments involved with implementation is absolutely necessary. It is also imperative to set up reasonable working relationship with Panchayat Raj Bodies,NGOs and Public Private Partnerships,. If the government is serious about transformation of rural economy and rural society through massive programmes like RKVY it must take early steps to provide for a strong inspired implementing agency to lead that movement in the district and to get results.
This C-DAP has recommended several strategies for various sub-sectors to overcome the reasons of backwardness and to accomplish the vision stated in Para above. Details like rationale behind them, action plans with physical targets, financial requirements and outcomes, and implementing schedules will

23 | P a g e
be found in th related chapters. Action plans have been formulated so that their implementation will make a great impact on the agricultural growth and development of the district. It is worthwhile to emphasize that every element of action plan under each strategy positively contributes to the desired results. Most elements will be simultaneously in operation and will have additive effects on outcomes of each other. That add-on effect would lead to still higher growth.
C-DAP targets are realistic and not difficult to achieve. Individual mediocrities and indifference and departmental egos have, however, halted many fast trains in the past. Top bosses should be alert. The above weakness and many more have to be overcome. Enthusiasm for a good work has to be sustained at all official and non-official levels.
The C-DAP should be implemented in a mission mode. Print & electronic media will help to motivate people for more hard work and more positive roles. Every farmer (large or small), every Gram Panchayat, every NGO or informal group or committee should be a doer (karta), earnest and fired by the spirit of the C-DAP . The opportunity should not be lost. C-DAP throw a challenge to them. Everyone is on trial and has to contribute his utmost towards the successful accomplishment of the mission.

24 | P a g e
CHAPTER III
SWOT ANALYSIS OF THE DISTRICT
SECTION-I
3.1 INTRODUCTION :
Analysis of strengths, weaknesses, opportunities and threats is called SWOT Analysis and is an effective tool in decision making. The job of the Development Administration is to :
Capitalize upon the strengths; Minimize the effect of weaknesses; Take advantage of opportunities; and Avoid or overcome threats
We set certain objectives like raising of productivity and production, social justice and removal of poverty. SWOT analysis is to look at the possibilities of achieving them from the input end. It is to check how the existing conditions would affect the future programme of action for development. Strengths and weakness are two internal attributes of the district while opportunities and threats are of external environment.
Strength relates to the potential for future development. It is a potential which is as yet unused or underutilized. Strengths do not get translated into development until they are matched with opportunities.
Weakness of the district are negative aspects or liabilities which tend to make it less effective on its path of development. They are of two types, i) the incurable ones, and ii) the correctible ones. Weakness causes great harm when they are matched with threats from the environment. An example may be, of poor agricultural practices subject to uncertain climate conditions. Similarly,

25 | P a g e
obsolete technology is a weakness. Old traditions inhibit acceptance of improvements and to that extent add to the harm of that weakness.
Opportunity: as used in this chapter is any chance to follow a new or revived strategy which would benefit the district in the process of growth and development. Opportunities always exist and only need to be identified. Most opportunities have to be sought. In a few cases, they have to be and can be created. The focus of development administration must always be on indentifying additional opportunities, selecting those which are most promising and capitalizing on them.
Threats are probable events which can seriously hamper the process of development in the district. Threats always exist. They become less severe if they are recognized soon enough and care is taken to guard against them. The development process should avoid the threats in the environment or overcome them.
Analysis of strength, weakness, opportunities and threats (SWOT) is a complex process. It can deal with the whole system or organization of growth and development at once.
We are presenting examples and lists of a few strengths, weakness, opportunities and threats of the district in the following sections 2), 3),4) and 5) Issues emerging from those lists are presented in section 6) Strategies or action proposals to deal with these issues are discussed in chapters 4,5 and 6.
This SWOT analysis very briefly shows, what the district is capable of doing, what it is doing and what it should be doing. Development is a dynamic process, continuously making impact and changes in all the four aspects of the SWOT analysis. A periodical review of SWOT should, therefore, be an essential element of any development process.
3.2 SECTION -2 :

26 | P a g e
WATER RESOURCES INTRODUCTION
Water Resources projects can be classified into three categories a) Major Irrigation Projects where cultivable command area is more than 10000 ha; b) Medium Irrigation Projects where cultivable command area is between 2000 ha to 10000 ha and c) Minor Irrigation Projects where the cultivable command irrigated area is below 2000 ha. Assessment of potential for 2015-16
Due to increased awareness about use of sprinker, lift irrigation, etc.the potential has been worked out as under
(Rs.lakh) Sr.No. Activity Unit (No
/ Area) Base PLP (2015-16) Revised (2015-16)
Physical Units
Financial Physical units
Financial
1 Dug well No. 185 179.82 185 183.15 2 Pump set No. 360 110.16 36 178.20 3 DRIP set No. 3100 914.50 3100 1085.00
4 Sprinkler sets
No. 1750 297.50 1750 297.50
5 Pipelines No. 1100 178.20 960 172.80
6 Lift Irrigation Small
No. 230 92.61 245 92.61
7 Deepening of well
No. 525 226.80 320 138.24
8 Energisation of Pump sets
No. 520 187.20 520 214.50
9 I P Diesel No. 225 87.08 160 43.20

27 | P a g e
sets Total 2273.87 2405.20 Suggested Action Points : Government Departments:
Looking at the poor cropping intensity and huge ground water potential, programme of new wells can be initiated in the district that would give a demonstrative effect. GSDA may work out a plan to recharge open/bore wells during the monsoon season through construction of rain water harvesting structures like storage tanks, percolation tanks, farm ponds, check dams. There is a need to increase water-use efficiency of lift irrigation schemes by adopting micro irrigation and cultivating high value crops in their command. Flood irrigation for sugarcane and banana crops may be replaced by drip irrigation so that surplus water can be used for other high value crops. Case by case study of each LIS for revival. Sensitization of LIS members, proactive role of bankers and support from State/Central governments are necessary to achieve the task of reviving the Co-op. For this purpose, GoM can avail loan from RIDF. LAND DEVELOPMENT Introduction
Top layer of soil is instrument for existence of life on the planet. Soil and water are the two basic natural resources in agriculture. These are to be conserved well and used scientifically to ensure sustained level of production and productivity .Any agriculture production program can be successful only it the soil maintains fertility and has sufficient moisture to support plant growth. Land development activities includes all activities undertaken by by farmers to improve productivity of land to prevent erosion of soil and to improve land quality, which include, soil conservation measures, land reclamation, on farm development, etc. On –farm development activities are important for increasing

28 | P a g e
water use efficiently and avoiding ill effects of excess water in case of irrigation and other projects. Land provides food, fuel, fodder and shelter besides supporting other economic life supporting system. The quality of land is deteriorating due to various factor like soil erosion caused mainly due to shift in cultivation, deforestation, reckless mining activities, overgrazing, etc. The agronomic productivity of land is highly dependent on effective soil and plant nutrition management. In addition to suit climatic condition, plants require a suitable medium for physical support and anchoring of the root system and also the availability of water and essential nutrients. While crop yield depends on the complex interaction of plant growth and all other development factors, the role of prudent soil and plant nutrition management is particularly important to ensure a sustained level of productivity for any given cropping system. The district has 30000 ha. cultivable wasteland, land under miscellaneous trees and horticulture 8000 ha. which can be reclaimed for plantation/cultivation of crops. With the increase in population stress on food security and pressure on land, it has become necessary to increase the productivity of land by its suitable development. Review of Ground Level Credit floe : (lakh)
Land Development 2011-12 2012-13
2013-14
Target 2331..00 504.12 0.00 Achievement 6.55 0 317.39
Source LDM : II Assessment of credit Potential for 2015-16 Sr.No. Activity Unit (No
/ Area) Base PLP (2015-
16) Revised (2015-16)
Physical Units
Financial (lakh)
Physical units
Financial (lakh)
1 LD- Ha. 16 3.13 16 2.88

29 | P a g e
CADA/Non CADA/OFD
2 Vermit Composting
No. 65 35.39 65 29.25
3 Water & Soil Conservation
Ha. 100 116.16 100 99.00
4 Organic Farming
No. 50 25.41 50 20.25
5 Compost Organic Manure
No. 20 31.46 20 27.00
Total 251 211.55 251 178.38 (Reduction due to change in unit cost) FARM MECHANISATION Introduction
Farm Mechanization generally cover tractors, power tillers, self propelled harvesters/reapers, bulldozers etc. besides other farm equipment and accessories like disk and mould board plough, harrow, seed drill, fertilizer drill, peddlers, threshers, sprayers, trailers, etc. The potential for those machinery is assessed based on land holding pattern change in the cropping pattern their existing number and the likely future demand considering utilization of technology for better production and productivity, timely completion of land preparation and tilling operations and reduction of cost and drudgery. Total numbers of 379505 farmers are holding 803607 ha. and around 27000 farmers are holding more than 5 ha. of land. As per the awareness towards mechanization of farming is increasing those farmers can be considered for increase the scope of farm mechanization.

30 | P a g e
The total power availability of Maharashtra state was 0.70 kw/ha during the year 2001 which was less than national average of 1.35 kw/ha during the same year. The food grains production of the state is less than the national average. There is great scope for mechanization in the state and especially horticulture crops. The timeliness of operations has assumed greater signification in obtaining optimal yields from different crops, which has been possible by way of mechanization. Assessment of Credit Potential for 2015-16
Considering the shortage and labour problems for cultivation of land beside decreasing population of drought animals in the village necessitates the increased use of farm machineries and implements. There is an increased scope for financing tractors due to its of farm and on farm requirement, combined harvesters, power tillers and paddy reapers in the district. There is also increase in need for financing for purchase of agricultural implements considering consistent increase in the irrigated area.
(Rs.lakh) Sr.No. Activity Unit (No /
Area) Base PLP (2015-16) Revised (2015-16)
Physical Units
Financial Physical units
Financial
1 Tractors No. 495 2227.50 475 2493.75 2 Power
tillers No. 85 160.65 75 168.75
3 Thresher No. 340 191.25 320 240.00 4 Agriculture
Implements No. 1950 780.00 1800 1080.00
5 Reapers No. 240 220.80 225 243.00 Total 3110 3580.20 2895 4225.50 (The block wise allocation of the total estimate for 2015-16 in Annexure-1 . The projection are reduced as against the district requirement)

31 | P a g e
Availability Of Infrastructure, critical gaps & intervention required, action points / issue to be addressed :
The approximate number of agriculture implements and machinery in the district are as under : Seed cum Fertilizer Drill
Equipments
Thresher
Cultivator
Harrow
Levelers
Reaper
Combine Harvester
Trailer
17300 52300 5798 3565 2351 4307 6246 26 299 Actions Points : Government Departments
Equipment such as tractors, power sprayers will need repair facilities in the rural areas. Govt. agencies may arrange for mobile workshop to service these activities.
There is a need to increase extension efforts and the awareness programmes for farmers
The demonstrations regarding usefulness of power tillers/paddy reapers may be organized in tie-up with suppliers/distributors
The small, affordable, hand operated crop specific equipments and tools developed by CIAE, Bhopal and other Agricultural Universities may be popularized.
The skilled operators of combine harvester are generally come from other State. The training facility on operation, repair and maintain need to be made available to district youth will get the good employment during crop harvesting season. PLANTATION AND HORTICULTURE INTRODUCTION
The agro-climatic conditions of the district, especially that of talukas Ardhapur, Mudkhed, Bhokar, Biloli and Nanded are ideally suitable for Banana

32 | P a g e
plantation. The area covered under Government Sponserd Programme viz.Employment Guarantee Schemes (EGS) forms major horticulture base in the district. The district has suitable agro-climatic condition for production of fruit crops like mango, custard apple, anola, tamarind, sweet lemon, sapota, pomegranate etc, vegetable crops like tomato, brinjal, cucumber, cabbage etc. floricultural crops like rose, daisy, aster etc. Besides, the activities like sericulture, bee keeping, medicinal & aromatic plant cultivation etc. are also being undertaken in the district.Net sown area of district is 7.22 lakh ha.While fruit crops cover 17648 Ha (2.4%) vegetable crops cover 29430 Ha (0.41% floriculture crops cover) 417 Ha.(.06%) of the arable land. The is about 1507 Ha (0.20%) under various fruit crops, which is old and has become senile. Such area needs immediate replanting to improve its productivity. The district has been allotted a target 300 acres year for silk development. Mulberry plantation was taken by 143 farmers on 126.5acres is planned for the next 3 years from 2012-13 onwards. In the 12th Five year plan (2012-17),GoI has set a target of 8% growth over the five year period for P&H sector. With a view to giving focused attention of horticultural development in the country, GoI has launched a Centrally Sponsored Scheme namely Mission for Integrated Development of Horticulture (MIDH) for the holistic growth of the horticulture sector sumsuming interventions under Nation Horticulture Mission (NHM) National Bamboo Mission, Coconut Development Board, National Horticulture Board etc. The Mission emphasizes on area based regionally differentiated cluster approach for development of horticulture crops, having comparative advantage. To encourage capital formation in agriculture, thrust is given for term loans for which Rs.10,000 crore is allotted to NABARD in the Union Budget 2014-15.
The GLC for the year 2011-12,2012-13&2013-14 was to the tune of 150.80 lakh,287.22lakh & 350.33 lakh respectively. Assessment of credit Potential for 2015-16

33 | P a g e
Based on available infrastructure and gap the potential has been worked out for 2015-16 as under:
Sr.No. Activity Unit (No / Area)
Base PLP (2015-16)
Revised (2015-16)
Physical Units
Financial (lakh)
Physical units
Financial (lakh)
1 Mango Ha. 635 812.17 605 696.96 2 Mandarin
orange Ha. 20 38.22 10 17.20
3 Sweet orange
Ha. 385 545.55 360 459.11
4 Sapota Ha. 45 45.00 30 30.51 5 Custard
apple Ha. 65 64.81 50 30.51
6 Ber Ha. 85 42.50 77 34.65 7 Acid lime Ha. 205.61 120 164.48 8 Floriculture Ha. 185 1063.75 160 828.00 9 Other P/H
(Tamrind) Ha. 95 47.50 80 39.60
10 Horticulture Nursery
Ha. 180 225.00 160 194.40
11 Green poly house
Ha. 185 957.38 165 916.99
12 Aromatic Plants
Ha. 125 309.00 105 257.04
13 Banana Ha. 335 837.50 320 792.00 14 Grape Ha. 95 522.50 80 396.00
Sub Total
5716.49 4876.44

34 | P a g e
1 Sericulture-plant/Rearing Equipment
Ha. 9 6.72 6 4.70
2 Sericulture-MP Rearing House
9 10.35 6 13.50
Sub total 17.07 18.20 Gr.Total 5733.56 4894.64
Forestry and Wasteland Development
Of the total geographical area of 1033100 ha; sq.km.is covered under forests in Nanded district. Out of this an area of 3 sq.km. is under reserve forest and 218 sq. km. on private waste land. The District has cultivable wasteland of 773800 ha. which can be brought under a forestation or Silvia horticulture. The Major forest species found in the district includes teak, babul, bamboo. The wasteland owned by farmers, Panchayat, corporate bodies can be profitably engaged in forestry plantation. Presently village forest protection committee and 594 Joint Forest Management (JFM) have been formed in 1970 villages of the district and 93979 families are the members of JFM.
Efforts therefore may be made by the Govt. banks and forest department to increase the area under certain economically important species which can provide good returns to farmers and also help in maintaining the ecological balance. Ground level credit flow is indicated in annexure-III Assessment of Potential for the year 2015-16
Keeping in view the available infrastructure, the potential has been estimated as under.

35 | P a g e
Sr.No. Activity Unit (No
/ Area) Base PLP (2015-16) Revised (2015-16)
Physical Units
Financial (lakh)
Physical units
Financial (lakh)
Social Forestry
Ha. 150 39.60 140 36.96
Farm Forestry
75 21.53 60 22.20
1 Bamboo 225 67.28 200 60.00 2 Jatropha 220 37.84 190 38.00
Total 166.24 157.16 Forest and wasteland cover :
The area under cultivable wasteland and fallow land for a forestation are estimated in table : Sr.No Category of
land Total area
(ha) Area which afforested (
ha)
Total area available for wasteland
development (ha) 1 Area under
non-agriculture 57,404 7,790 49,614
2 Fallow land suitable for cultivation
829,100 32,461 796,639
3 Cultivable land not under cultivation
22,461 8,326 24,135
4 permanent pasture and
38,119 38,119

36 | P a g e
other pasture land
ANIMAL HUSBANDRY-DAIRY DEVELOPMENT INTRODUCTION Animal Husbandry sector is one of the rapidly progressing sector playing a significant role in improving rural economy of the district by providing gainful employment to rural poor and thereby increasing their ability to face crop failures during droughts and floods. Dairy has been recognized as an important allied activity due to its contribution in the form of providing gainful occupation and supplementary income. As per the Provisional livestock census in 2007,there are 6.586 lakh indigenous & DB cow and 2.490 lakh Buffaloes. The breed able female numbers include – 2.059 CB cattle & indigenous cattle and 1.354 buffaloes. The milk production of 2339.53 lakh ltr / year, has accounted for 2.87% of total State milk production. Indigenous cows, DB cows and buffaloes accounted for 29.0% ,10.30% and 56.0% respectively. The estimated per capital daily milk availability works out to 222 gm. as compared to State average of 190 gm. There is a excellent potential for milk production and its marketing in the district Production of milk has become a necessity in order to compete in the international market. In additional to the milk, manure from animals provides good source of organic matter for improving soil fertility and crop yield. The gobar gas from the dung is used as fuel from domestic purposes and also for running engines. The surplus fodder and agricultural by products are gainfully utilized for feeding the animals.
Review of Ground Level Credit : GLC by all agencies during the years 2011-12,2012-13 & 2013-14 was 74.96 lakh,588.03 lakh & 404.97 lakh respectively. There is a good potential for credit delivery for the activity,

37 | P a g e
however, due to non allocation of budgetary provision for DEDS by the Central Govt. banks are not eager for loan disbursement. Assessment of credit Potential for 2015-16 :
PLP projections have been estimated considering the infrastructure available and planned.
Sr.No. Activity Unit (No / Area)
Base PLP (2015-16)
Revised (2015-16)
Physical Units
Financial (lakh)
Physical units
Financial (lakh)
1 Cow (CB) No 785 847.80 750 810.00 2 Buffaloes No 420 151.20 400 216.00 3 Indigenous
cow No 370 99.90 350 157.50
4 Mini Dairy (5 animal unit)
No 340 612.00 325 715.00
5 Calf rearing No 170 43.61 150 47.25 6 Fodder
cultivation No 320 43.20 300 40.50
7 Commercial Dairy (10 animal unit)
No 320 1280.00 300 1440.00
8 Milk parlour No 170 85.68 160 94.46 9 Veterinary
clinic (private)
No 170 275.40 160 324.00
10 Bulk cooler AMCU
No 45 506.25 35
472.50
11 Dairy Transport &
No 95 2137.50 85 2231.25

38 | P a g e
Cold chain 6082.54 6548.46
Government Departments
There is need to increase the number of milk routes and revive dormant societies. Steps may be taken to improve the functioning of the primary milk products cooperative societies to augment the daily milk collection as well as credit flow. Steps may be taken for enhancing the supply of good quality milk animals and also established the cattle market in the district.
ANIMAL HUSBANDRY-POULTRY DEVELOPMENT INTRODUCTION
Poultry development is considered as an important allied commercial activity. As per latest information there are 5.549 lakh poultry birds in the district. The estimated egg production was 354.77 lakh in the district. Desi birds accounted for nearly 77% of the district egg production. The district accounted for about 1.0% of the State egg production. There is a consistent demand for poultry birds and products. Since the demand is not satisfied by the district it is procured by from Hyderabad. Small and marginal farmers are undertaking poultry farming activity in their backyards. However, there is a growing trend among educated unemployed youths to undertake this activity on commercial basis. The per capita availability is only 14 eggs as against standard requirement of 180 eggs per person per year. Nearly 85% of egg production is accounted by Desi birds. Eggs and poultry meat provide high quality animal protein. Poultry farming provide as a good source of income and gainful employment to farmers throughout the year. Backyard poultry in rural areas have also become popular. Due to the fact that the demand for eggs and chicken products both in urban & rural area is always on increasing scale, there is a good potential for poultry development in the district.

39 | P a g e
Assessment of potential for the period of 2015-16 Considering the infrastructure available in the district and the past performance under this sector, PLP projections have been estimated as under : Sr.No.
Activity Unit (No / Area)
Base PLP (2015-16)
Revised (2015-16)
Physical Units
Financial
(lakh)
Physical units
Financial (lakh)
1 Com.Broiler (500 birds)
No 180 194.40 160 201.00
2 Com.Layer (500 birds)
No 75 158.63 66 158.40
3 Back yard poultry
No 95 5.70 85 5.10
4 Feed plant No 7 78.75 5 67.50 5 Emu farming No 0 0.00 0 0.00 6 Poultry
breeding farm (improved birds)
No 22 495.00 18 405.00
7 Retail poultry dressing unit
No 23 103.50 21 94.50
Total 1035.98
932.10
(The block wise allocation of the total estimate for 2015-16 are indicated in Annexure I )
Action points / issues Banks :

40 | P a g e
Poultry unit could be expanded on the line of VCF through tie-up with corporate/privates units, besides exploring assistance under special subsidy schemes and RSVY
Contract broiler farming could be explored in tie up with M/s Venkateswara Hatchery, Hyderabad and M/s Suguna hatchery.
Government Department :
Backyard poultry with LIT birds could be promoted as income generating activity through SHGs in coordination with banks.
AH department may conduct training programmers for entrepreneurs on commercial poultry farming and backyard poultry with LIT birds.
Animal Husbandry-Sheep, Goat and Piggery
Introduction
Sheep and goat reusing are supplementary income generation activities for small and marginal farmers, besides providing nutritious food material. Another important feature of this investment is that no substantial amount is to be invested by the beneficiary towards feed cost of the animals except for supplementary feeding in support to grazing and use of crop residues. As per 2007 livestock (Provisional) census, there are 379501 goats,52758 sheep and 8747 pigs in the district. There are about 0.15 lakh Osmanabaddi goats in the district. Goat milk and Wool production was 92.03 lakh kg. and 31.644 MT. Assessment of Credit Potential for 2015-16

41 | P a g e
Based on the existing infrastructure and past performance under the activity, the potential have been estimated.
(Rs.lakh) Sr.No.
Activity Unit (No / Area)
Base PLP (2015-16) Revised (2015-16)
Physical Units
Financial Physical units
Financial
1 Sheep Rearing (20 + 1)
No. 320 240.00 300 225.00
2 Goat Rearing (10+1)
No. 1200 630.00 1100 577.50
3 Commercial Goat rearing (Stall fed 40+2)
No. 120 315.00 100 337.50
4 Pig Rearing (10+1)
No. 55 14.85 49 13.23
5 Sheep & Goat breeding
No. 14 262.50 10 187.50
Total 1462.35 1340.73
FISHERIES DEVELOPMENT
INTRODUCTION Government of Maharashtra has introduced various fisheries schemes through cooperatives for enhancing the status of economically backward class. Although intensive fish culture is not yet developed in the district, progressive farmers in low lying areas and those in a position to get leased ponds are showing increasing interest in this sector. Fishery as important allied activity providing gainful employment and sustained income for considerable section other population in the district. Nanded is landlocked district; there is scope only for development of Inland Fisheries in the rivers, tanks and rivers, tanks and reservoirs located in the district. It has 8407 ha. water spread area suitable for inland fisheries development.
Sr.No. Classification of No.of ponds Water spread (ha)

42 | P a g e
ponds (ha) 1 0-60 362 3339 2 61-200 21 2541 3 Above 200 3 2527
Total 385 8407 Assessment of Credit Potential for 2015-16 :
Keeping in view available infrastructure and the past performance, the projection of Base PLP retained as such :
(Rs.lakh) Sr.No. Activity Unit (No /
Area) Base PLP (2015-16) Revised (2015-16)
Physical Units
Financial Physical units
Financial
1 Composite fish culture in existing ponds
No. 10 13.11 10 13.11
2 Composite fish culture in new ponds
No. 6 11.61 6 11.61
Total 24.72 24.72 (Ground level credit flow is indicated in annexure-III The block wise allocation are indicated in Annexure I)
STORAGE GODOWNS/MARKET YARDS
Introduction There is significant growth in Agriculture production and productivity over
the years. However, the producers/farmers continue to face hurdles in realizing reasonable returns for their produce. Inadequate infrastructure for post harvest services like cleaning, grading ,sorting, storage and marketing of their surplus produce inter alia, is the hurdle of the farming community. The farmers therefore need a well developed infrastructure/adequate captive storage capacity at the

43 | P a g e
village, or facilities available for hiring in the areas to cater to the post-harvest requirement of production and marketable surplus of various farm produce so that wastage and produce deterioration are avoided and also their credit needs are met with so that they are not compelled for distress sale of their produce.
Review of Ground Level Credit floe : (lakh) ?
Storage go downs / Market Yards
2011-12
2012-13
2013-14
Target 1221.00 2683.15 882.90 Achievement 573.38 206.91 54.88
(Source LDM)
Assessment of credit potential for 2015-16
(Rs.lakh) Sr.No. Activity Unit (No
/ Area) Base PLP (2015-16) Revised (2015-16)
Physical Units
Financial Physical units
Financial
1 Storage Godown (1000 Mt)
Ton 345000 6037.50 30000 525.00
2 Cold Storage 2500 T
Ton. 105000 2541.00 5000 150.00
3 AMI-AMIGS No. 45 2722.50 53 2650.00 Total 11301.00 3325.00 (The block wise allocation of the total estimate for 2015-16 are indicated in Annexure I )
Maharashtra Energy Development Agency (MEDA)

44 | P a g e
Proposed Target for generation for grid connected project for 12th five year plan 2012-17 :
Resources 2012-13
2013-14 2014-15 2015-16 2016-17 Total
Wind power 300 300 300 400 400 1700 Small hydro power 10 10 10 10 10 50
Biogases based co-generation power
50 75 75 50 50 300
Biomass based power 30 25 25 30 30 140 Industrial waste/MSW
power 5 20 30 10 25 90
Solar Thermal & Solar Photovoltaic power
125 125 125 75 75 525
Total 520 555 565 575 590 2805
Sanctioned proposed outlay for 12th five year plan (2012-17) :
Sr.no.
Resources Sanctioned budget
Proposed Outlay
2012-13 2013-14
2014-15
2015-16
2016-17
Total
1 Wind power 21.00 27.50 30.95 31.75 34.10 145.30 2 Small hydro power 3.00 8.88 9.63 1.64 11.65 43.80 3 Biogases based co-
generation power 54.00 285.84 198.52 209.20 226.51 974.07
Total 78.00 322.22 239.10 251.59 272.26 1163.17
45 | P a g e
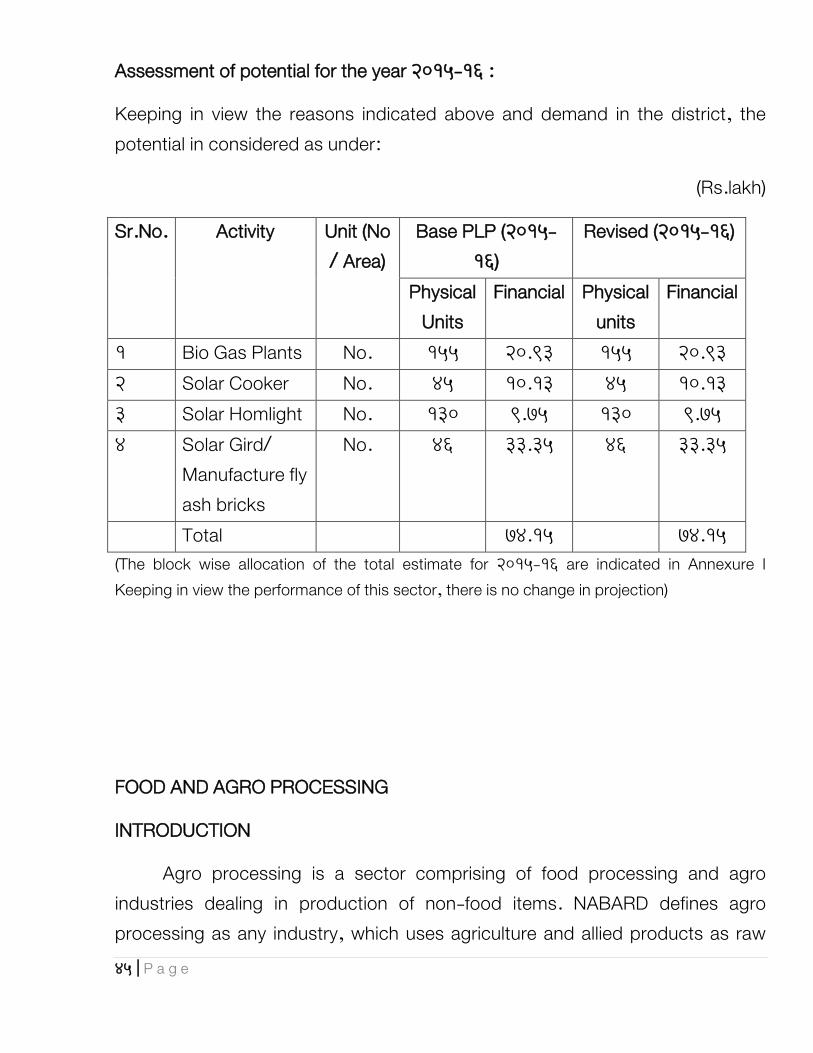
Assessment of potential for the year 2015-16 :
Keeping in view the reasons indicated above and demand in the district, the potential in considered as under:
(Rs.lakh)
Sr.No. Activity Unit (No / Area)
Base PLP (2015-16)
Revised (2015-16)
Physical Units
Financial Physical units
Financial
1 Bio Gas Plants No. 155 20.93 155 20.93 2 Solar Cooker No. 45 10.13 45 10.13 3 Solar Homlight No. 130 9.75 130 9.75 4 Solar Gird/
Manufacture fly ash bricks
No. 46 33.35 46 33.35
Total 74.15 74.15 (The block wise allocation of the total estimate for 2015-16 are indicated in Annexure I Keeping in view the performance of this sector, there is no change in projection)
FOOD AND AGRO PROCESSING
INTRODUCTION
Agro processing is a sector comprising of food processing and agro industries dealing in production of non-food items. NABARD defines agro processing as any industry, which uses agriculture and allied products as raw

46 | P a g e
material. The sector has strategic place in rural economy, hence it has been granted the status of thrust/high priority. GoI has introduced various policy initiatives like food security act, Integrated food law, setting up of National Institute of Food Technology Entrepreneurship and Management establishment of Agri-export zones/food parks and encouraging contract farming etc. Food Security act may ensure availability of food to the masses while Nutrition Security Act will ensure better nutrition and health to the population.
Under National Horticulture Mission, Credit linked assistance of 25% of investment in plant and machinery (maximum of 5 lakhs) is provided for setting up post harvest infrastructure like packing and grading hall. pre-cooling hall and cold storage, refrigerated vans and private markets to promote employment generation and improve post harvest utilization of horticulture crops. Due to lack of adequate agro processing facilities, the post harvest losses are very high in agriculture, especially under horticultural crops’ Losses are estimated at about 25 to 30% The value addition in dairy sector is very low. Hardly 11% of the production is being converted into value added products, remaining 89% is consumed as liquid milk. Processing and value addition of meat is negligible. Similarly, the spoilage loss is very high in fisheries sector due to lack of processing. Maharashtra is one the major products of fruits & vegetables, spices, cereals, pulses, oilseeds, milk and Meat. It has a number of MNCs like Lever, Britannia, Nestle, Nissan, Pepsi, Coca-cola, etc. amongst others with manufacturing facilities in the state. The success of the agro processing depends upon effective marketing for industries. The power is an essential input. The shortage of power is the main bottleneck for running the industries. Further, small industries face difficulties in marketing their product. Many units in cottage and small-scale sector do not have adequate storage packaging and refrigeration facilities. Qualities of the final product and processing have to be improved to meet the required standard.

47 | P a g e
Assessment of Credit Potential for 2015-16 : Keeping in view the above factors, the potential for credit requirements for
the sector is assessed as under :
(Rs.lakh) Sr.N
o. Activity Unit (No
/ Area) Base PLP (2015-
16) Revised (2015-16)
Physical Units
Financial Physical units
Financial
Working capital & Term loan requirements for existing units
1 Rice Mills (WC+TL)
No. 9+7 70.69 5+7 53.06
2 Dal Mill (WC+TL)
No. 12+24 405.00 10+20 390.00
3 Oil Mill (WC+TL) No. 8+19 251.25 6+17 256.50 4 Animal Feed
(WC+TL) No. 7+35 65.63 5+32 69.38
5 Solvent Extraction Plant (WC+TL)
No. 4+7 206.25 2+5 176.24
6 Papad,Noodles etc. (WC)
No. 18 20.25 18.00
Sugar Derivaties
No.
7 Gur (Jaggery) No. 6+37 24.19 4+35 35.06

48 | P a g e
(WC+TL) 8 Khandsari (WC) No. 7 63.00 5 45.00 Other crops No. 9 Turmeric &
chilly powder (WC)
No. 5 5.63 4 4.50
10 Medicinal & Aromatic plants (WC)
No. 3 5.63 2 3.75
11 Fruits (WC) No. 11 49.50 10 45.00 12 Spices (WC) No. 3 3.38 1 1.13 Sub Total A No. 1170.40 1097.62 Working capital & Term loan requirements for new units
1 Rice Mills No. 9 202.50 7 183.75 2 Dal Mill No. 19 498.75 17 510.00 3 Oil Mill No. 19 427.50 17 510.00 4 Animal Feed No. 34 382.50 32 360.00 5 Solvent
Extraction Plant No. 7 525.00 5 468.75
6 Papad,Noodles etc
No. 41 461.25 39 438.75
Sugar Derivaties
No. 0 0
7 Gur (Jaggery) No. 12 22.50 10 26.25 Other crops No. 0 0 8 Turmeric &
chilly powder No. 19 99.75 17 102.00
9 Fruits No. 19 99.75 17 89.25

49 | P a g e
10 Allied sector-Dairy products
No. 11 12.39 9 10.13
Sub total B No. 2731.89 2698.88
Grand total A+B
No. 3902.29 3796.50
Total (The block wise allocation of the total estimate for 2015-16 are indicated
in Annexure I. Projections are revised compared to Base PLP Keeping in view the performance of past trend & SLBC instruction)
WORKING CAPITAL REQUIRMENT FOR NFS ACTIVITIES
Introduction
Provision of adequate and timely working capital is of critical importance for successful and profitable running of industrial units. There are more than 1200 units, besides weavers in the district which require working capital for their day to day operations. On the basis of past performance banks are unable to finance new unit of Handloom and Power loom, there is no potential for Block capital for weavers.
Assessment of Credit Potential for 2015-16
Since more no of SSI units require working capital, the potential have been estimated as under :
(Rs.lakh)
Sr.No.
Activity Unit (No / Area)
Base PLP (2015-16)
Revised (2015-16)
Physical Units
Financial Physical units
Financial

50 | P a g e
1 Weavers No. 320 640.00 300 840.00 Total 640.00 840.00 (The block wise allocation is indicated in Annexure I. Considering prevailing market escalation quantum of WC is increased)
INFRASTRUCTURE AND LINKAGE SUPPORT
INTRODUCTION
Importance of Infrastructure Development
The importance of infrastructure for sustained economic development is well recognized. Inadequate and inefficient infrastructure can prevent the economy from realizing its full growth potential regardless of the progress on other fronts. Physical infrastructure covering transportation, power and communication through is backward and forward linkages facilitates growth; social infrastructure including water supply, sanitation, sewage disposal, education and health, which are in the nature of primary services, has direct impact on the quality of life. Infrastructure development is therefore essential for integrated rural development and robust infrastructure improves the quality of life and reduces vulnerability of rural power. Investment in rural infrastructure
Creates new economic opportunities and activities; Generates additional employment and income; Facilities and improves delivery of other rural services, Enhances democratic processes and skill among rural poor.
Rural infrastructure comprises all activities and facilities which help to sustain the growth in production and income generation in rural areas. Infrastructure development in the form of transport and communication-rural roads, bridges, irrigation structures, flood control, power, education, technology, water and soil conservation measures through watershed development etc. are therefore essential prerequisites for accelerated economic

51 | P a g e
development of any economy and regarded as crucial noncredit inputs. Investment in rural infrastructure creates new economic opportunities and activities, generates additional employment and income, facilities and improves delivery of other rural services and enhances democratic process and skills among the rural poor.
Status of RIDF in the State of Maharashtra:
In the state of Maharashtra since inception of RIDF,28868 projects for Roads & Bridges, Irrigation, WWM, Watershed, Warehouse have been sanctioned. RIDF loan sanctioned 532748.64 lakh has on 31 march 2014. The cumulative purpose wise number of projects and amount sanctioned, projects completed and amount disbursed (i.e.RIDF I to XVIII) is given here under :
(crore)
Sr.No Sector Sanctioned No.of
Projects Loan
Sanctioned % share in total
Loan Disbursed
1 Roads & Bridges (PWD)
12870 5414.50 51.79 3993.80
2 Irrigation (WRD)
597 3407.10 32.59 2839.72
3 Check Dams (Agriculture)
24 151.53 1.45 120.69
4 Rural Drinking Water Supply (MJP)
240 304.34 2.91 277.31
5 Anganwadi Centre
5000 170.00 1.63 126.65

52 | P a g e
6 Kharland Dev 95 82.44 0.79 40.28 7 Fisheries 20 110.34 1.06 49.31 8 Watershed
Dev 30 162.80 1.56 54.87
9 Waste Water mgt
28 97.35 0.93 19.62
10 Public Health Centre
66 94.25 0.90 18.85
11 Warehousing 584 459.93 4.39 142.81 Total 19554 10454.58 100 7683.91
Performance Highlights in 2013-14
Total amount sanctioned: 650.94 Type of Projects Sanctioned: Minor Irrigation Rural Road Rural Bridges Waste water management Watershed Development Projects Kharland (Flood protection) Projects in coastal areas.
Potential Sectors for Support under RIDF in Maharashtra
Rural Roads Bridges network-improving connectivity Irrigation projects-more intensive finance to ensure completion potential creation for agricultural purpose Micro irrigation for optimum water utilization Animal Husbandry Sector Fisheries-Inland and Marine Fisheries infrastructure Rural Godowns, Cold Storages, Market yareds, Rural Hatts, Cold Chain, Export facilitation centre etc
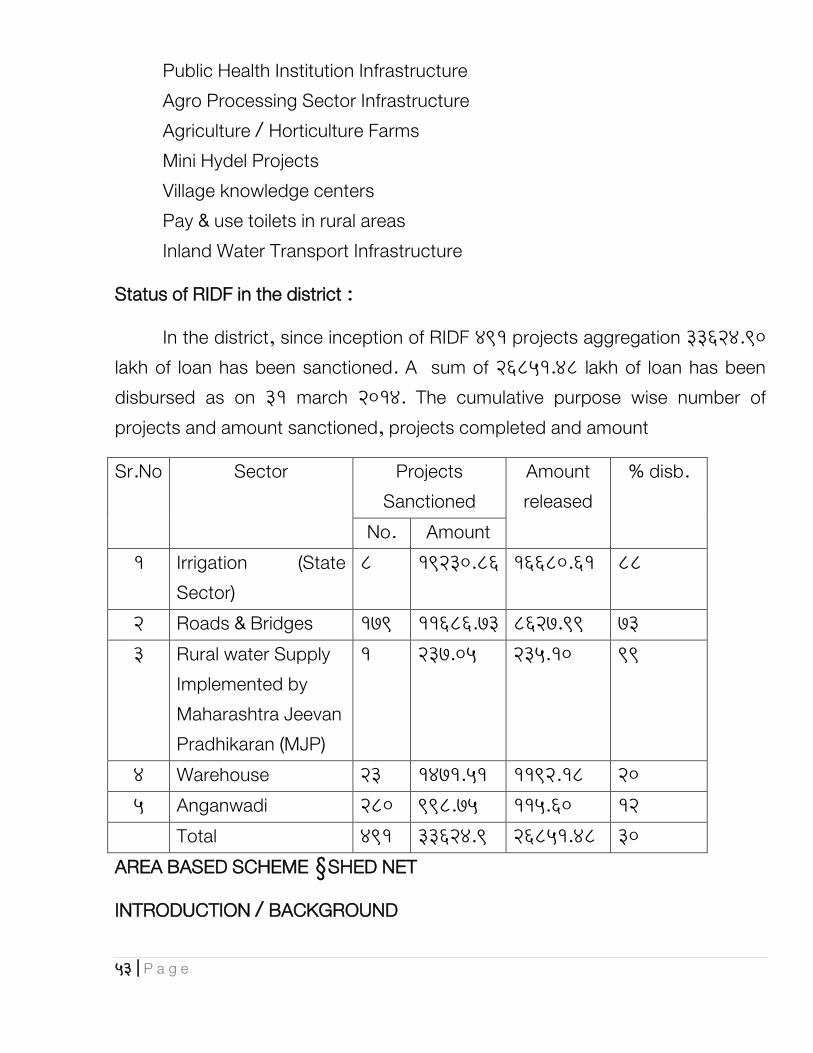
53 | P a g e
Public Health Institution Infrastructure Agro Processing Sector Infrastructure Agriculture / Horticulture Farms Mini Hydel Projects Village knowledge centers Pay & use toilets in rural areas Inland Water Transport Infrastructure
Status of RIDF in the district :
In the district, since inception of RIDF 491 projects aggregation 33624.90 lakh of loan has been sanctioned. A sum of 26851.48 lakh of loan has been disbursed as on 31 march 2014. The cumulative purpose wise number of projects and amount sanctioned, projects completed and amount
Sr.No Sector Projects Sanctioned
Amount released
% disb.
No. Amount 1 Irrigation (State
Sector) 8 19230.86 16680.61 88
2 Roads & Bridges 179 11686.73 8627.99 73 3 Rural water Supply
Implemented by Maharashtra Jeevan Pradhikaran (MJP)
1 237.05 235.10 99
4 Warehouse 23 1471.51 1192.18 20 5 Anganwadi 280 998.75 115.60 12
Total 491 33624.9 26851.48 30 AREA BASED SCHEME –SHED NET
INTRODUCTION / BACKGROUND

54 | P a g e
Water scarcity is the main problem in agriculture development. The ground water column is declining due to shortage of rain in the area. It has become necessary to adopt to such practices which will not only save the water but still production will increase. Agriculture development under controlled manner in Shed Net may be one solution to overcome the water scarcity problem. It is now proved that to achieve higher production level, productivity has to be increased through the adoption of improved production technology. This has resulted in the emergence of SHADENET, with the advent of which even the small and medium farmers will be able to exploit the benefits of protected cultivation.
Objectives :
The main objectives of the scheme is to increase the production of vegetables and flowers under controlled environment. With the adoption of the technique by small and marginal farmers will give sustained remunerative prices. To promote value addition and direct integration of processing units with producers. To provide the low cost technology and spread ti among small and marginal farmers by converging the provisions for agriculture activities/infrastructure. Attaract the rural educated youth generation & provide employment and opportunities for skill development.
Area of operation:
Being the activity sustainable in all weather condition the activity can be developed in all parts of the district. Any interested farmer may prepare the project report, layout and structural plan and approach agricultural department for details of the scheme.
Sanction and release of fund :
The Agri. department will scrutinize the application received by the and eligibility will be decide in the District Meeting. These application / project report

55 | P a g e
will be forwarded to bank branched for sanction of loan by the branch Manager. After the sanction of the project,15% start up fund shall be released to the farmer by banks. The farmer shall inform the department about the commencement of the work of project. The authorized officer from Agriculture Department will visit the site and give commencement report. Based on the commencement report, the 60% amount shall be released after receipt of claim from the farmers. The team of Agriculture Department & bank shall undertake the joint inspection of the unit and submit the report. After the recommendation by joint inspection team, remaining 25% amount shall be released.
Technical aspects of the proposed investment :
Sr.No. Particulars Specification 1 Type of shed Flat roof 2 Structural Materials GI pipes of 1.5” dia and 2
mm thickness at 6 m c/c 3 Roof materials GI wire/bar of 6 mm dia 4 Size of shadenet Length:
46m,Width:22m,Height:3m 5 Area of shadenet 1012 Sq.meters
Unit cost with item-wise break –up : Shed net house has primarily four components :
Steel frame structure Cladding material

56 | P a g e
Erecting of net house working capital cost
Sr.No
Particular Quantity Amount
1 Material Cost a) GI
Fondation,Pole,truss,hockey 98000
b) Shed net,G fabrics,spring,door,GI wire HDPE thread etc.
85000
c) VAT 10000 Sub Total 19300
0 2` Labour Charges for
foundation, Fabrication, instalation
68200
3 Transportation cost 7800 4 Operational Expenditure 13000 5 DRIP irrigation System 20000 Sub total 30200
0 6 Working Capital for one cycle a) Planting Material 2024 20000 b) Bed preparation 20000 c) Mulching Sheet 1012 8000 d) Liquid fertilizer 1012 50000 e) Crop protection 1012 50000
Sub total 148000

57 | P a g e
Grand total 450000
Backward and Forward linkages :
The information on availability of raw material, Planting material etc. will be provided by the Agriculture department. ATMA will be arrange training & capacity building of beneficiaries. Technical support will be provided by Agricultural Department. Marketing Tie-up arrangements may by arranged by the Agriculture Department.
Bank Loan :
Loans with the borrower margin will be provided by Banks as per months of the bank. The activity is provided with the 50% subsidy benefit by the Agriculture Department under NHM. The risk factor providing loans is reduced to the extent.
Financial viability of the proposed investment :
Gross income from the project will be 5.44 lakh and net profit will be around Rs.0.80 lakh for a plot taken on 10 guntha land. NPW of the project will be 214074,IRR will be 45% and BCR will be 113.The repayment period is 5 years & above with a grace period of 6 months from commencement of the project. Monitoring of the project will be done by respective Banks & Agriculture Department.
PESA-Coverage
Panchayat (Extension to Scheduled Areas) Act (PESA) 1996
The 73rd amendment to the Constitution in 1992,had mandated the decision making power on resource mobilization, development of area and fixed

58 | P a g e
responsibility on the lowest unit of the governance, the Gram Sabha (Gram Panchayat) or the Village Assembly from the Central Government. A three tier structure of local Self Governance was established under this amendment. The village Level Democracy established under the act had proved a mile stone for the prosperity and development of rural area of the country.
However, it was observed that the Law was unable to cover the Scheduled areas, the PESC Act was in-acted on 24 December 1996 to enable the Tribal Self Rule in the Scheduled Areas. The act extended the provision to Panchayats of the tribal areas of nine states included in the Fifth Schedule Areas. Most of the North eastern states under Sixth Schedule Areas (Where autonomous councils exist) are not covered by PESA, as these states have their own Autonomous councils for Governance. Kinwat & Mahur Blocks of Nanded District are included under the PESA Act.
The credit potential estimated in these blocks are as under :
Name of the Block
Population (2011)
% to district population
Credit Potential
% to district potential
Kinwat 210730 9.70 1186.21 5.06 Mahur 86782 3.99 10805.35 4.68 STRENGTHS :
Abundant availability of Solar energy and wind power. Awaiting development of suitable useable technologies at National and state levels.
Enough water resources, needing speedy exploitation and improved careful management and utilization to optimal levels. Great potential for new wells, field ponds and micro systems of irrigation.

59 | P a g e
Climate – Situated in an assured rain fall zone. Capability of raising varieties of fruits and of raising diverse and multiple rain fed crops both in Kharif and Rabi Seasons.
Soils – Good with capability of growing higher value crops. Great potential of increasing productivities and growing better crop combinations.
Good soils have however, been getting degraded and eroded for long and need adequate inputs of nutrients as well as watershed development for their conservation. Particularly in rolling topography in Mukhed, Kandhar & Kinwat block.
Good Roads, Direct Broad gauge Railway and Air access to great markets and cities: like Mumbai, Pune, Aurangabad and Hyderabad.
Big passenger Bus Transport Centre at Nanded
Adequate goods (Roads) Transport available.
Existence of a big food Grains Market as well as cotton market at Nanded.
Sugar factories, Gur,Khand Sari mills, Dal mills, ginning factories, 16 oil mills are processing sugarcane, pulses, cotton and oil seeds, rice mills, chili mills.
One Agriculture college & cotton research centre at Nanded.
A good active Krishi Vidnyan Kendra (KVK) at Nanded., having training facilities for farmers and established good rapport with groups of progressive farmers. Demographic advantage Nanded district has all large proportion of working age group. Low dependency ration.
3.3 SECTION -3 WEAKNESSES:
The list of Weakness is naturally long. Each item should lead to one or more action points. we have dealt with aspects other than agriculture very

60 | P a g e
briefly. Even for agriculture our list covers weakness common all over the district. There are several mostly local weakness which we have not covered. Development situation also goes on changing. A few weakness get corrected while a few may newly crop-up. A periodical review of the SWOT analysis should be a rewarding exercise.
We are presenting the list of weakness under different subheads like social, infrastructural, economic other than agriculture, economic, agriculture and governance. C-DAP strategies naturally focus on the last two groups.
3.4 SOCIAL WEAKNESS :
Nanded is a socially backward district. Identified as such also by GOIs Sharma Committee.
3.5 POOR LITERACY :
Rate for 7 + age group in 2001 was 68.52% against the state average of 77.27 Among 35 districts of the state the district rank on the literacy count is 29th . Its ranking for schooling years is the lowest in the state with value of 3.507 years against the state average of 4.97 . Dropout rates are also very high.
3.6 Poor Health Services :
Infant mortality rate is lower at 68 than the state average of 74 for 1991.
Many social disparities prevailing in rural areas.
Many gender disparities.
Low Human Development index district HDI is 0.37 against the state average of 0.58 The district rank for HDI is 329 out of 35.
The percentage of below poverty line families in the district is 37.5 According to the survey of 1997-98 there are 1.10 laksh BPL families in the rural areas of the district.

61 | P a g e
The indices i) to vii) above show that the quality of life in the district is generally poor.
3.7 INFRASTRUCTURAL:
The greatest infrastructural gap in the process of growth and development is the shortage of electricity (power) supply resulting in load shedding in the rural areas for the whole day and more. Farmers feel handicapped and harassed as the agricultural laborers are reluctant to work and help during nights. There is water available but it cannot be lifted and served to the thirsty crops. There is no possibility of correcting the situation in the plan period. The development process of digging new wells and expanding micro irrigation systems on old and new wells will get stuck up as it depends on how we face and overcome this weakness. Going back to diesel engines and pumps seems to be one remedy. But it means restarting manufacturing of diesel engines and pumps to the level of 1960/s. Higher prices and shortages of oil will mean another weakness in that situation also.
Poor agricultural credit : The co-operative moment and the D.C.C. bank are both very weak. Memberships of the primary coop. credit society does not cover a majority of farmers, especially the small and marginal farmers and other asset-poor or asset-less groups. Moreover the primary co-op societies do not go beyond short term crop finance.
The nationalized and other commercial banks appear to have liberalized lending policies. But they have, as yet, not strengthened their organizational networks at the grass-roots. A large number of Bank employees appear to be still holding to the old thinking of credit worthiness and returns.
Poor Network of Communication : With the rapid expansion of Telephones, Radio and TVS, a few informative programmes are run among many other entertainment items. But their duration is small and time not suitable to a majority of farmers. In fact, there is in almost every village a small group of young farmers very curious about modern technologies and willing to do

62 | P a g e
experimenting on their own farms. There is need of exclusive channels all the time running agricultural programmes relevant for the day and the season.
The tenor and tone of the relays should be appropriate to the 21st century audience and technology. Their audience is no longer the illiterate ignorant and awestruck mass of villagers. Today’s farmers are curious to know what practices which countries are adopting and with what results. They are to be informed and motivated to Act. 3.8 ECONOMIC NON AGRICULTURAL WEAKNESSES. :
Poor Industrial progress. There is no major manufacturing industry in the district. There were only 318 registered working factories in the district in 2000 AD with only 11287 workers. Percentage share of the district in the income from the Secondary Sector of the State was 1.14 in the three year average for 1999-2002.
Low per capita income. For Nanded district the 1998-99 value was 13068 against Maharashtra State average of 22763 and the very high value for Mumbai 45471. On the criterion of per capita income the rank of the district is 31 out of 35 i.e. the third lowest from the bottom.
3.9 ECONOMIC-AGRICULUTURAL WEAKNESSES:
A Major weakness is the skewed land holding or land ownership pattern. 60% of land holders in the district are holding and operating holdings of less than 2 hectares together holding 30% of cultivated area. Most of these small holding are fragmented, meaning that they consist of more than one piece of land scattered or located away from each other. Those holdings are un-economic and non-viable. The owners do not afford to keep a pair of bullocks. Their cultivation is indifferent. The lands are rarely deep ploughed and do not at all get any manures or fertilizers for soil health. As a result their soils have gone on degrading and their productivities are very low. Thus 30% of the cultivated area is not contributing in the process of agricultural growth and 60% of the

63 | P a g e
holders are living a low level of life of bare existence. We have proposed an innovative scheme (see section 5.8 in chapter-5) for organizing these asset poor farmers in self Help and train and help them to undertake agro-services and small agro - producting enterprises in the village which are critical for rejuvenating the whole system of agriculture of the village. In the process these SHGs will also bring their own holding back to viability and with additional employment and earnings get out of poverty.
Second important weakness is deteriorating soil health. There are no adequate facilities of testing soils for advice as to the nutrients or other inputs required for restoration of soil health or enrichment. As a result productivities of all crops are lower.
We have made proposals (Para – chapter-v ) for a network of soil testing laboratories and upgrading of the existing ones.
Vast areas in the district have not yet been covered for watershed development. As a result precious soils are continuously getting eroded and scarce water resource is lost through floods and is not conserved or stored as recharged ground water. We have proposed that watershed development work of all remaining areas should be undertaken and completed in the next 5 years (see para chapter 5) 3.10 IRRIGATION
Rainfed area is 88% and irrigated only 12% we have not been using even the available potential properly. Digging of new wells and farm ponds, completion of watershed development, maintenance of the existing canal system and introduction of micro irrigation systems are a few but very important remedies we have proposed in chapter IV & V.
There is over watering of certain crops especially of sugarcane. That does not add to yields but is likely to harm the soil through salinity or water logging.

64 | P a g e
3.11 Crops :
Proportion of high value crops is low but can be increased. Recommended crop rotations or combinations are not followed.
Cultivation practices do not fit the requirement of the crops or modern technologies.
There are productivity gaps as the average yields for all the crops are far below what has been achieved by progressive farmers with best practices within the district.
Seeds, nursery plants or even chemical fertilizers or pesticides with standards of purity are not available in time and in adequate quantities.
Organic manures have become rare. A lot of village or town sweepings and stunk or leaves are not composted and go waste.
There is unbalanced use of chemical fertilizers both by focusing on a few selected crops like sugarcane and in uncontrolled doses likely to harm the crops and soils.
Proven inputs like vermi culture, Bio fertilizers or Bio-pesticides are rarely used. There is vast scope for their use as well as their local production. Similar is the case for Bio-dynamic farming.
3.12 MECHANISATION :
The level of farm mechanization is low. Labour shortages are already experienced in the peak seasons. Mechanization and new tools and small machines would help the situation sand relief drudgery of worker. We have advocated local production of improved tools, implements and smaller machines as well as their repairs and those of heavier machines.
3.13 LOW LEVELS OF ACTIVITY IN ALL ALLIED SECTORS :

65 | P a g e
There have been many failure and setbacks to the allied sectors because of management gaps and improper functioning of cooperative societies. Vast potentials exist for addition to incomes and employment and meeting the needs of the people and the demands of the market. All these weakness should be corrected. Our proposals are in chapter V.
3.14 GOVERNANCE :
There appear to be many executive gaps likely to show down the process of implementation of the programmes, schemes and project by this C-DAP . We describe below the weaknesses which are likely to cause those executive gaps.
The district has staff under the department of Agriculture including those working for extension i.e.for motivating the farmers and to reach the most modern technologies to them
This huge extension establishment in the district needs upgrading through very intensive and rigorous rounds of training and motivation.
Those who are senior and well qualified and who also show promise for extension work may have to be picked up as Trainers. Those who do not like extension work may be posted to other duties.
Qualified and Trained workers staying in the extension work may be given better scales. Those picked up as effective trainers should be given promotions to higher ranks.
The whole work of extension should be re-modeled to fit the 21st century requirements of both the modernties of technologies and of the reformed approaches to the now fairly awakened groups of farmers. The extension workers needs in fact to function as a grass roots driver in the movement for development. Upgrading of the present day staff with effective training and

66 | P a g e
motivating them form their new roles are tough challenges for the departments not so much for the expenses involved, but for the human efforts needed to accomplish them Presently, the coordination linkages between different departments and between different wings of the same department are weak. The interface between the departments and Panchayat Raj bodies also appears to be weak. Those missing links combined with mediocre performance of most of the entities are likely to cause many executive gaps.
Competent and strong executive authorities for implementation of the C-DAP will,therefore have to be set up with full backing of the state and central government.
3.15 SECTION (4) : OPPORTUNITIES :
We have already explained in para 3.1.5 above, what opportunity means, how it is an external attributes of the environment and how it has to be identified., sought and in some cases to be created. Opportunities should not be confused with strengths which are internal attributes of the district.
We present a few examples of opportunities below. After an opportunity is availed of, it becomes a strength of the district. In course of time new and never opportunities may crop up. The development process has to be continuously on the lookout for them.
Globalization and the WTO agreements have opened up tremendous opportunities of export and international trade. Except for expanding export of Cesar Mangoes, the district does not, as yet, appear to be exploiting these opportunities. Progressive farmers may have to set up some institutions to expose those possibilities and establish linkages in the markets abroad.
Because of the businessmen had to face transshipment costs, delays and thefts at Manmad. With the conversion of that line into broad gauge that

67 | P a g e
Manmad bottleneck and the delays and costs involved have disappeared a direct railways access to markets all over the country.
There is a demand for a north south railway link between Khamgaon and Sholapur . With that shorter route, would have a cheaper access for trade to central and Eastern India. That will provide new opportunities.
A major gas pipe line from Hajira to Hyderabad is passing through Osmanabad district. Work is in Progress. If a branch district is sought and secured, it will provide new opportunities through cheaper fuel to existing rolled steel industries and may lead to further growth of other industuries.
3.16 The RKVY :
The many recent initiatives taken by the Government of India, described in paras 1.2-10 and 1.2-11 and especially the RKVY, with assurances of funding, are all a great opportunity for this district. This SWOT analysis and the strategies, programmes, scheme and projects presented in this CDAP are all rare chances fortunately coming to this district. The competent authorities will, therefore, certainly do everything needed to actualize them.

68 | P a g e
CHAPTER IV
DEVELOPMENT OF AGRICULTURE SECTOR
4.1 INTRODUCTION
Agriculture is the major occupation of majority of the population in Nanded district. Economic, Industrial, educational, social development of this area is depend on agricultural production. Despite of higher promotions per capita availability of food over time did not increase significantly. The growth rate of production in agriculture must be more than the growth rate of population. Hence there is an urgent need to accelerate agricultural growth to address issues on food security, nutritional adequacy and income generation. This can be achieved by identifying the problems in crop production, infrastructure facilities, issues related to the natural resources, input management and accordingly there is need to improve agricultural services keeping in view the vision and objectives.
4.2 LAND USE : The total geographical area of Nanded district is 1033100 ha. the net
sown area is 722000 ha (93.30 percent) out of total cultivable area, the area sown more than once is about 136300 ha and hence gross cropped area has increased up to 858300 ha (83.08 percent of total geographical area) and the cropping intensity in the district is 111 percent. The area under forest is 92700 ha which is only 8.97 percent of the total geographical area. Cultivable Waste Land and fallow land is about 3.10 percent and 14.16 per cent of total geographical area respectively which can also be converted as productive land in future. (see table 4.1) The land use pattern of Nanded district is compared with the land use pattern of Maharashtra state. 4.3 SOIL HEALTH

69 | P a g e
The soils in Nanded district are highly variable is capability classes. There is no class I land while 3.62 ha, is occupied by III and II classes. This means basically the chemical and biological factor. These physical and fertility constraints most of the soil are highly depleted in nutrients are proper air : ratio conditions are poor. Some of the constraints of various soil are narrated below for proper management to restive soil health.
4.4 CONTRAINTS : Low hydraulic conductivity and hence water stagnation or longer duration
for Vapsa condition which does not allow favorable air water ratio around root zone. Occurrence of calcium carbonate induces imbalance in nutrient availability.
Shallow soil poses a problem of low water holding capacity and low organic matter. Multi-nutrient deficiency Susceptible to erosion Soil health in terms of physical, chemical and biological condition is poor.
4.5 POTENTIALS : Soil provide fairly long duration of growing period. Soil are productive if properly managed. Soil suitability facilities growing of number of different crops. Irrigation facilities further increase in productivity.
4.6 LAND MANAGEMENT STRATEGIES : Watershed development needs first priority. Watershed based crop planning is : a must in order to exploit high potential of the district. Soil water storage and long growth periods for crops available in black soil should be properly utilized for increasing growth rate of productivity. Mango, Tamarind and Jambhul based horticulture need to be developed under larger areas.
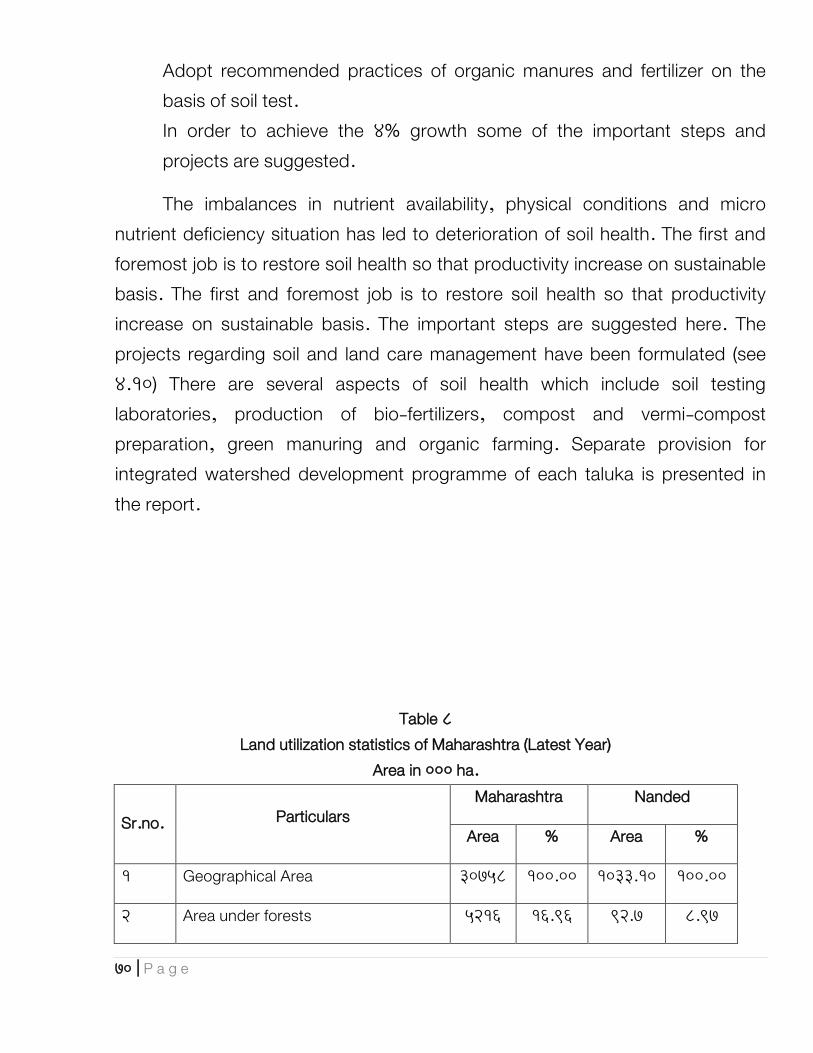
70 | P a g e
Adopt recommended practices of organic manures and fertilizer on the basis of soil test. In order to achieve the 4% growth some of the important steps and projects are suggested.
The imbalances in nutrient availability, physical conditions and micro nutrient deficiency situation has led to deterioration of soil health. The first and foremost job is to restore soil health so that productivity increase on sustainable basis. The first and foremost job is to restore soil health so that productivity increase on sustainable basis. The important steps are suggested here. The projects regarding soil and land care management have been formulated (see 4.10) There are several aspects of soil health which include soil testing laboratories, production of bio-fertilizers, compost and vermi-compost preparation, green manuring and organic farming. Separate provision for integrated watershed development programme of each taluka is presented in the report.
Table 8 Land utilization statistics of Maharashtra (Latest Year)
Area in 000 ha.
Sr.no. Particulars Maharashtra Nanded
Area % Area %
1 Geographical Area 30758 100.00 1033.10 100.00
2 Area under forests 5216 16.96 92.7 8.97

71 | P a g e
3
Land not available for cultivation
a) Barren & uncultivable 1721 5.60 1.821 0.18
b) Land put to non-agric. Uses 1374 4.47 1.379 0.13
4
Other uncultivated land
a) cultivable waste land 914 2.97 32.00 3.10
b) permanent pastures and grazing lands
1249 4.06 50.60 4.90
c) land under miscellaneous tree 246 0.80 8 0.77
5 Current fallows
6 Other fallows 1216 3.95 146.294 14.16
7 Net area sown 1192 3.88 5.729 0.55
8 Area sown more than once 17631 57.32 719.057 69.60
9 Gross cropped area 4773 15.52 199.352 19.30
Source: Economic survey of Maharashtra (As per latest record), GOM.P.T 20

72 | P a g e
4.7 WATER RESOURCES AND MANAGEMENT :
Availability of surface water in Marathwada region is far less than other regions of Maharashtra as under
Sr.No Region Availability of Water per hectare
1 Marathwada 1500M3 2 Vidharbha 4348M3 3 Rest of
Maharastra 9100M3
Normal requirement of water for irrigation is 3000 m3 / Ha as per Maharashtra Irrigation Commission.
Availability of surface water in Nanded district is of the order of 1952 M3 / Ha. as against requirement of 3000 M3 / Ha. The average rainfall for Nanded is 854 mm. Moreover six out of sixteen talukas have been included in the latest list of 195 D.P.A.P. Talukas.
The total availability of ground water in the district is about 1,44,957 HaM. The no. of existing wells is about 31,479. About 5891 wells are in the command area of irrigation projects, where as balance 25588, say 26000 wells are in non command area and need recharging. There exists potential for digging additional 1,13,478 say 1,13,000 wells as per latest survey.
Godavari river flows through the middle of the district. Manjra, Manar, Aasana, Sita, lendi, Penganga are some of main rivers flowing through the district. Command areas of major irrigation projects viz. Jaikwadi, upper Penganga Purna, Manar & Lendi lie in the district. Purna, upper Penganga and manar irrigation projects have already been completed along with medium projects and minor irrigation projects. Two major projets viz. Lendi & Majalgaon

73 | P a g e
Project are still under construction along with a no of medium and minor irrigation projects.
The total surface water potential of the district as per present plan is about 270391 ha. Irrigation potential of about 186974 ha has already been created up to June 2007. It is obligatory that the balance irrigation potential is created in next 4 years and all area brought under irrigation. Adequate provision will have to be made under Bharat Nirman, A.I.BP etc and additional irrigation potential of 356093 created before end of 12th plan.
Thus the total irrigation potential of Nanded district is about 438998+144957=583955 ha. Say 584000 ha. It is desirable that all this potential is created in next four years.
Actual irrigation during the year 2006-07 is only of the order of 820585 ha. The low utilization of created irrigation potential is mainly due to non uniform spatial distribution of rainfall resulting in non-availability of adequate storage of water in times of need, poor maintenance and repairs of irrigation project and Deep Black Cotton Soil etc.
In view of the paucity of water in general in Marathwada, it is obligatory that all available water is used most economically and efficiently by switching over to micro irrigation to feasible extent. It is desirable and recommended that 90% subsidy should be considered for all farmers as an incentive to switch over to micro irrigation. However only 50% subsidy is considered while preparation of C-DAP estimates as per current practice.
The following measure are recommended for judicious ,economic efficient use of all available water :
The existing canal and Distribution system of Irrigation projects in operation is renovated and modernized so as to ensure that water in adequate quantity reaches all created potential area in next 4 years. Most of the major and

74 | P a g e
medium projects in operation are 30 to 40 years old and hence it is obligatory that all available water is judiciously and efficient enclosed. Adequate provision for modernization and Renovation of canal Distribution system of canal Distribution system of major and medium projects will have to be made under Bharat Nirman, AIBP or any other source. so as to ensure that irrigation utilization is increased. The provision for modernization of minor irrigation projects are included C-DAP under head minor irrigation.
All Major and medium irrigation projects presently approved and those under construction are completed in next 4 years and addl. irrigation potential created by making Adequate provision under C-DAP plan or Bharat Nirman or ABIP etc provision for completion of all approved minor irrigation project is made in C-DAP under head minor irrigation.
About 25 % of the surface irrigation potential viz 110000 Ha. is brought under into micro irrigation 50% of this area i.e. about 55000 Ha is brought under drip irrigation and balance 55000 Ha is provided with sprinkler irrigation in next 4 years.
All the existing 26000 wells outside command area of irrigation projects are recharged so as to ensure increased availability of water in next 4 years.
About 113000 new wells are dug and completed in next 4 years Govt.may facilitate granting of loans to farmers by giving guaranty.
50% of the total wells in the district i.e. 72500 are provided with drip irrigation facility and balance 50% i.e. 72500 wells are provided with sprinkler irrigation facilities in next 4 years. In this context it is strongly proposed that 90% subsidy is provided to all farmers in view of shortage of water and the farmer’s contribution is limited to 10% only. However subsidy of 50% is considered for farmers as per existing rules in preparation of C-DAP plan.

75 | P a g e
1250 farm ponds are created in each taluka every year there by creating 80000 farm ponds in the district by end of 4 years.(16 talukas)
Encouraging and making obligatory participatory irrigation by forming water user’s societies so as to ensure efficient use of available water Statement showing requirement of funds every year are enclosed for ready reference.
4.8 MAJOR CROPS IN THE DISTRICT :
CROPPING PATTERN AND PRODUCTIVITY :
Agriculture and allied activities are the main sources of livelihood for majority of rural masses and control the economy of the district. Out of total geographical area (1033100 ha) of Nanded, the net sown area is 722000 ha. (69.88%) and total gross cropped area is 858300 Ha (83.08%) (Table-4.2) About 84.11 percent of total gross cropped area is under Kharif crops, (Table 4.3) and 15.84 percent is under rabi Hw. crops. About 22.45 percent of the gross cropped is cultivated for different cereal crops such as K.Jowar, R.Jowar, Wheat, 18.58 percent area for pulses (Tur,Gram.,Green gram, Black gram) 25.63 percent area for cotton, 2.26 percent area for sugarcane and other area for fruits, Vegetables etc. Proportion of cotton is maximum in Kharif season followed by K.Jowar, Soybean, Tur, Mung etc. Similarly proportion of Gram is maximum in rabi season. Wheat, Sugarcane, Gram, Sunflower, Groundnuts are cultivated on irrigation area.

76 | P a g e
Table No. 9 Area production and productivity of crops
(Average of Three Years)
Sr. No.
Crops
2012-13 2013-14 2014-15
Area in ‘00’ ha.
Production in ‘00’
ton.
Productivity kg / ha
Area in
‘00’ ha.
Production
in ‘00’ ton.
Productivity kg
/ ha
Area in ‘00’ ha.
Production in ‘00’ ton.
Productivity kg / ha
1 Kh. Jowar 1107.45 145408.1
8 1313 1105
92435.46
836.52 573.31 25225.6
4 440
2 Rice 28.78 2213.61 769.15 31.7
5 1456.
78 458.83 10.69 315.35 295
3 Bajra 1.59 0 0.00 1.59 0.13 0.8544 0.65 0 0
4 Maize 1.64 0 0.00 1.64 0 0 4.59 0 0
Other cereals
18.15 0 0 17.6
9 0 0 8.81 0 0
5 Tur 573.6 32668.24 569.53 576.
5 37742
.87 654.69 546.4 12294 225
6 Mung 278.5 18538.90 665.67 292 15351
.31 525.73 198.98 3183.68 160
7 Udid 307.25 21159.38 688.67 0.56 31.78 567.60 207.3 3752.13 181
Other pulses
49.22 0 0.00 1.9 0 0 2.33 0 0
8 Groundnut 0 0 0 2752.14
0 0 0.37 0 0
9 Sunflower 5.66 417.14 737 7.1 0 0 1.77 0 0
10 Soybean 2101.83 324615.0 1544.4 2097 27218 1297.52 2607.2 81347.4 312

77 | P a g e
3 4 .75 7.25 9 4
11 Sesamum 10.29 0 0 2763.78
0 0 7.94 0 0
Other Kh. Oil seed crops
359.89 11.83 4257.5
0 314.03
16.56 5200.33
7 153.23 0 0
12 Sugarcane 249.46 13.66 3407.6
2 397.68
12.00 4772.16 135.34 4332.8 32000
13 Cotton 4.09 26.91 110.06 25.6
8 11.72
300.9696
2724.10
28717.46
105.42
14 K. Vegetables
762.06 10.27 7826.3
6 1020.97
9.16 9352.08
5 449.63 0 0
Total kh. Season
42.04 7.36 309.41 45.3
7 6.88
312.1456
11.43 0 0
15 R. Jowar 359.89 32498.06 903
0 804 153.23 7048.58 460
16 Wheat 249.46 43381.09 1739 0
0 154.11 4777.41 310
17 R. Maize 4.01 0 0.00 0 12.38 0 0 0 0
Other cereals
0.25 0 0.00 0 0 0 2.67 0 0
18 Gram 762.06 63336.50 818 1020.97
9.16 9352.08
5 449.63
24639.72
548
19 Safflower 42.04 22281.20 530 45.3
7 6.88
312.1456
11.43 330.32 289
20 R.Sunflower
9.7 465.60 480 4.38 0 0 0.69 19.32 280
Other R. oil seed crops
49.72 2 99.44 3.17 0 0 1.04 0 0

78 | P a g e
21 Summer Jowar
35.5 21 745.50 63.8 0 0 17.96 0 0
22 Summer groundnut
0 0 0.00 0 12.38 0 0 0 0
Total Rabi crops
881.71 26.38 23259.
51 1082
.1 37.6
40686.96
478.23 0 0
Total summer crops
35.5 21 745.50 63.8 12.38 789.844 17.96 0 0
Gross cropped area
17.94 0 0.00 4.38 0 0 11.48 0 0
Total Cereals
49.72 7 348.04 3.17 0 0 2.33 0 0
Total Pulses
35.5 31 1100.5
0 63.8 0 0 17.96 0 0
Total Oilseeds
409.61 13.83 5664.9
1 317.
2 16.56
5252.832
155.56 0 0
Table No. 10 Distribution of area under different crops
Sr. No.
Crops Distribution of area under different Crops (%)
1 K. Jowar 573.31 2 Rice 10.69 3 Other
Kh. Cereals 8.81

79 | P a g e
4 Tur 546.4 5 Mung 198.98 6 Udid 207.3 7 Other Kh. Pulses 2.33 8 Sunflower 1.77 9 Soybean 2607.29 10 Sesamum 7.94 11 Other Kh. Oil seed
crops 3.25
12 Sugarcane 135.34 13 Cotton 2724.1 14 Fruits, vegetables
spices etc
Total Kharif 7027.51 15 R. Jowar 153.23 16 Wheat 154.11 17 Other R. cereals 2.67 18 Gram 449.63 19 Safflower 11.43 20 R. Sunflower 0.69 21 Summer Groundnut 0 22 Total
Rabi season 771.76
23 Gross cropped area 7799.27 24 Total cereals 11.48 25 Total pulses 2.33 26 Total oilseed 3.25

80 | P a g e
Average yield of cotton is only 338 kg/ha of lint, which is higher as compared to state average. But the average yield of cotton in the district is very low when it is compared with frontline demonstration. Second important crop of this area is Kh. Jowar which is grown on 57331 ha. area of of the district and average yields of Kh. Jowar is only 440 kg / ha.
The average yields of Bajra, Wheat, gram, Tur, Mung, Udid are also not satisfactory. The yields of crops, which are grown on irrigated area are higher as compared to rainfed. But, the proportion of irrigated area is very low, which needs to be increased.
Yields gaps are maximum in Udid, Mung, K.Jowar and soybean and comparatively minimum in R. Jowar, Sugarcane, cotton, summer groundnut D.sunflower (table) To bridge the yield gaps (1) there is a need to increase the irrigated area, 2) watershed development work should also be completed as early as possible on all area and then 3) it is essential to improve the agricultural services (Availability of inputs, Training to the farmers, Research & extension activities, Marketing. Transport Storage, Processing etc. Restoring soil health is a prerequisite.
Growth rates required to achieve the yield obtained in frontline demonstration in 5 years are shown in table. It is possible to improve the productivity of crop with the growth rate of 6 to 10 percent per year under improved agricultural services.

81 | P a g e
table no. 11
Planning of plant Protection Chemicals Requirement (wt. /kg.)
Sr No.
Main Crop Pesticides Used Used in
2011-12
Requirement
2012-13 2013-14
2014-15
2015-16 2016-17
1 Cotton
Chloropyriphos Imidacloprid Bavistin Blue co oper
76800 74725 77200 65210 64900 64600
2 Soyabean 576 8370 8948 9435 9395 90200
3 Gram 19200 17300 16350 17600 16600 15600
4 Tur 48000 47350 49000 46400 43400 41400
5 Mung 33600 34000 33900 32100 31200 29100
6 Udid 48000 47000 44800 43000 43600 4400
7 vegetable 4800 4600 4750 4200 4400 4530
8 G.nut 24000 25800 27000 2300 2100 2200
9 S.cane 14400 14000 13500 11200 119700 117100
10 Banana 48000 47500 49000 48600 47400 4600
11 Hort.Crops 33600 33850 34000 30700 29400 28100
12 Total 350976 354495 358448 310745 412095 401830

82 | P a g e
table no. 12 Farm Machinery Status and Projection
Agri census 2003
Sr.No Taluka
Name of Improved Farm Implements and farm machineries
Present Status (Nos)
Plough
Plough Wodden
iron Bullock Cart
1 2 3 4 5 6
1 Nanded 2862 1188 2114
2 Ardhapur 6553 3954 2339
3 Kandhar 4293 204 948
4 Loha 8853 1503 3647
5 Bhokar 6598 618 3926
6 Mudkhed 2618 1294 1438
7 Hadgaon 7975 2506 7141
8 H.Nagar 3640 587 3019
9 Kinwat 6926 2375 5652

83 | P a g e
10 Mahur 3789 1480 2369
11 Degloor 4439 57 1504
12 Mukhed 5557 464 1448
13 Biloli 3058 936 2919
14 Naigaon 7068 410 1952
15 Dharmabad 6525 379 2024
16 Umri 3893 428 2399
Total 84647 18383 44839
Source (CDAP)
Table No. 13 Yield gaps (%) analysis
Sr. No. Crops
Dist. Average
yield kg/ha
Yield obtained in front line
demonstration kg/ha
Yield gap % with
respect to FLD
Growth rates required to achieve the
yield obtained in FLD (%) year in
5 years
1 Paddy irrigated 438.86 1500 24.38
2 Paddy rainfed 458.83 825 25.49
3 Kh. Jowar 836.523 1800 46.47

84 | P a g e
4 Tur 654.69 950 36.37
5 Mung 525.734 600 29.21
6 Udid 567.605 840 31.53
7 Sesamum 57.5 200 3.19
8 Safflower 688.25 815 38.24
9 Soybean 1297.521 1900 72.08
10 Wheat 1200.89 2200 66.72
11 Gram 916.36 925 50.91
12 R. Jowar 202.328 1115 11.24
13 R. Sunflower 918.95 815 51.05
14
Summer Groundnut
1238.291 1800 68.79
15 Cotton 781.555 340 43.42
16 Sugarcane 83.389 85 4.63
4.9 IRRIGATED AREA :
The total source wise irrigated of the district is 140946 ha., which is 15.42 percent of total cropped area (Table 10) Maximum irrigated area occurs in Nanded Tahsil (22852) ha. 16.21% while minimum irrigated area in Himayatnagar Tahsil 3268 ha. 2.32% Major source of irrigation in this district is open well through, which maximum area is irrigated 63809 ha. 45.27% followed by Tank Water 26869 ha, 19.06% It is well known fact that crop yield increase under irrigated condition table 4.10 It is possible to take 2 to 3 crops per year on the same piece of land one after another. Hence. it is proposed to increase the irrigated area up to maximum possible limit, as early as possible.

85 | P a g e
Irrigated are can be increased by 50% or so if modern methods of irrigation such as drip or sprinkles are used. It is also suggested that necessary arrangements for improved on farms surface irrigation methods be made. 4.10 CROPS AND CROPPING SYSTEM IN IRRIGATED AREA : Irrigation in Nanded District is 160979 ha, but the actual irrigation in last year is 136940 ha (table 4.9) wheat, gram, sugarcane, cotton are the major crops grown under irrigated conditions. Crop yields are higher under irrigated conditions. Land utilization efficiency increase due to irrigation and hence, it is suggested to increase irrigated area. Irrigated area can be increased by constructing minor, medium or major irrigation projects as early as possible and wells in untapped ground water areas considering the availability of rainwater. Irrigated area can also be increased up to 20% -25% (of treated area ) by integrated Watershed Development Work. After construction of irrigation projects and integrated watershed development work, it is expected that irrigated area may increase in Nanded District.
Table – 14
Source wise area irrigated
Sr. no.
Source of water
for irrigation
Area
irrigated
(ha)
Percentage
1 Tanks 30869
2 Open wells 67809
3 Tube/Bore wells 25311
4 Lift irrigation 7220
5 Other sources 29770
Total 160979
The crops which generate higher monitory return should be preferred in irrigated area. The irrigation water is not available for all the area for all the crops in the district. It means water is a limiting input. In this situation our aim should

86 | P a g e
be to harvest more yields per unit of water. Awareness amongst the farmer in this regard should be created so that, they should try to convert the irrigation water into more agricultural production and ultimately higher monetary returns. At present, most of the farmers, prefer sugarcane crop. Sugarcane requires about 1600 mm of irrigation water i.e. 16000 m3 water for one hectare area. If same quantity of water is used for chili crop, more than 2 hectares of area and the total monetary return of chilies or onion will be much higher as compared to sugarcane. This concept needs to be explained to all farmers in training programmes.
Area of cotton in this district is maximum i.e. 272410 ha. but only 13.91% area is irrigated. Proportion of rain fed area is maximum hence the average yield is only 338 kg / ha of lint (965 kg /ha of seed cotton) . Priority should be given to this crop for irrigation because it gives much higher yield under irrigated condition as compared to other crops. Cotton is a two seasonal crop (duration is 170-180 days) maximum growth period occurs in rainy season, hence irrigation requirement of cotton in this area is only about 250 mm, it means only two irrigation are required. Under irrigated conditions, it is possible to harvest more than 30-40 q/ ha of seed cotton. Hence, it is suggested that area under irrigated cotton should be increased. Same policy should also be adopted for tur, in which by giving one or two protective irrigations after rainy season i.e. at flowering and at pod development stage increase yield from 7 q/ ha to more than 25 q / ha.
Table 16
Irrigated crops
Sr.
no. Crops
Total
area Irrigated
area (ha)
% to
total
area
Distribution
of irri. Area
under
different
crops (%)
(ha)
1 Rice 1069 2100 1.53
2 Kh. Maize 459 100 0.07

87 | P a g e
3 Tur 54640 4000 2.92
4 Groundnut 3700 50 0.04
5 Soybean 260729 3500 2.56
6 Cotton 272410 29000 21.18
7 Sugarcane 13534 33900 24.76
8 R. Jowar 15323 5400 3.94
9 Wheat 15411 19500 14.24
10 R. maize 1697 800 0.58
11 Gram 44963 19500 14.24
12 Safflower 1143 1200 0.88
13 Seasumum 60 50 0.04
14 R. sunflower 69 8100 5.91
15 Summer Jowar 60 640 0.47
16 Summer Maiz 10 100 0.07
17 Summer
Groundnut 830 8300
6.06
18 Summer
Sunflower 500 500
0.37
19 Summer Mung 200 200 0.15
Total 686807 136940.0 100.00
Farmers of this area are prefer wheat crop, which is comparatively a sensitive crop for water stress and short winders. In case of wheat about 550 mm of irrigation water is required to harvest maximum yield. There is drastic reduction in yield, if water supply is reduced. Hence, under scarcity situation it is suggested to take drought resistant crops like gram, sorghum, safflower which require less irrigation water and more area can be irrigated. The quantity of irrigation water, which is required for wheat, is sufficient to irrigate 2 to 2.5 ha higher in case of gram or rabi Jowar. Therefore there is a need to increase the irrigated area of rabi jowar and gram, because yields response to irrigation water is good in both the crops.
4.11 INPUT MANAGEMENT :
To harvest maximum crop yields, it is expected that the farmers should use all inputs (pure seed of high yielding or hybrid variety, manures, fertilizer, irrigation water, pesticides, weed sides, growth regulators etc) as

88 | P a g e
recommended by the experts. It is also expected that the farmers should complete all operations such as preparatory tillage operation, seed bed preparation, sowing, intercultural tillage operations, spraying, dusting etc. at a right time. But there are difficulties to the farmers. Irrigation facility is available only for 15.42 percent area. Remaining 84.58 percent area is rain fed on which watershed development work is not completed up till now. In this situation farmers are not ready to take risk for more inputs. There is a need to create confidence among cultivators. Adequate and timely credit facilities needs to be created.
4.12 SEEDS :
Use of pure seed of improved varieties is the basis of all agricultural improvement. Reap as you sow, is a age old saying which is true in scientific farming also. No amount of advanced agricultural practices will boost up crop yield if the seed used is not of high quality. Good seed does not cost much but relatively it pays more. There are several varieties released in some of the crops like cotton maize but in some of the crops local varieties are used. Yield potentials are very low. More and continuous research is essential for increasing productivity.
In crops like K.Jowar,Maize, cotton the seed replacement ratio 100 percent (table) which can be considered as good sign of improvement but is case of Tur, Mung, Udid, Groundnut, Soyabean, R. Jowar, wheat gram the seed replacement rate is very low. Rabi Jowar is grown on large area but the seed replacement rate is only 4 percent. in such cases farmers are using local seeds without seed treatment which may or may not be good quality seeds. There should be provision of seed testing in laboratory. 4.13 ORGANIC MANURES : Integrated approach for nutrient management is suggested by the scientist but it is observed that, most of the farmers are using only chemical

89 | P a g e
fertilizers and they are not using organic inputs because of unavailability at local level. Organic manure is a complete food for the crops. All nutrients (including micro nutrients) are available in manure. Farmer should produce organic manure, compost,vermicompost at their site. 4.14 FERTILIZERS : Crop wise NPK consumption shows (Table no 30) that in cotton, sugarcane, wheat and maize, the farmers of this district are using NPK almost equal to recommended dose per hectare, even though the yield of wheat and sugarcane are not satisfactory when it is compared with expected yields. This is because farmers are not adopting the principles of integrated nutrient management. It is also observed that they are not using balanced fertilizers. In case of Tur, Mung, Udid and Soybean nitrogen is used as recommended dose but p2o5 is not used in sufficient quantity. In most of the cases, bio fertilizers are not used which is very essential to harvest higher yield. All type of fertilizers (straight fertilizers, complex fertilizers, micro-nutrients liquid fertilizers should be made available to the farmers. The requirement of micronutrient to the crop is comparatively low but it is equally important as major nutrients. Liquid fertilizers are more useful and efficient in drip and sprinkler irrigation systems. 4.15 CHEMICALS : Different type of pesticides, weedicides, growth regulators are required in crop production programme. Chemicals should be standard and of best quality. Pesticides are required to protect the crop. There should be provision of testing of chemicals in laboratory of Agro polyclinic. 4.16 LABOURS : Human labours and bullock labours are not available in adequate number. At many places it is observed that the farm operations like preparatory tillage, land layouts, sowing, intercultural operations, spraying, irrigation , harvesting etc. are not completed in time, which adversely affect the crop yield. Load

90 | P a g e
shading of electricity has also become a serious problem. When labours are available for irrigation, during daytime, the electricity is not available and when electricity is available during night time, labours are not available. Numbers of marginal farmers, small farmers are more in number. They cannot afford to keep a bullock pair, they cannot afford to buy a tractor, they are unable to complete the farm operations. In this situation is very essential to shift as mechanization hence a proposal is given separately.
Table No. 18
Planning of Agriculture Inputs in the District - Seed 2012-13
Sr. No. Name of crop
Area under crop (ha) (2012-13)
Present SRR %
1 2 3 4
1 Jawar 110500 100
2 Tur 57650 24
3 Soya bean 209800 35
4 Cotton 310200 100
5 Mug 29200 22
6 Udid 32800 56
Total 750150 337
Table No 19
Crop wise NPK Consumption
Sr. No. Major Crops Fertiliser Consumption( kg/ha)
N P K Total
1 Cotton 100 50 50 200
2 Jawar 80 40 40 160
3 Soyabean 30 60 30 120
4 Mung / Udid 25 50 0 75
5 Tur 25 50 50 125
6 Sunflower 25 50 0 75
7 Wheat 100 50 50 200
8 Rice 100 50 50 200
9 Gram 25 50 0 75
10 Banana 800 700 800 2300
11 Sugar Cane 250 115 115 480
12 Grond Nut 25 50 0 75
13 Soffiower 50 25 25 100
14 Vegetable 50 50 50 150

91 | P a g e
15 Hort. Crops 200 110 110 420
0 0 0 0
Total 1885 1500 1370 4755
(source ADO )
4.17 FARM MECHANIZATION / FARM EQUIPMENTS
Farm operations are the most drudgery, difficult and laborious work in crop production prgogramme. It appropriate type of implement / tool/ machinery is available, the farm work can be completed in short time and the quality of work is also good. Because of comfort to agricultural workers, it improves efficiency and reduces labour cost. farm mechanization increase profitabilility. Women play a major role in crop production and post-harvest activities related to agriculture, horticulture dairy ; poultry etc. Women are involved in large number of agricultural operations including sowing, planting, weeding, hoeing, fertilizer application, spraying, dusting, harvesting, threshing, grading, processing etc. If women – friendly tools, implements machineries are available it improves efficiency of working. In Nanded district, availability of farm implements,machineries are studied and it is observed that farm implements/ machineries are at lower (table 4.13) level. Number of tractors, seed drills, sprayers, Treshers, Ele. Pumps drip and sprinkler seits were studied. It shows that highest number of tractors (175) were in the area of Mudkhed tahsil, indicating 175 ha of cropped area per tractor whereas lowest number of tractors. The staff of SRTMRU Nanded has discussed the issue of mechanization with farmers of Nanded district and it is reported by the several farmers that there is shortage of farm labours. This is a serious problem. Therefore it is very essential to switch on to farm mechanization. Considering the requirement, it is proposed to have an organization at district place to manufacture & repair different types of tools, implements, equipments, machineries etc. The

92 | P a g e
organization may be Govt. co-operation or private but they should be involved in research, manufacture and sale of tools, implements, machineries required for crop production programme and post –harvest activities. More labours are required for transplanting of seedlings, planting of sugarcane, harvesting of Jowar, Maize, Picking of cotton, harvesting of Wheat, safflower, grading of sweet orange etc. The use of equipment , machineries should reduce the labour requirement. The machineries required for post harvest activities may also be given more priority. The Lead Bank and NDCC Bank should provide adequate investment credit, reasonable rate of interest, to the cultivator, for the purchase of tractors, electric pumps and other farm machinery, to improve their productivity. Talukawise project investment credit for XI Plan period is shown in table 29.
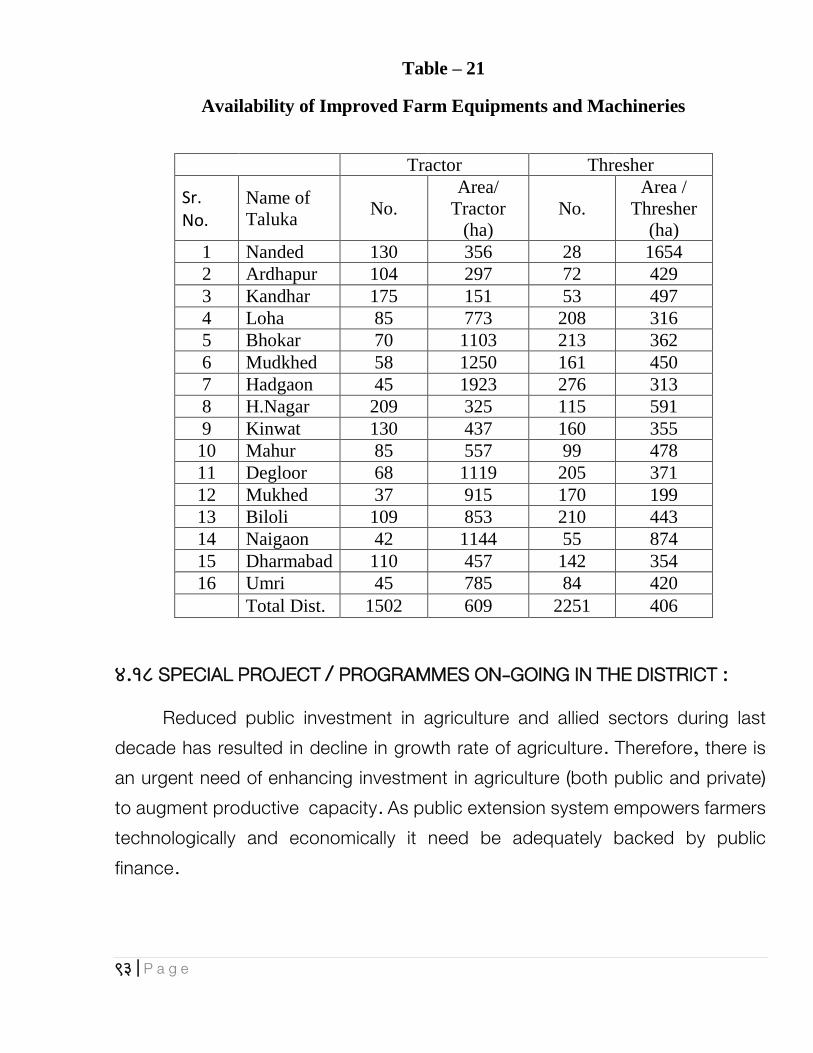
93 | P a g e
Table – 21
Availability of Improved Farm Equipments and Machineries
Tractor Thresher
Sr. No.
Name of
Taluka No.
Area/
Tractor
(ha)
No.
Area /
Thresher
(ha)
1 Nanded 130 356 28 1654
2 Ardhapur 104 297 72 429
3 Kandhar 175 151 53 497
4 Loha 85 773 208 316
5 Bhokar 70 1103 213 362
6 Mudkhed 58 1250 161 450
7 Hadgaon 45 1923 276 313
8 H.Nagar 209 325 115 591
9 Kinwat 130 437 160 355
10 Mahur 85 557 99 478
11 Degloor 68 1119 205 371
12 Mukhed 37 915 170 199
13 Biloli 109 853 210 443
14 Naigaon 42 1144 55 874
15 Dharmabad 110 457 142 354
16 Umri 45 785 84 420
Total Dist. 1502 609 2251 406
4.18 SPECIAL PROJECT / PROGRAMMES ON-GOING IN THE DISTRICT :
Reduced public investment in agriculture and allied sectors during last decade has resulted in decline in growth rate of agriculture. Therefore, there is an urgent need of enhancing investment in agriculture (both public and private) to augment productive capacity. As public extension system empowers farmers technologically and economically it need be adequately backed by public finance.
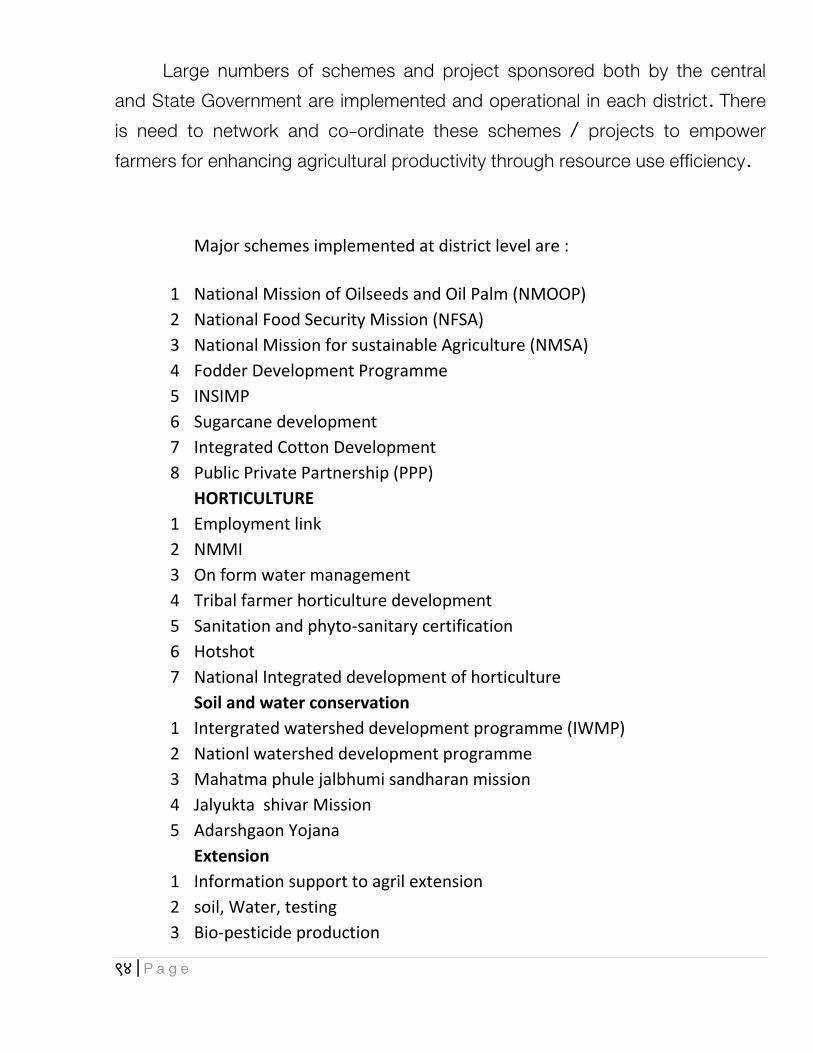
94 | P a g e
Large numbers of schemes and project sponsored both by the central and State Government are implemented and operational in each district. There is need to network and co-ordinate these schemes / projects to empower farmers for enhancing agricultural productivity through resource use efficiency.
Major schemes implemented at district level are :
Agriculture 1 National Mission of Oilseeds and Oil Palm (NMOOP)
2 National Food Security Mission (NFSA) 3 National Mission for sustainable Agriculture (NMSA)
4 Fodder Development Programme 5 INSIMP
6 Sugarcane development 7 Integrated Cotton Development
8 Public Private Partnership (PPP)
HORTICULTURE
1 Employment link 2 NMMI
3 On form water management 4 Tribal farmer horticulture development
5 Sanitation and phyto-sanitary certification 6 Hotshot
7 National Integrated development of horticulture
Soil and water conservation
1 Intergrated watershed development programme (IWMP)
2 Nationl watershed development programme 3 Mahatma phule jalbhumi sandharan mission 4 Jalyukta shivar Mission
5 Adarshgaon Yojana
Extension
1 Information support to agril extension 2 soil, Water, testing
3 Bio-pesticide production
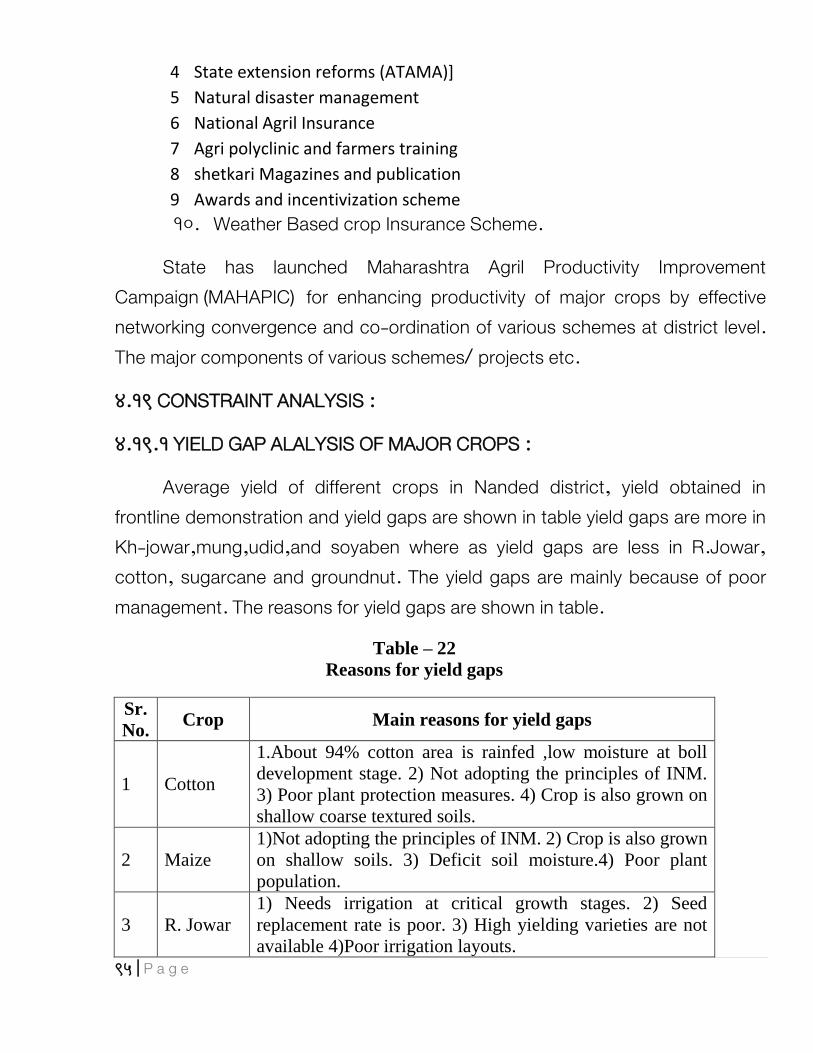
95 | P a g e
4 State extension reforms (ATAMA)] 5 Natural disaster management
6 National Agril Insurance 7 Agri polyclinic and farmers training
8 shetkari Magazines and publication 9 Awards and incentivization scheme 10. Weather Based crop Insurance Scheme.
State has launched Maharashtra Agril Productivity Improvement Campaign (MAHAPIC) for enhancing productivity of major crops by effective networking convergence and co-ordination of various schemes at district level. The major components of various schemes/ projects etc.
4.19 CONSTRAINT ANALYSIS :
4.19.1 YIELD GAP ALALYSIS OF MAJOR CROPS :
Average yield of different crops in Nanded district, yield obtained in frontline demonstration and yield gaps are shown in table yield gaps are more in Kh-jowar,mung,udid,and soyaben where as yield gaps are less in R.Jowar, cotton, sugarcane and groundnut. The yield gaps are mainly because of poor management. The reasons for yield gaps are shown in table.
Table – 22
Reasons for yield gaps
Sr.
No. Crop Main reasons for yield gaps
1 Cotton
1.About 94% cotton area is rainfed ,low moisture at boll
development stage. 2) Not adopting the principles of INM.
3) Poor plant protection measures. 4) Crop is also grown on
shallow coarse textured soils.
2 Maize
1)Not adopting the principles of INM. 2) Crop is also grown
on shallow soils. 3) Deficit soil moisture.4) Poor plant
population.
3 R. Jowar
1) Needs irrigation at critical growth stages. 2) Seed
replacement rate is poor. 3) High yielding varieties are not
available 4)Poor irrigation layouts.

96 | P a g e
4 Bajra 1) Poor intercultural operation 2) Poor nutrient
management.
5 Tur
1) Needs irrigation at flowering and pod development stage.
2) Seed replacement rate is very poor. 3) Not adopting the
principles of INM. 4)Inset moisture conservation techniques
needs to be adopted.5) Appropriate spacing in plant to plant
maintain. 6) Protective irrigation given at critical stage.
6 Mung,
Udid
1) High yielding varieties are not available 2)Seed
replacement rate is very poor. 3)Poor or no plant protection
measures. 4) late sowing due to insufficient moisture.
7 Soyabean 1)Poor nutrient management.2) Poor intercultural operation
3)Not adopting the principles of IPM.
8 Wheat
1) Late sowing, poor plant population. 2)Need adequate
number of irrigation. 3) varieties of higher yield potential
are not available. 4) Poor nutrient management.5) Seed
replacement rate is poor.
9 Gram
1) Need irrigation at critical growth stages, poor irrigation
layouts. 2)Need medium to deep soils only 3) Not adopting
the principles of INM.
10 Sugarcane
1) Planting is not scientific. 2) No seed treatment 3)Not
adopting the principles of INM and IPM. 4) Poor irrigation
management.
11 Kh. Jowar
1) Late sowing because of low moisture in soil. 2) varieties
of high yield inertial are not available . 3) Poor intercultural
operation 4) Not adopting the principles of INM and IPM.
12 Safflower 1) High yielding varieties are not available 2) Poor or no
plant protection measures.
4.19.2 EXTENSION & ADOPTING GAPS/LIMITATIONS:
Though extension services are essential ingredients is agriculture and rural development, there is a wide gap between scientific know-flow and field level do-how. According to NSSO, Govt. of India (2005) report, only 40% of the farmers in the country accessed one or the other source for getting information related to modern forming while 60% farmers are unaware of modern agriculture technology. Further, the farmers who received farming related information from one or the other source, only about 50% actually tried the information or

97 | P a g e
adopted the recommended technology indicating huge technology transfer (Extension) and adoption gaps and this gap being largest in Jive stock and fisheries sub-sectors which are emerging as an important contributors to the total agriculture GDP.
The huge technology unawareness, technology transfer and adoption gaps may be ascribed to : 1) Inappropriate and non-attractiveness of technology package 2) Farmers unawareness of new and modern technology due to low literacy rate 3) Non-availability of modern technology related quality inputs at right time, in right quantity and at right and affordable cost. 4) Deteriorating terms and inadequate infrastructure for trade of agriculture produce and 5) Ineffective agriculture extension services.
4.19 3 LIMITATIONS OF PUBLIC EXTENSION SYSTEM :
The size of existing extension service network in agriculture and allied sectors at district level is, by and large, satisfactory. Although the ATMA has been established for integration, co-ordination and convergence of extension efforts within the district, the perceived innovations in institutional reforms through ATMA still face the implementation and operational linkage problems. Decentralization and participatory approach in Agri Extension delivery is a step in right direction, However the flow of appropriate technology., and value – added Information and combination of various supports services at right time and place to empower small and marginal farmers for improving efficiency and viability of farming is in effective due to lack of sensitization, orientation and capacity building of field extension personnel of line departments and bottom level decision makers. The evidences of impact of ATMA module of extension delivery on small and marginal holding and other disadvantage! group of farmers and farm women, which constitute huge number and prominent for food and social security of the rural communities, are still not visible. The key limitations of district extension system are :

98 | P a g e
Public extension services are widely viewed as supply driven rather than demand-driven.
There is more focus on input distribution and subsidy administration rather than core function of farmer’s empowerment through credible extension work.
Segmented approach in extension service delivery without considering farmers interests and priorities.
Public extension deals with at large area and population with diverse cropping pattern and extension services are general in nature.
Poor networking and weak co-ordination in district line departments. In inadequate capacity building/still up gradation of extension workers to
provide demand-driven, specialized, location specific extension services. Due to large vacant posts, deployment of extension workers to other
supervisory work, and constraints on budgetary allocation. the public extension system is not able to effectively perform its extension services.
Weak and / or non-existence of research – extension-farmer market linkages.
4.19.4 EXISTING INSTITUTIONAL MECHANISM IN THE GOVT.
Besides deficits in public investment, credit, infrastructure and marker economy, the knowledge defect, is the primary cause for the, development deficit, in agriculture and rural economy. The gap between scientific know-how and the field level do-how has been widening in recent years. This knowledge deficit needs to overcome speedily arid effectively through efficient and accountable Agriculture extension machinery to enhance productivity, profitability and viability of farming, specially of small and marginal holdings.
4.20 EVOLUTION OF PUBLIC EXTENSION SYSTEM IN STATE :
99 | P a g e
Public Extension System has undergone several changes since early 1950. Beginning with Community Development (CD) programme in 1952 through the National Extension Service in 1953,the main focus was on human and community development. There has been a steady progression towards technology transfer, with IADP in 1961.-62, IAAP in 1964-65, HYKP and FTEP in 1966-67, and SMFDP in 1969-70.
The most significant development was the introduction of the Training and Visit (T&V) extension management system in mid 1970’s. T&V extension system was well suited to rapid dissemination of broad based crop management practices and registered impressive gain in irrigated area. Indeed, the T& V system played an important role in ushering the Green Revolution. The various mechanisms evolved in T&V system were very successful in providing a two-way channel for dissemination, of technology to farmers and the feed backs of the problems faced by the farmers to research system with better Research- Extension-Farmer( R-E-F) linkages.
However, the T&V system being “Top –down” in approach generated uniformity rather than specificity with low level of involvement of farmers. The capacity building of extension functionaries and not adequately addressed and mostly remained with centralized operations. During post-green revolution period, when the T&V extension approach / vas extended to rainfed farming, the system failed to respond to the more location specific, risk-prone situation in sustainable manner.
The system did not meet with success, the needs of diversified agriculture in rain fed area. Further due to closure of the World-Bank support to T&V extension approach.
The state Department of Agriculture was reorganized in 1998 pm “one window” pattern with a view to deploy more of its technical manpower in the field for technical services to farmers through single village level worker (VLW).
100 | P a g e
This was a broad based extension model but lacked functional integration and the staff was equipped with traditional managerial skill of input supply, quality control with poor awareness about changing needs of farmers. This field staff is heavily burden with various scheme/projects and targets with very less emphasis on technology transfer and technology application in real-life field situation of farmers.
4.21 PRESENT EXTENSION SERVICES
1.GOVERNMENT SECTOR
The Department of Agriculture of the state is the nodal agency for ensuring overall development and growth of agriculture. At the district level. the Department of Agriculture is headed by Superintendent Agriculture officer (DSAO) assisted by Deputy Director of Agriculture (DDA) Sub-Divisional Agriculture Officers (SAG), Taluka Agriculture Officers (TAO) Circle / Mandal Agriculture Officer (CAO), Agriculture Supervisors (AS) and Agriculture Assistant/ village level work;: (VLW). The main responsibilities of Agriculture Department are :
Implementation of various central and state sponsored schemes. Transfer of Technology and Providing other technical services
Department of Agriculture assists in transferring the latest agriculture technologies developed by SAU,ICAR arid other Research organizations to the farm families through farmer’s field school, village seed programme, field demonstrations kisan melas, training of farmers, direct contact, literature and

101 | P a g e
print and electronic media. The department has introduced Krishi Vigyan Mandate (KVM) and Self Helps Groups (SHGs) for participatory extension services.
The district line Departments of the state Govt. such as Horticulture, Animal Husbandry, Dairy Development, Sericulture, Forestry, Fisheries etc. are involved in providing extension services through supply of subsidized inputs and routine.
Apart from Agriculture and other Line departments, the Zilla Parishad (ZP) also has the department of Agriculture headed by Agriculture Development Officer (ADO) assisted by supporting staff at District Parishad and taluka and village Panchayats. They are mainly engaged in input supply and distribution, and quality control besides Extension services.
Following State Govt. setup corporations are mainly responsible for production, supply and procurement of inputs along with products related extension services in the district.
a) MAIDC Ltd. b) MSSC Ltd. and c) M.S. Seed certification Agency.
Agriculture University extension Services in the district covers. The organization of zonal Agri. Res. and Extension Advisory committee meetings, monthly district workshops, Diagnostic team visits, joint field visits,. demonstration training of extension personnel’s and farmers mainly through Krushi Vigyan Kendera, ZRS / Sub stations and District Extension Agronomist with a team of subject matter specialists.
Krushi Vigyan Kendra’s (KVK) mandate is technology assessment and refinement through On Farm Testing (OFT) and Front Line Demonstrations (FLD) of improved technology / products and its dissemination through training of extension personnel’s and farmers, and vocational training of rural youths and

102 | P a g e
farm women. The Programme Co-coordinator (PC) as the head of KVK plans and implements tailor-made extension programmes based on thrust areas of the district. The PC of the KVK is assisted by six Training Associates of major discipline and three Training Assistant and supporting staff. The scientific Advisory Committee (SAC) of the KVK comprised of district heads of various line Departments, progressive farmers and KVK/SAU scientists meet twice in a year to review the progress of the work and discuss the future plan of work. The success of KVK largely depends on its linkages with line departments and contact farmers.
4.22 CORPORATE/PRIVATE/ NGOs SECTOR
Increasing restraints on Govt. finances and new arrangement in extension services, the corporate, private and large number of NGOs/agencies are increasingly involved in providing technical and materialistic extension services in the district. The corporate houses, private wholesale dealers, retailers, traders are mainly involved in farm business through consultants and agri-business outlets. The major corporate players, which have already come up with their Agri - products are “ e-chaupal” of ITC , “Aadhar“ of Godrej Agro-vet, Shub Labh of Mahindra Group, Tata Krishi Seva Kendra of TATA Group etc. Most of these outlets are offering Agri-inputs at a single window and agricultural extension services related to their brand products. Some of the sugar mills in the district have also adopted the innovative method of agro-extension.
The farmer’s organizations (KVMs, SHGs) and NGOs largely dependent on Govt. grants/ subsidies are also providing extension services in the district though participatory mode. The NGOs are mostly involved in promotion and credit linkages of SHGs, watershed development, organic farming, rain water harvesting, rural sanitation and health awareness etc. These private groups of extension agents are giving services free to nominal charges.
4.23 INNOVATIONS IN TECHNOLOGY DISSEMINATION:

103 | P a g e
With a view to increase the quality and of public extension system to face the challenges of 21st century, it was necessary to evolve new strategies for effectively disseminating newer technologies being evolved by the “MARS. As reforms in the present public extension system an Agriculture Technology Management Agency (ATMA) was established and pilot-tested in four districts of the state during 10th five year plan. The main aim of ATMA is to integrate the various stakeholders at district: level associated and involved with agriculture development activities within district Based on experiences gained through pilot testing, the ATMA module of Extension delivery has been adopted in all the district of the state in the 12th plan,
The details of extension services provided by various line departments are given in table-4.15 and the structure of Agri-extension services at district level is shown in table – 4.16
104 | P a g e
Chapter V
5.1 ALLIED AGRICULTURE SECTOR
Introduction :
C-DAP of the district is aimed at enchancing the growth rate of Agriculture. Along with it other allied activities like, Sericulture, Horticulture, Animal Hunsbandry Fishers, Watershed development, Agro based rural development, Food processing units, Development of Rural Industries, Agricultural marketing and Agricultural credit have also been included in the project report.
Critical analysis of the available data / statistics and information was made to Agriculture as well as of allied activities. Thus, by increasing the growth rate of allied activities to minimum level of 6 percent per annum, it is expected that the overall growth of agriculture and allied activities together will help in achieving CGR to 4 percent during the 11th plan period.

105 | P a g e
5.2 Development of Horticulture in Nanded district during 11th five year plan :
Introduction :
In Nanded district there are 16 talukas and the soils of the district is medium to veavy type in almost all the talukas. The rainfall received during the year ranges from 800 to 1000 mm higher in proportion in north esastern regions with high density of forests. The climate of the district is suitable for growing tropical and sub tropical fruits and vegetables. Banana is an important fruit crop growth traditionally in the district. Ardhapur variety of banana its famous with is grown in Ardhapur and adjoining areas. Mango, Sweet orange, mandarin orange are other fruit crops with area grown in the district on commercial scale since along time. Among vegetables and spices onion, garlic, turmeric and chilli crops are grown in the district. Dharmabad and Dagloor are famous talukas for growing chilli as rainfed crop. Mudkhed is well known centre for growing citrus and flower crops like Jasmins, rose, chrysanthemum, gillardia etc. Due to completion of irrigation projects like Jayakwadi, Vishnupuri and other medium and minor projects, there is significant increase in the irrigated area in the Nanded district and therefore, the scope for development of Horticulture in the district has increased to considerable extent.
5.3 Development of fruit crops :
In Nanded district banana, sweet orange, mango, guava and sapota are major fruit crops grown on 29775 hectare area. Among these sweet orange is alone grown on 10452 hectare area and banana is grown on 9500 hectare area. during 11th plan it is proposed to increase the area under fruit crops upto 56800 hectares with compounded growth rete of 13.80 per cent. The area under

106 | P a g e
banana is increasing at faster rate and it is proposed to expand the area under banana to 1200 hectares. Similarly sapota is also becoming another important fruit crop of the region.
The total, production under fruit crops is 419882 tonnes and during 11th plan it is proposed to increase this production to 1171907.50 tonners with the growth rate of 22.70 per cent. The production of fruit crops can be increased by two means viz. by increasing the area under fruit crops and by increasing the area under fruit crops and by increasing the productivity. In case of banana it is proposed to increase the productivity from 25 to 47.5 tonnes with the growth rate of 13.70 per cent. The productivity of banana can be increased by proper management of banana crop particularly in respect of manuring and irrigation. Under Marathwada conditions very limited research work has been undertaken on cultural aspects of banana. The state government has sanctioned on research station for banana at Nanded. It is essential to strengthen this research station. Therefore a proposal for strengthening of banana research station has been prepared and is being submitted separately.
Besides banana there is good scope to increase the area under sweet orange, mango and sapota. The area under sapota is also increasing at faster rate and during 11th plan the area expansion plan has been prepared.
Major varieties of Horticulture crops in Nanded district.
A) Fruit crops 1) Sweet orange Nucellar mosabi 2) Banana Ardhapuri, Barrow 3) Mango Kesar, Dashahari, Hapus

107 | P a g e
4) Papaya Taivan 5) Sapota Kali Patti
B) Vegatable crops 1) Chilli Jwala, NP 46A, Parbhani 2) Bhendi Parbhani, Kranti 3) Tomato Pusa Rubaj, Mangle 4) Bringal Marjro cota, Vaishali
5.4 Nursary Activities :
With the increase in area under fruit crops, the demands for the planting material will also increase. There is always demand for quality plant metrical and material in sufficient quantities to cater the needs of the farmers. This is due to inadequate facilities available for production of planting material. The mother trees of improved varieties should be available in sufficient number for supply of sufficient quantities of scion wood or buds for grafting and budding. Similarly the seeds of root stock plants should also become available in sufficient quantities for raising of root stock seedlings. Similarly the availabilities of skilled laborers’ for propagation work is also an important factor in production of plant material. The state Government nurseries should be strengthened by providing additional grants. Therefore, a separate proposal for strengthening of State Government nurseries has been prepared and is being submitted separately. If this proposed is approved by the Government then the nurseries will be able to produce required quantities of planting material to cater the demands of the farmers and the objectivie of area expansion under fruit crops can be achieved.
108 | P a g e
Besides open propagation of the nursery plants, if would be possible to undertake the production of plants under green house conditions continuously throughout the year. In green houses the climatic parameters like temperature, humidity, light etc. are controlled artificially and therefore, it is possible to provide the desired type of atmosphere for propagation of a particular fruit crop. Under high humid conditions the rooting of cutting becomes more successful. Similarly the success for grafting and budding can also be increased under controlled atmospheric conditions. Tissue culture of plants like banana is also undertaken on large scale in the tissue culture laboratory of agricultural university. If the plant material produced in tissue culture is used for planting of banana plantations, then the farmers can obtain early and higher yields.
Rejuvenation of old Garden :
The old gardens of mango, ber, sweet orange are many times deteriorated and biomelaess productive. The fruit quality is also not superior and therefore maintenance of such fruit gardents becomes uneconomic. The State Department of Agriculture has a scheme for rejuvenation of old fruit gardens. The old, less peoductive plants and the plants having poor fruit quality are converted into superior types by different methods of propagation like side grafting, crown grafting etc. In case of ber the old trees with inferior fruit quality have been converted into a plant of superior fruit quality by following patch or ring budding methods on new sprouts of the old cut trees.
Besides rejuvenation of the unproductive plats, the productivity of the fruit grees can be increased by proper nutrition and irrigation and irrigation

109 | P a g e
management, intensive pest management (IPM), use of plant growth regulators and other shemicals and by following special horticultural practices like bahar treatment in citrus, ringing in mango, notching in fig and so on. The farmers are not aware of such practices for induction of flowering and improvement of fruit size and yield. Therefore, it is necessary to provide the training to the farmers for increasing the to yield of fruit crops without deterioration of plant health.
Development of vegetable crops :
In Nanded district the cultivation of vegetable crops is more concentrated around the city and towns. Because the urban people are more health cautions and there is good demand for the fresh vegetables in urban areas. The vegetables can be grown throughout the year as there is good demand for the vegetables all the year round. The kharif season vegetable like bhendi, beans , cucurbits, chilli, tomato, brinjal, etc. are produced by the farmers on small scale and these vegetables are transported daily from the villages to the vegetable markets in the towns and city like Nanded. In rabi season the vegetables like cabbage, cauliflower, pea, carrot, onion, tomato etc. are grown on commercial scale as market gardens and truck gardens. In summer season cucumber, water melon and musk melon are grown on river banks and are transported to distant maerkets.
In Nanded district at present 7532 hectare are is occupied by different vegetable crops which is proposed to raise upto 10663 hectares. The present production of vegetables to the extent of 55057 tonnes can be raised to 117500 tonnes with the compounded growth rate of 16.3 per cent. during 11th plan it is possible to have such development of vegetables in Nanded district. Organic Farming in Vegetables :

110 | P a g e
There is good demand for the vegetables produced through organic farming particularly urban areas. Because the educated people from urban areas are more health cautions and they prefer the food produced through organic farming. Therefore, a separate proposal on organbic farming in vegetables for Nanded district has been prepared and is being submitted separately. Vegetable seed production : As there will be an increase in are under vegetable the demand for the seeds of different vegetables will increased. There is always shortage of good quality seeds of recommended varieties of vegetables. In order to meet out the demand of seeds of different vegetables, it would be essential to undertake the programme of vegetable seed production. The Seed companies in Nanded district should take the seed production programmes so that the demands of the farmers will be fulfilled. Development of Floriculture : In Nanded district the cultivation of flower crops in undertaken on commercial scale in some pockets like Mudkhed. The crops like rose, marigold, tube rose, gillardia, Jasmins etc. are grown and the fresh flowers are transported at different centres in Nanded and other adjoining districts. The present area under different flower crops in Nanded district is 456 hectares with production of 1400 tonnes. In 11th plan it is proposed to increase the area upto 1048 hectares and production to 4722 tonnes with the growth rates of 18.1 per cent and 27.6 per cent respectively. The farmers will be provided necessary help for increasing this production of flower crops. High Tech Floriculture :

111 | P a g e
The production of flowers in polyhouses in gaining much more importance during last two decades. The flowers so produced by high tech cultivation are specially used for export in western contries and thereby the farmers are able to earn more profit through the high tech cultivation of flowers. The State Government is also providing the financial aids to the farmers for high tech cultivation of flowers. A proposal has been prepared for high tech cultivation of flowers in Nanded district and is being submitted separately.
Chapter VI District Plan – Nanded
Introduction :
We are presenting in this chapter a detailed District Plan of Nanded, for the XII plan (2012-17). It includes important growth drivers, innovative schemes, and budgetary provisions for the XI plan, to achieve the targeted growth rate. This also contains the necessary requirement of inputs such as improved seeds, fertilizers, pest-control measures. Projects are also included on improved water management, specifically, use of drip/sprinkler irrigation. Watershed management & soil health. Training and technology transfer facilitating farmers knowledge, have been projected. Some of the innovative schemes have been suggested. 6.1 Strategy for achieving XII Year plan projections
A focus on Command Area Development and the rehabilitation and physical modernization of
existing major irrigation systems. Comprehensive aquifer mapping and extensive ground water recharge. Move towards sprinkler and drip irrigation and away from flood irrigation

112 | P a g e
Improvement of productivity and income of farmers in the existing enterprises and farming system by adoption of demonstration.
Organization of technology based training program. Diversification and intensification of existing farming system. Sustainability in productivity / income through integrated farming
approach. Integrated Nutrient Management Integrated Pest Management Seed multiplication and Replication Up gradation of marketing strategy. Strengthening and formation of farmers organization Human Resource Development Adoption of a farming systems approach with livestock and commons as
an integral component of the farm; Generation of biomass for bulk addition of organic matter in the soil to
maintain proper soil health. We should educate the farmers not to burn standing crop residue but to plough it into the soil;
In situ degeneration of biomass through sole cropping/inter-cropping/bund cropping of green manure crops;
Recycling of farm and household waste through use of intensive nutrient recycling methods such as composting, including the use of sericulture;
Producing and encouraging use of bio-fertilizers at regional and local levels, along with adoption of bio-dynamic farming methods;
Crop rotations to enrich soil (e.g. to include pulses and leguminous crops). Multiple cropping
which enriches soil should be encouraged instead of mono-cropping; 6.2 Sectoral / Regional Growth Drivers of the districts:

113 | P a g e
Out of the several proposals made in the C DAP, we are highlighting a few below, which, in over opinion, set the direction of development and on which the success of the C -DAP depends. (i) The massive program of watershed development combined with the expansion of soil testing facilities and supported by inputs for soil health enhancement is the key driving force for the sustained growth and long term development of agriculture in the district. All the small and marginal holdings which are degraded for want of inputs and will be covered by these two very positive aspects of soil conservation and soil health enhancement. Combined with other inputs and improvements, one third of all the cultivated area which has not been making any positive contribution to production will come back in the production stream. (ii) Diligent water Resources Management : The huge watershed development programme proposed in the C DAP will augment ground water availability substantially. Its diligent use through old and new wells fitted with micro irrigation systems will double the irrigated areas, enable growing of high value crops including horticulture and raise their productivities. Thousands of farm ponds will provide irrigation for at least one more crop and improve the viability of presently nonviable farms. Better maintenance and management of the canal systems of the existing projects will add large areas under irrigation. Agriculture itself and several supporting activities are in the private sector. This should mean that the process will not be much burdened by official inertia or indifference. The reward being their own district’s development and well being of the people, we do hope that everyone concerned would do his

114 | P a g e
best and make the CDAP a success. (a) Building commodity Groups and Farmer's Organization: A major weakness is the skewed land holding or land ownership in the district and operating holdings of less than 2 ha together holding 30% of cultivated area. Most of these small holdings are meaning that they consist of more than one piece of land scattered or located away each other. Those holdings are un-economic and non-viable. The owners do not afford to keep even a pair of bullocks. Their cultivation is indifferent. The lands receive desired village rarely and do not at all get any manures or fertilizers for soil health, As a result their soils have gone on degrading and their productivities are very low. Thus, 30% of the cultivated area is not contributing in the process of agricultural growth and 60% of the ' holders are living a low level of bare existence. We have proposed an innovative scheme to organize these asset poor and asset less farmers in Self Help Groups and to train and help them undertake agro-services and small agro- producing enterprises which are critical for rejuvenating the whole system of agriculture of the village. In the process the members of these SHGs will also be enabled to bring their own holdings back to viability and with additional employment and earnings get out of the poverty trap. 6.3 Seed processing for seed village program
To upgrade the quality of farmer-saved seed which is about 80-85% of the total seed used for crop production programme, it is proposed to provide financial assistance for distribution of foundation/certified seed at 50% cost of the seed of crops for production of certified /quality seeds

115 | P a g e
only and to provide training on seed production and technology to the farmers.
The seed produced in these seed villages will have to be preserved/stored till the next sowing season. In order to encourage farmers to develop storage capacity of appropriate quality, assistance will be given to farmers for making/procuring of Pusa Bin/Mud bin/Bin made from paper pulp for storing of seed produced by the farmers on their farms.
Soil Health Management
Main constraints in promoting balanced use of fertilizers include inadequate and ill equipped soil testing facilities, neglect of organic manures, inadequate extension system, wide gap in dissemination of knowledge between research institutions, soil testing laboratories and the extension machinery, and lack of awareness among farmers about benefits of balanced fertilization. The scheme's main components were: i. To establish compost plants to process biodegradable city solid waste into compost. ii. To strengthen soil testing facilities by setting up of new Soil Testing Laboratories (STLs) and strengthening of existing STLs.
Increasing Women participation An important component of empowerment in Third World Countries comprises rural women who play multiple crucial roles in all spheres of development activities. In the recent past added emphasis has been laid on

116 | P a g e
acknowledging and preparing database on multidimensional role sets of women where their roles have become an inbuilt factor for input–output system of empowerment. So increasing women’s participation in agriculture is an important task which can be achieved by
Capacity building of women groups. Organization of women summit block wise. Formulation of food security groups of women. Organizing skill development training on home & cottage industry.
Custard apple processing unit
Custard apple, once largely grown on hill slopes or boundary walls of farms hardly attracted the attention of farmers till recent times. The popularity drastically increased once custard apple was introduced as a flavor in ice-creams, milk-shakes and in a delicacy like rabadi on special occasions. Many major ice-cream companies are now in search of pulp producers who can ensure smooth and continuous supply of the pulp over the year. Compared to the custard apples supplied from Chapara in Jabalpur, Madhya Pradesh (MP), fruit grown in Maharashtra has more pulp and sweeter taste, hence it is in greater demand. Several custard apple growing clusters has identified in Nanded district (Loha kandhar Mukhed etc) & new scheme has been suggested to increase production of custard apple as well as to improve returns to farmers by selling processed fruits.

117 | P a g e
6.4 Encouraging the production & processing marketing of spices Chilly & Turmeric
Vision of XII Plan In present CDAP emphasis on an ambitious target of 4 percent annual
growth rate in GDP over the next 5 year to eradicate poverty, achieve food security and build the foundation of sustainable economic development of the district. Developing farmers Centric Need Base Comprehensive District Agriculture Plan (CDAP) aiming to achieve 4 percent annual growth in the agriculture and allied sector during XIth plan period for District Nanded by adopting inclusive and participatory approaches 1. Agriculture growth to be maintained at 4 percent per annum by enhancing the double the agriculture production in next 10 years by improving the productivity of agriculture and the allied sectors. 2. Attain food security in terms of both availability and affordability and ensuring access of the poor to adequate food and nutrition. 3. Focus on creating opportunities for farmers to enhance their net income to a Respectable level. 4. Present irrigation coverage in the district is 9.01 percent it is expected that by the Intervention proposed under 11 th five year it will reach by 14 percent 5. Promotion of public private partnership in agriculture. 6. Area under Micro irrigation by the promotion of drip and sprinkler irrigation it is Targeted to cover an additional area of 6596 Ha in next five year. 7. Encourage the farmers to investment in food processing sector. 8. Post Harvest technology and Agro Processing to be given additional thrust. 9. Development of future markets for major commodities by dynamic agriculture

118 | P a g e
Markets among the nation. 10. A planned soil health program 11. Increasing active involvement of self help group. 12. Making good seed available by the farmers for the farmers through Grambeejotpadan. 13. Reduction in land degradation through soil conservative measures. Enhancing the area under organic farming from 5729 Ha to 11250 Ha For actualizing this vision, the C- DAP attempts to explore possible ways of better utilization of natural, physical and human resources. It attempts to discover and locate latent potentials of growth and development and is making proposals for activating human energies and social organizations for their full utilization. C -DAP proposals for reforms and strengthening of the extension agencies should help inform the farmers of the latest technologies and adequately motivate them to diligently work for their own advancement.
The reforms and strengthening of the implementation agencies in the district are of crucial importance. The best policies and programmes fail because of poor governance and shortcomings in implementation. An innovative re-organization to provide missing coordination links within the different wings and departments involved with implementation is absolutely necessary.lt is also imperative to set up reasonable working relationships with Pnchayat Raj Bodies, NGO's and Public Private Partnerships,. If the government is serious about transformation of rural economy and rural society through massive programmes like RKVY it must take early steps to provide for a strong inspired implementing agency to lead that 411 movement in the district and to get results.

119 | P a g e
This C-DAP has recommended several strategies for various sub-sectors to overcome the reasons of backwardness and to accomplish the vision stated in para 2.3.1 above. Details like rationale behind them, action plans with physical targets, financial requirements and outcomes, and implementing schedules will be found in the related chapters. Action plans have been formulated so that their implementation will make a great impact on the agricultural growth and development of the district. It is worthwhile to emphasize that every element of action plan under each strategy positively contributes to the desired results. Most elements will be simultaneously in operation and will have additive effects on outcomes of each other. That add-on effect would lead to still higher growth. 6.5 improved technology dissemination co-ordination of teaching, research and
extension institutions rationale:
People's aspiration about agricultural development in the district is improving the economic viability of farming and enhancing the livelihood security. Increasing the net income of the fanner is only possible by enhancing the productivity, profitability and stability of overall agricultural production on sustained basis. The National Agriculture Policy 2000, National Farmers Commission 2006 and IIth five year plan approach paper 2007 targeted 4% growth in agriculture and allied sector. As more than 70% of the population derives its livelihood from agriculture and allied sectors and the solution to eradicate poverty lies in the development and growth of this important sector of economy, National Development Council (NDC) , reaffirmed to achieve 4 per cent annual growth in agricultural sector during the 12th plan, NDC has directed

120 | P a g e
the state Govts to formulate comprehensive District Agriculture Plan (C-DAP) for the holistic development of agriculture and allied sectors in the district to ensure that farming becomes more viable and economic conditions of farmers especially that of the small and marginal segment, is improved on a sustainable basis. There is huge knowledge deficit in agriculture and allied sectors. Agricultural extension and support services system therefore, have to play a key role in effective dissemination and use of available improved agricultural technology. Infect, credible and quality extension services would be one of the major drivers for high and inclusive growth in agriculture and allied sector. The accepted frame work of Agricultural extension system at district level for technology delivery and dissemination is presented in Fig- 1. It consists of network of Institutions and groups which includes Zonal Agri. Res. Stations (ZARS)/ Sub-Res. Stations, kvk, Line departments, private and non-Govt. (NG's organizations and farmers groups (FiGs.,SHGs) and individuals. The district extension network must develop partnership, complementary" and synergy among them to bring in the continuity of various supplies arid services and market on one side and technology development, delivery and dissemination on the other side. In this Basic District Level Interactive Extension Model (BDIEM), Agri. Technology Management Agency ATMA assumes utmost position in designing appropriate mechanisms and linkages basically required in the extension system at district, block and village level for technology transfer with functional process interventions. (Fig - 2). In order to facilitate the effective functioning of ATMA, following action points are suggested. Suggested action points • Organizational arrangement and operational modalities at district, block and village (field) level need to be properly strengthened to create integrated (single
121 | P a g e
window) extension system. • ATMA should strive hard for greater coordination among different players for effective implementation of extension Programmes, • Orientation, sensitization and capacity building of extension functionaries of key line departments, public/private organizations and farmer's interest/self help groups need to be tailor-made for effective functioning of various arms of ATMA like AMC, FIAC, BTT, FAC etc. * Members of village Panchayat, village level farmers groups, commodity groups, village level role model farmers be trained and involved in preparing block level extension plan and its implementation. • Project-Director, ATMA be an independent senior officer of the rank of joint director of Agriculture to effectively lead and co-ordinate a multi- disciplinary team of senior officers from various key line departments as members of AMC, • Office incharge (OIC) at block level to provide effective administrative supervision under the auspices of FIAC to be of the rank of Deputy Director of Agriculture. • It is proposed to delink input supply arrangements, seed and soil testing etc from the primary responsibility of providing extension services. • Public investment through ATMA need to enhance for training and capacity building of grass root level partners in public/private extension system. • District and block level officials of key line department should regularly and

122 | P a g e
judiciously participate in SAC of KVK and ZREAC of SAU for better interface. • ATMA should strive hard in converging all the extension efforts and pooling all resources, infrastructure and expertise available at various institutions, in the district network to develop real time integrated farming system model of extension service delivery to bring breakthrough in development and growth of agriculture and allied sector. KVK As technology hub and light house of the district for farmers, KVK must act as link between technology generation system of the ZRS/SAU and extension system in the district. KVK must strive hard for continuous flow of knowledge, techniques and technologies of research institutes and SAU to various stakeholders in the district extension system and researchable feed backs from extension system to ZRS/SAU to minimize the time lag between generation of technology and its awareness and adoption. KVK must regularly participate in GB and AMC meetings of ATMA and monthly district workshops and ZREAC conducted by the ZRS/SAU. KVK must plan and implement their programmes as per the needs of district based on the SREP. KVK should facilitate capacity building of various extension functionaries of the district both public and private /NGOS through need based effective trainings.

123 | P a g e
The context and methodology of trainings and the trainers and trainees must be periodically evaluated for suitable modifications to ensure effective training programmes. KVK should bestow their attention for developing and maintaining model demonstration farms /units, effective conduct of OFTs and FLD's by involving all line departments, NGO's etc for large scale dissemination and adoption of improved technologies. Being a specialized institution at the district level, the KVK has to serve as a Light house for farmers who look forward for something new, something novel and something innovative to add value to their agriculture in meeting aspirations. ZRS/SAU District Extension Education centers with a team of subject matter specialists be established by the SAU with necessary infrastructure for specialized Training and capacity building of District Extension staff and farmers/change agents and diagnostic and farm advisory services. Mobile crop/soil health clinics be established for diagnostic team visits for on spoit solution to the problems of the farmers. 6.6 Implementing CDAP I Raising Productivity and Production : The first key objective of CDAP is raising productivity and production of all crops and all other allied activities of every farmer by adopting modern farming
technologies and best practices. Eight critical areas and objectives for

124 | P a g e
accomplishing this objective are as follows:- i) A network of blockwise soil testing laboratories with an upgraded district H.Q. laboratory along with setting up, through the SHGs of asset poor and asset less farmers, local agro-services for drawing soil samples, reaching these to the laboratories , getting scientific advice (cards) for the farmers and helping them in buying and putting the advised inputs for preservation or enrichment of their soils. ii) Increasing use of modernized tools, implements and farm machines iii) Increasing areas of high value crops including rainfed or irrigated horticulture. iv) Adoption of best practices, modern technologies and inputs for raising
productivity of all crops and allied activities motivated and supported by a caring and technologically competent extension agency.
v) Intensive effort on training of farmers and demonstrations preceded by equally
intensive effort on training and technological upgradation of trainers and all
extension workers. vi) Each farmer or each farm should have at least one dug well or a farm pond
with micro irrigation system installed for optimally using his rainwater or ground water resources.
vii) Local sector has to develop new M.I. Schemes, do good repairs and

125 | P a g e
maintenance of the existing M.I. Schemes and restore those in disrepair so that
huge investments made in the past are brought back to gainful use. viii) Ensuring adequate and timely supplies of pure quality seeds, fertilizers,
pesticides and other inputs.
The State Agriculture department and the Zilla Parishad have been traditionally engaged in all the activities described above though without outstanding results. They are, however, the most appropriate agencies to lift up all those activities to a higher pitch needed to accomplish the first key objective. Their extension wings need to be strengthened so that they carry out the mission more vigorously and get results. II. SHGs of Asset poor and Asset less Farmers:
The second key objective is to promote self help groups (SHGs) of asset poor and asset less farmers and with training, and promotional and motivational support as well as financial back up to empower them to transform themselves as providers of critically useful agro services to the village community and thus contribute to the rejuvenation of agriculture of the village including their own presently non-viable farms.
The DRDA has been promoting SHGs for some years now thought mostly of women. It has been set up to implement antipoverty schemes. DRDA is, therefore, the most appropriate agency for promoting SHGs of asset poor and asset less farmers, their training and initiation of several possible agro services and micro-enterprises through those SHGs with the object of bringing those poor farmers out of poverty. DRDA has to do that promotional activity more vigorously and in a result oriented manner. DRDA has to be suitably

126 | P a g e
strengthened for that purpose. III. Association For Progressive Farming :
The third key objective is the promotion and formation of an Association For Progressive Farming (AFPF) separately for each block with village-wise branches and a district-wise federation. These associations will constitute the peoples’ participatory compliment to the CDAP mission. It has a great potential of future development and should be supported and encouraged to gradually take over and run the CDAP mission as its own enterprise.
When the Association gets a clear sense of its purpose and the prospect of lifting up the agriculture economy of the district to higher and higher levels, the individual progressive farmers and other social workers will be willingly making important contributions. When they feel that they can improve the society in which they are living through their participation through the Association For Progressive Farming, they will certainly bring vigor and enthusiasm to their roles and get positive results. The AFPF, therefore has a tremendous potential of mobilizing people’s energies for growth and development. On the lines of public private partnership, the AFPF may, in future be taking up watershed development projects, composting projects for utilizing solid waste and sweepings of cities, towns and bigger villages, setting up soil testing laboratories and/ or operating them, organizing viable network of agro-processing units and endless number of other creative activities for supporting and caring for the farmers in general and the poor among them in particular. The AFPF is not envisaged as a mass organization with thousands of members. At the block level it is envisaged as an NGO or voluntary organization with a band of about fifty active, committed and progressive farmers with

127 | P a g e
orientation to science and social service. At the village level about ten progressive farmers inclined to social causes would do. Their commitments to the CDAP cause will get firmed up through the work they do and the potential they would find. The AFPF should be developed based on local perceptions of rural development and talents available. The promoters should, however, keep the successful models of Jazira of SUDAN, vicos of Peru, comila of Bangladesh and particularly the Joint Commission on Rural Reconstruction (JCRR) of Taiwan and their numerous present day successor NGOs working in India and all over the world. The promotional work may have to be done mainly by the department of Agriculture and specially by the Senior Officers in the district. The Collector and ATMA should take initiatives, assemble well known Social Workers in the district and build up the block wise associations to a working status in the first three months. Names better approved locally than AFPF may be allowed. A sort of competition should be encouraged for work and results among the various block wise associations. Best work should be suitably recognized and rewarded by the government year after year. The department of agriculture and/or ATMA may have to provide funds to the AFPFs for their initial steps until they build up their own resources through membership fees, donations or works. Institutional Membership of AFPFs should be open to large co-operative ventures, societies, market committee’s, banks, NGOs/V.Os and local bodies.
IV. Strengthening of the existing organization structures: In our opinion ATMA presently chaired by the Collector of the district should be designated as the Chief Authority for implementing the CDAP. It is necessary to provide adequate support to the Collector so that ATMA functions effectively. We propose; A senior S.A.O. (full time) as Secretary and Executive Officer of ATMA;

128 | P a g e
A Senior B.D.O. (full time) to secure co-ordination with Panchayat Raj Institutions; promotional work of AFPFs A publicity Officer to continuously work with the media for the CDAP mission and organizing educative programmes, conferences, workshops etc. preparing write up and publicity material Customary staffing assistance to the above three officers. A block annual grant of 10 lakhs for promotional work/rewards etc. A vehicle (like a jeep) for the officers touring in rural areas.
Zilla Parishad: 1 - One Senior BDO to work as addl. Dy. CEO to build up vigorous activities at the Z.P. Panchayat Samiti and Gram Panchayat levels in support of C-DAP programmes and specially those of development of M.I. schemes and assured adequate and timely supplies of pure quality inputs like seeds, fertilizers, pesticides etc. DRDA ; Two Assistant Project Officers in the office of Project Director for the work of promoting SHGs of asset poor and asset less farmers and setting them to designed agro services and micro-agro enterprises. One additional APO for each block to assist the work of SHGs of poor farmers. Customary staffing assistance to the new APO/s. Panchayat Samities: Block level agricultural officer extensions should be of at least class II rank. Agriculture Department: Strengthening of the department of Agriculture is inevitable. It is tern that it already has a huge staff in the district. But restructuring to keep in tune with improving technologies, growing awareness among the farmers and developing Panchayat raj institutions is necessary. All agricultural production and activities to be promoted or motivated are is private sector. Extraordinary skills of

129 | P a g e
communication are required to be effective in this situation. The farmers in general have, nowadays, exposure to both print and electronic media extension programmes for them need to be redesigned now both for larger technological content and an inspiring motivational appeal. In the meantime, the department itself seems to be deliberating upon restructuring proposals. Without any reference to those matters, we are proposing following measures of strengthening required for effective implementation of CDAP. A new full time Senior SAO as Secretary and CEO of ATMA a) All Taluka level Agricultural officers should be in class I and designated as Deputy Directors. b) Each Dy. Director would also be working as ex-officio Secretary and Executive officer of the proposed Association for progressive farming. C) Each Deputy Director should be provided a jeep and a driver. Each Agricultural Polyclinic should have an Agriculture Officer in class II to be in charge. New polyclinics should be opened for new talukas which do not have them now. These clinics should grow as centers of all CDAP activities, Farmers meetings, training and demonstrations. They should be undertaking activities supporting the farmers like manufacture; storage and sale on a no profit no loss basis of composting, vermi culture, seeds, fertilizers, pesticides, tools etc.

Executive Summary
This comprehensive district agricultural plan (C – DAP)
a. Assesses the available natural physical and human resources in the district and possibilities of their fuller or better utilization for acceleration in growth with more scientific and technological methods and purposive investments;
b. Identifies the social, infrastructural, agronomical, and governance weaknesses which have so long impeded the processes of growth and development and led to backwardness, lower levels of living and poverty;
c. Recommends strategies and scores of practicable projects, schemes and programmes for overcoming the weaknesses along with estimates of financial out lays required and the outcomes expected from them; and
d. Suggests appropriate agencies for implementing the various projects, schemes and programmes along with the proposals for strengthening them and for raising their capabilities to match the requirements of effective implementation. This (C-DAP) describes what the district can achieve over a medium term of four years and how it should work to achieve it. The C-DAP has prepared with the following objectives :
1. To continuously raise productivity, production, employment and income in agriculture and allied activities through optimal utilization of natural and human resources ;
2. To strengthen, reorganize or newly build up physical infrastructure and institutions to effectively help adopt and operate modern technologies

and practices to provide further impetus to agricultural growth and rural Development;
3. To provide food security and to eliminate hunger; 4. To focus all activities in support of small and marginal farmers,poor and
people with a view to secure social justice and to reduce poverty and distress;
5. To continuously improve economic well being and quality of life of all stake holders in the district; and
6. To help the district to take off on a faster track of growth and sustainable development.
E.S. 2 VISION,GOALS AND THE MAIN POINTS OF SWOT :
A ten year vision for the district is that:
I. It should be doubling its productions from agriculture and allied activities;
II. It should have modern physical, social and institutional infrastructure; III. it should be have healthy sustainable environment and full employment;
and IV. it should be free of overtly, ignorance and social or gender disparities.
The goals for the Medium term of 5 years of the eleventh plan should be to I. Quickly set all the processes of growth and equity in motion in a mission
mode ; II. Achieve a growth rate of not less than 4 % per for agriculture and not
less than 8% per for allied activities;

III. Pro toe and activate gram panchayats to functionally contribute to improvement of primary education health services minor irrigation and agricultural production: and
IV. Organize asset poor and asset less farmers into self help groups and help them transform into providers of services critically beneficial in rejuvenation of agriculture of the village including their own holding and thereby reduce poverty to less than 15 percent: The SWOT analysis shows what the district is capable of doing what it
is doing and what it should be doing. The district has substantial but underutilized potential of irrigation. It has a capability of raising higher value crops and raising productivities of almost all the crops with better cultivation practices. The district has inherently good soils but they have been getting degraded for long for want of watershed development work as well as lack of nourishment based upon soil testing and scientific advice. Thirty percent of lands are owned and operated by small and marginal farmers who make almost sixty percent of all farmers. They are generally poor and do not afford to keep even a pair of bullocks. Those small farms and non-viable and because of indifferent cultivation are not making any contribution to agricultural production. As a result sixty percent of all farmer owning and operating those nonviable farms are all poor and living a life of bare existence. The greatest infrastructural gap likely to impede the process of growth is the shortage of electricity supply and the load shedding in the rural areas for the whole day and more.

E.S. 3 AREAS AND SECTORS WHICH NEED TO BE ADRESSED On the background of the vision, medium term goals and the SWOT
analysis of the district we have identified a few areas and sectors tobe addressed and formulated a few strategies, schemes, projects and programmes for implementation during the eleventh five year plan. More important of them are briefly described below; 1. Watershed development – project is to complete watershed
development Work on all lands not tackled so far. 2. Minor Irrigation – 46,000 new wells 40,000 farm ponds and 20,000
micro irrigation systems. Good maintenance of existing M.I. schemes and restoration of those in disrepair.
3. Net work of new talukawise soil testing laboratories, upgrading of the existing laboratory at the dist.H.Q.and organizing local services for drawing soil samples and for reaching them upto laboratories.
4. Strengthening of extension services and intensification of training and demonstrations.
5. Organizing asset poor and asset less farmers into self help groups and empowering, training and helping them to transform themselves as providers of services critically beneficial to the village community. Because of their services their nonviable farms would be joining in the production line and because of additional employment and income they will be coming out of the poverty trap.
6. Supporting and functionally activating Gram Panchayats,Panchayat Samities and Zilla Parishad to positively contribute towards i)improvements in primary education and health services; ii) Development of minor irrigation and restoration of existing schemes now in disrepair; iii) Organizing asset poor and asset less farmers into

SHGs help them undertake agro-services to create employment and reduce poverty; and iv) to actively participate in all CDAP projects. Schemes and programmes under implementation for raising agricultural production of the district.
7. Ensuring adequacy, timeliness and purity of all input supplies; 8. Strengthening of implementation agencies. Particular attention is given
to provide for participation by Panchayat Raj Institutions, NGOs and non-official experts at all levels. They are to be organizationally strengthened and motivated so that they participate in implementation of CDAP with enhanced capabilities more effectively.
9. The following areas need special attention for development; I. Taluka has large proportion of class I soils but is not ranking high in
crop-productivities. II. Command Area of Jayakawadi needs better water management for
optimizing productivities. New potential arising out of four barrages has to be berry carefully utilized for ravine like lands which are included in the command but have received irrigation.
III. Remote sensing techniques have indentified numerous local pockets having ground water lineaments and thus having rich potential. Exploitation of that potential and optimum use through micro irrigation systems should receive priority.
10) The CDAP to be implemented in a mission mode, supported by all official and non-official agencies, backed by powerful media and publicity efforts, monitored, supported and inspired by the highest authorities in the state and central governments.
11) As Nanded District is short of water. It is necessary that all farmers are given a high subsides at 90% of the .
E.S.VARIOUS ON GOING PROGRAMMES IN THE DISTRICT – A BRIEF CONTEXTUAL GIST
Reduced public investment in agriculture and allied sectors during last decade has resulted in decline in growth rate of agriculture. Therefore, there is an urgent need of enhancing investment in agriculture(both public and private) to augment productive capacity. As public extension system empowers farmers technologically and economically it need to be adequately strengthened.
A large number of schemes and projects sponsored both by the central and Stae Government are implemented and are operational in the district. There is need to network and co ordinate these schemes/projects to empower farmers for enhancing agricultural productivity through resource use efficiency.
Major schemes implemented at the district level are; AGRICULTURE : 1. Integrated cereal development 2. Rapid maize development. 3. National pulse development 4. National Oil seeds production 5. Sugarcane development 6. Integrated cotton development 7. Seed quality testing 8. Fertilizer and Pesticide residue analysis.
HORTICULTURE 9. Employment Linked Horticulture development. 10. Mango Plantation Scheme

11. Rice based fruit planting 12. Inter cropping of spices in coconut 13. Nursery management 14. Micro irrigation system 15. Tribal farmers horticulture development 16. Pomegranate oily-disease management 17. National Bamboo Mission 18. National Horticulture Mission(NHM) 19. Sanitation and photo-sanitary certification 20. Sweet Orange / Lemon SOIL AND WATER CONSERVATION : 21. National Watershed development 22. River –Valley project 23. Farmers participation in national programme of soil and water
conservation 24. Saline & so die soil development 25. Marathwada watershed development mission programme EXTENSION : 26. Gender sensitization and participation 27. Information support to agril extension 28. Soil, Water, testing 29. Bio Pesticide production 30. State extension reforms(ATMA) 31. Natural disaster management 32. National Argil Insurance 33. Agri-polyclinics and farmers training

34. Shetkari magazines and publication 35. a wards and incentivization scheme
The state Government has launched maharashtra Agril Productivity Improvement campaign (MAHAPIC) for enhancing productivity of major crops by effective networking, convergence and co-ordination of various schemes at district level. Major components of these schemes/projects are; 1. Quality seed/planting material supply 2. Promotion of village seed movement 3. Training of field extension staff 4. Training of farmers/groups 5. Field frontline demonstrations 6. promotion of IPM,INM,ICM 7. Supply of critical inputs 8. Gender Sensitization 9. Exposure Visits of farmer within and outside country 10. Farmers field schools 11. Publications, information support and awareness programme.

Details of CDAP proposals are given in chapters IV,V and VI along with targets and outcomes and costs for each. The above table is the summary of financial outlays of the CDAP shown separately for both new and ongoing projects,innovative schemes and programmes.
Total outlay proposed in this CDAP is Rs 1007.88 crores out of which Rs 918.28 crores is for new projects. (streem I) The total outlay for the CDAP works out to Rs 1931 per capita per annum for rural population of the district. The CDAP wil improve the per annum per cultivator agricultural production from Rs 40002 to Rs 67494/-
In stream II,we have mainly included ongoing schemes. the department may have to reexamine stream II proposals both for adequacy of allocations and Inclusion of all on going schemes.
CDAP has assumed that all approved and ongoing major irrigation projects would be completed in the eleventh plan period. The total outlay required for completing them is 505 crores. This is not included in CDAP proposals as we are sure the department of water resources will provide them ouside the CDAP. It would be desirable that Ministry of Agriculture pursues this case with Ministry of water resources and ensures that adequate provision to complete & modernize irrigation projects are provided adequate budget under Bharat Nirman/AIBP or other sources.
E.S.6 PUBLIC PRIVATE PARTNERSHIPS THAT CAN BE ENVISAGED IN THE C DAP
The planning commission has set a very high target for investment in infrastructure sector. The Eleventh Five year plan would be consequentially looking out for the possiblilities of public private partnerships(PPPS) to meet a
part of the investment needs. The CDAP proposals also have a large element of small and widely scattered works spread all over the rural areas. Moreover, the individual beneficiaries can be identified for minor irrigation works like dug wells and farm ponds but not for watershed development. If however,it is necessary to bring in more investments through the PPP route. mandalwise or village cluster wise lots of all the three types of works combined can be made for appropriate sizes of investment say 10,25 or 50 crores. All aspects of tendering contracting and other modalities may have to be handled by the department of Agriculture as the Chief Authority for implementing the CDAP. Implementing projects through the PPPs should however be more challenging than that under conventional practices. One advantage of PPPs should obviously be timely and speedy completion of projects enabling reaping benefits of the works relatively very fast. It is suggested that the implementation of CDAP projects should not in any case be tied up with EGS funds and the availability of local unemployed labour. Agriculture growth is more important and speedy implementation of CDAP will do much more for reducing unemployment and poverty and rural development.PPP pattern is likely to sue machines and keep to the time schedules without which a part of soil work done under conventional methods and even in private sector goes waste because of delays or untimely rains.
Another project for which PPP may be envisaged is setting up of eight talukawise soil testing laboratories,upgrading of the district H.Q. Laboratory and operating the entire net work for five years.
Other projects which may attract PPP are setting up and operating a large wheat flour mill and a plant for production of modern agricultural tools
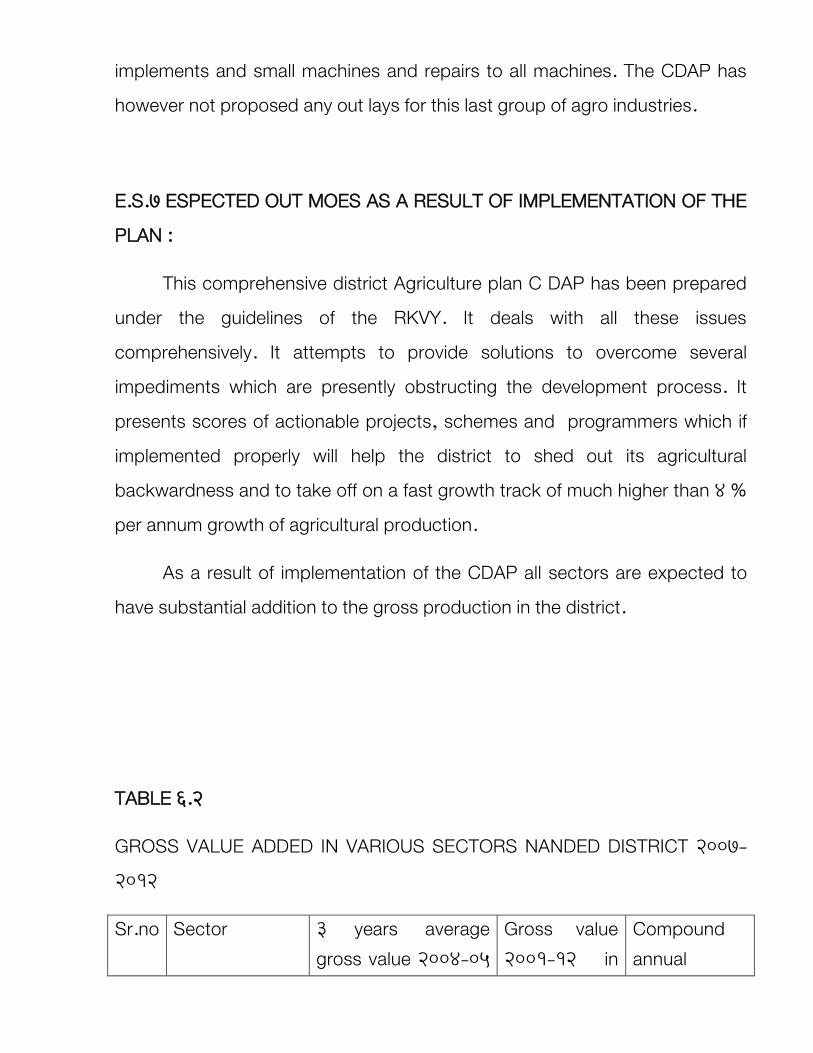
implements and small machines and repairs to all machines. The CDAP has however not proposed any out lays for this last group of agro industries.
E.S.7 ESPECTED OUT MOES AS A RESULT OF IMPLEMENTATION OF THE PLAN :
This comprehensive district Agriculture plan C DAP has been prepared under the guidelines of the RKVY. It deals with all these issues comprehensively. It attempts to provide solutions to overcome several impediments which are presently obstructing the development process. It presents scores of actionable projects, schemes and programmers which if implemented properly will help the district to shed out its agricultural backwardness and to take off on a fast growth track of much higher than 4 % per annum growth of agricultural production.
As a result of implementation of the CDAP all sectors are expected to have substantial addition to the gross production in the district.
TABLE 6.2
GROSS VALUE ADDED IN VARIOUS SECTORS NANDED DISTRICT 2007-2012
Sr.no Sector 3 years average gross value 2004-05
Gross value 2001-12 in
Compound annual

to 2006-07 in lakh lakhs growth rate %
1 Agriculture 91820 119580 5.43 2 Horticulture 18513.8 52703.3 23.2 3 Animal
Husbandary 2573.3 3471.8 6.17
4 Sericulture 18.18 30.75 11.08 5 Fisheries 37044.00(2007-08) 38535 1.00 149969.28 214320.85 7.50
Highest growth is in horticulture sector both because of expansion of areas and increase in productivities. Significant increases in production and productivities will, however, accrue in the next four years when very large plan investments in watershed development and minor irrigation star ;bearing fruit.
The proposal of CDAP will provide employment to thousands of unemployed or partly employed people, raise standards of living in rural areas, reduce poverty and distress, and specially reach the benefits of growth and development to the thousands of small and marginal farmers who are mostly in distress today because of the non-viability of their farms and several other consequential handicaps. Naturally this last group of small and marginal farmers and their handicaps are the focus of attention of many C DAP proposals.
Earnest implementation of all CDAP projects, schemes and programmes will result in simultaneous increments in productivity of each crop and each of the allied activities in each farm in each village and in each block in the district. Combined with improvements in credit, marketing marketing, employment and other infrastructure, the overall growth is bound

to have a multiplier effect. It should be certainly possible to raise farm production and farmer incomes at least by 50% over a medium term of five years. That should mean the beginning of the second green revolution. The momentum generated. the self confidence grained by the farmers in the process and the continuing upgrading of agro-technologies will continue to lift the district economy to higher and higher levels in future. Outcomes of all the efforts will remain in the farmers hands. No one else will claim any share or tax from them. Even the access to credit will be much easier and cheaper than what it has been during the past several decades. Accomplishment of this C DAP will thus lead to the most desired will being of the people of the district.

2012-13 2013-14 2014-15 2015-16 2016-17
1
1Building commodity Groups and
Farmer's Organisation at Rs.0.50
lakh per talukas per year
0.00 0.00 0.00 128.00 128.00 256.00
2Increasing Women participation
Rs. 1 lakh per block / year0.00 0.00 0.00 8.00 8.00 16.00
3Seed processing for seed village
programm 0.00 0.00 0.00 51.84 51.84 103.68
4 Adarsh Sansad Gram 0.00 0.00 0.00 3.00 3.00 6.00
5 Soil Health Management 0.00 0.00 6.39 16.00 16.00 38.39
Total 0.00 0.00 0.00 190.84 190.84 381.68
2
1Strengthing water sources
&Desalting of water bodies0.00 0.00 0.00 495.94 495.94 991.88
2 Recharge Trench 0.00 0.00 0.00 701.30 701.30 1402.60
Total 0.00 0.00 0.00 1197.24 1197.24 2394.48
3
1Establishment of custard apple
fruit processing unit0.00 0.00 0.00 10.60 10.60 21.20
2
Encouraging the production &
processing marketing of spices
Chilly & Termaric
0.00 0.00 0.00 15.00 15.00 30.00
` Total 0.00 0.00 0.00 25.60 25.60 51.20
4
1Establishment of Gokul Grams
under Rashtriya Gokul Mission0.00 0.00 0.00 500.00 500 1000
2
Establishment of Mobile Extension
Centers for publicity of govt. of
scheme & creation of awerness
among farmers at District level
0.00 0.00 0.00 100.00 50 150
3Mobile marketing units for poultry
meat andg eggs, subsidy ceiling Rs.
3.75 lakh per unit
0.00 0.00 0.00 100.00 100 200
4
Faciliating market linkage for live
birds, Animals, subsidy ceiling Rs.
2.00 lakh per unit
0.00 0.00 0.00 100.00 100 200
5 Supply of Veterinary Mobile Units
cum Diagnostic Laboratories
0.00 0.00 0.00 24.00 0 24
6
Modernization of Veterinary
Dispensaris Gr -I for online data
entry
0.00 0.00 0.00 46.15 0 46.15
7
Clean Milk Production through
supply of Milking machines to
Farmers on 25% subsidy0.00 0.00 0.00 31.25 31.25 62.5
8Assistance to farmers for
promotion of Integrated Livestock
Farming on 25 % subsidy
0.00 0.00 0.00 625.00 625 1250
9Foddre production From Fallow
Lands0.00 0.00 0.00 30.00 30 60
Agriculture
Water Conservation
Horticulture
Animal Husbandry
I
Production Growth / Infrastructure & Assets Stream New / Ongoing
(Rs. In lack)
Sr.
No
Name of
departmentScheme Proposed Total
Year Wise Programme (Financial)
D: CDAP 2015 STREAM I II

2012-13 2013-14 2014-15 2015-16 2016-17
10Establishment of Hydroponics
fodder Production unit0.00 0.00 0.00 15.00 15 30
11Establishment of A Azolla
production unit0.00 0.00 0.00 15.00 0 30
12
Fodder production at farms of
MLDB, Ships & Goat Dev.
Carporation of Maharashtra
0.00 0.00 0.00 33.345 0 33.345
Total 0.00 0.00 0.00 1619.75 1451.25 3086.00
5
1 Strengthening of milk routes 0.00 0.00 0.00 0.00 0.00 0.00
2Strengthening of chilling
plants/machinary0.00 0.00 0.00 0.00 0.00 0.00
Total0.00 0.00 0.00 0.00 0.00 0.00
6
1
Distribution of seeds in local
reservire like farm ponds,
percolation tank
0.00 0.00 0.00 25 35 60
2 Feed Development 0.00 0.00 0.00 10 15 25
3Improvement strengthening and
Development of fished rearing
unit manar Dist Nanded
0.00 0.00 0.00 30 10 40
Total 0.00 0.00 0.00 65.00 60.00 125.00
7
1Package for mulbery plantation
0.00 0.008.93 22.64 31.64 63.20
2 Supply of rearing appliances 0.00 0.00 11.64 24.00 24.00 59.64
Total 0.00 0.00 20.57 46.64 55.64 122.84
8
Plantation-Afforestation 0.00 0.00 0.00 0.00 0.00 0.00
Total 0.00 0.00 0.00 0.00 0.00 0.00
Total Stream I 0.00 0.00 20.57 3145.06 2980.57 6161.19
Dairy Development
Sericulture
Social Forestry
I
Fisheries
Production Growth / Infrastructure & Assets Stream New / Ongoing
(Rs. In lack)Sr.
No
Name of
departmentScheme Proposed
Year Wise Programme (Financial)Total
DISTRICT SUPERINTENDENT AGRICULTURE
NANDED
D: CDAP 2015 STREAM I II

2012-13 2013-14 2014-15 2015-16 2016-17
1
1 National Food Security Mission 363.64 520.43 507.33 550.00 580.00 1637.33
2 National Oilseed Production 64.79 98.57 194.42 210.00 238.00 642.42
3 INSIMP 79.56 87.62 96.62 263.80
4 Integrated cotton development
programme16.56 9.02 49.73 56.78 62.73 169.24
5Sugarcane development
programme15.05 10.97 22.50 25.00 30.00 77.50
6Accelatrated Fodder development
programme80.00 400.00 216.74 238.34 262.34 717.42
7 Crop Sap 24.87 44.34 32.55 40.00 45.00 117.55
8 Dryland Farming mission (DLFM) 200.39 312.03 309.31 349.31 349.31 1007.93
National Mission for Sustainable
Agriculture
A) Rainfed Area Development
(RAD)
10 ATMA 169.6 381.68 380.2 418.22 459.22 1257.64
11Maharashtra Agriculture
Compititiveness Project (MACP)71.71 57.97 58.91 70.00 75.00 203.91
12 Farm Mechanisation Mission 0.00 0.00 111.82 122.35 133.00 367.17
13On Farm Water Management
(OFWM)0.00 0.00 592.58 490.25 540.25 1623.08
14National Mission for Micro
Irrigation (NMMI)2201.91 1104.64 704.08 1740.58 1914.58 4359.24
15 PPP cotton 0.00 0.00 17.50 20.00 22.00 59.50
16 Organic farming Demonstration. 0.00 0.00 5.91 13.54 13.54 32.99
17Establishment of Taluka seed
Farms Agro Polyclinic11.20 4.40 8.50 12.50 12.50 33.50
18Hybrid Tur Designation
Programme0.00 0.00 5.12 7.53 7.53 20.18
Total 2454.42 1548.69 1884.62 2894.97 3177.62 7957.21
2
1Well recharging 5000 wells/
year/dist/@ Rs. 4000 per well0.00 0.00 0.00 200.00 200.00 400.00
2
Land Use Board Publicist a waren
regarded water budgeting + soil +
water conservation
0.00 0.00 0.00 5.00 5.00 10.00
3 TSP 198.24 600.00 110.00 121.00 133.00 254.00
4 OTSP 80.29 167.22 85.82 93.82 102.84 196.66
5 Gatiman Panlot 32.32 46.00 106.05 117.05 129.05 246.10
6 3) Creating awarness for use of
soil of water at Rs, 2 lakh per dist.
0.00 0.00 368.44 404.44 500.00 904.44
75) DPAP one watershed at cost Rs.
12000 ha.0.00 0.00 392.00 450.00 450.00 900.00
8 Adarshgaon 18.29 38.02 19.56 21.56 24.54 46.10
9 RKVY Check Dam 44.85 185.22 150.12 165.15 180.12 345.27
10 IWMP 0.00 0.00 7252.60 8000.00 8800.00 16800.00
Total 373.99 1036.46 8484.59 9578.02 10524.55 20102.57
3
1 EGS Horticulture 39.29 53.91 157.68 214.69 214.68 587.05
2 Protective cultivation 269.35 463.09 279.40 304.00 375 958.40
3 Precision farming 0.00 0.00 0.00 4.50 5.5 10.00
4 Organic farming 0.00 0.00 0.00 5.00 5 10.00
5 Technology Demonstration 8.55 1.36 0.00 3.00 4 7.00
6 Post harvest managment 65.17 36.08 0.00 125.00 60 185.00
7 Market Inteligence 0.00 0.00 0.00 4.00 4 8.00
Water Conservation
Horticulture
9 138.84 152.84 168.84 460.5280.60 80.38
Production Growth / Infrastructure & Assets Stream New / Ongoing Sr.
No
Name of
DepartmentScheme Proposed Total
year wise programme (Financial)
II
Agriculture
D: CDAP 2015 STREAM I II

2012-13 2013-14 2014-15 2015-16 2016-17
8Strenghtening of State Govt.
Nurseries25.00 25.00 11.00 10.00 10 31.00
9 High Tech floriculture project 0.00 0.00 0.00 4.00 5 9.00
10 Production of planting material 0.00 0.00 57.61 25.00 25 107.61
11 Vegetable seed production 0.00 0.00 0.00 5.00 5 10.00
12 Establishment of new gardens 174.41 143.22 12.50 77.00 82 171.50
13
Rejuevnation and productivity
enhancement sweet orange,
mango, guava, sitaphat etc.
0.00 1.51 27.00 20.00 20 67.00
14 Community Tank Nos 14.20 24.00 4.33 50.00 75 129.33
15 RKVY Plastic Creat 0.00 5.00 2.00 6.00 6 14.00
16 Tribal Parasbag Yojana 0.80 0.40 0.37 0.40 0.5 1.27
17Strenghtening of Taluka Seed
Farm11.20 4.40 0.85 5.00 10 15.85
18Surveillance & Monitoring of pest
(HORTSAP)0.00 0.00 12.48 26.00 30 68.48
19Project vegetable initatives for
urban cluster - Aurangabad0.00 0.00 57.52 70.00 90 217.52
20 Horticulture Census 0.00 2.92 0.00 0.00 0 0.00
` Total 607.97 760.89 622.74 958.59 1026.68 2608.01
4
1
Stall fed 40+2 goat unit by
Punyashlok Ahilyadevi
Maharashtra Mendhi va Sheli
vikas mahamandal
0.00 0.00 0.00 54.00 0 54
2Supply of Mini setter & Hatchers
of 5000 eggs capacity0.00 0.00 0.00 53.00 53 106
3Introduction of Power driven chaff
cutter0.00 0.00 0.00 30.00 30 60
4 A.I. Delivery System Under RKVY 0.00 0.69337 0.00 100.00 50 150
5 Distribution of Fodder seed 0.00 0.00 0.00 15.00 15 30
6Establishment of Silage Making
Unit0.00 0.00 0.00 30.00 30 60
7Distribution of 40 female & 2 male
goat in DPAP area0.00 0.00 0.00 0.00 1.943 1.943
Total 0.00 0.69 0.00 282.00 179.94 461.94
5
1 Stainless steel can 0.00 0.00 0.00 0.00 0.00 0.00
Total 0.00 0.00 0.00 0.00 0.00 0.00
6
1Establishment fish production unit
0.00 0.004.50 2.00 5.00 11.50
2Fish farming in impounded water
0.00 0.003.50 4.00 4.00 11.50
3Assistance for supply of fishery
requisite0.00 0.00
0.40 0.70 1.00 2.10
4 Development of fishery Co-op 0.00 0.00 0.10 0.10 0.10 0.30
Total 0.00 0.00 8.50 6.80 10.10 25.40
7
1 Mulbery cultivation 0.00 0.00 8.73 18.00 18.00 44.73
2 Cocoon production 0.00 0.00 7.14 5.82 14.40 27.36
3 Farmers training 0.00 0.00 102.00 300.00 300.00 702.09
Total 0.00 0.00 117.87 323.82 332.40 774.18
8
1
Integrated waterShed
development programme0.00 0.00 0.00 321.46 200.00 521.46
Total 0.00 0.00 0.00 321.46 200.00 521.46
Total Stream II 3436.38 3346.73 11118.32 14365.66 15451.29 32450.77
Animal Husbandry
Dairy Development
Fisheries
Production Growth / Infrastructure & Assets Stream New / Ongoing Sr.
No
Name of
DepartmentScheme Proposed
year wise programme (Financial)Total
DISTRICT SUPERINTENDENT AGRICULTURE
Social Forestry
Sericulture
NANDED
II
D: CDAP 2015 STREAM I II

RKVY
Abstract of Project
1. Name of the project :
2. Type of the Project : Production Growth / Infrastructure & Assets
Stream
3. Core objectives : 1.
2.
3.
4.
4. Administrative Department :
5. Implementing Agency :
6. Name of the sector :
7. Name of the sub-sector :
8. Classification of the project :
9. Duration of Project/ Year :
10. Name & no. of Districts covered
11. District wise page No. and serial
No of the projects in C-DAP :
12. Area to be covered (Hect) :
13. No of farmers would be impacted:
14. Total Cost of the project : (Rs. in Lakh)
15. Componentwise applicable cost norms of ongoining Scheme of GoI/GoM
(Rs. in Lakh)
S.
N. Components
Total
Cost
Applicable ongoing
scheme of GoI/GoM Cost Sharing pattern
Name Cost norm for
subsidy RKVY Beneficary
Implementing
Agency.
Grand Total
% Share 100% -- --
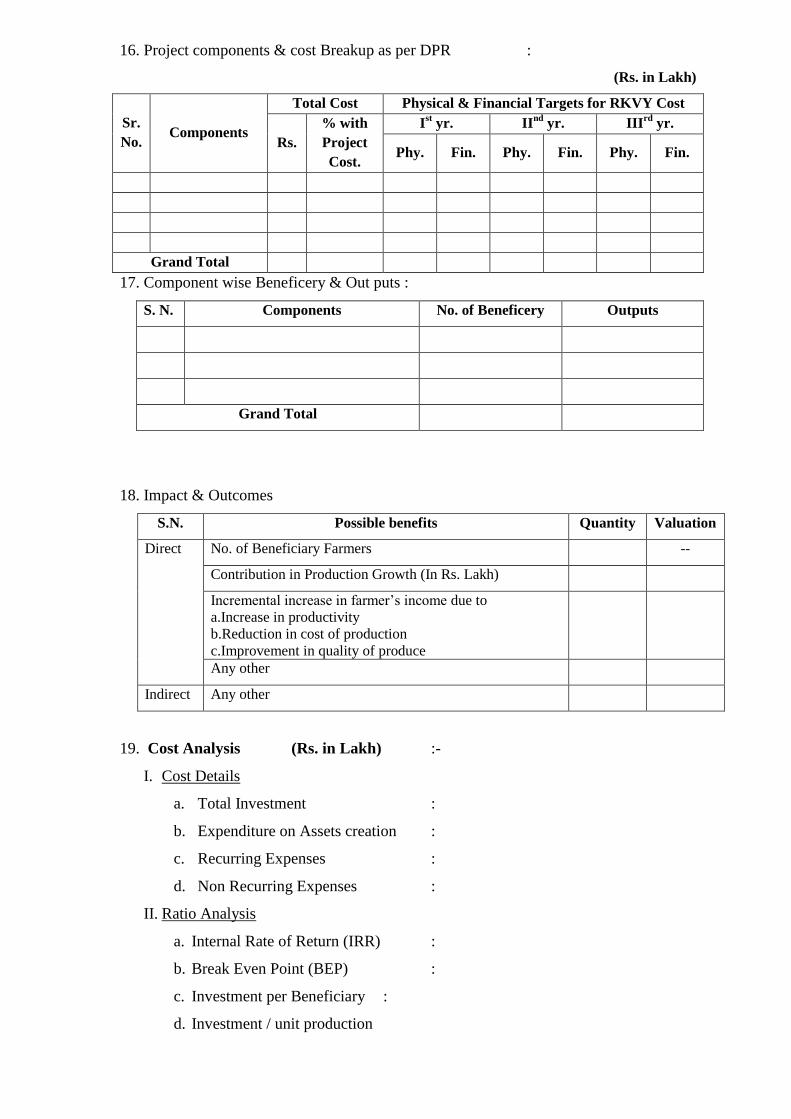
16. Project components & cost Breakup as per DPR :
(Rs. in Lakh)
Sr.
No. Components
Total Cost Physical & Financial Targets for RKVY Cost
Rs.
% with
Project
Cost.
Ist yr. II
nd yr. III
rd yr.
Phy. Fin. Phy. Fin. Phy. Fin.
Grand Total
17. Component wise Beneficery & Out puts :
S. N. Components No. of Beneficery Outputs
Grand Total
18. Impact & Outcomes
S.N. Possible benefits Quantity Valuation
Direct No. of Beneficiary Farmers --
Contribution in Production Growth (In Rs. Lakh)
Incremental increase in farmer’s income due to
a.Increase in productivity
b.Reduction in cost of production
c.Improvement in quality of produce
Any other
Indirect Any other
19. Cost Analysis (Rs. in Lakh) :-
I. Cost Details
a. Total Investment :
b. Expenditure on Assets creation :
c. Recurring Expenses :
d. Non Recurring Expenses :
II. Ratio Analysis
a. Internal Rate of Return (IRR) :
b. Break Even Point (BEP) :
c. Investment per Beneficiary :
d. Investment / unit production

20. If Project cost is more than Rs. 25 Crore -
a. Details of Comments of GoI :
b. Gist of third party technical and financial Evaluation.
21. Comments of ICAR in case of Research Project. :
22. Authority wise Monitoring Mechanism :
a .Regular checking authority :
b. Annual quality & work progress certificate issuing authority:
to release next years grant as per DPR.
23. Financial sustainability of the project in future :
24. Any other information :

RKVY
Abstract of Project
1.Name of the project . : Establishment of Gokul Grams under
Rashtriya Gokul Mission.
2.Type of the Project : Production Growth / Infrastructure & Assets
Stream
3 Core objectives : 1. To undertake breed
2. Improvement of breed program me
3. Enhance milk Production
4 Upgrade ND cattle using RK .
4 Administrative Department : Animal Husbandry ,Dairy& Fishery
5 Implementing Agency : DDC / DAHO
6 Name of the sector : State / Local
7 Name of the sub-sector : Animal Husbandry
8 Classification of the project : / Infrastructure & Assets Stream
9 Duration of Project/ Year : 2015-16 , 2016-17
10 Name & no. of Districts covered : Nanded - One
11 District wise page No. and serial
No of the projects in C-DAP :
12 Area to be covered (Hect) :-
13 No of farmers would be impacted : 2000
14 Total Cost of the project : (Rs. in Lakh) 1000 Thousands
15 Componentwise applicable cost norms of ongoining Scheme of GoI/GoM
(Rs. in Lakh)
S.
N. Components
Total
Cost
Applicable ongoing
scheme of GoI/GoM Cost Sharing pattern
Name Cost norm for
subsidy RKVY Beneficary
Implementing
Agency.
1 Gokul Gram 1000 GoI 100 % 100 %
- -
Grand Total
% Share 100% -- 100% 100%

16 Project components & costBreakup as per DPR :
(Rs. in Lakh)
Sr.
No. Components
Total Cost Physical & Financial Targets for RKVY Cost
Rs.
% with
Project
Cost.
Ist yr. II
nd yr. III
rd yr.
Phy. Fin. Phy. Fin. Phy. Fin.
1 Gokul Gram 1000 100 % One
Gokul
Gram
Thausands
500
One Thausand
500
- -
Grand Total
17 Component wise Beneficery & Out puts :
S. N. Components No. of Beneficery Outputs
1 2015-16 1000
2 2016-17 1000
Grand Total
18 Impact & Outcomes
S.N. Possible benefits Quantity Valuation
Direct No. of Beneficiary Farmers --
Contribution in Production Growth (In Rs. Lakh)
Incremental increase in farmer’s income due to
a.Increase in productivity
b.Reduction in cost of production
c.Improvement in quality of produce
Any other
Indirect Any other
19 Cost Analysis (Rs. in Lakh) :- 1000
1. Cost Details
a.Total Investment :
b.Expenditure on Assets creation :
c.Recurring Expenses :
d.Non Recurring Expenses :
2. Ratio Analysis
a. Internal Rate of Return (IRR) :
b.Break Even Point (BEP) :
c.Investment per Beneficiary :
d.Investment / unit production
20 If Project cost is more than Rs. 25 Crore - Not Applicable
Details of Comments of GoI :
Gist of third party technical and financial Evaluation.

21 Comments of ICAR in case of Research Project. : --
22 Authority wise Monitoring Mechanism :
a .Regular checking authority : GOM
b. Annual quality & work progress certificate issuing authority: Gom
to release next years grant as per DPR.
23 Financial sustainability of the project in future :
24 Any other information :
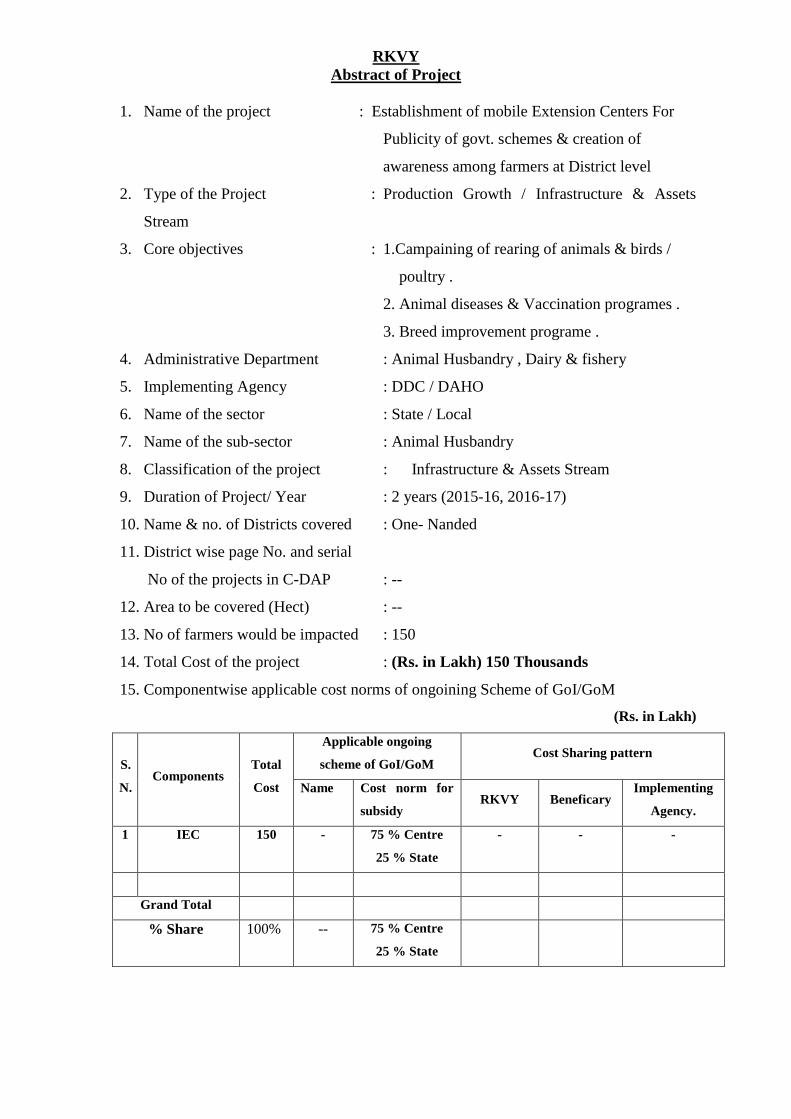
RKVY
Abstract of Project
1. Name of the project : Establishment of mobile Extension Centers For
Publicity of govt. schemes & creation of
awareness among farmers at District level
2. Type of the Project : Production Growth / Infrastructure & Assets
Stream
3. Core objectives : 1.Campaining of rearing of animals & birds /
poultry .
2. Animal diseases & Vaccination programes .
3. Breed improvement programe .
4. Administrative Department : Animal Husbandry , Dairy & fishery
5. Implementing Agency : DDC / DAHO
6. Name of the sector : State / Local
7. Name of the sub-sector : Animal Husbandry
8. Classification of the project : Infrastructure & Assets Stream
9. Duration of Project/ Year : 2 years (2015-16, 2016-17)
10. Name & no. of Districts covered : One- Nanded
11. District wise page No. and serial
No of the projects in C-DAP : --
12. Area to be covered (Hect) : --
13. No of farmers would be impacted : 150
14. Total Cost of the project : (Rs. in Lakh) 150 Thousands
15. Componentwise applicable cost norms of ongoining Scheme of GoI/GoM
(Rs. in Lakh)
S.
N. Components
Total
Cost
Applicable ongoing
scheme of GoI/GoM Cost Sharing pattern
Name Cost norm for
subsidy RKVY Beneficary
Implementing
Agency.
1 IEC 150 - 75 % Centre
25 % State
- - -
Grand Total
% Share 100% -- 75 % Centre
25 % State

16. Project components & cost Breakup as per DPR :
(Rs. in Lakh)
Sr.
No. Components
Total Cost Physical & Financial Targets for RKVY Cost
Rs.
% with
Project
Cost.
Ist yr. II
nd yr. III
rd yr.
Phy. Fin. Phy. Fin. Phy. Fin.
1 IEC 150 75%
25%
20 75%
25%
10 37.50
12.50
- -
Grand Total 150 75%
25%
20 75%
25%
10 37.50
12.50
17. Component wise Beneficery & Out puts :
S. N. Components No. of Beneficery Outputs
1 IEC 20 camp --
Grand Total 20 camp
18. Impact & Outcomes
S.N. Possible benefits Quantity Valuation
Direct No. of Beneficiary Farmers 20 camp --
Contribution in Production Growth (In Rs. Lakh)
Incremental increase in farmer’s income due to
a.Increase in productivity
b.Reduction in cost of production
c.Improvement in quality of produce
Any other
Indirect Any other
19. Cost Analysis (Rs. in Lakh) :- 150 Thousands
1. Cost Details
a.Total Investment :
b.Expenditure on Assets creation :
c.Recurring Expenses :
d.Non Recurring Expenses :
2.Ratio Analysis
a.Internal Rate of Return (IRR) :
b.Break Even Point (BEP) :
c.Investment per Beneficiary :
d.Investment / unit production

20 If Project cost is more than Rs. 25 Crore - Not applicable
a.Details of Comments of GoI :
b.Gist of third party technical and financial Evaluation.
21 Comments of ICAR in case of Research Project. :
22 Authority wise Monitoring Mechanism : GOM
a .Regular checking authority : GOM
b. Annual quality & work progress certificate issuing authority:
to release next years grant as per DPR.
23 Financial sustainability of the project in future :
24 Any other information

RKVY
Abstract of Project
1. Name of the project : Supply of mini Setter & Hatchers of 5000 eggs
Capacity .
2. Type of the Project : Production Growth / Infrastructure & Assets
Stream
3. Core objectives : 1. Encaurage the poultry Development &
Rearing
2. Encaurage the production of poultry products
3. Encaurage the production of Eggs & chikan
4. Production of Deshi & Improved Birds
4. Administrative Department. : Animal Husbandry, Dairy & fishery
5. Implementing Agency : DDC / DAHO
6. Name of the sector : State /Local
7. Name of the sub-sector : Animal Husbandry
8. Classification of the project : Infrastructure & Assets Stream
9. Duration of Project/ Year : 2 years (2015-16, 2016-17)
10. Name & no. of Districts covered : one - Nanded
11. District wise page No. and serial
No of the projects in C-DAP :
12. Area to be covered (Hect) :
13. No of farmers would be impacted:
14. Total Cost of the project : 106 (Rs. in Lakh)
15. Componentwise applicable cost norms of ongoining Scheme of GoI/GoM
(Rs. in Lakh)
S.
N. Components
Total
Cost
Applicable ongoing
scheme of GoI/GoM Cost Sharing pattern
Name Cost norm for
subsidy RKVY Beneficary
Implementing
Agency.
1 Mini Hatcher
& Setter
106 100 % 100%
Grand Total
% Share 100% -- 100%

16. Project components & cost Breakup as per DPR :
(Rs. in Lakh)
Sr.
No. Components
Total Cost Physical & Financial Targets for RKVY Cost
Rs.
% with
Project
Cost.
Ist yr. II
nd yr. III
rd yr.
Phy. Fin. Phy. Fin. Phy. Fin.
1 Mini Hatcher &
Setter
106 16 53 16 53 -- --
Grand Total 106 16 53 16 53 -- --
17. Component wise Beneficery & Out puts :
S. N. Components No. of Beneficery Outputs
Hathar & setter 32
Grand Total 32
18. Impact & Outcomes
S.N. Possible benefits Quantity Valuation
Direct No. of Beneficiary Farmers 32 --
Contribution in Production Growth (In Rs. Lakh)
Incremental increase in farmer’s income due to
a.Increase in productivity
b.Reduction in cost of production
c.Improvement in quality of produce
Any other
Indirect Any other
19. Cost Analysis (Rs. in Lakh) :-
1Cost Details
a.Total Investment :
b.Expenditure on Assets creation :
c.Recurring Expenses :
d.Non Recurring Expenses :
2. Ratio Analysis
a.Internal Rate of Return (IRR) :
b.Break Even Point (BEP) :
c.Investment per Beneficiary :

d.Investment / unit production
20. If Project cost is more than Rs. 25 Crore - Not Aplicable
a.Details of Comments of GoI :
b.Gist of third party technical and financial Evaluation.
21. Comments of ICAR in case of Research Project. : --
22. Authority wise Monitoring Mechanism :
a .Regular checking authority : GOM
b. Annual quality & work progress certificate issuing authority : GOM
to release next years grant as per DPR.
23. Financial sustainability of the project in future : Sustainable
24. Any other information

RKVY
Abstract of Project
1. Name of the project : Mobile marketing units of poultry
2. Type of the Project : Production Growth / Infrastructure & Assets
Stream
3. Core objectives : 1. For Promotion of dean meat
4. Administrative Department. : Animal Husbandry, Dairy & Fishery
5. Implementing Agency : DDC / DAHO
6. Name of the sector : State /Local
7. Name of the sub-sector : Animal Husbandry
8. Classification of the project : Hatching of eggs , Rearing of Chicks
9. Duration of Project/ Year : 2 years –(2015-16. 2016-17)
10. Name & no. of Districts covered : one - Nanded
11. District wise page No. and serial
No of the projects in C-DAP :
12. Area to be covered (Hect) :
13. No of farmers would be impacted: 16
14. Total Cost of the project : 100 (Rs. in Lakh)
15. Componentwise applicable cost norms of ongoining Scheme of GoI/GoM
(Rs. in Lakh)
S.
N. Components
Total
Cost
Applicable ongoing
scheme of GoI/GoM Cost Sharing pattern
Name Cost norm for
subsidy RKVY Beneficary
Implementing
Agency.
1 Mobile
marketing unit
for poultry
6.25 x
16
100 % 100%
Grand Total 6.25 x
16
100 % 100%
% Share 100% -- 100% 100%

16. Project components & cost Breakup as per DPR :
(Rs. in Lakh)
Sr.
No. Components
Total Cost Physical & Financial Targets for RKVY Cost
Rs.
% with
Project
Cost.
Ist yr. II
nd yr. III
rd yr.
Phy. Fin. Phy. Fin. Phy. Fin.
Mobile marketing
unit for poultry
100 16 100 16 100 -- --
Grand Total 100 16 100 16 100 -- --
17. Component wise Beneficery & Out puts :
S. N. Components No. of Beneficery Outputs
Mobile marketing of unite 32
Grand Total 32
18. Impact & Outcomes
S.N. Possible benefits Quantity Valuation
Direct No. of Beneficiary Farmers 32 --
Contribution in Production Growth (In Rs. Lakh)
Incremental increase in farmer’s income due to
a.Increase in productivity
b.Reduction in cost of production
c.Improvement in quality of produce
Any other
Indirect Any other
19. Cost Analysis (Rs. in Lakh) :- 200
1.Cost Details
a.Total Investment :
b.Expenditure on Assets creation :
c.Recurring Expenses :
d.Non Recurring Expenses :
2.Ratio Analysis
a.Internal Rate of Return (IRR) :
b.Break Even Point (BEP) :
c.Investment per Beneficiary :
d.Investment / unit production
20. If Project cost is more than Rs. 25 Crore - Not Applicable
c. Details of Comments of Gov. of India :
d. Gist of third party technical and financial Evaluation.
21. Comments of ICAR in case of Research Project. : --
22. Authority wise Monitoring Mechanism :
a .Regular checking authority : GOM
b. Annual quality & work progress certificate issuing authority : GOM
to release next years grant as per DPR.
23. Financial sustainability of the project in future : Sustainable
24. Any other information :

RKVY
Abstract of Project
1. Name of the project : Facilitating Market Linkage for live birds,
Animals
2. Type of the Project : Production Growth / Infrastructure & Assets
Stream
3. Core objectives : 1. For Marketing of live birds & goats etc.
4. Administrative Department. : Animal Husbandry, Dairy & Fishery
5. Implementing Agency : DDC / DAHO
6. Name of the sector : State /Local
7. Name of the sub-sector : Animal Husbandry
8. Classification of the project : Infrastructure & Assets Stream
9. Duration of Project/ Year : 2 yr (2015-16, 2016-17)
10. Name & no. of Districts covered : one - Nanded
11. District wise page No. and serial
No of the projects in C-DAP :
12. Area to be covered (Hect) :
13. No of farmers would be impacted:
14. Total Cost of the project : 200 (Rs. in Lakh)
15. Componentwise applicable cost norms of ongoining Scheme of GoI/GoM
(Rs. in Lakh)
S.
N. Components
Total
Cost
Applicable ongoing
scheme of GoI/GoM Cost Sharing pattern
Name Cost norm for
subsidy RKVY Beneficary
Implementing
Agency.
1 Marketing
Van
40 lac 100 % 100 x
Grand Total
% Share 100% -- --

16. Project components & cost Breakup as per DPR :
(Rs. in Lakh)
Sr.
No. Components
Total Cost Physical & Financial Targets for RKVY Cost
Rs.
% with
Project
Cost.
Ist yr. II
nd yr. III
rd yr.
Phy. Fin. Phy. Fin. Phy. Fin.
Marketing Van 40
Lakh
40 Lakh 10 20 10 20 -- --
Grand Total 40Lakh 40 Lakh 10 20 10 20 -- --
17. Component wise Beneficiary & Out puts :
S. N. Components No. of Beneficery Outputs
Marketing of unite 20
Grand Total
18. Impact & Outcomes
S.N. Possible benefits Quantity Valuation
Direct No. of Beneficiary Farmers 20 --
Contribution in Production Growth (In Rs. Lakh)
Incremental increase in farmer’s income due to
a. Increase in productivity
b. Reduction in cost of production
c. Improvement in quality of produce
Any other
Indirect Any other
19. Cost Analysis (Rs. in Lakh) :- 40
1..Cost Details
a.Total Investment :
b..Expenditure on Assets creation :
c.Recurring Expenses :
d. Non Recurring Expenses :
2.Ratio Analysis
a.Internal Rate of Return (IRR) :
b.Break Even Point (BEP) :
c.Investment per Beneficiary :
d.Investment / unit production
20. If Project cost is more than Rs. 25 Crore - Not Applicable
a. Details of Comments of Gov. of India :
b. Gist of third party technical and financial Evaluation.
21 Comments of ICAR in case of Research Project. : --
22 Authority wise Monitoring Mechanism : GOM
a .Regular checking authority : GOM
b. Annual quality & work progress certificate issuing authority : GOM
to release next years grant as per DPR.
23 Financial sustainability of the project in future : ----
24 Any other information :

RKVY
Abstract of Project
1. Name of the project : Introduction of Power driven chaff cutter
2. Type of the Project : Production Growth / Infrastructure & Assets
Stream
3. Core objectives : 1. Minimize the fodder shortage.
2. Proper Use of Available fodder
4. Administrative Department. : Animal Husbandry, Dairy & Fishery
5. Implementing Agency : DDC / DAHO
6. Name of the sector : State /Local
7. Name of the sub-sector : Animal Husbandry
8. Classification of the project : Infrastructure & Assets Stream
9. Duration of Project/ Year : 2 years (2015-16,2016-17)
10. Name & no. of Districts covered : one -Nanded
11. District wise page No. and serial
No of the projects in C-DAP :
12. Area to be covered (Hect) :
13. No of farmers would be impacted: 16
14. Total Cost of the project : (Rs. in Lakh)
15. Component wise applicable cost norms of ongoining Scheme of GoI/GoM
(Rs. in Lakh)
S.
N. Components
Total
Cost
Applicable ongoing
scheme of GoI/GoM Cost Sharing pattern
Name Cost norm for
subsidy RKVY Beneficiary
Implementing
Agency.
1 Power driver
chaff chatter
60 60 100 %
Grand Total
% Share 100% -- 60 100%

16. Project components & cost Breakup as per DPR :
(Rs. in Lakh)
Sr.
No. Components
Total Cost Physical & Financial Targets for RKVY Cost
Rs.
% with
Project
Cost.
Ist yr. II
nd yr. III
rd yr.
Phy. Fin. Phy. Fin. Phy. Fin.
Power driver
chaff chatter
60 400 30 400 30 -- --
Grand Total 60 400 30 400 30 -- --
17. Component wise Beneficery & Out puts :
S. N. Components No. of Beneficery Outputs
Power driver chaff chatter 800
Grand Total 800
18. Impact & Outcomes
S.N. Possible benefits Quantity Valuation
Direct No. of Beneficiary Farmers 800 --
Contribution in Production Growth (In Rs. Lakh)
Incremental increase in farmer’s income due to
a.Increase in productivity
b.Reduction in cost of production
c.Improvement in quality of produce
Any other
Indirect Any other
19. Cost Analysis (Rs. in Lakh) :- 60
I. Cost Details
a. Total Investment :
b. Expenditure on Assets creation :
c. Recurring Expenses :
d. Non Recurring Expenses :
II. Ratio Analysis
a. Internal Rate of Return (IRR) :
b. Break Even Point (BEP) :
c. Investment per Beneficiary :
d. Investment / unit production

20. If Project cost is more than Rs. 25 Crore - Not Applicable
a.Details of Comments of Gov. of India :
b.Gist of third party technical and financial Evaluation.
21. Comments of ICAR in case of Research Project. : --
22. Authority wise Monitoring Mechanism : GOM
a .Regular checking authority : GOM
b. Annual quality & work progress certificate issuing authority : GOM
to release next years grant as per DPR.
23. Financial sustainability of the project in future : Sustainable
24. Any other information

Abstract of Project
1. Name of the project : Supply of Veterinary Mobile Units Cum
Diagnostic Laboratories
2. Type of the Project : Production Growth / Infrastructure & Assets
Stream
3. Core objectives : 1. Providing Doorstep Service to ailing
animals
2. Providing Lab Facility to remote villages
4. Administrative Department. : Animal Husbandry, Dairy & Fishery
5. Implementing Agency : DDC / DAHO
6. Name of the sector : State /Local
7. Name of the sub-sector : Animal Husbandry
8.Classification of the project : Infrastructure & Assets Stream
9. Duration of Project/ Year : 1 years -2015-16
10. Name & no. of Districts covered : one Nanded
11. District wise page No. and serial
No of the projects in C-DAP :
12. Area to be covered (Hect) :
13. No of farmers would be impacted:
14. Total Cost of the project : (Rs. in Lakh) 24
15. Component wise applicable cost norms of ongoining Scheme of GoI/GoM
(Rs. in Lakh)
S.
N. Components
Total
Cost
Applicable ongoing
scheme of GoI/GoM Cost Sharing pattern
Name Cost norm for
subsidy RKVY Beneficiary
Implementing
Agency.
1 Supply of
Veterinary
Mobile Units
Cum Diagnostic
Laboratories
24 100 100 %
Grand Total 24 100 100 %

16. Project components & cost Breakup as per DPR :
(Rs. in Lakh)
Sr.
No. Components
Total Cost Physical & Financial Targets for RKVY Cost
Rs.
% with
Project
Cost.
Ist yr. II
nd yr. III
rd yr.
Phy. Fin. Phy. Fin. Phy. Fin.
Supply of Veterinary
Mobile Units Cum
Diagnostic
Laboratories
24 24 1 24 -- -- -- --
Grand Total 24 24 1 24 -- -- -- --
17. Component wise Beneficiary & Out puts :
S. N. Components No. of Beneficery Outputs
Supply of Veterinary Mobile Units Cum
Diagnostic Laboratories
- Disease dignosis
Grand Total
18. Impact & Outcomes
S.N. Possible benefits Quantity Valuation
Direct No. of Beneficiary Farmers --
Contribution in Production Growth (In Rs. Lakh)
Incremental increase in farmer’s income due to
a.Increase in productivity
b.Reduction in cost of production
c.Improvement in quality of produce
Any other
Indirect Any other Disease
dignosis
19. Cost Analysis (Rs. in Lakh) :- 24
I. Cost Details
a. Total Investment :
b. Expenditure on Assets creation :
c. Recurring Expenses :
d. Non Recurring Expenses :
II. Ratio Analysis
a. Internal Rate of Return (IRR) :
b. Break Even Point (BEP) :
c. Investment per Beneficiary :
d. Investment / unit production

20. If Project cost is more than Rs. 25 Crore - Not Applicable
a. Details of Comments of Gov. of India :
b. Gist of third party technical and financial Evaluation.
21. Comments of ICAR in case of Research Project. : --
22. Authority wise Monitoring Mechanism : GOM
a .Regular checking authority : GOM
b. Annual quality & work progress certificate issuing authority : GOM
to release next years grant as per DPR.
23. Financial sustainability of the project in future :
24. Any other information

RKVY
Abstract of Project
1. Name of the project :Clean milk production through supply of milking
Machines to farmers on 25 % subsidy
2. Type of the Project : Production Growth / Infrastructure & Assets
Stream
3. Core objectives : 1.clean milk production
2.
3.
4.
4. Administrative Department : Animal Husbandry , Dairy & fishery
5. Implementing Agency : DDC / DAHO
6. Name of the sector : State / Local
7. Name of the sub-sector : - Animal Husbandry
8. Classification of the project : Production Growth
9. Duration of Project/ Year : 2 years (2015-16 , 2016-17)
10. Name & no. of Districts covered Nanded - 1
11. District wise page No. and serial
No of the projects in C-DAP : --
12. Area to be covered (Hect) : -
13. No of farmers would be impacted: 250
14. Total Cost of the project : 62.50 (Rs. in Lakh)
15. Componentwise applicable cost norms of ongoining Scheme of GoI/GoM
(Rs. in Lakh)
S.
N. Components
Total
Cost
Applicable ongoing
scheme of GoI/GoM Cost Sharing pattern
Name Cost norm for
subsidy RKVY Beneficary
Implementing
Agency.
1 Supply of
milking
machine
62.5 25 % subsidy 25 % 75%
Grand Total 62.5 25 % subsidy 25 % 75%
% Share 100% -- -- 25 % 75%

16. Project components & cost Breakup as per DPR :
(Rs. in Lakh)
Sr.
No. Components
Total Cost Physical & Financial Targets for RKVY Cost
Rs.
% with
Project
Cost.
Ist yr. II
nd yr. III
rd yr.
Phy. Fin. Phy. Fin. Phy. Fin.
1 Supply of milking
machine
62.5 125 31.25 125 31.25 - -
Grand Total 62.5 125 31.25 125 31.25 - -
17. Component wise Beneficery & Out puts :
S. N. Components No. of Beneficery Outputs
1 Milking machine 250
Grand Total 250
18. Impact & Outcomes
S.N. Possible benefits Quantity Valuation
Direct No. of Beneficiary Farmers 250 --
Contribution in Production Growth (In Rs. Lakh)
Incremental increase in farmer’s income due to
a.Increase in productivity
b.Reduction in cost of production
c.Improvement in quality of produce
Any other
Indirect Any other
19. Cost Analysis (Rs. in Lakh) :- 62.50
I. Cost Details
a. Total Investment :
b. Expenditure on Assets creation :
c. Recurring Expenses :
d. Non Recurring Expenses :
II. Ratio Analysis
a. Internal Rate of Return (IRR) :
b. Break Even Point (BEP) :
c. Investment per Beneficiary :
d. Investment / unit production
20. If Project cost is more than Rs. 25 Crore - not applicale
a. Details of Comments of GoI :
b. Gist of third party technical and financial Evaluation.
21. Comments of ICAR in case of Research Project. :
22. Authority wise Monitoring Mechanism : GOM
a .Regular checking authority :GOM
b. Annual quality & work progress certificate issuing authority:
to release next years grant as per DPR.
23. Financial sustainability of the project in future :
24. Any other information :

RKVY
Abstract of Project
1 Name of the project : Establishment of Hydrophonic Fodder
production
unit
2 Type of the Project : Production Growth / Infrastructure & Assets
Stream
3 Core objectives : 1.scercity –hydrophonic fodder production
2.
3.
4.
4 Administrative Department : Animal Husbandry ,Dairy & Fishery
5 Implementing Agency : DDC / DAHO
6 Name of the sector : State / Local
7 Name of the sub-sector : - Animal Husbandry
8 Classification of the project : Production Growth
9 Duration of Project/ Year : 2 years (2015-16 , 2016-17)
10 Name & no. of Districts covered Nanded - 1
11 District wise page No. and serial
No of the projects in C-DAP : --
12 Area to be covered (Hect) : -
13 No of farmers would be impacted: 60
14 Total Cost of the project : 30 (Rs. in Lakh)
15 Componentwise applicable cost norms of ongoining Scheme of GoI/GoM
(Rs. in Lakh)
S.
N. Components
Total
Cost
Applicable ongoing
scheme of GoI/GoM Cost Sharing pattern
Name Cost norm for
subsidy RKVY Beneficary
Implementing
Agency.
1 Hydrophonic
fodder
production
30 100 % subsidy 100 % -
Grand Total 30 100 % subsidy 100 %
% Share 100% -- -- 100 % -
16 Project components & cost Breakup as per DPR :

(Rs. in Lakh)
Sr.
No. Components
Total Cost Physical & Financial Targets for RKVY Cost
Rs.
% with
Project
Cost.
Ist yr. II
nd yr. III
rd yr.
Phy. Fin. Phy. Fin. Phy. Fin.
1 Hydrophonic
fodder
production
30 30 15 30 15 - -
Grand Total 30 30 15 30 15 - -
17 Component wise Beneficery & Out puts :
S. N. Components No. of Beneficery Outputs
1 Hydrophonic fodder production 60
Grand Total 60
18 Impact & Outcomes
S.N. Possible benefits Quantity Valuation
Direct No. of Beneficiary Farmers 60 --
Contribution in Production Growth (In Rs. Lakh)
Incremental increase in farmer’s income due to
a.Increase in productivity
b.Reduction in cost of production
c.Improvement in quality of produce
Any other
Indirect Any other
19 Cost Analysis (Rs. in Lakh) :- 30
1 Cost Details
a.Total Investment :
b Expenditure on Assets creation :
c Recurring Expenses :
d Non Recurring Expenses :
2 Ratio Analysis
a. Internal Rate of Return (IRR) :
b.Break Even Point (BEP) :
c.Investment per Beneficiary :
d.Investment / unit production

20 If Project cost is more than Rs. 25 Crore - not applicable
aDetails of Comments of GoI :
bGist of third party technical and financial Evaluation.
21 Comments of ICAR in case of Research Project. :
22 Authority wise Monitoring Mechanism : GOM
a .Regular checking authority :GOM
b. Annual quality & work progress certificate issuing authority:
to release next years grant as per DPR.
23 Financial sustainability of the project in future :
Any other information

RKVY
Abstract of Project
1 Name of the project : Establishment of Azola production unit
2 Type of the Project : Production Growth / Infrastructure & Assets
Stream
3 Core objectives : 1. Production of Azola which contains 30%
protins
2.
3.
4.
4 Administrative Department : Animal Husbandry ,Dairy & Fishery
5 Implementing Agency : DDC / DAHO
6 Name of the sector : State / Local
7 Name of the sub-sector : - Animal Husbandry
8 Classification of the project : Production Growth
9 Duration of Project/ Year : 2 years (2015-16 , 2016-17)
10 Name & no. of Districts covered Nanded - 1
11 District wise page No. and serial
No of the projects in C-DAP : --
12 Area to be covered (Hect) : -
13 No of farmers would be impacted: 100
14 Total Cost of the project : 30 (Rs. in Lakh)
15 Componentwise applicable cost norms of ongoining Scheme of GoI/GoM
(Rs. in Lakh)
S.
N. Components
Total
Cost
Applicable ongoing
scheme of GoI/GoM Cost Sharing pattern
Name Cost norm for
subsidy RKVY Beneficary
Implementing
Agency.
1 Azola
production
unit
30 75 % subsidy 75 % 25%
Grand Total
% Share 100% -- -- 75 % 25%

16 Project components & cost Breakup as per DPR :
(Rs. in Lakh)
Sr.
No. Components
Total Cost Physical & Financial Targets for RKVY Cost
Rs.
% with
Project
Cost.
Ist yr. II
nd yr. III
rd yr.
Phy. Fin. Phy. Fin. Phy. Fin.
1 Azola production
unit
30 50 15 50 15 - -
Grand Total 30 50 15 50 15 - -
17 Component wise Beneficery & Out puts :
S. N. Components No. of Beneficery Outputs
1 Azola production unit 100
Grand Total 100
18 Impact & Outcomes
S.N. Possible benefits Quantity Valuation
Direct No. of Beneficiary Farmers 100 --
Contribution in Production Growth (In Rs. Lakh)
Incremental increase in farmer’s income due to
a.Increase in productivity
b.Reduction in cost of production
c.Improvement in quality of produce
Any other
Indirect Any other
19 Cost Analysis (Rs. in Lakh) :- 30
1. Cost Details
a.Total Investment :
b Expenditure on Assets creation :
c Recurring Expenses :
d Non Recurring Expenses :
2. Ratio Analysis
b. Internal Rate of Return (IRR) :
b.Break Even Point (BEP) :
c.Investment per Beneficiary :
d.Investment / unit production

20 If Project cost is more than Rs. 25 Crore - not applicable
a. Details of Comments of GoI :
b Gist of third party technical and financial Evaluation.
21 Comments of ICAR in case of Research Project. :
22 Authority wise Monitoring Mechanism : GOM
a .Regular checking authority :GOM
b. Annual quality & work progress certificate issuing authority:
to release next years grant as per DPR.
23 Financial sustainability of the project in future :
24 Any other information

RKVY
Abstract of Project
1 Name of the project : Establishment of silage making unit
2 Type of the Project : Production Growth / Infrastructure & Assets
Stream
3 Core objectives : 1. Preservation of grass fodder
2.useful in scarcity condetition
3.
4.
4 Administrative Department : Animal Husbandry ,Dairy & Fishery
5 Implementing Agency : DDC / DAHO
6 Name of the sector : State / Local
7 Name of the sub-sector : - Animal Husbandry
8 Classification of the project : Production Growth
9 Duration of Project/ Year : 2 years (2015-16 , 2016-17)
10 Name & no. of Districts covered Nanded - 1
11 District wise page No. and serial
No of the projects in C-DAP : --
12 Area to be covered (Hect) : -
13 No of farmers would be impacted: 80
14 Total Cost of the project : 60 (Rs. in Lakh)
15 Componentwise applicable cost norms of ongoining Scheme of GoI/GoM
(Rs. in Lakh)
S.
N. Components
Total
Cost
Applicable ongoing
scheme of GoI/GoM Cost Sharing pattern
Name Cost norm for
subsidy RKVY Beneficary
Implementing
Agency.
1 Sailage making
unit
60 75 % subsidy 75 % 25%
Grand Total
% Share 100% -- -- 75 % 25%

16 Project components & cost Breakup as per DPR :
(Rs. in Lakh)
Sr.
No. Components
Total Cost Physical & Financial Targets for RKVY Cost
Rs.
% with
Project
Cost.
Ist yr. II
nd yr. III
rd yr.
Phy. Fin. Phy. Fin. Phy. Fin.
1 Sailage making
unit
60 40 30 40 30 - -
Grand Total 60 40 30 40 30 - -
17 Component wise Beneficery & Out puts :
S. N. Components No. of Beneficery Outputs
1 Sailage making unit 80
Grand Total 80
18 Impact & Outcomes
S.N. Possible benefits Quantity Valuation
Direct No. of Beneficiary Farmers 80 --
Contribution in Production Growth (In Rs. Lakh)
Incremental increase in farmer’s income due to
a.Increase in productivity
b.Reduction in cost of production
c.Improvement in quality of produce
Any other
Indirect Any other
19 Cost Analysis (Rs. in Lakh) :- 60
1.Cost Details
a.Total Investment :
b Expenditure on Assets creation :
c Recurring Expenses :
d Non Recurring Expenses :
2.Ratio Analysis
c. Internal Rate of Return (IRR) :
b.Break Even Point (BEP) :
c.Investment per Beneficiary :
d.Investment / unit production

20 If Project cost is more than Rs. 25 Crore - not applicable
a. Details of Comments of GoI :
b Gist of third party technical and financial Evaluation.
21 Comments of ICAR in case of Research Project. :
22 Authority wise Monitoring Mechanism : GOM
a .Regular checking authority :GOM
b. Annual quality & work progress certificate issuing authority:
to release next years grant as per DPR.
23 Financial sustainability of the project in future :
24 Any other information

RKVY
Abstract of Project
1 Name of the project : Establishment of silage making unit
2 Type of the Project : Production Growth / Infrastructure & Assets
Stream
3 Core objectives : 1. Preservation of grass fodder
2.useful in scarcity condetition
3.
4.
4 Administrative Department : Animal Husbandry , Dairy & Fishery
5 Implementing Agency : DDC / DAHO
6 Name of the sector : State / Local
7 Name of the sub-sector : - Animal Husbandry
8 Classification of the project : Production Growth
9 Duration of Project/ Year : 2 years (2015-16 , 2016-17)
10 Name & no. of Districts covered Nanded - 1
11 District wise page No. and serial
No of the projects in C-DAP : --
12 Area to be covered (Hect) : -
13 No of farmers would be impacted: 80
14 Total Cost of the project : 60 (Rs. in Lakh)
15 Componentwise applicable cost norms of ongoining Scheme of GoI/GoM
(Rs. in Lakh)
S.
N. Components
Total
Cost
Applicable ongoing
scheme of GoI/GoM Cost Sharing pattern
Name Cost norm for
subsidy RKVY Beneficary
Implementing
Agency.
1 Sailage making
unit
60 75 % subsidy 75 % 25%
Grand Total
% Share 100% -- -- 75 % 25%

16 Project components & cost Breakup as per DPR :
(Rs. in Lakh)
Sr.
No. Components
Total Cost Physical & Financial Targets for RKVY Cost
Rs.
% with
Project
Cost.
Ist yr. II
nd yr. III
rd yr.
Phy. Fin. Phy. Fin. Phy. Fin.
1 Sailage making
unit
60 40 30 40 30 - -
Grand Total 60 40 30 40 30 - -
17 Component wise Beneficery & Out puts :
S. N. Components No. of Beneficery Outputs
1 Sailage making unit 80
Grand Total 80
18 Impact & Outcomes
S.N. Possible benefits Quantity Valuation
Direct No. of Beneficiary Farmers 80 --
Contribution in Production Growth (In Rs. Lakh)
Incremental increase in farmer’s income due to
a.Increase in productivity
b.Reduction in cost of production
c.Improvement in quality of produce
Any other
Indirect Any other
19 Cost Analysis (Rs. in Lakh) :- 60
1.Cost Details
a.Total Investment :
b Expenditure on Assets creation :
c Recurring Expenses :
d Non Recurring Expenses :
2.Ratio Analysis
d. Internal Rate of Return (IRR) :
b.Break Even Point (BEP) :
c.Investment per Beneficiary :
d.Investment / unit production

20 If Project cost is more than Rs. 25 Crore - not applicable
a. Details of Comments of GoI :
b Gist of third party technical and financial Evaluation.
21 Comments of ICAR in case of Research Project. :
22 Authority wise Monitoring Mechanism : GOM
a .Regular checking authority :GOM
b. Annual quality & work progress certificate issuing authority:
to release next years grant as per DPR.
23 Financial sustainability of the project in future :
24 Any other information

RKVY
Abstract of Project
1. Name of the project : Distribution of fodder seed
2. Type of the Project : Production Growth / Infrastructure & Assets
Stream
3. Core objectives : 1. To overcome The shortage of fodder
2. To increase the fodder prodding &
availability
4. Administrative Department. : Animal Husbandry, Dairy & Fishery
5. Implementing Agency : DDC / DAHO
6. Name of the sector : State /Local
7. Name of the sub-sector : Animal Husbandry
8. Classification of the project : Production Growth
9. Duration of Project/ Year : 2 (2015-16, 2016-17)
10. Name & no. of Districts covered : one - Nanded
11. District wise page No. and serial
No of the projects in C-DAP :
12. Area to be covered (Hect) :
13. No of farmers would be impacted:
14. Total Cost of the project : (Rs. in Lakh) 30
15. Component wise applicable cost norms of ongoining Scheme of GoI/GoM
(Rs. in Lakh)
S.
N. Components
Total
Cost
Applicable ongoing
scheme of GoI/GoM Cost Sharing pattern
Name Cost norm for
subsidy RKVY Beneficiary
Implementing
Agency.
1 Fodder Seed
Distribution
75 75% 25%
Grand Total
% Share 100% 75 75% 25%

16. Project components & cost Breakup as per DPR :
(Rs. in Lakh)
Sr.
No. Components
Total Cost Physical & Financial Targets for RKVY Cost
Rs.
% with
Project
Cost.
Ist yr. II
nd yr. III
rd yr.
Phy. Fin. Phy. Fin. Phy. Fin.
Fodder Seed
Distribution
6500 15.00 6500 15.00 -- -- --
Grand Total 6500 15.00 6500 15.00 -- -- --
17. Component wise Beneficiary & Out puts :
S. N. Components No. of Beneficery Outputs
Fodder Seed Distribution 13000
Grand Total
18. Impact & Outcomes
S.N. Possible benefits Quantity Valuation
Direct No. of Beneficiary Farmers 13000
Contribution in Production Growth (In Rs. Lakh)
Incremental increase in farmer’s income due to
a.Increase in productivity
b.Reduction in cost of production
c.Improvement in quality of produce
Any other
Indirect Any other
19. Cost Analysis (Rs. in Lakh) :- 30
I. Cost Details
a. Total Investment :
b. Expenditure on Assets creation :
c. Recurring Expenses :
d. Non Recurring Expenses :
II. Ratio Analysis
a. Internal Rate of Return (IRR) :
b. Break Even Point (BEP) :
c. Investment per Beneficiary :
d. Investment / unit production

20. If Project cost is more than Rs. 25 Crore - Not Applicant
a. Details of Comments of Gov. of India :
b. Gist of third party technical and financial Evaluation.
21. Comments of ICAR in case of Research Project. : --
22. Authority wise Monitoring Mechanism : GOM
a .Regular checking authority : GOM
b. Annual quality & work progress certificate issuing authority : GOM
to release next years grant as per DPR.
23. Financial sustainability of the project in future :
24. Any other information :

RKVY
Abstract of Project
1. Name of the project : Distribution of fodder seed
2. Type of the Project : Production Growth / Infrastructure & Assets
Stream
3. Core objectives : 1. To overcome The shortage of fodder
2. To increase the fodder prodding &
availability
4. Administrative Department. : Animal Husbandry, Dairy & Fishery
5. Implementing Agency : DDC / DAHO
6. Name of the sector : State /Local
7. Name of the sub-sector : Animal Husbandry
8. Classification of the project : Production Growth
9. Duration of Project/ Year : 2 Yr (2015-16 , 2016-17)
10. Name & no. of Districts covered : one Nanded
11. District wise page No. and serial
No of the projects in C-DAP :
12. Area to be covered (Hect) :
13. No of farmers would be impacted:
14. Total Cost of the project : (Rs. in Lakh) 30
15. Component wise applicable cost norms of ongoining Scheme of GoI/GoM
(Rs. in Lakh)
S.
N. Components
Total
Cost
Applicable ongoing
scheme of GoI/GoM Cost Sharing pattern
Name Cost norm for
subsidy RKVY Beneficiary
Implementing
Agency.
1 Fodder Seed
Distribution
75 75% 25%
Grand Total 75 75% 25%
% Share 100% -- --

16. Project components & cost Breakup as per DPR :
(Rs. in Lakh)
Sr.
No. Components
Total Cost Physical & Financial Targets for RKVY Cost
Rs.
% with
Project
Cost.
Ist yr. II
nd yr. III
rd yr.
Phy. Fin. Phy. Fin. Phy. Fin.
Fodder Seed
Distribution
6500 15.00 6500 15.00 -- -- --
Grand Total 6500 15.00 6500 15.00 -- -- --
17. Component wise Beneficiary & Out puts :
S. N. Components No. of Beneficery Outputs
Fodder Seed Distribution 13000
Grand Total
18. Impact & Outcomes
S.N. Possible benefits Quantity Valuation
Direct No. of Beneficiary Farmers 13000
Contribution in Production Growth (In Rs. Lakh)
Incremental increase in farmer’s income due to
a.Increase in productivity
b.Reduction in cost of production
c.Improvement in quality of produce
Any other
Indirect Any other
19. Cost Analysis (Rs. in Lakh) :- 30
I. Cost Details
a.Total Investment :
b.Expenditure on Assets creation :
c.Recurring Expenses :
d.Non Recurring Expenses :
II. Ratio Analysis
a.Internal Rate of Return (IRR) :
b.Break Even Point (BEP) :
c.Investment per Beneficiary :
d.Investment / unit production
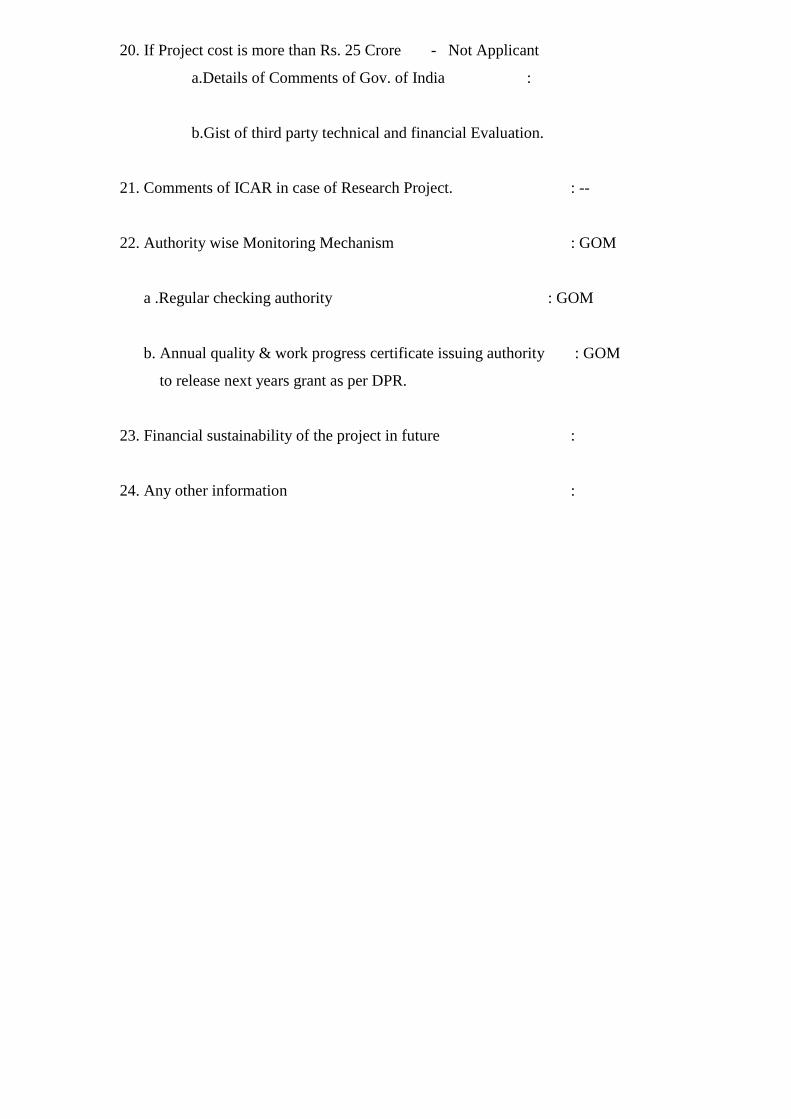
20. If Project cost is more than Rs. 25 Crore - Not Applicant
a.Details of Comments of Gov. of India :
b.Gist of third party technical and financial Evaluation.
21. Comments of ICAR in case of Research Project. : --
22. Authority wise Monitoring Mechanism : GOM
a .Regular checking authority : GOM
b. Annual quality & work progress certificate issuing authority : GOM
to release next years grant as per DPR.
23. Financial sustainability of the project in future :
24. Any other information :

RKVY
Abstract of Project
1. Name of the project : AI Delivery System
2. Type of the Project : Production Growth / Infrastructure & Assets
Stream
3. Core objectives : 1. To Provide AI Facility to Famers at
doorstep
2.
4. Administrative Department. : Animal Husbandry, Dairy & Fishery
5. Implementing Agency : DDC / DAHO
6. Name of the sector : State /Local
7. Name of the sub-sector : Animal Husbandry
8. Classification of the project : Production Growth
9. Duration of Project/ Year : 2 (15-16, 16-17)
10. Name & no. of Districts covered : One - Nanded
11. District wise page No. and serial
No of the projects in C-DAP :
12. Area to be covered (Hect) :
13. No of farmers would be impacted:
14. Total Cost of the project : (Rs. in Lakh) 150
15. Component wise applicable cost norms of ongoining Scheme of GoI/GoM
(Rs. in Lakh)
S.
N. Components
Total
Cost
Applicable ongoing
scheme of GoI/GoM Cost Sharing pattern
Name Cost norm for
subsidy RKVY Beneficiary
Implementing
Agency.
1 AI Delivery
System
150 100 100%
Grand Total 150 100 100%
% Share 100% -- --

16. Project components & cost Breakup as per DPR :
(Rs. in Lakh)
Sr.
No. Components
Total Cost Physical & Financial Targets for RKVY Cost
Rs.
% with
Project
Cost.
Ist yr. II
nd yr. III
rd yr.
Phy. Fin. Phy. Fin. Phy. Fin.
AI Delivery
System
150 -- 120 100 120 50 -- --
Grand Total 150 -- 120 100 120 50 -- --
17. Component wise Beneficiary & Out puts :
S. N. Components No. of Beneficery Outputs
AI Delivery System --
Grand Total
18. Impact & Outcomes
S.N. Possible benefits Quantity Valuation
Direct No. of Beneficiary Farmers
Contribution in Production Growth (In Rs. Lakh)
Incremental increase in farmer’s income due to
a.Increase in productivity
b.Reduction in cost of production
c.Improvement in quality of produce
Any other
Indirect Any other
19. Cost Analysis (Rs. in Lakh) :-
I. Cost Details
a.Total Investment :
b.Expenditure on Assets creation :
c.Recurring Expenses :
d.Non Recurring Expenses :
II. Ratio Analysis
a.Internal Rate of Return (IRR) :
b.Break Even Point (BEP) :
c.Investment per Beneficiary :
d.Investment / unit production

20. If Project cost is more than Rs. 25 Crore - Not Applicant
a.Details of Comments of Gov. of India :
b.Gist of third party technical and financial Evaluation.
21. Comments of ICAR in case of Research Project. : --
22. Authority wise Monitoring Mechanism : GOM
a .Regular checking authority : GOM
b. Annual quality & work progress certificate issuing authority : GOM
to release next years grant as per DPR.
23. Financial sustainability of the project in future :
24. Any other information :

RKVY
Abstract of Project
1. Name of the project : Assistance to farmers for promotion of
integrated
livestock farming on 25% subsidy.
2. Type of the Project : Production Growth / Infrastructure & Assets
Stream
3. Core objectives : 1. Production Enhancement, former should get
employment throughout the year, to increase
income to increase of farmer
4. Administrative Department. : Animal Husbandry,Dairy & Fishery
5. Implementing Agency : DDC / DAHO
6. Name of the sector : State /Local
7. Name of the sub-sector : Animal Husbandry
8. Classification of the project : Production Growth
9. Duration of Project/ Year : 2 Year (15-16, 16-17)
10. Name & no. of Districts covered : One - Nanded
11. District wise page No. and serial
No of the projects in C-DAP :
12. Area to be covered (Hect) :
13. No of farmers would be impacted:
14. Total Cost of the project : 1250 (Rs. in Lakh)
15. Component wise applicable cost norms of ongoining Scheme of GoI/GoM
(Rs. in Lakh)
S.
N. Components
Total
Cost
Applicable ongoing
scheme of GoI/GoM Cost Sharing pattern
Name Cost norm for
subsidy RKVY Beneficiary
Implementing
Agency.
1 Farmers
Promotion for
Integrated
Family.
1250 25% 25 25 50%
Grand Total 1250 25% 25 25 50%
% Share 100% -- --
16. Project components & cost Breakup as per DPR :

(Rs. in Lakh)
Sr.
No. Components
Total Cost Physical & Financial Targets for RKVY Cost
Rs.
% with
Project
Cost.
Ist yr. II
nd yr. III
rd yr.
Phy. Fin. Phy. Fin. Phy. Fin.
Farmers
Promotion for
Integrated Family.
1250 416 625 416 625 -- --
Grand Total 1250 416 625 416 625 -- --
17. Component wise Beneficiary & Out puts :
S. N. Components No. of Beneficery Outputs
Farmers Promotion for Integrated
Family.
832
Grand Total 832
18. Impact & Outcomes
S.N. Possible benefits Quantity Valuation
Direct No. of Beneficiary Farmers 832 ---
Contribution in Production Growth (In Rs. Lakh)
Incremental increase in farmer’s income due to
a.Increase in productivity
b.Reduction in cost of production
c.Improvement in quality of produce
Any other
Indirect Any other
19. Cost Analysis (Rs. in Lakh) :- 1250
I. Cost Details
a.Total Investment :
b.Expenditure on Assets creation :
c.Recurring Expenses :
d.Non Recurring Expenses :
II. Ratio Analysis
a.Internal Rate of Return (IRR) :
b.Break Even Point (BEP) :
c.Investment per Beneficiary :
d.Investment / unit production

20. If Project cost is more than Rs. 25 Crore - Not Applicant
a.Details of Comments of Gov. of India :
b.Gist of third party technical and financial Evaluation.
21. Comments of ICAR in case of Research Project. : --
22. Authority wise Monitoring Mechanism : GOM
a .Regular checking authority : GOM
b. Annual quality & work progress certificate issuing authority : GOM
to release next years grant as per DPR.
23. Financial sustainability of the project in future :
24. Any other information :

RKVY
Abstract of Project
1. Name of the project : Fodder Production From Fallow lands
2. Type of the Project : Production Growth / Infrastructure & Assets
Stream
3. Core objectives : 1. Cultivation of fodder crop in the fallow
lands
4. Administrative Department. : Animal Husbandry,Dairy & Fishery
5. Implementing Agency : DDC / DAHO
6. Name of the sector : State /Local
7. Name of the sub-sector : Animal Husbandry
8. Classification of the project : Production Growth
9. Duration of Project/ Year : 2 Year (15-16, 16-17)
10. Name & no. of Districts covered : one - Nanded
11. District wise page No. and serial
No of the projects in C-DAP :
12. Area to be covered (Hect) :
13. No of farmers would be impacted: 200
14. Total Cost of the project : (Rs. in Lakh) 60
15. Component wise applicable cost norms of ongoining Scheme of GoI/GoM
(Rs. in Lakh)
S.
N. Components
Total
Cost
Applicable ongoing
scheme of GoI/GoM Cost Sharing pattern
Name Cost norm for
subsidy RKVY Beneficiary
Implementing
Agency.
1 Fodder
Production
From Fallow
lands
60 75 75 -- 25%
Grand Total
% Share 100% -- --
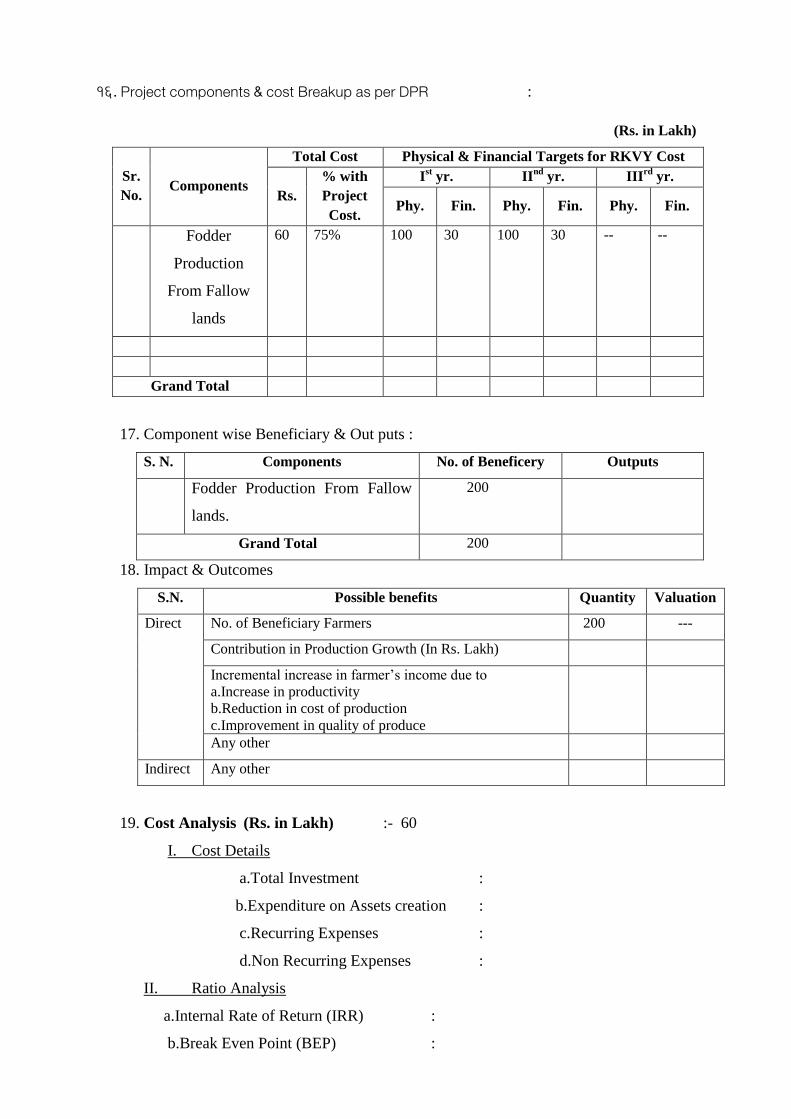
16. Project components & cost Breakup as per DPR :
(Rs. in Lakh)
Sr.
No. Components
Total Cost Physical & Financial Targets for RKVY Cost
Rs.
% with
Project
Cost.
Ist yr. II
nd yr. III
rd yr.
Phy. Fin. Phy. Fin. Phy. Fin.
Fodder
Production
From Fallow
lands
60 75% 100 30 100 30 -- --
Grand Total
17. Component wise Beneficiary & Out puts :
S. N. Components No. of Beneficery Outputs
Fodder Production From Fallow
lands.
200
Grand Total 200
18. Impact & Outcomes
S.N. Possible benefits Quantity Valuation
Direct No. of Beneficiary Farmers 200 ---
Contribution in Production Growth (In Rs. Lakh)
Incremental increase in farmer’s income due to
a.Increase in productivity
b.Reduction in cost of production
c.Improvement in quality of produce
Any other
Indirect Any other
19. Cost Analysis (Rs. in Lakh) :- 60
I. Cost Details
a.Total Investment :
b.Expenditure on Assets creation :
c.Recurring Expenses :
d.Non Recurring Expenses :
II. Ratio Analysis
a.Internal Rate of Return (IRR) :
b.Break Even Point (BEP) :
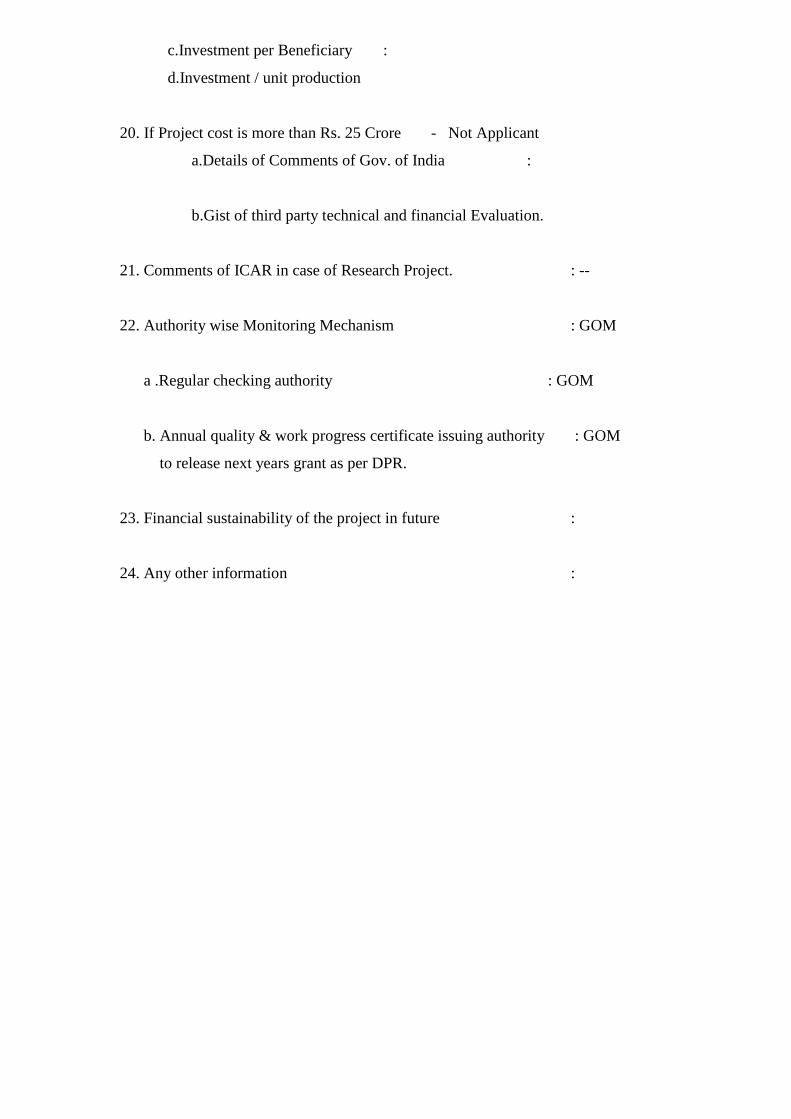
c.Investment per Beneficiary :
d.Investment / unit production
20. If Project cost is more than Rs. 25 Crore - Not Applicant
a.Details of Comments of Gov. of India :
b.Gist of third party technical and financial Evaluation.
21. Comments of ICAR in case of Research Project. : --
22. Authority wise Monitoring Mechanism : GOM
a .Regular checking authority : GOM
b. Annual quality & work progress certificate issuing authority : GOM
to release next years grant as per DPR.
23. Financial sustainability of the project in future :
24. Any other information :

RKVY
Abstract of Project
1. Name of the project : Distributing of 40+2 goat unit in DPAP
2. Type of the Project : Production Growth / Infrastructure & Assets
Stream
3. Core objectives : 1. Cultivation of fodder crop in the fallow
lands
4. Administrative Department. : Animal Husbandry, Dairy & Fishery
5. Implementing Agency : DDC / DAHO
6. Name of the sector : State /Local
7. Name of the sub-sector : Animal Husbandry
8. Classification of the project : Production Growth
9. Duration of Project/ Year : Given for only one year 2013-14
10. Name & no. of Districts covered : one - Nanded
11. District wise page No. and serial
No of the projects in C-DAP :
12. Area to be covered (Hect) :
13. No of farmers would be impacted: 26
14. Total Cost of the project : (Rs. in Lakh)
15. Component wise applicable cost norms of ongoining Scheme of GoI/GoM
(Rs. in Lakh)
S.
N. Components
Total
Cost
Applicable ongoing
scheme of GoI/GoM Cost Sharing pattern
Name Cost norm for
subsidy RKVY Beneficiary
Implementing
Agency.
1 Distributi
ng of
40+2
goat unit
in DPAP
39.00 50% 50% 50%
Grand Total 39.00 50% 50% 50%
% Share 100% -- --

16. Project components & cost Breakup as per DPR :
(Rs. in Lakh)
Sr.
No. Components
Total Cost Physical & Financial Targets for RKVY Cost
Rs.
% with
Project
Cost.
Ist yr. II
nd yr. III
rd yr.
Phy. Fin. Phy. Fin. Phy. Fin.
Distributing
of 40+2
goat unit in
DPAP
50% 26 39.00 - - -- --
Grand Total 50% 26 39.00 - - -- --
17. Component wise Beneficiary & Out puts :
S. N. Components No. of Beneficery Outputs
26
Grand Total 26
18. Impact & Outcomes
S.N. Possible benefits Quantity Valuation
Direct No. of Beneficiary Farmers 26
Contribution in Production Growth (In Rs. Lakh)
Incremental increase in farmer’s income due to
a.Increase in productivity
b.Reduction in cost of production
c.Improvement in quality of produce
Any other
Indirect Any other
19. Cost Analysis (Rs. in Lakh) :- 39.00
I. Cost Details
a.Total Investment :
b.Expenditure on Assets creation :
c.Recurring Expenses :
d.Non Recurring Expenses :
II. Ratio Analysis
a.Internal Rate of Return (IRR) :
b.Break Even Point (BEP) :
c.Investment per Beneficiary :
d.Investment / unit production

20. If Project cost is more than Rs. 25 Crore - Not Applicant
c. Details of Comments of Gov. of India :
d. Gist of third party technical and financial Evaluation.
21. Comments of ICAR in case of Research Project. : --
22. Authority wise Monitoring Mechanism : GOM
a .Regular checking authority : GOM
b. Annual quality & work progress certificate issuing authority : GOM
to release next years grant as per DPR.
23. Financial sustainability of the project in future :
24. Any other information :

RKAY Abstract of project ( stream-1)
1. Name of the project : Supply of wooden boat to fishermen
2. Type of the project : Production Growth / Infrastructure & Assets Stream
3. Core objectives 1. For better fishing
2. To get more fish catch
3. To get more income from the fishing
4.
4. Administrative Department : Fisheries dep. Of Maharashtra
5. Implementing Agency :
6. Name of the sector :
7. Name of the sub- sector :
8. Classification of the project :
9. Duration of project/ year :
10. Name & no of Districts Covered: Nanded
11. District Wise page No and serial
No of the projects in C- DAP :
12.Area to be covered (Hect) :
13.No of farmers Would be impacted : 5000-6000
14. Total Cost of the project : (Rs in Lakh) 52.50 lakh ( for five year )
15. Component wise applicable cost norms of ongoining schemes of Gol/Gom
(Rs in Lakh) S.R.
components Total Cost
Applicable on goining Scheme of Gol/Gom
Cost Sharing pattern
Name Cost norm for subsidy
RKVY
Beneficiary
Implementing Agency

Grand Total % Share 100% -- -- 16. project Components & cost Breakup as par DPR (Rs in Lakh) s. r.
components Total cost Physical & financial Targets for RKVY cost Rs %Withproject
Cost I st II nd III rd
1 Wooden boat phy fin phy fin phy fin Each boat
cost@10500/- 100 10.5
lakh 100 10.5
lakh 100 10.5
lakh Garand Total 17.Component Wise beneficiary & Out puts s.r. components No of Beneficiary Outputs Five boat each society 20 soc/year Increase in
production Garand Total 18.Impact & Outcomes S.N Possible Benefits Quantity Valuation Direct No of Beneficiary Farmers 100 society
Contribution in production Growth (Rs 200-300 ton

in Lakh) fish production Incremental increase in Farmer s income due to a. increase in productivity b. Reduction in cost of production C. Improvement in quality of produce
Any other Indirect Any other 19. Cost Analysis (Rs in Lakh) :- 52.5 lakh for five year
1. cost Details
a. Total Investment :- Each wooden boat@10500/- *100=10.5 lakh/year
Each society @5 *20 society per year =100 boat/year
b. Expenditure on Assets creation:- 10.5 lakh/year
c. Recurring Expenses :-
d. Non Recurring Expenses :-10.5 lakh/yrs
II. Ratio Analysis
a. Internal Rate of Return (IRR) :-
b. Break Even Point (BEP) :-
c. Investment per beneficiary :-
d. Investment / unit production

20. If project cost is more than Rs. 25 Core
a. Details of Comments of Gol :-
b. Gist of third party technical and financial Evaluation
21. Comments of ICAR in case of Research project :-
22. Authority wise Monitoring Mechanism :-
a. Regular checking authority :-
b. Annual quality & work Progress certificate issuing authority:-
to release next year’s grant as par DPR
23. Financial sustainability of the project in future :-
24. Any other information :-
(A detailed note containing the executive summary of the proposed project should be submitted along with above abstract & power point presentation Refer RKVY guidelines 2015)
RKAY

Abstract of project( stream-1)
1. Name of the project : Fish seed rearing in cages
2. Type of the project : Production Growth / Infrastructure & Assets Stream
3. Core objectives :
1. To get more production
2. To get good size of fish seed
3. To improve the socio- economic status of fishermen
4.
4. Administrative Department : fisheries dept. of Maharashtra
5. Implementing Agency : Fisheries dep. Of Maharashtra
6. Name of the sector : Fisheries
7. Name of the sub- sector :
8. Classification of the project :
9. Duration of project/ year : 3 year
10. Name & no of Districts Covered : Nanded
11. District Wise page No and serial
No of the projects in C- DAP:
12.Area to be covered (Hect) :
13.No Of farmers Would be impacted: 1200-1500 fisherman
14. Total Cost of the project : (Rs in Lakh) 120.00 lakh for 3 years
15. Component wise applicable cost norms of ongoining schemes of Gol/Gom
(Rs in Lakh) S.R.
components Total Cost
Applicable ongoining Scheme of Gol/Gom
Cost Sharing pattern
Name Cost norm for
RKVY Beneficiary
Implementing

subsidy Agency cages 180.00 10 60.00 10 60.0 60.00 Each cage@
6.00 *10 society/year
Grand Total % Share 100% -- -- -- -- 16. project Components & cost Breakup as par DPR (Rs in Lakh) S.N. components Total cost Pyhysical & financial Targets for RKVY cost
Rs % With project Cost
I st II nd III rd
phy fin phy fin phy fin 1 cages 180.00 10 60.00 10 60.0 10 60.00 Each cage@
6.00 *10 society/year
Garand Total 120.00 10 60.00 10 60.0 10 60.00 17.Component Wise beneficiary & Out puts s.r. components No of Beneficiary Outputs 1 Cage for seed 1200-1500 More production Garand Total

18.Impact & Outcomes S.N Possible Benefits Quantity Valuation Direct No of Beneficiary Farmers
Contribution in production Growth (Rs in Lakh)
Incremental increase in Farmer s income due to a. increase in productivity b. Reduction in cost of production C. Improvement in quality of produce
200-300 tonn/year
Any other Indirect Any other 19. Cost Analysis (Rs in Lakh) :- 60.00/year
1.cost Details
a. Total Investment :- 60.00 Lakh
b. Expenditure on Assets creation:- 60.00 Lakh
c. Recurring Expenses :- --
d. Non Recurring Expenses :- 60.00 Lakh
II. Ratio Analysis
a. Internal Rate of Return (IRR) :-
b. Break Even Point (BEP) :-
c. Investment per Benrficficiary :- Nil
d. Investment / unit production 6.00 lakh/unit total cost is160.0 lakh
20. If project cost is more then Rs. 25 Crore
a. Details of Comments of Gol :-

b. Gist of third party technical and financial Evaluation
21. Comments of ICAR in case of Research project :-
22. Authority wise Monitoring Mechanism :-
a. Regular checking authority :-
b. Annual quality & work Progress certificate issuing authority:-
to release next year’s grant as par DPR
23. Financial sustainability of the project in future :-
24. Any other information :-
(A detailed note containing the executive summary of the proposed project should be submitted along with above abstract & power point presentation Refer RKVY guidelines 2015)
RKAY Abstract of project( stream-1)
1. Name of the project : Development in retail fish marketing infrastructure

2. Type of the project : Production Growth / Infrastructure & Assets Stream
3. Core objectives :
1 to get good quality fish
2. Will get more profit
3. easy to market approach
4. Increase in profit
4.Administrative Department : Fisheries dept. of Maharashtra
5. Implementing Agency : Fisheries dept. of Maharashtra
6. Name of the sector : Fisheries sector
7. Name of the sub- sector :
8. Classification of the project :
9. Duration of project/ year :
10. Name & no of Districts Covered :
11. District Wise page No and serial
No of the projects in C- DAP:
12.Area to be covered (Hect) :
13.No Of farmers Would be impacted
14. Total Cost of the project : (Rs in Lakh)
15. Component wise applicable cost norms of ongoining schemes of Gol/Gom
(Rs in Lakh) S.R.
components Total Cost
Applicable ongoining Scheme of Gol/Gom
Cost Sharing pattern
Name Cost norm for subsidy
RKVY Beneficiary
Implementing Agency

Grand Total % Share 100% -- -- 16. project Components & cost Breakup as par DPR (Rs in Lakh) S.N. components Total cost Physical & financial Targets for RKVY cost
Rs % With project Cost
I st II nd III rd
phy fin phy fin phy fin 1 For dev. In
marketing the society will be granted for one shop and each shop @ 5.0 lakh
75.0 lakh for 3 yrs
5 shop
25.0 lakh
5 shop
25.0 lakh
5 shop
25.0 lakh
Garand Total 17.Component Wise beneficiary & Out puts s.r. components No of Beneficiary Outputs Retail market shop with equipment 5 society/year More profit and
quality fish food Garand Total 18.Impact & Outcomes S.N Possible Benefits Quantity Valuation Direct No of Beneficiary Farmers 15 societ400-
500 fishermen

Contribution in production Growth (Rs Lakh)
Incremental increase in Farmer s income due to a. increase in productivity b. Reduction in cost of production C. Improvement in quality of produce
Any other Indirect Any other 19. Cost Analysis (Rs in Lakh) :- 75.0 lakh for 3 year 1.cost Details
a. Total Investment :- each shop @5.0 lakh*5 society in each year =25.0 lakh
b. Expenditure on Assets creation:-
c. Recurring Expenses :-
d. Non Recurring Expenses :-
II. Ratio Analysis
a. Internal Rate of Return (IRR) :-
b. Break Even Point (BEP) :-
c. Investment per Beneficiary :-
d. Investment / unit production
20. If project cost is more then Rs. 25 Crore :-
a. Details of Comments of Gol :-

b. Gist of third party technical and financial Evaluation
21. Comments of ICAR in case of Research project :-
22. Authority wise Monitoring Mechanism :-
a. Regular checking authority :-
b. Annual quality & work Progress certificate issuing authority:-
to release next year’s grant as par DPR
23. Financial sustainability of the project in future :-
24. Any other information :-
(A detailed note containing the executive summary of the proposed project should be submitted along with above abstract & power point presentation Refer RKVY guidelines 2015)
RKAY Abstract of project ( stream-1)
1. Name of the project : Improvement and strengthening of Govt.Dept.fish
seed hatchery
2. Type of the project : Production Growth / Infrastructure & Assets Stream
3. Core objectives 1. Production of more fish seed

2. Quality of fish seed
3. More seed availability for fishermen
4. Administrative Department : Fisheries dep. Of Maharashtra
5. Implementing Agency :
6. Name of the sector :
7. Name of the sub- sector :
8. Classification of the project :
9. Duration of project/ year :
10. Name & no of Districts Covered: Nanded
11. District Wise page No and serial
No of the projects in C- DAP :
12.Area to be covered (Hect) :
13.No of farmers Would be impacted : 5000-6000
14. Total Cost of the project : (Rs in Lakh) 95.00 lakh ( for three year )
15. Component wise applicable cost norms of ongoining schemes of Gol/Gom
(Rs in Lakh) S.R.
components Total Cost
Applicable on goining Scheme of Gol/Gom
Cost Sharing pattern
Name Cost norm for subsidy
RKVY
Beneficiary
Implementing Agency
1 Hatchery structure repairing
25.0 Fishermen society
Fisheries dept.of Maharashtra
2 Strengthening of pond
35.0
3 Repairing of water supply structure
35.0
Grand Total 95.0

% Share 100% -- -- 16. project Components & cost Breakup as par DPR (Rs in Lakh) s. r.
components
Total cost Physical & financial Targets for RKVY cost Rs %Withprojec
t Cost
I st II nd III rd
phy fin phy fin phy fin 1 Govt.seed
hatchery repairing
95.0 25.0 lakh
35.0 lakh
35.0 lakh
Garand Total 17.Component Wise beneficiary & Out puts s.r. components No of Beneficiary Outputs Govt fish seed hatchery repairing All fisheries society
of nanded district Increase in production
Garand Total 18.Impact & Outcomes S.N Possible Benefits Quantity Valuation Direct No of Beneficiary Farmers 100 society
Contribution in production Growth (Rs in Lakh)
200-300 ton fish production
Incremental increase in Farmer s income due to a. increase in productivity

b. Reduction in cost of production C. Improvement in quality of produce
Any other Indirect Any other 19. Cost Analysis (Rs in Lakh) :- 95.0 lakh for three year
1. cost Details
a. Total Investment :- 95.0 lakh in three year
b. Expenditure on Assets creation:- 95.0 lakh for three year
c. Recurring Expenses :-
d. Non Recurring Expenses :-
II. Ratio Analysis
a. Internal Rate of Return (IRR) :-
b. Break Even Point (BEP) :-
c. Investment per beneficiary :-
d. Investment / unit production
20. If project cost is more than Rs. 25 Core
a. Details of Comments of Gol :-
b. Gist of third party technical and financial Evaluation

21. Comments of ICAR in case of Research project :-
22. Authority wise Monitoring Mechanism :-
a. Regular checking authority :-
b. Annual quality & work Progress certificate issuing authority:-
to release next year’s grant as par DPR
23. Financial sustainability of the project in future :-
24. Any other information :-
(A detailed note containing the executive summary of the proposed project should be submitted along with above abstract & power point presentation Refer RKVY guidelines 2015)
RKAY Abstract of project ( stream-2 )
1. Name of the project : Establishament fish production unit
2. Type of the project : Infrastructure & Assets Stream
3. Core objectives 1. Production of more fish seed
2. Quality of fish seed
3. More seed availability for fishermen
4. Administrative Department : Fisheries dep. Of Maharashtra

5. Implementing Agency :
6. Name of the sector :
7. Name of the sub- sector :
8. Classification of the project :
9. Duration of project/ year :
10. Name & no of Districts Covered: Nanded
11. District Wise page No and serial
No of the projects in C- DAP :
12.Area to be covered (Hect) :
13.No of farmers Would be impacted : 5000-6000
14. Total Cost of the project : (Rs in Lakh) 11.50 lakh ( for three year )
15. Component wise applicable cost norms of ongoining schemes of Gol/Gom
(Rs in Lakh) S.R.
components Total Cost
Applicable on goining Scheme of Gol/Gom
Cost Sharing pattern
Name Cost norm for subsidy
RKVY
Beneficiary Implementing Agency
1 Hatchery structure repairing
5.0 Fisheries dept.of Maharashtra
Fisheries dept.of Maharashtra
2 Input for hatchey
6.5
3 Grand Total 11.5 % Share 100% -- -- 16. project Components & cost

Breakup as par DPR (Rs in Lakh) s. r.
components
Total cost Physical & financial Targets for RKVY cost Rs %Withprojec
t Cost
I st II nd III rd
phy fin phy fin phy fin 1 Govt.seed
hatchery repairing
5.0 Seed prduct.
2.5 lakh
Seed prduct.
2.5 lakh
Input for hatchery
6.5 Seed prduct.
2.0 lakh
Seed prduct.
2.0 lakh
Seed prduct.
2.5 lakh
Garand Total 11.
5 4.5 2.0 5.0
17.Component Wise beneficiary & Out puts s.r. components No of Beneficiary Outputs Govt fish seed hatchery repairing All fisheries society
of nanded district Increase in production
Garand Total 18.Impact & Outcomes S.N Possible Benefits Quantity Valuation Direct No of Beneficiary Farmers 100 society
Contribution in production Growth (Rs in Lakh)
200-300 ton fish production
Incremental increase in Farmer s income due to a. increase in productivity b. Reduction in cost of production C. Improvement in quality of produce

Any other Indirect Any other 19. Cost Analysis (Rs in Lakh) :- 11.5 lakh for three year
1. cost Details
a. Total Investment :- 11.5 lakh in three year
b. Expenditure on Assets creation:- 11.5 lakh for three year
c. Recurring Expenses :-
d. Non Recurring Expenses :-
II. Ratio Analysis
a. Internal Rate of Return (IRR) :-
b. Break Even Point (BEP) :-
c. Investment per beneficiary :-
d. Investment / unit production
20. If project cost is more than Rs. 25 Core
a. Details of Comments of Gol :-
b. Gist of third party technical and financial Evaluation
21. Comments of ICAR in case of Research project :-

22. Authority wise Monitoring Mechanism :-
a. Regular checking authority :-
b. Annual quality & work Progress certificate issuing authority:-
to release next year’s grant as par DPR
23. Financial sustainability of the project in future :-
24. Any other information :-
(A detailed note containing the executive summary of the proposed project should be submitted along with above abstract & power point presentation Refer RKVY guidelines 2015)
RKAY Abstract of project ( stream-2 )
1. Name of the project : fish farming in impounded water
2. Type of the project : Infrastructure & Assets Stream
3. Core objectives 1. more fish production
2. Quality of fish seed
3. More seed availability for fishermen
4. Administrative Department : Fisheries dep. Of Maharashtra
5. Implementing Agency :
6. Name of the sector :

7. Name of the sub- sector :
8. Classification of the project :
9. Duration of project/ year :
10. Name & no of Districts Covered: Nanded
11. District Wise page No and serial
No of the projects in C- DAP :
12.Area to be covered (Hect) :
13.No of farmers Would be impacted : 5000-6000
14. Total Cost of the project : (Rs in Lakh) 11.50 lakh ( for three year )
15. Component wise applicable cost norms of ongoining schemes of Gol/Gom
(Rs in Lakh) S.R.
components Total Cost
Applicable on goining Scheme of Gol/Gom
Cost Sharing pattern
Name Cost norm for subsidy
RKVY
Beneficiary Implementing Agency
1 Fish seed stocking in pond
11.5 Fisheries society
Fisheries dept.of Maharashtra
2 3 Grand Total 11.5 % Share 100% -- -- 16. project Components & cost Breakup as par DPR (Rs in Lakh) s. Total cost Physical & financial Targets for RKVY cost

r. components
Rs %Withproject Cost
I st II nd III rd
phy fin phy fin phy fin 1 Fish seed
stocking in pond
11.5
Fish prduct.
3.5 lakh
Fish prduct.
4.0 lakh
Fish prduct.
4.0 lakh
Garand Total 11.
5 3.5 4.0 4.0
17.Component Wise beneficiary & Out puts s.r. components No of Beneficiary Outputs Fish seed stocking in pond All fisheries society
of nanded district Increase in production
Garand Total 18.Impact & Outcomes S.N Possible Benefits Quantity Valuation Direct No of Beneficiary Farmers 100 society
Contribution in production Growth (Rs in Lakh)
200-300 ton fish production
Incremental increase in Farmer s income due to a. increase in productivity b. Reduction in cost of production C. Improvement in quality of produce
Any other Indirect Any other

19. Cost Analysis (Rs in Lakh) :- 11.5 lakh for three year
1. cost Details
a. Total Investment :- 11.5 lakh in three year
b. Expenditure on Assets creation:- 11.5 lakh for three year
c. Recurring Expenses :-
d. Non Recurring Expenses :-
II. Ratio Analysis
a. Internal Rate of Return (IRR) :-
b. Break Even Point (BEP) :-
c. Investment per beneficiary :-
d. Investment / unit production
20. If project cost is more than Rs. 25 Core
a. Details of Comments of Gol :-
b. Gist of third party technical and financial Evaluation
21. Comments of ICAR in case of Research project :-
22. Authority wise Monitoring Mechanism :-
a. Regular checking authority :-

b. Annual quality & work Progress certificate issuing authority:-
to release next year’s grant as par DPR
23. Financial sustainability of the project in future :-
24. Any other information :-
(A detailed note containing the executive summary of the proposed project should be submitted along with above abstract & power point presentation Refer RKVY guidelines 2015)
RKAY Abstract of project ( stream-2 )
1. Name of the project : Development of fisheries co-op society
2. Type of the project : Infrastructure & Assets Stream
3. Core objectives 1. more fish production
2. build up co-op societies
3. More socio-economic dev. for fishermen
4. Administrative Department : Fisheries dep. Of Maharashtra
5. Implementing Agency :
6. Name of the sector :
7. Name of the sub- sector :

8. Classification of the project :
9. Duration of project/ year :
10. Name & no of Districts Covered: Nanded
11. District Wise page No and serial
No of the projects in C- DAP :
12.Area to be covered (Hect) :
13.No of farmers Would be impacted : 5000-6000
14. Total Cost of the project : (Rs in Lakh) 0.30 lakh ( for three year )
15. Component wise applicable cost norms of ongoining schemes of Gol/Gom
(Rs in Lakh) S.R.
components Total Cost
Applicable on goining Scheme of Gol/Gom
Cost Sharing pattern
Name Cost norm for subsidy
RKVY
Beneficiary Implementing Agency
1 Share capital for fish society
0.30 Fisheries society
Fisheries dept.of Maharashtra
2 3 Grand Total 0.30 % Share 100% -- -- 16. project Components & cost Breakup as par DPR (Rs in Lakh) s. r.
components
Total cost Physical & financial Targets for RKVY cost Rs %Withprojec
t I st II nd III rd
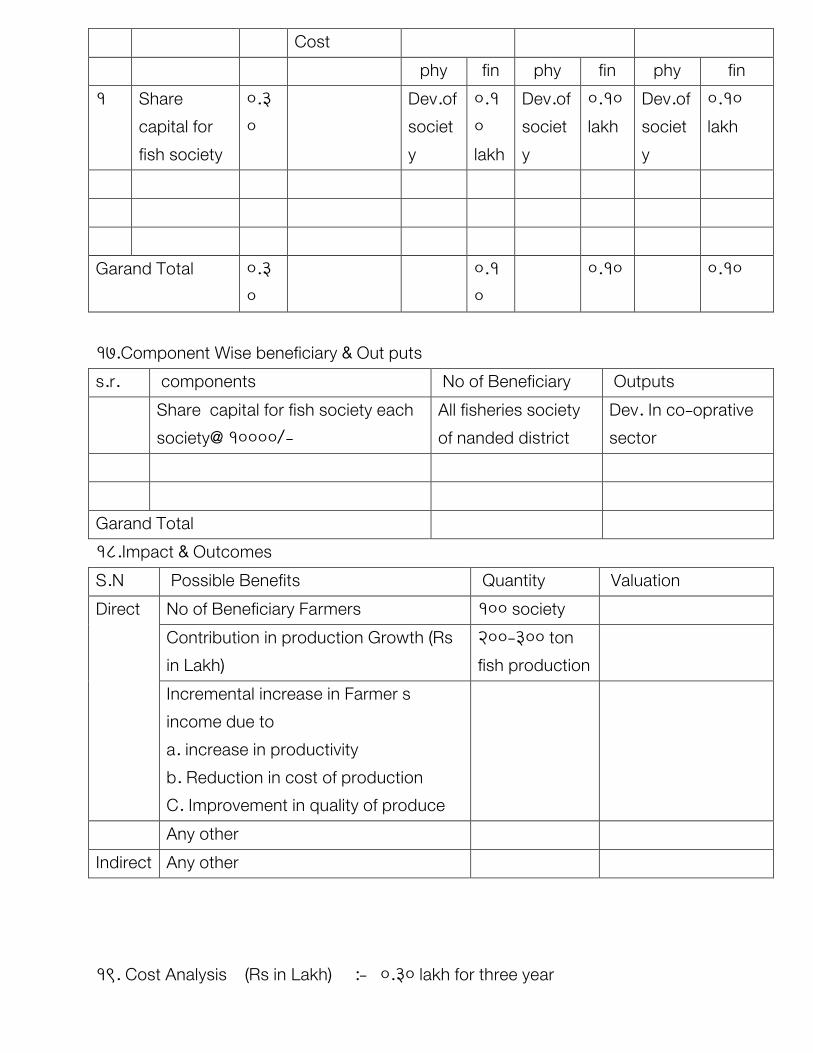
Cost phy fin phy fin phy fin 1 Share
capital for fish society
0.30
Dev.of society
0.10 lakh
Dev.of society
0.10 lakh
Dev.of society
0.10 lakh
Garand Total 0.3
0 0.1
0 0.10 0.10
17.Component Wise beneficiary & Out puts s.r. components No of Beneficiary Outputs Share capital for fish society each
society@ 10000/- All fisheries society of nanded district
Dev. In co-oprative sector
Garand Total 18.Impact & Outcomes S.N Possible Benefits Quantity Valuation Direct No of Beneficiary Farmers 100 society
Contribution in production Growth (Rs in Lakh)
200-300 ton fish production
Incremental increase in Farmer s income due to a. increase in productivity b. Reduction in cost of production C. Improvement in quality of produce
Any other Indirect Any other 19. Cost Analysis (Rs in Lakh) :- 0.30 lakh for three year

1. cost Details
a. Total Investment :- 0.30 lakh in three year
b. Expenditure on Assets creation:- 0.30 lakh for three year
c. Recurring Expenses :-
d. Non Recurring Expenses :-
II. Ratio Analysis
a. Internal Rate of Return (IRR) :-
b. Break Even Point (BEP) :-
c. Investment per beneficiary :-
d. Investment / unit production
20. If project cost is more than Rs. 25 Core
a. Details of Comments of Gol :-
b. Gist of third party technical and financial Evaluation
21. Comments of ICAR in case of Research project :-
22. Authority wise Monitoring Mechanism :-
a. Regular checking authority :-

b. Annual quality & work Progress certificate issuing authority:-
to release next year’s grant as par DPR
23. Financial sustainability of the project in future :-
24. Any other information :-
(A detailed note containing the executive summary of the proposed project should be submitted along with above abstract & power point presentation Refer RKVY guidelines 2015)
RKAY Abstract of project ( stream-2 )
1. Name of the project : Assistance for supply of fishery requisite
2. Type of the project : Infrastructure & Assets Stream
3. Core objectives 1. more fish production
2. more fish catch with effective gear
3. dev.in socio-economic status
4. Administrative Department : Fisheries dep. Of Maharashtra
5. Implementing Agency :
6. Name of the sector :
7. Name of the sub- sector :
8. Classification of the project :

9. Duration of project/ year :
10. Name & no of Districts Covered: Nanded
11. District Wise page No and serial
No of the projects in C- DAP :
12.Area to be covered (Hect) :
13.No of farmers Would be impacted : 5000-6000
14. Total Cost of the project : (Rs in Lakh) 2.10 lakh ( for three year )
15. Component wise applicable cost norms of ongoining schemes of Gol/Gom
(Rs in Lakh) S.R.
components Total Cost
Applicable on goining Scheme of Gol/Gom
Cost Sharing pattern
Name Cost norm for subsidy
RKVY
Beneficiary Implementing Agency
1 Subsidy on fishing nets
2.10 Fisheries society
Fisheries dept.of Maharashtra
2 3 Grand Total 2.10 % Share 100% -- -- 16. project Components & cost Breakup as par DPR (Rs in Lakh) s. r.
components
Total cost Physical & financial Targets for RKVY cost Rs %Withprojec
t Cost
I st II nd III rd

phy fin phy fin phy fin 1 Subsidy on
fishing nets 2.1 Net in
kg 0.40 lakh
Net in kg
0.70 lakh
Net in kg
1.0 lakh
Garand Total 2.1
0 0.4
0 0.70 1.0
17.Component Wise beneficiary & Out puts s.r. components No of Beneficiary Outputs Subsidy on fishing nets All fisheries society
of nanded district Increase in production
Garand Total 18.Impact & Outcomes S.N Possible Benefits Quantity Valuation Direct No of Beneficiary Farmers 100 society
Contribution in production Growth (Rs in Lakh)
200-300 ton fish production
Incremental increase in Farmer s income due to a. increase in productivity b. Reduction in cost of production C. Improvement in quality of produce
Any other Indirect Any other 19. Cost Analysis (Rs in Lakh) :- 2.10 lakh for three year
1. cost Details

a. Total Investment :- 2.10 lakh in three year
b. Expenditure on Assets creation:- 2.10 lakh for three year
c. Recurring Expenses :-
d. Non Recurring Expenses :-
II. Ratio Analysis
a. Internal Rate of Return (IRR) :-
b. Break Even Point (BEP) :-
c. Investment per beneficiary :-
d. Investment / unit production
20. If project cost is more than Rs. 25 Core
a. Details of Comments of Gol :-
b. Gist of third party technical and financial Evaluation
21. Comments of ICAR in case of Research project :-
22. Authority wise Monitoring Mechanism :-
a. Regular checking authority :-
b. Annual quality & work Progress certificate issuing authority:-

to release next year’s grant as par DPR
23. Financial sustainability of the project in future :-
24. Any other information :-
(A detailed note containing the executive summary of the proposed project should be submitted along with above abstract & power point presentation Refer RKVY guidelines 2015)

1 | P a g e
CHAPTER -1
INTRODUCTION
1.1OBJECTIVES : This comprehensive District Agricultural Plan (C-DAP) describes what the
district can achieve over a medium term of five years and how it should work to achieve it. The C-DAP has been repaired with the following objectives:-
To continuously raise productivity, production, employment and income in agriculture and allied activities through optimal utilization of natural and human resources;
To strengthen, reorganize or newly build up physical infrastructure and institutions to effectively help adopt and operate modern technologies and practices to provide further impetus to agricultural growth and rural Development;
To provide food security and to eliminate hunger; To focus all activities in support of small and marginal farmers, poor and
disadvantaged people with a view to secure social justice and to reduce poverty and distress;
To continuously improve economic well being and quality of life of all stake holders in the district; and
To help the district to take off on a faster track of growth and sustainable development.
Along with crops and their productivities the C-DAP deals with all the infrastructural and allied activities like soil health and conservation optimal utilization of land and water resources, adequacy and purity of inputs, credit, marketing, livestock, dairying, poultry, fisheries, sericulture, agro-processing, agro services and strengthening of research, education and extension services, for continuing technological up gradation of the entire farming system.

2 | P a g e
These goals and the strategies (meaning courses of action) to achieve them have been discussed in the following chapters on different sectors and services supporting them. All the strategies are designed to continuously raise productivity.
The C-DAP proposals will provide employment to thousands of employed or partly employed people, raise standards of living in rural areas, reduce poverty and distress, and specially reach the benefits of growth and development to the thousands of small and marginal farmers who are mostly in distress today because of the non-viability of their farms and several other consequential handicaps; Naturally, this last group of small and marginal farmers and their handicaps are the focus of attention of many C-DAP proposals.
The most important aspect of C-DAP is the implementation of strategies. For doing it effectively we have to strengthen, reorganize or newly build up physical infrastructure and institution to effectively help adopt and operate modern technologies and practices and to provide farther impetus to agricultural growth and rural development.
Earnest implementation of all C-DAP projects, schemes and programmes will result in simultaneous increments in productivity of each crop and each of the allied activities, in each farm in each village, and in each block in the district. Combined with improvements in credit, marketing, employment and other infrastructure, the overall growth in bound to have a multiplier effect. It should be certainly possible to raise farm production and farmer incomes at least by 50% over a medium terra of five years. That should mean the beginning of the Second Green Revolution. The momentum generated, the self confidence gained in reprocess and the continuing upgrading of agro-technologies will continue to lift the district economy to higher and higher levels in future. Outcomes of all the efforts will remain in the farmer’s hands. No one else will claim any share or tax from there. Even the access to credit will be much easier and cheaper than what it has been during the past several decades.

3 | P a g e
Accomplishment of this C-DAP will thus lead to the most desired well-being of the people of the district.
1.2 GOVERNMENT OF INDIA’S INITIATIVES :
The Government of India has taken several significant initiatives during the last 3/4 years. A few of them may be mentioned :
The task force on revival of co-operative credit institutions (vaidayanath committee) constituted in 2004,It reported in December 2004.
Launching of the National Rural Employment Guarantee scheme in 2004 Constitution of an Expert Group on Ground water Management and
ownership 2005
National Farmers Commission 2006 It submitted five reports. Declaration of National Policy on Farmers 2007
Launching of Food Security Mission 2007
Establishment of National Rainfed Areas Authority 2007
Launching of Rashtriya Krishi Vikas Yojana (RKVY) 2007
Watershed Development and micro irrigation programmes;
The Loan waiver scheme for 2008
The Planning Commission’s approach paper to the 12th five year plan also reflects the national concern for inclusive growth. In fact, that paper is titled “Towards a faster and more inclusive growth. The pro poor inclusiveness is bound to the future strategy of development. It shall be operative in two ways. First is that sector line agriculture which had been neglected in the earlier decade would again be contributing to the vibrant economy. Second is that the

4 | P a g e
poor sections of the population whom the earlier growth process had bypassed shall be enabled to fully engage themselves with the development process.
The core purposes behind all the above initiatives are Rejuvenation of Agriculture and reversal of the downward trend in agricultural productions;
Acceleration of growth of agricultural production;
Optimal utilization of land and water resources;
Creation of additional employment;
Reduction of poverty;
Immediate relief to indebted farmers;
Decentralized development planning with reference to location specific, potential, needs and problems Special attention to and focus generally upon poor and especially upon small and marginal farmers whose farm holding are not viable and who for this and several other handicaps live in poverty and distress.
Looking to the above initiatives and the core purpose underlying them generally, and especially to the RKVY with its assertive precondition of decentralized comprehensive District Agriculture Plans (C-DAP) based upon agro climatic variation, location specific potential, needs and problems, one can confidently say that the bas days of neglect and indifference towards this district, its development potential, its needs and its problems are at last gone. In their place a new era has dawned in which well organized and determined efforts of each and every farmer will be enthusiastically and actively supported by Gram Panchayat, NGO’s. Local Technology Support groups, Banks, and higher entities in the Agricultural Department. District Administration. KVKs and the Agricultural University. The GP,NGOs and the village TSG will together ensure that no farmer or no farm remains out of the campaign or remains

5 | P a g e
unsupported. Generally, the farmers will need technological advice on soil health, soil nutrients, fertilizers, adequate and pure seeds and harvesting or marketing. The poor small and marginal farmers would, in addition, need support of agro-services, bulloks, tools implements etc, and a sort of small working capital loan for payment of those services. A tripartite arrangement may have to be made between a Bank, GP and the individual small farmer or a self help group formed by a group of small farmers for meeting expenses up to harvesting time.
1.3 THE STRUCTURE OF THIS C-DAP :
This C-DAP has been prepared in accordance with the RKVY guidelines and Planning Commission’s Manual. The scheme of six chapters and their sections follows the manual , paragraphs in each section have been numbered separately.
The Manual scheme does not have separate chapters or sections for a new important topics like extension, research, implementation of C-DAP etc. In such cases, we have incorporated our proposals in the sections dealing with constraints or interventions. Our proposals on plan implementation are included in chapter 6’towards the end of the section on C-DAP.
In accordance with the Manual, we have an Executive Summary’of the C-DAP at its beginning used in this C-DAP.
A list of maps and figures is presented after the contents indicating their location as pages containing those maps or figures.
APPENDIX-II
1.4 Structure of C-Dap METHODOLOGY – TECHNICAL NOTE :

6 | P a g e
The following methodology is adopted in different chapter analyses of the problems and to suggest solutions. Estimation of Intra-District Growth Differentials: For estimation of intra-district (or inter-taluka) difference, the district average is considered as the base or (100). The productivity of each crop the district level has been compared with the productivity of that crop at taluka level and productivity indices prepared. Finally, the productivity indices of 12 major crops in each taluka are added and a composite’s index of all crops was prepared. This composite index represents the intra-district growth differentials of that district.(Chapter II) Lorenz curve: To measure the inequality in distribution of land holding and land operated by various categories of farmers (marginal, small, large farmers) the well known method of Lorenz Curve is used. Two Lorenz Curves are depicted for the State of Maharashtra, to understand the level of inequality at the district compared to the state level. Growth Rates : For estimating the projected level of output at given period of time (for 5 years) compound growth rates (CGR) are used. i.e.4% for agriculture, and 6% for allied activities’. The following formula is used. A=P(1+r)n/100 Where, A = Amount of final output, P=initial output, R=growth rate N=number of years 1.5 GAP ANALYSIS :
For estimating the difference between district/taluka level per hectare productivity and the productivity per hectare of Front Line Demonstration, the gap analysis is follow.
Formula for estimating growth rate : R=(A/P)1/n-1)

7 | P a g e
1.6 Estimation of trend growth rates :
For estimating the long-term growth rates of the past 8-10 years of each crop (i.e.2013-14 to 2014-15) the method of Least square is followed :
Yc = a + bx ....................(i) for estimating trend growth rate Usefulness of the method : Generally productivity / production of crops differs form year to year, may by due to climate conditions scanty & irregular rainfall, disease, etc. the least square method eliminates such fluctuations and a trend growth rate over a period can be obtained. This trend growth rate can be used for projections during the 5 year period. Estimation of Gross Value Added of District : For estimating the Gross Value of output of agriculture, horticulture, floriculture, milk, meat, eggs, fish etc. we have used 1999-2000 prices (constant prices) so as to understand the real changes in the value of output. The prices have been obtained from the respective APMC offices, of the district. Estimation of income of carious categories of farmers; after estimating the Gross Values of output of each district, this total value of output has been allocated to each category of cultivators in their proportion. i.e. proportion of marginal farmers; small farmers, medium and large farmers, etc. This allocated proportion is divided by the total number of farmers in each category so as to obtain average income of the cultivator in each category.
This kind of estimation is made at two points of time, i.e. base year ( )and final year-------.This will enable us to find out the changes in level of incomes of the cultivators at two points of time.
The compound Growth Rate of incomes of cultivators are also estimated at two points of time.
CHAPTER – II
GENERAL DESCRIPTION OF NANDED DISTRICT

8 | P a g e
INTRODUCTION:
The XII five year plan aims at the improvement of the farming community in particular and the rural masses in general through investment in agriculture and allied sectors of the Indian economy. To achieve this broader objective the Govt. of India has initiated a number of projects/ programmes/ schemes during the XII Plan period,2013-2017.
2.1WHY COMPREHENSIVE-DISTRICT AGRICULTURE DEVELOPMENT PLAN (C-DAP)
To raise productivity, production employment and income in agriculture & allied sectors. To achieve optimal utilization of natural and human resources. To strengthen, recognize and build up physical infrastructure and institutions. To ensure higher adoption or modern technologies. To provide further impetus to agricultural growth and rural development Provide food security and eliminate hunger. To secure social social justice by focusing all activities / programme in support of small and marginal farmers, poor & disadvantaged people. Top reduce poverty and ditress. To continuously improve economic well being and quality of life of all stake holders in the district. To help the district to take off on a faster track of growth and sustainable development.
2.2 GROWTH TARGETS :

9 | P a g e
The Eleventh Five year Plan (2013-2017) has per the 4% growth target for agricultural sector, and, II) 6% for the allied sectors, like, animal husbandry and horticulture, sericulture, fisheries, etc. per annum.
INTRODUCTION
Nanded district is known as one of the district in mahatashtra, with historical background. Guru Govindsingh has laid down his life in Nanded. It is located on the banks of the Godavari River.
2.3 LOCATION AND GEOGRAPHICAL CHARACTERISTICS :
Nanded district is one of the eight district of the Marathwada region. It is locate between 18.150
to 19.550 North latitude and between 77.70 to 78.150
East longitude. The district is bounded by Hingoli and Yavatmal districts to the North; by Parbhani district to the West; by Adilabad and Nizamabad districts (of Andhra Pradesh) to the East; and by Bidar district (of Karnataka) to the South.
AREA : The total geographical area of the Nanded district is 1033100 ha. which forms 3.35% of the total geographical area of Mahrashtra state. Out of this area 211.1 sqkms (2.01%) is urban are while the remaining 10290.9 sqkms (or 97.99% ) is rural area.
Of the total geographical area of the district about 8.97% area is forest area; 52% of forest area is concentrated in Kinwat Taluka alone. The southern part of the district is hilly and has light soils; while the North-Eastern part is hilly

10 | P a g e
and not very useful for cultivation. The rest of the land of district is very fertile and black soil.
2.4 NATURAL RESOURCES :
The district does not have much natural resources like mines etc. However, in some part of Kinwat Taluka low quality calcium is available. Soils, useful for brick making is available in the district.
2.5 RIVER SYSTEM :
The Godavari is the main river which flows through Nanded district. The other rivers in the district are, Saraswati, Painganga, Asana, Seeta, Lendi etc. Godavari, Manjra, Maniad and Painganga are rivers with perennial flow.
2.6 CLIMATE AND RAINFALL :
The district experience three climatic seasons, namely i) Rainy season during June to September ii) Winter season, during October to February and iii) Summer season during March to May.
In 2005,the maximum rain fall was recorded in Himayatnagar Tehsil (i.e.2081 mm) while minimum was recorded in Nanded tahsil (795mm ) The district comes under Assured Rainfall Zone.
2.7 DEMOGRAPHIC PROFILE :
Population : According to the population census of 2011 Nanded district has a total population of 33.56 lakhs,of which 27.18 lakhs is rural 80.98% while 6.38 lakhs is urban population (or 19.02%) The male and female population of the district is 17.32 lakh and 16.23 lakh respectively. The sex ratio is 937 as against the state average of 897 per 1000 males
2.8 SC & ST POPULATION :

11 | P a g e
The schedule caste population of the district is 640483 (or 19.07%) and the scheduled Tribes population is 281665 (or 8.37% ) of the total population.
2.9 DENSITY OF POPULATION :
The density of population in Nanded district is 319 persons per sqkm of area as against the state average of 365 persons.
2.10 AGE COMPOSITION :
The age composition of population in Nanded district is as follow : (in %)
BPL families 148016
Total Rural families = 2447394
Total BPL families = 148016
% of BPL families = 6.04
2.11 GENERAL INFORMATION
Table 1 show the general information of Nanded district. These are a total no. of 16 talukas in Nanded district, with a total no of 1575 revenue villages. There are a total no of 1309 Gram Panchayat in the district. This table also incites, total male and female population as well as scheduled caste and Scheduled Tribes population of Nanded district.
2.12 1.LAND CAPABILITY CLASSES :
There is no capability class I land in Nanded District, this means that the land without any limitation for crop production does not occur. However the land of class II and class III occupy nearly 3.62 lakh ha area. With proper management these soils have good potential for crop production class four areas is 1.9 lakh ha. This is not productive. This area is in to steep slopes indicating the need for watershed development programme.

12 | P a g e
2.13 2.SOIL FERTILITY :
The data PH, EC, organic, carbon, available NP, and have been presented in tables. The sample soil is too small to arrive at any conclusion. However, the soil health is poor. Pure is depletion of nutrients with high yielding variation group over a long period. The nutrients imbalance has been indicate. There is a velocity to adopt integrated nutrient the soil use sufficient in copper and manganese while they are deficient in available iron and zinc.
2.14 IRRIGATION AND GROUND WATER :
SURFACE IRRIGATION :
The total cultivable area in the district is of the order of 8,73,300 ha ie. 82.92% of the Geographical area of 1053100 ha. The total surface irrigation potential is of the order of 97332 ha after completion of the following projects.
Major projects 31800 ha Medium projects 7486 ha Minor projects (state & local sector) 3150 ha K.T. wears (state & local sector) 20828 Total : 63264
Average rainfall in the district 875 to 900 mms. A potential of about 1,60,979 ha. has been created up to June 2014 irrigation 18.43%
2.15 2.GROUND WATER :
The total no of watershed in the district is 88. As per latest Ground water survey, the total recharge available from ground water is of the order of 144,957 ha. The no of existing wells is 97809. Thus there is potential for digging additional 1,13,478 wells. Presently actual irrigation from existing open and tube wells is of the order of 85120 as per table 10, furnished by Agriculture Department.

13 | P a g e
Table 2 Land utilization in District
Sr. no.
Nanded
Area %
1 Geographical Area 1033.16 100.00
2 Forest Area 92.70 8.97
3
Land not available i) + ii)
i) Non-agricultural use 1.82 0.18
ii) Un-cultivable land 1.38 0.13
4
Other cultivated land 0.00 0.00
Cultivable waste land 32.00 3.10
permanent pastures and grazing lands
50.60 4.90
land under miscellaneous tree 8.00 0.77
5
Fallow land i) + ii)
i) Current fallow 146.29 14.16
ii) Other fallow 5.73 0.55
6 Net cultivated area 719.06 69.60
7 Gross cropped area 199.35 19.30
8 Intensity of cropping 27.72

14 | P a g e
2.16 LAND UTILIZATION STATISTICS (PRECEDING 3 YEARS)
The land utilization statics of a district explains the use of the land resources for various proposes. Table -13 indicate the land utilization statistics of Nanded district, which is the average of the last 3 years.
2.17 Forest area :
At the district level, the total area under forest is only 92700 of the total geographical area of the district. At the taluka level lowest the percentage of forest area is only (0.28%) in Dharmabad. While lightest in Mahoor,(21.23%) taluka. The proportion of the Taluka to the state level is about 17% Hence, from the point of view of maintaining of ecological or environmental balance,the area under forest in Nanded district needs to improved with priority through the social forestry programmes in the district.
2.18 CURRENT AND OTHER FALLOW LANDS :
At the district level, the current fallows form 14.16% and other fallows from 0.55% of total geographical area of the district. Taluka - wise proportions of fallow land are shown in table no 2.
2.19 NET AND GROSS CROPPED AREA :
At the district level, the total cultivable area is 858300 hectares forming about 83.08% of the total geographical area of the district; at the physical area of the district; at the Taluka level the proportion of net sown area to total geographical area of each Taluka is shown in table No 1.
2.20 CROPPING INTENSITY :

15 | P a g e
Cropping intensity explain the efficient use of available land resources in a given region. It depends upon nature of soils, rainfall and irrigation facilities. Hence, table 2 shows data on gross cropped area of each Taluka which explain the intensity of cropping. At the district level the intensity of cropping is 117% which is reasonable.
MAIN AND MARGINAL WORKERS IN NANDED DISTRCIT : Table no.2.3
Main and Marginal Workers in District (2011)
Sr. no.
Sector Main
workers Marginal Total %
1 Cultivators 3795.05 NA 3795.05 2.89
2 Agriculture labour 5010.00 NA 5010.00 3.81
3 Manufacture repairs, maintenance Household industry
1240.00 NA 1240.00 0.94
4 Other Workers 5460.00 1159 1213.6 2222.71
Total workers 15505.05 1159 1314.05 100.00
% workers to total population 49% % of non-workers to total population 55% source : socio –Economic Review of Nanded District 2004-05, P 127 GOM
To achieve full employment is generally one of the major objectives of the economic policy of the Central and State Government and unemployment in Nanded district, with the help of latest available data. (see table) 2011

16 | P a g e
There are a total no. of 1042500 workers in Nanded district as in 2001; of which 88.9% (or 926600) workers are main workers, while the remaining 11.1% (or 115900) workers are Marginal workers.
Of the total workers,32.7% are cultivators, while another 36.8% are agricultural labour. In this way the cultivators and agricultural workers, together constitute 69.5% of the total workers.
The secondary sector (manufacturing, household industry) employs hardly 1.2% of total work force, indicating a very weak industrial base.
The service sector (other workers) employs 29.3% of total workers. It may be concluded from the above data that there is huge burden of workers on agriculture sector, which needs to be shifted to the non farm sector, by the expansion of industrial sector during XII plan.
Table 2.4 Employment/Unemployment (District)
No. of posts declared vacant 343
Employers using Employment Exchange for recruitment 73
Total unemployed persons on the register last year 116370
No. of new persons registered in current year 21640
No. of persons obtaining Jobs 56
No. of persons unemployed at the end of the year 120500
(source : IBid Nanded)
Rate of unemployment :
i) Labour force = workforce + No. of employed
1163000 = 1042500+120500

17 | P a g e
Rate of Unemployment 10.36%
2.21 RATE OF UNEMPLOYMENT :
Table 15 shows the no. of unemployed in Nanded district at the end of the year 2004,as recorded by the District employment Exchange & Guidance centre. There a total no. of 120500 persons in Nanded district seeking employment at the end of 2004.
The rate of unemployment is quite serious at 10.36% of the total labour force in the district. Most of these unemployed persons are unskilled as well as educated; but they are unemployable due to lack of any skills. Therefore, to make them employable, a large no of vocational schools, ITI s, and job oriented courses need to be introduced on large scale in the district there has to be a linkage between Universities/ Colleges and the industrial sector, so that suitable courses needed by the industrial sector could be introduced in the syllabus of Universities / Colleges.
2.22 LAND HOLDING PATTERN :
The following table show the land holding pattern in Nanded district
Table No 2.5
Land holding pattern in Nanded district (1991)
Sr. no. Size of land Holding (ha)
No. of Holders
Land Operated
(ha)
% of Land
Holders
% of Area
operated

18 | P a g e
(100)
1 0.0 to 1.00 100489 61275 26.48 7.62
2 1.0 to 2.00 132988 195186 35.04 24.29
3 2.0 to 5.00 119740 358063 31.55 44.56
4 5.0 to 10.00 23672 154799 6.24 19.26
5 10.00 to 20.00 2488 30819 0.66 3.84
6 20.00 to above 128 3465 0.03 0.43
Total 379505 803607 100 100
source:
Agricultural Census 2010-11
There are 379505 cultivators in Nanded district cultivating a total land area of 802607 hectares, or an average of 2.11 hect per cultivator. The marginal farmer’s group formed 26.5% of total, but they operated only 7.6% of total land; another group of small farmers (1.00 to 2.00) formed 35.04% of total land holders while they operated 24.29% of land. While other groups formed lower percentage of land holders but they operated high percentage of land. Hence, it may be concluded that land distribution in Nanded district is skewed in favor of large farmers, which is also depicted by the Lorenz Curve shown here. More land reform measures as well as consolidation of land holding is necessary to make farming a viable proposition. 2.23 PER CAPITA INCOME :
The per capita income of a region reflects upon the standard of living of the common people residing in that region. The per capita income of Nanded district,in 2010-11, at constant prices, was observed to be Rs. 44978/- as

19 | P a g e
against the state average of Rs.46492/- In other words, the per capita income of Nanded district is about 96.74% of state per capita income, indicating a low standard of living of the masses in Nanded district (See diagram) 2.24 HUMAN DEVELOPMENT INDEX :
Recently, the United Nations Development Index (HDI) , which is much more comprehensive than the per capita income. The HDI is the average value of three major variable , viz (1) per capita income ii) Education and iii) Health
Table no. 6 Gross District Domestic Product, of District
at constant Prices (latest 2011-12Year) Rs. Lakhs
Sr. No
Sector Amount % to total State
GSDP% 1 Primary sector 38.97 74.58 - 2 Secondary sector 2.42 4.63 - 3 Tertiary sector 10.86 20.78 - Total GDDP 52.25 100.00 - 4 Per capita District Income Rs. 52.58 55.15 - 5 Per Capita State Income Rs. 95.33 100.00 -
6 Dist. Per capita income as % of State per capita Income 1.58 1.65 -
7 Human Development Index (HDI) 0.37 0.38 - 8 Human Poverty Index (HPI) 23.39 2453 -
source Socio economic review of Nanded District year 2011-12
VISION :
I-OUR VISION OF THE DISTRICT IS THAT IN THE NEXT TEN YEARS :
It should be doubling its production from agriculture and allied activities;

20 | P a g e
It should have ------
\Modern physical infrastructure;
Modern social and institutional infrastructure;
Healthy and sustainable environment; and
Full employment; and
It should be free of
Poverty;
Illiteracy and ignorace;
Social disparties;and
Gender disparities
2.25 OUR TEN YEAR VISION FOR THE FARMERS OF THE DISTRICT IS THAT ALL OF THEM SHOULD
Have adopted modern farming technologies and best practices and should be reaching achievement of maximum yields and optimum agriculture production from their farms, water and other resources;
Have at least one well or one farm pond each fitted with micro irrigation system and should be optimally utilizing their rain water and ground water resources;
Have had soils testing of their lands done and received and acted upon scientific advice from experts and used inputs for preservation and enrichment of their soils;
Be getting adequate, timely, and quality pure supplies of seeds, fertilizers, pesticides and other inputs;

21 | P a g e
Have taken to using modernized tools and implements, reduced drudgery of manual work and have taken to farm mechanization to overcome shortage of hired labour;
Have taken to growing higher value crops and specially to irrigated or rainfaid horticulture;
Have good credit and marketing facilities and supporting infrastructure like all weather connectivity, transport and market intelligence; and
Have caring and technologically competent extension workers willing to rush advice and help at the shortest notice of needs,
We also envision formation of an Associations For Progressive Fanning (AFPFS) separetly for each block with village wise branches and a federation for the district to positively support spreading of modern implementation of CDAP programmes at the Panchayat Samiti and Gram Panchayat levels. PPFs will take special care to ensure total coverage of all the farmers and that no farmer is left out.
2.26 OUR TEN YEARS VISION SPECIALLY FOR THE ASSET POOR AND ASSET LESS FARMERS IS THAT ALL OF THEM :
Have joined self help groups (SHGs) specially promoted for them; Through those SHGs and with training, financial and backup promotional
support from DRDA, Z.P. Gram Panchayat, Panchayat Samiti, Progressive Farming Society, Banks and the Agriculture department get themselves transformed into capable providers of critical service to agriculture of the village;
With those critical agro services they have started contributing to the rejuvenation of agriculture of the village including their own presently non-viable small farms,

22 | P a g e
With their non-viable farms back in progressive production line and with the additional employment and incomes they get from the agro services they are providing, most of them have come out of poverty; At least 20% out of them have made more progress and have setup their own micro-agro enterprises; and
All of them have gained self confidence for making more progress in future and are all living with dignity and in well being.
For actualizing this vision, the C-DAP attempts to explore possible ways of better utilization of natural, physical and human resources. It attempts to discover and locate laten potentials of growth and development and is making proposals for activating human energies and social organizations for their full utilization.
C-DAP proposals for reforms and strengthening of the extension agencies should help inform the farmers of the latest technologies and adequately motivate them to diligently work for their own advancement.
The reforms and strengthening of the implementation agencies in the district are of crucial importance. The best policies and programmes fail because of poor governance and shortcoming in implementation. An innovative re-organization to provide missing coordination links within the different wings and departments involved with implementation is absolutely necessary. It is also imperative to set up reasonable working relationship with Panchayat Raj Bodies,NGOs and Public Private Partnerships,. If the government is serious about transformation of rural economy and rural society through massive programmes like RKVY it must take early steps to provide for a strong inspired implementing agency to lead that movement in the district and to get results.
This C-DAP has recommended several strategies for various sub-sectors to overcome the reasons of backwardness and to accomplish the vision stated in Para above. Details like rationale behind them, action plans with physical targets, financial requirements and outcomes, and implementing schedules will

23 | P a g e
be found in th related chapters. Action plans have been formulated so that their implementation will make a great impact on the agricultural growth and development of the district. It is worthwhile to emphasize that every element of action plan under each strategy positively contributes to the desired results. Most elements will be simultaneously in operation and will have additive effects on outcomes of each other. That add-on effect would lead to still higher growth.
C-DAP targets are realistic and not difficult to achieve. Individual mediocrities and indifference and departmental egos have, however, halted many fast trains in the past. Top bosses should be alert. The above weakness and many more have to be overcome. Enthusiasm for a good work has to be sustained at all official and non-official levels.
The C-DAP should be implemented in a mission mode. Print & electronic media will help to motivate people for more hard work and more positive roles. Every farmer (large or small), every Gram Panchayat, every NGO or informal group or committee should be a doer (karta), earnest and fired by the spirit of the C-DAP . The opportunity should not be lost. C-DAP throw a challenge to them. Everyone is on trial and has to contribute his utmost towards the successful accomplishment of the mission.

24 | P a g e
CHAPTER III
SWOT ANALYSIS OF THE DISTRICT
SECTION-I
3.1 INTRODUCTION :
Analysis of strengths, weaknesses, opportunities and threats is called SWOT Analysis and is an effective tool in decision making. The job of the Development Administration is to :
Capitalize upon the strengths; Minimize the effect of weaknesses; Take advantage of opportunities; and Avoid or overcome threats
We set certain objectives like raising of productivity and production, social justice and removal of poverty. SWOT analysis is to look at the possibilities of achieving them from the input end. It is to check how the existing conditions would affect the future programme of action for development. Strengths and weakness are two internal attributes of the district while opportunities and threats are of external environment.
Strength relates to the potential for future development. It is a potential which is as yet unused or underutilized. Strengths do not get translated into development until they are matched with opportunities.
Weakness of the district are negative aspects or liabilities which tend to make it less effective on its path of development. They are of two types, i) the incurable ones, and ii) the correctible ones. Weakness causes great harm when they are matched with threats from the environment. An example may be, of poor agricultural practices subject to uncertain climate conditions. Similarly,

25 | P a g e
obsolete technology is a weakness. Old traditions inhibit acceptance of improvements and to that extent add to the harm of that weakness.
Opportunity: as used in this chapter is any chance to follow a new or revived strategy which would benefit the district in the process of growth and development. Opportunities always exist and only need to be identified. Most opportunities have to be sought. In a few cases, they have to be and can be created. The focus of development administration must always be on indentifying additional opportunities, selecting those which are most promising and capitalizing on them.
Threats are probable events which can seriously hamper the process of development in the district. Threats always exist. They become less severe if they are recognized soon enough and care is taken to guard against them. The development process should avoid the threats in the environment or overcome them.
Analysis of strength, weakness, opportunities and threats (SWOT) is a complex process. It can deal with the whole system or organization of growth and development at once.
We are presenting examples and lists of a few strengths, weakness, opportunities and threats of the district in the following sections 2), 3),4) and 5) Issues emerging from those lists are presented in section 6) Strategies or action proposals to deal with these issues are discussed in chapters 4,5 and 6.
This SWOT analysis very briefly shows, what the district is capable of doing, what it is doing and what it should be doing. Development is a dynamic process, continuously making impact and changes in all the four aspects of the SWOT analysis. A periodical review of SWOT should, therefore, be an essential element of any development process.
3.2 SECTION -2 :

26 | P a g e
WATER RESOURCES INTRODUCTION
Water Resources projects can be classified into three categories a) Major Irrigation Projects where cultivable command area is more than 10000 ha; b) Medium Irrigation Projects where cultivable command area is between 2000 ha to 10000 ha and c) Minor Irrigation Projects where the cultivable command irrigated area is below 2000 ha. Assessment of potential for 2015-16
Due to increased awareness about use of sprinker, lift irrigation, etc.the potential has been worked out as under
(Rs.lakh) Sr.No. Activity Unit (No
/ Area) Base PLP (2015-16) Revised (2015-16)
Physical Units
Financial Physical units
Financial
1 Dug well No. 185 179.82 185 183.15 2 Pump set No. 360 110.16 36 178.20 3 DRIP set No. 3100 914.50 3100 1085.00
4 Sprinkler sets
No. 1750 297.50 1750 297.50
5 Pipelines No. 1100 178.20 960 172.80
6 Lift Irrigation Small
No. 230 92.61 245 92.61
7 Deepening of well
No. 525 226.80 320 138.24
8 Energisation of Pump sets
No. 520 187.20 520 214.50
9 I P Diesel No. 225 87.08 160 43.20

27 | P a g e
sets Total 2273.87 2405.20 Suggested Action Points : Government Departments:
Looking at the poor cropping intensity and huge ground water potential, programme of new wells can be initiated in the district that would give a demonstrative effect. GSDA may work out a plan to recharge open/bore wells during the monsoon season through construction of rain water harvesting structures like storage tanks, percolation tanks, farm ponds, check dams. There is a need to increase water-use efficiency of lift irrigation schemes by adopting micro irrigation and cultivating high value crops in their command. Flood irrigation for sugarcane and banana crops may be replaced by drip irrigation so that surplus water can be used for other high value crops. Case by case study of each LIS for revival. Sensitization of LIS members, proactive role of bankers and support from State/Central governments are necessary to achieve the task of reviving the Co-op. For this purpose, GoM can avail loan from RIDF. LAND DEVELOPMENT Introduction
Top layer of soil is instrument for existence of life on the planet. Soil and water are the two basic natural resources in agriculture. These are to be conserved well and used scientifically to ensure sustained level of production and productivity .Any agriculture production program can be successful only it the soil maintains fertility and has sufficient moisture to support plant growth. Land development activities includes all activities undertaken by by farmers to improve productivity of land to prevent erosion of soil and to improve land quality, which include, soil conservation measures, land reclamation, on farm development, etc. On –farm development activities are important for increasing

28 | P a g e
water use efficiently and avoiding ill effects of excess water in case of irrigation and other projects. Land provides food, fuel, fodder and shelter besides supporting other economic life supporting system. The quality of land is deteriorating due to various factor like soil erosion caused mainly due to shift in cultivation, deforestation, reckless mining activities, overgrazing, etc. The agronomic productivity of land is highly dependent on effective soil and plant nutrition management. In addition to suit climatic condition, plants require a suitable medium for physical support and anchoring of the root system and also the availability of water and essential nutrients. While crop yield depends on the complex interaction of plant growth and all other development factors, the role of prudent soil and plant nutrition management is particularly important to ensure a sustained level of productivity for any given cropping system. The district has 30000 ha. cultivable wasteland, land under miscellaneous trees and horticulture 8000 ha. which can be reclaimed for plantation/cultivation of crops. With the increase in population stress on food security and pressure on land, it has become necessary to increase the productivity of land by its suitable development. Review of Ground Level Credit floe : (lakh)
Land Development 2011-12 2012-13
2013-14
Target 2331..00 504.12 0.00 Achievement 6.55 0 317.39
Source LDM : II Assessment of credit Potential for 2015-16 Sr.No. Activity Unit (No
/ Area) Base PLP (2015-
16) Revised (2015-16)
Physical Units
Financial (lakh)
Physical units
Financial (lakh)
1 LD- Ha. 16 3.13 16 2.88

29 | P a g e
CADA/Non CADA/OFD
2 Vermit Composting
No. 65 35.39 65 29.25
3 Water & Soil Conservation
Ha. 100 116.16 100 99.00
4 Organic Farming
No. 50 25.41 50 20.25
5 Compost Organic Manure
No. 20 31.46 20 27.00
Total 251 211.55 251 178.38 (Reduction due to change in unit cost) FARM MECHANISATION Introduction
Farm Mechanization generally cover tractors, power tillers, self propelled harvesters/reapers, bulldozers etc. besides other farm equipment and accessories like disk and mould board plough, harrow, seed drill, fertilizer drill, peddlers, threshers, sprayers, trailers, etc. The potential for those machinery is assessed based on land holding pattern change in the cropping pattern their existing number and the likely future demand considering utilization of technology for better production and productivity, timely completion of land preparation and tilling operations and reduction of cost and drudgery. Total numbers of 379505 farmers are holding 803607 ha. and around 27000 farmers are holding more than 5 ha. of land. As per the awareness towards mechanization of farming is increasing those farmers can be considered for increase the scope of farm mechanization.
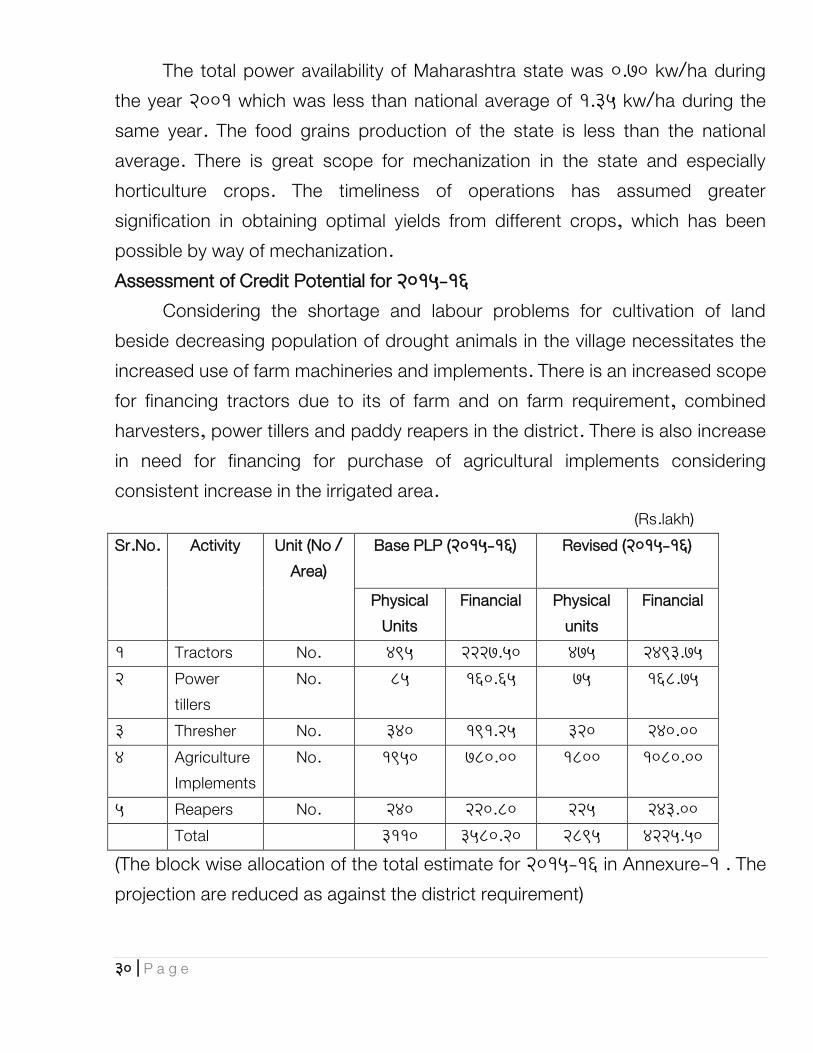
30 | P a g e
The total power availability of Maharashtra state was 0.70 kw/ha during the year 2001 which was less than national average of 1.35 kw/ha during the same year. The food grains production of the state is less than the national average. There is great scope for mechanization in the state and especially horticulture crops. The timeliness of operations has assumed greater signification in obtaining optimal yields from different crops, which has been possible by way of mechanization. Assessment of Credit Potential for 2015-16
Considering the shortage and labour problems for cultivation of land beside decreasing population of drought animals in the village necessitates the increased use of farm machineries and implements. There is an increased scope for financing tractors due to its of farm and on farm requirement, combined harvesters, power tillers and paddy reapers in the district. There is also increase in need for financing for purchase of agricultural implements considering consistent increase in the irrigated area.
(Rs.lakh) Sr.No. Activity Unit (No /
Area) Base PLP (2015-16) Revised (2015-16)
Physical Units
Financial Physical units
Financial
1 Tractors No. 495 2227.50 475 2493.75 2 Power
tillers No. 85 160.65 75 168.75
3 Thresher No. 340 191.25 320 240.00 4 Agriculture
Implements No. 1950 780.00 1800 1080.00
5 Reapers No. 240 220.80 225 243.00 Total 3110 3580.20 2895 4225.50 (The block wise allocation of the total estimate for 2015-16 in Annexure-1 . The projection are reduced as against the district requirement)

31 | P a g e
Availability Of Infrastructure, critical gaps & intervention required, action points / issue to be addressed :
The approximate number of agriculture implements and machinery in the district are as under : Seed cum Fertilizer Drill
Equipments
Thresher
Cultivator
Harrow
Levelers
Reaper
Combine Harvester
Trailer
17300 52300 5798 3565 2351 4307 6246 26 299 Actions Points : Government Departments
Equipment such as tractors, power sprayers will need repair facilities in the rural areas. Govt. agencies may arrange for mobile workshop to service these activities.
There is a need to increase extension efforts and the awareness programmes for farmers
The demonstrations regarding usefulness of power tillers/paddy reapers may be organized in tie-up with suppliers/distributors
The small, affordable, hand operated crop specific equipments and tools developed by CIAE, Bhopal and other Agricultural Universities may be popularized.
The skilled operators of combine harvester are generally come from other State. The training facility on operation, repair and maintain need to be made available to district youth will get the good employment during crop harvesting season. PLANTATION AND HORTICULTURE INTRODUCTION
The agro-climatic conditions of the district, especially that of talukas Ardhapur, Mudkhed, Bhokar, Biloli and Nanded are ideally suitable for Banana

32 | P a g e
plantation. The area covered under Government Sponserd Programme viz.Employment Guarantee Schemes (EGS) forms major horticulture base in the district. The district has suitable agro-climatic condition for production of fruit crops like mango, custard apple, anola, tamarind, sweet lemon, sapota, pomegranate etc, vegetable crops like tomato, brinjal, cucumber, cabbage etc. floricultural crops like rose, daisy, aster etc. Besides, the activities like sericulture, bee keeping, medicinal & aromatic plant cultivation etc. are also being undertaken in the district.Net sown area of district is 7.22 lakh ha.While fruit crops cover 17648 Ha (2.4%) vegetable crops cover 29430 Ha (0.41% floriculture crops cover) 417 Ha.(.06%) of the arable land. The is about 1507 Ha (0.20%) under various fruit crops, which is old and has become senile. Such area needs immediate replanting to improve its productivity. The district has been allotted a target 300 acres year for silk development. Mulberry plantation was taken by 143 farmers on 126.5acres is planned for the next 3 years from 2012-13 onwards. In the 12th Five year plan (2012-17),GoI has set a target of 8% growth over the five year period for P&H sector. With a view to giving focused attention of horticultural development in the country, GoI has launched a Centrally Sponsored Scheme namely Mission for Integrated Development of Horticulture (MIDH) for the holistic growth of the horticulture sector sumsuming interventions under Nation Horticulture Mission (NHM) National Bamboo Mission, Coconut Development Board, National Horticulture Board etc. The Mission emphasizes on area based regionally differentiated cluster approach for development of horticulture crops, having comparative advantage. To encourage capital formation in agriculture, thrust is given for term loans for which Rs.10,000 crore is allotted to NABARD in the Union Budget 2014-15.
The GLC for the year 2011-12,2012-13&2013-14 was to the tune of 150.80 lakh,287.22lakh & 350.33 lakh respectively. Assessment of credit Potential for 2015-16
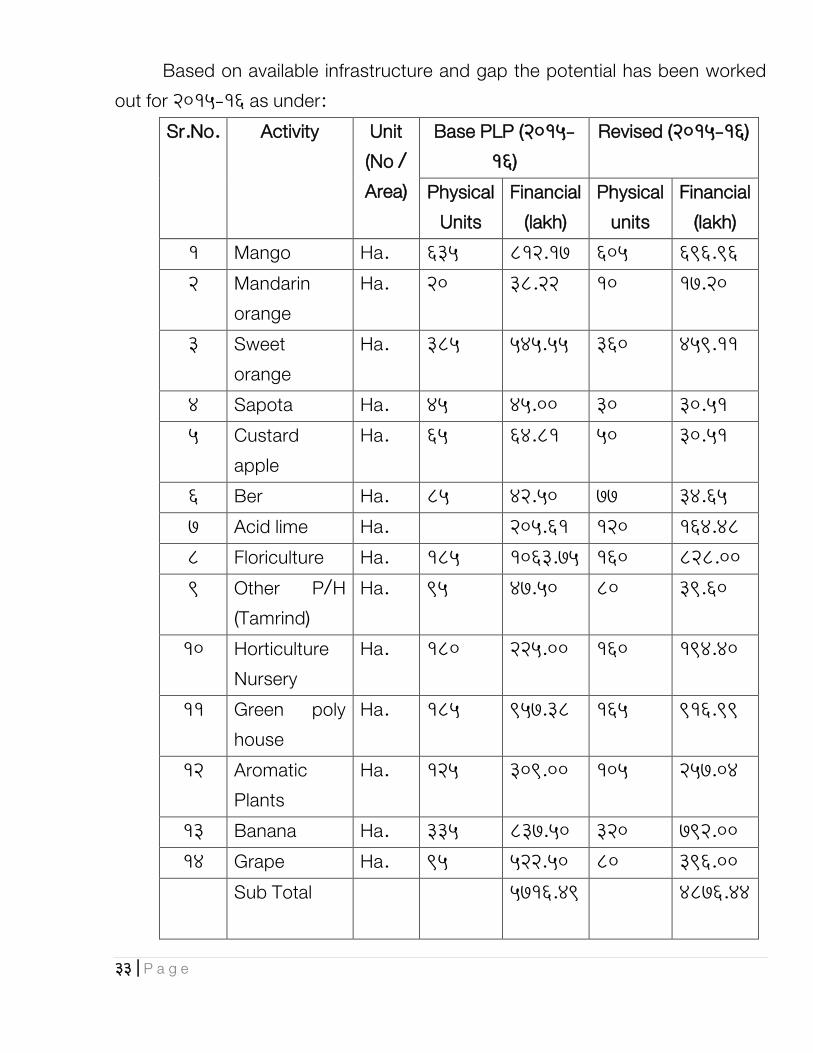
33 | P a g e
Based on available infrastructure and gap the potential has been worked out for 2015-16 as under:
Sr.No. Activity Unit (No / Area)
Base PLP (2015-16)
Revised (2015-16)
Physical Units
Financial (lakh)
Physical units
Financial (lakh)
1 Mango Ha. 635 812.17 605 696.96 2 Mandarin
orange Ha. 20 38.22 10 17.20
3 Sweet orange
Ha. 385 545.55 360 459.11
4 Sapota Ha. 45 45.00 30 30.51 5 Custard
apple Ha. 65 64.81 50 30.51
6 Ber Ha. 85 42.50 77 34.65 7 Acid lime Ha. 205.61 120 164.48 8 Floriculture Ha. 185 1063.75 160 828.00 9 Other P/H
(Tamrind) Ha. 95 47.50 80 39.60
10 Horticulture Nursery
Ha. 180 225.00 160 194.40
11 Green poly house
Ha. 185 957.38 165 916.99
12 Aromatic Plants
Ha. 125 309.00 105 257.04
13 Banana Ha. 335 837.50 320 792.00 14 Grape Ha. 95 522.50 80 396.00
Sub Total
5716.49 4876.44

34 | P a g e
1 Sericulture-plant/Rearing Equipment
Ha. 9 6.72 6 4.70
2 Sericulture-MP Rearing House
9 10.35 6 13.50
Sub total 17.07 18.20 Gr.Total 5733.56 4894.64
Forestry and Wasteland Development
Of the total geographical area of 1033100 ha; sq.km.is covered under forests in Nanded district. Out of this an area of 3 sq.km. is under reserve forest and 218 sq. km. on private waste land. The District has cultivable wasteland of 773800 ha. which can be brought under a forestation or Silvia horticulture. The Major forest species found in the district includes teak, babul, bamboo. The wasteland owned by farmers, Panchayat, corporate bodies can be profitably engaged in forestry plantation. Presently village forest protection committee and 594 Joint Forest Management (JFM) have been formed in 1970 villages of the district and 93979 families are the members of JFM.
Efforts therefore may be made by the Govt. banks and forest department to increase the area under certain economically important species which can provide good returns to farmers and also help in maintaining the ecological balance. Ground level credit flow is indicated in annexure-III Assessment of Potential for the year 2015-16
Keeping in view the available infrastructure, the potential has been estimated as under.

35 | P a g e
Sr.No. Activity Unit (No
/ Area) Base PLP (2015-16) Revised (2015-16)
Physical Units
Financial (lakh)
Physical units
Financial (lakh)
Social Forestry
Ha. 150 39.60 140 36.96
Farm Forestry
75 21.53 60 22.20
1 Bamboo 225 67.28 200 60.00 2 Jatropha 220 37.84 190 38.00
Total 166.24 157.16 Forest and wasteland cover :
The area under cultivable wasteland and fallow land for a forestation are estimated in table : Sr.No Category of
land Total area
(ha) Area which afforested (
ha)
Total area available for wasteland
development (ha) 1 Area under
non-agriculture 57,404 7,790 49,614
2 Fallow land suitable for cultivation
829,100 32,461 796,639
3 Cultivable land not under cultivation
22,461 8,326 24,135
4 permanent pasture and
38,119 38,119

36 | P a g e
other pasture land
ANIMAL HUSBANDRY-DAIRY DEVELOPMENT INTRODUCTION Animal Husbandry sector is one of the rapidly progressing sector playing a significant role in improving rural economy of the district by providing gainful employment to rural poor and thereby increasing their ability to face crop failures during droughts and floods. Dairy has been recognized as an important allied activity due to its contribution in the form of providing gainful occupation and supplementary income. As per the Provisional livestock census in 2007,there are 6.586 lakh indigenous & DB cow and 2.490 lakh Buffaloes. The breed able female numbers include – 2.059 CB cattle & indigenous cattle and 1.354 buffaloes. The milk production of 2339.53 lakh ltr / year, has accounted for 2.87% of total State milk production. Indigenous cows, DB cows and buffaloes accounted for 29.0% ,10.30% and 56.0% respectively. The estimated per capital daily milk availability works out to 222 gm. as compared to State average of 190 gm. There is a excellent potential for milk production and its marketing in the district Production of milk has become a necessity in order to compete in the international market. In additional to the milk, manure from animals provides good source of organic matter for improving soil fertility and crop yield. The gobar gas from the dung is used as fuel from domestic purposes and also for running engines. The surplus fodder and agricultural by products are gainfully utilized for feeding the animals.
Review of Ground Level Credit : GLC by all agencies during the years 2011-12,2012-13 & 2013-14 was 74.96 lakh,588.03 lakh & 404.97 lakh respectively. There is a good potential for credit delivery for the activity,

37 | P a g e
however, due to non allocation of budgetary provision for DEDS by the Central Govt. banks are not eager for loan disbursement. Assessment of credit Potential for 2015-16 :
PLP projections have been estimated considering the infrastructure available and planned.
Sr.No. Activity Unit (No / Area)
Base PLP (2015-16)
Revised (2015-16)
Physical Units
Financial (lakh)
Physical units
Financial (lakh)
1 Cow (CB) No 785 847.80 750 810.00 2 Buffaloes No 420 151.20 400 216.00 3 Indigenous
cow No 370 99.90 350 157.50
4 Mini Dairy (5 animal unit)
No 340 612.00 325 715.00
5 Calf rearing No 170 43.61 150 47.25 6 Fodder
cultivation No 320 43.20 300 40.50
7 Commercial Dairy (10 animal unit)
No 320 1280.00 300 1440.00
8 Milk parlour No 170 85.68 160 94.46 9 Veterinary
clinic (private)
No 170 275.40 160 324.00
10 Bulk cooler AMCU
No 45 506.25 35
472.50
11 Dairy Transport &
No 95 2137.50 85 2231.25

38 | P a g e
Cold chain 6082.54 6548.46
Government Departments
There is need to increase the number of milk routes and revive dormant societies. Steps may be taken to improve the functioning of the primary milk products cooperative societies to augment the daily milk collection as well as credit flow. Steps may be taken for enhancing the supply of good quality milk animals and also established the cattle market in the district.
ANIMAL HUSBANDRY-POULTRY DEVELOPMENT INTRODUCTION
Poultry development is considered as an important allied commercial activity. As per latest information there are 5.549 lakh poultry birds in the district. The estimated egg production was 354.77 lakh in the district. Desi birds accounted for nearly 77% of the district egg production. The district accounted for about 1.0% of the State egg production. There is a consistent demand for poultry birds and products. Since the demand is not satisfied by the district it is procured by from Hyderabad. Small and marginal farmers are undertaking poultry farming activity in their backyards. However, there is a growing trend among educated unemployed youths to undertake this activity on commercial basis. The per capita availability is only 14 eggs as against standard requirement of 180 eggs per person per year. Nearly 85% of egg production is accounted by Desi birds. Eggs and poultry meat provide high quality animal protein. Poultry farming provide as a good source of income and gainful employment to farmers throughout the year. Backyard poultry in rural areas have also become popular. Due to the fact that the demand for eggs and chicken products both in urban & rural area is always on increasing scale, there is a good potential for poultry development in the district.

39 | P a g e
Assessment of potential for the period of 2015-16 Considering the infrastructure available in the district and the past performance under this sector, PLP projections have been estimated as under : Sr.No.
Activity Unit (No / Area)
Base PLP (2015-16)
Revised (2015-16)
Physical Units
Financial
(lakh)
Physical units
Financial (lakh)
1 Com.Broiler (500 birds)
No 180 194.40 160 201.00
2 Com.Layer (500 birds)
No 75 158.63 66 158.40
3 Back yard poultry
No 95 5.70 85 5.10
4 Feed plant No 7 78.75 5 67.50 5 Emu farming No 0 0.00 0 0.00 6 Poultry
breeding farm (improved birds)
No 22 495.00 18 405.00
7 Retail poultry dressing unit
No 23 103.50 21 94.50
Total 1035.98
932.10
(The block wise allocation of the total estimate for 2015-16 are indicated in Annexure I )
Action points / issues Banks :

40 | P a g e
Poultry unit could be expanded on the line of VCF through tie-up with corporate/privates units, besides exploring assistance under special subsidy schemes and RSVY
Contract broiler farming could be explored in tie up with M/s Venkateswara Hatchery, Hyderabad and M/s Suguna hatchery.
Government Department :
Backyard poultry with LIT birds could be promoted as income generating activity through SHGs in coordination with banks.
AH department may conduct training programmers for entrepreneurs on commercial poultry farming and backyard poultry with LIT birds.
Animal Husbandry-Sheep, Goat and Piggery
Introduction
Sheep and goat reusing are supplementary income generation activities for small and marginal farmers, besides providing nutritious food material. Another important feature of this investment is that no substantial amount is to be invested by the beneficiary towards feed cost of the animals except for supplementary feeding in support to grazing and use of crop residues. As per 2007 livestock (Provisional) census, there are 379501 goats,52758 sheep and 8747 pigs in the district. There are about 0.15 lakh Osmanabaddi goats in the district. Goat milk and Wool production was 92.03 lakh kg. and 31.644 MT. Assessment of Credit Potential for 2015-16

41 | P a g e
Based on the existing infrastructure and past performance under the activity, the potential have been estimated.
(Rs.lakh) Sr.No.
Activity Unit (No / Area)
Base PLP (2015-16) Revised (2015-16)
Physical Units
Financial Physical units
Financial
1 Sheep Rearing (20 + 1)
No. 320 240.00 300 225.00
2 Goat Rearing (10+1)
No. 1200 630.00 1100 577.50
3 Commercial Goat rearing (Stall fed 40+2)
No. 120 315.00 100 337.50
4 Pig Rearing (10+1)
No. 55 14.85 49 13.23
5 Sheep & Goat breeding
No. 14 262.50 10 187.50
Total 1462.35 1340.73
FISHERIES DEVELOPMENT
INTRODUCTION Government of Maharashtra has introduced various fisheries schemes through cooperatives for enhancing the status of economically backward class. Although intensive fish culture is not yet developed in the district, progressive farmers in low lying areas and those in a position to get leased ponds are showing increasing interest in this sector. Fishery as important allied activity providing gainful employment and sustained income for considerable section other population in the district. Nanded is landlocked district; there is scope only for development of Inland Fisheries in the rivers, tanks and rivers, tanks and reservoirs located in the district. It has 8407 ha. water spread area suitable for inland fisheries development.
Sr.No. Classification of No.of ponds Water spread (ha)

42 | P a g e
ponds (ha) 1 0-60 362 3339 2 61-200 21 2541 3 Above 200 3 2527
Total 385 8407 Assessment of Credit Potential for 2015-16 :
Keeping in view available infrastructure and the past performance, the projection of Base PLP retained as such :
(Rs.lakh) Sr.No. Activity Unit (No /
Area) Base PLP (2015-16) Revised (2015-16)
Physical Units
Financial Physical units
Financial
1 Composite fish culture in existing ponds
No. 10 13.11 10 13.11
2 Composite fish culture in new ponds
No. 6 11.61 6 11.61
Total 24.72 24.72 (Ground level credit flow is indicated in annexure-III The block wise allocation are indicated in Annexure I)
STORAGE GODOWNS/MARKET YARDS
Introduction There is significant growth in Agriculture production and productivity over
the years. However, the producers/farmers continue to face hurdles in realizing reasonable returns for their produce. Inadequate infrastructure for post harvest services like cleaning, grading ,sorting, storage and marketing of their surplus produce inter alia, is the hurdle of the farming community. The farmers therefore need a well developed infrastructure/adequate captive storage capacity at the
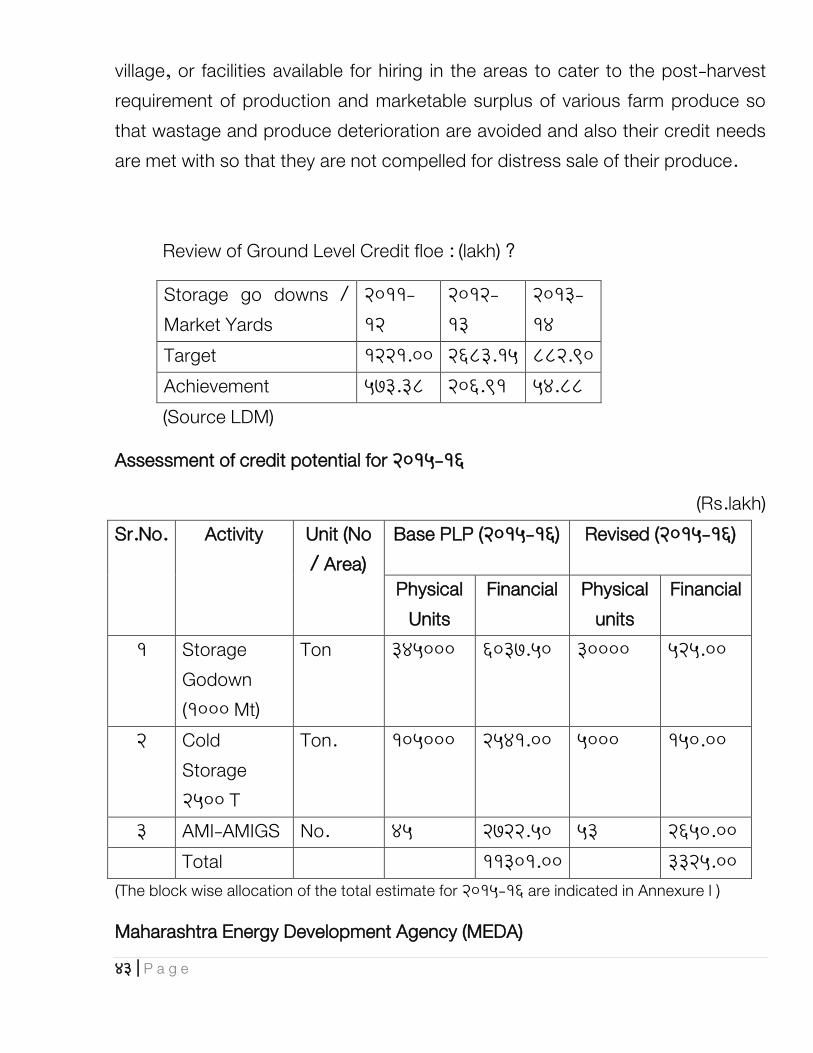
43 | P a g e
village, or facilities available for hiring in the areas to cater to the post-harvest requirement of production and marketable surplus of various farm produce so that wastage and produce deterioration are avoided and also their credit needs are met with so that they are not compelled for distress sale of their produce.
Review of Ground Level Credit floe : (lakh) ?
Storage go downs / Market Yards
2011-12
2012-13
2013-14
Target 1221.00 2683.15 882.90 Achievement 573.38 206.91 54.88
(Source LDM)
Assessment of credit potential for 2015-16
(Rs.lakh) Sr.No. Activity Unit (No
/ Area) Base PLP (2015-16) Revised (2015-16)
Physical Units
Financial Physical units
Financial
1 Storage Godown (1000 Mt)
Ton 345000 6037.50 30000 525.00
2 Cold Storage 2500 T
Ton. 105000 2541.00 5000 150.00
3 AMI-AMIGS No. 45 2722.50 53 2650.00 Total 11301.00 3325.00 (The block wise allocation of the total estimate for 2015-16 are indicated in Annexure I )
Maharashtra Energy Development Agency (MEDA)

44 | P a g e
Proposed Target for generation for grid connected project for 12th five year plan 2012-17 :
Resources 2012-13
2013-14 2014-15 2015-16 2016-17 Total
Wind power 300 300 300 400 400 1700 Small hydro power 10 10 10 10 10 50
Biogases based co-generation power
50 75 75 50 50 300
Biomass based power 30 25 25 30 30 140 Industrial waste/MSW
power 5 20 30 10 25 90
Solar Thermal & Solar Photovoltaic power
125 125 125 75 75 525
Total 520 555 565 575 590 2805
Sanctioned proposed outlay for 12th five year plan (2012-17) :
Sr.no.
Resources Sanctioned budget
Proposed Outlay
2012-13 2013-14
2014-15
2015-16
2016-17
Total
1 Wind power 21.00 27.50 30.95 31.75 34.10 145.30 2 Small hydro power 3.00 8.88 9.63 1.64 11.65 43.80 3 Biogases based co-
generation power 54.00 285.84 198.52 209.20 226.51 974.07
Total 78.00 322.22 239.10 251.59 272.26 1163.17

45 | P a g e
Assessment of potential for the year 2015-16 :
Keeping in view the reasons indicated above and demand in the district, the potential in considered as under:
(Rs.lakh)
Sr.No. Activity Unit (No / Area)
Base PLP (2015-16)
Revised (2015-16)
Physical Units
Financial Physical units
Financial
1 Bio Gas Plants No. 155 20.93 155 20.93 2 Solar Cooker No. 45 10.13 45 10.13 3 Solar Homlight No. 130 9.75 130 9.75 4 Solar Gird/
Manufacture fly ash bricks
No. 46 33.35 46 33.35
Total 74.15 74.15 (The block wise allocation of the total estimate for 2015-16 are indicated in Annexure I Keeping in view the performance of this sector, there is no change in projection)
FOOD AND AGRO PROCESSING
INTRODUCTION
Agro processing is a sector comprising of food processing and agro industries dealing in production of non-food items. NABARD defines agro processing as any industry, which uses agriculture and allied products as raw

46 | P a g e
material. The sector has strategic place in rural economy, hence it has been granted the status of thrust/high priority. GoI has introduced various policy initiatives like food security act, Integrated food law, setting up of National Institute of Food Technology Entrepreneurship and Management establishment of Agri-export zones/food parks and encouraging contract farming etc. Food Security act may ensure availability of food to the masses while Nutrition Security Act will ensure better nutrition and health to the population.
Under National Horticulture Mission, Credit linked assistance of 25% of investment in plant and machinery (maximum of 5 lakhs) is provided for setting up post harvest infrastructure like packing and grading hall. pre-cooling hall and cold storage, refrigerated vans and private markets to promote employment generation and improve post harvest utilization of horticulture crops. Due to lack of adequate agro processing facilities, the post harvest losses are very high in agriculture, especially under horticultural crops’ Losses are estimated at about 25 to 30% The value addition in dairy sector is very low. Hardly 11% of the production is being converted into value added products, remaining 89% is consumed as liquid milk. Processing and value addition of meat is negligible. Similarly, the spoilage loss is very high in fisheries sector due to lack of processing. Maharashtra is one the major products of fruits & vegetables, spices, cereals, pulses, oilseeds, milk and Meat. It has a number of MNCs like Lever, Britannia, Nestle, Nissan, Pepsi, Coca-cola, etc. amongst others with manufacturing facilities in the state. The success of the agro processing depends upon effective marketing for industries. The power is an essential input. The shortage of power is the main bottleneck for running the industries. Further, small industries face difficulties in marketing their product. Many units in cottage and small-scale sector do not have adequate storage packaging and refrigeration facilities. Qualities of the final product and processing have to be improved to meet the required standard.
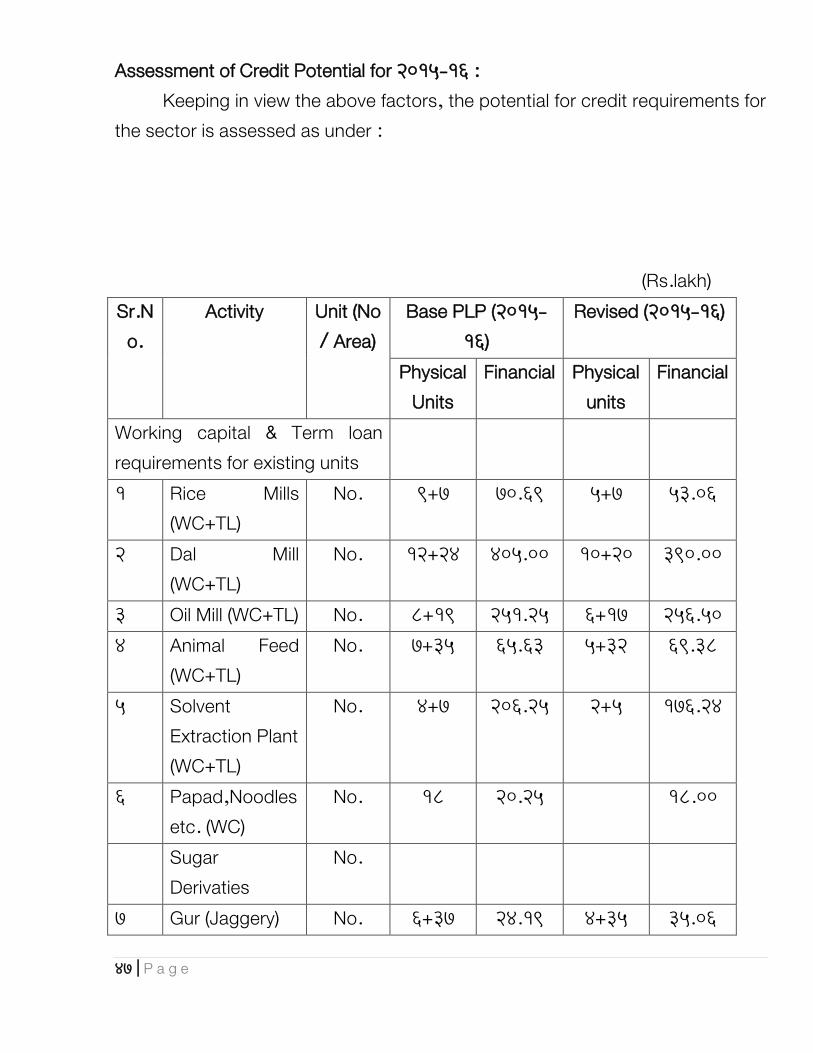
47 | P a g e
Assessment of Credit Potential for 2015-16 : Keeping in view the above factors, the potential for credit requirements for
the sector is assessed as under :
(Rs.lakh) Sr.N
o. Activity Unit (No
/ Area) Base PLP (2015-
16) Revised (2015-16)
Physical Units
Financial Physical units
Financial
Working capital & Term loan requirements for existing units
1 Rice Mills (WC+TL)
No. 9+7 70.69 5+7 53.06
2 Dal Mill (WC+TL)
No. 12+24 405.00 10+20 390.00
3 Oil Mill (WC+TL) No. 8+19 251.25 6+17 256.50 4 Animal Feed
(WC+TL) No. 7+35 65.63 5+32 69.38
5 Solvent Extraction Plant (WC+TL)
No. 4+7 206.25 2+5 176.24
6 Papad,Noodles etc. (WC)
No. 18 20.25 18.00
Sugar Derivaties
No.
7 Gur (Jaggery) No. 6+37 24.19 4+35 35.06

48 | P a g e
(WC+TL) 8 Khandsari (WC) No. 7 63.00 5 45.00 Other crops No. 9 Turmeric &
chilly powder (WC)
No. 5 5.63 4 4.50
10 Medicinal & Aromatic plants (WC)
No. 3 5.63 2 3.75
11 Fruits (WC) No. 11 49.50 10 45.00 12 Spices (WC) No. 3 3.38 1 1.13 Sub Total A No. 1170.40 1097.62 Working capital & Term loan requirements for new units
1 Rice Mills No. 9 202.50 7 183.75 2 Dal Mill No. 19 498.75 17 510.00 3 Oil Mill No. 19 427.50 17 510.00 4 Animal Feed No. 34 382.50 32 360.00 5 Solvent
Extraction Plant No. 7 525.00 5 468.75
6 Papad,Noodles etc
No. 41 461.25 39 438.75
Sugar Derivaties
No. 0 0
7 Gur (Jaggery) No. 12 22.50 10 26.25 Other crops No. 0 0 8 Turmeric &
chilly powder No. 19 99.75 17 102.00
9 Fruits No. 19 99.75 17 89.25

49 | P a g e
10 Allied sector-Dairy products
No. 11 12.39 9 10.13
Sub total B No. 2731.89 2698.88
Grand total A+B
No. 3902.29 3796.50
Total (The block wise allocation of the total estimate for 2015-16 are indicated
in Annexure I. Projections are revised compared to Base PLP Keeping in view the performance of past trend & SLBC instruction)
WORKING CAPITAL REQUIRMENT FOR NFS ACTIVITIES
Introduction
Provision of adequate and timely working capital is of critical importance for successful and profitable running of industrial units. There are more than 1200 units, besides weavers in the district which require working capital for their day to day operations. On the basis of past performance banks are unable to finance new unit of Handloom and Power loom, there is no potential for Block capital for weavers.
Assessment of Credit Potential for 2015-16
Since more no of SSI units require working capital, the potential have been estimated as under :
(Rs.lakh)
Sr.No.
Activity Unit (No / Area)
Base PLP (2015-16)
Revised (2015-16)
Physical Units
Financial Physical units
Financial

50 | P a g e
1 Weavers No. 320 640.00 300 840.00 Total 640.00 840.00 (The block wise allocation is indicated in Annexure I. Considering prevailing market escalation quantum of WC is increased)
INFRASTRUCTURE AND LINKAGE SUPPORT
INTRODUCTION
Importance of Infrastructure Development
The importance of infrastructure for sustained economic development is well recognized. Inadequate and inefficient infrastructure can prevent the economy from realizing its full growth potential regardless of the progress on other fronts. Physical infrastructure covering transportation, power and communication through is backward and forward linkages facilitates growth; social infrastructure including water supply, sanitation, sewage disposal, education and health, which are in the nature of primary services, has direct impact on the quality of life. Infrastructure development is therefore essential for integrated rural development and robust infrastructure improves the quality of life and reduces vulnerability of rural power. Investment in rural infrastructure
Creates new economic opportunities and activities; Generates additional employment and income; Facilities and improves delivery of other rural services, Enhances democratic processes and skill among rural poor.
Rural infrastructure comprises all activities and facilities which help to sustain the growth in production and income generation in rural areas. Infrastructure development in the form of transport and communication-rural roads, bridges, irrigation structures, flood control, power, education, technology, water and soil conservation measures through watershed development etc. are therefore essential prerequisites for accelerated economic

51 | P a g e
development of any economy and regarded as crucial noncredit inputs. Investment in rural infrastructure creates new economic opportunities and activities, generates additional employment and income, facilities and improves delivery of other rural services and enhances democratic process and skills among the rural poor.
Status of RIDF in the State of Maharashtra:
In the state of Maharashtra since inception of RIDF,28868 projects for Roads & Bridges, Irrigation, WWM, Watershed, Warehouse have been sanctioned. RIDF loan sanctioned 532748.64 lakh has on 31 march 2014. The cumulative purpose wise number of projects and amount sanctioned, projects completed and amount disbursed (i.e.RIDF I to XVIII) is given here under :
(crore)
Sr.No Sector Sanctioned No.of
Projects Loan
Sanctioned % share in total
Loan Disbursed
1 Roads & Bridges (PWD)
12870 5414.50 51.79 3993.80
2 Irrigation (WRD)
597 3407.10 32.59 2839.72
3 Check Dams (Agriculture)
24 151.53 1.45 120.69
4 Rural Drinking Water Supply (MJP)
240 304.34 2.91 277.31
5 Anganwadi Centre
5000 170.00 1.63 126.65

52 | P a g e
6 Kharland Dev 95 82.44 0.79 40.28 7 Fisheries 20 110.34 1.06 49.31 8 Watershed
Dev 30 162.80 1.56 54.87
9 Waste Water mgt
28 97.35 0.93 19.62
10 Public Health Centre
66 94.25 0.90 18.85
11 Warehousing 584 459.93 4.39 142.81 Total 19554 10454.58 100 7683.91
Performance Highlights in 2013-14
Total amount sanctioned: 650.94 Type of Projects Sanctioned: Minor Irrigation Rural Road Rural Bridges Waste water management Watershed Development Projects Kharland (Flood protection) Projects in coastal areas.
Potential Sectors for Support under RIDF in Maharashtra
Rural Roads Bridges network-improving connectivity Irrigation projects-more intensive finance to ensure completion potential creation for agricultural purpose Micro irrigation for optimum water utilization Animal Husbandry Sector Fisheries-Inland and Marine Fisheries infrastructure Rural Godowns, Cold Storages, Market yareds, Rural Hatts, Cold Chain, Export facilitation centre etc

53 | P a g e
Public Health Institution Infrastructure Agro Processing Sector Infrastructure Agriculture / Horticulture Farms Mini Hydel Projects Village knowledge centers Pay & use toilets in rural areas Inland Water Transport Infrastructure
Status of RIDF in the district :
In the district, since inception of RIDF 491 projects aggregation 33624.90 lakh of loan has been sanctioned. A sum of 26851.48 lakh of loan has been disbursed as on 31 march 2014. The cumulative purpose wise number of projects and amount sanctioned, projects completed and amount
Sr.No Sector Projects Sanctioned
Amount released
% disb.
No. Amount 1 Irrigation (State
Sector) 8 19230.86 16680.61 88
2 Roads & Bridges 179 11686.73 8627.99 73 3 Rural water Supply
Implemented by Maharashtra Jeevan Pradhikaran (MJP)
1 237.05 235.10 99
4 Warehouse 23 1471.51 1192.18 20 5 Anganwadi 280 998.75 115.60 12
Total 491 33624.9 26851.48 30 AREA BASED SCHEME –SHED NET
INTRODUCTION / BACKGROUND

54 | P a g e
Water scarcity is the main problem in agriculture development. The ground water column is declining due to shortage of rain in the area. It has become necessary to adopt to such practices which will not only save the water but still production will increase. Agriculture development under controlled manner in Shed Net may be one solution to overcome the water scarcity problem. It is now proved that to achieve higher production level, productivity has to be increased through the adoption of improved production technology. This has resulted in the emergence of SHADENET, with the advent of which even the small and medium farmers will be able to exploit the benefits of protected cultivation.
Objectives :
The main objectives of the scheme is to increase the production of vegetables and flowers under controlled environment. With the adoption of the technique by small and marginal farmers will give sustained remunerative prices. To promote value addition and direct integration of processing units with producers. To provide the low cost technology and spread ti among small and marginal farmers by converging the provisions for agriculture activities/infrastructure. Attaract the rural educated youth generation & provide employment and opportunities for skill development.
Area of operation:
Being the activity sustainable in all weather condition the activity can be developed in all parts of the district. Any interested farmer may prepare the project report, layout and structural plan and approach agricultural department for details of the scheme.
Sanction and release of fund :
The Agri. department will scrutinize the application received by the and eligibility will be decide in the District Meeting. These application / project report

55 | P a g e
will be forwarded to bank branched for sanction of loan by the branch Manager. After the sanction of the project,15% start up fund shall be released to the farmer by banks. The farmer shall inform the department about the commencement of the work of project. The authorized officer from Agriculture Department will visit the site and give commencement report. Based on the commencement report, the 60% amount shall be released after receipt of claim from the farmers. The team of Agriculture Department & bank shall undertake the joint inspection of the unit and submit the report. After the recommendation by joint inspection team, remaining 25% amount shall be released.
Technical aspects of the proposed investment :
Sr.No. Particulars Specification 1 Type of shed Flat roof 2 Structural Materials GI pipes of 1.5” dia and 2
mm thickness at 6 m c/c 3 Roof materials GI wire/bar of 6 mm dia 4 Size of shadenet Length:
46m,Width:22m,Height:3m 5 Area of shadenet 1012 Sq.meters
Unit cost with item-wise break –up : Shed net house has primarily four components :
Steel frame structure Cladding material

56 | P a g e
Erecting of net house working capital cost
Sr.No
Particular Quantity Amount
1 Material Cost a) GI
Fondation,Pole,truss,hockey 98000
b) Shed net,G fabrics,spring,door,GI wire HDPE thread etc.
85000
c) VAT 10000 Sub Total 19300
0 2` Labour Charges for
foundation, Fabrication, instalation
68200
3 Transportation cost 7800 4 Operational Expenditure 13000 5 DRIP irrigation System 20000 Sub total 30200
0 6 Working Capital for one cycle a) Planting Material 2024 20000 b) Bed preparation 20000 c) Mulching Sheet 1012 8000 d) Liquid fertilizer 1012 50000 e) Crop protection 1012 50000
Sub total 148000

57 | P a g e
Grand total 450000
Backward and Forward linkages :
The information on availability of raw material, Planting material etc. will be provided by the Agriculture department. ATMA will be arrange training & capacity building of beneficiaries. Technical support will be provided by Agricultural Department. Marketing Tie-up arrangements may by arranged by the Agriculture Department.
Bank Loan :
Loans with the borrower margin will be provided by Banks as per months of the bank. The activity is provided with the 50% subsidy benefit by the Agriculture Department under NHM. The risk factor providing loans is reduced to the extent.
Financial viability of the proposed investment :
Gross income from the project will be 5.44 lakh and net profit will be around Rs.0.80 lakh for a plot taken on 10 guntha land. NPW of the project will be 214074,IRR will be 45% and BCR will be 113.The repayment period is 5 years & above with a grace period of 6 months from commencement of the project. Monitoring of the project will be done by respective Banks & Agriculture Department.
PESA-Coverage
Panchayat (Extension to Scheduled Areas) Act (PESA) 1996
The 73rd amendment to the Constitution in 1992,had mandated the decision making power on resource mobilization, development of area and fixed

58 | P a g e
responsibility on the lowest unit of the governance, the Gram Sabha (Gram Panchayat) or the Village Assembly from the Central Government. A three tier structure of local Self Governance was established under this amendment. The village Level Democracy established under the act had proved a mile stone for the prosperity and development of rural area of the country.
However, it was observed that the Law was unable to cover the Scheduled areas, the PESC Act was in-acted on 24 December 1996 to enable the Tribal Self Rule in the Scheduled Areas. The act extended the provision to Panchayats of the tribal areas of nine states included in the Fifth Schedule Areas. Most of the North eastern states under Sixth Schedule Areas (Where autonomous councils exist) are not covered by PESA, as these states have their own Autonomous councils for Governance. Kinwat & Mahur Blocks of Nanded District are included under the PESA Act.
The credit potential estimated in these blocks are as under :
Name of the Block
Population (2011)
% to district population
Credit Potential
% to district potential
Kinwat 210730 9.70 1186.21 5.06 Mahur 86782 3.99 10805.35 4.68 STRENGTHS :
Abundant availability of Solar energy and wind power. Awaiting development of suitable useable technologies at National and state levels.
Enough water resources, needing speedy exploitation and improved careful management and utilization to optimal levels. Great potential for new wells, field ponds and micro systems of irrigation.

59 | P a g e
Climate – Situated in an assured rain fall zone. Capability of raising varieties of fruits and of raising diverse and multiple rain fed crops both in Kharif and Rabi Seasons.
Soils – Good with capability of growing higher value crops. Great potential of increasing productivities and growing better crop combinations.
Good soils have however, been getting degraded and eroded for long and need adequate inputs of nutrients as well as watershed development for their conservation. Particularly in rolling topography in Mukhed, Kandhar & Kinwat block.
Good Roads, Direct Broad gauge Railway and Air access to great markets and cities: like Mumbai, Pune, Aurangabad and Hyderabad.
Big passenger Bus Transport Centre at Nanded
Adequate goods (Roads) Transport available.
Existence of a big food Grains Market as well as cotton market at Nanded.
Sugar factories, Gur,Khand Sari mills, Dal mills, ginning factories, 16 oil mills are processing sugarcane, pulses, cotton and oil seeds, rice mills, chili mills.
One Agriculture college & cotton research centre at Nanded.
A good active Krishi Vidnyan Kendra (KVK) at Nanded., having training facilities for farmers and established good rapport with groups of progressive farmers. Demographic advantage Nanded district has all large proportion of working age group. Low dependency ration.
3.3 SECTION -3 WEAKNESSES:
The list of Weakness is naturally long. Each item should lead to one or more action points. we have dealt with aspects other than agriculture very

60 | P a g e
briefly. Even for agriculture our list covers weakness common all over the district. There are several mostly local weakness which we have not covered. Development situation also goes on changing. A few weakness get corrected while a few may newly crop-up. A periodical review of the SWOT analysis should be a rewarding exercise.
We are presenting the list of weakness under different subheads like social, infrastructural, economic other than agriculture, economic, agriculture and governance. C-DAP strategies naturally focus on the last two groups.
3.4 SOCIAL WEAKNESS :
Nanded is a socially backward district. Identified as such also by GOIs Sharma Committee.
3.5 POOR LITERACY :
Rate for 7 + age group in 2001 was 68.52% against the state average of 77.27 Among 35 districts of the state the district rank on the literacy count is 29th . Its ranking for schooling years is the lowest in the state with value of 3.507 years against the state average of 4.97 . Dropout rates are also very high.
3.6 Poor Health Services :
Infant mortality rate is lower at 68 than the state average of 74 for 1991.
Many social disparities prevailing in rural areas.
Many gender disparities.
Low Human Development index district HDI is 0.37 against the state average of 0.58 The district rank for HDI is 329 out of 35.
The percentage of below poverty line families in the district is 37.5 According to the survey of 1997-98 there are 1.10 laksh BPL families in the rural areas of the district.

61 | P a g e
The indices i) to vii) above show that the quality of life in the district is generally poor.
3.7 INFRASTRUCTURAL:
The greatest infrastructural gap in the process of growth and development is the shortage of electricity (power) supply resulting in load shedding in the rural areas for the whole day and more. Farmers feel handicapped and harassed as the agricultural laborers are reluctant to work and help during nights. There is water available but it cannot be lifted and served to the thirsty crops. There is no possibility of correcting the situation in the plan period. The development process of digging new wells and expanding micro irrigation systems on old and new wells will get stuck up as it depends on how we face and overcome this weakness. Going back to diesel engines and pumps seems to be one remedy. But it means restarting manufacturing of diesel engines and pumps to the level of 1960/s. Higher prices and shortages of oil will mean another weakness in that situation also.
Poor agricultural credit : The co-operative moment and the D.C.C. bank are both very weak. Memberships of the primary coop. credit society does not cover a majority of farmers, especially the small and marginal farmers and other asset-poor or asset-less groups. Moreover the primary co-op societies do not go beyond short term crop finance.
The nationalized and other commercial banks appear to have liberalized lending policies. But they have, as yet, not strengthened their organizational networks at the grass-roots. A large number of Bank employees appear to be still holding to the old thinking of credit worthiness and returns.
Poor Network of Communication : With the rapid expansion of Telephones, Radio and TVS, a few informative programmes are run among many other entertainment items. But their duration is small and time not suitable to a majority of farmers. In fact, there is in almost every village a small group of young farmers very curious about modern technologies and willing to do

62 | P a g e
experimenting on their own farms. There is need of exclusive channels all the time running agricultural programmes relevant for the day and the season.
The tenor and tone of the relays should be appropriate to the 21st century audience and technology. Their audience is no longer the illiterate ignorant and awestruck mass of villagers. Today’s farmers are curious to know what practices which countries are adopting and with what results. They are to be informed and motivated to Act. 3.8 ECONOMIC NON AGRICULTURAL WEAKNESSES. :
Poor Industrial progress. There is no major manufacturing industry in the district. There were only 318 registered working factories in the district in 2000 AD with only 11287 workers. Percentage share of the district in the income from the Secondary Sector of the State was 1.14 in the three year average for 1999-2002.
Low per capita income. For Nanded district the 1998-99 value was 13068 against Maharashtra State average of 22763 and the very high value for Mumbai 45471. On the criterion of per capita income the rank of the district is 31 out of 35 i.e. the third lowest from the bottom.
3.9 ECONOMIC-AGRICULUTURAL WEAKNESSES:
A Major weakness is the skewed land holding or land ownership pattern. 60% of land holders in the district are holding and operating holdings of less than 2 hectares together holding 30% of cultivated area. Most of these small holding are fragmented, meaning that they consist of more than one piece of land scattered or located away from each other. Those holdings are un-economic and non-viable. The owners do not afford to keep a pair of bullocks. Their cultivation is indifferent. The lands are rarely deep ploughed and do not at all get any manures or fertilizers for soil health. As a result their soils have gone on degrading and their productivities are very low. Thus 30% of the cultivated area is not contributing in the process of agricultural growth and 60% of the

63 | P a g e
holders are living a low level of life of bare existence. We have proposed an innovative scheme (see section 5.8 in chapter-5) for organizing these asset poor farmers in self Help and train and help them to undertake agro-services and small agro - producting enterprises in the village which are critical for rejuvenating the whole system of agriculture of the village. In the process these SHGs will also bring their own holding back to viability and with additional employment and earnings get out of poverty.
Second important weakness is deteriorating soil health. There are no adequate facilities of testing soils for advice as to the nutrients or other inputs required for restoration of soil health or enrichment. As a result productivities of all crops are lower.
We have made proposals (Para – chapter-v ) for a network of soil testing laboratories and upgrading of the existing ones.
Vast areas in the district have not yet been covered for watershed development. As a result precious soils are continuously getting eroded and scarce water resource is lost through floods and is not conserved or stored as recharged ground water. We have proposed that watershed development work of all remaining areas should be undertaken and completed in the next 5 years (see para chapter 5) 3.10 IRRIGATION
Rainfed area is 88% and irrigated only 12% we have not been using even the available potential properly. Digging of new wells and farm ponds, completion of watershed development, maintenance of the existing canal system and introduction of micro irrigation systems are a few but very important remedies we have proposed in chapter IV & V.
There is over watering of certain crops especially of sugarcane. That does not add to yields but is likely to harm the soil through salinity or water logging.

64 | P a g e
3.11 Crops :
Proportion of high value crops is low but can be increased. Recommended crop rotations or combinations are not followed.
Cultivation practices do not fit the requirement of the crops or modern technologies.
There are productivity gaps as the average yields for all the crops are far below what has been achieved by progressive farmers with best practices within the district.
Seeds, nursery plants or even chemical fertilizers or pesticides with standards of purity are not available in time and in adequate quantities.
Organic manures have become rare. A lot of village or town sweepings and stunk or leaves are not composted and go waste.
There is unbalanced use of chemical fertilizers both by focusing on a few selected crops like sugarcane and in uncontrolled doses likely to harm the crops and soils.
Proven inputs like vermi culture, Bio fertilizers or Bio-pesticides are rarely used. There is vast scope for their use as well as their local production. Similar is the case for Bio-dynamic farming.
3.12 MECHANISATION :
The level of farm mechanization is low. Labour shortages are already experienced in the peak seasons. Mechanization and new tools and small machines would help the situation sand relief drudgery of worker. We have advocated local production of improved tools, implements and smaller machines as well as their repairs and those of heavier machines.
3.13 LOW LEVELS OF ACTIVITY IN ALL ALLIED SECTORS :

65 | P a g e
There have been many failure and setbacks to the allied sectors because of management gaps and improper functioning of cooperative societies. Vast potentials exist for addition to incomes and employment and meeting the needs of the people and the demands of the market. All these weakness should be corrected. Our proposals are in chapter V.
3.14 GOVERNANCE :
There appear to be many executive gaps likely to show down the process of implementation of the programmes, schemes and project by this C-DAP . We describe below the weaknesses which are likely to cause those executive gaps.
The district has staff under the department of Agriculture including those working for extension i.e.for motivating the farmers and to reach the most modern technologies to them
This huge extension establishment in the district needs upgrading through very intensive and rigorous rounds of training and motivation.
Those who are senior and well qualified and who also show promise for extension work may have to be picked up as Trainers. Those who do not like extension work may be posted to other duties.
Qualified and Trained workers staying in the extension work may be given better scales. Those picked up as effective trainers should be given promotions to higher ranks.
The whole work of extension should be re-modeled to fit the 21st century requirements of both the modernties of technologies and of the reformed approaches to the now fairly awakened groups of farmers. The extension workers needs in fact to function as a grass roots driver in the movement for development. Upgrading of the present day staff with effective training and

66 | P a g e
motivating them form their new roles are tough challenges for the departments not so much for the expenses involved, but for the human efforts needed to accomplish them Presently, the coordination linkages between different departments and between different wings of the same department are weak. The interface between the departments and Panchayat Raj bodies also appears to be weak. Those missing links combined with mediocre performance of most of the entities are likely to cause many executive gaps.
Competent and strong executive authorities for implementation of the C-DAP will,therefore have to be set up with full backing of the state and central government.
3.15 SECTION (4) : OPPORTUNITIES :
We have already explained in para 3.1.5 above, what opportunity means, how it is an external attributes of the environment and how it has to be identified., sought and in some cases to be created. Opportunities should not be confused with strengths which are internal attributes of the district.
We present a few examples of opportunities below. After an opportunity is availed of, it becomes a strength of the district. In course of time new and never opportunities may crop up. The development process has to be continuously on the lookout for them.
Globalization and the WTO agreements have opened up tremendous opportunities of export and international trade. Except for expanding export of Cesar Mangoes, the district does not, as yet, appear to be exploiting these opportunities. Progressive farmers may have to set up some institutions to expose those possibilities and establish linkages in the markets abroad.
Because of the businessmen had to face transshipment costs, delays and thefts at Manmad. With the conversion of that line into broad gauge that

67 | P a g e
Manmad bottleneck and the delays and costs involved have disappeared a direct railways access to markets all over the country.
There is a demand for a north south railway link between Khamgaon and Sholapur . With that shorter route, would have a cheaper access for trade to central and Eastern India. That will provide new opportunities.
A major gas pipe line from Hajira to Hyderabad is passing through Osmanabad district. Work is in Progress. If a branch district is sought and secured, it will provide new opportunities through cheaper fuel to existing rolled steel industries and may lead to further growth of other industuries.
3.16 The RKVY :
The many recent initiatives taken by the Government of India, described in paras 1.2-10 and 1.2-11 and especially the RKVY, with assurances of funding, are all a great opportunity for this district. This SWOT analysis and the strategies, programmes, scheme and projects presented in this CDAP are all rare chances fortunately coming to this district. The competent authorities will, therefore, certainly do everything needed to actualize them.

68 | P a g e
CHAPTER IV
DEVELOPMENT OF AGRICULTURE SECTOR
4.1 INTRODUCTION
Agriculture is the major occupation of majority of the population in Nanded district. Economic, Industrial, educational, social development of this area is depend on agricultural production. Despite of higher promotions per capita availability of food over time did not increase significantly. The growth rate of production in agriculture must be more than the growth rate of population. Hence there is an urgent need to accelerate agricultural growth to address issues on food security, nutritional adequacy and income generation. This can be achieved by identifying the problems in crop production, infrastructure facilities, issues related to the natural resources, input management and accordingly there is need to improve agricultural services keeping in view the vision and objectives.
4.2 LAND USE : The total geographical area of Nanded district is 1033100 ha. the net
sown area is 722000 ha (93.30 percent) out of total cultivable area, the area sown more than once is about 136300 ha and hence gross cropped area has increased up to 858300 ha (83.08 percent of total geographical area) and the cropping intensity in the district is 111 percent. The area under forest is 92700 ha which is only 8.97 percent of the total geographical area. Cultivable Waste Land and fallow land is about 3.10 percent and 14.16 per cent of total geographical area respectively which can also be converted as productive land in future. (see table 4.1) The land use pattern of Nanded district is compared with the land use pattern of Maharashtra state. 4.3 SOIL HEALTH
69 | P a g e
The soils in Nanded district are highly variable is capability classes. There is no class I land while 3.62 ha, is occupied by III and II classes. This means basically the chemical and biological factor. These physical and fertility constraints most of the soil are highly depleted in nutrients are proper air : ratio conditions are poor. Some of the constraints of various soil are narrated below for proper management to restive soil health.
4.4 CONTRAINTS : Low hydraulic conductivity and hence water stagnation or longer duration
for Vapsa condition which does not allow favorable air water ratio around root zone. Occurrence of calcium carbonate induces imbalance in nutrient availability.
Shallow soil poses a problem of low water holding capacity and low organic matter. Multi-nutrient deficiency Susceptible to erosion Soil health in terms of physical, chemical and biological condition is poor.
4.5 POTENTIALS : Soil provide fairly long duration of growing period. Soil are productive if properly managed. Soil suitability facilities growing of number of different crops. Irrigation facilities further increase in productivity.
4.6 LAND MANAGEMENT STRATEGIES : Watershed development needs first priority. Watershed based crop planning is : a must in order to exploit high potential of the district. Soil water storage and long growth periods for crops available in black soil should be properly utilized for increasing growth rate of productivity. Mango, Tamarind and Jambhul based horticulture need to be developed under larger areas.

70 | P a g e
Adopt recommended practices of organic manures and fertilizer on the basis of soil test. In order to achieve the 4% growth some of the important steps and projects are suggested.
The imbalances in nutrient availability, physical conditions and micro nutrient deficiency situation has led to deterioration of soil health. The first and foremost job is to restore soil health so that productivity increase on sustainable basis. The first and foremost job is to restore soil health so that productivity increase on sustainable basis. The important steps are suggested here. The projects regarding soil and land care management have been formulated (see 4.10) There are several aspects of soil health which include soil testing laboratories, production of bio-fertilizers, compost and vermi-compost preparation, green manuring and organic farming. Separate provision for integrated watershed development programme of each taluka is presented in the report.
Table 8 Land utilization statistics of Maharashtra (Latest Year)
Area in 000 ha.
Sr.no. Particulars Maharashtra Nanded
Area % Area %
1 Geographical Area 30758 100.00 1033.10 100.00
2 Area under forests 5216 16.96 92.7 8.97
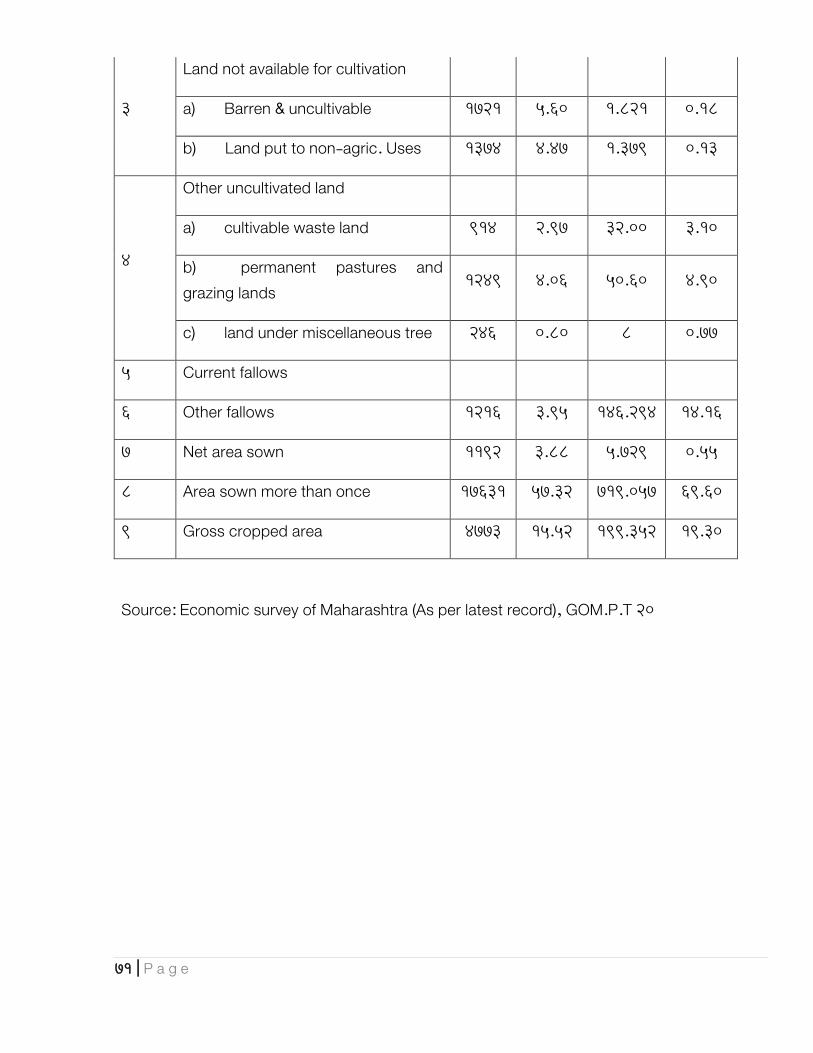
71 | P a g e
3
Land not available for cultivation
a) Barren & uncultivable 1721 5.60 1.821 0.18
b) Land put to non-agric. Uses 1374 4.47 1.379 0.13
4
Other uncultivated land
a) cultivable waste land 914 2.97 32.00 3.10
b) permanent pastures and grazing lands
1249 4.06 50.60 4.90
c) land under miscellaneous tree 246 0.80 8 0.77
5 Current fallows
6 Other fallows 1216 3.95 146.294 14.16
7 Net area sown 1192 3.88 5.729 0.55
8 Area sown more than once 17631 57.32 719.057 69.60
9 Gross cropped area 4773 15.52 199.352 19.30
Source: Economic survey of Maharashtra (As per latest record), GOM.P.T 20

72 | P a g e
4.7 WATER RESOURCES AND MANAGEMENT :
Availability of surface water in Marathwada region is far less than other regions of Maharashtra as under
Sr.No Region Availability of Water per hectare
1 Marathwada 1500M3 2 Vidharbha 4348M3 3 Rest of
Maharastra 9100M3
Normal requirement of water for irrigation is 3000 m3 / Ha as per Maharashtra Irrigation Commission.
Availability of surface water in Nanded district is of the order of 1952 M3 / Ha. as against requirement of 3000 M3 / Ha. The average rainfall for Nanded is 854 mm. Moreover six out of sixteen talukas have been included in the latest list of 195 D.P.A.P. Talukas.
The total availability of ground water in the district is about 1,44,957 HaM. The no. of existing wells is about 31,479. About 5891 wells are in the command area of irrigation projects, where as balance 25588, say 26000 wells are in non command area and need recharging. There exists potential for digging additional 1,13,478 say 1,13,000 wells as per latest survey.
Godavari river flows through the middle of the district. Manjra, Manar, Aasana, Sita, lendi, Penganga are some of main rivers flowing through the district. Command areas of major irrigation projects viz. Jaikwadi, upper Penganga Purna, Manar & Lendi lie in the district. Purna, upper Penganga and manar irrigation projects have already been completed along with medium projects and minor irrigation projects. Two major projets viz. Lendi & Majalgaon

73 | P a g e
Project are still under construction along with a no of medium and minor irrigation projects.
The total surface water potential of the district as per present plan is about 270391 ha. Irrigation potential of about 186974 ha has already been created up to June 2007. It is obligatory that the balance irrigation potential is created in next 4 years and all area brought under irrigation. Adequate provision will have to be made under Bharat Nirman, A.I.BP etc and additional irrigation potential of 356093 created before end of 12th plan.
Thus the total irrigation potential of Nanded district is about 438998+144957=583955 ha. Say 584000 ha. It is desirable that all this potential is created in next four years.
Actual irrigation during the year 2006-07 is only of the order of 820585 ha. The low utilization of created irrigation potential is mainly due to non uniform spatial distribution of rainfall resulting in non-availability of adequate storage of water in times of need, poor maintenance and repairs of irrigation project and Deep Black Cotton Soil etc.
In view of the paucity of water in general in Marathwada, it is obligatory that all available water is used most economically and efficiently by switching over to micro irrigation to feasible extent. It is desirable and recommended that 90% subsidy should be considered for all farmers as an incentive to switch over to micro irrigation. However only 50% subsidy is considered while preparation of C-DAP estimates as per current practice.
The following measure are recommended for judicious ,economic efficient use of all available water :
The existing canal and Distribution system of Irrigation projects in operation is renovated and modernized so as to ensure that water in adequate quantity reaches all created potential area in next 4 years. Most of the major and

74 | P a g e
medium projects in operation are 30 to 40 years old and hence it is obligatory that all available water is judiciously and efficient enclosed. Adequate provision for modernization and Renovation of canal Distribution system of canal Distribution system of major and medium projects will have to be made under Bharat Nirman, AIBP or any other source. so as to ensure that irrigation utilization is increased. The provision for modernization of minor irrigation projects are included C-DAP under head minor irrigation.
All Major and medium irrigation projects presently approved and those under construction are completed in next 4 years and addl. irrigation potential created by making Adequate provision under C-DAP plan or Bharat Nirman or ABIP etc provision for completion of all approved minor irrigation project is made in C-DAP under head minor irrigation.
About 25 % of the surface irrigation potential viz 110000 Ha. is brought under into micro irrigation 50% of this area i.e. about 55000 Ha is brought under drip irrigation and balance 55000 Ha is provided with sprinkler irrigation in next 4 years.
All the existing 26000 wells outside command area of irrigation projects are recharged so as to ensure increased availability of water in next 4 years.
About 113000 new wells are dug and completed in next 4 years Govt.may facilitate granting of loans to farmers by giving guaranty.
50% of the total wells in the district i.e. 72500 are provided with drip irrigation facility and balance 50% i.e. 72500 wells are provided with sprinkler irrigation facilities in next 4 years. In this context it is strongly proposed that 90% subsidy is provided to all farmers in view of shortage of water and the farmer’s contribution is limited to 10% only. However subsidy of 50% is considered for farmers as per existing rules in preparation of C-DAP plan.

75 | P a g e
1250 farm ponds are created in each taluka every year there by creating 80000 farm ponds in the district by end of 4 years.(16 talukas)
Encouraging and making obligatory participatory irrigation by forming water user’s societies so as to ensure efficient use of available water Statement showing requirement of funds every year are enclosed for ready reference.
4.8 MAJOR CROPS IN THE DISTRICT :
CROPPING PATTERN AND PRODUCTIVITY :
Agriculture and allied activities are the main sources of livelihood for majority of rural masses and control the economy of the district. Out of total geographical area (1033100 ha) of Nanded, the net sown area is 722000 ha. (69.88%) and total gross cropped area is 858300 Ha (83.08%) (Table-4.2) About 84.11 percent of total gross cropped area is under Kharif crops, (Table 4.3) and 15.84 percent is under rabi Hw. crops. About 22.45 percent of the gross cropped is cultivated for different cereal crops such as K.Jowar, R.Jowar, Wheat, 18.58 percent area for pulses (Tur,Gram.,Green gram, Black gram) 25.63 percent area for cotton, 2.26 percent area for sugarcane and other area for fruits, Vegetables etc. Proportion of cotton is maximum in Kharif season followed by K.Jowar, Soybean, Tur, Mung etc. Similarly proportion of Gram is maximum in rabi season. Wheat, Sugarcane, Gram, Sunflower, Groundnuts are cultivated on irrigation area.
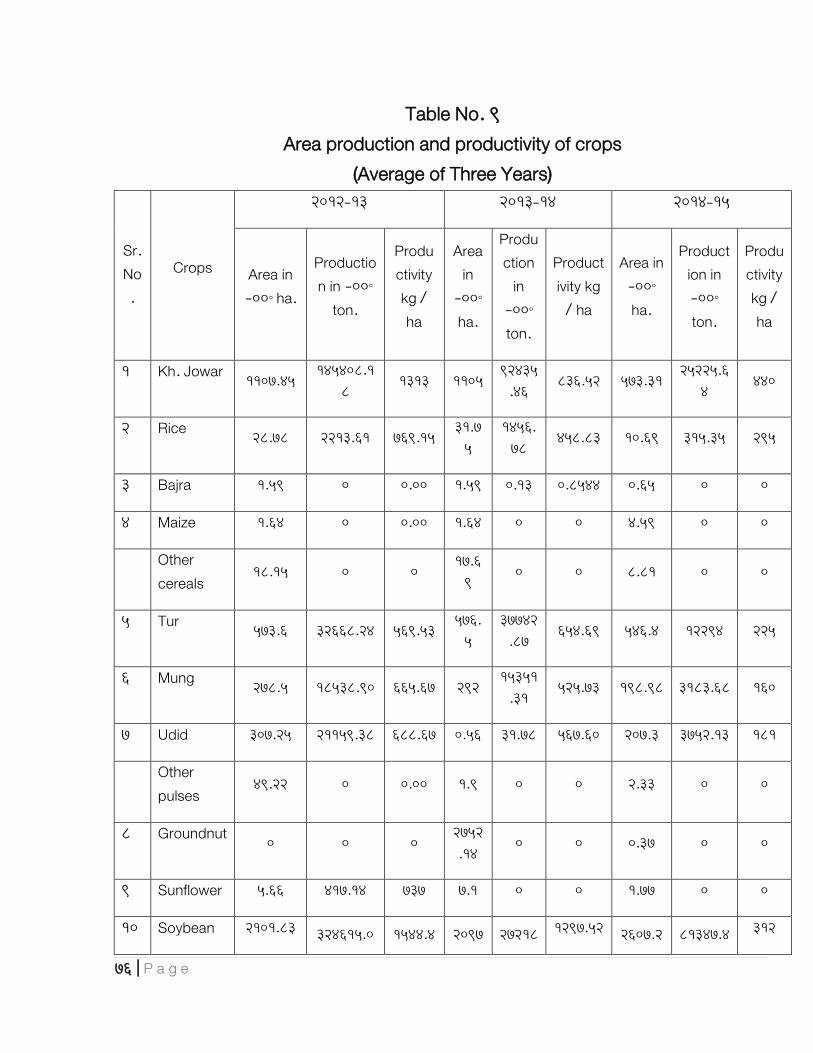
76 | P a g e
Table No. 9 Area production and productivity of crops
(Average of Three Years)
Sr. No.
Crops
2012-13 2013-14 2014-15
Area in ‘00’ ha.
Production in ‘00’
ton.
Productivity kg / ha
Area in
‘00’ ha.
Production
in ‘00’ ton.
Productivity kg
/ ha
Area in ‘00’ ha.
Production in ‘00’ ton.
Productivity kg / ha
1 Kh. Jowar 1107.45 145408.1
8 1313 1105
92435.46
836.52 573.31 25225.6
4 440
2 Rice 28.78 2213.61 769.15 31.7
5 1456.
78 458.83 10.69 315.35 295
3 Bajra 1.59 0 0.00 1.59 0.13 0.8544 0.65 0 0
4 Maize 1.64 0 0.00 1.64 0 0 4.59 0 0
Other cereals
18.15 0 0 17.6
9 0 0 8.81 0 0
5 Tur 573.6 32668.24 569.53 576.
5 37742
.87 654.69 546.4 12294 225
6 Mung 278.5 18538.90 665.67 292 15351
.31 525.73 198.98 3183.68 160
7 Udid 307.25 21159.38 688.67 0.56 31.78 567.60 207.3 3752.13 181
Other pulses
49.22 0 0.00 1.9 0 0 2.33 0 0
8 Groundnut 0 0 0 2752.14
0 0 0.37 0 0
9 Sunflower 5.66 417.14 737 7.1 0 0 1.77 0 0
10 Soybean 2101.83 324615.0 1544.4 2097 27218 1297.52 2607.2 81347.4 312

77 | P a g e
3 4 .75 7.25 9 4
11 Sesamum 10.29 0 0 2763.78
0 0 7.94 0 0
Other Kh. Oil seed crops
359.89 11.83 4257.5
0 314.03
16.56 5200.33
7 153.23 0 0
12 Sugarcane 249.46 13.66 3407.6
2 397.68
12.00 4772.16 135.34 4332.8 32000
13 Cotton 4.09 26.91 110.06 25.6
8 11.72
300.9696
2724.10
28717.46
105.42
14 K. Vegetables
762.06 10.27 7826.3
6 1020.97
9.16 9352.08
5 449.63 0 0
Total kh. Season
42.04 7.36 309.41 45.3
7 6.88
312.1456
11.43 0 0
15 R. Jowar 359.89 32498.06 903
0 804 153.23 7048.58 460
16 Wheat 249.46 43381.09 1739 0
0 154.11 4777.41 310
17 R. Maize 4.01 0 0.00 0 12.38 0 0 0 0
Other cereals
0.25 0 0.00 0 0 0 2.67 0 0
18 Gram 762.06 63336.50 818 1020.97
9.16 9352.08
5 449.63
24639.72
548
19 Safflower 42.04 22281.20 530 45.3
7 6.88
312.1456
11.43 330.32 289
20 R.Sunflower
9.7 465.60 480 4.38 0 0 0.69 19.32 280
Other R. oil seed crops
49.72 2 99.44 3.17 0 0 1.04 0 0
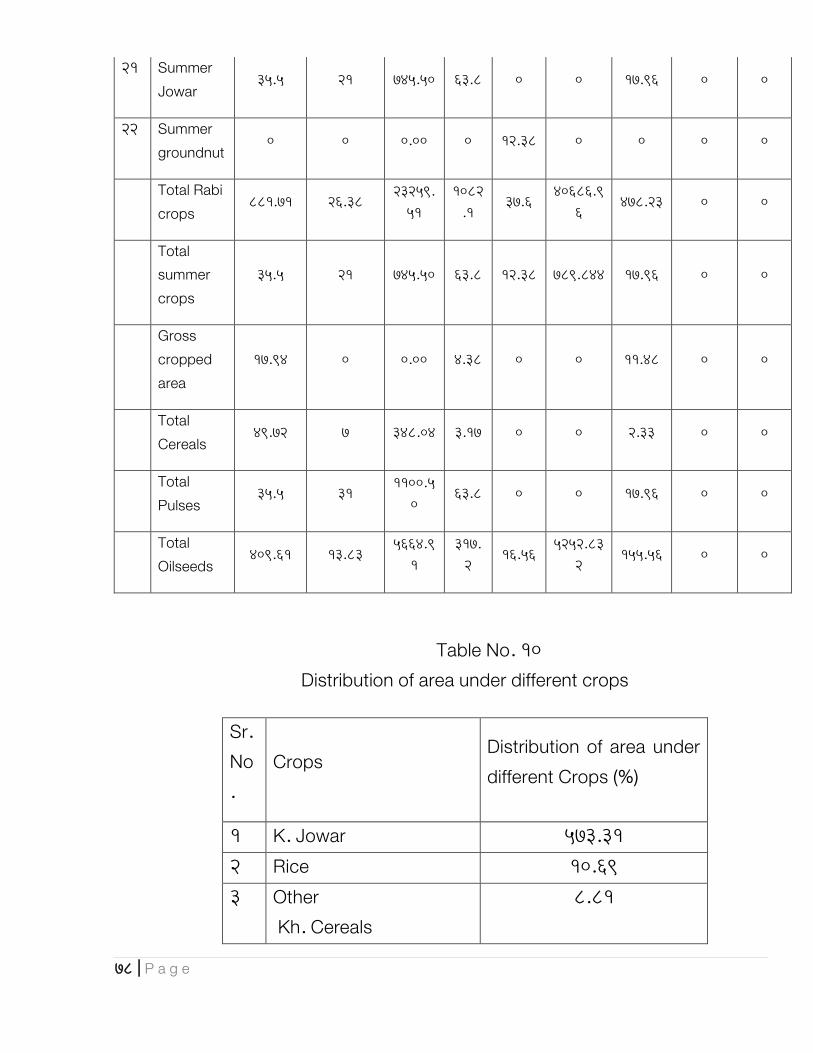
78 | P a g e
21 Summer Jowar
35.5 21 745.50 63.8 0 0 17.96 0 0
22 Summer groundnut
0 0 0.00 0 12.38 0 0 0 0
Total Rabi crops
881.71 26.38 23259.
51 1082
.1 37.6
40686.96
478.23 0 0
Total summer crops
35.5 21 745.50 63.8 12.38 789.844 17.96 0 0
Gross cropped area
17.94 0 0.00 4.38 0 0 11.48 0 0
Total Cereals
49.72 7 348.04 3.17 0 0 2.33 0 0
Total Pulses
35.5 31 1100.5
0 63.8 0 0 17.96 0 0
Total Oilseeds
409.61 13.83 5664.9
1 317.
2 16.56
5252.832
155.56 0 0
Table No. 10 Distribution of area under different crops
Sr. No.
Crops Distribution of area under different Crops (%)
1 K. Jowar 573.31 2 Rice 10.69 3 Other
Kh. Cereals 8.81

79 | P a g e
4 Tur 546.4 5 Mung 198.98 6 Udid 207.3 7 Other Kh. Pulses 2.33 8 Sunflower 1.77 9 Soybean 2607.29 10 Sesamum 7.94 11 Other Kh. Oil seed
crops 3.25
12 Sugarcane 135.34 13 Cotton 2724.1 14 Fruits, vegetables
spices etc
Total Kharif 7027.51 15 R. Jowar 153.23 16 Wheat 154.11 17 Other R. cereals 2.67 18 Gram 449.63 19 Safflower 11.43 20 R. Sunflower 0.69 21 Summer Groundnut 0 22 Total
Rabi season 771.76
23 Gross cropped area 7799.27 24 Total cereals 11.48 25 Total pulses 2.33 26 Total oilseed 3.25

80 | P a g e
Average yield of cotton is only 338 kg/ha of lint, which is higher as compared to state average. But the average yield of cotton in the district is very low when it is compared with frontline demonstration. Second important crop of this area is Kh. Jowar which is grown on 57331 ha. area of of the district and average yields of Kh. Jowar is only 440 kg / ha.
The average yields of Bajra, Wheat, gram, Tur, Mung, Udid are also not satisfactory. The yields of crops, which are grown on irrigated area are higher as compared to rainfed. But, the proportion of irrigated area is very low, which needs to be increased.
Yields gaps are maximum in Udid, Mung, K.Jowar and soybean and comparatively minimum in R. Jowar, Sugarcane, cotton, summer groundnut D.sunflower (table) To bridge the yield gaps (1) there is a need to increase the irrigated area, 2) watershed development work should also be completed as early as possible on all area and then 3) it is essential to improve the agricultural services (Availability of inputs, Training to the farmers, Research & extension activities, Marketing. Transport Storage, Processing etc. Restoring soil health is a prerequisite.
Growth rates required to achieve the yield obtained in frontline demonstration in 5 years are shown in table. It is possible to improve the productivity of crop with the growth rate of 6 to 10 percent per year under improved agricultural services.

81 | P a g e
table no. 11
Planning of plant Protection Chemicals Requirement (wt. /kg.)
Sr No.
Main Crop Pesticides Used Used in
2011-12
Requirement
2012-13 2013-14
2014-15
2015-16 2016-17
1 Cotton
Chloropyriphos Imidacloprid Bavistin Blue co oper
76800 74725 77200 65210 64900 64600
2 Soyabean 576 8370 8948 9435 9395 90200
3 Gram 19200 17300 16350 17600 16600 15600
4 Tur 48000 47350 49000 46400 43400 41400
5 Mung 33600 34000 33900 32100 31200 29100
6 Udid 48000 47000 44800 43000 43600 4400
7 vegetable 4800 4600 4750 4200 4400 4530
8 G.nut 24000 25800 27000 2300 2100 2200
9 S.cane 14400 14000 13500 11200 119700 117100
10 Banana 48000 47500 49000 48600 47400 4600
11 Hort.Crops 33600 33850 34000 30700 29400 28100
12 Total 350976 354495 358448 310745 412095 401830

82 | P a g e
table no. 12 Farm Machinery Status and Projection
Agri census 2003
Sr.No Taluka
Name of Improved Farm Implements and farm machineries
Present Status (Nos)
Plough
Plough Wodden
iron Bullock Cart
1 2 3 4 5 6
1 Nanded 2862 1188 2114
2 Ardhapur 6553 3954 2339
3 Kandhar 4293 204 948
4 Loha 8853 1503 3647
5 Bhokar 6598 618 3926
6 Mudkhed 2618 1294 1438
7 Hadgaon 7975 2506 7141
8 H.Nagar 3640 587 3019
9 Kinwat 6926 2375 5652

83 | P a g e
10 Mahur 3789 1480 2369
11 Degloor 4439 57 1504
12 Mukhed 5557 464 1448
13 Biloli 3058 936 2919
14 Naigaon 7068 410 1952
15 Dharmabad 6525 379 2024
16 Umri 3893 428 2399
Total 84647 18383 44839
Source (CDAP)
Table No. 13 Yield gaps (%) analysis
Sr. No. Crops
Dist. Average
yield kg/ha
Yield obtained in front line
demonstration kg/ha
Yield gap % with
respect to FLD
Growth rates required to achieve the
yield obtained in FLD (%) year in
5 years
1 Paddy irrigated 438.86 1500 24.38
2 Paddy rainfed 458.83 825 25.49
3 Kh. Jowar 836.523 1800 46.47

84 | P a g e
4 Tur 654.69 950 36.37
5 Mung 525.734 600 29.21
6 Udid 567.605 840 31.53
7 Sesamum 57.5 200 3.19
8 Safflower 688.25 815 38.24
9 Soybean 1297.521 1900 72.08
10 Wheat 1200.89 2200 66.72
11 Gram 916.36 925 50.91
12 R. Jowar 202.328 1115 11.24
13 R. Sunflower 918.95 815 51.05
14
Summer Groundnut
1238.291 1800 68.79
15 Cotton 781.555 340 43.42
16 Sugarcane 83.389 85 4.63
4.9 IRRIGATED AREA :
The total source wise irrigated of the district is 140946 ha., which is 15.42 percent of total cropped area (Table 10) Maximum irrigated area occurs in Nanded Tahsil (22852) ha. 16.21% while minimum irrigated area in Himayatnagar Tahsil 3268 ha. 2.32% Major source of irrigation in this district is open well through, which maximum area is irrigated 63809 ha. 45.27% followed by Tank Water 26869 ha, 19.06% It is well known fact that crop yield increase under irrigated condition table 4.10 It is possible to take 2 to 3 crops per year on the same piece of land one after another. Hence. it is proposed to increase the irrigated area up to maximum possible limit, as early as possible.

85 | P a g e
Irrigated are can be increased by 50% or so if modern methods of irrigation such as drip or sprinkles are used. It is also suggested that necessary arrangements for improved on farms surface irrigation methods be made. 4.10 CROPS AND CROPPING SYSTEM IN IRRIGATED AREA : Irrigation in Nanded District is 160979 ha, but the actual irrigation in last year is 136940 ha (table 4.9) wheat, gram, sugarcane, cotton are the major crops grown under irrigated conditions. Crop yields are higher under irrigated conditions. Land utilization efficiency increase due to irrigation and hence, it is suggested to increase irrigated area. Irrigated area can be increased by constructing minor, medium or major irrigation projects as early as possible and wells in untapped ground water areas considering the availability of rainwater. Irrigated area can also be increased up to 20% -25% (of treated area ) by integrated Watershed Development Work. After construction of irrigation projects and integrated watershed development work, it is expected that irrigated area may increase in Nanded District.
Table – 14
Source wise area irrigated
Sr. no.
Source of water
for irrigation
Area
irrigated
(ha)
Percentage
1 Tanks 30869
2 Open wells 67809
3 Tube/Bore wells 25311
4 Lift irrigation 7220
5 Other sources 29770
Total 160979
The crops which generate higher monitory return should be preferred in irrigated area. The irrigation water is not available for all the area for all the crops in the district. It means water is a limiting input. In this situation our aim should

86 | P a g e
be to harvest more yields per unit of water. Awareness amongst the farmer in this regard should be created so that, they should try to convert the irrigation water into more agricultural production and ultimately higher monetary returns. At present, most of the farmers, prefer sugarcane crop. Sugarcane requires about 1600 mm of irrigation water i.e. 16000 m3 water for one hectare area. If same quantity of water is used for chili crop, more than 2 hectares of area and the total monetary return of chilies or onion will be much higher as compared to sugarcane. This concept needs to be explained to all farmers in training programmes.
Area of cotton in this district is maximum i.e. 272410 ha. but only 13.91% area is irrigated. Proportion of rain fed area is maximum hence the average yield is only 338 kg / ha of lint (965 kg /ha of seed cotton) . Priority should be given to this crop for irrigation because it gives much higher yield under irrigated condition as compared to other crops. Cotton is a two seasonal crop (duration is 170-180 days) maximum growth period occurs in rainy season, hence irrigation requirement of cotton in this area is only about 250 mm, it means only two irrigation are required. Under irrigated conditions, it is possible to harvest more than 30-40 q/ ha of seed cotton. Hence, it is suggested that area under irrigated cotton should be increased. Same policy should also be adopted for tur, in which by giving one or two protective irrigations after rainy season i.e. at flowering and at pod development stage increase yield from 7 q/ ha to more than 25 q / ha.
Table 16
Irrigated crops
Sr.
no. Crops
Total
area Irrigated
area (ha)
% to
total
area
Distribution
of irri. Area
under
different
crops (%)
(ha)
1 Rice 1069 2100 1.53
2 Kh. Maize 459 100 0.07

87 | P a g e
3 Tur 54640 4000 2.92
4 Groundnut 3700 50 0.04
5 Soybean 260729 3500 2.56
6 Cotton 272410 29000 21.18
7 Sugarcane 13534 33900 24.76
8 R. Jowar 15323 5400 3.94
9 Wheat 15411 19500 14.24
10 R. maize 1697 800 0.58
11 Gram 44963 19500 14.24
12 Safflower 1143 1200 0.88
13 Seasumum 60 50 0.04
14 R. sunflower 69 8100 5.91
15 Summer Jowar 60 640 0.47
16 Summer Maiz 10 100 0.07
17 Summer
Groundnut 830 8300
6.06
18 Summer
Sunflower 500 500
0.37
19 Summer Mung 200 200 0.15
Total 686807 136940.0 100.00
Farmers of this area are prefer wheat crop, which is comparatively a sensitive crop for water stress and short winders. In case of wheat about 550 mm of irrigation water is required to harvest maximum yield. There is drastic reduction in yield, if water supply is reduced. Hence, under scarcity situation it is suggested to take drought resistant crops like gram, sorghum, safflower which require less irrigation water and more area can be irrigated. The quantity of irrigation water, which is required for wheat, is sufficient to irrigate 2 to 2.5 ha higher in case of gram or rabi Jowar. Therefore there is a need to increase the irrigated area of rabi jowar and gram, because yields response to irrigation water is good in both the crops.
4.11 INPUT MANAGEMENT :
To harvest maximum crop yields, it is expected that the farmers should use all inputs (pure seed of high yielding or hybrid variety, manures, fertilizer, irrigation water, pesticides, weed sides, growth regulators etc) as

88 | P a g e
recommended by the experts. It is also expected that the farmers should complete all operations such as preparatory tillage operation, seed bed preparation, sowing, intercultural tillage operations, spraying, dusting etc. at a right time. But there are difficulties to the farmers. Irrigation facility is available only for 15.42 percent area. Remaining 84.58 percent area is rain fed on which watershed development work is not completed up till now. In this situation farmers are not ready to take risk for more inputs. There is a need to create confidence among cultivators. Adequate and timely credit facilities needs to be created.
4.12 SEEDS :
Use of pure seed of improved varieties is the basis of all agricultural improvement. Reap as you sow, is a age old saying which is true in scientific farming also. No amount of advanced agricultural practices will boost up crop yield if the seed used is not of high quality. Good seed does not cost much but relatively it pays more. There are several varieties released in some of the crops like cotton maize but in some of the crops local varieties are used. Yield potentials are very low. More and continuous research is essential for increasing productivity.
In crops like K.Jowar,Maize, cotton the seed replacement ratio 100 percent (table) which can be considered as good sign of improvement but is case of Tur, Mung, Udid, Groundnut, Soyabean, R. Jowar, wheat gram the seed replacement rate is very low. Rabi Jowar is grown on large area but the seed replacement rate is only 4 percent. in such cases farmers are using local seeds without seed treatment which may or may not be good quality seeds. There should be provision of seed testing in laboratory. 4.13 ORGANIC MANURES : Integrated approach for nutrient management is suggested by the scientist but it is observed that, most of the farmers are using only chemical

89 | P a g e
fertilizers and they are not using organic inputs because of unavailability at local level. Organic manure is a complete food for the crops. All nutrients (including micro nutrients) are available in manure. Farmer should produce organic manure, compost,vermicompost at their site. 4.14 FERTILIZERS : Crop wise NPK consumption shows (Table no 30) that in cotton, sugarcane, wheat and maize, the farmers of this district are using NPK almost equal to recommended dose per hectare, even though the yield of wheat and sugarcane are not satisfactory when it is compared with expected yields. This is because farmers are not adopting the principles of integrated nutrient management. It is also observed that they are not using balanced fertilizers. In case of Tur, Mung, Udid and Soybean nitrogen is used as recommended dose but p2o5 is not used in sufficient quantity. In most of the cases, bio fertilizers are not used which is very essential to harvest higher yield. All type of fertilizers (straight fertilizers, complex fertilizers, micro-nutrients liquid fertilizers should be made available to the farmers. The requirement of micronutrient to the crop is comparatively low but it is equally important as major nutrients. Liquid fertilizers are more useful and efficient in drip and sprinkler irrigation systems. 4.15 CHEMICALS : Different type of pesticides, weedicides, growth regulators are required in crop production programme. Chemicals should be standard and of best quality. Pesticides are required to protect the crop. There should be provision of testing of chemicals in laboratory of Agro polyclinic. 4.16 LABOURS : Human labours and bullock labours are not available in adequate number. At many places it is observed that the farm operations like preparatory tillage, land layouts, sowing, intercultural operations, spraying, irrigation , harvesting etc. are not completed in time, which adversely affect the crop yield. Load

90 | P a g e
shading of electricity has also become a serious problem. When labours are available for irrigation, during daytime, the electricity is not available and when electricity is available during night time, labours are not available. Numbers of marginal farmers, small farmers are more in number. They cannot afford to keep a bullock pair, they cannot afford to buy a tractor, they are unable to complete the farm operations. In this situation is very essential to shift as mechanization hence a proposal is given separately.
Table No. 18
Planning of Agriculture Inputs in the District - Seed 2012-13
Sr. No. Name of crop
Area under crop (ha) (2012-13)
Present SRR %
1 2 3 4
1 Jawar 110500 100
2 Tur 57650 24
3 Soya bean 209800 35
4 Cotton 310200 100
5 Mug 29200 22
6 Udid 32800 56
Total 750150 337
Table No 19
Crop wise NPK Consumption
Sr. No. Major Crops Fertiliser Consumption( kg/ha)
N P K Total
1 Cotton 100 50 50 200
2 Jawar 80 40 40 160
3 Soyabean 30 60 30 120
4 Mung / Udid 25 50 0 75
5 Tur 25 50 50 125
6 Sunflower 25 50 0 75
7 Wheat 100 50 50 200
8 Rice 100 50 50 200
9 Gram 25 50 0 75
10 Banana 800 700 800 2300
11 Sugar Cane 250 115 115 480
12 Grond Nut 25 50 0 75
13 Soffiower 50 25 25 100
14 Vegetable 50 50 50 150

91 | P a g e
15 Hort. Crops 200 110 110 420
0 0 0 0
Total 1885 1500 1370 4755
(source ADO )
4.17 FARM MECHANIZATION / FARM EQUIPMENTS
Farm operations are the most drudgery, difficult and laborious work in crop production prgogramme. It appropriate type of implement / tool/ machinery is available, the farm work can be completed in short time and the quality of work is also good. Because of comfort to agricultural workers, it improves efficiency and reduces labour cost. farm mechanization increase profitabilility. Women play a major role in crop production and post-harvest activities related to agriculture, horticulture dairy ; poultry etc. Women are involved in large number of agricultural operations including sowing, planting, weeding, hoeing, fertilizer application, spraying, dusting, harvesting, threshing, grading, processing etc. If women – friendly tools, implements machineries are available it improves efficiency of working. In Nanded district, availability of farm implements,machineries are studied and it is observed that farm implements/ machineries are at lower (table 4.13) level. Number of tractors, seed drills, sprayers, Treshers, Ele. Pumps drip and sprinkler seits were studied. It shows that highest number of tractors (175) were in the area of Mudkhed tahsil, indicating 175 ha of cropped area per tractor whereas lowest number of tractors. The staff of SRTMRU Nanded has discussed the issue of mechanization with farmers of Nanded district and it is reported by the several farmers that there is shortage of farm labours. This is a serious problem. Therefore it is very essential to switch on to farm mechanization. Considering the requirement, it is proposed to have an organization at district place to manufacture & repair different types of tools, implements, equipments, machineries etc. The
92 | P a g e
organization may be Govt. co-operation or private but they should be involved in research, manufacture and sale of tools, implements, machineries required for crop production programme and post –harvest activities. More labours are required for transplanting of seedlings, planting of sugarcane, harvesting of Jowar, Maize, Picking of cotton, harvesting of Wheat, safflower, grading of sweet orange etc. The use of equipment , machineries should reduce the labour requirement. The machineries required for post harvest activities may also be given more priority. The Lead Bank and NDCC Bank should provide adequate investment credit, reasonable rate of interest, to the cultivator, for the purchase of tractors, electric pumps and other farm machinery, to improve their productivity. Talukawise project investment credit for XI Plan period is shown in table 29.

93 | P a g e
Table – 21
Availability of Improved Farm Equipments and Machineries
Tractor Thresher
Sr. No.
Name of
Taluka No.
Area/
Tractor
(ha)
No.
Area /
Thresher
(ha)
1 Nanded 130 356 28 1654
2 Ardhapur 104 297 72 429
3 Kandhar 175 151 53 497
4 Loha 85 773 208 316
5 Bhokar 70 1103 213 362
6 Mudkhed 58 1250 161 450
7 Hadgaon 45 1923 276 313
8 H.Nagar 209 325 115 591
9 Kinwat 130 437 160 355
10 Mahur 85 557 99 478
11 Degloor 68 1119 205 371
12 Mukhed 37 915 170 199
13 Biloli 109 853 210 443
14 Naigaon 42 1144 55 874
15 Dharmabad 110 457 142 354
16 Umri 45 785 84 420
Total Dist. 1502 609 2251 406
4.18 SPECIAL PROJECT / PROGRAMMES ON-GOING IN THE DISTRICT :
Reduced public investment in agriculture and allied sectors during last decade has resulted in decline in growth rate of agriculture. Therefore, there is an urgent need of enhancing investment in agriculture (both public and private) to augment productive capacity. As public extension system empowers farmers technologically and economically it need be adequately backed by public finance.

94 | P a g e
Large numbers of schemes and project sponsored both by the central and State Government are implemented and operational in each district. There is need to network and co-ordinate these schemes / projects to empower farmers for enhancing agricultural productivity through resource use efficiency.
Major schemes implemented at district level are :
Agriculture 1 National Mission of Oilseeds and Oil Palm (NMOOP)
2 National Food Security Mission (NFSA) 3 National Mission for sustainable Agriculture (NMSA)
4 Fodder Development Programme 5 INSIMP
6 Sugarcane development 7 Integrated Cotton Development
8 Public Private Partnership (PPP)
HORTICULTURE
1 Employment link 2 NMMI
3 On form water management 4 Tribal farmer horticulture development
5 Sanitation and phyto-sanitary certification 6 Hotshot
7 National Integrated development of horticulture
Soil and water conservation
1 Intergrated watershed development programme (IWMP)
2 Nationl watershed development programme 3 Mahatma phule jalbhumi sandharan mission 4 Jalyukta shivar Mission
5 Adarshgaon Yojana
Extension
1 Information support to agril extension 2 soil, Water, testing
3 Bio-pesticide production

95 | P a g e
4 State extension reforms (ATAMA)] 5 Natural disaster management
6 National Agril Insurance 7 Agri polyclinic and farmers training
8 shetkari Magazines and publication 9 Awards and incentivization scheme 10. Weather Based crop Insurance Scheme.
State has launched Maharashtra Agril Productivity Improvement Campaign (MAHAPIC) for enhancing productivity of major crops by effective networking convergence and co-ordination of various schemes at district level. The major components of various schemes/ projects etc.
4.19 CONSTRAINT ANALYSIS :
4.19.1 YIELD GAP ALALYSIS OF MAJOR CROPS :
Average yield of different crops in Nanded district, yield obtained in frontline demonstration and yield gaps are shown in table yield gaps are more in Kh-jowar,mung,udid,and soyaben where as yield gaps are less in R.Jowar, cotton, sugarcane and groundnut. The yield gaps are mainly because of poor management. The reasons for yield gaps are shown in table.
Table – 22
Reasons for yield gaps
Sr.
No. Crop Main reasons for yield gaps
1 Cotton
1.About 94% cotton area is rainfed ,low moisture at boll
development stage. 2) Not adopting the principles of INM.
3) Poor plant protection measures. 4) Crop is also grown on
shallow coarse textured soils.
2 Maize
1)Not adopting the principles of INM. 2) Crop is also grown
on shallow soils. 3) Deficit soil moisture.4) Poor plant
population.
3 R. Jowar
1) Needs irrigation at critical growth stages. 2) Seed
replacement rate is poor. 3) High yielding varieties are not
available 4)Poor irrigation layouts.

96 | P a g e
4 Bajra 1) Poor intercultural operation 2) Poor nutrient
management.
5 Tur
1) Needs irrigation at flowering and pod development stage.
2) Seed replacement rate is very poor. 3) Not adopting the
principles of INM. 4)Inset moisture conservation techniques
needs to be adopted.5) Appropriate spacing in plant to plant
maintain. 6) Protective irrigation given at critical stage.
6 Mung,
Udid
1) High yielding varieties are not available 2)Seed
replacement rate is very poor. 3)Poor or no plant protection
measures. 4) late sowing due to insufficient moisture.
7 Soyabean 1)Poor nutrient management.2) Poor intercultural operation
3)Not adopting the principles of IPM.
8 Wheat
1) Late sowing, poor plant population. 2)Need adequate
number of irrigation. 3) varieties of higher yield potential
are not available. 4) Poor nutrient management.5) Seed
replacement rate is poor.
9 Gram
1) Need irrigation at critical growth stages, poor irrigation
layouts. 2)Need medium to deep soils only 3) Not adopting
the principles of INM.
10 Sugarcane
1) Planting is not scientific. 2) No seed treatment 3)Not
adopting the principles of INM and IPM. 4) Poor irrigation
management.
11 Kh. Jowar
1) Late sowing because of low moisture in soil. 2) varieties
of high yield inertial are not available . 3) Poor intercultural
operation 4) Not adopting the principles of INM and IPM.
12 Safflower 1) High yielding varieties are not available 2) Poor or no
plant protection measures.
4.19.2 EXTENSION & ADOPTING GAPS/LIMITATIONS:
Though extension services are essential ingredients is agriculture and rural development, there is a wide gap between scientific know-flow and field level do-how. According to NSSO, Govt. of India (2005) report, only 40% of the farmers in the country accessed one or the other source for getting information related to modern forming while 60% farmers are unaware of modern agriculture technology. Further, the farmers who received farming related information from one or the other source, only about 50% actually tried the information or

97 | P a g e
adopted the recommended technology indicating huge technology transfer (Extension) and adoption gaps and this gap being largest in Jive stock and fisheries sub-sectors which are emerging as an important contributors to the total agriculture GDP.
The huge technology unawareness, technology transfer and adoption gaps may be ascribed to : 1) Inappropriate and non-attractiveness of technology package 2) Farmers unawareness of new and modern technology due to low literacy rate 3) Non-availability of modern technology related quality inputs at right time, in right quantity and at right and affordable cost. 4) Deteriorating terms and inadequate infrastructure for trade of agriculture produce and 5) Ineffective agriculture extension services.
4.19 3 LIMITATIONS OF PUBLIC EXTENSION SYSTEM :
The size of existing extension service network in agriculture and allied sectors at district level is, by and large, satisfactory. Although the ATMA has been established for integration, co-ordination and convergence of extension efforts within the district, the perceived innovations in institutional reforms through ATMA still face the implementation and operational linkage problems. Decentralization and participatory approach in Agri Extension delivery is a step in right direction, However the flow of appropriate technology., and value – added Information and combination of various supports services at right time and place to empower small and marginal farmers for improving efficiency and viability of farming is in effective due to lack of sensitization, orientation and capacity building of field extension personnel of line departments and bottom level decision makers. The evidences of impact of ATMA module of extension delivery on small and marginal holding and other disadvantage! group of farmers and farm women, which constitute huge number and prominent for food and social security of the rural communities, are still not visible. The key limitations of district extension system are :

98 | P a g e
Public extension services are widely viewed as supply driven rather than demand-driven.
There is more focus on input distribution and subsidy administration rather than core function of farmer’s empowerment through credible extension work.
Segmented approach in extension service delivery without considering farmers interests and priorities.
Public extension deals with at large area and population with diverse cropping pattern and extension services are general in nature.
Poor networking and weak co-ordination in district line departments. In inadequate capacity building/still up gradation of extension workers to
provide demand-driven, specialized, location specific extension services. Due to large vacant posts, deployment of extension workers to other
supervisory work, and constraints on budgetary allocation. the public extension system is not able to effectively perform its extension services.
Weak and / or non-existence of research – extension-farmer market linkages.
4.19.4 EXISTING INSTITUTIONAL MECHANISM IN THE GOVT.
Besides deficits in public investment, credit, infrastructure and marker economy, the knowledge defect, is the primary cause for the, development deficit, in agriculture and rural economy. The gap between scientific know-how and the field level do-how has been widening in recent years. This knowledge deficit needs to overcome speedily arid effectively through efficient and accountable Agriculture extension machinery to enhance productivity, profitability and viability of farming, specially of small and marginal holdings.
4.20 EVOLUTION OF PUBLIC EXTENSION SYSTEM IN STATE :

99 | P a g e
Public Extension System has undergone several changes since early 1950. Beginning with Community Development (CD) programme in 1952 through the National Extension Service in 1953,the main focus was on human and community development. There has been a steady progression towards technology transfer, with IADP in 1961.-62, IAAP in 1964-65, HYKP and FTEP in 1966-67, and SMFDP in 1969-70.
The most significant development was the introduction of the Training and Visit (T&V) extension management system in mid 1970’s. T&V extension system was well suited to rapid dissemination of broad based crop management practices and registered impressive gain in irrigated area. Indeed, the T& V system played an important role in ushering the Green Revolution. The various mechanisms evolved in T&V system were very successful in providing a two-way channel for dissemination, of technology to farmers and the feed backs of the problems faced by the farmers to research system with better Research- Extension-Farmer( R-E-F) linkages.
However, the T&V system being “Top –down” in approach generated uniformity rather than specificity with low level of involvement of farmers. The capacity building of extension functionaries and not adequately addressed and mostly remained with centralized operations. During post-green revolution period, when the T&V extension approach / vas extended to rainfed farming, the system failed to respond to the more location specific, risk-prone situation in sustainable manner.
The system did not meet with success, the needs of diversified agriculture in rain fed area. Further due to closure of the World-Bank support to T&V extension approach.
The state Department of Agriculture was reorganized in 1998 pm “one window” pattern with a view to deploy more of its technical manpower in the field for technical services to farmers through single village level worker (VLW).

100 | P a g e
This was a broad based extension model but lacked functional integration and the staff was equipped with traditional managerial skill of input supply, quality control with poor awareness about changing needs of farmers. This field staff is heavily burden with various scheme/projects and targets with very less emphasis on technology transfer and technology application in real-life field situation of farmers.
4.21 PRESENT EXTENSION SERVICES
1.GOVERNMENT SECTOR
The Department of Agriculture of the state is the nodal agency for ensuring overall development and growth of agriculture. At the district level. the Department of Agriculture is headed by Superintendent Agriculture officer (DSAO) assisted by Deputy Director of Agriculture (DDA) Sub-Divisional Agriculture Officers (SAG), Taluka Agriculture Officers (TAO) Circle / Mandal Agriculture Officer (CAO), Agriculture Supervisors (AS) and Agriculture Assistant/ village level work;: (VLW). The main responsibilities of Agriculture Department are :
Implementation of various central and state sponsored schemes. Transfer of Technology and Providing other technical services
Department of Agriculture assists in transferring the latest agriculture technologies developed by SAU,ICAR arid other Research organizations to the farm families through farmer’s field school, village seed programme, field demonstrations kisan melas, training of farmers, direct contact, literature and

101 | P a g e
print and electronic media. The department has introduced Krishi Vigyan Mandate (KVM) and Self Helps Groups (SHGs) for participatory extension services.
The district line Departments of the state Govt. such as Horticulture, Animal Husbandry, Dairy Development, Sericulture, Forestry, Fisheries etc. are involved in providing extension services through supply of subsidized inputs and routine.
Apart from Agriculture and other Line departments, the Zilla Parishad (ZP) also has the department of Agriculture headed by Agriculture Development Officer (ADO) assisted by supporting staff at District Parishad and taluka and village Panchayats. They are mainly engaged in input supply and distribution, and quality control besides Extension services.
Following State Govt. setup corporations are mainly responsible for production, supply and procurement of inputs along with products related extension services in the district.
a) MAIDC Ltd. b) MSSC Ltd. and c) M.S. Seed certification Agency.
Agriculture University extension Services in the district covers. The organization of zonal Agri. Res. and Extension Advisory committee meetings, monthly district workshops, Diagnostic team visits, joint field visits,. demonstration training of extension personnel’s and farmers mainly through Krushi Vigyan Kendera, ZRS / Sub stations and District Extension Agronomist with a team of subject matter specialists.
Krushi Vigyan Kendra’s (KVK) mandate is technology assessment and refinement through On Farm Testing (OFT) and Front Line Demonstrations (FLD) of improved technology / products and its dissemination through training of extension personnel’s and farmers, and vocational training of rural youths and

102 | P a g e
farm women. The Programme Co-coordinator (PC) as the head of KVK plans and implements tailor-made extension programmes based on thrust areas of the district. The PC of the KVK is assisted by six Training Associates of major discipline and three Training Assistant and supporting staff. The scientific Advisory Committee (SAC) of the KVK comprised of district heads of various line Departments, progressive farmers and KVK/SAU scientists meet twice in a year to review the progress of the work and discuss the future plan of work. The success of KVK largely depends on its linkages with line departments and contact farmers.
4.22 CORPORATE/PRIVATE/ NGOs SECTOR
Increasing restraints on Govt. finances and new arrangement in extension services, the corporate, private and large number of NGOs/agencies are increasingly involved in providing technical and materialistic extension services in the district. The corporate houses, private wholesale dealers, retailers, traders are mainly involved in farm business through consultants and agri-business outlets. The major corporate players, which have already come up with their Agri - products are “ e-chaupal” of ITC , “Aadhar“ of Godrej Agro-vet, Shub Labh of Mahindra Group, Tata Krishi Seva Kendra of TATA Group etc. Most of these outlets are offering Agri-inputs at a single window and agricultural extension services related to their brand products. Some of the sugar mills in the district have also adopted the innovative method of agro-extension.
The farmer’s organizations (KVMs, SHGs) and NGOs largely dependent on Govt. grants/ subsidies are also providing extension services in the district though participatory mode. The NGOs are mostly involved in promotion and credit linkages of SHGs, watershed development, organic farming, rain water harvesting, rural sanitation and health awareness etc. These private groups of extension agents are giving services free to nominal charges.
4.23 INNOVATIONS IN TECHNOLOGY DISSEMINATION:

103 | P a g e
With a view to increase the quality and of public extension system to face the challenges of 21st century, it was necessary to evolve new strategies for effectively disseminating newer technologies being evolved by the “MARS. As reforms in the present public extension system an Agriculture Technology Management Agency (ATMA) was established and pilot-tested in four districts of the state during 10th five year plan. The main aim of ATMA is to integrate the various stakeholders at district: level associated and involved with agriculture development activities within district Based on experiences gained through pilot testing, the ATMA module of Extension delivery has been adopted in all the district of the state in the 12th plan,
The details of extension services provided by various line departments are given in table-4.15 and the structure of Agri-extension services at district level is shown in table – 4.16

104 | P a g e
Chapter V
5.1 ALLIED AGRICULTURE SECTOR
Introduction :
C-DAP of the district is aimed at enchancing the growth rate of Agriculture. Along with it other allied activities like, Sericulture, Horticulture, Animal Hunsbandry Fishers, Watershed development, Agro based rural development, Food processing units, Development of Rural Industries, Agricultural marketing and Agricultural credit have also been included in the project report.
Critical analysis of the available data / statistics and information was made to Agriculture as well as of allied activities. Thus, by increasing the growth rate of allied activities to minimum level of 6 percent per annum, it is expected that the overall growth of agriculture and allied activities together will help in achieving CGR to 4 percent during the 11th plan period.

105 | P a g e
5.2 Development of Horticulture in Nanded district during 11th five year plan :
Introduction :
In Nanded district there are 16 talukas and the soils of the district is medium to veavy type in almost all the talukas. The rainfall received during the year ranges from 800 to 1000 mm higher in proportion in north esastern regions with high density of forests. The climate of the district is suitable for growing tropical and sub tropical fruits and vegetables. Banana is an important fruit crop growth traditionally in the district. Ardhapur variety of banana its famous with is grown in Ardhapur and adjoining areas. Mango, Sweet orange, mandarin orange are other fruit crops with area grown in the district on commercial scale since along time. Among vegetables and spices onion, garlic, turmeric and chilli crops are grown in the district. Dharmabad and Dagloor are famous talukas for growing chilli as rainfed crop. Mudkhed is well known centre for growing citrus and flower crops like Jasmins, rose, chrysanthemum, gillardia etc. Due to completion of irrigation projects like Jayakwadi, Vishnupuri and other medium and minor projects, there is significant increase in the irrigated area in the Nanded district and therefore, the scope for development of Horticulture in the district has increased to considerable extent.
5.3 Development of fruit crops :
In Nanded district banana, sweet orange, mango, guava and sapota are major fruit crops grown on 29775 hectare area. Among these sweet orange is alone grown on 10452 hectare area and banana is grown on 9500 hectare area. during 11th plan it is proposed to increase the area under fruit crops upto 56800 hectares with compounded growth rete of 13.80 per cent. The area under

106 | P a g e
banana is increasing at faster rate and it is proposed to expand the area under banana to 1200 hectares. Similarly sapota is also becoming another important fruit crop of the region.
The total, production under fruit crops is 419882 tonnes and during 11th plan it is proposed to increase this production to 1171907.50 tonners with the growth rate of 22.70 per cent. The production of fruit crops can be increased by two means viz. by increasing the area under fruit crops and by increasing the area under fruit crops and by increasing the productivity. In case of banana it is proposed to increase the productivity from 25 to 47.5 tonnes with the growth rate of 13.70 per cent. The productivity of banana can be increased by proper management of banana crop particularly in respect of manuring and irrigation. Under Marathwada conditions very limited research work has been undertaken on cultural aspects of banana. The state government has sanctioned on research station for banana at Nanded. It is essential to strengthen this research station. Therefore a proposal for strengthening of banana research station has been prepared and is being submitted separately.
Besides banana there is good scope to increase the area under sweet orange, mango and sapota. The area under sapota is also increasing at faster rate and during 11th plan the area expansion plan has been prepared.
Major varieties of Horticulture crops in Nanded district.
A) Fruit crops 1) Sweet orange Nucellar mosabi 2) Banana Ardhapuri, Barrow 3) Mango Kesar, Dashahari, Hapus

107 | P a g e
4) Papaya Taivan 5) Sapota Kali Patti
B) Vegatable crops 1) Chilli Jwala, NP 46A, Parbhani 2) Bhendi Parbhani, Kranti 3) Tomato Pusa Rubaj, Mangle 4) Bringal Marjro cota, Vaishali
5.4 Nursary Activities :
With the increase in area under fruit crops, the demands for the planting material will also increase. There is always demand for quality plant metrical and material in sufficient quantities to cater the needs of the farmers. This is due to inadequate facilities available for production of planting material. The mother trees of improved varieties should be available in sufficient number for supply of sufficient quantities of scion wood or buds for grafting and budding. Similarly the seeds of root stock plants should also become available in sufficient quantities for raising of root stock seedlings. Similarly the availabilities of skilled laborers’ for propagation work is also an important factor in production of plant material. The state Government nurseries should be strengthened by providing additional grants. Therefore, a separate proposal for strengthening of State Government nurseries has been prepared and is being submitted separately. If this proposed is approved by the Government then the nurseries will be able to produce required quantities of planting material to cater the demands of the farmers and the objectivie of area expansion under fruit crops can be achieved.

108 | P a g e
Besides open propagation of the nursery plants, if would be possible to undertake the production of plants under green house conditions continuously throughout the year. In green houses the climatic parameters like temperature, humidity, light etc. are controlled artificially and therefore, it is possible to provide the desired type of atmosphere for propagation of a particular fruit crop. Under high humid conditions the rooting of cutting becomes more successful. Similarly the success for grafting and budding can also be increased under controlled atmospheric conditions. Tissue culture of plants like banana is also undertaken on large scale in the tissue culture laboratory of agricultural university. If the plant material produced in tissue culture is used for planting of banana plantations, then the farmers can obtain early and higher yields.
Rejuvenation of old Garden :
The old gardens of mango, ber, sweet orange are many times deteriorated and biomelaess productive. The fruit quality is also not superior and therefore maintenance of such fruit gardents becomes uneconomic. The State Department of Agriculture has a scheme for rejuvenation of old fruit gardens. The old, less peoductive plants and the plants having poor fruit quality are converted into superior types by different methods of propagation like side grafting, crown grafting etc. In case of ber the old trees with inferior fruit quality have been converted into a plant of superior fruit quality by following patch or ring budding methods on new sprouts of the old cut trees.
Besides rejuvenation of the unproductive plats, the productivity of the fruit grees can be increased by proper nutrition and irrigation and irrigation

109 | P a g e
management, intensive pest management (IPM), use of plant growth regulators and other shemicals and by following special horticultural practices like bahar treatment in citrus, ringing in mango, notching in fig and so on. The farmers are not aware of such practices for induction of flowering and improvement of fruit size and yield. Therefore, it is necessary to provide the training to the farmers for increasing the to yield of fruit crops without deterioration of plant health.
Development of vegetable crops :
In Nanded district the cultivation of vegetable crops is more concentrated around the city and towns. Because the urban people are more health cautions and there is good demand for the fresh vegetables in urban areas. The vegetables can be grown throughout the year as there is good demand for the vegetables all the year round. The kharif season vegetable like bhendi, beans , cucurbits, chilli, tomato, brinjal, etc. are produced by the farmers on small scale and these vegetables are transported daily from the villages to the vegetable markets in the towns and city like Nanded. In rabi season the vegetables like cabbage, cauliflower, pea, carrot, onion, tomato etc. are grown on commercial scale as market gardens and truck gardens. In summer season cucumber, water melon and musk melon are grown on river banks and are transported to distant maerkets.
In Nanded district at present 7532 hectare are is occupied by different vegetable crops which is proposed to raise upto 10663 hectares. The present production of vegetables to the extent of 55057 tonnes can be raised to 117500 tonnes with the compounded growth rate of 16.3 per cent. during 11th plan it is possible to have such development of vegetables in Nanded district. Organic Farming in Vegetables :

110 | P a g e
There is good demand for the vegetables produced through organic farming particularly urban areas. Because the educated people from urban areas are more health cautions and they prefer the food produced through organic farming. Therefore, a separate proposal on organbic farming in vegetables for Nanded district has been prepared and is being submitted separately. Vegetable seed production : As there will be an increase in are under vegetable the demand for the seeds of different vegetables will increased. There is always shortage of good quality seeds of recommended varieties of vegetables. In order to meet out the demand of seeds of different vegetables, it would be essential to undertake the programme of vegetable seed production. The Seed companies in Nanded district should take the seed production programmes so that the demands of the farmers will be fulfilled. Development of Floriculture : In Nanded district the cultivation of flower crops in undertaken on commercial scale in some pockets like Mudkhed. The crops like rose, marigold, tube rose, gillardia, Jasmins etc. are grown and the fresh flowers are transported at different centres in Nanded and other adjoining districts. The present area under different flower crops in Nanded district is 456 hectares with production of 1400 tonnes. In 11th plan it is proposed to increase the area upto 1048 hectares and production to 4722 tonnes with the growth rates of 18.1 per cent and 27.6 per cent respectively. The farmers will be provided necessary help for increasing this production of flower crops. High Tech Floriculture :

111 | P a g e
The production of flowers in polyhouses in gaining much more importance during last two decades. The flowers so produced by high tech cultivation are specially used for export in western contries and thereby the farmers are able to earn more profit through the high tech cultivation of flowers. The State Government is also providing the financial aids to the farmers for high tech cultivation of flowers. A proposal has been prepared for high tech cultivation of flowers in Nanded district and is being submitted separately.
Chapter VI District Plan – Nanded
Introduction :
We are presenting in this chapter a detailed District Plan of Nanded, for the XII plan (2012-17). It includes important growth drivers, innovative schemes, and budgetary provisions for the XI plan, to achieve the targeted growth rate. This also contains the necessary requirement of inputs such as improved seeds, fertilizers, pest-control measures. Projects are also included on improved water management, specifically, use of drip/sprinkler irrigation. Watershed management & soil health. Training and technology transfer facilitating farmers knowledge, have been projected. Some of the innovative schemes have been suggested. 6.1 Strategy for achieving XII Year plan projections
A focus on Command Area Development and the rehabilitation and physical modernization of
existing major irrigation systems. Comprehensive aquifer mapping and extensive ground water recharge. Move towards sprinkler and drip irrigation and away from flood irrigation

112 | P a g e
Improvement of productivity and income of farmers in the existing enterprises and farming system by adoption of demonstration.
Organization of technology based training program. Diversification and intensification of existing farming system. Sustainability in productivity / income through integrated farming
approach. Integrated Nutrient Management Integrated Pest Management Seed multiplication and Replication Up gradation of marketing strategy. Strengthening and formation of farmers organization Human Resource Development Adoption of a farming systems approach with livestock and commons as
an integral component of the farm; Generation of biomass for bulk addition of organic matter in the soil to
maintain proper soil health. We should educate the farmers not to burn standing crop residue but to plough it into the soil;
In situ degeneration of biomass through sole cropping/inter-cropping/bund cropping of green manure crops;
Recycling of farm and household waste through use of intensive nutrient recycling methods such as composting, including the use of sericulture;
Producing and encouraging use of bio-fertilizers at regional and local levels, along with adoption of bio-dynamic farming methods;
Crop rotations to enrich soil (e.g. to include pulses and leguminous crops). Multiple cropping
which enriches soil should be encouraged instead of mono-cropping; 6.2 Sectoral / Regional Growth Drivers of the districts:

113 | P a g e
Out of the several proposals made in the C DAP, we are highlighting a few below, which, in over opinion, set the direction of development and on which the success of the C -DAP depends. (i) The massive program of watershed development combined with the expansion of soil testing facilities and supported by inputs for soil health enhancement is the key driving force for the sustained growth and long term development of agriculture in the district. All the small and marginal holdings which are degraded for want of inputs and will be covered by these two very positive aspects of soil conservation and soil health enhancement. Combined with other inputs and improvements, one third of all the cultivated area which has not been making any positive contribution to production will come back in the production stream. (ii) Diligent water Resources Management : The huge watershed development programme proposed in the C DAP will augment ground water availability substantially. Its diligent use through old and new wells fitted with micro irrigation systems will double the irrigated areas, enable growing of high value crops including horticulture and raise their productivities. Thousands of farm ponds will provide irrigation for at least one more crop and improve the viability of presently nonviable farms. Better maintenance and management of the canal systems of the existing projects will add large areas under irrigation. Agriculture itself and several supporting activities are in the private sector. This should mean that the process will not be much burdened by official inertia or indifference. The reward being their own district’s development and well being of the people, we do hope that everyone concerned would do his

114 | P a g e
best and make the CDAP a success. (a) Building commodity Groups and Farmer's Organization: A major weakness is the skewed land holding or land ownership in the district and operating holdings of less than 2 ha together holding 30% of cultivated area. Most of these small holdings are meaning that they consist of more than one piece of land scattered or located away each other. Those holdings are un-economic and non-viable. The owners do not afford to keep even a pair of bullocks. Their cultivation is indifferent. The lands receive desired village rarely and do not at all get any manures or fertilizers for soil health, As a result their soils have gone on degrading and their productivities are very low. Thus, 30% of the cultivated area is not contributing in the process of agricultural growth and 60% of the ' holders are living a low level of bare existence. We have proposed an innovative scheme to organize these asset poor and asset less farmers in Self Help Groups and to train and help them undertake agro-services and small agro- producing enterprises which are critical for rejuvenating the whole system of agriculture of the village. In the process the members of these SHGs will also be enabled to bring their own holdings back to viability and with additional employment and earnings get out of the poverty trap. 6.3 Seed processing for seed village program
To upgrade the quality of farmer-saved seed which is about 80-85% of the total seed used for crop production programme, it is proposed to provide financial assistance for distribution of foundation/certified seed at 50% cost of the seed of crops for production of certified /quality seeds

115 | P a g e
only and to provide training on seed production and technology to the farmers.
The seed produced in these seed villages will have to be preserved/stored till the next sowing season. In order to encourage farmers to develop storage capacity of appropriate quality, assistance will be given to farmers for making/procuring of Pusa Bin/Mud bin/Bin made from paper pulp for storing of seed produced by the farmers on their farms.
Soil Health Management
Main constraints in promoting balanced use of fertilizers include inadequate and ill equipped soil testing facilities, neglect of organic manures, inadequate extension system, wide gap in dissemination of knowledge between research institutions, soil testing laboratories and the extension machinery, and lack of awareness among farmers about benefits of balanced fertilization. The scheme's main components were: i. To establish compost plants to process biodegradable city solid waste into compost. ii. To strengthen soil testing facilities by setting up of new Soil Testing Laboratories (STLs) and strengthening of existing STLs.
Increasing Women participation An important component of empowerment in Third World Countries comprises rural women who play multiple crucial roles in all spheres of development activities. In the recent past added emphasis has been laid on
116 | P a g e
acknowledging and preparing database on multidimensional role sets of women where their roles have become an inbuilt factor for input–output system of empowerment. So increasing women’s participation in agriculture is an important task which can be achieved by
Capacity building of women groups. Organization of women summit block wise. Formulation of food security groups of women. Organizing skill development training on home & cottage industry.
Custard apple processing unit
Custard apple, once largely grown on hill slopes or boundary walls of farms hardly attracted the attention of farmers till recent times. The popularity drastically increased once custard apple was introduced as a flavor in ice-creams, milk-shakes and in a delicacy like rabadi on special occasions. Many major ice-cream companies are now in search of pulp producers who can ensure smooth and continuous supply of the pulp over the year. Compared to the custard apples supplied from Chapara in Jabalpur, Madhya Pradesh (MP), fruit grown in Maharashtra has more pulp and sweeter taste, hence it is in greater demand. Several custard apple growing clusters has identified in Nanded district (Loha kandhar Mukhed etc) & new scheme has been suggested to increase production of custard apple as well as to improve returns to farmers by selling processed fruits.

117 | P a g e
6.4 Encouraging the production & processing marketing of spices Chilly & Turmeric
Vision of XII Plan In present CDAP emphasis on an ambitious target of 4 percent annual
growth rate in GDP over the next 5 year to eradicate poverty, achieve food security and build the foundation of sustainable economic development of the district. Developing farmers Centric Need Base Comprehensive District Agriculture Plan (CDAP) aiming to achieve 4 percent annual growth in the agriculture and allied sector during XIth plan period for District Nanded by adopting inclusive and participatory approaches 1. Agriculture growth to be maintained at 4 percent per annum by enhancing the double the agriculture production in next 10 years by improving the productivity of agriculture and the allied sectors. 2. Attain food security in terms of both availability and affordability and ensuring access of the poor to adequate food and nutrition. 3. Focus on creating opportunities for farmers to enhance their net income to a Respectable level. 4. Present irrigation coverage in the district is 9.01 percent it is expected that by the Intervention proposed under 11 th five year it will reach by 14 percent 5. Promotion of public private partnership in agriculture. 6. Area under Micro irrigation by the promotion of drip and sprinkler irrigation it is Targeted to cover an additional area of 6596 Ha in next five year. 7. Encourage the farmers to investment in food processing sector. 8. Post Harvest technology and Agro Processing to be given additional thrust. 9. Development of future markets for major commodities by dynamic agriculture

118 | P a g e
Markets among the nation. 10. A planned soil health program 11. Increasing active involvement of self help group. 12. Making good seed available by the farmers for the farmers through Grambeejotpadan. 13. Reduction in land degradation through soil conservative measures. Enhancing the area under organic farming from 5729 Ha to 11250 Ha For actualizing this vision, the C- DAP attempts to explore possible ways of better utilization of natural, physical and human resources. It attempts to discover and locate latent potentials of growth and development and is making proposals for activating human energies and social organizations for their full utilization. C -DAP proposals for reforms and strengthening of the extension agencies should help inform the farmers of the latest technologies and adequately motivate them to diligently work for their own advancement.
The reforms and strengthening of the implementation agencies in the district are of crucial importance. The best policies and programmes fail because of poor governance and shortcomings in implementation. An innovative re-organization to provide missing coordination links within the different wings and departments involved with implementation is absolutely necessary.lt is also imperative to set up reasonable working relationships with Pnchayat Raj Bodies, NGO's and Public Private Partnerships,. If the government is serious about transformation of rural economy and rural society through massive programmes like RKVY it must take early steps to provide for a strong inspired implementing agency to lead that 411 movement in the district and to get results.

119 | P a g e
This C-DAP has recommended several strategies for various sub-sectors to overcome the reasons of backwardness and to accomplish the vision stated in para 2.3.1 above. Details like rationale behind them, action plans with physical targets, financial requirements and outcomes, and implementing schedules will be found in the related chapters. Action plans have been formulated so that their implementation will make a great impact on the agricultural growth and development of the district. It is worthwhile to emphasize that every element of action plan under each strategy positively contributes to the desired results. Most elements will be simultaneously in operation and will have additive effects on outcomes of each other. That add-on effect would lead to still higher growth. 6.5 improved technology dissemination co-ordination of teaching, research and
extension institutions rationale:
People's aspiration about agricultural development in the district is improving the economic viability of farming and enhancing the livelihood security. Increasing the net income of the fanner is only possible by enhancing the productivity, profitability and stability of overall agricultural production on sustained basis. The National Agriculture Policy 2000, National Farmers Commission 2006 and IIth five year plan approach paper 2007 targeted 4% growth in agriculture and allied sector. As more than 70% of the population derives its livelihood from agriculture and allied sectors and the solution to eradicate poverty lies in the development and growth of this important sector of economy, National Development Council (NDC) , reaffirmed to achieve 4 per cent annual growth in agricultural sector during the 12th plan, NDC has directed

120 | P a g e
the state Govts to formulate comprehensive District Agriculture Plan (C-DAP) for the holistic development of agriculture and allied sectors in the district to ensure that farming becomes more viable and economic conditions of farmers especially that of the small and marginal segment, is improved on a sustainable basis. There is huge knowledge deficit in agriculture and allied sectors. Agricultural extension and support services system therefore, have to play a key role in effective dissemination and use of available improved agricultural technology. Infect, credible and quality extension services would be one of the major drivers for high and inclusive growth in agriculture and allied sector. The accepted frame work of Agricultural extension system at district level for technology delivery and dissemination is presented in Fig- 1. It consists of network of Institutions and groups which includes Zonal Agri. Res. Stations (ZARS)/ Sub-Res. Stations, kvk, Line departments, private and non-Govt. (NG's organizations and farmers groups (FiGs.,SHGs) and individuals. The district extension network must develop partnership, complementary" and synergy among them to bring in the continuity of various supplies arid services and market on one side and technology development, delivery and dissemination on the other side. In this Basic District Level Interactive Extension Model (BDIEM), Agri. Technology Management Agency ATMA assumes utmost position in designing appropriate mechanisms and linkages basically required in the extension system at district, block and village level for technology transfer with functional process interventions. (Fig - 2). In order to facilitate the effective functioning of ATMA, following action points are suggested. Suggested action points • Organizational arrangement and operational modalities at district, block and village (field) level need to be properly strengthened to create integrated (single

121 | P a g e
window) extension system. • ATMA should strive hard for greater coordination among different players for effective implementation of extension Programmes, • Orientation, sensitization and capacity building of extension functionaries of key line departments, public/private organizations and farmer's interest/self help groups need to be tailor-made for effective functioning of various arms of ATMA like AMC, FIAC, BTT, FAC etc. * Members of village Panchayat, village level farmers groups, commodity groups, village level role model farmers be trained and involved in preparing block level extension plan and its implementation. • Project-Director, ATMA be an independent senior officer of the rank of joint director of Agriculture to effectively lead and co-ordinate a multi- disciplinary team of senior officers from various key line departments as members of AMC, • Office incharge (OIC) at block level to provide effective administrative supervision under the auspices of FIAC to be of the rank of Deputy Director of Agriculture. • It is proposed to delink input supply arrangements, seed and soil testing etc from the primary responsibility of providing extension services. • Public investment through ATMA need to enhance for training and capacity building of grass root level partners in public/private extension system. • District and block level officials of key line department should regularly and

122 | P a g e
judiciously participate in SAC of KVK and ZREAC of SAU for better interface. • ATMA should strive hard in converging all the extension efforts and pooling all resources, infrastructure and expertise available at various institutions, in the district network to develop real time integrated farming system model of extension service delivery to bring breakthrough in development and growth of agriculture and allied sector. KVK As technology hub and light house of the district for farmers, KVK must act as link between technology generation system of the ZRS/SAU and extension system in the district. KVK must strive hard for continuous flow of knowledge, techniques and technologies of research institutes and SAU to various stakeholders in the district extension system and researchable feed backs from extension system to ZRS/SAU to minimize the time lag between generation of technology and its awareness and adoption. KVK must regularly participate in GB and AMC meetings of ATMA and monthly district workshops and ZREAC conducted by the ZRS/SAU. KVK must plan and implement their programmes as per the needs of district based on the SREP. KVK should facilitate capacity building of various extension functionaries of the district both public and private /NGOS through need based effective trainings.

123 | P a g e
The context and methodology of trainings and the trainers and trainees must be periodically evaluated for suitable modifications to ensure effective training programmes. KVK should bestow their attention for developing and maintaining model demonstration farms /units, effective conduct of OFTs and FLD's by involving all line departments, NGO's etc for large scale dissemination and adoption of improved technologies. Being a specialized institution at the district level, the KVK has to serve as a Light house for farmers who look forward for something new, something novel and something innovative to add value to their agriculture in meeting aspirations. ZRS/SAU District Extension Education centers with a team of subject matter specialists be established by the SAU with necessary infrastructure for specialized Training and capacity building of District Extension staff and farmers/change agents and diagnostic and farm advisory services. Mobile crop/soil health clinics be established for diagnostic team visits for on spoit solution to the problems of the farmers. 6.6 Implementing CDAP I Raising Productivity and Production : The first key objective of CDAP is raising productivity and production of all crops and all other allied activities of every farmer by adopting modern farming
technologies and best practices. Eight critical areas and objectives for

124 | P a g e
accomplishing this objective are as follows:- i) A network of blockwise soil testing laboratories with an upgraded district H.Q. laboratory along with setting up, through the SHGs of asset poor and asset less farmers, local agro-services for drawing soil samples, reaching these to the laboratories , getting scientific advice (cards) for the farmers and helping them in buying and putting the advised inputs for preservation or enrichment of their soils. ii) Increasing use of modernized tools, implements and farm machines iii) Increasing areas of high value crops including rainfed or irrigated horticulture. iv) Adoption of best practices, modern technologies and inputs for raising
productivity of all crops and allied activities motivated and supported by a caring and technologically competent extension agency.
v) Intensive effort on training of farmers and demonstrations preceded by equally
intensive effort on training and technological upgradation of trainers and all
extension workers. vi) Each farmer or each farm should have at least one dug well or a farm pond
with micro irrigation system installed for optimally using his rainwater or ground water resources.
vii) Local sector has to develop new M.I. Schemes, do good repairs and

125 | P a g e
maintenance of the existing M.I. Schemes and restore those in disrepair so that
huge investments made in the past are brought back to gainful use. viii) Ensuring adequate and timely supplies of pure quality seeds, fertilizers,
pesticides and other inputs.
The State Agriculture department and the Zilla Parishad have been traditionally engaged in all the activities described above though without outstanding results. They are, however, the most appropriate agencies to lift up all those activities to a higher pitch needed to accomplish the first key objective. Their extension wings need to be strengthened so that they carry out the mission more vigorously and get results. II. SHGs of Asset poor and Asset less Farmers:
The second key objective is to promote self help groups (SHGs) of asset poor and asset less farmers and with training, and promotional and motivational support as well as financial back up to empower them to transform themselves as providers of critically useful agro services to the village community and thus contribute to the rejuvenation of agriculture of the village including their own presently non-viable farms.
The DRDA has been promoting SHGs for some years now thought mostly of women. It has been set up to implement antipoverty schemes. DRDA is, therefore, the most appropriate agency for promoting SHGs of asset poor and asset less farmers, their training and initiation of several possible agro services and micro-enterprises through those SHGs with the object of bringing those poor farmers out of poverty. DRDA has to do that promotional activity more vigorously and in a result oriented manner. DRDA has to be suitably

126 | P a g e
strengthened for that purpose. III. Association For Progressive Farming :
The third key objective is the promotion and formation of an Association For Progressive Farming (AFPF) separately for each block with village-wise branches and a district-wise federation. These associations will constitute the peoples’ participatory compliment to the CDAP mission. It has a great potential of future development and should be supported and encouraged to gradually take over and run the CDAP mission as its own enterprise.
When the Association gets a clear sense of its purpose and the prospect of lifting up the agriculture economy of the district to higher and higher levels, the individual progressive farmers and other social workers will be willingly making important contributions. When they feel that they can improve the society in which they are living through their participation through the Association For Progressive Farming, they will certainly bring vigor and enthusiasm to their roles and get positive results. The AFPF, therefore has a tremendous potential of mobilizing people’s energies for growth and development. On the lines of public private partnership, the AFPF may, in future be taking up watershed development projects, composting projects for utilizing solid waste and sweepings of cities, towns and bigger villages, setting up soil testing laboratories and/ or operating them, organizing viable network of agro-processing units and endless number of other creative activities for supporting and caring for the farmers in general and the poor among them in particular. The AFPF is not envisaged as a mass organization with thousands of members. At the block level it is envisaged as an NGO or voluntary organization with a band of about fifty active, committed and progressive farmers with

127 | P a g e
orientation to science and social service. At the village level about ten progressive farmers inclined to social causes would do. Their commitments to the CDAP cause will get firmed up through the work they do and the potential they would find. The AFPF should be developed based on local perceptions of rural development and talents available. The promoters should, however, keep the successful models of Jazira of SUDAN, vicos of Peru, comila of Bangladesh and particularly the Joint Commission on Rural Reconstruction (JCRR) of Taiwan and their numerous present day successor NGOs working in India and all over the world. The promotional work may have to be done mainly by the department of Agriculture and specially by the Senior Officers in the district. The Collector and ATMA should take initiatives, assemble well known Social Workers in the district and build up the block wise associations to a working status in the first three months. Names better approved locally than AFPF may be allowed. A sort of competition should be encouraged for work and results among the various block wise associations. Best work should be suitably recognized and rewarded by the government year after year. The department of agriculture and/or ATMA may have to provide funds to the AFPFs for their initial steps until they build up their own resources through membership fees, donations or works. Institutional Membership of AFPFs should be open to large co-operative ventures, societies, market committee’s, banks, NGOs/V.Os and local bodies.
IV. Strengthening of the existing organization structures: In our opinion ATMA presently chaired by the Collector of the district should be designated as the Chief Authority for implementing the CDAP. It is necessary to provide adequate support to the Collector so that ATMA functions effectively. We propose; A senior S.A.O. (full time) as Secretary and Executive Officer of ATMA;

128 | P a g e
A Senior B.D.O. (full time) to secure co-ordination with Panchayat Raj Institutions; promotional work of AFPFs A publicity Officer to continuously work with the media for the CDAP mission and organizing educative programmes, conferences, workshops etc. preparing write up and publicity material Customary staffing assistance to the above three officers. A block annual grant of 10 lakhs for promotional work/rewards etc. A vehicle (like a jeep) for the officers touring in rural areas.
Zilla Parishad: 1 - One Senior BDO to work as addl. Dy. CEO to build up vigorous activities at the Z.P. Panchayat Samiti and Gram Panchayat levels in support of C-DAP programmes and specially those of development of M.I. schemes and assured adequate and timely supplies of pure quality inputs like seeds, fertilizers, pesticides etc. DRDA ; Two Assistant Project Officers in the office of Project Director for the work of promoting SHGs of asset poor and asset less farmers and setting them to designed agro services and micro-agro enterprises. One additional APO for each block to assist the work of SHGs of poor farmers. Customary staffing assistance to the new APO/s. Panchayat Samities: Block level agricultural officer extensions should be of at least class II rank. Agriculture Department: Strengthening of the department of Agriculture is inevitable. It is tern that it already has a huge staff in the district. But restructuring to keep in tune with improving technologies, growing awareness among the farmers and developing Panchayat raj institutions is necessary. All agricultural production and activities to be promoted or motivated are is private sector. Extraordinary skills of

129 | P a g e
communication are required to be effective in this situation. The farmers in general have, nowadays, exposure to both print and electronic media extension programmes for them need to be redesigned now both for larger technological content and an inspiring motivational appeal. In the meantime, the department itself seems to be deliberating upon restructuring proposals. Without any reference to those matters, we are proposing following measures of strengthening required for effective implementation of CDAP. A new full time Senior SAO as Secretary and CEO of ATMA a) All Taluka level Agricultural officers should be in class I and designated as Deputy Directors. b) Each Dy. Director would also be working as ex-officio Secretary and Executive officer of the proposed Association for progressive farming. C) Each Deputy Director should be provided a jeep and a driver. Each Agricultural Polyclinic should have an Agriculture Officer in class II to be in charge. New polyclinics should be opened for new talukas which do not have them now. These clinics should grow as centers of all CDAP activities, Farmers meetings, training and demonstrations. They should be undertaking activities supporting the farmers like manufacture; storage and sale on a no profit no loss basis of composting, vermi culture, seeds, fertilizers, pesticides, tools etc.

1 Name of the Project :-
2 Type of the Project :-
3 Core Objectives 1
2
3
4
5
4 Administrative Department :-
5 Implementing Agency :-
6 Name of the Sector :-
7 Name of the Sub-sector :-
8 Classification of Project :-
9 Duration of Project /Year :-
10 Name & No of Districts Covered :-
11 District wise page No and serial No of the
projects in C-DAP
:-
12 Area to be covered(Hect) :-
13 No of farmers would be impacted :-
14 Total Cost of the Project :-
15 Componentwise applicable cost norms of
ongoinging Scheme of GoI /GoM
:-
Sr.No Components Total Cost
Name Cost norm for subsidy RKVY Beneficary Implementing
Agency
1 Cereals Groups (Pop corn) 16.00 - 1.0/Unit 50% 50% DSAO
2 Pulses Groups (Mini Dalmill) 32.00 NFSM 1.0/ Unit 50% 50% DSAO
3 Oilseeds Groups (Oil extraction) 80.00 MOOP 2.5/Unit 50% 50% DSAO
Grand Total 128.00
% Share 100%
48000
256.00
Applicable ongoing scheme of GoI/GoM Cost Sharing Pattern
14400
To provide FO's with value addition support.
To develop brands of processed agri commoding produced by CIG's & FO's
To provide post harvest technologies i.e. mobile cold storage van, Buyer seller meet.
Department of Agriculture
DSAO Nanded
Public Sector
2015-16 to 2016-17
Dist.Nanded
To provide revolving funds to groups
RKVY
Abstract of Project
BUILDING COMMODITY GROUPS AND FARMER
ORGANISATIONS
Production Growth / Infrastructure & Assests Stream
To create Commodity interest groups

Phy. Fin. Phy. Fin.
1 Cereals Groups 32.00 12.50 16.00 16.00 16.00 16.00
2 Pulses Groups 64.00 25.00 16.00 32.00 16.00 32.00
3 Oilseeds Groups 160.00 62.50 16.00 80.00 16.00 80.00
256.00 100.00 128.00 128.00
S. N. Components No. of Beneficery
1 Cerial Groups 640
2 Pulses Groups 640
3 Oilseed Groups 640
1920
S.N. Possible benefits Quantity Valuation
No. of Beneficiary Farmers 1920 --
Contribution in Production Growth (In Rs. Lakh) 366
Incremental increase in farmer’s income due to
a.Increase in productivity 20%
b.Reduction in cost of production 10%
c.Improvement in quality of produce 70%
Any other
Indirect Employment generation in rural area
acts as supplimentary enterprise for pultry, fishery etc
through biproducts
Helps to develop local market and Village economy
: 256.00
256.00
: 128.00
: 128.00
:
:
0.06 AVERAGE
2.66 AVERAGE
:
b. Gist of third party technical and financial Evaluation.
:
:
:
:
:
22. Authority wise Monitoring Mechanism
a .Regular checking authority
b. Annual quality & work progress certificate issuing
23. Financial sustainability of the project in future
24. Any other information
21.Comments of ICAR in case of Research Project.
a. Total Investment
b. Expenditure on Assets creation
c. Recurring Expenses
d. Non Recurring Expenses
II. Ratio Analysis
a. Internal Rate of Return (IRR)
b. Break Even Point (BEP)
c. Investment per Beneficiary
d. Investment / unit production
20. If Project cost is more than Rs. 25 Crore
a. Details of Comments of GoI
I. Cost Details
Grand Total
17. Component wise Beneficery & Out puts :
Grand Total
18. Impact & Outcomes
Direct
19. Cost Analysis
Outputs
Value addition of an average
Rs96.0 Lakh
Value addition of an average
Rs90.0 Lakh
Value addition of an average
Rs180.0 Lakh
16. Project components & cost Breakup as per DPR
(Rs. in Lakh)
Sr. No. Components
Total Cost Physical & Financial Targets for RKVY
Rs.
% with Project
Cost.
Ist yr. II
nd yr.

1 Name of the Project :-
2 Type of the Project :-
3 Core Objectives 1
2
3
4
4 Administrative Department :-
5 Implementing Agency :-
6 Name of the Sector :-
7 Name of the Sub-sector :-
8 Classification of Project :-
9 Duration of Project /Year :-
10 Name & No of Districts Covered :-
11 District wise page No and serial No of the
projects in C-DAP
:-
12 Area to be covered(Hect) :-
13 No of farmers would be impacted :-
14 Total Cost of the Project :-
15 Componentwise applicable cost norms of
ongoinging Scheme of GoI /GoM
:-
Sr.No Components Total Cost
Name Cost norm for subsidy RKVY Beneficary Implementing
Agency
1 Automated Machine operated pulp
seperator
8.00
2.0 / unit75% 25% DSAO
2 Plasctic Crate 0.20 0.05 / group for 25 crates 75% 25% DSAO
3 Stainless still container 0.40 0.10 / unit 75% 25% DSAO
4 Refrigerator 2.00 0.50 / unit 75% 25% DSAO
Grand Total 10.60
% Share 100%
2000
21.2
Applicable ongoing scheme of GoI/GoM Cost Sharing Pattern
2760
To develop custard apple pulp brand in the district.
To improve farmers income through custard apple processing.
Department of Agriculture
DSAO Nanded
Public Sector
2015-16 to 2016-17
Dist.Nanded
To Create custard apple pulp extraction facilities.
RKVY
Abstract of Project
ESTABLISHMENT OF CUSTARD APPLE FRUIT
PROCESSING UNITProduction Growth / Infrastructure & Assests Stream
To identify Custard apple growing group for extraction of pulp.

Phy. Fin. Phy. Fin.
1 Automized Machine operated pulp seperator 16.00 75% 4 8.00 4 8.00
2 Plasctic Crate 0.40 2% 4 0.20 4 0.20
3 Stainless still container 0.80 4% 4 0.40 4 0.40
4 Refrigerator 4.00 19% 4 2.00 4 2.00
21.20 100% 10.60 10.60
S. N. Components No. of Beneficery Outputs
2 Automized Machine operated pulp seperator 8 Eliminates
browning of
pulp
3 Plasctic Crate 8 Reduced
damages
4 Stainless still container 8Hygienic storage
5 Refrigerator 8 Shelf life
32
S.N. Possible benefits Quantity Valuation
No. of Beneficiary Farmers 32 --
Contribution in Production Growth (In Rs. Lakh) 46.08
Incremental increase in farmer’s income due to
a.Increase in productivity 20%
b.Reduction in cost of production 20%
c.Improvement in quality of produce 60%
Any other
Adoption by other farmers
Improvement in shelf life and quality of pulp
: 21.2
21.2
: 5.3
: 15.9
:
:
0.66
5.3
:
b. Gist of third party technical and financial Evaluation.
:
:
:
:
:
Indirect
20. If Project cost is more than Rs. 25 Crore
19. Cost Analysis
I. Cost Details
a. Total Investment
b. Expenditure on Assets creation
c. Recurring Expenses
d. Non Recurring Expenses
II. Ratio Analysis
a. Internal Rate of Return (IRR)
b. Break Even Point (BEP)
c. Investment per Beneficiary
d. Investment / unit production
24. Any other information
a. Details of Comments of GoI
21.Comments of ICAR in case of Research Project.
22. Authority wise Monitoring Mechanism
a .Regular checking authority
b. Annual quality & work progress certificate issuing
23. Financial sustainability of the project in future
16. Project components & cost Breakup as per DPR
(Rs. in Lakh)
Sr. No. Components
Total Cost Physical & Financial Targets for RKVY
Rs.
% with Project
Cost.
Ist yr. II
nd yr.
Grand Total
17. Component wise Beneficery & Out puts :
Grand Total
18. Impact & Outcomes
Direct

1 Name of the Project :-
2 Type of the Project :-
3 Core Objectives 1
2
3
4
4 Administrative Department :-
5 Implementing Agency :-
6 Name of the Sector :-
7 Name of the Sub-sector :-
8 Classification of Project :-
9 Duration of Project /Year :-
10 Name & No of Districts Covered :-
11 District wise page No and serial No of the
projects in C-DAP
:-
12 Area to be covered(Hect) :-
13 No of farmers would be impacted :-
14 Total Cost of the Project :-
15 Componentwise applicable cost norms of
ongoinging Scheme of GoI /GoM
:-
Sr.No Components Total Cost
Name Cost norm for subsidy RKVY Beneficary Implementing
Agency
1 Capacity Building 0.80 ATMA 0.05 / group 100% Nil
2 Womens summit 4.00 0.25/ Summit 100% Nil
3 Skill development training 1.60 ATMA 1000/ day farmer 100% Nil
4 Food security group 1.60 ATMA 0.10 / group 100% Nil
Grand Total 8.00
% Share 100%
To organize women summit blockwise.
RKVY
Abstract of Project
Increasing Woman Participation Rs. 0.50 lakh per talukas
block/ year
Production Growth / Infrastructure & Assests Stream
To provide capacity building of women groups.
9600
To formulate food security groups of women.
To organzie skill development training on home & cottage industry.
Department of Agriculture
DSAO Nanded
Public Sector
2015-16 to 2016-17
Dist.Nanded
16000
16.00
Applicable ongoing scheme of GoI/GoM Cost Sharing Pattern

Phy. Fin. Phy. Fin.
1 Capacity Building 1.6 10% 16 0.80 16 0.80
2 Womens summit 8.00 50% 16 4.00 16 4.00
3 Skill development training 3.20 20% 160 1.60 160 1.60
4 Food security group 3.20 20% 16 1.60 16 1.60
16.00 100.00 8.00 8.00
S. N. Components No. of Beneficery
1 Capacity Building 640
2 Womens summit 4800
3 Skill development training 320
4 Food security group 640
6400
S.N. Possible benefits Quantity Valuation
No. of Beneficiary Farmers 6400 --
Contribution in Production Growth (In Rs. Lakh) 153.60
Incremental increase in farmer’s income due to
a.Increase in productivity 60%
b.Reduction in cost of production 30%
c.Improvement in quality of produce 10%
Any other
Indirect 1) Awareness creation
: 16
3.2
: 0
: 16
:
:
0.0025 (Average)
0.5 (Average)
:
b. Gist of third party technical and financial Evaluation.
:
:
:
:
:
Direct
16. Project components & cost Breakup as per DPR
(Rs. in Lakh)
Sr. No. Components
Total Cost Physical & Financial Targets for RKVY
Rs.
% with Project
Cost.
Ist yr. II
nd yr.
Grand Total
17. Component wise Beneficery & Out puts :
Strenthens the group approach
Grand Total
18. Impact & Outcomes
Exchange of thoughts
Upgradation of knowledge
Developement of backyard pultry house
hold gardens
Outputs
24. Any other information
a. Details of Comments of GoI
21.Comments of ICAR in case of Research Project.
22. Authority wise Monitoring Mechanism
a .Regular checking authority
b. Annual quality & work progress certificate issuing
23. Financial sustainability of the project in future
20. If Project cost is more than Rs. 25 Crore
19. Cost Analysis
I. Cost Details
a. Total Investment
b. Expenditure on Assets creation
c. Recurring Expenses
d. Non Recurring Expenses
II. Ratio Analysis
a. Internal Rate of Return (IRR)
b. Break Even Point (BEP)
c. Investment per Beneficiary
d. Investment / unit production

1 Name of the Project :-
2 Type of the Project :-
3 Core Objectives 1
2
3
4
4 Administrative Department :-
5 Implementing Agency :-
6 Name of the Sector :-
7 Name of the Sub-sector :-
8 Classification of Project :-
9 Duration of Project /Year :-
10 Name & No of Districts Covered :-
11 District wise page No and serial No of the
projects in C-DAP
:-
12 Area to be covered(Ha) :-
13 No of farmers would be impacted :-
14 Total Cost of the Project :-
15 Componentwise applicable cost norms of
ongoinging Scheme of GoI /GoM
:-
Sr.No Components Total Cost
Name Cost norm for subsidy RKVY Beneficary Implementing
Agency
1 Distribution of Foundation Seed 48.00 Village seed production
Programme
50% 100% Nil DSAO
2 Distribution of gravity separator 3.84 60% 40% DSAO
Grand Total 51.84
% Share 100%
To improve self sufficiancy of farmers regarding seed input.
RKVY
Abstract of Project
Seed Processing Unit
Production Growth / Infrastructure & Assests Stream
To aggregate village seed production programme.
1280
To introduce HYV and disease & pest resistant varieties
To develope location specific varieties based on cluster approach.
Department of Agriculture
DSAO Nanded
Public Sector
2015-16 to 2016-17
Dist.Nanded
3200
103.68
Applicable ongoing scheme of GoI/GoM Cost Sharing Pattern

Phy. Fin. Phy. Fin.
1 Distribution of Foundation Seed 96 92.59% 32 48.0 32 48.0
2 Distribution of gravity separator 7.68 7.40% 32 3.84 32 3.84
103.68 100% 51.84 51.84
S. N. Components No. of Beneficery
1 Distribution of Foundation Seed 3200
2 Distribution of gravity separator 32
3232
S.N. Possible benefits Quantity Valuation
No. of Beneficiary Farmers 3232 --
Contribution in Production Growth (In Rs. Lakh) 960.00
Incremental increase in farmer’s income due to
a.Increase in productivity 55%
b.Reduction in cost of production 15%
c.Improvement in quality of produce 30%
Any other
Indirect Adoption by the near by Farmers
Self sufficiancy in seed procurement
Reduces seed scarcity in the market.
Assurance of quality seed
103.68
103.68
3.07
100.61
:
:
0.032 (AVERAGE)
1.62
:
b. Gist of third party technical and financial Evaluation.
:
:
:
:
:
Outputs
16. Project components & cost Breakup as per DPR
(Rs. in Lakh)
Sr. No. Components
Total Cost Physical & Financial Targets for RKVY
Rs.
% with Project
Cost.
Ist yr. II
nd yr.
Grand Total
17. Component wise Beneficery & Out puts :
Multiplication of seeds and self
sufficiancy
Grading and cleaning of seed
Grand Total
18. Impact & Outcomes
20. If Project cost is more than Rs. 25 Crore
19. Cost Analysis
I. Cost Details
a. Total Investment
b. Expenditure on Assets creation
c. Recurring Expenses
d. Non Recurring Expenses
II. Ratio Analysis
a. Internal Rate of Return (IRR)
b. Break Even Point (BEP)
c. Investment per Beneficiary
d. Investment / unit production
Direct
24. Any other information
a. Details of Comments of GoI
21.Comments of ICAR in case of Research Project.
22. Authority wise Monitoring Mechanism
a .Regular checking authority
b. Annual quality & work progress certificate issuing
23. Financial sustainability of the project in future

1 Name of the Project :-
2 Type of the Project :-
3 Core Objectives 1
2
3
4 Administrative Department :-
5 Implementing Agency :-
6 Name of the Sector :-
7 Name of the Sub-sector
8 Classification of Project :-
9 Duration of Project /Year :-
10 Name & No of Districts Covered :-
11 District wise page No and serial No of the
projects in C-DAP
:-
12 Area to be covered(Hect) :-
13 No of farmers would be impacted :-
14 Total Cost of the Project :-
15 Componentwise applicable cost norms of
ongoinging Scheme of GoI /GoM
:-
Sr.No Components Total Cost
Name Cost norm for subsidy RKVY Beneficary Implementing
Agency
1 Dugout Sunkan pond 991.89 100% DSAO
2 Nalla Deepening 700.95 100% DSAO
3
4
5
6
7
8
9
Grand Total
% Share 100%
1692.84
Applicable ongoing scheme of GoI/GoM Cost Sharing Pattern
8184 ha
To increase water table
Department of Agriculture
DSAO Nanded
Public Sector
2015-16 to 2016-17
Dist.Nanded
To Improve land utilization by using dugout sanken ponel
RKVY
Abstract of Project
Strengthing water sources & Desalting of water bodies
Production Growth / Infrastructure & Assests Stream
To Improve conservation of water in low cost
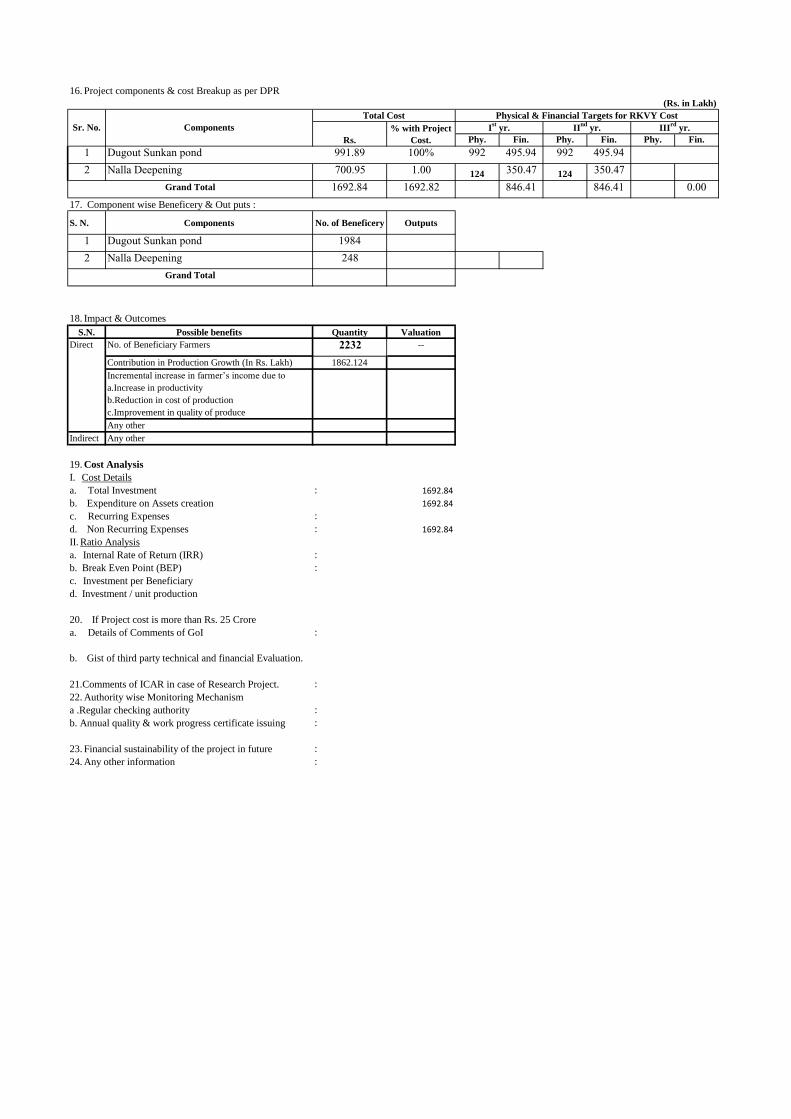
Phy. Fin. Phy. Fin. Phy. Fin.
1 Dugout Sunkan pond 991.89 100% 992 495.94 992 495.94
2 Nalla Deepening 700.95 1.00 124 350.47 124 350.47
1692.84 1692.82 846.41 846.41 0.00
S. N. Components No. of Beneficery Outputs
1 Dugout Sunkan pond 1984
2 Nalla Deepening 248
S.N. Possible benefits Quantity Valuation
No. of Beneficiary Farmers 2232 --
Contribution in Production Growth (In Rs. Lakh) 1862.124
Incremental increase in farmer’s income due to
a.Increase in productivity
b.Reduction in cost of production
c.Improvement in quality of produce
Any other
Indirect Any other
: 1692.84
1692.84
:
: 1692.84
:
:
:
b. Gist of third party technical and financial Evaluation.
:
:
:
:
:
Direct
24. Any other information
a. Details of Comments of GoI
21.Comments of ICAR in case of Research Project.
22. Authority wise Monitoring Mechanism
a .Regular checking authority
b. Annual quality & work progress certificate issuing
23. Financial sustainability of the project in future
20. If Project cost is more than Rs. 25 Crore
19. Cost Analysis
I. Cost Details
a. Total Investment
b. Expenditure on Assets creation
c. Recurring Expenses
d. Non Recurring Expenses
II. Ratio Analysis
a. Internal Rate of Return (IRR)
b. Break Even Point (BEP)
c. Investment per Beneficiary
d. Investment / unit production
16. Project components & cost Breakup as per DPR
(Rs. in Lakh)
Sr. No. Components
Total Cost Physical & Financial Targets for RKVY Cost
Rs.
% with Project
Cost.
Ist yr. II
nd yr. III
rd yr.
Grand Total
17. Component wise Beneficery & Out puts :
Grand Total
18. Impact & Outcomes
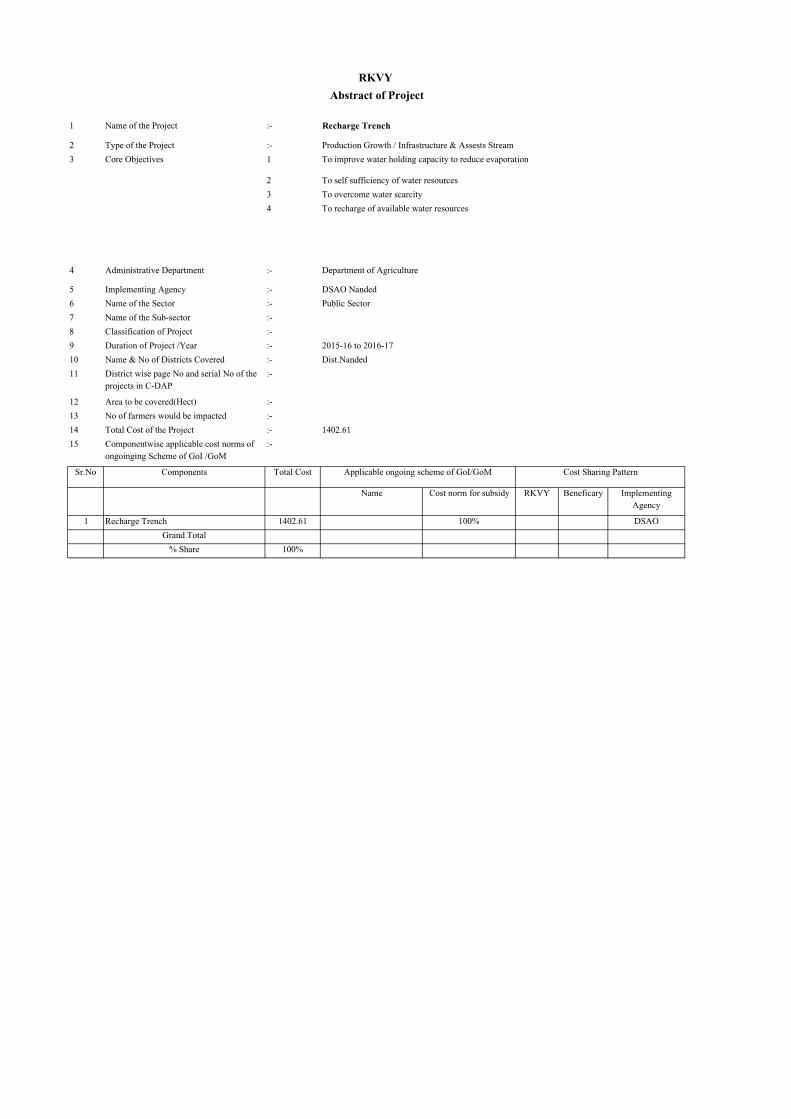
1 Name of the Project :-
2 Type of the Project :-
3 Core Objectives 1
2
3
4
4 Administrative Department :-
5 Implementing Agency :-
6 Name of the Sector :-
7 Name of the Sub-sector :-
8 Classification of Project :-
9 Duration of Project /Year :-
10 Name & No of Districts Covered :-
11 District wise page No and serial No of the
projects in C-DAP
:-
12 Area to be covered(Hect) :-
13 No of farmers would be impacted :-
14 Total Cost of the Project :-
15 Componentwise applicable cost norms of
ongoinging Scheme of GoI /GoM
:-
Sr.No Components Total Cost
Name Cost norm for subsidy RKVY Beneficary Implementing
Agency
1 Recharge Trench 1402.61 100% DSAO
Grand Total
% Share 100%
1402.61
Applicable ongoing scheme of GoI/GoM Cost Sharing Pattern
To overcome water scarcity
To recharge of available water resources
Department of Agriculture
DSAO Nanded
Public Sector
2015-16 to 2016-17
Dist.Nanded
To self sufficiency of water resources
RKVY
Abstract of Project
Recharge Trench
Production Growth / Infrastructure & Assests Stream
To improve water holding capacity to reduce evaporation

Phy. Fin. Phy. Fin. Phy. Fin.
1 Recharge Trench 1402.61 100% 62 701.30 62 701.30
1402.61 1402.60 701.30 701.30 0.00
S. N. Components No. of Beneficery Outputs
1 Recharge Trench 124
S.N. Possible benefits Quantity Valuation
No. of Beneficiary Farmers 124 --
Contribution in Production Growth (In Rs. Lakh) 1542.87
Incremental increase in farmer’s income due to
a.Increase in productivity
b.Reduction in cost of production
c.Improvement in quality of produce
Any other
Indirect Any other
: 1402.61
1402.61
:
: 1402.61
:
:
:
b. Gist of third party technical and financial Evaluation.
:
:
:
:
:
Direct
24. Any other information
a. Details of Comments of GoI
21.Comments of ICAR in case of Research Project.
22. Authority wise Monitoring Mechanism
a .Regular checking authority
b. Annual quality & work progress certificate issuing
23. Financial sustainability of the project in future
20. If Project cost is more than Rs. 25 Crore
19. Cost Analysis
I. Cost Details
a. Total Investment
b. Expenditure on Assets creation
c. Recurring Expenses
d. Non Recurring Expenses
II. Ratio Analysis
a. Internal Rate of Return (IRR)
b. Break Even Point (BEP)
c. Investment per Beneficiary
d. Investment / unit production
16. Project components & cost Breakup as per DPR
(Rs. in Lakh)
Sr. No. Components
Total Cost Physical & Financial Targets for RKVY Cost
Rs.
% with Project
Cost.
Ist yr. II
nd yr. III
rd yr.
Grand Total
17. Component wise Beneficery & Out puts :
Grand Total
18. Impact & Outcomes

1 Name of the Project :-
2 Type of the Project :-
3 Core Objectives 1
2
3
4
4 Administrative Department :-
5 Implementing Agency :-
6 Name of the Sector :-
7 Name of the Sub-sector :-
8 Classification of Project :-
9 Duration of Project /Year :-
10 Name & No of Districts Covered :-
11 District wise page No and serial No of the
projects in C-DAP
:-
12 Area to be covered(Hect) :-
13 No of farmers would be impacted :-
14 Total Cost of the Project :-
15 Componentwise applicable cost norms of
ongoinging Scheme of GoI /GoM
:-
Sr.No Components Total Cost
Name Cost norm for subsidy RKVY Beneficary Implementing
Agency
1 Distribution of Turmeric & chilly powder
Machine
9.00 1.5/ unit 50% 50% DSAO
2 Distribution of semi automatic packing
machine
6.00
1.0/unit
50% 50% DSAO
Grand Total 15.00
% Share 100%
To establish processing facilities for chilly and turmeric
RKVY
Abstract of Project
Encouraging the production, processing & marketing of
Chilly & turmeric
Production Growth / Infrastructure & Assests Stream
To improve the area under chilly and termeric
3600
To develop brands of chilly & termeric powder
To establish mechanism for attachment of termic & chilly powder plants to urban centres & Malls.
Department of Agriculture
DSAO Nanded
Public Sector
2015-16 to 2016-17
Dist.Nanded
6000
30.00
Applicable ongoing scheme of GoI/GoM Cost Sharing Pattern

Details of CDAP proposals are given in chapters IV,V and VI along with targets and outcomes and costs for each. The above table is the summary of financial outlays of the CDAP shown separately for both new and ongoing projects,innovative schemes and programmes.
Total outlay proposed in this CDAP is Rs 1007.88 crores out of which Rs 918.28 crores is for new projects. (streem I) The total outlay for the CDAP works out to Rs 1931 per capita per annum for rural population of the district. The CDAP wil improve the per annum per cultivator agricultural production from Rs 40002 to Rs 67494/-
In stream II,we have mainly included ongoing schemes. the department may have to reexamine stream II proposals both for adequacy of allocations and Inclusion of all on going schemes.
CDAP has assumed that all approved and ongoing major irrigation projects would be completed in the eleventh plan period. The total outlay required for completing them is 505 crores. This is not included in CDAP proposals as we are sure the department of water resources will provide them ouside the CDAP. It would be desirable that Ministry of Agriculture pursues this case with Ministry of water resources and ensures that adequate provision to complete & modernize irrigation projects are provided adequate budget under Bharat Nirman/AIBP or other sources.
E.S.6 PUBLIC PRIVATE PARTNERSHIPS THAT CAN BE ENVISAGED IN THE C DAP
The planning commission has set a very high target for investment in infrastructure sector. The Eleventh Five year plan would be consequentially looking out for the possiblilities of public private partnerships(PPPS) to meet a

part of the investment needs. The CDAP proposals also have a large element of small and widely scattered works spread all over the rural areas. Moreover, the individual beneficiaries can be identified for minor irrigation works like dug wells and farm ponds but not for watershed development. If however,it is necessary to bring in more investments through the PPP route. mandalwise or village cluster wise lots of all the three types of works combined can be made for appropriate sizes of investment say 10,25 or 50 crores. All aspects of tendering contracting and other modalities may have to be handled by the department of Agriculture as the Chief Authority for implementing the CDAP. Implementing projects through the PPPs should however be more challenging than that under conventional practices. One advantage of PPPs should obviously be timely and speedy completion of projects enabling reaping benefits of the works relatively very fast. It is suggested that the implementation of CDAP projects should not in any case be tied up with EGS funds and the availability of local unemployed labour. Agriculture growth is more important and speedy implementation of CDAP will do much more for reducing unemployment and poverty and rural development.PPP pattern is likely to sue machines and keep to the time schedules without which a part of soil work done under conventional methods and even in private sector goes waste because of delays or untimely rains.
Another project for which PPP may be envisaged is setting up of eight talukawise soil testing laboratories,upgrading of the district H.Q. Laboratory and operating the entire net work for five years.
Other projects which may attract PPP are setting up and operating a large wheat flour mill and a plant for production of modern agricultural tools

implements and small machines and repairs to all machines. The CDAP has however not proposed any out lays for this last group of agro industries.
E.S.7 ESPECTED OUT MOES AS A RESULT OF IMPLEMENTATION OF THE PLAN :
This comprehensive district Agriculture plan C DAP has been prepared under the guidelines of the RKVY. It deals with all these issues comprehensively. It attempts to provide solutions to overcome several impediments which are presently obstructing the development process. It presents scores of actionable projects, schemes and programmers which if implemented properly will help the district to shed out its agricultural backwardness and to take off on a fast growth track of much higher than 4 % per annum growth of agricultural production.
As a result of implementation of the CDAP all sectors are expected to have substantial addition to the gross production in the district.
TABLE 6.2
GROSS VALUE ADDED IN VARIOUS SECTORS NANDED DISTRICT 2007-2012
Sr.no Sector 3 years average gross value 2004-05
Gross value 2001-12 in
Compound annual

to 2006-07 in lakh lakhs growth rate %
1 Agriculture 91820 119580 5.43 2 Horticulture 18513.8 52703.3 23.2 3 Animal
Husbandary 2573.3 3471.8 6.17
4 Sericulture 18.18 30.75 11.08 5 Fisheries 37044.00(2007-08) 38535 1.00 149969.28 214320.85 7.50
Highest growth is in horticulture sector both because of expansion of areas and increase in productivities. Significant increases in production and productivities will, however, accrue in the next four years when very large plan investments in watershed development and minor irrigation star ;bearing fruit.
The proposal of CDAP will provide employment to thousands of unemployed or partly employed people, raise standards of living in rural areas, reduce poverty and distress, and specially reach the benefits of growth and development to the thousands of small and marginal farmers who are mostly in distress today because of the non-viability of their farms and several other consequential handicaps. Naturally this last group of small and marginal farmers and their handicaps are the focus of attention of many C DAP proposals.
Earnest implementation of all CDAP projects, schemes and programmes will result in simultaneous increments in productivity of each crop and each of the allied activities in each farm in each village and in each block in the district. Combined with improvements in credit, marketing marketing, employment and other infrastructure, the overall growth is bound

to have a multiplier effect. It should be certainly possible to raise farm production and farmer incomes at least by 50% over a medium term of five years. That should mean the beginning of the second green revolution. The momentum generated. the self confidence grained by the farmers in the process and the continuing upgrading of agro-technologies will continue to lift the district economy to higher and higher levels in future. Outcomes of all the efforts will remain in the farmers hands. No one else will claim any share or tax from them. Even the access to credit will be much easier and cheaper than what it has been during the past several decades. Accomplishment of this C DAP will thus lead to the most desired will being of the people of the district.

RKVY
Abstract of Project
1. Name of the project : EGS Horticulture
2. Type of the Project : Production Growth / Infrastructure & Assets Stream
3. Core objectives : 1. Providing wage employment opportunities
2. Creating sustainable rural livelihoods through
rejuvenation of horticultural plants i.e. augmenting
productivity and supporting creation of durable
assets
3.
4.
4. Administrative Department : Deprt. Of Agriculture
5. Implementing Agency : Dist. Superintending Agril. Officer Nanded
6. Name of the sector : Public Sector
7. Name of the sub-sector :
8. Classification of the project :
9. Duration of Project/ Year : Three Years
10. Name & no. of Districts covered : One
11. District wise page No. and serial
No of the projects in C-DAP :
12. Area to be covered (Hect) : 237.20 Ha.
13. No of farmers would be impacted: 311
14. Total Cost of the project : (Rs. 107.98 Lakh)
15. Component wise applicable cost norms of on goining Scheme of GoI/GoM
(Rs. in Lakh)
S. N. Components Total
Cost
Applicable ongoing
scheme of GoI/GoM Cost Sharing pattern
Name Cost norm for
subsidy RKVY Beneficiary Implementing
Agency.
1 Horticulture
Plantation
I Mango 0.47 EGS 0.47 111 DSAO Nanded
Ii Sweet Orange 0.39 EGS 0.39 75 DSAO Nanded
iii Orange 0.39 EGS 0.39 2 DSAO Nanded
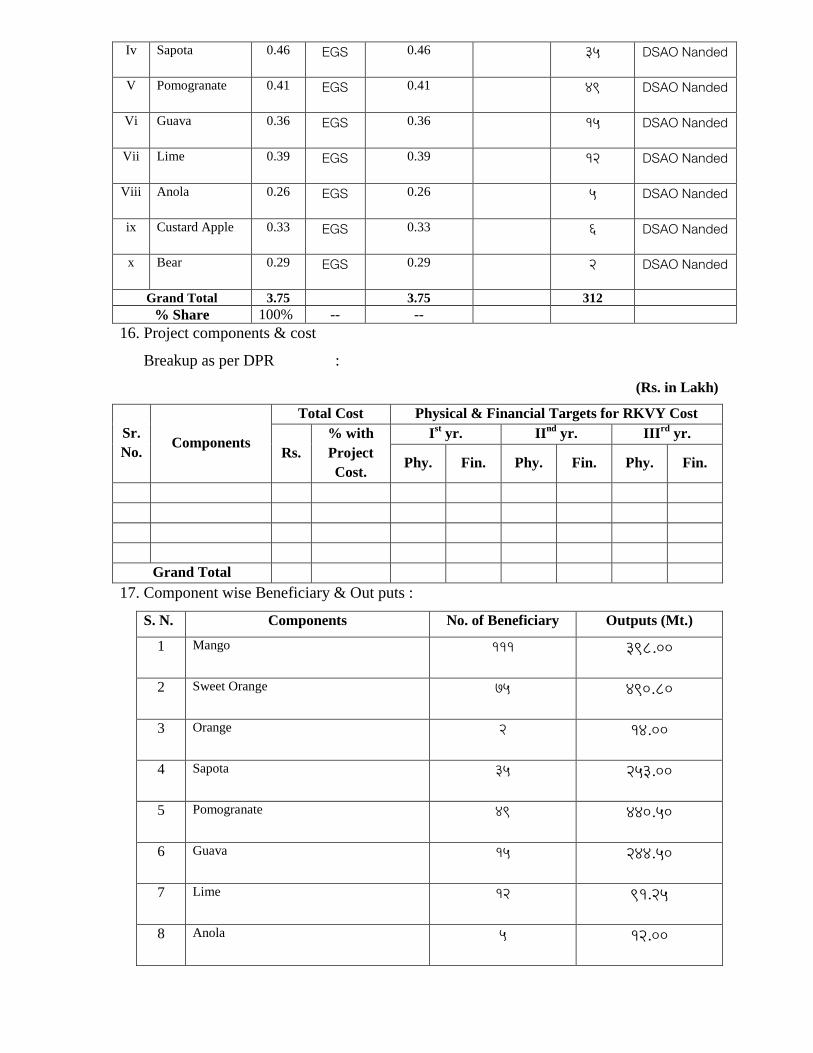
Iv Sapota 0.46 EGS 0.46 35 DSAO Nanded
V Pomogranate 0.41 EGS 0.41 49 DSAO Nanded
Vi Guava 0.36 EGS 0.36 15 DSAO Nanded
Vii Lime 0.39 EGS 0.39 12 DSAO Nanded
Viii Anola 0.26 EGS 0.26 5 DSAO Nanded
ix Custard Apple 0.33 EGS 0.33 6 DSAO Nanded
x Bear 0.29 EGS 0.29 2 DSAO Nanded
Grand Total 3.75 3.75 312
% Share 100% -- --
16. Project components & cost
Breakup as per DPR :
(Rs. in Lakh)
Sr.
No. Components
Total Cost Physical & Financial Targets for RKVY Cost
Rs.
% with
Project
Cost.
Ist yr. II
nd yr. III
rd yr.
Phy. Fin. Phy. Fin. Phy. Fin.
Grand Total
17. Component wise Beneficiary & Out puts :
S. N. Components No. of Beneficiary Outputs (Mt.)
1 Mango 111 398.00
2 Sweet Orange 75 490.80
3 Orange 2 14.00
4 Sapota 35 253.00
5 Pomogranate 49 440.50
6 Guava 15 244.50
7 Lime 12 91.25
8 Anola 5 12.00

9 Custard Apple 6 46.80
10 Bear 2 20.00
Grand Total 312 2010.85
18. Impact & Outcomes
S.N. Possible benefits Quantity Valuation
Direct No. of Beneficiary Farmers 312 2010.85 Mt.
Contribution in Production Growth (In Rs. Lakh)
Incremental increase in farmer’s income due to
a. Increase in productivity
b. Reduction in cost of production
c. Improvement in quality of produce
Any other
Indirect Any other
19. Cost Analysis (Rs. in Lakh) :- 10.00 Lakh
I. Cost Details
a. Total Investment : 10.00 Lakh
b. Expenditure on Assets creation : 10.00 Lakh
c. Recurring Expenses :
d. Non Recurring Expenses : 10.00 Lakh
II. Ratio Analysis
a. Internal Rate of Return (IRR) :
b. Break Even Point (BEP) :
c. Investment per Beneficiary :
d. Investment / unit production
20. If Project cost is more than Rs. 25 Crore - No.
a. Details of Comments of GoI :
b. Gist of third party technical and financial Evaluation.

21. Comments of ICAR in case of Research Project. :
22. Authority wise Monitoring Mechanism :
a .Regular checking authority :
b. Annual quality & work progress certificate issuing authority:
to release next years grant as per DPR.
23. Financial sustainability of the project in future :
24. Any other information :
(A detailed note containing the executive summary of the proposed project should be submitted
along with above abstract & power point presentation. Refer RKVY guidelines 2014)

Executive Summary
This comprehensive district agricultural plan (C – DAP)
a. Assesses the available natural physical and human resources in the district and possibilities of their fuller or better utilization for acceleration in growth with more scientific and technological methods and purposive investments;
b. Identifies the social, infrastructural, agronomical, and governance weaknesses which have so long impeded the processes of growth and development and led to backwardness, lower levels of living and poverty;
c. Recommends strategies and scores of practicable projects, schemes and programmes for overcoming the weaknesses along with estimates of financial out lays required and the outcomes expected from them; and
d. Suggests appropriate agencies for implementing the various projects, schemes and programmes along with the proposals for strengthening them and for raising their capabilities to match the requirements of effective implementation. This (C-DAP) describes what the district can achieve over a medium term of four years and how it should work to achieve it. The C-DAP has prepared with the following objectives :
1. To continuously raise productivity, production, employment and income in agriculture and allied activities through optimal utilization of natural and human resources ;
2. To strengthen, reorganize or newly build up physical infrastructure and institutions to effectively help adopt and operate modern technologies

and practices to provide further impetus to agricultural growth and rural Development;
3. To provide food security and to eliminate hunger; 4. To focus all activities in support of small and marginal farmers,poor and
people with a view to secure social justice and to reduce poverty and distress;
5. To continuously improve economic well being and quality of life of all stake holders in the district; and
6. To help the district to take off on a faster track of growth and sustainable development.
E.S. 2 VISION,GOALS AND THE MAIN POINTS OF SWOT :
A ten year vision for the district is that:
I. It should be doubling its productions from agriculture and allied activities;
II. It should have modern physical, social and institutional infrastructure; III. it should be have healthy sustainable environment and full employment;
and IV. it should be free of overtly, ignorance and social or gender disparities.
The goals for the Medium term of 5 years of the eleventh plan should be to I. Quickly set all the processes of growth and equity in motion in a mission
mode ; II. Achieve a growth rate of not less than 4 % per for agriculture and not
less than 8% per for allied activities;

III. Pro toe and activate gram panchayats to functionally contribute to improvement of primary education health services minor irrigation and agricultural production: and
IV. Organize asset poor and asset less farmers into self help groups and help them transform into providers of services critically beneficial in rejuvenation of agriculture of the village including their own holding and thereby reduce poverty to less than 15 percent: The SWOT analysis shows what the district is capable of doing what it
is doing and what it should be doing. The district has substantial but underutilized potential of irrigation. It has a capability of raising higher value crops and raising productivities of almost all the crops with better cultivation practices. The district has inherently good soils but they have been getting degraded for long for want of watershed development work as well as lack of nourishment based upon soil testing and scientific advice. Thirty percent of lands are owned and operated by small and marginal farmers who make almost sixty percent of all farmers. They are generally poor and do not afford to keep even a pair of bullocks. Those small farms and non-viable and because of indifferent cultivation are not making any contribution to agricultural production. As a result sixty percent of all farmer owning and operating those nonviable farms are all poor and living a life of bare existence. The greatest infrastructural gap likely to impede the process of growth is the shortage of electricity supply and the load shedding in the rural areas for the whole day and more.
E.S. 3 AREAS AND SECTORS WHICH NEED TO BE ADRESSED
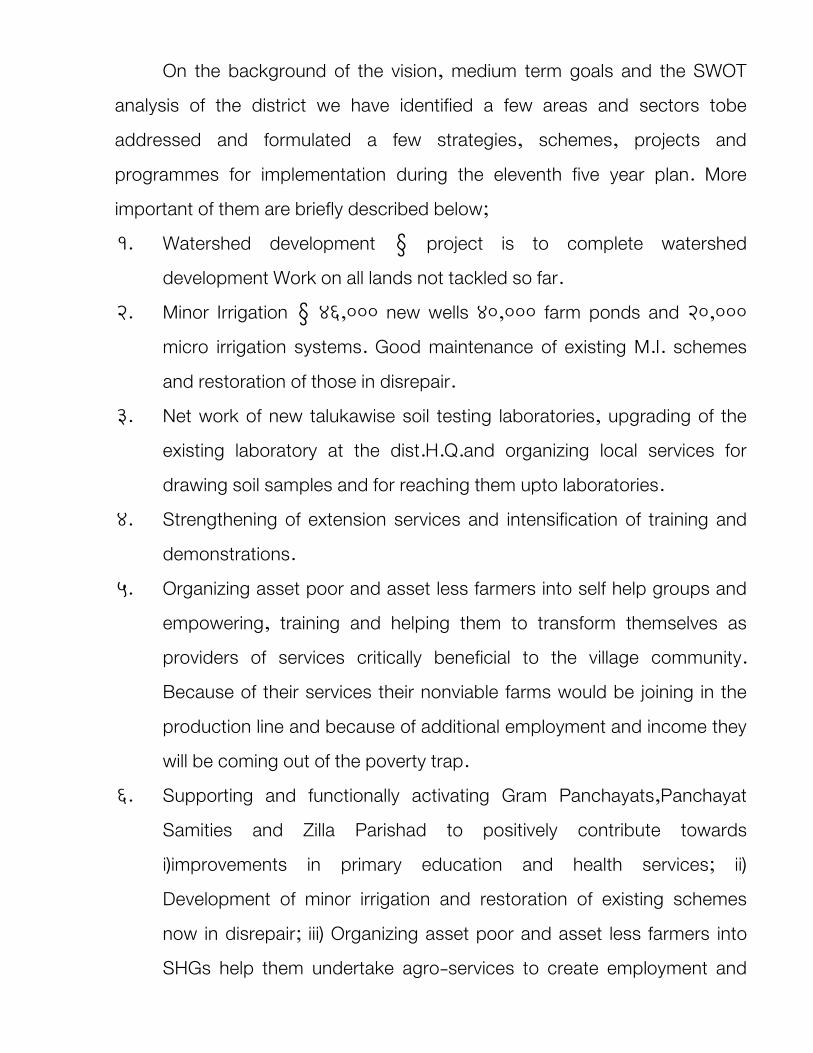
On the background of the vision, medium term goals and the SWOT analysis of the district we have identified a few areas and sectors tobe addressed and formulated a few strategies, schemes, projects and programmes for implementation during the eleventh five year plan. More important of them are briefly described below; 1. Watershed development – project is to complete watershed
development Work on all lands not tackled so far. 2. Minor Irrigation – 46,000 new wells 40,000 farm ponds and 20,000
micro irrigation systems. Good maintenance of existing M.I. schemes and restoration of those in disrepair.
3. Net work of new talukawise soil testing laboratories, upgrading of the existing laboratory at the dist.H.Q.and organizing local services for drawing soil samples and for reaching them upto laboratories.
4. Strengthening of extension services and intensification of training and demonstrations.
5. Organizing asset poor and asset less farmers into self help groups and empowering, training and helping them to transform themselves as providers of services critically beneficial to the village community. Because of their services their nonviable farms would be joining in the production line and because of additional employment and income they will be coming out of the poverty trap.
6. Supporting and functionally activating Gram Panchayats,Panchayat Samities and Zilla Parishad to positively contribute towards i)improvements in primary education and health services; ii) Development of minor irrigation and restoration of existing schemes now in disrepair; iii) Organizing asset poor and asset less farmers into SHGs help them undertake agro-services to create employment and

reduce poverty; and iv) to actively participate in all CDAP projects. Schemes and programmes under implementation for raising agricultural production of the district.
7. Ensuring adequacy, timeliness and purity of all input supplies; 8. Strengthening of implementation agencies. Particular attention is given
to provide for participation by Panchayat Raj Institutions, NGOs and non-official experts at all levels. They are to be organizationally strengthened and motivated so that they participate in implementation of CDAP with enhanced capabilities more effectively.
9. The following areas need special attention for development; I. Taluka has large proportion of class I soils but is not ranking high in
crop-productivities. II. Command Area of Jayakawadi needs better water management for
optimizing productivities. New potential arising out of four barrages has to be berry carefully utilized for ravine like lands which are included in the command but have received irrigation.
III. Remote sensing techniques have indentified numerous local pockets having ground water lineaments and thus having rich potential. Exploitation of that potential and optimum use through micro irrigation systems should receive priority.
10) The CDAP to be implemented in a mission mode, supported by all official and non-official agencies, backed by powerful media and publicity efforts, monitored, supported and inspired by the highest authorities in the state and central governments.
11) As Nanded District is short of water. It is necessary that all farmers are given a high subsides at 90% of the .
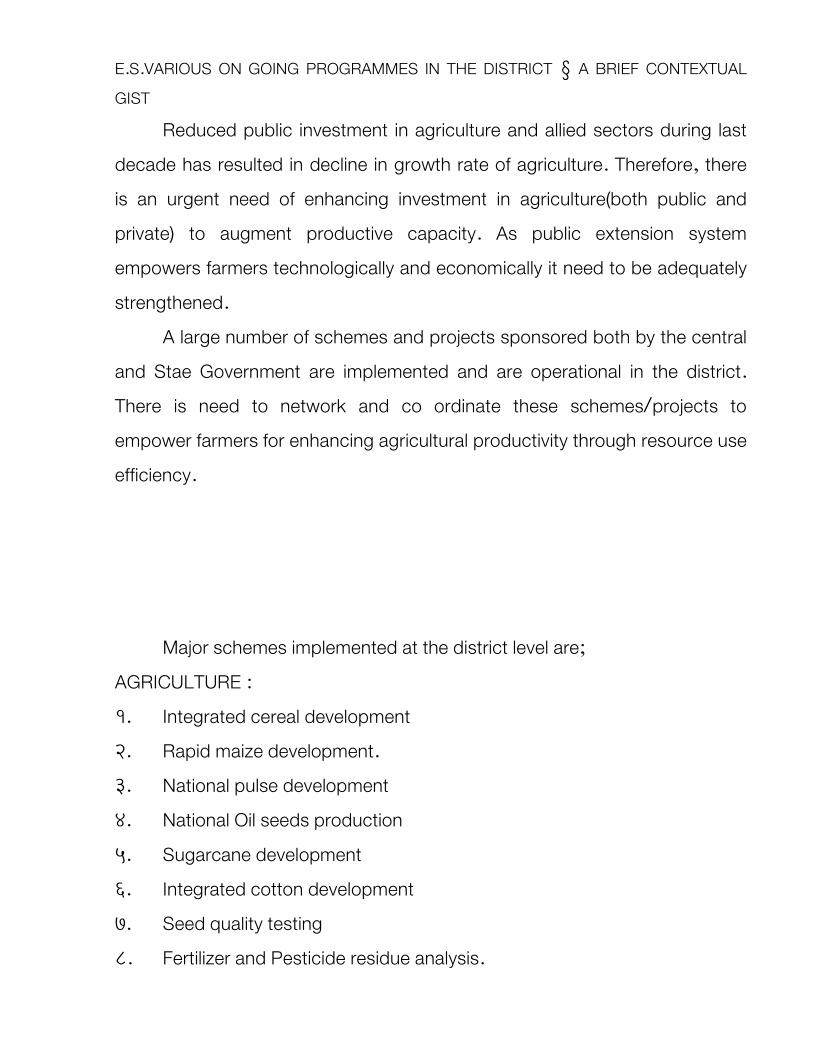
E.S.VARIOUS ON GOING PROGRAMMES IN THE DISTRICT – A BRIEF CONTEXTUAL GIST
Reduced public investment in agriculture and allied sectors during last decade has resulted in decline in growth rate of agriculture. Therefore, there is an urgent need of enhancing investment in agriculture(both public and private) to augment productive capacity. As public extension system empowers farmers technologically and economically it need to be adequately strengthened.
A large number of schemes and projects sponsored both by the central and Stae Government are implemented and are operational in the district. There is need to network and co ordinate these schemes/projects to empower farmers for enhancing agricultural productivity through resource use efficiency.
Major schemes implemented at the district level are;
AGRICULTURE : 1. Integrated cereal development 2. Rapid maize development. 3. National pulse development 4. National Oil seeds production 5. Sugarcane development 6. Integrated cotton development 7. Seed quality testing 8. Fertilizer and Pesticide residue analysis.

HORTICULTURE 9. Employment Linked Horticulture development. 10. Mango Plantation Scheme 11. Rice based fruit planting 12. Inter cropping of spices in coconut 13. Nursery management 14. Micro irrigation system 15. Tribal farmers horticulture development 16. Pomegranate oily-disease management 17. National Bamboo Mission 18. National Horticulture Mission(NHM) 19. Sanitation and photo-sanitary certification 20. Sweet Orange / Lemon SOIL AND WATER CONSERVATION : 21. National Watershed development 22. River –Valley project 23. Farmers participation in national programme of soil and water
conservation 24. Saline & so die soil development 25. Marathwada watershed development mission programme EXTENSION : 26. Gender sensitization and participation 27. Information support to agril extension 28. Soil, Water, testing 29. Bio Pesticide production
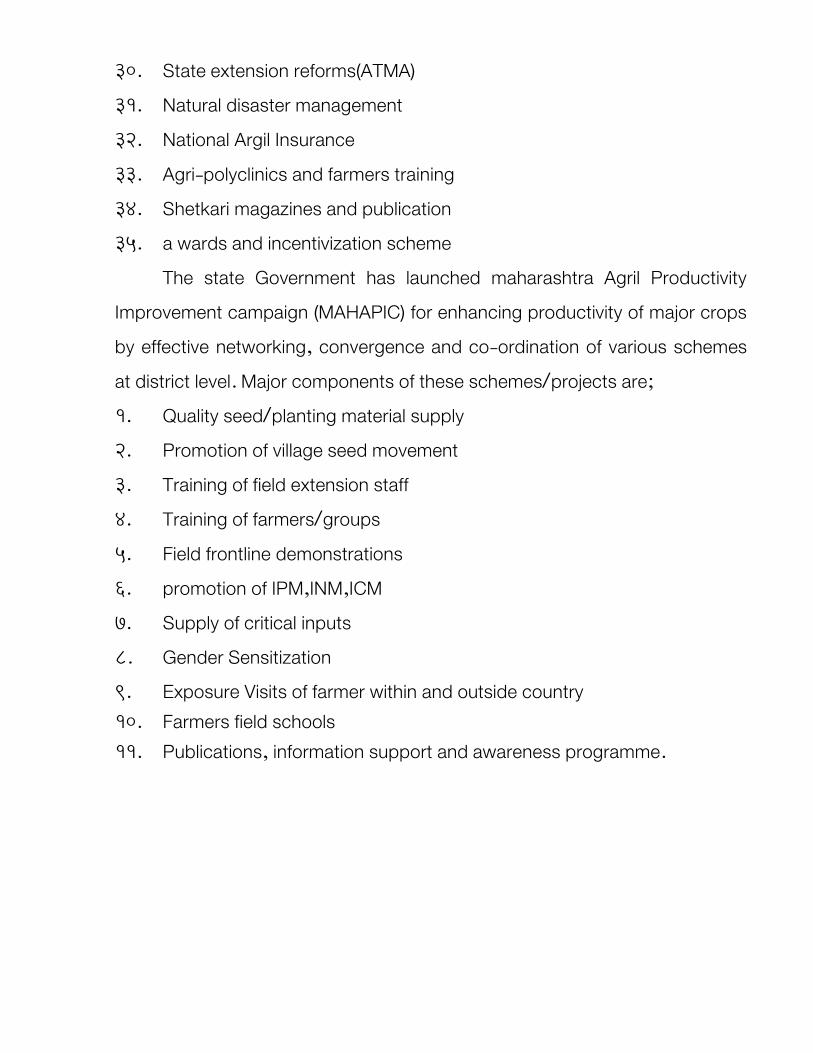
30. State extension reforms(ATMA) 31. Natural disaster management 32. National Argil Insurance 33. Agri-polyclinics and farmers training 34. Shetkari magazines and publication 35. a wards and incentivization scheme
The state Government has launched maharashtra Agril Productivity Improvement campaign (MAHAPIC) for enhancing productivity of major crops by effective networking, convergence and co-ordination of various schemes at district level. Major components of these schemes/projects are; 1. Quality seed/planting material supply 2. Promotion of village seed movement 3. Training of field extension staff 4. Training of farmers/groups 5. Field frontline demonstrations 6. promotion of IPM,INM,ICM 7. Supply of critical inputs 8. Gender Sensitization 9. Exposure Visits of farmer within and outside country 10. Farmers field schools 11. Publications, information support and awareness programme.


2014-15 2015-16 2016-17
4
1Establishment of Gokul Grams
under Rashtriya Gokul Mission- 500.00 500 1000
2
Establishment of Mobile Extension
Centers for publicity of govt. of
scheme & creation of awerness
among farmers at District level
- 100.00 50 150
3Supply of Mini setter & Hatchers
of 5000 eggs capacity- 53.00 53 106
4Mobile marketing units for poultry
meat andg eggs, subsidy ceiling Rs.
3.75 lakh per unit
- 100.00 100 200
5
Faciliating market linkage for live
birds, Animals, subsidy ceiling Rs.
2.00 lakh per unit
- 100.00 100 200
6Introduction of Power driven chaff
cutter- 30.00 30 60
7 Supply of Veterinary Mobile Units
cum Diagnostic Laboratories
- 24.00 0 24
8
Modernization of Veterinary
Dispensaris Gr -I for online data
entry
- 46.15 0 46.15
9A.I. Delivery System Under RKVY
100.00 50 150
10Clean Milk Production through
supply of Milking machines to
Farmers on 25% subsidy
31.25 31.25 62.5
11Assistance to farmers for
promotion of Integrated Livestock
Farming on 25 % subsidy
625.00 625 1250
12 Distribution of Fodder seed 15.00 15 30
13Establishment of Silage Making
Unit30.00 30 60
14Foddre production From Fallow
Lands30.00 30 60
15Establishment of Hydroponics
fodder Production unit15.00 15 30
16Establishment of A Azolla
production unit15.00 0 30
17
Fodder production at farms of
MLDB, Ships & Goat Dev.
Carporation of Maharashtra
33.345 0 33.345
18Distribution of 40 female & 2 male
goat in DPAP area0.00 1.943 1.943
Total 1847.75 1631.19 3493.94
STREAM I
Outlay of Stream - I under RKVY scheme for Nanded district
(Rs. In lack)
Sr.NoName of
departmeScheme Proposed
Year Wise Programme (Financial)Total
Animal Husbandry

5
1 Strengthening of milk routes - - - -
2Strengthening of chilling
plants/machinary- - - -
Total - - - -
6
1
Distribution of seeds in local
reservire like farm ponds,
percolation tank
- 25 35 60
2 Feed Development - 10 15 25
3
Improvement strengthening and
Development of fished rearing unit
manar Dist Nanded
- 30 10 40
Total - 65 60 125
7
1 Package for mulbery plantation 8.93 22.64 31.64 63.20
2Supply of rearing appliances 11.64 24.00 24.00 59.64
Total 20.565 46.635 55.635 122.835
8
Plantation-Afforestation - - - -
Total - - - -
Total Stream I 20.565 1959.38 1746.83 3618.94
Dairy Development
Fisheries
Sericulture
Social Forestry

2014-15 2015-16 2016-17
4
1
Stall fed 40+2 goat unit by
Punyashlok Ahilyadevi
Maharashtra Mendhi va Sheli vikas
mahamandal
- 54.00 0 54
Total 54.00 0.00 54.00
5
1 Stainless steel can - - - -
Total - - - -
6
1Establishment fish production unit 4.50 2.00 5.00 11.50
2Fish farming in impounded water 3.50 4.00 4.00 11.50
3Assistance for supply of fishery
requisite 0.40 0.70 1.00 2.10
4 Development of fishery Co-op 0.10 0.10 0.10 0.30
Total 8.50 6.80 10.10 25.40
7
1 Mulbery cultivation 8.73 18.00 18.00 44.73
2 Cocoon production 7.14 5.82 14.40 27.36
3 Farmers training 102.00 300.00 300.00 702.09
Total 117.87 323.82 332.40 774.18
8
1
Integrated waterShed
development programme- 321.46 200.00 521.46
Total - 321.46 200.00 521.46Total Stream II 126.37 699.28 542.50 1375.04
STREAM II
Outlay for Strenghtening of existing scheme Stream - II under RKVY scheme for
Department wise stream - II (Revised ) scheme Proposed (Rs. In lack)
Sr.NoName of
DepartmeScheme Proposed
year wise programme (Financial)Total
Animal Husbandry
Dairy Development
Fisheries
Sericulture
Social Forestry
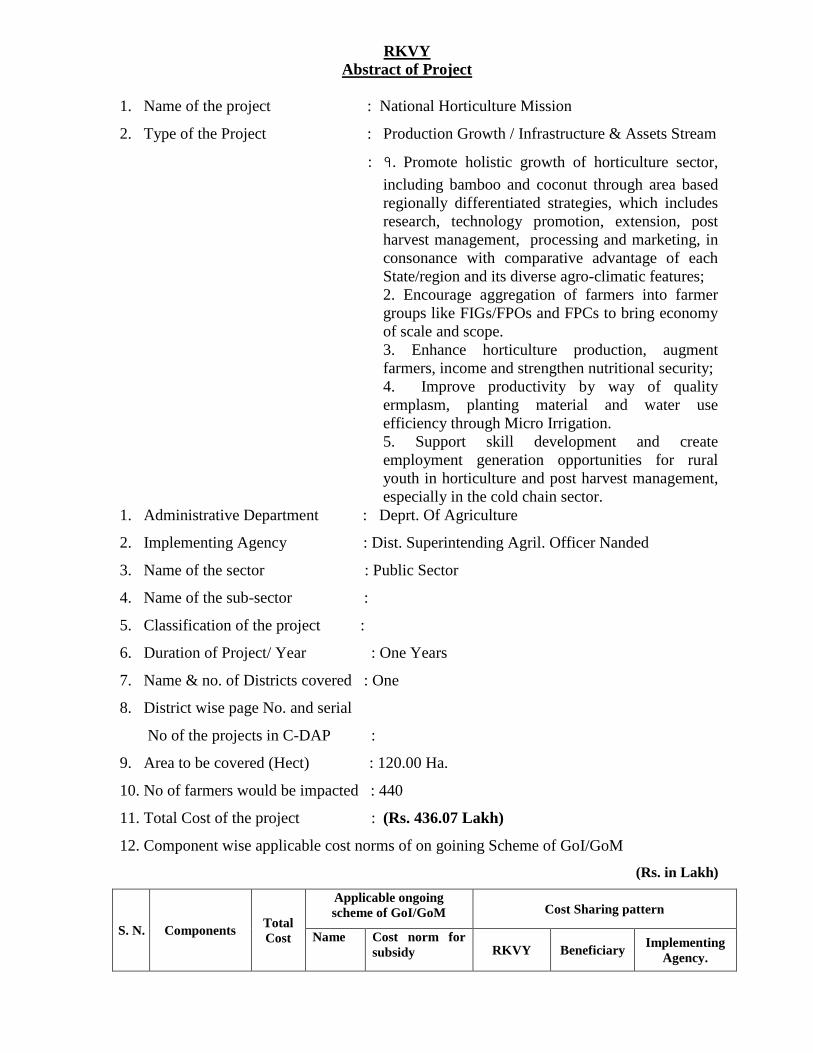
RKVY
Abstract of Project
1. Name of the project : National Horticulture Mission
2. Type of the Project : Production Growth / Infrastructure & Assets Stream
: 1. Promote holistic growth of horticulture sector,
including bamboo and coconut through area based
regionally differentiated strategies, which includes
research, technology promotion, extension, post
harvest management, processing and marketing, in
consonance with comparative advantage of each
State/region and its diverse agro-climatic features;
2. Encourage aggregation of farmers into farmer
groups like FIGs/FPOs and FPCs to bring economy
of scale and scope.
3. Enhance horticulture production, augment
farmers, income and strengthen nutritional security;
4. Improve productivity by way of quality
ermplasm, planting material and water use
efficiency through Micro Irrigation.
5. Support skill development and create
employment generation opportunities for rural
youth in horticulture and post harvest management,
especially in the cold chain sector. 1. Administrative Department : Deprt. Of Agriculture
2. Implementing Agency : Dist. Superintending Agril. Officer Nanded
3. Name of the sector : Public Sector
4. Name of the sub-sector :
5. Classification of the project :
6. Duration of Project/ Year : One Years
7. Name & no. of Districts covered : One
8. District wise page No. and serial
No of the projects in C-DAP :
9. Area to be covered (Hect) : 120.00 Ha.
10. No of farmers would be impacted : 440
11. Total Cost of the project : (Rs. 436.07 Lakh)
12. Component wise applicable cost norms of on goining Scheme of GoI/GoM
(Rs. in Lakh)
S. N. Components Total
Cost
Applicable ongoing
scheme of GoI/GoM Cost Sharing pattern
Name Cost norm for
subsidy RKVY Beneficiary Implementing
Agency.
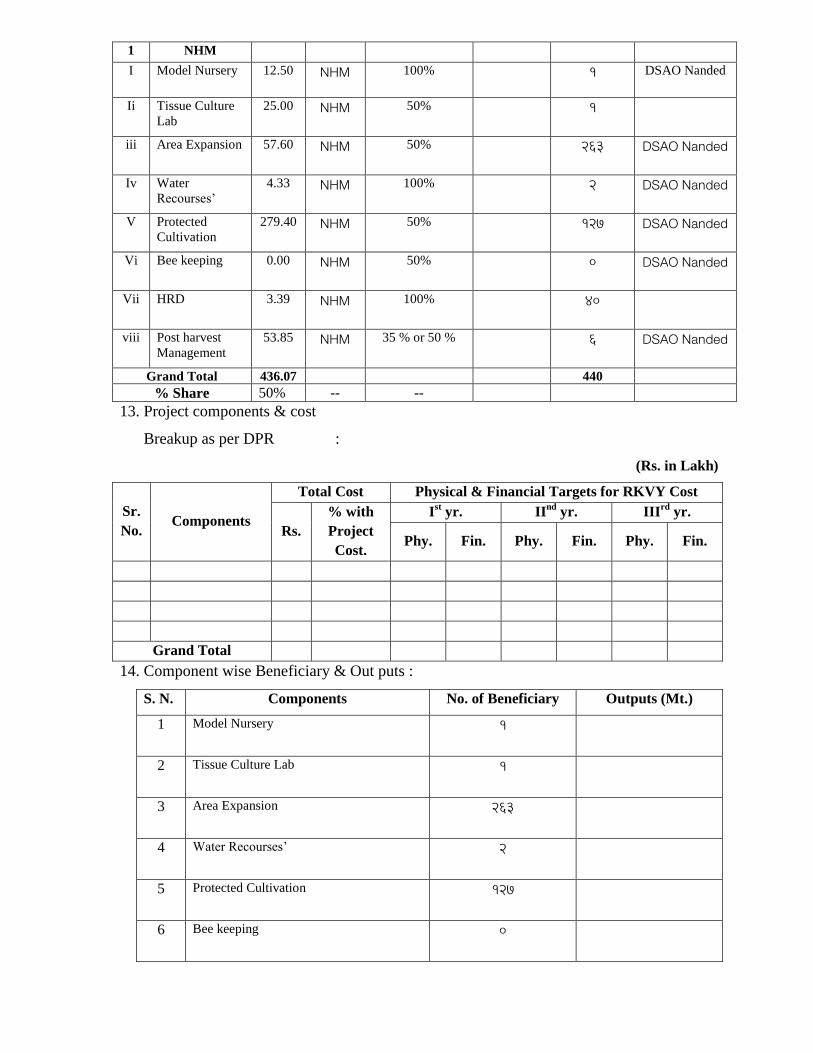
1 NHM
I Model Nursery 12.50 NHM 100% 1 DSAO Nanded
Ii Tissue Culture
Lab
25.00 NHM 50% 1
iii Area Expansion 57.60 NHM 50% 263 DSAO Nanded
Iv Water
Recourses’
4.33 NHM 100% 2 DSAO Nanded
V Protected
Cultivation
279.40 NHM 50% 127 DSAO Nanded
Vi Bee keeping 0.00 NHM 50% 0 DSAO Nanded
Vii HRD 3.39 NHM 100% 40
viii Post harvest
Management
53.85 NHM 35 % or 50 % 6 DSAO Nanded
Grand Total 436.07 440
% Share 50% -- --
13. Project components & cost
Breakup as per DPR :
(Rs. in Lakh)
Sr.
No. Components
Total Cost Physical & Financial Targets for RKVY Cost
Rs.
% with
Project
Cost.
Ist yr. II
nd yr. III
rd yr.
Phy. Fin. Phy. Fin. Phy. Fin.
Grand Total
14. Component wise Beneficiary & Out puts :
S. N. Components No. of Beneficiary Outputs (Mt.)
1 Model Nursery 1
2 Tissue Culture Lab 1
3 Area Expansion 263
4 Water Recourses’ 2
5 Protected Cultivation 127
6 Bee keeping 0

7 HRD 40
8 Post harvest Management 6
Grand Total 440
15. Impact & Outcomes
S.N. Possible benefits Quantity Valuation
Direct No. of Beneficiary Farmers 440
Contribution in Production Growth (In Rs. Lakh)
Incremental increase in farmer’s income due to
a. Increase in productivity
b. Reduction in cost of production
c. Improvement in quality of produce
Any other
Indirect Any other
16. Cost Analysis (Rs. in Lakh) :- 436.07 Lakh
I. Cost Details
a. Total Investment : 436.07 Lakh
b. Expenditure on Assets creation : 436.07 Lakh
c. Recurring Expenses :
d. Non Recurring Expenses : 436.07 Lakh
II. Ratio Analysis
a. Internal Rate of Return (IRR) :
b. Break Even Point (BEP) :
c. Investment per Beneficiary :
d. Investment / unit production
17. If Project cost is more than Rs. 25 Crore - No.
a. Details of Comments of GoI :
b. Gist of third party technical and financial Evaluation.

18. Comments of ICAR in case of Research Project. :
19. Authority wise Monitoring Mechanism :
a .Regular checking authority :
b. Annual quality & work progress certificate issuing authority:
to release next years grant as per DPR.
20. Financial sustainability of the project in future :
21. Any other information :
(A detailed note containing the executive summary of the proposed project should be submitted
along with above abstract & power point presentation. Refer RKVY guidelines 2014)

RKVY
Abstract of Project
1. Name of the project : Plastic Crates
2. Type of the Project : Production Growth / Infrastructure & Assets Stream
3. Core objectives : 1.
2.
3.
4.
4. Administrative Department : Deprt. Of Agriculture
5. Implementing Agency : Dist. Superintending Agril. Officer Nanded
6. Name of the sector : Public Sector
7. Name of the sub-sector :
8. Classification of the project :
9. Duration of Project/ Year : One Years
10. Name & no. of Districts covered : One
11. District wise page No. and serial
No of the projects in C-DAP :
12. Area to be covered (Hect) :
13. No of farmers would be impacted : 40
14. Total Cost of the project : (Rs. 2.00 Lakh)
15. Component wise applicable cost norms of on goining Scheme of GoI/GoM
16.
(Rs. in Lakh)
S. N. Components Total
Cost
Applicable ongoing
scheme of GoI/GoM Cost Sharing pattern
Name Cost norm for
subsidy RKVY Beneficiary Implementing
Agency.
1 Plastic Crates 200/
Crates
RKVY 100/ Crates 40 DSAO Nanded
Grand Total 100 40
% Share 50% -- --

17. Project components & cost
Breakup as per DPR :
(Rs. in Lakh)
Sr.
No. Components
Total Cost Physical & Financial Targets for RKVY Cost
Rs.
% with
Project
Cost.
Ist yr. II
nd yr. III
rd yr.
Phy. Fin. Phy. Fin. Phy. Fin.
1 Plastic Crates 2.00 50% 2000 2.00 2500 2.50 3000 3.00
Grand Total 2.00 2000 2.00 2500 2.50 3000 3.00
18. Component wise Beneficiary & Out puts :
S. N. Components No. of Beneficiary Outputs (Mt.)
1 Plastic Crates 40
Grand Total 40
19. Impact & Outcomes
S.N. Possible benefits Quantity Valuation
Direct No. of Beneficiary Farmers 40 .
Contribution in Production Growth (In Rs. Lakh)
Incremental increase in farmer’s income due to
a. Increase in productivity
b. Reduction in cost of production
c. Improvement in quality of produce
Any other
Indirect Any other
20. Cost Analysis (Rs. in Lakh) :- 4.00 Lakh
I. Cost Details
a. Total Investment : 2.00 Lakh
b. Expenditure on Assets creation : 2.00 Lakh
c. Recurring Expenses :
d. Non Recurring Expenses : 2.00 Lakh
II. Ratio Analysis
a. Internal Rate of Return (IRR) :
b. Break Even Point (BEP) :
c. Investment per Beneficiary :
d. Investment / unit production

21. If Project cost is more than Rs. 25 Crore - No.
a. Details of Comments of GoI :
b. Gist of third party technical and financial Evaluation.
22. Comments of ICAR in case of Research Project. :
23. Authority wise Monitoring Mechanism :
a .Regular checking authority :
b. Annual quality & work progress certificate issuing authority:
to release next years grant as per DPR.
24. Financial sustainability of the project in future :
25. Any other information :
(A detailed note containing the executive summary of the proposed project should be submitted
along with above abstract & power point presentation. Refer RKVY guidelines 2014)

2014-15 2015-16 2016-17
1
1Bio-pesticides production unit one
in each block- 16.00 16.00 32.00
2 Bio-dynamic compost - 16.00 16.00 32.00
3
Building commodity Groups and
Farmer's Organisation at Rs.1 lakh
per talukas per year
- 9.00 9.00 18.00
4Increasing Women participation
Rs. 3 lakh per block / year- 18.00 18.00 36.00
5
Seed processing for seed village
programm at Rs. 10 lakh per
district 8 village per taluka
- 20.00 20.00 40.00
6Special Exposure visit ar Rs,. 20
lakh per year/ district- 24.00 24.00 48.00
Total - 103.00 103.00 206.00
2
1
Development of mega watershed
dev.In each block at cost Rs.
12000/ha for 25000 ha each mega
block (or 5000 h)
- 3600.00 3600.00 7200.00
2 Farm ponds - 2000.00 2000.00 4000.00
3 Desalting of water bodies - 200.00 200.00 400.00
4Award's incentives for people
participation and...........- 10.00 10.00 20.00
Total - 5810.00 5810.00 11620.00
3
1Establishment of custard apple
fruit processing unit0.00 4.50 4.50 9.00
2 HRD in Horticulture 4.00 5.00 5.00 14.00
3Establishment of mosambi
research station0.00 5.00 5.00 10.00
4Scheme for export of fruits and
Vegatable0.00 4.00 4.00 8.00
5Encouraging the production of
spices0.00 4.00 4.00 8.00
6 Medicinal & aromatic processing 0.00 10.00 10.00 20.00
7Extraction of aromatic oil from
flowers0.00 5.00 5.00 10.00
` Total 4.00 33.00 0.00 37.00
(Rs. In lack)
STREAM I
Agriculture
Water Conservation
Horticulture
Outlay of Stream - I under RKVY scheme for Nanded district
Year Wise Programme
(Financial)Sr.
No
Name of
departmentScheme Proposed Total

2014-15 2015-16 2016-17
(Rs. In lack)
Year Wise Programme
(Financial)Sr.
No
Name of
departmentScheme Proposed Total
4
1Establishment of Gokul Grams
under Rashtriya Gokul Mission- 500.00 500 1000
2
Establishment of Mobile Extension
Centers for publicity of govt. of
scheme & creation of awerness
among farmers at District level
- 100.00 50 150
3Supply of Mini setter & Hatchers
of 5000 eggs capacity- 53.00 53 106
4Mobile marketing units for poultry
meat andg eggs, subsidy ceiling Rs.
3.75 lakh per unit
- 100.00 100 200
5
Faciliating market linkage for live
birds, Animals, subsidy ceiling Rs.
2.00 lakh per unit
- 100.00 100 200
6Introduction of Power driven chaff
cutter- 30.00 30 60
7 Supply of Veterinary Mobile Units
cum Diagnostic Laboratories
- 24.00 0 24
8
Modernization of Veterinary
Dispensaris Gr -I for online data
entry
- 46.15 0 46.15
9 A.I. Delivery System Under RKVY 100.00 50 150
10
Clean Milk Production through
supply of Milking machines to
Farmers on 25% subsidy31.25 31.25 62.5
11Assistance to farmers for
promotion of Integrated Livestock
Farming on 25 % subsidy
625.00 625 1250
12 Distribution of Fodder seed 15.00 15 30
13Establishment of Silage Making
Unit30.00 30 60
14Foddre production From Fallow
Lands30.00 30 60
15Establishment of Hydroponics
fodder Production unit15.00 15 30
16Establishment of A Azolla
production unit15.00 0 30
17
Fodder production at farms of
MLDB, Ships & Goat Dev.
Carporation of Maharashtra
33.345 0 33.345
18Distribution of 40 female & 2 male
goat in DPAP area0.00 1.943 1.943
Total 1847.75 1631.19 3493.94
5
1 Strengthening of milk routes - - - -
2Strengthening of chilling
plants/machinary- - - -
Total - - - -
Animal Husbandry
Dairy Development

2014-15 2015-16 2016-17
(Rs. In lack)
Year Wise Programme
(Financial)Sr.
No
Name of
departmentScheme Proposed Total
6
1
Distribution of seeds in local
reservire like farm ponds,
percolation tank
- 25 35 60
2 Feed Development - 10 15 25
3
Improvement strengthening and
Development of fished rearing unit
manar Dist Nanded- 30 10 40
Total - 65 60 125
7
1 Package for mulbery plantation 8.93 22.64 31.64 63.20
2 Supply of rearing appliances 11.64 24.00 24.00 59.64
Total 20.565 46.635 55.635 122.835
8
Plantation-Afforestation - - - -
Total - - - -
Total Stream I 24.57 7905.38 7659.83 15604.77
Fisheries
Sericulture
Social Forestry

2014-15 2015-16 2016-17
(Rs. In lack)
Year Wise Programme
(Financial)Sr.
No
Name of
departmentScheme Proposed Total
2014-15 2015-16 2016-17
1
1 National Food Security Mission 1120.43 1232.43 1355.43 3708.29
2 National Oilseed Production 129.41 142.31 156.51 428.23
3 INSIMP 79.56 87.62 96.62 263.80
4Integrated cotton development
programme49.73 56.78 62.73 169.24
5Sugarcane development
programme22.50 25.00 30.00 77.50
6Accelatrated Fodder development
programme216.74 238.34 262.34 717.42
7 Crop Sap 34.61 40.00 45.00 119.61
8 Dryland Farming mission (DLFM) 309.31 349.31 349.31 1007.93
National Mission for Sustainable
Agriculture
A) Rainfed Area Development
(RAD)
10 ATMA 380.2 418.22 459.22 1257.64
11Maharashtra Agriculture
Compititiveness Project (MACP)
12 Farm Mechanisation Mission 111.82 122.35 133.00 367.17
13On Farm Water Management
(OFWM)442.50 490.25 540.25 1473.00
14National Mission for Micro
Irrigation (NMMI)1582.58 1740.58 1914.58 5237.74
15 PPP cotton 17.50 20.00 22.00 59.50
16 Soil Health Card 17.66 17.66 17.66 52.98
17 Organic farming Demonstration. 12.54 13.54 13.54 39.62
18Establishment of Taluka seed
Farms Agro Polyclinic8.50 12.50 12.50 33.50
19Hybrid Tur Designation
Programme5.12 7.53 7.53 20.18
Total 2578.42 2842.63 3120.28 8541.33
2
1Well recharging 5000 wells/
year/dist/@ Rs. 4000 per well- 200.00 200.00 400.00
2 Well Recharging - 200.00 200.00 400.00
3Land Use Board Publicist a waren
regarded water budgeting + soil +
water conservation
- 5.00 5.00 10.00
4 TSP 110.00 121.00 133.00 254.00
5 OTSP 85.82 93.82 102.84 196.66
6 Gatiman Panlot 106.05 117.05 129.05 246.10
7 3) Creating awarness for use of
soil of water at Rs, 2 lakh per dist.
368.44 404.44 500.00 904.44
(Rs. In lack)Department wise stream - II (Revised ) scheme Proposed
Water Conservation
Sr.
No
Name of
DepartmentScheme Proposed
year wise programme (Financial)Total
9 138.84 152.84 168.84
Agriculture
STREAM II
Outlay for Strenghtening of existing scheme Stream - II under RKVY scheme
460.52

2014-15 2015-16 2016-17
(Rs. In lack)
Year Wise Programme
(Financial)Sr.
No
Name of
departmentScheme Proposed Total
8
4) Incentive for peoples
participation per dist. Rs. 3 lakh
per year
- 3.00 3.00 6.00
95) DPAP one watershed at cost Rs.
12000 ha.392.00 450.00 450.00 900.00
10 Adarshgaon 19.56 21.56 24.54 46.10
11 RKVY Check Dam 150.12 165.15 180.12 345.27
12 IWMP 7252.60 8000.00 8800.00 16800.00
Total 8288.77 9161.2 10086.71 19247.91
3
1 EGS Horticulture 39.26 214.69 214.68 468.63
2 Protective cultivation 266.10 304.00 375 945.10
3 Precision farming 3.00 4.50 5.5 13.00
4 Organic farming 4.00 5.00 5 14.00
5 Technology Demonstration 3.00 3.00 4 10.00
6 Post harvest managment 45.00 125.00 60 230.00
7 Market Inteligence 0.00 4.00 4 8.00
8Strenghtening of State Govt.
Nurseries 20.00 10.00 10 40.00
9 High Tech floriculture project 0.00 4.00 5 9.00
10 Production of planting material 25.00 25.00 25 75.00
11 Vegetable seed production 0.00 5.00 5 10.00
12 Establishment of new gardens 57.00 77.00 82 216.00
13
Rejuevnation and productivity
enhancement sweet orange,
mango, guava, sitaphat etc. 39.00 20.00 20 79.00
14 Community Tank Nos 25.00 50.00 75 150.00
15 RKVY Plastic Creat 5.17 6.00 6 17.17
` Total 531.53 857.19 896.18 2284.90
4
1
Stall fed 40+2 goat unit by
Punyashlok Ahilyadevi
Maharashtra Mendhi va Sheli vikas
mahamandal
- 54.00 0 54
Total 54.00 0.00 54.00
5
1 Stainless steel can - - - -
Total - - - -
6
1Establishment fish production unit 4.50 2.00 5.00 11.50
2Fish farming in impounded water 3.50 4.00 4.00 11.50
3Assistance for supply of fishery
requisite 0.40 0.70 1.00 2.10
4 Development of fishery Co-op 0.10 0.10 0.10 0.30
Total 8.50 6.80 10.10 25.40
7
1 Mulbery cultivation 8.73 18.00 18.00 44.73
2 Cocoon production 7.14 5.82 14.40 27.36
3 Farmers training 102.00 300.00 300.00 702.09
Total 117.87 323.82 332.40 774.18
8
1
Integrated waterShed
development programme- 321.46 200.00 521.46
Total - 321.46 200.00 521.46Total Stream II 11525.09 13567.10 14645.67 31449.18
Social Forestry
Horticulture
Animal Husbandry
Dairy Development
Fisheries
Sericulture

RKVY
Abstract of Project
1. Name of the project : Vegetable Initiative Program me for Aurangabad City
2. Type of the Project : Production Growth / Infrastructure & Assets Stream
3. Core objectives : 1.
2.
3.
4.
4. Administrative Department : Deprt. Of Agriculture
5. Implementing Agency : Dist. Superintending Agril. Officer Nanded
6. Name of the sector : Public Sector
7. Name of the sub-sector :
8. Classification of the project :
9. Duration of Project/ Year : One Years
10. Name & no. of Districts covered : One
11. District wise page No. and serial
No of the projects in C-DAP :
12. Area to be covered (Hect) :
13. No of farmers would be impacted : 18
14. Total Cost of the project : (Rs. 57.52 Lakh)
15. Component wise applicable cost norms of ongoing Scheme of GoI/GoM
(Rs. in Lakh)
S. N. Components Total
Cost
Applicable ongoing
scheme of GoI/GoM Cost Sharing pattern
Name Cost norm
for subsidy RKVY Beneficiary Implementing
Agency.
1 Vegetable
Infinitive
I Shed Net House 32.64 RKVY Vegetabl
e
50% 50% 8 DSAO Nanded
Ii Green House 15.08 RKVY Vegetabl
e
50% 50% 4
iii Plantation in
Shed net House
1.49 RKVY Vegetabl
50% 50% 1 DSAO Nanded

e
Iv Onion Storage
Unit
0.875 RKVY Vegetabl
e
50% 50% 1 DSAO Nanded
V Pack House 7.43 RKVY Vegetabl
e
50% 50% 4 DSAO Nanded
Grand Total 57.52 18
% Share 50% -- --
16. Project components & cost
Breakup as per DPR :
(Rs. in Lakh)
Sr.
No. Components
Total Cost Physical & Financial Targets for RKVY Cost
Rs.
% with
Project
Cost.
Ist yr. II
nd yr. III
rd yr.
Phy. Fin. Phy. Fin. Phy. Fin.
I Shed Net House 32.64 50 % 8 32.64
Ii Green House 15.08 50 % 4 15.08
iii Plantation in Shed
net House
1.49 50 % 1 1.49
Iv Onion Storage Unit 0.875 50 % 1 0.875
V Pack House 7.43 50 % 4 7.43
Grand Total 57.52 18 57.52
17. Component wise Beneficiary & Out puts :
S. N. Components No. of Beneficiary Outputs (Mt.)
1 Shed Net House 8
2 Green House 4
3 Plantation in Shed net House 1
4 Onion Storage Unit 1
5 Pack House 4
Grand Total 18

18. Impact & Outcomes
S.N. Possible benefits Quantity Valuation
Direct No. of Beneficiary Farmers 18
Contribution in Production Growth (In Rs. Lakh)
Incremental increase in farmer’s income due to
a. Increase in productivity
b. Reduction in cost of production
c. Improvement in quality of produce
Any other
Indirect Any other
19. Cost Analysis (Rs. in Lakh) :- 57.52 Lakh
I. Cost Details
a. Total Investment : 57.52 Lakh
b. Expenditure on Assets creation : 57.52 Lakh
c. Recurring Expenses :
d. Non Recurring Expenses : 57.52 Lakh
II. Ratio Analysis
a. Internal Rate of Return (IRR) :
b. Break Even Point (BEP) :
c. Investment per Beneficiary :
d. Investment / unit production
20. If Project cost is more than Rs. 25 Crore - No.
a. Details of Comments of GoI :
b. Gist of third party technical and financial Evaluation.
21. Comments of ICAR in case of Research Project. :
22. Authority wise Monitoring Mechanism :
a .Regular checking authority :

b. Annual quality & work progress certificate issuing authority:
to release next years grant as per DPR.
23. Financial sustainability of the project in future :
24. Any other information :
(A detailed note containing the executive summary of the proposed project should be submitted
along with above abstract & power point presentation. Refer RKVY guidelines 2014)


![Elevator Catalog [1.3 MB] - Wirerope Works](https://static.fdokumen.com/doc/165x107/6327034c6d480576770d1104/elevator-catalog-13-mb-wirerope-works.jpg)