1998 SOUTHERN AFRICA ECONOMIC SUMMIT WINDHOEK ...
94
1998 SOUTHERN AFRICA ECONOMIC SUMMIT WINDHOEK, NAMIBIA 17-19 MAY Theme: “Priorities for Global Competitiveness in the 21st Century” Prepared by the SADC Finance and Investment Sector Co-ordinating Unit (FISCU) Department of Finance - South Africa
-
Upload
khangminh22 -
Category
Documents
-
view
0 -
download
0
Transcript of 1998 SOUTHERN AFRICA ECONOMIC SUMMIT WINDHOEK ...
1998 SOUTHERN AFRICAECONOMIC SUMMITWINDHOEK, NAMIBIA 17-19 MAY
Theme:“Priorities for Global Competitiveness in the 21st Century”
Prepared by theSADC Finance and Investment Sector Co-ordinating Unit (FISCU)
Department of Finance - South Africa
2
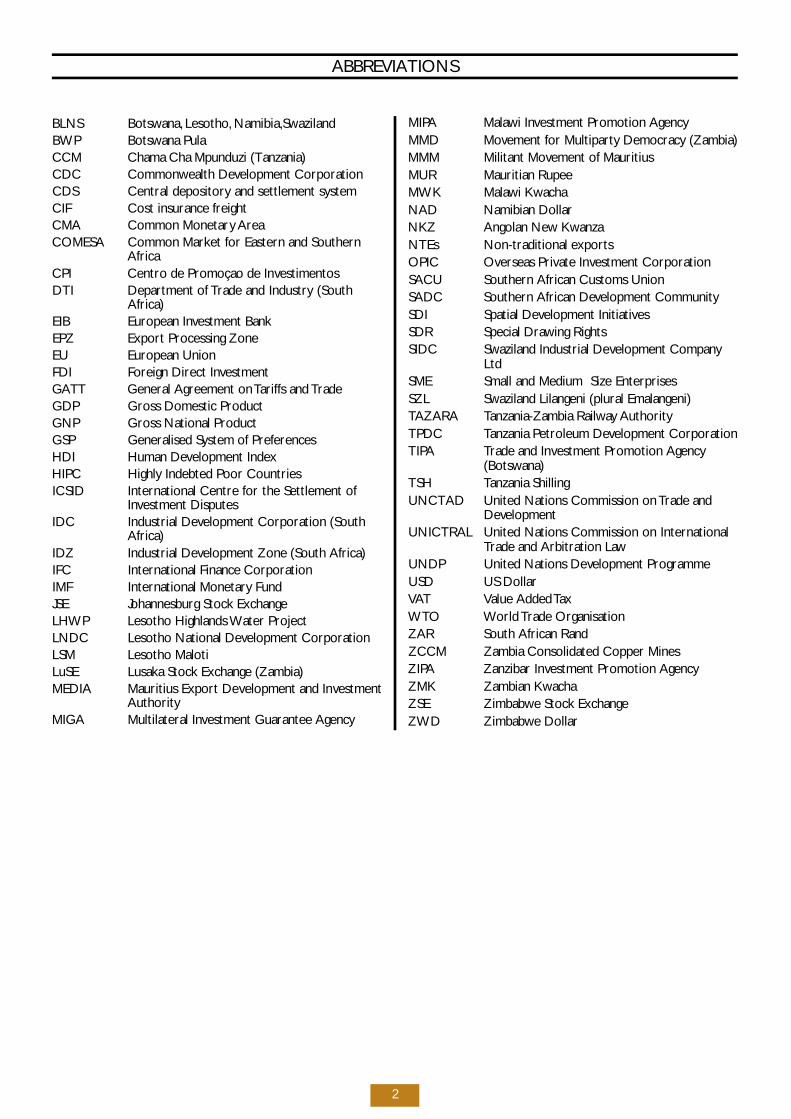
BLNS Botswana, Lesotho, Namibia,SwazilandBWP Botswana PulaCCM Chama Cha Mpunduzi (Tanzania)CDC Commonwealth Development CorporationCDS Central depository and settlement systemCIF Cost insurance freightCMA Common Monetary AreaCOMESA Common Market for Eastern and Southern
AfricaCPI Centro de Promoçao de InvestimentosDTI Department of Trade and Industry (South
Africa)EIB European Investment Bank EPZ Export Processing ZoneEU European UnionFDI Foreign Direct InvestmentGATT General Agreement on Tariffs and TradeGDP Gross Domestic ProductGNP Gross National ProductGSP Generalised System of PreferencesHDI Human Development IndexHIPC Highly Indebted Poor CountriesICSID International Centre for the Settlement of
Investment DisputesIDC Industrial Development Corporation (South
Africa)IDZ Industrial Development Zone (South Africa)IFC International Finance CorporationIMF International Monetary FundJSE Johannesburg Stock ExchangeLHWP Lesotho Highlands Water ProjectLNDC Lesotho National Development CorporationLSM Lesotho MalotiLuSE Lusaka Stock Exchange (Zambia)MEDIA Mauritius Export Development and Investment
AuthorityMIGA Multilateral Investment Guarantee Agency
MIPA Malawi Investment Promotion AgencyMMD Movement for Multiparty Democracy (Zambia)MMM Militant Movement of MauritiusMUR Mauritian RupeeMWK Malawi KwachaNAD Namibian DollarNKZ Angolan New KwanzaNTEs Non-traditional exportsOPIC Overseas Private Investment CorporationSACU Southern African Customs UnionSADC Southern African Development CommunitySDI Spatial Development InitiativesSDR Special Drawing RightsSIDC Swaziland Industrial Development Company
LtdSME Small and Medium Size EnterprisesSZL Swaziland Lilangeni (plural Emalangeni)TAZARA Tanzania-Zambia Railway AuthorityTPDC Tanzania Petroleum Development CorporationTIPA Trade and Investment Promotion Agency
(Botswana)TSH Tanzania ShillingUNCTAD United Nations Commission on Trade and
DevelopmentUNICTRAL United Nations Commission on International
Trade and Arbitration LawUNDP United Nations Development ProgrammeUSD US DollarVAT Value Added TaxWTO World Trade OrganisationZAR South African RandZCCM Zambia Consolidated Copper MinesZIPA Zanzibar Investment Promotion AgencyZMK Zambian KwachaZSE Zimbabwe Stock ExchangeZWD Zimbabwe Dollar
ABBREVIATIONS
3
I N D E X
Abbreviations 2Foreword 5The SADC Finance and 7Investment SectorRegional Macro-Economic 13Highlights
Southern Africa and 17
Competitiveness
C O U N T RY PRO F I L E S
Angola 21
Botswana 27
Lesotho 33
Malawi 39
Mauritius 46
Mozambique 53
Namibia 63
South Africa 73
Swaziland 83
Tanzania 91
Zambia 96
Zimbabwe 103
List of Sources 109
AC K N OW L E D G E M E N T S
This is the second document produced by the Finance andI nvestment Sector Coordinating Unit (FISCU) for theS A D C / World Economic Forum Southern A f r i c aEconomic Summit. This year most of the information wassupplied by FISCU’s stakeholders in the re g i o n . F I S C Uc o o rdinated the wo r k , edited and supplemented thei n formation with data found on the Internet, and inn ew s p apers and magazines.
We would there fo re like to thank the staff members ofthe investment promotion agencies, the stock exchanges,the central banks and the Ministries of Finance of thet we l ve SADC Countries cove red in this document.U n fo rt u n a t e ly, we we re not able to cover the two newSADC member States, the Democratic Republic of Congoand the Seychelles in this document.
Our gratitude also encompasses the Swedish InternationalD evelopment Co-operation A g e n c y,which contributed tothe printing and production costs, and the adve rtisers fo rs u p p o rting the balance of the cost. P h o t o g r aphs byc o u rtesy of Southern African Marketing Co. F u rt h e r m o re,we are grateful to Mr Philip Clay t o n , Senior Economist,S t a n d a rd Bank of South A f r i c a , who provided editoriala s s i s t a n c e.
The contributors to the document are :Ms Bongi Ku n e n e,Mr Phakamani Radebe, Ms Eva Bursvik, Ms RosalindM owatt and Mr Themba Zulu of FISCU.
P re t o r i a ,M ay 1998.
CONTENTS
The information that appears in this document is, to the best of ourk n ow l e d ge, c o r rect at the time of the pri n t i n g , and has been veri fied byC e n t ral Banks and/or Ministries of Finance of the respective countri e s.H ow ev e r, the SADC countries are facing difficulties in the ge n e ration ofstatistical data. The issue is re c ognised and is currently being addre s s e dby, inter alia, the Committee of Central Bank Gov e r n o rs. M e a n w h i l e, w es u g gest that a degree of caution be exercised when using them a c roeconomic statistics. FISCU disclaims liability for any erro rs andomissions that might occur in the document.
SADC Finance and Investment Sector Coordinating Unit (FISCU)
D e p a rtment of Finance, Private Bag X115,P retoria 0001,South A f r i c a
Te l : +27-12-315 5395, 315 5653 Fax: +27-12-315 5395
e - m a i l :r m t 1 @ m we b. c o. z a
C O P Y R I G H T
No part of this publication may be re p roduced without the prior wri t t e npermission of FISCU, P R I VATE BAG X115, P R E TORIA 0001
5
The second publication of the Southern Africa EconomicSummit pre p a red by the Finance and Investment SectorC o o rdinating Unit (FISCU) takes place in the context ofsignificant regional and international political and financiald eve l o p m e n t s .Within SADC the political situation is stableand there is close collaboration by member-states to ensurethat peace holds in A n gola and the Democratic Republic ofthe Congo. M u l t i - p a rty democracy has become the norm inall SADC economies and the robustness of thesedemocracies is attested by the procedural elections to beheld in at least four SADC countries in 1998 and 1999. M o s tof the fo rthcoming elections will have internationalo b s e rvers and the presence of independent electoralcommissions ensure that the process is proper and fair. I nkeeping with mature democracies it is expected that thefo rthcoming elections will yield smooth succession andgovernment functions will not be disrupted in any way.
Significant economic policy changes within SADC haveo c c u rred over time as economies we re adjusting. T h o u g hadjustments we re a result of diffe rent circumstances thewhole region is benefiting from the positive contagion effe c t .Economic policy has become the focus of public debate asm a c ro-economic management issues are discussed with awide range of re l evant stakeholders such as labor, c o m m e rc eand industry, and non-government organizations. T h ecommitment of SADC governments to adhering to soundeconomic principles can not be questioned. As SADCeconomies continue to grow the debate is no longer onwhat economic systems to adopt but the focus has shifted toa point where the debate is on how to ensure that a marke tbased economic system embraces a wide majority in ord e rto add ress pove rty and other social backlogs. It is a concernof SADC citizens that the economic policy env i ronment isc o n d u c t i ve to attracting and keeping domestic, regional andfo reign inve s t o r s .
I n t e r n a t i o n a l ly the focus of multilateral deliberations havebeen on the Asian financial crisis which have outperfo r m e dp revious crises such as the Tu r key and Mexican crises of 1994re s p e c t i ve ly.The consequences of the Asian crisis continue toreverberate world-wide and the effect is transmitted ind eveloped economies through diminished demand of dollar-priced goods and serv i c e s , and through deleveraging infinancial marke t s . SADC economies have not been immu n eto the crisis.Asian countries import base metals and mineralsand other raw materials from the southern Africa re g i o n .Textiles and other labor intensive products from A s i acompete with textiles and other products produced by there g i o n . It is thus expected that the effect of the crisis will befelt in these sectors. In South A f r i c a , owing to the emergingm a r ket status accorded to the country, the impact felt in theEmerging Market Index (EMI) was easily and immediately fe l tin the first ro u n d .As a result of slower growth in Asia and itsimpact on world grow t h , SADC expects that the demand fo re x p o rted materials to decline and impact negative ly onregional export s . Notwithstanding the pessimistic outlookSADC economies are expected to grow faster than the re s tof Africa and other developing economies for the ye a r1 9 9 8 / 1 9 9 9 . It may be pre m a t u re to conclusive ly assess theimpact of the Asian crisis. H oweve r, c o m p a r a t i ve ly speaking,the effect on SADC seems to be minimal because theregional financial markets are not as globally integrated asthe financial markets in the rest of the wo r l d .
BONGI KUENE
D i rector (FISCU)
FOREWORD
7
The SADC Sector for Finance and Investment held its inauguralmeeting in Ju ly 1995.The SADC Ministers of Finance agreed thatt h ey will work tow a rds the fo l l owing objective s :
• To provide a framework for regional co-operation in the are aof finance in collaboration with the central banks, o t h e rre g u l a t o ry and superv i s o ry authorities, banks and otherfinancial intermediaries in order to mobilise re s o u rces fo ri nve s t m e n t .
• To promote the development of sound investment policies ofmember states in order to establish an enabling inve s t m e n te nv i ronment for the re g i o n .
• To encourage movement tow a rds regional macro - e c o n o m i cstability by, among other things, p romoting prudent fiscal andm o n e t a ry policies.
• To analyse and assess the impact of structural adjustmentpolicies and programmes on the attainment of the objective sof this Sector.
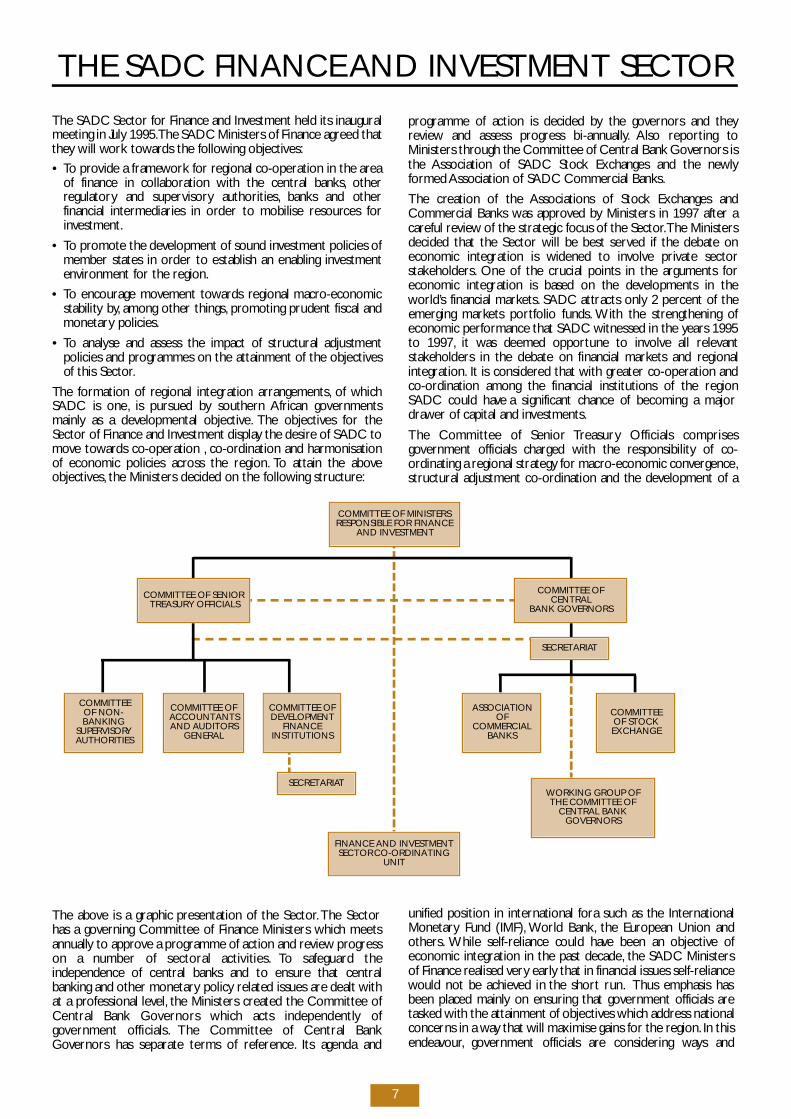
The formation of regional integration arr a n g e m e n t s , of whichSADC is one, is pursued by southern African gove r n m e n t sm a i n ly as a developmental objective. The objectives for theSector of Finance and Investment display the desire of SADC tom ove tow a rds co-operation , c o - o rdination and harmonisationof economic policies across the re g i o n . To attain the aboveo b j e c t i ve s , the Ministers decided on the fo l l owing structure :
p rogramme of action is decided by the governors and theyrev i ew and assess pro g ress bi-annu a l ly. Also re p o rting toMinisters through the Committee of Central Bank Governors isthe Association of SADC Stock Exchanges and the new lyformed Association of SADC Commercial Banks.
The creation of the Associations of Stock Exchanges andC o m m e rcial Banks was ap p roved by Ministers in 1997 after ac a reful rev i ew of the strategic focus of the Sector.The Ministersdecided that the Sector will be best served if the debate oneconomic integration is widened to invo l ve private sectors t a ke h o l d e r s . One of the crucial points in the arguments fo reconomic integration is based on the developments in thewo r l d ’s financial marke t s . SADC attracts only 2 percent of theemerging markets port folio funds. With the strengthening ofeconomic performance that SADC witnessed in the years 1995to 1997, it was deemed opportune to invo l ve all re l ev a n ts t a keholders in the debate on financial markets and re g i o n a li n t e g r a t i o n . It is considered that with greater co-operation andc o - o rdination among the financial institutions of the re g i o nSADC could have a significant chance of becoming a majord r awer of capital and inve s t m e n t s .
The Committee of Senior Tre a s u ry Officials comprisesgovernment officials charged with the responsibility of co-o rdinating a regional strategy for macro-economic conve r g e n c e,structural adjustment co-ordination and the development of a
THE SADC FINANCE AND INVESTMENT SECTO R
The above is a graphic presentation of the Sector.The Sectorhas a governing Committee of Finance Ministers which meetsa n nu a l ly to ap p rove a programme of action and rev i ew pro g re s son a number of sectoral activities. To safe g u a rd theindependence of central banks and to ensure that centralbanking and other monetary policy related issues are dealt withat a pro fessional leve l , the Ministers created the Committee ofCentral Bank Governors which acts independently ofgovernment officials. The Committee of Central BankG overnors has separate terms of re fe re n c e. Its agenda and
COMMITTEE OF MINISTERSRESPONSIBLE FOR FINANCE
AND INVESTMENT
COMMITTEE OF SENIORTREASURY OFFICIALS
COMMITTEE OFCENTRAL
BANK GOVERNORS
COMMITTEE OF NON-BANKING
SUPERVISORYAUTHORITIES
COMMITTEE OFACCOUNTANTSAND AUDITORS
GENERAL
COMMITTEE OFDEVELOPMENT
FINANCEINSTITUTIONS
SECRETARIAT
ASSOCIATIONOF
COMMERCIAL BANKS
COMMITTEEOF STOCKEXCHANGE
WORKING GROUP OFTHE COMMITTEE OF
CENTRAL BANKGOVERNORS
FINANCE AND INVESTMENTSECTOR CO-ORDINATING
UNIT
SECRETARIAT
unified position in international fora such as the InternationalM o n e t a ry Fund (IMF), World Bank, the European Union ando t h e r s . While self-reliance could have been an objective ofeconomic integration in the past decade, the SADC Ministersof Finance realised ve ry early that in financial issues self-re l i a n c ewould not be achieved in the short run. Thus emphasis hasbeen placed mainly on ensuring that government officials aret a s ked with the attainment of objectives which add ress nationalconcerns in a way that will maximise gains for the re g i o n . In thise n d e avo u r, government officials are considering ways and

9
means that will have beneficial results in the spill over effects ofstructural adjustment pro c e s s e s , and in general, p romote soundm a c ro-economic management principles.
R e p o rting through the Committee of Tre a s u ry Officials are theCommittee of Accountants-Generals and A u d i t o r s - G e n e r a l s ,and the Committee of Non-Banking Superv i s o ry A u t h o r i t i e s .The Ministers realised that since trade integration effo rts arebeing seriously add ressed by the re g i o n , it would be prudent toe n s u re that institutional problems associated with macro -economic policy re form and financial infrastructure areattended to as a matter of urgency. Hence the invo l vement ofprivate and public sector pro fessionals such as the accountantsand auditors, and superv i s o ry authorities. The issue in thisre g a rd is that while SADC is developing region specific solutionsassociated with regional integration, it would be easy to losesight of integration as a tool for small open economies toexpand marke t s , but more import a n t ly, to take advantages ofglobalisation and international competitive n e s s .
A c c o rd i n g ly the regional accountants and auditors are taske dwith the responsibility to:
• determine the desirability and feasibility of harmonisings t a n d a rds within the re g i o n ;a n d
• determine what needs to be done at a pro fe s s i o n a l ,t e c h n i c a land political level to ensure that the private and public sectorsof the SADC region adhere to international standard s .
S i m i l a r ly, the regional superv i s o ry authorities are tasked with:
• obtaining an understanding of the nature, s t r u c t u re, p e r s o n sand institutions invo l ved in superv i s o ry activities in the re g i o n ;
• discussing the various cross border activities and superv i s o ryresponses that may be re q u i red as a re s u l t ;
• looking at the way fo r w a rd and considering a strategy inrelation to the establishment of a regional body,which may beprivate or public, charged with the responsibility for off-sitea n a lyses of adherence to prudential rules and regulations ona regional basis.
It is hoped that the invo l vement of various superv i s o ryauthorities in SADC fora will go a long way in the design ofefficient re g u l a t o ry systems, and as they will advise the Ministersand make recommendations on desirable changes, t h ey will addvalue tow a rds a solution to the negative perceptions on risk inS A D C.
The Finance and Investment Sector Co-ordinating Unit (FISCU)acts as a secretariat for the Ministers of Finance Committee.A ssuch it is responsible for the daily management of sectoriala c t i v i t i e s .The functions allocated to FISCU are dedicated to thes e rving of all sectorial committees and sub-committees. T h i si nvo l ves setting up the terms of re fe rence and determining awork plan and agenda for each sub-structure that is establishedin the support of sectorial objective s . FISCU also plays amonitoring role on all projects befo re submission to theM i n i s t e r s . Most of the projects undert a ken by the sector arefunded in collaboration with international co-operatingp a rt n e r s . FISCU is responsible for the identification of suitabledonors and partners for each pro j e c t , and negotiation offinancing pro p o s a l s .The process of identifying suitable part n e r sis critical to the success of each project as it identifies possibleconditionalities that the sector need to comply with andeliminates unnecessary processes and pro c e d u re s .The matchingof donors, p rojects and focus groups within the Sector re s u l t sin the signing of a memorandum of understanding (MOU) whichsets out the framework of the relationship between the Sectorand donors. FISCU pre p a res all the MOUs and where a pro j e c tre q u i res the services of consultants FISCU contracts a suitablyqualified candidate.
For the financial year 1998/99 FISCU’s key functions are :
• to produce a framework document that will be a composite
of policies and strategies that the sector needs to adopt tof u rther the aims of economic integration.
• to produce a Finance and Investment Protocol that will besubmitted to the Ministers for final ap p roval in June 1999.
• to produce a quart e r ly newsletter with information on theactivities of the sector.
• to identify suitable international co-operating partners for thes e c t o r ’s new activities.
• to produce a SADC macro-economic analysis document thatwill be used to inform current and potential regional andinternational investors of, amongst others, the inve s t m e n tclimate in each SADC economy, potential inve s t m e n to p p o rt u n i t i e s , and legal provisions for doing trade in SADC.This document will be available to participants at theSouthern Africa Economic Summit to be held on 17 - 19 May1998 in Namibia. It will also be available on Internet add re s s :w w w. f i n a n c e. gov. z a / S A D C.
• to work with the SADC stock exchanges in their pursuit ofharmonised policies and operations.
• to promote the establishment of effe c t i ve networks betwe e nSADC development finance institutions.
• to promote the adherence of SADC governments to prudentfiscal and monetary policies, t h rough inter alia, d evising anacceptable macro-economic convergence model.
• to promote effe c t i ve networking between non-bankingre g u l a t o ry agencies so as to devise a set of compatibleregional rules.
• to work with all re l evant stakeholders in the harmonisation ofpractices and standards in the accounting and auditingp ro fe s s i o n s .
• to provide input on regional dimensions in dialogue thatMinisters of Finance have with multilateral institutions such asthe IMF, World Bank, the Non Aligned Move m e n t ,C o m m o n wealth and others.
S E C TORAL AC T I V I T I E SIn a broad sense the Sector is add ressing various issues offinancial co-operation. In 1995 it was decided that financial co-operation will add ress the fo l l ow i n g :
• Financial re forms including the promotion of investment andtrade financing;
• The possibilities of establishing a regional finance andd evelopment mechanism with cognisance to the need for am o re balanced geographical pattern of inve s t m e n t ;
• Co-operation in the field of monetary matters such asm o n e t a ry policy, exchange rate policy, c u rrency conve rt i b i l i t y,fo reign exchange re s e rve management, fo reign debtmanagement and other issues related to the liberalisation offinancial marke t s ;
• The development of compatible rules and re g u l a t i o n sgoverning supervision of banks and other financial institutions;
• The development and strengthening of capital and moneym a r kets including national and regional stock exchanges;
• The development of human re s o u rce capacity in the areas offinance and inve s t m e n t ;
• The development of payment and clearance systems tofacilitate efficient cross border pay m e n t .
The Sector has three main themes and a number of pro j e c t sthat complement each other and add ress the adopted themes.
I . M AC RO-ECONOMIC MANAG E M E N TThe main thrust of this theme is to complement tradeintegration effo rts and to ensure that the political will that
10
c u rre n t ly exists in SADC governments is supported by soundeconomic management. In this context while the argument isdominated by trade liberalisation there is a realisation that non-tariff barriers affect trade, p roduction and inve s t m e n t . T h eMinisters of Trade and Industry are mainly concerned with thefirst two barr i e r s .The Ministers of Finance on the other handa re more concerned with ensuring that the gains from macro -economic re forms which counties have been undert a k i n gi n d i v i d u a l ly are regionalised by varying the intensity, scope andsequencing of economic policies.
H owever the Sector has had considerable difficulties inunderstanding the nature of the problems because of lack of anadequate database on which to base the analy s i s . In 1996 theCommittee of Governors ap p roved a project on thed evelopment of a statistical database with economic andfinancial info r m a t i o n . A re p o rt “Statistical tables and graphs fo rSADC countries” is produced bi-annu a l ly for presentation tothe meeting of SADC Central Bank Gove r n o r s . The ap p rove dstatistics appearing in this re p o rt are now available on In t e r n e t ,a dd re s s : w w w. s a d c b a n ke r s . o r g . The developments in thestatistical data base are discussed by senior officials from thecentral banks’ Departments of Research and Economics. T h elatest development concerns the proposed inclusion of fiscalstatistics to show the sources of government income anddistribution of government expenditure.
The statistics project is part of the Sector’s effo rts in thed evelopment of public confidence and information efficiency. I thas not been possible in the past to tackle governance issuesbecause the information base was ve ry narrow. T h ei m p rovements in the database will ensure that the sectore f fe c t i ve ly deals with macro-economic convergence issues anda c c o rd i n g ly adopts measurable indicators for conve r g e n c ec r i t e r i a .
An improvement in the management of SADC economies hasbeen characterised by the re m oval of exchange controls as partof economic re fo r m . H oweve r, the speed and effe c t i veness ofrelaxation of exchange controls have not been assessedre g i o n a l ly. The governors adopted a project looking at at h e o retical study on the macro-economic and re g u l a t o ryf r a m ework that should accompany the liberalisation ofexchange contro l s . The study noted that most SADCeconomies have already liberalised exchange controls on cert a i nc a t e gories of the current account, such as other export s ,i m p o rt s , s e rvices and income. A first objective for SADCeconomies should be to adopt A rticle VIII of the IMF’s A rt i c l e sof A g re e m e n t .Once this has been attained, f u rther relaxation onthe capital account are called fo r. G i ven the need for fo re i g ni nvestment in SADC countries it was recommended toMinisters that obstacles hindering inward financial flows shouldbe re c o n s i d e re d ,e s p e c i a l ly control restrictions on inward dire c ti nve s t m e n t , equity and port folio inve s t m e n t .
The consistency of the above conclusions we re echoed by theCommittee of Stock Exchanges in their recommendations toMinisters on harmonisation of economic activities withre fe rence to movement of capital flow s . South Africa acted onthese re c o m m e n d a t i o n s .The 1998/99 South African budget hasa l l owed a further relaxation of capital flows within SADC fro ma limit of ZAR50 million to ZAR250 million. L i kew i s einstitutional investors can now increase their fo reign curre n c yt r a n s fers from 2 percent to 10 percent of their previous ye a r ’snet inflow of funds.
The developments in SADC are happening in the context ofg l o b a l i s a t i o n , as a result of the expansion of internationally -d r i ven economic changes. It has thus been deemed useful toinclude cooperation in international negotiations with themultilateral institutions, e s p e c i a l ly in the development ofMultilateral Investment A g re e m e n t s , in the discussions of theMinisters of Finance. At present this debate is not we l la rticulated but it is clear that in the process of re-orientation of
the development strategy from a national strategy to a re g i o n a lo n e, it would be re l evant to assess the possibility ofs t rengthening the bargaining power of member countries. T h econcern is that as developments are instituted by the Wo r l dTrade Organisation (WTO ) , the Organisation for EconomicCo-operation and Development (OECD) and the UnitedNations Confe rence on Trade and Development (UNCTA D ) ,i tis almost impossible for developing countries to single-handedlyp o s i t i ve ly influence the outcomes for themselve s . Instead ofwaiting to respond to events once they are final it is perc e i ve dthat SADC Finance Ministers should collaborate with theirtrade counterparts for the fo r mulation of a coherent strategyon multilateral investment agreements for the benefit of there g i o n . It is envisaged that the issues arising out of this debatewill be codified to form a significant section of the pro p o s e dFinance and Investment pro t o c o l .
I I . FINANCIAL MANAG E M E N TMultilateral institutions have alw ays emphasised the import a n c eof good governance in any developing country. This in manyinstances has been used as a criteria for evaluating the level ofd evelopment finance flows that the developing countries get. I Nas much as good governance is part of the debate in SouthernA f r i c a , the SADC Ministers of Finance decided that financialmanagement as a theme would be one of the crucial areas thatSADC would be evaluated upon.A c c o rd i n g ly a programme thata dd ress this theme have been adopted. At the core of thisp rogramme is an attempt to add ress national problems in a waythat simu l t a n e o u s ly add resses regional needs.
Together with organisations, i n s t i t u t i o n s , and associations atinternational and regional leve l , the Finance and Inve s t m e n tSector Co-ordinating Unit (FISCU) is invo l ved in devising as t r a t e gy to add ress accounting and auditing matters within theSADC re g i o n .Among the regional bodies invo l ved are the Eastand Southern African Association of Accountants- General( E S A AG ) , the Eastern, Central and Southern African Fe d e r a t i o nof Accountants (ECSAFA ) , the Southern African Deve l o p m e n tC o m munity Organisation of Supreme Audit Institutions( S A D C O S A I ) .The World Bank and the Canadian InternationalD evelopment Agency are the two international partners whoseassistance has been sought to fund the activities of theseo r g a n i s a t i o n s .
At the core of the financial management agenda is the desire tobring about harmonisation of the accountancy and auditingp ro fessions on a regional basis.
The scope of the issues to be cove red in this programme cove r sa c c o u n t i n g , a u d i t i n g , government accountability, ethics andnorms of the pro fe s s i o n , m e rcantile law, and education andtraining of pro fessionals in the accounting and auditing fields. I twould be a futile exe rcise if SADC we re to attempt to conductthis work independent of the developments in the pro fe s s i o n sworld wide. For this reason the associations have had to bec o nversant with developments on improved financial re p o rt i n gbased on the adoption of international accounting and auditings t a n d a rds as pro mulgated by the International Federation ofAccountants (IFAC) and the International Accounting andS t a n d a rds Committee (IASC). E f fo rts by the governments withinSADC to improve accountability and there by prov i d eresponsible control of government finances will have the add e dbenefit of increasing investor confidence while complying withinternational standard s . F u rt h e r m o re ; with the inclusion ofAuditors-Generals in this initiative, c a re will be placed ons t rengthening their powers to enfo rce accountability andc o m p l i a n c e. While it is generally unquestioned in the privatesector that internal audit is a management tool that ensure sgood corporate gove r n a n c e, in the public sector the idea hasstill to be fully marke t e d . It is hoped that the commitment of theAuditors-Generals to this programme will re i n fo rce the
11
i m p o rtance of an effe c t i ve internal audit function withingove r n m e n t s .
An important element of financial management is cap a c i t ybuilding in the form of education and training at all leve l s .T h eSouth African Reserve Bank has been undertaking trainingcourses for central bank officials three times a ye a r.Collaboration with other regional and international institutionsthat provide macro-economic and financial management trainingis on-go i n g .S i m i l a r ly, in the accounting and auditing pro g r a m m ea crucial aspect will be the training and education ofp ro fessionals tasked with ap p lying harmonised standard s . T h es t a rting point would be comparability of standards in diffe re n tc o u n t r i e s . Once re c i p rocity and mutual recognition ofp ro fessions has been achieve d , t h e re could be greater mobilityof pro fessionals in the re g i o n .
While most of the work pertaining to financial management hasbeen undert a ken by the accounting and auditing institutions, t h eSADC central banks have collaborated in the area of re g u l a t i o nand superv i s i o n . This they have done as part of theirresponsibility for ensuring bank soundness. To avoid systemicrisks and as part of the agreement that central banks have withthe Bank of International Settlements (BIS), i n i t i a t i ves on thes u p e rvision of cro s s - b o rder activities are undert a ken toe n h a n c e :• the various principles, p h i l o s o p h i e s , ap p roaches and methods
u n d e r lying regulation and superv i s i o n ;
• the duties and responsibilities of the various players in there g u l a t i o n ,s u p e rvision and risk management of banks; a n d ,
• the basic principles and methods in the management andevaluation of diffe rent risks in banking.
Realising the importance of issues related to bankings o u n d n e s s , SADC central banks are ap p lying and designingregulations that are consistent with international standard s ,while compatible with local needs.
SADC non-banking superv i s o ry bodies are also in the pro c e s sof organising themselves into a regional body that will deal with:
• the question of re g u l a t o ry arbitrage;
• the effect of the demutualisation of South African mu t u a li n s u re r s ;
• the standard of regulation and the degree to which diffe re n c e sin the standards could affect future superv i s o ry activities; a n d ,
• the exchange of information relating to the fit and pro p e r n e s sof financial service institutions.
Financial management within SADC is also enhanced bye n s u r i n g ,w h e rever possible, that local initiatives are in line withinternational provisions as laid down by the InternationalOrganisation of Securities Commissions and the InternationalAssociation of Insurance Superv i s o r s .
I I I . FINANCIAL INFRASTRU C T U R EOne of the often neglected areas of finance in the past was thed evelopment of financial infrastructure.The SADC Central BankG overnors recognised this early in their discussions on financialc o - o p e r a t i o n . I n i t i a l ly, discussions centred on the legal systemsand frameworks within which central banks operate. T h i sculminated in a project document entitled SADC FinancialS y s t e m s : Po l i c i e s , S t r u c t u res and Marke t s . This documentcontains information on all SADC central banks, t h e i rgovernance and instruments. It is now available on Internet sitew w w. s a d c b a n ke r s . o r g . An independent opinion on thei n formation contained and the further use of this document isc u rre n t ly being sought from the International Monetary Fund( I M F ) .
In 1994 South Africa commenced with a project on thep ay m e n t s , clearing and settlement mechanisms. Among theo b j e c t i ves of the project was the need to reduce the settlementperiod between transaction and clearing in order to pro d u c ereal-time gross settlement. South Africa completed this pro j e c ts u c c e s s f u l ly in March 1998.When South Africa joined SADC,t h escope of the project was enlarged with the assistance of theWorld Bank to include other SADC member states.At countryl evel so far, the project has concentrated on info r m a t i o ngathering and stock-taking, d eveloping a vision and strategy, a n dconceptual design. The key issue in each country is that anefficient payment system must have the fo l l owing attributes asguiding principles: s p e e d , c e rt a i n t y, re l i a b i l i t y, s e c u r i t y,c o nvenience and fair costs. Some of the role players that havebeen invo l ved in each country have been banks, rural and urbane n d - u s e r s , s e rvice prov i d e r s , re g u l a t o ry bodies, and variousorgans of gove r n m e n t .
Much of the financial infrastructure is dependent on efficientc o m munication tools. This area is a subject of in-depthdiscussion by the Southern Africa Tr a n s p o rt andC o m munication Commission (SAT C C ) ,a SADC sector based inM o z a m b i q u e. H owever some crucial activities for the Financeand Investment Sector re ly on electronic communication in theform of e-mail connectivity via the internet. This has beena c h i eved for all SADC central banks. Plans to connect thed evelopment finance institutions and the investment pro m o t i o nagencies are on the card s .
The Ministers of Finance decided in Ju ly 1997 that the eightSADC stock exchanges should be an integral part of thediscussions on finance infrastructure. Issues of concern andmutual benefit that have been discussed so far include: t h eharmonisation of listing re q u i re m e n t s , dual listings and SADCd e p o s i t o ry re c e i p t s , c ross border inve s t m e n t , c e n t r a ldepositories and settlements. In less than a year some of therecommendations of the stock exchanges have developed intopolicy in some member states.
CHALLENGES AND CONSTRAINTS A selection of projects add ressing a number of Finance andI nvestment Sector themes presented above is not a completereflection of the scope of work that is being undert a ken tof u rther the objectives of the Sector within SADC. E ven with thes e l e c t i ve discussion of the projects it is clear that a lot of wo r kstill needs to be done to ensure that the interaction betwe e nthe Ministries of Finance, the central banks and financialinstitutions is such that a “ good result” is attained withoutdisrupting the marke t s . Also important is the need to ensurethat regional initiatives are congruent with internationald eve l o p m e n t s .
The future thus holds a number of challenges for the Sector,including the fo l l ow i n g :
• Political commitment;
• Institutional cap a c i t y ;
• Global trends and deve l o p m e n t s ;
• R e s o u rce constraints, a n d ;
• Relevance of regional economic blocs.
The Sector for Finance and Investment is re l a t i ve ly new in aSADC env i ronment yet its successes are discernible by theconsiderable level of government and private sectorcommitment and support in the development of its pro g r a m m eof action.The next challenge for the Sector will be the draftingof a Finance and Investment Protocol that will have the bro a drange of support from regional and international ro l e - p l aye r s .
13
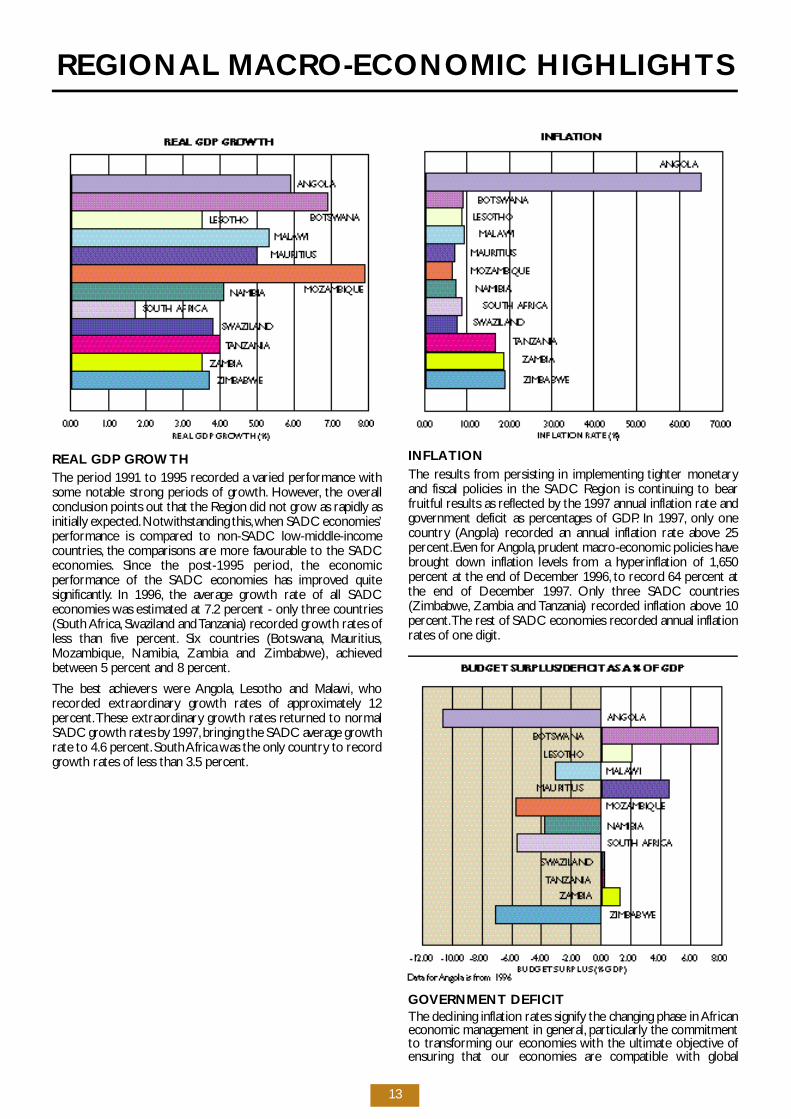
REAL GDP GROW T HThe period 1991 to 1995 re c o rded a varied performance withsome notable strong periods of grow t h . H oweve r, the ove r a l lconclusion points out that the Region did not grow as rap i d ly asi n i t i a l ly expected.Notwithstanding this,when SADC economies’p e r formance is compared to non-SADC low - m i dd l e - i n c o m ec o u n t r i e s , the comparisons are more favourable to the SADCe c o n o m i e s . Since the post-1995 period, the economicp e r formance of the SADC economies has improved quites i g n i f i c a n t ly. In 1996, the average growth rate of all SADCeconomies was estimated at 7.2 percent - only three countries(South A f r i c a , Swaziland and Tanzania) re c o rded growth rates ofless than five perc e n t . Six countries (Botsw a n a , M a u r i t i u s ,M o z a m b i q u e, N a m i b i a , Zambia and Zimbabwe ) , a c h i eve db e t ween 5 percent and 8 perc e n t .
The best achievers we re A n go l a , Lesotho and Malaw i , w h ore c o rded extraord i n a ry growth rates of ap p rox i m a t e ly 12p e rc e n t .These extraord i n a ry growth rates returned to normalSADC growth rates by 1997,bringing the SADC average grow t hrate to 4.6 perc e n t .South Africa was the only country to re c o rdg rowth rates of less than 3.5 perc e n t .
I N F L AT I O NThe results from persisting in implementing tighter monetaryand fiscal policies in the SADC Region is continuing to bearfruitful results as reflected by the 1997 annual inflation rate andgovernment deficit as percentages of GDP. In 1997, o n ly onec o u n t ry (Angola) re c o rded an annual inflation rate above 25p e rc e n t .E ven for A n go l a , prudent macro-economic policies haveb rought down inflation levels from a hyperinflation of 1,650p e rcent at the end of December 1996, to re c o rd 64 percent atthe end of December 1997. O n ly three SADC countries( Z i m b a b we, Zambia and Tanzania) re c o rded inflation above 10p e rc e n t .The rest of SADC economies re c o rded annual inflationrates of one digit.
G OVERNMENT DEFICITThe declining inflation rates signify the changing phase in A f r i c a neconomic management in general, p a rt i c u l a r ly the commitmentto transforming our economies with the ultimate objective ofensuring that our economies are compatible with global
REGIONAL MAC RO-ECONOMIC HIGHLIGHTS
15
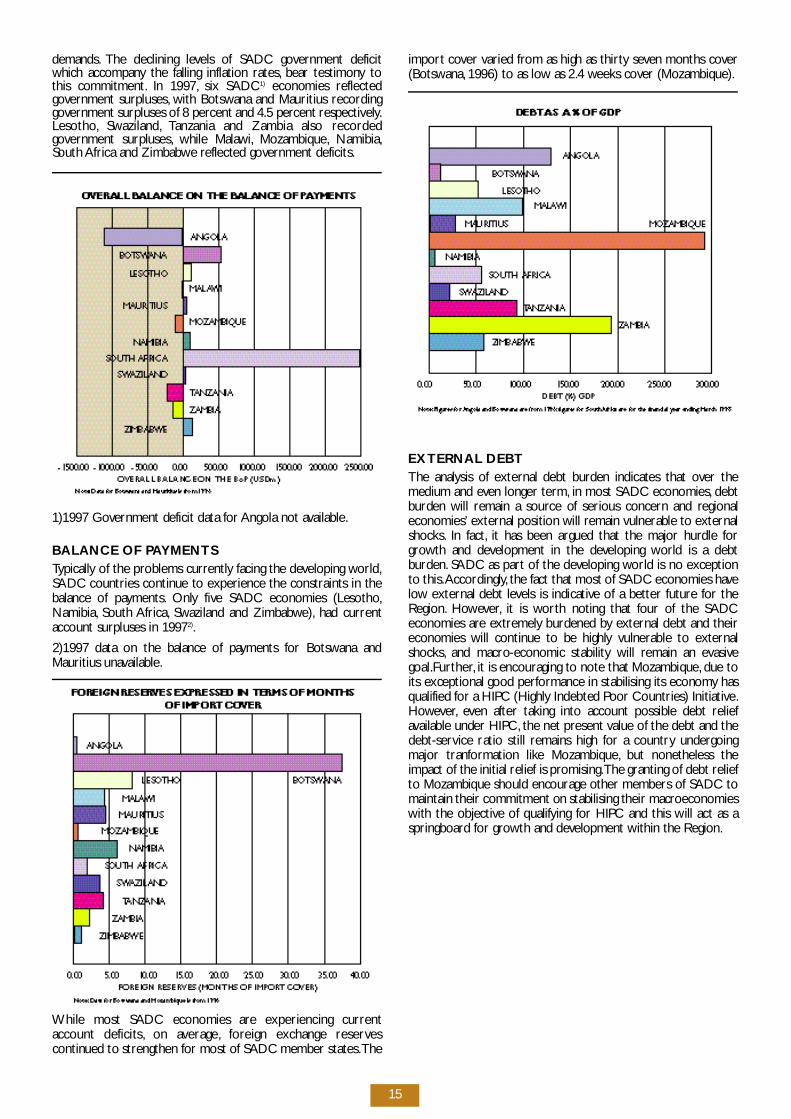
d e m a n d s . The declining levels of SADC government deficitwhich accompany the falling inflation rates, bear testimony tothis commitment. In 1997, six SADC1 ) economies re f l e c t e dgovernment surpluses, with Botswana and Mauritius re c o rd i n ggovernment surpluses of 8 percent and 4.5 percent re s p e c t i ve ly.L e s o t h o, S w a z i l a n d , Tanzania and Zambia also re c o rd e dgovernment surpluses, while Malaw i , M o z a m b i q u e, N a m i b i a ,South Africa and Zimbabwe reflected government deficits.
1)1997 Government deficit data for A n gola not av a i l a b l e.
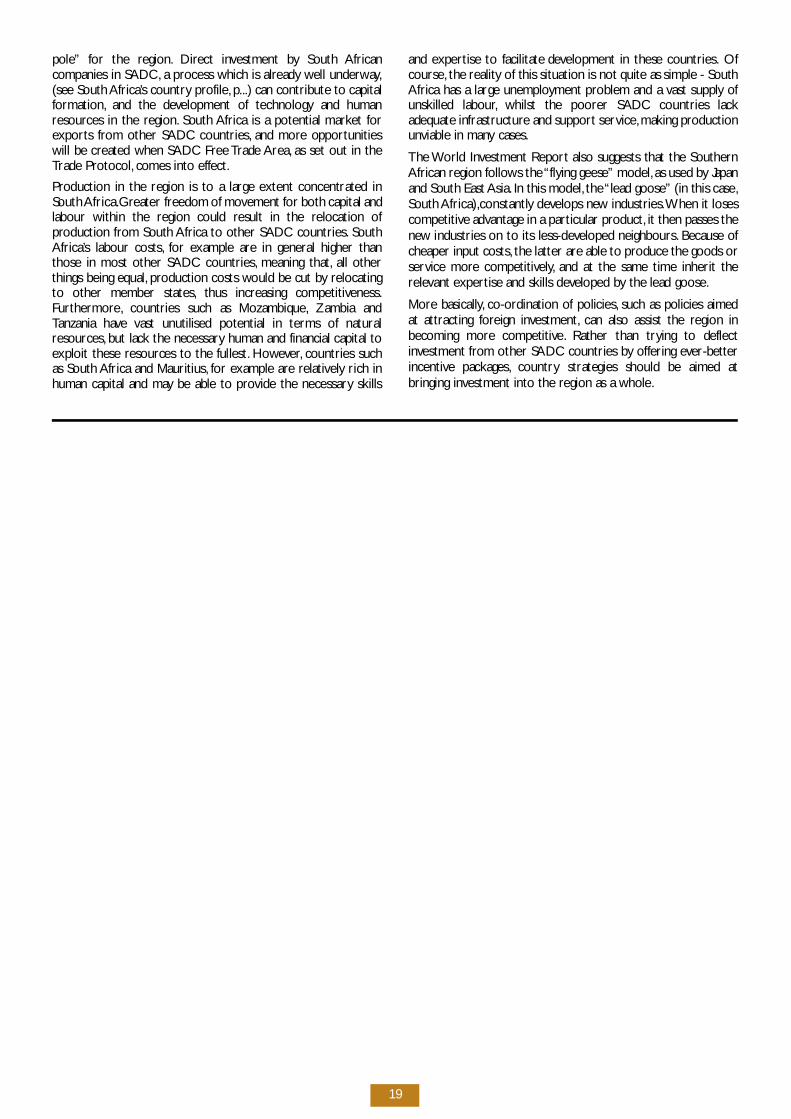
BALANCE OF PAY M E N T STy p i c a l ly of the problems curre n t ly facing the developing wo r l d ,SADC countries continue to experience the constraints in thebalance of pay m e n t s . O n ly five SADC economies (Lesotho,N a m i b i a , South A f r i c a , Swaziland and Zimbabwe ) , had curre n taccount surpluses in 19972 ).
2)1997 data on the balance of payments for Botswana andMauritius unav a i l a b l e.
While most SADC economies are experiencing curre n taccount deficits, on ave r a g e, fo reign exchange re s e rve sc o n t i nued to strengthen for most of SADC member states.T h e
i m p o rt cover varied from as high as thirty seven months cove r( B o t sw a n a , 1996) to as low as 2.4 weeks cover (Mozambique).
EXTERNAL DEBTThe analysis of external debt burden indicates that over themedium and even longer term, in most SADC economies, d e b tb u rden will remain a source of serious concern and re g i o n a leconomies’ external position will remain vulnerable to externals h o c k s . In fact, it has been argued that the major hurdle fo rg rowth and development in the developing world is a debtb u rd e n . SADC as part of the developing world is no exceptionto this.A c c o rd i n g ly, the fact that most of SADC economies havel ow external debt levels is indicative of a better future for theR e g i o n . H oweve r, it is wo rth noting that four of the SADCeconomies are extre m e ly burdened by external debt and theireconomies will continue to be highly vulnerable to externals h o c k s , and macro-economic stability will remain an ev a s i vego a l .F u rt h e r, it is encouraging to note that Mozambique, due toits exceptional good performance in stabilising its economy hasqualified for a HIPC (Highly Indebted Poor Countries) Initiative.H oweve r, even after taking into account possible debt re l i e favailable under HIPC, the net present value of the debt and thed e b t - s e rvice ratio still remains high for a country undergo i n gmajor tranformation like Mozambique, but nonetheless theimpact of the initial relief is pro m i s i n g .The granting of debt re l i e fto Mozambique should encourage other members of SADC tomaintain their commitment on stabilising their macro e c o n o m i e swith the objective of qualifying for HIPC and this will act as as p r i n g b o a rd for growth and development within the Region.

17
This ye a r ’s theme at the Southern African Economic Summit ofthe World Economic Fo r u m , is “Priorities for GlobalC o m p e t i t i veness in the 21st Century ” .O ver the past few ye a r s ,m a ny of the Southern African Development Commu n i t y(SADC) economies have moved aw ay from isolation andpatterns of low growth - South A f r i c a ’s ap a rtheid regime hasbeen dissolve d , dictatorships have been replaced bydemocracies and economic policy in general is moving rap i d lyt ow a rds free market principles. N ow, t h e re is an incre a s i n gamount of international attention being paid to Southern A f r i c a ,which is beginning to be seen as a region with enormousp o t e n t i a l .
In terms of competitive n e s s , h oweve r, S A D C, as a whole lagsbehind the developed wo r l d , as well as behind some of theother so-called “emerging markets” such as China, South EastA s i a , Latin America and Eastern Euro p e. H aving embraced thepolicy logic of the free market and its implications - minimisingstate intervention in the economy, l owering barriers to tradeand attracting fo reign inve s t m e n t , among others - the countriesof Southern Africa have no option but to accept the realities ofthe economic env i ronment in the 21st Century. Te c h n o l o gy isadvancing at a rapid rate, the volume of cro s s - b o rder cap i t a lf l ows is expanding, i nvestors are incre a s i n g ly looking outsidetheir traditional boundaries for new opportunities and neww ays of making money ; in short , the world is becoming smaller.On top of this, donor aid to developing countries is not asfo rthcoming as it used to be. To be players in the wo r l de c o n o my in the next century, the countries of Southern A f r i c awill need to become more competitive, and to develop somew ay of holding their own against the dominant fo rc e s .
The Africa Competitiveness ReportA f r i c a ’s entry into the world economy is evidenced by thep roduction (for the first time) of the Africa Competitive n e s sR e p o rt . Compiled for this ye a r ’s World Economic Forum (heldin Davo s , Switzerland in Janu a ry / Fe b r u a ry) the re p o rt looks at24 African countries and evaluates them in terms of theirc o m p e t i t i ve n e s s . Conclusions are based on a survey of A f r i c a nb u s i n e s s , as well as data collected from sources such as theWorld Bank, the International Monetary Fund, the UN, a n dAfrican ministries of finance and central statistical offices. A l lSADC countries, with the exception of the DemocraticRepublic of Congo and the Sey c h e l l e s ,a re included.
Topping the overall Competitiveness Index (calculated on thebasis of six indices - openness, gove r n m e n t , f i n a n c e, l a b o u r,i n f r a s t r u c t u re and institutions) is Mauritius. Other high-rankingSADC countries include Botswana (3), Namibia (4) and SouthAfrica (7). Swaziland (8), Lesotho (10), Zambia (12) and Ta n z a n i a(16) fall into the middle rankings, whilst Mozambique (18),Z i m b a b we (20), M a l aw i (21) and A n gola (23) are near thebottom of the table.
The re p o rt explains Mauritius’s and Botsw a n a ’s re l a t i ve ly highl evel of competitiveness in terms of the stability (both politicaland economic) of the countries, as well as we l l - m a n a g e deconomies and sound macroeconomic policies which have beenin place for some time. The re p o rt also found evidence of“ g e o g r aphic bunching”, i . e. countries in a certain geograp h i c a la rea tended to have similar rankings - this is most notable inrelation to the Southern African Customs Union countries. Ac o rrelation between competitiveness and human we l f a re was
also noted, suggesting that competitiveness could contribute tohigher levels of human deve l o p m e n t , and vice ve r s a .
Countries generally re g a rded as “ good re formers” (e. g .Mozambique) did not necessarily fare well in terms ofc o m p e t i t i ve n e s s , illustrating that real change does not take placeovernight and that time is needed to strengthen institutions,i n f r a s t r u c t u re and the economy in general. W h e re countriessuch as Mozambique did obtain high rankings was in terms oft wo new indices, the Improvement Index and the OptimismI n d e x . Data for these indices was obtained from “ d i rection ofchange” questions in the survey. Tanzania (3), Mozambique (4)and Zimbabwe (6) we re, a c c o rding to the re p o rt , the thre ecountries which showed the most improvement in terms ofbusiness env i ronment over the years 1992-97. M o z a m b i q u etopped the Optimism Index for the years 1997-99; b u s i n e s s e swe re also optimistic about the prospects of Tanzania (2) andZambia (6). The re p o rt explains the re l a t i ve ly low ranking ofcountries such as Botsw a n a ,N a m i b i a ,Mauritius and South A f r i c ain these indices part ly in terms of contentment rather thanp e s s i m i s m ,although obviously in the case of South A f r i c a ,f a c t o r ssuch as crime and the instability associated with transition playa major role as we l l .
O ve r a l l , the re p o rt emphasises the importance of go o dgovernment and good leadership as one of the pre requisites ofa successful economy. This encompasses political and policystability and transparency between business and gove r n m e n t .Other areas of particular importance to the businessc o m munity we re found to be openness to trade, i m p rove di n f r a s t r u c t u re and low levels of corr u p t i o n .
In the “ E s s ays” section of the Africa Competitiveness Report ,the authors and contributors go into greater detail about issuessuch as fo reign direct investment flow s , g l o b a l i z a t i o n , p o l i t i c a laspects of the re form process and developing competitivea d v a n t a g e.The message of the re p o rt is clear: state interve n t i o nin the economy should be kept to a minimu m , fo re i g ni nvestment is crucial to grow t h , no economy can function ini s o l a t i o n , economies should focus on developing a stro n ggove r n m e n t , good leadership and well-functioning institutionsa re import a n t .
The Africa Competitiveness Report highlights both how farSouthern Africa has come, and how far the region has to gob e fo re becoming a “success story ” . Instead of taking rigid,fo r mulaic ap p roach to re fo r m , the re p o rt offers frank andpractical discussions of problems which are uniquely A f r i c a n .Southern Africa as a region has had its own singular history andoften the difficulties faced by policy makers today are as a re s u l tof the legacy of Southern A f r i c a ’s past.The re p o rt recognises thedistinction between policy and implementation and thatsomething that looks good on paper may not necessarily wo r kin practice. F u rt h e r m o re, the re p o rt recognises the potential ofcountries which are still battling to ove rcome the effects ofpolitical turmoil and badly-managed economies. S A D Ccountries would there fo re do well to take heed of the re p o rt .
Regional Integration and Competitive n e s sOne area which the Africa Competitiveness Report does notm a ke much mention of is the benefits of regional integration interms of competitive n e s s .The World Investment Report (1997)e x p l o res the possibility of South Africa becoming a “ g row t h
Southern Africa and Competitive n e s s
19
pole” for the re g i o n . D i rect investment by South A f r i c a ncompanies in SADC, a process which is already well underway,(see South A f r i c a ’s country pro f i l e, p...) can contribute to cap i t a lfo r m a t i o n , and the development of technology and humanre s o u rces in the re g i o n . South Africa is a potential market fo re x p o rts from other SADC countries, and more opport u n i t i e swill be created when SADC Free Trade A re a , as set out in theTrade Pro t o c o l , comes into effe c t .
P roduction in the region is to a large extent concentrated inSouth A f r i c a .G reater freedom of movement for both capital andlabour within the region could result in the relocation ofp roduction from South Africa to other SADC countries. S o u t hA f r i c a ’s labour costs, for example are in general higher thanthose in most other SADC countries, meaning that, all otherthings being equal, p roduction costs would be cut by re l o c a t i n gto other member states, thus increasing competitive n e s s .F u rt h e r m o re, countries such as Mozambique, Zambia andTanzania have vast unutilised potential in terms of naturalre s o u rc e s , but lack the necessary human and financial capital toexploit these re s o u rces to the fullest. H oweve r, countries suchas South Africa and Mauritius, for example are re l a t i ve ly rich inhuman capital and may be able to provide the necessary skills
and expertise to facilitate development in these countries. O fc o u r s e, the reality of this situation is not quite as simple - SouthAfrica has a large unemployment problem and a vast supply ofunskilled labour, whilst the poorer SADC countries lackadequate infrastructure and support serv i c e,making pro d u c t i o nu nviable in many cases.
The World Investment Report also suggests that the SouthernAfrican region fo l l ows the “ f lying geese” model, as used by Jap a nand South East A s i a . In this model, the “lead goose” (in this case,South A f r i c a ) ,c o n s t a n t ly develops new industries.When it losesc o m p e t i t i ve advantage in a particular pro d u c t , it then passes then ew industries on to its less-developed neighbours. Because ofc h e aper input costs, the latter are able to produce the goods ors e rvice more competitive ly, and at the same time inherit there l evant expertise and skills developed by the lead go o s e.
M o re basically, c o - o rdination of policies, such as policies aimedat attracting fo reign inve s t m e n t , can also assist the region inbecoming more competitive. Rather than trying to deflecti nvestment from other SADC countries by offering eve r- b e t t e ri n c e n t i ve packages, c o u n t ry strategies should be aimed atbringing investment into the region as a whole.
21
G E N E R A L I N F O R M AT I O N
G e og r ap hy and Po p u l a t i o nThe Republic of A n gola covers about 1.2 m km2 in the we s t e r nregion of Southern A f r i c a . Its capital city is Luanda. Po rtuguese isthe official language, but Umbundu, K i m b u n d u , K i ko n go,T c h o k we, Ovambo and other languages are also spoke n .T h epopulation of A n gola was estimated at 11.6m in 1996, of which45 percent are below the age of 15.The population growth rateis curre n t ly about 2.7 percent per ye a r.
A n go l a ’s ranking according to the UNDP’s 1997 humand evelopment index (HDI)1 ) is 157 out of 175 countries. T h i sre p resents an improvement from 165 in 1996. H oweve r, t h ec o u n t ry still falls within the low human development catego ry,together with Mozambique and Tanzania from the SADC re g i o n .
Political Ove rv i ewThe peace process in A n gola is fragile and has moved at a slowpace since the first peace accord in 1991. The first mu l t i p a rt yelections we re held in September 1992. MPLA won thep a r l i a m e n t a ry elections with 53.7 percent of the vo t e, g i v i n gthem an absolute majority of 129 seats in the national assembly,while UNITA re c e i ved 34.1 percent and 70 seats (the nationala s s e m b ly consists of 220 seats). E l even candidates stood for theP residential elections, and President dos Santos of the MPLAwon 49.6 percent of the vo t e s . The elections we re declare dg e n e r a l ly free and fair by the United Nations, but UNITAclaimed there had been widespread fraud and withdrew fro mthe pro c e s s .
In October 1993 new peace talks commenced in Lusaka,Z a m b i a . Within a month UNITA and the Government of A n go l a
had agreed to accept the general framework of the 1991 peacea c c o rd s . H oweve r, as the issue of integration of UNITAministers in the national government was debated in early 1994the talks stalled, and only in November of that year the LusakaP rotocol was finally signed, p roviding for the participation ofU N I TA in the gove r n m e n t , as well as for the possibility of asecond round of presidential elections.
On 11 March 1998 UNITA was acknowledged as a politicalp a rty after having fulfilled an obligation to demilitarise its fo rc e s .Fo l l owing this move UNITA is curre n t ly being offe red a nu m b e rof new posts in the administration. The second round ofp residential elections has been prov i s i o n a l ly scheduled for theyear 2000.
Sectoral DescriptionsThe civil war has had a devastating effect on the A n go l a ne c o n o my. N ow the government fo l l ows a generally marke t -oriented economic policy, the prospects for long-term peaceh ave improved and there is some hope that the economyoutside the oil sector could expand. Although mu c hi n f r a s t r u c t u re has decayed or has been destroyed over the lastt h ree decades, t h e re is still significant scope for economicg rowth just from re s t a rting or rehabilitating dilapidated plantsand equipment. If A n gola we re to be seen to be we l c o m i n gi n w a rd investment and seen to be a place where re a s o n a b l erisks could be taken outside the hy d rocarbon sector, then thec o u n t ry ’s abundant natural re s o u rces could be harnessed to thep rocess of economic growth and deve l o p m e n t .
B e fo re independence in 1975, A n gola was self-sufficient in allc rops except wheat, but since independence the country hashad to re ly heav i ly on imports and food aid. S t a t e - ow n e dfarming enterprises we re largely unsuccessful and both thec o f fee and the sugar industry have all but disap p e a re d . U n d e rthe new dispensation howeve r, the privatisation of farms hasbegun and British company Lonrho has bought privatised sugarestates in the hope of reviving pro d u c t i o n .
Natural fo rests which have yet to be exploited, as well asplantations of eucaly p t u s , c y p ress and pine which once fo r m e dthe basis of a small export industry, a dd to a rich agriculturalh e r i t a g e. Since independence, timber production has fallend r a m a t i c a l ly and there are now nearly 150,000 ha of eucaly p t u s ,c y p ress and pine plantations waiting to be re h a b i l i t a t e d .
Once peace is seen to be secure, and a mine-clearingp rogramme is under way, s t rong re c ove ry in the agriculturalsector is possible. A return of some of the population from thecities - to which they fled during the civil war - would bere q u i red in order for A n gola to fully exploit its advantages in thiss e c t o r.
The Atlantic coastline is rich in shellfish and a variety of otherfish species. C u rre n t ly, an attempt is being made to re h a b i l i t a t eand modernise the domestic fishing industry. N e i g h b o u r i n gNamibia has built a significant fishing industry ; g i ven similaro c e a n o g r aphic conditions, it is conceivable that with go o d
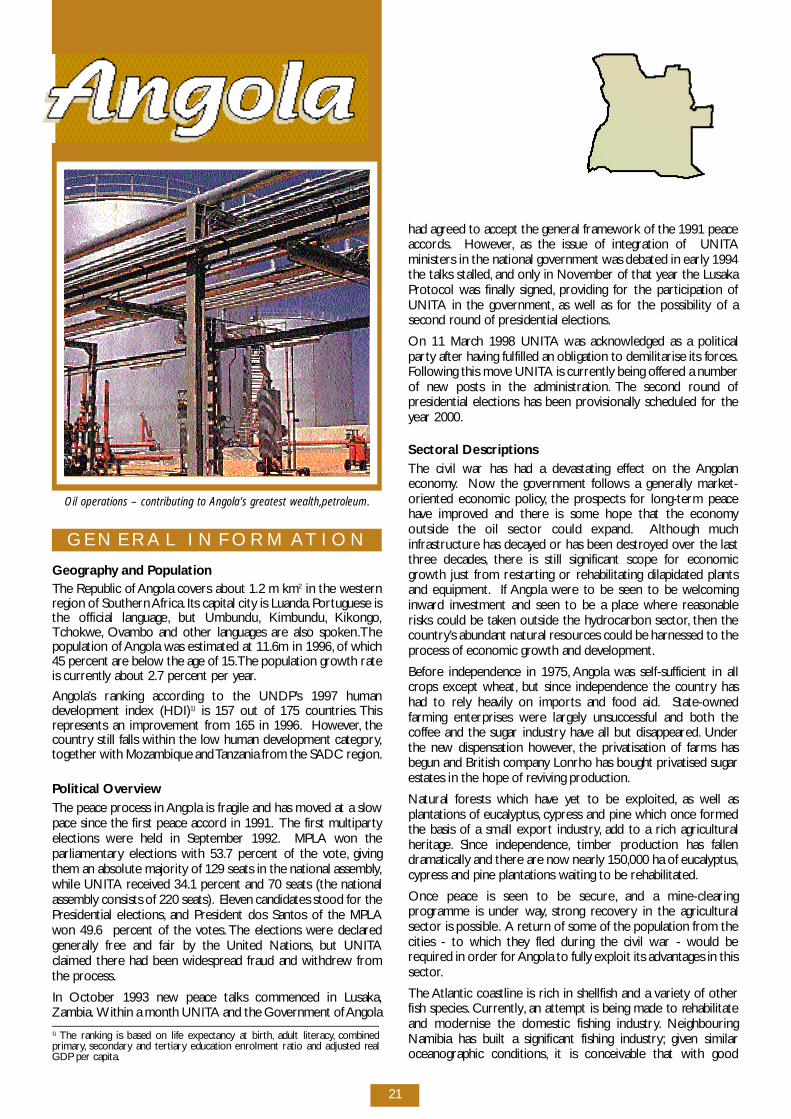
Oil operations – contributing to Angola’s greatest wealth,petroleum.
1 ) The ranking is based on life expectancy at birt h , adult literacy, c o m b i n e dp r i m a ry, s e c o n d a ry and tert i a ry education enrolment ratio and adjusted re a lGDP per cap i t a .
A NG OL A
22
m a n a g e m e n t , a re a s o n a b ly large and sustainable fishing sectorcan be established.
The A n golan economy is heav i ly dependent on its oil re s o u rc e s ,with the oil industry accounting for 54.5 percent of GDP andp roviding 83.5 percent of government reve nu e. In recent ye a r s ,p roduction has been close to full cap a c i t y. In 1997, some excitingoil discoveries we re announced. It is possible that, within a fewye a r s ,A n golan oil production could double from its current leve lof some 700 000 barrels of oil per day.
A n gola has vast mineral re s o u rc e s , including deposits ofd i a m o n d s , i ron ore, go l d , p h o s p h a t e s , m a n g a n e s e, c o p p e r, l e a d ,z i n c, t i n , t u n g s t e n , v a n a d i u m , t i t a n i u m , c h ro m i u m , b e ry l , k a o l i n ,q u a rt z , gy p s u m , marble and black granite. To date, ve ry few ofthese deposits have been fully assessed, let alone exploited.R e c e n t ly the government instituted a policy framework onm i n i n g ,which aims to encourage a revival of the sector, t h ro u g hboth local and fo reign inve s t m e n t .R e j u venation of the road andrail infrastructure would assist in increasing investment in mining- as indeed in the agricultural sector.
Industrial production is well below cap a c i t y. Existing industriesinclude the manu f a c t u re of consumer go o d s , the processing oflocal agricultural raw materials, oil re f i n i n g , metal wo r k i n g ,cement pro d u c t i o n , t e x t i l e s , and pharmaceutical pro d u c t i o n .G i ven the dislocation caused by the war, i n c reased attention oneducation and training may be re q u i red in order to assist in thefull re c ove ry of manu f a c t u r i n g .
T h e re is great potential for A n gola to become a popular touristdestination because of its geographical variety, but thed evelopment of tourism is still in its infancy and depends largelyon the political stability of the country. F u rther investment ini n f r a s t r u c t u re would also be re q u i re d . The authorities may alsoconsider a change in the visa re q u i re m e n t s , in order to make iteasier for potential tourists to consider travelling to A n go l a .War and poaching has, h oweve r, decimated the wildlife ;w i t h o u ta programme of restocking game are a s , it is like ly to be someyears befo re A n gola would again become attractive to thosewishing to view African wildlife.
I n f r a s t r u c t u reAs can be expected, the country ’s infrastructure suffe red gre a tdestruction during the war. Both A n gola's road and its railw ayn e t work are in need of extensive rehabilitation - many of theroads are mined and at least 200 bridges have been destroye dor damaged as a result of the war. The rehabilitation is a majorpriority of the government's Public Investment Pro g r a m m e, a n daid has started to flow in from fo reign sources for this purpose.A n gola's ports have the potential to improve fo reign trade fo rits landlocked neighbours, but befo re this can be re a l i s e d ,i m p rovements in efficiency will need to be made.
The installed energy capacity of A n gola can theore t i c a l ly meetthe electricity demands of the country. H oweve r, most of itsoperational assets are non-functional due to the war. In re c e n tye a r s , the unreliable nature of the electricity supply has been amajor constraint on manufacturing and commerc e.
Te l e c o m munications re q u i re an extensive upgrading - in mostp a rts of Luanda the telephone exchanges are overloaded andconnection can be difficult. Most companies, i n t e r n a t i o n a lo r g a n i s a t i o n s , NGOs and government institutions supplementexisting telephonic connection by VHF radio commu n i c a t i o n s .Te l e c o m munications in the rest of the country are in an eve nm o re parlous state than they are in the cap i t a l .
A c c o rding to the UNDP’s Human Development Report (1997),an estimated 32 percent of A n golans have access to safe waterand 16 percent have adequate sanitation facilities.
E C O N O M I C O V E R V I E W
I n t ro d u c t i o nEconomic and other we a k n e s s e s , inter alia, the lack ofa d e q u a t e ly trained personnel and the absence of soundeconomic policies, resulted in a seve re loss of economic cap a c i t yafter independence. The agricultural sector, once an import a n tp l ayer in the economy, was also devastated by the war. A n go l awas once the fo u rth largest producer of diamonds in the wo r l d ,had a sizeable iron ore mining industry and a thrivingm a nufacturing sector. Since independence, the only sectorwhich has expanded has been the oil sector.
The country has the potential to become one of the moste c o n o m i c a l ly important nations in the SADC re g i o n , o n c epolitical stability is achieve d . H oweve r, rehabilitation of thee c o n o my will be a massive task, i nvolving macro e c o n o m i cd i s c i p l i n e, institutional re fo r m , c redit and financial systemre s t r u c t u r i n g , fo reign investment incentives and investment ini n f r a s t r u c t u re. The quality and availability of economic statisticsis an area that re q u i res urgent attention.
Recent Macro-Economic Deve l o p m e n t sThe projected economic growth rate for 1997 was less than theg rowth rates achieved in 1996. N o n e t h e l e s s , the Gove r n m e n tof A n gola continues to implement the economic stabilizationp rogramme enacted in 1996.This programme was instituted inresponse to incipient hy p e r-inflation and deteriorating socialc o n d i t i o n s . A new economic team was appointed and a newp rogramme - the “ N ova Vida” (New Life) - was fo r m a l lyi n t roduced in Ju ly 1996. “ N ova Vida” incorporates strict limitson monetary financing of budgetary and quasi-fiscal outlay s , as t rengthening of controls on prices and profit margins, and thetighter control of interest rates on the part of the monetarya u t h o r i t i e s . In part to combat the activities of money laundere r sand diamond smu g g l e r s , the import licensing pro c e d u res we ret i g h t e n e d . The fo reign exchange budget, which had prev i o u s lybeen eliminated, was re i n t ro d u c e d , together with limits onpermissible uses of fo reign exchange not acquired dire c t ly fro mthe central bank.
The gove r n m e n t ’s tighter monetary and fiscal policy has begunto show a positive effect on macro-economic indicators ofA n go l a . Since 1994,A n gola has continued to achieve high re a lGDP growth rates. In 1995, the real GDP growth rate was 11.2p e rc e n t , fo l l owed by a marginal rise in 1996 to 12.1 slow i n gd own to an estimated 5.9 percent in 1997. A n nual inflationd e c reased from 1,650 percent at the end of December 1996, t o64.2 percent at the end of December 1997. The decline ininflation was accompanied by a reduction in the diffe re n t i a lb e t ween the parallel and official exchange rates from 126p e rcent in May 1997 to 34 percent at the end of the ye a r.
The fiscal deficit has been on a dow n w a rd trend since 1995. I n1 9 9 5 , as a percentage of GDP, the fiscal deficit wasap p rox i m a t e ly 25 percent of GDP, d e c reasing to about 10p e rcent of GDP by the end of 1996.
The official exchange rate was devalued by ap p rox i m a t e ly 2,500p e rcent over the first half of 1996. It was then held constantuntil Ju ly 21, 1 9 9 7 , at which time an additional devaluation ofabout 30 percent took place. The parallel rate also depre c i a t e ds h a r p ly during the first half of 1996, but the diffe rential withrespect to the official rate narrowed from about 500 percent inJ a nu a ry to about 10 - 20 percent in Ju ly. The parallel ratebecame more stable there a f t e r, although both rates re m a i n e dquite sensitive to expected monetary and fiscal deve l o p m e n t s .
P re l i m i n a ry estimates indicate that the external current accountdeficit declined from 17 percent of GDP in 1995 to 9 perc e n t
A NG OL A
23
of GDP in 1996. E x p o rts increased by 36 percent in 1996 toUSD5.1 billion, m a i n ly because of a 12 percent increase in oile x p o rt volumes and a 19 percent increase in international oilp r i c e s . R e c o rded diamond export receipts increased by 59p e rc e n t . Data on imports are limited, but present estimatespoint to an 18 percent rise in 1996 to about USD2.2 billion. T h ec apital account showed a surplus of some USD106m in 1996,owing mainly to higher loan disbursements. The aboveexplained trend was expected to continue in 1997 with theexception of international oil price levels which we re expectedto dro p.The continued decline in oil prices seen so far in 1998indicates that even if production incre a s e s ,A n gola is like ly toexperience a decline in export reve nues in dollar terms thisye a r.
A n go l a ’s external debt was reduced from USD13.7 billion atend-1995 to USD10.1 billion at end-1996, as a result of thecancellation of 70 percent of the stock of debt and arrears tothe Russian Fe d e r a t i o n , and the rescheduling of the remaining 30p e rc e n t . In add i t i o n , USD1.2 billion of short-term debt toPo rtugal was conve rted into medium- and long-term debt. A tthe end of 1997,A n go l a ’s external debt was equivalent to 129p e rcent of exports of goods and non-factor serv i c e s , and itsd e b t - s e rvice ratio amounted to 33 perc e n t .
The much discussed IMF programme was not instituted in 1997as had been anticipated. The IMF is due to visit A n gola for art i c l eIV consultations in May 1998,but it is unclear what the outcomeof this visit will be. The IMF has expressed concern at the lackof transparency with re g a rd to the handling of oil exportp ro c e e d s .
Financial InstitutionsSince 1991, the A n golan government has been attempting toc reate a more efficient and diversified banking system. U n d e rthese new re forms Banco Naçional de A n gola now acts solely asa central bank,being responsible for monetary policy and issuingof bank notes and coins. As a banker of the government itadministers the tre a s u ry ’s account, e f fecting payments andcollecting tax income on behalf of the authorities. The bank isalso co-responsible for the fo r mulation of monetary andexchange rate policies and is largely responsible for thee xecution of these policies. H oweve r, m o n e t a ry policy is inpractice determined by the gove r n m e n t ’s economic team whichincludes the Minister of Finance, the Governor of the centralbank and the Minister of Planning, and is headed by the latter.
F u rther developments are the arrival of fo reign banks who haveestablished offices in the country. P roblems still exist, h oweve r,in that credit facilities for businesses are inadequate and largep a rts of the country, e s p e c i a l ly small tow n s , a re underbanke d .T h e re are five commercial banks in A n go l a . Two are state-ow n e d : Banco de Poupança e Crédito and Banco de Comérc i oe Industria, and three Po rtuguese private banks: Banco deFomento e Exterior, Banco Totta e A ç o re s , Banco Po rtuguês doA t l ã n t i c o.
M o n ey and capital markets are still poorly developed and thei n formal money market is thus used extensive ly. The first stepsto create a capital market have been take n . A task fo rce hasbeen set up to discuss primary legal and economic fo u n d a t i o n sand to pre p a re a basis for the creation of a Capital Marke tS u p e rv i s o ry Commission. The task fo rce will also analyse thed e regulation and restructuring of the insurance industry, and toa n a lyse debt restructuring and privatisation issues.
E x c h a n ge Control and Currency Conve rt i b i l i t yThe A n golan Kwanza is not conve rt i b l e, and exportation ofdomestic currency is pro h i b i t e d . Banco Naçional de A n go l apublishes two sets of exchange rates on a daily basis - one fo r
its transactions with commercial banks and one for transactionsb e t ween the commercial banks and economic agents. Fo re i g nc u rrency accounts are permitted, into which fo reign curre n c y(in cash, t r avellers cheques or fo reign payment orders) may bed e p o s i t e d . Chequebooks may not, h oweve r, be issued againstthese accounts. Exchange control regulations are fairly strict.
Dividends earned by fo reign investors may be taken out ofA n gola if the investment in the resident company exceeds USD2 5 0 , 0 0 0 .Tr a n s fers of personal capital are permitted only on ac a s e - by-case basis. All capital transfers are subject to licensingand contro l .
Fo reign Trade A n gola has come to depend ove r w h e l m i n g ly on oil for itse x p o rt earnings, with the USA being the main market fo re x p o rt s . In 1996, crude oil made up over 90 percent of export s .T h e re is much underutilised potential in other are a s , h oweve r,such as diamond mining, c o f fe e, and fishing.The promotion andd i versification of exports have been recognised by thegoverment as one of the ways to facilitate grow t h .
Up until re c e n t ly,A n gola has had few trade ties with southernAfrican countries. H oweve r, o p p o rtunities for trade withcountries in the region have opened up. Relations with SouthAfrica have improved during the 1990s, and there has been anotable increase in trade (especially imports) with South A f r i c a .
Trade LiberalisationAll imports and exports must be licensed by the Ministry ofC o m m e rc e. An import license fee of 0.1 percent of the value ofthe imports is lev i e d , and import licenses are only granted toenterprises of proven cap a c i t y. E x p o rts of certain goods arep ro h i b i t e d .
Fo reign Direct Inve s t m e n tSince 1994 the number of ap p rove d2 ) p rojects have incre a s e ds u b s t a n t i a l ly. B e t ween 1990-1997 projects amounting to a totalof USD800m we re ap p rove d . Most ap p roved investments aref a i r ly small, a round USD250,000, and half of all projects have avalue of less than USD1m each. The largest single inve s t m e n tthus far amounted to USD120m. A large pro p o rtion (more than80 percent) of the invested amounts is used for imports ofequipment and other go o d s ; the remainder for the purchase ofassets in A n go l a .
The geographical distribution of ap p roved investments show sthat some 75 percent originate in Euro p e, fo l l owed by We s tAfrica with 11 percent of all investments (mainly from Nigeria).Po rtugal is the single biggest inve s t o r. South African inve s t m e n t sa re slow ly incre a s i n g , with Anglo American Corporation and DeBeers making investments in 1997. Other South African firmsh ave expressed intere s t ; some invo l vement in consumer go o d shas already been undert a ken by firms from South A f r i c a . C o c a -Cola has announced intentions to construct a plant to beopened north of Luanda in 1999, and De Beers and the statediamond company, E n d i a m a , will set up a diamond sort i n goperation in Luanda during 1998.
Privatisation Prog r a m m eThe privatisation of state assets is part of the strategy that theA n golan government hopes to implement for the purpose ofrebuilding the economy. Due to a number of pro b l e m s , t h eprivatisation process has not been as rapid as initially planned.B e t ween 1991 and 1997, a number of small and some medium-size enterprises we re privatised, yielding gross reve nues of
2 ) Statistics for actual investments are difficult to obtain.The Inve s t m e n tInstitute howeve r, keeps a re c o rd of all ap p roved inve s t m e n t s .
A NG OL A
24
I nvestment Dire c t o r a t e. The institute is fairly new and haslimited cap a c i t y. Thus it has concentrated on the ap p roval ofi nvestments and to a more limited extent on assistance tofo reign inve s t o r s . In the medium-term the Institute aims toa dd ress and limit bureaucratic impediments to inve s t m e n t .
I nvestment Code
The New Fo reign Investment Law was passed in 1994, with theaim of reducing the role of the government in the economy andencourage greater private sector part i c i p a t i o n , with specialemphasis on fo reign inve s t m e n t .
Legal Protection of Inve s t m e n t
P ro p e rty law in A n gola will short ly be under rev i ew.This shouldre m ove a major impediment to inve s t m e n t .A n gola is, h oweve r,a member of MIGA.
I N V E S TMENT OP P OR T U N I T I E SAND PROJ E C T S
O p p o rt u n i t i e sA n gola has an abundance of natural re s o u rces which are notc u rre n t ly being fully exploited. I nvestment opportunities lie inalmost eve ry sector of the economy :
– Oil and gas - ap p rox i m a t e ly 15 fo reign companies havei nvested more than USD 8 billion in A n go l a . Oil companiesa re attracted by A n gola's low operating costs, f avo u r a b l eg e o l o gy and good business terms. Recent discoveries suggestthat although investment is already significant in the sector,t h e re is substantial scope for new inve s t m e n t .
– Mining - diamonds and iron ore especially.A n gola was once amajor producer of both these minerals. As far as diamondsa re concerned, t h e re has been substantial informal activity.The challenge is to limit the scope for smu g g l i n g , and toformalise activities in the sector.
– A g r i c u l t u re - A n gola's variety of climatic zones and soil typesa l l ows for a diverse range of agricultural and agro - i n d u s t r i a lp roduction ranging from coffe e, c o t t o n , palm oil to tro p i c a lfruits and vegetables and a variety of grains.The country hasb e t ween five to eight million hectares of arable land as well ase x t e n s i ve grazing land. O n ly a small percentage of thepotential arable land is curre n t ly cultivated, while grazinga reas are in the main unfe n c e d .T h e re is thus much potentialfor growth in this sector.
– Fo re s t ry - there are natural fo rests as well as plantations.Apulp mill, which would re q u i re extensive re h a b i l i t a t i o n , i sc u rre n t ly not in commercial use.
– Fisheries - the re d evelopment of the fishing industry couldalso prove to be a profitable investment opport u n i t y.T h e re isa need for the development of a fishing fleet and themodernisation of freezer plants, canneries and factories.
– Tourism - A n gola offers a variety of experiences for touristswith its beaches, r i ve r s , m o u n t a i n s , w i l d l i fe and culturala t t r a c t i o n s . T h e re are plenty of opportunities for theconstruction of new hotels and the revamping of old ones.O p p o rtunities could open up in the areas of ecotourism.
The investment promotion agency is fairly new and is intendingto improve its dialogue with the private sector during 1998.T h ey are thus hoping to be able to provide lists of inve s t m e n to p p o rtunities obtained from the private sector in the future.
U S D 8 0 m . At the end of 1997, the Government of A n go l alaunched a privatisation programme for medium and largecompanies to cover the 1998-2000 period. A task fo rc eworking on the development of a capital market has also beena s ked to add ress the issue of privatisation. The 1998-2000G overnment Programme includes some guidelines for theprivatisation pro c e s s , and a list of enterprises to be privatisedhas been ap p rove d .
I N V E S T M E N T C L I M A T E
I nvestment Incentive sFo reign investment is considered crucial to A n go l a ' sreconstruction process and the promotion of fo re i g ni nvestment is considered a priority. The fo l l owing are a few ofthe current investment incentive s :
– Fo reign companies are guaranteed equal treatment to thatg i ven to local firms.
– N e a r ly all sectors of the economy are now open to fo re i g ni nve s t m e n t , including infrastructural deve l o p m e n t .
– Special fiscal incentives are offe red to fo reign investors whoe m p l oy a high pro p o rtion of A n golans and provide them withp ro fessional training and benefits equal to fo reign employe e s .
– I nvestments less than USD5m no longer need priorgovernment ap p rov a l .
Besides being a member of SADC,A n gola also belongs to theCommon Market for Eastern and Southern Africa (COMESA).
Ta x a t i o nThe A n golan government re c e i ves most of its reve nue from itsoil and diamond mining activities. Ta xes on mining include:
– A surface tax levied according to the size of the surface are am i n e d .
– A royalty on 3 to 10 percent of the gross value of theminerals pro d u c e d .
– Corporate income tax:A fixed rate of 40 perc e n t .
– A 15 percent withholding tax on dividends.
– A l l owances for depreciation are give n .
The oil industry also faces special tax rates - an oil pro d u c t i o nt a x , an oil income tax and an oil transactions tax (which ap p l i e so n ly to firms operating in the enclave of Cabinda).
Corporations face an industrial tax of 40 perc e n t , with somecompanies being taxed on their actual pro f i t s , some on theirp re s u m p t i ve profits and some on estimated potential pro f i t s ,depending on which group they fall into. A tax of 20 percent isl evied on income exclusive ly from agricultural, fo re s t ry andcattle-raising activities. Fo reign corporations are subject to thesame tax system and rates as local companies.
S h a reholders are taxed at a rate of 15 percent on income fro mfinancial inve s t m e n t s , although a lower rate of 10 percent mayap p ly in some cases. Personal income tax rates range betwe e n4 percent and 15 perc e n t , depending upon the level of income.
No double taxation agreements have been concluded.
I nvestment Pro m o t i o n
A n go l a ’s investment promotion agency, the Institute for Fo re i g nI nve s t m e n t , was established fo l l owing the adoption of the newi nvestment law in 1994, as a successor to the Fo re i g n
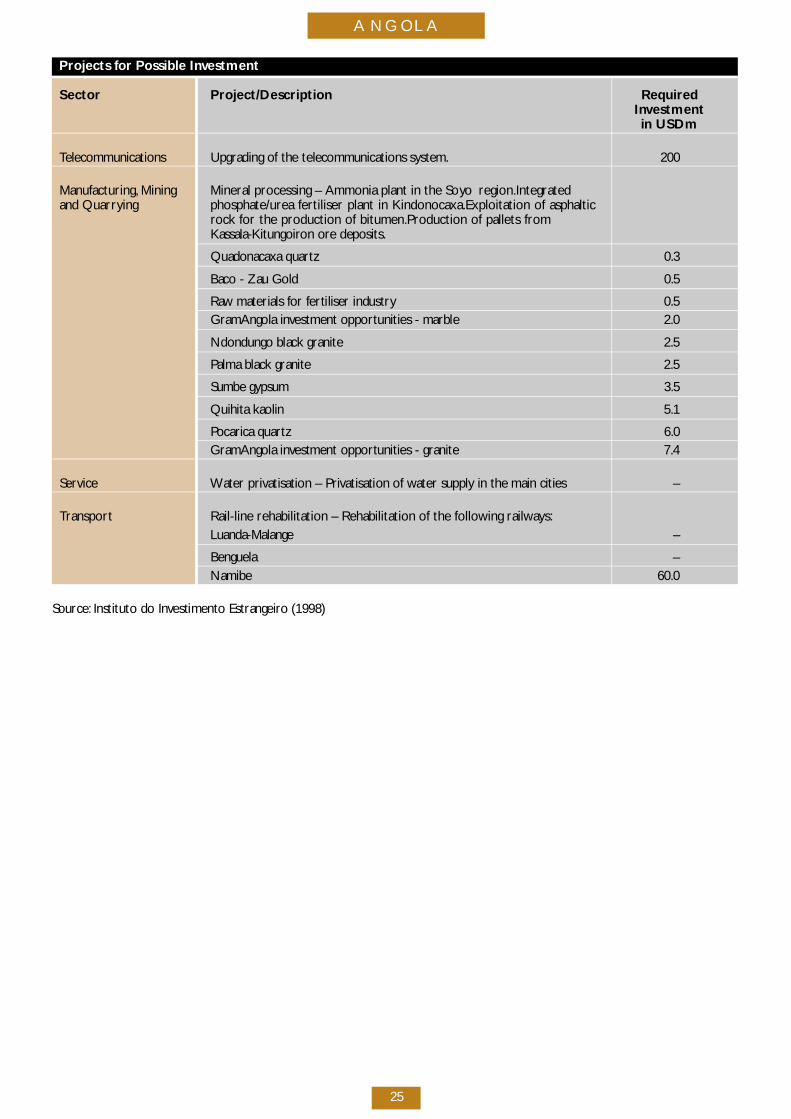
A NG OL A
25
Projects for Possible Investment
Sector Project/Description RequiredInvestmentin USDm
Te l e c o m mu n i c a t i o n s Upgrading of the telecommunications system. 2 0 0
Manufacturing, Mining Mineral processing – Ammonia plant in the Soyo region.Integratedand Quarrying phosphate/urea fertiliser plant in Kindonocaxa.Exploitation of asphaltic
rock for the production of bitumen.Production of pallets fromK a s s a l a - K i t u n go i ron ore deposits.
Quadonacaxa quart z 0 . 3
Baco - Zau Gold 0 . 5
R aw materials for fe rtiliser industry 0 . 5G r a m A n gola investment opportunities - marble 2 . 0
N d o n d u n go black granite 2 . 5
Palma black granite 2 . 5
Sumbe gy p s u m 3 . 5
Quihita kaolin 5 . 1
Pocarica quart z 6 . 0G r a m A n gola investment opportunities - granite 7 . 4
S e rv i c e Water privatisation – Privatisation of water supply in the main cities –
Transport Rail-line rehabilitation – Rehabilitation of the following railways:Luanda-Malange –
B e n g u e l a –N a m i b e 6 0 . 0
S o u rc e : Instituto do Investimento Estrangeiro (1998)
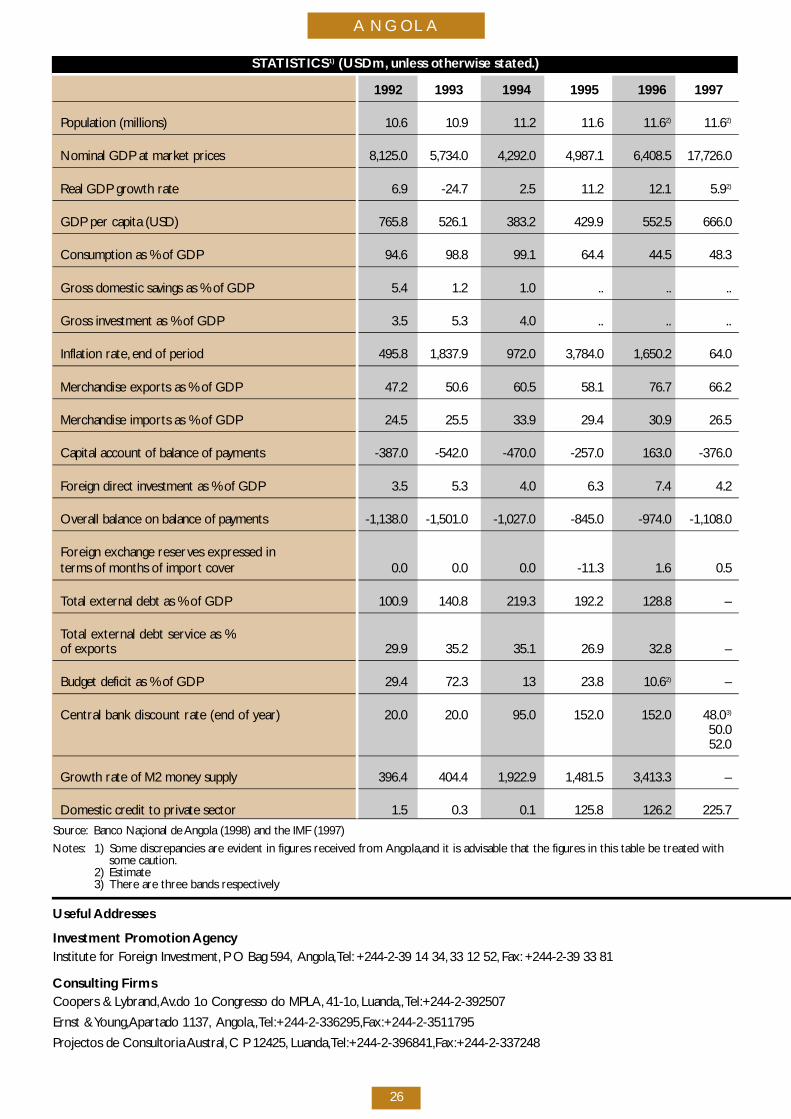
A NG OL A
26
S TAT I S T I C S1 ) ( U S D m , unless otherwise stated.)
1 9 9 2 1 9 9 3 1 9 9 4 1 9 9 5 1 9 9 6 1 9 9 7
Population (millions) 1 0 . 6 1 0 . 9 1 1 . 2 1 1 . 6 1 1 . 62 ) 1 1 . 62 )
Nominal GDP at market prices 8 , 1 2 5 . 0 5 , 7 3 4 . 0 4 , 2 9 2 . 0 4 , 9 8 7 . 1 6 , 4 0 8 . 5 1 7 , 7 2 6 . 0
Real GDP growth rate 6 . 9 - 2 4 . 7 2 . 5 1 1 . 2 1 2 . 1 5 . 92 )
GDP per capita (USD) 7 6 5 . 8 5 2 6 . 1 3 8 3 . 2 4 2 9 . 9 5 5 2 . 5 6 6 6 . 0
Consumption as % of GDP 9 4 . 6 9 8 . 8 9 9 . 1 6 4 . 4 4 4 . 5 4 8 . 3
G ross domestic savings as % of GDP 5 . 4 1 . 2 1 . 0 . . . . . .
G ross investment as % of GDP 3 . 5 5 . 3 4 . 0 . . . . . .
Inflation rate, end of period 4 9 5 . 8 1 , 8 3 7 . 9 9 7 2 . 0 3 , 7 8 4 . 0 1 , 6 5 0 . 2 6 4 . 0
M e rchandise exports as % of GDP 4 7 . 2 5 0 . 6 6 0 . 5 5 8 . 1 7 6 . 7 6 6 . 2
M e rchandise imports as % of GDP 2 4 . 5 2 5 . 5 3 3 . 9 2 9 . 4 3 0 . 9 2 6 . 5
C apital account of balance of payments - 3 8 7 . 0 - 5 4 2 . 0 - 4 7 0 . 0 - 2 5 7 . 0 1 6 3 . 0 - 3 7 6 . 0
Fo reign direct investment as % of GDP 3 . 5 5 . 3 4 . 0 6 . 3 7 . 4 4 . 2
O verall balance on balance of pay m e n t s - 1 , 1 3 8 . 0 - 1 , 5 0 1 . 0 - 1 , 0 2 7 . 0 - 8 4 5 . 0 - 9 7 4 . 0 - 1 , 1 0 8 . 0
Foreign exchange reserves expressed interms of months of import cove r 0 . 0 0 . 0 0 . 0 - 1 1 . 3 1 . 6 0 . 5
Total external debt as % of GDP 1 0 0 . 9 1 4 0 . 8 2 1 9 . 3 1 9 2 . 2 1 2 8 . 8 –
Total external debt service as %of export s 2 9 . 9 3 5 . 2 3 5 . 1 2 6 . 9 3 2 . 8 –
Budget deficit as % of GDP 2 9 . 4 7 2 . 3 1 3 2 3 . 8 1 0 . 62 ) –
Central bank discount rate (end of year) 20.0 20.0 95.0 152.0 152.0 48.03)
50.05 2 . 0
G rowth rate of M2 money supply 3 9 6 . 4 4 0 4 . 4 1 , 9 2 2 . 9 1 , 4 8 1 . 5 3 , 4 1 3 . 3 –
Domestic credit to private sector 1 . 5 0 . 3 0 . 1 1 2 5 . 8 1 2 6 . 2 2 2 5 . 7
S o u rc e : Banco Naçional de A n gola (1998) and the IMF (1997)
Notes: 1) Some discrepancies are evident in figures received from Angola,and it is advisable that the figures in this table be treated with some caution.
2) Estimate3) There are three bands respectively
Useful A dd resses
I nvestment Promotion A ge n c yInstitute for Fo reign Inve s t m e n t , P O Bag 594, A n go l a ,Te l : +244-2-39 14 34, 33 12 52, F a x : +244-2-39 33 81
Consulting FirmsCoopers & Ly b r a n d ,Av.do 1o Congresso do MPLA, 4 1 - 1 o, L u a n d a , ,Te l :+ 2 4 4 - 2 - 3 9 2 5 0 7
Ernst & Yo u n g ,A p a rtado 1137, A n go l a , ,Te l :+ 2 4 4 - 2 - 3 3 6 2 9 5 ,F a x :+ 2 4 4 - 2 - 3 5 1 1 7 9 5
P rojectos de Consultoria A u s t r a l , C P 12425, L u a n d a ,Te l :+ 2 4 4 - 2 - 3 9 6 8 4 1 ,F a x :+ 2 4 4 - 2 - 3 3 7 2 4 8
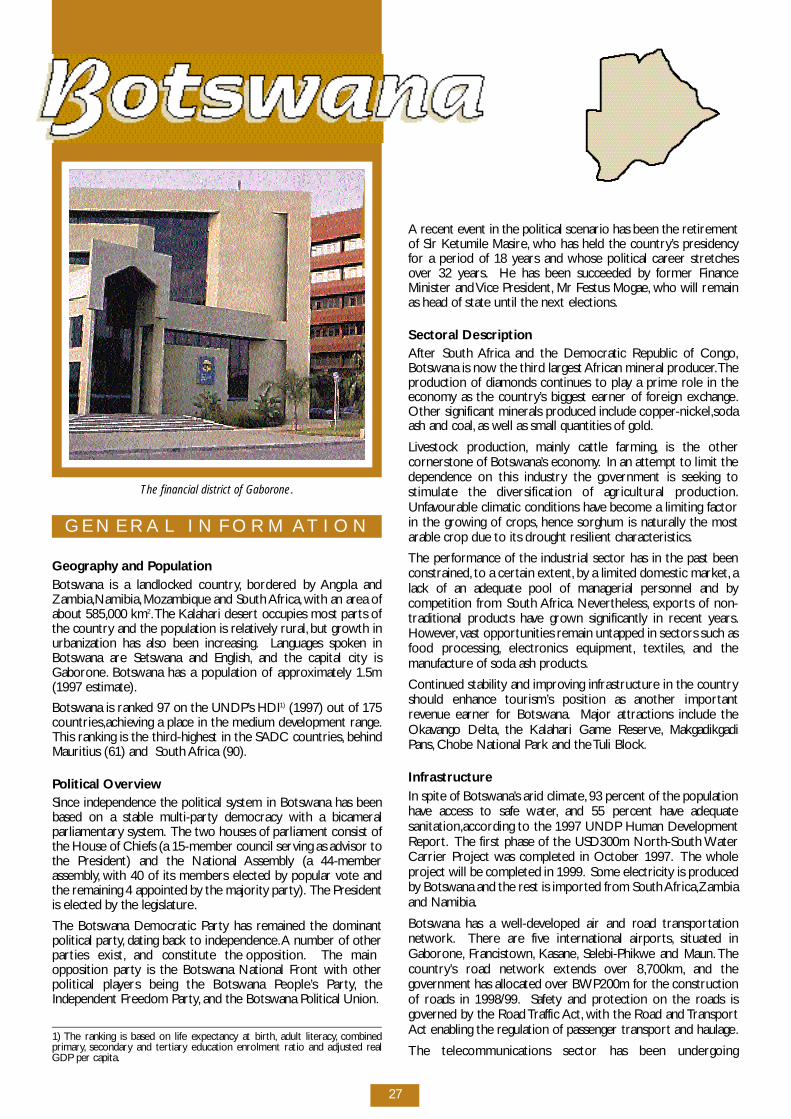
27
G E N E R A L I N F O R M AT I O N
G e og r ap hy and Po p u l a t i o nB o t swana is a landlocked country, b o rd e red by A n gola andZ a m b i a ,N a m i b i a ,Mozambique and South A f r i c a , with an area ofabout 585,000 km2.The Kalahari desert occupies most parts ofthe country and the population is re l a t i ve ly rural, but growth inurbanization has also been incre a s i n g . Languages spoken inB o t swana are Setswana and English, and the capital city isG a b o ro n e. B o t swana has a population of ap p rox i m a t e ly 1.5m(1997 estimate).
B o t swana is ranked 97 on the UNDP’s HDI1 ) (1997) out of 175c o u n t r i e s ,a c h i eving a place in the medium development range.This ranking is the third-highest in the SADC countries, b e h i n dMauritius (61) and South Africa (90).
Political Ove rv i ewSince independence the political system in Botswana has beenbased on a stable mu l t i - p a rty democracy with a bicameralp a r l i a m e n t a ry system. The two houses of parliament consist ofthe House of Chiefs (a 15-member council serving as advisor tothe President) and the National A s s e m b ly (a 44-membera s s e m b ly, with 40 of its members elected by popular vote andthe remaining 4 appointed by the majority part y ) . The Pre s i d e n tis elected by the legislature.
The Botswana Democratic Party has remained the dominantpolitical part y, dating back to independence.A number of otherp a rties exist, and constitute the opposition. The mainopposition party is the Botswana National Front with otherpolitical players being the Botswana Pe o p l e ’s Part y, t h eIndependent Freedom Part y, and the Botswana Political Union.
A recent event in the political scenario has been the re t i re m e n tof Sir Ketumile Masire, who has held the country ’s pre s i d e n c yfor a period of 18 years and whose political career stre t c h e sover 32 ye a r s . He has been succeeded by former FinanceMinister and Vice Pre s i d e n t , Mr Festus Mogae, who will re m a i nas head of state until the next elections.
Sectoral DescriptionAfter South Africa and the Democratic Republic of Congo,B o t swana is now the third largest African mineral pro d u c e r.T h ep roduction of diamonds continues to play a prime role in thee c o n o my as the country ’s biggest earner of fo reign exchange.Other significant minerals produced include copper- n i c ke l ,s o d aash and coal, as well as small quantities of go l d .
L i vestock pro d u c t i o n , m a i n ly cattle farming, is the othercornerstone of Botsw a n a ’s economy. In an attempt to limit thedependence on this industry the government is seeking tos t i mulate the diversification of agricultural pro d u c t i o n .U n f avourable climatic conditions have become a limiting factorin the growing of cro p s , hence sorghum is naturally the mostarable crop due to its drought resilient characteristics.
The performance of the industrial sector has in the past beenc o n s t r a i n e d , to a certain extent, by a limited domestic marke t , alack of an adequate pool of managerial personnel and bycompetition from South A f r i c a . N eve rt h e l e s s , e x p o rts of non-traditional products have grown significantly in recent ye a r s .H oweve r, vast opportunities remain untapped in sectors such asfood pro c e s s i n g , e l e c t ronics equipment, t e x t i l e s , and them a nu f a c t u re of soda ash pro d u c t s .
C o n t i nued stability and improving infrastructure in the countryshould enhance tourism’s position as another import a n treve nue earner for Botsw a n a . Major attractions include theO k av a n go Delta, the Kalahari Game Reserve, M a k g a d i k g a d iP a n s , Chobe National Park and the Tuli Block.
I n f r a s t r u c t u reIn spite of Botsw a n a ’s arid climate, 93 percent of the populationh ave access to safe water, and 55 percent have adequates a n i t a t i o n ,a c c o rding to the 1997 UNDP Human Deve l o p m e n tR e p o rt . The first phase of the USD300m North-South Wa t e rC a rrier Project was completed in October 1997. The wholep roject will be completed in 1999. Some electricity is pro d u c e dby Botswana and the rest is imported from South A f r i c a ,Z a m b i aand Namibia.
B o t swana has a we l l - d eveloped air and road transport a t i o nn e t wo r k . T h e re are five international airport s , situated inG a b o ro n e, F r a n c i s t ow n , K a s a n e, S e l e b i - P h i k we and Maun. T h ec o u n t ry ’s road network extends over 8,700km, and thegovernment has allocated over BWP200m for the constructionof roads in 1998/99. S a fety and protection on the roads isgoverned by the Road Traffic A c t , with the Road and Tr a n s p o rtAct enabling the regulation of passenger transport and haulage.
The telecommunications sector has been undergo i n g1) The ranking is based on life expectancy at birt h , adult literacy, c o m b i n e dp r i m a ry, s e c o n d a ry and tert i a ry education enrolment ratio and adjusted re a lGDP per cap i t a .
The financial district of Gaborone .
B O T S WA N A
28
restructuring during the 1990s. The government formed theB o t swana Te l e c o m munications Authority in 1996, which isgoverned by an act of parliament.The mandate of the body is,among other things, to regulate competition and oversee thep rovision of telecommunications equipment. A significantupgrading of the telecommunications system is curre n t lyu n d e r w ay. The programme is aimed at rural areas through theRural Te l e c o m munications Pro j e c t , and also the envisaged link-up with South A f r i c a ,Z i m b a b we, Zambia and Namibia once theG a n t s i - M a muno microw ave radio is completed.The Internet hasre c e n t ly been intro d u c e d , and fo l l owing the aw a rding of twolicences for cellular phone networks these should becomeavailable in the near future.
E C O N O M I C O V E R V I E W
I n t ro d u c t i o nThe discove ry of diamonds after independence in 1966 set thec o u n t ry on a successful economic growth path leading to risingliving standard s . The diamond industry transformed Botsw a n af rom an agriculture-based economy to one in which diamondsaccount for 80 percent of exports and 50 percent ofgovernment reve nu e. A c k n owledging the risk of re ly i n gp re d o m i n a n t ly on diamonds as a source of economic pro s p e r i t y,the government has initiated steps aimed at broadening thee x p o rt base of the economy by stimulating the development ofthe small-scale sector as well as large industries. P romising fieldsfor diversification are the manufacturing and services sectors,such as textiles, tourism and financial serv i c e s .
Recent Macro-Economic Deve l o p m e n tA real GDP growth rate of 6.9 percent was re c o rded for thefiscal year 1 Ju ly 1996 to 30 June 1997. This growth rate wasattributable in large part to the 7.5 percent real growth rate inthe non-mining sector, which was significantly higher than the5.6 percent real growth re c o rded in 1996. While the miningsector growth rate had dropped by 5.8 percent in the ye a rending June 1997 from 9.9 percent in the previous ye a r, g row t hin the non-mining economy has been less err a t i c, s h owing asustained upward trend since 1993. In 1997, the highest grow t hrate was re c o rded in the transport and trade, hotel andrestaurants sectors, which re c o rded real increases in output of13.6 percent and 10.6 percent re s p e c t i ve ly. All other sectors,with the sole exception of agriculture, re c o rded real grow t hrates of 5 percent and above.This expansion is reflected stro n g lyin Botsw a n a ’s export perfo r m a n c e.
With respect to the fiscal position, the 1996/97 budget fo re c a s ts h owed a deficit of BWP636m (USD193m) and this wass u b s e q u e n t ly revised at the end of 1996 to reflect an expectedsurplus of about BWP400m (USD121m).The downgrading ofthe estimate was on account of the 1996 Pula depreciation andthe improvement in mining output and receipts in 1996 and1 9 9 7 . In fact, the actual outcome has been a budget surplus ofBWP1,302m (USD395m).This was due to both rapid growth ingovernment reve nues and lower than expected spending. T h elatest estimates for the 1997/98 budget, fo recast a surplus ofBWP1,270m (USD385m) in the current fiscal ye a r, despite aplanned 22 percent increase in development spending.
B o t swana has established itself as a low-tax jurisdiction in re c e n tyears with a manufacturing company tax rate of 15 percent anda personal income and basic company tax rate of 25 perc e n t .C o n s e q u e n t ly, the 1998 budget did not include any changes tothe basic income tax structure. I n s t e a d , the emphasis in the 1998b u d g e t , has been on upgrading the tax administration system,the objective being to increase the efficiency of assessment and
to improve on the collection of outstanding income taxe s .
A sustained decline in the inflation rate in recent years hass u p p o rted the positive growth tre n d . Since 1992, the annu a laverage inflation rate has declined each ye a r, falling from 16.1p e rcent in 1992 to 8.9 percent in 1997. On a monthly basis,a n nual average inflation dropped from a ten-year high of 17.7p e rcent in June 1992, to 7 percent in Fe b r u a ry 1998. E x c h a n g erate stability (both nominal and real) has also improve ds i g n i f i c a n t ly in 1997, when compared to developments in 1996.In nominal terms, the Pula depreciated by just 4 percent againstthe US Dollar in 1997, c o m p a red to the 23 percent depre c i a t i o nre c o rded in 1996. Against SDR, it ap p reciated about 2 perc e n tin 1997, c o m p a red to the 20 percent depreciation re c o rded in1 9 9 6 .
In 1997 through March 1998, exchange rate policy focused onreal effe c t i ve exchange rate stability, while monetary policyc o n t i nued to focus on maintaining positive real interest ratesthat are in line with those prevailing in major internationalc apital marke t s .These objectives we re largely achieve d .
Financial InstitutionsSince 1975, the Bank of Botswana has acted as both the banke rand financial advisor to the gove r n m e n t . The Bank also managesthe country ’s fo reign exchange re s e rve s , administers exchangec o n t rols and regulates the country ’s overall financial system.Since the Bank is the custodian of the Botswana curre n c y, it hasre c e n t ly been, t h rough a statutory prov i s i o n ,a l l owed to act as awatchdog over counterfeiting and fo r g e ry of the local curre n c y.The Bank of Botswana also conducts open market operationsto mop up superfluous liquidity in the banking system.
The country ’s financial sector has experienced grow i n gc o m p e t i t i o n , leading to a pro l i feration of financial products ands e rv i c e s . T h e re are four main commercial banks in Botsw a n a :B a rc l ay s ,S t a n b i c, First National and Standard Bank.These banksc a rry out normal retail and commercial banking activities,l e a s i n g , p ro p e rty finance and merchant banking and also act asauthorized dealers of fo reign exchange. D evelopment financeinstitutions supplement the commercial banks, o f fe r i n gspecialised services targeted to certain economic sectors.
B o t swana Stock ExchangeThe Botswana Stock Exchange had a ve ry successful year in1 9 9 7 . The number of listed companies on the Botswana StockExchange has increased rap i d ly over the past ye a r s . To date theexchange boasts about 20 listed companies compared with 11 in1 9 9 3 , an increase in excess of 67 perc e n t .
M a r ket capitalisation more than doubled in 1997 rising to morethan USD600m. Liquidity has also improved as seen by asubstantial surge in volume of shares traded. The number offo reign companies maintaining share custody accounts surgedc o n s i d e r a b ly to 50 in 1997 compared with 3 in 1993. A n o t h e rsignificant milestone was the listing in December of the firstbond issue by the Botswana Development Corporation.
The top five domestic companies listed on the Botswana StockExchange in terms of market capitalisation are Sechaba (aconsolidation of companies under the Botswana Deve l o p m e n tC o r p o r a t i o n ) , B a rc l ays Bank of Botsw a n a , S t a n d a rd Chart e re dB o t sw a n a , First National Bank of Botswana and Metro Sefalana.S everal new dual listings have been made in the first four monthsof 1997, n a m e ly Regent, De Beers, M c C a rt hy and Av i s . In Marc hEllerine Holdings became the first South African company in1998 to list on the Botswana exchange, i n c reasing the number offo reign companies with dual listings to nine. The Exchange isexpecting a substantial growth in 1998 fo l l owing re c e n t lyannounced exchange control re l a x a t i o n s .
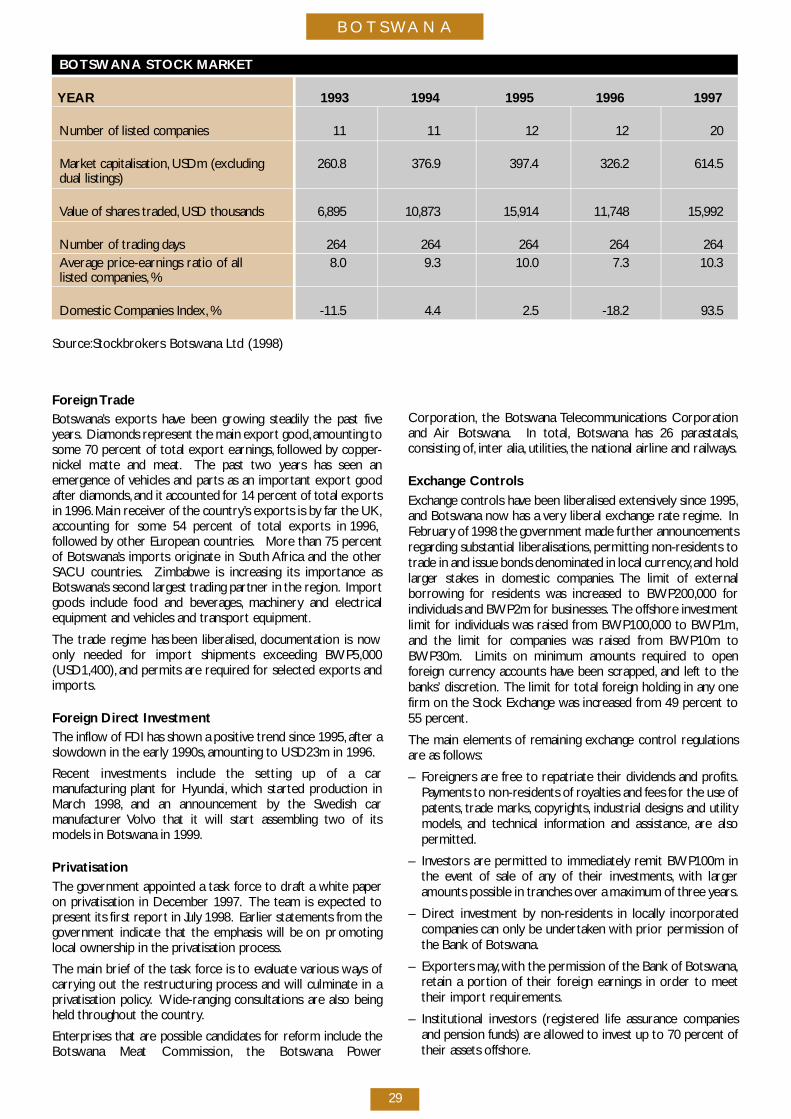
B O T S WA N A
29
Fo reign Tr a d eB o t sw a n a ’s exports have been growing steadily the past fiveye a r s . Diamonds re p resent the main export go o d ,amounting tosome 70 percent of total export earnings, fo l l owed by copper-n i c kel matte and meat. The past two years has seen anemergence of vehicles and parts as an important export go o dafter diamonds, and it accounted for 14 percent of total export sin 1996.Main re c e i ver of the country ’s exports is by far the UK,accounting for some 54 percent of total exports in 1996,fo l l owed by other European countries. M o re than 75 perc e n tof Botsw a n a ’s imports originate in South Africa and the otherS ACU countries. Z i m b a b we is increasing its importance asB o t sw a n a ’s second largest trading partner in the re g i o n . I m p o rtgoods include food and beve r a g e s , m a c h i n e ry and electricalequipment and vehicles and transport equipment.
The trade regime has been liberalised, documentation is nowo n ly needed for import shipments exceeding BWP5,000( U S D 1 , 4 0 0 ) , and permits are re q u i red for selected exports andi m p o rt s .
Fo reign Direct Inve s t m e n tThe inflow of FDI has shown a positive trend since 1995, after as l ow d own in the early 1990s, amounting to USD23m in 1996.
Recent investments include the setting up of a carm a nufacturing plant for Hyundai, which started production inM a rch 1998, and an announcement by the Swedish carm a nu f a c t u rer Vo l vo that it will start assembling two of itsmodels in Botswana in 1999.
P r i v a t i s a t i o nThe government appointed a task fo rce to draft a white pap e ron privatisation in December 1997. The team is expected top resent its first re p o rt in Ju ly 1998. Earlier statements from thegovernment indicate that the emphasis will be on pro m o t i n glocal ownership in the privatisation pro c e s s .
The main brief of the task fo rce is to evaluate various ways ofc a rrying out the restructuring process and will culminate in aprivatisation policy. Wide-ranging consultations are also beingheld throughout the country.
Enterprises that are possible candidates for re form include theB o t swana Meat Commission, the Botswana Powe r
C o r p o r a t i o n , the Botswana Te l e c o m munications Corporationand Air Botsw a n a . In total, B o t swana has 26 parastatals,consisting of, inter alia, u t i l i t i e s , the national airline and railw ay s .
E x c h a n ge Contro l s
Exchange controls have been liberalised extensive ly since 1995,and Botswana now has a ve ry liberal exchange rate re g i m e. I nFe b r u a ry of 1998 the government made further announcementsre g a rding substantial liberalisations, permitting non-residents totrade in and issue bonds denominated in local curre n c y,and holdlarger stakes in domestic companies. The limit of externalb o rrowing for residents was increased to BWP200,000 fo rindividuals and BWP2m for businesses. The offshore inve s t m e n tlimit for individuals was raised from BWP100,000 to BWP1m,and the limit for companies was raised from BWP10m toB W P 3 0 m . Limits on minimum amounts re q u i red to openfo reign currency accounts have been scrap p e d , and left to thebanks’ discre t i o n . The limit for total fo reign holding in any onefirm on the Stock Exchange was increased from 49 percent to55 perc e n t .
The main elements of remaining exchange control re g u l a t i o n sa re as fo l l ow s :
– Fo reigners are free to repatriate their dividends and pro f i t s .P ayments to non-residents of royalties and fees for the use ofp a t e n t s , trade marks, c o py r i g h t s , industrial designs and utilitym o d e l s , and technical information and assistance, a re alsop e r m i t t e d .
– I nvestors are permitted to immediately remit BWP100m inthe event of sale of any of their inve s t m e n t s , with largeramounts possible in tranches over a maximum of three ye a r s .
– D i rect investment by non-residents in locally incorporatedcompanies can only be undert a ken with prior permission ofthe Bank of Botsw a n a .
– E x p o rters may, with the permission of the Bank of Botsw a n a ,retain a portion of their fo reign earnings in order to meettheir import re q u i re m e n t s .
– Institutional investors (re g i s t e red life assurance companiesand pension funds) are allowed to invest up to 70 percent oftheir assets offshore.
B OT S WANA STOCK MARKET
Y E A R 1 9 9 3 1 9 9 4 1 9 9 5 1 9 9 6 1 9 9 7
Number of listed companies 1 1 11 1 2 1 2 2 0
M a r ket cap i t a l i s a t i o n , USDm (excluding 2 6 0 . 8 3 7 6 . 9 3 9 7 . 4 3 2 6 . 2 6 1 4 . 5dual listings)
Value of shares traded, USD thousands 6 , 8 9 5 1 0 , 8 7 3 1 5 , 9 1 4 1 1 , 7 4 8 1 5 , 9 9 2
Number of trading day s 2 6 4 2 6 4 2 6 4 2 6 4 2 6 4Average price-earnings ratio of all 8.0 9.3 10.0 7.3 10.3listed companies, %
Domestic Companies Index, % - 1 1 . 5 4 . 4 2 . 5 - 1 8 . 2 9 3 . 5
Source:Stockbrokers Botswana Ltd (1998)
B O T S WA N A
30
and serv i c e s .
Ta x a t i o nC o m p a ny taxation
– 15 percent for manufacturing companies and 25 percent fo rn o n - m a nufacturing companies. C apital gain is included in thedefinition of taxable income.
– A l l owances on capital (100 percent of cost), plant andm a c h i n e ry (10-25 perc e n t ) , and buildings (25 percent for an ew building, and a further BWP5,000 for prov i d i n gaccommodation for employe e s ) .
– An employer can claim a deduction of 200 percent of the costof training of employe e s , if the training is ap p roved by theC o m m i s s i o n e r.
– Withholding tax: 15 percent on dividends paid to re s i d e n t sand non-re s i d e n t s , and 15 percent on interest paid to non-residents only.
– C o m m e rcial royalties and management and consultancy fe e s :15 percent tax to non-re s i d e n t s .
– The top marginal rate for resident and non-re s i d e n tindividuals is 25 perc e n t . The top rate is applicable for incomeg reater than BWP 60,000.
– C apital gains and benefits are taxe d , and a capital transfer taxis also lev i e d .
– B o t swana has double taxation agreements with the UnitedK i n g d o m , South A f r i c a ,S we d e n , and Mauritius.
Sales tax– A general sales tax of 10 percent is imposed, with some
p roducts being exe m p t .
– Some items (such as alcoholic beverages) are taxed at ahigher rate.
I nvestment Promotion A ge n c i e sThe Trade and Investment Promotion Agency (TIPA) wasestablished in 1984 under the auspices of the Ministry ofC o m m e rce and Industry. T I PA encourages potential inve s t o r st h rough the dissemination of information and the provision ofa d v i c e,and organises and participates in various trade affairs andi nvestment missions, p roduces promotional material and liaiseswith potential inve s t o r s .
T I PA is curre n t ly undergoing a rationalisation pro c e s s , w h i c hshould culminate in the formation of a parastatal to be called theB o t swana Export Development and Investment A u t h o r i t y.T h en ew organisation will be fully autonomous and will beresponsible for export and investment pro m o t i o n , and will alsoact as a one-stop-centre for pre-and post-investor serv i c e.
Other inve s t m e n t - s u p p o rt institutions include the Botsw a n aD evelopment Corporation whose prime focus is, inter alia, t h ep reparation of project feasibility studies, p rovision of long-termloans and equity participation.The Botswana Confederation ofC o m m e rc e, I n d u s t ry and Manpower provides advisory serv i c e sto its members in addition to re p resenting the interests ofe m p l oyees pertaining to industrial and commercial issues.
I nvestment CodeT h e re is no legislation in Botswana that deals specifically withi nve s t m e n t . Regulations governing investment are contained,among others, in the Companies A c t , the Factories A c t , t h eE m p l oyment Act and the Income Tax A c t .
I N V E S T M E N T C L I M A T E
I nvestment Incentive s
At the end of 1997 Botswana introduced a number of newm e a s u res to attract fo reign inve s t m e n t . This includessimplification of application pro c e d u res to obtain re s i d e n c ep e r m i t s , including the introduction of a three-month visitors’p e r m i t ,a l l owing pro s p e c t i ve investors to develop their planswhile in the country, and a five - year residence permitobtainable by actual inve s t o r s .The Financial Assistance Policy (FA P ) :
The objective of the policy is to assist businesses engaged ini m p o rt substitution, e x p o rt pro m o t i o n , e m p l oyment cre a t i o n ,selected “linking” services and tourism. Applications arec o n s i d e red on a case-by-case basis. Large-scale mining and beefp roduction operations are, h oweve r, not considered for thistype of assistance. The value of the grants is diffe rentiated ina c c o rdance with the size of the business. T h ree separate grantsfor medium or large scale projects are av a i l a b l e :
– C apital grant: This is intended to support the purchase off i xed assets (plant and machinery ) . If the project is 100p e rcent citizen ow n e d , BWP 1,500 (USD 420) is granted fo reach job cre a t e d . If the project is owned by non-citizens or isa joint ve n t u re, the amount is BWP 1,000 (USD295) per jobc re a t e d .
– Training grant: This part i a l ly covers 50 percent off-the-jobtraining costs incurred over the first five years of the pro j e c t ,including the costs of tuition, b o a rd and lodging, t r ave l ,materials and wages. The value of the grant is tied toi m p rovements in pro d u c t i v i t y.
– Unskilled labour grant:This is a partial reimbursement of thewages paid to unskilled employees over the first five years ofthe pro j e c t . 50 percent of wages paid during the first twoyears are re i m b u r s e d , declining to 20 percent in the fifth ye a r.
Applicants should allow for a waiting period of about thre em o n t h s . FAP grants are tax-fre e.
E x p o rt Incentive sP roduction for the export market is encouraged, with thefo l l owing export incentives in place:
– Duty drawback facility in the pro c u rement of raw materialsneeded for the production of exportable merc h a n d i s e.
– No surcharge (sales tax) on the importation of machineryand equipment re q u i red in the production for export s .
– A Bureau of Standards has been established to help facilitatee x p o rters obtaining quality and standards certificates and alsothe receiving of advice on maintaining high quality.
– The Botswana Export Credit Guarantee Company has beenestablished with assistance from the Botswana Deve l o p m e n tCorporation to add ress the pre- and post-shipment cre d i tp roblems faced by export e r s .
– G overnment maintains stable competitive real exchange andwage rates in order to enable manu f a c t u re r s / e x p o rters to bec o m p e t i t i ve in the international marke t s .
– “Buy Botswana” is a gove r n m e n t - d r i ven campaign to enhancethe competitiveness of manu f a c t u rers and exporters so as toi n c rease the share of the domestic market of their pro d u c t s
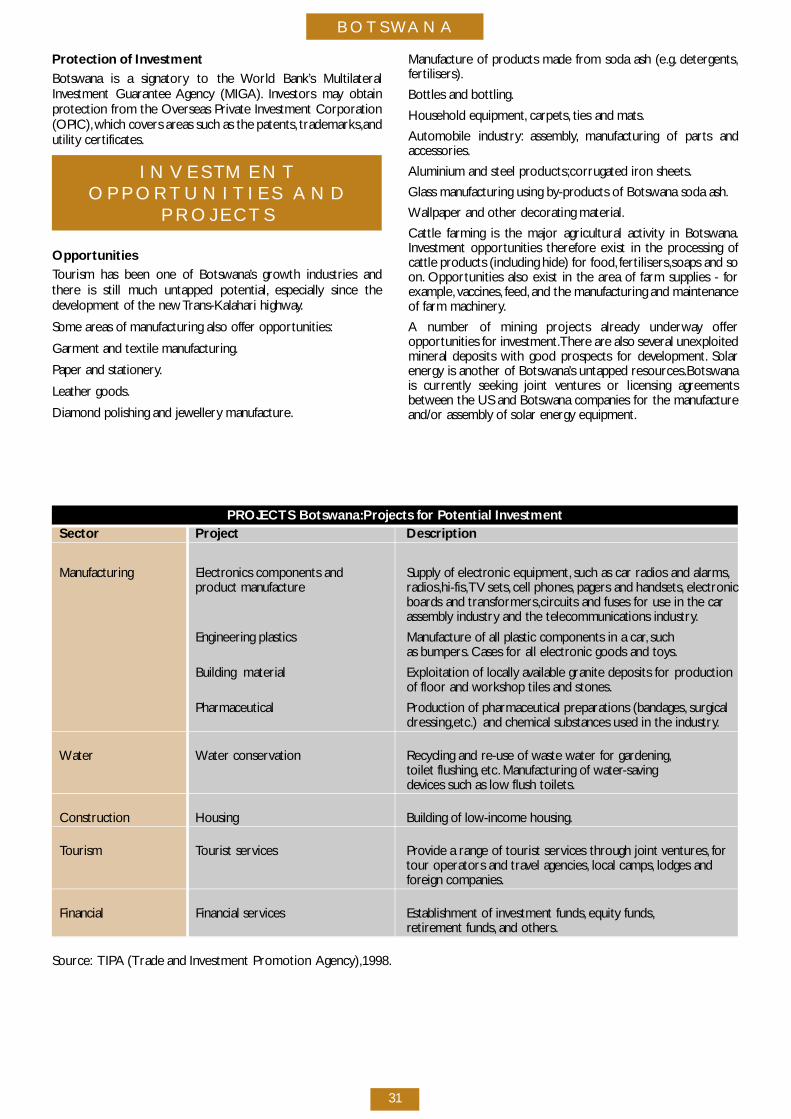
B O T S WA N A
31
P rotection of Inve s t m e n tB o t swana is a signatory to the World Bank’s MultilateralI nvestment Guarantee Agency (MIGA). I nvestors may obtainp rotection from the Overseas Private Investment Corporation( O P I C ) ,which covers areas such as the patents, t r a d e m a r k s ,a n dutility cert i f i c a t e s .
I N V E S TM E N TO P P O R T U N I T I E S A N D
P R O J E C T S
O p p o rt u n i t i e sTourism has been one of Botsw a n a ’s growth industries andt h e re is still much untapped potential, e s p e c i a l ly since thed evelopment of the new Trans-Kalahari highway.
Some areas of manufacturing also offer opport u n i t i e s :
Garment and textile manu f a c t u r i n g .
P aper and stationery.
Leather go o d s .
Diamond polishing and jewe l l e ry manu f a c t u re.
M a nu f a c t u re of products made from soda ash (e. g . d e t e r g e n t s ,fe rt i l i s e r s ) .
Bottles and bottling.
Household equipment, c a r p e t s , ties and mats.
Automobile industry : a s s e m b ly, m a nufacturing of parts anda c c e s s o r i e s .
Aluminium and steel pro d u c t s ;c o rrugated iron sheets.
Glass manufacturing using by - p roducts of Botswana soda ash.
Wa l l p aper and other decorating material.
Cattle farming is the major agricultural activity in Botsw a n a .I nvestment opportunities there fo re exist in the processing ofcattle products (including hide) for fo o d , fe rt i l i s e r s ,s o aps and soo n . O p p o rtunities also exist in the area of farm supplies - fo re x a m p l e, v a c c i n e s , fe e d , and the manufacturing and maintenanceof farm machinery.
A number of mining projects already underway offe ro p p o rtunities for inve s t m e n t .T h e re are also several unexploitedmineral deposits with good prospects for deve l o p m e n t . S o l a re n e r gy is another of Botsw a n a ’s untapped re s o u rc e s .B o t sw a n ais curre n t ly seeking joint ve n t u res or licensing agre e m e n t sb e t ween the US and Botswana companies for the manu f a c t u reand/or assembly of solar energy equipment.
P RO J E C T S B o t sw a n a :P rojects for Potential Inve s t m e n tS e c t o r P ro j e c t D e s c r i p t i o n
M a nu f a c t u r i n g E l e c t ronics components and S u p p ly of electronic equipment, such as car radios and alarms,p roduct manu f a c t u re r a d i o s , h i - f i s ,TV sets, cell phones, pagers and handsets, e l e c t ro n i c
b o a rds and transfo r m e r s ,c i rcuits and fuses for use in the car a s s e m b ly industry and the telecommunications industry.
Engineering plastics M a nu f a c t u re of all plastic components in a car, such as bumpers. Cases for all electronic goods and toy s .
Building material Exploitation of locally available granite deposits for p roduction of floor and workshop tiles and stones.
P h a r m a c e u t i c a l P roduction of pharmaceutical preparations (bandages, surgical d re s s i n g ,e t c.) and chemical substances used in the industry.
Wa t e r Water conserv a t i o n Recycling and re-use of waste water for gard e n i n g ,toilet flushing, e t c. M a nufacturing of water- s aving d evices such as low flush toilets.
C o n s t r u c t i o n H o u s i n g Building of low-income housing.
To u r i s m Tourist serv i c e s P rovide a range of tourist services through joint ve n t u re s , for tour operators and travel agencies, local camps, lodges and fo reign companies.
F i n a n c i a l Financial serv i c e s Establishment of investment funds, equity funds,re t i rement funds, and others.
Source: TIPA (Trade and Investment Promotion Agency),1998.
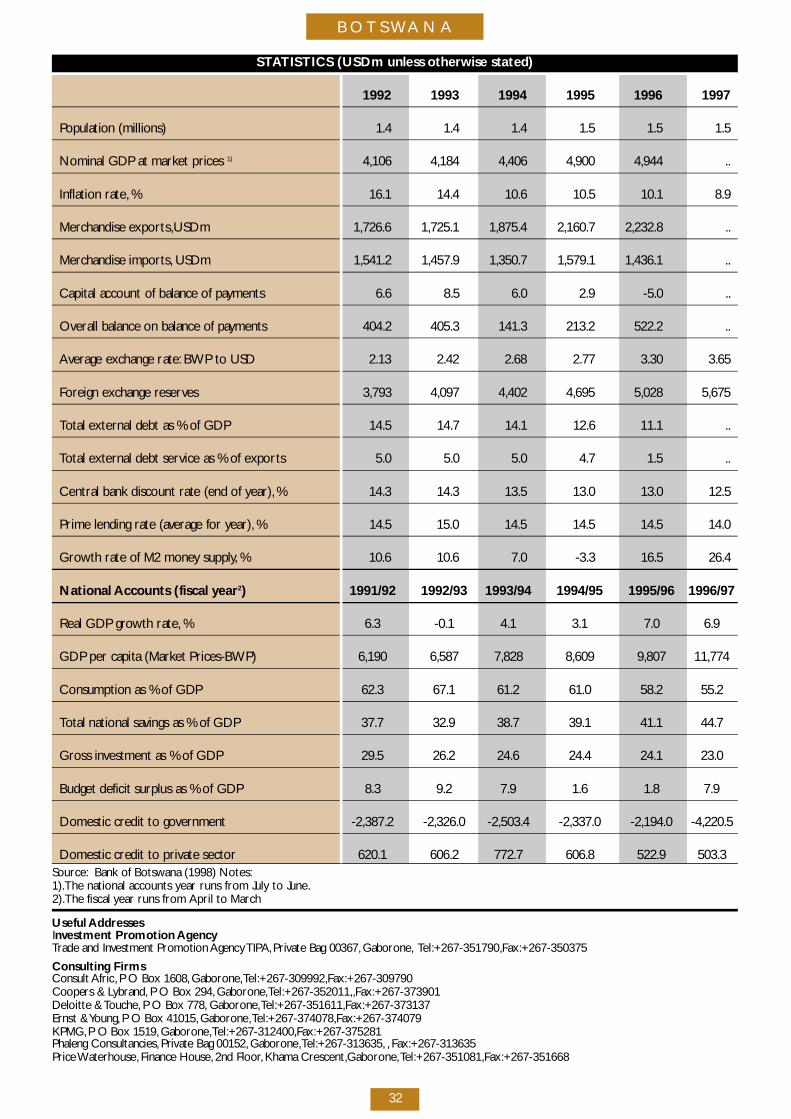
B O T S WA N A
32
S TATISTICS (USDm unless otherwise stated)
1 9 9 2 1 9 9 3 1 9 9 4 1 9 9 5 1 9 9 6 1 9 9 7
Population (millions) 1 . 4 1 . 4 1 . 4 1 . 5 1 . 5 1 . 5
Nominal GDP at market prices 1 ) 4 , 1 0 6 4 , 1 8 4 4 , 4 0 6 4 , 9 0 0 4 , 9 4 4 . .
Inflation rate, % 1 6 . 1 1 4 . 4 1 0 . 6 1 0 . 5 1 0 . 1 8 . 9
M e rchandise export s ,U S D m 1 , 7 2 6 . 6 1 , 7 2 5 . 1 1 , 8 7 5 . 4 2 , 1 6 0 . 7 2 , 2 3 2 . 8 . .
M e rchandise import s , U S D m 1 , 5 4 1 . 2 1 , 4 5 7 . 9 1 , 3 5 0 . 7 1 , 5 7 9 . 1 1 , 4 3 6 . 1 . .
C apital account of balance of payments 6 . 6 8 . 5 6 . 0 2 . 9 - 5 . 0 . .
O verall balance on balance of pay m e n t s 4 0 4 . 2 4 0 5 . 3 1 4 1 . 3 2 1 3 . 2 5 2 2 . 2 . .
Average exchange rate: BWP to USD 2 . 1 3 2 . 4 2 2 . 6 8 2 . 7 7 3 . 3 0 3 . 6 5
Fo reign exchange re s e rves 3 , 7 9 3 4 , 0 9 7 4 , 4 0 2 4 , 6 9 5 5 , 0 2 8 5 , 6 7 5
Total external debt as % of GDP 1 4 . 5 1 4 . 7 1 4 . 1 1 2 . 6 1 1 . 1 . .
Total external debt service as % of export s 5 . 0 5 . 0 5 . 0 4 . 7 1 . 5 . .
Central bank discount rate (end of ye a r ) , % 1 4 . 3 1 4 . 3 1 3 . 5 1 3 . 0 1 3 . 0 1 2 . 5
Prime lending rate (average for ye a r ) , % 1 4 . 5 1 5 . 0 1 4 . 5 1 4 . 5 1 4 . 5 1 4 . 0
G rowth rate of M2 money supply, % 1 0 . 6 1 0 . 6 7 . 0 - 3 . 3 1 6 . 5 2 6 . 4
National Accounts (fiscal ye a r2) 1 9 9 1 / 9 2 1 9 9 2 / 9 3 1 9 9 3 / 9 4 1 9 9 4 / 9 5 1 9 9 5 / 9 6 1 9 9 6 / 9 7
Real GDP growth rate, % 6 . 3 - 0 . 1 4 . 1 3 . 1 7 . 0 6 . 9
GDP per capita (Market Prices-BWP) 6 , 1 9 0 6 , 5 8 7 7 , 8 2 8 8 , 6 0 9 9 , 8 0 7 1 1 , 7 7 4
Consumption as % of GDP 6 2 . 3 6 7 . 1 6 1 . 2 6 1 . 0 5 8 . 2 5 5 . 2
Total national savings as % of GDP 3 7 . 7 3 2 . 9 3 8 . 7 3 9 . 1 4 1 . 1 4 4 . 7
G ross investment as % of GDP 2 9 . 5 2 6 . 2 2 4 . 6 2 4 . 4 2 4 . 1 2 3 . 0
Budget deficit surplus as % of GDP 8 . 3 9 . 2 7 . 9 1 . 6 1 . 8 7 . 9
Domestic credit to government - 2 , 3 8 7 . 2 - 2 , 3 2 6 . 0 - 2 , 5 0 3 . 4 - 2 , 3 3 7 . 0 - 2 , 1 9 4 . 0 - 4 , 2 2 0 . 5
Domestic credit to private sector 6 2 0 . 1 6 0 6 . 2 7 7 2 . 7 6 0 6 . 8 5 2 2 . 9 5 0 3 . 3Source: Bank of Botswana (1998) Notes:1).The national accounts year runs from July to June.2).The fiscal year runs from April to March
Useful A dd re s s e sInvestment Promotion A ge n c yTrade and Investment Promotion Agency T I PA , Private Bag 00367, G a b o ro n e, Te l :+ 2 6 7 - 3 5 1 7 9 0 ,F a x :+ 2 6 7 - 3 5 0 3 7 5
Consulting FirmsConsult A f r i c, P O Box 1608, G a b o ro n e,Te l :+ 2 6 7 - 3 0 9 9 9 2 ,F a x :+ 2 6 7 - 3 0 9 7 9 0Coopers & Ly b r a n d , P O Box 294, G a b o ro n e,Te l :+ 2 6 7 - 3 5 2 0 1 1 , ,F a x :+ 2 6 7 - 3 7 3 9 0 1Deloitte & To u c h e, P O Box 778, G a b o ro n e,Te l :+ 2 6 7 - 3 5 1 6 1 1 ,F a x :+ 2 6 7 - 3 7 3 1 3 7Ernst & Yo u n g , P O Box 41015, G a b o ro n e,Te l :+ 2 6 7 - 3 7 4 0 7 8 ,F a x :+ 2 6 7 - 3 7 4 0 7 9K P M G , P O Box 1519, G a b o ro n e,Te l :+ 2 6 7 - 3 1 2 4 0 0 ,F a x :+ 2 6 7 - 3 7 5 2 8 1Phaleng Consultancies, Private Bag 00152, G a b o ro n e,Te l :+ 2 6 7 - 3 1 3 6 3 5 , , F a x :+ 2 6 7 - 3 1 3 6 3 5Price Wa t e r h o u s e, Finance House, 2nd Floor, Khama Cre s c e n t ,G a b o ro n e,Te l :+ 2 6 7 - 3 5 1 0 8 1 ,F a x :+ 2 6 7 - 3 5 1 6 6 8
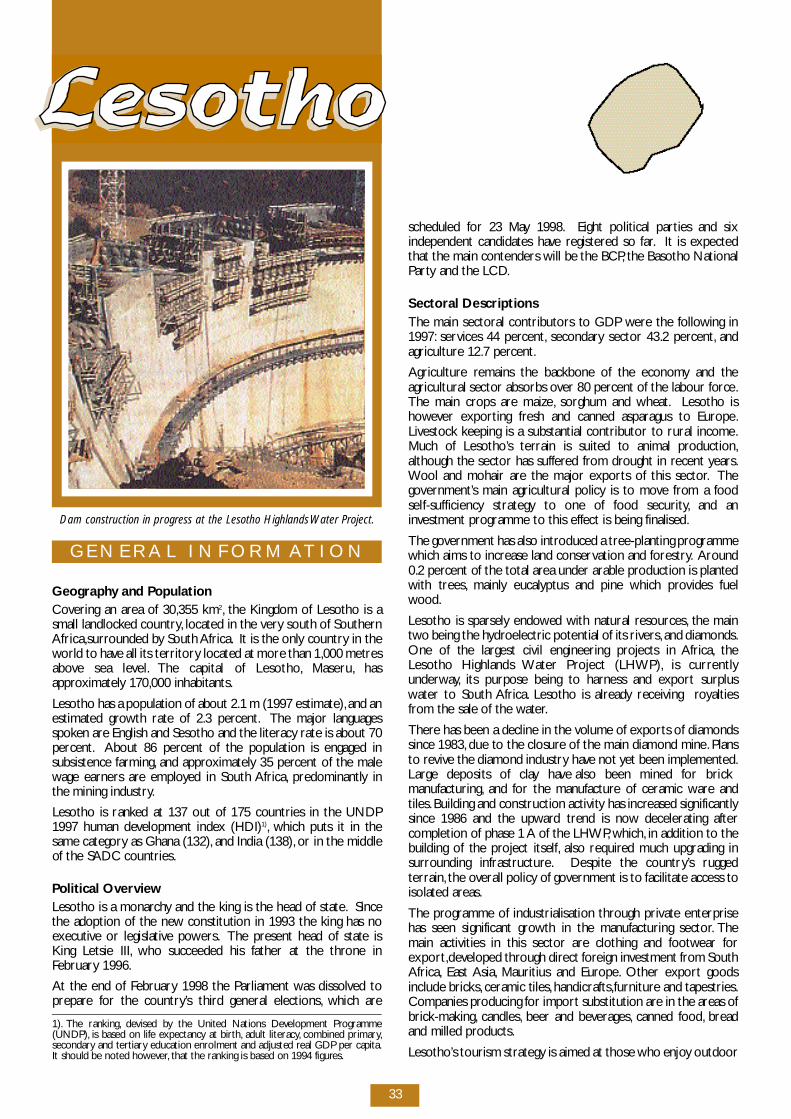
33
G E N E R A L I N F O R M AT I O N
G e og r ap hy and Po p u l a t i o nC overing an area of 30,355 km2, the Kingdom of Lesotho is asmall landlocked country, located in the ve ry south of SouthernA f r i c a ,s u rrounded by South A f r i c a . It is the only country in theworld to have all its terr i t o ry located at more than 1,000 metre sa b ove sea leve l . The capital of Lesotho, M a s e r u , h a sap p rox i m a t e ly 170,000 inhabitants.
Lesotho has a population of about 2.1 m (1997 estimate),and anestimated growth rate of 2.3 perc e n t . The major languagess p o ken are English and Sesotho and the literacy rate is about 70p e rc e n t . About 86 percent of the population is engaged insubsistence farming, and ap p rox i m a t e ly 35 percent of the malewage earners are employed in South A f r i c a , p re d o m i n a n t ly inthe mining industry.
Lesotho is ranked at 137 out of 175 countries in the UNDP1997 human development index (HDI)1 ), which puts it in thesame catego ry as Ghana (132), and India (138), or in the midd l eof the SADC countries.
Political Ove rv i ewLesotho is a monarc hy and the king is the head of state. S i n c ethe adoption of the new constitution in 1993 the king has noe xe c u t i ve or legislative powe r s . The present head of state isKing Letsie III, who succeeded his father at the throne inFe b r u a ry 1996.
At the end of Fe b r u a ry 1998 the Parliament was dissolved top re p a re for the country ’s third general elections, which are
scheduled for 23 May 1998. Eight political parties and sixindependent candidates have re g i s t e red so far. It is expectedthat the main contenders will be the BCP, the Basotho NationalP a rty and the LCD.
Sectoral DescriptionsThe main sectoral contributors to GDP we re the fo l l owing in1 9 9 7 : s e rvices 44 perc e n t , s e c o n d a ry sector 43.2 perc e n t , a n da g r i c u l t u re 12.7 perc e n t .
A g r i c u l t u re remains the backbone of the economy and theagricultural sector absorbs over 80 percent of the labour fo rc e.The main crops are maize, sorghum and wheat. Lesotho ish owever exporting fresh and canned asparagus to Euro p e.L i vestock keeping is a substantial contributor to rural income.Much of Lesotho’s terrain is suited to animal pro d u c t i o n ,although the sector has suffe red from drought in recent ye a r s .Wool and mohair are the major exports of this sector. T h egove r n m e n t ’s main agricultural policy is to move from a fo o dself-sufficiency strategy to one of food security, and ani nvestment programme to this effect is being finalised.
The government has also introduced a tree-planting pro g r a m m ewhich aims to increase land conservation and fo re s t ry. A ro u n d0.2 percent of the total area under arable production is plantedwith tre e s , m a i n ly eucalyptus and pine which provides fuelwo o d .
Lesotho is sparsely endowed with natural re s o u rc e s , the maint wo being the hy d roelectric potential of its rive r s , and diamonds.One of the largest civil engineering projects in A f r i c a , t h eLesotho Highlands Water Project (LHWP), is curre n t lyu n d e r w ay, its purpose being to harness and export surpluswater to South A f r i c a . Lesotho is already receiving roy a l t i e sf rom the sale of the water.
T h e re has been a decline in the volume of exports of diamondssince 1983, due to the closure of the main diamond mine. P l a n sto rev i ve the diamond industry have not yet been implemented.Large deposits of clay have also been mined for brickm a nu f a c t u r i n g , and for the manu f a c t u re of ceramic ware andt i l e s . Building and construction activity has increased significantlysince 1986 and the upward trend is now decelerating aftercompletion of phase 1 A of the LHWP, w h i c h , in addition to thebuilding of the project itself, also re q u i red much upgrading ins u rrounding infrastructure. Despite the country ’s ruggedt e rr a i n , the overall policy of government is to facilitate access toisolated are a s .
The programme of industrialisation through private enterprisehas seen significant growth in the manufacturing sector. T h emain activities in this sector are clothing and fo o t wear fo re x p o rt ,d eveloped through direct fo reign investment from SouthA f r i c a , East A s i a , Mauritius and Euro p e. Other export go o d sinclude bricks, ceramic tiles, h a n d i c r a f t s ,f u r n i t u re and tap e s t r i e s .Companies producing for import substitution are in the areas ofb r i c k - m a k i n g , c a n d l e s , beer and beve r a g e s , canned fo o d , b re a dand milled pro d u c t s .
L e s o t h o ’s tourism strategy is aimed at those who enjoy outdoor
1 ) . The ranking, d evised by the United Nations Development Pro g r a m m e( U N D P ) , is based on life expectancy at birt h , adult literacy, combined primary,s e c o n d a ry and tert i a ry education enrolment and adjusted real GDP per cap i t a .It should be noted howeve r, that the ranking is based on 1994 figure s .
Dam construction in progress at the Lesotho Highlands Water Project.

L E S O T HO
34
a c t i v i t i e s . A c c o rd i n g ly, tourist accommodation is continu a l lybeing deve l o p e d , although on a small scale, m a i n ly aimed athiking and horse riding in summer and skiing in winter. T h escenic Lesotho Highlands are considered the main tourista t t r a c t i o n .
I n f r a s t r u c t u reLesotho purchases most of its power from the South A f r i c a ne n e r gy company Esko m .The government is pursuing a policy toexploit Lesotho’s largely untapped hy d roelectric potential in abid to achieve self-sufficiency in energy by the early part of the21st century. Once operational, the hy d roelectric scheme ofthe LHWP should meet all fo reseeable re q u i re m e n t s .
L e s o t h o ’s mountainous terrain makes access to many are a sdifficult and Lesotho relies heav i ly on its domestic air netwo r kfor transport . The road network has been deve l o p e dc o n s i d e r a b ly to facilitate easier access to and from the moreremote are a s , and there are roads linking Lesotho dire c t ly withSouth African export port s . I n c reased physical infrastructuret h roughout the country has not only provided swift and efficientt r a n s p o rt , it has also facilitated increased trade and tourism.Lesotho today boasts a road network of over 6,000 km. C a rh i re companies and freight carriers operate in Lesotho. I n l a n dp o rt and container facilities are also av a i l a b l e, p rov i d i n gsubstantial cost savings on imports and export clearance.
With re g a rd to air trave l , the re c e n t ly privatised national airlinep rovides domestic flights to Mokhotlong and Quacha’s Nek, a n dLesotho is dire c t ly linked with Johannesburg InternationalA i r p o rt through Air Lesotho and Air Link. Moshoeshoe IInternational A i r p o rt became operational in 1985 and is locatedap p rox i m a t e ly 20 km from the capital Maseru.
The telephone system has been extensive ly modernised andexpanded in recent years with connections growing by anaverage of 13 percent per ye a r. T h e re is direct dialling bothl o c a l ly and ove r s e a s .
E C O N O M I C O V E R V I E W
I n t ro d u c t i o nL e s o t h o ’s economy has traditionally been based on agricultureand animal husbandry, as well as migrant labour re m i t t a n c e s .Industrial exports have become incre a s i n g ly valuable in re c e n tyears and are outpacing the traditional exports of wool andm o h a i r, p a rt ly due to an aggre s s i ve programme ofindustrialisation driven by the private sector.
The gove r n m e n t , t o o, recognises the need for industry inLesotho to eve n t u a l ly become the driving fo rce in the economy.In order to facilitate this, the government of Lesotho hase m b a r ked on sectoral re form pro g r a m m e s , i n c l u d i n gprivatisation and parastatal re form pro g r a m m e s .These re fo r mp rogrammes we re initiated in 1988 and are still on-go i n g . T h eyh ave been largely implemented under IMF-support e dadjustment programmes with significant technical assistancep rovided by the Fund and other agencies.
Recent Macro-Economic Deve l o p m e n t sThe performance of the economy in 1997 reve rted back to thep re-LHWP trend according to the latest estimates.The ave r a g ereal growth rate in gross domestic product (GDP) hadi n c reased from 3 percent during 1990-93 to 12 percent during1994 - 1996. In 1997 GDP rose by 3.5 perc e n t .While the LHWPwas initiated in 1987/8, the peak of the activities was re a c h e dduring 1994-96 - hence the significant impact on the domestice c o n o my during that period. The sharp decline in thep e r formance of the domestic economy in 1997 was
accompanied by a reduced net factor income from abro a d , as aresult of a continued decline in the number of migrantm i n ewo r kers employed in the South African mining industry.The combined effect was a deceleration in the growth rate ofnational income.
Fiscal perfo r m a n c e, h oweve r, was better than expected. Abudgeted deficit turned out to be a surplus,m a i n ly as a result ofa stronger than anticipated growth in government reve nu e s .Official re s e rves are estimated at 8.2 months import cove r.To t a ldomestic credit is expected to continue declining as a result ofthe buildup of government deposits with the banking sector.
The money supply growth rate for 1997 is estimated to bel ower than that of the previous year - the annualised quart e r- t o -q u a rter percentage change in money supply (M2) was on ad e c l i n e. It started at a level of 14.6 percent (annual) in Marc h1997 and declined gradually to 14.4 percent and 14.2 in June andSeptember 1997, re s p e c t i ve ly, to reach a level of 9.9 percent inDecember 1997.This dow n w a rd trend fo l l owed a sharp risingt rend observed in 1996.
The deficit in the current account is projected to have declinedin line with the decrease LHWP related import s . The cap i t a lbalance is expected to have improved (though at a lower pace)while the overall balance continued to show a stro n gp e r fo r m a n c e.
M o n ey and capital market interest rates decreased by anaverage of 1.5 percentage points, fo l l owing movements in theregional financial markets during the ye a r. T h ey re m a i n e dp o s i t i ve in real terms.
The inflation rate, based on the consumer price index,c o n t i nued to remain below 10 percent in 1997.At 8.5 perc e n tin the first quart e r, it increased marginally to 8.8 percent in thesecond and third quart e r s , and then fell to 7.5 percent in thefinal quarter of the ye a r. Responsible for the stable annual rateof inflation was the lower growth rate of the food and beve r a g e sprice index, which weighs heav i ly in the overall consumer priceindex (CPI). The improvement in inflation and budget deficitl evels also signify an improvement in the economic perfo r m a n c ethat is mainly attributeable to the implementation of re forms bythe Government of Lesotho with assistance from the IMF’senhanced structural adjustment facility.
Financial Institutions The Central Bank of Lesotho acts as a banker to thegovernment and other financial institutions, and is re s p o n s i b l efor the management of Lesotho’s monetary policy. In add i t i o n ,the Central Bank supervises the financial institutions andinsurance companies and administers exchange contro lre g u l a t i o n s . The Bank was established in Janu a ry 1980 as theLesotho Monetary Authority and gained the status of a centralbank in 1982.
Lesotho has three commercial banks, the gove r n m e n t - ow n e dLesotho Bank and the South A f r i c a n - owned banks StandardBank (which acquired Barc l ays Bank PLC Lesotho in 1995) andN e d b a n k .All three banks deal with both the commercial and thecorporate marke t s . Lesotho also has an agriculturald evelopment bank, t h ree insurance companies and a number ofinsurance bro ke r s . The Lesotho National Deve l o p m e n tCorporation (LNDC) operates as a development financei n s t i t u t i o n , i nvestment promotion agency and promotes thed evelopment of industry and commerc e.
As Lesotho is part of the Common Monetary A rea (CMA),which allows access to the South African capital market for theLesotho banking system, the country has no exchange ratepolicy independent of the CMA. The currency is pegged at parwith the South African Rand.
L E S O T HO
35
All major infrastructure investments have been financed thro u g hexternal sources in the form of grants and concessional finance.The best known project is the LHWP that commenced in 1987.The project is immense in comparison with the economy ofL e s o t h o, accounting for more than 25 percent of GDP in itspeak construction year of 1994. The Katse dam enables Lesothoto supply water to the Gauteng area of South A f r i c a , and it willalso generate hy d roelectric power for the country itself. O t h e rinfrastructural components of the project includes ro a d s ,b r i d g e s , p ower lines and power supply systems. T h eUSD1,500m first phase of the project was completed at thebeginning of 1998, marking the start of the transfer of watert h rough a complex system of dams and tunnels from Lesotho toG a u t e n g .
Lesotho Privatisation Prog r a m m eThe legislation governing the privatisation programme was putin place in 1995. The programme is carried out by thePrivatisation Unit of the Ministry of Finance, headed by aD i rector who is responsible to the Minister of Finance andEconomic Planning.
The participation of Basotho nationals in the privatisationp rogramme is deemed paramount for the success andacceptability of the pro g r a m m e. The government has thus take na conscious decision to sell its smaller enterprises to the localbusiness commu n i t y, and to re s e rve share holdings in largerenterprises for sale to employees and for future publicf l o a t a t i o n . To facilitate such floatation the Privatisation Unit ischarged with the task of coordinating work tow a rds theestablishment of a capital market facility. F u rt h e r m o re thep rogramme encourages joint ve n t u res between fo re i g ni nvestors and individuals and groups in Lesotho’s businessc o m mu n i t y. Cooperation is also encouraged between inve s t o r sin agro-industries and Basotho farmers who traditionally holdl a n d , but have had little incentive to grow cash-crops likea s p a r a g u s , fruits and flowe r s , which have proved to grows u c c e s s f u l ly in Lesotho.
The port folio of companies to be privatised includes more thant h i rty state-owned enterprises, and others in which thegovernment holds shares through LNDC and the LesothoD evelopment Bank. These include shares in South Africa basedretail store s , a g ro - i n d u s t ry and utility companies (electricity,water and telecommu n i c a t i o n s ) . For the latter the gove r n m e n tis seeking to enter into strategic part n e r s h i p s . The nationalb a n k s , Lesotho National Development Bank and the LesothoAgricultural Bank have been placed under a managementcontract to pre p a re them for privatisation.
Privatisations to date include that of the national airline,L e s o t h oA i r w ays Corporation,which was sold to a South African chart e rc o m p a ny, Ross Air in August 1997 at about USD2.2m. This dealb rought about an application from the South African airlineAirlink to have its traffic rights on the Johannesburg-Maseru linere i n s t a t e d , resulting in creation of jobs and a healthy increase inthe competition on the ro u t e.
Other industries that are curre n t ly being privatised include theLesotho Flour Mills, the Basotho Fruit and Vegetable Cannery,the International Freight and Tr avel Serv i c e, t wo mountain lodgesand government mechanical wo r k s h o p s .
I N V E S T M E N T C L I M AT E
I nvestment Incentive s– A non-re p ayable skills training grant which covers up to 50
The money market is developing steadily and there are nowm o n t h ly auctions of tre a s u ry bills. In 1997 the central banki n t roduced a Central Bank paper which is aimed atcomplementing the tre a s u ry bills. T h e re is no capital market inLesotho as ye t , but in order to facilitate public sale of stateenterprises the government has tasked the Privatisation Unit ofthe Ministry of Finance to coordinate the establishment of astock exchange. Regulations governing the operations of them a r ket are being pro mulgated under the Central Bank A c t .
E x c h a n ge Contro l sP rofits and dividends from investments held in Lesotho may berepatriated fre e ly. All inward transfers of capital should bere g i s t e red with the central bank to facilitate subsequentre p a t r i a t i o n . Prior ap p roval is re q u i red for outward transfer ofc ap i t a l .
Residents are only allowed to transfer capital within the CMAre g i o n , and they are re q u i red by law to declare any fo re i g nexchange earnings within seven day s . Companies are howeve ra l l owed to invest outside the CMA, p rovided fo reign exchangeearnings are re p a t r i a t e d .
Fo reign Tr a d eM e rchandise exports have increased rap i d ly since 1986, g row i n gby a phenomenal 39.9 percent during 1996. M a nu f a c t u re dgoods (pre d o m i n a n t ly from the textile and leather we a rindustries) made up 76.3 percent of the total export value in1 9 9 7 . Total exports to Africa (mainly SACU) have re g i s t e red 89p e rcent growth in 1996, and account for 71 percent of ove r a l le x p o rt s . While the SACU countries remain the largest tradingp a rt n e r s , Lesotho is diversifying its markets to increase export sto North America in part i c u l a r, thus reducing its reliance onS AC U. L e s o t h o ’s network of trade pre fe rences has played acrucial role in providing favourable access to markets such ast h e s e.
Main export products are clothing, f u r n i t u re, fo o t wear andwo o l . Lesotho imports corn, c l o t h i n g , building materials,ve h i c l e s ,m a c h i n e ry and medicines.
Trade LiberalisationI m p o rt licenses are issued to licensed traders andm a nu f a c t u rers resident in Lesotho, and will only be issued fo rquantities not in excess of local demand.
Fo reign Direct Inve s t m e n tL e s o t h o, in concert with other countries wo r l d - w i d e,recognises that FDI is important for the much needede m p l oyment generation, i nvestment cap i t a l , and technologyt r a n s fe r, and a lot of effo rt is being made to put in place a liberalFDI framework to facilitate greater direct inward inve s t m e n tf l ows into the country.
FDI into Lesotho has increased steadily throughout the 1990s,f rom USD3m in 1992 to USD19m in 1994 and to USD28m in1 9 9 6 .
The transformation of South Africa to a democracy has had ap o s i t i ve impact on the inflow of FDI to Lesotho. South A f r i c aremains the main source of FDI, accounting for nearly 38p e rcent of the total port fo l i o, p re d o m i n a n t ly in agri-business,construction and engineering, m a nufacturing and serv i c e s ,fo l l owed by East Asia (27 percent) which re g i o n ’s presence isl a r g e ly concentrated in the clothing, textiles and fo o t wear sub-s e c t o r. The residual 35 percent comes from Europe (e. g .G e r m a ny, S w i t z e r l a n d , United Kingdom Po rtugal and Italy) andis mainly in the garment manufacturing business. Of the 23clothing manu f a c t u rers curre n t ly operating in Lesotho, 14 aref rom Taiwan and five are from South A f r i c a .
L E S O T HO
36
p e rcent of the wage bill during the initial training period for an ew ly established manufacturing company.
– A compre h e n s i ve export finance facility to support export e r swith working capital on concessionary cre d i t s .
– Loan guarantees for loan finance provided to clients of theLNDC by other financial institutions.
– Loan finance from the LNDC to projects which candemonstrate long-term viability.
– Equity participation in strategic projects by the LNDC, in theabsence of a private inve s t o r, or in partnership with locali nve s t o r s .
– Manu f a c t u rers re c e i ve a full rebate on imported raw materialsor components for use solely in the processing orm a nufacturing of goods for the export marke t .
– Provision of serviced industrial plots, customised orspecialised factories and commercial and residential pro p e rt i e sfor lease.
E x p o rt Incentive sLesotho has an Export Finance Scheme, enabling exports tocompete better in world marke t s .The main components of thisscheme are :
– Credit guarantee scheme - the exporters’ bank applies fo re x p o rt finance on behalf of its client, to obtain credit guaranteef rom the LNDC.
– Pre-shipment credit scheme - finances exporters wo r k i n gc apital needs on the basis of confirmed export ord e r s .
– Post-shipment credit scheme - a loan which enables thee x p o rter to start a new manufacturing cycle from the day ofshipment until payment from the fo reign buyer is re c e i ve d ,a l l owing companies to offer favourable credit terms to theirc u s t o m e r s .
– Refinance arrangement - a re-lending facility granted by theCentral Bank of Lesotho to commercial banks to prov i d ee x p o rters with concessionary export finance.
– Counter-guarantee arrangement - the Central Bank assumes95 percent of the risk associated with guarantees issued by theL N D C.
– Central Export Development Fund - the latter twoa rrangements re c e i ve financial backing from the Central ExportD evelopment Fund which is organised on a revolving basis.T h efund is managed by the Central Bank of Lesotho.
Trade A g reements Lesotho is a signatory to a number of trade agreements withvarious countries:
– EU: The Lomé Convention facilitates duty-free access toconsumers in the EU for goods wholly produced in Lesotho, o rwhose value-added content satisfies the criteria.
– SAC U : Access to the markets of Namibia, South A f r i c a ,B o t swana and Swaziland is mostly duty-fre e, although somei m p o rt restrictions do exist to protect infant industries.
– USA, J ap a n , C a n a d a , Australia and New Zealand: T h eGeneralised System of Pre fe rences (GSP) scheme provides fo rd u t y - f ree and quota-free entry for certain pro d u c t s .
– SADC: Lesotho enjoys concessionary access to the marke t sof the SADC member states.
Ta x a t i o nThe corporate tax rate is 15 perc e n t . No withholding tax ondividends distributed by manufacturing companies to local or
fo reign share h o l d e r s . Double tax avoidance treaties with SouthA f r i c a ,M a u r i t i u s , the USA and the UK.
The maximum individual tax rate is 35 perc e n t .GST is curre n t lyat 10 perc e n t . It is envisaged that the country will move to aValue A dded Tax (VAT) in the near future.
Institutions invo l ved in Investment Promotion Established in 1992, the Lesotho Investment Promotion Centreis a division of the LNDC, which is a 90 percent gove r n m e n t -owned parastatal, with the remaining 10 percent owned by theGerman Finance Company for Investments in Deve l o p i n gC o u n t r i e s . The Investment Promotion Centre promotes thef l ow of fo reign direct investment into Lesotho, and further actsas a “one-stop” centre to assist investors during the pre- andp o s t - i nvestment period, e g to obtain the necessary ap p rov a l sand licences to start up their business and to obtain wo r k ,residence and other permits necessary to operate a business inL e s o t h o. The Trade Promotion Unit, another gove r n m e n ta g e n c y, p romotes Lesotho’s goods wo r l d w i d e. It offe r sm a r ke t i n g , technical and management assistance to investors aswell as a series of trade advisory serv i c e s , and prov i d e si n formation and publicity.
I nvestment CodeWhile no investment code as such exists in Lesotho, i n c e n t i ve savailable to investors are all set out in legislation and the rightsof investors are protected by the constitution of Lesotho.
P rotection of Inve s t m e n tLesotho is a signatory to the convention on the settlement ofi nvestment disputes between states and nationals of others t a t e s . This convention allows for fo reign investors to gaininternational jurisdiction of the International Centre for theSettlement of Investment Disputes (ICSID) in the event of legaldisputes concerning investment in Lesotho. Lesotho is also amember of MIGA.
I N V E S TM E N TO P P O R T U N I T I E S A N D
P R O J E C T S
O p p o rt u n i t i e sI nvestment opportunities promoted in Lesotho include:
Clothing and blanket manu f a c t u re, a g ro - i n d u s t r i e s ,f u r n i t u re andfo o t wear pro d u c t i o n .
In response to the growing demand for consumer electronics inthe SADC re g i o n ,e s p e c i a l ly since the democratisation pro c e s sin South A f r i c a , Lesotho intends to expand its production baseinto these products to cap t u re this emerging marke t , t a k i n gadvantage of the sector’s labour intensity and the highp roductivity rates and cost effe c t i veness of the country ’s labourfo rc e. Strategic partners with the fo l l owing attributes arere q u i re d : technical know - h ow ; financial strength andmanagement know - h ow to produce TV sets, video cassettere c o rd e r s , electric stove s , re f r i g e r a t o r s , m i c row ave ove n s ,washing machines and drye r s , and telecommu n i c a t i o n se q u i p m e n t .
F u rt h e r m o re, t h e re is a wide range of potential projects in them a nu f a c t u r i n g , construction and services sector connected tothe LHWP.
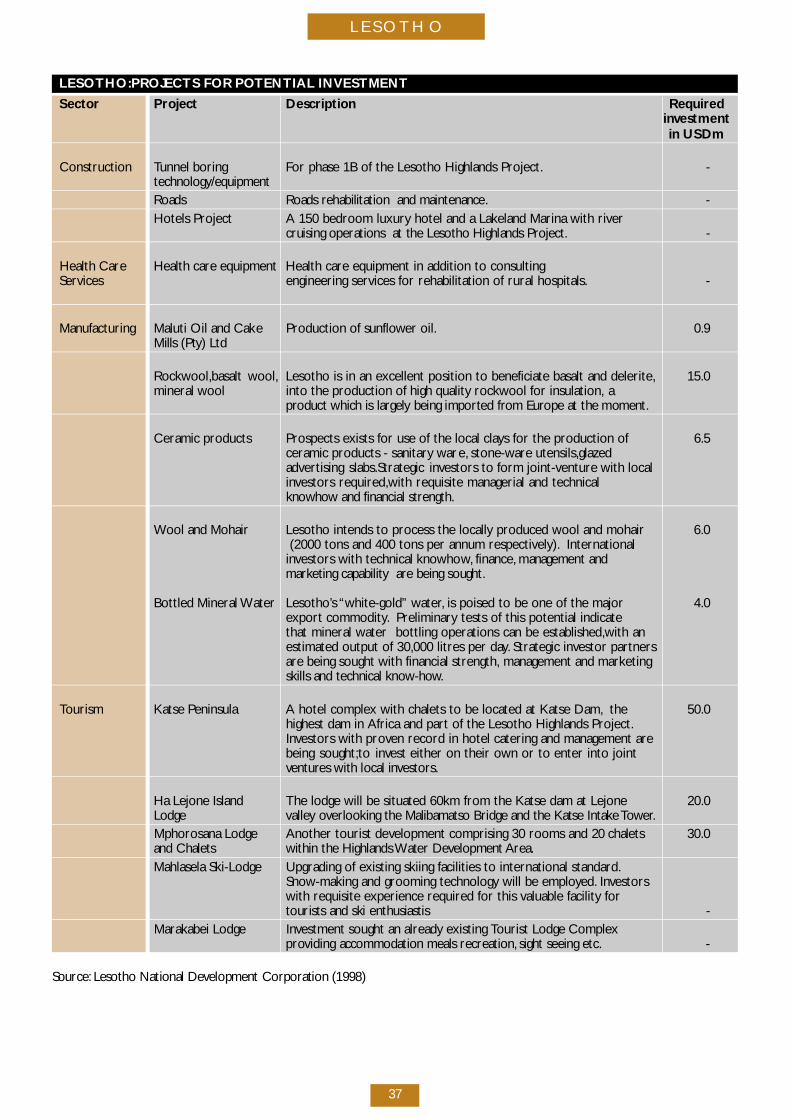
L E S O T HO
37
L E S OT H O :P ROJECTS FOR POTENTIAL INVESTMENT
Sector P ro j e c t D e s c r i p t i o n R e q u i red i nvestment in USDm
Construction Tunnel boring For phase 1B of the Lesotho Highlands Project. -t e c h n o l o gy / e q u i p m e n tRoads Roads rehabilitation and maintenance. -Hotels Project A 150 bedroom luxury hotel and a Lakeland Marina with river
cruising operations at the Lesotho Highlands Pro j e c t . -
Health Care Health care equipment Health care equipment in addition to consultingServices engineering services for rehabilitation of rural hospitals. -
Manufacturing Maluti Oil and Cake Production of sunflower oil. 0.9Mills (Pty) Ltd
Rockwool,basalt wool, Lesotho is in an excellent position to beneficiate basalt and delerite, 15.0mineral wool into the production of high quality rockwool for insulation, a
p roduct which is largely being imported from Europe at the moment.
Ceramic products Prospects exists for use of the local clays for the production of 6.5ceramic products - sanitary ware, stone-ware utensils,glazed advertising slabs.Strategic investors to form joint-venture with localinvestors required,with requisite managerial and technicalk n ow h ow and financial stre n g t h .
Wool and Mohair Lesotho intends to process the locally produced wool and mohair 6.0(2000 tons and 400 tons per annum respectively). International
investors with technical knowhow, finance, management andm a r keting capability are being sought.
Bottled Mineral Water Lesotho’s “white-gold” water, is poised to be one of the major 4.0export commodity. Preliminary tests of this potential indicate that mineral water bottling operations can be established,with an estimated output of 30,000 litres per day. Strategic investor partners are being sought with financial strength, management and marketing skills and technical know - h ow.
Tourism Katse Peninsula A hotel complex with chalets to be located at Katse Dam, the 50.0highest dam in Africa and part of the Lesotho Highlands Project.Investors with proven record in hotel catering and management arebeing sought;to invest either on their own or to enter into joint ve n t u res with local inve s t o r s .
Ha Lejone Island The lodge will be situated 60km from the Katse dam at Lejone 20.0 L o d g e valley overlooking the Malibamatso Bridge and the Katse Intake Towe r.Mphorosana Lodge Another tourist development comprising 30 rooms and 20 chalets 30.0 and Chalets within the Highlands Water Development A re a .Mahlasela Ski-Lodge Upgrading of existing skiing facilities to international standard.
Snow-making and grooming technology will be employed. Investorswith requisite experience required for this valuable facility fortourists and ski enthusiastis -
Marakabei Lodge Investment sought an already existing Tourist Lodge Complexproviding accommodation meals re c re a t i o n , sight seeing etc. -
S o u rc e : Lesotho National Development Corporation (1998)
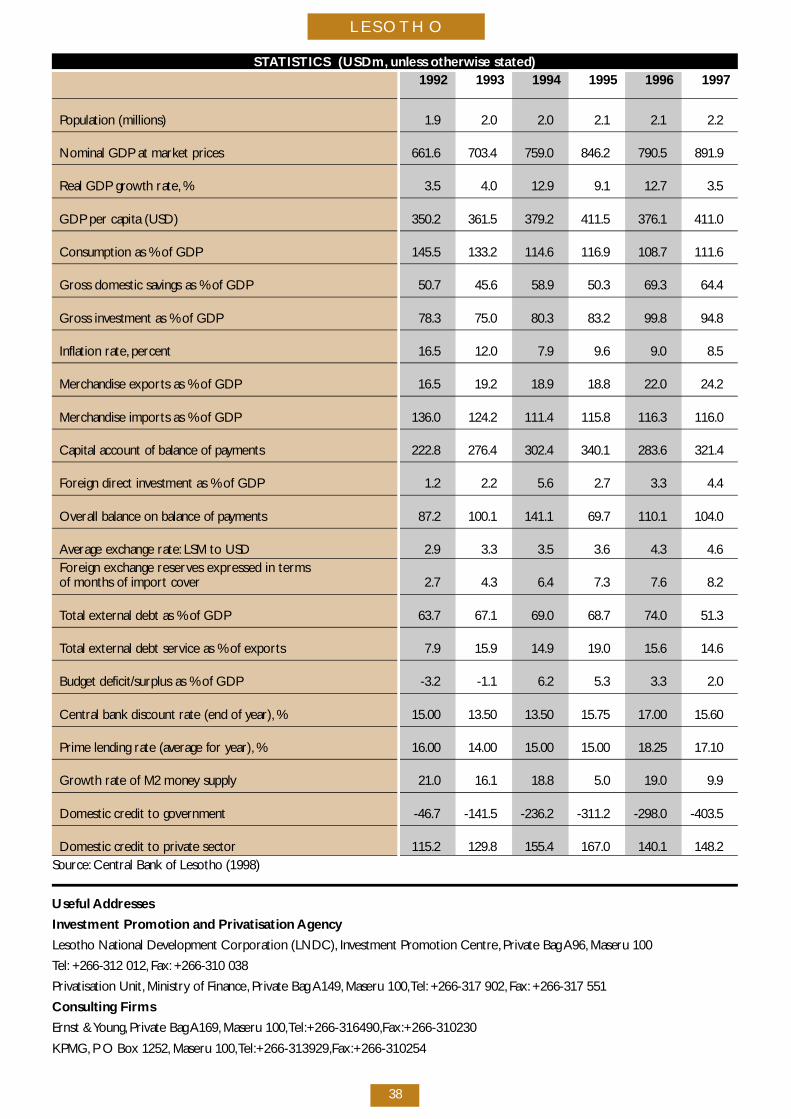
L E S O T HO
38
S TATISTICS (U S D m , unless otherwise stated)1 9 9 2 1 9 9 3 1 9 9 4 1 9 9 5 1 9 9 6 1 9 9 7
Population (millions) 1 . 9 2 . 0 2 . 0 2 . 1 2 . 1 2 . 2
Nominal GDP at market prices 6 6 1 . 6 7 0 3 . 4 7 5 9 . 0 8 4 6 . 2 7 9 0 . 5 8 9 1 . 9
Real GDP growth rate, % 3 . 5 4 . 0 1 2 . 9 9 . 1 1 2 . 7 3 . 5
GDP per capita (USD) 3 5 0 . 2 3 6 1 . 5 3 7 9 . 2 4 1 1 . 5 3 7 6 . 1 4 1 1 . 0
Consumption as % of GDP 1 4 5 . 5 1 3 3 . 2 1 1 4 . 6 1 1 6 . 9 1 0 8 . 7 1 1 1 . 6
G ross domestic savings as % of GDP 5 0 . 7 4 5 . 6 5 8 . 9 5 0 . 3 6 9 . 3 6 4 . 4
G ross investment as % of GDP 7 8 . 3 7 5 . 0 8 0 . 3 8 3 . 2 9 9 . 8 9 4 . 8
Inflation rate, p e rc e n t 1 6 . 5 1 2 . 0 7 . 9 9 . 6 9 . 0 8 . 5
M e rchandise exports as % of GDP 1 6 . 5 1 9 . 2 1 8 . 9 1 8 . 8 2 2 . 0 2 4 . 2
M e rchandise imports as % of GDP 1 3 6 . 0 1 2 4 . 2 1 1 1 . 4 1 1 5 . 8 1 1 6 . 3 1 1 6 . 0
C apital account of balance of payments 2 2 2 . 8 2 7 6 . 4 3 0 2 . 4 3 4 0 . 1 2 8 3 . 6 3 2 1 . 4
Fo reign direct investment as % of GDP 1 . 2 2 . 2 5 . 6 2 . 7 3 . 3 4 . 4
O verall balance on balance of payments 8 7 . 2 1 0 0 . 1 1 4 1 . 1 6 9 . 7 1 1 0 . 1 1 0 4 . 0
Average exchange rate: LSM to USD 2 . 9 3 . 3 3 . 5 3 . 6 4 . 3 4 . 6Foreign exchange reserves expressed in termsof months of import cove r 2 . 7 4 . 3 6 . 4 7 . 3 7 . 6 8 . 2
Total external debt as % of GDP 6 3 . 7 6 7 . 1 6 9 . 0 6 8 . 7 7 4 . 0 5 1 . 3
Total external debt service as % of export s 7 . 9 1 5 . 9 1 4 . 9 1 9 . 0 1 5 . 6 1 4 . 6
Budget deficit/surplus as % of GDP - 3 . 2 - 1 . 1 6 . 2 5 . 3 3 . 3 2 . 0
Central bank discount rate (end of ye a r ) , % 1 5 . 0 0 1 3 . 5 0 1 3 . 5 0 1 5 . 7 5 1 7 . 0 0 1 5 . 6 0
Prime lending rate (average for ye a r ) , % 1 6 . 0 0 1 4 . 0 0 1 5 . 0 0 1 5 . 0 0 1 8 . 2 5 1 7 . 1 0
G rowth rate of M2 money supply 2 1 . 0 1 6 . 1 1 8 . 8 5 . 0 1 9 . 0 9 . 9
Domestic credit to government - 4 6 . 7 - 1 4 1 . 5 - 2 3 6 . 2 - 3 1 1 . 2 - 2 9 8 . 0 - 4 0 3 . 5
Domestic credit to private sector 1 1 5 . 2 1 2 9 . 8 1 5 5 . 4 1 6 7 . 0 1 4 0 . 1 1 4 8 . 2S o u rc e : Central Bank of Lesotho (1998)
Useful A dd re s s e s
I nvestment Promotion and Privatisation A ge n c y
Lesotho National Development Corporation (LNDC), I nvestment Promotion Centre, Private Bag A 9 6 , Maseru 100
Te l : +266-312 012, F a x : +266-310 038
Privatisation Unit, M i n i s t ry of Finance, Private Bag A 1 4 9 , Maseru 100,Te l : +266-317 902, F a x : +266-317 551
Consulting Firms
Ernst & Yo u n g , Private Bag A 1 6 9 , Maseru 100,Te l :+ 2 6 6 - 3 1 6 4 9 0 ,F a x :+ 2 6 6 - 3 1 0 2 3 0
K P M G , P O Box 1252, Maseru 100,Te l :+ 2 6 6 - 3 1 3 9 2 9 ,F a x :+ 2 6 6 - 3 1 0 2 5 4
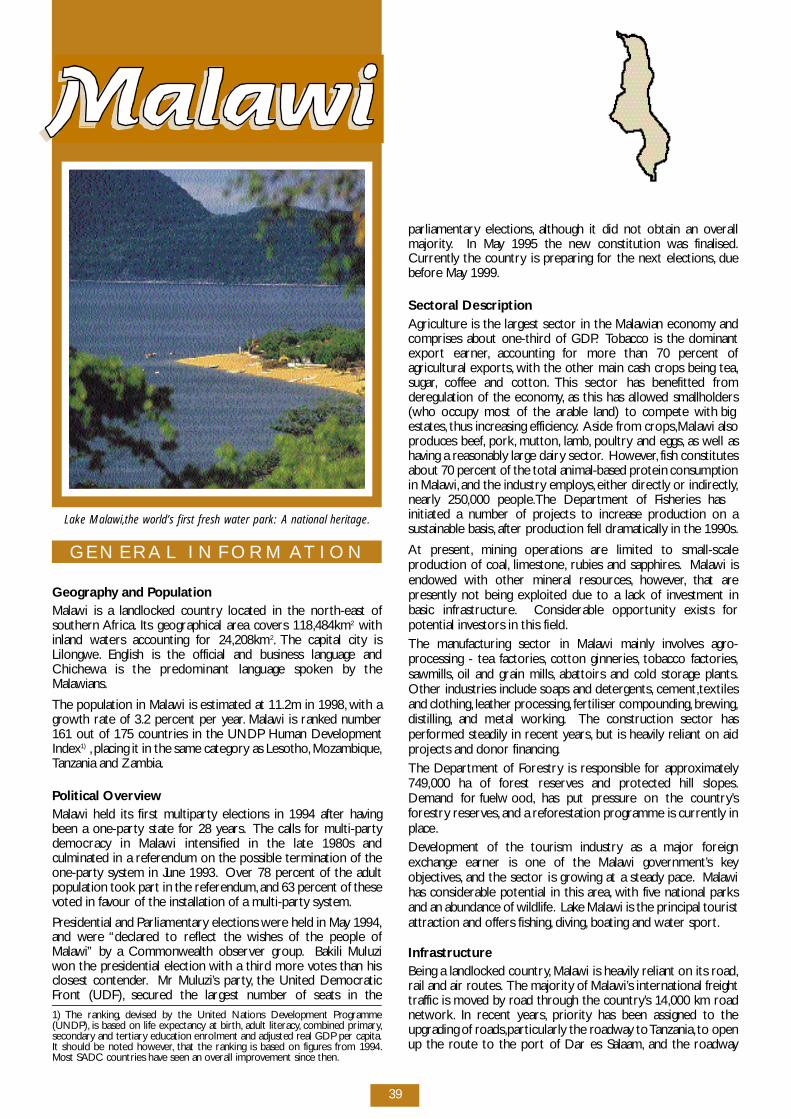
39
G E N E R A L I N F O R M AT I O N
G e og r ap hy and Po p u l a t i o nM a l awi is a landlocked country located in the north-east ofsouthern A f r i c a . Its geographical area covers 118,484km2 w i t hinland waters accounting for 24,208km2. The capital city isL i l o n g we. English is the official and business language andC h i c h ewa is the predominant language spoken by theM a l aw i a n s .
The population in Malawi is estimated at 11.2m in 1998, with ag rowth rate of 3.2 percent per ye a r. M a l awi is ranked nu m b e r161 out of 175 countries in the UNDP Human Deve l o p m e n tI n d e x1 ) , placing it in the same catego ry as Lesotho, M o z a m b i q u e,Tanzania and Zambia.
Political Ove rv i ewM a l awi held its first mu l t i p a rty elections in 1994 after hav i n gbeen a one-party state for 28 ye a r s . The calls for mu l t i - p a rt ydemocracy in Malawi intensified in the late 1980s andculminated in a re fe rendum on the possible termination of theo n e - p a rty system in June 1993. O ver 78 percent of the adultpopulation took part in the re fe re n d u m , and 63 percent of thesevoted in favour of the installation of a mu l t i - p a rty system.
P residential and Parliamentary elections we re held in May 1994,and we re “ d e c l a red to reflect the wishes of the people ofM a l awi” by a Commonwealth observer gro u p. Bakili Muluziwon the presidential election with a third more votes than hisclosest contender. Mr Muluzi’s part y, the United DemocraticF ront (UDF), s e c u red the largest number of seats in the
p a r l i a m e n t a ry elections, although it did not obtain an ove r a l lm a j o r i t y. In May 1995 the new constitution was finalised.C u rre n t ly the country is preparing for the next elections, d u eb e fo re May 1999.
Sectoral DescriptionA g r i c u l t u re is the largest sector in the Malawian economy andcomprises about one-third of GDP. Tobacco is the dominante x p o rt earner, accounting for more than 70 percent ofagricultural export s , with the other main cash crops being tea,s u g a r, c o f fee and cotton. This sector has benefitted fro md e regulation of the economy, as this has allowed smallholders(who occupy most of the arable land) to compete with bige s t a t e s , thus increasing efficiency. Aside from cro p s ,M a l awi alsop roduces beef, p o r k , mu t t o n , l a m b, p o u l t ry and eggs, as well ash aving a re a s o n a b ly large dairy sector. H oweve r, fish constitutesabout 70 percent of the total animal-based protein consumptionin Malaw i , and the industry employ s , either dire c t ly or indire c t ly,n e a r ly 250,000 people. The Department of Fisheries hasinitiated a number of projects to increase production on asustainable basis, after production fell dramatically in the 1990s.
At pre s e n t , mining operations are limited to small-scalep roduction of coal, l i m e s t o n e, rubies and sap p h i re s . M a l awi ise n d owed with other mineral re s o u rc e s , h oweve r, that arep re s e n t ly not being exploited due to a lack of investment inbasic infrastructure. Considerable opportunity exists fo rpotential investors in this field.The manufacturing sector in Malawi mainly invo l ves agro -p rocessing - tea factories, cotton ginneries, tobacco factories,s aw m i l l s , oil and grain mills, abattoirs and cold storage plants.Other industries include soaps and detergents, c e m e n t ,t e x t i l e sand clothing, leather pro c e s s i n g , fe rtiliser compounding, b rew i n g ,d i s t i l l i n g , and metal wo r k i n g . The construction sector hasp e r formed steadily in recent ye a r s , but is heav i ly reliant on aidp rojects and donor financing.The Department of Fo re s t ry is responsible for ap p rox i m a t e ly749,000 ha of fo rest re s e rves and protected hill slopes.Demand for fuelwo o d , has put pre s s u re on the country ’sfo re s t ry re s e rve s , and a re fo restation programme is curre n t ly inp l a c e.D evelopment of the tourism industry as a major fo re i g nexchange earner is one of the Malawi gove r n m e n t ’s keyo b j e c t i ve s , and the sector is growing at a steady pace. M a l aw ihas considerable potential in this are a , with five national parksand an abundance of wildlife. L a ke Malawi is the principal touristattraction and offers fishing, d i v i n g , boating and water sport .
I n f r a s t r u c t u reBeing a landlocked country, M a l awi is heav i ly reliant on its ro a d ,rail and air ro u t e s . The majority of Malaw i ’s international fre i g h ttraffic is moved by road through the country ’s 14,000 km ro a dn e t wo r k . In recent ye a r s , priority has been assigned to theupgrading of ro a d s ,p a rt i c u l a r ly the ro a d w ay to Ta n z a n i a , to openup the route to the port of Dar es Salaam, and the ro a d w ay
1) The ranking, d evised by the United Nations Development Pro g r a m m e( U N D P ) , is based on life expectancy at birt h , adult literacy, combined primary,s e c o n d a ry and tert i a ry education enrolment and adjusted real GDP per cap i t a .It should be noted howeve r, that the ranking is based on figures from 1994.Most SADC countries have seen an overall improvement since then.
Lake Malawi,the world’s first fresh water park: A national heritage.
M A L AW I
40
b e t ween Lilongwe and Lake Malawi to facilitate easy access fo rt o u r i s t s . In mid 1997,M a l aysia undertook to construct highway slinking the country ’s three main commercial centre s . T h ea g reement is part of a thre e - year plan to lease outadministration of roads to private companies. Rail freight linksh ave also been bolstered in recent years by the improvement ofr a i lw ay s . If the plans to create a development corridor aro u n dthe existing Nacala corridor should take off, it is like ly to have ap o s i t i ve impact on Malaw i .
After having operated at a loss for several years the nationala i r l i n e,Air Malaw i ,e m b a r ked on a restructuring programme twoyears ago, including joint ve n t u res with neighbouring airlines toopen up new flight ro u t e s , and an expansion of the fleet. T h ep rospect of privatising parts or all of the airline is beingd i s c u s s e d . The airports at Lilongwe and Blantyre have cargoc apacity as well as bonded and refrigerated warehouse facilities.
The telecommunications network in Malawi is pre s e n t ly beingu p g r a d e d . Facsimile transmissions, e l e c t ronic mail and data cann ow be transmitted from Malawi to most places in the wo r l d .
M a l awi has developed a number of hy d roelectric schemes sinceindependence which have enhanced the electricity generatingc ap a c i t y. The rural electrification programme has notp ro g ressed as well as expected, and at present about thre ep e rcent of rural households have access to electricity. T h eM i n i s t ry of Water Development is responsible for ove r a l lnational water re s o u rces management. About 47 percent ofM a l aw i ’s population have access to safe water, and 53 percent tos a n i t a t i o n .
E C O N O M I C O V E R V I E W
M a l awi adopted an export-oriented ap p roach afteri n d e p e n d e n c e, focusing on agriculture and agro - i n d u s t r i e s .Parastatals including Press Corporation Limited (a largeconglomerate) operated in all key areas of the economy, o f t e ne n j oying monopoly status.G overnment regulation of the privatesector was also significant. In the 1980s howeve r, s t r u c t u r a ladjustment re forms we re initiated, aimed at liberalising thee c o n o my and improving incentives for private sectori nve s t m e n t . These re fo r m s , along with the transition todemocracy in 1994, h ave pro g ressed successfully.
M a l aw i ’s main economic activity continues to be agriculture,with about 37 percent of GDP coming from this sector. T h eother major sectors are manu f a c t u r i n g , u t i l i t i e s , c o n s t r u c t i o n ,t r a n s p o rt , distribution and commu n i c a t i o n s , and gove r n m e n ts e rv i c e s .
Recent Macro-Economic Deve l o p m e n t sThe momentum of growth of the Malawian economy slowe dd own in 1997 as GDP grew by 5.3 percent in real terms, f ro mg rowth rates of 13.4 percent and 12.0 percent in 1995 and 1996re s p e c t i ve ly. I n f l a t i o n a ry pre s s u res abated significantly during1997 and developments in the monetary, and fiscal sectors alsod r a m a t i c a l ly improved as reflected by a slower growth inm o n e t a ry expansion and a reduction in the fiscal deficit. In theexternal sector, h oweve r, a deficit in the overall balance ofp ayments position was re c o rd e d , reversing a large surplus whichwas realised in 1996. The Malawi kwacha exchange rate vis-a-vis other major fo reign curre n c i e s , c o n t i nued to depre c i a t ereaching MWK21.0 per USD by the end of the year from anaverage rate of about MWK15.0 per USD in 1995 and 1996.
In the past, the agricultural sector has been the mainc o n t r i b u t o ry sector behind the growth rate in GDP,but in 1997the manufacturing sector spearheaded the grow t h , reflecting the
liberalisation of the economy and an increase in the supply offo reign exchange on the marke t .
On the external fro n t , the overall balance of payments positionas measured by the change in net fo reign assets of the bankings y s t e m , re g i s t e red a deficit of MWK178m (USD11m) in 1997.This outcome largely reflected low earnings from tobaccos u p p o rt facilities.Thus the official gross fo reign re s e rves stoodat K3 378.5m (USD198m) by end of the ye a r, re p resenting 4.3months of import cove r.At the end of 1996, the official gro s sre s e rves equalled 5.7 months of import s .
During 1997 the authorities made good pro g ress on the fiscalf ro n t .The budget deficit (after grants) declined to 3.0 percent ofGDP during 1997 compared to 4.0 percent of GDP in 1996.This development resulted from a combination of effo rts by thegovernment which ranged from stringent control measures tocurb ove r- e x p e n d i t u re, to broadening the tax base andi m p roving tax administration to boost reve nu e s .
M o n e t a ry expansion decreased significantly in 1997 as theg rowth in broad money supply decelerated sharply from 39.9p e rcent in 1996 to only 2.2 perc e n t . This outcome mainlyreflected a tight monetary policy stance by the monetarya u t h o r i t i e s . Open market operations intensified in order tomop-up excess liquidity while the liquidity re s e rve re q u i re m e n tstood at 35 perc e n t .The penalty for non-compliance was 20.0p e rcent above the ruling Bank rate. I n t e rest rates dro p p e dd r a s t i c a l ly during 1997 and the Bank rate was adjustedd ow n w a rds from 27 percent in 1996 to 23 percent with effe c tf rom 1 A u g u s t ,1 9 9 7 .
P rospects for 1998 are that real growth will improve marginallyto 6.2 percent owing mainly to a slight improvement in we a t h e rc o n d i t i o n s . H oweve r, the excessive rainfall experienced in the1997/98 growing season adve r s e ly affected the quality oft o b a c c o, the major fo reign exchange earner in Malaw i . This isl i ke ly to result in a we a ker performance of the external sector.I n f l a t i o n a ry pre s s u res are also expected to incre a s e.
Financial Institutions
The Malawian government has re c e n t ly embarked on ap rogramme to liberalise and modernise the financial system,aiming for market-based interest rates, no direct gove r n m e n tc o n t rol over credit and unrestricted access to financing facilitiesfor both local and fo reign inve s t o r s .
The Reserve Bank of Malawi began its operations in 1965. T h ebank is fully independent in the areas of monetary policy andthe issuance of the Malawi curre n c y.The Bank also administersthe Exchange Control Act and operates the market ingovernment securities. The money market comprises tre a s u ryb i l l s , bills of exchange and pro m i s s o ry notes.
T h e re are five commercial banks, with the National Bank ofM a l awi and the Commercial Bank of Malawi operatingc o u n t ry w i d e.These banks offer a conventional range of serv i c e sincluding cheque accounts, registration of fo reign capital withthe Reserve Bank, s h o rt and medium-term credit facilities, t r a d ef i n a n c i n g , e x p o rt credit guarantees, fo reign remittances andrepatriation of cap i t a l . F u rt h e r m o re, t h e re are four financehouses and merchant banks, t wo savings institutions, fo u rd evelopment finance institutions, one building society and nineinsurance institutions.
Indebank is a development finance institution which prov i d e sloan and equity financing for pro j e c t s .The state-owned Malaw iD evelopment Corporation invests in projects with local orfo reign part n e r s .
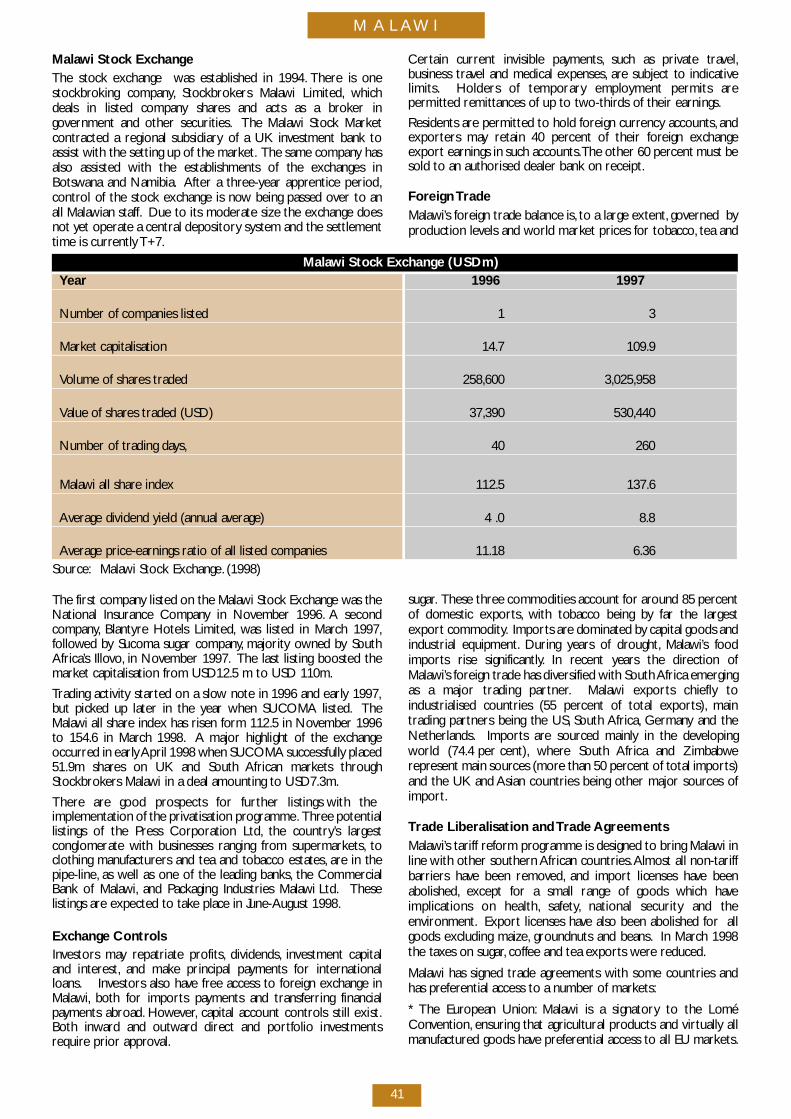
M A L AW I
41
M a l awi Stock ExchangeThe stock exchange was established in 1994. T h e re is ones t o c k b roking company, S t o c k b ro kers Malawi Limited, w h i c hdeals in listed company shares and acts as a bro ker ingovernment and other securities. The Malawi Stock Marke tcontracted a regional subsidiary of a UK investment bank toassist with the setting up of the marke t . The same company hasalso assisted with the establishments of the exchanges inB o t swana and Namibia. After a thre e - year ap p rentice period,c o n t rol of the stock exchange is now being passed over to anall Malawian staff. Due to its moderate size the exchange doesnot yet operate a central depository system and the settlementtime is curre n t ly T + 7 .
M a l awi Stock Exchange (USDm)Ye a r 1 9 9 6 1 9 9 7
Number of companies listed 1 3
M a r ket capitalisation 1 4 . 7 1 0 9 . 9
Volume of shares traded 2 5 8 , 6 0 0 3 , 0 2 5 , 9 5 8
Value of shares traded (USD) 3 7 , 3 9 0 5 3 0 , 4 4 0
Number of trading day s , 4 0 2 6 0
M a l awi all share index 112.5 1 3 7 . 6
Average dividend yield (annual ave r a g e ) 4 .0 8 . 8
Average price-earnings ratio of all listed companies 1 1 . 1 8 6 . 3 6S o u rc e : M a l awi Stock Exchange. ( 1 9 9 8 )
The first company listed on the Malawi Stock Exchange was theNational Insurance Company in November 1996. A secondc o m p a ny, B l a n t y re Hotels Limited, was listed in March 1997,fo l l owed by Sucoma sugar company, majority owned by SouthA f r i c a ’s Illovo, in November 1997. The last listing boosted them a r ket capitalisation from USD12.5 m to USD 110m.
Trading activity started on a slow note in 1996 and early 1997,but picked up later in the year when SUCOMA listed. T h eM a l awi all share index has risen form 112.5 in November 1996to 154.6 in March 1998. A major highlight of the exchangeo c c u rred in early April 1998 when SUCOMA successfully placed51.9m shares on UK and South African markets thro u g hS t o c k b ro kers Malawi in a deal amounting to USD7.3m.
T h e re are good prospects for further listings with theimplementation of the privatisation pro g r a m m e. T h ree potentiallistings of the Press Corporation Ltd, the country ’s largestconglomerate with businesses ranging from supermarke t s , t oclothing manu f a c t u rers and tea and tobacco estates, a re in thep i p e - l i n e, as well as one of the leading banks, the Commerc i a lBank of Malaw i , and Packaging Industries Malawi Ltd. T h e s elistings are expected to take place in June-August 1998.
E x c h a n ge Contro l sI nvestors may repatriate pro f i t s , d i v i d e n d s , i nvestment cap i t a land intere s t , and make principal payments for internationall o a n s . I nvestors also have free access to fo reign exchange inM a l aw i , both for imports payments and transfe rring financialp ayments abro a d . H oweve r, c apital account controls still exist.Both inward and outward direct and port folio inve s t m e n t sre q u i re prior ap p rov a l .
s u g a r. These three commodities account for around 85 perc e n tof domestic export s , with tobacco being by far the largeste x p o rt commodity. I m p o rts are dominated by capital goods andindustrial equipment. During years of dro u g h t , M a l aw i ’s fo o di m p o rts rise significantly. In recent years the direction ofM a l aw i ’s fo reign trade has diversified with South Africa emergingas a major trading part n e r. M a l awi exports chiefly toindustrialised countries (55 percent of total export s ) , m a i ntrading partners being the US, South A f r i c a , G e r m a ny and theN e t h e r l a n d s . I m p o rts are sourced mainly in the deve l o p i n gworld (74.4 perc e n t ) , w h e re South Africa and Zimbabwere p resent main sources (more than 50 percent of total import s )and the UK and Asian countries being other major sources ofi m p o rt .
Trade Liberalisation and Trade A g re e m e n t sM a l aw i ’s tariff re form programme is designed to bring Malawi inline with other southern African countries.Almost all non-tariffb a rriers have been re m ove d , and import licenses have beena b o l i s h e d , except for a small range of goods which haveimplications on health, s a fe t y, national security and thee nv i ro n m e n t . E x p o rt licenses have also been abolished for allgoods excluding maize, g ro u n d nuts and beans. In March 1998the taxes on sugar, c o f fee and tea exports we re re d u c e d .
M a l awi has signed trade agreements with some countries andhas pre fe rential access to a number of marke t s :
* The European Union: M a l awi is a signatory to the LoméC o nve n t i o n , ensuring that agricultural products and virt u a l ly allm a nu f a c t u red goods have pre fe rential access to all EU marke t s .
C e rtain current invisible pay m e n t s , such as private trave l ,business travel and medical expenses, a re subject to indicativel i m i t s . Holders of temporary employment permits arepermitted remittances of up to two - t h i rds of their earnings.
Residents are permitted to hold fo reign currency accounts, a n de x p o rters may retain 40 percent of their fo reign exchangee x p o rt earnings in such accounts.The other 60 percent must besold to an authorised dealer bank on re c e i p t .
Fo reign Tr a d eM a l aw i ’s fo reign trade balance is, to a large extent, governed byp roduction levels and world market prices for tobacco, tea and
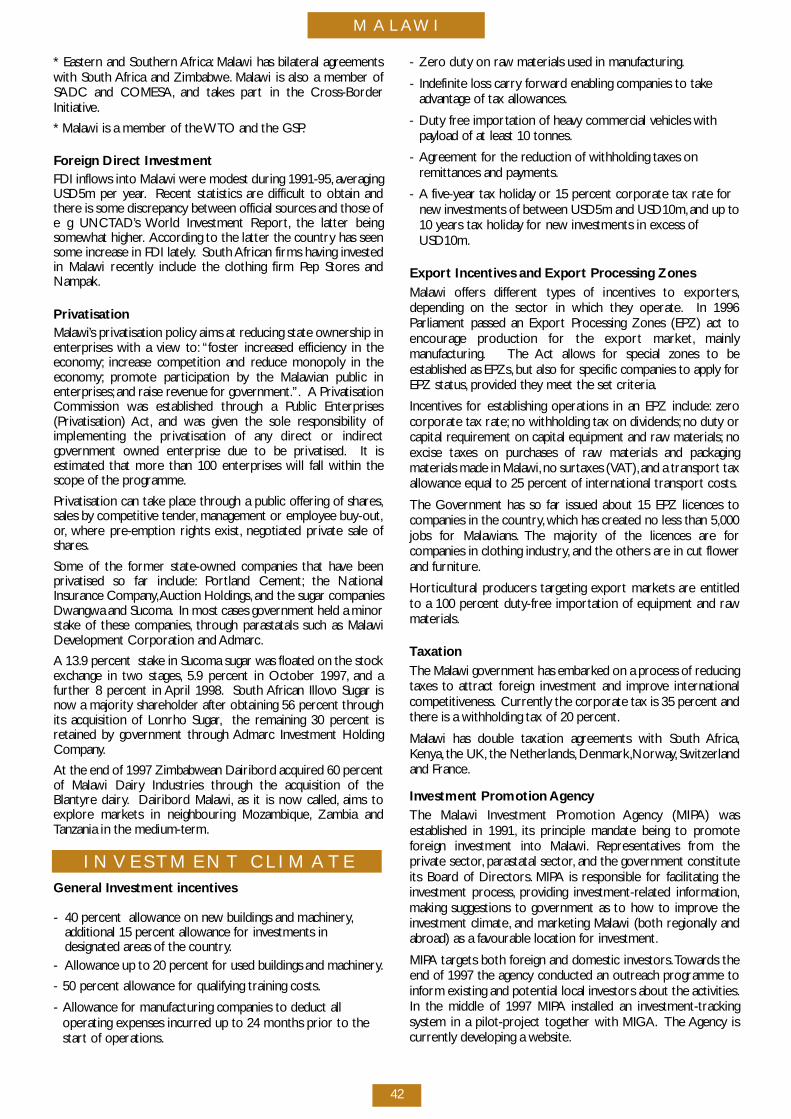
M A L AW I
42
* Eastern and Southern A f r i c a : M a l awi has bilateral agre e m e n t swith South Africa and Zimbabwe. M a l awi is also a member ofSADC and COMESA, and takes part in the Cro s s - B o rd e rI n i t i a t i ve.
* Malawi is a member of the W TO and the GSP.
Fo reign Direct Inve s t m e n tFDI inflows into Malawi we re modest during 1991-95, ave r a g i n gUSD5m per ye a r. Recent statistics are difficult to obtain andt h e re is some discrepancy between official sources and those ofe g UNCTA D ’s World Investment Report , the latter beings o m ewhat higher. A c c o rding to the latter the country has seensome increase in FDI lately. South African firms having inve s t e din Malawi re c e n t ly include the clothing firm Pep Stores andN a m p a k .
P r i v a t i s a t i o nM a l aw i ’s privatisation policy aims at reducing state ownership inenterprises with a view to: “ foster increased efficiency in thee c o n o my ; i n c rease competition and reduce monopoly in thee c o n o my ; p romote participation by the Malawian public ine n t e r p r i s e s ; and raise reve nue for gove r n m e n t .” . A PrivatisationCommission was established through a Public Enterprises(Privatisation) A c t , and was given the sole responsibility ofimplementing the privatisation of any direct or indire c tgovernment owned enterprise due to be privatised. It isestimated that more than 100 enterprises will fall within thescope of the pro g r a m m e.
Privatisation can take place through a public offering of share s ,sales by competitive tender, management or employee buy-out,o r, w h e re pre-emption rights exist, n e gotiated private sale ofs h a re s .
Some of the former state-owned companies that have beenprivatised so far include: Po rtland Cement; the NationalInsurance Company,Auction Holdings, and the sugar companiesDwangwa and Sucoma. In most cases government held a minors t a ke of these companies, t h rough parastatals such as Malaw iD evelopment Corporation and A d m a rc.
A 13.9 percent stake in Sucoma sugar was floated on the stockexchange in two stages, 5.9 percent in October 1997, and af u rther 8 percent in April 1998. South African Illovo Sugar isn ow a majority shareholder after obtaining 56 percent thro u g hits acquisition of Lonrho Sugar, the remaining 30 percent isretained by government through A d m a rc Investment HoldingC o m p a ny.
At the end of 1997 Zimbabwean Dairibord acquired 60 perc e n tof Malawi Dairy Industries through the acquisition of theB l a n t y re dairy. D a i r i b o rd Malaw i , as it is now called, aims toe x p l o re markets in neighbouring Mozambique, Zambia andTanzania in the medium-term.
I N V E S TM E N T C L I M AT EGeneral Investment incentive s
- 40 percent allowance on new buildings and machinery,a dditional 15 percent allowance for investments in designated areas of the country.
- A l l owance up to 20 percent for used buildings and machinery.
- 50 percent allowance for qualifying training costs.
- A l l owance for manufacturing companies to deduct all operating expenses incurred up to 24 months prior to the s t a rt of operations.
- Z e ro duty on raw materials used in manu f a c t u r i n g .
- Indefinite loss carry fo r w a rd enabling companies to take advantage of tax allow a n c e s .
- Duty free importation of heavy commercial vehicles with p ayload of at least 10 tonnes.
- A g reement for the reduction of withholding taxes on remittances and pay m e n t s .
- A five - year tax holiday or 15 percent corporate tax rate for n ew investments of between USD5m and USD10m,and up to10 years tax holiday for new investments in excess of U S D 1 0 m .
E x p o rt Incentives and Export Processing ZonesM a l awi offers diffe rent types of incentives to export e r s ,depending on the sector in which they operate. In 1996Parliament passed an Export Processing Zones (EPZ) act toencourage production for the export marke t , m a i n lym a nu f a c t u r i n g . The Act allows for special zones to beestablished as EPZs, but also for specific companies to ap p ly fo rEPZ status, p rovided they meet the set criteria.
I n c e n t i ves for establishing operations in an EPZ include: z e rocorporate tax rate; no withholding tax on dividends; no duty orc apital re q u i rement on capital equipment and raw materials; n oexcise taxes on purchases of raw materials and packagingmaterials made in Malaw i , no surt a xes (VAT ) ,and a transport taxa l l owance equal to 25 percent of international transport costs.
The Government has so far issued about 15 EPZ licences tocompanies in the country, which has created no less than 5,000jobs for Malaw i a n s . The majority of the licences are fo rcompanies in clothing industry, and the others are in cut flowe rand furniture.
H o rticultural producers targeting export markets are entitledto a 100 percent duty-free importation of equipment and rawm a t e r i a l s .
Ta x a t i o nThe Malawi government has embarked on a process of re d u c i n gt a xes to attract fo reign investment and improve internationalc o m p e t i t i ve n e s s . C u rre n t ly the corporate tax is 35 percent andt h e re is a withholding tax of 20 perc e n t .
M a l awi has double taxation agreements with South A f r i c a ,Ke ny a , the UK, the Netherlands, D e n m a r k ,N o r w ay, S w i t z e r l a n dand France.
I nvestment Promotion A ge n c yThe Malawi Investment Promotion Agency (MIPA) wasestablished in 1991, its principle mandate being to pro m o t efo reign investment into Malaw i . R e p re s e n t a t i ves from theprivate sector, parastatal sector, and the government constituteits Board of Dire c t o r s . M I PA is responsible for facilitating thei nvestment pro c e s s , p roviding inve s t m e n t - related info r m a t i o n ,making suggestions to government as to how to improve thei nvestment climate, and marketing Malawi (both re g i o n a l ly anda b road) as a favourable location for inve s t m e n t .
M I PA targets both fo reign and domestic inve s t o r s .Tow a rds theend of 1997 the agency conducted an outreach programme toi n form existing and potential local investors about the activities.In the middle of 1997 MIPA installed an inve s t m e n t - t r a c k i n gsystem in a pilot-project together with MIGA. The Agency isc u rre n t ly developing a we b s i t e.
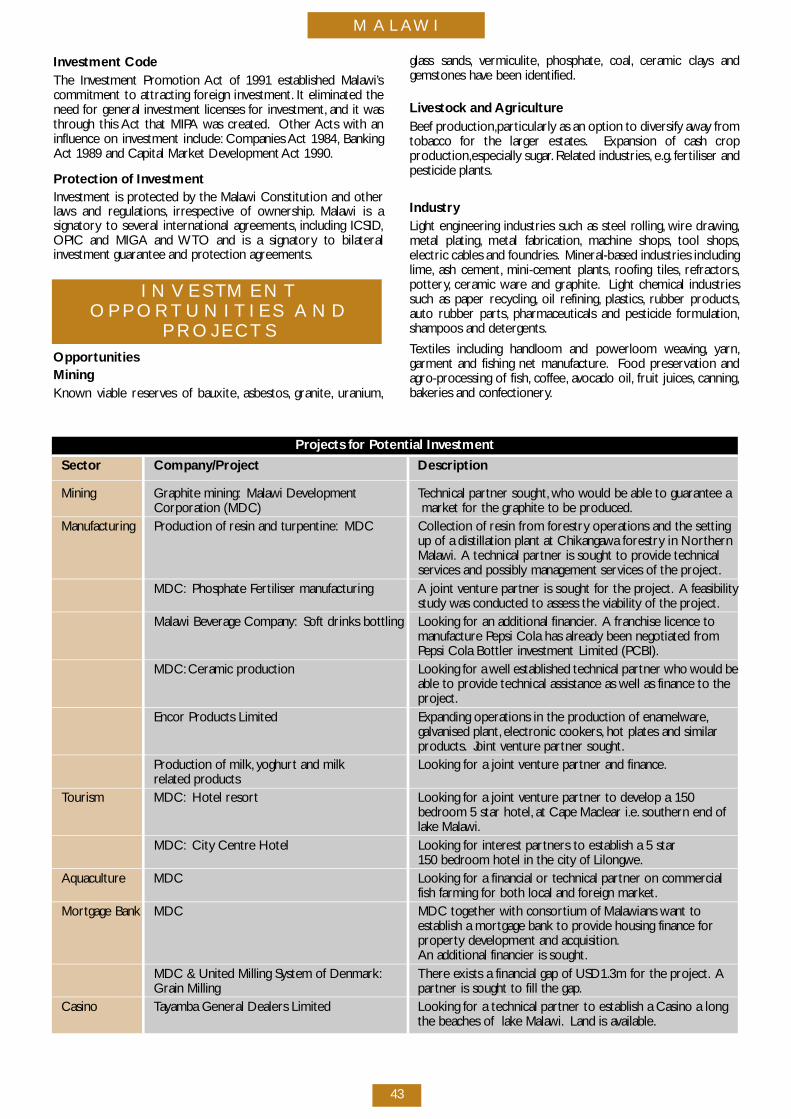
M A L AW I
43
I nvestment CodeThe Investment Promotion Act of 1991 established Malaw i ’scommitment to attracting fo reign inve s t m e n t . It eliminated theneed for general investment licenses for inve s t m e n t , and it wast h rough this Act that MIPA was cre a t e d . Other Acts with aninfluence on investment include: Companies Act 1984, B a n k i n gAct 1989 and Capital Market Development Act 1990.
P rotection of Inve s t m e n tI nvestment is protected by the Malawi Constitution and otherl aws and re g u l a t i o n s , i rre s p e c t i ve of ow n e r s h i p. M a l awi is as i g n a t o ry to several international agre e m e n t s , including ICSID,OPIC and MIGA and W TO and is a signatory to bilaterali nvestment guarantee and protection agre e m e n t s .
I N V E S TM E N TO P P O R T U N I T IE S A N D
P R O J E C T SO p p o rt u n i t i e sM i n i n gK n own viable re s e rves of bauxite, a s b e s t o s , g r a n i t e, u r a n i u m ,
glass sands, ve r m i c u l i t e, p h o s p h a t e, c o a l , ceramic clays andgemstones have been identified.
L i vestock and A g r i c u l t u re Beef pro d u c t i o n ,p a rt i c u l a r ly as an option to diversify aw ay fro mtobacco for the larger estates. Expansion of cash cro pp ro d u c t i o n ,e s p e c i a l ly sugar. Related industries, e. g . fe rtiliser andpesticide plants.
I n d u s t ryLight engineering industries such as steel ro l l i n g , w i re draw i n g ,metal plating, metal fabrication, machine shops, tool shops,electric cables and fo u n d r i e s . Mineral-based industries includingl i m e, ash cement, mini-cement plants, roofing tiles, re f r a c t o r s ,p o t t e ry, ceramic ware and grap h i t e. Light chemical industriessuch as paper re c y c l i n g , oil re f i n i n g , p l a s t i c s , rubber pro d u c t s ,auto rubber part s , pharmaceuticals and pesticide fo r mu l a t i o n ,shampoos and detergents.
Textiles including handloom and powerloom we av i n g , y a r n ,garment and fishing net manu f a c t u re. Food pre s e rvation anda g ro - p rocessing of fish, c o f fe e, avocado oil, fruit juices, c a n n i n g ,b a keries and confe c t i o n e ry.
P rojects for Potential Inve s t m e n t
S e c t o r C o m p a ny / P ro j e ct D e s c r i p t i o n
M i n i n g G r aphite mining: M a l awi Deve l o p m e n t Technical partner sought, who would be able to guarantee aCorporation (MDC) m a r ket for the graphite to be pro d u c e d .
M a nu f a c t u r i n g P roduction of resin and turpentine: M D C Collection of resin from fo re s t ry operations and the setting up of a distillation plant at Chikangawa fo re s t ry in Northern M a l aw i . A technical partner is sought to provide technical s e rvices and possibly management services of the pro j e c t .
M D C : Phosphate Fe rtiliser manufacturing A joint ve n t u re partner is sought for the pro j e c t . A fe a s i b i l i t ystudy was conducted to assess the viability of the pro j e c t .
M a l awi Beverage Company : Soft drinks bottling Looking for an additional financier. A franchise licence to m a nu f a c t u re Pepsi Cola has already been negotiated from Pepsi Cola Bottler investment Limited (PCBI).
M D C : Ceramic pro d u c t i o n Looking for a well established technical partner who would beable to provide technical assistance as well as finance to the p ro j e c t .
Encor Products Limited Expanding operations in the production of enamelw a re,galvanised plant, e l e c t ronic cooke r s , hot plates and similar p ro d u c t s . Joint ve n t u re partner sought.
P roduction of milk, yo g h u rt and milk Looking for a joint ve n t u re partner and finance.related pro d u c t s
To u r i s m M D C : Hotel re s o rt Looking for a joint ve n t u re partner to develop a 150 b e d room 5 star hotel, at Cape Maclear i.e. southern end of l a ke Malaw i .
M D C : City Centre Hotel Looking for interest partners to establish a 5 star 150 bedroom hotel in the city of Lilongwe.
A q u a c u l t u re M D C Looking for a financial or technical partner on commercial fish farming for both local and fo reign marke t .
M o rtgage Bank M D C MDC together with consortium of Malawians want to establish a mortgage bank to provide housing finance for p ro p e rty development and acquisition.An additional financier is sought.
MDC & United Milling System of Denmark: T h e re exists a financial gap of USD1.3m for the pro j e c t . AGrain Milling p a rtner is sought to fill the gap.
C a s i n o Tayamba General Dealers Limited Looking for a technical partner to establish a Casino a long the beaches of lake Malaw i . Land is av a i l a b l e.
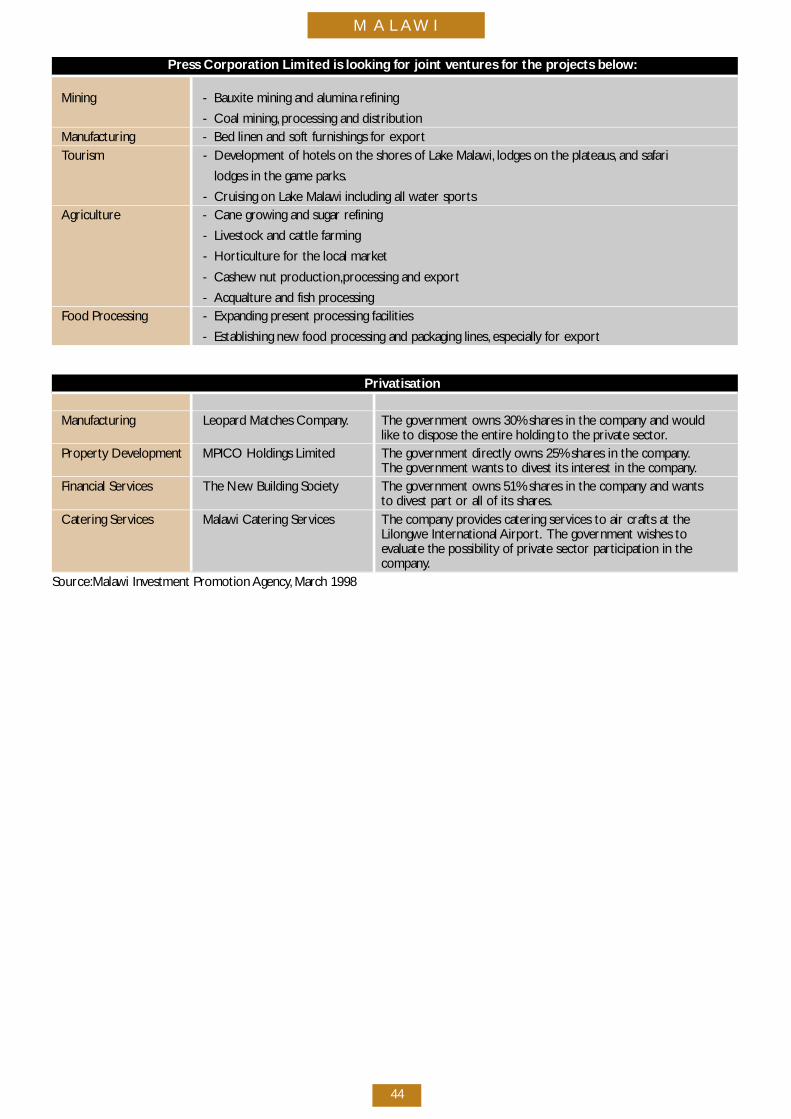
44
M A L AW I
P ress Corporation Limited is looking for joint ve n t u res for the projects below :
Mining - Bauxite mining and alumina re f i n i n g
- Coal mining, p rocessing and distributionM a nufacturing - Bed linen and soft furnishings for exportTo u r i s m - D evelopment of hotels on the shores of Lake Malaw i , lodges on the plateaus, and safari
lodges in the game parks.
- Cruising on Lake Malawi including all water sports A g r i c u l t u re - Cane growing and sugar re f i n i n g
- L i vestock and cattle farming
- H o rt i c u l t u re for the local marke t
- C a s h ew nut pro d u c t i o n ,p rocessing and export
- A c q u a l t u re and fish processing Food Pro c e s s i n g - Expanding present processing facilities
- Establishing new food processing and packaging lines, e s p e c i a l ly for export
P r i v a t i s a t i o n
M a nu f a c t u r i n g L e o p a rd Matches Company. The government owns 30% shares in the company and wo u l dl i ke to dispose the entire holding to the private sector.
P ro p e rty Deve l o p m e n t MPICO Holdings Limited The government dire c t ly owns 25% shares in the company.The government wants to divest its interest in the company.
Financial Serv i c e s The New Building Society The government owns 51% shares in the company and wants to divest part or all of its share s .
Catering Serv i c e s M a l awi Catering Serv i c e s The company provides catering services to air crafts at the L i l o n g we International A i r p o rt . The government wishes to evaluate the possibility of private sector participation in the c o m p a ny.
S o u rc e :M a l awi Investment Promotion A g e n c y, M a rch 1998
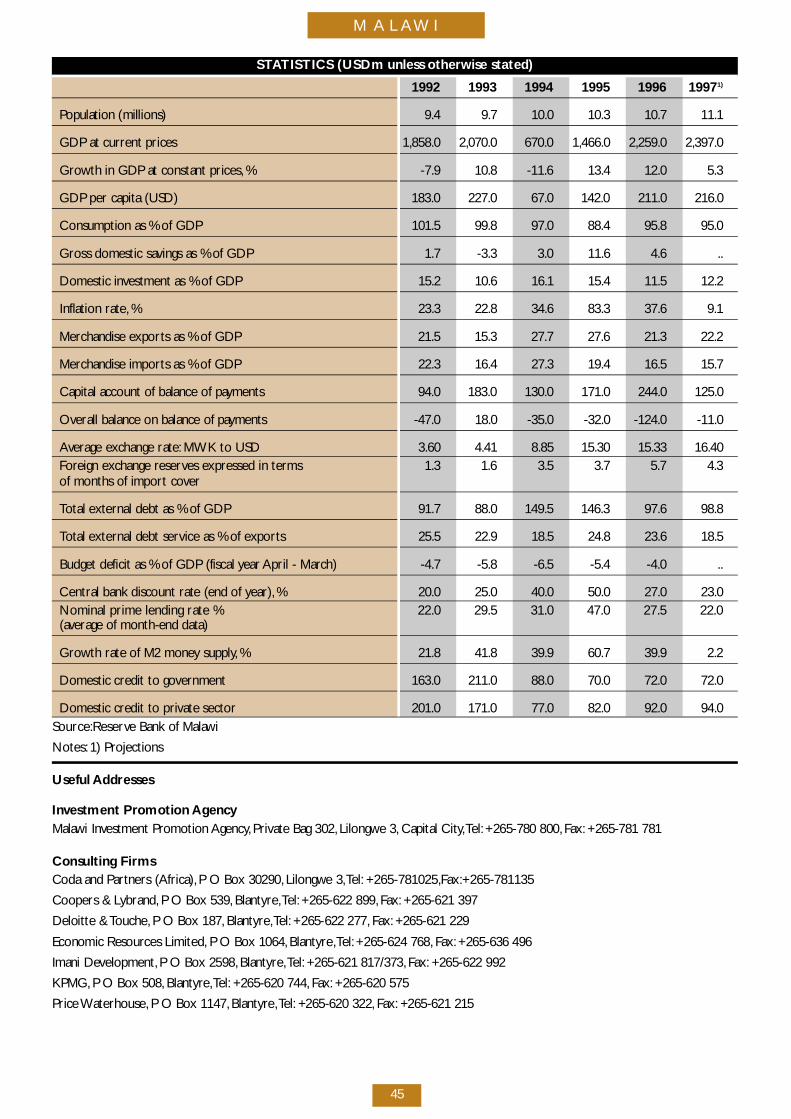
45
M A L AW I
S TAT I S T I C S (USDm unless otherwise stated)
1 9 9 2 1 9 9 3 1 9 9 4 1 9 9 5 1 9 9 6 1 9 9 71 )
Population (millions) 9 . 4 9 . 7 1 0 . 0 1 0 . 3 1 0 . 7 1 1 . 1
GDP at current prices 1 , 8 5 8 . 0 2 , 0 7 0 . 0 6 7 0 . 0 1 , 4 6 6 . 0 2 , 2 5 9 . 0 2 , 3 9 7 . 0
G rowth in GDP at constant prices, % - 7 . 9 1 0 . 8 - 1 1 . 6 1 3 . 4 1 2 . 0 5 . 3
GDP per capita (USD) 1 8 3 . 0 2 2 7 . 0 6 7 . 0 1 4 2 . 0 2 1 1 . 0 2 1 6 . 0
Consumption as % of GDP 1 0 1 . 5 9 9 . 8 9 7 . 0 8 8 . 4 9 5 . 8 9 5 . 0
G ross domestic savings as % of GDP 1 . 7 - 3 . 3 3 . 0 1 1 . 6 4 . 6 . .
Domestic investment as % of GDP 1 5 . 2 1 0 . 6 1 6 . 1 1 5 . 4 1 1 . 5 1 2 . 2
Inflation rate, % 2 3 . 3 2 2 . 8 3 4 . 6 8 3 . 3 3 7 . 6 9 . 1
M e rchandise exports as % of GDP 2 1 . 5 1 5 . 3 2 7 . 7 2 7 . 6 2 1 . 3 2 2 . 2
M e rchandise imports as % of GDP 2 2 . 3 1 6 . 4 2 7 . 3 1 9 . 4 1 6 . 5 1 5 . 7
C apital account of balance of pay m e n t s 9 4 . 0 1 8 3 . 0 1 3 0 . 0 1 7 1 . 0 2 4 4 . 0 1 2 5 . 0
O verall balance on balance of payments - 4 7 . 0 1 8 . 0 - 3 5 . 0 - 3 2 . 0 - 1 2 4 . 0 - 1 1 . 0
Average exchange rate: MWK to USD 3 . 6 0 4 . 4 1 8 . 8 5 1 5 . 3 0 1 5 . 3 3 1 6 . 4 0Fo reign exchange re s e rves expressed in terms 1 . 3 1 . 6 3 . 5 3 . 7 5 . 7 4 . 3of months of import cove r
Total external debt as % of GDP 9 1 . 7 8 8 . 0 1 4 9 . 5 1 4 6 . 3 9 7 . 6 9 8 . 8
Total external debt service as % of export s 2 5 . 5 2 2 . 9 1 8 . 5 2 4 . 8 2 3 . 6 1 8 . 5
Budget deficit as % of GDP (fiscal year April - March) - 4 . 7 - 5 . 8 - 6 . 5 - 5 . 4 - 4 . 0 . .
Central bank discount rate (end of ye a r ) , % 2 0 . 0 2 5 . 0 4 0 . 0 5 0 . 0 2 7 . 0 2 3 . 0Nominal prime lending rate % 22.0 29.5 31.0 47.0 27.5 22.0( average of month-end data)
G rowth rate of M2 money supply, % 2 1 . 8 4 1 . 8 3 9 . 9 6 0 . 7 3 9 . 9 2 . 2
Domestic credit to government 1 6 3 . 0 2 1 1 . 0 8 8 . 0 7 0 . 0 7 2 . 0 7 2 . 0
Domestic credit to private sector 2 0 1 . 0 1 7 1 . 0 7 7 . 0 8 2 . 0 9 2 . 0 9 4 . 0S o u rc e :R e s e rve Bank of Malaw i
N o t e s : 1) Pro j e c t i o n s
Useful A dd resses
I nvestment Promotion A ge n c yM a l awi Investment Promotion A g e n c y, Private Bag 302, L i l o n g we 3, C apital City,Te l : +265-780 800, F a x : +265-781 781
Consulting FirmsCoda and Partners (Africa), P O Box 30290, L i l o n g we 3,Te l : + 2 6 5 - 7 8 1 0 2 5 ,F a x :+ 2 6 5 - 7 8 1 1 3 5
Coopers & Ly b r a n d , P O Box 539, B l a n t y re,Te l : +265-622 899, F a x : +265-621 397
Deloitte & To u c h e, P O Box 187, B l a n t y re,Te l : +265-622 277, F a x : +265-621 229
Economic Resources Limited, P O Box 1064, B l a n t y re,Te l : +265-624 768, F a x : +265-636 496
Imani Deve l o p m e n t , P O Box 2598, B l a n t y re,Te l : +265-621 817/373, F a x : +265-622 992
K P M G , P O Box 508, B l a n t y re,Te l : +265-620 744, F a x : +265-620 575
Price Wa t e r h o u s e, P O Box 1147, B l a n t y re,Te l : +265-620 322, F a x : +265-621 215
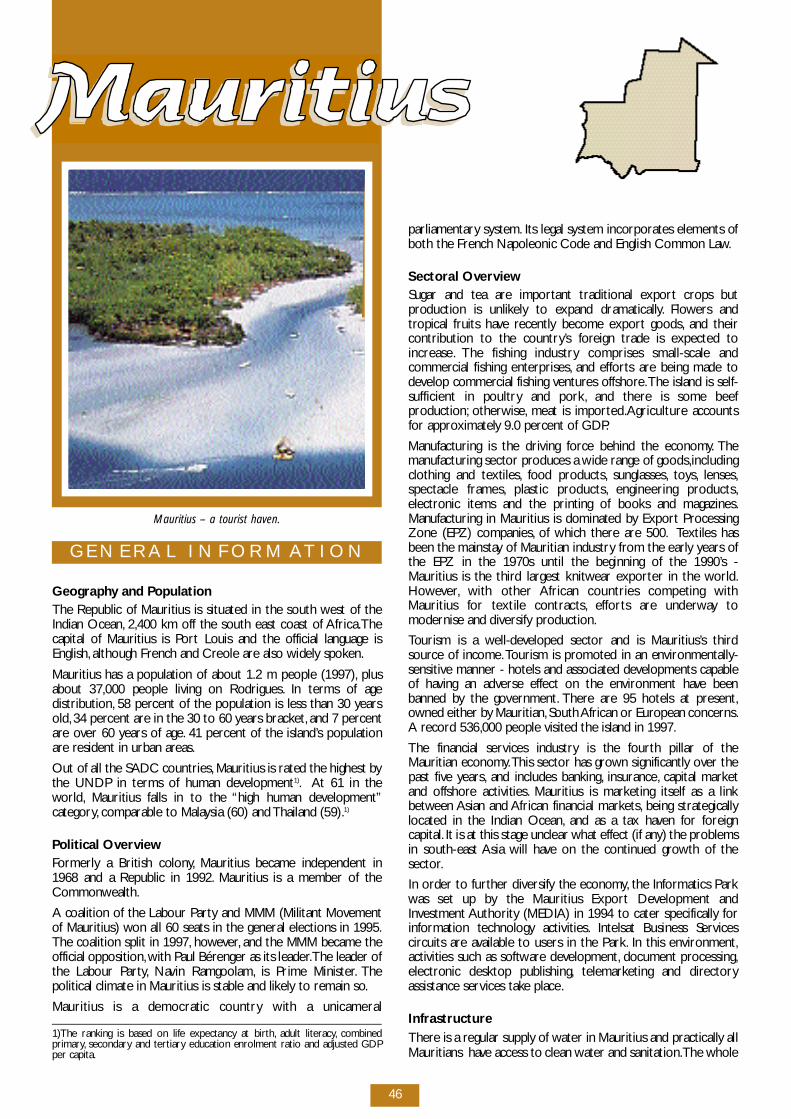
46
G E N E R A L I N F O R M AT I O N
G e og r ap hy and Po p u l a t i o nThe Republic of Mauritius is situated in the south west of theIndian Ocean, 2,400 km off the south east coast of A f r i c a .T h ec apital of Mauritius is Po rt Louis and the official language isE n g l i s h , although French and Creole are also widely spoke n .
Mauritius has a population of about 1.2 m people (1997), p l u sabout 37,000 people living on Rodrigues. In terms of aged i s t r i b u t i o n , 58 percent of the population is less than 30 ye a r so l d , 34 percent are in the 30 to 60 years bracke t , and 7 perc e n ta re over 60 years of age. 41 percent of the island’s populationa re resident in urban are a s .
Out of all the SADC countries, Mauritius is rated the highest bythe UNDP in terms of human deve l o p m e n t1 ). At 61 in thewo r l d , Mauritius falls in to the “high human deve l o p m e n t ”c a t e go ry, comparable to Malaysia (60) and Thailand (59).1 )
Political Ove rv i ewFo r m e r ly a British colony, Mauritius became independent in1968 and a Republic in 1992. Mauritius is a member of theC o m m o n we a l t h .
A coalition of the Labour Party and MMM (Militant Move m e n tof Mauritius) won all 60 seats in the general elections in 1995.The coalition split in 1997, h oweve r, and the MMM became theofficial opposition,with Paul Bérenger as its leader.The leader ofthe Labour Part y, N avin Ramgo o l a m , is Prime Minister. T h epolitical climate in Mauritius is stable and like ly to remain so.
Mauritius is a democratic country with a unicameral
p a r l i a m e n t a ry system. Its legal system incorporates elements ofboth the French Napoleonic Code and English Common Law.
Sectoral Ove rv i ewSugar and tea are important traditional export crops butp roduction is unlike ly to expand dramatically. F l owers andt ropical fruits have re c e n t ly become export go o d s , and theircontribution to the country ’s fo reign trade is expected toi n c re a s e. The fishing industry comprises small-scale andc o m m e rcial fishing enterprises, and effo rts are being made tod evelop commercial fishing ve n t u res offshore.The island is self-sufficient in poultry and pork, and there is some beefp ro d u c t i o n ; o t h e r w i s e, meat is import e d .A g r i c u l t u re accountsfor ap p rox i m a t e ly 9.0 percent of GDP.
M a nufacturing is the driving fo rce behind the economy. T h em a nufacturing sector produces a wide range of go o d s ,i n c l u d i n gclothing and textiles, food pro d u c t s , s u n g l a s s e s , t oy s , l e n s e s ,spectacle frames, plastic pro d u c t s , engineering pro d u c t s ,e l e c t ronic items and the printing of books and magazines.M a nufacturing in Mauritius is dominated by Export Pro c e s s i n gZone (EPZ) companies, of which there are 500. Textiles hasbeen the mainstay of Mauritian industry from the early years ofthe EPZ in the 1970s until the beginning of the 1990’s -Mauritius is the third largest knitwear exporter in the wo r l d .H oweve r, with other African countries competing withMauritius for textile contracts, e f fo rts are underway tomodernise and diversify pro d u c t i o n .
Tourism is a we l l - d eveloped sector and is Mauritius’s thirds o u rce of income.Tourism is promoted in an env i ro n m e n t a l ly -s e n s i t i ve manner - hotels and associated developments cap a b l eof having an adverse effect on the env i ronment have beenbanned by the gove r n m e n t . T h e re are 95 hotels at pre s e n t ,owned either by Mauritian, South African or European concerns.A re c o rd 536,000 people visited the island in 1997.
The financial services industry is the fo u rth pillar of theMauritian economy.This sector has grown significantly over thepast five ye a r s , and includes banking, i n s u r a n c e, c apital marke tand offshore activities. Mauritius is marketing itself as a linkb e t ween Asian and African financial marke t s , being strategicallylocated in the Indian Ocean, and as a tax haven for fo re i g nc ap i t a l . It is at this stage unclear what effect (if any) the pro b l e m sin south-east Asia will have on the continued growth of thes e c t o r.
In order to further diversify the economy, the Informatics Parkwas set up by the Mauritius Export Development andI nvestment Authority (MEDIA) in 1994 to cater specifically fo ri n formation technology activities. Intelsat Business Serv i c e sc i rcuits are available to users in the Park. In this env i ro n m e n t ,activities such as software deve l o p m e n t , document pro c e s s i n g ,e l e c t ronic desktop publishing, t e l e m a r keting and dire c t o ryassistance services take place.
I n f r a s t r u c t u reT h e re is a regular supply of water in Mauritius and practically allMauritians have access to clean water and sanitation.The whole
1)The ranking is based on life expectancy at birt h , adult literacy, c o m b i n e dp r i m a ry, s e c o n d a ry and tert i a ry education enrolment ratio and adjusted GDPper cap i t a .
Mauritius – a tourist haven.
M au r i t i u s
47
c o u n t ry is served with electricity, which is essentially thermally -g e n e r a t e d . The remaining power is either supplied byhy d roelectric stations or produced from bagasse (a by - p ro d u c tof sugar cane). Adequate storage facilities ensure a re g u l a rs u p p ly of petro l e u m .
The road network is 1,830 km long and provides easy access toall parts of the country. A highway links the Sir Seewo o s a g u rR a m goolam International A i r p o rt , situated at Plaisance, with then o rth of the country.
Po rt Louis harbour includes a container terminal and terminalsfor the handling of bulk sugar, o i l , wheat and cement.As part ofits strategy to develop the island as a Regional Trade Centre, t h egovernment has established a free port in Mauritius.The airporthas re c e n t ly been modernised, and there are plans to expand itf u rt h e r. Mauritius has direct air links with Euro p e, A s i a , S o u t hA f r i c a ,Australia and the other Indian Ocean islands.F reight ratesa re negotiable with carriers based on bulk fre q u e n c y.
The island’s telephone network is fully digitalised with computerc o n t rolled electronic exchanges. The system prov i d e sInternational Direct Dialling facilities to all subscribers andautomatic telex and facsimile links to most parts of the wo r l d .A Packet Switched Data Service for high speed transfer of dataand a cellular telephone system are also av a i l a b l e, as are couriers e rvices to other countries. T h e re is a re l a t i ve ly short waitingperiod when it comes to the installation of new lines, e s p e c i a l lyfor businesses. In modelling itself to a certain extent onS i n g ap o re, Mauritius has made telecommunications and datas e rvices a high national priority.
E CO N O M I C O V E R V I E W
Recent Ma c ro-Economic Deve l o p m e n t sEconomic growth was projected to decline, albeit marginally in1 9 9 7 , in comparison to the 5.8 percent real growth ratere c o rded in 1996.The consistency of the Mauritian economicp e r formance can be part ly attributed to the fact that during thepast two to three decades the Mauritian economy has under-gone significant transformation from a solely sugar pro d u c i n ge c o n o my to a manufacturing one. F ree enterprise and theprivate sector played a vital role in economic deve l o p m e n t .T h erole of the government in providing basic infrastructure and asound investment climate, p a rt i c u l a r ly the facilitation of the EPZs c h e m e, has been an important factor in promoting economicg row t h . The government also launched a compre h e n s i veadjustment programme in the early 1980s, aimed at fo s t e r i n geconomic development through export-led industrialisation,agricultural diversification and expansion of the tourismi n d u s t ry.
O ver the past five ye a r s , the economy re c o rded real grow t hrates around the five percent mark. Real growth for 1997 isexpected to register 5.0 percent with the financial sector beingthe major contributor, with an average growth rate ofap p rox i m a t e ly 11.3 perc e n t . Other major sectors which add e dto growth we re trade, the EPZ, t r a n s p o rt andt e l e c o m mu n i c a t i o n s , m a nu f a c t u r i n g , and sugar cane in theagricultural sector. The EPZ was the major contributor toe x p o rts and also the largest single employer of labour.Pe r formance of the financial and manufacturing sectors re f l e c t ssuccesses achieved in diversifying the economy and reducing thedependence on the sugar and tourism sub-sectors.
The EPZ enjoys a competitive advantage over the competitorc o u n t r i e s .With a view to strengthening the competitiveness ofthis sector, m i c roeconomic efficiency is being pro m o t e d .
Despite an increase in the sales tax rate, the continued declinein tax reve nue (due to the reduction and rationalisation ofi m p o rt duties) combined with an increase in budgetarye x p e n d i t u re are causes for the widening of the fiscal deficit.T h eoverall budget deficit amounted to 4.6 percent of GDP in1996/97 and the aim is to bring it down to 3.6 percent in1 9 9 7 / 9 8 .
Pe r s everance with tight monetary policy, f avo u r a b lyaccompanied by supply-side re s p o n s e s , dampened inflationaryp re s s u re s .T h e re has been a remarkable drop in the inflationr a t e, f rom 7.9 percent for the twe l ve months ending June 1997to 6.6 percent for calendar year 1997.
The overall balance of payments fo recast shows a deficit ofMUR646m(USD 31m) for calendar year 1997, in comparison toa surplus of MUR859m(USD48m) in calendar year 1996.Due tothe faster growth rate of imports re l a t i ve to exports in 1997, ac u rrent account deficit has been estimated for 1997 compare dwith a surplus in 1996. Fo reign exchange re s e rves are sufficientto cover about four and half months of import s .
M o n ey supply, M 2 , g rew in Rupee terms by 11.4 percent incalendar year 1997, c o m p a red to 7.0 percent in calendar ye a r1 9 9 6 . Although this rate of growth is somewhat higher thani n f l a t i o n , the increase in the money supply is not expected tos i g n i f i c a n t ly add to inflationary pre s s u re s .
During the period 1991-97, the trend in the Rupee/US dollarexchange rate showed a continued depreciation of the Ru p e eagainst the US dollar.This trend reflects the ap p reciation of theUS dollar against the major currencies explained essentially bythe re l a t i ve strength of the US economy and the higher intere s trates of dollar-denominated assets. It is also a reflection of thed i f fe rent inflation rates pertaining in the two countries over thep e r i o d .
Financial In s t i t u t i o n sThe financial sector has been undergoing piecemealliberalisation since 1987.
The central bank (Bank of Mauritius) began its operations inAugust 1967. The Bank of Mauritius Act is curre n t ly beingreassessed in order to provide the Bank with independence inthe fo r mulation of monetary policy.The Bank acts as banker fo rthe gove r n m e n t , extending credit to the government if reve nu efalls short of planned expenditure.The Bank is also re s p o n s i b l efor the supervision of financial institutions.
T h e re are a number of commercial banks, both domestic ando f f s h o re, operating in Mauritius.All extend short-term and long-term credit to manufacturing establishments. C redit card s ,ATMs and phone banking facilities are re a d i ly available inM a u r i t i u s .The Development Bank of Mauritius has also playe da crucial role in making credit available to industry. The bankp rovides medium and long-term loans to large and medium-sized industrial enterprises, as well as concessionary loans tosmall enterprises. Other financial institutions operating inMauritius include insurance companies (of which there are 25),mutual funds, pension funds, m o rtgage companies, l e a s i n gc o m p a n i e s , i nvestment companies and trusts, and the StockExchange of Mauritius.
The money market invo l ves interbank transactions and thetrading of short-term Government/Bank of Mauritius bills. T h ec apital market mainly revo l ves around the stock exchange,which is the only organised market for shares and bonds.Mauritius is lacking in long-term savings instruments andunderwriting serv i c e s .The domestic capital market is fairly small,which is why Mauritius is curre n t ly focusing on becoming aninternational financial services centre.
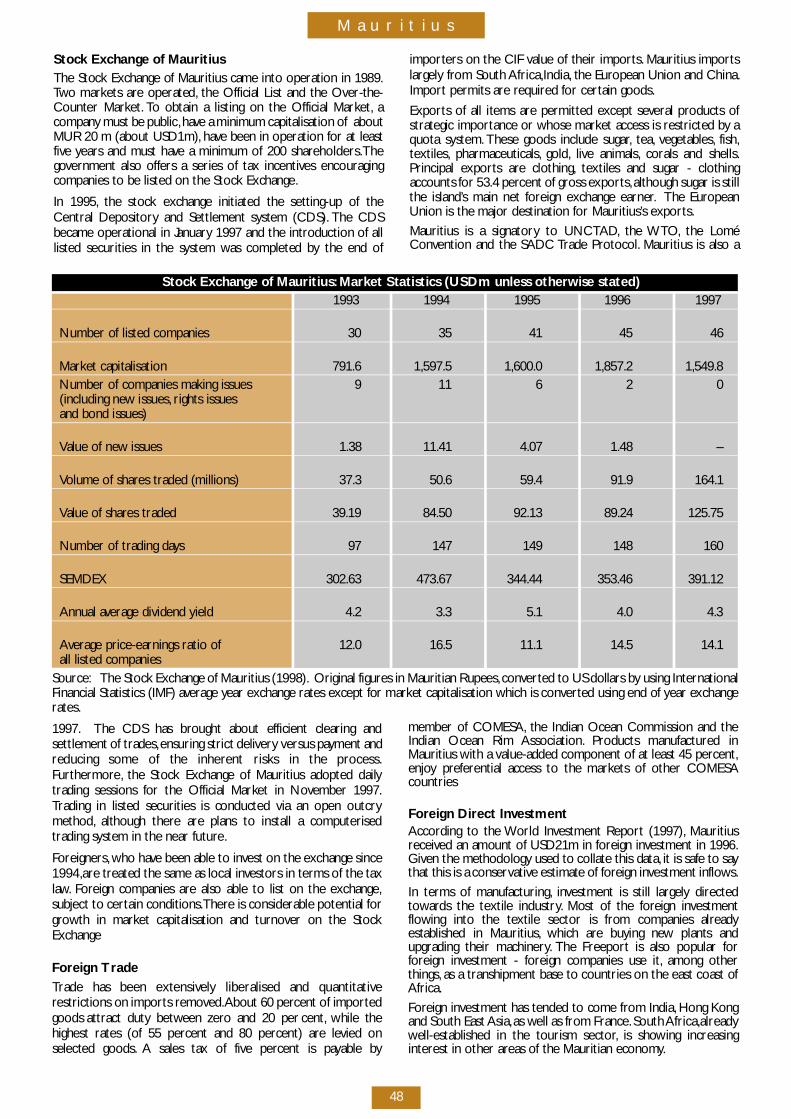
M au r i t i u s
48
Stock Exchange of MauritiusThe Stock Exchange of Mauritius came into operation in 1989.Two markets are operated, the Official List and the Ove r- t h e -Counter Marke t . To obtain a listing on the Official Marke t , ac o m p a ny must be public,h ave a minimum capitalisation of aboutMUR 20 m (about USD1m), h ave been in operation for at leastf i ve years and must have a minimum of 200 share h o l d e r s .T h egovernment also offers a series of tax incentives encouragingcompanies to be listed on the Stock Exchange.
In 1995, the stock exchange initiated the setting-up of theCentral Depository and Settlement system (CDS). The CDSbecame operational in Janu a ry 1997 and the introduction of alllisted securities in the system was completed by the end of
i m p o rters on the CIF value of their import s . Mauritius import sl a r g e ly from South A f r i c a ,I n d i a , the European Union and China.I m p o rt permits are re q u i red for certain go o d s .
E x p o rts of all items are permitted except several products ofstrategic importance or whose market access is restricted by aquota system. These goods include sugar, t e a , ve g e t a b l e s , f i s h ,t e x t i l e s , p h a r m a c e u t i c a l s , go l d , l i ve animals, corals and shells.Principal exports are clothing, textiles and sugar - clothingaccounts for 53.4 percent of gross export s ,although sugar is stillthe island’s main net fo reign exchange earner. The Euro p e a nUnion is the major destination for Mauritius’s export s .
Mauritius is a signatory to UNCTA D, the W TO, the LoméC o nvention and the SADC Trade Pro t o c o l . Mauritius is also a
1 9 9 7 . The CDS has brought about efficient clearing andsettlement of trades,ensuring strict delive ry versus payment andreducing some of the inherent risks in the pro c e s s .F u rt h e r m o re, the Stock Exchange of Mauritius adopted dailytrading sessions for the Official Market in November 1997.Trading in listed securities is conducted via an open outcrym e t h o d , although there are plans to install a computerisedtrading system in the near future.
Fo re i g n e r s , who have been able to invest on the exchange since1 9 9 4 ,a re treated the same as local investors in terms of the taxl aw. Fo reign companies are also able to list on the exchange,subject to certain conditions.There is considerable potential fo rg rowth in market capitalisation and turnover on the StockE x c h a n g e
Fo reign Tr a d eTrade has been extensive ly liberalised and quantitativerestrictions on imports re m ove d .About 60 percent of import e dgoods attract duty between zero and 20 perc e n t , while thehighest rates (of 55 percent and 80 percent) are levied onselected go o d s . A sales tax of five percent is payable by
member of COMESA, the Indian Ocean Commission and theIndian Ocean Rim A s s o c i a t i o n . P roducts manu f a c t u red inMauritius with a value-added component of at least 45 perc e n t ,e n j oy pre fe rential access to the markets of other COMESAc o u n t r i e s
Fo reign Di rect Inve s t m e n tA c c o rding to the World Investment Report (1997), M a u r i t i u sre c e i ved an amount of USD21m in fo reign investment in 1996.G i ven the methodology used to collate this data, it is safe to saythat this is a conserv a t i ve estimate of fo reign investment inflow s .
In terms of manu f a c t u r i n g , i nvestment is still largely dire c t e dt ow a rds the textile industry. Most of the fo reign inve s t m e n tf l owing into the textile sector is from companies alre a d yestablished in Mauritius, which are buying new plants andupgrading their machinery. The Fre e p o rt is also popular fo rfo reign investment - fo reign companies use it, among othert h i n g s , as a transhipment base to countries on the east coast ofA f r i c a .
Fo reign investment has tended to come from India, Hong Ko n gand South East A s i a ,as well as from France. South A f r i c a ,a l re a d ywell-established in the tourism sector, is showing incre a s i n gi n t e rest in other areas of the Mauritian economy.
Stock Exchange of Mauritius: M a r ket Statistics (USDm unless otherwise stated)1 9 9 3 1 9 9 4 1 9 9 5 1 9 9 6 1 9 9 7
Number of listed companies 3 0 3 5 4 1 4 5 4 6
M a r ket capitalisation 7 9 1 . 6 1 , 5 9 7 . 5 1 , 6 0 0 . 0 1 , 8 5 7 . 2 1 , 5 4 9 . 8Number of companies making issues 9 1 1 6 2 0(including new issues, rights issuesand bond issues)
Value of new issues 1 . 3 8 1 1 . 4 1 4 . 0 7 1 . 4 8 –
Volume of shares traded (millions) 3 7 . 3 5 0 . 6 5 9 . 4 9 1 . 9 1 6 4 . 1
Value of shares traded 3 9 . 1 9 8 4 . 5 0 9 2 . 1 3 8 9 . 2 4 1 2 5 . 7 5
Number of trading days 9 7 1 4 7 1 4 9 1 4 8 1 6 0
S E M D E X 3 0 2 . 6 3 4 7 3 . 6 7 3 4 4 . 4 4 3 5 3 . 4 6 3 9 1 . 1 2
A n nual average dividend yield 4 . 2 3 . 3 5 . 1 4 . 0 4 . 3
Average price-earnings ratio of 1 2 . 0 1 6 . 5 1 1 . 1 1 4 . 5 1 4 . 1all listed companies
S o u rc e : The Stock Exchange of Mauritius (1998). Original figures in Mauritian Rupees, c o nve rted to US dollars by using InternationalFinancial Statistics (IMF) average year exchange rates except for market capitalisation which is conve rted using end of year exchanger a t e s .
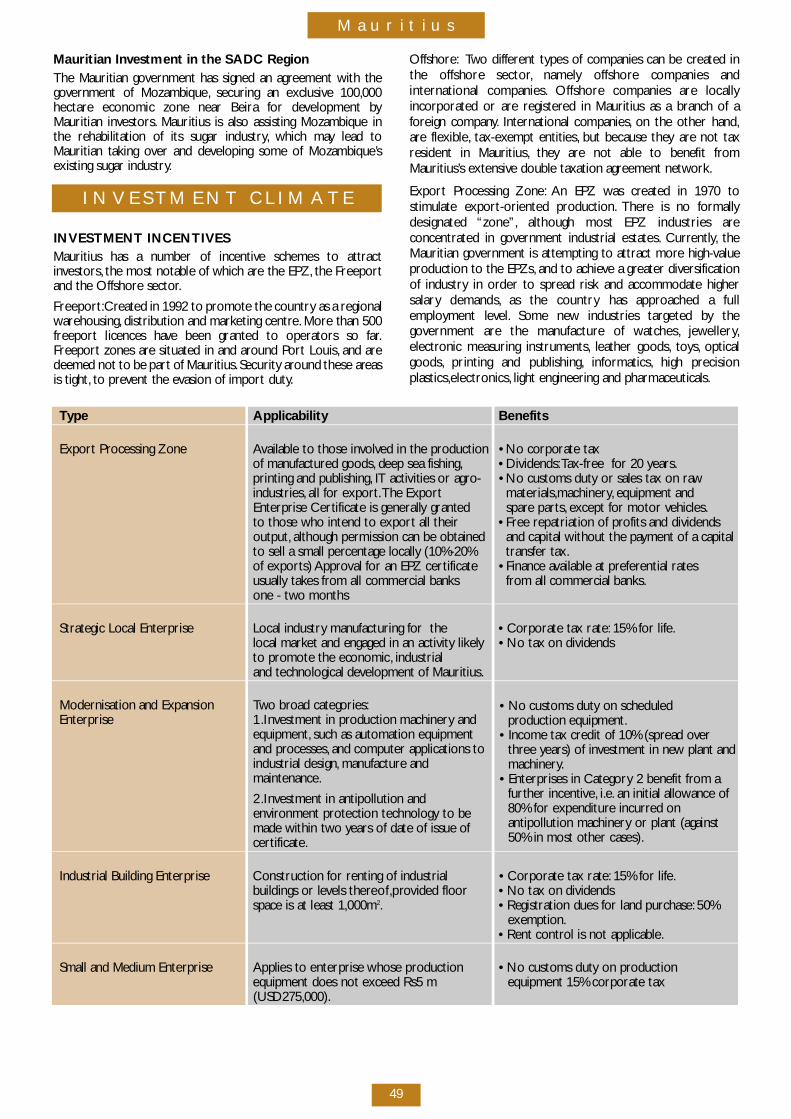
M au r i t i u s
49
Mauritian Investment in the SADC Re g i o nThe Mauritian government has signed an agreement with thegovernment of Mozambique, securing an exclusive 100,000h e c t a re economic zone near Beira for development byMauritian inve s t o r s . Mauritius is also assisting Mozambique inthe rehabilitation of its sugar industry, which may lead toMauritian taking over and developing some of Mozambique’sexisting sugar industry.
I N V E S TM E N T C L I M AT E
INVESTMENT INCENTIVESMauritius has a number of incentive schemes to attracti nve s t o r s , the most notable of which are the EPZ, the Fre e p o rtand the Offshore sector.
F re e p o rt :C reated in 1992 to promote the country as a re g i o n a lw a re h o u s i n g , distribution and marketing centre. M o re than 500f re e p o rt licences have been granted to operators so far.F re e p o rt zones are situated in and around Po rt Louis, and aredeemed not to be part of Mauritius. Security around these are a sis tight, to prevent the evasion of import duty.
O f f s h o re : Two diffe rent types of companies can be created inthe offshore sector, n a m e ly offshore companies andinternational companies. O f f s h o re companies are locallyincorporated or are re g i s t e red in Mauritius as a branch of afo reign company. International companies, on the other hand,a re flexible, t a x - e xempt entities, but because they are not taxresident in Mauritius, t h ey are not able to benefit fro mM a u r i t i u s ’s extensive double taxation agreement netwo r k .
E x p o rt Processing Zone: An EPZ was created in 1970 tos t i mulate export-oriented pro d u c t i o n . T h e re is no fo r m a l lydesignated “ z o n e ” , although most EPZ industries areconcentrated in government industrial estates. C u rre n t ly, t h eMauritian government is attempting to attract more high-valuep roduction to the EPZs, and to achieve a greater dive r s i f i c a t i o nof industry in order to spread risk and accommodate highers a l a ry demands, as the country has ap p roached a fulle m p l oyment leve l . Some new industries targeted by thegovernment are the manu f a c t u re of watches, j ewe l l e ry,e l e c t ronic measuring instruments, leather go o d s , t oy s , o p t i c a lgo o d s , printing and publishing, i n fo r m a t i c s , high pre c i s i o np l a s t i c s ,e l e c t ro n i c s , light engineering and pharmaceuticals.
• No customs duty on scheduled p roduction equipment.
• Income tax credit of 10% (spread ove rt h ree years) of investment in new plant andm a c h i n e ry.
• Enterprises in Catego ry 2 benefit from af u rther incentive, i . e. an initial allowance of80% for expenditure incurred onantipollution machinery or plant (against50% in most other cases).
Ty p e A p p l i c a b i l i t y B e n e f i t s
E x p o rt Processing Zone Available to those invo l ved in the pro d u c t i o n • No corporate taxof manu f a c t u red go o d s , deep sea fishing, • D i v i d e n d s :Ta x - f ree for 20 ye a r s .printing and publishing, IT activities or agro - • No customs duty or sales tax on rawi n d u s t r i e s , all for export .The Export m a t e r i a l s ,m a c h i n e ry, equipment and Enterprise Certificate is generally granted s p a re part s , except for motor ve h i c l e s .to those who intend to export all their • F ree repatriation of profits and dividends o u t p u t , although permission can be obtained and capital without the payment of a capital to sell a small percentage locally (10%-20% t r a n s fer tax.of exports) A p p roval for an EPZ cert i f i c a t e • Finance available at pre fe rential rates u s u a l ly takes from all commercial banks f rom all commercial banks.one - two months
Strategic Local Enterprise Local industry manufacturing for the • Corporate tax rate: 15% for life.local market and engaged in an activity like ly • No tax on dividendsto promote the economic, i n d u s t r i a land technological development of Mauritius.
Modernisation and Expansion Two broad catego r i e s :E n t e r p r i s e 1 .I nvestment in production machinery and
e q u i p m e n t , such as automation equipment and pro c e s s e s , and computer applications to industrial design, m a nu f a c t u re and m a i n t e n a n c e.
2 .I nvestment in antipollution and e nv i ronment protection technology to be made within two years of date of issue of c e rt i f i c a t e.
Industrial Building Enterprise Construction for renting of industrial • Corporate tax rate: 15% for life.buildings or levels there o f ,p rovided floor • No tax on dividends space is at least 1,000m2. • Registration dues for land purc h a s e : 50%
e xe m p t i o n .• Rent control is not ap p l i c a b l e.
Small and Medium Enterprise Applies to enterprise whose pro d u c t i o n • No customs duty on production equipment does not exceed Rs5 m equipment 15% corporate tax( U S D 2 7 5 , 0 0 0 ) .
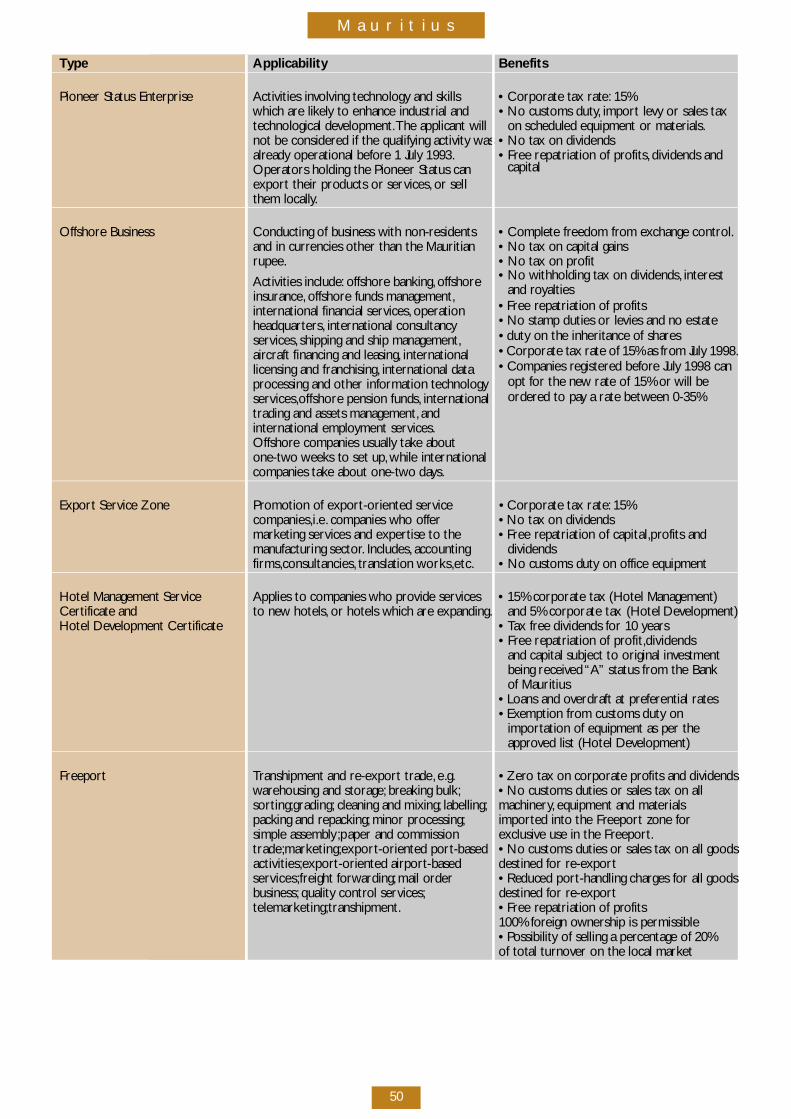
M au r i t i u s
50
Ty p e A p p l i c a b i l i t y B e n e f i t s
Pioneer Status Enterprise Activities involving technology and skills • Corporate tax rate: 1 5 %which are like ly to enhance industrial and • No customs duty, i m p o rt levy or sales tax technological deve l o p m e n t .The applicant will on scheduled equipment or materials.not be considered if the qualifying activity was • No tax on dividendsa l ready operational befo re 1 Ju ly 1993. • F ree repatriation of pro f i t s , dividends andOperators holding the Pioneer Status can c ap i t a le x p o rt their products or serv i c e s , or sell them locally.
O f f s h o re Business Conducting of business with non-residents • Complete freedom from exchange contro l .and in currencies other than the Mauritian • No tax on capital gainsr u p e e. • No tax on pro f i t
Activities include: o f f s h o re banking, o f f s h o re • No withholding tax on dividends, i n t e re s t
i n s u r a n c e, o f f s h o re funds management, and roy a l t i e s
international financial serv i c e s , operation • Free repatriation of pro f i t s
h e a d q u a rt e r s , international consultancy • No stamp duties or levies and no estate
s e rv i c e s , shipping and ship management, • duty on the inheritance of share sa i rcraft financing and leasing, international • Corporate tax rate of 15% as from Ju ly 1998.licensing and franchising, international data • Companies re g i s t e red befo re Ju ly 1998 canp rocessing and other information technology opt for the new rate of 15% or will bes e rv i c e s ,o f f s h o re pension funds, international o rd e red to pay a rate between 0-35%trading and assets management, and international employment serv i c e s .O f f s h o re companies usually take abouto n e - t wo weeks to set up, while internationalcompanies take about one-two day s .
E x p o rt Service Zone P romotion of export-oriented service • Corporate tax rate: 1 5 %c o m p a n i e s ,i . e. companies who offer • No tax on dividends m a r keting services and expertise to the • Free repatriation of cap i t a l ,p rofits andm a nufacturing sector. I n c l u d e s , accounting d i v i d e n d sf i r m s ,c o n s u l t a n c i e s , translation wo r k s ,e t c. • No customs duty on office equipment
Hotel Management Service Applies to companies who provide services • 15% corporate tax (Hotel Management) C e rtificate and to new hotels, or hotels which are expanding. and 5% corporate tax (Hotel Deve l o p m e n t )Hotel Development Cert i f i c a t e • Tax free dividends for 10 ye a r s
• F ree repatriation of pro f i t ,d i v i d e n d sand capital subject to original investment being re c e i ved “A” status from the Bank of Mauritius
• Loans and ove rdraft at pre fe rential rates• Exemption from customs duty on
i m p o rtation of equipment as per the ap p roved list (Hotel Deve l o p m e n t )
F re e p o rt Transhipment and re - e x p o rt trade, e. g . • Zero tax on corporate profits and dividendsw a rehousing and storage; b reaking bulk; • No customs duties or sales tax on alls o rt i n g ;g r a d i n g ; cleaning and mixing; l a b e l l i n g ; m a c h i n e ry, equipment and materials packing and re p a c k i n g ; minor pro c e s s i n g ; i m p o rted into the Fre e p o rt zone for simple assembly ;p aper and commission e x c l u s i ve use in the Fre e p o rt .t r a d e ;m a r ke t i n g ;e x p o rt-oriented port-based • No customs duties or sales tax on all go o d sa c t i v i t i e s ;e x p o rt-oriented airport-based destined for re - e x p o rts e rv i c e s ;f reight fo r w a rd i n g ; mail order • Reduced port-handling charges for all go o d sb u s i n e s s ; quality control serv i c e s ; destined for re - e x p o rtt e l e m a r ke t i n g ;t r a n s h i p m e n t . • Free repatriation of pro f i t s
100% fo reign ownership is permissible• Possibility of selling a percentage of 20%of total turnover on the local marke t
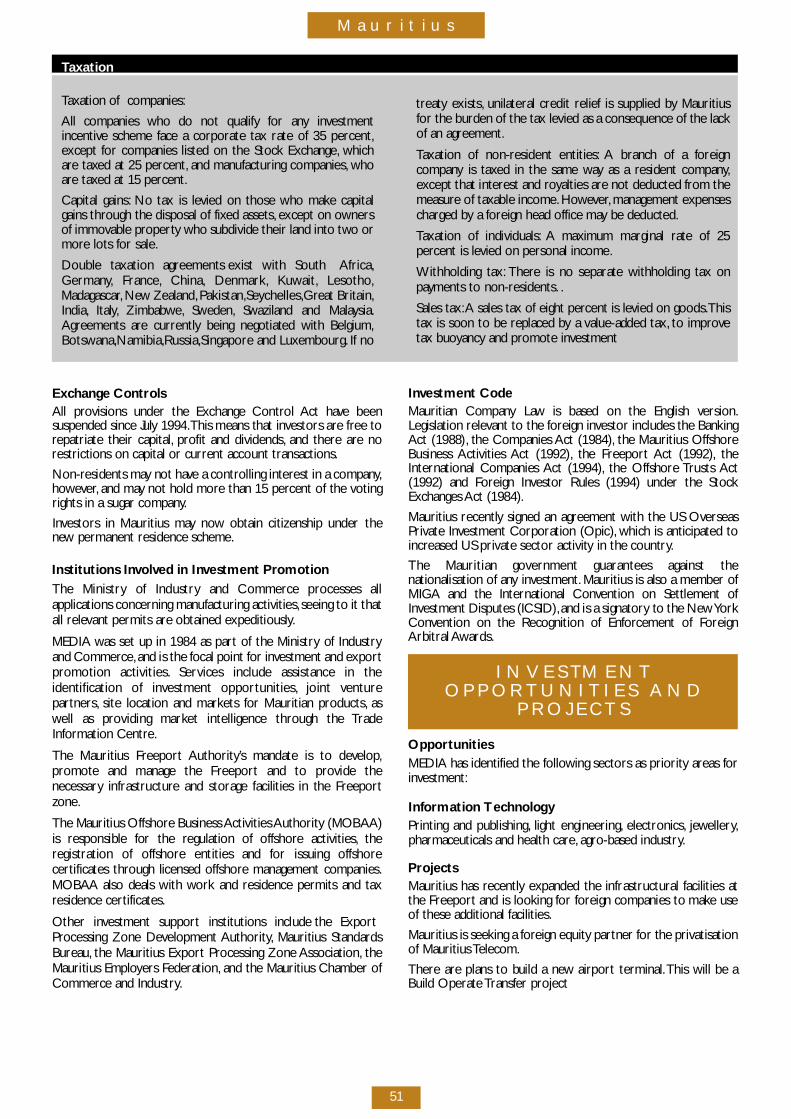
M au r i t i u s
51
Ta x a t i o n
Taxation of companies:
All companies who do not qualify for any inve s t m e n ti n c e n t i ve scheme face a corporate tax rate of 35 perc e n t ,except for companies listed on the Stock Exchange, w h i c ha re taxed at 25 perc e n t , and manufacturing companies, w h oa re taxed at 15 perc e n t .
C apital gains: No tax is levied on those who make cap i t a lgains through the disposal of fixed assets, except on ow n e r sof immovable pro p e rty who subdivide their land into two orm o re lots for sale.
Double taxation agreements exist with South A f r i c a ,G e r m a ny, F r a n c e, C h i n a , D e n m a r k , Ku w a i t , L e s o t h o,M a d a g a s c a r, N ew Zealand,P a k i s t a n ,S ey c h e l l e s ,G reat Britain,I n d i a , I t a ly, Z i m b a b we, S we d e n , Swaziland and Malay s i a .A g reements are curre n t ly being negotiated with Belgium,B o t sw a n a ,N a m i b i a ,R u s s i a ,S i n g ap o re and Luxe m b o u r g . If no
E x c h a n ge Co n t ro l sAll provisions under the Exchange Control Act have beensuspended since Ju ly 1994.This means that investors are free torepatriate their cap i t a l , p rofit and dividends, and there are norestrictions on capital or current account transactions.
N o n - residents may not have a controlling interest in a company,h oweve r, and may not hold more than 15 percent of the vo t i n grights in a sugar company.
I nvestors in Mauritius may now obtain citizenship under then ew permanent residence scheme.
Institutions Invo l ved in Investment Pro m o t i o nThe Ministry of Industry and Commerce processes allapplications concerning manufacturing activities, seeing to it thatall re l evant permits are obtained expeditiously.
MEDIA was set up in 1984 as part of the Ministry of Industryand Commerc e, and is the focal point for investment and exportp romotion activities. S e rvices include assistance in theidentification of investment opport u n i t i e s , joint ve n t u rep a rt n e r s , site location and markets for Mauritian pro d u c t s , a swell as providing market intelligence through the Tr a d eI n formation Centre.
The Mauritius Fre e p o rt A u t h o r i t y ’s mandate is to deve l o p,p romote and manage the Fre e p o rt and to provide then e c e s s a ry infrastructure and storage facilities in the Fre e p o rtz o n e.
The Mauritius Offshore Business Activities Authority (MOBA A )is responsible for the regulation of offshore activities, t h eregistration of offshore entities and for issuing offshorec e rtificates through licensed offshore management companies.M O BAA also deals with work and residence permits and taxresidence cert i f i c a t e s .
Other investment support institutions include the ExportP rocessing Zone Development A u t h o r i t y, Mauritius Standard sB u re a u , the Mauritius Export Processing Zone A s s o c i a t i o n , t h eMauritius Employers Fe d e r a t i o n , and the Mauritius Chamber ofC o m m e rce and Industry.
I nvestment Co d eMauritian Company Law is based on the English ve r s i o n .Legislation re l evant to the fo reign investor includes the BankingAct (1988), the Companies Act (1984), the Mauritius OffshoreBusiness Activities Act (1992), the Fre e p o rt Act (1992), t h eInternational Companies Act (1994), the Offshore Trusts A c t(1992) and Fo reign Investor Rules (1994) under the StockExchanges Act (1984).
Mauritius re c e n t ly signed an agreement with the US Ove r s e a sPrivate Investment Corporation (Opic), which is anticipated toi n c reased US private sector activity in the country.
The Mauritian government guarantees against thenationalisation of any inve s t m e n t . Mauritius is also a member ofMIGA and the International Convention on Settlement ofI nvestment Disputes (ICSID),and is a signatory to the New Yo r kC o nvention on the Recognition of Enfo rcement of Fo re i g nArbitral Aw a rd s .
I N V E S TM E N TO P P O R T U N I T I E S A N D
P R O J E C T S
O p p o rt u n i t i e sMEDIA has identified the fo l l owing sectors as priority areas fo ri nve s t m e n t :
I n formation Te c h n o l ogyPrinting and publishing, light engineering, e l e c t ro n i c s , j ewe l l e ry,pharmaceuticals and health care, a g ro-based industry.
P ro j e c t sMauritius has re c e n t ly expanded the infrastructural facilities atthe Fre e p o rt and is looking for fo reign companies to make useof these additional facilities.
Mauritius is seeking a fo reign equity partner for the privatisationof Mauritius Te l e c o m .
T h e re are plans to build a new airport terminal.This will be aBuild Operate Tr a n s fer pro j e c t
t reaty exists, unilateral credit relief is supplied by Mauritiusfor the burden of the tax levied as a consequence of the lackof an agre e m e n t .
Taxation of non-resident entities: A branch of a fo re i g nc o m p a ny is taxed in the same way as a resident company,except that interest and royalties are not deducted from them e a s u re of taxable income. H oweve r, management expensescharged by a fo reign head office may be deducted.
Taxation of individuals: A maximum marginal rate of 25p e rcent is levied on personal income.
Withholding tax: T h e re is no separate withholding tax onp ayments to non-re s i d e n t s . .
Sales tax:A sales tax of eight percent is levied on go o d s .T h i stax is soon to be replaced by a value-added tax, to improvetax buoyancy and promote inve s t m e n t
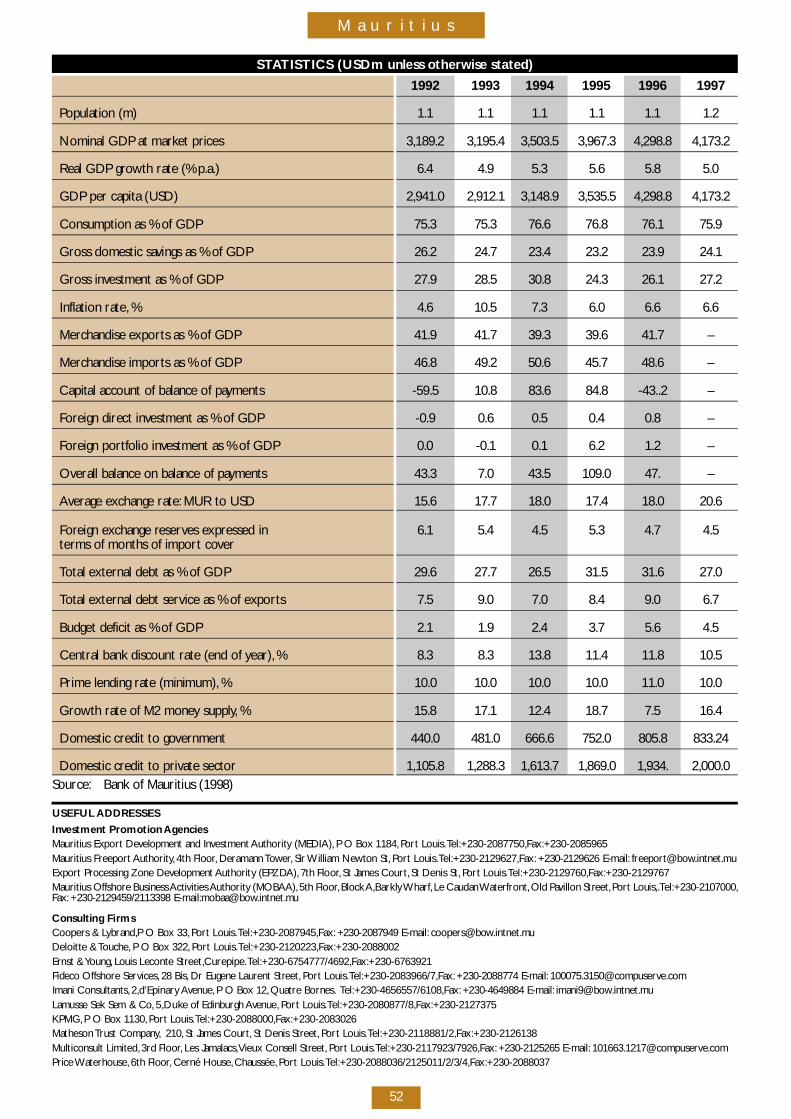
M au r i t i u s
52
S TAT I S T I C S (USDm unless otherwise stated)
1 9 9 2 1 9 9 3 1 9 9 4 1 9 9 5 1 9 9 6 1 9 9 7
Population (m) 1 . 1 1 . 1 1 . 1 1 . 1 1 . 1 1 . 2
Nominal GDP at market prices 3 , 1 8 9 . 2 3 , 1 9 5 . 4 3 , 5 0 3 . 5 3 , 9 6 7 . 3 4 , 2 9 8 . 8 4 , 1 7 3 . 2
Real GDP growth rate (% p. a . ) 6 . 4 4 . 9 5 . 3 5 . 6 5 . 8 5 . 0
GDP per capita (USD) 2 , 9 4 1 . 0 2 , 9 1 2 . 1 3 , 1 4 8 . 9 3 , 5 3 5 . 5 4 , 2 9 8 . 8 4 , 1 7 3 . 2
Consumption as % of GDP 7 5 . 3 7 5 . 3 7 6 . 6 7 6 . 8 7 6 . 1 7 5 . 9
G ross domestic savings as % of GDP 2 6 . 2 2 4 . 7 2 3 . 4 2 3 . 2 2 3 . 9 2 4 . 1
G ross investment as % of GDP 2 7 . 9 2 8 . 5 3 0 . 8 2 4 . 3 2 6 . 1 2 7 . 2
Inflation rate, % 4 . 6 1 0 . 5 7 . 3 6 . 0 6 . 6 6 . 6
M e rchandise exports as % of GDP 4 1 . 9 4 1 . 7 3 9 . 3 3 9 . 6 4 1 . 7 –
M e rchandise imports as % of GDP 4 6 . 8 4 9 . 2 5 0 . 6 4 5 . 7 4 8 . 6 –
C apital account of balance of payments - 5 9 . 5 1 0 . 8 8 3 . 6 8 4 . 8 - 4 3 . . 2 –
Fo reign direct investment as % of GDP - 0 . 9 0 . 6 0 . 5 0 . 4 0 . 8 –
Fo reign port folio investment as % of GDP 0 . 0 - 0 . 1 0 . 1 6 . 2 1 . 2 –
O verall balance on balance of payments 4 3 . 3 7 . 0 4 3 . 5 1 0 9 . 0 4 7 . –
Average exchange rate: MUR to USD 1 5 . 6 1 7 . 7 1 8 . 0 1 7 . 4 1 8 . 0 2 0 . 6
Fo reign exchange re s e rves expressed in 6 . 1 5 . 4 4 . 5 5 . 3 4 . 7 4 . 5terms of months of import cove r
Total external debt as % of GDP 2 9 . 6 2 7 . 7 2 6 . 5 3 1 . 5 3 1 . 6 2 7 . 0
Total external debt service as % of export s 7 . 5 9 . 0 7 . 0 8 . 4 9 . 0 6 . 7
Budget deficit as % of GDP 2 . 1 1 . 9 2 . 4 3 . 7 5 . 6 4 . 5
Central bank discount rate (end of ye a r ) , % 8 . 3 8 . 3 1 3 . 8 1 1 . 4 1 1 . 8 1 0 . 5
Prime lending rate (minimu m ) , % 1 0 . 0 1 0 . 0 1 0 . 0 1 0 . 0 1 1 . 0 1 0 . 0
G rowth rate of M2 money supply, % 1 5 . 8 1 7 . 1 1 2 . 4 1 8 . 7 7 . 5 1 6 . 4
Domestic credit to government 4 4 0 . 0 4 8 1 . 0 6 6 6 . 6 7 5 2 . 0 8 0 5 . 8 8 3 3 . 2 4
Domestic credit to private sector 1 , 1 0 5 . 8 1 , 2 8 8 . 3 1 , 6 1 3 . 7 1 , 8 6 9 . 0 1 , 9 3 4 . 2 , 0 0 0 . 0S o u rc e : Bank of Mauritius (1998)
USEFUL A D D R E S S E S
I nvestment Promotion A ge n c i e sMauritius Export Development and Investment Authority (MEDIA), P O Box 1184, Po rt Louis.Te l :+ 2 3 0 - 2 0 8 7 7 5 0 ,F a x :+ 2 3 0 - 2 0 8 5 9 6 5Mauritius Fre e p o rt A u t h o r i t y, 4th Floor, Deramann Towe r, Sir William Newton St, Po rt Louis.Te l :+ 2 3 0 - 2 1 2 9 6 2 7 ,F a x : +230-2129626 E-mail: f re e p o rt @ b ow. i n t n e t . muE x p o rt Processing Zone Development Authority (EPZDA ) , 7th Floor, St James Court , St Denis St, Po rt Louis.Te l :+ 2 3 0 - 2 1 2 9 7 6 0 ,F a x :+ 2 3 0 - 2 1 2 9 7 6 7Mauritius Offshore Business Activities Authority (MOBA A ) , 5th Floor,Block A ,B a r k ly W h a r f , Le Caudan Wa t e r f ro n t , Old Pavillon Stre e t , Po rt Louis,.Te l :+ 2 3 0 - 2 1 0 7 0 0 0 ,F a x : +230-2129459/2113398 E-mail:mobaa@bow. i n t n e t . mu
Consulting FirmsCoopers & Lybrand,P O Box 33, Po rt Louis.Te l :+ 2 3 0 - 2 0 8 7 9 4 5 ,F a x : +230-2087949 E-mail: c o o p e r s @ b ow. i n t n e t . muDeloitte & To u c h e, P O Box 322, Po rt Louis.Te l :+ 2 3 0 - 2 1 2 0 2 2 3 ,F a x :+ 2 3 0 - 2 0 8 8 0 0 2Ernst & Yo u n g , Louis Leconte Stre e t ,C u re p i p e.Te l :+ 2 3 0 - 6 7 5 4 7 7 7 / 4 6 9 2 ,F a x :+ 2 3 0 - 6 7 6 3 9 2 1Fideco Offshore Serv i c e s , 28 Bis, Dr Eugene Laurent Stre e t , Po rt Louis.Te l :+ 2 3 0 - 2 0 8 3 9 6 6 / 7 ,F a x : +230-2088774 E-mail: 1 0 0 0 7 5 . 3 1 5 0 @ c o m p u s e rve. c o mImani Consultants, 2 ,d ’ E p i n a ry Ave nu e, P O Box 12, Q u a t re Bornes. Te l :+ 2 3 0 - 4 6 5 6 5 5 7 / 6 1 0 8 ,F a x : +230-4649884 E-mail: i m a n i 9 @ b ow. i n t n e t . muL a musse Sek Sem & Co, 5 ,D u ke of Edinburgh Ave nu e, Po rt Louis.Te l :+ 2 3 0 - 2 0 8 0 8 7 7 / 8 ,F a x :+ 2 3 0 - 2 1 2 7 3 7 5K P M G , P O Box 1130, Po rt Louis.Te l :+ 2 3 0 - 2 0 8 8 0 0 0 ,F a x :+ 2 3 0 - 2 0 8 3 0 2 6Matheson Trust Company, 2 1 0 , St James Court , St Denis Stre e t , Po rt Louis.Te l :+ 2 3 0 - 2 1 1 8 8 8 1 / 2 ,F a x :+ 2 3 0 - 2 1 2 6 1 3 8Multiconsult Limited, 3 rd Floor, Les Jamalacs,Vieux Consell Stre e t , Po rt Louis.Te l :+ 2 3 0 - 2 1 1 7 9 2 3 / 7 9 2 6 ,F a x : +230-2125265 E-mail: 1 0 1 6 6 3 . 1 2 1 7 @ c o m p u s e rve. c o mPrice Wa t e r h o u s e, 6th Floor, Cerné House, C h a u s s é e, Po rt Louis.Te l :+ 2 3 0 - 2 0 8 8 0 3 6 / 2 1 2 5 0 1 1 / 2 / 3 / 4 ,F a x :+ 2 3 0 - 2 0 8 8 0 3 7
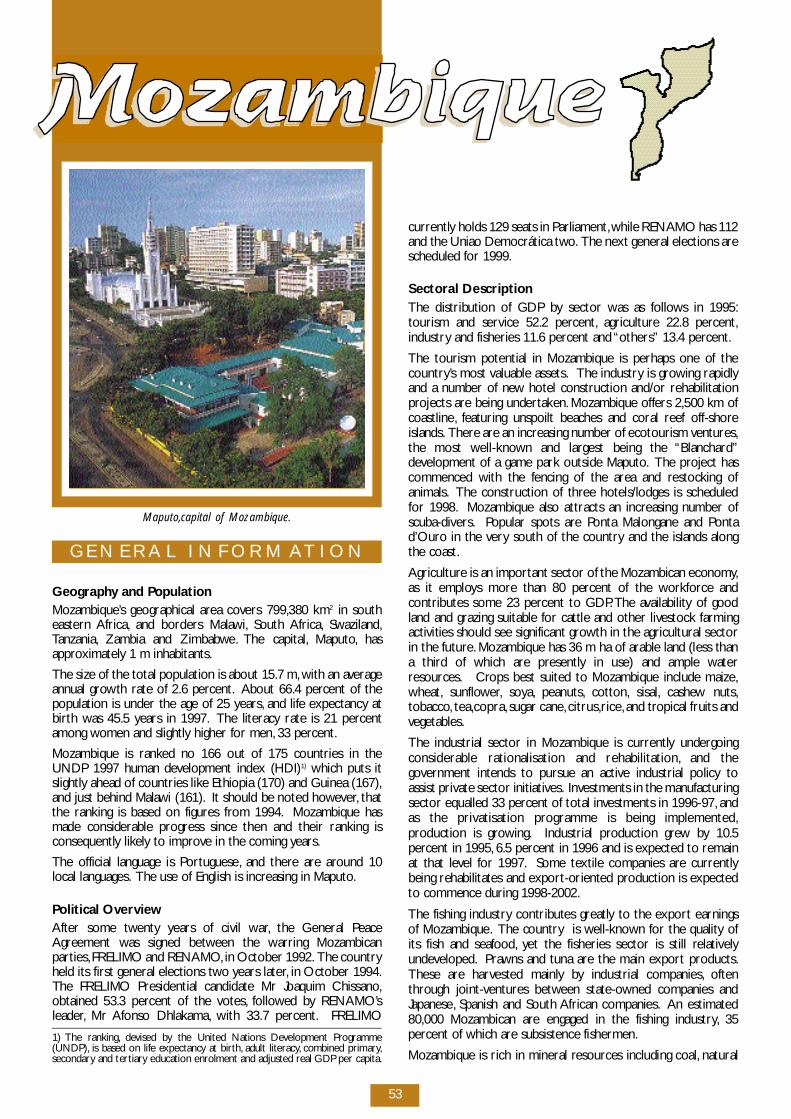
53
G E N E R A L I N F O R M AT I O N
G e og r ap hy and Po p u l a t i o nM o z a m b i q u e ’s geographical area covers 799,380 km2 in southeastern A f r i c a , and borders Malaw i , South A f r i c a , S w a z i l a n d ,Ta n z a n i a , Zambia and Zimbabwe. The cap i t a l , M ap u t o, h a sap p rox i m a t e ly 1 m inhabitants.
The size of the total population is about 15.7 m, with an ave r a g ea n nual growth rate of 2.6 perc e n t . About 66.4 percent of thepopulation is under the age of 25 ye a r s , and life expectancy atb i rth was 45.5 years in 1997. The literacy rate is 21 perc e n tamong women and slightly higher for men, 33 perc e n t .
Mozambique is ranked no 166 out of 175 countries in theUNDP 1997 human development index (HDI)1 ) which puts its l i g h t ly ahead of countries like Ethiopia (170) and Guinea (167),and just behind Malawi (161). It should be noted howeve r, t h a tthe ranking is based on figures from 1994. Mozambique hasmade considerable pro g ress since then and their ranking isc o n s e q u e n t ly like ly to improve in the coming ye a r s .
The official language is Po rt u g u e s e, and there are around 10local languages. The use of English is increasing in Map u t o.
Political Ove rv i ewAfter some twenty years of civil war, the General Pe a c eA g reement was signed between the warring Mozambicanp a rt i e s ,FRELIMO and RENAMO, in October 1992. The countryheld its first general elections two years later, in October 1994.The FRELIMO Presidential candidate Mr Joaquim Chissano,obtained 53.3 percent of the vo t e s , fo l l owed by RENAMO’sl e a d e r, Mr A fonso Dhlakama, with 33.7 perc e n t . F R E L I M O
c u rre n t ly holds 129 seats in Parliament,while RENAMO has 112and the Uniao Democrática two. The next general elections arescheduled for 1999.
Sectoral DescriptionThe distribution of GDP by sector was as fo l l ows in 1995:tourism and service 52.2 perc e n t , a g r i c u l t u re 22.8 perc e n t ,i n d u s t ry and fisheries 11.6 percent and “others” 13.4 perc e n t .
The tourism potential in Mozambique is perhaps one of thec o u n t ry ’s most valuable assets. The industry is growing rap i d lyand a number of new hotel construction and/or re h a b i l i t a t i o np rojects are being undert a ke n . Mozambique offers 2,500 km ofc o a s t l i n e, featuring unspoilt beaches and coral reef off-shorei s l a n d s . T h e re are an increasing number of ecotourism ve n t u re s ,the most we l l - k n own and largest being the “ B l a n c h a rd ”d evelopment of a game park outside Map u t o. The project hascommenced with the fencing of the area and restocking ofa n i m a l s . The construction of three hotels/lodges is scheduledfor 1998. Mozambique also attracts an increasing number ofs c u b a - d i ve r s . Popular spots are Ponta Malongane and Po n t ad ’ O u ro in the ve ry south of the country and the islands alongthe coast.
A g r i c u l t u re is an important sector of the Mozambican economy,as it employs more than 80 percent of the wo r k fo rce andcontributes some 23 percent to GDP. The availability of go o dland and grazing suitable for cattle and other livestock farmingactivities should see significant growth in the agricultural sectorin the future. Mozambique has 36 m ha of arable land (less thana third of which are pre s e n t ly in use) and ample waterre s o u rc e s . C rops best suited to Mozambique include maize,w h e a t , s u n f l owe r, s oy a , p e a nu t s , c o t t o n , s i s a l , c a s h ew nu t s ,t o b a c c o, t e a ,c o p r a , sugar cane, c i t r u s ,r i c e, and tropical fruits andve g e t a b l e s .
The industrial sector in Mozambique is curre n t ly undergo i n gconsiderable rationalisation and re h a b i l i t a t i o n , and thegovernment intends to pursue an active industrial policy toassist private sector initiative s . I nvestments in the manu f a c t u r i n gsector equalled 33 percent of total investments in 1996-97, a n das the privatisation programme is being implemented,p roduction is grow i n g . Industrial production grew by 10.5p e rcent in 1995, 6.5 percent in 1996 and is expected to re m a i nat that level for 1997. Some textile companies are curre n t lybeing rehabilitates and export-oriented production is expectedto commence during 1998-2002.
The fishing industry contributes gre a t ly to the export earningsof Mozambique. The country is we l l - k n own for the quality ofits fish and seafo o d , yet the fisheries sector is still re l a t i ve lyu n d eve l o p e d . P r awns and tuna are the main export pro d u c t s .These are harvested mainly by industrial companies, o f t e nt h rough joint-ve n t u res between state-owned companies andJ ap a n e s e, Spanish and South African companies. An estimated80,000 Mozambican are engaged in the fishing industry, 3 5p e rcent of which are subsistence fishermen.
Mozambique is rich in mineral re s o u rces including coal, n a t u r a l1) The ranking, d evised by the United Nations Development Pro g r a m m e( U N D P ) , is based on life expectancy at birt h , adult literacy, combined primary,s e c o n d a ry and tert i a ry education enrolment and adjusted real GDP per cap i t a .
Maputo,capital of Mozambique.
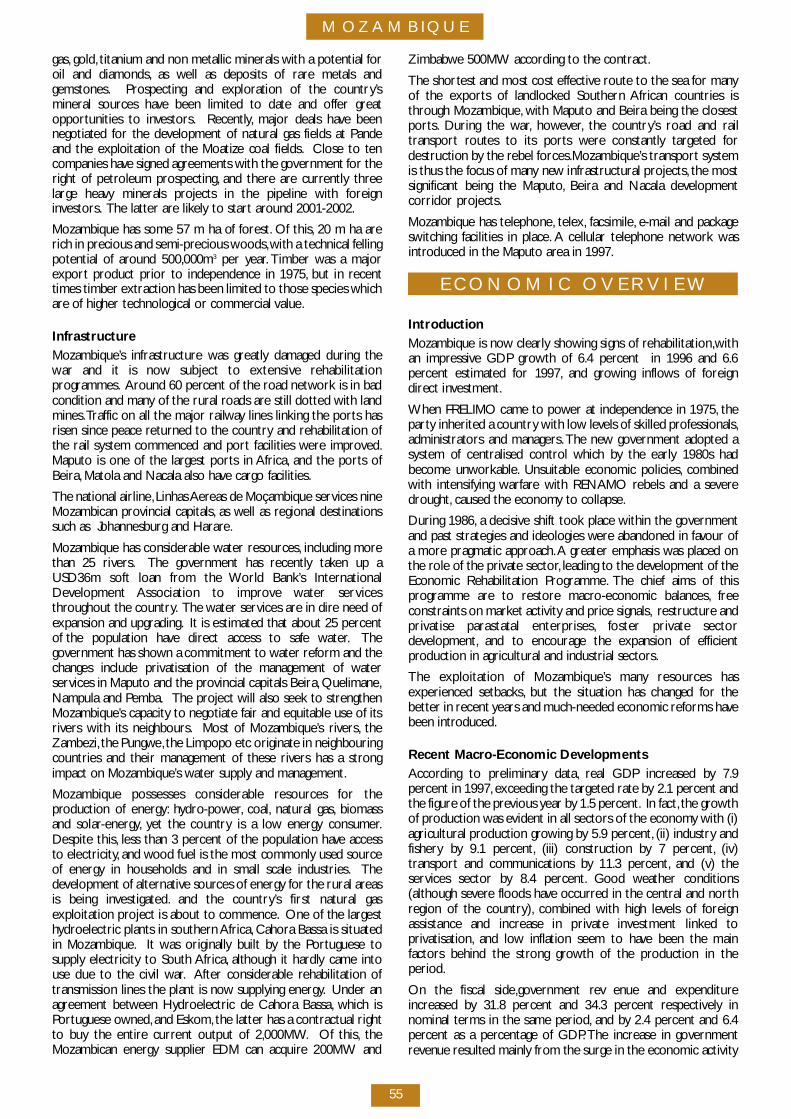
M O Z A M B IQ U E
55
g a s , go l d , titanium and non metallic minerals with a potential fo roil and diamonds, as well as deposits of rare metals andg e m s t o n e s . P rospecting and exploration of the country ’smineral sources have been limited to date and offer gre a to p p o rtunities to inve s t o r s . R e c e n t ly, major deals have beenn e gotiated for the development of natural gas fields at Pandeand the exploitation of the Moatize coal fields. Close to tencompanies have signed agreements with the government for theright of petroleum pro s p e c t i n g , and there are curre n t ly thre elarge heavy minerals projects in the pipeline with fo re i g ni nve s t o r s . The latter are like ly to start around 2001-2002.
Mozambique has some 57 m ha of fo re s t . Of this, 20 m ha arerich in precious and semi-precious wo o d s ,with a technical fe l l i n gpotential of around 500,000m3 per ye a r. Timber was a majore x p o rt product prior to independence in 1975, but in re c e n ttimes timber extraction has been limited to those species whicha re of higher technological or commercial value.
I n f r a s t r u c t u reM o z a m b i q u e ’s infrastructure was gre a t ly damaged during thewar and it is now subject to extensive re h a b i l i t a t i o np ro g r a m m e s . A round 60 percent of the road network is in badcondition and many of the rural roads are still dotted with landm i n e s .Traffic on all the major railw ay lines linking the ports hasrisen since peace returned to the country and rehabilitation ofthe rail system commenced and port facilities we re improve d .M aputo is one of the largest ports in A f r i c a , and the ports ofB e i r a , Matola and Nacala also have cargo facilities.
The national airline,Linhas A e reas de Moçambique services nineMozambican provincial cap i t a l s , as well as regional destinationssuch as Johannesburg and Harare.
Mozambique has considerable water re s o u rc e s , including morethan 25 rive r s . The government has re c e n t ly taken up aUSD36m soft loan from the World Bank’s InternationalD evelopment Association to improve water serv i c e st h roughout the country. The water services are in dire need ofexpansion and upgrading. It is estimated that about 25 perc e n tof the population have direct access to safe water. T h egovernment has shown a commitment to water re form and thechanges include privatisation of the management of waters e rvices in Maputo and the provincial capitals Beira, Q u e l i m a n e,Nampula and Pe m b a . The project will also seek to stre n g t h e nM o z a m b i q u e ’s capacity to negotiate fair and equitable use of itsr i vers with its neighbours. Most of Mozambique’s rive r s , t h eZ a m b e z i , the Pungwe,the Limpopo etc originate in neighbouringcountries and their management of these rivers has a stro n gimpact on Mozambique’s water supply and management.
Mozambique possesses considerable re s o u rces for thep roduction of energy : hy d ro - p owe r, c o a l , natural gas, b i o m a s sand solar- e n e r gy, yet the country is a low energy consumer.Despite this, less than 3 percent of the population have accessto electricity, and wood fuel is the most commonly used sourc eof energy in households and in small scale industries. T h ed evelopment of alternative sources of energy for the rural are a sis being inve s t i g a t e d . and the country ’s first natural gasexploitation project is about to commence. One of the largesthy d roelectric plants in southern A f r i c a , Cahora Bassa is situatedin Mozambique. It was originally built by the Po rtuguese tos u p p ly electricity to South A f r i c a , although it hard ly came intouse due to the civil war. After considerable rehabilitation oftransmission lines the plant is now supplying energy. Under ana g reement between Hydroelectric de Cahora Bassa, which isPo rtuguese ow n e d , and Esko m , the latter has a contractual rightto buy the entire current output of 2,000MW. Of this, t h eMozambican energy supplier EDM can acquire 200MW and
Z i m b a b we 500MW according to the contract.
The shortest and most cost effe c t i ve route to the sea for manyof the exports of landlocked Southern African countries ist h rough Mozambique, with Maputo and Beira being the closestp o rt s . During the war, h oweve r, the country ’s road and railt r a n s p o rt routes to its ports we re constantly targeted fo rdestruction by the rebel fo rc e s .M o z a m b i q u e ’s transport systemis thus the focus of many new infrastructural pro j e c t s , the mostsignificant being the Map u t o, Beira and Nacala deve l o p m e n tc o rridor pro j e c t s .
Mozambique has telephone, t e l e x , f a c s i m i l e, e-mail and packageswitching facilities in place. A cellular telephone network wasi n t roduced in the Maputo area in 1997.
E C O N O M IC O V E R V I E W
I n t ro d u c t i o nMozambique is now clearly showing signs of re h a b i l i t a t i o n ,w i t han impre s s i ve GDP growth of 6.4 percent in 1996 and 6.6p e rcent estimated for 1997, and growing inflows of fo re i g nd i rect inve s t m e n t .
When FRELIMO came to power at independence in 1975, t h ep a rty inherited a country with low levels of skilled pro fe s s i o n a l s ,administrators and managers.The new government adopted asystem of centralised control which by the early 1980s hadbecome unwo r k a b l e. Unsuitable economic policies, c o m b i n e dwith intensifying warfare with RENAMO rebels and a seve red ro u g h t , caused the economy to collap s e.
During 1986, a decisive shift took place within the gove r n m e n tand past strategies and ideologies we re abandoned in favour ofa more pragmatic ap p ro a c h .A greater emphasis was placed onthe role of the private sector, leading to the development of theEconomic Rehabilitation Pro g r a m m e. The chief aims of thisp rogramme are to re s t o re macro-economic balances, f re econstraints on market activity and price signals, re s t r u c t u re andprivatise parastatal enterprises, foster private sectord eve l o p m e n t , and to encourage the expansion of efficientp roduction in agricultural and industrial sectors.
The exploitation of Mozambique’s many re s o u rces hasexperienced setbacks, but the situation has changed for thebetter in recent years and much-needed economic re forms havebeen intro d u c e d .
Recent Macro-Economic Deve l o p m e n t sA c c o rding to pre l i m i n a ry data, real GDP increased by 7.9p e rcent in 1997, exceeding the targeted rate by 2.1 percent andthe figure of the previous year by 1.5 perc e n t . In fact, the grow t hof production was evident in all sectors of the economy with (i)agricultural production growing by 5.9 perc e n t , (ii) industry andf i s h e ry by 9.1 perc e n t , (iii) construction by 7 perc e n t , ( i v )t r a n s p o rt and communications by 11.3 perc e n t , and (v) thes e rvices sector by 8.4 perc e n t . Good weather conditions(although seve re floods have occurred in the central and nort hregion of the country ) , combined with high levels of fo re i g nassistance and increase in private investment linked top r i v a t i s a t i o n , and low inflation seem to have been the mainfactors behind the strong growth of the production in thep e r i o d .
On the fiscal side, government reve nue and expenditurei n c reased by 31.8 percent and 34.3 percent re s p e c t i ve ly innominal terms in the same period, and by 2.4 percent and 6.4p e rcent as a percentage of GDP. The increase in gove r n m e n treve nue resulted mainly from the surge in the economic activity
M O Z A M B IQ U E
56
combined with a set of measures implemented by theauthorities aiming at improving its reve nue collection.T h e re wasa slight worsening of the fiscal deficit as a percentage of GDP,which is mainly attributable to the increase of expenditure morethan reve nu e. It should be noted however that a 23 perc e n ti n c rease in trade related reve nue has been achieved since thecontracting of the British Crown Agents in May 1997 to assist inthe operation of the customs serv i c e.
The cumu l a t i ve average inflation rate up to end-December 1997declined sharply to 5.8 percent from a level of 24.3 percent inthe same period of the previous ye a r.The slow down of inflationis a result of the improvement in the monetary contro l ,exchange rate stability, and the strong supply response in thee c o n o my. In fact, inflation begun a declining trend in 1995 with ac u mu l a t i ve rate of 54.2 percent after 70.0 percent in 1994.
The current account, in nominal US dollar terms, i m p roved by4.2 perc e n t , as a result of the increase in exports by 6.7 perc e n twith imports increasing by 0.8 perc e n t .
The currency (Metical) maintained a strong perfo r m a n c e,resulting in a cumu l a t i ve nominal depreciation of only 1.5p e rcent in the official exchange market and an ap p reciation by1.7 percent in the parallel marke t . As a re s u l t , the spre a db e t ween the exchange rates of the two markets re m a i n e db e l ow 2 perc e n t .The exchange rate stability was mainly due toa tight monetary policy, the good performance of the externalsector combined with favourable inflows of external assistancef u n d s , as well as the dynamism of the interbank exchangem a r ke t .
M o n ey supply growth has increased slightly from 13.2 perc e n tin 1996 to 16.6 percent in 1997.The authorities shifted tow a rd si n d i rect monetary contro l , with the creation of the interbankm o n ey market in September,w h e re tre a s u ry bills and monetaryauthority bill are traded. The interbank money market alsoa l l ows commercial banks to lend and borrow funds to eacho t h e r. The interbank exchange market operation has beeni m p rove d , with the introduction of non-fixing sessions.
With the conclusion of the Paris Club A g re e m e n t s , about 10p e rcent of the Mozambican external debt was re d u c e d . O fthese USD500m we re rescheduled and USD100m cancelled.A dd i t i o n a l ly, in recognition of the country ’s re c o rd of economicre fo r m s , the World Bank and the IMF along with other donorsdecided on April 7, 1998 to provide exceptional support ,amounting to USD2.9 billion in nominal terms in debt serv i c erelief for Mozambique, equivalent to USD1.4 billion in NetP resent Value terms in June 1999.
With this initiative Mozambique’s external debt will be re d u c e df rom USD5.6 billion in late 1996 to USD1.1 billion in June 1999when the HIPC (Highly Indebted Poor Countries) package isi m p l e m e n t e d . Debt service payments will have been reduced tob e l ow 20 percent of export earnings.The stock of debt in NPVterms will be reduced to 200 percent of export s ,c o m p a red to466 percent without the initiative.
Financial Institutions The Government of Mozambique and the World Bank haved eveloped a financial sector adjustment programme aimed ati m p roving the efficiency of the banking sector, d eveloping them o n ey and capital marke t s , and fo r mulating better re g u l a t i o n sgoverning the sector.
The Banco de Moçambique was split into a central bank and ac o m m e rcial bank (Banco Comercial de Moçambique) in 1992.The independence of the central bank was laid down in law,although it is stated that the bank must respect the economicpolicy defined by the gove r n m e n t . Since then it has increased itsindependence and expanded its oversight cap a b i l i t i e s .
T h e re are seven commercial banks operating in Mozambique,and some are beginning to take steps fo r w a rd in terms ofo f fering their customers new products and taking marke t -oriented initiative s . The newest entrant on the banking scene isBanco Internaçional de Moçambique Investimento that wasc reated in early 1998. The bank is co-owned by Po rt u g u e s eBanco Commercial Po rtuguês (25 perc e n t ) , its subsidiary BancoInternational de Moçambique (50 percent) the IFC (15 perc e n t ) ,and the parastatals Te l e c o m municações de Moçambique andElectricidade de Moçambique each own 5 perc e n t . B I MI nvestimento will concentrate on joint-ve n t u res in connectionwith the current privatisation pro g r a m m e, and on thed evelopment of links with South A f r i c a . Electricidade deM o ç a m b i q u e ’s interests in the bank is associated with itsp robable invo l vement in future hy d roelectric projects in theZambezi valley and the construction of an aluminum smelteroutside Map u t o.
In September 1997 the government sold sixty percent of thelast state-owned bank, the Pe o p l e ’s Development Bank, t oSouthern Bank Berhard of Malaysia and a Mozambican privatec o m p a ny, I nve s t e c. The state retained 20 percent of the share sand 20 percent we re re s e rved for bank employees andm a n a g e r s . Liberalisation of the insurance sector is alsop ro c e e d i n g , but as yet there are no long-term insurers inM o z a m b i q u e.
The money market is still undeveloped in Mozambique, a l t h o u g hthe legal framework for a money market is under finalisation.The central bank issues short-term bonds on a quart e r ly basis,which are sold mainly to commercial banks. The info r m a lm o n ey market is used extensive ly.
Mozambique Stock ExchangeOne of the key reasons for the establishment of a stockexchange in Maputo is to provide a vehicle for the facilitation ofthe privatisation pro g r a m m e. The “Installation Commission fo rthe Mozambique Stock Exchange” was consequently set upunder the Ministry of Planning and Finance in 1997 to pre p a refor the establishment of the exchange. The work is curre n t ly inits final stages and the market is expected to open befo re theend of 1998.
E x c h a n ge Contro l sFo reign investors are permitted to operate both local andfo reign currency accounts. Fo reign currency accounts fo ri nvestors may be denominated as retention accounts, m e a n i n gthe availability of fo reign currency is guaranteed. Fo re i g nretention accounts, w h e re fo reign currency receipts fro mM o z a m b i q u e - d e r i ved production and sales are re c e i ved andheld in fo reign bank accounts, a re permitted on a case-by - c a s eb a s i s .
The right to repatriate cap i t a l , dividends and other distributionsof profit is guaranteed by law to fo reign inve s t o r s . Firms areobliged to register all imports of goods or money with theCentral Bank. F u t u re repatriation of non-re g i s t e red inve s t m e n tis not guaranteed.
Fo reign Tr a d eM o z a m b i q u e ’s principal trading partners are South A f r i c a ,Po rt u g a l ,S p a i n ,USA and Jap a n . Due to the limited industrial andfood production in Mozambique, the value of the country ’si m p o rts far exceeds that of its export s .
The country ’s main export products are cashew nu t s , p r aw n s ,lobster and cotton. Main import goods are transport andelectrical equipment, food and ve g e t a b l e s .
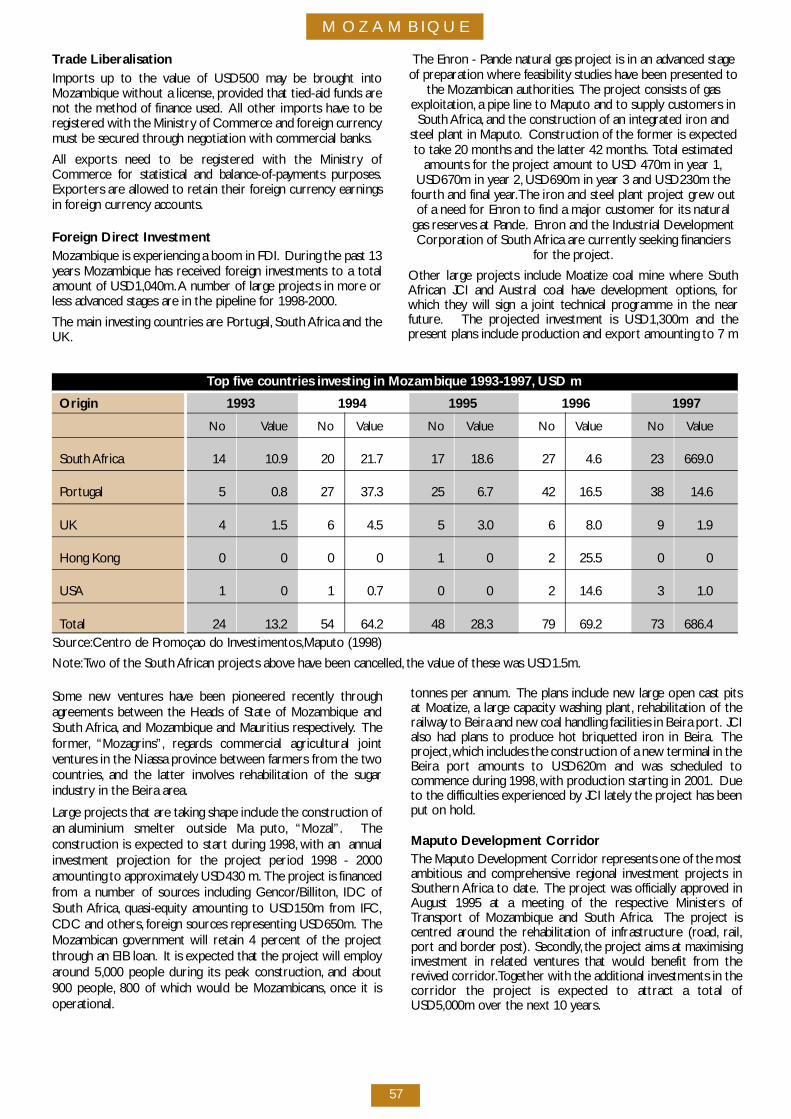
M O Z A M B IQ U E
57
Trade LiberalisationI m p o rts up to the value of USD500 may be brought intoMozambique without a license, p rovided that tied-aid funds arenot the method of finance used. All other imports have to bere g i s t e red with the Ministry of Commerce and fo reign curre n c ymust be secured through negotiation with commercial banks.
All exports need to be re g i s t e red with the Ministry ofC o m m e rce for statistical and balance-of-payments purposes.E x p o rters are allowed to retain their fo reign currency earningsin fo reign currency accounts.
Fo reign Direct Inve s t m e n tMozambique is experiencing a boom in FDI. During the past 13years Mozambique has re c e i ved fo reign investments to a totalamount of USD1,040m.A number of large projects in more orless advanced stages are in the pipeline for 1998-2000.
The main investing countries are Po rt u g a l , South Africa and theU K .
The Enron - Pande natural gas project is in an advanced stageof preparation where feasibility studies have been presented to
the Mozambican authorities. The project consists of gase x p l o i t a t i o n , a pipe line to Maputo and to supply customers inSouth A f r i c a , and the construction of an integrated iron and
steel plant in Map u t o. Construction of the former is expectedto take 20 months and the latter 42 months. Total estimated
amounts for the project amount to USD 470m in year 1,USD670m in year 2, USD690m in year 3 and USD230m the
fo u rth and final ye a r.The iron and steel plant project grew outof a need for Enron to find a major customer for its natural
gas re s e rves at Pande. E n ron and the Industrial Deve l o p m e n tCorporation of South Africa are curre n t ly seeking financiers
for the pro j e c t .
Other large projects include Moatize coal mine where SouthAfrican JCI and Austral coal have development options, fo rwhich they will sign a joint technical programme in the nearf u t u re. The projected investment is USD1,300m and thep resent plans include production and export amounting to 7 m
Some new ve n t u res have been pioneered re c e n t ly thro u g ha g reements between the Heads of State of Mozambique andSouth A f r i c a , and Mozambique and Mauritius re s p e c t i ve ly. T h efo r m e r, “ M o z a g r i n s ” , re g a rds commercial agricultural jointve n t u res in the Niassa province between farmers from the twoc o u n t r i e s , and the latter invo l ves rehabilitation of the sugari n d u s t ry in the Beira are a .
Large projects that are taking shape include the construction ofan aluminium smelter outside Map u t o, “ M o z a l ” . T h econstruction is expected to start during 1998, with an annu a li nvestment projection for the project period 1998 - 2000amounting to ap p rox i m a t e ly USD430 m. The project is financedf rom a number of sources including Gencor/Billiton, IDC ofSouth A f r i c a , quasi-equity amounting to USD150m from IFC,CDC and others, fo reign sources re p resenting USD650m. T h eMozambican government will retain 4 percent of the pro j e c tt h rough an EIB loan. It is expected that the project will employa round 5,000 people during its peak construction, and about900 people, 800 of which would be Mozambicans, once it iso p e r a t i o n a l .
tonnes per annu m . The plans include new large open cast pitsat Moatize, a large capacity washing plant, rehabilitation of ther a i lw ay to Beira and new coal handling facilities in Beira port . J C Ialso had plans to produce hot briquetted iron in Beira. T h ep ro j e c t ,which includes the construction of a new terminal in theBeira port amounts to USD620m and was scheduled tocommence during 1998, with production starting in 2001. D u eto the difficulties experienced by JCI lately the project has beenput on hold.
M aputo Development Corr i d o rThe Maputo Development Corridor re p resents one of the mostambitious and compre h e n s i ve regional investment projects inSouthern Africa to date. The project was officially ap p roved inAugust 1995 at a meeting of the re s p e c t i ve Ministers ofTr a n s p o rt of Mozambique and South A f r i c a . The project isc e n t red around the rehabilitation of infrastructure (ro a d , r a i l ,p o rt and border post). S e c o n d ly, the project aims at maximisingi nvestment in related ve n t u res that would benefit from therev i ved corr i d o r.Together with the additional investments in thec o rridor the project is expected to attract a total ofUSD5,000m over the next 10 ye a r s .
Top five countries investing in Mozambique 1993-1997, USD m
O r i g i n 1 9 9 3 1 9 9 4 1 9 9 5 1 9 9 6 1 9 9 7
N o Value N o Va l u e N o Va l u e N o Va l u e N o Va l u e
South A f r i c a 1 4 1 0 . 9 2 0 2 1 . 7 1 7 1 8 . 6 2 7 4 . 6 2 3 6 6 9 . 0
Po rt u g a l 5 0 . 8 2 7 3 7 . 3 2 5 6 . 7 4 2 1 6 . 5 3 8 1 4 . 6
U K 4 1 . 5 6 4 . 5 5 3 . 0 6 8 . 0 9 1 . 9
Hong Ko n g 0 0 0 0 1 0 2 2 5 . 5 0 0
U S A 1 0 1 0 . 7 0 0 2 1 4 . 6 3 1 . 0
To t a l 2 4 1 3 . 2 5 4 6 4 . 2 4 8 2 8 . 3 7 9 6 9 . 2 7 3 6 8 6 . 4S o u rc e :C e n t ro de Promoçao do Inve s t i m e n t o s ,M aputo (1998)
N o t e :Two of the South African projects above have been cancelled, the value of these was USD1.5m.
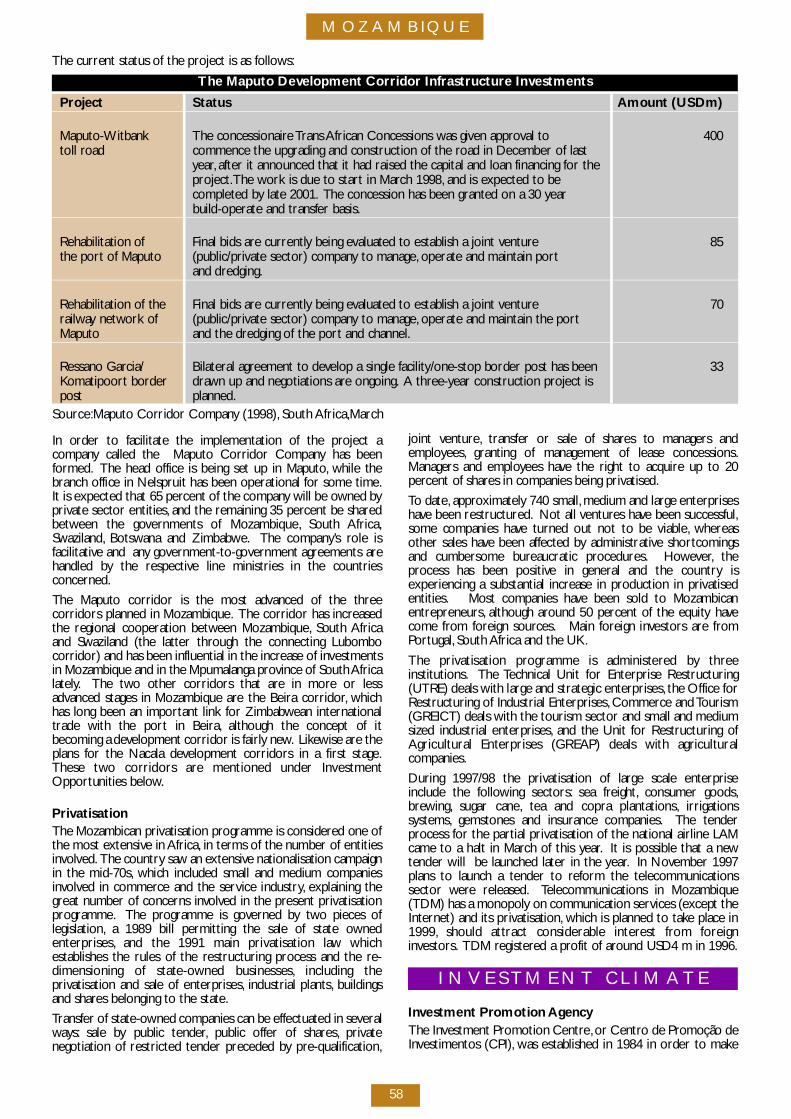
M O Z A M B IQ U E
58
In order to facilitate the implementation of the project ac o m p a ny called the Maputo Corridor Company has beenfo r m e d . The head office is being set up in Map u t o, while thebranch office in Nelspruit has been operational for some time.It is expected that 65 percent of the company will be owned byprivate sector entities, and the remaining 35 percent be share db e t ween the governments of Mozambique, South A f r i c a ,S w a z i l a n d , B o t swana and Zimbabwe. The company ’s role isf a c i l i t a t i ve and any gove r n m e n t - t o - government agreements arehandled by the re s p e c t i ve line ministries in the countriesc o n c e r n e d .
The Maputo corridor is the most advanced of the thre ec o rridors planned in Mozambique. The corridor has incre a s e dthe regional cooperation between Mozambique, South A f r i c aand Swaziland (the latter through the connecting Lubomboc o rridor) and has been influential in the increase of inve s t m e n t sin Mozambique and in the Mpumalanga province of South A f r i c al a t e ly. The two other corridors that are in more or lessadvanced stages in Mozambique are the Beira corr i d o r, w h i c hhas long been an important link for Zimbabwean internationaltrade with the port in Beira, although the concept of itbecoming a development corridor is fairly new. L i kewise are theplans for the Nacala development corridors in a first stage.These two corridors are mentioned under Inve s t m e n tO p p o rtunities below.
P r i v a t i s a t i o nThe Mozambican privatisation programme is considered one ofthe most extensive in A f r i c a , in terms of the number of entitiesi nvo l ve d . The country saw an extensive nationalisation campaignin the mid-70s, which included small and medium companiesi nvo l ved in commerce and the service industry, explaining theg reat number of concerns invo l ved in the present privatisationp ro g r a m m e. The programme is governed by two pieces ofl e g i s l a t i o n , a 1989 bill permitting the sale of state ow n e de n t e r p r i s e s , and the 1991 main privatisation law whichestablishes the rules of the restructuring process and the re -dimensioning of state-owned businesses, including theprivatisation and sale of enterprises, industrial plants, b u i l d i n g sand shares belonging to the state.
Tr a n s fer of state-owned companies can be effectuated in seve r a lw ay s : sale by public tender, public offer of share s , p r i v a t en e gotiation of restricted tender preceded by pre - q u a l i f i c a t i o n ,
joint ve n t u re, t r a n s fer or sale of shares to managers ande m p l oye e s , granting of management of lease concessions.Managers and employees have the right to acquire up to 20p e rcent of shares in companies being privatised.
To date, ap p rox i m a t e ly 740 small, medium and large enterprisesh ave been re s t r u c t u re d . Not all ve n t u res have been successful,some companies have turned out not to be viable, w h e re a sother sales have been affected by administrative short c o m i n g sand cumbersome bureaucratic pro c e d u re s . H oweve r, t h ep rocess has been positive in general and the country isexperiencing a substantial increase in production in privatisede n t i t i e s . Most companies have been sold to Mozambicane n t re p re n e u r s , although around 50 percent of the equity havecome from fo reign sourc e s . Main fo reign investors are fro mPo rt u g a l , South Africa and the UK.
The privatisation programme is administered by thre ei n s t i t u t i o n s . The Technical Unit for Enterprise Restructuring(UTRE) deals with large and strategic enterprises, the Office fo rRestructuring of Industrial Enterprises, C o m m e rce and To u r i s m(GREICT) deals with the tourism sector and small and mediumsized industrial enterprises, and the Unit for Restructuring ofAgricultural Enterprises (GREAP) deals with agriculturalc o m p a n i e s .
During 1997/98 the privatisation of large scale enterpriseinclude the fo l l owing sectors: sea fre i g h t , consumer go o d s ,b rew i n g , sugar cane, tea and copra plantations, i rr i g a t i o n ss y s t e m s , gemstones and insurance companies. The tenderp rocess for the partial privatisation of the national airline LAMcame to a halt in March of this ye a r. It is possible that a newtender will be launched later in the ye a r. In November 1997plans to launch a tender to re form the telecommu n i c a t i o n ssector we re re l e a s e d . Te l e c o m munications in Mozambique(TDM) has a monopoly on communication services (except theInternet) and its privatisation, which is planned to take place in1 9 9 9 , should attract considerable interest from fo re i g ni nve s t o r s . TDM re g i s t e red a profit of around USD4 m in 1996.
I N V E S TM E N T C L I M AT E
I nvestment Promotion A gency The Investment Promotion Centre,or Centro de Promoção deI nvestimentos (CPI), was established in 1984 in order to make
The current status of the project is as fo l l ow s :
The Maputo Development Corridor Infrastructure Investments
P ro j e c t S t a t u s Amount (USDm)
M ap u t o - W i t b a n k The concessionaire Trans African Concessions was given ap p roval to 4 0 0toll ro a d commence the upgrading and construction of the road in December of last
ye a r, after it announced that it had raised the capital and loan financing for the p ro j e c t .The work is due to start in March 1998, and is expected to be completed by late 2001. The concession has been granted on a 30 year build-operate and transfer basis.
Rehabilitation of Final bids are curre n t ly being evaluated to establish a joint ve n t u re 8 5the port of Map u t o (public/private sector) company to manage, operate and maintain port
and dre d g i n g .
Rehabilitation of the Final bids are curre n t ly being evaluated to establish a joint ve n t u re 7 0r a i lw ay network of (public/private sector) company to manage, operate and maintain the port M ap u t o and the dredging of the port and channel.
Ressano Garc i a / Bilateral agreement to develop a single facility/one-stop border post has been 3 3Ko m a t i p o o rt bord e r d r awn up and negotiations are ongo i n g . A thre e - year construction project is post p l a n n e d .
S o u rc e :M aputo Corridor Company (1998), South A f r i c a ,M a rc h
business application pro c e d u res simpler and more consistent.The CPI is also taking a pro a c t i ve role in obtaining permits andap p rovals from diffe rent government ministries and nationald i rectorates on behalf of fo reign inve s t o r s . CPI provides a“matchmaking” service for fo reign investors seeking to identifylocal Mozambican part n e r s , and has attempted to simplify andspeed up the process for gaining project ap p roval with the helpof the private sector and the World Bank. B u re a u c r a c ys u rrounding investment is unfo rt u n a t e ly still high.
A step tow a rds the reduction of investment related bure a u c r a c ywas the execution of a compre h e n s i ve study on administrativeb a rriers to investment at the end of 1996. The study wasc a rried out under the auspices of the International FinanceC o r p o r a t i o n . A commission examining outdated laws pert a i n i n gto the business sector was due to present its proposals togovernment by December 1997.
I n c e n t i ves Offe red To Investors includes:- Full exemption from customs duties and consumption and
c i rculation tax on some equipment for green field i nve s t m e n t s , i e a new enterprise constitution with new b u i l d i n g s .
– Reduction by 80 percent of the Industrial Contribution Tax (corporate tax) and supplementary taxes during the period ofre c ove ry of investment expenditures in Niassa,Tete and CaboDelgado prov i n c e s . Reduction by 65 percent of the same t a xes for investments located outside other provincial c ap i t a l s , and 50 percent reduction of taxes for investments inthe capitals of other prov i n c e s .
– Deduction from the taxable income of operating ve n t u res of100 percent of investments in new equipment, plant and i n f r a s t r u c t u re and construction for up to five ye a r s .
– Deduction of losses for tax purposes of expenditures on c o n s t r u c t i o n , rehabilitation of public ro a d s ,s c h o o l s ,s ewe r a g eand training of Mozambican wo r ke r s .
E x p o rt Incentive sM o z a m b i q u e ’s main effo rt to expand its export markets are theIndustrial Free Zones (IFZ). I nvestors are invited to deve l o pand/or administer an IFZ, p rovided they make a minimu mi nvestment of USD5m. Companies operating in an IFZ aree xempt from all taxes and customs duties. To qualify for IFZstatus a company must export at least 85 percent of itsp ro d u c t i o n , and a minimum investment of USD50,000 isre q u i re d . Both developers of and operators in an IFZ arere q u i red to pay a royalty of 1 percent of their gross turnove r,the former from their 6th year of operation and the latter fro mtheir 2nd year of operation. Although the regulations gove r n i n gIFS came into effect in Janu a ry the concept has not yet taken off.The first IFZ to be developed will be located in Map u t o.
Mozambique is eligible for duty-free exports quotas to EUm a r kets and also to the USA and other developed economiesunder the GSP. Mozambique also enjoys pre fe rential low - d u t ye x p o rt quotas to the Eastern and Southern African marke tunder COMESA, and has a special trade agreement with SouthA f r i c a .
Ta x a t i o nCompanies are taxed at various rates according to their type ofb u s i n e s s ; the rate for industrial companies is 40 perc e n t , fo ra g r i c u l t u re 35 percent and for commerce and services 45p e rc e n t . In add i t i o n ,t h e re is a circulation tax on invoices of 10p e rc e n t . Personal income tax is pro g re s s i ve with a maximu mrate of 30 perc e n t .
I nvestment Code and Protection of Inve s t m e n tThe 1993 Investment Law lays down the framework for fo re i g nand domestic inve s t m e n t s , including guarantees and incentive s ,
M O Z A M B IQ U E
59
as outlined above. The law stipulates modalities for re m i t t a n c eof funds abro a d .
F u rt h e r m o re the law offers the fo l l owing guarantees toi nve s t o r s :
– Security and legal protection of pro p e rty over goods and rights in connection with investments made.
– F reedom to import equity capital or take up loans to carry out inve s t m e n t s . .
– Repatriation of capital invested upon liquidation or sale, t o t a lor part i a l , of goods or rights of an investment undert a k i n g .
– Just and equitable compensation in event of expropriation based on absolutely necessary and weighty reasons of publicand national intere s t , health and public ord e r.
Mozambique is a member of MIGA, OPIC and offers re c o u r s eto arbitration through ICSID and the Paris based InternationalChamber of Commerc e.
I N V E S TM E N TO P P O R T U N I T I E S A N D
P R O J E C T S
O p p o rt u n i t i e sMozambique has a vast potential for deve l o p m e n t ,c o m m e n c i n gwith the development of and/or rehabilitation of infrastructurep rojects in all sectors of the economy. Other areas of intere s tto investors include: a g r i c u l t u re, a g ro - p ro c e s s i n g , m i n i n g ,m a nu f a c t u r i n g , f i s h i n g , a q u a c u l t u re (the culture of oy s t e r s ,mu s s e l s , algae and pearls) and tourism.
A g r i c u l t u re / Fo re s t ry SectorIn part i c u l a r, o p p o rtunities exist in the production of crops suchas cashew nuts in the Nampula and Gaza Provinces andc o c o nuts in the Zambezia Prov i n c e. The government isrehabilitating its sugar industry, and partners are also beingsought for the production of cotton and sisal around Mocuba inZambezia prov i n c e s . Plenty of opportunities exist for inve s t o r sto process agricultural pro d u c t s .
O p p o rtunities for investment exist in fo rest plantations and theindustrial processing of wood pro d u c t s . P rovincial fo re s t ryp rojects are being established and re fo restation pro g r a m m e sa re planned.
Mining SectorFo reign partners are being sought by a number ofe n t re p reneurs for the development of tantalite and pegmatitemining in Zambezia, bauxite in Manica prov i n c e,gold pro d u c t i o n ,also mainly in Manica, and the mining of a number of otherminerals and precious and semi-precious stones
M a nufacturing SectorThe re i n t roduction of sugar production for the local and exportm a r kets is already underway and government is seekinga dditional investment in this industry. Factories in Mafambisse,X i n av a n e,Maragra and Sena sugar estate have been identified fo rfo reign inve s t m e n t . N e gotiations with fo reign investors areu n d e r w ay for some of these factories.
Industries in both the centre and the north of the country offe ro p p o rtunities for expansion resulting dire c t ly from easy accessto raw materials, c h e ap power sources and quick ro a d / r a i laccess to the sea. Industries such as cement manu f a c t u re enjoya high demand as a result of the re c ove ry in the constructioni n d u s t ry.
Fishing T h e re are openings in praw n , l o b s t e r, c r ayfish and quality
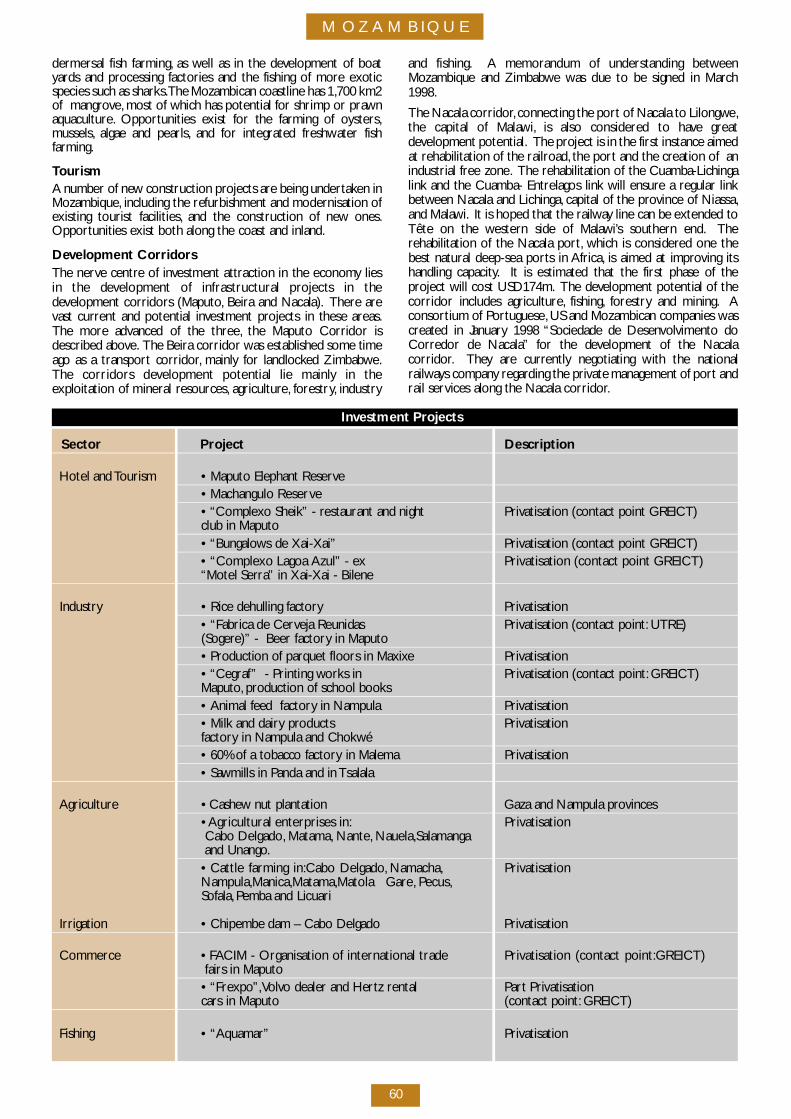
M O Z A M B IQ U E
60
dermersal fish farming, as well as in the development of boaty a rds and processing factories and the fishing of more exoticspecies such as sharks.The Mozambican coastline has 1,700 km2of mangrove, most of which has potential for shrimp or praw na q u a c u l t u re. O p p o rtunities exist for the farming of oy s t e r s ,mu s s e l s , algae and pearls, and for integrated freshwater fishf a r m i n g .
To u r i s mA number of new construction projects are being undert a ken inM o z a m b i q u e, including the refurbishment and modernisation ofexisting tourist facilities, and the construction of new ones.O p p o rtunities exist both along the coast and inland.
D evelopment Corr i d o r sThe nerve centre of investment attraction in the economy liesin the development of infrastructural projects in thed evelopment corridors (Map u t o, Beira and Nacala). T h e re arevast current and potential investment projects in these are a s .The more advanced of the thre e, the Maputo Corridor isdescribed above. The Beira corridor was established some timea go as a transport corr i d o r, m a i n ly for landlocked Zimbabwe.The corridors development potential lie mainly in theexploitation of mineral re s o u rc e s , a g r i c u l t u re, fo re s t ry, i n d u s t ry
and fishing. A memorandum of understanding betwe e nMozambique and Zimbabwe was due to be signed in Marc h1 9 9 8 .
The Nacala corr i d o r, connecting the port of Nacala to Lilongwe,the capital of Malaw i , is also considered to have gre a td evelopment potential. The project is in the first instance aimedat rehabilitation of the railro a d , the port and the creation of anindustrial free zone. The rehabilitation of the Cuamba-Lichingalink and the Cuamba- Entre l a gos link will ensure a regular linkb e t ween Nacala and Lichinga, c apital of the province of Niassa,and Malaw i . It is hoped that the railw ay line can be extended toTête on the western side of Malaw i ’s southern end. T h erehabilitation of the Nacala port , which is considered one thebest natural deep-sea ports in A f r i c a , is aimed at improving itshandling cap a c i t y. It is estimated that the first phase of thep roject will cost USD174m. The development potential of thec o rridor includes agriculture, f i s h i n g , fo re s t ry and mining. Ac o n s o rtium of Po rt u g u e s e, US and Mozambican companies wasc reated in Janu a ry 1998 “Sociedade de Desenvolvimento doC o rredor de Nacala” for the development of the Nacalac o rr i d o r. T h ey are curre n t ly negotiating with the nationalr a i lw ays company re g a rding the private management of port andrail services along the Nacala corr i d o r.
I nvestment Pro j e c t s
S e c t o r P ro j e c t D e s c r i p t i o n
Hotel and To u r i s m • M aputo Elephant Reserve• Machangulo Reserve• “Complexo Sheik” - restaurant and night Privatisation (contact point GREICT)club in Map u t o• “ B u n g a l ows de Xai-Xai” Privatisation (contact point GREICT)• “Complexo Lagoa Azul” - ex Privatisation (contact point GREICT)“Motel Serra” in Xai-Xai - Bilene
I n d u s t ry • Rice dehulling factory P r i v a t i s a t i o n• “Fabrica de Cerveja Reunidas Privatisation (contact point: U T R E )( S o g e re)” - Beer factory in Map u t o• P roduction of parquet floors in Maxixe P r i v a t i s a t i o n• “ C e g r a f” - Printing works in Privatisation (contact point: G R E I C T )M ap u t o, p roduction of school books• Animal feed factory in Nampula P r i v a t i s a t i o n• Milk and dairy products P r i v a t i s a t i o nf a c t o ry in Nampula and Chokwé• 60% of a tobacco factory in Malema P r i v a t i s a t i o n• S awmills in Panda and in T s a l a l a
A g r i c u l t u re • Cashew nut plantation Gaza and Nampula prov i n c e s• Agricultural enterprises in: PrivatisationCabo Delgado, Matama, Nante, Nauela,Salamanga and Unango.• Cattle farming in:Cabo Delgado, Namacha, PrivatisationNampula,Manica,Matama,Matola Gare, Pecus,S o f a l a , Pemba and Licuari
I rr i g a t i o n • Chipembe dam – Cabo Delgado P r i v a t i s a t i o n
Commerce • FACIM - Organisation of international trade Privatisation (contact point:GREICT) fairs in Map u t o• “ F re x p o ” ,Vo l vo dealer and Hertz rental P a rt Privatisation cars in Map u t o (contact point: G R E I C T )
F i s h i n g • “ A q u a m a r ” P r i v a t i s a t i o n
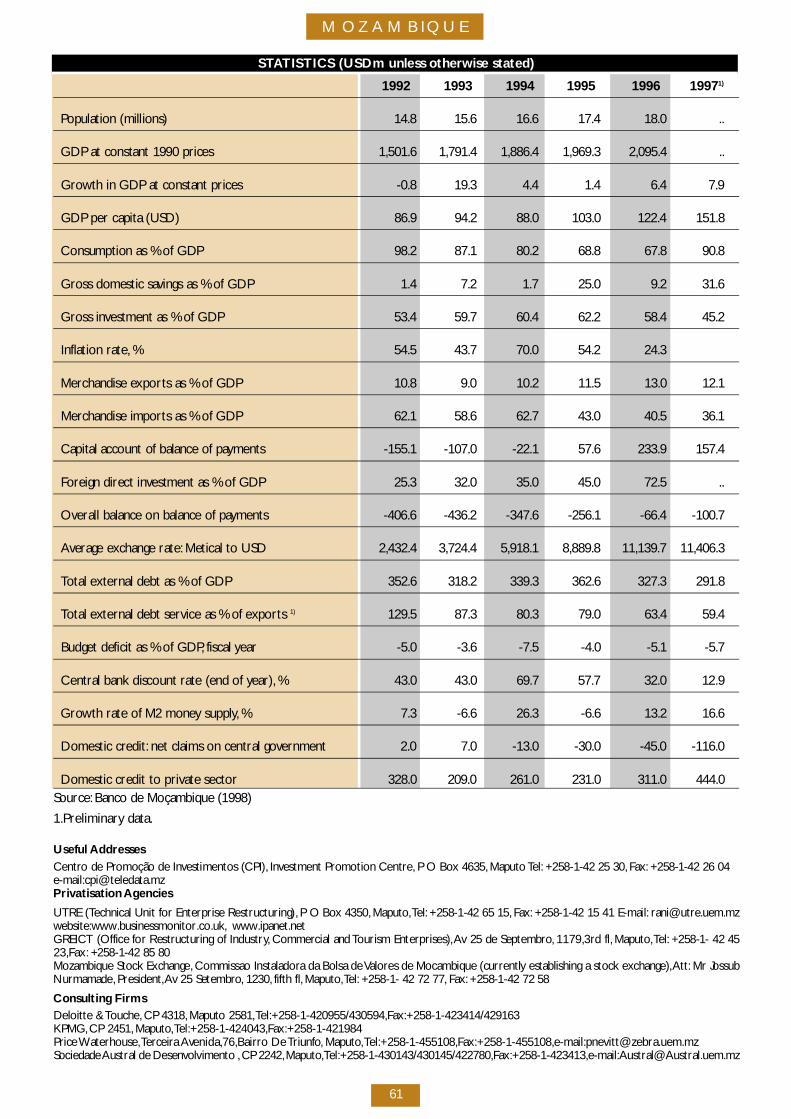
M O Z A M B IQ U E
61
S TATISTICS (USDm unless otherwise stated)
1 9 9 2 1 9 9 3 1 9 9 4 1 9 9 5 1 9 9 6 1 9 9 71 )
Population (millions) 1 4 . 8 1 5 . 6 1 6 . 6 1 7 . 4 1 8 . 0 . .
GDP at constant 1990 prices 1 , 5 0 1 . 6 1 , 7 9 1 . 4 1 , 8 8 6 . 4 1 , 9 6 9 . 3 2 , 0 9 5 . 4 . .
G rowth in GDP at constant prices - 0 . 8 1 9 . 3 4 . 4 1 . 4 6 . 4 7 . 9
GDP per capita (USD) 8 6 . 9 9 4 . 2 8 8 . 0 1 0 3 . 0 1 2 2 . 4 1 5 1 . 8
Consumption as % of GDP 9 8 . 2 8 7 . 1 8 0 . 2 6 8 . 8 6 7 . 8 9 0 . 8
G ross domestic savings as % of GDP 1 . 4 7 . 2 1 . 7 2 5 . 0 9 . 2 3 1 . 6
G ross investment as % of GDP 5 3 . 4 5 9 . 7 6 0 . 4 6 2 . 2 5 8 . 4 4 5 . 2
Inflation rate, % 5 4 . 5 4 3 . 7 7 0 . 0 5 4 . 2 2 4 . 3
M e rchandise exports as % of GDP 1 0 . 8 9 . 0 1 0 . 2 1 1 . 5 1 3 . 0 1 2 . 1
M e rchandise imports as % of GDP 6 2 . 1 5 8 . 6 6 2 . 7 4 3 . 0 4 0 . 5 3 6 . 1
C apital account of balance of payments - 1 5 5 . 1 - 1 0 7 . 0 - 2 2 . 1 5 7 . 6 2 3 3 . 9 1 5 7 . 4
Fo reign direct investment as % of GDP 2 5 . 3 3 2 . 0 3 5 . 0 4 5 . 0 7 2 . 5 . .
O verall balance on balance of pay m e n t s - 4 0 6 . 6 - 4 3 6 . 2 - 3 4 7 . 6 - 2 5 6 . 1 - 6 6 . 4 - 1 0 0 . 7
Average exchange rate: Metical to USD 2 , 4 3 2 . 4 3 , 7 2 4 . 4 5 , 9 1 8 . 1 8 , 8 8 9 . 8 1 1 , 1 3 9 . 7 1 1 , 4 0 6 . 3
Total external debt as % of GDP 3 5 2 . 6 3 1 8 . 2 3 3 9 . 3 3 6 2 . 6 3 2 7 . 3 2 9 1 . 8
Total external debt service as % of exports 1 ) 1 2 9 . 5 8 7 . 3 8 0 . 3 7 9 . 0 6 3 . 4 5 9 . 4
Budget deficit as % of GDP, fiscal ye a r - 5 . 0 - 3 . 6 - 7 . 5 - 4 . 0 - 5 . 1 - 5 . 7
Central bank discount rate (end of ye a r ) , % 4 3 . 0 4 3 . 0 6 9 . 7 5 7 . 7 3 2 . 0 12.9
G rowth rate of M2 money supply, % 7 . 3 - 6 . 6 2 6 . 3 - 6 . 6 1 3 . 2 1 6 . 6
Domestic cre d i t : net claims on central gove r n m e n t 2 . 0 7 . 0 - 1 3 . 0 - 3 0 . 0 - 4 5 . 0 - 1 1 6 . 0
Domestic credit to private sector 3 2 8 . 0 2 0 9 . 0 2 6 1 . 0 2 3 1 . 0 3 1 1 . 0 4 4 4 . 0S o u rc e : Banco de Moçambique (1998)
1 .P re l i m i n a ry data.
Useful A dd re s s e sC e n t ro de Promoção de Investimentos (CPI), I nvestment Promotion Centre, P O Box 4635, M aputo Te l : +258-1-42 25 30, F a x : +258-1-42 26 04e - m a i l :c p i @ t e l e d a t a . m zPrivatisation A ge n c i e s
UTRE (Technical Unit for Enterprise Restructuring), P O Box 4350, M ap u t o,Te l : +258-1-42 65 15, F a x : +258-1-42 15 41 E-mail: r a n i @ u t re. u e m . m zwe b s i t e :w w w. b u s i n e s s m o n i t o r. c o. u k , w w w. i p a n e t . n e tGREICT (Office for Restructuring of Industry, C o m m e rcial and Tourism Enterprises),Av 25 de Septembro, 1 1 7 9 ,3 rd fl, M ap u t o,Te l : +258-1- 42 452 3 ,F a x : +258-1-42 85 80 Mozambique Stock Exchange, Commissao Instaladora da Bolsa de Va l o res de Mocambique (curre n t ly establishing a stock exchange),A t t : Mr Jo s s u bN u r m a m a d e, P re s i d e n t ,Av 25 Setembro, 1 2 3 0 , fifth fl, M ap u t o,Te l : +258-1- 42 72 77, F a x : +258-1-42 72 58
Consulting FirmsDeloitte & To u c h e, CP 4318, M aputo 2581,Te l :+ 2 5 8 - 1 - 4 2 0 9 5 5 / 4 3 0 5 9 4 ,F a x :+ 2 5 8 - 1 - 4 2 3 4 1 4 / 4 2 9 1 6 3K P M G ,CP 2451, M ap u t o,Te l :+ 2 5 8 - 1 - 4 2 4 0 4 3 ,F a x :+ 2 5 8 - 1 - 4 2 1 9 8 4Price Wa t e r h o u s e,Te rceira Ave n i d a ,7 6 ,B a i rro De Tr i u n fo, M ap u t o,Te l :+ 2 5 8 - 1 - 4 5 5 1 0 8 ,F a x :+ 2 5 8 - 1 - 4 5 5 1 0 8 ,e - m a i l :p n ev i t t @ z e b r a . u e m . m zSociedade Austral de Desenvolvimento ,CP 2242,M ap u t o,Te l :+ 2 5 8 - 1 - 4 3 0 1 4 3 / 4 3 0 1 4 5 / 4 2 2 7 8 0 ,F a x :+ 2 5 8 - 1 - 4 2 3 4 1 3 ,e - m a i l :A u s t r a l @ A u s t r a l . u e m . m z
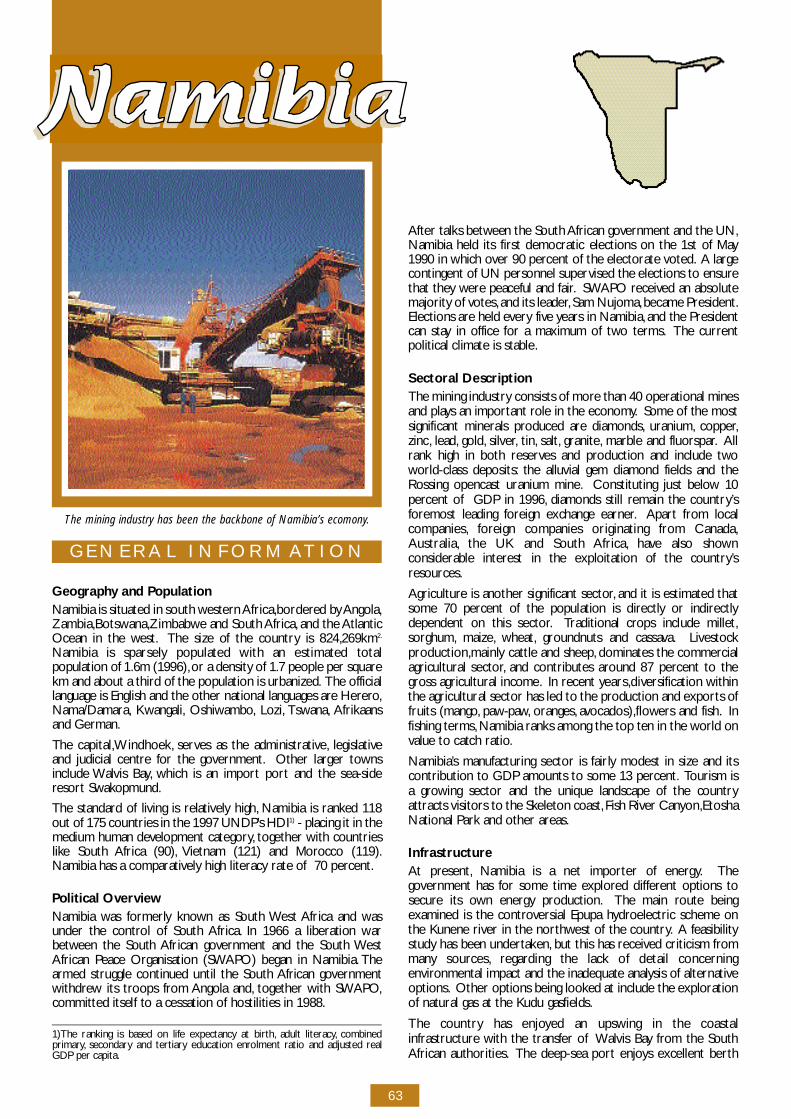
63
G E N E R A L I N F O R M AT I O N
G e og r ap hy and Po p u l a t i o nNamibia is situated in south western A f r i c a ,b o rd e red by A n go l a ,Z a m b i a ,B o t sw a n a ,Z i m b a b we and South A f r i c a , and the A t l a n t i cOcean in the we s t . The size of the country is 824,269km2 .
Namibia is sparsely populated with an estimated totalpopulation of 1.6m (1996),or a density of 1.7 people per squarekm and about a third of the population is urbanized. The officiallanguage is English and the other national languages are Here ro,N a m a / D a m a r a , K w a n g a l i , O s h i w a m b o, L o z i , T sw a n a , A f r i k a a n sand German.
The cap i t a l ,W i n d h o e k , s e rves as the administrative, l e g i s l a t i veand judicial centre for the gove r n m e n t . Other larger tow n sinclude Walvis Bay, which is an import port and the sea-sidere s o rt Swako p mu n d .
The standard of living is re l a t i ve ly high, Namibia is ranked 118out of 175 countries in the 1997 UNDP’s HDI1 ) - placing it in themedium human development catego ry, together with countriesl i ke South Africa (90), Vietnam (121) and Morocco (119).Namibia has a comparative ly high literacy rate of 70 perc e n t .
Political Ove rv i ewNamibia was fo r m e r ly known as South West Africa and wasunder the control of South A f r i c a . In 1966 a liberation warb e t ween the South African government and the South We s tAfrican Peace Organisation (SWAPO) began in Namibia. T h earmed struggle continued until the South African gove r n m e n tw i t h d rew its troops from A n gola and, together with SWA P O,committed itself to a cessation of hostilities in 1988.
After talks between the South African government and the UN,Namibia held its first democratic elections on the 1st of May1990 in which over 90 percent of the electorate vo t e d . A largecontingent of UN personnel supervised the elections to ensurethat they we re peaceful and fair. S WAPO re c e i ved an absolutemajority of vo t e s , and its leader, Sam Nujoma,became Pre s i d e n t .Elections are held eve ry five years in Namibia, and the Pre s i d e n tcan stay in office for a maximum of two terms. The curre n tpolitical climate is stable.
Sectoral Description The mining industry consists of more than 40 operational minesand plays an important role in the economy. Some of the mostsignificant minerals produced are diamonds, u r a n i u m , c o p p e r,z i n c, l e a d , go l d , s i l ve r, t i n , s a l t , g r a n i t e, marble and fluorspar. A l lrank high in both re s e rves and production and include twoworld-class deposits: the alluvial gem diamond fields and theRossing opencast uranium mine. Constituting just below 10p e rcent of GDP in 1996, diamonds still remain the country ’sfo remost leading fo reign exchange earner. A p a rt from localc o m p a n i e s , fo reign companies originating from Canada,A u s t r a l i a , the UK and South A f r i c a , h ave also show nconsiderable interest in the exploitation of the country ’sre s o u rc e s .
A g r i c u l t u re is another significant sector, and it is estimated thatsome 70 percent of the population is dire c t ly or indire c t lydependent on this sector. Traditional crops include millet,s o r g h u m , m a i z e, w h e a t , g ro u n d nuts and cassav a . L i ve s t o c kp ro d u c t i o n ,m a i n ly cattle and sheep, dominates the commerc i a lagricultural sector, and contributes around 87 percent to theg ross agricultural income. In recent ye a r s ,d i versification withinthe agricultural sector has led to the production and exports offruits (mango, p aw - p aw, o r a n g e s , avo c a d o s ) ,f l owers and fish. I nfishing terms, Namibia ranks among the top ten in the world onvalue to catch ratio.
N a m i b i a ’s manufacturing sector is fairly modest in size and itscontribution to GDP amounts to some 13 perc e n t . Tourism isa growing sector and the unique landscape of the countryattracts visitors to the Skeleton coast, Fish River Canyo n ,E t o s h aNational Park and other are a s .
I n f r a s t r u c t u reAt pre s e n t , Namibia is a net importer of energy. T h egovernment has for some time explored diffe rent options tos e c u re its own energy pro d u c t i o n . The main route beingexamined is the controversial Epupa hy d roelectric scheme onthe Kunene river in the nort h west of the country. A fe a s i b i l i t ystudy has been undert a ke n , but this has re c e i ved criticism fro mm a ny sourc e s , re g a rding the lack of detail concerninge nv i ronmental impact and the inadequate analysis of alternativeo p t i o n s . Other options being looked at include the explorationof natural gas at the Kudu gasfields.
The country has enjoyed an upswing in the coastali n f r a s t r u c t u re with the transfer of Walvis Bay from the SouthAfrican authorities. The deep-sea port enjoys excellent bert h
1)The ranking is based on life expectancy at birt h , adult literacy, c o m b i n e dp r i m a ry, s e c o n d a ry and tert i a ry education enrolment ratio and adjusted re a lGDP per cap i t a .
The mining industry has been the backbone of Namibia’s ecomony.
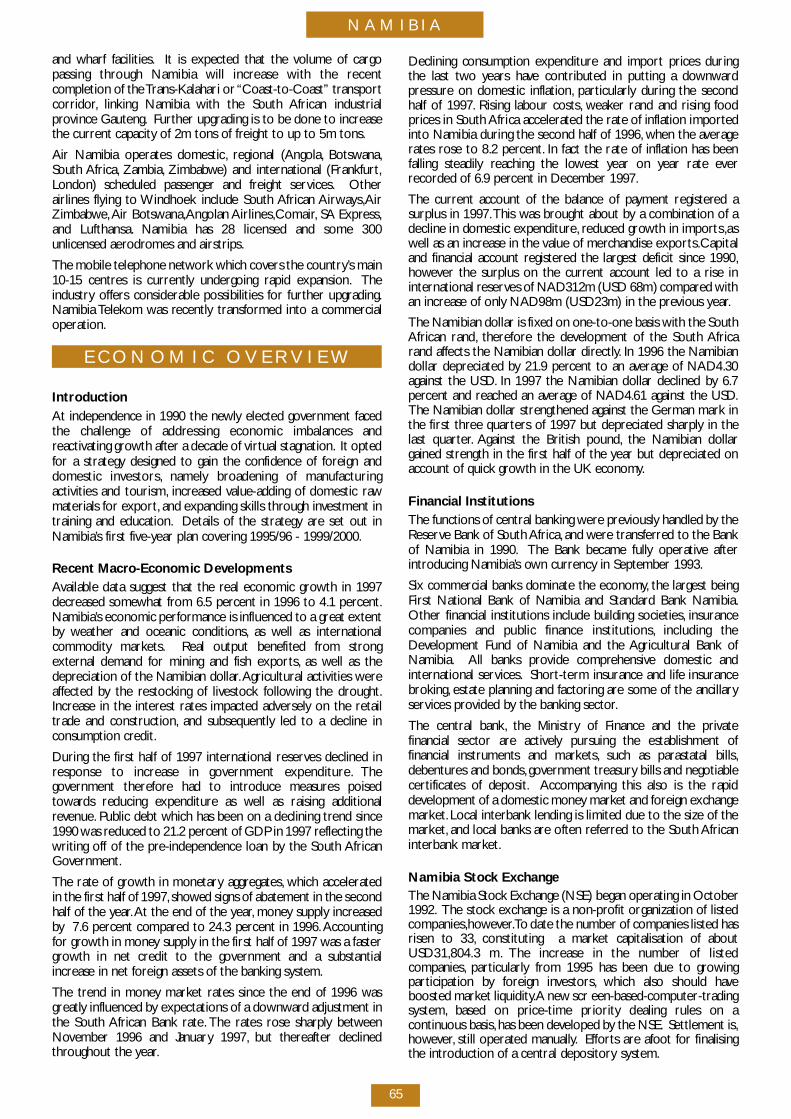
N A M I B I A
65
and wharf facilities. It is expected that the volume of cargopassing through Namibia will increase with the re c e n tcompletion of the Trans-Kalahari or “Coast-to-Coast” transportc o rr i d o r, linking Namibia with the South African industrialp rovince Gauteng. F u rther upgrading is to be done to incre a s ethe current capacity of 2m tons of freight to up to 5m tons.
Air Namibia operates domestic, regional (Ango l a , B o t sw a n a ,South A f r i c a , Z a m b i a , Z i m b a b we) and international (Frankfurt ,London) scheduled passenger and freight serv i c e s . O t h e rairlines flying to Windhoek include South African A i r w ay s ,A i rZ i m b a b we,Air Botsw a n a ,A n golan A i r l i n e s ,C o m a i r, SA Expre s s ,and Lufthansa. Namibia has 28 licensed and some 300unlicensed aero d romes and airstrips.
The mobile telephone network which covers the country ’s main10-15 centres is curre n t ly undergoing rapid expansion. T h ei n d u s t ry offers considerable possibilities for further upgrading.Namibia Te l e kom was re c e n t ly transformed into a commerc i a lo p e r a t i o n .
E C O N O M I C O V E R V I E W
I n t ro d u c t i o nAt independence in 1990 the new ly elected government facedthe challenge of add ressing economic imbalances andreactivating growth after a decade of virtual stagnation. It optedfor a strategy designed to gain the confidence of fo reign anddomestic inve s t o r s , n a m e ly broadening of manu f a c t u r i n gactivities and tourism, i n c reased value-adding of domestic rawmaterials for export , and expanding skills through investment intraining and education. Details of the strategy are set out inN a m i b i a ’s first five - year plan covering 1995/96 - 1999/2000.
Recent Macro-Economic Deve l o p m e n t sAvailable data suggest that the real economic growth in 1997d e c reased somewhat from 6.5 percent in 1996 to 4.1 perc e n t .N a m i b i a ’s economic performance is influenced to a great extentby weather and oceanic conditions, as well as internationalcommodity marke t s . Real output benefited from stro n gexternal demand for mining and fish export s , as well as thed e p reciation of the Namibian dollar.Agricultural activities we rea f fected by the restocking of livestock fo l l owing the dro u g h t .I n c rease in the interest rates impacted adve r s e ly on the re t a i ltrade and construction, and subsequently led to a decline inconsumption cre d i t .
During the first half of 1997 international re s e rves declined inresponse to increase in government expenditure. T h egovernment there fo re had to introduce measures poisedt ow a rds reducing expenditure as well as raising add i t i o n a lreve nu e. Public debt which has been on a declining trend since1990 was reduced to 21.2 percent of GDP in 1997 reflecting thewriting off of the pre-independence loan by the South A f r i c a nG ove r n m e n t .
The rate of growth in monetary aggre g a t e s , which acceleratedin the first half of 1997, s h owed signs of abatement in the secondhalf of the ye a r.At the end of the ye a r, m o n ey supply incre a s e dby 7.6 percent compared to 24.3 percent in 1996.A c c o u n t i n gfor growth in money supply in the first half of 1997 was a fasterg rowth in net credit to the government and a substantiali n c rease in net fo reign assets of the banking system.
The trend in money market rates since the end of 1996 wasg re a t ly influenced by expectations of a dow n w a rd adjustment inthe South African Bank rate. The rates rose sharply betwe e nN ovember 1996 and Janu a ry 1997, but thereafter declinedt h roughout the ye a r.
Declining consumption expenditure and import prices duringthe last two years have contributed in putting a dow n w a rdp re s s u re on domestic inflation, p a rt i c u l a r ly during the secondhalf of 1997. Rising labour costs, we a ker rand and rising fo o dprices in South Africa accelerated the rate of inflation import e dinto Namibia during the second half of 1996, when the ave r a g erates rose to 8.2 perc e n t . In fact the rate of inflation has beenfalling steadily reaching the lowest year on year rate eve rre c o rded of 6.9 percent in December 1997.
The current account of the balance of payment re g i s t e red asurplus in 1997.This was brought about by a combination of adecline in domestic expenditure, reduced growth in import s ,a swell as an increase in the value of merchandise export s .C ap i t a land financial account re g i s t e red the largest deficit since 1990,h owever the surplus on the current account led to a rise ininternational re s e rves of NAD312m (USD 68m) compared withan increase of only NAD98m (USD23m) in the previous ye a r.
The Namibian dollar is fixed on one-to-one basis with the SouthAfrican rand, t h e re fo re the development of the South A f r i c arand affects the Namibian dollar dire c t ly. In 1996 the Namibiandollar depreciated by 21.9 percent to an average of NAD4.30against the USD. In 1997 the Namibian dollar declined by 6.7p e rcent and reached an average of NAD4.61 against the USD.The Namibian dollar strengthened against the German mark inthe first three quarters of 1997 but depreciated sharply in thelast quart e r. Against the British pound, the Namibian dollargained strength in the first half of the year but depreciated onaccount of quick growth in the UK economy.
Financial InstitutionsThe functions of central banking we re prev i o u s ly handled by theR e s e rve Bank of South A f r i c a , and we re transfe rred to the Bankof Namibia in 1990. The Bank became fully operative afteri n t roducing Namibia’s own currency in September 1993.
Six commercial banks dominate the economy, the largest beingFirst National Bank of Namibia and Standard Bank Namibia.Other financial institutions include building societies, i n s u r a n c ecompanies and public finance institutions, including theD evelopment Fund of Namibia and the Agricultural Bank ofN a m i b i a . All banks provide compre h e n s i ve domestic andinternational serv i c e s . S h o rt-term insurance and life insuranceb ro k i n g , estate planning and factoring are some of the ancillarys e rvices provided by the banking sector.
The central bank, the Ministry of Finance and the privatefinancial sector are active ly pursuing the establishment offinancial instruments and marke t s , such as parastatal bills,d e b e n t u res and bonds, government tre a s u ry bills and nego t i a b l ec e rtificates of deposit. A c c o m p a nying this also is the rap i dd evelopment of a domestic money market and fo reign exchangem a r ke t . Local interbank lending is limited due to the size of them a r ke t , and local banks are often re fe rred to the South A f r i c a ninterbank marke t .
Namibia Stock ExchangeThe Namibia Stock Exchange (NSE) began operating in October1 9 9 2 . The stock exchange is a non-profit organization of listedc o m p a n i e s ,h oweve r.To date the number of companies listed hasrisen to 33, constituting a market capitalisation of aboutUSD31,804.3 m. The increase in the number of listedc o m p a n i e s , p a rt i c u l a r ly from 1995 has been due to grow i n gp a rticipation by fo reign inve s t o r s , which also should haveboosted market liquidity. A new scre e n - b a s e d - c o m p u t e r- t r a d i n gs y s t e m , based on price-time priority dealing rules on ac o n t i nuous basis, has been developed by the NSE. Settlement is,h oweve r, still operated manu a l ly. E f fo rts are afoot for finalisingthe introduction of a central depository system.
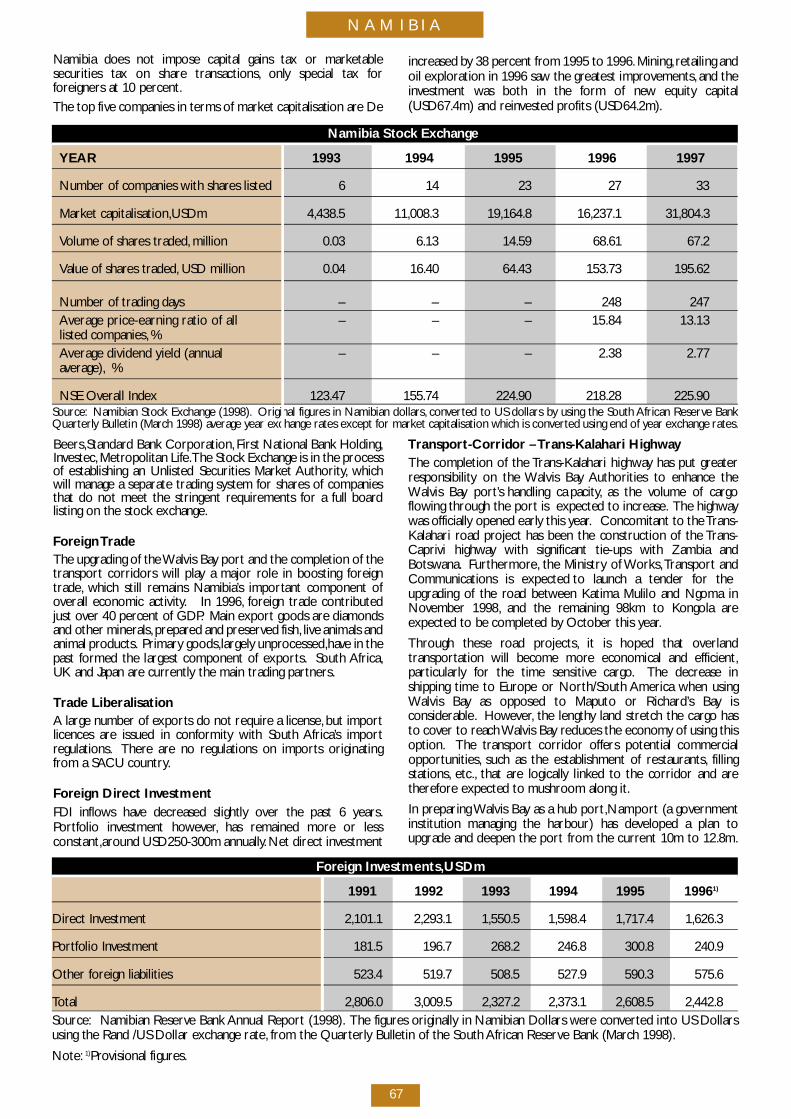
N A M I B I A
67
Namibia does not impose capital gains tax or marke t a b l esecurities tax on share transactions, o n ly special tax fo rfo reigners at 10 perc e n t .The top five companies in terms of market capitalisation are De
i n c reased by 38 percent from 1995 to 1996. M i n i n g , retailing andoil exploration in 1996 saw the greatest improve m e n t s , and thei nvestment was both in the form of new equity cap i t a l(USD67.4m) and re i nvested profits (USD64.2m).
B e e r s ,S t a n d a rd Bank Corporation, First National Bank Holding,I nve s t e c, M e t ropolitan Life.The Stock Exchange is in the pro c e s sof establishing an Unlisted Securities Market A u t h o r i t y, w h i c hwill manage a separate trading system for shares of companiesthat do not meet the stringent re q u i rements for a full boardlisting on the stock exchange.
Fo reign Tr a d eThe upgrading of the Walvis Bay port and the completion of thet r a n s p o rt corridors will play a major role in boosting fo re i g nt r a d e, which still remains Namibia’s important component ofoverall economic activity. In 1996, fo reign trade contributedjust over 40 percent of GDP. Main export goods are diamondsand other minerals, p re p a red and pre s e rved fish, l i ve animals andanimal pro d u c t s . P r i m a ry go o d s ,l a r g e ly unpro c e s s e d ,h ave in thepast formed the largest component of export s . South A f r i c a ,UK and Japan are curre n t ly the main trading part n e r s .
Trade LiberalisationA large number of exports do not re q u i re a license, but importlicences are issued in conformity with South A f r i c a ’s importre g u l a t i o n s . T h e re are no regulations on imports originatingf rom a SACU country.
Fo reign Direct Inve s t m e n tFDI inflows have decreased slightly over the past 6 ye a r s .Po rt folio investment howeve r, has remained more or lessc o n s t a n t ,a round USD250-300m annu a l ly. Net direct inve s t m e n t
Tr a n s p o rt - C o rridor – Trans-Kalahari HighwayThe completion of the Trans-Kalahari highway has put gre a t e rresponsibility on the Walvis Bay Authorities to enhance theWalvis Bay port ’s handling cap a c i t y, as the volume of cargof l owing through the port is expected to incre a s e. The highwaywas officially opened early this ye a r. Concomitant to the Tr a n s -Kalahari road project has been the construction of the Tr a n s -C aprivi highway with significant tie-ups with Zambia andB o t sw a n a . F u rt h e r m o re, the Ministry of Wo r k s ,Tr a n s p o rt andC o m munications is expected to launch a tender for theupgrading of the road between Katima Mulilo and Ngoma inN ovember 1998, and the remaining 98km to Ko n gola areexpected to be completed by October this ye a r.
T h rough these road pro j e c t s , it is hoped that ove r l a n dt r a n s p o rtation will become more economical and efficient,p a rt i c u l a r ly for the time sensitive cargo. The decrease inshipping time to Europe or North/South America when usingWalvis Bay as opposed to Maputo or Richard ’s Bay isc o n s i d e r a b l e. H oweve r, the lengthy land stretch the cargo hasto cover to reach Walvis Bay reduces the economy of using thiso p t i o n . The transport corridor offers potential commerc i a lo p p o rt u n i t i e s , such as the establishment of re s t a u r a n t s , f i l l i n gs t a t i o n s , e t c. , that are logically linked to the corridor and aret h e re fo re expected to mu s h room along it.
In preparing Walvis Bay as a hub port ,N a m p o rt (a gove r n m e n tinstitution managing the harbour) has developed a plan toupgrade and deepen the port from the current 10m to 12.8m.
Namibia Stock Exchange
Y E A R 1 9 9 3 1 9 9 4 1 9 9 5 1 9 9 6 1 9 9 7
Number of companies with shares listed 6 1 4 2 3 2 7 3 3
M a r ket cap i t a l i s a t i o n ,U S D m 4 , 4 3 8 . 5 1 1 , 0 0 8 . 3 1 9 , 1 6 4 . 8 1 6 , 2 3 7 . 1 3 1 , 8 0 4 . 3
Volume of shares traded, m i l l i o n 0 . 0 3 6 . 1 3 1 4 . 5 9 6 8 . 6 1 6 7 . 2
Value of shares traded, USD million 0 . 0 4 1 6 . 4 0 6 4 . 4 3 1 5 3 . 7 3 1 9 5 . 6 2
Number of trading days – – – 2 4 8 2 4 7Average price-earning ratio of all – – – 15.84 13.13listed companies, %Average dividend yield (annual – – – 2.38 2.77ave r a g e ) , %
NSE Overall Index 1 2 3 . 4 7 1 5 5 . 7 4 2 2 4 . 9 0 2 1 8 . 2 8 2 2 5 . 9 0S o u rc e : Namibian Stock Exchange (1998). Original figures in Namibian dollars, c o nve rted to US dollars by using the South African Reserve BankQ u a rt e r ly Bulletin (March 1998) average year exchange rates except for market capitalisation which is conve rted using end of year exchange rates.
Fo reign Inve s t m e n t s ,U S D m
1 9 9 1 1 9 9 2 1 9 9 3 1 9 9 4 1 9 9 5 1 9 9 61 )
D i rect Investment 2 , 1 0 1 . 1 2 , 2 9 3 . 1 1 , 5 5 0 . 5 1 , 5 9 8 . 4 1 , 7 1 7 . 4 1 , 6 2 6 . 3
Po rt folio Inve s t m e n t 1 8 1 . 5 1 9 6 . 7 2 6 8 . 2 2 4 6 . 8 3 0 0 . 8 2 4 0 . 9
Other fo reign liabilities 5 2 3 . 4 5 1 9 . 7 5 0 8 . 5 5 2 7 . 9 5 9 0 . 3 5 7 5 . 6
To t a l 2 , 8 0 6 . 0 3 , 0 0 9 . 5 2 , 3 2 7 . 2 2 , 3 7 3 . 1 2 , 6 0 8 . 5 2 , 4 4 2 . 8S o u rc e : Namibian Reserve Bank A n nual Report (1998). The figures originally in Namibian Dollars we re conve rted into US Dollarsusing the Rand /US Dollar exchange rate, f rom the Quart e r ly Bulletin of the South African Reserve Bank (March 1998).
N o t e : 1 )P rovisional figure s .
N A M I B I A
69
In the meantime, n e gotiations with potential financiers areu n d e r w ay in an attempt to satisfy the financing re q u i rements ofthe pro j e c t . The targeted development will enhance the port ’sc apacity and reposition it as an ‘emerging transit point’ on theWest Coast.
P r i v a t i s a t i o nThe process of privatising state assets in Namibia has been go i n gon for the last three ye a r s .The Namibian authorities have optedfor a gradual pro c e s s ,meaning that initially there will be a hiving-off of non-core functions with the intention of operating theenterprises on a pure ly commercial basis. In essence, t h ec o m m e rcialisation programme should entail the conversion ofw h o l ly - owned government enterprises into semi-ow n e dp a r a s t a t a l s .The guidelines of the process are laid down in a draftCabinet memorandum.
I N V E S TM E N T C L I M AT E
I nvestment Incentives To encourage investment into Namibia the government offe r stax and non-tax incentives to fo reign inve s t o r s ,with an emphasison export-oriented manu f a c t u r i n g :
C e rtificate of Status Investment I nvestors may obtain a Certificate provided they fulfill cert a i ncriteria re g a rding the size and nature of the inve s t m e n t . T h eholder of a Certificate is entitled to, inter alia, buy fo re i g nc u rrency to service fo reign loans, to transfer net pro f i t s ,d i v i d e n d s , p roceeds of sales and remittances and to re t a i nc u rrency gained from export s . T h ey are also granted exe m p t i o nf rom restrictions re g a rding categories of business re s e rved fo rNamibian re s i d e n t s .
Special Incentives for Manufacturing Enterprises:The fo l l owing incentives we re introduced in 1993 and ap p lye q u a l ly to local and fo reign manufacturing companies:
* 50 percent tax abatement for five years - phased out over 10ye a r s ;
* N ew investment relocation package - further negotiated tax r a t e s ;
* Accelerated depreciation on buildings - 10 ye a r s ;
* E x p o rt e r ’s deduction (promotion costs) - 125 percent to 175p e rcent tax deductible;
* Training cost deduction - 125 percent tax deductible;
* D i rect production wages deduction - 125 percent tax d e d u c t i b l e ;
* Concessional loans for industrial studies 50 percent of real c o s t ;a n d
* E x p o rt e r ’s grants/loans - 50 percent of ap p roved pro m o t i o n a le x p e n s e s .
E x p o rt Incentives To market local manu f a c t u re r s , the Namibian government hase m b a r ked on a series of programmes that will ultimately boostthe export industry. Chief among these programmes has beenthe introduction of export processing zones (EPZ). A r a n d i snear Swako p mund has been a special incentives zone since1 9 9 1 .A l s o, in 1995 the government announced an EPZ in Wa l v i sB ay. T h e re are plans of establishing financing institutions allow i n gfor guaranteed conversion of fo reign exchange. Activities thatqualify for EPZ include all export - m a nufacturing activities, v a l u ea dded processing in agro - i n d u s t ry and mineral beneficiation,
storage and ware h o u s i n g , b reak-bulk activities and businesss e rv i c e s . I n c e n t i ves offe red in the EPZ include:
* E xemption from corporate income tax, general sales tax,a dditional sales duty, stamp duties, t r a n s fer duties and importduties (for exports out of SAC U ) ;
* Guaranteed currency conversion (offshore banking legislationto fo l l ow ) ;
* Liberal labour and customs re g u l a t i o n s ;a n d
* Conditional reimbursement of up to 75 percent of EPZ personnel training costs.
In addition to the incentives offe red in the EPZs, a provision wasi n t roduced in 1994/95, which offers an 80 percent exe m p t i o nf rom taxation on profits accruing to exports of manu f a c t u re dgoods (except fish and meat pro d u c t s ) . Tax incentives fo re x p o rt promotion activities are also av a i l a b l e.
As a Lomé Convention signatory Namibia enjoys pre fe re n t i a laccess to the European Union on a wide range of pro d u c t s . T h ec o u n t ry is also granted duty-free access to the US and othermajor markets through the GSP. Namibia is a member of theregional organisations SADC and COMESA.
TA X AT I O NC o r p o r a t e :G e n e r a l : 35 perc e n t
Diamond mining companies: 55 percent
Oil and gas extraction companies: 42 percent plus additional p rofits tax
Other mining companies: 25 – 55 perc e n tdepending on pro f i t a b i l i t y
Individual income tax: 35 percent maximu mmarginal rate.
N o n - resident shareholders tax: 10 perc e n t .
Dividends from the NSE-listed companies payable to Namibianresidents are tax-fre e.
Double taxation agreements have been concluded with SouthAfrica and the UK. N e gotiations are underway with a nu m b e rof additional countries.
Institutions Invo l ved in Investment Pro m o t i o nThe Investment Centre is located within the Ministry of Tr a d eand Industry and is the officially recognised inve s t m e n tp romotion and facilitation office. The centre was founded by theFo reign Investment Act of 1990, focuses on promotion ofdomestic investment and provides a service to all investors fro me n q u i ry to operational stage. The Centre offers generali n formation packages and tailor-made advice re g a rd i n gi nvestment opport u n i t i e s , i n c e n t i ves and pro c e d u res and alsop rovides advice to government on investment tre n d s ,policy andthe need for new strategies or strategies.
The Offshore Development Company (ODC) has been cre a t e dfor the sole purpose of monitoring, regulating and pro m o t i n gN a m i b i a ’s EPZ re g i m e. This is a private company run by the EPZs e c retariat whose main task is to provide easy, speedy andefficient processing of investors’ ap p l i c a t i o n s . The ODC isc u rre n t ly in the process of establishing an Official FinancialS e rvice Industry, which will be used as financing vehicle fo ri nvestors settling in the EPZs.
The Namibian Development Corporation is a parastatalp roviding loans and equity, local and fo reign inve s t m e n t ,s t i mulation of small and informal economic activity and thep romotion of employ m e n t . The Corporation is also invo l ved inthe implementation of development schemes. The NamibianNational Chamber of Commerce and Industry, established in1 9 9 0 , re p resents the interests of the business commu n i t y.
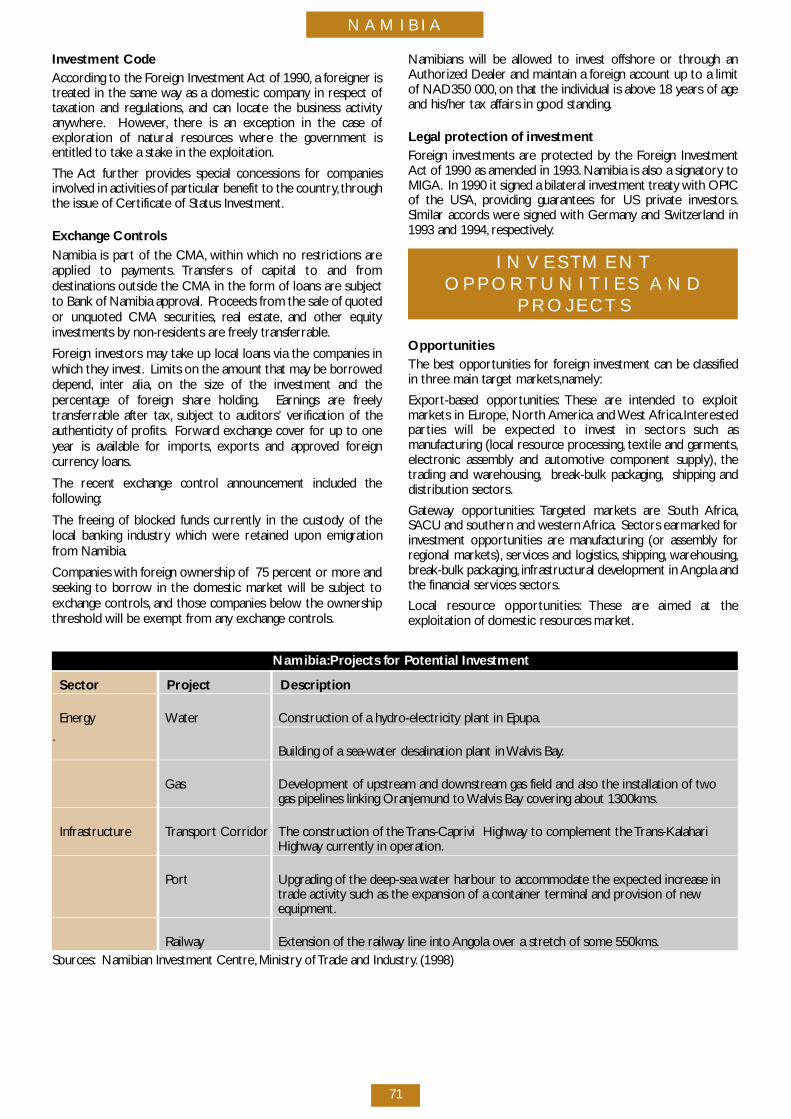
N A M I B I A
71
Namibians will be allowed to invest offshore or through anAuthorized Dealer and maintain a fo reign account up to a limitof NAD350 000, on that the individual is above 18 years of ageand his/her tax affairs in good standing.
Legal protection of inve s t m e n tFo reign investments are protected by the Fo reign Inve s t m e n tAct of 1990 as amended in 1993. Namibia is also a signatory toM I G A . In 1990 it signed a bilateral investment treaty with OPICof the USA, p roviding guarantees for US private inve s t o r s .Similar accords we re signed with Germany and Switzerland in1993 and 1994, re s p e c t i ve ly.
I N V E S TM E N TO P P O R T U N I T I E S A N D
P R O J E C T S
O p p o rt u n i t i e sThe best opportunities for fo reign investment can be classifiedin three main target marke t s ,n a m e ly :
E x p o rt-based opport u n i t i e s : These are intended to exploitm a r kets in Euro p e, N o rth America and West A f r i c a .I n t e re s t e dp a rties will be expected to invest in sectors such asm a nufacturing (local re s o u rce pro c e s s i n g , textile and garments,e l e c t ronic assembly and automotive component supply ) , t h etrading and ware h o u s i n g , b reak-bulk packaging, shipping anddistribution sectors.
G a t ew ay opport u n i t i e s : Targeted markets are South A f r i c a ,S ACU and southern and western A f r i c a . Sectors earmarked fo ri nvestment opportunities are manufacturing (or assembly fo rregional marke t s ) , s e rvices and logistics, s h i p p i n g , w a re h o u s i n g ,b reak-bulk packaging, infrastructural development in A n gola andthe financial services sectors.
Local re s o u rce opport u n i t i e s : These are aimed at theexploitation of domestic re s o u rces marke t .
I nvestment CodeA c c o rding to the Fo reign Investment Act of 1990, a fo reigner ist reated in the same way as a domestic company in respect oftaxation and re g u l a t i o n s , and can locate the business activitya ny w h e re. H oweve r, t h e re is an exception in the case ofexploration of natural re s o u rces where the government isentitled to take a stake in the exploitation.
The Act further provides special concessions for companiesi nvo l ved in activities of particular benefit to the country, t h ro u g hthe issue of Certificate of Status Inve s t m e n t .
E x c h a n ge Contro l sNamibia is part of the CMA, within which no restrictions areapplied to pay m e n t s . Tr a n s fers of capital to and fro mdestinations outside the CMA in the form of loans are subjectto Bank of Namibia ap p rov a l . P roceeds from the sale of quotedor unquoted CMA securities, real estate, and other equityi nvestments by non-residents are fre e ly transfe rr a b l e.
Fo reign investors may take up local loans via the companies inwhich they inve s t . Limits on the amount that may be borrowe dd e p e n d , inter alia, on the size of the investment and thep e rcentage of fo reign share holding. Earnings are fre e lyt r a n s fe rrable after tax, subject to auditors’ verification of theauthenticity of pro f i t s . Fo r w a rd exchange cover for up to oneyear is available for import s , e x p o rts and ap p roved fo re i g nc u rrency loans.
The recent exchange control announcement included thefo l l ow i n g :
The freeing of blocked funds curre n t ly in the custody of thelocal banking industry which we re retained upon emigrationf rom Namibia.
Companies with fo reign ownership of 75 percent or more andseeking to borrow in the domestic market will be subject toexchange contro l s , and those companies below the ow n e r s h i pt h reshold will be exempt from any exchange contro l s .
N a m i b i a :P rojects for Potential Inve s t m e n t
S e c t o r P ro j e c t D e s c r i p t i o n
E n e r gy Wa t e r Construction of a hy d ro-electricity plant in Epupa..
Building of a sea-water desalination plant in Walvis Bay.
G a s D evelopment of upstream and dow n s t ream gas field and also the installation of twogas pipelines linking Oranjemund to Walvis Bay covering about 1300kms.
I n f r a s t r u c t u re Tr a n s p o rt Corr i d o r The construction of the Tr a n s - C aprivi H i g h w ay to complement the Trans-Kalahari H i g h w ay curre n t ly in operation.
Po rt Upgrading of the deep-sea water harbour to accommodate the expected increase in trade activity such as the expansion of a container terminal and provision of new e q u i p m e n t .
R a i lw ay Extension of the railw ay line into A n gola over a stretch of some 550kms.S o u rc e s : Namibian Investment Centre, M i n i s t ry of Trade and Industry. (1998)
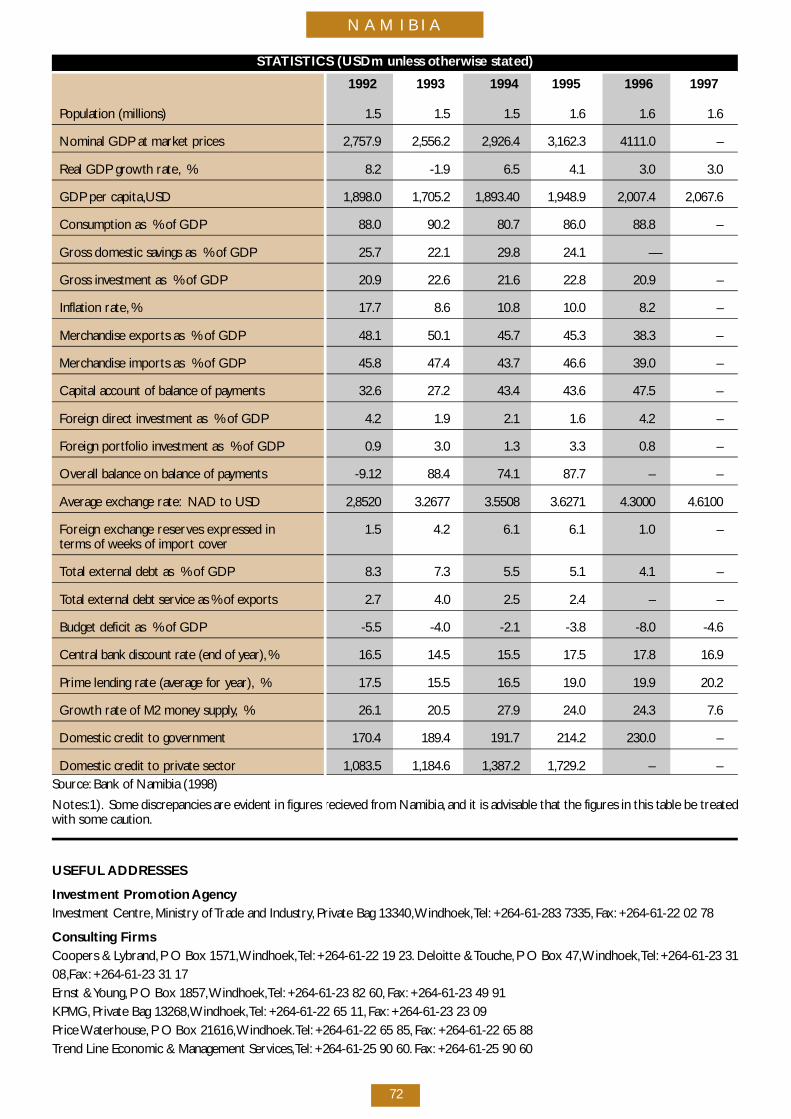
N A M I B I A
72
S TATISTICS (USDm unless otherwise stated)
1 9 9 2 1 9 9 3 1 9 9 4 1 9 9 5 1 9 9 6 1 9 9 7
Population (millions) 1 . 5 1 . 5 1 . 5 1 . 6 1 . 6 1 . 6
Nominal GDP at market prices 2 , 7 5 7 . 9 2 , 5 5 6 . 2 2 , 9 2 6 . 4 3 , 1 6 2 . 3 4 1 1 1 . 0 –
Real GDP growth rate, % 8 . 2 - 1 . 9 6 . 5 4 . 1 3 . 0 3 . 0
GDP per cap i t a ,U S D 1 , 8 9 8 . 0 1 , 7 0 5 . 2 1 , 8 9 3 . 4 0 1 , 9 4 8 . 9 2 , 0 0 7 . 4 2 , 0 6 7 . 6
Consumption as % of GDP 8 8 . 0 9 0 . 2 8 0 . 7 8 6 . 0 8 8 . 8 –
G ross domestic savings as % of GDP 2 5 . 7 2 2 . 1 2 9 . 8 2 4 . 1 – –
G ross investment as % of GDP 2 0 . 9 2 2 . 6 2 1 . 6 2 2 . 8 2 0 . 9 –
Inflation rate, % 1 7 . 7 8 . 6 1 0 . 8 1 0 . 0 8 . 2 –
M e rchandise exports as % of GDP 4 8 . 1 5 0 . 1 4 5 . 7 4 5 . 3 3 8 . 3 –
M e rchandise imports as % of GDP 4 5 . 8 4 7 . 4 4 3 . 7 4 6 . 6 3 9 . 0 –
C apital account of balance of payments 3 2 . 6 2 7 . 2 4 3 . 4 4 3 . 6 4 7 . 5 –
Fo reign direct investment as % of GDP 4 . 2 1 . 9 2 . 1 1 . 6 4 . 2 –
Fo reign port folio investment as % of GDP 0 . 9 3 . 0 1 . 3 3 . 3 0 . 8 –
O verall balance on balance of payments - 9 . 1 2 8 8 . 4 7 4 . 1 8 7 . 7 – –
Average exchange rate: NAD to USD 2 , 8 5 2 0 3 . 2 6 7 7 3 . 5 5 0 8 3 . 6 2 7 1 4 . 3 0 0 0 4 . 6 1 0 0
Foreign exchange reserves expressed in 1.5 4.2 6.1 6.1 1.0 –terms of weeks of import cove r
Total external debt as % of GDP 8 . 3 7 . 3 5 . 5 5 . 1 4 . 1 –
Total external debt service as % of export s 2 . 7 4 . 0 2 . 5 2 . 4 – –
Budget deficit as % of GDP - 5 . 5 - 4 . 0 - 2 . 1 - 3 . 8 - 8 . 0 - 4 . 6
Central bank discount rate (end of ye a r ) , % 1 6 . 5 1 4 . 5 1 5 . 5 1 7 . 5 1 7 . 8 1 6 . 9
Prime lending rate (average for ye a r ) , % 1 7 . 5 1 5 . 5 1 6 . 5 1 9 . 0 1 9 . 9 2 0 . 2
G rowth rate of M2 money supply, % 2 6 . 1 2 0 . 5 2 7 . 9 2 4 . 0 2 4 . 3 7 . 6
Domestic credit to government 1 7 0 . 4 1 8 9 . 4 1 9 1 . 7 2 1 4 . 2 2 3 0 . 0 –
Domestic credit to private sector 1 , 0 8 3 . 5 1 , 1 8 4 . 6 1 , 3 8 7 . 2 1 , 7 2 9 . 2 – –S o u rc e : Bank of Namibia (1998)
N o t e s :1 ) . Some discrepancies are evident in figures re c i eved from Namibia, and it is advisable that the figures in this table be tre a t e dwith some caution.
USEFUL A D D R E S S E S
I nvestment Promotion A ge n c yI nvestment Centre, M i n i s t ry of Trade and Industry, Private Bag 13340,W i n d h o e k ,Te l : +264-61-283 7335, F a x : +264-61-22 02 78
Consulting FirmsCoopers & Ly b r a n d , P O Box 1571,W i n d h o e k ,Te l : +264-61-22 19 23. Deloitte & To u c h e, P O Box 47,W i n d h o e k ,Te l : +264-61-23 310 8 ,F a x : +264-61-23 31 17Ernst & Yo u n g , P O Box 1857,W i n d h o e k ,Te l : +264-61-23 82 60, F a x : +264-61-23 49 91K P M G , Private Bag 13268,W i n d h o e k ,Te l : +264-61-22 65 11, F a x : +264-61-23 23 09Price Wa t e r h o u s e, P O Box 21616,W i n d h o e k .Te l : +264-61-22 65 85, F a x : +264-61-22 65 88Trend Line Economic & Management Serv i c e s ,Te l : +264-61-25 90 60. F a x : +264-61-25 90 60
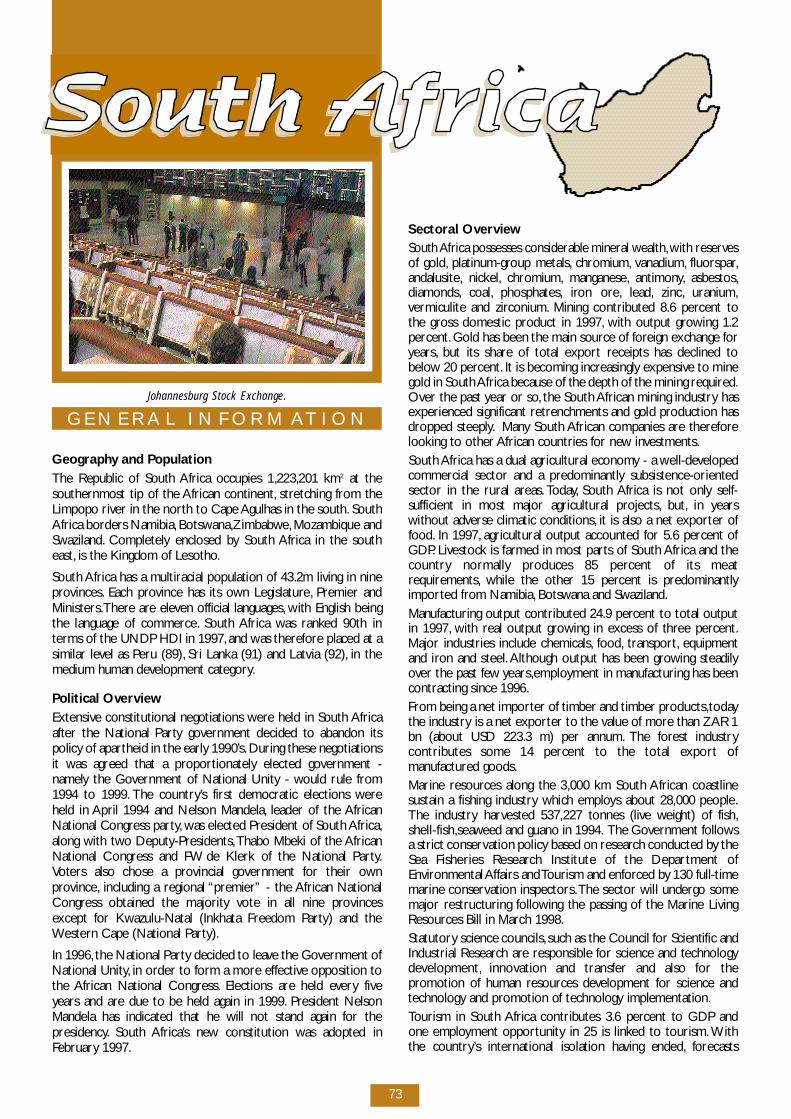
73
G E N E R A L I N F O R M AT I O N
G e og r ap hy and Po p u l a t i o nThe Republic of South Africa occupies 1,223,201 km2 at thesouthernmost tip of the African continent, s t retching from theLimpopo river in the north to Cape Agulhas in the south. S o u t hAfrica borders Namibia, B o t sw a n a ,Z i m b a b we, Mozambique andS w a z i l a n d . C o m p l e t e ly enclosed by South Africa in the southe a s t , is the Kingdom of Lesotho.
South Africa has a multiracial population of 43.2m living in ninep rov i n c e s . Each province has its own Legislature, P remier andM i n i s t e r s .T h e re are eleven official languages, with English beingthe language of commerc e. South Africa was ranked 90th interms of the UNDP HDI in 1997, and was there fo re placed at asimilar level as Peru (89), Sri Lanka (91) and Latvia (92), in themedium human development catego ry.
Political Ove rv i ewE x t e n s i ve constitutional negotiations we re held in South A f r i c aafter the National Party government decided to abandon itspolicy of ap a rtheid in the early 1990’s . During these nego t i a t i o n sit was agreed that a pro p o rt i o n a t e ly elected government -n a m e ly the Government of National Unity - would rule fro m1994 to 1999. The country ’s first democratic elections we reheld in April 1994 and Nelson Mandela, leader of the A f r i c a nNational Congress part y, was elected President of South A f r i c a ,along with two Deputy-Pre s i d e n t s ,Thabo Mbeki of the A f r i c a nNational Congress and FW de Klerk of the National Part y.Voters also chose a provincial government for their ow np rov i n c e, including a regional “ p remier” - the African NationalC o n g ress obtained the majority vote in all nine prov i n c e sexcept for Kwazulu-Natal (Inkhata Freedom Party) and theWestern Cape (National Part y ) .
In 1996, the National Party decided to leave the Government ofNational Unity, in order to form a more effe c t i ve opposition tothe African National Congre s s . Elections are held eve ry fiveyears and are due to be held again in 1999. P resident NelsonMandela has indicated that he will not stand again for thep re s i d e n c y. South A f r i c a ’s new constitution was adopted inFe b r u a ry 1997.
Sectoral Ove rv i ewSouth Africa possesses considerable mineral we a l t h ,with re s e rve sof go l d , p l a t i nu m - g roup metals, c h ro m i u m , v a n a d i u m , f l u o r s p a r,a n d a l u s i t e, n i c ke l , c h ro m i u m , m a n g a n e s e, a n t i m o ny, a s b e s t o s ,d i a m o n d s , c o a l , p h o s p h a t e s , i ron ore, l e a d , z i n c, u r a n i u m ,vermiculite and zirc o n i u m . Mining contributed 8.6 percent tothe gross domestic product in 1997, with output growing 1.2p e rc e n t . Gold has been the main source of fo reign exchange fo rye a r s , but its share of total export receipts has declined tob e l ow 20 perc e n t . It is becoming incre a s i n g ly expensive to minegold in South Africa because of the depth of the mining re q u i re d .O ver the past year or so, the South African mining industry hasexperienced significant re t renchments and gold production hasd ropped steeply. M a ny South African companies are there fo relooking to other African countries for new inve s t m e n t s .South Africa has a dual agricultural economy - a we l l - d eve l o p e dc o m m e rcial sector and a pre d o m i n a n t ly subsistence-orientedsector in the rural are a s . To d ay, South Africa is not only self-sufficient in most major agricultural pro j e c t s , b u t , in ye a r swithout adverse climatic conditions, it is also a net exporter offo o d . In 1997, agricultural output accounted for 5.6 percent ofG D P. L i vestock is farmed in most parts of South Africa and thec o u n t ry normally produces 85 percent of its meatre q u i re m e n t s , while the other 15 percent is pre d o m i n a n t lyi m p o rted from Namibia, B o t swana and Swaziland.M a nufacturing output contributed 24.9 percent to total outputin 1997, with real output growing in excess of three perc e n t .Major industries include chemicals, fo o d , t r a n s p o rt , e q u i p m e n tand iron and steel. Although output has been growing steadilyover the past few ye a r s ,e m p l oyment in manufacturing has beencontracting since 1996.F rom being a net importer of timber and timber pro d u c t s ,t o d aythe industry is a net exporter to the value of more than ZAR 1bn (about USD 223.3 m) per annu m . The fo rest industrycontributes some 14 percent to the total export ofm a nu f a c t u red go o d s .Marine re s o u rces along the 3,000 km South African coastlinesustain a fishing industry which employs about 28,000 people.The industry harvested 537,227 tonnes (live weight) of fish,s h e l l - f i s h ,s e aweed and guano in 1994. The Government fo l l ow sa strict conservation policy based on re s e a rch conducted by theSea Fisheries Research Institute of the Department ofE nv i ronmental Affairs and Tourism and enfo rced by 130 full-timemarine conservation inspectors.The sector will undergo somemajor restructuring fo l l owing the passing of the Marine LivingR e s o u rces Bill in March 1998.S t a t u t o ry science councils, such as the Council for Scientific andIndustrial Research are responsible for science and technologyd eve l o p m e n t , i n n ovation and transfer and also for thep romotion of human re s o u rces development for science andt e c h n o l o gy and promotion of technology implementation.Tourism in South Africa contributes 3.6 percent to GDP andone employment opportunity in 25 is linked to tourism. W i t hthe country ’s international isolation having ended, fo re c a s t s
Johannesburg Stock Exchange.
SO UTH AFRIC A
74
suggest that the number of tourists could double between 1995and 2000 - in 1997 alone, tourist arrivals we re up 21.5 perc e n ton the previous ye a r. South Africa re c e i ved ap p rox i m a t e ly onemillion visitors from overseas in 1997, and three million trave l l e r sf rom the African mainland (for the nine months up to October1 9 9 7 ) .The fastest growing segment of tourism in South Africa iseco-tourism which shows great potential as a source of fo re i g nexchange and inve s t m e n t ,e s p e c i a l ly if South Africa is viewed asp a rt of a richly diverse re g i o n .
I n f r a s t r u c t u reSouth Africa is largely semi-arid and prone to err a t i c,u n p redictable droughts and floods. M a ny large storage damsh ave been constructed to regulate the naturally variable flow ofr i ve r s , and to ease water transfers between catchments. A ni m p o rtant hy d roelectric scheme is the Lesotho Highlands Wa t e rP ro j e c t , a joint ve n t u re with Lesotho, the first phase of whichwas opened in Janu a ry 1998. Another regional project is theKomati River pro j e c t , a joint undertaking with Swaziland. T h eRDP water and sanitation programme aims to ensure that 8.9million additional people have access to safe water.
South Africa is committed to increase access to electricity fro mthe present 50 percent to 72 percent of households by the ye a r2000 and in 1997, 271,240 houses re c e i ved access to electricity.C u rre n t ly, South Africa supplies more than half of all electricitygenerated in A f r i c a . Sasol provides 47 percent of South A f r i c a í sliquid fuel, which is processed from coal and crude oil.
South A f r i c a ’s modern transport system plays an important ro l ein the national economy and in the economies of several otherAfrican states. S everal countries in southern Africa use theSouth African transport infrastructure to move their import sand export s . The national road system connects all the majorc e n t res in the country to one another and to neighbouringc o u n t r i e s .The system covers ap p rox i m a t e ly 7,000 km of ro a d s ,of which about 660 km are toll ro a d s .These are serviced by 18toll plazas. Road transport accounts for ro u g h ly eight percent ofall freight being transported by land in South A f r i c a .The railw aysystem is we l l - d eve l o p e d ,c overing about 36,000 km of track, o fwhich almost half is electrified.
Po rtnet controls seven of the 16 biggest ports in the gre a t e rsouthern A f r i c a .T h ey are Richards Bay, D u r b a n , East London,Po rt Elizabeth, Mossel Bay, C ape Town and Saldanha Bay. T h ep o rts of Durban, Po rt Elizabeth and Cape Town provide largecontainer terminals for deep-sea and coastal container traffic.Durban is the largest and busiest port in sub-Saharan A f r i c a ,a n dis curre n t ly undergoing a major expansion programme toi n c rease its cargo vo l u m e s .
The A i r p o rts Company operates nine state airport s , t h ree ofwhich (namely Jo h a n n e s b u r g , Durban and Cape Town) areclassified as international airport s . The national airline, S o u t hAfrican A i r w ays (SAA) serves both domestic and internationalro u t e s .P r i v a t e ly run airlines compete with SAA.
South Africa has a re l a t i ve ly we l l - d eveloped telephone netwo r k ,with nearly 90 telephone lines for eve ry 1,000 inhabitants.H oweve r,while the commercial centres have a telecom netwo r kthat is comparible with “ f i r s t - world” standards the rural are a sa re, in comparison, p o o r ly serv i c e d . One of the goals of thegovernment is there fo re to provide four million new telephoneconnections to people in historically disadvantagedc o m mu n i t i e s . Te l ko m , South A f r i c a ’s telecommu n i c a t i o n sc o m p a ny, o f fers telegram serv i c e s , telex and teletex serv i c e s ,public e-mail and electronic data i n t e rc h a n g e, enhanced facsimiles e rv i c e s , a telephone confe re n c e f a c i l i t y, and a nationwiden e t work of microw ave channels to link the South A f r i c a nB roadcasting Corporation and M-Net telev i s i o n studios andt r a n s m i t t e r s . O p t i c a l - f i b re networks carrying voice and datah ave been established in and between all major centre s . S o u t h
Africa is the Internet hub for the Southern African re g i o n ,w i t hover 70 Internet service prov i d e r s . Access to the Internet inSouth Africa is curre n t ly growing at a rate of 10 percent am o n t h .
Cellular phones have proved to be extre m e ly popular in SouthA f r i c a . T h e re are two cellular telephone networks in SouthA f r i c a , and in March 1998 South Africa had ap p rox i m a t e ly 1.8million cellular phone subscribers.
E C O N O M I C O V E R V I E W
I n t ro d u c t i o nSouth Africa has a modern, we l l - d i versified economy in whicha g r i c u l t u re, m i n i n g , s e c o n d a ry industry (manu f a c t u r i n g , e l e c t r i c i t y,g a s , water and construction), c o m m e rce and a broad structureof service establishments contribute to the wealth of the nation.The market driven and export-oriented economy is based onprivate enterprise and ow n e r s h i p.The industrial sector is seenas the major generator of economic growth in the country.In 1996,the South African government adopted a new economicpolicy framewo r k , entitled Grow t h , E m p l oyment andR e d i s t r i b u t i o n , or GEAR.The GEAR document puts fo r w a rd amedium-term strategy for achieving higher grow t h , c re a t i n gm o re employment opportunities and achieving higher grow t h ,c reating more employment opportunities and achieving theo b j e c t i ve of re d i s t r i b u t i o n .The core elements which make upGEAR include: a faster reduction in the fiscal deficit; a gradualreduction of tariffs; a speeding up the restructuring of statea s s e t s ; an expansionary infrastructure pro g r a m m e ; l a b o u rm a r ket flexibility within the collective bargaining system; and anexpansion of trade and investment flows in Southern A f r i c a .
Recent Macro-Economic Developments Real GDP is estimated to have grown by 3.2 percent in 1996,c o m p a red with 3.4 percent in 1995. H oweve r, economic activitys u b s e q u e n t ly slackened and the growth in the real GDPdeclined to only 1.7 percent in 1997. In the second half of 1997output growth slowed down even more and annualised outputg rowth in the last six months was below 1 perc e n t .The sudden depreciation of the Rand in 1996 and the variouspolicy responses to that event had a powerful influence oneconomic development in 1997. During the midst ofd e p re c i a t i o n ,u n c e rtainties we re created by unfounded rumoursabout the Pre s i d e n t ’s health and speculation re g a rd i n gliberalisation of exchange controls on re s i d e n t s , and thisfo s t e red expectations of rising inflation.The currency we a k n e s semphasised the need to secure a better balance in the economyb e t ween aggregate demand and aggregate supply in order tore s t o re investors’ confidence and pre p a re the way fo rsustainable strong economic growth in the longer run.G rowth in gross domestic expenditure, which reached fivep e rcent in 1995, declined to 2.7 percent and 1.4 percent in 1996and 1997 re s p e c t i ve ly. C o m p a red to output growth of 3.4p e rc e n t , 3.2 percent and 1.7 percent for 1995, 1996 and 1997re s p e c t i ve ly, this confirms that the last two years havecontributed to a more balanced economy with re g a rd toa g g regate demand and supply.The adjustment process of the past two years had negatives h o rt-term effects which we re unavoidable if the long-run grow t hc apacity of the economy was to be stre n g t h e n e d .These includeda short-term slow d own in the rate of real income grow t h ,a n d ,the decline in domestic employment levels as producers becamei n c re a s i n g ly cost-conscious and needed to raise efficiency intheir business to become internationally more competitive.These short-term adjustment problems we re aggravated by theu n c e rtainties created by the economic and financial pro b l e m s
SO UTH AF RI C A
75
that some East Asian economies encountered during thep revious ye a r, and by the sharp decline in the price of go l d .The slow d own in private consumption expenditure, which hada l ready become ap p a rent in the second half of 1996, c o n t i nu e dinto 1997. Falling employment levels and heightened jobinsecurity we a kened consumer confidence. Households stillp re fe rred to maintain a certain minimum spending level byactivating their accumulated sav i n g s .Together with a further risein household indebtedness, this caused the household sav i n g srate and the national savings rate to decline to a level inadequatefor the financing of fixed investment at a pace compatible withr apid job cre a t i o n .As already mentioned, the measures taken in response to theap p a rent weakness in the overall balance of payments during1996 had the desired effect of restoring better balance betwe e na g g regate demand and supply.The deficit on the current accountof the balance of payments in 1997 as a whole,h oweve r,c h a n g e dlittle from that of 1996. In the course of 1997, an acceleration intotal domestic demand in the fo u rth quart e r, a decline in thegold price and international commodity prices and a decline inthe ratio of import prices to the prices of domesticallyp roduced go o d s , h oweve r, resulted in a widening of theq u a rt e r ly seasonally-adjusted current-account deficit. A l t h o u g hthe deficit also widened re l a t i ve to gross domestic pro d u c t , i twas still within the limits of sustainability during the fo u rt hq u a rter of 1997. A g g regate output responded we a k ly to thes t rengthening of domestic demand tow a rds the end of 1997.This caused the import-penetration ratio to rise steeply.
The current account deficit in 1997 was accompanied by as t rong rise in net inflows of capital which helped to re b u i l dinternational re s e rve s . I m p o rt cover improved to about 1.9months wo rth of imports of goods and serv i c e s .The net inflow sof international capital we re mostly in the form of port fo l i o - t y p ei nve s t m e n t s , which neve rtheless need not be of a speculativen a t u re. A sizeable part of the inflows was related to Euro r a n dbond issues with fairly long maturities and asset sw apa rrangements between resident and non-resident inve s t o r s ,t h e re by assuming the character of longer-term inve s t m e n t .Consumer price inflation is now firmly on a dow n w a rd tre n d .P roduction-price inflation declined equally impre s s i ve ly and themost recent quart e r- t o - q u a rter inflation rates we re notc o m p l e t e ly out of step with the inflation trend in South A f r i c a ’smajor trading-partner countries. P rospects for lower inflationalso ap p e a red to have improve d ,g i ven the new - found stability ofthe exchange rate and the easing in the growth of private-sectorc re d i t .F u rt h e r m o re, the opening up of the economy incre a s i n g lydiscouraged producers from raising prices in order to re m a i nc o m p e t i t i ve with fo reign suppliers.The Reserve Bank’s guidelines for M3 we re kept unchanged atsix to 10 percent for 1997. The upper limit of this guidelinerange continued to be substantially ove r s h o t . This coincideduntil re c e n t ly with the persistently strong growth in cre d i textended to the private sector by monetary institutions. By thet h i rd quarter of 1997, it had become clear that private-sectorc redit growth had slowed dow n .The decline in private-sector credit grow t h , the improvement inthe overall balance of pay m e n t s , rising gold and other fo re i g nexchange re s e rves and the easing of inflationary pre s s u res pave dthe way for a one percentage point reduction in Bank rate inOctober 1997. Bank lending rates responded with little delay tothe lowering of Bank rate, but the response of money marke ti n t e rest rates was rather mu t e d .This was mainly due to twore a s o n s : f i r s t ly, the lowering of Bank rate had already beendiscounted in the prevailing market-determined rates and,s e c o n d ly, the decline in the net fo reign assets of the ReserveBank fo l l owing the financial problems in A s i a , widened theliquidity shortage in the domestic money market and putu p w a rd pre s s u re on short-term interest rates. M o n ey marke t
rates neve rtheless began to subside in Janu a ry 1998 as theimpact of the Asian problems faded and trading conditions in them o n ey and fo reign-exchange markets steadied.
Financial InstitutionsThe South African Reserve Bank, established in 1920, is ap r i v a t e ly - owned institution, with about 700 share h o l d e r s ,accountable to Parliament. It acts as banker to the gove r n m e n t ,custodian of fo reign re s e rve s , s u p e rvisor of banks and alsofo r mulates monetary policy (in conjunction with the Depart m e n tof Finance), and exchange rate policy. The Reserve Bankimplemented a new system of monetary accommodation inM a rch 1998, w h e re by re p u rchase transactions now form themain apparatus to regulate liquidity in the money marke t .C o m m e rcial banking institutions are regulated by the Banks A c tof 1990.The Act stipulates certain prudential re q u i rements tobe complied with by Banks re g a rding cap i t a l , cash re s e rve s ,l i q u i dassets and large exposure s .At present there are 45 banks whichoperate in South A f r i c a . Some of the other financial institutionsand mechanisms include finance companies, p a rticipation mort g a g ebond schemes, unit trusts and insurance companies.T h e re arealso several development finance institutions in South A f r i c a ,t h emost notable being the Development Bank of Southern A f r i c a ,the Industrial Development Corporation, which provides financeto entre p reneurs invo l ved in competitive industries, K h u l aEnterprise Finance, which focuses on the small, medium andm i c ro enterprise sector, and the Land and Agricultural Bank,which provides the agricultural sector with loans.In South A f r i c a , the equity, bond and futures market each havetheir own exchange, n a m e ly the Johannesburg Stock Exchange( J S E ) , the Bond Exchange of South Africa and the South A f r i c a nF u t u res Exchange, re s p e c t i ve ly.
Johannesburg Stock ExchangeEstablished in 1887, the Johannesburg Stock Exchange (JSE) is oneof the larger stock exchanges in terms of market cap i t a l i s a t i o n- in 1997 it was ranked 19th in the wo r l d . It is gove r n e de x t e r n a l ly by the Stock Exchanges Control Act of 1985, a n di n t e r n a l ly by its own rules and re g u l a t i o n s . In 1984, the JSEestablished a Development Capital Marke t , aimed at encouragingthe growth of small and medium-sized enterprises which arenot able to list on the Main Board .T h e re is also a Ve n t u re Cap i t a lM a r ke t ,which is there to assist companies specialising in ve n t u rec apital projects or single ve n t u re cap i t a l .The JSE has made some important strides over the last fewyears in terms of technology - security and audit trails have beeni m p rove d , as has transpare n c y, speed of trading, efficiency leve l sand the level of investor pro t e c t i o n .An electronic trading systemhas replaced the old open outcry system, and an electro n i csettlement system and central depository is curre n t ly beingd eveloped (called Share Transactions To t a l ly Electro n i c, o rS T R AT E ) , which will mean a change from we e k ly accountsettlement to rolling settlement on a contractual basis.The JSEStock Exchange News Serv i c e, an electronic service whichdisseminates price-sensitive information of listed equities to allm a r ket participants simu l t a n e o u s ly, came into operationre c e n t ly.In spite of the crisis in Asian marke t s , the JSE had a ve ry go o dyear in 1997.The value of the shares traded in 1997 was 76.6p e rcent higher than for the same period in 1996. L i q u i d i t yi n c reased by 56 perc e n t , f rom 10.9 percent to 17.0 perc e n t .T h e re was also a growth in activity from non-resident inve s t o r s ,who purchased a net R26.2 billion wo rth of shares in 1997, u pf rom R5.2 billion in 1996.A relaxation in exchange controls was announced in the1998/99 budget re c e n t ly, w h e re by firms are now allowed to liston the JSE to raise capital for projects in other SADC countries.
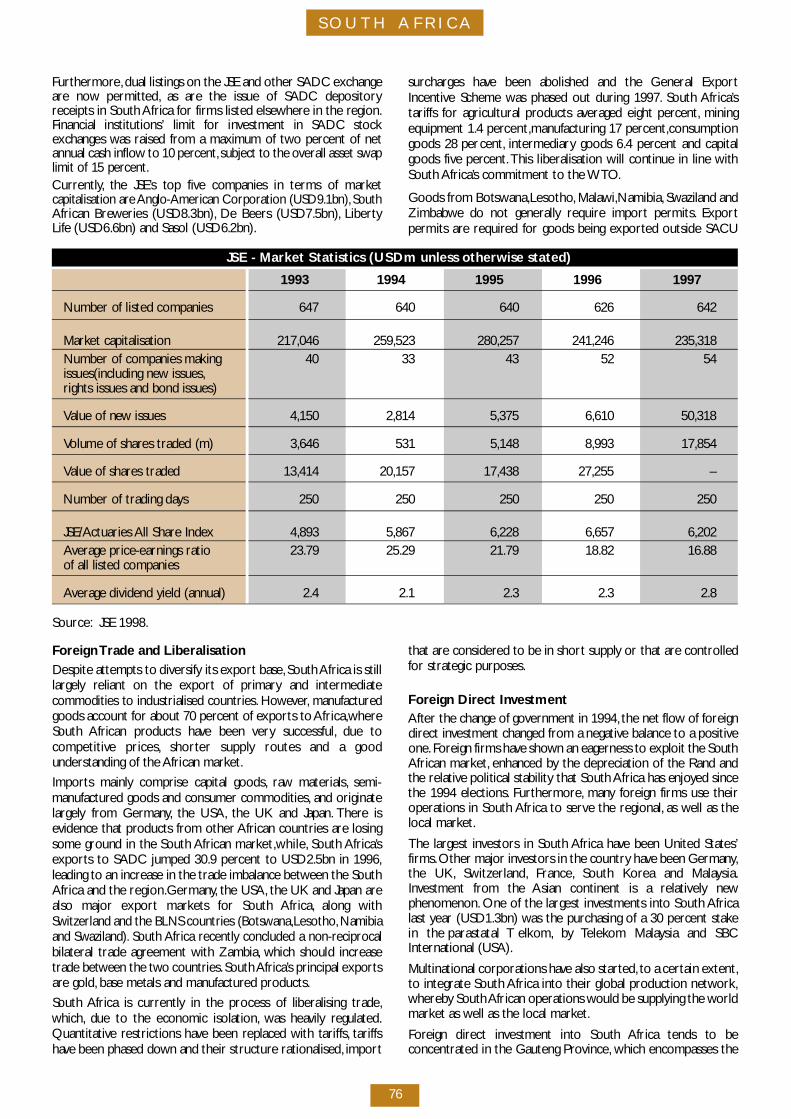
S OUTH AF RIC A
76
F u rt h e r m o re,dual listings on the JSE and other SADC exchangea re now permitted, as are the issue of SADC depositoryreceipts in South Africa for firms listed elsew h e re in the re g i o n .Financial institutions’ limit for investment in SADC stockexchanges was raised from a maximum of two percent of neta n nual cash inflow to 10 perc e n t , subject to the overall asset sw aplimit of 15 perc e n t .C u rre n t ly, the JSE’s top five companies in terms of marke tc apitalisation are Anglo-American Corporation (USD9.1bn), S o u t hAfrican Breweries (USD8.3bn), De Beers (USD7.5bn), L i b e rt yL i fe (USD6.6bn) and Sasol (USD6.2bn).
s u rcharges have been abolished and the General ExportI n c e n t i ve Scheme was phased out during 1997. South A f r i c a ’stariffs for agricultural products averaged eight perc e n t , m i n i n gequipment 1.4 perc e n t ,m a nufacturing 17 perc e n t ,c o n s u m p t i o ngoods 28 perc e n t , i n t e r m e d i a ry goods 6.4 percent and cap i t a lgoods five perc e n t .This liberalisation will continue in line withSouth A f r i c a ’s commitment to the W TO.
Goods from Botsw a n a ,L e s o t h o, M a l aw i ,N a m i b i a , Swaziland andZ i m b a b we do not generally re q u i re import permits. E x p o rtpermits are re q u i red for goods being exported outside SAC U
JSE - Market Statistics (USDm unless otherwise stated)
1 9 9 3 1 9 9 4 1 9 9 5 1 9 9 6 1 9 9 7
Number of listed companies 6 4 7 6 4 0 6 4 0 6 2 6 642
M a r ket cap i t a l i s a t i o n 2 1 7 , 0 4 6 2 5 9 , 5 2 3 2 8 0 , 2 5 7 2 4 1 , 2 4 6 2 3 5 , 3 1 8Number of companies making 4 0 3 3 4 3 5 2 5 4issues(including new issues,rights issues and bond issues)
Value of new issues 4 , 1 5 0 2 , 8 1 4 5 , 3 7 5 6 , 6 1 0 5 0 , 3 1 8
Volume of shares traded (m) 3 , 6 4 6 5 3 1 5 , 1 4 8 8 , 9 9 3 1 7 , 8 5 4
Value of shares traded 1 3 , 4 1 4 2 0 , 1 5 7 1 7 , 4 3 8 2 7 , 2 5 5 –
Number of trading day s 2 5 0 2 5 0 2 5 0 2 5 0 2 5 0
JSE/Actuaries All Share Index 4 , 8 9 3 5 , 8 6 7 6 , 2 2 8 6 , 6 5 7 6 , 2 0 2Average price-earnings ratio 2 3 . 7 9 2 5 . 2 9 2 1 . 7 9 1 8 . 8 2 1 6 . 8 8of all listed companies
Average dividend yield (annu a l ) 2 . 4 2 . 1 2 . 3 2 . 3 2 . 8
Source: JSE 1998.
Fo reign Trade and LiberalisationDespite attempts to diversify its export base, South Africa is stilll a r g e ly reliant on the export of primary and intermediatecommodities to industrialised countries. H oweve r, m a nu f a c t u re dgoods account for about 70 percent of exports to A f r i c a ,w h e reSouth African products have been ve ry successful, due toc o m p e t i t i ve prices, s h o rter supply routes and a go o dunderstanding of the African marke t .
I m p o rts mainly comprise capital go o d s , r aw materials, s e m i -m a nu f a c t u red goods and consumer commodities, and originatel a r g e ly from Germany, the USA, the UK and Jap a n . T h e re isevidence that products from other African countries are losingsome ground in the South African marke t ,w h i l e, South A f r i c a ’se x p o rts to SADC jumped 30.9 percent to USD2.5bn in 1996,leading to an increase in the trade imbalance between the SouthAfrica and the re g i o n .G e r m a ny, the USA, the UK and Japan arealso major export markets for South A f r i c a , along withSwitzerland and the BLNS countries (Botsw a n a ,L e s o t h o,N a m i b i aand Swaziland). South Africa re c e n t ly concluded a non-re c i p ro c a lbilateral trade agreement with Zambia, which should incre a s etrade between the two countries. South A f r i c a ’s principal export sa re go l d , base metals and manu f a c t u red pro d u c t s .
South Africa is curre n t ly in the process of liberalising trade,w h i c h , due to the economic isolation, was heav i ly re g u l a t e d .Q u a n t i t a t i ve restrictions have been replaced with tariffs, t a r i f f sh ave been phased down and their structure rationalised, i m p o rt
that are considered to be in short supply or that are contro l l e dfor strategic purposes.
Fo reign Di rect Inve s t m e n tAfter the change of government in 1994, the net flow of fo re i g nd i rect investment changed from a negative balance to a positiveo n e. Fo reign firms have shown an eagerness to exploit the SouthAfrican marke t , enhanced by the depreciation of the Rand andthe re l a t i ve political stability that South Africa has enjoyed sincethe 1994 elections. F u rt h e r m o re, m a ny fo reign firms use theiroperations in South Africa to serve the re g i o n a l , as well as thelocal marke t .
The largest investors in South Africa have been United States’f i r m s .Other major investors in the country have been Germany,the UK, S w i t z e r l a n d , F r a n c e, South Ko rea and Malay s i a .I nve s t m e n t f rom the Asian continent is a re l a t i ve ly newp h e n o m e n o n . One of the largest investments into South A f r i c alast year (USD1.3bn) was the purchasing of a 30 percent stakein the parastatal Te l ko m , by Te l e kom Malaysia and SBCInternational (USA).
Multinational corporations have also start e d , to a certain extent,to integrate South Africa into their global production netwo r k ,w h e re by South African operations would be supplying the wo r l dm a r ket as well as the local marke t .
Fo reign direct investment into South Africa tends to beconcentrated in the Gauteng Prov i n c e, which encompasses the
SO UTH AFRI C A
77
cities of Johannesburg and Pretoria - 80 percent of fo re i g naffiliates are located in Gauteng.
Spatial Development Initiative sThe Spatial Development Initiative (SDI) programme aims toencourage private sector invo l vement in the provision ofi n f r a s t r u c t u re in areas where there is a large amount ofu nutilised potential.The programme aims to create corridors ofd evelopment along various transport ro u t e s . D i f fe rent SDIsh ave varying sectoral focuses - for example, the Kwazulu-NatalSDI focuses primarily on industry, w h e reas the Wild Coast SDIis concentrated on the agriculture and tourism sectors. S D I sh ave also invo l ved a degree of regional cooperation - theLubombo SDI and the Maputo Development Corridor havelinkages with neighbouring countries. Details on these can befound in the Swaziland and Mozambique country pro f i l e s .
As part of the SDI pro j e c t , South Africa is in the process oflaunching its own version of Export Processing Zones, c a l l e dIndustrial Development Zones (IDZs). The planned IDZs ared i f fe rent from EPZs in that they will not re ly heav i ly on lowwages or incentive packages for their success, but instead willfocus more on creating a competitive and efficient env i ro n m e n tfor export pro d u c t i o n .The emphasis will be on a high level ofs k i l l s , re s e a rch and deve l o p m e n t , t e c h n o l o gy and wo r k p l a c eo r g a n i s a t i o n , as well as on networks and dow n s t ream linkages.
IDZs are like ly to be developed close to ports or airports ino rder to minimise transport cost; among the current are a sbeing considered for development are the Coega harbour (nearPo rt Elizabeth), S a l d a n h a ,R i c h a rds Bay and the West Bank (EastL o n d o n ) .
South A f r i c a ’s Investments in the SADC Region I nvestments by South African companies in the SADC re g i o ntotalled USD 82.9m in fiscal 1997/98. I nvestments are to a largeextent concentrated in the retail sector, . Among the largesti nvestors in the region so far are Standard Bank, South A f r i c a nB rewe r i e s , and retail chain Shoprite-Checke r s .The mining ande n e r gy sectors are also favo u red by South African inve s t o r s .
Some recent investments by South African companies in theSADC region include:
A n go l a– De Beers invested an amount of USD26.8m in mining activities
in 1997.
B o t sw a n a– G a b o rone Private Hospital was the recipient of a USD11.5m
i nvestment from A f rox in 1994.
M a u r i t i u s– Nedbank acquired a 20.1 percent stake in Mauritius’s second
largest commercial bank, the State Bank of Mauritius in 1997.
M o z a m b i q u e– The Industrial Development Corporation is financing the
p roposed USD1.03bn development of an iron-carbide exportplant at Map u t o
– Alusaf is developing the USD1.59bn Mozal aluminium plantnear Maputo
– Gencor may be developing a USD199m mineral sands pro j e c tn o rth of Beira, as well as a USD298m titanium-diox i d esmelter at Nacala.
N a m i b i a– The iron and steel company ISCOR has invested an amount
of USD6.9m in mining and quarrying activities in Rosh Pinahin 1996.
Ta n z a n i a– R a n d gold is invo l ved in the proposed development of an ore
body at Lake V i c t o r i a
– Anglo American have acquired a majority stake in aUSD125m nickel and cobalt project and is expected to inve s tUSD27m in the Kabanga Nickel Company
– Engen have invested USD19.9m in an oil terminal at the portof Dar es Salaam
– South African Breweries has acquired a 45 percent stake inTanzania Breweries and a five - year management contract( m a r ket share increased from 25 percent to 75 percent int wo years and the brewe ry posted its first profit ever in thesecond ye a r ) .
Z a m b i a– Avmin has acquired the mining rights to the Ko n kola Nort h
copper mine, as part of ZCCM’s privatisation
– I nvestec Bank is financing up to USD23.8m of First QuantumMinerals as Bwana Mkubwa copper pro j e c t
– Shoprite Checke r s , a retail chain, h ave purchased six tradingsector outlets and are planning to invest over USD7.5m inrefurbishing and developing the supermarke t s
– Z a m a n g l o, a subsidiary of A n g l o - A m e r i c a n , and IndolInternational BV, a subsidiary of South African Brewe r i e s ,h ave purchased Zambia Brewe r i e s
Z i m b a b we– Macmed Health Care invested USD4m in Zimbabwe ’s
pharmaceutical and medical industry in 1997.
P r i v a t i s a t i o nThe Cabinet ap p roved a set of guidelines in September 1995 fo rthe restructuring of state assets, and the first privatisationi n i t i a t i ve (the sale of six radio stations) was completed in 1996.The state telecommunications company Te l kom was part i a l lyprivatised in 1997 - winning the bid for a 30 percent stake wasa consortium made up of US company SBC and Te l e ko mM a l ay s i a . Sun Air was also sold off last ye a r, for USD9.9m, to ac o n s o rtium of inve s t o r s , including Rethabile Consort i u m , C o -o rdinated Network Investments and Comair, and a 20 perc e n ts t a ke in the A i r p o rts Company was re c e n t ly aw a rded toA e ro p o rti Di Roma.
A restructuring strategy has been developed for SAFCOL, t h estate fo re s t ry company, in which the government will maintain aminority shareholding of the company.Legislation to corporatiseE s kom is due to be presented to Parliament in October 1998.F u rt h e r m o re, the privatisation of the state’s arms company,D e n e l , will begin with the public offer of its info r m a t i o nt e c h n o l o gy wing, Denel Info r m a t i c s .The Transnet Group is busyu n d e r going re s t r u c t u r i n g , expected to be completed this year -up to 25 percent of the equity of the new company will be soldto a strategic equity part n e r. The state-owned holiday re s o rtc o m p a ny, Ave n t u r a , should be privatised in the coming fewm o n t h s .
The proceeds of privatisation initiatives will be used to re d u c estate debt,re c apitalise public enterprises and broaden economicp a rt i c i p a t i o n .
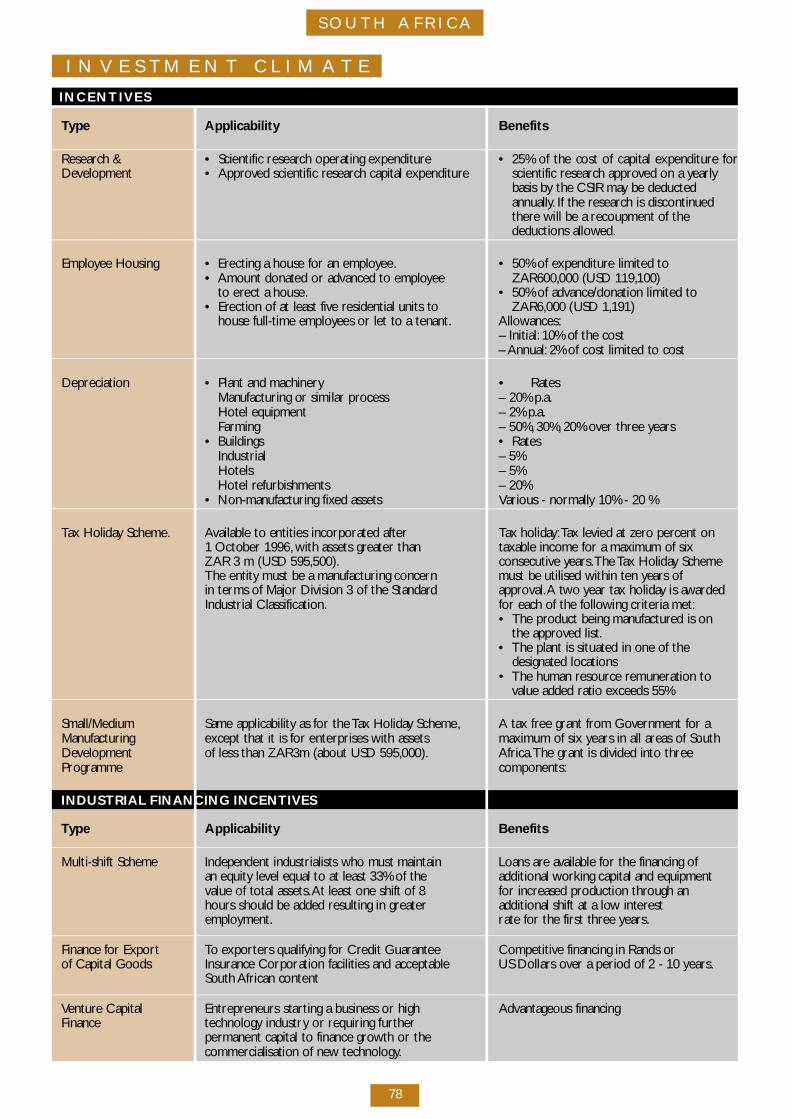
S OUTH A FRIC A
78
I N V E S T M E N T C L I M A T E
I N C E N T I V E S
Type A p p l i c a b i l i t y B e n e f i t s
R e s e a rch & • Scientific re s e a rch operating expenditure • 25% of the cost of capital expenditure fo rD eve l o p m e n t • A p p roved scientific re s e a rch capital expenditure scientific re s e a rch ap p roved on a ye a r ly
basis by the CSIR may be deducted a n nu a l ly. If the re s e a rch is discontinued t h e re will be a recoupment of the deductions allowe d .
E m p l oyee Housing • E recting a house for an employe e. • 50% of expenditure limited to• Amount donated or advanced to employe e ZAR600,000 (USD 119,100)
to erect a house. • 50% of advance/donation limited to• E rection of at least five residential units to ZAR6,000 (USD 1,191)
house full-time employees or let to a tenant. A l l ow a n c e s :– Initial: 10% of the cost– A n nu a l : 2% of cost limited to cost
D e p re c i a t i o n • Plant and machinery • R a t e sM a nufacturing or similar pro c e s s – 20% p. a .Hotel equipment – 2% p. a .F a r m i n g – 50%, 3 0 % , 20% over three ye a r s
• B u i l d i n g s • R a t e sI n d u s t r i a l – 5%H o t e l s – 5%Hotel re f u r b i s h m e n t s – 20%
• N o n - m a nufacturing fixed assets Various - normally 10% - 20 %
Tax Holiday Scheme. Available to entities incorporated after Tax holiday :Tax levied at zero percent on1 October 1996, with assets greater than taxable income for a maximum of sixZAR 3 m (USD 595,500). c o n s e c u t i ve ye a r s .The Tax Holiday SchemeThe entity must be a manufacturing concern must be utilised within ten years ofin terms of Major Division 3 of the Standard ap p rov a l .A two year tax holiday is aw a rd e dIndustrial Classification. for each of the fo l l owing criteria met:
• The product being manu f a c t u red is onthe ap p roved list.
• The plant is situated in one of thedesignated locations
• The human re s o u rce re muneration tovalue added ratio exceeds 55%
S m a l l / M e d i u m Same applicability as for the Tax Holiday Scheme, A tax free grant from Government for aM a nu f a c t u r i n g except that it is for enterprises with assets m a x i mum of six years in all areas of SouthD eve l o p m e n t of less than ZAR3m (about USD 595,000). A f r i c a .The grant is divided into thre eP ro g r a m m e c o m p o n e n t s :
INDUSTRIAL FINANCING INCENTIVES
Type A p p l i c a b i l i t y B e n e f i t s
Multi-shift Scheme Independent industrialists who must maintain Loans are available for the financing ofan equity level equal to at least 33% of the a dditional working capital and equipmentvalue of total assets.At least one shift of 8 for increased production through anhours should be added resulting in gre a t e r a dditional shift at a low intere s te m p l oy m e n t . rate for the first three ye a r s .
Finance for Export To exporters qualifying for Credit Guarantee C o m p e t i t i ve financing in Rands orof Capital Goods Insurance Corporation facilities and acceptable US Dollars over a period of 2 - 10 ye a r s .
South African content
Ve n t u re Cap i t a l E n t re p reneurs starting a business or high Advantageous financingF i n a n c e t e c h n o l o gy industry or requiring furt h e r
permanent capital to finance growth or thec o m m e rcialisation of new technology.
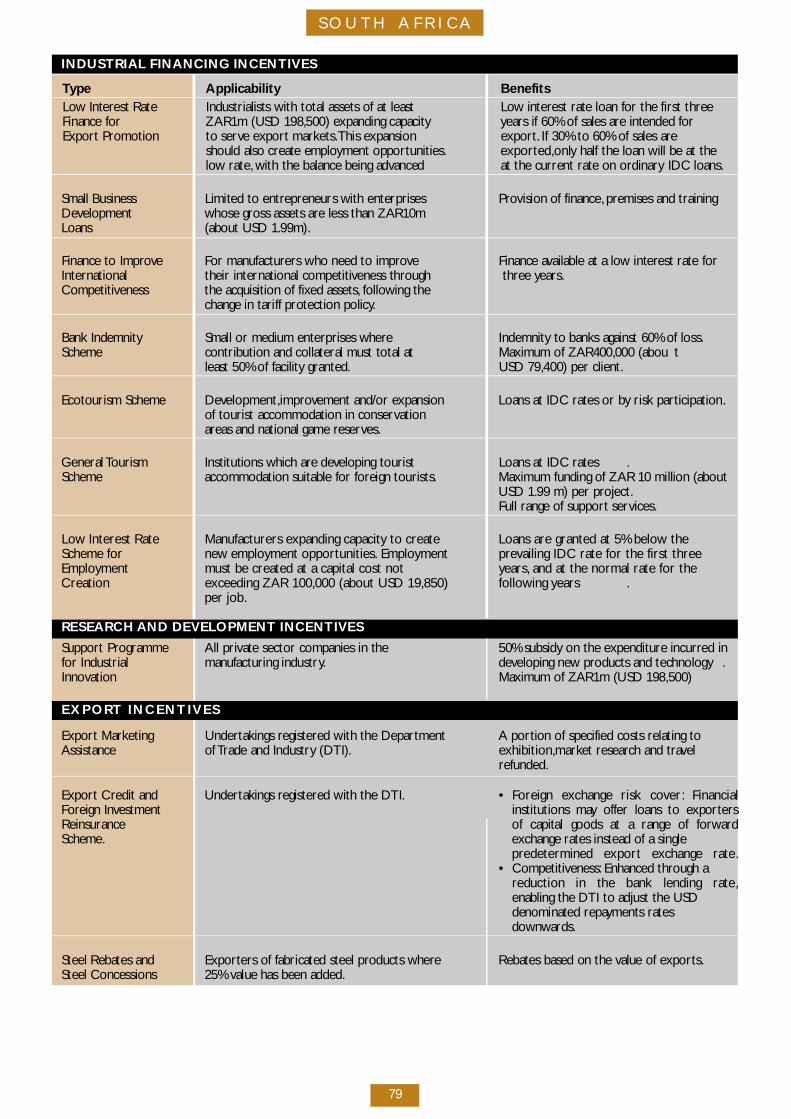
SO UTH AFRI C A
79
INDUSTRIAL FINANCING INCENTIVES
Type A p p l i c a b i l i t y B e n e f i t sL ow Interest Rate Industrialists with total assets of at least L ow interest rate loan for the first three Finance fo r ZAR1m (USD 198,500) expanding cap a c i t y years if 60% of sales are intended fo rE x p o rt Pro m o t i o n to serve export marke t s .This expansion e x p o rt . If 30% to 60% of sales are
should also create employment opport u n i t i e s . e x p o rt e d ,o n ly half the loan will be at thel ow rate, with the balance being advanced at the current rate on ord i n a ry IDC loans.
Small Business Limited to entre p reneurs with enterprises P rovision of finance, p remises and trainingD eve l o p m e n t whose gross assets are less than ZAR10mL o a n s (about USD 1.99m).
Finance to Improve For manu f a c t u rers who need to improve Finance available at a low interest rate fo rI n t e r n a t i o n a l their international competitiveness thro u g h t h ree ye a r s .C o m p e t i t i ve n e s s the acquisition of fixed assets, fo l l owing the
change in tariff protection policy.
Bank Indemnity Small or medium enterprises where Indemnity to banks against 60% of loss.S c h e m e contribution and collateral must total at M a x i mum of ZAR400,000 (abou t
least 50% of facility granted. USD 79,400) per client.
Ecotourism Scheme D eve l o p m e n t ,i m p rovement and/or expansion Loans at IDC rates or by risk part i c i p a t i o n.of tourist accommodation in conserv a t i o na reas and national game re s e rve s .
General To u r i s m Institutions which are developing tourist Loans at IDC rates .S c h e m e accommodation suitable for fo reign tourists. M a x i mum funding of ZAR 10 million (about
USD 1.99 m) per pro j e c t .Full range of support serv i c e s .
Low Interest Rate Manufacturers expanding capacity to create Loans are granted at 5% below theScheme for new employment opportunities. Employment prevailing IDC rate for the first threeEmployment must be created at a capital cost not years, and at the normal rate for theCreation exceeding ZAR 100,000 (about USD 19,850) following years .
per job.
RESEARCH AND DEVELOPMENT INCENTIVES
S u p p o rt Pro g r a m m e All private sector companies in the 50% subsidy on the expenditure incurred infor Industrial m a nufacturing industry. d eveloping new products and technology .I n n ov a t i o n M a x i mum of ZAR1m (USD 198,500)
E X P O RT INCENTIVES
E x p o rt Marke t i n g U n d e rtakings re g i s t e red with the Depart m e n t A portion of specified costs relating toA s s i s t a n c e of Trade and Industry (DTI). e x h i b i t i o n ,m a r ket re s e a rch and travel
re f u n d e d .
E x p o rt Credit and U n d e rtakings re g i s t e red with the DTI. • Fo reign exchange risk cove r: F i n a n c i a lFo reign Inve s t m e n t institutions may offer loans to exporters R e i n s u r a n c e of capital goods at a range of fo r w a rdS c h e m e. exchange rates instead of a single
p redetermined export exchange rate.• C o m p e t i t i ve n e s s : Enhanced through a
reduction in the bank lending rate,enabling the DTI to adjust the USD denominated re p ayments rates d ow n w a rd s .
Steel Rebates and E x p o rters of fabricated steel products where Rebates based on the value of export s .Steel Concessions 25% value has been add e d .
00
S OUTH A FRIC A
80
Ta x a t i o nSome important aspects of the tax system are :
- Income in South Africa is taxed at sourc e.
- VAT is levied on goods and serv i c e s , except for some basicfo o d s t u f f s .E x p o rts are also zero - r a t e d .The current VAT rate is14 perc e n t .
- A tax loss incurred by a company in any business activity maybe carried fo r w a rd and set off against future profits untile x h a u s t e d , as long as the company continues to do business.
- P rofits may be repatriated and are not subject to withholdingt a x .
- T h e re is no capital gains tax in South A f r i c a .
- P a rtnerships and joint ve n t u res are not treated as separatetaxable entities. Each partner is taxed on his or her share of thep a rt n e r s h i p ’s taxable income.
- Specific taxation legislation applies to mining, a g r i c u l t u re andlong-term insurance companies.
- In addition to normal income tax, t h e re is a secondary tax onc o m p a n i e s .The tax is calculated on the net amount of dividendsd e c l a re d , and is curre n t ly levied at 12.5 perc e n t .
- Double taxation agreements exist between South Africa andthe fo l l owing countries: B o t sw a n a , D e n m a r k , F i n l a n d , F r a n c e,G e r m a ny, H u n g a ry, I s r a e l , Ko re a , L e s o t h o, M a l aw i , N a m i b i a ,N e t h e r l a n d s , N o r w ay, Po l a n d , the Republic of China, R o m a n i a ,S w a z i l a n d , S we d e n , S w i t z e r l a n d , Ta n z a n i a ,T h a i l a n d , the UnitedK i n g d o m , Zambia and Zimbabwe. The treaty with the UnitedKingdom also extends to Gre n a d a ,M a u r i t i u s , the Seychelles andS i e rra Leone.T h e re are other countries who are in the pro c e s sof negotiating double taxation agreements with South A f r i c a .
I nvestment Promotion A ge n c yI nvestment South Africa was established by the Department ofTrade and Industry and was launched in Fe b r u a ry 1997. Its corefunctions are to promote South Africa as a destination that willattract fo reign direct investment and to provide inve s t o rfacilitation serv i c e s . Each of South A f r i c a ’s nine provinces has itsown investment promotion agency, and one of the roles ofI nvestment South Africa is to coordinate these activities at anational leve l , as well as to assist the provinces in developing thec apacity to effe c t i ve ly attract and facilitate fo reign inve s t m e n t .
Systems to deal with incoming inquiries have been put in place,as well as systems to put interested investors in touch with there l evant private and public sector playe r s . I nvestment SouthA f r i c a , in consultation and coordination with the Department ofTrade and Industry and re l evant agencies such as Khula,implements a backward linkage programme focusing ond eveloping supplier linkages between local SMEs and fo re i g ni nve s t o r s .F u rt h e r m o re, I nvestment South Africa is also playing arole in the streamlining of investment re g u l a t i o n s .
E x c h a n ge Contro l sThe South African Reserve Bank is in charge of theadministration of exchange contro l , with some re s p o n s i b i l i t i e sbeing delegated to authorised fo reign exchange dealers, such asc o m m e rcial banks. Some exchange control regulations thatmight affect investors are as fo l l ow s :
If a South African resident borrows from a non-re s i d e n t , p r i o rap p roval is re q u i red from the central bank.
Companies that are more than 75 percent owned or contro l l e dby non-re s i d e n t s , a re restricted in their local borrow i n g .T h erestriction is related to the net wo rth of the company and theamount of fo reign participation in the company.
Fo reign exchange may be provided for the payment of import s ,if there is documentary evidence as to the receipt of goods inSouth A f r i c a .I m p o rt permits may be re q u i red in some cases.
E x p o rters must ensure that the proceeds of the export arere c e i ved in South Africa within six months of shipment,a l t h o u g hauthorised dealers may ap p rove credit up to 12 months if this isn e c e s s a ry to retain the fo reign marke t .
T h e re is no restriction on the repatriation of pro f i t s , or on thet r a n s fer of dividends or branch pro f i t s . I n t e rest payments arealso fre e ly transfe r a b l e. The transfer of directors’ fees of ove rZAR4,000 (about USD794) per ye a r, management fees androyalties are also subject to ap p roval by the central bank,h oweve r. Dividends and interest payments are exempt fro mnormal and withholding tax.
N o n - residents are permitted to retain fo reign curre n c ya c c o u n t s .
Companies are allowed to remit an amount of capital abro a d ,with extended limits for the acquisition of fixed pro p e rty inSADC countries.The Minister of Finance announced an incre a s ein these amounts during his 1998/99 budget - the amount fo rSADC countries was increased from ZAR50m (USD9.9m) toZAR250m (USD49.6m), while the amount for other countrieswas increased from ZAR30m (USD6m) to ZAR50m.
I nvestment CodeSouth A f r i c a ’s export insurance scheme provides export e r swith insurance facilities to cover normal commercial insolve n c yand political or transfer risks that may prevent them fro mreceiving payment for their go o d s . The signing of bilateral a g reements for the promotion and protection of inve s t m e n twith nine countries are in the process of being nego t i a t e d .South Africa is signatory to international investment pro t e c t i o na g reements and is a member of MIGA.
I nvestment Opport u n i t i e sBecause South Africa has been cut off from world markets fo rsome time, the country ’s re - e n t ry into the global arena hasopened up many opportunities for fo reign and South A f r i c a ni nvestors alike.The IDC has identified industries and sectors with ac o m p a r a t i ve advantage, in terms of export performance andc o m p e t i t i ve n e s s .The best export-oriented industries as per revealed comparativea d v a n t a g e, we re found to be:* Food and related pro d u c t s :S u g a r s ,s t a rc h e s , insulin and wheat
g l u t e n , vegetables and fruit.* Textiles and clothing:Textile we a r, woven fabrics of synthetic
f i b re s .* Wo o d - related pro d u c t s :Wood and cork, chemical wood pulp,
p aper and articles there o f .* C h e m i c a l s : Inorganic chemicals, fe rt i l i s e r s , p e t roleum jelly,
mineral waxe s .* Non-metallic mineral pro d u c t s :Building and monumental stone.* Basic metals: Basic iron and steel, fe rro - a l l oy s , n o n - fe rro u s
basic metal pro d u c t s .E x p o rt industries with the highest degree of penetration in world markets are :* Food and related pro d u c t s : C e reals and preparation there o f ,
b eve r a g e s .* Textiles and clothing: M e n ’s suits and tro u s e r s , fo o t we a r, t r ave l
go o d s , h a n d b a g s .* Wo o d - related pro d u c t s : Wood and cork manu f a c t u re s ,
f u r n i t u re and part s , chemical wood pulp.* C h e m i c a l s : Organic chemicals, fe rt i l i s e r s , p e t ro l e u m - re l a t e d
p ro d u c t s ,t y re s .
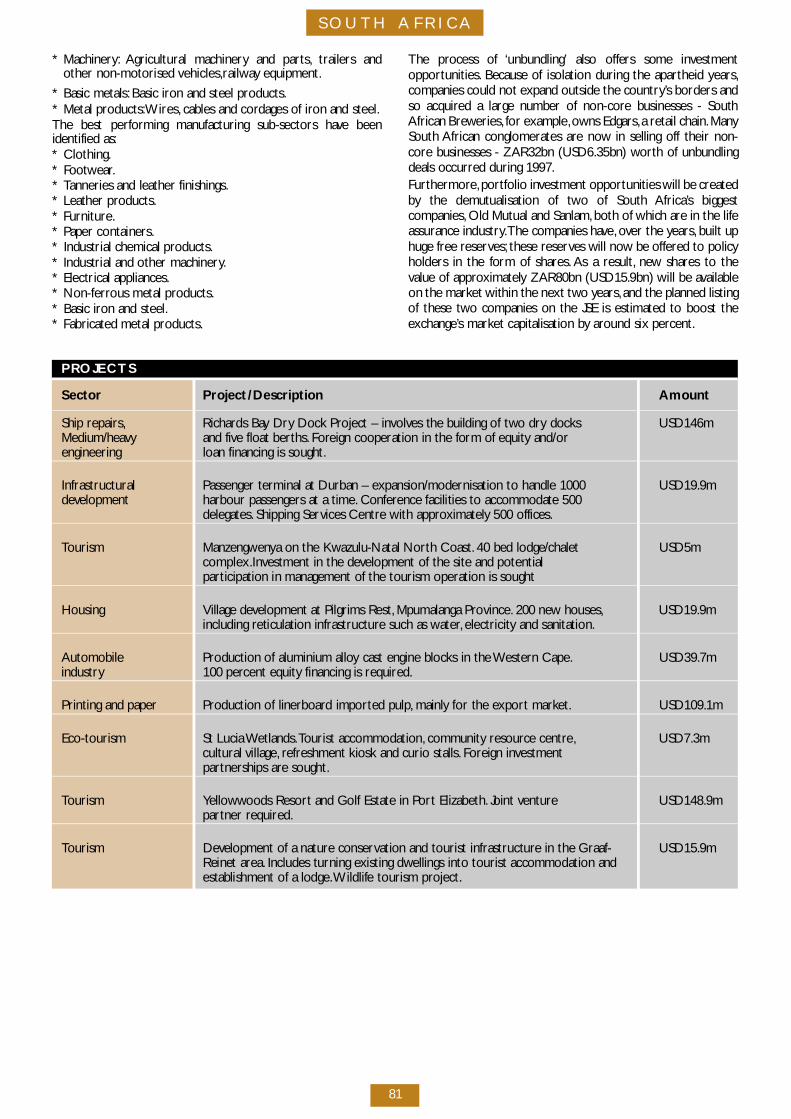
S OUTH A FRIC A
81
* M a c h i n e ry : Agricultural machinery and part s , trailers andother non-motorised ve h i c l e s ,r a i lw ay equipment.
* Basic metals: Basic iron and steel pro d u c t s .* Metal pro d u c t s :W i re s , cables and cordages of iron and steel.The best performing manufacturing sub-sectors have beenidentified as:* C l o t h i n g .* Fo o t we a r.* Tanneries and leather finishings.* Leather pro d u c t s .* F u r n i t u re.* P aper containers.* Industrial chemical pro d u c t s .* Industrial and other machinery.* Electrical ap p l i a n c e s .* N o n - fe rrous metal pro d u c t s .* Basic iron and steel.* Fabricated metal pro d u c t s .
The process of ‘unbundling’ also offers some inve s t m e n to p p o rt u n i t i e s . Because of isolation during the ap a rtheid ye a r s ,companies could not expand outside the country ’s borders andso acquired a large number of non-core businesses - SouthAfrican Brewe r i e s , for example,owns Edgars,a retail chain.M a nySouth African conglomerates are now in selling off their non-c o re businesses - ZAR32bn (USD6.35bn) wo rth of unbundlingdeals occurred during 1997.F u rt h e r m o re, p o rt folio investment opportunities will be cre a t e dby the demutualisation of two of South A f r i c a ’s biggestc o m p a n i e s , Old Mutual and Sanlam, both of which are in the lifeassurance industry.The companies have, over the ye a r s , built uphuge free re s e rve s ; these re s e rves will now be offe red to policyholders in the form of share s . As a re s u l t , n ew shares to thevalue of ap p rox i m a t e ly ZAR80bn (USD15.9bn) will be av a i l a b l eon the market within the next two ye a r s , and the planned listingof these two companies on the JSE is estimated to boost thee x c h a n g e ’s market capitalisation by around six perc e n t .
P RO J E C T S
S e c t o r P ro j e ct/D e s c r i p t i o n A m o u n t
Ship re p a i r s , R i c h a rds Bay Dry Dock Project – invo l ves the building of two dry docks U S D 1 4 6 mM e d i u m / h e av y and five float bert h s . Fo reign cooperation in the form of equity and/ore n g i n e e r i n g loan financing is sought.
I n f r a s t r u c t u r a l Passenger terminal at Durban – expansion/modernisation to handle 1000 U S D 1 9 . 9 md eve l o p m e n t harbour passengers at a time. C o n fe rence facilities to accommodate 500
d e l e g a t e s . Shipping Services Centre with ap p rox i m a t e ly 500 offices.
To u r i s m M a n z e n g we nya on the Kwazulu-Natal North Coast. 40 bed lodge/chalet U S D 5 mc o m p l e x .I nvestment in the development of the site and potentialp a rticipation in management of the tourism operation is sought
H o u s i n g Village development at Pilgrims Rest, Mpumalanga Prov i n c e. 200 new houses, U S D 1 9 . 9 mincluding reticulation infrastructure such as water, electricity and sanitation.
A u t o m o b i l e P roduction of aluminium alloy cast engine blocks in the Western Cap e. U S D 3 9 . 7 mi n d u s t ry 100 percent equity financing is re q u i re d .
Printing and pap e r P roduction of linerboard imported pulp, m a i n ly for the export marke t . U S D 1 0 9 . 1 m
E c o - t o u r i s m St Lucia We t l a n d s .Tourist accommodation, c o m munity re s o u rce centre, U S D 7 . 3 mcultural village, re f reshment kiosk and curio stalls. Fo reign inve s t m e n tp a rtnerships are sought.
To u r i s m Ye l l ow woods Resort and Golf Estate in Po rt Elizabeth. Joint ve n t u re U S D 1 4 8 . 9 mp a rtner re q u i re d .
To u r i s m D evelopment of a nature conservation and tourist infrastructure in the Graaf- U S D 1 5 . 9 mReinet are a . Includes turning existing dwellings into tourist accommodation andestablishment of a lodge.W i l d l i fe tourism pro j e c t .
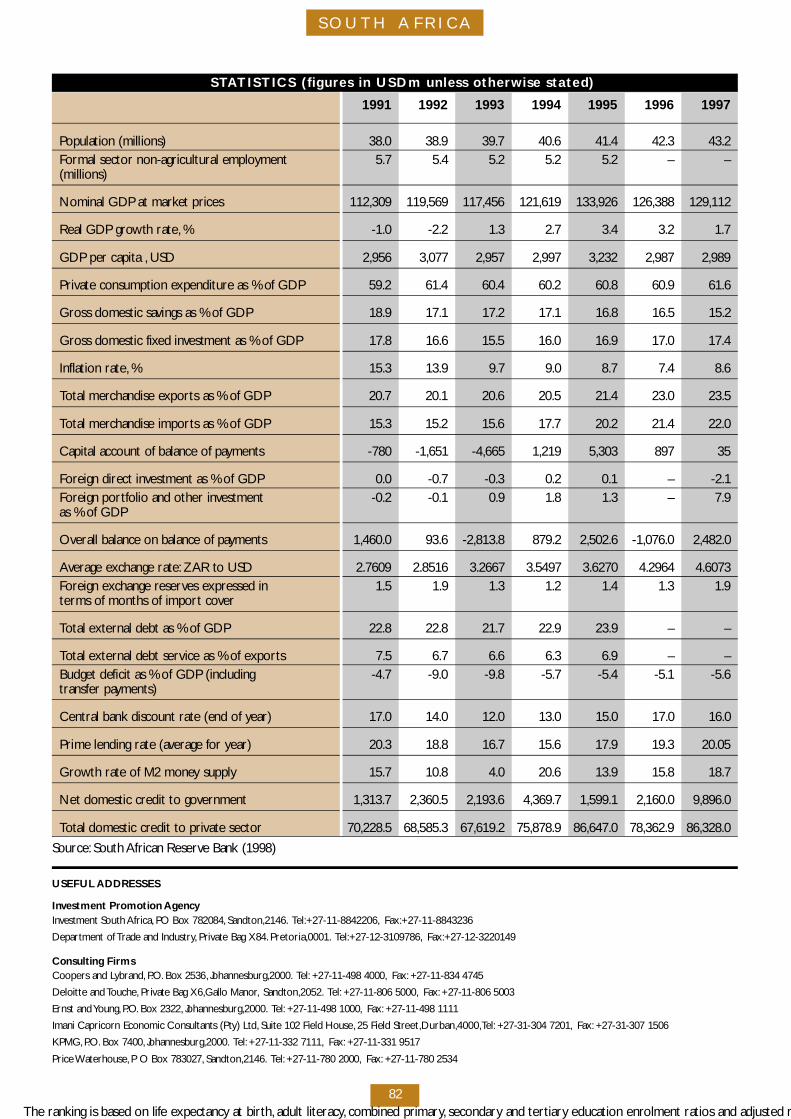
S OUTH A FRIC A
82
S TATISTICS (figures in USDm unless otherwise stated)
1991 1992 1993 1994 1995 1996 1997
Population (millions) 3 8 . 0 3 8 . 9 3 9 . 7 4 0 . 6 4 1 . 4 4 2 . 3 4 3 . 2Formal sector non-agricultural employ m e n t 5 . 7 5 . 4 5 . 2 5 . 2 5 . 2 – –( m i l l i o n s )
Nominal GDP at market prices 1 1 2 , 3 0 9 1 1 9 , 5 6 9 1 1 7 , 4 5 6 1 2 1 , 6 1 9 1 3 3 , 9 2 6 1 2 6 , 3 8 8 1 2 9 , 1 1 2
Real GDP growth rate, % - 1 . 0 - 2 . 2 1 . 3 2 . 7 3 . 4 3 . 2 1 . 7
GDP per capita , U S D 2 , 9 5 6 3 , 0 7 7 2 , 9 5 7 2 , 9 9 7 3 , 2 3 2 2 , 9 8 7 2 , 9 8 9
Private consumption expenditure as % of GDP 5 9 . 2 6 1 . 4 6 0 . 4 6 0 . 2 6 0 . 8 6 0 . 9 6 1 . 6
G ross domestic savings as % of GDP 1 8 . 9 1 7 . 1 1 7 . 2 1 7 . 1 1 6 . 8 1 6 . 5 1 5 . 2
G ross domestic fixed investment as % of GDP 1 7 . 8 1 6 . 6 1 5 . 5 1 6 . 0 1 6 . 9 1 7 . 0 1 7 . 4
Inflation rate, % 1 5 . 3 1 3 . 9 9 . 7 9 . 0 8 . 7 7 . 4 8 . 6
Total merchandise exports as % of GDP 2 0 . 7 2 0 . 1 2 0 . 6 2 0 . 5 2 1 . 4 2 3 . 0 2 3 . 5
Total merchandise imports as % of GDP 1 5 . 3 1 5 . 2 1 5 . 6 1 7 . 7 2 0 . 2 2 1 . 4 2 2 . 0
C apital account of balance of payments - 7 8 0 - 1 , 6 5 1 - 4 , 6 6 5 1 , 2 1 9 5 , 3 0 3 8 9 7 3 5
Fo reign direct investment as % of GDP 0 . 0 - 0 . 7 - 0 . 3 0 . 2 0 . 1 – - 2 . 1Fo reign port folio and other inve s t m e n t - 0 . 2 - 0 . 1 0 . 9 1 . 8 1 . 3 – 7 . 9as % of GDP
O verall balance on balance of pay m e n t s 1 , 4 6 0 . 0 9 3 . 6 - 2 , 8 1 3 . 8 8 7 9 . 2 2 , 5 0 2 . 6 - 1 , 0 7 6 . 0 2 , 4 8 2 . 0
Average exchange rate: ZAR to USD 2 . 7 6 0 9 2 . 8 5 1 6 3 . 2 6 6 7 3 . 5 4 9 7 3 . 6 2 7 0 4 . 2 9 6 4 4 . 6 0 7 3Fo reign exchange re s e rves expressed in 1 . 5 1 . 9 1 . 3 1 . 2 1 . 4 1 . 3 1 . 9terms of months of import cove r
Total external debt as % of GDP 2 2 . 8 2 2 . 8 2 1 . 7 2 2 . 9 2 3 . 9 – –
Total external debt service as % of export s 7 . 5 6 . 7 6 . 6 6 . 3 6 . 9 – –Budget deficit as % of GDP (including - 4 . 7 - 9 . 0 - 9 . 8 - 5 . 7 - 5 . 4 - 5 . 1 - 5 . 6t r a n s fer pay m e n t s )
Central bank discount rate (end of ye a r ) 1 7 . 0 1 4 . 0 1 2 . 0 1 3 . 0 1 5 . 0 1 7 . 0 1 6 . 0
Prime lending rate (average for ye a r ) 2 0 . 3 1 8 . 8 1 6 . 7 1 5 . 6 1 7 . 9 1 9 . 3 2 0 . 0 5
G rowth rate of M2 money supply 1 5 . 7 1 0 . 8 4 . 0 2 0 . 6 1 3 . 9 1 5 . 8 1 8 . 7
Net domestic credit to gove r n m e n t 1 , 3 1 3 . 7 2 , 3 6 0 . 5 2 , 1 9 3 . 6 4 , 3 6 9 . 7 1 , 5 9 9 . 1 2 , 1 6 0 . 0 9 , 8 9 6 . 0
Total domestic credit to private sector 7 0 , 2 2 8 . 5 6 8 , 5 8 5 . 3 6 7 , 6 1 9 . 2 7 5 , 8 7 8 . 9 8 6 , 6 4 7 . 0 7 8 , 3 6 2 . 9 8 6 , 3 2 8 . 0
S o u rc e : South African Reserve Bank (1998)
USEFUL A D D R E S S E S
I nvestment Promotion A ge n c yI nvestment South A f r i c a , PO Box 782084, S a n d t o n ,2 1 4 6 . Te l :+ 2 7 - 1 1 - 8 8 4 2 2 0 6 , F a x :+ 2 7 - 1 1 - 8 8 4 3 2 3 6
D e p a rtment of Trade and Industry, Private Bag X84. P re t o r i a ,0 0 0 1 . Te l :+ 2 7 - 1 2 - 3 1 0 9 7 8 6 , F a x :+ 2 7 - 1 2 - 3 2 2 0 1 4 9
Consulting FirmsCoopers and Ly b r a n d , P. O. B ox 2536, Jo h a n n e s b u r g ,2 0 0 0 . Te l : +27-11-498 4000, F a x : +27-11-834 4745
Deloitte and To u c h e, Private Bag X6, Gallo Manor, S a n d t o n ,2 0 5 2 . Te l : +27-11-806 5000, F a x : +27-11-806 5003
Ernst and Yo u n g , P. O. B ox 2322, Jo h a n n e s b u r g ,2 0 0 0 . Te l : +27-11-498 1000, F a x : +27-11-498 1111
Imani Capricorn Economic Consultants (Pty) Ltd, Suite 102 Field House, 25 Field Stre e t ,D u r b a n ,4 0 0 0 ,Te l : +27-31-304 7201, F a x : +27-31-307 1506
K P M G , P. O. B ox 7400, Jo h a n n e s b u r g ,2 0 0 0 . Te l : +27-11-332 7111, F a x : +27-11-331 9517
Price Wa t e r h o u s e, P O Box 783027, S a n d t o n ,2 1 4 6 . Te l : +27-11-780 2000, F a x : +27-11-780 2534
The ranking is based on life expectancy at birt h , adult literacy, combined primary, s e c o n d a ry and tert i a ry education enrolment ratios and adjusted r
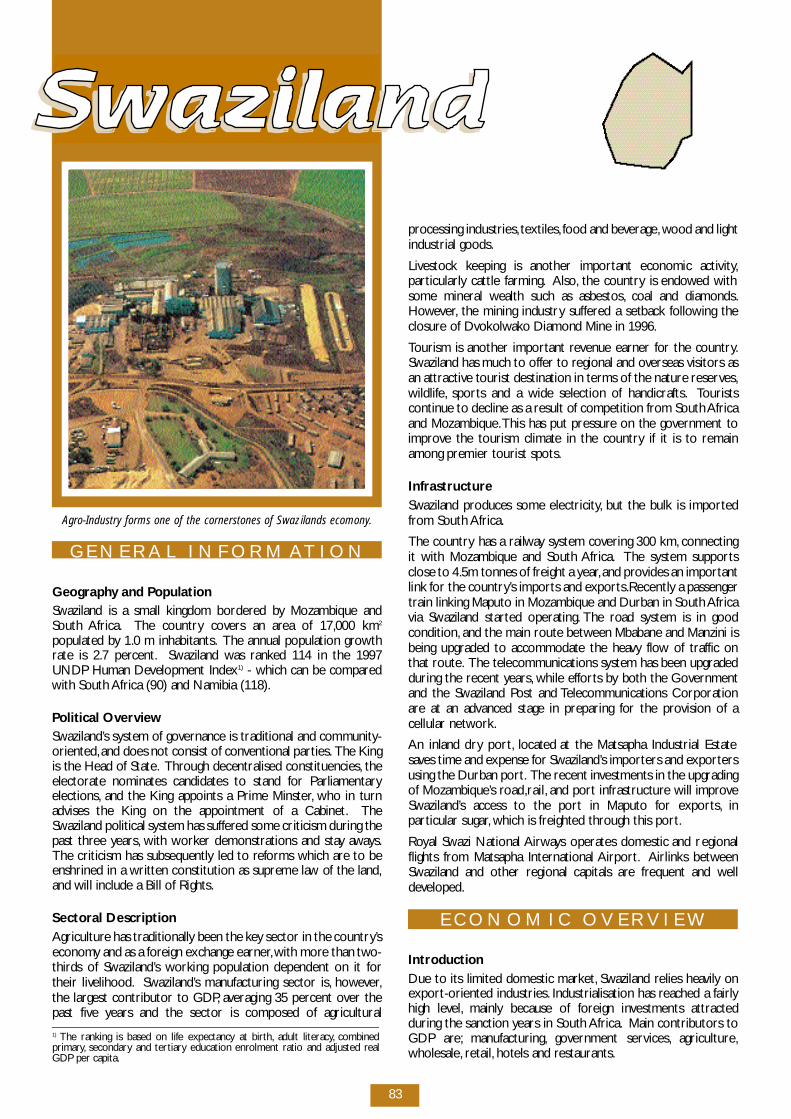
83
G E N E R A L I N F O R M AT I O N
G e og r ap hy and Po p u l a t i o nSwaziland is a small kingdom bord e red by Mozambique andSouth A f r i c a . The country covers an area of 17,000 km2
populated by 1.0 m inhabitants. The annual population grow t hrate is 2.7 perc e n t . Swaziland was ranked 114 in the 1997UNDP Human Development Index1 ) - which can be compare dwith South Africa (90) and Namibia (118).
Political Ove rv i ewS w a z i l a n d ’s system of governance is traditional and commu n i t y -o r i e n t e d ,and does not consist of conventional part i e s . The Kingis the Head of State. T h rough decentralised constituencies, t h eelectorate nominates candidates to stand for Parliamentarye l e c t i o n s , and the King appoints a Prime Minster, who in turnadvises the King on the appointment of a Cabinet. T h eSwaziland political system has suffe red some criticism during thepast three ye a r s , with wo r ker demonstrations and stay aw ay s .The criticism has subsequently led to re forms which are to beenshrined in a written constitution as supreme law of the land,and will include a Bill of Rights.
Sectoral De s c r i p t i o nA g r i c u l t u re has traditionally been the key sector in the country ’se c o n o my and as a fo reign exchange earner,with more than two -t h i rds of Swaziland’s working population dependent on it fo rtheir live l i h o o d . S w a z i l a n d ’s manufacturing sector is, h oweve r,the largest contributor to GDP, averaging 35 percent over thepast five years and the sector is composed of agricultural
p rocessing industries, t e x t i l e s , food and beve r a g e, wood and lightindustrial go o d s .
L i vestock keeping is another important economic activity,p a rt i c u l a r ly cattle farming. A l s o, the country is endowed withsome mineral wealth such as asbestos, coal and diamonds.H oweve r, the mining industry suffe red a setback fo l l owing thec l o s u re of Dvo ko lw a ko Diamond Mine in 1996.
Tourism is another important reve nue earner for the country.Swaziland has much to offer to regional and overseas visitors asan attractive tourist destination in terms of the nature re s e rve s ,w i l d l i fe, s p o rts and a wide selection of handicrafts. To u r i s t sc o n t i nue to decline as a result of competition from South A f r i c aand Mozambique.This has put pre s s u re on the government toi m p rove the tourism climate in the country if it is to re m a i namong premier tourist spots.
I n f r a s t r u c t u reSwaziland produces some electricity, but the bulk is import e df rom South A f r i c a .
The country has a railw ay system covering 300 km, c o n n e c t i n git with Mozambique and South A f r i c a . The system support sclose to 4.5m tonnes of freight a ye a r,and provides an import a n tlink for the country ’s imports and export s .R e c e n t ly a passengertrain linking Maputo in Mozambique and Durban in South A f r i c avia Swaziland started operating. The road system is in go o dc o n d i t i o n , and the main route between Mbabane and Manzini isbeing upgraded to accommodate the heavy flow of traffic onthat ro u t e. The telecommunications system has been upgradedduring the recent ye a r s , while effo rts by both the Gove r n m e n tand the Swaziland Post and Te l e c o m munications Corporationa re at an advanced stage in preparing for the provision of acellular netwo r k .
An inland dry port , located at the Matsapha Industrial Estates aves time and expense for Swaziland’s importers and export e r susing the Durban port . The recent investments in the upgradingof Mozambique’s ro a d ,r a i l , and port infrastructure will improveS w a z i l a n d ’s access to the port in Maputo for export s , i np a rticular sugar, which is freighted through this port .
R oyal Swazi National A i r w ays operates domestic and re g i o n a lflights from Matsapha International A i r p o rt . Airlinks betwe e nSwaziland and other regional capitals are frequent and we l ld eve l o p e d .
E C O N O M IC O V E R V I E W
I n t ro d u c t i o nDue to its limited domestic marke t , Swaziland relies heav i ly one x p o rt-oriented industries. Industrialisation has reached a fairlyhigh leve l , m a i n ly because of fo reign investments attractedduring the sanction years in South A f r i c a . Main contributors toGDP are ; m a nu f a c t u r i n g , government serv i c e s , a g r i c u l t u re,w h o l e s a l e, re t a i l , hotels and re s t a u r a n t s .
1 ) The ranking is based on life expectancy at birt h , adult literacy, c o m b i n e dp r i m a ry, s e c o n d a ry and tert i a ry education enrolment ratio and adjusted re a lGDP per cap i t a .
Agro-Industry forms one of the cornerstones of Swazilands ecomony.
S WA Z I L A N D
85
fo l l owing a similar move in South A f r i c a .
Total debt stock stood at USD168m at end March 1997, a ni n c rease of only 3.5 percent over the ye a r. The increase in thedebt is a result of the continued depreciation of the lilangeniagainst some major curre n c i e s , in which the country ’s debt isn o m i n a t e d , coupled with disbursements from existing loansduring the course of the ye a r. Total debt service increased in1 9 9 6 / 1 9 9 7 , to re c o rd USD21m, f rom USD14m, a year befo re,l a r g e ly constituted by capital re p ay m e n t s . The country ’s externaldebt structure did not change over the year 1996, with thedominating share still being that of central government at 93p e rc e n t .
On the fiscal side, an encouraging result was achieved in1 9 9 6 / 1 9 9 7 . P re l i m i n a ry figures for 1997/98 point tow a rds amodest estimated surplus of E0.7m
It is encouraging to note that the government has emphasisedthe need to intensify the internal structural adjustmentp rogramme started during the 1995/96-budget period. In ord e rto improve its reve nu e, a new taxation bill that aims atd i versifying the reve nue base will short ly be tabled in Pa r l i a m e n tfor ap p rov a l .
Financial InstitutionsThe Central Bank of Swaziland was established as the country ’sm o n e t a ry authority in April 1974 and assumed its operativefunctions in 1979. The mandate of the Bank includes the issue ofc u rre n c y, clearing and settlement of pay m e n t s , s u p e rvision andinspectorate of banks, management of re s e rve s , s e rvice andredemption of domestic debt, administration of exchangec o n t ro l , and fo r mulation and implementation of monetary policy.T h e re are three lending schemes that are operated by theCentral Bank. These consist of the Export Credit GuaranteeS c h e m e, the Small Scale Enterprise Loan Guarantee Scheme andthe Public Enterprise Loan Guarantee Fund. T h e re arec o m m e rcial banks in Swaziland: First National Bank of Swaziland,S t a n d a rd Bank Swaziland, which acquired Barc l ays Bank on 1J a nu a ry 1998, and Nedbank Swaziland (fo r m e r ly StandardC h a rt e red Bank). T h e re is also one development bank,Swaziland Development and Savings Bank, and a building society.
C o m m o n ly used securities in the money market include stocks,t re a s u ry bills, bank acceptances, n e gotiable certificates ofd e p o s i t s .
Swaziland Stock ExchangeIn the seve n - year period of its operation Swaziland’s stockm a r ket has listed the fo l l owing companies; Masterfridge Limited,The Royal Swaziland Sugar Corporation Ltd,Nedbank SwazilandL t d , and Swazispa Holdings Limited. The number of listedcompanies dropped to four after the de-listing of Lonrho SugarL t d , in 1997, hence the fall in the exchange’s marke tc ap i t a l i s a t i o n . Lonrho Sugar Ltd constituted about 66 percent ofthe total market capitalisation prior to de-listing. Due to this, t h evolume of traded shares in 1997 leaped substantially to ove r1 3 4 m .
Recent macro-Economic Developments For 1997, economic growth is projected to remain at 1996l eve l s , judging from estimates produced by the Ministry ofEconomic Planning and Deve l o p m e n t , which put growth at 3.8p e rc e n t . With the re c e n t ly estimated population growth of 3.3p e rcent per annu m , this state of affairs implies a slight incre a s ein real GDP per cap i t a , indicating marginal improvement in thes t a n d a rd of living of the Swazi people.
The robust economic performance is expected to stem largelyf rom a strong re c ove ry of the agricultural sector and anexpanding manufacturing sector. The good rains re c e i ved sincethe beginning of 1996 and throughout 1997, despite concerns ofn e g a t i ve El Nino effe c t s , a re expected to improve agriculturalp ro d u c t i o n .Economic growth during 1997 could have exceededthe projected grow t h , had it not been for the stay - aw ay inFe b r u a ry 1997, which extended over an unprecedented 5we e k s . The manufacturing sector’s contribution to GDP atfactor cost, i m p roved marginally to 35.7 percent in 1997 fro m35.1 percent the previous ye a r. H oweve r, the stro n gp e r formance of this sector has been impaired in recent ye a r s ,a sa result of a slow d own in fo reign inve s t m e n t s . Since the early1990s Swaziland’s balance of payments posted an overall surplusof SZL66.1m (USD15m) in 1996, f rom a surplus of SZL108.2m(USD30m) in 1995. The financial account, excluding re s e rve s ,posted yet another net outflow of USD48m in 1996 from ano u t f l ow of USD44m the year befo re.
The trade account continued to deteriorate during 1996 tore c o rd a deficit of USD158m from USD135m the year befo re,as a result of comparative slower growths in exports againsti m p o rt s .
Fo reign direct investment re c o rded a net inflow of USD39m in1 9 9 6 ,f rom an inflow of USD7m the year befo re. No major newc apital injections we re re c o rded in 1996, s ave for an increase inre i nvested earnings, as some companies expanded theiro p e r a t i o n s . The tentative position for 1997 indicates a neti n f l ow of USD25m.
On the monetary fro n t , net fo reign assets re g i s t e red an incre a s eof about 16.7 percent the previous ye a r. E x p o rt pro c e e d s ,m a i n ly from the manufacturing sector, we re responsible for thei m p roved position. This increase was also supported by a firmerlilangeni exchange rate against major trading curre n c i e s ,p a rt i c u l a r ly during the first half of 1997. The re s e rves re f l e c t e d3.6 months of the country ’s estimated import cover at the endof December, the same level as in 1996.
G overnment net credit position with the banking system duringthe same period amounted to USD196m, 18.5 percent abovethe previous ye a r ’s leve l . The position was supported byperiodic inflows of customs and tax re c e i p t s . C redit to theprivate sector rose by 15 percent over the year endedDecember 1997.
I n t e rest rates continued to be slightly below those ruling inSouth Africa during the year ended December 1997. T h egeneral structure of interest rates was revised dow n w a rd 1p e rcentage point in October 1997 and again early 1998,
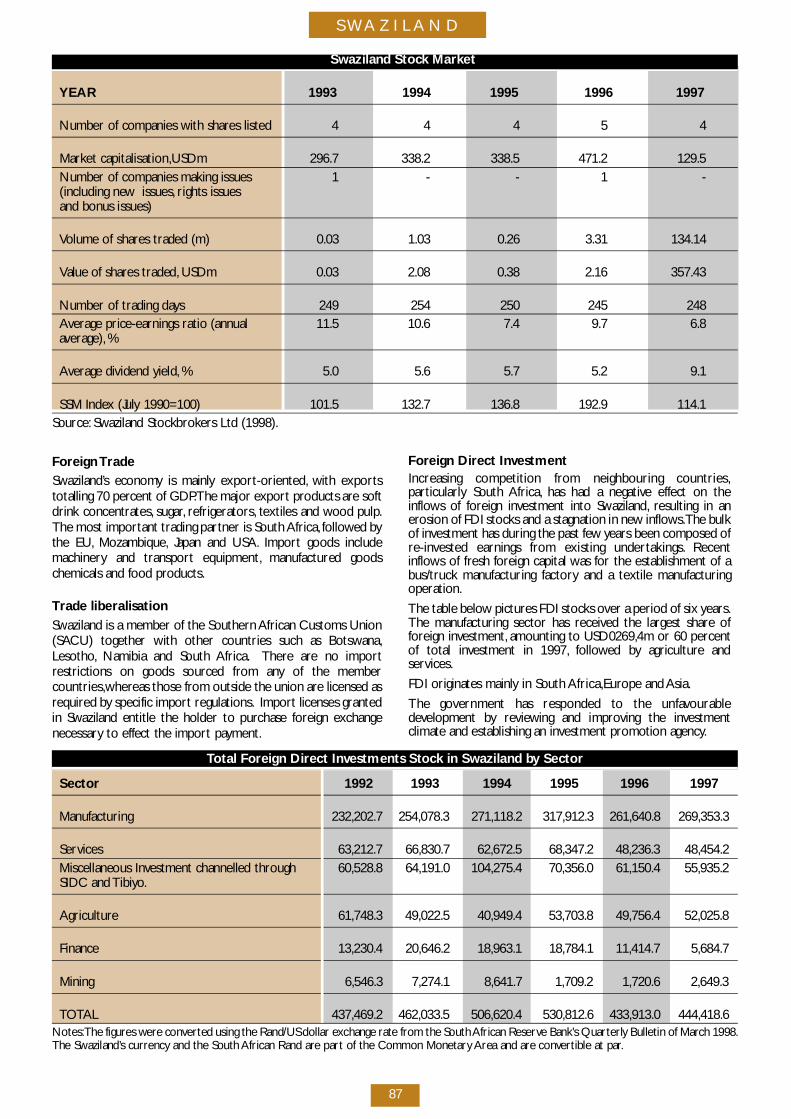
S WA Z I L A N D
87
Fo reign Tr a d eS w a z i l a n d ’s economy is mainly export - o r i e n t e d , with export stotalling 70 percent of GDP.The major export products are softdrink concentrates, s u g a r, re f r i g e r a t o r s , textiles and wood pulp.The most important trading partner is South A f r i c a , fo l l owed bythe EU, M o z a m b i q u e, J apan and USA. I m p o rt goods includem a c h i n e ry and transport equipment, m a nu f a c t u red go o d schemicals and food pro d u c t s .
Trade liberalisationSwaziland is a member of the Southern African Customs Union( S ACU) together with other countries such as Botsw a n a ,L e s o t h o, Namibia and South A f r i c a . T h e re are no importrestrictions on goods sourced from any of the memberc o u n t r i e s ,w h e reas those from outside the union are licensed asre q u i red by specific import re g u l a t i o n s . I m p o rt licenses grantedin Swaziland entitle the holder to purchase fo reign exchangen e c e s s a ry to effect the import pay m e n t .
Fo reign Direct Inve s t m e n tI n c reasing competition from neighbouring countries,p a rt i c u l a r ly South A f r i c a , has had a negative effect on thei n f l ows of fo reign investment into Swaziland, resulting in ane rosion of FDI stocks and a stagnation in new inflow s .The bulkof investment has during the past few years been composed ofre - i nvested earnings from existing undert a k i n g s . R e c e n ti n f l ows of fresh fo reign capital was for the establishment of abus/truck manufacturing factory and a textile manu f a c t u r i n go p e r a t i o n .
The table below pictures FDI stocks over a period of six ye a r s .The manufacturing sector has re c e i ved the largest share offo reign inve s t m e n t , amounting to USD0269,4m or 60 perc e n tof total investment in 1997, fo l l owed by agriculture ands e rv i c e s .
FDI originates mainly in South A f r i c a ,E u rope and A s i a .
The government has responded to the unfavo u r a b l ed evelopment by rev i ewing and improving the inve s t m e n tclimate and establishing an investment promotion agency.
Total Fo reign Direct Investments Stock in Swaziland by Sector
S e c t o r 1 9 9 2 1 9 9 3 1 9 9 4 1 9 9 5 1 9 9 6 1 9 9 7
M a nufacturing 2 3 2 , 2 0 2 . 7 2 5 4 , 0 7 8 . 3 2 7 1 , 1 1 8 . 2 3 1 7 , 9 1 2 . 3 2 6 1 , 6 4 0 . 8 2 6 9 , 3 5 3 . 3
S e rvices 6 3 , 2 1 2 . 7 6 6 , 8 3 0 . 7 6 2 , 6 7 2 . 5 6 8 , 3 4 7 . 2 4 8 , 2 3 6 . 3 4 8 , 4 5 4 . 2Miscellaneous Investment channelled thro u g h 6 0 , 5 2 8 . 8 6 4 , 1 9 1 . 0 1 0 4 , 2 7 5 . 4 7 0 , 3 5 6 . 0 6 1 , 1 5 0 . 4 5 5 , 9 3 5 . 2SIDC and T i b i yo.
A g r i c u l t u re 6 1 , 7 4 8 . 3 4 9 , 0 2 2 . 5 4 0 , 9 4 9 . 4 5 3 , 7 0 3 . 8 4 9 , 7 5 6 . 4 5 2 , 0 2 5 . 8
F i n a n c e 1 3 , 2 3 0 . 4 2 0 , 6 4 6 . 2 1 8 , 9 6 3 . 1 1 8 , 7 8 4 . 1 1 1 , 4 1 4 . 7 5 , 6 8 4 . 7
M i n i n g 6 , 5 4 6 . 3 7 , 2 7 4 . 1 8 , 6 4 1 . 7 1 , 7 0 9 . 2 1 , 7 2 0 . 6 2 , 6 4 9 . 3
TOTA L 4 3 7 , 4 6 9 . 2 4 6 2 , 0 3 3 . 5 5 0 6 , 6 2 0 . 4 5 3 0 , 8 1 2 . 6 4 3 3 , 9 1 3 . 0 4 4 4 , 4 1 8 . 6N o t e s :The figures we re conve rted using the Rand/US dollar exchange rate from the South African Reserve Bank’s Quart e r ly Bulletin of March 1998.The Swaziland’s currency and the South African Rand are part of the Common Monetary A rea and are conve rtible at par.
Swaziland Stock Market
Y E A R 1 9 9 3 1 9 9 4 1 9 9 5 1 9 9 6 1 9 9 7
Number of companies with shares listed 4 4 4 5 4
M a r ket cap i t a l i s a t i o n ,U S D m 2 9 6 . 7 3 3 8 . 2 3 3 8 . 5 4 7 1 . 2 1 2 9 . 5Number of companies making issues 1 - - 1 -(including new issues, rights issuesand bonus issues)
Volume of shares traded (m) 0 . 0 3 1 . 0 3 0 . 2 6 3 . 3 1 1 3 4 . 1 4
Value of shares traded, U S D m 0 . 0 3 2 . 0 8 0 . 3 8 2 . 1 6 3 5 7 . 4 3
Number of trading day s 2 4 9 2 5 4 2 5 0 2 4 5 2 4 8Average price-earnings ratio (annual 1 1 . 5 1 0 . 6 7 . 4 9 . 7 6 . 8ave r a g e ) , %
Average dividend yield, % 5 . 0 5 . 6 5 . 7 5 . 2 9 . 1
SSM Index (Ju ly 1990=100) 1 0 1 . 5 1 3 2 . 7 1 3 6 . 8 1 9 2 . 9 1 1 4 . 1S o u rc e : Swaziland Stockbro kers Ltd (1998).
S WA Z I L A N D
88
The Lubombo Spatial Development InitiativeThe Lubombo Spatial Development Initiative (SDI), adjoining theM aputo development corr i d o r, is a partnership of theG overnments of Swaziland, South Africa and Mozambique and isexpected to provide the necessary growth stimulus to theLubombo are a .
The main focal points include areas such as the Maputo Prov i n c ein Mozambique, the north-eastern parts of Kwa-Zulu Natal inSouth Africa and eastern Swaziland.The development initiativewill open up unique opportunities to vast stretches of coastline(about 350km), w i l d l i fe covering over 300,000 ha of gamere s e rves and significant agricultural deve l o p m e n t .The LubomboSDI is viewed as complementing the Maputo corr i d o r, t h e re byc reating an exceptional investment zone. T h e re are plans toupgrade roads joining Richards Bay in South Africa and Map u t o ;and on the other hand, to improve the current N2 linkingR i c h a rds Bay and Lavumisa/Namacha/Goba in Swaziland toaccommodate future traffic vo l u m e.
A number of transitional tourism projects offering integratedw i l d l i fe experiences are curre n t ly being developed in areas suchas Nduma (joining Te m b e, F u t h i , Usuthu George and cove r i n gw i l d l i fe in all three countries), L av u m i s a - Po n gola project witho p p o rtunities for re c reation and leisure activities, Ko s iB ay / Ponto Do Ouro project offering opportunities for beachre s o rts and marina, and Hlane/Mlawula W i l d l i fe Zone.
A l s o, various national projects have been deve l o p e d . T h e s einclude the Greater St Lucia Wetland Park (South A f r i c a ) , L a keS i b ayi (South Africa) and nu m e rous others involving Swazilandand Mozambique.
G overnments from all three countries have created SDIs t r u c t u res to co-ordinate overall activities pertaining to theLubombo SDI. In order to accelerate participation by privatei nvestors and the forging of strategic links with the public sector,priority has been given to an improved investment climate andthe streamlining of investment pro c e d u re s .
P r i v a t i s a t i o nThe task of privatisation in Swaziland seems less daunting thanin other SADC countries, due to the modest size of publicow n e r s h i p. In total, some 25 enterprises are either fully orm a j o r i t y - owned by gove r n m e n t , with a minority interest insome smaller companies.
The process has been commenced by the commercialisation ofSwaziland Railw ay s , and the restructuring of the SwazilandD evelopment and Savings Bank.The monopoly status granted tothe Swaziland Royal Insurance Corporation will also be lifted,and the process of acquiring a strategic partner for the nationala i r l i n e, R oyal Swazi A i r w ays has been ongoing for some time.F u rt h e r m o re, the restructuring of the Swaziland Post andTe l e c o m munications Corporation, a parastatal established in1 9 8 6 , is on the card s . It is believed that the company will be splitinto a holding company with rights over the entire netwo r ks y s t e m , and an operating company, which should be re s p o n s i b l efor providing serv i c e s .A dd i t i o n a l ly, p rovision will be made for astrategic partner to acquire a minority stake, including possiblythe issue of a cellular license.
The government has created a special monitoring unit, k n ow nas the Public Enterprises Unit, to evaluate the performance ofspecific enterprises, and to pre p a re them for commerc i a l i s a t i o nor privatisation.The stipulated enterprises are re q u i red by lawto submit quart e r ly financial re p o rts to the unit, w i t hrecommendation sent for sanctioning by the Cabinet.
I N V E S TM E N T C L I M AT E
I nvestment incentive s
Highlights of the incentives include:The five - year tax exemption for new manufacturing companiesi nvo l ved in exports has since been phased out. N ew taxre fo r m s , to be implemented soon, a re aimed at reducing thel evel of corporate tax from 37.5 percent to 30 percent leadingto 25 percent in the medium term. F u rther tax incentives arep re s e n t ly being considere d .
An employee training programme allows for expenses incurre din training personnel to be deducted for tax purposes.
Assessed losses may be carried fo r w a rd and offset against futurep ro f i t s .
An initial depreciation allowance of up to 50 percent on plantand machinery may be claimed in the first year or spread ove rs everal ye a r s .
A 10 percent local pre fe rence on public tenders is allowe d .
An allowance is granted for the cost of building houses fo re m p l oye e s .
Business sites for industrial operations are available from theM i n i s t ry of Enterprise and Employment and Swaziland IndustrialD evelopment Company (SIDC). O n going expansion of theM a t s apha Industrial and other sites is being carried out alongwith the upgrading of the country ’s infrastructure.
E x p o rt In c e n t i ve sThe Central Bank operates an Export Credit GuaranteeScheme established in 1991.The scheme includes pre- and post-shipment loans granted by commercial banks, which re c e i veguarantee bonds from the scheme as risk cove r. Swaziland hasdecided not to adopt the export processing zones concept.
As a Lomé Convention signatory Swaziland enjoys pre fe re n t i a laccess to the EU for a wide range of pro d u c t s . Under the GSP,Swaziland also has access to other major markets such as USA,C a n a d a ,Australia and Jap a n .
Swaziland is a member of SAC U, which provides for the fre em ovement of goods between the member countries (Botsw a n a ,L e s o t h o, N a m i b i a , South Africa and Swaziland). It is also amember of the regional organisations SADC and COMESA.
Ta x a t i o nCorporate tax rate is 37.5 percent (will be reduced to 30p e rcent during 1999).
M a x i mum rate for individual tax is 39 perc e n t .
Withholding tax is at 15 percent (12.5 percent within SAC U ) .
Double taxation agreements exist with South A f r i c a , M a u r i t i u sand the United Kingdom.
Institutions Invo l ved in Investment Pro m o t i o nSwaziland Industrial Development Corporation (SIDC), aj o i n t ly - owned by the government of Swaziland and fiveinternational development finance institutions, is the principald evelopment finance institution. Its chief activities, t h e re fo re,i nvo l ve the provision of long-term loans, equity financing, a s s e tl e a s i n g , acquisition of industrial land and buildings, and prov i d i n gtechnical advice and guidance to both local and internationali nve s t o r s . Some of the projects that are like ly to re c e i ves u p p o rt from the institution include the manu f a c t u r i n g , m i n i n g ,a g ro - i n d u s t ry, t o u r i s m ,c o m m e rce and service sector.
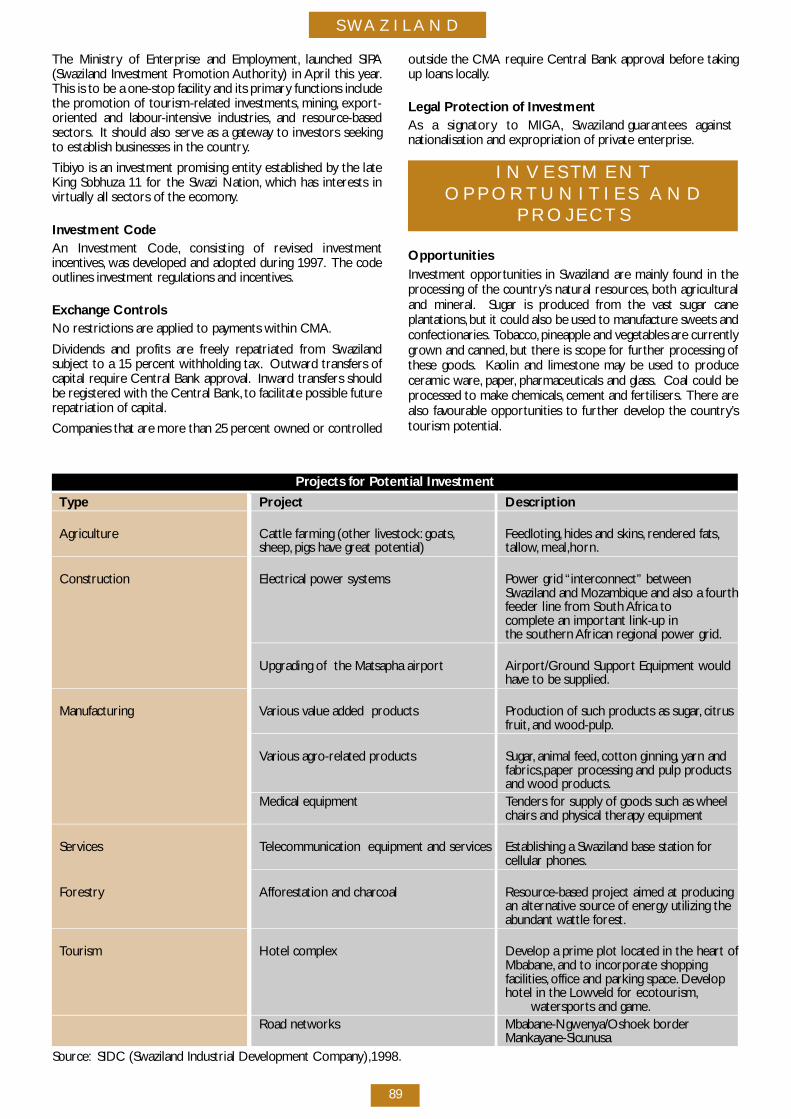
S WA Z I L A N D
89
The Ministry of Enterprise and Employ m e n t , launched SIPA(Swaziland Investment Promotion Authority) in April this ye a r.This is to be a one-stop facility and its primary functions includethe promotion of tourism-related inve s t m e n t s , m i n i n g , e x p o rt -oriented and labour- i n t e n s i ve industries, and re s o u rc e - b a s e ds e c t o r s . It should also serve as a gatew ay to investors seekingto establish businesses in the country.
T i b i yo is an investment promising entity established by the lateKing Sobhuza 11 for the Swazi Nation, which has interests inv i rt u a l ly all sectors of the ecomony.
I nvestment Co d eAn Investment Code, consisting of revised inve s t m e n ti n c e n t i ve s , was developed and adopted during 1997. The codeoutlines investment regulations and incentive s .
E x c h a n ge Co n t rols No restrictions are applied to payments within CMA.
Dividends and profits are fre e ly repatriated from Swazilandsubject to a 15 percent withholding tax. O u t w a rd transfers ofc apital re q u i re Central Bank ap p rov a l . I n w a rd transfers shouldbe re g i s t e red with the Central Bank, to facilitate possible futurerepatriation of cap i t a l .
Companies that are more than 25 percent owned or contro l l e d
outside the CMA re q u i re Central Bank ap p roval befo re takingup loans locally.
Legal Protection of Inve s t m e n tAs a signatory to MIGA, Swaziland guarantees againstnationalisation and expropriation of private enterprise.
I N V E S TM E N TO P P O R T U N I T I E S A N D
P R O J E C T S
O p p o rt u n i t i e sI nvestment opportunities in Swaziland are mainly found in thep rocessing of the country ’s natural re s o u rc e s , both agriculturaland mineral. Sugar is produced from the vast sugar canep l a n t a t i o n s , but it could also be used to manu f a c t u re sweets andc o n fe c t i o n a r i e s . To b a c c o, p i n e apple and vegetables are curre n t lyg rown and canned, but there is scope for further processing ofthese go o d s . Kaolin and limestone may be used to pro d u c eceramic ware, p ap e r, pharmaceuticals and glass. Coal could bep rocessed to make chemicals, cement and fe rt i l i s e r s . T h e re arealso favourable opportunities to further develop the country ’stourism potential.
P rojects for Potential Inve s t m e n t
Ty p e P ro j e c t D e s c r i p t i o n
A g r i c u l t u re Cattle farming (other live s t o c k : go a t s , Fe e d l o t i n g , hides and skins, re n d e red fats,s h e e p, pigs have great potential) t a l l ow, m e a l ,h o r n .
C o n s t r u c t i o n Electrical power systems Power grid “ i n t e rconnect” between Swaziland and Mozambique and also a fo u rt hfeeder line from South Africa to complete an important link-up in the southern African regional power grid.
Upgrading of the Matsapha airport A i r p o rt / G round Support Equipment wo u l dh ave to be supplied.
M a nu f a c t u r i n g Various value added pro d u c t s P roduction of such products as sugar, citrus f r u i t , and wo o d - p u l p.
Various agro - related pro d u c t s S u g a r, animal fe e d , cotton ginning, yarn andf a b r i c s ,p aper processing and pulp pro d u c t sand wood pro d u c t s .
Medical equipment Tenders for supply of goods such as wheel chairs and physical therapy equipment
S e rv i c e s Te l e c o m munication equipment and serv i c e s Establishing a Swaziland base station for cellular phones.
Fo re s t ry A f fo restation and charc o a l R e s o u rce-based project aimed at producing an alternative source of energy utilizing the abundant wattle fo re s t .
To u r i s m Hotel complex D evelop a prime plot located in the heart ofM b a b a n e, and to incorporate shoppingf a c i l i t i e s , office and parking space. D evelop hotel in the Low veld for ecotourism,
w a t e r s p o rts and game.Road netwo r k s M b a b a n e - N g we nya/Oshoek bord e r
M a n k ay a n e - S i c u nu s aS o u rc e : SIDC (Swaziland Industrial Development Company ) ,1 9 9 8 .
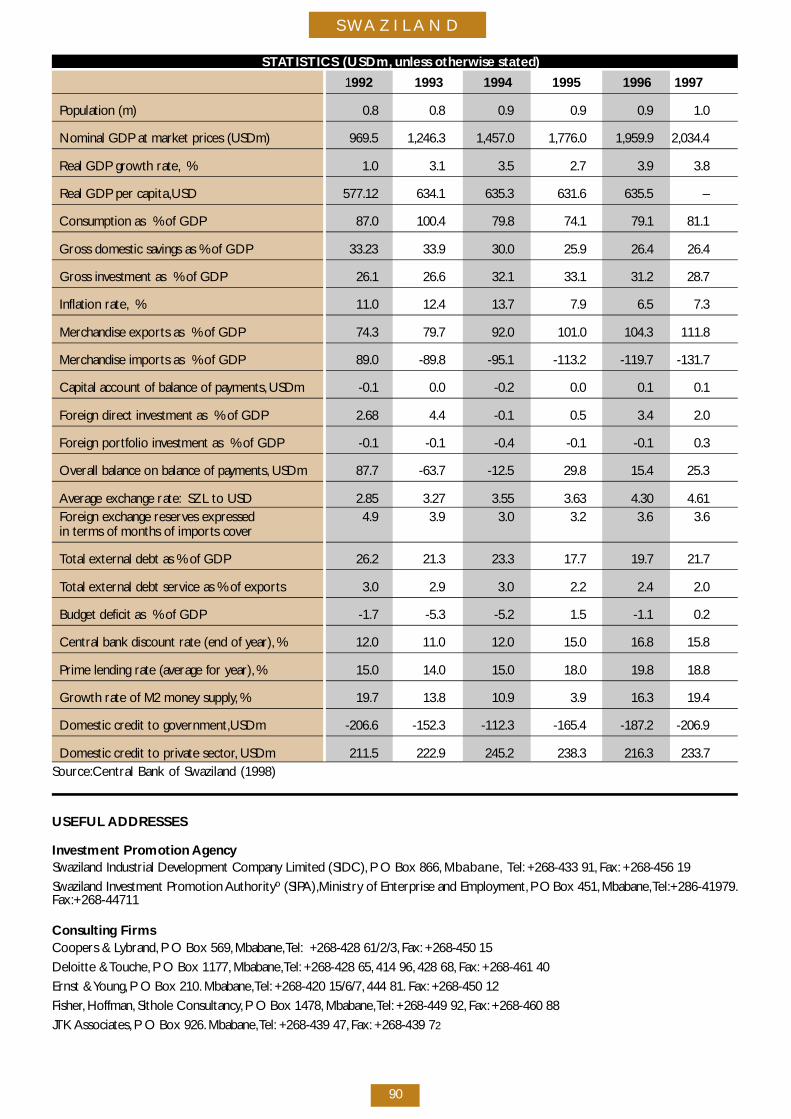
S WA Z I L A N D
90
S TATISTICS (USDm, unless otherwise stated)
19 9 2 1 9 9 3 1 9 9 4 1 9 9 5 1 9 9 6 1 9 9 7
Population (m) 0 . 8 0 . 8 0 . 9 0 . 9 0 . 9 1 . 0
Nominal GDP at market prices (USDm) 9 6 9 . 5 1 , 2 4 6 . 3 1 , 4 5 7 . 0 1 , 7 7 6 . 0 1 , 9 5 9 . 9 2 , 0 3 4 . 4
Real GDP growth rate, % 1 . 0 3 . 1 3 . 5 2 . 7 3 . 9 3 . 8
Real GDP per cap i t a ,U S D 5 7 7 . 1 2 6 3 4 . 1 6 3 5 . 3 6 3 1 . 6 6 3 5 . 5 –
Consumption as % of GDP 8 7 . 0 1 0 0 . 4 7 9 . 8 7 4 . 1 7 9 . 1 8 1 . 1
G ross domestic savings as % of GDP 3 3 . 2 3 3 3 . 9 3 0 . 0 2 5 . 9 2 6 . 4 2 6 . 4
G ross investment as % of GDP 2 6 . 1 2 6 . 6 3 2 . 1 3 3 . 1 3 1 . 2 2 8 . 7
Inflation rate, % 1 1 . 0 1 2 . 4 1 3 . 7 7 . 9 6 . 5 7 . 3
M e rchandise exports as % of GDP 7 4 . 3 7 9 . 7 9 2 . 0 1 0 1 . 0 1 0 4 . 3 1 1 1 . 8
M e rchandise imports as % of GDP 8 9 . 0 - 8 9 . 8 - 9 5 . 1 - 1 1 3 . 2 - 1 1 9 . 7 - 1 3 1 . 7
C apital account of balance of pay m e n t s , USDm - 0 . 1 0 . 0 - 0 . 2 0 . 0 0 . 1 0 . 1
Fo reign direct investment as % of GDP 2 . 6 8 4 . 4 - 0 . 1 0 . 5 3 . 4 2 . 0
Fo reign port folio investment as % of GDP - 0 . 1 - 0 . 1 - 0 . 4 - 0 . 1 - 0 . 1 0 . 3
O verall balance on balance of pay m e n t s , USDm 8 7 . 7 - 6 3 . 7 - 1 2 . 5 2 9 . 8 1 5 . 4 2 5 . 3
Average exchange rate: SZL to USD 2 . 8 5 3 . 2 7 3 . 5 5 3 . 6 3 4 . 3 0 4 . 6 1Fo reign exchange re s e rves expressed 4 . 9 3 . 9 3 . 0 3 . 2 3 . 6 3 . 6in terms of months of imports cove r
Total external debt as % of GDP 2 6 . 2 2 1 . 3 2 3 . 3 1 7 . 7 1 9 . 7 2 1 . 7
Total external debt service as % of export s 3 . 0 2 . 9 3 . 0 2 . 2 2 . 4 2 . 0
Budget deficit as % of GDP - 1 . 7 - 5 . 3 - 5 . 2 1 . 5 - 1 . 1 0 . 2
Central bank discount rate (end of ye a r ) , % 1 2 . 0 1 1 . 0 1 2 . 0 1 5 . 0 1 6 . 8 1 5 . 8
Prime lending rate (average for ye a r ) , % 1 5 . 0 1 4 . 0 1 5 . 0 1 8 . 0 1 9 . 8 1 8 . 8
G rowth rate of M2 money supply, % 1 9 . 7 1 3 . 8 1 0 . 9 3 . 9 1 6 . 3 1 9 . 4
Domestic credit to gove r n m e n t ,U S D m - 2 0 6 . 6 - 1 5 2 . 3 - 1 1 2 . 3 - 1 6 5 . 4 - 1 8 7 . 2 - 2 0 6 . 9
Domestic credit to private sector, U S D m 2 1 1 . 5 2 2 2 . 9 2 4 5 . 2 2 3 8 . 3 2 1 6 . 3 2 3 3 . 7Source:Central Bank of Swaziland (1998)
USEFUL A D D R E S S E S
I nvestment Promotion A ge n c ySwaziland Industrial Development Company Limited (SIDC), P O Box 866, Mbabane, Te l : +268-433 91, F a x : +268-456 19Swaziland Investment Promotion Authorityº (SIPA ) ,M i n i s t ry of Enterprise and Employ m e n t , P O B ox 451, M b a b a n e,Te l :+ 2 8 6 - 4 1 9 7 9 .F a x :+ 2 6 8 - 4 4 7 1 1
Consulting FirmsCoopers & Ly b r a n d , P O Box 569, M b a b a n e,Te l : +268-428 61/2/3, F a x : +268-450 15Deloitte & To u c h e, P O Box 1177, M b a b a n e,Te l : +268-428 65, 414 96, 428 68, F a x : +268-461 40Ernst & Yo u n g , P O Box 210. M b a b a n e,Te l : +268-420 15/6/7, 444 81. F a x : +268-450 12F i s h e r, H o f f m a n , Sithole Consultancy, P O Box 1478, M b a b a n e,Te l : +268-449 92, F a x : +268-460 88JTK A s s o c i a t e s , P O Box 926. M b a b a n e,Te l : +268-439 47, F a x : +268-439 72
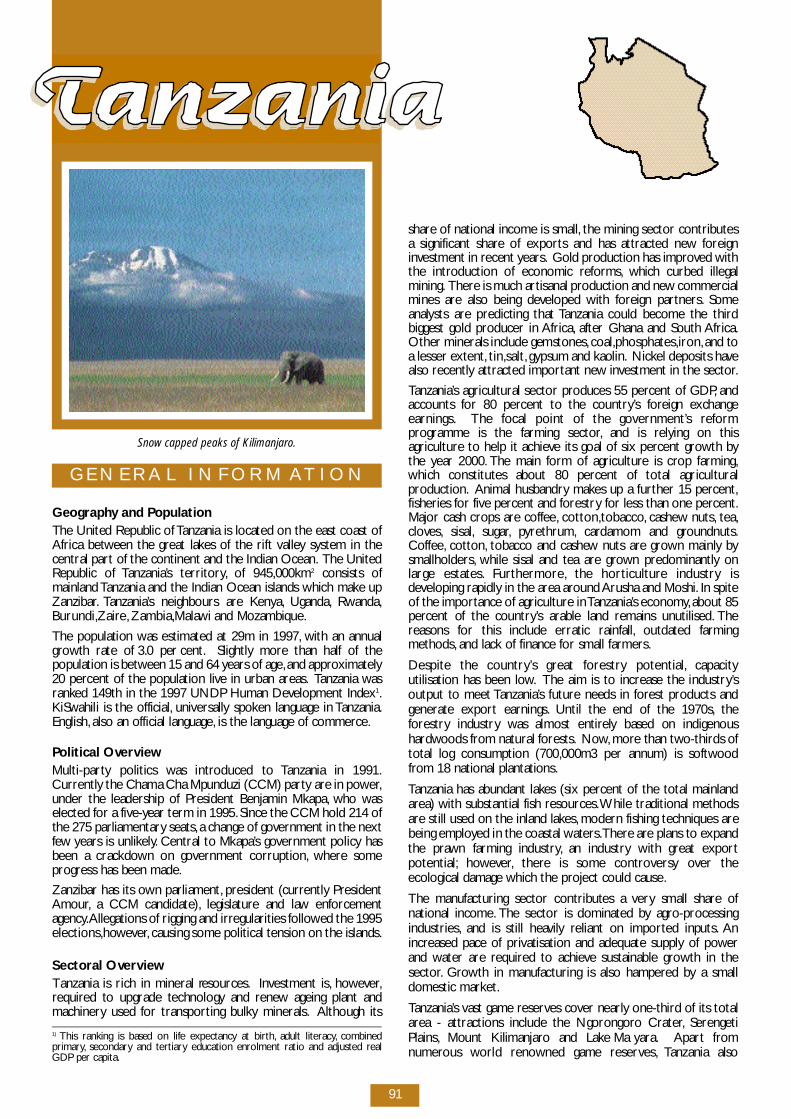
91
G E N E R A L I N F O R M AT I O N
G e og r ap hy and Po p u l a t i o nThe United Republic of Tanzania is located on the east coast ofAfrica between the great lakes of the rift valley system in thecentral part of the continent and the Indian Ocean. The UnitedRepublic of Ta n z a n i a ’s terr i t o ry, of 945,000km2 consists ofmainland Tanzania and the Indian Ocean islands which make upZ a n z i b a r. Ta n z a n i a ’s neighbours are Ke ny a , U g a n d a , R w a n d a ,B u r u n d i ,Z a i re, Z a m b i a ,M a l awi and Mozambique.
The population was estimated at 29m in 1997, with an annu a lg rowth rate of 3.0 perc e n t . S l i g h t ly more than half of thepopulation is between 15 and 64 years of age,and ap p rox i m a t e ly20 percent of the population live in urban are a s . Tanzania wasr a n ked 149th in the 1997 UNDP Human Development Index1.KiSwahili is the official, u n i ve r s a l ly spoken language in Ta n z a n i a .E n g l i s h , also an official language, is the language of commerc e.
Political Ove rv i ewM u l t i - p a rty politics was introduced to Tanzania in 1991.C u rre n t ly the Chama Cha Mpunduzi (CCM) party are in powe r,under the leadership of President Benjamin Mkap a , who waselected for a five - year term in 1995. Since the CCM hold 214 ofthe 275 parliamentary seats, a change of government in the nextfew years is unlike ly. Central to Mkap a ’s government policy hasbeen a crackdown on government corr u p t i o n , w h e re somep ro g ress has been made.
Zanzibar has its own parliament, p resident (curre n t ly Pre s i d e n tA m o u r, a CCM candidate), l e g i s l a t u re and law enfo rc e m e n ta g e n c y.Allegations of rigging and irregularities fo l l owed the 1995e l e c t i o n s ,h oweve r, causing some political tension on the islands.
Sectoral Ove rv i ew Tanzania is rich in mineral re s o u rc e s . I nvestment is, h oweve r,re q u i red to upgrade technology and re n ew ageing plant andm a c h i n e ry used for transporting bulky minerals. Although its
s h a re of national income is small, the mining sector contributesa significant share of exports and has attracted new fo re i g ni nvestment in recent ye a r s . Gold production has improved withthe introduction of economic re fo r m s , which curbed illegalm i n i n g . T h e re is much artisanal production and new commerc i a lmines are also being developed with fo reign part n e r s . S o m ea n a lysts are predicting that Tanzania could become the thirdbiggest gold producer in A f r i c a , after Ghana and South A f r i c a .Other minerals include gemstones, c o a l ,p h o s p h a t e s ,i ro n ,and toa lesser extent, t i n ,s a l t , gypsum and kaolin. N i c kel deposits havealso re c e n t ly attracted important new investment in the sector.
Ta n z a n i a ’s agricultural sector produces 55 percent of GDP, a n daccounts for 80 percent to the country ’s fo reign exchangee a r n i n g s . The focal point of the gove r n m e n t ’s re fo r mp rogramme is the farming sector, and is re lying on thisa g r i c u l t u re to help it achieve its goal of six percent growth bythe year 2000. The main form of agriculture is crop farming,which constitutes about 80 percent of total agriculturalp ro d u c t i o n . Animal husbandry makes up a further 15 perc e n t ,fisheries for five percent and fo re s t ry for less than one perc e n t .Major cash crops are coffe e, c o t t o n ,t o b a c c o, c a s h ew nu t s , t e a ,c l ove s , s i s a l , s u g a r, py re t h r u m , c a rdamom and gro u n d nu t s .C o f fe e, c o t t o n , tobacco and cashew nuts are grown mainly bys m a l l h o l d e r s , while sisal and tea are grown pre d o m i n a n t ly onlarge estates. F u rt h e r m o re, the hort i c u l t u re industry isd eveloping rap i d ly in the area around Arusha and Moshi. In spiteof the importance of agriculture in Ta n z a n i a ’s economy, about 85p e rcent of the country ’s arable land remains unu t i l i s e d . T h ereasons for this include erratic rainfall, outdated farmingm e t h o d s , and lack of finance for small farmers.
Despite the country ’s great fo re s t ry potential, c ap a c i t yutilisation has been low. The aim is to increase the industry ’soutput to meet Ta n z a n i a ’s future needs in fo rest products andgenerate export earnings. Until the end of the 1970s, t h efo re s t ry industry was almost entire ly based on indigenoush a rd woods from natural fo re s t s . N ow, m o re than two - t h i rds oftotal log consumption (700,000m3 per annum) is softwo o df rom 18 national plantations.
Tanzania has abundant lakes (six percent of the total mainlanda rea) with substantial fish re s o u rc e s .While traditional methodsa re still used on the inland lake s , modern fishing techniques arebeing employed in the coastal waters.T h e re are plans to expandthe prawn farming industry, an industry with great exportp o t e n t i a l ; h oweve r, t h e re is some controversy over theecological damage which the project could cause.
The manufacturing sector contributes a ve ry small share ofnational income. The sector is dominated by agro - p ro c e s s i n gi n d u s t r i e s , and is still heav i ly reliant on imported inputs. A ni n c reased pace of privatisation and adequate supply of powe rand water are re q u i red to achieve sustainable growth in thes e c t o r. G rowth in manufacturing is also hampered by a smalldomestic marke t .
Ta n z a n i a ’s vast game re s e rves cover nearly one-third of its totala rea - attractions include the Ngo ro n go ro Crater, S e re n g e t iP l a i n s , Mount Kilimanjaro and Lake May a r a . A p a rt fro mnu m e rous world re n owned game re s e rve s , Tanzania also
1 ) This ranking is based on life expectancy at birt h , adult literacy, c o m b i n e dp r i m a ry, s e c o n d a ry and tert i a ry education enrolment ratio and adjusted re a lGDP per cap i t a .
Snow capped peaks of Kilimanjaro.
TA N Z A N I A
92
possesses an unspoilt 800km stretch of the Indian Oceanc o a s t l i n e, as well as the ‘spice islands’ of Zanzibar and Pe m b a .The government encourages private investment in ‘ u p - m a r ke t ’tourist deve l o p m e n t s , including joint ve n t u res with the Ta n z a n i aTourism Board .Tanzania re c e i ved 310,000 visitors in 1996 andtourism curre n t ly accounts for about eight percent of GDP, b u tthe sector needs a substantial amount of investment befo re itcan reach its full potential.
T h e re is also potential for oil mining and exploration off theTanzanian coast,as well as certain inland are a s .Drilling for oil hasbeen taking place since 1952. One project which will soon beu n d e r w ay is the Songo Songo gas to electricity pro j e c t ,l o c a t e don Songo Songo island.T h e re are special incentives available fo rcompanies planning to invest in oil exploration in Tanzania (seesection on investment incentive s )
I n f r a s t r u c t u reThe national Urban Water Authority administers urban waters u p p ly, and regional water engineers service the rural systemst h rough local/village gove r n m e n t s . The UNDP estimates thatabout 38 percent of all Tanzanians have access to safe water and86 percent to sanitation.
Pe t roleum meets nine percent of energy needs, w h i l ehy d roelectricity and coal provide the balance. Pe t roleum has tobe imported thus absorbing large amounts of the country ’sfo reign exchange. T h e re is great potential for deve l o p i n ga l t e r n a t i ve sources of energy, n o t a b ly hy d roelectric powe r, c o a l ,natural gas and solar energy. Restrictions on power use areapplied in drought times, reducing the efficiency of Ta n z a n i a ’sm a nufacturing sector. The privatisation of the Ta n z a n i a nElectricity Supply Commission should improve the reliability ofp ower supply.
Tanzania is well served by international, l a n d , sea and airt r a n s p o rtation ro u t e s . In most parts of the transport sector,major rehabilitation works are being undert a ke n . The size of thec o u n t ry and its low population density make maintenance andexpansion of the transport infrastructure ve ry costly. A ro a dn e t work connects Tanzania with Ke ny a ,M a l aw i ,Z a m b i a ,U g a n d a ,Burundi and Rwanda, and any part of the country can bereached by the existing compre h e n s i ve road network of almost82,000 km of which 3,200 km are asphalt. M a ny roads arec u rre n t ly in poor condition and a major rehabilitation pro j e c tbegan in 1990.
Tanzania Railw ays Corporation runs the 2,600 km systemlinking Dar es Salaam with the central and northern re g i o n s .The Tanzania-Zambia Railw ay Authority (TAZARA) operates1,860 km of track, 976 km of it in Ta n z a n i a , which links Dar esSalaam with Kapiri Mposhi in Zambia’s Copperbelt. It is mainlyused to transport Zambian copper to Dar es Salaam port andZambian imports in the opposite dire c t i o n . The principal coastalp o rts are Dar es Salaam,Ta n g a ,L i n d i , Mtwara and Zanzibar. A l lp o rts are managed by the Tanzania Harbour A u t h o r i t y, e x c e p tfor Zanzibar which is managed by the Zanzibar Po rt sC o r p o r a t i o n .
International airlines operate in and out of Tanzania through Dares Salaam and Kilimanjaro airport s . T h e re is a third internationala i r p o rt on Zanzibar. T h e re are also several regional airports andnu m e rous landing strips for use by charter planes. Air Ta n z a n i aoperates regular services to most regional towns and hasscheduled flights to neighbouring countries and to the Midd l eE a s t .
Te l e c o m munication facilities are available in most parts of thec o u n t ry, and Tanzania has an average of three telephones per1000 persons (1994), although the aim is to increase it to oneper 100 persons by the year 2000. The telephone system in Dares Salaam is being rehabilitated in a five year project due to endin 1998 and curre n t ly there is a surplus of exchange lines.Te l e p h o n e, f a x , t e l e x , expedited mail serv i c e, private couriers
and cellular phones are av a i l a b l e.T h ree private companies havebeen granted licences as providers of cellular phones, w h i c hh ave proved ve ry popular. Tanzania has two earth satellitestations situated in Dar es Salaam.
ECONOMIC OV E RV I E W
Recent Ma c ro-Economic Deve l o p m e n t sM a c roeconomic performance in Tanzania for 1997 has beenre l a t i ve ly satisfactory, despite the seve re drought and powe rs h o rtage experienced during the second and third quarter of1 9 9 7 , and the El Nino-induced floods in the latter part of theye a r. Fo reign exchange re s e rves incre a s e d , inflation dro p p e d ,t h erate of GDP growth declined and the reve nue collectionc o n t i nued to improve. Despite substantial pro g ress made inrestructuring and stabilising the economy, the future outlook ofthe country ’s economy for 1998 is bleak given the effects of theo n going El Nino weather conditions being experiencedt h roughout the country. Serious flooding has washed aw ay manyroads and bridges, t h e re by seve re ly damaging thec o m munication netwo r k , to the extent of halting movements insome areas of the country.As a consequence, the 1997/98 cro pis expected to perform far below targets.
The overall real GDP growth for 1997 has been estimated at 4.0p e rc e n t , c o m p a red with 4.2 percent growth re c o rded in 1996.G rowth in agricultural and manufacturing sectors for 1997 hasbeen projected at 3.1 and 3.0 percent re s p e c t i ve ly, c o m p a re dwith the previous ye a r ’s growth of 4.5 percent in the agriculturalsector and 4.8 percent in the manufacturing sector.
The Bank of Tanzania re c o rded considerable success in thepursuit of its monetary policy objectives during the first half of1 9 9 7 / 9 8 . On an annual basis, the money supply growth (M3)decelerated to 13.3 percent by December 1997 compared with18.1 percent re c o rded in Ju ly 1997.During the re p o rting period,net domestic assets of the banking system declined by TZS 7.5bn (USD11.6m), on account of a decrease of TZS 38.6 bn(USD59.9m) in domestic cre d i t , coupled with an increase of T Z S31.1 billion (USD48.3m) in other items net.The decline in cre d i twas caused by considerable re p ayment to the banking system,by both the Government and the private sector.
S i m i l a r ly, inflation exhibited significant improvements during thefirst half of 1997/98. Despite the food shortage experiencedduring the second half of 1997 when the road haulage systemwas brought to a standstill, inflation dropped to 15.2 percent byDecember 1997, c o m p a red with a high of 17.8 perc e n tre c o rded in Ju ly 1997.
The overall weighted average annualised yield for all maturitiesfell from 14.8 percent in August 1997, to 10.5 percent inN ovember 1997, b e fo re picking up again to 11.4 percent byDecember 1997.This was attributed to increased competitionin the marke t , and decline in tender size. M e a n w h i l e, t h eS t a t u t o ry Minimum Reserve Ratio of 12.0 percent that prev a i l e dt h roughout 1997 was reduced to 10.0 percent with effect fro mN ovember 1997.
The government fiscal performance for the second quarter of1997/98 was satisfactory.R eve nue collections amounted to T Z S163.2 bn (USD266m) equivalent to 99.0 percent of theestimated reve nue collection for the period. S i m i l a r ly, t h e re wasan increase in re c u rrent expenditure to TZS 161.2 bn(USD263m) resulting in an increase in expenditure on othergoods and serv i c e s . The improvement in the fiscal positionw a s m a i n ly attributed to the increased reve nue collection fro menhanced corporate tax collection effo rt s , and from parastatald i v i d e n d s .
Net international re s e rves of the Bank of Tanzania increased andby December 1997 had reached USD 272.6 m. The Bank ofTanzania has targeted to build-up re s e rves equivalent to 20weeks of import re q u i rements by June 1998.With re g a rd to the
TA N Z A N I A
93
exchange rate, the shilling ap p reciated from TZS 631.2 per USDin Ju ly 1997, to TZS 617.7 per USD by November 1997 befo red e p reciating to TZS 631.3 per USD by December 1997. T h ed e p reciation has been on account of tight supplies of fo re i g nexchange in the marke t , fo l l owing reduced export earnings.
The external debt at 31st December 1997 was USD 7,931.2 m.Out of the total debt, disbursed outstanding debt was USD6,522.9 m, or 82.2 perc e n t , and committed undisbursed debtwas USD 1,408.3 m, or 17.8 perc e n t .
During the second quarter of 1997/98, the trade accountre c o rded a deficit of USD 151.8 m.The poor performance wasl a r g e ly attributed to a big drop in export earnings. E x p o rtreceipts decreased by 19.9 percent to USD 202.6 m, w h e re a sthe import bill increased slightly to USD 354.4 m.
Financial In s t i t u t i o n sTa n z a n i a ’s central bank, the Bank of Ta n z a n i a , was established in1 9 6 6 . The primary objective of the bank, as outlined in the Bankof Tanzania Act of 1995, is “..to fo r mulate and implementm o n e t a ry policy directed to the economic objective ofmaintaining price stability, c o n d u c i ve to a balanced andsustainable growth of the national economy of Ta n z a n i a .”
In 1991, the financial services sector was opened to private andfo reign cap i t a l . A l ready sixteen fo reign banks and nine non-bankfinancial institutions have been licensed to do business inTa n z a n i a . M o re than 80 bureaux de change are curre n t ly ino p e r a t i o n .
B e fo re the deregulation of the financial sector,Ta n z a n i a ’s state-owned National Bank of Commerce dominated the bankings e c t o r, cornering 70 percent of the marke t . The National Bankof Commerce is due for privatisation soon; the bank will be splitinto three separate entities - a regional bank, a trade bank and am i c ro finance bank. C u rre n t ly, the focus is mainly on thecorporate sector rather than in the retail marke t .F u rt h e r m o re,t h e re is a need for more finance for micro enterprises.
Liberalisation of the financial services sector and theestablishment of open markets in fo reign exchange andgovernment paper have extended the scope for theimplementation of an active monetary policy. I n t e rest rates havebeen liberalised and are now determined fre e ly by the marke t .Since the launching of regular Tre a s u ry Bill auctions in A u g u s t1 9 9 3 , it has been possible for the central bank to set its discountrate on the weighted average yield of all maturities.
Dar es Salaam Stock ExchangeThe Dar es Salaam Stock Exchange is fo r m a l ly scheduled tobegin operations on 15 April 1998. The Capital Markets andSecurities Authority was tasked with developing the rules andre g u l a t i o n s , and with launching the stock exchange marke t .When it opens for business, the stock exchange will have onequoted company, n a m e ly Tanzania Oxygen. It is expected that
Tanzania Breweries and Agip will list on the exchange in 1998.
The exchange operates on a three-tier system, the first tierbeing listed shares that meet international listings re q u i re m e n t s ,the second tier having less stringent re q u i rements and the thirdbeing an ove r-the-counter tier, for those which fail to meet theconditions for the first two segments. F i ve stockbro kers we relicensed in June 1997.
Fo reign Tr a d eMain export goods are agricultural commodities such as coffe e,t e a ,t o b a c c o, c o t t o n , and cashew nu t s . E x p o rts of manu f a c t u re sh ave been growing steadily during the 1990s, and accounted fo r16 percent of total exports in 1995. I m p o rted products arem a c h i n e ry, textiles and ap p a re l , fuel and transport equipment.Ta n z a n i a ’s main export markets are Germany, the UK, t h eN e t h e r l a n d s , China and the USA. I m p o rts are sourced from theU K ,G e r m a ny, J ap a n ,I t a ly and France.
Tanzania now has a compre h e n s i ve liberalised trade re g i m e.Restrictions on imports have been re m oved (except for thoseitems on which control is necessary for health or securityre a s o n s ) , e x p o rt and import pro c e d u res have been simplifiedand single channel export of traditional crops has ended. Fo rstatistical purposes, all imports still need to be declared on ani m p o rt fo r m .
Tanzania is a member of SADC and COMESA.
Fo reign Di rect Inve s t m e n tFo reign direct investment into Tanzania has incre a s e ds u b s t a n t i a l ly over the past two ye a r s . Most of the fo reign dire c ti nvestment into Tanzania flows into the mining and explorationsector - during 1997,Tanzania re c e i ved investments to the valueof USD300m in mining and exploration.The companies invo l ve dh ave included Sutton Resources (Buly a n h u l u ) , Pangea Goldfieldsof Canada and Randgold of South Africa (Golden Ridge inS u k u m a l a n d ) , and Resolute of Australia and Samax Resources ofBritain (Golden Pride on Lake V i c t o r i a ) .
Other major investments in 1997 included a USD50mi nvestment by South African Breweries in a new brewe ry, aUSD55m investment by R.J. R eynolds in the Tanzania Cigare t t eC o m p a ny. Substantial opportunities for investment have alsobeen created by Ta n z a n i a ’s privatisation programme (see below ) .
P r i v a t i s a t i o nThe Parastatal Sector Reform Commission manages thed i ve s t i t u re of non-performing government parastatals. By theend of 1997, ap p rox i m a t e ly 150 companies had been privatised.
The first sugar firm to be privatised in Tanzania is KilomberoS u g a r.The company was bought by Illovo Sugar Limited of SouthAfrica and F Man Ground from the UK in March 1998. Due fo rprivatisation soon is the National Bank of Commerc e.
Fo reign investors participating in Ta n z a n i a ’s privatisation programme so far have included the fo l l ow i n g :
International Company I nve s t m e n tR . J .R eynolds (Switzerland) Tanzania Cigarette CompanyTadema (Switzerland) 77 percent stake in New Africa Hotel in 1993W i l c roft (South Africa) 75 percent of Williamson Diamonds LtdAsea Brown Boveri (Switzerland) 70 percent of TA N E L E CHolderbank (Switzerland) 60 percent of Tanga CementS CANCEM (Scandinavia) 60 percent of Tanzania Po rtland CementCarnaud Metal Box (UK) CMB Ta n z a n i aDae Sung (South Ko rea) Tanzania CablesKabool (South Ko rea) M o ro go ro Po lye s t e rModern Trading Agencies (Saudi Arabia) National Engineering Company
A commitment has been made by the government to privatise Tanzaniaís major public utilities, including water, s ewe r a g e,t e l e c o m munications and electricity.

TA N Z A N I A
94
Withholding tax on dividends andp rofit-sharing tax for non-re s i d e n t s : 10 perc e n t .
A new value-added tax was introduced in 1997, replacing theold sales tax, at a rate of 20 perc e n t .
E x c h a n ge contro l sFo reign exchange controls we re re m oved by the Fo re i g nExchange Act (1992), and Bureau de change regulations of 1992,and Tanzania accepted the obligations of the IMFs A rticle VIII in1 9 9 6 . Residents are now permitted to hold fo reign curre n c ya c c o u n t s . C apital transfers are however still subject to ap p rov a lby the Bank of Ta n z a n i a .
To ensure eventual repatriation of cap i t a l , all inward inve s t m e n t sinto Tanzania should be re g i s t e red with the Tanzania Inve s t m e n tC e n t re. I nvestments in Zanzibar should either be re g i s t e re dwith the Zanzibar Investment Promotion Agency or ZanzibarF ree Economic Zones A u t h o r i t y. I nvestors are allowed to re t a i n100 percent of their net fo reign exchange earnings for purposesof remittance of dividends, p rofits and settlement of externalo b l i g a t i o n s . B o rrowing of funds from local banks by non-residents is allowe d .
Institutions invo l ved in investment pro m o t i o nThe Tanzania Investment Centre, established in 1991, p ro c e s s e si nvestment proposals and assists investors with ap p l i c a t i o np ro c e d u re s . Their mandate is to be the focal point for theimplementation of the National Investment Policy and top ro m o t e, c o o rdinate and monitor domestic and fo re i g ni nve s t m e n t s .
Zanzibar operates a separate Investment Promotion A g e n c y( Z I PA) which was established in 1991. To benefit from thei n c e n t i ve schemes offe red by Zanzibar, i nvestors should contactZ I PA first.
I nvestment codeThe Tanzania Investment Act (1997) outlines provisions andi n c e n t i ves for investment in areas of national priority.E x t e n s i ve guarantees are provided to investors under theI nvestment Promotion Centre ’s Certificate of A p p rov a l , such asguarantees re g a rding ownership of pro p e rt i e s , dispensation ofa s s e t s , repatriation of income and others. Tanzania is also amember of MIGA and ICSID.I nvestments in Zanzibar are regulated by the NationalI nvestment Promotion Act of 1986 (under rev i s i o n ) , o u t l i n i n gp rovisions and incentives for investments in areas of nationalp r i o r i t y. The Economic Zones Act (1992) governs EPZs. I na ddition to the guarantees provided by Ta n z a n i a , Z a n z i b a rguarantees against compulsory acquisition by gove r n m e n t ,except on payment of full compensation.
I N V E S TM E N TO P P O R T U N I T I E S A N D
P R O J E C T S
I nvestment Opport u n i t i e sThe government has identified the fo l l owing priority areas fo ri nve s t m e n t : m a nu f a c t u r i n g , a g r i c u l t u re, p e t roleum and mining,c o n s t r u c t i o n ,t r a n s p o rt , transit trade, computer and other hight e c h n o l o gy businesses, tourism and natural re s o u rc e s .I nvestment opportunities in Zanzibar include: l a b o u r- i n t e n s i veindustries and assembly plants, construction and housing, h o t e land tourism, t r a n s p o rt by sea and air, human re s o u rc ed evelopment schemes, transit trade and warehousing and off-s h o re activities.
P ro j e c t sU n fo rt u n a t e ly we we re unable to obtain a list of projects fo ri nve s t m e n t .
I N V E S TM E N T C L I M AT E
I nvestment Incentive sIn August 1997 the National A s s e m b ly repealed the NationalI nvestment (Promotion and Protection) Act of 1990 andenacted the Tanzania Investment Act (1997) to replace it.I n c e n t i ves under the new Act are :
• Favourable investment allowances and deductions onindustrial buildings, plant and machinery and on agriculturale x p e n d i t u re.
• Total exemption from import duty and sales tax on import e dc apital assets for projects relating to mining, i n f r a s t r u c t u re (i.e.road construction, b r i d g e s , r a i lw ay s , a i r p o rt s , generation ofe l e c t r i c i t y,water serv i c e s , back-up services to mining) and EPZs.
• Import duty for investment in other sectors of the economyis five percent on the pro j e c t ’s imported capital assets.
• Straight line accelerated depreciation is allowed on cap i t a lgo o d s .
• T h e re is unlimited/indefinite carry - over of all business lossesagainst future pro f i t s .
• A ny ap p roved investment has the right to employ up to fivefo reign nationals on it pro j e c t . For mining, h oweve r, the amountof fo reigners which can be employed is not limited.
• Investors are at liberty to export both capital and pro f i t soutside of Ta n z a n i a .• T h e re is a 20 year tax holiday for certain mining activities.
I n c e n t i ves for companies investing in oil ex p l o r a t i o n :• Long exploration periods of four (initial), four (first extension)and three (second extension), totalling 11 ye a r s .
• Relative ly large exploration are a s .
• Maximum Tanzania Pe t roleum Development Corporation(TPDC) participation is capped at 20 perc e n t .
• Corporate income tax and royalties paid for by T P D C.
• T h reshold rates of return for A dditional Profit Tax at 20p e rcent for first tranche and 30 percent for the second tranche.
• Separate incentives in order to encourage deep sea (gre a t e rthan 200m water depth) are under consideration by thegovernment and T P D C.
I nvestment is treated favo u r a b ly under Ta n z a n i a ’s corporate taxs y s t e m . M a ny tax incentives relate dire c t ly to capital outlay s ,f rom full write-off for clearing and planting of agricultural land inthe year of inve s t m e n t , to extensive depreciation allow a n c e s .
E x p o rt incentive s :At present exporters are benefiting from the liberalisation ofe x p o rt licensing, and the duty drawback scheme. A fe a s i b i l i t ystudy for the establishment of EPZs in Tanzania was carried outduring 1996, and the draft regulations and organisation of EPZsa re under pre p a r a t i o n .
Z a n z i b a r:The government of Zanzibar offers the same incentives toi nve s t o r s . F u rt h e r m o re, EPZs are in place in Zanzibar andcompanies established in EPZs are offe red 10 years corporatetax holiday and duty exemption on imports of raw materials andc apital equipment.
Ta x a t i o nM e a s u res have been implemented to combat tax evasion and tos t reamline customs pro c e d u re s .Corporate tax: 30 perc e n tIndividual tax: ( m a x i mum rate) 35 perc e n t
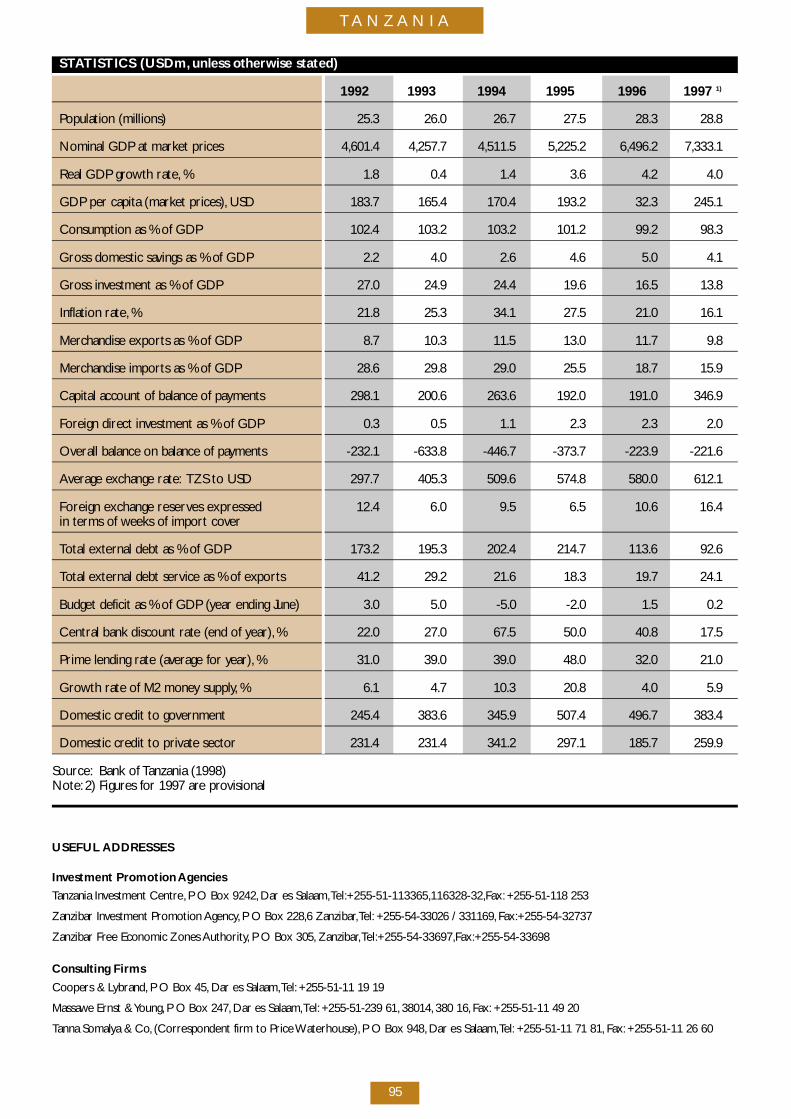
TA N Z A N I A
95
S TATISTICS (USDm, unless otherwise stated)
1 9 9 2 1 9 9 3 1 9 9 4 1 9 9 5 1 9 9 6 1997 1 )
Population (millions) 2 5 . 3 2 6 . 0 2 6 . 7 2 7 . 5 2 8 . 3 2 8 . 8
Nominal GDP at market prices 4 , 6 0 1 . 4 4 , 2 5 7 . 7 4 , 5 1 1 . 5 5 , 2 2 5 . 2 6 , 4 9 6 . 2 7 , 3 3 3 . 1
Real GDP growth rate, % 1 . 8 0 . 4 1 . 4 3 . 6 4 . 2 4 . 0
GDP per capita (market prices), U S D 1 8 3 . 7 1 6 5 . 4 1 7 0 . 4 1 9 3 . 2 3 2 . 3 2 4 5 . 1
Consumption as % of GDP 1 0 2 . 4 1 0 3 . 2 1 0 3 . 2 1 0 1 . 2 9 9 . 2 9 8 . 3
G ross domestic savings as % of GDP 2 . 2 4 . 0 2 . 6 4 . 6 5 . 0 4 . 1
G ross investment as % of GDP 2 7 . 0 2 4 . 9 2 4 . 4 1 9 . 6 1 6 . 5 1 3 . 8
Inflation rate, % 2 1 . 8 2 5 . 3 3 4 . 1 2 7 . 5 2 1 . 0 1 6 . 1
M e rchandise exports as % of GDP 8 . 7 1 0 . 3 1 1 . 5 1 3 . 0 1 1 . 7 9 . 8
M e rchandise imports as % of GDP 2 8 . 6 2 9 . 8 2 9 . 0 2 5 . 5 1 8 . 7 1 5 . 9
C apital account of balance of payments 2 9 8 . 1 2 0 0 . 6 2 6 3 . 6 1 9 2 . 0 1 9 1 . 0 3 4 6 . 9
Fo reign direct investment as % of GDP 0 . 3 0 . 5 1 . 1 2 . 3 2 . 3 2 . 0
O verall balance on balance of pay m e n t s - 2 3 2 . 1 - 6 3 3 . 8 - 4 4 6 . 7 - 3 7 3 . 7 - 2 2 3 . 9 - 2 2 1 . 6
Average exchange rate: TZS to USD 2 9 7 . 7 4 0 5 . 3 5 0 9 . 6 5 7 4 . 8 5 8 0 . 0 6 1 2 . 1
Foreign exchange reserves expressed 12.4 6.0 9.5 6.5 10.6 16.4in terms of weeks of import cove r
Total external debt as % of GDP 1 7 3 . 2 1 9 5 . 3 2 0 2 . 4 2 1 4 . 7 1 1 3 . 6 9 2 . 6
Total external debt service as % of export s 4 1 . 2 2 9 . 2 2 1 . 6 1 8 . 3 1 9 . 7 2 4 . 1
Budget deficit as % of GDP (year ending Ju n e ) 3 . 0 5 . 0 - 5 . 0 - 2 . 0 1 . 5 0 . 2
Central bank discount rate (end of ye a r ) , % 2 2 . 0 2 7 . 0 6 7 . 5 5 0 . 0 4 0 . 8 1 7 . 5
Prime lending rate (average for ye a r ) , % 3 1 . 0 3 9 . 0 3 9 . 0 4 8 . 0 3 2 . 0 2 1 . 0
G rowth rate of M2 money supply, % 6 . 1 4 . 7 1 0 . 3 2 0 . 8 4 . 0 5 . 9
Domestic credit to government 2 4 5 . 4 3 8 3 . 6 3 4 5 . 9 5 0 7 . 4 4 9 6 . 7 3 8 3 . 4
Domestic credit to private sector 2 3 1 . 4 2 3 1 . 4 3 4 1 . 2 2 9 7 . 1 1 8 5 . 7 2 5 9 . 9
Source: Bank of Tanzania (1998)N o t e : 2) Figures for 1997 are prov i s i o n a l
USEFUL A D D R E S S E S
I nvestment Promotion A ge n c i e s
Tanzania Investment Centre, P O Box 9242, Dar es Salaam,Te l :+ 2 5 5 - 5 1 - 1 1 3 3 6 5 ,1 1 6 3 2 8 - 3 2 ,F a x : +255-51-118 253
Zanzibar Investment Promotion A g e n c y, P O Box 228,6 Zanzibar,Te l : +255-54-33026 / 331169, F a x :+ 2 5 5 - 5 4 - 3 2 7 3 7
Zanzibar Free Economic Zones A u t h o r i t y, P O Box 305, Z a n z i b a r,Te l :+ 2 5 5 - 5 4 - 3 3 6 9 7 ,F a x :+ 2 5 5 - 5 4 - 3 3 6 9 8
Consulting Firms
Coopers & Ly b r a n d , P O Box 45, Dar es Salaam,Te l : +255-51-11 19 19
M a s s awe Ernst & Yo u n g , P O Box 247, Dar es Salaam,Te l : +255-51-239 61, 3 8 0 1 4 , 380 16, F a x : +255-51-11 49 20
Tanna Somalya & Co, ( C o rrespondent firm to Price Wa t e r h o u s e ) , P O Box 948, Dar es Salaam,Te l : +255-51-11 71 81, F a x : +255-51-11 26 60
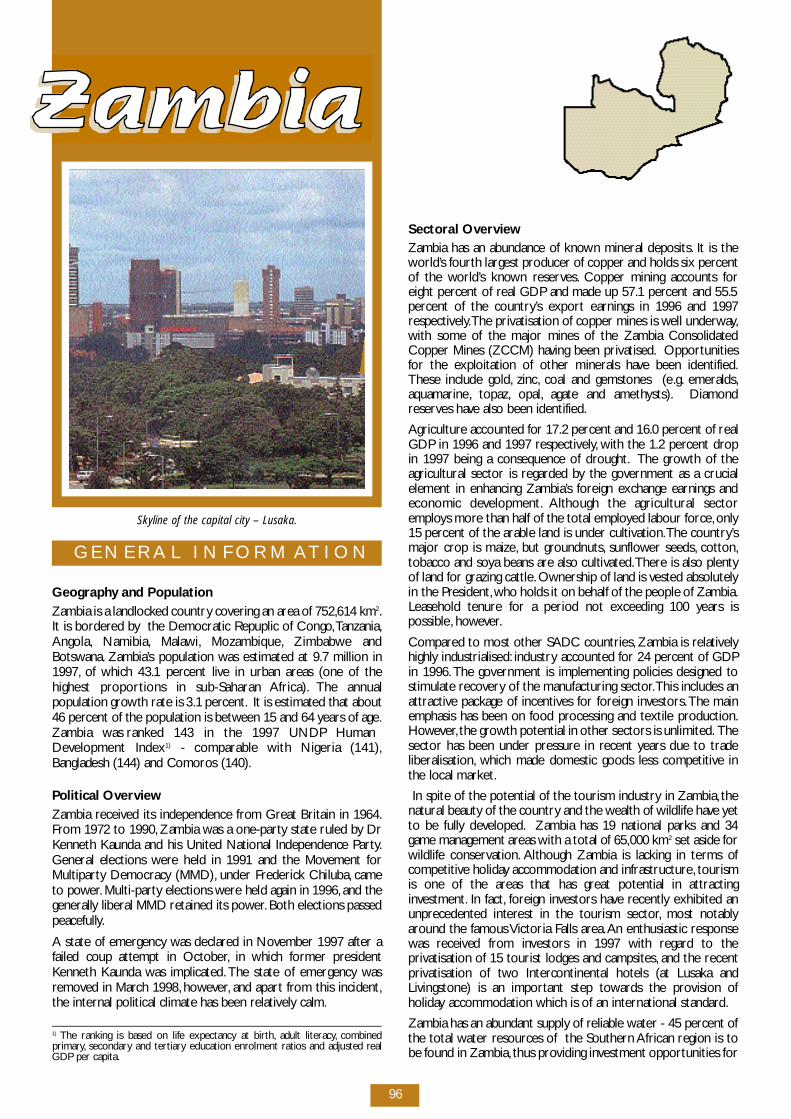
96
G E N E R A L I N F O R M AT I O N
G e og r ap hy and Po p u l a t i o nZambia is a landlocked country covering an area of 752,614 km2.It is bord e red by the Democratic Repuplic of Congo,Ta n z a n i a ,A n go l a , N a m i b i a , M a l aw i , M o z a m b i q u e, Z i m b a b we andB o t sw a n a . Z a m b i a ’s population was estimated at 9.7 million in1 9 9 7 , of which 43.1 percent live in urban areas (one of thehighest pro p o rtions in sub-Saharan A f r i c a ) . The annu a lpopulation growth rate is 3.1 perc e n t . It is estimated that about46 percent of the population is between 15 and 64 years of age.Zambia was ranked 143 in the 1997 UNDP HumanD evelopment Index1 ) - comparable with Nigeria (141),Bangladesh (144) and Comoros (140).
Political Ove rv i ewZambia re c e i ved its independence from Great Britain in 1964.F rom 1972 to 1990, Zambia was a one-party state ruled by DrKenneth Kaunda and his United National Independence Part y.General elections we re held in 1991 and the Movement fo rM u l t i p a rty Democracy (MMD), under Frederick Chiluba, c a m eto powe r. M u l t i - p a rty elections we re held again in 1996, and theg e n e r a l ly liberal MMD retained its powe r. Both elections passedp e a c e f u l ly.
A state of emergency was declared in November 1997 after afailed coup attempt in October, in which former pre s i d e n tKenneth Kaunda was implicated. The state of emergency wasre m oved in March 1998, h oweve r, and ap a rt from this incident,the internal political climate has been re l a t i ve ly calm.
Sectoral Ove rv i ewZambia has an abundance of known mineral deposits. It is thewo r l d ’s fo u rth largest producer of copper and holds six perc e n tof the wo r l d ’s known re s e rve s . Copper mining accounts fo reight percent of real GDP and made up 57.1 percent and 55.5p e rcent of the country ’s export earnings in 1996 and 1997re s p e c t i ve ly.The privatisation of copper mines is well underway,with some of the major mines of the Zambia ConsolidatedCopper Mines (ZCCM) having been privatised. O p p o rt u n i t i e sfor the exploitation of other minerals have been identified.These include go l d , z i n c, coal and gemstones (e. g . e m e r a l d s ,a q u a m a r i n e, t o p a z , o p a l , agate and amethy s t s ) . D i a m o n dre s e rves have also been identified.
A g r i c u l t u re accounted for 17.2 percent and 16.0 percent of re a lGDP in 1996 and 1997 re s p e c t i ve ly, with the 1.2 percent dro pin 1997 being a consequence of dro u g h t . The growth of theagricultural sector is re g a rded by the government as a crucialelement in enhancing Zambia’s fo reign exchange earnings andeconomic deve l o p m e n t . Although the agricultural sectore m p l oys more than half of the total employed labour fo rc e,o n ly15 percent of the arable land is under cultivation.The country ’smajor crop is maize, but gro u n d nu t s , s u n f l ower seeds, c o t t o n ,tobacco and soya beans are also cultivated.T h e re is also plentyof land for grazing cattle. Ownership of land is vested absolutelyin the Pre s i d e n t ,who holds it on behalf of the people of Zambia.Leasehold tenu re for a period not exceeding 100 years isp o s s i b l e, h oweve r.
C o m p a red to most other SADC countries, Zambia is re l a t i ve lyh i g h ly industrialised: i n d u s t ry accounted for 24 percent of GDPin 1996. The government is implementing policies designed tos t i mulate re c ove ry of the manufacturing sector.This includes ana t t r a c t i ve package of incentives for fo reign inve s t o r s .The mainemphasis has been on food processing and textile pro d u c t i o n .H oweve r, the growth potential in other sectors is unlimited. T h esector has been under pre s s u re in recent years due to tradel i b e r a l i s a t i o n , which made domestic goods less competitive inthe local marke t .
In spite of the potential of the tourism industry in Zambia, t h enatural beauty of the country and the wealth of wildlife have ye tto be fully deve l o p e d . Zambia has 19 national parks and 34game management areas with a total of 65,000 km2 set aside fo rw i l d l i fe conserv a t i o n . Although Zambia is lacking in terms ofc o m p e t i t i ve holiday accommodation and infrastructure, t o u r i s mis one of the areas that has great potential in attractingi nve s t m e n t . In fact, fo reign investors have re c e n t ly exhibited anu n p recedented interest in the tourism sector, most notablya round the famous Victoria Falls are a .An enthusiastic re s p o n s ewas re c e i ved from investors in 1997 with re g a rd to theprivatisation of 15 tourist lodges and campsites, and the re c e n tprivatisation of two Intercontinental hotels (at Lusaka andLivingstone) is an important step tow a rds the provision ofh o l i d ay accommodation which is of an international standard .
Zambia has an abundant supply of reliable water - 45 percent ofthe total water re s o u rces of the Southern African region is tobe found in Zambia, thus providing investment opportunities fo r
1 ) The ranking is based on life expectancy at birt h , adult literacy, c o m b i n e dp r i m a ry, s e c o n d a ry and tert i a ry education enrolment ratios and adjusted re a lGDP per cap i t a .
Skyline of the capital city – Lusaka.

Z A M B I A
97
the supply of water for irr i g a t i o n , home and industrial use( t h rough Build Operate, Build Own Operate and Tr a n s fe rs c h e m e s ) . In areas where surface water is inadequate,u n d e r g round water re s o u rces are used at no great cost.
I n f r a s t r u c t u re All air and road transport services are provided by the privatesector in Zambia.
The government of Zambia has embarked on the process ofrehabilitating the road netwo r k , which covers 35,168 km.A fiveand ten year Road Sector Investment Pro g r a m m e, estimated atUSD411.9m and USD860.3 m re s p e c t i ve ly, is receiving supportf rom the World Bank. I nvestment opportunities are available inthe areas of road re h a b i l i t a t i o n , routine maintenance andc o n s u l t a n c y.
The rail network is also in need of urgent re h a b i l i t a t i o n .H i s t o r i c a l ly Zambia has been served by a rail line running southto South Africa via Zimbabwe and north through the ZambianCopperbelt to Kinshasa in Zaire. Zambia Railw ays isresponsible for this rail line. In the mid-1970s another rail linelinking Zambia and Tanzania became operational. This is jointlyrun by Zambia and Tanzania through Tanzania-Zambia Railw ayAuthority (TA Z A R A ) . Other promising rail routes are Zambia-Mozambique (Beira line), Z a m b i a - M a l awi (Mchinje line),Z a m b i a -Namibia and Zambia-Ango l a . Construction of the Zambia-M a l awi line has reached an advanced stage.
Lusaka International A i r p o rt is Zambia’s main airport connectingZambia with other African countries and Euro p e. C u rre n t ly,t h e re are two commercial airlines which serve the re g i o n a lm a r ke t . British A i r w ays operates flights between Lusaka andL o n d o n . Lusaka International A i r p o rt is assisted by three smalla i r p o rts in Ndola, Livingstone and Mfuwe.
Zambia has vast water re s o u rces and coal re s e rve s , making itideal for the provision of hy d ro-electric power and re n d e r i n gelectricity re l a t i ve ly inexpensive in Zambia. Although most ofthe electricity is supplied from major hy d ro stations, t h e re arealso small diesel power stations in rural are a s .The distributionof electricity is however mainly concentrated to Lusaka and theC o p p e r b e l t .T h e re are plans to develop a 600 megawatt hy d ro -electric generation plant on the Kafue Rive r. Zambia export selectricity to some of its neighbours, n o t a b ly Zimbabwe andB o t sw a n a .
O ver 97 percent of the telephone exchanges are automatic, a n dthe country enjoys direct dialling facilities, f a x , e-mail andt e l evision links with the rest of the wo r l d . In the main urbanc e n t res public telephones and independently operated cellulartelephone networks are in place. The state-owned ZambiaTe l e c o m munications Company (ZamTel) is due for privatisation.Zambia also boasts ZamNet, the first full Internet serv i c ep rovider in sub-Saharan Africa outside of South A f r i c a .
E C O N O M I C O V E R V I E W
I n t ro d u c t i o nDuring the 1960s and 1970s, Z a m b i a ’s economy, h i s t o r i c a l lybased on the production and export of copper, was re g a rded asone of the strongest in Sub-Saharan A f r i c a .The United NationalIndependence Party government nationalised much of thee c o n o my, (including small businesses) and enfo rced rigo ro u sprice and exchange contro l s . This resulted in decliningp roductivity and pro f i t s , and a reliance on copper export s .W i t hthe decline of world copper prices and deteriorating terms oft r a d e, coupled with disinvestment in the key sectors of thee c o n o my and dro u g h t , GDP growth declined from 3.7 perc e n t
per annum in the early 1970s to an average of only 1.0 perc e n tduring the 1974-90 period. The poor performance of thee c o n o my in the 1980s, together with political transition in thee a r ly 1990s, led to a recognition of the need to minimize therole of the government in the economy and to promote policiesthat seek to create a private sector led economy.
It is against this background that Zambia adopted structuraladjustment programmes which have since contributed to ani m p roved policy env i ro n m e n t . These re forms includeliberalisation of exchange regimes and fo reign currency contro lre g u l a t i o n s .The emphasis has been the adoption of policies thatseek to reduce government budget deficit. This has contributedto an increased pace of economic growth fo l l owing theprivatisation of several state-owned enterprises.
Recent Ma c ro-Economic Deve l o p m e n t sThe economy of Zambia continued to re c o rd positive economicg rowth rates in 1997, with real GDP growing by 3.5 perc e n t .Although this is lower than the growth of 6.4 percent re c o rd e din 1996, it is impre s s i ve when one considers the adve r s eweather conditions that prevailed during the 1996/97agricultural season. As a result of poor we a t h e r, a g r i c u l t u r a loutput declined by 3.4 perc e n t .H oweve r, the growth of outputin the manufacturing and construction sectors rebounded dueto a generally conducive and stable macro e c o n o m i ce nv i ro n m e n t . Sectoral growth rates we re as fo l l ow s :m a nufacturing 7.4 perc e n t , mining and quarrying 2.4 perc e n t ,e n e r gy and water 10.6 perc e n t , t r a n s p o rt and commu n i c a t i o n0.6 perc e n t , construction 33.8 perc e n t , and real estate andbusiness service 2.5 perc e n t .
For the sixth year running, inflation has continued to decline.The end of December 1997 annual inflation (CPI) rate was 18.6p e rc e n t , d own from 35.2 percent in December 1996. T h edecline in inflation was attributed to tight monetary and fiscalpolicies adopted by gove r n m e n t , and a stable exchange rate. A sa result of a tight monetary stance, the annual growth rate ofb road money supply decelerated to 24.0 percent in December1997 from 28.3 percent on December 1996. The gove r n m e n t ’sa d h e rence to the cash budget which resulted in a domestic fiscalsurplus of 1.2 percent of the nominal GDP, also contributed toconstraining money supply.
M o n ey market interest rates have dropped due to the fall ini n f l a t i o n . The gove r n m e n t ’s policy of using the domestic fiscalsurplus to reduce the domestic debt, e s p e c i a l ly the stock ofoutstanding Tre a s u ry bills so as to release loanable funds to theprivate sector, also contributed to the fall in interest rates in1 9 9 7 . F u rt h e r m o re, the fall in Tre a s u ry bill yield rates was dueto the fall in both the actual inflation rate and inflatione x p e c t a t i o n s .
In the financial market there was further deepening, as theinteraction of banks became more noticeable. The deve l o p m e n tof the interbank money marke t , as well as the fo reign exchangem a r ke t , gained momentum as both the number of transactionsand the values transacted went up. To improve efficiency in them o n ey marke t , the national payments system was revamped andthe Lusaka Clearing House was moved from the Central Bankto the commercial banks. F u rt h e r m o re, efficiency in the moneym a r ket has been enhanced with the reduction of the clearingperiod for cheques, and the introduction of a second clearingsession for large-value cheques.
The kwacha exchange rate against other currencies re m a i n e dre l a t i ve ly stable during the first three quarters of 1997. T h estability of the kwacha was achieved mainly because of the tightm o n e t a ry conditions which prevailed for most of the ye a r, a n df avourable supply and demand for fo reign exchange. H oweve r,in the fo u rth quarter the kwacha began to depre c i a t e, due to
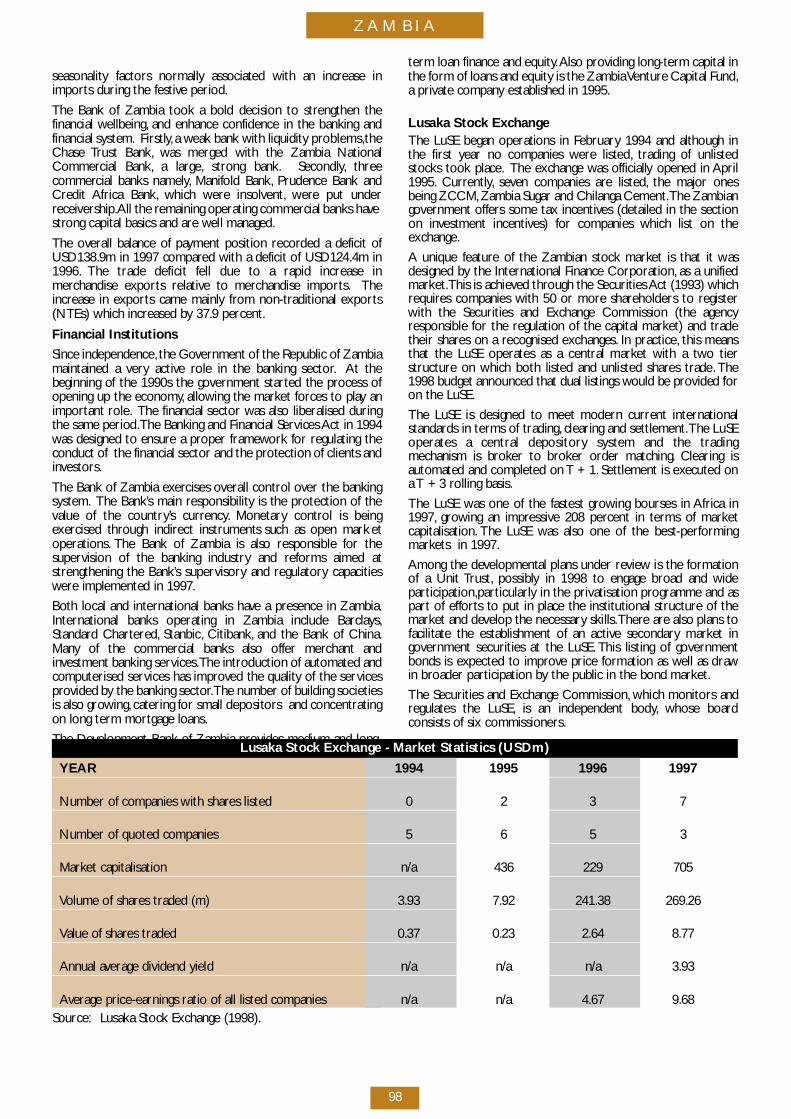
Z A M B I A
98
seasonality factors normally associated with an increase ini m p o rts during the fe s t i ve period.
The Bank of Zambia took a bold decision to strengthen thefinancial we l l b e i n g , and enhance confidence in the banking andfinancial system. F i r s t ly, a weak bank with liquidity pro b l e m s ,t h eChase Trust Bank, was merged with the Zambia NationalC o m m e rcial Bank, a large, s t rong bank. S e c o n d ly, t h re ec o m m e rcial banks namely, M a n i fold Bank, Prudence Bank andC redit Africa Bank, which we re insolve n t , we re put underre c e i ve r s h i p. All the remaining operating commercial banks haves t rong capital basics and are well managed.
The overall balance of payment position re c o rded a deficit ofUSD138.9m in 1997 compared with a deficit of USD124.4m in1 9 9 6 . The trade deficit fell due to a rapid increase inm e rchandise exports re l a t i ve to merchandise import s . T h ei n c rease in exports came mainly from non-traditional export s(NTEs) which increased by 37.9 perc e n t .
Financial Institutions
Since independence, the Government of the Republic of Zambiamaintained a ve ry active role in the banking sector. At thebeginning of the 1990s the government started the process ofopening up the economy, a l l owing the market fo rces to play ani m p o rtant ro l e. The financial sector was also liberalised duringthe same period.The Banking and Financial Services Act in 1994was designed to ensure a proper framework for regulating theconduct of the financial sector and the protection of clients andi nve s t o r s .
The Bank of Zambia exe rcises overall control over the bankings y s t e m . The Bank’s main responsibility is the protection of thevalue of the country ’s curre n c y. M o n e t a ry control is beinge xe rcised through indirect instruments such as open marke to p e r a t i o n s . The Bank of Zambia is also responsible for thes u p e rvision of the banking industry and re forms aimed ats t rengthening the Bank’s superv i s o ry and re g u l a t o ry cap a c i t i e swe re implemented in 1997.
Both local and international banks have a presence in Zambia.International banks operating in Zambia include Barc l ay s ,S t a n d a rd Chart e re d , S t a n b i c, C i t i b a n k , and the Bank of China.M a ny of the commercial banks also offer merchant andi nvestment banking serv i c e s .The introduction of automated andcomputerised services has improved the quality of the serv i c e sp rovided by the banking sector.The number of building societiesis also grow i n g , catering for small depositors and concentratingon long term mortgage loans.
The Development Bank of Zambia provides medium and long-
term loan finance and equity.Also providing long-term capital inthe form of loans and equity is the Zambia Ve n t u re Capital Fund,a private company established in 1995.
Lusaka Stock ExchangeThe LuSE began operations in Fe b r u a ry 1994 and although inthe first year no companies we re listed, trading of unlistedstocks took place. The exchange was officially opened in A p r i l1 9 9 5 . C u rre n t ly, s even companies are listed, the major onesbeing ZCCM, Zambia Sugar and Chilanga Cement.The Zambiangovernment offers some tax incentives (detailed in the sectionon investment incentives) for companies which list on thee x c h a n g e.
A unique fe a t u re of the Zambian stock market is that it wasdesigned by the International Finance Corporation, as a unifiedm a r ke t .This is achieved through the Securities Act (1993) whichre q u i res companies with 50 or more shareholders to re g i s t e rwith the Securities and Exchange Commission (the agencyresponsible for the regulation of the capital market) and tradetheir shares on a recognised exchanges. In practice, this meansthat the LuSE operates as a central market with a two tiers t r u c t u re on which both listed and unlisted shares trade. T h e1998 budget announced that dual listings would be provided fo ron the LuSE.
The LuSE is designed to meet modern current internationals t a n d a rds in terms of trading, clearing and settlement.The LuSEoperates a central depository system and the tradingmechanism is bro ker to bro ker order matching. Clearing isautomated and completed on T + 1. Settlement is executed ona T + 3 rolling basis.
The LuSE was one of the fastest growing bourses in Africa in1 9 9 7 , g rowing an impre s s i ve 208 percent in terms of marke tc ap i t a l i s a t i o n . The LuSE was also one of the best-perfo r m i n gm a r kets in 1997.
Among the developmental plans under rev i ew is the fo r m a t i o nof a Unit Tr u s t , p o s s i b ly in 1998 to engage broad and widep a rt i c i p a t i o n ,p a rt i c u l a r ly in the privatisation programme and asp a rt of effo rts to put in place the institutional structure of them a r ket and develop the necessary skills.T h e re are also plans tofacilitate the establishment of an active secondary market ingovernment securities at the LuSE. This listing of gove r n m e n tbonds is expected to improve price formation as well as drawin broader participation by the public in the bond marke t .
The Securities and Exchange Commission, which monitors andregulates the LuSE, is an independent body, whose boardconsists of six commissioners.
Lusaka Stock Exchange - Market Statistics (USDm)
Y E A R 1 9 9 4 1 9 9 5 1 9 9 6 1 9 9 7
Number of companies with shares listed 0 2 3 7
Number of quoted companies 5 6 5 3
M a r ket cap i t a l i s a t i o n n / a 4 3 6 2 2 9 7 0 5
Volume of shares traded (m) 3 . 9 3 7 . 9 2 2 4 1 . 3 8 2 6 9 . 2 6
Value of shares traded 0 . 3 7 0 . 2 3 2 . 6 4 8 . 7 7
A n nual average dividend yield n / a n / a n / a 3 . 9 3
Average price-earnings ratio of all listed companies n / a n / a 4 . 6 7 9 . 6 8S o u rc e : Lusaka Stock Exchange (1998).
Z A M B I A
99
Fo reign Tr a d eZambia has fully liberalised external trade, and tradep ro c e d u res and documentation have been simplified ands t a n d a rd i s e d . Copper and cobalt form the traditional mainstayof Zambia’s export goods but the country has also embarked ona process of promoting NTEs in sectors such as agriculture,m a nu f a c t u r i n g , mining and handicraft. NTEs include textiles,fabricated pro d u c t s , p r i m a ry agricultural commodities (soy a ,cotton lint, t o b a c c o ) , s u g a r, engineering pro d u c t s , cement andfloricultural pro d u c t s . In 1997, NTEs accounted for 28 perc e n tof fo reign exchange earnings.A p p rox i m a t e ly 30 percent of NTEswe re exported to the EU under the Lomé Conve n t i o n ;f u rt h e r m o re, NTEs re c e i ved support from the EU in terms oflong-term concessional loans. A p a rt from the EU countries,Zambia also exports to Jap a n , Saudi A r a b i a ,Thailand and India.
Crude oil, c h e m i c a l s ,m a c h i n e ry, i ro n ,s t e e l , textiles and ve h i c l e sa re the chief import go o d s . South A f r i c a , the United Kingdom,Z i m b a b we and Japan are Zambia’s major sources of import s .Within the re g i o n , South A f r i c a , M a l aw i , Z i m b a b we and, m o rere c e n t ly, the Democratic Republic of Congo are the leadingtrading part n e r s .
E x p o rt licences are re q u i red for most go o d s , but the pro c e d u reis a formality handled by commercial banks. E x p o rts of someagricultural commodities, such as white maize, m ay be subject torestrictions when domestic supplies are short . I m p o rt licencesa re re q u i red for statistical purposes and are issued byc o m m e rcial banks.
The tariff regime has been liberalised and simplified. M a x i mu mtariffs have been lowe red from 100 percent to 25 perc e n t , t h etariff structure now comprises four tiers, ranging from 0 - 25p e rc e n t .
Fo reign Di rect Inve s t m e n tThe privatisation programme has brought a substantial amountof investment into Zambia. F u rt h e r m o re, Z a m b i a ’s inve s t o r-f r i e n d ly climate and effe c t i ve promotion of investment has alsogenerated fo reign interest in the country. Fo reign inve s t o r sb rought in USD58m into the country in 1996.
Some examples of fo reign direct investment into Zambia ove rthe past year are :
L o u vet Distillers Limited, a multinational company, has pledgedto invest USD16.7m in the production of alcohol for industrialu s e.
China Hainan corporation, a company owned by the Chinesegove r n m e n t , intends to invest USD8.3m in the construction ofb r i d g e s , roads and buildings in Zambia.
Sun International Limited of South Africa will invest USD45.65m in the purchase and modernisation of the Musio-O-Tu nya Intercontinental hotel in Livingstone.
Telcel Zambia Limited, a subsidiary of Telcel International, h a sbeen granted an investment license to install and operate adigital cellular system in Zambia.Te l c e l , the largest cellular phoneoperator in Africa (outside of South A f r i c a ) , plans to inve s tUSD35.3m in the country over the next five ye a r s .
Z a m c e l l , a joint ve n t u re between a Dutch, J apanese andAmerican firms, will provide a GSM digital cellularc o m munication service in Zambia.The firm is expected to bringin an amount of USD13.5m.
In the future, Zambia plans to establish a number of exportp rocessing zones, a pro p o rtion of which will be located in are a sw h e re there is little industrial activity at pre s e n t .This should be
a further stimulant to fo reign direct investment in the country.
P r i v a t i s a t i o nIn 1991, the Zambian government embarked on a massiveprivatisation pro g r a m m e, at a time when over 80 percent of thec o u n t ry ’s economy was comprised of parastatals. A speciala g e n c y, Zambia Privatisation A g e n c y, was established under thePrivatisation Act in 1992 to plan, implement and control theprivatisation of state owned enterprises.The parastatals we re ahuge burden on the government in terms of subsidies, a n dc o n s e q u e n t ly privatisation has become one of the priority are a sof government policy. The process is regulated by thePrivatisation Act (1992).
The second wave of privatisation began in early 1998, i nvo l v i n gthe privatisation of telecommu n i c a t i o n s , u t i l i t i e s , e n e r gy, p o s t a ls e rv i c e s , mines and pro p e rt i e s . Smaller entities we re privatisedfirst to gain experience and by March 1998, 215 companies (outof a port folio of 321) and 198 commercial pro p e rties had beens o l d .E a r ly in 1998, the President of Zambia made a re a f f i r m a t i o non the sale of state-owned enterprises in the sectors oft r a n s p o rt (e. g . National A i r p o rts Corporation), e n e r gy andutilities (e. g . Zambia Electricity Supply Corporation), p ro p e rt y( e. g .ZIMCO pro p e rt i e s ) , finance (Zambia National Commerc i a lBank) and others including the Zambia Te l e c o m mu n i c a t i o n sC o m p a ny, Ndola Lime and the gemstone industry.All of thesea re expected to be privatised within the next 24 months.
The privatisation of the ZCCM is curre n t ly at an advanceds t a g e. The parastatal has been unbundled into nine operatingpackages and is in the process of being sold off to variousb i dd e r s .Thus far,Kansanshi Mine has been sold to Cyprus A m a zMinerals (USA); a Memorandum of Understanding has beensigned with a consortium of Anglo American Corporation,Falconbridge and Gencor with re g a rd to the Ko n kola DeepMining Pro j e c t ; Ko n kola North has been aw a rded to A n g l ov a a lMinerals (South A f r i c a ) ; Nkana and Nchanga mines have beensold to the Kafue Consort i u m , as has the Chambeshi ConbaltP l a n t ; Chibuluma Mine has been aw a rded to Meteore xC o n s o rt i u m , L u a n s hya/Baluba Division to the Binani Gro u p( I n d i a ) , and Chambisi Mine to Ivanhoe Capital Corporation.ZCCM will retain a minority shareholding plus a golden sharethat will ensure that the government retains a strategic intere s tin the various mines. The privatisation of mines alone isscheduled to generate USD2.8bn over the next five ye a r s .
The majority of companies are sold on competitive tender basis.The Privatisation Trust Fund makes it possible for ord i n a ryZambians to buy shares on the stock exchange in state-ow n e denterprises being privatised.
Privatisation has also led to investment in the country byinternational firms: some examples are :
African Oxygen Limited (South A f r i c a ) , C o m m o n we a l t hD evelopment Corporation (UK), Floco Verwaitungs (Germany ) ,Lonrho Africa Ltd (UK), National Breweries Limited, L o n r h oZambia Ltd (UK) and Clark Cotton (South Africa) PhelpsDodge Outokumpu Copper Oy International, C o r p. (USA) andBikana International (Zambia),Shoprite Checkers (South A f r i c a ) ,Tate & Lyle (UK) and Commonwealth Deve l o p m e n tCorporation (UK), U n i l ever PLC (UK/Netherlands), Z a m a n g l oand Indol International BV (South Africa) and Benicon Limited(South A f r i c a )
These companies invested in the fo l l owing Zambian firms:Zambia Oxygen Limited, Munkumpa Farms, K apiri Glass,Z a m h o rt Metal Fabricators of Zambia Limited, Modern RetailO u t l e t s , Cotton Ginning, Zambia Sugar Company, Refined OilP ro d u c t s , Zambia Brewe r i e s , Maamba Colleries.

Z A M B I A
100
I N V E S TM E N T C L I M AT E
INVESTMENT INCENTIVESZambia has designed a package of incentives aimed specificallyat establishing a profitable env i ronment for increased domesticindustrial grow t h , e x p o rt pro m o t i o n , the development ofm a r ket-oriented production management and private sectord eve l o p m e n t .
Income Tax A l l ow a n c e :Buildings used for manu f a c t u r i n g , mining or hotels qualify for awear and tear allowance of five percent of the cost, plus andinitial allowance of 10 percent of the cost in the year in whichthe building is first used.
Income Tax Deduction:E x p e n d i t u res on the conduction of re s e a rc h , on technicale d u c a t i o n , or any further training related to a company ’s specificbusiness activity
I n c e n t i ves for Agricultural Enterprises:Dividends payable to farmers are tax exempt for the first fiveyears of operation.
15 percent income tax on farming pro f i t s .
Full tax allowance for outlay on land deve l o p m e n t ,c o n s e rv a t i o nand other costs.
C apital expenditure on farm improvements qualify for ana l l owance of 20 percent per annum for each of the five firstye a r s .
Substantial rate of depreciation allowing farm machinery to ber ap i d ly written off against tax.
100 percent capital allowances on farm works and farmi m p rove m e n t s .
Farm machinery and implements qualify for capital allowances atthe rate of 50 percent on straight line basis.
Z e ro import tariffs on agricultural equipment.
Special development allowances for growing certain cro p s :t e a ,c o f fe e, banana plants, citrus fruit trees or other similar plants ort re e s .
M i n i n gZ e ro percent duty on mining equipment
C apital allowance of 100 percent on mining plant andm a c h i n e ry, building and structure s
Small-Scale EnterprisesE xemption from the re q u i rement of any manufacturing license,if ap p l i c a b l e
E xemption from the payment of any rates on factory pre m i s e sfor the first five ye a r s
E xemption from payment of any license fees in the case of aperson who invests at least K5m (USD2,900) or more.
E xemption from tax for the first three or first five years ofoperations if operating in urban or rural areas re s p e c t i ve ly.
I n c e n t i ves Relating to Investments on the LuSE Include:Corporate income tax reduced to 30 perc e n t ,c o m p a red to thenormal 35 percent corporate tax;
No restrictions on fo reign ownership and share holding leve l s
No capital gains tax
No pro p e rty transfer tax
E x p o rt Incentive sSpecial incentives are offe red to exporters of non-traditionalp ro d u c t s , such as reduced corporate tax at 15 perc e n t . S p e c i a le xemption from duty and sales tax on imports and machinery iso f fe red to exporters of NTEs with net fo reign exchangee a r n i n g s , tourism investment with fo reign exchange earnings inexcess of 25 percent of the gross annual earnings, and agro -related products for export .
Ta x a t i o n
Corporate tax:* Manu f a c t u r i n g 35 perc e n t* NTEs companies 15 perc e n t* Companies listed on the LuSE 30 perc e n t* Chemical fe rtiliser pro d u c t i o n 15 perc e n t* Farming 15 perc e n tPersonal income tax 10-30 perc e n tWithholding tax 15 perc e n tVa l u e - a dded tax 17.5 perc e n t
T h e re is no capital gains tax but pro p e rty transfer tax isapplicable on the transfer of immovable pro p e rty and on thet r a n s fer of stock and shares in Zambian incorporatedc o m p a n i e s . Withholding tax is not levied on re s i d e n tcontractors and suppliers or on public entertainment fe e s .
All former ZCCM companies will enjoy some tax concessions.
Double taxation agre e m e n t s : Zambia has signed doubletaxation agreements with ap p rox i m a t e ly 17 countries. In theevent that a double taxation agreement has not beenconcluded between Zambia and the country concerned, a taxc redit will be granted.
In the 1998 budget, a number of changes to the tax regime inrespect of mining we re announced:
• Mineral Royalty Tax rate reduced from three percent to twop e rc e n t
• The period of carry - fo r w a rd of losses was extended fro mf i ve years to 10 ye a r s
• The withholding tax rate on interest and dividends wasreduced from 15 percent to 10 perc e n t
• The restriction of offsetting losses against pro f i t s , limited to20 percent for those mines which are not geograp h i c a l lya d j a c e n t , has been re m ove d .N ow, 100 percent losses can beo f f s e t .
E x c h a n ge Contro lM a r ket oriented re forms have been implemented successfully inZ a m b i a . Exchange control regulations have been re m ove d ,a n dprices and interest rates have been dere g u l a t e d . P ro f i t ,dividends and capital may be repatriated without re s t r i c t i o n s .
Institutions Invo l ved in Investment Pro m o t i o n
The Zambia Investment Centre was established in 1992 top ro m o t e, i m p l e m e n t , c o o rdinate and facilitate inve s t m e n tp rogrammes and policies. The centre provides information onthe investment climate and identifies and pro m o t e so p p o rtunities for inve s t m e n t . The Investment Centre is alsot h e re to ensure that the investment process is a smooth one fo rthe inve s t o r, for example by assisting the investor to secure anyp e r m i t , l i c e n c e, land etc. that he or she might need. O t h e rfunctions include the provision of consultancy services for thei nve s t o r, u n d e rtaking economic and sector studies with a viewto identifying investment opport u n i t i e s , and facilitating jointve n t u re arrangements between fo reign and domestice n t re p re n e u r s .
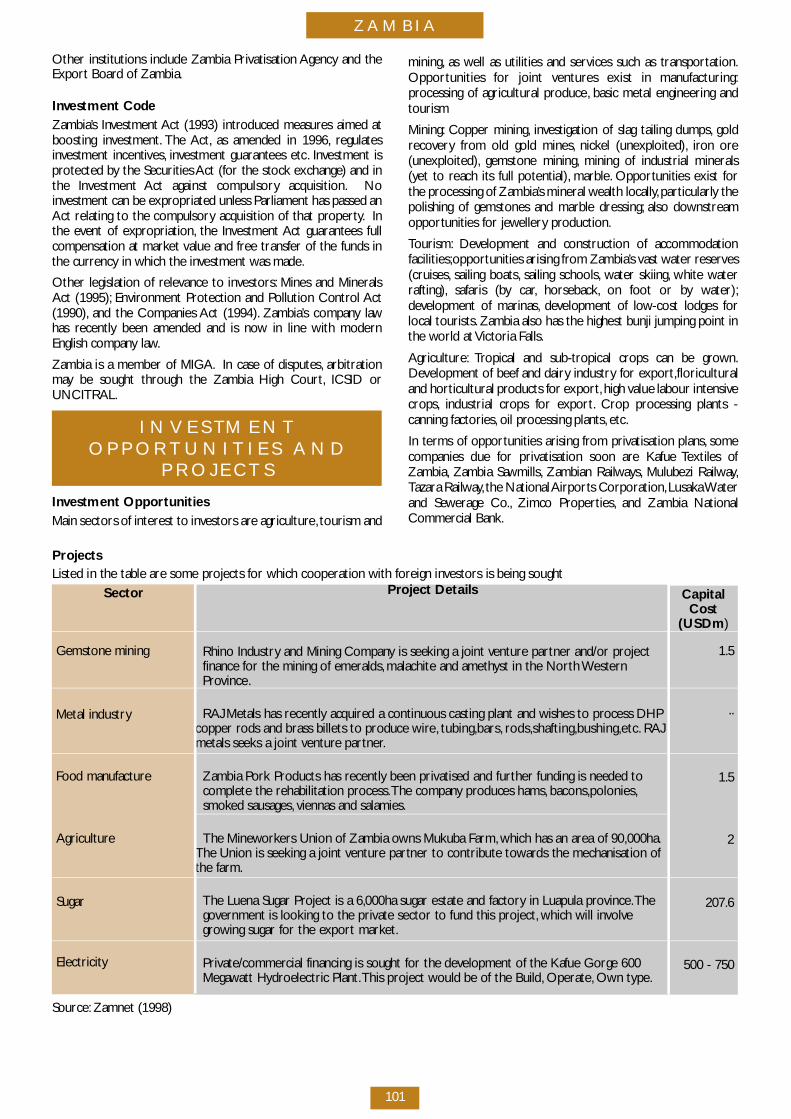
Z A M B I A
101
Other institutions include Zambia Privatisation Agency and theE x p o rt Board of Zambia.
I nvestment CodeZ a m b i a ’s Investment Act (1993) introduced measures aimed atboosting inve s t m e n t . The A c t , as amended in 1996, re g u l a t e si nvestment incentive s , i nvestment guarantees etc. I nvestment isp rotected by the Securities Act (for the stock exchange) and inthe Investment Act against compulsory acquisition. N oi nvestment can be expropriated unless Parliament has passed anAct relating to the compulsory acquisition of that pro p e rt y. I nthe event of expro p r i a t i o n , the Investment Act guarantees fullcompensation at market value and free transfer of the funds inthe currency in which the investment was made.
Other legislation of re l evance to inve s t o r s : Mines and MineralsAct (1995); E nv i ronment Protection and Pollution Control A c t( 1 9 9 0 ) , and the Companies Act (1994). Z a m b i a ’s company lawhas re c e n t ly been amended and is now in line with modernEnglish company law.
Zambia is a member of MIGA. In case of disputes, a r b i t r a t i o nm ay be sought through the Zambia High Court , ICSID orU N C I T R A L .
I N V E S TM E N TO P P O R T U N I T I E S A N D
P R O J E C T S
I nvestment Opport u n i t i e sMain sectors of interest to investors are agriculture, tourism and
m i n i n g , as well as utilities and services such as transport a t i o n .O p p o rtunities for joint ve n t u res exist in manu f a c t u r i n g :p rocessing of agricultural pro d u c e, basic metal engineering andt o u r i s m
M i n i n g : Copper mining, i nvestigation of slag tailing dumps, go l dre c ove ry from old gold mines, n i c kel (unexploited), i ron ore( u n e x p l o i t e d ) , gemstone mining, mining of industrial minerals( yet to reach its full potential), m a r b l e. O p p o rtunities exist fo rthe processing of Zambia’s mineral wealth locally,p a rt i c u l a r ly thepolishing of gemstones and marble dre s s i n g ; also dow n s t re a mo p p o rtunities for jewe l l e ry pro d u c t i o n .
To u r i s m : D evelopment and construction of accommodationf a c i l i t i e s ;o p p o rtunities arising from Zambia’s vast water re s e rve s( c r u i s e s , sailing boats, sailing schools, water skiing, white waterr a f t i n g ) , safaris (by car, h o r s e b a c k , on foot or by water);d evelopment of marinas, d evelopment of low-cost lodges fo rlocal tourists. Zambia also has the highest bunji jumping point inthe world at Victoria Falls.
A g r i c u l t u re : Tropical and sub-tropical crops can be grow n .D evelopment of beef and dairy industry for export ,f l o r i c u l t u r a land horticultural products for export , high value labour intensivec ro p s , industrial crops for export . C rop processing plants -canning factories, oil processing plants, e t c.
In terms of opportunities arising from privatisation plans, s o m ecompanies due for privatisation soon are Kafue Textiles ofZ a m b i a , Zambia Saw m i l l s , Zambian Railw ay s , Mulubezi Railw ay,Tazara Railw ay, the National A i r p o rts Corporation,Lusaka Wa t e rand Sewerage Co. , Zimco Pro p e rt i e s , and Zambia NationalC o m m e rcial Bank.
S e c t o r
Gemstone mining
Metal industry
Food manu f a c t u re
A g r i c u l t u re
S u g a r
E l e c t r i c i t y
P roject Details
Rhino Industry and Mining Company is seeking a joint ve n t u re partner and/or project finance for the mining of emeralds, malachite and amethyst in the North Western P rov i n c e.
RAJ Metals has re c e n t ly acquired a continuous casting plant and wishes to process DHP copper rods and brass billets to produce wire, t u b i n g ,b a r s , ro d s ,s h a f t i n g ,b u s h i n g ,e t c. RAJ metals seeks a joint ve n t u re part n e r.
Zambia Pork Products has re c e n t ly been privatised and further funding is needed to complete the rehabilitation pro c e s s .The company produces hams, b a c o n s ,p o l o n i e s ,s m o ked sausages, viennas and salamies.
The Minewo r kers Union of Zambia owns Mukuba Farm, which has an area of 90,000ha.The Union is seeking a joint ve n t u re partner to contribute tow a rds the mechanisation of the farm.
The Luena Sugar Project is a 6,000ha sugar estate and factory in Luapula prov i n c e.The government is looking to the private sector to fund this pro j e c t , which will invo l ve g rowing sugar for the export marke t .
P r i v a t e / c o m m e rcial financing is sought for the development of the Kafue Gorge 600 M e g awatt Hydroelectric Plant.This project would be of the Build, O p e r a t e, Own type.
P ro j e c t sListed in the table are some projects for which cooperation with fo reign investors is being sought
S o u rc e : Zamnet (1998)
C ap i t a lC o s t
( U S D m)
1 . 5
. .
1 . 5
2
2 0 7 . 6
500 - 750
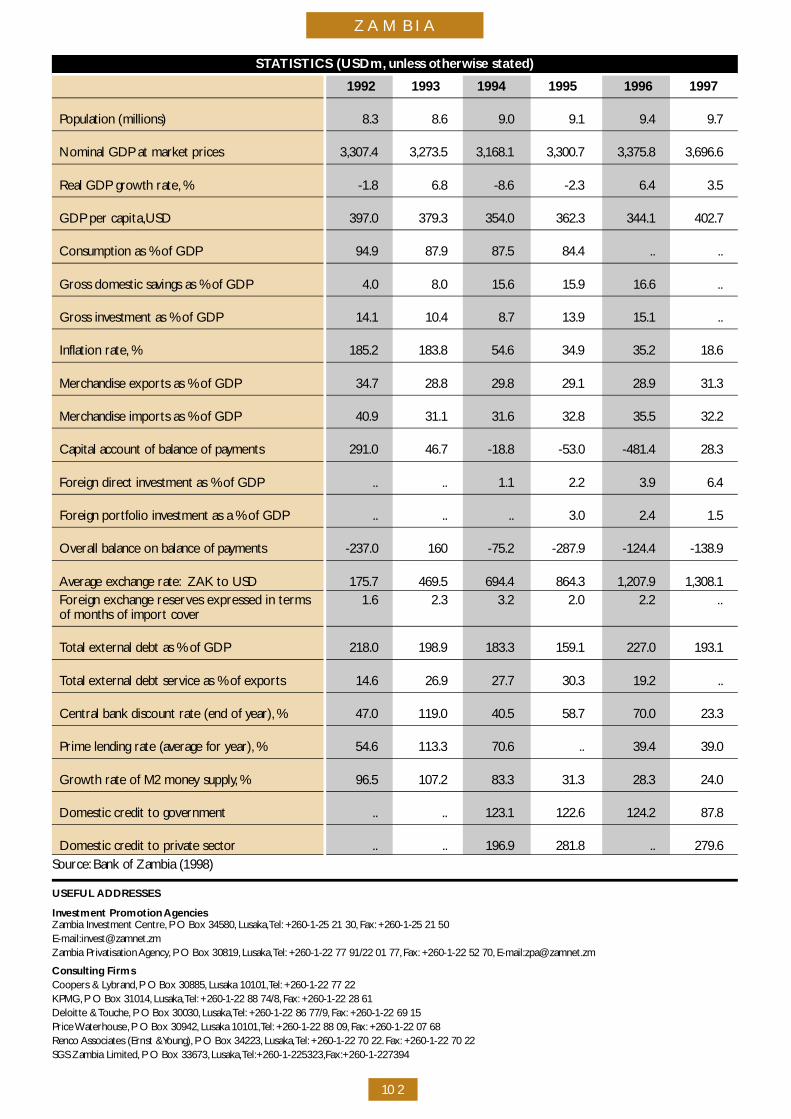
Z A M B I A
102
S TATISTICS (USDm, unless otherwise stated)
1 9 9 2 1 9 9 3 1 9 9 4 1 9 9 5 1 9 9 6 1 9 9 7
Population (millions) 8 . 3 8 . 6 9 . 0 9 . 1 9 . 4 9 . 7
Nominal GDP at market prices 3 , 3 0 7 . 4 3 , 2 7 3 . 5 3 , 1 6 8 . 1 3 , 3 0 0 . 7 3 , 3 7 5 . 8 3 , 6 9 6 . 6
Real GDP growth rate, % - 1 . 8 6 . 8 - 8 . 6 - 2 . 3 6 . 4 3 . 5
GDP per cap i t a ,U S D 3 9 7 . 0 3 7 9 . 3 3 5 4 . 0 3 6 2 . 3 3 4 4 . 1 4 0 2 . 7
Consumption as % of GDP 9 4 . 9 8 7 . 9 8 7 . 5 8 4 . 4 . . . .
G ross domestic savings as % of GDP 4 . 0 8 . 0 1 5 . 6 1 5 . 9 1 6 . 6 . .
G ross investment as % of GDP 1 4 . 1 1 0 . 4 8 . 7 1 3 . 9 1 5 . 1 . .
Inflation rate, % 1 8 5 . 2 1 8 3 . 8 5 4 . 6 3 4 . 9 3 5 . 2 1 8 . 6
M e rchandise exports as % of GDP 3 4 . 7 2 8 . 8 2 9 . 8 2 9 . 1 2 8 . 9 3 1 . 3
M e rchandise imports as % of GDP 4 0 . 9 3 1 . 1 3 1 . 6 3 2 . 8 3 5 . 5 3 2 . 2
C apital account of balance of payments 2 9 1 . 0 4 6 . 7 - 1 8 . 8 - 5 3 . 0 - 4 8 1 . 4 2 8 . 3
Fo reign direct investment as % of GDP . . . . 1 . 1 2 . 2 3 . 9 6 . 4
Fo reign port folio investment as a % of GDP . . . . . . 3 . 0 2 . 4 1 . 5
O verall balance on balance of payments - 2 3 7 . 0 1 6 0 - 7 5 . 2 - 2 8 7 . 9 - 1 2 4 . 4 - 1 3 8 . 9
Average exchange rate: ZAK to USD 1 7 5 . 7 4 6 9 . 5 6 9 4 . 4 8 6 4 . 3 1 , 2 0 7 . 9 1 , 3 0 8 . 1Foreign exchange reserves expressed in terms 1.6 2.3 3.2 2.0 2.2 ..of months of import cove r
Total external debt as % of GDP 2 1 8 . 0 1 9 8 . 9 1 8 3 . 3 1 5 9 . 1 2 2 7 . 0 1 9 3 . 1
Total external debt service as % of export s 1 4 . 6 2 6 . 9 2 7 . 7 3 0 . 3 1 9 . 2 . .
Central bank discount rate (end of ye a r ) , % 4 7 . 0 1 1 9 . 0 4 0 . 5 5 8 . 7 7 0 . 0 2 3 . 3
Prime lending rate (average for ye a r ) , % 5 4 . 6 1 1 3 . 3 7 0 . 6 . . 3 9 . 4 3 9 . 0
G rowth rate of M2 money supply, % 9 6 . 5 1 0 7 . 2 8 3 . 3 3 1 . 3 2 8 . 3 2 4 . 0
Domestic credit to government . . . . 1 2 3 . 1 1 2 2 . 6 1 2 4 . 2 8 7 . 8
Domestic credit to private sector . . . . 1 9 6 . 9 2 8 1 . 8 . . 2 7 9 . 6S o u rc e : Bank of Zambia (1998)
USEFUL A D D R E S S E S
I nvestment Promotion A ge n c i e sZambia Investment Centre, P O Box 34580, L u s a k a ,Te l : +260-1-25 21 30, F a x : +260-1-25 21 50E - m a i l :i nve s t @ z a m n e t . z mZambia Privatisation A g e n c y, P O Box 30819, L u s a k a ,Te l : +260-1-22 77 91/22 01 77, F a x : +260-1-22 52 70, E - m a i l :z p a @ z a m n e t . z m
Consulting FirmsCoopers & Ly b r a n d , P O Box 30885, Lusaka 10101,Te l : +260-1-22 77 22K P M G , P O Box 31014, L u s a k a ,Te l : +260-1-22 88 74/8, F a x : +260-1-22 28 61Deloitte & To u c h e, P O Box 30030, L u s a k a ,Te l : +260-1-22 86 77/9, F a x : +260-1-22 69 15Price Wa t e r h o u s e, P O Box 30942, Lusaka 10101,Te l : +260-1-22 88 09, F a x : +260-1-22 07 68Renco Associates (Ernst &Yo u n g ) , P O Box 34223, L u s a k a ,Te l : +260-1-22 70 22. F a x : +260-1-22 70 22SGS Zambia Limited, P O Box 33673, L u s a k a ,Te l :+ 2 6 0 - 1 - 2 2 5 3 2 3 ,F a x :+ 2 6 0 - 1 - 2 2 7 3 9 4
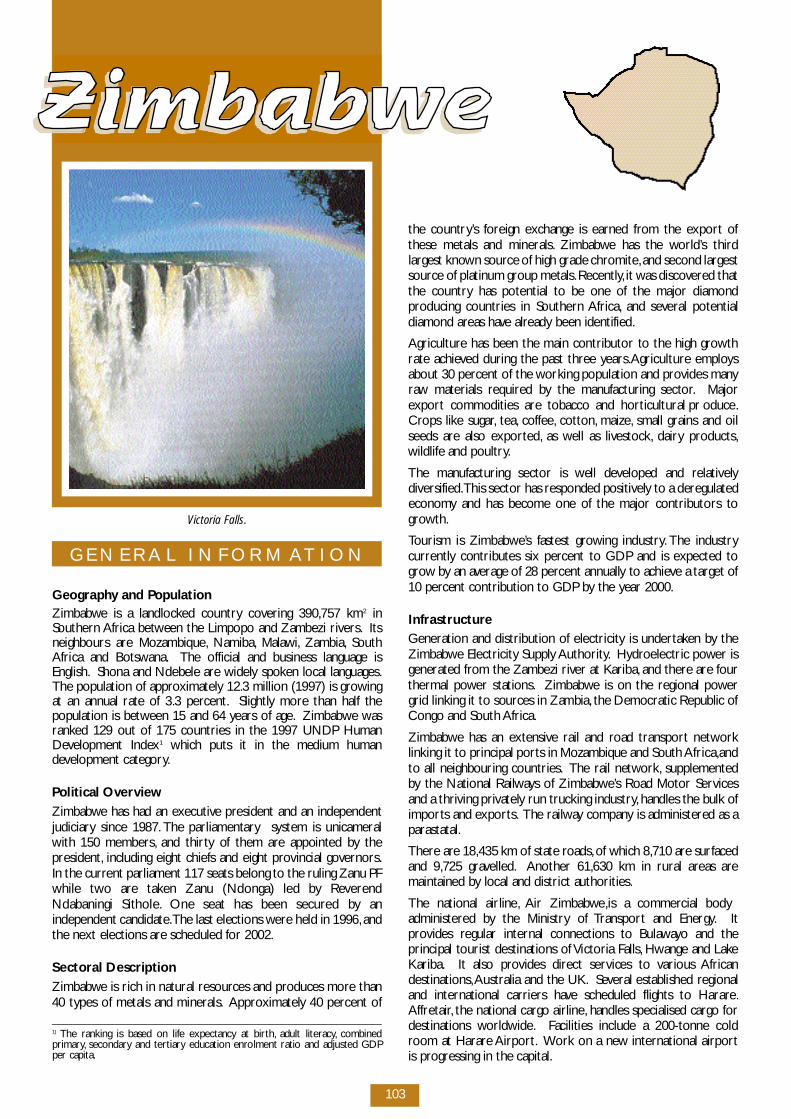
103
G E N E R A L I N F O R M AT I O N
G e og r ap hy and Po p u l a t i o nZ i m b a b we is a landlocked country covering 390,757 km2 i nSouthern Africa between the Limpopo and Zambezi rive r s . I t sneighbours are Mozambique, N a m i b a , M a l aw i , Z a m b i a , S o u t hAfrica and Botsw a n a . The official and business language isE n g l i s h . Shona and Ndebele are widely spoken local languages.The population of ap p rox i m a t e ly 12.3 million (1997) is grow i n gat an annual rate of 3.3 perc e n t . S l i g h t ly more than half thepopulation is between 15 and 64 years of age. Z i m b a b we wasr a n ked 129 out of 175 countries in the 1997 UNDP HumanD evelopment Index1 which puts it in the medium humand evelopment catego ry.
Political Ove rv i ewZ i m b a b we has had an exe c u t i ve president and an independentj u d i c i a ry since 1987. The parliamentary system is unicameralwith 150 members, and thirty of them are appointed by thep re s i d e n t , including eight chiefs and eight provincial gove r n o r s .In the current parliament 117 seats belong to the ruling Zanu PFwhile two are taken Zanu (Ndonga) led by Reve re n dNdabaningi Sithole. One seat has been secured by anindependent candidate.The last elections we re held in 1996, a n dthe next elections are scheduled for 2002.
Sectoral DescriptionZ i m b a b we is rich in natural re s o u rces and produces more than40 types of metals and minerals. A p p rox i m a t e ly 40 percent of
the country ’s fo reign exchange is earned from the export ofthese metals and minerals. Z i m b a b we has the wo r l d ’s thirdlargest known source of high grade chro m i t e,and second largests o u rce of platinum group metals.R e c e n t ly, it was discove red thatthe country has potential to be one of the major diamondp roducing countries in Southern A f r i c a , and several potentialdiamond areas have already been identified.
A g r i c u l t u re has been the main contributor to the high grow t hrate achieved during the past three ye a r s .A g r i c u l t u re employ sabout 30 percent of the working population and provides manyr aw materials re q u i red by the manufacturing sector. M a j o re x p o rt commodities are tobacco and horticultural pro d u c e.C rops like sugar, t e a , c o f fe e, c o t t o n , m a i z e, small grains and oilseeds are also export e d , as well as live s t o c k , d a i ry pro d u c t s ,w i l d l i fe and poultry.
The manufacturing sector is well developed and re l a t i ve lyd i ve r s i f i e d .This sector has responded positive ly to a dere g u l a t e de c o n o my and has become one of the major contributors tog row t h .
Tourism is Zimbabwe ’s fastest growing industry. The industryc u rre n t ly contributes six percent to GDP and is expected tog row by an average of 28 percent annu a l ly to achieve a target of10 percent contribution to GDP by the year 2000.
I n f r a s t r u c t u reGeneration and distribution of electricity is undert a ken by theZ i m b a b we Electricity Supply A u t h o r i t y. H y d roelectric power isgenerated from the Zambezi river at Kariba, and there are fo u rthermal power stations. Z i m b a b we is on the regional powe rgrid linking it to sources in Zambia, the Democratic Republic ofC o n go and South A f r i c a .
Z i m b a b we has an extensive rail and road transport netwo r klinking it to principal ports in Mozambique and South A f r i c a ,a n dto all neighbouring countries. The rail netwo r k , s u p p l e m e n t e dby the National Railw ays of Zimbabwe ’s Road Motor Serv i c e sand a thriving privately run trucking industry, handles the bulk ofi m p o rts and export s . The railw ay company is administered as ap a r a s t a t a l .
T h e re are 18,435 km of state ro a d s , of which 8,710 are surfacedand 9,725 grave l l e d . Another 61,630 km in rural areas aremaintained by local and district authorities.
The national airline, Air Zimbabwe, is a commercial bodya d m i n i s t e red by the Ministry of Tr a n s p o rt and Energy. I tp rovides regular internal connections to Bulaw ayo and theprincipal tourist destinations of Victoria Falls, Hwange and LakeK a r i b a . It also provides direct services to various A f r i c a nd e s t i n a t i o n s ,Australia and the UK. S everal established re g i o n a land international carriers have scheduled flights to Harare.A f f re t a i r, the national cargo airline, handles specialised cargo fo rdestinations wo r l d w i d e. Facilities include a 200-tonne coldroom at Harare A i r p o rt . Work on a new international airportis pro g ressing in the cap i t a l .
1 ) The ranking is based on life expectancy at birt h , adult literacy, c o m b i n e dp r i m a ry, s e c o n d a ry and tert i a ry education enrolment ratio and adjusted GDPper cap i t a .
Victoria Falls.
Z I M BA BW E
104
c o m p a red to a deficit of USD21m in 1996. The gross fo re i g nexchange re s e rves position declined from USD830m in 1996 toUSD272m in 1997, re p resenting about one month of importc ove r.
The Zimbabwe dollar, after having remained re l a t i ve ly stableduring most of 1997, came under considerable pre s s u ret ow a rds the end of the ye a r. During November 1997, the localc u rrency depreciated in nominal terms by 11 percent againstthe major trading partner curre n c i e s . By end-December 1997,the currency had depreciated further by 20,3 perc e n t . T h eZ i m b a b we dollar part i a l ly re c ove red its November andDecember 1997 losses, ap p reciating by 2,9 percent in nominalterms against the major trading partner currencies in Janu a ry1 9 9 8 . This was against the background of a slow d own indemand and improving fo reign exchange re s e rve s .
Financial Institutions
Fundamental to the efficient operation of Zimbabwe ’s financialsystem is the Reserve Bank of Zimbabwe established, under theaegis of the Reserve Bank Act of 1973.The Bank enjoys a cert a i nm e a s u re of autonomy allowing it there fo re to perform itss t a t u t o ry obligations without external influence.
The country ’s financial services sector comprises fivec o m m e rcial banks, ten merchant banks, six finance houses, f i vebuilding societies and two accepting houses, as well as the Po s tOffice Savings Bank, insurance companies and pension funds,a n ds everal re g i s t e red re p re s e n t a t i ve offices of fo reign banks. M o s tof the restrictions fo r m e r ly facing the sector have beenre m oved and banking regulations are being rev i ewed to makethem more re s p o n s i ve to a market-led economy. L a t e lycontained in the budget speech was the fine-tuning of moneym a r ket operation by confining clearing functions exclusive ly toc o m m e rcial banks. Also any crunch in the money market will beremedied through re p u rchase agreements since Tre a s u ry billswill hencefo rth become government financing instruments only.
Z i m b a b we Stock ExchangeT h e re are 67 companies curre n t ly listed on the ZimbabweStock Exchange (ZSE).The most important listed companies, i nterms of market cap i t a l i s a t i o n ,a re Ashanti (dual listed), B a rc l ay sBank and Meikles. ZSE is part of the International FinanceCorporation Global Index which monitors performance ofemerging marke t s . Since the opening of the ZSE to fo re i g np a rticipation in June 1993, activity by fo reign investors hasi n c reased considerably.A fo reign investor is allowed to own upto 10 percent of a listed company, with a maximum fo re i g nownership of 40 perc e n t .
The Stock Exchange had mixed fo rtunes in 1997. Its ove r a l lm e a s u re of perfo r m a n c e, as indicated by the Industrial index, h i ta re c o rd high of 12,082 in August fo l l owing a bull run whichbegan in Janu a ry and fuelled by re l a t i ve ly stable interest rates,but thereafter fell sharply in the last four months of the ye a r. B yye a r- e n d , the index had shed over 40 percent of its gains to7 , 1 9 6 , l a r g e ly because investor confidence took a knock onaccount of the negative assessment of the local economicp ro s p e c t s . P re s s u re on the Zimbabwe dollar, on the back oframpant speculative activity, did little to assuage the ailing stockm a r ket and added to the substandard performance of theIndustrial index.
Institutional developments includes the drafting of new listingre q u i re m e n t s , and re s e a rch undert a ken for the purpose ofestablishing a central depository and settlement company.
E C O N O M IC O V E R V I E W
I n t ro d u c t i o nThe thriving agricultural sector and rich natural re s o u rc ee n d owment in Zimbabwe has created an env i ronment that isc o n d u c i ve to the development of a comparative ly dynamicm a nufacturing sector. In the Southern African context,Z i m b a b we ’s industrial base is second only to South A f r i c a .
A compre h e n s i ve re form programme initiated in 1990 hassought to create a dere g u l a t e d , m a r ket driven economy inZ i m b a b we.The liberalisation of the economy has stimulated thep a rticipation of the private sector in the economy, and there byi n c reasing the role of the manufacturing sector.
Recent Macro-Economic Developments The growth of the economy, is fo recast to have decelerated toan estimated 3.7 percent in 1997, d own from the originalestimate of 4.5 perc e n t . The decline is mainly attributable ton e g a t i ve growth in the agricultural and mining sectors, e s t i m a t e dat 2 percent and 6 percent re s p e c t i ve ly. The fall in theagricultural sector was mainly due to excessive rains, resulting inl owe r-than expected average yields of major cro p s , such ast o b a c c o, cotton and maize and the contraction in mining was onaccount of lower international prices of metals, m a i n ly go l d ,n i c kel and copper. The manufacturing sector, h oweve r, a c h i eve da growth rate of 8.5 percent in 1997 compared to 4 percent inthe preceding ye a r. In 1998, the economy is fo recast to grow by3 perc e n t , with the major sectors, v i z , mining manufacturing anda g r i c u l t u re contributing positive ly. Sectoral growth of 5 perc e n t ,3 percent and 2.8 percent are fo recast for mining,m a nu f a c t u r i n gand agriculture in 1998 re s p e c t i ve ly.
The fiscal deficit for 1997/98 is estimated to be around 8p e rcent of GDP. On an annual basis, the inflation rate decre a s e din the third quarter of 1997, but then rose to 16.0 percent inO c t o b e r, 19.4 percent in November and to 20.1 percent inDecember 1997. Fo l l owing an increase in sales tax of 2.5p e rcentage points, inflation rose marke d ly to 24.2 percent inJ a nu a ry. It is anticipated that by ye a r- e n d , inflation will haveeased to around 17 perc e n t .
A n nual growth in broad money supply (M3), which haddecelerated to a thre e - year low of 13.3 percent in September1 9 9 7 , surged significantly to 28.2 percent in November andf u rther to 36.1 percent in December 1997. G rowth in M3 wasunderpinned by a 42.8 percent domestic credit expansion.
Tight liquidity conditions, which characterised the moneym a r ket during the last quarter of 1997, persisted into Janu a ry1998 with shortages re c o rded throughout the month. M o n eym a r ket interest rates, which started firming in October 1997 inresponse to the tight liquidity conditions and the rise in inflation,c o n t i nued to harden through to end-December 1997.
The balance of payment was under considerable pre s s u re,e s p e c i a l ly during the latter half of 1997. It is estimated that, i nvalue terms, e x p o rts fell by 0.4 percent while imports grew byabout 19.4 perc e n t .The trade account, t h e re fo re, swung from asurplus of USD249m in 1996 to a deficit of USD198m in 1997.The weak export performance caused a worsening in thec u rrent account deficit, which deteriorated to 8.8 percent in1997 from 2.1 percent in 1996. The capital account balance,h oweve r, s l i g h t ly increased from a surplus of USD110m in 1996to a surplus of USD118m in 1997. T h u s , the deficit on theoverall balance deteriorated significantly to USD768m in 1997
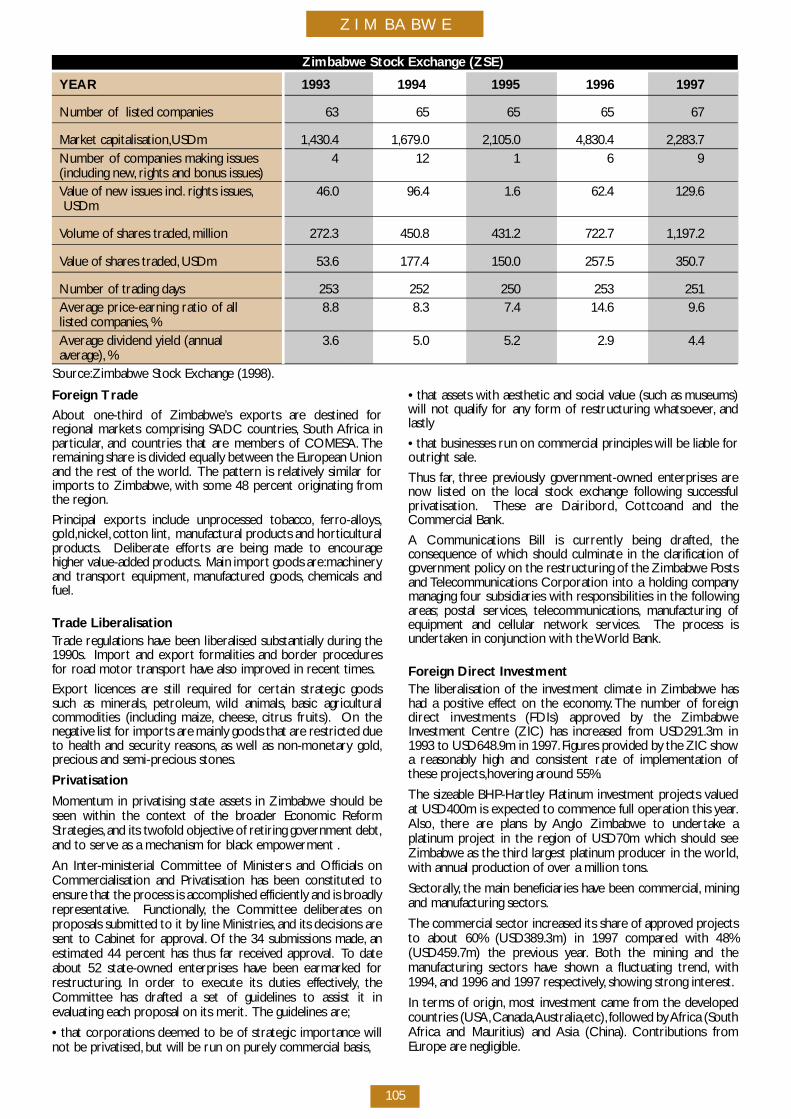
Z I M BA BW E
105
Z i m b a b we Stock Exchange (ZSE)
Y E A R 1 9 9 3 1 9 9 4 1 9 9 5 1 9 9 6 1 9 9 7
Number of listed companies 6 3 6 5 6 5 6 5 6 7
M a r ket cap i t a l i s a t i o n ,U S D m 1 , 4 3 0 . 4 1 , 6 7 9 . 0 2 , 1 0 5 . 0 4 , 8 3 0 . 4 2 , 2 8 3 . 7Number of companies making issues 4 12 1 6 9(including new, rights and bonus issues)Value of new issues incl. rights issues, 4 6 . 0 9 6 . 4 1 . 6 6 2 . 4 1 2 9 . 6U S D m
Volume of shares traded, million 2 7 2 . 3 4 5 0 . 8 4 3 1 . 2 7 2 2 . 7 1 , 1 9 7 . 2
Value of shares traded, U S D m 5 3 . 6 1 7 7 . 4 1 5 0 . 0 2 5 7 . 5 3 5 0 . 7
Number of trading day s 2 5 3 2 5 2 2 5 0 2 5 3 2 5 1Average price-earning ratio of all 8.8 8.3 7.4 14.6 9.6listed companies, %Average dividend yield (annual 3.6 5.0 5.2 2.9 4.4ave r a g e ) , %
S o u rc e :Z i m b a b we Stock Exchange (1998).
Fo reign Tr a d e
About one-third of Zimbabwe ’s exports are destined fo rregional markets comprising SADC countries, South Africa inp a rt i c u l a r, and countries that are members of COMESA. T h eremaining share is divided equally between the European Unionand the rest of the wo r l d . The pattern is re l a t i ve ly similar fo ri m p o rts to Zimbabwe, with some 48 percent originating fro mthe re g i o n .
Principal exports include unprocessed tobacco, fe rro - a l l oy s ,go l d ,n i c ke l , cotton lint, m a nufactural products and hort i c u l t u r a lp ro d u c t s . Deliberate effo rts are being made to encouragehigher value-added pro d u c t s . Main import goods are :m a c h i n e ryand transport equipment, m a nu f a c t u red go o d s , chemicals andf u e l .
Tr a d e Li b e r a l i s a t i o nTrade regulations have been liberalised substantially during the1 9 9 0 s . I m p o rt and export formalities and border pro c e d u re sfor road motor transport have also improved in recent times.
E x p o rt licences are still re q u i red for certain strategic go o d ssuch as minerals, p e t ro l e u m , wild animals, basic agriculturalcommodities (including maize, c h e e s e, citrus fruits). On then e g a t i ve list for imports are mainly goods that are restricted dueto health and security re a s o n s , as well as non-monetary go l d ,p recious and semi-precious stones.
P r i v a t i s a t i o n
Momentum in privatising state assets in Zimbabwe should beseen within the context of the broader Economic Refo r mS t r a t e g i e s , and its two fold objective of retiring government debt,and to serve as a mechanism for black empowerment .
An Inter-ministerial Committee of Ministers and Officials onC o m m e rcialisation and Privatisation has been constituted toe n s u re that the process is accomplished efficiently and is bro a d lyre p re s e n t a t i ve. F u n c t i o n a l ly, the Committee deliberates onp roposals submitted to it by line Ministries, and its decisions aresent to Cabinet for ap p rov a l . Of the 34 submissions made, a nestimated 44 percent has thus far re c e i ved ap p rov a l . To dateabout 52 state-owned enterprises have been earmarked fo rre s t r u c t u r i n g . In order to execute its duties effe c t i ve ly, t h eCommittee has drafted a set of guidelines to assist it inevaluating each proposal on its merit. The guidelines are ;
• that corporations deemed to be of strategic importance willnot be privatised, but will be run on pure ly commercial basis,
• that assets with aesthetic and social value (such as mu s e u m s )will not qualify for any form of restructuring whatsoeve r, a n dl a s t ly
• that businesses run on commercial principles will be liable fo routright sale.
Thus far, t h ree prev i o u s ly gove r n m e n t - owned enterprises aren ow listed on the local stock exchange fo l l owing successfulp r i v a t i s a t i o n . These are Dairibord , Cottcoand and theC o m m e rcial Bank.
A Communications Bill is curre n t ly being drafted, t h econsequence of which should culminate in the clarification ofgovernment policy on the restructuring of the Zimbabwe Po s t sand Te l e c o m munications Corporation into a holding companymanaging four subsidiaries with responsibilities in the fo l l ow i n ga re a s ; postal serv i c e s , t e l e c o m mu n i c a t i o n s , m a nufacturing ofequipment and cellular network serv i c e s . The process isu n d e rt a ken in conjunction with the World Bank.
Fo reign Di rect Inve s t m e n tThe liberalisation of the investment climate in Zimbabwe hashad a positive effect on the economy. The number of fo re i g nd i rect investments (FDIs) ap p roved by the ZimbabweI nvestment Centre (ZIC) has increased from USD291.3m in1993 to USD648.9m in 1997. F i g u res provided by the ZIC showa re a s o n a b ly high and consistent rate of implementation ofthese pro j e c t s ,h overing around 55%.
The sizeable BHP-Hart l ey Platinum investment projects valuedat USD400m is expected to commence full operation this ye a r.A l s o, t h e re are plans by Anglo Zimbabwe to undert a ke ap l a t i num project in the region of USD70m which should seeZ i m b a b we as the third largest platinum producer in the wo r l d ,with annual production of over a million tons.
S e c t o r a l ly, the main beneficiaries have been commerc i a l , m i n i n gand manufacturing sectors.
The commercial sector increased its share of ap p roved pro j e c t sto about 60% (USD389.3m) in 1997 compared with 48%(USD459.7m) the previous ye a r. Both the mining and them a nufacturing sectors have shown a fluctuating tre n d , w i t h1 9 9 4 , and 1996 and 1997 re s p e c t i ve ly, s h owing strong intere s t .
In terms of origin, most investment came from the deve l o p e dcountries (USA,C a n a d a ,A u s t r a l i a ,e t c ) , fo l l owed by Africa (SouthAfrica and Mauritius) and Asia (China). Contributions fro mE u rope are negligible.
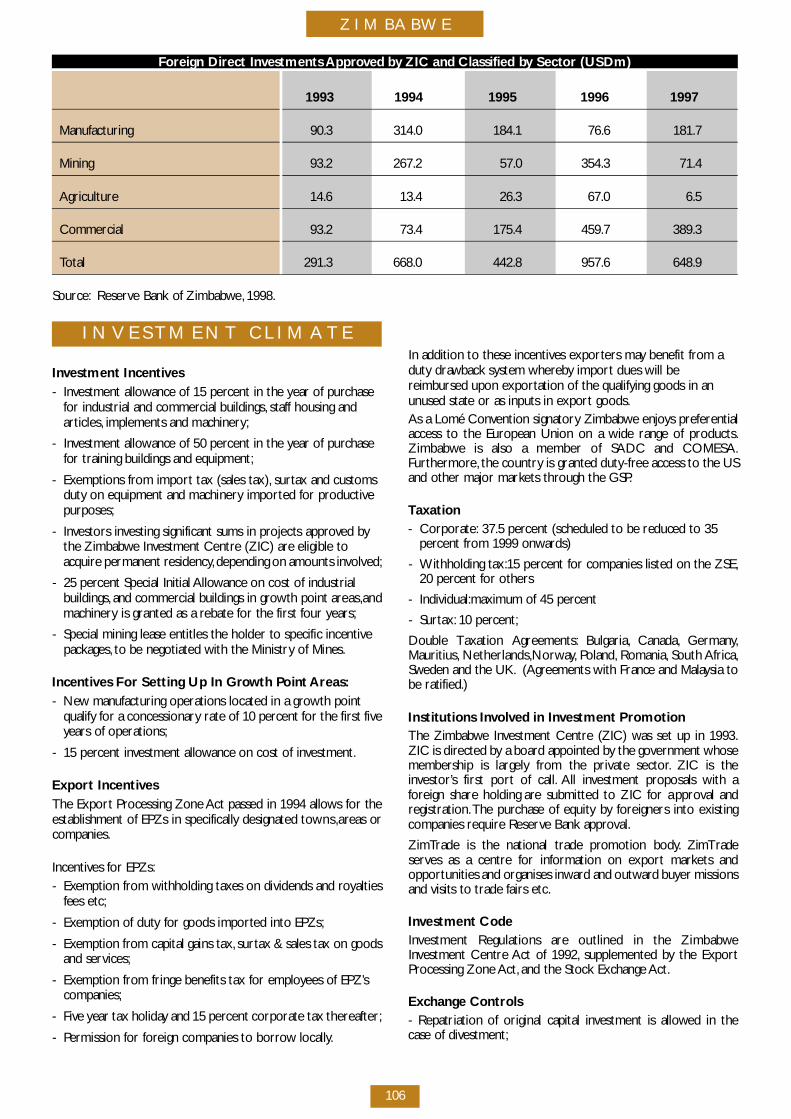
Z I M BA BW E
106
I N V E S TM E N T C L I M AT E
I nvestment In c e n t i ve s- I nvestment allowance of 15 percent in the year of purchase
for industrial and commercial buildings, staff housing and a rt i c l e s , implements and machinery ;
- I nvestment allowance of 50 percent in the year of purchase for training buildings and equipment;
- E xemptions from import tax (sales tax), s u rtax and customs duty on equipment and machinery imported for pro d u c t i ve p u r p o s e s ;
- I nvestors investing significant sums in projects ap p roved by the Zimbabwe Investment Centre (ZIC) are eligible to a c q u i re permanent re s i d e n c y, depending on amounts invo l ve d ;
- 25 percent Special Initial A l l owance on cost of industrial b u i l d i n g s , and commercial buildings in growth point are a s ,a n dm a c h i n e ry is granted as a rebate for the first four ye a r s ;
- Special mining lease entitles the holder to specific incentive p a c k a g e s , to be negotiated with the Ministry of Mines.
I n c e n t i ve s For Setting Up In Growth Point A re a s :- N ew manufacturing operations located in a growth point
qualify for a concessionary rate of 10 percent for the first fiveyears of operations;
- 15 percent investment allowance on cost of inve s t m e n t .
E x p o rt Incentive sThe Export Processing Zone Act passed in 1994 allows for theestablishment of EPZs in specifically designated tow n s ,a reas orc o m p a n i e s .
I n c e n t i ves for EPZs:- E xemption from withholding taxes on dividends and roy a l t i e s
fees etc;
- E xemption of duty for goods imported into EPZs;
- E xemption from capital gains tax, s u rtax & sales tax on go o d sand serv i c e s ;
- E xemption from fringe benefits tax for employees of EPZ’s c o m p a n i e s ;
- F i ve year tax holiday and 15 percent corporate tax there a f t e r;
- Permission for fo reign companies to borrow locally.
In addition to these incentives exporters may benefit from aduty drawback system where by import dues will bereimbursed upon exportation of the qualifying goods in anu nused state or as inputs in export go o d s .As a Lomé Convention signatory Zimbabwe enjoys pre fe re n t i a laccess to the European Union on a wide range of pro d u c t s .Z i m b a b we is also a member of SADC and COMESA.F u rt h e r m o re, the country is granted duty-free access to the USand other major markets through the GSP.
Ta x a t i o n- C o r p o r a t e : 37.5 percent (scheduled to be reduced to 35
p e rcent from 1999 onward s )
- Withholding tax:15 percent for companies listed on the ZSE,20 percent for others
- I n d i v i d u a l :m a x i mum of 45 percent
- S u rt a x : 10 perc e n t ;
Double Taxation Ag re e m e n t s : B u l g a r i a , C a n a d a , G e r m a ny,M a u r i t i u s , N e t h e r l a n d s ,N o r w ay, Po l a n d , R o m a n i a , South A f r i c a ,S weden and the UK. ( A g reements with France and Malaysia tobe ratified.)
Institutions Invo l ved in Investment Pro m o t i o nThe Zimbabwe Investment Centre (ZIC) was set up in 1993.ZIC is directed by a board appointed by the government whosemembership is largely from the private sector. ZIC is thei nve s t o r ’s first port of call. All investment proposals with afo reign share holding are submitted to ZIC for ap p roval andre g i s t r a t i o n .The purchase of equity by fo reigners into existingcompanies re q u i re Reserve Bank ap p rov a l .
Z i m Trade is the national trade promotion body. Z i m Tr a d es e rves as a centre for information on export markets ando p p o rtunities and organises inward and outward buyer missionsand visits to trade fairs etc.
I nvestment Co d eI nvestment Regulations are outlined in the ZimbabweI nvestment Centre Act of 1992, supplemented by the ExportP rocessing Zone A c t , and the Stock Exchange A c t .
E x c h a n ge Co n t ro l s- Repatriation of original capital investment is allowed in thecase of dive s t m e n t ;
Fo reign Direct Investments A p p roved by ZIC and Classified by Sector (USDm)
1 9 9 3 1 9 9 4 1 9 9 5 1 9 9 6 1 9 9 7
M a nu f a c t u r i n g 9 0 . 3 3 1 4 . 0 1 8 4 . 1 7 6 . 6 1 8 1 . 7
M i n i n g 9 3 . 2 2 6 7 . 2 5 7 . 0 3 5 4 . 3 7 1 . 4
A g r i c u l t u re 1 4 . 6 1 3 . 4 2 6 . 3 6 7 . 0 6 . 5
C o m m e rc i a l 9 3 . 2 7 3 . 4 1 7 5 . 4 4 5 9 . 7 3 8 9 . 3
To t a l 2 9 1 . 3 6 6 8 . 0 4 4 2 . 8 9 5 7 . 6 6 4 8 . 9
S o u rc e : R e s e rve Bank of Zimbabwe, 1 9 9 8 .
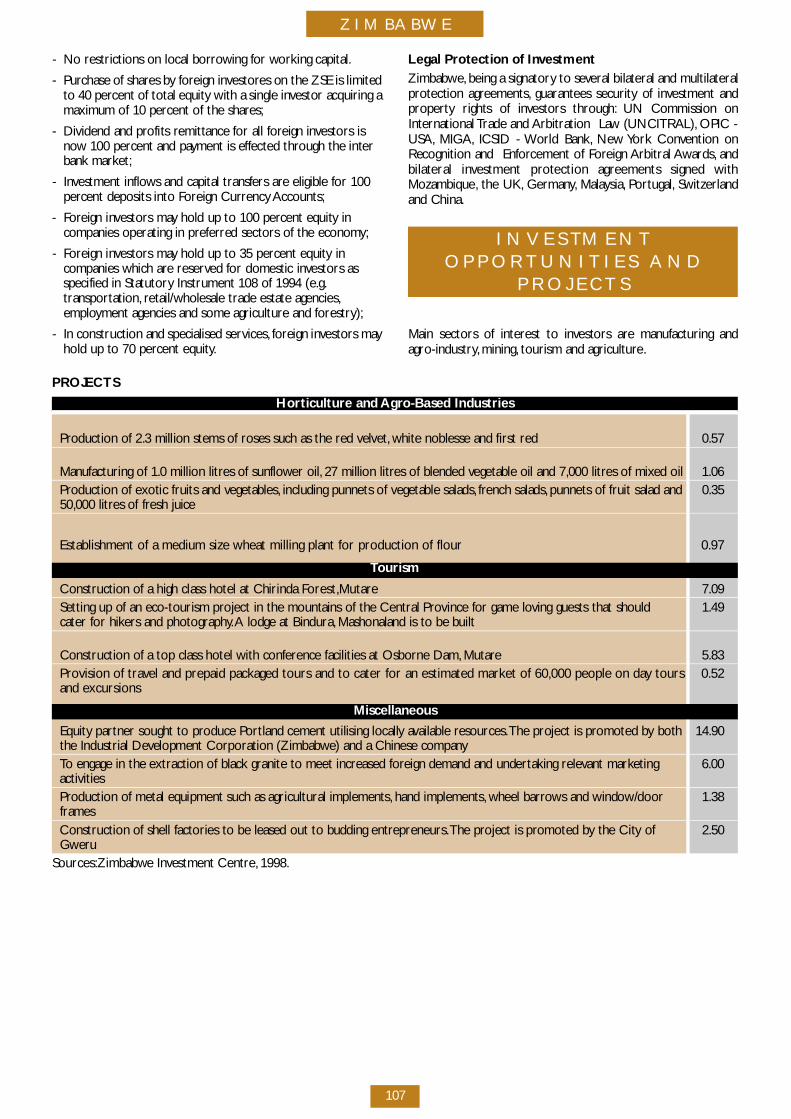
Z I M BA BW E
107
- No restrictions on local borrowing for working cap i t a l .
- P u rchase of shares by fo reign inve s t o res on the ZSE is limitedto 40 percent of total equity with a single investor acquiring am a x i mum of 10 percent of the share s ;
- Dividend and profits remittance for all fo reign investors is n ow 100 percent and payment is effected through the inter bank marke t ;
- I nvestment inflows and capital transfers are eligible for 100 p e rcent deposits into Fo reign Currency A c c o u n t s ;
- Fo reign investors may hold up to 100 percent equity in companies operating in pre fe rred sectors of the economy ;
- Fo reign investors may hold up to 35 percent equity in companies which are re s e rved for domestic investors as specified in Statutory Instrument 108 of 1994 (e. g .t r a n s p o rt a t i o n , retail/wholesale trade estate agencies,e m p l oyment agencies and some agriculture and fo re s t ry ) ;
- In construction and specialised serv i c e s , fo reign investors mayhold up to 70 percent equity.
Legal Protection of Inve s t m e n tZ i m b a b we, being a signatory to several bilateral and mu l t i l a t e r a lp rotection agre e m e n t s , guarantees security of investment andp ro p e rty rights of investors thro u g h : UN Commission onInternational Trade and Arbitration Law (UNCITRAL), OPIC -U S A , M I G A , ICSID - World Bank, N ew York Convention onRecognition and Enfo rcement of Fo reign Arbitral Aw a rd s , a n dbilateral investment protection agreements signed withM o z a m b i q u e, the UK, G e r m a ny, M a l ay s i a , Po rt u g a l , S w i t z e r l a n dand China.
I N V E S TM E N TO P P O R T U N I T I E S A N D
P R O J E C T S
Main sectors of interest to investors are manufacturing anda g ro - i n d u s t ry, m i n i n g , tourism and agriculture.
P RO J E C T S
H o rt i c u l t u re and A g ro-Based Industries
P roduction of 2.3 million stems of roses such as the red ve l ve t , white noblesse and first re d 0 . 5 7
M a nufacturing of 1.0 million litres of sunflower oil, 27 million litres of blended vegetable oil and 7,000 litres of mixed oil 1 . 0 6P roduction of exotic fruits and ve g e t a b l e s , including punnets of vegetable salads, f rench salads, punnets of fruit salad and 0 . 3 550,000 litres of fresh juice
Establishment of a medium size wheat milling plant for production of flour 0.97
To u r i s m
Construction of a high class hotel at Chirinda Fo re s t ,M u t a re 7 . 0 9Setting up of an eco-tourism project in the mountains of the Central Province for game loving guests that should 1 . 4 9cater for hikers and photograp hy.A lodge at Bindura, Mashonaland is to be built
Construction of a top class hotel with confe rence facilities at Osborne Dam, M u t a re 5 . 8 3Provision of travel and prepaid packaged tours and to cater for an estimated market of 60,000 people on day tours 0.52and excursions
M i s c e l l a n e o u s
Equity partner sought to produce Po rtland cement utilising locally available re s o u rc e s .The project is promoted by both 1 4 . 9 0the Industrial Development Corporation (Zimbabwe) and a Chinese companyTo engage in the extraction of black granite to meet increased fo reign demand and undertaking re l evant marketing 6 . 0 0a c t i v i t i e sP roduction of metal equipment such as agricultural implements, hand implements, wheel barrows and window/door 1 . 3 8f r a m e sConstruction of shell factories to be leased out to budding entre p re n e u r s .The project is promoted by the City of 2 . 5 0G we r u
S o u rc e s :Z i m b a b we Investment Centre, 1 9 9 8 .
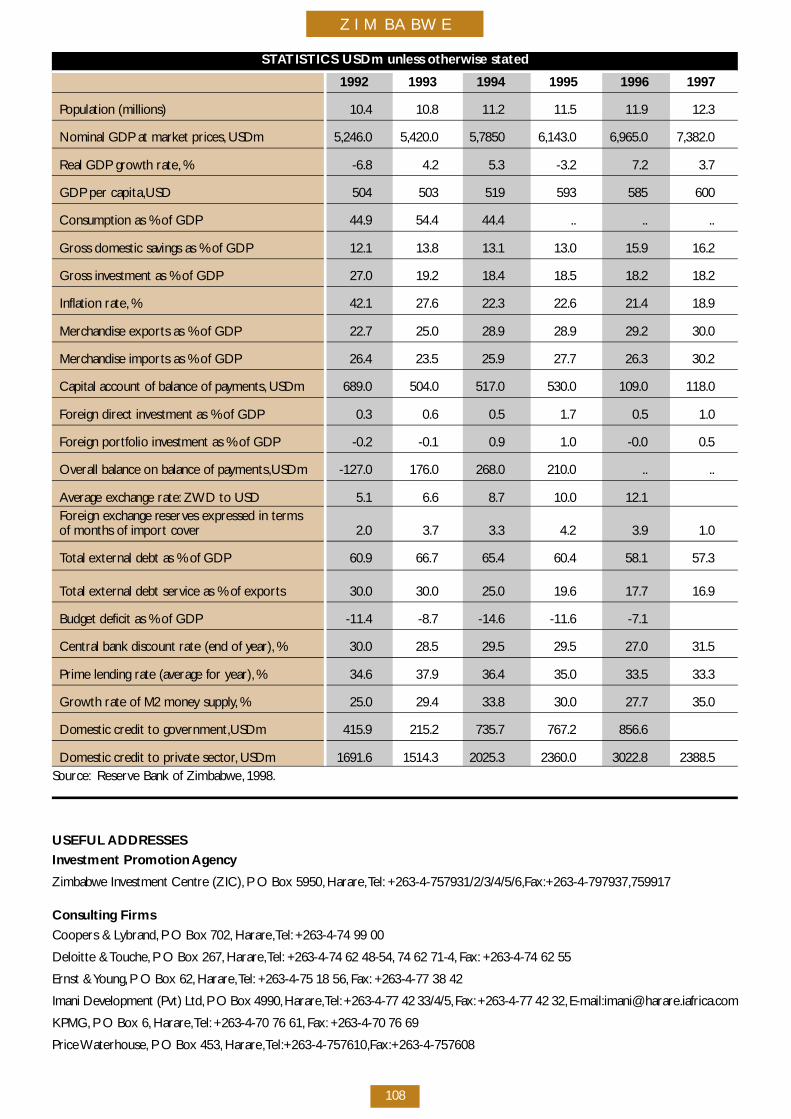
Z I M BA BW E
108
S TATISTICS USDm unless otherwise stated
1 9 9 2 1 9 9 3 1 9 9 4 1 9 9 5 1 9 9 6 1 9 9 7
Population (millions) 1 0 . 4 1 0 . 8 1 1 . 2 1 1 . 5 1 1 . 9 1 2 . 3
Nominal GDP at market prices, USDm 5 , 2 4 6 . 0 5 , 4 2 0 . 0 5 , 7 8 5 0 6 , 1 4 3 . 0 6 , 9 6 5 . 0 7 , 3 8 2 . 0
Real GDP growth rate, % - 6 . 8 4 . 2 5 . 3 - 3 . 2 7 . 2 3 . 7
GDP per cap i t a ,U S D 5 0 4 5 0 3 5 1 9 5 9 3 5 8 5 6 0 0
Consumption as % of GDP 4 4 . 9 5 4 . 4 4 4 . 4 . . . . . .
G ross domestic savings as % of GDP 1 2 . 1 1 3 . 8 1 3 . 1 1 3 . 0 1 5 . 9 1 6 . 2
G ross investment as % of GDP 2 7 . 0 1 9 . 2 1 8 . 4 1 8 . 5 1 8 . 2 1 8 . 2
Inflation rate, % 4 2 . 1 2 7 . 6 2 2 . 3 2 2 . 6 2 1 . 4 1 8 . 9
M e rchandise exports as % of GDP 2 2 . 7 2 5 . 0 2 8 . 9 2 8 . 9 2 9 . 2 3 0 . 0
M e rchandise imports as % of GDP 2 6 . 4 2 3 . 5 2 5 . 9 2 7 . 7 2 6 . 3 3 0 . 2
C apital account of balance of pay m e n t s , USDm 6 8 9 . 0 5 0 4 . 0 5 1 7 . 0 5 3 0 . 0 1 0 9 . 0 1 1 8 . 0
Fo reign direct investment as % of GDP 0 . 3 0 . 6 0 . 5 1 . 7 0 . 5 1 . 0
Fo reign port folio investment as % of GDP - 0 . 2 - 0 . 1 0 . 9 1 . 0 - 0 . 0 0 . 5
O verall balance on balance of pay m e n t s ,U S D m - 1 2 7 . 0 1 7 6 . 0 2 6 8 . 0 2 1 0 . 0 . . . .
Average exchange rate: ZWD to USD 5 . 1 6 . 6 8 . 7 1 0 . 0 1 2 . 1Fo reign exchange re s e rves expressed in termsof months of import cove r 2 . 0 3 . 7 3 . 3 4 . 2 3 . 9 1 . 0
Total external debt as % of GDP 6 0 . 9 6 6 . 7 6 5 . 4 6 0 . 4 5 8 . 1 5 7 . 3
Total external debt service as % of export s 3 0 . 0 3 0 . 0 2 5 . 0 1 9 . 6 1 7 . 7 1 6 . 9
Budget deficit as % of GDP - 1 1 . 4 - 8 . 7 - 1 4 . 6 - 1 1 . 6 - 7 . 1
Central bank discount rate (end of ye a r ) , % 3 0 . 0 2 8 . 5 2 9 . 5 2 9 . 5 2 7 . 0 3 1 . 5
Prime lending rate (average for ye a r ) , % 3 4 . 6 3 7 . 9 3 6 . 4 3 5 . 0 3 3 . 5 3 3 . 3
G rowth rate of M2 money supply, % 2 5 . 0 2 9 . 4 3 3 . 8 3 0 . 0 2 7 . 7 3 5 . 0
Domestic credit to gove r n m e n t ,U S D m 4 1 5 . 9 2 1 5 . 2 7 3 5 . 7 7 6 7 . 2 8 5 6 . 6
Domestic credit to private sector, U S D m 1 6 9 1 . 6 1 5 1 4 . 3 2 0 2 5 . 3 2 3 6 0 . 0 3 0 2 2 . 8 2 3 8 8 . 5S o u rc e : R e s e rve Bank of Zimbabwe, 1 9 9 8 .
USEFUL A D D R E S S E S
I nvestment Promotion A ge n c y
Z i m b a b we Investment Centre (ZIC), P O Box 5950, H a r a re,Te l : + 2 6 3 - 4 - 7 5 7 9 3 1 / 2 / 3 / 4 / 5 / 6 ,F a x :+ 2 6 3 - 4 - 7 9 7 9 3 7 ,7 5 9 9 1 7
Consulting Firms
Coopers & Ly b r a n d , P O Box 702, H a r a re,Te l : +263-4-74 99 00
Deloitte & To u c h e, P O Box 267, H a r a re,Te l : +263-4-74 62 48-54, 74 62 71-4, F a x : +263-4-74 62 55
Ernst & Yo u n g , P O Box 62, H a r a re,Te l : +263-4-75 18 56, F a x : +263-4-77 38 42
Imani Development (Pvt) Ltd, P O Box 4990,H a r a re,Te l :+263-4-77 42 33/4/5, F a x :+263-4-77 42 32, E - m a i l :i m a n i @ h a r a re. i a f r i c a . c o m
K P M G , P O Box 6, H a r a re,Te l : +263-4-70 76 61, F a x : +263-4-70 76 69
Price Wa t e r h o u s e, P O Box 453, H a r a re,Te l :+ 2 6 3 - 4 - 7 5 7 6 1 0 ,F a x :+ 2 6 3 - 4 - 7 5 7 6 0 8
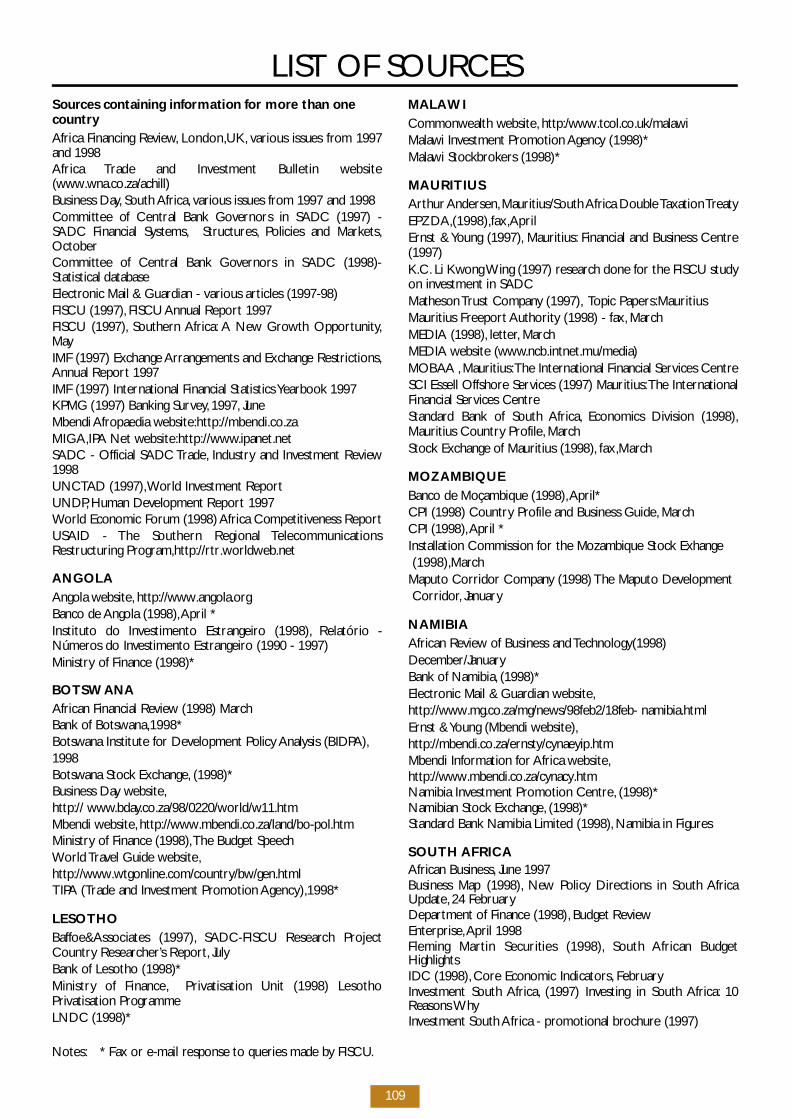
109
LIST OF SOURCES
N o t e s : * Fax or e-mail response to queries made by FISCU.
S o u rces containing information for more than onec o u n t ryAfrica Financing Rev i ew, L o n d o n ,U K , various issues from 1997and 1998Africa Trade and Investment Bulletin we b s i t e( w w w. w n a . c o. z a / a c h i l l )Business Day, South A f r i c a , various issues from 1997 and 1998Committee of Central Bank Governors in SADC (1997) -SADC Financial Systems, S t r u c t u re s , Policies and Marke t s ,O c t o b e rCommittee of Central Bank Governors in SADC (1998)-Statistical database E l e c t ronic Mail & Guardian - various articles (1997-98)FISCU (1997), FISCU A n nual Report 1997FISCU (1997), Southern A f r i c a : A New Growth Opport u n i t y,M ay IMF (1997) Exchange A rrangements and Exchange Restrictions,A n nual Report 1997IMF (1997) International Financial Statistics Yearbook 1997KPMG (1997) Banking Survey, 1 9 9 7 , Ju n eMbendi A f ropaedia we b s i t e :h t t p : / / m b e n d i . c o. z aM I G A ,I PA Net we b s i t e :h t t p : / / w w w.ipanet.net SADC - Official SADC Tr a d e, I n d u s t ry and Investment Rev i ew1 9 9 8U N C TAD (1997),World Investment ReportU N D P, Human Development Report 1997World Economic Forum (1998) Africa Competitiveness Report USAID - The Southern Regional Te l e c o m mu n i c a t i o n sRestructuring Pro g r a m ,h t t p : / / rt r. wo r l d we b.net
A N G O L AA n gola we b s i t e, h t t p : / / w w w. a n go l a . o r gBanco de A n gola (1998),April *Instituto do Investimento Estrangeiro (1998), Relatório -N ú m e ros do Investimento Estrangeiro (1990 - 1997)M i n i s t ry of Finance (1998)*
B OT S WA N AAfrican Financial Rev i ew (1998) Marc hBank of Botsw a n a ,1 9 9 8 *B o t swana Institute for Development Policy A n a lysis (BIDPA ) ,1 9 9 8B o t swana Stock Exchange, ( 1 9 9 8 ) *Business Day we b s i t e,http:// www. b d ay. c o. z a / 9 8 / 0 2 2 0 / wo r l d / w 1 1 . h t mMbendi we b s i t e, h t t p : / / w w w. m b e n d i . c o. z a / l a n d / b o - p o l . h t mM i n i s t ry of Finance (1998),The Budget SpeechWorld Tr avel Guide we b s i t e,h t t p : / / w w w. w t go n l i n e. c o m / c o u n t ry / b w / g e n . h t m lT I PA (Trade and Investment Promotion A g e n c y ) ,1 9 9 8 *
L E S OT H OB a f foe&Associates (1997), SADC-FISCU Research Pro j e c tC o u n t ry Researc h e r ’s Report , Ju lyBank of Lesotho (1998)*M i n i s t ry of Finance, Privatisation Unit (1998) LesothoPrivatisation Programme LNDC (1998)*
M A L AW IC o m m o n wealth we b s i t e, h t t p : / w w w. t c o l . c o. u k / m a l aw iM a l awi Investment Promotion Agency (1998)*M a l awi Stockbro kers (1998)*
M AU R I T I U SA rthur A n d e r s e n ,Mauritius/South Africa Double Taxation Tre a t yE P Z DA ,( 1 9 9 8 ) ,f a x ,A p r i lErnst & Young (1997), M a u r i t i u s : Financial and Business Centre( 1 9 9 7 )K . C. Li Kwong Wing (1997) re s e a rch done for the FISCU studyon investment in SADCMatheson Trust Company (1997), Topic Pap e r s :M a u r i t i u sMauritius Fre e p o rt Authority (1998) - fax, M a rc hMEDIA (1998), l e t t e r, M a rc hMEDIA website (www. n c b. i n t n e t . mu / m e d i a )M O BAA , M a u r i t i u s :The International Financial Services CentreSCI Essell Offshore Services (1997) Mauritius:The InternationalFinancial Services CentreS t a n d a rd Bank of South A f r i c a , Economics Division (1998),Mauritius Country Pro f i l e, M a rch Stock Exchange of Mauritius (1998), f a x ,M a rch
M O Z A M B I Q U EBanco de Moçambique (1998),A p r i l *CPI (1998) Country Profile and Business Guide, M a rc hCPI (1998),April *Installation Commission for the Mozambique Stock Exhange( 1 9 9 8 ) ,M a rch
M aputo Corridor Company (1998) The Maputo Deve l o p m e n tC o rr i d o r, J a nu a ry
N A M I B I AAfrican Rev i ew of Business and Te c h n o l o gy ( 1 9 9 8 )D e c e m b e r / J a nu a ry Bank of Namibia, ( 1 9 9 8 ) *E l e c t ronic Mail & Guardian we b s i t e,h t t p : / / w w w. m g . c o. z a / m g / n ew s / 9 8 fe b 2 / 1 8 feb- namibia.htmlErnst & Young (Mbendi we b s i t e ) ,h t t p : / / m b e n d i . c o. z a / e r n s t y / c y n a ey i p. h t mMbendi Information for Africa we b s i t e,h t t p : / / w w w. m b e n d i . c o. z a / c y n a c y. h t mNamibia Investment Promotion Centre, ( 1 9 9 8 ) *Namibian Stock Exchange, ( 1 9 9 8 ) *S t a n d a rd Bank Namibia Limited (1998), Namibia in Figures
SOUTH A F R I C AAfrican Business, June 1997Business Map (1998), N ew Policy Directions in South A f r i c aU p d a t e, 24 Fe b r u a ry D e p a rtment of Finance (1998), Budget Rev i ewE n t e r p r i s e,April 1998Fleming Martin Securities (1998), South African BudgetHighlights IDC (1998), C o re Economic Indicators, Fe b r u a ry I nvestment South A f r i c a , (1997) Investing in South A f r i c a : 1 0Reasons W hyI nvestment South Africa - promotional bro c h u re (1997)
110
I nvestment South Africa (1998), f a x ,A p r i lJohannesburg Stock Exchange (1998), f a x ,M a rch S awubona (1997) SAA Flight Magazine),August Star Business Report , various articles 1997-98S u n d ay Times Business Times - Various articles 1997 and 1998
S WA Z I L A N DBusiness Day we b s i t e,h t t p : / / w w w. b d ay. c o. z a / 9 7 / 0 6 0 9 / wo r l d / w 6 . h t mCentral Bank of Swaziland, ( 1 9 9 8 ) *Institutional Inve s t o r, Focus Swaziland, 1 9 9 8M i n i s t ry of Economic Planning and Deve l o p m e n t ,D eve l o p m e n tP l a n : 1997/98 – 1999/00, 1 9 9 8M i n i s t ry of Finance,The Budget Speech, 1 9 9 8Public Policy Co-ordination Unit, Economic and Social Refo r mAgenda (ESRA), 1 9 9 8Swaziland Industrial Corporation Company (SIDC), (1998)* Swaziland Stockbro kers Limited, ( 1 9 9 8 ) *Regional Te l e c o m munications Restructuring Program we b s i t e,h t t p : / / rt r. wo r l d we b. n e t / sw ap r 1 . h t mThe Swazi Observer (1998),A p r i l
TA N Z A N I A
Deutsche Morgan Gre n fell (1998) Ta n z a n i a : C apacity pro b l e m sundermining macro achieve m e n t s ,J a nu a rySouthern African Economist (1997) Ju ly-August S t a n d a rd Bank of South A f r i c a , Economics Division (1998)Tanzania Country Pro f i l e, J a nu a ry Star Business Report , various articles 1998Tanzania Daily Business News - Various art i c l e s
Tanzanian Ministry of Energy and Minerals (1998), f a x ,M a rc hZanzibar Investment Promotion Agency (1997) ZipaN ew s l e t t e r, October - DecemberZanzibar Investment Promotion Agency (1998), f a x ,A p r i l
Z A M B I A
African Rev i ew of Business and Te c h n o l o gy (1997),August Lusaka Stock Exchange (1998), e - m a i l ,M a rc hPrice Waterhouse (1997),The Compre h e n s i ve Investors’ Guideto ZambiaPrice Waterhouse (1998) The 1998 Zambia Budget HighlightsZambia Investment Centre - e-mail (April 1998)Zambia Privatisation Agency - fax (April 1998)Z a m n e t :w w w. z a m n e t . z m
Z I M B A B W E
D e p a rtment of State Enterprises and Indigenization,P r i v a t i z a t i o n :The Case of Zimbabwe, 1 9 9 8M i n i s t ry of Finance, P ress Statement by the Minister of Finance,N ovember 1997Reserve Bank of Zimbabwe, Fo reign Dire c tI nvestment in Zimbabwe, ( 1 9 9 8 ) *R e s e rve Bank of Zimbabwe, Q u a rt e r ly Economic and StatisticalR ev i ew, September/December 1998Regional Te l e c o m munications Restructuring Program we b s i t e,h t t p : / / rt r. wo r l d we b. n e t / z i m p r 1 . h t mThe Herald,April (1998)Z i m b a b we Stock Exchange, ( 1 9 9 8 ) * Z i m b a b we Inve s t m e n tC e n t re (ZIC), ( 1 9 9 8 )