1.1: Introduction to Physical Science
65
1.1: Introduction to Physical Science
-
Upload
khangminh22 -
Category
Documents
-
view
0 -
download
0
Transcript of 1.1: Introduction to Physical Science

1.1: Introduction to Physical Science

What Is Science?
• Science From Curiosity• Human curiosity has led to the discovery of many things.
• Curiosity is the basis of science.
• Science: a system of knowledge and the methods you use to find that knowledge

What Is Science?
• Science and Technology• Scientific knowledge can be applied in ways that
improve the lives of people.
• Technology: the use of knowledge to solve practical problems
• Science goal: to expand knowledge
• Technology goal: to apply that knowledge

Branches of Science
• Study of Science: Social and Natural• Social science is the study of human society and
behavior (ex: anthropology, psychology, sociology)
• Natural science is generally divided into three branches (physical science, Earth and space science, and life science).

Branches of Science – Physical Science• Focuses on non-living things
• Physical science (2 main areas): physics and chemistry• Chemistry: the study of the composition, structure,
properties, and the reactions of matter
• Physics: the study of matter and energy and the interactions between the two through forces and motion

Branches of Science – Earth and Space Science• Earth science: the application of physics and
chemistry to the study of Earth
• Geology: the study of the origin, history, and structure of Earth
• Astronomy: the study of the universe beyond Earth, including the sun, moon, planets, and stars

Branches of Science – Life Science
• Biology: the study of living things

Branches of Science
• Problem with subdividing science: the different areas often overlap with each other

The Big Ideas of Physical Science
• There are basic rules of nature and there are unknown rules waiting to be discovered.• Space and Time: the universe is very big and very old
(13.7 billion years old; 700 million billion billion meters in diameter).
• Matter: a very small amount of the universe is matter (has mass and volume).• Matter on Earth is usually solid, liquid, or gas.
• Forces and Motion: forces cause changes in motion.• Energy: energy exists in many forms (kinetic and
potential); energy can be transferred from one form or object to another, but it can’t be destroyed.

Science and Your Perspective
• Science is both a process and a body of knowledge.
• Scientific facts of today might change tomorrow.

1.2: Scientific Method
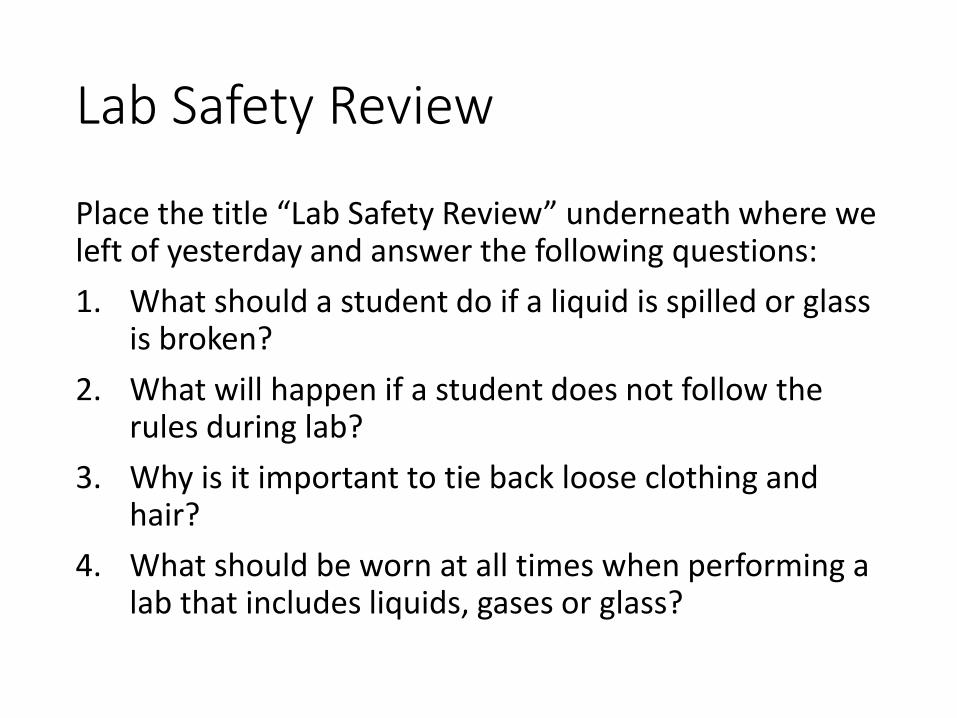
Lab Safety Review
Place the title “Lab Safety Review” underneath where we left of yesterday and answer the following questions:
1. What should a student do if a liquid is spilled or glass is broken?
2. What will happen if a student does not follow the rules during lab?
3. Why is it important to tie back loose clothing and hair?
4. What should be worn at all times when performing a lab that includes liquids, gases or glass?

Scientific Method
• Scientific method: an organized plan for gathering, organizing, and communicating information• The goal of any scientific method is to solve a problem
or to better understand an observed event.

How do you design an experiment?• Write the statement below in your notebook:
• Your friend says, “I think it will take less time to freeze hot water than cold water.”
• Written Response #1: How could you design an experiment to test this idea?

Problem / Purpose
1. The question the lab will answer
2. Identifies the independent and dependent variables• Independent Variable: the factor the scientist changes
from group to group• Dependent Variable: the factor the scientist measures to
see the effect of the independent variable
• Written response #2: Based on the situation mentioned on the previous slide, what is the purpose?

Research / Background Information1. Lets the reader learn about the topic
2. Helps the scientist develop an educated hypothesis

Observation vs. Inference
• Observation: describing something you are studying, using only facts that you can see, touch, hear or smell. An observation is not an opinion.
• Inference: using your observations to make a guess about an object or an outcome.

Think you’ve got it?!
• We can OBSERVE that the turtle is on the stump.
• We can OBSERVE that the stump is too high for the turtle to climb on.
• We can INFER that someone put the turtle on the stump.

Written Response #3: Write the statement and fill in each blank with either INFER or OBSERVE
1. We can _____ that someone is smiling.
2. We can _____ that they are happy.
3. We can _____ that a student is writing downtheir homework.
4. We can _____ that they are a successful student.
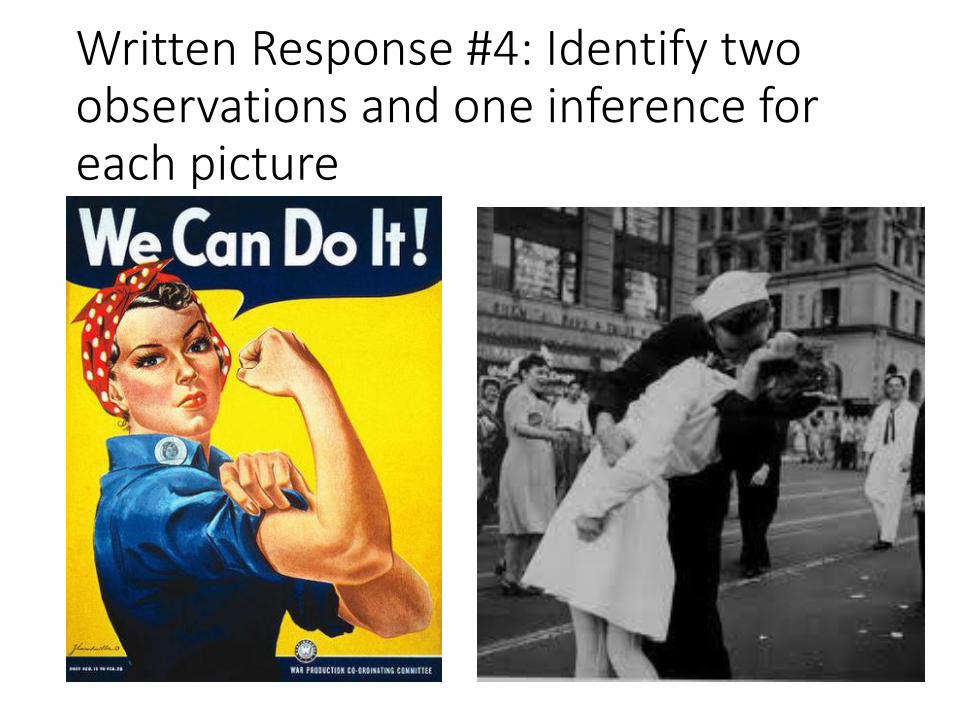
Written Response #4: Identify two observations and one inference for each picture

Optical Illusions Handout
1. Complete assignment with your table partner.
2. Bring to me so that I can check for completion.
3. Glue/tape into notebook where the stamp is visible.

Hypothesis
1. An educated prediction based on prior knowledge (observations) or research
2. Can be tested, proven false and agrees with research
3. Hypothesis are written in “if…then” format to show a cause and effect relationship
• Written Response #5: What is the hypothesis for the water scenario?

Independent and Dependent Variables• Independent Variable: The variable that the
scientist CHANGES
• Dependent Variable: The variable that the scientist observes and MEASURES the result of change

Procedure / Experiment
1. Steps must be precise and detailed
2. Has at least one control group• Control group: normal conditions or absence of
independent variable• Used for comparison
3. Experimental group(s) have only one changing variable (independent variable)
• Written Response #6: Design a procedure for the water experiment. Make sure you include the control group and experimental group.

Placebo
• “Sugar pill” that has no effect
• Participants’ condition improves thinking they are receiving the drug

Observations / Data
• Must be objective.• Good example: the bacterial colony is yellow.
• Bad example: the bacterial colony is nasty.
• Use measurements whenever possible.• Good example: there are 50 bacterial colonies
• Bad example: there are a whole bunch of colonies

Observations / Data
• Do not draw conclusions in the data section of the report.• Good example: there are bacteria and fungal colonies in
the shoe section.
• Bad example: the show was really dirty and so it was the most contaminated and grew a lot of stuff.
• Should be organized.• May use a graph, table or drawing(s)
• Always include units of measurement and title.
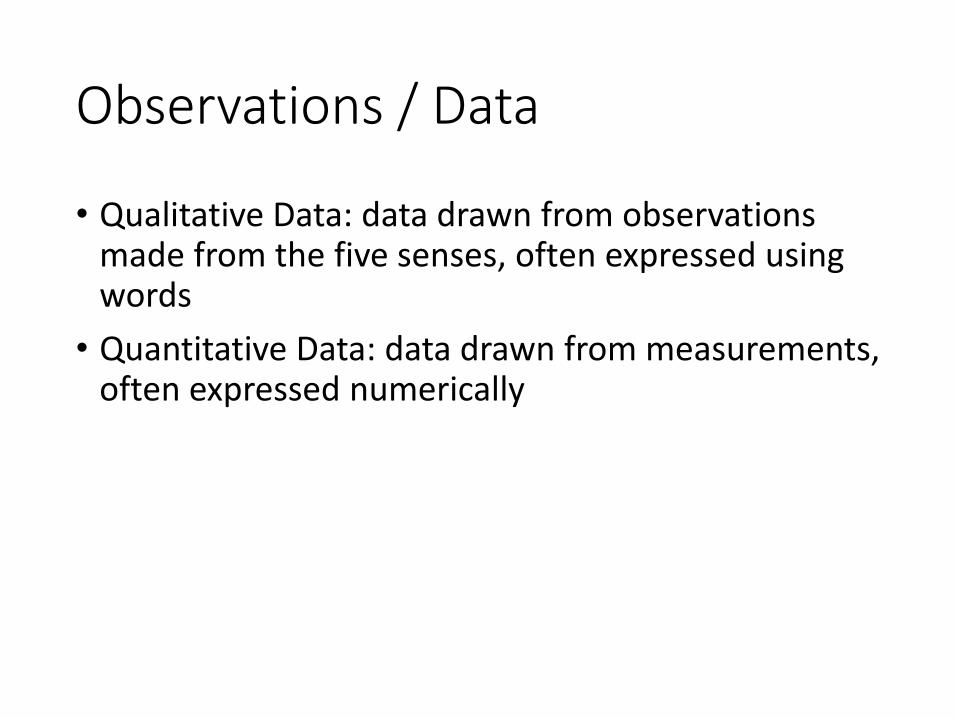
Observations / Data
• Qualitative Data: data drawn from observations made from the five senses, often expressed using words
• Quantitative Data: data drawn from measurements, often expressed numerically

Observation / Data – draw the chart on the left-side of your notebook.Data Collection from Experiment
Type of Water
Time to Begin
Freezing (sec)
Time to Complete Freezing
(sec)
Hot Water (110 C)
3500 12,400
Cold Water (68 C)
2000 16,800
Written Response #7
• Draw a chart/graph to represent the data in the table to the left.

Analysis / Conclusions
1. Answers the purpose question.
2. Accepts or rejects the hypothesis.
3. Explains what can be inferred from the data.
• Written Response #8: Draw a conclusion that takes in consideration the points mentioned above.

Scientific Theories and Laws
1. Theories are well-tested explanations for a set of observations or experimental results• Theories are never proven; they become strong if the
facts continue to support them.
2. Laws are statements that summarizes a pattern found in nature without attempting to explain it
• Theories and laws are connected because scientific theories are used to explain scientific laws/


Example #1
• Question: Is there a relationship between the number of hours spent studying and the score a student gets on the weekly quiz?
• Written Response #9:• Identify the following from the scenario above:
1. Independent Variable
2. Dependent Variable
3. Experimental Group
4. Control Group

Example #2
• A psychologist is studying the effects of steroids on the aggressive behavior of female rats. 24 female rats receive daily injections of a placebo (sugar pill that has no effect), while 24 others receive daily injections of the steroid. Round-the-clock videotapes of the rats allow all aggressive encounters to be counted and timed.
• Written Response #10:• Identify the following from the scenario above:
1. Independent Variable2. Dependent Variable3. Experimental Group4. Control Group

Variables Practice - Spongebob
1. Complete assignment with your table partner.
2. Bring to me so that I can check for completion.
3. Glue/tape into notebook where the stamp is visible.

Scientific Method Lab – “Drops on a Coin”

1.3: Measurement and Scientific Notation

SI Units of Measurement
• A measurement must have a number and a unit in order to makes sense.• Units such as inches, feet, °F are not used in science
• Scientists use a set of measuring units called SI, or the International System of Units.• Scientists can interpret one another’s measurements
using SI.

Base and Derived Units
• SI Units of Measurement: base units and derived units• SI is built upon seven
metric units (base units)• Base unit: length
(meter), mass (kg)

Base and Derived Units
• SI Units of Measurement: base units and derived units• Derived units: units
made from combinations of base units• Ex. Density
(mass/volume)=kg/m3

Metric System
• SI Units of Measurement: Metric Prefixes
• A metric prefix indicates how many times a unit should be multiplied or divided by 10.
• Sometimes units have to be converted to other units (grams to kilograms)

Metric System
• Conversion Factor: a ratio of equivalent measurements that is used to convert a quantity expressed in one unit to another unit• Example: 1 kilometer (km) = 1000 meters (m)
OR 1000 meters (m) = 1 kilometer (km)

1.3: Metric Mania - Handout

Precision in Measurement
• Precision: a gauge of how exact a measurement is• If a measurement has more significant figures, it is more
precise.
• Significant figures: all the digits that are known in a measurement, plus the last digit that is estimated.• Example: 2.5 = two significant figures (sig figs)
• Example 2: 3.156 = four significant figures (sig figs)

Precision in Measurement
• The precision of a calculated answer is limited by the least precise measurement used in the calculation.• Example: 2.5 x 3.156 = 7.89 = 7.9
• 2.5 is the least precise (contains two significant figures, while 3.156 contains four significant figures)
Accuracy in Measurement
• Accuracy: the closeness of a measurement to the actual value of what is being measured• Example: the actual time is 8:35 pm. A clock with 8:32
pm is more accurate than a clock with 8:30 pm.

Measuring Temperature
• Temperature: a measure of how hot or how cold something is [base unit is Kelvin (K)]• Thermometer: device used to measure temperature
• Two most familiar scales: Celsius and Fahrenheit (Fahrenheit is not used in science)• Water Boils at 100° C = 212° F
• Water Freezes at 0° C = 32° F

Measuring Temperature
• Temperature can be converted from Fahrenheit to Celsius to Kelvins.• ° F = 1.8 (° C) + 32
• ° C = (° F ) / 1.8 – 32
• ° K = ° C + 273.15
• Note: Fahrenheit cannot be converted directly to Kelvins.
• 0 ° Kelvin: lowest possible temp that can be reached (absolute zero).• 0 ° K = -273.15 C

1.3: Metric Worksheet - Handout

Measurement Lab

Scientific Notation
• Scientific notation: a way of expressing a value as the product of a number between 1 and 10 and a power of 10• Used when working with very large or very small
numbers.
• Example: 6,000,000=6.0 x 10⁶

Scientific Notation
• 6.0 x 10⁶ (exponent indicates the decimal is really 6 places to the right of the 6)
• For any number <1, the exponent is negative (exponent indicates the number of places to the left of the number that the decimal is)

Scientific Notation
• Multiplication: multiply numbers in front of the multiplication sign and add the exponents together• Example: (3.0 x 103) x (2.0 x 105) = 6.0 x 10⁸
• Division: divide numbers in front and subtract the exponents• Example: (8.0 x 10¹²) / (2.0 x 10⁶) = 4.0 x 10⁶

Section 1.3: Using Scientific Notation

1.3: Scientific Notation – Handout

1.4: Scientific Data

Scientific Notation - Handout
• Pick up a handout from the front table.
• Complete with your table partner

Organizing Data
• Large/vast amounts of data are better interpreted if they are organized.
• Scientists can organize their data by using data tables and graphs.
• Using these, you can see patterns and trends in data that can support or disprove a hypothesis.

Scientific Models
• Model: a representation of an object or event• Scientific models make it easier to understand things
that might be too difficult to observe directly. (Atomic models)
• If a model is wrong, it can be changed or replaced by a new one.

Organizing Data: Data Tables
Average Temperature in Lincolnton, NC
Time Temp.
7am 75o
8am 77o
9am 85o
• Simplest way to organize data
• Relates two variables: manipulated (independent) and responding (dependent)
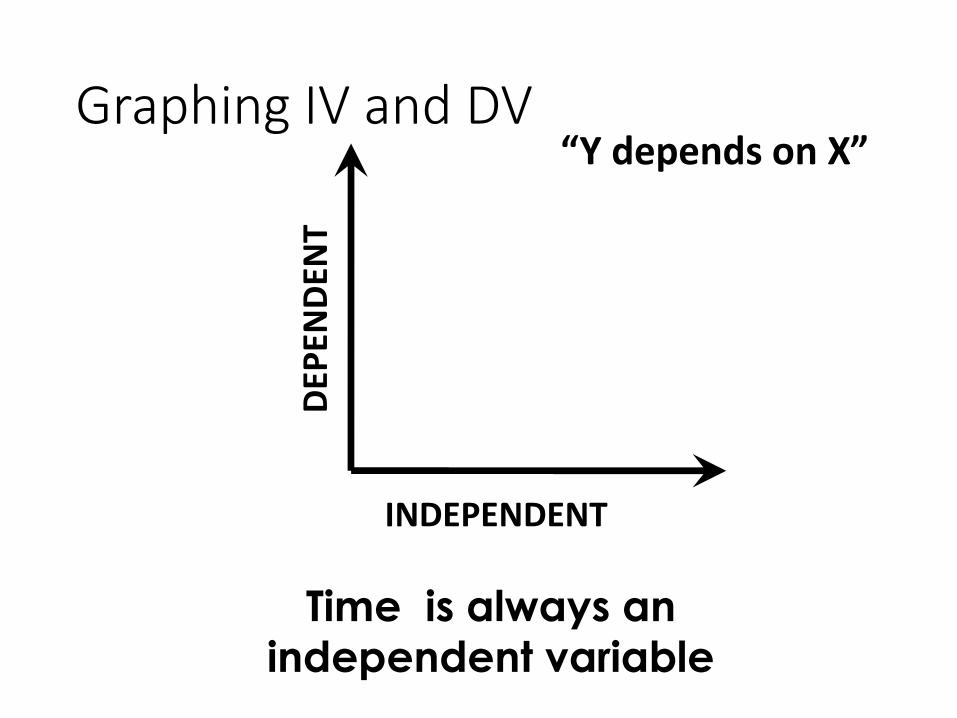
Graphing IV and DV
INDEPENDENT
DEP
END
ENT
Time is always an independent variable
“Y depends on X”

Types of Graphs Foldable
• Label each outside flap with a type of graph:• Bar• Line• Pie• Scatterplot
• Open the flap and include the following information:• Function of the graph• Draw a picture to
represent the graph

GraphingChange over time
Relationship/correlation% of whole
Comparison (single event)

Communicating Data
• Reporting the results of scientific investigations is important.• Scientists can communicate results by writing in
scientific journals, speaking at conferences, conversations, and e-mails
• Peer review: a process in which scientists examine other scientists’ work• Peer review encourages comments, suggestions,
questions, and criticism from other scientists.

1.4: Graphing Skills Practice -Handout1. Complete
assignment.
2. Bring to me so that I can check for completion.
3. Glue/tape into notebook where the stamp is visible.