1.1 How to Use This Guide 1.2 Instructions
141
-
Upload
independent -
Category
Documents
-
view
0 -
download
0
Transcript of 1.1 How to Use This Guide 1.2 Instructions


TABLE OF CONTENTS Page No SECTION 1. 1 1. INTRODUCTION 1 1.1 How to Use This Guide 1 1.2 Instructions 1 THE BASICS
SECTION 2. 2 2.1 WHAT IS POWERPOINT 2 2.1.1 Launching PowerPoint 2 2.1.2 The PowerPoint Screen 2 2.1.3 Toolbars 4 2.1.4 Task Pane 5 2.2 ABOUT SMART TAGS 5 2.2.1 Autocorrect Options Smart Tag 5 2.2.2 Paste Options Smart Tag 6 2.2.3 AutoFit Options Smart Tag 6 2.3.4 Automatic Layout Options Smart Tag 6 TO ACCESS HELP: 6 CREATING A PRESENTATION 7 SECTION 3. 7 3.1 CREATING PRESENTATIONS 7 3.1.1 Adding New Slides 8 3.1.2 Entering And Editing Text 9 3.1.3 Multi-Level Bullets 10 3.2 CHANGING THE SLIDE LAYOUT 11 3.3 SAVING A PRESENTATION 11 3.3.1 Name And Save A Presentation File 12 3.3.2 Subsequent Saves 13 3.3.3 Saving A Presentation With A New Name 13 POWERPOINT VIEWS 14 SECTION 4.
4.1 DIFFERENT WAYS TO VIEW SLIDES 14 4.1.1 The Normal (Tri Pane) View 15 4.2 WORKING WITH OUTLINE VIEW 16 4.2.1 The Outline Tab 16 4.2.2. Creating Slides in Outline View 16 4.2.3 The Outlining Tools 17 4.2.4 Expand or Collapse Text 17 4.2.5 Demote Or Promote Text 18 4.2.6 Creating a Summary Slide 18 4.2.7 Importing an Outline 18

4.2.8 Add A Slide From Another Presentation File 19 4.3 SLIDE SORTER VIEW 20 4.3.1 Working With Slide Sorter View 20 4.3.2 Moving & Copying Slides in A Presentation 21 4.3.3 Moving and Copying Between Presentations 22 4.3.4 View in Black And White 24 4.3.5 To Print Grayscale 24 4.4 SLIDE SHOW VIEW 25 4.4.1 Viewing A Slideshow 25 4.4.2Print Preview 26
FORMATTING SLIDES SECTION 5. 5.1 SELECTING PLACEHOLDERS AND TEXT...45 27
5.1.1 Selecting Placeholders 27 5.1.2 Selecting Text 28 5.2 FORMATTING TEXT 28 5.2.1 Text Formatting Using the Home Ribbon 29 5.2.2 Text Formatting Using the Format Ribbon 29 5.2.3 The Format Painter 31 5.2.4 Changing Case 32 5.2.5 Formatting the Placeholder 32 5.2.6 Formatting Slide Backgrounds 33 5.3 FORMATTING NUMBERED AND BULLETED LISTS 34 5.3.1 Formatting a Bulleted List 34 OBJECTS 36 SECTION 6.
6.1 CHARTS 36 6.1.1 Chart Elements 36 6.1.2 To Create A Chart 37 6.1.3 Moving And Resizing Embedded Charts 38 6.1.4 Data Layout 39 6.1.5 Shortcut Menu (Right Click) 40 6.1.6 Chart Types 41 6.1.7 Default Chart Type 43 6.2 FORMATTING CHARTS 44 6.2.1 Design Ribbon.. 45 6.2.2 Switch Rows And Columns 46 6.2.3 Changing The Chart Layout 45 6.2.4 Chart Styles 46 6.2.5 Layout Ribbon 47 6.2.6 Formatting Chart Elements 47 6.2.7 Resetting Custom Formats 48

6.2.8 Adding, Removing And Formatting Labels 48 6.2.9 Axes 49 6.2.10 Gridlines 51 6.2.11 Unattached Text 51 6.2.12 Format Dialog 51 6.2.13 Add A Series Manually 53 6.2.14 Charting With Blocks Of Data 54 6.3 ILLUSTRATIONS 54 6.3.1 Drawing 54 6.3.2 Creating Regular Shapes 54 6.3.3 Drawing Perfect Squares, Circles And Straight Lines 55 6.3.4 Drawing Objects from Centre Outwards 55 6.3.5 Drawing Lines 55 6.3.6 Selecting Objects 56 6.3.7 Format Objects Using the Format Ribbon 56 6.3.8 Quickstyles 57 6.3.9 Connecting Shapes 60 6.4 SMART ART 61 6.4.1 Creating a Smart Art Organisation Chart 62 6.4.2 WordArt 64 6.5 PICTURES 64 6.5.1 Inserting a Picture 64 6.5.2 Formatting Your Picture 65 6.5.3 Picture Tools 66 6.5.4 Picture Effects 68 6.5.5 Cropping Pictures 69 6.5.6 Working With Gridlines And Guides 69 6.5.7 Snap To Grid 71 6.5.8 Aligning And Distributing Objects 72 6.5.9 Rotating/ Flipping Objects 72 6.5.10 The Rotation Handle 72 6.5.11 Ordering (Stacking) Objects 73 6.5.12 Grouping Objects 74 6.5.13 Inserting Text Within An Object 74 6.6 CLIP ART 74 6.6.1 Format Options 75 6.6.2 Ungrouping Clip Art 76 6.6.3 Resizing Clipart 76 6.6.4 Copying Objects, Clipart, Pictures 77 6.7 TABLES 77 6.7.1 Working With Tables 77 6.7.2 Inserting A Table 78 6.7.3 Adding New Columns And Rows 79

6.7.4 Enter Data In A Table 80 6.7.5 Select Items In A Table 80 6.7.6 Format Table Data 81 6.7.7 Change Column And Row Size 82
6.7.8 Add Rows And Columns
83 6.7.9 Remove Rows And Columns 83 6.7.10 Text Alignment 83 6.7.11 Table Borders And Shading 84 6.7.12 Border Style 84 6.7.13 Table Shading 85 6.7.14 Table Styles 86 6.7.15 Merging And Splitting 86 SLIDE TYPES AND LAYOUTS 87 SECTION 7. 87 7.1 SLIDES 87 7.1.1 Slide Layouts 87 7.2 SLIDE FORMATTING 88 7.2.1 Themes 88 7.2.2 Applying A Theme 89 7.2.3 Slide Colour Scheme 90 7.2.4 Slide Background 90 7.2.5 Headers And Footers 91 7.3 MASTER SLIDES 92 7.3.1 Selecting The Correct Master 93 7.4 FORMATTING THE MASTERS 94 7.4.1 Office Theme Master 94 7.4.2 Title Master 95 7.4.3 Title And Text Master 95 7.4.4 Create Your Own Master 96 7.4.5 Multiple Slide Masters 98 7.4.6 Preserving A Slide Master 99 TRANSITION AND ANIMATION EFFECTS 99 SECTION 8. 99 8.1 ANIMATION EFFECTS 99 8.1.1 Slide Transitions 100 8.1.2 Slide Timings On Transitions 100 8.1.3 Setting Slide Timings Manually 100 8.1.4 Animating Text 101 8.1.5 Removing Animation 103 8.1.6 Preset Animation Schemes 103 8.1.7 Applying A Preset Animation 104 8.1.8 Animating Objects 104

8.1.9 Adding Animation Effects 104 8.1.10 Adding Multiple Animation Effects 105 8.1.11 Animating Objects Simultaneously 105 8.1.12 Using Motion Paths 106 8.1.13 Custom Motion Paths 107 8.1.14 Modifying A Custom Motion Path 108 ORGANISE AND DELIVER PRESENTATIONS 109 SECTION 9. 110 9.1 RUNNING A SLIDE SHOW 110 9.1.1 Starting A Slide Show From Within PowerPoint 110 9.1.2 Rehearsing Timings 111 9.1.3 Running A Show Using Timings 111 9.1.4 Hiding Slides 112 9.1.5 Custom Shows 112 9.1.6 Hyperlinks (Action Buttons) 114 9.1.7 Inserting Hyperlinks (Objects And Text) 114 SECTION 10.
10.1 SAVING AS DIFFERENT TYPES 116 10.1.1 Web Page 116 10.1.2 Saving A Presentation As A PowerPoint Show 117 10.1.3 Save As Earlier 117 10.1.4 Templates 118 QUESTIONS 122


1 | P a g e
PowerPoint 2007
INTRODUCTION
1. Introduction
PowerPoint 2007 is a powerful graphics application that allows you to create presentations for printing or on-line viewing using a variety of different tools. These range from wizards to help you with the content and look and feel of your presentation to animation tools to create moving images. 1.1 How to Use This Guide
This manual should be used as a point of reference following attendance of the introductory level Word 2007 training course. It covers all the topics taught and aims to act as a support aid for any tasks carried out by the user after the course. The manual is divided into sections, each section covering an aspect of the introductory course. The table of contents lists the page numbers of each section and the table of figures indicates the pages containing tables and diagrams.
1.2 Instructions Those who have already used a spreadsheet before may not need to read explanations on what each command does, but would rather skip straight to the instructions to find out how to do it. Look out for the arrow icon which precedes a list of instructions. Keyboard Keys are referred to throughout the manual in the following way: ENTER – Denotes the return or enter key, DELETE – denotes the Delete key and so on. Where a command requires two keys to be pressed, the manual displays this as CTRL P – this means press the letter ―p‖ while holding down the Control key. Commands When a command is referred to in the manual, the following distinctions have been made: When Ribbon commands are referred to, the manual will refer you to the Ribbon – E.g. ―Choose HOME from the Ribbons and then B for bold”. When dialog box options are referred to, the following style has been used for the text – ―In the PAGE RANGE section of the PRINT dialog, click the CURRENT PAGE option‖ Dialog box buttons are shaded and boxed – ―Click OK to close the PRINT dialog and launch the print.‖ Within each section, any items that need further explanation or extra attention devoted to them are denoted by shading. E.G.: “Power point will not let you close a file that you have not already saved changes to without prompting you to save.”

PowerPoint 2007
Section 2 The Basics
2 | P a g e
SECTION 2: THE BASICS
By the end of this section you will be able to identify
Title Bar Ribbons PowerPoint window, Tri Pane View (Normal) Ask a Question
2.1 What Is PowerPoint? PowerPoint is a presentation graphics package that lets you create formatted presentations which can be used in a number of ways. You can produce projects such as overheads for a team briefing, slides for a business meeting or interactive on-screen presentations on your company‘s products. It allows you to produce: Animated Presentations shown on a monitor or overhead screen Overhead Projector Transparencies Paper Printouts of your slides
Notes for the Speaker
Handouts for the Audience
35 mm slides 2.1.1 Launching PowerPoint To launch PowerPoint: Mouse
i. Click the START button on the Taskbar, and select PROGRAMS. Click Microsoft PowerPoint 2007, from the sub-menu list.
2.1.2 The PowerPoint Screen WINDOW BORDER The box that surrounds the PowerPoint screen when it is not maximised is called the window border. When the mouse is over the border, the pointer changes from a single to a double-headed arrow – clicking and dragging with this shape allows the window to be resized. TITLE BAR The coloured bar that appears at the top of the PowerPoint window. The title bar tells you which application you are using and if the workbook you are in is maximised, it will also contain the name of the workbook. If the PowerPoint window is not maximised, by positioning the mouse over the title bar and clicking and dragging, you can move the PowerPoint window to a new location on the screen.
MAXIMISE BUTTON When working in a workbook, the PowerPoint screen contains two windows, an application window and a workbook window. You can

3 | P a g e
maximise both windows to capitalise on the space you have on-screen. If you would like the window that your PowerPoint application is in to fill up the whole screen, click the outermost maximise button. You may find that the workbook you are in can still be bigger – click the inner maximise button to fill the remaining space within the PowerPoint application window.
MINIMISE BUTTON This button is very useful if you need to temporarily switch from PowerPoint into another application without closing PowerPoint down completely. Click the minimise button to shrink PowerPoint to an icon on the task bar; you will then be able to view other icons and applications you may wish to access. When you are finished and ready to continue, click the PowerPoint icon from the task bar to resume. The innermost minimise button will minimise the current workbook window. RESTORE BUTTON This button only appears when a window is maximised.
A maximised window has no border and you cannot see what is behind it. If you want to put the window back inside its border so that you can move and size it, click the restore button. CLOSE BUTTON This button is used to close a window. If you click the close button for a workbook window you close the document. The last button will close the PowerPoint application.
DIALOG BOX LAUNCHER this button launches dialog boxes specific to the part of the ribbon you see them the category will be named such as FONT, CLIPBOARD,etc
The OFFICE BUTTON is the start of PowerPoint and has many important commands and option. Such as PowerPoint settings, opening, saving, printing and closing files. This will be looked into much further later in the manual. PowerPoint 2007 displays the Tri-pane displayed below when it is first launched. This view is also known as Normal view. Underneath ribbon on the left there are tabs to show you your slides or the outline (text structure) while below the main slide part of the window is the section to type notes on the slide.( these will not be seen in the slideshow but can be printed to aid the presenter)

PowerPoint 2007
Section 2 The Basics
4 | P a g e
To Activate a Button on the ribbon Mouse
i. Click the left mouse button on the required tool. Dialog Box
To open a dialog box use the DIALOG BOX LAUNCHER when the dialog box is open, make a choice from the various options and click OK at the bottom of the dialog box. If you wish to change your mind and close the dialog box without making a choice then click on CANCEL. The dialog box will close without any choice being applied. If you would like help while the dialog box is open then click on the ―? ― in the top right hand corner this will bring up a help window that will display the relevant topics. Groups Look at a group type on the ribbon such as FONT and in the bottom right hand corner of that group you may see a small box with an arrow, clicking this is another method to call up a dialog box, this time, directly from the ribbon. Many dialog boxes may be more familiar if you have used PowerPoint before. 2.1.3 Toolbars
There are only two toolbars within the new version of Office 2007 there is the QUICK ACCESS TOOLBAR seen here next to the OFFICE BUTTON, and there is the MINI TOOLBAR
Office button
Quick Access Toolbar
Customizing menu
for toolbar

PowerPoint 2007
5 | P a g e
2.1.4 Task Pane
A task pane is a window that collects commonly used actions in one place. The task pane enables you to quickly create or modify a file, perform a search, or view the clipboard. It is a Web-style area that you can either, dock along the right or left edge of the window or float anywhere on the screen. It displays information, commands and controls for choosing options. Like links on a Web page, the commands on a task pane are highlighted in blue text, they are underlined when you move the mouse pointer over them, and you run them with a single click. A task pane is displayed automatically when you perform certain tasks, for example when you choose CLIPART from the INSERT, Ribbon, to insert a picture About Smart Tags Smart Tags, first introduced in Microsoft Office XP, make it easier for you to complete some of the most common tasks in PowerPoint 2007 and provide you with more control over automatic features. You do not have to complete any additional steps to make the Smart Tags appear or disappear in PowerPoint. The PASTE OPTIONS, AUTOCORRECT Options and AUTOFIT smart tags appear automatically to allow you to quickly choose actions and remain in place until you begin another action. For example, when you complete a paste operation, the PASTE OPTIONS smart tag (below) remains in place alongside your text until you begin typing new text.
A "smart tag" is a type of button in Microsoft PowerPoint 2007 that appears after certain actions, such as an automatic text correction or a copy-and-paste, have taken place. The button has a menu of options that help you control the result of the action. For instance, if PowerPoint automatically capitalizes the first letter of a word, but you want the word lowercased in this instance, you can click the "undo capitalization" option on the button menu to reverse the action. PowerPoint includes several of these smart tag buttons. They function similarly but their look can vary and each has a specific purpose. Autocorrect Options Smart Tag The AUTOCORRECT OPTIONS Smart Tag appears after an automatic correction or change, such as a lowercased letter that's changed to a capital or a network path that's converted to a hyperlink. The Smart Tag shows as a small, blue box when you rest the mouse pointer near text that was changed; it then becomes a button icon

PowerPoint 2007
6 | P a g e
which, when you point to it and click it, displays a menu. If you don't want the correction, use the options on the menu to undo it; turn off this type of correction completely; or connect to the AUTOCORRECT dialog box to adjust settings. Paste Options Smart Tag The PASTE OPTIONS Smart Tag gives you greater control and flexibility in choosing the format for a pasted item. The Smart Tag appears just below a pasted item, such as text, a table, or a slide, with options for formatting. For example, if you copy and paste a slide and insert it after a slide that uses a different design template, you can choose to retain the original design for the slide or let the pasted slide assume the design of the slide it now follows. Autofit Options Smart Tag The AUTOFIT OPTIONS Smart Tag appears when PowerPoint resizes text you're typing to make it fit the current placeholder. If you don't want the text to be resized, you can select options on the Smart Tag menu to undo the resizing or to connect to the AUTOCORRECT dialog box to turn AutoFit settings off. Also, for single-column layouts, you can change to a two-column layout, start a new slide to accommodate the text, or split the text between two slides. Automatic Layout Options Smart Tag The AUTOMATIC LAYOUT OPTIONS Smart Tag appears after you insert an item, such as a picture, diagram, chart, or table that changes the initial layout of the slide. To accommodate the added item, PowerPoint will automatically adjust the slide layout. If you want, use the options to undo the automatic layout or turn it off completely. To Access Help: i. Click the help button below the title bar on the far right OR press F1. The
Help window will open: ii. This is very similar to a web page iii. You may enter search criteria and press ENTER (like a search when on the
internet) iv. The window will display the topics that match your search. Click on a topic in
order for it to be displayed To Find a specific topic
v. The contents page allows you to select from a list of topic headings. Like search results on the internet these are HYPERLINKS to help files.
vi. You may need to be online to access some of the help links. The search will be more extensive if you are online as it will search online help files from Microsoft.
vii. Single click to access the help topic you need. Using ScreenTips:

PowerPoint 2007
7 | P a g e
Use ScreenTips to see information about different items on the screen. If the dialog box does not have a Question Mark button look for a Help button or press F1. SECTION 3. 3. CREATING A PRESENTATION The following topics are covered in this chapter:
Creating a New Presentation Adding New Slides – entering and editing Text Slide Layouts – title slide, bulleted list, two column text Changing the Slide Layout Creating Blank Slides Adding Freeform Text Save a Presentation
3.1 Creating Presentations When you launch PowerPoint 2007, you are placed into a blank PowerPoint presentation, with one Title slide To start a new presentation Mouse
i. Launch PowerPoint. The following screen will automatically be shown, bringing you into a blank presentation, displaying a blank title slide.

PowerPoint 2007
8 | P a g e
3.1.1 Adding New Slides
When you start your new presentation, you are automatically placed into a Title slide layout. Whilst this is the default, you are free to choose any layout listed in the Slide Layout Task pane (see page 24). There are a number of methods to add further slides to your presentation. To add a new slide Mouse i. Click on the drop down arrow beneath the
NEW SLIDE button in the slides group, on the HOME ribbon. A menu with the different layout types of slides will appear.
ii. Make a selection by clicking on one of these with the left mouse button.
Keyboard iii. Press CTRL + M PowerPoint will create a new slide and this new slide and all subsequent new slides will be based on the bulleted list layout.
3.1.2 Entering and Editing Text

PowerPoint 2007
9 | P a g e
Both the Title and Bulleted list layouts are specifically designed so that you can easily enter titles and bulleted list items. To enter text on a Title slide i. To add text to a slide click into the predefined text areas (placeholders) and
type.
Pre-Defined Areas
(Placeholders)
To create bullets on a Bulleted slide:
Mouse i. Click in the bullets area placeholder to show the flashing cursor. ii. Type your list item. To begin a new item, press ENTER. The bullet will
automatically appear next to your cursor on the new line.

PowerPoint 2007
10 | P a g e
3.1.3 Multi-Level Bullets PowerPoint can create five levels of bullet points. Each has a different bullet point, a smaller text size and is progressively indented.
Demoting your bullets Mouse
i. Use the Increase Indent button on the Formatting Toolbar Or Keyboard i. Press TAB
Promoting your bullets i. Use the Decrease Indent button on the Formatting Toolbar. Or Keyboard
ii. Press SHIFT TAB
You can use the options on the FORMAT ribbon to enhance a text box for example, to change the fill colour just as you can with any other drawing object.

PowerPoint 2007
11 | P a g e
3.2 Changing the Slide Layout LAYOUT refers to the way things are arranged on a slide. A layout contains placeholders, which in turn hold text such as titles and bulleted lists and slide content such as tables, charts, pictures, shapes, and clip art. The default slide that holds bulleted text in 2007 also allows the easy insertion of basic objects you might wish WITHOUT having to change the slide layout. In the centre of the main bulleted text area are faint icons that if you move over them will allow you, with one click on them, to insert a range of objects. (See below) Slide layouts where the main placeholder or title placeholder needs to be in different positions can be selected. All available layouts are displayed in the Slide Layout drop down menu.
To change a slide layout
Mouse
i. Click on the Slide you wish to change the layout for.
ii. Click on the LAYOUT button in the SLIDES group on the HOME ribbon.
iii. Select a layout you wish to apply by clicking on the desired layout from the displayed list with the left mouse button.
iv. This will apply the selected slide layout to the current slide

PowerPoint 2007
12 | P a g e
Reapplying a slide layout
i. A layout can be reapplied to a slide by repeating the steps above.
Or
ii.Select the slide you wish to return to the default content layout for that slide type
iii.Click on the RESET button on the SLIDES group, HOME ribbon. iv. This will reset the layout if you have moved your placeholders or deleted some.
3.3 Saving a Presentation
It is important to save your presentation regularly so that your work is not lost in the event of a system crash or a power failure.
3.3.1 Name And Save A Presentation File
The first time you save a presentation that you have created, you will need to allocate a file name.
To save and name a presentation file: Mouse
i. Click on the OFFICE BUTTON and select, SAVE AS. ii. Use the SAVE IN dropdown field to select the drive in which
to save the presentation.
Specify File Name
SpecifyLocation
iii. Double click on a folder to open it. Repeat as necessary until the required folder is displayed in the SAVE IN field.
iv. Type in a FILE NAME v. Click on SAVE.
Files, by default in 2007 are saved with the SAVE AS TYPE extension
PPTX and are not compatible with earlier versions of power point. To make compatible with earlier versions
Specify
File
Name
Specify
Location

PowerPoint 2007
13 | P a g e
i. Save as above but before clicking on the save button change the save as type
by using the drop down arrow to the right of that box and change to save as type of the version you wish (97-2003 file format)
File Names can contain up to 255 characters and can include characters such as spaces and hyphens.
3.3.2 Subsequent Saves
Once you have given a presentation a name and specified a location, you should then save that file regularly as you work.
To save a presentation: Mouse
i. Select OFFICE BUTTON and SAVE
Or ii. Click on on the QUICK ACCESS toolbar
Or iii. Press CTRL+ S
3.3.3 Saving A Presentation With A New Name
If you need to copy a presentation then you can save the current presentation under a different name thus creating a copy of the original. To save a presentation with a new name:
Mouse
iv. Click on the OFFICE BUTTON and select, SAVE AS. The original
presentation file name is automatically selected. v. Delete this and type in a new file name. vi. Click on SAVE.
SECTION 4: POWERPOINT VIEWS

PowerPoint 2007
14 | P a g e
The following topics are covered in this chapter: Normal (Tripane) View Slide Sorter View Outline View Notes Pages View View in Black and White Print Preview Using Outline View to enter text Creating slides in Outline View The Outlining Toolbar Creating a Summary Slide Using Slide Sorter View Deleting Slides Moving and copying slides within the same presentation Moving and copying slides between different presentations Using colour/grayscale options Print preview
4.1 Different Ways to View Slides When you are creating your presentation you can switch between different views within PowerPoint, each of which allows you to work in different ways. The views available in PowerPoint 2007 are:
Normal (Tri Pane) View
Slide Sorter
View
Notes Page
View
Slide Show
To switch between these different presentation views you simply need to select

PowerPoint 2007
15 | P a g e
The view from the VIEW ribbon, in the PRESENTATION VIEWS group Alternatively, you can click on the required view button at the bottom left of the screen. However, this option only gives you access to NORMAL. SLIDE SORTER, and
SLIDE SHOW views.
The Normal Pane View In the Normal view you can display the slide, outline and notes views in their own adjustable panes, so you can see everything at once. NORMAL view is the main editing view, which you use to write and design your presentation. The view has three working areas: on the left, tabs that alternate between an outline of your slide text (OUTLINE tab) and your slides displayed as thumbnails (SLIDES tab); on the right, the SLIDE PANE, which displays a large view of the current slide; and on the bottom, the NOTES PANE. The notes area allows you to enter notes about the current slide that will not be seen on screen but can be printed with a picture of the slide to aid a presenter in front of his audience.
4.2 WORKING WITH OUTLINE VIEW

PowerPoint 2007
16 | P a g e
4.2.1 The Outline Tab This pane enables you to edit your presentation quickly when it contains a large amount of text. You can add new slides and text in Outline View. This area is a great place to start writing your content, planning the logical order you want to present your ideas in, and move slides and text around. To work in Outline View Mouse i.Click the OUTLINE tab from the NORMAL (Tri Pane) View ii.The outline format helps you edit your presentation's content and move bullet
points or slides around. It allows you to create new slides and add text to slides very quickly.
To add text: Keyboard
i. Type your title for the slide
ii. Position the cursor at the end of the title
iii. Press CTRL+ ENTER
iv. Type in first paragraph of bulleted text. v. Press ENTER for each new line of bulleted text. vi. Text will appear in the appropriate place on the SLIDE.
When you save your presentation as a Web page, the text on the Outline tab becomes a table of contents so that you can navigate through the slides.
4.2.2 Creating Slides in Outline View
It is also possible to create new slides using Outline View. Add a new slide Keyboard
i. Position the cursor at the end of the previous slides text in the outline area. ii. Press CTRL+ ENTER.
iii. Type in the title of the new slide. And continue with your text
Outline View will display all slides with a slide icon to the left . Outline View will NOT display graphic object or text from extra text objects placed on the slide but ONLY from the original placeholders
4.2.3 The Outlining Tools

PowerPoint 2007
17 | P a g e
You can increase or decrease text indents, collapse and expand content so that you see slide titles but no subordinate bullet points, and show or hide text formatting as you work. To select text in Outline View.
Mouse
i. To select all text on a slide, on the OUTLINE tab in normal view, points to
the slide icon, and when the pointer changes to a four-pointed arrow, click the icon.
ii. To select a bulleted item and all its subordinate paragraphs, points to the
bullet, and when the pointer changes to a four-pointed arrow, click.
4.2.4 Expand or Collapse Text
When you work with text on the OUTLINE tab in normal view, you can collapse text so that you see only the first outline level (slide titles) as you organise. You can re-expand text at any time. You increase or decrease text indents, collapse and expand content so that you see slide titles but no subordinate bullet points, and show or hide text formatting as you work
To collapse text on one slide
i. Double-click the SLIDE icon.
OR
ii. Press ALT + SHIFT + MINUS SIGN.
To Collapse all text in the presentation
i. Right click and select COLLAPSE ALL. OR
ii. Press ALT + SHIFT + 1.
To Expand text on one slide
i. Double-click the SLIDE icon.
OR
ii. Press ALT + SHIFT + PLUS SIGN. Expand all text in the presentation
i. Right click and select EXPAND ALL.
OR ii. Press ALT + SHIFT + 9
4.2.5 Demote or Promote Text

PowerPoint 2007
18 | P a g e
You can increase or decrease text indents, (demote or promote text) using the right click. On the OUTLINE tab in normal view, click the text whose indent level you want to change. To decrease an indent,
i. Right click and select
PROMOTE. OR
ii. Press SHIFT + TAB
To increase an indent iii. Right click and select DEMOTE. OR iv. Press TAB.
4.2.6 Creating a Summary Slide
The ability to create a summary slide and a table of contents slide in your presentation is not available in Microsoft Office PowerPoint 2007. Instead, to create your own summary or table of contents slide by copying slide titles onto a new slide, do the following: To create a summary Mouse
i. On the HOME ribbon, in the SLIDES group, click the arrow under NEW
SLIDE, and then click a slide layout that contains a large body text placeholder
If you add a BLANK slide layout, you must then add a text box. To do this, on the INSERT tab, in the TEXT group, click TEXT BOX, and then drag to draw a large text box on the new slide.
ii. In the pane that contains the OUTLINE and SLIDES tabs, click SLIDES. iii. For each slide that you want to add to the summary or table of
contents, copy the title in the title placeholder, and then paste it onto the new slide in the order in which the slide appears in your presentation.
4.2.7 Importing an Outline
In some cases, you may prefer to use a Word Processor to create your slide show outline. As long as that document uses a format that PowerPoint understands (RTF, TXT, DOC, etc), it can create a slide show outline directly from the document, saving you valuable time.
To Import a pre-existing outline
i. Create a new presentation.

PowerPoint 2007
19 | P a g e
ii. On the HOME ribbon, in the SLIDES group, click NEW SLIDE, and then click SLIDES FROM OUTLINE a dialog appears
iii. Outlines can be any textual documents that can contain an outline. Locate the
file and click on insert. The textual outline will be inserted within your presentation generating slides as necessary.
4.2.8 Add a Slide from another Presentation File
To add one or more slides, from a different presentation file that is located on your computer or on a network share, do the following:
i. Open the presentation that you want to add a slide to
ii. In the pane that contains the OUTLINE and SLIDES tabs, click SLIDES, and then click where you want to add a slide. iii. On the HOME ribbon, in the SLIDES group, click
NEW SLIDE, and then click REUSE SLIDES. iv. In the REUSE SLIDES pane, click
OPEN A POWERPOINT FILE.
v. In the BROWSE dialog box, locate and click the presentation file
that contains the slide that you want, and then click OPEN. In the REUSE SLIDES pane, Microsoft Office
PowerPoint 2007 displays thumbnails of the slides from the presentation that you selected. Rest the pointer on a thumbnail to see a larger version of the slide's contents.

PowerPoint 2007
20 | P a g e
vi. In the REUSE SLIDES pane, do one of the following:
If you want the slide that you are adding to the destination presentation to maintain the formatting of the original presentation, select the KEEP SOURCE FORMATTING check box before you add the slide to the destination presentation.
To add a single slide, click the slide. To add all of the slides, right-click any slide, and then click Insert All
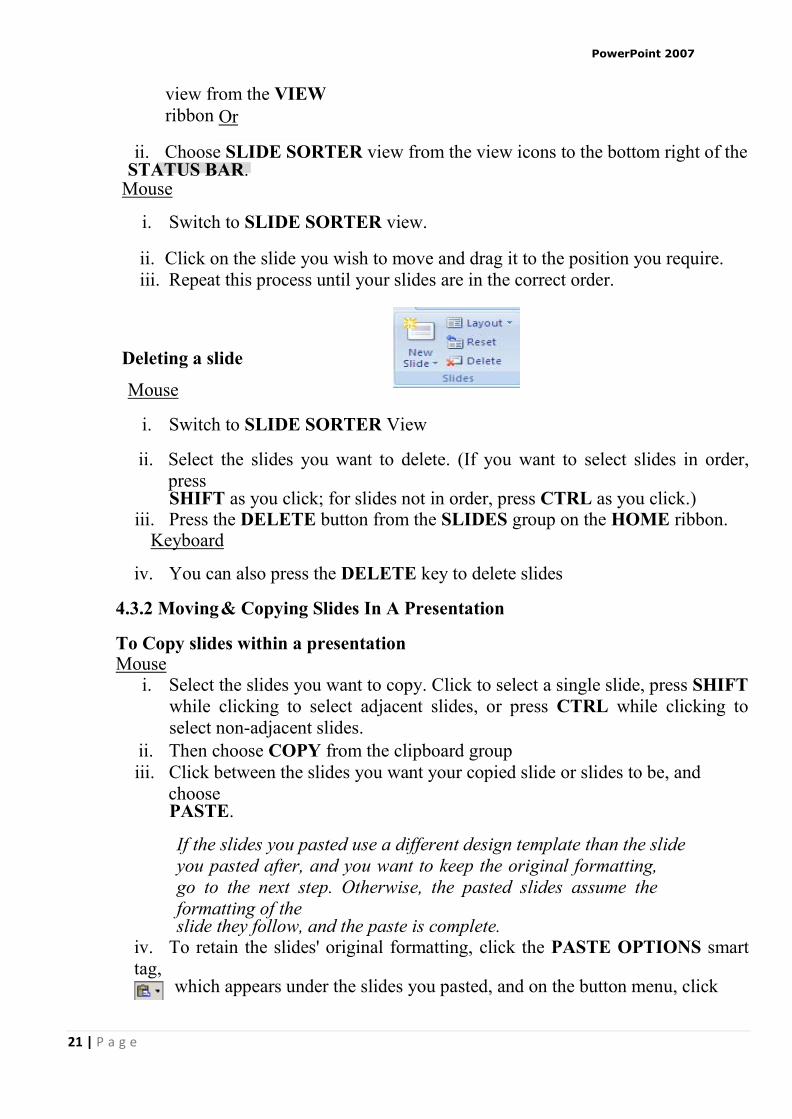
Slides on the shortcut menu 4.3 SLIDE SORTER VIEW
Slide sorter view is an exclusive view of your slides in thumbnail form. When you are finished creating and editing your presentation, slide sorter gives you an overall picture of it making it easy to reorder, add, or delete slides and preview your transition and animation effects.
4.3.1 Working With Slide Sorter View When you are finished creating and editing your presentation, slide sorter gives you an overall picture of it - making it easy to reorder, add, or delete slides and preview your transition and animation effects.
To change to Slide Sorter View
Mouse
i. Choose SLIDE SORTER
PowerPoint 2007
21 | P a g e
view from the VIEW ribbon Or
ii. Choose SLIDE SORTER view from the view icons to the bottom right of the
STATUS BAR. Mouse
i. Switch to SLIDE SORTER view.
ii. Click on the slide you wish to move and drag it to the position you require. iii. Repeat this process until your slides are in the correct order.
Deleting a slide
Mouse
i. Switch to SLIDE SORTER View
ii. Select the slides you want to delete. (If you want to select slides in order, press SHIFT as you click; for slides not in order, press CTRL as you click.)
iii. Press the DELETE button from the SLIDES group on the HOME ribbon. Keyboard
iv. You can also press the DELETE key to delete slides
4.3.2 Moving & Copying Slides In A Presentation
To Copy slides within a presentation Mouse
i. Select the slides you want to copy. Click to select a single slide, press SHIFT while clicking to select adjacent slides, or press CTRL while clicking to select non-adjacent slides.
ii. Then choose COPY from the clipboard group iii. Click between the slides you want your copied slide or slides to be, and
choose PASTE. If the slides you pasted use a different design template than the slide you pasted after, and you want to keep the original formatting, go to the next step. Otherwise, the pasted slides assume the formatting of the slide they follow, and the paste is complete.
iv. To retain the slides' original formatting, click the PASTE OPTIONS smart tag,
which appears under the slides you pasted, and on the button menu, click

PowerPoint 2007
22 | P a g e
v. If you decide you want the current design template styles to apply, click USE DESIGN TEMPLATE FORMATTING (this is the default).
To Move slides within a presentation
Mouse
i. Select the slides you want to move. Click to select a single slide, press ii. SHIFT while clicking to select slides in a row, or press CTRL while iii. Clicking to select slides not in a row. iv. Then choose CUT. Click the slide you want your cut slides to follow, and
choose PASTE. If the slides you pasted use a different design template than the slide you pasted after, and you want to keep the original formatting, go to the next step. Otherwise, the pasted slides assume the formatting of the slide they follow, and the paste is complete.
v. To retain the slides' original formatting, click the PASTE OPTIONS button, which appears under the slides you pasted, and on the button menu,
click
vi. If you decide you want the current design template styles to apply, click USE DESIGN TEMPLATE FORMATTING (this is the default).
To drag the slides, select them, drag them to the new position on the Slides tab, look for the horizontal line under the slide where you want to paste, then release To copy, you can also press CTRL+C; to cut, you can press CTRL+X; to paste, you can press CTRL+V.
4.3.3 Moving and Copying Between Presentations
Moving and copying slides between presentations allows you to easily access slides contained in different presentations and include them in your current presentation.
To copy slides between presentations Mouse
i. Ensure that both the PowerPoint files are open i.e. both the source of the
PowerPoint slides being copied and the destination file that the slides are being copied into.
ii. On the VIEW menu in the WINDOW group, click ARRANGE ALL. iii. Select the slides you want to copy (within the source file). Click to
select a single slide, press SHIFT while clicking to select slides in a row, or press CTRL while clicking to select slides not in a row.

PowerPoint 2007
23 | P a g e
iv. Then choose COPY. v. Click into the slide you want your copied slides to follow (within the
destination file), and choose PASTE.
If the slides you pasted use a different design template than the slide you pasted after, and you want to keep the original formatting, go to the next step. Otherwise, the pasted slides assume the formatting of the slide they follow, and the paste is complete.
vi. To retain the slides' original formatting, click the PASTE OPTIONS button,
which appears under the slides you pasted, and on the button menu, click
vii. If you decide you want the current design template styles to apply, click USE DESIGN TEMPLATE FORMATTING (this is the default).
To move slides between presentations i. Ensure that both the PowerPoint files are open i.e., both the source of the
PowerPoint slides being copied and the destination file that the slides are being copied into.
ii. On the VIEW menu in the WINDOW group, click ARRANGE ALL.
iii. Select the slides you want to Move (within the source file). Click to select a single slide, press SHIFT while clicking to select slides in a row, or press CTRL while clicking to select slides not in a row.
iv. Then choose CUT. v. Click into the slide you want your copied slides to follow (within the
destination file), and choose PASTE. If the slides you pasted use a different design template than the slide
you pasted after, and you want to keep the original formatting, go to the next step. Otherwise, the pasted slides assume the formatting of the slide they follow, and the paste is complete.
vi. To retain the slides' original formatting, click the PASTE OPTIONS button, Which appears under the slides you pasted, and on the button menu, click
vii. If you decide you want the current design template styles to apply, click USE DESIGN TEMPLATE FORMATTING (this is the default).
4.3.4 View in Black And White To see slides in Black and White or grayscale.
Mouse i. Select the view ribbon and select the BLACK AND WHITE, COLOUR or
GRAYSCALE from the COLOUR/GRAYSCALE group
ii. The presentation slides and the thumbnails will

PowerPoint 2007
24 | P a g e
now display in black and white if legibility and contrast has deteriorated, select each object and you will notice that you have a new ribbon called grayscale to allow you to fine tune the settings for each object on all of your slides
4.3.5 To Print Grayscale The settings above are purely for onscreen while building your presentation they have nothing to do with the running of the presentation or the printing of it. If you want your presentation to print in Black and White, the Colour/Grayscale option in the Print dialog box (File, Print) will convert your presentation to grey scale as it prints. The Pure Black and White option in the Print dialog box will print all colours as black or white only. To print grayscale/black and white
Mouse
i. Click on the OFFICE BUTTON and select PRINT from menu to call up the PRINT dialog box.
ii. To the bottom left of the dialog select the COLOUR/GRAYSCALE type
you wish to print in from the drop down box. iii. Click OK to print in that colour format

PowerPoint 2007
25 | P a g e
4.4 SLIDE SHOW VIEW
4.4.1 Viewing a Slideshow
Instead of having OHP transparencies produced you can show your presentation directly from your computer, using the electronic slide show. You can show the presentation on the computer monitor or use an LCD panel and project the show onto an overhead screen. Slides fill the whole screen and display exactly as formatted. As you click with your mouse or press ENTER on your keyboard you will automatically be taken through each slide. Furthermore you can incorporate a range of extra features such as transitions (the way one slide makes way for the next) and animated build effects (which allow objects such as text and graphics to ―fly‖ onto the slide in different ways). You can also include movies and sounds in your presentation as well as buttons which allow the user to branch from one slide to another. Transitions and Animations will be detailed in later sections. When choosing the slide show button at the bottom left of your screen, your slide show is started from the slide you have selected. However, when starting the slide show from View, Slide Show you will always be started from the first slide in the presentation.
To view a slideshow presentation

PowerPoint 2007
26 | P a g e
Mouse
i. Go to the view ribbon and select slideshow from the presentation views group.
Or ii. Use the slideshow button from the status bar view icons Or
Keyboard i. Press the F5 key
ii. Use the left mouse click or ENTER key to move through to the end of your presentation.
iii. The ESC key will end your presentation at any time.
4.4.2 Print Preview
PowerPoint 2007 gives you the ability to preview the way your slides will look before they are printed out on paper.
To use print preview Mouse
iv. From the OFFICE BUTTON choose PRINT then PRINT
PREVIEW. v. Use the NEXT PAGE and PREVIOUS PAGE buttons to advance
through your slides.
vi. You can choose other options for what to print e.g. handouts with three
slides per page, by choosing a new option from the PRINT WHAT box by clicking on the drop down arrow.

PowerPoint 2007
27 | P a g e
vii. You can choose other printing options by clicking on the OPTIONS button on the menu. E.g. to create a frame around each slide choose FRAME SLIDES. The resize your slides for
printing on A4 SCALE TO FIT PAPER option will paper. viii. To return to your previous view after working in Print Preview, click on the CLOSE button.
SECTION 5: FORMATTING SLIDES
The following are covered in this section:
Selecting Placeholders and Text Formatting Text Formatting Backgrounds Formatting Numbered and Bulleted Lists Changing Case Format Painter
5.1 SELECTING PLACEHOLDERS AND TEXT
In order to change the appearance of text, it is firstly necessary to select or highlight either the text or the placeholder that the text sits in. There are a number of different methods used for selecting the text.
5.1.1 Selecting Placeholders
Selecting the entire frame or placeholder is a very quick, efficient and consistent method of selecting text. Any formatting applied to a selected place holder will format all text sitting in the place holder
To select the Placeholder: Mouse
i. Click into the text to be formatted. ii. Click on the shaded border of the text box. This will change the pattern of the
border line to indicate that all text in it is selected.
Unselected Placeholder

PowerPoint 2007
28 | P a g e
Selected Placeholder
Or
Keyboard
iii. Click into the text to be formatted. iv. Press CTRL A.
5.1.2 Selecting Text You may to apply different formatting to different parts of text within the one place holder or frame.
To select some of the text in a box:
Mouse
i. Click into the text to be formatted. ii. Click and drag through text to select it.
To select text by paragraph:
Mouse
i. Click into the text to be formatted. ii. Triple click in the text to select a paragraph and any second, third,
fourth and fifth level paragraphs below it.
5.2 FORMATTING TEXT
Text formatting allows you to change the font, size, colour and style of your text. Using similar formatting across your Word, Excel and PowerPoint documents helps to present a consistent and professional corporate image. Don‘t forget, in order to format text, it is firstly necessary to select it.
The HOME ribbon contains a variety of different options for formatting

PowerPoint 2007
29 | P a g e
text on a slide. The FORMAT ribbon contains many options for changing the appearance of text radically or of formatting the whole placeholder
5.2.1 Text Formatting Using the Home Ribbon
To format text using the home ribbon: Mouse
iii. Select the text you want to format. Either
iv. Use the buttons on the home ribbon to change many aspects of the font style. Or
v. Use the dialog box launcher on the font group
vi. Set the options for FONT, SIZE, COLOUR and EFFECTS. Choose from
Effects such as SUPERSCRIPT and UNDERLINE. vii. Click on OK.
Colours offered are from your Colour Scheme, to use additional colours choose the More Colour option.
5.2.2 Text Formatting Using the Format Ribbon
For more advanced and drastic formats, you can make use of the Format ribbon. To apply formats using the Format Ribbon
Mouse
PowerPoint 2007
30 | P a g e
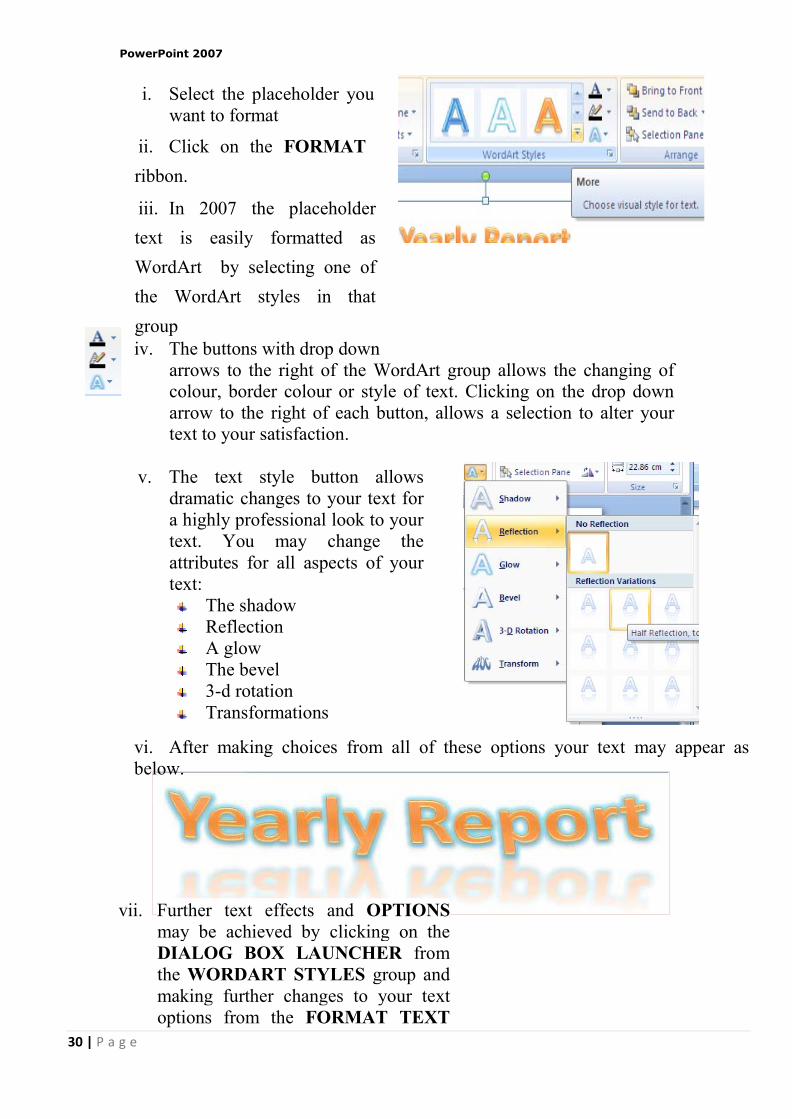
i. Select the placeholder you want to format
ii. Click on the FORMAT ribbon.
iii. In 2007 the placeholder text is easily formatted as WordArt by selecting one of the WordArt styles in that group iv. The buttons with drop down
arrows to the right of the WordArt group allows the changing of colour, border colour or style of text. Clicking on the drop down arrow to the right of each button, allows a selection to alter your text to your satisfaction.
v. The text style button allows
dramatic changes to your text for a highly professional look to your text. You may change the attributes for all aspects of your text:
The shadow Reflection A glow The bevel 3-d rotation Transformations
vi. After making choices from all of these options your text may appear as below.
vii. Further text effects and OPTIONS
may be achieved by clicking on the DIALOG BOX LAUNCHER from the WORDART STYLES group and making further changes to your text options from the FORMAT TEXT

PowerPoint 2007
31 | P a g e
EFFECTS dialog which offers many options that will allow you to refine your initial choices from the preset menu‘s. Such as:
Text fill Text outline The text outline style
3-d format of the text
It‘s rotation Text box options, shown in the
following dialog.
5.2.3 The Format Painter
The Format Painter is a tool that you can use to copy all the formats from one area of text to another. This is particularly useful when you have spent time formatting one placeholder and you decide that you would like to apply the same formatting to another placeholder – rather than reapplying the formats again manually, one by one, you can paint them in to the new placeholder or text with the Format Painter.
To paint formats:
Mouse

PowerPoint 2007
32 | P a g e
i. Select the placeholder or the text that contains the formatting that you want to use.
ii. Click the FORMAT PAINTER button from the HOME ribbon. Your
mouse pointer will change to display a paintbrush next to the selection pointer
iii. Select the placeholder you want to apply the formats to by clicking on it. As soon as you release the mouse, the format will appear. The FORMAT PAINTER will paint the formats from your chosen placeholder and will then turn off. You can keep the FORMAT PAINTER turned on to enable the painting of multiple placeholders by double clicking on the FORMAT PAINTER instead of single clicking as above. To turn the format painter off when finished, press ESC or click once on the FORMAT PAINTER button.
5.2.4 Changing Case
If the case of the letters is wrong, rather than deleting and re-typing in the correct case, you can use the following formatting option. To change text case: Mouse
i. Select your text. ii. Select the drop down arrow next to the
CHANGE CASE button in the FONT group on the HOME ribbon
iii. Choose desired case.
Once your text is selected you can also use SHIFT + F3 to toggle between Upper, Lower and Sentence case.
5.2.5 Formatting the Placeholder
The placeholder itself can be formatted further by using the options on the FORMAT ribbon in the SHAPE STYLES group.
To format a placeholder
Mouse
i. Use the preset styles by clicking
on the drop down arrow to the bottom right of the viewable preset styles and make a selection from the displayed options
ii. Use the drop down arrows to right of the three buttons in the shape styles group to define your own choices for the:
Shape fill. Shape outline.

PowerPoint 2007
33 | P a g e
Shape effects.
Or
iii. Use the DIALOG BOX LAUNCHER to bring up a similar dialog as we did for the text effects but THESE options are specifically for the placeholder shape and as you can see from the title the dialog is called FORMAT SHAPE.
iv. When you have selected the desired
options form the various categories displayed (which are immediately applied) click on CLOSE.
v. Your placeholder may appear as below.
5.2. 6 Formatting Slide Backgrounds
The background colour of all new slides is, by default, white. It is possible to apply a different colour, graded fill colour, pattern, texture or picture, which will override the default setting. The change applies to all slides that follow the design template of the currently selected slide
To change the background formatting
i. On the DESIGN ribbon, click on the BACKGROUND STYLES button from the BACKGROUND group. Make a choice from one of the preset options displayed.
Or
To use a dialog
ii. On the DESIGN ribbon, click on the BACKGROUND STYLES button
from the BACKGROUND group. Select format background. Or

PowerPoint 2007
34 | P a g e
iii. On the DESIGN ribbon, click on the DIALOG BOX LAUNCHER from the BACKGROUND group. A dialog appears.
iv. Make selections from the
FILL category or click on the PICTURE category to select a picture for your background. When all desired selections have been made click CLOSE.
DO NOT CLICK APPLY TO ALL THIS WILL BE DISCUSSED LATER
A picture you use as a slide background will be stretched to fill the slide background area. If it is not of suitable proportions it will be distorted. You can insert many popular graphics file formats into your presentation including Enhanced Metafile (.emf), Joint Photographic Experts Group (.jpg), Portable Network Graphics (.png), Windows Bitmap (.bmp, .rle, .dib) and Windows Metafile (.wmf) graphics. To insert other file formats you will need to install additional graphic filters.
5.3 FORMATTING NUMBERED AND BULLETED LISTS
The bullets that PowerPoint assigns when you switch them on or use a bulleted list auto layout are controlled by the slide master template, you can however choose different bullet symbols if you wish. This can be done on each individual slide or for all slides on the master. However in this section we will deal with just formatting them on the slides themselves as slide masters will be dealt with later.
5.3.1 Formatting A Bulleted List
To change bullet symbols:
Mouse
i. Select the place holder to format all bullets or
click in a paragraph to change just an individual bullet.
ii. On the HOME ribbon in the PARAGRAPH group use the drop down arrow to the right of the BULLETS button.
iii. Make a selection with the left mouse button by clicking on the bullet format you want.

PowerPoint 2007
35 | P a g e
Or i. On the HOME ribbon in the
PARAGRAPH group use the drop down arrow to the right of the BULLETS button and select BULLETS AND NUMBERING at the bottom of the displayed options. A dialog will appear.
ii. Make a selection of bullet type, size and colour before clicking ok
iv. For further options or to choose a different style of bullet then you could click on CUSTOMISE which opens a further dialog to select the bullet from a selection of fonts.
iv. To select a symbol from a different font change the FONT prompt in the top left of the dialog box.
v. Click on your chosen bullet point and click on OK. You will find a good choice of symbols in the WEBDINGS,
WINGDINGS and MONOTYPE SORTS fonts.
The numbers that PowerPoint assigns when you switch them on or are controlled by the slide master template. You can however choose to edit the numbering if you wish.
To change Number Styles:
Mouse
i. Select the placeholder to format all numbering or click in a paragraph to change just an individual numbered item.
ii. On the HOME ribbon in the PARAGRAPH group use the drop down arrow to the right of the NUMBERING (LIST) button.
iii. Make a selection with the left mouse button by clicking on the
numbering format you want.Or

PowerPoint 2007
36 | P a g e
iv. On the HOME ribbon in the PARAGRAPH group use the drop down arrow to the right of the NUMBERING (LIST) button and click on the BULLETS AND NUMBERING selection at the bottom of the displayed options a dialog appears.
v. Select a STYLE OF NUMBERING, SIZE and COLOUR before clicking
OK vi. To change the colour, click the arrow next to COLOUR, and either select a
COLOUR from the displayed choices — which represent the current colour scheme — or click More Colours for additional choices
vii. Click on OK.
SECTION 6: OBJECTS
By the end of this section you will be able to: Create and edit a chart Insert and use quick parts Use SmartArt Insert and format shapes Insert and format pictures and clipart Work with photo albums Insert, format and work with tables
6.1 CHARTS
Charts in PowerPoint 2007 are very different from earlier versions and for the most part it is just like working in Excel. In fact the underlying datasheet IS Excel and when you select the data or edit the data you will be working in the underlying spreadsheet. The charting program is exactly the same otherwise as you would find in excel. An embedded chart appears on the worksheet where it was created. It is an embedded object, which does not normally appear in its own window, and has no separate existence apart from the slide

PowerPoint 2007
37 | P a g e
6.1.1 Chart Elements
Some chart elements to be aware of.
Chart Element
Description
Titles This is the area where you can specify the titles to have on the chart (i.e. X-axis ―1998‖, Z-axis ―GBP‖
Axes Here you specify whether you want a Y/Z axis and whether you are using timescales to plot your data
Gridlines The gridline ribbon allows you to switch on and off horizontal and vertical gridlines
Legend Use this ribbon to switch the legend on and off or reposition it
Data Labels
The Data Labels ribbon allows you to display the amount each point represents or display the label (i.e. in the example above, each cylinder would have Qtr1, Qtr2 displayed as appropriate at the top of each data marker)
Data Table The Data Table ribbon will display a grid underneath the chart that will show the information that is being plotted.
6.1.2 To Create a Chart
To create a chart Mouse
i. Go to the INSERT ribbon and click on the CHART button
ii. The INSERT CHART dialog will appear
to enable you to insert a chart type of your

PowerPoint 2007
38 | P a g e
choice iii. Select the chart type you wish and click on OK.
Or
iv. Click on the chart icon of a slide with a chart content v. The same INSERT CHART dialog will appear vi. Make a selection and click OK.
6.1.3 Moving and Resizing Embedded Charts
Once the chart object has been created and stored as an embedded object, you can move and resize it.
To move an embedded chart: Mouse
i. Move mouse over the chart frame border your
mouse cursor should have a four pointed black arrow
ii. Click on the chart frame border and hold the mouse button down as you drag. Release the mouse when the chart is in the desired location.
PowerPoint 2007
39 | P a g e
To resize an embedded chart: Mouse
i. Move your mouse over the dotted handles on the Chart frame border. ii. The mouse cursor should change to a double arrow.
iii. Click and Drag up, down, left or right. Hold down the ALT key if you wish the chart to resize by snapping to the cell gridlines
6.1.4 Data Layout
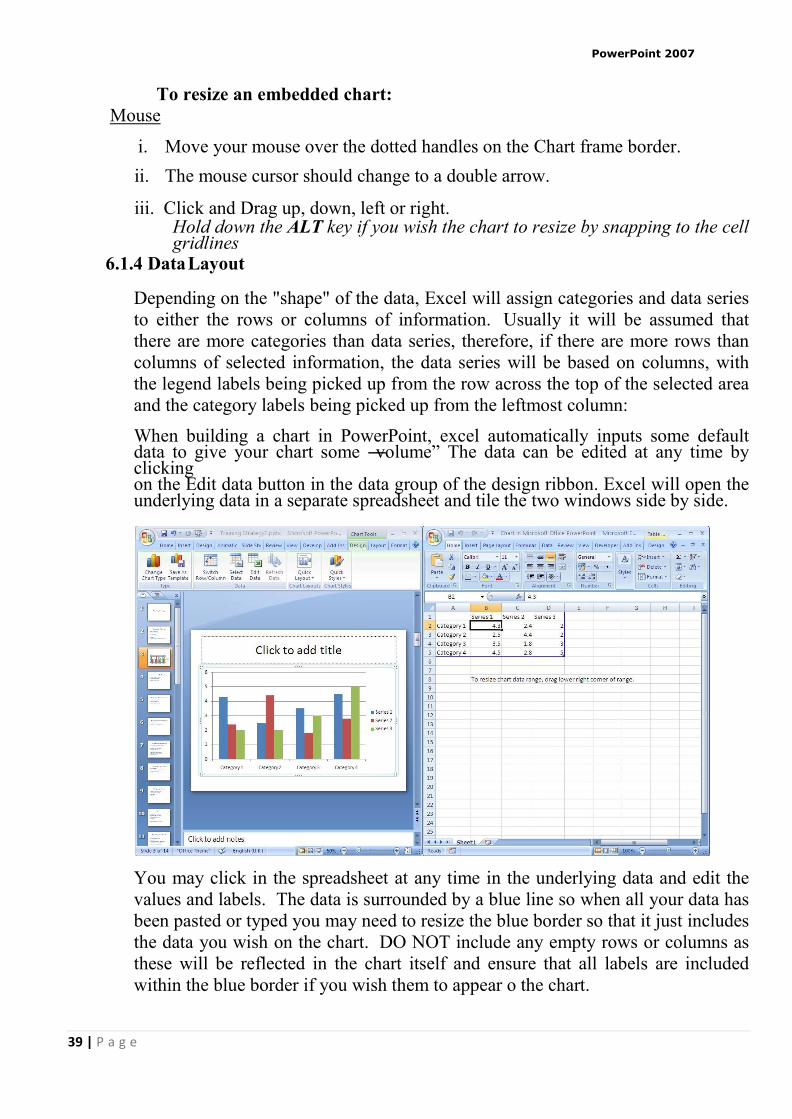
Depending on the "shape" of the data, Excel will assign categories and data series to either the rows or columns of information. Usually it will be assumed that there are more categories than data series, therefore, if there are more rows than columns of selected information, the data series will be based on columns, with the legend labels being picked up from the row across the top of the selected area and the category labels being picked up from the leftmost column: When building a chart in PowerPoint, excel automatically inputs some default data to give your chart some ―volume‖ The data can be edited at any time by clicking on the Edit data button in the data group of the design ribbon. Excel will open the underlying data in a separate spreadsheet and tile the two windows side by side.
You may click in the spreadsheet at any time in the underlying data and edit the values and labels. The data is surrounded by a blue line so when all your data has been pasted or typed you may need to resize the blue border so that it just includes the data you wish on the chart. DO NOT include any empty rows or columns as these will be reflected in the chart itself and ensure that all labels are included within the blue border if you wish them to appear o the chart.

PowerPoint 2007
40 | P a g e
6.1.5 Shortcut Menu (Right Click)
You may be familiar with the Shortcut menus associated with the selected cell(s) on the Excel worksheet. When working on a chart clicking on the chart with the secondary mouse button will call up a Charting Shortcut menu. The Shortcut menu will contain a selection of choices from some of the Standard Menu bar options mostly relating to the chart as an embedded object - almost like a graphic on the worksheet.
To enter or edit data
Mouse
i. On the DESIGN tab, in the DATA group click on the EDIT DATA button.
ii. Click on the spreadsheet that opens on the cells within the blue border.
iii. Type in new values for the labels and the data. iv. Move your mouse to the bottom right of the blue border until you mouse
cursor changes to a double pointed arrow v. Resize the blue border to encompass all of the your entered data. vi. As your new data is entered your chart in PowerPoint will adjust automatically
to display your new values. vii. Close the spreadsheet WITHOUT SAVING.
6.1.6 Chart
Types

PowerPoint 2007
41 | P a g e
There are several different types of chart available within Excel. The type to choose will vary depending on the data involved and what information the chart is intended to convey or highlight. Practice will improve your instinct on which type of chart to use in each instance. Initially it may be useful to try different typesunt if the result is reasonably close to your requirements t, and hen add custom formats and elements as desired. Some chart types are specialised and may only be of use to particular business sectors. Available Types of Chart Selecting any of the types listed will apply a given chart type to the active chart. The most useful types available and some of their applications have been summarised below: Area Area charts can be 2 or 3-dimensional. They are used to compare the change in volume of a data series over time, emphasising the amount of change rather than the rate of change. Area charts show clearly how individual data series contribute to make up the whole volume of information represented in the graph. Bar Bar charts can be 2 or 3-Dimensional. They are used to show individual figures at a specific time or to compare different items. Categories are listed vertically, so that bars appear on the horizontal, thus there is less emphasis on time flow. Bars extending to the right represent positive values while those extending left represent negative values. Column Column charts can be 2 or 3-Dimensional. They are frequently used to show variation of different items over a period of time. Categories (often days or months for example, representing a progression of time) are listed horizontally and columns are displayed side by side, making for easy comparisons. Two variations on the theme of Column charts are represented by further tools on the Chart toolbar. The Stacked Column chart can be used to show variations over a period of time, but also shows how each data series contributes to the whole. A further variation on the 3-D column chart produces 3-D columns in a 3-D plot area, receding away from the viewer. Line Line charts can be 2 or 3-Dimensional. Line charts are used to compare trends over time. There are similarities with Area charts, but line charts tend to emphasise the rate of change rather than volume of change over time. 3-D lines appear as "ribbons" which can be easier to see on the chart.
Pie

PowerPoint 2007
42 | P a g e
Pie charts can be 2 or 3-Dimensional. They are used to compare the size of the parts with the whole. Only one data series can be plotted, making up 100%. Pie charts within their own window can be made to "explode" by dragging one or more pieces of pie away from the centre. Radar Each category in a radar chart has its own axis radiating from the centre point. Data points are plotted along each spoke, and data points belonging to the same series are connected by lines. Xy Scatter Charts XY charts are used to compare two different numeric data series, and can be useful in determining whether one set of figures might be dependent on the other. They are also useful if the data on the X axis represents uneven intervals of time or increments of measurement. 3-D Surface 3-D Surface charts present information in an almost topographical layout. They can be used to pinpoint the high and low points resulting from two changing variables. It can be helpful to think of a 3-D surface chart as a 3-D Column chart which has had a rubber sheet stretched over the tops of the columns. Combination A combination chart allows you to overlay one 2-Dimensional chart type on top of another. This can be useful for comparing different types of data, or for charting data requiring two different axis scales. Once the combination chart has been set up, the actual type of the main or overlay chart can be changed by you.
To change the chart type:
Mouse i. Click on chart to be

PowerPoint 2007
43 | P a g e
changed. ii. Go to the TYPE group on
the DESIGN ribbon. Click on the CHANGE CHART TYPE button. A dialog will appear.
iii. Hovering your mouse over a chart type in the menu will bring up an explanation of that chart type
iv. When you have chosen click once to select a chart type
v. Your chart will have changed
OR
vi. Right click on the chart to call up the shortcut menu Click on CHANGE
CHART TYPE vii. The INSERT CHART dialog will appear Select a type from the left hand
section and a sub type from the right hand section. Click OK to change the chart type
6.1.7 Default Chart Type
The default graph setting in Excel is set to a simple 2-dimensional column chart; however you can change the default to any of the types offered within the chart type dialog. To set the default chart type:
Mouse
i. Go to the TYPE group on the DESIGN ribbon. Click on the CHANGE CHART TYPE button. A dialog will appear
ii. Select a type from the left hand section and click on the specific format that you want the chart to have from the gallery of pictures on the right.
iii. Click the SET AS DEFAULT CHART button. iv. New charts created from now on will use the default format as defined by you
when pressing F11 6.2 FORMATTING CHARTS
There are several different ways of formatting the various elements in a chart. Some formats, such as adding a legend can be applied to a chart using the following sections

PowerPoint 2007
44 | P a g e
Calling up the Shortcut menu on a Chart will also allow you to access the dialog boxes which can be used to change formatting on the entire chart.
6.2.1 Design Ribbon
The DESIGN ribbon is to change some very basic aspects of your chart globally for the chart we have already looked at changing the chart type. We will look at creating some of our own later on
To add or remove a series or category.
Mouse
i. Click on the Chart.
ii. Click on SELECT DATA in the DATA group the SELECT DATA SOURCE dialog will appear above the excel spreadsheet as it opens.
iii. In the LEGEND ENTRIES (SERIES) box click on ADD the EDIT SERIES dialog will appear.
iv. In the series name box select the cell that holds the series label
v. In the series values box select the range of cells that will make up the data for that series.
vi. Click OK
vii. In the HORIZONTAL (CATEGORY) AXIS
LABELS box click on EDIT
viii. The AXIS LABELS dialog will appear
ix. Reselect the range that will include any new category labels. x. Click OK. And OK again to apply the new data to your chart.

PowerPoint 2007
45 | P a g e
To delete a series
Mouse
i. Click on the Chart. ii. Click on SELECT DATA in the DATA group the SELECT DATA
SOURCE dialog will appear
iii. Select the series you wish to delete. iv. Click on DELETE the series will be removed.
To delete a category
i. Click on the Chart. ii. Click on SELECT DATA in the DATA group the
SELECT DATA SOURCE dialog will appear
iii. Click on the SWITCH ROW/COLUMN button. What was a category has now become a series
iv. Now delete series as previously explained. v. Click on the SWITCH ROW/COLUMN button on the dialog box.
What were series have now become categories with the category you wished, removed.
6.2.2 Switch Rows and Columns To switch between rows and columns
Mouse i. Click on the Chart. ii. Click on SELECT DATA in the DATA group the SELECT DATA
SOURCE dialog will appear
iii. Click on the SWITCH ROW/COLUMN button. What was a category has now become a series
OR
Mouse
i. Click on the Chart. ii. Click on the EDIT DATA button in the DATA group of the DESIGN ribbon. iii. When the excel spreadsheet opens click in the data. iv. Click on SWITCH ROW/COLUMN in the DATA group
v. Your data has now switched rows to columns
vi. This facility may not be available if multiple data ranges have been selected for your chart especially if they are different sizes from different locations.

PowerPoint 2007
46 | P a g e
6.2.3 Changing the Chart Layout
As discussed earlier a chart is made up from many elements that can be turned on or off depending on the type of chart or arranged in different places on the chart. To change the layout swiftly instead of laboriously changing each element the change layout tool allows some quick global options.
To change the chart layout
Mouse i. Click on the drop down arrow on the
CHART LAYOUT group ii. Select a chart Layout
iii. The layout is applied
6.2.4 Chart Styles
A chart style is mainly a theme of formatting for your chart using the existing elements of your chart there are some very exciting colour schemes in this feature
To apply a chart style
Mouse
i. Select chart ii. Click on the drop down arrow to the right of the CHART
STYLES group. iii. Select a chart style
iv. Your chart should now adopt the style chosen. If the chart style is not to your liking apply another style following the same method until you have a style close to what you wish. We will look at formatting the various elements in a later chapter to achieve exactly what you want
6.2.5 Layout Ribbon
The Layout ribbon allows us to format, add or remove various elements of a chart. Some tools are only available, however for certain types of chart. E.G. you cannot apply 3D rotation to a 2D chart.

PowerPoint 2007
47 | P a g e
6.2.6 Formatting Chart Elements
To select and format a chart element.
Mouse
i. Go to the LAYOUT ribbon. ii. To select an element of your
chart, click on the drop down arrow to the right of top box in the CURRENT SELECTION group.
iii. Click on a chart element. That element will be selected
iv. Click on FORMAT SELECTION in the CURRENT SELECTION group, the following dialog will appear.
v. The left hand section of the dialog will give the various categories of how you may format your selection (These options may vary depending on the selection.)
vi. The right hand section contains the available formats for that category.
vii. Clicking on each category and setting your format choices will immediately affect you chart.
viii. When you are satisfied with your formatting choices, click CLOSE.
Many of the options displayed in the category options section may involve other drop down boxes to make a selection. (See picture) if you move your mouse over these possible selections a help tip should appear to give you a description of that choice BEFORE actually making a selection. Any choice already applied will already be selected and have a different colour. 6.2.7 Resetting Custom Formats
When experimenting with various formats you may find it difficult to remember exactly what settings were applied to a specific element and therefore you would find it

PowerPoint 2007
48 | P a g e
difficult to make it appear as it once was. Resetting the format of specific chart elements can be very useful.
To reset an element
Mouse i. Make a selection of element to be reset
ii. Click on RESET TO MATCH STYLE button on the CURRENT
SELECTION group. iii. The selected element will revert back to the original format settings of the
applied chart style.
6.2.8 Adding, Removing and Formatting Labels
Information labels on your chart are very important on your chart especially if it is on a separate sheet. The LABELS group offers a selection of labels you may wish to show or hide on your chart. The chart layout choices previously explained uses a mixture of labels in different locations on your chart but you may wish to put specific labels on your chart and format them yourself and place them where you wish.
To add or remove labels.
Mouse
i. Select the chart ii. Click on drop down arrow of type of label you
wish to add or remove from the LABELS group. iii. Make a selection from choices present. iv. Label will appear or disappear, dependant on choice
e.g. v. Use the DATA LABELS button on the LABELS to write the values or the
labels on the data markers. vi. Use the DATA TABLE button on the LABELS to add the plot data so that it
is visible on the chart itself.
To format labels Mouse
i. Select label element from drop down box in the CURRENT SELECTION
group as mentioned previously. ii. Click on FORMAT SELECTION in the CURRENT SELECTION group
as mentioned previously.

PowerPoint 2007
49 | P a g e
To edit label text
Mouse
i. Select label as previously discussed. ii. Click within the label and delete and retype with the text you require.
iii. Click off label
To move or resize chart elements Mouse
i. Make a selection of a chart element. (E.G. a label) ii. Handles will appear at each corner to show selection. iii. Moving mouse over label border should show a 4 pointed Black
arrow. This appears to indicate that you are in the right position to click and drag to move the selected element.
iv. Clicking within the label to edit the text the label will automatically resize to the size of the text entered
Selecting an element like the PLOT AREA will allow a double black arrow when moving over a handle. Clicking and dragging will resize that element.
6.2.9 Axes
For various types of charts you may not wish to see both axes on the chart you are able to hide or show these axes dependant on your needs.
To add or remove axes from chart
Mouse
i. Select chart if embedded. ii. Click on drop down button on AXES button on AXES group iii. Select PRIMARY HORIZONTAL or
PRIMARY VERTICAL AXIS. Make a selection from choices shown.
Selecting more primary horizontal or vertical options opens the formatting dialog which would appear if you selected the axis and formatted it. Using the axes menu is best for turning it off or on.
To format the Category (X) Axis:

PowerPoint 2007
50 | P a g e
Mouse
i. Under TICK MARK TYPE, you may click on the appropriate option
button to specify that tick marks on the axis will appear on the inside or outside of the axis line, cross the axis line, or not appear at all. Minor tick marks can also be included (click on the Scale... button to set the intervals for major and minor tick marks).
ii. The TICK LABELS section allows you to dictate where the Labels associated with the selected axis will display. This can be at the High Values end of the axis, the low values end of the axis, next to the axis, or completely suppressed.
iii. Use the SCALE ribbon to specify at where the value axis will appear, which categories are labelled and how many categories will appear between each pair of tick marks.
iv. A series of boxes [a]use automatic positioning. The default setting is to have this box checked which produces a Value Axis at the edge of a given category. Putting a value in the next box down will result in a Value Axis which cuts down the middle of a category. This will also affect the location of tick marks on the axis. Categories may be displayed in reverse order if desired, and the Value Axis may be required to cross at the last plotted category on the chart.
v. Use the ALIGNMENT category to specify the orientation of the category labels.
To format the Value (Y) axis: Mouse
i. Follow steps described above for the category axis. ii. The SCALE ribbon will have different options relating to the values
on the axis. iii. From the SCALE ribbon, you may specify the Minimum and
Maximum values to appear on the axis. The intervals to be used as Major and Minor units on the axis may also be set. You may dictate the point at which the value and category axes cross, whether or not the axes are plotted on a Logarithmic Scale, or whether to have the values plotted in Reverse order.
6.2.10 Gridlines
Gridlines are the indicator lines that run across your chart to either divide up your categories or give visual help when deciding on a value for a

PowerPoint 2007
51 | P a g e
data point more distant from the value axis. You may need more, or less of these, dependent upon your needs for accuracy or visual impact.
To change gridline options Mouse
i. Select chart ii. Click on drop down arrow on GRIDLINES on the AXES group.
iii. Choose PRIMARY HORIZONTAL or PRIMARY VERTICAL GRIDLINES and make a selection from the choices given. 6.2.11 Unattached Text
Floating text may be typed directly onto the Chart, then dragged to the desired position.
To add floating text to a chart:
Mouse
i. Go to the INSERT ribbon and select the TEXT BOX button click on your chart and a text box will appear. Type required text, resize and format text box and drag to required location.
6.2.12 Format Dialog Element options
This category varies dependent on what is selected it may show AXIS, CATEGORY OR SERIES OPTIONS. For SERIES OPTIONS it allows you to change the width of the column or gap between the series. AXIS OPTIONS allows you to specify widths and separation options where the axis begins and ends (if available) Fill Use the FILL category to specify background colours or designs.
Shape
Use this category to set the shape for a selected element (series or data point if available) Borders

PowerPoint 2007
52 | P a g e
Select the BORDER colour to change the border colour and set a border Set the BORDER STYLES category to add a border around the outside of the selected element
Shadow
This option allows you to set the shadow depth, colour and direction for the selected element.
3-D Format If you have a chart that has a 3-D format this category will allow you to change many aspects of the 3-D appearance such as the material, lighting, contour, depth and bevel. Depending on the data being displayed, some data markers on a 3-D chart may be obscured. It is possible to adjust the view so that your data may be seen to its best advantage. You may influence the degree of elevation, perspective or rotation of your chart. A sample chart within the 3-D view dialog box reflects the new views as you change these factors. Elevation and Rotation can be adjusted either by typing values into the appropriate sections within the dialog box, or by clicking on the arrow buttons displayed around the sample chart. The latter technique is obviously easier. Elevation dictates the height from which you view the data. Ranging from 90°(above the plot area) to -90°(below the plot area), where 0° represents a view level with the centre of the plot area. With 3-D Pie Charts, the range varies from 10°, almost level with the edge of the pie, to 80°, looking down on the surface of the pie. 3-D Rotation Selecting the plot or chart area will allow you to rotate your chart in any direction or change the perspective of your chart. Rotation Rotation allows you to turn the graph on its vertical axis. The range goes from 0° to 360°, where zero views the chart from the front, 90°would view it from the side, and 180° would allow you to see it from the back - effectively reversing the order of the data series for the chart display. Perspective Perspective can be changed to make the data at the back of a 3-D chart appear more distant. A perspective of zero means that the farthest edge of the chart will appear as equal in width to the nearest edge. Increasing perspective (up to a maximum of 100) will make the farthest edge appear proportionally smaller. You may also affect the height of the graph in relation to its width and whether or not you want the axes to remain at right angles. This latter setting would preclude the use of perspective in 3-D charts. Auto-scaling allows Excel to scale a 3-D chart so that, where possible, it is similar in size to its 2-D equivalent.

PowerPoint 2007
53 | P a g e
Font The font for any selected textual element can be set on the HOME ribbon from the FONT group or right clicking on the highlighted text and using the mini toolbar. Formatting The Legend The Legend can be selected and formatting like the other chart elements The legend can be positioned manually simply by pointing and dragging it to a new position on the chart, but there are some preset positions which can be selected from legend button in the LABEL group the size of the overall legend to adjust, but it cannot be resized by dragging on the selection handles. No chart element which shows white selection handles (rather Note that the legend cannot actually be resized. Changing the font size will cause than the usual white) can be resized by dragging. Dragging the legend to a new position on the chart will sometimes affect the shape of the legend and the size of the chart. The legend may be placed overlapping the chart. Note that the text appearing in the Legend box is picked up from the worksheet data. Edit the text on the worksheet in order to change the legend text (The legend may be deleted(hidden) by selecting it and pressing the Delete key on the keyboard.
6.2.13 Add a Series Manually
Other methods to add a new data series to a chart:
Mouse
i. Select the worksheet cells containing the relevant data (including the label to be used if labels were included in the original data).
ii. Copy this data to the clipboard in the usual way. iii. Activate the chart by clicking on it and choose Edit, Paste. The data series
will appear in the chart. Or
i. Select the worksheet cells containing the relevant data ii. Drag and drop selected data onto chart.
The added series will invariably come in as the final data series, but the order can be changed by you as outlined later in this document.
6.2.14 Charting With Blocks of Data
As it is possible to select separate ranges in Excel, it is possible to produce charts based on non-contiguous data. This is vital if some of the information on the worksheet is to be omitted. There are some guidelines to be aware of however. The layout of data is important as was demonstrated at the beginning of this document. The selected ranges must amount to a regular block with consistent height and width measurements so that Excel can interpret it correctly, with categories and data series matching up. Once the data has been successfully

PowerPoint 2007
54 | P a g e
selected, choose File, New and click on Chart before clicking on OK, or tap [F11]. An extension of this idea leads to the fact that ranges from separate worksheet files can be included in a single chart. Simply select the worksheet data to be included (subject to the layout provisos above), copy to the clipboard then paste them into the chart.
6.3 ILLUSTRATIONS 6.3.1 Drawing
PowerPoint offers a wide range of drawing tools which allow you to create your own pictures to visually enhance your presentation. You also have a comprehensive Clip Art gallery of pictures which can be inserted into your slides.
6.3.2 Creating Regular Shapes
To draw a shape Mouse
i. In the DRAWING group
on the HOME ribbon select a shape from the SHAPE gallery.
Or
ii. Go to the ILLUSTRATIONS
group on the INSERT ribbon and click on the SHAPES button to open the shapes menu.
iii. To draw a shape, click on the shape to select it, then click on the slide at the top left corner where you want to start and drag the outline of the shape diagonally. Release the mouse and the shape appears on the slide.
6.3.3 Drawing Perfect Squares, Circles and Straight
Lines If you hold down the SHIFT key while dragging an oval or a rectangle, PowerPoint keeps the object the same width and height. That way you can make perfect circles and squares. Release the mouse before you release the SHIFT key.

PowerPoint 2007
55 | P a g e
Holding down the SHIFT key while dragging a line or arrow keeps your line at an angel that‘s an exact multiple of 15 degree increments, which is particularly useful for making exactly horizontal or vertical lines. Release the mouse before you release the SHIFT key.
To draw “perfect” objects:
Mouse i. Select a SHAPE Tool. ii. Hold SHIFT as you click and drag to define the shape on the slide. iii. Release the mouse before you release the SHIFT key.
6.3.4 Drawing Objects from Centre Outwards
Sometimes, it‘s useful to draw a shape by anchoring its centre point and then dragging. This is particularly useful when trying to position things accurately on a slide.
To draw an object from the centre out: Mouse
i. Select a Shape Tool. ii. Hold CTRL as you click and drag to define the shape on the slide. iii. Release the mouse before you release the CTRL key.
You can draw a perfectly regular shape from the centre outwards by holding down SHIFT + CTRL as you draw the shape.
6.3.5 Drawing Lines To draw Lines
i. In the DRAWING group on the HOME ribbon select a line from the SHAPE
gallery. Or
ii. Go to the ILLUSTRATIONS group on the INSERT ribbon and click on the SHAPES button to open the shapes menu.
iii. You can click on the FREEFORM button to draw an object with both curved and straight segments. Drag
to draw freehand shapes; click and move the mouse to draw straight lines.
iv. To end a shape and leave it open, double-click at any time. To close a shape,
click near its starting point.

PowerPoint 2007
56 | P a g e
v. The Scribble button can be used to and drag out a shape that looks more like it was drawn with a pen or to create smooth curves
6.3.6 Selecting Objects
Any shape or line that you draw is called an OBJECT and must be selected before you can move, resize or format it. Selected objects display eight resizing handles around them.
To select one object:
Mouse i. Click on the object.
To select several objects:
Mouse
i. Click on the first object. ii. Press the CTRL key. Click on each other object in turn.
Or iii. Click and drag a rectangle around the objects. All objects within the area will
be selected. Or
iv. Press CTRL A to select all objects on the slide (including text objects).
6.3.7 Format Objects Using the Format Ribbon
Once a shape, line, picture, chart, SmartArt, is selected new ribbons appear to allow you to format the object. In the following chapters we will explore the FORMAT, DESIGN and LAYOUT ribbons.
6.3.8 Quickstyles Quick Styles are combinations of different formatting options and are displayed in a thumbnail in the various Quick Style galleries. When you place your pointer over a Quick Style thumbnail, you can see how the Quick Style affects your SmartArt graphic or shape. Quick Styles for SmartArt graphics (SmartArt Styles) include edges, shadows, line styles, gradients and three-dimensional (3-D) perspectives. Try different combinations of SmartArt Styles and colours until you find one that matches the

PowerPoint 2007
57 | P a g e
message that you want to communicate. You can pick a layout, a SmartArt Style, and a colour variation that you like, and then change the layout again — your SmartArt Style and colours will stay with your SmartArt graphic, so that you do not need to re-do them. SmartArt Styles map the theme effects (theme effects: A set of visual attributes that is applied to elements in a file. Theme effects, theme colours and theme fonts compose a theme.) of the document theme to the shapes within the
SmartArt graphic. For example, shapes might have thick lines or edges, while arrows might have a more subtle style applied to them. You can also apply colours from the theme colours of the document in different ways, such as changing the colour of the shape border. If you create multiple SmartArt graphics and want them to look alike, you can apply the same colours and SmartArt Style to achieve a consistent, professional look. You can have shapes that display with edges, depth, and rotate in 3-D space. To make a SmartArt graphic three-dimensional, apply a 3-D SmartArt Style or manually apply a 3-D rotation to each shape. If the entire SmartArt graphic is three-dimensional (called scene coherent 3D), you can continue to edit the text and formatting of each of the individual shapes, but the shapes cannot be repositioned or resized. You can only reposition or resize shapes in a two- dimensional scene. To switch between 2-D and 3-D, under SMARTART TOOLS on the FORMAT ribbon, in the SHAPES group, click EDIT IN 2-D. The EDIT IN 2-D button temporarily unlocks your SmartArt graphic for editing so that you can move and resize shapes— but the 3-D SmartArt Style is still applied to your SmartArt graphic and reappears when you click EDIT IN 2-D again. When your SmartArt graphic is displayed in a 3-D scene, you can rotate it as a whole and position light sources and the "camera" such that the entire SmartArt graphic appears to pop out of the screen. SmartArt Styles affect an entire SmartArt graphic, while Quick Styles for Shapes (Shape Styles) affect only the selected shape. You can manually customize a shape by changing the colour, effects or border, or by replacing it with another shape. It is recommended that you customize your SmartArt graphic only after you settle on its content and layout, as some customizations are not transferred because they might not look good in the new layout. For more information about switching layouts for SmartArt graphics, see Switch the layout or type of a SmartArt graphic. To apply a QuickStyle
Mouse
i. Select the shape or shapes you wish to apply a QuickStyle to. ii. As you move your mouse over the various options your shape on the
worksheet will temporarily take on that format as a preview. See below.

PowerPoint 2007
58 | P a g e
Other theme fills
iii. If you prefer to look at the other theme fills option at the bottom you will be given the above options
iv. When you locate the style you want click on it
to apply it to your shape.
To format the fill of an object Mouse
i. Select the Object to be formatted.
ii. Select the FORMAT ribbon, SHAPE FILL command from the shape styles group to open a menu.
iii. Make a selection from the options shown. You may choose a simple fill colour You may select a picture You may select a predefined
gradient You may select a texture
Fill
The fill is the colour of the shape. Choose from solid or semitransparent fill, gradient, textured, pattern and picture fills, background colour or none.
Semitransparent Fill allows objects behind to show through:
Solid Fill
Semitransparent Fill

PowerPoint 2007
59 | P a g e
Picture This option allows you to use any digitally stored picture you have saved. Click on the SELECT PICTURE button to specify the file name and location of the picture. The picture will be stretched to fill the Slide background. If it is not of suitable proportions it will be distorted.
You can insert many popular graphics file formats into your presentation including Enhanced Metafile (.emf), Joint Photographic Experts Group (.jpg), Portable Network Graphics (.png), Windows Bitmap (.bmp, .rle, .dib) and Windows Metafile (.wmf) graphics. To insert other file formats you will need to install additional graphic filters.
To format the border or line style
iv. Select the FORMAT ribbon, SHAPE FILL command from the shape styles
group to open a menu. The options are basically the same as formatting a placeholder. (See formatting Placeholders)
Shape outlines
Use the options in the shape lines button to format the colour, style and weight of a line or exterior border and to set a dashed effect if desired. Connectors can be changed between straight, elbowed and curved types and any line can be converted to an arrow or vice versa.
Arrows Lines can be formatted with arrow heads and tails. The beginning of a line is the end at which the line was started when drawn. The Default for new Objects options allows you to specify current settings as the default for all new objects drawn from that point forward. Shape effects Just like the placeholders mentioned previously all shapes can use the 3d effects within this menu there are many preset options to select from to enhance your shape Shape styles All of the shape effects are just parts of the preset

PowerPoint 2007
60 | P a g e
options of the shape styles from that gallery. Select an option from here and it will enhance all aspects of your shape in one quick easy manner.
The Size group
This group allows you to set the size of your shape to an exact size
Opening the dialog box
launcher on any of these groups brings you to a dialog box. the size dialog allows you further options to do with the size of your shape. Altering the size by a percentage larger or smaller, rather than just the specific size. The Lock aspect ratio option allows you to easily resize your object without losing the original proportions. 6.3.9 Connecting Shapes
Instead of using predefined shapes already connected SmartArt to create a flowchart or organisation chart we can use ordinary existing shapes that will give us more flexibility in how we lay them out, We can then connect them with lines that will stay connected even if we move the shapes around.
To connect two shapes
Mouse
i. Draw shapes onto your slide as previously directed and lay them out in your
desired manner. ii. Go to the DRAWING group on the HOME ribbon and select one of the
CONNECTORS from the shapes on display.
iii. Use the drop down arrow to the bottom right of the SHAPES and select a
CONNECTOR from the LINES section of the displayed menu.

PowerPoint 2007
61 | P a g e
iv. A crossed cursor will appear as you move your mouse over the slide.
v. Move your mouse cursor over one of the shapes you wish to connect, a number of red dots will appear on the border of the shape these are connection points.
vi. Move your mouse over a connection point and click with your left
mouse and hold the mouse button down. vii. Drag your mouse over to the other shape you wish to connect still
holding the mouse button – connection points will appear on that shape. viii. Move your mouse over the point you wish to connect to and release the
mouse button. ix. A connector will appear
with a red dot on each end of it indicating that it is now connected to that shape.
x. If one of the dots is not red, click on it, and drag it to the desired connection point as this means you missed the connection point when either clicking or releasing the mouse.
6.4 SMARTART
A SmartArt graphic is a visual representation of your information and ideas. You can create SmartArt graphics by choosing from among many different layouts to quickly, easily and effectively communicate your message. Most people create content that contains only text; even though illustrations and graphics help audiences understand and recall information better than text. Creating designer-quality illustrations can be challenging, especially if you are not a professional designer or you cannot afford to hire a professional designer. If you use earlier versions of Microsoft Office, you can spend a lot of time making shapes the same size and aligning them properly, getting your text to look right, and manually formatting the shapes to match the document's overall style, instead of focusing on your content. With SmartArt graphics and other new features such as themes, you can create designer-quality illustrations with only a few clicks of your mouse. When you create a SmartArt graphic, you are prompted to choose a type such as PROCESS, HIERARCHY, CYCLE, or RELATIONSHIP. A type is similar to a category of SmartArt graphic, and each type contains

PowerPoint 2007
62 | P a g e
several different layouts. When you choose a layout for your SmartArt graphic, ask yourself what you want to convey and whether you want your information to appear a certain way. Because you can quickly and easily switch layouts, try different layouts (across types) until you find the one that best illustrates your message. Experiment with different types and layouts by using the table below as a starting point.
When you switch layouts, most of your text and other content, colours, styles, effects, and text formatting are automatically carried over to the new layout.
6.4.1 Creating a SmartArt Organisation Chart
To insert a SmartArt graphic Mouse
i. On the INSERT ribbon in the ILLUSTRATIONS group, click on the drop down arrow to the right of SMARTART the SMARTART dialog above will appear ii. Choose a category from the left then a graphic from the centre to see a preview in the right hand panel of the window. iii. When you have the selection you desire click ok to insert the SmartArt on your worksheet
iv. The smart art will appear on your worksheet as in picture below.

PowerPoint 2007
63 | P a g e
About the Text pane The Text pane is the pane that you can use to enter and edit the text that appears in your SmartArt graphic. The Text pane appears to the left of your SmartArt graphic. As you add and edit your content in the Text pane, your SmartArt graphic is automatically updated— shapes are added or removed as needed. When you create a SmartArt graphic, the SmartArt graphic and its Text pane are populated with placeholder text that you can replace with your information. At the top of the Text pane, you can edit the text that will appear in your SmartArt graphic. At the bottom of the Text pane, you can view additional information about the SmartArt graphic.
To enter text into SmartArt
Mouse
i. Click on placeholder in the TEXT PANE. ii. Placeholder text will disappear. iii. Type required text and press ENTER iv. Focus will create a new placeholder and new shape waiting for text v. Press TAB to move the text lower in the hierarchy in the example above or
SHIFT + TAB to move it higher.
To remove a SmartArt shape Mouse
i. Select the text or placeholder text of the shape you wish to remove in
the TEXT PANE. ii. Press DELETE key on keyboard iii. Both text and shape will be removed from graphic
6.4.2 WordArt
WordArt is a gallery of text styles that you can add to your 2007 Microsoft

PowerPoint 2007
64 | P a g e
Office system documents to create decorative effects, such as shadowed or mirrored (reflected) text. You can change WordArt text, as you can change any other text in a shape. Mouse
i. On the INSERT ribbon, in the
TEXT group, click WORDART, and then click the WordArt style that you want.
ii. Enter your text. # iii. A WordArt graphic can be resized, rotated, deleted and moved like
any other shape. 6.5 PICTURES
There are many new features for editing your pictures within PowerPoint as we will see they are there to greatly enhance your presentation much more so than in any previous version. Be aware though that there is a distinct difference between clipart and pictures. Pictures are more often than not photographic images although they can look like cartoons but they will be stored in a picture style. Clipart is the inbuilt standard from office containing many images as a windows metafile format, although, clipart holds many photographs as well. Pictures are stored as file type such PCX, JPG or JPEG, GIF, BMP; office clipart is generally stored as file type WMF.
6.5.1 Inserting a Picture
Inserting a picture is a lot easier and less troublesome than previous versions.
To insert a picture Mouse
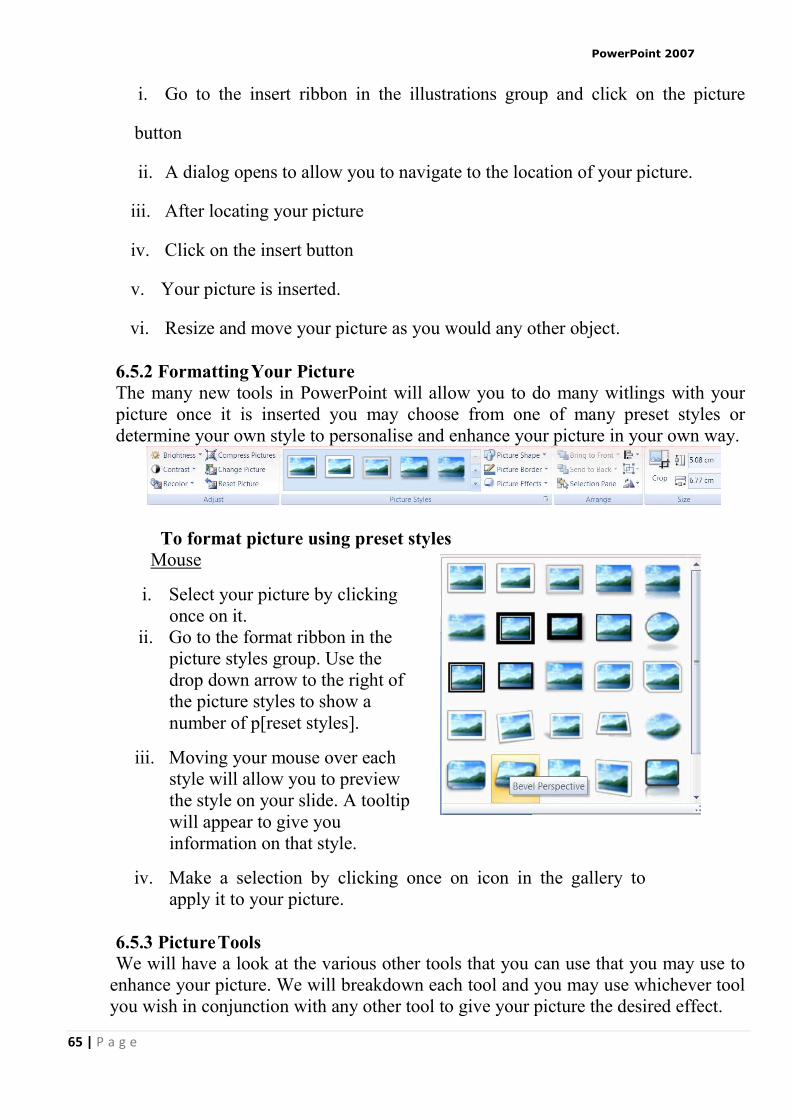
PowerPoint 2007
65 | P a g e
i. Go to the insert ribbon in the illustrations group and click on the picture
button
ii. A dialog opens to allow you to navigate to the location of your picture.
iii. After locating your picture
iv. Click on the insert button
v. Your picture is inserted.
vi. Resize and move your picture as you would any other object.
6.5.2 Formatting Your Picture The many new tools in PowerPoint will allow you to do many witlings with your picture once it is inserted you may choose from one of many preset styles or determine your own style to personalise and enhance your picture in your own way.
To format picture using preset styles
Mouse
i. Select your picture by clicking once on it.
ii. Go to the format ribbon in the picture styles group. Use the drop down arrow to the right of the picture styles to show a number of p[reset styles].
iii. Moving your mouse over each
style will allow you to preview the style on your slide. A tooltip will appear to give you information on that style.
iv. Make a selection by clicking once on icon in the gallery to
apply it to your picture.
6.5.3 Picture Tools We will have a look at the various other tools that you can use that you may use to
enhance your picture. We will breakdown each tool and you may use whichever tool you wish in conjunction with any other tool to give your picture the desired effect.

PowerPoint 2007
66 | P a g e
Brightness Use this tool to change the brightness of your picture it is in the ADJUST group. Clicking on it will give you the option to increase or decrease the brightness of your picture.
Contrast
This tool will allow you to change the variance between light and dark and is in the adjust group
Compress picture pictures is a useful thing to be able to do because of the great file size of pictures in general when you have many in your slideshow it can make the file size unmanageably large it is useful to compress these pictures so that much picture data that does nothing to Enhance the picture on screen is thrown away and can greatly reduce the file size of you presentation. This button opens a small dialog. By default all pictures in your presentation will be compressed if you wish to compress only the ones you have selected ensure you click on the check box before clicking on OK.
N.B. ensure your pictures are the size you wish them to be before using this tool because data is wiped from picture if you wish to make the picture larger. Poor picture quality can occur when doing this
Recolor
This allows you to change the RGB (red green blue) properties of your picture to alter your picture colour in a specific way. Move your mouse over an option to see a preview on your picture on the slide and

PowerPoint 2007
67 | P a g e
click with the left mouse to apply it. Set Transparent Colour
It allows you to integrate a picture with your slide background. This option is available for bitmap pictures that don't already have transparency information. It's also available for some, but not all, clip art. You can make only one colour transparent. When printed, transparent areas will be the same colour as the paper they're printed on. In an electronic display, such as a PowerPoint presentation, transparent areas will be the same colour as the background.
Reset picture
Resetting the picture just removes all the changes you have just previously made to the pictures default settings as it was inserted. This tool is also in the adjust group
Change picture This button allows you to swap the selected picture for another you find more to your liking the insert dialog is opened allowing you to select another picture. Picture shape Change the shape of your picture to any of the shapes you would use from shape menu. 6.5.4 Picture Effects The picture effects is one of the newest and most fun ways of altering your picture on screen. Preset The preset selection shows you some picture styles made up from the other formatting choices. Shadow Choose shadow to see a range of shadows. Reflection This choice gives some stunning ways to alter your picture. Move your mouse over your selection to see a preview on your slide and click to apply selection see over.

PowerPoint 2007
68 | P a g e
Glow
This gives some rosy ways to soften your picture and idealise it.
Soft edges
Instead of having a bevel on the edges of your picture you may further idealise your photo by softening the edges.
Bevel
If you wish your picture to look more of a 3D object on screen you may opt for a bevel option such as the picture that is used in the header of this manual. Any picture could look like that. Picture border
Changing the thickness, colour or whether the border of your picture contains dashes. Is fairly
simple on here just like any other shape or text box.
6.5.5 Cropping Pictures
Pictures can be cropped to remove parts of the picture to allow you to focus on

PowerPoint 2007
69 | P a g e
one object or part of the scene.
To Crop a picture
Mouse
i. Select picture. ii. Select the Format ribbon, size group, and click on the crop button
iii. Position mouse over one of the resizing handles.
iv. Click and drag to crop. Pictures can be uncropped again at any time using the techniques above. Providing they have not been compressed as this removes the extra data stored in the unseen cropped areas.
6.5.6 Working With Gridlines and Guides
Guides are vertical and horizontal lines used to visually align objects. When an object is close to a guide line the edge or centre of the object will snap to the guide. Gridlines are similar but while you have one set of guides that are movable gridlines are fixed The grid is a set of intersecting lines used to align objects. It can make it easier for you to align objects, because they give you a visual cue in relation to the objects and the slide. Use the grid to help align objects more precisely, particularly in relation to each other. The grid can be shown or hidden. Grids are not visible in a slide show and they do not print.
To display and hide gridlines:
Mouse
i. Choose GRIDLINES from the
SHOW/HIDE group on the VIEW ribbon.
Or ii. Select an object. iii. Choose the ALIGNMENT button from
the ARRANGE group on the FORMAT ribbon.
iv. Select GRID SETTINGS a dialog
appears v. Select DISPLAY GRID ON SCREEN. vi. Choose OK

PowerPoint 2007
70 | P a g e
To display guides:
i. Select an object. ii. Choose the ALIGNMENT button from the
ARRANGE group on the FORMAT ribbon.
iii. Select GRID SETTINGS a dialog appears iv. Select DISPLAY DRAWING GUIDES ON SCREEN
v. Choose OK
Mouse
vi. Click on the guide line.
vii. Drag the guide to the required position.
As you drag the guide a measurement will appear. This is the distance of the guide from the centre of the page.
To create additional guides:
Mouse
i. Click on an existing guide line.
ii. Hold the CTRL key, and drag to the
required position. As you drag the guide a measurement will appear. This is the distance of the guide from the centre of the page.
To delete guides:
Mouse
i. Click on the guide line and drag it back to the original guide you created it from

PowerPoint 2007
71 | P a g e
6.5.7 Snap To Grid
The grid includes an option called snap-to, which aligns objects to the nearest intersection of the grid or to another object as you draw or move objects. The snap-to option is turned on by default and works even when the grid is not visible. In most cases, having objects snap-to assists you in laying out your slide accurately. However, occasionally, you may find the grid snap-to option prevents you moving objects freely and placing them exactly where you want. In these cases, turn off the grid snap.
Turning off grid snap
ii. Select an object. iii. Choose the ALIGNMENT button from the ARRANGE group on the FORMAT ribbon. iv. Select GRID SETTINGS a dialog appears
v. Uncheck the SNAP OBJECTS TO GRID option. This will turn off grid snap for all objects until you choose to turn it back on. vi. Choose OK OR
vii. Hold down ALT as you are moving an object. This will temporarily turn off grid snap.
6.5.8 Aligning and Distributing Objects
After you have created several objects you may wish to align them in relation to each other and to distribute them evenly. For example you can align three rectangles so that their top edges are all at the same height and the gap between each one is equal.
To align or distribute objects:
Mouse
viii. Select the Objects to be aligned. ix. Choose the ALIGNMENT button from the ARRANGE group on the
FORMAT ribbon. x. Choose an alignment you wish to apply
Original positions of

PowerPoint 2007
72 | P a g e
objects. After ALIGN
TOPS.
After DISTRIBUTE HORIZONTALLY.
6.5.9 Rotating/ Flipping Objects
If you need a mirror image of an object you can flip it over in any direction. To rotate or flip an object:
Mouse
i. Select the object. ii. Choose the ROTATE button from the
ARRANGE group on the FORMAT ribbon. iii. Choose the appropriate option from
the cascading menu. Use the pictures to help you select the option you need.
6.5.10 The Rotation Handle
In PowerPoint 2007 you have the ability to free rotate all objects easily using the rotation handle.
Using the rotation handle
i. Hover your mouse over the rotation handle until your ii. mouse pointer changes to a circular arrow symbol. ii. Click and drag with the mouse to move the object around to the desired new position.
The rotation handle can be found on most objects in PowerPoint 2007 e.g. images inserted from file, text boxes, clipart and AutoShapes.
6.5.11 Ordering (Stacking) Objects
Rotation Handle PowerPoint stacks objects automatically as you add them to a slide, giving every object its own layer. You see the stacking order when objects overlap: the
Rotation Handle

PowerPoint 2007
73 | P a g e
top object covers a portion of the objects underneath it. This is exactly like putting down several pieces of paper on a desk. The top (front) piece will obscure the piece underneath it. You can move individual objects or groups of objects within a stack. For example, you can move objects forwards or backwards through the stack one level at a time or you can bring an object to the front of the stack or send it to the back of the stack in one move.
To change stacking order:
Mouse i. Click on the object to be moved. ii. Choose the drop down arrow to the right of the
BRING TO FRONT or MOVE TO BACK button from the ARRANGE group on the FORMAT ribbon.
iii. Select the option required. 6.5.12 Grouping Objects
Grouping objects combines them so you can work with them as though they were a single object. You can flip, rotate, and resize all the objects in the group as a single unit. You can also change the formatting of all objects in a group at one time. Grouping is particularly recommended if you individual objects that as a whole make up a diagram or flow chart. To prevent one object accidentally coming out of alignment with the rest, when you have finished working on the diagram objects, group the objects together for safety. It is always possible to ungroup later to make amendment to individual objects. PowerPoint 2007 also lets you change certain attributes of individual objects even though they may be part of a group.
To group objects:
Mouse i. Select all the objects.

PowerPoint 2007
74 | P a g e
ii. Choose the drop down arrow to the right of the GROUP button from the ARRANGE group on the FORMAT ribbon. To work on the objects individually again, ungroup them using the same location but UNGROUP command.
6.5.13 Inserting Text within An Object
All the objects that you can draw onto a slide that have an interior have a text anchor point, which means that you can type text inside them. If the object is moved, the text will move with it.
To add text to an object:
Mouse
i. Select the object. ii. Type text straight in. (Do not select the Text Box button). iii. The text is part of the object itself; when the object is moved the text
will move with it. 6.6 CLIP ART
Because we are not all equally talented in the drawing stakes and because drawing anything with a mouse is extremely difficult, Microsoft supply a huge gallery of pictures ready and waiting to be picked and used. These pictures are referred to as Clip Art. Inserting a piece of Clip Art onto a slide is very easy.
To insert a Clip Art picture:
Mouse
i. Select INSERT ribbon, ILLUSTRATIONS group, CLIP ART
ii. Type a word or text string that describes the clip you are looking for or type in all or some of the file name of the clip.

PowerPoint 2007
75 | P a g e
iii. To narrow your search, do one or both of the following:
To limit search results to a specific collection of clips, in the Search in box, click the arrow and select the collections you want to search.
To limit search results to a specific type of media file, in the Results should be box, click the arrow and select the check box next to the types of clips you want to find.
iv. Click SEARCH. Then Click on ClipArt piece to insert. v. For further options, click on the drop down arrow that appears as you move
over the clip vi. If you cannot find a clip that you want click on CLIP ART ON OFFICE
ONLINE to browse Microsoft‘s online clip art library
6.6.1 Format Options
All the format options thus discussed for pictures applies to clipart as well. Remember clipart is just a Picture and all the formatting options for picture apply to a piece of clipart as well
6.6.2 Ungrouping Clip Art
If you need to adjust more than colour in a Clip Art picture you can ungroup it. Ungrouping will convert it to a Microsoft office drawing object allowing you to manipulate the objects which make up the picture and recolor individual parts of the picture using the PowerPoint drawing tools and commands. When finished, the picture can be regrouped, however it will then treated as a PowerPoint drawing rather than Clip Art and options such as Recolor will not be available. To use the picture tools again it will need to be resaved as a picture
To ungroup Clip Art:
Mouse i. Click on the Clip Art picture.
ii. From the FORMAT ribbon in the ARRANGE group, select the GROUP command and then UNGROUP.
It may be necessary to ungroup a Clip Art more than once. For example, a Clip Art of a person when first ungrouped may allow you to separate the

PowerPoint 2007
76 | P a g e
head, body and limbs. The head may need to be ungrouped again to allow you to separate the facial features.
Regrouping the picture:
Mouse i. Select all objects in picture. ii. From the FORMAT
ribbon in the ARRANGE group, select the GROUP command and then UNGROUP.
The original Clip Art on the right was ungrouped. The scrolled parchment was Flipped, the rosette moved and text added before the picture was regrouped
6.6.3 Resizing Clipart
If you need to enlarge or reduce the size of a piece of Clip Art, you can use the sizing handles that appear when it is selected.
To resize Clip Art:
Mouse i. Select the Clip Art. (8 resizing handles should
appear).
ii. Click and drag a resizing handle to resize the object.
Or iii. Click and drag an adjustment handle (top bottom or side) to re-proportion the
object. Shapes also display Adjustment Handles when selected. These are small, diamonds which when moved will adjust the proportions of the shape.
Resizing Handles are small circles which
Appear at each corner and along the sides of a rectangular area that surrounds each object.
Text boxes are also objects and have similar resizing handles to graphic objects and can be resized in the same way. 6.6.4 Copying Objects, Clipart, Pictures

PowerPoint 2007
77 | P a g e
If you need to ensure that you have an exact duplicate of an object you have drawn, or inserted and formatted the best technique is to copy it. There are several ways you can do this described below.
To copy an object:
Mouse
i. Select the object then Press the CTRL key. ii. Click and drag to move and copy (click on centre of object or on fuzzy border).
Keyboard
iii. Select the Object. iv. Press CTRL C to cut the object out. (Use copy button on home ribbon) v. Press CTRL V to paste a duplicate back onto the slide. (use paste button
on the home ribbon) Note: Holding down the SHIFT + CTRL keys and dragging an object will COPY an object and keep it parallel to the original
6.7 TABLES
6.7.1 Working with Tables A table allows you to present information in a clear and easily accessible format. PowerPoint makes use of the table feature in its sister application Microsoft Word, so if you are already familiar with using tables in Word, you will find using tables in PowerPoint is very similar.
6.7.2 Inserting a Table
You can insert a table into your presentation in two ways; insert a new slide with a layout that contains a content pane into which you can insert a table, or insert a table onto your pre-existing PowerPoint slide.
Using a table slide layout i. Ensure that the layout for the slide holds the CONTENT placeholder ii. Click on the TABLE icon and select the numbers of columns and rows that you need from the small dialog that appears.
iii. Click OK vi. Enter text into the table.

PowerPoint 2007
78 | P a g e
Inserting a table onto an existing slide
i. Click on the INSERT TABLE button on the insert ribbon in the tables group and select the number of rows and the number of columns required by highlighting the number of cells you require across and down.
ii. A table will be inserted onto your slide with the requested number of columns and rows. All columns will have equal width and the table will fill the width of the page (less the margins). See above.
iii. Insert the text you require. If you have existing content on the slide you will have to manually arrange the objects as described previously, resizing and moving them as necessary.
You could if, you prefer, create a new layout in the masters so enable this type of slide layout to be used regularly. (please see masters)
6.7.3 Adding New Columns And Rows

PowerPoint 2007
79 | P a g e
It‘s always a good idea to try and predict how many columns and rows you will need in your table before you first insert it, but you can add more columns and rows later if you need to or delete out extra columns and rows that you no longer want. When you are entering data into your table, you can simply click into different cells with your mouse to move your cursor around. This will allow you to enter text into different cells. However, you may find it faster to move around using the keyboard. The table below outlines some keyboard techniques for moving in a table:
To Press Move to the next cell TAB (If the insertion point is in the
last cell of a table, pressing TAB adds a new row.) Move to the preceding cell SHIFT TAB
Move to the preceding or next row
Ç or È Move to the first cell in the row ALT HOME, or ALT 7 on the
numeric keypad (NUM LOCK must be off.)
Move to the last cell in the row ALT END, or ALT 1 on the numeric keypad (NUM LOCK must be off.) Move to the first cell in the
column ALT PAGE UP, or ALT 9 on the numeric keypad (NUM LOCK must be off.) Move to the last cell in the
column ALT PAGE DOWN, or ALT 3 on the numeric keypad (NUM LOCK must be off.) Start a new paragraph ENTER
Add a new row at the bottom of the table
TAB at the end of the last row
Add text before a table at the beginning of a document
ENTER at the beginning of the first cell
6.7.4 Enter Data in a Table
You can enter text into each cell in your table – your text can even run to multiple lines within one cell. Working within a cell is almost like working on a very small document your text will wrap, you can insert objects, set indents and numbering and the text can be formatted as usual.
To enter data in a table:
Keyboard i. Position the cursor in the cell where you want the information, and type it in. ii. Press ENTER to start a new paragraph within the same cell or SHIFT

PowerPoint 2007
80 | P a g e
To Do this Select a cell Click the left edge of the cell.
Select a row Click to the left of the row.
Select a column Click the column's top gridline
or border.
Select multiple cells, rows, or
columns Drag across the cell, row, or column; or
select a single cell, row, or column, and
then hold down SHIFT while you click
another cell, row, or column. Select text in the next cell Press TAB Select text in the previous cell Press SHIFT TAB
ENTER to start a new line.
Or iv. Press TAB to move to the next cell.
6.7.5 Select Items in A Table
The table below outlines some methods for selecting table components:
Mouse
Or
iv. You can also select rows, columns, or the entire
table by clicking on the table and then using the Select commands from the SELECT button on the LAYOUT ribbon, TABLE group
Keyboard
To Press Select the next cell's contents
TAB
Select the preceding cell's contents
SHIFT TAB
Extend a selection to adjacent cells
Hold down SHIFT and press an arrow key repeatedly
Select a column Click in the column's top or bottom cell. Hold down SHIFT and press Ç or È repeatedly

PowerPoint 2007
81 | P a g e
Extend a selection (or block)
CTRL SHIFT F8, and then use the arrow keys; press ESC to cancel selection mode
Reduce the selection size SHIFT F8 Select an entire table ALT 5 on the numeric keypad (with
off) N
6.7.6 Format Table Data
You can apply the same character and paragraph formats to table data as to standard text.
To format data in a table:
Mouse
i. Select the data to format. ii. Click the buttons to apply formatting from the HOME ribbon as
discussed in earlier sections Word treats each cell in a table as a separate document. Be sure if you have used the enter key in a cell and are applying paragraph formatting to select the appropriate paragraphs. This means that when you use alignment options for example, the data lines up between the edges of the CELL according to the selected alignment.
6.7.7 Change Column and Row Size
The initial width of the columns and height of your rows for your table will depend upon the page orientation and how many columns or rows you selected to insert. The standard widths that Word applies can be easily altered.
To change column widths and row height
Mouse
iii. Ensure that nothing in your table is highlighted (click away from any highlighting to remove it).
iv. Move the mouse over the right edge of the column whose width you want to change – the mouse pointer will change shape (see below).

PowerPoint 2007
82 | P a g e
v. Click and drag the column edge to make the column wider or narrower as required. A vertical guide appears as soon as you start dragging allowing you to preview the new position of the column edge and its width.
vi. Release the mouse. The column will ―jump‖ to its new width.
Or
In the CELL SIZE group on the layout ribbon enter the row and column sizes you wish for the selected rows

83 | P a g e
6.7.8 Add Rows and Columns
A new row can be added to the bottom of a table by pressing the TAB key when
the cursor is in the last cell. If you need to, you can choose where new rows and columns should be inserted or deleted from your table and add or remove them accordingly.
To add a row or column:
Mouse
i. Select the row above or below where you want to insert the new row left or right of where you would want a new column.
ii. Select from the ROWS & COLUMNS GROUP on the LAYOUT ribbon where you would want to insert a row or column.
iii. A new column or row will appear. Repeat for more. 6.7.9 Remove Rows and Columns You can delete selected rows and columns from your table if they are no longer needed.
To remove rows: Menu
i. Select the cells, rows or columns that you want to delete.
ii. ii. Select the DELETE button from the ROWS & COLUMNS GROUP on the LAYOUT ribbon. Choose one of the options.
6.7.10 Text Alignment
Because your rows and columns may have different quantities of data in them it may be necessary to align certain textual elements to various parts of the cell. I.E. you may have a one word tile in a tall cell and wish to align it to the very centre of the cell.
To align text

PowerPoint 2007
84 | P a g e
Mouse i. Select the cell or cells you wish to align the text for. ii. Choose an alignment from the ALIGNMENT group on the LAYOUT tab.
If aligning the text does not put your text where you want it you may set the cell margins as you would for a document to line up your text perfectly
To set cell margins
Mouse
i. Select CELL MARGINS from the ALIGNMENT group on the LAYOUT tab a dialog will appear.
ii. Enter required margin sizes for selected cells.
iii. Click OK to apply
6.7.11 Table Borders and Shading
When you insert a table, Word automatically borders the outline and all the gridlines within – these will appear on a print out. You may want to change the border style and colour or even remove the borders altogether. You can also shade in parts of your table to emphasise them. You can decide which borders should appear in parts of the table, or in the table as a whole. To choose the bordered edges:
Mouse
i. Select the cell(s), row(s) or column(s) where you want to change which edges are bordered, or select the whole table.
ii. Click the drop down arrow on the right of the BORDERS button on the TABLE STYLES group on the DESIGN ribbon.
iii. From the palette that displays, click the button that displays the required option to control which edges of the selection will have borders and which will not.
6.7.12 Border Style
You can change the line style, thickness and

PowerPoint 2007
85 | P a g e
colour that Word uses to border the elements that make up your table. We do this in Word 2007 by drawing the border around the cells. To draw border
Mouse i. Click within your table
ii. Click on the DESIGN ribbon. iii. On the DRAW BORDERS group select
a line style from the top left box (use drop down arrow) the DRAW TABLE button will be enabled
iv. Select a thickness for your border from the box beneath using the drop down arrow
v. Finally choose a pen colour from the button marked. vi. Click on the border of a cell and drag along the border of a cell and release. A
border will be applied with your selections.
vii. Repeat step around cell or table to apply your border formatting
6.7.13 Table Shading
You can apply shading to tables using an option on the TABLE STYLES group on the DESIGN ribbon.
To apply shading: Mouse
i. Select the cell(s), row(s) or column(s) where you want to apply shading or select the whole table if you want to shade the whole table.
ii. Click the drop down arrow to the right of the
Shading colour button on the TABLE STYLES group on the DESIGN ribbon to display a list of different colours.
iii. Click the required colour to apply it to your selection.
You can remove shading by selecting the items that are shaded, clicking the Shading Colour button and choosing the No colour option
6.7.14 Table Styles
There are many predefined styles available to enable you to create a consistently

PowerPoint 2007
86 | P a g e
formatted table quickly and easily that looks professional.
To apply a table style Mouse
i. Click within the table
you wish to format. ii. Move your mouse cursor
over the various styles. The style will preview on your table. When you have located the style you wish click and the style will be applied.
6.7.15 Merging and Splitting
When you have inserted your table there may be times in a
number of cells that you would want them as one cell and not several and similarly you may wish for one cell to be split into several. In 2007 this feature is easy to do.
To split cells Mouse
i. Select the cell(s) you wish to split ii. Go to the MERGE group on the LAYOUT ribbon and click the SPLIT
CELLS button.
To merge cells Mouse
i. Select the cells you wish to merge. ii. Go to the MERGE group on the LAYOUT ribbon and click the MERGE
CELLS button.

PowerPoint 2007
87 | P a g e
SECTION 7: SLIDE TYPES AND LAYOUTS By the end of this section you will be able to:
Know the difference between slides and masters Set default formatting on masters Format default bullets and fonts Create your own master and define new layouts Create office theme master Use or create multiple masters Preserve and delete masters
7.1 SLIDES Slides are the main articles of use in PowerPoint and have been mentioned many times so far in this manual they are the building blocks of your presentation and as such will form the content of your presentation showing one slide after another displaying the content you have inserted, formatted and animated from the first to the last slide. They are not however the best or fastest way to construct a formatted presentation. Every slide you have inserted has had placeholders formatted in a default way. A default background colour, default positioning on the slide and no animation effects applied whatsoever. If we could change the defaults for each of the slide layouts you have applied to your presentation then we could concentrate putting the text in the outline and the slides themselves would be already formatted for the main part in the way we would like. This is a much faster way of working and enables us to concentrate on the content rather than having to spend so much time formatting each and every slide. To do this we use master slides to hold the default formatting or objects that we wish. BUT NOT THE TEXTUAL CONTENT.
7.1.1 Slide Layouts
After inserting a slide you may wish you had chosen a different layout. There is no need to delete a slide and reinserting one of another type. You may just change the layout this is especially useful if your slide already has content.

PowerPoint 2007
88 | P a g e
To change the layout of a slide Mouse
i. Make sure that the slide that you wish to change the layout for is in the main window in normal view.
ii. Click on the drop down arrow to
the right of the LAYOUT button.
iii. Select a new layout for the
chosen slide by clicking with the left mouse button.
iv. The selected layout is applied.
7.2 SLIDE FORMATTING
Before, or instead of, the formatting of all objects on your slide you may wish to make changes to the slide format globally by either colouring the background of each slide in one go or manually formatting one slide and applying it to all slides this can save much time when you have many slides within your presentation. Presentations within PowerPoint are based on a theme and the formatting of that theme determines the placement and colours and styles of all objects within the presentation. The area where these themes are kept and can be altered is in the slide master view of your presentation and any change there will apply globally to the whole presentation or to the slides of a particular layout we will now look at applying those @themes‘ and then manually editing them to create one of our own.
7.2.1 Themes
Themes are used to give your slide presentations a consistent and stylish appearance. They contain colour schemes, slide and title masters with custom formatting, and some also include background graphics which have been placed into the masters. When you apply a Theme to your presentation, the Office Theme

PowerPoint 2007
89 | P a g e
master and its subset of slide layouts have the colour scheme of the of the theme applied and it will replace the previous office theme master and colour scheme of the presentation. Once you apply a Design Template, each slide you add, regardless of the layout, has the same custom look to it. PowerPoint 2007 comes with a variety of professionally designed themes.
7.2.2 Applying a Theme
To Apply a Theme
i. Ensure no object is selected as this may confuse you having two design ribbons. (One for the object, one for the slide)
ii. Choose the DESIGN ribbon, go to
THEMES.
iii. Click on the drop down arrow to the bottom right hand side of the visible themes.
iv. Move your mouse over a theme to see
a preview of how it will look on your slide.
v. Click on a template thumbnail. It will
be applied to all the slides in the presentation.
It is possible to apply a design template to selected slides, rather than the entire presentation.
To apply a template to selected slides i. Select the slides and then right click on a template
thumbnail. ii. ii. Right click on the thumbnail
iii. Choose APPLY TO SELECTED SLIDES.
When you apply a template to your presentation any logos, graphics and extra text you have previously placed on your Slide Masters will disappear. If you want to use a design template and show your own logo too, you must apply the template BEFORE adding the logo to the Slide master.

PowerPoint 2007
90 | P a g e
The change in Colour Scheme will affect the colour of many of the objects you may have drawn. It will also cause charts/ graphs to be re-coloured. For these reasons it is better to apply a Design Template as early on in the creation of your presentation as possible.
7.2.3 Slide Colour Scheme
Before starting any formatting you should choose an overall colour scheme. A colour scheme is a set of eight balanced colours. This default palette of colours will automatically be used for text, slide background, and any graphics you create such as charts, graphs and artwork. Once you have chosen your colour scheme you will always be offered this palette of eight colours first when formatting everything from text to bullets to background to pictures. However you will still have access to the full PowerPoint colour palette which you can choose from at any time.
7.2.4 Slide Background
You can apply different backgrounds to all or to individual slides. Use this option to colour the background of your slides. Although you could choose to have different backgrounds for each slide it gives a more professional effect if you use the same background on all slides of a presentation.
To apply a standard background:
i. Select BACKGROUND STYLES from the DESIGN ribbon
ii. Choose a style from the dropdown list. iii. Right Click on the style to show menu so you
may APPLY TO ALL OR TO JUST SELECTED SLIDES if you have several slides using the same layout then you may apply to matching slides.
To use a fill effect for the background: Mouse
i. Select BACKGROUND STYLES from the DESIGN ribbon
ii. Select FORMAT BACKGROUND at the bottom of the displayed
list. A dialog appears.

PowerPoint 2007
91 | P a g e
iii. Use the guidelines below to select GRADIENT, TEXTURE, or PICTURE fills for the slide background.
iv. Click on CLOSE to apply to selected slides or click on APPLY TO ALL.
Gradients
A gradient fill is one where one colour gradually changes into another without any harshly defined edge. You can used gradient fills to mix two or more colours on a slide background. Preset offers a range of pre-designed gradients which may include more than two colours, and unusually patterned gradients. Choose a Preset style, direction, number of changes in the colour and the type of gradient. Enter the stop colour as the gradient changes. Texture or picture PowerPoint offers a range of preloaded textured fills including marble, granite, wood, tissue paper and grass. Or if those are not to your taste it offers you the opportunity to use any picture file you wish. Solid fill
Solid fill is just the basic colours palette that you have seen many times throughout this manual.
7.2.5 Headers and Footers
A header or footer is text or graphics that appears at the top or bottom of every slide in a presentation. You can add company logos or other pictures, slide numbering and informative text, such as the date or author. To add text use the Header and Footer command. To add graphics and to format the header and footer text use the Slide Master.
To Add Headers &
Footers to Slides Mouse
i. Select HEADER AND
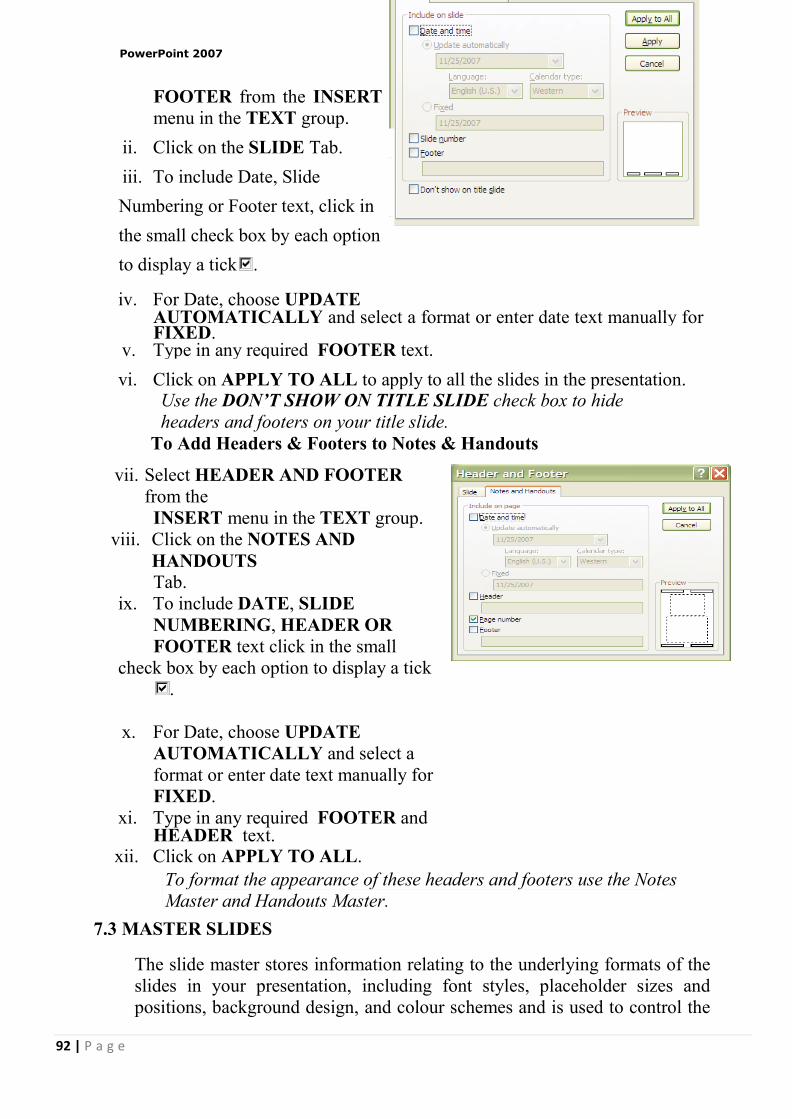
PowerPoint 2007
92 | P a g e
FOOTER from the INSERT menu in the TEXT group.
ii. Click on the SLIDE Tab. iii. To include Date, Slide Numbering or Footer text, click in the small check box by each option to display a tick .
iv. For Date, choose UPDATE
AUTOMATICALLY and select a format or enter date text manually for FIXED.
v. Type in any required FOOTER text. vi. Click on APPLY TO ALL to apply to all the slides in the presentation.
Use the DON’T SHOW ON TITLE SLIDE check box to hide headers and footers on your title slide.
To Add Headers & Footers to Notes & Handouts
vii. Select HEADER AND FOOTER from the INSERT menu in the TEXT group.
viii. Click on the NOTES AND HANDOUTS Tab.
ix. To include DATE, SLIDE NUMBERING, HEADER OR FOOTER text click in the small
check box by each option to display a tick.
x. For Date, choose UPDATE
AUTOMATICALLY and select a format or enter date text manually for FIXED.
xi. Type in any required FOOTER and HEADER text.
xii. Click on APPLY TO ALL. To format the appearance of these headers and footers use the Notes Master and Handouts Master.
7.3 MASTER SLIDES
The slide master stores information relating to the underlying formats of the slides in your presentation, including font styles, placeholder sizes and positions, background design, and colour schemes and is used to control the

PowerPoint 2007
93 | P a g e
appearance of the presentation. Each presentation can have a series of Slide Masters to match the layouts you choose. When you want to apply consistent formatting through all slides in your presentation, you change global attributes by editing the Slide Masters. These changes will be automatically reflected through each slide (apart from the Title Slide). This is done through the VIEW ribbon, PRESENTATION VIEWS group, SLIDE MASTER Button.
Ac ces s i ng the Slide Master
Mouse i. Click on the VIEW ribbon, PRESENTATION VIEWS group, SLIDE
MASTER button. Or
ii. Press SHIFT and the NORMAL VIEW button on the STATUS BAR icons. 7.3.1 Selecting the Correct Master
The master view appears as on the previous page. On the left hand side in are masters for each of the layout types that you may choose for your presentation in NORMAL view. They contain the default formatting and positioning for the place holders and backgrounds. You may select each master and change the layout or format of each of them and wherever that layout is used in NORMAL view it will pick up its default formatting from that master.
To select the correct master Since the most often used layouts in your presentation would be the title layout (used for the first slide and possibly each new part within your presentation it contains a title and subtitle placeholder) and the default

PowerPoint 2007
94 | P a g e
text layout (title and bulleted text placeholders) we could start with those.
To select the title master Mouse
i. Make sure you are in MASTER view. ii. Select from the masters on the left the TITLE MASTER (second in list
usually) it contains a TITLE and SUBTITLE placeholder.
iii. The appropriate master appears in the main window. To select the title and text slide master
Mouse iv. Make sure you are in MASTER view. v. Select from the masters on the left the TITLE AND TEXT SLIDE
MASTER (last in list usually) it contains a TITLE and BULLETED TEXT placeholder.
vi. The appropriate master appears in the main window.
7.4 FORMATTING THE MASTERS
Formatting the master is much the same as formatting a normal slide as far as formatting the various elements of the master goes.
7.4.1 Office Theme Master
The office theme master (title and content) is the master that oversees all other masters. Any formatting applied to this master will APPLY TO ALL SLIDE MASTERS. You would then tweak each master with any separate formats or placeholder positions that you wish.
To format the Office theme slide master
Mouse
i. Select the OFFICE THEME SLIDE MASTER, usually first in the list. (Title and content)
i. In the main window select the MASTER TITLE placeholder.
ii. Format the text and fill as you would on a normal slide.
iii. Change its position if you need to. iv. Select the BULLETED TEXT placeholder
vi. Format the bulleted levels by clicking on each level in turn and format
as previously explained text and bullet or number style vii. Place any required graphics, logos and additional headers and footers on
the slide master and format as desired. viii. Format the background as described previously

PowerPoint 2007
95 | P a g e
ix. Any formatting changes made to the OFFICE THEME MASTER can be seen reflected in all of the masters to the left in the SLIDE MASTER view.
x. All slides that you have used the TITLE AND CONTENT SLIDE layout on will now have picked up the format from the OFFICE THEME SLIDE master and the positioning of placeholders. Bulleted text will now display the format you have set for each level.
xi. To change the position of any graphic or box of click and drag the object to a new position.
xii. Return to NORMAL View. (Click on the CLOSE MASTER VIEW button or on Normal View button).
All your slides will now follow the formatting of the Slide Master. All graphics, logos, headers and footers on the master will show on all slides.If you would prefer the text on any individual slide not to follow the Slide Master format the text of that slides individually.
7.4.2 Title Master
To format the title master
Mouse
xiii. Select the TITLE MASTER
xiv. In the main window select the MASTER TITLE placeholder.
xv. Format the text and fill as you would on a normal slide.
xvi. Change its position if you need to. xvii. Select the SUBTITLE placeholder xviii. Format the placeholders text and fill how you desire and move it if you need to. xix. Format the background as described previously
Only select APPLY TO ALL if you want your whole presentation to have the same default background as this will apply that background TO ALL MASTERS.
xx. Place any required graphics, logos and additional headers and footers on
the slide master and format as desired. xxi. Return to NORMAL view. (Click on the CLOSE MASTER VIEW button or
on Normal View button) xii. All slides that you have used the TITLE SLIDE layout on will now
have picked up the format from the TITLE SLIDE master and the positioning of placeholders
7.4.3 Title and Text Master
To format the title and text slide master

PowerPoint 2007
96 | P a g e
Mouse
i. Select the TITLE AND TEXT SLIDE MASTER. ii. In the main window select the MASTER TITLE placeholder.
iii. Format the text and fill as you would on a normal slide.
iv. Change its position if you need to. v. Select the BULLETED TEXT placeholder vi. Format the placeholders text and fill how you desire and move it if you need to. vii. Format the bulleted levels by clicking on each level in turn and format as
previously explained text and bullet or number style
viii. Place any required graphics, logos and additional headers and footers on the slide master and format as desired.
ix. Format the background as described previously only select APPLY TO ALL if you want your whole presentation to have the same default background as this will apply that background TO ALL MASTERS it would appear as though you have changed the office theme master..
x. All slides that you have used the TITLE AND TEXT SLIDE layout on will now have picked up the format from the TITLE AND TEXT SLIDE MASTER and the positioning of placeholders. Bulleted text will now display the format you have set for each level.
xi. To change the position of any graphic or box of click and drag the object to a new position.
xii. Return to NORMAL View. (Click on the CLOSE MASTER VIEW button or
on Normal View button). All your slides will now follow the formatting of the Slide Master. All graphics, logos, headers and footers on the master will show on all slides.
If you would prefer the text on any individual slide not to follow the SLIDE MASTER format the texts of that slide individually. To hide SLIDE MASTER items, such as graphics/ logos on an individual slide use from the BACKGROUND group on the DESIGN ribbon, HIDE BACKGROUND GRAPHICS.
7.4.4 Create Your Own Master
One of the brand new features in 2007 is the ability to create your own master slide layout and insert placeholders and position them in any place

PowerPoint 2007
97 | P a g e
you wish. You may even create your own office theme master (Global Master) This means that you are not bound by the inbuilt masters within PowerPoint. These masters will become layout options for your slides as you build your presentation.
To create your own master slide
Mouse
i. Go to slide master view. Either
ii. Click on insert layout in the EDIT MASTER group. iii. A new master layout will appear in your left hand panel and be
highlighted. It will also appear in the main window. Or
iv. Click on INSERT SLIDE MASTER. (a new office theme master will appear)
Then v. Click on the drop down arrow to INSERT A PLACEHOLDER in the
MASTER LAYOUT group.
vi. Select the type of content you will want to use for your master layout and place and position the placeholders on the slide master.
vii. Format and position the placeholders as previously instructed.

PowerPoint 2007
98 | P a g e
viii. Click on CLOSE MASTER VIEW.
To rename a master
Mouse
i. Go to MASTER view ii. Select in the left hand pane the master you wish to rename. ii. Click on RENAME in the SLIDE MASTER group a dialog will appear. iv. Enter a new name for your master. v. Click on RENAME.
To delete a master Mouse
i. Go to MASTER view ii. Select in the left hand pane the master you wish to delete. iii. Click on the DELETE button in the SLIDE MASTER group.
7.4.5 Multiple Slide Masters
In PowerPoint 2007, it is possible to have more than one Slide Master. PowerPoint users can easily create more than one slide master within one file. This makes it possible for users to combine multiple presentations in one file or create separate sections within the same presentation.
To Insert a Second Slide Master Mouse
iv. Go to MASTER view iv. Click on the button to insert new slide master. v. A new office theme master is inserted vi. Format this as described earlier in the way
you wish it to be different from the first slide master.
vii. You may insert then new layouts and format them as you wish.
viii. You may create and format as many masters as you wish each will be numbered.
To establish the formatting for title text, body text, bullets and footers for all layouts select the relevant sample text or bullet and format them as previously discussed.
Mouse
ix. In NORMAL view from the DESIGN ribbon, apply a new theme TO SELECTED SLIDES or to ALL SLIDES, meaning the whole presentation, as previously explained.

PowerPoint 2007
99 | P a g e
Warning: if you apply a new master to the entire presentation, the original slide master becomes unused and will be deleted. You need to preserve the original slide master to avoid it being deleted
7.4.6 Preserving a Slide Master
If you apply a new master to the entire presentation, the original slide master becomes unused and will be deleted. You need to preserve the original slide master to avoid it being deleted. New slide masters that you create are automatically preserved.
To preserve a slide master
Mouse i. Go to MASTER SLIDE view. ii. Select the slide master you wish to preserve. iii. Click on the PRESERVE Master button. iv. If a master is preserved the preserve icon will
be lit like above to indicate it is preserved v. You only need to preserve the theme master to
preserve all layout masters dependent on it. vi. You can still delete an unwanted slide master, if it has been preserved using
the DELETE Master Button. Any slides still using the master will revert back to using the previous master applied.
SECTION 8: TRANSITION AND ANIMATION EFFECTS
By the end of this section you will be able to:
Apply Entry (Transition) Effects to slides Build Bullet Points Use Animation Schemes Preview Animations Use Custom Animation Use Path Animation Animate multiple objects simultaneously
8.1 ANIMATION EFFECTS There are many levels of animation effects that can be used within PowerPoint 2007 to create movement, excitement and impact within a presentation. Obviously, animation effects applied will not be seen if slides are printed out onto paper or OHP transparency slides, but can be enjoyed when a slide show is delivered from a computer using electronic projection equipment. Animation effects can be applied to whole slides to control the way they appear on the screen. Animation can also be added to text (e.g. to make bullet points build up one by one) and drawn objects.

PowerPoint 2007
100 | P a g e
8.1.1 Slide Transitions
A transition controls the way one slide moves off the screen to make way for the next one during an electronic slide show. You have a choice of transitions for each slide, including Fade through black, Dissolve, Cover Left, and Checkerboard Across. You can vary the speed of each one. Transitions can be applied to individual slides, a number of selected slides or across the whole presentation. Slide transitions are applied and modified using the Slide Transition task pane.
Setting Slide Transitions
Mouse
i. Be in either NORMAL view or SLIDE SORTER view. ii. Click on the ANIMATIONS ribbon go to the TRANSITION TO THIS SLIDE group. ii. Select a transition from the drop down box to apply.
iii. Select a speed if too fast or slow.
v. Select a sound if you wish. This will play as the transition occurs. vi. Click on APPLY TO ALL if you wish to set the same transition for all slides.
vii. The slides which now have a transition applied will have a small star
icon next to their slide number in the thumbnails area. To remove a transition, select the NO TRANSITION option in the transitions area.
viii. You can also apply transition effects while working in Slide Sorter
view. This may make it easier to select the slides you wish to apply transitions to.
8.1.2 Slide Timings On Transitions
You can set timings for your slides which will result in a PowerPoint show that will automatically run. Slides will be shown on screen for the amount of time you specify before the show automatically advances on to the next slide. There are two different ways you can set slide timings; setting them manually for each slide or using the Rehearse tool.
8.1.3 Setting Slide Timings Manually
It is easiest to work in Slide Sorter view whilst setting slide timings although

PowerPoint 2007
101 | P a g e
it can be done using the slide thumbnails in Normal view. To set slide timings
i. Select the slide(s) you want to apply timings to. ii. You can set the timing for one or more
selected slides by entering in seconds the length of time you want the slides to appear on the screen Timings are shown in Slide Sorter View beneath each slide.
iii. Run your presentation in Slide Show view to see the effect of the timings you have added.
iv. The slides will advance on a mouse click OR after the specified time has elapsed, the trigger is whichever occurs first.
8.1.4 Animating Text
You can animate the text in your slide to add emphasis to your topics. On a bulleted list slide, animation can be applied to both the title area and the bullets area and is most commonly used to get bullet points to appear one by one. Text animation is applied using the Custom Animation task pane. You may only apply animation in normal slide view. cc
There are four categories of animation effect to choose from in PowerPoint 2007:
Entrance Effects change the way that objects arrive onto a slide. Text can be made to simply appear, or there are more exciting effects such as Crawl In or Fly In.
Emphasis Effects can be applied to objects that are already on the slide. Emphasis Effects will bring attention to an item without actually moving its location e.g. text can be made to spin in position.
Exit Effects change the way that objects leave a slide. The effects applied are similar to Entrance Effects.
Motion Paths can be used to make objects move along a certain trajectory e.g. down, up, spiral. Motion paths are not particularly applicable to animating text and will be looked at in more detail later in this section.
There are a large number of animation effects within each of the categories above. To help you make your selection, you will find you are offered five common effects within each category first. Under More Effects, the animation effects are divided into Basic, Moderate, Subtle and exciting to help you gauge

PowerPoint 2007
102 | P a g e
© The Mouse Trainin
which might be more appropriate for your needs You are able to apply more than one type of animation to an object e.g. you could have an entrance, then an emphasis and finally an exit effect. However, don‘t be tempted to apply too much animation into your slides as it can start to look unprofessional. A little animation goes a long way!
Custom
To apply text animation
Mouse
i. Select the text object you want to animate ii. Open the CUSTOM ANIMATION TASK PANE by
choosing custom animation on the animations ribbon iii. Click on the ADD EFFECT button. iv. There are 4 types of animation effect to choose from: v. Select the animation effect you require and either
choose one of the five common effects, or select from the More Effects area.
vi. Choose appropriate options under Start, Direction and Speed.
vii. The animation effect will be previewed in the slide. To change animation settings
Mouse i. Select the animation to change in the list on the
TASK PANE.
ii. Click on the CHANGE button.
iii. You can also make changes by clicking on the down arrow next to the animation in the list and selecting effect options
iv. A dialog appears go to the TEXT ANIMATION tab. v. If you use bulleted lists in your text you set here
they come in by a certain level of paragraph, in effect, bringing in points and sub points individually or as a group.
vi. On the EFFECT tab you have the choice to bring in the text ALL AT ONCE, BY WORD, or BY

PowerPoint 2007
103 | P a g e
LETTER. vii. The TIMING tab allows you to set delays
on the time between each piece of text appearing.
Be careful to SELECT the animation you wish to modify and then use the CHANGE button or you can end up applying a new animation effect by mistake.
Adding another animation effect
Mouse
i. Select the text object you want to apply an additional effect onto. ii. Click on the ADD EFFECT button and select options as required. iii. Use the Play button to run your animation effects in the slide. iv. You can change the order in which items on your slide are animated
by using the green re-order arrows The effects appear in the Custom Animation List, top to bottom, in the order you apply them. The animated items are noted on the slide by a non-printing numbered tag that correlates to the effects in the list. This tag does not show up in the slide show view or in Print Preview
8.1.5 Removing Animation
To remove applied animations
Mouse i. Select the animation to remove in the
list on the Task Pane. ii. Click on the REMOVE button.
8.1.6 Preset Animation Schemes
It can be lots of fun building up your own custom animation for different areas of text in your slides. However, sometimes you may want to create text animation more quickly. You can achieve a professional result easily using a preset animation. Animations contain combinations of animation that apply to the title area, bulleted area or both. Preset PRESET animations are available on the animations ribbon just select the object then choose a preset from the drop down menu. Some of these animations include sound as well as

PowerPoint 2007
104 | P a g e
animations. 8.1.7 Applying a Preset Animation
Mouse i. Select the object(s) you wish to apply the animation to. ii. Click on the drop down arrow to the right of the ―No animation‖ box iii. Select an animation. It is applied to the object(s) you have selected.
8.1.8 Animating Objects
Objects that you have drawn (e.g. autoshapes, squares, circles etc), clipart and images can all be animated to add excitement to a slide. In PowerPoint 2007 is the ability to apply more than one kind of animation effect to an object, animate multiple objects simultaneously and use motion paths.
8.1.9 Adding Animation Effects
Adding animation effects to objects is very similar to animating text as described earlier in this section. There are four different categories of animation that can be added: Entrance, Emphasis, Exit and Motion Paths. Animation is applied using the Custom Animation task pane.
To apply animation
Mouse
i. Select the item you want to animate. ii. Open the CUSTOM ANIMATION task pane as described iii. Click on the ADD EFFECT button. iv. There are 4 types of animation effect to choose from: v. Select the animation effect you require and either
choose one of the five common effects, or select from the MORE EFFECTS area.
vi. Choose appropriate options under Start, Direction and Speed.
vii. The animation effect will be previewed in the slide.
To change animation settings
Mouse viii. Select the animation to change in the list on the
Task Pane.
ix. Click on the CHANGE button.

PowerPoint 2007
105 | P a g e
x. You can also make changes by clicking on the down arrow next to the animation in the list.
Note: be careful to SELECT the animation you wish to modify and then use the CHANGE button, or you can end up applying a new animation effect by mistake.
8.1.10 Adding Multiple Animation Effects
It is quite possible to add additional animation effects to one object. You could have an object with an Entry, Emphasis, Exit and Motion Paths effect can you can choose the order in which they occur. You are even able to apply more than one animation effect under each category, so for example, you could have an object with 2 Entrance Effects, 3 Emphasis Effects and then 1 Exit Effect, the combinations are limitless. However, always consider how your audience will view your animations. Excessive animation can detract from your message and look unprofessional. With animation in PowerPoint, less really is more!
To Add additional animation effects
Mouse i. Select the item you want to apply an additional effect onto. ii. Click on the ADD EFFECT button and select options as required. iii. Use the Play button to run your animation effects in the slide. iv. You can change the order in which items on your slide are animated
by using the green re-order arrows
v. The effects appear in the Custom Animation List, top to bottom, in the order you apply them. The animated items are noted on the slide by a non-printing numbered tag that correlates to the effects in the list. This tag does not show up in the slide show view or in Print Preview
Remember: clicking on an object and choosing the ADD EFFECT button will add a new animation effect to the object. To make changes to an existing animation effect, select the effect in the animation list, and choose the CHANGE button.
8.1.11 Animating Objects Simultaneously
PowerPoint 2007 gives you the ability to animate multiple objects simultaneously. In previous versions of PowerPoint you could only add one animation effect to each object and only one animation effect could be running at one time, so objects had to be animated in turn. Not anymore! As we have seen, you can apply as many animation effects to one object as you

PowerPoint 2007
106 | P a g e
like and you can also have all of your animation effects running at once, which does make the possibilities for what you can achieve with PowerPoint animation virtually limitless. Animating objects simultaneously is achieved by adjusting the Start options for each animation. By default, animations start on a mouse click. You can change this to the animation starting at the same time as the previous animation (With Previous) or a short time after the previous animation (After Previous). You can specify the delay for the After Previous setting.
To animate objects simultaneously Mouse
i. Apply animation to the objects in your slide (see previous instructions for guidance)
ii. Select an animation in your list. iii. Adjust the START options (choosing from ON CLICK, WITH PREVIOUS or
AFTER PREVIOUS). iv. To further control timing options for the After
Previous option, click on the down arrow next to the selected animation in the list, and choose TIMING.
v. Apply options as needed. Choose OK. vi. You can preview your animation effects by using
the Play button to run your animation effects in the slide.
OR
vii. You can use the button to see the effects as they will when run as part of the final slide show presentation.
8.1.12 Using Motion Paths
PowerPoint 2007 allows you to customise the entrance of an animated object by using a motion path. Motion paths can make your object travel around on the slide, rather than appearing (Entrance Effect), being animated in situ (Emphasis Effect) or leaving the slide (Exit Effect). There are preset motion paths to choose from (e.g. Down, Up, Spiral) or you can custom draw a motion path to suit your requirements.
To Apply a Motion Path
Mouse
i. Select the object to be animated.

PowerPoint 2007
107 | P a g e
ii. In the Custom Animation Task Pane, select ADD EFFECT and choose Motion Paths.
iii. Select from one of the six common motion paths: iv. The animation will be previewed quickly in the slide. v. A motion path arrow has now been added to your object, indicating the
direction of travel. The green arrow is the start point of the movement; the red arrow is the end point of the movement.
vi. You can adjust the start and end point of the motion path by hovering over the white circle on the red or green arrow and dragging with your mouse to a new location.
vii. You do not need to keep to the original type of movement chosen. In the example above, the
movement is initially diagonal, but by adjusting the end point of the movement, you can change the type of movement.
iii. You can add multiple motion paths to one object. Try adjusting the motion path arrows so that the end of one motion path arrow meets with the start point of the next motion path arrow.
ix. Experiment with some of the motion path types listed under . Remember, you can control the order of your animations using the green re-
order arrows
8.1.13 Custom Motion Paths There are plenty of preset motion paths to choose from but they might not always suit your needs. In these cases, you can draw your own motion path free hand by clicking and dragging with your mouse. There are four types of custom motion path you can draw:
Choose LINE and drag to draw a
straight path.
Choose CURVE and click where you want the curved path to start, and then continue to move the mouse and click wherever you want to add a curve. Choose FREEFORM to draw a path with both curved and straight segments. Drag to draw freehand shapes; lick and move the mouse to draw straight lines. Choose SCRIBBLE and drag to draw a path that
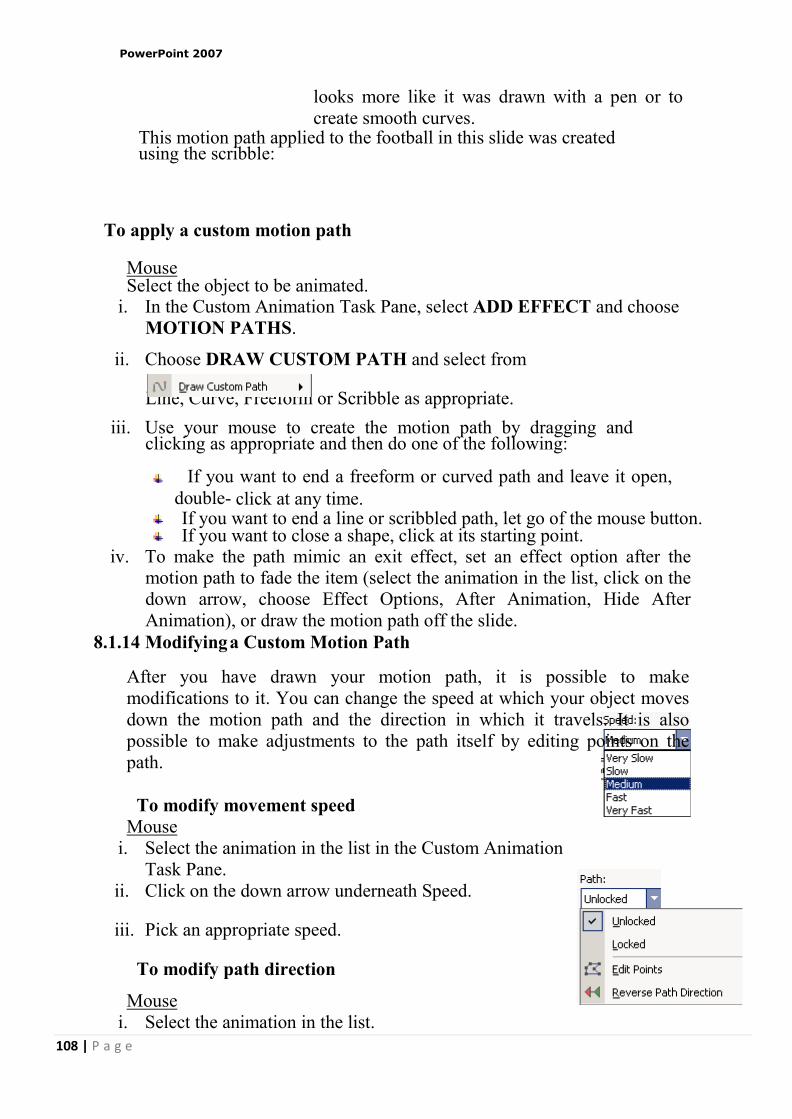
PowerPoint 2007
108 | P a g e
looks more like it was drawn with a pen or to create smooth curves.
This motion path applied to the football in this slide was created using the scribble:
To apply a custom motion path
Mouse Select the object to be animated.
i. In the Custom Animation Task Pane, select ADD EFFECT and choose MOTION PATHS.
ii. Choose DRAW CUSTOM PATH and select from
Line, Curve, Freeform or Scribble as appropriate.
iii. Use your mouse to create the motion path by dragging and clicking as appropriate and then do one of the following:
If you want to end a freeform or curved path and leave it open,
double- click at any time. If you want to end a line or scribbled path, let go of the mouse button. If you want to close a shape, click at its starting point.
iv. To make the path mimic an exit effect, set an effect option after the motion path to fade the item (select the animation in the list, click on the down arrow, choose Effect Options, After Animation, Hide After Animation), or draw the motion path off the slide.
8.1.14 Modifying a Custom Motion Path
After you have drawn your motion path, it is possible to make modifications to it. You can change the speed at which your object moves down the motion path and the direction in which it travels. It is also possible to make adjustments to the path itself by editing points on the path.
To modify movement speed
Mouse i. Select the animation in the list in the Custom Animation
Task Pane. ii. Click on the down arrow underneath Speed.
iii. Pick an appropriate speed.
To modify path direction
Mouse i. Select the animation in the list.

PowerPoint 2007
109 | P a g e
ii. Click on the down arrow underneath Path.
iii. Select Reverse Path Direction.
iv. You can make other adjustments to the motion path animation by hovering on the animation in the animation list, clicking on the down arrow and choosing from the options in Effect Options or Timing.
To Edit Points on the Motion Path
Mouse
i. Select the animation in the list. ii. Click on the down arrow beside PATH.
iii. Select Edit Points.
iv. There are now black squares at intervals on the motion path. v. Hover your mouse on a square and click and drag to adjust its position. vi. If you have many modifications to make, it may be quicker and easier to redraw the motion path.
SECTION 9: ORGANISE AND DELIVER PRESENTATIONS
By the end of this section you will familiar with: Running a Slideshow Rehearsing a show Custom Shows Hyperlinks

PowerPoint 2007
110 | P a g e
Action buttons 9.1 RUNNING A SLIDE SHOW
When you eventually present your PowerPoint slides, you will want to run the slides as a slide show so the slides occupy the whole of the screen area available and none of the regular PowerPoint toolbars, menu bars and task panes are shown. It is also necessary to run your slides as a slide show to get the full effect of any animation effects you may have applied to your slides. When presenting a slide show to an audience, you advance your slides by clicking on your mouse or using the PAGE DOWN or ENTER buttons on your keyboard. PAGE UP can also be used to take you back to the previous slide if necessary.
Depending on the purpose and audience of your presentation, you can run a slide show in several ways. One way is to start a slide show from within PowerPoint. Another way is to save a presentation so that whenever it is opened it always starts as a slide show. You can also set up a self-running presentation that will run in an ever-repeating loop until you press ESC. This is useful if the presentation is to run in a kiosk, or on a monitor at an exhibition.
9.1.1 Starting A Slide Show From Within PowerPoint
i. Click on the FROM BEGINNING button on the SLIDESHOW ribbon. Or
ii. Click the SLIDE SHOW button in the lower-right corner of the
presentation window. This will start the show at your currently select slide.
Or
iii. Select VIEW ribbon the PRESENTATION VIEWS group and SLIDE SHOW button
Or iv. Press F5 on the keyboard. All these options will start the show from
the first slide. To advance slides in the presentation
i. Click your mouse. ii. Press PAGE DOWN or ENTER on your keyboard.

PowerPoint 2007
111 | P a g e
To move back to previous slides
i. Press PAGE UP on your keyboard. OR
ii. Right click with your mouse. From the menu that appears, choose PREVIOUS.
To end your slide show
i. Press ESC on the keyboard OR
ii. Right click with your mouse and choose END SHOW. iii. The show will also end automatically when you have reached the end of
all your slides. You will see a black screen and can click with the mouse or press PAGE DOWN or ENTER to return to PowerPoint.
9.1.2 Rehearsing Timings
You can ‗rehearse‘ your presentation, talking through the explanation of each slide and PowerPoint will record the amount of time you spent on each slide. These timings can then be used to run the presentation in future. They will adjust all of the previously set manual timings you may have entered within your presentation for transitions
Rehearsing Timings:
Mouse
i. Select rehearse timings on the slideshow ribbon. ii. Advance the show as you rehearse so that the timings reflect how long
youneed each slide to be displayed. iii. Use the buttons in the Rehearsal dialog box to
pause between slides, restart a slide, and advance to the next slide. The timer shows you how long the current slide has been on screen.
iv. If you wish to start timing again for any slide click on the REPEAT button. PowerPoint will record only the last timing for each slide. v. When you finish PowerPoint will indicate the total timing for the
presentation. If this is acceptable, click on YES to save the timings with the show.
9.1.3 Running A Show Using Timings
When you have entered slide timings either manually or via the Rehearse option, you will want to know how to run the slide show using the timings so the slides advance automatically.

PowerPoint 2007
112 | P a g e
To run a show using timings
i. Select Slide Show, Set Up Show. ii. In the ADVANCE SLIDES area specify that the slide show should be run
USING SLIDE TIMINGS, IF PRESENT. iii. Click on OK.
Run the Slide show as normal. If timings have been set they will be used. You can use the Set Up Show dialogue box to set other options for the slide show e.g. running the slide show in a continuous loop.
9.1.4 Hiding Slides
If you wish not to show a particular slide within a show but don‘t wish to delete it because you will use it again in the future. Then select the slide and use the hide slide button on the slideshow ribbon. Use it again to unhide the slide(s). It is best to do this in slide sorter view.
9.1.5 Custom Shows
If there are many slides to be hidden and unhidden every time you go to run your show then custom shows may be a better option for you to use. Custom Shows allow you to create presentations within a presentation. Instead of creating multiple, nearly identical presentations for different audiences, you can create one presentation which includes all the slides for all the audience groups. Custom Shows then allows you to save different
Continuous
loop option

PowerPoint 2007
113 | P a g e
groupings of these slides under different names. By including all slides in the one presentation you will not need to recreate slides twice but will still be able to offer tailored shows to both groups. For example, you might want to give a presentation at induction days for new staff and prefer to present slightly different information to your new graduate trainees than to your other recruits. Slides 1 to 5 may be identical for both groups, but slides 6 to 7 may be different, with subsequent slides the same. Once you have created all the slides to be used you can set up two custom shows specifying which slides to be shown in which order for each group.
To create A Custom Show
Mouse
i. Select SLIDE SHOW ribbon, CUSTOM SHOWS button, CUSTOM SHOW to bring up a dialog of all shows in presentation.
ii. Click on NEW.
iii. Type in a name for the show.
iv. Under SLIDES IN
PRESENTATION, select a slide you want to include in the custom show.
v. To select multiple slides, hold down CTRL as you click the slides. vi. To include the selected slide(s) in the custom show click ADD or
double click on the slide name. vii. To change the order in which slides appear, select a slide, and then click
one of the arrows to move the slide up or down in the list. viii. Click on OK. To see a preview of a custom show, select the name of the
show in the Custom Shows dialog box, and click on SHOW. Adding Or Removing Slides in A Custom Show:

PowerPoint 2007
114 | P a g e
Mouse
i. Select SLIDE SHOW ribbon, CUSTOM SHOWS button, CUSTOM SHOW to bring up a dialog of all shows in presentation.
ii. Select the name of the custom show you want to change. iii. Click on EDIT. iv. Add or remove the slides you want. v. Click OK. vi. To remove an entire custom show, select its name in the CUSTOM
SHOWS dialog box, and then click REMOVE. This removes the custom show, but the actual slides remain in the presentation.
9.1.6 Hyperlinks (Action Buttons)
You may wish to include slides in your presentation which may or may not be shown depending on the audience reaction or questions. Action buttons allow you to set up hyperlinks between pages so that you can jump to a page out of sequence if you wish.
Creating an Action Button Hyperlink: Mouse
i. Switch to NORMAL View. ii. From the Insert ribbon select the shapes
drop down and scroll to the end of the menu of shapes, ACTION BUTTONS, and choose the button tool you require.
iii. Click and drag to create a button on the slide.
iv. Press SHIFT to create a symmetrical button.
v. When you release the mouse button the Action Settings dialog box is displayed.
vi. Set ACTION ON CLICK as
HYPERLINK TO.
vii. Pick from available slides in the presentation.
viii. Click on OK. ix. When the slideshow is run clicking on that action button will take you
to the slide you specified It is best not to use these with timings but more as an interactive show so individuals can navigate the show at their leisure.
9.1.7 Inserting Hyperlinks (Objects and Text)
It is not only action buttons that can help you navigate around your presentation ANY object can become a hyperlink to another slide or presentation, a web address even another

PowerPoint 2007
115 | P a g e
program or file. Mouse
i. Select any object or piece of text that you wish to create a hyperlink
from.
ii. Go to the insert ribbon and notice the two buttons on the Links group.
iii. If you select the Hyperlink button the dialog below appears
iv. On the LINK TO area to the left make a choice of where you wish to link to the default is to a web page or a file on your system (could be from any application like word or excel)
v. Select the file in the navigation area in the middle part of the dialog You may have to navigate to find it but it would be best if it was located where the current presentation file was saved.
vi. Enter a screen tip if you wish by clicking on the screen tip button on the top right and enter some help text that will appear as the mouse hovers over the link when the slideshow is running.
vii. Click on OK viii. If you choose the action button instead
the action dialog will appear which allows you to determine the action you wish it to do.
ix. Follow the steps as for the action button but in the hyperlink to area you have many other options from the drop down box.
x. Make a selection, Click OK.
These action settings allow anything to behave like an action button or hyperlink.

PowerPoint 2007
116 | P a g e
SECTION 10: 10.1 SAVING AS DIFFERENT TYPES
10.1.1 Web Page
After you have made and saved your PowerPoint file with all its interactive buttons and links you may wish for people to view the file as a web page, which behaves like any other web page with the additional resource of being able to run it as a show.
To save file as web page
Mouse
i. Open the presentation you want to save as a web page ii. Select the OFFICE button and SAVE AS. iii. From the
displayed choices choose OTHER FORMATS
iv From the SAVE
AS dialog which appears go to the SAVE AS TYPE box near the bottom of the dialog and from that box choose WEB PAGE.
v. Enter a
FILE NAME and choose a location to save presentation.
vi. Click on SAVE.
PowerPoint 2007
117 | P a g e
vii. When you open
the file it will open in internet explorer and behave as a web page.
10.1.2 Saving a Presentation As A PowerPoint Show
Once you have finished creating and editing all your slides, you may always want the presentation to always open as a slide show without giving you the normal PowerPoint screen first. This can be useful when you deliver the presentation as it can look more professional. When you save your presentation as a PowerPoint show you will end up with two separate files; the original PowerPoint file which is editable and the PowerPoint show which will always open up into slide show view but will not be editable. Saving a Presentation to Open As a PowerPoint Show: Mouse
i. Open the presentation you want to save as a show ii. Select the OFFICE button and SAVE AS. iii. From the displayed choices choose
iv. In the Save as type list, choose PowerPoint Show.
v. Enter file name and location to save presentation. vi. Click on SAVE.
When this PowerPoint Show is next opened it will automatically launch into a slide show. You can advance the slides as normal by pressing Page Down on the keyboard or clicking with your mouse. Right clicking with the mouse with also bring up a menu of useful options
This PowerPoint show is a run only show and is uneditable so please remember to save any changes you have made to the normal PowerPoint file before saving as a show.
10.1.3 Save As Earlier Version

PowerPoint 2007
118 | P a g e
Because many of the new features and formats in PowerPoint 2007 would not be recognised by earlier versions of PowerPoint it may be necessary to convert the file to an earlier version File format so that it may be viewed by all and not just those with PowerPoint 2007 on their machine.
To save file as
earlier version Mouse
i. Open the presentation
you want to save as a web page
ii. Select the OFFICE button and SAVE AS. iii. From the displayed choices choose POWERPOINT 97-2003 Presentation. iv. This will open up the save as dialog box where the save as type has
been set to the preferred version. v. Name and save in the normal way.
10.1.4 Templates
If you have a standard type of presentation you need to deliver holding standard content that you will build on later. You may consider creating a template. A template enables you to quickly fill a presentation with added content in a very quick manner.
To create a template
Mouse
i. Open or create a presentation with content that you would
use in many future presentations.

PowerPoint 2007
119 | P a g e
ii. Format the masters if you wish to your preferred style.
iii. When complete iv. Select the OFFICE button and SAVE AS. v. From the displayed choices choose OTHER FORMATS. vi. From the SAVE AS dialog which appears go to the SAVE AS TYPE box near
the bottom of the dialog and from that box choose POWERPOINT TEMPLATE.
vii. Enter a FILE NAME viii. The location to save a template has been chosen by power point. ix. Click on SAVE.
To open a template file
Mouse
i. Locate the file if it is a known location and double click on it. ii. Select the My templates category from the categories on the left.
iv. Another dialog will appear showing all of the templates you have
created with a preview on the right of the template you select.

PowerPoint 2007
120 | P a g e
v. Make your selection and click on ok vi. A new file is created based on that template vii. Add your additional data and slides and save in the normal way
10.1.5 Comments
The Send for Review command is not available in Microsoft Office PowerPoint 2007. In earlier versions of PowerPoint, by using the Send for Review command with Microsoft Office Outlook or another e-mail program, you could request feedback about a draft of your presentation from reviewers, such as your colleagues and partners. To send your Office PowerPoint 2007 presentation to reviewers, attach your presentation to an e-mail message. Reviewers can comment on your presentation by using the COMMENTS features (located on the REVIEW ribbon, in the COMMENTS group) in Office PowerPoint 2007, and then attach the marked-up presentation to an e-mail message to you. By using the COMMENTS features in Office PowerPoint 2007, you or your reviewers can do the following:
Show or hide revisions Add new comments Edit existing comments Delete comments Move through comments forward or backward
Comments are like electronic sticky notes that can be attached to a slide. If you would

PowerPoint 2007
121 | P a g e
like your presentation to be reviewed by colleagues you can ask them to insert comments about suggested changes instead of making changes to the presentation itself. The comments appear in yellow comment boxes. Each Note inserted will show the reviewers name at the top. Comments won't appear in outline view or in slide show view.
Inserting comments in a presentation: Mouse
i. In NORMAL view, display the slide you want to add comments
to.
ii. Go to the REVIEW ribbon and select NEW COMMENT. vi. Type your comments
into the yellow comments box and then click away.
iv. Move the comment box to your preferred position on the slide.
v. Comments may be edited or deleted by selecting the comment and clicking on the appropriate button.

PowerPoint 2007
122 | P a g e
Power point Multiple Choice Questions
1. Which file format can be added to a PowerPoint show?
a. .jpg
b. .giv
c. .wav
d. All of the above
2. In Microsoft PowerPoint two kind of sound effects files that can be added to the presentation are
a. .wav files and .mid files
b. .wav files and .gif files
c. .wav files and .jpg files
d. .jpg files and .gif files
3. Material consisting of text and numbers is best presented as
a. A table slide
b. A bullet slide
c. A title slide
d. All of the above
4. What is a motion path?
a. A type of animation entrance effect
b. A method of advancing slides
c. A method of moving items on a slide
d. All of the above
5. What is a slide-title master pair?
a. The title area and text area of a specific slide
b. a slide master and title master merged into a single slide
c. A slide master and title master for a specific design template
d. All of above
6. Which of the following should you use if you want the entire slide in the presentation to have the same ―look‖?
a. the slide layout option
b. add a slide option
c. outline view
d. a presentation design template
7. In the context of animations, what is a trigger?
a. An action button that advances to the next slide
b. An item on the slide that performs an action when clicked
c. The name of a motion path
d. All of above
8. If you have a PowerPoint show you created and want to send using email to

PowerPoint 2007
123 | P a g e
another teacher you can add the show to your email message as a (an)
a. Inclusion
b. Attachment
c. Reply
d. Forward
9. In order to edit a chart, you can
a. Triple click the chart object
b. Click and drag the chart object
c. Double click the chart object
d. Click the chart object
10. To exit the PowerPoint
a. click the application minimize button
b. click the document close button
c. double click the applications control menu icon
d. double click the document control menu icon
11. To preview a motion path effect using the custom animation task pane, you should
a. click the play button
b. click the show effect button
c. double click the motion path
d. all of above
12. You can create a new presentation by completing all of the following except
a. Clicking the new button on the standard toolbar
b. Clicking file, new
c. Clicking file open
d. Pressing ctrl + N
13. You can embed a MS-Organization Chart in a slide by
a. Clicking the object command on the edit menu
b. Clicking the object command on the edit menu
c. Clicking the insert new slide button the standard toolbar, then double click the organization chart button on the formatting toolbar
d. Clicking the MS-Organization Chart button on the standard toolbar
14. To select one hyperlink after another during a slide presentation, what do you press?
a. Tab
b. Ctrl + K
c. Ctrl + h
d. All of above
15. Special effects used to introduce slides in a presentation are called
a. effects

PowerPoint 2007
124 | P a g e
b. custom animations
c. transitions
d. present animations
16. You can edit an embedded organization chart object by
a. Clicking edit object
b. Double clicking the organization chart object
c. Right clicking the chart object, then clicking edit MS- Organisation Chart object
d. b and c both
17. What is the term used when you press and hold the left mouse key and more the mouse around the slide?
a. Highlighting
b. Dragging
c. Selecting
d. Moving
18. Which of the following toolbars provide different options in various master views?
a. Common tasks toolbar
b. Drawing toolbar
c. Formatting toolbar
d. Standard toolbar
19. How can you create a uniform appearance by adding a background image to all slides?
a. Create a template
b. Edit the slide master
c. Use the autocorrect wizard
d. All of the above
20. How do you create speaker note pages that show the slides, related notes, and your company logo on each page?
a. Edit the notes master and add your company logy
b. Edit the slide master and insert your company logo and notes pane
c. Edit the handout master to include your company logo and one slide per page with additional note space
d. All of the above
Which option on the custom animation task pane allows you to apply a preset or custom motion path?
a. Add effect
b. Emphasis
c. Animate now
d. All of the above
22. What is the term used when a clip art image changes the direction of faces?
a. Group

PowerPoint 2007
125 | P a g e
b. Flip
c. Rotate
d. All of the above
23. The slide that is used to introduce a topic and set the tone for the presentation is called the
a. table slide
b. graph slide
c. bullet slide
d. title slide
24. Which of the following features should you use when typing in the notes text box?
a. Slide show
b. Insert
c. Slide maser
d. Zoom
25. Which option allows you to select line, curve, freeform or scribble tools?
a. Create effect
b. Insert motion path
c. Draw custom path
d. All of the above
26. Which of the following should be used when you want to add a slide to an existing presentation?
a. File, add a new slide
b. Insert, New slide
c. File Open
d. File, New
27. The size of the organization chart object
a. Is determined by the presentation design and can not be changed
b. Is determined by the presentation design but can be changed in PowerPoint
c. Is dependent on the amount of text within the organization chart
d. b and c
28. Which of the following is the default page setup orientation of slide in PowerPoint
a. rVertical
b. Landscape
c. Portrait
d. None of above
29. Want a PowerPoint photo album slide show to play continuously?
a. Use random slide transitions
b. Launch an online broadcast
c. Loop continuously
d. All of the above

PowerPoint 2007
126 | P a g e
30. What is defined by the handout master?
a. Slide formatting
b. Layout of audience handout notes
c. Handout content formatting for Microsoft word export
d. All of above
31. Which of the following tool enables you to add text to a slide without using the standard placeholders?
a. Text tool box
b. Line tool
c. Drawing tool
d. Auto shapes tool
32. In notes master view, how do you modify the font size of text for all hte4 notes of a presentation?
a. rModify the slide design
b. Modify the notes master layout
c. Modify the text within the body placeholder
d. All of the above
33. Want your logo in the same position on every slide, automatically? Insert it on the
a. Handout master
b. Notes master
c. Slide master
d. All of the above
34. Which of the following views is the best view to use when setting transition effects for all slides in a presentation?
a. Slide sorter view
b. Notes pages view
c. Slide view
d. Outline view
35. Objects on the slide that hold text are called
a. Placeholders
b. Object holders
c. Auto layouts
d. Text holders
36. Which of the following provides a means of printing out feature notes with a miniature slide on a printed page?
a. Slide with animation
b. Outline view
c. Notes page
d. Audience handout
37. Which command brings you to the first slide in your presentation?
a. Next slide button
b. Page up

PowerPoint 2007
127 | P a g e
c. Ctrl + Home
d. Ctrl + End
38. In normal view, how can you quickly change to handout master view?
a. Click the outline tab and select handout master view
b. Press the shift key and click the handout master view button
c. On the view menu, click slide sorter, and click handouts.
d. All of above
39. How can you quickly reinstate a deleted footer placeholder in master view?
a. Create a new slide master
b. Re-apply the footer placeholder
c. Re-apply the slide layout
d. All of the above
40. Which of the following can you use to add times to the slides in a presentation?
a. Slide show menu
b. Rehearse timings button
c. Slide transition button
d. All of the above
41. To select all of the boxes of an organization chart
a. Clicking and edit and select all
b. Right click the chart background and then click select all
c. Press and hgold the SHIFT key and click each box
d. All of above
42. You can show the shortcut menu during the slide show by
a. Clicking the shortcut button on the formatting toolbar
b. Right clicking the current slide
c. Clicking an icon on the current slide
d. a and b
43. Auto clipart is a feature that
a. Automatically places clipart in your presentation
b. Scans your presentation for incorrect spelling in your words on each slide
c. Scans your presentation for incorrect spelling in Word Arts objects
d. All of above
44. To edit the text within the boxes of an organization chart, you
a. select the box and text, then make changes
b. select the box, then make the dchanges
c. highlight the text, them make the changes
d. a and b both

PowerPoint 2007
128 | P a g e
45. Which of the following allow you to select more than one slide in a presentation?
a. Alt + Click each slide
b. Shift + drag each slide
c. Shift + Click each slide
d. Ctrl + Click each slide
46. The view that displays the slides on a presentation as miniature representations of the slides is called
a. slide show
b. slide sorter view
c. notes page view
d. outline view
47. The PowerPoint view that displays only text (title and bullets) is
a. Slide show
b. Slide sorter view
c. Notes page view
d. Outline view
48. In Microsoft PowerPoint the entry effect as one slide replaces another in a show is called a (an)
a. animation
b. slide transition
c. custom animation
d. preset animation
49. Which of the following presentation elements can you modify using the slide master?
a. Slide comments
b. Slide transitions
c. Speaker note font and color
d. All of above
50. Which of the following provides a printed copy of your presentation?
a. Outline
b. Speaker notes
c. Audience handouts
d. All of the above
51. Slide show options available to the presenter include all of the following except
a. Transitions command
b. Speaker notes command
c. Meeting reminder command
d. Navigation commands
52. Presentation designs regulate the formatting and layout for the slide and are commonly called
a. Design plates
b. Templates

PowerPoint 2007
129 | P a g e
c. Placeholders
d. Blueprints
53. Which of the following bypasses the print dialog box when printing individual slides or an entire presentation?
a. File, print, preview
b. The print button
c. File, print
d. Ctrl + p
54. To add a header or footer to your handout, you can use
a. The title master
b. The slide master
c. The handout master
d. All of above
55. Which of the following will not advance the slides in a slide show view?
a. Esc key
b. The spacebar
c. The Enter key
d. The mouse button
56. What are lines, curve, freeform, and scribble?
a. Emphasis effects that can be applied to animations
b. Types of custom motion paths
c. Predefined entrance and exit effects
d. All of the above
57. Comments on a presentation can record who wrote them and when they were added. What‘s the automatic way in PowerPoint 2002?
a. Use online collaboration
b. Use comments
c. Use the notes page
d. All of the above
58. When using PowerPoint, to play a PowerPoint show for previewing the show, select
a. View, slide sorter
b. View, slide
c. View, slide show
d. View outline
59. In Microsoft PowerPoint in order to see all the slides on one screen use
a. view, slide sorter
b. view, slide
c. view, master
d. view, slide show
60. What‘s the best place to find animated images for your PowerPoint 2002 presentation?
a. Microsoft online

PowerPoint 2007
130 | P a g e
b. Word clipart
c. PowerPoint tools and ins
d. All of the above
61 What‘s the easy way to apply varied animations to test on slides
a. apply effects in the custom animation text pane b. apply an animation scheme c. customize bullets with animated clipart d. all of above 62. Using a custom animation effect, how do you make text appear on a slide by letter a. Apply the animation scheme fade in one by one. b. Apply an entrance effect, and then set it to by letter in the effect option dialog box c. Apply the fly in entrance to the text, and then set its speed to very slow. d. All of above
63. To exit the PowerPoint application, you should a. Click the application minimize button b. Click the document close button c. Double click the application control menu icon d. Double click the document control menu icon
64. You can create a new presentation by completing all of the following except: a. Clicking the new button on the standard toolbar b. Clicking file, new c. Clicking file open d. Pressing Ctrl + N
65. You have customized a design template in one presentation and you want to use it in another presentation. What the best way to do this? a. Use the browse feature in the slide design task pane to find the file that has your design template and apply it to the current file. b. Copy and paste the slide with the design template you want to include the new presentation; inserted slide will inherit the design c. Save the presentation that has the design template with a new name, and then use a new file to your presentation d. All of the above.
66. Which of the following options in the printer dialog box would you select to prit slides 5 and 12 in a presentation? a. Slides b. Custom shows c. Current slide d. All
67. Which of the following toolbars provides different options in various master views? a. Common tasks toolbar b. Drawing toolbar c. Formatting toolbar d. Standard toolbar 68. You can tell when an object is active because a. The object is highlighted b. Eight small sizing handles appear surrounding the text c. A box frame appears surrounding the text

PowerPoint 2007
131 | P a g e
d. b and c
69. Which of the following is not an option when printing handouts? a. Six slides per page b. Five slides per page c. Three slides per page d. Two slides per page
70. What‘s the best way to design the layout for your slides? a. Create layouts for slides, handouts and notes using the Master Layout dialog box in slide master view b. For each new slide, select a layout from the Slide Layout task pane c. Apply templates from the Slide Design task pane d. None of above
71. Any and every command can be found on the a. Drawing toolbar b. Formatting toolbar c. Standard toolbar d. Menu bar
72. The slide that is used to introduce a topic and set the tone for the presentation is called the a. Table slide b. Graph slide c. Bullet slide d. Title slide
73. How do you print your slides in a handout that includes lines for notes? a. In the print dialog box, select handout and set the number of slides per page to 3 b. In the print dialog box, select handout and set the number of slides per page, then select the include comment page option
c. In the print dialog box select note page instead of handout d. All of above 74. Which of the following features should you use when typing in he notes text box? a. Slide shows b. Insert c. Slide master d. Zoom
75. Which of the following should e used when you want to add a slide to an existing presentation? a. File, add a new slide b. Insert, new slide c. File, open d. File, new
76. Which of the following is the default page setup orientation for notes pages, outlines and handouts? a. Vertical b. Landscape c. Portrait d. None of above
77. Which of the following is the default page setup orientation for slides in PowerPoint? a. Vertical b. Landscape c. Portrait d. None of above
78. How can you get your photo album slide show to play continuously? a. Use random slide transition b. Launch an online broadcast c. Loop continuously d. All of above

PowerPoint 2007
132 | P a g e
79. What are symbols used to identify items in a list? a. Icons b. Markers c. Bullets d. Graphics
80. The toolbars that are displayed by default in the PowerPoint window includes a. Menu bar, standard toolbar, formatting toolbar, drawing toolbar, status bar b. Menu bar, standard toolbar, formatting toolbar, drawing toolbar, status bar c. Standard toolbar, formatting toolbar, drawing toolbar, status bar d. Menu bar, standard toolbar, status bar, drawing toolbar
81. Objects on the slide that hold text are called
a. Placeholders b. Object holders c. Auto layout d. Text holders
82. You have got a bunch of digital holiday photo you want to put into a slide show. What the quickest method? a. Apply a multiple-picture layout to several slides, and use the clipart icon on the slides to import your picture b. On the insert menu, point to the picture, click from file, and select your picture in a group for each slide c. On the insert menu, point the picture and click new photo album d. All of the above
83. How would you create the following diagram in Power Point a. Use auto shapes and the drawing toolbar to create the diagram and design it
b. Open the diagram gallery from the drawing toolbar and choose this diagram type c. Use the chart command on the insert menu to import the diagram d. All of above
84. Which of the following provides a means of printing out features notes with a miniature slide on a printed page? a. Slides with animation b. Outline view c. Notes page d. Audience handout
85. Which command brings you to the first slide in your presentation? a. Next slide button b. Page up c. Ctrl + home d. Ctrl + end
86. You were giving your presentation, and you need to click a slide that‘s few slides back. How do you get there? a. Press ESC to get back into a normal view; click the slide thumbnail in normal view; then click the resume slide show button b. Press backspace until your desired slide c. Right click, point to go on the shortcut menu, point to by title, and click the slide you want to go to d. All of above
87. Which of the following should you do to bring a bullet back to a previous level? a. Press the shift + tab keys b. Press the shift key c. Press the enter key d. Press the tab key

PowerPoint 2007
133 | P a g e
88.Good design determines a. Credibility b. Readability c. First impression d. All of above
89. To make a selection of slides on our presentation, use a different design template from the other slides, what do you do? a. Select the slides thumbnails in that section, and apply a different colour scheme b. Select the slide thumbnails in that section and apply a different design template c. Select one of the slide in the section you want to change, customize the fonts and colours, and use the format painter tool to apply those styles to the other slides in the section d. All of above
90. Your presentation is ready to go, but you don‘t know if PowerPoint is installed on the computer, you will use to present with what‘s the safe way a. Save your presentation as a web page b. Set up your presentation to be ‖browse as a kiosk‖ c. Use the Pack and Go wizard d. All of the above
91. The view that displays the slides of a presentation as miniature representations of the slides is called a. Slide show b. Slide sorter view c. Notes page view d. Outline view
92. The power point view that displays only text (title and bullets) is:
a. Slide show b. Slide sorter view c. Notes page view d. Outline view
93. Which of the following provides a printed copy of your presentation? a. Outlines b. Speaker notes c. Audience handouts d. All of above 94. Presentation designs regulate the formatting and layout for the slide and are commonly called a. Design templates b. Templates c. Placeholders d. Blueprints
95. Which of the following should you use if you want all the slides in the presentation to have the same look? a. The slid layout option b. The add a slide option c. Outline view d. A presentation design template
96. Line spacing refers to a. The space between the lines of text b. The height of the line c. The length of the line d. a and c
97. Which of the following uses the spelling and grammar feature to indicate an incorrect spelling? a. The incorrect word appears in all capital letters b. The incorrect word has a wavy red line under it c. The incorrect word appears italicized d. The incorrect word appears bold

PowerPoint 2007
134 | P a g e
98. Which of the following bypasses the print dialog box when printing individual slides or an entire presentation? a. File, Print Preview b. The print button c. File, print d. Ctrl + P 99. The handout master contains placeholders for all of the following except a. Slide number b. Title c. Footer
d. Header
100. How do you add degrees of transparency to shapes such as arrows, so that the slide background shows though? a. Use #D style 4 button on the drawing toolbar b. Use the Set Transparent Colour button on the Picture toolbar c. Use the Transparency slider in the Format AutoShapes dialog box d. All of above


![Pathway examples [version 2021] 1.2](https://static.fdokumen.com/doc/165x107/63223a7a117b4414ec0bce38/pathway-examples-version-2021-12.jpg)