1.0 DESCRIPTION OF WATER SYSTEM - Oroville Washington
35
1200901_OrovilleWSP_DRAFT(2018.6.5).docx 1 Varela & Associates 1.0 DESCRIPTION OF WATER SYSTEM 1.1 Ownership and Management The water system is owned and operated by the City of Oroville (referred to as Oroville or the City in this Water System Plan). DOH ID Number 64400 Address: City of Oroville 1308 Ironwood, PO Box 2200 Oroville, WA 98844 Phone: (509) 476-2926 Fax: (509) 476-9067 Mayor: Jon Neal City Superintendent: Rod Noel 1.2 System Background 1.2.1 History of Water System Development The City of Oroville is located 44 miles north of Omak in Okanogan County, Washington. The service area is located at the south end of Lake Osoyoos and runs along the east and west sides of the lake. Oroville was first settled in the late 1800’s as a center for gold mining activities. The City was originally platted in 1906 and incorporated in 1908. The primary economic sector includes tree fruit production, wood products manufacturing, and tourism. In recent years, areas outside City Limits to the north along Lake Osoyoos have been developed into resort areas catering to tourism. The Cascade and Columbia Railroad tracks, part of which is abandoned, separates the City in North and South sections. The major transportation corridor, State Route (SR) 97, further separates the City into quarters as the highway generally runs north and south. Within the City, industrial uses are located along the railroad tracks, widening the division between the north and south sections. This linear industrial area continues beyond the City boundary to the southeast where two small sawmills are located near the Okanogan River. The central portion of the City, along SR 97 (North Main Street), is the central business district of Oroville. Commercial uses have developed along SR 97 to the north and south of the central business district and from the commercial corridor, which extends beyond the City Limits in both directions. The City of Oroville acquired the Westlake Water User System in 1989, providing water on the west side of the lake from the northern City Limits to the Canadian border. Wastewater in the Westlake area is treated by onsite septic systems. Additionally, Deep Bay Park is located in this area which is owned and operated by the City. The park is an incorporated shoreline area located approximately one mile north of the City Limits. In 2013 the City constructed Reservoir 7 (220,000 gal) to provide fire flow to
-
Upload
khangminh22 -
Category
Documents
-
view
1 -
download
0
Transcript of 1.0 DESCRIPTION OF WATER SYSTEM - Oroville Washington

1200901_OrovilleWSP_DRAFT(2018.6.5).docx 1 Varela & Associates
1.0 DESCRIPTION OF WATER SYSTEM
1.1 Ownership and Management The water system is owned and operated by the City of Oroville (referred to as Oroville or the City in this Water System Plan).
DOH ID Number 64400 Address: City of Oroville 1308 Ironwood, PO Box 2200 Oroville, WA 98844 Phone: (509) 476-2926 Fax: (509) 476-9067 Mayor: Jon Neal City Superintendent: Rod Noel
1.2 System Background
1.2.1 History of Water System Development The City of Oroville is located 44 miles north of Omak in Okanogan County, Washington. The service area is located at the south end of Lake Osoyoos and runs along the east and west sides of the lake. Oroville was first settled in the late 1800’s as a center for gold mining activities. The City was originally platted in 1906 and incorporated in 1908. The primary economic sector includes tree fruit production, wood products manufacturing, and tourism. In recent years, areas outside City Limits to the north along Lake Osoyoos have been developed into resort areas catering to tourism. The Cascade and Columbia Railroad tracks, part of which is abandoned, separates the City in North and South sections. The major transportation corridor, State Route (SR) 97, further separates the City into quarters as the highway generally runs north and south. Within the City, industrial uses are located along the railroad tracks, widening the division between the north and south sections. This linear industrial area continues beyond the City boundary to the southeast where two small sawmills are located near the Okanogan River. The central portion of the City, along SR 97 (North Main Street), is the central business district of Oroville. Commercial uses have developed along SR 97 to the north and south of the central business district and from the commercial corridor, which extends beyond the City Limits in both directions. The City of Oroville acquired the Westlake Water User System in 1989, providing water on the west side of the lake from the northern City Limits to the Canadian border. Wastewater in the Westlake area is treated by onsite septic systems. Additionally, Deep Bay Park is located in this area which is owned and operated by the City. The park is an incorporated shoreline area located approximately one mile north of the City Limits. In 2013 the City constructed Reservoir 7 (220,000 gal) to provide fire flow to

City of Oroville Water System Plan 1. Description of Water System
1200901_OrovilleWSP_DRAFT(2018.6.5).docx 2 Varela & Associates
the Border Patrol Station. The City refers to water services served outside of City Limits along the west side of Lake Osoyoos as the Westlake Area. In 2005 the City began providing water and sewer to Veranda Beach Resort located at the north-east end of the UGA on the east side of Lake Osoyoos. The first phase of development included approximately 100 cottages/vacation homes and other resort amenities. Full buildout of the development includes an additional 350 cottages as well as several pools, vineyards, and a golf course. At this time the Veranda Beach development is not expected to grow beyond its current size due to a lack of funds. In 2014, the City extended water and sewer from Veranda Beach Resort to the Champerty Shores system which is located just north of Veranda Beach. The City refers to water services served outside of the City Limits along the east side of Lake Osoyoos as the Eastlake Area. In 2016, the City of Oroville received a Department of Health (DOH) grant to study the consolidation between Oroville and the Eastlake Water Association water system. The Eastlake Water Association (ELWA) is a private water system located at the southeast end of Lake Osoyoos in the Eastlake Area. ELWA currently has 27 active connections and has DOH approval for up to 28 connections.
1.2.2 Governance The ownership is municipal with a council decision making process. The City Council sets the budget for the water department. The City Superintendent runs the day to day operation of the City and has discretionary control of the water system budget to make purchases and to have work performed. For situations where large expenses are required or long term decisions are needed, the City Superintendent works in conjunction with the Mayor and City Council to determine a course of action and method of funding. The City Superintendent consults the City’s most recent planning documents to determine the number of connections the system can serve, and uses these documents to guide planning efforts and to plan short-term project phasing. Finally, the City Superintendent works with the City Engineer when large projects are necessary, when the City is seeking funding for a project, or if a developer requires above average fire flow.
1.2.3 Geography Oroville is situated between the Okanogan and Similkameen Rivers with the exception of the northwest portion of the City, which lies to the north of where the Similkameen enters the valley. Lake Osoyoos is located to the immediate north of Oroville. The Okanogan River flows to the south from Lake Osoyoos. Unincorporated agricultural land is found on the south border of the City. Bordered on three sides by bodies of water and having a general flat topography, portions of Oroville are considered to be in the floodplain.
1.3 Inventory of Existing Facilities
1.3.1 Description of Facilities and Major Components The City service area spans approximately 5 miles north to south and approximately 200 vertical feet which necessitates multiple pressure zones. Oroville has a total of four pressure zones which serve the retail service area. The City’s four wells pump to the main pressure zone while the four booster stations make use of check valves to fill each additional pressure zone’s reservoir. In total the City maintains three main zone reservoirs, one airport zone reservoir, one Veranda Beach zone reservoir, and one

City of Oroville Water System Plan 1. Description of Water System
1200901_OrovilleWSP_DRAFT(2018.6.5).docx 3 Varela & Associates
Summit Ave zone reservoir. Refer to Tables 1-1, 1-2, 1-3, and 1-4 for details and information on Oroville’s water system components.
1.3.2 Number of Service Connections Oroville’s 2017 Water Facilities Inventory (WFI) was last updated in March 2017 and differs from the City’s billing information. The WFI lists the City’s total service connections at 1,664 while the City lists its’ total number of connections for 2016 at 1,513. The WFI indicates the approved number of service connections available to the City is 2,348. Refer to Appendix B for a copy of the City’s most recent WFI form. The total number of bills provided by the City for 2015 is hereafter referred to as the total number of service connections within the City of Oroville Water System Plan (refer to Table 2-1).
1.3.3 Interties with Neighboring Systems Oroville has no interties with any other water system.
1.3.4 Supply, Storage and Distribution System The tables following contain a summary of the City’s supply, storage, and distribution system facilities.
Table 1-1 Summary of Groundwater Sources (wells)
Description
Groundwater Source Well 1 (1)
(S01) Well 2 (1)
(S02) Well 3 (1)
(S03) Well 4 (S04)
Date Constructed 1941 1947 1981 1987 Part of Wellfield Yes Yes Yes No Diameter (in) Dug Dug 24 18 Depth (ft) 33 33 47 80 Depth to SWL (ft) (2) 19 24 24 22
Screen/ Perforations (ft) (3) (3) Screen from 32 - 37
Screen from 53 -73
Present Pumping Rate (gpm) 650 500 600 800 Motor (HP) 50 50 100 100 Equipped with VFD No No No No Automatic Backup Power No No No No
Location NW ¼, SE ¼, S28, T40N, R27E
NW ¼, SE ¼, S28, T40N, R27E
NW ¼, SE ¼, S28, T40N, R27E
SE ¼, SW ¼, S21, T40N, R27E
(1) Wells #1, #2, and #3 are within well field WF/S01,2,3. See Appendix B for WFI. (2) Depth to SWL was recorded at date of construction (3) Screen and perforation data unavailable

City of Oroville Water System Plan 1. Description of Water System
1200901_OrovilleWSP_DRAFT(2018.6.5).docx 4 Varela & Associates
Table 1-2 Summary of Reservoirs Reservoir
Name Pressure Zones
Served Volume
(gal) Overflow Elevation
Height (ft)
Type of Reservoir
Year Built
Last Recoated
1 (1) Main 157,000 1,138.5 9 Concrete, buried 1940’s N/A 2 Main 300,000 1,138.5 18 Concrete, buried 1947 N/A 3 Main 500,000 1,138.5 31 Welded Steel 1987 1987 4 Main 100,000 1,138.5 23.5 Welded Steel 1970’s 1998 5 Airport 200,000 1,240.0 32 Bolted Steel 1995 1995 6 Veranda Beach 269,000 1,256.7 32 Bolted Steel 2008 2008 7 Main 220,000 1,138.5 23.5 Bolted Steel 2013 2013
(1) Currently offline due to decayed wood roof, not likely to be put back in to service
Table 1-3 Summary of Distribution System
Length of Water Main of Diameter Shown (LF) (1) 2” 4” 6” 8” 10” 12” Total
Steel 2,967 1,251 1,849 790 0 0 6,858 Ductile Iron 3,384 160 9,074 6,524 0 3,581 22,723 Galvanized Iron 1,117 0 0 0 0 0 1,117 Cast Iron 352 1,147 12,582 11,798 1,984 1,102 28,965 Asbestos Cement 502 1,793 2,081 2,694 2,319 0 9,388 PVC 12,355 34,620 24,659 40,649 3,517 29,557 145,357 HDPE 280 0 0 0 0 0 280
Total 20,958 38,971 50,245 62,455 7,820 34,239 214,688 (1) Lengths based on past information and updated piping provided by the City The City has approximately 214,700 LF (40.7 miles) of water main. Pipe materials vary between the City, Eastlake, and Westlake areas. Pipe material within the City Limits consists primarily of cast iron pipe north of Apple Way Ave and ductile iron pipe south of Apple Way Ave. The Westlake zone consists primarily of old and failing glued PVC mains and the Eastlake zone consists entirely of PVC main installed after 2006.
1.3.5 Booster Stations
Table 1-4 Summary of Booster Stations
Name Pressure Zone
No. of Pumps (1) Capacity (gpm) (2) Supply Discharge
North End Main Main 1 175 Summit Avenue (2) Main Summit Avenue 2 100
Airport Main Airport 2 500
Eastlake (2) Main Veranda Beach 2 300
(1) Does not include fire flow booster pump. The Summit Avenue and Eastlake Booster Stations include one additional fire flow booster pump rated at 1,000 gpm.
(2) Indicates the combined capacity of the pumps when operated in parallel (does not include fire flow booster capacity)
1.4 Overview of System Operation Oroville operates four well pump stations, seven reservoirs, and four pressure zones. The City’s wells are automatically controlled based on the water level of Reservoir 3, which is communicated to the well pump controls via telephone lines. The Airport booster is controlled based on water level in the

City of Oroville Water System Plan 1. Description of Water System
1200901_OrovilleWSP_DRAFT(2018.6.5).docx 5 Varela & Associates
Airport reservoir. The Eastlake booster is controlled based on water level in the Veranda Beach reservoir. The system operates satisfactorily with no major issues.
1.4.1 Main Zone (HGL 1,138.5) The Main Pressure Zone is comprised of everything within the City Limits and includes areas at the south-east end of Lake Osoyoos and the west side of the lake all the way up to the Canadian border. All the City’s wells are located within the City Limits and Main Zone. Service pressures in the Main Zone range from 45 psi to 95 psi. Services along the west side of the lake (Westlake) along Westlake Rd and SR 97 require a small booster station to increase pressures and fill Reservoir 4 and Reservoir°7 when Well 4 is not in operation, due to the length and small pipe size of the dead end system servicing this area.
1.4.2 Airport Zone (HGL 1,240) The Airport Zone is located on the southeast side of Lake Osoyoos and is served by a booster station and a 200,000-gallon reservoir. The booster station supplies the reservoir from the Main Zone. The area served is referred to as the Eastside Industrial Park and also serves the Dorothy Scott Airport and a mobile home park. The booster station supplies the reservoir from the Main Zone.
1.4.3 Veranda Beach Zone (HGL 1,256.7) The Veranda Beach Zone is located on the east shore of Lake Osoyoos in Grubbs Cove located north-east of the City Limits and just south of the Canadian border. A 269,000-gallon reservoir serves the area and is supplied by the Eastlake Booster Station via the Main Zone. The Veranda Beach Zone is comprised of mainly vacation and resort residences and facilities as well as the Champerty Shores development located slightly north of Veranda Beach. A PRV station reduces pressures for the lower portions of this zone.
1.4.4 Summit Avenue Zone (HGL 1,288) The Summit Avenue Zone is a closed system located at the northwest corner of the City Limits next to the three Main Zone reservoirs on Summit Avenue. The booster station boosts pressures from the Main Zone to roughly 20 residential services and also provides fire flow to the same area.
1.5 Related Planning Documents Planning activities of other institutions or government entities can affect planning for water utilities. Oroville seeks to reduce potential conflicts and overlaps in planning through coordination with local entities. The sections following outline the City’s efforts to coordinate the planning in this Water System Plan with other interested entities.
1.5.1 City of Oroville Comprehensive Plan The City is in the process of updating it’s 1995 Comprehensive Plan. The City’s updated Comprehensive Plan is not expected to be completed by this Water System Plan’s submittal date. Refer to Appendix A for a copy of the City’s planning consistency checklist.

City of Oroville Water System Plan 1. Description of Water System
1200901_OrovilleWSP_DRAFT(2018.6.5).docx 6 Varela & Associates
1.5.2 City of Oroville Consolidation Feasibility Study In 2016, the Drinking Water State Revolving Fund (DWSRF) awarded the City of Oroville a grant to study the feasibility of consolidating the Eastlake Water Association (ELWA) water system into Oroville’s water system. The goal of this consolidation feasibility study is to provide the City of Oroville and the Eastlake Water Association a basis for considering integration of the small water system into the City of Oroville’s water system. The analysis and alternatives presented in the study depend on the location, condition, and situation within the small system and its potential impact on the City of Oroville’s water supply and infrastructure. Completion of the consolidation study does not preclude the need for subsequent financial or technical investigations which may become evident as a result of the consolidation study. Figure 2 shows the ELWA water system considered for consolidation. Copies of the ELWA Feasibility Study are available under separate cover.
1.5.3 Okanogan County Comprehensive Plan This Water System Plan is consistent with Okanogan County’s Comprehensive Plan (2014). Refer to Appendix A for a copy of the County’s planning consistency checklist.
1.6 Neighboring Purveyors There are no water purveyors adjacent to Oroville. The nearest publicly owned water system is the City of Tonasket approximately 22 miles south. The community of Ellisford is 10 miles south and is served by a community well or individual residential wells.
1.7 Existing Service Area and Characteristics
1.7.1 Existing Service Area Figure 2 shows a schematic map of the City’s existing water system facilities. The figure shows locations of wells, reservoirs, booster stations, water mains, and pertinent elevation data as needed to understand the hydraulic performance of the system.
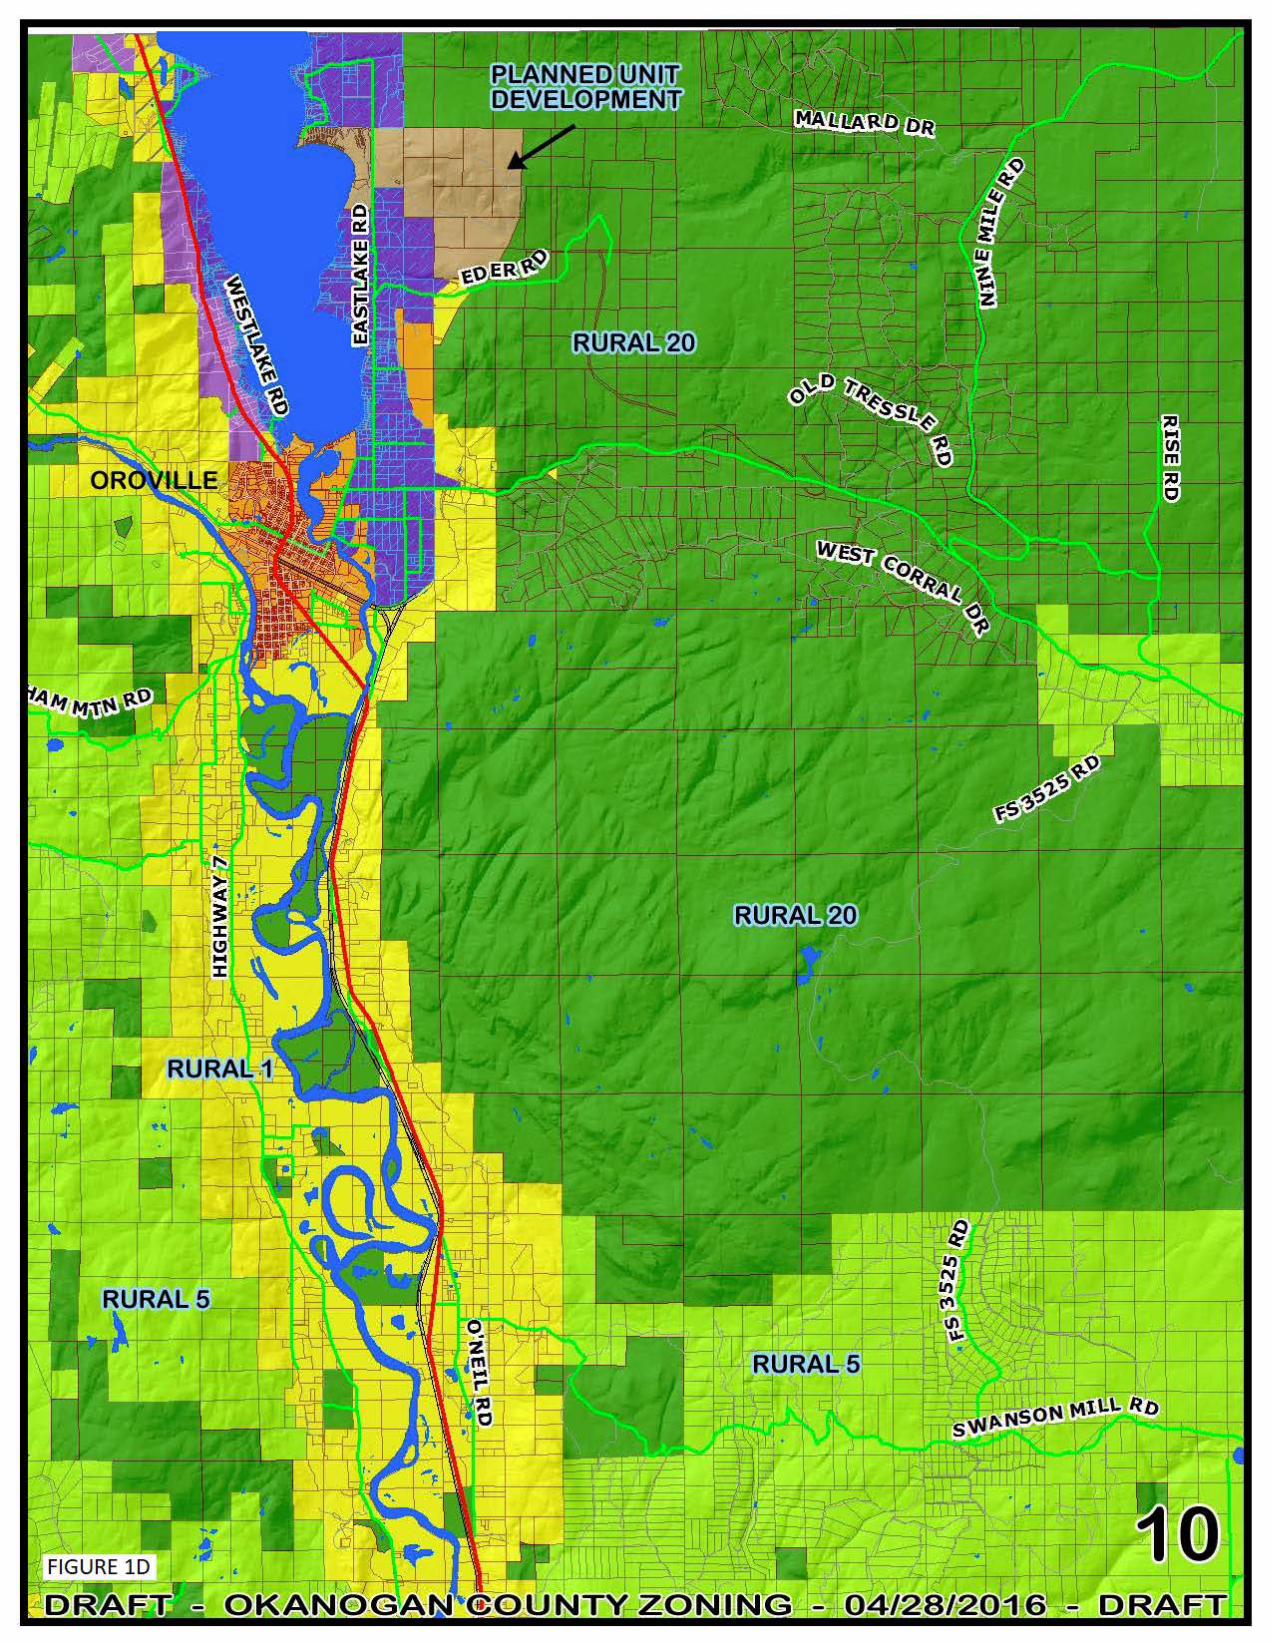
1.7.2 Zoning and Land Use Figures 1B and 1D shows zoning designations provided by local planning jurisdictions (City of Oroville, Okanogan County). Okanogan County is not mandated to plan under the Growth Management Act. In the future, Oroville may choose to expand the Growth Area beyond its current boundary.
1.8 Service, Retail, and Water Rights Place of Use Areas The service, retail service, and water rights place of use areas are shown on Figure 1. Future development within the City of Oroville retail service area will occur primarily within City Limits as infill and outside of City Limits as small concentrated developments such as the Veranda Beach development.

City of Oroville Water System Plan 1. Description of Water System
1200901_OrovilleWSP_DRAFT(2018.6.5).docx 7 Varela & Associates
1.9 Duty to Serve and Conditions of Service
1.9.1 Duty to Serve The City of Oroville has a duty to provide service to all new persons or entities seeking water service within the Retail Service Area (refer to Figure 1) when the circumstances meet four threshold factors (see RCW 43.20.260):
1. The municipal water supplier has sufficient capacity to serve water in a safe and reliable manner.
2. The service request is consistent with adopted local plans and development regulations. 3. The municipal water supplier has sufficient water rights to provide service. 4. The municipal water supplier can provide service in a timely and reasonable manner.
The City’s process for addressing a request for service determines whether the request meets the four threshold factors defined in RCW 43.20.260. The City’s Development Policy Manual outlines the City’s conditions for water service. Process for Requesting Service A potential customer submits a water service application to the City. The City processes and responds the all application within two weeks of receiving the service request. System Capacity Determination The City consults the Water System Plan to see if any obvious issues exist that would prevent service of an additional customer. The City consults the City Engineering Consultant if it appears the system may not have capacity to serve the proposed connection. The City Engineering Consultant then conducts an analysis to ascertain whether sufficient system capacity exists (supply, storage, distribution system, water rights, etc.) to serve the requesting customer and determines what additional improvements are required to provide service. The customer requesting service is responsible for financing the system improvements necessary to provide service. If the City has insufficient water rights to serve the customer requesting service, the requestor is responsible for supplying water rights to the City in the amount necessary for the addition of the customer. Non-Technical Conditions Affecting Provision of Service Those requesting annexation must comply with relevant City Ordinances and Development Codes. The City can only provide service if adequate water rights are available to serve the requestor (see System Capacity Determination above). Denial of Service and Appeals If City Staff deny a request for service based on the process described above, the person/entity requesting service may appeal the decision to the City Council which meets twice monthly.
1.10 Service Area Policies The City of Oroville Municipal Code contains the City’s administrative policies. Appendix D contains a copy of Title 13 of the Municipal Code which includes policies for the water system and sewer

City of Oroville Water System Plan 1. Description of Water System
1200901_OrovilleWSP_DRAFT(2018.6.5).docx 8 Varela & Associates
system. Water System policies include requirements for new service connections, as well as construction and maintenance requirements for system expansion.
1.11 Satellite Systems Presently Oroville does not plan to own, operate, or manage satellite systems.
1.12 Complaints Customer complaints are directed to the system City Superintendent. If a customer’s service has been interrupted or restricted, the condition is corrected by the City Superintendent. If the complaint is a service issue, such as low pressure during peak use, the City Superintendent advises the customer of the cause of the condition, what corrective measures are being taken, and what the customer can do to lessen the impact of the condition.

1200901_OrovilleWSP_DRAFT(2018.6.5).docx 9 Varela & Associates
2.0 PLANNING DATA
2.1 Current System Data
2.1.1 Types and Numbers of Connections The City serves the following connections:
Table 2-1 Types and Numbers of Connections (1)
Area Single-Family Multi-Family (2) Commercial Public Total City 660 25 166 17 868 Eastlake 300 8 11 5 324 Westlake 299 4 17 1 321
Total System 1,259 37 194 23 1,513 (1) Provided by City of Oroville; number of connections current as of Spring 2017 (2) Serves 196 dwelling units total
2.1.2 Population The City’s water Retail Service Area shown on Figure 1 includes customers both inside and outside City Limits. The population data within City Limits is taken from the Washington State Office of Financial Management (OFM). The OFM lists the City’s 2015 population as 1,695 and the City lists the number of single-family residential connections for 2015 as 665. The City’s Retail Service Area population is estimated herein based on the number of single-family residential connections within the retail service area multiplied by the 2015 number of persons per single-family residential household. Assuming the average single family residence houses 2.55 residents, the City provides services to approximately 3,200 individuals. The City’s 2016 retail service area population is estimated as follows:
Table 2-2 Population (1)
Area Residential
Connections (2) Population City 660 1,682 (3)
Eastlake 300 765 Westlake 299 762
Total System 1,259 3,209 (1) 1,695 / 665 = 2.55 persons per household. 2015 City of Oroville Population Trends for Washington State, Office of Financial
Management divided by known number of 2015 single family residential services provides persons per household. (2) Based on Table 2-1. Total Residential Connections are single-family connections (3) 2.55 x 660 = 1,682 persons. 2015 persons per household times the number of 2016 residential services
2.1.3 Source Production Production data was provided by the City. Water Use Efficiency (WUE) Reports (Refer to Appendix B) also provide a record of City water production. The following table summarizes 2014 – 2016 source production.

City of Oroville Water System Plan 2. Planning Data
1200901_OrovilleWSP_DRAFT(2018.6.5).docx 10 Varela & Associates
Table 2-3 Total Water Production (1)
Description 2014 (gal)
2015 (gal)
2016 (gal)
Average (gal)
Well 1 0 (2) 0 (2) 17,742,950 5,914,317 Well 2 33,834,000 60,693,100 77,531,000 57,352,700 Well 3 58,650,100 55,162,360 10,254,000 41,355,487 Well 4 134,593,300 112,559,300 103,378,300 116,843,633
Total System 227,077,400 228,414,760 208,906,250 221,466,137 (1) Provided by City of Oroville staff (2) Well 1 offline due to failing well pump. Pump house, electrical, and pump were replaced in the Fall of 2016.
2.1.4 Water Consumption The City of Oroville meters all services and sources. This allows the City to accurately account and bill for water used by customers. The following Table contains metered use for the past three years (2014-2016).
Table 2-4 Total Water Consumption (1)
Area Customer Class
2014 (gal)
2015 (gal)
2016 (gal)
Average (gal)
City
Single-family 71,697,000 73,849,000 67,810,000 71,118,667 Multi-family 8,038,000 8,553,000 8,373,000 8,321,333 Commercial 33,444,000 33,922,000 32,958,000 33,441,333 Public 34,136,000 37,396,000 29,035,000 33,522,333
Total 147,315,000 153,720,000 138,176,000 146,403,667
Eastlake
Single-family 6,860,000 5,440,000 6,739,000 6,346,333 Multi-family 1,545,000 705,000 835,000 1,028,333 Commercial 2,178,000 1,941,000 1,353,000 1,824,000 Public 35,000 105,000 32,000 57,333
Total 10,618,000 8,191,000 8,959,000 9,256,000
Westlake
Single-family 16,860,000 16,715,000 17,225,000 16,933,333 Multi-family 730,000 1,034,000 554,000 772,667 Commercial 1,007,000 1,119,000 1,645,000 1,257,000 Public 9,395,000 9,918,000 9,287,000 9,533,333
Total 27,992,000 28,786,000 28,711,000 28,496,333 Total Annual Consumption 185,925,000 190,697,000 175,846,000 184,156,000
(1) Provided by City of Oroville staff
2.1.5 Seasonal Production Patterns The following table shows monthly system water production totals for each well in 2016.

City of Oroville Water System Plan 2. Planning Data
1200901_OrovilleWSP_DRAFT(2018.6.5).docx 11 Varela & Associates
Table 2-5 Monthly System Water Production by Well (1)
Month Groundwater Source Total Well 1 (2) Well 2 Well 3 Well 4 Jan 0 8.9 0 0 8.9 Feb 0 9 0 0.6 9.6 Mar 0 9.7 0 0 9.7 Apr 0 11.4 0 0 11.4
May 0 14 3.5 (3) 0.2 (3) 17.7 Jun 0 16.8 6.7 6.8 30.3 Jul 0 0 0 27.7 27.7 Aug 0 0 0 35.1 35.1 Sep 0 1.9 0 21.5 23.4 Oct 0 5.9 0 11 16.9 Nov 8.7 0 0 0.5 9.2 Dec 9 0 0 0 9 Total 17.7 77.5 10.3 103.4 208.9
(1) 2016 production values from City of Oroville staff (2) Offline due to failing well pumps. Well 1 pump house, electrical, and a new well pump were replaced in the fall of 2016. (3) Estimated values
2.1.6 Water Consumption The City of Oroville meters all services and sources. This allows the City to accurately account and bill for water used by customers. The following Table contains metered use for the past three years (2014-2016).
Table 2-6 Total Water Consumption (1)
Area Customer Class
2014 (gal)
2015 (gal)
2016 (gal)
Average (gal)
City
Single-family 71,697,000 73,849,000 67,810,000 71,118,667 Multi-family 8,038,000 8,553,000 8,373,000 8,321,333 Commercial 33,444,000 33,922,000 32,958,000 33,441,333 Public 34,136,000 37,396,000 29,035,000 33,522,333
Total 147,315,000 153,720,000 138,176,000 146,403,667
Eastlake
Single-family 6,860,000 5,440,000 6,739,000 6,346,333 Multi-family 1,545,000 705,000 835,000 1,028,333 Commercial 2,178,000 1,941,000 1,353,000 1,824,000 Public 35,000 105,000 32,000 57,333
Total 10,618,000 8,191,000 8,959,000 9,256,000
Westlake
Single-family 16,860,000 16,715,000 17,225,000 16,933,333 Multi-family 730,000 1,034,000 554,000 772,667 Commercial 1,007,000 1,119,000 1,645,000 1,257,000 Public 9,395,000 9,918,000 9,287,000 9,533,333
Total 27,992,000 28,786,000 28,711,000 28,496,333 Total Annual Consumption 185,925,000 190,697,000 175,846,000 184,156,000
(1) Provided by City of Oroville staff
2.1.7 Seasonal Consumption Patterns WAC 246-290-100(4)(b)(ii)(D) requires systems serving more than 1,000 connections to provide sufficient consumption data to identify trends in the seasonal variation in consumption patterns of each customer class. The rate of consumption within some customer classes changes seasonally throughout the year. Oroville has four main customer classes: Single-Family, Multi-Family, Commercial, and

City of Oroville Water System Plan 2. Planning Data
1200901_OrovilleWSP_DRAFT(2018.6.5).docx 12 Varela & Associates
Public. The Table following shows the average monthly percentage use by each customer class in 2016.
Table 2-7 Monthly System Water Consumption by Customer Class (1)
Month Customer Class
Total Single-Family
Multi-Family Commercial Public
Jan 54% 8% 27% 11% 100% Feb 51% 9% 28% 13% 100% Mar 50% 8% 30% 12% 100% Apr 50% 6% 24% 20% 100%
May 50% 4% 18% 27% 100% Jun 54% 5% 17% 24% 100% Jul 53% 5% 17% 25% 100% Aug 58% 4% 13% 25% 100% Sep 48% 5% 20% 27% 100% Oct 46% 5% 24% 25% 100% Nov 53% 9% 37% 1% 100% Dec 54% 9% 36% 1% 100% Average 52% 6% 24% 18% 100%
(1) 2016 consumption percentages based on consumption data provided by City of Oroville staff Based on the above Table it appears that Single-Family and Multi-Family consumption rates relative to total consumption rates do not vary considerably between summer and winter months. Commercial consumption rates relative to total consumption is highest during the winter months while Public consumption rates relative to total consumption rates are highest during the summer months which can be attributed to the large irrigation users in the City.
2.1.8 Equivalent Residential Units The Washington State Department (DOH) defines an equivalent residential unit (ERU) as the amount of water consumed by a typical full-time single family residence. Calculating the amount of water consumed by a typical full time single family residence requires a system to possess accurate water volume sales records for a one year period for single family connections. The following calculations show the average water use of an Oroville single family residence and the total ERUs in Oroville. Approximate Average Breakdown of Uses (2014-2016)
Single-family (in City) 32.1% Single-family (Eastlake/Westlake) 10.5% Multi-family Residential 4.6% Commercial 16.5% Public 19.5% Leakage/Unaccounted 16.8% Total 100%
Annual Volume per ERU per Day (avg. annual volume 2014-2016) x (percent single family use) ÷ (avg. single-family conn. 2014-2016) ÷ 365 days In City: (221.5 MG x 32.1%) ÷ 662 single family connections ÷ 365 days/year = 294 gpd/ERU Eastlake/Westlake: (221.5 MG x 10.5%) ÷ 596 single family connections ÷ 365 days/year = 107 gpd/ERU Combined: (221.5 MG x 42.6%) ÷ 1,257 single family connections ÷ 365 days/year = 206 gpd/ERU

City of Oroville Water System Plan 2. Planning Data
1200901_OrovilleWSP_DRAFT(2018.6.5).docx 13 Varela & Associates
The difference in average usage between Eastlake/Westlake and in City customers can likely be attributed to the availability of a separate irrigation source which serves Westlake (the Oroville-Tonasket Irrigation District) as well as the relatively large number of part time/vacation residences located in the Eastlake area (see Figure 1D for OTID Map). For projecting future system demands, the combined system-wide ERU of 206 gpd will be used since the separate irrigation source for the Westlake and the relatively high quantity of seasonal resort use in the Eastlake area is likely to continue through the 10-year planning horizon. The following table shows the breakdown of City ERUs based on the 2014-2016 average annual water use for each customer class. ERUs are calculated using the system-wide combined ERU consumption of 206 gpd/ERU. Because the combined ERU consumption is less than the City’s ERU consumption, the total number of single-family (in City) ERUs is larger than the City’s total number of single-family connections. Likewise, the total number of single-family (Eastlake/Westlake) ERUs is less than Eastlake/Westlake’s total number of single family connections because the combined ERU consumption is greater than the Eastlake/Westlake ERU consumption. Number of ERUs (based on annual average water use)
Single-family (in City) 947 Single-family (Eastlake/Westlake) 310 Multi-family Residential 135 Commercial 486 Public 574 Leakage 499 Total 2,950
Both the City and Westlake/Eastlake areas have non-revenue (leakage) volumes of water that Oroville could potentially recover to serve additional ERUs. Leakage volumes are defined as the total well production minus the total metered consumption and is reported in the City’s annual Water Use Efficiency (WUE) reports as distribution system leakage (DSL). The following table contains a summary of the City’s current number of ERUs.
Table 2-8 Current Numbers of ERUs
Area Single-family Residential
Multi-family Residential Commercial Public
Non-revenue (DSL) (1) Total
City Limits 947 111 445 446 395 2,344 Eastlake 85 14 24 1 25 149 Westlake 226 10 17 127 77 457
Total System 1,258 135 486 574 497 2,950 (1) The 497 ERUs of system wide DSL are distributed in this table to different areas of the system as a percentage of total ERUs in
each area.
2.1.9 Existing System Demands The following table contains a summary of system demands; the table footnotes contain relevant assumptions associated with the demands.

City of Oroville Water System Plan 2. Planning Data
1200901_OrovilleWSP_DRAFT(2018.6.5).docx 14 Varela & Associates
Table 2-9 Existing System Demands Item Units 2014 2015 2016 Average
Total Consumed (1) (MG) 185.925 190.700 175.800 184.142 Distribution System Leakage (2) (MG) 41.175 37.700 33.100 37.325 Total Produced (1) (MG) 227.100 228.400 208.900 221.467
ADD: Average Day Demand (3) (MGD) 0.622 0.626 0.572 0.607 (gpm) 432 435 397 422
MDD: Max Day Demand (4) (MGD) 1.418 1.431 1.538 1.463 (gpm) 985 994 1,068 1,016
PHD: Peak Hour Demand (5) (gpm) 1,669 1,684 1,809 1,721 (1) Provided by City of Oroville staff (2) DSL is Total Produced – Total Consumed (3) Total annual produced / 365 days (4) Based on daily well pump meter records for 2014-2016 (5) Estimated using WSDOH WSDM Eq. 5-1: PHD = (MDD/1440)(CN+F)+18, C = 1.6, N = 2,950 (avg) and F = 225
2.2 Future Data Projections Water use can be correlated with population. Increases in population generally increases a system’s water use. For the purpose of estimating future water demand this WSP uses population projections for 10-year and 20-year planning periods. The Washington State Office of Financial Management, (OFM) provides the most current information on growth for counties. Larger cities often have planning departments which make these projections. Smaller cities may adopt their own projections based on one or more of the following: projections done by the OFM: historical population trends, known development plans, Comprehensive Plans, etc.
2.2.1 Projected Population Available data sources for population projections include the Washington State Office of Financial Management (OFM) and historical population trends. Oroville knows of no state or federal agency which makes projections for smaller cities such as Oroville. Therefore, the following sections develop population projections based on the OFM projections and historical trends observed within the City’s Service Area. The City’s current Comprehensive Plan (1995) is outdated and therefore was not used to project population growth.
2.2.1.1 Historical Trends Population figures within the City Limits have historically been in the range of 1,600-1,700 over the past 15 years. Population data indicate growth within the Oroville City Limits at approximately 0.2% annually since 2000. The Eastlake and Westlake areas of the system which are outside the City Limits have experienced the majority of growth in recent years. These areas combined have roughly doubled in population over the last 15 years at an average annual rate of about 5.3% per year. Much of this growth can be attributed to the Eastlake area because of the addition of the Veranda Beach development which has completed approximately 100 of its planned 450 vacation homes. The City reports that the Veranda Beach development has not grown since the previous Water System Plan and that limited growth is anticipated during the 10-year and 20-year planning horizons.
2.2.1.2 Washington State OFM Projections OFM makes low, medium and high series population projections for each county. OFM does not make projections for towns and cities. For Okanogan County the OFM projections range from -0.26% to 1.3% growth per year.

City of Oroville Water System Plan 2. Planning Data
1200901_OrovilleWSP_DRAFT(2018.6.5).docx 15 Varela & Associates
2.2.1.3 Selected Growth Projections For planning purposes, growth within the City Limits as well as the Eastlake/Westlake areas will be projected at the medium annual OFM growth rate of 0.35%, the same projection is used in the County’s 2014 Comprehensive Plan. Based on the above considerations, for the purposes of this Water System Plan, population for each area is projected in the following table.
Table 2-10 Projected 10 and 20-Year Water Service Area Population
Time Frame
Approximate Population in City
Limits (1)
Approximate Eastlake Population
(2)(3)
Approximate Westlake Population
(2) Total Current (4) 1,695 742 760 3,196 10-year 1,768 774 792 3,334 20-year 1,832 802 821 3,454
(1) 0.35% annual growth inside City Limits based on medium OFM projections (2) 0.35% annual growth outside City Limits based on medium OFM projections (3) Assumes Veranda Beach development construction will be limited within the 20-year planning period (4) Current population from Table 2-2
2.2.1.4 2010 WSP Growth Rates vs 2017 WSP Growth Rates The table below shows projected annual growth rates from the City’s 2010 WSP and growth rates shown in the table above. Growth rates provided in the City’s 2010 WSP were based largely on expected development within the Veranda Beach zone as well as continued development within the Westlake zone and City Limits. Since the 2010 WSP, growth within the City and the other areas has fallen short of the previously projected growth rates. The City expects a moderate amount of infill and does not expect concentrated growth as a result of specific developments within the system.
Table 2-11 2010 WSP Growth Rates vs 2017 Growth Rates
WSP Area Timeframe
Projected Annual Growth Rate
Approximate Population
2010 (1) 2017 (2) 2010 (1) 2017 (2)
2010 (1)
City Limits
Current 1.50% 0.35% 1,715 1,695 6-year 1.50% 0.35% 1,903 1,768 20-year 1.50% 0.35% 2,345 1,832
Westlake Current 3.00% 0.35% 780 760 6-year 3.00% 0.35% 959 792 20-year 3.00% 0.35% 1,451 821
Eastlake Current 10.00% 0.35% 608 742 6-year 10.00% 0.35% 1,187 774 20-year 3.00% 0.35% 1,796 802
(1) From 2010 WSP (2) From Table 2-10
2.2.1.5 Population Distribution Three planning area distinctions are generally used for the City of Oroville and surrounding unincorporated areas: 1) current City Limits, 2) Eastlake area, 3) Westlake area. The City Limits and Westlake areas are supplied entirely by the Main Pressure Zone. Eastlake is supplied by three different pressure zones: 1) Main Zone, 2) Airport Zone, and 3) Veranda Beach Zone.

City of Oroville Water System Plan 2. Planning Data
1200901_OrovilleWSP_DRAFT(2018.6.5).docx 16 Varela & Associates
From the table above, it is projected that the Oroville water service area population will increase by 258 persons to a population of 3,454 by the end of the 20 year planning period.
2.2.2 Projected System ERUs The following table projects ERUs through the 20-year planning period based on the medium OFM projection. It is assumed that water usage will grow at the same rate as population. Table 2-14 breaks down the Eastlake area further to accommodate the different pressure zones within the Eastlake area.
Table 2-12 Projected ERU Distribution (1) (2) (3)
Time Frame In City Limits Westlake
Eastlake (4)
Total ERUs Main Zone Airport Zone Veranda
Beach Zone (5)
Current 2,344 457 57 12 80 2,950 10-year 2,445 477 60 13 83 3,077 20-year 2,533 494 62 13 86 3,188
(1) Assumes an annual growth rate of 0.35% for each area (2) Refer to Section 2.1.6 for percent usage by each area (3) Includes DSL, refer to Table 2-8 (4) Eastlake ERU distribution is based on current ERU distribution within each pressure zone (5) Includes Champerty Shores development
2.2.2.1 Future Estimated Demand Distribution by Pressure Zone The following tables summarize existing and projected demands for the City. Refer to the footnotes following the table for pertinent information and explanation of the figures contained therein.
Table 2-13 Summary of Existing and Projected Demands by Pressure Zone
Time Frame
ADD MDD (4)(5)(6) PHD (7)
Area ERUs (3) MGD (gpm) MGD (gpm) (gpm)
Current
City Limits (1) 2,344 0.482 335 1.151 800 1,374 Westlake (1) 457 0.094 65 0.227 158 345 Eastlake (2) 149 0.031 22 0.084 59 200
System Total 2,950 0.607 422 1.463 1,017 1,919
10-year
City Limits (1) 2,445 0.503 349 1.201 834 1,429 Westlake (1) 477 0.098 68 0.237 165 357 Eastlake (2) 155 0.032 22 0.088 61 204
System Total 3,077 0.633 440 1.526 1,060 1,990
20-year
City Limits (1) 2,533 0.521 362 1.244 864 1,477 Westlake (1) 494 0.102 71 0.246 171 368 Eastlake (2) 161 0.033 23 0.091 63 208
System Total 3,188 0.656 456 1.581 1,098 2,053 (1) All services within these areas are supplied by the Main Pressure Zone. (2) The Eastlake area is supplied by 3 different pressure zones (Main, Airport, and Veranda Beach). (3) ERUs are based on well pump production, includes Distribution System Leakage (DSL). See Section 2.1.6 (4) Current system total MDD based on daily well pump data for 2014-2016 (5) City Limits, Westlake, and Eastlake area MDD based on max month demand for each area. (ΣMMDC,W,E / MMDC,W,E) x MDD,
where MMDC = max month of City, MMDW = max month of Westlake, MMDE = max month of Eastlake, MDD = current system MDD
(6) ADD x (MDD:ADD) : MDD:ADD; refer to Table 2-9 average ratio of 2.41 (7) PHD = (MDD/1440)(CN+F)+18, C = 1.6, 1.8, or 2, N = ERUs for City, Westlake, and Eastlake and F = 75, 125, or 225, WSDOH
WSDM Eq. 5-1

City of Oroville Water System Plan 2. Planning Data
1200901_OrovilleWSP_DRAFT(2018.6.5).docx 17 Varela & Associates
Table 2-14 Summary of Existing and Projected Demands within Eastlake (1)
Time Frame
ADD MDD (3) PHD Area ERUs (2) MGD (gpm) (4) MGD (gpm) (5) (gpm) (6)
Current
Main Zone 57 0.012 8 0.032 22 84 Airport Zone 12 0.002 2 0.007 5 32 Veranda Beach Zone 80 0.017 12 0.045 31 106
Eastlake Total 149 0.031 22 0.084 59 222
10-year
Main Zone 59 0.012 9 0.034 24 87 Airport Zone 13 0.003 2 0.007 5 33 Veranda Beach Zone 83 0.017 12 0.047 33 109
Eastlake Total 155 0.032 22 0.088 61 229
20-year
Main Zone 62 0.013 9 0.035 24 89 Airport Zone 13 0.003 2 0.007 5 33 Veranda Beach Zone 86 0.018 12 0.049 34 113
Eastlake Total 161 0.033 23 0.091 63 234 (1) The Eastlake area is supplied by 3 different pressure zones: Main, Airport, and Veranda Beach. (2) See Table 2-13 for Eastlake pressure zone distribution. Includes Distribution System Leakage (DSL). (3) ADD x (MDD:ADD) : MDD:ADD; refer to Table 2-9 average ratio of 2.41 (4) PHD = (MDD/1440)(CN+F)+18, C = 2.5 or 3, N = ERUs for Main, Airport, and Veranda Beach, and F = 25 or 0, WSDOH WSDM
Eq. 5-1

RE
TA
IL
S
ER
VIC
E A
RE
A
WA
TE
R R
IG
HT
S P
LA
CE
O
F U
SE
VA
RE
LA
A
ND
A
SS
OC
IA
TE
S, IN
C.
EN
GIN
EE
RIN
G A
ND
M
AN
AG
EM
EN
T
FIG
UR
E
CIT
Y O
F O
RO
VIL
LE
, W
AS
HIN
GT
ON
WA
TE
R S
YS
TE
M P
LA
N
1
EASTLAKE
CHAMPERTY SHORESWESTLAKE
VERANDA BEACH(LEGENDS RESORTS)
EASTLAKE WATER ASSOCIATION
AutoCAD SHX Text
BURLINGTON NORTHERN RAILROAD
AutoCAD SHX Text
SUMMIT AVE
AutoCAD SHX Text
RIVER ST
AutoCAD SHX Text
HIGHLAND DRIVE
AutoCAD SHX Text
23RD AVE
AutoCAD SHX Text
22ND AVE
AutoCAD SHX Text
WESTLAKE AVE
AutoCAD SHX Text
21ST AVE
AutoCAD SHX Text
DEERPATH DR
AutoCAD SHX Text
KAY ST
AutoCAD SHX Text
20TH AVE
AutoCAD SHX Text
20TH AVE
AutoCAD SHX Text
18TH AVE
AutoCAD SHX Text
19TH AVE
AutoCAD SHX Text
18TH AVE
AutoCAD SHX Text
WESTERN AVE
AutoCAD SHX Text
CENTRAL AVE
AutoCAD SHX Text
DEERPATH DRIVE
AutoCAD SHX Text
SUMMIT AVE
AutoCAD SHX Text
SUMMIT AVE
AutoCAD SHX Text
17TH AVE
AutoCAD SHX Text
MAIN STREET
AutoCAD SHX Text
16TH AVE
AutoCAD SHX Text
JUNIPER ST
AutoCAD SHX Text
KAY ST
AutoCAD SHX Text
IRONWOOD ST
AutoCAD SHX Text
MAIN ST
AutoCAD SHX Text
GOLDEN ST
AutoCAD SHX Text
FIR ST
AutoCAD SHX Text
ELM ST
AutoCAD SHX Text
DOGWOOD ST
AutoCAD SHX Text
CHERRY ST
AutoCAD SHX Text
BIRCH ST
AutoCAD SHX Text
ALDER ST
AutoCAD SHX Text
14TH AVE
AutoCAD SHX Text
CENTRAL AVE
AutoCAD SHX Text
16TH AVE
AutoCAD SHX Text
ELM ST
AutoCAD SHX Text
JUNIPER ST
AutoCAD SHX Text
KAY ST
AutoCAD SHX Text
IRONWOOD ST
AutoCAD SHX Text
MAIN ST
AutoCAD SHX Text
GOLDEN ST
AutoCAD SHX Text
FIR ST
AutoCAD SHX Text
2ND AVE
AutoCAD SHX Text
3RD AVE
AutoCAD SHX Text
4TH AVE
AutoCAD SHX Text
5TH AVE
AutoCAD SHX Text
6TH AVE
AutoCAD SHX Text
7TH AVE
AutoCAD SHX Text
8TH AVE
AutoCAD SHX Text
9TH AVE
AutoCAD SHX Text
10TH AVE
AutoCAD SHX Text
11TH AVE
AutoCAD SHX Text
12TH AVE
AutoCAD SHX Text
APPLE WAY AVE
AutoCAD SHX Text
CHESAW ROAD
AutoCAD SHX Text
SPROUSE ROAD
AutoCAD SHX Text
SPROUSE RD
AutoCAD SHX Text
EASTLAKE RD
AutoCAD SHX Text
EASTSIDE OSOYOOS RD
AutoCAD SHX Text
BALMES RD
AutoCAD SHX Text
SAWTELL RD
AutoCAD SHX Text
CHESAW RD
AutoCAD SHX Text
EMERY ROAD
AutoCAD SHX Text
DEMERCHANT RD
AutoCAD SHX Text
LAKE VIEW CIRCLE
AutoCAD SHX Text
AIRPORT RD
AutoCAD SHX Text
BUCKMILLER RD
AutoCAD SHX Text
THORNDIKE LOOP RD
AutoCAD SHX Text
EASTSIDE OSOYOOS RD
AutoCAD SHX Text
THORNDIKE LOOP RD
AutoCAD SHX Text
BOB NEIL RD
AutoCAD SHX Text
EDER RD
AutoCAD SHX Text
14TH AVE
AutoCAD SHX Text
HWY 97
AutoCAD SHX Text
HIGHWAY 97
AutoCAD SHX Text
WESTLAKE RD
AutoCAD SHX Text
WESTLAKE RD
AutoCAD SHX Text
BLAKLER RD
AutoCAD SHX Text
HWY 97
AutoCAD SHX Text
HWY 97
AutoCAD SHX Text
WESTLAKE RD
AutoCAD SHX Text
WESTLAKE RD
AutoCAD SHX Text
BOUNDARY
AutoCAD SHX Text
BOUNDARY POINT RD
AutoCAD SHX Text
POINT RD
AutoCAD SHX Text
JACKSON ST.
AutoCAD SHX Text
DOROTHY SCOTT AIRPORT
AutoCAD SHX Text
LEVEE
AutoCAD SHX Text
LEGEND
AutoCAD SHX Text
N
AutoCAD SHX Text
SCALE
AutoCAD SHX Text
0
AutoCAD SHX Text
1000
AutoCAD SHX Text
2000
AutoCAD SHX Text
L A K E O S O Y O O S
AutoCAD SHX Text
OKANOGAN RIVER
AutoCAD SHX Text
SCALE:
AutoCAD SHX Text
PROJ. NO.:
AutoCAD SHX Text
APPROVED:
AutoCAD SHX Text
DRAWN:
AutoCAD SHX Text
DESIGNED:
AutoCAD SHX Text
CHECKED:
AutoCAD SHX Text
DATE:
AutoCAD SHX Text
AS SHOWN
AutoCAD SHX Text
TVP
AutoCAD SHX Text
120-09-01
AutoCAD SHX Text
12/27/17
AutoCAD SHX Text
1200901-WSP-Figure 1
AutoCAD SHX Text
CITY LIMITS URBAN GROWTH BOUNDARY, RETAIL SERVICE AREA, WATER RIGHTS PLACE OF USE SERVICE AREA
AutoCAD SHX Text
1. RETAIL SERVICE AREA: THE AREA INSIDE WHICH A WATER RETAIL SERVICE AREA: THE AREA INSIDE WHICH A WATER SYSTEM HAS A DUTY TO PROVIDE NEW WATER SERVICE CONNECTIONS UPON REQUEST AS OUTLINED IN WAC 246-290-106. 2. WATER RIGHTS PLACE OF USE SERVICE AREA: WAC WATER RIGHTS PLACE OF USE SERVICE AREA: WAC 246-290-107 ALLOWS A SYSTEM TO EXPAND ITS WATER RIGHTS PLACE OF USE TO INCLUDE ANY PORTION OF THE SERVICE AREA NOT INCLUDED IN THE ORIGINAL WATER RIGHT. 3. SERVICE AREA: THE AREA WHERE A WATER SYSTEM PLANS SERVICE AREA: THE AREA WHERE A WATER SYSTEM PLANS TO SERVE.
AutoCAD SHX Text
NOTES ON SERVICE AREA BOUNDARIES

MAINST
CHESAW
RD
14TH AVE
HIGHWAY97
IRONWOODST
HIGHWAY7
FIRST
EASTSIDEOROVILLE
RD
APPLE WAY CENTRALAVE
SAWTELLRD
5TH AVE
EASTLAKERD
HARTRD
KAYST
CASCADE&COLUMBIA RR
GOLDENST
16TH AVE
JUNIPER
ST
4TH AVE
DEERPATH
DR
6TH AVE
GAYES POINT RD
WESTLAKE
RD
BALMES RD
SUMMITDR
3RD AVE
SPROUSE
RD
CLARKRD
12TH AVE
DEMERCHANT RD
KERNAN RD
10TH AVE
21ST AVE
11TH AVE
BOBNEILRD
VINYARD LN
ALDER
ST
2ND AVE
CHERRYST
GOLDENRD
BLACKLERRD
HIGHLANDDR
ELLEMEH
AM MTN R
D
RIVER ST
23RD AVE
19TH AVE
R OSEST
8TH AVE
7TH AVE
JENNINGS LOOP RD
17TH AVE
BIRCHST
18THAVE DELROSARIOR
EMERY RD
LAKEVIEW LN
SOUT H LAKE LOOP
EISEN LN
MOONLIGHT DR
ELMST
9TH AVE
22ND AVE
1ST AVE
LAGOONTRCT
20TH AVE
DOGWOODST
HOMEDR
DOGWOODST
HIGHWAY97
ELMST
JUNIPERST
8TH AVE
9TH AVE
17TH AVE
BIRCHST
KAYST
16TH AVE
KAYST
18TH AVE
9TH AVE
JUNIPERST
GOLDENST
18TH AVE
10TH AVE
7TH AVE
FIRSTGOLDEN
ST
18TH AVE
9TH AVE
I2
R3
R2
R1
C2
R2
C1
C2
R4
R2
AD
I2R3
R2
Cons
R4
REC
I1Cons
I1
Cons
Cons
Z1 inch = 300 feet
YARD LN
AIRPORTDISTRICT
Cons
1 inch = 400 feet
1 inch = 300 feet
Deep Bay Park
Dorothy Scott Airport
ZONING MAP
AIRPORT DISTRICT
COMMERCIAL 1
COMMERCIAL 2
CONSERVANCY
INDUSTRIAL 1
INDUSTRIAL 2
RECREATION
RESIDENTIAL 1
RESIDENTIAL 2
RESIDENTIAL 3
RESIDENTIAL 4
FIGURE 1B


1 6
T40N-R27E36 31
1
36
1 6 1
HIGHWAY 97
EASTLAKE RD
EDER RD
CHESAW RD
LOOMIS-OROVILLE RD
ELLEMEHAM MTN RD
BLUE LAKE RD
HIGHWAY 7
OROVILLE
Oroville-Tonasket
OROVILLEIRRIGATION
14FIGURE 1E

1120
1120
1
0
2
0
1
0
2
0
1
0
2
0
1
0
2
0
1
0
2
0
A
I
R
P
O
R
T
Z
O
N
E
9
5
P
S
I
(
S
T
A
T
I
C
)
5
1
P
S
I
(
S
T
A
T
I
C
)
M
A
I
N
Z
O
N
E
M
A
I
N
Z
O
N
E
5
1
P
S
I
(
S
T
A
T
I
C
)
P
O
R
T
Z
O
N
E
A
I
R
1
1
4
0
V
E
R
A
N
D
A
B
E
A
C
H
U
P
P
E
R
Z
O
N
E
5
1
P
S
I (S
T
A
T
IC
)
1
0
2
0
1
0
2
0
5
1
P
S
I(S
TA
TIC
)
9
7
0
V
E
R
A
N
D
A
B
E
A
C
H
L
O
W
E
R
Z
O
N
E
5
1
P
S
I (S
T
A
T
IC
)
M
A
I
N
Z
O
N
E
5
1
P
S
I
(
S
T
A
T
I
C
)
V
E
R
A
N
D
A
B
E
A
C
H
U
P
P
E
R
Z
O
N
E
1
2
4
P
S
I (S
T
A
T
IC
)
·
·
·
·
1020
EX
IS
TIN
G W
AT
ER
S
YS
TE
M
VA
RE
LA
A
ND
A
SS
OC
IA
TE
S, IN
C.
EN
GIN
EE
RIN
G A
ND
M
AN
AG
EM
EN
T
FIG
UR
E
CIT
Y O
F O
RO
VIL
LE
, W
AS
HIN
GT
ON
WA
TE
R S
YS
TE
M P
LA
N
2
CHAMPERTY SHORES
WESTLAKE
EASTLAKE VERANDA BEACH(LEGENDS RESORTS)
EASTLAKE WATER ASSOCIATION
AutoCAD SHX Text
1180
AutoCAD SHX Text
1160
AutoCAD SHX Text
1140
AutoCAD SHX Text
1120
AutoCAD SHX Text
1080
AutoCAD SHX Text
1060
AutoCAD SHX Text
1040
AutoCAD SHX Text
1020
AutoCAD SHX Text
1180
AutoCAD SHX Text
1160
AutoCAD SHX Text
1140
AutoCAD SHX Text
1120
AutoCAD SHX Text
1080
AutoCAD SHX Text
1060
AutoCAD SHX Text
1040
AutoCAD SHX Text
1020
AutoCAD SHX Text
920
AutoCAD SHX Text
940
AutoCAD SHX Text
960
AutoCAD SHX Text
980
AutoCAD SHX Text
920
AutoCAD SHX Text
940
AutoCAD SHX Text
960
AutoCAD SHX Text
980
AutoCAD SHX Text
980
AutoCAD SHX Text
960
AutoCAD SHX Text
940
AutoCAD SHX Text
920
AutoCAD SHX Text
920
AutoCAD SHX Text
940
AutoCAD SHX Text
960
AutoCAD SHX Text
980
AutoCAD SHX Text
980
AutoCAD SHX Text
960
AutoCAD SHX Text
940
AutoCAD SHX Text
920
AutoCAD SHX Text
1000
AutoCAD SHX Text
1000
AutoCAD SHX Text
1100
AutoCAD SHX Text
1200
AutoCAD SHX Text
1300
AutoCAD SHX Text
1000
AutoCAD SHX Text
1100
AutoCAD SHX Text
1200
AutoCAD SHX Text
1000
AutoCAD SHX Text
1100
AutoCAD SHX Text
1000
AutoCAD SHX Text
1000
AutoCAD SHX Text
1000
AutoCAD SHX Text
1200
AutoCAD SHX Text
1300
AutoCAD SHX Text
1200
AutoCAD SHX Text
1300
AutoCAD SHX Text
1000
AutoCAD SHX Text
1100
AutoCAD SHX Text
980
AutoCAD SHX Text
960
AutoCAD SHX Text
940
AutoCAD SHX Text
920
AutoCAD SHX Text
1400
AutoCAD SHX Text
1500
AutoCAD SHX Text
1600
AutoCAD SHX Text
1700
AutoCAD SHX Text
1800
AutoCAD SHX Text
1900
AutoCAD SHX Text
1100
AutoCAD SHX Text
1200
AutoCAD SHX Text
1100
AutoCAD SHX Text
2"
AutoCAD SHX Text
2"PVC
AutoCAD SHX Text
6"
AutoCAD SHX Text
PVC
AutoCAD SHX Text
6"
AutoCAD SHX Text
2"
AutoCAD SHX Text
2"
AutoCAD SHX Text
8"
AutoCAD SHX Text
8"
AutoCAD SHX Text
8"
AutoCAD SHX Text
12"
AutoCAD SHX Text
2"
AutoCAD SHX Text
2"
AutoCAD SHX Text
2"
AutoCAD SHX Text
6"
AutoCAD SHX Text
2"
AutoCAD SHX Text
8"
AutoCAD SHX Text
8"
AutoCAD SHX Text
8"
AutoCAD SHX Text
6"
AutoCAD SHX Text
STL
AutoCAD SHX Text
6"
AutoCAD SHX Text
6"
AutoCAD SHX Text
2"
AutoCAD SHX Text
2"
AutoCAD SHX Text
8"
AutoCAD SHX Text
12"
AutoCAD SHX Text
2"
AutoCAD SHX Text
2"
AutoCAD SHX Text
12"
AutoCAD SHX Text
12"
AutoCAD SHX Text
6"
AutoCAD SHX Text
2"
AutoCAD SHX Text
6"CI
AutoCAD SHX Text
8"
AutoCAD SHX Text
8"
AutoCAD SHX Text
8"
AutoCAD SHX Text
2"
AutoCAD SHX Text
6"
AutoCAD SHX Text
6"
AutoCAD SHX Text
6"
AutoCAD SHX Text
6"
AutoCAD SHX Text
6"
AutoCAD SHX Text
6"
AutoCAD SHX Text
8"
AutoCAD SHX Text
6"
AutoCAD SHX Text
8"
AutoCAD SHX Text
2"
AutoCAD SHX Text
6"
AutoCAD SHX Text
6"
AutoCAD SHX Text
6"
AutoCAD SHX Text
PVC
AutoCAD SHX Text
4"STL
AutoCAD SHX Text
6"UNIV
AutoCAD SHX Text
6"
AutoCAD SHX Text
UNIV
AutoCAD SHX Text
12"
AutoCAD SHX Text
2"
AutoCAD SHX Text
12"
AutoCAD SHX Text
6"
AutoCAD SHX Text
8"CI
AutoCAD SHX Text
8"CI
AutoCAD SHX Text
12"
AutoCAD SHX Text
PVC
AutoCAD SHX Text
8"CI
AutoCAD SHX Text
8"
AutoCAD SHX Text
8"UNIV
AutoCAD SHX Text
8"
AutoCAD SHX Text
8"
AutoCAD SHX Text
8"CI
AutoCAD SHX Text
8"CI
AutoCAD SHX Text
6"UNIV
AutoCAD SHX Text
10"
AutoCAD SHX Text
PVC
AutoCAD SHX Text
12"PVC
AutoCAD SHX Text
8"PVC
AutoCAD SHX Text
6"
AutoCAD SHX Text
UNIV
AutoCAD SHX Text
6"
AutoCAD SHX Text
6"
AutoCAD SHX Text
UNIV
AutoCAD SHX Text
4"CI
AutoCAD SHX Text
6"
AutoCAD SHX Text
PVC
AutoCAD SHX Text
2"
AutoCAD SHX Text
PVC
AutoCAD SHX Text
2"
AutoCAD SHX Text
1"
AutoCAD SHX Text
4"AC
AutoCAD SHX Text
4"AC
AutoCAD SHX Text
4"AC
AutoCAD SHX Text
4"AC
AutoCAD SHX Text
2"
AutoCAD SHX Text
AC
AutoCAD SHX Text
2"AC
AutoCAD SHX Text
2"PVC
AutoCAD SHX Text
6"
AutoCAD SHX Text
6"CI
AutoCAD SHX Text
6"CI
AutoCAD SHX Text
6"
AutoCAD SHX Text
6"AC
AutoCAD SHX Text
6"CI
AutoCAD SHX Text
8"
AutoCAD SHX Text
8"
AutoCAD SHX Text
8"
AutoCAD SHX Text
6"AC
AutoCAD SHX Text
6"AC
AutoCAD SHX Text
6"
AutoCAD SHX Text
6"
AutoCAD SHX Text
6"PVC
AutoCAD SHX Text
6"PVC
AutoCAD SHX Text
4"STL
AutoCAD SHX Text
4"PVC
AutoCAD SHX Text
4"PVC
AutoCAD SHX Text
8"CI
AutoCAD SHX Text
8"PVC
AutoCAD SHX Text
8"
AutoCAD SHX Text
PVC
AutoCAD SHX Text
6"CI
AutoCAD SHX Text
6"CI
AutoCAD SHX Text
4"ST
AutoCAD SHX Text
10"CI
AutoCAD SHX Text
8"CI
AutoCAD SHX Text
6"CI
AutoCAD SHX Text
6"CI
AutoCAD SHX Text
8"PVC
AutoCAD SHX Text
4"STL
AutoCAD SHX Text
8"
AutoCAD SHX Text
8"
AutoCAD SHX Text
6"
AutoCAD SHX Text
6"
AutoCAD SHX Text
6"
AutoCAD SHX Text
6"
AutoCAD SHX Text
4"
AutoCAD SHX Text
4"
AutoCAD SHX Text
4"
AutoCAD SHX Text
4"
AutoCAD SHX Text
4"
AutoCAD SHX Text
4"
AutoCAD SHX Text
4"
AutoCAD SHX Text
2"
AutoCAD SHX Text
2"
AutoCAD SHX Text
4"
AutoCAD SHX Text
4"
AutoCAD SHX Text
4"
AutoCAD SHX Text
6"
AutoCAD SHX Text
6"
AutoCAD SHX Text
4"
AutoCAD SHX Text
4"
AutoCAD SHX Text
4"
AutoCAD SHX Text
1"
AutoCAD SHX Text
1"
AutoCAD SHX Text
1"
AutoCAD SHX Text
1"
AutoCAD SHX Text
4"
AutoCAD SHX Text
4"
AutoCAD SHX Text
6"
AutoCAD SHX Text
4"
AutoCAD SHX Text
4"
AutoCAD SHX Text
4"
AutoCAD SHX Text
2"
AutoCAD SHX Text
2"
AutoCAD SHX Text
4"
AutoCAD SHX Text
2"
AutoCAD SHX Text
2"
AutoCAD SHX Text
2"
AutoCAD SHX Text
4"
AutoCAD SHX Text
4"
AutoCAD SHX Text
4"
AutoCAD SHX Text
4"
AutoCAD SHX Text
4"
AutoCAD SHX Text
6"
AutoCAD SHX Text
2"
AutoCAD SHX Text
6"
AutoCAD SHX Text
2"
AutoCAD SHX Text
2"
AutoCAD SHX Text
PVC
AutoCAD SHX Text
8"PVC
AutoCAD SHX Text
8"
AutoCAD SHX Text
8"
AutoCAD SHX Text
10"
AutoCAD SHX Text
10"
AutoCAD SHX Text
10"CI
AutoCAD SHX Text
10"PVC
AutoCAD SHX Text
10"
AutoCAD SHX Text
10"
AutoCAD SHX Text
10"
AutoCAD SHX Text
2"
AutoCAD SHX Text
6"
AutoCAD SHX Text
UNIV
AutoCAD SHX Text
6"
AutoCAD SHX Text
UNIV
AutoCAD SHX Text
6"
AutoCAD SHX Text
6"
AutoCAD SHX Text
6"
AutoCAD SHX Text
10"
AutoCAD SHX Text
10"TRANSITE
AutoCAD SHX Text
10"
AutoCAD SHX Text
6"
AutoCAD SHX Text
6"PL
AutoCAD SHX Text
6"PL
AutoCAD SHX Text
6"PL
AutoCAD SHX Text
6"PL
AutoCAD SHX Text
6"CI
AutoCAD SHX Text
6"
AutoCAD SHX Text
6"CI
AutoCAD SHX Text
6"CI
AutoCAD SHX Text
4"UNIV
AutoCAD SHX Text
8"CI
AutoCAD SHX Text
8"
AutoCAD SHX Text
8"
AutoCAD SHX Text
8"CI
AutoCAD SHX Text
8"CI
AutoCAD SHX Text
8"CI
AutoCAD SHX Text
8"CI
AutoCAD SHX Text
8"CI
AutoCAD SHX Text
10"
AutoCAD SHX Text
12"PVC
AutoCAD SHX Text
12"PVC
AutoCAD SHX Text
12"PVC
AutoCAD SHX Text
12"PVC
AutoCAD SHX Text
12"PVC
AutoCAD SHX Text
12"PVC
AutoCAD SHX Text
12"
AutoCAD SHX Text
12"
AutoCAD SHX Text
12"
AutoCAD SHX Text
12"PVC
AutoCAD SHX Text
12"
AutoCAD SHX Text
PVC
AutoCAD SHX Text
12"
AutoCAD SHX Text
PVC
AutoCAD SHX Text
12"
AutoCAD SHX Text
PVC
AutoCAD SHX Text
6"
AutoCAD SHX Text
6"
AutoCAD SHX Text
8"
AutoCAD SHX Text
6"
AutoCAD SHX Text
6"
AutoCAD SHX Text
6"
AutoCAD SHX Text
6"
AutoCAD SHX Text
6"
AutoCAD SHX Text
6"
AutoCAD SHX Text
6"
AutoCAD SHX Text
8"
AutoCAD SHX Text
6"
AutoCAD SHX Text
6"
AutoCAD SHX Text
6"
AutoCAD SHX Text
6"
AutoCAD SHX Text
8"
AutoCAD SHX Text
8"
AutoCAD SHX Text
8"
AutoCAD SHX Text
8"
AutoCAD SHX Text
8"
AutoCAD SHX Text
8"
AutoCAD SHX Text
8"
AutoCAD SHX Text
10"
AutoCAD SHX Text
8"
AutoCAD SHX Text
10"
AutoCAD SHX Text
8"
AutoCAD SHX Text
12"
AutoCAD SHX Text
8"
AutoCAD SHX Text
12"
AutoCAD SHX Text
12"
AutoCAD SHX Text
12"
AutoCAD SHX Text
2"HDPE
AutoCAD SHX Text
6"
AutoCAD SHX Text
6"
AutoCAD SHX Text
8"
AutoCAD SHX Text
4"
AutoCAD SHX Text
2"PVC
AutoCAD SHX Text
6"
AutoCAD SHX Text
STL
AutoCAD SHX Text
6"
AutoCAD SHX Text
STL
AutoCAD SHX Text
6"
AutoCAD SHX Text
STL
AutoCAD SHX Text
6"STL
AutoCAD SHX Text
8"AC
AutoCAD SHX Text
4"STL
AutoCAD SHX Text
4"CI
AutoCAD SHX Text
2"CI
AutoCAD SHX Text
12"
AutoCAD SHX Text
PVC
AutoCAD SHX Text
12"
AutoCAD SHX Text
PVC
AutoCAD SHX Text
12"
AutoCAD SHX Text
PVC
AutoCAD SHX Text
8"
AutoCAD SHX Text
8"PVC
AutoCAD SHX Text
2"PVC
AutoCAD SHX Text
8"CI
AutoCAD SHX Text
2"
AutoCAD SHX Text
1"
AutoCAD SHX Text
4"
AutoCAD SHX Text
4"
AutoCAD SHX Text
2"PVC
AutoCAD SHX Text
8"
AutoCAD SHX Text
8"
AutoCAD SHX Text
2"
AutoCAD SHX Text
2"
AutoCAD SHX Text
4"
AutoCAD SHX Text
PVC
AutoCAD SHX Text
12"
AutoCAD SHX Text
PVC
AutoCAD SHX Text
8"CI
AutoCAD SHX Text
12"
AutoCAD SHX Text
SUMMIT AVE
AutoCAD SHX Text
RIVER ST
AutoCAD SHX Text
HIGHLAND DRIVE
AutoCAD SHX Text
23RD AVE
AutoCAD SHX Text
22ND AVE
AutoCAD SHX Text
WESTLAKE AVE
AutoCAD SHX Text
21ST AVE
AutoCAD SHX Text
DEERPATH DR
AutoCAD SHX Text
KAY ST
AutoCAD SHX Text
20TH AVE
AutoCAD SHX Text
20TH AVE
AutoCAD SHX Text
18TH AVE
AutoCAD SHX Text
19TH AVE
AutoCAD SHX Text
18TH AVE
AutoCAD SHX Text
WESTERN AVE
AutoCAD SHX Text
CENTRAL AVE
AutoCAD SHX Text
DEERPATH DRIVE
AutoCAD SHX Text
SUMMIT AVE
AutoCAD SHX Text
SUMMIT AVE
AutoCAD SHX Text
17TH AVE
AutoCAD SHX Text
MAIN STREET
AutoCAD SHX Text
JUNIPER ST
AutoCAD SHX Text
16TH AVE
AutoCAD SHX Text
KAY ST
AutoCAD SHX Text
IRONWOOD ST
AutoCAD SHX Text
MAIN ST
AutoCAD SHX Text
GOLDEN ST
AutoCAD SHX Text
FIR ST
AutoCAD SHX Text
ELM STREET
AutoCAD SHX Text
CHERRY ST
AutoCAD SHX Text
DOGWOOD ST
AutoCAD SHX Text
BIRCH ST
AutoCAD SHX Text
ALDER ST
AutoCAD SHX Text
14TH AVE
AutoCAD SHX Text
CENTRAL AVE
AutoCAD SHX Text
16TH AVE
AutoCAD SHX Text
BURLINGTON NORTHERN RAILROAD
AutoCAD SHX Text
ELM ST
AutoCAD SHX Text
KAY ST
AutoCAD SHX Text
JUNIPER ST
AutoCAD SHX Text
IRONWOOD ST
AutoCAD SHX Text
MAIN ST
AutoCAD SHX Text
GOLDEN ST
AutoCAD SHX Text
FIR ST
AutoCAD SHX Text
2ND AVE
AutoCAD SHX Text
3RD AVE
AutoCAD SHX Text
4TH AVE
AutoCAD SHX Text
5TH AVE
AutoCAD SHX Text
6TH AVE
AutoCAD SHX Text
7TH AVE
AutoCAD SHX Text
8TH AVE
AutoCAD SHX Text
9TH AVE
AutoCAD SHX Text
10TH AVE
AutoCAD SHX Text
11TH AVE
AutoCAD SHX Text
12TH AVE
AutoCAD SHX Text
APPLE WAY AVE
AutoCAD SHX Text
CHESAW ROAD
AutoCAD SHX Text
SPROUSE ROAD
AutoCAD SHX Text
SPROUSE ROAD
AutoCAD SHX Text
EASTLAKE ROAD
AutoCAD SHX Text
EASTSIDE OSOYOOS ROAD
AutoCAD SHX Text
BALMES ROAD
AutoCAD SHX Text
SAWTELL ROAD
AutoCAD SHX Text
CHESAW ROAD
AutoCAD SHX Text
EMERY ROAD
AutoCAD SHX Text
DEMERCHANT ROAD
AutoCAD SHX Text
LAKE VIEW CIRCLE
AutoCAD SHX Text
AIRPORT ROAD
AutoCAD SHX Text
BUCKMILLER ROAD
AutoCAD SHX Text
THORNDIKE LOOP ROAD
AutoCAD SHX Text
EASTSIDE OSOYOOS ROAD
AutoCAD SHX Text
THORNDIKE LOOP ROAD
AutoCAD SHX Text
BOB NEIL ROAD
AutoCAD SHX Text
EDER ROAD
AutoCAD SHX Text
2"
AutoCAD SHX Text
14TH AVE
AutoCAD SHX Text
HWY 97
AutoCAD SHX Text
HIGHWAY 97
AutoCAD SHX Text
12"
AutoCAD SHX Text
4"
AutoCAD SHX Text
4"
AutoCAD SHX Text
6"
AutoCAD SHX Text
4"
AutoCAD SHX Text
4"
AutoCAD SHX Text
6"
AutoCAD SHX Text
8"PVC
AutoCAD SHX Text
2"GALV
AutoCAD SHX Text
12"
AutoCAD SHX Text
8"CI
AutoCAD SHX Text
8"
AutoCAD SHX Text
8"
AutoCAD SHX Text
WESTLAKE RD
AutoCAD SHX Text
WESTLAKE RD
AutoCAD SHX Text
BLAKLER RD
AutoCAD SHX Text
HWY 97
AutoCAD SHX Text
HWY 97
AutoCAD SHX Text
WESTLAKE RD
AutoCAD SHX Text
WESTLAKE RD
AutoCAD SHX Text
BOUNDARY
AutoCAD SHX Text
BOUNDARY POINT RD
AutoCAD SHX Text
POINT RD
AutoCAD SHX Text
JACKSON ST.
AutoCAD SHX Text
6"
AutoCAD SHX Text
6"
AutoCAD SHX Text
6"
AutoCAD SHX Text
6"
AutoCAD SHX Text
12"
AutoCAD SHX Text
12"
AutoCAD SHX Text
12"
AutoCAD SHX Text
TOM
AutoCAD SHX Text
DULL
AutoCAD SHX Text
RD.
AutoCAD SHX Text
ROSE RD.
AutoCAD SHX Text
2"
AutoCAD SHX Text
LEVEE
AutoCAD SHX Text
LEVEE
AutoCAD SHX Text
LEVEE
AutoCAD SHX Text
LEVEE
AutoCAD SHX Text
12"
AutoCAD SHX Text
10"PVC
AutoCAD SHX Text
8"PVC
AutoCAD SHX Text
8"PVC
AutoCAD SHX Text
8"PVC
AutoCAD SHX Text
8"PVC
AutoCAD SHX Text
6"PVC
AutoCAD SHX Text
LEGEND
AutoCAD SHX Text
L A K E O S O Y O O S
AutoCAD SHX Text
N
AutoCAD SHX Text
SCALE
AutoCAD SHX Text
0
AutoCAD SHX Text
1000
AutoCAD SHX Text
2000
AutoCAD SHX Text
200,000 GAL STEEL RESERVOIR #5 OVERFLOW EL. 1239
AutoCAD SHX Text
BOOSTER STATION
AutoCAD SHX Text
WELL #4 1000 GPM (800 GPM)
AutoCAD SHX Text
500,000 GAL STEEL RESERVOIR #3 OVERFLOW EL. 1138.5
AutoCAD SHX Text
SUMMIT AVE. BOOSTER STATION
AutoCAD SHX Text
300,000 GAL CONCRETE RESERVOIR #2 OVERFLOW EL. 1138.5
AutoCAD SHX Text
157,000 GAL CONCRETE RESERVOIR #1 OVERFLOW EL. 1138.5
AutoCAD SHX Text
WELL #2 500 GPM
AutoCAD SHX Text
WELL #1 650 GPM
AutoCAD SHX Text
WELL #3 600 GPM
AutoCAD SHX Text
OKANOGAN RIVER
AutoCAD SHX Text
EASTLAKE BOOSTER STATION
AutoCAD SHX Text
NORTH END BOOSTER STATION
AutoCAD SHX Text
220,000 GAL STEEL RESERVOIR #7 OVERFLOW EL. 1138.5
AutoCAD SHX Text
CHECK VALVE RESTRICTING SOUTHERLY FLOW
AutoCAD SHX Text
AIR VALVE
AutoCAD SHX Text
AIR VALVE
AutoCAD SHX Text
1. APPROXIMATE PRESSURE ZONE BOUNDARIES ARE BASED ON APPROXIMATE PRESSURE ZONE BOUNDARIES ARE BASED ON MINIMUM 45 PSI SERVICE PRESSURE (AT PHD) AT THE UPPER END OF EACH ZONE. NOT ACTUAL PRESSURE ZONE BOUNDARIES. 2. 45 PSI PRESSURE ZONE BOUNDARIES ARE BASED ON THE 45 PSI PRESSURE ZONE BOUNDARIES ARE BASED ON THE FOLLOWING ASSUMPTIONS: 45 PSI IS MINIMUM SERVICE PRESSURE CITY WOULD LIKE TO PROVIDE TANK LEVELS 2' BELOW THE OVERFLOW ELEVATIONS SHOWN (PHD) 10' (4.5 PSI) ADDED TO ALLOW FOR HEAD LOSSES AT PHD VERANDA BEACH PRV CURRENT SETTING (24 PSI DOWNSTREAM)
AutoCAD SHX Text
NOTES
AutoCAD SHX Text
CITY LIMITS URBAN GROWTH BOUNDARY, RETAIL SERVICE AREA, WATER RIGHTS PLACE OF USE SERVICE AREA APPROXIMATE THEORETICAL PRESSURE ZONE MAIN PRESSURE ZONE AIRPORT PRESSURE ZONE VERANDA BEACH PRESSURE ZONE SUMMIT AVE. BOOSTER PRESSURE ZONE EXISTING FIRE HYDRANT EXISTING VALVE EXISTING WELL EXISTING BOOSTER STATION EXISTING RESERVOIR EXISTING AIR VALVE
AutoCAD SHX Text
8"
AutoCAD SHX Text
8"
AutoCAD SHX Text
8"
AutoCAD SHX Text
8"
AutoCAD SHX Text
LOWEST GROUND ELEVATION APPROXIMATELY 920 (72 PSI AT PRV SETTING OF 24 PSI)
AutoCAD SHX Text
EXISTING VERANDA BEACH PRV STATION GROUND ELEV: 1032 CURRENT SETTING: 100 PSI UPSTREAM 24 PSI DOWNSTREAM (HGL=1087)
AutoCAD SHX Text
SCALE:
AutoCAD SHX Text
PROJ. NO.:
AutoCAD SHX Text
APPROVED:
AutoCAD SHX Text
DRAWN:
AutoCAD SHX Text
DESIGNED:
AutoCAD SHX Text
CHECKED:
AutoCAD SHX Text
DATE:
AutoCAD SHX Text
AS SHOWN
AutoCAD SHX Text
TVP
AutoCAD SHX Text
120-09-01
AutoCAD SHX Text
12/27/17
AutoCAD SHX Text
1200901-WSP-Figure 2
AutoCAD SHX Text
DOROTHY SCOTT AIRPOIRT
AutoCAD SHX Text
1. RETAIL SERVICE AREA: THE AREA INSIDE WHICH A WATER RETAIL SERVICE AREA: THE AREA INSIDE WHICH A WATER SYSTEM HAS A DUTY TO PROVIDE NEW WATER SERVICE CONNECTIONS UPON REQUEST AS OUTLINED IN WAC 246-290-106. 2. WATER RIGHTS PLACE OF USE SERVICE AREA: WAC WATER RIGHTS PLACE OF USE SERVICE AREA: WAC 246-290-107 ALLOWS A SYSTEM TO EXPAND ITS WATER RIGHTS PLACE OF USE TO INCLUDE ANY PORTION OF THE SERVICE AREA NOT INCLUDED IN THE ORIGINAL WATER RIGHT. 3. SERVICE AREA: THE AREA WHERE A WATER SYSTEM PLANS SERVICE AREA: THE AREA WHERE A WATER SYSTEM PLANS TO SERVE.
AutoCAD SHX Text
NOTES ON SERVICE AREA BOUNDARIES
AutoCAD SHX Text
120,000 GAL STEEL RESERVOIR #4 OVERFLOW EL. 1138.5
AutoCAD SHX Text
269,000 GAL STEEL RESERVOIR #6 OVERFLOW EL. 1256.7

1120
1120
1
0
2
0
1
0
2
0
1
0
2
0
1
0
2
0
1
0
2
0
A
I
R
P
O
R
T
Z
O
N
E
9
5
P
S
I
(
S
T
A
T
I
C
)
5
1
P
S
I
(
S
T
A
T
I
C
)
M
A
I
N
Z
O
N
E
M
A
I
N
Z
O
N
E
5
1
P
S
I
(
S
T
A
T
I
C
)
P
O
R
T
Z
O
N
E
A
I
R
1
1
4
0
V
E
R
A
N
D
A
B
E
A
C
H
U
P
P
E
R
Z
O
N
E
5
1
P
S
I (S
T
A
T
IC
)
1
0
2
0
1
0
2
0
5
1
P
S
I(S
TA
TIC
)
9
7
0
V
E
R
A
N
D
A
B
E
A
C
H
L
O
W
E
R
Z
O
N
E
5
1
P
S
I (S
T
A
T
IC
)
M
A
I
N
Z
O
N
E
5
1
P
S
I
(
S
T
A
T
I
C
)
V
E
R
A
N
D
A
B
E
A
C
H
U
P
P
E
R
Z
O
N
E
1
2
4
P
S
I (S
T
A
T
IC
)
8"
8"
8"
8
"
1
2
"
8
"
8
"
1
2
"
8
"
8
"
1
2
"
1
2
"
8
"
8
"
1
1
1
2
2
1
2
"
3
4
5
4
5
3
1020
·
·
·
·
IM
PR
OV
EM
EN
TS
VA
RE
LA
A
ND
A
SS
OC
IA
TE
S, IN
C.
EN
GIN
EE
RIN
G A
ND
M
AN
AG
EM
EN
T
FIG
UR
E
CIT
Y O
F O
RO
VIL
LE
, W
AS
HIN
GT
ON
WA
TE
R S
YS
TE
M P
LA
N
3
8
"
1
2
"
1
2
"
NORTH END TRANSMISSION
& DISTRIBUTION MAIN
IMPROVEMENTS
SEGMENT 1
NORTH END TRANSMISSION
& DISTRIBUTION MAIN
IMPROVEMENTS
SEGMENT 2
NORTH END TRANSMISSION
& DISTRIBUTION MAIN
IMPROVEMENTS
SEGMENT 3
1
CHAMPERTY SHORES
WELL #4
AIRPORT BOOSTER STATION
157,000 GAL
CONCRETE RESERVOIR #1
WESTLAKENORTH END
BOOSTER STATION
VERANDA BEACH(LEGENDS RESORTS)
EASTLAKE
EASTLAKE WATER ASSOCIATION
8
"
AutoCAD SHX Text
1180
AutoCAD SHX Text
1160
AutoCAD SHX Text
1140
AutoCAD SHX Text
1120
AutoCAD SHX Text
1080
AutoCAD SHX Text
1060
AutoCAD SHX Text
1040
AutoCAD SHX Text
1020
AutoCAD SHX Text
1180
AutoCAD SHX Text
1160
AutoCAD SHX Text
1140
AutoCAD SHX Text
1120
AutoCAD SHX Text
1080
AutoCAD SHX Text
1060
AutoCAD SHX Text
1040
AutoCAD SHX Text
1020
AutoCAD SHX Text
920
AutoCAD SHX Text
940
AutoCAD SHX Text
960
AutoCAD SHX Text
980
AutoCAD SHX Text
920
AutoCAD SHX Text
940
AutoCAD SHX Text
960
AutoCAD SHX Text
980
AutoCAD SHX Text
980
AutoCAD SHX Text
960
AutoCAD SHX Text
940
AutoCAD SHX Text
920
AutoCAD SHX Text
920
AutoCAD SHX Text
940
AutoCAD SHX Text
960
AutoCAD SHX Text
980
AutoCAD SHX Text
980
AutoCAD SHX Text
960
AutoCAD SHX Text
940
AutoCAD SHX Text
920
AutoCAD SHX Text
1000
AutoCAD SHX Text
1000
AutoCAD SHX Text
1100
AutoCAD SHX Text
1200
AutoCAD SHX Text
1300
AutoCAD SHX Text
1000
AutoCAD SHX Text
1100
AutoCAD SHX Text
1200
AutoCAD SHX Text
1000
AutoCAD SHX Text
1100
AutoCAD SHX Text
1000
AutoCAD SHX Text
1000
AutoCAD SHX Text
1000
AutoCAD SHX Text
1200
AutoCAD SHX Text
1300
AutoCAD SHX Text
1200
AutoCAD SHX Text
1300
AutoCAD SHX Text
1000
AutoCAD SHX Text
1100
AutoCAD SHX Text
980
AutoCAD SHX Text
960
AutoCAD SHX Text
940
AutoCAD SHX Text
920
AutoCAD SHX Text
1400
AutoCAD SHX Text
1500
AutoCAD SHX Text
1600
AutoCAD SHX Text
1700
AutoCAD SHX Text
1800
AutoCAD SHX Text
1900
AutoCAD SHX Text
1100
AutoCAD SHX Text
1200
AutoCAD SHX Text
1100
AutoCAD SHX Text
1180
AutoCAD SHX Text
1160
AutoCAD SHX Text
1140
AutoCAD SHX Text
1120
AutoCAD SHX Text
1080
AutoCAD SHX Text
1060
AutoCAD SHX Text
1040
AutoCAD SHX Text
1020
AutoCAD SHX Text
1180
AutoCAD SHX Text
1160
AutoCAD SHX Text
1140
AutoCAD SHX Text
1120
AutoCAD SHX Text
1080
AutoCAD SHX Text
1060
AutoCAD SHX Text
1040
AutoCAD SHX Text
1020
AutoCAD SHX Text
920
AutoCAD SHX Text
940
AutoCAD SHX Text
960
AutoCAD SHX Text
980
AutoCAD SHX Text
920
AutoCAD SHX Text
940
AutoCAD SHX Text
960
AutoCAD SHX Text
980
AutoCAD SHX Text
980
AutoCAD SHX Text
960
AutoCAD SHX Text
940
AutoCAD SHX Text
920
AutoCAD SHX Text
920
AutoCAD SHX Text
940
AutoCAD SHX Text
960
AutoCAD SHX Text
980
AutoCAD SHX Text
980
AutoCAD SHX Text
960
AutoCAD SHX Text
940
AutoCAD SHX Text
920
AutoCAD SHX Text
1000
AutoCAD SHX Text
1000
AutoCAD SHX Text
1100
AutoCAD SHX Text
1200
AutoCAD SHX Text
1300
AutoCAD SHX Text
1000
AutoCAD SHX Text
1100
AutoCAD SHX Text
1200
AutoCAD SHX Text
1000
AutoCAD SHX Text
1100
AutoCAD SHX Text
1000
AutoCAD SHX Text
1000
AutoCAD SHX Text
1000
AutoCAD SHX Text
1200
AutoCAD SHX Text
1300
AutoCAD SHX Text
1200
AutoCAD SHX Text
1300
AutoCAD SHX Text
1000
AutoCAD SHX Text
1100
AutoCAD SHX Text
980
AutoCAD SHX Text
960
AutoCAD SHX Text
940
AutoCAD SHX Text
920
AutoCAD SHX Text
1400
AutoCAD SHX Text
1500
AutoCAD SHX Text
1600
AutoCAD SHX Text
1700
AutoCAD SHX Text
1800
AutoCAD SHX Text
1900
AutoCAD SHX Text
1100
AutoCAD SHX Text
1200
AutoCAD SHX Text
1100
AutoCAD SHX Text
2"
AutoCAD SHX Text
2"PVC
AutoCAD SHX Text
6"
AutoCAD SHX Text
PVC
AutoCAD SHX Text
6"
AutoCAD SHX Text
2"
AutoCAD SHX Text
2"
AutoCAD SHX Text
8"
AutoCAD SHX Text
8"
AutoCAD SHX Text
8"
AutoCAD SHX Text
12"
AutoCAD SHX Text
2"
AutoCAD SHX Text
2"
AutoCAD SHX Text
2"
AutoCAD SHX Text
6"
AutoCAD SHX Text
2"
AutoCAD SHX Text
8"
AutoCAD SHX Text
8"
AutoCAD SHX Text
8"
AutoCAD SHX Text
6"
AutoCAD SHX Text
STL
AutoCAD SHX Text
6"
AutoCAD SHX Text
6"
AutoCAD SHX Text
2"
AutoCAD SHX Text
2"
AutoCAD SHX Text
8"
AutoCAD SHX Text
12"
AutoCAD SHX Text
2"
AutoCAD SHX Text
2"
AutoCAD SHX Text
12"
AutoCAD SHX Text
12"
AutoCAD SHX Text
6"
AutoCAD SHX Text
2"
AutoCAD SHX Text
6"CI
AutoCAD SHX Text
8"
AutoCAD SHX Text
8"
AutoCAD SHX Text
8"
AutoCAD SHX Text
2"
AutoCAD SHX Text
6"
AutoCAD SHX Text
6"
AutoCAD SHX Text
6"
AutoCAD SHX Text
6"
AutoCAD SHX Text
6"
AutoCAD SHX Text
6"
AutoCAD SHX Text
8"
AutoCAD SHX Text
6"
AutoCAD SHX Text
8"
AutoCAD SHX Text
2"
AutoCAD SHX Text
6"
AutoCAD SHX Text
6"
AutoCAD SHX Text
6"
AutoCAD SHX Text
PVC
AutoCAD SHX Text
4"STL
AutoCAD SHX Text
6"UNIV
AutoCAD SHX Text
6"
AutoCAD SHX Text
UNIV
AutoCAD SHX Text
12"
AutoCAD SHX Text
2"
AutoCAD SHX Text
12"
AutoCAD SHX Text
6"
AutoCAD SHX Text
8"CI
AutoCAD SHX Text
8"CI
AutoCAD SHX Text
12"
AutoCAD SHX Text
PVC
AutoCAD SHX Text
8"CI
AutoCAD SHX Text
8"
AutoCAD SHX Text
8"UNIV
AutoCAD SHX Text
8"
AutoCAD SHX Text
8"
AutoCAD SHX Text
8"CI
AutoCAD SHX Text
8"CI
AutoCAD SHX Text
6"UNIV
AutoCAD SHX Text
10"
AutoCAD SHX Text
PVC
AutoCAD SHX Text
12"PVC
AutoCAD SHX Text
8"PVC
AutoCAD SHX Text
6"
AutoCAD SHX Text
UNIV
AutoCAD SHX Text
6"
AutoCAD SHX Text
6"
AutoCAD SHX Text
UNIV
AutoCAD SHX Text
4"CI
AutoCAD SHX Text
6"
AutoCAD SHX Text
PVC
AutoCAD SHX Text
2"
AutoCAD SHX Text
PVC
AutoCAD SHX Text
2"
AutoCAD SHX Text
1"
AutoCAD SHX Text
4"AC
AutoCAD SHX Text
4"AC
AutoCAD SHX Text
4"AC
AutoCAD SHX Text
4"AC
AutoCAD SHX Text
2"
AutoCAD SHX Text
AC
AutoCAD SHX Text
2"AC
AutoCAD SHX Text
2"PVC
AutoCAD SHX Text
6"
AutoCAD SHX Text
6"CI
AutoCAD SHX Text
6"CI
AutoCAD SHX Text
6"
AutoCAD SHX Text
6"AC
AutoCAD SHX Text
6"CI
AutoCAD SHX Text
8"
AutoCAD SHX Text
8"
AutoCAD SHX Text
8"
AutoCAD SHX Text
6"AC
AutoCAD SHX Text
6"AC
AutoCAD SHX Text
6"
AutoCAD SHX Text
6"
AutoCAD SHX Text
6"PVC
AutoCAD SHX Text
6"PVC
AutoCAD SHX Text
4"STL
AutoCAD SHX Text
4"PVC
AutoCAD SHX Text
4"PVC
AutoCAD SHX Text
8"CI
AutoCAD SHX Text
8"PVC
AutoCAD SHX Text
8"
AutoCAD SHX Text
PVC
AutoCAD SHX Text
6"CI
AutoCAD SHX Text
6"CI
AutoCAD SHX Text
4"ST
AutoCAD SHX Text
10"CI
AutoCAD SHX Text
8"CI
AutoCAD SHX Text
6"CI
AutoCAD SHX Text
6"CI
AutoCAD SHX Text
8"PVC
AutoCAD SHX Text
4"STL
AutoCAD SHX Text
8"
AutoCAD SHX Text
8"
AutoCAD SHX Text
6"
AutoCAD SHX Text
6"
AutoCAD SHX Text
6"
AutoCAD SHX Text
6"
AutoCAD SHX Text
4"
AutoCAD SHX Text
4"
AutoCAD SHX Text
4"
AutoCAD SHX Text
4"
AutoCAD SHX Text
4"
AutoCAD SHX Text
4"
AutoCAD SHX Text
4"
AutoCAD SHX Text
2"
AutoCAD SHX Text
2"
AutoCAD SHX Text
4"
AutoCAD SHX Text
4"
AutoCAD SHX Text
4"
AutoCAD SHX Text
6"
AutoCAD SHX Text
6"
AutoCAD SHX Text
4"
AutoCAD SHX Text
4"
AutoCAD SHX Text
4"
AutoCAD SHX Text
1"
AutoCAD SHX Text
1"
AutoCAD SHX Text
1"
AutoCAD SHX Text
1"
AutoCAD SHX Text
4"
AutoCAD SHX Text
4"
AutoCAD SHX Text
6"
AutoCAD SHX Text
4"
AutoCAD SHX Text
4"
AutoCAD SHX Text
4"
AutoCAD SHX Text
2"
AutoCAD SHX Text
2"
AutoCAD SHX Text
4"
AutoCAD SHX Text
2"
AutoCAD SHX Text
2"
AutoCAD SHX Text
2"
AutoCAD SHX Text
4"
AutoCAD SHX Text
4"
AutoCAD SHX Text
4"
AutoCAD SHX Text
4"
AutoCAD SHX Text
4"
AutoCAD SHX Text
6"
AutoCAD SHX Text
2"
AutoCAD SHX Text
6"
AutoCAD SHX Text
2"
AutoCAD SHX Text
2"
AutoCAD SHX Text
PVC
AutoCAD SHX Text
8"PVC
AutoCAD SHX Text
8"
AutoCAD SHX Text
8"
AutoCAD SHX Text
10"
AutoCAD SHX Text
10"
AutoCAD SHX Text
10"CI
AutoCAD SHX Text
10"PVC
AutoCAD SHX Text
10"
AutoCAD SHX Text
10"
AutoCAD SHX Text
10"
AutoCAD SHX Text
2"
AutoCAD SHX Text
6"
AutoCAD SHX Text
UNIV
AutoCAD SHX Text
6"
AutoCAD SHX Text
UNIV
AutoCAD SHX Text
6"
AutoCAD SHX Text
6"
AutoCAD SHX Text
6"
AutoCAD SHX Text
10"
AutoCAD SHX Text
10"TRANSITE
AutoCAD SHX Text
10"
AutoCAD SHX Text
6"
AutoCAD SHX Text
6"PL
AutoCAD SHX Text
6"PL
AutoCAD SHX Text
6"PL
AutoCAD SHX Text
6"PL
AutoCAD SHX Text
6"CI
AutoCAD SHX Text
6"
AutoCAD SHX Text
6"CI
AutoCAD SHX Text
6"CI
AutoCAD SHX Text
4"UNIV
AutoCAD SHX Text
8"CI
AutoCAD SHX Text
8"
AutoCAD SHX Text
8"
AutoCAD SHX Text
8"CI
AutoCAD SHX Text
8"CI
AutoCAD SHX Text
8"CI
AutoCAD SHX Text
8"CI
AutoCAD SHX Text
8"CI
AutoCAD SHX Text
10"
AutoCAD SHX Text
12"PVC
AutoCAD SHX Text
12"PVC
AutoCAD SHX Text
12"PVC
AutoCAD SHX Text
12"PVC
AutoCAD SHX Text
12"PVC
AutoCAD SHX Text
12"PVC
AutoCAD SHX Text
12"
AutoCAD SHX Text
12"
AutoCAD SHX Text
12"
AutoCAD SHX Text
12"PVC
AutoCAD SHX Text
12"
AutoCAD SHX Text
PVC
AutoCAD SHX Text
12"
AutoCAD SHX Text
PVC
AutoCAD SHX Text
12"
AutoCAD SHX Text
PVC
AutoCAD SHX Text
6"
AutoCAD SHX Text
6"
AutoCAD SHX Text
8"
AutoCAD SHX Text
6"
AutoCAD SHX Text
6"
AutoCAD SHX Text
6"
AutoCAD SHX Text
6"
AutoCAD SHX Text
6"
AutoCAD SHX Text
6"
AutoCAD SHX Text
6"
AutoCAD SHX Text
8"
AutoCAD SHX Text
6"
AutoCAD SHX Text
6"
AutoCAD SHX Text
6"
AutoCAD SHX Text
6"
AutoCAD SHX Text
8"
AutoCAD SHX Text
8"
AutoCAD SHX Text
8"
AutoCAD SHX Text
8"
AutoCAD SHX Text
8"
AutoCAD SHX Text
8"
AutoCAD SHX Text
8"
AutoCAD SHX Text
10"
AutoCAD SHX Text
8"
AutoCAD SHX Text
10"
AutoCAD SHX Text
8"
AutoCAD SHX Text
12"
AutoCAD SHX Text
8"
AutoCAD SHX Text
12"
AutoCAD SHX Text
12"
AutoCAD SHX Text
12"
AutoCAD SHX Text
2"HDPE
AutoCAD SHX Text
6"
AutoCAD SHX Text
6"
AutoCAD SHX Text
8"
AutoCAD SHX Text
4"
AutoCAD SHX Text
2"PVC
AutoCAD SHX Text
6"
AutoCAD SHX Text
STL
AutoCAD SHX Text
6"
AutoCAD SHX Text
STL
AutoCAD SHX Text
6"
AutoCAD SHX Text
STL
AutoCAD SHX Text
6"STL
AutoCAD SHX Text
8"AC
AutoCAD SHX Text
4"STL
AutoCAD SHX Text
4"CI
AutoCAD SHX Text
2"CI
AutoCAD SHX Text
12"
AutoCAD SHX Text
PVC
AutoCAD SHX Text
12"
AutoCAD SHX Text
PVC
AutoCAD SHX Text
12"
AutoCAD SHX Text
PVC
AutoCAD SHX Text
8"
AutoCAD SHX Text
8"PVC
AutoCAD SHX Text
2"PVC
AutoCAD SHX Text
8"CI
AutoCAD SHX Text
2"
AutoCAD SHX Text
1"
AutoCAD SHX Text
4"
AutoCAD SHX Text
4"
AutoCAD SHX Text
2"PVC
AutoCAD SHX Text
8"
AutoCAD SHX Text
8"
AutoCAD SHX Text
2"
AutoCAD SHX Text
2"
AutoCAD SHX Text
4"
AutoCAD SHX Text
PVC
AutoCAD SHX Text
12"
AutoCAD SHX Text
PVC
AutoCAD SHX Text
8"CI
AutoCAD SHX Text
12"
AutoCAD SHX Text
SUMMIT AVE
AutoCAD SHX Text
RIVER ST
AutoCAD SHX Text
HIGHLAND DRIVE
AutoCAD SHX Text
23RD AVE
AutoCAD SHX Text
22ND AVE
AutoCAD SHX Text
WESTLAKE AVE
AutoCAD SHX Text
21ST AVE
AutoCAD SHX Text
DEERPATH DR
AutoCAD SHX Text
KAY ST
AutoCAD SHX Text
20TH AVE
AutoCAD SHX Text
20TH AVE
AutoCAD SHX Text
18TH AVE
AutoCAD SHX Text
19TH AVE
AutoCAD SHX Text
18TH AVE
AutoCAD SHX Text
WESTERN AVE
AutoCAD SHX Text
CENTRAL AVE
AutoCAD SHX Text
DEERPATH DRIVE
AutoCAD SHX Text
SUMMIT AVE
AutoCAD SHX Text
SUMMIT AVE
AutoCAD SHX Text
17TH AVE
AutoCAD SHX Text
MAIN STREET
AutoCAD SHX Text
JUNIPER ST
AutoCAD SHX Text
16TH AVE
AutoCAD SHX Text
KAY ST
AutoCAD SHX Text
IRONWOOD ST
AutoCAD SHX Text
MAIN ST
AutoCAD SHX Text
GOLDEN ST
AutoCAD SHX Text
FIR ST
AutoCAD SHX Text
ELM STREET
AutoCAD SHX Text
CHERRY ST
AutoCAD SHX Text
DOGWOOD ST
AutoCAD SHX Text
BIRCH ST
AutoCAD SHX Text
ALDER ST
AutoCAD SHX Text
14TH AVE
AutoCAD SHX Text
CENTRAL AVE
AutoCAD SHX Text
16TH AVE
AutoCAD SHX Text
BURLINGTON NORTHERN RAILROAD
AutoCAD SHX Text
ELM ST
AutoCAD SHX Text
KAY ST
AutoCAD SHX Text
JUNIPER ST
AutoCAD SHX Text
IRONWOOD ST
AutoCAD SHX Text
MAIN ST
AutoCAD SHX Text
GOLDEN ST
AutoCAD SHX Text
FIR ST
AutoCAD SHX Text
2ND AVE
AutoCAD SHX Text
3RD AVE
AutoCAD SHX Text
4TH AVE
AutoCAD SHX Text
5TH AVE
AutoCAD SHX Text
6TH AVE
AutoCAD SHX Text
7TH AVE
AutoCAD SHX Text
8TH AVE
AutoCAD SHX Text
9TH AVE
AutoCAD SHX Text
10TH AVE
AutoCAD SHX Text
11TH AVE
AutoCAD SHX Text
12TH AVE
AutoCAD SHX Text
APPLE WAY AVE
AutoCAD SHX Text
CHESAW ROAD
AutoCAD SHX Text
SPROUSE ROAD
AutoCAD SHX Text
SPROUSE ROAD
AutoCAD SHX Text
EASTLAKE ROAD
AutoCAD SHX Text
EASTSIDE OSOYOOS ROAD
AutoCAD SHX Text
BALMES ROAD
AutoCAD SHX Text
SAWTELL ROAD
AutoCAD SHX Text
CHESAW ROAD
AutoCAD SHX Text
EMERY ROAD
AutoCAD SHX Text
DEMERCHANT ROAD
AutoCAD SHX Text
LAKE VIEW CIRCLE
AutoCAD SHX Text
AIRPORT ROAD
AutoCAD SHX Text
BUCKMILLER ROAD
AutoCAD SHX Text
THORNDIKE LOOP ROAD
AutoCAD SHX Text
EASTSIDE OSOYOOS ROAD
AutoCAD SHX Text
THORNDIKE LOOP ROAD
AutoCAD SHX Text
BOB NEIL ROAD
AutoCAD SHX Text
EDER ROAD
AutoCAD SHX Text
2"
AutoCAD SHX Text
14TH AVE
AutoCAD SHX Text
HWY 97
AutoCAD SHX Text
HIGHWAY 97
AutoCAD SHX Text
12"
AutoCAD SHX Text
4"
AutoCAD SHX Text
4"
AutoCAD SHX Text
6"
AutoCAD SHX Text
4"
AutoCAD SHX Text
4"
AutoCAD SHX Text
6"
AutoCAD SHX Text
8"PVC
AutoCAD SHX Text
2"GALV
AutoCAD SHX Text
12"
AutoCAD SHX Text
8"CI
AutoCAD SHX Text
8"
AutoCAD SHX Text
8"
AutoCAD SHX Text
WESTLAKE RD
AutoCAD SHX Text
WESTLAKE RD
AutoCAD SHX Text
BLAKLER RD
AutoCAD SHX Text
HWY 97
AutoCAD SHX Text
HWY 97
AutoCAD SHX Text
WESTLAKE RD
AutoCAD SHX Text
WESTLAKE RD
AutoCAD SHX Text
BOUNDARY
AutoCAD SHX Text
BOUNDARY POINT RD
AutoCAD SHX Text
POINT RD
AutoCAD SHX Text
JACKSON ST.
AutoCAD SHX Text
6"
AutoCAD SHX Text
6"
AutoCAD SHX Text
6"
AutoCAD SHX Text
6"
AutoCAD SHX Text
12"
AutoCAD SHX Text
12"
AutoCAD SHX Text
12"
AutoCAD SHX Text
TOM
AutoCAD SHX Text
DULL
AutoCAD SHX Text
RD.
AutoCAD SHX Text
ROSE RD.
AutoCAD SHX Text
2"
AutoCAD SHX Text
LEVEE
AutoCAD SHX Text
LEVEE
AutoCAD SHX Text
LEVEE
AutoCAD SHX Text
LEVEE
AutoCAD SHX Text
12"
AutoCAD SHX Text
10"PVC
AutoCAD SHX Text
8"PVC
AutoCAD SHX Text
8"PVC
AutoCAD SHX Text
8"PVC
AutoCAD SHX Text
8"PVC
AutoCAD SHX Text
6"PVC
AutoCAD SHX Text
LEGEND
AutoCAD SHX Text
L A K E O S O Y O O S
AutoCAD SHX Text
N
AutoCAD SHX Text
SCALE
AutoCAD SHX Text
0
AutoCAD SHX Text
1000
AutoCAD SHX Text
2000
AutoCAD SHX Text
200,000 GAL STEEL RESERVOIR #5 OVERFLOW EL. 1239
AutoCAD SHX Text
500,000 GAL STEEL RESERVOIR #3 OVERFLOW EL. 1138.5
AutoCAD SHX Text
SUMMIT AVE. BOOSTER STATION
AutoCAD SHX Text
300,000 GAL CONCRETE RESERVOIR #2 OVERFLOW EL. 1138.5
AutoCAD SHX Text
WELL #2 500 GPM
AutoCAD SHX Text
WELL #3 600 GPM
AutoCAD SHX Text
OKANOGAN RIVER
AutoCAD SHX Text
EASTLAKE BOOSTER STATION
AutoCAD SHX Text
220,000 GAL STEEL RESERVOIR #7 OVERFLOW EL. 1138.5
AutoCAD SHX Text
CHECK VALVE RESTRICTING SOUTHERLY FLOW
AutoCAD SHX Text
AIR VALVE
AutoCAD SHX Text
AIR VALVE
AutoCAD SHX Text
FIRE FLOW IMPROVEMENT PIPE REPLACEMENT/ADDITION
AutoCAD SHX Text
NORTH END IMPROVEMENTS SEE SECTION 6
AutoCAD SHX Text
NORTH END BOOSTER STATION TO BE REMOVED
AutoCAD SHX Text
AIRPORT BOOSTER STATION - ADD GENERATOR AND BOOSTER PUMP
AutoCAD SHX Text
WELL #4 REHABILITAION
AutoCAD SHX Text
RESERVOIR #1 ROOF REPLACEMENT
AutoCAD SHX Text
8"
AutoCAD SHX Text
8"
AutoCAD SHX Text
8"
AutoCAD SHX Text
8"
AutoCAD SHX Text
EXISTING VERANDA BEACH PRV STATION GROUND ELEV: 1032 CURRENT SETTING: 100 PSI UPSTREAM 24 PSI DOWNSTREAM (HGL=1087)
AutoCAD SHX Text
LOWEST GROUND ELEVATION APPROXIMATELY 920 (72 PSI AT PRV SETTING OF 24 PSI)
AutoCAD SHX Text
1. APPROXIMATE PRESSURE ZONE BOUNDARIES ARE BASED ON MINIMUM 45 PSI APPROXIMATE PRESSURE ZONE BOUNDARIES ARE BASED ON MINIMUM 45 PSI SERVICE PRESSURE (AT PHD) AT THE UPPER END OF EACH ZONE. NOT ACTUAL PRESSURE ZONE BOUNDARIES. 2. 45 PSI PRESSURE ZONE BOUNDARIES ARE BASED ON THE FOLLOWING 45 PSI PRESSURE ZONE BOUNDARIES ARE BASED ON THE FOLLOWING ASSUMPTIONS: 45 PSI IS MINIMUM SERVICE PRESSURE CITY WOULD LIKE TO PROVIDE TANK LEVELS 2' BELOW THE OVERFLOW ELEVATIONS SHOWN (PHD) 10' (4.5 PSI) ADDED TO ALLOW FOR HEAD LOSSES AT PHD VERANDA BEACH PRV CURRENT SETTING (24 PSI DOWNSTREAM)
AutoCAD SHX Text
NOTES
AutoCAD SHX Text
SCALE:
AutoCAD SHX Text
PROJ. NO.:
AutoCAD SHX Text
APPROVED:
AutoCAD SHX Text
DRAWN:
AutoCAD SHX Text
DESIGNED:
AutoCAD SHX Text
CHECKED:
AutoCAD SHX Text
DATE:
AutoCAD SHX Text
AS SHOWN
AutoCAD SHX Text
TVP
AutoCAD SHX Text
120-09-01
AutoCAD SHX Text
12/27/17
AutoCAD SHX Text
1200901-WSP-Figure 3
AutoCAD SHX Text
DOROTHY SCOTT AIRPOIRT
AutoCAD SHX Text
IMPROVEMENTS
AutoCAD SHX Text
CITY LIMITS URBAN GROWTH BOUNDARY, RETAIL SERVICE AREA, WATER RIGHTS PLACE OF USE SERVICE AREA APPROXIMATE THEORETICAL PRESSURE ZONE MAIN PRESSURE ZONE AIRPORT PRESSURE ZONE VERANDA BEACH PRESSURE ZONE SUMMIT AVE. BOOSTER PRESSURE ZONE EXISTING FIRE HYDRANT EXISTING VALVE EXISTING WELL EXISTING BOOSTER STATION EXISTING RESERVOIR EXISTING AIR VALVE
AutoCAD SHX Text
WELL #1 650 GMP
AutoCAD SHX Text
1000 GPM (800 GPM)
AutoCAD SHX Text
OVERFLOW EL. 1138.5
AutoCAD SHX Text
1. RETAIL SERVICE AREA: THE AREA INSIDE WHICH A WATER RETAIL SERVICE AREA: THE AREA INSIDE WHICH A WATER SYSTEM HAS A DUTY TO PROVIDE NEW WATER SERVICE CONNECTIONS UPON REQUEST AS OUTLINED IN WAC 246-290-106. 2. WATER RIGHTS PLACE OF USE SERVICE AREA: WAC WATER RIGHTS PLACE OF USE SERVICE AREA: WAC 246-290-107 ALLOWS A SYSTEM TO EXPAND ITS WATER RIGHTS PLACE OF USE TO INCLUDE ANY PORTION OF THE SERVICE AREA NOT INCLUDED IN THE ORIGINAL WATER RIGHT. 3. SERVICE AREA: THE AREA WHERE A WATER SYSTEM PLANS SERVICE AREA: THE AREA WHERE A WATER SYSTEM PLANS TO SERVE.
AutoCAD SHX Text
NOTES ON SERVICE AREA BOUNDARIES
AutoCAD SHX Text
120,000 GAL STEEL RESERVOIR #4 OVERFLOW EL. 1138.5
AutoCAD SHX Text
269,000 GAL STEEL RESERVOIR #6 OVERFLOW EL. 1256.7