1 TAIL SWING PERFORMANCE OF THE SOUTH AFRICAN CAR ...
10
1 TAIL SWING PERFORMANCE OF THE SOUTH AFRICAN CAR-CARRIER FLEET Obtained BSc and currently completing MSc at the University of the Witwatersrand. Researcher at the Council for Scientific and Industrial Research (CSIR) through the CSIR’s Studentship programme. Obtained BSc and MSc from the University of the Witwatersrand and PhD from the University of Cambridge. Senior Lecturer in the School of Mechanical, Industrial and Aeronautical Engineering at the University of the Witwatersrand. C. DE SAXE The Council for Scientific and Industrial Research (CSIR) South Africa F. KIENHÖFER University of the Witwatersrand South Africa Obtained BSc from the University of KwaZulu-Natal and MSc from the University of the Witwatersrand. Completing PhD at the University of KwaZulu-Natal. Principal Researcher at the CSIR, Past President of the SA Road Federation and President of the IFRTT. P. NORDENGEN The Council for Scientific and Industrial Research (CSIR) South Africa Abstract The practice of issuing of abnormal load permits to South African car-carriers (allowing a 300 mm increase in height and 500 mm increase in length) is being phased out. Such allowances will only be granted if a car-carrier complies with the Australian Performance-Based Standards scheme, which is currently the basis for a PBS demonstration project in South Africa. This study calculated that only 20% of the existing South African car-carrier fleet complies with the required 0.30 m Level 1 tail swing limit. This limit is shown to be consistent with the 3.7 m rear overhang limit enforced by the Australian Design Rule 43/04. In contrast, South African legislation allows rear overhangs of up to 7 m. This is shown to result in a tail swing of 1.25 m. A proposal to temporarily relax the 0.30 m tail swing limit to 0.45 m, and hence include around 80% of the existing fleet, was turned down by the South African road authorities. Keywords: Performance-Based Standards; Car-Carriers; Tail Swing; Vehicle Dimensions; South African Heavy Vehicle Legislation.
-
Upload
khangminh22 -
Category
Documents
-
view
2 -
download
0
Transcript of 1 TAIL SWING PERFORMANCE OF THE SOUTH AFRICAN CAR ...
1
TAIL SWING PERFORMANCE OF THE SOUTH AFRICAN
CAR-CARRIER FLEET
Obtained BSc and currently
completing MSc at the University
of the Witwatersrand. Researcher at
the Council for Scientific and
Industrial Research (CSIR) through
the CSIR’s Studentship
programme.
Obtained BSc and MSc from the
University of the Witwatersrand
and PhD from the University of
Cambridge. Senior Lecturer in the
School of Mechanical, Industrial
and Aeronautical Engineering at the
University of the Witwatersrand.
C. DE SAXE
The Council for Scientific and Industrial Research
(CSIR)
South Africa
F. KIENHÖFER
University of the Witwatersrand
South Africa
Obtained BSc from the University
of KwaZulu-Natal and MSc from
the University of the
Witwatersrand. Completing PhD at
the University of KwaZulu-Natal.
Principal Researcher at the CSIR,
Past President of the SA Road
Federation and President of the
IFRTT.
P. NORDENGEN
The Council for Scientific and Industrial Research
(CSIR)
South Africa
Abstract
The practice of issuing of abnormal load permits to South African car-carriers (allowing a 300
mm increase in height and 500 mm increase in length) is being phased out. Such allowances
will only be granted if a car-carrier complies with the Australian Performance-Based
Standards scheme, which is currently the basis for a PBS demonstration project in South
Africa. This study calculated that only 20% of the existing South African car-carrier fleet
complies with the required 0.30 m Level 1 tail swing limit. This limit is shown to be
consistent with the 3.7 m rear overhang limit enforced by the Australian Design Rule 43/04.
In contrast, South African legislation allows rear overhangs of up to 7 m. This is shown to
result in a tail swing of 1.25 m. A proposal to temporarily relax the 0.30 m tail swing limit to
0.45 m, and hence include around 80% of the existing fleet, was turned down by the South
African road authorities.
Keywords: Performance-Based Standards; Car-Carriers; Tail Swing; Vehicle Dimensions;
South African Heavy Vehicle Legislation.
HVTT12: Tail Swing Performance of the South African Car-Carrier Fleet 2
1. Introduction
Until recently, car-carriers in South Africa operated under abnormal load permits allowing an
additional 500 mm length and 300 mm height over the legal limits set by the National Road
Traffic Regulations (NRTR) (DoT, 2003). New car-carriers must now comply with the NRTR
or – if legal length and height limits are to be exceeded – comply with the requirements of the
Australian Performance-Based Standards (PBS) scheme, which is currently being used as a
basis for a PBS demonstration project in South Africa.
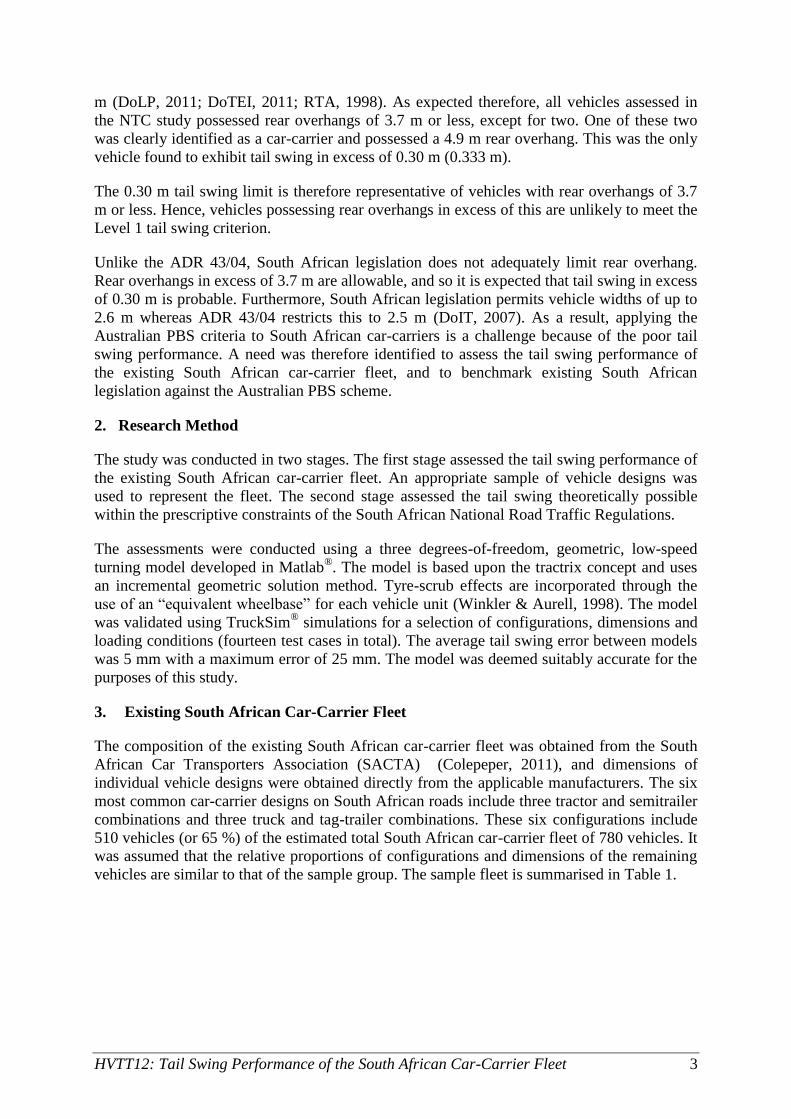
Figure 1 shows examples of the two predominant car-carrier configurations in South Africa: a
tractor and semitrailer combination and a truck and centre-axle tag-trailer combination. The
superseded abnormal load allowances are also indicated in the figure.
Figure 1 – Typical South African Car-Carriers: (a) Tractor and Semitrailer, (b) Truck
and Centre-Axle Tag-Trailer (Courtesy of Mr. Andrew Colepeper)
Large rear overhangs are common with car-carriers (particularly tag-trailer combinations) and
this causes poor tail swing performance. Furthermore, the short wheelbase of the centre-axle
tag-trailer causes poor yaw damping, rearward amplification and high-speed transient
offtracking (NRTC, 2002). This paper focuses on the tail swing performance of car-carriers.
The Australian PBS scheme – as regulated by the National Transport Commission of
Australia (NTC) – restricts tail swing to 0.30 m for vehicles with unrestricted (Level 1) road
access. Most if not all South African car-carriers would require Level 1 access. The Level 2, 3
and 4 limits are 0.35 m, 0.35 m and 0.50 m respectively. During the implementation stages of
the Australian PBS scheme, the proposed Level 1 tail swing limit was 0.50 m (NRTC, 2001).
In 2002, the NTC benchmarked the Australian heavy vehicle fleet and found that all but one
of the 139 vehicles assessed exhibited a tail swing of less than 0.30 m (NRTC, 2002).
Consequently, a reduction of the limit to 0.35 m was recommended. In 2003, the limit was
further reduced to 0.30 m in response to a proposal made by the New South Wales Roads and
Traffic Authority (NRTC, 2003).
Australian heavy vehicle dimensions are governed by the Australian Design Rule 43/04 (ADR
43/04) which limits rear overhang to 3.7 m (DoIT, 2007). Subject to State-specific legislation,
car-carriers may possess a load projection in excess of this up to a total rear overhang of 4.9
18.5 m (maximum legal length) 0.5 m
0.5 m22 m (maximum legal length)
(a)
(b)
4.6
m
4.6
m
Rear overhang
Rear overhang
Max
imu
m l
egal
hei
gh
t =
4.3
m
HVTT12: Tail Swing Performance of the South African Car-Carrier Fleet 3
m (DoLP, 2011; DoTEI, 2011; RTA, 1998). As expected therefore, all vehicles assessed in
the NTC study possessed rear overhangs of 3.7 m or less, except for two. One of these two
was clearly identified as a car-carrier and possessed a 4.9 m rear overhang. This was the only
vehicle found to exhibit tail swing in excess of 0.30 m (0.333 m).
The 0.30 m tail swing limit is therefore representative of vehicles with rear overhangs of 3.7
m or less. Hence, vehicles possessing rear overhangs in excess of this are unlikely to meet the
Level 1 tail swing criterion.
Unlike the ADR 43/04, South African legislation does not adequately limit rear overhang.
Rear overhangs in excess of 3.7 m are allowable, and so it is expected that tail swing in excess
of 0.30 m is probable. Furthermore, South African legislation permits vehicle widths of up to
2.6 m whereas ADR 43/04 restricts this to 2.5 m (DoIT, 2007). As a result, applying the
Australian PBS criteria to South African car-carriers is a challenge because of the poor tail
swing performance. A need was therefore identified to assess the tail swing performance of
the existing South African car-carrier fleet, and to benchmark existing South African
legislation against the Australian PBS scheme.
2. Research Method
The study was conducted in two stages. The first stage assessed the tail swing performance of
the existing South African car-carrier fleet. An appropriate sample of vehicle designs was
used to represent the fleet. The second stage assessed the tail swing theoretically possible
within the prescriptive constraints of the South African National Road Traffic Regulations.
The assessments were conducted using a three degrees-of-freedom, geometric, low-speed
turning model developed in Matlab®. The model is based upon the tractrix concept and uses
an incremental geometric solution method. Tyre-scrub effects are incorporated through the
use of an “equivalent wheelbase” for each vehicle unit (Winkler & Aurell, 1998). The model
was validated using TruckSim® simulations for a selection of configurations, dimensions and
loading conditions (fourteen test cases in total). The average tail swing error between models
was 5 mm with a maximum error of 25 mm. The model was deemed suitably accurate for the
purposes of this study.
3. Existing South African Car-Carrier Fleet
The composition of the existing South African car-carrier fleet was obtained from the South
African Car Transporters Association (SACTA) (Colepeper, 2011), and dimensions of
individual vehicle designs were obtained directly from the applicable manufacturers. The six
most common car-carrier designs on South African roads include three tractor and semitrailer
combinations and three truck and tag-trailer combinations. These six configurations include
510 vehicles (or 65 %) of the estimated total South African car-carrier fleet of 780 vehicles. It
was assumed that the relative proportions of configurations and dimensions of the remaining
vehicles are similar to that of the sample group. The sample fleet is summarised in Table 1.
HVTT12: Tail Swing Performance of the South African Car-Carrier Fleet 4
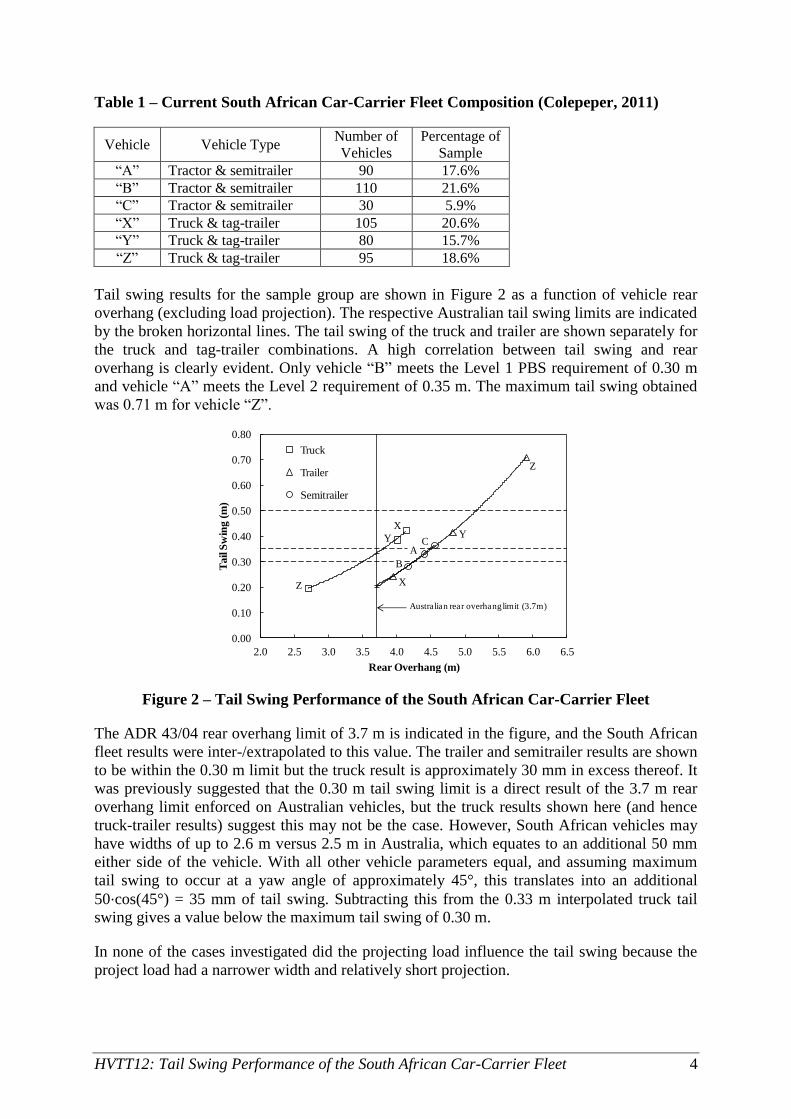
Table 1 – Current South African Car-Carrier Fleet Composition (Colepeper, 2011)
Vehicle Vehicle Type Number of
Vehicles
Percentage of
Sample
“A” Tractor & semitrailer 90 17.6%
“B” Tractor & semitrailer 110 21.6%
“C” Tractor & semitrailer 30 5.9%
“X” Truck & tag-trailer 105 20.6%
“Y” Truck & tag-trailer 80 15.7%
“Z” Truck & tag-trailer 95 18.6%
Tail swing results for the sample group are shown in Figure 2 as a function of vehicle rear
overhang (excluding load projection). The respective Australian tail swing limits are indicated
by the broken horizontal lines. The tail swing of the truck and trailer are shown separately for
the truck and tag-trailer combinations. A high correlation between tail swing and rear
overhang is clearly evident. Only vehicle “B” meets the Level 1 PBS requirement of 0.30 m
and vehicle “A” meets the Level 2 requirement of 0.35 m. The maximum tail swing obtained
was 0.71 m for vehicle “Z”.
Figure 2 – Tail Swing Performance of the South African Car-Carrier Fleet
The ADR 43/04 rear overhang limit of 3.7 m is indicated in the figure, and the South African
fleet results were inter-/extrapolated to this value. The trailer and semitrailer results are shown
to be within the 0.30 m limit but the truck result is approximately 30 mm in excess thereof. It
was previously suggested that the 0.30 m tail swing limit is a direct result of the 3.7 m rear
overhang limit enforced on Australian vehicles, but the truck results shown here (and hence
truck-trailer results) suggest this may not be the case. However, South African vehicles may
have widths of up to 2.6 m versus 2.5 m in Australia, which equates to an additional 50 mm
either side of the vehicle. With all other vehicle parameters equal, and assuming maximum
tail swing to occur at a yaw angle of approximately 45°, this translates into an additional
50⋅cos(45°) = 35 mm of tail swing. Subtracting this from the 0.33 m interpolated truck tail
swing gives a value below the maximum tail swing of 0.30 m.
In none of the cases investigated did the projecting load influence the tail swing because the
project load had a narrower width and relatively short projection.
0.00
0.10
0.20
0.30
0.40
0.50
0.60
0.70
0.80
2.0 2.5 3.0 3.5 4.0 4.5 5.0 5.5 6.0 6.5
Ta
il S
win
g (
m)
Rear Overhang (m)
Truck
Trailer
Semitrailer
Australian rear overhang limit (3.7m)
X
X
Y Y
Z
Z
A
B
C
HVTT12: Tail Swing Performance of the South African Car-Carrier Fleet 5
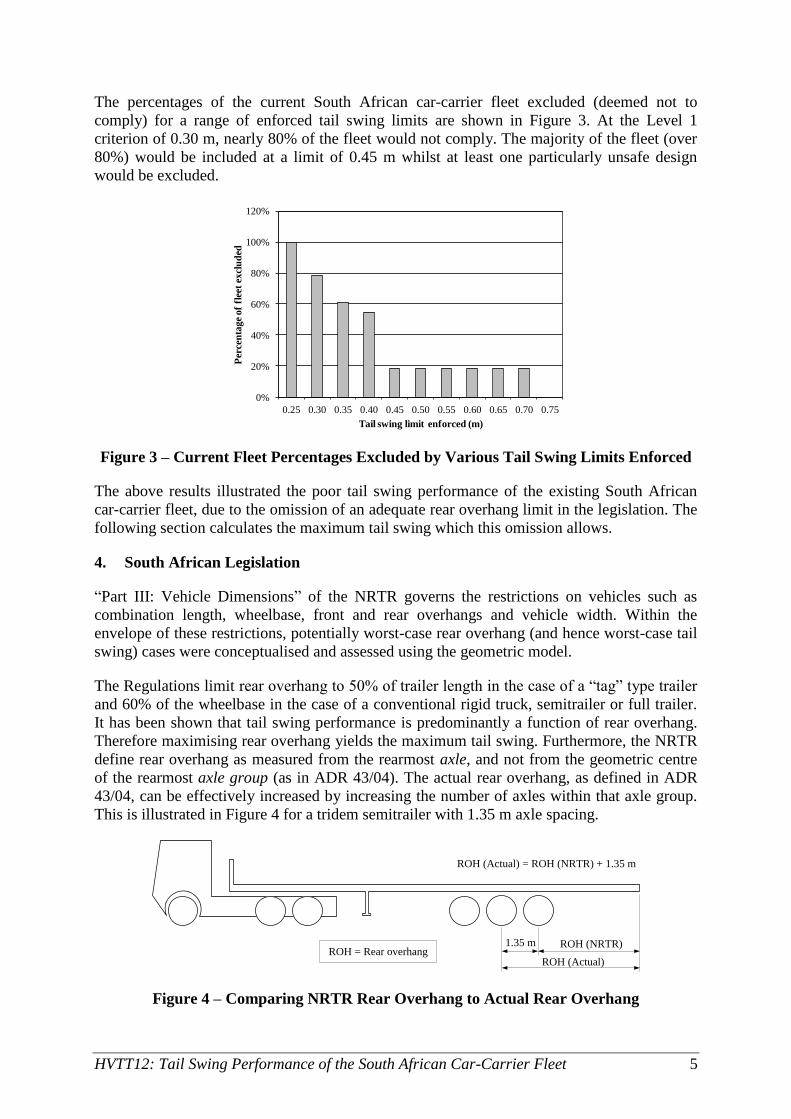
The percentages of the current South African car-carrier fleet excluded (deemed not to
comply) for a range of enforced tail swing limits are shown in Figure 3. At the Level 1
criterion of 0.30 m, nearly 80% of the fleet would not comply. The majority of the fleet (over
80%) would be included at a limit of 0.45 m whilst at least one particularly unsafe design
would be excluded.
Figure 3 – Current Fleet Percentages Excluded by Various Tail Swing Limits Enforced
The above results illustrated the poor tail swing performance of the existing South African
car-carrier fleet, due to the omission of an adequate rear overhang limit in the legislation. The
following section calculates the maximum tail swing which this omission allows.
4. South African Legislation
“Part III: Vehicle Dimensions” of the NRTR governs the restrictions on vehicles such as
combination length, wheelbase, front and rear overhangs and vehicle width. Within the
envelope of these restrictions, potentially worst-case rear overhang (and hence worst-case tail
swing) cases were conceptualised and assessed using the geometric model.
The Regulations limit rear overhang to 50% of trailer length in the case of a “tag” type trailer
and 60% of the wheelbase in the case of a conventional rigid truck, semitrailer or full trailer.
It has been shown that tail swing performance is predominantly a function of rear overhang.
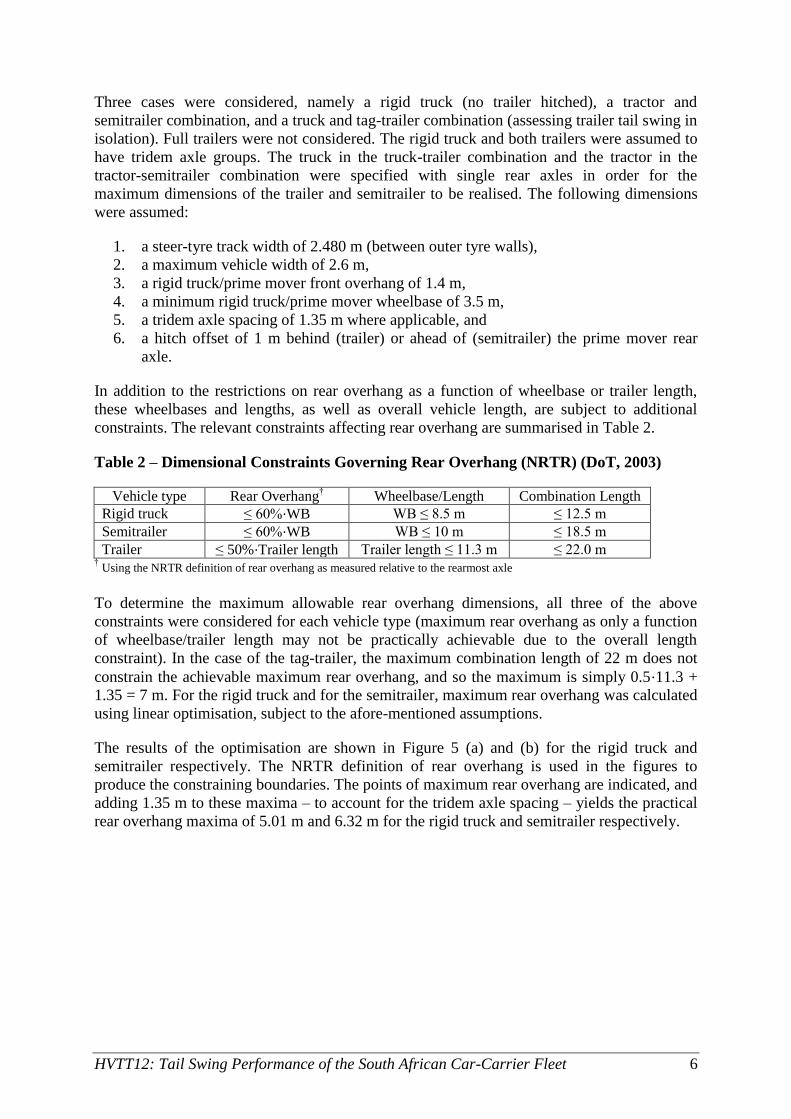
Therefore maximising rear overhang yields the maximum tail swing. Furthermore, the NRTR
define rear overhang as measured from the rearmost axle, and not from the geometric centre
of the rearmost axle group (as in ADR 43/04). The actual rear overhang, as defined in ADR
43/04, can be effectively increased by increasing the number of axles within that axle group.
This is illustrated in Figure 4 for a tridem semitrailer with 1.35 m axle spacing.
Figure 4 – Comparing NRTR Rear Overhang to Actual Rear Overhang
0%
20%
40%
60%
80%
100%
120%
0.25 0.30 0.35 0.40 0.45 0.50 0.55 0.60 0.65 0.70 0.75
Per
cen
tag
e o
f fl
eet
excl
ud
ed
Tail swing limit enforced (m)
1.35 m ROH (NRTR)
ROH (Actual)
ROH (Actual) = ROH (NRTR) + 1.35 m
ROH = Rear overhang
HVTT12: Tail Swing Performance of the South African Car-Carrier Fleet 6
Three cases were considered, namely a rigid truck (no trailer hitched), a tractor and
semitrailer combination, and a truck and tag-trailer combination (assessing trailer tail swing in
isolation). Full trailers were not considered. The rigid truck and both trailers were assumed to
have tridem axle groups. The truck in the truck-trailer combination and the tractor in the
tractor-semitrailer combination were specified with single rear axles in order for the
maximum dimensions of the trailer and semitrailer to be realised. The following dimensions
were assumed:
1. a steer-tyre track width of 2.480 m (between outer tyre walls),
2. a maximum vehicle width of 2.6 m,
3. a rigid truck/prime mover front overhang of 1.4 m,
4. a minimum rigid truck/prime mover wheelbase of 3.5 m,
5. a tridem axle spacing of 1.35 m where applicable, and
6. a hitch offset of 1 m behind (trailer) or ahead of (semitrailer) the prime mover rear
axle.
In addition to the restrictions on rear overhang as a function of wheelbase or trailer length,
these wheelbases and lengths, as well as overall vehicle length, are subject to additional
constraints. The relevant constraints affecting rear overhang are summarised in Table 2.
Table 2 – Dimensional Constraints Governing Rear Overhang (NRTR) (DoT, 2003)
Vehicle type Rear Overhang† Wheelbase/Length Combination Length
Rigid truck ≤ 60%⋅WB WB ≤ 8.5 m ≤ 12.5 m
Semitrailer ≤ 60%⋅WB WB ≤ 10 m ≤ 18.5 m
Trailer ≤ 50%⋅Trailer length Trailer length ≤ 11.3 m ≤ 22.0 m † Using the NRTR definition of rear overhang as measured relative to the rearmost axle
To determine the maximum allowable rear overhang dimensions, all three of the above
constraints were considered for each vehicle type (maximum rear overhang as only a function
of wheelbase/trailer length may not be practically achievable due to the overall length
constraint). In the case of the tag-trailer, the maximum combination length of 22 m does not
constrain the achievable maximum rear overhang, and so the maximum is simply 0.5⋅11.3 +
1.35 = 7 m. For the rigid truck and for the semitrailer, maximum rear overhang was calculated
using linear optimisation, subject to the afore-mentioned assumptions.
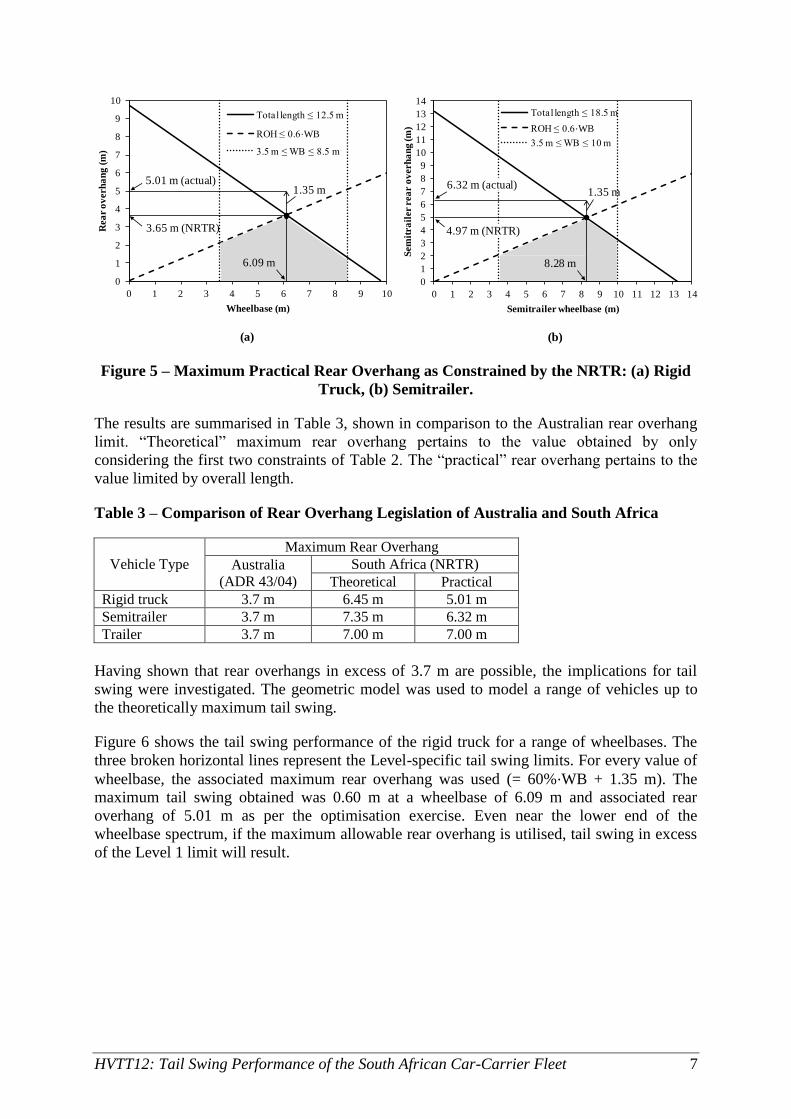
The results of the optimisation are shown in Figure 5 (a) and (b) for the rigid truck and
semitrailer respectively. The NRTR definition of rear overhang is used in the figures to
produce the constraining boundaries. The points of maximum rear overhang are indicated, and
adding 1.35 m to these maxima – to account for the tridem axle spacing – yields the practical
rear overhang maxima of 5.01 m and 6.32 m for the rigid truck and semitrailer respectively.
HVTT12: Tail Swing Performance of the South African Car-Carrier Fleet 7
Figure 5 – Maximum Practical Rear Overhang as Constrained by the NRTR: (a) Rigid
Truck, (b) Semitrailer.
The results are summarised in Table 3, shown in comparison to the Australian rear overhang
limit. “Theoretical” maximum rear overhang pertains to the value obtained by only
considering the first two constraints of Table 2. The “practical” rear overhang pertains to the
value limited by overall length.
Table 3 – Comparison of Rear Overhang Legislation of Australia and South Africa
Vehicle Type
Maximum Rear Overhang
Australia
(ADR 43/04)
South Africa (NRTR)
Theoretical Practical
Rigid truck 3.7 m 6.45 m 5.01 m
Semitrailer 3.7 m 7.35 m 6.32 m
Trailer 3.7 m 7.00 m 7.00 m
Having shown that rear overhangs in excess of 3.7 m are possible, the implications for tail
swing were investigated. The geometric model was used to model a range of vehicles up to
the theoretically maximum tail swing.
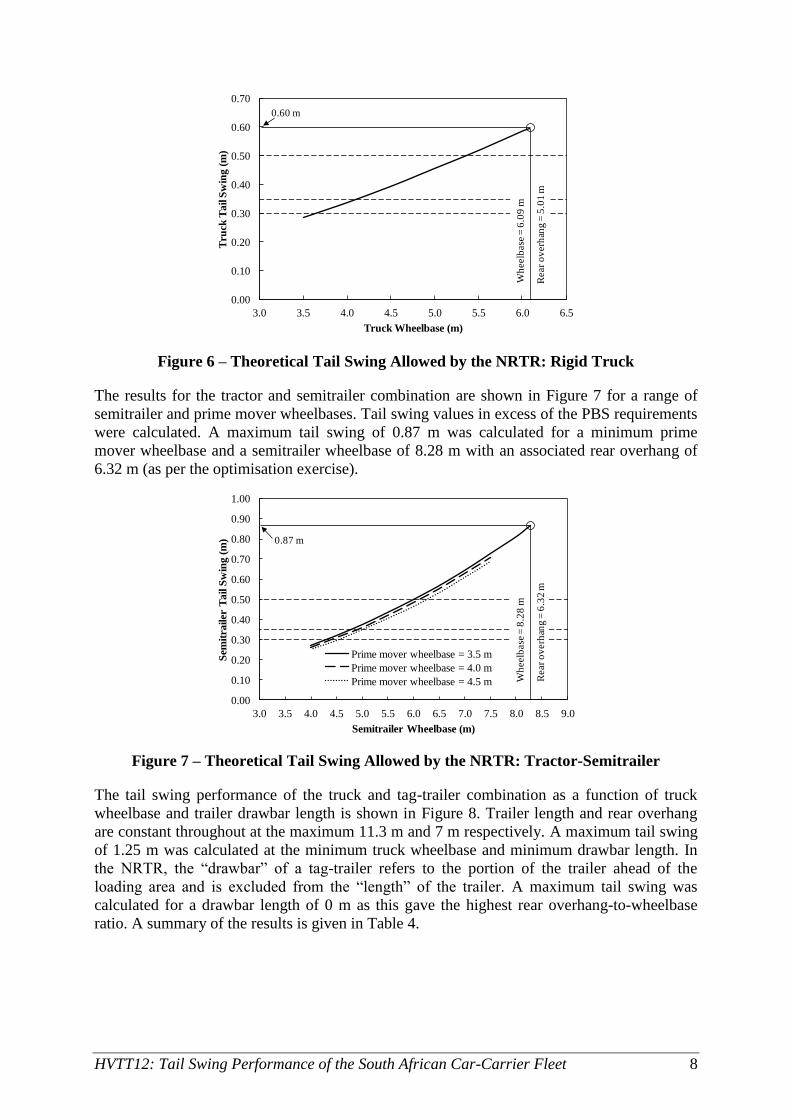
Figure 6 shows the tail swing performance of the rigid truck for a range of wheelbases. The
three broken horizontal lines represent the Level-specific tail swing limits. For every value of
wheelbase, the associated maximum rear overhang was used (= 60%⋅WB + 1.35 m). The
maximum tail swing obtained was 0.60 m at a wheelbase of 6.09 m and associated rear
overhang of 5.01 m as per the optimisation exercise. Even near the lower end of the
wheelbase spectrum, if the maximum allowable rear overhang is utilised, tail swing in excess
of the Level 1 limit will result.
0
1
2
3
4
5
6
7
8
9
10
0 1 2 3 4 5 6 7 8 9 10
Rea
r o
verh
an
g (
m)
Wheelbase (m)
Total length ≤ 12.5 m
ROH ≤ 0.6⋅WB
3.5 m ≤ WB ≤ 8.5 m
1.35 m5.01 m (actual)
3.65 m (NRTR)
6.09 m
0
1
2
3
4
5
6
7
8
9
10
11
12
13
14
0 1 2 3 4 5 6 7 8 9 10 11 12 13 14
Sem
itra
iler r
ea
r o
verh
an
g (m
)
Semitrailer wheelbase (m)
Total length ≤ 18.5 m
ROH ≤ 0.6⋅WB
3.5 m ≤ WB ≤ 10 m
1.35 m6.32 m (actual)
4.97 m (NRTR)
8.28 m
(a) (b)
HVTT12: Tail Swing Performance of the South African Car-Carrier Fleet 8
Figure 6 – Theoretical Tail Swing Allowed by the NRTR: Rigid Truck
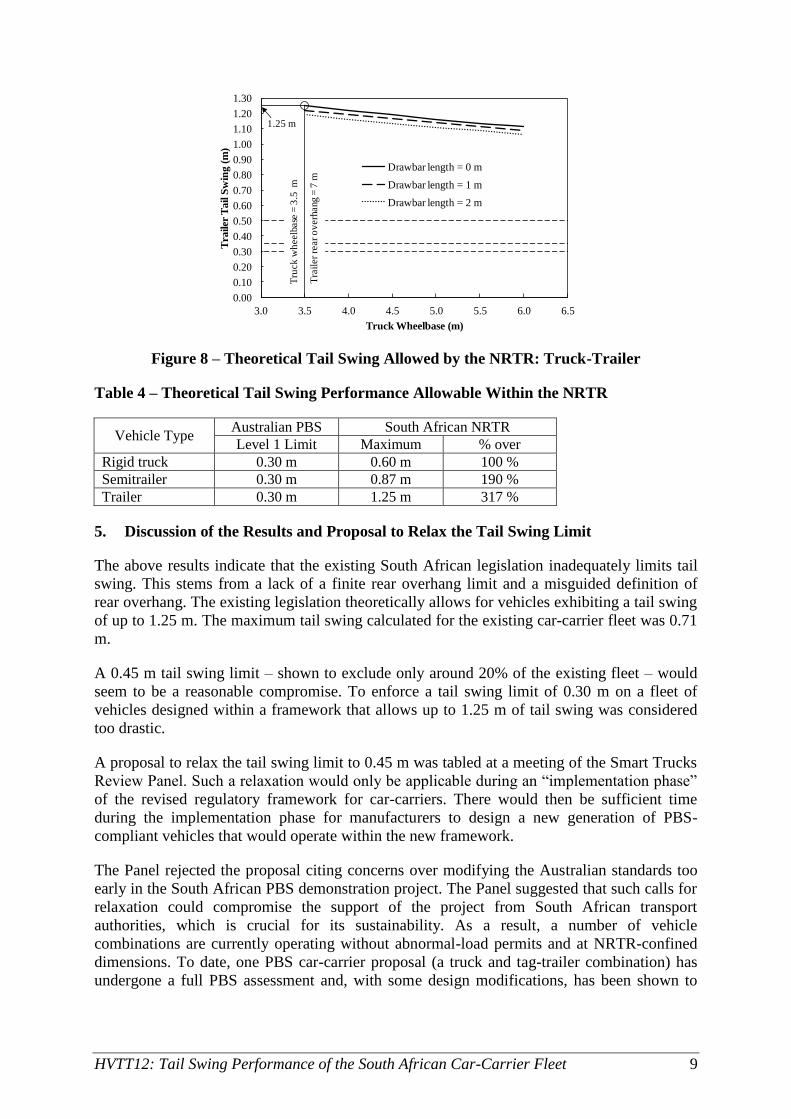
The results for the tractor and semitrailer combination are shown in Figure 7 for a range of
semitrailer and prime mover wheelbases. Tail swing values in excess of the PBS requirements
were calculated. A maximum tail swing of 0.87 m was calculated for a minimum prime
mover wheelbase and a semitrailer wheelbase of 8.28 m with an associated rear overhang of
6.32 m (as per the optimisation exercise).
Figure 7 – Theoretical Tail Swing Allowed by the NRTR: Tractor-Semitrailer
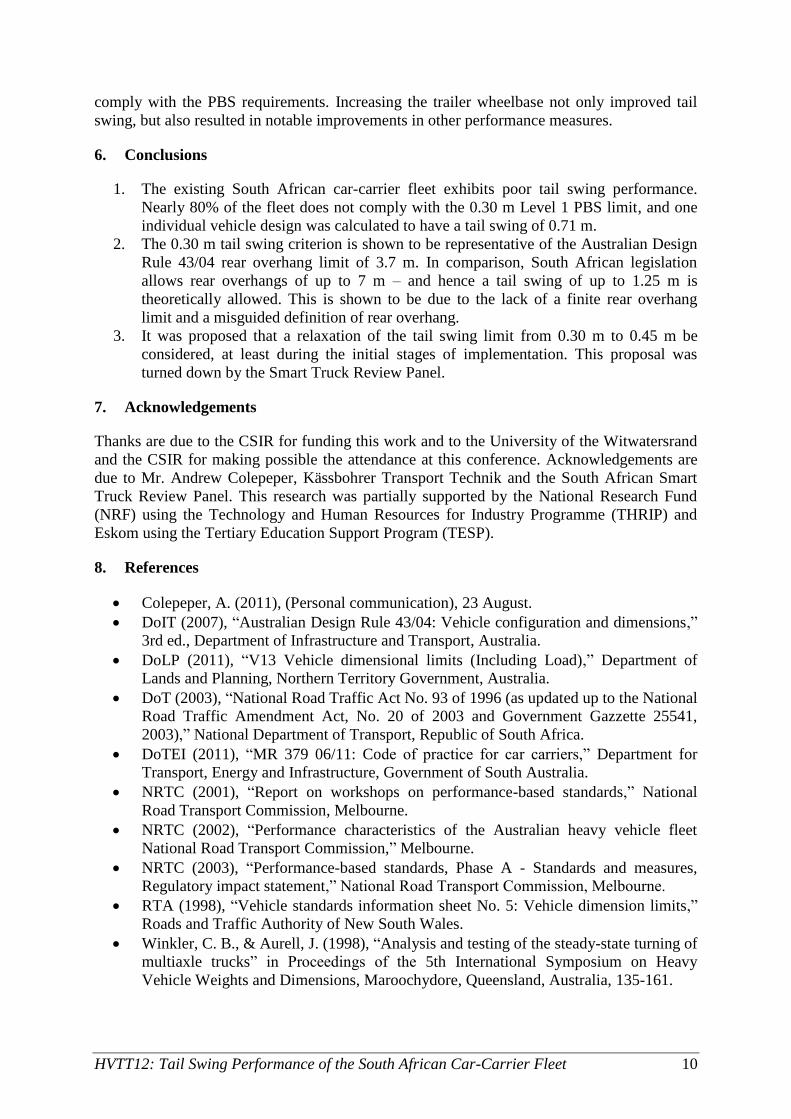
The tail swing performance of the truck and tag-trailer combination as a function of truck
wheelbase and trailer drawbar length is shown in Figure 8. Trailer length and rear overhang
are constant throughout at the maximum 11.3 m and 7 m respectively. A maximum tail swing
of 1.25 m was calculated at the minimum truck wheelbase and minimum drawbar length. In
the NRTR, the “drawbar” of a tag-trailer refers to the portion of the trailer ahead of the
loading area and is excluded from the “length” of the trailer. A maximum tail swing was
calculated for a drawbar length of 0 m as this gave the highest rear overhang-to-wheelbase
ratio. A summary of the results is given in Table 4.
0.00
0.10
0.20
0.30
0.40
0.50
0.60
0.70
3.0 3.5 4.0 4.5 5.0 5.5 6.0 6.5
Tru
ck T
ail
Sw
ing (
m)
Truck Wheelbase (m)
Wh
eelb
ase
= 6
.09
m
0.60 m
Rear
ov
erh
ang =
5.0
1 m
0.00
0.10
0.20
0.30
0.40
0.50
0.60
0.70
0.80
0.90
1.00
3.0 3.5 4.0 4.5 5.0 5.5 6.0 6.5 7.0 7.5 8.0 8.5 9.0
Sem
itra
iler
Tail S
win
g (
m)
Semitrailer Wheelbase (m)
Prime mover wheelbase = 3.5 m
Prime mover wheelbase = 4.0 m
Prime mover wheelbase = 4.5 m Wh
eelb
ase
= 8
.28
m
0.87 mR
ear
ov
erh
ang =
6.3
2 m
HVTT12: Tail Swing Performance of the South African Car-Carrier Fleet 9
Figure 8 – Theoretical Tail Swing Allowed by the NRTR: Truck-Trailer
Table 4 – Theoretical Tail Swing Performance Allowable Within the NRTR
Vehicle Type Australian PBS South African NRTR
Level 1 Limit Maximum % over
Rigid truck 0.30 m 0.60 m 100 %
Semitrailer 0.30 m 0.87 m 190 %
Trailer 0.30 m 1.25 m 317 %
5. Discussion of the Results and Proposal to Relax the Tail Swing Limit
The above results indicate that the existing South African legislation inadequately limits tail
swing. This stems from a lack of a finite rear overhang limit and a misguided definition of
rear overhang. The existing legislation theoretically allows for vehicles exhibiting a tail swing
of up to 1.25 m. The maximum tail swing calculated for the existing car-carrier fleet was 0.71
m.
A 0.45 m tail swing limit – shown to exclude only around 20% of the existing fleet – would
seem to be a reasonable compromise. To enforce a tail swing limit of 0.30 m on a fleet of
vehicles designed within a framework that allows up to 1.25 m of tail swing was considered
too drastic.
A proposal to relax the tail swing limit to 0.45 m was tabled at a meeting of the Smart Trucks
Review Panel. Such a relaxation would only be applicable during an “implementation phase”
of the revised regulatory framework for car-carriers. There would then be sufficient time
during the implementation phase for manufacturers to design a new generation of PBS-
compliant vehicles that would operate within the new framework.
The Panel rejected the proposal citing concerns over modifying the Australian standards too
early in the South African PBS demonstration project. The Panel suggested that such calls for
relaxation could compromise the support of the project from South African transport
authorities, which is crucial for its sustainability. As a result, a number of vehicle
combinations are currently operating without abnormal-load permits and at NRTR-confined
dimensions. To date, one PBS car-carrier proposal (a truck and tag-trailer combination) has
undergone a full PBS assessment and, with some design modifications, has been shown to
0.00
0.10
0.20
0.30
0.40
0.50
0.60
0.70
0.80
0.90
1.00
1.10
1.20
1.30
3.0 3.5 4.0 4.5 5.0 5.5 6.0 6.5
Tra
iler
Ta
il S
win
g (
m)
Truck Wheelbase (m)
Drawbar length = 0 m
Drawbar length = 1 m
Drawbar length = 2 m
Tru
ck
wh
eelb
ase
= 3
.5 m
1.25 m
Tra
iler
rear
ov
erh
ang =
7 m
HVTT12: Tail Swing Performance of the South African Car-Carrier Fleet 10
comply with the PBS requirements. Increasing the trailer wheelbase not only improved tail
swing, but also resulted in notable improvements in other performance measures.
6. Conclusions
1. The existing South African car-carrier fleet exhibits poor tail swing performance.
Nearly 80% of the fleet does not comply with the 0.30 m Level 1 PBS limit, and one
individual vehicle design was calculated to have a tail swing of 0.71 m.
2. The 0.30 m tail swing criterion is shown to be representative of the Australian Design
Rule 43/04 rear overhang limit of 3.7 m. In comparison, South African legislation
allows rear overhangs of up to 7 m – and hence a tail swing of up to 1.25 m is
theoretically allowed. This is shown to be due to the lack of a finite rear overhang
limit and a misguided definition of rear overhang.
3. It was proposed that a relaxation of the tail swing limit from 0.30 m to 0.45 m be
considered, at least during the initial stages of implementation. This proposal was
turned down by the Smart Truck Review Panel.
7. Acknowledgements
Thanks are due to the CSIR for funding this work and to the University of the Witwatersrand
and the CSIR for making possible the attendance at this conference. Acknowledgements are
due to Mr. Andrew Colepeper, Kässbohrer Transport Technik and the South African Smart
Truck Review Panel. This research was partially supported by the National Research Fund
(NRF) using the Technology and Human Resources for Industry Programme (THRIP) and
Eskom using the Tertiary Education Support Program (TESP).
8. References
Colepeper, A. (2011), (Personal communication), 23 August.
DoIT (2007), “Australian Design Rule 43/04: Vehicle configuration and dimensions,”
3rd ed., Department of Infrastructure and Transport, Australia.
DoLP (2011), “V13 Vehicle dimensional limits (Including Load),” Department of
Lands and Planning, Northern Territory Government, Australia.
DoT (2003), “National Road Traffic Act No. 93 of 1996 (as updated up to the National
Road Traffic Amendment Act, No. 20 of 2003 and Government Gazzette 25541,
2003),” National Department of Transport, Republic of South Africa.
DoTEI (2011), “MR 379 06/11: Code of practice for car carriers,” Department for
Transport, Energy and Infrastructure, Government of South Australia.
NRTC (2001), “Report on workshops on performance-based standards,” National
Road Transport Commission, Melbourne.
NRTC (2002), “Performance characteristics of the Australian heavy vehicle fleet
National Road Transport Commission,” Melbourne.
NRTC (2003), “Performance-based standards, Phase A - Standards and measures,
Regulatory impact statement,” National Road Transport Commission, Melbourne.
RTA (1998), “Vehicle standards information sheet No. 5: Vehicle dimension limits,”
Roads and Traffic Authority of New South Wales.
Winkler, C. B., & Aurell, J. (1998), “Analysis and testing of the steady-state turning of
multiaxle trucks” in Proceedings of the 5th International Symposium on Heavy
Vehicle Weights and Dimensions, Maroochydore, Queensland, Australia, 135-161.