
1 PSFC JA-06-3 Onboard Plasmatron Hydrogen Production ...
173
1 PSFC JA-06-3 Onboard Plasmatron Hydrogen Production for Improved Vehicles L. Bromberg, D.R. Cohn, A. Rabinovich, N. Alexeev, A. Samokhin, K. Hadidi, J. Palaia, N. Margarit-Bel February 6, 2006 MIT Plasma Science and Fusion Center Work supported by the US Department of Energy, Office of FreedomCar and Vehicle Technologies, Contract number: DE-AC03-99EE50565
-
Upload
khangminh22 -
Category
Documents
-
view
2 -
download
0
Transcript of 1 PSFC JA-06-3 Onboard Plasmatron Hydrogen Production ...

1
PSFC JA-06-3
Onboard Plasmatron Hydrogen Productionfor Improved Vehicles
L. Bromberg, D.R. Cohn, A. Rabinovich, N. Alexeev,A. Samokhin, K. Hadidi, J. Palaia, N. Margarit-Bel
February 6, 2006
MIT Plasma Science and Fusion Center
Work supported by the US Department of Energy, Office of FreedomCar and VehicleTechnologies, Contract number: DE-AC03-99EE50565

2
AbstractThis paper describes progress in plasmatron fuel reformers and applications to internalcombustion vehicles. Several plasmatron configurations and their performance with avariety of fuels are described. Fuels investigated range from methane and propane togasoline, diesel and biofuels. Applications described include lean spark ignitionoperation, NOx trap regeneration, diesel particulate filter regeneration and ignition timingcontrol in advanced combustion mode engines.
3
Table of Contents
1) INTRODUCTION AND ORGANIZATION OF REPORT................................................................. 5
2) PLASMATRON DESCRIPTION............................................................................................................ 7
A) THERMAL PLASMATRON (GEN 1)............................................................................................................. 8Summary of thermal plasmatron features ................................................................................................. 11
B) LOW CURRENT PLASMATRON FUEL CONVERTERS (GEN 2) ................................................................... 12Summary of gen 2 plasmatron features..................................................................................................... 14
C) WIDE AREA ELECTRODE, LOW CURRENT PLASMATRON FUEL REFORMER (GEN 3) .............................. 14Summary of the gen 3 plasmatron features............................................................................................... 17
D) PLASMATRON DEVELOPMENT AT ARVINMERITOR............................................................................... 17E) DESCRIPTION OF THE EXPERIMENTAL SETUP ........................................................................................ 18
Transient analysis with a mass spectrometer............................................................................................ 21Description of the mass spectrometer .....................................................................................................................21Calculations vs experiments ....................................................................................................................................24Calibration with CFD code......................................................................................................................................25
3) PLASMATRON APPLICATIONS TO SPARK-IGNITION ENGINE ........................................... 27
A) SI ENGINE TEST SETUP AND PLASMATRON PERFORMANCE................................................................... 28B) RESULTS................................................................................................................................................. 29C) DISCUSSION ........................................................................................................................................... 33
4) PLASMATRON APPLICATION TO AFTERTREATMENT I: NOX TRAP ............................... 35
A) INTRODUCTION ...................................................................................................................................... 35B) PLASMATRON TECHNOLOGY FOR NOX AFTERTREATMENT.................................................................. 35C) ADVANTAGES OF COMPACT PLASMATRON FUEL CONVERTERS.......................................................... 36D) CATALYST REGENERATION ESTIMATION............................................................................................... 37E) BIOFUEL REFORMATION ........................................................................................................................ 41F) DIESEL REFORMATION........................................................................................................................... 42G) HYDROGEN ASSISTED NOX TRAP REGENERATION AT ARVINMERITOR............................................... 43H) TEST CELL SETUP AND RESULTS ............................................................................................................ 44I) VEHICLE INSTALLATION AND RESULTS................................................................................................. 48J) ARVINMERITOR/MIT RESULTS SUMMARY........................................................................................... 50K) CUMMINS/MIT NOX TRAP REGENERATION TESTS ............................................................................... 50
5) PLASMATRON APPLICATION TO AFTERTREATMENT II: DPF TRAP............................... 52
A) PLASMATRON TECHNOLOGY FOR DPF REGENERATION ...................................................................... 54B) CALCULATIONS OF REFORMER REQUIREMENTS................................................................................... 55C) TESTING PROCEDURE ............................................................................................................................ 58D) HOMOGENEOUS OXIDATION OF REFORMATE IN THE EXHAUST........................................................... 60
Model .......................................................................................................................................................... 60Results from the PSR Model ...................................................................................................................... 61
Plug Flow Reactor Simulation.................................................................................................................................62Non-Equilibrium Reformer .....................................................................................................................................64
6) PLASMATRON AIDED HCCI OPERATION.................................................................................... 67
A) TEMPERATURE CONTROL....................................................................................................................... 67B) OCTANE CONTROL ................................................................................................................................. 69
7) MODELING ............................................................................................................................................. 72
A) FLUID DYNAMICS MODELING................................................................................................................. 72Methane plasmatron CFD modeling ......................................................................................................... 72Axial injection of methane ......................................................................................................................... 73
4
Methane premixed with swirl gas.............................................................................................................. 78Propane plasmatron CFD modeling ......................................................................................................... 81Gasoline plasmatron CFD modeling......................................................................................................... 85
50 µm diameter droplets ..........................................................................................................................................8610 µm diameter droplets ..........................................................................................................................................89Finite spray angle .....................................................................................................................................................90Cooling of the gas by evaporating fuel ...................................................................................................................91
B) CHEMICAL MODELING ........................................................................................................................... 92PSR model .................................................................................................................................................. 92
Two Stage PSR results.............................................................................................................................................93Effect of residence time in the conversion..............................................................................................................96Discussion.................................................................................................................................................................98
Partially Stirred Reactor Model .............................................................................................................. 101Partial Stirred Reactor (PaSR)................................................................................................................ 103Discussion................................................................................................................................................. 110
8) STEADY STATE EXPERIMENTS .................................................................................................... 112
A) METHANE REFORMING ........................................................................................................................ 112Reforming with plasma on ....................................................................................................................... 112Reforming without plasma ....................................................................................................................... 116Power effect .............................................................................................................................................. 120
B) PROPANE REFORMING.......................................................................................................................... 121C) BIOFUELS ............................................................................................................................................. 137
Biodiesel ................................................................................................................................................... 137Biodiesel reformation (gen 3)............................................................................................................................... 138
Ethanol...................................................................................................................................................... 140Discussion of biofuel reforming............................................................................................................... 142
D) REFORMATION THROUGH PLASMA CATALYSIS ................................................................................... 143Bio-fuel reformation................................................................................................................................. 143Ethanol...................................................................................................................................................... 147Energy consumption................................................................................................................................. 148
E) CATALYTIC VS HOMOGENEOUS REFORMING OF DIESEL WITH GEN 2 PLASMATRON .......................... 148F) THERMAL PLASMATRON (GEN 1) REFORMATION................................................................................ 150
9) PLASMATRON TRANSIENTS .......................................................................................................... 153
A) METHANE............................................................................................................................................. 153Start-up experiments – pulse ignition...................................................................................................... 153Start-up – continuous ignition. ................................................................................................................ 156
B) GASOLINE TRANSIENT ......................................................................................................................... 158C) PERIODICALLY PULSED DIESEL PLASMATRON PERFORMANCE ........................................................... 159
10) SUMMARY........................................................................................................................................ 161Engine tests............................................................................................................................................................ 161NOx trap regeneration........................................................................................................................................... 161DPF regeneration .................................................................................................................................................. 161CFD modeling ....................................................................................................................................................... 162PSR Modeling of methane.................................................................................................................................... 162PASR modeling of methane ................................................................................................................................. 163Methane reforming................................................................................................................................................ 163Propane reforming................................................................................................................................................. 164Biofuels reforming ................................................................................................................................................ 164Biofuel plasma catalytic reforming ...................................................................................................................... 164
11) ACKNOWLEDGEMENTS ............................................................................................................. 165
12) BIBLIOGRAPHY AND REFERENCES....................................................................................... 166

5
1) Introduction and organization of report
This report documents work done on the program entitled “Onboard PlasmatronHydrogen Production for Improved Vehicles.” This program was funded by USDepartment of Energy, Office of FreedomCar and Vehicle Technologies, from May 27,1999 through Dec 31, 2005, through grant DE-AC03-99EE50565. The PI of the programwas Dr. Daniel Cohn at the Plasma Science and Fusion Center at MIT, with Dr. LeslieBromberg as Co-PI. The technical point of contact at DoE Office of FreedomCar andVehicle Technologies was Dr. Sidney Diamond.
Although there were many tasks, the main goals of the program were:
• Develop plasmatron fuel reformers for aftertreatment applications• Test plasmatron fuel reformers for diesel engine aftertreatment• Test plasmatron fuel reformer for gasoline engine operation.• Reform biofuels using plasmatron fuel converters• Study performance for high flow rates.• Technology transfer to industry
This report covers the work on the tasks described above. The main highlights of thiswork are:
• Technology has been transferred to ArvinMeritor, who is applying largeresources to develop products for aftertreatment and for lean SI operation.
• Effectiveness of the technology has been demonstrated for NOx trapregeneration and for SI combustion enhancement, as well as advantages ofhydrogen rich gas sulfur removal from NOx traps.
• Developed understanding of the operation of the plasmatron through modelingand experiments.
• Demonstrated ability of reform a large variety of fuels, including gasoline,diesel, ethanol, bio-diesel, bio-oils, methane and propane, and otheralternative fuels.
• Demonstrated ability to operate over a wide range, and scaled device tooperate at large flow rates.
These topics and others are described in the following sections. The report is organizedas follows: first the different plasmatron fuel reformers used during the program aredescribed in Section 2, as well as the facility and analytical instrumentation developed forthe program. Then applications of the plasmatron are described. Section 3 describesapplications to SI engines, including tests carried out in collaboration with ORNL.Section 4 and 5 describe applications for aftertreatment, first to NOx trap regenerationfollowed by DPF regeneration in Section 5. Section 6 describes application forplasmatron fuel reformers to HCCI (Homogeneous Charge Compression Ignition) enginecontrol. Section 7 describes the modeling effort, including fluid dynamics and well as

6
chemistry. Section 8 describes the experimental results of reformation using theplasmatron fuel reformer, during steady state operation. Section 9 describes transientoperation of the plasmatron fuel reformers for the fuels investigated, with the exceptionof propane, whose transient operation was integrated with the steady state investigation insection 8. Finally, section 10 provides a brief summary of the work.
Section 11 presents the bibliography as well as the references cited throughout the report.
7
2) Plasmatron description
There is a need for a compact, efficient hydrogen generator for onboard applications[Ste74, Hou74, Mac76, Jam94, Bro97, Coh97, Bro99a, Kir99, Gre00, Bro00b, Bro01a,Bro01b, Kir02, Bro02, Ath03, Bro03]. Such a device could also find applications, inaddition, to the stationary manufacturing of synthetic fuels which starts with thegeneration of synthesis gas [see, for example, Bro00a]. The development of ahomogeneous (without the use of a catalyst) process would be attractive, as the cost ofthe catalyst and the reactor is a major component of plants used to generate hydrogen richgas for natural gas upgrading. It may be particularly useful for smaller scale plants.
Homogeneous plasma-based reactors have been studied in the past [Mul86, Ful95,Gau98]. Their performance has been lacking, and thus industrial generators of synthesisgas use catalytic processes.
The plasma assisted fuel converters [Coh98, Bro99e, Bro99f, Cze01a, Cze01b, Sob01,Dem02, Sob02, Cze03a, Cze03b. Cze03c] use continuously generated plasma as meansof facilitating the reformation of hydrocarbon fuels. By increasing the reaction rates,plasmatron fuel converters can reduce size requirements for effective reforming, increasespeed of response and increase fuel flexibility. A wide range of fuels can be converted tohydrogen rich gas. The boost provided by the plasma can facilitate partial oxidationreactions with negligible soot production and efficient conversion of hydrocarbon fuelinto hydrogen-rich gas. Plasmatron fuel converters can alleviate problems associated withcatalytic reformation, such as response time limitations, sensitivity to fuel composition,poisoning, soot formation and a narrow operational temperature range.
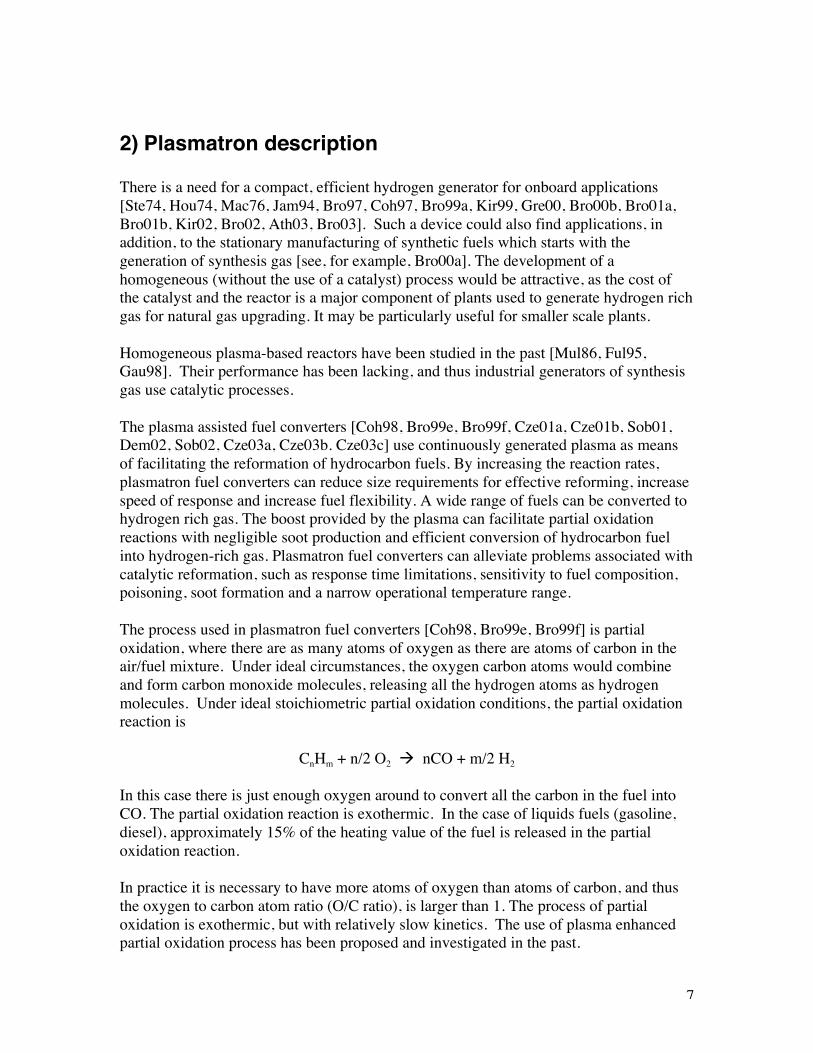
The process used in plasmatron fuel converters [Coh98, Bro99e, Bro99f] is partialoxidation, where there are as many atoms of oxygen as there are atoms of carbon in theair/fuel mixture. Under ideal circumstances, the oxygen carbon atoms would combineand form carbon monoxide molecules, releasing all the hydrogen atoms as hydrogenmolecules. Under ideal stoichiometric partial oxidation conditions, the partial oxidationreaction is
CnHm + n/2 O2 nCO + m/2 H2
In this case there is just enough oxygen around to convert all the carbon in the fuel intoCO. The partial oxidation reaction is exothermic. In the case of liquids fuels (gasoline,diesel), approximately 15% of the heating value of the fuel is released in the partialoxidation reaction.
In practice it is necessary to have more atoms of oxygen than atoms of carbon, and thusthe oxygen to carbon atom ratio (O/C ratio), is larger than 1. The process of partialoxidation is exothermic, but with relatively slow kinetics. The use of plasma enhancedpartial oxidation process has been proposed and investigated in the past.
8
There have been many designs of plasmatrons used during this program. However, allthe plasmatron designs are based on one of three types: 1) high current, thermalplasmatron (gen 1); 2) low current, non-thermal plasmatron with central electrodes (gen2); and 3) low current, non-thermal plasmatron with large area electrodes (gen 3). Thepurpose of this section is to provide a description of the different types of plasmatrons.
a) Thermal plasmatron (gen 1)
All plasmatrons provide ohmic heating of gases to elevated temperatures. At thesetemperatures the gas is partially ionized. Plasmatrons provide highly controllableelectrical heating of this gas. The increased temperatures, ionization levels and mixingprovided by plasmatron heating accelerate reformation of hydrocarbon fuels intohydrogen rich gas. The high temperatures can be used for reforming a wide range ofhydrocarbon fuels into hydrogen-rich gas without the use of a catalyst. It thus is possibleto eliminate problems associated with catalyst use, such as narrow operating temperature,sensitivity to fuel composition, poisoning, and response time limitations.
By increasing the reaction rates, plasma heating could significantly reduce sizerequirements for effective reforming, increase speed of response and increase fuelflexibility. A wide range of operation is possible, from partial oxidation to steamreforming. The boosting of the reaction rate would occur by creation of a small very hightemperature region (5000-10000 K) where radicals are produced and by increasing theaverage temperature in an extended region.
The additional heating provided by the plasma can ensure a sufficiently high number ofchemically reactive species, ionization states, and elevated temperatures for the partialoxidation reaction to occur with negligible soot production and with a high conversion ofhydrocarbon fuel into hydrogen-rich gas. The effective conversion of hydrocarbon fuel isaided by both the high peak temperature in the plasma and the high turbulence created bythe plasma.
A plasma boosted reformer can be made very small because of the high power density.The rapidly variable plasmatron parameters (energy input, flow rate, product gascomposition, etc) make this technology very attractive for application to the dynamicdemands for hydrogen-rich gas production in vehicles. It should be possible topractically instantaneously produce hydrogen-rich gas for use during cold startup.Throughout the driving cycle, rapid changes in hydrogen-rich gas flow can beaccommodated by variation of plasmatron parameters. [Coh97]
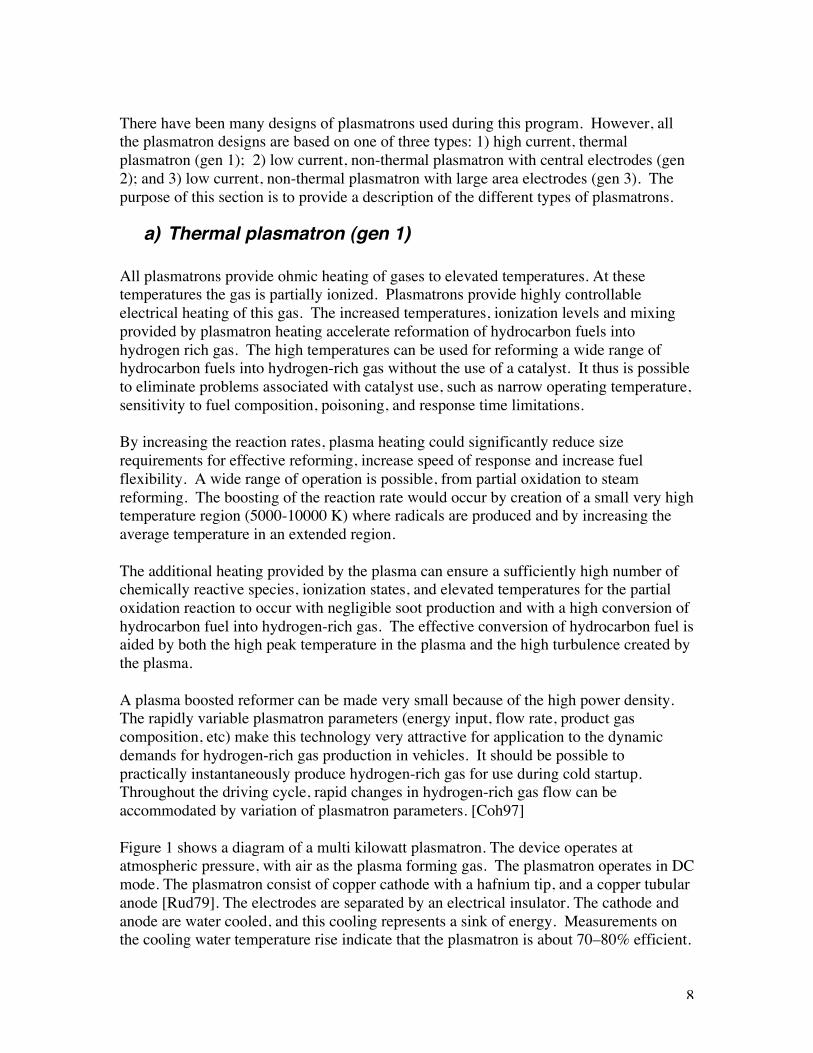
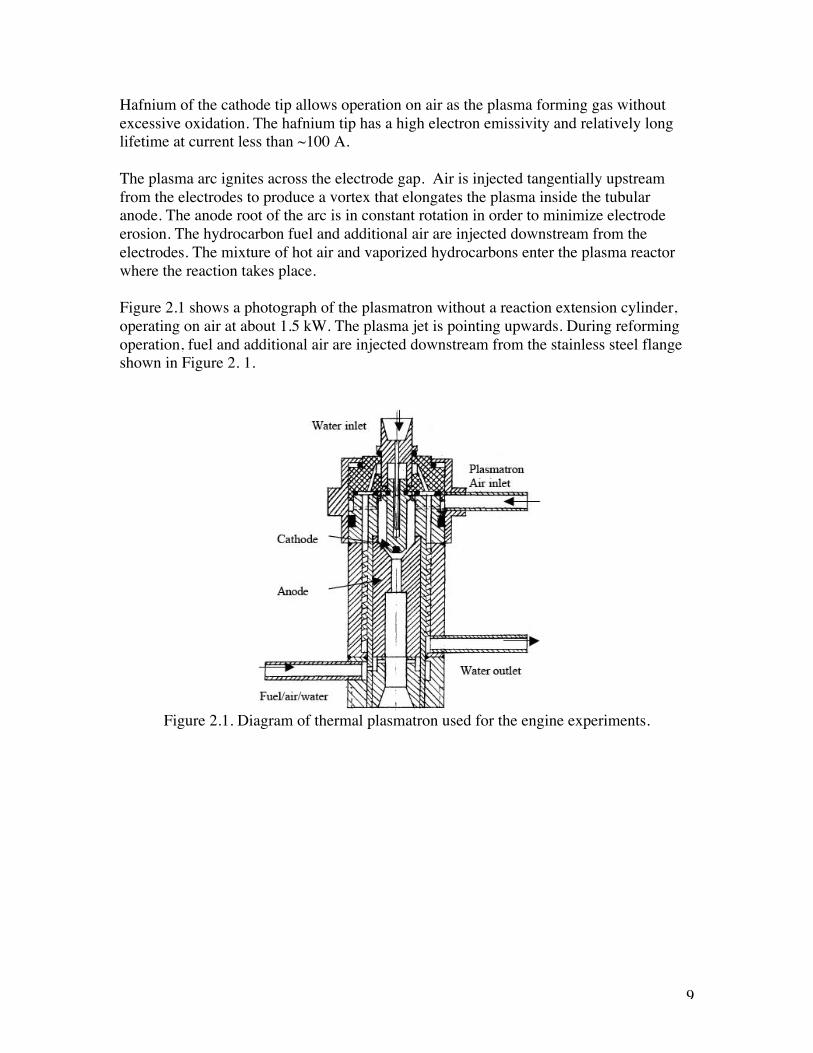
Figure 1 shows a diagram of a multi kilowatt plasmatron. The device operates atatmospheric pressure, with air as the plasma forming gas. The plasmatron operates in DCmode. The plasmatron consist of copper cathode with a hafnium tip, and a copper tubularanode [Rud79]. The electrodes are separated by an electrical insulator. The cathode andanode are water cooled, and this cooling represents a sink of energy. Measurements onthe cooling water temperature rise indicate that the plasmatron is about 70–80% efficient.
9
Hafnium of the cathode tip allows operation on air as the plasma forming gas withoutexcessive oxidation. The hafnium tip has a high electron emissivity and relatively longlifetime at current less than ~100 A.
The plasma arc ignites across the electrode gap. Air is injected tangentially upstreamfrom the electrodes to produce a vortex that elongates the plasma inside the tubularanode. The anode root of the arc is in constant rotation in order to minimize electrodeerosion. The hydrocarbon fuel and additional air are injected downstream from theelectrodes. The mixture of hot air and vaporized hydrocarbons enter the plasma reactorwhere the reaction takes place.
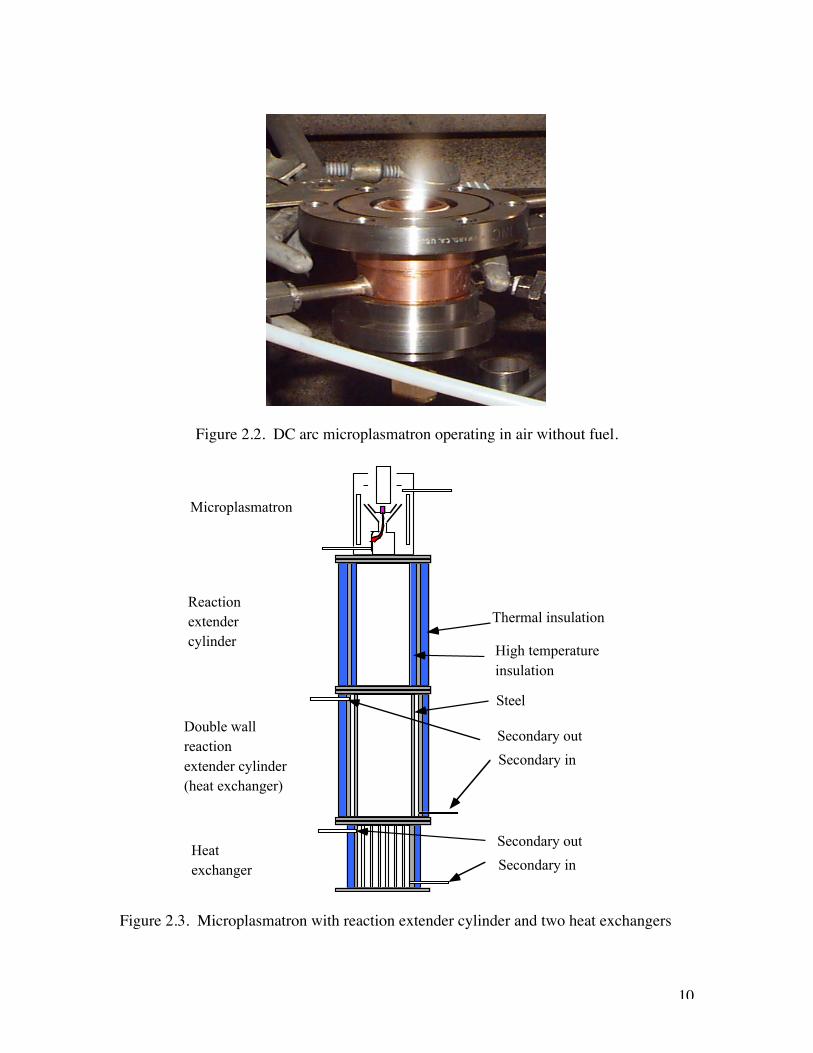
Figure 2.1 shows a photograph of the plasmatron without a reaction extension cylinder,operating on air at about 1.5 kW. The plasma jet is pointing upwards. During reformingoperation, fuel and additional air are injected downstream from the stainless steel flangeshown in Figure 2. 1.
Figure 2.1. Diagram of thermal plasmatron used for the engine experiments.
10
Figure 2.2. DC arc microplasmatron operating in air without fuel.
Microplasmatron
Double wallreactionextender cylinder(heat exchanger)
Heatexchanger
Reactionextendercylinder
Secondary in
Secondary out
Thermal insulation
High temperatureinsulation
Steel
Secondary in
Secondary out
Figure 2.3. Microplasmatron with reaction extender cylinder and two heat exchangers
11
Figure 2.2 shows a photograph of the plasmatron without a reaction extension cylinder,operating on air at about 1.5 kW. The plasma jet is pointing upwards. During reformingoperation, fuel and additional air are injected downstream from the stainless steel flangeshown in the Figure 2.2.
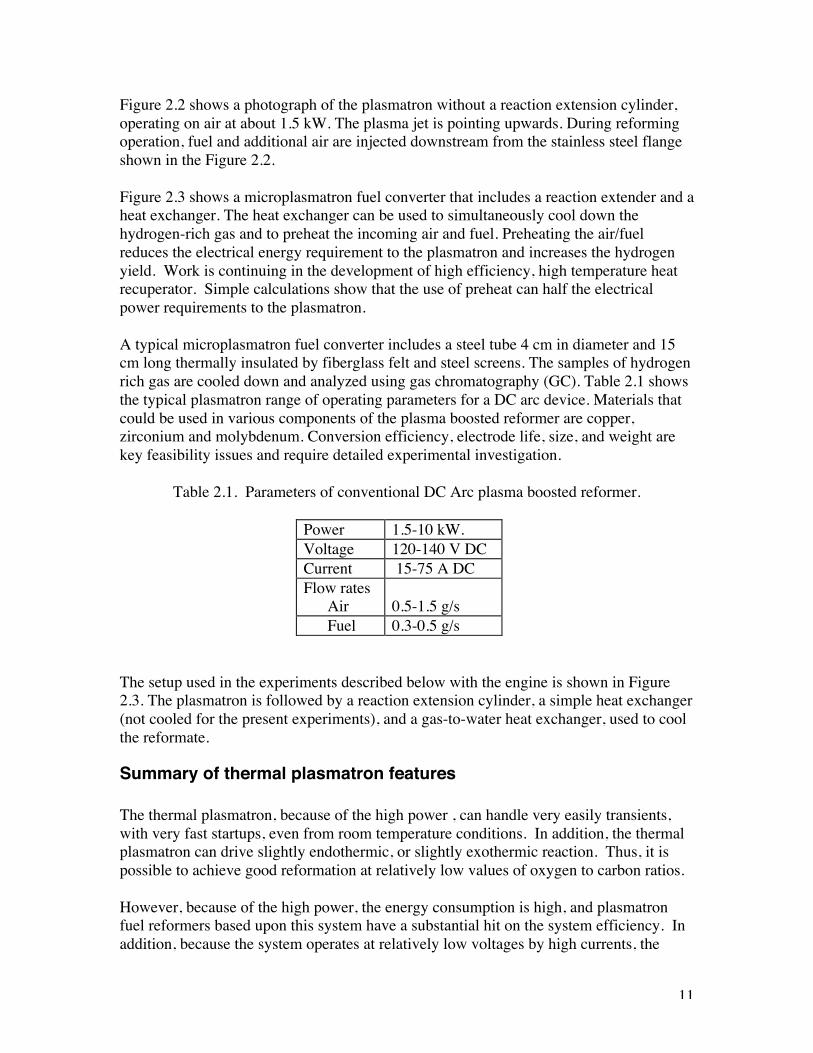
Figure 2.3 shows a microplasmatron fuel converter that includes a reaction extender and aheat exchanger. The heat exchanger can be used to simultaneously cool down thehydrogen-rich gas and to preheat the incoming air and fuel. Preheating the air/fuelreduces the electrical energy requirement to the plasmatron and increases the hydrogenyield. Work is continuing in the development of high efficiency, high temperature heatrecuperator. Simple calculations show that the use of preheat can half the electricalpower requirements to the plasmatron.
A typical microplasmatron fuel converter includes a steel tube 4 cm in diameter and 15cm long thermally insulated by fiberglass felt and steel screens. The samples of hydrogenrich gas are cooled down and analyzed using gas chromatography (GC). Table 2.1 showsthe typical plasmatron range of operating parameters for a DC arc device. Materials thatcould be used in various components of the plasma boosted reformer are copper,zirconium and molybdenum. Conversion efficiency, electrode life, size, and weight arekey feasibility issues and require detailed experimental investigation.
Table 2.1. Parameters of conventional DC Arc plasma boosted reformer.
Power 1.5-10 kW.Voltage 120-140 V DCCurrent 15-75 A DCFlow rates Air 0.5-1.5 g/s Fuel 0.3-0.5 g/s
The setup used in the experiments described below with the engine is shown in Figure2.3. The plasmatron is followed by a reaction extension cylinder, a simple heat exchanger(not cooled for the present experiments), and a gas-to-water heat exchanger, used to coolthe reformate.
Summary of thermal plasmatron features
The thermal plasmatron, because of the high power , can handle very easily transients,with very fast startups, even from room temperature conditions. In addition, the thermalplasmatron can drive slightly endothermic, or slightly exothermic reaction. Thus, it ispossible to achieve good reformation at relatively low values of oxygen to carbon ratios.
However, because of the high power, the energy consumption is high, and plasmatronfuel reformers based upon this system have a substantial hit on the system efficiency. Inaddition, because the system operates at relatively low voltages by high currents, the
12
electrodes, and in particularly the cathode, have substantial erosion. Typically, a cathodewould last for a day or two (20-50 hours).
Finally, the system requires cooling water for aggressively cooling the electrodes. Theuse of cooling water put a constraint on the potential use of thermal plasmatron fuelconverters to mobile sources.
b) Low current plasmatron fuel converters (gen 2)
Plasmatron fuel converters provide low current electrical discharges in flowing gases ofhydrocarbon fuels and air (and/or other oxidants). The resulting very local generation ofreactive species in the flowing gases along with increased mixing accelerates reformationof hydrocarbon fuels into hydrogen rich gas. Although thermal plasmatron fuelconverters may also be utilized for increasing enthalpy, further accelerating the reactionrates, the second generation, low current plasmatron does not increase the enthalpy of thegas substantially. The conditions of the low current, second generation plasmatron,however, still facilitate the reforming of a wide range of hydrocarbon fuels intohydrogen-rich gas without the requirement of using a reformer catalyst. It is possible toeliminate problems associated with reformer catalyst use, such as narrow operatingtemperature, soot formation, sensitivity to fuel composition, poisoning, and response timelimitations.
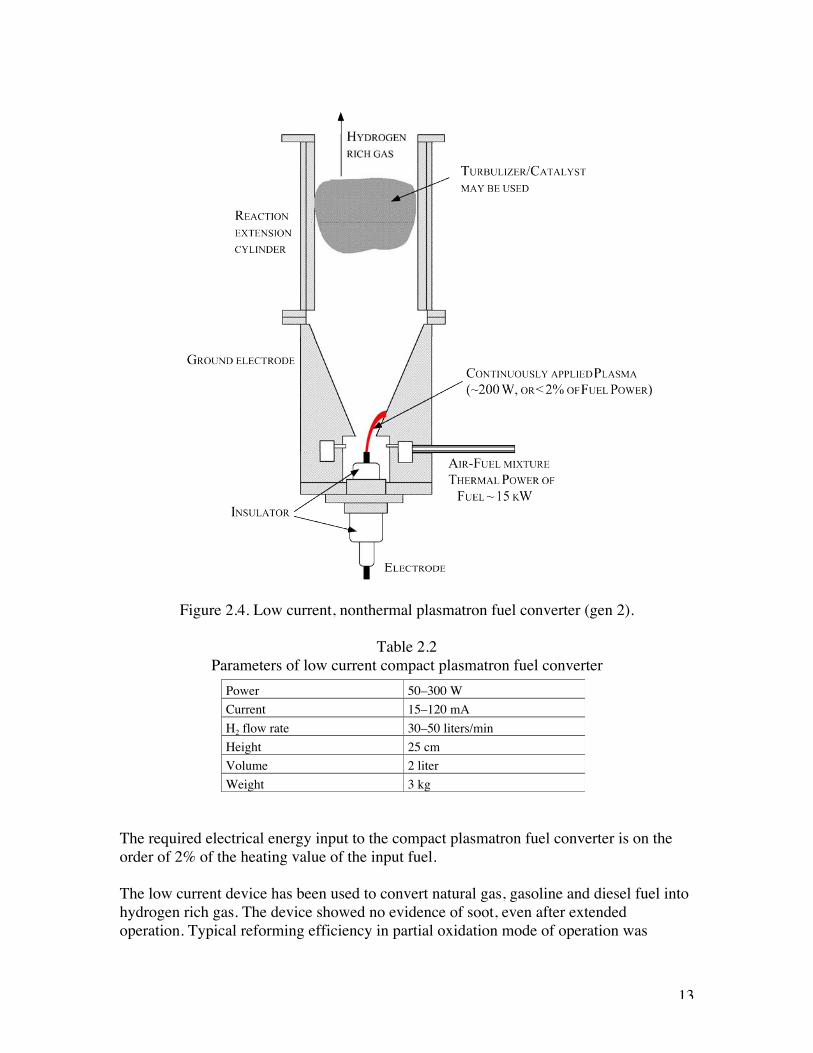
Figure 2.4 shows a diagram of a low current, second generation plasmatron reformer. Airand fuel are continuously injected in a plasma region provided by a discharge establishedacross an electrode gap. The device operates at atmospheric pressure, with air as theplasma forming gas. Use of a discharge mode with non-equilibrium features allows foroperation at relatively small electrical powers, at much reduced current relative to earliercompact arc plasmatron fuel reformers developed at MIT. When operating DC, thecathode can be a spark plug. The ground electrode of the spark plug would have beenremoved. The anode can be a steel or copper cylinder. Neither electrode is water cooled.
Table 2.2 shows the typical plasmatron parameters for a low current, low power compactplasmatron fuel converter.
The plasma source is followed by a reaction extension cylinder. A simple heat exchangercan be used downstream from the reaction extension cylinder, both to cool the reformateand to preheat the incoming air and/or fuel.
13
Figure 2.4. Low current, nonthermal plasmatron fuel converter (gen 2).
Table 2.2Parameters of low current compact plasmatron fuel converter
The required electrical energy input to the compact plasmatron fuel converter is on theorder of 2% of the heating value of the input fuel.
The low current device has been used to convert natural gas, gasoline and diesel fuel intohydrogen rich gas. The device showed no evidence of soot, even after extendedoperation. Typical reforming efficiency in partial oxidation mode of operation was
Power 50–300 WCurrent 15–120 mAH2 flow rate 30–50 liters/minHeight 25 cmVolume 2 literWeight 3 kg
14
around 60-70% (ratio of heating value of the hydrogen rich gas to heating value of thefuel). Diesel fuel streams with power levels of 5 to 20 kW have been processed intohydrogen rich gas. It is projected that reforming efficiencies of 80% will be attainablewith improved devices. Previously, diesel fuel has been successfully reformed using acompact plasmatron reformer using arc plasmas [Bromberg3]. However, arc plasmatronreforming utilizes substantially higher electrical powers and currents.
Projected parameters for higher throughput versions of low current compact plasmatronfuel converter systems are an H2 flow rate of 500 liters per minute, and electrical powerrequirements of 50-1000 W.
Summary of gen 2 plasmatron features
The second generation plasmatron operated adequately although at much lower powerthan the thermal plasmatron (gen 1). It required operation at slightly value of oxygen tocarbon ration, especially during startup. It was able to operate without soot production.
However, the fact that the electrode is on the middle of the system, the place where itwould be most convenient to injected liquid fuels, makes the system hard to design, andto avoid conditions where the fuel spray hits the walls. It has been determined that dropletcoalescence is one of the largest reasons for soot formation.
In addition, as the axial electrode is much smaller than the other one, it suffers fromerosion, although not in the scale of the thermal plasmatron.
c) Wide area electrode, low current plasmatron fuel reformer(gen 3)
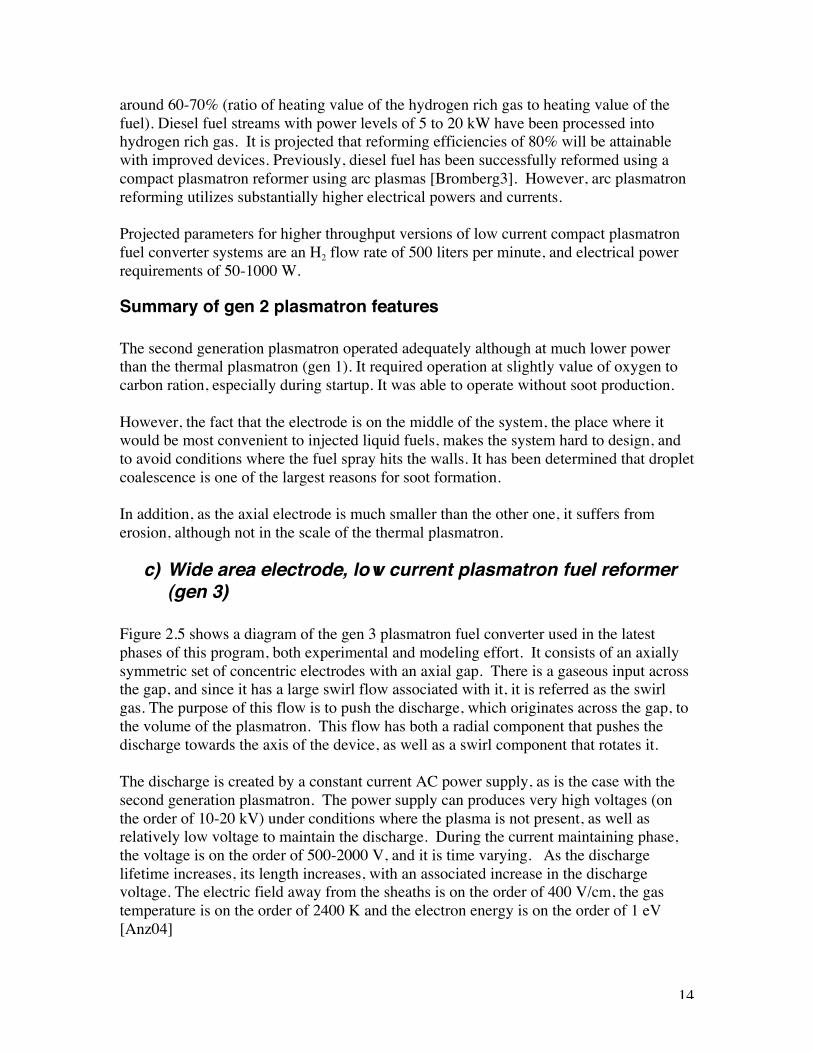
Figure 2.5 shows a diagram of the gen 3 plasmatron fuel converter used in the latestphases of this program, both experimental and modeling effort. It consists of an axiallysymmetric set of concentric electrodes with an axial gap. There is a gaseous input acrossthe gap, and since it has a large swirl flow associated with it, it is referred as the swirlgas. The purpose of this flow is to push the discharge, which originates across the gap, tothe volume of the plasmatron. This flow has both a radial component that pushes thedischarge towards the axis of the device, as well as a swirl component that rotates it.
The discharge is created by a constant current AC power supply, as is the case with thesecond generation plasmatron. The power supply can produces very high voltages (onthe order of 10-20 kV) under conditions where the plasma is not present, as well asrelatively low voltage to maintain the discharge. During the current maintaining phase,the voltage is on the order of 500-2000 V, and it is time varying. As the dischargelifetime increases, its length increases, with an associated increase in the dischargevoltage. The electric field away from the sheaths is on the order of 400 V/cm, the gastemperature is on the order of 2400 K and the electron energy is on the order of 1 eV[Anz04]
15
The setup used in the experiments, as well as the experimental results with methane, havebeen reported elsewhere, and will only briefly be described here.
The plasmatron shown in Figure 2.5 has three different gaseous flows, introducedthrough the wall gas, the swirl (plasma) gas, and the axially injected gas. The wall gas isinjected in the axial direction at an axial location similar to the axial nozzle, with noswirl. The swirl (plasma) gas is injected downstream from the wall air and the axial gas,with a large amount of vorticity. The swirl gas moves the discharge into the fuel region,and provides the rotation motion that moves the arc roots on the electrodes (to minimizeelectrode erosion).
There are several other inputs to the plasmatron. There is an axially directed centeredinput that is commonly used for liquid fuels. The liquid nozzle is surrounded by a fast gasflow, making up an air-assisted injector. The nozzle and axial injection has not been usedin the present experiments, as previous experiments with propane indicated that bestperformance is obtained when the hydrocarbon fuel is mixed with the swirl gas.
There is a third input of gases, an axial gas that is injected at the same axial location ofthe air assist injector, but at large radii. The wall air is injected mainly in the axialdirection. In the cases of the experiments described in this paper, and the modeling toanalyze them, the axial gas is composed exclusively of air.
Typical parameters of the gen3 plasmatron are shown in Table 2.3. It is the gen-3plasmatron that has been used for testing with NOx traps, A device similar to the gen-3 isbeing developed by ArvinMeritor for combustion enhancement in spark ignited engines.
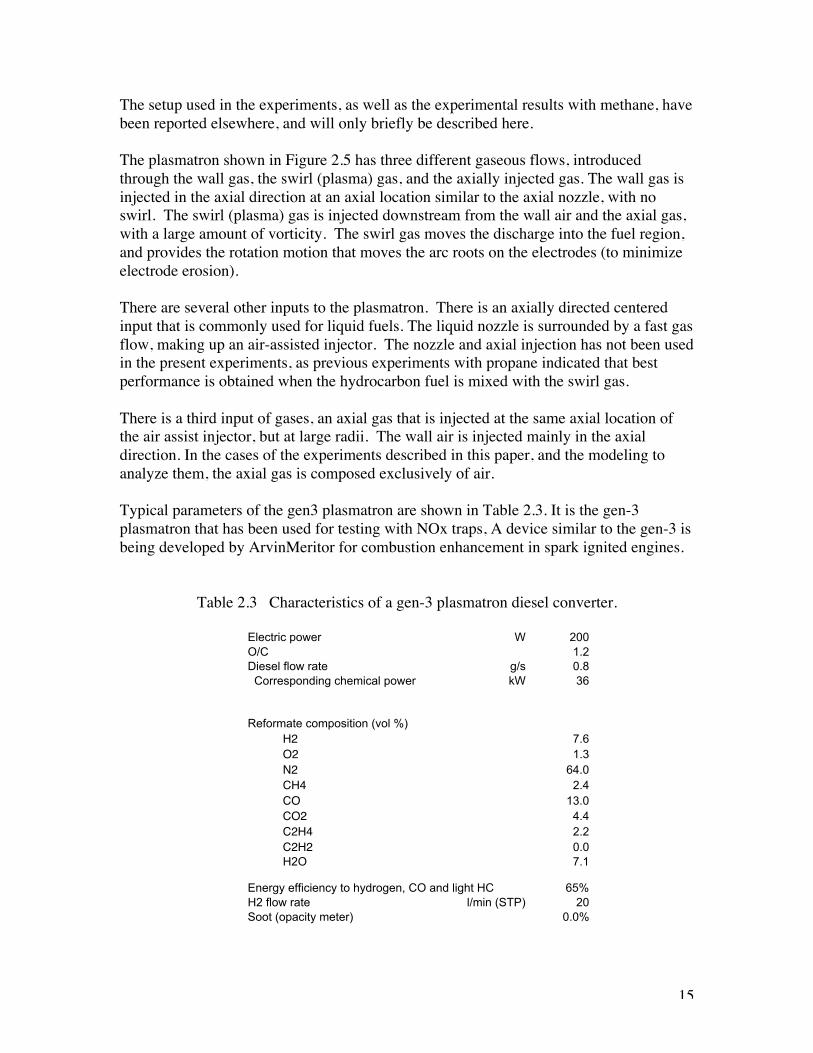
Table 2.3 Characteristics of a gen-3 plasmatron diesel converter.
Electric power W 200O/C 1.2Diesel flow rate g/s 0.8 Corresponding chemical power kW 36
Reformate composition (vol %)H2 7.6O2 1.3N2 64.0CH4 2.4CO 13.0CO2 4.4C2H4 2.2C2H2 0.0H2O 7.1
Energy efficiency to hydrogen, CO and light HC 65%H2 flow rate l/min (STP) 20Soot (opacity meter) 0.0%
16
Figure 2.5 Diagram of a gen-3 plasmatron optimized for diesel reforming.
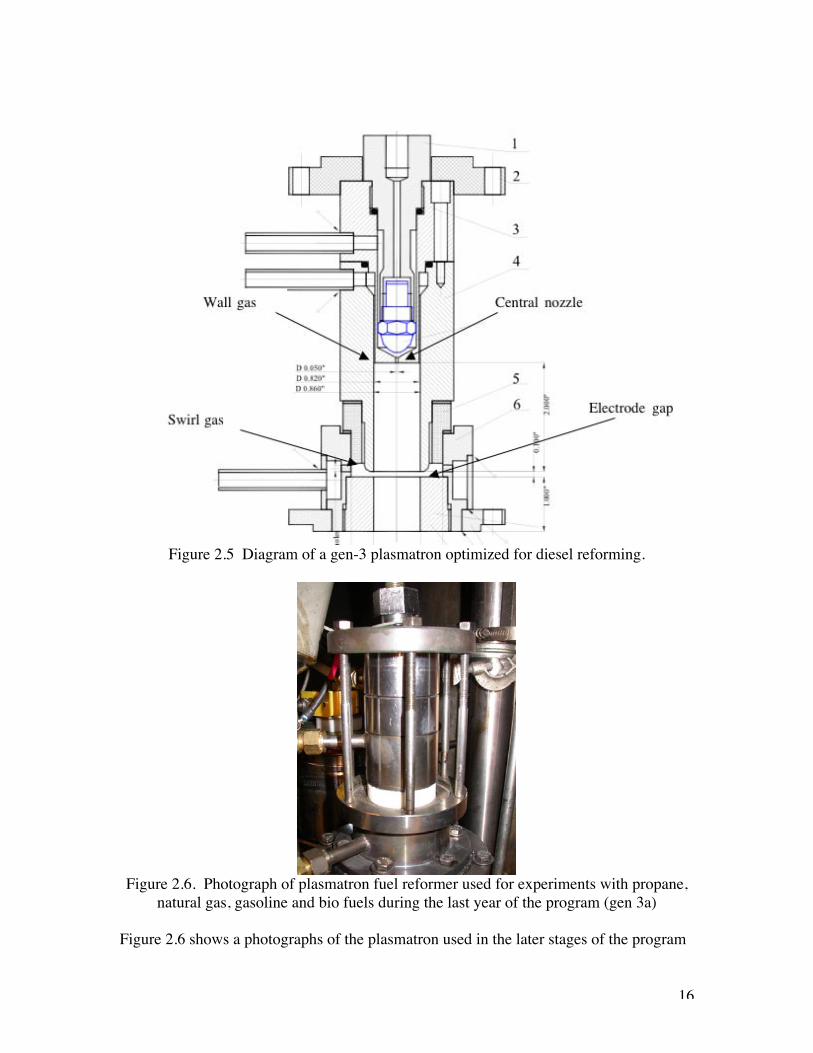
Figure 2.6. Photograph of plasmatron fuel reformer used for experiments with propane,natural gas, gasoline and bio fuels during the last year of the program (gen 3a)
Figure 2.6 shows a photographs of the plasmatron used in the later stages of the program
17
Summary of the gen 3 plasmatron features
The gen 3 plasmatron is reliable, easy to use, and can operate over very wide range, withno noticeable electrode wear. The flexible introduction of the air and the fuel allows foroperation over wide throughputs as well as O/C ratios, with good conversion and no sootproduction.
However, the system is quite complex, requiring 3 air flows. There has been work toinvestigate the use of flows produced by a simple set of controllers. For the bestperformance, the 3 air inputs needed to be controlled independently.
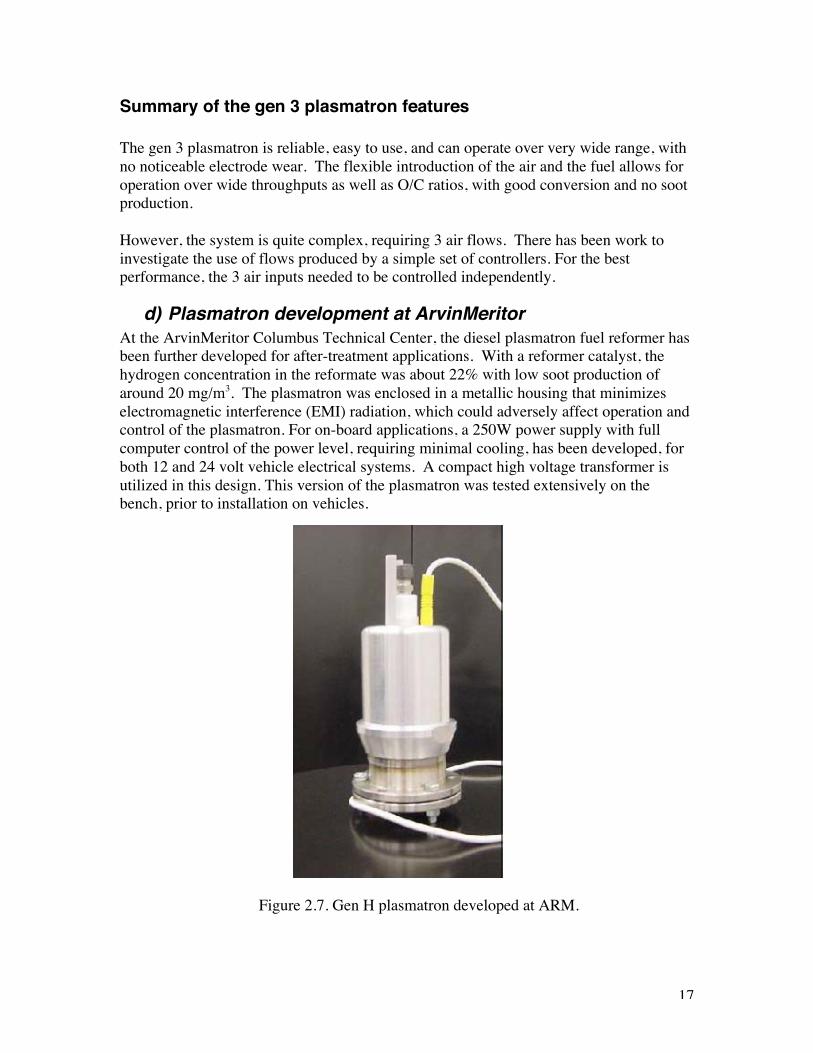
d) Plasmatron development at ArvinMeritorAt the ArvinMeritor Columbus Technical Center, the diesel plasmatron fuel reformer hasbeen further developed for after-treatment applications. With a reformer catalyst, thehydrogen concentration in the reformate was about 22% with low soot production ofaround 20 mg/m3. The plasmatron was enclosed in a metallic housing that minimizeselectromagnetic interference (EMI) radiation, which could adversely affect operation andcontrol of the plasmatron. For on-board applications, a 250W power supply with fullcomputer control of the power level, requiring minimal cooling, has been developed, forboth 12 and 24 volt vehicle electrical systems. A compact high voltage transformer isutilized in this design. This version of the plasmatron was tested extensively on thebench, prior to installation on vehicles.
Figure 2.7. Gen H plasmatron developed at ARM.
18
Figure 2.7 shows the Gen-H Fuel Reformer which is ArvinMeritor’s implementation ofthe MIT plasmatron .
e) Description of the experimental setup
The plasmatron reformer facility used in the latest sets of experiments is a modificationof a plasmatron fuel reformer that had been optimized for diesel fuel operation. The unitwas operated mainly at 50-500 W of electrical power. The power supplies were operatedas constant current sources operating between 200 kHz and 260 kHz.
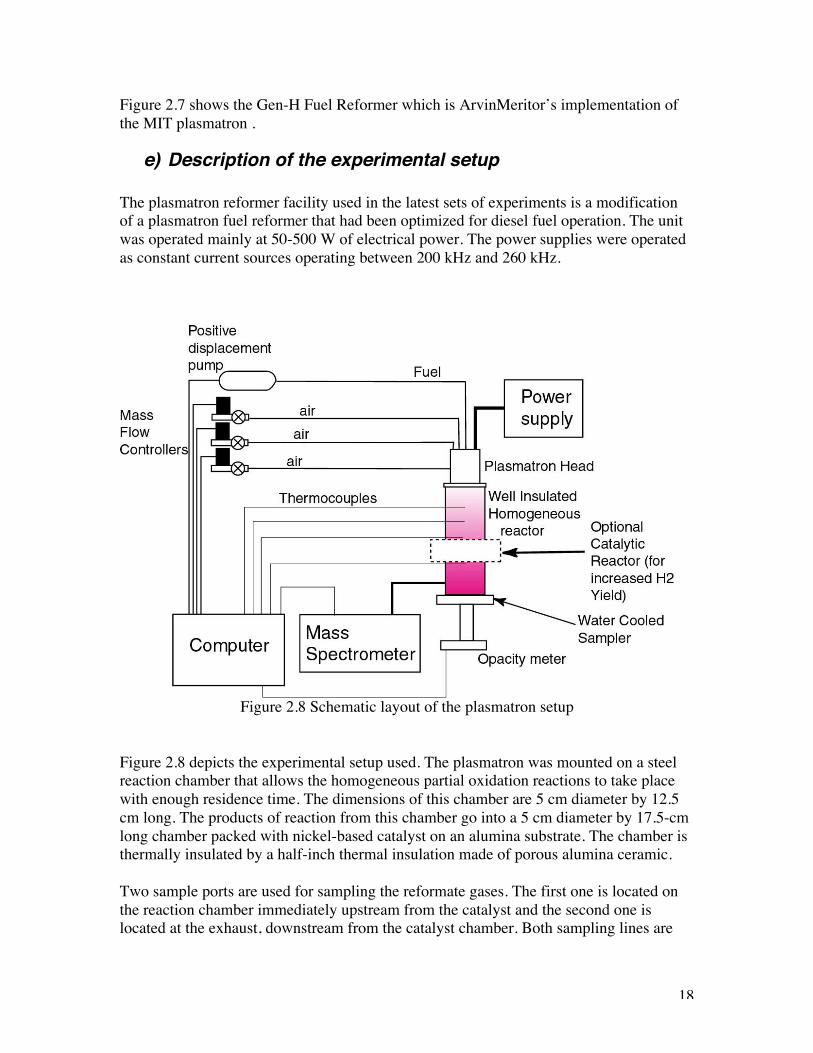
Figure 2.8 Schematic layout of the plasmatron setup
Figure 2.8 depicts the experimental setup used. The plasmatron was mounted on a steelreaction chamber that allows the homogeneous partial oxidation reactions to take placewith enough residence time. The dimensions of this chamber are 5 cm diameter by 12.5cm long. The products of reaction from this chamber go into a 5 cm diameter by 17.5-cmlong chamber packed with nickel-based catalyst on an alumina substrate. The chamber isthermally insulated by a half-inch thermal insulation made of porous alumina ceramic.
Two sample ports are used for sampling the reformate gases. The first one is located onthe reaction chamber immediately upstream from the catalyst and the second one islocated at the exhaust, downstream from the catalyst chamber. Both sampling lines are
19
water cooled. The temperature inside the reactor is measured by a thermocouple locatedinside reaction extension cylinder.
Calibrated mass flow controllers are used to control the multiple air inputs into theplasmatron. The atomization air flow rate was monitored by a TSI air flow sensor. TheTSI sensor was also used to confirm that the two other mass-flow controllers (for the wallair and for the plasma air) were within certification.
The gaseous fuel (methane, propane) flow is measured using a calibrated rotameter, whilethe air flows are measured and controlled with mass flow controllers. It was difficult touse a mass flow controller with gaseous fuels because the low flow rates of the fuel madevery difficult to maintain proper calibration. Two rotameters in parallel were used toprovide the required methane flow, with both operating near the middle of their range.Under these conditions, the methane flow was accurate within 10-20%. The rotametersare compensated for pressure variations that occurs as the swirl air is varied. There is novariation in pressure at the rotameters when the wall air is varied.
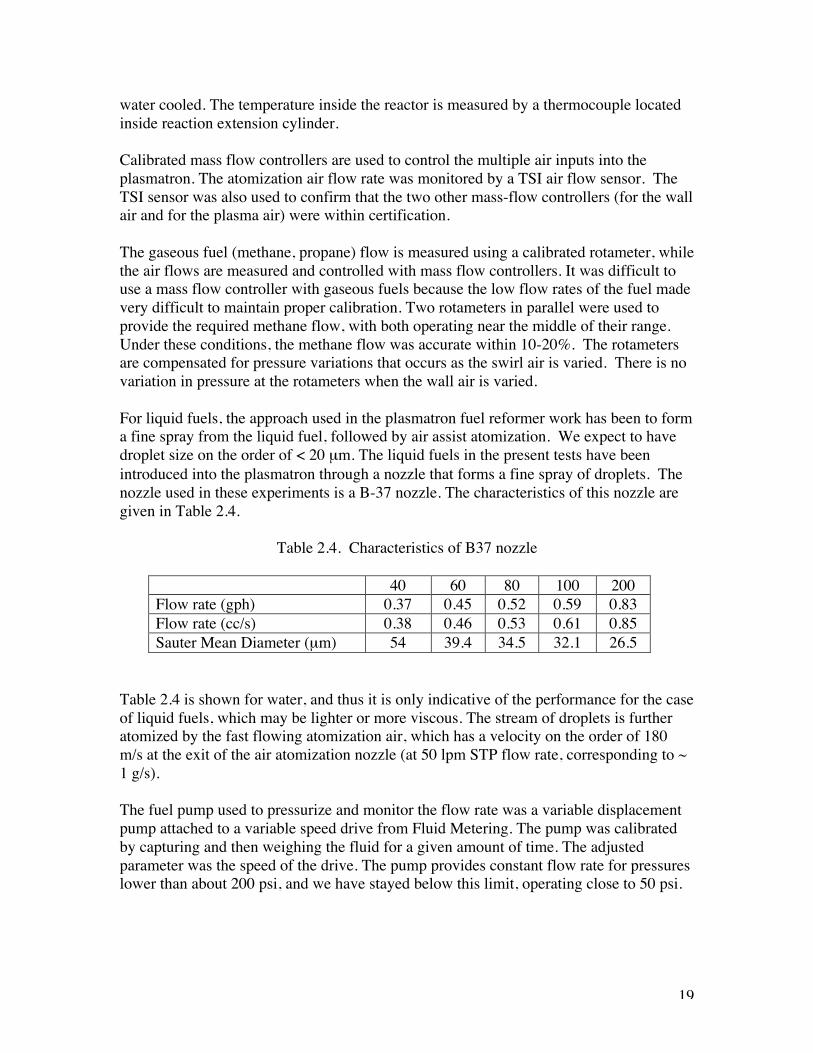
For liquid fuels, the approach used in the plasmatron fuel reformer work has been to forma fine spray from the liquid fuel, followed by air assist atomization. We expect to havedroplet size on the order of < 20 µm. The liquid fuels in the present tests have beenintroduced into the plasmatron through a nozzle that forms a fine spray of droplets. Thenozzle used in these experiments is a B-37 nozzle. The characteristics of this nozzle aregiven in Table 2.4.
Table 2.4. Characteristics of B37 nozzle
40 60 80 100 200Flow rate (gph) 0.37 0.45 0.52 0.59 0.83Flow rate (cc/s) 0.38 0.46 0.53 0.61 0.85Sauter Mean Diameter (µm) 54 39.4 34.5 32.1 26.5
Table 2.4 is shown for water, and thus it is only indicative of the performance for the caseof liquid fuels, which may be lighter or more viscous. The stream of droplets is furtheratomized by the fast flowing atomization air, which has a velocity on the order of 180m/s at the exit of the air atomization nozzle (at 50 lpm STP flow rate, corresponding to ~1 g/s).
The fuel pump used to pressurize and monitor the flow rate was a variable displacementpump attached to a variable speed drive from Fluid Metering. The pump was calibratedby capturing and then weighing the fluid for a given amount of time. The adjustedparameter was the speed of the drive. The pump provides constant flow rate for pressureslower than about 200 psi, and we have stayed below this limit, operating close to 50 psi.
20
The system is controlled by a LabView software developed in our laboratory. Thesoftware continuously acquires and stores several parameters such as temperature, air andfuel flow rates during operation.
The composition of the gas is determined using both a gas chromatograph and a massspectrometer.
The mass spectrometer is a Pfeiffer OmniScan 200. The device has a 200 micron IDcapillary sampling line that is directly introduced into the reactor, at a location close tothe exit of the reactor. The volume of the reactor upstream from the sampling point,including the plasmatron head volume, is about 1000 cm3. The reactor volume is used inthe calculations in the accompanying papers. The capillary is heated in order to preventcondensation in the column. The length of the capillary is about 1.5 m, and results in atime delay of about 3 s. This is a pure time delay. The device can take samples at a rateof 3 Hz, and the length of the capillary does result in small but measurable diffusion. Realtime concentration of oxygen, methane, water and hydrogen can be obtained.Unfortunately, because of interference between N2 and CO (with both masses of 28), it isnot possible to reliably monitor either. The accompanying paper describing the startup ofthe plasmatron methane converter further described the MS system. The massspectrometer is calibrated by placing gas standards through the plasmatron, and thenmeasuring the signal. The signal is compensated by the pressure in the massspectrometer.
The GC is an Agilent MTI-2000 model with two columns, one for permanent gases andthe second one for hydrocarbons. The GC is calibrated using gas standards from BOCgases in the range approximately similar to those that are being measured. The GCsampling point is near the mass spectrometer location.
Special attention was given to measure the composition of the gas as accurate as possible.The results indicated that the GC has a reproducibility of about 8%. The mass flowcontrollers are calibrated at the manufacturer (Omega), and are supposed to have anaccuracy of 1% through the middle of the range. The rotameters used in the experimentshave an accuracy of about 5%. It was determined that the key parameter for thereforming, the O/C ratio, could vary by about 15%, and it differed from themeasurements of the composition of mixed reagents, and that calculated from the inputs.However, during a given set of runs the deviation remained relatively constant, as someof the parameters were being slightly varied while the other remained constant. Thus,although comparison between experiments carried out in different days have theuncertainty in the O/C ratio of ~15%, results from a given set of results during the sameset of experiments have decreased relative uncertainty.
There are one or multiple temperature sensors (thermocouple) located near the axis, atseveral places along the reaction extension cylinder.
21
Transient analysis with a mass spectrometer
In order to be able to use the mass spectrometer as quick, real time concentrationanalysis, it was necessary to develop both software and hardware. This section describesthe mass spectrometer setup, which has been used for determining the transient behaviorof plasmatron fuel reformers.
Description of the mass spectrometer
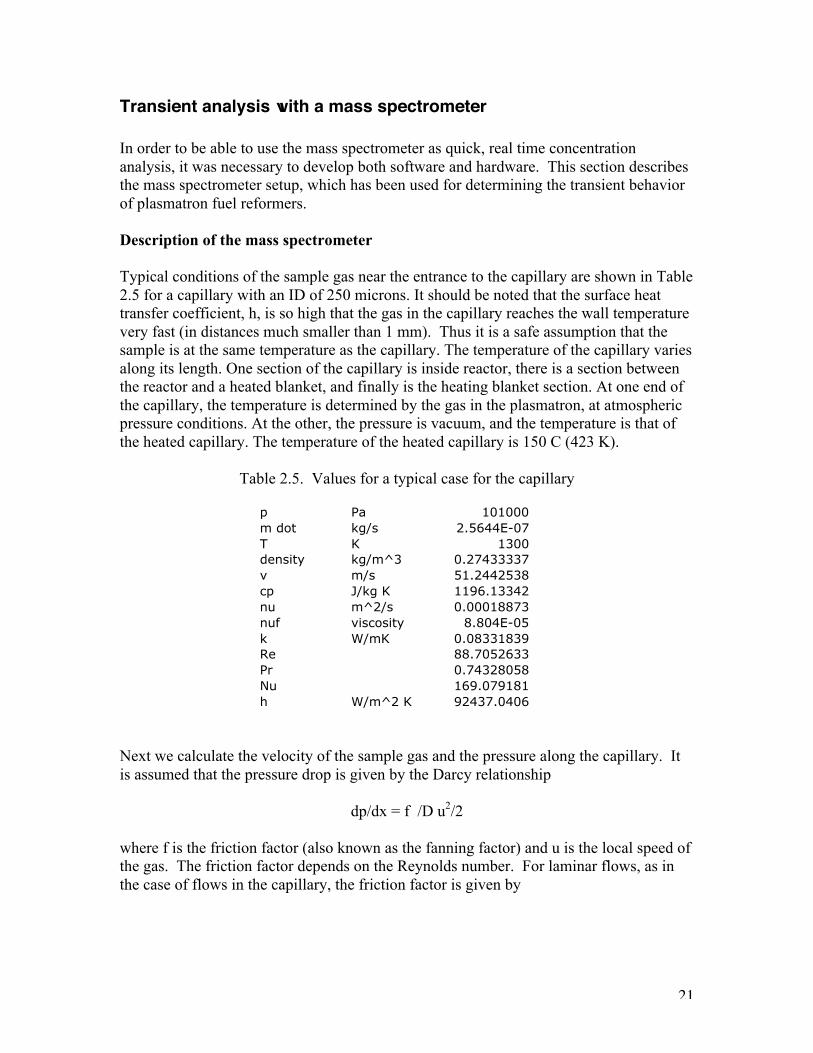
Typical conditions of the sample gas near the entrance to the capillary are shown in Table2.5 for a capillary with an ID of 250 microns. It should be noted that the surface heattransfer coefficient, h, is so high that the gas in the capillary reaches the wall temperaturevery fast (in distances much smaller than 1 mm). Thus it is a safe assumption that thesample is at the same temperature as the capillary. The temperature of the capillary variesalong its length. One section of the capillary is inside reactor, there is a section betweenthe reactor and a heated blanket, and finally is the heating blanket section. At one end ofthe capillary, the temperature is determined by the gas in the plasmatron, at atmosphericpressure conditions. At the other, the pressure is vacuum, and the temperature is that ofthe heated capillary. The temperature of the heated capillary is 150 C (423 K).
Table 2.5. Values for a typical case for the capillary
Next we calculate the velocity of the sample gas and the pressure along the capillary. Itis assumed that the pressure drop is given by the Darcy relationship
dp/dx = f /D u2/2
where f is the friction factor (also known as the fanning factor) and u is the local speed ofthe gas. The friction factor depends on the Reynolds number. For laminar flows, as inthe case of flows in the capillary, the friction factor is given by
p Pa 101000m dot kg/s 2.5644E-07T K 1300density kg/m^3 0.27433337v m/s 51.2442538cp J/kg K 1196.13342nu m^2/s 0.00018873nuf viscosity 8.804E-05k W/mK 0.08331839Re 88.7052633Pr 0.74328058Nu 169.079181h W/m^2 K 92437.0406
22
f = 64/Re
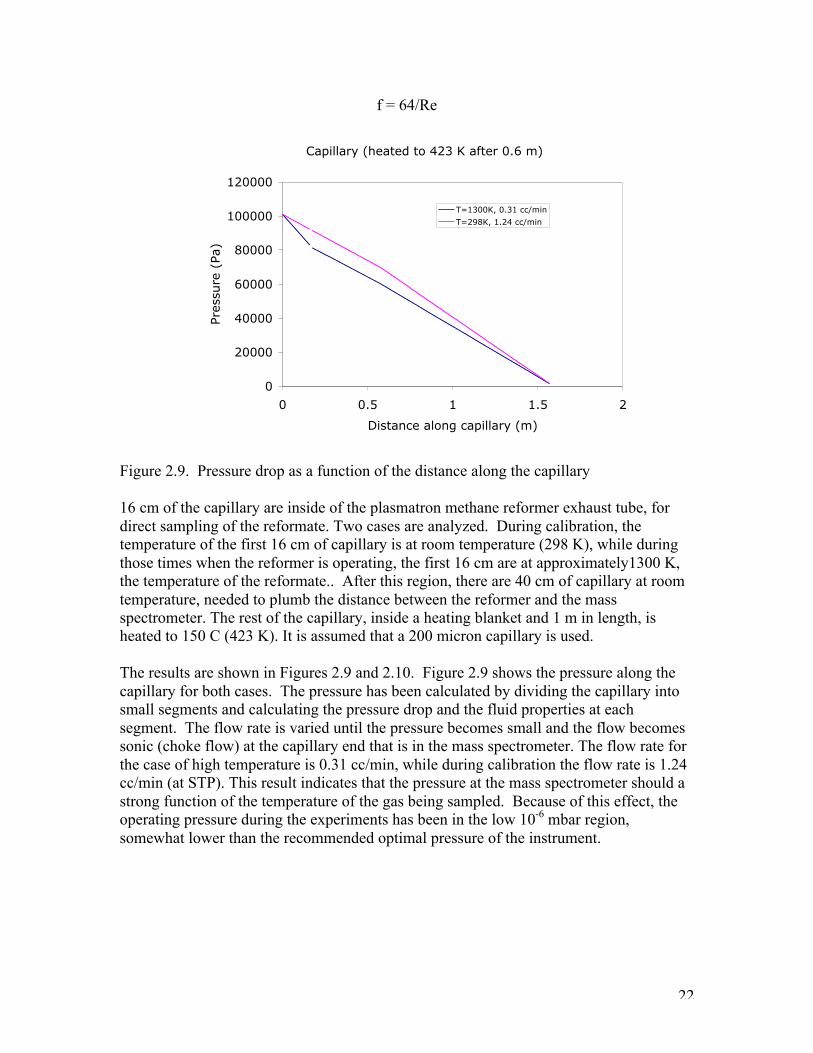
Figure 2.9. Pressure drop as a function of the distance along the capillary
16 cm of the capillary are inside of the plasmatron methane reformer exhaust tube, fordirect sampling of the reformate. Two cases are analyzed. During calibration, thetemperature of the first 16 cm of capillary is at room temperature (298 K), while duringthose times when the reformer is operating, the first 16 cm are at approximately1300 K,the temperature of the reformate.. After this region, there are 40 cm of capillary at roomtemperature, needed to plumb the distance between the reformer and the massspectrometer. The rest of the capillary, inside a heating blanket and 1 m in length, isheated to 150 C (423 K). It is assumed that a 200 micron capillary is used.
The results are shown in Figures 2.9 and 2.10. Figure 2.9 shows the pressure along thecapillary for both cases. The pressure has been calculated by dividing the capillary intosmall segments and calculating the pressure drop and the fluid properties at eachsegment. The flow rate is varied until the pressure becomes small and the flow becomessonic (choke flow) at the capillary end that is in the mass spectrometer. The flow rate forthe case of high temperature is 0.31 cc/min, while during calibration the flow rate is 1.24cc/min (at STP). This result indicates that the pressure at the mass spectrometer should astrong function of the temperature of the gas being sampled. Because of this effect, theoperating pressure during the experiments has been in the low 10-6 mbar region,somewhat lower than the recommended optimal pressure of the instrument.
Capillary (heated to 423 K after 0.6 m)
0
20000
40000
60000
80000
100000
120000
0 0.5 1 1.5 2
Distance along capillary (m)
Pres
sure
(Pa
)T=1300K, 0.31 cc/min
T=298K, 1.24 cc/min
23
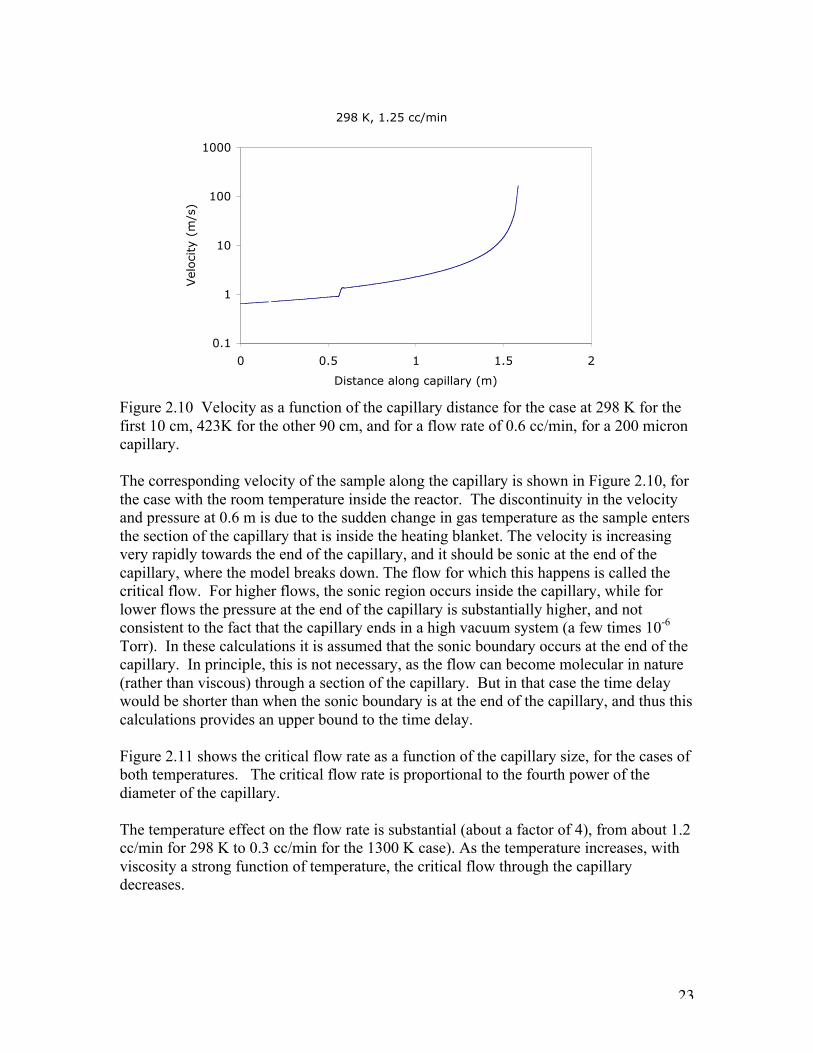
Figure 2.10 Velocity as a function of the capillary distance for the case at 298 K for thefirst 10 cm, 423K for the other 90 cm, and for a flow rate of 0.6 cc/min, for a 200 microncapillary.
The corresponding velocity of the sample along the capillary is shown in Figure 2.10, forthe case with the room temperature inside the reactor. The discontinuity in the velocityand pressure at 0.6 m is due to the sudden change in gas temperature as the sample entersthe section of the capillary that is inside the heating blanket. The velocity is increasingvery rapidly towards the end of the capillary, and it should be sonic at the end of thecapillary, where the model breaks down. The flow for which this happens is called thecritical flow. For higher flows, the sonic region occurs inside the capillary, while forlower flows the pressure at the end of the capillary is substantially higher, and notconsistent to the fact that the capillary ends in a high vacuum system (a few times 10-6
Torr). In these calculations it is assumed that the sonic boundary occurs at the end of thecapillary. In principle, this is not necessary, as the flow can become molecular in nature(rather than viscous) through a section of the capillary. But in that case the time delaywould be shorter than when the sonic boundary is at the end of the capillary, and thus thiscalculations provides an upper bound to the time delay.
Figure 2.11 shows the critical flow rate as a function of the capillary size, for the cases ofboth temperatures. The critical flow rate is proportional to the fourth power of thediameter of the capillary.
The temperature effect on the flow rate is substantial (about a factor of 4), from about 1.2cc/min for 298 K to 0.3 cc/min for the 1300 K case). As the temperature increases, withviscosity a strong function of temperature, the critical flow through the capillarydecreases.
298 K, 1.25 cc/min
0.1
1
10
100
1000
0 0.5 1 1.5 2
Distance along capillary (m)
Vel
oci
ty (
m/s
)

24
Figure 2.11. Flow rate as a function of the capillary size, for the cases of high and lowtemperatures in the plasmatron methane reformer exhaust.
Calculations vs experiments
The experimental results indicated that there was a 3 s delay at the high temperature, anda 0.5 s broadened rise time. In the experiments it was not possible to determine whetherthe broadening is due to the time response of the plasmatron methane reformer, or due tothe resolution of the MS system (including the sampling).
The volume of the reactor is estimated to be 0.5 l (2in diameter, 10 in long), with a factorof 2 increase due to the volume in the exhaust tube upstream from the sampling point.Then, with 300 liter/min flow rate, it is estimated that the transit time through the reactoris about 0.2 s at room temperature, and that two transit times (for 2 e-foldings, for thecase of mixing) is on the order of 0.4 s. For the warm reformate, the2-transit times are onthe order of 0.1 s.
The transport delay time through the capillary is calculated through the integral
τdelay = integral (dl/v)
where dl is the step length along the capillary and v is the sample velocity along thecapillary, calculated above.
The calculated time delays as well as the critical flow rates are shown in Table 2.5 as afunction of the ID of the capillary, for both the lower temperature operation as well as thehigh temperature..
298 K or 1300 K for 16 cm
0
0.5
1
1.5
2
2.5
3
3.5
100 150 200 250 300
Capillary diameter (microns)
Flow
rat
e (c
c/m
in) 298 K
1300 K
25
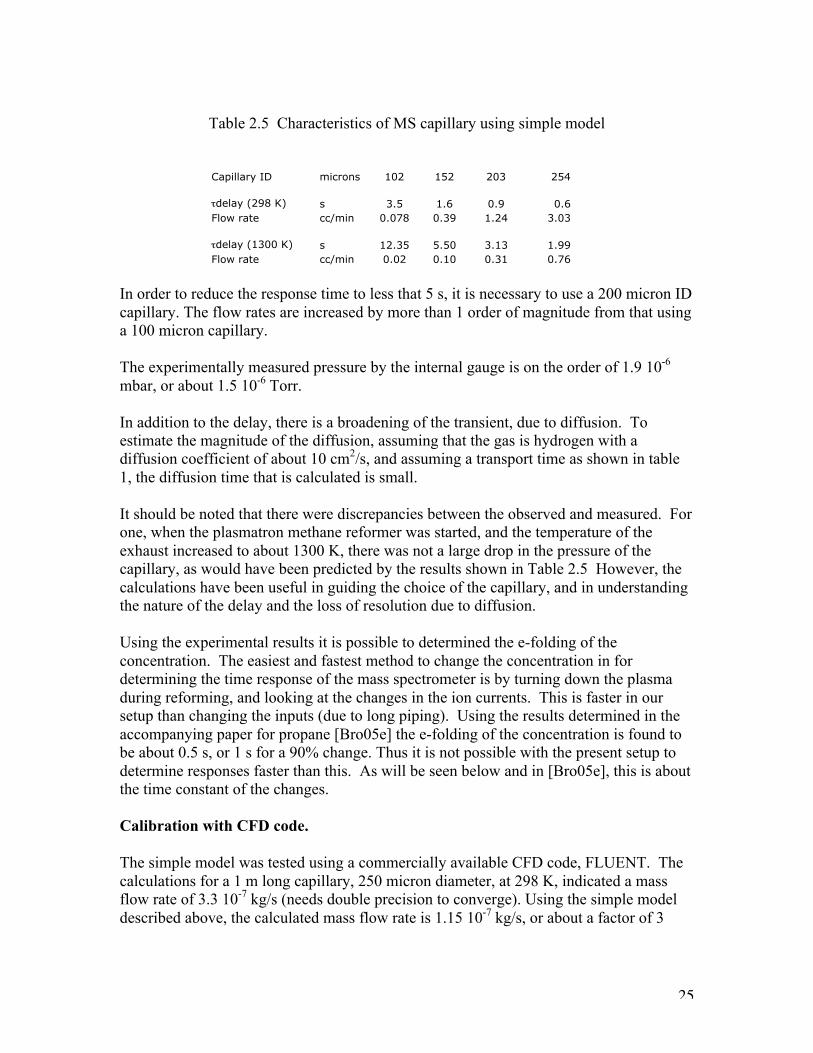
Table 2.5 Characteristics of MS capillary using simple model
In order to reduce the response time to less that 5 s, it is necessary to use a 200 micron IDcapillary. The flow rates are increased by more than 1 order of magnitude from that usinga 100 micron capillary.
The experimentally measured pressure by the internal gauge is on the order of 1.9 10-6
mbar, or about 1.5 10-6 Torr.
In addition to the delay, there is a broadening of the transient, due to diffusion. Toestimate the magnitude of the diffusion, assuming that the gas is hydrogen with adiffusion coefficient of about 10 cm2/s, and assuming a transport time as shown in table1, the diffusion time that is calculated is small.
It should be noted that there were discrepancies between the observed and measured. Forone, when the plasmatron methane reformer was started, and the temperature of theexhaust increased to about 1300 K, there was not a large drop in the pressure of thecapillary, as would have been predicted by the results shown in Table 2.5 However, thecalculations have been useful in guiding the choice of the capillary, and in understandingthe nature of the delay and the loss of resolution due to diffusion.
Using the experimental results it is possible to determined the e-folding of theconcentration. The easiest and fastest method to change the concentration in fordetermining the time response of the mass spectrometer is by turning down the plasmaduring reforming, and looking at the changes in the ion currents. This is faster in oursetup than changing the inputs (due to long piping). Using the results determined in theaccompanying paper for propane [Bro05e] the e-folding of the concentration is found tobe about 0.5 s, or 1 s for a 90% change. Thus it is not possible with the present setup todetermine responses faster than this. As will be seen below and in [Bro05e], this is aboutthe time constant of the changes.
Calibration with CFD code.
The simple model was tested using a commercially available CFD code, FLUENT. Thecalculations for a 1 m long capillary, 250 micron diameter, at 298 K, indicated a massflow rate of 3.3 10-7 kg/s (needs double precision to converge). Using the simple modeldescribed above, the calculated mass flow rate is 1.15 10-7 kg/s, or about a factor of 3
Capillary ID microns 102 152 203 254
τdelay (298 K) s 3.5 1.6 0.9 0.6Flow rate cc/min 0.078 0.39 1.24 3.03
τdelay (1300 K) s 12.35 5.50 3.13 1.99Flow rate cc/min 0.02 0.10 0.31 0.76

26
lower. In order to make the two agree, the Reynolds model for the friction factor f wasdecreased until the two agreed. They did agree for a multiplier of 0.35.
27
3) Plasmatron applications to spark-ignition engine
Decreasing emissions from motor vehicles and increasing efficiency is a necessary steptoward improving air quality and decreasing greenhouse gases. Internal combustionengines for transportation constitute the single largest consumer of imported oil and arealso a major source of ozone-producing gases such as NOx that affect urban areas. Avariety of potential improvements are presently being investigated: lean-burn engines;increased compression ratio; improved catalyst formulations; use of close coupledcatalysts; new types of exhaust treatment; electric and fuel-cell powered vehicles; andalternative fuels.
A concept that could substantially reduce emissions is onboard hydrogen generationusing microplasmatron fuel converters. Plasmatrons are electrical gas heaters that makeuse of the conductivity of gases at high temperature. Microplasmatron fuel converters arecompact, rugged, can be used with a variety of fuels and provide rapid response. Largereductions in emissions from SI engines are possible using the hydrogen-rich gasproduced by plasmatron conversion of hydrocarbon fuel. Increased flame speed in thecylinder extends the lean limit of SI engine operation [Hey88]. The combination ofincreased flame speed and lower flammability limits of hydrogen can thus stabilizecombustion during lean operation.
Very lean operation could reduce engine NOx production by a factor of one hundredrelative to stoichiometric operation [Bre7, Mac76, Hom83]. Hydrogen addition couldalso be used to reduce NOx emissions by facilitating use of increased exhaust gasrecirculation (EGR) [Kur79]. Onboard production of hydrogen is also attractive forreduction of cold start emissions, as well as for catalyst regeneration and post treatment.
Hydrogen addition can also be found useful to increase the octane of the fuel, as bothhydrogen as well as CO have high octane numbers [Top04]. The increase octaneprovided by the hydrogen rich gas can be used to increase the compression ratio of theengine or allow for turbocharging, further increasing the efficiency of the engine. Finally,the hydrogen rich gas may be useful during cold start, both minimizing the cranking, aswell as potentially decreasing the hydrocarbon emissions due to cold start.
Concepts for use of plasmatron generated hydrogen-rich gas in spark ignition engineshave been discussed in papers [Rab95, Coh96, Coh98, Bro99a]. Engine experiments havealso performed using bottled synthesis gas [Bre73, Mac76, Hom83, Kir99], and withconventional reformers operating on methane [Smi97] or ethanol [Dob98,Hod98]. Thisprogram reports the first use of a compact plasma boosted reformer to convert gasolineinto hydrogen rich gas which is then combusted in an internal combustion engineresulting in a large decrease in air pollutants [Gre00, Bro99b].
28
a) SI engine test setup and plasmatron performance
A gen-1 compact plasma boosted reformer was installed and tested on a production in-line four-cylinder SI gasoline-fueled engine (1994 General Motors Quad-4) at Oak RidgeNational Laboratory (ORNL)). The Quad4 has a 2.3 L displacement, 9.2 cm bore, 8.5 cmstroke and compression ratio of 9.5. This engine is port-fuel-injected and does not utilizea turbocharger or exhaust gas recirculation. The engine was coupled to a 130 kW (175hp) eddy-current (Power Dyne, Inc.) dynamometer for engine speed and load control.Engine control management was carried out with a TEC-II control system(Electromotive, Inc.) The TEC-II provided access to all calibration parameters (raw fuelcurve, enrichment, spark advance, and exhaust O2) for proper engine operation. TheTEC-II control allows the user to set desired air/fuel ratios (lean, rich, andstoichiometric). It can also adjust the fuel automatically to maintain stoichiometricair/fuel ratio by monitoring the exhaust gas oxygen.
Along with engine operating parameters and in-cylinder pressure, engine out regulatedemissions (CO, HC and NOx) and PM were measured at each operating point. Totalmass concentration and rate of PM was measured with a Tapered Element OscillatingMicrobalance (TEOM, R and P Co. Model 1105). A scanning mobility particle sizer(SMPS, TSI, Inc.) measured PM size and number. CARB Phase II certification gradegasoline was used for engine and plasmatron operation. The gasoline equivalent air/fuelratio was measured with a universal exhaust gas oxygen (UEGO) sensor (Horiba MEXA110) in the exhaust stream. Therefore during reformate addition the reported equivalenceratio is actually slightly higher because of partial combustion in the microplasmatron.
The microplasmatron was operated with a constant gasoline throughput of 0.25 g/s. Thereformate was cooled down to room temperature by a low pressure shell-in-tube heatexchanger. The composition of the microplasmatron output was continuously monitoredusing a conventional tailpipe emissions monitor (Horiba MEXA 554). Table 3.1 showsthe measured parameters of the microplasmatron during experiments conducted at ORNLand MIT. The electrical power input to the microplasmatron was about 2% of the heatingvalue of the fuel processed. This microplasmatron incorporated several designimprovements which will be discussed in a later publication.
Experiments were conducted at two engine operating conditions: the first one at 2300rpm and 4.2 bar brake mean effective pressure (BMEP); and the second one at 1500 rpmand 2.6 bar BMEP. Maximum brake torque (MBT) spark timing was defined for bothoperating conditions at stoichiometric conditions with the engine in closed-loop controlmode. Once the MBT spark timing was defined for each condition, spark timingremained fixed as air/fuel ratio was increased with the engine in open-loop control mode.BMEP was also kept constant as air/fuel ratio was increased.
29
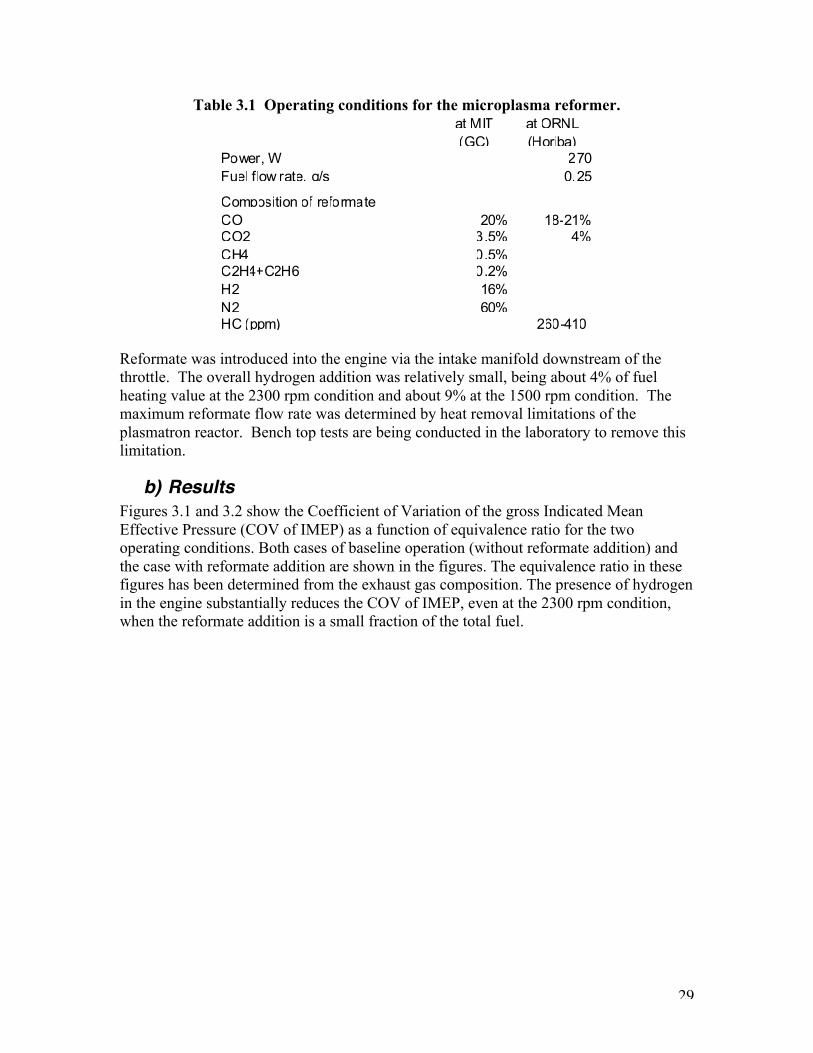
Table 3.1 Operating conditions for the microplasma reformer.Microplasma reformer used for engine testsat MIT at ORNL(GC) (Horiba)
Power, W 270Fuel flow rate, g/s 0.25
Composition of reformateCO 20% 18-21%CO2 3.5% 4%CH4 0.5%C2H4+C2H6 0.2%H2 16%N2 60%HC (ppm) 260-410
Reformate was introduced into the engine via the intake manifold downstream of thethrottle. The overall hydrogen addition was relatively small, being about 4% of fuelheating value at the 2300 rpm condition and about 9% at the 1500 rpm condition. Themaximum reformate flow rate was determined by heat removal limitations of theplasmatron reactor. Bench top tests are being conducted in the laboratory to remove thislimitation.
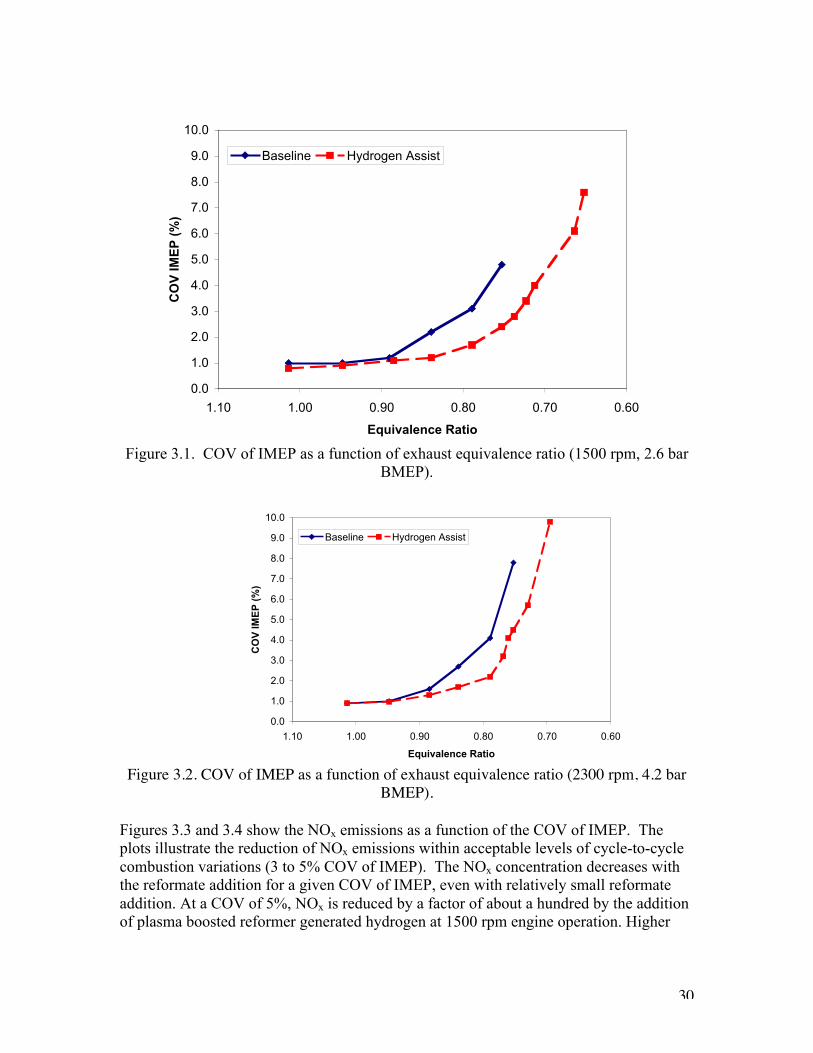
b) ResultsFigures 3.1 and 3.2 show the Coefficient of Variation of the gross Indicated MeanEffective Pressure (COV of IMEP) as a function of equivalence ratio for the twooperating conditions. Both cases of baseline operation (without reformate addition) andthe case with reformate addition are shown in the figures. The equivalence ratio in thesefigures has been determined from the exhaust gas composition. The presence of hydrogenin the engine substantially reduces the COV of IMEP, even at the 2300 rpm condition,when the reformate addition is a small fraction of the total fuel.
30
Figure 3.1. COV of IMEP as a function of exhaust equivalence ratio (1500 rpm, 2.6 barBMEP).
Figure 3.2. COV of IMEP as a function of exhaust equivalence ratio (2300 rpm, 4.2 barBMEP).
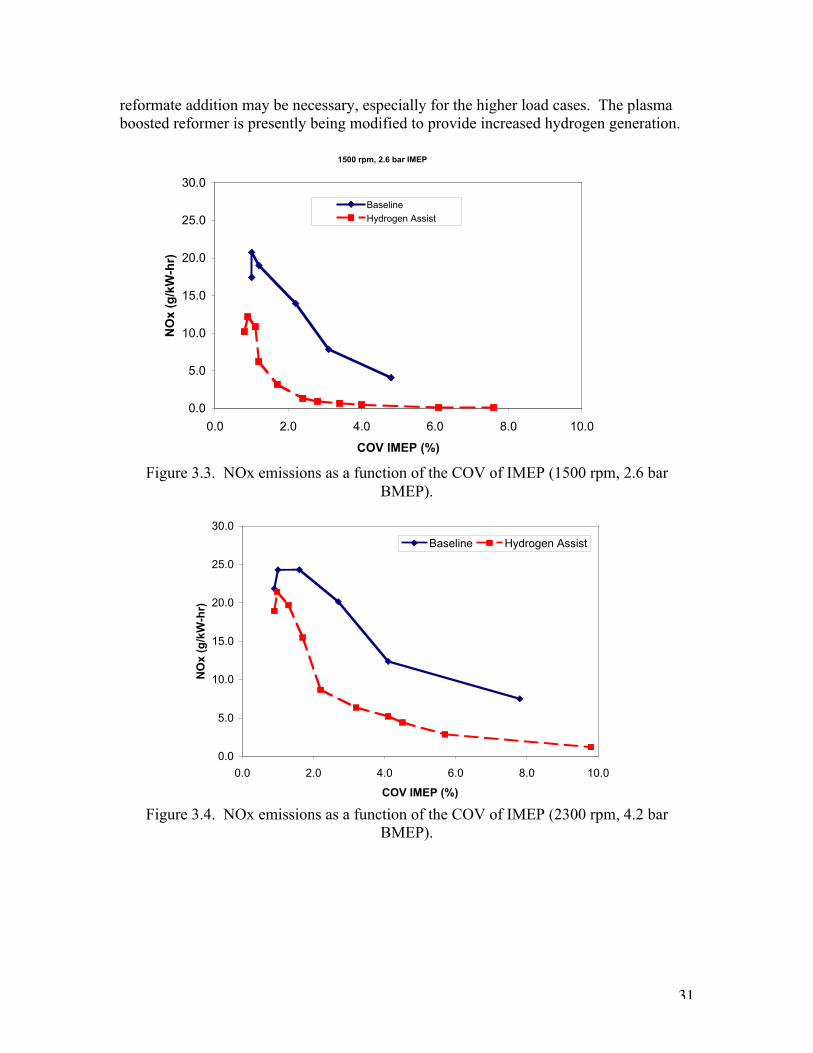
Figures 3.3 and 3.4 show the NOx emissions as a function of the COV of IMEP. Theplots illustrate the reduction of NOx emissions within acceptable levels of cycle-to-cyclecombustion variations (3 to 5% COV of IMEP). The NOx concentration decreases withthe reformate addition for a given COV of IMEP, even with relatively small reformateaddition. At a COV of 5%, NOx is reduced by a factor of about a hundred by the additionof plasma boosted reformer generated hydrogen at 1500 rpm engine operation. Higher
0.0
1.0
2.0
3.0
4.0
5.0
6.0
7.0
8.0
9.0
10.0
0.600.700.800.901.001.10
Equivalence Ratio
CO
V IM
EP
(%
)
Baseline Hydrogen Assist
0.0
1.0
2.0
3.0
4.0
5.0
6.0
7.0
8.0
9.0
10.0
0.600.700.800.901.001.10
Equivalence Ratio
CO
V IM
EP
(%
)
Baseline Hydrogen Assist
31
reformate addition may be necessary, especially for the higher load cases. The plasmaboosted reformer is presently being modified to provide increased hydrogen generation.
Figure 3.3. NOx emissions as a function of the COV of IMEP (1500 rpm, 2.6 barBMEP).
Figure 3.4. NOx emissions as a function of the COV of IMEP (2300 rpm, 4.2 barBMEP).
1500 rpm, 2.6 bar IMEP
0.0
5.0
10.0
15.0
20.0
25.0
30.0
0.0 2.0 4.0 6.0 8.0 10.0
COV IMEP (%)
NO
x (g
/kW
-hr)
Baseline
Hydrogen Assist
0.0
5.0
10.0
15.0
20.0
25.0
30.0
0.0 2.0 4.0 6.0 8.0 10.0
COV IMEP (%)
NO
x (g
/kW
-hr)
Baseline Hydrogen Assist
32
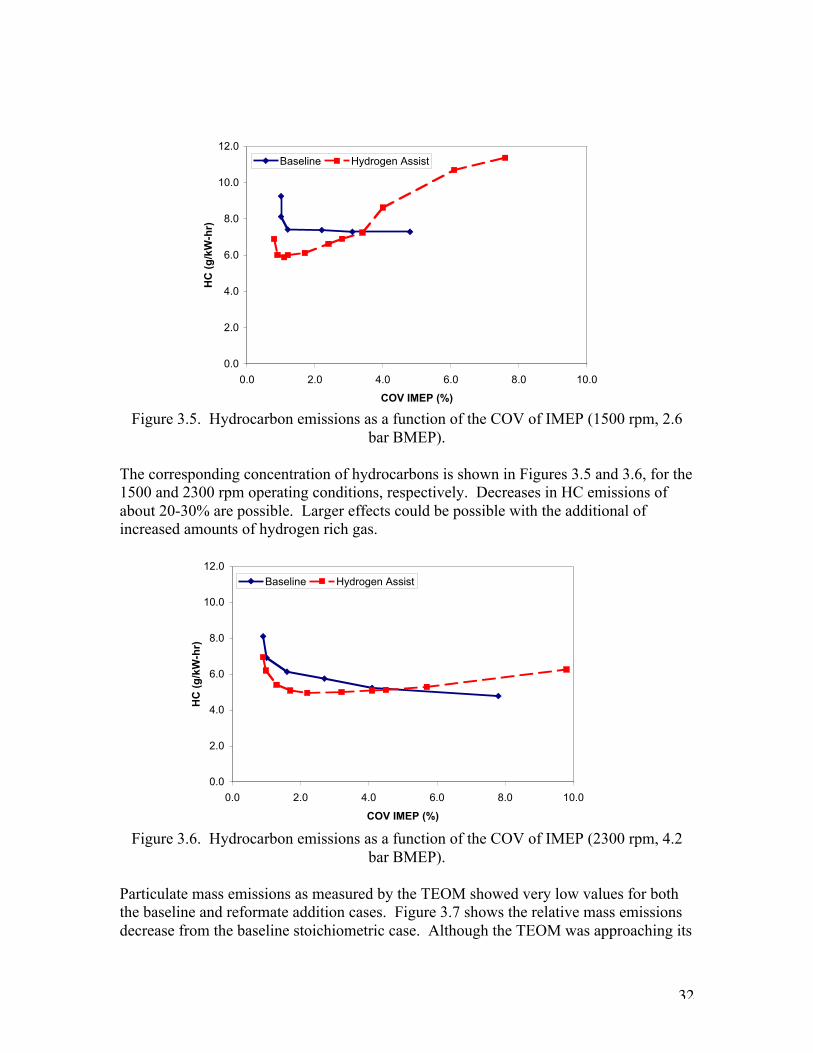
Figure 3.5. Hydrocarbon emissions as a function of the COV of IMEP (1500 rpm, 2.6bar BMEP).
The corresponding concentration of hydrocarbons is shown in Figures 3.5 and 3.6, for the1500 and 2300 rpm operating conditions, respectively. Decreases in HC emissions ofabout 20-30% are possible. Larger effects could be possible with the additional ofincreased amounts of hydrogen rich gas.
Figure 3.6. Hydrocarbon emissions as a function of the COV of IMEP (2300 rpm, 4.2bar BMEP).
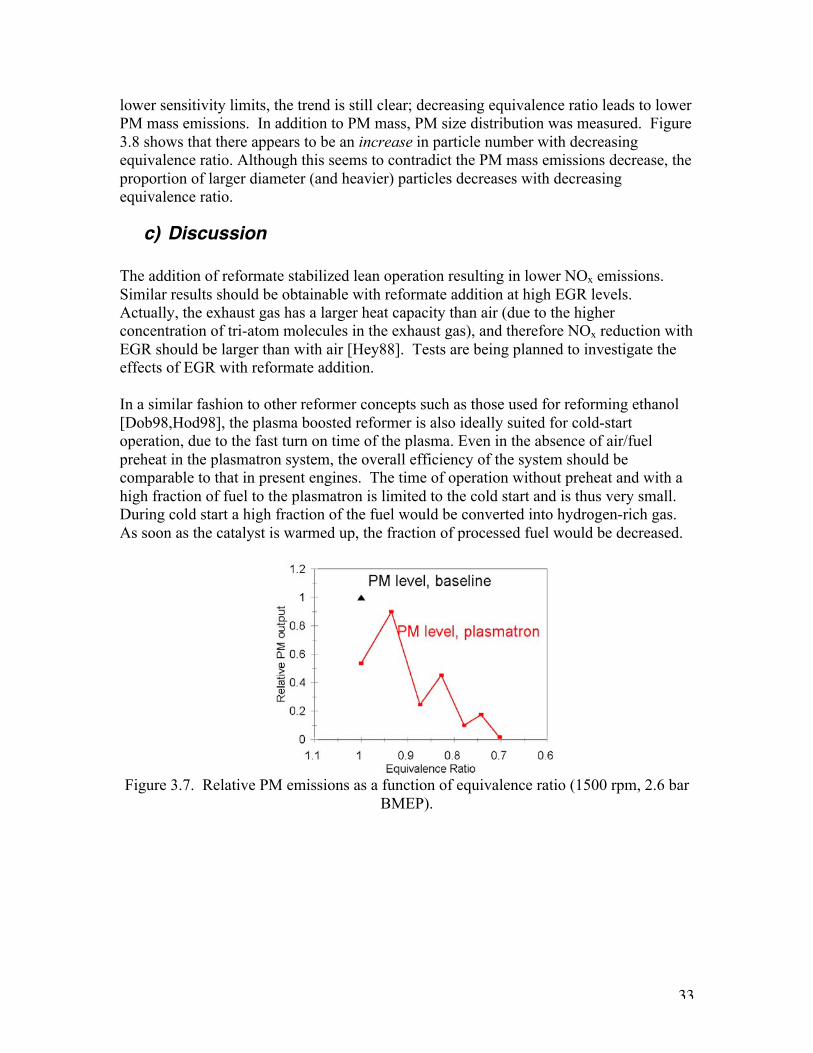
Particulate mass emissions as measured by the TEOM showed very low values for boththe baseline and reformate addition cases. Figure 3.7 shows the relative mass emissionsdecrease from the baseline stoichiometric case. Although the TEOM was approaching its
0.0
2.0
4.0
6.0
8.0
10.0
12.0
0.0 2.0 4.0 6.0 8.0 10.0
COV IMEP (%)
HC
(g
/kW
-hr)
Baseline Hydrogen Assist
0.0
2.0
4.0
6.0
8.0
10.0
12.0
0.0 2.0 4.0 6.0 8.0 10.0
COV IMEP (%)
HC
(g
/kW
-hr)
Baseline Hydrogen Assist
33
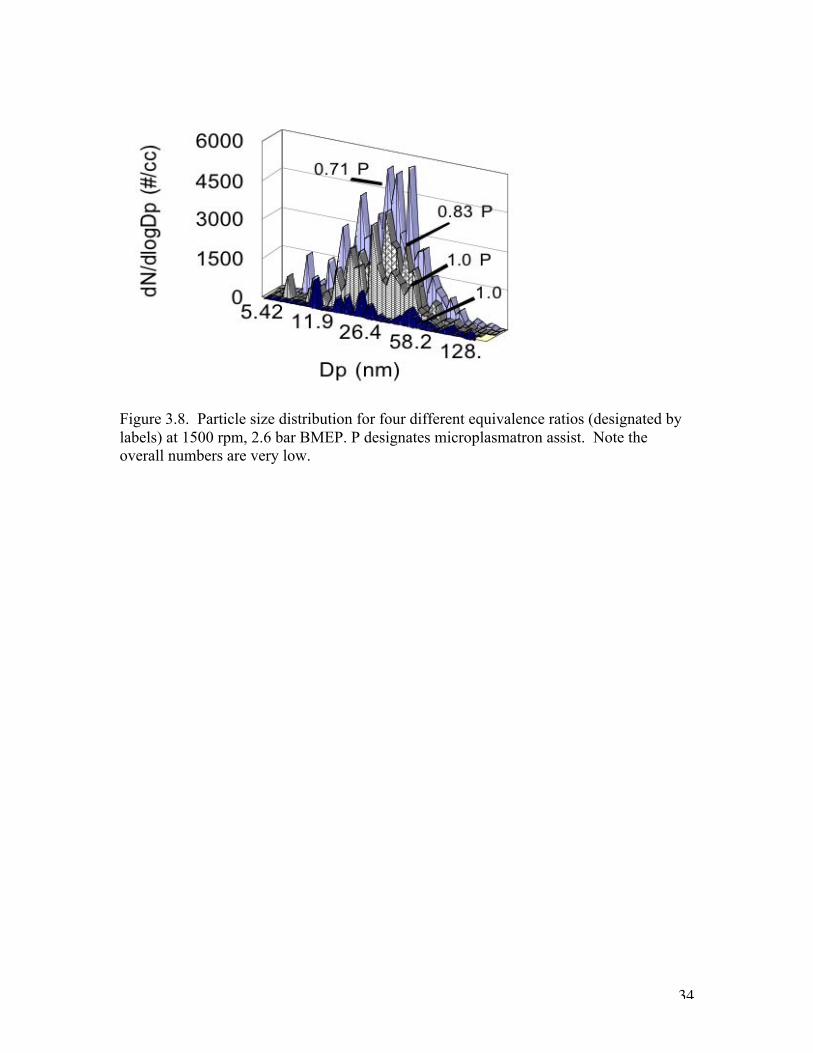
lower sensitivity limits, the trend is still clear; decreasing equivalence ratio leads to lowerPM mass emissions. In addition to PM mass, PM size distribution was measured. Figure3.8 shows that there appears to be an increase in particle number with decreasingequivalence ratio. Although this seems to contradict the PM mass emissions decrease, theproportion of larger diameter (and heavier) particles decreases with decreasingequivalence ratio.
c) Discussion
The addition of reformate stabilized lean operation resulting in lower NOx emissions.Similar results should be obtainable with reformate addition at high EGR levels.Actually, the exhaust gas has a larger heat capacity than air (due to the higherconcentration of tri-atom molecules in the exhaust gas), and therefore NOx reduction withEGR should be larger than with air [Hey88]. Tests are being planned to investigate theeffects of EGR with reformate addition.
In a similar fashion to other reformer concepts such as those used for reforming ethanol[Dob98,Hod98], the plasma boosted reformer is also ideally suited for cold-startoperation, due to the fast turn on time of the plasma. Even in the absence of air/fuelpreheat in the plasmatron system, the overall efficiency of the system should becomparable to that in present engines. The time of operation without preheat and with ahigh fraction of fuel to the plasmatron is limited to the cold start and is thus very small.During cold start a high fraction of the fuel would be converted into hydrogen-rich gas.As soon as the catalyst is warmed up, the fraction of processed fuel would be decreased.
Figure 3.7. Relative PM emissions as a function of equivalence ratio (1500 rpm, 2.6 barBMEP).
34
Figure 3.8. Particle size distribution for four different equivalence ratios (designated bylabels) at 1500 rpm, 2.6 bar BMEP. P designates microplasmatron assist. Note theoverall numbers are very low.

35
4) Plasmatron application to aftertreatment I: NOx trap
Plasmatron reformer technology has been evaluated for regeneration of NOx adsorberafter-treatment systems. [Bro03] At ArvinMeritor tests were performed on a dual-legNOx adsorber system using a Cummins 8.3L diesel engine both in a test cell and on avehicle. A NOx adsorber system was tested using the plasmatron reformer as aregenerator and without the reformer (i.e., with straight diesel fuel based regeneration asthe baseline case. The plasmatron reformer was shown to improve NOx regenerationsignificantly compared to the baseline diesel case. The net result of these initial tests wasa significant decrease in fuel penalty, roughly 50% at moderate adsorber temperatures.This fuel penalty improvement is accompanied by a dramatic drop in slippedhydrocarbon emissions, which decreased by 90% or more. Significant advantages aredemonstrated across a wide range of engine conditions and temperatures. The study alsoindicated the potential to regenerate NOx adsorbers at low temperatures where diesel fuelbased regeneration is not effective, such as those typical of idle conditions. Two vehicles,a bus and a light duty truck, have been equipped for plasmatron reformer NOx adsorberregeneration tests.
a) IntroductionIn order to meet stringent US emissions regulations for 2007-2010 diesel vehicle modelyears, after-treatment technology is being developed. Both particulate and NOx emissionsafter-treatment technology will be necessary, as it seems that engine in-cylindertechniques alone will be unable to meet the regulations.
The purpose of the present work is to develop hydrogen based technology for addressingafter-treatment issues. In this paper recent developments in both the technology for on-board generation of hydrogen as well as applications to NOx after-treatment issues will bediscussed.
Potential on-board generation of hydrogen from renewable energy biofuels for thetransportation sector is also discussed. This application could provide a means toalleviate oil dependency and reduce greenhouse gas emissions.
b) Plasmatron technology for NOx aftertreatment
An absorber catalyst can be used for first trapping the NOx in diesel engine exhaust, andthen chemically reducing it during regeneration periods. The process of trapping could beeither catalytic absorption or adsorption, or conventional absorption or adsorption[Cam99]. The catalyst for NOx treatment is very sensitive to poisoning by sulfur. Inorder to solve this problem, a sulfur trap is under development [Par99a, Parks99b], in

36
conjunction with the development of NOx absorber catalysts that are more sulfur tolerant.In this case, the sulfur and the NOx traps are regenerated simultaneously
Experimental studies of combined SOx and NOx traps have been carried out recently byGoal Line Technologies [Par99a, Par99b]. These studies examined both the use of dieselfuel and hydrogen as reducing agents for trap regeneration. Greater than 90% NOxremoval was obtained. Further work is needed to determine effects of sulfur on catalystlifetime and the differences in the use of diesel fuel and hydrogen rich gas for catalystregeneration.
Goal Line Environmental Technologies has recently claimed a 98.9% reduction in NOxand Hydrocarbon (HC) emissions from diesel engines at their test facility last spring.Using their proprietary catalyst system, attached to a Cummins 50-kW/86-bhp dieselengine, NOx and HC have been reduced to 0.4 grams per brake horsepower-hour(g/bhph), an emissions reduction that is a full order of magnitude lower than the U.S.EPA’s 2002 emission reduction requirement of 4.0 g/bhph for diesel engines.
A similar process may be used for trapping/regenerating particulates. The harmful ornoxious emission can be trapped in one system, and then released and treated in adownstream unit (engine or another catalyst).
A recent patent by Daimler Benz [Boe99] describes the regeneration of one of thecatalyst while the other is in the adsorbing mode. This patent discusses a motor vehicleexhaust emission control system that has tandem adsorber catalysts connected in parallelfor alternate adsorption and desorption. NOx from the engine goes to the operatingadsorber catalyst while the other adsorber catalyst is in the desorption mode. Anoxidizing converter is located upstream of the adsorber part and near the engine foroxidation of the NO contained in the exhaust to form NO2, so as to permit an increase inthe NOx adsorption rate for the nitrogen adsorber parts. A reducing agent is used toregenerate the catalysts.
c) Advantages of Compact Plasmatron Fuel ConvertersThe use of compact plasmatron fuel converters in systems for regeneration of thesecatalysts could provide a number of significant advantages. Hydrogen rich gas is asignificantly stronger reducing agent than diesel or gasoline. Use of hydrogen rich gascould potentially provide:
• Higher regeneration effectiveness• Reduced poisoning of catalyst (since diesel fuel is not used for regeneration)• Reduced emissions of hydrocarbons, since it is easier to prevent release of hydrogen
and CO than hydrocarbons due to faster catalytic removal• Reduced loss in overall fuel efficiency due to lower requirements on amount of
reducing gas and greater ease of reuse of hydrogen rich gas in the engine.• Shorter regeneration time due to greater reducing capability of hydrogen rich gas and
high concentration of reducing gases.

37
• Reduced adverse effects of sulfur (hydrogen-sulfur interactions could reduce sulfurpoisoning effects)
Compact plasmatron reformers are very well suited for the required hydrogen-rich gasgeneration due to:
• Robustness when operating with diesel fuel• No soot production• High efficiency• Low cost• Small size and weight• Rapid reformer response• Warm up capability provided by hot gas, since the hydrogen rich gas from the
compact plasmatron fuel converter is hot; catalyst warm-up time could be decreased,or the catalyst could be further heated up during regeneration.
d) Catalyst regeneration estimation
Figure 4.1 shows a schematic diagram of a compact plasmatron fuel converter feedinghydrogen rich gas to a NOx-absorber/adsorber and/or a particulate trap catalyst. In thecase of the NOx absorber catalyst, the injection of hydrogen rich gas reduces the nitrogenin NO and NO2 to N2. Hydrogen rich gas produced from partial oxidation (which canconsist of approximately 20% H2, 20% CO with the balance mainly N2) is a powerfulreducing agent.
In catalyst regeneration by direct injection of hydrogen rich gas, the exhaust flow fromthe engine is diverted from the catalyst to be regenerated. The diverted exhaust flow maybe sent to a second catalyst. Hydrogen rich gas is then rapidly injected onto the catalyst.Some of the gas from close-cycle operation of the NOx-absorber catalyst needs to bereleased, in order to prevent pressure buildup in the closed system. The gas from thecatalyst during regeneration can be sent to the engine, a second catalyst and/or theplasmatron fuel converter.
There are several variations in which the compact plasmatron fuel converter can becombined with the catalysts. In one variation, the compact plasmatron fuel converter isintegrated with the NOx-absorber catalyst. If there are two NOx-absorber catalyst units,then two compact plasmatron fuel converters are required. An alternative approachconsists of a single plasma fuel converter, directing the hydrogen rich gas into the unitthat is being regenerated. This method of operation saves on the cost of the plasma fuelconverter units, but requires a high temperature valve. A high temperature EGR valvecould be used for this purpose. If the gas from the NOx-absorber catalyst beingregenerated is to be recycled, either in the engine, in the compact plasmatron fuelconverter or in the other NOx-absorber catalyst unit, then it is necessary to have a valveat the exhaust to control the flow of the gases.
38
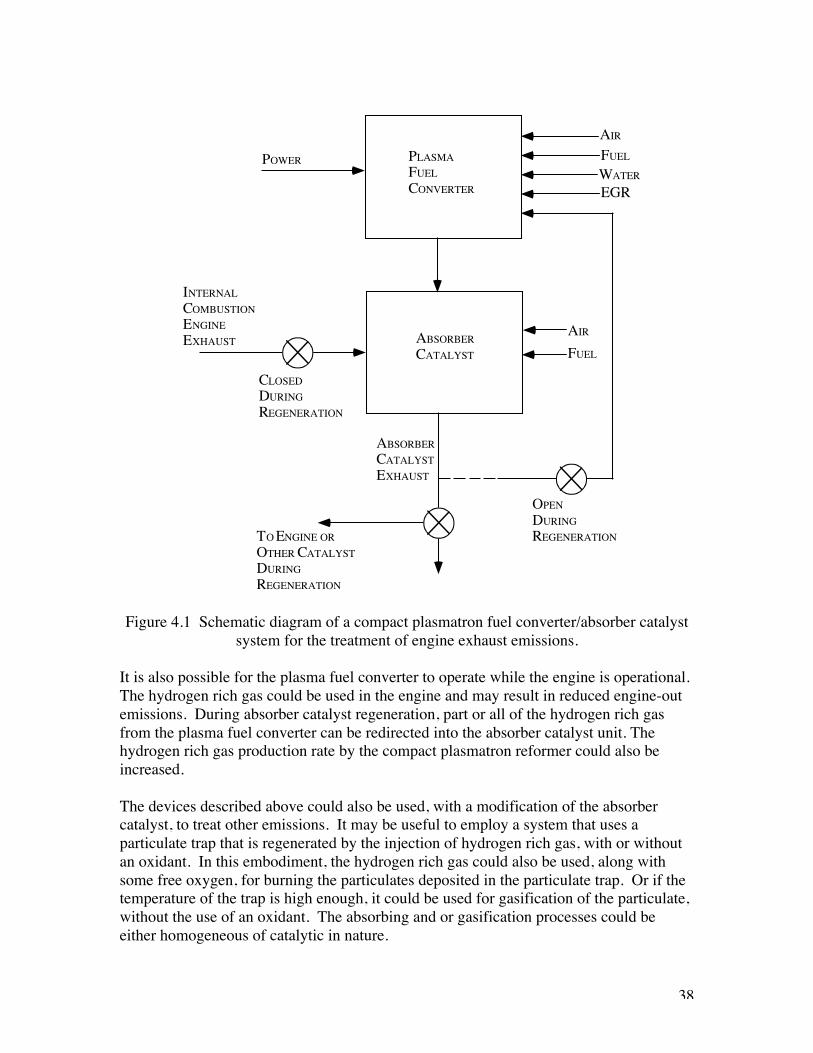
Figure 4.1 Schematic diagram of a compact plasmatron fuel converter/absorber catalystsystem for the treatment of engine exhaust emissions.
It is also possible for the plasma fuel converter to operate while the engine is operational.The hydrogen rich gas could be used in the engine and may result in reduced engine-outemissions. During absorber catalyst regeneration, part or all of the hydrogen rich gasfrom the plasma fuel converter can be redirected into the absorber catalyst unit. Thehydrogen rich gas production rate by the compact plasmatron reformer could also beincreased.
The devices described above could also be used, with a modification of the absorbercatalyst, to treat other emissions. It may be useful to employ a system that uses aparticulate trap that is regenerated by the injection of hydrogen rich gas, with or withoutan oxidant. In this embodiment, the hydrogen rich gas could also be used, along withsome free oxygen, for burning the particulates deposited in the particulate trap. Or if thetemperature of the trap is high enough, it could be used for gasification of the particulate,without the use of an oxidant. The absorbing and or gasification processes could beeither homogeneous of catalytic in nature.
PLASMAFUELCONVERTER
POWER
AIR
FUEL
WATEREGR
ABSORBERCATALYST
INTERNALCOMBUSTIONENGINEEXHAUST
CLOSEDDURINGREGENERATION
OPENDURINGREGENERATION
ABSORBERCATALYSTEXHAUST
AIR
FUEL
TO ENGINE OROTHER CATALYSTDURINGREGENERATION
39
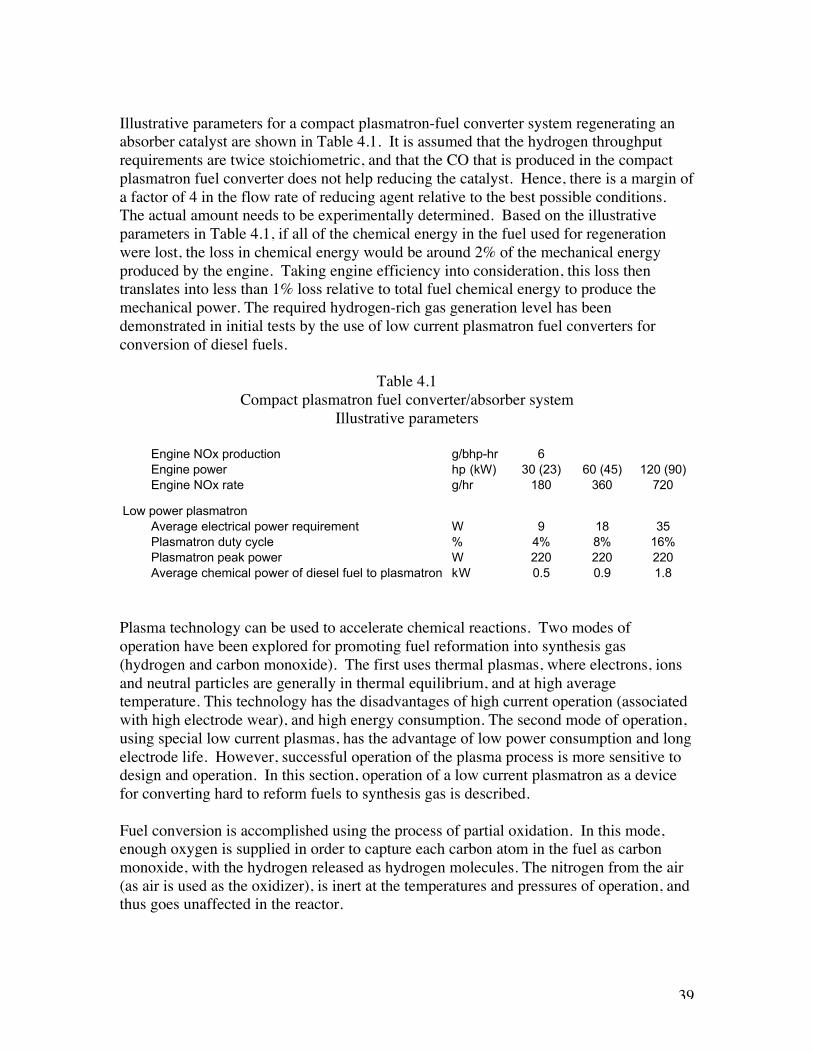
Illustrative parameters for a compact plasmatron-fuel converter system regenerating anabsorber catalyst are shown in Table 4.1. It is assumed that the hydrogen throughputrequirements are twice stoichiometric, and that the CO that is produced in the compactplasmatron fuel converter does not help reducing the catalyst. Hence, there is a margin ofa factor of 4 in the flow rate of reducing agent relative to the best possible conditions.The actual amount needs to be experimentally determined. Based on the illustrativeparameters in Table 4.1, if all of the chemical energy in the fuel used for regenerationwere lost, the loss in chemical energy would be around 2% of the mechanical energyproduced by the engine. Taking engine efficiency into consideration, this loss thentranslates into less than 1% loss relative to total fuel chemical energy to produce themechanical power. The required hydrogen-rich gas generation level has beendemonstrated in initial tests by the use of low current plasmatron fuel converters forconversion of diesel fuels.
Table 4.1Compact plasmatron fuel converter/absorber system
Illustrative parameters
Plasma technology can be used to accelerate chemical reactions. Two modes ofoperation have been explored for promoting fuel reformation into synthesis gas(hydrogen and carbon monoxide). The first uses thermal plasmas, where electrons, ionsand neutral particles are generally in thermal equilibrium, and at high averagetemperature. This technology has the disadvantages of high current operation (associatedwith high electrode wear), and high energy consumption. The second mode of operation,using special low current plasmas, has the advantage of low power consumption and longelectrode life. However, successful operation of the plasma process is more sensitive todesign and operation. In this section, operation of a low current plasmatron as a devicefor converting hard to reform fuels to synthesis gas is described.
Fuel conversion is accomplished using the process of partial oxidation. In this mode,enough oxygen is supplied in order to capture each carbon atom in the fuel as carbonmonoxide, with the hydrogen released as hydrogen molecules. The nitrogen from the air(as air is used as the oxidizer), is inert at the temperatures and pressures of operation, andthus goes unaffected in the reactor.
Engine NOx production g/bhp-hr 6Engine power hp (kW) 30 (23) 60 (45) 120 (90)Engine NOx rate g/hr 180 360 720
Low power plasmatronAverage electrical power requirement W 9 18 35Plasmatron duty cycle % 4% 8% 16%Plasmatron peak power W 220 220 220Average chemical power of diesel fuel to plasmatron kW 0.5 0.9 1.8
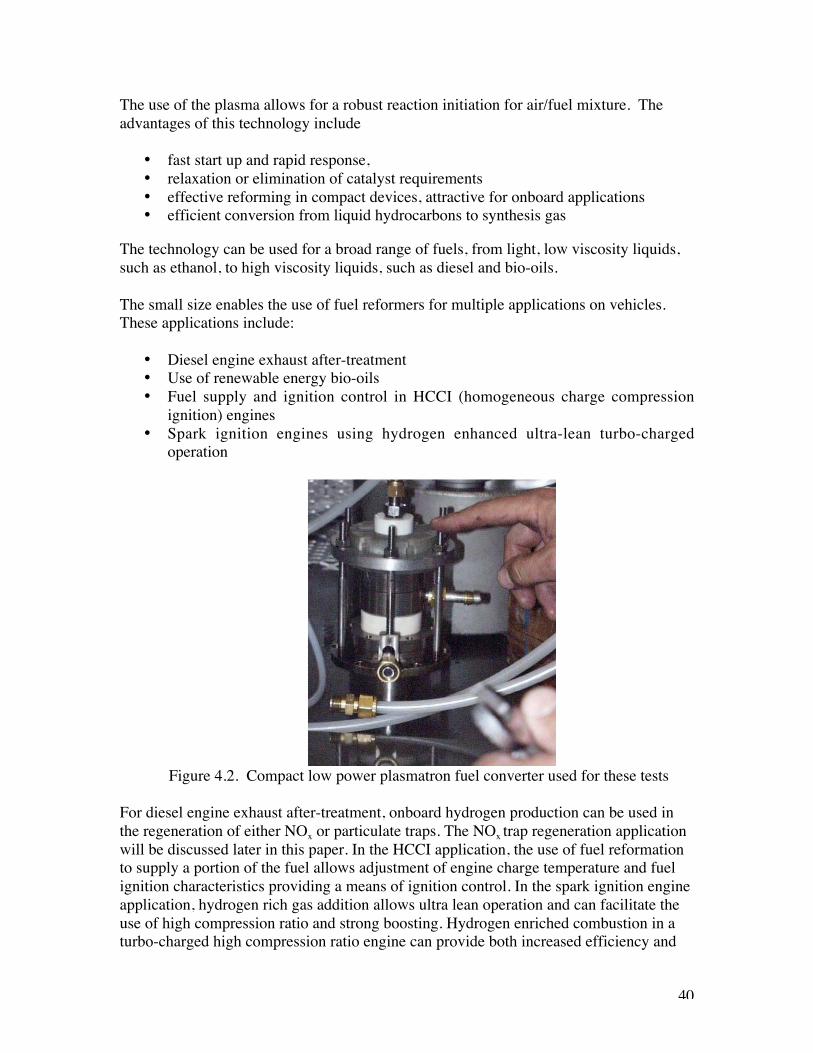
40
The use of the plasma allows for a robust reaction initiation for air/fuel mixture. Theadvantages of this technology include
• fast start up and rapid response,• relaxation or elimination of catalyst requirements• effective reforming in compact devices, attractive for onboard applications• efficient conversion from liquid hydrocarbons to synthesis gas
The technology can be used for a broad range of fuels, from light, low viscosity liquids,such as ethanol, to high viscosity liquids, such as diesel and bio-oils.
The small size enables the use of fuel reformers for multiple applications on vehicles.These applications include:
• Diesel engine exhaust after-treatment• Use of renewable energy bio-oils• Fuel supply and ignition control in HCCI (homogeneous charge compression
ignition) engines• Spark ignition engines using hydrogen enhanced ultra-lean turbo-charged
operation
Figure 4.2. Compact low power plasmatron fuel converter used for these tests
For diesel engine exhaust after-treatment, onboard hydrogen production can be used inthe regeneration of either NOx or particulate traps. The NOx trap regeneration applicationwill be discussed later in this paper. In the HCCI application, the use of fuel reformationto supply a portion of the fuel allows adjustment of engine charge temperature and fuelignition characteristics providing a means of ignition control. In the spark ignition engineapplication, hydrogen rich gas addition allows ultra lean operation and can facilitate theuse of high compression ratio and strong boosting. Hydrogen enriched combustion in aturbo-charged high compression ratio engine can provide both increased efficiency and

41
reduced emissions. System optimization studies indicate that a substantial increase in fuelefficiency (up to a 30% increase in net efficiency) and decrease in NOx emissions areachievable.
Present plasmatron reformers have volumes on the order of 1-2 liters, with an electricalpower consumption of about 250 W. Figure 4.2 shows a photograph of a recentlydeveloped plasmatron. The plasmatron is followed by a reaction section which providestime for the development of homogeneous reactions. When high hydrogen yields aredesired, a catalyst can be placed downstream from the homogeneous zone.
At present, goals for the diesel plasmatron reformer development includes increased flowrates, operational and configuration optimization and increased simplicity, among othergoals.
e) Biofuel reformation
At MIT, plasmatron reforming technology has been used with for a wide range ofbiofuels. These fuels include corn, canola and soybean oils (both refined and unrefined),and ethanol.
Reformation was achieved with a plasmatron fuel reformer optimized for diesel fueloperation. The device operated at 200 W of electrical power, and at stoichiometry forpartial oxidation (O/C ratio ~ 1.1). The available energy from the reformate flow rate wasabout 20 kW (LHV of the reformate gas, as calculated from the LHV of compoundsmeasured in the gas analysis). Some of the oxygen required for the reformation isprovided by the fuel itself; the O/C ratio includes this oxygen,
Figure 4.3. Hydrogen yield as a function of the O/C ratio, for corn and soybean oils
0
20
40
60
80
100
1.0 1.2 1.4 1.6 1.8ratio O/C
H2 y
ield
, %
Corn oil
Soybean oil
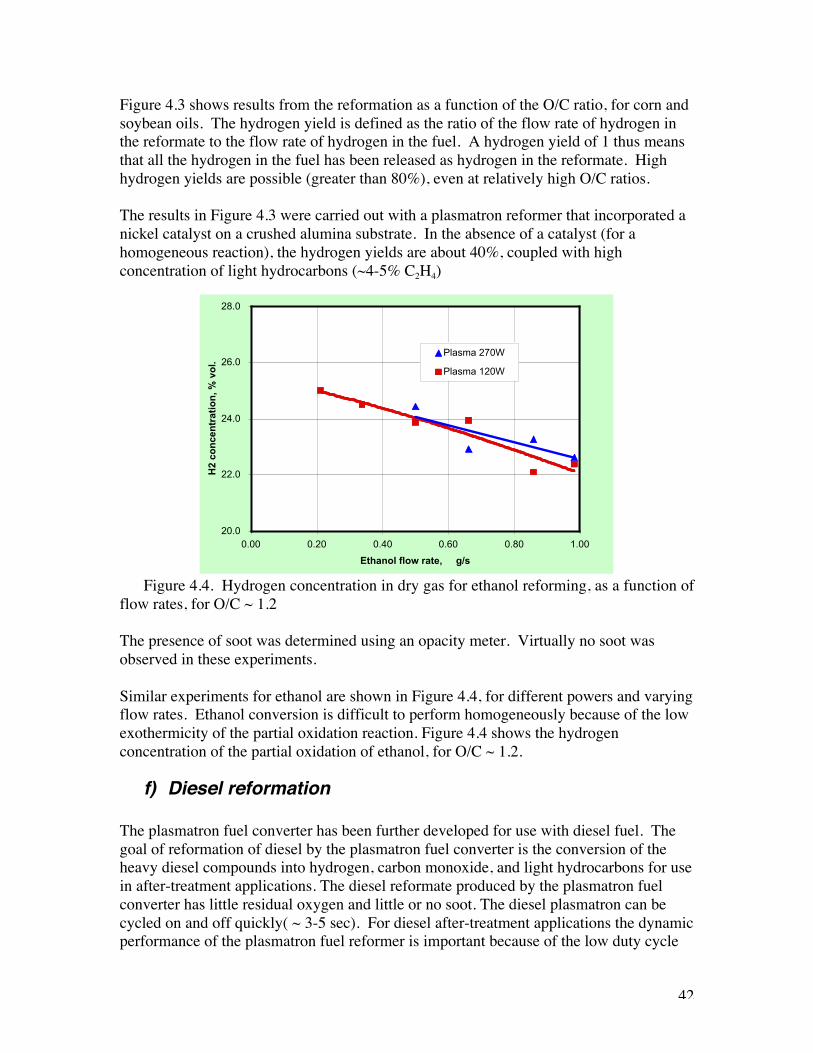
42
Figure 4.3 shows results from the reformation as a function of the O/C ratio, for corn andsoybean oils. The hydrogen yield is defined as the ratio of the flow rate of hydrogen inthe reformate to the flow rate of hydrogen in the fuel. A hydrogen yield of 1 thus meansthat all the hydrogen in the fuel has been released as hydrogen in the reformate. Highhydrogen yields are possible (greater than 80%), even at relatively high O/C ratios.
The results in Figure 4.3 were carried out with a plasmatron reformer that incorporated anickel catalyst on a crushed alumina substrate. In the absence of a catalyst (for ahomogeneous reaction), the hydrogen yields are about 40%, coupled with highconcentration of light hydrocarbons (~4-5% C2H4)
Figure 4.4. Hydrogen concentration in dry gas for ethanol reforming, as a function offlow rates, for O/C ~ 1.2
The presence of soot was determined using an opacity meter. Virtually no soot wasobserved in these experiments.
Similar experiments for ethanol are shown in Figure 4.4, for different powers and varyingflow rates. Ethanol conversion is difficult to perform homogeneously because of the lowexothermicity of the partial oxidation reaction. Figure 4.4 shows the hydrogenconcentration of the partial oxidation of ethanol, for O/C ~ 1.2.
f) Diesel reformation
The plasmatron fuel converter has been further developed for use with diesel fuel. Thegoal of reformation of diesel by the plasmatron fuel converter is the conversion of theheavy diesel compounds into hydrogen, carbon monoxide, and light hydrocarbons for usein after-treatment applications. The diesel reformate produced by the plasmatron fuelconverter has little residual oxygen and little or no soot. The diesel plasmatron can becycled on and off quickly( ~ 3-5 sec). For diesel after-treatment applications the dynamicperformance of the plasmatron fuel reformer is important because of the low duty cycle
20.0
22.0
24.0
26.0
28.0
0.00 0.20 0.40 0.60 0.80 1.00
Ethanol flow rate, g/s
H2
con
cen
trat
ion
, % v
ol.
Plasma 270W
Plasma 120W
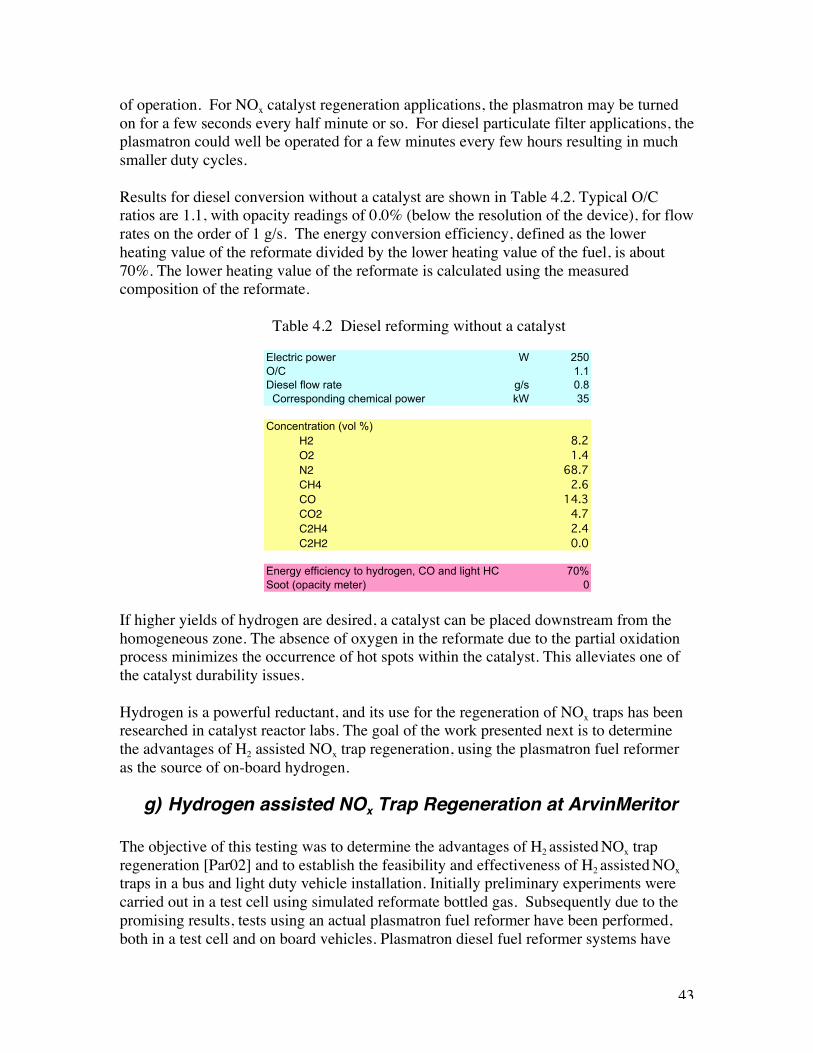
43
of operation. For NOx catalyst regeneration applications, the plasmatron may be turnedon for a few seconds every half minute or so. For diesel particulate filter applications, theplasmatron could well be operated for a few minutes every few hours resulting in muchsmaller duty cycles.
Results for diesel conversion without a catalyst are shown in Table 4.2. Typical O/Cratios are 1.1, with opacity readings of 0.0% (below the resolution of the device), for flowrates on the order of 1 g/s. The energy conversion efficiency, defined as the lowerheating value of the reformate divided by the lower heating value of the fuel, is about70%. The lower heating value of the reformate is calculated using the measuredcomposition of the reformate.
Table 4.2 Diesel reforming without a catalyst
If higher yields of hydrogen are desired, a catalyst can be placed downstream from thehomogeneous zone. The absence of oxygen in the reformate due to the partial oxidationprocess minimizes the occurrence of hot spots within the catalyst. This alleviates one ofthe catalyst durability issues.
Hydrogen is a powerful reductant, and its use for the regeneration of NOx traps has beenresearched in catalyst reactor labs. The goal of the work presented next is to determinethe advantages of H2 assisted NOx trap regeneration, using the plasmatron fuel reformeras the source of on-board hydrogen.
g) Hydrogen assisted NOx Trap Regeneration at ArvinMeritor
The objective of this testing was to determine the advantages of H2 assisted NOx trapregeneration [Par02] and to establish the feasibility and effectiveness of H2 assisted NOxtraps in a bus and light duty vehicle installation. Initially preliminary experiments werecarried out in a test cell using simulated reformate bottled gas. Subsequently due to thepromising results, tests using an actual plasmatron fuel reformer have been performed,both in a test cell and on board vehicles. Plasmatron diesel fuel reformer systems have
Electric power W 250O/C 1.1Diesel flow rate g/s 0.8 Corresponding chemical power kW 35
Concentration (vol %)H2 8.2O2 1.4N2 68.7CH4 2.6CO 14.3CO2 4.7C2H4 2.4C2H2 0.0
Energy efficiency to hydrogen, CO and light HC 70%Soot (opacity meter) 0
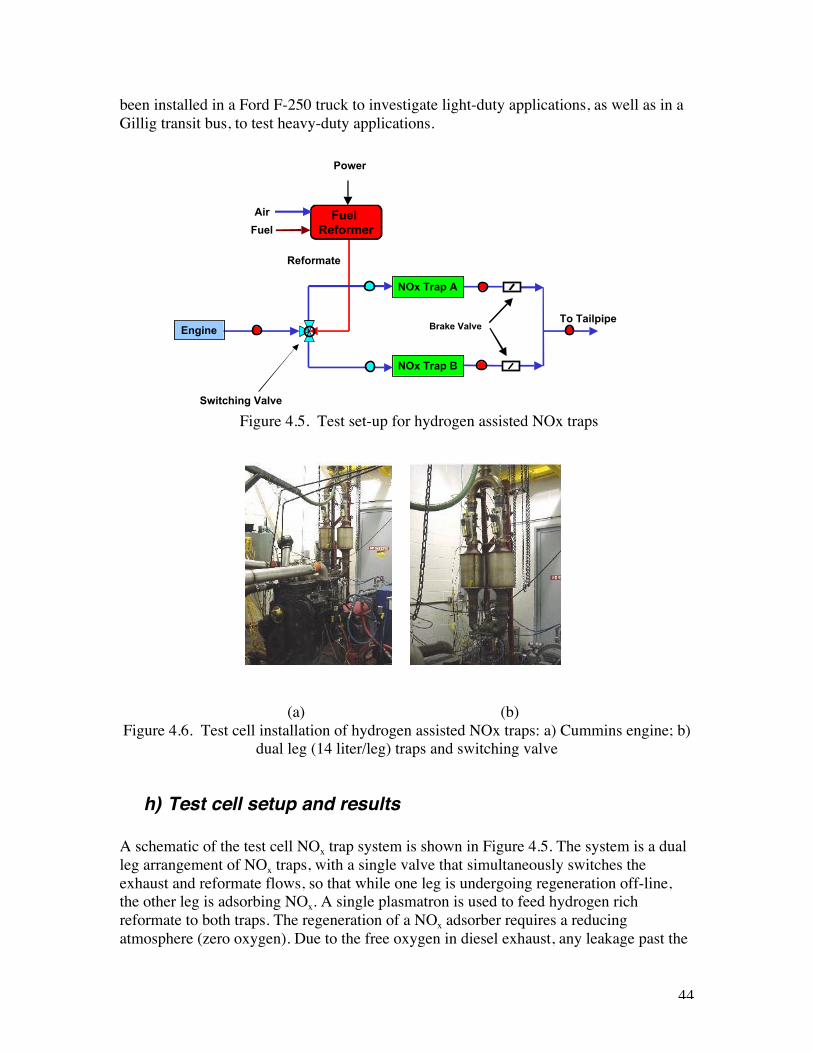
44
been installed in a Ford F-250 truck to investigate light-duty applications, as well as in aGillig transit bus, to test heavy-duty applications.
Figure 4.5. Test set-up for hydrogen assisted NOx traps
(a) (b)Figure 4.6. Test cell installation of hydrogen assisted NOx traps: a) Cummins engine; b)
dual leg (14 liter/leg) traps and switching valve
h) Test cell setup and results
A schematic of the test cell NOx trap system is shown in Figure 4.5. The system is a dualleg arrangement of NOx traps, with a single valve that simultaneously switches theexhaust and reformate flows, so that while one leg is undergoing regeneration off-line,the other leg is adsorbing NOx. A single plasmatron is used to feed hydrogen richreformate to both traps. The regeneration of a NOx adsorber requires a reducingatmosphere (zero oxygen). Due to the free oxygen in diesel exhaust, any leakage past the
NOx Trap A
Engine
Reformate
To Tailpipe
NOx Trap B
Switching Valve
Fuel ReformerFuel
Air
Power
Brake Valve
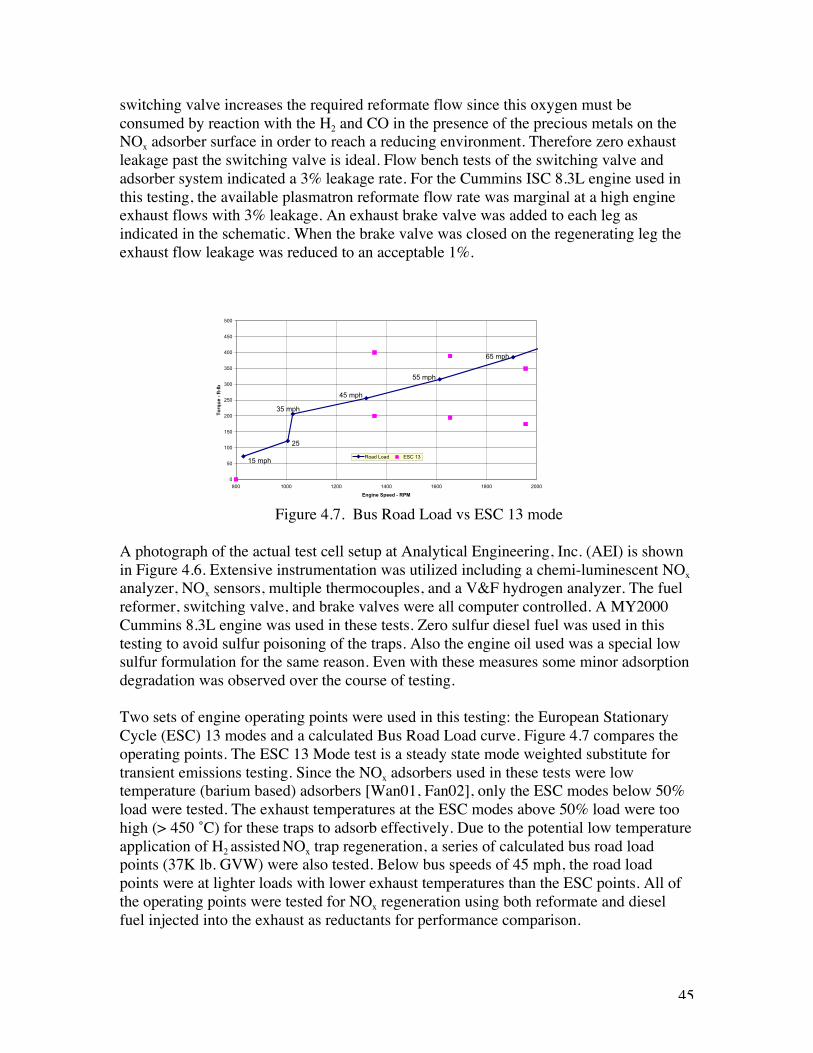
45
switching valve increases the required reformate flow since this oxygen must beconsumed by reaction with the H2 and CO in the presence of the precious metals on theNOx adsorber surface in order to reach a reducing environment. Therefore zero exhaustleakage past the switching valve is ideal. Flow bench tests of the switching valve andadsorber system indicated a 3% leakage rate. For the Cummins ISC 8.3L engine used inthis testing, the available plasmatron reformate flow rate was marginal at a high engineexhaust flows with 3% leakage. An exhaust brake valve was added to each leg asindicated in the schematic. When the brake valve was closed on the regenerating leg theexhaust flow leakage was reduced to an acceptable 1%.
Figure 4.7. Bus Road Load vs ESC 13 mode
A photograph of the actual test cell setup at Analytical Engineering, Inc. (AEI) is shownin Figure 4.6. Extensive instrumentation was utilized including a chemi-luminescent NOxanalyzer, NOx sensors, multiple thermocouples, and a V&F hydrogen analyzer. The fuelreformer, switching valve, and brake valves were all computer controlled. A MY2000Cummins 8.3L engine was used in these tests. Zero sulfur diesel fuel was used in thistesting to avoid sulfur poisoning of the traps. Also the engine oil used was a special lowsulfur formulation for the same reason. Even with these measures some minor adsorptiondegradation was observed over the course of testing.
Two sets of engine operating points were used in this testing: the European StationaryCycle (ESC) 13 modes and a calculated Bus Road Load curve. Figure 4.7 compares theoperating points. The ESC 13 Mode test is a steady state mode weighted substitute fortransient emissions testing. Since the NOx adsorbers used in these tests were lowtemperature (barium based) adsorbers [Wan01, Fan02], only the ESC modes below 50%load were tested. The exhaust temperatures at the ESC modes above 50% load were toohigh (> 450 ˚C) for these traps to adsorb effectively. Due to the potential low temperatureapplication of H2 assisted NOx trap regeneration, a series of calculated bus road loadpoints (37K lb. GVW) were also tested. Below bus speeds of 45 mph, the road loadpoints were at lighter loads with lower exhaust temperatures than the ESC points. All ofthe operating points were tested for NOx regeneration using both reformate and dieselfuel injected into the exhaust as reductants for performance comparison.
0
50
100
150
200
250
300
350
400
450
500
800 1000 1200 1400 1600 1800 2000
Engine Speed - RPM
To
rqu
e -
ft-l
b
Road Load ESC 13
45 mph
35 mph
25
15 mph
55 mph
65 mph
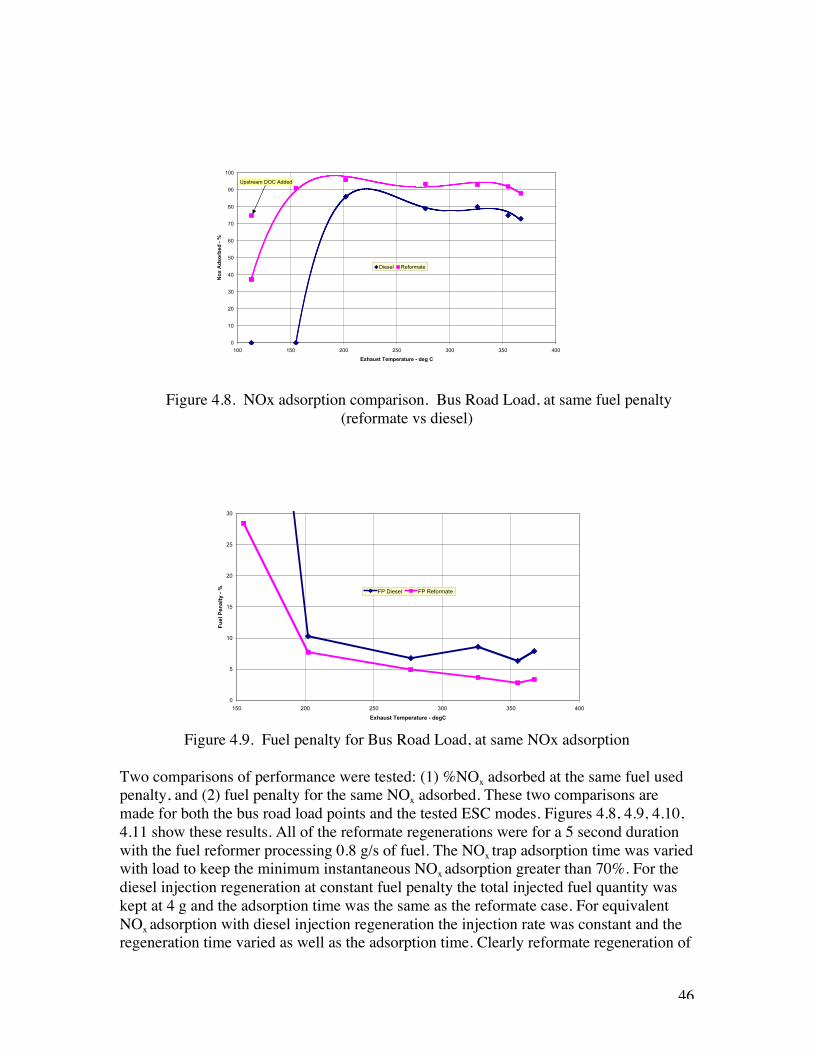
46
Figure 4.8. NOx adsorption comparison. Bus Road Load, at same fuel penalty(reformate vs diesel)
Figure 4.9. Fuel penalty for Bus Road Load, at same NOx adsorption
Two comparisons of performance were tested: (1) %NOx adsorbed at the same fuel usedpenalty, and (2) fuel penalty for the same NOx adsorbed. These two comparisons aremade for both the bus road load points and the tested ESC modes. Figures 4.8, 4.9, 4.10,4.11 show these results. All of the reformate regenerations were for a 5 second durationwith the fuel reformer processing 0.8 g/s of fuel. The NOx trap adsorption time was variedwith load to keep the minimum instantaneous NOx adsorption greater than 70%. For thediesel injection regeneration at constant fuel penalty the total injected fuel quantity waskept at 4 g and the adsorption time was the same as the reformate case. For equivalentNOx adsorption with diesel injection regeneration the injection rate was constant and theregeneration time varied as well as the adsorption time. Clearly reformate regeneration of
0
5
10
15
20
25
30
150 200 250 300 350 400
Exhaust Temperature - degC
Fu
el P
enal
ty -
% FP Diesel FP Reformate
0
10
20
30
40
50
60
70
80
90
100
100 150 200 250 300 350 400
Exhaust Temperature - deg C
No
x A
dso
rbed
- %
Diesel Reformate
Upstream DOC Added
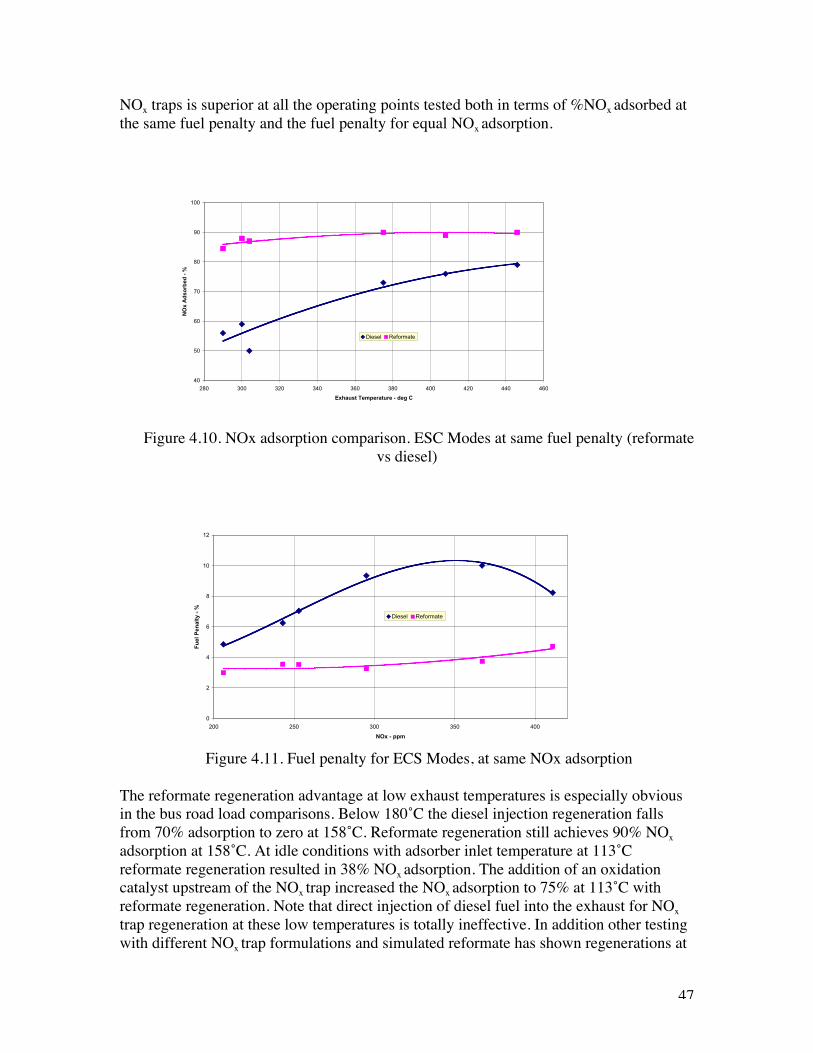
47
NOx traps is superior at all the operating points tested both in terms of %NOx adsorbed atthe same fuel penalty and the fuel penalty for equal NOx adsorption.
Figure 4.10. NOx adsorption comparison. ESC Modes at same fuel penalty (reformatevs diesel)
Figure 4.11. Fuel penalty for ECS Modes, at same NOx adsorption
The reformate regeneration advantage at low exhaust temperatures is especially obviousin the bus road load comparisons. Below 180˚C the diesel injection regeneration fallsfrom 70% adsorption to zero at 158˚C. Reformate regeneration still achieves 90% NOxadsorption at 158˚C. At idle conditions with adsorber inlet temperature at 113˚Creformate regeneration resulted in 38% NOx adsorption. The addition of an oxidationcatalyst upstream of the NOx trap increased the NOx adsorption to 75% at 113˚C withreformate regeneration. Note that direct injection of diesel fuel into the exhaust for NOxtrap regeneration at these low temperatures is totally ineffective. In addition other testingwith different NOx trap formulations and simulated reformate has shown regenerations at
40
50
60
70
80
90
100
280 300 320 340 360 380 400 420 440 460
Exhaust Temperature - deg C
NO
x A
dso
rbed
- %
Diesel Reformate
0
2
4
6
8
10
12
200 250 300 350 400
NOx - ppm
Fu
el P
enal
ty -
%
Diesel Reformate
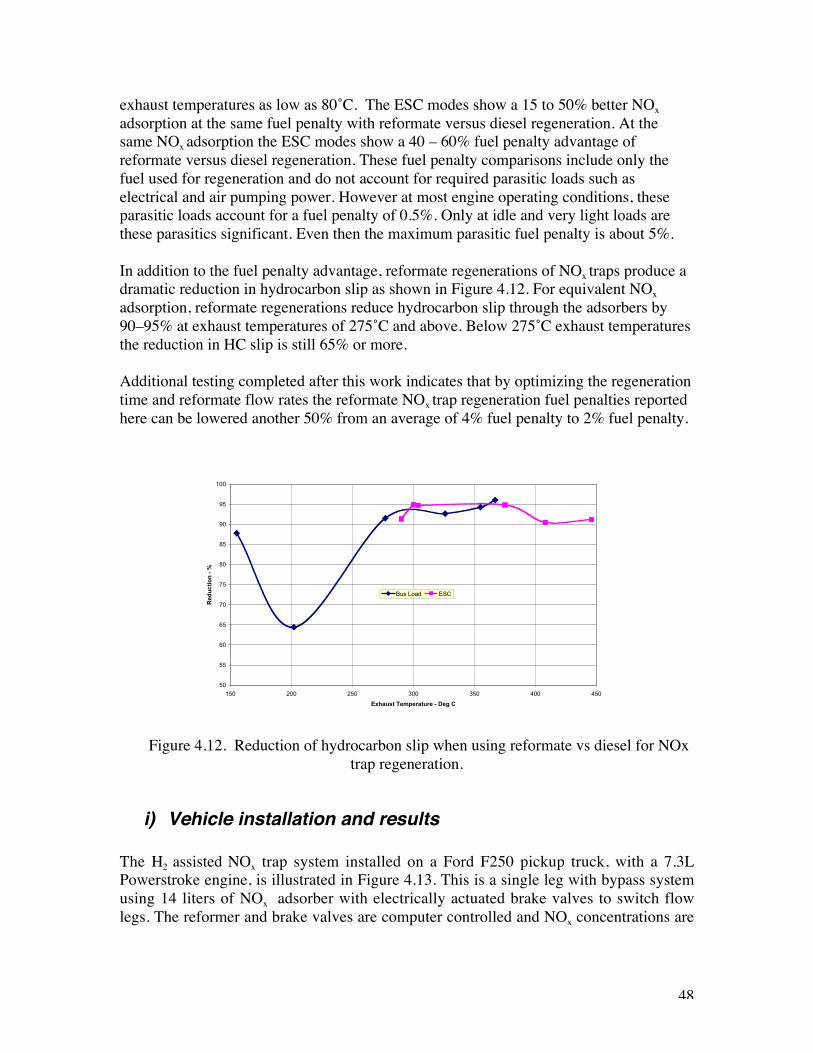
48
exhaust temperatures as low as 80˚C. The ESC modes show a 15 to 50% better NOxadsorption at the same fuel penalty with reformate versus diesel regeneration. At thesame NOx adsorption the ESC modes show a 40 – 60% fuel penalty advantage ofreformate versus diesel regeneration. These fuel penalty comparisons include only thefuel used for regeneration and do not account for required parasitic loads such aselectrical and air pumping power. However at most engine operating conditions, theseparasitic loads account for a fuel penalty of 0.5%. Only at idle and very light loads arethese parasitics significant. Even then the maximum parasitic fuel penalty is about 5%.
In addition to the fuel penalty advantage, reformate regenerations of NOx traps produce adramatic reduction in hydrocarbon slip as shown in Figure 4.12. For equivalent NOxadsorption, reformate regenerations reduce hydrocarbon slip through the adsorbers by90–95% at exhaust temperatures of 275˚C and above. Below 275˚C exhaust temperaturesthe reduction in HC slip is still 65% or more.
Additional testing completed after this work indicates that by optimizing the regenerationtime and reformate flow rates the reformate NOx trap regeneration fuel penalties reportedhere can be lowered another 50% from an average of 4% fuel penalty to 2% fuel penalty.
Figure 4.12. Reduction of hydrocarbon slip when using reformate vs diesel for NOxtrap regeneration.
i) Vehicle installation and results
The H2 assisted NOx trap system installed on a Ford F250 pickup truck, with a 7.3LPowerstroke engine, is illustrated in Figure 4.13. This is a single leg with bypass systemusing 14 liters of NOx adsorber with electrically actuated brake valves to switch flowlegs. The reformer and brake valves are computer controlled and NOx concentrations are
50
55
60
65
70
75
80
85
90
95
100
150 200 250 300 350 400 450
Exhaust Temperature - Deg C
Red
uct
ion
- %
Bus Load ESC
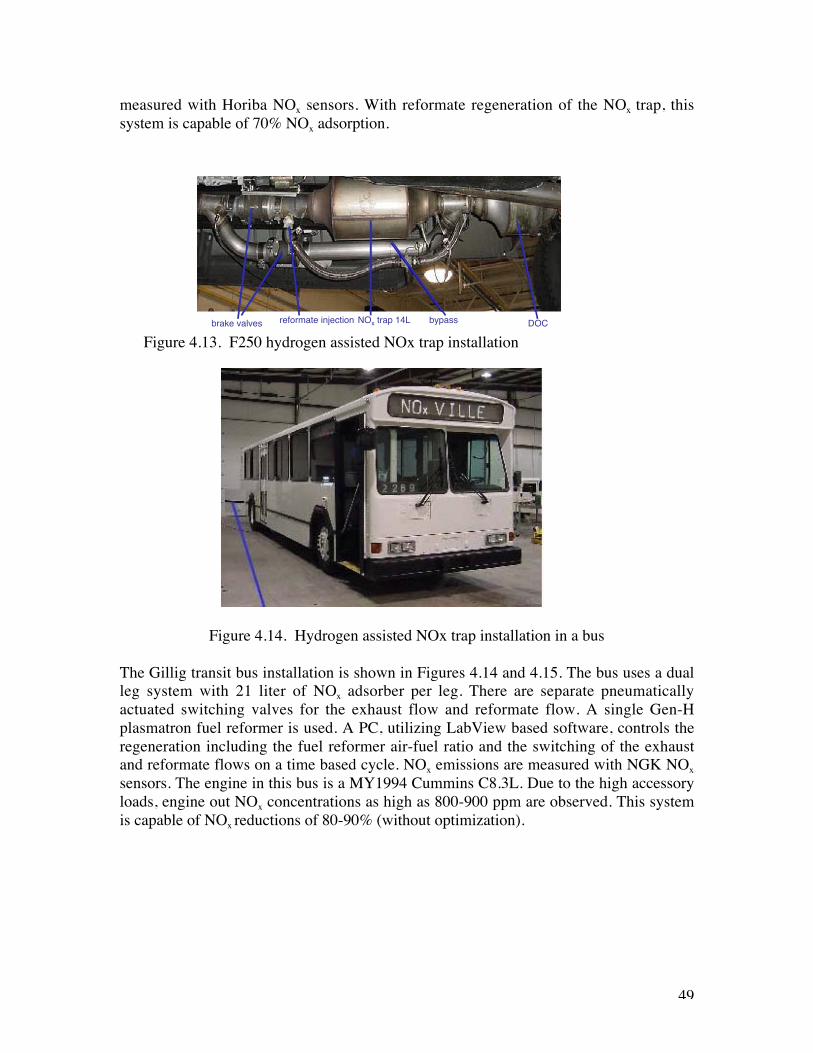
49
measured with Horiba NOx sensors. With reformate regeneration of the NOx trap, thissystem is capable of 70% NOx adsorption.
Figure 4.13. F250 hydrogen assisted NOx trap installation
Figure 4.14. Hydrogen assisted NOx trap installation in a bus
The Gillig transit bus installation is shown in Figures 4.14 and 4.15. The bus uses a dualleg system with 21 liter of NOx adsorber per leg. There are separate pneumaticallyactuated switching valves for the exhaust flow and reformate flow. A single Gen-Hplasmatron fuel reformer is used. A PC, utilizing LabView based software, controls theregeneration including the fuel reformer air-fuel ratio and the switching of the exhaustand reformate flows on a time based cycle. NOx emissions are measured with NGK NOxsensors. The engine in this bus is a MY1994 Cummins C8.3L. Due to the high accessoryloads, engine out NOx concentrations as high as 800-900 ppm are observed. This systemis capable of NOx reductions of 80-90% (without optimization).
brake valves reformate injection NOx trap 14L bypass DOC
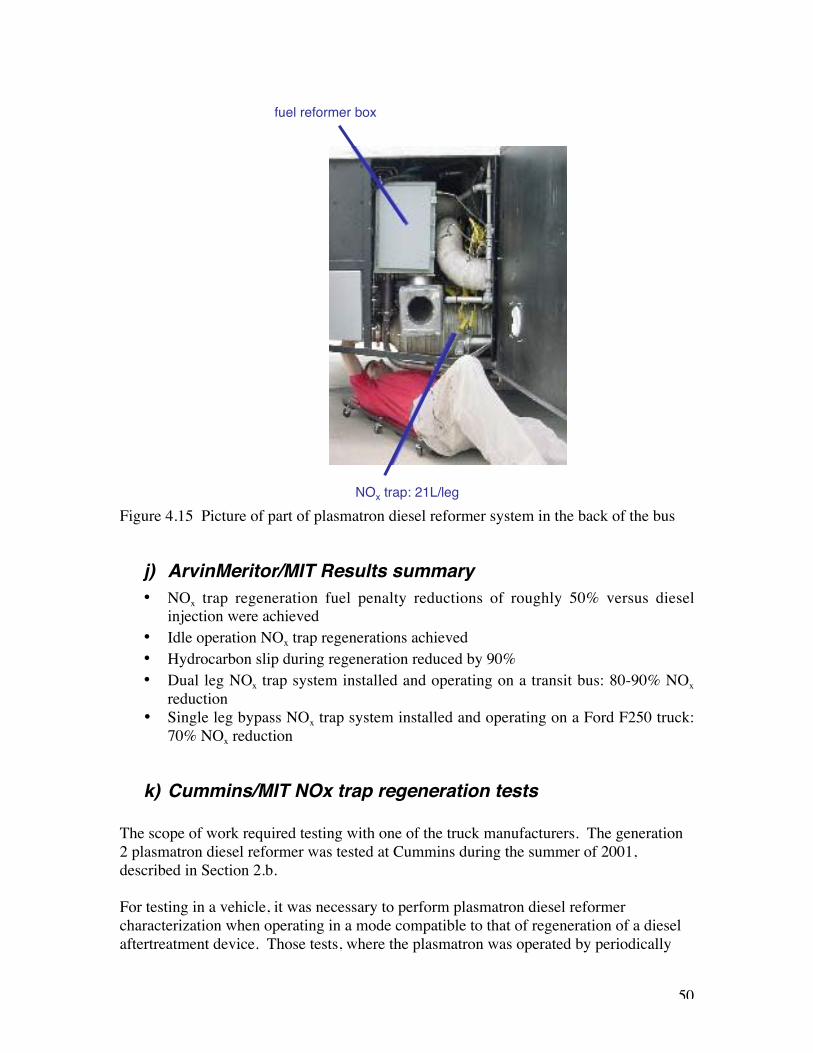
50
Figure 4.15 Picture of part of plasmatron diesel reformer system in the back of the bus
j) ArvinMeritor/MIT Results summary• NOx trap regeneration fuel penalty reductions of roughly 50% versus diesel
injection were achieved• Idle operation NOx trap regenerations achieved• Hydrocarbon slip during regeneration reduced by 90%• Dual leg NOx trap system installed and operating on a transit bus: 80-90% NOx
reduction• Single leg bypass NOx trap system installed and operating on a Ford F250 truck:
70% NOx reduction
k) Cummins/MIT NOx trap regeneration tests
The scope of work required testing with one of the truck manufacturers. The generation2 plasmatron diesel reformer was tested at Cummins during the summer of 2001,described in Section 2.b.
For testing in a vehicle, it was necessary to perform plasmatron diesel reformercharacterization when operating in a mode compatible to that of regeneration of a dieselaftertreatment device. Those tests, where the plasmatron was operated by periodically
NOx trap: 21L/leg
fuel reformer box
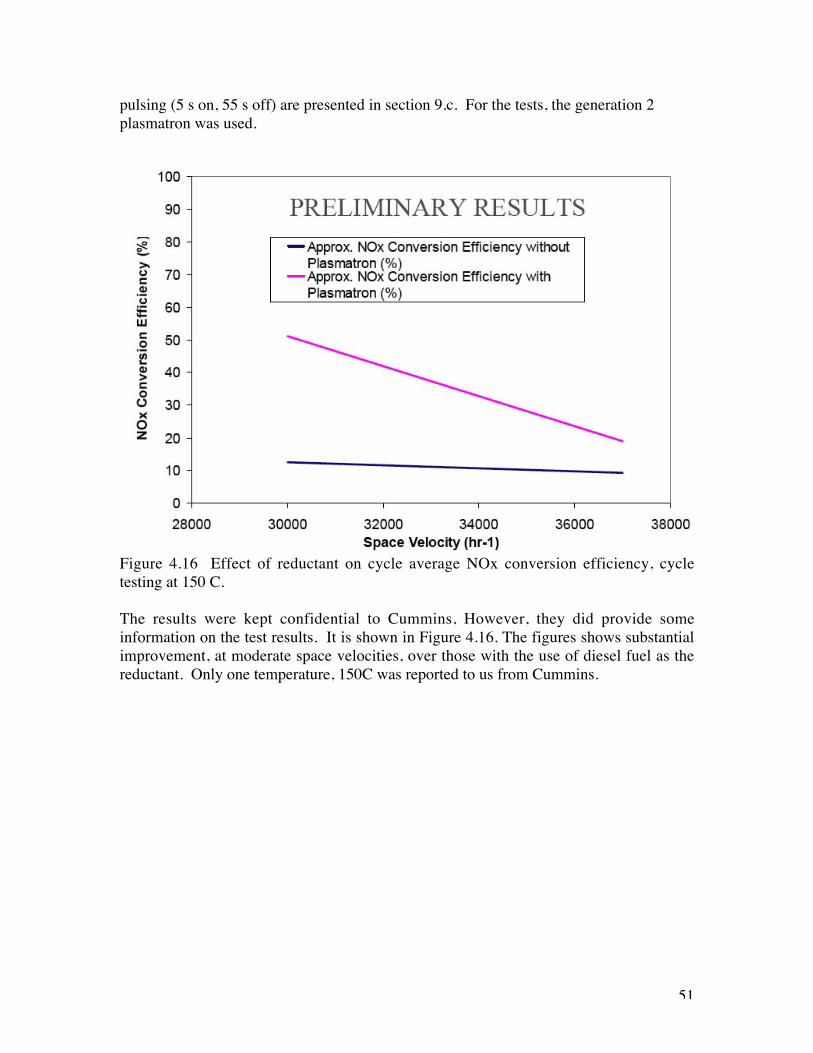
51
pulsing (5 s on, 55 s off) are presented in section 9.c. For the tests, the generation 2plasmatron was used.
Figure 4.16 Effect of reductant on cycle average NOx conversion efficiency, cycletesting at 150 C.
The results were kept confidential to Cummins, However, they did provide someinformation on the test results. It is shown in Figure 4.16. The figures shows substantialimprovement, at moderate space velocities, over those with the use of diesel fuel as thereductant. Only one temperature, 150C was reported to us from Cummins.
52
5) Plasmatron application to aftertreatment II: DPF trap
Particulate and emissions from diesel vehicles have been determined to be hazardous tohealth. In addition, particulate emissions may aid to the global warming trends because ofthe reduced reflectivity of large masses of ice/snow. Diesel emissions have beenregulated in the developed countries. Tighter regulations already in the books requiresubstantially decreased emissions in the next 5 years.
A promising technology to accomplish the required reduction is the Diesel ParticulateFilter (DPF). The filters are porous ceramics through which the gases flow relativelyunimpeded, but the solids in the exhaust are trapped. Eventually there is sufficientbuildup of the particulates in the trap that the gas flow is impeded, and regeneration needsto take place.
Two types of traps exist, with or without a catalyst coating. Uncoated DPF are attractivebecause of reduced cost, and because it is likely that some method of active regenerationwill be required even if used rarely. The uncoated DPF need to be regenerated by thecombination of temperature and oxygen. Combustor technology has been developed.However, there may be important advantages to regenerate the DPF using hydrogen richgas, in which the reformate is combusted in the trap itself, hopefully by the soot. Thepotential advantages are reduced thermal stress, lower temperature of trap regeneration,reduced possibility of uncontrolled regeneration that may result in the destruction of thetrap and lower fuel penalty by the use of controlled burn. These advantages may result inenhanced reliability and increased lifetime. For both catalyzed and non-catalyzed traps,there has to be sufficient oxygen in the flow through the DPF in order to combust thesoot. For any active regeneration method, the system should be able to operate over awide range of non-stationary conditions.
In order to “ignite” the particulate matter, it has also determined that a temperature in therange of 600-650 C was required in the presence of oxygen. Measured activation energiesvaries from ~60 kJ/mol to 170 kJ/mol. The temperature rise of the gas across the DPF(and the temperature of the DPF unit) depends on the oxygen content, the mass loading ofthe field and the flow rate. The temperature excursion due to the soot combustion can beas low as a few degrees to high temperature excursions that can result in the destructionof the trap.
Two modes of regeneration have been observed in uncatalyzed traps. Visual evidence ofthe mode modes has been obtained by Haralampous [Har03, Han03]. The first moderesults in a uniform regeneration of the trap, with mild temperature excursions andrelatively long regeneration times because of the low temperatures. This mode ofregeneration built in margins, results in a more uniform regeneration, but increases thefuel consumption due to the fact that the temperatures need to be maintained longer, inthe case of non-self-sustaining regeneration. The second regeneration mode results in aself-sustained or near-self sustained burn, with higher temperatures, non-uniform andfaster regeneration (in some cases resembling a propagating front). The nature of the
53
regeneration process is determined mainly by the trap soot loading, the free oxygencontent of the exhaust and the exhaust flow rate.
In the second mode of operation the regeneration is performed by increasing thetemperature of the exhaust to the point where the soot ignites and starts a self-sustainingburn. Once started, it is uncontrolled. If there is too much soot in the trap or if the free-oxygen concentration is increased (from lower torque operation, for example) thetemperatures of the combustion process can exceed the temperature limitations of thefilter. A single event may result in unintentional destruction of the filter.
Low temperature regeneration may result in more uniform regeneration. Non-uniformregeneration that results in partial regeneration of the DPF has been modeled and testedby Haralampous et al. [Har03], and others. The flow through the DPF, even if uniformlyloaded, changes during regeneration. If some regions are cleaned prior to others, the flowpattern downstream of the clean channel can be substantially modified, with anincreasing fraction of the flow occurring through the clean region. Non-uniform channelregeneration affects both the radial and axial flow patterns. Axial flow patternmaldistribution occurs when the upstream region of a channel is cleansed faster, afterwhich the gas flows across the cleansed region instead of the downstream, soot-loadedchannel.
The first mode of operation is attractive in that the rate of combustion, and thetemperature of the regeneration process, is dominated by the exhaust gas and not by theself-sustained combustion of the soot. From the above discussion, low temperature, slowuniform regeneration has attractive features.
Tests with active regeneration are taking place both in the US [And04] as well as inEurope [Fay04]. Active techniques at present seem to be necessary for those vehicleswith substantial idling, where the exhaust temperatures are too low for self-sustainedDPF regeneration. These concepts depend on thermal management to increase thetemperature of the DPF, as well as active introduction of fuel upstream in the exhaust.The fuel is injected upstream from a diesel oxidation catalyst (DOC) that is locatedupstream from the trap. The fuel is consumed in the DOC, increasing the temperature ofthe exhaust. The oxygen content downstream from the DOC is sufficient for sootcombustion.
Alternative methods to the catalytic combustor involves a conventional combustor. Thistechnology is being tested by Arvin Meritor.
Fuel reformers are being considered for on-board applications, for hydrogen generationfor use with fuel cells, for use in NOx trap regeneration, and for combustionimprovement in SI engines. The MIT team is developing plasmatron fuel reformers, bothfor gasoline and diesel applications. Both catalytic and homogenous reformers are beinginvestigated. Plasma based reformers are robust, fast response and have wide operatingcapability. It is the purpose of this section to illustrate the options investigated under this
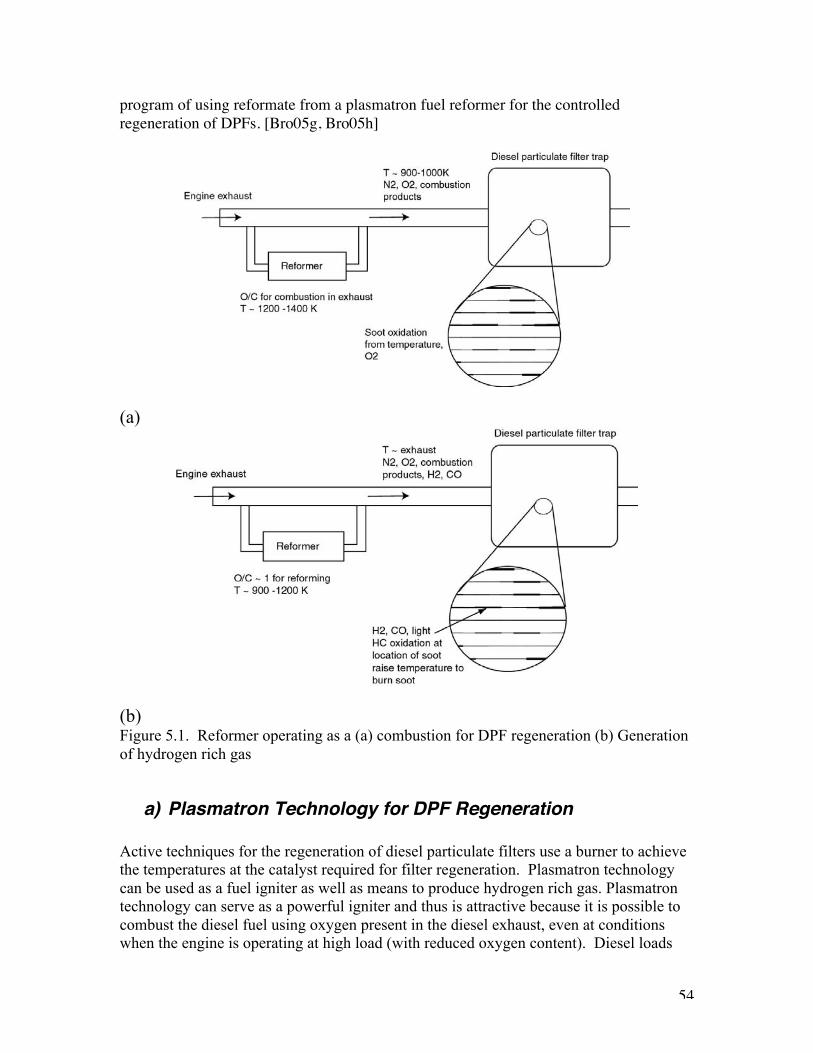
54
program of using reformate from a plasmatron fuel reformer for the controlledregeneration of DPFs. [Bro05g, Bro05h]
(a)
(b)Figure 5.1. Reformer operating as a (a) combustion for DPF regeneration (b) Generationof hydrogen rich gas
a) Plasmatron Technology for DPF Regeneration
Active techniques for the regeneration of diesel particulate filters use a burner to achievethe temperatures at the catalyst required for filter regeneration. Plasmatron technologycan be used as a fuel igniter as well as means to produce hydrogen rich gas. Plasmatrontechnology can serve as a powerful igniter and thus is attractive because it is possible tocombust the diesel fuel using oxygen present in the diesel exhaust, even at conditionswhen the engine is operating at high load (with reduced oxygen content). Diesel loads
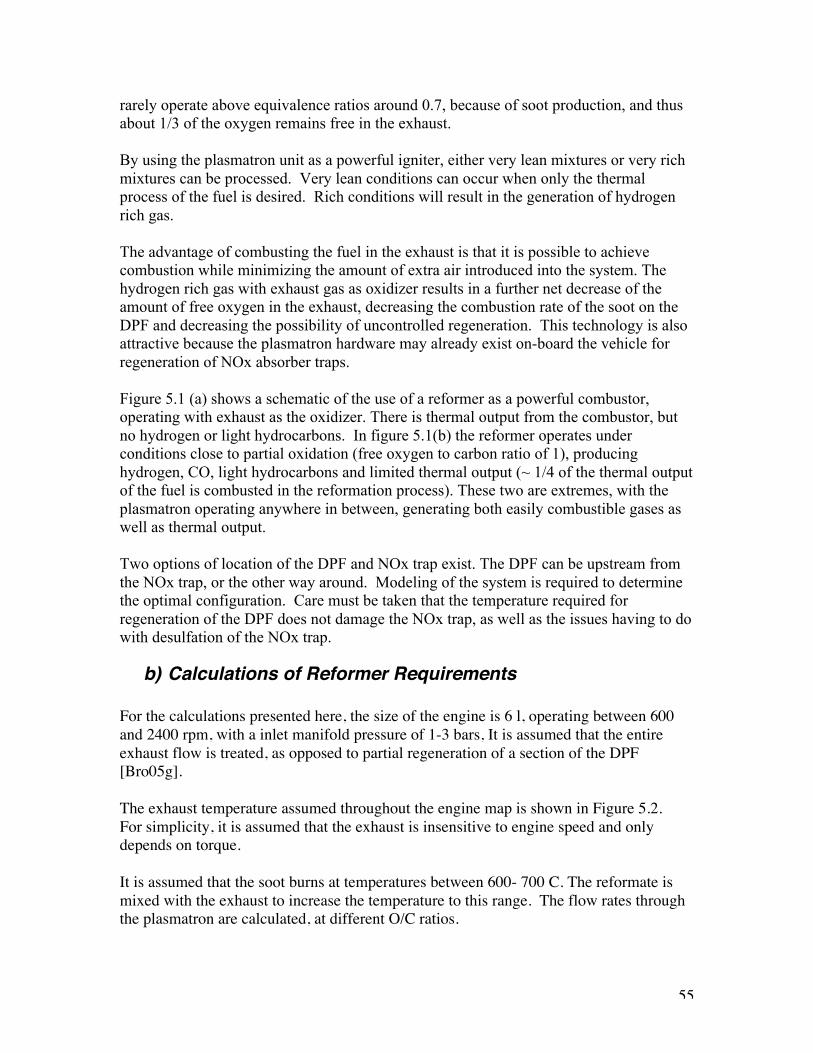
55
rarely operate above equivalence ratios around 0.7, because of soot production, and thusabout 1/3 of the oxygen remains free in the exhaust.
By using the plasmatron unit as a powerful igniter, either very lean mixtures or very richmixtures can be processed. Very lean conditions can occur when only the thermalprocess of the fuel is desired. Rich conditions will result in the generation of hydrogenrich gas.
The advantage of combusting the fuel in the exhaust is that it is possible to achievecombustion while minimizing the amount of extra air introduced into the system. Thehydrogen rich gas with exhaust gas as oxidizer results in a further net decrease of theamount of free oxygen in the exhaust, decreasing the combustion rate of the soot on theDPF and decreasing the possibility of uncontrolled regeneration. This technology is alsoattractive because the plasmatron hardware may already exist on-board the vehicle forregeneration of NOx absorber traps.
Figure 5.1 (a) shows a schematic of the use of a reformer as a powerful combustor,operating with exhaust as the oxidizer. There is thermal output from the combustor, butno hydrogen or light hydrocarbons. In figure 5.1(b) the reformer operates underconditions close to partial oxidation (free oxygen to carbon ratio of 1), producinghydrogen, CO, light hydrocarbons and limited thermal output (~ 1/4 of the thermal outputof the fuel is combusted in the reformation process). These two are extremes, with theplasmatron operating anywhere in between, generating both easily combustible gases aswell as thermal output.
Two options of location of the DPF and NOx trap exist. The DPF can be upstream fromthe NOx trap, or the other way around. Modeling of the system is required to determinethe optimal configuration. Care must be taken that the temperature required forregeneration of the DPF does not damage the NOx trap, as well as the issues having to dowith desulfation of the NOx trap.
b) Calculations of Reformer Requirements
For the calculations presented here, the size of the engine is 6 l, operating between 600and 2400 rpm, with a inlet manifold pressure of 1-3 bars, It is assumed that the entireexhaust flow is treated, as opposed to partial regeneration of a section of the DPF[Bro05g].
The exhaust temperature assumed throughout the engine map is shown in Figure 5.2.For simplicity, it is assumed that the exhaust is insensitive to engine speed and onlydepends on torque.
It is assumed that the soot burns at temperatures between 600- 700 C. The reformate ismixed with the exhaust to increase the temperature to this range. The flow rates throughthe plasmatron are calculated, at different O/C ratios.
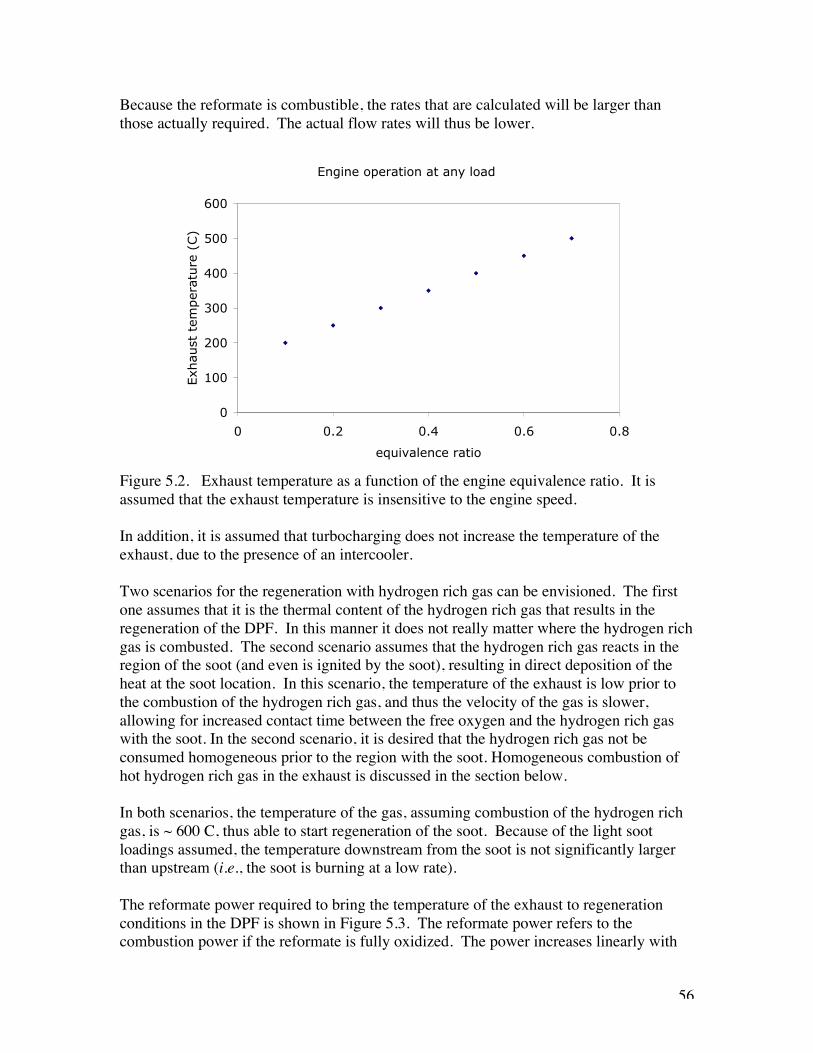
56
Because the reformate is combustible, the rates that are calculated will be larger thanthose actually required. The actual flow rates will thus be lower.
Figure 5.2. Exhaust temperature as a function of the engine equivalence ratio. It isassumed that the exhaust temperature is insensitive to the engine speed.
In addition, it is assumed that turbocharging does not increase the temperature of theexhaust, due to the presence of an intercooler.
Two scenarios for the regeneration with hydrogen rich gas can be envisioned. The firstone assumes that it is the thermal content of the hydrogen rich gas that results in theregeneration of the DPF. In this manner it does not really matter where the hydrogen richgas is combusted. The second scenario assumes that the hydrogen rich gas reacts in theregion of the soot (and even is ignited by the soot), resulting in direct deposition of theheat at the soot location. In this scenario, the temperature of the exhaust is low prior tothe combustion of the hydrogen rich gas, and thus the velocity of the gas is slower,allowing for increased contact time between the free oxygen and the hydrogen rich gaswith the soot. In the second scenario, it is desired that the hydrogen rich gas not beconsumed homogeneous prior to the region with the soot. Homogeneous combustion ofhot hydrogen rich gas in the exhaust is discussed in the section below.
In both scenarios, the temperature of the gas, assuming combustion of the hydrogen richgas, is ~ 600 C, thus able to start regeneration of the soot. Because of the light sootloadings assumed, the temperature downstream from the soot is not significantly largerthan upstream (i.e., the soot is burning at a low rate).
The reformate power required to bring the temperature of the exhaust to regenerationconditions in the DPF is shown in Figure 5.3. The reformate power refers to thecombustion power if the reformate is fully oxidized. The power increases linearly with
Engine operation at any load
0
100
200
300
400
500
600
0 0.2 0.4 0.6 0.8
equivalence ratio
Exh
aust
tem
per
ature
(C)
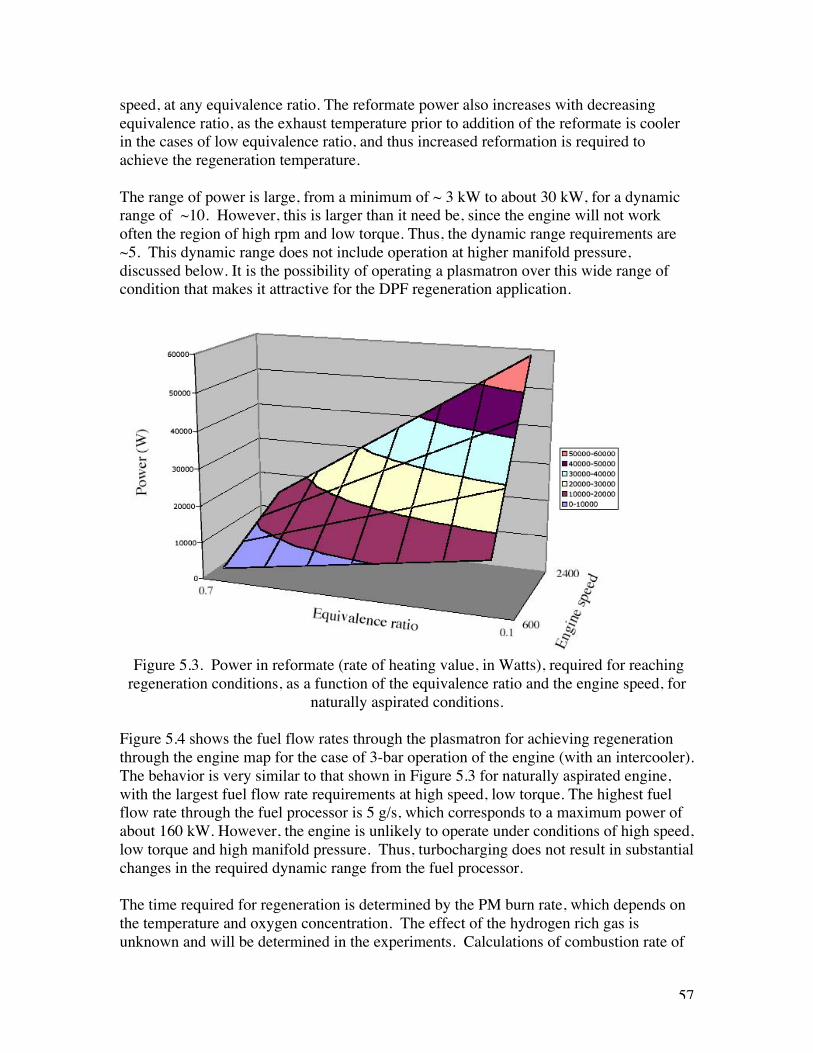
57
speed, at any equivalence ratio. The reformate power also increases with decreasingequivalence ratio, as the exhaust temperature prior to addition of the reformate is coolerin the cases of low equivalence ratio, and thus increased reformation is required toachieve the regeneration temperature.
The range of power is large, from a minimum of ~ 3 kW to about 30 kW, for a dynamicrange of ~10. However, this is larger than it need be, since the engine will not workoften the region of high rpm and low torque. Thus, the dynamic range requirements are~5. This dynamic range does not include operation at higher manifold pressure,discussed below. It is the possibility of operating a plasmatron over this wide range ofcondition that makes it attractive for the DPF regeneration application.
Figure 5.3. Power in reformate (rate of heating value, in Watts), required for reachingregeneration conditions, as a function of the equivalence ratio and the engine speed, for
naturally aspirated conditions.
Figure 5.4 shows the fuel flow rates through the plasmatron for achieving regenerationthrough the engine map for the case of 3-bar operation of the engine (with an intercooler).The behavior is very similar to that shown in Figure 5.3 for naturally aspirated engine,with the largest fuel flow rate requirements at high speed, low torque. The highest fuelflow rate through the fuel processor is 5 g/s, which corresponds to a maximum power ofabout 160 kW. However, the engine is unlikely to operate under conditions of high speed,low torque and high manifold pressure. Thus, turbocharging does not result in substantialchanges in the required dynamic range from the fuel processor.
The time required for regeneration is determined by the PM burn rate, which depends onthe temperature and oxygen concentration. The effect of the hydrogen rich gas isunknown and will be determined in the experiments. Calculations of combustion rate of
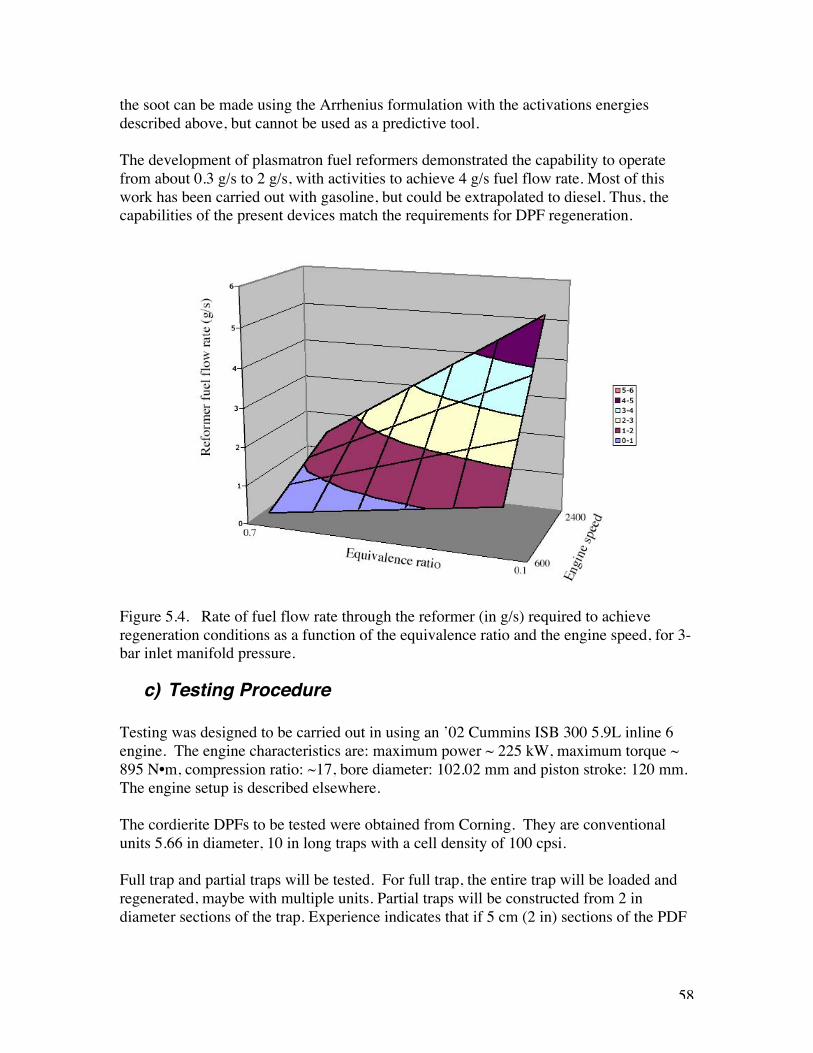
58
the soot can be made using the Arrhenius formulation with the activations energiesdescribed above, but cannot be used as a predictive tool.
The development of plasmatron fuel reformers demonstrated the capability to operatefrom about 0.3 g/s to 2 g/s, with activities to achieve 4 g/s fuel flow rate. Most of thiswork has been carried out with gasoline, but could be extrapolated to diesel. Thus, thecapabilities of the present devices match the requirements for DPF regeneration.
Figure 5.4. Rate of fuel flow rate through the reformer (in g/s) required to achieveregeneration conditions as a function of the equivalence ratio and the engine speed, for 3-bar inlet manifold pressure.
c) Testing Procedure
Testing was designed to be carried out in using an ’02 Cummins ISB 300 5.9L inline 6engine. The engine characteristics are: maximum power ~ 225 kW, maximum torque ~895 N•m, compression ratio: ~17, bore diameter: 102.02 mm and piston stroke: 120 mm.The engine setup is described elsewhere.
The cordierite DPFs to be tested were obtained from Corning. They are conventionalunits 5.66 in diameter, 10 in long traps with a cell density of 100 cpsi.
Full trap and partial traps will be tested. For full trap, the entire trap will be loaded andregenerated, maybe with multiple units. Partial traps will be constructed from 2 indiameter sections of the trap. Experience indicates that if 5 cm (2 in) sections of the PDF
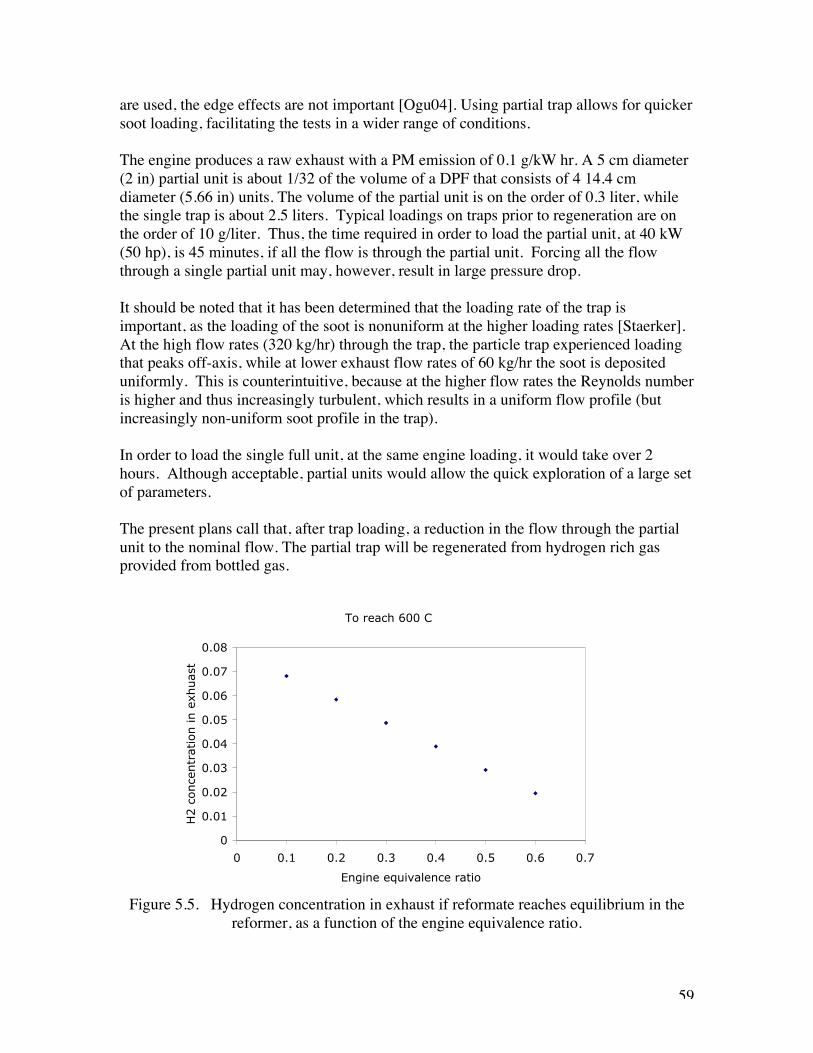
59
are used, the edge effects are not important [Ogu04]. Using partial trap allows for quickersoot loading, facilitating the tests in a wider range of conditions.
The engine produces a raw exhaust with a PM emission of 0.1 g/kW hr. A 5 cm diameter(2 in) partial unit is about 1/32 of the volume of a DPF that consists of 4 14.4 cmdiameter (5.66 in) units. The volume of the partial unit is on the order of 0.3 liter, whilethe single trap is about 2.5 liters. Typical loadings on traps prior to regeneration are onthe order of 10 g/liter. Thus, the time required in order to load the partial unit, at 40 kW(50 hp), is 45 minutes, if all the flow is through the partial unit. Forcing all the flowthrough a single partial unit may, however, result in large pressure drop.
It should be noted that it has been determined that the loading rate of the trap isimportant, as the loading of the soot is nonuniform at the higher loading rates [Staerker].At the high flow rates (320 kg/hr) through the trap, the particle trap experienced loadingthat peaks off-axis, while at lower exhaust flow rates of 60 kg/hr the soot is depositeduniformly. This is counterintuitive, because at the higher flow rates the Reynolds numberis higher and thus increasingly turbulent, which results in a uniform flow profile (butincreasingly non-uniform soot profile in the trap).
In order to load the single full unit, at the same engine loading, it would take over 2hours. Although acceptable, partial units would allow the quick exploration of a large setof parameters.
The present plans call that, after trap loading, a reduction in the flow through the partialunit to the nominal flow. The partial trap will be regenerated from hydrogen rich gasprovided from bottled gas.
Figure 5.5. Hydrogen concentration in exhaust if reformate reaches equilibrium in thereformer, as a function of the engine equivalence ratio.
To reach 600 C
0
0.01
0.02
0.03
0.04
0.05
0.06
0.07
0.08
0 0.1 0.2 0.3 0.4 0.5 0.6 0.7
Engine equivalence ratio
H2 c
once
ntr
atio
n in e
xhuas
t
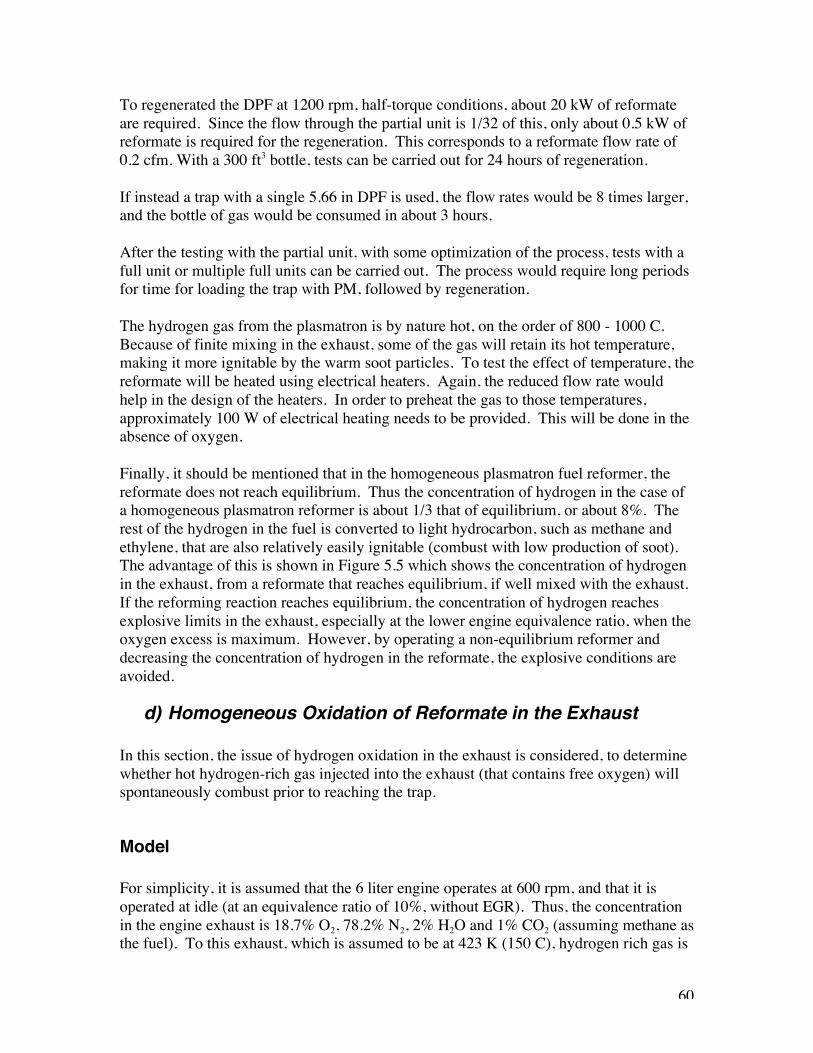
60
To regenerated the DPF at 1200 rpm, half-torque conditions, about 20 kW of reformateare required. Since the flow through the partial unit is 1/32 of this, only about 0.5 kW ofreformate is required for the regeneration. This corresponds to a reformate flow rate of0.2 cfm. With a 300 ft3 bottle, tests can be carried out for 24 hours of regeneration.
If instead a trap with a single 5.66 in DPF is used, the flow rates would be 8 times larger,and the bottle of gas would be consumed in about 3 hours.
After the testing with the partial unit, with some optimization of the process, tests with afull unit or multiple full units can be carried out. The process would require long periodsfor time for loading the trap with PM, followed by regeneration.
The hydrogen gas from the plasmatron is by nature hot, on the order of 800 - 1000 C.Because of finite mixing in the exhaust, some of the gas will retain its hot temperature,making it more ignitable by the warm soot particles. To test the effect of temperature, thereformate will be heated using electrical heaters. Again, the reduced flow rate wouldhelp in the design of the heaters. In order to preheat the gas to those temperatures,approximately 100 W of electrical heating needs to be provided. This will be done in theabsence of oxygen.
Finally, it should be mentioned that in the homogeneous plasmatron fuel reformer, thereformate does not reach equilibrium. Thus the concentration of hydrogen in the case ofa homogeneous plasmatron reformer is about 1/3 that of equilibrium, or about 8%. Therest of the hydrogen in the fuel is converted to light hydrocarbon, such as methane andethylene, that are also relatively easily ignitable (combust with low production of soot).The advantage of this is shown in Figure 5.5 which shows the concentration of hydrogenin the exhaust, from a reformate that reaches equilibrium, if well mixed with the exhaust.If the reforming reaction reaches equilibrium, the concentration of hydrogen reachesexplosive limits in the exhaust, especially at the lower engine equivalence ratio, when theoxygen excess is maximum. However, by operating a non-equilibrium reformer anddecreasing the concentration of hydrogen in the reformate, the explosive conditions areavoided.
d) Homogeneous Oxidation of Reformate in the Exhaust
In this section, the issue of hydrogen oxidation in the exhaust is considered, to determinewhether hot hydrogen-rich gas injected into the exhaust (that contains free oxygen) willspontaneously combust prior to reaching the trap.
Model
For simplicity, it is assumed that the 6 liter engine operates at 600 rpm, and that it isoperated at idle (at an equivalence ratio of 10%, without EGR). Thus, the concentrationin the engine exhaust is 18.7% O2, 78.2% N2, 2% H2O and 1% CO2 (assuming methane asthe fuel). To this exhaust, which is assumed to be at 423 K (150 C), hydrogen rich gas is
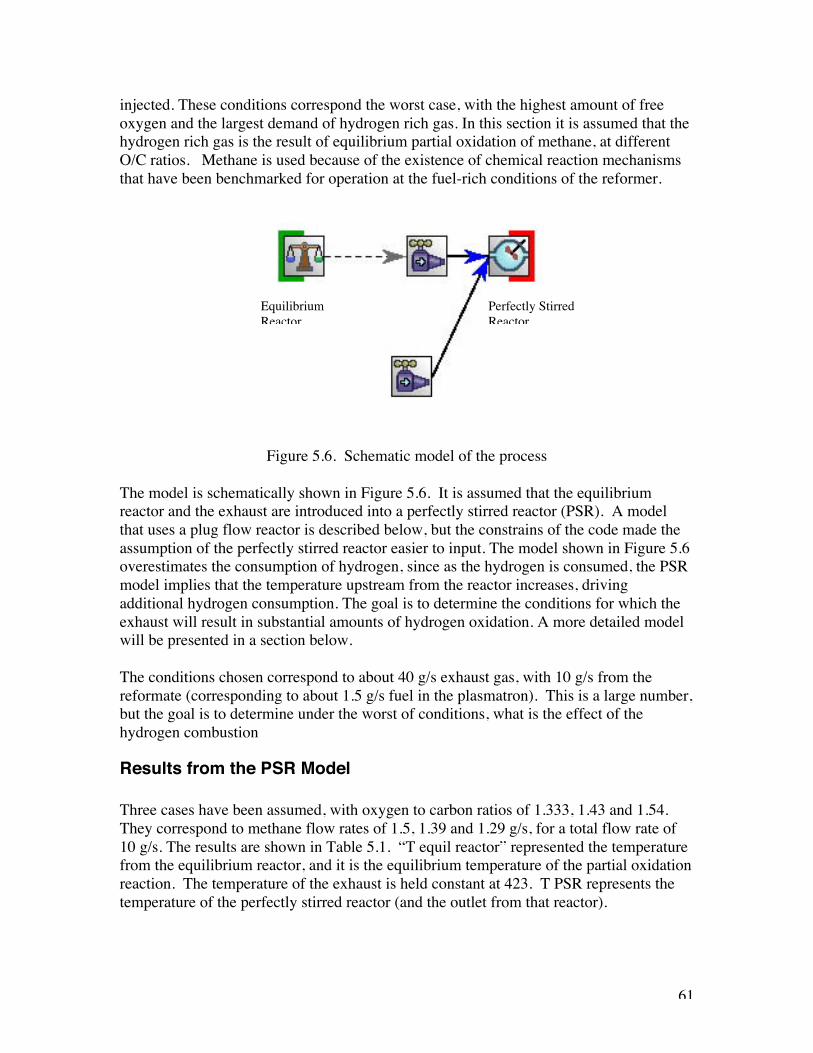
61
injected. These conditions correspond the worst case, with the highest amount of freeoxygen and the largest demand of hydrogen rich gas. In this section it is assumed that thehydrogen rich gas is the result of equilibrium partial oxidation of methane, at differentO/C ratios. Methane is used because of the existence of chemical reaction mechanismsthat have been benchmarked for operation at the fuel-rich conditions of the reformer.
Figure 5.6. Schematic model of the process
The model is schematically shown in Figure 5.6. It is assumed that the equilibriumreactor and the exhaust are introduced into a perfectly stirred reactor (PSR). A modelthat uses a plug flow reactor is described below, but the constrains of the code made theassumption of the perfectly stirred reactor easier to input. The model shown in Figure 5.6overestimates the consumption of hydrogen, since as the hydrogen is consumed, the PSRmodel implies that the temperature upstream from the reactor increases, drivingadditional hydrogen consumption. The goal is to determine the conditions for which theexhaust will result in substantial amounts of hydrogen oxidation. A more detailed modelwill be presented in a section below.
The conditions chosen correspond to about 40 g/s exhaust gas, with 10 g/s from thereformate (corresponding to about 1.5 g/s fuel in the plasmatron). This is a large number,but the goal is to determine under the worst of conditions, what is the effect of thehydrogen combustion
Results from the PSR Model
Three cases have been assumed, with oxygen to carbon ratios of 1.333, 1.43 and 1.54.They correspond to methane flow rates of 1.5, 1.39 and 1.29 g/s, for a total flow rate of10 g/s. The results are shown in Table 5.1. “T equil reactor” represented the temperaturefrom the equilibrium reactor, and it is the equilibrium temperature of the partial oxidationreaction. The temperature of the exhaust is held constant at 423. T PSR represents thetemperature of the perfectly stirred reactor (and the outlet from that reactor).
EquilibriumReactor
Perfectly StirredReactor

62
Table 5.1. Results for the PSR case
For the first two cases, with relatively low O/C, the hydrogen flow rate out of the PSRreactor is approximately the same as the hydrogen rate into the PSR. That is, there is nooxidation of the hydrogen in the flow rate. The same is the case for the CO that is alsoproduced. The last case, though, with a relatively high O/C, results in almost allconsumption of the hydrogen rich gas. The temperature of the system becomes verylarge, as the hydrogen rich gas has substantial thermal content, increasing the reactionrate of hydrogen. There is oxidation at reformate/exhaust temperatures exceeding 700 K.
This case represents the most pessimistic and unrealistic case, since it requires substantialmass and temperature equilibration in the exhaust pipe. This flow resembles more theplug flow model, which will be described next.
Plug Flow Reactor Simulation
In this section, an alternative reactor is used as a model. This reactor simulates moreclosely the processes inside the system. The PFR is a more appropriate model for thebehavior of the hydrogen rich gas in and environment with free oxygen in the exhaust ofa vehicle.
Figure 5.7. Schematic diagram of model for hydrogen oxidation in exhaust pipe.
The model is shown schematically in Figure 5.7. It includes, as in the previous section,an equilibrium reactor that represents the reformer, a second input to the PSR thatrepresents the engine. The PSR is used with very short residence time (0.001 s) as amixing, nonreacting reactor. The PSR is then followed by a plug flow reactor (PFR). It isassumed that the PFR has a diameter of 5 cm (2 in) and a length of 30 cm (12 in). Thisdistance corresponds to the length between the injection point of the hydrogen rich gas in
O/C 1.33 1.43 1.54Fuel flow rate g/s 1.49 1.39 1.29T equil reactor K 1157 1255 1359T exhaust K 423 423 423T PSR K 628 654 1489
PSR H2 input mols/s 0.164 0.147 0.130PSR H2 out mols/s 0.164 0.147 0.001
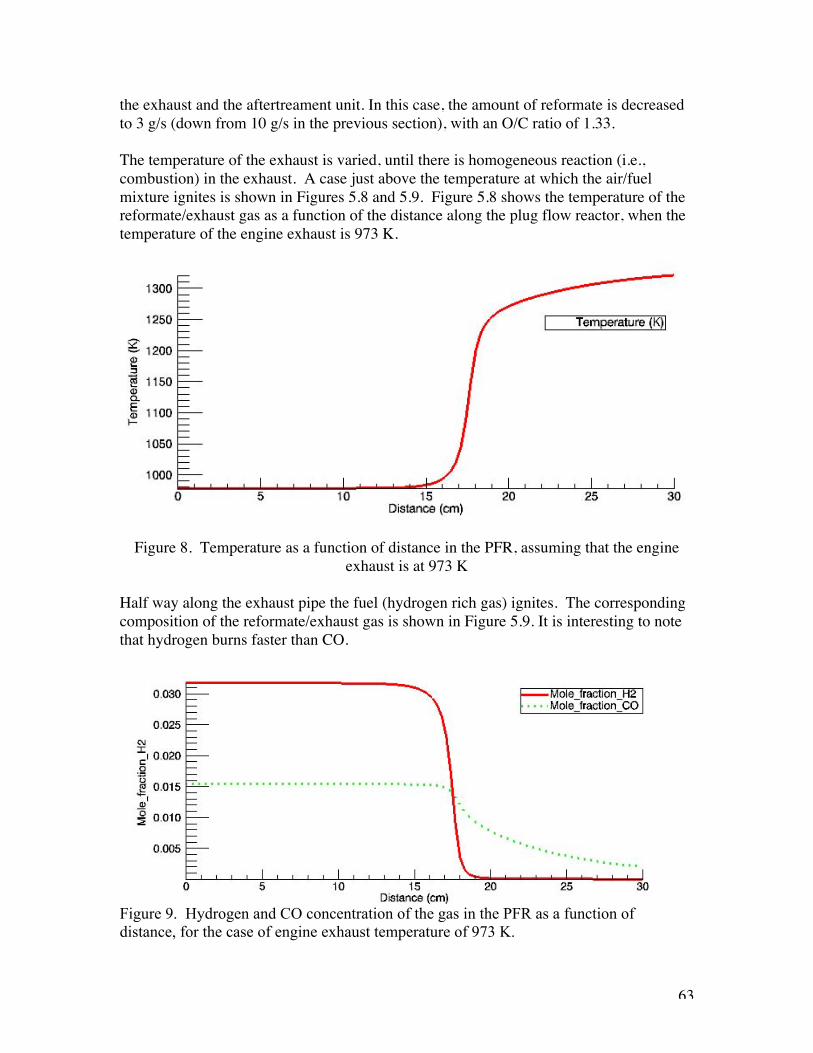
63
the exhaust and the aftertreament unit. In this case, the amount of reformate is decreasedto 3 g/s (down from 10 g/s in the previous section), with an O/C ratio of 1.33.
The temperature of the exhaust is varied, until there is homogeneous reaction (i.e.,combustion) in the exhaust. A case just above the temperature at which the air/fuelmixture ignites is shown in Figures 5.8 and 5.9. Figure 5.8 shows the temperature of thereformate/exhaust gas as a function of the distance along the plug flow reactor, when thetemperature of the engine exhaust is 973 K.
Figure 8. Temperature as a function of distance in the PFR, assuming that the engineexhaust is at 973 K
Half way along the exhaust pipe the fuel (hydrogen rich gas) ignites. The correspondingcomposition of the reformate/exhaust gas is shown in Figure 5.9. It is interesting to notethat hydrogen burns faster than CO.
Figure 9. Hydrogen and CO concentration of the gas in the PFR as a function ofdistance, for the case of engine exhaust temperature of 973 K.
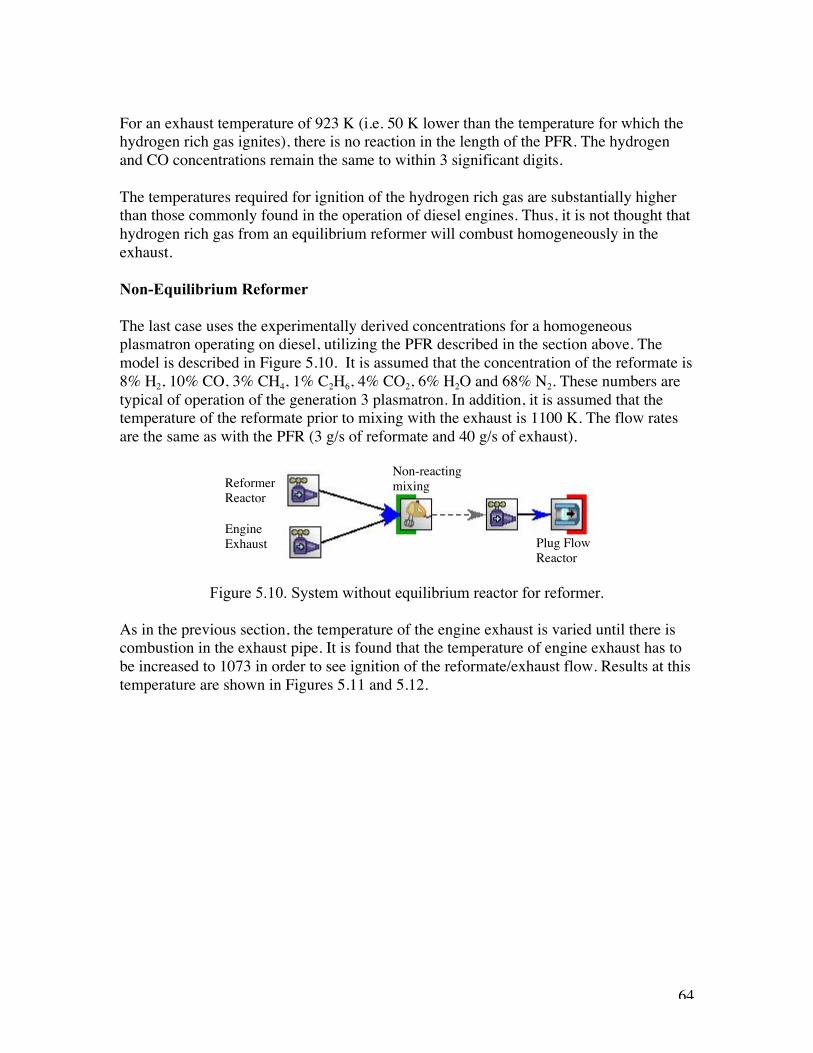
64
For an exhaust temperature of 923 K (i.e. 50 K lower than the temperature for which thehydrogen rich gas ignites), there is no reaction in the length of the PFR. The hydrogenand CO concentrations remain the same to within 3 significant digits.
The temperatures required for ignition of the hydrogen rich gas are substantially higherthan those commonly found in the operation of diesel engines. Thus, it is not thought thathydrogen rich gas from an equilibrium reformer will combust homogeneously in theexhaust.
Non-Equilibrium Reformer
The last case uses the experimentally derived concentrations for a homogeneousplasmatron operating on diesel, utilizing the PFR described in the section above. Themodel is described in Figure 5.10. It is assumed that the concentration of the reformate is8% H2, 10% CO, 3% CH4, 1% C2H6, 4% CO2, 6% H2O and 68% N2. These numbers aretypical of operation of the generation 3 plasmatron. In addition, it is assumed that thetemperature of the reformate prior to mixing with the exhaust is 1100 K. The flow ratesare the same as with the PFR (3 g/s of reformate and 40 g/s of exhaust).
Figure 5.10. System without equilibrium reactor for reformer.
As in the previous section, the temperature of the engine exhaust is varied until there iscombustion in the exhaust pipe. It is found that the temperature of engine exhaust has tobe increased to 1073 in order to see ignition of the reformate/exhaust flow. Results at thistemperature are shown in Figures 5.11 and 5.12.
ReformerReactor
Plug FlowReactor
EngineExhaust
Non-reactingmixing
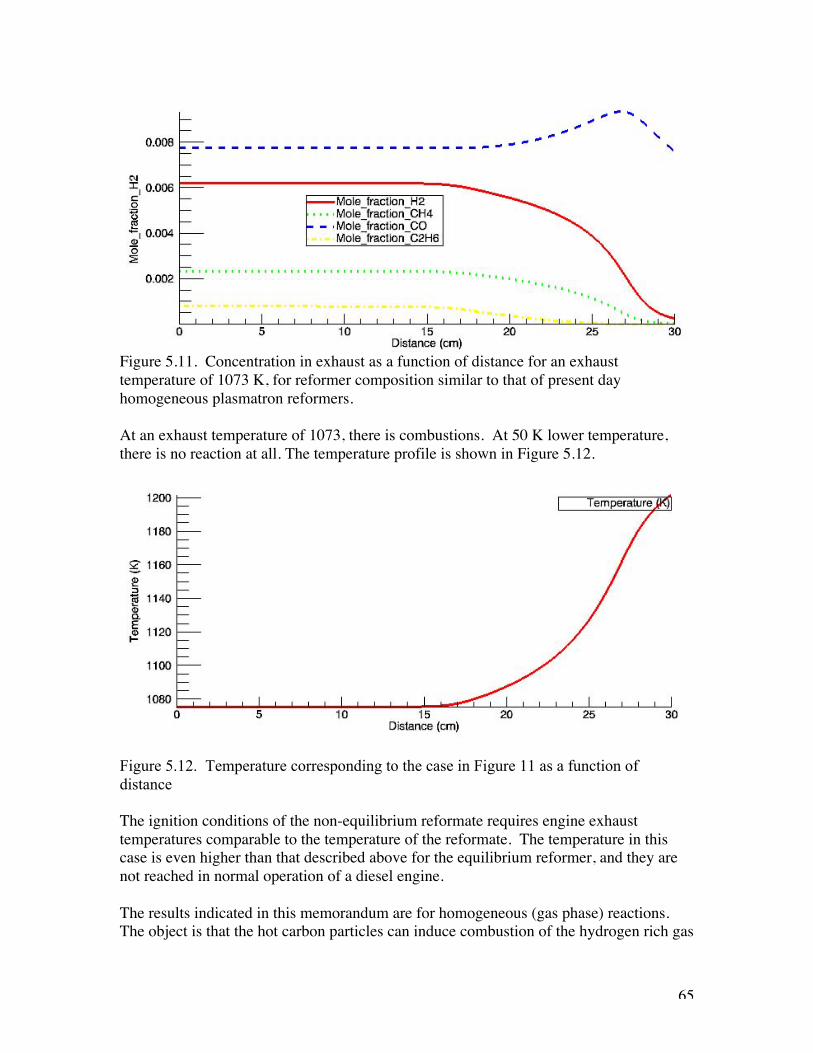
65
Figure 5.11. Concentration in exhaust as a function of distance for an exhausttemperature of 1073 K, for reformer composition similar to that of present dayhomogeneous plasmatron reformers.
At an exhaust temperature of 1073, there is combustions. At 50 K lower temperature,there is no reaction at all. The temperature profile is shown in Figure 5.12.
Figure 5.12. Temperature corresponding to the case in Figure 11 as a function ofdistance
The ignition conditions of the non-equilibrium reformate requires engine exhausttemperatures comparable to the temperature of the reformate. The temperature in thiscase is even higher than that described above for the equilibrium reformer, and they arenot reached in normal operation of a diesel engine.
The results indicated in this memorandum are for homogeneous (gas phase) reactions.The object is that the hot carbon particles can induce combustion of the hydrogen rich gas

66
locally, substantially increasing the particulate temperature and thus the combustion ofthe particulates.
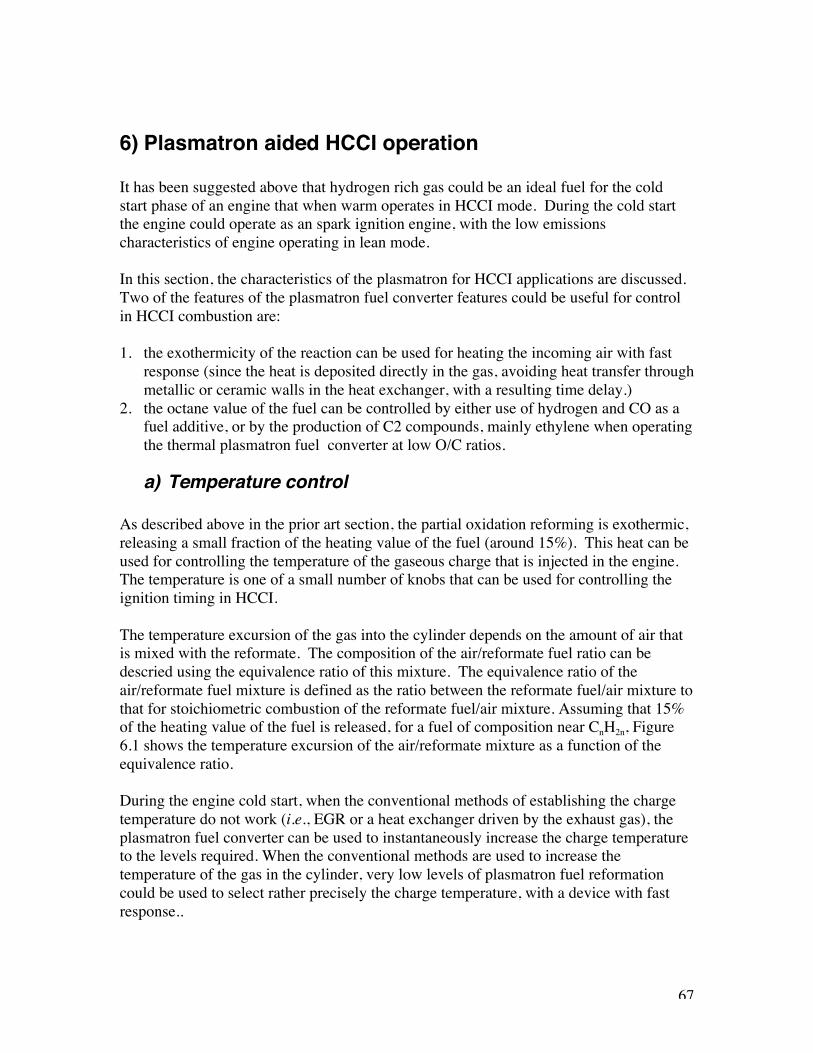
67
6) Plasmatron aided HCCI operation
It has been suggested above that hydrogen rich gas could be an ideal fuel for the coldstart phase of an engine that when warm operates in HCCI mode. During the cold startthe engine could operate as an spark ignition engine, with the low emissionscharacteristics of engine operating in lean mode.
In this section, the characteristics of the plasmatron for HCCI applications are discussed.Two of the features of the plasmatron fuel converter features could be useful for controlin HCCI combustion are:
1. the exothermicity of the reaction can be used for heating the incoming air with fastresponse (since the heat is deposited directly in the gas, avoiding heat transfer throughmetallic or ceramic walls in the heat exchanger, with a resulting time delay.)
2. the octane value of the fuel can be controlled by either use of hydrogen and CO as afuel additive, or by the production of C2 compounds, mainly ethylene when operatingthe thermal plasmatron fuel converter at low O/C ratios.
a) Temperature control
As described above in the prior art section, the partial oxidation reforming is exothermic,releasing a small fraction of the heating value of the fuel (around 15%). This heat can beused for controlling the temperature of the gaseous charge that is injected in the engine.The temperature is one of a small number of knobs that can be used for controlling theignition timing in HCCI.
The temperature excursion of the gas into the cylinder depends on the amount of air thatis mixed with the reformate. The composition of the air/reformate fuel ratio can bedescried using the equivalence ratio of this mixture. The equivalence ratio of theair/reformate fuel mixture is defined as the ratio between the reformate fuel/air mixture tothat for stoichiometric combustion of the reformate fuel/air mixture. Assuming that 15%of the heating value of the fuel is released, for a fuel of composition near CnH2n, Figure6.1 shows the temperature excursion of the air/reformate mixture as a function of theequivalence ratio.
During the engine cold start, when the conventional methods of establishing the chargetemperature do not work (i.e., EGR or a heat exchanger driven by the exhaust gas), theplasmatron fuel converter can be used to instantaneously increase the charge temperatureto the levels required. When the conventional methods are used to increase thetemperature of the gas in the cylinder, very low levels of plasmatron fuel reformationcould be used to select rather precisely the charge temperature, with a device with fastresponse..

68
To increase the charge temperature to the temperatures that are desirable, above 100C,the equivalence ratio of the gaseous mixture should be around 0.1. Since the enginecould run at equivalence ratios around 0.5-0.6 to minimize emissions, the maximumrequired fuel to be processed by the plasmatron fuel converter for startup is on the orderof 20% of maximum load. The minimum torque of the engine during startup, whenoperating the fuel converter for maximum hydrogen yield, is around 20% of maximumtorque. At lower loads, the charge temperature would be lower than required for HCCIoperation. To operate the engine at lower powers, it would be required to operate theplasmatron in a mode with higher O/C ratios, therefore combusting a fraction of the fuel.Operating the plasmatron in this mode has the advantages of both decreasing the heatingvalue of the reformate fuel (therefore decreasing the engine load) and increasing theenthalpy of the reformate, thus increasing the temperature of the air/reformate fuelmixture.
On the other hand, during the warm phase operation, relatively small values of fuel needto be processed to control the temperature. Assuming that a temperature excursion of 5 Kis desirable, then the equivalence ratio of the charge is on the order of .01. If the engineoperates at a equivalence ratio of 0.6 (assuming that the engine can be operated at highload in the HCCI mode), then about 2% of the fuel needs to be processed by theplasmatron fuel converter.
Figure 6.1 Temperature excursion of the gaseous charge to the cylinder as a function ofthe equivalence ratio of the air/reformate fuel mixture.
Liquid fuel partial oxidation
0
20
40
60
80
100
120
140
0.01 0.1 1
homogeneous mixture equivalence ratio
Del
ta T
(K)
69
b) Octane control
In addition to helping control the temperature in the charge, the plasmatron can be used togenerate fuels of different octane value. When operating at O/.C > 1.2, the reformate hasa composition similar to synthesis gas, with about 20mol% H2 and CO, and smallconcentration of CO2, C2’s, water, and the balance nitrogen. The synthesis gas can beused to increase the octane value of the fuel (since hydrogen has a very high octanevalue, while CO is similar to that of methane), but requires its use not as a additive but asa substantial fraction of the fuel.
When the O/C is smaller that 1.2-1.3, it is possible to generate substantial concentrationof C2 compounds, which have very low octane number. In this case, the reformatecomposition may include a ethylene concentration that can be as high as a few percent.Since the concentration of hydrogen and CO is on the order of 20%, but since the heatingvalue of ethylene is about 4 times that of the reformate, then
Under ideal circumstances, the process can be written as:
CnH2n + m/2 O2 + 2m N2 mCO + mH2 + (n-m)/2 C2H4 + 2m N2
In practice, the process is somewhat less efficient, but for the process of illustration theabove is adequate.
The concentration of hydrogen and CO in the reformate, as a function of theconcentration of ethane in the reformate, are shown in Figure 6.2. Since a fraction of thefuel is pyrolyzed into ethylene, the required oxygen, and therefore nitrogen, are reduced.The reduction in the nitrogen concentration is the main reason why the hydrogen and COconcentrations remain relatively constant.
Also shown in Figure 6.2 is the ratio of the heating value of the ethane in the reformatecompared to that of hydrogen and CO. Ethane has about 4 times the heating value permol than does hydrogen or CO.
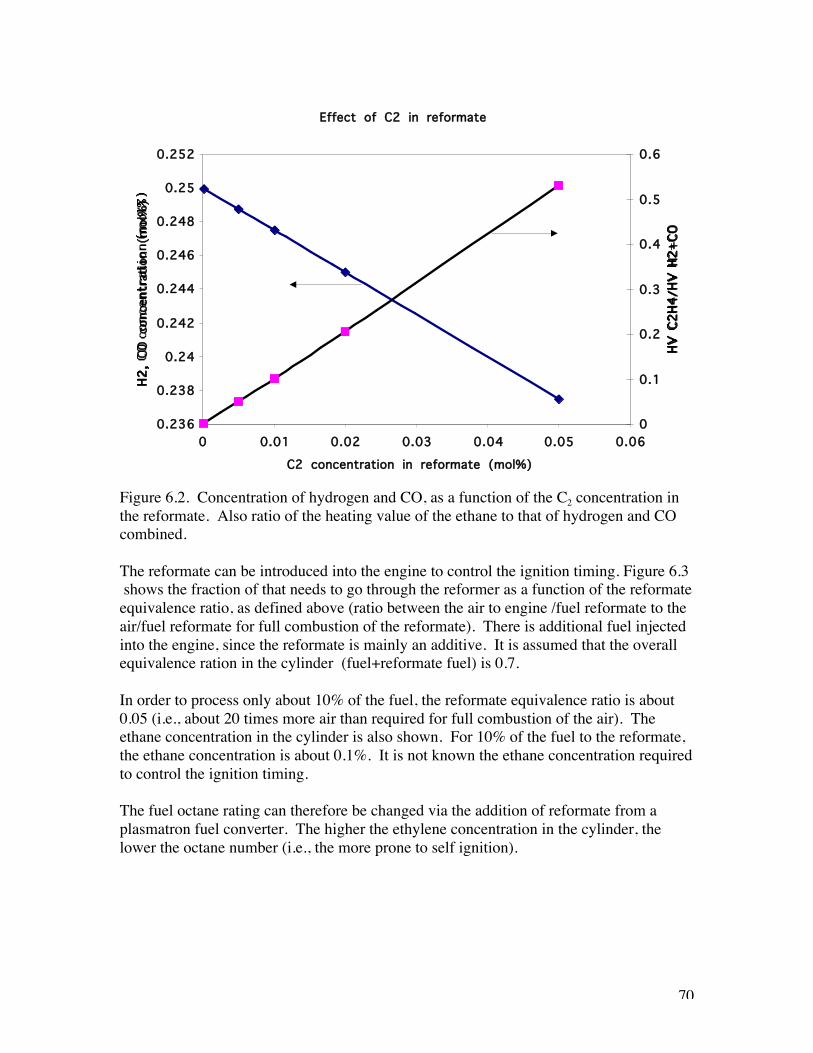
70
Figure 6.2. Concentration of hydrogen and CO, as a function of the C2 concentration inthe reformate. Also ratio of the heating value of the ethane to that of hydrogen and COcombined.
The reformate can be introduced into the engine to control the ignition timing. Figure 6.3 shows the fraction of that needs to go through the reformer as a function of the reformateequivalence ratio, as defined above (ratio between the air to engine /fuel reformate to theair/fuel reformate for full combustion of the reformate). There is additional fuel injectedinto the engine, since the reformate is mainly an additive. It is assumed that the overallequivalence ration in the cylinder (fuel+reformate fuel) is 0.7.
In order to process only about 10% of the fuel, the reformate equivalence ratio is about0.05 (i.e., about 20 times more air than required for full combustion of the air). Theethane concentration in the cylinder is also shown. For 10% of the fuel to the reformate,the ethane concentration is about 0.1%. It is not known the ethane concentration requiredto control the ignition timing.
The fuel octane rating can therefore be changed via the addition of reformate from aplasmatron fuel converter. The higher the ethylene concentration in the cylinder, thelower the octane number (i.e., the more prone to self ignition).
Effect of C2 in reformate
0.236
0.238
0.24
0.242
0.244
0.246
0.248
0.25
0.252
0 0.01 0.02 0.03 0.04 0.05 0.06
C2 concentration in reformate (mol%)
H2,
CO
con
cent
rati
on (
mol
%)
0
0.1
0.2
0.3
0.4
0.5
0.6
HV C
2H4/
HV H
2+CO
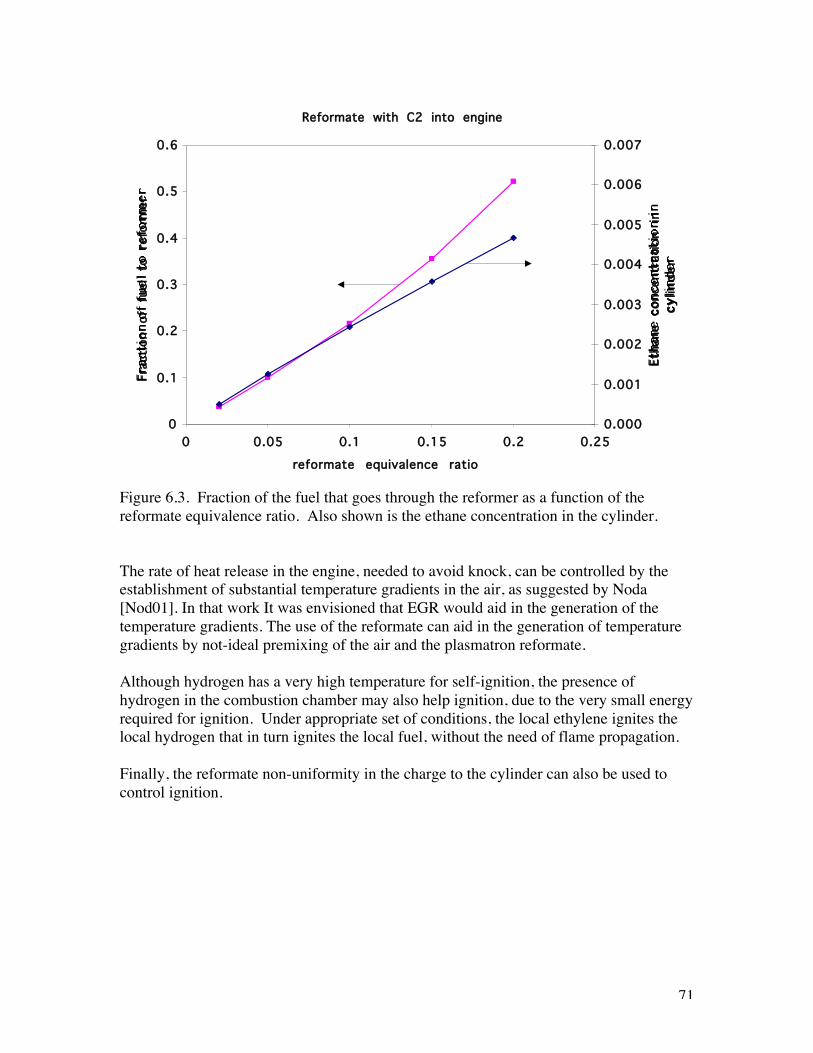
71
Figure 6.3. Fraction of the fuel that goes through the reformer as a function of thereformate equivalence ratio. Also shown is the ethane concentration in the cylinder.
The rate of heat release in the engine, needed to avoid knock, can be controlled by theestablishment of substantial temperature gradients in the air, as suggested by Noda[Nod01]. In that work It was envisioned that EGR would aid in the generation of thetemperature gradients. The use of the reformate can aid in the generation of temperaturegradients by not-ideal premixing of the air and the plasmatron reformate.
Although hydrogen has a very high temperature for self-ignition, the presence ofhydrogen in the combustion chamber may also help ignition, due to the very small energyrequired for ignition. Under appropriate set of conditions, the local ethylene ignites thelocal hydrogen that in turn ignites the local fuel, without the need of flame propagation.
Finally, the reformate non-uniformity in the charge to the cylinder can also be used tocontrol ignition.
Reformate with C2 into engine
0
0.1
0.2
0.3
0.4
0.5
0.6
0 0.05 0.1 0.15 0.2 0.25
reformate equivalence ratio
Frac
tion
of
fu
el
to
refo
rmer
0.000
0.001
0.002
0.003
0.004
0.005
0.006
0.007
Etha
ne
conc
entr
atio
n in
cy
linde
r
72
7) Modeling
In this section, modeling of the plasmatron is described.
There are two aspects of the modeling that have been performed, somewhatindependently, to attempt to understand the experimental results. The first modelinvolved fluid dynamics, without chemistry. The reason why chemistry is not included inthis model is that the Reynolds average numerical simulation (RANS) is used. Thecomposition of the plasmatron is very inhomogeneous, both in time and spatially. TheRANS describe only average quantities, including concentration, but chemistry will nottake place until they are mixed at the molecular level (i.e., a pocket of fuel passingthrough a volume element will not interact with a pocket element of fuel passing throughthe same element at a different time, even though the code says that in average there areboth air and fuel at this locations). Thus the steady state CFD model will not model theplasmatron appropriately.
The second model described the chemistry, using CHEMKIN. Mixing effects areinvestigated using PSR as well as the PaSR model. Both models will be described in thissection.
a) Fluid dynamics modeling
The fluid model is used to understand the mixing upstream from the region wherechemistry occurs, to try to determine mixing parameters (such as k, the turbulent kineticenergy, and ε, the turbulent energy dissipation rate.
Methane plasmatron CFD modeling
In the experiments the generation 3 plasmatron is used. The geometry of the plasmatronused in the experiments is shown in Figure 2.5. Details of this model and results aredescribed in [Bro05e].
For the case of methane, only two independent airs are used: the wall air and the swirl air(no axial air is used in the experiments described in Section 8.a). The wall air is injectedin the axial direction at the same axial location where the methane nozzle is located. Theswirl air is injected downstream from the wall air and the methane, with a large amountof vorticity. The swirl gas moves the discharge into the central region of the plasmatron,and provides the rotation motion that moves the arc roots on the electrodes to minimizeelectrode erosion.
Two locations for introduction of the methane have been investigated: the methane canbe introduced through the axial nozzle, upstream from the plasma, without any air; or themethane can be premixed with the swirl air and injected as the plasma gas.
73
Downstream from the plasmatron head there is a 5 in long section of the reactionextension cylinder which is also included in the model.
The axisymmetric, steady state solution of the fluid dynamics in the plasmatron methanereformer has been calculated using a commercially available CFD code, FLUENT. Themodel includes compressibility of the air, using ideal gas. Wall temperatures are at thesame temperature as the gas (300K). Inlet conditions in all three ports (swirl air, wall airand methane) are as mass flow rate. The outlet condition is atmospheric pressure.
The effect of changing the grid structure has been investigated to determine theconvergence of the problem, by using a grid that has four times the node density, and ithas been determined that the mesh is appropriate for the problems investigated in thispaper.
The model uses a turbulent model based upon the k-epsilon RNG model, with standardwall functions. The RNG mode is better suited for analysis of flows with substantialswirl, as is the case with the plasmatron methane reformer. The model solved the steadystate conditions, using an implicit formulation and segregated solver. The convergencecriteria for momentum, swirl, axial and radial velocities, k, epsilon and speciesconcentrations was 10-4. The energy was monitored and controlled, with a convergencecriteria of 10-8.
Since no chemistry is included in the model, the model cannot be used to describe theflows downstream from the plasma. The object of these calculations is to determine theconditions at and immediately following the plasma zone. In particular, the presence ofrecirculating flows that constitute exhaust gas recirculation, are likely to have substantialeffect on the performance of the plasmatron methane reformer.
Axial injection of methane
In this section, the results for the case when the methane is injected introduced throughthe axial nozzle are presented. Although this is not the best configuration for methane, itis the preferred configuration for liquid fuels, which require air-assist atomization. Axialinjection minimizes wall wetting.
The swirl air and wall air flows in the model are1.29 and 2.59 g/s respectively, while theinput of methane is 0.45 g/s, corresponding to an O/C ratio of about 1.8. The high O/Ccorresponds to that shown experimentally to produce good conversion of the methane andmoderate hydrogen yield in a non-catalytic reactor. The wall air is injected without swirl,but the plasma gas has a swirl ratio of 12/40 (radial to tangential speed).
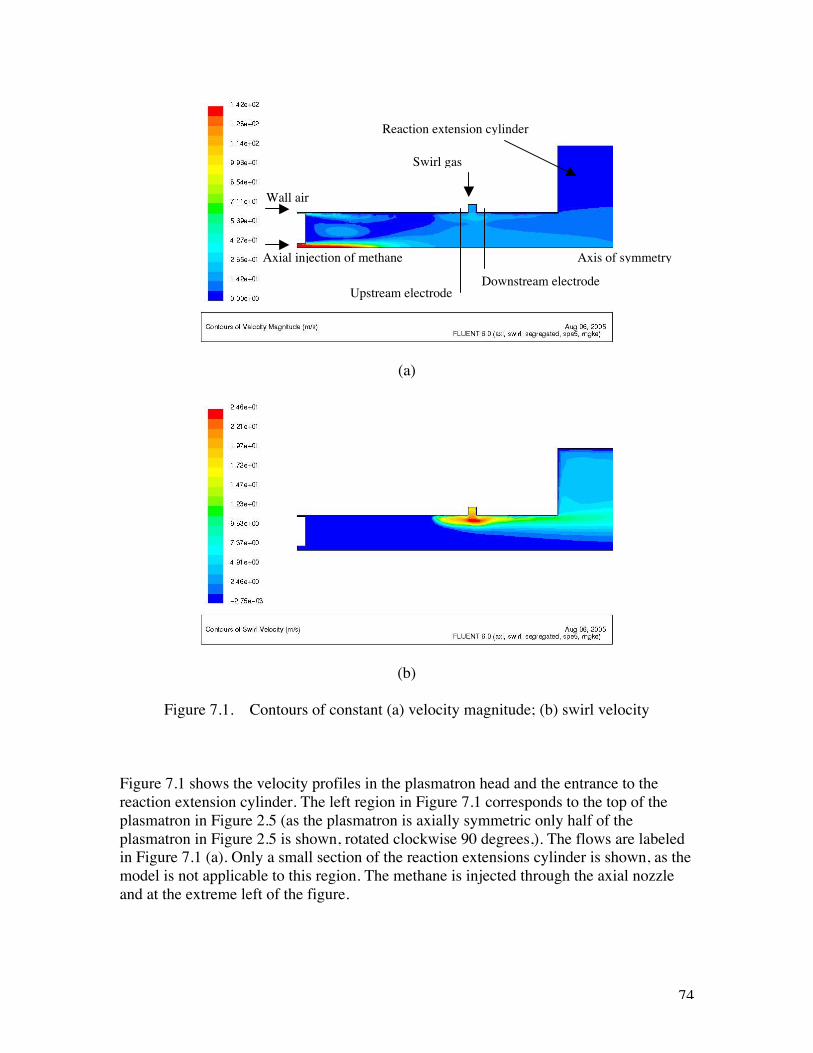
74
(a)
(b)
Figure 7.1. Contours of constant (a) velocity magnitude; (b) swirl velocity
Figure 7.1 shows the velocity profiles in the plasmatron head and the entrance to thereaction extension cylinder. The left region in Figure 7.1 corresponds to the top of theplasmatron in Figure 2.5 (as the plasmatron is axially symmetric only half of theplasmatron in Figure 2.5 is shown, rotated clockwise 90 degrees,). The flows are labeledin Figure 7.1 (a). Only a small section of the reaction extensions cylinder is shown, as themodel is not applicable to this region. The methane is injected through the axial nozzleand at the extreme left of the figure.
Reaction extension cylinder
Axis of symmetryAxial injection of methane
Wall air
Swirl gas
Upstream electrodeDownstream electrode
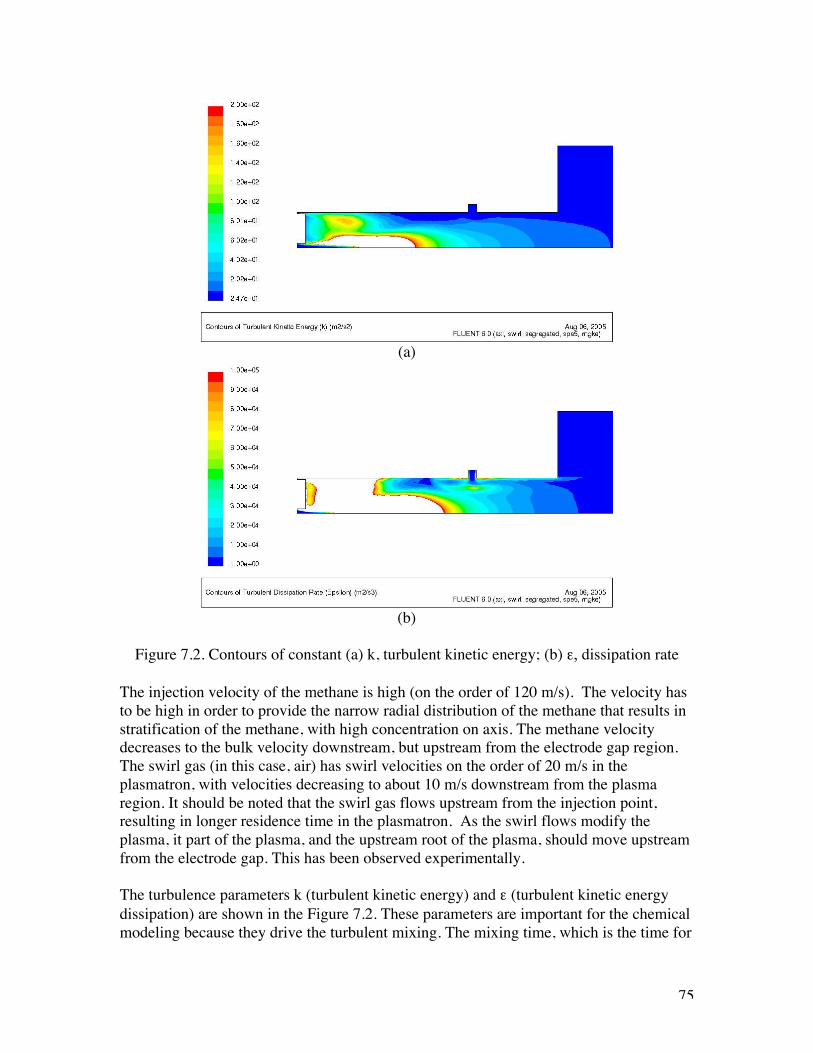
75
(a)
(b)
Figure 7.2. Contours of constant (a) k, turbulent kinetic energy; (b) ε, dissipation rate
The injection velocity of the methane is high (on the order of 120 m/s). The velocity hasto be high in order to provide the narrow radial distribution of the methane that results instratification of the methane, with high concentration on axis. The methane velocitydecreases to the bulk velocity downstream, but upstream from the electrode gap region.The swirl gas (in this case, air) has swirl velocities on the order of 20 m/s in theplasmatron, with velocities decreasing to about 10 m/s downstream from the plasmaregion. It should be noted that the swirl gas flows upstream from the injection point,resulting in longer residence time in the plasmatron. As the swirl flows modify theplasma, it part of the plasma, and the upstream root of the plasma, should move upstreamfrom the electrode gap. This has been observed experimentally.
The turbulence parameters k (turbulent kinetic energy) and ε (turbulent kinetic energydissipation) are shown in the Figure 7.2. These parameters are important for the chemicalmodeling because they drive the turbulent mixing. The mixing time, which is the time for
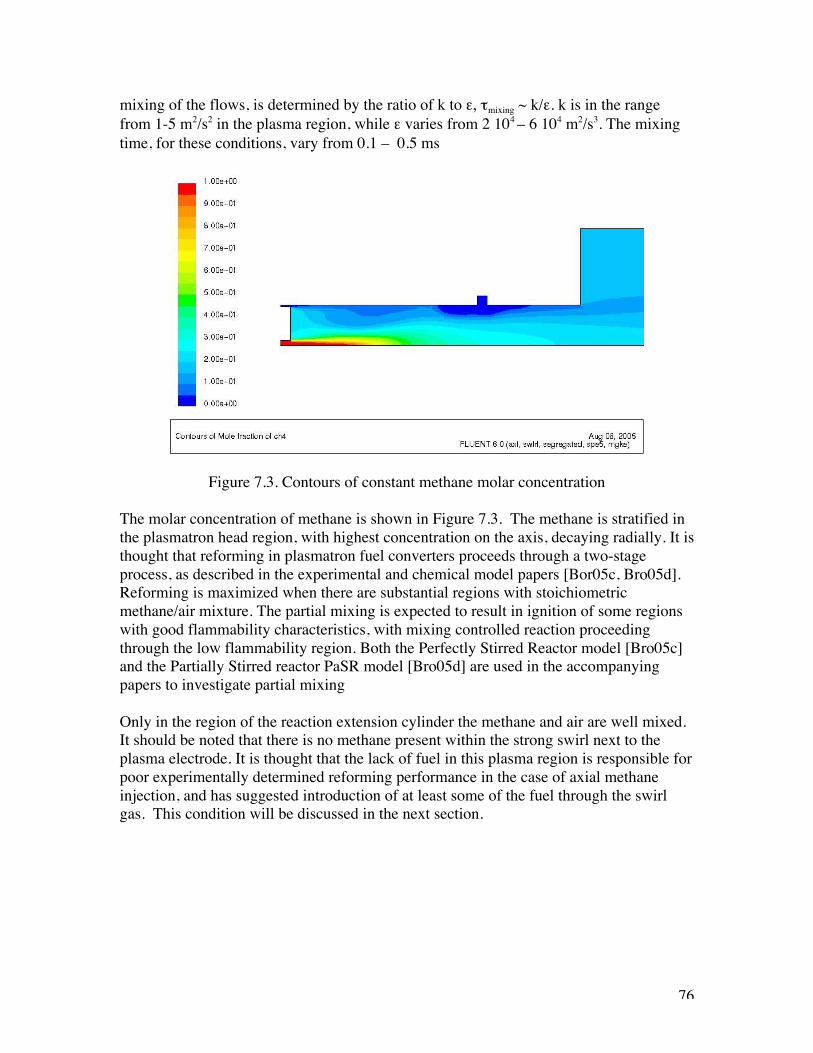
76
mixing of the flows, is determined by the ratio of k to ε, τmixing ~ k/ε. k is in the rangefrom 1-5 m2/s2 in the plasma region, while ε varies from 2 104 – 6 104 m2/s3. The mixingtime, for these conditions, vary from 0.1 – 0.5 ms
Figure 7.3. Contours of constant methane molar concentration
The molar concentration of methane is shown in Figure 7.3. The methane is stratified inthe plasmatron head region, with highest concentration on the axis, decaying radially. It isthought that reforming in plasmatron fuel converters proceeds through a two-stageprocess, as described in the experimental and chemical model papers [Bor05c, Bro05d].Reforming is maximized when there are substantial regions with stoichiometricmethane/air mixture. The partial mixing is expected to result in ignition of some regionswith good flammability characteristics, with mixing controlled reaction proceedingthrough the low flammability region. Both the Perfectly Stirred Reactor model [Bro05c]and the Partially Stirred reactor PaSR model [Bro05d] are used in the accompanyingpapers to investigate partial mixing
Only in the region of the reaction extension cylinder the methane and air are well mixed.It should be noted that there is no methane present within the strong swirl next to theplasma electrode. It is thought that the lack of fuel in this plasma region is responsible forpoor experimentally determined reforming performance in the case of axial methaneinjection, and has suggested introduction of at least some of the fuel through the swirlgas. This condition will be discussed in the next section.
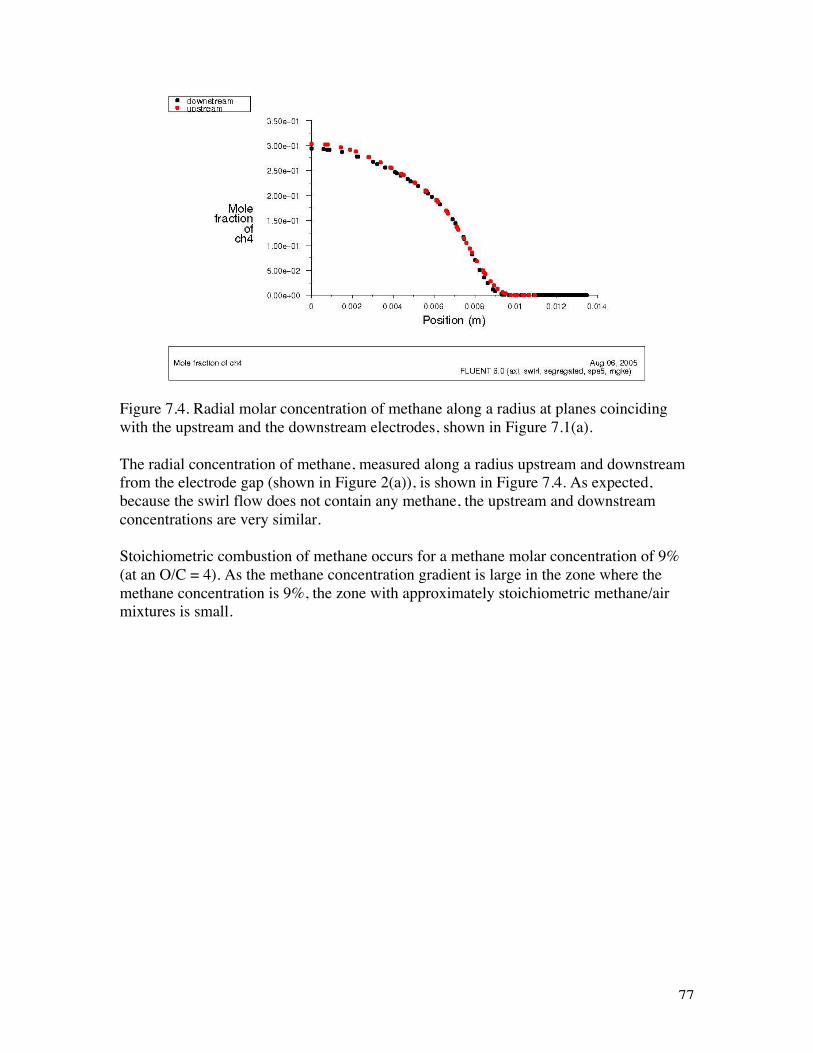
77
Figure 7.4. Radial molar concentration of methane along a radius at planes coincidingwith the upstream and the downstream electrodes, shown in Figure 7.1(a).
The radial concentration of methane, measured along a radius upstream and downstreamfrom the electrode gap (shown in Figure 2(a)), is shown in Figure 7.4. As expected,because the swirl flow does not contain any methane, the upstream and downstreamconcentrations are very similar.
Stoichiometric combustion of methane occurs for a methane molar concentration of 9%(at an O/C = 4). As the methane concentration gradient is large in the zone where themethane concentration is 9%, the zone with approximately stoichiometric methane/airmixtures is small.
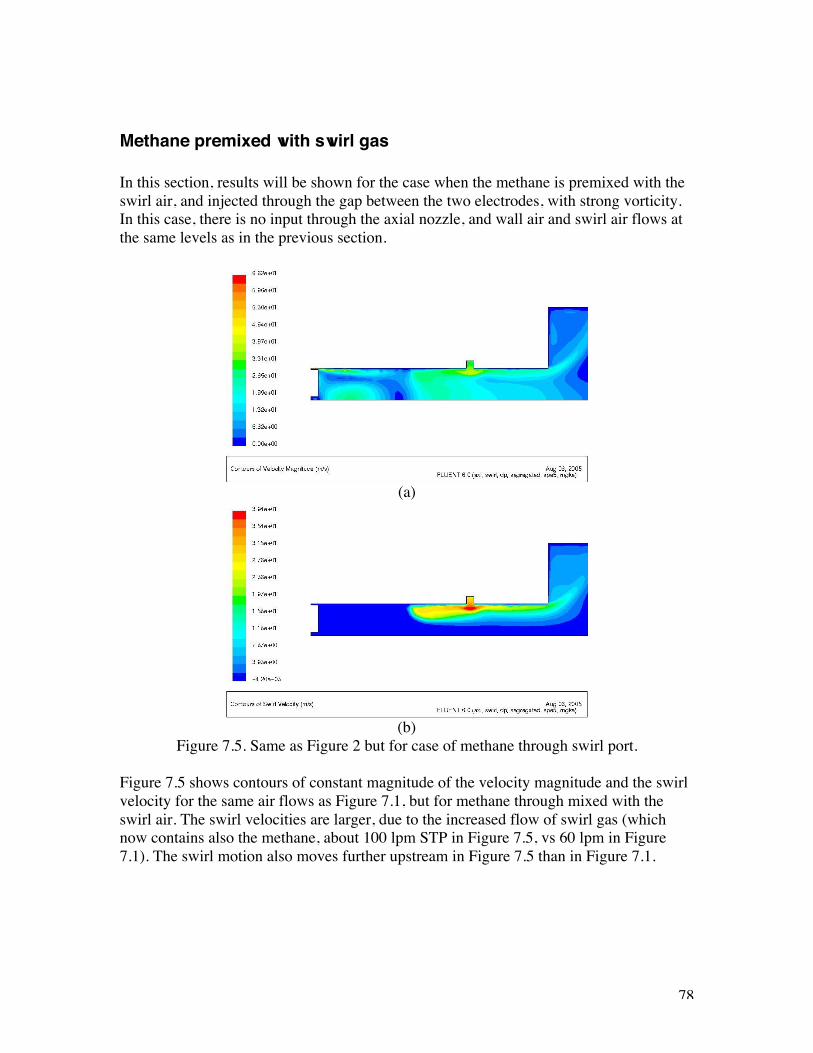
78
Methane premixed with swirl gas
In this section, results will be shown for the case when the methane is premixed with theswirl air, and injected through the gap between the two electrodes, with strong vorticity.In this case, there is no input through the axial nozzle, and wall air and swirl air flows atthe same levels as in the previous section.
(a)
(b)Figure 7.5. Same as Figure 2 but for case of methane through swirl port.
Figure 7.5 shows contours of constant magnitude of the velocity magnitude and the swirlvelocity for the same air flows as Figure 7.1, but for methane through mixed with theswirl air. The swirl velocities are larger, due to the increased flow of swirl gas (whichnow contains also the methane, about 100 lpm STP in Figure 7.5, vs 60 lpm in Figure7.1). The swirl motion also moves further upstream in Figure 7.5 than in Figure 7.1.
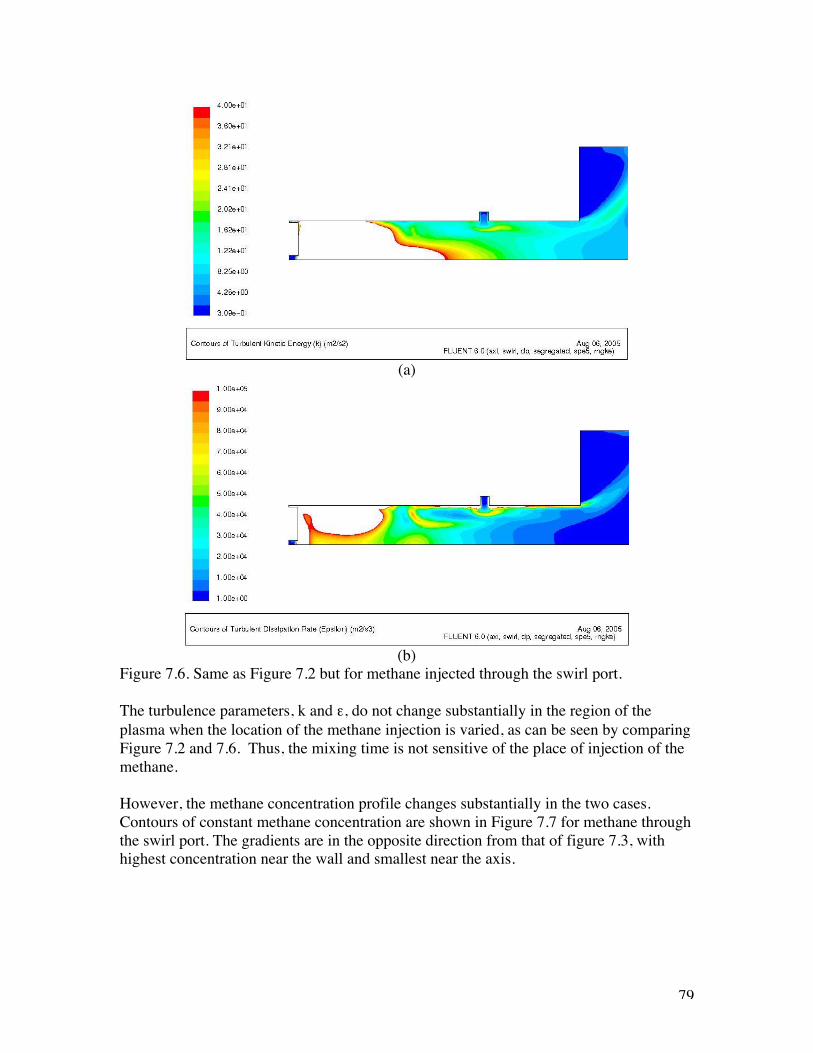
79
(a)
(b)Figure 7.6. Same as Figure 7.2 but for methane injected through the swirl port.
The turbulence parameters, k and ε, do not change substantially in the region of theplasma when the location of the methane injection is varied, as can be seen by comparingFigure 7.2 and 7.6. Thus, the mixing time is not sensitive of the place of injection of themethane.
However, the methane concentration profile changes substantially in the two cases.Contours of constant methane concentration are shown in Figure 7.7 for methane throughthe swirl port. The gradients are in the opposite direction from that of figure 7.3, withhighest concentration near the wall and smallest near the axis.

80
Figure 7.7. Molar concentration of methane for the case of methane premixed with swirlair.
Figure 7.8 shows the molar concentration of methane at the location of the upstream anddownstream electrodes. As opposed to the case shown in Figure 7.4, the gradients in themethane concentration are small near the region with stoichiometric methane/air mixture(at around a radius of 0.055 m), which results in a larger fraction of the methane nearcombustion conditions, and should be better suited to two-stage reforming. The locationof the stoichiometric conditions is not that different from the case shown in Figure 7.4,but it is substantially larger because the gradients are smaller.
Figure 7.8. Radial concentration of methane at the location of the upstream anddownstream electrodes.
81
In this case, there is a difference between the upstream and downstream planes, as themethane is part of the swirl flow, and some of it moves upstream while the rest movesdownstream.
Thus, the conditions generated in the case of methane premixed with the swirl air aremore conducive to two-stage reforming than that for axial injection of methane. Resultsnot shown in this paper indicate that premixing the methane with the wall air has similarmethane concentration profiles than the case with axial injection, and thus should havecomparable reforming characteristics. It has been experimentally shown [Bro05a,Bro05b] that the case of methane through the swirl port results in improved reforming(defined as methane conversion at a given overall O/C and at a given power).
Propane plasmatron CFD modeling
One of the disadvantages of using methane as a surrogate hydrocarbon for heavier fuels isthat the methane chemistry is substantially different from that of heavy hydrocarbons. Inorder to address the issue of the different chemistry, a heavier gaseous hydrocarbonneeded to be tested. In this paper, the performance of plasmatron propane reformers isinvestigated. Propane-air mixture is the simplest hydrocarbon system that exhibitschemical behavior, laminar flame speeds and thicknesses, and extinction limits that arecomparable to those of heavier fuels [Tur96]. It is probably the smallest system fromwhich quantitative information directly relevant to the partial oxidation of heavier liquidgasoline and diesel fuels can be extracted, and is therefore an appropriate choice for thisstudy [Haw98]. Unfortunately, unlike the case of methane where chemical modeling ofthe experiments were performed [Bro05c, Bro05d, Bro05e], propane mechanisms are notas well developed, and we have not performed chemical modeling to compare with theseexperiments,
The experimental results, and the accompanying calculations, were carried out withpropane introduced in 5 different ways: (a) through the axial nozzle, similarly to what isdone with liquid fuels (described in section 3); (b) premixed with the wall air; (c)premixed with the swirl (plasma) air; (d) premixed with all the air, so that the air/propanedistribution in the plasmatron and the reactor are homogeneous; and finally, (e)stoichiometric conditions in the swirl gas, with the rest of the propane introduced with thewall air.
Downstream from the plasmatron head there is an insulated 12 cm (5 in) long reactionextension cylinder which is also included in the model. The volume of this section isapproximately 1000 cm3.
Air/propane mixtures
The axisymmetric steady state solution of the flows in a plasmatron propane converter iscalculated using a commercially available CFD code, FLUENT. Description of themodel and results for the case of methane are presented in reference [Bro05e]. The model
82
was used to determine the effect of initial conditions on the mixing upstream of theregion where sufficient thermal energy has been released to modify the result, whichoccurs downstream from the plasma region.
Because of the multitude of cases, only three cases will be presented: the case of axialinjection of propane, propane premixed with the wall air, and propane premixed with theswirl air. The flow rates used in the simulation of the different injection modes are shownin Table 7.1. The flow rates for the different modes correspond to those thatexperimentally optimize the reforming. The flow rate of propane is held constant in theexperiments and in the model (at 0.5 g/s), but the total amount of air and the distributionof the air is varied to optimize the reforming.
Table 7.1. Flow rates (in g/s) for the different modes of injection
The model indicates very different distribution of the air/propane mixture for the differentmodes of injection. The propane concentrations for the three modes of injection areshown in Figure 7.1. Also shown are the axial velocities of the gas for the three cases.The figure shows a cross-section of the plasmatron. The axis is the horizontals at thebottom of the figure, with the radius in the vertical direction, the axial and wall gasinjection are at the left of the figure, the swirl gas is introduced in the upper boundarytowards the middle of the narrow section, and wide section at the right is the beginning ofthe reactor. Only a section of the reactor is shown in the figure, as the model is notappropriate for this region because of the absence of chemistry. The figures thereforeshow half of the plasmatron section shown in Figure 2.5, rotated counterclockwise by 90degrees.
Fuel injection Axial Premixed
wallPremixed plasma
plasma air 1.29 1.51 1.51plasma fuel 0 0 0.5
wall air 3.67 2.59 1.51wall fuel 0 0.5 0
axial fuel 0.5 0 0
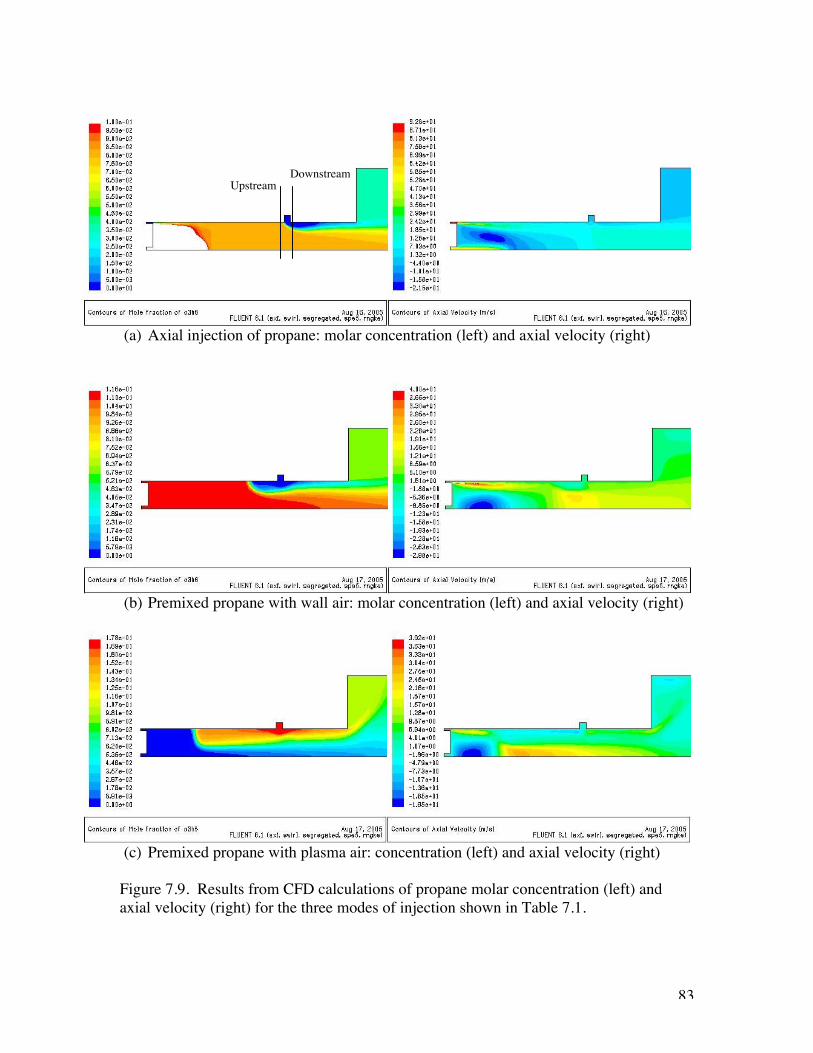
83
(a) Axial injection of propane: molar concentration (left) and axial velocity (right)
(b) Premixed propane with wall air: molar concentration (left) and axial velocity (right)
(c) Premixed propane with plasma air: concentration (left) and axial velocity (right)
Figure 7.9. Results from CFD calculations of propane molar concentration (left) andaxial velocity (right) for the three modes of injection shown in Table 7.1.
UpstreamDownstream
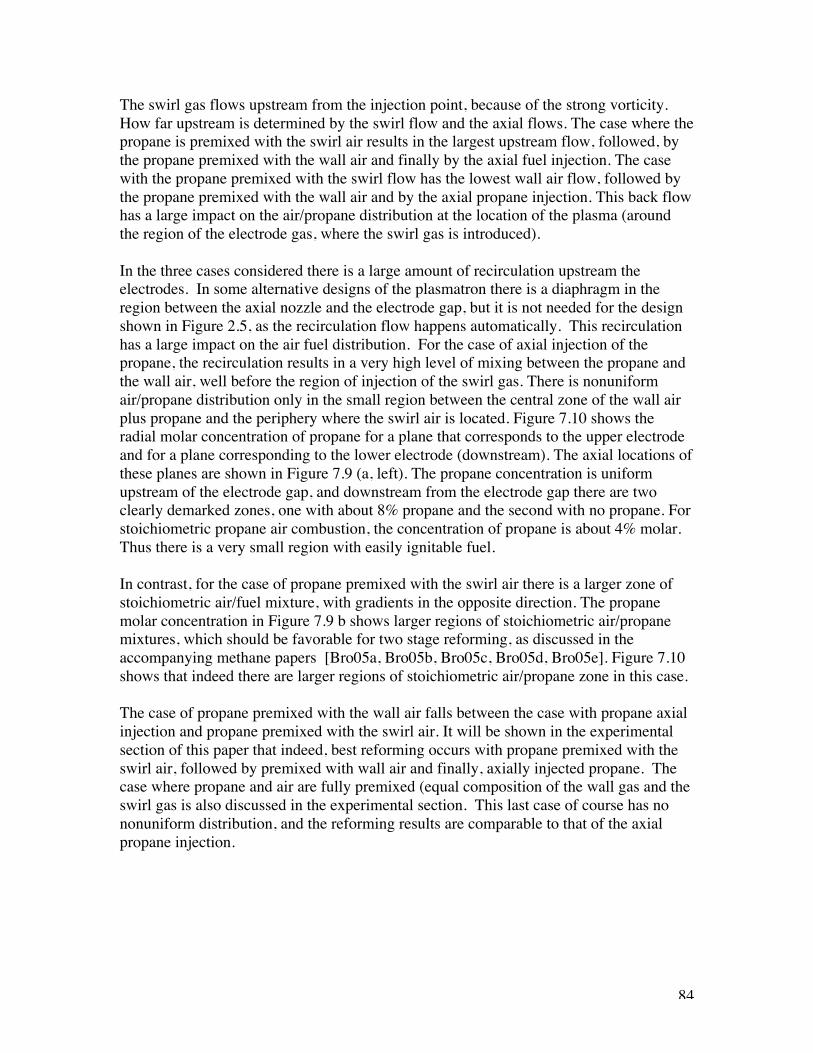
84
The swirl gas flows upstream from the injection point, because of the strong vorticity.How far upstream is determined by the swirl flow and the axial flows. The case where thepropane is premixed with the swirl air results in the largest upstream flow, followed, bythe propane premixed with the wall air and finally by the axial fuel injection. The casewith the propane premixed with the swirl flow has the lowest wall air flow, followed bythe propane premixed with the wall air and by the axial propane injection. This back flowhas a large impact on the air/propane distribution at the location of the plasma (aroundthe region of the electrode gas, where the swirl gas is introduced).
In the three cases considered there is a large amount of recirculation upstream theelectrodes. In some alternative designs of the plasmatron there is a diaphragm in theregion between the axial nozzle and the electrode gap, but it is not needed for the designshown in Figure 2.5, as the recirculation flow happens automatically. This recirculationhas a large impact on the air fuel distribution. For the case of axial injection of thepropane, the recirculation results in a very high level of mixing between the propane andthe wall air, well before the region of injection of the swirl gas. There is nonuniformair/propane distribution only in the small region between the central zone of the wall airplus propane and the periphery where the swirl air is located. Figure 7.10 shows theradial molar concentration of propane for a plane that corresponds to the upper electrodeand for a plane corresponding to the lower electrode (downstream). The axial locations ofthese planes are shown in Figure 7.9 (a, left). The propane concentration is uniformupstream of the electrode gap, and downstream from the electrode gap there are twoclearly demarked zones, one with about 8% propane and the second with no propane. Forstoichiometric propane air combustion, the concentration of propane is about 4% molar.Thus there is a very small region with easily ignitable fuel.
In contrast, for the case of propane premixed with the swirl air there is a larger zone ofstoichiometric air/fuel mixture, with gradients in the opposite direction. The propanemolar concentration in Figure 7.9 b shows larger regions of stoichiometric air/propanemixtures, which should be favorable for two stage reforming, as discussed in theaccompanying methane papers [Bro05a, Bro05b, Bro05c, Bro05d, Bro05e]. Figure 7.10shows that indeed there are larger regions of stoichiometric air/propane zone in this case.
The case of propane premixed with the wall air falls between the case with propane axialinjection and propane premixed with the swirl air. It will be shown in the experimentalsection of this paper that indeed, best reforming occurs with propane premixed with theswirl air, followed by premixed with wall air and finally, axially injected propane. Thecase where propane and air are fully premixed (equal composition of the wall gas and theswirl gas is also discussed in the experimental section. This last case of course has nononuniform distribution, and the reforming results are comparable to that of the axialpropane injection.
85
Figure 7.10. Propane concentration as a function of radius for locations upstream anddownstream from the electrode gas, for the three difference modes of injection ofpropane.
Gasoline plasmatron CFD modeling
The performance of liquid fuels and gaseous fuels is very different due to the latent heatof vaporization of the liquid fuel. There are three main differences between liquid andgaseous fuels. First, there is a finite rate of vaporization of the fuel, and thus eithercombustion occurs as a diffusion flame (as is the case in a diesel engine). The second hasto do with the heat of vaporization of the fuel, which cools the air/fuel mixture. Finally,because of the need to prevent wall coating, the liquid fuel is exclusively injected throughthe axial port, while the gaseous fuels could be injected through any set of ports, andindeed had best performance when injected through the swirl gas.
Section a describes a simple CFD model that is useful to understand the air/fuel mixing,as well as the vaporization of the gasoline droplets. Section b discusses the setup and thecharacteristics of the plasmatron gasoline reformers, in particular the effect of the fuelatomization and the cooling of the air/fuel mixture due to the latent heat of vaporizationof the gasoline.
The calculations were performed using FLUENT 6.0 CFD package. The solution is for asteady state solution, axisymmetric, with air as the fluid. A Reynolds-Average Navier-Stokes model has been chose, with a k-ε formulation for the turbulence. The modelincludes swirl and compressibility of the air. The energy equation is solved. The solutionis shown on half of the cross section of the plasmatron. A small section (1 in) long of thereaction extension cylinder is also included in the model.
0%
2%
4%
6%
8%
10%
12%
14%
16%
18%
20%
0 0.002 0.004 0.006 0.008 0.01 0.012
radius (m)
C3H
8 co
ncen
trat
ion
(mol
ar)
Axial propane injection
Propane premixed with swirl air
Propane premixed with wall air
86
No chemistry is assumed. Wall temperatures are at the same temperature as the gas(300K). The outlet condition is atmospheric pressure. Inlet conditions in all three ports(plasma air, wall air, atomization air) are as mass flow rate. Under-relaxation has beenused for the pressure (0.3) and momentum (0.7). The scheme for solution is 2nd orderupwind.
Table 7.2 shows the parameters used in the calculations. The gasoline flow rate assumedwas 1 g/s, twice that of the experiments. The fuel was injected using “surface” injectionat the port for the atomization air (uniformly distributed). Fuel droplets were injectedexclusively in the axial direction, with no radial or tangential component, that is, with azero spray angle. It was assumed that the injection velocity of the droplets was 50 m/s.The droplets composition was n-octane and uniform in diameter, with the droplet size inthe first set of calculations is assumed to be 50 µm. This is a relatively large drop size.Evaporation of the droplets was included, and the concentrations of the n-octane vaporshave been calculated. Smaller drop sizes will be considered later in this paper. Finally,the effects of spray distribution are discussed in the last section.
50 µm diameter droplets
In this section, the upper range of the particulate size is investigated.
Table 7.2
Plasmatron gen 3APlasma air 0.0018 g/sVelocities: swirl 50./s Radial -12 m/sWall air 0.0028 g/sAtomization air 0.0013 g/sAtomization air temp 300 KFuel injectionDroplet size 50 µmInitial droplet speed -50 m/sComposition of droplet n-octane liquidSpray angle 0
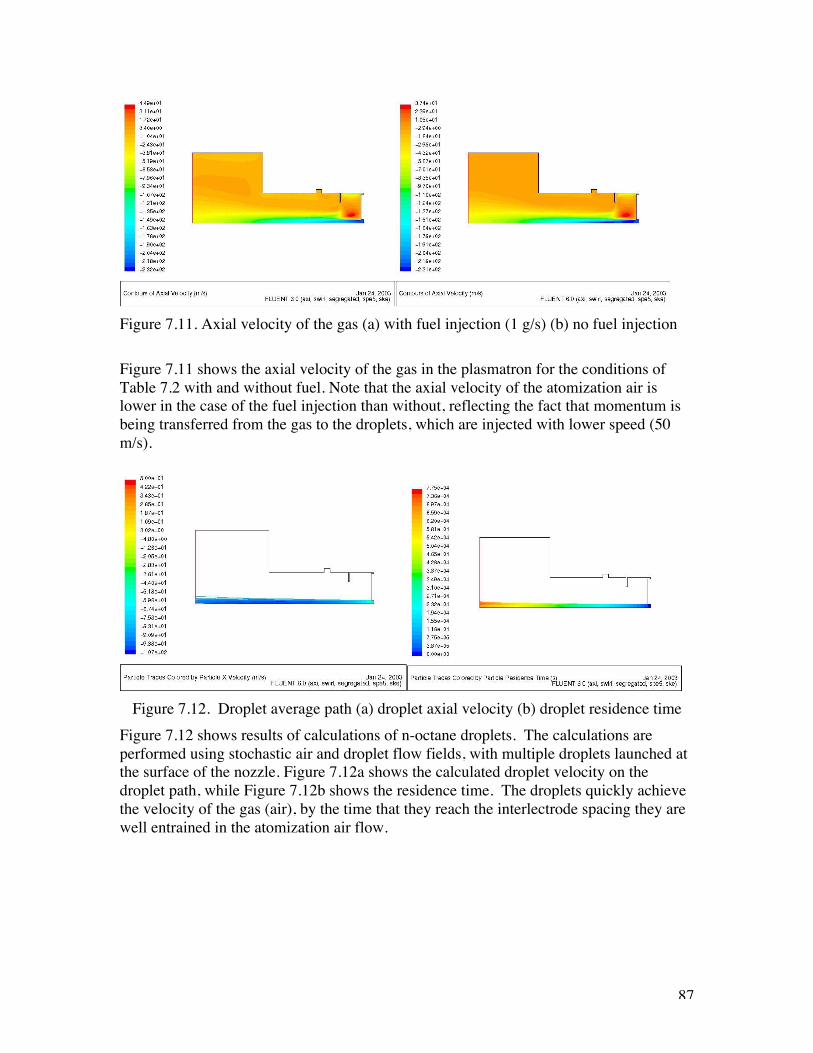
87
Figure 7.11. Axial velocity of the gas (a) with fuel injection (1 g/s) (b) no fuel injection
Figure 7.11 shows the axial velocity of the gas in the plasmatron for the conditions ofTable 7.2 with and without fuel. Note that the axial velocity of the atomization air islower in the case of the fuel injection than without, reflecting the fact that momentum isbeing transferred from the gas to the droplets, which are injected with lower speed (50m/s).
Figure 7.12. Droplet average path (a) droplet axial velocity (b) droplet residence timeFigure 7.12 shows results of calculations of n-octane droplets. The calculations areperformed using stochastic air and droplet flow fields, with multiple droplets launched atthe surface of the nozzle. Figure 7.12a shows the calculated droplet velocity on thedroplet path, while Figure 7.12b shows the residence time. The droplets quickly achievethe velocity of the gas (air), by the time that they reach the interlectrode spacing they arewell entrained in the atomization air flow.
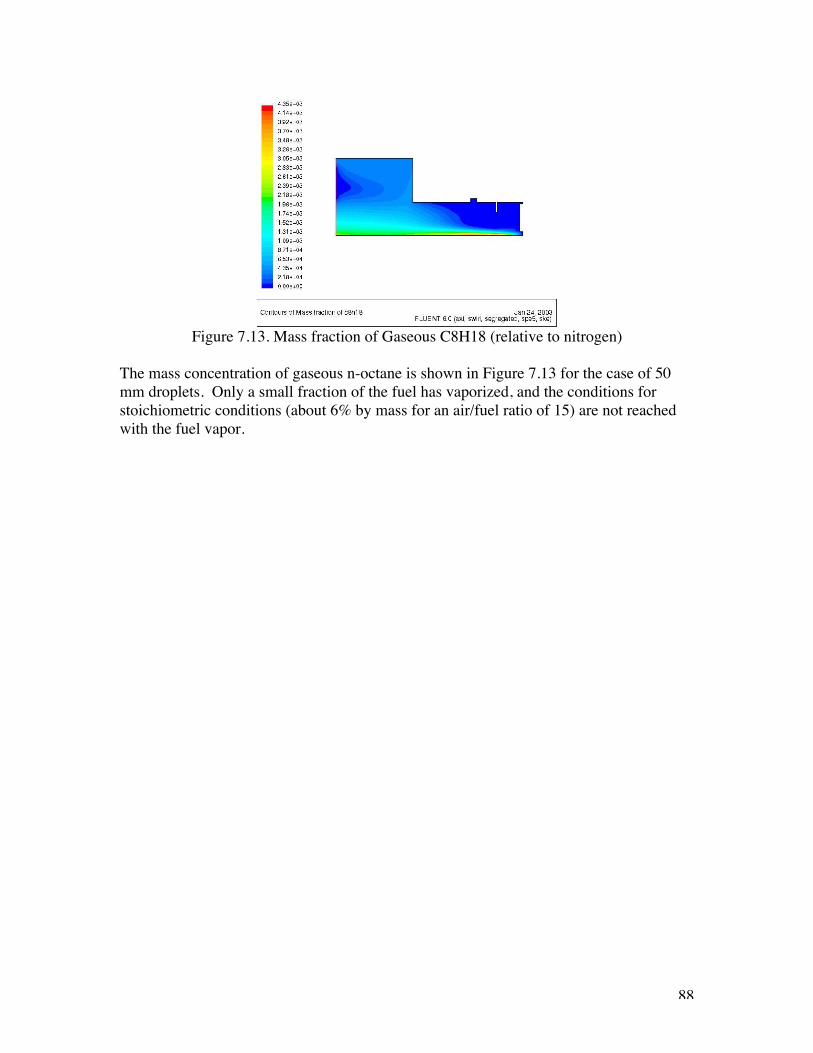
88
Figure 7.13. Mass fraction of Gaseous C8H18 (relative to nitrogen)
The mass concentration of gaseous n-octane is shown in Figure 7.13 for the case of 50mm droplets. Only a small fraction of the fuel has vaporized, and the conditions forstoichiometric conditions (about 6% by mass for an air/fuel ratio of 15) are not reachedwith the fuel vapor.
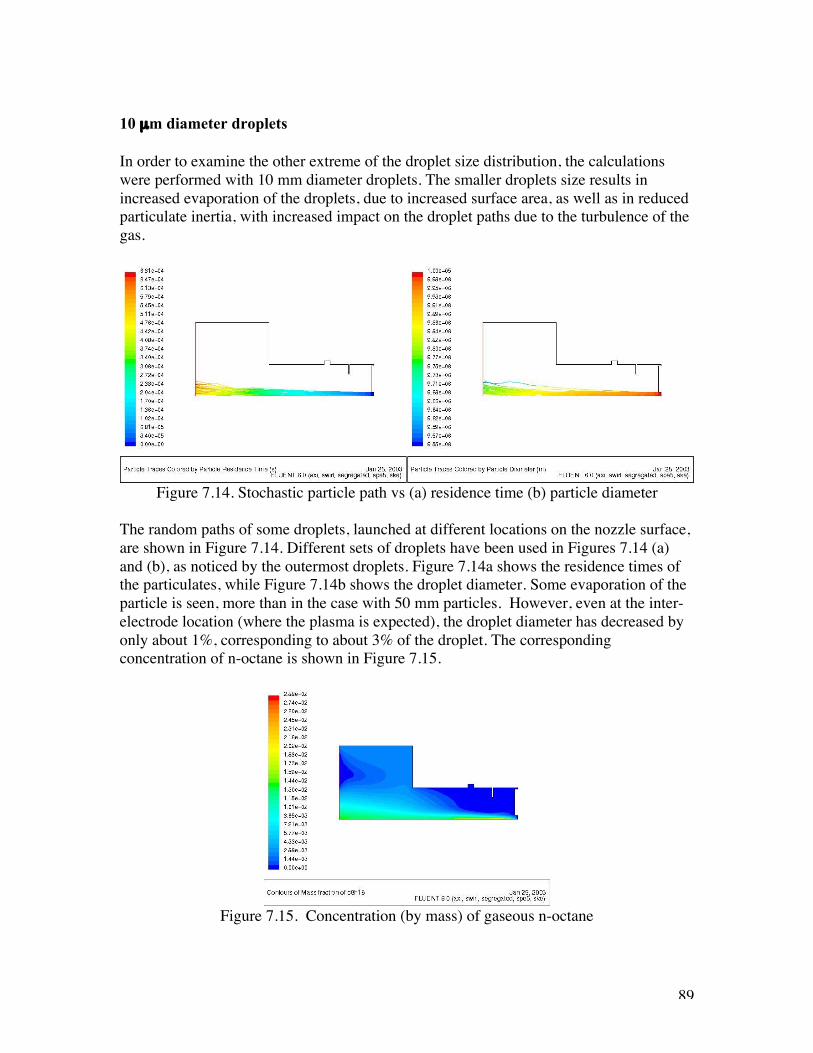
89
10 µm diameter droplets
In order to examine the other extreme of the droplet size distribution, the calculationswere performed with 10 mm diameter droplets. The smaller droplets size results inincreased evaporation of the droplets, due to increased surface area, as well as in reducedparticulate inertia, with increased impact on the droplet paths due to the turbulence of thegas.
Figure 7.14. Stochastic particle path vs (a) residence time (b) particle diameter
The random paths of some droplets, launched at different locations on the nozzle surface,are shown in Figure 7.14. Different sets of droplets have been used in Figures 7.14 (a)and (b), as noticed by the outermost droplets. Figure 7.14a shows the residence times ofthe particulates, while Figure 7.14b shows the droplet diameter. Some evaporation of theparticle is seen, more than in the case with 50 mm particles. However, even at the inter-electrode location (where the plasma is expected), the droplet diameter has decreased byonly about 1%, corresponding to about 3% of the droplet. The correspondingconcentration of n-octane is shown in Figure 7.15.
Figure 7.15. Concentration (by mass) of gaseous n-octane
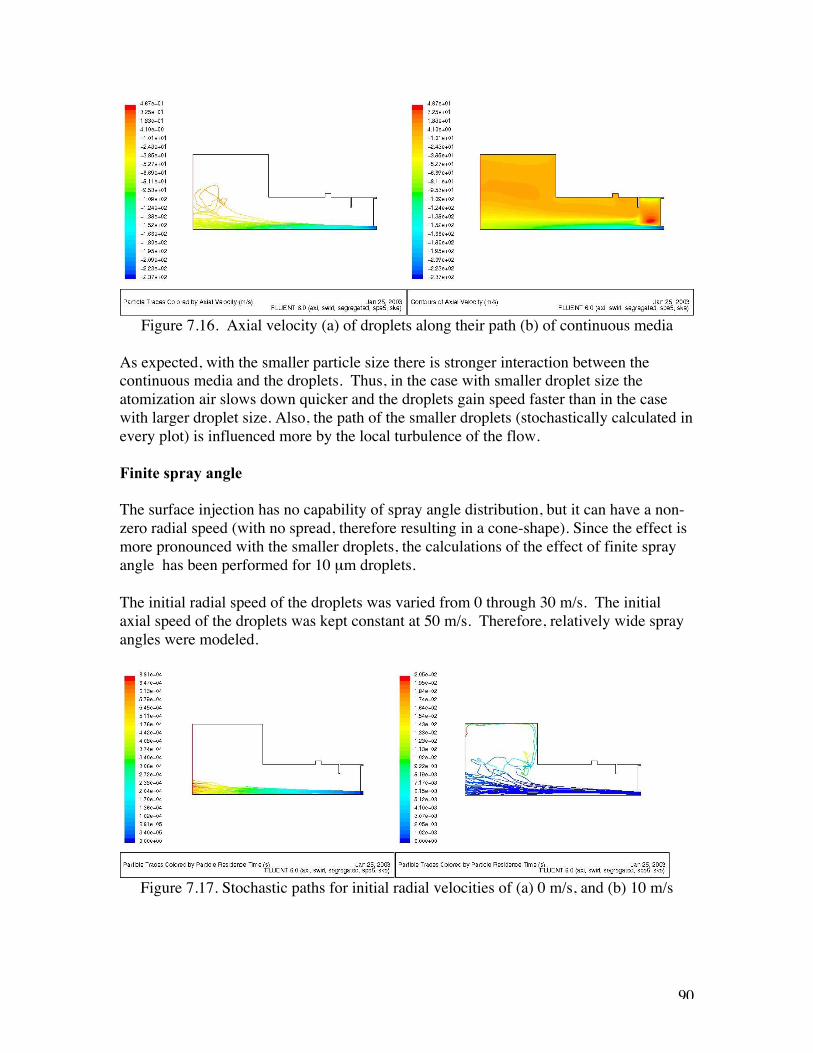
90
Figure 7.16. Axial velocity (a) of droplets along their path (b) of continuous media
As expected, with the smaller particle size there is stronger interaction between thecontinuous media and the droplets. Thus, in the case with smaller droplet size theatomization air slows down quicker and the droplets gain speed faster than in the casewith larger droplet size. Also, the path of the smaller droplets (stochastically calculated inevery plot) is influenced more by the local turbulence of the flow.
Finite spray angle
The surface injection has no capability of spray angle distribution, but it can have a non-zero radial speed (with no spread, therefore resulting in a cone-shape). Since the effect ismore pronounced with the smaller droplets, the calculations of the effect of finite sprayangle has been performed for 10 µm droplets.
The initial radial speed of the droplets was varied from 0 through 30 m/s. The initialaxial speed of the droplets was kept constant at 50 m/s. Therefore, relatively wide sprayangles were modeled.
Figure 7.17. Stochastic paths for initial radial velocities of (a) 0 m/s, and (b) 10 m/s
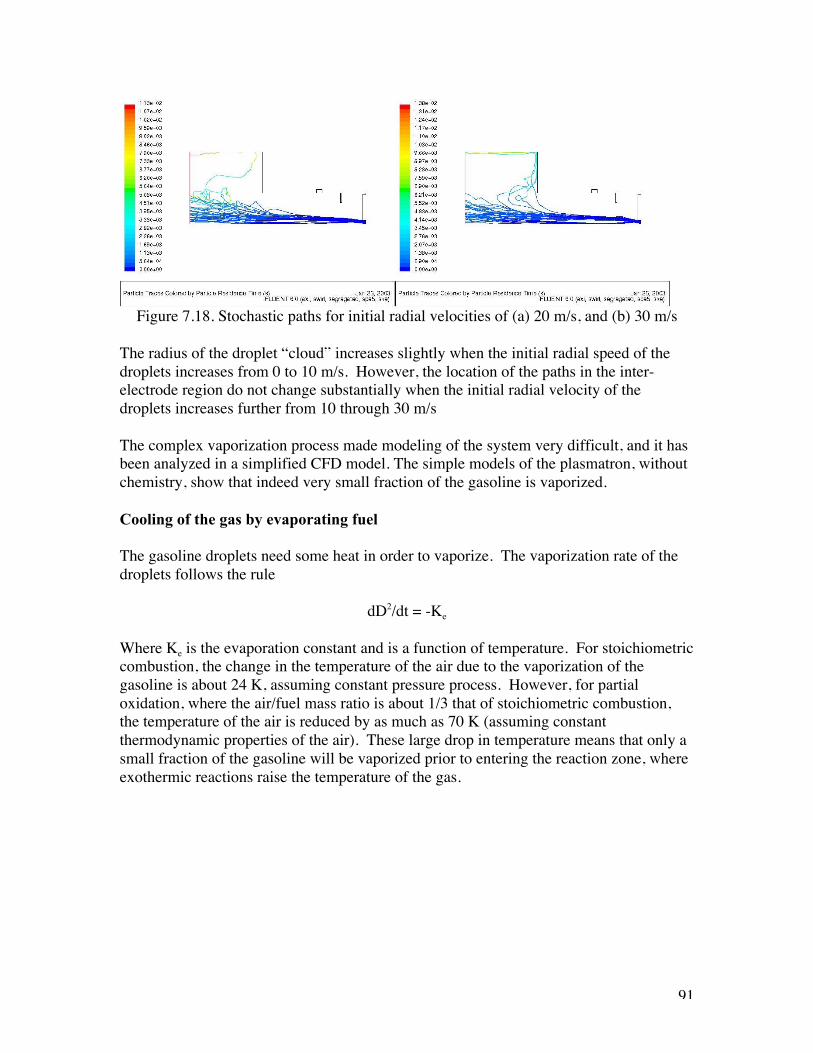
91
Figure 7.18. Stochastic paths for initial radial velocities of (a) 20 m/s, and (b) 30 m/s
The radius of the droplet “cloud” increases slightly when the initial radial speed of thedroplets increases from 0 to 10 m/s. However, the location of the paths in the inter-electrode region do not change substantially when the initial radial velocity of thedroplets increases further from 10 through 30 m/s
The complex vaporization process made modeling of the system very difficult, and it hasbeen analyzed in a simplified CFD model. The simple models of the plasmatron, withoutchemistry, show that indeed very small fraction of the gasoline is vaporized.
Cooling of the gas by evaporating fuel
The gasoline droplets need some heat in order to vaporize. The vaporization rate of thedroplets follows the rule
dD2/dt = -Ke
Where Ke is the evaporation constant and is a function of temperature. For stoichiometriccombustion, the change in the temperature of the air due to the vaporization of thegasoline is about 24 K, assuming constant pressure process. However, for partialoxidation, where the air/fuel mass ratio is about 1/3 that of stoichiometric combustion,the temperature of the air is reduced by as much as 70 K (assuming constantthermodynamic properties of the air). These large drop in temperature means that only asmall fraction of the gasoline will be vaporized prior to entering the reaction zone, whereexothermic reactions raise the temperature of the gas.
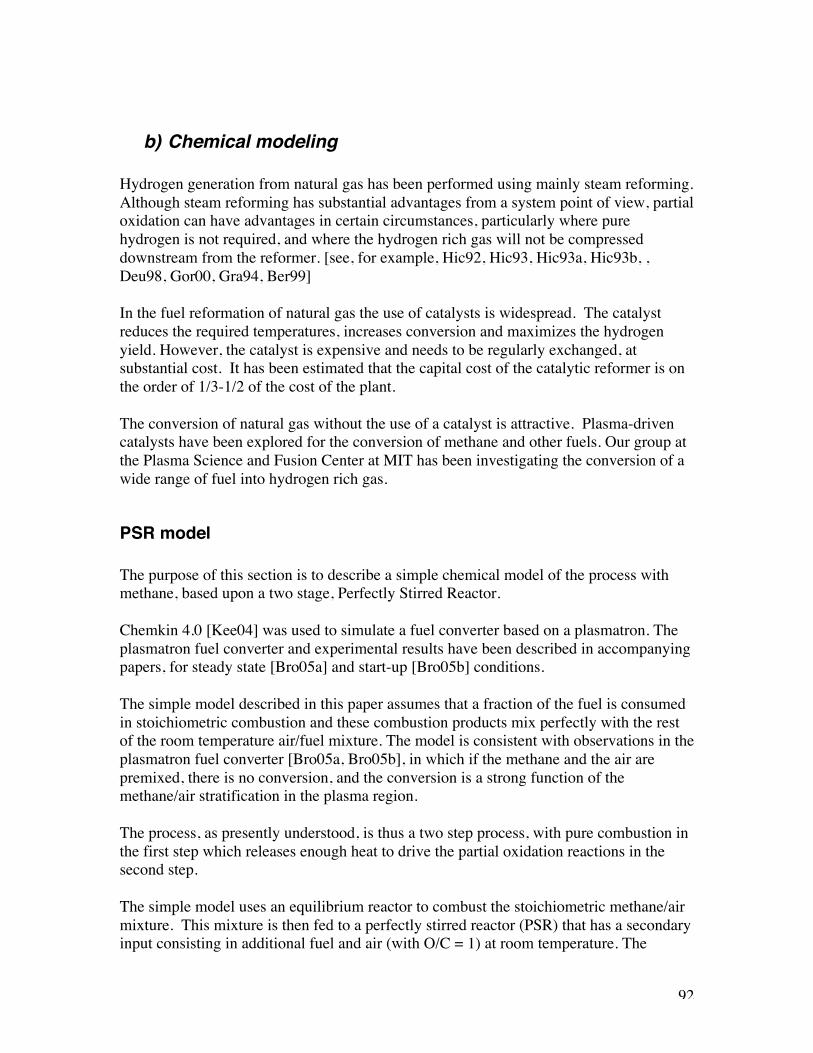
92
b) Chemical modeling
Hydrogen generation from natural gas has been performed using mainly steam reforming.Although steam reforming has substantial advantages from a system point of view, partialoxidation can have advantages in certain circumstances, particularly where purehydrogen is not required, and where the hydrogen rich gas will not be compresseddownstream from the reformer. [see, for example, Hic92, Hic93, Hic93a, Hic93b, ,Deu98, Gor00, Gra94, Ber99]
In the fuel reformation of natural gas the use of catalysts is widespread. The catalystreduces the required temperatures, increases conversion and maximizes the hydrogenyield. However, the catalyst is expensive and needs to be regularly exchanged, atsubstantial cost. It has been estimated that the capital cost of the catalytic reformer is onthe order of 1/3-1/2 of the cost of the plant.
The conversion of natural gas without the use of a catalyst is attractive. Plasma-drivencatalysts have been explored for the conversion of methane and other fuels. Our group atthe Plasma Science and Fusion Center at MIT has been investigating the conversion of awide range of fuel into hydrogen rich gas.
PSR model
The purpose of this section is to describe a simple chemical model of the process withmethane, based upon a two stage, Perfectly Stirred Reactor.
Chemkin 4.0 [Kee04] was used to simulate a fuel converter based on a plasmatron. Theplasmatron fuel converter and experimental results have been described in accompanyingpapers, for steady state [Bro05a] and start-up [Bro05b] conditions.
The simple model described in this paper assumes that a fraction of the fuel is consumedin stoichiometric combustion and these combustion products mix perfectly with the restof the room temperature air/fuel mixture. The model is consistent with observations in theplasmatron fuel converter [Bro05a, Bro05b], in which if the methane and the air arepremixed, there is no conversion, and the conversion is a strong function of themethane/air stratification in the plasma region.
The process, as presently understood, is thus a two step process, with pure combustion inthe first step which releases enough heat to drive the partial oxidation reactions in thesecond step.
The simple model uses an equilibrium reactor to combust the stoichiometric methane/airmixture. This mixture is then fed to a perfectly stirred reactor (PSR) that has a secondaryinput consisting in additional fuel and air (with O/C = 1) at room temperature. The
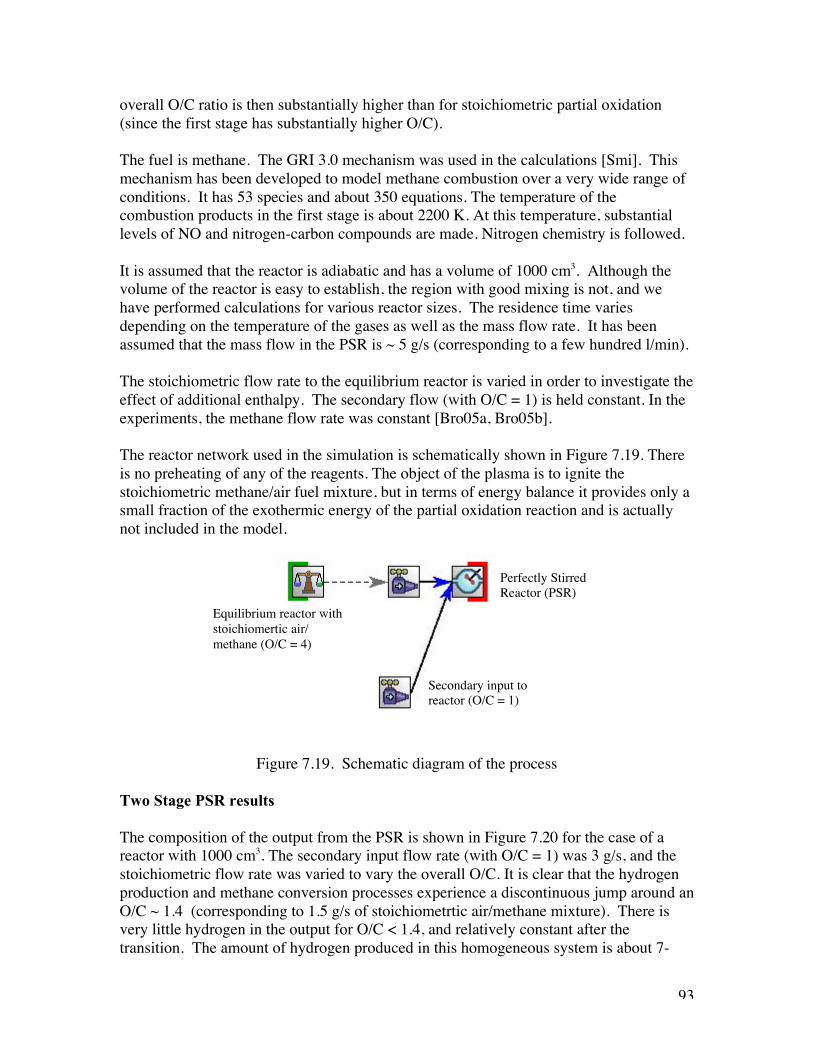
93
overall O/C ratio is then substantially higher than for stoichiometric partial oxidation(since the first stage has substantially higher O/C).
The fuel is methane. The GRI 3.0 mechanism was used in the calculations [Smi]. Thismechanism has been developed to model methane combustion over a very wide range ofconditions. It has 53 species and about 350 equations. The temperature of thecombustion products in the first stage is about 2200 K. At this temperature, substantiallevels of NO and nitrogen-carbon compounds are made. Nitrogen chemistry is followed.
It is assumed that the reactor is adiabatic and has a volume of 1000 cm3. Although thevolume of the reactor is easy to establish, the region with good mixing is not, and wehave performed calculations for various reactor sizes. The residence time variesdepending on the temperature of the gases as well as the mass flow rate. It has beenassumed that the mass flow in the PSR is ~ 5 g/s (corresponding to a few hundred l/min).
The stoichiometric flow rate to the equilibrium reactor is varied in order to investigate theeffect of additional enthalpy. The secondary flow (with O/C = 1) is held constant. In theexperiments, the methane flow rate was constant [Bro05a, Bro05b].
The reactor network used in the simulation is schematically shown in Figure 7.19. Thereis no preheating of any of the reagents. The object of the plasma is to ignite thestoichiometric methane/air fuel mixture, but in terms of energy balance it provides only asmall fraction of the exothermic energy of the partial oxidation reaction and is actuallynot included in the model.
Figure 7.19. Schematic diagram of the process
Two Stage PSR results
The composition of the output from the PSR is shown in Figure 7.20 for the case of areactor with 1000 cm3. The secondary input flow rate (with O/C = 1) was 3 g/s, and thestoichiometric flow rate was varied to vary the overall O/C. It is clear that the hydrogenproduction and methane conversion processes experience a discontinuous jump around anO/C ~ 1.4 (corresponding to 1.5 g/s of stoichiometrtic air/methane mixture). There isvery little hydrogen in the output for O/C < 1.4, and relatively constant after thetransition. The amount of hydrogen produced in this homogeneous system is about 7-
Equilibrium reactor withstoichiomertic air/methane (O/C = 4)
Secondary input toreactor (O/C = 1)
Perfectly StirredReactor (PSR)
94
8%, relatively independent on the overall O/C ratio. It should be noted that withincreased stoichiometric mass flow rate (more combustion), the residence time decreases,both because of the increased mass flow rate as well as increased temperature.
Figure 7.20. Composition of the exhaust as a function of the overall O/C ratio.
The PSR temperature and residence time are shown in Figure 7.21. The temperatureincreases with increasing stoichiometric flow rate. The temperature of the PSR reachesvalues where substantial reactions can take place, at which point the fuel rich mixture inthe PSR ignites. The steady state temperatures of the PSR are on the order of 1400-1500K. The residence time varied from about 80 ms at the conditions of the lowest O/Cvalues considered, to about 30 ms to the highest flow rates.
The corresponding stoichiometric flow rate is plotted in Figure 7.22 as a function of thecalculated O/C ratio. Substantial precombustion of the methane is required in order todrive the reforming reaction. A stoichiometric flow rate of 1.5 g/s is required for asecondary flow rate of 3 g/s, corresponding to an overall O/C of about 1.4. Theseconditions result in large enough temperatures to maintain the reaction.
0%
5%
10%
15%
20%
25%
1.2 1.3 1.4 1.5 1.6 1.7 1.8Overall O/C
Conce
ntr
atio
n (
mola
r)
H2
CO
CO2
H2O
O2
CH4
C2H4
C2H6
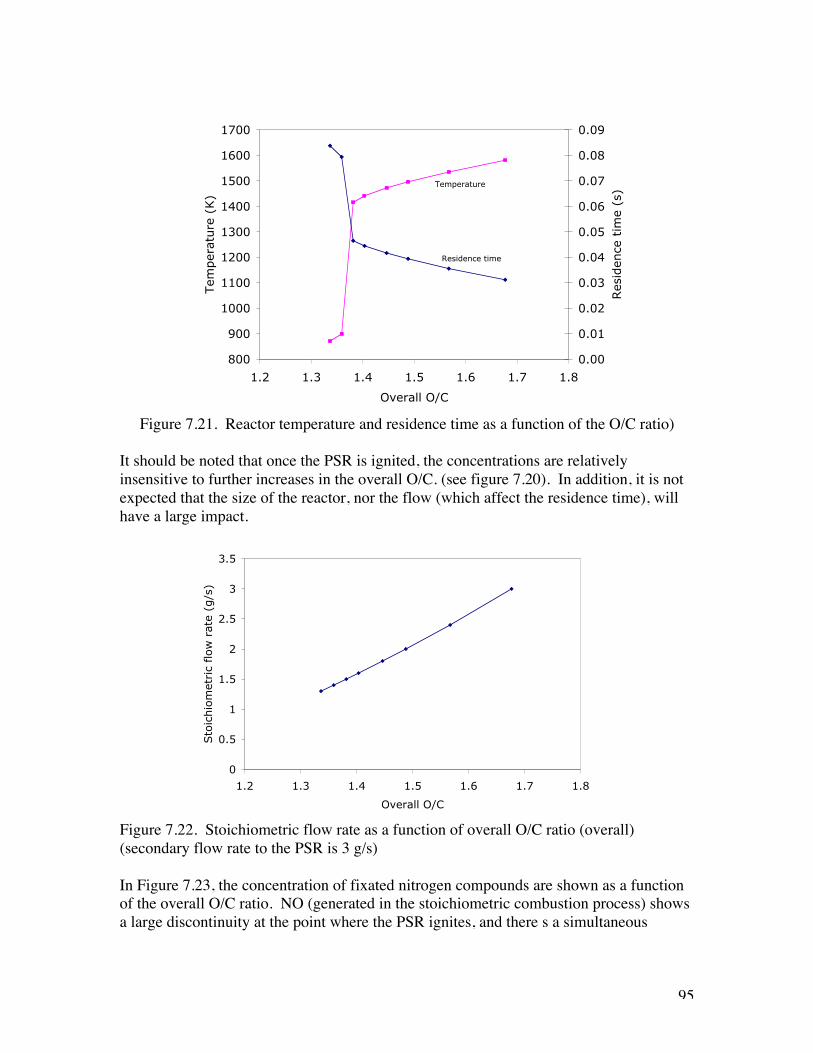
95
Figure 7.21. Reactor temperature and residence time as a function of the O/C ratio)
It should be noted that once the PSR is ignited, the concentrations are relativelyinsensitive to further increases in the overall O/C. (see figure 7.20). In addition, it is notexpected that the size of the reactor, nor the flow (which affect the residence time), willhave a large impact.
Figure 7.22. Stoichiometric flow rate as a function of overall O/C ratio (overall)(secondary flow rate to the PSR is 3 g/s)
In Figure 7.23, the concentration of fixated nitrogen compounds are shown as a functionof the overall O/C ratio. NO (generated in the stoichiometric combustion process) showsa large discontinuity at the point where the PSR ignites, and there s a simultaneous
800
900
1000
1100
1200
1300
1400
1500
1600
1700
1.2 1.3 1.4 1.5 1.6 1.7 1.8
Overall O/C
Tem
per
ature
(K)
0.00
0.01
0.02
0.03
0.04
0.05
0.06
0.07
0.08
0.09
Res
iden
ce t
ime
(s)
Temperature
Residence time
0
0.5
1
1.5
2
2.5
3
3.5
1.2 1.3 1.4 1.5 1.6 1.7 1.8
Overall O/C
Sto
ichio
met
ric
flow
rat
e (g
/s)

96
increase of HCN and NH3, as would be expected from a system with a reducingenvironment.
Figure 7.23. Fixated nitrogen as a function overall O/C (secondary flow rate is 3 g/s)
It would be useful to determine whether the fixated is generated in the equilibrium reactoror in the PSR. The equilibrium reactor generates, at a flow rate of 1.5 g/s, an NO flowrate of 10-4 moles/s. The output from the PSR has about 0.9 10-4 moles/s. Thus, most ofthe NO from the equilibrium reactor flows to the output of the PSR when there is littlereforming in the PSR. Nor surprisingly, as it is in the equilibrium reactor where thenitrogen is fixated.
Effect of residence time in the conversion
In order to determine the effect of residence time, the flow rates were scaled down, withfixed reactor volume. These flow rates do correspond to more realistic flow rates in theexperiment.
The total gas flow rate was varied from 2.5 g/s total to 20 g/s. The results are shown inFigure 7.24. Increasing the residence time only slightly increases the hydrogen yield andthe methane conversion. The model suggests fast initial chemistry, followed by slowchemistry.
The composition of the fixated nitrogen compounds for different residence times isshown in Figure 7.25. There are changes in the composition of the fixated nitrogen, withNO decreasing and NH3 increasing. As with the composition of the major components,slow chemistry follows relatively fast chemistry. For residence times larger than about 20ms, the rates of conversion are very slow and the concentration rate of change is slow. It
0.0000
0.0001
0.0002
0.0003
0.0004
0.0005
0.0006
1.2 1.4 1.6 1.8
Overall O/C
Conce
ntr
atio
n (
mola
r)
NO
NO2
HCN
NH3
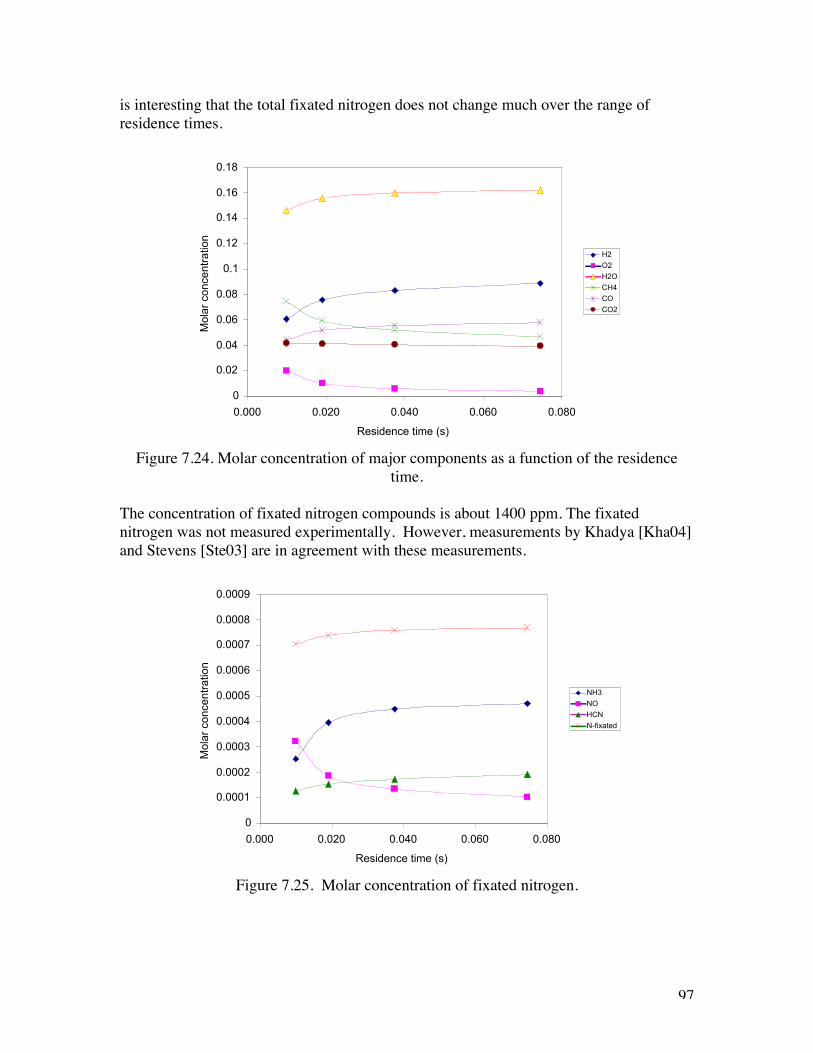
97
is interesting that the total fixated nitrogen does not change much over the range ofresidence times.
0
0.02
0.04
0.06
0.08
0.1
0.12
0.14
0.16
0.18
0.000 0.020 0.040 0.060 0.080
Residence time (s)
Mol
ar c
once
ntra
tion
H2
O2
H2O
CH4
CO
CO2
Figure 7.24. Molar concentration of major components as a function of the residencetime.
The concentration of fixated nitrogen compounds is about 1400 ppm. The fixatednitrogen was not measured experimentally. However, measurements by Khadya [Kha04]and Stevens [Ste03] are in agreement with these measurements.
0
0.0001
0.0002
0.0003
0.0004
0.0005
0.0006
0.0007
0.0008
0.0009
0.000 0.020 0.040 0.060 0.080
Residence time (s)
Mol
ar c
once
ntra
tion
NH3
NO
HCN
N-fixated
Figure 7.25. Molar concentration of fixated nitrogen.
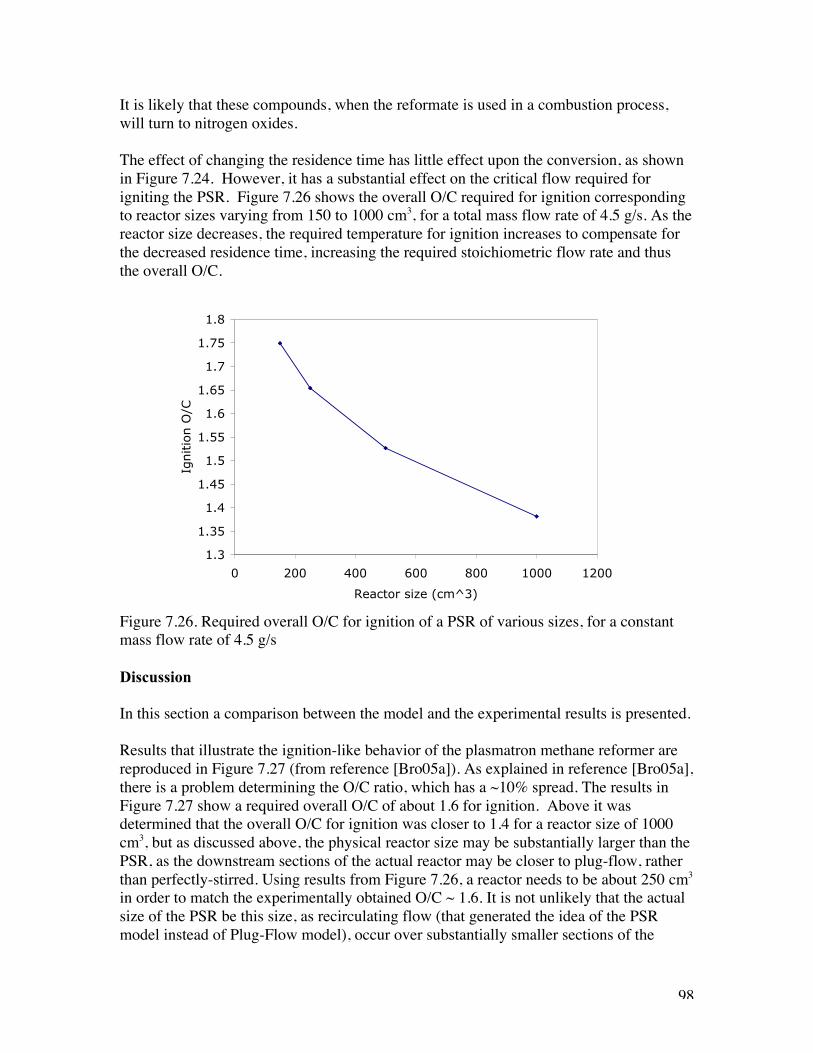
98
It is likely that these compounds, when the reformate is used in a combustion process,will turn to nitrogen oxides.
The effect of changing the residence time has little effect upon the conversion, as shownin Figure 7.24. However, it has a substantial effect on the critical flow required forigniting the PSR. Figure 7.26 shows the overall O/C required for ignition correspondingto reactor sizes varying from 150 to 1000 cm3, for a total mass flow rate of 4.5 g/s. As thereactor size decreases, the required temperature for ignition increases to compensate forthe decreased residence time, increasing the required stoichiometric flow rate and thusthe overall O/C.
Figure 7.26. Required overall O/C for ignition of a PSR of various sizes, for a constantmass flow rate of 4.5 g/s
Discussion
In this section a comparison between the model and the experimental results is presented.
Results that illustrate the ignition-like behavior of the plasmatron methane reformer arereproduced in Figure 7.27 (from reference [Bro05a]). As explained in reference [Bro05a],there is a problem determining the O/C ratio, which has a ~10% spread. The results inFigure 7.27 show a required overall O/C of about 1.6 for ignition. Above it wasdetermined that the overall O/C for ignition was closer to 1.4 for a reactor size of 1000cm3, but as discussed above, the physical reactor size may be substantially larger than thePSR, as the downstream sections of the actual reactor may be closer to plug-flow, ratherthan perfectly-stirred. Using results from Figure 7.26, a reactor needs to be about 250 cm3
in order to match the experimentally obtained O/C ~ 1.6. It is not unlikely that the actualsize of the PSR be this size, as recirculating flow (that generated the idea of the PSRmodel instead of Plug-Flow model), occur over substantially smaller sections of the
1.3
1.35
1.4
1.45
1.5
1.55
1.6
1.65
1.7
1.75
1.8
0 200 400 600 800 1000 1200
Reactor size (cm^3)
Ignitio
n O
/C
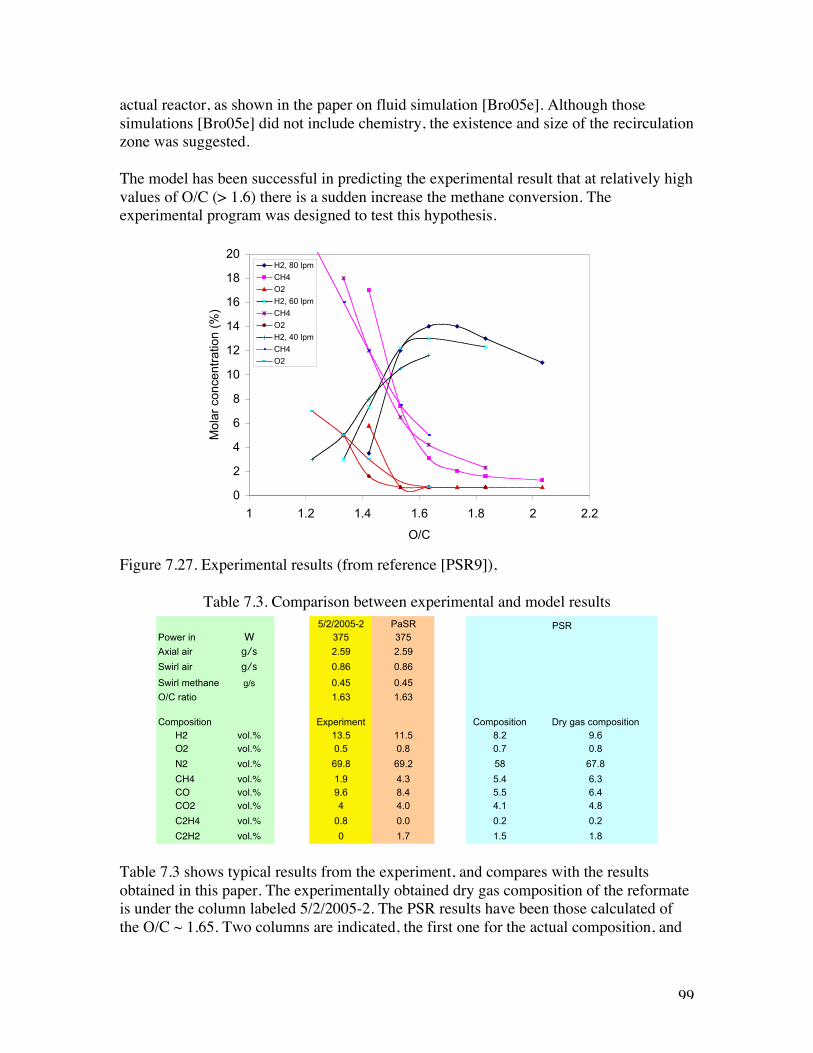
99
actual reactor, as shown in the paper on fluid simulation [Bro05e]. Although thosesimulations [Bro05e] did not include chemistry, the existence and size of the recirculationzone was suggested.
The model has been successful in predicting the experimental result that at relatively highvalues of O/C (> 1.6) there is a sudden increase the methane conversion. Theexperimental program was designed to test this hypothesis.
Figure 7.27. Experimental results (from reference [PSR9]),
Table 7.3. Comparison between experimental and model results
Table 7.3 shows typical results from the experiment, and compares with the resultsobtained in this paper. The experimentally obtained dry gas composition of the reformateis under the column labeled 5/2/2005-2. The PSR results have been those calculated ofthe O/C ~ 1.65. Two columns are indicated, the first one for the actual composition, and
0
2
4
6
8
10
12
14
16
18
20
1 1.2 1.4 1.6 1.8 2 2.2
O/C
Mol
ar c
once
ntra
tion
(%)
H2, 80 lpm
CH4
O2
H2, 60 lpm
CH4
O2
H2, 40 lpm
CH4
O2
5/2/2005-2 PaSRPower in W 375 375
Axial air g/s 2.59 2.59
Swirl air g/s 0.86 0.86
Swirl methane g/s 0.45 0.45
O/C ratio 1.63 1.63
Composition Experiment Composition Dry gas compositionH2 vol.% 13.5 11.5 8.2 9.6O2 vol.% 0.5 0.8 0.7 0.8
N2 vol.% 69.8 69.2 58 67.8
CH4 vol.% 1.9 4.3 5.4 6.3CO vol.% 9.6 8.4 5.5 6.4CO2 vol.% 4 4.0 4.1 4.8
C2H4 vol.% 0.8 0.0 0.2 0.2
C2H2 vol.% 0 1.7 1.5 1.8
PSR

100
the second one for dry gas composition (to compare with the experiments). Also shownare the modeling results from the PsAR calculation [Bro05d].
The models underestimate the concentration of hydrogen (the PSR by about 40%, whilethe PaSR by about 20%). The assumption in this paper of very fast combustion in the firststage, followed by very fast mixing in the second stage, are crude approximation for thesystem. The PaSR model, which includes finite rate mixing, does a better job. A fullfledged model using CFD and chemistry is outside the scope of the work.
It is not clear how large is the well mixed reactor, as there are regions in the downstreamsection of the physical reactor that resemble more a plug flow reactor than a well mixedreactor.
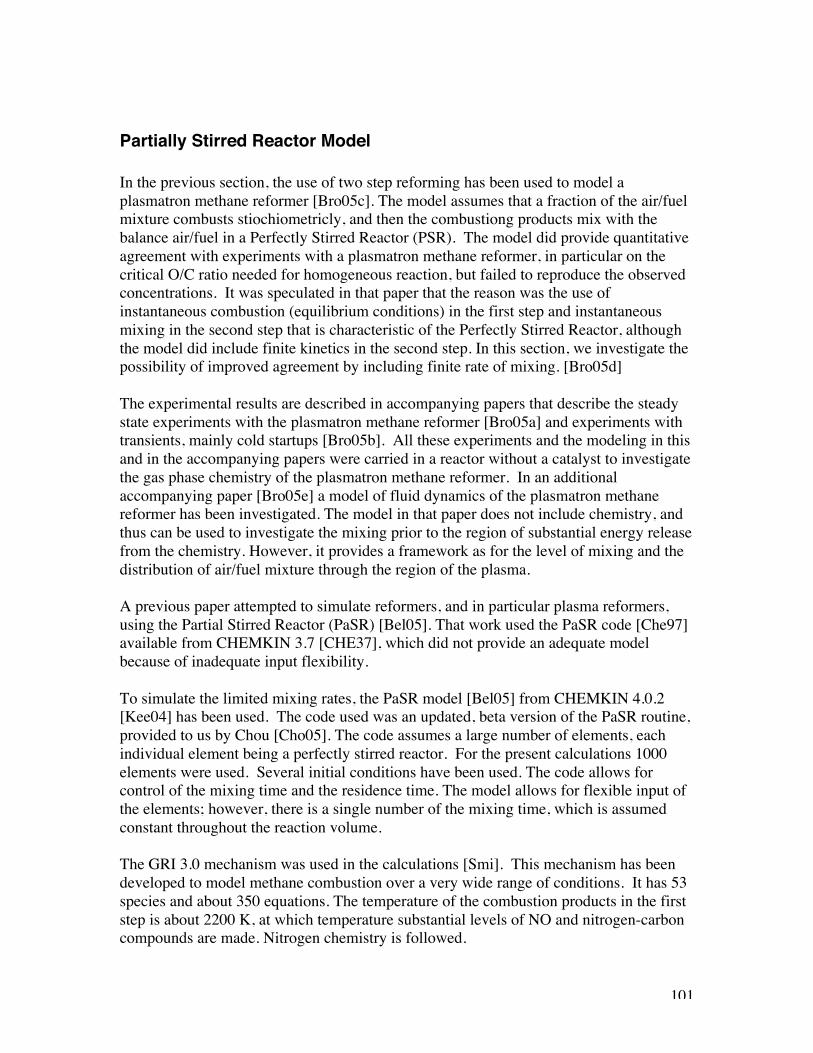
101
Partially Stirred Reactor Model
In the previous section, the use of two step reforming has been used to model aplasmatron methane reformer [Bro05c]. The model assumes that a fraction of the air/fuelmixture combusts stiochiometricly, and then the combustiong products mix with thebalance air/fuel in a Perfectly Stirred Reactor (PSR). The model did provide quantitativeagreement with experiments with a plasmatron methane reformer, in particular on thecritical O/C ratio needed for homogeneous reaction, but failed to reproduce the observedconcentrations. It was speculated in that paper that the reason was the use ofinstantaneous combustion (equilibrium conditions) in the first step and instantaneousmixing in the second step that is characteristic of the Perfectly Stirred Reactor, althoughthe model did include finite kinetics in the second step. In this section, we investigate thepossibility of improved agreement by including finite rate of mixing. [Bro05d]
The experimental results are described in accompanying papers that describe the steadystate experiments with the plasmatron methane reformer [Bro05a] and experiments withtransients, mainly cold startups [Bro05b]. All these experiments and the modeling in thisand in the accompanying papers were carried in a reactor without a catalyst to investigatethe gas phase chemistry of the plasmatron methane reformer. In an additionalaccompanying paper [Bro05e] a model of fluid dynamics of the plasmatron methanereformer has been investigated. The model in that paper does not include chemistry, andthus can be used to investigate the mixing prior to the region of substantial energy releasefrom the chemistry. However, it provides a framework as for the level of mixing and thedistribution of air/fuel mixture through the region of the plasma.
A previous paper attempted to simulate reformers, and in particular plasma reformers,using the Partial Stirred Reactor (PaSR) [Bel05]. That work used the PaSR code [Che97]available from CHEMKIN 3.7 [CHE37], which did not provide an adequate modelbecause of inadequate input flexibility.
To simulate the limited mixing rates, the PaSR model [Bel05] from CHEMKIN 4.0.2[Kee04] has been used. The code used was an updated, beta version of the PaSR routine,provided to us by Chou [Cho05]. The code assumes a large number of elements, eachindividual element being a perfectly stirred reactor. For the present calculations 1000elements were used. Several initial conditions have been used. The code allows forcontrol of the mixing time and the residence time. The model allows for flexible input ofthe elements; however, there is a single number of the mixing time, which is assumedconstant throughout the reaction volume.
The GRI 3.0 mechanism was used in the calculations [Smi]. This mechanism has beendeveloped to model methane combustion over a very wide range of conditions. It has 53species and about 350 equations. The temperature of the combustion products in the firststep is about 2200 K, at which temperature substantial levels of NO and nitrogen-carboncompounds are made. Nitrogen chemistry is followed.
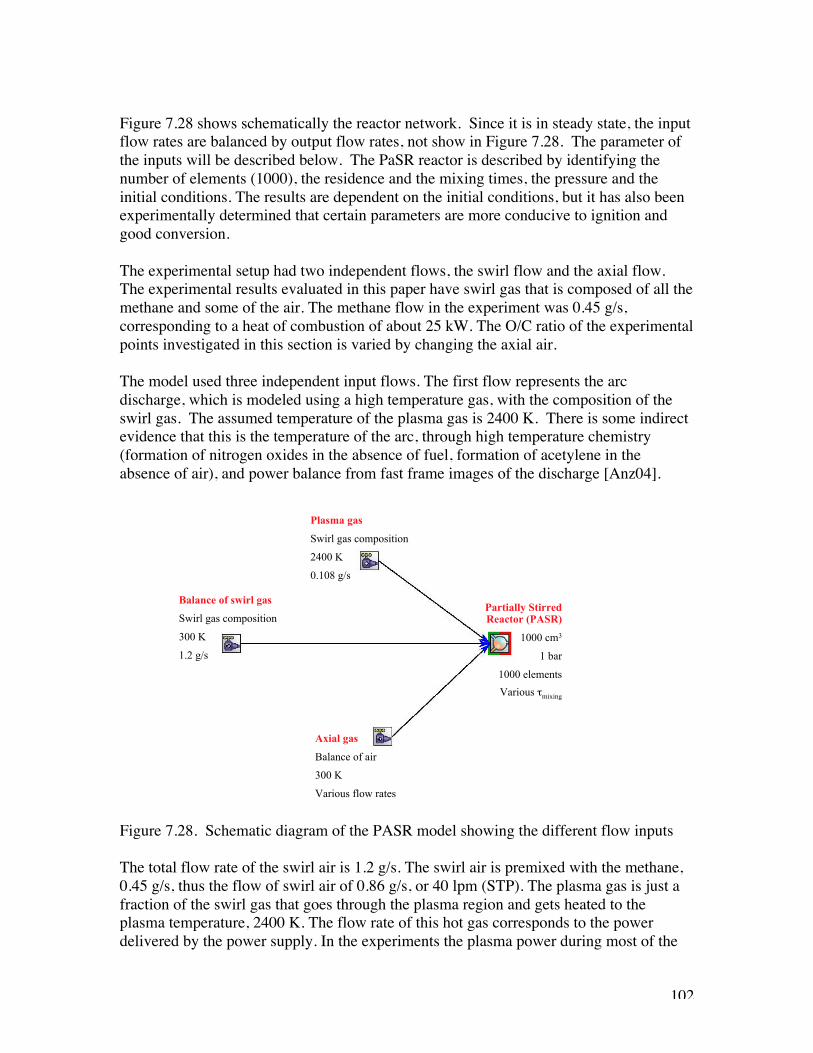
102
Figure 7.28 shows schematically the reactor network. Since it is in steady state, the inputflow rates are balanced by output flow rates, not show in Figure 7.28. The parameter ofthe inputs will be described below. The PaSR reactor is described by identifying thenumber of elements (1000), the residence and the mixing times, the pressure and theinitial conditions. The results are dependent on the initial conditions, but it has also beenexperimentally determined that certain parameters are more conducive to ignition andgood conversion.
The experimental setup had two independent flows, the swirl flow and the axial flow.The experimental results evaluated in this paper have swirl gas that is composed of all themethane and some of the air. The methane flow in the experiment was 0.45 g/s,corresponding to a heat of combustion of about 25 kW. The O/C ratio of the experimentalpoints investigated in this section is varied by changing the axial air.
The model used three independent input flows. The first flow represents the arcdischarge, which is modeled using a high temperature gas, with the composition of theswirl gas. The assumed temperature of the plasma gas is 2400 K. There is some indirectevidence that this is the temperature of the arc, through high temperature chemistry(formation of nitrogen oxides in the absence of fuel, formation of acetylene in theabsence of air), and power balance from fast frame images of the discharge [Anz04].
Figure 7.28. Schematic diagram of the PASR model showing the different flow inputs
The total flow rate of the swirl air is 1.2 g/s. The swirl air is premixed with the methane,0.45 g/s, thus the flow of swirl air of 0.86 g/s, or 40 lpm (STP). The plasma gas is just afraction of the swirl gas that goes through the plasma region and gets heated to theplasma temperature, 2400 K. The flow rate of this hot gas corresponds to the powerdelivered by the power supply. In the experiments the plasma power during most of the
Plasma gas
Swirl gas composition
2400 K
0.108 g/s
Balance of swirl gas
Swirl gas composition
300 K
1.2 g/s
Axial gas
Balance of air
300 K
Various flow rates
Partially StirredReactor (PASR)
1000 cm3
1 bar
1000 elements
Various τmixing

103
steady state experiments is ~ 375 W. For this power, this temperature and gascomposition, the flow rate of the high temperature gas is 0.108 g/s. The impact of theturning off the plasma is investigated by changing the temperature of the plasma gas from2400 K to 300 K. The balance of the swirl flow that is not plasma is at room temperature(300 K).
Table 7.4Flow rates of axial air for the overall O/C ratios considered
The third input flow is the wall air, adding up to the overall air flow rate. The temperatureof the third input flow is 300 K. The flow rate of this gas varies, to model theexperimental results and to change the O/C ratio. The axial air flow rate varies as shownin Table 7.4.
The residence time in the reactor is variable, as the volume of the reactor is constant(1000 cm3). The residence time is determined by the volume of the reactor, the averagedensity of the gases in the reactor, and the mass flow rate.
The simulation is a statistical simulation using the MonteCarlo method. Each element ofthe simulation is modeled as a Perfectly Stirred Reactor. Every MonteCarlo time steprandom cells are mixed (with both mass and heat transfer), some are removed and newones are introduced. The overall response of the system is such to reproduce the mixingtime, the average residence time in the reactor and the characteristics of the input (massflow rates, input composition and temperatures of the gases [Che97]).
The MonteCarlo step is an input that has been varied through the calculations, but it is onthe order of 150 µs. The time has to be long enough to insure that some elements in thereactor are changed, but small enough to make sure that the number of the introducedelements do not significantly change the instantaneous composition or temperature in thereactor.
Several mixing models have been used. The IEM (Interchange by Exchange with Mean),as well as the CURL methods were used. There was no difference in the results usingboth methods, and thus only the results from the CURL method will be presented.
Partial Stirred Reactor (PaSR)
It is necessary to provide adequate initial conditions for the system to evolve to a steadystate condition with good reforming. The results are dependent on initial conditions(initial composition and temperature). If these initial conditions are not provided, such as
O/C Axial air(g/s)
1.43 2.161.63 2.591.83 3.02
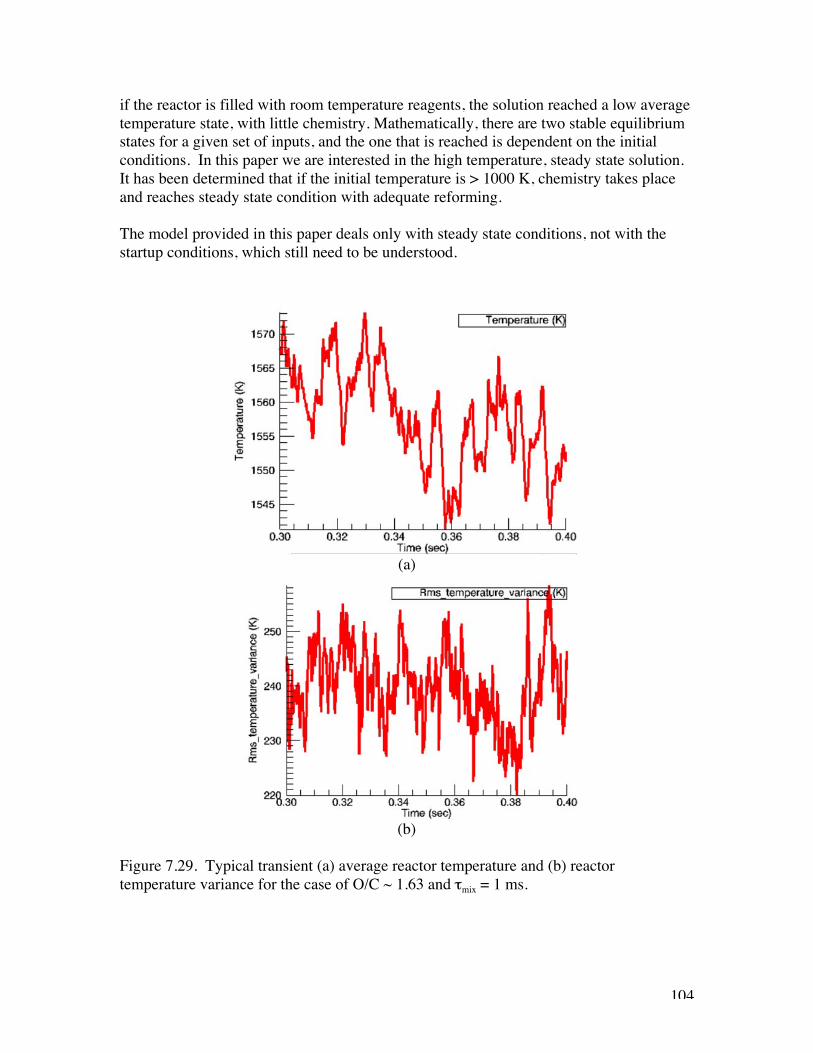
104
if the reactor is filled with room temperature reagents, the solution reached a low averagetemperature state, with little chemistry. Mathematically, there are two stable equilibriumstates for a given set of inputs, and the one that is reached is dependent on the initialconditions. In this paper we are interested in the high temperature, steady state solution.It has been determined that if the initial temperature is > 1000 K, chemistry takes placeand reaches steady state condition with adequate reforming.
The model provided in this paper deals only with steady state conditions, not with thestartup conditions, which still need to be understood.
(a)
(b)
Figure 7.29. Typical transient (a) average reactor temperature and (b) reactortemperature variance for the case of O/C ~ 1.63 and τmix = 1 ms.
105
Once the reactor is started in a mode that results in a good conditions for reforming (hightemperature), the inputs are modified and the run restarted to investigate the effect of thenew conditions. The run is continued until steady state is obtained.
Figure 7.29 shows the results for the transient to steady state in the case of O/C ~ 1.63and τmix = 1 ms. The average temperature is shown in Figure 7.29 (a), while thetemperature variance is shown in Figure 7.29 (b). There is a relatively short-livedtransient at the start of the simulation (from 0.3 s through about 0.35 s), as the conditionsof the simulation have changed. The transients after this short initial period are fromfluctuations due to the statistical nature of the MonteCarlo simulation.
Figure 7.29 follows the transient for 0.1 s, starting from conditions obtained in theprevious 0.3 s. The mixing time in Figure 7.29 is 1 ms, and thus there are plenty ofmixing times for reaching steady state. The residence time, on the other hand is about0.02 s, and thus there are only about 5 residence times in the transient analyzed.
The mixing time although initially estimated from the fluid dynamic calculations, is notknown once chemistry takes place. CFD calculations [Bro05e] indicate that inside theplasmatron head mixing is strong, with mixing times on the order of 100 µs but withshort residence times (the plasmatron volume is small), with longer residence times in thereaction extension cylinder (about 20 ms) and longer mixing times (about 1 ms). We haveused the mixing time as a parameter, calculating the results for mixing times from 0.5 msto 10 ms.
The results for O/C ~ 1.43 are shown in Figure 7.30. Figure 7.30a shows theconcentrations (molar) of the reformate at the end of the simulation period, for differentvalues of the mixing time, τmix. The balance is mostly nitrogen, with < 1% of otherspecies.
Figure 7.30 show that the conversion of methane decreases (and so does the hydrogenconcentration) as the mixing time is increased. The composition is relatively sensitivewith mixing times for short mixing times, but then becomes relatively independent ofmixing time. Similarly, the temperature decreases with increasing mixing time, andbecause of constant reactor volume, the residence time increases. The temperaturevariance also increases, as a direct result of reduced mixing.
To investigate the effect of statistics, two points were calculated for the residence time of1 ms. Both points are plotted in Figure 7.30 for the case with plasma. Although notthorough measurement of the statistics, it indicates the amount of spread in the curves,demonstrating that the error bars in Figure 7.30 are small.
Figure 7.30 shows also the case when the plasma is turned off. It is interesting to notethat the reaction continues, at reduced temperature (by about 150 K), decreasedtemperature variance, and slightly reduced methane conversion (methane concentrationup by about 30%, with hydrogen concentration decreasing by about 20%).

106
Figure 7.31 shows the results for the O/C ratio of 1.63. The trends are similar, withslightly higher methane conversion. The hydrogen concentration has remained relativelyconstant with respect to the previous case of O/C ~ 1.43, but the methane conversion ishigher by about 25%. The hydrogen yield is up because although the concentrationremained constant, the total flow rate has gone up. The test for spread was also performedin this Figure, but for the case with no plasma and 1 ms mixing time.
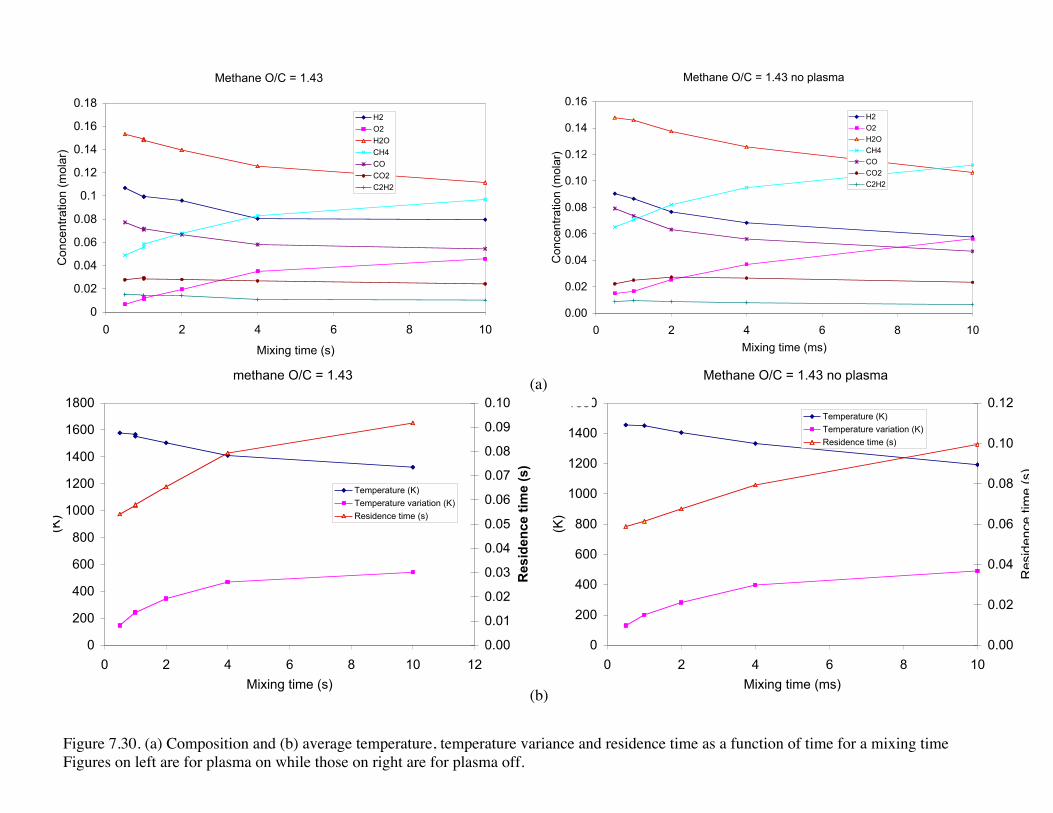
107
Methane O/C = 1.43
0
0.02
0.04
0.06
0.08
0.1
0.12
0.14
0.16
0.18
0 2 4 6 8 10
Mixing time (s)
Con
cent
ratio
n (m
olar
)
H2
O2
H2O
CH4
CO
CO2
C2H2
methane O/C = 1.43
0
200
400
600
800
1000
1200
1400
1600
1800
0 2 4 6 8 10 12
Mixing time (s)
(K)
0.00
0.01
0.02
0.03
0.04
0.05
0.06
0.07
0.08
0.09
0.10
Res
iden
ce t
ime
(s)
Temperature (K)
Temperature variation (K)
Residence time (s)
Methane O/C = 1.43 no plasma
0.00
0.02
0.04
0.06
0.08
0.10
0.12
0.14
0.16
0 2 4 6 8 10
Mixing time (ms)
Con
cent
ratio
n (m
olar
)
H2
O2
H2O
CH4
CO
CO2
C2H2
Methane O/C = 1.43 no plasma
0
200
400
600
800
1000
1200
1400
1600
0 2 4 6 8 10
Mixing time (ms)
(K)
0.00
0.02
0.04
0.06
0.08
0.10
0.12
Res
iden
ce ti
me
(s)
Temperature (K)
Temperature variation (K)
Residence time (s)
Figure 7.30. (a) Composition and (b) average temperature, temperature variance and residence time as a function of time for a mixing timeFigures on left are for plasma on while those on right are for plasma off.
(a)
(b)

108
Methane O/C = 1.63
0
0.02
0.04
0.06
0.08
0.1
0.12
0.14
0.16
0.18
0 2 4 6 8 10Mixing time (ms)
Con
cent
ratio
n (m
olar
)
H2O2H2OCH4COCO2C2H2
Methane O/C 1.63 no plasma
0
0.02
0.04
0.06
0.08
0.1
0.12
0.14
0.16
0.18
0 2 4 6 8 10
Mixing time (ms)
Com
posi
tion
(mol
arl)
H2O2H2OCH4COCO2C2H2
Methane O/C = 1.63 no plasma
0
200
400
600
800
1000
1200
1400
1600
1800
0 2 4 6 8 10
Mixing time (s)
(K)
Temperature
Variation (K)
Methane O/C = 1.63
0
200
400
600
800
1000
1200
1400
1600
1800
0 2 4 6 8 10Mixing time (ms)
(K)
Temperature (K)
Temperature variance (K)
Figure 7.31. Same as Figure 7.30 but for O/C = 1.63.
(a)
(b)
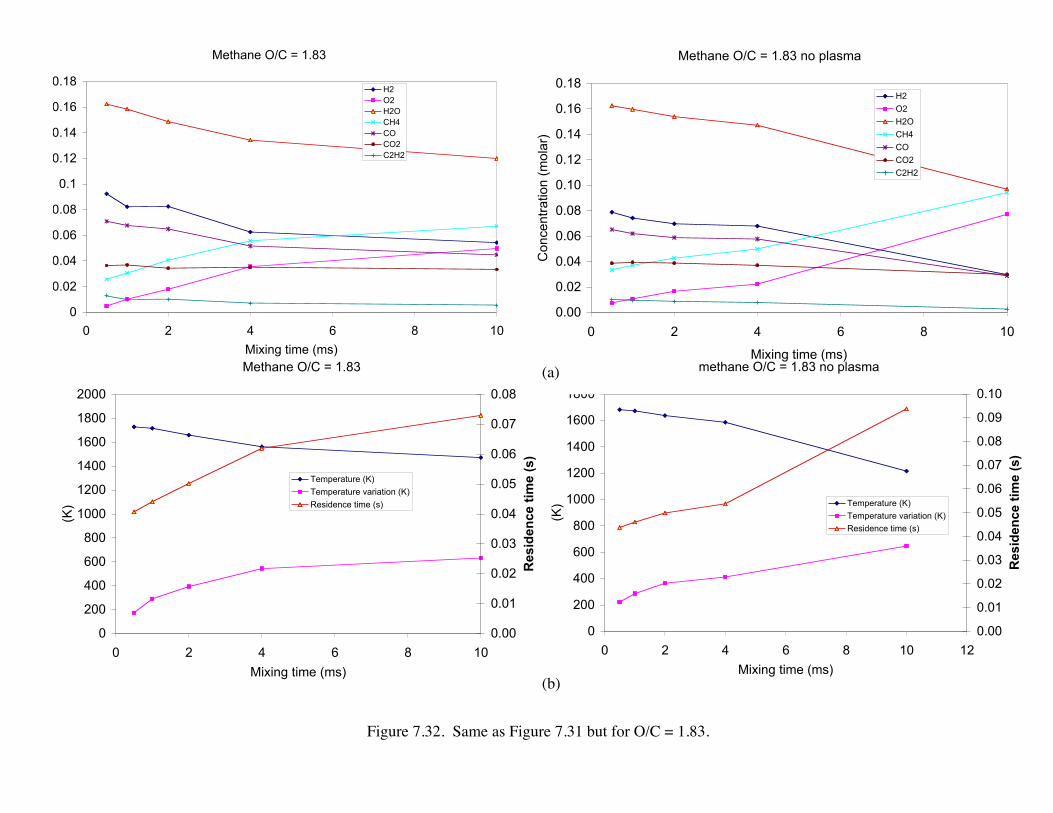
109
Methane O/C = 1.83
0
0.02
0.04
0.06
0.08
0.1
0.12
0.14
0.16
0.18
0 2 4 6 8 10
Mixing time (ms)
Con
cent
ratio
n (m
olar
)
H2O2H2OCH4COCO2C2H2
Methane O/C = 1.83 no plasma
0.00
0.02
0.04
0.06
0.08
0.10
0.12
0.14
0.16
0.18
0 2 4 6 8 10
Mixing time (ms)
Con
cent
ratio
n (m
olar
)
H2
O2
H2O
CH4
CO
CO2
C2H2
Methane O/C = 1.83
0
200
400
600
800
1000
1200
1400
1600
1800
2000
0 2 4 6 8 10
Mixing time (ms)
(K)
0.00
0.01
0.02
0.03
0.04
0.05
0.06
0.07
0.08
Res
iden
ce t
ime
(s)
Temperature (K)
Temperature variation (K)
Residence time (s)
methane O/C = 1.83 no plasma
0
200
400
600
800
1000
1200
1400
1600
1800
0 2 4 6 8 10 12
Mixing time (ms)
(K)
0.00
0.01
0.02
0.03
0.04
0.05
0.06
0.07
0.08
0.09
0.10
Res
iden
ce t
ime
(s)
Temperature (K)
Temperature variation (K)
Residence time (s)
Figure 7.32. Same as Figure 7.31 but for O/C = 1.83.
(a)
(b)
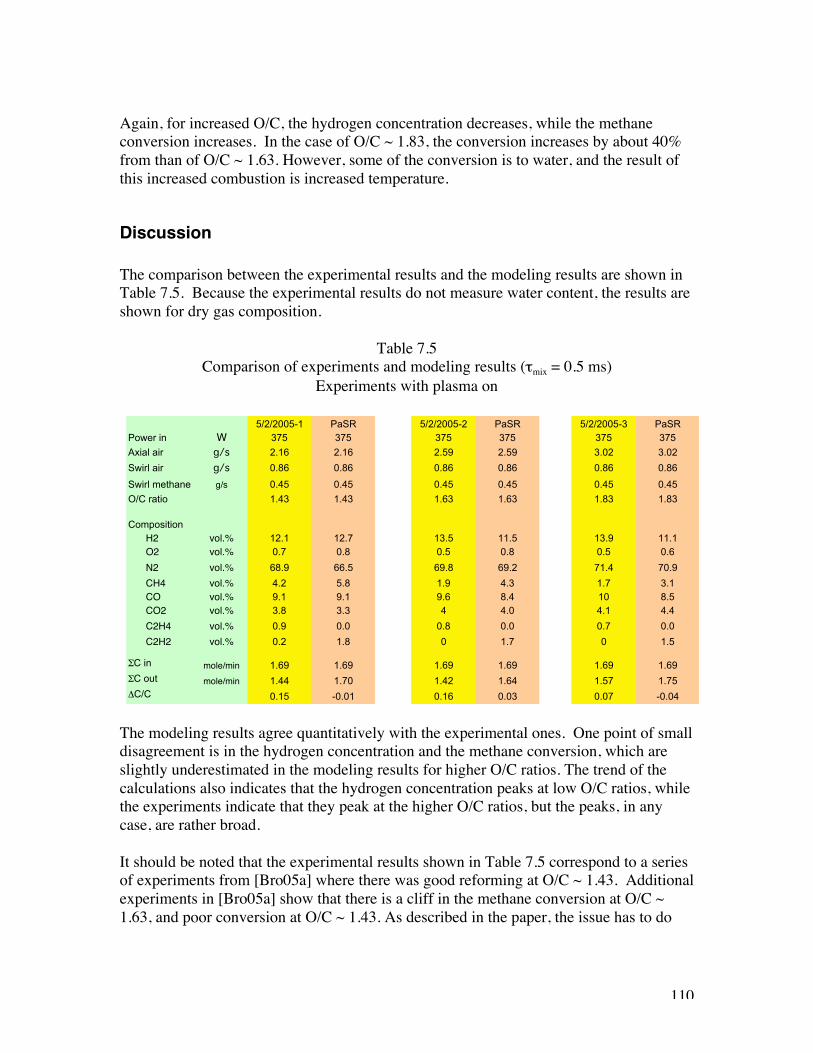
110
Again, for increased O/C, the hydrogen concentration decreases, while the methaneconversion increases. In the case of O/C ~ 1.83, the conversion increases by about 40%from than of O/C ~ 1.63. However, some of the conversion is to water, and the result ofthis increased combustion is increased temperature.
Discussion
The comparison between the experimental results and the modeling results are shown inTable 7.5. Because the experimental results do not measure water content, the results areshown for dry gas composition.
Table 7.5Comparison of experiments and modeling results (τmix = 0.5 ms)
Experiments with plasma on
The modeling results agree quantitatively with the experimental ones. One point of smalldisagreement is in the hydrogen concentration and the methane conversion, which areslightly underestimated in the modeling results for higher O/C ratios. The trend of thecalculations also indicates that the hydrogen concentration peaks at low O/C ratios, whilethe experiments indicate that they peak at the higher O/C ratios, but the peaks, in anycase, are rather broad.
It should be noted that the experimental results shown in Table 7.5 correspond to a seriesof experiments from [Bro05a] where there was good reforming at O/C ~ 1.43. Additionalexperiments in [Bro05a] show that there is a cliff in the methane conversion at O/C ~1.63, and poor conversion at O/C ~ 1.43. As described in the paper, the issue has to do
5/2/2005-1 PaSR 5/2/2005-2 PaSR 5/2/2005-3 PaSRPower in W 375 375 375 375 375 375
Axial air g/s 2.16 2.16 2.59 2.59 3.02 3.02
Swirl air g/s 0.86 0.86 0.86 0.86 0.86 0.86
Swirl methane g/s 0.45 0.45 0.45 0.45 0.45 0.45
O/C ratio 1.43 1.43 1.63 1.63 1.83 1.83
CompositionH2 vol.% 12.1 12.7 13.5 11.5 13.9 11.1O2 vol.% 0.7 0.8 0.5 0.8 0.5 0.6
N2 vol.% 68.9 66.5 69.8 69.2 71.4 70.9
CH4 vol.% 4.2 5.8 1.9 4.3 1.7 3.1CO vol.% 9.1 9.1 9.6 8.4 10 8.5CO2 vol.% 3.8 3.3 4 4.0 4.1 4.4
C2H4 vol.% 0.9 0.0 0.8 0.0 0.7 0.0
C2H2 vol.% 0.2 1.8 0 1.7 0 1.5
ΣC in mole/min 1.69 1.69 1.69 1.69 1.69 1.69ΣC out mole/min 1.44 1.70 1.42 1.64 1.57 1.75ΔC/C 0.15 -0.01 0.16 0.03 0.07 -0.04

111
with reproducibility of the measurement of the O/C ratio, which could be off by as muchas 25%.
The code does not reproduce the experimental results with the C2 compounds. Themodeling indicates that the highest conversion is to acetylene, with small yields of C2H4and C2H6.(about 0.1% molar each). The experimental results indicate the opposite, withsubstantial concentration of C2H4 and/or C2H4 (C2H4 and C2H6 are not separated by ourchromatographic column) and very small concentration of C2H2. The impact on themethane conversion and hydrogen yields are, however, small.
Also shown in the table are the carbon balance, for both the modeling and theexperiments. The last three rows of Table 7.5 show the sum of the carbon in the input(i.e., the methane), and the carbon sum of the output, and their relative differences. Thecarbon balance in the experiments are about 10-15%, while in the computation the carbonbalance is within 1-4% (due to statistics).
It should be noted that in order for the chemistry to take place, mixing has to be at themolecular level. The effects of turbulence on mixing at this level are still not understood.However, it seems that high Reynolds numbers, higher than laminar-to-turbulenttransition, are required (Re > 10,000) to achiever mixing at the molecular level [Dim02].For reference, the Reynolds number in the plasmatron head region of the device is Re ~6000 (prior to chemistry).
The cases analyzed in Figure 7.30-7.32 without plasma show different quantitative resultsthan the experiments. Good performance is only obtained in the experiments byoperating at higher values of O/C than the numerical results. It is not clear why this is thecase.
Two possible alternative explanations have been conceived to explain the differenceobserved between the experimental and numerical calculations without the plasma and atlow O/C. The first one is that there are power losses not accounted by the code. Thecode models an adiabatic reactor. At conditions of lower O/C the exothermicity of thereaction is decreased, and reforming would be more sensitive to losses. The absence ofthe losses would thus explain both the good numerical reforming without the plasma aswell as at the lower O/C ratio
The second possible explanation is the implication of the PaSR code itself. The codeallows for a single mixing time. There is substantial recirculation in the reactor, but it isnot as assumed in the code. When the exothermicity is high, decreased mixing may notaffect as much the results. This behavior is shown in Figures 7.30-7.32. On those casesin the presence of the plasma (on the left of the figures), as mixing time increases,reforming degrades but asymptotes to good reforming (that is, the rate of changedecreases with increasing mixing time). This is changing for the conditions without theplasma, where as the mixing time increases there no asymptote but instead the rate ofchange increases. Thus the reforming without the plasma is more sensitive to poormixing than the case with plasma.
112
8) Steady state experiments
a) Methane reforming
Tests were carried for a single flow rate of methane, which is injected in the swirl gas.The methane flow rate was 0.45 g/s, about 25 kW heating power. A comprehensive set oftests was carried out, from steady state variations of O/C, catalytic vs uncatalyzedreactors, as well as the effects of shutting the plasma off after steady state conditions arereached. The next section will cover steady state conditions where the plasma wasmaintained.
Reforming with plasma on
In this section the steady state plasma reforming characteristics are described. We havecarried out a series of experiments with a systematic variation of the air in the swirl gasand the axial air. The experiment is carried out at well-determined conditions (flows,electrical power), and the composition is monitored with the mass spectrometer. Thetemperature is monitored by a thermocouple in the reactor. Gas samples for analysis withthe GC are taken when the temperature and composition have stabilized.
Results of these experiments are shown in Figure 8.1. Shown are contours of constanthydrogen, carbon monoxide, carbon dioxide and methane concentrations in the dry gas,as a function of the air flow rates in the axial gas and the swirl gas. The value of thecontour is shown in the bar to right of each graph.
The experimental protocol held the swirl air at a given flow rate, while changing the wallair. This process was repeated for 3 different swirl airs. In this manner, the requiredadjustment of the methane rotameters was minimized. We have followed this method asit is experimentally easier, and more reproducible, to vary one air or the other, instead ofvarying both in order to keep constant the overall O/C ratio.
The results indicate that the hydrogen concentration has a broad, saddle-like peak, withthe maximum along the diagonal. The variation of the hydrogen concentration does notvary much, from about 10 to 14%. The variations of the concentration of CO show thesame characteristics as hydrogen, following the maximum for hydrogen, across thediagonal. In contrast, the concentration of CO2 and the methane conversion increasemonotonically towards conditions of higher O/C ratios.
Figure 8.2 shows some of the overall parameters of the conditions analyzed in Figure 8.1.The O-to-C ratio is shown. The constant O/C lines are aligned along the diagonal, just asthe H2 and CO concentrations in Figure 8.1. This indicates the importance of the

113
parameter O/C for hydrogen generation. The CO2 concentration and the methaneconversion are also functions of the O/C ratio.
Figure 8.2 also shows the temperature in the reactor, which increases, in the generaldirection of increased O/C (as more of the fuel in fully combusted, as indicated by theincreased CO2 concentration).
The efficiency shown in Figure 8.2 refers to the heating value of the reformate divided bythe heating value of the fuel. A substantial fraction of the fuel, about 1/3- 1/2 is spent indriving the gas phase partial oxidation. Thus, it seems that without heat recuperation, theprocess is rather inefficient.
Finally, the hydrogen yield shows the same saddle-type behavior than the hydrogenconcentration, with a maximum along the diagonal (with an O/C of about 1.7).
The results indicate that the performance of the plasmatron fuel reformer is dependent onthe overall O/C ratio, and rather independent of the distribution of the air (in either swirlair or wall air). The swirl air needs to be sufficiently high to result in the generation of aplasma in the volume of the plasmatron. For swirl air flow rates less than about 40 lpm,the plasma remained in the electrode gap, not being pushed out into the volume of thereactor.
The results in Figures 8.1 and 8.2 have been used in the Perfectly Stirred reactor (PSR)[Bro05c] as well as the Partially Stirred Reactor (PaSR) [Bro05d] analysis discussed inabove in Section 7.b.
The experiments were repeated for lower O/C ratios, in order to determine thedependence of the process parameters in this regime, even though it results in non-optimal reforming. As in the experiments described above, the methane flow is 0.45 g/s.and the axial air flow was changed. However, the swirl air flow was held constant. Themethane was premixed with the swirl air, as in the previous experiments. The results areshown in Figure 8.3, as a function of the O/C ratio.

114
H2 CO
CO2 CH4
Figure 8.1. Contours of constant H2, CO, CO2 and CH4 as a function of swirl air (plasma air) and axial air (wall air)
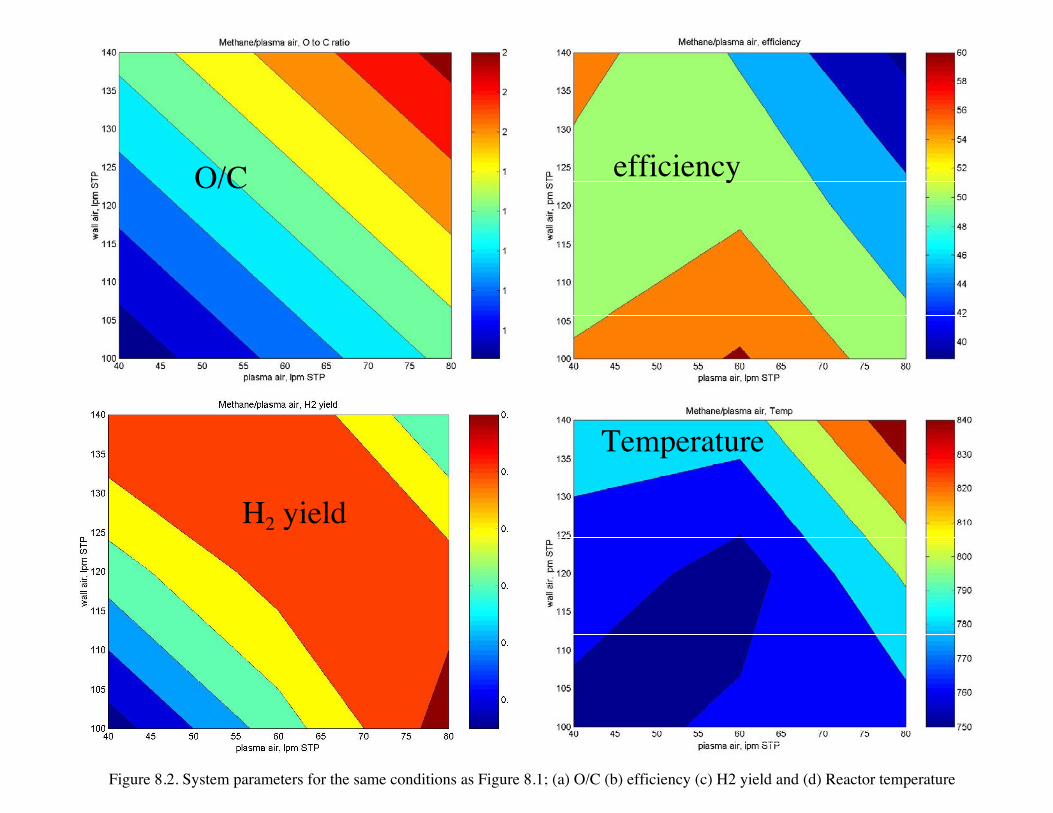
115
O/C efficiency
H2 yield
Temperature
Figure 8.2. System parameters for the same conditions as Figure 8.1; (a) O/C (b) efficiency (c) H2 yield and (d) Reactor temperature
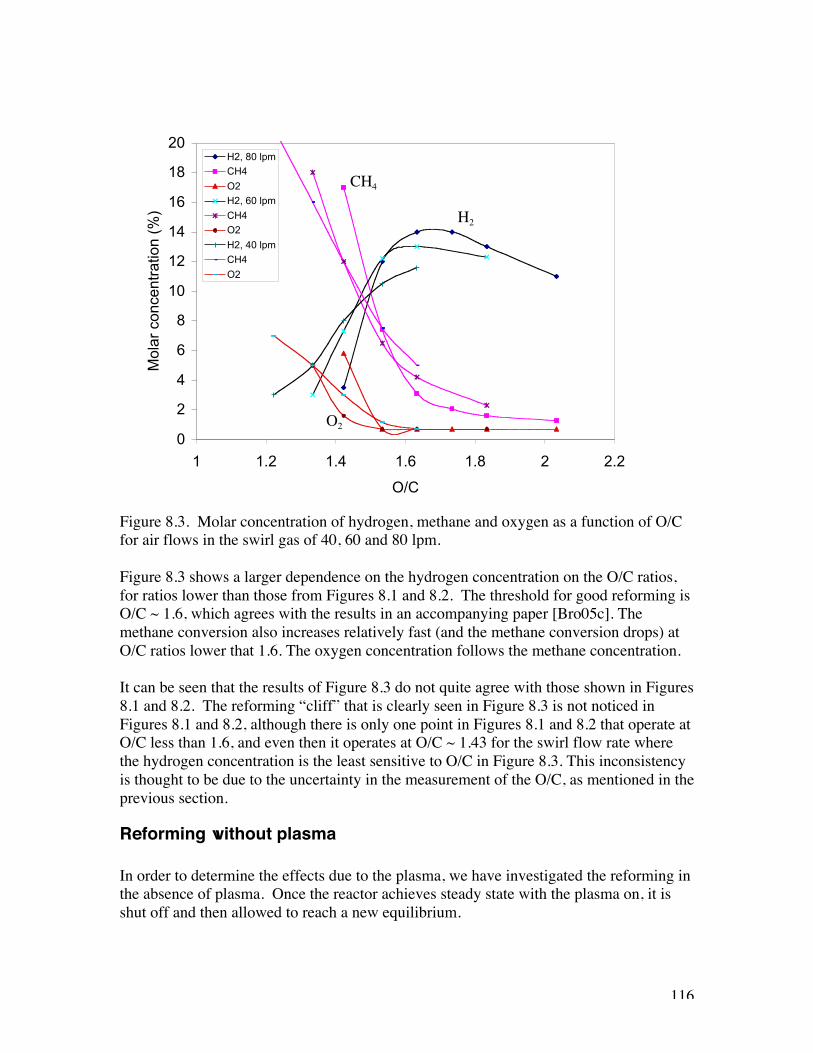
116
Figure 8.3. Molar concentration of hydrogen, methane and oxygen as a function of O/Cfor air flows in the swirl gas of 40, 60 and 80 lpm.
Figure 8.3 shows a larger dependence on the hydrogen concentration on the O/C ratios,for ratios lower than those from Figures 8.1 and 8.2. The threshold for good reforming isO/C ~ 1.6, which agrees with the results in an accompanying paper [Bro05c]. Themethane conversion also increases relatively fast (and the methane conversion drops) atO/C ratios lower that 1.6. The oxygen concentration follows the methane concentration.
It can be seen that the results of Figure 8.3 do not quite agree with those shown in Figures8.1 and 8.2. The reforming “cliff” that is clearly seen in Figure 8.3 is not noticed inFigures 8.1 and 8.2, although there is only one point in Figures 8.1 and 8.2 that operate atO/C less than 1.6, and even then it operates at O/C ~ 1.43 for the swirl flow rate wherethe hydrogen concentration is the least sensitive to O/C in Figure 8.3. This inconsistencyis thought to be due to the uncertainty in the measurement of the O/C, as mentioned in theprevious section.
Reforming without plasma
In order to determine the effects due to the plasma, we have investigated the reforming inthe absence of plasma. Once the reactor achieves steady state with the plasma on, it isshut off and then allowed to reach a new equilibrium.
0
2
4
6
8
10
12
14
16
18
20
1 1.2 1.4 1.6 1.8 2 2.2
O/C
Mol
ar c
once
ntra
tion
(%)
H2, 80 lpm
CH4
O2
H2, 60 lpm
CH4
O2
H2, 40 lpm
CH4
O2
H2
CH4
O2
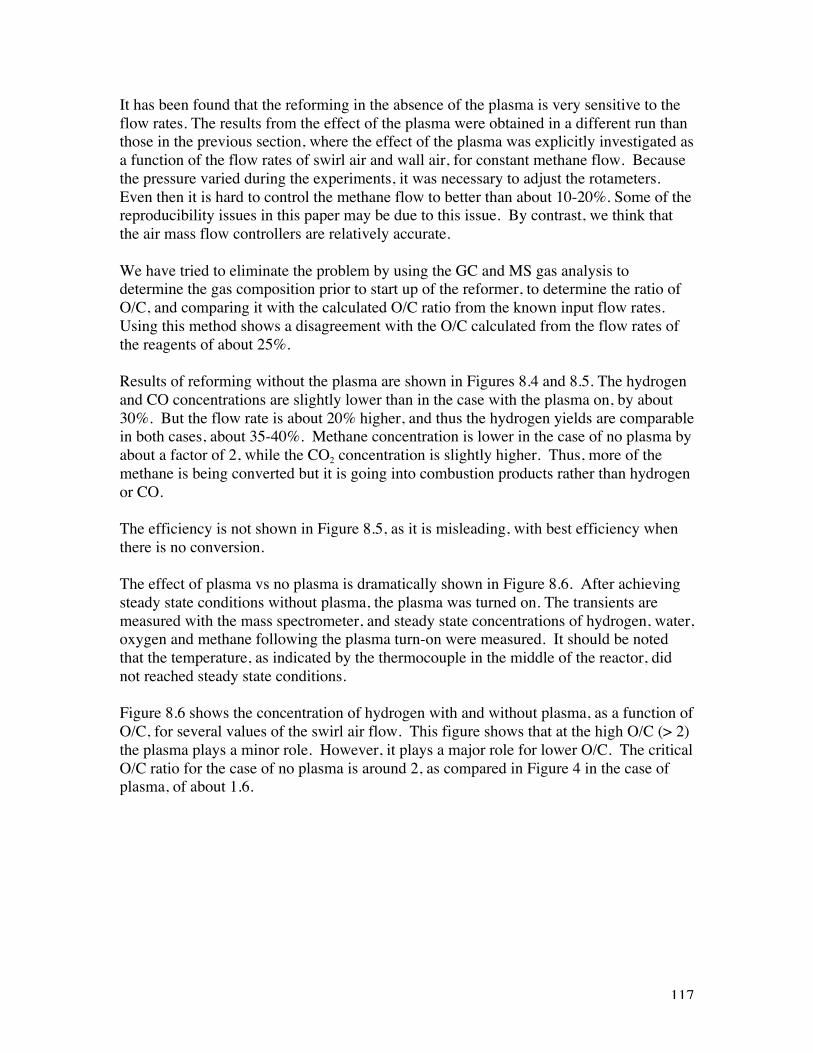
117
It has been found that the reforming in the absence of the plasma is very sensitive to theflow rates. The results from the effect of the plasma were obtained in a different run thanthose in the previous section, where the effect of the plasma was explicitly investigated asa function of the flow rates of swirl air and wall air, for constant methane flow. Becausethe pressure varied during the experiments, it was necessary to adjust the rotameters.Even then it is hard to control the methane flow to better than about 10-20%. Some of thereproducibility issues in this paper may be due to this issue. By contrast, we think thatthe air mass flow controllers are relatively accurate.
We have tried to eliminate the problem by using the GC and MS gas analysis todetermine the gas composition prior to start up of the reformer, to determine the ratio ofO/C, and comparing it with the calculated O/C ratio from the known input flow rates.Using this method shows a disagreement with the O/C calculated from the flow rates ofthe reagents of about 25%.
Results of reforming without the plasma are shown in Figures 8.4 and 8.5. The hydrogenand CO concentrations are slightly lower than in the case with the plasma on, by about30%. But the flow rate is about 20% higher, and thus the hydrogen yields are comparablein both cases, about 35-40%. Methane concentration is lower in the case of no plasma byabout a factor of 2, while the CO2 concentration is slightly higher. Thus, more of themethane is being converted but it is going into combustion products rather than hydrogenor CO.
The efficiency is not shown in Figure 8.5, as it is misleading, with best efficiency whenthere is no conversion.
The effect of plasma vs no plasma is dramatically shown in Figure 8.6. After achievingsteady state conditions without plasma, the plasma was turned on. The transients aremeasured with the mass spectrometer, and steady state concentrations of hydrogen, water,oxygen and methane following the plasma turn-on were measured. It should be notedthat the temperature, as indicated by the thermocouple in the middle of the reactor, didnot reached steady state conditions.
Figure 8.6 shows the concentration of hydrogen with and without plasma, as a function ofO/C, for several values of the swirl air flow. This figure shows that at the high O/C (> 2)the plasma plays a minor role. However, it plays a major role for lower O/C. The criticalO/C ratio for the case of no plasma is around 2, as compared in Figure 4 in the case ofplasma, of about 1.6.
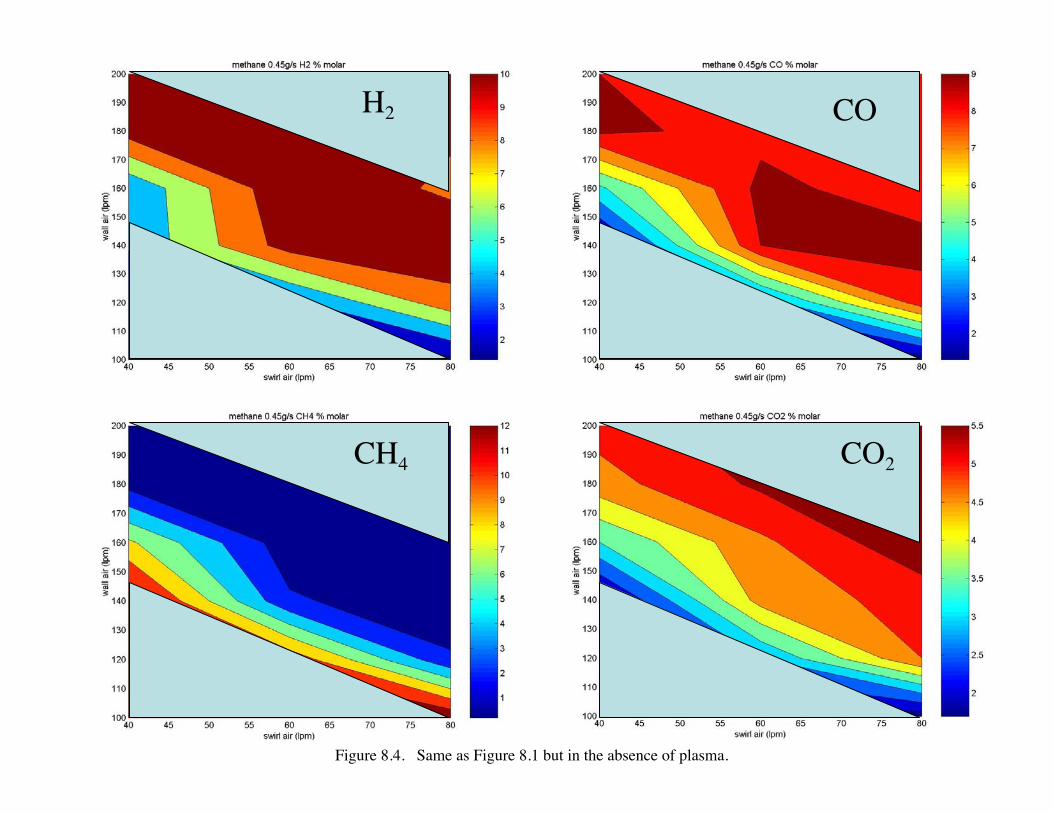
118
H2 CO
CH4 CO2
Figure 8.4. Same as Figure 8.1 but in the absence of plasma.
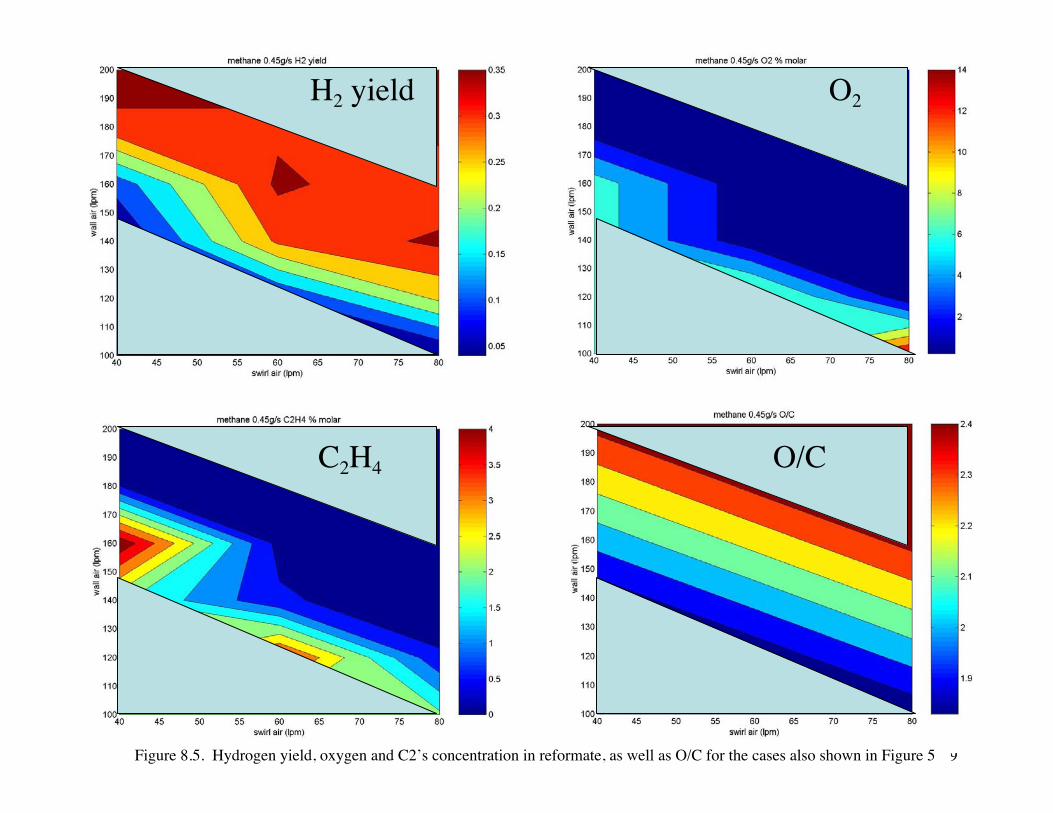
119
Figure ********SDFSDF
H2 yield O2
C2H4 O/C
Figure 8.5. Hydrogen yield, oxygen and C2’s concentration in reformate, as well as O/C for the cases also shown in Figure 5
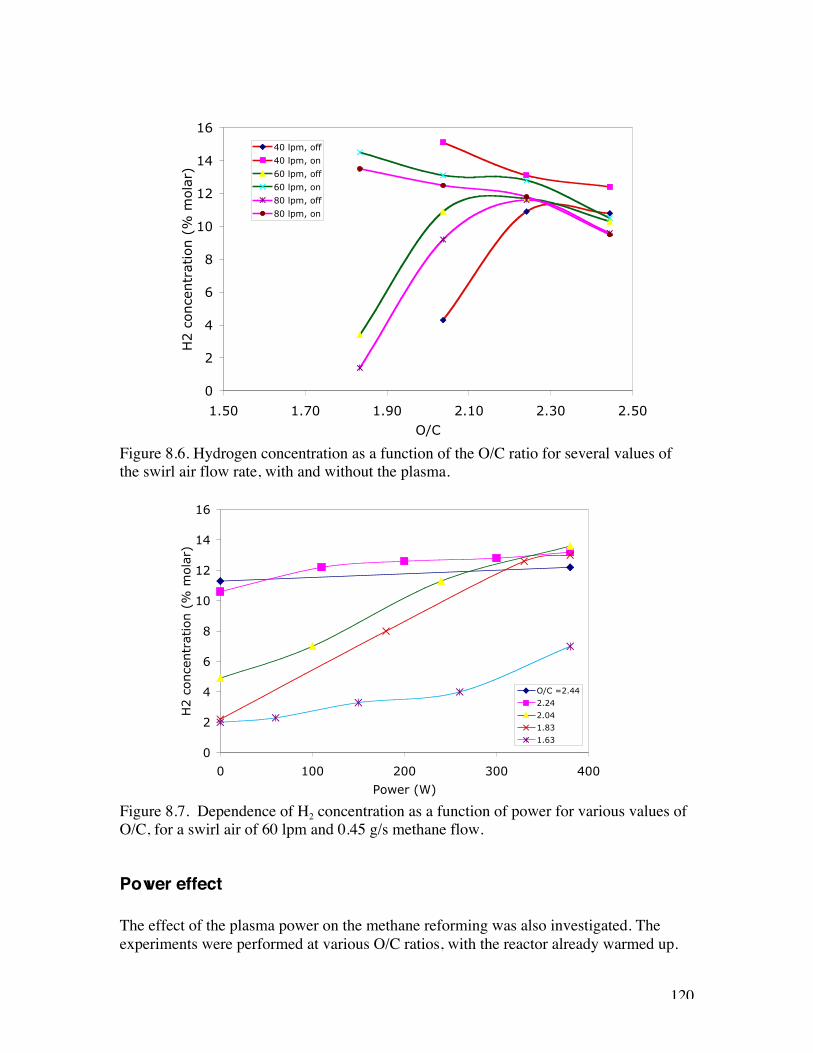
120
Figure 8.6. Hydrogen concentration as a function of the O/C ratio for several values ofthe swirl air flow rate, with and without the plasma.
Figure 8.7. Dependence of H2 concentration as a function of power for various values ofO/C, for a swirl air of 60 lpm and 0.45 g/s methane flow.
Power effect
The effect of the plasma power on the methane reforming was also investigated. Theexperiments were performed at various O/C ratios, with the reactor already warmed up.
0
2
4
6
8
10
12
14
16
1.50 1.70 1.90 2.10 2.30 2.50O/C
H2 c
once
ntr
atio
n (
% m
ola
r)
40 lpm, off
40 lpm, on
60 lpm, off
60 lpm, on
80 lpm, off
80 lpm, on
0
2
4
6
8
10
12
14
16
0 100 200 300 400
Power (W)
H2 c
once
ntr
atio
n (
% m
ola
r)
O/C =2.44
2.24
2.04
1.83
1.63
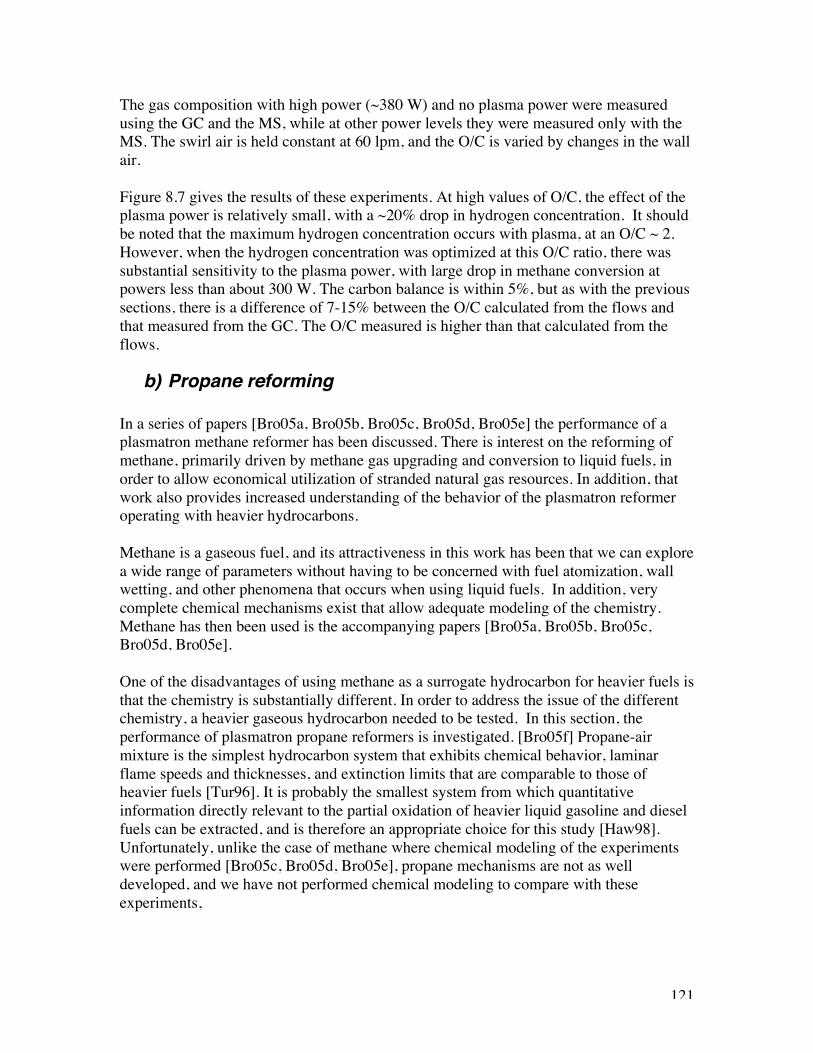
121
The gas composition with high power (~380 W) and no plasma power were measuredusing the GC and the MS, while at other power levels they were measured only with theMS. The swirl air is held constant at 60 lpm, and the O/C is varied by changes in the wallair.
Figure 8.7 gives the results of these experiments. At high values of O/C, the effect of theplasma power is relatively small, with a ~20% drop in hydrogen concentration. It shouldbe noted that the maximum hydrogen concentration occurs with plasma, at an O/C ~ 2.However, when the hydrogen concentration was optimized at this O/C ratio, there wassubstantial sensitivity to the plasma power, with large drop in methane conversion atpowers less than about 300 W. The carbon balance is within 5%, but as with the previoussections, there is a difference of 7-15% between the O/C calculated from the flows andthat measured from the GC. The O/C measured is higher than that calculated from theflows.
b) Propane reforming
In a series of papers [Bro05a, Bro05b, Bro05c, Bro05d, Bro05e] the performance of aplasmatron methane reformer has been discussed. There is interest on the reforming ofmethane, primarily driven by methane gas upgrading and conversion to liquid fuels, inorder to allow economical utilization of stranded natural gas resources. In addition, thatwork also provides increased understanding of the behavior of the plasmatron reformeroperating with heavier hydrocarbons.
Methane is a gaseous fuel, and its attractiveness in this work has been that we can explorea wide range of parameters without having to be concerned with fuel atomization, wallwetting, and other phenomena that occurs when using liquid fuels. In addition, verycomplete chemical mechanisms exist that allow adequate modeling of the chemistry.Methane has then been used is the accompanying papers [Bro05a, Bro05b, Bro05c,Bro05d, Bro05e].
One of the disadvantages of using methane as a surrogate hydrocarbon for heavier fuels isthat the chemistry is substantially different. In order to address the issue of the differentchemistry, a heavier gaseous hydrocarbon needed to be tested. In this section, theperformance of plasmatron propane reformers is investigated. [Bro05f] Propane-airmixture is the simplest hydrocarbon system that exhibits chemical behavior, laminarflame speeds and thicknesses, and extinction limits that are comparable to those ofheavier fuels [Tur96]. It is probably the smallest system from which quantitativeinformation directly relevant to the partial oxidation of heavier liquid gasoline and dieselfuels can be extracted, and is therefore an appropriate choice for this study [Haw98].Unfortunately, unlike the case of methane where chemical modeling of the experimentswere performed [Bro05c, Bro05d, Bro05e], propane mechanisms are not as welldeveloped, and we have not performed chemical modeling to compare with theseexperiments,

122
Propane injection through axial nozzle
In this section the results of experiments with propane injected through the axial nozzleare presented. As described in the previous section, this configuration results in highlyhomogeneous air/fuel mixtures, with constant propane in the central region and withlarge concentration gradients in the region where the air/propane mixtures formstoichiometric combustion mixtures.
The results of the reforming experiments are shown in Figures 8.8 and 8.9, as contours ofconstant quantity as a function of the wall air and swirl (plasma) air, for a propane flowrate of 0.5 g/s. Figure 8.8 shows the H2, CO, CO2 concentrations and overall O/C ratio,while Figure 8.9 shows methane concentration, reactor temperature, efficiency andcarbon balance. The carbon balance is within 5%. Since water is not measured, it is notpossible to close the mass balance for oxygen or hydrogen.
The hydrogen concentration peaks in a band that corresponds to constant O/C ~ 2.Stoichiometric combustion of propane occurs at O/C ~ 3.33, and thus O/C ~ 2 is still faraway from combustion. Hydrogen concentration is about 12%, with a power efficiency toH2, CO, CH4 and C2’s of about 60%. At the higher values of O/C more and more of thehydrogen gets combusted, while at the lower values of O/C the conversion of propane isreduced, thus resulting in a maximum concentration as a function of O/C.
The concentration of CO2 increases with increasing O/C ratio, as expected, as more of thefuel is combusted. The temperature measured by the thermocouple, which is only anindication of the actual gas temperature, increases with O/C.
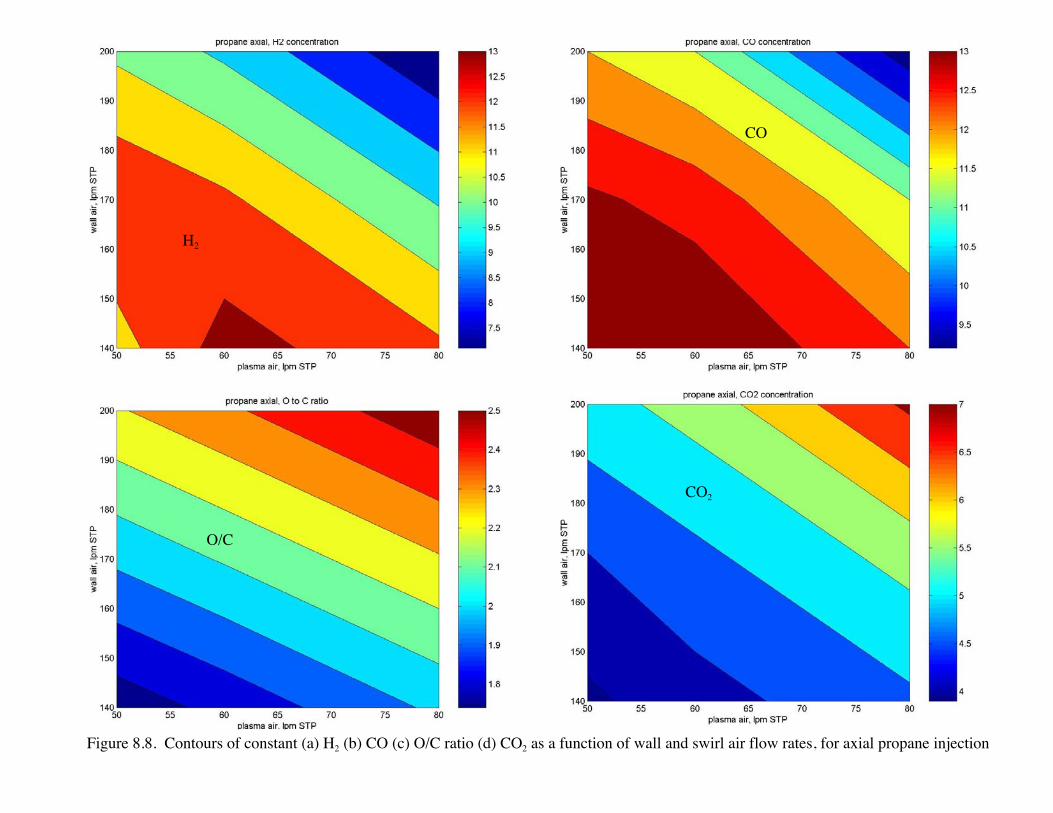
123
H2
CO2
O/C
CO
Figure 8.8. Contours of constant (a) H2 (b) CO (c) O/C ratio (d) CO2 as a function of wall and swirl air flow rates, for axial propane injection
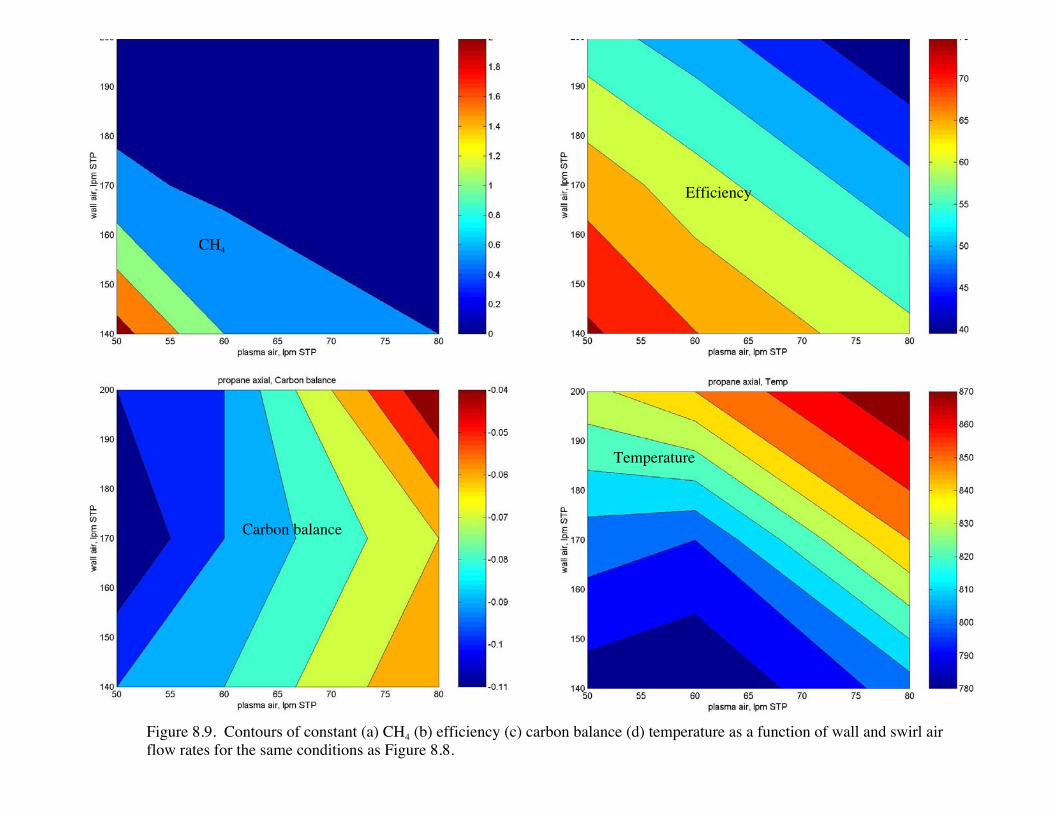
124
CH4
Efficiency
Carbon balance
Temperature
Figure 8.9. Contours of constant (a) CH4 (b) efficiency (c) carbon balance (d) temperature as a function of wall and swirl airflow rates for the same conditions as Figure 8.8.
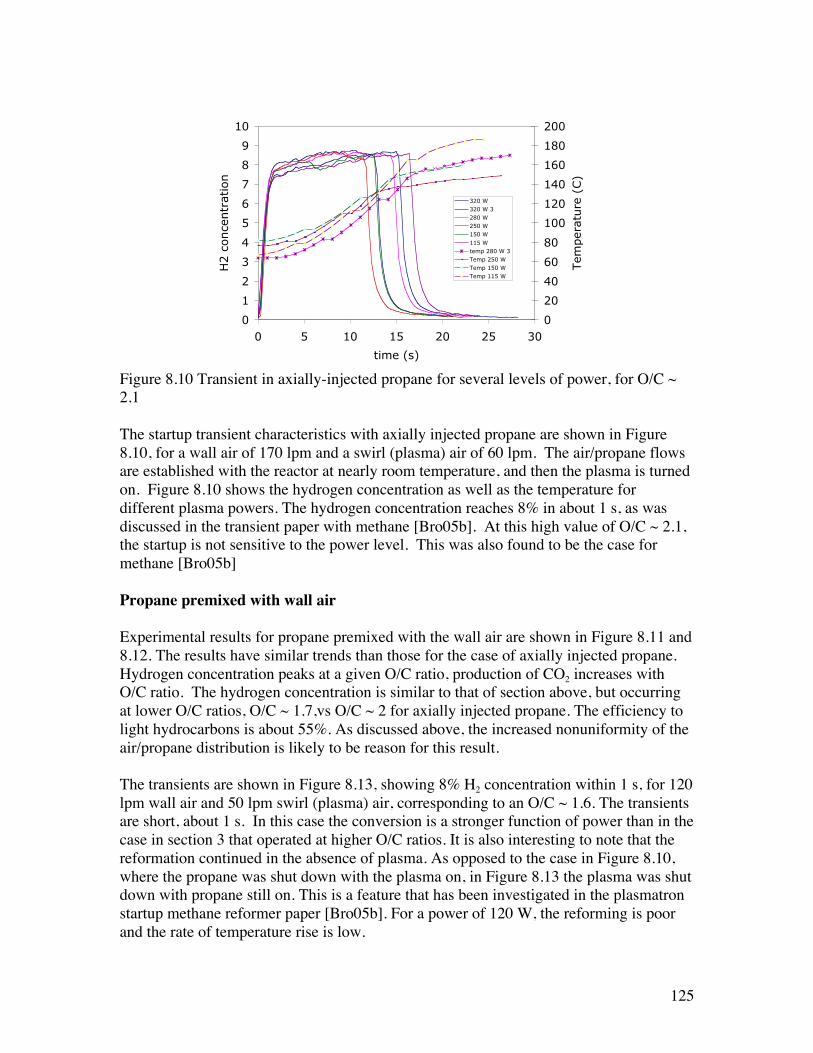
125
Figure 8.10 Transient in axially-injected propane for several levels of power, for O/C ~2.1
The startup transient characteristics with axially injected propane are shown in Figure8.10, for a wall air of 170 lpm and a swirl (plasma) air of 60 lpm. The air/propane flowsare established with the reactor at nearly room temperature, and then the plasma is turnedon. Figure 8.10 shows the hydrogen concentration as well as the temperature fordifferent plasma powers. The hydrogen concentration reaches 8% in about 1 s, as wasdiscussed in the transient paper with methane [Bro05b]. At this high value of O/C ~ 2.1,the startup is not sensitive to the power level. This was also found to be the case formethane [Bro05b]
Propane premixed with wall air
Experimental results for propane premixed with the wall air are shown in Figure 8.11 and8.12. The results have similar trends than those for the case of axially injected propane.Hydrogen concentration peaks at a given O/C ratio, production of CO2 increases withO/C ratio. The hydrogen concentration is similar to that of section above, but occurringat lower O/C ratios, O/C ~ 1.7,vs O/C ~ 2 for axially injected propane. The efficiency tolight hydrocarbons is about 55%. As discussed above, the increased nonuniformity of theair/propane distribution is likely to be reason for this result.
The transients are shown in Figure 8.13, showing 8% H2 concentration within 1 s, for 120lpm wall air and 50 lpm swirl (plasma) air, corresponding to an O/C ~ 1.6. The transientsare short, about 1 s. In this case the conversion is a stronger function of power than in thecase in section 3 that operated at higher O/C ratios. It is also interesting to note that thereformation continued in the absence of plasma. As opposed to the case in Figure 8.10,where the propane was shut down with the plasma on, in Figure 8.13 the plasma was shutdown with propane still on. This is a feature that has been investigated in the plasmatronstartup methane reformer paper [Bro05b]. For a power of 120 W, the reforming is poorand the rate of temperature rise is low.
0
1
2
3
4
5
6
7
8
9
10
0 5 10 15 20 25 30
time (s)
H2 c
once
ntr
atio
n
0
20
40
60
80
100
120
140
160
180
200
Tem
per
ature
(C)
320 W320 W 3280 W250 W150 W115 Wtemp 280 W 3Temp 250 WTemp 150 WTemp 115 W

126
H2
CO2
O/C
CO
Figure 8.11. Contours of constant (a) H2 (b) CO (c) O/C ratio (d) CO2 as a function of wall and swirl air flow rates, forpropane premixed with wall air
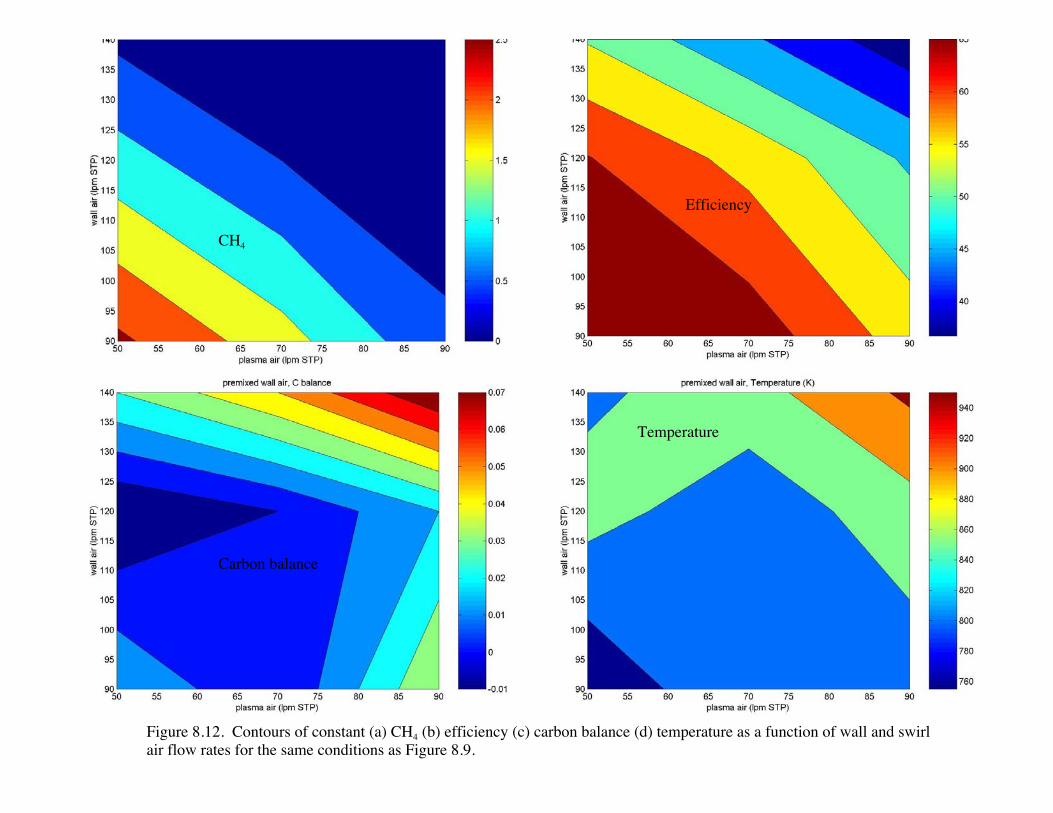
127
CH4
Efficiency
Carbon balance
Temperature
Figure 8.12. Contours of constant (a) CH4 (b) efficiency (c) carbon balance (d) temperature as a function of wall and swirlair flow rates for the same conditions as Figure 8.9.
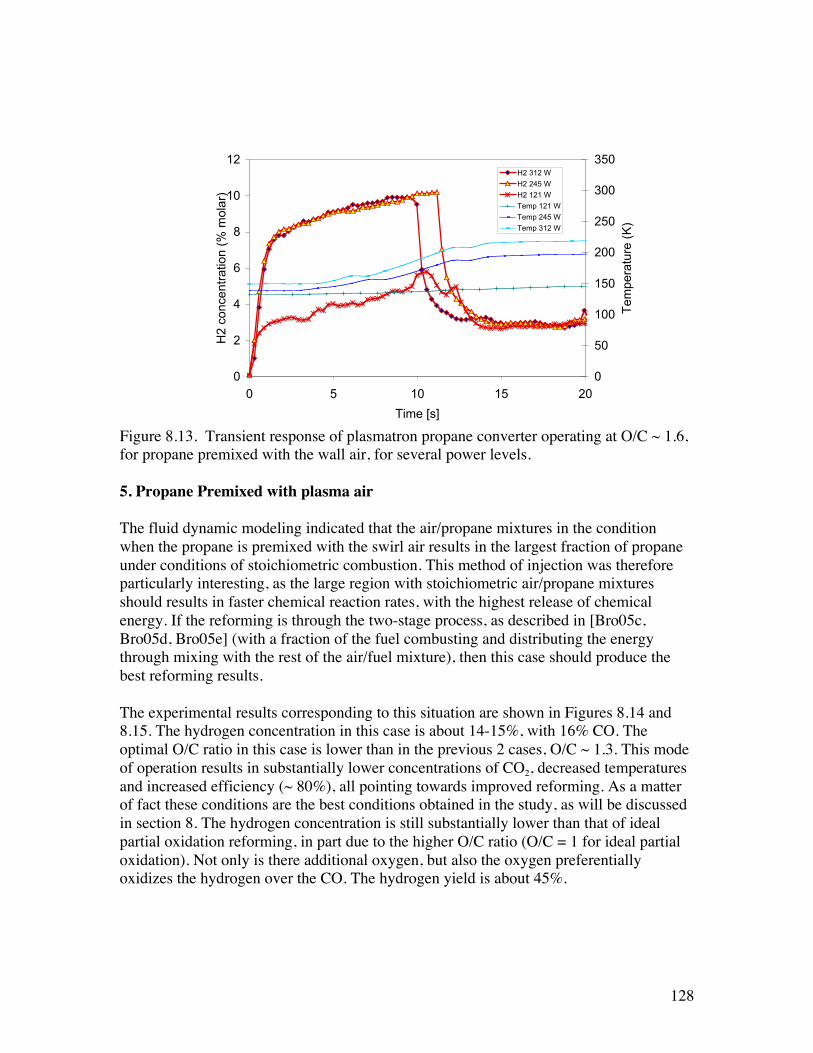
128
Figure 8.13. Transient response of plasmatron propane converter operating at O/C ~ 1.6,for propane premixed with the wall air, for several power levels.
5. Propane Premixed with plasma air
The fluid dynamic modeling indicated that the air/propane mixtures in the conditionwhen the propane is premixed with the swirl air results in the largest fraction of propaneunder conditions of stoichiometric combustion. This method of injection was thereforeparticularly interesting, as the large region with stoichiometric air/propane mixturesshould results in faster chemical reaction rates, with the highest release of chemicalenergy. If the reforming is through the two-stage process, as described in [Bro05c,Bro05d, Bro05e] (with a fraction of the fuel combusting and distributing the energythrough mixing with the rest of the air/fuel mixture), then this case should produce thebest reforming results.
The experimental results corresponding to this situation are shown in Figures 8.14 and8.15. The hydrogen concentration in this case is about 14-15%, with 16% CO. Theoptimal O/C ratio in this case is lower than in the previous 2 cases, O/C ~ 1.3. This modeof operation results in substantially lower concentrations of CO2, decreased temperaturesand increased efficiency (~ 80%), all pointing towards improved reforming. As a matterof fact these conditions are the best conditions obtained in the study, as will be discussedin section 8. The hydrogen concentration is still substantially lower than that of idealpartial oxidation reforming, in part due to the higher O/C ratio (O/C = 1 for ideal partialoxidation). Not only is there additional oxygen, but also the oxygen preferentiallyoxidizes the hydrogen over the CO. The hydrogen yield is about 45%.
0
2
4
6
8
10
12
0 5 10 15 20
Time [s]
H2
conc
entr
atio
n (%
mol
ar)
0
50
100
150
200
250
300
350
Tem
pera
ture
(K
)
H2 312 W
H2 245 W
H2 121 W
Temp 121 W
Temp 245 W
Temp 312 W

129
H2
CO2O/C
CO
Figure 8.14. Contours of constant (a) H2 (b) CO (c) O/C ratio (d) CO2 as a function of wall and swirl air flow rates, forpropane premixed with swirl (plasma) air
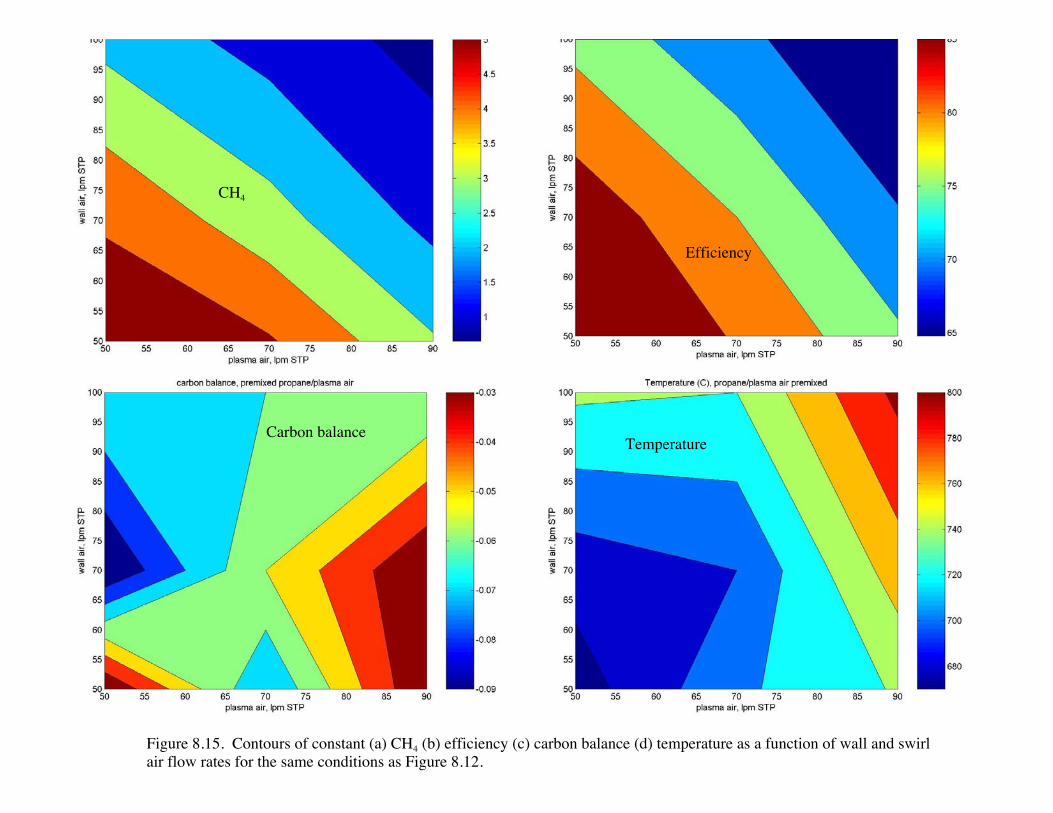
130
CH4
Efficiency
Carbon balanceTemperature
Figure 8.15. Contours of constant (a) CH4 (b) efficiency (c) carbon balance (d) temperature as a function of wall and swirlair flow rates for the same conditions as Figure 8.12.
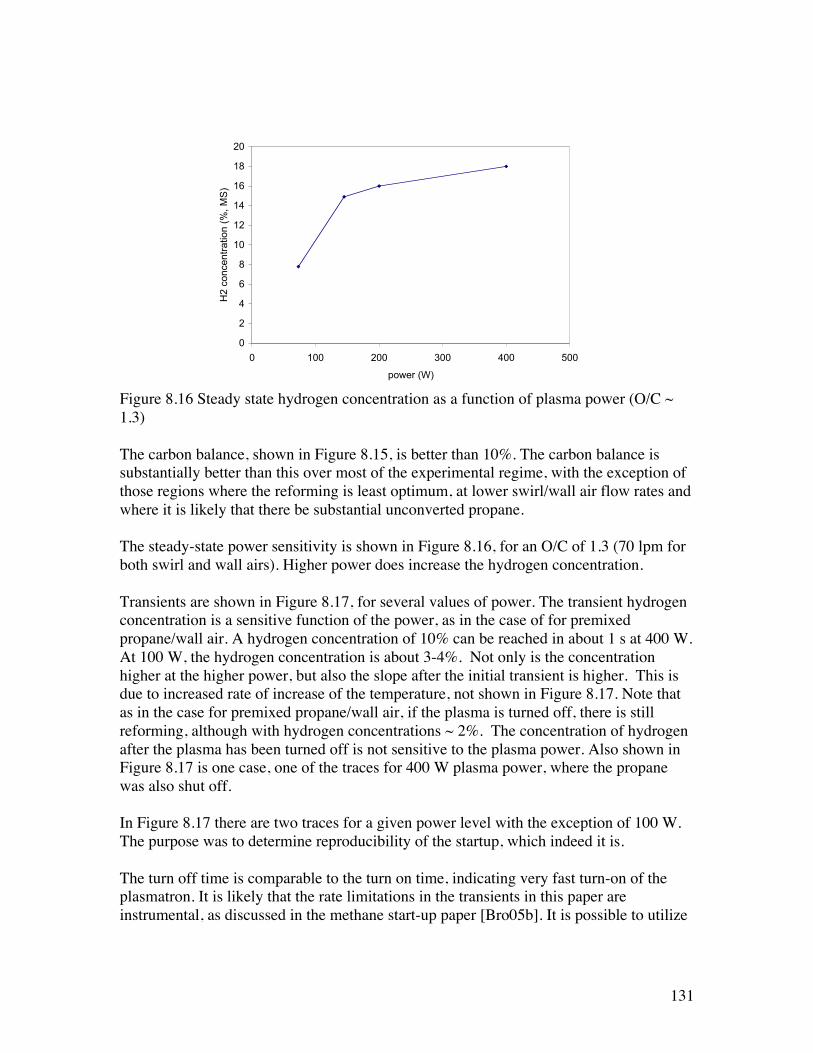
131
Figure 8.16 Steady state hydrogen concentration as a function of plasma power (O/C ~1.3)
The carbon balance, shown in Figure 8.15, is better than 10%. The carbon balance issubstantially better than this over most of the experimental regime, with the exception ofthose regions where the reforming is least optimum, at lower swirl/wall air flow rates andwhere it is likely that there be substantial unconverted propane.
The steady-state power sensitivity is shown in Figure 8.16, for an O/C of 1.3 (70 lpm forboth swirl and wall airs). Higher power does increase the hydrogen concentration.
Transients are shown in Figure 8.17, for several values of power. The transient hydrogenconcentration is a sensitive function of the power, as in the case of for premixedpropane/wall air. A hydrogen concentration of 10% can be reached in about 1 s at 400 W.At 100 W, the hydrogen concentration is about 3-4%. Not only is the concentrationhigher at the higher power, but also the slope after the initial transient is higher. This isdue to increased rate of increase of the temperature, not shown in Figure 8.17. Note thatas in the case for premixed propane/wall air, if the plasma is turned off, there is stillreforming, although with hydrogen concentrations ~ 2%. The concentration of hydrogenafter the plasma has been turned off is not sensitive to the plasma power. Also shown inFigure 8.17 is one case, one of the traces for 400 W plasma power, where the propanewas also shut off.
In Figure 8.17 there are two traces for a given power level with the exception of 100 W.The purpose was to determine reproducibility of the startup, which indeed it is.
The turn off time is comparable to the turn on time, indicating very fast turn-on of theplasmatron. It is likely that the rate limitations in the transients in this paper areinstrumental, as discussed in the methane start-up paper [Bro05b]. It is possible to utilize
0
2
4
6
8
10
12
14
16
18
20
0 100 200 300 400 500
power (W)
H2
conc
entr
atio
n (%
, MS
)
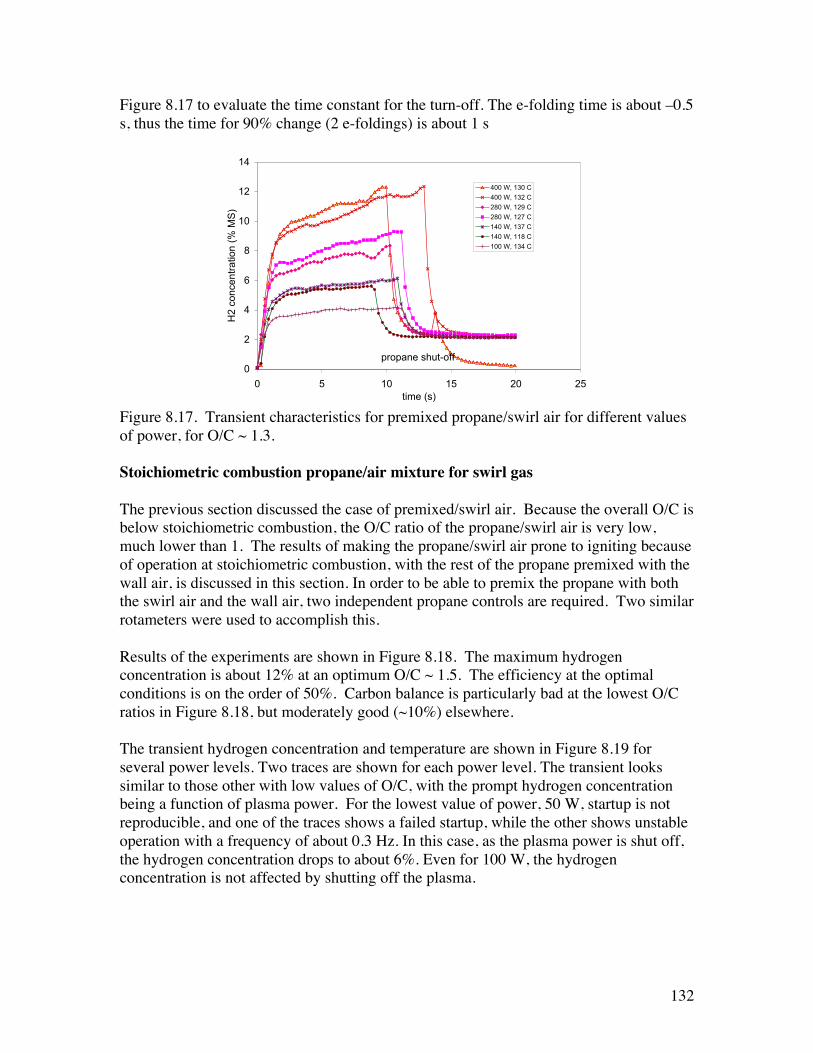
132
Figure 8.17 to evaluate the time constant for the turn-off. The e-folding time is about –0.5s, thus the time for 90% change (2 e-foldings) is about 1 s
Figure 8.17. Transient characteristics for premixed propane/swirl air for different valuesof power, for O/C ~ 1.3.
Stoichiometric combustion propane/air mixture for swirl gas
The previous section discussed the case of premixed/swirl air. Because the overall O/C isbelow stoichiometric combustion, the O/C ratio of the propane/swirl air is very low,much lower than 1. The results of making the propane/swirl air prone to igniting becauseof operation at stoichiometric combustion, with the rest of the propane premixed with thewall air, is discussed in this section. In order to be able to premix the propane with boththe swirl air and the wall air, two independent propane controls are required. Two similarrotameters were used to accomplish this.
Results of the experiments are shown in Figure 8.18. The maximum hydrogenconcentration is about 12% at an optimum O/C ~ 1.5. The efficiency at the optimalconditions is on the order of 50%. Carbon balance is particularly bad at the lowest O/Cratios in Figure 8.18, but moderately good (~10%) elsewhere.
The transient hydrogen concentration and temperature are shown in Figure 8.19 forseveral power levels. Two traces are shown for each power level. The transient lookssimilar to those other with low values of O/C, with the prompt hydrogen concentrationbeing a function of plasma power. For the lowest value of power, 50 W, startup is notreproducible, and one of the traces shows a failed startup, while the other shows unstableoperation with a frequency of about 0.3 Hz. In this case, as the plasma power is shut off,the hydrogen concentration drops to about 6%. Even for 100 W, the hydrogenconcentration is not affected by shutting off the plasma.
0
2
4
6
8
10
12
14
0 5 10 15 20 25time (s)
H2
conc
entr
atio
n (%
MS
)
400 W, 130 C
400 W, 132 C
280 W, 129 C
280 W, 127 C
140 W, 137 C
140 W, 118 C
100 W, 134 C
propane shut-off
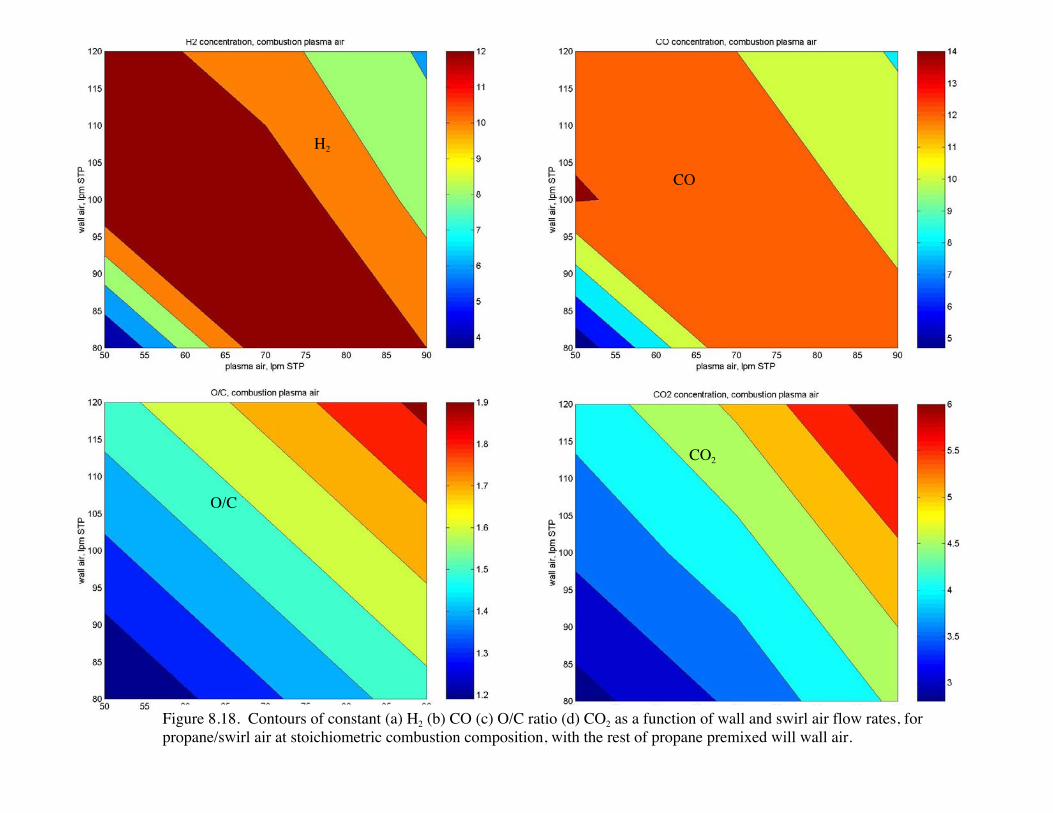
133
H2
CO2
O/C
CO
Figure 8.18. Contours of constant (a) H2 (b) CO (c) O/C ratio (d) CO2 as a function of wall and swirl air flow rates, forpropane/swirl air at stoichiometric combustion composition, with the rest of propane premixed will wall air.
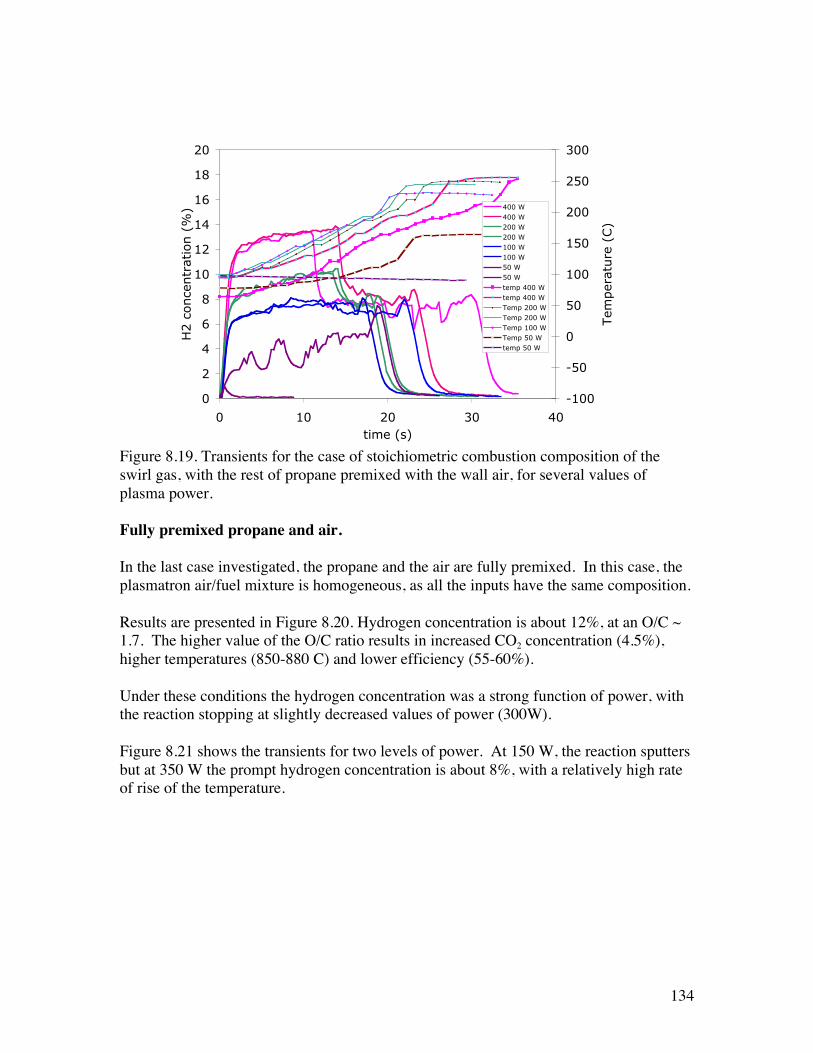
134
Figure 8.19. Transients for the case of stoichiometric combustion composition of theswirl gas, with the rest of propane premixed with the wall air, for several values ofplasma power.
Fully premixed propane and air.
In the last case investigated, the propane and the air are fully premixed. In this case, theplasmatron air/fuel mixture is homogeneous, as all the inputs have the same composition.
Results are presented in Figure 8.20. Hydrogen concentration is about 12%, at an O/C ~1.7. The higher value of the O/C ratio results in increased CO2 concentration (4.5%),higher temperatures (850-880 C) and lower efficiency (55-60%).
Under these conditions the hydrogen concentration was a strong function of power, withthe reaction stopping at slightly decreased values of power (300W).
Figure 8.21 shows the transients for two levels of power. At 150 W, the reaction sputtersbut at 350 W the prompt hydrogen concentration is about 8%, with a relatively high rateof rise of the temperature.
0
2
4
6
8
10
12
14
16
18
20
0 10 20 30 40time (s)
H2 c
once
ntr
atio
n (
%)
-100
-50
0
50
100
150
200
250
300
Tem
per
ature
(C)
400 W400 W200 W200 W100 W100 W50 W50 Wtemp 400 Wtemp 400 WTemp 200 WTemp 200 WTemp 100 WTemp 50 Wtemp 50 W
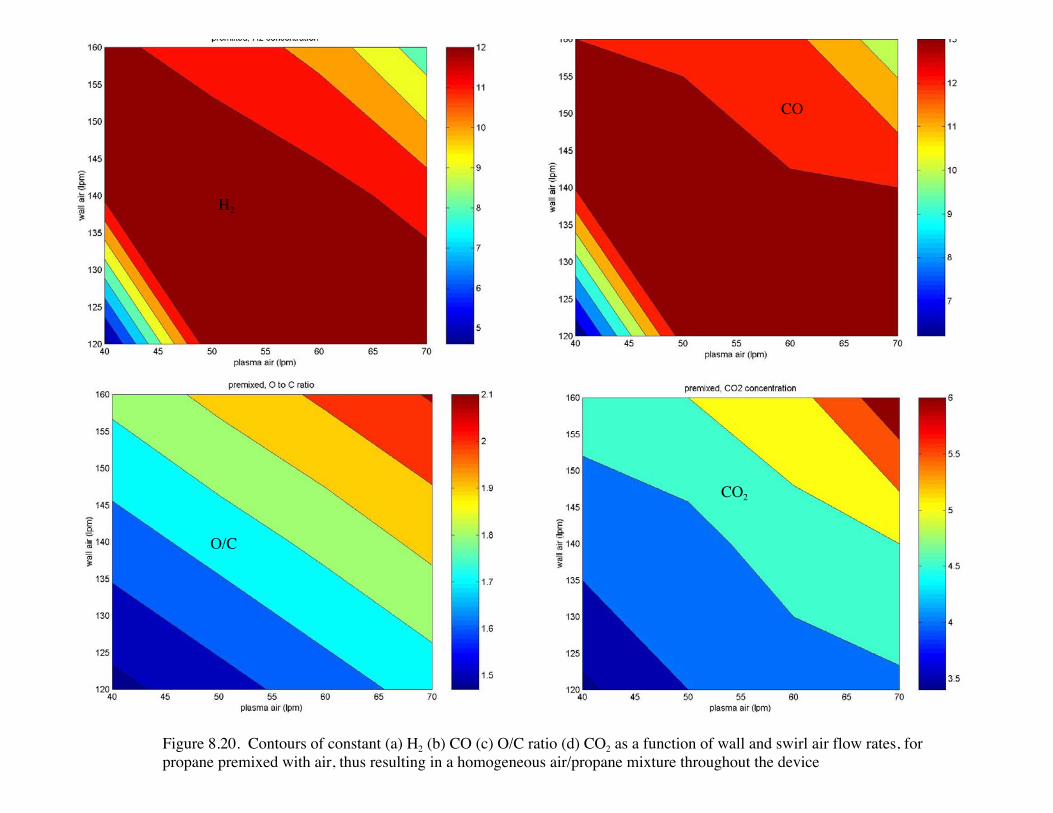
135
H2
CO2
O/C
CO
Figure 8.20. Contours of constant (a) H2 (b) CO (c) O/C ratio (d) CO2 as a function of wall and swirl air flow rates, forpropane premixed with air, thus resulting in a homogeneous air/propane mixture throughout the device
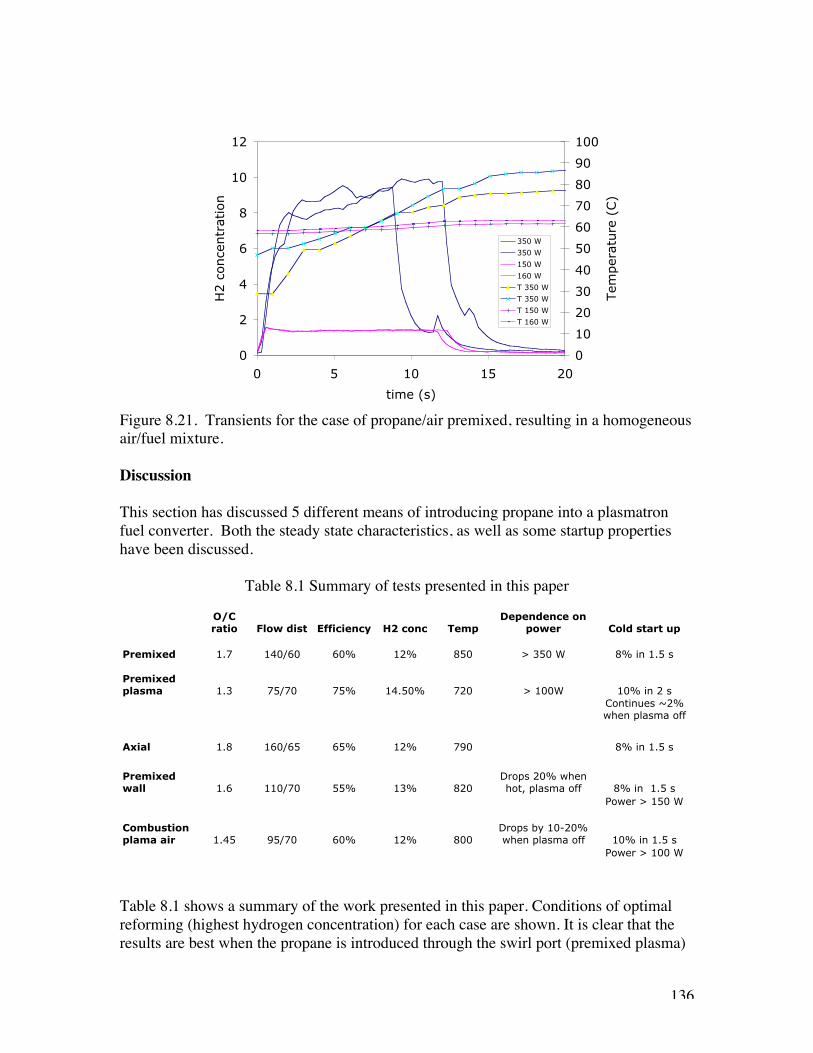
136
Figure 8.21. Transients for the case of propane/air premixed, resulting in a homogeneousair/fuel mixture.
Discussion
This section has discussed 5 different means of introducing propane into a plasmatronfuel converter. Both the steady state characteristics, as well as some startup propertieshave been discussed.
Table 8.1 Summary of tests presented in this paper
Table 8.1 shows a summary of the work presented in this paper. Conditions of optimalreforming (highest hydrogen concentration) for each case are shown. It is clear that theresults are best when the propane is introduced through the swirl port (premixed plasma)
0
2
4
6
8
10
12
0 5 10 15 20
time (s)
H2 c
once
ntr
atio
n
0
10
20
30
40
50
60
70
80
90
100
Tem
per
ature
(C)
350 W
350 W
150 W
160 W
T 350 W
T 350 W
T 150 W
T 160 W
O/C ratio Flow dist Efficiency H2 conc Temp
Dependence on power Cold start up
Premixed 1.7 140/60 60% 12% 850 > 350 W 8% in 1.5 s
Premixed plasma 1.3 75/70 75% 14.50% 720 > 100W 10% in 2 s
Continues ~2% when plasma off
Axial 1.8 160/65 65% 12% 790 8% in 1.5 s
Premixed wall 1.6 110/70 55% 13% 820
Drops 20% when hot, plasma off 8% in 1.5 s
Power > 150 W
Combustion plama air 1.45 95/70 60% 12% 800
Drops by 10-20% when plasma off 10% in 1.5 s
Power > 100 W
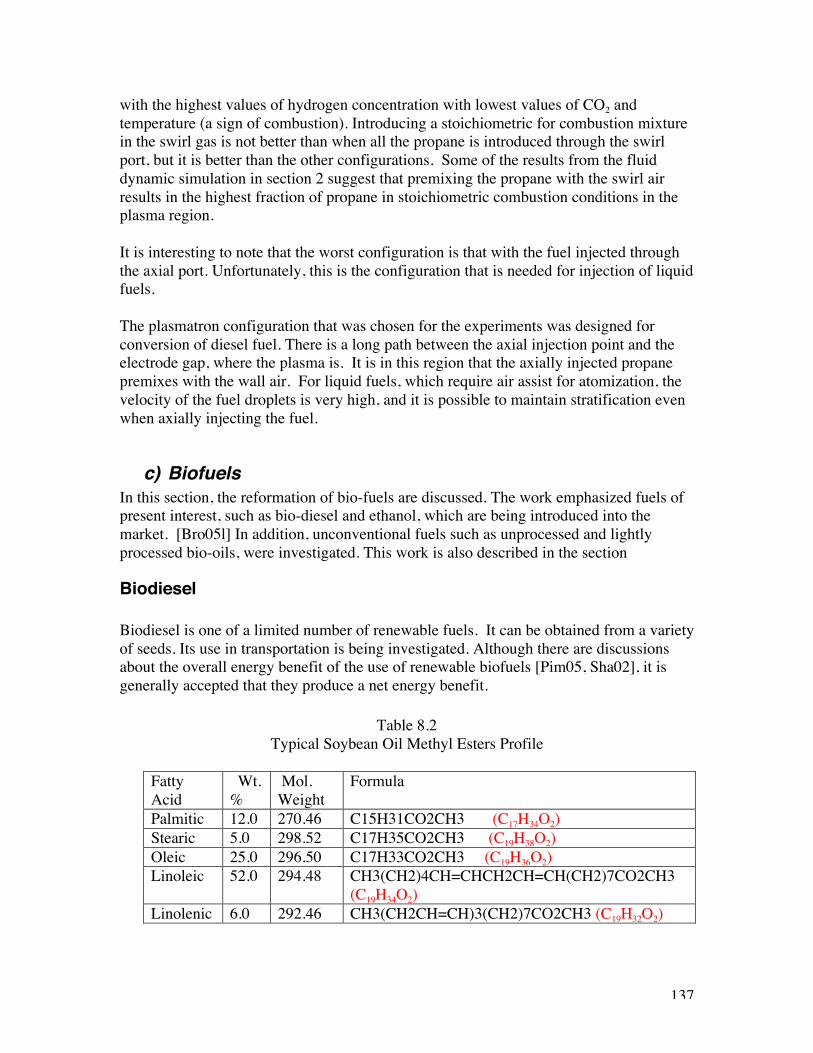
137
with the highest values of hydrogen concentration with lowest values of CO2 andtemperature (a sign of combustion). Introducing a stoichiometric for combustion mixturein the swirl gas is not better than when all the propane is introduced through the swirlport, but it is better than the other configurations. Some of the results from the fluiddynamic simulation in section 2 suggest that premixing the propane with the swirl airresults in the highest fraction of propane in stoichiometric combustion conditions in theplasma region.
It is interesting to note that the worst configuration is that with the fuel injected throughthe axial port. Unfortunately, this is the configuration that is needed for injection of liquidfuels.
The plasmatron configuration that was chosen for the experiments was designed forconversion of diesel fuel. There is a long path between the axial injection point and theelectrode gap, where the plasma is. It is in this region that the axially injected propanepremixes with the wall air. For liquid fuels, which require air assist for atomization, thevelocity of the fuel droplets is very high, and it is possible to maintain stratification evenwhen axially injecting the fuel.
c) BiofuelsIn this section, the reformation of bio-fuels are discussed. The work emphasized fuels ofpresent interest, such as bio-diesel and ethanol, which are being introduced into themarket. [Bro05l] In addition, unconventional fuels such as unprocessed and lightlyprocessed bio-oils, were investigated. This work is also described in the section
Biodiesel
Biodiesel is one of a limited number of renewable fuels. It can be obtained from a varietyof seeds. Its use in transportation is being investigated. Although there are discussionsabout the overall energy benefit of the use of renewable biofuels [Pim05, Sha02], it isgenerally accepted that they produce a net energy benefit.
Table 8.2Typical Soybean Oil Methyl Esters Profile
FattyAcid
Wt.%
Mol.Weight
Formula
Palmitic 12.0 270.46 C15H31CO2CH3 (C17H34O2)Stearic 5.0 298.52 C17H35CO2CH3 (C19H38O2)Oleic 25.0 296.50 C17H33CO2CH3 (C19H36O2)Linoleic 52.0 294.48 CH3(CH2)4CH=CHCH2CH=CH(CH2)7CO2CH3
(C19H34O2)Linolenic 6.0 292.46 CH3(CH2CH=CH)3(CH2)7CO2CH3 (C19H32O2)

138
The B-100 biodiesel was provided by Renewable Solutions, Oakland Park, Kansas. Theaverage molecular weight of soybean oil methyl esters is 292.2, calculated using theaverage fatty acid distribution for soybean oil methyl ester shown in Table 8.2 [Bio05].Shown in Table 8.3 are the molecular weight and chemical formula for each of thecomponent esters [Bio05].
Table 8.3Carbon Chain Length Distribution and Percent Oxygen
Produced from Typical Soybean Oil.
Compound CAS# Bonding Weight % % O2Methyl Palmitate 112-39-0 C-16 10.0 11.8Methyl Stearate 112-61-8 C –18 4.0 10.7
% Saturated 14.0Methyl Oleate 112-62-9 C-18=1 25.0 10.8Methyl Linoleate 112-63-0 C-18=2 53.0 10.9Methyl Linolenate 301-00-8 C-18=3 8.0 10.9
% Unsaturated 86.0Total average O2 11.0
Biodiesel reformation (gen 3)
In this section, experiments of plasmatron biodiesel reformers are described. The flowrate of the biodiesel fuel is about 0.5 g/s, which match those of methane and propanecarried out previously [Bro05a, Bro05b, Bro05c, Bro05d, Bro05e, Bro05f] with the sameplasmatron setup.
In order to investigate performance with different stoichiometries, the O/C ratio of theplasmatron was changed by adjusting the wall air (see Figure 8.22). The plasma air andthe atomization air were kept constant at 50 lpm (1 g/s). The plasma air has a narrowoperating region, as too little air does not push the discharge into the volume of theplasmatron (the discharge remains in the inter-electrode region), and too high a flowresults in an unstable discharge. Similarly, for atomization air flow rates less than about50 lpm the fuel atomization decreases substantially, and much higher flow rates can notbe obtained because of choke-flow limitations.
The wall air was varied from no flow all the way to 80 lpm.
The steady state composition of the reformate was measured using a calibrated gaschromatograph, described in [Bro05a]. It was assumed that steady state conditions wereobtained when the temperature, measured by a thermocouple downstream from theplasmatron [Bro05a], reaches steady state conditions.
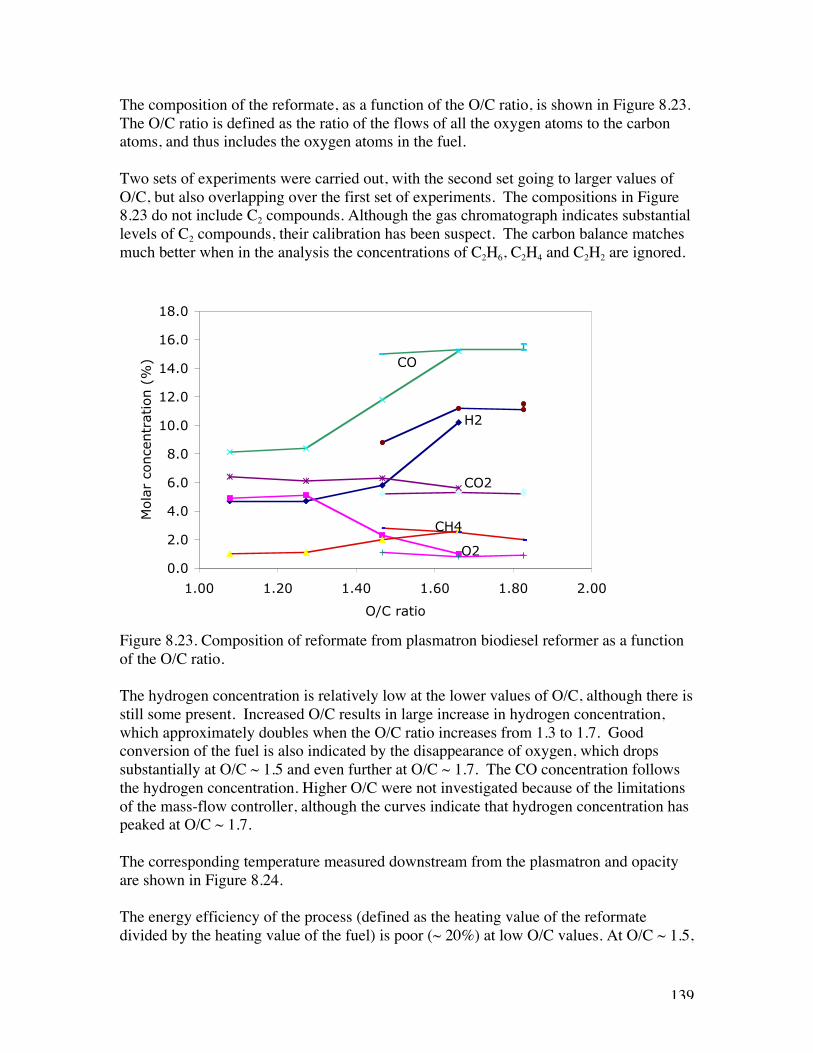
139
The composition of the reformate, as a function of the O/C ratio, is shown in Figure 8.23.The O/C ratio is defined as the ratio of the flows of all the oxygen atoms to the carbonatoms, and thus includes the oxygen atoms in the fuel.
Two sets of experiments were carried out, with the second set going to larger values ofO/C, but also overlapping over the first set of experiments. The compositions in Figure8.23 do not include C2 compounds. Although the gas chromatograph indicates substantiallevels of C2 compounds, their calibration has been suspect. The carbon balance matchesmuch better when in the analysis the concentrations of C2H6, C2H4 and C2H2 are ignored.
Figure 8.23. Composition of reformate from plasmatron biodiesel reformer as a functionof the O/C ratio.
The hydrogen concentration is relatively low at the lower values of O/C, although there isstill some present. Increased O/C results in large increase in hydrogen concentration,which approximately doubles when the O/C ratio increases from 1.3 to 1.7. Goodconversion of the fuel is also indicated by the disappearance of oxygen, which dropssubstantially at O/C ~ 1.5 and even further at O/C ~ 1.7. The CO concentration followsthe hydrogen concentration. Higher O/C were not investigated because of the limitationsof the mass-flow controller, although the curves indicate that hydrogen concentration haspeaked at O/C ~ 1.7.
The corresponding temperature measured downstream from the plasmatron and opacityare shown in Figure 8.24.
The energy efficiency of the process (defined as the heating value of the reformatedivided by the heating value of the fuel) is poor (~ 20%) at low O/C values. At O/C ~ 1.5,
0.0
2.0
4.0
6.0
8.0
10.0
12.0
14.0
16.0
18.0
1.00 1.20 1.40 1.60 1.80 2.00
O/C ratio
Mola
r co
nce
ntr
atio
n (
%) CO
H2
CO2
CH4
O2
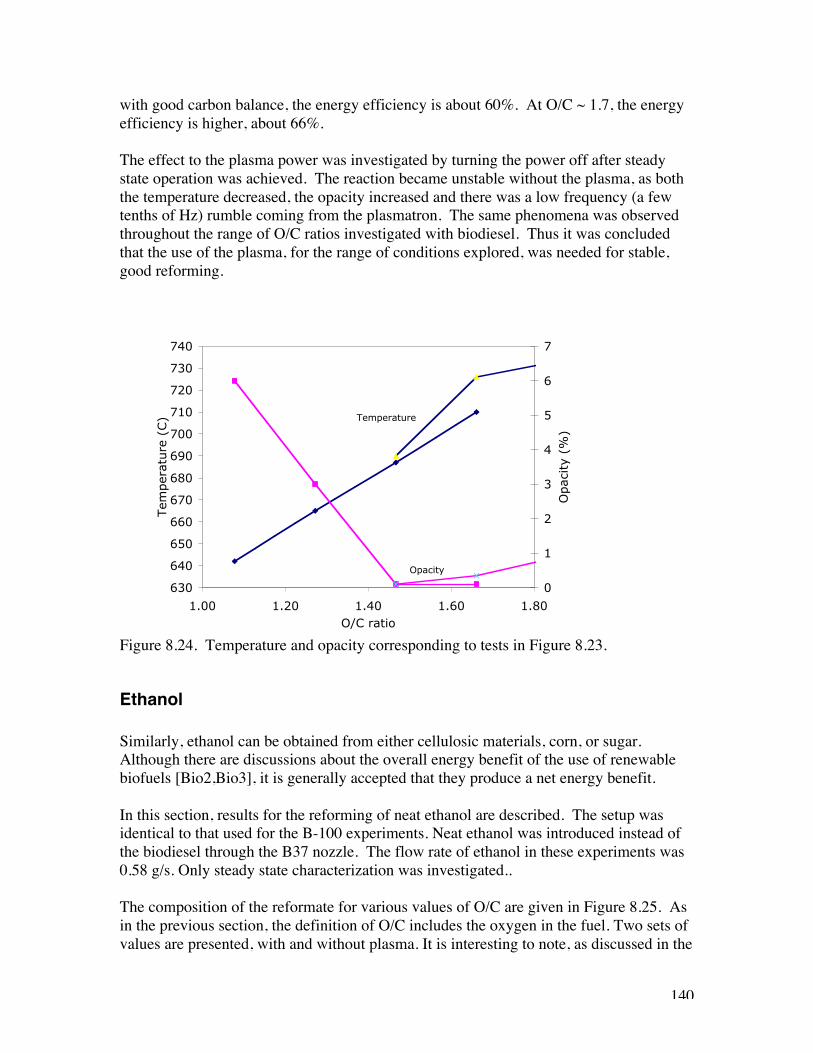
140
with good carbon balance, the energy efficiency is about 60%. At O/C ~ 1.7, the energyefficiency is higher, about 66%.
The effect to the plasma power was investigated by turning the power off after steadystate operation was achieved. The reaction became unstable without the plasma, as boththe temperature decreased, the opacity increased and there was a low frequency (a fewtenths of Hz) rumble coming from the plasmatron. The same phenomena was observedthroughout the range of O/C ratios investigated with biodiesel. Thus it was concludedthat the use of the plasma, for the range of conditions explored, was needed for stable,good reforming.
Figure 8.24. Temperature and opacity corresponding to tests in Figure 8.23.
Ethanol
Similarly, ethanol can be obtained from either cellulosic materials, corn, or sugar.Although there are discussions about the overall energy benefit of the use of renewablebiofuels [Bio2,Bio3], it is generally accepted that they produce a net energy benefit.
In this section, results for the reforming of neat ethanol are described. The setup wasidentical to that used for the B-100 experiments. Neat ethanol was introduced instead ofthe biodiesel through the B37 nozzle. The flow rate of ethanol in these experiments was0.58 g/s. Only steady state characterization was investigated..
The composition of the reformate for various values of O/C are given in Figure 8.25. Asin the previous section, the definition of O/C includes the oxygen in the fuel. Two sets ofvalues are presented, with and without plasma. It is interesting to note, as discussed in the
630
640
650
660
670
680
690
700
710
720
730
740
1.00 1.20 1.40 1.60 1.80O/C ratio
Tem
per
ature
(C)
0
1
2
3
4
5
6
7
Opac
ity
(%)
Temperature
Opacity
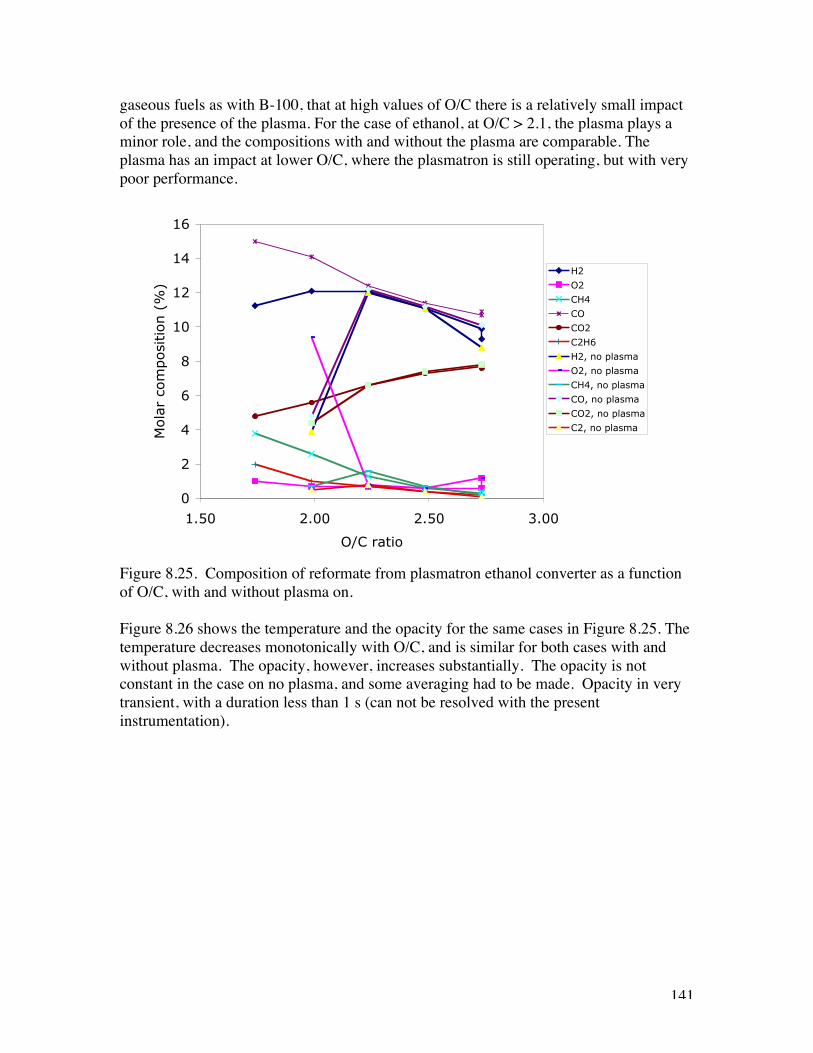
141
gaseous fuels as with B-100, that at high values of O/C there is a relatively small impactof the presence of the plasma. For the case of ethanol, at O/C > 2.1, the plasma plays aminor role, and the compositions with and without the plasma are comparable. Theplasma has an impact at lower O/C, where the plasmatron is still operating, but with verypoor performance.
Figure 8.25. Composition of reformate from plasmatron ethanol converter as a functionof O/C, with and without plasma on.
Figure 8.26 shows the temperature and the opacity for the same cases in Figure 8.25. Thetemperature decreases monotonically with O/C, and is similar for both cases with andwithout plasma. The opacity, however, increases substantially. The opacity is notconstant in the case on no plasma, and some averaging had to be made. Opacity in verytransient, with a duration less than 1 s (can not be resolved with the presentinstrumentation).
0
2
4
6
8
10
12
14
16
1.50 2.00 2.50 3.00
O/C ratio
Mola
r co
mposi
tion (
%)
H2
O2
CH4
CO
CO2
C2H6
H2, no plasma
O2, no plasma
CH4, no plasma
CO, no plasma
CO2, no plasma
C2, no plasma
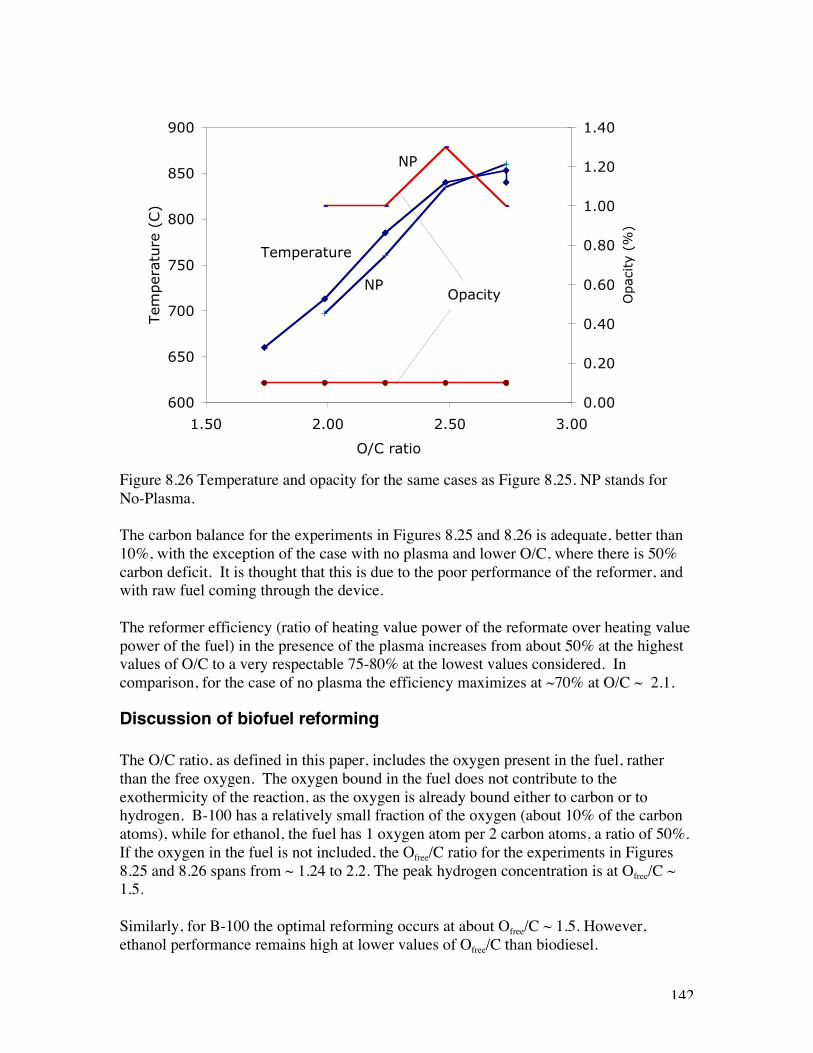
142
Figure 8.26 Temperature and opacity for the same cases as Figure 8.25. NP stands forNo-Plasma.
The carbon balance for the experiments in Figures 8.25 and 8.26 is adequate, better than10%, with the exception of the case with no plasma and lower O/C, where there is 50%carbon deficit. It is thought that this is due to the poor performance of the reformer, andwith raw fuel coming through the device.
The reformer efficiency (ratio of heating value power of the reformate over heating valuepower of the fuel) in the presence of the plasma increases from about 50% at the highestvalues of O/C to a very respectable 75-80% at the lowest values considered. Incomparison, for the case of no plasma the efficiency maximizes at ~70% at O/C ~ 2.1.
Discussion of biofuel reforming
The O/C ratio, as defined in this paper, includes the oxygen present in the fuel, ratherthan the free oxygen. The oxygen bound in the fuel does not contribute to theexothermicity of the reaction, as the oxygen is already bound either to carbon or tohydrogen. B-100 has a relatively small fraction of the oxygen (about 10% of the carbonatoms), while for ethanol, the fuel has 1 oxygen atom per 2 carbon atoms, a ratio of 50%.If the oxygen in the fuel is not included, the Ofree/C ratio for the experiments in Figures8.25 and 8.26 spans from ~ 1.24 to 2.2. The peak hydrogen concentration is at Ofree/C ~1.5.
Similarly, for B-100 the optimal reforming occurs at about Ofree/C ~ 1.5. However,ethanol performance remains high at lower values of Ofree/C than biodiesel.
600
650
700
750
800
850
900
1.50 2.00 2.50 3.00
O/C ratio
Tem
per
ature
(C)
0.00
0.20
0.40
0.60
0.80
1.00
1.20
1.40
Opac
ity
(%)
Opacity
Temperature
NP
NP

143
Hydrogen concentration in the reformate when using ethanol on the order of 12% can beobtained with or without a plasma, and the plasma is needed O/C ratios lower than about2.1. For B-100, the comparable numbers are 11%, but a plasma is needed throughout therange that was explored. It is interesting to note that the heat of vaporization of ethanol issubstantially higher than that of B-100. Under the assumption that the fuel needs to bevaporized prior to reforming, ethanol should be more difficult to reform. However, theexperimental evidence points to the contrary, with better performance of ethanolreformers at lower O/C ratios and less sensitivity to the presence of the plasma..
The reformation at lower values of O/C degrades, with decreased conversion andincreased opacity. It is possible that the increased opacity is due to raw fuel. However, forthe fuel to be raw, the temperature must be lower (fuel would either pyrolyze orevaporate at 700 C). Thus, raw fuel must be accompanied with lower temperatures, froma reformer where the reformation has stopped. It has been determined that in the shortresidence time in the system, there is not enough surface heat transfer from the walls tothe air/fuel mixture to increase the temperature of the air fuel mixture to more than 100C. Thus, when there is a transient and the reforming stops, the air/fuel mixture remainsrelatively cold. This behavior may also be behind the “puffing” sounds that come fromthe exhaust under these conditions, with the reforming turning on and shutting down witha period of a few seconds..
Finally, it is not clear why the carbon balance is poor in the case of B-100. Carbonbalance (including C2H4 and C2H6) is better than 10% for the case of ethanol, but about30% for the case of B-100.
d) Reformation through plasma catalysis
This section reports further investigations of plasma enhanced partial oxidation reformingof biofuels that include corn, canola and soybean oils, and ethanol. Results were obtainedfor both homogeneous (non-catalytic) and catalytic reforming.
Other work on methane catalytic reforming has been reported in previous papers[Bro99d. Bro99e, Bro00a]. In addition, biofuel reforming has been reported by Hadidi[Had04, Bro05j].
Bio-fuel reformation
Figure 8.26 shows results for hydrogen yields from the reformation of canola, corn, andsoybean oils as a function of O/C ratio for catalytic and homogeneous (non-catalytic)reforming. The hydrogen yield is defined as the ratio of the mass flow rate of hydrogen inthe reformat gases to the mass flow rate of hydrogen in the fuel. The bio-oil flow rate was0.4 g/s, which corresponds to about 17 kW of chemical power.
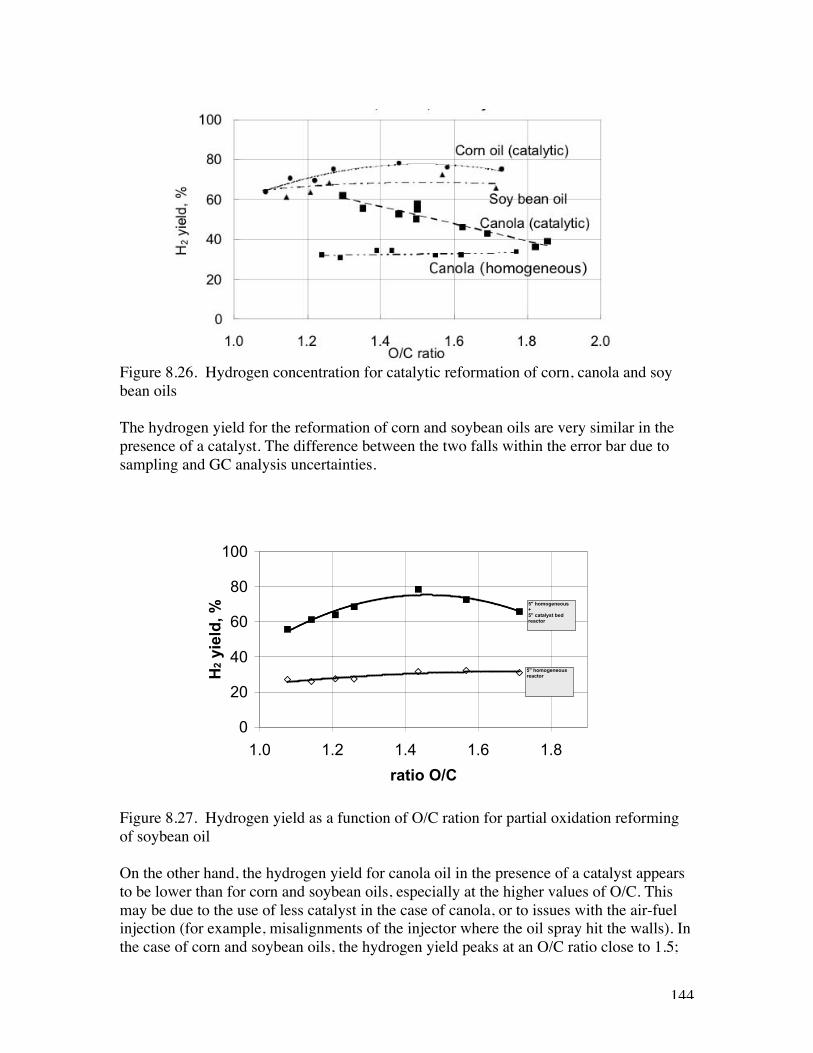
144
Figure 8.26. Hydrogen concentration for catalytic reformation of corn, canola and soybean oils
The hydrogen yield for the reformation of corn and soybean oils are very similar in thepresence of a catalyst. The difference between the two falls within the error bar due tosampling and GC analysis uncertainties.
Figure 8.27. Hydrogen yield as a function of O/C ration for partial oxidation reformingof soybean oil
On the other hand, the hydrogen yield for canola oil in the presence of a catalyst appearsto be lower than for corn and soybean oils, especially at the higher values of O/C. Thismay be due to the use of less catalyst in the case of canola, or to issues with the air-fuelinjection (for example, misalignments of the injector where the oil spray hit the walls). Inthe case of corn and soybean oils, the hydrogen yield peaks at an O/C ratio close to 1.5;
0
20
40
60
80
100
1.0 1.2 1.4 1.6 1.8
ratio O/C
H2
yiel
d, %
5" homogeneous+5" catalyst bed reactor
5" homogeneousreactor
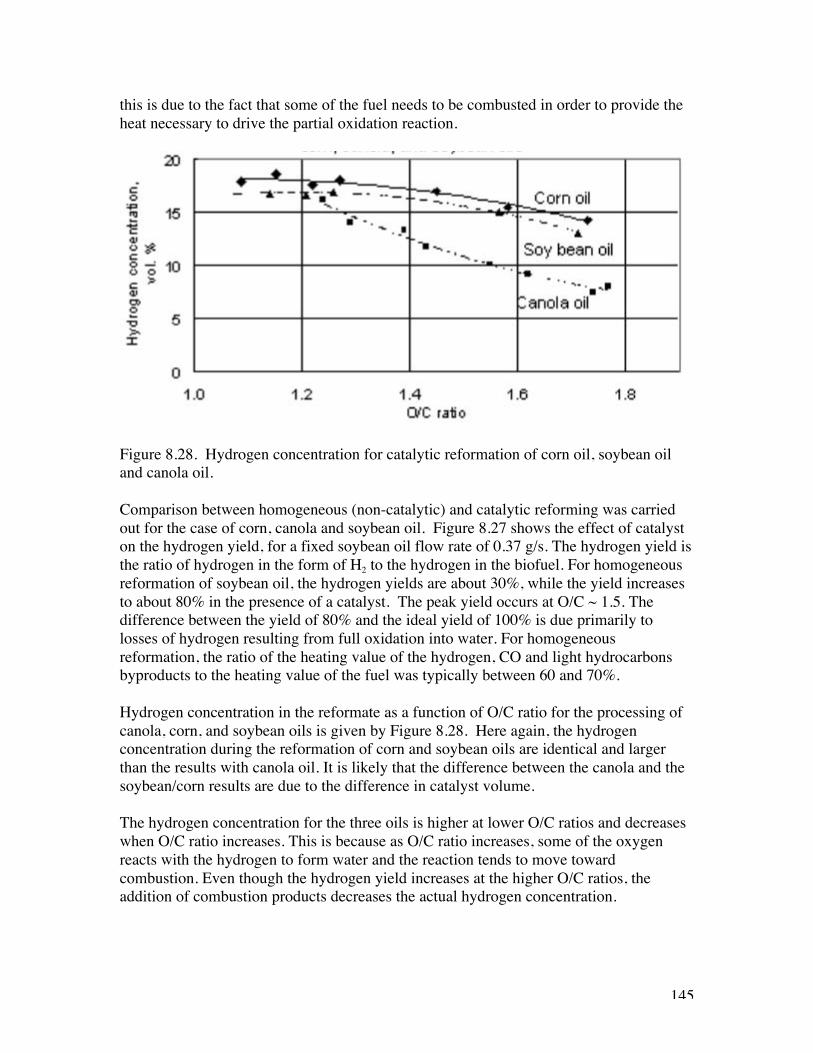
145
this is due to the fact that some of the fuel needs to be combusted in order to provide theheat necessary to drive the partial oxidation reaction.
Figure 8.28. Hydrogen concentration for catalytic reformation of corn oil, soybean oiland canola oil.
Comparison between homogeneous (non-catalytic) and catalytic reforming was carriedout for the case of corn, canola and soybean oil. Figure 8.27 shows the effect of catalyston the hydrogen yield, for a fixed soybean oil flow rate of 0.37 g/s. The hydrogen yield isthe ratio of hydrogen in the form of H2 to the hydrogen in the biofuel. For homogeneousreformation of soybean oil, the hydrogen yields are about 30%, while the yield increasesto about 80% in the presence of a catalyst. The peak yield occurs at O/C ~ 1.5. Thedifference between the yield of 80% and the ideal yield of 100% is due primarily tolosses of hydrogen resulting from full oxidation into water. For homogeneousreformation, the ratio of the heating value of the hydrogen, CO and light hydrocarbonsbyproducts to the heating value of the fuel was typically between 60 and 70%.
Hydrogen concentration in the reformate as a function of O/C ratio for the processing ofcanola, corn, and soybean oils is given by Figure 8.28. Here again, the hydrogenconcentration during the reformation of corn and soybean oils are identical and largerthan the results with canola oil. It is likely that the difference between the canola and thesoybean/corn results are due to the difference in catalyst volume.
The hydrogen concentration for the three oils is higher at lower O/C ratios and decreaseswhen O/C ratio increases. This is because as O/C ratio increases, some of the oxygenreacts with the hydrogen to form water and the reaction tends to move towardcombustion. Even though the hydrogen yield increases at the higher O/C ratios, theaddition of combustion products decreases the actual hydrogen concentration.
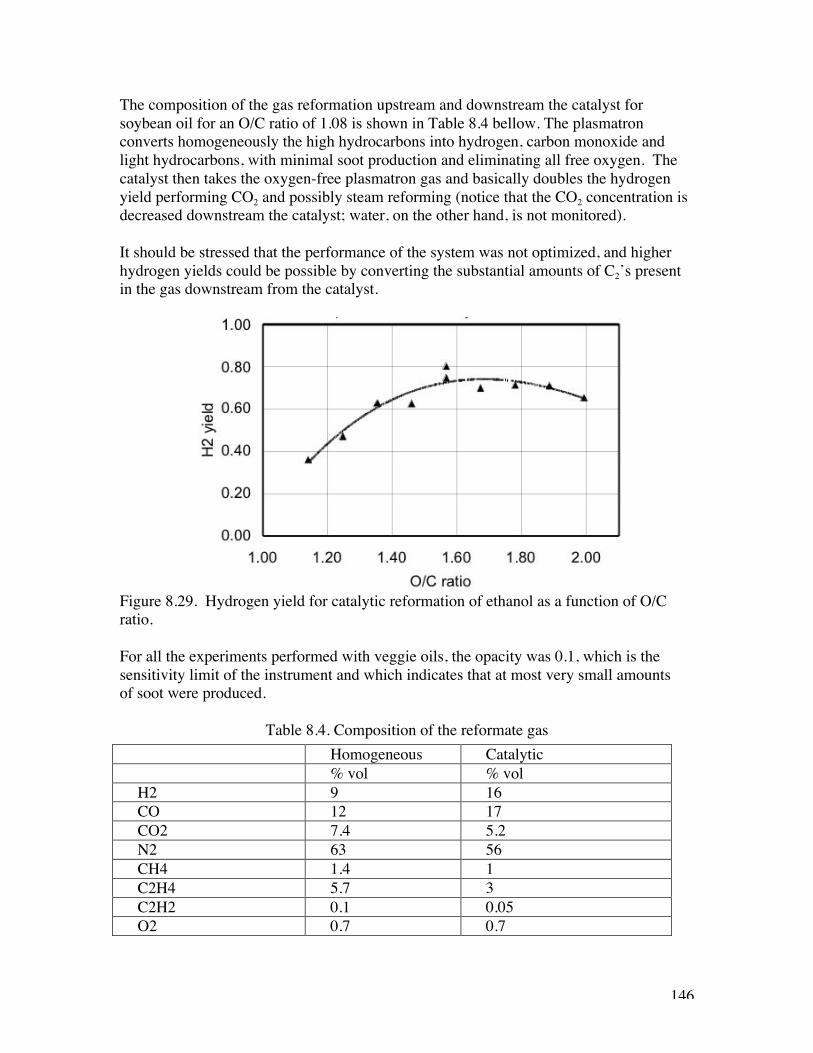
146
The composition of the gas reformation upstream and downstream the catalyst forsoybean oil for an O/C ratio of 1.08 is shown in Table 8.4 bellow. The plasmatronconverts homogeneously the high hydrocarbons into hydrogen, carbon monoxide andlight hydrocarbons, with minimal soot production and eliminating all free oxygen. Thecatalyst then takes the oxygen-free plasmatron gas and basically doubles the hydrogenyield performing CO2 and possibly steam reforming (notice that the CO2 concentration isdecreased downstream the catalyst; water, on the other hand, is not monitored).
It should be stressed that the performance of the system was not optimized, and higherhydrogen yields could be possible by converting the substantial amounts of C2’s presentin the gas downstream from the catalyst.
Figure 8.29. Hydrogen yield for catalytic reformation of ethanol as a function of O/Cratio.
For all the experiments performed with veggie oils, the opacity was 0.1, which is thesensitivity limit of the instrument and which indicates that at most very small amountsof soot were produced.
Table 8.4. Composition of the reformate gasHomogeneous Catalytic% vol % vol
H2 9 16CO 12 17CO2 7.4 5.2N2 63 56CH4 1.4 1C2H4 5.7 3C2H2 0.1 0.05O2 0.7 0.7
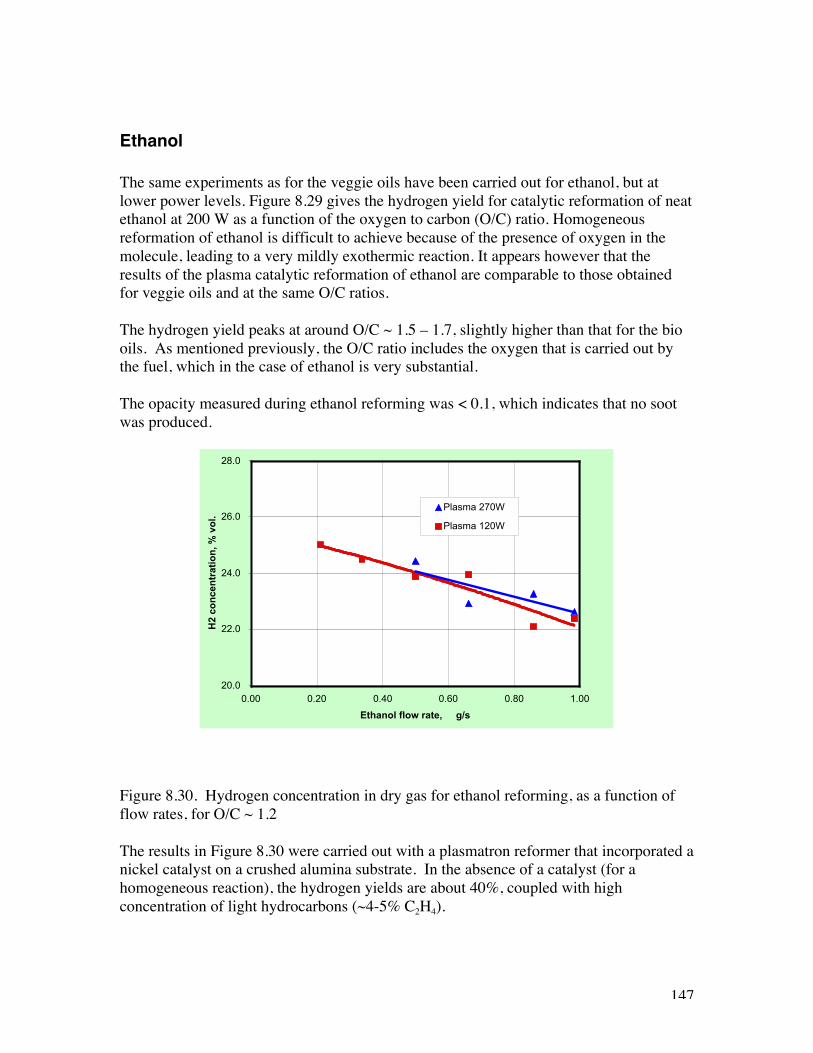
147
Ethanol
The same experiments as for the veggie oils have been carried out for ethanol, but atlower power levels. Figure 8.29 gives the hydrogen yield for catalytic reformation of neatethanol at 200 W as a function of the oxygen to carbon (O/C) ratio. Homogeneousreformation of ethanol is difficult to achieve because of the presence of oxygen in themolecule, leading to a very mildly exothermic reaction. It appears however that theresults of the plasma catalytic reformation of ethanol are comparable to those obtainedfor veggie oils and at the same O/C ratios.
The hydrogen yield peaks at around O/C ~ 1.5 – 1.7, slightly higher than that for the biooils. As mentioned previously, the O/C ratio includes the oxygen that is carried out bythe fuel, which in the case of ethanol is very substantial.
The opacity measured during ethanol reforming was < 0.1, which indicates that no sootwas produced.
Figure 8.30. Hydrogen concentration in dry gas for ethanol reforming, as a function offlow rates, for O/C ~ 1.2
The results in Figure 8.30 were carried out with a plasmatron reformer that incorporated anickel catalyst on a crushed alumina substrate. In the absence of a catalyst (for ahomogeneous reaction), the hydrogen yields are about 40%, coupled with highconcentration of light hydrocarbons (~4-5% C2H4).
20.0
22.0
24.0
26.0
28.0
0.00 0.20 0.40 0.60 0.80 1.00
Ethanol flow rate, g/s
H2
con
cen
trat
ion
, % v
ol.
Plasma 270W
Plasma 120W
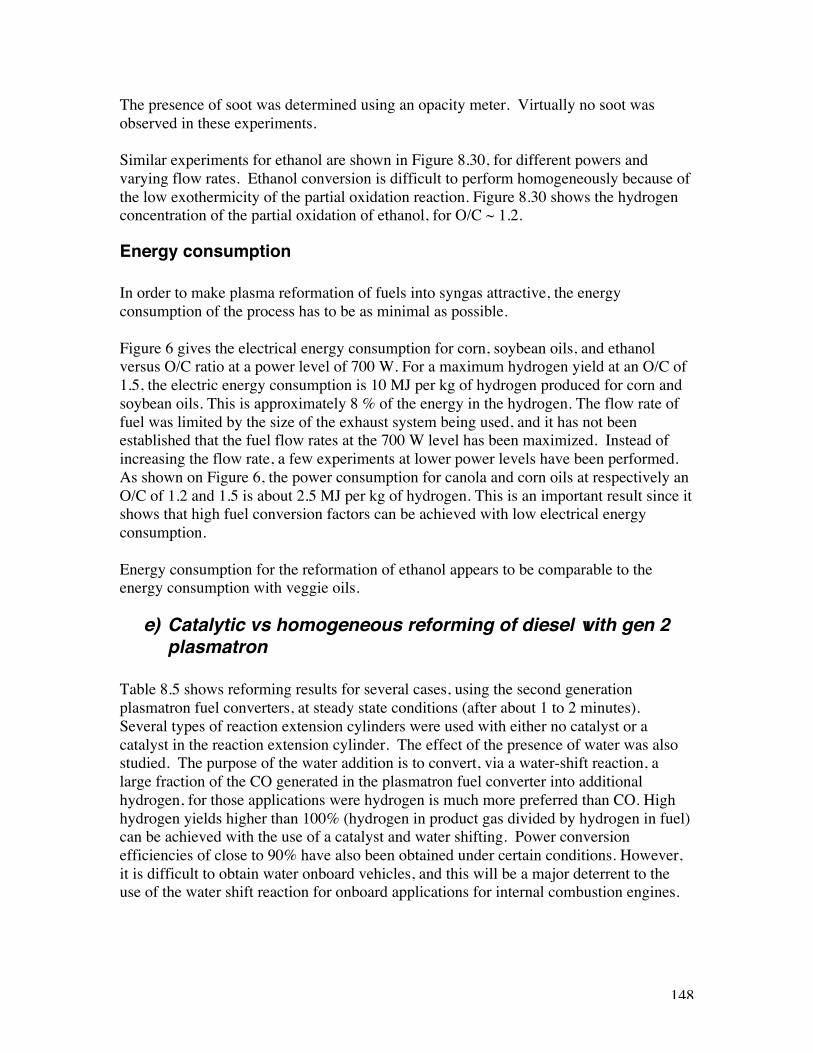
148
The presence of soot was determined using an opacity meter. Virtually no soot wasobserved in these experiments.
Similar experiments for ethanol are shown in Figure 8.30, for different powers andvarying flow rates. Ethanol conversion is difficult to perform homogeneously because ofthe low exothermicity of the partial oxidation reaction. Figure 8.30 shows the hydrogenconcentration of the partial oxidation of ethanol, for O/C ~ 1.2.
Energy consumption
In order to make plasma reformation of fuels into syngas attractive, the energyconsumption of the process has to be as minimal as possible.
Figure 6 gives the electrical energy consumption for corn, soybean oils, and ethanolversus O/C ratio at a power level of 700 W. For a maximum hydrogen yield at an O/C of1.5, the electric energy consumption is 10 MJ per kg of hydrogen produced for corn andsoybean oils. This is approximately 8 % of the energy in the hydrogen. The flow rate offuel was limited by the size of the exhaust system being used, and it has not beenestablished that the fuel flow rates at the 700 W level has been maximized. Instead ofincreasing the flow rate, a few experiments at lower power levels have been performed.As shown on Figure 6, the power consumption for canola and corn oils at respectively anO/C of 1.2 and 1.5 is about 2.5 MJ per kg of hydrogen. This is an important result since itshows that high fuel conversion factors can be achieved with low electrical energyconsumption.
Energy consumption for the reformation of ethanol appears to be comparable to theenergy consumption with veggie oils.
e) Catalytic vs homogeneous reforming of diesel with gen 2plasmatron
Table 8.5 shows reforming results for several cases, using the second generationplasmatron fuel converters, at steady state conditions (after about 1 to 2 minutes).Several types of reaction extension cylinders were used with either no catalyst or acatalyst in the reaction extension cylinder. The effect of the presence of water was alsostudied. The purpose of the water addition is to convert, via a water-shift reaction, alarge fraction of the CO generated in the plasmatron fuel converter into additionalhydrogen, for those applications were hydrogen is much more preferred than CO. Highhydrogen yields higher than 100% (hydrogen in product gas divided by hydrogen in fuel)can be achieved with the use of a catalyst and water shifting. Power conversionefficiencies of close to 90% have also been obtained under certain conditions. However,it is difficult to obtain water onboard vehicles, and this will be a major deterrent to theuse of the water shift reaction for onboard applications for internal combustion engines.
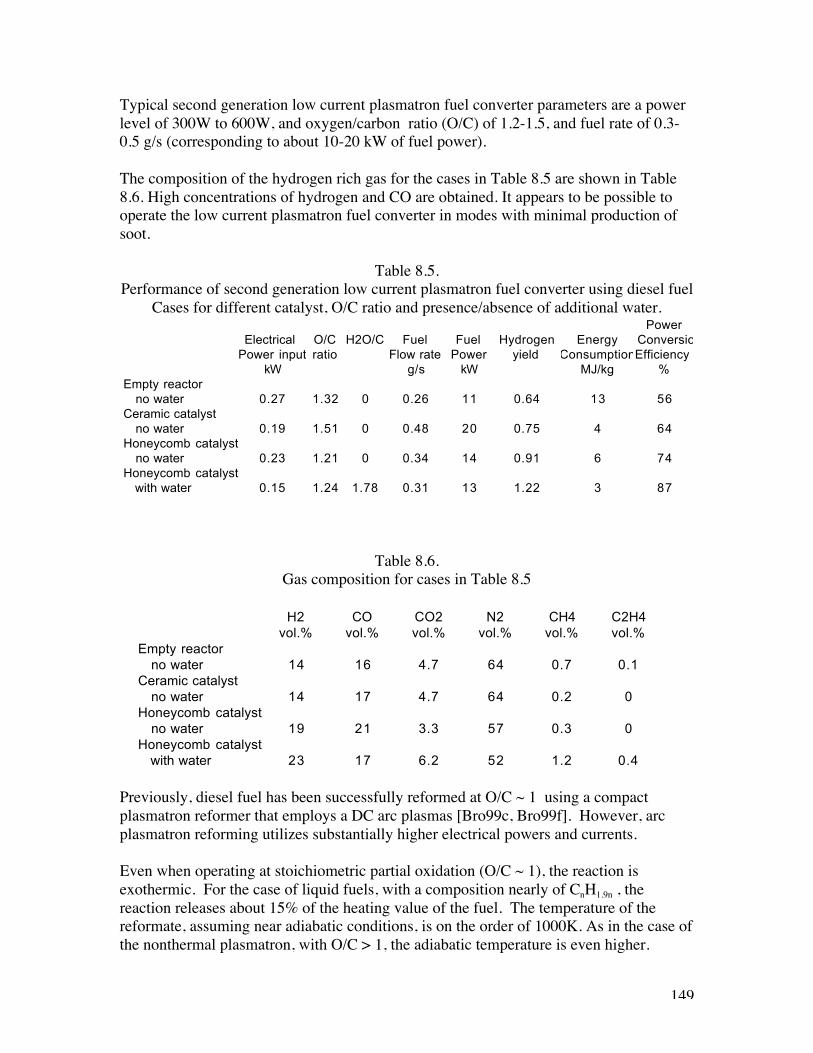
149
Typical second generation low current plasmatron fuel converter parameters are a powerlevel of 300W to 600W, and oxygen/carbon ratio (O/C) of 1.2-1.5, and fuel rate of 0.3-0.5 g/s (corresponding to about 10-20 kW of fuel power).
The composition of the hydrogen rich gas for the cases in Table 8.5 are shown in Table8.6. High concentrations of hydrogen and CO are obtained. It appears to be possible tooperate the low current plasmatron fuel converter in modes with minimal production ofsoot.
Table 8.5.Performance of second generation low current plasmatron fuel converter using diesel fuel
Cases for different catalyst, O/C ratio and presence/absence of additional water.
Table 8.6.Gas composition for cases in Table 8.5
Previously, diesel fuel has been successfully reformed at O/C ~ 1 using a compactplasmatron reformer that employs a DC arc plasmas [Bro99c, Bro99f]. However, arcplasmatron reforming utilizes substantially higher electrical powers and currents.
Even when operating at stoichiometric partial oxidation (O/C ~ 1), the reaction isexothermic. For the case of liquid fuels, with a composition nearly of CnH1.9n , thereaction releases about 15% of the heating value of the fuel. The temperature of thereformate, assuming near adiabatic conditions, is on the order of 1000K. As in the case ofthe nonthermal plasmatron, with O/C > 1, the adiabatic temperature is even higher.
H2 CO CO2 N2 CH4 C2H4vol.% vol.% vol.% vol.% vol.% vol.%
Empty reactor no water 14 16 4.7 64 0.7 0.1Ceramic catalyst no water 14 17 4.7 64 0.2 0Honeycomb catalyst no water 19 21 3.3 57 0.3 0Honeycomb catalyst with water 23 17 6.2 52 1.2 0.4
PowerElectrical O/C H2O/C Fuel Fuel Hydrogen Energy Conversion
Power input ratio Flow rate Power yield ConsumptionEfficiencykW g/s kW MJ/kg %
Empty reactor no water 0.27 1.32 0 0.26 11 0.64 13 56Ceramic catalyst no water 0.19 1.51 0 0.48 20 0.75 4 64Honeycomb catalyst no water 0.23 1.21 0 0.34 14 0.91 6 74Honeycomb catalyst with water 0.15 1.24 1.78 0.31 13 1.22 3 87
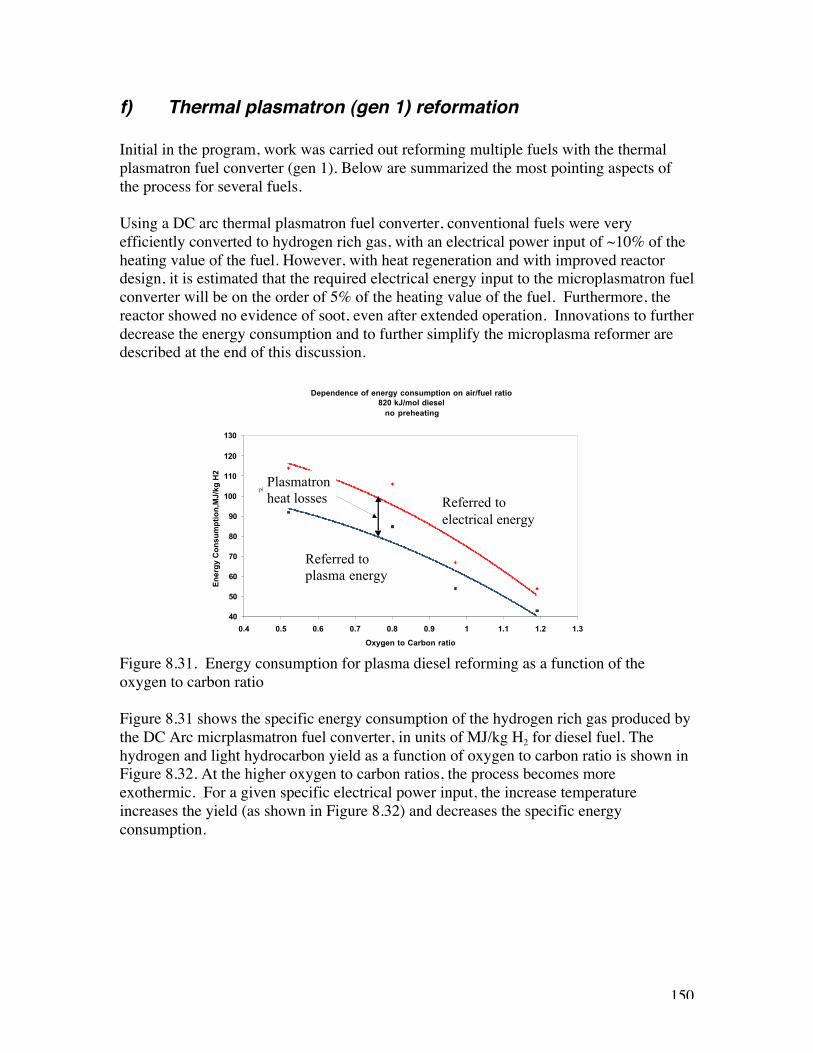
150
f) Thermal plasmatron (gen 1) reformation
Initial in the program, work was carried out reforming multiple fuels with the thermalplasmatron fuel converter (gen 1). Below are summarized the most pointing aspects ofthe process for several fuels.
Using a DC arc thermal plasmatron fuel converter, conventional fuels were veryefficiently converted to hydrogen rich gas, with an electrical power input of ~10% of theheating value of the fuel. However, with heat regeneration and with improved reactordesign, it is estimated that the required electrical energy input to the microplasmatron fuelconverter will be on the order of 5% of the heating value of the fuel. Furthermore, thereactor showed no evidence of soot, even after extended operation. Innovations to furtherdecrease the energy consumption and to further simplify the microplasma reformer aredescribed at the end of this discussion.
Dependence of energy consumption on air/fuel ratio820 kJ/mol diesel
no preheating
40
50
60
70
80
90
100
110
120
130
0.4 0.5 0.6 0.7 0.8 0.9 1 1.1 1.2 1.3
Oxygen to Carbon ratio
En
erg
y C
on
sum
pti
on
,MJ/
kg H
2
related to electrical energy
referred to plasma energy
plasmatron heat losses
Referred toelectrical energy
Referred toplasma energy
Plasmatronheat losses
Figure 8.31. Energy consumption for plasma diesel reforming as a function of theoxygen to carbon ratio
Figure 8.31 shows the specific energy consumption of the hydrogen rich gas produced bythe DC Arc micrplasmatron fuel converter, in units of MJ/kg H2 for diesel fuel. Thehydrogen and light hydrocarbon yield as a function of oxygen to carbon ratio is shown inFigure 8.32. At the higher oxygen to carbon ratios, the process becomes moreexothermic. For a given specific electrical power input, the increase temperatureincreases the yield (as shown in Figure 8.32) and decreases the specific energyconsumption.
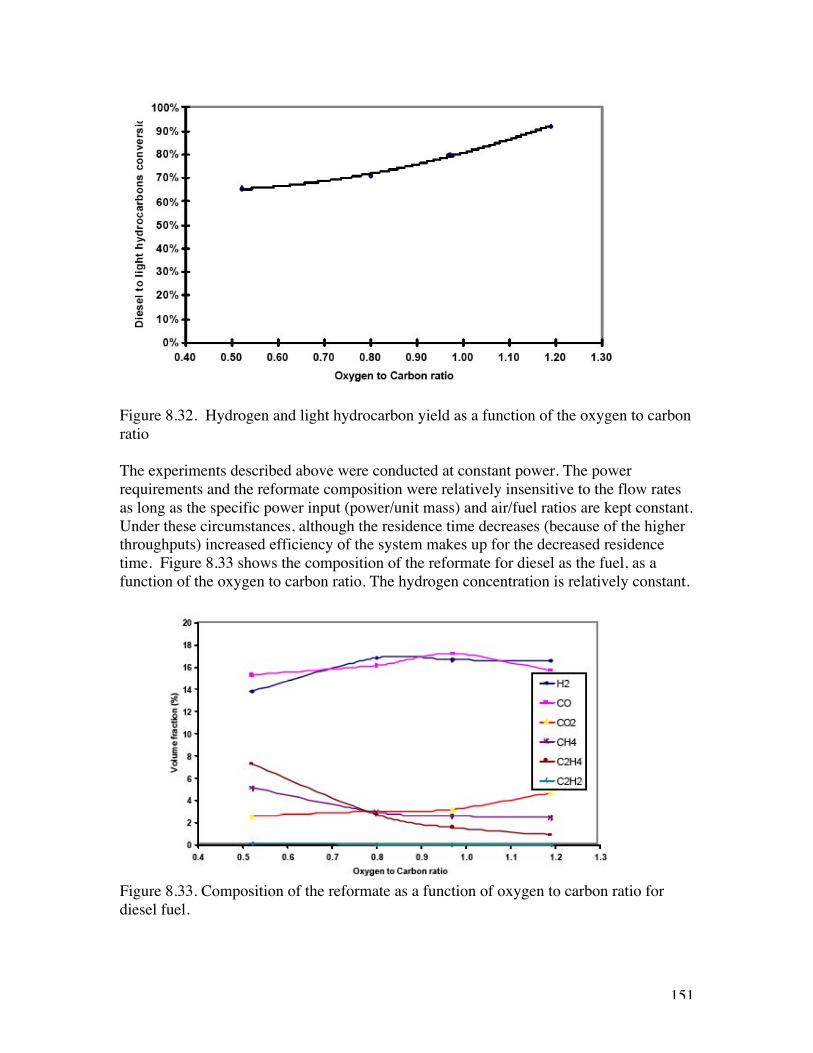
151
Figure 8.32. Hydrogen and light hydrocarbon yield as a function of the oxygen to carbonratio
The experiments described above were conducted at constant power. The powerrequirements and the reformate composition were relatively insensitive to the flow ratesas long as the specific power input (power/unit mass) and air/fuel ratios are kept constant.Under these circumstances, although the residence time decreases (because of the higherthroughputs) increased efficiency of the system makes up for the decreased residencetime. Figure 8.33 shows the composition of the reformate for diesel as the fuel, as afunction of the oxygen to carbon ratio. The hydrogen concentration is relatively constant.
Figure 8.33. Composition of the reformate as a function of oxygen to carbon ratio fordiesel fuel.

152
Microplasmatron fuel converters have substantial dynamic range. The lower power isdetermined by the maximum voltage capability of the power supply (the voltageincreases with decreasing current), while the highest power is determined by erosion ofthe electrodes. It is expected that a dynamic range of a factor of 10 is possible withoutsubstantial modification to the plasmatron device. This is sufficient to provide therequired change in throughput for conventional engines. For hybrid vehicles, withengines operating at constant or near constant conditions, the plasmatron fuel converterwould operate at near constant conditions, with air/fuel/power management requirementsthat are much simpler than for conventional drive.
153
9) Plasmatron transients
In this section, the plasmatron transient performance is described. Limited results areshown for methane and gasoline. More extensive results are presented elsewhere. Theresults for transients for propane were described in the section of steady state propane inSection 8.b, as they were integral part of the results.
In addition, pulsed performance of diesel plasmatron is described in this section.Operation of plasmatron diesel reformers for NOx aftertreatment applications, asdescribed in Section 4, requires periodic operation of the plasmatron with small dutycycle. Plasmatron performance under these conditions is described in Section 9.c.
a) Methane
In this section, the startup performance of homogeneous plasmatron methane reformers isdescribed. Two start ups have been considered. One where the plasmatron is turned onand kept on, while the other one, pulse ignition, the plasmatron was turned on only forvery short period of time.
Start-up experiments – pulse ignition
The experiments were carried out by establishing the flows, and the turning on theplasma. Two sets of experiments were carried out. In this section, experiments with shortoperation of the plasmatron will be described.
The power supply was turned on and then off, such that the on time was less than 1 s. Theprocess was done manually, and thus the on-time differs from experiment to experiment,but the resulting performance of the plasmatron does not seem to be sensitive to thelength of the on-time of the plasmatron.
The value of the instantaneous power in the plasma was varied in these experiments. Theprocess involved adjusting the power without the presence of the methane. Then thepower was turned off, the methane turned on, and the plasma pulsed in the mannerdescribed above.
The mass spectrometer was calibrated for hydrogen, oxygen and methane. Hydrogen wascalibrated using measurements of the reformate with the GC, while oxygen wascalibrated using air as the sample gas and methane by measuring the composition of theair/methane mixture and calculating the methane concentration from the known flowrates.

154
The experiments were carried out at various ratios of O/C. As in [Bro05a], the O/C ratiowas varied by changing the wall air, with constant swirl air (60 lpm) and methane (40lpm). The O/C ratio was varied from 1.63 to 2.24.
Figure 9.1. Time response of H2, O2 and CH4 for O/C = 2.24 and 160 W.
Results of the hydrogen, oxygen and methane concentrations are show in Figure 9.1 as afunction of time for conditions of O/C = 2.24 and 160 W of plasma power. Because ofthe ~ 3 s time delay, it is not clear where the start up occurs in the mass spectrometer.The second measured point by the MS shows increase of H2 and decrease of bothmethane and oxygen. The transient lasts about 0.8 s, where the transient is defined as thetime it takes for the 10%-90% change. It is not possible to determine whether the widthof the transient is due to instrumental limitations of the MS system or time responseimplications of the plasmatron methane reformer. However, it can be said that theresponse of the plasmatron methane reformer cannot be longer than about 0.8 s, andcould in fact be smaller.
The hydrogen concentration reaches more than about 4% in less than 1 s, and then slowlyincreases. The methane conversion is about 30% at times of about 2 s, increasing toabout 50% at 10 s. The oxygen concentration follows the methane concentration.
The temperature, as measured by the thermocouple, is also shown in Figure 9.1. Thetemperature is increasing at a rate of more than 2 K/s. The temperature measured by thethermocouple is not a measurement of the gas temperature and it may be more anindication of the temperature of the walls.
O/C 2.24
0
2
4
6
8
10
12
14
16
18
20
0 2 4 6 8 10
time (s)
Mola
r co
nce
ntr
atio
n
0
20
40
60
80
100
120
140
Tem
per
ature
(C)
H2
CH4
O2
temp
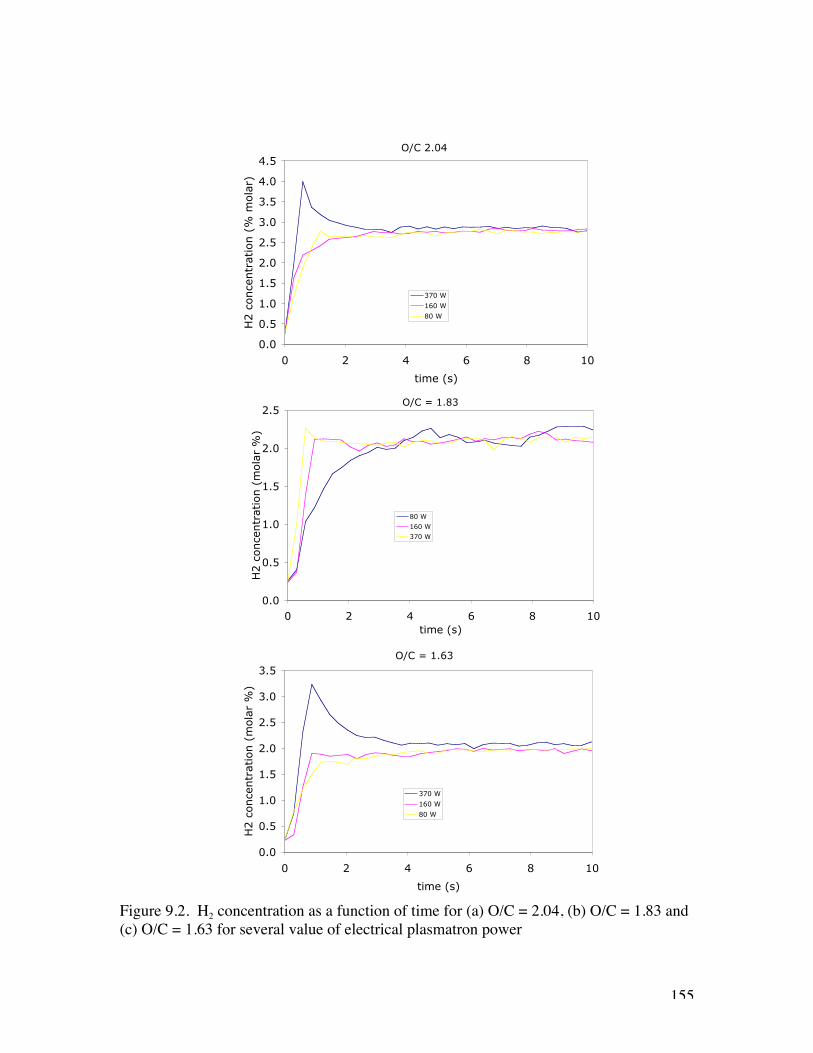
155
Figure 9.2. H2 concentration as a function of time for (a) O/C = 2.04, (b) O/C = 1.83 and(c) O/C = 1.63 for several value of electrical plasmatron power
O/C 2.04
0.0
0.5
1.0
1.5
2.0
2.5
3.0
3.5
4.0
4.5
0 2 4 6 8 10
time (s)
H2 c
once
ntr
atio
n (
% m
ola
r)
370 W
160 W
80 W
O/C = 1.83
0.0
0.5
1.0
1.5
2.0
2.5
0 2 4 6 8 10time (s)
H2 c
once
ntr
atio
n (
mola
r %
)
80 W
160 W
370 W
O/C = 1.63
0.0
0.5
1.0
1.5
2.0
2.5
3.0
3.5
0 2 4 6 8 10
time (s)
H2 c
once
ntr
atio
n (
mola
r %
)
370 W
160 W
80 W
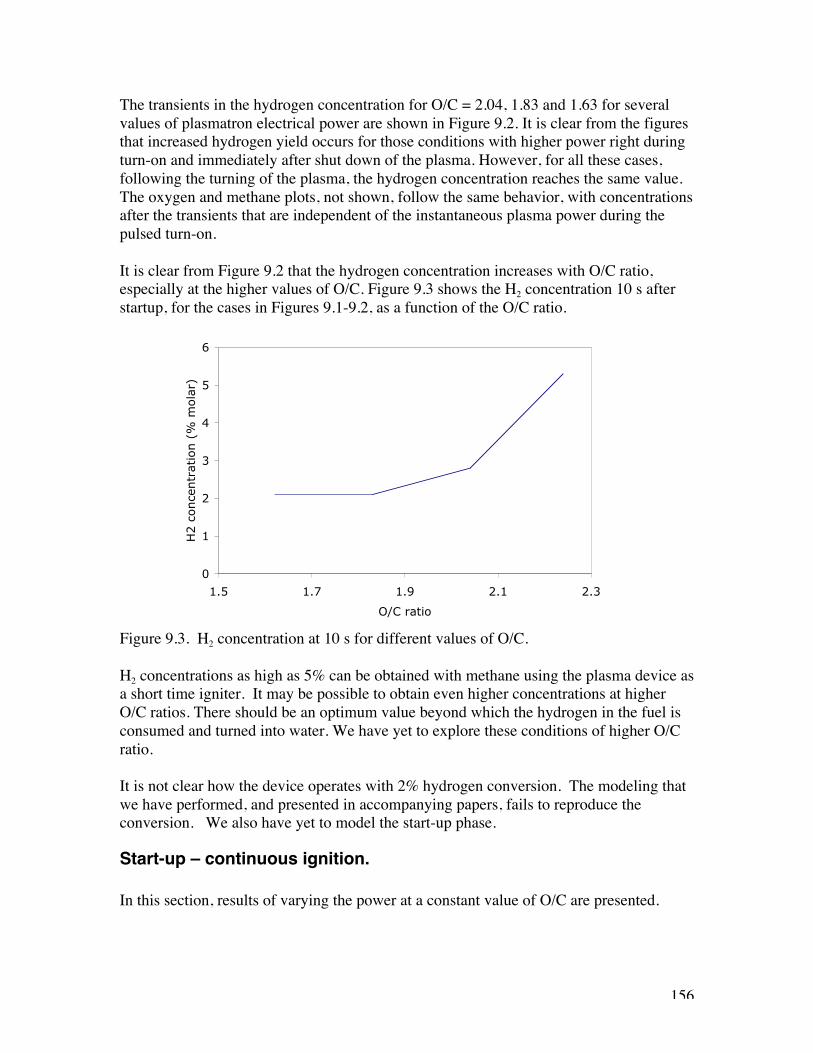
156
The transients in the hydrogen concentration for O/C = 2.04, 1.83 and 1.63 for severalvalues of plasmatron electrical power are shown in Figure 9.2. It is clear from the figuresthat increased hydrogen yield occurs for those conditions with higher power right duringturn-on and immediately after shut down of the plasma. However, for all these cases,following the turning of the plasma, the hydrogen concentration reaches the same value.The oxygen and methane plots, not shown, follow the same behavior, with concentrationsafter the transients that are independent of the instantaneous plasma power during thepulsed turn-on.
It is clear from Figure 9.2 that the hydrogen concentration increases with O/C ratio,especially at the higher values of O/C. Figure 9.3 shows the H2 concentration 10 s afterstartup, for the cases in Figures 9.1-9.2, as a function of the O/C ratio.
Figure 9.3. H2 concentration at 10 s for different values of O/C.
H2 concentrations as high as 5% can be obtained with methane using the plasma device asa short time igniter. It may be possible to obtain even higher concentrations at higherO/C ratios. There should be an optimum value beyond which the hydrogen in the fuel isconsumed and turned into water. We have yet to explore these conditions of higher O/Cratio.
It is not clear how the device operates with 2% hydrogen conversion. The modeling thatwe have performed, and presented in accompanying papers, fails to reproduce theconversion. We also have yet to model the start-up phase.
Start-up – continuous ignition.
In this section, results of varying the power at a constant value of O/C are presented.
0
1
2
3
4
5
6
1.5 1.7 1.9 2.1 2.3
O/C ratio
H2 c
once
ntr
atio
n (
% m
ola
r)
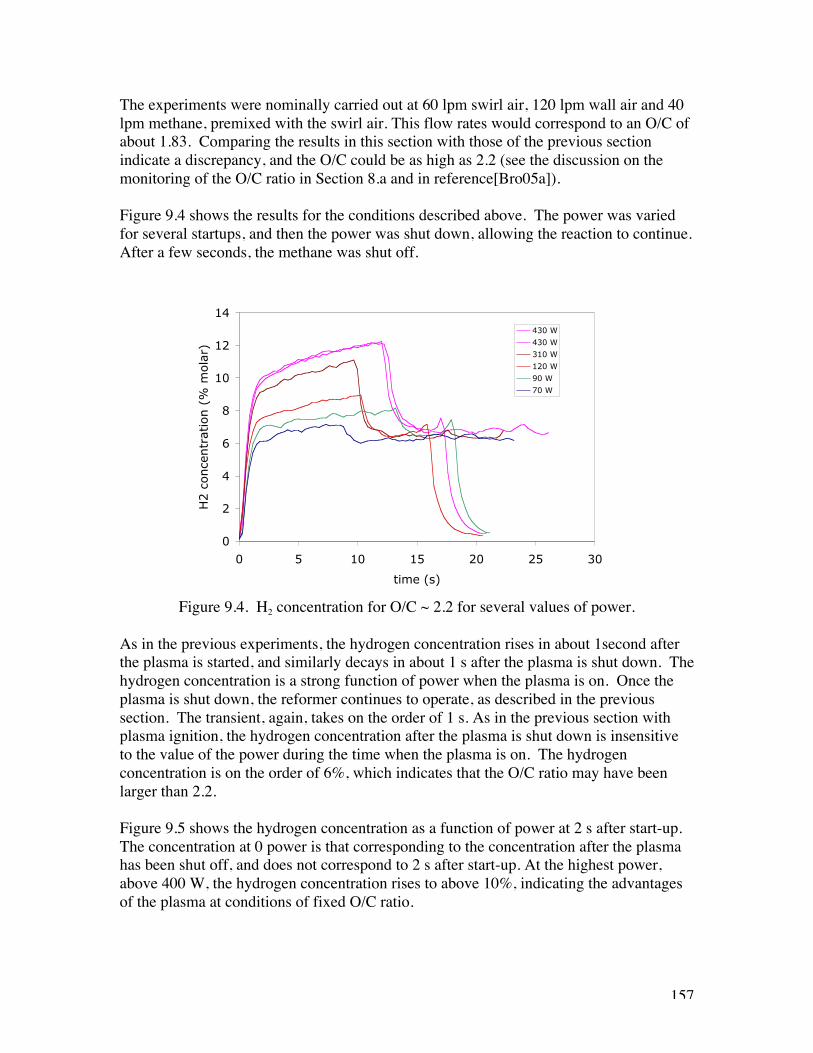
157
The experiments were nominally carried out at 60 lpm swirl air, 120 lpm wall air and 40lpm methane, premixed with the swirl air. This flow rates would correspond to an O/C ofabout 1.83. Comparing the results in this section with those of the previous sectionindicate a discrepancy, and the O/C could be as high as 2.2 (see the discussion on themonitoring of the O/C ratio in Section 8.a and in reference[Bro05a]).
Figure 9.4 shows the results for the conditions described above. The power was variedfor several startups, and then the power was shut down, allowing the reaction to continue.After a few seconds, the methane was shut off.
Figure 9.4. H2 concentration for O/C ~ 2.2 for several values of power.
As in the previous experiments, the hydrogen concentration rises in about 1second afterthe plasma is started, and similarly decays in about 1 s after the plasma is shut down. Thehydrogen concentration is a strong function of power when the plasma is on. Once theplasma is shut down, the reformer continues to operate, as described in the previoussection. The transient, again, takes on the order of 1 s. As in the previous section withplasma ignition, the hydrogen concentration after the plasma is shut down is insensitiveto the value of the power during the time when the plasma is on. The hydrogenconcentration is on the order of 6%, which indicates that the O/C ratio may have beenlarger than 2.2.
Figure 9.5 shows the hydrogen concentration as a function of power at 2 s after start-up.The concentration at 0 power is that corresponding to the concentration after the plasmahas been shut off, and does not correspond to 2 s after start-up. At the highest power,above 400 W, the hydrogen concentration rises to above 10%, indicating the advantagesof the plasma at conditions of fixed O/C ratio.
0
2
4
6
8
10
12
14
0 5 10 15 20 25 30
time (s)
H2 c
once
ntr
atio
n (
% m
ola
r)
430 W
430 W
310 W
120 W
90 W
70 W
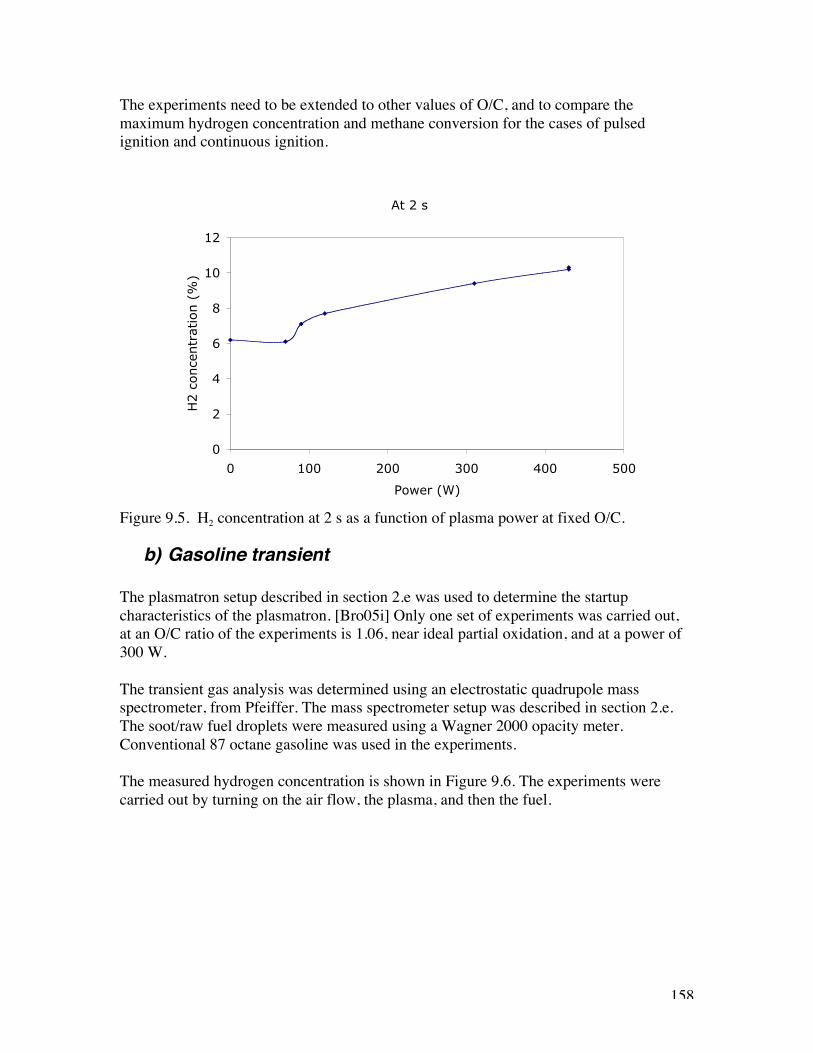
158
The experiments need to be extended to other values of O/C, and to compare themaximum hydrogen concentration and methane conversion for the cases of pulsedignition and continuous ignition.
Figure 9.5. H2 concentration at 2 s as a function of plasma power at fixed O/C.
b) Gasoline transient
The plasmatron setup described in section 2.e was used to determine the startupcharacteristics of the plasmatron. [Bro05i] Only one set of experiments was carried out,at an O/C ratio of the experiments is 1.06, near ideal partial oxidation, and at a power of300 W.
The transient gas analysis was determined using an electrostatic quadrupole massspectrometer, from Pfeiffer. The mass spectrometer setup was described in section 2.e.The soot/raw fuel droplets were measured using a Wagner 2000 opacity meter.Conventional 87 octane gasoline was used in the experiments.
The measured hydrogen concentration is shown in Figure 9.6. The experiments werecarried out by turning on the air flow, the plasma, and then the fuel.
At 2 s
0
2
4
6
8
10
12
0 100 200 300 400 500
Power (W)
H2 c
once
ntr
atio
n (
%)
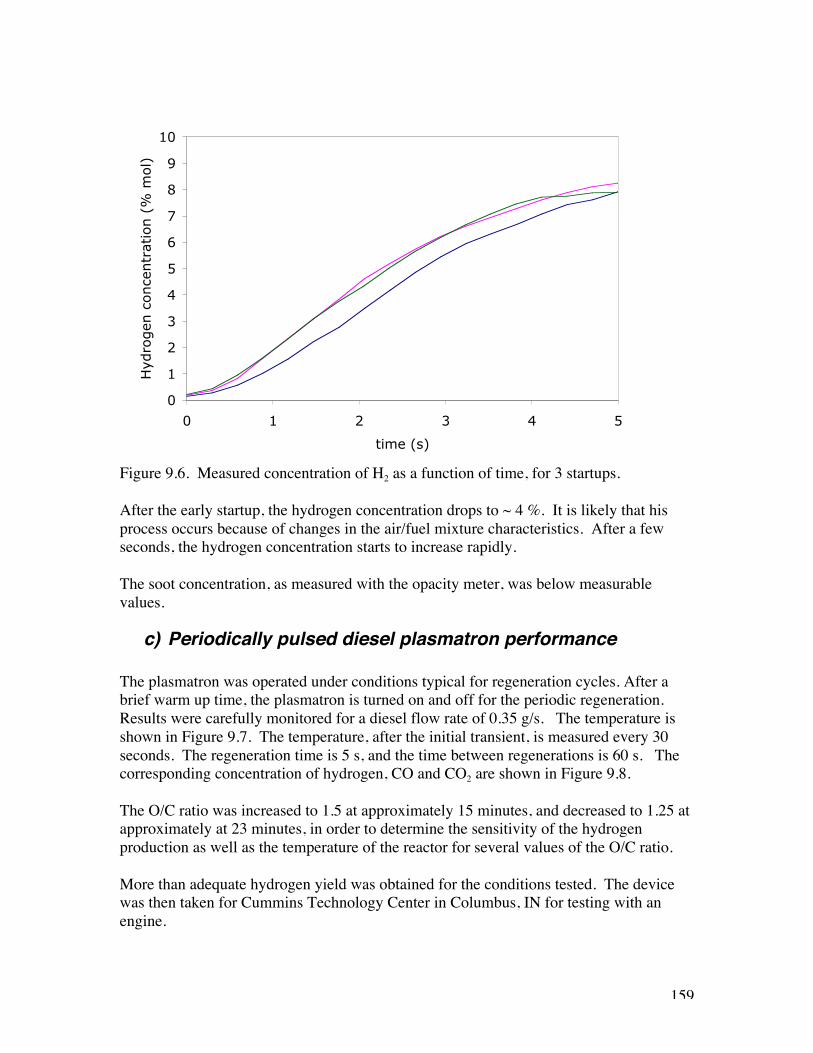
159
Figure 9.6. Measured concentration of H2 as a function of time, for 3 startups.
After the early startup, the hydrogen concentration drops to ~ 4 %. It is likely that hisprocess occurs because of changes in the air/fuel mixture characteristics. After a fewseconds, the hydrogen concentration starts to increase rapidly.
The soot concentration, as measured with the opacity meter, was below measurablevalues.
c) Periodically pulsed diesel plasmatron performance
The plasmatron was operated under conditions typical for regeneration cycles. After abrief warm up time, the plasmatron is turned on and off for the periodic regeneration.Results were carefully monitored for a diesel flow rate of 0.35 g/s. The temperature isshown in Figure 9.7. The temperature, after the initial transient, is measured every 30seconds. The regeneration time is 5 s, and the time between regenerations is 60 s. Thecorresponding concentration of hydrogen, CO and CO2 are shown in Figure 9.8.
The O/C ratio was increased to 1.5 at approximately 15 minutes, and decreased to 1.25 atapproximately at 23 minutes, in order to determine the sensitivity of the hydrogenproduction as well as the temperature of the reactor for several values of the O/C ratio.
More than adequate hydrogen yield was obtained for the conditions tested. The devicewas then taken for Cummins Technology Center in Columbus, IN for testing with anengine.
0
1
2
3
4
5
6
7
8
9
10
0 1 2 3 4 5
time (s)
Hyd
rogen
conce
ntr
atio
n (
% m
ol)
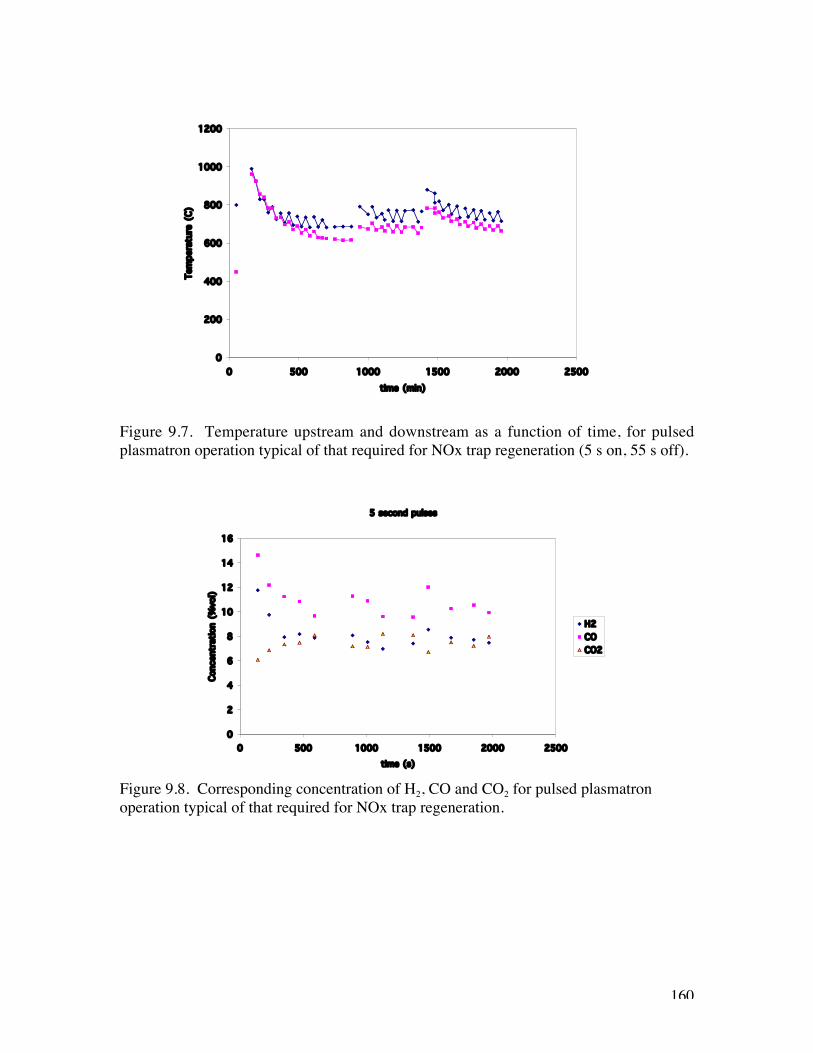
160
Figure 9.7. Temperature upstream and downstream as a function of time, for pulsedplasmatron operation typical of that required for NOx trap regeneration (5 s on, 55 s off).
Figure 9.8. Corresponding concentration of H2, CO and CO2 for pulsed plasmatronoperation typical of that required for NOx trap regeneration.
0
200
400
600
800
1000
1200
0 500 1000 1500 2000 2500
time (min)
Tem
pera
ture
(C)
5 second pulses
0
2
4
6
8
10
12
14
16
0 500 1000 1500 2000 2500
time (s)
Conc
entr
atio
n (%
vol)
H2COCO2
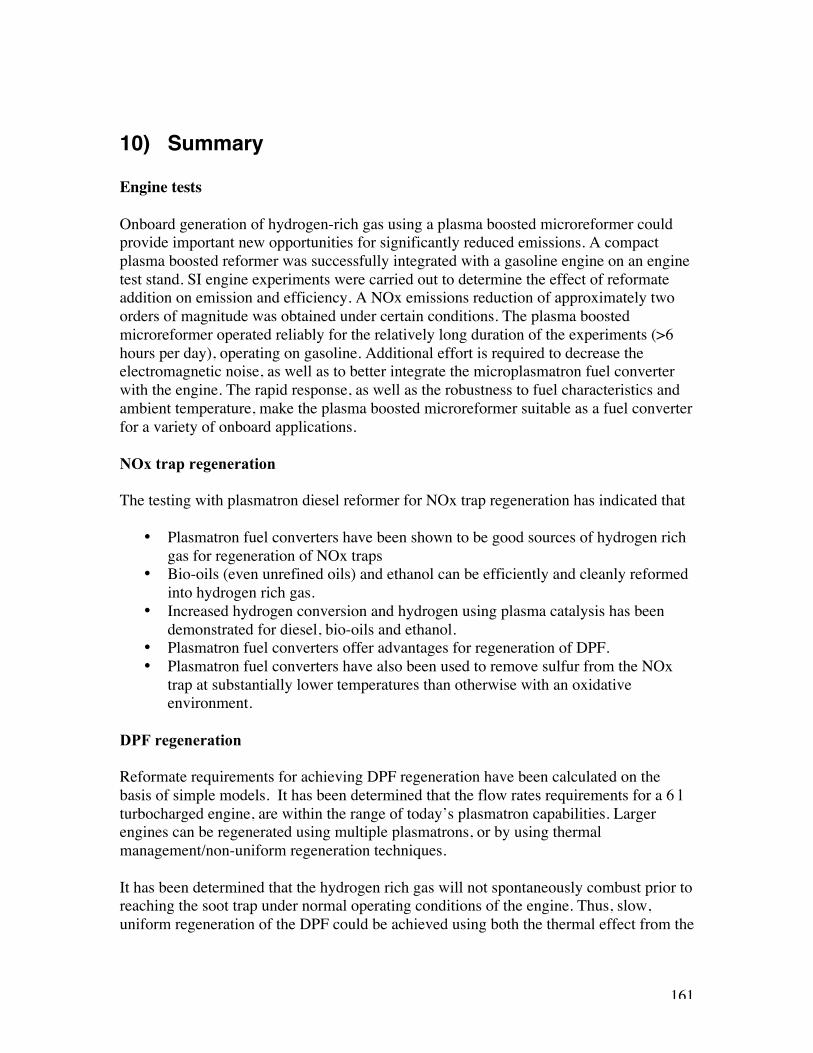
161
10) Summary
Engine tests
Onboard generation of hydrogen-rich gas using a plasma boosted microreformer couldprovide important new opportunities for significantly reduced emissions. A compactplasma boosted reformer was successfully integrated with a gasoline engine on an enginetest stand. SI engine experiments were carried out to determine the effect of reformateaddition on emission and efficiency. A NOx emissions reduction of approximately twoorders of magnitude was obtained under certain conditions. The plasma boostedmicroreformer operated reliably for the relatively long duration of the experiments (>6hours per day), operating on gasoline. Additional effort is required to decrease theelectromagnetic noise, as well as to better integrate the microplasmatron fuel converterwith the engine. The rapid response, as well as the robustness to fuel characteristics andambient temperature, make the plasma boosted microreformer suitable as a fuel converterfor a variety of onboard applications.
NOx trap regeneration
The testing with plasmatron diesel reformer for NOx trap regeneration has indicated that
• Plasmatron fuel converters have been shown to be good sources of hydrogen richgas for regeneration of NOx traps
• Bio-oils (even unrefined oils) and ethanol can be efficiently and cleanly reformedinto hydrogen rich gas.
• Increased hydrogen conversion and hydrogen using plasma catalysis has beendemonstrated for diesel, bio-oils and ethanol.
• Plasmatron fuel converters offer advantages for regeneration of DPF.• Plasmatron fuel converters have also been used to remove sulfur from the NOx
trap at substantially lower temperatures than otherwise with an oxidativeenvironment.
DPF regeneration
Reformate requirements for achieving DPF regeneration have been calculated on thebasis of simple models. It has been determined that the flow rates requirements for a 6 lturbocharged engine, are within the range of today’s plasmatron capabilities. Largerengines can be regenerated using multiple plasmatrons, or by using thermalmanagement/non-uniform regeneration techniques.
It has been determined that the hydrogen rich gas will not spontaneously combust prior toreaching the soot trap under normal operating conditions of the engine. Thus, slow,uniform regeneration of the DPF could be achieved using both the thermal effect from the

162
reformate as well as reducing capabilities and localized thermal effect of the hydrogenrich gas.
Experimental setup for determining the advantages of the hydrogen rich gas have beendetermined. Trap soot loading and regeneration tests will be carried out in the nearfuture.
CFD modeling
Computational fluid dynamics tools have been used to investigate the effects ofalternative injection points for the fuel, in this case, methane. The purpose was todetermine the characteristics of the air/fuel mixture at the location of the plasma, as wellas to determine the mixing rates. It was determined that changes in injection pointchanges significantly the distribution of the methane in the region of the plasma, but doesnot significantly change the mixing parameters at this location.
This information will be used in accompanying papers to investigate the characteristics ofmethane reforming in plasmatron fuel converters.
Experiments and modeling of the vaporization with the time response of a plasmatrongasoline reformer were carried out.
We have determined that the response time of the mass spectrometer is on the order of 1s. Thus, it is likely that the hydrogen concentration reaches about 4% 1 s after turn-on. Bycomparison, the response time with gaseous fuels was on the order of 2 s, at substantiallyhigher O-to-C ratios.
PSR Modeling of methane
A 2-stage model has been developed for the homogeneous reforming of methane. Themodel was investigated using a simple Perfectly Stirred Reactor (PSR) with multipleinputs. It was determined that the reforming process ignited the overall O/C ratio isbetween 1.4 and 1.6. About 10-15% of the methane needs to be stoichiometricallycombusted.
The actual composition of the reformate in the calculations underestimate the hydrogenconcentration and the methane conversion. The PaSR model does better in predicting thecomposition of the reformate.
The results show a lack of sensitivity of the conversion to residence time. Increasedconversion is difficult through the use of larger reactors. Instead, increased temperatureis a more effective way to achieving high conversion of methane. The same results areobtained by increasing the reactor size by a factor of 8 or increasing the O/C ratio from1.6 to 2. However, there is a minimum PSR size (defined as the section of the actualreactor with good mixing) for good reforming, and increased O/C ratio is needed tocompensate for smaller well-mixed reactors.
163
PASR modeling of methane
A model of a plasmatron methane reformer where limited mixing is included hasproduced quantitative agreement with experimental results. The process uses only gasphase chemistry, without the use of a catalyst. The model reproduces the hydrogen andother main components of the reformate, as well as the methane conversion.
The model also has been used to determine the effect of the plasma at steady stateconditions. It has been shown that the plasma increases the hydrogen concentration byabout 20%, but the reaction continues at lower temperatures even in the absence of theplasma. As the cold reagents are introduced into the hot reactor gas, they are heated andrelease sufficient energy to maintain the reaction, although at decreased temperature.
The composition of the reformate is accurately described by the model. However, thereare regimes (low O/C, absence of plasma) where there is only qualitative agreement withthe observations. Additional modeling is needed that includes losses or improveddescription of the fluid dynamics, mainly for the case without plasma.
Methane reforming
The effect of the stratification of the methane/air mixture of the air has been investigated,at fixed methane flow rate. It was determined that the hydrogen concentration and yieldsdepended on the overall O/C ratio, and that the distribution of the air between swirl andwall had only a small effect.
The plasma power required depends on the O/C ratio. At high O/C ratios (O/C ~ 2.2) thedependence on plasma power is small, with a ~20% decrease in hydrogen concentrationwithout the plasma. However, at O/C ~ 2, the plasma is needed, and higher power isbetter. At even lower O/C ratios (O/C < 1.6), the reforming even in the presence ofplasma, is poor.
The start-up of plasmatron methane reformers has been studied. The experimentsindicate that when the plasmatron is used as an igniter, the hydrogen concentration is afunction of O/C. Furthermore, the tests indicate that it is possible to increase thehydrogen concentration and the methane conversion by increasing the O/C to about 2.2.As the O/C for stoichiometric combustion of methane is O/C ~ 4, the reformer is stilloperating at very fuel rich conditions.
When the plasmatron is used in continuous ignition mode, the use of the plasma at agiven O/C ratio increases the hydrogen concentration and the methane conversion.Increasing the power increases the hydrogen concentration. High hydrogen concentration,as high as 10-12%, can be obtained in ~ 1 s with O/C on the order of 2.2 with 300-400W.
164
Propane reforming
In general, the following conclusions can be derived from this work:
• O/C controls the performance of the plasmatron propane reformer, more than wherethe air is introduced (swirl air, wall air),
• The performance of the plasmatron propane reformer is sensitive to the place ofintroduction of the propane, with best results premixing the propane with the swirlair and the worst results with the propane injected through the axial nozzle.
• Reforming is sensitive to plasma power at lower values of O/C. At higher values ofO/C, the plasma is mainly needed for startup.
• Startup is sensitive to power at lower values of O/C.
Biofuels reforming
Conditions of good non-catalytic bio-oil reforming were investigated, with hydrogenconcentration in the dry reformate > 10% and energy efficiency > 70%. Operation atrelatively high O-to-C ratio was required. The ratio of free-oxygen to carbon ratio,however, is Ofree/C ~ 1.5 at the conditions of good performance.
The plasma is required for the start up for both ethanol and bio-oils, until conditions nearsteady state are achieved. However, once steady state is achieved in ethanol, hydrogenconcentration in the absence of plasma is maintained for all but the lowest value of O/Cratio, although with higher opacity that in the case with the plasma. For B-100, theplasma is needed throughout the O/C range explored.
Biofuel plasma catalytic reforming
Low-current plasmatron fuel reformer technology has been used to convert both bio-oilsand ethanol into a hydrogen-rich gas with high hydrogen yields (70 to 80%) where acatalyst is positioned after the homogeneous reforming zone. For homogeneousreforming alone hydrogen yields are typically about half those obtained with catalyticreforming. However, the conversion rate into H2, CO and light hydrocarbons is stillrelatively high (close to 70%) for homogeneous reforming. More work is needed tofurther lower the energy consumption and increase the hydrogen yield by operating theplasmatron fuel reformer closer to an O/C ratio of 1.
165
11) Acknowledgements
We want to thank the continued support of Dr. Sidney Diamond. His encouragement,depth and width of knowledge, enthusiasm and `Joye de Vivre’ will serve as standards forus to reach. In addition, encouragement and useful discussions were carried with Dr.Tecle Rufael fromm Chevron Texacon, and with colleagues from Arvin Meritor, inparticular Dr Rudi Smalling, Dr. Navin Khadya and Mr. Samuel Crane.
166
12) Bibliography and references
[Anz04] Anziani, Felipe Rene, Development and characterization of the magneticplasmatron, MIT Physics Department S.B. Thesis 2004
[Ath03] Ather A. Quader, John E. Kirwan and M. James Grieve, Engine Performanceand Emissions Near the Dilute Limit with Hydrogen Enrichment Using an On-BoardReforming Strategy, 2003-01-1356, 2003
[Bel05] N. Margarit Bel1, J.B. Heywood, L. Bromberg, Simulation of HydrogenGeneration from Methane Partial Oxidation in a Plasma Fuel Reformer, PSFC-ReportRR-05-001
[Ber99] Berger, R.J., Marin, G.B, Investigation of gas-phase reactions and ignitiondelay occurring at conditions typical for partial oxidation of methane to synthesis gas,Industrial and Engineering Chemistry Research 38 7, Jul 1999, p 2582-2592
[Bio05] Data of B-100 fuel used was provided by Bill Ayres, President, RenewableSolutions LLC (2005)
[Boe99] INTERNAL COMBUSTION ENGINE EXHAUST EMISSION CONTROLSYSTEM WITH ADSORBERS FOR NITROGEN OXIDES THE USE OF TANDEMCATALYSTS, Boegner; Walter , Haak; Karl-Ernst, Krutzsch; Bernd, Verrelst; Wim,Voigtlaender; Dirk, Wenninger; Guenter, Wirbeleit; Friedrich, US Patent US 5910097,issued 06/08/1999; assignee: Daimler Benz
[Bre73] Breshears, R., Cotrill, H. and Rupe, T., Partial Hydrogen Injection into InternalCombustion Engines Proc EPA 1st Symp on Low Pollution Power Systems Development,Ann Arbon, MI Oct (1973)
[Bro97] L. Bromberg, A. Rabinovich and D.R. Cohn, Plasma Reformer/Fuel CellSystems for Decentralized Energy Applications, International Journal of HydrogenEnergy 22 83 (1997)
[Bro99a] L. Bromberg, D.R. Cohn, A. Rabinovich, J.E. Surma and J. Virden, CompactPlasmatron Boosted Hydrogen Generation Technology for Vehicular Applications, Int.Journal of Hydrogen Energy, 24, 341-350 (1999)
[Bro99b] L. Bromberg, D.R. Cohn, A. Rabinovich, N. Alexeev, J.B. Green, Jr., N.Domingo, J.M.E. Storey, R.M. Wagner and J. S. Armfield, Experimental Evaluation of SIEngine Operation Supplemented by Hydrogen Rich Gas from a Compact Plasma BoostedReformer, PSFC Report JA-99-32 (November 1999)
167
[Bro99c] L. Bromberg; A. Rabinovich; N. Alexeev; and D.R. Cohn, Plasma Reforming ofDiesel Fuel. Plasma Science and Fusion Center Report PSFC/JA-99-4 (presented at theNational Meeting of the American Chemical Society, Annaheim, CA March 1999)
[Bro99d] Plasma Catalytic Reforming of Methane, L. Bromberg, D.R. Cohn, A.Rabinovich and N. Alexeev, Int. J. Hydrogen Energy 24 1131 (1999)
[Bro99e] Bromberg, L., A. Rabinovitch, N. Alexeev, and D.R. Cohn, 1999, PlasmaCatalytic Reforming of Natural Gas, Proceedings of the 1999 Hydrogen ProgramReview, NREL/CP-570-26938, 1999; available at:http://www.psfc.mit.edu/library/99ja/99ja016/99ja016_abs.html
[Bro99f] Bromberg, L., A. Rabinovitch, N. Alexeev, and D.R. Cohn, 1999, PlasmaReforming of Diesel Fuel, Proceedings of the 1999 Hydrogen Program Review,NREL/CP-570-26938, 1999; available athttp://www.psfc.mit.edu/library/99ja/99ja004/99ja004_abs.html
[Bro00a] L. Bromberg, D.R. Cohn, A. Rabinovich, N. Alexeev, R. Ramprasad and S.Tamhankar, System Optimization And Cost Analysis Of Plasma Catalytic Reforming OfHydrocarbons, Int. Journal of Hydrogen Energy 25 1157 (2000)
[Bro00b] L. Bromberg, D.R. Cohn, A. Rabinovich and J. Heywood, EmissionsReductions Using Hydrogen from Plasmatron Fuel Converters, presented at DieselEngine Emission Reduction (DEER-2000) Workshop (August 20–24, 2000, San Diego,CA)
[Bro01a] L. Bromberg, D.R. Cohn, A. Rabinovich, Aftertreatment of Diesel VehicleEmissions Using Compact Plasmatron Fuel Converter-Catalyst Systems, Int. Journal ofVehicle Design 25, n 4, p 275-282 (2001)
[Bro01b] L. Bromberg, D.R. Cohn, A. Rabinovich, J. Heywood, Emissions reductionsusing hydrogen from plasmatron fuel converters, Int. Journal of Hydrogen Energy, v 26,1115-21 (2001)
[Bro02] L. Bromberg, D.R. Cohn, J. Heywood, A. Rabinovich, N. Alexeev, A.Samokhin, On-Board Plasmatron generation of Hydrogen Rich Gas for DieselAftertreatment and Other Applications, presented at the 8th DEER Meeting, San DiegoCA (August 2002)
[Bro03] L. Bromberg, D.R. Cohn, J. Heywood, A. Rabinovich, N. Alexeev, A.Samokhin, and S. Crane, Hydrogen Generation from Plasmatron Reformers and Use forDiesel Exhaust Aftertreatment, presented at the 9th DEER Meeting, Newport RI (August2003)
168
[Bro05a] L. Bromberg, K. Hadidi and D.R. Cohn, Experimental Investigation of PlasmaAssisted Reforming of Methane I: Steady State Operation, Plasma Science and FusionCenter Report JA-05-10
[Bro05b] L. Bromberg, K. Hadidi and D.R. Cohn, Experimental Investigation of PlasmaAssisted Reforming of Methane II: Start-up, Plasma Science and Fusion Center ReportJA-05-11
[Bro05c] L. Bromberg and N. Alexeev Plasma assisted reforming of methane: Two stagePerfectly Stirred Reactor (PSR) simulation, Plasma Science and Fusion Center ReportJA-05-12
[Bro05d] L. Bromberg, Modeling of plasma assisted reforming of methane II: PartiallyStirred Reactor (PASR) simulation, Plasma Science and Fusion Center Report JA-05-13
[Bro05e] L. Bromberg, CFD modeling of Plasmatron Methane Reformers, PlasmaScience and Fusion Center Report JA-05-14, 2005
[Bro05f] L. Bromberg, K. Hadidi and D.R. Cohn, Experimental Investigation of PlasmaAssisted Reforming of Propane, Plasma Science and Fusion Center Report JA-05-15
[Bro05g] L. Bromberg, D.R. Cohn, K. Hadidi, J. Heywood, A. Rabinovich and V. Wong,Optimum Regeneration Of Diesel Particulate Filters And NOx Traps Using FuelReformers, U.S. patent application
[Bro05h] L. Bromberg, D.R. Cohn and V. Wong, Regeneration Of Diesel ParticulateFilters with Hydrogen Rich Gas, Plasma Science and Fusion Center Report PSFC/RR-05-2 (January 25, 2005)
[Bro05i] L. Bromberg, Startup Characteristics Of Plasmatron Gasoline Reformers,Plasma Science and Fusion Center Report PSFC/JA-05-49 (December 15, 2005)
[Bro05j] L. Bromberg, D.R. Cohn, K. Hadidi, J.B. Heywood and A. Rabinovich,Plasmatron Fuel Reformer Development and Internal Combustion Engine VehicleApplications, Plasma Science and Fusion Center Report PSFC/JA-05-22; also presentedat the Diesel Engine Exhaust Reduction DEER 2004 (August 2004)
[Bro05k] L. Bromberg, In-Cylinder Laminar Flame Propagation Speed: Effect ofHydrogen And Hydrogen Rich Gas Addition, Plasma Science and Fusion Center ReportPSFC/JA-05-21
[Bromberg05l] L. Bromberg, K. Hadidi, D.R. Cohn, Plasmatron Reformation ofRenewable Fuels, Plasma Science and Fusion Center Report PSFC/JA-05-3
[Cam99] NOX REMOVAL PROCESS, Campbell, Larry E., Guth, Eugene D., Danziger;Robert, US patent US5650127, issued July 22, 1997; assignee: Goal Line Environmental
169
Technologies; REGENERATION OF CATALYST/ABSORBER, Guth; Eugene D.,Campbell; Larry E., Wagner; Gregory J. US patent US5953911, issued Sept. 21, 1999;assignee: Goal Line Environmental Technologies
[Che97] Chen, J. Y., Stochastic Modeling of Partially Stirred Reactors, CombustionScience and Technology 122 (1-6) 63-94 (1997)
[Che37] CHEMKIN 3.7, released by Reaction Design 2003,http://www.reactiondesign.com/
[Cho05] Chen-Pang Chou, Reaction Design, PASR code, privatecommunication (April 2005)
[Coh96] D.R. Cohn, A. Rabinovich and C. H. Titus, Onboard Plasmatron OperationGeneration of Hydrogen for Extremely Low Emission Vehicles with Internal CombustionEngines, Int. J. Vehicle Design 17 550 (1996)
[Coh97] D.R. Cohn, A. Rabinovich, C.H. Titus and L. Bromberg, Near TermPossibilities for Extremely Low Emission Vehicles using On-Board PlasmatronGeneration of Hydrogen, International Journal of Hydrogen Energy .22, 715 (1997)
[Coh98] D.R. Cohn, A. Rabinovich, L. Bromberg, J.E. Surma and J. Virden, OnboardPlasmatron Reforming of Biofuels, Gasoline and Diesel Fuel, presented at the FutureTransportation Technology Conference & Exposition, Costa Mesa, CA (1998); SAE-981920
[And04] Anderson, M., T. Angelo, J. Hou, M. Protas, E. Steinbruck, W. Wagner, P. Way,W. Zhang, Development of an Active Regeneration Diesel Particulate Filter System,Diesel Engine Exhaust Reduction DEER 2004 (2004)
[Deu98] O.D. Deutschmann and L.D. Schmidt, AIChE J. (1998).
[Dim02] Dimotakis, P.E., Some Issues on Turbulent Mixing and Turbulence, Caltech(2002)
[Dob98] K. Dobrot Isherwood, J.R. Linna and P.J. Loftus, Using Onboard FuelReforming by Partial Oxidation to Improve SI Engine Cold-Start Performance andEmissions, SAE 980939 (SP-1352)
[Hey88] Heywood, John B., Internal Combustion Engine Fundamentals, McGraw Hill,1988.
[Cze01a] A. Czernichowski1, M. Czernichowski, and P. Czernichowski, InternationalSymp Plasma Chem. (2001) 55
[Cze01b] A. Czernichowski. Oil Gas Sci. Technol.-Rev. IFP 56 (2), 181–198 (2001).
170
[Cze03a] A. Czernichowski, M. Czernichowski, and K. Wesolowska, Glidarc-AssistedProduction of Synthesis Gas from Biogas, 1st European Hydrogen Energy Conference,September 2-5, 2003, Grenoble, France, poster and full paper (CP1 63) in CD-Conference Proceedings, 10 pp.
[Cze03b] A. Czernichowski, M. Czernichowski, and P. Czernichowski, Glidarc-AssistedReforming of Gasoline and Diesel Oils into Synthesis Gas, idem, poster and full paper(CP1 64) in CD-Conference Proceedings, 7 pp.
[Cze03c] A. Czernichowski, M. Czernichowski, and P. Czernichowski, Glidarc-AssistedProduction of Synthesis Gas from Natural Gas, idem, poster and full paper (CP1 65) inCD-Conference Proceedings, 7 pp.
[Dem02] Maxim Deminsky, Victor Jivotov, Boris Potapkin, and Vladimir Rusanov,Plasma-assisted production of hydrogen from Hydrocarbons, Pure Appl. Chem 74, 3, pp.413–418, 2002.
[Jam94] [Jamal, Y.; and Wyszynski, M. L. On-Board Generation of Hydrogen-RichGaseous Fuels: A Review, International Journal of Hydrogen Energy, Vol. 19, No. 7, pp.557-572, Elsevier Science, 1994.
[Fan02] Fang, H.L, Huang, S.C., Yu, R.C., Wan, C.Z., Howden, K., A FundamentalConsideration of Nox Adsorber Technology for DI Diesel Applications, SAE 2002-01-2889 (2002)
[Fay04] J.C. Fayard, T. Seguelong, A New Active DPF System for “Stop-&-Go” DutyCycle Vehicles, presented at the 2004 Deer Conference
[Ful95] Fulcheri, L., Schwob, Y, From methane to hydrogen, carbon black and water,International Journal of Hydrogen Energy, 20, n 3, Mar, 1995, p 197-202
[Gau98] Gaudernack, Bjorn, Lynum, Steinar, Hydrogen from natural gas without releaseof CO2 to the atmosphere, International Journal of Hydrogen Energy, 23, n 12, Dec,1998, p 1087-1093
[Gor00] C.T. Goralski, Jr., R.P. O’Connor and L.D. Schmidt, Chem. Eng. Sci. 55 (2000)1357.
[Gra94] Gray BF, Griffiths JF, Goulds GA, Charlton BG, Walker GS, The relevance ofthermokinetic interactions and numerical modelling to the homogeneous partialoxidation of methane, Industrial and Engineering Chemistry Research, 33 (1994), 1126-1135.
171
[Gre00] J.B. Green, L. Bromberg, D. R. Cohn. A., N. Domingo, J.M. Storey, R.M.Wagner, J.S Armfield, Experimental Evaluation of SI Engine Operation Supplemented byHydrogen Rich Gas from a Compact Plasma Boosted Reformer, SAE 2000-01-2206
[Had04] K. Hadidi, L. Bromberg, D.R. Cohn, A. Rabinovich, N. Alexeev, A. Samokhin,Hydrogen-Rich Gas Production From Plasmatron Reforming Of Biofuels, presented atthe World Renewable Energry Congress VIII and Expo, Denver CO (Aug 2004)
[Han03] K. Hanamura, T. Suzuki, T. Tanaka and Y. Miyairi, Visualization of CombustionPhenomena in Regeneration of Diesel Particulate Filter, SAE Paper 2003-01-0836
[Har03] O.C. Haralampous, G.C. Koltsakis, Z.C. Samaran, Partial Regenerations inDiesel Particulate Filters, JSAE 20030088 (SAE 2002-01-1881)
[Haw98] D. Haworth, B. Cuenot, T. Poinsot, AND R. Blint, Numerical simulation ofturbulent propane-air combustion with non-homogeneous reactants: initial results,Stanford Center for Turbulence Research, Proceedings of the Summer Program 1998
[Hic92] Hickman, D., and Schmidt, L. D., J. Catal. 138:267 (1992)
[Hic93] D.A. Hickman, E.A. Haupfear and L.D. Schmidt, Catal. Lett. 17 (1993) 223.
[Hic93a] D.A. Hickman and L.D. Schmidt, Science 259 (1993) 343.
[Hic93b] D.A. Hickman and L.D. Schmidt, AIChE J. 39 (1993) 1164.
[Hom83] H.S. Homan et al., The Effect of Fuel Injection on NOx Emissions andUndesirable Combustion of Hydrogen Fueled Piston Engines, Int J of Hydrogen Ener 81983
[Hod98] J. W. Hodgson, D.K. Irick, and M.V. Whalen, Improving the cold-startperformance of alcohol-fueled engines using a rich combustor, SAE Paper 981359, 1998.
[Hou74] Houseman, J., and Cerini, D. J., On-Board Hydrogen Generator for a PartialHydrogen Injection Internal Combustion Engine, SAE paper 740600, 1974.
[Kha04] Khadya, N., ArvinMeritor, private communication (2004)
[Kee04] R. J. Kee, F. M. Rupley, J. A. Miller, M. E. Coltrin, J. F. Grcar, E. Meeks, H. K.Moffat, A. E. Lutz, G. Dixon-Lewis, M. D. Smooke, J. Warnatz, G. H. Evans, R. S.Larson, R. E. Mitchell, L. R. Petzold, W. C.Reynolds, M. Caracotsios, W. E. Stewart, P.Glarborg, C. Wang, O. Adigun, W. G. Houf, C. P. Chou, S. F. Miller, P. Ho, and D. J.Young, CHEMKIN Release 4.0, Reaction Design, Inc., San Diego, CA (2004)
172
[Kir99] John E. Kirwan, Ather A. Quader and M. James Grieve, Advanced EngineManagement Using On-Board Gasoline Partial Oxidation Reforming for Meeting Super-ULEV (SULEV) Emissions Standards, 1999-01-2927 (SP-1469)
[Kir02] John E. Kirwan, Ather A. Quader and M. James Grieve, Fast Start-Up On-Board Gasoline Reformer for Near Zero Emissions in Spark-Ignition Engines, SAE paper2002-01-1011, 2002
[Kur79] Kuroda, H., Nakajima, Y., Sugihara, K, Takagi, Y. and Muranaka, S. The FastBurn with Heavy EGR, New Approach for Low NOx and Improved Fuel Economy,Society for Automotive Engineers, 1979, Paper 780006. P1
[Mac76] MacDonald, J.S., Evaluation of the Hydrogen-Supplemented Fuel Concept withand Experimental Multicylinder Engine, SAE paper 760101, Detroit, MI (1976)
[Mul86] Muller, R., The Use of Hydrogen Plasma Processes in the Petrochemical andIron-Smelting Industries, in: Hydrogen Energy Progress IV, 3 885(1982); Kaske, G., L.Kerke, and R. Muller, Hydrogen Production in the Huls Plasma-Reforming Process,Hydrogen Energy Progress VI, 1 (1986).
[Nod01] Noda, T and D. Foster, A Numerical Study to Control Combustion Duration ofHydrogen fueld HCCI by using Multi-Zone Chemical Kinetics Simulations, SAE 2001-01-0250
[Par99a] James E. Parks - Larry E. Campbell - G. J. Wagner - W. E. Epling - M. S.Sanders, SCONOxTM and SCOSOxTM Sorbate Catalyst System for the Aftertreatment ofNO2 Diesel Exhaust, SAE paper 1999-01-3557; see alsohttp://www.glet.com/update_10-99.htm#CUMMINS
[Par99b] James E. Parks, G. J. Wagner, W. E. Epling, M. S. Sanders and Larry E.Campbell, Near Zero NOx Control for Diesel Aftertreatment, SAE paper 1999-01
[Par02] Parks, J.E., Emerachem, private communication (2002)
[Ogu04] Stephen Ogunwumi, Corning Inc, private communication (2004)
[Pim05] Pimentel, D. and T.W. Patzek, Ethanol Production Using Corn, Switchgrass,and Wood; Biodiesel Production Using Soybean and Sunflower, Natural ResourcesResearch, 14, No. 1, March 2005 (2005)
[Rab95] A. Rabinovich, D.R. Cohn and L. Bromberg, Plasmatron Internal CombustionEngine System for Vehicle Pollution Reduction Int J. Vehicle Design 15 234 (1995)
[Rud79] Rudiak, E.M.A, A. Rabinovich and N.A. Tul, USSR patent 700935 (Aug 1979)
173
[Sob01] M.G. Sobacchi, A.V. Saveliev, A.A. Fridman and Lawrence A. Kennedy,Hydrocarbon Reforming in Combined Plasma / Catalytic Partial Oxidation System,,Proc. 15th Int. Symp. on Plasma Chemistry, v VII, 2939-2944, 2001.
[Sob02] M.G. Sobacchi, A.V. Saveliev, A.A. Fridman and Lawrence A. Kennedy,Experimental Assessment of a Combined Plasma/ Catalytic System for HydrogenProduction via Partial Oxidation of Hydrocarbon Fuels, Int. J Hydrogen Energy, 27/6,635-642 2002.
[Sha02] Shapouri, H., Duffield, J. A., and Wang, M., The energy balance of cornethanol: an update: USDA, Office of Energy Policy and New Uses, AgriculturalEconomics. Rept. No. 813 (2002)
[Smi] Gregory P. Smith, David M. Golden, Michael Frenklach, Nigel W. Moriarty, BorisEiteneer, Mikhail Goldenberg, C. Thomas Bowman, Ronald K. Hanson, Soonho Song,William C. Gardiner, Jr., Vitali V. Lissianski, and Zhiwei Qin, GRI 3.0 mechanism,http://www.me.berkeley.edu/gri_mech/
[Smi97] A. Smith and G.J.J. Bartley, Stoichiometric Operation of a Gas Engine UtilizingSynthesis Gas and EGR for NOx Control, ASME ICE- 29-3, Engine CombusionPerformance and Emission, 1997
[Ste74] R. F. Stebar, F. B. Parks, Emission control with lean operation using hydrogen-supplemented fuel, SAE paper 740187 (1974)
[Ste03] Stevens, J., Chevron Texaco, private communication (2003)
[Top04] Topinka, J.A., M.D. Gerty, J.B. Heywood and J.C. Keck, Knock Behavior of aLean-Burn, H2 and CO Enhanced, SI Gasoline Engine Concept,SAE paper 2004-01-0975
[Tur96] Turns, S. R. An Introduction to Combustion. McGraw-Hill, Inc., New York.1996
[Wan01] Wan, C.Z., Mital, R., Dipshand, J., Low Temperature Regeneration of NoxAsorber Systems, Diesel Engine Exhaust Reduction Workshop DEER 2001, 2001
[Yez02] A. Yezerets, N.W. Currier, H. Eadler, S. Popuri and A. Suresh, QuantitativeFlow-Reactor Study of Diesel Soot Oxidation Process, SAE paper 2002-01-1684
[Zha02] Z Zhang, S.L. Yang and J.H. Johnson, Modeling and Numerical Simulation ofDiesel Particulate Trap Performance During Loading and Regeneration, SAE Paper2002-01-1019.