1 HRM and small-firm employee motivation - UCL Discovery
48
1 HRM and small-firm employee motivation – before and after the Great Recession Alex Bryson (University College London) and Michael White (University of Westminster) Abstract A long-running debate in the small firms’ literature questions the value of formal ‘human resource management’ (HRM) practices which have been linked to high performance in larger firms. We contribute to this literature by exploiting linked employer-employee surveys for 2004 and 2011. Using employees’ intrinsic job satisfaction and organizational commitment as motivational outcomes we find the returns to small firm investments in HRM are U-shaped. Small firms benefit from intrinsically motivating work situations in the absence of HRM practices, find this advantage disturbed when formal HRM practices are initially introduced, but can restore positive motivation when they invest intensively in HRM practices in a way that characterizes ‘high performance work systems’ (HWPS). Although the HPWS effect on employee motivation is modified somewhat by the Great Recession, it remains rather robust and continues to have positive promise for small firms. Key words: small firms; human resource management; High Performance Work System; workplace motivation; intrinsic job satisfaction; organizational commitment JEL Codes: L23; M50; M54 Acknowledgements: We thank Paul Edwards for his advice and we acknowledge the Department for Business, Energy and Industrial Strategy, the Economic and Social Research Council, the Advisory, Conciliation and Arbitration Service and the National Institute of Economic and
-
Upload
khangminh22 -
Category
Documents
-
view
0 -
download
0
Transcript of 1 HRM and small-firm employee motivation - UCL Discovery

1
HRM and small-firm employee motivation – before and after the Great Recession
Alex Bryson (University College London) and Michael White (University of Westminster)
Abstract
A long-running debate in the small firms’ literature questions the value of formal ‘human
resource management’ (HRM) practices which have been linked to high performance in larger
firms. We contribute to this literature by exploiting linked employer-employee surveys for 2004
and 2011. Using employees’ intrinsic job satisfaction and organizational commitment as
motivational outcomes we find the returns to small firm investments in HRM are U-shaped.
Small firms benefit from intrinsically motivating work situations in the absence of HRM
practices, find this advantage disturbed when formal HRM practices are initially introduced, but
can restore positive motivation when they invest intensively in HRM practices in a way that
characterizes ‘high performance work systems’ (HWPS). Although the HPWS effect on
employee motivation is modified somewhat by the Great Recession, it remains rather robust and
continues to have positive promise for small firms.
Key words: small firms; human resource management; High Performance Work System;
workplace motivation; intrinsic job satisfaction; organizational commitment
JEL Codes: L23; M50; M54
Acknowledgements: We thank Paul Edwards for his advice and we acknowledge the Department
for Business, Energy and Industrial Strategy, the Economic and Social Research Council, the
Advisory, Conciliation and Arbitration Service and the National Institute of Economic and

2
Social Research as the originators of the 2004 and 2011 Workplace Employee Relations Survey
data, and the Data Archive at the University of Essex as the distributor of the data.

3
For over two decades there has been interest within the human resource management (HRM)
practitioner and research community in systems of practice that form a cohesive and integrated
set designed to maximize business effectiveness and employee wellbeing. These are commonly
termed ‘high performance work systems’ (HPWS), or ‘strategic human resource management’
(SHRM) whereby the HRM systems are tuned to harmonize with business strategic objectives.
This system or strategic perspective distinguishes between HRM practices adopted by a firm in a
piecemeal way, and more extensive initiatives that cross several domains of people management.
There is emerging evidence that HPWS yield worthwhile performance gains for firms.
However, most of this evidence applies to large firms. Indeed, the value of HRM/HPWS for
small firms remains contentious. Some small business experts suggest that HRM development is
likely to interfere with distinctive small-firm advantages such as flexibility and informality,
which small businesses should use to the full. On the other hand, it is argued that human
resources repay intensive development in small firms, as these are often constrained in respect of
other resources, notably financial.
Our focus is on the role of HRM/HPWS in the small firm sector, which constitutes a large and
growing part of the economy in the United States (Acs, 1999) and in Britain (Hijzen et al, 2010),
the country we consider here. We define ‘small’ firms as those with fewer than 50 employees,
while excluding micro-businesses (1-4 employees). However, we also show that our findings
hold when extended to firms with up to 100 employees. The study focuses on employee
attitudes that represent motivation, using measures that have been shown in previous research to
be strongly linked with individual performance.

4
Ours is the first British quantitative study to investigate the relationship between HRM/HPWS
and employee motivation in small firms. It makes several contributions to the debate sketched
above. It shows that small firms with no or minimal investment in formal HRM tend to have
highly motivated employees, but that with the adoption of HRM, employee motivation declines
somewhat. So far, the story accords with the critics’ warnings. However, in those small firms
that proceed to a more intensive and integrated HRM/HPWS, a threshold is reached from which
employee motivation climbs again. In short, the HRM-to -motivation relationship in small firms
depends on the variety and complementarity of practices adopted. There are positive messages
as well as warnings to be drawn for small-firm practice.
A feature of our research is its coverage of two contrasting economic periods, 2004 and 2011. In
2004, economic conditions were stable and prosperous. In 2011, the British economy was
struggling in the wake of a severe recession. The coverage of these two periods makes two
additional contributions: first, by testing the constructive validity (Treadway et al., 2005) of
HRM/HPWS effects; second, by showing, somewhat counter-intuitively, that HRM/HPWS can
have positive effects in the adverse context of a recession. We find that although the
HRM/HPWS effect on employee motivation is modified somewhat by the Great Recession, it
remains rather robust and continues to have positive promise for small firms.
MOTIVATION AND ATTITUDES
We view small firms’ employees in a motivational perspective, through a study of their attitudes.
There is a lack of consensus about the meaning of ‘motivation’, and about the relationship
between motivation and attitudes. It is therefore necessary to start by outlining our notion, which
comes from the mainstream of attitude theory and work motivation theory. We assume first that

5
attitudes are essentially motivational. Fishbein (1967: 389) quotes with approval Thurstone’s
definition of an attitude (‘the amount of affect for or against an object’), and equates it with a
‘mediating evaluative response’ that tends toward overt behavior. Locke (1996: 121) continues
to make values the basis of affective attitudes: “Emotions are the form in which one experiences
automatized value judgements... according to the standard of one’s values.... Events and
situations seen as furthering one’s values produce positive emotions (happiness, satisfaction,
love)”. In their review of contemporary work motivation theory, Latham and Pinder (2005)
explain how attitudes express the pursuit of desired goals and values, and how the realization of
goals and values sustains motivated behaviour.
If this conceptual model is valid, one should observe links between attitudes and work behaviour.
This link is supplied by Harrison et al. (2006) with their meta-analysis showing that ‘overall job
attitude’ explains about 25 per cent of the variation (i.e., r=0.50) in workers’ ‘engagement’
behaviours (task performance, organizational citizenship, attendance, timeliness and reduced
propensity to quit).
The components of overall job attitude are job satisfaction and organizational commitment. A
definition of job satisfaction that fits the general framework sketched above comes from Locke
and Latham (1990: 243): ‘The degree of satisfaction or dissatisfaction will be a joint function of
the degree of fulfilment of the value and the importance of the value to the individual’.
Organizational commitment then enters the frame, according to these authors, as a consequence
of and complement to job satisfaction: ‘Only if satisfaction leads to commitment to the
organization and its goals ... will subsequent high performance result’ (Locke and Pinder, 1990:
245). Kalleberg and Berg (1987) define affective organizational commitment in terms of

6
employees’ identification with the goals and values of the organization, and their willingness to
exert effort in its behalf.
To represent employee motivation in the present research, we followed this approach in using
measures of job satisfaction and organizational commitment, but adapted the former to focus on
‘intrinsic’ or autonomous satisfaction, reflecting the valued experience of autonomous working
(Gagné and Deci, 2005). The reason for this focus will become apparent in the following
section.
SMALL FIRMS AND THEIR EMPLOYEES
We define small firms as those with fewer than 50 employees. This is consistent with official
definitions in both the UK and the EU, but some previous studies have used different definitions:
for instance, Way (2002) studied US firms with 20-100 employees. However, we do not think
this crucial, since our variant analyses show results are similar if we expand our sample up to
firms with 99 employees.
Evidence suggests employees in small firms have particularly positive work attitudes. For
instance, studies for the USA using the Quality of Employment Surveys of 1973 and 1977
reported higher satisfaction in small firms (for a review see Tansel and Gazioglu, 2013 who cite
20 studies). In Britain, one can draw on studies using the Workplace Employment Relations
(WERS) series, with their linked workplace and employee data in 1998, 2004 and 2011. Tansel
and Gazioglu (2013) have re-analysed the 1998 survey and report numerous respects, including
job satisfaction and perceptions of employee-management relations, in which smallness is
associated with more positive attitudes. Forth et al. (2006: 41, 70), analysing the 2004 dataset,

7
report that small firms’ employees have the highest levels of self-rated wellbeing and - according
to management respondents - relatively low incidence of employee grievances or disciplinary
hearings. The present study is the first to use the WERS 2011 data to analyse influences on
employee attitudes in small firms, but Lai et al. (2016) consider employee attitudes as
explanatory variables for performance, and in passing (see their Table 6) report that on all the
attitudinal items considered, small firms score somewhat higher than medium sized firms.
These are remarkable findings, bearing in mind that small firms offer relatively low pay and
fringe benefits, little training, and sometimes coercive forms of supervision and management (for
Britain, see e.g. Rainnie 1989; for the USA, see the extensive literature on segmented labour
markets, e.g. Edwards, 1979). Some insight into what seems a paradox is provided by the study
of Kalleberg and van Buren (1996). Using linked employer and employee data for the USA,
they showed that larger size was significantly associated with greater material rewards but also
lower feelings of job autonomy even with controls for many variables that might be linked to
size. Autonomy was measured as a composite of working independently, having a say over job
changes, taking part in decisions, and not being closely supervised. Interpreting this in a work
motivation framework, we suggest that small firms offer greater scope for autonomous or
intrinsic motivation (see especially the ‘self-determination’ theory of Gagné and Deci, 2005) to
compensate for the relatively weak provision of extrinsic rewards. This also reinforces the
warnings of those who have pointed to dangers in introducing HRM into small firms (see, e.g.,
Cardon and Stevens, 2004; Marlow, 2006).

8
Further insight into how small firms provide intrinsic rewards is provided by British case study
research. For instance, in his intensive study of three clothing manufacturers Ram (1994)
depicted an ethos of extensive freedoms and responsibilities for employees, all the more
convincing because Ram’s focus was chiefly on how small businesses survived in intensely
competitive markets, rather than on employees’ job quality as such. Established employees had
an important role in determining their own working methods, even in one case where the
supervisor judged them to be inefficient; they socialized freely with their colleagues; and they
had great discretion over their working times to fit work to the needs of their families. Their
responsibilities included finding new recruits when these were needed, and for training and
embedding them into the work process; and, as also noted by de Kok examining small firms in
the Netherlands (2003), they exerted subtle but considerable influence over the decision making
of their managers and principals. Case studies in restaurant businesses (Ram et al, 2001)
provide a similar picture. Moule (1998), studying a small manufacturing firm, shows in detail
how a work group maintains its autonomy in the face of somewhat autocratic principals.
A factor that tends to maintain a positive quality of work in some small firms is the closeness of
the proprietors to employees. This aspect is strongly underlined in the group of Netherlands case
studies analysed by de Kok (2003): he observes that the employer-owner often works alongside
employees, seeks personal satisfaction in the work (as a distinct objective alongside profit),
places a high value on ‘team spirit’, and is in frequent one-to-one communication with
employees, which offers scope for them to be influential.

9
In recent years, British small business has developed strongly in industries requiring high levels
of technical and professional expertise, such as health services, ICT, creative media, finance and
specialized consultancy. Case research by Tsai et al. (2007) and Gilman and Edwards (2008)
addresses this area. The professional staff typically work in a highly autonomous manner, with
proprietors reliant on selecting people with appropriate skills. Tsai et al. (2007) report high levels
of employee satisfaction with management, in part because of the opportunities employees have
to learn from seniors working alongside them. A repeated motif in these studies is the extreme
flexibility of workloads and hours, with minimal planning and a ‘fluid’ type of team working that
is described as ‘a natural extension of the way work is performed’ (Gilman and Edwards 2008:
547).
Within the small-firm literature, a concept frequently deployed to describe employer-employee
relationships is ‘informality’. This is certainly applicable to the examples of autonomous
working and freedom from controls cited above, but can also be applied to aspects of small firm
relationships that are more negative, such as proprietors’ unconcern about workplace regulations,
arbitrary treatment of employees, and favouritism. At an extreme, the ‘informal’ small firm can
end by moving into the grey economy and the casualization of its workforce (Ram et al., 2001).
None the less, there is evidence that informality is valued within small firms by both owners and
employees, and movement toward a more systematized or ‘modern’ approach, including by
HRM adoption, is often resisted. In the Electron Co. case of Gilman and Edwards (2008),
supervisors and team leaders were being introduced but the company was stressing that the roles
would be chiefly of a mentoring rather than monitoring type. In Ram et al.’s (2001) PatCo study
a specialist food manufacturer was being pushed toward formal controls, with reduced employee
discretion, as a consequence of selling to supermarkets, but management was representing the

10
development to employees as ‘organized autonomy’ (Ram et al. 2001: 855). Small-firm case
research can be cross-checked with large-sample analysis. Storey et al. (2010) developed a
survey questionnaire instrument to measure formalization and showed higher formality to be
associated with lower ratings of job quality.
Our overall conclusion from this review of evidence is that small firm employment is high in
terms of intrinsic rewards, in the form of job autonomy and freedom from external controls.
The strength of autonomous or intrinsic motivation (see Gagné and Deci, 2005) suffices to
explain the highly positive attitudes that have been reported. Much of the evidence however
comes from small firms that have retained an informal approach and it remains to consider how
the introduction of HRM affects the picture.
HRM/HPWS EFFECTS ON SMALL FIRMS’ EMPLOYEES
In this section, we first consider, in a general way, how HRM systems can have performance-
enhancing motivational effects on employees. We then go on to discuss whether similar results
can be achieved in the small-firm sector. We will focus particularly on ‘high-performance work
systems’ (HPWS).
Many of the leading studies in this field have used intuitive motivational concepts for
interpretation and prescription. For instance, Macduffie (1995) states that an essential condition
for performance enhancement is that employees possessing knowledge and skills ‘are motivated
to apply them in discretionary effort’. Economists interested in the economic effects of
complementary work practices stress their value in generating ‘incentives to productivity’
(Ichniowski et al., 1997). Becker and Huselid (1998) argued that the aim of HPWS is to
11
construct a ‘skilled and motivated workforce providing the speed and flexibility required by new
market imperatives’. Appelbaum et al. (2000:46) stated that ‘Jobs that are challenging and make
use of workers’ skills are intrinsically rewarding’. Batt (2002) theorized that HPWS produce a
positive effect via increased employee satisfaction that lowers the firm’s quit rate and thus helps
to build up human capital and organizational learning.
Previous research (notably the seminal HPWS study of Appelbaum et al., 2000) suggests
participation and team organization (team-working) are central domains of HPWS.
‘Participation’ refers to methods by which employees can make contributions that directly relate
to work tasks, work organization and the management of change. Team roles supported by skill
development enable employees to widen skills, experience more challenge in their work, and
experience increased relatedness with colleagues. Several more traditional aspects of
HRM/personnel management have been adapted to fit into an HPWS specification (see
Appelbaum et al. 2000). Financial incentives can be extended with group/workplace bonuses or
profit-shares. Training and development can help employees take on variable job roles within
teams and achieve enhanced levels of skill and self-efficacy. Recruitment and selection are
complementary to training and help build a workforce committed to high performance goals
(Locke 1996).
Becker and Huselid (2006), elaborating earlier contributions, argued that for HRM to have a
major positive impact it is necessary that relevant work practices are ‘bundled’ in a mutually
supportive way. This points to a threshold effect, with motivation and performance rising more
steeply once the threshold has been crossed. Why this may be so is theorized more fully by
Bowen and Ostroff (2004). These authors maintain that ‘HRM practices can be viewed as a

12
symbolic or signalling function’ (Bowen and Ostroff, 2004: 206). If HRM is to alter employee
behaviour and performance, it must be a ‘strong system’ communicating persuasive messages:
implementing a wide range of practices is valuable in strengthening the HRM message and
making it salient. This thesis connects with the idea that HPWS can project organizational
values, such as developing employees’ capabilities and valuing their views, with which
individuals can identify. Such a message is more likely to be trusted when the organization
demonstrates its seriousness by implementing a wide range of complementary practices.
Inconsistency or half-hearted ‘dabbling’ in HRM, on the other hand, can be interpreted as
insincerity. While Bowen and Ostroff refer generally to HRM, and do not specify a particular
configuration of practices as ideal, a fully developed HPWS appears to meet their criteria for a
‘strong system’.
Our assumption is that the motivations of small firm employees tend to be highly positive before
any HRM development has started. As HRM practices enter the scene, they may infringe upon
established employee freedoms and autonomous working. Since this freedom and autonomy is
the main reason for initially positive attitudes, the effect of HRM adoption is to drive motivation
downward. However, as a firm moves close to constructing a full HPWS, it signals a new
participative, collaborative and self-developing ethos with which employees can identify. To the
extent that this is successful, attitudes (satisfaction and commitment) will move in a positive
direction once again.
With the foregoing discussion in mind we propose the following hypotheses:

13
H1. Intensive adoption of HPWS (a ‘strong system’) results in increased intrinsic work
motivation, and this is expressed in two testable forms that we base on the work of Harrison et al.
(2006) and the more general theory of Locke and Latham (1990):
H1a. There is a positive relationship between the intensity of HPWS practices and the intrinsic
job satisfaction (IJS) of employees.
H1b. There is a positive relationship between the intensity of HPWS practices and the
organizational commitment (OC) of employees.
The positive relationships indicated in H1a and H1b only apply above some threshold of HPWS
implementation that is to be identified empirically.
H2. At below-threshold levels of adoption of HPWS, there will tend to be reduced levels of
intrinsic work motivation. This will have identifiable consequences H2a and H2b, relating to
reduction in IJS and in OC, respectively, from the high ‘baseline’ state of motivation that we
regard as characteristic of small firms.
The overall prediction, therefore, is a non-linear (‘U-shaped’) relationship between overall job
attitudes and HPWS intensity. Such a relationship is represented by a model with both linear and
quadratic (squared) terms, the linear term having a negative sign and the quadratic term having a
positive sign.
Since our study covers two distinct economic periods or situations, the question arises whether
the above hypotheses apply without modification to both. Some previous studies suggest that in
firms where employee relations are adversely affected by business conditions the positive
impacts of HRM/HPWS are cancelled. For example, Zatzick and Iverson (2006) showed that

14
during recessionary conditions in Canada, the positive link between HRM and performance was
lost in firms laying off workers, while those firms that avoided layoffs were able to maintain this
positive linkage. A British case-study (Hailey et al. 2005) documents the damage to employee
relations arising when a firm overlays a highly participative and empowering HRM system with
coercive managerial behaviors responding to business pressures. On the other hand, Cappelli
(1999) observed that employees in the USA in the 1990s tended to be forgiving toward
managements that imposed layoffs because this was seen as forced by external circumstances
affecting most firms. In the UK recession of 2008-12, most firms were driven to make cost-
reducing changes and so managements may have been insulated from blame by similar employee
responses as those observed by Cappelli (1999). In that case, the effect of HRM/HPWS on
employee attitudes/motivation would likely not be modified by the recession. Outcomes might
partly depend on how ‘baseline’ or pre-HRM attitudes in small firms react to recessionary
pressures, but we have found no previous study directly addressing this issue. In the absence of
a compelling argument to the contrary, we leave our hypotheses unaltered for the recessionary
period.
DATA, MEASURES AND ANALYSIS METHODS
Data
We use the Workplace Employment Relations Surveys for 2004 and 2011 (henceforth,
WERS2004 and WERS2011).1 We make use of employee within-firm samples to derive
1 For details on the surveys see van Wanrooy et al. (2013).

15
attitudinal outcome measures,2 while management interviews (conducted prior to data collection
from employees) provide the HRM/HPWS variables and other control variables. This
combination reduces the risk of common method artefact (Podsakoff et al. 2003) and respects
time sequencing of the independent and dependent variables (Wright et al. 2005). In keeping
with most of the literature on the effects of HRM or HPWS we confine our analyses to the
private sector subsamples.
A sharp fall in response between 2004 and 2011 (typical of British social surveys during this
period) poses a threat to comparability when we assess over-time consistency of findings.3 We
develop a new way of mitigating this problem explained in the analysis section below.
From the management information, we identify those workplaces that represent small firms (less
than 50 employees in the overall organization). Each firm is represented by only one workplace,
but this is not problematic, since in the case of small firms, approximately 80 per cent are single-
establishment.4 There are 280 private sector small firms in the 2004 survey and 375 in 2011.
The analysis focuses on these small firms.
Dependent variables
The chief analyses refer to overall job attitude (Harrison et al. 2006) through two variables that
we label intrinsic job satisfaction (IJS) and organizational commitment (OC). We obtain the
2 At workplaces with up to 25 employees, all were sent a self-completion questionnaire; in those with more than 25
employees, a sample of 25 was drawn.
3 Response to the management interview survey fell from 64 per cent in 2004 to 46 per cent in 2011.
4 We have also made analyses on the sub-sample of single-establishment small firms. Results are qualitatively
similar to those reported for the full small firm sample below.

16
measures from employee responses that are averaged at the level of the workplace that represents
the firm. This aggregation and averaging results in smooth quasi-continuous measures.
Unobserved individual attributes that may bias attitudinal responses (notably personality – see
Diener and Lucas, 1999) will tend to be averaged out at the mean workplace level (there could
however still be unobserved selection effects imposed by consistent selection processes). From
the viewpoint of firm management, the aim is to have positive motivation across all employees,
and the workplace-average measures reflect this managerial perspective.
[INSERT TABLE 1]
In both years the WERS employee questionnaire contained eight facet satisfaction items and
from these four were selected for their similarity to the ‘job itself intrinsic satisfaction’ subscale
of Warr et al. (1979). Table 1 provides item details. The Cronbach alpha of the IJS items in the
full employee survey sample was 0.87 in both 2004 and 2011. Responses are summed at the
level of the individual respondent and the summed IJS scores are averaged over the employee
respondents at each workplace.
The WERS measure of OC consists of three items (see Table 1 again) which have counterparts in
the six-item Lincoln-Kalleberg measure of affective organizational commitment. OC has a
Cronbach alpha of 0.85 in the full employee surveys of both years. To compute the measure, the
three items were summed at the individual level and then averaged across the employees at each
workplace.

17
The aggregation and averaging of these items requires an assumption that the items themselves
constitute cardinal (interval) measures. Applied psychologists have been (implicitly) adopting
the cardinality assumption since the introduction of Likert scales in the 1930s, accompanied by
the method of ‘summative ratings’ (Murphy and Likert, 1937). More recently, economists have
also tended to accept the cardinality assumption for the analysis of multi-point attitude scales.
Recent examples include Powdthavee (2011) and Taylor et al. (2011). Econometric
methodological investigations that emphasize the advantages of the cardinal, or linear,
assumption include Ferrer-i-Carbonell and Frijters (2004) and Riedl and Geishecker (2014).
To check the selection of items for our constructs, a principal components analysis was
performed using the full employee sample on the eight satisfaction items, the three OC items and
eight further items relating to individual well-being. After varimax rotation, the IJS and OC
constructs emerged as distinct components with high loadings on all their items. These results
(not shown here) are available on request. Another distinct component was formed of the three
items relating to satisfaction with pay received, training received, and job security: we label this
‘extrinsic job satisfaction’ (EJS). We ran variant models with EJS as the dependent variable in
place of IJS, as a test of the discriminant validity of the IJS construct.
Measures of HPWS practice
Information about HRM practices comes from the WERS interview with the senior manager
responsible for HRM or personnel management at the workplace. We consider only items that
are descriptive of current practice and ignore any items that seek the manager’s opinion about
climate, management-employee relationships etc. British studies that similarly emphasize
descriptive measures of HRM practice include Brown et al. (2008), Forth and Millward (2004),

18
and Ramsay et al. (2000); for North America, see e.g. Cappelli and Neumark (2001); Godard
(2001); Osterman (2006); Wright et al. (2005); Zatzick and Iverson (2006).
In the HRM-performance literature all the HPWS items from a cross-sectional survey are usually
aggregated into a single overall index of practices (e.g., Becker and Huselid (1998:63)).5 It has
often been remarked, however, that this approach has not led to consistent, replicable measures
of HRM practice, because of differences across studies in the available items. We find in the
present study that although many descriptive items are available, they sometimes do not remain
the same across the 2004 and 2011 surveys, and there is also marked variation in the statistical
reliability of domain measures over time. We therefore introduce a new measurement
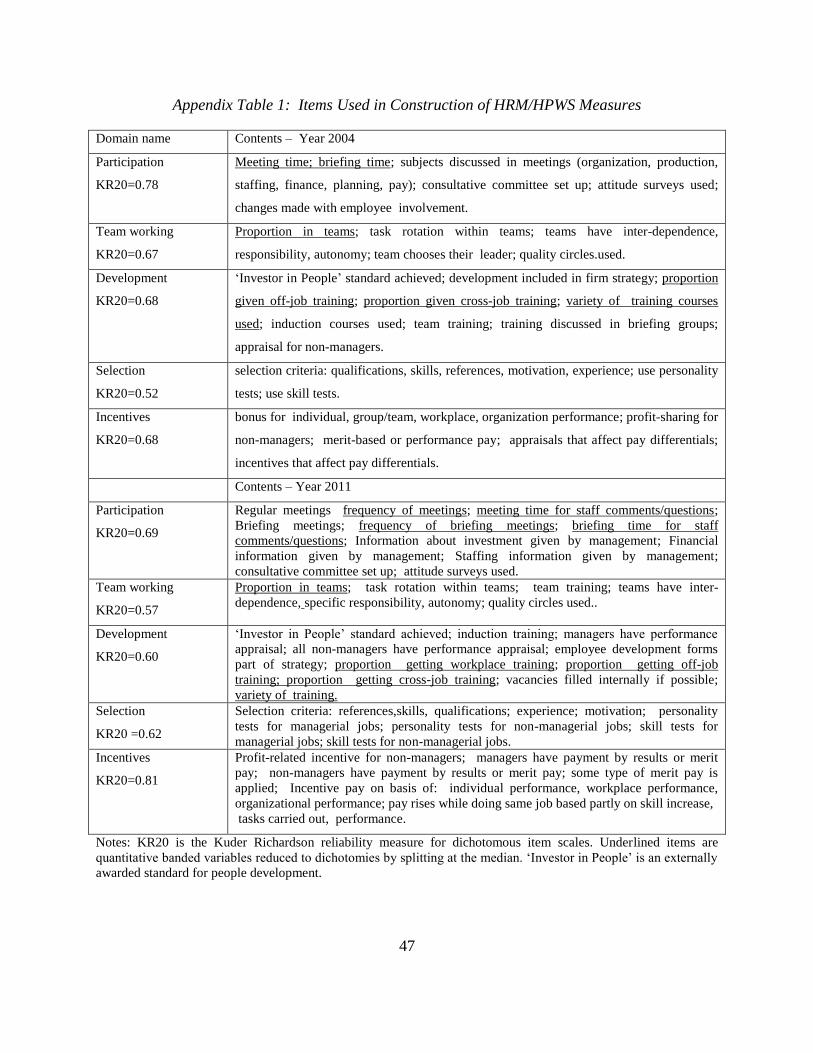
approach, as follows. (1) Five domains that correspond with the HPWS concept of Appelbaum
et al. are defined; these are participation, teams, development, recruitment, and incentives.
Across these domains, we find 43 suitable item measures in 2004 and 44 in 2011. (2) We group
items by domains, and the grouping is checked by reliability analysis. (3) In each firm, we count
how many practices are reported to be present in each domain. If three or more items are
present,6 we classify the firm as achieving ‘high’ on that practice domain. (4) In each firm, we
count how many domains are classified as ‘high’, and this number is taken as the HPWS-
intensity score for that firm. This yields a six-point scale with values from 0 to 5. Among small
5 This approach is also common in the literature using the Workplace Employment Relations Survey. Recently, for
example, Wu et al. (2015) use the 2011 survey to construct a single index based on 17 factor-weighted dichotomous,
categorical and count items. The practices they focus on are a subset of those used in our analyses. The advantage
of using a broader set of practices is that it makes separate domain counts feasible and hence is also valuable for the
new measure of intensity we have derived which relies on having a minimum number of practices within each
domain.
6 We also investigated on each side of this criterion, setting the ‘high’ domain criterion as having two or more
practices implemented, or alternatively four or more practices. We discuss these sensitivity tests in the Results
section.

19
firms, this scale has correlation 0.91 with the additive index of HPWS items in 2004, and 0.83 in
2011. The HPWS-intensity measure has a high degree of face validity with respect to the
Bowen-Ostroff concept of a ‘strong system’ HRM. Its criterion validity (with respect to
employee attitudes) is demonstrated in the Results section below. Further, there are a great many
ways in which a firm can reach the ‘high’ threshold in any given domain, and there are numerous
ways in which firms can select from the five domains which ones they wish to develop: thus the
HPWS-intensity score provides for uniqueness and equifinality in firm HRM/HPWS strategy
(Becker and Huselid, 2006) at both item and domain level. We believe that this method provides
robust comparability across surveys: it is not necessary that the item pool be identical across
time.
Our use of the label ‘intensity score’ is consistent with practice in economics, where (for
example) the term ‘intensive margin’ refers to the number of hours worked by employees.
While many items are of the simple ‘present/absent’ type, others are derived by reducing a
quantified banded variable (such as proportion of employees taking part in the practice, or time
devoted to the practice) to dichotomous form by splitting at the median.7 Note also that while
some items refer to fairly basic HRM practices, others can be regarded as toward the
sophisticated or ‘deep’ (Cox et al., 2006) extreme: for instance, teams that select their own
leader, or communication meetings that discuss staffing levels or company finances (see Annex
Table 1). Overall, the item pools for both surveys provide a reasonable basis for assessing how
7 Dichotomizing at the median is an efficient method of removing measurement error from a regressor variable
(Wald 1940).

20
far firms have progressed toward HPWS8; although there is doubtless scope for further
refinement in scaling, we have held back from pursuing that because of the bias that would likely
be introduced by having estimated variables among the regressors.
Table 2 gives further details of the derived domain-high and HPWS-intensity scores. There was
a substantial increase in high-scoring domains between 2004 and 2011, notably in regard to
participative practices and to incentives.
[INSERT TABLE 2]
Control variables
‘Structural’ control variables, obtained from the management interview, are included in all the
reported analyses. Industry is represented by 11 dummies; and there are controls indicating the
percentage of workplace employees in ‘higher’ (professional and managerial) occupations; the
percentage in ‘intermediate’ (administrative, technician and craft) occupations; the percentage of
female employees; the percentage (banded) of employees in non-permanent jobs; and a dummy
for presence of recognised union(s). We could not include a variable sub-dividing size within
the ‘small’ (5-49 employees) segment, as this information was not available in 2004. However,
we count the number of managers at the workplace and create a dummy for those that had three
or more managers – an indication of organizational complexity. We additionally included an
8 That said, there are notable increases in the incidence of participation and incentives between 2004 and 2011.
These might partly reflect changes in the way data were collected between 2004 and 2011, or might reflect wider
managerial familiarity with HRM concepts. It is not necessary for our measures to be identical in the two years.
What is important is that we count practices in such a way as to be able to distinguish between workplaces according
to their high and low intensity use of HRM within those two years.

21
item relating to job security guarantees made by management – an HRM variable considered
important by Forth and Millward (2004), but not combining with any of our HPWS domains.
Characteristics special to small firms as additional control variables
In all analyses, we include controls for further characteristics regarded as significant in the small
firm literature. The number of years that the business has been located at its present workplace,
or at previous workplaces from which it has moved, is used as a measure of ‘newness’ (see
Cardon and Stevens, 2004). This is divided into five bands approximating quintiles of the firm-
age distribution. To represent family control over the firm, a frequently noted characteristic of
small firms, we constructed a dummy based on whether there is a family that holds more than
half the shareholding. We also included the Storey et al. (2010) measure of ‘formality’ that can
be regarded as particularly relevant to small firms. Full details of this measure are given in
Storey et al. (2010:311); it has a Cronbach alpha of 0.77 in these surveys.
Firms’ recessionary policies in 2011
In analysing the 2011 data we incorporate a dummy variable identifying workplaces having more
than one type of employment policy in response to the recession – commonly a wage freeze
coupled with some restriction of hours or change of hours contract (e.g., zero hours contracts).
One third of small firms had two or more employment policies responding to the recession.9
[INSERT TABLE 3]
9 We investigated several other ways of representing recessionary employment policies (e.g., separate dummies for
wage policies and hours policies) but the two-plus criterion yielded the clearest results.

22
Table 3 presents correlations between the independent variables in 2004 (panel (a)) and 2011
(panel (b)) for numeric (continuous and multi-categorical) variables followed by the tetrachoric
correlations for dummy variables, excluding industry dummies.
Analysis method
The analysis used the survey regression method with a robust variance estimator (also known as
robust regression: see Berk 1990). The measures of IJS and OC were treated as continuous
variables, since they are smoothly distributed workplace means. These means are themselves
sample-based estimates. They are therefore measured with error, and heteroskedastic because the
workplace samples vary in size. However, as these are always dependent variables,
measurement error is incorporated in the usual disturbance term and this does not affect
consistency of estimates. The robust variance estimator allows for heteroskedasticity as well as
for complex survey design including weighting.
The HPWS-intensity variable was represented in two different ways in variant specifications. In
the first variant, it was represented as a linear effect; in the second, it was represented with both
linear and quadratic (squared) terms. The latter specification makes it possible to assess the
existence of nonlinearities (U-shaped relationship) as specified in the hypotheses.
The lower response rate in 2011 compared with 2004 suggests possible bias from sample
selectivity. Effects on the covariance structure are unpredictable. Both surveys employed
stratified sampling by workplace size and industry, and establishment weighting is intended to
restore representativeness with respect to these variables. However, this does not guarantee
representativeness with respect to the other control variables used in our analyses. We therefore

23
use an alternative approach derived from the statistical matching methodology used in
programme evaluation research (Fröhlich et al., 2015). We take WERS2004 as the ‘target’
sample, both because of its superior response rate and because of the more typical economic
conditions in which it took place, and re-weight WERS2011 to achieve mean covariate balance
across all control variables that are present in both 2004 and 2011. This is made possible by the
entropy balancing programme developed by Hainmueller and Xu (2013). We carry out the 2011
analyses along the same lines as for 2004, but with control variables that, when the sample is re-
weighted, have the same mean values (within a small tolerance) as in 2004. For example, before
re-weighting the small firms in 2011 report having a mean of 49 per cent of employees in ‘lower-
skilled’ occupations, but after reweighting this falls to 43 per cent. Other variables that were
substantially modified by rebalancing were the proportion of family-controlled business, the
proportion of non-permanent employees, and the proportion of firms with a trade union. By
reducing mean differences in control variables between surveys, we render comparative
assessment more plausible. At the same time, however, we respect theoretically relevant
differences between surveys by permitting the HPWS measure to vary and by introducing the
additional measure of policy response to the recession in the 2011 analysis.
In variant analyses, we ran the 2011 data without the re-balancing procedure and obtained
HRM/HPWS effects that were neither significant nor readily interpretable. To the extent that our
analyses after carrying out covariate rebalancing yield a convincing story, the method’s value is
supported.10
10 This technique is relatively simple to implement. However, whether it is appropriate or not is something analysts
need to consider on a case-by-case basis.

24
RESULTS
HRM/HPWS and overall attitudes in small firms, 2004
Table 4 shows the key results from regression analyses for 2004. In models (1) and (3), referring
respectively to IJS and OC, the coefficient of HRM-intensity is negative and significant (albeit
only at the 10 per cent level in the case of IJS). This appears to give support to those who have
argued that HRM is ill-suited to small firms’ employment relationships.
However, results from models (2) and (4), which introduce a non-linear functional form, paint a
different picture. While the linear term is negative in both models, the quadratic is positive, and
both are statistically significant at the one per cent level. The ‘turning point’ row indicates the
value at which the effect of HRM intensity changes from negative to positive. For both IJS and
OC, small firms can expect positive outcomes once they have three HRM domains substantially
developed (approximately 40 per cent of the small firms had reached this level of HRM
development), with further improvement as they proceed toward a more complete HPWS. These
results provide strong evidence in support of both H1 (a and b) and H2 (a and b).
[INSERT TABLE 4]
Table 4 also reports the estimated effects of formality, family control, internal structural
complexity (3 or more managers), and age of firm. Somewhat unexpectedly, the level of
formality was positively and significantly related to OC and was positive but non-significant in
relation to IJS. This is inconsistent with the results reported by Storey et al. (2010), who
included no representation of HRM intensity. The other small-firm characteristics had little
effect on the IJS and OC outcomes.

25
Estimates for the other control variables are not shown for reasons of space, but the full results
are available on request.
HRM/HPWS and overall attitudes in small firms, 2011
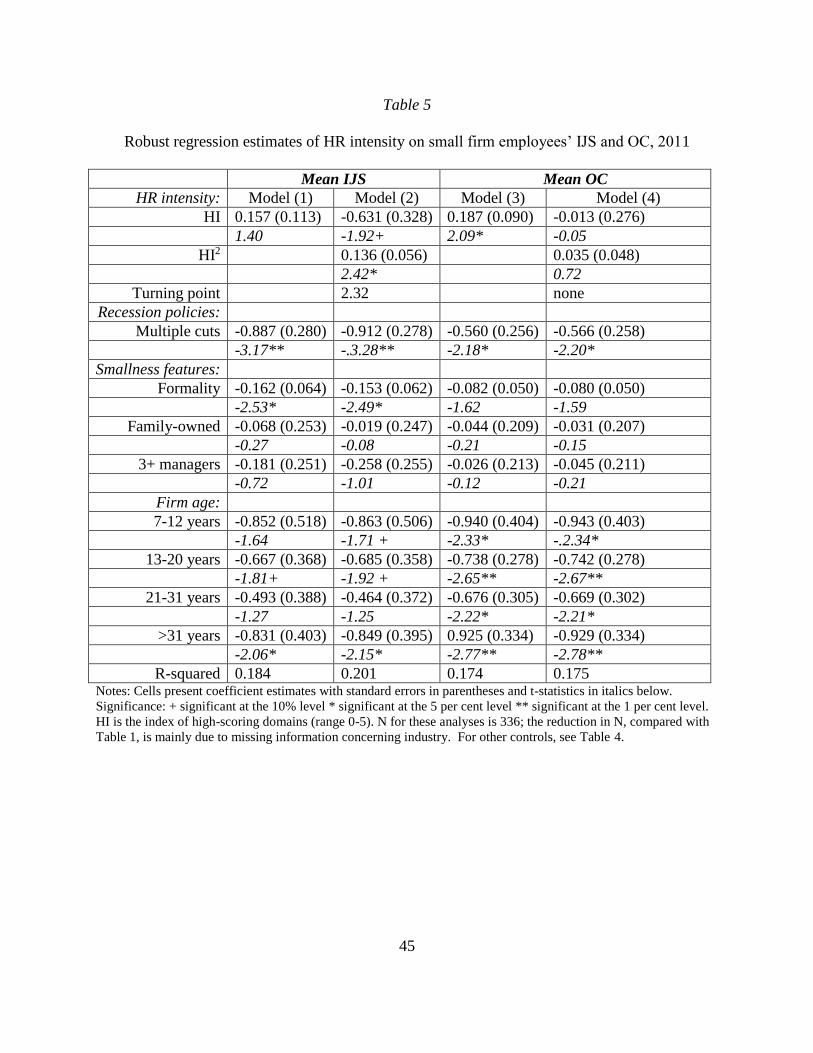
Table 5 shows the results for 2011, with weighting that achieves covariate balance to 2004. This
table follows the same general pattern as in Table 4, except that there is an additional variable
representing the use of multiple cost-cutting policies by the firm in response to the recession.
This additional variable is key to understanding the 2011 results. Employees in the one-third of
small firms using multiple cost-cutting methods have, other things being equal, substantially
lower levels of IJS and OC. With respect to the HPWS effect, for IJS the non-linear model
continues to perform well, with the linear term significant at the 10 per cent level and the
quadratic term significant at the 5 per cent level; IJS begins to climb once a firm has achieved,
roughly speaking, substantial implementation of more than two HRM domains (about two-thirds
of small firms had by 2011 reached this stage of development). In the case of OC, however, the
non-linear model fails and a simple linear model is adequate: substantial development of any
HRM domain is associated with higher OC.
[INSERT TABLE 5]
To clarify what is taking place as a result of firms’ employment response to the recession, we
also ran models separately for those who had multiple cost-cutting policy responses to the
recession and those who had not (i.e., the latter comprise firms with no cost-cutting response or
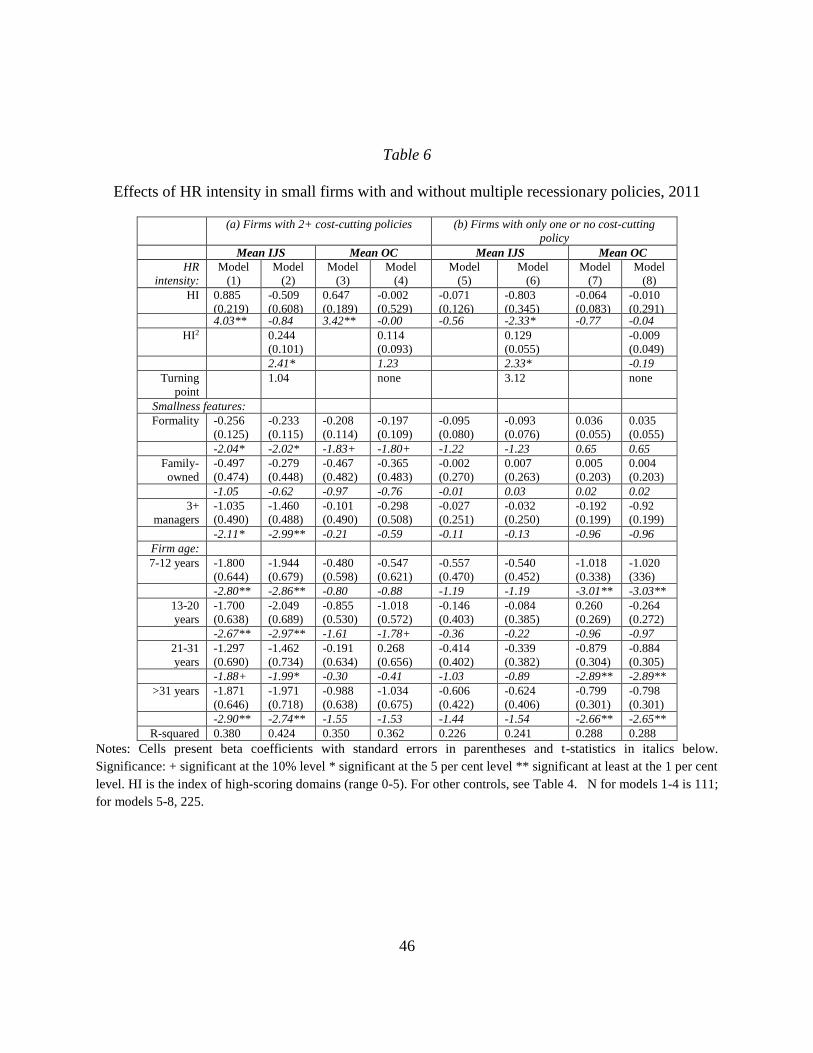
with only one). The estimates are shown in Table 6. When multiple cost-cutting responses are
absent (panel (b)), the effect of HPWS intensity is similar to 2004 in the case of IJS, but

26
disappears in the case of OC. When however multiple cost-cutting responses are present (panel
(a)) a simple linear model with positive coefficient is now supported for both IJS and OC, while
the nonlinear model is only maintained in a much weakened form for IJS. Overall then, it seems
as if the recessionary pressures transmitted to employees via small firm cost-cutting policies in
the recession tended to increase the positivity of HRM/HPWS effects (the opposite result to the
Canadian study of Zatzick and Iverson, 2006). A possible interpretation is that recessionary
policies erase the baseline motivational advantage of small firms but not the positive impact of
HPWS. Note that some caution is needed over the magnitude of point estimates in models based
on 111 observations, as there is a risk of over-fitting.
[INSERT TABLE 6]
Additional tests of robustness and validity
We carried out several tests relating to aspects of model robustness and validity; to avoid the
additional complication of rebalancing the 2011 data these tests were confined to 2004.
Appendix Table 2 shows estimates, comparable to those in Table 4, when the definition of
‘small’ firm is extended to 5-99 employees. The estimates change very little with this extension,
suggesting that the methodology is robust to moderate changes in population definition.
Variant analyses were conducted with the HPWS intensity variable based on domains that met a
criterion of two or more practices adopted (instead of three or more). The results were similar to
those shown above at Table 4. Confining attention to the linear-quadratic specifications, for IJS
the HI effect was -1.16 with t-statistic of -2.86 and the HI-squared effect was 0.168 with t-
statistic of 2.64; both test statistics are significant at the 1 per cent level. For OC, the

27
corresponding effects were -0.664 and 0.094, with t-statistics of -1.95 and 1.74, both significant
at the 10 per cent level. These results indicate that our method of specifying the HPWS variable
permits a degree of flexibility in the domain criterion, and this contributes to its constructive
validity. However, when we shifted the domain criterion in the other direction, to four or more
practices, all estimates for the linear and quadratic HPWS terms became non-significant. This
may be because relatively few small firms achieved the higher criterion.
We also ran an analysis with extrinsic job satisfaction (EJS) as the dependent variable. Here the
results for the linear HPWS term were b=-0.34, t=-1.22, and for the quadratic term b=0.054,
t=1.21. (Full results are available on request). This non-significant result indicates the
discriminant validity of IJS as against EJS, hence supporting our notion that working in a small
firm is intrinsically motivating.
CONCLUSIONS
The aim of this research has been to assess the effects of human resource management (HRM)
and the more systematic use of such practices in High Performance Work Systems (HPWS) on
the intrinsic job satisfaction (IJS) and organizational commitment (OC) of small firms’
employees, both before and after the 2008 recession in Britain. These attitudes represent
dimensions of employee motivation that previous research has demonstrated to have substantial
implications for individual behaviour and performance.
The analyses for 2004, when the British economy was buoyant, provide strong evidence that the
effects of HRM are non-linear (‘U-shaped’), with negative effects at low levels of HRM
implementation, but positive effects once more intensive implementation has been reached.

28
These findings are consistent with our depiction of small firms’ employees as having somewhat
positive attitudes at a baseline where HRM is undeveloped, initially reacting negatively to the
introduction of HRM, but then recovering more positive attitudes as a firm moves to a more
developed HPWS that fosters participation, team-work and skill development.
Results are somewhat more complex for 2011. Differences then appeared both between the
effects on IJS and the effects on OC, and between small firms that had introduced multiple cost-
cutting policies to counter the recession, and those that had not. For the overall 2011 sample, the
U-shaped relation between HRM/HPWS was maintained for IJS but for OC a simpler linear or
additive effect of HRM/HPWS now appeared best. Further analysis showed that the linear
model applied for both IJS and OC in the case of the sub-sample of small firms that had
introduced multiple cost-cutting policies. When small firms responded to the recession through
cost-cutting employment policies, the former negative effect of low-intensity HRM on
motivation tended to be suppressed. This was accompanied by strongly negative reactions
toward the cost-cutting employment policies themselves. A parsimonious interpretation is that
the cost-cutting policies severely constrained the autonomous working and time freedoms
normally enjoyed by small firm employees, and against that frame the development of
HRM/HPWS practices appeared relatively benign to employees.
The practical implications of these findings are challenging for small enterprise management.
There is much in our investigation that accords with criticisms of HRM: attitudes are highly
positive when HRM is absent. It seems unrealistic, however, to recommend staying in this
‘never-never land’. As the enterprise grows, there is a normal, possibly inevitable, movement
toward more complexity, leading management to seek a more systematized approach. Such a

29
transition is certain to be difficult and the early stages of HRM/HPWS implementation forms
part of this difficulty. The key for the small firm is to press on to a more intensive and more
integrated form of HPWS that sends stronger signals of positive intent toward employees.
Descriptive information for 2011 indicates that this is the direction in which many small firms
are moving. The 2011 results also suggest that in turbulent competitive conditions, that may
well affect small firms for the foreseeable future, HRM/HPWS will be accepted more readily by
their employees. This however requires further confirmation; qualitative research with
employees of small firms adopting HRM/HPWS would be of particular value.

30
References
Acs, Z. J. (1999) Are Small Firms Important? Their Role and Impact, Springer: New York
Appelbaum, Eileen, Thonas Bailey,, Peter Berg, and Arne L. Kalleberg (2000) Manufacturing
advantage: Why high-performance work systems pay off, Ithaca NY: Cornell University Press.
Batt, Rosemary (2002) Managing customer services: Human resource practices, quit rates, and
sales growth, Academy of Management Journal, 45(3): 587-97.
Becker, Brian E. and Mark A. Huselid (1998) ‘High performance work systems and firm
performance: A synthesis of research and managerial implications’. In Ferris, G.R. (ed.)
Research in personnel and human resources management, Vol. 16, Stamford, CT: JAI Press: 53-
101.
Becker, Brian E. and Mark A. Huselid, M.A. (2006) Strategic human resources management:
where do we go from here?, Journal of Management, 32(6): 898-925.
Berk, Richard A. (1990) ‘A Primer on Robust Regression’, in Fox, J. and Long, J.S. (eds.)
Modern Methods of Data Analysis, Newbury Park, CA: Sage: 292-324.
Bloom, Nick. and John van Reenen (2010) ‘Human Resource Management and Productivity’, in
Orley Ashenfelter and David Card (eds.) Handbook of Labor Economics, North-Holland.

31
Bowen, David E., and Cheri Ostroff (2004) Understanding HRM-performance linkages: The role
of the “strength” of the HRM system, Academy of Management Review, 29(2): 203-21.
Brown, Andrew Christopher Forde, David Spencer and Andy Charlwood (2008) Changes in
HRM and job Satisfaction, 1998-2004; Evidence from the Workplace Employment Relations
Survey, Human Resource Management Journal, 18(3):237-56.
Cappelli, Peter (1999) The New Deal at Work: Managing the Market Driven Workforce,
BostonMA: Harvard University Press.
Cappelli, Peter and David Neumark (2001) Do “high performance” work practices improve
establishment-level outcomes? Industrial and Labor Relations Review, 54(4): 737-75.
Cardon, Melissa S. and Christopher E. Stevens (2004) Managing human resources in small
organizations: What do we know? Human Resource Management Review, 14: 295-323.
Cox, Annette, Stefan Zegelmeyer and Mick Marchington (2006) Embedding employee
involvement and participation at work, Human Resource Management Journal, 16(3): 250-67.
de Kok, Johannes M (2003) Human Resource Management within Small and Medium-Sized
Enterprises, No. 313, Tinbergen Institute Research Series.

32
Diener, Ed and Richard E. Lucas. (1999) ‘Personality and Subjective Well-Being’, in Daniel
Kahneman Ed Diener, and David N. Schwartz (eds.) Well-Being: The Foundations of Hedonic
Psychology, New York: Russell Sage Foundation: 213-229.
Edwards, Richard C. (1979) Contested Terrain: The Transformation of the Workplace in the
Twentieth Century, New York: Basic Books.
Ferrer-i-Carbonell, Ada and Paul Frijters (2004) How important is methodology for the estimates
of the determinants of happiness? The Economic Journal, vol 114, 641-59.
Fishbein, Martin (1967) ‘A Behavior Theory Approach to the Relations between Beliefs about an
Object and the Attitude Toward the Object’, in Martin Fishbein (ed.) Attitude Theory and
Measurement, London; John Wiley & Sons: 389-400.
Forth, John and Neil Millward (2004) ‘High-involvement management and pay in Britain’,
Industrial Relations, 43(1): 98-119.
Forth, John, Helen Bewley and Alex Bryson (2006) Small and Medium-sized enterprises:
Findings from the 2004 Workplace Employment Relations Survey, London: Department for
Trade and Industry.
Frölich, Markus, Martin Huber and Manuel Weisenfarth (2015) The Finite Sample Performance
of Semi- and Nonparametric Estimators for Treatment Effects and Policy Evaluation, IZA
Discussion Paper 8756

33
Gagné, Marylène and Edward L. Deci (2005) ‘Self-determination theory and work motivation’,
Journal of Organizational Behavior, 26(4): 331-62.
Gilman, Mark W. and Paul K. Edwards (2008) Testing a Framework of the Organization of
Small Firms: Fast Growth, High Tech SMEs. International Small Business Journal, 26(5): 531-
58.
Godard, John (2001) High Performance and the Transformation of Work? The Implications of
Alternative Work Practices for the Experience and Outcomes of Work, Industrial and Labor
Relations Review, 54(4): 776-805.
Hailey, Veronica H., Elaine Farndale and Caherine Truss. (2005) ‘The HR Department’s Role in
Organisational Performance’, Human Resource Management Journal, 15(3): 49-66.
Hainmueller, Jens and Yiqing Xu (2013) ebalance: A Stata Package for Entropy Balancing
Journal of Statistical Software,54(7) 1-18
Harrison, David A, Daniel A. Newman and Philip L. Roth (2006) How Important are Job
Attitudes? Meta-analytical Comparisons of Integrative Behavioral Outcomes and Time
Sequences, Academy of Management Journal, 45(2): 305-325.

34
Hijzen, Alex, Richard Upward and Peter W. Wright (2010) Job Creation, Job Destruction and the
Role of Small Firms: Firm-Level Evidence for the UK, Oxford Bulletin of Economics and
Statistics, 72(5):621-47.
Ichniowski, Casey, Kathryn Shaw and Giovanna Prennushi (1997) The effects of human
resource management practices on productivity: A study of steel finishing lines, American
Economic Review, 87(3): 171-88.
Kalleberg, Arne L. and Ivar Berg, (1987) Work and Industry: Structures, Markets and Processes,
New York: Plenum.
Kalleberg, Arne L. and Mark E. Van Buren (1996) Is Bigger Better? Explaining the Relationship
between Organization Size and Job Rewards, American Sociological Review, 61(1):47-66.
Lai, Yanqing, George Saridakis and Stewart Johstone (2016) Human Resource Practices,
Employee Attitudes and Small Firm Performance, International Small Business Journal, 31:1-
25.
Latham, Gary P. and Craig C. Pinder (2005) Work Motivation Theory and Research at the Dawn
of the Twenty-First Century, Annual Review of Psychology,56:485-516.
Locke, Edwin A. (1996) Motivation through conscious goal setting, Applied and Preventive
Psychology, 5(5): 117-124.

35
Locke, Edwin A and Gary P. Latham (1990) Work Motivation and Satisfaction: Light at the End
of the Tunnel, Psychological Science, 1 (4): 240-6.
Macduffie, John P. (1995) Human resource bundles and manufacturing performance:
Organizational logic and flexible production systems in the world auto industry, Industrial &
Labor Relations Review, 48: 197-221.
Marlow, Susan. (2006) Human resource management in smaller firms: A contradiction in terms?
Human Resource Management Review, 16:467-77.
Matlay, Harry (2002) Industrial relations in the SME sector of the British economy: an empirical
perspective, Journal of Small Business and Enterprise Development, 9(3):307-18.
Moule, Chris (1998) Regulation of Work in Small Firms: A View from the Inside, Work,
Employment and Society, 12(4): 635-53.
Murphy, Gardner and Rensis Likert (1937) Public Opinion and the Individual, New York:
Harper.
Nolan, Ciara T and Thomas N. Garavan (2016) Human Resource Development in SMEs: A
Systematic Review of the Literature, International Journal of Management Reviews, 18: 85-107.

36
Osterman, Paul (2006) he wage effects of high performance work organization in
manufacturing, Industrial & Labor Relations Review, 59(2): 187-204.
Podsakoff, Philip M., Scott B. MacKenzie, Joong-Yeon Lee, and Nathan P. Podsakoff (2003)
Common Method Biases in Behavioral Research: A Critical Review of the Literature and
Recommended Remedies, Journal of Applied Psychology, 88(5): 879-903.
Powdthavee, Nattavudh (2011) Anticipation, free rider problem, and adaptation to trade union:
Re-examining the curious case of dissatisfied union members, Industrial & Labor Relations
Review,64(5): 1000-19.
Ram, Monder (1994) Managing to Survive: Working Lives in Small Firms, Oxford: Blackwell.
Ram, Monder, Paul K. Edwards, , Mark W. Gilman, and James Arrowsmith (2001) The
Dynamics of Informality: Employment Relations in Small Firms and the Effects of Regulatory
Change, Work, Employment and Society, 15(4): 845-61.
Ramsay, Harvey, Dora Scholarios and Bill Harley (2000) Employees and high-performance
work systems: Testing inside the black box, British Journal of Industrial Relations, 38(4): 501-
32.

37
Riedl, Maximilian and Ingo Geishecker (2014) Keep it Simple: Estimation strategies for ordered
response models with fixed effects, Journal of Applied Statistics,41(11):
doi.org/10.180/02664763.2014.909969.
Rainnie, Al (1989) Industrial Relations in Small Firms: Small Isn’t Beautiful, London:
Routledge.
Storey, David J., George Saridakis, Sukanya Sen-Gupta, Paul K. Edwards and Robert A.
Blackburn (2010) Linking HR Formality with Employee Job Quality: The Role of Firm and
Workplace Size, Human Resource Management, 49(2): 305-29.
Tanzel, Aysit and Saziye Gazioglu (2013) Management-Employee Relations, Firm Size and Job
Satisfaction, IZA Discussion Paper No. 7308.
Taylor, Mark P., Stephen P. Jenkins, and Amanda Sacker (2011) Financial capability and
psychological health, Journal of Economic Psychology, 32:710-23.
Treadway, Darren C., Gerald R. Ferris, ,Wayne A. Hochwarter,Pamela L. Perrewé,, L.A. Witt,,
and Joseph M. Goodman (2005) The Role of Age in the Perception of Politics – Job Performance
Relationship: A Three-Study Constructive Replication, Journal of Applied Psychology, 90(5)
872-81.
Tsai, Chib-Ju, Sukanya Sengupta, and Paul K. Edwards (2007) When and Why is Small
Beautiful? The Experience of Work in the Small Firm, Human Relations, 60(12): 1779-1807.

38
van Wanrooy,Brigid, Helen Bewley, Alex Bryson, John Forth, Stephanie Freeth, Lucy Stokes,
and Stephen Wood.(2013) Employment Relations in the Shadow of Recession, Basingstoke:
Palgrave Macmillan.
Wald, Abraham. (1940) The Fitting of Straight Lines If Both Variables Are Subject to Error,
Annals of Mathematical Statistics 11:284-300.
Warr, Peter, John Cook, and Toby Wall (1979) Scales for the measurement of some work
attitudes and aspects of psychological well-being, Journal of Occupational Psychology, 52(2):
129-48.
Way, Sean A. (2002) High Performance Work Systems and Intermediate Indicators of Firm
Performance Within the US Small Business Sector, Journal of Management, 28(6): 765-85.
Wright, Patrick M., Timothy M. Gardner, Lisa M. Moynihan, and Mathew R. Allen. (2005) The
relationship between HR practices and firm performance: examining causal order, Personnel
Psychology, 58(2): 409-46.
Wu, Ning, Kim Hoque, Nicolas Bacon, and Juan C. Llusar (2015). High-performance work
systems and workplace performance in small, medium-sized and large firms. Human Resource
Management Journal. 25 (4): 408-423

39
Zatzick, Christopher D. and Roderick D. Iverson (2006) High-involvement management and
workforce reduction: Competitive advantage or disadvantage?, Academy of Management
Journal, 49(5): 999-1015.

40
Table 1. Intrinsic Job Satisfaction (IJS) and Organizational Commitment (OC) scales for small
firms, 2004 and 2011
2004 2011
range mean s.d. N mean s.d. N Items
IJS
scale
4-20 15.84
1.61 280 16.02 1.79 375 (Satisfaction with..) Sense of
achievement from your work, Scope for
using your own initiative, Amount of
influence over your job, The work itself.
5-point item response, high=more
satisfied.
Alpha = 0.87
OC
scale
3-15 11.67 1.54 279 12.10 1.56 375 (Agreement that …) Share many of the
values of my organization, Feel loyal to
my organization, Proud to tell people
who I work for. 5-point item response,
high=stronger agreement. Alpha = 0.85
Note: Unweighted estimates. Alphas are based on the full employee sample

41
Table 2. HRM domains and HPWS intensity measure in small firms, 2004 and 2011
% ‘High’ on: 2004 2011
participation 44 81
teams 42 46
development 46 55
recruitment 79 80
incentives 12 40
Mean HPWS intensity (s.e.): 2.23 (0.102) 3.02 (0.089) Note: ‘High’ is a dummy variable for each domain, taking value 1 when 3 or more practices are implemented in that
domain. All estimates are survey-weighted. For further details of items used in domain construction, see Appendix
Table 1.

42
Table 3: correlations of regressor variables
Panel 3 (a) Year 2004
1. Correlations of numeric regressors
Hi-hr % fem % higher %inter formal age nonperm
HI-hr 1.0
% female 0.205 1.0
% higher 0.159 -0.057 1.0
% intermediate 0.069 -0.119 -0.079 1.0
formality 0.647 0.222 0.307 0.185 1.0
firm age -0.164 0.005 -0.188 0.070 -0.143 1.0
% nonpermanent 0.111 0.087 0.042 0.044 0.126 -0.122 1.0 Note: Firm age and % nonpermanent are banded variables; as the bands are based on approximate quintiles, we treat
them here as numeric but in models they are treated as categorical.
2. Tetrachoric correlations of dummy variables
family union managers security
family owned 1.0
unionized -0.296 1.0
3+ managers 0.095 -0.067 1.0
job security -0.037 0.224 0.112 1.0
Note: Matrix adjusted to be positive semi-definite. ‘Job security’ means a promise by the firm not to make
compulsory redundancies. Industry dummies are not included.

43
Panel 3 b) Year 2011
1. Correlations of numeric regressors
Hi-hr % fem % higher %inter formal age nonperm
HI-hr 1.0
% female 0.074 1.0
% higher 0.146 -0.048 1.0
% intermediate -0.018 -0.205 -0.089 1.0
formality 0.648 0.111 0.237 0.023 1.0
firm age -0.105 0.032 -0.085 0.101 -0.074 1.0
% nonpermanent 0.105 0.095 -0.029 -0.011 0.018 0.030 1.0 Note: Firm age and % nonpermanent are banded variables; as the bands are based on approximate quintiles, we treat
them here as numeric but in models they are treated as categorical.
2. Tetrachoric correlations of dummy variables
2+ cuts family union managers security
2+ cost-cuts 1.0
family owned 0.040 1.0
unionized -1.0 -0.495 1.0
3+ managers 0.229 0.068 0.083 1.0
job security -0.317 -0.147 -1.00 -0.059 1.0
Note: Matrix adjusted to be positive semi-definite. ‘2+ cost cuts’ refers to cuts made in response to the 2008
recession. ‘Job security’ means a promise by the firm not to make compulsory redundancies. The perfect negative
correlations between union and cuts, union and job security probably arise because of small number of unionized
firms. Industry dummies are not included.

44
Table 4.
Robust regression estimates of HR intensity on small firm employees’ IJS and OC, 2004.
Mean IJS Mean OC
HR intensity: Model (1) Model (2) Model (3) Model (4)
HI -0.192 (0.109) -0.983 (0.334)
-0.199 (0.096) -0.855 (0.265)
-1.77 + -2.94 ** -2.07 * -3.23**
HI2 0.156 (0.056) 0.130 (0.048)
2.77 ** 2.73**
Turning point 3.15 3.29
Smallness features:
Formality 0.058 (0.069) 0.090 (0.072) 0.111 (0.057) 0.138 (0.059)
0.84 1.26 1.95 + 2.33 *
Family-owned -0.245 (0.248) -0.240 (0.244) -0.290 (0.213) -0.288 (0.214)
-0.99 -0.98 -1.36 -1.35
3+ managers -0.070 (0.246) -0.104 (0.242) -0.345 (0.220) -0.377 (0.218)
-0.28 -0.43 -1.57 -1.73 +
Firm age:
7-12 years -0.186 (0.339) -0.022 (0.358) 0.093 (0.289) 0.225 (0.305)
-0.55 -0.06 0.32 0.74
13-20 years -0.018 (0.416) 0.103 (0.413) -0.107 (0.349) -0.007 (0.344)
-0.04 0.25 -0.31 -0.02
21-31 years 0.294 (0.433) 0.438 (0.411) 0.353 (0.358) 0.470 (0.336)
0.68 1.06 0.99 1.40
>31 years -0.576 (0.404) -0.417 (0.400) -0.347 (0.296) -0.216 (0.303)
-1.42 -1.04 -1.17 -0.71
R-squared 0.174 0.208 0.286 0.312 Notes: cells present coefficient estimates with standard errors in parentheses and t-statistics in italics below.
Significance: + significant at the 10% level * significant at the 5 per cent level ** significant t at the 1 per cent level.
HI is the index of high-scoring domains (range 0-5). All above analyses have N=276. Analyses have additional
controls for industry, proportion female employees, proportions higher-level and intermediate-level employees,
proportion (banded) of non-permanent employees, trade union recognition, and ‘no compulsory redundancy’ policy.
45
Table 5
Robust regression estimates of HR intensity on small firm employees’ IJS and OC, 2011
Mean IJS Mean OC
HR intensity: Model (1) Model (2) Model (3) Model (4)
HI 0.157 (0.113) -0.631 (0.328) 0.187 (0.090) -0.013 (0.276)
1.40 -1.92+ 2.09* -0.05
HI2 0.136 (0.056) 0.035 (0.048)
2.42* 0.72
Turning point 2.32 none
Recession policies:
Multiple cuts -0.887 (0.280) -0.912 (0.278) -0.560 (0.256) -0.566 (0.258)
-3.17** -.3.28** -2.18* -2.20*
Smallness features:
Formality -0.162 (0.064) -0.153 (0.062) -0.082 (0.050) -0.080 (0.050)
-2.53* -2.49* -1.62 -1.59
Family-owned -0.068 (0.253) -0.019 (0.247) -0.044 (0.209) -0.031 (0.207)
-0.27 -0.08 -0.21 -0.15
3+ managers -0.181 (0.251) -0.258 (0.255) -0.026 (0.213) -0.045 (0.211)
-0.72 -1.01 -0.12 -0.21
Firm age:
7-12 years -0.852 (0.518) -0.863 (0.506) -0.940 (0.404) -0.943 (0.403)
-1.64 -1.71 + -2.33* -.2.34*
13-20 years -0.667 (0.368) -0.685 (0.358) -0.738 (0.278) -0.742 (0.278)
-1.81+ -1.92 + -2.65** -2.67**
21-31 years -0.493 (0.388) -0.464 (0.372) -0.676 (0.305) -0.669 (0.302)
-1.27 -1.25 -2.22* -2.21*
>31 years -0.831 (0.403) -0.849 (0.395) 0.925 (0.334) -0.929 (0.334)
-2.06* -2.15* -2.77** -2.78**
R-squared 0.184 0.201 0.174 0.175 Notes: Cells present coefficient estimates with standard errors in parentheses and t-statistics in italics below.
Significance: + significant at the 10% level * significant at the 5 per cent level ** significant at the 1 per cent level.
HI is the index of high-scoring domains (range 0-5). N for these analyses is 336; the reduction in N, compared with
Table 1, is mainly due to missing information concerning industry. For other controls, see Table 4.
46
Table 6
Effects of HR intensity in small firms with and without multiple recessionary policies, 2011
(a) Firms with 2+ cost-cutting policies (b) Firms with only one or no cost-cutting
policy
Mean IJS Mean OC Mean IJS Mean OC
HR
intensity:
Model
(1)
Model
(2)
Model
(3)
Model
(4)
Model
(5)
Model
(6)
Model
(7)
Model
(8)
HI 0.885
(0.219)
-0.509
(0.608)
0.647
(0.189)
-0.002
(0.529)
-0.071
(0.126)
-0.803
(0.345)
-0.064
(0.083)
-0.010
(0.291) 4.03** -0.84 3.42** -0.00 -0.56 -2.33* -0.77 -0.04
HI2 0.244
(0.101)
0.114
(0.093)
0.129
(0.055)
-0.009
(0.049)
2.41* 1.23 2.33* -0.19
Turning
point
1.04 none 3.12 none
Smallness features:
Formality -0.256
(0.125)
-0.233
(0.115)
-0.208
(0.114)
-0.197
(0.109)
-0.095
(0.080)
-0.093
(0.076)
0.036
(0.055)
0.035
(0.055)
-2.04* -2.02* -1.83+ -1.80+ -1.22 -1.23 0.65 0.65
Family-
owned
-0.497
(0.474)
-0.279
(0.448)
-0.467
(0.482)
-0.365
(0.483)
-0.002
(0.270)
0.007
(0.263)
0.005
(0.203)
0.004
(0.203)
-1.05 -0.62 -0.97 -0.76 -0.01 0.03 0.02 0.02
3+
managers
-1.035
(0.490)
-1.460
(0.488)
-0.101
(0.490)
-0.298
(0.508)
-0.027
(0.251)
-0.032
(0.250)
-0.192
(0.199)
-0.92
(0.199)
-2.11* -2.99** -0.21 -0.59 -0.11 -0.13 -0.96 -0.96
Firm age:
7-12 years -1.800
(0.644)
-1.944
(0.679)
-0.480
(0.598)
-0.547
(0.621)
-0.557
(0.470)
-0.540
(0.452)
-1.018
(0.338)
-1.020
(336)
-2.80** -2.86** -0.80 -0.88 -1.19 -1.19 -3.01** -3.03**
13-20
years
-1.700
(0.638)
-2.049
(0.689)
-0.855
(0.530)
-1.018
(0.572)
-0.146
(0.403)
-0.084
(0.385)
0.260
(0.269)
-0.264
(0.272)
-2.67** -2.97** -1.61 -1.78+ -0.36 -0.22 -0.96 -0.97
21-31
years
-1.297
(0.690)
-1.462
(0.734)
-0.191
(0.634)
0.268
(0.656)
-0.414
(0.402)
-0.339
(0.382)
-0.879
(0.304)
-0.884
(0.305)
-1.88+ -1.99* -0.30 -0.41 -1.03 -0.89 -2.89** -2.89**
>31 years -1.871
(0.646)
-1.971
(0.718)
-0.988
(0.638)
-1.034
(0.675)
-0.606
(0.422)
-0.624
(0.406)
-0.799
(0.301)
-0.798
(0.301)
-2.90** -2.74** -1.55 -1.53 -1.44 -1.54 -2.66** -2.65**
R-squared 0.380 0.424 0.350 0.362 0.226 0.241 0.288 0.288
Notes: Cells present beta coefficients with standard errors in parentheses and t-statistics in italics below.
Significance: + significant at the 10% level * significant at the 5 per cent level ** significant at least at the 1 per cent
level. HI is the index of high-scoring domains (range 0-5). For other controls, see Table 4. N for models 1-4 is 111;
for models 5-8, 225.
47
Appendix Table 1: Items Used in Construction of HRM/HPWS Measures
Domain name Contents – Year 2004
Participation
KR20=0.78
Meeting time; briefing time; subjects discussed in meetings (organization, production,
staffing, finance, planning, pay); consultative committee set up; attitude surveys used;
changes made with employee involvement.
Team working
KR20=0.67
Proportion in teams; task rotation within teams; teams have inter-dependence,
responsibility, autonomy; team chooses their leader; quality circles.used.
Development
KR20=0.68
‘Investor in People’ standard achieved; development included in firm strategy; proportion
given off-job training; proportion given cross-job training; variety of training courses
used; induction courses used; team training; training discussed in briefing groups;
appraisal for non-managers.
Selection
KR20=0.52
selection criteria: qualifications, skills, references, motivation, experience; use personality
tests; use skill tests.
Incentives
KR20=0.68
bonus for individual, group/team, workplace, organization performance; profit-sharing for
non-managers; merit-based or performance pay; appraisals that affect pay differentials;
incentives that affect pay differentials.
Contents – Year 2011
Participation
KR20=0.69
Regular meetings frequency of meetings; meeting time for staff comments/questions;
Briefing meetings; frequency of briefing meetings; briefing time for staff
comments/questions; Information about investment given by management; Financial
information given by management; Staffing information given by management;
consultative committee set up; attitude surveys used.
Team working
KR20=0.57
Proportion in teams; task rotation within teams; team training; teams have inter-
dependence, specific responsibility, autonomy; quality circles used..
Development
KR20=0.60
‘Investor in People’ standard achieved; induction training; managers have performance
appraisal; all non-managers have performance appraisal; employee development forms
part of strategy; proportion getting workplace training; proportion getting off-job
training; proportion getting cross-job training; vacancies filled internally if possible;
variety of training.
Selection
KR20 =0.62
Selection criteria: references,skills, qualifications; experience; motivation; personality
tests for managerial jobs; personality tests for non-managerial jobs; skill tests for
managerial jobs; skill tests for non-managerial jobs.
Incentives
KR20=0.81
Profit-related incentive for non-managers; managers have payment by results or merit
pay; non-managers have payment by results or merit pay; some type of merit pay is
applied; Incentive pay on basis of: individual performance, workplace performance,
organizational performance; pay rises while doing same job based partly on skill increase,
tasks carried out, performance.
Notes: KR20 is the Kuder Richardson reliability measure for dichotomous item scales. Underlined items are
quantitative banded variables reduced to dichotomies by splitting at the median. ‘Investor in People’ is an externally
awarded standard for people development.

48
Appendix Table 2:Robust regression estimates of HRM/HPWS effects on small firm employees’
IJS and OC, 2004 – with ‘small’ defined as 5-99 employees
Mean IJS Mean OC
HR intensity: Model (1) Model (2) Model (3) Model (4)
HI: -0.191 (-1.77+) -0.954 (-2.98**)
-0.190 (-2.10*) -0.763 (-2.96**)
HI2: 0.151 (2.82**) --- 0.113 (2.50*)
Turning point 3.16 3.38
R-squared 0.164 N=352 0.196 N=352 0.268 N=351 0.289 N=351 Note: Cells present coefficient estimates with t-statistics in parentheses. HI is the index of high-scoring domains
(range 0-5). Significance: + significant at the 10% level * significant at the 5 per cent level ** significant at the 1 per
cent level. For controls, see Table 4.