1 Development of Alternate Building Materials for ... - BuildWell Source
36
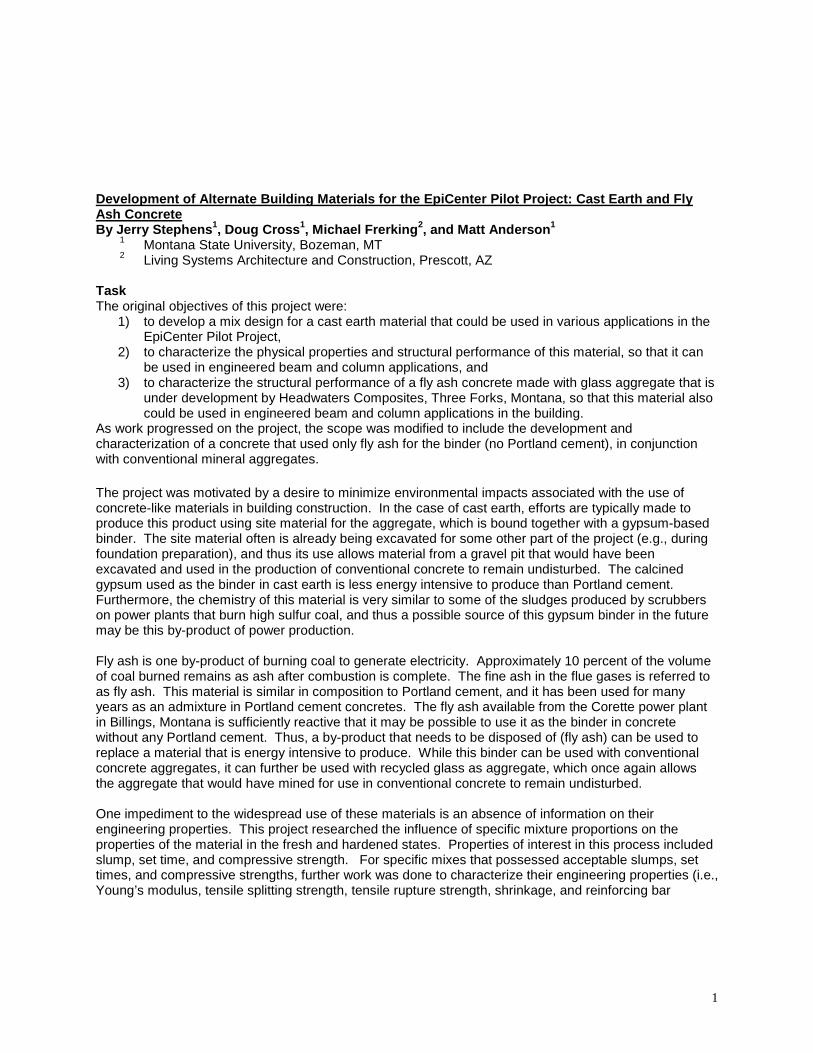
1 Development of Alternate Building Materials for the EpiCenter Pilot Project: Cast Earth and Fly Ash Concrete By Jerry Stephens 1 , Doug Cross 1 , Michael Frerking 2 , and Matt Anderson 1 1 Montana State University, Bozeman, MT 2 Living Systems Architecture and Construction, Prescott, AZ Task The original objectives of this project were: 1) to develop a mix design for a cast earth material that could be used in various applications in the EpiCenter Pilot Project, 2) to characterize the physical properties and structural performance of this material, so that it can be used in engineered beam and column applications, and 3) to characterize the structural performance of a fly ash concrete made with glass aggregate that is under development by Headwaters Composites, Three Forks, Montana, so that this material also could be used in engineered beam and column applications in the building. As work progressed on the project, the scope was modified to include the development and characterization of a concrete that used only fly ash for the binder (no Portland cement), in conjunction with conventional mineral aggregates. The project was motivated by a desire to minimize environmental impacts associated with the use of concrete-like materials in building construction. In the case of cast earth, efforts are typically made to produce this product using site material for the aggregate, which is bound together with a gypsum-based binder. The site material often is already being excavated for some other part of the project (e.g., during foundation preparation), and thus its use allows material from a gravel pit that would have been excavated and used in the production of conventional concrete to remain undisturbed. The calcined gypsum used as the binder in cast earth is less energy intensive to produce than Portland cement. Furthermore, the chemistry of this material is very similar to some of the sludges produced by scrubbers on power plants that burn high sulfur coal, and thus a possible source of this gypsum binder in the future may be this by-product of power production. Fly ash is one by-product of burning coal to generate electricity. Approximately 10 percent of the volume of coal burned remains as ash after combustion is complete. The fine ash in the flue gases is referred to as fly ash. This material is similar in composition to Portland cement, and it has been used for many years as an admixture in Portland cement concretes. The fly ash available from the Corette power plant in Billings, Montana is sufficiently reactive that it may be possible to use it as the binder in concrete without any Portland cement. Thus, a by-product that needs to be disposed of (fly ash) can be used to replace a material that is energy intensive to produce. While this binder can be used with conventional concrete aggregates, it can further be used with recycled glass as aggregate, which once again allows the aggregate that would have mined for use in conventional concrete to remain undisturbed. One impediment to the widespread use of these materials is an absence of information on their engineering properties. This project researched the influence of specific mixture proportions on the properties of the material in the fresh and hardened states. Properties of interest in this process included slump, set time, and compressive strength. For specific mixes that possessed acceptable slumps, set times, and compressive strengths, further work was done to characterize their engineering properties (i.e., Young’s modulus, tensile splitting strength, tensile rupture strength, shrinkage, and reinforcing bar
-
Upload
khangminh22 -
Category
Documents
-
view
0 -
download
0
Transcript of 1 Development of Alternate Building Materials for ... - BuildWell Source
1
Development of Alternate Building Materials for the EpiCenter Pilot Project: Cast Earth and Fly Ash Concrete By Jerry Stephens1, Doug Cross1, Michael Frerking2, and Matt Anderson1
1 Montana State University, Bozeman, MT 2 Living Systems Architecture and Construction, Prescott, AZ
Task The original objectives of this project were: 1) to develop a mix design for a cast earth material that could be used in various applications in the
EpiCenter Pilot Project, 2) to characterize the physical properties and structural performance of this material, so that it can
be used in engineered beam and column applications, and 3) to characterize the structural performance of a fly ash concrete made with glass aggregate that is
under development by Headwaters Composites, Three Forks, Montana, so that this material also could be used in engineered beam and column applications in the building.
As work progressed on the project, the scope was modified to include the development and characterization of a concrete that used only fly ash for the binder (no Portland cement), in conjunction with conventional mineral aggregates. The project was motivated by a desire to minimize environmental impacts associated with the use of concrete-like materials in building construction. In the case of cast earth, efforts are typically made to produce this product using site material for the aggregate, which is bound together with a gypsum-based binder. The site material often is already being excavated for some other part of the project (e.g., during foundation preparation), and thus its use allows material from a gravel pit that would have been excavated and used in the production of conventional concrete to remain undisturbed. The calcined gypsum used as the binder in cast earth is less energy intensive to produce than Portland cement. Furthermore, the chemistry of this material is very similar to some of the sludges produced by scrubbers on power plants that burn high sulfur coal, and thus a possible source of this gypsum binder in the future may be this by-product of power production. Fly ash is one by-product of burning coal to generate electricity. Approximately 10 percent of the volume of coal burned remains as ash after combustion is complete. The fine ash in the flue gases is referred to as fly ash. This material is similar in composition to Portland cement, and it has been used for many years as an admixture in Portland cement concretes. The fly ash available from the Corette power plant in Billings, Montana is sufficiently reactive that it may be possible to use it as the binder in concrete without any Portland cement. Thus, a by-product that needs to be disposed of (fly ash) can be used to replace a material that is energy intensive to produce. While this binder can be used with conventional concrete aggregates, it can further be used with recycled glass as aggregate, which once again allows the aggregate that would have mined for use in conventional concrete to remain undisturbed. One impediment to the widespread use of these materials is an absence of information on their engineering properties. This project researched the influence of specific mixture proportions on the properties of the material in the fresh and hardened states. Properties of interest in this process included slump, set time, and compressive strength. For specific mixes that possessed acceptable slumps, set times, and compressive strengths, further work was done to characterize their engineering properties (i.e., Young’s modulus, tensile splitting strength, tensile rupture strength, shrinkage, and reinforcing bar
2
anchorage properties). Finally, the behavior of these materials in reinforced structural elements was characterized (i.e., basic performance in beam and column elements). This report specifically summarizes the work done in developing cast earth and fly ash concrete for possible use in structural applications in the EpiCenter Pilot Project. The work done on reinforced elements made with the fly ash concrete/glass aggregate product being developed by Headwaters Composites, was turned over to that company for dissemination elsewhere. While the work reported herein addresses many of the questions that a structural designer will have regarding the use of cast earth and fly ash concrete in building applications, some unresolved issues regarding their performance still remain. Notably, their performance under fire conditions and their durability over time require further investigation. Methodology and Process The objectives of this project were realized through experimental testing. Sufficient uncertainties still exist in analytically predicting the behavior of concrete materials that their performance is best evaluated through testing. Work began by characterizing the various constituents in each material. This work was followed sequentially by the mix design effort, the characterization of the engineering properties of the “best” mixtures identified in that effort, and finally the evaluation of the behavior of reinforced beams and columns constructed with these “best” mixtures. The various sampling and testing done in this program was conducted as possible and appropriate in accordance with accepted procedures (e.g., American Society for Testing and Materials (ASTM) Standards, 1999). While considerable information is available on tests for evaluating the properties of Portland cement based concrete, little is available on evaluating cast earth and fly ash concrete. The procedures used in this project were adapted from those available for Portland cement concrete as possible and appropriate for these materials. This approach was judged appropriate for fly ash concrete, as the mechanism of strength gain for this material (hydration of cementitious compounds over time in a wet environment) is similar to that of Portland cement concrete. This approach, however, should be used more cautiously, for cast earth. In working with the cast earth mixtures and in evaluating their properties, it is important to recognize that despite some similarities between cast earth and concrete with respect to constituents and material consistency, cast earth gains strength through a different mechanism from Portland cement concrete. After cast earth is mixed, immediate chemical reactions occur between the mix water and the calcined gypsum; once these reactions have occurred, the material needs to dry out to achieve its full strength. Description of Materials Cast earth and fly ash concrete both basically consist of a binder material, an aggregate filler, water, and retarder. The binder and the water are combined to form a paste, which when it hardens, holds together the aggregate filler material. Retarders are used to slow down the set time of the binder, so that the materials can be placed and consolidated before they harden. Calcined gypsum (CaSO4
. 1/2H20) is used for the binder in cast earth mixtures. The specific material used in this investigation was an industrial plaster produced in Sigurd, Utah by the Georgia-Pacific Company. This material is produced by calcining gypsum in kettles at atmospheric pressure, resulting in what is known as Beta gypsum. Physical properties of the material (as reported by the manufacturer) include a set time of 27 to 37 minutes and a strength of 1500 to 2000 psi. Other sources of calcined gypsum include the material produced for a) sheet rock manufacturing, b) floor slab applications, and c) as a by-
3
product of burning high sulfur coal for electric power generation. Of these possible sources of calcined gypsum, the Georgia Pacific product was selected for this project based on availability, price, and consistency of the product. Naturally, from an environmental perspective, use of the calcined gypsum product created as a by-product of electric power generation is an attractive alternate and should be pursued in future work. The fly ash concrete in this project was made using ash obtained from the Corette Power Plant in Billings, Montana. This ash, provided by the Billings, Montana office of ISG Resources, Inc., is a class C fly ash. Specific properties of this ash are summarized in Table 1. Several types of aggregates were considered for use in the cast earth and the fly ash concrete, as summarized in Table 2. Issues considered in the aggregate selection process included the environmental impacts associated with obtaining the aggregate, the effect of the aggregate on the properties of the cast earth and fly ash concrete, and the price/availabiltity of various aggregates in the project area. While any soil free from organic materials and excessive clay may be used as aggregate in cementitious building materials, workability, strength, and durability generally improve with the use of clean, well graded, sands and gravels. Such materials, however, can be difficult to locate in certain areas, and extensive cleaning and screening of available soils may be necessary to produce them. An attractive alternative aggregate source is the material excavated at the building site as part of the site preparation/foundation excavation operations. Such materials potentially offer the least environmental impact of the various aggregate options available, as the use of such materials eliminates the need to disturb virgin materials at another location. Ideally, such materials would be used without substantial processing. In this case, however, the surface site materials consist of clays (8 to 16 feet in depth), which generally perform poorly in cast earth and concrete applications. With respect to materials available in the surrounding area, gravels are abundant. Common commercially available gravel products in the Bozeman area include unprocessed gravel, gravel screened through a 4 inch mesh, road mix, and conventional concrete aggregate (meets the requirements of ASTM C33). These products are listed in ascending order with respect to the processing effort (and thus the environmental impacts) associated with their production, with the exception of the washing/crusher by-products included as the last item in the list. Note that the maximum aggregate size was set at 3/4 inch, so that the cast earth and fly ash concrete could be placed using a conventional concrete pump. Notably, even the naturally occurring gravels in the area need to be screened to eliminate larger particles. In the absence of a retarding agent, cast earth and fly ash concrete mixtures can set within a few minutes after the ingredients are mixed. Use of retarders is necessary to obtain sufficient time for these materials to be placed and consolidated before they set. A minimum set time of two to three hours is reasonable for these materials, based on past construction experience. Set time in this project was regulated using three different retarding agents: 1) a powdered borax (specifically the borax marketed by the Dial Corporation, Scottsdale, Arizona,
as 20 Mule Team Borax) which worked to retard the set of both cast earth and fly ash concrete; 2) a proprietary liquid agent discovered by Harris Lowenhaupt and used by Living Systems
Architecture and Construction, Prescott, Arizona, specifically in cast earth applications, and 3) a product marketed under the name of Delvo produced by Master Builders Technologies,
Cleveland, Ohio, for the purpose of arresting the set of Portland cement concrete (used in this investigation with the fly ash mixtures).
4
While all three admixtures performed acceptably, the decision was made (somewhat arbitrarily) to proceed with borax as the primary retarding agent. The retarding effect of borax on Portland cement concrete is well known (Kosmatka and Panarese, 1988; Ramachandran, Feldman, and Beaudoin, 1981), although it was difficult to find any specific information on the method whereby the borax is introduced into the mix or what amount should be used to achieve particular set times. Note that the supplier of the fly ash for the project, ISG Resources, specifically suggested borax as a possible set retarder to be used with fly ash. It subsequently was observed that borax also effectively retarded the set of the cast earth mixtures, so the decision was made to simply use the same retarder with both the cast earth and the fly ash concrete. A final ingredient used in the fly ash concrete mixtures was lime (CaO). Portland cement contains considerably more calcium oxide than is found in fly ash, and it has been observed that the cementitious nature of some fly ashes is enhanced through the addition of lime. The lime used in this investigation was a Chemstar Type S lime produced by the Chemical Lime Company, Scottsdale, Arizona. Limited experimentation was done with some other lime products, notably materials available from the Continental Lime facility near Townsend, Montana. While the best results were obtained with the Chemstar material, the Townsend limes are locally available in bulk form and merit further investigation in future studies. Mix Design Effort The specific objective of the mix design effort was to develop one cast earth mixture and one fly ash concrete mixture: 1) that have adequate workability and sufficiently long set time that they can be placed and
consolidated in typical building construction situations, and 2) that develop sufficient compression strength when they subsequently hardened that they can be
used in structural applications. Workability was measured in terms of slump, with an “adequate” workability for common construction applications being judged at 4 inches. Concrete is increasingly being placed by pump, and this slump is consistent with a pumpable mix. The desire to produce a pumpable mix also placed a constraint on the maximum size of aggregate that can be used in the mix. An aggregate size of 3/4 inch can comfortably be pumped using standard equipment available for conventional Portland cement concrete. An acceptable set time was judged to be 2 to 3 hours. With respect to strength, a minimum unconfined compression strength of 1000 psi was established after a review of the strengths provided by existing building materials. To some extent, common existing cementitious building materials range in strength from 4000 psi (conventional Portland cement concrete) to 300 psi (clay adobe, State of New Mexico Regulation and Licensing Department, 1991). Mix parameters that were varied in this investigation consisted of the ratio of water-to-cementitious materials, type of aggregate, the volume of the paste as a fraction of the total mix ingredients, the amount and type of retarder, and the mix procedure. In the case of fly ash concrete, use of small amounts of lime as an admixture to improve the workability and strength of the material was also investigated. The target workability of all the mixtures was held constant at 4 inches as these various features of the mixtures were changed. The intent of the mix design effort was to identify a cast earth and a fly ash concrete mixture for use in the EpiCenter project, which is not necessarily the same as comprehensively characterizing the effects of various parameters on mix performance. None-the-less, in the interest of optimizing the mixtures developed for the EpiCenter project, information was generated on the general
5
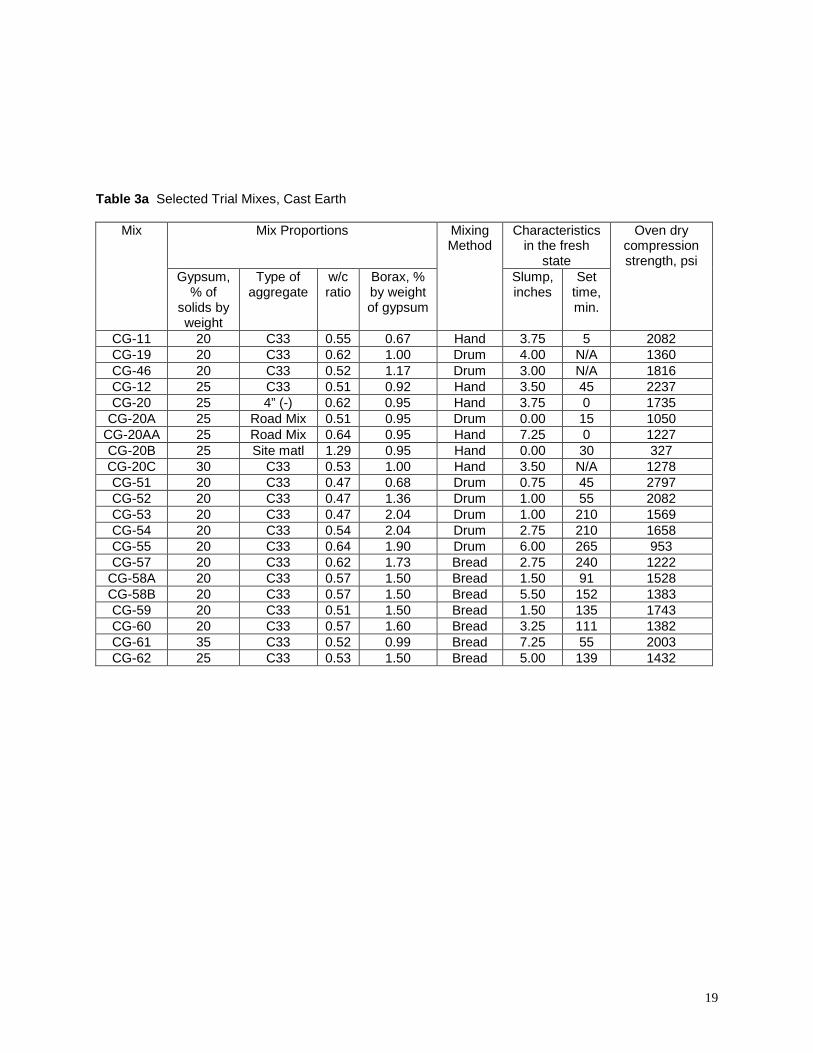
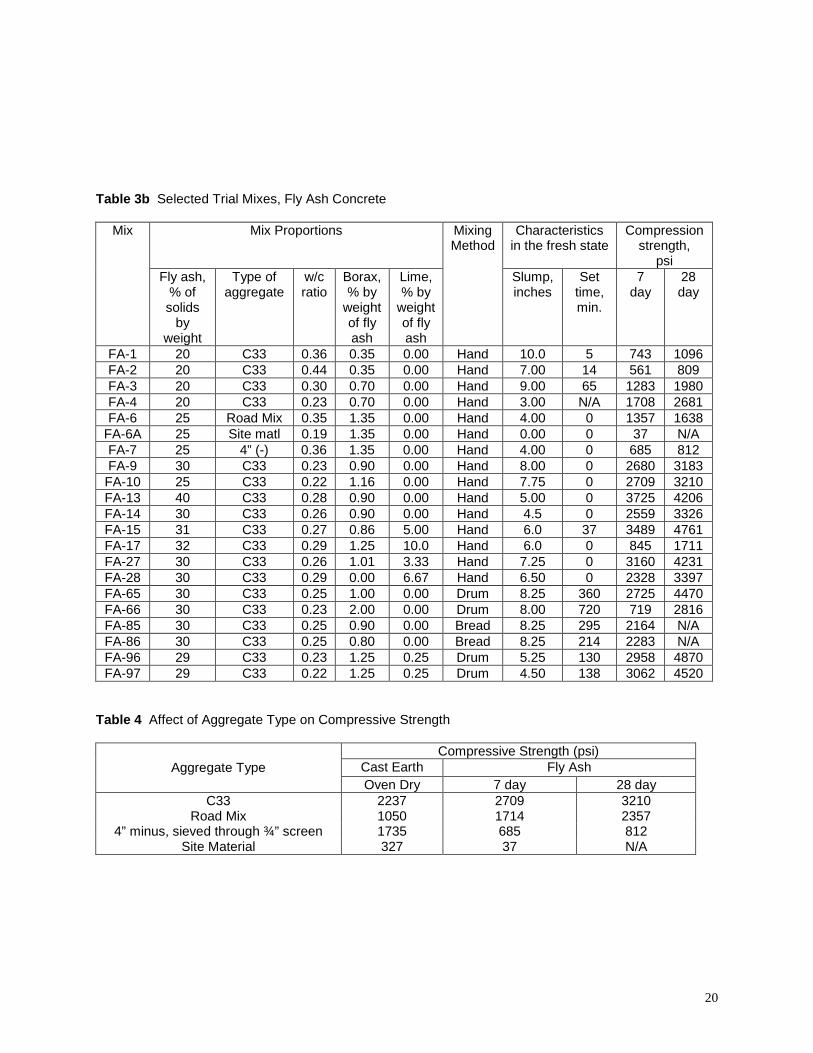
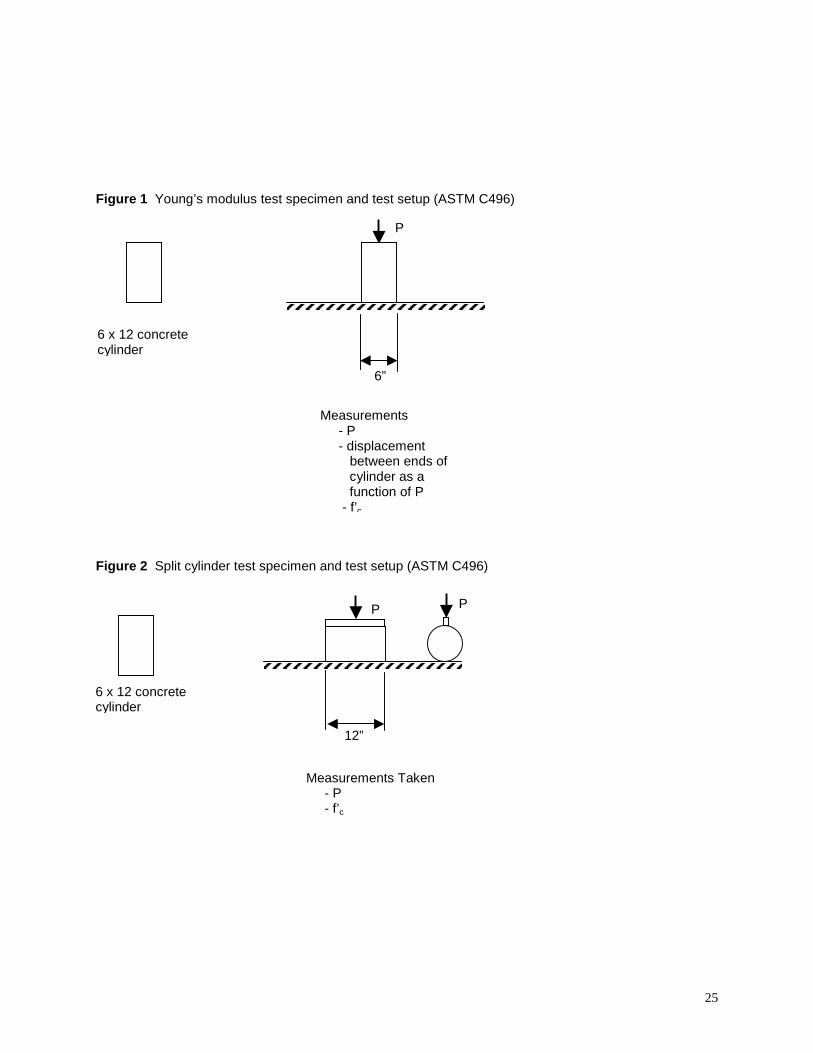
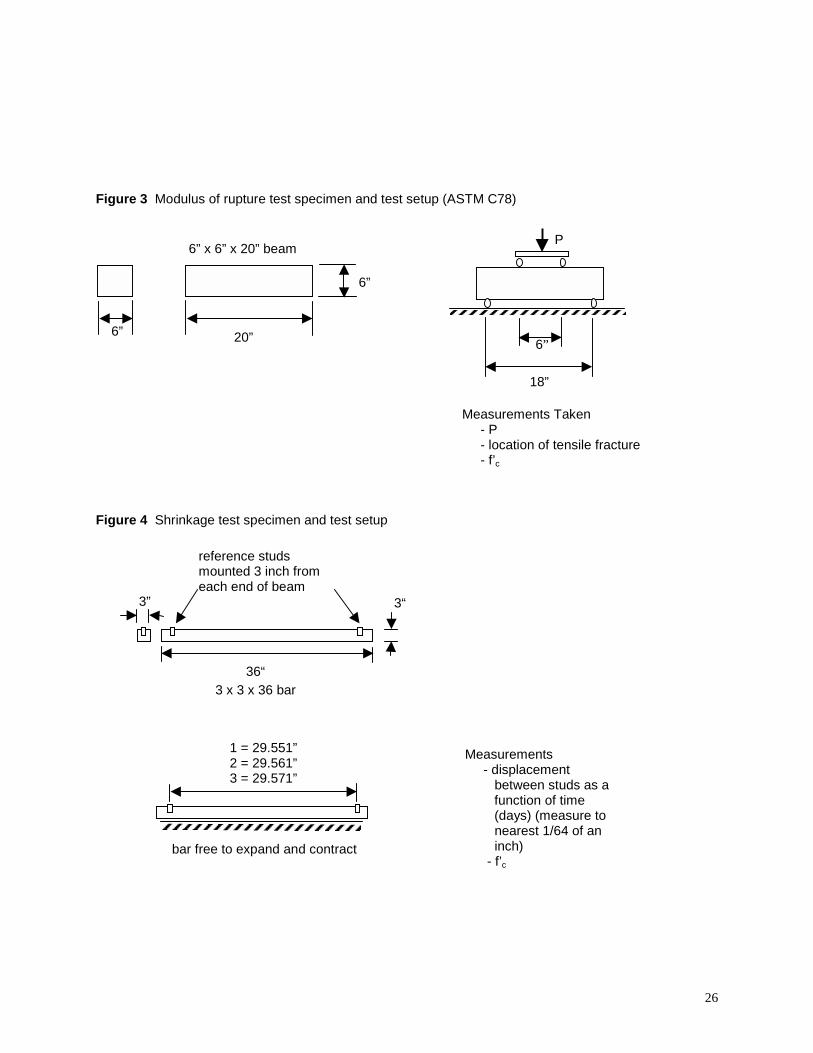
effects of these parameters on mix behavior (specifically on workability, set time, and unconfined compression strength). To definitively establish comprehensive relationships between mix performance and the various mix parameters discussed herein, a test program needs to be planned and conducted in which the parameters of interest are carefully isolated and systematically varied. A sampling of the 60 trial mixtures prepared in this investigation is presented in Table 3. Trial mixes were prepared in substantial conformance with ASTM C192. That is, all ingredients were mixed together for a set period of time, they then were allowed to stand undisturbed for a period of time, and finally they were again mixed for a set period of time. Following this mix regime, the slump was measured, test specimens were cast, and the set time was noted. Generally, nine specimens, each 4 inches in diameter and 8 inches tall, were cast from each trial batch. Twenty-four hours after molding, the specimens were stripped and moved to their respective “curing” locations. The cast earth specimens were placed in an oven operating at 100 degrees Fahrenheit. These specimens were subsequently tested when the moisture loss between successive days was negligible (less than 0.5% by weight of the material). The fly ash concrete specimens were moist cured according to ASTM requirements and tested typically at 7, 28, and 56 days after casting. All specimens were tested in uniaxial compression using neoprene end caps. In evaluating the test results, recognize that 4-by-8 inch test cylinders typically fail at approximately 5 percent higher load than 6-by-12 inch specimens made of the same material (Davis, Troxell, and Hauck, 1982). Characterization of Engineering Properties for Design While many investigations of innovative cementitious building materials are preliminary in scope and end with the identification of promising mixtures based only on compression strength, this project looked further at other properties of interest with respect to the engineering design and practical performance of these materials. Tests were done to determine Young’s modulus, E, splitting tensile strength, fct, tensile flexural strength, fr, shrinkage properties, and reinforcing bar bond behavior of cast earth and fly ash concrete specimens made using the “best” mixes identified in the mix design effort. For cast earth, additional tests were done to determine the sensitivity of this material to ambient moisture conditions. Young’s modulus was determined for each material from load-deformation measurements made on 6-by-12 inch cylinders of each material tested in uniaxial compression (ASTM C469). The method used for these tests is summarized in Figure 1. Splitting tensile strength was also calculated from tests on 6-by-12 inch concrete specimens (ASTM C496). In these tests, the cylinders were loaded laterally to failure, as shown in Figure 2. Tensile flexural strength, referred to as the modulus of rupture, was determined from bending tests done on 6-by-6-by-20 inch beams cast from each material (ASTM C78). The setup for these tests is shown in Figure 3. While an ASTM test is available to measure shrinkage in concrete (ASTM C490), a simpler test commonly used with cast earth was employed in this investigation. Following this test, the change in length of a beam 3 inches square in cross-section that is initially 36 inches long is monitored after the beam is cast. This test was implemented in this investigation as described in Figure 4. Shrinkage in cementitious materials is generally associated with moisture loss, which typically occurs over time. In most situations, the rate at which shrinkage occurs decreases with elapsed time. For the cast earth material, total shrinkage was easily determined simply by taking measurements from the specimens after they had been oven dried. These beams were subsequently placed on the bench top, and length measurements were made periodically over a one month period. While shrinkage of the fly ash concrete
6
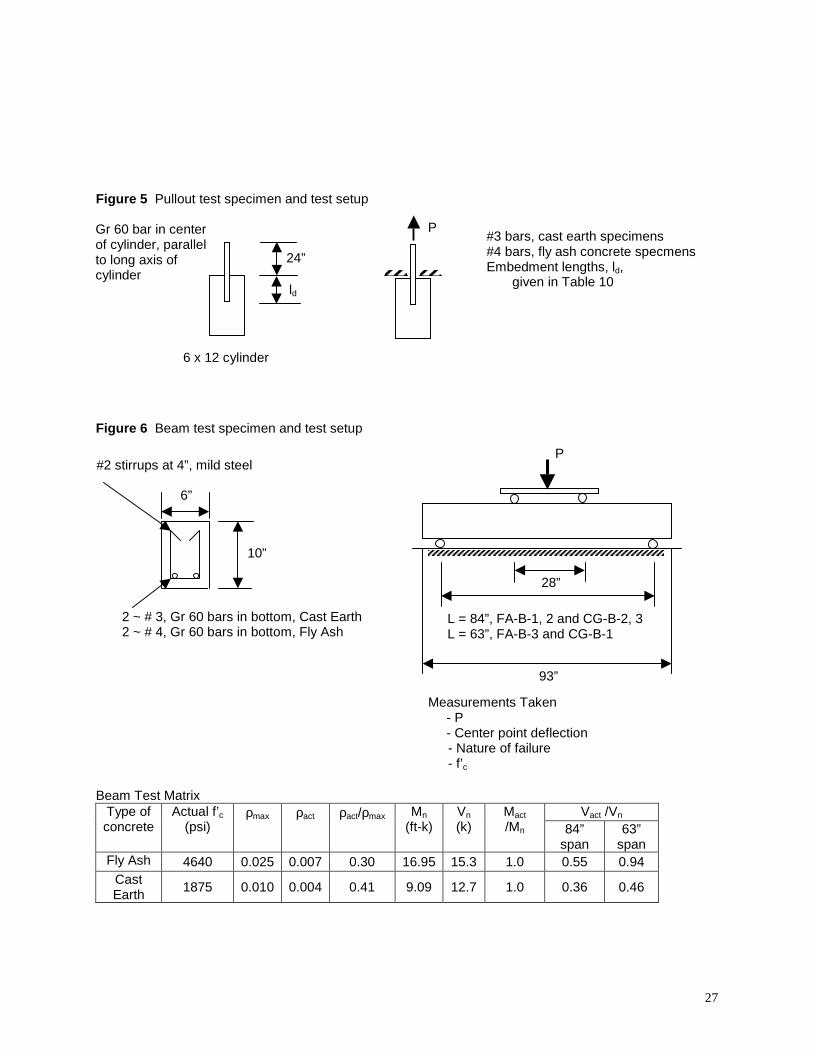
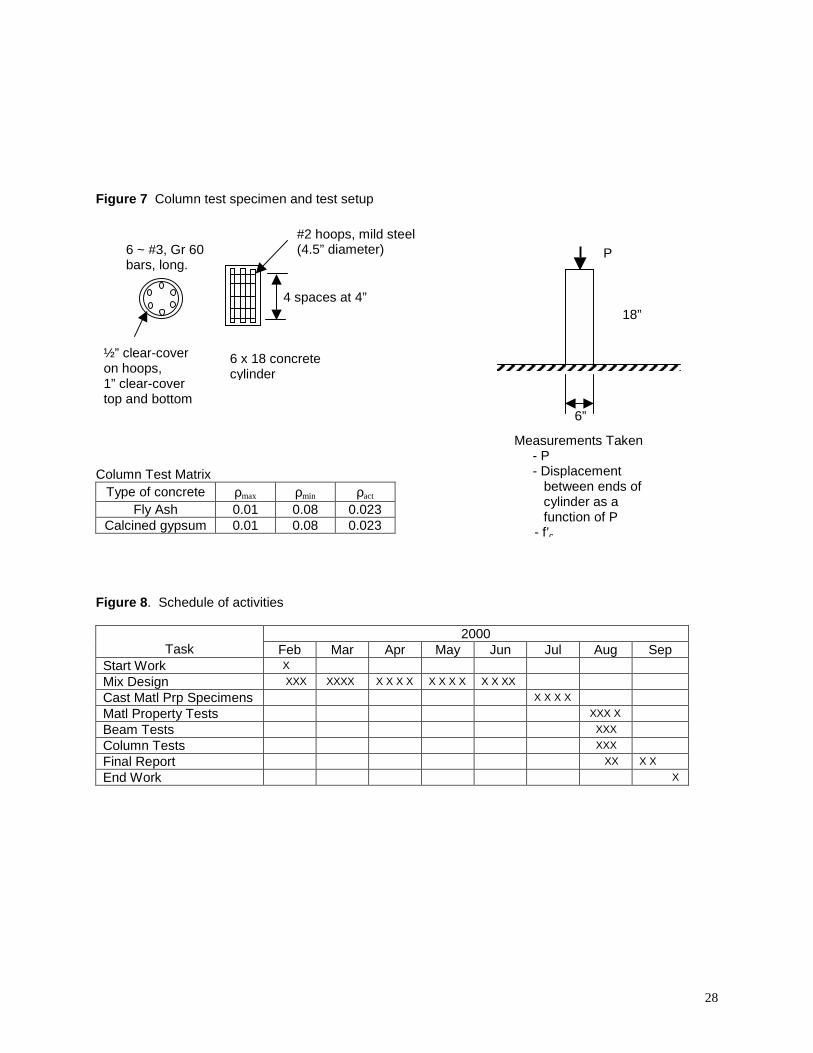
specimens was measured using the same basic approach as for cast earth, the specimens could not simply be oven dried, as this process would interfere with the chemical activity associated with hydration. Therefore, the fly ash concrete specimens were simply placed on the bench top and allowed to age under ambient temperature (approximately 70 degrees Fahrenheit) and humidity (relative humidity of 20 to 40 percent) conditions. Length measurements were made periodically over a one month period. The ability of cast earth and fly ash concrete to bond with, and develop pull-out resistance in steel reinforcing bars was investigated through a sequence of simple pullout tests of deformed bars embedded in 6-by-12 inch test specimens (ASTM C234). Note that while this test method is simple to perform and may yield useful information on bar performance, it has been retired by ASTM, and no specific standard has been developed as a replacement for evaluating concrete bond performance. ASTM A944 does address bond behavior of reinforcing steel embedded in concrete, but it is intended to determine relative bond performance based on surface characteristics of the bar rather than the properties of the concrete. The decision was made to proceed in this investigation following the provisions of the suspended standard ASTM C234. No information was discovered on the performance of conventional Portland cement concretes in this type of test, so the decision was made to construct some Portland cement concrete specimens in addition to the cast earth and fly ash concrete specimens. The specimen configurations used in the pullout tests are given in Figure 5. During these tests, a record was made of the maximum tension force carried by the specimen as a the pullout force was applied to the bar. The failure mechanism of the specimen was also noted (i.e., bar failed, bar pulled out, cast earth/concrete split). The strength of cast earth has been observed to change with ambient moisture conditions. The effect of ambient moisture conditions on strength was evaluated by curing 4-by-8 inch cast earth test specimens under three different conditions of relative humidity, and testing these specimens in unconfined compression. Four environments were considered, namely, relative humidities of 0 percent (oven dried), variable from 20 to 35 percent, variable from approximately 30 to 40 percent, and 100 percent. After the specimens were stripped from their molds, they were stored in each environment for approximately 4 weeks before testing. By this time, the weight of the specimens was constant (they were neither gaining or losing water from the atmosphere). Behavior of Reinforced Structural Elements As stated above, many investigations of innovative cementitious building materials terminate with the generation of a mix design based on workability and compression strength. This project went further, first in looking at additional engineering properties as discussed above, and second, in looking at the performance of these materials in reinforced beam and column elements. Cementitious building materials must be reinforced in contemporary designs to provide strength in tension and more importantly, ductility under overloads. Therefore, tests were conducted on simple beam and column elements to look at these two features of their performance. Cast earth and fly ash beams singly reinforced in accordance with ACI Building Code requirements (American Concrete Institute, 1999) were tested to failure under monotonically increasing transverse loads. The test specimens and the test setup are described in Figure 6. The basic test specimens were simply supported beams, approximately 93 inches long, 10 inches deep, and 6 inches wide. The beams were normally reinforced with conventional, Grade 60 reinforcing steel at steel ratios of 0.004 and 0.007 for the cast earth and fly ash concrete specimens, respectively. Shear reinforcement was provided along
7
the entire length of each beam spaced at 4 inches on center (approximately one-half of the effective depth of the beams, d). The beams were loaded with two symmetrically placed point loads of equal magnitude. Two of the beams for each material were subjected to 1/3 point loads applied vertically on a simply supported span of 84 inches. One beam for each material was tested on a span of 63 inches to increase the shear demands experienced by the beams. Note that all the beams, including those tested on a 63 inch span, were predicted to yield in flexure (as discussed further in the Results section below). Applied load and center point deflection were measured in each test. Cast earth and fly ash concrete columns approximately 6 inches in diameter and 18 inches long were tested in uniaxial compression to failure. These columns, constructed generally in accordance with ACI Building Code requirements, were all identically reinforced with deformed longitudinal steel bars confined by discrete hoops, as detailed in Figure 7. Applied load and deformation were measured in each test. Timetable Work on this project began in February 2000. Testing was completed in August, 2000, with the final report completed in September, 2000. The schedule in which the various project tasks were completed is presented in Figure 8. Originally, work was scheduled to be finished in June, 2000. When the scope of work was altered to include parallel development of both cast earth and fly ash concrete as engineered materials, the schedule was extended. The schedule was further impacted at completion of the mix design effort, when it was discovered that set time and workability of the mixes were substantially reduced when scaled up in volume from small bench top trial batches to larger volume batches made with a commercial concrete mixture. This effect was expected in the cast earth, and adjustments to the cast earth mixtures were easily made in response to the observed changes in material performance. The absence of any experience with the fly ash concrete produced under production conditions resulted in considerable time being spent adjusting the mix proportions to maintain adequate workability and set time, and still obtain relatively high early compression strengths in the hardened state.
8
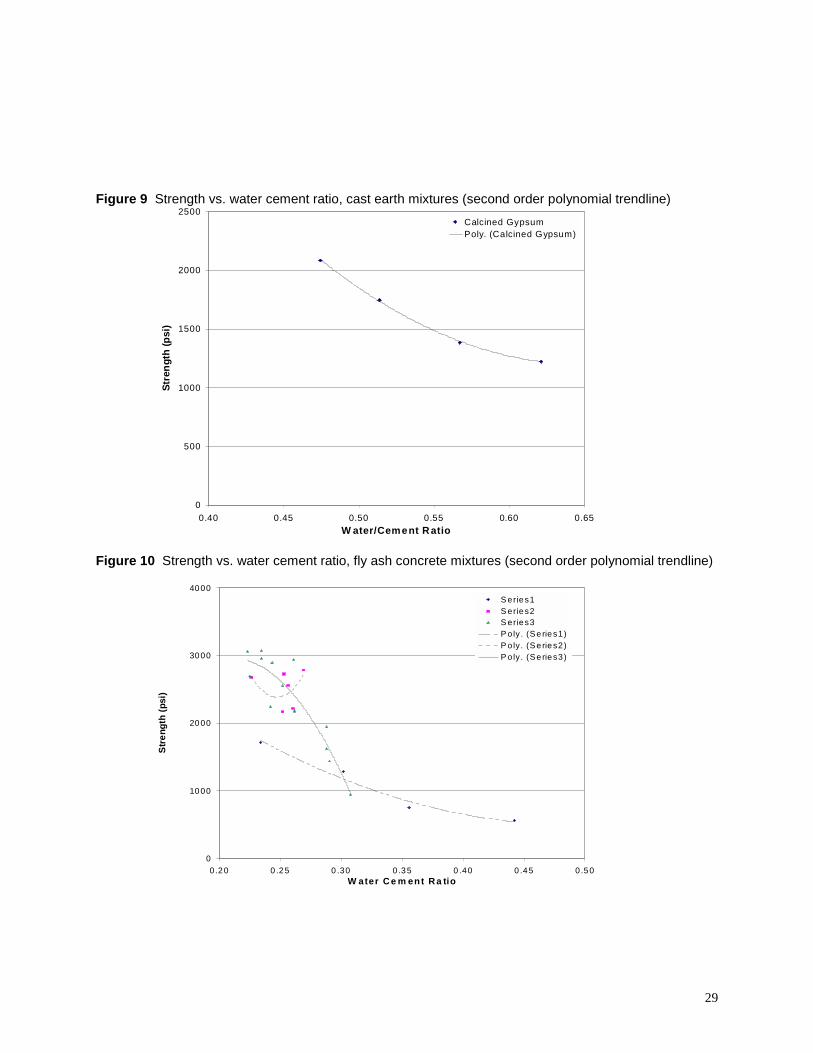
Results Mix Design Effort One of the most fundamental trends observed in the mix design effort was the inverse relationship between compression strength of a mixture and the ratio of water to cementitious material in the mix. That is, as the ratio by weight of the water to cementitious material in the mix decreased, the strength of the mixture increased. The water-to-cement ratio (w/c ratio) has long been acknowledged in conventional Portland cement concrete as the most critical parameter for estimating strength and durability of a mixture (with a low w/c ratio corresponding to a strong and durable mixture). While the existence of a similar relationship for fly ash concrete has previously been documented, it was interesting to see that a similar relationship exists for cast earth. Presented in Figure 9 is compression strength (oven dry) as a function of w/c ratio for aseries of cast earth mixtures in which all other mix parameters were approximately held constant. All the mixtures shown in the Figure easily met the minimum target strength for this material of 1000 psi. These results further show that strengths of 1500 to 2000 psi can be obtained for these types of mixes if the w/c ratios are below 0.55. Compressive strength as a function of w/c ratio is plotted in Figure 10 for three series of fly ash concretes. These mixtures were also made with clean, well-graded concrete aggregate. The only significant difference between the mixtures in each series was the w/c ratio. Once again, all the mixes easily met the target compression strength of 1000 psi. These curves indicate that fly ash concrete strengths in excess of 2000 and 3000 psi (at 7 days) can be readily achieved if the w/c ratio of the mix is less than 0.28 and 0.23, respectively. The approach to increasing the strength of a mixture by reducing its w/c ratio is eventually limited by the effect such reductions have on the workability of the mix in the fresh state (presuming no chemical plasticizers are used to maintain the slump). The slump of both the cast earth and fly ash concrete mixtures decreased as the w/c ratio decreased. This basic effect is well documented in Portland cement concretes. The limiting w/c ratio at which the workability of a mixture is no longer acceptable is affected by the type of aggregate (shape and gradation) and the volume of paste used in the mix. To some extent, slump can be maintained as the w/c ratio is decreased by increasing the paste volume. Using concrete aggregate with a paste volume of 20 percent, for example, a 3.75 inch slump was produced for a cast earth mix with a w/c ratio of 0.57. By increasing the paste volume to 25 percent in the same basic mix, a similar slump (3.5 inches) was obtained at a w/c ratio of 0.51. With respect to the fly ash concretes, at a w/c ratio of 0.23, a slump of only 3 inches was obtained at a paste volume of 20 percent, while a slump of 4.5 inches was obtained at this same w/c ratio for a paste volume of 30 percent. For the cast earth and fly ash mixtures considered in this investigation, increasing the volume of paste in the mixture generally increased its strength, above and beyond the w/c ratio issues discussed above. Compression strength as a function of paste volume (all other things being held approximately constant) is plotted in Figure 11 for the both the cast earth and fly ash concrete materials. This increase in strength with paste volume was attributed to the reduction in the total aggregate-to-paste interface area in the material as the paste volume increased. In typical compression failures in both materials, the paste cleanly separated from the aggregate at the aggregate-to-paste interface. Thus, reducing the interface area by increasing the paste volume resulted in increased strength. While it might appear attractive to optimize mix performance based on this parameter simply by using 100 percent paste in the mixture (eliminating the aggregate), there are some problems with this approach. Increased paste volumes typically result in an increase in shrinkage (the paste is the ingredient in the mixture that usually is responsible for the shrinkage) and often result in an increase in cost (typically, the binder is the expensive ingredient in these types of building products). (Note that all the mixtures considered in this investigation
9
had at least the minimum amount of paste required to coat all the aggregate particles and fill all the voids between these particles.) The effects of the type of aggregate on material performance are presented in Table 4. As expected, highest strengths for both the cast earth and fly ash concrete were obtained using clean, well graded concrete aggregate. Comparative reductions in strength of 25 to 75 percent were observed moving from concrete aggregate to road mix and screened native sands and gravels. Aggregate gradation influences the workability of concrete mixes. The gradation of the screened native materials and the road mix were less than optimum from a workability perspective. Therefore, to obtain the same workability as equivalent mixes made with concrete aggregate, more water had to be used. This increased water resulted in a higher w/c ratio for these mixtures, which translated into a lower compression strength. As expected based on its clay content, the site material produced the weakest cast earth and fly ash concrete mixtures. Of all the trial mixtures made in this investigation, those made with the site material had strengths dramatically lower than the minimum target unconfined compression strength of 1000 psi. The strength of the cast earth made with the site material (327 psi, oven dried) significantly exceeded that of the fly ash concrete made with this material (37 psi at 7 days). Note, however, that the cast earth specimens from this mixture were tested in an oven dry state, while the fly ash concrete specimens were tested in a saturated state (moist cured). The clay content in this aggregate may have been sufficient to create an adobe like material when oven dried. With respect to retarder performance, set time as a function of the amount of borax used in the mix (as a percent by weight of the binder material) is plotted in Figure 12 for both cast earth and fly ash mixtures. As might be expected, set times increased as the amount of borax in the mixture increased. The desired set time of 2 to 3 hours was achieved in the trial batches mixed in a 2 cubic foot rotating drum mixer using 1.5 and 1.25 percent borax by weight of binder for the cast earth and fly ash concrete mixtures, respectively. In the case of cast earth, the strength of the oven dry material decreased as the borax content increased aboved 1.5 percent. The effect of borax on strength was fairly constant over the range of 0.75 to 1.0 percent. In the case of fly ash concrete, early strengths (7 day) dramatically declined at a borax content of 1.5 percent. Strengths were fairly uniform at borax concentrations below 1.25 percent. Long term fly ash concrete strength was less sensitive to percentage of borax than the 7 day strengths. Both set time and workability were influenced by the mixing procedure used. With respect to set time, batches mixed in a 2 cubic foot, fixed vane rotating drum mixer set at least twice as fast as those mixed by hand, if in the mixing process, the mix water was added in two increments (i.e., the water content was being adjusted to meet slump criteria). The difference in set times between batches made with the two different mixers noticeably decreased when the mix water was added all at once. The sequence in which the mixer was charged also effected set time and workability. Best results were achieved by mixing the sand, gravel, water, and retarder for approximately 30 seconds, then adding the binder. The materials were then mixed for 3 minutes, allowed to stand for 3 minutes, and than mixed a final 2 minutes. The sensitivity of the workability and the set time of cast earth and fly ash concrete to the specific mixing process may indicate that special care must be exercised in using these materials in building applications. Notably, it may be important to make full size trial batches employing exactly the procedures that will be used in actual production to insure that acceptable workability and set time is achieved. Furthermore, the mechanical action associated with pumping these materials may further influence their workability and set time. Therefore, these trial batches should also be placed using precisely the equipment to be used on the job site.
10
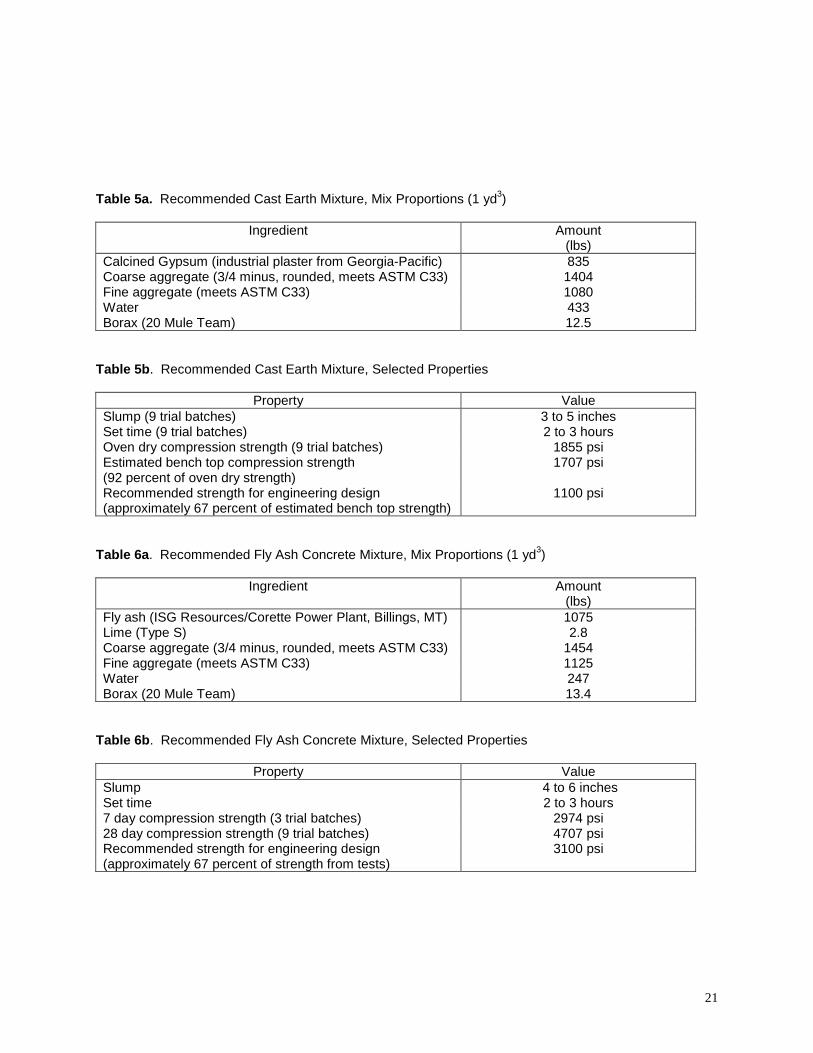
For the fly ash concrete, an additional investigation was done on the effects of adding lime to the mixture. From a workability perspective, lime reduced the “stickiness” of the fly ash concrete in the fresh state. In the hardened state, the addition of small amounts of lime significantly increased the compression strength of the concrete and somewhat improved the abrasion resistance of the surface of the material. The relationship between lime content and strength is presented in Figure 13. The optimum lime content from a strength perspective was found to be around 3 percent by weight of fly ash. At this lime content, the strength was found to increase by 10 to 15 percent relative to equivalent mixtures without lime. Unfortunately, it was discovered that borax was only nominally effective in retarding the set of fly ash concretes made with a lime content in excess of 0.25 percent. For two hours of retardation coupled with reasonable strength gain by 7 days, the maximum amount of lime that can be used in the mix is approximately 0.3 percent. While this amount of lime may appear to be negligible, it still produced a distinct reduction in the “stickiness” of the mixtures, and its use is strongly recommended. Recommended Cast Earth and Fly Ash Concrete Mixtures The cast earth and fly ash concrete mixtures recommended for the Epicenter project are presented in Tables 5 and 6, respectively. These mix proportions were selected based on the results of the mix design effort described above. In the context of that effort, these mixtures were selected as offering a reasonable combination of w/c ratio, paste volume, and retarder content to produce a material with an adequate strength (1000 psi minimum), workability (4 inches), and set time (2 to 3 hours) for structural applications in the EpiCenter project. Of the available aggregates, the mixes were formulated using a conventional concrete aggregate. In this case, the site material is simply unacceptable for use either in the cast earth or the fly ash concrete due to its high clay content. With respect to off-site materials, natural sands and gravels are abundant. As all these materials still require some processing before they can be used, the decision was made to simply proceed with a readily available processed concrete aggregate. The recommended strengths to be used for each material for engineering design purposes are lower than those determined by test due to the inherent variability in the strength of each batch of material. The minimum possible strength that might reasonably occur in any given batch should be used for design purposes, rather than the average strength across several batches. In standard practice with Portland cement concretes, the design strength of these materials would be reduced by up to 1000 psi in the absence of extensive experience with their performance (Kosmatka and Panarese, 1988). This reduction is generally on the order of magnitude of 33 percent of common Portland cement concretes (3000 psi mixtures), so the decision was made to reduce the strengths determined by test by 33 percent for design purposes, which corresponds to a reduction of 607 and 1607 psi for the cast earth and fly ash concrete, respectively. As additional information is collected on the variability of these mixes, the design strengths may be adjusted. Further note that the fly ash concretes will continue to gain strength with time. At 56 days, a further 10 percent increase in strength over the 28 day strength has been observed with this mixture. With respect to commercial production of these mixtures, they should be batched based on meeting the target w/c ratio for the mixture rather than adjusting the amount of water in the mix to meet a target slump. The strength of these materials is very sensitive to w/c ratio, and small increases in this parameter can produce a dramatic reduction in compressive strength. As stated above, full-size trial batches should be prepared for each material prior to using them at the job site. These trial batches
11
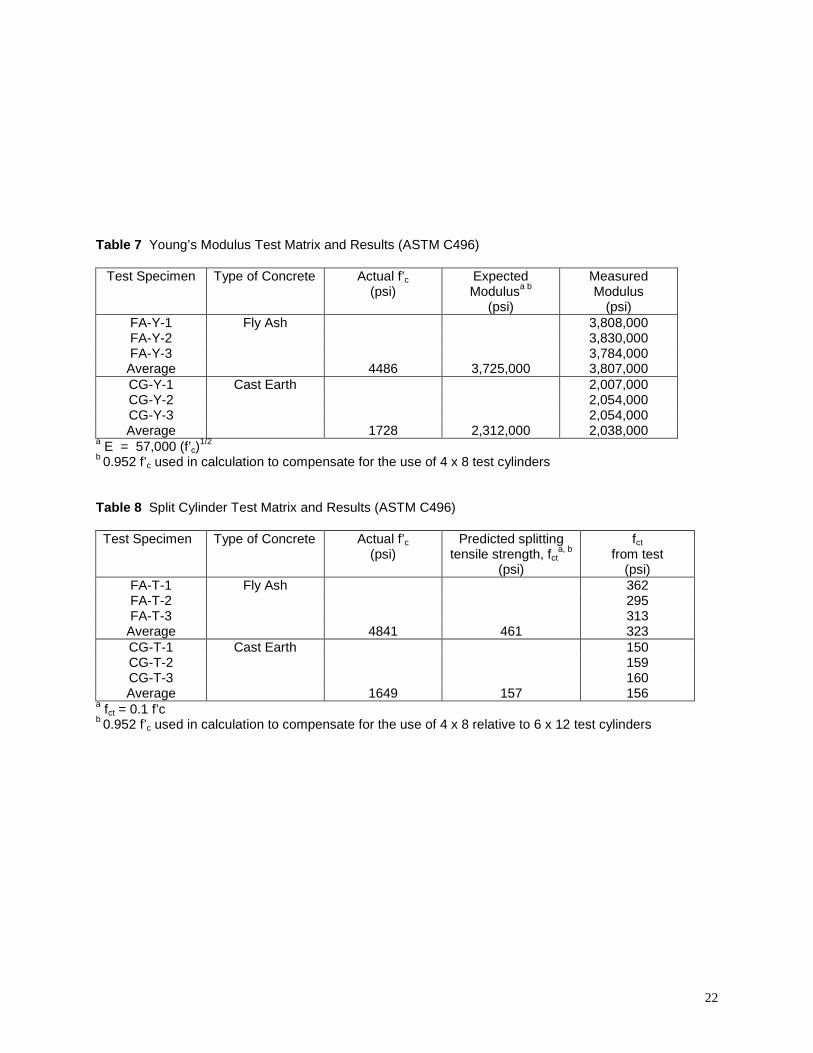
should be made using the specific mixing and placing equipment that will be employed at the job site. The workability and set time of the mixtures is very sensitive to these parameters. Two qualitative behaviors observed in these materials that deviate from Portland cement concrete merit specific comment. First, the cast earth had a propensity to quickly generate oxidation/rust products on steel surfaces it contacted. Rust immediately appeared, for example, on the steel beam forms and on the steel drum of the concrete mixer. Second, the surface of the fly ash concrete was less abrasion resistant than would be expected in a Portland cement concrete of similar compression strength. The surface of material cured 28 days and with a compression strength of over 4000 psi could still be easily scratched, for example, with a finger nail. Characterization of Engineering Properties for Design Young’s modulus, splitting tensile strength, modulus of rupture, shrinkage, and pullout tests were determined using the tests described above conducted on specimens made using the recommended mixtures presented in Tables 5 and 6. Empirically derived equations are available to estimate some of these properties for conventional Portland cement concretes based on the unconfined compression strength of the material (which is perhaps the simplest property to obtain and single most informative property for conventional Portland cement concrete). The appropriateness of these equations for estimating similar properties of cast earth and fly ash concrete based on their compression strength was evaluated. Average values for Young’s modulus of 2,038,000 and 3,807,000 psi were determined for the cast earth and fly ash concrete mixtures, respectively. Complete test results are presented in Table 7. The values determined by test closely match (within 3 percent) those determined using the equation for Portland cement concrete that relates Young’s modulus, E, to unit weight ,wc, and unconfined compression strength, f’c, (Wang and Salmon, 1998)): E = 33 wc
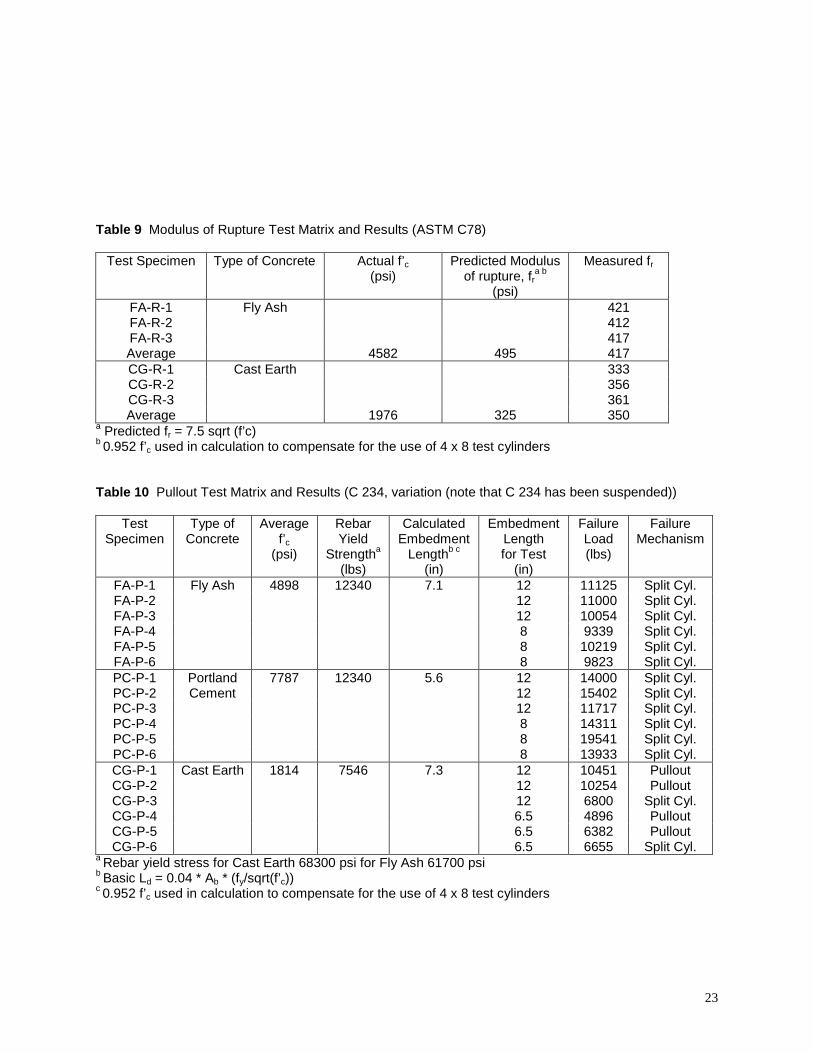
1.5 sqrt(f’c) Average tensile splitting strengths of 156 and 323 psi were determined for the cast earth and fly ash concrete mixtures, respectively. Results of these tests are given in Table 8. The average splitting tensile strength for the cast earth mixture was almost identical to that predicted using the estimate for this property from conventional Portland cement concrete technology of one-tenth of the compression strength (Park and Paulay, 1975). The average splitting tensile strength experimentally determined for the fly ash concrete, however, was 30 percent below the value predicted by this method. The average modulus of rupture for the cast earth and fly ash concrete were found from test to be 350 and 417 psi, respectively. Complete test results are presented in Table 9. As observed for the splitting tensile strength, the modulus of rupture for the cast earth specimens matched (within 7 percent) that which was predicted from the compression strength using the equation relating these parameters developed for Portland cement concrete (Park and Paulay, 1975): f’r = K sqrt(f’c); K often taken as 7.5 out of range of possible K values of 6 to 12 The experimentally determined modulus of rupture for the fly ash concrete material, however, was only 84 percent of the value estimated using the above relationship.
12
Both the splitting tensile strength and the modulus of rupture of the fly ash concrete were below the values that were predicted from the compression strength using relationships developed for Portland cement concrete. These results indicate that the tension strength of the fly ash concrete may be relatively lower than the compression strength compared to the relationship between these strengths for Portland cement concrete. Both the cast earth and fly ash concrete exhibited nominal expansive behavior. The results of shrinkage measurements made on the fly ash specimens through time are presented in Figure 14. Both materials appeared to expand immediately after casting, followed by a gradual reduction in size with the passage of time. The cast earth specimens initially expanded from 0.04 to 0.06 percent. The specimens generally stabilized after 2 months in the oven at an expansion of 0.02 to 0.04 percent. After 7days of moist cure, the fly ash concrete specimens expanded from 0.08 to 0.12 percent. After sitting on the bench top for approximately 2 months, these specimens exhibited a net expansion of 0.07 percent. The basic expansion of both the cast earth and fly ash concrete mixtures is inconsistent with behavior generally observed in Portland cement concretes. Portland cement based concretes generally exhibit ultimate shrinkage in the range of 0.02 to 0.06 percent (Park and Paulay, 1975). The magnitude of the expansion of the cast earth and fly ash concrete is sufficiently small that it should not be a problem in building applications. The compression strength of the cast earth specimens varied inversely with the ambient relative humidity at which they were stored. Compression strength as a function of relative humidity is plotted in Figure 15. The measured compression strength of the specimens decreased from approximately 2000 to 500 psi as the relative humidity varied from 0 percent (oven dried) to 100 percent (stored in moist cure room). When simply stored for a month on the bench top in the laboratory (relative humidity of 20 to 35 percent), the cast earth had a compression strength of only 92 percent of its oven dried strength. Certainly these results support the practice of not using cast earth in wet environments and of generally applying surficial waterproofing to cast earth installations. The cast earth and fly ash concrete pull-out test specimens all failed at loads below those expected based on minimum embedment lengths calculated using equations developed for Portland cement concrete. Results of the pull-out tests are presented in Table 10. In Portland cement concrete, adequate anchorage is provided if the yield strength of the bar can be developed in tension before an anchorage failure occurs in the concrete. The embedment length required for full bar development, Ld, is calculated in terms of the bar area, Ab, the yield strength of the bar, fy, and the strength of the concrete, f’c (Wang and Salmon, 1998)
Ld = 0.04 Ab fy / (sqrt(f’c))
The results of applying this equation to the cast earth, fly ash concrete, and Portland cement concrete specimens used in this investigation are given in Table 10, along with the actual embedment lengths used for the specimens made with each material. The shorter of the two embedment lengths for each type of material was set close to these theoretical development lengths. Note that the Portland cement concrete mixture was considerably stronger than expected; thus, the embedment length actually used (8 inches) significantly exceeds the minimum length (5.6 inches). The longer of the two embedment lengths used with each material was simply set at the full depth of the test cylinders (12 inches). In all the tests, the
13
expected minimum pullout strengths should have exceeded the yield strengths of the bars. Referring to Table 10, however, only the Portland cement based concrete specimens developed at least the tensile yield strength of the bars at its short development length (although this length did exceed the minimum calculated development length). In tests on the corresponding cast earth and fly ash concrete specimens with approximately minimum embedment depths, the bars were only developed to an average of 79 percent of their yield strength at specimen failure. At 12 inches of embedment, full development of the reinforcing steel was observed in the cast earth specimens. Note that one of these specimens did fail at a load substantially below the yield strength of the bar; this failure, however, is attributed to an irregularity in the test specimen. The fly ash concrete specimens still were only able to develop an average of 87 percent of the bar yield strength at 12 inches of embedment. These results indicate that development lengths need to be increased in reinforced cast earth and fly ash concrete elements relative to those in Portland cement concrete elements. The failure mechanism in all of the Portland cement concrete and fly ash concrete pullout tests and in two of the cast earth pullout tests was tensile splitting of the base of the specimens. Pullout capacity is related to tensile strength of the concrete material. The low pullout resistance of the fly ash concrete relative to Portland cement concrete may simply be a reflection of the relatively lower tensile strength of fly ash concrete relative to Portland cement concrete. Reasons for the low pullout strengths in the minimum embedment specimens made with cast earth are still under investigation. Behavior of Reinforced Structural Elements Simple reinforced beam and column elements were made with cast earth and fly ash concrete to determine if their strength can be predicted using equations developed for Portland cement concrete and to determine if they provide sufficient ductility to be used in engineered structures.
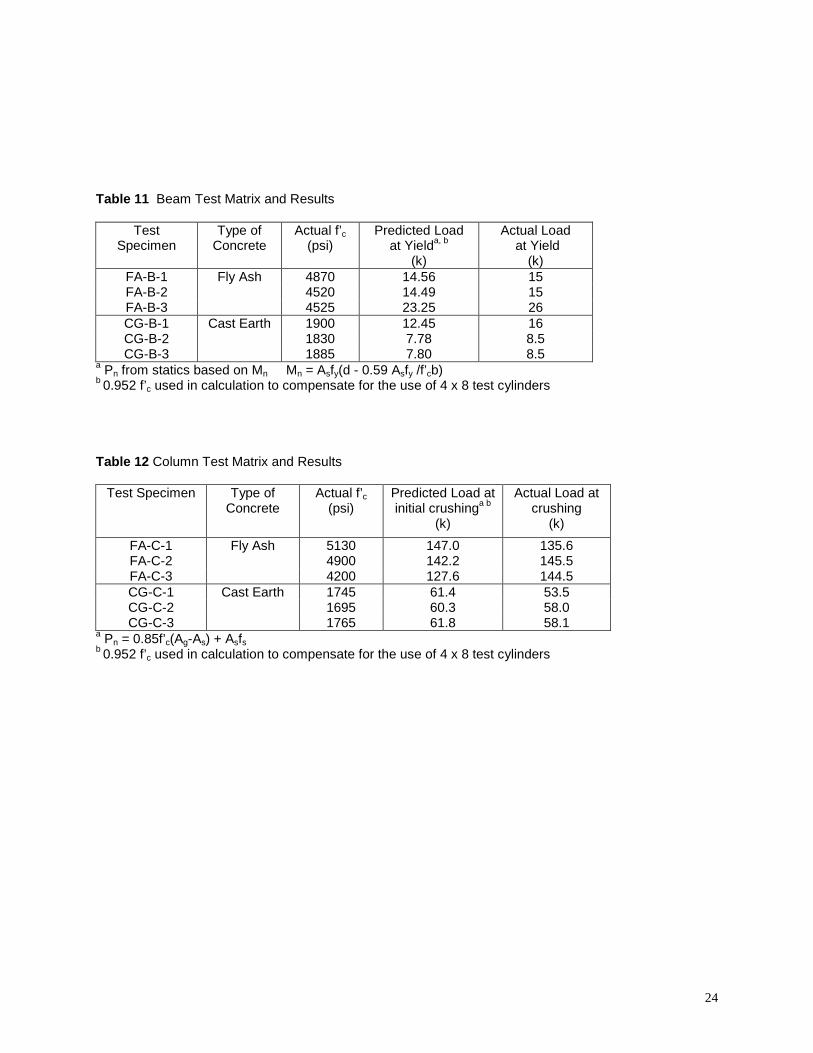
All of the cast earth and fly ash concrete beams performed satisfactorily in flexure. In all the beam tests, the first distress consisted of flexural tension cracks on the bottom of the beam in the center of the span. These cracks widened and propagated toward the top of the beams as the load increased. While initially the vertical deflection of each beam increased proportionally with the applied load, a point was reached in each test at which the beam began to move down without an increase in the applied load. Based on conventional reinforced concrete beam theory, this point corresponds to the point at which the reinforcing steel in the beam yielded. The yield point in each test can be readily identified in the load versus displacement plots presented in Figures 16 and 17 for the cast earth and fly ash beams, respectively. Eventually, as the beams continued to deflect vertically, the cast earth/fly ash concrete at the top of the beams in the center of the span began to spall off, and the load carrying capacity of the beams began to decrease as this compression failure propagated horizontally and vertically in extent. Throughout all the beam tests, there was no evidence of any anchorage problems with the primary flexural or shear reinforcement. Photographs of typical failed cast earth and fly ash beams are shown in Figures 18 and 19, respectively. Note that during many of the tests, diagonal cracks also appeared in the end panel zones between the points of the applied load and the supports. These shear cracks, generally remaining hairline in width throughout the tests, were generated by the shear demands in the end panel zones of the beams. The beam behavior described above closely matches that predicted by theory for conventional reinforced Portland cement concrete beams with respect to both the yield strength and the post-yield ductility. The load measured in each test at which the beams first yielded is reported in Table 11. The observed yield
14
loads in the cast earth and concrete beams tested on an 84 inch span were within 8 and 4 percent, respectively of the predicted yield loads based on the moment capacity equation for conventional Portland cement concrete. This well established equation for moment capacity, Mn, is based on the compression strength of the material, f’c, the width of the cross-section, b, the location of the reinforcing steel, d, the area of steel, As, and the yield strength of the steel, fy (Wang and Salmon, 1998):
Mn = Asfy(d – (0.59fAsfy)/(f’cb)) The observed yield loads in the beams tested on a 63 inch span were within 29 and 12 percent of the predicted loads for the cast earth and fly ash concrete beams, respectively. Note that while the tests conducted at the 84 inch span length were expected to produce simple flexural behavior in the failure zone, more complex behaviors may have occurred in the center failure zone in the 63 inch span situation. The supports in these tests were close enough to the center failure zone that end induced effects could have influenced the stress conditions in this area. Thus, the difference between the actual and predicted yield loads at the 63 inch span length may be related more to edge/end effects influencing the beams’ behavior than to an inherent inability of the Portland cement based moment capacity equation to predict the strength of these cast earth and fly ash concrete elements. All of the beams demonstrated adequate shear resistance, although they were not challenged to failure in shear in these tests. That is, no shear failures were expected based on the shear capacity of these beams calculated using equations developed for Portland cement concrete, and none occurred. Shear capacities, Vn, were calculated from the strength of the material, f’c; the width, b, and effective depth, d, of the cross section; and the spacing of the shear reinforcement, s, its yield strength, fy, and its cross-sectional area, Av, using the equation (Wang and Salmon, 1998): Vn = 2 sqrt(f’c)bd + (Av fy d)/s The highest shear demands occurred in the 63 inch span beams. The maximum loads in these tests produced shear demands in the cast earth and fly ash concrete beams, respectively, at 46 and 94 percent of their predicted shear capacity, respectively. At these loads, the beams exhibited hairline shear cracks in the end panel zones, as the shear demand was shared between the material and the shear reinforcement. Shear capacity of concrete-like materials is related to the material’s tension strength, and thus consideration should be given to researching more thoroughly the shear capacity of the fly ash concrete (in that its tension strength is less than expected relative to its compression strength). With respect to ductility, the cast earth and fly ash concrete beams exhibited displacement ductility ratios on the order of magnitude of 4 and 7, respectively. The displacement ductility ratio was calculated as the ratio of the displacement at final loss of load carrying capacity divided by the displacement at initial yield. These displacements were estimated for each test from the load versus displacement data presented in Figures 16 and 17. Note that similar beams made with Portland cement concrete generally have ductility ratios between 5 and 10. Displacement ductility ratios of 3 to 5 are typically required to provide adequate seismic response (Park and Paulay, 1975). The behavior of the cast earth and fly ash concrete columns matched that expected based on conventional Portland cement concrete theory. Complete results of the column tests are summarized in Table 12. In the case of the cast earth, at the maximum capacity of the reinforced column, the cast earth
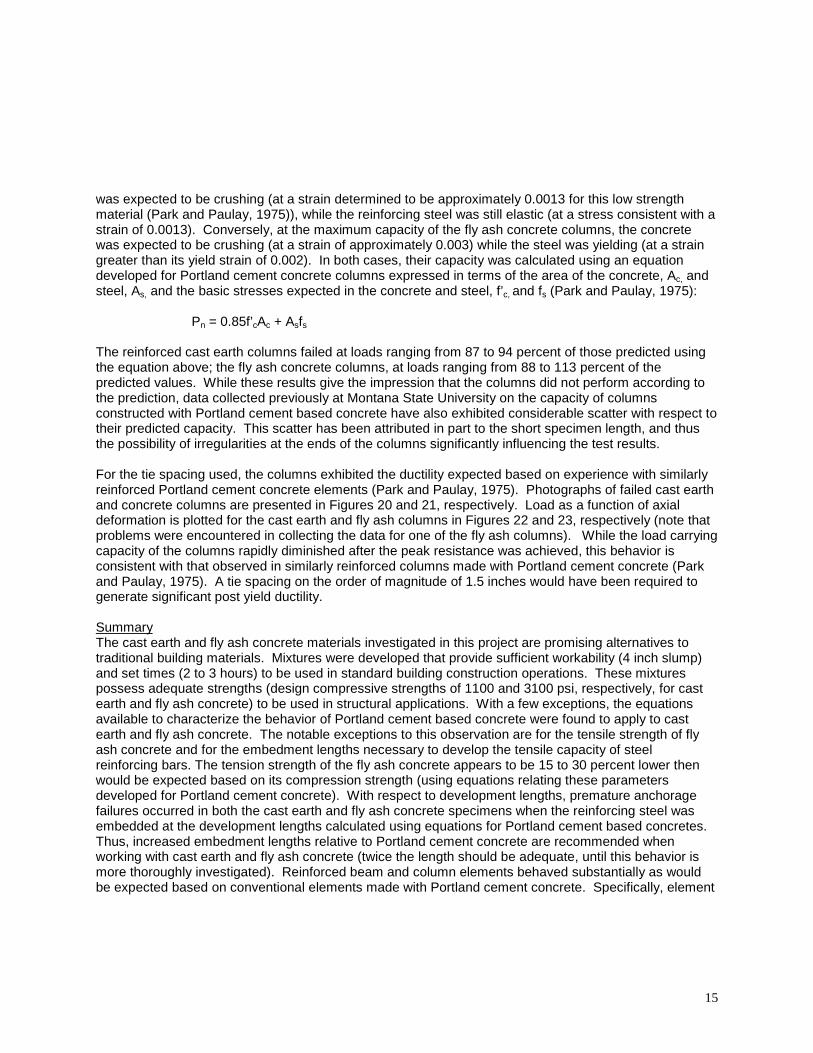
15
was expected to be crushing (at a strain determined to be approximately 0.0013 for this low strength material (Park and Paulay, 1975)), while the reinforcing steel was still elastic (at a stress consistent with a strain of 0.0013). Conversely, at the maximum capacity of the fly ash concrete columns, the concrete was expected to be crushing (at a strain of approximately 0.003) while the steel was yielding (at a strain greater than its yield strain of 0.002). In both cases, their capacity was calculated using an equation developed for Portland cement concrete columns expressed in terms of the area of the concrete, Ac, and steel, As, and the basic stresses expected in the concrete and steel, f’c, and fs (Park and Paulay, 1975):
Pn = 0.85f’cAc + Asfs The reinforced cast earth columns failed at loads ranging from 87 to 94 percent of those predicted using the equation above; the fly ash concrete columns, at loads ranging from 88 to 113 percent of the predicted values. While these results give the impression that the columns did not perform according to the prediction, data collected previously at Montana State University on the capacity of columns constructed with Portland cement based concrete have also exhibited considerable scatter with respect to their predicted capacity. This scatter has been attributed in part to the short specimen length, and thus the possibility of irregularities at the ends of the columns significantly influencing the test results. For the tie spacing used, the columns exhibited the ductility expected based on experience with similarly reinforced Portland cement concrete elements (Park and Paulay, 1975). Photographs of failed cast earth and concrete columns are presented in Figures 20 and 21, respectively. Load as a function of axial deformation is plotted for the cast earth and fly ash columns in Figures 22 and 23, respectively (note that problems were encountered in collecting the data for one of the fly ash columns). While the load carrying capacity of the columns rapidly diminished after the peak resistance was achieved, this behavior is consistent with that observed in similarly reinforced columns made with Portland cement concrete (Park and Paulay, 1975). A tie spacing on the order of magnitude of 1.5 inches would have been required to generate significant post yield ductility. Summary The cast earth and fly ash concrete materials investigated in this project are promising alternatives to traditional building materials. Mixtures were developed that provide sufficient workability (4 inch slump) and set times (2 to 3 hours) to be used in standard building construction operations. These mixtures possess adequate strengths (design compressive strengths of 1100 and 3100 psi, respectively, for cast earth and fly ash concrete) to be used in structural applications. With a few exceptions, the equations available to characterize the behavior of Portland cement based concrete were found to apply to cast earth and fly ash concrete. The notable exceptions to this observation are for the tensile strength of fly ash concrete and for the embedment lengths necessary to develop the tensile capacity of steel reinforcing bars. The tension strength of the fly ash concrete appears to be 15 to 30 percent lower then would be expected based on its compression strength (using equations relating these parameters developed for Portland cement concrete). With respect to development lengths, premature anchorage failures occurred in both the cast earth and fly ash concrete specimens when the reinforcing steel was embedded at the development lengths calculated using equations for Portland cement based concretes. Thus, increased embedment lengths relative to Portland cement concrete are recommended when working with cast earth and fly ash concrete (twice the length should be adequate, until this behavior is more thoroughly investigated). Reinforced beam and column elements behaved substantially as would be expected based on conventional elements made with Portland cement concrete. Specifically, element
16
behavior with respect to strength and ductility closely matched that expected for similar Portland cement concrete elements. Thus, existing flexural design procedures can generally be employed when using these materials (with the exception of embedment lengths). Note that while shear behaviors were not directly investigated in this project, no shear related problems in performance were observed. Future Work This project investigated many of the characteristics of cast earth and fly ash concrete required in the structural design process and important in the subsequent construction of buildings made with these materials. There are a few other aspects of the behavior of these materials that require further study for their use to become commonplace. Notably, additional features of the of these materials that require further investigation include:
1) long term stability and durability. The long term stability and durability of building materials is important from both an economic and a life safety perspective. Evaluating the long term stability and durability of new building materials can be difficult. Often, the ability of accelerated exposure/aging tests to mimic real life conditions is questionable. One general concern with cementitious materials is that deleterious long term chemical reactions may be occurring between various ingredients in the mix that result in a gradual loss of strength. While such reactions are not obviously occurring in either the cast earth or fly ash concrete considered in this investigation, they can be difficult to detect over a short period of time. In cast earth, specific concerns do exist regarding possible accelerated corrosion of embedded steel objects. In fly ash concrete, concerns exist regarding its resistance to the deterioration related to successive freeze thaw cycles. This issue is not a concern for cast earth, in that by its nature it must be protected from severe moisture exposure. Concerns about incidental moisture compromising the strength and durability of cast earth could be eliminated if some form of integral waterproofing could be developed. The range of applications for cast earth could also possibly be extended if such waterproofing was available.
2) reinforcing bar anchorage requirements. The length of embedment necessary to develop the tensile yield capacity of these bars needs to be definitively established.
3) fire resistance. The ability of these materials to continue to carry loads at elevated temperatures during a fire needs to be evaluated.
4) creep behavior. The possibility that these materials may experience objectionable long term deflections under sustained loads needs to be investigated.
From a structural engineering perspective, these materials would be more attractive if their tensile strength and surface toughness (particularly in the case of the fly ash concrete) could be improved. Furthermore, if the influence of various mix parameters on material performance could be more thoroughly established, mixtures could be custom designed by the engineer and contractor to fit the unique requirements of various projects. Designers and contractors would be more receptive to using such mixtures if standard specifications were developed for mixing and placing them. The attractiveness of these materials would be increased from an economic and environmental perspective if methods could be developed to enhance their insulating value in wall applications (by reducing their density) and to allow them to be placed without the use of form work (by adjusting the mix design). From the same perspective, one of the appeals of these materials (notably in the case of cast earth) is the possibility of using site soils as filler/aggregate in the mix. Use of site soils would be facilitated if the engineering properties and performance of the resulting mixtures could be readily predicted. Such predictions could
17
be made based on a testing program that investigated generic types of soils representative of those encountered at building sites around the country. Dissemination This investigation was only just completed at the time this report was prepared. It is anticipated that the results will be disseminated at conferences on innovative building materials and by-product re-utilization, and in appropriate engineering publications. Research Partners Participants in this program included: Consultants Living Systems Architecture and Construction, Prescott, Arizona Beaudette Engineers, Missoula, Montana Advisors ISG Resources, Billings, Montana BNIM Architects, Kansas City, Missouri References American Concrete Institute (1999), Building Code Requirements for Structural Concrete (ACI 318-99), American Concrete Institute, Detroit, MI. American Society for Testing and Materials (1999), ASTM Standards, American Society for Testing and Materials, Philadelphia, PA. Davis, H., Troxell, G., and Hauck, G. (1982), The Testing of Engineering Materials, McGraw-Hill Book Company, New York, NY. Kosmatka, S. and Panarese W. (1988), Design and Control of Concrete Mixtures, Portland Cement Association, Skokie, IL. Park, R. and Paulay, T. (1975), Reinforced Concrete Structures, John Wiley and Sons, New York, NY. Ramachandran, V., Feldman, R., and Beaudoin, J. (1981), Concrete Science, Heyden, London, England. State of New Mexico Regulation and Licensing Department (1991), New Mexico Adobe and Rammed Earth Building Code, State of New Mexico Regulation and Licensing Department, Santa Fe, NM. Wang, C-K. and Salmon, C. (1998), Reinforced Concrete Design, Addison-Wesley, Menlo Park, Ca. Acknowledgements This work was performed under the sponsorship of the U.S. Department of Commerce, National Institute of Standards and Technology. Reproduction of this report, giving credit to the authors, is permitted.
18
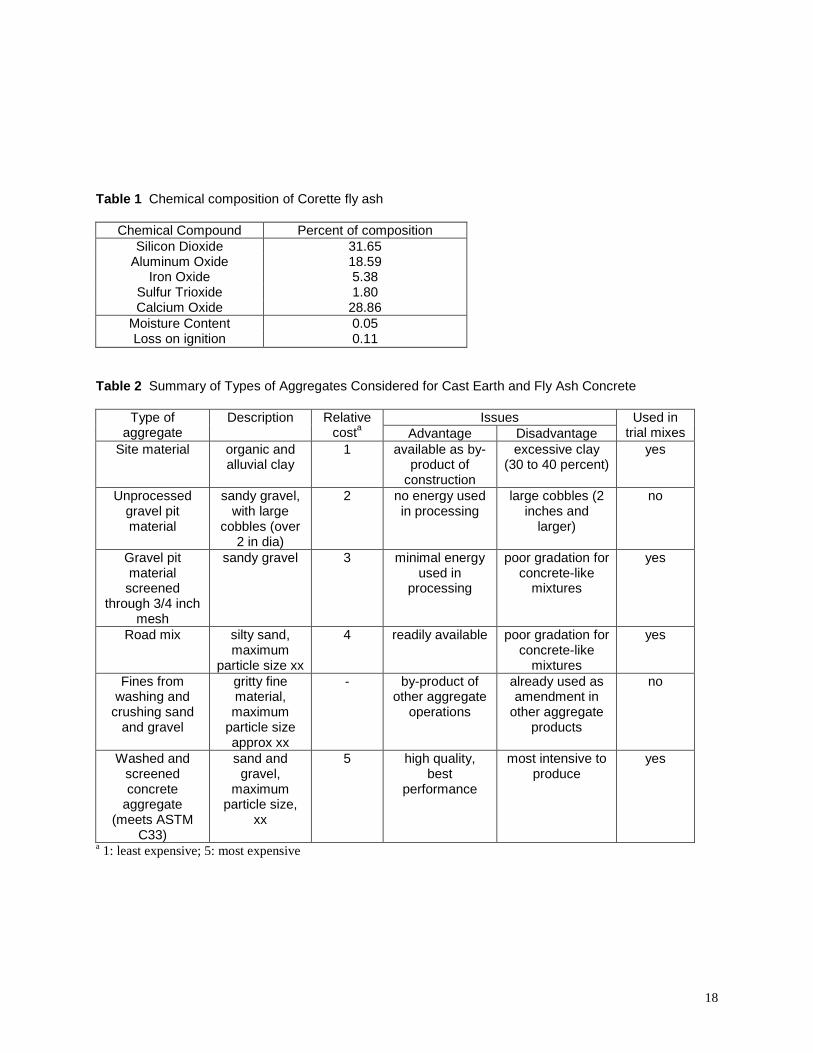
Table 1 Chemical composition of Corette fly ash
Chemical Compound Percent of composition Silicon Dioxide 31.65
Aluminum Oxide 18.59 Iron Oxide 5.38
Sulfur Trioxide 1.80 Calcium Oxide 28.86
Moisture Content 0.05 Loss on ignition 0.11
Table 2 Summary of Types of Aggregates Considered for Cast Earth and Fly Ash Concrete
Issues Type of aggregate
Description Relative costa Advantage Disadvantage
Used in trial mixes
Site material organic and alluvial clay
1 available as by-product of
construction
excessive clay (30 to 40 percent)
yes
Unprocessed gravel pit material
sandy gravel, with large
cobbles (over 2 in dia)
2 no energy used in processing
large cobbles (2 inches and
larger)
no
Gravel pit material screened
through 3/4 inch mesh
sandy gravel 3 minimal energy used in
processing
poor gradation for concrete-like
mixtures
yes
Road mix silty sand, maximum
particle size xx
4 readily available poor gradation for concrete-like
mixtures
yes
Fines from washing and
crushing sand and gravel
gritty fine material, maximum
particle size approx xx
- by-product of other aggregate
operations
already used as amendment in
other aggregate products
no
Washed and screened concrete
aggregate (meets ASTM
C33)
sand and gravel,
maximum particle size,
xx
5 high quality, best
performance
most intensive to produce
yes
a 1: least expensive; 5: most expensive
19
Table 3a Selected Trial Mixes, Cast Earth
Mix Proportions Characteristics in the fresh
state
Mix
Gypsum, % of
solids by weight
Type of aggregate
w/c ratio
Borax, % by weight of gypsum
Mixing Method
Slump, inches
Set time, min.
Oven dry compression strength, psi
CG-11 20 C33 0.55 0.67 Hand 3.75 5 2082 CG-19 20 C33 0.62 1.00 Drum 4.00 N/A 1360 CG-46 20 C33 0.52 1.17 Drum 3.00 N/A 1816 CG-12 25 C33 0.51 0.92 Hand 3.50 45 2237 CG-20 25 4” (-) 0.62 0.95 Hand 3.75 0 1735
CG-20A 25 Road Mix 0.51 0.95 Drum 0.00 15 1050 CG-20AA 25 Road Mix 0.64 0.95 Hand 7.25 0 1227 CG-20B 25 Site matl 1.29 0.95 Hand 0.00 30 327 CG-20C 30 C33 0.53 1.00 Hand 3.50 N/A 1278 CG-51 20 C33 0.47 0.68 Drum 0.75 45 2797 CG-52 20 C33 0.47 1.36 Drum 1.00 55 2082 CG-53 20 C33 0.47 2.04 Drum 1.00 210 1569 CG-54 20 C33 0.54 2.04 Drum 2.75 210 1658 CG-55 20 C33 0.64 1.90 Drum 6.00 265 953 CG-57 20 C33 0.62 1.73 Bread 2.75 240 1222
CG-58A 20 C33 0.57 1.50 Bread 1.50 91 1528 CG-58B 20 C33 0.57 1.50 Bread 5.50 152 1383 CG-59 20 C33 0.51 1.50 Bread 1.50 135 1743 CG-60 20 C33 0.57 1.60 Bread 3.25 111 1382 CG-61 35 C33 0.52 0.99 Bread 7.25 55 2003 CG-62 25 C33 0.53 1.50 Bread 5.00 139 1432
20
Table 3b Selected Trial Mixes, Fly Ash Concrete
Mix Proportions Characteristics in the fresh state
Compression strength,
psi
Mix
Fly ash, % of solids
by weight
Type of aggregate
w/c ratio
Borax, % by
weight of fly ash
Lime, % by
weight of fly ash
Mixing Method
Slump, inches
Set time, min.
7 day
28 day
FA-1 20 C33 0.36 0.35 0.00 Hand 10.0 5 743 1096 FA-2 20 C33 0.44 0.35 0.00 Hand 7.00 14 561 809 FA-3 20 C33 0.30 0.70 0.00 Hand 9.00 65 1283 1980 FA-4 20 C33 0.23 0.70 0.00 Hand 3.00 N/A 1708 2681 FA-6 25 Road Mix 0.35 1.35 0.00 Hand 4.00 0 1357 1638
FA-6A 25 Site matl 0.19 1.35 0.00 Hand 0.00 0 37 N/A FA-7 25 4” (-) 0.36 1.35 0.00 Hand 4.00 0 685 812 FA-9 30 C33 0.23 0.90 0.00 Hand 8.00 0 2680 3183 FA-10 25 C33 0.22 1.16 0.00 Hand 7.75 0 2709 3210 FA-13 40 C33 0.28 0.90 0.00 Hand 5.00 0 3725 4206 FA-14 30 C33 0.26 0.90 0.00 Hand 4.5 0 2559 3326 FA-15 31 C33 0.27 0.86 5.00 Hand 6.0 37 3489 4761 FA-17 32 C33 0.29 1.25 10.0 Hand 6.0 0 845 1711 FA-27 30 C33 0.26 1.01 3.33 Hand 7.25 0 3160 4231 FA-28 30 C33 0.29 0.00 6.67 Hand 6.50 0 2328 3397 FA-65 30 C33 0.25 1.00 0.00 Drum 8.25 360 2725 4470 FA-66 30 C33 0.23 2.00 0.00 Drum 8.00 720 719 2816 FA-85 30 C33 0.25 0.90 0.00 Bread 8.25 295 2164 N/A FA-86 30 C33 0.25 0.80 0.00 Bread 8.25 214 2283 N/A FA-96 29 C33 0.23 1.25 0.25 Drum 5.25 130 2958 4870 FA-97 29 C33 0.22 1.25 0.25 Drum 4.50 138 3062 4520
Table 4 Affect of Aggregate Type on Compressive Strength
Compressive Strength (psi) Cast Earth Fly Ash Aggregate Type Oven Dry 7 day 28 day
C33 2237 2709 3210 Road Mix 1050 1714 2357
4” minus, sieved through ¾” screen 1735 685 812 Site Material 327 37 N/A
21
Table 5a. Recommended Cast Earth Mixture, Mix Proportions (1 yd3)
Ingredient Amount (lbs)
Calcined Gypsum (industrial plaster from Georgia-Pacific) 835 Coarse aggregate (3/4 minus, rounded, meets ASTM C33) 1404 Fine aggregate (meets ASTM C33) 1080 Water 433 Borax (20 Mule Team) 12.5
Table 5b. Recommended Cast Earth Mixture, Selected Properties
Property Value Slump (9 trial batches) 3 to 5 inches Set time (9 trial batches) 2 to 3 hours Oven dry compression strength (9 trial batches) 1855 psi Estimated bench top compression strength (92 percent of oven dry strength)
1707 psi
Recommended strength for engineering design (approximately 67 percent of estimated bench top strength)
1100 psi
Table 6a. Recommended Fly Ash Concrete Mixture, Mix Proportions (1 yd3)
Ingredient Amount (lbs)
Fly ash (ISG Resources/Corette Power Plant, Billings, MT) 1075 Lime (Type S) 2.8 Coarse aggregate (3/4 minus, rounded, meets ASTM C33) 1454 Fine aggregate (meets ASTM C33) 1125 Water 247 Borax (20 Mule Team) 13.4
Table 6b. Recommended Fly Ash Concrete Mixture, Selected Properties
Property Value Slump 4 to 6 inches Set time 2 to 3 hours 7 day compression strength (3 trial batches) 2974 psi 28 day compression strength (9 trial batches) 4707 psi Recommended strength for engineering design (approximately 67 percent of strength from tests)
3100 psi
22
Table 7 Young’s Modulus Test Matrix and Results (ASTM C496)
Test Specimen Type of Concrete Actual f’c (psi)
Expected Modulusa b
(psi)
Measured Modulus
(psi) FA-Y-1 Fly Ash 3,808,000 FA-Y-2 3,830,000 FA-Y-3 3,784,000 Average 4486 3,725,000 3,807,000 CG-Y-1 Cast Earth 2,007,000 CG-Y-2 2,054,000 CG-Y-3 2,054,000 Average 1728 2,312,000 2,038,000
a E = 57,000 (f’c)1/2 b 0.952 f’c used in calculation to compensate for the use of 4 x 8 test cylinders Table 8 Split Cylinder Test Matrix and Results (ASTM C496) Test Specimen Type of Concrete Actual f’c
(psi)
Predicted splitting tensile strength, fct
a, b
(psi)
fct from test
(psi) FA-T-1 Fly Ash 362 FA-T-2 295 FA-T-3 313
Average 4841 461 323 CG-T-1 Cast Earth 150 CG-T-2 159 CG-T-3 160 Average 1649 157 156
a fct = 0.1 f’c b 0.952 f’c used in calculation to compensate for the use of 4 x 8 relative to 6 x 12 test cylinders
23
Table 9 Modulus of Rupture Test Matrix and Results (ASTM C78)
Test Specimen Type of Concrete Actual f’c (psi)
Predicted Modulus of rupture, fra b
(psi)
Measured fr
FA-R-1 Fly Ash 421 FA-R-2 412 FA-R-3 417 Average 4582 495 417 CG-R-1 Cast Earth 333 CG-R-2 356 CG-R-3 361 Average 1976 325 350
a Predicted fr = 7.5 sqrt (f’c) b 0.952 f’c used in calculation to compensate for the use of 4 x 8 test cylinders Table 10 Pullout Test Matrix and Results (C 234, variation (note that C 234 has been suspended))
Test Specimen
Type of Concrete
Average f’c
(psi)
Rebar Yield
Strengtha
(lbs)
Calculated Embedment
Lengthb c
(in)
Embedment Length for Test
(in)
Failure Load (lbs)
Failure Mechanism
FA-P-1 Fly Ash 4898 12340 7.1 12 11125 Split Cyl. FA-P-2 12 11000 Split Cyl. FA-P-3 12 10054 Split Cyl. FA-P-4 8 9339 Split Cyl. FA-P-5 8 10219 Split Cyl. FA-P-6 8 9823 Split Cyl. PC-P-1 Portland 7787 12340 5.6 12 14000 Split Cyl. PC-P-2 Cement 12 15402 Split Cyl. PC-P-3 12 11717 Split Cyl. PC-P-4 8 14311 Split Cyl. PC-P-5 8 19541 Split Cyl. PC-P-6 8 13933 Split Cyl. CG-P-1 Cast Earth 1814 7546 7.3 12 10451 Pullout CG-P-2 12 10254 Pullout CG-P-3 12 6800 Split Cyl. CG-P-4 6.5 4896 Pullout CG-P-5 6.5 6382 Pullout CG-P-6 6.5 6655 Split Cyl.
a Rebar yield stress for Cast Earth 68300 psi for Fly Ash 61700 psi b Basic Ld = 0.04 * Ab * (fy/sqrt(f’c)) c 0.952 f’c used in calculation to compensate for the use of 4 x 8 test cylinders
24
Table 11 Beam Test Matrix and Results
Test Specimen
Type of Concrete
Actual f’c (psi)
Predicted Load at Yielda, b
(k)
Actual Load at Yield
(k) FA-B-1 Fly Ash 4870 14.56 15 FA-B-2 4520 14.49 15 FA-B-3 4525 23.25 26 CG-B-1 Cast Earth 1900 12.45 16 CG-B-2 1830 7.78 8.5 CG-B-3 1885 7.80 8.5
a Pn from statics based on Mn Mn = Asfy(d - 0.59 Asfy /f’cb) b 0.952 f’c used in calculation to compensate for the use of 4 x 8 test cylinders
Table 12 Column Test Matrix and Results
Test Specimen Type of Concrete
Actual f’c (psi)
Predicted Load at initial crushinga b
(k)
Actual Load at crushing
(k) FA-C-1 Fly Ash 5130 147.0 135.6 FA-C-2 4900 142.2 145.5 FA-C-3 4200 127.6 144.5 CG-C-1 Cast Earth 1745 61.4 53.5 CG-C-2 1695 60.3 58.0 CG-C-3 1765 61.8 58.1
a Pn = 0.85f’c(Ag-As) + Asfs b 0.952 f’c used in calculation to compensate for the use of 4 x 8 test cylinders
25
Figure 1 Young’s modulus test specimen and test setup (ASTM C496) Figure 2 Split cylinder test specimen and test setup (ASTM C496)
6 x 12 concrete cylinder
P
6”
Measurements - P - displacement between ends of cylinder as a function of P - f’c
6 x 12 concrete cylinder
P P
12”
Measurements Taken - P - f’c
26
Figure 3 Modulus of rupture test specimen and test setup (ASTM C78) Figure 4 Shrinkage test specimen and test setup
6”
6” 20”
6” x 6” x 20” beam
6”
P
18”
Measurements Taken - P - location of tensile fracture - f’c
Measurements - displacement between studs as a function of time (days) (measure to nearest 1/64 of an inch) - f’c
3 x 3 x 36 bar
3“ 3”
36“
reference studs mounted 3 inch from each end of beam
bar free to expand and contract
1 = 29.551” 2 = 29.561” 3 = 29.571”
27
Figure 5 Pullout test specimen and test setup Figure 6 Beam test specimen and test setup Beam Test Matrix
Vact /Vn Type of concrete
Actual f’c (psi)
ρmax ρact ρact/ρmax Mn (ft-k)
Vn (k)
Mact /Mn 84”
span 63”
span Fly Ash 4640 0.025 0.007 0.30 16.95 15.3 1.0 0.55 0.94
Cast Earth 1875 0.010 0.004 0.41 9.09 12.7 1.0 0.36 0.46
10”
2 ~ # 3, Gr 60 bars in bottom, Cast Earth2 ~ # 4, Gr 60 bars in bottom, Fly Ash
#2 stirrups at 4”, mild steel
6”
P
Measurements Taken - P - Center point deflection
- Nature of failure - f’c
L = 84”, FA-B-1, 2 and CG-B-2, 3 L = 63”, FA-B-3 and CG-B-1
28”
93”
24”
ld
Gr 60 bar in center of cylinder, parallel to long axis of cylinder
6 x 12 cylinder
P #3 bars, cast earth specimens #4 bars, fly ash concrete specmens Embedment lengths, ld, given in Table 10
28
Figure 7 Column test specimen and test setup Column Test Matrix
Type of concrete ρmax ρmin ρact Fly Ash 0.01 0.08 0.023
Calcined gypsum 0.01 0.08 0.023 Figure 8. Schedule of activities
2000 Task Feb Mar Apr May Jun Jul Aug Sep
Start Work X Mix Design XXX XXXX X X X X X X X X X X XX Cast Matl Prp Specimens X X X X Matl Property Tests XXX X Beam Tests XXX Column Tests XXX Final Report XX X X End Work X
P
6”
Measurements Taken - P - Displacement between ends of cylinder as a function of P - f’c
18”
6 x 18 concrete cylinder
#2 hoops, mild steel(4.5” diameter) 6 ~ #3, Gr 60
bars, long.
4 spaces at 4”
½” clear-cover on hoops, 1” clear-cover top and bottom
29
Figure 9 Strength vs. water cement ratio, cast earth mixtures (second order polynomial trendline)
0
500
1000
1500
2000
2500
0.40 0.45 0.50 0.55 0.60 0.65W ater/Cement Ratio
Stre
ngth
(psi
)
Calcined GypsumPoly. (Calcined Gypsum)
Figure 10 Strength vs. water cement ratio, fly ash concrete mixtures (second order polynomial trendline)
0
1000
2000
3000
4000
0.20 0 .25 0 .30 0 .35 0 .40 0 .45 0.50W ater C e m ent R a tio
Stre
ngth
(psi
)
S eries1S eries2S eries3P oly . (Se ries1)P oly . (Se ries2)P oly . (Se ries3)
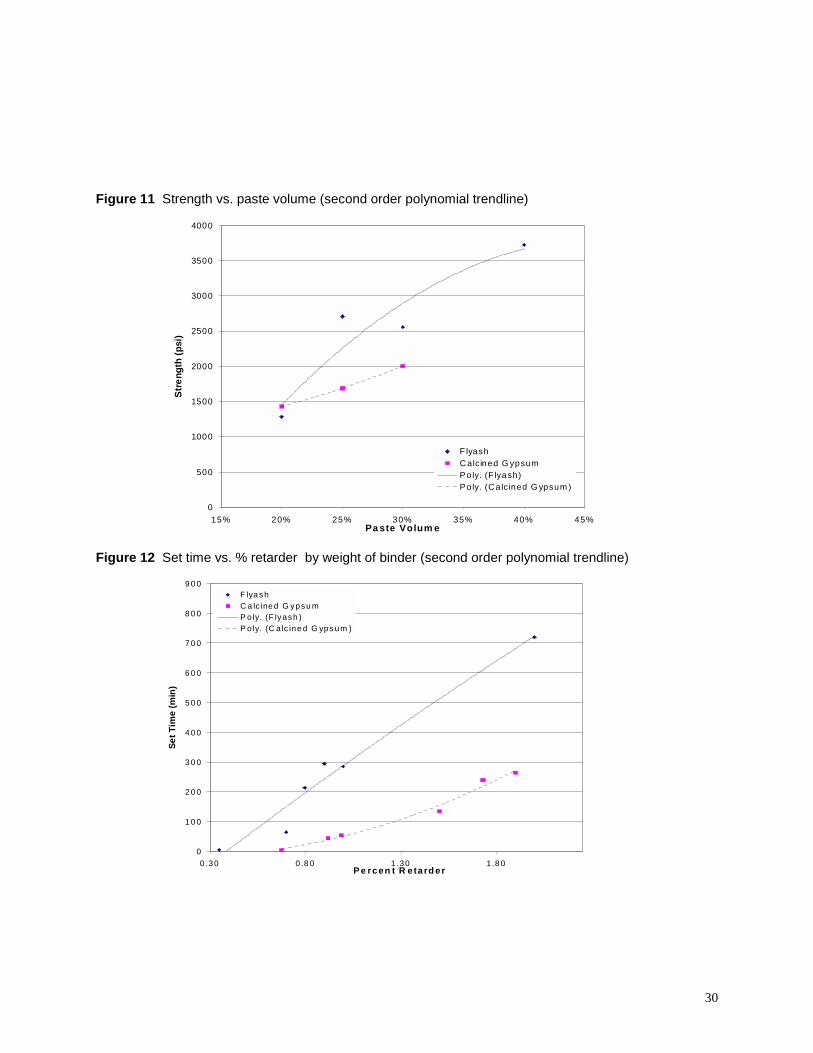
30
Figure 11 Strength vs. paste volume (second order polynomial trendline)
0
500
1000
1500
2000
2500
3000
3500
4000
15% 20% 25% 30% 35% 40% 45%Pa ste Volum e
Stre
ngth
(psi
)
F lyashC alcined G ypsumPoly. (F lyash)Po ly. (Ca lcined G ypsum )
Figure 12 Set time vs. % retarder by weight of binder (second order polynomial trendline)
0
1 0 0
2 0 0
3 0 0
4 0 0
5 0 0
6 0 0
7 0 0
8 0 0
9 0 0
0 .30 0 .8 0 1 .30 1 .8 0P e rcen t R e ta rd er
Set T
ime
(min
)
F lya shC a lc ined G ypsu mP o ly. (F lyash )P o ly. (C a lc ine d G yps um )
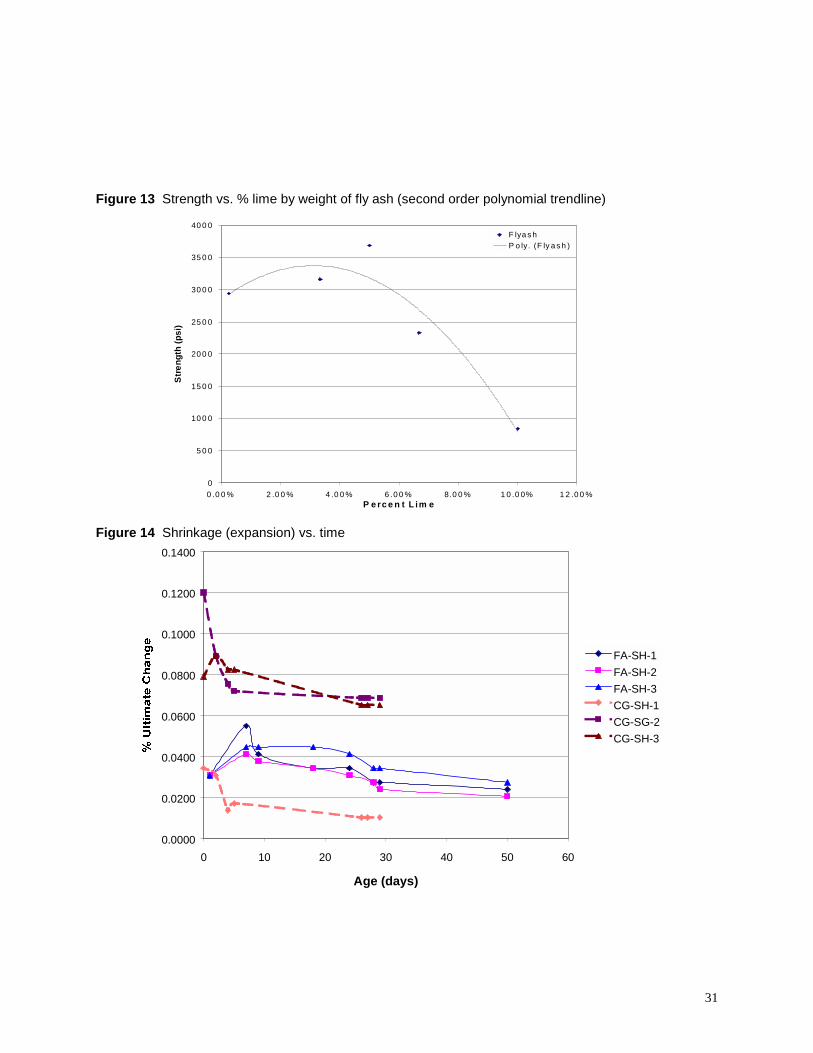
31
Figure 13 Strength vs. % lime by weight of fly ash (second order polynomial trendline)
0
5 0 0
10 0 0
15 0 0
20 0 0
25 0 0
30 0 0
35 0 0
40 0 0
0 .0 0 % 2 .0 0 % 4 .0 0 % 6 .0 0 % 8.0 0 % 1 0 .0 0% 1 2 .0 0 %P e rc e n t L im e
Stre
ngth
(psi
)
F lya s hP o ly. (F ly a s h )
Figure 14 Shrinkage (expansion) vs. time
0.0000
0.0200
0.0400
0.0600
0.0800
0.1000
0.1200
0.1400
0 10 20 30 40 50 60
Age (days)
FA-SH-1FA-SH-2FA-SH-3CG-SH-1CG-SG-2CG-SH-3
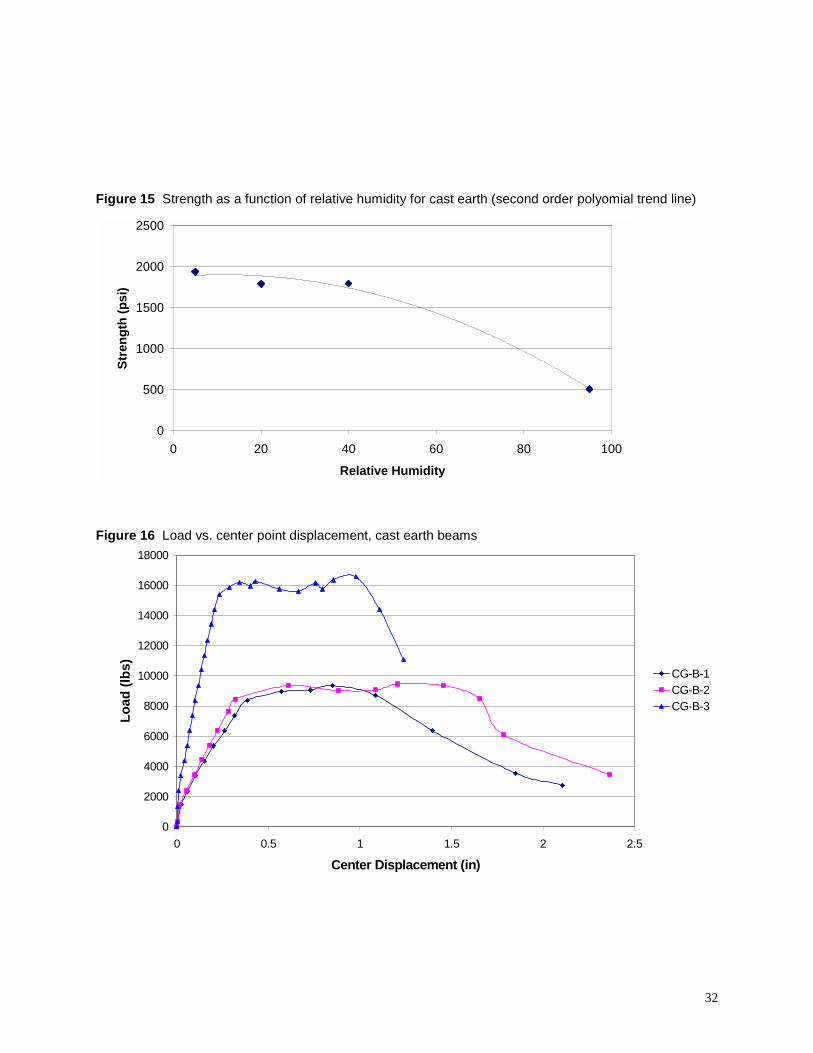
32
Figure 15 Strength as a function of relative humidity for cast earth (second order polyomial trend line) Figure 16 Load vs. center point displacement, cast earth beams
0
2000
4000
6000
8000
10000
12000
14000
16000
18000
0 0.5 1 1.5 2 2.5
Center Displacement (in)
Load
(lbs
)
CG-B-1CG-B-2CG-B-3
0
500
1000
1500
2000
2500
0 20 40 60 80 100
Relative Humidity
Stre
ngth
(psi
)
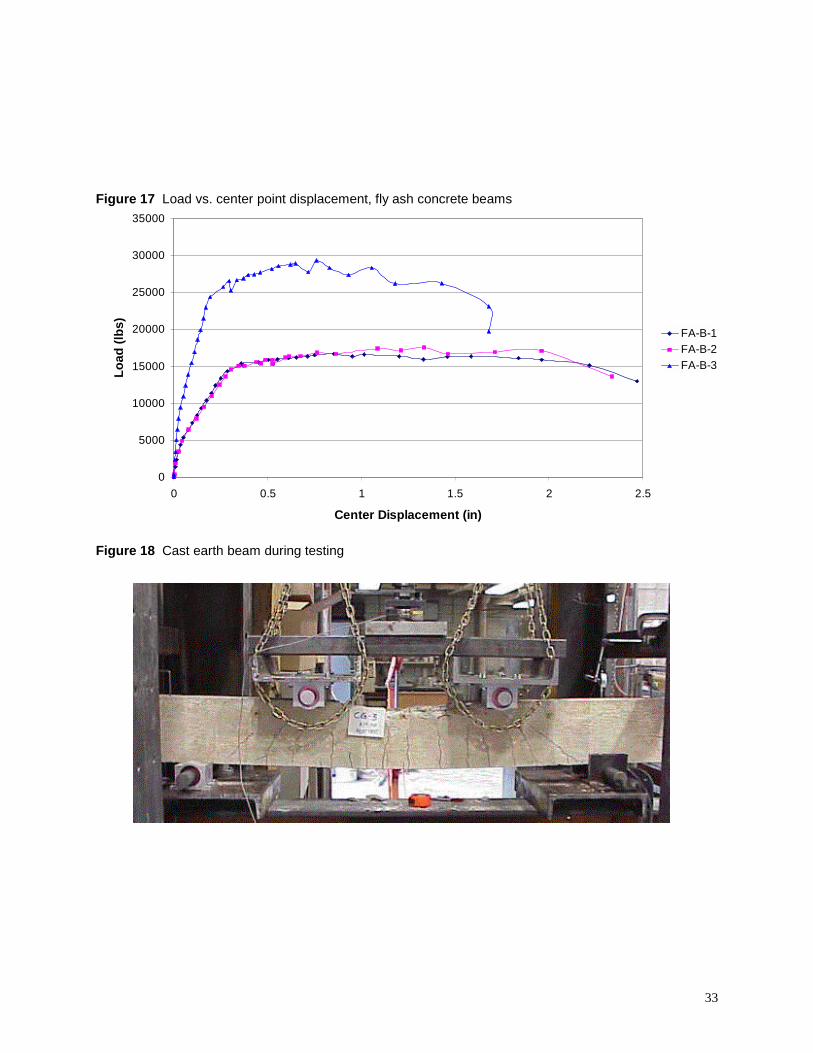
33
Figure 17 Load vs. center point displacement, fly ash concrete beams Figure 18 Cast earth beam during testing
0
5000
10000
15000
20000
25000
30000
35000
0 0.5 1 1.5 2 2.5
Center Displacement (in)
Load
(lbs
)
FA-B-1FA-B-2FA-B-3
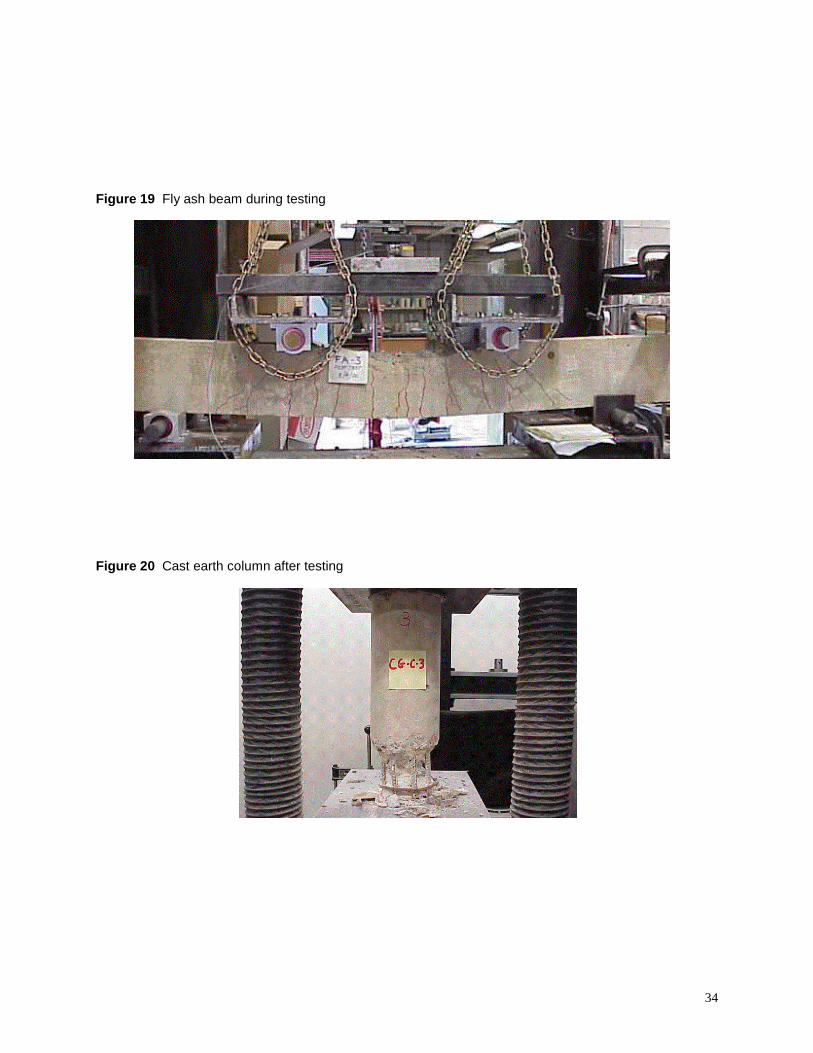
34
Figure 19 Fly ash beam during testing Figure 20 Cast earth column after testing
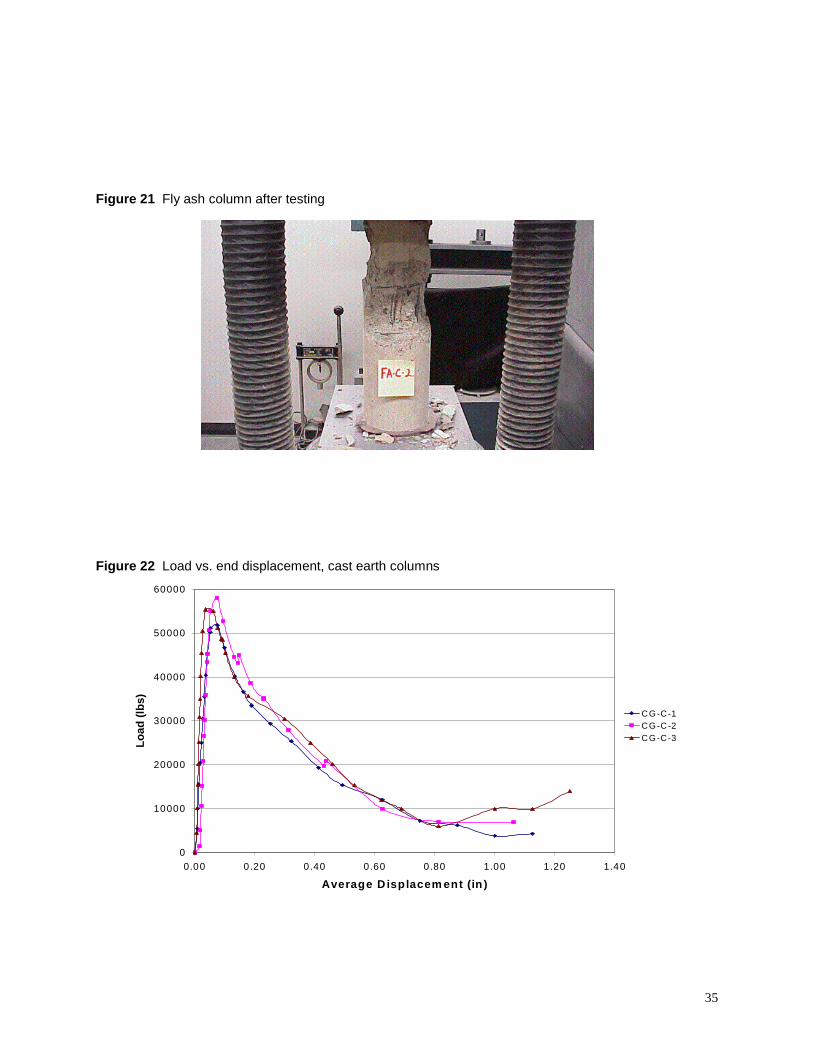
35
Figure 21 Fly ash column after testing Figure 22 Load vs. end displacement, cast earth columns
0
10000
20000
30000
40000
50000
60000
0.00 0.20 0.40 0.60 0.80 1.00 1.20 1.40
Average D isplacem ent (in )
Load
(lbs
)
CG-C-1CG-C-2CG-C-3
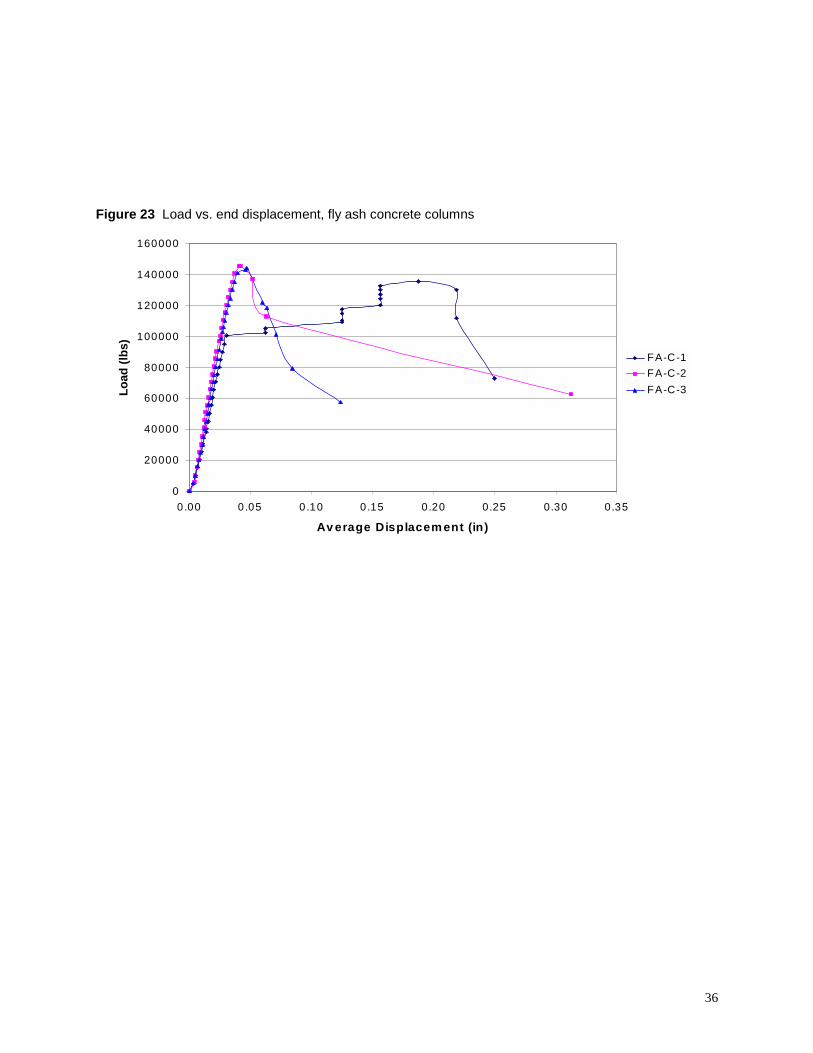
36
Figure 23 Load vs. end displacement, fly ash concrete columns
0
20000
40000
60000
80000
100000
120000
140000
160000
0.00 0.05 0.10 0.15 0.20 0.25 0.30 0.35
Av erage Displacem ent (in)
Load
(lbs
)
FA-C-1FA-C-2FA-C-3