02-03.pdf - JICA
46
1 Philippines “ASEAN-Japan Development Fund for Republic of the Philippines Category B (AJDF), Industrial and Support Services Expansion Program (ISSEP)” Project Summary Borrower: Development Bank of the Philippines (DBP) (Guarantor: Government of Republic of the Philippines) Executing Agency: Development Bank of the Philippines (DBP) Exchange of Notes: (AJDF) May 1991 (ISSEP) November 1994 Date of Loan Agreement: (AJDF) June 1991 (ISSEP) December 1994 Loan Disbursed Period: (AJDF) September 1996 (ISSEP) March 2000 Loan Amount: (AJDF) ¥30,084 million (ISSEP) ¥22,500 million Loan Disbursed Amount: (AJDF) ¥30,084 million (ISSEP) ¥22,500 million Loan Conditions: (AJDF) 2.5% p.a. (ISSEP) 3.0% p.a. Repayment Period: 30 years 30 years (10 years for grace period) (10 years for grace period) Procurement Conditions: General Untied (both AJDF and ISSEP) Loan Type: Financial Intermediary Loan (Two-Step Loan) Final Disbursement Date: March 1995 (AJDF) June 1997 (ISSEP)
-
Upload
khangminh22 -
Category
Documents
-
view
0 -
download
0
Transcript of 02-03.pdf - JICA

1
Philippines
“ASEAN-Japan Development Fund for Republic of the Philippines
Category B (AJDF), Industrial and Support Services Expansion Program (ISSEP)”
Project Summary
Borrower: Development Bank of the Philippines (DBP)
(Guarantor: Government of Republic of the Philippines)
Executing Agency: Development Bank of the Philippines (DBP)
Exchange of Notes: (AJDF) May 1991 (ISSEP) November 1994
Date of Loan Agreement: (AJDF) June 1991 (ISSEP) December 1994
Loan Disbursed Period: (AJDF) September 1996 (ISSEP) March 2000
Loan Amount: (AJDF) ¥30,084 million (ISSEP) ¥22,500 million
Loan Disbursed Amount: (AJDF) ¥30,084 million (ISSEP) ¥22,500 million
Loan Conditions: (AJDF) 2.5% p.a. (ISSEP) 3.0% p.a. Repayment Period: 30 years 30 years (10 years for grace period) (10 years for grace period)
Procurement Conditions: General Untied (both AJDF and ISSEP)
Loan Type: Financial Intermediary Loan (Two-Step Loan)
Final Disbursement Date: March 1995 (AJDF) June 1997 (ISSEP)
2
<Reference>
1. Currency: Philippines: Peso
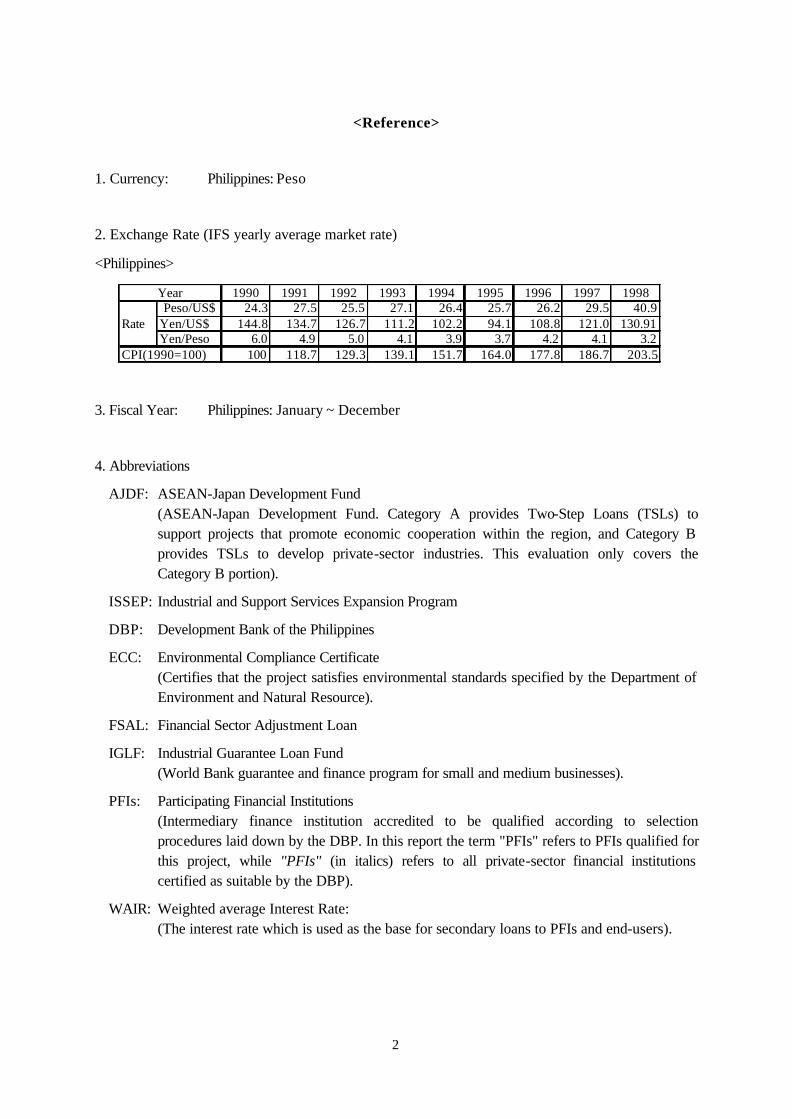
2. Exchange Rate (IFS yearly average market rate)
<Philippines>
1990 1991 1992 1993 1994 1995 1996 1997 1998Peso/US$ 24.3 27.5 25.5 27.1 26.4 25.7 26.2 29.5 40.9
Rate Yen/US$ 144.8 134.7 126.7 111.2 102.2 94.1 108.8 121.0 130.91Yen/Peso 6.0 4.9 5.0 4.1 3.9 3.7 4.2 4.1 3.2
CPI(1990=100) 100 118.7 129.3 139.1 151.7 164.0 177.8 186.7 203.5
Year
3. Fiscal Year: Philippines: January ~ December
4. Abbreviations
AJDF: ASEAN-Japan Development Fund (ASEAN-Japan Development Fund. Category A provides Two-Step Loans (TSLs) to support projects that promote economic cooperation within the region, and Category B provides TSLs to develop private-sector industries. This evaluation only covers the Category B portion).
ISSEP: Industrial and Support Services Expansion Program
DBP: Development Bank of the Philippines
ECC: Environmental Compliance Certificate (Certifies that the project satisfies environmental standards specified by the Department of Environment and Natural Resource).
FSAL: Financial Sector Adjustment Loan
IGLF: Industrial Guarantee Loan Fund (World Bank guarantee and finance program for small and medium businesses).
PFIs: Participating Financial Institutions (Intermediary finance institution accredited to be qualified according to selection procedures laid down by the DBP. In this report the term "PFIs" refers to PFIs qualified for this project, while "PFIs" (in italics) refers to all private-sector financial institutions certified as suitable by the DBP).
WAIR: Weighted average Interest Rate: (The interest rate which is used as the base for secondary loans to PFIs and end-users).
3
5. Terminology
Two-step loan: Common name for financial intermediary loans. Financial intermediary loans are provided to build up manufacturing, agriculture and other businesses by small and medium businesses. The loans are lent on to the actual borrower (the end-user) through a development finance institution within the recipient developing country, which is why these loans are also called Two-step loans (TSL).
End-user: The final borrower of the TSL, who needs finance for capital investment.
Sub-project: The end-user's investment project for which the loan was made.
Sub-loan: The loan to the end-user.
4
Chapter I Background and Need of Project Implementation
1.1 Objectives
The ASEAN-Japan Development Fund (the DBP portion)1 (referred to below as "AJDF") and the Industrial and Support Services Expansion Program (ISSEP) are two programs which aim to provide long-term finance at low and fixed interest rates, which is difficult to obtain in the Philippines. There are two main aims: 1) To promote the growth and development of small and medium businesses, particularly in the
manufacturing sector. 2) To improve the skills of private-sector financial institutions for financing small and medium
businesses. Specifically, funds are transferred to the Development Bank of the Philippines and channeled through Participating Financial Institutions (PFIs) to the small and medium businesses that are the end-users, in what is known as a Two-Step Loan (TSL). In the text that follows, "this project" refers to both the AJDF and ISSEP.
1.2 Background and Necessity
(1) Background
When the introduction of the AJDF was first considered in 1990, the importance of small and medium businesses was just starting to be recognized in the Philippines2. The Medium Term Philippines Development Plan 1987~1992 named the promotion of micro, small and medium businesses as one of 13 key national policies3. The plan included support for such businesses in terms of both finance and technology. It was decided that such support should be provided by the ASEAN Japan Development Fund within the period of the development plan, and the Fund was expected to meet the growing demand for finance from the private sector in the Philippines, where it is difficult to obtain long-term finance at low and fixed interest rates.
When the AJDF was implemented, the Philippines economy was moving into a growth phase and making steady progress. The demand from micro, small and medium businesses for credit was building rapidly, leading to a surge in applications after 1991 to the Philippines government's small and medium businesses' finance support program. However, under that situation the supply of long-term funds at low and fixed interest from private-sector financial institutions to small and medium businesses was insufficient.
Rapid economic growth in the Philippines continued, and the demand from small and medium businesses for funds was expected to continue growing until the end of the AJDF in 1995. Therefore
1 The ASEAN-Japan Development Fund was a TSL targeting the Philippines, Thailand, Malaysia and Indonesia. The fund
had two categories. Category A provides Two-Step Loans (TSLs) to support projects that promote economic cooperation within the region, and Category B provides TSLs to nurture private-sector industries. This evaluation only covers the Category B portion.
2 JBIC provided support through "Export Industry Modernization Programs" in 1980 and 1988, with the Technology and
Livelihood Resource Center (TLRC) as the executing agency. 3 Under the Medium Term Philippines Development Plan, the Philippines government ran 11 of its own programs of
financial assistance. The value of these finance programs grew by an annual average of 47.7% over the six years 1987 to 1992 to a total finance value 18 billion Pesos, achieving a considerable success.
5
the introduction of another program equivalent to the AJDF was considered, resulting in the creation of the ISSEP, effectively as a continuation of the AJDF.
(2) Status and Problems with Small and Medium Businesses in the Philippines
There had been a previous legal definition of small and medium businesses according to their total assets, but a range of other definitions were also employed, and different agencies and institution had different ones.
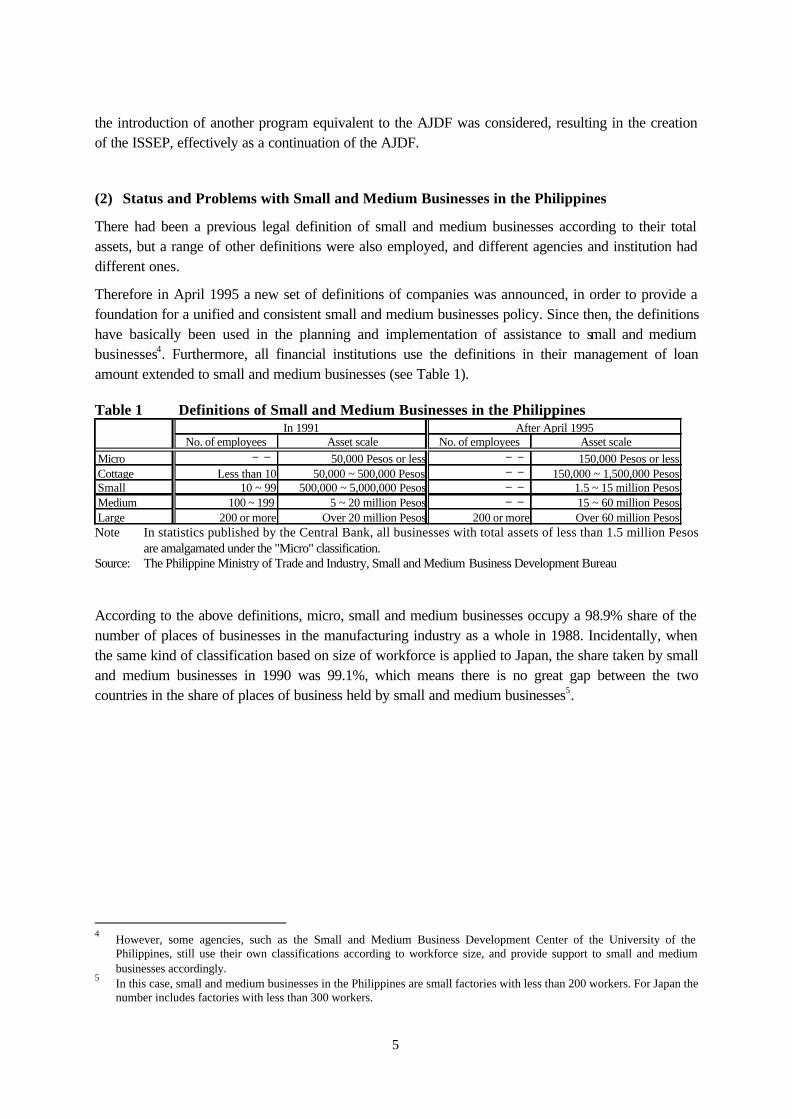
Therefore in April 1995 a new set of definitions of companies was announced, in order to provide a foundation for a unified and consistent small and medium businesses policy. Since then, the definitions have basically been used in the planning and implementation of assistance to small and medium businesses4. Furthermore, all financial institutions use the definitions in their management of loan amount extended to small and medium businesses (see Table 1).
Table 1 Definitions of Small and Medium Businesses in the Philippines In 1991 After April 1995
No. of employees Asset scale No. of employees Asset scaleMicro ―― 50,000 Pesos or less ―― 150,000 Pesos or lessCottage Less than 10 50,000 ~ 500,000 Pesos ―― 150,000 ~ 1,500,000 PesosSmall 10 ~ 99 500,000 ~ 5,000,000 Pesos ―― 1.5 ~ 15 million PesosMedium 100 ~ 199 5 ~ 20 million Pesos ―― 15 ~ 60 million PesosLarge 200 or more Over 20 million Pesos 200 or more Over 60 million Pesos Note In statistics published by the Central Bank, all businesses with total assets of less than 1.5 million Pesos
are amalgamated under the "Micro" classification. Source: The Philippine Ministry of Trade and Industry, Small and Medium Business Development Bureau According to the above definitions, micro, small and medium businesses occupy a 98.9% share of the number of places of businesses in the manufacturing industry as a whole in 1988. Incidentally, when the same kind of classification based on size of workforce is applied to Japan, the share taken by small and medium businesses in 1990 was 99.1%, which means there is no great gap between the two countries in the share of places of business held by small and medium businesses5.
4
However, some agencies, such as the Small and Medium Business Development Center of the University of the Philippines, still use their own classifications according to workforce size, and provide support to small and medium businesses accordingly.
5 In this case, small and medium businesses in the Philippines are small factories with less than 200 workers. For Japan the
number includes factories with less than 300 workers.
6
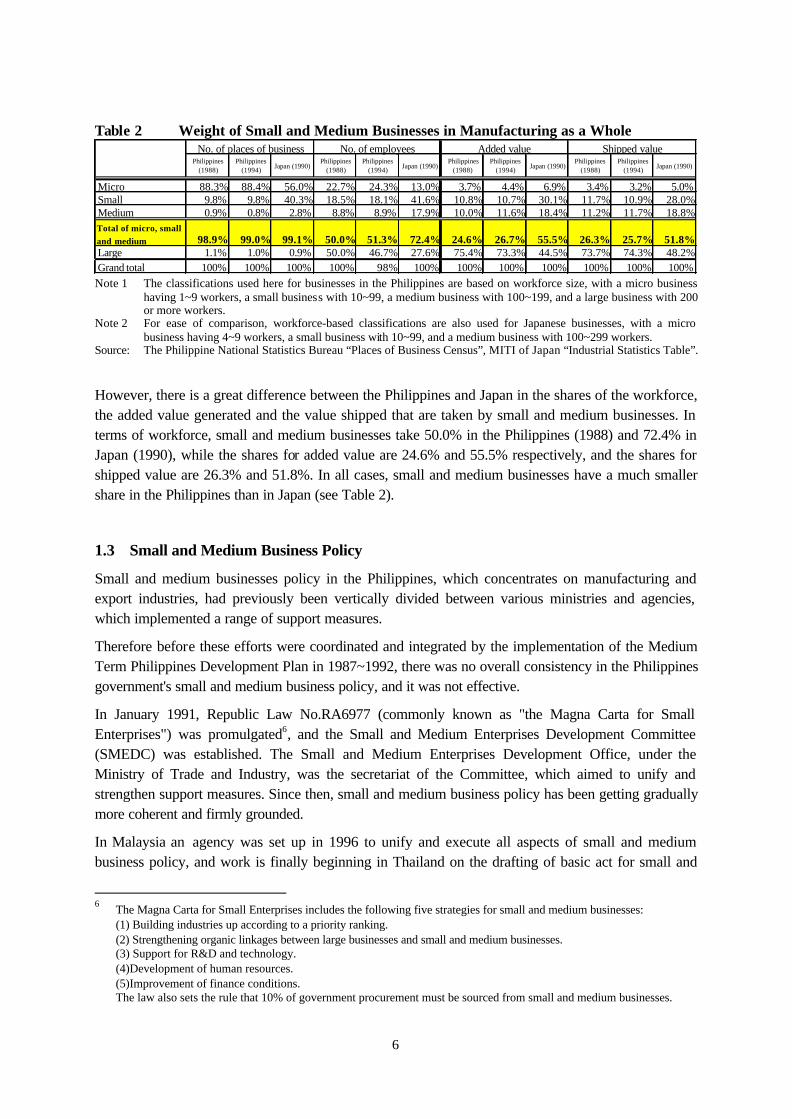
Table 2 Weight of Small and Medium Businesses in Manufacturing as a Whole No. of employees
Philippines(1988)
Philippines(1994)
Japan (1990)Philippines
(1988)Philippines
(1994)Japan (1990)
Philippines(1988)
Philippines(1994)
Japan (1990)Philippines
(1988)Philippines
(1994)Japan (1990)
Micro 88.3% 88.4% 56.0% 22.7% 24.3% 13.0% 3.7% 4.4% 6.9% 3.4% 3.2% 5.0%Small 9.8% 9.8% 40.3% 18.5% 18.1% 41.6% 10.8% 10.7% 30.1% 11.7% 10.9% 28.0%Medium 0.9% 0.8% 2.8% 8.8% 8.9% 17.9% 10.0% 11.6% 18.4% 11.2% 11.7% 18.8%Total of micro, smalland medium 98.9% 99.0% 99.1% 50.0% 51.3% 72.4% 24.6% 26.7% 55.5% 26.3% 25.7% 51.8%Large 1.1% 1.0% 0.9% 50.0% 46.7% 27.6% 75.4% 73.3% 44.5% 73.7% 74.3% 48.2%Grand total 100% 100% 100% 100% 98% 100% 100% 100% 100% 100% 100% 100%
No. of places of business Added value Shipped value
Note 1 The classifications used here for businesses in the Philippines are based on workforce size, with a micro business having 1~9 workers, a small business with 10~99, a medium business with 100~199, and a large business with 200 or more workers.
Note 2 For ease of comparison, workforce-based classifications are also used for Japanese businesses, with a micro business having 4~9 workers, a small business with 10~99, and a medium business with 100~299 workers.
Source: The Philippine National Statistics Bureau “Places of Business Census”, MITI of Japan “Industrial Statistics Table”.
However, there is a great difference between the Philippines and Japan in the shares of the workforce, the added value generated and the value shipped that are taken by small and medium businesses. In terms of workforce, small and medium businesses take 50.0% in the Philippines (1988) and 72.4% in Japan (1990), while the shares for added value are 24.6% and 55.5% respectively, and the shares for shipped value are 26.3% and 51.8%. In all cases, small and medium businesses have a much smaller share in the Philippines than in Japan (see Table 2).
1.3 Small and Medium Business Policy
Small and medium businesses policy in the Philippines, which concentrates on manufacturing and export industries, had previously been vertically divided between various ministries and agencies, which implemented a range of support measures.
Therefore before these efforts were coordinated and integrated by the implementation of the Medium Term Philippines Development Plan in 1987~1992, there was no overall consistency in the Philippines government's small and medium business policy, and it was not effective.
In January 1991, Republic Law No.RA6977 (commonly known as "the Magna Carta for Small Enterprises") was promulgated6, and the Small and Medium Enterprises Development Committee (SMEDC) was established. The Small and Medium Enterprises Development Office, under the Ministry of Trade and Industry, was the secretariat of the Committee, which aimed to unify and strengthen support measures. Since then, small and medium business policy has been getting gradually more coherent and firmly grounded.
In Malaysia an agency was set up in 1996 to unify and execute all aspects of small and medium business policy, and work is finally beginning in Thailand on the drafting of basic act for small and
6 The Magna Carta for Small Enterprises includes the following five strategies for small and medium businesses:
(1) Building industries up according to a priority ranking. (2) Strengthening organic linkages between large businesses and small and medium businesses. (3) Support for R&D and technology. (4)Development of human resources. (5)Improvement of finance conditions. The law also sets the rule that 10% of government procurement must be sourced from small and medium businesses.
7
medium businesses. By comparison, the Philippines began policy-based initia tives to promote small and medium businesses relatively early.
1-4 Finance to Small and Medium Businesses
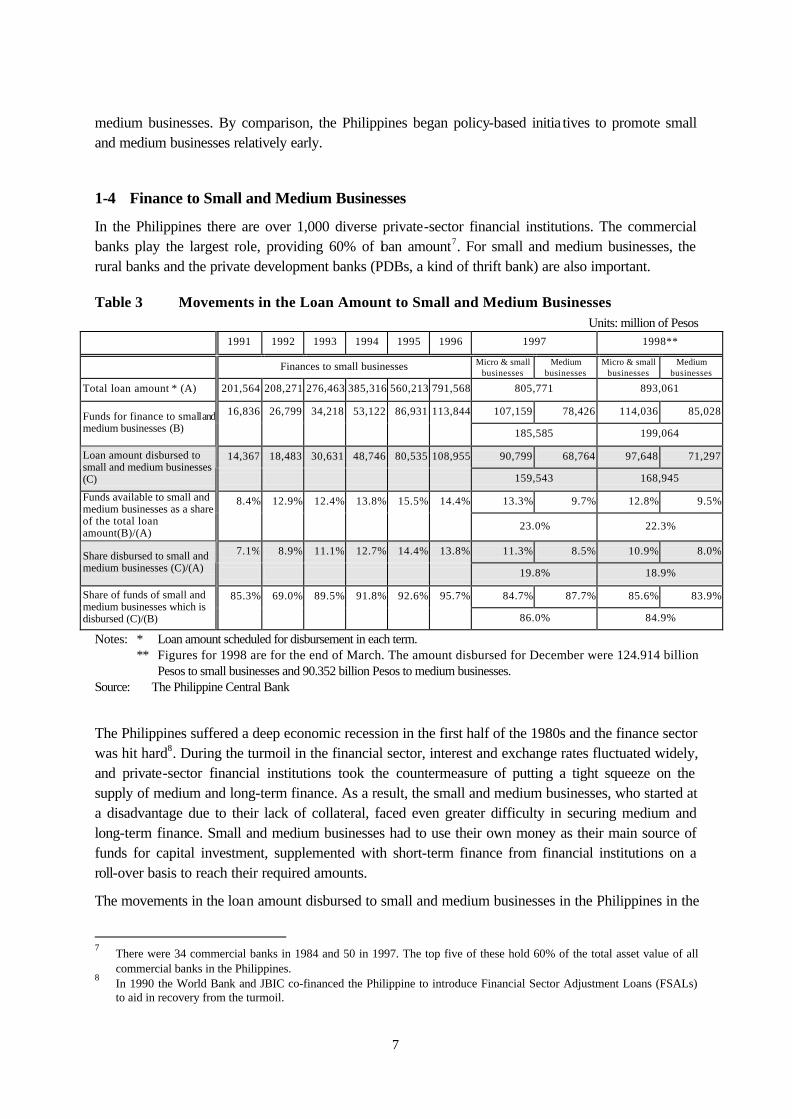
In the Philippines there are over 1,000 diverse private-sector financial institutions. The commercial banks play the largest role, providing 60% of loan amount7. For small and medium businesses, the rural banks and the private development banks (PDBs, a kind of thrift bank) are also important.
Table 3 Movements in the Loan Amount to Small and Medium Businesses Units: million of Pesos
1991 1992 1993 1994 1995 1996 1997 1998**
Finances to small businesses Micro & small businesses
Medium businesses
Micro & small businesses
Medium businesses
Total loan amount * (A) 201,564 208,271 276,463 385,316 560,213 791,568 805,771 893,061
16,836 26,799 34,218 53,122 86,931 113,844 107,159 78,426 114,036 85,028 Funds for finance to small and medium businesses (B) 185,585 199,064
14,367 18,483 30,631 48,746 80,535 108,955 90,799 68,764 97,648 71,297 Loan amount disbursed to small and medium businesses (C) 159,543 168,945
8.4% 12.9% 12.4% 13.8% 15.5% 14.4% 13.3% 9.7% 12.8% 9.5% Funds available to small and medium businesses as a share of the total loan amount(B)/(A)
23.0% 22.3%
7.1% 8.9% 11.1% 12.7% 14.4% 13.8% 11.3% 8.5% 10.9% 8.0% Share disbursed to small and medium businesses (C)/(A) 19.8% 18.9%
85.3% 69.0% 89.5% 91.8% 92.6% 95.7% 84.7% 87.7% 85.6% 83.9% Share of funds of small and medium businesses which is disbursed (C)/(B) 86.0% 84.9%
Notes: * Loan amount scheduled for disbursement in each term. ** Figures for 1998 are for the end of March. The amount disbursed for December were 124.914 billion
Pesos to small businesses and 90.352 billion Pesos to medium businesses. Source: The Philippine Central Bank
The Philippines suffered a deep economic recession in the first half of the 1980s and the finance sector was hit hard8. During the turmoil in the financial sector, interest and exchange rates fluctuated widely, and private-sector financial institutions took the countermeasure of putting a tight squeeze on the supply of medium and long-term finance. As a result, the small and medium businesses, who started at a disadvantage due to their lack of collateral, faced even greater difficulty in securing medium and long-term finance. Small and medium businesses had to use their own money as their main source of funds for capital investment, supplemented with short-term finance from financial institutions on a roll-over basis to reach their required amounts.
The movements in the loan amount disbursed to small and medium businesses in the Philippines in the
7 There were 34 commercial banks in 1984 and 50 in 1997. The top five of these hold 60% of the total asset value of all
commercial banks in the Philippines. 8 In 1990 the World Bank and JBIC co-financed the Philippine to introduce Financial Sector Adjustment Loans (FSALs)
to aid in recovery from the turmoil.

8
1990s show a steady rise until the Asian economic crisis began in 1997. This rise was largely influenced by the stipulation in the "Magna Carta for Small Business" of 1991 that a set percentage of the loan outstanding should be applied as finance for small businesses9. The fact that the total amount for 1997 was more than that for 1996 is because, in addition to the fund allocation for small businesses, a further allocation was made for finance to medium businesses. The underlying trend in the disbursement rates of funds for small (and medium) businesses was upwards between 1991 and 1996, before deteriorating almost as far as 10% in 1997, where it has remained steady ever since.
9 Nevertheless, most of the finance provided was still short term, and it is still not easy for small and medium businesses to
obtain stable medium and long-term funding.
9
Chapter II Project Summary
2.1 Overview of the Project Scheme
(1) Summary of the Scheme
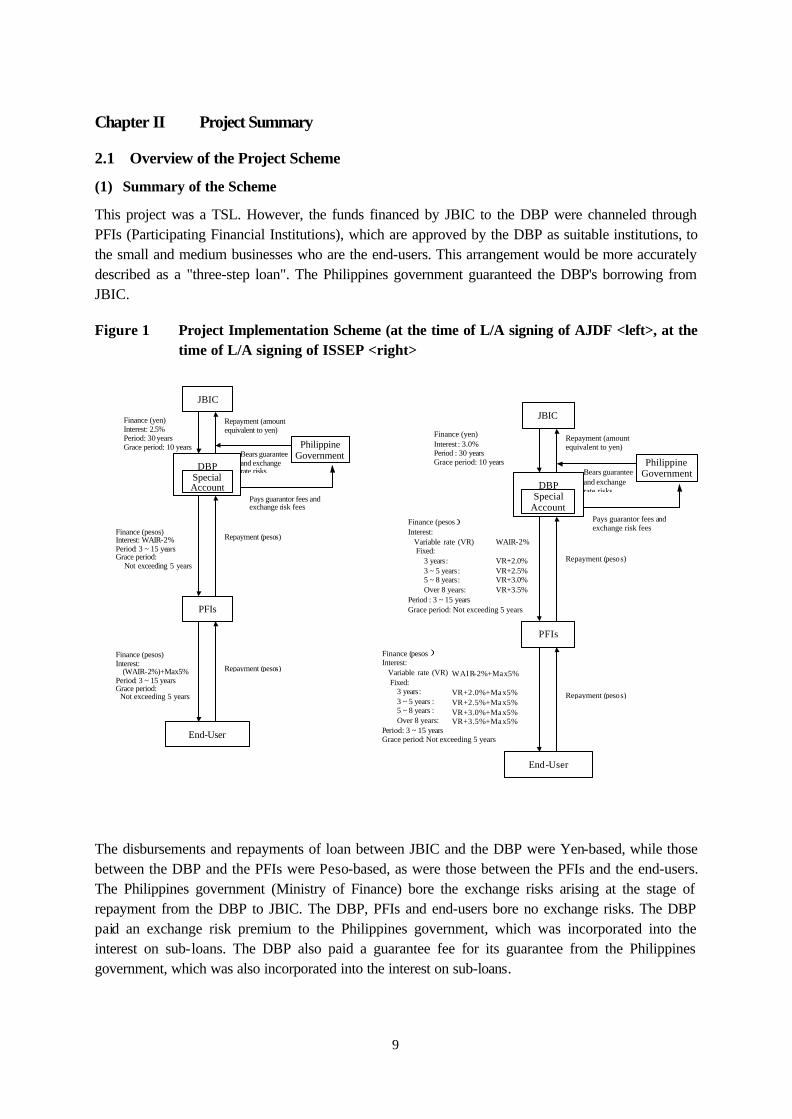
This project was a TSL. However, the funds financed by JBIC to the DBP were channeled through PFIs (Participating Financial Institutions), which are approved by the DBP as suitable institutions, to the small and medium businesses who are the end-users. This arrangement would be more accurately described as a "three-step loan". The Philippines government guaranteed the DBP's borrowing from JBIC.
Figure 1 Project Implementation Scheme (at the time of L/A signing of AJDF <left>, at the time of L/A signing of ISSEP <right>
JBIC
DBP
Philippine Government
Finance (yen) Interest : 3.0% Period : 30 years Grace period: 10 years
Repayment (amount equivalent to yen)
Bears guarantee and exchange rate risks
PFIs
End-User
Finance (pesos) Interest: Variable rate (VR) WAIR-2% Fixed: 3 years: VR+2.0% 3 ~ 5 years: VR+2.5% 5 ~ 8 years: VR+3.0% Over 8 years: VR+3.5% Period : 3 ~ 15 years Grace period: Not exceeding 5 years
Repayment (pesos)
Repayment (pesos)
Finance (pesos) Interest: Variable rate (VR) WAIR-2%+Max5% Fixed: 3 years: VR+2.0%+Max5% 3 ~ 5 years : VR+2.5%+Max5% 5 ~ 8 years : VR+3.0%+Max5% Over 8 years: VR+3.5%+Max5% Period: 3 ~ 15 years Grace period: Not exceeding 5 years
Special Account
Pays guarantor fees and exchange risk fees
The disbursements and repayments of loan between JBIC and the DBP were Yen-based, while those between the DBP and the PFIs were Peso-based, as were those between the PFIs and the end-users. The Philippines government (Ministry of Finance) bore the exchange risks arising at the stage of repayment from the DBP to JBIC. The DBP, PFIs and end-users bore no exchange risks. The DBP paid an exchange risk premium to the Philippines government, which was incorporated into the interest on sub-loans. The DBP also paid a guarantee fee for its guarantee from the Philippines government, which was also incorporated into the interest on sub-loans.
JBIC
DBP
Philippine Government
Finance (yen) Interest: 2.5% Period: 30 years Grace period: 10 years
Repayment (amount equivalent to yen)
Bears guarantee and exchange rate risks
PFIs
End-User
Repayment (pesos)
Repayment (pesos)
Special Account
Pays guarantor fees and exchange risk fees
Finance (pesos) Interest: WAIR-2% Period: 3 ~ 15 years Grace period: Not exceeding 5 years
Finance (pesos) Interest: (WAIR-2%)+Max5% Period: 3 ~ 15 years Grace period: Not exceeding 5 years
10
(2) Summary of Executive Agency
The DBP is one of the two largest special government-affiliated financial institutions in the Philippines, alongside the Land Bank of the Philippines (LBP). It was established in 1958 to supply medium and long-term finance to all industry in the country. However, under the Marcos regime the borrowers were determined by political considerations, and for many years the DBP did not function appropriately as a financial institution. As a result its business position was grave in the 1970s. In 1987, after the start of the Aquino administration, it received Economic Recovery Loans through co-financing from the World Bank and JBIC. At the same time it transferred its bad debts to asset privatization trusts and began its reconstruction process. At the time the AJDF was introduced, the DBP was still in the reconstruction process, and the degree of real improvement in the appraising and operation abilities of its retail division was an unknown quantity. Furthermore, the reconstruction plan called for specialization in indirect "wholesale" finance. Therefore a sub-loan scheme was adopted for JBIC's AJDF project, with the funds channeled through PFIs, which were mainly private-sector financial institutions.
After that, the managerial ability of the DBP went on improving steadily, eventually reaching a high standard. During the duration of the AJDF, the DBP's record of sub-loans through the PFIs was good, and there were no notable problems. Therefore the same finance scheme using the same channels was chosen for use with ISSEP.
(3) Summary of PFIs
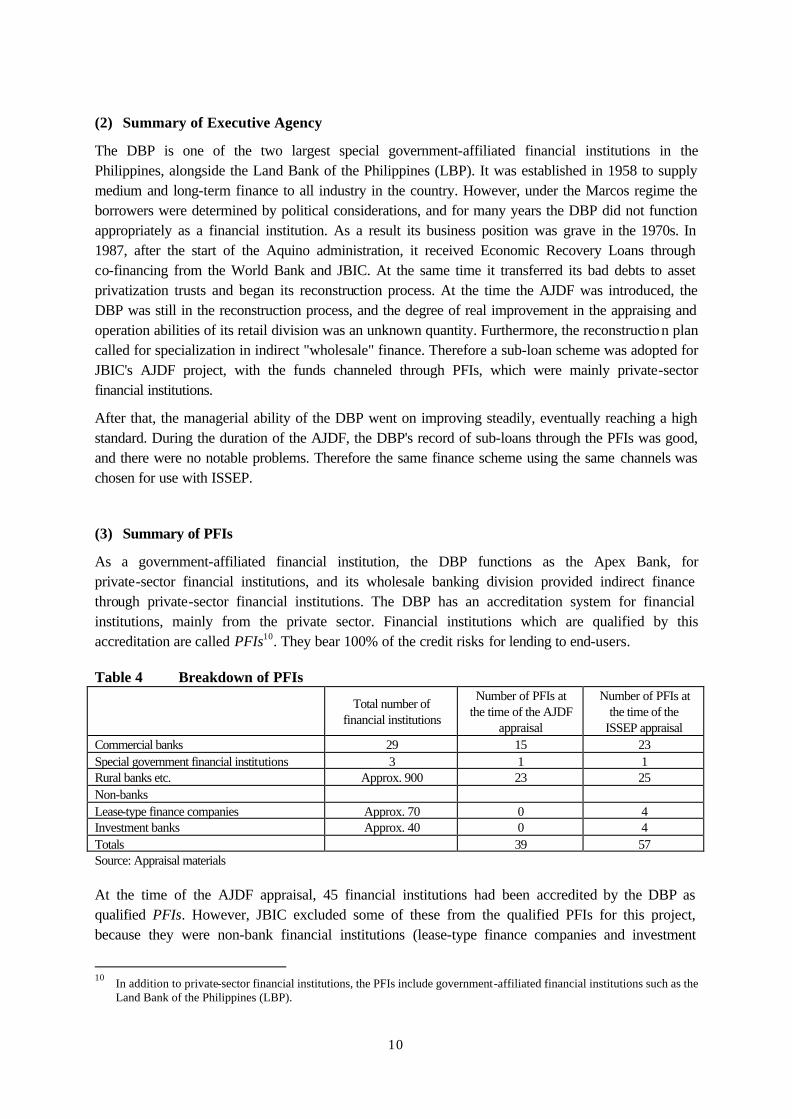
As a government-affiliated financial institution, the DBP functions as the Apex Bank, for private-sector financial institutions, and its wholesale banking division provided indirect finance through private-sector financial institutions. The DBP has an accreditation system for financial institutions, mainly from the private sector. Financial institutions which are qualified by this accreditation are called PFIs10. They bear 100% of the credit risks for lending to end-users.
Table 4 Breakdown of PFIs
Total number of
financial institutions
Number of PFIs at the time of the AJDF
appraisal
Number of PFIs at the time of the
ISSEP appraisal Commercial banks 29 15 23 Special government financial institutions 3 1 1 Rural banks etc. Approx. 900 23 25 Non-banks Lease-type finance companies Approx. 70 0 4 Investment banks Approx. 40 0 4 Totals 39 57 Source: Appraisal materials
At the time of the AJDF appraisal, 45 financial institutions had been accredited by the DBP as qualified PFIs. However, JBIC excluded some of these from the qualified PFIs for this project, because they were non-bank financial institutions (lease-type finance companies and investment
10
In addition to private-sector financial institutions, the PFIs include government-affiliated financial institutions such as the Land Bank of the Philippines (LBP).
11
banks) for which finance was not their main area of business. This change left 39 qualified PFIs. (in the following text, "PFIs" refers to PFIs qualified for this project and "PFIs" in italics refers to all private financial institutions which are accredited by the DBP as qualified as intermediary institutions for government finance programs).
However, when ISSEP was introduced it was decided11, after checking the content of their operations, to include the non-bank financial institutions in the PFIs, partly due to strong request from the DBP. Therefore there were 57 financial institutions accredited as PFIs at the time of the appraisal for ISSEP.
In order to judge the suitability of PFIs, the DBP studies quarterly reports from all private-sector financial institutions concerning their finances and operation, and conducts an annual review of all the PFIs. The number of accredited financial institutions varies because of this scrutiny. Therefore even financial institutions which have won PFIs accreditation may lose it again later, and some gain it la ter. Under ISSEP, the number of PFIs rose to 70 in 1997.
Under both AJDF and ISSEP, multiple PFIs were allowed to conduct syndicated finance, as long as they did not exceed the limit for finance to any one end-user. Under ISSEP the DBP (retail division) was also allowed to participate in syndication.
2.2 Sub-loan Finance Terms
The finance terms for sub-loans under these two projects are as described below.
(1) Eligible Business Types
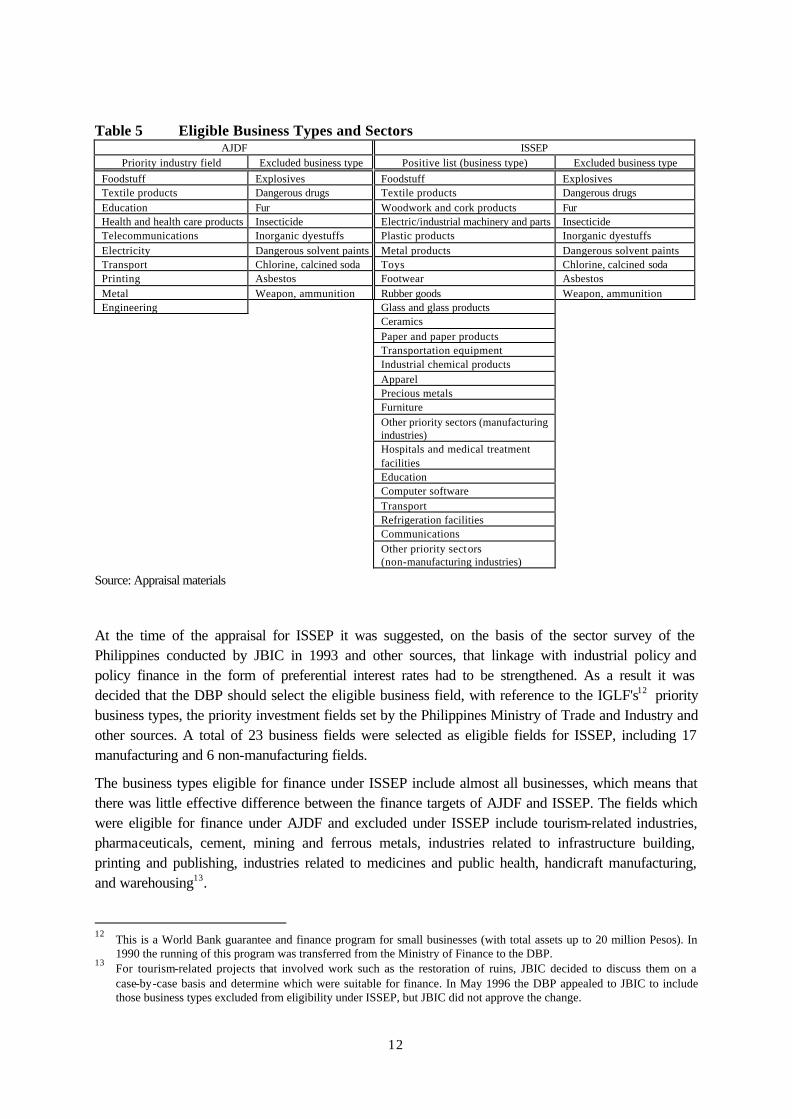
The AJDF was intended to promote the whole range of "small and medium pr ivate enterprises" and did not place any major limitations on the eligible business types. However, ten industrial fields within the manufacturing and non-manufacturing industries were listed as priority sectors for their substantial social and economic impact. The "excluded business types" listed in Table 5 are excluded from eligibility for finance due to social and environmental considerations.
11
The DBP asked JBIC to include non-bank financial institutions among the PFIs in order to increase convenience for end-users, based on the extensive experience lease-type finance companies and other non-banks have in supplying funds to small and medium businesses for their capital investments.
12
Table 5 Eligible Business Types and Sectors AJDF ISSEP
Priority industry field Excluded business type Positive list (business type) Excluded business type
Foodstuff Explosives Foodstuff Explosives Textile products Dangerous drugs Textile products Dangerous drugs Education Fur Woodwork and cork products Fur Health and health care products Insecticide Electric/industrial machinery and parts Insecticide Telecommunications Inorganic dyestuffs Plastic products Inorganic dyestuffs Electricity Dangerous solvent paints Metal products Dangerous solvent paints Transport Chlorine, calcined soda Toys Chlorine, calcined soda Printing Asbestos Footwear Asbestos Metal Weapon, ammunition Rubber goods Weapon, ammunition Engineering Glass and glass products Ceramics Paper and paper products Transportation equipment Industrial chemical products Apparel Precious metals Furniture Other priority sectors (manufacturing
industries)
Hospitals and medical treatment facilities
Education Computer software Transport Refrigeration facilities Communications Other priority sectors
(non-manufacturing industries)
Source: Appraisal materials
At the time of the appraisal for ISSEP it was suggested, on the basis of the sector survey of the Philippines conducted by JBIC in 1993 and other sources, that linkage with industrial policy and policy finance in the form of preferential interest rates had to be strengthened. As a result it was decided that the DBP should select the eligible business field, with reference to the IGLF's12 priority business types, the priority investment fields set by the Philippines Ministry of Trade and Industry and other sources. A total of 23 business fields were selected as eligible fields for ISSEP, including 17 manufacturing and 6 non-manufacturing fields.
The business types eligible for finance under ISSEP include almost all businesses, which means that there was little effective difference between the finance targets of AJDF and ISSEP. The fields which were eligible for finance under AJDF and excluded under ISSEP include tourism-related industries, pharmaceuticals, cement, mining and ferrous metals, industries related to infrastructure building, printing and publishing, industries related to medicines and public health, handicraft manufacturing, and warehousing13.
12
This is a World Bank guarantee and finance program for small businesses (with total assets up to 20 million Pesos). In 1990 the running of this program was transferred from the Ministry of Finance to the DBP.
13 For tourism-related projects that involved work such as the restoration of ruins, JBIC decided to discuss them on a
case-by-case basis and determine which were suitable for finance. In May 1996 the DBP appealed to JBIC to include those business types excluded from eligibility under ISSEP, but JBIC did not approve the change.
13
In addition to the positive list of "Other priority industries" eligible for finance under ISSEP, additional remedial measures will be taken in future if new business types of projects emerge which suit the nature of this project.
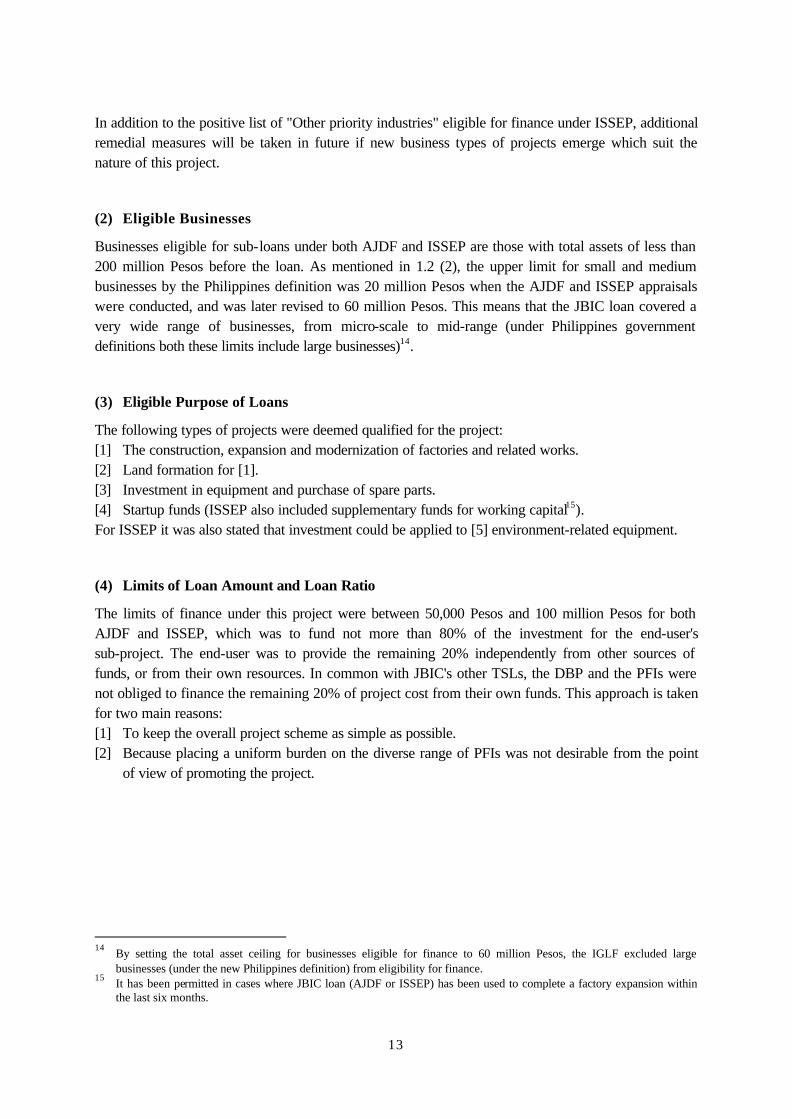
(2) Eligible Businesses
Businesses eligible for sub-loans under both AJDF and ISSEP are those with total assets of less than 200 million Pesos before the loan. As mentioned in 1.2 (2), the upper limit for small and medium businesses by the Philippines definition was 20 million Pesos when the AJDF and ISSEP appraisals were conducted, and was later revised to 60 million Pesos. This means that the JBIC loan covered a very wide range of businesses, from micro-scale to mid-range (under Philippines government definitions both these limits include large businesses)14.
(3) Eligible Purpose of Loans
The following types of projects were deemed qualified for the project: [1] The construction, expansion and modernization of factories and related works. [2] Land formation for [1]. [3] Investment in equipment and purchase of spare parts. [4] Startup funds (ISSEP also included supplementary funds for working capital15). For ISSEP it was also stated that investment could be applied to [5] environment-related equipment.
(4) Limits of Loan Amount and Loan Ratio
The limits of finance under this project were between 50,000 Pesos and 100 million Pesos for both AJDF and ISSEP, which was to fund not more than 80% of the investment for the end-user's sub-project. The end-user was to provide the remaining 20% independently from other sources of funds, or from their own resources. In common with JBIC's other TSLs, the DBP and the PFIs were not obliged to finance the remaining 20% of project cost from their own funds. This approach is taken for two main reasons: [1] To keep the overall project scheme as simple as possible. [2] Because placing a uniform burden on the diverse range of PFIs was not desirable from the point
of view of promoting the project.
14
By setting the total asset ceiling for businesses eligible for finance to 60 million Pesos, the IGLF excluded large businesses (under the new Philippines definition) from eligibility for finance.
15 It has been permitted in cases where JBIC loan (AJDF or ISSEP) has been used to complete a factory expansion within
the last six months.
14
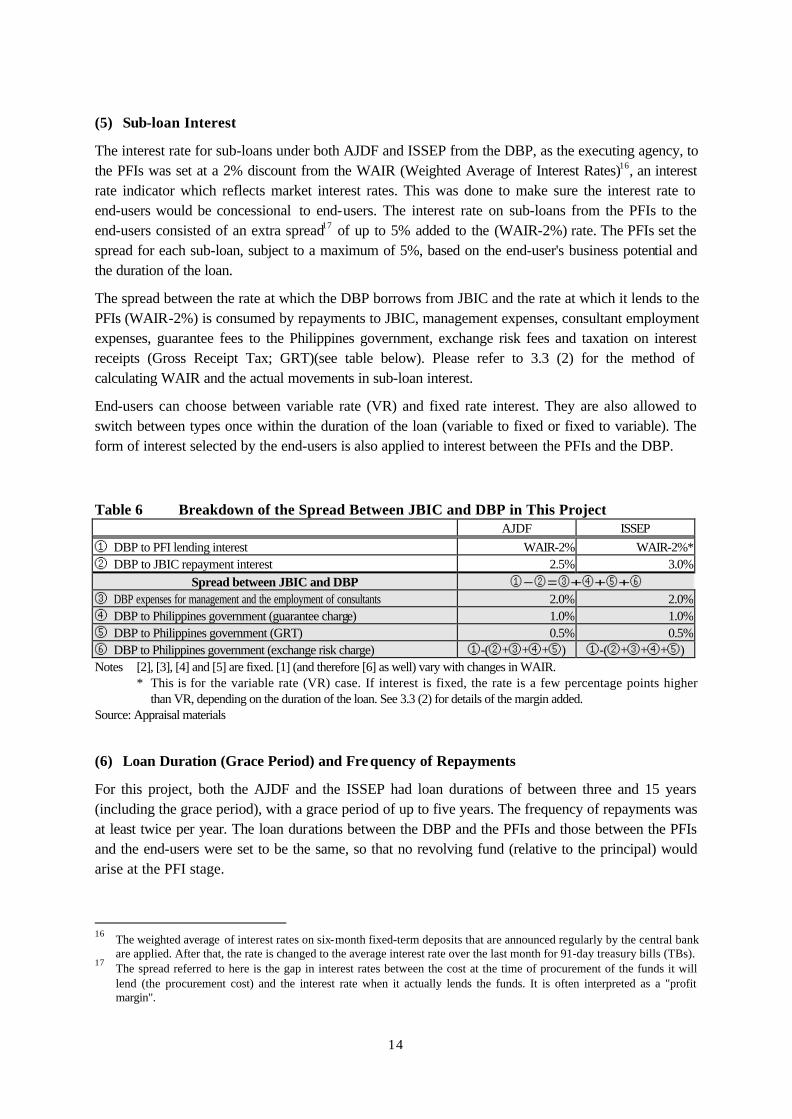
(5) Sub-loan Interest
The interest rate for sub-loans under both AJDF and ISSEP from the DBP, as the executing agency, to the PFIs was set at a 2% discount from the WAIR (Weighted Average of Interest Rates)16, an interest rate indicator which reflects market interest rates. This was done to make sure the interest rate to end-users would be concessional to end-users. The interest rate on sub-loans from the PFIs to the end-users consisted of an extra spread17 of up to 5% added to the (WAIR-2%) rate. The PFIs set the spread for each sub-loan, subject to a maximum of 5%, based on the end-user's business potential and the duration of the loan.
The spread between the rate at which the DBP borrows from JBIC and the rate at which it lends to the PFIs (WAIR-2%) is consumed by repayments to JBIC, management expenses, consultant employment expenses, guarantee fees to the Philippines government, exchange risk fees and taxation on interest receipts (Gross Receipt Tax; GRT)(see table below). Please refer to 3.3 (2) for the method of calculating WAIR and the actual movements in sub-loan interest.
End-users can choose between variable rate (VR) and fixed rate interest. They are also allowed to switch between types once within the duration of the loan (variable to fixed or fixed to variable). The form of interest selected by the end-users is also applied to interest between the PFIs and the DBP.
Table 6 Breakdown of the Spread Between JBIC and DBP in This Project AJDF ISSEP
① DBP to PFI lending interest WAIR-2% WAIR-2%* ② DBP to JBIC repayment interest 2.5% 3.0%
Spread between JBIC and DBP ①-②=③+④+⑤+⑥ ③ DBP expenses for management and the employment of consultants 2.0% 2.0% ④ DBP to Philippines government (guarantee charge) 1.0% 1.0% ⑤ DBP to Philippines government (GRT) 0.5% 0.5% ⑥ DBP to Philippines government (exchange risk charge) ①-(②+③+④+⑤) ①-(②+③+④+⑤) Notes [2], [3], [4] and [5] are fixed. [1] (and therefore [6] as well) vary with changes in WAIR. * This is for the variable rate (VR) case. If interest is fixed, the rate is a few percentage points higher
than VR, depending on the duration of the loan. See 3.3 (2) for details of the margin added. Source: Appraisal materials
(6) Loan Duration (Grace Period) and Frequency of Repayments
For this project, both the AJDF and the ISSEP had loan durations of between three and 15 years (including the grace period), with a grace period of up to five years. The frequency of repayments was at least twice per year. The loan durations between the DBP and the PFIs and those between the PFIs and the end-users were set to be the same, so that no revolving fund (relative to the principal) would arise at the PFI stage.
16
The weighted average of interest rates on six-month fixed-term deposits that are announced regularly by the central bank are applied. After that, the rate is changed to the average interest rate over the last month for 91-day treasury bills (TBs).
17 The spread referred to here is the gap in interest rates between the cost at the time of procurement of the funds it will
lend (the procurement cost) and the interest rate when it actually lends the funds. It is often interpreted as a "profit margin".

15
(7) Collateral and Guarantee
As a rule, loans are provided against collateral, with the amount of collateral being at the discretion of each PFI. Specifically, physical collateral (movable and immovable assets) and a guarantee (including the use of the IGLF) are demanded. As mentioned above, the PFIs bear 100% of the credit risks for sub-projects, and each one determines the credit evaluation for the collateral on each sub-loan according to its own standards.
(8) Environmental Consideration
When the PFIs and the DBP appraise sub-projects, they confirm that the end-user has completed the application procedure to obtain an Environmental Compliance Certificate from the Environmental Management Bureau of the Department of Environment and Natural Resource. The end-user must complete ECC acquisition within one year of loan approval. Thus consideration is given to avoiding negative environmental impacts from this project. However, if the amount of a sub-loan is 20 million Pesos or less, there is no obligation to obtain an ECC, if the end-user's field of business is one of those exempted from the Environmental Management Bureau's environmental impact assessment system18.
2.3 Consulting Services
This project included technical assistance (TA) by consultants to the DBP, PFIs and the end-users (small and medium businesses) to improve their operations in aspects other than finance. The terms of reference (TOR) for the consultants are as shown in Table 7. The expenses for employing the consultants to provide TA were paid from the DBP's own funds (the 2% for management and consultant expenses within the DBP's interest rate spread).
Table 7 Consultant TOR AJDF ISSEP
① Promotion of the AJDF program ① Promotion of ISSEP (i) Preparation of documents required for
promotion ② Staging a series of seminars on Japan's
development finance and economic development (ii) Implementation of promotion
② Improvement of the functions of PFIs (related to project finance)
③ Training and technical assistance for small and medium businesses (including an impact survey of the AJDF)
(i) Training of DBP staff ④ Improvement of the functions of PFIs (project evaluation etc.)
(ii) Training of PFI staff ⑤ Training of DBP staff ③ Monitoring of the AJDF program ⑥ Investigation of assistance systems for peripheral
industries (i) Monitoring within the DBP and PFIs (ii) Review of monitoring
④ Support for end-users Provision of information on marketing,
technology and business management
Source: Appraisal materials 18
The DBP set the conditions for exemption from ECC acquisition in order to simplify the loan application procedure as far as possible. However, at present the list for Environmental Management Bureau's environmental assessment system does not clearly state the eligible business types or project content, so all end-users are obliged to obtain an ECC. The PFIs confirm the acquisition of ECCs and there is no apparent problem with ECC acquisition.
16
Chapter III Evaluation and Analysis on Project Implementation
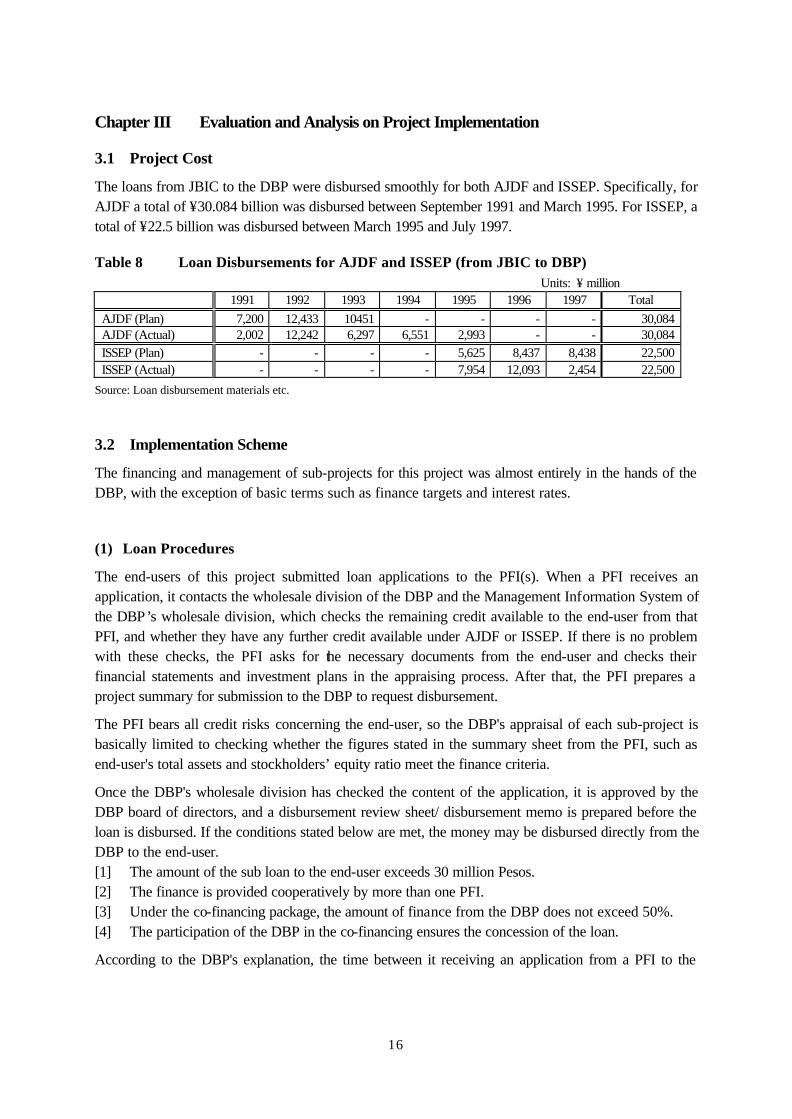
3.1 Project Cost
The loans from JBIC to the DBP were disbursed smoothly for both AJDF and ISSEP. Specifically, for AJDF a total of ¥30.084 billion was disbursed between September 1991 and March 1995. For ISSEP, a total of ¥22.5 billion was disbursed between March 1995 and July 1997.
Table 8 Loan Disbursements for AJDF and ISSEP (from JBIC to DBP) Units: ¥ million
1991 1992 1993 1994 1995 1996 1997 Total
AJDF (Plan) 7,200 12,433 10451 - - - - 30,084 AJDF (Actual) 2,002 12,242 6,297 6,551 2,993 - - 30,084 ISSEP (Plan) - - - - 5,625 8,437 8,438 22,500 ISSEP (Actual) - - - - 7,954 12,093 2,454 22,500
Source: Loan disbursement materials etc.
3.2 Implementation Scheme
The financing and management of sub-projects for this project was almost entirely in the hands of the DBP, with the exception of basic terms such as finance targets and interest rates.
(1) Loan Procedures
The end-users of this project submitted loan applications to the PFI(s). When a PFI receives an application, it contacts the wholesale division of the DBP and the Management Information System of the DBP’s wholesale division, which checks the remaining credit available to the end-user from that PFI, and whether they have any further credit available under AJDF or ISSEP. If there is no problem with these checks, the PFI asks for the necessary documents from the end-user and checks their financial statements and investment plans in the appraising process. After that, the PFI prepares a project summary for submission to the DBP to request disbursement.
The PFI bears all credit risks concerning the end-user, so the DBP's appraisal of each sub-project is basically limited to checking whether the figures stated in the summary sheet from the PFI, such as end-user's total assets and stockholders’ equity ratio meet the finance criteria.
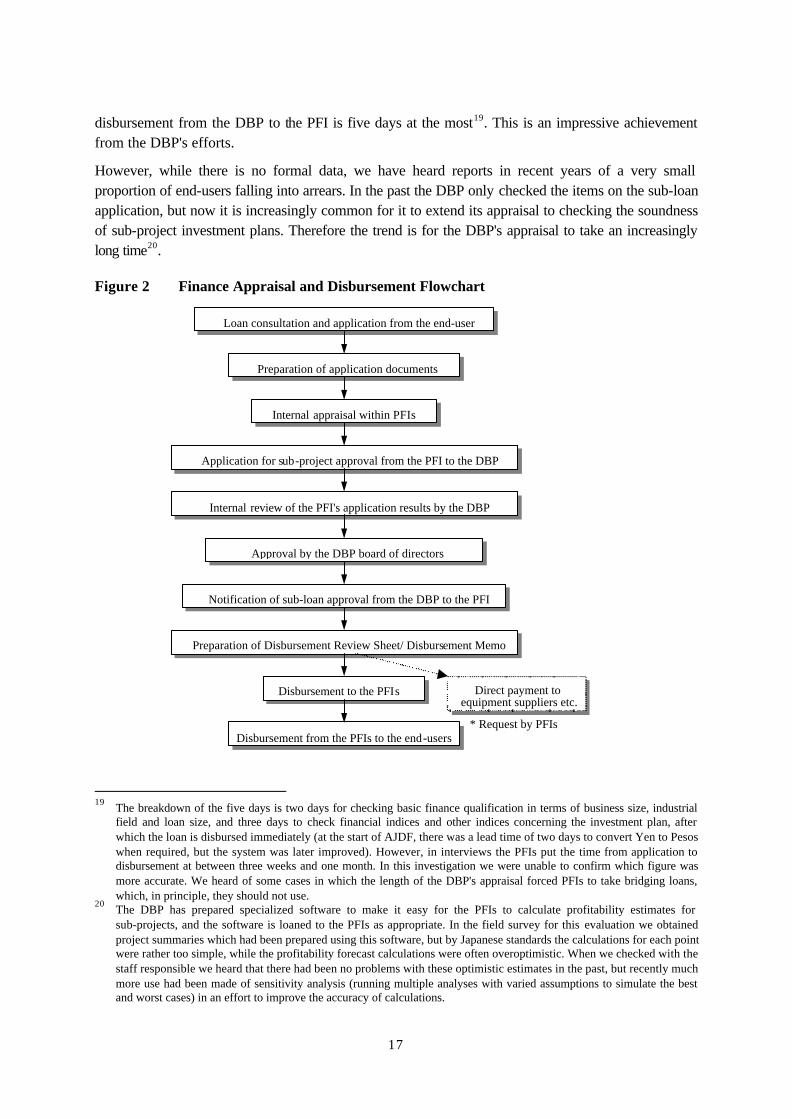
Once the DBP's wholesale division has checked the content of the application, it is approved by the DBP board of directors, and a disbursement review sheet/ disbursement memo is prepared before the loan is disbursed. If the conditions stated below are met, the money may be disbursed directly from the DBP to the end-user. [1] The amount of the sub loan to the end-user exceeds 30 million Pesos. [2] The finance is provided cooperatively by more than one PFI. [3] Under the co-financing package, the amount of finance from the DBP does not exceed 50%. [4] The participation of the DBP in the co-financing ensures the concession of the loan.
According to the DBP's explanation, the time between it receiving an application from a PFI to the
17
disbursement from the DBP to the PFI is five days at the most19. This is an impressive achievement from the DBP's efforts.
However, while there is no formal data, we have heard reports in recent years of a very small proportion of end-users falling into arrears. In the past the DBP only checked the items on the sub-loan application, but now it is increasingly common for it to extend its appraisal to checking the soundness of sub-project investment plans. Therefore the trend is for the DBP's appraisal to take an increasingly long time20.
Figure 2 Finance Appraisal and Disbursement Flowchart
19
The breakdown of the five days is two days for checking basic finance qualification in terms of business size, industrial field and loan size, and three days to check financial indices and other indices concerning the investment plan, after which the loan is disbursed immediately (at the start of AJDF, there was a lead time of two days to convert Yen to Pesos when required, but the system was later improved). However, in interviews the PFIs put the time from application to disbursement at between three weeks and one month. In this investigation we were unable to confirm which figure was more accurate. We heard of some cases in which the length of the DBP's appraisal forced PFIs to take bridging loans, which, in principle, they should not use.
20 The DBP has prepared specialized software to make it easy for the PFIs to calculate profitability estimates for
sub-projects, and the software is loaned to the PFIs as appropriate. In the field survey for this evaluation we obtained project summaries which had been prepared using this software, but by Japanese standards the calculations for each point were rather too simple, while the profitability forecast calculations were often overoptimistic. When we checked with the staff responsible we heard that there had been no problems with these optimistic estimates in the past, but recently much more use had been made of sensitivity analysis (running multiple analyses with varied assumptions to simulate the best and worst cases) in an effort to improve the accuracy of calculations.
Loan consultation and application from the end-user
Preparation of application documents
Internal appraisal within PFIs by
Application for sub-project approval from the PFI to the DBP Application for sub-project approval from the PFI to the DBP
Internal review of the PFI's application results by the DBP
Approval by the DBP board of directors
Notification of sub-loan approval from the DBP to the PFI
Preparation of Disbursement Review Sheet/ Disbursement Memo
Disbursement to the PFIs
Disbursement from the PFIs to the end-users
Direct payment to equipment suppliers etc. * Request by PFIs
18
(2) Implementation Scheme
(2)-1 Management Systems within the Executing Agency
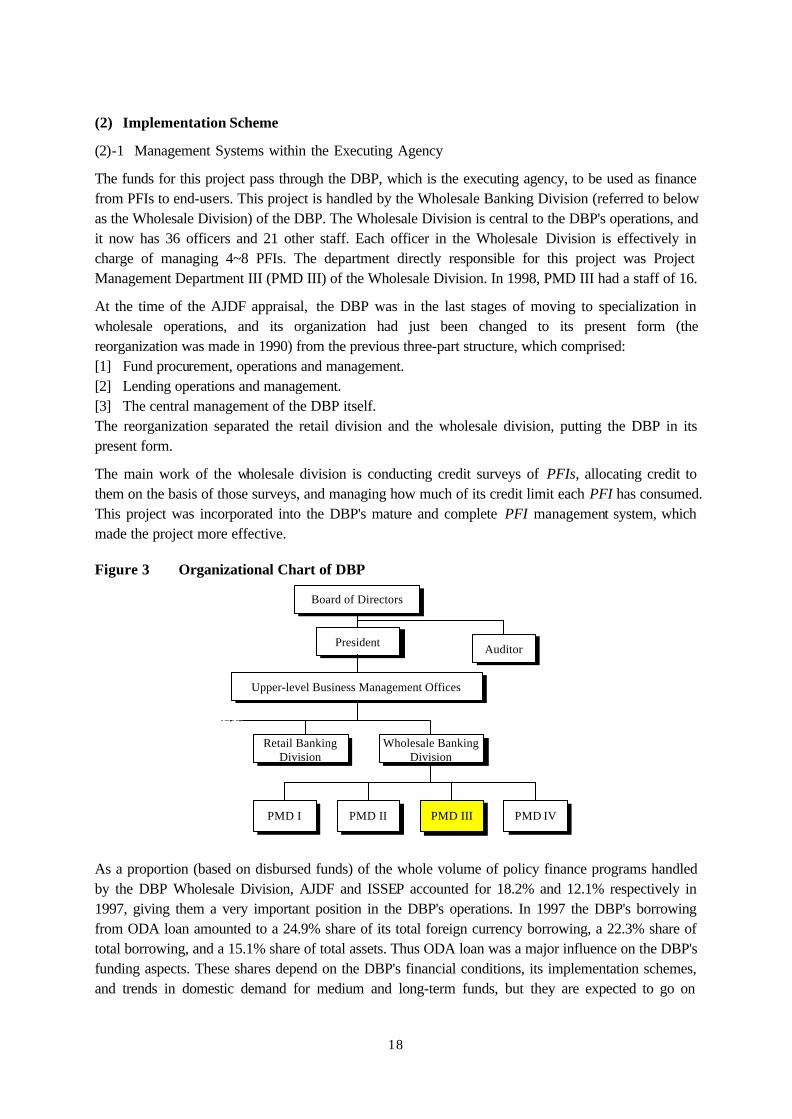
The funds for this project pass through the DBP, which is the executing agency, to be used as finance from PFIs to end-users. This project is handled by the Wholesale Banking Division (referred to below as the Wholesale Division) of the DBP. The Wholesale Division is central to the DBP's operations, and it now has 36 officers and 21 other staff. Each officer in the Wholesale Division is effectively in charge of managing 4~8 PFIs. The department directly responsible for this project was Project Management Department III (PMD III) of the Wholesale Division. In 1998, PMD III had a staff of 16.
At the time of the AJDF appraisal, the DBP was in the last stages of moving to specialization in wholesale operations, and its organization had just been changed to its present form (the reorganization was made in 1990) from the previous three-part structure, which comprised: [1] Fund procurement, operations and management. [2] Lending operations and management. [3] The central management of the DBP itself. The reorganization separated the retail division and the wholesale division, putting the DBP in its present form.
The main work of the wholesale division is conducting credit surveys of PFIs, allocating credit to them on the basis of those surveys, and managing how much of its credit limit each PFI has consumed. This project was incorporated into the DBP's mature and complete PFI management system, which made the project more effective.
Figure 3 Organizational Chart of DBP
Board of Directors
President
Upper-level Business Management Offices
Retail BankingDivision
Wholesale BankingDivision
PMD I PMD II PMD III PMD IV
Auditor
As a proportion (based on disbursed funds) of the whole volume of policy finance programs handled by the DBP Wholesale Division, AJDF and ISSEP accounted for 18.2% and 12.1% respectively in 1997, giving them a very important position in the DBP's operations. In 1997 the DBP's borrowing from ODA loan amounted to a 24.9% share of its total foreign currency borrowing, a 22.3% share of total borrowing, and a 15.1% share of total assets. Thus ODA loan was a major influence on the DBP's funding aspects. These shares depend on the DBP's financial conditions, its implementation schemes, and trends in domestic demand for medium and long-term funds, but they are expected to go on
19
increasing.
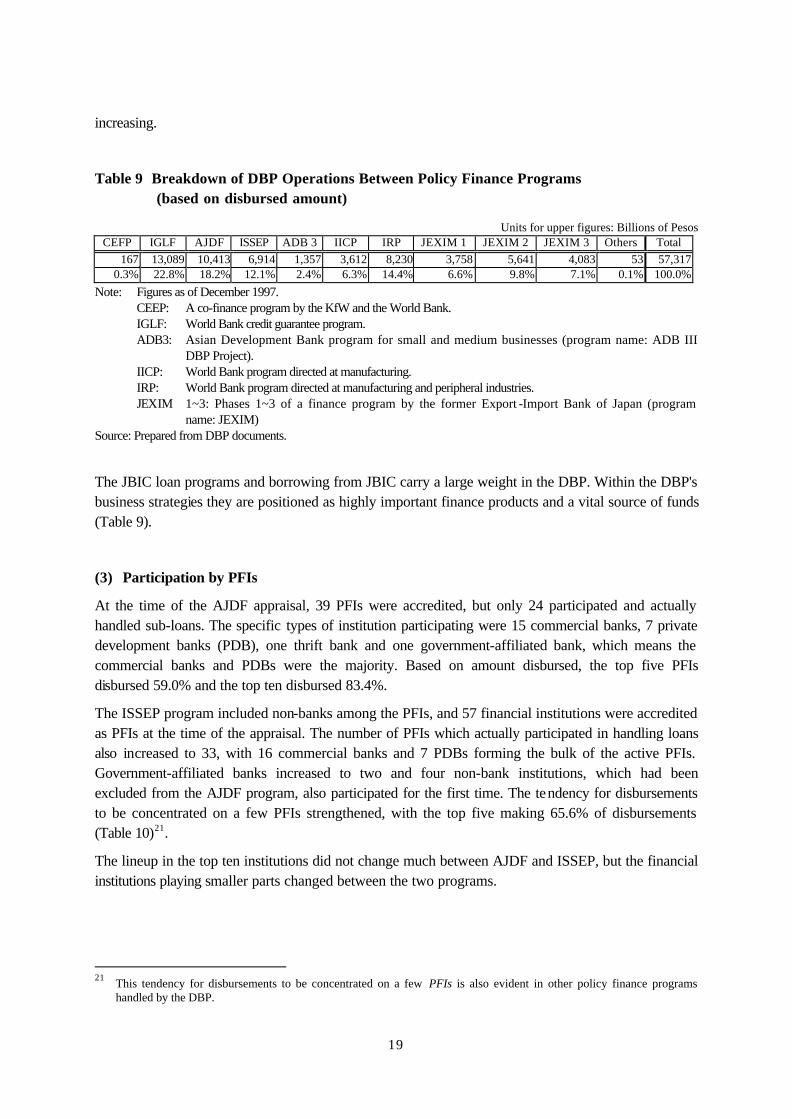
Table 9 Breakdown of DBP Operations Between Policy Finance Programs (based on disbursed amount)
Units for upper figures: Billions of Pesos CEFP IGLF AJDF ISSEP ADB 3 IICP IRP JEXIM 1 JEXIM 2 JEXIM 3 Others Total
167 13,089 10,413 6,914 1,357 3,612 8,230 3,758 5,641 4,083 53 57,317 0.3% 22.8% 18.2% 12.1% 2.4% 6.3% 14.4% 6.6% 9.8% 7.1% 0.1% 100.0%
Note: Figures as of December 1997. CEEP: A co-finance program by the KfW and the World Bank. IGLF: World Bank credit guarantee program. ADB3: Asian Development Bank program for small and medium businesses (program name: ADB III
DBP Project). IICP: World Bank program directed at manufacturing. IRP: World Bank program directed at manufacturing and peripheral industries. JEXIM 1~3: Phases 1~3 of a finance program by the former Export -Import Bank of Japan (program
name: JEXIM) Source: Prepared from DBP documents.
The JBIC loan programs and borrowing from JBIC carry a large weight in the DBP. Within the DBP's business strategies they are positioned as highly important finance products and a vital source of funds (Table 9).
(3) Participation by PFIs
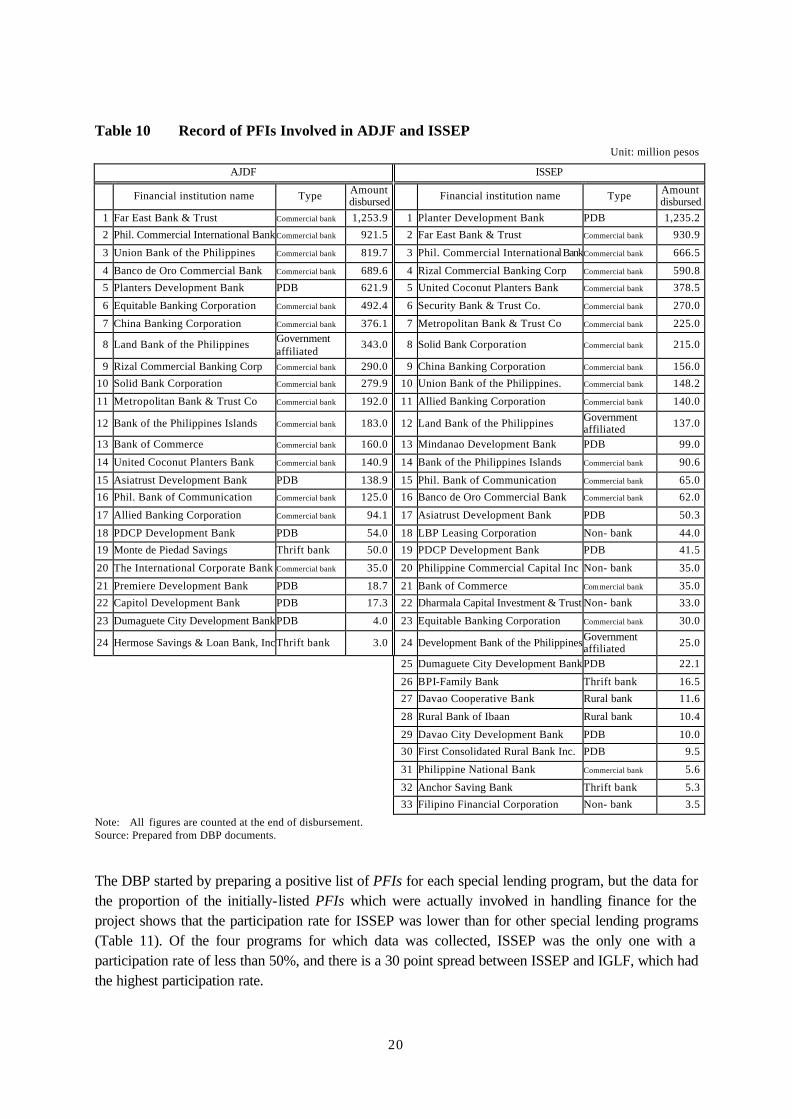
At the time of the AJDF appraisal, 39 PFIs were accredited, but only 24 participated and actually handled sub-loans. The specific types of institution participating were 15 commercial banks, 7 private development banks (PDB), one thrift bank and one government-affiliated bank, which means the commercial banks and PDBs were the majority. Based on amount disbursed, the top five PFIs disbursed 59.0% and the top ten disbursed 83.4%.
The ISSEP program included non-banks among the PFIs, and 57 financial institutions were accredited as PFIs at the time of the appraisal. The number of PFIs which actually participated in handling loans also increased to 33, with 16 commercial banks and 7 PDBs forming the bulk of the active PFIs. Government-affiliated banks increased to two and four non-bank institutions, which had been excluded from the AJDF program, also participated for the first time. The tendency for disbursements to be concentrated on a few PFIs strengthened, with the top five making 65.6% of disbursements (Table 10)21.
The lineup in the top ten institutions did not change much between AJDF and ISSEP, but the financial institutions playing smaller parts changed between the two programs.
21
This tendency for disbursements to be concentrated on a few PFIs is also evident in other policy finance programs handled by the DBP.
20
Table 10 Record of PFIs Involved in ADJF and ISSEP Unit: million pesos
AJDF ISSEP
Financial institution name Type Amount disbursed Financial institution name Type Amount
disbursed 1 Far East Bank & Trust Commercial bank 1,253.9 1 Planter Development Bank PDB 1,235.2
2 Phil. Commercial International BankCommercial bank 921.5 2 Far East Bank & Trust Commercial bank 930.9
3 Union Bank of the Philippines Commercial bank 819.7 3 Phil. Commercial International BankCommercial bank 666.5
4 Banco de Oro Commercial Bank Commercial bank 689.6 4 Rizal Commercial Banking Corp Commercial bank 590.8
5 Planters Development Bank PDB 621.9 5 United Coconut Planters Bank Commercial bank 378.5
6 Equitable Banking Corporation Commercial bank 492.4 6 Security Bank & Trust Co. Commercial bank 270.0
7 China Banking Corporation Commercial bank 376.1 7 Metropolitan Bank & Trust Co Commercial bank 225.0
8 Land Bank of the Philippines Government affiliated
343.0 8 Solid Bank Corporation Commercial bank 215.0
9 Rizal Commercial Banking Corp Commercial bank 290.0 9 China Banking Corporation Commercial bank 156.0
10 Solid Bank Corporation Commercial bank 279.9 10 Union Bank of the Philippines. Commercial bank 148.2
11 Metropolitan Bank & Trust Co Commercial bank 192.0 11 Allied Banking Corporation Commercial bank 140.0
12 Bank of the Philippines Islands Commercial bank 183.0 12 Land Bank of the Philippines Government affiliated 137.0
13 Bank of Commerce Commercial bank 160.0 13 Mindanao Development Bank PDB 99.0
14 United Coconut Planters Bank Commercial bank 140.9 14 Bank of the Philippines Islands Commercial bank 90.6
15 Asiatrust Development Bank PDB 138.9 15 Phil. Bank of Communication Commercial bank 65.0
16 Phil. Bank of Communication Commercial bank 125.0 16 Banco de Oro Commercial Bank Commercial bank 62.0
17 Allied Banking Corporation Commercial bank 94.1 17 Asiatrust Development Bank PDB 50.3
18 PDCP Development Bank PDB 54.0 18 LBP Leasing Corporation Non- bank 44.0
19 Monte de Piedad Savings Thrift bank 50.0 19 PDCP Development Bank PDB 41.5
20 The International Corporate Bank Commercial bank 35.0 20 Philippine Commercial Capital Inc Non- bank 35.0
21 Premiere Development Bank PDB 18.7 21 Bank of Commerce Commercial bank 35.0
22 Capitol Development Bank PDB 17.3 22 Dharmala Capital Investment & Trust Non- bank 33.0
23 Dumaguete City Development BankPDB 4.0 23 Equitable Banking Corporation Commercial bank 30.0
24 Hermose Savings & Loan Bank, IncThrift bank 3.0 24 Development Bank of the PhilippinesGovernment affiliated 25.0
25 Dumaguete City Development BankPDB 22.1
26 BPI-Family Bank Thrift bank 16.5
27 Davao Cooperative Bank Rural bank 11.6
28 Rural Bank of Ibaan Rural bank 10.4
29 Davao City Development Bank PDB 10.0
30 First Consolidated Rural Bank Inc. PDB 9.5
31 Philippine National Bank Commercial bank 5.6
32 Anchor Saving Bank Thrift bank 5.3
33 Filipino Financial Corporation Non- bank 3.5
Note: All figures are counted at the end of disbursement. Source: Prepared from DBP documents.
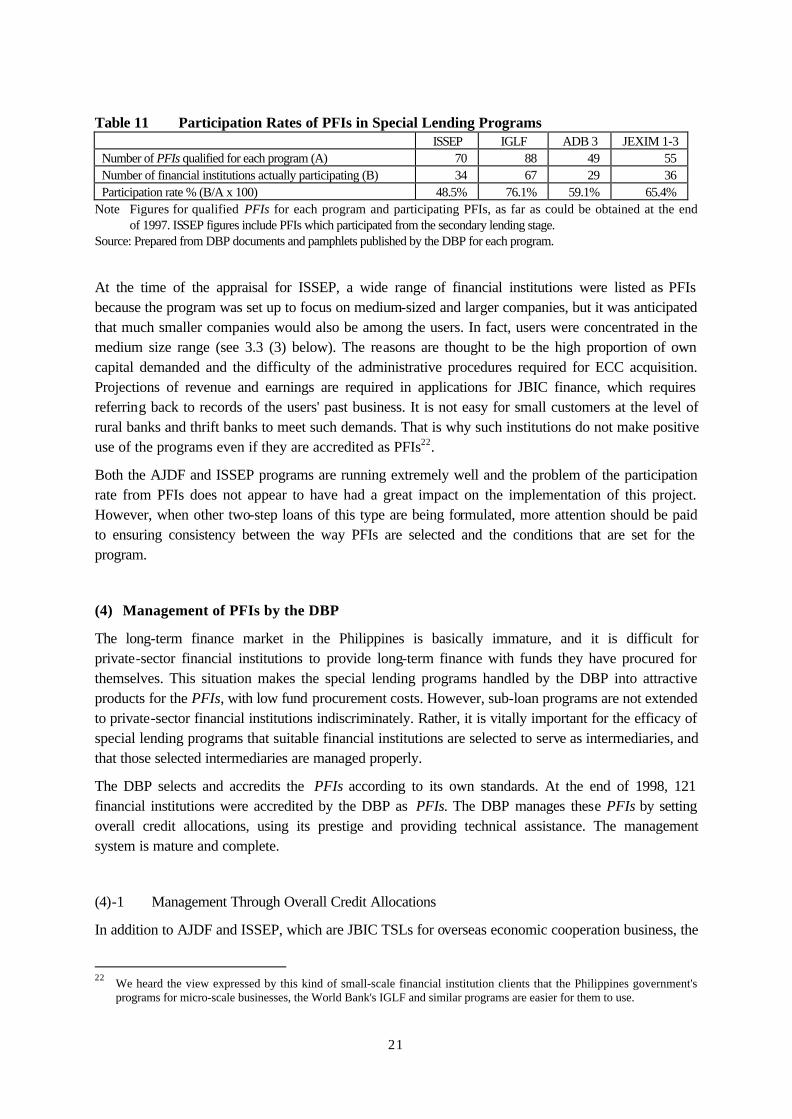
The DBP started by preparing a positive list of PFIs for each special lending program, but the data for the proportion of the initially-listed PFIs which were actually involved in handling finance for the project shows that the participation rate for ISSEP was lower than for other special lending programs (Table 11). Of the four programs for which data was collected, ISSEP was the only one with a participation rate of less than 50%, and there is a 30 point spread between ISSEP and IGLF, which had the highest participation rate.
21
Table 11 Participation Rates of PFIs in Special Lending Programs ISSEP IGLF ADB 3 JEXIM 1-3
Number of PFIs qualified for each program (A) 70 88 49 55 Number of financial institutions actually participating (B) 34 67 29 36 Participation rate % (B/A x 100) 48.5% 76.1% 59.1% 65.4%
Note Figures for qualified PFIs for each program and participating PFIs, as far as could be obtained at the end of 1997. ISSEP figures include PFIs which participated from the secondary lending stage.
Source: Prepared from DBP documents and pamphlets published by the DBP for each program.
At the time of the appraisal for ISSEP, a wide range of financial institutions were listed as PFIs because the program was set up to focus on medium-sized and larger companies, but it was anticipated that much smaller companies would also be among the users. In fact, users were concentrated in the medium size range (see 3.3 (3) below). The reasons are thought to be the high proportion of own capital demanded and the difficulty of the administrative procedures required for ECC acquisition. Projections of revenue and earnings are required in applications for JBIC finance, which requires referring back to records of the users' past business. It is not easy for small customers at the level of rural banks and thrift banks to meet such demands. That is why such institutions do not make positive use of the programs even if they are accredited as PFIs22.
Both the AJDF and ISSEP programs are running extremely well and the problem of the participation rate from PFIs does not appear to have had a great impact on the implementation of this project. However, when other two-step loans of this type are being formulated, more attention should be paid to ensuring consistency between the way PFIs are selected and the conditions that are set for the program.
(4) Management of PFIs by the DBP
The long-term finance market in the Philippines is basically immature, and it is difficult for private-sector financial institutions to provide long-term finance with funds they have procured for themselves. This situation makes the special lending programs handled by the DBP into attractive products for the PFIs, with low fund procurement costs. However, sub-loan programs are not extended to private-sector financial institutions indiscriminately. Rather, it is vitally important for the efficacy of special lending programs that suitable financial institutions are selected to serve as intermediaries, and that those selected intermediaries are managed properly.
The DBP selects and accredits the PFIs according to its own standards. At the end of 1998, 121 financial institutions were accredited by the DBP as PFIs. The DBP manages these PFIs by setting overall credit allocations, using its prestige and providing technical assistance. The management system is mature and complete.
(4)-1 Management Through Overall Credit Allocations
In addition to AJDF and ISSEP, which are JBIC TSLs for overseas economic cooperation business, the
22
We heard the view expressed by this kind of small-scale financial institution clients that the Philippines government's programs for micro-scale businesses, the World Bank's IGLF and similar programs are easier for them to use.
22
DBP simultaneously handles special lending programs for the former Export-Import Bank of Japan, the World Bank and the Asia Development Bank. When the DBP sets credit limits for each PFI, they are not allocated credit limits for each program. Instead, they are set an overall credit limit, and the choices of which programs to use and to what extent are left to the discretion of each PFI. This method of making an overall credit allocation is commendable, both for the smooth disbursement and the assimilation of funds.
In deciding which special lending program to emphasize, each PFI must have information on its customers' funding needs, the ability of the staff in charge of the loans, its management policies, organizational characteristics and other factors which the DBP cannot know accurately at the time it makes the credit allocation. Therefore the next best option is to allow each PFI to exercise its independent judgement so that it can give priority to handling the programs which suit it best. This approach leads to effective use of funds23. The overall credit allocation method is a realistic and practical approach which functions very well.
(4)-2 Use of the DBP's Prestige
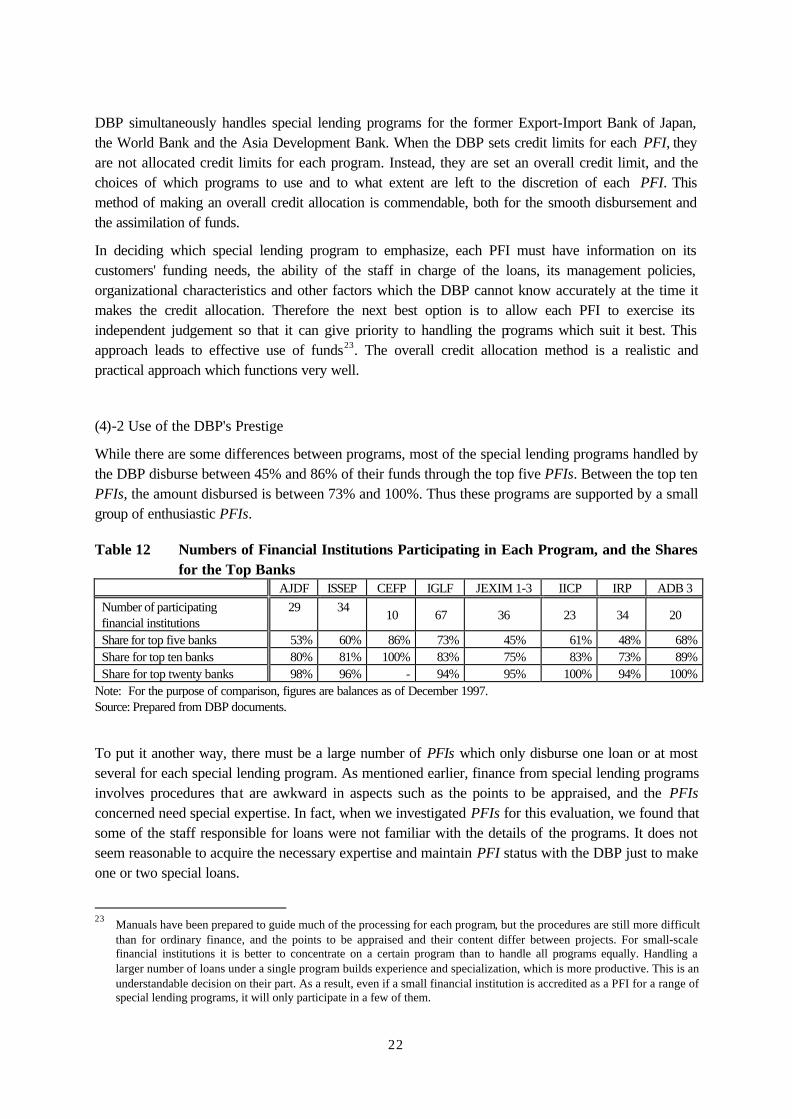
While there are some differences between programs, most of the special lending programs handled by the DBP disburse between 45% and 86% of their funds through the top five PFIs. Between the top ten PFIs, the amount disbursed is between 73% and 100%. Thus these programs are supported by a small group of enthusiastic PFIs.
Table 12 Numbers of Financial Institutions Participating in Each Program, and the Shares for the Top Banks
AJDF ISSEP CEFP IGLF JEXIM 1-3 IICP IRP ADB 3
Number of participating financial institutions
29 34 10 67 36 23 34 20
Share for top five banks 53% 60% 86% 73% 45% 61% 48% 68% Share for top ten banks 80% 81% 100% 83% 75% 83% 73% 89% Share for top twenty banks 98% 96% - 94% 95% 100% 94% 100%
Note: For the purpose of comparison, figures are balances as of December 1997. Source: Prepared from DBP documents.
To put it another way, there must be a large number of PFIs which only disburse one loan or at most several for each special lending program. As mentioned earlier, finance from special lending programs involves procedures that are awkward in aspects such as the points to be appraised, and the PFIs concerned need special expertise. In fact, when we investigated PFIs for this evaluation, we found that some of the staff responsible for loans were not familiar with the details of the programs. It does not seem reasonable to acquire the necessary expertise and maintain PFI status with the DBP just to make one or two special loans.
23
Manuals have been prepared to guide much of the processing for each program, but the procedures are still more difficult than for ordinary finance, and the points to be appraised and their content differ between projects. For small-scale financial institutions it is better to concentrate on a certain program than to handle all programs equally. Handling a larger number of loans under a single program builds experience and specialization, which is more productive. This is an understandable decision on their part. As a result, even if a small financial institution is accredited as a PFI for a range of special lending programs, it will only participate in a few of them.
23
Nevertheless, for private-sector financial institutions in the Philippines, and particularly for small banks, being a PFI for the DBP confers a certain prestige, and wins them greater trust from their clients. Therefore even some small banks are keen to become PFIs for DBP special lending programs. Their enthusiasm increases the number of businesses able to use the programs and contributes to the advancement of small and medium businesses.
(4)-3 Management Through Technical Assistance
As mentioned earlier, consultants provided technical assistance under this project.
One element of this technical assistance is training for PFIs in skills related to project finance. This transfer of expertise relevant to long-term funds is behind the DBP's ability to guide the PFIs. Recently the large financial institutions have built up their expertise in the field of long-term finance to a reasonably high level, but in areas such as credit investigations, project financed evaluation and the preparation of written loan procedures, there is still strong demand for training from the DBP.
(5) Management of End-Users by PFIs
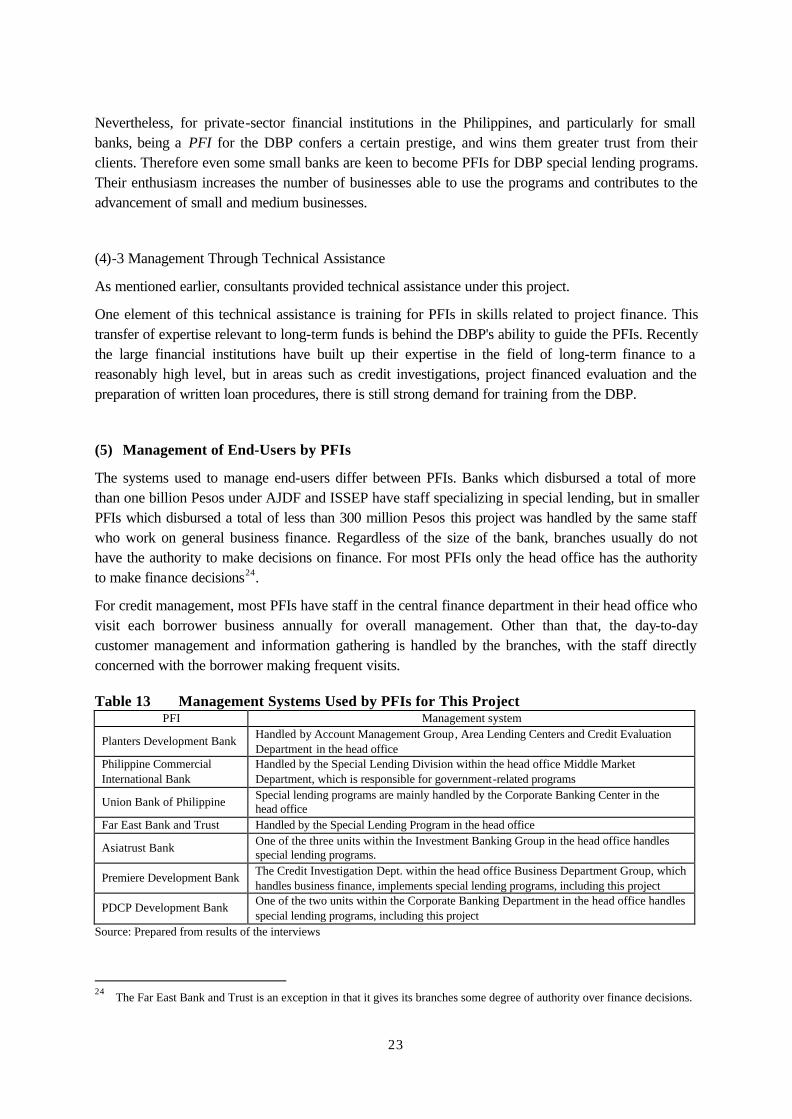
The systems used to manage end-users differ between PFIs. Banks which disbursed a total of more than one billion Pesos under AJDF and ISSEP have staff specializing in special lending, but in smaller PFIs which disbursed a total of less than 300 million Pesos this project was handled by the same staff who work on general business finance. Regardless of the size of the bank, branches usually do not have the authority to make decisions on finance. For most PFIs only the head office has the authority to make finance decisions24.
For credit management, most PFIs have staff in the central finance department in their head office who visit each borrower business annually for overall management. Other than that, the day-to-day customer management and information gathering is handled by the branches, with the staff directly concerned with the borrower making frequent visits.
Table 13 Management Systems Used by PFIs for This Project PFI Management system
Planters Development Bank Handled by Account Management Group, Area Lending Centers and Credit Evaluation Department in the head office
Philippine Commercial International Bank
Handled by the Special Lending Division within the head office Middle Market Department, which is responsible for government-related programs
Union Bank of Philippine Special lending programs are mainly handled by the Corporate Banking Center in the head office
Far East Bank and Trust Handled by the Special Lending Program in the head office
Asiatrust Bank One of the three units within the Investment Banking Group in the head office handles special lending programs.
Premiere Development Bank The Credit Investigation Dept. within the head office Business Department Group, which handles business finance, implements special lending programs, including this project
PDCP Development Bank One of the two units within the Corporate Banking Department in the head office handles special lending programs, including this project
Source: Prepared from results of the interviews
24
The Far East Bank and Trust is an exception in that it gives its branches some degree of authority over finance decisions.
24
The sample investigation of end-users carried out for this evaluation (see section 3.5 below) found that the responsible staff in branches of PFIs performed their customer management duties well, and the evaluation of their performance was generally high.
3.3 The Status of Sub-loan Implementation
(1) Sub-loan Disbursement
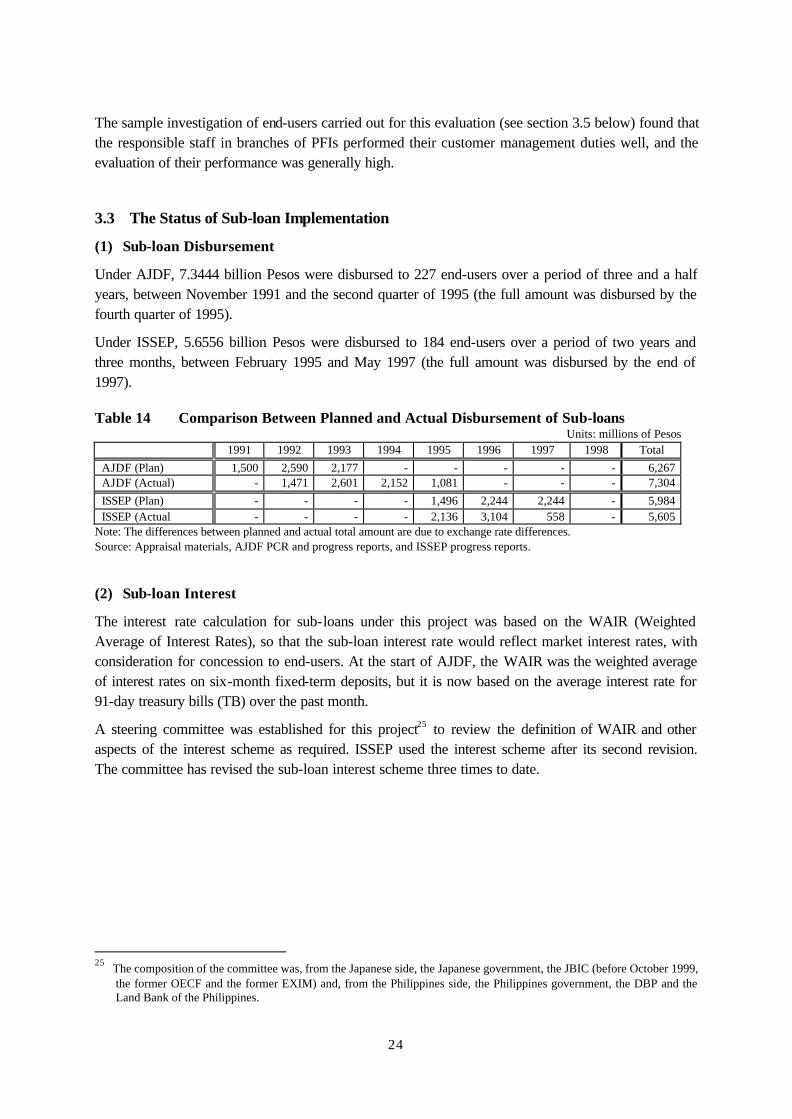
Under AJDF, 7.3444 billion Pesos were disbursed to 227 end-users over a period of three and a half years, between November 1991 and the second quarter of 1995 (the full amount was disbursed by the fourth quarter of 1995).
Under ISSEP, 5.6556 billion Pesos were disbursed to 184 end-users over a period of two years and three months, between February 1995 and May 1997 (the full amount was disbursed by the end of 1997).
Table 14 Comparison Between Planned and Actual Disbursement of Sub-loans Units: millions of Pesos
1991 1992 1993 1994 1995 1996 1997 1998 Total
AJDF (Plan) 1,500 2,590 2,177 - - - - - 6,267 AJDF (Actual) - 1,471 2,601 2,152 1,081 - - - 7,304
ISSEP (Plan) - - - - 1,496 2,244 2,244 - 5,984 ISSEP (Actual - - - - 2,136 3,104 558 - 5,605
Note: The differences between planned and actual total amount are due to exchange rate differences. Source: Appraisal materials, AJDF PCR and progress reports, and ISSEP progress reports.
(2) Sub-loan Interest
The interest rate calculation for sub-loans under this project was based on the WAIR (Weighted Average of Interest Rates), so that the sub-loan interest rate would reflect market interest rates, with consideration for concession to end-users. At the start of AJDF, the WAIR was the weighted average of interest rates on six-month fixed-term deposits, but it is now based on the average interest rate for 91-day treasury bills (TB) over the past month.
A steering committee was established for this project25 to review the definition of WAIR and other aspects of the interest scheme as required. ISSEP used the interest scheme after its second revision. The committee has revised the sub-loan interest scheme three times to date.
25
The composition of the committee was, from the Japanese side, the Japanese government, the JBIC (before October 1999, the former OECF and the former EXIM) and, from the Philippines side, the Philippines government, the DBP and the Land Bank of the Philippines.
25
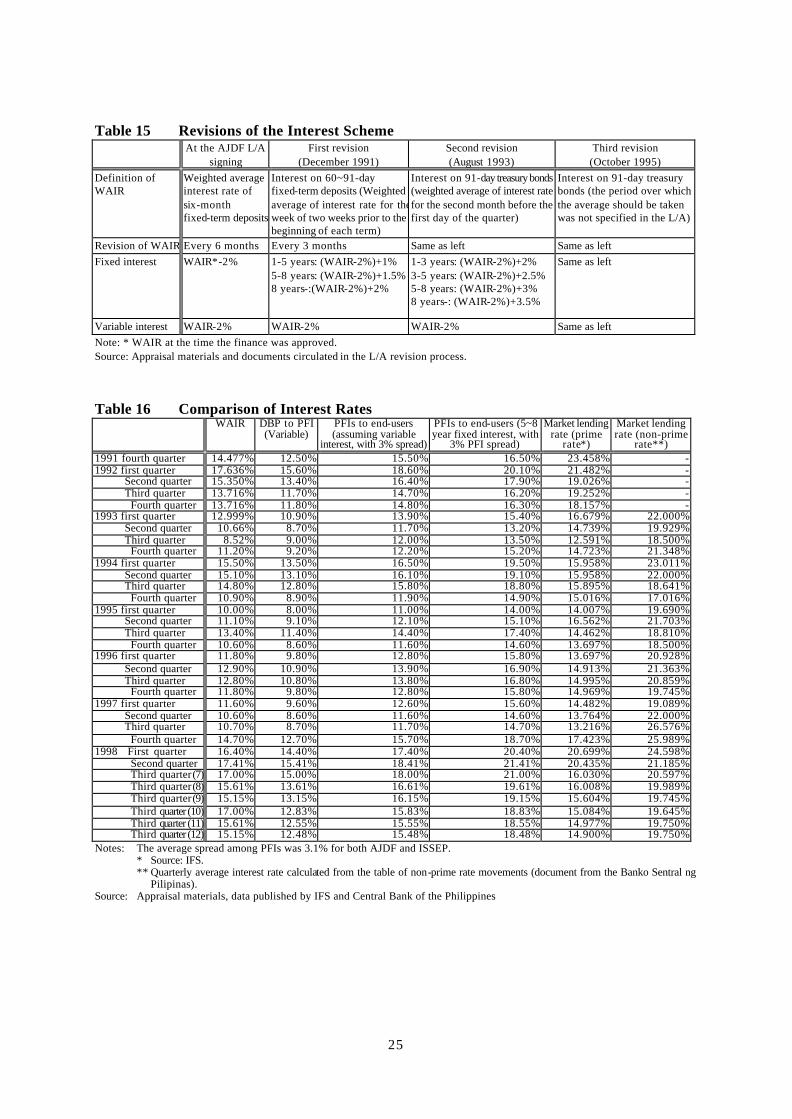
Table 15 Revisions of the Interest Scheme At the AJDF L/A
signing First revision
(December 1991) Second revision (August 1993)
Third revision (October 1995)
Definition of WAIR
Weighted average interest rate of six-month fixed-term deposits
Interest on 60~91-day fixed-term deposits (Weighted average of interest rate for the week of two weeks prior to the beginning of each term)
Interest on 91-day treasury bonds (weighted average of interest rate for the second month before the first day of the quarter)
Interest on 91-day treasury bonds (the period over which the average should be taken was not specified in the L/A)
Revision of WAIR Every 6 months Every 3 months Same as left Same as left
Fixed interest WAIR*-2% 1-5 years: (WAIR-2%)+1% 5-8 years: (WAIR-2%)+1.5% 8 years-:(WAIR-2%)+2%
1-3 years: (WAIR-2%)+2% 3-5 years: (WAIR-2%)+2.5% 5-8 years: (WAIR-2%)+3% 8 years-: (WAIR-2%)+3.5%
Same as left
Variable interest WAIR-2% WAIR-2% WAIR-2% Same as left
Note: * WAIR at the time the finance was approved. Source: Appraisal materials and documents circulated in the L/A revision process.
Table 16 Comparison of Interest Rates WAIR DBP to PFI
(Variable) PFIs to end-users (assuming variable
interest, with 3% spread)
PFIs to end-users (5~8 year fixed interest, with
3% PFI spread)
Market lending rate (prime
rate*)
Market lending rate (non-prime
rate**) 1991 fourth quarter 14.477% 12.50% 15.50% 16.50% 23.458% - 1992 first quarter 17.636% 15.60% 18.60% 20.10% 21.482% - Second quarter 15.350% 13.40% 16.40% 17.90% 19.026% - Third quarter 13.716% 11.70% 14.70% 16.20% 19.252% - Fourth quarter 13.716% 11.80% 14.80% 16.30% 18.157% - 1993 first quarter 12.999% 10.90% 13.90% 15.40% 16.679% 22.000% Second quarter 10.66% 8.70% 11.70% 13.20% 14.739% 19.929% Third quarter 8.52% 9.00% 12.00% 13.50% 12.591% 18.500% Fourth quarter 11.20% 9.20% 12.20% 15.20% 14.723% 21.348% 1994 first quarter 15.50% 13.50% 16.50% 19.50% 15.958% 23.011% Second quarter 15.10% 13.10% 16.10% 19.10% 15.958% 22.000% Third quarter 14.80% 12.80% 15.80% 18.80% 15.895% 18.641% Fourth quarter 10.90% 8.90% 11.90% 14.90% 15.016% 17.016% 1995 first quarter 10.00% 8.00% 11.00% 14.00% 14.007% 19.690% Second quarter 11.10% 9.10% 12.10% 15.10% 16.562% 21.703% Third quarter 13.40% 11.40% 14.40% 17.40% 14.462% 18.810% Fourth quarter 10.60% 8.60% 11.60% 14.60% 13.697% 18.500% 1996 first quarter 11.80% 9.80% 12.80% 15.80% 13.697% 20.928% Second quarter 12.90% 10.90% 13.90% 16.90% 14.913% 21.363% Third quarter 12.80% 10.80% 13.80% 16.80% 14.995% 20.859% Fourth quarter 11.80% 9.80% 12.80% 15.80% 14.969% 19.745% 1997 first quarter 11.60% 9.60% 12.60% 15.60% 14.482% 19.089% Second quarter 10.60% 8.60% 11.60% 14.60% 13.764% 22.000% Third quarter 10.70% 8.70% 11.70% 14.70% 13.216% 26.576% Fourth quarter 14.70% 12.70% 15.70% 18.70% 17.423% 25.989% 1998 First quarter 16.40% 14.40% 17.40% 20.40% 20.699% 24.598% Second quarter 17.41% 15.41% 18.41% 21.41% 20.435% 21.185% Third quarter (7) 17.00% 15.00% 18.00% 21.00% 16.030% 20.597% Third quarter (8) 15.61% 13.61% 16.61% 19.61% 16.008% 19.989% Third quarter (9) 15.15% 13.15% 16.15% 19.15% 15.604% 19.745% Third quarter (10) 17.00% 12.83% 15.83% 18.83% 15.084% 19.645% Third quarter (11) 15.61% 12.55% 15.55% 18.55% 14.977% 19.750% Third quarter (12) 15.15% 12.48% 15.48% 18.48% 14.900% 19.750% Notes: The average spread among PFIs was 3.1% for both AJDF and ISSEP. * Source: IFS. ** Quarterly average interest rate calculated from the table of non-prime rate movements (document from the Banko Sentral ng
Pilipinas). Source: Appraisal materials, data published by IFS and Central Bank of the Philippines

26
The interest rates were reasonably concessional throughout AJDF and the first half of the implementation of ISSEP. In the interview survey of end-users conducted for this evaluation, most respondents said they were satisfied with the level of interest, particularly those end-users who received loans in the early stages of AJDF. However, in recent years the interest rates for sub-loans have approached market rates and have even reached the same level at some times.
Other than WAIR, the spread chosen by the PFIs (up to 5%) is another important factor in determining the interest rates used in this project. The PFIs are free to set their spread for each individual sub-loan. In situations such as now, where sub-loan interest rates are approaching the market rates, the end-users become dissatisfied with the PFIs' spread. In future we will have to consider how to maintain interest at levels concessional to end-users, and how to set a level of spread that satisfies both the end-users and the PFIs26.
Under this project, end-users were able to choose between fixed and variable forms of interest for their sub-loans. They are also allowed to switch forms (variable to fixed or fixed to variable) once in the duration of the loan. However, for end-users to make appropriate choices and changes to interest rate types, they must receive a continuing and detailed flow of information on interest rate movements. They appear to have been provided with largely accurate information, but a few respondents in the interview survey of end-users said that their PFI had not provided any information at all for a comparative examination of the forms of interest27.
(3) Distribution by Scale
Dividing the end-users of sub-loans from this project by size 28, both AJDF and ISSEP had around five instances each of loans to micro-scale businesses, amounting to about 1% of the amount disbursed. For small businesses the numbers of loans were 60 under AJDF and 50 under ISSEP, but those loans only accounted for 14% of total amount. The majority of sub-loans went to medium businesses. Compared to the distribution of business size, in terms of added value, for all industries in the Philippines, AJDF and ISSEP directed a higher share than the national average to medium businesses29.
26
The PFIs' spread serves as an incentive for private-sector financial institutions to participate in special lending programs, so some degree of spread is necessary. Under this project, the PFIs bear all risks of defaults by end-users, so the risk, which differs for each project, must be reflected in the loan interest. Therefore it would be irrational to apply a uniform spread for all sub-projects.
27 If the level of information provision from the PFI staff concerned is poor, it can diminish the efficacy of the project. To
date we have not heard any reports of any borrowers suffering major ill effects to their business due to selecting the form of interest rate without adequate information from their PFI. However, in a situation where end-users are obliged to make the choice in the absence of adequate information, this project is certainly made less attractive. In future we would like to see thorough information provision from the PFI staff concerned.
28 The business size classifications employed at the end of AJDF lending differed from those used later. See note two to
Table 17 for details. 29
The classification "large businesses" referred to end-users with total assets of 40~200 million pesos at the time of the first primary loan for AJDF. At other times it referred to end-users with total assets of 60~200 million pesos.

27
Table 17 Size Distribution of Sub-loan End-Users
Size classification AJDF
(amount based)
ISSEP (amount based)
(Nationwide) Shares of added value
(Manufacturing) Shares of added value
Micro 0.8% 1.2% 7.6% 4.4% Small 14.6% 14.2% 13.5% 10.7% Middle 35.7% 37.6% 11.1% 11.6% Total of micro, small and middle 51.1% 52.9% 32.2% 26.7% Large 48.9% 47.1% 67.8% 73.3% Grand total 100.0% 100.0% 100.0% 100.0%
Source: Data from National Statistics Bureau (the Philippines), AJDF and ISSEP progress reports, ISSEP Impact Assessment Note: 1 For the ISSEP Impact Assessment, cottage industries are included in the "micro" category. 2 The classifications of figures at the end of AJDF lending are based on total assets before the loan, such that micro
businesses had 100,000~1 million Pesos, small businesses had 1~10 million, medium businesses had 10~40 million and large businesses had 40~200 million Pesos. For other classifications, similarly, micro businesses had 150,000~1.5 million Pesos, small businesses had 1.5~15 million, medium businesses had 10~60 million and large businesses had 60~200 million Pesos.
The range of finance for this project was 50,000~100 million Pesos for both AJDF and ISSEP. The distribution of sub-loans between the size categories shows that for both programs over 30% of loans were in the 10~40 million Peso range and over 60% were above 40 million Pesos. Over 95% exceeded ten million Pesos. The share of sub-loans worth one million Pesos or less was less than 0.1% under either program, meaning that there was almost no use of loans of that size.
Table 18 Distribution by Loan Size (Amount Based) AJDF ISSEP
100,000 ~999,999 Pesos 0.03% 0.05% 1~10 million Pesos 5.02% 4.70% 10~40 million Pesos 32.85% 32.50% Over 40 million Pesos 62.10% 62.75%
Total 100.00% 100.00%
Source: AJDF PCR and progress report, ISSEP progress report.
As mentioned earlier, this is the case because the appraisal conditions for AJDF and ISSEP were geared towards medium businesses, making it difficult for micro and small businesses to qualify. As a result, both micro and small businesses and the PFIs which appraise and manage the loans stayed away from them. There was almost no demand for funds from this project to invest in very low-cost equipment. However, at the time of the appraisal for AJDF, the DBP anticipated supplying 20% of the funds to medium businesses and 80% to la rge businesses. In fact, more money was provided to medium businesses than was initially anticipated.
(4) Distribution by Duration
The finance duration for sub-loans under this project could be set in the range 3~15 years, but in each program the duration of sub-loans was concentrated between three and eight years. Under ISSEP the proportion of longer loans increased slightly. Under AJDF the average duration was 5.66 years, rising to 6.48 years under ISSEP.
28
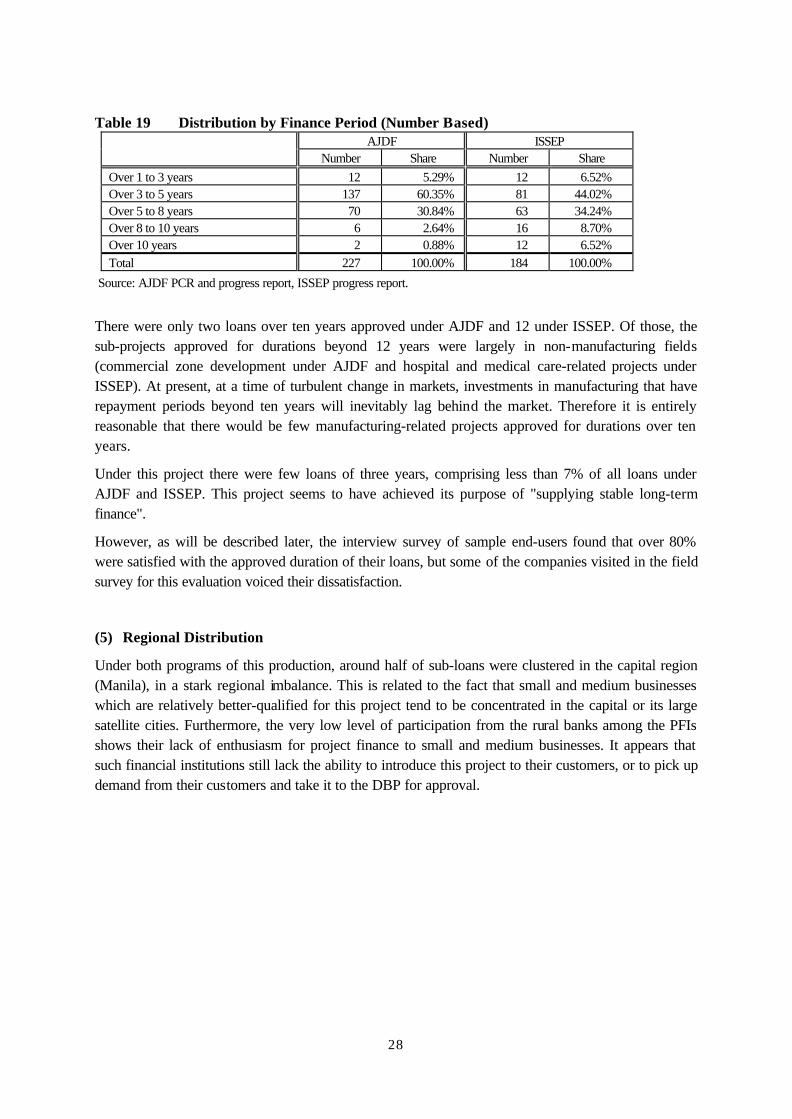
Table 19 Distribution by Finance Period (Number Based) AJDF ISSEP
Number Share Number Share
Over 1 to 3 years 12 5.29% 12 6.52% Over 3 to 5 years 137 60.35% 81 44.02% Over 5 to 8 years 70 30.84% 63 34.24% Over 8 to 10 years 6 2.64% 16 8.70% Over 10 years 2 0.88% 12 6.52% Total 227 100.00% 184 100.00%
Source: AJDF PCR and progress report, ISSEP progress report.
There were only two loans over ten years approved under AJDF and 12 under ISSEP. Of those, the sub-projects approved for durations beyond 12 years were largely in non-manufacturing fields (commercial zone development under AJDF and hospital and medical care-related projects under ISSEP). At present, at a time of turbulent change in markets, investments in manufacturing that have repayment periods beyond ten years will inevitably lag behind the market. Therefore it is entirely reasonable that there would be few manufacturing-related projects approved for durations over ten years.
Under this project there were few loans of three years, comprising less than 7% of all loans under AJDF and ISSEP. This project seems to have achieved its purpose of "supplying stable long-term finance".
However, as will be described later, the interview survey of sample end-users found that over 80% were satisfied with the approved duration of their loans, but some of the companies visited in the field survey for this evaluation voiced their dissatisfaction.
(5) Regional Distribution
Under both programs of this production, around half of sub-loans were clustered in the capital region (Manila), in a stark regional imbalance. This is related to the fact that small and medium businesses which are relatively better-qualified for this project tend to be concentrated in the capital or its large satellite cities. Furthermore, the very low level of participation from the rural banks among the PFIs shows their lack of enthusiasm for project finance to small and medium businesses. It appears that such financial institutions still lack the ability to introduce this project to their customers, or to pick up demand from their customers and take it to the DBP for approval.

29
Table 20 Distribution by Region AJDF ISSEP
Region Number of
loans
Share of amount
disbursed
Number of loans
Share of amount
disbursed
National small and medium businesses
(Number of places of business)
I Ilocos 4 1.7% 3 0.90% 10.1% II Cagayan Gorge 1 0.1% 1 0.34% 4.1% III Central Luzon 28 9.9% 16 11.89% 10.0% IV South Tagalog 46 19.0% 33 19.96% 15.5% V ピコール 1 0.2% 0 0.00% 4.5% VI Western Visaya 3 1.9% 1 0.50% 7.7% VII Central Visaya 19 9.4% 17 6.50% 5.5% VIII Eastern Visaya 0 0.0% 0 0.00% 3.0% IX Western Samar 1 0.3% 0 0.00% 2.8% X Northern Mindanao 7 4.1% 11 1.85% 4.4% XI Southern Mindanao 11 5.0% 9 5.51% 7.1% XII Central Mindanao 1 0.3% 1 1.72% 4.1% CAR Cordillera Autonomous Region 0 0.0% 0 0.00% 1.7% NCR Capital region 105 48.2% 92 50.84% 19.5%
Totals 227 100.0% 184 100.0% 100.0%
Source: National Statistics Bureau data, AJDF PCR progress report, ISSEP progress report
The DBP sees the participation30 of its own retail division in syndication finance as an opportunity to draw small rural PFIs into participation in the project. However, the DBP's participation in syndication only amounted to four loans up to the end of 1998, and three of those were with relatively large commercial banks, so the syndication effort is not proceeding as the DBP wished.
(6) Distribution by Purpose of Loan
Under AJDF around three quarters of the projects, in terms of both amount and number, were for investment in the expansion of equipment 31 . There is no documentation in this classification concerning ISSEP, but it appears likely that ISSEP provided finance for a higher proportion of new factories and business startups.
Table 21 Classification of Applications under AJDF
Application No. of loans Share by number (%)
Amount of loans (thousands of Pesos)
Share by amount (%)
New factories 55 24.2% 1,871,874 25.6% Expansion of equipment 171 75.3% 5,392,563 73.8% Renewal of equipment 1 0.4% 40,000 0.5% Other 0 0.0% 0 0.0% Totals 227 100.0% 7,304,437 100.0% Source: AJDF PCR
30
The DBP retail division was first allowed to participate as a PFI in syndication finance under ISSEP. 31
The form of the report to JBIC was altered, so the DBP did not record information in its database on the applications of sub-loans made under ISSEP.

30
(7) Distribution by Business Type
In terms of loan amount, manufacturing industry received a 75% share under AJDF (5.462 billion Pesos in 171 loans) and non-manufacturing industry received 25% (1.842 billion Pesos in 56 loans). Under ISSEP the shares were 70% for manufacturing (3.933 billion Pesos in 118 loans) and 30% for non-manufacturing industry (1.672 billion Pesos in 66 loans).
Table 22 Distribution by Business Type AJDF ISSEP
Foodstuff & beverage manufacturing 13.7% 15.0% Textile-related industry 13.5% 7.2% Metal products 8.9% 11.5% Paper and paper products 8.2% 4.9% Timber, cork 7.2% 1.8% Chemical products 6.6% 8.9% Apparel products 1.4% 2.1% Non-metal products 1.9% 0.0% Furniture & related products 0.5% 4.6% Daily goods 7.9% 0.0% Sundries 2.2% 0.0% Stone-quarrying industry 0.3% 0.0% Petroleum and coal products 1.2% 0.0% Transport facilities, repairs 1.2% 0.0% Handcrafts, home industry 0.2% 0.0% Rubber products 0.4% 0.0% Plastic products 0.0% 7.5% Electric and industrial machinery 0.0% 1.4% Jewelry and accessories 0.0% 0.2% Pottery and related industry 0.0% 0.5% Glass and glass-related products 0.0% 0.2%
Total of manufacturing industries 75.1% 66.0% Transport and communications 15.9% 26.5% Marketing distribution 2.8% 0.0% Fishing 2.6% 0.0% Private service 0.9% 0.0% Electricity, gas, water supply 1.6% 0.0% Publishing and printing 1.1% 0.0% Refrigerating warehouse 0.0% 2.7% Hospitals and medical treatment related 0.0% 2.6% Education 0.0% 1.9% Environment 0.0% 0.3% Total of non-manufacturing industries 24.9% 34.0%
Grand Total 100.0% 100.0% Source: AJDF PCR and Impact Assessment of ISSEP
No loans were provided for business types outside the AJDF eligible types and the ISSEP positive list.
Looking at distribution by business type for AJDF and ISSEP in the manufacturing industries, the finance proportion to the top four business types (foodstuff, textiles, metals and furniture) in the national added-value production in the Philippines exceeded 31.0% and 45.4% of added-value based structure by industry for small and medium businesses (number of employees are less than 200) (49.9% for AJDF, 61.4% for ISSEP). In particular, the weights were high for the fields of foods and
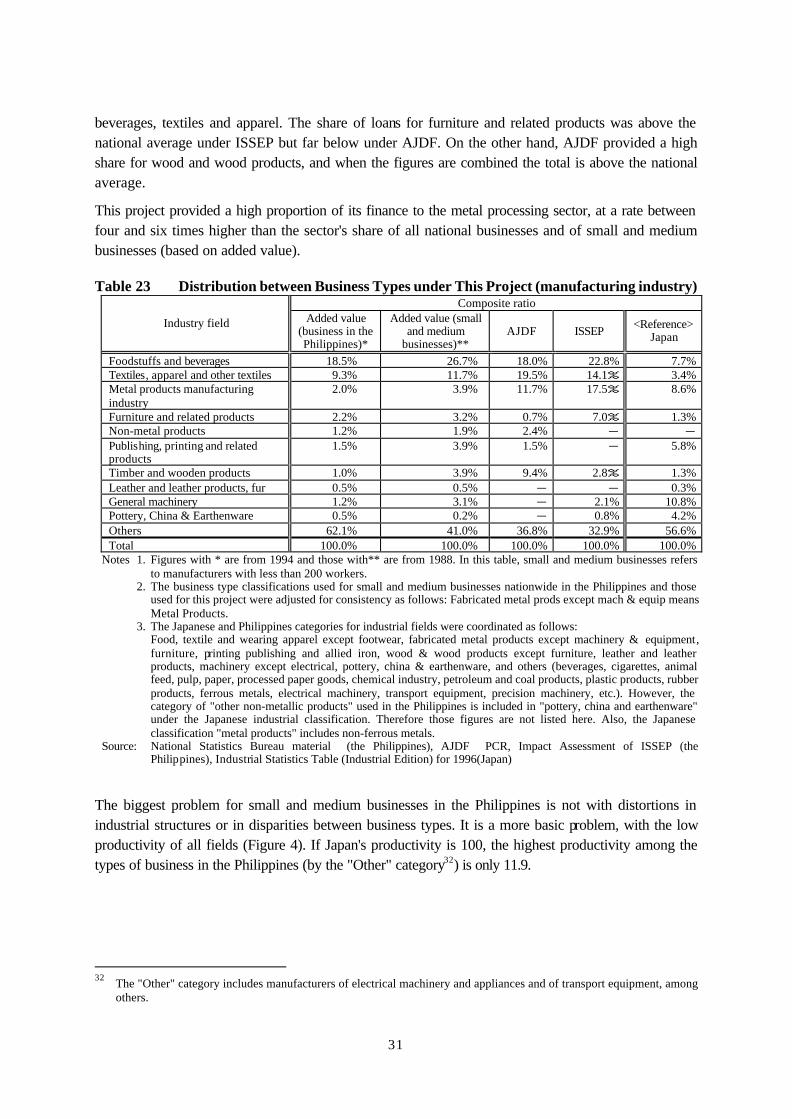
31
beverages, textiles and apparel. The share of loans for furniture and related products was above the national average under ISSEP but far below under AJDF. On the other hand, AJDF provided a high share for wood and wood products, and when the figures are combined the total is above the national average.
This project provided a high proportion of its finance to the metal processing sector, at a rate between four and six times higher than the sector's share of all national businesses and of small and medium businesses (based on added value).
Table 23 Distribution between Business Types under This Project (manufacturing industry) Composite ratio
Industry field Added value (business in the Philippines)*
Added value (small and medium
businesses)** AJDF ISSEP
<Reference> Japan
Foodstuffs and beverages 18.5% 26.7% 18.0% 22.8% 7.7% Textiles, apparel and other textiles 9.3% 11.7% 19.5% 14.1% 3.4% Metal products manufacturing industry
2.0% 3.9% 11.7% 17.5% 8.6%
Furniture and related products 2.2% 3.2% 0.7% 7.0% 1.3% Non-metal products 1.2% 1.9% 2.4% - - Publishing, printing and related products
1.5% 3.9% 1.5% - 5.8%
Timber and wooden products 1.0% 3.9% 9.4% 2.8% 1.3% Leather and leather products, fur 0.5% 0.5% - - 0.3% General machinery 1.2% 3.1% - 2.1% 10.8% Pottery, China & Earthenware 0.5% 0.2% - 0.8% 4.2% Others 62.1% 41.0% 36.8% 32.9% 56.6% Total 100.0% 100.0% 100.0% 100.0% 100.0%
Notes 1. Figures with * are from 1994 and those with** are from 1988. In this table, small and medium businesses refers to manufacturers with less than 200 workers.
2. The business type classifications used for small and medium businesses nationwide in the Philippines and those used for this project were adjusted for consistency as follows: Fabricated metal prods except mach & equip means Metal Products.
3. The Japanese and Philippines categories for industrial fields were coordinated as follows: Food, textile and wearing apparel except footwear, fabricated metal products except machinery & equipment, furniture, printing publishing and allied iron, wood & wood products except furniture, leather and leather products, machinery except electrical, pottery, china & earthenware, and others (beverages, cigarettes, animal feed, pulp, paper, processed paper goods, chemical industry, petroleum and coal products, plastic products, rubber products, ferrous metals, electrical machinery, transport equipment, precision machinery, etc.). However, the category of "other non-metallic products" used in the Philippines is included in "pottery, china and earthenware" under the Japanese industrial classification. Therefore those figures are not listed here. Also, the Japanese classification "metal products" includes non-ferrous metals.
Source: National Statistics Bureau material (the Philippines), AJDF PCR, Impact Assessment of ISSEP (the Philippines), Industrial Statistics Table (Industrial Edition) for 1996(Japan)
The biggest problem for small and medium businesses in the Philippines is not with distortions in industrial structures or in disparities between business types. It is a more basic problem, with the low productivity of all fields (Figure 4). If Japan's productivity is 100, the highest productivity among the types of business in the Philippines (by the "Other" category32) is only 11.9.
32
The "Other" category includes manufacturers of electrical machinery and appliances and of transport equipment, among others.

32
Figure 4 Comparison of Added Value Productivity Among Small and Medium Businesses in the Philippines
Japa
n=
100
7.8 7.4
3.5
6.8
3.74.3
3.03.5 3.6
11.9
7.3
0.0
2.0
4.0
6.0
8.0
10.0
12.0
14.0
Food
Text
ileap
pare
l
Meta
lpr
oduc
ts
Furn
iture
Publ
ishi
ngpr
intin
g
Woo
den
prod
ucts
Leat
her
prod
ucts
Gen
eral
mac
hine
ry
Potte
ry
Oth
ers
Ove
rall
Note: The amount of added value production (calculated by one Peso = ¥3) divided by the number of workers. The classifications for which the Japanese value was set at 100 are as listed for Table 23.
Source: National Statistics Bureau materials (the Philippines), Industrial Statistics Table (Industrial Edition) for 1996 (Japan)
These data indicate that the task for the near term in building up small and medium businesses in the Philippines is to increase productivity in all business types33. Therefore it seems that at present the range of businesses eligible for assistance should not be narrowed, although consideration should also be given to the policies of the Philippines government.
In such a situation, this project has performed well in providing funds to superior small and medium businesses in all fields which are keen to invest in equipment, rather than setting an excessively narrow range of target businesses.
(8) Arrears
To date there have been no instances of repayments from PFIs to the DBP falling into arrears. When the DBP accredited financial institutions as PFIs, one of the conditions it set was that the overall rate of arrears for the financial institution concerned should not exceed 20% for rural banks and 15% for other commercial and thrift banks. If a PFI's arrears rate subsequently exceeded this standard, its PFI status was withdrawn34. Their management appears to have yielded good results in this project. However, after the economic crisis, some PFIs consulted with the DBP over rescheduling their payments, and there appears to be some cause for concern over future developments.
When this evaluation was carried out, the PFIs had reported to the DBP that there had been absolutely no cases of end-users falling into arrears. However, when a questionnaire survey of PFIs was conducted as part of this post-evaluation, we heard from some PFIs that some cases of arrears were
33
Of course it is also necessary to set strategic targets and develop specific business types, but while doing so, adequate consideration must be given to other business types.
34 The DBP demands quarterly business and financial statements from all PFIs, which it uses to check arrears rates.
33
gradually emerging due to the impact of the economic crisis of the second half of 199735.
This happened because from October 1997 the definition of a debt in arrears was changed from "no repayment of principal or interest in six months" to "no repayment of principal or interest in three months". It is probably unavoidable that arrears are increasing within the project, given the increasing amount of debts in arrears in the Philippines as a whole under the new definition.
The fact that there were no arrears in payments from end-users to PFIs before the economic crisis, at least in reports to the DBP, is partly due to the buoyant state of the whole Philippines economy at that time. That aside, the following factors had a considerable influence on the absence of arrears. 1) The end-users approved for finance under this project were strictly selected by the PFIs. 2) The private-sector financial institutions paid particularly close attention to managing their
end-users out of concern to avoid losing their PFI status.
(9) Management of the Revolving Fund
The funds repaid by end-users through the PFIs to the DBP were monitored in a special account (named the "Loan Administration Account" in this project) within the DBP, to be used under the scheme as this project and towards the same objectives. In other words, it is a revolving fund. Within this project the special accounts for AJDF and ISSEP were merged, with the progress of the merged account to be reported in the "Statement of Loan Administration Account" in the AJDF progress reports submitted to JBIC every three months. The special account is well managed and further loans are being made from the revolving fund.
3.4 Implementation of Technical Assistance
Both programs of this project involved consultants selected by a shortlist method, in line with JBIC guidelines and DBP procedures.
The DBP contracted one local consulting firm for AJDF. Under ISSEP, one local consulting firm was contracted for the training of DBP and PFI staff and another for the survey of peripheral industries.
The TOR of the technical assistance for this project were all carried out (including ones still in progress36). In particular, the training provided for DBP staff, PFIs and small and medium businesses won high praise at the time of its completion. As it is difficult to gauge the quantitative impact of the technical assistance, we have not made any quantitative analysis. However, a questionnaire survey of participants conducted under ISSEP, and the findings of the field survey for this evaluation lead to the conclusion that the skill levels of the beneficiaries of the technical assistance were enhanced. This project can be regarded as a commendably successful example of technical assistance through a financial intermediary loan.
35
According to the questionnaire survey of PFIs (sent to ten banks), four of the PFIs had sub-loans in arrears, with an arrears rate of 3.1~7.5%. Compared to the corresponding average figure of 10.5% for all financial institutions in the Philippines in August 1998, it is a respectable figure. If the DBP receives a report from a PFI of a sub-loan in arrears, it encourages the PFI to take early action to balance accounts, but it does not give any concrete directions.
36 The training of PFIs and technical guidance for small and medium businesses carried out under technical assistance
phase II of AJDF was carried on under ISSEP after the end of AJDF, and is still being carried on after the end of ISSEP.
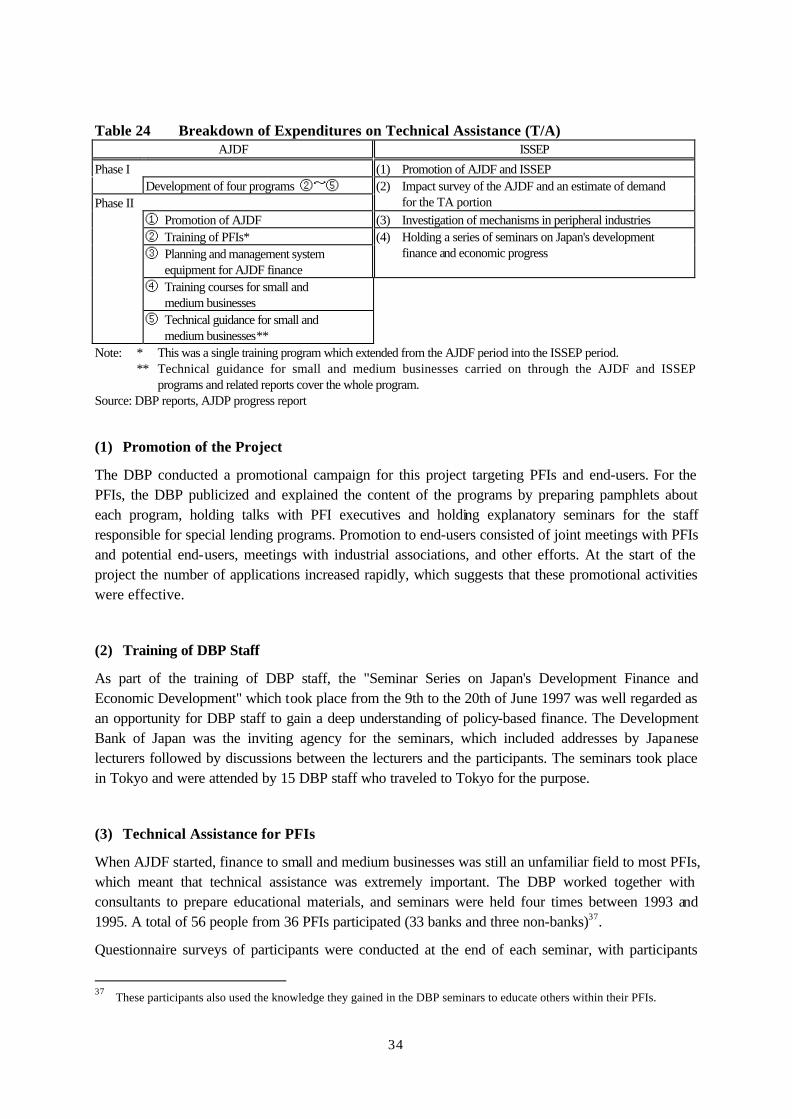
34
Table 24 Breakdown of Expenditures on Technical Assistance (T/A) AJDF ISSEP
Phase I (1) Promotion of AJDF and ISSEP Development of four programs ②~⑤
Phase II (2) Impact survey of the AJDF and an estimate of demand
for the TA portion ① Promotion of AJDF (3) Investigation of mechanisms in peripheral industries ② Training of PFIs* ③ Planning and management system
equipment for AJDF finance
(4) Holding a series of seminars on Japan's development finance and economic progress
④ Training courses for small and medium businesses
⑤ Technical guidance for small and medium businesses**
Note: * This was a single training program which extended from the AJDF period into the ISSEP period. ** Technical guidance for small and medium businesses carried on through the AJDF and ISSEP
programs and related reports cover the whole program. Source: DBP reports, AJDP progress report
(1) Promotion of the Project
The DBP conducted a promotional campaign for this project targeting PFIs and end-users. For the PFIs, the DBP publicized and explained the content of the programs by preparing pamphlets about each program, holding talks with PFI executives and holding explanatory seminars for the staff responsible for special lending programs. Promotion to end-users consisted of joint meetings with PFIs and potential end-users, meetings with industrial associations, and other efforts. At the start of the project the number of applications increased rapidly, which suggests that these promotional activities were effective.
(2) Training of DBP Staff
As part of the training of DBP staff, the "Seminar Series on Japan's Development Finance and Economic Development" which took place from the 9th to the 20th of June 1997 was well regarded as an opportunity for DBP staff to gain a deep understanding of policy-based finance. The Development Bank of Japan was the inviting agency for the seminars, which included addresses by Japanese lecturers followed by discussions between the lecturers and the participants. The seminars took place in Tokyo and were attended by 15 DBP staff who traveled to Tokyo for the purpose.
(3) Technical Assistance for PFIs
When AJDF started, finance to small and medium businesses was still an unfamiliar field to most PFIs, which meant that technical assistance was extremely important. The DBP worked together with consultants to prepare educational materials, and seminars were held four times between 1993 and 1995. A total of 56 people from 36 PFIs participated (33 banks and three non-banks)37.
Questionnaire surveys of participants were conducted at the end of each seminar, with participants
37
These participants also used the knowledge they gained in the DBP seminars to educate others within their PFIs.

35
rating various aspects on five-point scales. On most points, the seminars received favorable scores of four or more from the PFIs. As noted earlier, most PFIs now have the confidence to offer finance to small and medium businesses and the effects of these seminars can be seen in some areas. One of the factors behind this success was the detailed survey of demand from PFIs which was made in the development of each TA program, as the first phase of TA implementation.
(4) Implementation of Training Courses for Small and Medium Businesses
The local consultants employed for AJDF ran a total of 19 training courses for small and medium businesses38. These courses were hosted jointly with the Small Enterprise Research and Development Foundation (SERDF), which is part of the University of the Philippines Institute for Small-Scale Industries (UP-ISSI). By the second quarter of 1995, 517 people had taken part. Questionnaire surveys of participants were used in the same way as for the courses for PFIs, and all the courses gained high evaluation scores.
(5) Technical Assistance for Small and Medium Businesses
This scheme was mainly implemented through industrial associations registered with the Philippines Ministry of Trade and Industry39. At the end of 1998, technical assistance had been completed to nine associations and was under way at 15 more. Applications for technical assistance had been received by another ten associations.
This scheme provided guidance to selected members (small and medium businesses) of industrial associations on how to enhance their management and production skills and modernize their operations. A secondary effect of this scheme is that the industrial associations which received the assistance went beyond simple groupings of similar businesses or groups for exchanging technical information, to independently take up the needs of their members and act as an intermediary between their members and the government for the provision of technical assistance. In the development of small and medium businesses in Japan, industrial associations played a similarly important role to that of the chambers of commerce and industry, but the industrial associations of the Philippines are not yet fully effective. The provision of assistance to small and medium businesses through the industrial associations under this project made a highly significant contribution to their development.
(6) Implementation of an Impact survey on AJDF Finance to Estimate TA Demand
The DBP commissioned a local consulting firm to conduct a survey of the impact of AJDF finance on
38
The CRC was in charge of five courses and SERDEF/ UP-ISSI was in charge of 14. 39
In the selection of target industrial associations, the important factors considered in the choice were the level of need for the assistance and, whether or not there were plans for further transmission of the learned skill and expertise within the association. The first stage of the selection process established a tripartite council of the central federations of industrial associations for each industry in the Manila area, the DBP and the consultants. The council selected 1) the industries to be targeted for technical assistance and 2) the industrial federations which would provide the technical assistance. The second selection was made by the federation of industrial associations for industries targeted for technical assistance conducting a survey of the demand for technical assistance among its member associations. The selection decisions were based on the findings of the survey.
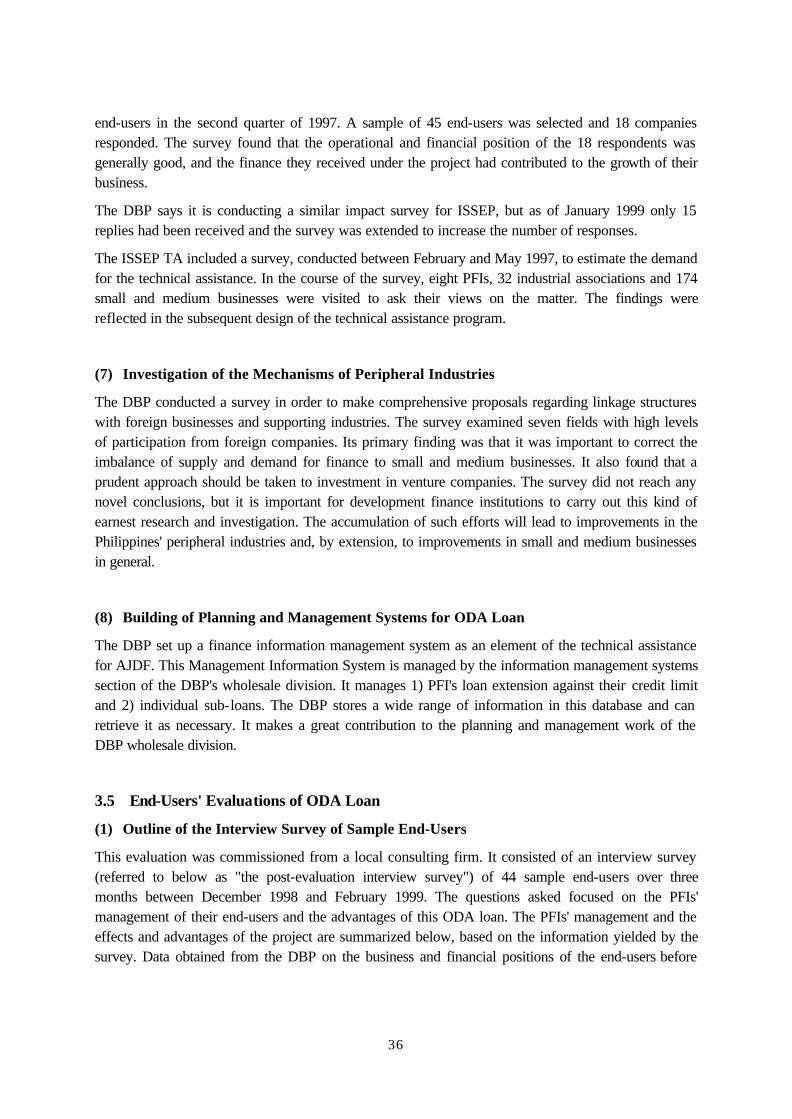
36
end-users in the second quarter of 1997. A sample of 45 end-users was selected and 18 companies responded. The survey found that the operational and financial position of the 18 respondents was generally good, and the finance they received under the project had contributed to the growth of their business.
The DBP says it is conducting a similar impact survey for ISSEP, but as of January 1999 only 15 replies had been received and the survey was extended to increase the number of responses.
The ISSEP TA included a survey, conducted between February and May 1997, to estimate the demand for the technical assistance. In the course of the survey, eight PFIs, 32 industrial associations and 174 small and medium businesses were visited to ask their views on the matter. The findings were reflected in the subsequent design of the technical assistance program.
(7) Investigation of the Mechanisms of Peripheral Industries
The DBP conducted a survey in order to make comprehensive proposals regarding linkage structures with foreign businesses and supporting industries. The survey examined seven fields with high levels of participation from foreign companies. Its primary finding was that it was important to correct the imbalance of supply and demand for finance to small and medium businesses. It also found that a prudent approach should be taken to investment in venture companies. The survey did not reach any novel conclusions, but it is important for development finance institutions to carry out this kind of earnest research and investigation. The accumulation of such efforts will lead to improvements in the Philippines' peripheral industries and, by extension, to improvements in small and medium businesses in general.
(8) Building of Planning and Management Systems for ODA Loan
The DBP set up a finance information management system as an element of the technical assistance for AJDF. This Management Information System is managed by the information management systems section of the DBP's wholesale division. It manages 1) PFI's loan extension against their credit limit and 2) individual sub-loans. The DBP stores a wide range of information in this database and can retrieve it as necessary. It makes a great contribution to the planning and management work of the DBP wholesale division.
3.5 End-Users' Evaluations of ODA Loan
(1) Outline of the Interview Survey of Sample End-Users
This evaluation was commissioned from a local consulting firm. It consisted of an interview survey (referred to below as "the post-evaluation interview survey") of 44 sample end-users over three months between December 1998 and February 1999. The questions asked focused on the PFIs' management of their end-users and the advantages of this ODA loan. The PFIs' management and the effects and advantages of the project are summarized below, based on the information yielded by the survey. Data obtained from the DBP on the business and financial positions of the end-users before
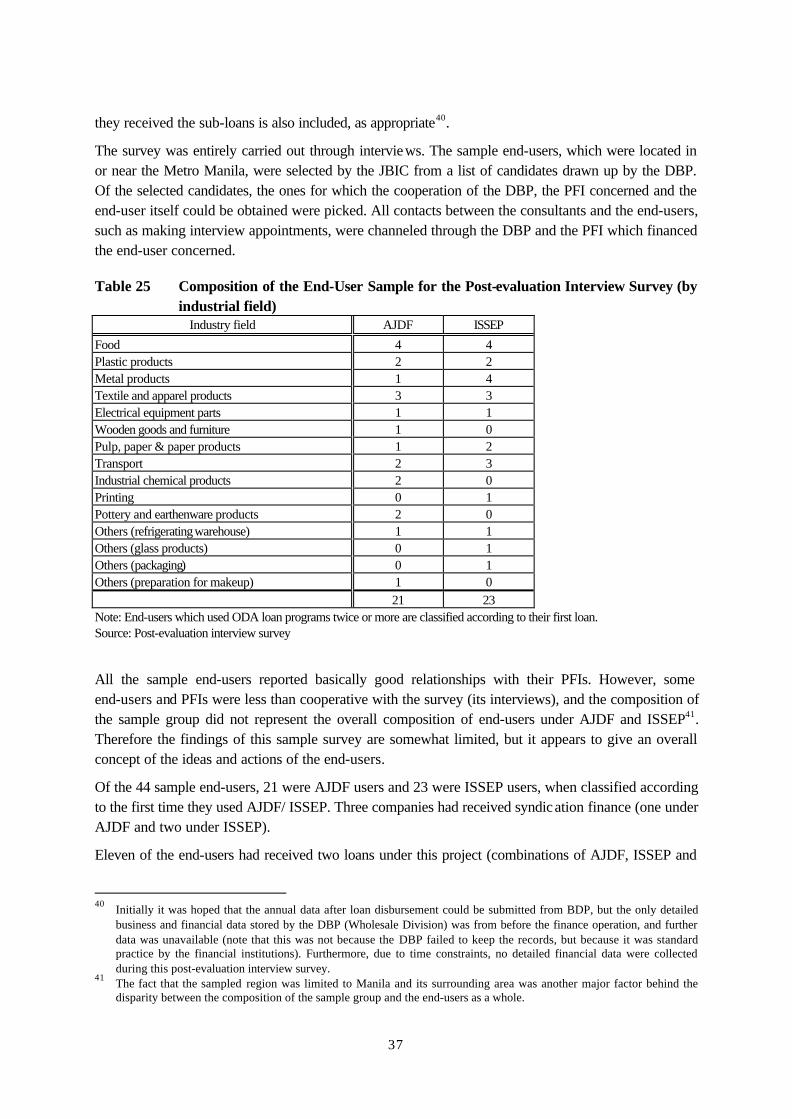
37
they received the sub-loans is also included, as appropriate40.
The survey was entirely carried out through interviews. The sample end-users, which were located in or near the Metro Manila, were selected by the JBIC from a list of candidates drawn up by the DBP. Of the selected candidates, the ones for which the cooperation of the DBP, the PFI concerned and the end-user itself could be obtained were picked. All contacts between the consultants and the end-users, such as making interview appointments, were channeled through the DBP and the PFI which financed the end-user concerned.
Table 25 Composition of the End-User Sample for the Post-evaluation Interview Survey (by industrial field)
Industry field AJDF ISSEP
Food 4 4 Plastic products 2 2 Metal products 1 4 Textile and apparel products 3 3 Electrical equipment parts 1 1 Wooden goods and furniture 1 0 Pulp, paper & paper products 1 2 Transport 2 3 Industrial chemical products 2 0 Printing 0 1 Pottery and earthenware products 2 0 Others (refrigerating warehouse) 1 1 Others (glass products) 0 1 Others (packaging) 0 1 Others (preparation for makeup) 1 0
21 23 Note: End-users which used ODA loan programs twice or more are classified according to their first loan. Source: Post-evaluation interview survey
All the sample end-users reported basically good relationships with their PFIs. However, some end-users and PFIs were less than cooperative with the survey (its interviews), and the composition of the sample group did not represent the overall composition of end-users under AJDF and ISSEP41. Therefore the findings of this sample survey are somewhat limited, but it appears to give an overall concept of the ideas and actions of the end-users.
Of the 44 sample end-users, 21 were AJDF users and 23 were ISSEP users, when classified according to the first time they used AJDF/ ISSEP. Three companies had received syndication finance (one under AJDF and two under ISSEP).
Eleven of the end-users had received two loans under this project (combinations of AJDF, ISSEP and
40
Initially it was hoped that the annual data after loan disbursement could be submitted from BDP, but the only detailed business and financial data stored by the DBP (Wholesale Division) was from before the finance operation, and further data was unavailable (note that this was not because the DBP failed to keep the records, but because it was standard practice by the financial institutions). Furthermore, due to time constraints, no detailed financial data were collected during this post-evaluation interview survey.
41 The fact that the sampled region was limited to Manila and its surrounding area was another major factor behind the
disparity between the composition of the sample group and the end-users as a whole.

38
loans from the revolving fund), with short intervals of two years between loans. Thus the attitude of the PFIs to end-users which have a good record of keeping up with their first loan, was to lend to them again and give them full support42. There were a total of 59 cases of this multiple lending to single end-users.
Table 26 Composition of Sample Sub-Loans for the Post-evaluation Interview Survey (divided by the time of loan approval)
1992 1993 1994 1995 1996 1997 1998
AJDF 8 7 4 2 0 (3) (3) ISSEP 0 0 0 26 2 1 0
Note: Figures in parenthesis are numbers of sub-loans from the AJDF revolving fund. Source: Post-evaluation interview survey
The AJDF sample sub-loans were approved between 1992 and 1995. Most of the ISSEP sample sub-loans were approved in 1995.
(2) Project Effects
[1] Effect on Worker Numbers
Comparing workforce size before end-users received finance under this project and that at the time of the post-evaluation interview survey, 26 companies had increased their workforce and 13 had cut back43. Taking into account the timing of this survey, which took place after the economic crisis, the fact that companies with increased workforces outnumber those with smaller workforces suggests a considerable benefit in job creation from this project. Totaling the results for all the sample end-users shows an increase of 6,355 workers compared to before the loans, an average of over 163 workers per company44.
However, disbursements to the sample end-users were dispersed between 1992 and 1997 and they came from a wide range of business types, so these figures alone are not sufficient to form an evaluation. It is also difficult to simply judge whether the productivity of these end-users has improved.
[2] Finance to Business Startup
Within this project, the standards for collating statistics on end-users were changed for ISSEP. Therefore for around half of the end-users we cannot distinguish the objective of the investment between "new factory construction/ business startup" and "expansion of equipment". However, by investigating the interval between the establishment of the end-user business and the time they first
42
Multiple loans to a single end-user occurred within one single program. Seven companies received loans twice under ISSEP.
43 The DBP documents available did not clearly state pre-finance workforce size for five of the sample end-users, which is
why the total is not for 44 companies. 44
However, one of the sample end-user companies boosted its workforce rapidly from 205 in 1995, before receiving the loan, to 5,000 at present, far exceeding the growth of other end-users. If this one company is excluded, the overall workforce increase in the other companies was 1,560.
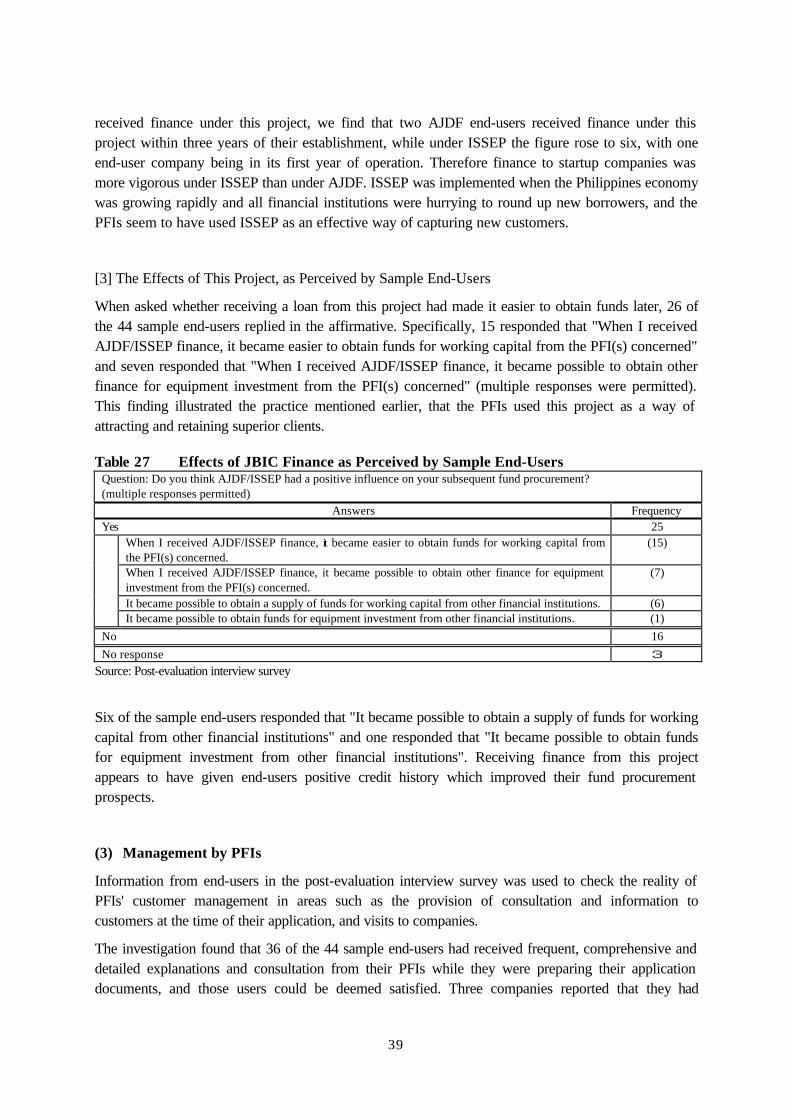
39
received finance under this project, we find that two AJDF end-users received finance under this project within three years of their establishment, while under ISSEP the figure rose to six, with one end-user company being in its first year of operation. Therefore finance to startup companies was more vigorous under ISSEP than under AJDF. ISSEP was implemented when the Philippines economy was growing rapidly and all financial institutions were hurrying to round up new borrowers, and the PFIs seem to have used ISSEP as an effective way of capturing new customers.
[3] The Effects of This Project, as Perceived by Sample End-Users
When asked whether receiving a loan from this project had made it easier to obtain funds later, 26 of the 44 sample end-users replied in the affirmative. Specifically, 15 responded that "When I received AJDF/ISSEP finance, it became easier to obtain funds for working capital from the PFI(s) concerned" and seven responded that "When I received AJDF/ISSEP finance, it became possible to obtain other finance for equipment investment from the PFI(s) concerned" (multiple responses were permitted). This finding illustrated the practice mentioned earlier, that the PFIs used this project as a way of attracting and retaining superior clients.
Table 27 Effects of JBIC Finance as Perceived by Sample End-Users Question: Do you think AJDF/ISSEP had a positive influence on your subsequent fund procurement? (multiple responses permitted)
Answers Frequency Yes 25
When I received AJDF/ISSEP finance, it became easier to obtain funds for working capital from the PFI(s) concerned.
(15)
When I received AJDF/ISSEP finance, it became possible to obtain other finance for equipment investment from the PFI(s) concerned.
(7)
It became possible to obtain a supply of funds for working capital from other financial institutions. (6)
It became possible to obtain funds for equipment investment from other financial institutions. (1)
No 16
No response 3 Source: Post-evaluation interview survey
Six of the sample end-users responded that "It became possible to obtain a supply of funds for working capital from other financial institutions" and one responded that "It became possible to obtain funds for equipment investment from other financial institutions". Receiving finance from this project appears to have given end-users positive credit history which improved their fund procurement prospects.
(3) Management by PFIs
Information from end-users in the post-evaluation interview survey was used to check the reality of PFIs' customer management in areas such as the provision of consultation and information to customers at the time of their application, and visits to companies.
The investigation found that 36 of the 44 sample end-users had received frequent, comprehensive and detailed explanations and consultation from their PFIs while they were preparing their application documents, and those users could be deemed satisfied. Three companies reported that they had
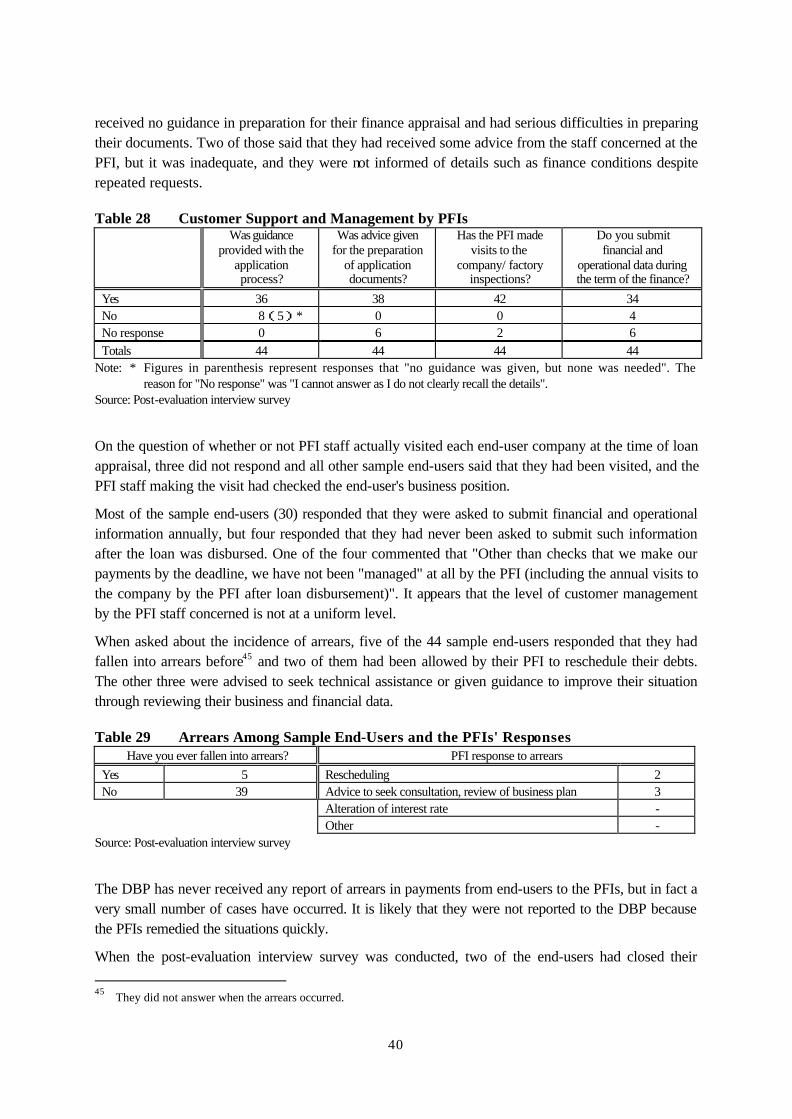
40
received no guidance in preparation for their finance appraisal and had serious difficulties in preparing their documents. Two of those said that they had received some advice from the staff concerned at the PFI, but it was inadequate, and they were not informed of details such as finance conditions despite repeated requests.
Table 28 Customer Support and Management by PFIs
Was guidance provided with the
application process?
Was advice given for the preparation
of application documents?
Has the PFI made visits to the
company/ factory inspections?
Do you submit financial and
operational data during the term of the finance?
Yes 36 38 42 34 No 8(5)* 0 0 4 No response 0 6 2 6 Totals 44 44 44 44
Note: * Figures in parenthesis represent responses that "no guidance was given, but none was needed". The reason for "No response" was "I cannot answer as I do not clearly recall the details".
Source: Post-evaluation interview survey
On the question of whether or not PFI staff actually visited each end-user company at the time of loan appraisal, three did not respond and all other sample end-users said that they had been visited, and the PFI staff making the visit had checked the end-user's business position.
Most of the sample end-users (30) responded that they were asked to submit financial and operational information annually, but four responded that they had never been asked to submit such information after the loan was disbursed. One of the four commented that "Other than checks that we make our payments by the deadline, we have not been "managed" at all by the PFI (including the annual visits to the company by the PFI after loan disbursement)". It appears that the level of customer management by the PFI staff concerned is not at a uniform level.
When asked about the incidence of arrears, five of the 44 sample end-users responded that they had fallen into arrears before45 and two of them had been allowed by their PFI to reschedule their debts. The other three were advised to seek technical assistance or given guidance to improve their situation through reviewing their business and financial data.
Table 29 Arrears Among Sample End-Users and the PFIs' Responses Have you ever fallen into arrears? PFI response to arrears
Yes 5 Rescheduling 2 No 39 Advice to seek consultation, review of business plan 3
Alteration of interest rate -
Other - Source: Post-evaluation interview survey
The DBP has never received any report of arrears in payments from end-users to the PFIs, but in fact a very small number of cases have occurred. It is likely that they were not reported to the DBP because the PFIs remedied the situations quickly.
When the post-evaluation interview survey was conducted, two of the end-users had closed their
45
They did not answer when the arrears occurred.

41
operations, but in each case the manager/ owner had other businesses and used the profits to carry on repaying the ODA loan, so these cases did not lead to arrears.
(4) Advantages of This Project
The post-evaluation survey gathered user evaluations for each aspect (scores out of five for each). The results are as shown in the table below. The length of the loan period and the amount of the loan were particularly appreciated.
Table 30 Advantages of This Project Length of
loan period Level of
interest rate Stability of interest rate
Option of choosing between variable and fixed interest rate
Amount of loan
Average score 4.2 3.8 3.7 3.5 4.1 Source: Post-evaluation interview survey
Note: Scores out of five for each.
The average scores, from the highest, were 4.2 for "Length of loan period", 4.1 for "Amount of loan", 3.8 for "Level of interest rate", 3.7 for "Stability of interest rate" and 3.5 for "Option of choosing between variable and fixed interest rate".
Another result was that 26 of the 44 companies (59.1%) asked responded that they were "Satisfied" (referred to below as "satisfied companies") with the approved amount of their loan. Another 12 (27.3%) said they were "Not wholly satisfied, but found it acceptable" (referred to below as "somewhat satisfied companies"). Six companies (13.6%) responded that they were "Dissatisfied because the loan was too small" (referred to below as "dissatisfied companies") (Figure 5).
Figure 5 Evaluation of Approved Loan Sizes under This Project
26
6
12
Satisfied companies
Somewhat satisfied companies
Dissatisfied companies
Note: Sample size = 44. Source: Post-evaluation interview survey
Looking at the evaluations of the advantages of this project from the groups of companies that were satisfied, somewhat satisfied and dissatisfied, we find that the dissatisfied companies tended to give a generally lower evaluation of the project for aspects other than loan size. While there was naturally a large gap between companies that were satisfied and those that were not in their evaluations of "Amount of loan", there was also a large disparity between the two groups in their evaluation of "Length of loan period". The evaluation of "Level of interest rate" was higher among satisfied companies, but was still rather low overall. There were no distinct trends in evaluations of "Stability of
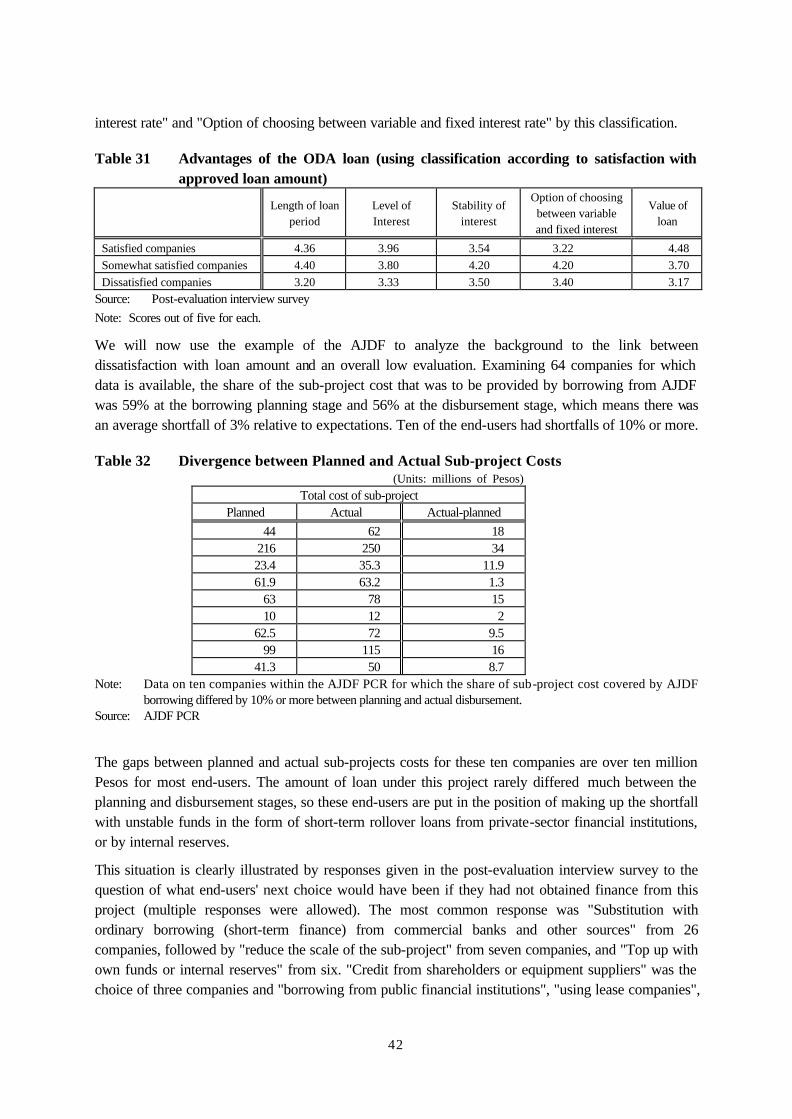
42
interest rate" and "Option of choosing between variable and fixed interest rate" by this classification.
Table 31 Advantages of the ODA loan (using classification according to satisfaction with approved loan amount)
Length of loan
period Level of Interest
Stability of interest
Option of choosing between variable and fixed interest
Value of loan
Satisfied companies 4.36 3.96 3.54 3.22 4.48 Somewhat satisfied companies 4.40 3.80 4.20 4.20 3.70 Dissatisfied companies 3.20 3.33 3.50 3.40 3.17
Source: Post-evaluation interview survey
Note: Scores out of five for each.
We will now use the example of the AJDF to analyze the background to the link between dissatisfaction with loan amount and an overall low evaluation. Examining 64 companies for which data is available, the share of the sub-project cost that was to be provided by borrowing from AJDF was 59% at the borrowing planning stage and 56% at the disbursement stage, which means there was an average shortfall of 3% relative to expectations. Ten of the end-users had shortfalls of 10% or more.
Table 32 Divergence between Planned and Actual Sub-project Costs (Units: millions of Pesos)
Total cost of sub-project Planned Actual Actual-planned
44 62 18 216 250 34 23.4 35.3 11.9 61.9 63.2 1.3
63 78 15 10 12 2
62.5 72 9.5 99 115 16
41.3 50 8.7 Note: Data on ten companies within the AJDF PCR for which the share of sub-project cost covered by AJDF
borrowing differed by 10% or more between planning and actual disbursement. Source: AJDF PCR
The gaps between planned and actual sub-projects costs for these ten companies are over ten million Pesos for most end-users. The amount of loan under this project rarely differed much between the planning and disbursement stages, so these end-users are put in the position of making up the shortfall with unstable funds in the form of short-term rollover loans from private-sector financial institutions, or by internal reserves.
This situation is clearly illustrated by responses given in the post-evaluation interview survey to the question of what end-users' next choice would have been if they had not obtained finance from this project (multiple responses were allowed). The most common response was "Substitution with ordinary borrowing (short-term finance) from commercial banks and other sources" from 26 companies, followed by "reduce the scale of the sub-project" from seven companies, and "Top up with own funds or internal reserves" from six. "Credit from shareholders or equipment suppliers" was the choice of three companies and "borrowing from public financial institutions", "using lease companies",

43
"borrowing from family and friends" and "using Dollar-based finance" were chosen by only two respondents each. Two companies said that they would "Abandon the project".
Figure 6 Second Choices in the Event of Refusal of Finance from This Project
222
6
3
2
2
26
7Ordinary borrowing from commercial banks and other sources
Borrowing from other public financial institutions
Using lease companies
Borrowing from family and friends
Own funds or internal reserves
Credit from shareholders or equipment suppliers
Other
Reduce the scale of the sub-project
Abandon the project
Source: Post-evaluation interview survey
Most end-users relied on this project for almost all of their borrowing of long-term, stable funds. In such a situation even a slight discrepancy from the anticipated loan amount can directly affect the stability and profitability of the project or eat into the end-user's own funds. That is apparently why companies that were dissatisfied with the approved amount of their loans were not well satisfied with the project as a whole.
(5) Awareness of the ODA Loan
In the post-evaluation survey, the sample end-users were asked "Were you aware that the source of funds for AJDF/ISSEP was a Japanese ODA loan?" to gauge their awareness of the ODA loan.
Table 33 Were you aware that the source of funds for AJDF/ISSEP was a Japanese ODA loan?
Yes No
Number of responses 44 0
Source: Post-evaluation interview survey
All end-users answered yes, even though the PFIs had been interposed between them and the executing agency in the flow of funds for this project46.
In common with other JBIC TSLs, the DBP prepared promotional pamphlets for the end-users. However, whether or not such pamphlets are used effectively depends on the executing agency or intermediary agency, which is in direct contact with the end-users. The PFIs made sure the end-users were well aware that these finance programs had ODA loans as their sources of funds. This was due in turn to the DBP's effective PR campaign to the PFIs, and the success of the DBP's skill enhancement programs for PFI staff.
46
In Thailand, where a similar survey of end-users was conducted, 13 of 33 sample end-users responded to this question.

44
Of the 44 sample end-users, 17 (seven under AJDF and ten under ISSEP were directly invited by PFI staff to apply. This clearly shows that PFI staff went "fishing" for applicants for this project from suitable businesses among their superior clients.
Table 34 How End-Users Heard of the ODA Loan Programs (multiple responses) DBP pamphlets 8 DBP seminars 0 PFI seminars 3 Direct approaches by PFI staff 17 Industrial associations 2 Chambers of commerce and industry 2 Friends and acquaintances 9 Other 4
Source: Post-evaluation interview survey.
3.6 Project Effects and Impacts
In addition to building and strengthening small and medium businesses in the Philippines by providing concessionary finance, this project aimed to develop the human resources of small and medium businesses by providing them with technical assistance. The intent was that carrying out such a program would encourage private-sector financial institutions to lend to small and medium businesses. This evaluation indicates that both objectives have been achieved.
(1) Development of Small and Medium Businesses
As a result of this project, 609 end-users were provided with funds at preferential terms for equipment investment and related startup funds. As quantitative data was lacking, this evaluation was unable to analyze the project's effect in building small and medium businesses through direct indicators such as increases in added value production. However, as the low rate of arrears among end-users clearly suggests, this project supplied funds to businesses with growth potential, and those end-users put the money to good use to develop their businesses. For example, even end-users in the Philippines' textile and clothing sector, which can no longer expect rapid growth, have been investing aggressively in equipment, and taking their operations to a more advanced level to ensure their own growth.
Discussions with companies visited in the course of the field survey and the post-evaluation interview survey for this project post evaluation confirmed that, while some end-users were severely damaged by the recent economic crisis, an environment in which companies can access special lending programs will prompt considerable numbers of end-users to plan new projects.
Several sample end-users commented in the post-evaluation interview survey that this project had enabled their businesses to achieve surging growth. This is another way in which the supply of preferential funds under this project contributed to the building of small and medium businesses in the Philippines.
45
(2) Enhancement of the Abilities of the Executing Agency and the Intermediary Agencies
The DBP, which was the executing agency for this project, was in the midst of restructuring its business systems when the AJDF program began, and it was also reconstructing its loan appraisal and management systems. Furthermore, most of the PFIs were not used to providing finance to small and medium businesses. JBIC TSLs, which provided large numbers of end-users with long-term funds, demanded rule-based loan appraisal systems and high levels of credit management ability from the executing agency and the PFIs which were the intermediary agencies. Therefore both programs under this project included technical assistance (TA) for the DBP and the PFIs. This technical assistance made a strong contribution to the smooth operation and management of both programs.
As mentioned earlier, the DBP makes effective use of an information management system introduced using AJDF technical assistance, which enables advanced and efficient management of PFIs and sub-loans. The training of key DBP staff in Japan under the ISSEP TA served to greatly deepen understanding of policy finance among DBP staff.
The training of PFI staff, which ran through the AJDF and ISSEP programs and still continues, has raised the level of skills the PFIs can apply to financing small and medium businesses, particularly through project finance. The ongoing flow of expertise from the DBP to the PFIs maintains the DBP's wholesale functions and its role as an intermediary agency. It is also important as a way of improving the finance available to small and medium businesses in the Philippines.
46
Chapter 4 Lessons Learned
Technical assistance to the executing agency and related institutions is valuable for ensuring the swift and smooth operation of financial intermediary loans.
When AJDF began, the DBP, which is the executing agency, was in the midst of restructuring its business systems, and it was also reconstructing its loan appraisal and management systems. Furthermore, as in most developing countries, most of the PFIs were not used to providing finance to small and medium businesses. Therefore technical assistance (TA) was provided, which made a great contribution to the smooth operation and management of both programs. The TA included a wide variety of programs, including training courses for the PFIs, technical assistance for key DBP staff and the construction of an information management system for the DBP. These programs were well regarded by their participants.
The TA for this project also included training courses for small and medium businesses and technical assistance programs implemented through industrial associations. The design and implementation of these courses and programs had the valuable effect of deepening the DBP's understanding of small and medium businesses.
These accumulated efforts and effects lead to higher levels of lending skills among financial institutions and, by extension, contribute to the building and reinforcement of small and medium businesses. When financial intermediary loans are provided in future, it is important to back them up with technical assistance for the executing agency and related agencies.