2. Port Development - JICA
268
Final Report Preparatory Survey on Matarbari Port Development Project in the People’s Republic of Bangladesh 2-1 2. Port Development 2.1 Port Policy and Trend of Maritime Logistics 2.1.1 Port Policy Direction A major strategic challenge for the Seventh Plan is to set investment priorities in a way that Bangladesh gets best results from its limited resources. While there has been improvement in Chittagong Port container handling efficiency, further efforts are needed to increase efficiency in line with good international practices. To this end, during the Seventh Plan, priority would be given to: a Reducing port induced semi-trailer truck traffic by developing wider intermodal rail and river connectivity. b Enhancing already saturated container storage port yard facilities by developing existing dilapidated 2.3km general cargo berthing (GCB) facilities at Karnaphuli into a modern gateway-terminal of international standard that can play a key role in boosting the nation’s trade and commerce and regional connectivity. c Developing the Chittagong Port as “Climate resilient” against sea level rise (SLR) and land subsidence potential. d Maintaining and improving the navigability of the channel through capital dredging and regular maintenance dredging ; e Increasing container handling capacity through expansion of terminal/yard facilities, acquisition of modern container handling equipment and procurement of harbour crafts and vessels to ensure improved operating system. f Setting up ICDs/CFS by the Public/Private sector at all potential cargo distribution centres across the country to decongest the port. g Involving private sector in port management and port development infrastructure on BOO/BOT/PPP model for which a clear, reliable and transparent policy guideline is to be approved by the Government h Improving institutional capability in training, planning, safety and environmental management control in the port. While Chittagong Port will continue to be the leading seaport of Bangladesh, in anticipation of the growing demand for port services emerging from growing income and international trade, including from neighbouring countries related to the implementation of the Government’s regional connectivity agenda, and the specific needs of the power sector emerging from the substitution of imported coal for domestic gas, substantial new port capacity will be needed during the Seventh Plan and beyond. The under-utilised Mongla Port provides one major option. The Government will take all necessary steps to step up the use of Mongla Port facility. However, it is clear that a new deep sea port is necessary for Bangladesh. In the past the Government pursued an initiative to construct a deep seaport in Sonadia of Cox’s Bazar under PPP. Due to the environmental preservation issues, steps have been taken to implement the project under Government to Government (G to G) arrangement. In addition, the Payra Port Authority Act, 2013 was enacted to establish a port at Payra in Patuakhali District. The development of port facilities for coal imports will be given top priority in order to support
-
Upload
khangminh22 -
Category
Documents
-
view
4 -
download
0
Transcript of 2. Port Development - JICA

Final Report Preparatory Survey on Matarbari Port Development Project in the People’s Republic of Bangladesh
2-1
2. Port Development
2.1 Port Policy and Trend of Maritime Logistics
2.1.1 Port Policy Direction
A major strategic challenge for the Seventh Plan is to set investment priorities in a way that Bangladesh gets best results from its limited resources. While there has been improvement in Chittagong Port container handling efficiency, further efforts are needed to increase efficiency in line with good international practices. To this end, during the Seventh Plan, priority would be given to: a Reducing port induced semi-trailer truck traffic by developing wider intermodal rail and river connectivity. b Enhancing already saturated container storage port yard facilities by developing existing dilapidated 2.3km general cargo berthing (GCB) facilities at Karnaphuli into a modern gateway-terminal of international standard that can play a key role in boosting the nation’s trade and commerce and regional connectivity. c Developing the Chittagong Port as “Climate resilient” against sea level rise (SLR) and land subsidence potential. d Maintaining and improving the navigability of the channel through capital dredging and regular maintenance dredging ; e Increasing container handling capacity through expansion of terminal/yard facilities, acquisition of modern container handling equipment and procurement of harbour crafts and vessels to ensure improved operating system. f Setting up ICDs/CFS by the Public/Private sector at all potential cargo distribution centres across the country to decongest the port. g Involving private sector in port management and port development infrastructure on BOO/BOT/PPP model for which a clear, reliable and transparent policy guideline is to be approved by the Government
h Improving institutional capability in training, planning, safety and environmental management
control in the port.
While Chittagong Port will continue to be the leading seaport of Bangladesh, in anticipation of the growing demand for port services emerging from growing income and international trade, including from neighbouring countries related to the implementation of the Government’s regional connectivity agenda, and the specific needs of the power sector emerging from the substitution of imported coal for domestic gas, substantial new port capacity will be needed during the Seventh Plan and beyond. The under-utilised Mongla Port provides one major option. The Government will take all necessary steps to step up the use of Mongla Port facility. However, it is clear that a new deep sea port is necessary for Bangladesh. In the past the Government pursued an initiative to construct a deep seaport in Sonadia of Cox’s Bazar under PPP. Due to the environmental preservation issues, steps have been taken to implement the project under Government to Government (G to G) arrangement. In addition, the Payra Port Authority Act, 2013 was enacted to establish a port at Payra in Patuakhali District. The development of port facilities for coal imports will be given top priority in order to support
Final Report Preparatory Survey on Matarbari Port Development Project in the People’s Republic of Bangladesh
2-2
the power generation plan. The 1200 MW Matarbari Ultra Super Critical Coal-fired Power Plant project funded by the Government of Japan contains the important component: the deep sea port for the coal import, which will provide the opportunity for generation companies planning to develop the coal-fired power plants to procure the international coal at a relatively cheaper price compared to the individual purchased coal from foreign countries. JICA is also examining the possibility of setting up a large coal transshipment terminal at the Matarbari port to cater to the power generation demand of nearly 3,500 MW by 2020. The Matarbari deep sea port and the associated transhipment terminal are critically linked to the Government’s successful implementation of the power generation plan and would have the highest priority in the public investment Programme for transport infrastructure during the Seventh Plan. Alongside, the Government is also taking steps to strengthen the land ports to facilitate trade with neighbours. This will be an important priority for the Seventh Plan

Final Report Preparatory Survey on Matarbari Port Development Project in the People’s Republic of Bangladesh
2-3
2.1.2 Trend of Maritime Logistics
(1) Container trades
1) Ship deployment in the container services currently calling at Bangladeshi ports
Shipping lines’ container services calling at Bangladeshi ports consist of 2 major categories; one is the feeder services connecting Chittagong and Mongla with Singapore (including Tanjung Pelepas and Port Klang), Colombo and Indian coastal ports. The other is the mainline services connecting Chittagong with ports in East Asian and Southeast Asian countries such as China, Taiwan, Malaysia, Vietnam etc. Most of those mainline services are also functioning as feeders calling at major hub ports such as Singapore, Tanjung Pelepas, Port Klang, Hong Kong and Kaohsiung. Container ship deployment of the shipping lines’ services calling at Chittagong Port was investigated in the previous study “Data Collection Survey on the Matarbari Port Development in the People’s Republic of Bangladesh” by use of MDS Containership Database as of August 2016. As a follow up of the previous study, the same investigation is made in this Survey using the latest data as of August 2017. Table 2.1-1 shows the comparison between the results as of August 2016 and August 2017. The yearly total of ships’ capacity as of August 2017 amounts to 1.97 million TEUs with yearly 1,210 calls by 23 services, while the ship capacity in the previous year was 1.88 million TEUs with 1,262 calls by 25 services. Though the year to year increase in the ships’ capacity is found as 4.6%, a considerable change is observed in the composition of services in the last 1 year; the capacity of mainline services decreased at 25% from 426,026 TEUs to 319,930 TEUs due to the extinguishment of Southeast Asia mainline services. Instead, the capacity of feeder services via Singapore, Tanjung Pelepas and Port Klang increased from 1.02 million TEUs to 1.24 million TEUs. The 2 mainline services which used to cover Laem Chabang, Bangkok, Sihanoukville have both withdrawn in the latest 1 year. Currently in Bangladesh, the container cargoes bound for those ports have to be loaded onto feeder ships and transshipped at Singapore (including Tanjung Pelepas and Port Klang).
Table 2.1-1 Vessel deployment of the container services calling at Chittagong Port
Nos of
Services
Yearly
Calls
Nos of
Ships
Deployed
Average
Ship Size
(TEU)
Maximum
Ship Size
(TEU)
Yearly
Capacity
(TEUs)
Nos of
Services
Yearly
Calls
Nos of
Ships
Deployed
Average
Ship Size
(TEU)
Maximum
Ship Size
(TEU)
Yearly
Capacity
(TEUs)
Intra‐Asia 3 156 14 2,044 2,339 314,434 3 156 14 2,411 2,500 319,930
SE Asia 2 104 7 1,070 1,120 111,592 ‐ ‐ ‐ ‐ ‐ ‐
S. Total 5 260 21 1,720 2,339 426,026 3 156 14 2,084 2,500 319,930
Singapore etc. 12 612 24 1,654 2,200 1,019,938 13 716 28 1,800 2,548 1,243,226
Colombo 5 234 11 1,657 1,730 385,970 4 208 8 1,727 1,812 359,216
Coastal/India 3 156 3 320 680 49,920 3 130 3 320 680 45,760
S.Total 20 1,002 38 1,549 2,200 1,455,828 20 1,054 39 2,309 2,548 1,648,202
25 1,262 59 1,610 2,339 1,881,854 23 1,210 53 2,336 2,548 1,968,132
August 2017August 2016
Total
Mainline
Feeder
Source: MDS Transmodal “MDS Containership Database” as of August 2016 and August 2017
2) Congestion at Chittagong Port
When considering what is behind the changes from the previous study, it is presumed that the congestion worsening in recent years at Chittagong Port could make a negative impact on the shipping lines’ mainline deployment. According to the hearings conducted in this Survey with the port users, the container ships entering Chittagong Port are currently forced to wait at the anchorage for berthing for 3 to 7 days due to the chronic berth congestion. Because of this, the mainline operators facing difficulty to maintain the weekly

Final Report Preparatory Survey on Matarbari Port Development Project in the People’s Republic of Bangladesh
2-4
fixed-day services might have withdrawn some of their mainline services and shift to feeder services that are easier for them to manage the sailing schedules. From the cargo owners’ viewpoint, this might have narrowed the choices of shipping services. Even in case loaded to a feeder ship, connection to the mainline ship could be missed and be forced to wait for the next week connection. To compensate the costs for waiting at Chittagong Port, shipping lines started to collect USD 150/TEU of “Congestion Surcharge” from the consignees and shippers from July 2017. This additional cost might be affecting the competitiveness of exporters/importers in Bangladesh.
(2) Non-Container Trades
As for non-container ships, type-wise deadweights and number of ship calls at Bangladeshi ports were investigated in the previous study as per the Table 2.1-2 below.
Table 2.1-2 Deadweight and Number of Callings by Port / Ship Type (2016)
Port Ship type →Bulk
carriers
Liquid bulk
tankers
LPG
tankers
Vehicle
carriersRoRo ships
General
cargo
ships
Full
container
ships
Total
Nos of callings 582 414 1 72 11 299 1,153 2,532
Total deadweight 25,611,141 12,838,804 29,565 613,882 218,976 4,389,145 26,680,569 70,382,082
Average deadweight 44,005 31,012 29,565 8,526 19,907 14,679 23,140 27,797
Maximum deadweight 178,373 164,746 29,565 12,077 55,649 27,352 37,157 178,373
Nos of callings 228 16 102 63 ‐ 61 45 515
Total deadweight 10,725,495 254,914 513,218 548,492 ‐ 768,739 935,540 13,746,398
Average deadweight 47,042 15,876 5,032 8,706 ‐ 12,602 20,790 26,692
Maximum deadweight 92,485 49,452 7,031 21,214 ‐ 37,332 24,157 92,485
Nos of callings 4 ‐ ‐ ‐ ‐ ‐ ‐ 4
Total deadweight 201,590 ‐ ‐ ‐ ‐ ‐ ‐ 201,590
Average deadweight 50,398 ‐ ‐ ‐ ‐ ‐ ‐ 50,398
Maximum deadweight 58,923 ‐ ‐ ‐ ‐ ‐ ‐ 50,398
Nos of callings 814 430 103 135 11 360 1,198 3,051
Total deadweight 36,538,226 13,093,718 542,783 1,162,374 218,976 5,157,884 27,616,109 84,330,070
Average deadweight 44,887 30,451 5,270 8,610 19,907 14,327 23,052 27,640
Maximum deadweight 178,373 164,746 29,565 21,214 55,649 37,332 37,157 178,373
Chittagong
Mongla
Payra
Total
Source: Lloyd’s List Intelligence “Seasearcher
(3) Coastal shipping
1) Containers
a) Current status of coastal container shipping
Coastal shipping for containers is developed mainly for imports from Chittagong Port (NCT) to the river ports near Dhaka. The number of containers carried by coastal shipping is approx. 26,000 TEUs in 2017, which is only 1 % in 2.67 million TEUs of the total throughput of Chittagong Port in 2017. Locations of the river ports are illustrated together with the railway ICDs in Figure 2.1-1 below. Currently 2 river ports are in operation; Pangaon ICT with 116,000 TEU capacity per annum and Summit Alliance (SAPL) with 100,000 TEU capacity per annum. In addition, 2 river ports are under construction; Rupayan Port & Logistic Services Ltd. (300,000 TEU capacity) and AK Khan Container Terminal (250,000 TEU

Final Report Preparatory Survey on Matarbari Port Development Project in the People’s Republic of Bangladesh
2-5
capacity). 2 more river ports are planned but currently uncertain to be constructed; Kumudini Container Terminal (150,000 TEU capacity), and Ananda Container Port (400,000 TEU capacity).
SummitAllianceRP
RupayanRPPangaon
RPKumudiniRP Ananda
RP
AK KhanRP
KamalapurRT
DhirasramRT
Note: “RP”: river port, “RT”: railway ICD, red font: in operation, blue font: planned
Source: JICA Survey Team
Figure 2.1-1 River Ports and Railway ICDs around Dhaka
The coastal shipping operators and ships currently deployed are shown in Table 2.1-3 below. MST has a service between Pangaon ICT and Haldia, which is regarded as coastal shipping under the bilateral agreement between Bangladesh and India. Currently 1 or 2 sailings per day are available from Chittagong Port to Pangaon ICT by 9 ships. Additional 4 ships are supposed to be deployed in 2018.

Final Report Preparatory Survey on Matarbari Port Development Project in the People’s Republic of Bangladesh
2-6
Table 2.1-3 Coastal Shipping Fleet (as of April 2018)
Route Operator Ship name Capacity
(TEU)
Chittagong Port
/ Pangaon ICT
Naaf Marine Pangaon Express 128
Pangaon Success 128
Pangaon Vision 128
SAPL-1 n/a
Karim Shipping KSL Pride 186
KSL Gladiator 186
Neepa Paribahan Harbor-1 176
Invicta Ltd. Invicta-1 176
Alian Trader Shamaya Jamal n/a
Haldia /
Pangaon ICT
MST Marine Trust 3 108
Marine Trust 4 123
Marine Trust 5 123
Source: Pangaon ICT
Container throughput of Pangaon ICT in the recent years is shown in Table 2.1-4 below. Throughput is expected to reach 40,000 to 45,000 TEUs in 2018.
Table 2.1-4 Container Throughput of Pangaon ICT
(TEUs)
Year 2014 2015 2016 2017
Import 433 652 2,466 13,182
Export 551 597 2,142 12,537
Total 984 1,249 4,608 25,719
Source: Pangaon ICT
b) Constraints in promoting coastal container shipping
There are some constraints in promoting coastal container shipping as follows; • Considerable amount of investment is required to develop a river port and purchase ships. • Total transportation cost per container is not so attractive than that of covered van and rail. • Occasional cancellation of sailings especially in the monsoon season (approx.. 17-18% of
cancellation in a year) As the countermeasure of the above, the Harbormaster of CPA has an idea on the standard particulars of coastal container ship as follows;
• Draft of the ship shall be 4.0m on condition that appropriate maintenance dredging is conducted at every river port.
• Sea worthiness against Beaufort Scale 7 is secured. • The ship shall have a larger capacity (250 TEU or more) to maintain profitability.
Since the coastal shipping is supposed to be developed by the private sector, the private operators need to

Final Report Preparatory Survey on Matarbari Port Development Project in the People’s Republic of Bangladesh
2-7
be encouraged to build new ships according to the standard above.
c) Future perspectives of coastal container shipping
As reported in the previous study, the volume of export containers will nearly double in 2041. At some point, the traffic of covered vans will become saturated which will necessitate a modal shift to mitigate the heavy traffic. In future, it is envisaged that ship and railway as mass transportation modes will play more important roles; bare garment cargoes will be carried in a shorter distance to the dry ports near Dhaka, stuffed into containers there and then carried to Chittagong and Matabari Ports by ships and railways. This shift will be welcomed by environment-conscious retailers of garment. The exporters will be able to clear customs procedures at the nearby dry ports. Moreover, the total cost of land transportation from factory to loading port could be reduced by use of mass transportation modes. As utilization of the ICDs in Chittagong will decrease, the ICD operators will relocate to the vicinity of Dhaka in order to survive. Further changes could be take place when cargo volumes increase and ships and railways are able to provide stable and reliable services. Shipping lines would try to extend their place of receipt from the legacy sea port toward an inland point of dry port in order to gain a competitive advantage. Shipping lines will receive export containers at dry ports near Dhaka and carry the containers in bond at their own cost and responsibility to Chittagong and Matabari Ports. At that time, customs procedures are expected to be very relaxed to allow shipping lines to carry bonded cargoes of multiple shippers by a simple bonded-transportation procedure. The desired shape of export cargo flows for the future is illustrated in Figure 2.1-2 below.
Shipping Line’s Responsibility
Shipping Line’s Responsibility
Shipper’s Responsibility
Factories
Chittagong Port
MatabariPort
Port of Discharge
Merchant Haulage
Ocean Carriage
Dry Portsnear Dhaka(River ports)(Dhirasram)
ICDsIn
Chittagong
Carrier’s Haulage
by Ship, Rail
by Covered Van
byShip
by Covered
Van
by Trailer
by Trailer
Source: JICA Survey Team
Figure 2.1-2 Desired Shape of Export Cargo Flows
2) Non-container cargoes
Currently barges are carrying non-container cargoes which directly trans-loaded from bulk carriers or general cargo ships off-shore of Chittagong Port (so called “mid-stream operation”). Major commodities are steel products, steel scrap, clinker, wheat, sugar, gravels etc. Those are mostly carried to the dedicated berths of private companies. Volume of those non-container cargoes is also expected to increase in future.

Final Report Preparatory Survey on Matarbari Port Development Project in the People’s Republic of Bangladesh
2-8
2.1.3 Relevant Port Development projects
(1) Chittagong Bay Container Terminal
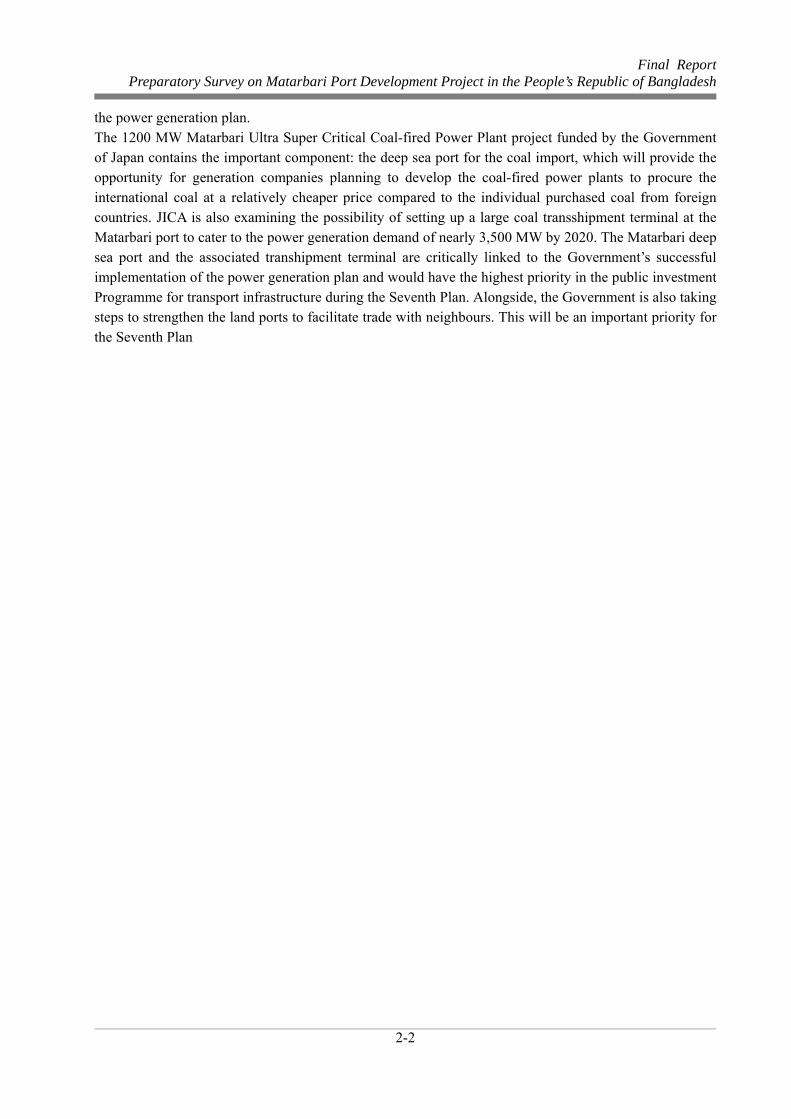
The study funded by ADB1 released a report in 2015, which recommended the redevelopment of several existing terminals of the Chittagong port, and new development of Bay Container Terminal (BCT) on the west coast of Chittagong. BCT is planned to enter into operation in 2023 with three berths and its final capacity is expected to be 2.8 million TEUs per annum with 6 container berths of 250m in length long each (see Figure 2.1-3). Target size of container vessel at BCT is 215m LOA, 30m Beam, -10.1m Draft, 30,250 Dead Weight Tons, and container loading capacity of 2,700 TEUs. To accommodate this size of vessel, the depth of basin is designed at -11.5m (ISIWL2), while the depth of the entrance channel is set at -12.5m. As the minimum depth of approach channel to Chittagong BCT is limited to -10m, target vessel will have to navigate during high tide. Strategic Master Plan for Chittagong Port, prepared by ADB in 2015, estimates that necessary number of container berths is 3 with a total length of 750m in 2023, 4 with a length of 1,000m in 2024, and 6 with a length of 1,500m in 2033. Details of cargo throughput and berth requirements are summarized in Table 2.1-5.
Table 2.1-5 BCT Cargo Throughput and Berth Requirements (ADB Report)
Year 2023 2024 2025 2026 2027 2028 2033 2038 2043
Container Throughput (1,000 TEU)
1,021 1,601 1,890 1,988 2,095 2,207 2,760 2,767 2,461
No. of Vessels 410 621 710 724 740 756 815 699 475
Avg. Cranes per Vessel 2.5 2.5 2.5 2.5 2.5 2.5 2.5 2.5 2.5
Number of Berths 3 4 4 4 4 5 6 6 6
Total Berth Length (m) 750 1.000 1.000 1.000 1.000 1.250 1.500 1.500 1.500
Source: Strategic Master Plan for Chittagong Port Final Report, ADB, Sep. 2015, Part 2, p292
CPA is planning to revise the plan of BCT and provisionally estimates that necessary number of container berths is 2 with a total length of 600m in 2021, 3 (900m) in 2028, 4 (1,200m) in 2033, and 6 with a total length of 1,800 m in 2038. Possible container throughput of BCT is planned at about 2.5 lakh TEUs per berth at the first stage till 2023, and 3.0 lakh TEUs per berth at the late stage after 2038. Total capacity of BCT is planned at 1.9 million TEUs, which is lower than the estimates of ADB report.
Table 2.1-6 BCT Container Throughput and Berth Requirements (CPA Plan)
Year 2021 2022 2023 2028 2033 2038 2043
Container Throughput (1,000TEU)
349 391 508 799 1,248 1,733 1,932
Number of Berths 2 2 2 3 4 6 6
Total Berth Length (m) 600 600 600 900 1,200 1,800 1,800
Source: Draft Final Report of BCT Feasibility Study in 2017, CPA
1 Strategic Master Plan for Chittagong Port Final Report Part 1, ADB, Sep. 2015 2 Indian Sea Low Water Level

Final Report Preparatory Survey on Matarbari Port Development Project in the People’s Republic of Bangladesh
2-9
Development plan of BCT is illustrated in Table 2.1-7, which is quoted from the Strategic Master Plan for Chittagong Port Final Report, ADB, Sep. 2015. Distance from Chittagong to Dhaka is 265km by road, 232km by inland waterway, more than 300km by rail, and 211km by air. CPA also plans to develop multi-purpose terminal next to the container terminal in BCT. Throughout the project period, non-container cargoes, i.e. general cargo, breakbulk, RoRo, and bulk, are estimated to increase slightly at new BCT, so that necessary number of berths for non-container cargoes is calculated to be 5 with a total length of 1,500m.
Table 2.1-7 BCT Berth Requirements for Multi-Purpose Terminal (CPA Plan)
Year 2021 2022 2023 2028 2033 2038 2043
General Cargo & Break Bulk
General Cargo (1,000 t) 1,099 1,044 992 767 594 459 356
Wood, logs, wooden products (1,000 t) 269 276 281 310 343 369 398
Steel products, coils, billets etc. (1,000 t) 1,267 1,289 1,306 1,403 1,519 1,615 1,723
RoRo
Vehicles (1,000 units) 176 180 184 203 224 241 260
Agri-Bulk
Grain (1,000 t) 95 98 100 115 131 150 171
Sugar (1,000 t) 202 207 213 243 277 317 362
Mineral Bulk
Clinker, Cement, Soda Ash (1,000 t) 848 864 881 977 1,093 1,231 1,392
Necessary Number of Berths 5 5 5 5 5 5 5
Total Berth Length (m) 1,500 1,500 1,500 1,500 1,500 1,500 1,500
Source: Draft Final Report of BCT Feasibility Study in 2017, CPA
Final Report Preparatory Survey on Matarbari Port Development Project in the People’s Republic of Bangladesh
2-10
Source: Strategic Master Plan for Chittagong Port Final Report, Annex 3, ADB, Sep. 2015
Figure 2.1-3 General Layout Plan of BCD, Phase II (ADB Report)
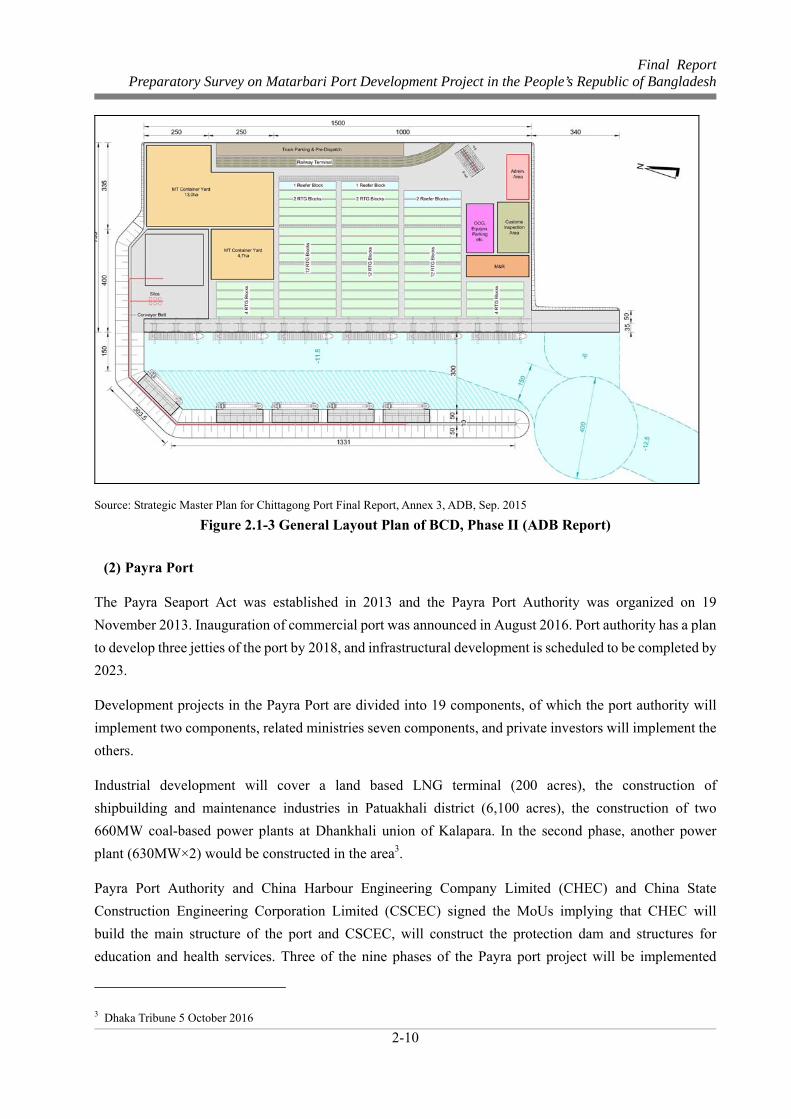
(2) Payra Port
The Payra Seaport Act was established in 2013 and the Payra Port Authority was organized on 19
November 2013. Inauguration of commercial port was announced in August 2016. Port authority has a plan
to develop three jetties of the port by 2018, and infrastructural development is scheduled to be completed by
2023.
Development projects in the Payra Port are divided into 19 components, of which the port authority will
implement two components, related ministries seven components, and private investors will implement the
others.
Industrial development will cover a land based LNG terminal (200 acres), the construction of
shipbuilding and maintenance industries in Patuakhali district (6,100 acres), the construction of two
660MW coal-based power plants at Dhankhali union of Kalapara. In the second phase, another power
plant (630MW×2) would be constructed in the area3.
Payra Port Authority and China Harbour Engineering Company Limited (CHEC) and China State
Construction Engineering Corporation Limited (CSCEC) signed the MoUs implying that CHEC will
build the main structure of the port and CSCEC, will construct the protection dam and structures for
education and health services. Three of the nine phases of the Payra port project will be implemented
3 Dhaka Tribune 5 October 2016
Final Report Preparatory Survey on Matarbari Port Development Project in the People’s Republic of Bangladesh
2-11
under a government-to-government cooperation4.
1) CPA Study in 2014
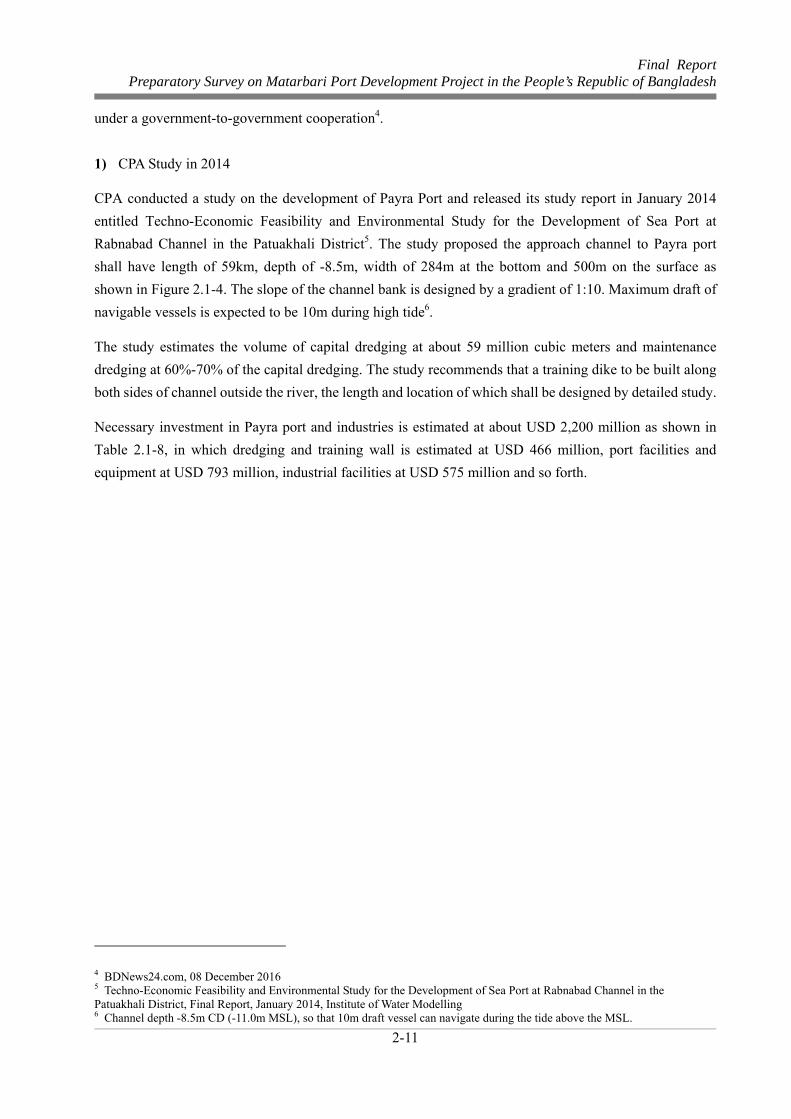
CPA conducted a study on the development of Payra Port and released its study report in January 2014
entitled Techno-Economic Feasibility and Environmental Study for the Development of Sea Port at
Rabnabad Channel in the Patuakhali District5. The study proposed the approach channel to Payra port
shall have length of 59km, depth of -8.5m, width of 284m at the bottom and 500m on the surface as
shown in Figure 2.1-4. The slope of the channel bank is designed by a gradient of 1:10. Maximum draft of
navigable vessels is expected to be 10m during high tide6.
The study estimates the volume of capital dredging at about 59 million cubic meters and maintenance
dredging at 60%-70% of the capital dredging. The study recommends that a training dike to be built along
both sides of channel outside the river, the length and location of which shall be designed by detailed study.
Necessary investment in Payra port and industries is estimated at about USD 2,200 million as shown in
Table 2.1-8, in which dredging and training wall is estimated at USD 466 million, port facilities and
equipment at USD 793 million, industrial facilities at USD 575 million and so forth.
4 BDNews24.com, 08 December 2016 5 Techno-Economic Feasibility and Environmental Study for the Development of Sea Port at Rabnabad Channel in the Patuakhali District, Final Report, January 2014, Institute of Water Modelling 6 Channel depth -8.5m CD (-11.0m MSL), so that 10m draft vessel can navigate during the tide above the MSL.

Final Report Preparatory Survey on Matarbari Port Development Project in the People’s Republic of Bangladesh
2-12
Table 2.1-8: Cost Estimation for Payra Port and Industrial Area Development
(USD in million)
Description Unit Cost
Planning Stage Lump Sum 52
Connectivity Utilities and Protective Works
Dredging Procurement, Dredging Lump Sum 75
Embankment and Shore Protection Work Lump Sum 125
Training Wall Lump Sum 188
Utilities/Others 78
Port Fundamental Infrastructure
Deep Sea Mooning 20 ship 15
Construction Jetty Berth 1000 M (in 4 phase) 500
Construction of Yard for Container 10000M x 1000M 50
Installation of Handling Equipment MC 6+ GT 6+ LTG 12+FL20 100
Other Construction 98
Port Ancillary Infrastructure 30
Support Service Industries and Facilities
Eco Dock for ship crapping and Dry Dock One 70
Ship Building Yard One 35
Industrial Facilities
Power Plant 200 MW 200
Food silo 100000 Ton 50
LNG/LPG Storage Tank, Coal Handling
Terminal
50000 Ton 170
Others 155
Physical Contingency (5%) 99
Price Contingency (6%) 119
Total 2,209
Source: Techno-Economic Feasibility and Environmental Study for the Development of Sea Port at Rabnabad Channel, 2014
2) Study by Private Investors
Private investors allegedly made a preliminary study on Payra Port in 2016, which examined ship
navigation and calls of 6,000 TEU container vessels to the port. The preliminary study concluded that Payra
port might have potential to be a gateway for container import and export, coal import terminal for coal
fired power plants, bulk terminal for cement clinker, grain, petro products and other bulk cargo, land base
LNG terminal, car import terminal, passenger terminal, general cargo terminal, off shore supply base, and
other ship related service base.

Final Report Preparatory Survey on Matarbari Port Development Project in the People’s Republic of Bangladesh
2-13
‐10m
‐20m
‐30m
‐40m
Payra Port
N
Approach Channel
Source: JICA Survey Team
Figure 2.1-4: Approach Channel to Payra Port
The preliminary study planned an approach channel of 40 nautical miles with width of 220m, which is 5.2
times of ship breadth of the target vessel (i.e. 41.8m), and depth of -15m. The volume of capital dredging
up to the depth of -10m is allegedly 68 million cubic meters, while it would be 120 million cubic meters
up to -12m, 180 million cubic meters up to -14m, 300 million cubic meters up to -16m, and 400 million
cubic meters up to -18m. The study also estimates that volume of maintenance dredging would be about
50 million cubic meters to maintain the depth of -10m, 60 million cubic meters to maintain a depth of
-12m, 70 million cubic meters to maintain a depth of -14m, and 90 million cubic meters to maintain a
depth of -16m. Cost of maintenance dredging is estimated at about USD 300 million for the depth of
-10m and USD 500 million for the depth of -16m. In terms of annual maintenance cost, these
expenditures would not be feasible.
Final Report Preparatory Survey on Matarbari Port Development Project in the People’s Republic of Bangladesh
2-14
2.2 Cargo Demand Forecast
2.2.1 Container Cargo Demand Forecast
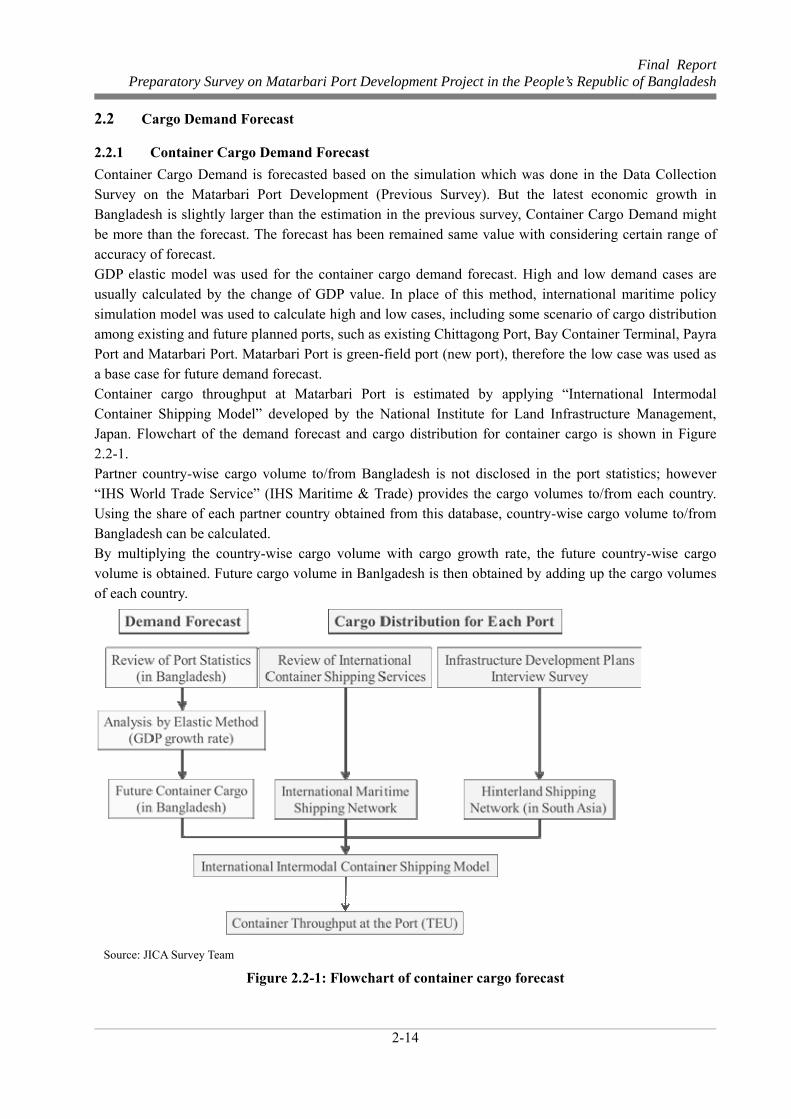
Container Cargo Demand is forecasted based on the simulation which was done in the Data Collection Survey on the Matarbari Port Development (Previous Survey). But the latest economic growth in Bangladesh is slightly larger than the estimation in the previous survey, Container Cargo Demand might be more than the forecast. The forecast has been remained same value with considering certain range of accuracy of forecast. GDP elastic model was used for the container cargo demand forecast. High and low demand cases are usually calculated by the change of GDP value. In place of this method, international maritime policy simulation model was used to calculate high and low cases, including some scenario of cargo distribution among existing and future planned ports, such as existing Chittagong Port, Bay Container Terminal, Payra Port and Matarbari Port. Matarbari Port is green-field port (new port), therefore the low case was used as a base case for future demand forecast. Container cargo throughput at Matarbari Port is estimated by applying “International Intermodal Container Shipping Model” developed by the National Institute for Land Infrastructure Management, Japan. Flowchart of the demand forecast and cargo distribution for container cargo is shown in Figure 2.2-1. Partner country-wise cargo volume to/from Bangladesh is not disclosed in the port statistics; however “IHS World Trade Service” (IHS Maritime & Trade) provides the cargo volumes to/from each country. Using the share of each partner country obtained from this database, country-wise cargo volume to/from Bangladesh can be calculated. By multiplying the country-wise cargo volume with cargo growth rate, the future country-wise cargo volume is obtained. Future cargo volume in Banlgadesh is then obtained by adding up the cargo volumes of each country.
Source: JICA Survey Team
Figure 2.2-1: Flowchart of container cargo forecast

Final Report Preparatory Survey on Matarbari Port Development Project in the People’s Republic of Bangladesh
2-15
Container demand forecast in 2026 and 2041 which were simulated by the Model for intermodal international container cargo shipping (MICS) for the base case are shown in Table 2.2-1. The ratio of cargo volume and total cargo volume in Bangladesh should theoretically add up to one but that isn’t the case because some cargos are imported / exported at ports in other countries such as Kolkata port in India. The conditions of base case are shown in Table 2.2-2.
Table 2.2-1 Results of MICS (Base Case)
2026 2041
Chittagong 0.7398 0.6721
Payra 0.1043 0.0532
Matarbari 0.1300 0.2485
Source: JICA Survey Team
Table 2.2-2 Simulation Conditions for Base Case
Depth (m)
Services and Ship Size (TEU)
Europe East Asia Bengal Bay
Chittagong -11.5 4,000 2,000
Payra -10.0 2,000
Matarbari -16.0 8,000 7,000
Source: JICA Survey Team
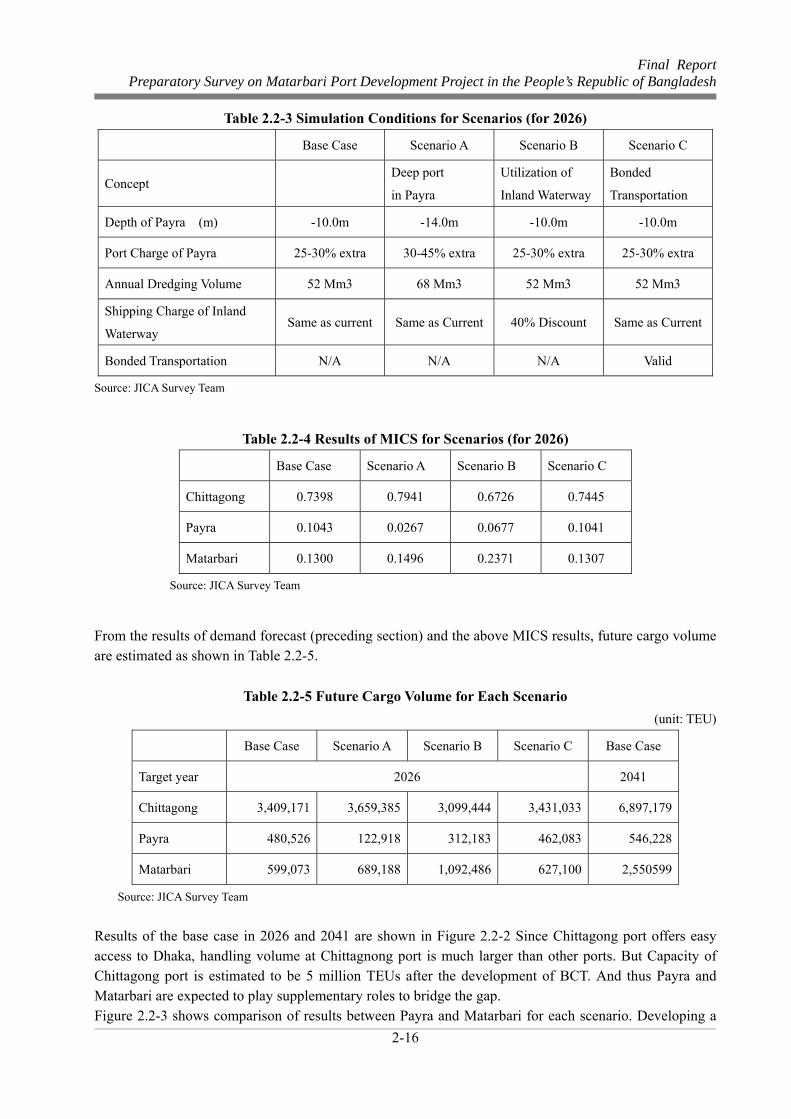
In MICS analysis, three scenarios (A, B and C) are simulated for 2026. Concepts for each scenario are as follows. For Scenario A, a deep berth (-14.0m) is developed in Payra port. Inland waterway is utilized by discount of shipping charge for Scenario B. In Scenario C, bonded transportation is implemented from Bhutan and northeast India to Bangladesh. Simulation conditions for each scenario are shown in Table 2.2-3 while the results of MICS for each scenario are shown in Table 2.2-4.
Final Report Preparatory Survey on Matarbari Port Development Project in the People’s Republic of Bangladesh
2-16
Table 2.2-3 Simulation Conditions for Scenarios (for 2026)
Base Case Scenario A Scenario B Scenario C
Concept Deep port
in Payra
Utilization of
Inland Waterway
Bonded
Transportation
Depth of Payra (m) -10.0m -14.0m -10.0m -10.0m
Port Charge of Payra 25-30% extra 30-45% extra 25-30% extra 25-30% extra
Annual Dredging Volume 52 Mm3 68 Mm3 52 Mm3 52 Mm3
Shipping Charge of Inland
Waterway Same as current Same as Current 40% Discount Same as Current
Bonded Transportation N/A N/A N/A Valid
Source: JICA Survey Team
Table 2.2-4 Results of MICS for Scenarios (for 2026)
Base Case Scenario A Scenario B Scenario C
Chittagong 0.7398 0.7941 0.6726 0.7445
Payra 0.1043 0.0267 0.0677 0.1041
Matarbari 0.1300 0.1496 0.2371 0.1307
Source: JICA Survey Team
From the results of demand forecast (preceding section) and the above MICS results, future cargo volume are estimated as shown in Table 2.2-5.
Table 2.2-5 Future Cargo Volume for Each Scenario
(unit: TEU)
Base Case Scenario A Scenario B Scenario C Base Case
Target year 2026 2041
Chittagong 3,409,171 3,659,385 3,099,444 3,431,033 6,897,179
Payra 480,526 122,918 312,183 462,083 546,228
Matarbari 599,073 689,188 1,092,486 627,100 2,550599
Source: JICA Survey Team
Results of the base case in 2026 and 2041 are shown in Figure 2.2-2 Since Chittagong port offers easy access to Dhaka, handling volume at Chittagnong port is much larger than other ports. But Capacity of Chittagong port is estimated to be 5 million TEUs after the development of BCT. And thus Payra and Matarbari are expected to play supplementary roles to bridge the gap. Figure 2.2-3 shows comparison of results between Payra and Matarbari for each scenario. Developing a

Final Report Preparatory Survey on Matarbari Port Development Project in the People’s Republic of Bangladesh
2-17
deep berth in Payra is not feasible due to the high dredging cost (Scenario A). Discount of inland waterway shipping charge is very effective for Matarbari port (Scenario B). Bonded transportation from Bhutan and northeast India has little effect on the cargo volume at Bangladesh ports because cargo to/from these areas is very small.
(unit: thousand TEUs)
0
5,000
10,000
2026 2041
Chittagong
Payra
Matarbari
Source: JICA Survey Team
Figure 2.2-2 Comparison of Base Case (2026 and 2041)
(unit: thousand TEUs)
0
200
400
600
800
1,000
1,200
Base Case Scenario A Scenario B Scenario C
Payra
Matarbari
Source: JICA Survey Team
Figure 2.2-3 Comparison between Payra and Matarbari for Each Scenario (2026)
Final Report Preparatory Survey on Matarbari Port Development Project in the People’s Republic of Bangladesh
2-18
2.2.2 Bulk Cargo Demand Forecast
(1) Coal
Coal import has reached 1.4 million tons at Chittagong Port and 110 thousand tons at Mongla Port. Import of coal is estimated to increase to supply coal fired power plants planned in Bangladesh. Coal transshipment terminal planned at Matarbari area is expected to import 9 million tons of coal in 2026, 14 million tons in 2031 and 41 million tons in 2041.
(2) LNG
As indicated in the study entitled “Power System Master Plan (PSMP) 2016”, import of LNG is estimated at 500 mmcfd (about 3.8 million tons) in 2026 and 4,200 mmcfd (about 32 million tons) except import by FSRU project.
(3) Crude Oil and Oil Products
Import of crude oil will be carried out by large tankers moored at SPM, which will be developed in the outer anchorage area of Matarbari Port. Export of oil products is planned by a refinery to be established in the Matarbari area, amount of which would be 8.9 million tons in 2026 and 27 million tons in 2041.
(4) Cement Clinker
Import of cement clinker has reached 19 million tons at Chittagong Port and 1.6 million tons at Mongla Port in 2016; future volumes are forecast to increase to meet the demand for cement production. Amount of clinker import is estimated at about 65 million tons in 2041, half of which would be handled at Matarbari Port.
(5) Fertilizer, Food Grain
Fertilizer of 1.6 million tons has been imported at Chittagong Port and the same amount at Mongla Port in 2016. It is estimated that import of fertilizer would not significantly increase due to the fact that agricultural land is limited. Import of wheat and sugar is estimated at 4.9 million tons and 3.4 million tons respectively in 2026, and 6.2 million tons and 5.0 million tons in 2041.
(6) Steel Products and Scrap Iron, Import of Vehicles
Import of steel products and scrap iron is estimated at about 9.9 million tons in 2026 and 17.8 million tons in 2041. Import of completed vehicles by RO/RO ship is estimated at about 90,000 - 224,000 units in 2016 and 90,000 - 298,000 units in 2041.

Final Report Preparatory Survey on Matarbari Port Development Project in the People’s Republic of Bangladesh
2-19
2.3 Port Development Plan
2.3.1 Regional Development Plans and Other Related Projects
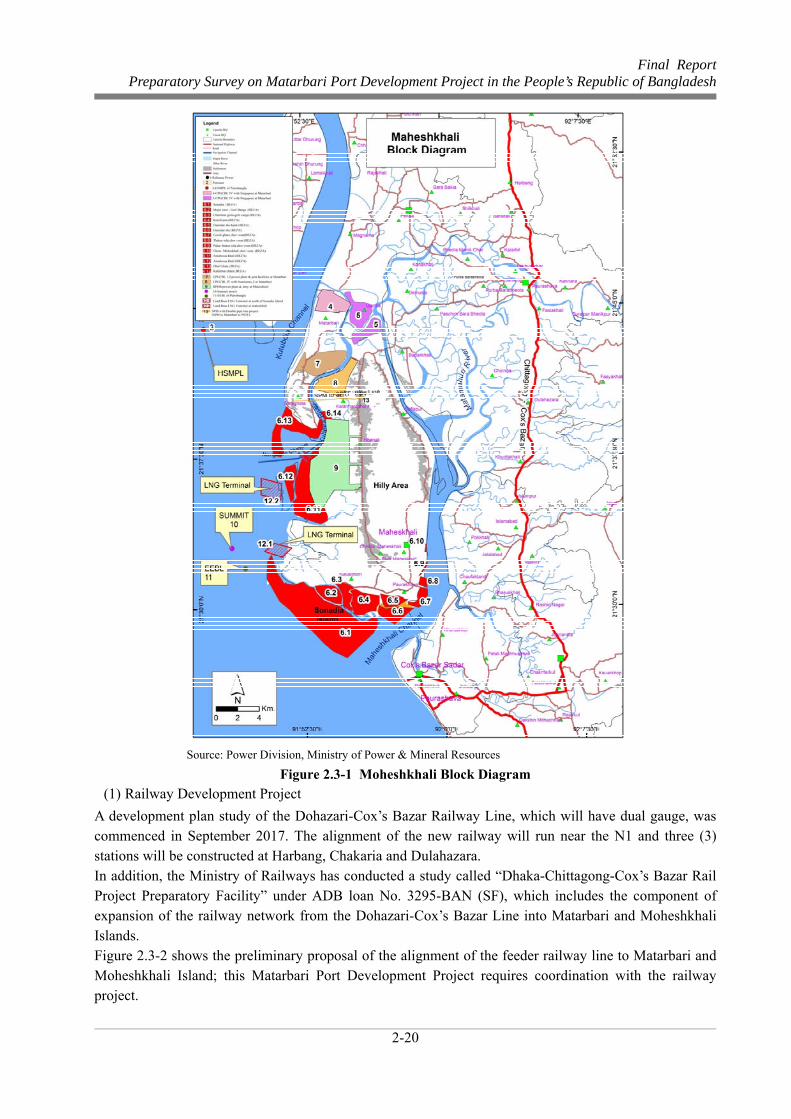
There are several proposals for development in Matarbari and Moheshkhali Islands as shown in Figure 2.3-1. BEZA has 14 area development plans for establishing economic zones and tourist attractive places. CPGCBL has an expansion plan of their power plant facility in Moheshkhali. In order to effectively develop these plans, inter-institutional coordination would be necessary and the Government of Bangladesh is now arranging for the establishment of a coordination committee called “Moheshkhali Coastal Development Committee (MCDC)”, which is chaired by PMO. Transportation infrastructure such as road and railway network in Matarbari and Moheshkhali Islands is currently in poor condition so that development of transport infrastructure in these islands is necessary for the success of such developments.
Final Report Preparatory Survey on Matarbari Port Development Project in the People’s Republic of Bangladesh
2-20
Source: Power Division, Ministry of Power & Mineral Resources
Figure 2.3-1 Moheshkhali Block Diagram
(1) Railway Development Project
A development plan study of the Dohazari-Cox’s Bazar Railway Line, which will have dual gauge, was commenced in September 2017. The alignment of the new railway will run near the N1 and three (3) stations will be constructed at Harbang, Chakaria and Dulahazara. In addition, the Ministry of Railways has conducted a study called “Dhaka-Chittagong-Cox’s Bazar Rail Project Preparatory Facility” under ADB loan No. 3295-BAN (SF), which includes the component of expansion of the railway network from the Dohazari-Cox’s Bazar Line into Matarbari and Moheshkhali Islands. Figure 2.3-2 shows the preliminary proposal of the alignment of the feeder railway line to Matarbari and Moheshkhali Island; this Matarbari Port Development Project requires coordination with the railway project.

Final Report Preparatory Survey on Matarbari Port Development Project in the People’s Republic of Bangladesh
2-21
Source: ADB Consultant
Figure 2.3-2 Preliminary Plan of Rail Route to Matarbari
(2) Matarbari Ultra Super Critical Coal Fired Plant
1) Objective
The objective of the project is to counter the rising demand for power while mitigating greenhouse gas emissions in Bangladesh by constructing the first ultra-supercritical coal-fired power plant (capable of producing 1,200 megawatts of power in total) in the Matarbari area of Moheshkhali Upazila, which is located in Cox’s Bazar District in Chittagong Division, thereby contributing to nationwide economic development and climate change alleviation.
2) Necessity
The electricity demand is rising in Bangladesh due to the electrification and industrialization as a result of

Final Report Preparatory Survey on Matarbari Port Development Project in the People’s Republic of Bangladesh
2-22
recent rapid economic growth and is estimated to continue to grow by 10 percent per annum over the next decade. While the current latent demand is estimated to be 8,920 megawatts, the power supply is limited to 8,177 megawatts (as of 2015), or approximately 90 percent of the latent demand. About 60 percent of the power supply in Bangladesh is provided by thermal power plants powered by domestic natural gas but domestic natural gas supplies are nearly depleted and the industrial and household demand for natural gas is rising. As such, a transformation to mixed sources of power is an upcoming challenge. The Government of Bangladesh is targeting the development of thermal power based on imported coal as the next source of power to counter the rising demand for power and to thereby contribute to further economic growth.
3) Japanese Yen Loan Project
Japanese ODA loans have been disbursed for the first phase of the project (June 2014, 41.498 billion yen), the second phase (June 2016, 37.821 billion yen), the third phase (June 2017, 10.745 billion yen) and the fourth phase (June 2018, 67.311 billion yen). As of April 2018, the construction of a temporary dike, the dredging of the basin, land reclamation, and soil improvement works has been already being carried out.
Source: CPGCBL Figure 2.3-3 Matarbari Ultra Super Critical Coal Fired Plant Layout
Final Report Preparatory Survey on Matarbari Port Development Project in the People’s Republic of Bangladesh
2-23
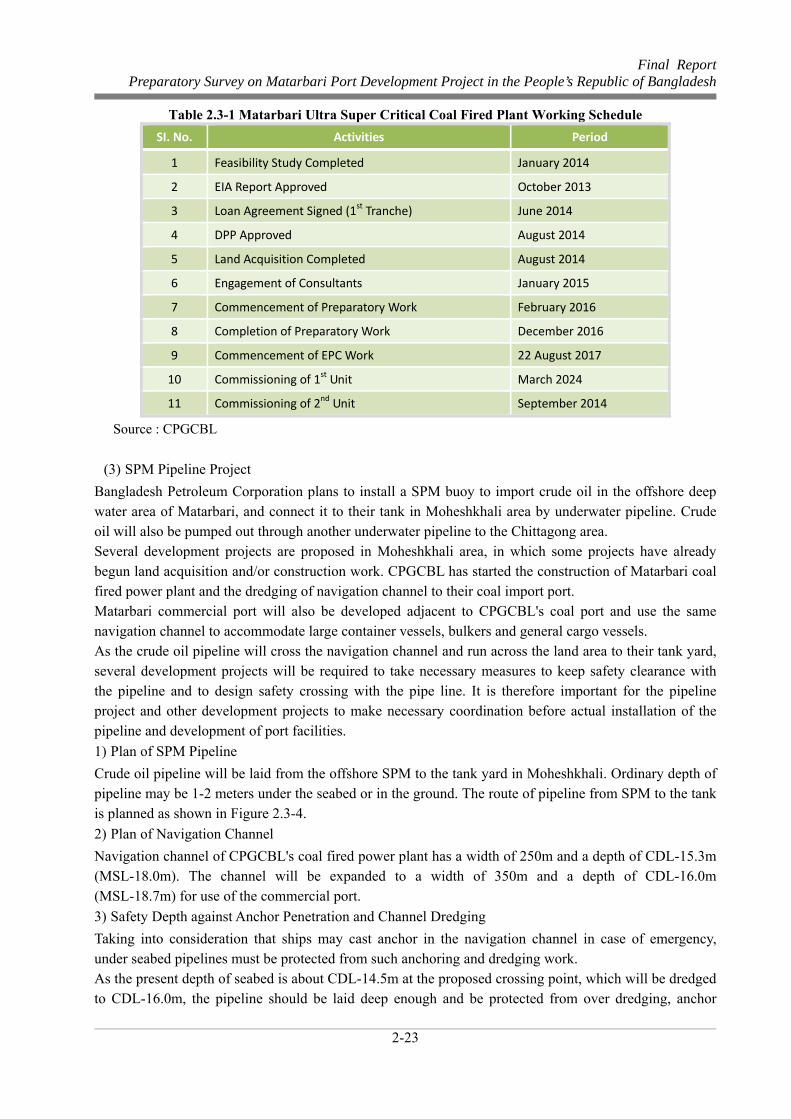
Table 2.3-1 Matarbari Ultra Super Critical Coal Fired Plant Working Schedule
SI. No. Activities Period
1 Feasibility Study Completed January 2014
2 EIA Report Approved October 2013
3 Loan Agreement Signed (1st Tranche) June 2014
4 DPP Approved August 2014
5 Land Acquisition Completed August 2014
6 Engagement of Consultants January 2015
7 Commencement of Preparatory Work February 2016
8 Completion of Preparatory Work December 2016
9 Commencement of EPC Work 22 August 2017
10 Commissioning of 1st Unit March 2024
11 Commissioning of 2nd Unit September 2014
Source : CPGCBL
(3) SPM Pipeline Project
Bangladesh Petroleum Corporation plans to install a SPM buoy to import crude oil in the offshore deep water area of Matarbari, and connect it to their tank in Moheshkhali area by underwater pipeline. Crude oil will also be pumped out through another underwater pipeline to the Chittagong area. Several development projects are proposed in Moheshkhali area, in which some projects have already begun land acquisition and/or construction work. CPGCBL has started the construction of Matarbari coal fired power plant and the dredging of navigation channel to their coal import port. Matarbari commercial port will also be developed adjacent to CPGCBL's coal port and use the same navigation channel to accommodate large container vessels, bulkers and general cargo vessels. As the crude oil pipeline will cross the navigation channel and run across the land area to their tank yard, several development projects will be required to take necessary measures to keep safety clearance with the pipeline and to design safety crossing with the pipe line. It is therefore important for the pipeline project and other development projects to make necessary coordination before actual installation of the pipeline and development of port facilities.
1) Plan of SPM Pipeline
Crude oil pipeline will be laid from the offshore SPM to the tank yard in Moheshkhali. Ordinary depth of pipeline may be 1-2 meters under the seabed or in the ground. The route of pipeline from SPM to the tank is planned as shown in Figure 2.3-4.
2) Plan of Navigation Channel
Navigation channel of CPGCBL's coal fired power plant has a width of 250m and a depth of CDL-15.3m (MSL-18.0m). The channel will be expanded to a width of 350m and a depth of CDL-16.0m (MSL-18.7m) for use of the commercial port.
3) Safety Depth against Anchor Penetration and Channel Dredging
Taking into consideration that ships may cast anchor in the navigation channel in case of emergency, under seabed pipelines must be protected from such anchoring and dredging work. As the present depth of seabed is about CDL-14.5m at the proposed crossing point, which will be dredged to CDL-16.0m, the pipeline should be laid deep enough and be protected from over dredging, anchor

Final Report Preparatory Survey on Matarbari Port Development Project in the People’s Republic of Bangladesh
2-24
penetration and dragging.
4) Necessary Measures
Based on a technical report on anchor penetration (Report on the depth of penetration of anchors into sea bottom through anchoring tests, Nakayama, Kiyomiya, Technical Note of the Port and Harbor Research Institute, Japan, No.215, June 1975), necessary depth of pipeline is provisionally calculated supposing that 300,000 DWT tanker casts its 22 ton anchor on the seabed pipeline. Taking into account that the depth of anchor dragging is about 2 m and over excavation of dredging work is about 1m in case of sandy seabed, necessary depth under the seabed may be about 3m (CDL-19.0m or under). In case of silty seabed, the depth of anchor dragging is about 5 m and over excavation of dredging work is about 1 m, so that necessary depth under seabed may be 6 m (CDL-22m). Necessary depth under the seabed should be carefully examined reviewing the result of the soil test at the crossing point. The pipeline belt area on land should have enough width to ensure that the pipeline is not affected by land reclamation outside the boundary.
Source: JICA Survey Team Figure 2.3-4 Pipelines from SPM and Delivery Pipeline to Chittagong
(4) SK GAS‐LPG Project
SK Gas has a plan to develop a gas loading pier with a depth of -16m. Their target vessel size is 43,000 DWT and LOA is 230m. The gas discharging piers for two 3,000 DWT vessels will be developed in the sea area of -12m. Their engineering, procurement and construction (EPC) will start in August 2018 and be completed in 2020. There are three options to coordinate both the projects: A) to displace the approach channel a little bit north, B) to displace the Gas facility more to the land side. C) to develop LPG pier near to the future coal distribution terminal (same site as LPG pier).

Final Report Preparatory Survey on Matarbari Port Development Project in the People’s Republic of Bangladesh
2-25
Option A would result in an increased dredging cost for the Matarbari Port Project while option B would raise the dredging cost of the SK gas project. Matarbari Port project is planned to avoid the shallow sand bar area to minimize the dredging and maintenance cost, therefore the approach channel cannot be displaced, and at the same time, the turning basin overlaps the approach channel and blocks vessels’ approach to the port. Moreover, the approach channel dredging has already started, and therefore the plan cannot be changed. BEZA also stressed that SK gas project should not interfere with the ongoing Matarbari port projects. Both sides agreed to continue discussion on the possibility of C.
Source: JICA Survey Team
Figure 2.3-5 Options of Marine Facility for LPG by SK GAS
(5) KISC(Kunming Iron and Steel Holding Company)
KISC is planning to construct an iron mill in Matarbari area, and develop an ore carrier berth for 200,000DWT. Larger berth than the multipurpose berth planned by JICA will be necessary. In the long term plan of Matarbari Port development, the 3rd phase development will be done in the mouth of Koheria River, and in addition to the commercial port facilities, industrial port facilities are planned. This kind of large scale project can be developed in land along Koheria River, which is acquired by BEZA.
Final Report Preparatory Survey on Matarbari Port Development Project in the People’s Republic of Bangladesh
2-26
2.3.2 Requirement of Facilities
Container cargo at Matarbari Port is estimated at about 0.6 to 1.1 million TEUs in 2026 and 1.4 to 4.2 million TEUs in 2041. Coal for power generation will be imported at the Coal Transshipment Terminal (CTT) planned in the Matarbari area. LNG will be imported from the FSRU terminal and new onshore terminal to be developed in the Matarbari area. Crude oil will be imported through SPM to be developed in the near future, and the import of oil products will remain at the present level due to the increase in domestic production. Oil products will be exported by new refineries to be built in the Matarbari area. Demand for cement clinker is large, so it will be transshipped from mother vessels to barges in anchorage. Demand for food grain will also increase, so that wheat and some grain from remote counties will be imported by large bulkers if a deep sea port becomes available. Import of iron products, scrap metals will also increase beyond the capacity of Chittagong port. Although some demand of completed vehicle import is forecasted, it is determined through discussion with CPA that increased import of complete vehicle to be handled in Chittagong Port.

Final Report Preparatory Survey on Matarbari Port Development Project in the People’s Republic of Bangladesh
2-27
2.3.3 Prediction of Vessel Type and Size
(1) Container ships
1) Methodology of calculation
In principle, shipping lines cope with increasing cargo volumes by 2 different means; one is to enlarge the size of ships, while the other is to increase the frequency of port calls. Ship enlargement is suitable for direct transportation from the origin regions to the destination regions. Increase of frequency will lead to enhancing the hub & spoke networks by using more feeder ships. A remote port with a small cargo volume tends to be served by feeder lines connecting with a nearby hub port. However, once the cargo volume of such a remote port grows to a certain level, some feeder lines could be replaced by mainlines, if the ”total network cost” including mainline ship operation cost, feeder deployment cost and transshipment cost at the hub port can be reduced. Possibility of mainline ship callings will increase in connection with the growth of import/export cargo volume, once a sufficient depth is secured. Assumption of maximum ship sizes for Matabari Port was investigated in the previous study by the calculation of “marginal laden TEUs” required for an extra calling by extended steaming from Singapore and Colombo. The result of the previous study could be applied to this Survey also, as hereinafter stated.
2) Prediction in the previous study
Minimum laden TEUs required to compensate the extra costs is given by dividing the total amount of extra costs (ship deviation costs and port charges) with the net profit rate (assumed as USD 150/TEU) as per Table 2.3-2 below.
Table 2.3-2 Marginal Laden TEUs Required for an Extra Calling by Size
TEU Capacity → 2,500 3,800 5,400 8,200 10,000
Laden TEUs required for an extra call (SIN/CHG/SIN) 2,022 2,756 3,528 5,135 6,344
Laden TEUs required for an extra call (CMB/CHG/CMB) 1,771 2,410 3,092 4,513 5,580
Source: JICA Survey Team
According to the statistics of CPA, the laden throughput per ship was 1,374 TEUs/ship for the year 2016. Average ship size as of August 2016 was 1,610 TEU. 1,374 TEUs/ship by the average ship size of 1,610 TEU could be considered to reflect 1,745,000 TEUs of laden throughput at Chittagong Port in 2016. Based on this, a simulation on the relation between yearly throughput and calling ship size could be roughly assumed as per Table 2.3-3 below. The figures imply that, if the laden throughput reaches 5.7 to 6.5 million TEUs in total of Chittagong Port and Matabari Port, there will be a possibility that a large container ship of 8,200 TEU type could call at either Chittagong or Matabari Port. Furthermore, 10,000 TEU type may call when the laden throughput reaches 7 to 8 million TEUs.
Table 2.3-3 Laden Throughputs Assumed to Receive an Extra Calling by Size
('000 TEUs)
TEU Capacity → 1,610 2,500 3,800 5,400 8,200 10,000
Intra‐Asia or North America Trades 1,745 2,568 3,501 4,480 6,521 8,057
Europe Trade 1,745 2,249 3,061 3,927 5,732 7,086
Source: JICA Survey Team

Final Report Preparatory Survey on Matarbari Port Development Project in the People’s Republic of Bangladesh
2-28
(2) Non-container ships
Dry and liquid bulk cargoes are usually transported directly from the origin ports to the destination ports without transshipment in between. The concept of “maritime network” doesn’t have to be considered for non-container trades. It should be noted that every bulk commodity has a particular ship type suitable for ocean transportation; for example, a large cape size is suitable for iron ore, a small cape size is suitable for coal, Panamax is suitable for grain, handy size is suitable for cement etc. The ship type for each bulk commodity has been determined by the world trade and shipping industry in consideration of the lot size of the commodity, loading/unloading facilities at origin/destination ports and other long business practices. Therefore, in proportion to the growth of trade volume, the ship size required for that commodity could be enlarged within the range of each particular ship type, but it would not go beyond it. Among the vehicle carriers currently moving in the world, Panamax is the most common size. However, it would be necessary to assume for the vehicle trades that short-distance transport will increase in future due to the localization of car manufacturing bases. In this sense, ship size enlargement will not necessarily happen for the vehicle carriers.

Final Report Preparatory Survey on Matarbari Port Development Project in the People’s Republic of Bangladesh
2-29
2.3.4 Alternatives
Taking into account industrial development plans in Matarbari and Moheshkhali area and geographical
features, two locations are recognized as possible port development sites. One is the estuary of Kohelia
River, and the other is area adjacent to the coal port of CPGCBL power plant in Matarbari.
Plan A is designed to build a commercial port in the estuary of Kohelia River and utilize the waterfront
for dedicated berths of backyard industries. As the Kohelia River flows into the estuary, siltation may be
an issue.
Plan B is designed to develop a commercial port that is separated from the flow of the Kohelia River, so
that siltation would be less than in Plan A. Both plans A and B require the construction of breakwaters and
channel dredging for the port development, which requires a large initial investment.
Plans C and D are designed to expand the coal port of CPGCBL to be developed in the near future. In
Plan C, port waters to connect BPDB power plant with the coal port of CPGCBL will be developed. Part
of the Kohelia River will be used as a channel in the port, and EZ planned on the left bank of the Kohelia
River can install its own berth along the channel.
In Plan D, a commercial port will be constructed with minimum investment and short construction period.
Coal to the BPDB power plant will be supplied through belt conveyors from CTT planned on the east side
of the commercial port. Cargo to/from EZ will be conveyed from/to port through the port access road.
Comparison among the four alternative plans is shown in Table 2.3-4. Container port for 8,000 TEU
Vessels needs wider and deeper channel (B350m, -16m under CD) than the coal port (B250m, -15.3m
under CD), however, channel depth of -15.3m will be sufficient in most cases if tidal allowance is used.
It is important to avoid the overlapping investment in two channels at Matarbari coal port and the estuary
of Kohelia River, as well as avoiding duplication in maintenance dredging. Expansion of Matarbari coal
port will be beneficial in terms of cost and time for construction. Plan E will be advantageous in the first
stage of port development, then Plan A can play a key role in industrial development of Matarbari and
Moheshkhali area.
The Plan D was adopted because of its advantage in short and middle term development.
Outline of alternative plans A, B, C, D is shown in Figure 2.3-6.

Final Report Preparatory Survey on Matarbari Port Development Project in the People’s Republic of Bangladesh
2-30
Table 2.3-4 Concept and outline of Alternative Port Development Plans
Key Factors Plan A Plan B Plan C Plan D
Concept Combination of industrial port and commercial port
Solo development of a commercial port; and Separation of river flow
Full expansion of the CPGCBL coal port to EZ and BPDB power plant
Minimum investment and early opening of the port, and Utilization of CPGCBL coal port
Location Estuary of Kohelia River
Estuary of Kohelia River
Expansion of the coal port to Dhalghata
Adjacent to the coal port
Initial Investment
Large investment in breakwaters and channel dredging
Medium investment in expansion of channel
Smaller than other plans
Channel Maintenance
New approach channel and coal port channel to be maintained
Channel to coal port can be used for the commercial port
Port Capacity Most Large Large Medium/Small Resident Population
0 0 11,500 Small for Phase I 4,000 for Phase II
Bottlenecks Large initial investment in breakwaters and dredging, and Maintenance of two channels
Large number of relocation of residents
Relocation of population for Phase II development
Short and Middle term Development
Large initial investment in breakwaters and dredging, even only for small capacity
More investment than Plan D for middle term development.
Minimum investment for short and middle term development
Source: JICA Survey Team
Plan A in the Estuary of Kohelia River Plan C in Matarbari
Plan B in the Estuary of Kohelia River Plan D in Matarbari
Source: JICA Survey Team
Figure 2.3-6 Alternative Plans in the Estuary of Kohelia River

Final Report Preparatory Survey on Matarbari Port Development Project in the People’s Republic of Bangladesh
2-31
2.3.5 Port Development Plan
(1) Phase 1 of the First Stage Development (Target Year 2026)
Phase 1 of the first stage development consists of the development of one multi-purpose berth with a length of 300m and back area of 17ha, and one container berth with a length of 460m and back area of 20ha. Approach channel is designed to have a width of 350m and a depth of CDL-16.0m. Phase 1 is expected to be completed by the end of year 2023. Layout plan and port facilities of the phase 1 of the first stage development are shown in Figure 2.3-7 and Table 2.3-5.
Table 2.3-5 Phase 1 of the First Stage Matarbari Port Development
Facilities Size Max Vessel Size Cargo & Capacity Remarks
Container Terminal L=460m, D= CDL-16m
Area=20ha
8,000 TEU Type
250 TEU (Feeder) Container 700,000 TEU
Full size berth x1,
Feeder berth x1
Multi-purpose
Terminal
L=300m, D=CDL-16m
Area 12ha 70,000 DWT
General Cargo 1.5 m.t.
Bulk Cargo 0.6 m.t.
General cargo ships,
Panamax bulker,
Breakwater
North L=2,150 m
(Icl.397 m by CPA)
South L=670 m
- - Phase 1 to be developed
by power plant project
Navigation Channel
Turning Basin
W=350m, L=11km
Turning Basin=75ha
100,000 DWT
(8,000-8,200 TEU)-
Phase 1 to be developed
by power plant project
Note: m.t. stands for million tons
Source: Data Collection Survey on the Matarbari Port Development in the People’s Republic of Bangladesh, 2017
Source: JICA Survey Team
Figure 2.3-7 Phase 1 of the First Stage Development
Future
Expansion
Area
Multi-Purpose
Terminal
Container
Terminal
Basin
Channel
North Breakwater
South Breakwater
Rail Yard
Access Road

Final Report Preparatory Survey on Matarbari Port Development Project in the People’s Republic of Bangladesh
2-32
(2) Phase 2 of the First Stage Development (Target Year 2036-2041)
Phase 2 of the first stage development will expand the turning basin to the south and add three full size container berths, which will have a length of 1,050m and back area of 50ha. Future expansion area will be used for truck parking, warehouses, logistic park, ancillary services, and further expansion of container berths if necessary. The expansion of turning basin to the south enables the development of CTT terminal and LNG terminal, which will accommodate 80,000 DWT coal bulkers and 145,000 (260,000) m3 type LNG carriers. For the navigation and berthing of LNG carriers, safe maneuvering is an important issue which requires deployment of patrol boats, tug boats as well as studies on wave conditions, tidal current, and safety regulations. Layout plan and port facilities of the phase 2 of the first stage development are shown in Figure 2.3-8 and Table 2.3-6.
Table 2.3-6 Phase 2 of the First Stage Matarbari Port Development
Facilities Size Max Vessel Size Cargo & Capacity Remarks
Container Terminal
L=1,050m, D= CDL-16m
Area=50ha
L=300m (Feeder)
8,000 TEU Type
250 TEU Type
Container 2.1 mil TEU
to 3.5 mil TEU
Full size berth x3,
Feeder berth x3
Coal and LNG
terminal (PPP)*
L=900m (Coal)
L=410m (LNG)
80,000 DWT
145,000 m3 Type
Coal 9.0-10.3 mil ton
LNG 3.8 mil ton
Coal berth x3
LNG berth x1
Note: * to be developed by private investors
Source: Data Collection Survey on the Matarbari Port Development in the People’s Republic of Bangladesh, 2017
Source: JICA Survey Team
Figure 2.3-8 Phase 2 of the First Stage Development
Future
Expansion
Area
Multi-Purpose
Terminal
Container
Terminal
Basin
Channel
North Breakwater
South Breakwater
Rail Yard
Access Road
Coal (PPP)
LNG (PPP)

Final Report Preparatory Survey on Matarbari Port Development Project in the People’s Republic of Bangladesh
2-33
(3) Second Stage and Industrial Port Development
The second stage of port development is recommended at the mouth of Kohelia River as shown in Figure 2.3-9. In addition to the phase 1 and 2 of the first stage, three full size container berths are proposed on the west side of commercial port with a length of 1,050m and area of 53ha. On the east side of commercial port, multi-purpose berths and bulk berths are proposed with a length of 1,200m and area of 60ha. Depth of the entrance channel and basin is -16m, which is the same as the first stage. Commercial port area has more space for future expansion, so that four additional full size container berths and four multi-purpose/bulk berths can be developed next to the proposed development. Based on the previous study “Data Collection Survey on Integrated Development for Southern Chittagong Region”, industrial port is proposed next to the commercial port. Since the master plan of industrial area development has not yet been established. Interviews to foreign port investors including Kunming Steel, but the proposed plan in Figure 2.3-9 is tentative and will require further study from viewpoints of commodities and volume of maritime cargo, vessel type and size of call, cost allocation between industrial port and commercial port, and so forth.
Table 2.3-7 Stage 2 of Matarbari Port Development
Facilities Size Max Vessel Size Cargo & Capacity Remarks
Container Terminal
L=1,050m, D= CDL-16m
Area=52.5 ha
L=300m (Feeder)
8,000 TEU Type
250 TEU Type
Container 2.1 mil TEU
to 3.5 mil TEU
Full size berth x3,
Feeder berth x3
Multi-Purpose and
Buk terminal
L=1200
Area 60ha
80,000 DWT
Multi and bulk berth x4
Source: Data Collection Survey on the Matarbari Port Development in the People’s Republic of Bangladesh, 2017
Figure 2.3-9 Second Stage and Industrial Port Development

Final Report Preparatory Survey on Matarbari Port Development Project in the People’s Republic of Bangladesh
2-34
2.4 Port Facility Plan
2.4.1 Mooring Facility
(1) Outline of the Study
The outline of the study on Mooring Facility is summarized below. 1) In order to cope with the large tide range of CDL + 9.4 m which is the characteristic of the natural condition related to mooring facilities, considering a big storm surge of 4.5 m (50 years return period), plus astronomical High Water Level (HWL) of CDL+4.88 m, the top elevation of the mooring facility has been raised to CDL + 9.0 m. 2) A large seismic lateral force due to a large seismic coefficient (kh = 0..25) is the main external force acting on the quay. 3) According to the sub-soil investigation survey, the characteristics of the sub-soil strata vary but generally the soil is firm as foundation, consisting of the upper layer (CDL + 4 m to -5 m) with soft cohesive soil, the middle layer (CDL-5 m to -25 m) with N value of 20 ~ 40 dense silty sand to sand layer, and a hard soil layer with N value of 50 or more at the lower layer (-25 m to -30 m or less). The depth of the bearing stratum is conceivable at CDL - 30 m to - 35 m. Since the sub-soil of the port construction site is changing with lens-shaped cohesive layers, it is recommended to conduct further detailed soil survey during implementation stage, including future detailed design and further detailed examinations such as embedded depth of steel piles and soil improvement. 4) The objective ship was assumed a container ship of 8,200 TEU loading (100,000 DWT) as the maximum ship size. The maximum draft is 14.5 m, and the quay plan depth is CDL - 16 m. Also, taking into consideration the recent increase in the size of the hull, the mold breadth is 45.3 m and the number of rows of on-deck containers is 18. Together with this large-sized container ship, the mid-sized container ship, the bulk carrier, and a 250 TEU loaded coastal ship with 2,500 DWT were also considered. 5) As external load on the quay, both of the berthing force (fender reaction force: approx. 1,600 kN) and mooring force of 1,000 kN are smaller than the seismic force (approx. 27,000 kN). 6) The reaction force of the fender is smaller than the seismic force, but in order to ensure that the objective ships with a large range in ship size are coming in and out safely at all times, a large protector is provided in front of the fender rubber to cover the range of ship’s freeboard height with water level difference. 7) The dead weight of the Quay Gantry Crane (QGC) which is approx. 1,000 ton is also considered as the design load of the quay. 8) Considering the above conditions, and comparing the structural types of mooring facilities – i.e., steel pipe sheet pile type, gravity type (concrete caisson, etc.), and steel pile pier type (batter pile type, strut type etc.) – with detached pier arrangement, the strut type steel pipe pile quay was found to be the most advantageous in terms of technical aspects, required construction period, costs, etc. The strut type steel pipe pile quay was then adopted as the recommendation. The contents of the study on mooring facilities are discussed hereunder.
(2) Study Conditions
1) Design Standard
Technical Standards and Commentaries for Port and Harbor Facilities in Japan
Strutted Frame Method Technical Manual

Final Report Preparatory Survey on Matarbari Port Development Project in the People’s Republic of Bangladesh
2-35
Bangladesh National Building Code (BNBC) 2015
ASCE/COPRI (American Society of Civil Engineers/Coasts, Oceans, Ports and Rivers
Institute
British Standard (BS), Rock Manual-CIRIAC683
2) Tidal Level (Astronomical Tide)
HWL: (High Water Level): CDL+4.88 m
MSL: (Mean Sea Level) CDL+2.68 m
LWL: (Low Water Level) CDL+0.55 m
CDL: (Chart Datum Level) CDL ±0.00 m
Source: CPGCBL Project
3) High Water Level considering storm surge occurrence
The design high water level CDL+9.4 m is determined, taking the cyclone storm surge for 50 years
return period and astronomical HWL as shown in Table 2.4-1below.
Table 2.4-1 Joint probability of assumed extreme Water Level
Return Period
(Year) Cyclone surges High Water Level (CDL) Extrema water Level (CDL)
100 6.3 4.88 11.2
50 4.5 4.88 9.4
30 3.5 4.88 8.4
Source: Survey Team
Water Level (m)
4) Objective ships’ dimensions and maximum berthing approach speed
Objective ships’ dimensions and relevant berthing approach speed are summarized in Table 2.4-2.The
berthing will require assistance of tug boat(s) and side thruster of the ships.
Table 2.4-2 Objective Ships Dimensions
DWT TEU LOA Draft BreadthNumber ofContainer
Row on deck
ApproachSpeed
(m/sec)Remarks
Container Ships100,000 8,500 338 m 14.6 45.3 18 0.10 1)3,500 250 83 m 5.5 m 15 m 6 0.20 2)
Bulk Ships70,000 225 14.0 m 32.3 m 0.10 1)
Source 1) Technical Standards and Commentaries for Port and Habour Facilities in Japan 20182) Hearing private operator
5) Mooring Force
Main Quay top (CDL+9.0 m) Bollard Pulling Force: 1,000 kN
Main Quay mid-level (CDL+4.5 m) Cleat Pulling Force: 350 kN

Final Report Preparatory Survey on Matarbari Port Development Project in the People’s Republic of Bangladesh
2-36
6) Load Conditions
Main Quay: Quay Gantry Crane : dead load, 960 ton
Uniform load (Normal): 10kN/m2
(Seismic): 5kN/m2
Harbor Crane: dead load
Trailer/Chassis/Container dead load
Container Yard:
RTG (6+1): dead load
RS (Reach Stacker): dead load
Trailer/Chassis/Container: dead load
Harbor Crane: Crane load
Container load dead load
Uniform load (Normal) : 10kN/m2
(Seismic): 5kN/m2
Multi-Purpose Yard:
Harbor Crane dead load
Uniform load (Steel) (Normal): 35kN/m2
(Seismic): 17.5 kN/m2
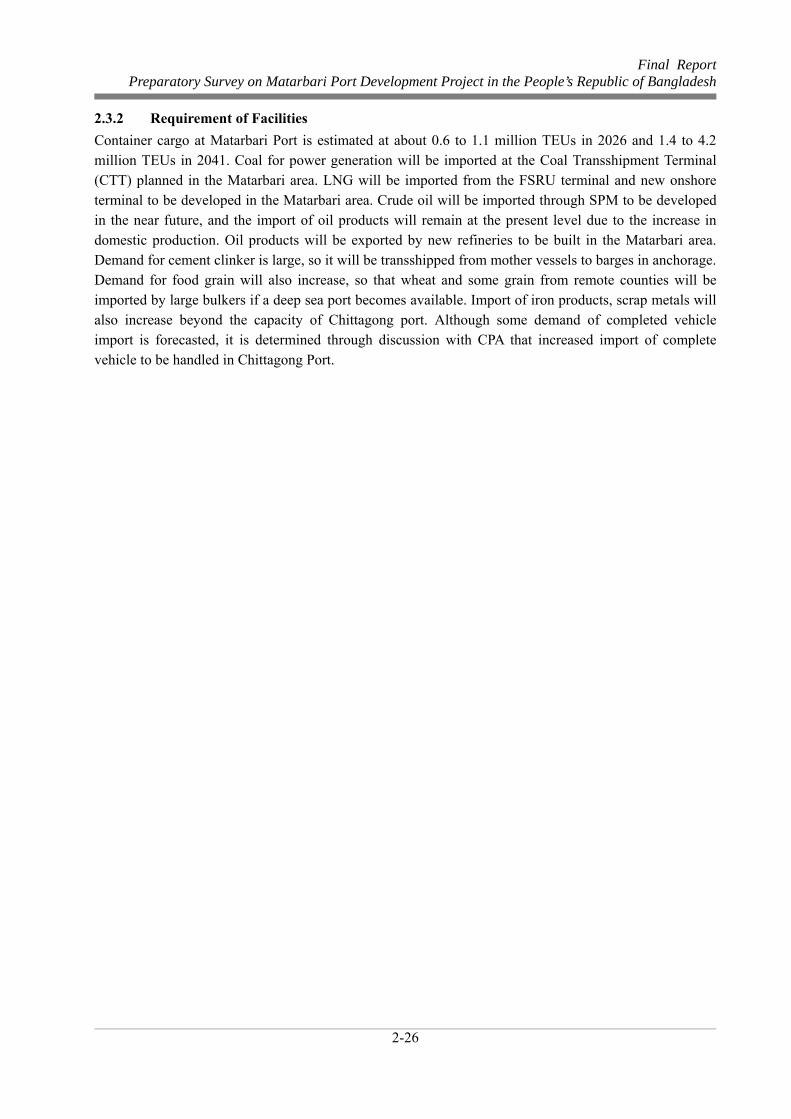
7) Geotechnical feature of the project site
Soil investigation through 13 borings was carried out for the study. The location of each boring,
ground level and coordinates are shown in Figure 2.4-1. Figure 2.4-2 to Figure 2.4-9 show the
stratifications of subsoil along boring points in line. Study result show that subsoil foundation at port
area is composed of three typical layers of silt, clay and sand and their distribution in terms of
geotechnical aspects seems complicated. Considering such complicated distribution of subsoil, the
following could be the features of this foundation:
- Ground level data at all points are higher than CDL, which is MSL-2.68m.
- Soft clayey layer with N value of 0~5 and thickness of 3~5m are distributed on the ground
surface within most of the boring points, except at BH-7 and BH-12. Underneath the
surface clay layer, medium to dense sandy/clay/silty soil with N of 4 to 50 is distributed in
thickness of 5m to 19m.
- At BH-7, medium to dense sand layer is distributed on the surface, and underneath it is soft
clay with N value of less than 10 distributed from -5m to -15m, thickness of which tend
to decrease toward BH-12 as shown in Figure 2.4-5.
- Bearing stratum for piling system along the face line of berth is distributed around CDL-24m
to -34m as shown in .Figure 2.4-2

Final Report Preparatory Survey on Matarbari Port Development Project in the People’s Republic of Bangladesh
2-37
Figure 2.4-1 Ground plan of the port area and boring locations
Table 2.4-3 shows the distribution of three groups of clay layers classified by N values A; <N≦5, B;
5<N≦15 and C; 15<N for all boring points. Since subsoil layer from BH-7 to BH-11 along the face
line of berth is to be removed for replacement work, most of soft soil layer would not cause any
geotechnical problem other than the area between BH-7 and BH-12. As shown in Figure 2.4-5,
thickness of clay layers distributed from BH-7 at depth of -3.3m to -18.3 tend to become thinner
toward BH-12. This clay layer might be necessary to be improved if post construction settlement
would exceed the allowable settlement.
The area enclosed by BH-12 to BH-19 is the yard area. It is understood that layers at group A would
mainly cause consolidation settlement, while settlement of groups B and C would be small due to thin
thickness of 1.8m clay layer for group B and very stiff clay layer for group C.
Table 2.4-3 Distribution of Clay layer
Figure 2.4-4shows properties of clay layers classified as groups A, B and C. Content of < silt + clay >
fractions are mostly larger than 90%; on the contrary, average natural water content (Wn) for Groups
A, B and C are 38%, 26% and 27%, respectively. It could be presumed that in the past, clay layer
might have been desiccated and water content had been reduced; hence clay layer currently show
high-yield stress compared with current over-burden pressure.
GH(CDL;m)
X-cord.
Y-cord.
BH07 3.7 381950 2399287BH08 4.3 382163 2399287BH09 3.7 382375 2399287BH10 3.0 382588 2399287BH11 3.1 382800 2399287BH12 3.9 381950 2399045BH13 3.6 382163 2399045BH14 3.7 382375 2399045BH15 3.2 382588 2399045BH16 3.9 382800 2399045BH17 3.8 381950 2398803BH18 3.7 382163 2398803BH19 3.6 382375 2398803
-7 -8 -9 -10 -11 -12 -13 -14 -15 -16 -17 -18 -19
A 0<N≦5 11* 3 7
** 3 8 0 0 3 4 4 5 1 3 3.1
B 5<N≦15 4 0 4 0 0 7 0 0 6 0 0 0 3 1.8C 15<N 4 6 2 2 4 2 10 9 8 0 8 5 4 4.9
Remarks; * BH-7; Clay layer with N of 8 distribute from CDL-3 to -17m** BH-9; Clay layer divided by upper clay (3m), sand layer(1m) and lower on (4m)
Ave.( m)BH No.
Classification

Final Report Preparatory Survey on Matarbari Port Development Project in the People’s Republic of Bangladesh
2-38
Table 2.4-4 Soil properties for group A,B and C
sandsilt+clay
WL PL Ip e0Pc
(kPa)Cc
Cv
(cm2/day)
8 1.8 9 91 33 58 17 41 1.8 28 1.20 100 0.35 831.2 4 96 51 61 22 39 1.8 - 1.10 90 0.38 66-3.3 4 96 59 71 23 48 1.8 - 1.20 55 0.33 73
10 0.5 18 82 41 59 20 39 1.9 13 1.10 110 0.31 9911 0.5 7 93 41 58 22 36 1.9 33 1.10 95 0.36 6514 1.2 8 92 36 55 18 37 2 44 0.80 85 0.28 12115 0.6 4 96 40 48 23 25 1.7 72 1.30 90 0.45 24316 1.4 8 92 37 61 27 34 1.7 41 1.10 110 0.18 22617 1.3 8 92 35 63 25 38 1.8 97 1.10 85 0.30 11919 1.1 1 99 36 48 19 29 1.8 - 1.10 70 0.39 125
6 86 38 53 20 33 1.67 48 1.09 93.2 0.33 12212 -12.6 4 96 30 58 22 36 1.76 152 1.10 55 0.21 105
15 -5.9 59 41 22 - - - 1.80 - 0.50 155 0.12 548
32 69 26 58 22 36 1.78 152 0.80 105 0.17 3277 -23.3 1 99 29 61 22 39 2 181 0.80 120 0.32 96
8 -19.7 9 91 22 30 11 19 1.8 205 1.2 55 0.33 -12 -19.1 7 93 45 62 22 40 1.9 48 1 120 0.44 16813 -21.9 3 97 25 57 23 34 1.72 201 1.1 40 0.32 7314 -20.5 9 91 15 34 12 23 2.2 190 0.5 160 0.164 5017 19.2 14 86 32 71 21 49 1.9 164 0.9 70 0.17 12218 -25.0 9 91 20 59 17 42 1.8 - 1 25 0.3 57
7 93 27 53 18 35 1.90 165 0.93 84 0.29 94
Consistency (%)γ
(g/cm3)
Consolidation Index
A(N<5)
9
LayerName
Bor.No.
Depth (in
CDL)
Sieve test result (%) Wn
(%)
qu
(kPa)
Note(1); Wn; Natural water content, WL;Liquid limit, Ip; Plastic limit,γ; Density of soil, eo; Initial void ratio, qu;
unconfined compression test result, C=qu/2, Pc; Consolidation yield stress, Cv; Consolidation coefficient, Cc;
Compression index.
Average A
5≦N<15
Average B
15≦N
Average C
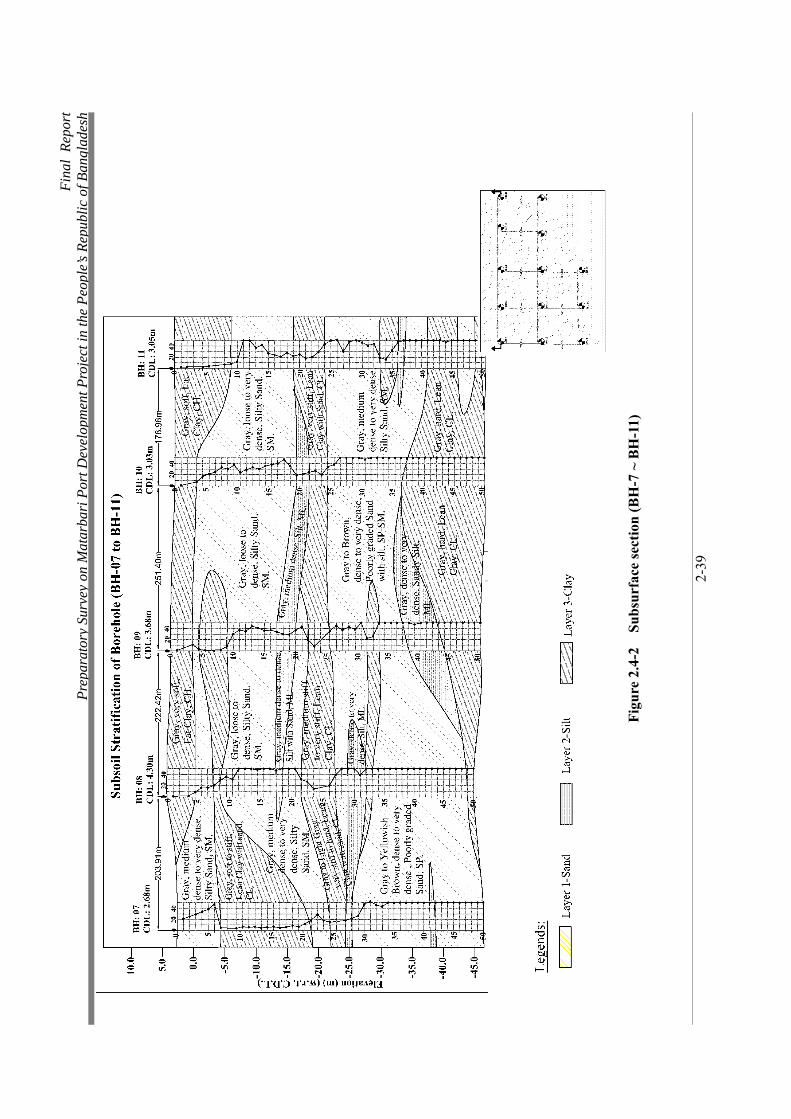
Fin
al R
epor
t P
repa
rato
ry S
urve
y on
Mat
arba
ri P
ort D
evel
opm
ent P
roje
ct in
the
Peo
ple’
s R
epub
lic
of B
angl
ades
h
2-39
F
igu
re 2
.4-2
S
ub
surf
ace
sect
ion
(B
H-7
~ B
H-1
1)

Fin
al R
epor
t P
repa
rato
ry S
urve
y on
Mat
arba
ri P
ort D
evel
opm
ent P
roje
ct in
the
Peo
ple’
s R
epub
lic
of B
angl
ades
h
2-40
Fig
ure
2.4
-3 S
ub
surf
ace
sect
ion
(B
H-1
2~B
H-1
6)
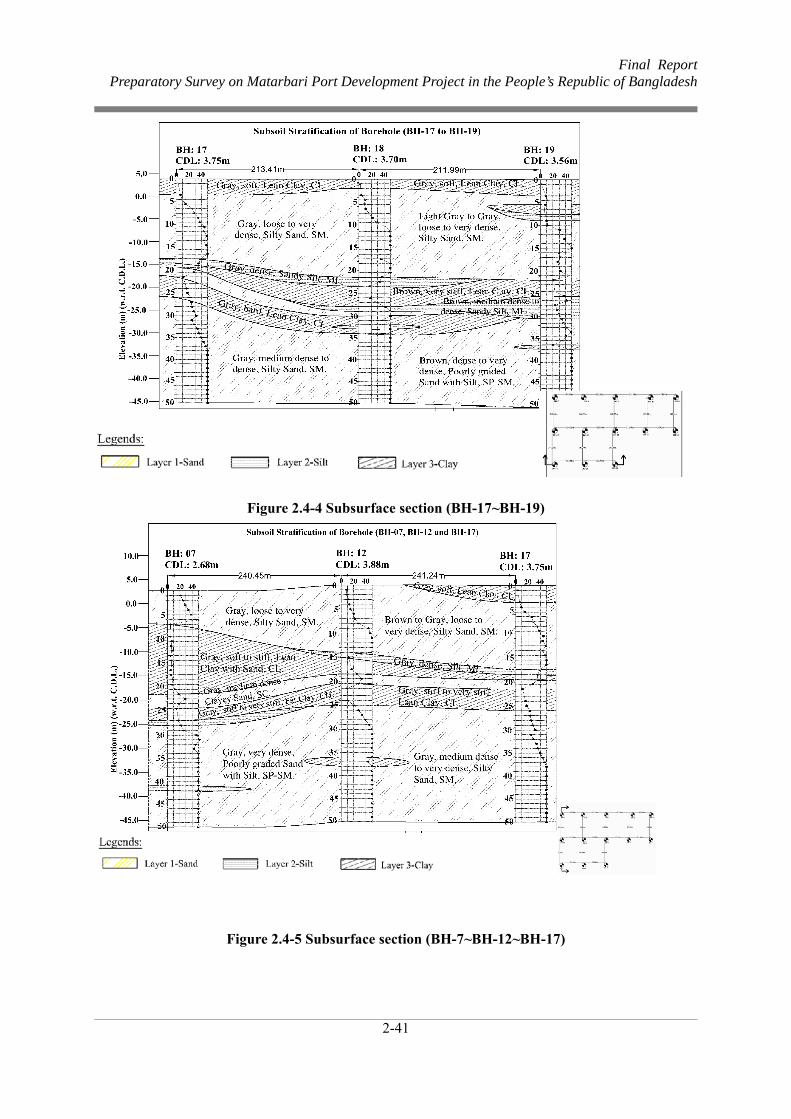
Final Report Preparatory Survey on Matarbari Port Development Project in the People’s Republic of Bangladesh
2-41
Figure 2.4-4 Subsurface section (BH-17~BH-19)
Figure 2.4-5 Subsurface section (BH-7~BH-12~BH-17)
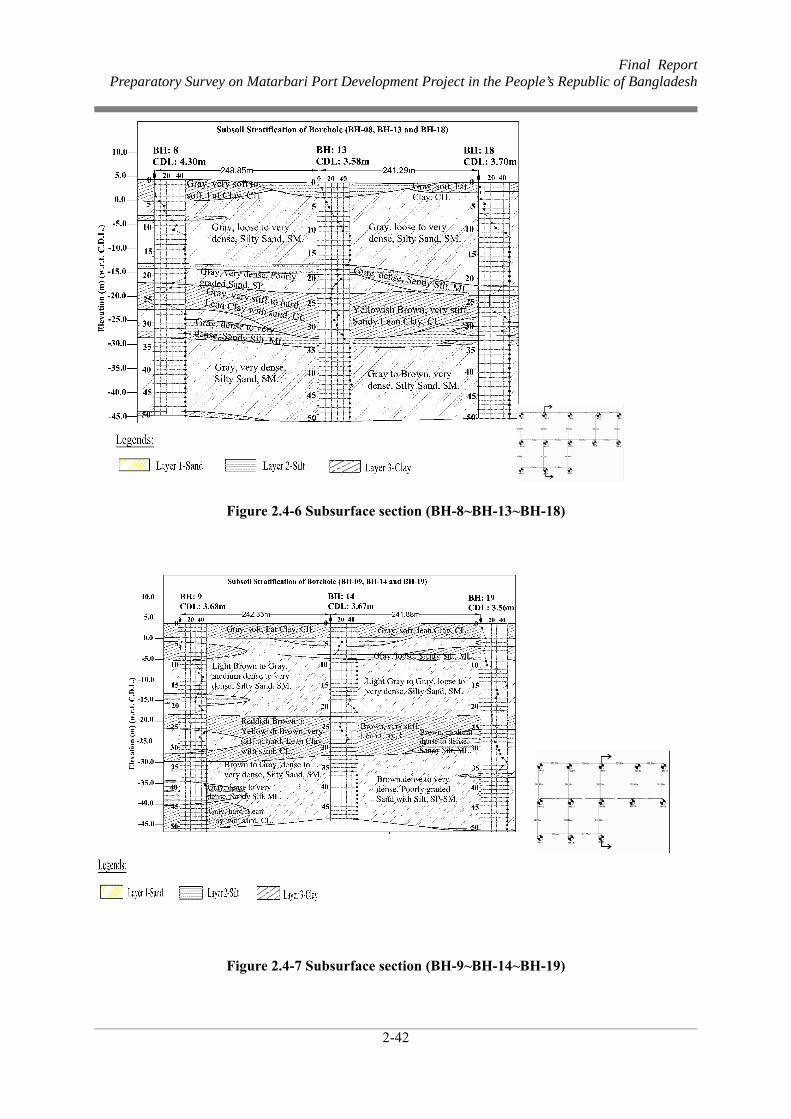
Final Report Preparatory Survey on Matarbari Port Development Project in the People’s Republic of Bangladesh
2-42
Figure 2.4-6 Subsurface section (BH-8~BH-13~BH-18)
Figure 2.4-7 Subsurface section (BH-9~BH-14~BH-19)
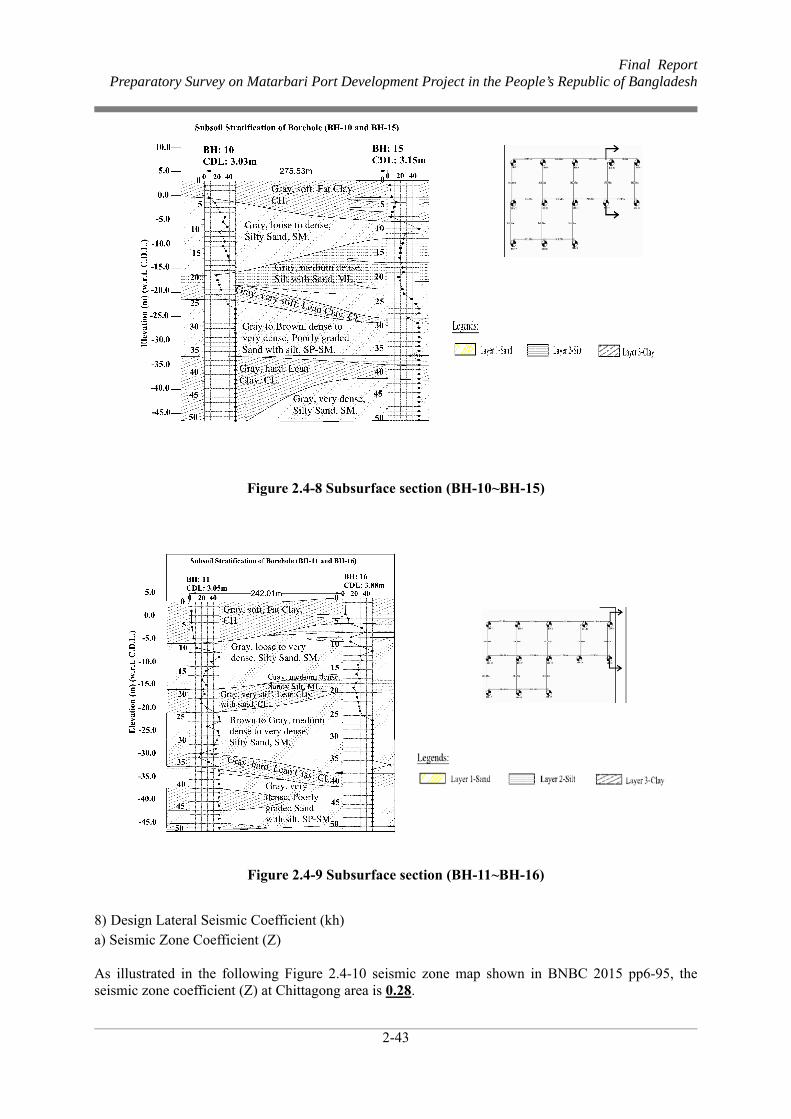
Final Report Preparatory Survey on Matarbari Port Development Project in the People’s Republic of Bangladesh
2-43
Figure 2.4-8 Subsurface section (BH-10~BH-15)
Figure 2.4-9 Subsurface section (BH-11~BH-16)
8) Design Lateral Seismic Coefficient (kh) a) Seismic Zone Coefficient (Z) As illustrated in the following Figure 2.4-10 seismic zone map shown in BNBC 2015 pp6-95, the seismic zone coefficient (Z) at Chittagong area is 0.28.

Final Report Preparatory Survey on Matarbari Port Development Project in the People’s Republic of Bangladesh
2-44
Figure 2.4-10 Seismic Zone Coefficient of Bangladesh
b) Structural Importance Factor (I) The structural importance factor (I) depends on classification of occupancy category specified in the following table (BNBC 2015, pp6-4). The port structure should be categorized as an essential facility, so that the occupancy category is selected as IV. The framed descriptions hereunder, in this Section, are extractions from BNBC 2015.

Final Report Preparatory Survey on Matarbari Port Development Project in the People’s Republic of Bangladesh
2-45
, The importance factor is accordingly given as 1.50 from the following table (BNBC 2015, pp6-99).

Final Report Preparatory Survey on Matarbari Port Development Project in the People’s Republic of Bangladesh
2-46
c) Response Reduction Factor (R) Table 5-1 in Seismic Design of Piers and Wharves (ASCE/COPRI 61-14, pp 12) provides the response reduction (modification) factors. It is assumed that the recommended type of the quay structure is deck on piles as a steel pipe pile. Therefore, the factor is to be R=2.
d) Building Period (T) The building period can be computed through the following formula as shown in BNBC 2015, pp 6-105.

Final Report Preparatory Survey on Matarbari Port Development Project in the People’s Republic of Bangladesh
2-47
The structure is assumed as steel moment resisting frames in the Table 6.2.20, so Ct and m are given respectively as 0.0724 and 0.8. The height of the structure (hn) is 25 m estimated from the seabed up to the top elevation of the quay. Eventually, T is given as 0.951 (sec). e) Soil Type Based on the sub-soil conditions at the target site, the soil type is categorized as SC based on the following table from BNBC 2015, pp6-94.
f) Soil Factor (S) and Other Parameters (TB, TC and TD) Upon classification of soil types, the soil factor (S) and other parameters are obtained from the following table:
g) Damping Correction Factor (η)
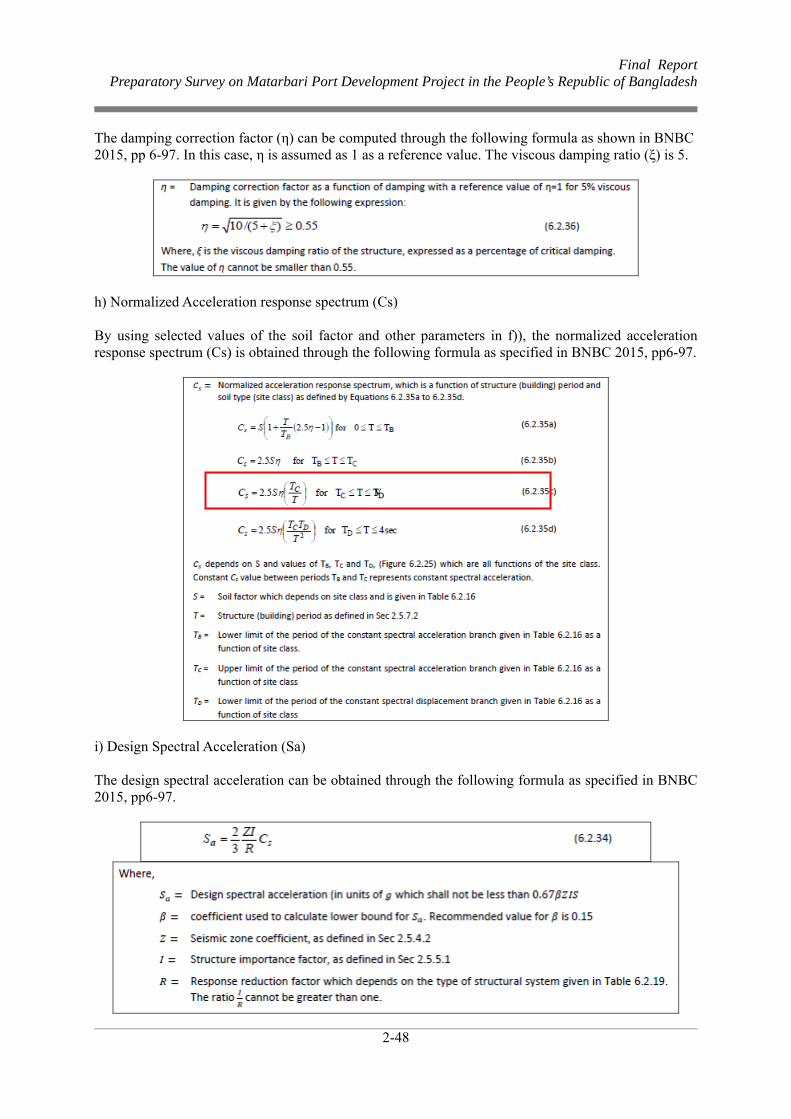
Final Report Preparatory Survey on Matarbari Port Development Project in the People’s Republic of Bangladesh
2-48
The damping correction factor (η) can be computed through the following formula as shown in BNBC 2015, pp 6-97. In this case, η is assumed as 1 as a reference value. The viscous damping ratio (ξ) is 5.
h) Normalized Acceleration response spectrum (Cs) By using selected values of the soil factor and other parameters in f)), the normalized acceleration response spectrum (Cs) is obtained through the following formula as specified in BNBC 2015, pp6-97.
i) Design Spectral Acceleration (Sa) The design spectral acceleration can be obtained through the following formula as specified in BNBC 2015, pp6-97.
v
Final Report Preparatory Survey on Matarbari Port Development Project in the People’s Republic of Bangladesh
2-49
j) Result: Lateral Seismic Coefficient (kh) By using the aforementioned formulas and the obtained values of the relevant factors and/parameters, the result of the computation for kh is given as 0.25 as shown below:
Z = 0.28 Soil Type = SCI = 1.5 S = 1.15R = 2 TB = 0.2Ct = 0.072 TC = 0.6m = 0.8 TD = 2.0hn = 25 ξ = 5T = 0.951 η = 1
Cs = 1.814
Sa = 0.25 g
Kh = Sa/g = 0.25 (3) Layout Plan of Mooring Facilities and Selection of Structural Type of the Quay
1) Layout Plan of Mooring Facilities and Water Area
As shown in Figure 2.4-11, the width of the navigation channel was determined to be 350 m, with
a margin for the length (LOA = 338 m) of the objective ship, on the assumption that the target
ship on the channel was less frequented.
The diameter of turning basin is 680 m, which is twice the LOA. The turning will be using tug
boat(s) or bow thruster. .
The berth box as the mooring space of the berth was considered to be 1.5 times the maximum
ship breadth of 45.3 m, and it was 70 m wide.
In addition, as shown in Figure 2.4-12, the ship entering the port was assumed as starboard
berthing with mooring head-in. Also, for departure was assumed to be turning ships with
tugboats. However, depending on wind direction and wave condition, the reverse could be also
possible. That is to turn the ship upon arrival before berthing. In this case ship will berth and
moor by head out position. , . . .
In order to ensure safe ship berthing, 50 m head space of dredging area was set at the eastern end
of the berth box.
As shown in Table 2.4-5, the length of the container quay was 460 m and that of the multipurpose
quay (bulk ship) was 300 m, and coastal ships moored in the middle of both berths dependent on
the berth window.
The planned water depth of the berth, turning basin, and port navigation channel were set at CDL
- 16.0 m, considering a margin of 10% for the draft of the maximum container ship.
Table 2.4-5 Required Berth Dimension
Objective ShipsDWT(ton)
LOA(m)
Breadth(m)
Draft(m)
WaterDepth(m)
Required BerthLength
(m)
ProjectBerth
Length (m)
Container Ship 100,000 338 45.3 14.6 410Coastal Ships 3,500 83 15.0 5.5 110Bulk Carrier 70,000 250 32.3 14.0 280 300
Source: Technical Standards and Commentaries for Port and Harbor Facilities in Japan 2018
16.0460

Final Report Preparatory Survey on Matarbari Port Development Project in the People’s Republic of Bangladesh
2-50
Figure 2.4-11 General Layout Plan of Mooring Facilities and Water Area
Ber
th P
osit
ion 0.
1L
(0.2
~0.3
)L
-16.0m
Berthing and Mooring Head-in Un-docking from Mooring Head-in Position
Source: Technical Standards and Commentaries for Port and Harbor Facilities in Japan
Figure 2.4-12 Required Water Area for Berthing and Un-docking
-16.0 m
-16.0 m

Final Report Preparatory Survey on Matarbari Port Development Project in the People’s Republic of Bangladesh
2-51
2) Selection of structural type of Quay
Taking the aforementioned conditions into consideration, four structural types, i.e. 1) Steel Pipe Pile
Wall Type, 2) Concrete Caisson Type, 3) Concrete Deck on Batter Piles Type and 4) Concrete Deck on
Vertical Piles with Struts, are compared as summarized in Table 2.4-6 below.
Determining the facts, particularly soft sub-soil condition with deep bearing strata and other points
(such as earthquake resistance), the possibility of future deepening of quay structures, calmness of port
basin and construction cost, the “Concrete Deck on Steel Pipe Piles Type” is recommendable.
Amongst above mentioned, further detail comparison of the “Concrete Deck on Steel Pile Type” was
made on two types, i.e., Batter piles Type and Strut Type as shown in Table 2.4-7 .
Alternative 1: RC (Reinforced Concrete) Deck on Steel Combination Batter Piles (Batter Pile Type)
Alternative 2: RC Deck on Steel Vertical Piles & Strut Braces (Strut Type)
Taking the results of the comparative items on 1) Cost, 2) Construction Period, 3) Structural Stability, Wave calmness of Harbor Basin, Construction Methodology, and others, it was concluded that the “Strut Type” is the most suitable for the Matarbari Port Quay structure and is recommendable.
By adopting the Detached Pier layout, the quay structure reduces the size of the superstructure deck,
reduces the seismic force acting on its dead-weight, and also suppresses the influence of the uplifting
pressure on the slab by the wave in the harbor basin. The detached pier and the back yard are
connected by access bridges.

Fin
al R
epor
t P
repa
rato
ry S
urve
y on
Mat
arba
ri P
ort D
evel
opm
ent P
roje
ct in
the
Peo
ple’
s R
epub
lic
of B
angl
ades
h
2-52
Tab
le 2
.4-6
Com
par
ison
of
Stru
ctu
ral T
ype
of Q
uay
Ver
tica
l Pile
wit
h S
trut
Typ
e
Sket
ch o
fT
ypic
alSe
ctio
ns
Pro
s an
d co
ns
1. S
teel
pip
e sh
eet p
ile w
all s
uppo
rted
by
tie r
ods
and
anch
or p
iles
2. D
ue to
big
wal
l hei
ght,
eart
h pr
essu
re a
ndre
sidu
al w
ater
pre
ssur
e w
ill b
e bi
g, th
us th
e si
ze o
fth
e fr
onta
l pip
e pi
le w
all a
nd a
ncho
ring
will
bec
ome
big.
3.T
he fr
onta
l wal
l and
anc
hor
pile
s w
ill b
eus
ed a
s th
e fo
unda
tion
of Q
GC
rai
ls o
rot
herw
ise
sepa
rate
pile
foun
dati
on w
ill b
ere
quir
ed.
4, I
n or
der
to m
inim
ize
the
eart
h pr
essu
re o
n th
epi
pe p
ile w
all t
he f
illin
g st
one
volu
me
will
be
big.
5. T
he w
ave
calm
ness
of
harb
or b
asin
by
wal
l typ
equ
ay, a
s w
ell a
s ca
isso
n ty
pe q
uay,
will
be
dist
urbe
d by
ref
lect
ed w
aves
due
to v
ertic
al w
all
stru
ctur
es.
1. C
aiss
on la
unch
ing
faci
litie
s su
ch a
s flo
atin
g do
ck o
r sl
ipw
ayw
ill b
e ne
eded
.2.
in o
rder
to r
esis
t the
sei
smic
for
ce, t
he s
ize
of e
ach
cais
son
will
bec
ome
big
and
laun
chin
g w
orks
will
be
expe
nsiv
e.3.
Dep
end
on th
e av
aila
bilit
y of
laun
chin
g sy
stem
, con
stru
ctio
npe
riod
will
be
long
er.
4. S
epar
ate
foun
datio
n fo
r Q
GC
rai
ls w
ill b
e ne
eded
. it w
illre
spon
d in
divi
dual
ly a
gain
st s
eism
ic f
orce
may
dam
age
QG
C5.
In
orde
r to
dis
trib
ute
the
cais
son
toe
pres
sure
, thi
ck b
ase
ston
e la
yer
will
be
need
ed.
6. A
s th
e m
ain
stru
ctur
e is
sol
id b
ody,
it w
ill b
e st
rong
agai
nst
ship
col
lisio
n or
irre
gula
r us
e of
han
dlin
geq
uipm
ent.
7. O
nce
the
cais
son
wal
l was
pro
perl
y m
ade,
the
ser
vice
life
will
be
long
er a
nd m
aint
enan
ce c
ost
will
be
less
tha
nan
othe
r ty
pe.
1. T
he h
oriz
onta
l sei
smic
forc
e w
ill b
ere
sist
ed b
y st
rut
brac
es c
onne
cted
to
vert
ical
pile
s.2.
Con
stru
ctio
n pe
riod
will
be
shor
ter
than
bat
ter
pile
typ
e.3.
Les
s nu
mbe
r of
pile
s th
an b
atte
rpi
le t
ype
mak
es lo
wer
cos
t4.
The
wav
e re
flect
ion
is s
ame
low
as
batt
er p
iles
type
.5.
Ant
icor
rosi
on m
easu
res
is r
equi
red.
6. U
nder
wat
er w
orks
for
cea
se p
ipe
are
need
ed
Ear
thqu
ake
Res
ista
ntB
BA
Con
stru
ctio
nW
ork
sB
BA
Dur
abili
tyB
AB
Pos
sibi
lity
ofD
eepe
ning
BC
A
Con
stru
ctio
nP
erio
dB
CA
Cos
tB
CA
Mai
nten
ance
BA
BR
esul
t(R
ank
ing)
34
1
A B 2
1. B
y us
ing
com
bina
tion
bat
ter
pile
s or
stru
t be
ams,
the
qua
y w
ill b
e st
rong
agai
nst
exte
rnal
forc
e su
ch a
sea
rthq
uak
e sh
ip b
erth
ing/
moo
ring
.2.
The
con
stru
ctio
n pe
riod
will
be
shor
ter
than
oth
er t
ypes
.3.
Les
s qu
arry
mat
eria
l tha
n ot
her
type
s.4.
The
wav
e re
flect
ion
is s
mal
ler
than
othe
r w
all t
ype
stru
ctur
es, T
hen
the
calm
ness
of h
arbo
r ba
sin
will
be
bett
erth
an o
ther
typ
es5.
Ant
i-cor
rosi
on m
easu
re is
req
uire
d su
chas
cat
hodi
c pr
otec
tion
or th
ickn
ess
allo
wan
ce o
f st
eel p
ipe
pile
s.
A A B A B
Stru
ctur
alT
ype
Ste
el P
ipe
She
et P
ile W
all T
ype
Con
cret
e C
aiss
on T
ype
Con
cret
e D
eck
on
Ste
el P
ile T
ype
Bat
ter
Pile
s T
ype

Final Report Preparatory Survey on Matarbari Port Development Project in the People’s Republic of Bangladesh
2-53
Table 2.4-7 Comparison of Pile Type Quay
Alternatives Alternative 1
RC Deck on Steel Combination Batter Pile
Alternative 2
RC Deck on Steel Vertical Pile & Strut Brace
Structural Illustration
Construction Cost for RC
Deck and Pile base (760m in
length x 35m in width)
Piling works (material and driving works) = 25890 t x US$ 2000= US$ 51 million RC Concrete Deck works: =34,800 m3 x $530= US$ 18.4 million Total = 51+18.4 =US$ 69.4 million
(22/25)
Piling works (material and driving works) = 12,115 t x US$ 2200= US$ 26.7 million Steel Strut Beam ( material and Installation) = 1,675t( strut part) x US$ 9,000=US$ 15.1 million RC Concrete Deck works: =37,460 m3 x $530= US$19.9 million Total = 26.7+15.1+19.9 =US$ 61.7 million (25/25)
Cost Ratio 1.12 1.00
Construction Period for
Berth (760m in length x 35m in deck width)
Pile Fabrication and Transport : 8 months Pile Driving: φ1000mm (1267 Nos /2.5 nos /23 day/ 2 teams)=11 months Slope Protection : starting after 1month of the piling works RC Deck construction : starting after 1month of the slope protection works and working period =(slab) 13300m3/30m3/2 teams/23day =10 months Berth Fitting : 1months after Construction of Deck Work period =8+ 11+1+1+10+1= 32 months (excluding access bridges and retaining wall)
(23/25)
Pile and Strut Beam Fabrication and Transport : 8 months Pile Driving: φ1300mm (434 Nos /2 nos /23day/2 teams)=5 months Strut Beam Installation : 512 sets / 2 sets/ 23day/2team =5.5 months, work starting 1 month after starting of piling works = 1month (50m )+ 5.5 =6.5 months Slope Protection : starting after 1month of the Strut Beam works RC Deck construction : starting after 1month of the slope protection works and working period =(slab) 15900m3/30m3/2 teams/23 day= 11.5 months Berth Fitting : 1month after Construction of Deck Work period= 8+ 6.5 +1+1+11.5+1=29 months (excluding access bridges and retaining wall) (25/25)
Time Ratio 1.10 1.00
Stability and Maintenance
Aspects
Good Structural Stability Necessary Maintenance for Steel Pile and RC Deck.Structural stability. =Very Good
(15/15)
Good Structural Stability Necessary Maintenance for Steel Pile and RC Deck.For stability for up-lift by large wave action, heavy weight of the deck or the pile dimension and the length shall be considered. = Good (12/15)
Procurement of Materials
and Quality Assurance
Steel Pipe Sheet Pile is imported from third country. =Good
(12/15)
Steel Pipe Pile is imported from third country. (good) Strut Beam is imported from Japanese Manufacture. =Very Good (15/15)
Methodologic difficulty
and Workability
Construction of battered steel pipe piles is difficult work that to be requires much experience and high accuracy. Concrete deck construction requires experience. = Good (12/15)
Driving of steel pipe pile and strut beam installationrequire high accuracy. Concrete deck construction requires experience. =Good (12/15)
Technical Transfer
As battered steel pipe pile’s the construction work will depends on the contractor’s experience, technical transfer may not be sufficient. = Good (4/5)
As strut beam is new construction technology of the construction, technical transfer can be achieved. = Very Good (5/5)
Evaluation Better (88/100) Best (94/100)

Final Report Preparatory Survey on Matarbari Port Development Project in the People’s Republic of Bangladesh
2-54
(4) Harbor Craft Basin/Inner Breakwater
As shown in Table 2.4-8 below, Harbor Service Crafts Basin is located near the port entrance. As shown in Figure 2.4-13, the Harbor Craft Basin Quay is working as an Inner Breakwater. With the entrance width to Basin set at 90 m, the maintenance dredging was made to be easy. The depth of Basin was set at CDL - 5.5 m against the draft of the tugboat, which is the maximum objective ship for the basin. The top of the Harbor Craft Quay was at CDL + 6.0 m, providing stairs for period of low tide. The apron width was considered to be 20 m, assuming that it will be used also for equipment maintenance and repair work. A slope was provided so that the working vehicle could go up and down from the apron to the yard behind with top elevation at CDL + 10.0 m. The structure of the Harbor Craft Quay comprised of a steel pipe sheet pile wall with tie rods and anchor, and the Inner Breakwater part is a double steel pipe sheet pile wall structure as shown in Figure 2.4-14. The part of the slip at the innermost part of the Harbor Craft Basin is planned to be wave dissipating concrete block quay to maintain the wave calmness in the Basin. (See Figure 2.4-15)
Table 2.4-8 Harbor Service Crafts
Craft Type Particulars Number of Units
Power: 4,000 HP
LOA: 35m*
B (Breadth): 11 m*
d (Draft): 4.6 m* Note)*Assumed
Pilot Boat 1Line Boat 2
Security Patrol cum Survey Boat 2
Tug Boat 3
Figure 2.4-13 Harbor Craft Basin

Final Report Preparatory Survey on Matarbari Port Development Project in the People’s Republic of Bangladesh
2-55
Figure 2.4-14 Steel Sheet Pile Quay and Inner Breakwater
Figure 2.4-15 Wave Dissipating Conc. Block Quay at Basin Slip
(5) Revetment
At the east and west ends of the terminal yard, revetments were provided. West Revetment
Since the west side is influenced by the waves coming from the port entrance and/or breakwater overtopping waves, concrete sheet pile wall was provided at the bottom of the L-shaped concrete wall as shown in to prevent suction of filling material. The case with parapet wall at CDL + 12.0 m and the case without the parapet (top elevation at CDL + 10.0 m for the opening of Access bridge connected to the quay wall) are estimated to be 0.003 m3/sec/m and 0.500 m3/sec/m, respectively.

Final Report Preparatory Survey on Matarbari Port Development Project in the People’s Republic of Bangladesh
2-56
Figure 2.4-16 West end Revetment
Relationship between the East Revetment and future expansion of mooring facilities (Phase 2)
Since the east end of the terminal is located inside the port basin, the influence of the wave would be
small, so a cross section with an L-shaped concrete wall on the riprap foundation mound was provided as
shown in Figure 2.4-17. This part is assumed for a coastal shipping vessel and small and medium type
ship quay in the future, hence the planned water depth is smaller than the main quay wall. Assumed width
of 61 m was considered as the construction margin of the mooring facility structure, which becomes its
extended part.
Figure 2.4-17 East Revetment and future Expansion of Mooring Facilities (Phase 2)

Final Report Preparatory Survey on Matarbari Port Development Project in the People’s Republic of Bangladesh
2-57
2.4.2 Yard and other Facilities
(1) Yard Plan
The proposed general layout plan of the Yards and Mooring facilities are shown in .
1) Container Yard
Yard Capacity
The container yard is determined on the basis of the container handling system that consists of the QGC
(Quay Gantry Crane) and RTG (Rubber Tired Gantry Crane) as the yard crane.
The capacity of the yard is roughly estimated as shown below:
① Container ground slot: (6 rows by 16TEU)/bay x 41 bays = 3,936 slots.
② Reefer Container ground slot (6 rows by 14 TEU)/bay x 2 bays =168 slots
The annual terminal capacity is estimated as shown below:
1) Number of average container tiers
Container: RTG 5+1 type: average 3.5 tiers
RTG 6+1 type: average 4.5 tiers
Reefer Container Reefer rack 4 layers
RTG average 3 tiers
2) Total capacity
Container RTG 5+1 type: 13,776 TEU
RTG 6+1 type: 17,712 TEU
Reefer Container RTG 504 TEU
3) Average dwell time: 7 days (Average of In/Export)
4) Peak ratio: 0.75
5) Annual terminal capacity
RTG 5+1 type
Container: 13,776TEU x 360/7 x 0.75 = 531,360 TEU/year
Reefer Container: 504 TEU x 360/7 x 0.75 = 19,440 TEU/year
Total 550.880 TEU/year
RTG 6+1 type
Container: 17,712TEU x 360/7 x 0.75 = 683,177 TEU/year
Reefer Container: 504 TEU x 360/7 x 0.75 = 19,440 TEU/year
Total 702,617 TEU/year
Accordingly RTG 6+1 type is recommended.
Terminal Gate
The required number of gate lanes is calculated by the following formula:
N=Mc x p/(Dy x H) x (t/60)
Where, N: Required number of gate lanes
Mc: Annual handling volume of containers (700,000 TEU/year)

Final Report Preparatory Survey on Matarbari Port Development Project in the People’s Republic of Bangladesh
2-58
p: Peak ratio (1.3)
Dy: Annual operating days (360 days)
H: Operating hours per day (24 hours)
r: TEU/FEU (20’/40’) assumed container ratio (0.6)
t: Necessary process time per truck (5 min.)
The required number of gate lanes is 6 lanes + 1 lane (for weigh-bridge).
Customs Inspection Area (to be done by Customs)
Customs inspection Area is proposed to locate near the roundabout so that it can cover the inspection
activities of future terminal(s) expansion. The facilities for inspection are assumed as shown in Table
2.4-9 below.
Table 2.4-9 Inspection Facilities of Customs and CPA
Customs CPAImport 1 unitExport 1 unitImportExport
1 unit
1 unit 1 unit
Weigh-Bridge
Scanner
Yard Area
The total area of the Container Terminal is 20.2 ha, excluding the Quay area.
Empty Container Yard
The capacity of Empty Container Yard is approximately 2,000 boxes (TEU) by average stack of 4 layers.
The total area of Empty Container Yard and Primary Power Station/Green area is approximately 4 ha.
2) Multi-Purpose Terminal Yard
The Multi-purpose terminal is proposed to handle wheat import of 600,000 tons, and steel products
import of 1,200,000 tons in 2026. It is assumed that wheat is discharged by pneumatic unloader and
conveyed to grain silo by belt conveyor. It is also assumed that grain will be carried from grain silo to
flour milling and bagging factory by belt conveyor or track transportation. These silo(s) and factories are
supposed to be built and operated by private sectors.
Steel products are assumed to be handled in open storage yard by chassis and cranes.
The outline of Multi-purpose terminal is shown in Table 2.4-10.
The total area of Multi-purpose Terminal yard is approximately 11.8 ha.
Table 2.4-10 Cargoes of Multi-Purpose Terminal
Commodities In/ExportAnnualCargo
Volume
HandlingEquipment
DomesticTransportation
Storage Facility Required Land Area Remarks
1 Grain Import 0.6 mill. ton
1) Quay Crane2) PneumaticUnloader3) Belt Conveyer
1) Coastal Shipping2) Road3) Railway
Grain SiloTentative capacity20,000 to 50,000m3
7 haFor grain silos and flourmill/bagging factory fordistribution
Built/ Operationby private sector
2Steel
ProductsImport 1.2 mill ton
1) Quay Crane2) Mobil crane3) Chassis
1) Coastal Shipping2) Road3) Railway
Open Yard Storagecapacity 70,000 ton.
5 haAssumed max. groundload capacity 30 kN/m2Capacity 1,800,000ton/year

Fin
al R
epor
t P
repa
rato
ry S
urve
y on
Mat
arba
ri P
ort D
evel
opm
ent P
roje
ct in
the
Peo
ple’
s R
epub
lic
of B
angl
ades
h
2-59
Fig
ure
2.4
-18
Mat
arb
ari P
ort
Gen
eral
Lay
out
Pla
n

Final Report Preparatory Survey on Matarbari Port Development Project in the People’s Republic of Bangladesh
2-60
2.4.3 Cargo Handling Equipment
(1) Scale of facilities
The scale of facilities of the container terminal and multipurpose terminal of Matarbari port is detailed in the chapter “2.4.2 Yard and Facilities”. 1) Main particulars The terminal layout of each phase of the Matarbari Port development plan is shown in Figure 2.4-19. The terminal layout of Phase 1 is shown in Figure 2.4-20.
Source: JICA Survey Team Figure 2.4-19 Terminal layout of each phase of the Matarbari Port development plan
Phase 1Phase 2
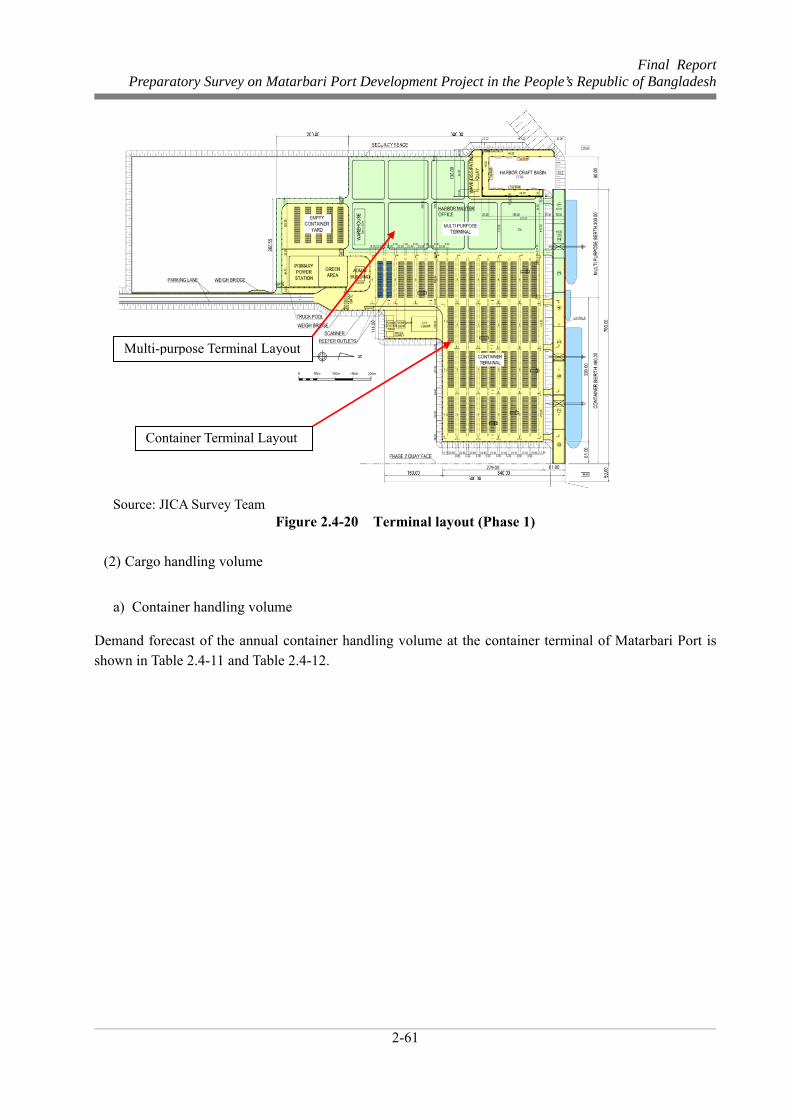
Final Report Preparatory Survey on Matarbari Port Development Project in the People’s Republic of Bangladesh
2-61
Source: JICA Survey Team Figure 2.4-20 Terminal layout (Phase 1)
(2) Cargo handling volume
a) Container handling volume
Demand forecast of the annual container handling volume at the container terminal of Matarbari Port is shown in Table 2.4-11 and Table 2.4-12.
Multi-purpose Terminal Layout
Container Terminal Layout

Final Report Preparatory Survey on Matarbari Port Development Project in the People’s Republic of Bangladesh
2-62
Table 2.4-11 Container handling volume in Matarbari Port (Demand Forecast) (1/2) (TEU)
Year Matarbari Container
Throughput (Base)
Overflow from
Chittagong Port
Matarbari with
Overflow from CHG
2022 - - -
2023 57,140 - -
2024 121,766 - -
2025 259,484 - -
2026 691,200 - -
2027 769,206 - -
2028 854,465 - -
2029 947,593 - -
2030 1,049,255 - -
2031 1,145,306 - -
2032 1,248,497 - -
2033 1,359,310 - -
2034 1,478,257 113,317 1,534,916
2035 1,605,886 352,952 1,782,361
2036 1,742,775 603,690 2,044,620
2037 1,889,542 866,040 2,322,562
2038 2,046,843 1,140,530 2,617,108
2039 2,215,377 1,427,713 2,929,234
2040 2,395,885 1,728,170 3,259,970
2041 2,550,000 1,957,293 3,528,646
Source: JICA Survey Team
Table 2.4-12 Container handling volume in Matarbari Port (Demand Forecast) (2/2)
0
500,000
1,000,000
1,500,000
2,000,000
2,500,000
3,000,000
2022
2023
2024
2025
2026
2027
2028
2029
2030
2031
2032
2033
2034
2035
2036
2037
2038
2039
2040
2041
Matarbari Container Throughput (Base)TEU
Source: JICA Survey Team
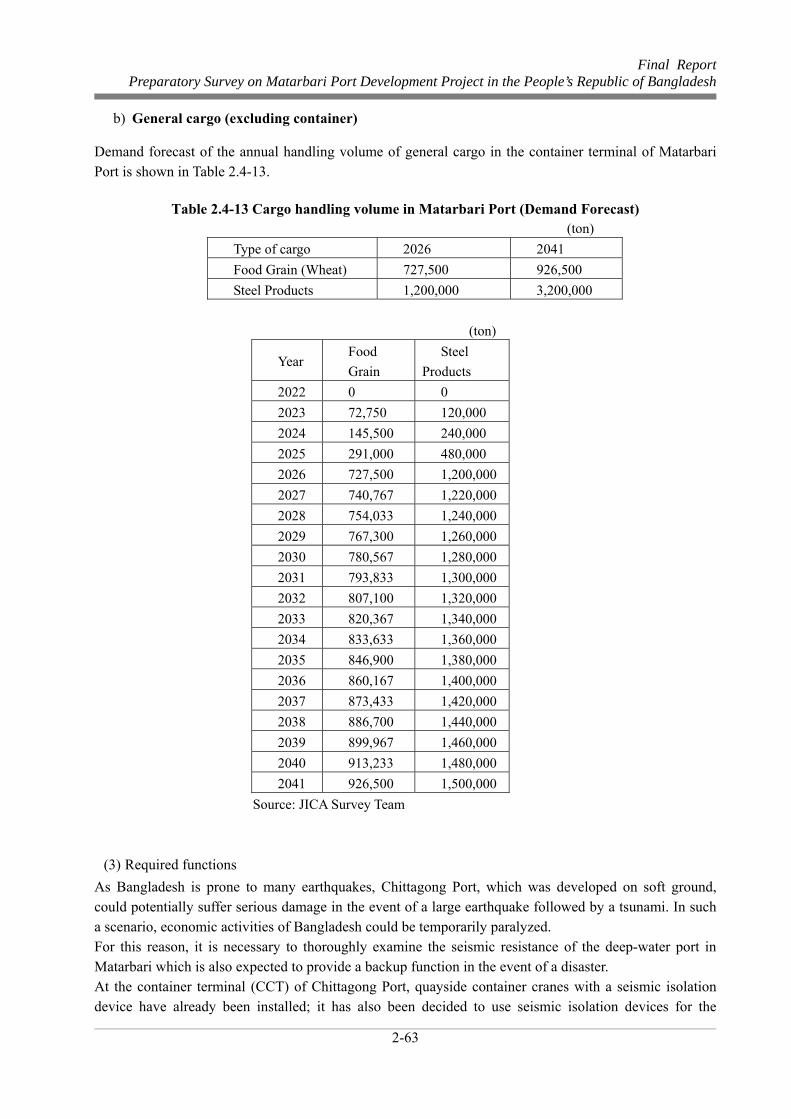
Final Report Preparatory Survey on Matarbari Port Development Project in the People’s Republic of Bangladesh
2-63
b) General cargo (excluding container)
Demand forecast of the annual handling volume of general cargo in the container terminal of Matarbari Port is shown in Table 2.4-13.
Table 2.4-13 Cargo handling volume in Matarbari Port (Demand Forecast) (ton)
Type of cargo 2026 2041
Food Grain (Wheat) 727,500 926,500
Steel Products 1,200,000 3,200,000
(ton)
Year Food
Grain
Steel
Products
2022 0 0
2023 72,750 120,000
2024 145,500 240,000
2025 291,000 480,000
2026 727,500 1,200,000
2027 740,767 1,220,000
2028 754,033 1,240,000
2029 767,300 1,260,000
2030 780,567 1,280,000
2031 793,833 1,300,000
2032 807,100 1,320,000
2033 820,367 1,340,000
2034 833,633 1,360,000
2035 846,900 1,380,000
2036 860,167 1,400,000
2037 873,433 1,420,000
2038 886,700 1,440,000
2039 899,967 1,460,000
2040 913,233 1,480,000
2041 926,500 1,500,000
Source: JICA Survey Team
(3) Required functions
As Bangladesh is prone to many earthquakes, Chittagong Port, which was developed on soft ground, could potentially suffer serious damage in the event of a large earthquake followed by a tsunami. In such a scenario, economic activities of Bangladesh could be temporarily paralyzed. For this reason, it is necessary to thoroughly examine the seismic resistance of the deep-water port in Matarbari which is also expected to provide a backup function in the event of a disaster. At the container terminal (CCT) of Chittagong Port, quayside container cranes with a seismic isolation device have already been installed; it has also been decided to use seismic isolation devices for the

Final Report Preparatory Survey on Matarbari Port Development Project in the People’s Republic of Bangladesh
2-64
quayside container cranes which will be introduced to NCT. The quayside gantry cranes installed at the quays of the container terminal and multipurpose terminal should be equipped with a seismic isolation device for the following reasons. 1) Since Matarbari Port will be the only deep-water port in Bangladesh, the maximum value of 1.5 of
the importance coefficient is used in the design seismic intensity. 2) Ordinary cranes are designed with Kh = 0.2 according to JIS standards, but the design seismic
intensity is assumed to be larger in this case. 3) Although it is possible to respond by raising the design seismic intensity, the seismic isolation device
is more reliable. 4) Gantry cranes with a seismic isolation device have already been introduced at Chittagong Port. 5) There is a high probability of a large earthquake.
In addition, as a countermeasure against storm surges, the main electrical equipment such as motors, brakes, etc. among the devices installed at the bottom of a crane will be waterproof equivalent to IP65. For cargo handling equipment such as RTG and Reach Stacker installed in the storage yard, since the installation position is about 2 m higher than the level of the quay, IP65 waterproof specification is not applied. The required functions of cargo handling equipment are shown in Table 2.4-14.
Table 2.4-14 Required functions of cargo handling equipment Cargo handling
equipment Required function
Necessary device and
equipment Remarks
Quayside container crane
(QC)
Multi-purpose Gantry
Crane (MPGC)
Ability to maintain and
perform functions even
in the event of an
earthquake
Seismic isolation device
After the occurrence of
an earthquake, large
damage such as collapse
of the crane, derailing,
plastic deformation of the
structure can be avoided
and original functions
can be maintained.
Ability to minimize
damage due to sea
water at high tide
Main electrical equipment
such as motors, brakes,
etc. among the devices
installed at the bottom of a
crane will be waterproof
equivalent to IP65.
Even when suffering
damage from the storm
surge, it is possible to use
the crane immediately
Rubber Tyred Gantry
crane (RTG)
Must be able to
withstand wind during
cyclones to prevent
overturning and
drifting from anchor
position
Crane anchoring device
Damage due to cranes
colliding with one
another or turning over
due to strong winds can
be avoided.
Source: JICA Survey Team
The container crane and multipurpose gantry crane shall be designed and manufactured according to the
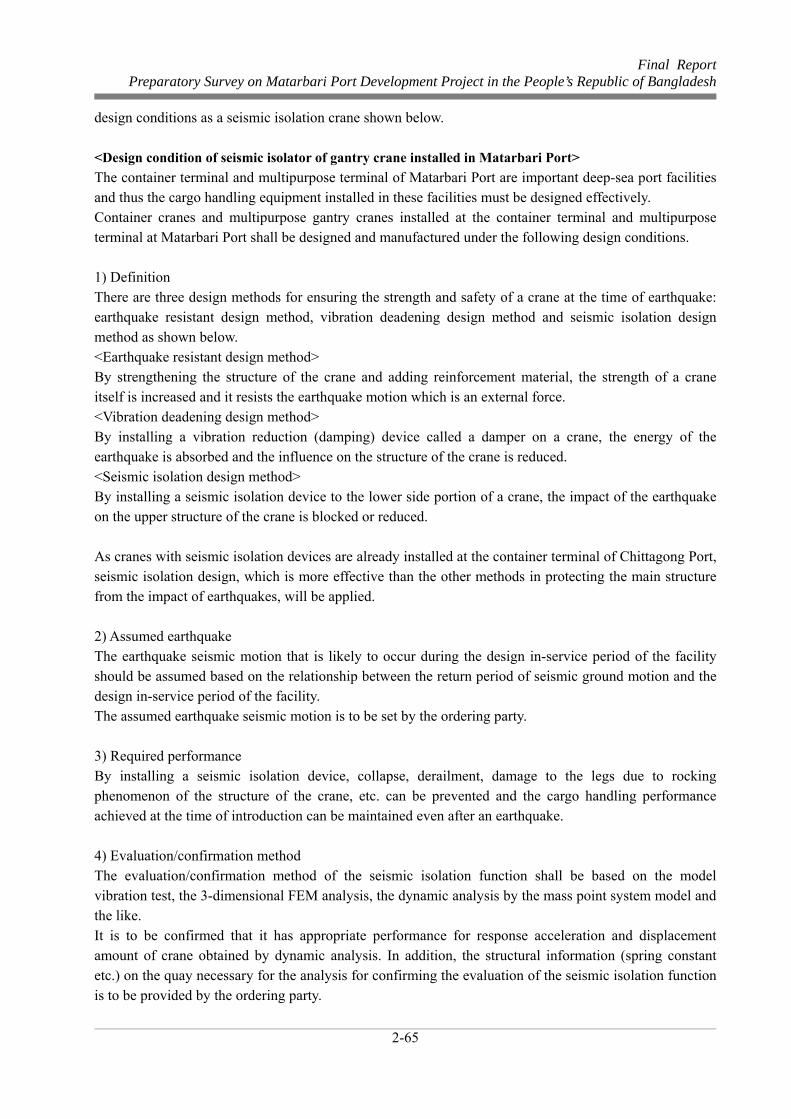
Final Report Preparatory Survey on Matarbari Port Development Project in the People’s Republic of Bangladesh
2-65
design conditions as a seismic isolation crane shown below. <Design condition of seismic isolator of gantry crane installed in Matarbari Port>
The container terminal and multipurpose terminal of Matarbari Port are important deep-sea port facilities and thus the cargo handling equipment installed in these facilities must be designed effectively. Container cranes and multipurpose gantry cranes installed at the container terminal and multipurpose terminal at Matarbari Port shall be designed and manufactured under the following design conditions. 1) Definition There are three design methods for ensuring the strength and safety of a crane at the time of earthquake: earthquake resistant design method, vibration deadening design method and seismic isolation design method as shown below. <Earthquake resistant design method> By strengthening the structure of the crane and adding reinforcement material, the strength of a crane itself is increased and it resists the earthquake motion which is an external force. <Vibration deadening design method> By installing a vibration reduction (damping) device called a damper on a crane, the energy of the earthquake is absorbed and the influence on the structure of the crane is reduced. <Seismic isolation design method> By installing a seismic isolation device to the lower side portion of a crane, the impact of the earthquake on the upper structure of the crane is blocked or reduced. As cranes with seismic isolation devices are already installed at the container terminal of Chittagong Port, seismic isolation design, which is more effective than the other methods in protecting the main structure from the impact of earthquakes, will be applied. 2) Assumed earthquake The earthquake seismic motion that is likely to occur during the design in-service period of the facility should be assumed based on the relationship between the return period of seismic ground motion and the design in-service period of the facility. The assumed earthquake seismic motion is to be set by the ordering party. 3) Required performance By installing a seismic isolation device, collapse, derailment, damage to the legs due to rocking phenomenon of the structure of the crane, etc. can be prevented and the cargo handling performance achieved at the time of introduction can be maintained even after an earthquake. 4) Evaluation/confirmation method The evaluation/confirmation method of the seismic isolation function shall be based on the model vibration test, the 3-dimensional FEM analysis, the dynamic analysis by the mass point system model and the like. It is to be confirmed that it has appropriate performance for response acceleration and displacement amount of crane obtained by dynamic analysis. In addition, the structural information (spring constant etc.) on the quay necessary for the analysis for confirming the evaluation of the seismic isolation function is to be provided by the ordering party.

Final Report Preparatory Survey on Matarbari Port Development Project in the People’s Republic of Bangladesh
2-66
5) Confirmation items The cargo handling equipment should be designed based on the input ground motion (time history acceleration at the crane gantry-rail level) given from the ordering party side. In addition, the following items should be confirmed and submitted to the ordering party side: total weight of crane, wheel load, acceptable natural frequency, width of the decay constant, upper limited value of up-lifting load and allowable opening amount of span. 6) Submission materials at the time of bidding At the time of bidding, the seismic isolation structure drawing and assembly drawing of the gantry travelling device (which indicates where the seismic isolation device is to be installed) should be submitted together with the crane specifications (including the overall drawing of crane, trolley assembly drawing, equipment layout drawing of the mechanical & electrical house, layout drawing of operator's cab and single line diagram).
(4) Handling capacity of Terminal
1) Handling capacity of the container terminal
Outline
As indicated in the demand forecast, the container handling volume at Matarbari Port is forecast to range from 600,000 to 1.1 million TEUs in 2026 and from 1.4 million to 4.2 million TEUs in 2041. However, at the commencement of service of the container terminal constructed in Phase 1, it is assumed that the annual handling volume of containers has not reached 600,000 TEUs For this reason, the cargo handling equipment installed in the container terminal in Phase 1 is set as follows. After the commencement of service, necessary cargo handling equipment will be added at appropriate times in accordance with an increase in the container handling volume. Handling capacity of Quay
Container Terminal Quantity of Quayside Container Crane (QC): 2 units Multi-purpose Terminal Quantity of Multi-purpose Gantry Crane (MGC): 1 unit MGC can move to the Container terminal to assist to handle containers when unloading and loading of large container carrier.)

Final Report Preparatory Survey on Matarbari Port Development Project in the People’s Republic of Bangladesh
2-67
2 Shifts 3 Shifts
Item Unit Value Value
Berth Length m 460
Type of Crane QC
QC No.
Annual Working Days Days 365 365
Theoretical Handling Capacity of QC Box/Hour 30 30
Operation Availability of QC 0.833 0.833
Handling Capacity of QC 25 25
Gross Working Hours 16 21
Operation Availability of Berth 0.769
(280/365)
0.769
(280/365)
Work-share Ratio of QC 1.0 1.0
Annual Handling Quantity / QC 112,270 147,350
Conversion Rate from Box to TEU TEU/Box 1.5 1.5
Annual Handling Volume (TEU)/QC TEU 168,405 221,025
Number of QC Unit 4 3
Annual Container Handling Volume of CT TEU 673,620 663,075s
The handling capacity of quay of the Container Terminal is about 663,075 TEUs, and almost equal to the forecast container handling volume 691,200 TEUs in 2026.
Storage capacity of Yard
The number of Ground slot is shown the following table.
Block No. of Lane
No. of Bay
No. of Row
Sub-total Remarks
(a) (b) (c) (a x b x c)
A 16 16 6 1,344 2 Lanes: for Reefer containers
B 9 16 6 168
C 9 16 6 864
D 9 16 6 864 E
(Empty containers) 5 16 6 480
Ground Slot (Total) 4,584
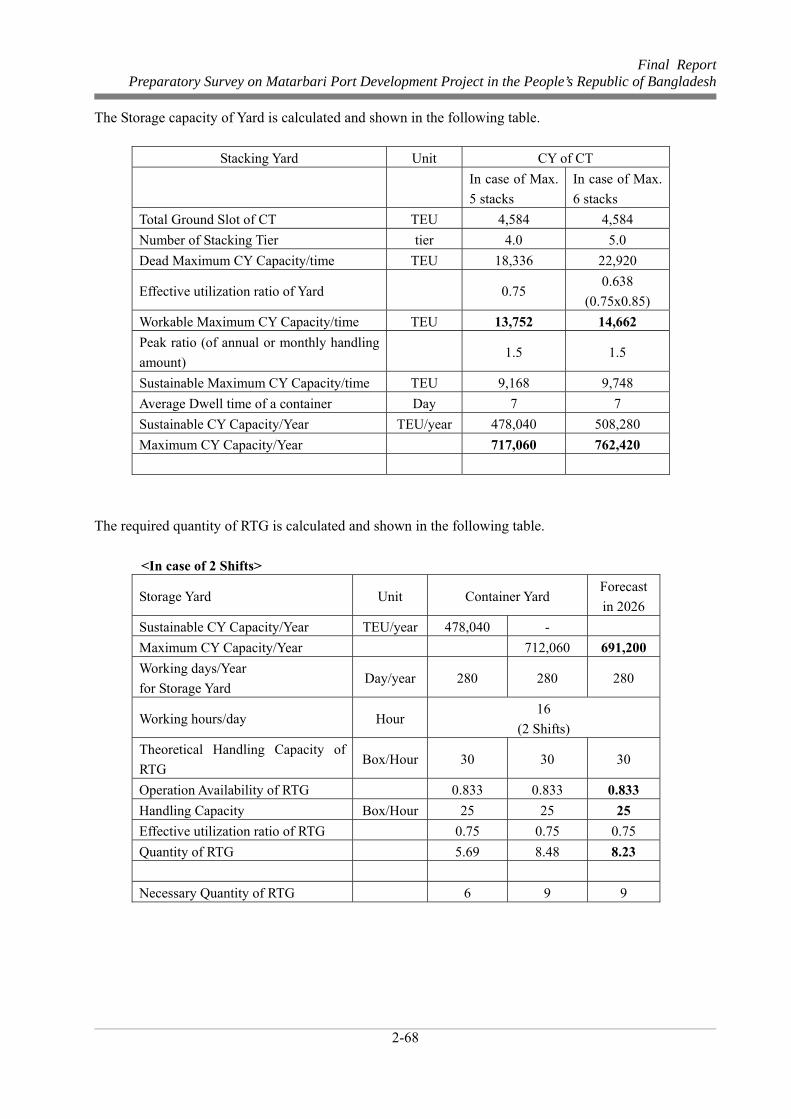
Final Report Preparatory Survey on Matarbari Port Development Project in the People’s Republic of Bangladesh
2-68
The Storage capacity of Yard is calculated and shown in the following table.
Stacking Yard Unit CY of CT
In case of Max.
5 stacks
In case of Max.
6 stacks
Total Ground Slot of CT TEU 4,584 4,584
Number of Stacking Tier tier 4.0 5.0
Dead Maximum CY Capacity/time TEU 18,336 22,920
Effective utilization ratio of Yard 0.75 0.638
(0.75x0.85)
Workable Maximum CY Capacity/time TEU 13,752 14,662
Peak ratio (of annual or monthly handling
amount) 1.5 1.5
Sustainable Maximum CY Capacity/time TEU 9,168 9,748
Average Dwell time of a container Day 7 7
Sustainable CY Capacity/Year TEU/year 478,040 508,280
Maximum CY Capacity/Year 717,060 762,420
The required quantity of RTG is calculated and shown in the following table.
<In case of 2 Shifts>
Storage Yard Unit Container Yard Forecast
in 2026
Sustainable CY Capacity/Year TEU/year 478,040 -
Maximum CY Capacity/Year 712,060 691,200
Working days/Year
for Storage Yard Day/year 280 280 280
Working hours/day Hour 16
(2 Shifts)
Theoretical Handling Capacity of
RTG Box/Hour 30 30 30
Operation Availability of RTG 0.833 0.833 0.833
Handling Capacity Box/Hour 25 25 25
Effective utilization ratio of RTG 0.75 0.75 0.75
Quantity of RTG 5.69 8.48 8.23
Necessary Quantity of RTG 6 9 9

Final Report Preparatory Survey on Matarbari Port Development Project in the People’s Republic of Bangladesh
2-69
<In case of 3 Shifts>
Storage Yard Unit Container Yard Forecast
in 2026
Sustainable CY Capacity/Year TEU/year 478,040 -
Maximum CY Capacity/Year 712,060 691,200
Working days/Year
for Storage Yard Day/year 280 280 280
Working hours/day Hour 21
(3 Shifts)
Theoretical Handling Capacity of
RTG Box/Hour 30 30 30
Operation Availability of RTG 0.833 0.833 0.833
Handling Capacity Box/Hour 25 25 25
Effective utilization ratio of RTG 0.75 0.75 0.75
Quantity of RTG 4.34 6.46 6.27
Necessary Quantity of RTG 5 < 6 7 7
Remarks: The quantity of RTGs is not less than 2 times of the quantity of QCs.
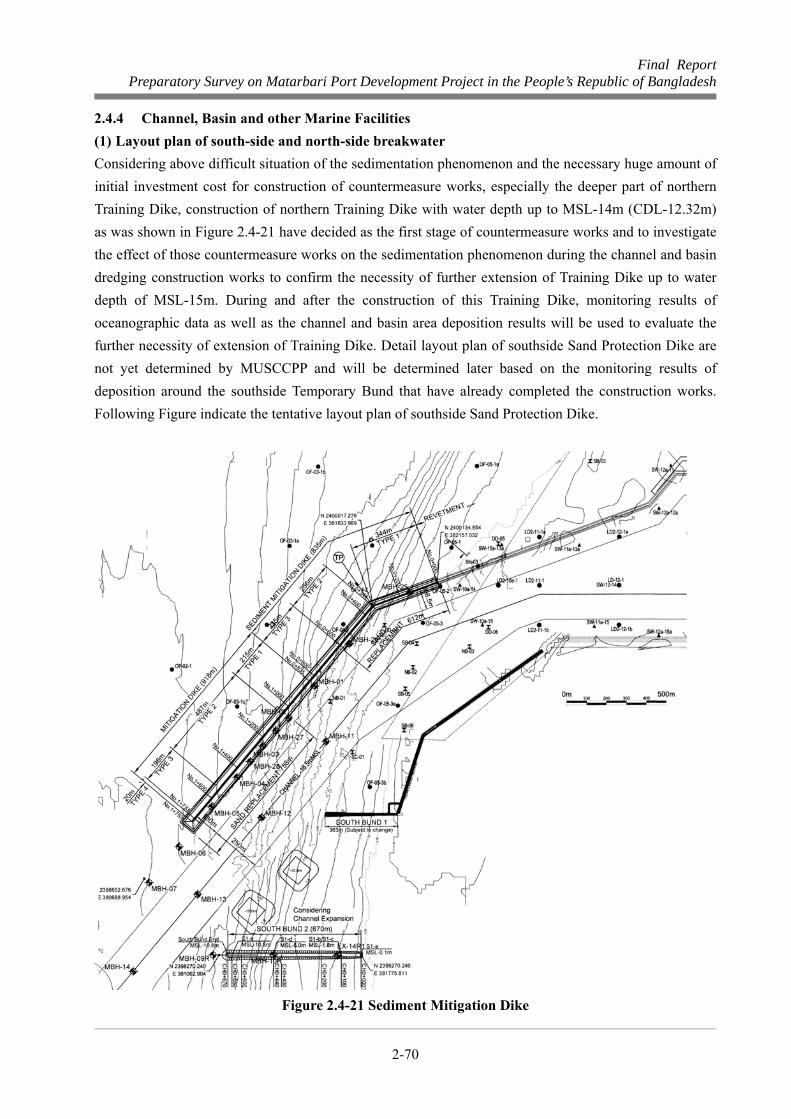
Final Report Preparatory Survey on Matarbari Port Development Project in the People’s Republic of Bangladesh
2-70
2.4.4 Channel, Basin and other Marine Facilities
(1) Layout plan of south-side and north-side breakwater
Considering above difficult situation of the sedimentation phenomenon and the necessary huge amount of
initial investment cost for construction of countermeasure works, especially the deeper part of northern
Training Dike, construction of northern Training Dike with water depth up to MSL-14m (CDL-12.32m)
as was shown in Figure 2.4-21 have decided as the first stage of countermeasure works and to investigate
the effect of those countermeasure works on the sedimentation phenomenon during the channel and basin
dredging construction works to confirm the necessity of further extension of Training Dike up to water
depth of MSL-15m. During and after the construction of this Training Dike, monitoring results of
oceanographic data as well as the channel and basin area deposition results will be used to evaluate the
further necessity of extension of Training Dike. Detail layout plan of southside Sand Protection Dike are
not yet determined by MUSCCPP and will be determined later based on the monitoring results of
deposition around the southside Temporary Bund that have already completed the construction works.
Following Figure indicate the tentative layout plan of southside Sand Protection Dike.
Figure 2.4-21 Sediment Mitigation Dike

Final Report Preparatory Survey on Matarbari Port Development Project in the People’s Republic of Bangladesh
2-71
As the tidal current velocity during the flood and ebb tide are very rapid, especially at the spring tide,
construction of dike structure to reduce the tidal current velocity at a certain level is preferable. For
considering the necessary stopping distance of the designed maximum container vessel to enter the port,
additional length of 397m of northern-side Training Dike as a countermeasure to reduce the tidal current
velocity behind the dike structure are recommended. Figure 2.4-22 shows the layout plan of north and
south side dike. Because the extension of northern side Training Dike is necessary for the operation of
new port, construction of this extension part of northern side Training Dike by new port project are
considered appropriate. Table 2.4-15 concludes the plan of north and south side dike structure and
proposed responsible organization of implementation.
Final Report Preparatory Survey on Matarbari Port Development Project in the People’s Republic of Bangladesh
2-72
Figure 2.4-22 Proposed layout plan of north and south side Dike structure for new port

Final Report Preparatory Survey on Matarbari Port Development Project in the People’s Republic of Bangladesh
2-73
Table 2.4-15 Proposed north and south side Dike structure and responsible organization
Length Responsible organization Remarks
Northside Training
Dike
1,753m MUSCCPP is responsible for construction
as the countermeasure against
sedimentation
Up to water depth of
MSL-14m
(CDL-11.32m)
Extension of northside
Training Dike
addition
of 397m
CPA is responsible for construction as the
necessary structure for entering of the
designed large container vessel
Southside Sand
Protection Dike
670m MUSCCPP is responsible for construction
as the countermeasure against
sedimentation
Tentative values
(2) Channel and basin layout plan
As was shown in the previous section, necessary channel width of new port is 350m which is 100m larger than the planned channel width of port for MUSCCPP. Because the dike structure against channel and basin sedimentation have been constructed by MUSCCPP at the northern side of the channel, expansion of the channel to the north and north-west side of the channel are difficult. Expansion to the south and south-east side of the channel are determined. As for the basin area for the new port, basin area is selected to avoid the forced resettlement of the residents in order to realize the early opening of the new port. Figure 2.4-23 shows the layout plan of channel and basin for new port.

Final Report Preparatory Survey on Matarbari Port Development Project in the People’s Republic of Bangladesh
2-74
Figure 2.4-23 Layout plan of channel and basin for new port
(3) Basin Calmness for work ratio for port unloading and loading operation by allowing the
overtopping wave from Training Dike and Sand Protection Dike
As was shown in previous section, necessary function of northern Training Dike and southern Sand Protection Dike are to modify the flow pattern of tidal current and to prevent littoral sand drift and the inflow of sea water that contains high concentration SS material. Because the effect of overtopping of waves from Training Dike and Sand Protection Dike on channel and basin sedimentation are considered relatively small compared with the effect from port entrance, there is no necessity of preventing wave overtopping at the time of high wave conditions. When we consider the possibility of lowing of crown height of Training Dike and Sand Protection Dike, effect of overtopping waves on working rate of port unloading and loading operation and the basin area calmness at the time of extreme wave conditions should be confirmed. In the following study, northern Training Dike with water depth up to MSL-15m (CDL-12.32m) and Sand Protection Dike with water depth up to MSL-11m (CDL-8.32m) are considered as the countermeasure structure against channel and basin sedimentation. As was mentioned in the previous section, construction of northern Training Dike with water depth up to MSL-15m (CDL-12.32m) have decided and started construction work in the Matarbari Power Plant Project and will be considered

Final Report Preparatory Survey on Matarbari Port Development Project in the People’s Republic of Bangladesh
2-75
the necessity of extension of the Training Dike, conditions of northern Training Dike with water depth up to MSL-14m (CDL-11.32m) are also studied for the estimation of the calmness of basin area and the safety of port facilities at the extreme storm surge. Basin calmness analysis were done in the previous study to confirm the port unloading and loading operation requirement without considering the overtopping of waves from Training Dike and Sand Protection Dike. Table 2.4-16 showed the results of working rate of port unloading and loading operation for the proposed port layout plan. In the previous study, offshore wave forecast data of 5 years from 2006 to 2010, obtained by grid interval of 0.5 degree of latitude and longitude, were used. Offshore wave data were obtained by 3rd generation wave forecasting model of JWA3G, developed by Japan Meteorological Agency, by using the ocean wind hindcasting data that were obtained by ECMWF. Joint frequency distribution such as wave height/wave period and wave direction/wave height were analyzed and representative wave conditions for wave deformation analysis by Energy balance equation method were selected to obtain the wave conditions at the front of MUSCCPP. Basin calmness analysis by nonlinear wave transformation method by Boussinesq equation method in which the effect of reflection, refraction and diffraction of wave can be considered were used to obtain the wave height distribution of basin and channel area. Calculated results were used to evaluate the working rate of port unloading and loading operation.
Table 2.4-16 Results of working rate of port unloading and loading operation
Berth location Operation rate (%) Critical significant wave height
1: multipurpose berth 99.18 H=0.50(m)
2: container berth 100.00 H=0.50(m)
3: coal unloading berth of MUSCCPP 99.86 H=0.50(m)
Table 2.4-17 showed the joint frequency distribution of wave height and wave period at the offshore point of MUSCCPP port site at water depth about MSL-15m (CDL-12.3m) in consideration of the hourly offshore wave forecast throughout the term from Jan. 1, 2006 to Dec. 31, 2010 and wave refraction and shoring effects by Energy balance equation method. According to the results shown in Table 2.4-17, probability of non-exceedance of significant wave height higher than 2.0m at the offshore point of MSUCCPP port site at water depth about MSL-15m (CDL-12.3m) is 98.5%. Table 2.4-18 showed previous study results of wave height ratio between the offshore point of MSUCCPP port site at water depth about MSL-15m (CDL-12.3m) and the berth front of Matarbari new port and MUSCCPP without considering the overtopping waves from Training Dike and Sand Protection Dike. For obtaining the wave height ratio shown in Table 2.4-18, nonlinear wave transformation model by Boussinesq equation in which the effect of reflection, refraction and diffraction of wave can be considered were used. Table 2.4-17 showed that if the wave height at the offshore point of MSUCCPP port site at water depth about MSL-15m (CDL-12.3m) is less than 2m and wave overtopping effect is negligible for the input waves which significant wave height is less than 2m, then the wave height at the berth front of Matarbari new port and MUSCCPP are expected to be less than 50cm (=2m*0.18 for case of SW at Point 1 = 0.36m). As the probability of non-exceedance of wave height higher than 2m at the offshore point of MSUCCPP port site at water depth about MSL-15m (CDL-12.3m) is 98.5%, then the expected rate of berth operation for Matarbari new port is more than 98.5% that is higher than the standard value of 97.5% which is the suggested requirement in Japanese Port Standard.

Final Report Preparatory Survey on Matarbari Port Development Project in the People’s Republic of Bangladesh
2-76
Table 2.4-17 Joint Frequency distribution of wave height and Wave direction in front of Matarbari
Port entrance at MSL-15m(CDL-12.3m)
(Unit %) Direction NNE to
SSE S SSW SW WSW W WNW NW NNW N Total Cumulative
Height(m) ~0.49 - 0.01 10.8 14.8 0.3 0.2 0.2 0.7 0.6 0.1 27.6 27.6
0.50~0.99 - - 6.9 32.7 1.0 0.7 1.0 1.4 0.4 - 44.1 71.71.00~1.49 - - 3.0 18.2 0.3 0.2 0.2 0.1 - - 22.0 93.81.50~1.99 - - 0.5 4.2 < 0.01 < 0.01 < 0.01 - - - 4.7 98.52.00~2.49 - - 0.1 1.1 < 0.01 - - - - - 1.2 99.72.50~2.99 - - 0.04 0.2 0.2 99.93.00~3.49 - - 0.02 0.1 0.1 100.03.50~3.99 - - < 0.01 0.02 0.0 100.04.00~4.49 - - < 0.01 < 0.01 0.0 100.04.50~4.99 - - - - - - - - - - 0.0 100.0
Total - 0.0 21.3 71.3 1.6 1.0 1.5 2.1 1.0 0.1 100.0 100.0
Table 2.4-18 Wave reduction ratio by Training Dike and Sand Protection Dike
Wave reduction ratio
Wave direction SSW SW WSW
location
1: multipurpose berth 0.12 0.18 0.17
2: container berth 0.10 0.10 0.11
3: coal unloading berth of MUSCCPP 0.07 0.05 0.09
As will be discussed in the latter section, Rubble Mound Sloping Dike were chosen as Training Dike and
Sand Protection Dike structure and crown height level of CDL+2.20m (MSL0.0m) for core Rubble
Mound are considered as a minimum requirement for the countermeasure structure against channel and
basin sedimentation. Because the core Rubble Mound structure are covered by wave dissipating block,
crown height level of Training Dike and Sand Protection Dike are CDL+8.68m to CDL+8.98m depending
on the necessary size of the wave dissipating concrete blocks. For these conditions, effect of overtopping
of waves by input wave which significant wave height is less than 2.0m are negligible even at the HWL
(CDL+4.88m). Required working rate of port unloading and loading operation can be achieved without
considering the leveling up of the Training Dike and Sand Protection Dike.
At the time of extreme storm surge conditions, overtopping wave from Training Dike and Sand Protection
Dike are not negligible for the basin and channel calmness. To confirm the calmness of basin and channel
area and the safety of the berth structure during the storm surge, wave deformation analysis by nonlinear
wave transformation model by Boussinesq equation in which the effect of reflection, refraction and
diffraction of wave can be considered are used. For this analysis, wave transmission ratio by Training
Dike and Sand Protection Dike for design offshore waves at the time of extreme storm surge of 50 years
return period and HWL are considered. Wave transmission ratio of 0.6 as a safe side analysis are
considered by referring the empirical results of wave transmission coefficient for Rubble Mound Sloping

Final Report Preparatory Survey on Matarbari Port Development Project in the People’s Republic of Bangladesh
2-77
Dike structure shown in Figure 2.4-24. Same procedure shown in the first part of this section are
employed for the calmness analysis. Those are, first evaluate the wave conditions at the offshore point of
MUSCCPP Port entrance from offshore wave conditions by Energy balance equation method. Then wave
deformation analysis by Boussinesq equation that consider the effect of reflection, refraction, diffraction
and transmission of wave can be considered are used. Although wave reflection and transmission at
Training Dike and Sand Protection Dike occurred at the same time, two separate wave deformation
analysis, that is one is considering reflection of wave and the other is considering transmission of wave
for the boundary conditions of Training Dike and Sand Protection Dike, are done to obtain the basin and
channel calmness. These two wave height results were combined by square root of sum of squares at each
point to obtain the resultant basin and channel calmness. Figure 2.4-25 shows the results of distribution of
wave height ratio compared with the wave height at offshore point of MSUCCPP port site at water depth
about MSL-15m (CDL-12.3m). Table 2.4-19 shows the wave height ratio at the berth front of Matarbari
new port. Design offshore wave of SW are used as the worst case. Above shown results are for the
northern Training Dike with water depth up to MSL-15m (CDL-12.32m). As was explained previously,
conditions of Training Dike with water depth up to MSL-14m (CDL-11.32m) are also studied. Figure
2.4-26 and Table 2.4-20 shows the results for same calculation conditions except the length of the
Training Dike. Other numerical simulation conditions and detailed procedure of the simulation method as
well as basic equations of numerical simulation method of Energy balance equation method and
Boussinesq equation method were shown in Appendix-2.4-1.
Figure 2.4-24 Experimental results of wave transmission coefficient for Rubble Mound type dike

Final Report Preparatory Survey on Matarbari Port Development Project in the People’s Republic of Bangladesh
2-78
Figure 2.4-25 Wave height distribution

Final Report Preparatory Survey on Matarbari Port Development Project in the People’s Republic of Bangladesh
2-79
Table 2.4-19 Maximum wave reduction ratio at berth location for extreme storm surge condition
Berth location Wave reduction ratio
(significant wave height)
1: multipurpose berth 0.23 (0.87m)
2: container berth 0.11 (0.42m)
3: coal unloading berth of MUSCCPP 0.22 (0.83m)
Final Report Preparatory Survey on Matarbari Port Development Project in the People’s Republic of Bangladesh
2-80
Figure 2.4-26 Wave height distribution

Final Report Preparatory Survey on Matarbari Port Development Project in the People’s Republic of Bangladesh
2-81
Table 2.4-20 Maximum wave reduction ratio at berth location for extreme storm surge condition
Berth location Wave reduction ratio
(significant wave height)
1: multipurpose berth 0.20 (0.87m)
2: container berth 0.10 (0.42m)
3: coal unloading berth of MUSCCPP 0.19 (0.83m)
According to the results of wave height ratio distribution in the basin and channel area during the extreme
storm surge conditions shown above, maximum significant wave height at the berth location are below
1.0m and the wave reduction ratio is below 0.3 (=1.14m significant wave height) for the vast majority of
the inner side basin area. Effect of the overtopping wave of Sand Protection Dike on the inner side basin
area are small compared with those of Training Dike. These results are to confirm the calmness of basin
and channel area and the safety of the berth structure even during extreme storm surge conditions.
(4) Harbor oscillation
As the shape of the channel and basin area are long and narrow rectangular shape, especially for Phase1,
harbor oscillation sometime becomes the serious problems for the moored vessels and cargo handing
operation. To see the harbor resonance phenomenon, numerical simulation of wave deformation analysis
by Boussinesq equation for the anticipated wave conditions are done to obtain the amplification factor.
Same wave deformation process from offshore to basin area and the boundary conditions of the structure
such as wave reflection coefficient are used as were shown in the previous section. Offshore wave
direction of WSW, SW and SSW are considered. Wave period from 30 second to 300 seconds with time
interval of 30second are considered. Table 2.4-21 shows the considered cases as an offshore wave
conditions.
3 points in a harbor basin area are selected to obtain the wave height ratio with the input wave height.
Here offshore wave height of 8cm are used Figure 2.4-27 shows the location of selected point for
calculation of wave height ratio in an example figure of calculated results of wave deformation analysis
by Boussinesq method. Figure 2.4-28 shows the wave height ratio versus input wave height with respect
to incident wave period that indicates the harbor resonance characteristics for corresponding wave period.
Results of wave height ratio distribution for all cases are shown in Appendix-2.4-2.

Final Report Preparatory Survey on Matarbari Port Development Project in the People’s Republic of Bangladesh
2-82
Table 2.4-21 Considered offshore wave conditions for harbor oscillation analysis
Item Description Remarks
Input
wave
Direction SSW, SW, WSW Dominant wave
directions
Height 0.08 m Assumed Value
Period 30 s ~ 300 s 10 cases at 30 s interval
Smax 25 Ho/Lo = 0.0801
Tide condition M. S. L.
Wave directional spectrum Bretschneider-Mitsuyasu spectrum
Reflectance of structure
Based on Technical Standard and
Commentaries for Port and Harbor Facilities
in Japan
Wave breaking calculation Considered
Area 9,000 m × 8,000 m
Grid interval 10 m
Time interval 0.03 s ~ 0.3 s Less than T0/800
Calculation Time 1200 s 20 minutes
Final Report Preparatory Survey on Matarbari Port Development Project in the People’s Republic of Bangladesh
2-83
Figure 2.4-27 Example of wave height ratio distribution by Boussinesq method and location of
evaluate point for harbor oscillation
Figure 2.4-28 Wave height ratio versus input wave height with respect to incident wave period

Final Report Preparatory Survey on Matarbari Port Development Project in the People’s Republic of Bangladesh
2-84
2.4.5 Navigational Safety Aids
Navigation safety aids are essential parts in order to maintain maritime safety in and around port areas. Matarbari Port needs to be equipped with necessary facilities. With reviewing navigation safety aids at ports in Bangladesh, the Survey Team proposes the necessary facilities at Matarbari Port. At Chittagong Port, types of navigation aids are mainly categorized to 1) Vessel Traffic Management System, 2) Lighted Buoys, Lighthouses, and Leading Lights, and 3) Service Vessels such as tugboats etc. In the following sections, these navigation aids at Chittagong Ports are reviewed and the necessary facilities in Matarbari Port are proposed.
(1) Vessel Traffic Management System
1) Facilities at Chittagong Port
CPA installed the Vessel Traffic Management System (VTMS) at Chittagong Port in 2015, and monitors vessels in and around port area 24 hours. Components which compose VTMS of Chittagong Port are shown in the following table.
Table 2.4-22 Components of VTMS at Chittagong Port
Bandar
BhabanPatenga
Point Tower
1 Tower
2 Tower
3 TOTAL
1 VTMS 1 1
2 Radar 1 1 1 1 4
3 Camera 9 4 4 4 21
4 VHF 1 1 1 1 1 5
5 Microwave 4 4 2 2 2 5
6 AIS 1 1 2
7 Console 4 4 8 Source: JICA Survey Team
The following figure shows the locations of VTMS control stations and towers. At Bandar Bhaban (CPA headquarters) and Patenga Point, VTMS control stations are installed and CPA officials monitor vessel movements and control vessel traffic. Since Chittagong Port is located on the winding river, control stations and towers are necessary more than one. The control station at Bandar Bhaban plays an essential role in the system and more than ten officials are working at the VTMS room with close communication with management class of the Marine Department which is in charge of vessel traffic control. Each tower except Patenga Point has four cameras which trace vessel movement; while the tower at Patenga Point has 9 cameras since this tower covers wide area in ocean where incoming vessels are waiting and some vessels are implementing mid-stream operation. These five locations are connected by a microwave communication system.

Final Report Preparatory Survey on Matarbari Port Development Project in the People’s Republic of Bangladesh
2-85
Source: JICA Survey Team
Figure 2.4-29 VTMS facilities in Chittagong Port
Source: JICA Survey Team
Figure 2.4-30 VTMS in Chittagong Port
VTMS Control Station(with tower) VTMS Tower
Port Limit7NM
CameraRadar VHF
CameraRadar VHF
AIS CameraRadar VHF
Patenga Point
AISVHF
CameraRadar VHF
Bandar Bhaban (CPA HQ) Tower 1
Tower 2
Tower 3

Final Report Preparatory Survey on Matarbari Port Development Project in the People’s Republic of Bangladesh
2-86
2) Necessary Facilities in Matarbari Port
Matarbari Port is located on the sea while Chittagong Port is on the river; therefore, the number of facilities is less in Matarbari Port than Chittagong Port. A control station which has a server, monitors, and communication equipment will be situated in the administrative building, and a tower which has radar, AIS receiver, VHF and cameras is constructed near the building. The tower can monitor the movement of vessels within port limit; however, it might necessary to install additional towers when the development of second stage inaugurates.
Source: JICA Survey Team
Figure 2.4-31 Location of VTMS Facilities in Matarbari Port
(2) Lighted Buoys, Lighthouses, and Leading Lights
1) Facilities at Chittagong Port
Within the port limit, installation, management and operation of lighted buoys, lighthouses, and leading lights are responsibility of CPA. CPA installed 32 lighted buoys, 2 lighthouses, and 6 pairs of leading lights as navigation aids. Most of lighted buoys are located around the entrance of port, namely, the mouth of Karnafli River while some of lighted buoys are situated in the outer anchorage areas where some vessels are waiting and some vessels are implementing mid-stream operation. One lighthouse is located at the Patenga Point on the north side of the river mouth; the other is at the Norman Point on the south coast of the river mouth. Pairs of leading lights are built at flexion points where vessels need to change direction safely. These lighted buoys, leading lights are installed in accordance with IALA (the International Association of Marine Aids to Navigation and Lighthouse Authorities) guidelines and manuals.
Final Report Preparatory Survey on Matarbari Port Development Project in the People’s Republic of Bangladesh
2-87
Source: JICA Survey Team
Figure 2.4-32 Lighted Buoys, and Leading Lights
Lithted Buoy and Lighted Pillar
Lighted Pillar
Light, Rador Beacon, Solar Panel
Patenga PointLighthouse Red, 10 second interval, 20NM, with rador becon
Leading Light(Red)
Hight 14mHIght 20m
Leading Light(White)
Lighted Buoy Red, 3 Sec
Self-charged
Red, 3 Second IntervalSelf-charged
GCB
CCT
NCT
Norman Point LighthouseWhite 10 Sec, 20 NM With Radar Becon

Final Report Preparatory Survey on Matarbari Port Development Project in the People’s Republic of Bangladesh
2-88
2) Necessary Facilities in Matarbari Port
As the result of discussions with CPA pilots, the Team drafted the locations of lighted buoys and leading lights which are shown in the following figure. First of all, the navigation aids are necessary along the channels to the point of approximately 10 km beyond the area where channel dredging is necessary. Even though two lighted pillars are installed at the channel entrance of Chittagong Port, two lighted buoys are recommended at Matarbari Port since the seabed is deep and the possibility of accidents exists. Outside of the channel entrance, a fairway buoy is necessary. Also, the lighted buoys are not paired in the vicinity of the channel entrance since some vessels enter and leave from the middle of the channel. Additionally, AIS is installed every other buoys near the channel entrance in order for vessels to recognize the direction of the channel even in dense fog or heavy rain. It is recommended that the interval of the flushing of lighted buoys is the similar to that of Chittagong Port, namely, one flashing every 3 seconds at general lighted buoys and two flashings every 6 seconds at the buoys installed at the channel entrance and at turning points. A pair of leading lights should be installed in the north of turning basin in order for vessels to recognize the point of flexion.
Source: JICA Survey Team
Figure 2.4-33 Location of Lighted Buoys, and Leading Lights in Matarbari Port
Although it is desirable to construct lighthouses on the breakwaters, it is impossible because of the type of structure of the breakwater. Therefore, pillar-type lighted buoys are installed to indicate the entrance of breakwaters and the flexion point inside the breakwaters. Moreover, large lighthouses such as the Patenga Point Lighthouse and the Norman Point Lighthouse might be necessary around Matarbari Port in order for smaller boats and vessels which pass off the coast to identify their locations. The numbers, the locations, and the sizes should be discussed at a certain time when the number of vessels has increased especially around outer anchorage.
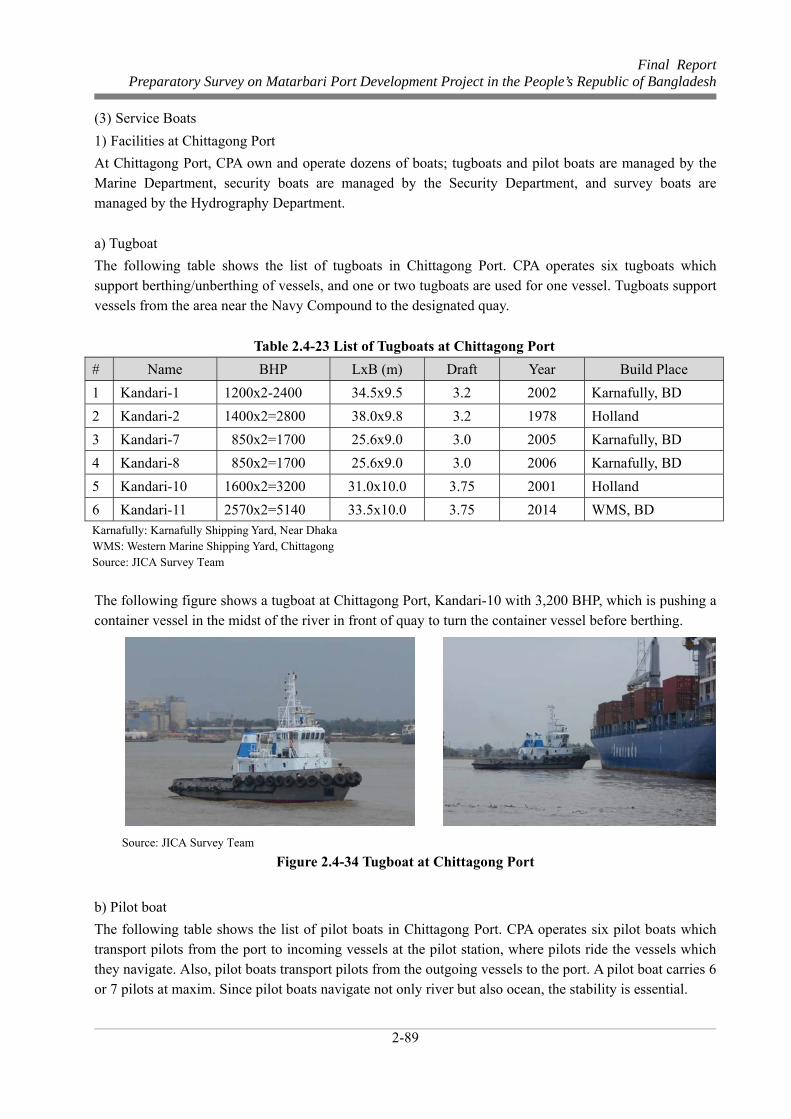
Final Report Preparatory Survey on Matarbari Port Development Project in the People’s Republic of Bangladesh
2-89
(3) Service Boats
1) Facilities at Chittagong Port
At Chittagong Port, CPA own and operate dozens of boats; tugboats and pilot boats are managed by the Marine Department, security boats are managed by the Security Department, and survey boats are managed by the Hydrography Department.
a) Tugboat
The following table shows the list of tugboats in Chittagong Port. CPA operates six tugboats which support berthing/unberthing of vessels, and one or two tugboats are used for one vessel. Tugboats support vessels from the area near the Navy Compound to the designated quay.
Table 2.4-23 List of Tugboats at Chittagong Port
# Name BHP LxB (m) Draft Year Build Place
1 Kandari-1 1200x2-2400 34.5x9.5 3.2 2002 Karnafully, BD
2 Kandari-2 1400x2=2800 38.0x9.8 3.2 1978 Holland
3 Kandari-7 850x2=1700 25.6x9.0 3.0 2005 Karnafully, BD
4 Kandari-8 850x2=1700 25.6x9.0 3.0 2006 Karnafully, BD
5 Kandari-10 1600x2=3200 31.0x10.0 3.75 2001 Holland
6 Kandari-11 2570x2=5140 33.5x10.0 3.75 2014 WMS, BD Karnafully: Karnafully Shipping Yard, Near Dhaka WMS: Western Marine Shipping Yard, Chittagong Source: JICA Survey Team
The following figure shows a tugboat at Chittagong Port, Kandari-10 with 3,200 BHP, which is pushing a container vessel in the midst of the river in front of quay to turn the container vessel before berthing.
Source: JICA Survey Team
Figure 2.4-34 Tugboat at Chittagong Port
b) Pilot boat
The following table shows the list of pilot boats in Chittagong Port. CPA operates six pilot boats which transport pilots from the port to incoming vessels at the pilot station, where pilots ride the vessels which they navigate. Also, pilot boats transport pilots from the outgoing vessels to the port. A pilot boat carries 6 or 7 pilots at maxim. Since pilot boats navigate not only river but also ocean, the stability is essential.

Final Report Preparatory Survey on Matarbari Port Development Project in the People’s Republic of Bangladesh
2-90
Table 2.4-24 List of Pilot Boats
# Name BHP LxB (m) Draft Year Build Place
1 Dishari-2 750x2=1500 31x6 N/A 2004 Dhaka, BD
2 Dishari-5 600x2=1200 26x5.6 1.22 1974 Japan
3 Dishari-6 830x2=1660 31x6 1.70 1989 Khulna, BD
4 Dishari-7 830x2=1660 31x6 1.70 1989 Khulna, BD
5 Dishari-8 830x2=1660 30x6 1.70 1989 BSEC, BD
6 Rakkhi 911x2=1822 30x6.9 2.00 2012 WMS, BD BSCE: Bangladesh Steel & Engineering Corporation WMS: Western Marine Shipping Yard, Chittagong Source: JICA Survey Team
The following figure shows a pilot boat at Chittagong Port, Dishari-6, which is a 31 m long and 6 m wide boat with 1,660 BHP, which has brought pilots back to the port who completed navigation of cargo vessels.
Source: JICA Survey Team
Figure2.4-35 Pilot Boat at Chittagong Port
The following figure shows the location of pilot station, where pilots ride the vessels which they navigate.

Final Report Preparatory Survey on Matarbari Port Development Project in the People’s Republic of Bangladesh
2-91
Source: JICA Survey Team
Figure 2.4-36 Location of Pilot Station at Chittagong Port
c) Survey Boats
The following table shows the list of survey boats in Chittagong Port. CPA operates seven survey boats which conduct surveys within port limit. Jarip-9, 10, 11, and 12 are main survey boats and implement surveys of whole areas within port limit twice a year, namely before and after monsoon season. Other than that, specific areas such as easily-to-be-buried areas are monitored more frequently. These survey boats are used as patrol boats when they are not in charge of survey; namely, in night time or emergency situations.
Pilot Station
GCBCCT
NCT
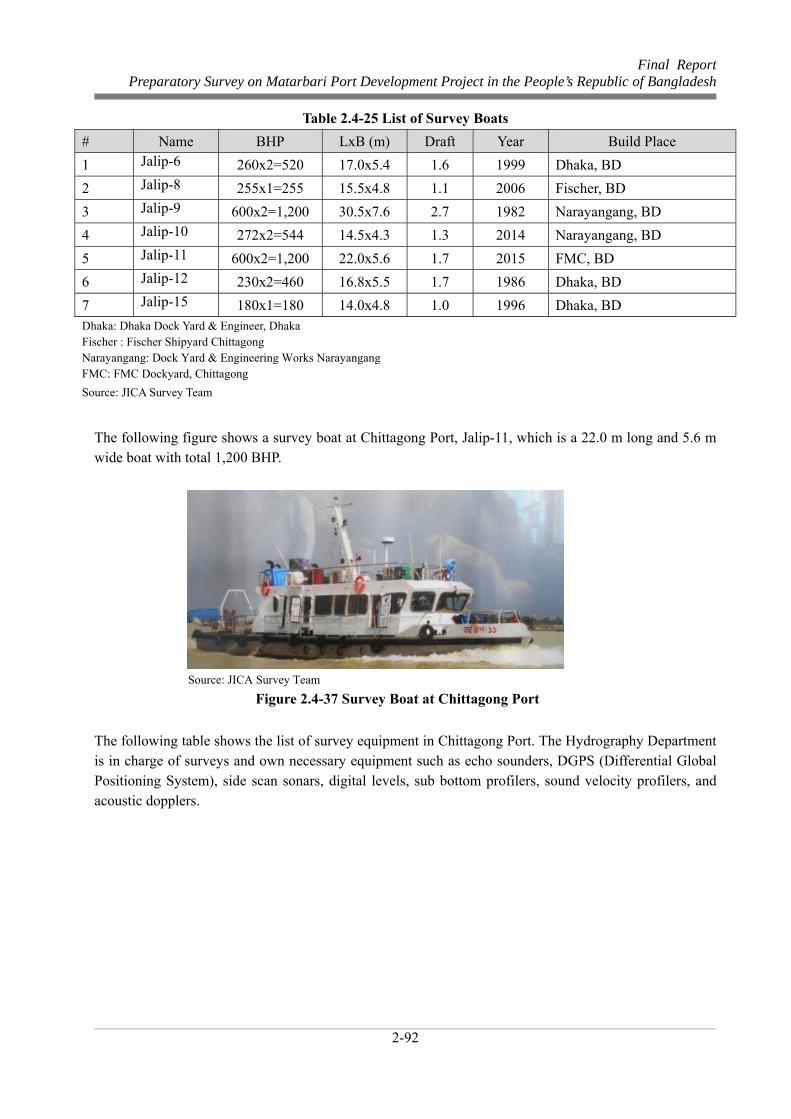
Final Report Preparatory Survey on Matarbari Port Development Project in the People’s Republic of Bangladesh
2-92
Table 2.4-25 List of Survey Boats
# Name BHP LxB (m) Draft Year Build Place
1 Jalip-6 260x2=520 17.0x5.4 1.6 1999 Dhaka, BD
2 Jalip-8 255x1=255 15.5x4.8 1.1 2006 Fischer, BD
3 Jalip-9 600x2=1,200 30.5x7.6 2.7 1982 Narayangang, BD
4 Jalip-10 272x2=544 14.5x4.3 1.3 2014 Narayangang, BD
5 Jalip-11 600x2=1,200 22.0x5.6 1.7 2015 FMC, BD
6 Jalip-12 230x2=460 16.8x5.5 1.7 1986 Dhaka, BD
7 Jalip-15 180x1=180 14.0x4.8 1.0 1996 Dhaka, BD Dhaka: Dhaka Dock Yard & Engineer, Dhaka Fischer : Fischer Shipyard Chittagong
Narayangang: Dock Yard & Engineering Works Narayangang FMC: FMC Dockyard, Chittagong
Source: JICA Survey Team
The following figure shows a survey boat at Chittagong Port, Jalip-11, which is a 22.0 m long and 5.6 m wide boat with total 1,200 BHP.
Source: JICA Survey Team
Figure 2.4-37 Survey Boat at Chittagong Port
The following table shows the list of survey equipment in Chittagong Port. The Hydrography Department is in charge of surveys and own necessary equipment such as echo sounders, DGPS (Differential Global Positioning System), side scan sonars, digital levels, sub bottom profilers, sound velocity profilers, and acoustic dopplers.

Final Report Preparatory Survey on Matarbari Port Development Project in the People’s Republic of Bangladesh
2-93
Table 2.4-26 List of Survey Equipment
Item Purpose Remarks
Echo Sounder Digital depth measurement Accuracy: +/- 0.1%
DGPS Global positioning Accuracy: 30 cm at kinematic mode
Side Scan Sonar Under water searching Accuracy: 1.5 cm at 900 khz
Digital level Digital leveling Measuring range: 1.6 m ~ 100 m
Sub Bottom Profiler Sub bottom searching Penetration: 6 m in coarse sand, 80 m in clay
Sound Velocity Profiler Aqua SVP profiling Accuracy: +/- 0.007 m/s
Acoustic Doppler Acoustic current profiling Accuracy: +/- 1% Source: JICA Survey Team
d) Security Boat
The following table shows the list of security boats in Chittagong Port. CPA operates two security boats which conduct patrol especially river areas with a cooperation with other entities such as the Navy and the Coast Guard.
Table 2.4-27 List of Security Boats
# Name BHP LxB (m) Draft GT Year Build Place
1 Harbor Security-1 355x2=710 12x3.5 0.81 6.7 2008 UK
2 Harbor Security-2 355x2=710 12x3.5 0.81 6.7 2009 UK Source: JICA Survey Team
The following figure shows security boats at Chittagong Port.
Source: JICA Survey Team
Figure 2.4-38 Security boats at Chittagong Port
e) Other Boat
Other than tugboats, pilot boats, security boats, and survey boats, CPA owns several types of boats in the following table for their port operation.
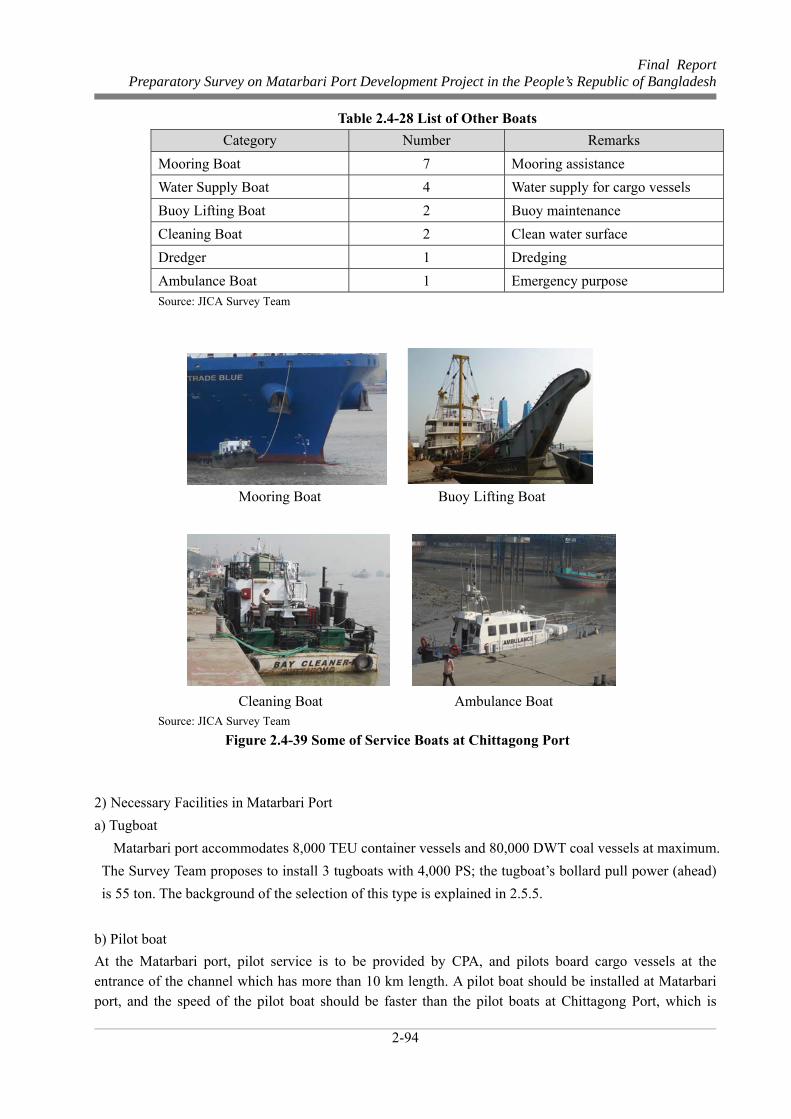
Final Report Preparatory Survey on Matarbari Port Development Project in the People’s Republic of Bangladesh
2-94
Table 2.4-28 List of Other Boats
Category Number Remarks
Mooring Boat 7 Mooring assistance
Water Supply Boat 4 Water supply for cargo vessels
Buoy Lifting Boat 2 Buoy maintenance
Cleaning Boat 2 Clean water surface
Dredger 1 Dredging
Ambulance Boat 1 Emergency purpose Source: JICA Survey Team
Mooring Boat Buoy Lifting Boat
Cleaning Boat Ambulance Boat
Source: JICA Survey Team
Figure 2.4-39 Some of Service Boats at Chittagong Port
2) Necessary Facilities in Matarbari Port
a) Tugboat
Matarbari port accommodates 8,000 TEU container vessels and 80,000 DWT coal vessels at maximum.
The Survey Team proposes to install 3 tugboats with 4,000 PS; the tugboat’s bollard pull power (ahead)
is 55 ton. The background of the selection of this type is explained in 2.5.5.
b) Pilot boat
At the Matarbari port, pilot service is to be provided by CPA, and pilots board cargo vessels at the entrance of the channel which has more than 10 km length. A pilot boat should be installed at Matarbari port, and the speed of the pilot boat should be faster than the pilot boats at Chittagong Port, which is

Final Report Preparatory Survey on Matarbari Port Development Project in the People’s Republic of Bangladesh
2-95
around 15 knots. The detail of the pilot boat is described in 2.5.5.
c) Survey boat
In the nature characteristics around Matarbari port, the sedimentation is expected in and around the port; and it is indispensable to implement measurements of the depth of the channel and the basin in order to maintain safe navigation in a regular manner. In this connection, a survey boat should be deployed in Matarbari port. The detail of the survey boat is described in 2.5.5. d) Other boats Most of service boats are owned and operated by CPA at Chittagong Port, and the same situation is expected in Matarbari Port. Regarding to security boats, it is necessary to install a few security boats to Matarbari Port in order for the Security Department to implement patrols regularly. The survey boat should complement the function of security boats. The discussion with the Coast Guard and other related entities should be implemented for effective and efficient implementation of security work. The necessity of mooring boat should be discussed since the infrastructure of Matarbari Port is better than that of Chittagong Port, therefore mooring work could be done efficiently from the landside. The water supply could be implemented from the landside, and the necessity should be discussed in the next stage. Buoy lifting boats are not provided by private sector in this country while the frequency of the use of this boats are not regular. Therefore, the necessity should be discussed carefully with the consideration of the use of the buoy lifting boats in Chittagong Port. The necessity of cleaning boat and dredger should be discussed with the consideration. Ambulance boat might be complemented by other service boats such as pilot boat and survey boat since it is necessary only in emergency situations.
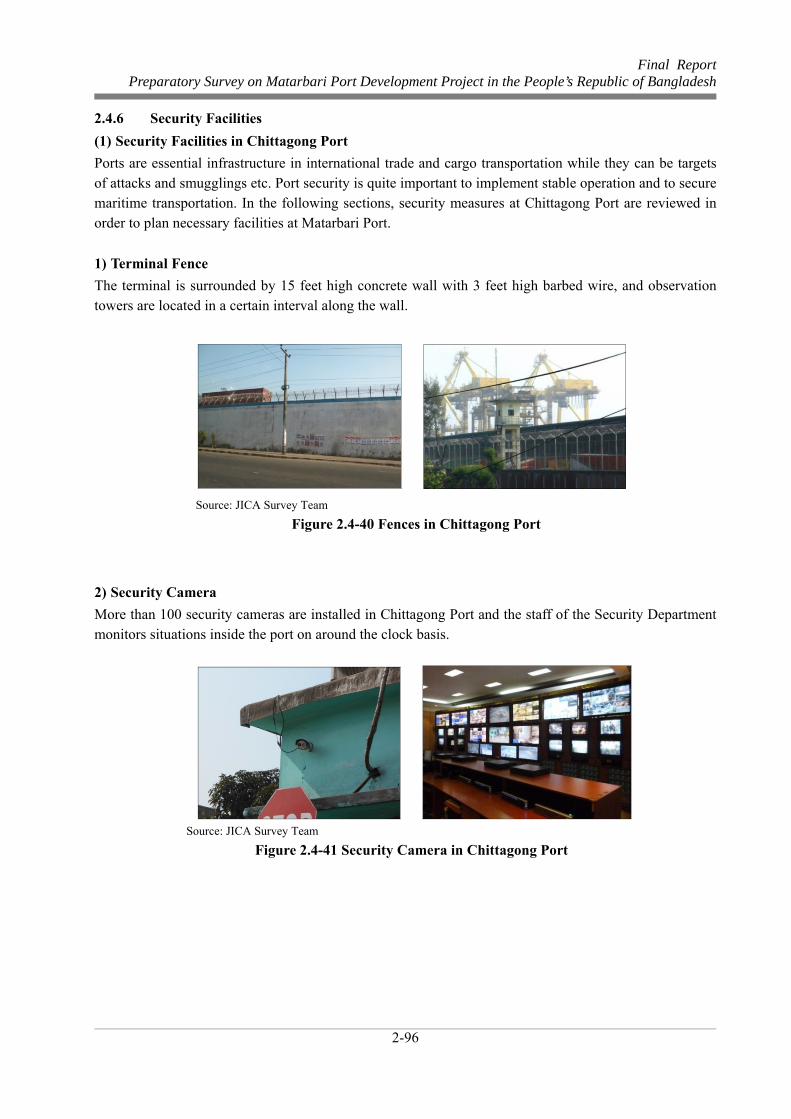
Final Report Preparatory Survey on Matarbari Port Development Project in the People’s Republic of Bangladesh
2-96
2.4.6 Security Facilities
(1) Security Facilities in Chittagong Port
Ports are essential infrastructure in international trade and cargo transportation while they can be targets of attacks and smugglings etc. Port security is quite important to implement stable operation and to secure maritime transportation. In the following sections, security measures at Chittagong Port are reviewed in order to plan necessary facilities at Matarbari Port.
1) Terminal Fence
The terminal is surrounded by 15 feet high concrete wall with 3 feet high barbed wire, and observation towers are located in a certain interval along the wall.
Source: JICA Survey Team
Figure 2.4-40 Fences in Chittagong Port
2) Security Camera
More than 100 security cameras are installed in Chittagong Port and the staff of the Security Department monitors situations inside the port on around the clock basis.
Source: JICA Survey Team
Figure 2.4-41 Security Camera in Chittagong Port

Final Report Preparatory Survey on Matarbari Port Development Project in the People’s Republic of Bangladesh
2-97
3) Lighting equipment
The height of the illumination tower is approximately 30m.
Source: JICA Survey Team
Figure 2.4-42 Lights in Chittagong Port
4) Gate
Chittagong Port has twelve gates and more than 15,000 people including truck drivers and cargo handling labors are crossing the gates. Metal detectors and X-ray scanner are under CPA’s control.
Source: JICA Survey Team
Figure 2.4-43Gate No.4 of Chittagong Port
5) Others
Speakers are installed in various places in the terminal in order to deliver information in emergency situations. Additionally, CPA is in charge of firefighting in port area with their staff and firefighting vehicles.
Source: JICA Survey Team
Figure 2.4-44 Fire Station in Chittagong Port
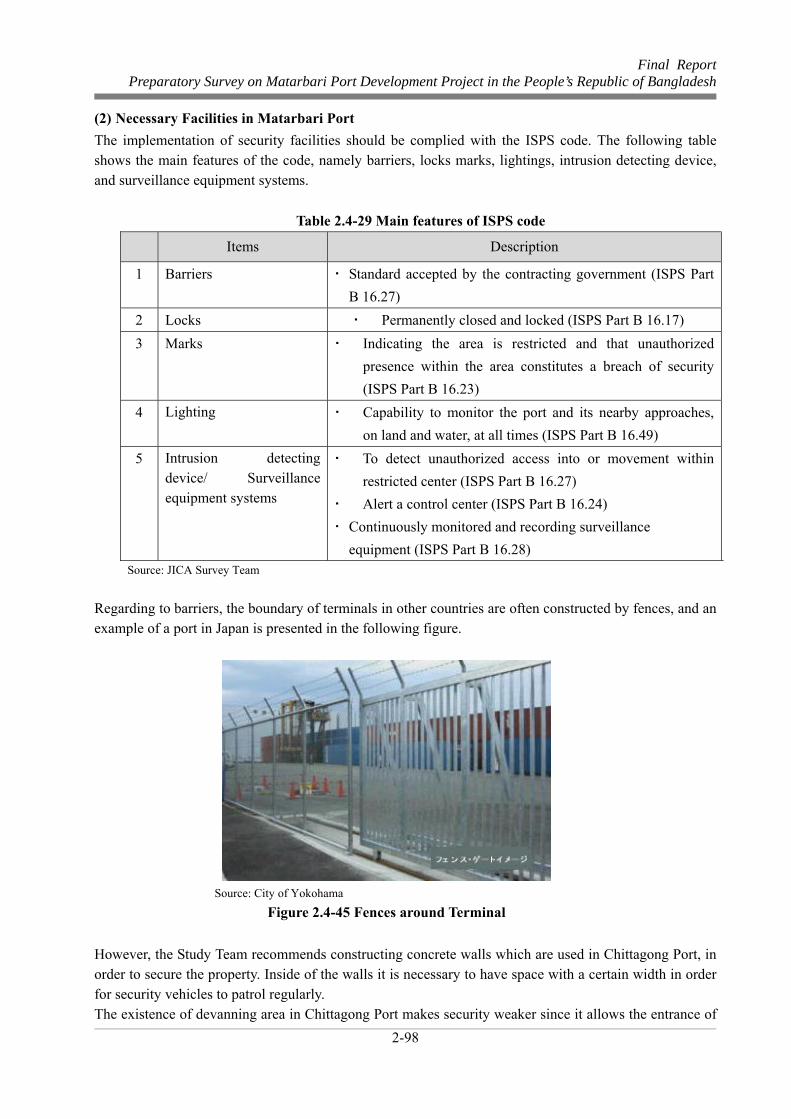
Final Report Preparatory Survey on Matarbari Port Development Project in the People’s Republic of Bangladesh
2-98
(2) Necessary Facilities in Matarbari Port
The implementation of security facilities should be complied with the ISPS code. The following table shows the main features of the code, namely barriers, locks marks, lightings, intrusion detecting device, and surveillance equipment systems.
Table 2.4-29 Main features of ISPS code Items Description
1 Barriers Standard accepted by the contracting government (ISPS Part
B 16.27)
2 Locks Permanently closed and locked (ISPS Part B 16.17)
3 Marks Indicating the area is restricted and that unauthorized
presence within the area constitutes a breach of security
(ISPS Part B 16.23)
4 Lighting Capability to monitor the port and its nearby approaches,
on land and water, at all times (ISPS Part B 16.49)
5 Intrusion detecting device/ Surveillance equipment systems
To detect unauthorized access into or movement within
restricted center (ISPS Part B 16.27)
Alert a control center (ISPS Part B 16.24)
Continuously monitored and recording surveillance
equipment (ISPS Part B 16.28) Source: JICA Survey Team
Regarding to barriers, the boundary of terminals in other countries are often constructed by fences, and an example of a port in Japan is presented in the following figure.
Source: City of Yokohama
Figure 2.4-45 Fences around Terminal
However, the Study Team recommends constructing concrete walls which are used in Chittagong Port, in order to secure the property. Inside of the walls it is necessary to have space with a certain width in order for security vehicles to patrol regularly. The existence of devanning area in Chittagong Port makes security weaker since it allows the entrance of

Final Report Preparatory Survey on Matarbari Port Development Project in the People’s Republic of Bangladesh
2-99
a lot of worker and vehicles; therefore, it should not be in the terminal in Matarbari Port. Additionally, the road congestion around port is also problematic from a security perspective. At the gate, installation of the following equipment should be considered.
・Automated barrier poles
・Under vehicle detector
・Secondary inspection area
・Separated entrance and exit for pedestrians
・CCTV
・Entry/ Exit management system with databese
・RPM (Radiation Port Monitoring)
・X-ray Scanner (Must be discussed with custom offices whether it can be shared with both entities.)
Inside the terminal, installation of the following equipment should be considered.
・Fire hydrant
・Fire Alarm( inside CFS)
・Fire distinguisher (Powder Type)
・CCTV
・PA(Public Announcement)
・Security Post
・Sign board (Illustration type which can be understandable by people without literary)
In the administration building, installation of the following equipment should be considered.
・CCTV control center (with a function of surveillance of fire security
As security purpose, deployment of the following vehicles should be considered.
・Security vehicle: 5 or 6 Nos.
・Firefighting vehicle: 2 or 3 Nos. (with necessary fire station)
Regarding to human resources necessary staff should be prepared before the commencement of the port operation with plenty training.

Final Report Preparatory Survey on Matarbari Port Development Project in the People’s Republic of Bangladesh
2-100
2.5 Preliminary Design, Specification and Quantity
2.5.1 Mooring Facility
(1) Main Quay Structure
1) Quay Structural Design
As described in the previous Section, the advantageous design is the Concrete Deck on Steel Piles with
Strut Members (Strut Type) Quay structure.
As to the structural Layout of Quay, Detached Pier, Concrete deck on pile type is recommended.
Detached Pier is one of the pier types that consist of a pier deck detached from the shore line. The pier
will be connected to the shore with access bridges. The detached type can minimize the pier deck area and
the dead weight of the concrete superstructure which will make seismic force caused by the dead weight
to be minimal. The detached pier type can release wave uplift action by the open space between the pier
deck and the shore revetment.
2) Top Elevation of Quay: CDL +9.00 m
HWL (CDL+4.88 m) +free board (4.0m) ≑ CDL +9.00 m
The quay deck top height, however, is determined for daily port activities of ship berthing, mooring,
cargo handling for both objective ships from large size of 8,000 TEU (100,000 DWT) container ship to
small size of 250 TEU (3,500 DWT) feeder ship, and limited the top elevation at CDL +9.00 m. As the
extreme water level of 50 years return period will be higher than the quay deck level, the quay deck top
and the legs of ship to shore quay gantry cranes (QGC) will be submerged during the extreme storm
condition. The travelling motors of QGC will be installed in elevated position above the extreme water
level and wave splash zone.
3) Top Elevation of Port Terminal Yard: CDL +10.00 to +12.00 m
The Quay and the Port Terminal Yard are connected through access bridges with top inclination of 1 to
1.6 % slope, which makes the yard elevation higher than the extreme water level. The average height of
the yard will be CDL +11.0 m to +11.5 m, which will allow storm drainage by gravity flow to the sea. The
sea-side perimeter of the Terminal yard along the Quay will be protected by parapet walls with the top
elevation of CDL +12.00 m.
4) Rough Structural Design of the Concrete Deck on Vertical Pile with Strut Type Quay
a) Quay Structure (See Figure 2.5-4 andFigure 2.5-1)
Struts on the vertical piles strengthen the stiffness of the pile structure to resist lateral
seismic forces
Number of struts: 3 units/bay (Across)
8 units/bay (for 2nd and 3rd longitudinal bays)
Space of pile bents: 7.5 m (Longitudinal)
10.0 m (Cross sectional)

Final Report Preparatory Survey on Matarbari Port Development Project in the People’s Republic of Bangladesh
2-101
Figure 2.5-1 Layout Plan of Quay Piles, Struts and Ancillary (Fenders Mooting Bollards)
b) Sub-soil condition
A summary of sub-soil conditions for Quay structure is given in Table 2.5-1.
Table 2.5-1 Sub-Soil Conditions of Quay
Layer Elevation (CDL: m) Type of Soil SPT (N-Value)
(1) +4 to -5 Gray Soft Clay 1 to 5
(2) -5 to-15 Gray loose to dense Silty Sand 20 to 30
(3) -15 to -25 Gray to brown, dense to very dense poorlygraded sand 20 to 40
(4) -25 and below Very denseSilty Sand >50Source: Survey Team
c) Section Force on the Structural Members
Section forces were obtained by numerical calculation of 2 dimensional rigid frame structure.
An example output under seismic conditions is shown in Figure 2.5-2.

Final Report Preparatory Survey on Matarbari Port Development Project in the People’s Republic of Bangladesh
2-102
Maximum bending
moment: 5,740
kN.m
Axial force: 4,101
kN
Working Stress:
205 N/mm2
Maximum
deflection of quay
superstructure:
ʆ=7.6 cm
Figure 2.5-2 Bending Moment Diagram
d) Required size of Structural Members
Vertical Piles (Steel pipe piles) Diameter 1,300 mm
Strut brace (Steel pipe) Diameter 700 mm
e) Typical Cross Section of Strut Type Quay is shown in Figure 2.5-4.
In order to improve the lateral soil resistance on the slope underneath the quay, the seabed soil will be
excavated and replaced with quarry materials.
This improvement is made for reinforcement of the quay pile structure and resistivity improvement
against the circular rupture of the slope.
f) Corrosion Control
Cathodic protection was provided for Steel piles, Strut members, and Steel Pipe Sheet Pile Walls for sea
walls and Harbor Craft Basin. Anti-corrosion coating was also applied to cover tidal area of the steel
members. 1 mm corrosion loss was considered on the sea-side surface of steel member.
g) Wave up-lift force on the concrete deck of Quay and Access Bridges
Taking joint probabilities of occurrence on the sea water level and wave height of 100 years return period,
wave up-lift force was determined. As a result, the wave uplift force was estimated more or less 2 tons/m2.
5,740kNm

Final Report Preparatory Survey on Matarbari Port Development Project in the People’s Republic of Bangladesh
2-103
This value is likely to be compensated by the dead weight of the Quay as a whole of the superstructure,
but for the individual structural members such as concrete deck slabs should be examined depend on the
structural dimensions of the slab in detail design stage.
Design Input assumption
Joint probability of occurrence for extreme waves and water level:
100 year Return Period (RP) joint probabilities of Extreme waves and Water levels are assumed for
Matarbari
Joint probabilities of two variables are calculated assuming that wave height and Extreme WL are two
independent variables
Thus Joint probabilities of Occurrences for two independent variables can be estimated as
P(A∩B) = P(A)*P(B)
Wave conditions at berth
Waves at berth is calculated as a sum of waves that (1) diffract through breakwater gap Hd and (2)
transmitted waves through breakwater due to overtopping, HT
Diffracted waves data are summarized and extracted from simulation results by Boussinesq Wave
modelling
Transmitted waves through breakwater body are calculated by either the Hatori's graph (Goda, 2000) and
Briganti et.al (2004) (The Rock Manual,2007). The maximum transmitted waves by both methods will be
assumed to be design transmitted wave to give a sufficient conservative measure.
Finally, the waves at berth will be calculated as:
Uplift force calculation method
The wave uplift forces on beam and slab is calculated based on Tirindelli1. et al (2004) as recommended
by Japanese standard
Design Output
13 scenarios corresponding to 100 RP joint probabilities of occurrence are calculated based on above
assumptions and shown in the below Table 2.5-2 and Figure 2.5-3 エラー! 参照元が見つかりません。.
1 Technical Standard and Commentaries for Port and Harbor Facilities in Japan

Final Report Preparatory Survey on Matarbari Port Development Project in the People’s Republic of Bangladesh
2-104
Table 2.5-2 Joint Probabilities and Uplift Forces
Crest level
RP (yrs) SWL RP (yrs) Hs (m) Ts (s)SWL +
Hs(mCD)
Beam Slab on beam on slab
1 100 11.17 1 1.56 7.83 100 yrs 12.72 7.7 8.3 1.92 1.922 50 9.29 2 1.33 8.53 100 yrs 10.62 7.7 8.3 1.64 1.643 40 8.79 3 1.25 8.69 100 yrs 10.03 7.7 8.3 1.54 1.544 33.33 8.41 3 1.19 8.81 100 yrs 9.60 7.7 8.3 1.47 1.475 25 7.86 4 1.17 8.98 100 yrs 9.03 7.7 8.3 1.45 1.206 20 7.47 5 1.21 9.11 100 yrs 8.69 7.7 8.3 1.38 0.937 10 6.46 10 1.33 9.49 100 yrs 7.79 7.7 8.3 0.39 0.00 Crest below slab soffit
8 5 5.66 20 1.44 9.83 100 yrs 7.09 7.7 8.3 0.00 0.00 Crest below beam and slab soffits
9 4 5.43 25 1.47 9.94 100 yrs 6.90 7.7 8.3 0.00 0.00 Crest below beam and slab soffits
10 3 5.15 33.33 1.51 10.07 100 yrs 6.66 7.7 8.3 0.00 0.00 Crest below beam and slab soffits
11 3 4.97 40 1.54 10.15 100 yrs 6.51 7.7 8.3 0.00 0.00 Crest below beam and slab soffits
12 2 4.88 50 1.57 10.25 100 yrs 6.45 7.7 8.3 0.00 0.00 Crest below beam and slab soffits
13 1 4.88 100 1.66 10.55 100 yrs 6.54 7.7 8.3 0.00 0.00 Crest below beam and slab soffits
Case
Water level (mCD)Joint
prob.ofoccurance
Remark
Wave condition @ berth Up lift forces (ton/m2)Soffit level (mCD)
0.00
0.50
1.00
1.50
2.00
2.50
5.00 7.00 9.00 11.00 13.00 15.00
Wave uplift (ton/m
2)
Wave crest = SWL + Hs (mCD)
On beam
on slab
Figure 2.5-3 Wave Uplift and Wave Crest Hight

Fin
al R
epor
t P
repa
rato
ry S
urve
y on
Mat
arba
ri P
ort D
evel
opm
ent P
roje
ct in
the
Peo
ple’
s R
epub
lic
of B
angl
ades
h
2-10
5
Fig
ure
2.5
-4
Typ
ical
Cro
ss S
ecti
on o
f Q
uay
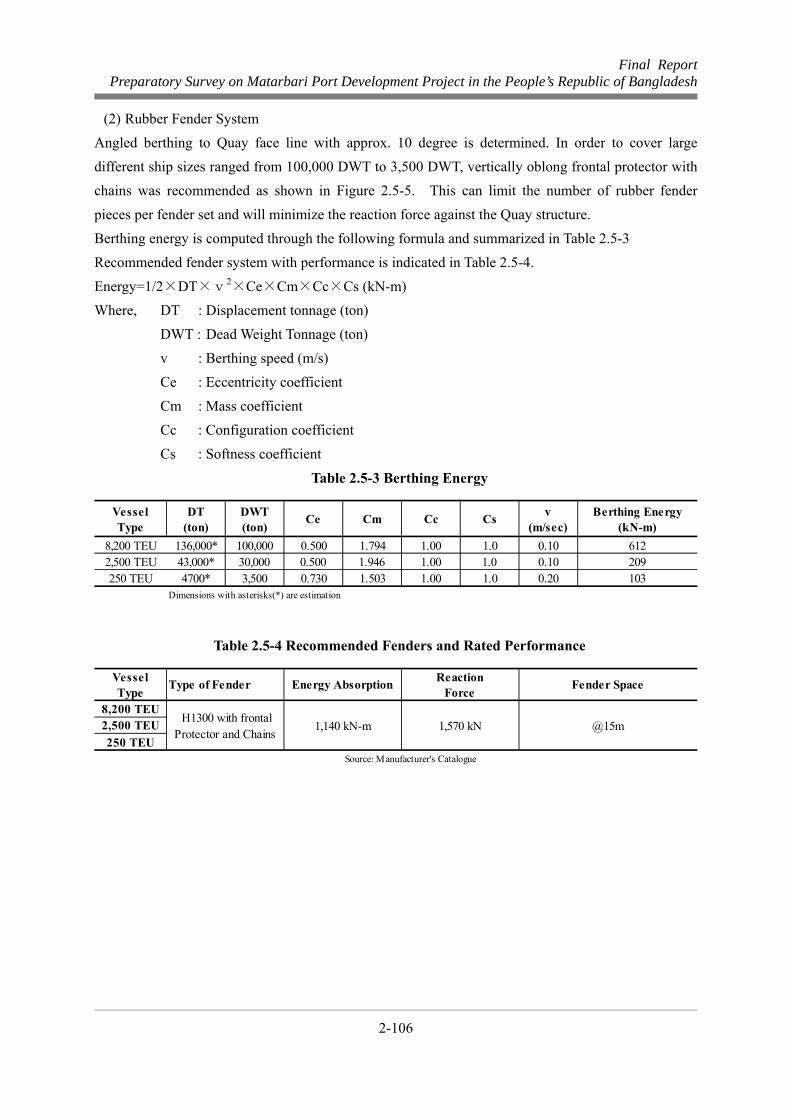
Final Report Preparatory Survey on Matarbari Port Development Project in the People’s Republic of Bangladesh
2-106
(2) Rubber Fender System
Angled berthing to Quay face line with approx. 10 degree is determined. In order to cover large
different ship sizes ranged from 100,000 DWT to 3,500 DWT, vertically oblong frontal protector with
chains was recommended as shown in Figure 2.5-5. This can limit the number of rubber fender
pieces per fender set and will minimize the reaction force against the Quay structure.
Berthing energy is computed through the following formula and summarized in Table 2.5-3
Recommended fender system with performance is indicated in Table 2.5-4.
Energy=1/2×DT×v2×Ce×Cm×Cc×Cs (kN-m)
Where, DT : Displacement tonnage (ton)
DWT : Dead Weight Tonnage (ton)
v : Berthing speed (m/s)
Ce : Eccentricity coefficient
Cm : Mass coefficient
Cc : Configuration coefficient
Cs : Softness coefficient
Table 2.5-3 Berthing Energy
VesselType
DT(ton)
DWT(ton)
Ce Cm Cc Csv
(m/sec)Berthing Energy
(kN-m)
8,200 TEU 136,000* 100,000 0.500 1.794 1.00 1.0 0.10 6122,500 TEU 43,000* 30,000 0.500 1.946 1.00 1.0 0.10 209250 TEU 4700* 3,500 0.730 1.503 1.00 1.0 0.20 103
Dimensions with asterisks(*) are estimation
Table 2.5-4 Recommended Fenders and Rated Performance
VesselType
8,200 TEU2,500 TEU
250 TEUSource: Manufacturer's Catalogue
H1300 with frontalProtector and Chains
1,140 kN-m 1,570 kN @15m
Type of Fender Energy AbsorptionReaction
ForceFender Space
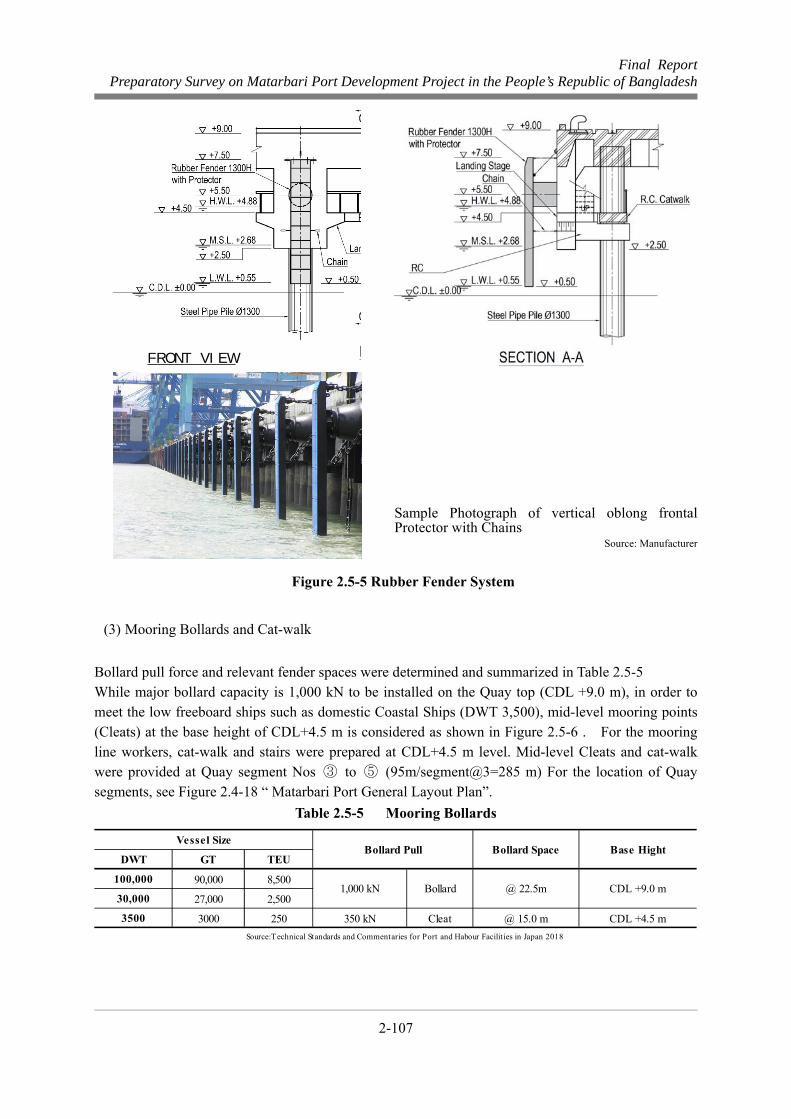
Final Report Preparatory Survey on Matarbari Port Development Project in the People’s Republic of Bangladesh
2-107
Sample Photograph of vertical oblong frontal Protector with Chains
Source: Manufacturer
Figure 2.5-5 Rubber Fender System
(3) Mooring Bollards and Cat-walk
Bollard pull force and relevant fender spaces were determined and summarized in Table 2.5-5 While major bollard capacity is 1,000 kN to be installed on the Quay top (CDL +9.0 m), in order to meet the low freeboard ships such as domestic Coastal Ships (DWT 3,500), mid-level mooring points (Cleats) at the base height of CDL+4.5 m is considered as shown in Figure 2.5-6 . For the mooring line workers, cat-walk and stairs were prepared at CDL+4.5 m level. Mid-level Cleats and cat-walk were provided at Quay segment Nos ③ to ⑤ (95m/segment@3=285 m) For the location of Quay segments, see Figure 2.4-18 “ Matarbari Port General Layout Plan”.
Table 2.5-5 Mooring Bollards
DWT GT TEU
100,000 90,000 8,500
30,000 27,000 2,500
3500 3000 250 350 kN Cleat @ 15.0 m CDL +4.5 m
Source:Technical Standards and Commentaries for Port and Habour Facilities in Japan 2018
Base Hight
CDL +9.0 m1,000 kN Bollard
Vessel SizeBollard Pull Bollard Space
@ 22.5m
FRONT VIEW

Final Report Preparatory Survey on Matarbari Port Development Project in the People’s Republic of Bangladesh
2-108
Figure 2.5-6 Mid-Level Mooring Point (Cleat) and Cat-walk
(4) Slope Protection under Quay Deck
Soil stratification (BH-7 ~ BH-11) along the Quay center line was shown in Figure 2.5-7. In this, only the BH-7 at the western end of Quay is consisted of the sandy clay layer softer than other bore holes to the depth of about CDL-20m, with N value 5. In order to respond to this, the slope underneath of the Quay deck , as shown in Figure 2.5-8, was reinforced by increasing the thickness of the replacement stone layer for the area of Quay deck segment ① at the west end of the Quay. This will help to increase the lateral resistance of the ground.
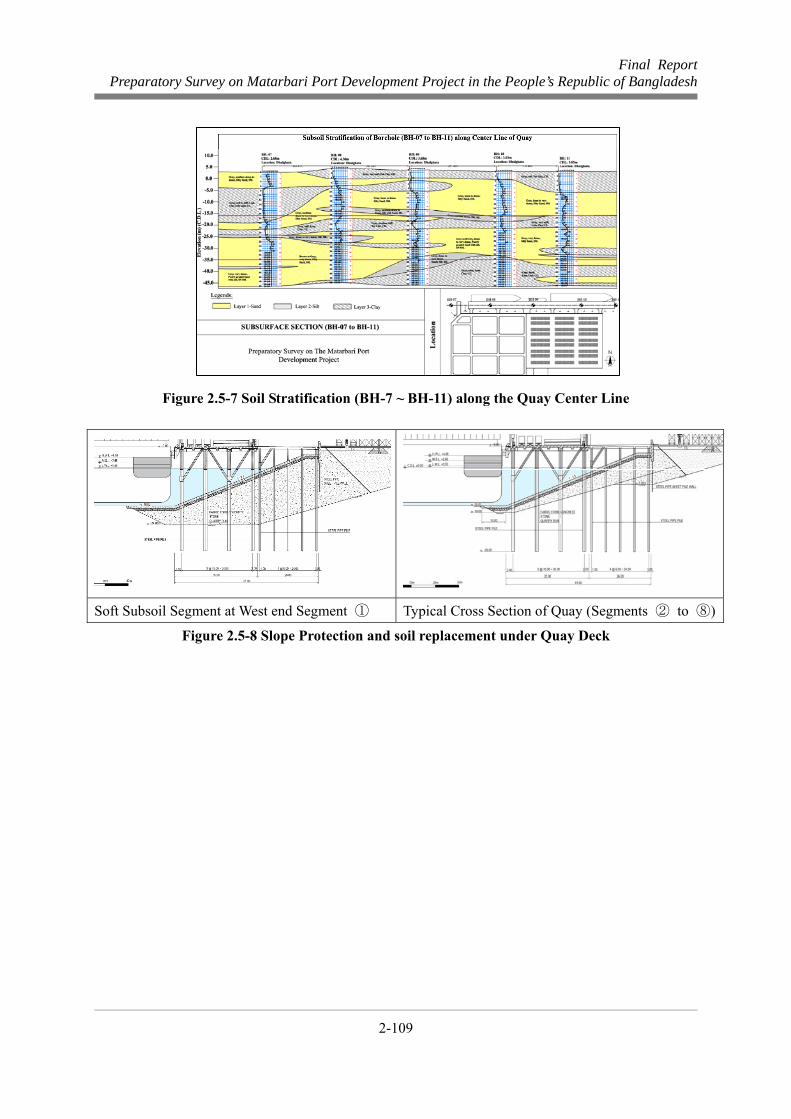
Final Report Preparatory Survey on Matarbari Port Development Project in the People’s Republic of Bangladesh
2-109
Figure 2.5-7 Soil Stratification (BH-7 ~ BH-11) along the Quay Center Line
Soft Subsoil Segment at West end Segment ① Typical Cross Section of Quay (Segments ② to ⑧)
Figure 2.5-8 Slope Protection and soil replacement under Quay Deck
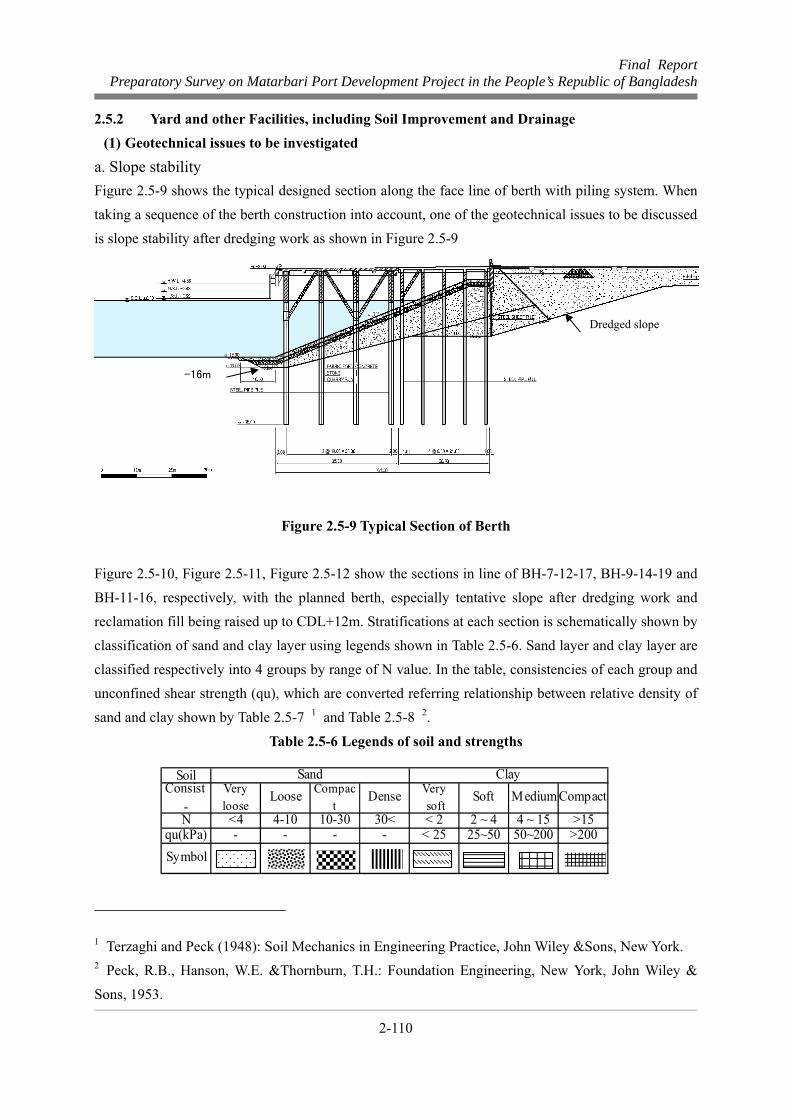
Final Report Preparatory Survey on Matarbari Port Development Project in the People’s Republic of Bangladesh
2-110
2.5.2 Yard and other Facilities, including Soil Improvement and Drainage
(1) Geotechnical issues to be investigated
a. Slope stability
Figure 2.5-9 shows the typical designed section along the face line of berth with piling system. When
taking a sequence of the berth construction into account, one of the geotechnical issues to be discussed
is slope stability after dredging work as shown in Figure 2.5-9
Figure 2.5-9 Typical Section of Berth
Figure 2.5-10, Figure 2.5-11, Figure 2.5-12 show the sections in line of BH-7-12-17, BH-9-14-19 and
BH-11-16, respectively, with the planned berth, especially tentative slope after dredging work and
reclamation fill being raised up to CDL+12m. Stratifications at each section is schematically shown by
classification of sand and clay layer using legends shown in Table 2.5-6. Sand layer and clay layer are
classified respectively into 4 groups by range of N value. In the table, consistencies of each group and
unconfined shear strength (qu), which are converted referring relationship between relative density of
sand and clay shown by Table 2.5-7 1 and Table 2.5-8 2.
Table 2.5-6 Legends of soil and strengths
1 Terzaghi and Peck (1948): Soil Mechanics in Engineering Practice, John Wiley &Sons, New York. 2 Peck, R.B., Hanson, W.E. &Thornburn, T.H.: Foundation Engineering, New York, John Wiley &
Sons, 1953.
Soil
N <4 4-10 10-30 30< < 2 2 ~ 4 4 ~ 15 >15qu(kPa) - - - - < 25 25~50 50~200 >200
Sand ClayConsist
-Veryloose
LooseCompac
tDense
Verysoft
Soft Medium Compact
Symbol
Dredged slope
-16m

Final Report Preparatory Survey on Matarbari Port Development Project in the People’s Republic of Bangladesh
2-111
Table 2.5-7 N vs Relative density of sand Table 2.5-8 Consistency of clay vs N & qu
N value0 〜 4
4 〜 1010 〜 3030 〜 50
> 50 Very dense
Relative densityVery loose
LooseMediumDense
N value Consistency qu (kPa) < 2 Very soft < 25
2 〜 4 Soft 25 ~ 504 〜 8 Medium 50 ~ 1008 〜 15 Firm 100 ~ 200
15 〜 30 Very firm 200 ~ 400> 30 Hard > 400
Figure 2.5-10 Tentative slope after dredging and subsoil stratification

Final Report Preparatory Survey on Matarbari Port Development Project in the People’s Republic of Bangladesh
2-112
Figure 2.5-11Tentative slope after dredging and subsoil stratification
Figure 2.5-12 Tentative slope after dredging and subsoil stratification
Table 2.5-9 shows the subsoil stratum of with distribution of averaged N value along the line on face
line of berth. The followings are summarized:
- Soft clay layer with N of 1 to 3 distribute from the ground surface to CDL+1 to -4m at
BH-8 ~ BH-11 except for BH-7. Underneath this clay layer, sand layer with averaged N
of 16 to 50 is distributed.
- At BH-7, dense sand layer with averaged N value of 34 distributes from the surface up to
-2m. Then from -3m to -17m, clay layer with range of N from 4 to 9 is distributed..
Final Report Preparatory Survey on Matarbari Port Development Project in the People’s Republic of Bangladesh
2-113
Dunhum3 (1953) proposed a conversion equation from N to friction angle of sand layer as shown by
Equation 2.5-1.
・・・・・・ Equation 2.5-1
Note: Applied to sand layer with uniform distribution of round particles.
As N values of sand layer above CDL-25m in Table 2.5-9 vary from 16 to 50, converted friction angle
for these sand layer could be 28°to 39°. Therefore slope angle after removal of soft soil should be
more gentle than this angle.
As shown by Figure 2.5-10 to Figure 2.5-12, as most of subsoil layer along the face line of berth is
to be removed by dredging, stability of tentative slope after dredging would be attained due to
distribution of compact or dense clay/sand layer other than in the proximity of BH-7, where clay layer
from CDL-0.3m to CDL-16m with N value of 4-7 is distributed. On the contrary, distribution of this
soft to medium clay layer is not identified at BH-12. Therefore distribution of this layer could be
disappeared between BH-7 and BH-12. Stability of the tentative slope after dredging might be affected
by the distribution of this soft clay layer.
3 Dunhum, J. W.: Pile Foundation for Buildings, Proc. of the ASCE, Jour.SMF Div., Vol.80, SM.1, Proc. Paper 385, pp. 1~21, 1954.

Final Report Preparatory Survey on Matarbari Port Development Project in the People’s Republic of Bangladesh
2-114
Table 2.5-9 Sand and sil/clay layers with N along berth
Note; a) “UD” means the depth where undisturbed sample is taken.
b) “( )” is not considered for averaged N value.
c) -19m and -24m means bottom of removed stratum
CDL(m) N soil Ave N soil Ave N soil Ave N soil Ave N soil Ave
+3 21 1 1 1 2+2 35 UD1 3+1 29 20 34 (8) 11 (Sand) 7-1 38 16 3 17 3-2 47 16 1 21 4-3 (5) 20 UD2 25 UD2-4 29 2 33 7-5 36 8 30 8-6 4 31 30 37 12-7 7 50 37 24 50-8 6 50 35 29 50-9 7 50 44 33 37-10 5 48 41 30 42-11 6 50 36 35 27-12 7 50 37 38 24-13 5 42 34 40 21 Silt 21-14 6 50 30 46 28 Sand 28-15 9 50 29 35 22-16 7 50 37 19 25-17 12 31 43 21 18-18 18 27 20 24 20
*-19 29 19 8 27 27-20 18 20 43-21 15 34 50-22 UD2 20 36 38 50-23 18 39 45 50 30
*-24 22 50 37 50 48-25 47 50 43 50 50-26 50 50 38 50 46-27 46 39 50 47 41-28 43 50 Sand 22 50 44-29 50 26 50 19 Clay-30 50 Sand 50 16
Clay
2
25
Sand 35
3
16
21
36
17Caly
Sand
Silt
Clay 24Sand 23
ClaySilt
Sand
Clay
Caly
UD1 UD1
BH-8 BH-9 BH-10BH-7
Sand 36
24
1
26
14
43
17UD2 UD3
SandSand 45
Silt/Clay
46
UD1
SandSand(2)
50
Silt
UD1
Sand
Clay
19
Sand 34
Clay 1 Clay
Sand(1)
24
Clay
8
BH-11

Final Report Preparatory Survey on Matarbari Port Development Project in the People’s Republic of Bangladesh
2-115
Consolidation settlement at yard area
Since berth area along its face line is to be dredged up to designed water depth, soft soil layer could
mostly be removed. Therefore the area of container yard or its related facilities, with which BH-12 to
BH-19 are related, would be the subject area for investigation of consolidation.
Overall feature of clay layer at yard area
As shown by Figure 2.5-10 to Figure 2.5-12, distribution of clay layer within yard area could be realized
as complicated to grasp a tendency of their distributions so as to determine representative clay layer to
calculate the consolidation settlement. On top of it, N values distribution at whole area tend to show
rather large N values compared with their shallow depth, where N values expected to be small ones.
Therefore, it is easily understood that clay layer to be investigated could be over-consolidated.
Table 2.5-10 shows the distribution of clay layers at BH-12〜BH-19, where clay layers are classified
into three types with their ranges of N, that is to say, layer A vary 0≦N<5, layer B; 5≦N<15 and Layer
C; 15<N. It is realized that thickness of Layer A vary only from 3m〜5m and Layer B barely distributed
at most boring points except for BH-12, BH-15 and BH-19. Layer C distribute in deeper ground and its
averaged thickness is approximately 6m..
Table 2.5-10 Distribution of classified clay into three Groups
Table 2.5-11 shows overall clay properties obtained by undisturbed clay specimens. According to
“Sievetest results”, contents of “Silt + Clay” (Fine fraction content (Fc) for most soil specimens are
approximately more than 90% except for at -5.9m (UD2) of BH-15. On the contrary, “Natural Water
Content (Wn)” are distributed around 50 %, which seems rather small compared with content of “Silt +
Clay”. These feature would explain that clay layer in this area has rather large values of N and thus has
been over-consolidated. Layer C distribute at depth of deeper than -20m, where N value shows mostly
larger than 20. Therefore, it would be presumed that settlement of Layer C by would be nominal.
-12 -13 -14 -15 -16 -17 -18 -19A 0<N≦5 0 0 3 4 4 5 1 3B 5<N≦15 7 0 0 6 0 0 0 3C 15<N 2 10 9 8 0 8 5 4
2.52.05.8
ClassificationBH No.
Ave.( m)
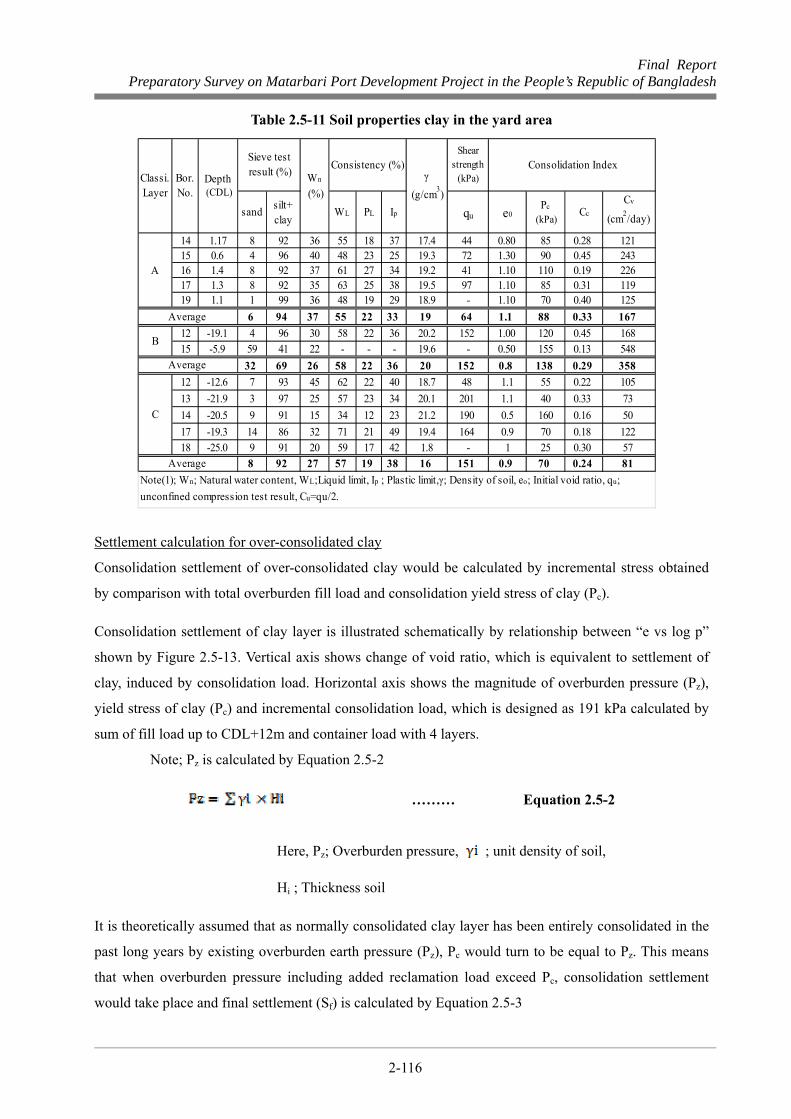
Final Report Preparatory Survey on Matarbari Port Development Project in the People’s Republic of Bangladesh
2-116
Table 2.5-11 Soil properties clay in the yard area
Settlement calculation for over-consolidated clay
Consolidation settlement of over-consolidated clay would be calculated by incremental stress obtained
by comparison with total overburden fill load and consolidation yield stress of clay (Pc).
Consolidation settlement of clay layer is illustrated schematically by relationship between “e vs log p”
shown by Figure 2.5-13. Vertical axis shows change of void ratio, which is equivalent to settlement of
clay, induced by consolidation load. Horizontal axis shows the magnitude of overburden pressure (Pz),
yield stress of clay (Pc) and incremental consolidation load, which is designed as 191 kPa calculated by
sum of fill load up to CDL+12m and container load with 4 layers.
Note; Pz is calculated by Equation 2.5-2
……… Equation 2.5-2
Here, Pz; Overburden pressure, ; unit density of soil,
Hi ; Thickness soil
It is theoretically assumed that as normally consolidated clay layer has been entirely consolidated in the
past long years by existing overburden earth pressure (Pz), Pc would turn to be equal to Pz. This means
that when overburden pressure including added reclamation load exceed Pc, consolidation settlement
would take place and final settlement (Sf) is calculated by Equation 2.5-3
Shearstrength
(kPa)
sandsilt+clay
WL PL Ip qu e0Pc
(kPa)Cc
Cv
(cm2/day)
14 1.17 8 92 36 55 18 37 17.4 44 0.80 85 0.28 12115 0.6 4 96 40 48 23 25 19.3 72 1.30 90 0.45 24316 1.4 8 92 37 61 27 34 19.2 41 1.10 110 0.19 22617 1.3 8 92 35 63 25 38 19.5 97 1.10 85 0.31 11919 1.1 1 99 36 48 19 29 18.9 - 1.10 70 0.40 125
6 94 37 55 22 33 19 64 1.1 88 0.33 167
12 -19.1 4 96 30 58 22 36 20.2 152 1.00 120 0.45 168
15 -5.9 59 41 22 - - - 19.6 - 0.50 155 0.13 548
32 69 26 58 22 36 20 152 0.8 138 0.29 358
12 -12.6 7 93 45 62 22 40 18.7 48 1.1 55 0.22 105
13 -21.9 3 97 25 57 23 34 20.1 201 1.1 40 0.33 73
14 -20.5 9 91 15 34 12 23 21.2 190 0.5 160 0.16 50
17 -19.3 14 86 32 71 21 49 19.4 164 0.9 70 0.18 122
18 -25.0 9 91 20 59 17 42 1.8 - 1 25 0.30 57
8 92 27 57 19 38 16 151 0.9 70 0.24 81
B
Average
C
Average
Note(1); Wn; Natural water content, WL;Liquid limit, Ip ; Plastic limit,γ; Density of soil, eo; Initial void ratio, qu;
unconfined compression test result, Cu=qu/2.
Consistency (%)γ
(g/cm3)
Consolidation Index
A
Average
Classi.Layer
Bor.No.
Depth (CDL)
Sieve test result (%) Wn
(%)
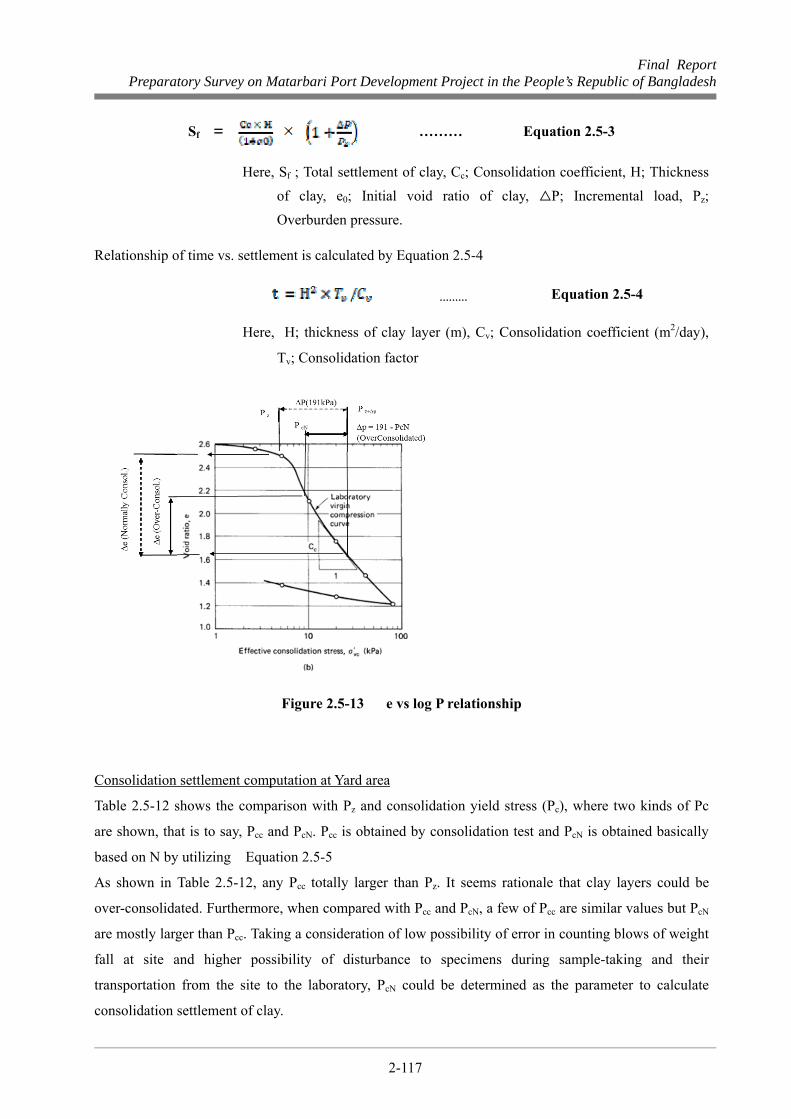
Final Report Preparatory Survey on Matarbari Port Development Project in the People’s Republic of Bangladesh
2-117
Sf = ……… Equation 2.5-3
Here, Sf ; Total settlement of clay, Cc; Consolidation coefficient, H; Thickness
of clay, e0; Initial void ratio of clay, △P; Incremental load, Pz;
Overburden pressure.
Relationship of time vs. settlement is calculated by Equation 2.5-4
……… Equation 2.5-4
Here, H; thickness of clay layer (m), Cv; Consolidation coefficient (m2/day),
Tv; Consolidation factor
Figure 2.5-13 e vs log P relationship
Consolidation settlement computation at Yard area
Table 2.5-12 shows the comparison with Pz and consolidation yield stress (Pc), where two kinds of Pc
are shown, that is to say, Pcc and PcN. Pcc is obtained by consolidation test and PcN is obtained basically
based on N by utilizing Equation 2.5-5
As shown in Table 2.5-12, any Pcc totally larger than Pz. It seems rationale that clay layers could be
over-consolidated. Furthermore, when compared with Pcc and PcN, a few of Pcc are similar values but PcN
are mostly larger than Pcc. Taking a consideration of low possibility of error in counting blows of weight
fall at site and higher possibility of disturbance to specimens during sample-taking and their
transportation from the site to the laboratory, PcN could be determined as the parameter to calculate
consolidation settlement of clay.

Final Report Preparatory Survey on Matarbari Port Development Project in the People’s Republic of Bangladesh
2-118
……… Equation 2.5-5
Here, assumed by Cu / Pc = 1/4, and Cu = N / 164
Table 2.5-12 Comparisons with Pz and Pc
In case of over-consolidated clay, equation of settlement calculation is turned to be .
In the equation, PcN is identified as Pc in the equation. Equation 2.5-6
…… Equation 2.5-6
Here, Δp’ = Total fill load + container load with 3 layers
Table 2.5-13 shows the calculated settlements at each boring point. It is realized that final settlement at
whole area covered by BH-12 to BH-19 are 2cm to 11cm. These ranges of magnitude are understood as
negligible in the sense of engineering. Therefore, settlement with time seems not to be essential.
However, in spite of small magnitude of calculated settlements at boring locations, there seems to still be
unknown subsoil layers, such as the area around the face line of berth and along BH-12 to BH-16, the
section of BH-7~BH-12 and the one of BH-11~BH-16. Therefore, it seems to be rationale to consider
the necessity of a vertical drain method such as Plastic Board Drain Method5 in the Detail Design based
on an additional geotechnical investigation.
4 Murayama et. al. (1956), Standard penetration test and bearing capacity of ground, “Tsuchi to Kiso”, Vol.2 No.5, PP.12-18, in Japanese. 5゙。
Pz Pcc PcN
1 -12.60 14 55 3722 -19.12 19 120 400
13 1 -21.92 22 40 7481 1.17 3 85 752 -20.50 24 160 7501 0.55 2 90 752 -5.85 6 155 200
16 1 1.38 3 110 1001 1.25 3 85 1502 -19.25 18 70 575
18 2 -25.00 1 25 65019 1 1.06 2 70 50
12
14
15
17
BH-No
Consolidation yeild stress (kPa)UD No
Depth(CDL)
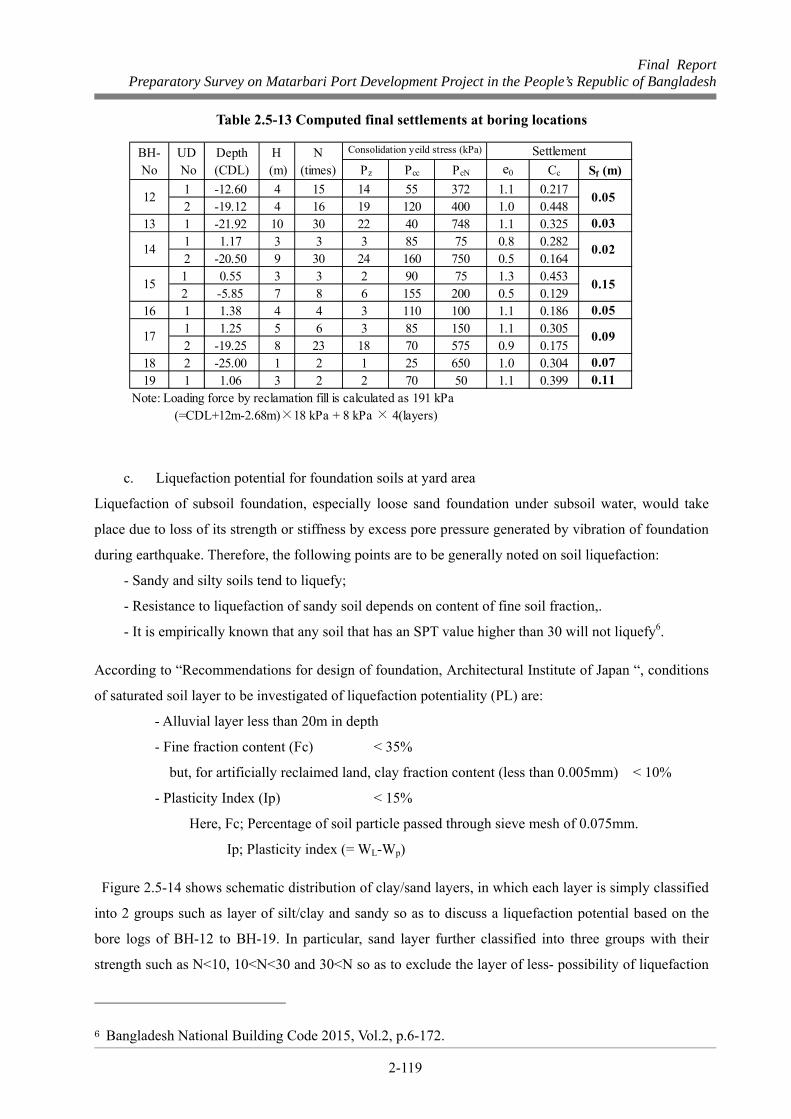
Final Report Preparatory Survey on Matarbari Port Development Project in the People’s Republic of Bangladesh
2-119
Table 2.5-13 Computed final settlements at boring locations
c. Liquefaction potential for foundation soils at yard area
Liquefaction of subsoil foundation, especially loose sand foundation under subsoil water, would take
place due to loss of its strength or stiffness by excess pore pressure generated by vibration of foundation
during earthquake. Therefore, the following points are to be generally noted on soil liquefaction:
- Sandy and silty soils tend to liquefy;
- Resistance to liquefaction of sandy soil depends on content of fine soil fraction,.
- It is empirically known that any soil that has an SPT value higher than 30 will not liquefy6.
According to “Recommendations for design of foundation, Architectural Institute of Japan “, conditions
of saturated soil layer to be investigated of liquefaction potentiality (PL) are:
- Alluvial layer less than 20m in depth
- Fine fraction content (Fc) < 35%
but, for artificially reclaimed land, clay fraction content (less than 0.005mm) < 10%
- Plasticity Index (Ip) < 15%
Here, Fc; Percentage of soil particle passed through sieve mesh of 0.075mm.
Ip; Plasticity index (= WL-Wp)
Figure 2.5-14 shows schematic distribution of clay/sand layers, in which each layer is simply classified
into 2 groups such as layer of silt/clay and sandy so as to discuss a liquefaction potential based on the
bore logs of BH-12 to BH-19. In particular, sand layer further classified into three groups with their
strength such as N<10, 10<N<30 and 30<N so as to exclude the layer of less- possibility of liquefaction
6 Bangladesh National Building Code 2015, Vol.2, p.6-172.
Pz Pcc PcN e0 Cc Sf (m)
1 -12.60 4 15 14 55 372 1.1 0.2172 -19.12 4 16 19 120 400 1.0 0.448
13 1 -21.92 10 30 22 40 748 1.1 0.325 0.031 1.17 3 3 3 85 75 0.8 0.2822 -20.50 9 30 24 160 750 0.5 0.1641 0.55 3 3 2 90 75 1.3 0.4532 -5.85 7 8 6 155 200 0.5 0.129
16 1 1.38 4 4 3 110 100 1.1 0.186 0.051 1.25 5 6 3 85 150 1.1 0.3052 -19.25 8 23 18 70 575 0.9 0.175
18 2 -25.00 1 2 1 25 650 1.0 0.304 0.0719 1 1.06 3 2 2 70 50 1.1 0.399 0.11
Note: Loading force by reclamation fill is calculated as 191 kPa (=CDL+12m-2.68m)×18 kPa + 8 kPa × 4(layers)
Depth(CDL)
UD No
BH-No
SettlementConsolidation yeild stress (kPa)N(times)
H (m)
15
17
0.05
0.02
0.15
0.09
12
14

Final Report Preparatory Survey on Matarbari Port Development Project in the People’s Republic of Bangladesh
2-120
as described above. Furthermore, it could be judged that layer with N lower than 10 would liquefy and
layers with N between 10 and 20 would liquefy on condition that other conditions such as Fc meet with
the criteria.
Taking such data of sandy layer/Clay layer, range of N value, fine fraction content (Fc) into account,
layers with liquefaction possibility are enclosed by two arrows in Figure 2.5-14. Although it seems
difficult to distinguish possible layers of liquefaction from all the layers, but it could be summarized as
the followings:
- From surface up to depth of 2 -5m are mostly covered by clayey layers with which they are
understood as less- liquefaction potentiality, except for BH-12.
- Surface sandy layer at BH-12 has 43 % of Fc, which is larger than 35%, thus this layer
would not liquefy as well.
- As shown in Figure 2.5-14, sandy with N of 10-20 at BH-12 to BH-19 and layers with N
value lower than 10 at BH-16 to BH-19 may have possibility of liquefaction. However, Fc of
most such layers would range around 30% so possibility of liquefaction might be low and if
any liquefaction would take place, presumed thickness of sandy layer would be at most 6m
only at BH-12, yet 1m to 4m at other location of BH-14 to BH-19.
- Since Sandy layers deeper than GL-10m have N values larger than 30, those layer would be
stable against liquefaction.
Due to complicated distribution of soil stratum, it seems to be difficult to make a clear boundary of
being liquefied layer or not. Therefore, it could be recommended to carry out additional boring
investigation at around BH-12 to BH-13 and BH-19 so that the area to be improved against liquefaction
could be identified. Table 2.5-14 shows some soil improvement techniques against liquefaction. As
shown in the table, DC method would be recommendable to the project. Improvement length would be
decided by the formation level of DC and the depth to be improved.

Final Report Preparatory Survey on Matarbari Port Development Project in the People’s Republic of Bangladesh
2-121
Figure 2.5-14 Schematic distribution of layers with possibility of liquefaction
Depth
GL-1 Fc=43
-2
-3 Fc=36 Fc=27
-4 Fc=31 Fc=33 Fc=79
-5 Fc=21 10 11 Fc=93
-6 Fc=32 Fc=36 Fc=86 10 Fc=5 Fc=38
-7 Fc=34 Fc=18 Fc=17
-8 Fc=35 Fc=46
-9 Fc=20 14 Fc=43 Fc=20
-10 Fc=34
-11
-12 Fc=95
-13 Fc=16 29
-14 Fc=80
-15
-16 Fc=53
-17 Fc=58
-18 28
-19 Fc=51 Fc=69
-20 Fc=97
-21 Fc=41 Fc=40 28
-22
-23 Fc=92
-24
-25
Note; Fc; <Clay+Silt> content in %, bald letter in each bore logs show N values.
2322 15
23
2313
25
1314
BH-12 BH-13 BH-14 BH-15 BH-16 BhH-17 BH-18 BH-19
Fc=17
11
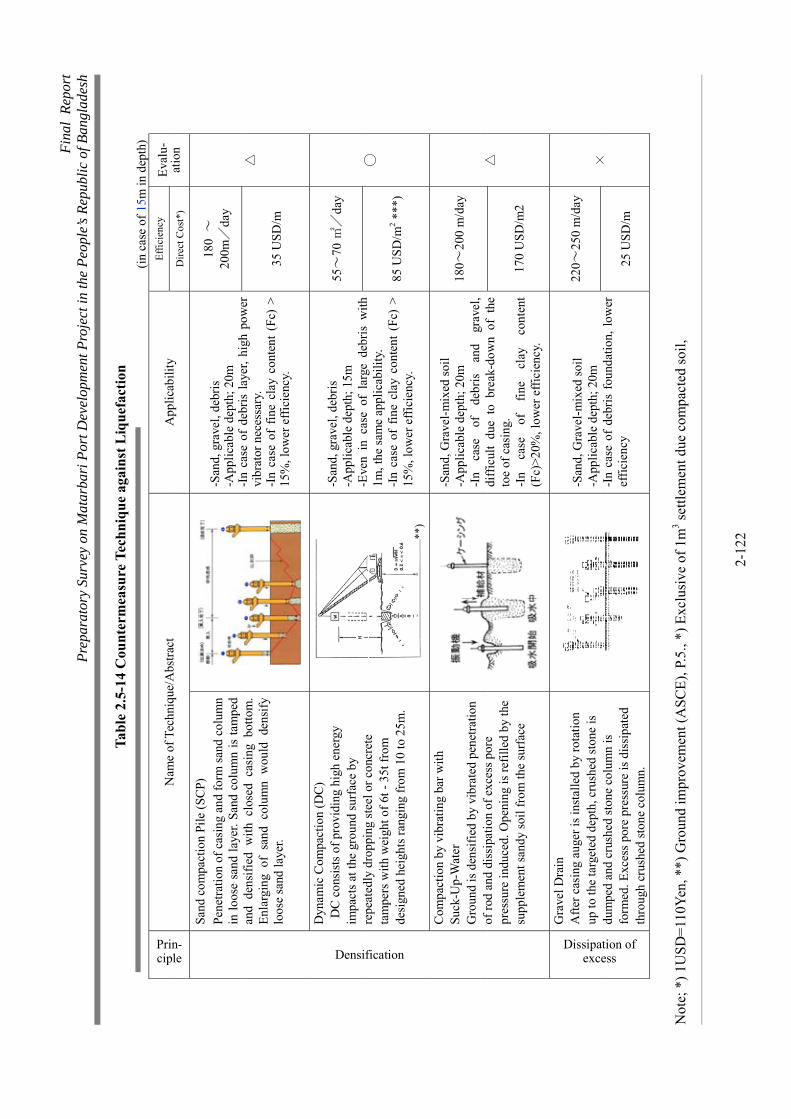
Fin
al R
epor
t P
repa
rato
ry S
urve
y on
Mat
arba
ri P
ort D
evel
opm
ent P
roje
ct in
the
Peo
ple’
s R
epub
lic
of B
angl
ades
h
2-12
2
Tab
le 2
.5-1
4 C
oun
term
easu
re T
ech
niq
ue
agai
nst
Liq
uef
acti
on
(
in c
ase
of 1
5m in
dep
th)
Prin- ciple
Nam
e of
Tec
hniq
ue/A
bstr
act
App
lica
bilit
y E
ffic
ienc
y E
valu
-at
ion
Dir
ect C
ost*
)
Densification
Sand
com
pact
ion
Pile
(SC
P)
Pene
trat
ion
of c
asin
g an
d fo
rm s
and
colu
mn
in l
oose
san
d la
yer.
Sand
col
umn
is t
ampe
d an
d de
nsif
ied
wit
h cl
osed
cas
ing
bott
om.
Enl
argi
ng o
f sa
nd c
olum
n w
ould
den
sify
lo
ose
sand
laye
r.
-San
d, g
rave
l, de
bris
-A
ppli
cabl
e de
pth;
20m
-I
n ca
se o
f de
bris
lay
er,
high
pow
er
vibr
ator
nec
essa
ry.
-In
case
of
fine
cla
y co
nten
t (F
c) >
15
%, l
ower
eff
icie
ncy.
180 ~
20
0m/
day
△
35 U
SD
/m
Dyn
amic
Com
pact
ion
(DC
) D
C c
onsi
sts
of p
rovi
ding
hig
h en
ergy
im
pact
s at
the
grou
nd s
urfa
ce b
y re
peat
edly
dro
ppin
g st
eel o
r co
ncre
te
tam
pers
with
wei
ght o
f 6t
- 3
5t f
rom
de
sign
ed h
eigh
ts r
angi
ng f
rom
10
to 2
5m.
**)
-San
d, g
rave
l, de
bris
-A
ppli
cabl
e de
pth;
15m
-E
ven
in c
ase
of l
arge
deb
ris
with
1m
, the
sam
e ap
plic
abili
ty.
-In
case
of
fine
cla
y co
nten
t (F
c) >
15
%, l
ower
eff
icie
ncy.
55~
70㎡/
day
◯
85 U
SD
/m2 *
**)
Com
pact
ion
by v
ibra
ting
bar
wit
h Su
ck-U
p-W
ater
G
roun
d is
den
sifi
ed b
y vi
brat
ed p
enet
ratio
n of
rod
and
dis
sipa
tion
of
exce
ss p
ore
pres
sure
indu
ced.
Ope
ning
is r
efill
ed b
y th
e su
pple
men
t san
dy s
oil f
rom
the
surf
ace
-San
d, G
rave
l-m
ixed
soi
l -A
ppli
cabl
e de
pth;
20m
-I
n ca
se
of
debr
is
and
grav
el,
diff
icul
t du
e to
bre
ak-d
own
of t
he
toe
of c
asin
g.
-In
case
of
fi
ne
clay
co
nten
t (F
c)>
20%
, low
er e
ffic
ienc
y.
180~
200
m/d
ay
△
170
USD
/m2
Dissipation of excess
Gra
vel D
rain
A
fter
cas
ing
auge
r is
inst
alle
d by
rot
atio
n up
to th
e ta
rget
ed d
epth
, cru
shed
sto
ne is
du
mpe
d an
d cr
ushe
d st
one
colu
mn
is
form
ed. E
xces
s po
re p
ress
ure
is d
issi
pate
d th
roug
h cr
ushe
d st
one
colu
mn.
-San
d, G
rave
l-m
ixed
soi
l -A
ppli
cabl
e de
pth;
20m
-I
n ca
se o
f de
bris
fou
ndat
ion,
low
er
effi
cien
cy
220~
250
m/d
ay
×
25 U
SD
/m
Not
e; *
) 1U
SD
=11
0Yen
, **)
Gro
und
impr
ovem
ent (
AS
CE
), P
.5.,
*) E
xclu
sive
of
1m3 s
ettl
emen
t due
com
pact
ed s
oil,

Final Report Preparatory Survey on Matarbari Port Development Project in the People’s Republic of Bangladesh
2-123
(2) Yard Pavement
The container terminal yard pavements were PC slab base traveling lanes, concrete sleepers for container stack base and concrete inter-locking blocks pavement. The uniform design load of steel product yards in multipurpose terminal was 3.5 ton/m2. The typical cross sections of pavement and RTG lane basement slab were sown in Figure 2.5-15 Typical section of Pavement and RTG Traveling PC Slab.
Typical Section of Pavement Basement of RTG
Figure 2.5-15 Typical section of Pavement and RTG Traveling PC Slab
(3) Storm Drainage System
The seaside end top elevation of the terminal yard was CDL + 10.0 m, and the center to land side end of the yard was CDL + 12.0 m on average, with the pavement slope of 1%。 The precipitation was determined on the bases of Cox’s Bazar rainfall record. Considering the discharge duration of 15 minutes for 10 years return period, probable rainfall intensity was 159 mm/hr. Drainage facility in the Container Terminal yard, were U-ditches provided under the container RC sleepers along the RTG traveling lanes, and RC pipes under RTG transverse lanes. Collecting drainage water from those yard drainage, the main drainage was pipes. (See Figure 2.5-16) As for the Multipurpose Terminal, drainage pipes with L-shaped gutters were provided along the yard circulation roads.

Final Report Preparatory Survey on Matarbari Port Development Project in the People’s Republic of Bangladesh
2-124
Figure 2.5-16 Storm Drainage Plan
(4) Water Supply and Fire Fighting System
1) Water Supply System for the Terminal
Two deep wells were determined as sources of water supply. The deep wells were assumed to locate in
the vicinity of Matarbari and/or Maheshkhali area. The water quality data of existing deep wells located at
the elementary schools and some other public facilities in the area are within the limits of potable water,
as prescribed by chemical tests of Chloride (Cl), Arsenic (As), and Ferrous (Fe) contents. Sterilization
units for the ground water were being proposed. Furthermore, the water volume capacity throughout a
year should be confirmed by test wells and pumping test by checking draw-down of well water level
observation, which would be conducted in succeeding design and implementation stages.
Water demand volume was estimated by considering the assumed number of staffs and some particular
demands by the facilities, such as container cleaning and Work-shops use. Water supply for the ships
along-side the quay was also considered and summarized in Table 2.5-15 below.
The relevant water distribution system was indicated as a schematic sketch in Figure 2.5-17. For the
distribution water pressure control, pressure tank(s) system was indicated in the Figure, or elevated water
tank system. An underground reservoir with minimum one day terminal water consumption volume not
less than 600 m3 was proposed.

Final Report Preparatory Survey on Matarbari Port Development Project in the People’s Republic of Bangladesh
2-125
Table 2.5-15 Estimated Fresh Water Demand
FacilitiesAssumuedPopulation
Unit Demand
(m3/day/person)
Water Demand
(m3/day)
Particular Demand
(m3/day)
Total
(m3/day)
Admin. Building 630 0.055 35 35Work Shop 30 0.055 2 3 5CFS 25 0.055 1 2 3Warehouse 50 0.055 3 2 5Harbor Master Office 60 0.055 3 5 8Canteen 100 0.040 4 4Cleaning Equipment 15 15Green Area 20 20
1) Sub Total 95
For Future Expansion 2) 100Ship Supply (Assumed) 3) 300 300
1)+2)+3) Total 495
Daily Demand (icluding Peak Factor 20%) say 600 m3/day
Figure 2.5-17 Schematic Water Supply System
2) Fire Fighting System
The water source for firefighting system is fresh water from underground reservoir.
Two units of fire-fighting pumps with the following hydrant system will be provided
Standard Rate of discharge : 1 m3/minute/hydrant
Minimum supply pressure : 70 m
Minimum diameter of hydrant pipe : 100 mm
Minimum duration of hydrant discharge : 40 min
Total demand for fire-fighting water of the least number of hydrants (5 units)
: 5 hydrants x 1.0 m3/min./hydrant x 40 min= 200 m3
20 units of fire hydrants are being considered to locate in the Terminal area, of which 8 units to be in

Final Report Preparatory Survey on Matarbari Port Development Project in the People’s Republic of Bangladesh
2-126
Container Terminal and 12 units in Multi-Purpose Terminal and connected areas.
(5) Sewerage Treatment System
Sewage water discharged from Administration Building, Work Shop, CFS, and other facilities are to be
collected separately as indicated in Table XX and treated by designated septic tanks.
The volume of sewage was estimated based on the freshwater supply volume as per the following steps
and summarized in Table 2.5-16 below.
Fresh water supply volume (Qw) (see “Fresh Water Supply”)
Daily sewage volume (Qs) = 0.9 x Qw (m3/day)
Infiltration (Qi) = 0.15 x Qs
Maximum daily sewage volume (Qmax) = Qs + Qi
Average daily sewage volume (Qave) = 0.8 x Qmax
Peak sewage volume (Qpk) = 1.5 x Qmax/24 (m3/hr)
Table 2.5-16 Sewerage System Volume Estimation
Fresh WaterDemand:
Qw
DailySewageflow: Qs
Infiltration:Qi
Maximumdaily Flow:
Qmax
Averagedaily Flow
Qave
Peak Flow:Qpk
(m3/day) (m
3/day) (m
3/day) (m
3/day) (m
3/day) (m
3/hr)
1) Admin. Bldg 39.0 35.1 5.3 40.4 32.3 2.52) Harbor Masters Office 8.0 7.2 1.1 8.3 6.6 0.53) Work Shop and CFS Area 23.0 20.7 3.1 23.8 19.0 1.54) Warehouse 5.0 4.5 0.7 5.2 4.1 0.3
75.0 67.5 10.1 77.6 62.1 4.9
Facility Groups
Total
(6) Power Supply and Lighting System
The Port terminal power load demand was estimated on the bases of unit load shown in Table 2.5-17 and
approx. 4.4 M kW total load demand as summarized in Table 2.5-18 of which power consumption of
QGC cranes motors and Reefer container outlets are the major power demand.
Table 2.5-17 Power Demand Unit Load
Lighting Receptacles Air-con. Others Total
Yard (Container) 1.5 - - - 1.5Yard (Multi-P)) 1 - - - 1Yard (Others) 0.5 - - - 0.5
Shop 21 11 - 20 52CFS 6 11 - 20 37
Office 38 11 62.5 20 131.5Canteen/Kitchen 38 11 62.5 20 131.5
FacilitiesUnit Load (VA/m
2)

Final Report Preparatory Survey on Matarbari Port Development Project in the People’s Republic of Bangladesh
2-127
Table 2.5-18 Power Load Estimation
(KVA)(Equivalent
in KW)1st stage 3 900,000 0.6 1,620 1,296 1,296Future 2 900,000 0.6 1,080 864 864
2,160500 15,000 0.25 1,875 1,500 1,500
1,500Container 202,000 1.5 0.7 212 170 170Multi-Purpose 118,000 1 0.5 59 47 47Others 52,000 0.5 0.4 10 8 8
225
Admin.Bldg. 3,000 131.5 0.6 237 189 189Harbor Master Office 600 131.5 0.6 47 38 38CFS 2,800 37 0.5 52 41 41Work Shop 500 52 0.6 16 12 100 112Power House 400 52 0.5 10 8 8Water Supply House 300 52 0.5 8 6 6Container Gate/house 750 52 0.7 27 22 22Warehouse 3,000 37 0.5 56 44 44Weigh-bridge 200 37 0.6 4 4 4Scanner 400 37 0.6 9 7 7
473
4,358
3) SubTotal (Yard/Road Lighting)
Buildings
4) SubTotal (Buildings)
1) to 4) Total
Total(KW)
GantryCranes(unit)
1) SubTotal (Gantry Crane)Reefer container Outlet (unit)
2) SubTotal (Reefer Outlets)
Yard/RoadLighting
Facilities Area (m2)(Unit)
Unit Load
(VA/m2)(VA/unit)
DemandFactor
Power LoadParticular
Load (KW)
The electric power of the Port terminal will be supplied from national power grid thorough REB (Rural
Electrification Board) and distributed to the Port. Those power sub-station (s) will be provided in Primary
Power Station area as indicated in Figure 2.5-19.
The power supply in the Port Terminal was divided into three groups i.e.
i) QGC (Quay Gantry Cranes) 6 KV
ii) Reefer Container outlets 400 V
iii) Yard/Street lighting/Buildings 400 V
As an emergency power supply, three groups of DEG (Diesel Engine Generator) were provided as
indicated in Figure 2.5-18. The yard lighting were by high mast flood lights and street lighting poles. A
Schematic Plan of Electric Power Supply and Yard Lighting System is indicated in Figure 2.5-19.
As for the power supply for future expansion area (Phase 2), some spare terminals will be provided in the
Primary Power Station area.
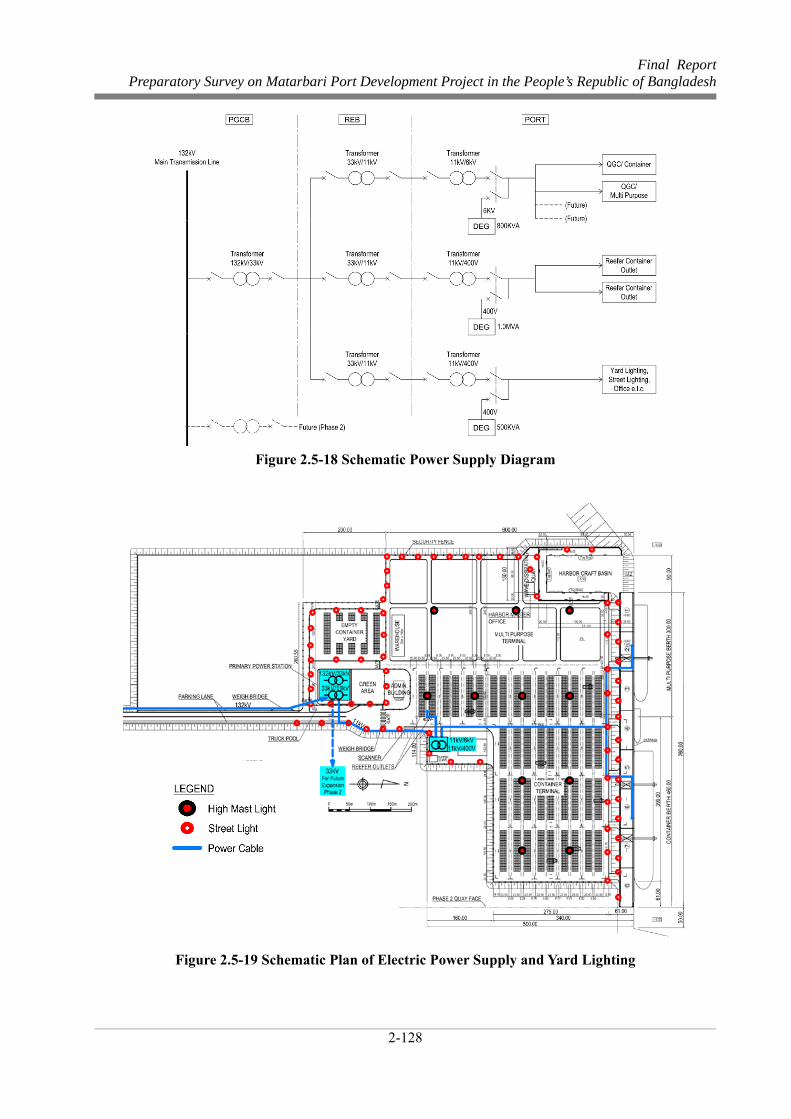
Final Report Preparatory Survey on Matarbari Port Development Project in the People’s Republic of Bangladesh
2-128
Figure 2.5-18 Schematic Power Supply Diagram
Figure 2.5-19 Schematic Plan of Electric Power Supply and Yard Lighting

Final Report Preparatory Survey on Matarbari Port Development Project in the People’s Republic of Bangladesh
2-129
(7) Terminal Buildings
Floor area, number of stories, and structures of major Terminal Buildings were shown in Table 2.5-19.
Table 2.5-19 Terminal Building
Foundation Frame Wall RoofAdmin. Office 4,100 4, partially 5 Pile R/C Conc. Blk. R/C
CFS 2,800 1 RC Footing/Beam Steel Conc. Blk. Ribbed RoofWarehouse 3,000 1 RC Footing/Beam Steel Conc. Blk. Ribbed Roof
Terminal Main Gate 1,850 1 RC Footing/Beam R/C Conc. Blk. R/CWork Shop 400 1 RC Footing/Beam R/C Conc. Blk. Ribbed Roof
Power House 400 1 RC Footing/Beam R/C Conc. Blk. Ribbed RoofHarbor Master Office 600 2 Pile R/C Conc. Blk. R/C
StructureName of Building
Floor Area(m2)
Number ofStories
Amongst those buildings in above Table 2.5-19, the details of the Administration Office building were shown in the following Table 2.5-20. The Admin Office was four stories building, with the pirotis type first floor for parking area, and the fifth floor was an observation/control tower. Floor area was estimated based on the anticipated number of employees.

Final Report Preparatory Survey on Matarbari Port Development Project in the People’s Republic of Bangladesh
2-130
Table 2.5-20 Administration Office Building
Office Room NameNo ofStaff
Unit area
(m2)
Floor Area
(m2)Remarks Floor
Harbor Master,Observation/Control Room
20 3.9 80
Stair Case 40120
Administration 15 3.9 60Director Room 60Sub Director Room 30Secretary/pantry 2 15Eng'g. & Develpmt. 150 3.9 495Meeting Room 30 60Meeting Room 10 30 2 roomsStair Case 70 2 unitsElevator 25Toilet (M) 30Toilet (F) 30Corridor 95
1,000
CPA Terminal Manager Sect. 258 3 750Stair Case 70 2 unitsElevator 25Toilet (M) 30Toilet (F) 30Corridor 95
1,000
Acccount & Computer 15 3.9 75Security (3 Shifts) 34 2.1 70Medical 25 50Pray Room 100 1.4 135
Immigration Office 50Quarantine Office 50
Private Sectors Offices (ShippingAgents, Forwarder, etc) 200Bank 40Stair Case 70 2 unitsElevator 25Toilet (M) 30Toilet (F) 30Corridor 95Entrance hall 80
1,000
Worker (Canteen) 100 200Kitchen 70Toilet (M) 15Toilet (F) 15Car parking 500Entrance hall 80Stair Case 70 2 unitsElevator 25Guard Room/Storage 25
1,000
Total Floor Area 4,120
CPA
GroundFloor
(pilotistype)
Sub Total
3rdFloor
Sub Total
CPA
2ndFloor
Private Office
Sub Total
CPA5th
Floor(Tower)
Sub Total
CPA
4thFloor
Sub Total

Final Report Preparatory Survey on Matarbari Port Development Project in the People’s Republic of Bangladesh
2-131
(8) Port Terminal Facilities and relevant Quantities
The major port terminal facilities and relevant quantities are summarized in Table 2.5-21
Table 2.5-21 Major Port Terminal Facilities and relevant Quantities
Facilities Particulars
Container Quay L=450m, B=35m, Water depth CDL-16 m,
Multi-Purpose Quay L=300 m, B=35 m, Water depth CDL-16m
Quay Ancillary items Rubber Fender w/Protector & Chains: 52 sets
Catwalk 321 m
Mooring Bollards (1,000 kN): 36 sets
Mooring Cleats (350 kN) : 20 sets
Access Bridges L=26m, B=15 m, 6 units
Harbor Craft Basin/Quay/Inner Breakwater Steel Pipe Pile Sheet Pile Wall: 150 m
Inner Breakwater: 150 m
Wave Dissipating Quay: 90 m
Revetment 389 m + 699 m + 279 m
Container Terminal 20.2 ha
Multi-Purpose Terminal 11.8 ha
Empty Container Yard, Primary Power
Station area, Green Area
4 ha
Administration Building 1,000 m2, 4 stories
Harbor Master Office 600 m2
CFS 2,800 m2
Warehouse 3,000 m2
Work shop 400m2
Power House, 400m2, Power Centre (11 kV)
with Emergency DEG 3 sets
Water Supply System Deep well x 2, Reservoir 600 m3 Distribution system,
Firefighting system, Fire Engine
Container Terminal Gate 6 lanes+ 1 lane with Weigh-Bridge (for Import)
Weigh-bridge (for Export)
Yard and street lighting system
Storm drainage system
Security system CCTV, Fence, Guard Houses,
Scanner: 1 set
Sewerage treatment system
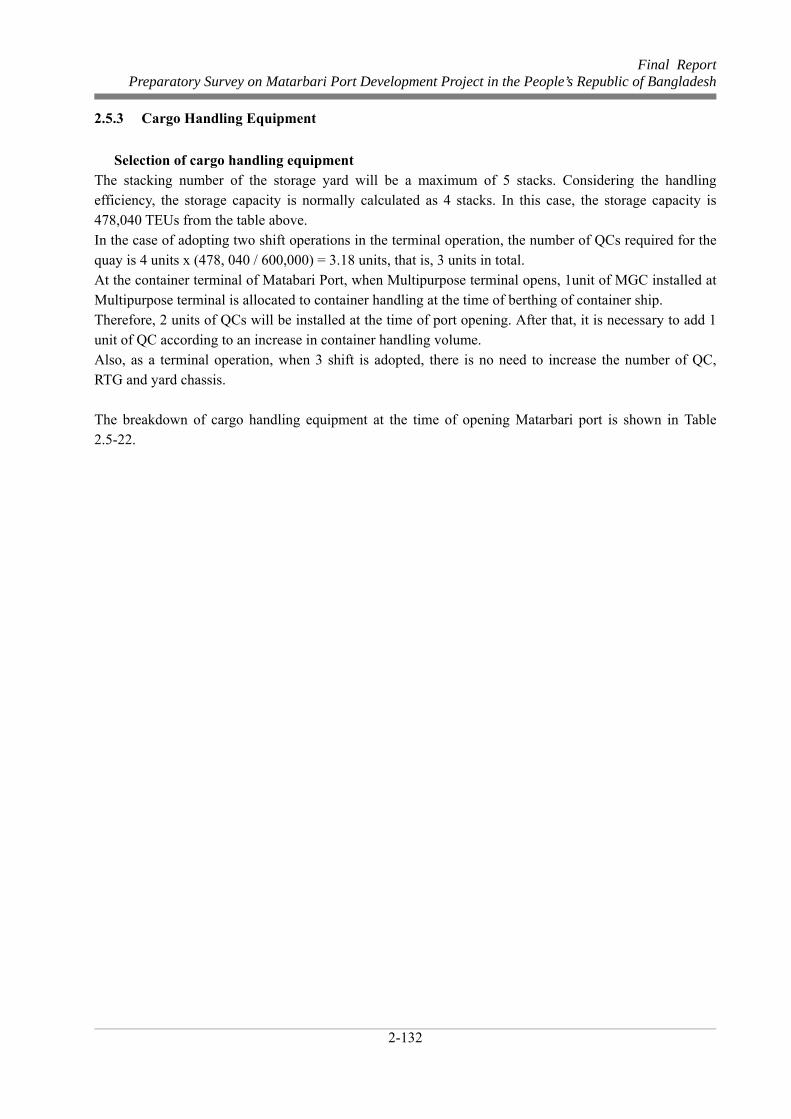
Final Report Preparatory Survey on Matarbari Port Development Project in the People’s Republic of Bangladesh
2-132
2.5.3 Cargo Handling Equipment
Selection of cargo handling equipment
The stacking number of the storage yard will be a maximum of 5 stacks. Considering the handling efficiency, the storage capacity is normally calculated as 4 stacks. In this case, the storage capacity is 478,040 TEUs from the table above. In the case of adopting two shift operations in the terminal operation, the number of QCs required for the quay is 4 units x (478, 040 / 600,000) = 3.18 units, that is, 3 units in total. At the container terminal of Matabari Port, when Multipurpose terminal opens, 1unit of MGC installed at Multipurpose terminal is allocated to container handling at the time of berthing of container ship. Therefore, 2 units of QCs will be installed at the time of port opening. After that, it is necessary to add 1 unit of QC according to an increase in container handling volume. Also, as a terminal operation, when 3 shift is adopted, there is no need to increase the number of QC, RTG and yard chassis. The breakdown of cargo handling equipment at the time of opening Matarbari port is shown in Table 2.5-22.

Final Report Preparatory Survey on Matarbari Port Development Project in the People’s Republic of Bangladesh
2-133
Table 2.5-22 Breakdown of cargo handling equipment at the time of opening Matarbari port
(4 stacks for 5 Tiers)
2 Shifts 3 Shifts
At the time of
services commencement
Maximum of Storage Capacity of Container Yard
Maximum of Storage Capacity of Container Yard
Terminal
Container Handling Volume
About 478,040TEUs
About 691,000TEUs
About 691,000TEUs
Cargo Handling Equipment
Quantity Quantity Quantity
Container Terminal
Quayside Container Crane (QC)
2 3 3
Rubber Tyred Gantry Crane (RTG) (for Storage Yard)
6 9 8
Reach Stacker (RS) 2 3 3
Yard Chassis (Tractor-head & Chassis) (YS)
12 18 16
Multi-purpose Terminal
Multi-purpose Gantry Crane
1 (for General cargo
& container)
1 (for General cargo & container)
1 (for General
cargo & container)
Terminal layout and Cargo handling equipment 1) The terminal layout plan of Phase 1 of the Matarbari Port Development Project is shown in Figure 2.4-20. 2) Cargo handling equipment and related equipment planned to be introduced in Phase 1 are shown in Table 2.5-23.

Final Report Preparatory Survey on Matarbari Port Development Project in the People’s Republic of Bangladesh
2-134
Table 2.5-23 Cargo handling equipment and other related equipment
Terminal Cargo handling equipment &
Related equipment Quantity Main specifications Remarks
Container Terminal
Quayside Container Crane (QC)
2
40LT, 30m Span 51.5m Outreach With 20-40 FT Telescopic Spreader
Equipped with a seismic isolator Major electric products such as motors of traveling equipment are waterproof IP65 equivalent. Equipped with Snag load protection device
Rubber Tyred Gantry Crane (RTG)
6
40LT, Correspond to (6+1) rows 1 over 5 Hybrid type
Equipped with crane anchoring device With transfer crane automatic steering system
Reach stacker (RS) 2 40LT, 6 stacks
Yard Chassis (YS) (with Tractor head)
12
Tractor head, 40FT chassis (20FT x 2 containers loading)
Spare Spreader for QC 2 20-40 FT Telescopic Spreader
Spare Spreader for RTG
2 20-40 FT Telescopic Spreader
Spreader Testing Panel for QC and RTG
1
Testing panel to maintain and inspect the spreaders of QC and RTG
Mount frame for maintenance of spreader is outside the scope of the budget.
Multi-purpose Terminal
Multi-purpose Gantry Crane (MGC)
1
30m Span 51.5m Outreach 40LT for Container handling 30Ton for Cargo handling by Lifting beam with 3hooks Correspond to container handling.
Equipped with a seismic isolator Major electric products such as motors of traveling equipment are waterproof IP65 equivalent. Equipped with 30T Lifting beam Container handling is possible by changing from Lifting beam with hooks to a spreader.
Spreader for MGC 1 20-40 FT Telescopic Spreader
(Same specifications as Spreader for QC)
(Remarks: Cargo handling equipment and related equipment not listed in the above table should be prepared by the counterpart.)
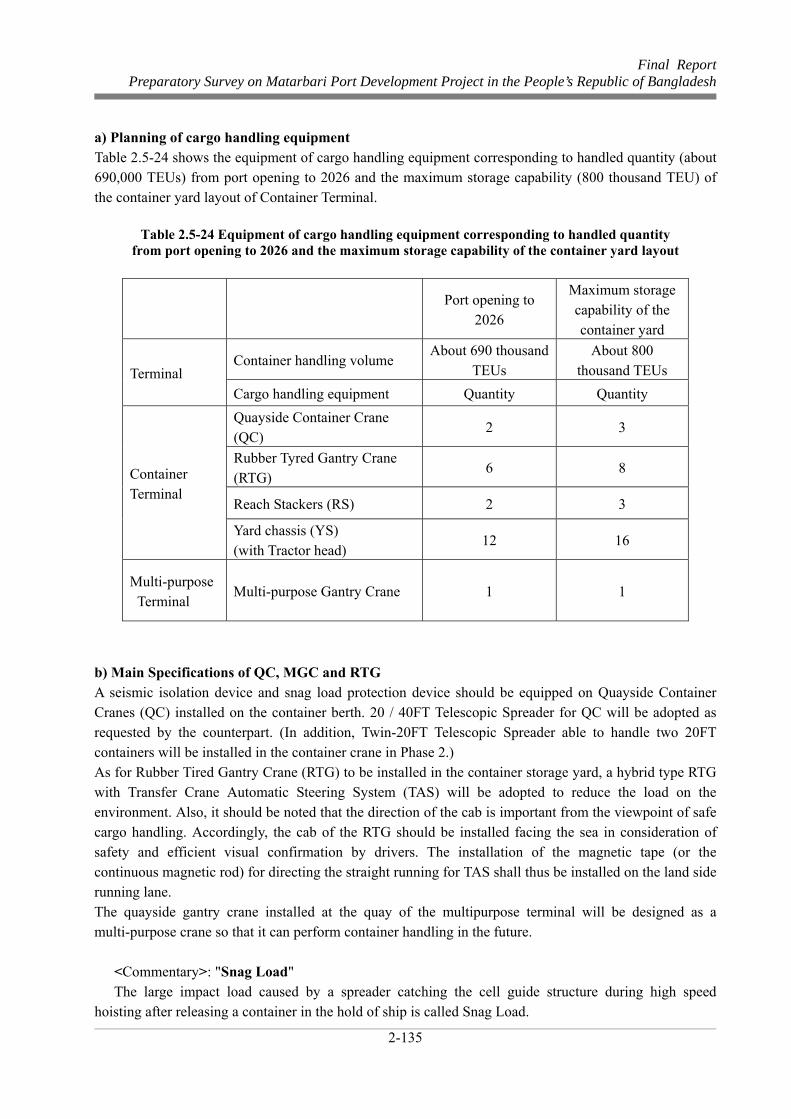
Final Report Preparatory Survey on Matarbari Port Development Project in the People’s Republic of Bangladesh
2-135
a) Planning of cargo handling equipment Table 2.5-24 shows the equipment of cargo handling equipment corresponding to handled quantity (about 690,000 TEUs) from port opening to 2026 and the maximum storage capability (800 thousand TEU) of the container yard layout of Container Terminal.
Table 2.5-24 Equipment of cargo handling equipment corresponding to handled quantity from port opening to 2026 and the maximum storage capability of the container yard layout
Port opening to
2026
Maximum storage capability of the container yard
Terminal Container handling volume
About 690 thousand TEUs
About 800 thousand TEUs
Cargo handling equipment Quantity Quantity
Container Terminal
Quayside Container Crane (QC)
2 3
Rubber Tyred Gantry Crane (RTG)
6 8
Reach Stackers (RS) 2 3
Yard chassis (YS) (with Tractor head)
12 16
Multi-purpose Terminal
Multi-purpose Gantry Crane 1 1
b) Main Specifications of QC, MGC and RTG A seismic isolation device and snag load protection device should be equipped on Quayside Container Cranes (QC) installed on the container berth. 20 / 40FT Telescopic Spreader for QC will be adopted as requested by the counterpart. (In addition, Twin-20FT Telescopic Spreader able to handle two 20FT containers will be installed in the container crane in Phase 2.) As for Rubber Tired Gantry Crane (RTG) to be installed in the container storage yard, a hybrid type RTG with Transfer Crane Automatic Steering System (TAS) will be adopted to reduce the load on the environment. Also, it should be noted that the direction of the cab is important from the viewpoint of safe cargo handling. Accordingly, the cab of the RTG should be installed facing the sea in consideration of safety and efficient visual confirmation by drivers. The installation of the magnetic tape (or the continuous magnetic rod) for directing the straight running for TAS shall thus be installed on the land side running lane. The quayside gantry crane installed at the quay of the multipurpose terminal will be designed as a multi-purpose crane so that it can perform container handling in the future.
<Commentary>: "Snag Load" The large impact load caused by a spreader catching the cell guide structure during high speed
hoisting after releasing a container in the hold of ship is called Snag Load.

Final Report Preparatory Survey on Matarbari Port Development Project in the People’s Republic of Bangladesh
2-136
The breadth of a container ship with a container loading capacity of 8,000 TEU is about 42.8 m ( which allows for 16 to 17 rows of containers on deck), but as the future size of container ships is expected to increase, the number of containers on-deck will be set to 18 rows. Taking the quay normal and the width of the fender into account for this breadth, the outreach of the container crane will be about 48 m or more. The specifications of the container crane to be installed at the container terminal are shown below. The outreach of the quayside gantry crane installed at the multipurpose terminal will be decided in consideration of the width of the 70,000 DWT target ship. The rated load shall be 30 tons taking into consideration the transport weight of the target cargo. The lifting beam for the Multi-purpose gantry crane is equipped with 3 hooks to handle the target cargoes.
The main specifications of the Quayside Container Crane are shown in Table 2.5-25 A schematic overview of the Quayside Container Crane is shown in Figure 2.5-20. Location and type of seismic isolation device of QC is shown in Figure 2.5-21.
Table 2.5-25 Main specifications of Quayside Container Crane (QC)C
Item Unit Value Remarks
Rated load ton
40.6 (Container)
40.6 (Hatch cover)
50 (Heavy cargo)
Lift (under Spreader)
m
36.5 (above Seaside gantry rail)
18.5 (under Seaside gantry rail)
55.0 Total lift
Span m 30
Outreach m 51.5
Backreach m 15
Hoist speed m/min 90 at rated load
180 at Spreader only
Boom hoist speed min/one
cycle 8
Trolley traverse speed
m/min 240
Gantry travel speed m/min 45
Power supply A.C. 6.6kV, 50Hz, 3-phase
Special specification
Equipped with seismic isolation device
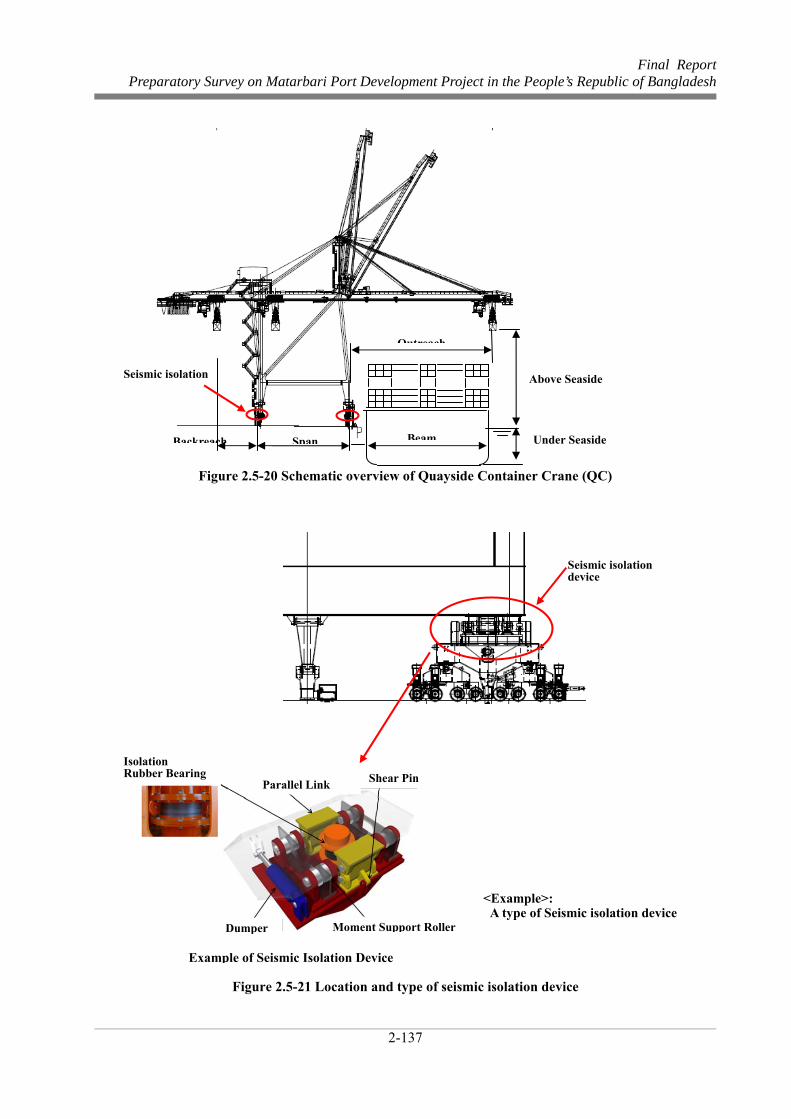
Final Report Preparatory Survey on Matarbari Port Development Project in the People’s Republic of Bangladesh
2-137
Figure 2.5-20 Schematic overview of Quayside Container Crane (QC)
Figure 2.5-21 Location and type of seismic isolation device
Outreach
Backreach
Above Seaside
Under Seaside BeamSpan
Seismic isolation
<Example>:A type of Seismic isolation device
Seismic isolation device
Dumper
Parallel Link
Moment Support Roller
Shear Pin
Isolation Rubber Bearing
Example of Seismic Isolation Device

Final Report Preparatory Survey on Matarbari Port Development Project in the People’s Republic of Bangladesh
2-138
The main specifications of the Multi-purpose Gantry Crane are shown in Table 2.5-26. A schematic overview of the Multi-purpose Gantry Crane is shown in Figure 2.5-22.
Table 2.5-26 Main specifications of Multi-purpose Gantry Crane (MGC)
Item Unit Value Remarks
Rated load ton
30 (under 30 Ton Lifting beam)
40.6 (Under Spreader) (Container handling)
Lift (under Spreader)
m
36.5 (above Seaside gantry rail
18.5 (under Seaside gantry rail)
55.0 Total lift
Span m 30
Outreach m 51.5
Backreach m 15
Hoist speed m/min 90 at rated load
180 at Spreader only
Boom hoist speed min/one cycle
8
Trolley traverse speed m/min 240
Gantry travel speed m/min 45
Power supply A.C. 6.6kV, 50Hz, 3-phase
Special specification Equipped with seismic isolation device
Figure 2.5-22 Schematic overview of Multi-purpose Gantry Crane (MGC)
Beam
Outreach
Above Seaside gantry rail
Under Seaside gantry rail
Backreach Span
Seismic isolation device
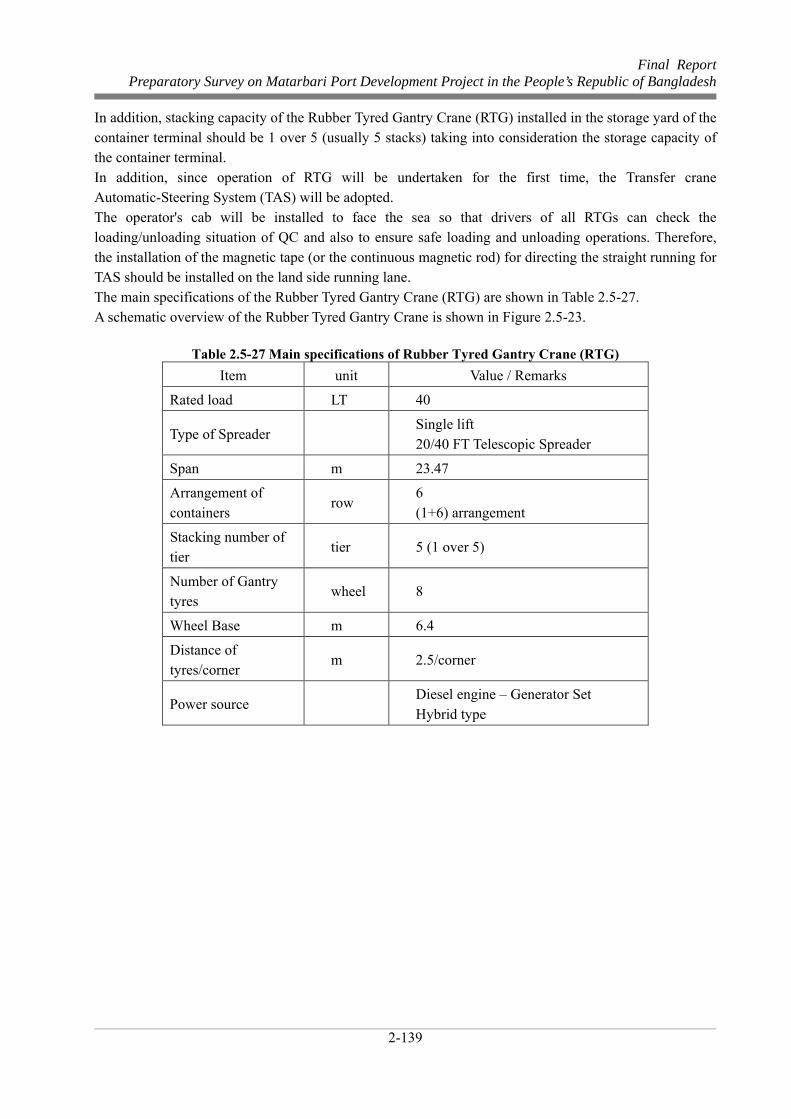
Final Report Preparatory Survey on Matarbari Port Development Project in the People’s Republic of Bangladesh
2-139
In addition, stacking capacity of the Rubber Tyred Gantry Crane (RTG) installed in the storage yard of the container terminal should be 1 over 5 (usually 5 stacks) taking into consideration the storage capacity of the container terminal. In addition, since operation of RTG will be undertaken for the first time, the Transfer crane Automatic-Steering System (TAS) will be adopted. The operator's cab will be installed to face the sea so that drivers of all RTGs can check the loading/unloading situation of QC and also to ensure safe loading and unloading operations. Therefore, the installation of the magnetic tape (or the continuous magnetic rod) for directing the straight running for TAS should be installed on the land side running lane. The main specifications of the Rubber Tyred Gantry Crane (RTG) are shown in Table 2.5-27. A schematic overview of the Rubber Tyred Gantry Crane is shown in Figure 2.5-23.
Table 2.5-27 Main specifications of Rubber Tyred Gantry Crane (RTG)
Item unit Value / Remarks
Rated load LT 40
Type of Spreader Single lift 20/40 FT Telescopic Spreader
Span m 23.47
Arrangement of containers
row 6 (1+6) arrangement
Stacking number of tier
tier 5 (1 over 5)
Number of Gantry tyres
wheel 8
Wheel Base m 6.4
Distance of tyres/corner
m 2.5/corner
Power source Diesel engine – Generator Set Hybrid type

Final Report Preparatory Survey on Matarbari Port Development Project in the People’s Republic of Bangladesh
2-140
Figure 2.5-23 Schematic overview of Rubber Tyred Gantry Crane (RTG)
Spreader
Gantry travel equipment Span
Diesel engine -Generator Set
Direction to see QC Operator’s
Cab
Wheel Base

Final Report Preparatory Survey on Matarbari Port Development Project in the People’s Republic of Bangladesh
2-141
2.5.4 Channel, Basin and other Marine Facilities
(1) Introduction The previous study results in Section 2.4.4 showed the necessity of extension of northern Training Dike and southside Sand Protection Dike and no necessity of function of breakwater for these Dike structure. Crown height level is determined to have the function of countermeasure works against channel and basin sedimentation. Detailed design works of extension part of Training Dike and Sand Protection Dike as well as the Channel and basin are done by the consultant of Matarbari Coal Fired Power Plant Project. In this section, basic design conditions, design procedure and the results of the design by the consultant of MUSCCPP are summarized. (2) Approach channel and basin
Design ship type and size supposed as shown below. In addition, one-way channel condition is considered
for Phase-1 and Phase-2.
Phase-1
Ship type: Container carrier
Size of the vessel: 100,000-110,000DWT (8,000TEU)
Length Overall: 325-340m
Breadth: 42.8-43.2m
Full Draft: 13.8-14.5m
Phase-2
Ship type: Container carrier
Size of the vessel: 100,000-110,000DWT (8,000TEU)
Length Overall: 325-340m
Breadth: 42.8-43.2m
Full Draft: 13.8-14.5m
i) Approach Channel Width
In determining the required width of the approach channel, “Technical Standards and Commentaries for Port and Harbour Facilities in Japan” is considered. According to this standard, required width of Approach channel for one-way navigation is 0.5L to 1.0L and depends on oceanographic conditions, interval of channel buoys, etc. Thus, at this stage of design, 350m which is slightly higher value of 1.0L (=340m) is applied.
ii) Approach Channel Water Depth
Similarly, “Technical Standards and Commentaries for Port and Harbour Facilities in Japan” is considered for the evaluation of required water depth of approach channel. Coefficient of channel depth of 1.10 is selected. Thus, CDL-16m (=CD-14.5m x 1.10 = CD-15.95m) is applied.
iii) Turning Basin
According to “Technical Standards and Commentaries for Port and Harbour Facilities in Japan”, circular

Final Report Preparatory Survey on Matarbari Port Development Project in the People’s Republic of Bangladesh
2-142
turning basin area having a diameter of 2.0L considering the tag boat assist for bow turning is required. As for the required water depth of turning basin, same water depth of inner channel is employed for the turning basin area.
By following this standard, the water depth of turning basin is CD-16.0m and the diameter of the circular
turning basin area is 700m (=2.0L) is considered.
iv) Side Slope Gradient
In order to determine the side slope gradient of the approach channel, experienced value of side slopes
gradient for various type of soil under typical wave and current conditions are taken into consideration
and slope stability analysis against the sloping failure are also taking into consideration to determine the
design value. Table 2.5-28 shows the example of the proposed side slope values by BS.
Because of the lack of information about the soil properties and its strata, side slope gradients of the approach channel used for Matarbari Coal Fired Power Plant are considered. Side slope gradient of 1:2 to 1:5 depending on the soil properties are obtained through the detailed design of Matarbari Coal Fired Power Plant. Table 2.5-29 showed the proposed values of side slope gradient of Matarbari Coal Fired Power Plant Project. Confirmation of these value by slope stability analysis against the sloping failure at the following stage study.
The safer side slope gradient of 1:5 for all soil strata is considered as a temporal value for the study.
Table 2.5-28: Typical Side Slopes for Various Soil for Underwater Slopes
Soil type Side slope
Still Water Active Water
Rock Nearly vertical x Nearly vertical x
Stiff clay 45° '1.0 45° '1.10
Firm clay 40° '1.12 35° '1.14
Sandy clay 25° 2 15° 4
Coarse sand 20° 3 10° 6
Fine sand 15° 4 5° 11
Mud and silt 10° to 1° '6-38 5° or Less
Source: BS6349 Part5 1991

Final Report Preparatory Survey on Matarbari Port Development Project in the People’s Republic of Bangladesh
2-143
Table 2.5-29: Results of Slope Stability Analysis along the Channel and Basin
Layer Soil N-value Property Necessary side slope
Proposed side slope under severe wave and current
condition
Bs Sandy soil 4 to 24 Very loose to Medium
Dense 1:3
Ac-1 Clayey soil 0 to 4 Very soft to soft 1:5
Ac-2 Clayey soil 4 to 8 Medium stiff 1:4
Ac-3 Clayey soil 8 to 15 Stiff 1:3
Ac-4 Clayey soil 15 to 30 Very stiff 1:2
As-1 Sandy soil 0 to 10 Very loose to loose 1:3
As-2 Sandy soil 10 to 30 Medium dense 1:2
As-3 Sandy soil 30 to 50 Dense 1:2
Dc Clayey soil More than 30 Hard
Ds Sandy soil More than 50 Very stiff
(3) Breakwater
1) Astronomical tide conditions
The tidal observation gauge installed at Kutbudia by Survey of Bangladesh was removed in the year of 2011. As a result, there is a lack in tidal data from 2012 to the beginning of 2015. According to the report of MUSCCPP, to investigate the tidal level at the Project Area, the tidal investigation was conducted in Kutubdia Island for 5 months from March to July 2015, and the harmonic analysis was conducted to predict 60 tidal constituents based on the tidal data of 2011 from January to August which was measured by the Bangladesh Climate Department. The amplitudes of 9 main constituents were predicted, and the tidal data for 18.6 years was regenerated based on these constituents. Figure 2.5-24 shows the results of each tide level. As a result, the range of tide at the Project site is estimated about 4.33m and the CDL is around 2.68m under the MSL. The estimated data have good correlation with the data in the existing report
Source: MUSCCPP
Figure 2.5-24 Tide condition at the project site

Final Report Preparatory Survey on Matarbari Port Development Project in the People’s Republic of Bangladesh
2-144
2) Storm surge
In the previous D/D study for MUSCCPP, extreme value statistical analysis by Goda method (modified PA method) had been done to obtain the storm surge height for several return periods. Because the storm surge observation near the site are not available, predicted storm surge height of past major cyclone records from 1991 to 2013 by numerical simulation method were used in the D/D study. Table 2.5-30 showed the predicted storm surge height for several return periods at southern side of Matarbari Area.
Table 2.5-30 Storm Surge Height at Southern Side of Matarbari Area
Return Period Probable Storm Surge Height
10 years 1.76 m
20 years 2.79 m
25 years 3.16 m
30 years 3.49 m
50 years 4.53 m
100 years 6.30 m
Source: JICA Survey Team
3) Offshore design wave conditions
In the previous F/S study for MUSCCPP, extreme value statistical analysis of deep water waves has been done by using the wave forecasting data at the coordinates of which are (91.5°E, 20.5°N), shown in Figure 2.5-25, for 50 years from 1961 to 2010. 3rd generation wave forecasting model “JWA3G” developed by the Japan Weather Agency were used for wave forecast. Offshore significant wave with 50 years return period shown in Table 2.5-31 were used as the offshore design waves for MUSCCPP. These results are also used as the offshore design wave conditions for the port facilities of this project.

Final Report Preparatory Survey on Matarbari Port Development Project in the People’s Republic of Bangladesh
2-145
Source: MUSCCPP
Figure 2.5-25: Location of the Wave Predicted Location
Table 2.5-31: Offshore Significant Design Waves with Return Period of 50 Years
Wave direction Significant wave height Significant wave period
SW 5.45m 9.4s
SSW 6.69m 10.2s
S 6.03m 9.8s
Source: MUSCCPP
4) Design waves for breakwater
3 tide level conditions shown in Table 2.5-32 are considered for the structural design of the breakwater.
Table 2.5-32 Tide conditions for the structural design of breakwater
Tide level Remarks
HHWL CDL+8.04 =HWL + Storm surge height of 25 years return period 3.16m are considered
HWL CDL+4.88m
LWL CDL+0.55m
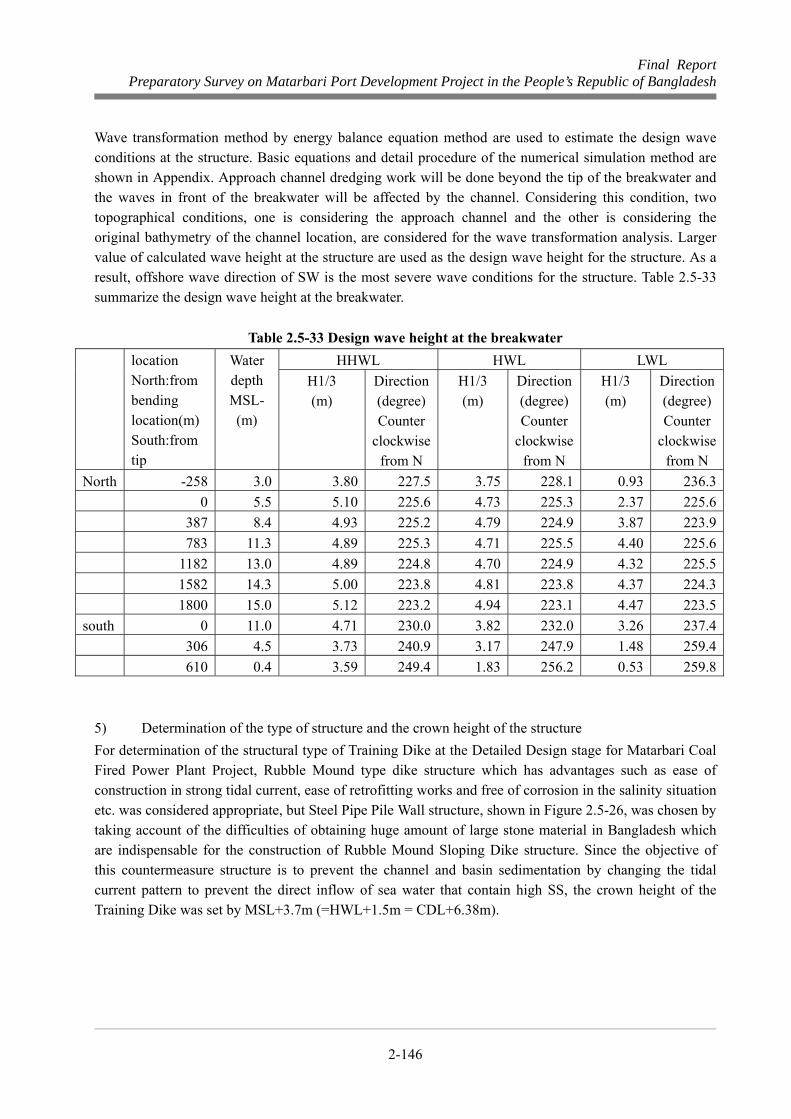
Final Report Preparatory Survey on Matarbari Port Development Project in the People’s Republic of Bangladesh
2-146
Wave transformation method by energy balance equation method are used to estimate the design wave conditions at the structure. Basic equations and detail procedure of the numerical simulation method are shown in Appendix. Approach channel dredging work will be done beyond the tip of the breakwater and the waves in front of the breakwater will be affected by the channel. Considering this condition, two topographical conditions, one is considering the approach channel and the other is considering the original bathymetry of the channel location, are considered for the wave transformation analysis. Larger value of calculated wave height at the structure are used as the design wave height for the structure. As a result, offshore wave direction of SW is the most severe wave conditions for the structure. Table 2.5-33 summarize the design wave height at the breakwater.
Table 2.5-33 Design wave height at the breakwater
location North:from bending location(m) South:from tip
Water depth MSL- (m)
HHWL HWL LWL
H1/3 (m)
Direction (degree)Counter
clockwise from N
H1/3 (m)
Direction (degree) Counter
clockwise from N
H1/3 (m)
Direction (degree) Counter
clockwise from N
North -258 3.0 3.80 227.5 3.75 228.1 0.93 236.3
0 5.5 5.10 225.6 4.73 225.3 2.37 225.6
387 8.4 4.93 225.2 4.79 224.9 3.87 223.9
783 11.3 4.89 225.3 4.71 225.5 4.40 225.6
1182 13.0 4.89 224.8 4.70 224.9 4.32 225.5
1582 14.3 5.00 223.8 4.81 223.8 4.37 224.3
1800 15.0 5.12 223.2 4.94 223.1 4.47 223.5
south 0 11.0 4.71 230.0 3.82 232.0 3.26 237.4
306 4.5 3.73 240.9 3.17 247.9 1.48 259.4
610 0.4 3.59 249.4 1.83 256.2 0.53 259.8
5) Determination of the type of structure and the crown height of the structure
For determination of the structural type of Training Dike at the Detailed Design stage for Matarbari Coal Fired Power Plant Project, Rubble Mound type dike structure which has advantages such as ease of construction in strong tidal current, ease of retrofitting works and free of corrosion in the salinity situation etc. was considered appropriate, but Steel Pipe Pile Wall structure, shown in Figure 2.5-26, was chosen by taking account of the difficulties of obtaining huge amount of large stone material in Bangladesh which are indispensable for the construction of Rubble Mound Sloping Dike structure. Since the objective of this countermeasure structure is to prevent the channel and basin sedimentation by changing the tidal current pattern to prevent the direct inflow of sea water that contain high SS, the crown height of the Training Dike was set by MSL+3.7m (=HWL+1.5m = CDL+6.38m).
Final Report Preparatory Survey on Matarbari Port Development Project in the People’s Republic of Bangladesh
2-147
Figure 2.5-26 Designed cross section of Steel Pipe Pile wall for Training Dike
As the Contractor of Matarbari Coal Fired Power Plant proposed the use of Rock Quarry in Malaysia so that the employment of Rubble Mound Sloping Dike structure as the type of structure for Training Dike and Sand Protection Dike. Considering the change of the situation of the supply of stone material, employment of Rubble Mound Dike structure that requires a large amount of rock material rather than the structural type using steel materials are determined for not only the extension part of the Training Dike but also the Training Dike that was designed by Steel Pipe Pile wall type structure at DD stage and southside Sand Protection Dike by considering the following reasons,
Assurance of continuous supply of large amount of stone material
Comparative easiness of construction in strong tidal current conditions
Convenience of periodical maintenance work and future expansion and modification works
Easiness of retrofitting works at the event of unexpected damages
Free from corrosion that was unavoidable with structures using steel materials
Core rubble mound that can be considered as Impermeable countermeasure structure against sedimentation is covered by artificial concrete blocks of Tetrapod. Crown height of core rubble mound are set as high as HWL (CDL+4.88m) that can prevent most of the outer sea water direct inflow through the dike structure. Crown height of Training Dike and Sand Protection Dike are dependent on the size of artificial armor concrete blocks which are determined by the incident design wave conditions. Because the crown height of the dike is relatively low compared with other conventional breakwater structure, same size of the artificial armor concrete blocks with outside part for inside part of the structure are employed considering the rather strong overtopping wave effect on the stability of the concrete blocks. Width of the crown of the dike are determined by the necessary width for deploying minimum 3 artificial armor concrete blocks at the top of dike. Figure 2.5-27 shows the typical Cross section of Rubble Mound Sloping Dike structure for the Training Dike and Sand Protection Dike.
Final Report Preparatory Survey on Matarbari Port Development Project in the People’s Republic of Bangladesh
2-148
Figure 2.5-27 Typical cross section of the proposed Rubble Mound Dike
Necessary size of wave dissipating blocks are determined by the Hudson’s formula shown below.
where,
M: required mass of concrete blocks (t) ρr: density of concrete blocks (t/m3) H: wave height (m) Ns: stability number determined by each concrete block Sr: specific gravity of concrete blocks relative to water
6) Sub soil conditions
Boring survey had been done along the planned location of Training Dike shown in Figure 2.5-28. Longitudinal soil profile shown in Figure 2.5-29 had been obtained. Design soil parameters shown in Table 2.5-34 were determined by the standard penetration test and laboratory soil test data for undisturbed soil samples. Stability analysis by circular slip failure analysis using Modified Fellenius Method showed that the necessity of soil improvement works due to the existence of very weak layer of “Ac1”. Sand replacement work down to the bottom of Ac1 layer had been chosen as the soil improvement work.
Final Report Preparatory Survey on Matarbari Port Development Project in the People’s Republic of Bangladesh
2-149
Figure 2.5-28 Location of Soil Survey for additional countermeasure works by MUSCCPP
Final Report Preparatory Survey on Matarbari Port Development Project in the People’s Republic of Bangladesh
2-150
Figure 2.5-29 (1) Longitudinal soil profile along Training Dike
Figure 2.5-29 (2) Longitudinal soil profile along Training Dike

Final Report Preparatory Survey on Matarbari Port Development Project in the People’s Republic of Bangladesh
2-151
Table 2.5-34 Design soil parameters
Soil layer
Wet unit weight
(kN/m3)
Internal friction angle
(degree)
Cohesion (kN/m2)
As1 20 28 0
Ac1 16 0 15
As2 20 35 0
Ac2 20 0 75
As3 20 35 0
Ac3 20 0 100
7) Resultant cross section of breakwater
Figure 2.5-30 showed the typical cross section of Training Dike. Sand replacement work is applied at the location where weak layer of “Ac1” is considered to be exist. Figure 2.5-31 showed the typical cross section of extension parts of Training Dike. Sand replacement work is also applied at the location where weak layer of “Ac1” is considered to be exist. Table 2.5-35 summarize the quantities of volume of those structures.
Figure 2.5-30 (1) Cross section of Training Dike

Final Report Preparatory Survey on Matarbari Port Development Project in the People’s Republic of Bangladesh
2-152
Figure 2.5-30 (2) Cross section of Training Dike
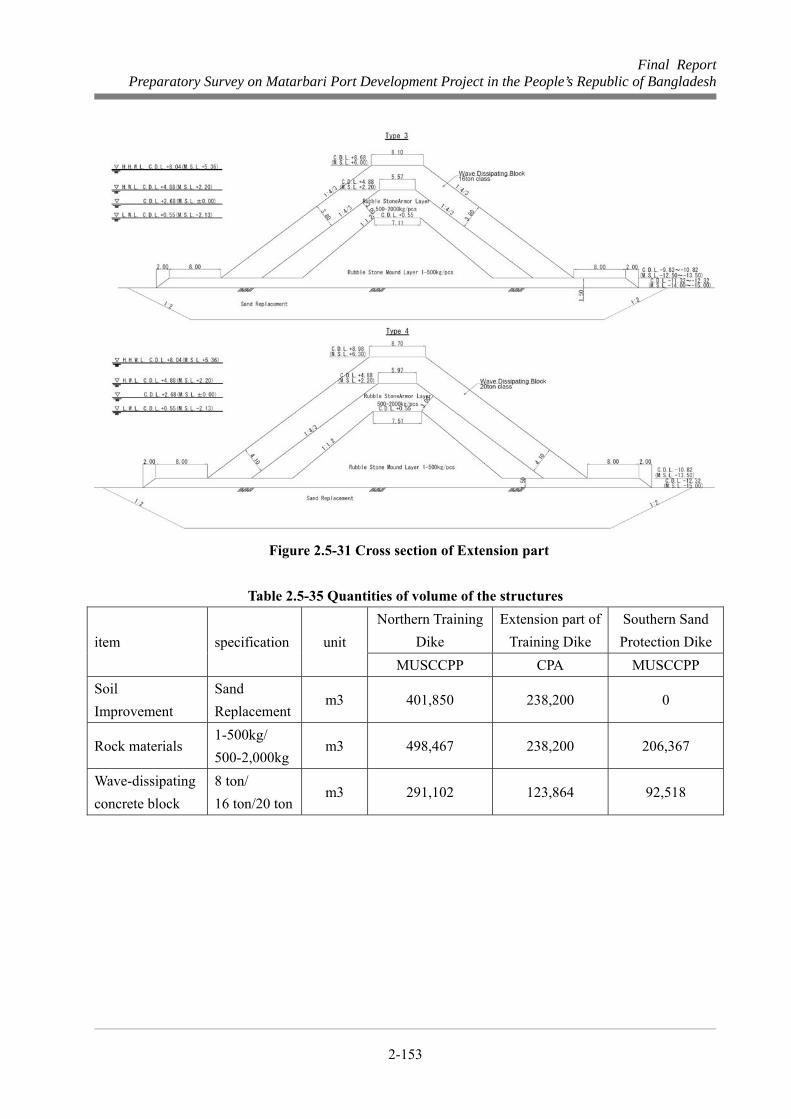
Final Report Preparatory Survey on Matarbari Port Development Project in the People’s Republic of Bangladesh
2-153
Figure 2.5-31 Cross section of Extension part
Table 2.5-35 Quantities of volume of the structures
item specification unit
Northern Training
Dike
Extension part of
Training Dike
Southern Sand
Protection Dike
MUSCCPP CPA MUSCCPP
Soil
Improvement
Sand
Replacement m3 401,850 238,200 0
Rock materials 1-500kg/
500-2,000kg m3 498,467 238,200 206,367
Wave-dissipating
concrete block
8 ton/
16 ton/20 ton m3 291,102 123,864 92,518
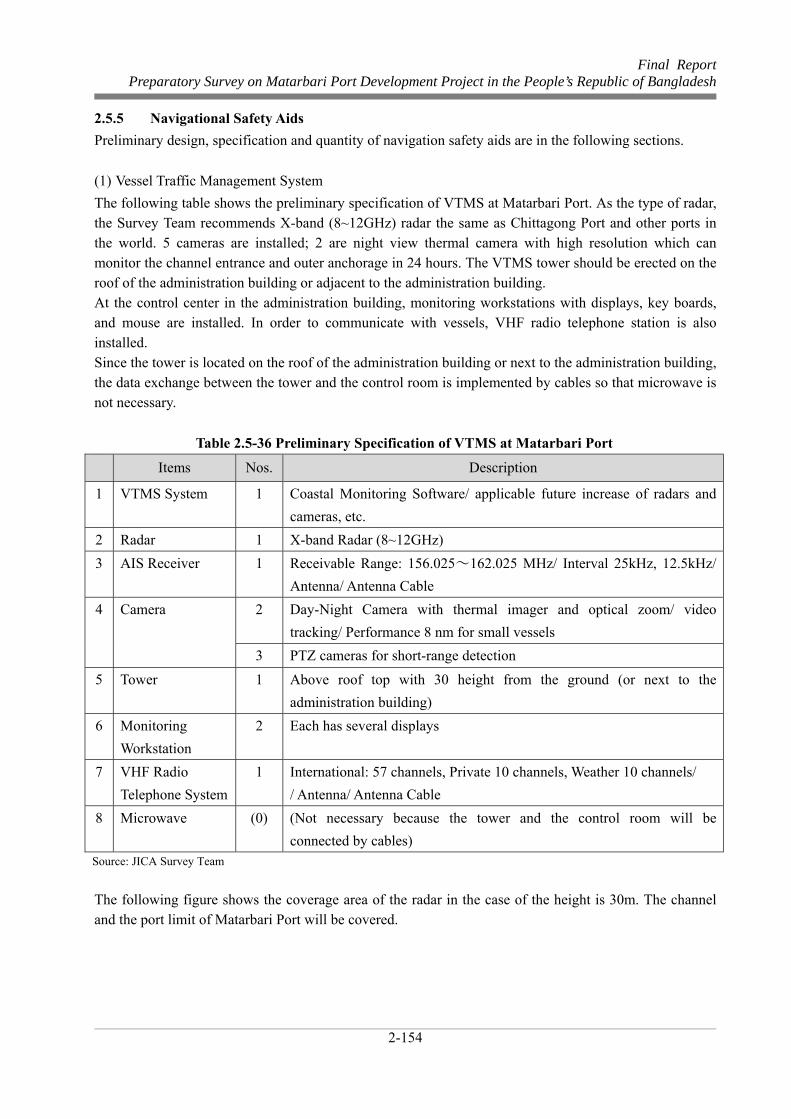
Final Report Preparatory Survey on Matarbari Port Development Project in the People’s Republic of Bangladesh
2-154
2.5.5 Navigational Safety Aids
Preliminary design, specification and quantity of navigation safety aids are in the following sections.
(1) Vessel Traffic Management System
The following table shows the preliminary specification of VTMS at Matarbari Port. As the type of radar, the Survey Team recommends X-band (8~12GHz) radar the same as Chittagong Port and other ports in the world. 5 cameras are installed; 2 are night view thermal camera with high resolution which can monitor the channel entrance and outer anchorage in 24 hours. The VTMS tower should be erected on the roof of the administration building or adjacent to the administration building. At the control center in the administration building, monitoring workstations with displays, key boards, and mouse are installed. In order to communicate with vessels, VHF radio telephone station is also installed. Since the tower is located on the roof of the administration building or next to the administration building, the data exchange between the tower and the control room is implemented by cables so that microwave is not necessary.
Table 2.5-36 Preliminary Specification of VTMS at Matarbari Port Items Nos. Description
1 VTMS System 1 Coastal Monitoring Software/ applicable future increase of radars and
cameras, etc.
2 Radar 1 X-band Radar (8~12GHz)
3 AIS Receiver 1 Receivable Range: 156.025~162.025 MHz/ Interval 25kHz, 12.5kHz/
Antenna/ Antenna Cable
4 Camera 2 Day-Night Camera with thermal imager and optical zoom/ video
tracking/ Performance 8 nm for small vessels
3 PTZ cameras for short-range detection
5 Tower 1 Above roof top with 30 height from the ground (or next to the
administration building)
6 Monitoring
Workstation
2 Each has several displays
7 VHF Radio
Telephone System
1 International: 57 channels, Private 10 channels, Weather 10 channels/
/ Antenna/ Antenna Cable
8 Microwave (0) (Not necessary because the tower and the control room will be
connected by cables) Source: JICA Survey Team
The following figure shows the coverage area of the radar in the case of the height is 30m. The channel and the port limit of Matarbari Port will be covered.
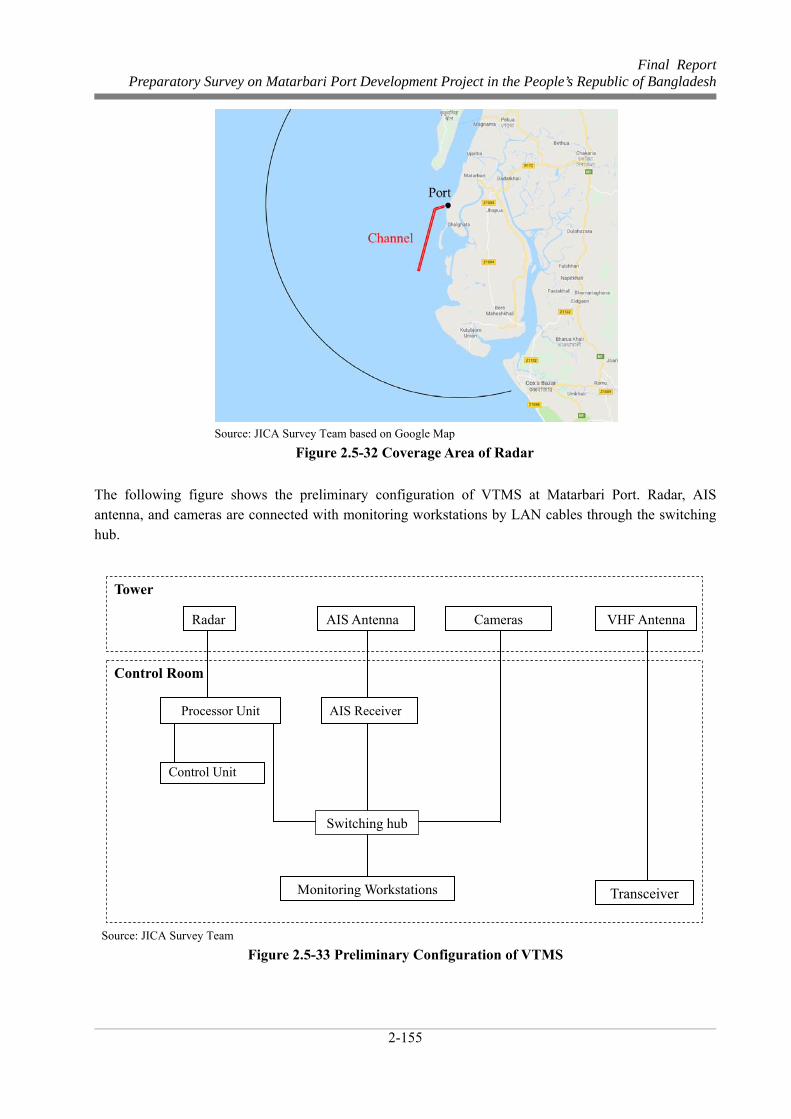
Final Report Preparatory Survey on Matarbari Port Development Project in the People’s Republic of Bangladesh
2-155
Source: JICA Survey Team based on Google Map
Figure 2.5-32 Coverage Area of Radar
The following figure shows the preliminary configuration of VTMS at Matarbari Port. Radar, AIS antenna, and cameras are connected with monitoring workstations by LAN cables through the switching hub.
Source: JICA Survey Team
Figure 2.5-33 Preliminary Configuration of VTMS
Tower
Control Room
Radar AIS Antenna VHF Antenna
Processor Unit
Control Unit
AIS Receiver
Cameras
Switching hub
Monitoring Workstations Transceiver

Final Report Preparatory Survey on Matarbari Port Development Project in the People’s Republic of Bangladesh
2-156
(2) Lighted Buoys, Leading Lights
Basically, lighted buoys for navigation are shared with the port of the power plant; and the installation of these facilities will be included in their portion. Therefore, in this section, lighted buoys and leading lights shown in the following figure, namely, two red lighted buoys, one green lighted buoy, and a pair of leading lights are mainly examined since these instruments are newly proposed as a result of discussion with CPA pilots.
Source: JICA Survey Team
Figure 2.5-34 Details around Terminals
1) Lighted Buoys
Usually, lighthouses are installed at the end of breakwaters in order for vessels to realize the existence of the infrastructure from the perspective of safe navigation. Although it is desirable to construct lighthouses on the breakwaters, it is impossible because of the type of structure of the breakwater. Therefore, pillar-type lighted buoys are installed to indicate the entrance of breakwaters and the flexion point inside the breakwaters. As a reference, the following figure shows a lighthouse on the breakwater which is replaced by a pillar-type lighted buoy.

Final Report Preparatory Survey on Matarbari Port Development Project in the People’s Republic of Bangladesh
2-157
Source: Japan Coast Guard
Figure 2.5-35 Pillar-type Lighted Buoy
The following table shows the preliminary specification of pillar-type lighted buoys at Matarbari Port. With considering the sea condition around the top of the breakwater, and the visibility from going vessels, the primary overall height of the buoy body is approximately 27 m. Light equipment is LED and luminous range should be 5 NM. The battery system is solar type; solar cell module, charging controller, and storage battery are installed. The expected life of pillar type buoys is approximately 10 years.
Table 2.5-37 Preliminary Specification of Pillar-type Lighted Buoys
Items Nos. Description
1 Buoy Body 3 Over all height: approximately 27 m/ Height of the lamp: 6.5m (HHWL)
Buoy body: Steel/ Platform Aluminum
2 Light Equipment 3 LED/ Green/ 2 flashings every 6 second/ Luminous range 5.0 NM
LED/ Red/ 2 flashings every 6 second/ Luminous range 5.0 NM
LED/ Red/ 1 flashing every 3 second/ Luminous range 5.0 NM
3 Solar Generator
with Battery
3 Solar cell module/ Charging controller/ Storage battery
4 Accessories 3 Top mark, Radar reflector, Antenna, Synchronizer, etc. Source: JICA Survey Team
Top mark and color of buoys need to comply with” Navguide, Aids to Navigation Manual, 2014” published by IALA (the International Association of Marine Aids to Navigation and Lighthouse Authorities) shown in the following figures.

Final Report Preparatory Survey on Matarbari Port Development Project in the People’s Republic of Bangladesh
2-158
Source: Navguide, Aids to Navigation Manual, 2014
Figure 2.5-36 Description of Lateral Marks
2) Leading Lights
Leading light is a pair of beacons which indicate the direction of navigation for vessels. When the front beacon and rear beacon are seen on line from the vessel, the vessel is on correct direction. The following figure shows the concept of leading lights.
Source: JICA Study Team with picture from Japan Coast Guard Web
Figure 2.5-37 Function of Leading Lights
Leading lights are pair of beacons; the front beacon is lower than the rear beacon. The following figure is

Final Report Preparatory Survey on Matarbari Port Development Project in the People’s Republic of Bangladesh
2-159
an example of beacon installed by JICA at a cooperation project in the Philippines.
Source: JICA website
Figure 2.5-38 Example of Beacon
The following table shows the preliminary specification of leading lights at Matarbari Port. With considering the visibility from going vessels, the primary overall height of the buoy body is approximately 16 m for the front light and 22 m for the rear light. Light equipment is LED and luminous range should be more than 5 NM. The battery system is solar type; solar cell module, charging controller, and storage battery are installed.
Table 2.5-38 Preliminary Specification of Leading Lights Items Nos. Description
1 Beacon Body 2 [Front] Over all height: approximately16 m/ Height of the lamp:
approx. 16 m/ Material: Aluminum/ Paint Color: White
[Rear] Over all height: approximately22 m/ Height of the lamp:
approx. 22 m/ Material: Aluminum/ Paint Color: White
2 Light Equipment 2 LED/ White/ Quick flashing every 1 sec/ Luminous range: more than
5.0 NM/ Stainless
3 Solar Generator
with Battery
2 Solar cell module/ Charging controller/ Storage battery
4 Accessories 2 Antenna, Synchronizer, etc. Source: JICA Survey Team
Color of leading lights need to comply with” Navguide, Aids to Navigation Manual, 2014” published by IALA (the International Association of Marine Aids to Navigation and Lighthouse Authorities) shown in
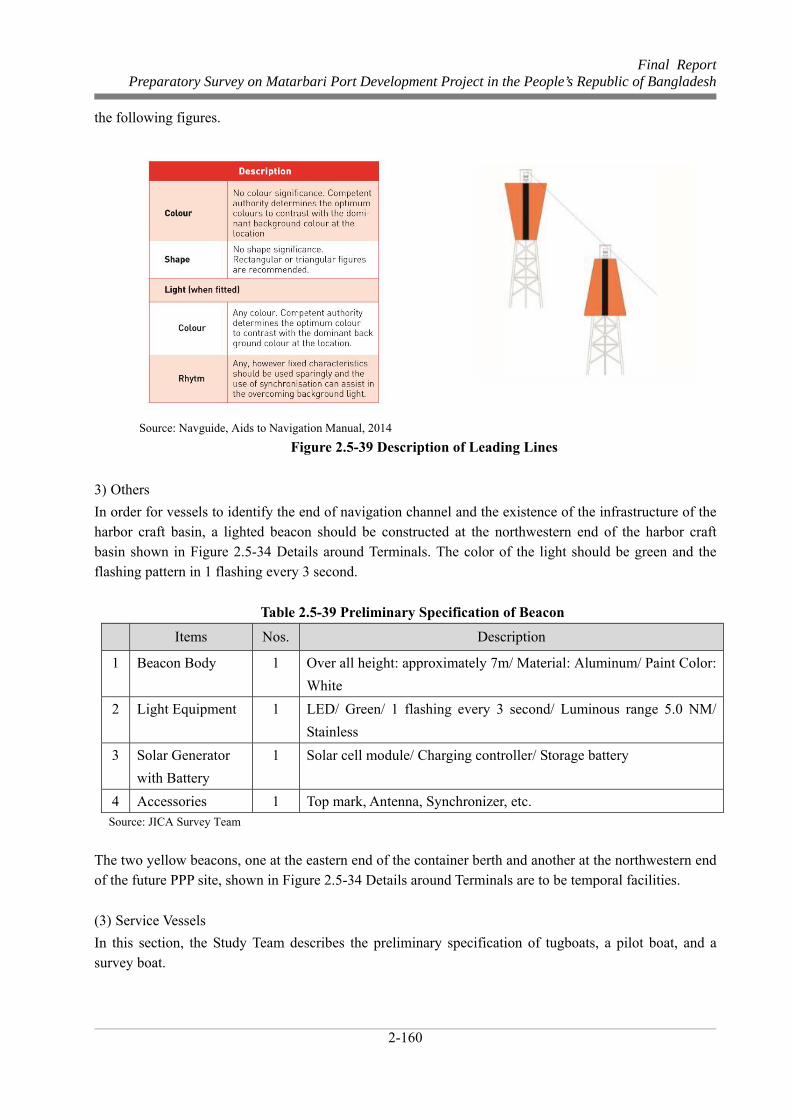
Final Report Preparatory Survey on Matarbari Port Development Project in the People’s Republic of Bangladesh
2-160
the following figures.
Source: Navguide, Aids to Navigation Manual, 2014
Figure 2.5-39 Description of Leading Lines
3) Others
In order for vessels to identify the end of navigation channel and the existence of the infrastructure of the harbor craft basin, a lighted beacon should be constructed at the northwestern end of the harbor craft basin shown in Figure 2.5-34 Details around Terminals. The color of the light should be green and the flashing pattern in 1 flashing every 3 second.
Table 2.5-39 Preliminary Specification of Beacon Items Nos. Description
1 Beacon Body 1 Over all height: approximately 7m/ Material: Aluminum/ Paint Color:
White
2 Light Equipment 1 LED/ Green/ 1 flashing every 3 second/ Luminous range 5.0 NM/
Stainless
3 Solar Generator
with Battery
1 Solar cell module/ Charging controller/ Storage battery
4 Accessories 1 Top mark, Antenna, Synchronizer, etc. Source: JICA Survey Team
The two yellow beacons, one at the eastern end of the container berth and another at the northwestern end of the future PPP site, shown in Figure 2.5-34 Details around Terminals are to be temporal facilities.
(3) Service Vessels
In this section, the Study Team describes the preliminary specification of tugboats, a pilot boat, and a survey boat.
Final Report Preparatory Survey on Matarbari Port Development Project in the People’s Republic of Bangladesh
2-161
1) Tugboats
The specification of tugboats is determined by the size of cargo vessels. The expected sizes of cargo
vessels calling at Matarbari Port will be 8,000 TEU container vessels and 80,000 DWT coal vessels at
maximum. The Survey Team examined the necessary numbers and powers of tugboats.
a) Analysis of necessary power in order to resist to wind pressure The following table shows the relation between wind resistance and necessary power of tugboat from the perspective of the resistance to wind pressure to cargo vessels. From the table, the necessary power of tugboat is 4,000~6,000, while, the tugboats are necessary to treat unexpected weather and sea conditions. Therefore, in the following sections, the Study Team conducted analysis from the statistical perspective and practices in a similar port to Matarbari port.
Table 2.5-40 Wind Resistance and Necessary Power of Tugboat
DWT of Cargo Vessel Wind pressure at 8m/sec (ton)
Necessary power of tugboat (Horse Power)
20,000 12 2,000~3,500
30,000 12.5 2,000~3,500
40,000 15 2,000~3,500
50,000 15 2,800~4,300
100,000 19 4,000~6,000
200,000 24 6,400~8,900 Source: Tugboat and its Manoeuvring (2nd Version)
b) Statistical Analysis
According to statistical data of the relationship between the size of cargo vessels and the power of tugboats, shown in the following table which is collected by Japan Work Vessel Association, 2~3 nos. of 4,000~4,400 horse power tugboats are necessary for a 50,000~100,000 DWT cargo vessel; 1~2 nos. of 4,000~4,400 horse power tugboat is necessary for a 5,000~20,000 DWT cargo vessel.

Final Report Preparatory Survey on Matarbari Port Development Project in the People’s Republic of Bangladesh
2-162
Source: Japan Work Vessel Association
Figure 2.5-40 Relationship between Size of Cargo Vessel and Power of Tugboat
c) Example of Kashima Port, Japan
Kashima Port is located in the eastern Japan and feces on the Pacific Ocean directly; the situation is similar to Matarbari Port. Kashima port accommodates more than 400,000 DWT cargo vessels such as iron ore careers and tankers. The port prepares 7 tugboats with 3,600 PS or 4,400 PS. According to the characteristics of cargo vessels, the size and number of the tugboats are determined in Kashima Port as the following. Bollard Pull Power = (DWT of the cargo vessel)/100,000 x 60 + 40. Calculated by this formula, Bollard Pull Power for a 8,000 TEU container vessel (approx. 100,000 DWT) = 100 ton Bollard Pull Power for a 80,000 DWT bulk cargo vessel = 86 tons It means that 2 tugboats with bollard pull power 55 ton can be applied to the operation for a 8,000 TEU container vessel. The Study Team recommended 3 sets of 4,400 PS tugboats with bollard pull power 55 tons for Matarbari Port in order to implement operation efficiently effectively and to prepare for periodical inspections and emergency cases such as malfunctions of tugboats or incidents in the port. The 3 sets of 4,400 PS tugboats have flexibility in their operation; namely, for small cargo vessels, one tugboat deploys while large cargo vessels, two tugboats are used. Additionally, this size of tugboats is easy to operate, highly maneuverable, and efficient in energy consumption. The propulsion system is to be azimuth thrusters. An azimuth thruster is a configuration of marine propellers placed in pods that can be rotated to any horizontal angle (azimuth), making a rudder unnecessary. These provide ships with better maneuverability than a fixed propeller and rudder system. The following figure shows the example of an azimuth propeller. The new tugboats in Matarbari Port should have azimuth propellers.
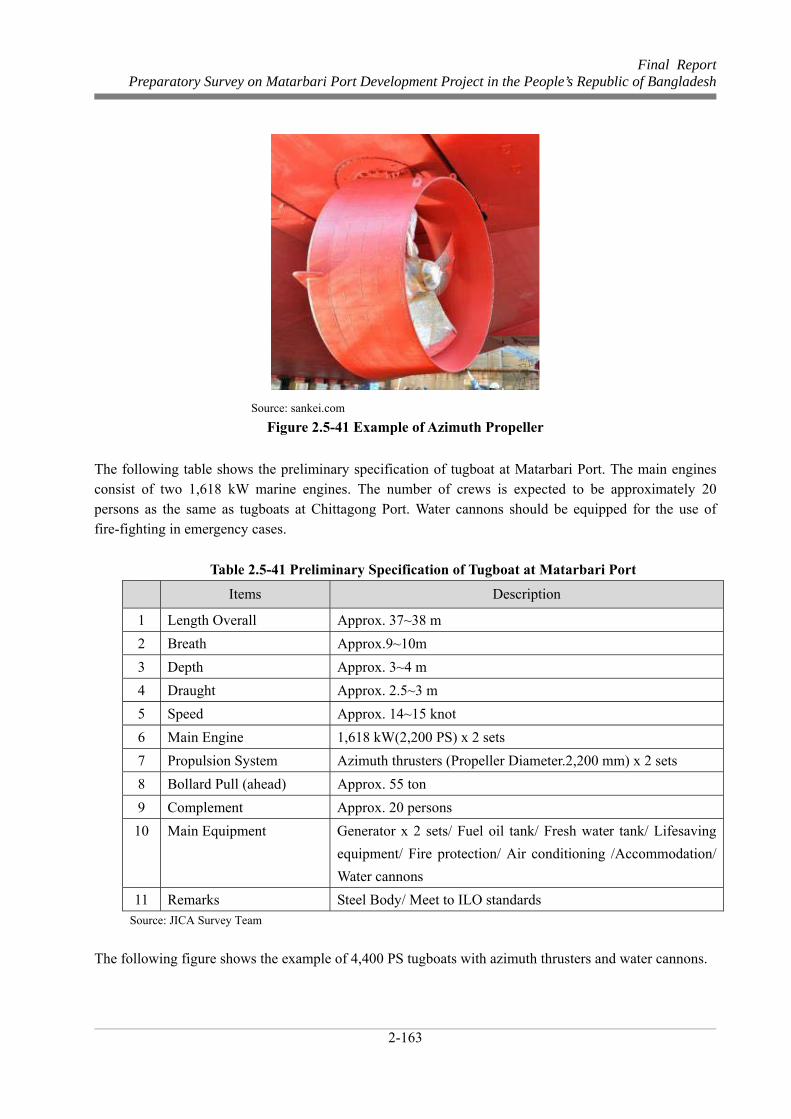
Final Report Preparatory Survey on Matarbari Port Development Project in the People’s Republic of Bangladesh
2-163
Source: sankei.com
Figure 2.5-41 Example of Azimuth Propeller
The following table shows the preliminary specification of tugboat at Matarbari Port. The main engines consist of two 1,618 kW marine engines. The number of crews is expected to be approximately 20 persons as the same as tugboats at Chittagong Port. Water cannons should be equipped for the use of fire-fighting in emergency cases.
Table 2.5-41 Preliminary Specification of Tugboat at Matarbari Port Items Description
1 Length Overall Approx. 37~38 m
2 Breath Approx.9~10m
3 Depth Approx. 3~4 m
4 Draught Approx. 2.5~3 m
5 Speed Approx. 14~15 knot
6 Main Engine 1,618 kW(2,200 PS) x 2 sets
7 Propulsion System Azimuth thrusters (Propeller Diameter.2,200 mm) x 2 sets
8 Bollard Pull (ahead) Approx. 55 ton
9 Complement Approx. 20 persons
10 Main Equipment Generator x 2 sets/ Fuel oil tank/ Fresh water tank/ Lifesaving
equipment/ Fire protection/ Air conditioning /Accommodation/
Water cannons
11 Remarks Steel Body/ Meet to ILO standards Source: JICA Survey Team
The following figure shows the example of 4,400 PS tugboats with azimuth thrusters and water cannons.
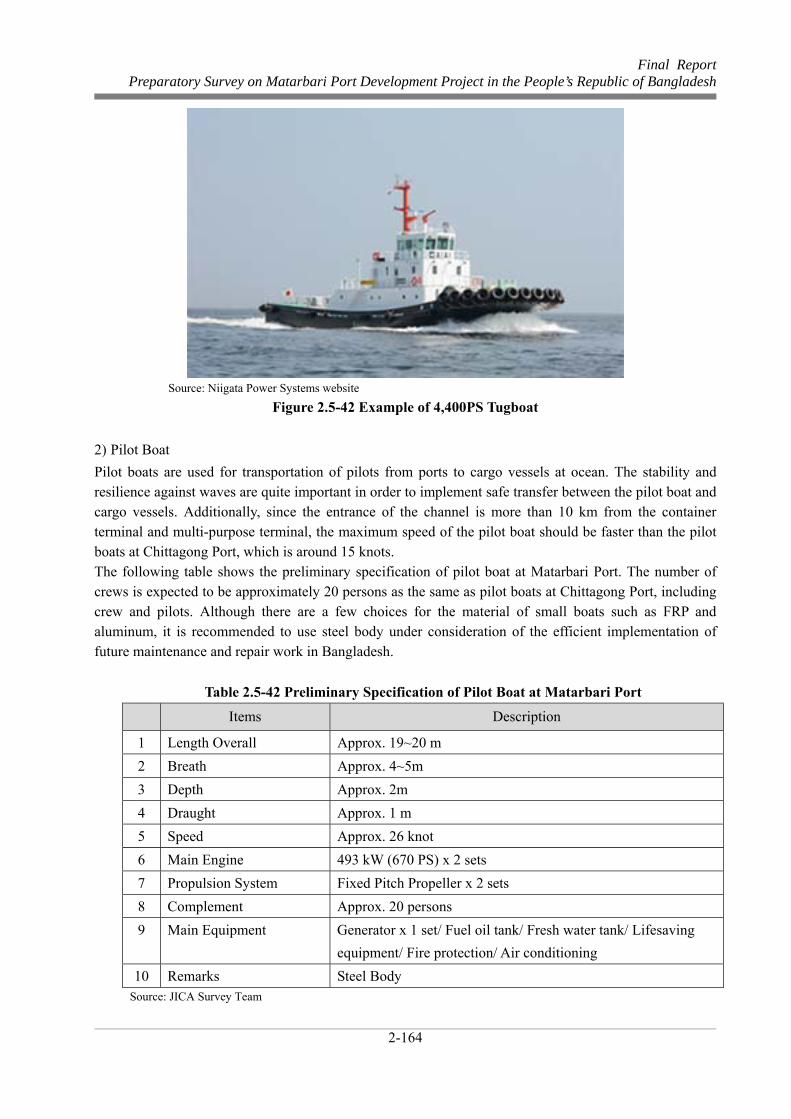
Final Report Preparatory Survey on Matarbari Port Development Project in the People’s Republic of Bangladesh
2-164
Source: Niigata Power Systems website
Figure 2.5-42 Example of 4,400PS Tugboat
2) Pilot Boat
Pilot boats are used for transportation of pilots from ports to cargo vessels at ocean. The stability and resilience against waves are quite important in order to implement safe transfer between the pilot boat and cargo vessels. Additionally, since the entrance of the channel is more than 10 km from the container terminal and multi-purpose terminal, the maximum speed of the pilot boat should be faster than the pilot boats at Chittagong Port, which is around 15 knots. The following table shows the preliminary specification of pilot boat at Matarbari Port. The number of crews is expected to be approximately 20 persons as the same as pilot boats at Chittagong Port, including crew and pilots. Although there are a few choices for the material of small boats such as FRP and aluminum, it is recommended to use steel body under consideration of the efficient implementation of future maintenance and repair work in Bangladesh.
Table 2.5-42 Preliminary Specification of Pilot Boat at Matarbari Port Items Description
1 Length Overall Approx. 19~20 m
2 Breath Approx. 4~5m
3 Depth Approx. 2m
4 Draught Approx. 1 m
5 Speed Approx. 26 knot
6 Main Engine 493 kW (670 PS) x 2 sets
7 Propulsion System Fixed Pitch Propeller x 2 sets
8 Complement Approx. 20 persons
9 Main Equipment Generator x 1 set/ Fuel oil tank/ Fresh water tank/ Lifesaving
equipment/ Fire protection/ Air conditioning
10 Remarks Steel Body Source: JICA Survey Team

Final Report Preparatory Survey on Matarbari Port Development Project in the People’s Republic of Bangladesh
2-165
The following figure shows the example of a pilot boat with the length of approximately 20 m. On the front side of the pilot boat, there is a complement ladder which is used by pilots to transfer to the ladder of cargo vessels at rough sea conditions such as flows of seawater into the deck. This can be equipped with the new pilot boat at Matarbari Port. The alternative is to prepare a space with handrails for this purpose on the top of the operating room.
Source: Shikase-zosen website
Figure 2.5-43 Example of Pilot Boat
3) Survey Boat
Survey boats are used for survey of channel conditions, sea conditions and etc. The stability and resilience against waves are quite important in order to implement necessary surveys accurately under safe condition. Additionally, since the port limit is more than 10 km from the container terminal and multi-purpose terminal and the area this boat needs to cover is quite large, the maximum speed of the survey boat should be faster than the survey boats at Chittagong Port which is 10~15 knot. Since this survey boat is used as a patrol boat, speed is an essential issue. The following table shows the preliminary specification of survey boat at Matarbari Port. The number of crews is expected to be approximately 15 persons as the same as survey boats at Chittagong Port, including crew and surveyors. As survey equipment, multi-beam echo sounder and Differential Global Positioning System are to be installed. Search lights, loud speakers and electric noticeboard are also equipped in order for the boat to work as a patrol boat when it does not conduct survey. Although there are a few choices for the material of small boats such as FRP and aluminum, it is recommended to use steel body under consideration of the efficient implementation of future maintenance and repair work in Bangladesh.

Final Report Preparatory Survey on Matarbari Port Development Project in the People’s Republic of Bangladesh
2-166
Table 2.5-43 Preliminary Specification of Survey Boat at Matarbari Port Items Description
1 Length Overall Approx. 17~18 m
2 Breath Approx.4~5 m
3 Depth Approx. 2 m
4 Draught Approx. less than 1.0 m
5 Speed Approx. 24 knot
6 Main Engine Approx. 368 kW (500 PS) x 2 sets
7 Propulsion System Fixed Pitch Propeller x 2 sets
8 Complement Approx. 15 persons
9 Main Equipment Generator x 1 set/ Fuel oil tank/ Fresh water tank/ Lifesaving
equipment/ Fire protection/ Air conditioning/ / Survey
equipment (multi-beam echo sounder, DGPS, data processor,
etc.)/ Search light x2/Loud speakers/ Electric noticeboard
10 Remarks Steel Body Source: JICA Survey Team
The following figure shows the example of a survey boat with the length of approximately 17 m which equips a narrow multi beam echo sounder with a certain speed.
Source: MLIT
Figure 2.5-44 Example of Survey boat
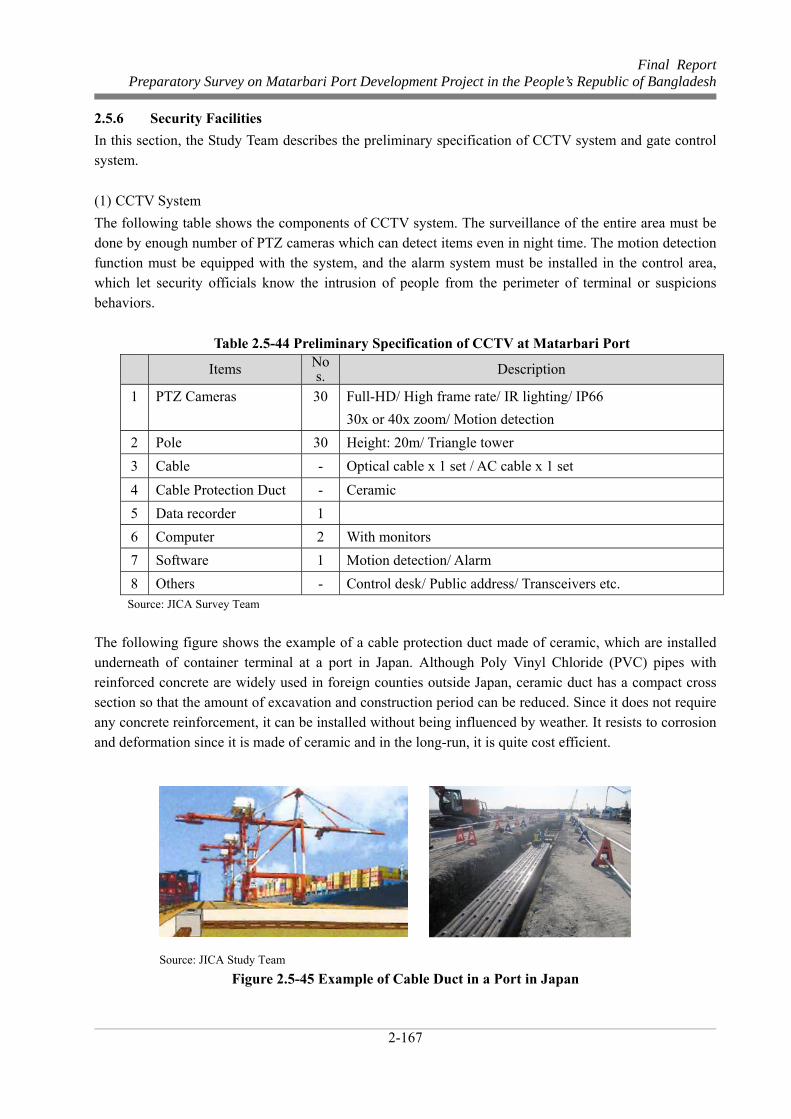
Final Report Preparatory Survey on Matarbari Port Development Project in the People’s Republic of Bangladesh
2-167
2.5.6 Security Facilities
In this section, the Study Team describes the preliminary specification of CCTV system and gate control system.
(1) CCTV System
The following table shows the components of CCTV system. The surveillance of the entire area must be done by enough number of PTZ cameras which can detect items even in night time. The motion detection function must be equipped with the system, and the alarm system must be installed in the control area, which let security officials know the intrusion of people from the perimeter of terminal or suspicions behaviors.
Table 2.5-44 Preliminary Specification of CCTV at Matarbari Port Items No
s. Description
1 PTZ Cameras 30 Full-HD/ High frame rate/ IR lighting/ IP66
30x or 40x zoom/ Motion detection
2 Pole 30 Height: 20m/ Triangle tower
3 Cable - Optical cable x 1 set / AC cable x 1 set
4 Cable Protection Duct - Ceramic
5 Data recorder 1
6 Computer 2 With monitors
7 Software 1 Motion detection/ Alarm
8 Others - Control desk/ Public address/ Transceivers etc. Source: JICA Survey Team
The following figure shows the example of a cable protection duct made of ceramic, which are installed underneath of container terminal at a port in Japan. Although Poly Vinyl Chloride (PVC) pipes with reinforced concrete are widely used in foreign counties outside Japan, ceramic duct has a compact cross section so that the amount of excavation and construction period can be reduced. Since it does not require any concrete reinforcement, it can be installed without being influenced by weather. It resists to corrosion and deformation since it is made of ceramic and in the long-run, it is quite cost efficient.
Source: JICA Study Team
Figure 2.5-45 Example of Cable Duct in a Port in Japan

Final Report Preparatory Survey on Matarbari Port Development Project in the People’s Republic of Bangladesh
2-168
(2) Gate Control System
The following table shows the components of gate control system. The control of gate is quite essential for port security. All the vehicles and pedestrians must be stopped at the gate and be checked their identity and belongings whether they bring explosives or other dangerous items. Additionally, the entrance and exit must be recorded and be saved for a certain period. It is recommended to pre-register labors, drivers and vehicles which enter ports with summons by the officials of the Security Department. The installation of bio-metric system should be considered in the detail design process.
Table 2.5-45 Preliminary Specification of Gate Control System at Matarbari Port Items Nos. Description
1 Entry/ Exit
Station
8 Entry and Exit station enable to control the gates/ All the vehicles,
trucks and people entry and exit recorded/ All the vehicles, trucks,
and people are monitored and recorded by cameras
simultaneously.
2 Control System 1 Personal computer/ Software/ Pre-registration Database
3 Others - Transceivers/ Public address/ etc.
Source: JICA Survey Team
Final Report Preparatory Survey on Matarbari Port Development Project in the People’s Republic of Bangladesh
2-169
2.6. Construction Plan
2.6.1. Mooring Facility
(1) Soil Improvement of the Terminal (under quay area)
In accordance with the new soil investigation conducted in this project, which is shown the results of sub-soil conditions in Section 2.5.2 (1), consolidation settlement of the sub-soil for the terminal area was not expected basically. However, in conditions of the earthquake, liquefaction for the sub-soil will be occurred and had a bad influence to the quay structure and slope stabilities under the quay. Therefore, the existing soil material formed the slope under the quay are replaced to the crushed rocks with brick stone to be stable the slope and quay structure.
Crushed stone/ brick stone and sand Replacement : 320,000 m3
Productivity: 320,000m3/1000 m3/day =320 days : 320/25day =13 months
(2) Berth Construction (Multipurpose and Container)
Both the container and multipurpose berths are planned as the detached pier (jetty) types connected with the terminals by six access bridges. The plan and typical section of the berths is shown in the Section 2.5.1 “Mooring Facilities”.
Berth structure of the container and multipurpose berths were planned as concrete deck on the steel pipe
piles with steel strut beam. The steel pipe pile (1300 mm dia. with 25mm thickness) is about 44 m in
length and 416 nos. to be used. Access bridges between the terminal and jetty are also planned as
concrete deck on the steel pipe piles and steel strut beam. The steel pipe pile (800 mm dia. with 19 mm
thickness) is about 44m in length and 90 nos are to be used for the bridges.
The piles could be driven about 1 nos. per day per pile driver for 1300mm dia. and 800mm dia. due to
hard sub-soil conditions and piling planned from the sea. A pile driving vessel would be required as
shown in the following calculation for the period of the works,
Productivity of Pile Driving Work: (416 nos + 90 nos/ 2 nos) /25 days =18 months
The piling work will be done separately for the container berth and multipurpose berth by one pile driving
machine.
Retaining wall made by Steel pipe sheet pile having 700mm dia. with 12mm in thick is also installed by
piling machine on land at the same time with piling work of quay structure.
Slope protection and the tile-rod with waling work for the retaining wall could follow after completion of
the pile driving works for the 100 m berth length which is calculated to be taken 2 months. The concrete
deck works are constructed by two construction teams and both teams would start the works 2 months
after the slope protection works.
Installation of the steel strut beams for the berth structure would be started one month after the slope
protection works.
The pile caps and beams for the half of deck concrete are planned to be constructed using the pre-cast
concrete method and the slab concrete works by casting in-situ at site could produce 30m3 per day on
average.
Therefore, the construction period for the Concrete deck works are calculated as follows:
Concrete Deck Slab Work: 16,000 m3(1/2 slab) /30 m3 / 25 days = 22 months
Pre-cast Concrete Elements : 21,500m3/40m3/25days = 22 months

Final Report Preparatory Survey on Matarbari Port Development Project in the People’s Republic of Bangladesh
2-170
(3) Harbor Craft Basin
Harbor Craft basin is divided into three quay structures, such as double SPSP wall quay for Inner breakwater part having 181m in length, SPSP wall quay having 150m in length and Wave dissipating Concrete Block wall having 90m in length. After soil Improvement works, the double SPSP wall quay for Inner breakwater part would be started and followed the SPSP wall quay and Wave dissipating Concrete Block wall construction.
Productivity of the double SPSP wall quay for Inner breakwater part:
1m/day = 181m/1/25day+ 1months for accessories =8 months
Productivity of the SPSP wall quay :2m/day+ coping Concrete = 150m/2m/25day
+ 2 months = 5 months
Productivity of Wave dissipating Concrete Block wall : 90m/1m/25 +1month = 5
months
With consideration of the above procedure and the working periods, berth construction schedule for the container and multipurpose is presented in the chapter 2.7.4.

Final Report Preparatory Survey on Matarbari Port Development Project in the People’s Republic of Bangladesh
2-171
2.6.2 Yard and other Facilities
(1) Temporary Works
As the temporary works for the construction of the terminal yard, the berthing facilities, terminal facilities and terminal utilities, the following temporary facilities and mobilization of the following construction equipment would be required on the basis of the Matarbari site conditions and the port development plan for the Package 1 construction.
Temporary Facilities
Accommodation Barge (1000 ton) and Project office
Concrete Batching Plant (100 m3/h)
Temporary Generator Set (500 KVA)
Temporary Shed (600 m2)
Fabrication Yard for Concrete Block and Inter-locking block (2 ha)
Stockpile Yard (for stone materials, Steel piper piles and Steel strut beams) (3 ha)
Temporary Jetty
Imported Construction Equipment (Mobilization/ Demobilization)
Grab Dredger for slope trimming and crushed stone replacement
Barges (2,000 m3 x 2 barge)
Tug-boats (1,000 PS x 1 boats)
Piling Vessel (60 m Leader) x 1 set for Multipurpose and Container Berth
Crawler Cranes (100 ton) with piling machine on land
Mobile Cranes (50 ton x 2 units)
Backhoe Barge (1.3 m3 class x 4 units)
Dump-trucks (20ton x 50 units)
(2) Terminal Reclamation
Basin dredging and reclamation works are designated to conduct in the Matarbari Coal Fired Power Plant (CFPP) project. Therefore, the reclamation works could start earlier than this project. In relation of the both project implementation schedule, the suitable reclaimed materials generated by the basin dredging works might be stockpiled out of the area for the container and mulita-purpose terminal. Hence, those suitable materials having about 2,900,000 m3 in volume for the terminal reclamation is planned to transport from the temporary stockpile area to the terminal area by dump trucks. Moreover, the sand dike around the terminal reclaimed area is also planned to construct approximately 2,600 m by this project.
Material transporting volume by dump-trucks : 2,900,000 m3
Productivity: 2,900,000m3/10 m3/10 trip /50 trucks =580 days : 580/25day =23 months
Sand Dike (including Geo-textile-tube ) : 2600 m
Productivity: 2,600m/ 10m/day =260 days :260/25day =10 months
(3) Terminal Buildings and Utilities
The Utility works such as drainage, water supply and power supply could be started after completion of the reclamation works. The Terminal building construction such as Administration Office, CFS and Warehouse, Terminal Gates, Workshop and Generator House, and Security / Boundary Fences would be started after completion of utility works for multi-purpose terminal. For terminal buildings and utilities both of Container and Multipurpose terminal, required facilities and construction period are summarized
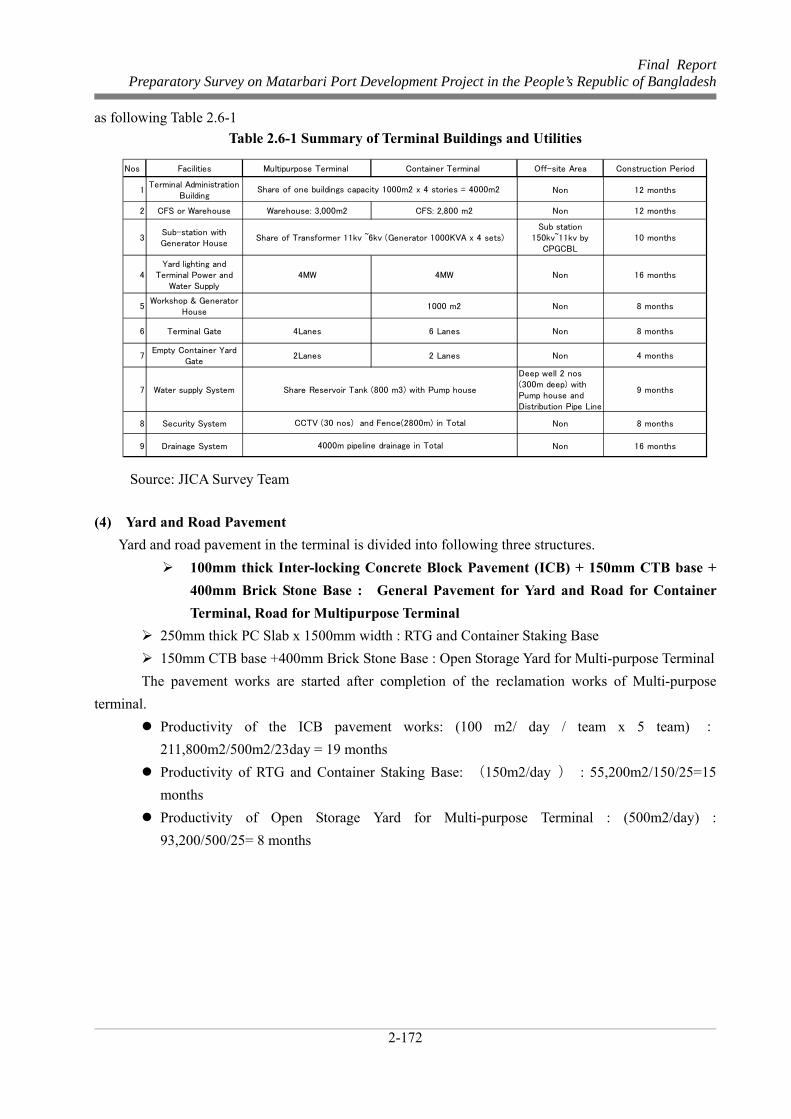
Final Report Preparatory Survey on Matarbari Port Development Project in the People’s Republic of Bangladesh
2-172
as following Table 2.6-1
Table 2.6-1 Summary of Terminal Buildings and Utilities
Nos Facilities Multipurpose Terminal Container Terminal Off-site Area Construction Period
1Terminal Administration
BuildingNon 12 months
2 CFS or Warehouse Warehouse: 3,000m2 CFS: 2,800 m2 Non 12 months
3Sub-station withGenerator House
Sub station150kv~11kv by
CPGCBL10 months
4Yard lighting and
Terminal Power andWater Supply
4MW 4MW Non 16 months
5Workshop & Generator
House1000 m2 Non 8 months
6 Terminal Gate 4Lanes 6 Lanes Non 8 months
7Empty Container Yard
Gate2Lanes 2 Lanes Non 4 months
7 Water supply System
Deep well 2 nos(300m deep) withPump house andDistribution Pipe Line
9 months
8 Security System Non 8 months
9 Drainage System Non 16 months
Share of one buildings capacity 1000m2 x 4 stories = 4000m2
Share of Transformer 11kv ~6kv (Generator 1000KVA x 4 sets)
Share Reservoir Tank (800 m3) with Pump house
CCTV (30 nos) and Fence(2800m) in Total
4000m pipeline drainage in Total
Source: JICA Survey Team
(4) Yard and Road Pavement
Yard and road pavement in the terminal is divided into following three structures.
100mm thick Inter-locking Concrete Block Pavement (ICB) + 150mm CTB base +
400mm Brick Stone Base : General Pavement for Yard and Road for Container
Terminal, Road for Multipurpose Terminal
250mm thick PC Slab x 1500mm width : RTG and Container Staking Base
150mm CTB base +400mm Brick Stone Base : Open Storage Yard for Multi-purpose Terminal
The pavement works are started after completion of the reclamation works of Multi-purpose
terminal.
Productivity of the ICB pavement works: (100 m2/ day / team x 5 team) :
211,800m2/500m2/23day = 19 months
Productivity of RTG and Container Staking Base: (150m2/day ) : 55,200m2/150/25=15
months
Productivity of Open Storage Yard for Multi-purpose Terminal : (500m2/day) :
93,200/500/25= 8 months
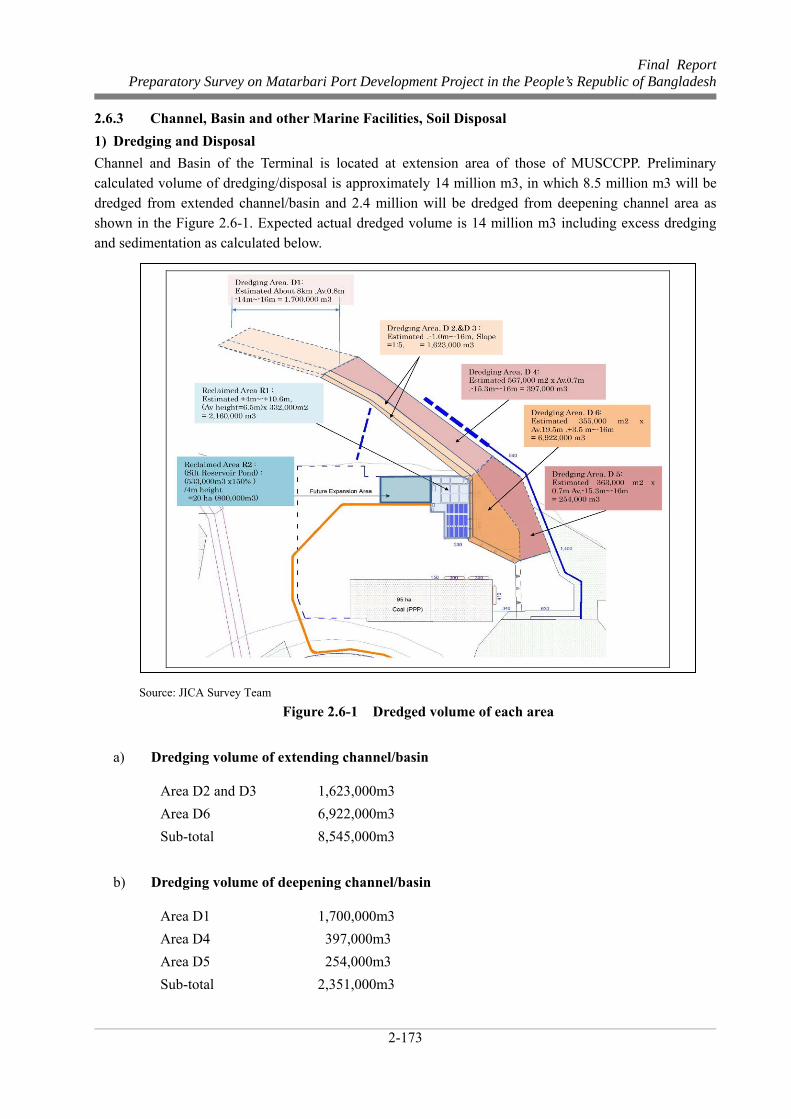
Final Report Preparatory Survey on Matarbari Port Development Project in the People’s Republic of Bangladesh
2-173
2.6.3 Channel, Basin and other Marine Facilities, Soil Disposal
1) Dredging and Disposal
Channel and Basin of the Terminal is located at extension area of those of MUSCCPP. Preliminary calculated volume of dredging/disposal is approximately 14 million m3, in which 8.5 million m3 will be dredged from extended channel/basin and 2.4 million will be dredged from deepening channel area as shown in the Figure 2.6-1. Expected actual dredged volume is 14 million m3 including excess dredging and sedimentation as calculated below.
Source: JICA Survey Team
Figure 2.6-1 Dredged volume of each area
a) Dredging volume of extending channel/basin
Area D2 and D3 1,623,000m3
Area D6 6,922,000m3
Sub-total 8,545,000m3
b) Dredging volume of deepening channel/basin
Area D1 1,700,000m3
Area D4 397,000m3
Area D5 254,000m3
Sub-total 2,351,000m3

Final Report Preparatory Survey on Matarbari Port Development Project in the People’s Republic of Bangladesh
2-174
c) Assumed volume of excess Dredging and sedimentation
Excess Dredging 10% of a) + b) 1,090,000m3
Sedimentation 1,000,000m3/year x 2years 2,000,000m3
Sub-total 3,090,000m3
Grand Total a) + b) + c) 13,986,000m3
Considering the target date of the Terminal opening, procurement of the reclamation material and dredging in front of the berth structure will be the critical activities to accomplish the project schedule. Therefore, earlier commencement of Dredging work is desired. One of the options for the earlier commencement of Dredging work is shifting scope of Dredging work to MUSCCPP. This option plan has advantage and risk, but in view of the Project schedule, this option plan has more advantages than original plan and is recommended. Main advantages and risks of this option are shown below.
Merits
1. Stockpiled Dredged sand will be available for preparation work without Dredging works,
which has schedule merit
2. Construction of disposal/stockpile area is not required during construction period, which has
schedule merit
3. Construction of Berth can be commenced immediately after preparation works without
Dredging of Basin area, which has schedule merit
Risks
1. Variation Order of MUSCCPP is required, which has contractual/cost risk
2. Dredging work will not be controlled by the Project, which has quality/schedule risk
*Risk related to the disposal area for the Dredged material described below is omitted because this is common risk on
both original and option plan.
CPA, MUSCCPP and other related authorities of GoB shall discuss and determine the application of the option. Considering efficiency and schedule of the work, dredging of the extension area as D2, D3 and D6 shall be executed by Cutter Suction Dredger (CSD) and deepening of existing channel as D4 and D5 shall be executed by Trailer Suction Hopper Dredger (TSHD). Sample pictures of each dredger are shown in the Figure 2.6-2.
Source: JICA Survey Team
Figure 2.6-2 Dredging Plants: SCD (left) and TSHD (right)
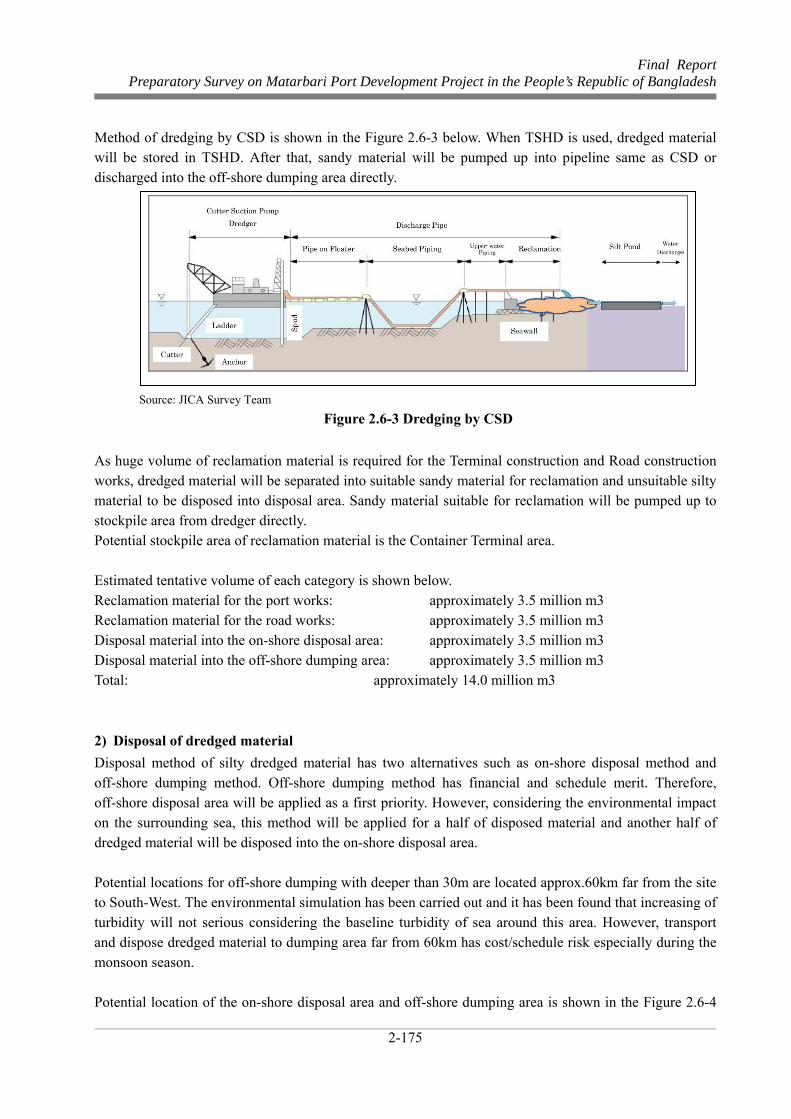
Final Report Preparatory Survey on Matarbari Port Development Project in the People’s Republic of Bangladesh
2-175
Method of dredging by CSD is shown in the Figure 2.6-3 below. When TSHD is used, dredged material will be stored in TSHD. After that, sandy material will be pumped up into pipeline same as CSD or discharged into the off-shore dumping area directly.
Source: JICA Survey Team
Figure 2.6-3 Dredging by CSD
As huge volume of reclamation material is required for the Terminal construction and Road construction works, dredged material will be separated into suitable sandy material for reclamation and unsuitable silty material to be disposed into disposal area. Sandy material suitable for reclamation will be pumped up to stockpile area from dredger directly. Potential stockpile area of reclamation material is the Container Terminal area. Estimated tentative volume of each category is shown below. Reclamation material for the port works: approximately 3.5 million m3 Reclamation material for the road works: approximately 3.5 million m3 Disposal material into the on-shore disposal area: approximately 3.5 million m3 Disposal material into the off-shore dumping area: approximately 3.5 million m3 Total: approximately 14.0 million m3
2) Disposal of dredged material
Disposal method of silty dredged material has two alternatives such as on-shore disposal method and off-shore dumping method. Off-shore dumping method has financial and schedule merit. Therefore, off-shore disposal area will be applied as a first priority. However, considering the environmental impact on the surrounding sea, this method will be applied for a half of disposed material and another half of dredged material will be disposed into the on-shore disposal area. Potential locations for off-shore dumping with deeper than 30m are located approx.60km far from the site to South-West. The environmental simulation has been carried out and it has been found that increasing of turbidity will not serious considering the baseline turbidity of sea around this area. However, transport and dispose dredged material to dumping area far from 60km has cost/schedule risk especially during the monsoon season. Potential location of the on-shore disposal area and off-shore dumping area is shown in the Figure 2.6-4

Final Report Preparatory Survey on Matarbari Port Development Project in the People’s Republic of Bangladesh
2-176
below.
Source: JICA Survey Team
Figure 2.6-4 Location of disposal area (left: on-shore) and (right: off-shore)
Offshore dumping will be executed dumping barge or TSHD as shown in the Figure 2.6-5 and Figure 2.6-6 below.
Source: JICA Survey Team
Figure 2.6-5 Off-shore dumping by CSD
Source: JICA Survey Team
Figure 2.6-6 Off-shore dumping by TSHD
On the other hand, on-shore disposal area may be located on south side of the Terminal area. Necessary facility for the disposal area is disposal pond, discharge channel and environmental protection sheet.

Final Report Preparatory Survey on Matarbari Port Development Project in the People’s Republic of Bangladesh
2-177
Disposal method is same as the dredging method of CSD as shown in the Figure 2.6-3. Sample picture of on-shore disposal method is shown in the Figure 2.6-7
Source: JICA Survey Team
Figure 2.6-7 Sample Picture of on-shore disposal method
3) Reclamation
Reclamation material will be transported by dump truck to the reclamation area and leveled/compacted by bulldozer. Sample picture of reclamation work is shown in the Figure 2.6-8
Source: JICA Survey Team
Figure 2.6-8 Sample Picture of reclamation work
4) Breakwater
To obtain the required operation condition of the port, Breakwater which composed by North Breakwater and South Breakwater is necessary. As Sediment Mitigation Dikes which is planned to be constructed by MUSCCPP has function of Breakwater, extension of the dike will be carried out in this Project considering vessel stopping distance of approximately 400m of the North Dike. General plan of Breakwater is summarized below.
a) North Sediment Mitigation Dike by MUSCCPP: 1,753m b) North Breakwater to be extended: 397m c) South Sediment Mitigation Dike by MUSCCPP: approx. 670m
Breakwater construction work is composed of following activities;
- Soil improvement (Sand Replace Method)
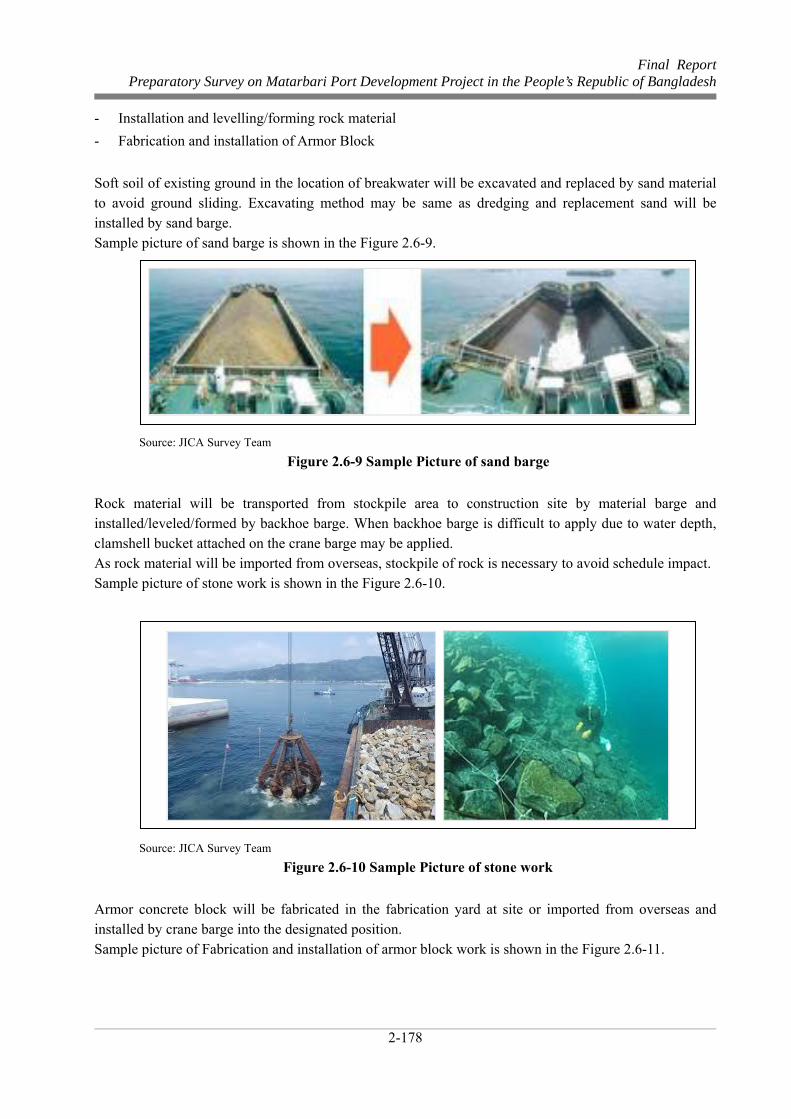
Final Report Preparatory Survey on Matarbari Port Development Project in the People’s Republic of Bangladesh
2-178
- Installation and levelling/forming rock material
- Fabrication and installation of Armor Block
Soft soil of existing ground in the location of breakwater will be excavated and replaced by sand material to avoid ground sliding. Excavating method may be same as dredging and replacement sand will be installed by sand barge. Sample picture of sand barge is shown in the Figure 2.6-9.
Source: JICA Survey Team
Figure 2.6-9 Sample Picture of sand barge
Rock material will be transported from stockpile area to construction site by material barge and installed/leveled/formed by backhoe barge. When backhoe barge is difficult to apply due to water depth, clamshell bucket attached on the crane barge may be applied. As rock material will be imported from overseas, stockpile of rock is necessary to avoid schedule impact. Sample picture of stone work is shown in the Figure 2.6-10.
Source: JICA Survey Team
Figure 2.6-10 Sample Picture of stone work
Armor concrete block will be fabricated in the fabrication yard at site or imported from overseas and installed by crane barge into the designated position. Sample picture of Fabrication and installation of armor block work is shown in the Figure 2.6-11.

Final Report Preparatory Survey on Matarbari Port Development Project in the People’s Republic of Bangladesh
2-179
Source: JICA Survey Team
Figure 2.6-11 Sample Picture of fabrication and installation of armor concrete block

Final Report Preparatory Survey on Matarbari Port Development Project in the People’s Republic of Bangladesh
2-198
2.7.5 Measures for Construction Safety
1) Background
Safety in any Construction Work is the most important and serious matter for all of the concerned organizations and individuals involved. In this Section, an effective safety plan for the construction works will be discussed and recommended, using “Safety Risk Analysis Method”, with due consideration of Project Component, respective Work Plans, Site conditions as well as Related Laws/ regulations in the Country for targeting to achieve a None-Accident Project.
2) Safety Risk Analysis
Risk Analysis Method is one of the mathematical methods to find out significant safety risks in the construction project. We can find significant safety risks through this method so that effective safety control plan and counter measures can be established. In this method, Safety Risk is obtained by “probability of occurrence” times “severity of damage if it was happened”. Probability and severity is generally indicated as grade 1 to grade 5. Considering the risk factors such as work method, used equipment, characteristics of site and other conditions, major possible risk and its grade are determined and shown as “Risk Analysis Table”. In the Risk Analysis table, “A” shows grade of “Probability of occurrence”, “B” shows grade of “severity of damage”, and “C” shows “Total Grade” which is calculated by A times B. Sample of the Risk Analysis table is shown below.
Table 2.7-8 Safety Risk Analysis Table (Sample) No. Potential Safety Risk A B C 1 Piling Works
1.1 When a SPP is lifted up, SPP drops down on workers 4 4 161.2 When a barge is shifted, tie lope is cut and hit workers 3 3 9 1.3 A worker falls down into the sea and gets in between barges 3 3 9 1.4 Workers go up piling leader and fall down from high position 3 3 9 1.5 Fishing boat hits the piling barge 2 2 4
Source: JICA Survey Team
There are many safety risks on the project. It is difficult to consider all risk and take counter measures for all of them. Therefore, the Significant Safety Risks are selected among all the risks and counter measures for these Risks will be recommended.
3) Counter Measures against Safety Risk
Generally, counter measures against the safety risks are divided into six groups such as;
- Establishment of the Safety Management System
- Important facilities for which special attention is required
- Necessity of Safety Facilities
- Prevention of Human Errors
- Retention of Safety Risks
- Removal of Safety Risks.
a) Establishment of the Safety Management System
Final Report Preparatory Survey on Matarbari Port Development Project in the People’s Republic of Bangladesh
2-199
It is very important to establish a Safety Management System to prevent the actualizing of safety risks. This system can act effectively on the whole safety risk. Main activities of the Safety Management System and its effectiveness are summarized in Table 2.7-9 below. It is recommended to establish Safety Management System and follow prescribed activities.
Table 2.7-9 Activity of Safety Management System
No. Activity Effectiveness 1 To determine the responsible
person All works, activities and facilities will be checked by the responsible staff
2 To determine the safety organization
Not only the staff but also the project team will take care of the safety activity
3 To determine the safety rules Most of human errors and facility faults will be prevented by the rules
4 To check the work procedure of dangerous works
Accidents caused by the faulty work procedure will be prevented
5 To check the design of temporary facilities
Serious accidents caused by collapse of the facilities such as ground sliding and stage collapse will be prevented
6 To hold safety meeting All staff and workers will have consciousness to prevent accident
7 To determine the emergency contact network
Quick and effective action will be able to be taken when accident happens
8 To carry out the safety patrol Faulty facility, action or work procedure can be found before accident happens
9 To carry out the safety training All workers will have knowledge and skill to prevent accident and to take effective action when accident happens
Source: JICA Survey Team
b) Important facilities for which special attention is required According to study of previous samples of Significant Safety Risks, some facilities are found to be taken care of especially. Important facilities to be taken care of and necessary actions as a result of the study is mentioned in Table 2.7-10. It is recommended to take these necessary actions to prevent serious accident.
Table 2.7-10 Important Facilities for which special attention is required
No. Important Facility Necessary Action 1 Lifting wire To conduct routine check and replacing damaged one (if any).
Damaged wire is not allowed to be recycled. Lifting parts should be checked, too
2 Lifting hook To conduct routine check to confirm the wire stopper is attached and it works effectively
3 Anchor and winch of the barge
To conduct routine check and replacing damaged one (if any). Wire rope of winches should be checked, too. Indication buoy should be attached for each anchor
4 Tie rope and tie wire To conduct routine check and replacing damaged one (if any). All tie rope and tie wire should be replaced before its lifetime
5 Ground condition of heavy equipment
To check whether the ground has enough strength against heavy equipment prior to mobilize them
6 Generator and welding machine
To conduct routine check of fuse and breaker to prevent a short circuit accident
7 Brakes of equipment and truck
To conduct routine check and replacing damaged one (if any). All brake pads should be replaced before its lifetime. Brake of winch attached on the crane needs to be checked, too.
Source: JICA Survey Team
c) Necessity of Safety Facilities According to study of previous samples of Significant Safety Risks, Safety Facilities are necessary to be

Final Report Preparatory Survey on Matarbari Port Development Project in the People’s Republic of Bangladesh
2-200
prepared in the site to prevent serious accident. Necessary Safety Facilities to be prepared and its explanations are mentioned in Table 2.7-11. It is recommended to prepare these necessary Safety Facilities to prevent serious accident.
Table 2.7-11 Safety Facilities
No. Important Facility Necessary Action 1 PPG (Personnel
Protection Gear) PPG means protection gears for the workers which put on the workers directly such as safety wear, safety shoes, helmet, safety glass, life jacket, safety glove, etc. It is important to establish rule that PPE should be put on when workers carry out related activities.
2 Watching Boat Watching Boat is effective to prevent water traffic accident and rescue person who falls into the water.
3 Security Fence and Gate
Security fence and gate is necessary to prevent third party person from invading the working site. Safety fence should be high, strong and dense enough to block children and residents. Safety Gate should be strictly controlled to prevent the person and vehicle unconcerned with the project from entering the project site.
4 Safety barricade and signboard
Safety barricade and signboard shall be installed and indicate following area. - Heavy equipment working area - Hole, slope and excavated area - Lifting work area (area under the lifted material) - Dangerous material stock area (gas, fuel, etc.) - High position work area - Electric power control area (sub-station, switch box) Other dangerous area and restricted area
5 Handrail, safety rope and safety net
Where working position is higher than 2.0m, safety working stage with handrail and safety rope is required to prevent falling down accident. Safety net may be required to prevent dropped material or tool from hitting workers working under the high position working area
6 Worker’s rest house
Worker’s rest house may be required to prevent sunstroke and/or struck by lightning. Smoking area should be located outside the working area to prevent fire accident.
7 Emergency Road in site and Safety path
There should be a good road in the site which can access any location of the site by vehicle in case of emergency. A safety path should be prepared to allow person to access anywhere without any dangerous factor. Workers shall use this path when they go to their working area. No material and equipment is allowed to be kept on the emergency road and safety path.
Source: JICA Survey Team
d) Prevention of Human Error According to the previous accident record, most of the accidents are caused by human error. They include traffic accident and heavy equipment accident caused by faulty work procedure. These accidents may be prevented if no error has happened in the whole procedure. Following countermeasures are recommended to prevent human error in this study.
① Daily Group Meeting before the commencement of works
Prior to commencement of each work, group meeting is recommended to be hold. Work procedure, physical condition of the group member and safety instructions should be discussed and shared among the group.
② Sharing the “Hiyari-Hatto (near-accidents event)” experiences
Most of the accidents are happened through the “Hiyari-Hatto” situations. Many staff and workers have these “Hiyari-Hatto” experiences. To share these experiences is very important to prevent the occurrence
Final Report Preparatory Survey on Matarbari Port Development Project in the People’s Republic of Bangladesh
2-201
of similar experience. It is recommended to collect the “Hiyari-Hatto” experiences to share staff and workers.
③ Case Study Training
Most of the accidents are caused by similar causes. Case studies of actual accident are effective to prevent the occurrence of similar accidents. It is recommended to conduct Case Study Training and take counter measures to prevent the occurrence of similar accidents. “Case Studies on Accidents and Near Misses in construction” by MOC in Vietnam and JICA is usable as the text for training.
④ Placing of “Warning Signboards”
Even trained, studied and join meeting, people may forget safety instructions sometimes. Therefore, “Warning Signboards” are recommended to be set up in the site. These signboards can remind staff and workers to be cautious about safety instructions. Followings are the example contents of the “Warning Signboards”.
- Don’t enter under the lifted material! - Be careful of floor condition! - Don’t run on the stage! - Watch around your equipment before moving! - Check lifting wire before using! - Don’t approach Backhoe!
e) Retention of Safety Risks There are many potential safety risks caused by human error which may cause insignificant accident such as shown below examples. It is very difficult to take care and make counter measure for all of these slight safety risks. Therefore, it is recommended to retain those risks and when those risks are actualized, related parties should take necessary action effectively to the accidents. <Example case of insignificant accident>
- A worker falls down from stairs by his own mistake. - A carpenter hit his hand by hammer by his own mistake.
f) Removal of Safety Risks When counter measures against the serious safety risks such as abnormal natural disaster or violent attack from other country are considered, it needs to take huge amount of cost and time, both of which will impact on the project feasibility. These Safety Risks occur in very rare case and project staff cannot prevent the occurrence of these events by themselves. Therefore, it is recommended to leave these very rare safety risks to the insurance.
4) Particular care for the Special Significant Safety Risks
According to study of previous samples of Significant Safety Risks, it is found that some Special Significant Safety Risks require the particular cares. Recommended particular cares are studied in this section. a) Particular cares for the risk of “Accident of lifted material drops down” Lifting work is one of the most dangerous works in the construction activity. Accident can happen with two factors such as “lifted load is dropped” and “people stay under the lifted load” are happening.

Final Report Preparatory Survey on Matarbari Port Development Project in the People’s Republic of Bangladesh
2-202
There are some reasons of drop of lifted load such as “broken of lifting wire or lifting gears”, “breakdown of winch brake” and “getting loose of tie rope”. Lifting wire or lifting gears may be broken caused by lack of checking, overload or wrong lifting procedure. They can be called “Human error”. Break down of winch brake may happen by the lack of checking or the mechanical trouble. It is difficult to find out such causes of trouble sometimes. Routine checking and keeping repairing records are important. Counter measures to prevent accident consist of generally two factors such as “no load is dropped down” and “no workers stay under the lifted load in case load is dropped down”. Necessary cares to prevent drop accident based on the above analyses are;
- To check lifting wire and lifting gears with certainty. - To check crane winch with certainty. - Tying shall be carried out by skilled worker. - Using guide rope to stabilize the lifted loads. - To warn workers not to enter position under the lifted loads. - Dangerous area under the lifted loads shall be restricted by barricade and signal person who take
care the safety of the working area. - To train all workers including welders regarding the drop accident by using the Case Study.
b) Particular cares for the risk of “Electric shock accident” Most of the electric shock accidents are caused by short circuit. Short circuit can happen due to mechanical problem or wet condition. Necessary cares to prevent electric shock accident are;
- To check short circuit breaker of the welding machine and generator. - To stop welding work in wet condition and at the rainy day. - Do not put welding machine, generator and power cable on wet floor - Welders need to wear PPG. - Sub-station and power house shall be restricted to enter.
Adding to above, training of workers including welders regarding the electric shock accident by using the Case Study is important and effective. c) Particular cares for the risk of “Accident by ground condition” The most important thing to prevent accident due to the ground condition is to make a good “planning of work procedure”. Slant of excavation should be planned based on the ground conditions and excavation depth. Heavy equipment is to be restricted to enter the shoulder area of excavation by barricade. And conditions of excavated slope shall be checked every day especially at the rainy day and when workers are working in the excavated trench. d) Particular cares for the risk of “Heavy equipment accident” Most of the heavy equipment accidents happened by human errors. To prevent the heavy equipment accidents, assign of the signal person who take care the safety of the working area is effective. Duties of the signal person are;
- To restrict the entering of the workers behind the equipment - To install barricade or safety tape around the equipment working area - To confirm operator wheel stopper when operator get out of the equipment
Final Report Preparatory Survey on Matarbari Port Development Project in the People’s Republic of Bangladesh
2-203
- To notify operator when the equipment is approaching slope, hole or people - To confirm equipment has been checked every day - To check operator’s physical conditions and his skill
Adding to above, training of workers including operators regarding the heavy equipment accident by using the Hiyari-Hatto experiences and the Case Study are important and effective. e) Particular cares for the risk of “Traffic Accident” Many vehicles including material supply and material removal will come to the site. Most of the traffic accidents in the working site happened by the human errors which is same as at the public road. However, it is difficult to train the whole driver at the project. Therefore, facility arrangement and determination of traffic rules become very important. Arrangement of facility and determination of traffic rules include;
- To maintain good road surface conditions (remove hole, mud or obstacles) - To limit the maximum speed of vehicles - To provide the traffic signboards (stop, speed limit, intersection, etc.) - To remove unnecessary materials, tools and equipment from the road - To provide safety path for workers
f) Particular cares for the risk of “Water Traffic Accident” In this project, many work barges like sand barge for the reclamation work are planned to cross the existing channel. This may cause near misses between work barges and vessels in operation. Basically, working vessels shall not disturb operations of other vessel, therefore it is necessary to provide a watching boat. Duties of the watching boat are;
- To restrict working vessels entering the existing channel - To restrict fishing boat and other unconcerned boat entering working area - To notify the dangerous situation to vessels passing by in case any dangerous situation is likely
to happen - To rescue persons in case the accident is happened
g) Particular cares for the risk of “Accident of temporary facility collapse” Temporary facility collapse may be happened due to the wrong designing, wrong construction works or wrong work plan. Important matters to prevent collapse accidents are to check design and construction works in the same manner as permanent works. Especially, at the temporary stage for casting concrete when many workers and tools may work, design and construction works shall be checked and inspected prior to the commencement of the work. Adding to that, overload is one of the causes of the accident therefore designer of the temporary facilities shall strictly check the work plan and the actual work conditions.
5) Emergency Plan
In the case that any accident happens, quick and effective response is necessary to protect human resources and prevent secondary accident. It is recommended to prepare the Emergency Plan prior to the commencement of the works. Emergency Plan consists of following action plan.
- First aid

Final Report Preparatory Survey on Matarbari Port Development Project in the People’s Republic of Bangladesh
2-204
- Action for preventing secondary accident by such as power cut, installation of barricade, suspending of surround activities
- Contact safety officer (safety responsible person) - Contact ambulance, hospital, police or fire service - Contact the Client and the Engineer - Report to the related authorities, the Client and the Engineer
It is necessary to understand that main purpose of the Emergency Plan is to protect human resources and prevent secondary accident in preparing the Emergency Plan.
6) Related local laws and regulations
There is no related local law or regulation with concrete manual or guidance for construction safety. However, there are some Safety Manuals which can be applied to the project. Safety Manual provided by government of Vietnam and Japan is usable such as;
- Construction Safety Manual by MLIT in Japan - Safety and Health Manual in Construction by MOC in Vietnam and JICA - Safety Manual of Construction Equipment by MLIT in Japan
As above manuals are prepared for general works with general site condition, each construction project should establish his own construction safety plan based on its specific site condition. The contractor should consider his actual construction work methods, equipments and conditions for the preparation of the Construction Safety Plan by referring the above manuals.
7) Conclusion
Human life is definitely more important than any other factors of the project such as cost, schedule or quality. When accident is happened, every related party should have penalty in view of financial and/or social status. Considering these meanings, “Safety” should be taken care of extremely. However, many accidents including several serious accidents happen in the construction project all over the world. Every related person should understand that most of the accidents have clear cause(s) and there should be a chance or chances for somebody to aware of these cause(s). Important thing is to take good care of these chances and to take necessary counter measure(s). For this purpose, every related person need to have interest of safety itself and courage to take action when he is aware of safety risk factor at any stage.

Final Report Preparatory Survey on Matarbari Port Development Project in the People’s Republic of Bangladesh
2-205
2.8 Maintenance and Management of Facilities
2.8.1 Channel and Basin
(1) Review of previous study at Matarbari Coal Fired Power Plant
At the Detailed Design stage of Matarbari Coal Fired Power Plant Project, numerical simulation study had done to determine the necessity of the countermeasure works, construction of Training Dike up to water depth of MSL-7.5m at the north side of the Channel, against channel and basin sedimentation which were considered unnecessary in the FS. By construction of this countermeasure works, annual channel and basin sedimentation volume reduction of 0.3 million m3 from 1.1 million m3 without any countermeasure works were estimated. Figure 2.8-1 showed the original layout plan of port for Matarbari Coal Fired Power Plant. Steel pipe pile wall structure with its crown height of MSL+3.7m was employed for the type of structure of Training Dike.
South Revetment (L=816m)
Turning Basin (D=500m)
Figure 2.8-1 Original layout plan of port for Matarbari Power Plant
Because the severe oceanographical conditions such as very rapid tidal current and large tidal difference and continuous rough sea state during Monsoon Season, two Monitoring Pockets for monitoring the sediment deposition at the water depth around MSL -5m and MSL -10m were dredged before the start of construction works of Matarbari Coal Fired Power Plant project to monitor the sediment deposition phenomenon by periodical bathymetric survey to verify the planned countermeasure structure against channel and basin sedimentation. During the monitoring period of sediment deposition at two monitoring pockets, continuous monitoring of sea-state such as wave height, current and SS concentration were also obtained for the evaluation of the sedimentation mechanism. Observed rate of deposition at two Monitoring Pockets were compared with the predicted rate of deposition obtained by numerical simulation model that were used for the estimation of Matarbari Coal Fired Power Plant Channel and Basin sedimentation volume at Detailed Design. As conclusive remarks of

Final Report Preparatory Survey on Matarbari Port Development Project in the People’s Republic of Bangladesh
2-206
Pocket at MSL-5m are obtained. Predicted rate of deposition of two Monitoring Pockets at Detailed Design were 1cm/day at Monitoring Pocket at MSL-5m and 0.3cm/day at Monitoring Pocket at MSL-10m and those predicted rates of deposition were by far less than those of obtained values. Temporary Access Channel which planned water depth is MSL. -7m as a preparation work for the Matarbari Coal Fired Power Plant Project had also dredged during the period from Apr. 2016 to Feb. 2017. Periodical bathymetric survey of this Temporary Access Channel had also been done to monitor the sediment deposition phenomenon. Observed rate of deposition at Temporary Channel were also measured and compared with the predicted rate of deposition by using the same numerical simulation model shown above. Predicted rate of deposition at Temporary Channel were also by far less than those of obtained values. Under these observation, JICA has set up the Supporting Committee, composed of academic and governmental committee member to discuss sedimentation of Channel and Basin because the channel and basin sedimentation needs the maintenance dredging work and directly affect the sound operation of new commercial port that will co-use the navigational access channel and basin area. The consultant of Matarbari Coal Fired Power Plant and JICA survey team are working together in this committee to improve the accuracy of numerical simulation method and to contribute the determination of the appropriate countermeasures against channel and basin sedimentation. Numerical simulation model that was used at DD stage were intensively checked in the cooperative work in the Supporting Committee set up by JICA and determined to modify the previous numerical simulation model by considering following four modes of sediment transport, (1) Siltation by tidal current, (2) Littoral sand drift by wave and wave induced currents, (3) Bed load by tidal current and (4) Suspended load by tidal current. Last two modes of sand transport were not considered in the previous model of Detailed Design study and considered to be the main cause of the discrepancy of the observed and predicted results of sedimentation at the two Monitoring Pockets and Temporary Channel. Numerical simulation model parameters and other important conditions were discussed and determined and modified to fit the observed results of sedimentation at the two Monitoring Pockets and Temporary Channel.
Figure 2.8-2 shows the observed and calculated results of cumulative deposition thickness at Monitoring Pocket at MSL-10m. Figure 2.8-3 shows the observed and calculated results of cumulative deposition thickness at Monitoring Pocket at MSL-5m. Observed sampling of sedimentation at these Monitoring Pockets indicate that the most sedimentation occurred by sand transport and very few siltation can be seen. A good accordance between observed and calculated results were obtained for both cases. In these calculation, constant representative wave conditions and tidal conditions from observed data for each Monitoring Pocket were considered.

Final Report Preparatory Survey on Matarbari Port Development Project in the People’s Republic of Bangladesh
2-207
Figure 2.8-2 Observed and Calculated Results of Cumulative Thickness at Monitoring Pocket with
water depth of MSL -10m
Figure 2.8-3 Observed and Calculated Results of Cumulative Thickness at Monitoring Pocket with
water depth of MSL -5m
For considering the Temporary Channel, topographical change of the surrounding area was taken into consideration for the verification and modification of the simulation model. Figure 2.8-4 showed the topographical change from Apr. 2016 to Feb. 2017. From this Figure, significant erosion at the sand bar that extends from south side was seen. Figure 2.8-5 shows the topographical change from Feb. 2017 to Oct. 2017. A significant erosion from adjacent north side shallow water zone was seen and considered to affect the deposition of Temporary Channel. As the ground level of north side of Temporary Channel is around MSL+1.0, sea water inflow with high SS from north side of Temporary Channel also affect the deposition. Those two factors are considered the important factors of channel deposition that should be considered in the evaluation of the simulation model. After the completion of the construction of the north revetment that was planned to construct, those two factors will not affect the channel deposition.
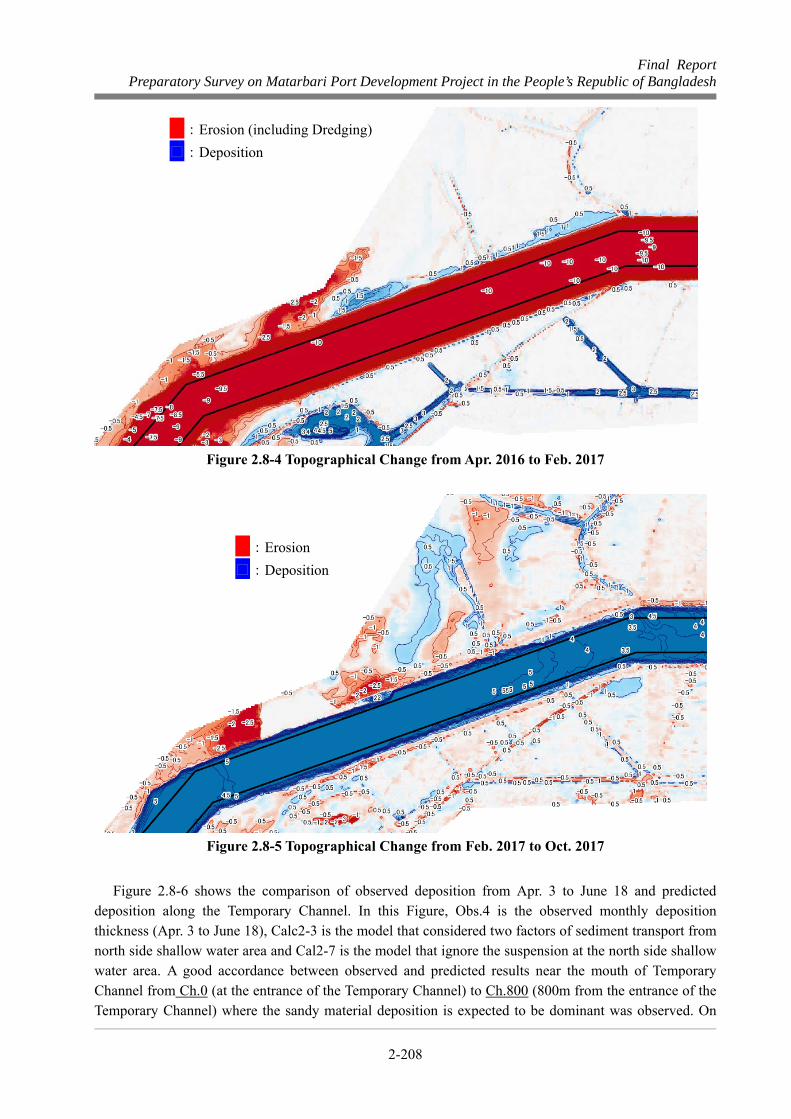
Final Report Preparatory Survey on Matarbari Port Development Project in the People’s Republic of Bangladesh
2-208
Figure 2.8-4 Topographical Change from Apr. 2016 to Feb. 2017
Figure 2.8-5 Topographical Change from Feb. 2017 to Oct. 2017
Figure 2.8-6 shows the comparison of observed deposition from Apr. 3 to June 18 and predicted deposition along the Temporary Channel. In this Figure, Obs.4 is the observed monthly deposition thickness (Apr. 3 to June 18), Calc2-3 is the model that considered two factors of sediment transport from north side shallow water area and Cal2-7 is the model that ignore the suspension at the north side shallow water area. A good accordance between observed and predicted results near the mouth of Temporary Channel from Ch.0 (at the entrance of the Temporary Channel) to Ch.800 (800m from the entrance of the Temporary Channel) where the sandy material deposition is expected to be dominant was observed. On
□:Erosion (including Dredging)
□:Deposition
□:Erosion
□:Deposition
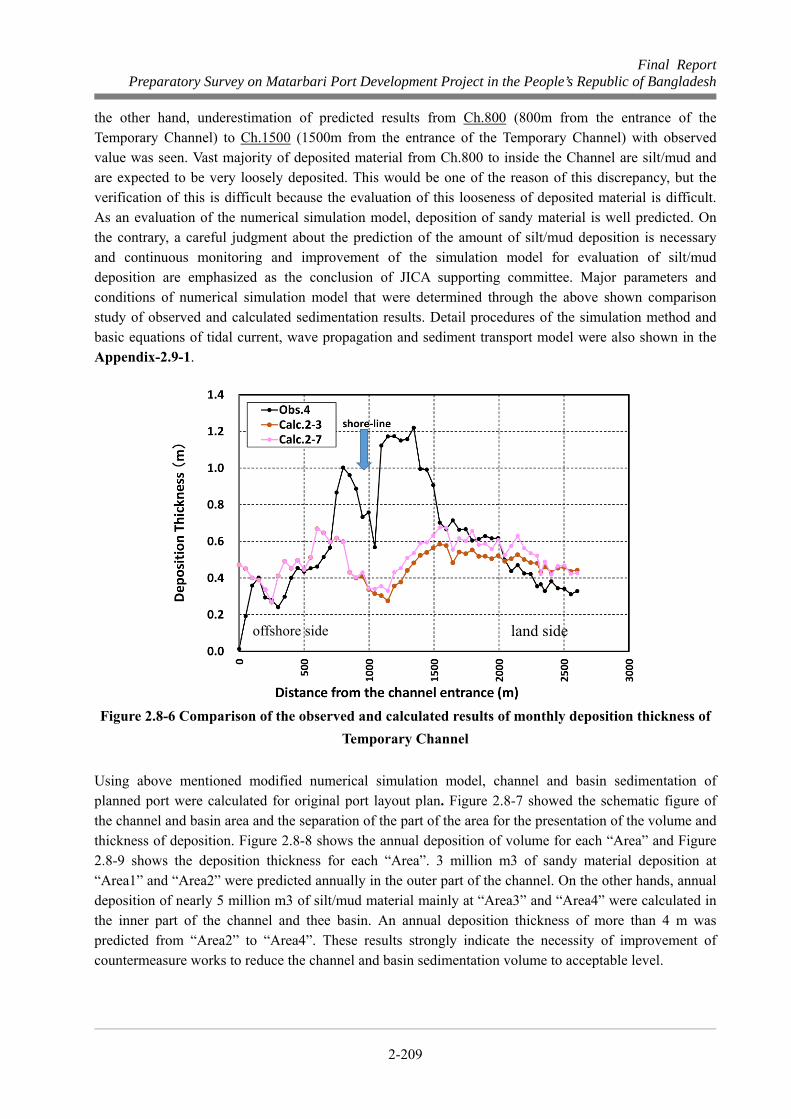
Final Report Preparatory Survey on Matarbari Port Development Project in the People’s Republic of Bangladesh
2-209
the other hand, underestimation of predicted results from Ch.800 (800m from the entrance of the Temporary Channel) to Ch.1500 (1500m from the entrance of the Temporary Channel) with observed value was seen. Vast majority of deposited material from Ch.800 to inside the Channel are silt/mud and are expected to be very loosely deposited. This would be one of the reason of this discrepancy, but the verification of this is difficult because the evaluation of this looseness of deposited material is difficult. As an evaluation of the numerical simulation model, deposition of sandy material is well predicted. On the contrary, a careful judgment about the prediction of the amount of silt/mud deposition is necessary and continuous monitoring and improvement of the simulation model for evaluation of silt/mud deposition are emphasized as the conclusion of JICA supporting committee. Major parameters and conditions of numerical simulation model that were determined through the above shown comparison study of observed and calculated sedimentation results. Detail procedures of the simulation method and basic equations of tidal current, wave propagation and sediment transport model were also shown in the Appendix-2.9-1.
Figure 2.8-6 Comparison of the observed and calculated results of monthly deposition thickness of
Temporary Channel
Using above mentioned modified numerical simulation model, channel and basin sedimentation of planned port were calculated for original port layout plan. Figure 2.8-7 showed the schematic figure of the channel and basin area and the separation of the part of the area for the presentation of the volume and thickness of deposition. Figure 2.8-8 shows the annual deposition of volume for each “Area” and Figure 2.8-9 shows the deposition thickness for each “Area”. 3 million m3 of sandy material deposition at “Area1” and “Area2” were predicted annually in the outer part of the channel. On the other hands, annual deposition of nearly 5 million m3 of silt/mud material mainly at “Area3” and “Area4” were calculated in the inner part of the channel and thee basin. An annual deposition thickness of more than 4 m was predicted from “Area2” to “Area4”. These results strongly indicate the necessity of improvement of countermeasure works to reduce the channel and basin sedimentation volume to acceptable level.
offshore side land side
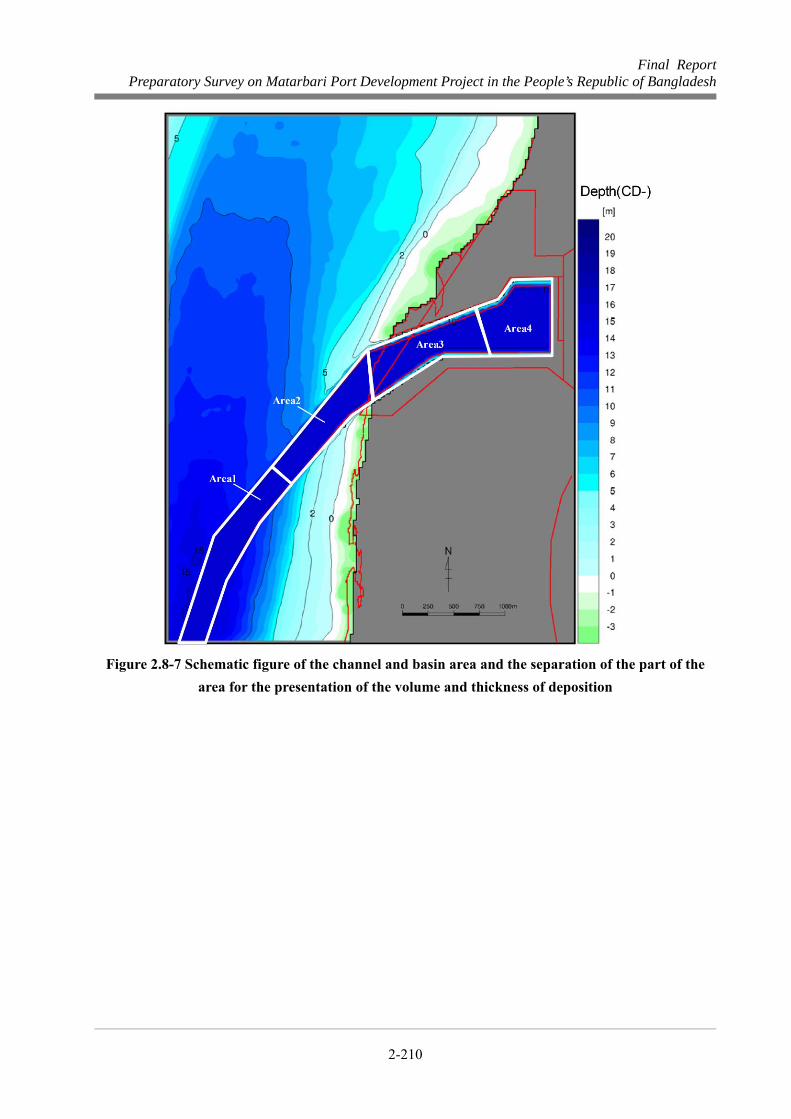
Final Report Preparatory Survey on Matarbari Port Development Project in the People’s Republic of Bangladesh
2-210
Figure 2.8-7 Schematic figure of the channel and basin area and the separation of the part of the
area for the presentation of the volume and thickness of deposition

Final Report Preparatory Survey on Matarbari Port Development Project in the People’s Republic of Bangladesh
2-211
0
1,000,000
2,000,000
3,000,000
4,000,000
5,000,000
6,000,000
7,000,000
8,000,000
Area1 Area2 Area3 Area4 Total
Amount of sedim
entation (m
3)
Area
Siltation(by Tidal Current)
Suspended load(by Tidal Current)
Bedload(by Wave & Wave‐induced Current)
Bedload(by Tidal Current)
Figure 2.8-8 Annual deposition volume of channel and basin for original port layout plan
0
100
200
300
400
500
600
700
800
Area1 Area2 Area3 Area4
Spatial‐averaged Deposition Thickn
ess (cm
)
Area
Siltation(by Tidal Current)
Suspended load(by Tidal Current)
Bedload(by Wave & Wave‐induced Current)
Bedload(by Tidal Current)
Figure 2.8-9 Annual deposition thickness of channel and basin for original port layout plan
Following 5 cases shown in Table 2.8-1 were considered for the evaluation of countermeasure works to reduce the channel and basin sedimentation based on the proposed numerical simulation method. Case1 was the originally planned countermeasure to extend the north side training dike up to water depth of MSL-7,5m. Case4 and Case5 are the cases of south side sand protection dike with north side training dike up to water depth of MSL-15.0m. Construction of this south side sand protection dike is recommended by the JICA’s supporting committee as was shown in previous section to compensate for the limitation of the

Final Report Preparatory Survey on Matarbari Port Development Project in the People’s Republic of Bangladesh
2-212
reliability of the simulation method.
Table 2.8-1 Combination of the countermeasure structure
Case Combination of countermeasure structure
Case0 Without any countermeasures
Case1 North side Training Dike up to water depth of MSL-7.5m (planned location)
Case2 North side Training Dike up to water depth of MSL-12.5m
Case3 North side Training Dike up to water depth of MSL-15.0m
Case4 Case3 + south side Sand Protection Dike 1
Case5 Case3 + south side Sand Protection Dike 2
Figure 2.8-7 were also used to evaluate the deposition of Channel and Basin with countermeasures of
sedimentation. Figure 2.8-10 shows the annual deposition volume for Case0 to Case5. Sand deposition at
the mouth of the channel will be decreased1/3 for Case3 to Case5 compared with the Case0 of without
any countermeasures. The reduction of silt/mud deposition of Case3 to Case5 are around 0.7 times of that
of Case0 that are rather small value compared with the case for sandy material deposition. Although the
difference between Case3 and Case4, Case5 are small, Case5 is proposed as the countermeasures for
reduction of channel and basin sedimentation to ensure the safety of uncertainty of the simulation model.
For proposed Case5, 1 million m3 of sand deposition and 3.2 million m3 of silt/mud deposition are
predicted. Figure 2.8-11 shows the deposition thickness for each “Area” of Case5
Figure 2.8-10 Annual deposition volume of channel and basin for countermeasure

Final Report Preparatory Survey on Matarbari Port Development Project in the People’s Republic of Bangladesh
2-213
Figure 2.8-11 Annual deposition thickness of channel and basin for countermeasure Case5
(2) Continuous monitoring of sedimentation phenomena
Because the numerical simulation model has the uncertainty of reliability, especially in the estimation of the mud/silty material deposition, continuous monitoring and improvement of the numerical simulation model are strongly recommended by JICA supporting committee during the construction period. Figure 2.8-12 showed the locations of monitoring of oceanographic conditions such as wave, current and SS that have already started from Jan. 2018. Temporary south bund for protecting the littoral sand drift from south side have also been constructed before the start of 2018 Monsoon Season, sand deposition and erosion around the Temporary south bund can also be used for the evaluation of the channel and basin sedimentation phenomenon.

Final Report Preparatory Survey on Matarbari Port Development Project in the People’s Republic of Bangladesh
2-214
Figure 2.8-12 Locations, P1 to P5, of monitoring of oceanographic
(3) Predicted amount of channel and basin sedimentation
According to the sedimentation study of Temporary Channel by MUSCCP, most of the sedimentation by sand occurred near the port entrance area and no sand deposition can be seen in the inside part of the port. And sedimentation of silt/mud are mainly occurred inside part of the port. By using the numerical simulation model proposed by the consultant of MUSCCP with the technical support by JICA supporting committee, expected channel and basin sedimentation are obtained. Figure 2.8-13 showed the layout plan of Phase 2 used for the simulation model and channel and basin area were divided into 5 areas. Because the with or without the existence of “Area5” did not affect the amount of sand deposition near the channel area, amount of sand depositions at “Area1” and “Area2” where the sand depositions occur for Phase 2 can directly be applied to the estimation of Phase 1. Similarly, the with or without the existence of “Area5” did not affect the amount of silt/mud deposition of “Area3” and “Area4” much, calculated amount of silt/mud deposition of those area can directly be applied to the estimation of Phase1. In other words, calculated results of sedimentation except the “Area5” for Phase 2 can directly applied for the evaluation of the amount of sedimentation of Phase 1.

Final Report Preparatory Survey on Matarbari Port Development Project in the People’s Republic of Bangladesh
2-215
Figure 2.8-13 Layout plan of Phase 2 (Left) and Areas for the calculation of the amount of total
sedimentation vokume for Phase2 (Right)
Figure 2.8-14 showed the calculated amount of annual sedimentation for “Area1” to “Area5” and total amount of sedimentaion for Phase 1 and for Phase 2 that correspond to the necessary annual maintenance volume. For obtaining the total volume of sedimentaion for Phase1, sedementaion volume of “Aera5” are elimminated. In this prediction of channel and basin sedimentatiion, northside Training Dike of water depth up to MSL-15m (CDL-12.32m) as a countermeasure structure of sedimentation are considered followed by the recommendation by JICA supporting committee. Figure 2.8-15 showed the calculated spatial average annual deposition thickness for each “Area”. Table 2.9-1 showed the calculated annual sedimentation volume for “Area1” to “Area5” and total annual sedimentaion volume for Phase 1 and for Phase 2.

Final Report Preparatory Survey on Matarbari Port Development Project in the People’s Republic of Bangladesh
2-216
Figure 2.8-14 Calculated annual sedimentation volume
Figure 2.8-15 Calculated spatial average annual deposition thickness
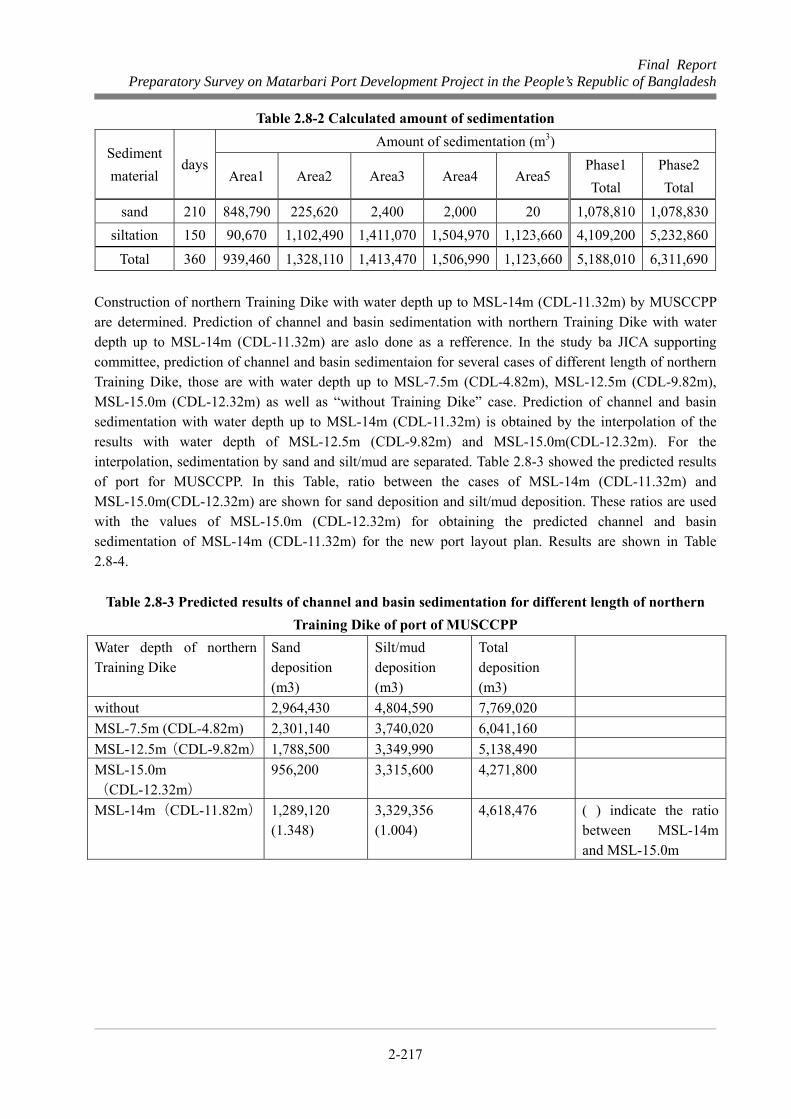
Final Report Preparatory Survey on Matarbari Port Development Project in the People’s Republic of Bangladesh
2-217
Table 2.8-2 Calculated amount of sedimentation
Sediment
material days
Amount of sedimentation (m3)
Area1 Area2 Area3 Area4 Area5 Phase1
Total
Phase2
Total
sand 210 848,790 225,620 2,400 2,000 20 1,078,810 1,078,830
siltation 150 90,670 1,102,490 1,411,070 1,504,970 1,123,660 4,109,200 5,232,860
Total 360 939,460 1,328,110 1,413,470 1,506,990 1,123,660 5,188,010 6,311,690
Construction of northern Training Dike with water depth up to MSL-14m (CDL-11.32m) by MUSCCPP are determined. Prediction of channel and basin sedimentation with northern Training Dike with water depth up to MSL-14m (CDL-11.32m) are aslo done as a refference. In the study ba JICA supporting committee, prediction of channel and basin sedimentaion for several cases of different length of northern Training Dike, those are with water depth up to MSL-7.5m (CDL-4.82m), MSL-12.5m (CDL-9.82m), MSL-15.0m (CDL-12.32m) as well as “without Training Dike” case. Prediction of channel and basin sedimentation with water depth up to MSL-14m (CDL-11.32m) is obtained by the interpolation of the results with water depth of MSL-12.5m (CDL-9.82m) and MSL-15.0m(CDL-12.32m). For the interpolation, sedimentation by sand and silt/mud are separated. Table 2.8-3 showed the predicted results of port for MUSCCPP. In this Table, ratio between the cases of MSL-14m (CDL-11.32m) and MSL-15.0m(CDL-12.32m) are shown for sand deposition and silt/mud deposition. These ratios are used with the values of MSL-15.0m (CDL-12.32m) for obtaining the predicted channel and basin sedimentation of MSL-14m (CDL-11.32m) for the new port layout plan. Results are shown in Table 2.8-4.
Table 2.8-3 Predicted results of channel and basin sedimentation for different length of northern
Training Dike of port of MUSCCPP
Water depth of northern Training Dike
Sand deposition (m3)
Silt/mud deposition (m3)
Total deposition (m3)
without 2,964,430 4,804,590 7,769,020
MSL-7.5m (CDL-4.82m) 2,301,140 3,740,020 6,041,160
MSL-12.5m(CDL-9.82m) 1,788,500 3,349,990 5,138,490
MSL-15.0m(CDL-12.32m)
956,200 3,315,600 4,271,800
MSL-14m(CDL-11.82m) 1,289,120 (1.348)
3,329,356 (1.004)
4,618,476 ( ) indicate the ratio between MSL-14m and MSL-15.0m

Final Report Preparatory Survey on Matarbari Port Development Project in the People’s Republic of Bangladesh
2-218
Table 2.8-4 Predicted results of channel and basin sedimentation for New Port
Water depth of northern Training
Dike
Phase1 Phase2
Sand deposition
(m3)
Silt/mud deposition
(m3)
Total deposition
(m3)
Sand deposition
(m3)
Silt/mud deposition
(m3)
Total deposition
(m3)
MSL-15.0m(CDL-12.32m)
1,078,830 4,109,200 5,188,030 1,078,830 5,232,860 6,311,690
ratio 1.348 1.004 1.348 1.004
MSL-14m(CDL-11.82m
1,454,260 4,125,640 5,579,900 1,454,260 5,253,790 6,708,050
(4) re-evaluation of the channel and basin sedimentation
Simulation model for siltation that are used to predict the amount of sedimentation volume for planned port
channel and basin is considered to have several issues in evaluation of recorded sedimentation volume at the
Temporary Channel of MUSCCPP. One of the possible cause of this issue is considered due to the lack of
consideration of effect of fluid mud layer that were observed at the time of bed material sampling of
Temporary Channel. Numerical simulation model for siltation that can consider the fluid mud layer at the sea
bottom are used for the modification of the simulation method. Detail of the simulation model and calculated
conditions are shown in Appendix-2.9-2.
Recorded sedimentation results of Temporary Channel from Apr. 2017 to Oct. 2017 are used for the
verification of the simulation model. In this period between Apr. 2017 to Oct. 2017, bathymetric survey have
been done for 4 times and topographic change between each consecutive bathymetric survey data were used.
Figure 2.8-16 to Figure 2.8-18 showed the observed and calculated results of sedimentation for each period. In
these Figures, simulation results by Silt.1 is the case without considering the existence of fluid mud layer that
have shown in the previous section. Simulation results by Silt.2 and Silt.3 are simulation model that consider
the fluid mud layer at the sea bottom. Difference of these two models is the parameter of agitation model. By
employing the fluid mud layer, simulated results showed better accordance with the recorded sedimentation
data.

Final Report Preparatory Survey on Matarbari Port Development Project in the People’s Republic of Bangladesh
2-219
Figure 2.8-16 Comparison of the observed and calculated results of monthly deposition thickness of
Temporary Channel from Apr. 3, 2017 to June 18, 2017
Figure 2.8-17 Comparison of the observed and calculated results of monthly deposition thickness of
Temporary Channel from Jun 18, 2017 to July 24, 2017

Final Report Preparatory Survey on Matarbari Port Development Project in the People’s Republic of Bangladesh
2-220
Figure 2.8-18 Comparison of the observed and calculated results of monthly deposition thickness of
Temporary Channel from July 24, 2017 to Oct 13, 2017
Using simulation model of Silt 3 that consider the fluid mud layer, annual sedimentation volume for port
layout of Phase 1 and Phase 2 shown in Figure 2.8-13 are calculated. As were shown in the previous
section, predicted amount of sedimentation volume are obtained for 5 divided area of channel and basin.
Figure 2.8-19 showed the Calculated annual sedimentation volume. Table 2.8-5 showed the calculated
annual sedimentation volume for “Area 1” to “Area 5” and total annual sedimentation volume for Phase 1
and Phase 2.
According to above shown results, amount of sedimentation by siltation in the Area 1 and Area 2 are
significantly increased by considering the fluid mud. But total amount of sedimentation in channel and
basin are almost same with the previous results shown in Figure 2.8-14 and Table 2.8-2.

Final Report Preparatory Survey on Matarbari Port Development Project in the People’s Republic of Bangladesh
2-221
Figure 2.8-19 Calculated annual sedimentation volume
Table 2.8-5 Calculated amount of sedimentation volume
Sediment
material days
Amount of sedimentation (m3)
Area1 Area2 Area3 Area4 Area5 Phase1
Total
Phase2
Total
sand 210 848,790 225,620 2,400 2,000 20 1,078,810 1,078,830
siltation 150 741,770 2,108,660 880,550 492,540 861,020 4,223,520 5,084,540
Total 360 1,590,560 2,334,280 882,950 494,540 861,040 5,302,330 6,163,370
Although the consideration of fluid mud layer to predict the channel and basin sedimentation contribute
the better accordance with the recorded data, there are still some discrepancy between observed and
recorded sedimentation data in view of longitudinal distribution of the sedimentation and absolute amount
of volume. Total amount of predicted sedimentation volume by both model showed small difference but
the location of the occurrence of sedimentation by siltation shows difference results between two models.
Those results indicate the necessity of continuous study by utilizing the planned monitoring data.

Final Report Preparatory Survey on Matarbari Port Development Project in the People’s Republic of Bangladesh
2-222
2.8.2 Offshore Disposal of Dredged Soil (1) Introduction
In this section, turbidity diffusion of Suspended Solids (SS) by dredging work and dumping of dredged soil material have been studied by numerical simulation model analysis. Numerical simulation model composed of two parts, one is to reproduce the tidal current conditions and the other is to calculate the advection and diffusion of SS material in the tidal current field.
(2) Candidate site for dumping of dredged soil material Location of the dumping site of dredged material should be located at the water depth deeper than 30m is considered preferable for ensuring the safe navigation of large ships. As the expected volume of dredged soil material dumping is as much as 7 million m3, necessary area for the dumping site is assumed to be 25,000,000m2 (5km x 5km), that is expected average increase of the area by dumping of the entire material is below 30cm. Figure 2.8-16 show the locations of the deep-sea area which water depth is more than 30m. Location A is the nearest deep-sea area from the site and is located just in front of the Sonadia Island where ECA (Ecologically Critical Area) is located. Location B is the second candidate of the dumping site, approximately 60km from the site to the South With respect to the regulation of dumping of dredged soil material, there are no legitimate restrictions in Bangladesh. There are several international conventions that concerned the dumping of dredged soil material such as the Convention on the Prevention of Marine Pollution by Dumping of Wastes and Other Matter, 1972, and the Amendments Adopted in 1978 and 1980, the so-called London Dumping Convention and relevant national regulations. For some regions specific Conventions or Protocols have been adopted, e.g. the SPDEP, Convention covering the South Pacific. As Bangladesh is not yet within this convention as per the Treaties in Force-2006 for Marine Pollution (attached). On the other hands, Bangladesh is a signatory country of International Convention for the Prevention of Pollution from Ships, 1973, as modified by the Protocol of 1978 relating thereto and DoE is the responsible agency. So, DoE will be the responsible authority to take care of the Marine pollution by Dumping of wastes. According to the hearing with Environmental Specialist of IUCN Bangladesh, although the regulation by GOB with these matters is not strict, they suggested that 10 to 15 km distance from Sonadia Ecologically Critical Area (ECA) where IUCN Red List of endangered species have been found and the requirement specified by Ramsar Convention for internationally important Wetlands should be kept by complying with the international standard. Sonadia Island should also comply with the conditions specified by JICA Guidelines for Environmental and Social Considerations as “critical natural habitats of critical species or forests” and international standard are strongly requested to be followed in this JICA Guidelines. Location A in Figure 2.8-16 which is the nearest candidate location of dumping from the site is located within 2km from Sonadia ECA and is considered not suitable for the dumping site. In this study, location B in Figure 2.8-16 is considered possible candidate site for dumping of dredged soil material.

Final Report Preparatory Survey on Matarbari Port Development Project in the People’s Republic of Bangladesh
2-223
Figure 2.8-16 Candidate site of dumping of dredged soil material near the project site
(3) Prediction of SS diffusion by dredging work and dredged soil material dumping 1) Prediction cases for the prediction of SS diffusion Dredging works at the site and dumping of dredged soil material are considered. Figure 2.8-17 shows the plan of the dredging and reclamation works. Dredging work area are divided by 5 areas. Considering the effect of dredging works to the surrounding area, dredging work at areas D1 and D2 are the most appropriate areas of dredging work to consider for prediction of SS diffusion. Planned dredging method (used dredger type) and daily maximum dredging volume are summarized in Table 2.8-5. Trailer Suction Hopper Dredger (TSHD) is a self-propelled type dredger that has hopper to contain the dredged soil material and dump dredged soil material at planned location. Cutter Suction Dredger (CSD) dredge needs a barge to carry the dredged soil material to the planned location of dumping. Considering above mentioned conditions of the dredging works, two sources of contamination by dredging works and dumping works at offshore planned site are considered. For the case of SS diffusion at the dumping site, dumping work by dredged material barge carrier and dumping work by dredged material barge carrier and TSHD are considered. For the case of SS diffusion at the dredging work site, dredging work by CSD and dredging work by both CSD and TSHD are considered. Table 2.8-6 summarized the study cases for the SS diffusion prediction. For each case in, with and without contamination diffusion prevention membrane for each case are considered.

Final Report Preparatory Survey on Matarbari Port Development Project in the People’s Republic of Bangladesh
2-224
Figure 2.8-17 Work plan of the dredging and reclamation
Table 2.8-5 Planned dredged method and expected maximum daily dredging volume
Area Used dredger Maximum dredging volume D1 TSHD 10,000m3/day D2 CSD+sand barge 14,400m3/day
Table 2.8-6 Study cases for the SS diffusion prediction
Case Contamination source
Location of contamination
Used working vessels
Handling volume
Case1-1 Offshore dumping Offshore dumping site
Sand barge 14,400m3/day Case1-2 +TSHD 24,400m3/day Case2-1 Dredging work D2 CSD 14,400m3/day Case2-2 D1+D2 CSD+TSHD 24,400m3/day
2) SS Estimation at the Source Location “Guideline of prediction of effect of turbidity diffusion by port construction work, April 2004, Ministry Land, Infrastructure, Transport and Tourism (MLIT)” is used for the estimation of the source turbidity density by the port construction works which are based on the conversion equation (a) and turbidity density formula (b) with standardization basic unit of source SS
w = 075
wR
R ꞏꞏꞏꞏꞏꞏꞏꞏꞏꞏꞏꞏꞏꞏꞏꞏꞏꞏꞏꞏꞏꞏꞏꞏꞏꞏꞏꞏꞏꞏꞏꞏꞏꞏꞏꞏꞏꞏꞏꞏꞏꞏꞏꞏꞏꞏꞏꞏꞏꞏꞏꞏꞏꞏꞏꞏꞏꞏꞏꞏꞏꞏꞏꞏꞏꞏꞏꞏꞏꞏꞏꞏꞏꞏꞏꞏꞏꞏꞏꞏꞏꞏꞏ (a)
Ws = w × Qs ꞏꞏꞏꞏꞏꞏꞏꞏꞏꞏꞏꞏꞏꞏꞏꞏꞏꞏꞏꞏꞏꞏꞏꞏꞏꞏꞏꞏꞏꞏꞏꞏꞏꞏꞏꞏꞏꞏꞏꞏꞏꞏꞏꞏꞏꞏꞏꞏꞏꞏꞏꞏꞏꞏꞏꞏꞏꞏꞏꞏꞏꞏꞏꞏꞏꞏꞏꞏꞏꞏꞏꞏꞏꞏꞏꞏꞏꞏꞏꞏꞏꞏꞏꞏ (b) where,
w :turbidity source basic unit (kg/m3)
w0 :existing turbidity source basic unit standardized with current velocity of 7cm/s (kg/m3)
R :particle size accumulation distribution percentage of critical turbidity sediment particle size by applying the local current velocity as the critical turbidity velocity (%)
R75:particle size accumulation distribution percentage of sediment smaller than 0.075mm by
Final Report Preparatory Survey on Matarbari Port Development Project in the People’s Republic of Bangladesh
2-225
applying the existing turbidity source basic unit of w0(%) Ws :amount of yielded turbidity (kg/day)
Qs :Execution volume (m3/day)
Following are the calculation procedure of SS estimation. Obtaining the critical turbidity velocity are obtained from local current velocity Representative particle size of the bottom sediment from the cumulative particle distribution
curve and obtaining the critical particle size of turbidity Obtaining the ratio of clayey and silty sediment particle smaller than 75μm and particle
percentage (R75) which are obtained from the calculated procedure of particle size accumulation distribution percentage (R) of critical turbidity sediment and existing basic unit (w0)
Obtaining the turbidity source basic unit based on equation (a) by multiplying the existing turbidity source basic unit standardized with current velocity of 7cm/s and above-mentioned ratio of clayey and silty sediment particle smaller than 75μm and particle percentage (R75)
Obtaining the amount of yielded turbidity based on the equation (b) by multiplying the turbidity source basic unit and Execution volume
According to the boring survey data, layered soil structures of sand and silty/clayey are found at the location of the dredging works. Taking account of this situation, dredging work of silty/clayey layer without sand inclusion is considered for the estimation of the SS at the source location as a safe side assumption. Particle size composition of 58% of silty material and 42% of Clayey material is considered as the representative values. Table 2.8-7 shows the representative particle size and settling velocity of silty and clayey material. Although the settling velocity of clayey and silty material are affected by the flocculation, Stokes formula for settling velocity of single particle is used to obtain the settling velocity because of the scarce information of the formation of floc and the resultant settling velocity of those floc.
Table 2.8-7 Representative Soil Particle Size and Settling Velocity of Considered Material for Turbidity Diffusion
Classification of soil
Particle size(mm) Representative
particle size (mm)
Settling velocity of representative soil particle
(m/day)
Silt 0.005~0.075 0.0194 30.58
Clay (0.001)~0.005 0.0022 0.39
Table 2.8-7 shows the relation between the sediment particle size and critical turbidity velocity. According to the several previous studies about the current field near the project site, maximum tidal current velocity more than 200cm/s that are by far exceeded the range of the current velocity shown in Table 2.8-7 are obtained. Taking account of this situation, critical turbidity sediment particle size is not considered in the estimation of turbidity source. In other words, R=100% is assumed in equation (a) and all the considered dredged soil material which composition are shown in Table 2.8-7 will be the source of SS diffusion. Table 2.8-8 shows the turbidity source basic unit applied in this study.
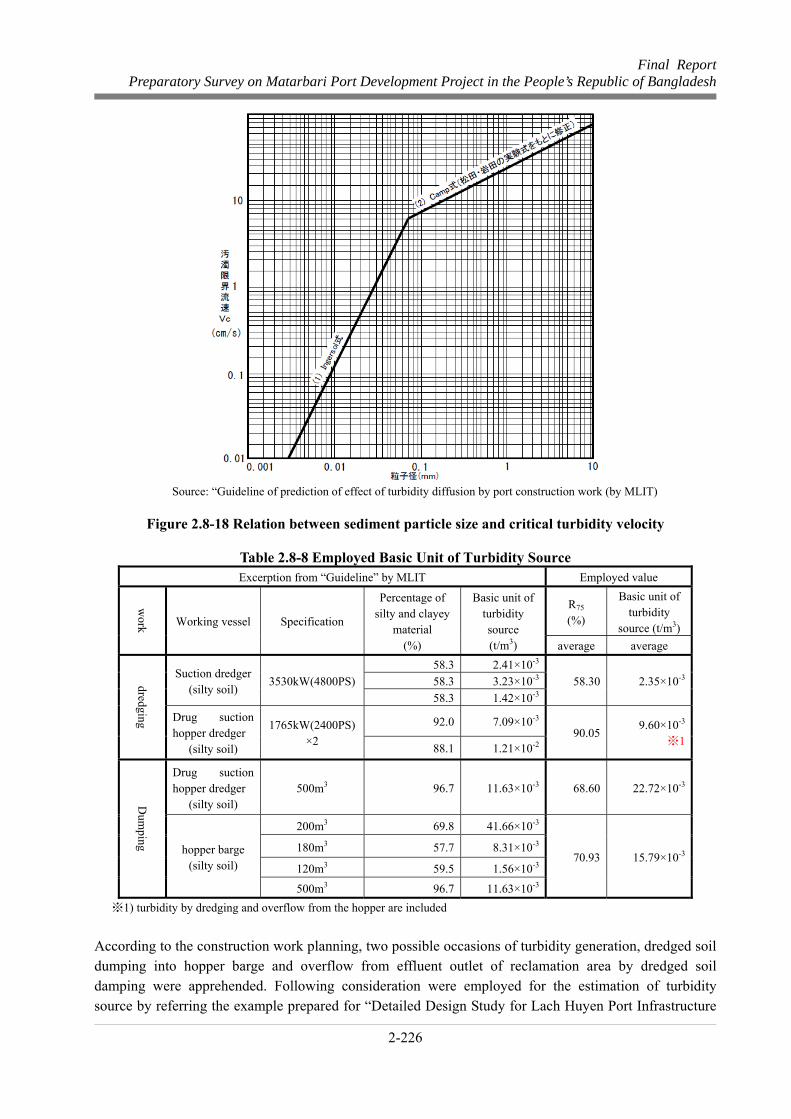
Final Report Preparatory Survey on Matarbari Port Development Project in the People’s Republic of Bangladesh
2-226
Source: “Guideline of prediction of effect of turbidity diffusion by port construction work (by MLIT)
Figure 2.8-18 Relation between sediment particle size and critical turbidity velocity
Table 2.8-8 Employed Basic Unit of Turbidity Source Excerption from “Guideline” by MLIT Employed value
work
Working vessel Specification
Percentage of silty and clayey
material (%)
Basic unit of turbidity source (t/m3)
R75 (%)
Basic unit of turbidity
source (t/m3)
average average dredging
Suction dredger (silty soil)
3530kW(4800PS)
58.3 2.41×10⁻³
58.30 2.35×10-358.3 3.23×10⁻³
58.3 1.42×10⁻³
Drug suction hopper dredger
(silty soil)
1765kW(2400PS)×2
92.0 7.09×10⁻³
90.05 9.60×10⁻³
※188.1 1.21×10⁻²
Dum
ping
Drug suction hopper dredger
(silty soil) 500m3 96.7 11.63×10⁻³ 68.60 22.72×10⁻³
hopper barge (silty soil)
200m3 69.8 41.66×10⁻³
70.93 15.79×10-3180m3 57.7 8.31×10⁻³
120m3 59.5 1.56×10⁻³
500m3 96.7 11.63×10⁻³
※1) turbidity by dredging and overflow from the hopper are included
According to the construction work planning, two possible occasions of turbidity generation, dredged soil dumping into hopper barge and overflow from effluent outlet of reclamation area by dredged soil damping were apprehended. Following consideration were employed for the estimation of turbidity source by referring the example prepared for “Detailed Design Study for Lach Huyen Port Infrastructure

Final Report Preparatory Survey on Matarbari Port Development Project in the People’s Republic of Bangladesh
2-227
Construction Project, Government of Viet Nam (Port and Road and bridge)”. Turbidity source basic unit by overflow from hopper barge was assumed to be the same with that of drag suction hopper dredger. Turbidity source basic unit by overflow from drag suction hopper dredger is assumed 0.8 times of the values shown in Table 2.8-8 and 0.2 times of the values are by dredging. Reduction rate of SS by contamination diffusion prevention membrane is specified 40 to 80% in the “Guideline of prediction of effect of turbidity diffusion by port construction work, April 2004, Ministry Land, Infrastructure, Transport and Tourism (MLIT)”. In this study lower limit value of 40% of reduction rate of SS by contamination diffusion prevention membrane by referring the past example of “Detailed Design Study for Lach Huyen Port Infrastructure Construction Project, Government of Viet Nam (Port and Road and bridge)”. Table 2.8-9 and Table 2.8-10 show the employed basic unit of turbidity source with and without contamination prevention membrane.

Fin
al R
epor
t P
repa
rato
ry S
urve
y on
Mat
arba
ri P
ort D
evel
opm
ent P
roje
ct in
the
Peo
ple’
s R
epub
lic
of B
angl
ades
h
2-22
8
Tab
le 2
.8-9
Em
plo
yed
am
oun
t of
SS
load
ing
at t
he s
ourc
e
Cas
e W
ork
item
E
mpl
oyed
wor
k ve
ssel
s an
d m
achi
nes
Exi
stin
g tu
rbid
ity
basi
c un
it (t
/m3)
×10
-3
R75
R
T
urbi
dity
bas
ic
unit
(t/m
3 ) ×
10-3
Tre
ated
vo
lum
e (m
3 /day
)
SS
lo
adin
g am
ount
(t
/day
)
Cas
e-1-
1-a
Off
shor
e du
mpi
ng
Hop
per
barg
e 15
.79
70.9
310
022
.26
14,4
0032
0.54
4
Cas
e-1-
2-a
Off
shor
e du
mpi
ng
Hop
per
barg
e 15
.79
70.9
310
022
.26
14,4
0032
0.54
4
TS
HD
22
.72
68.6
010
033
.12
10,0
0033
1.20
0
Cas
e2-1
-a
(Cha
nnel
D2)
Dre
dgin
g C
SD
2.35
58
.30
100
4.03
14,4
0058
.032
Ove
rflo
w
Hop
per
Bar
ge※
1 7.
68
90.0
510
08.
5314
,400
122.
832
Cas
e2-2
-a
(Cha
nnel
D2+
D1)
Dre
dgin
g C
SD
2.
35
58.3
010
04.
0314
,400
58.0
32
TS
HD
※2
1.92
(9
.60*
0.2)
90
.05
100
2.13
10,0
0021
.300
Ove
rflo
w
Hop
per
barg
e※1
7.68
90
.05
100
8.53
14,4
0012
2.83
2
TS
HD
※2
7.68
(9
.60*
0.8)
90
.05
100
8.53
10,0
0085
.200
※1)
Ove
rflo
w b
y ho
pper
bar
ge a
re a
ssum
ed to
be
equa
l with
the
valu
e of
TS
HD
※2)
Tur
bidi
ty s
ourc
e ba
sic
unit
by
over
flow
fro
m d
rag
suct
ion
hopp
er d
redg
er i
s as
sum
ed 0
.8 t
imes
of
the
valu
es s
how
n in
Tab
le 1
-3 a
nd 0
.2 t
imes
of
the
valu
es a
re b
y dr
edgi
ng
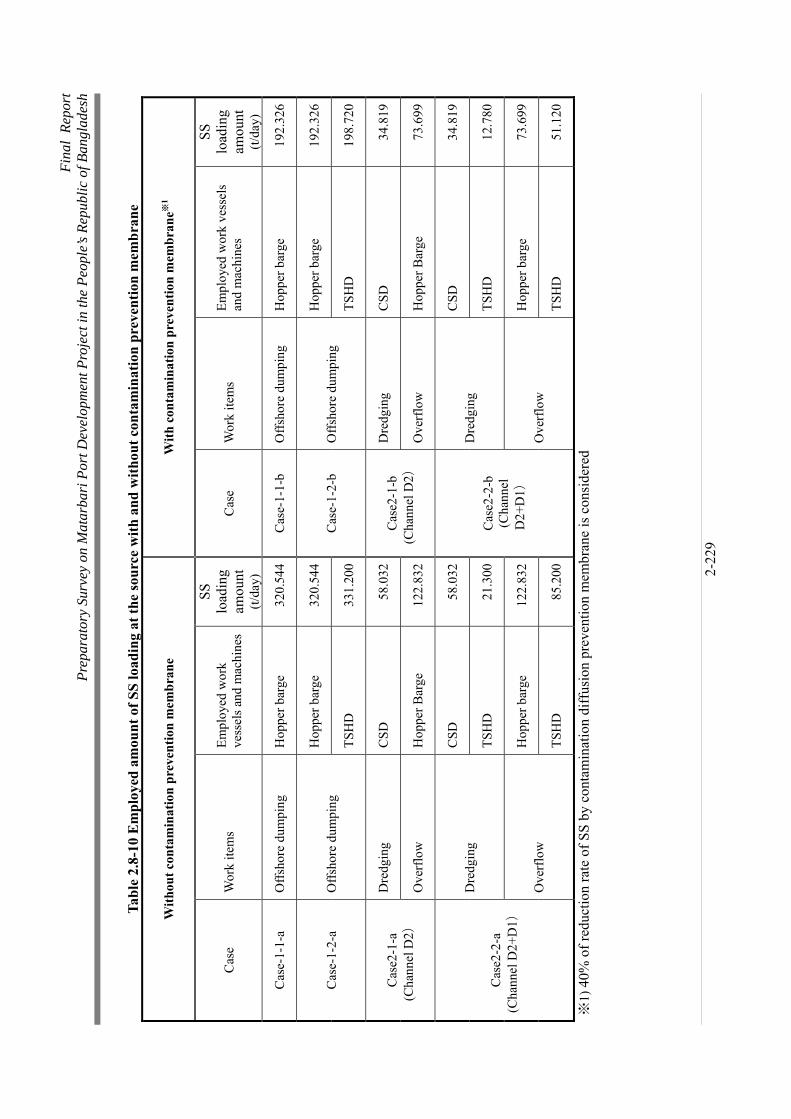
Fin
al R
epor
t P
repa
rato
ry S
urve
y on
Mat
arba
ri P
ort D
evel
opm
ent P
roje
ct in
the
Peo
ple’
s R
epub
lic
of B
angl
ades
h
2-22
9
Tab
le 2
.8-1
0 E
mp
loye
d a
mou
nt
of S
S lo
adin
g at
the
sou
rce
wit
h a
nd
wit
hou
t co
nta
min
atio
n p
reve
nti
on m
emb
ran
e
Wit
hou
t co
nta
min
atio
n p
reve
nti
on m
emb
ran
e W
ith
con
tam
inat
ion
pre
ven
tion
mem
bra
ne※
1
Cas
e W
ork
item
s E
mpl
oyed
wor
k ve
ssel
s an
d m
achi
nes
SS
lo
adin
g am
ount
(t
/day
)
Cas
e W
ork
item
s E
mpl
oyed
wor
k ve
ssel
s an
d m
achi
nes
SS
lo
adin
g am
ount
(t
/day
)
Cas
e-1-
1-a
Off
shor
e du
mpi
ng
Hop
per
barg
e 32
0.54
4C
ase-
1-1-
b O
ffsh
ore
dum
ping
H
oppe
r ba
rge
192.
326
Cas
e-1-
2-a
Off
shor
e du
mpi
ng
Hop
per
barg
e 32
0.54
4C
ase-
1-2-
b O
ffsh
ore
dum
ping
H
oppe
r ba
rge
192.
326
TS
HD
33
1.20
0T
SH
D
198.
720
Cas
e2-1
-a
(Cha
nnel
D2)
Dre
dgin
g C
SD
58.0
32C
ase2
-1-b
(C
hann
el D
2)
Dre
dgin
g C
SD
34.8
19
Ove
rflo
w
Hop
per
Bar
ge
122.
832
Ove
rflo
w
Hop
per
Bar
ge
73.6
99
Cas
e2-2
-a
(Cha
nnel
D2+
D1)
Dre
dgin
g C
SD
58
.032
Cas
e2-2
-b
(Cha
nnel
D
2+D
1)
Dre
dgin
g C
SD
34
.819
TS
HD
21
.300
TS
HD
12
.780
Ove
rflo
w
Hop
per
barg
e 12
2.83
2O
verf
low
H
oppe
r ba
rge
73.6
99
TS
HD
85
.200
TS
HD
51
.120
※1)
40%
of
redu
ctio
n ra
te o
f S
S b
y co
ntam
inat
ion
diff
usio
n pr
even
tion
mem
bran
e is
con
side
red
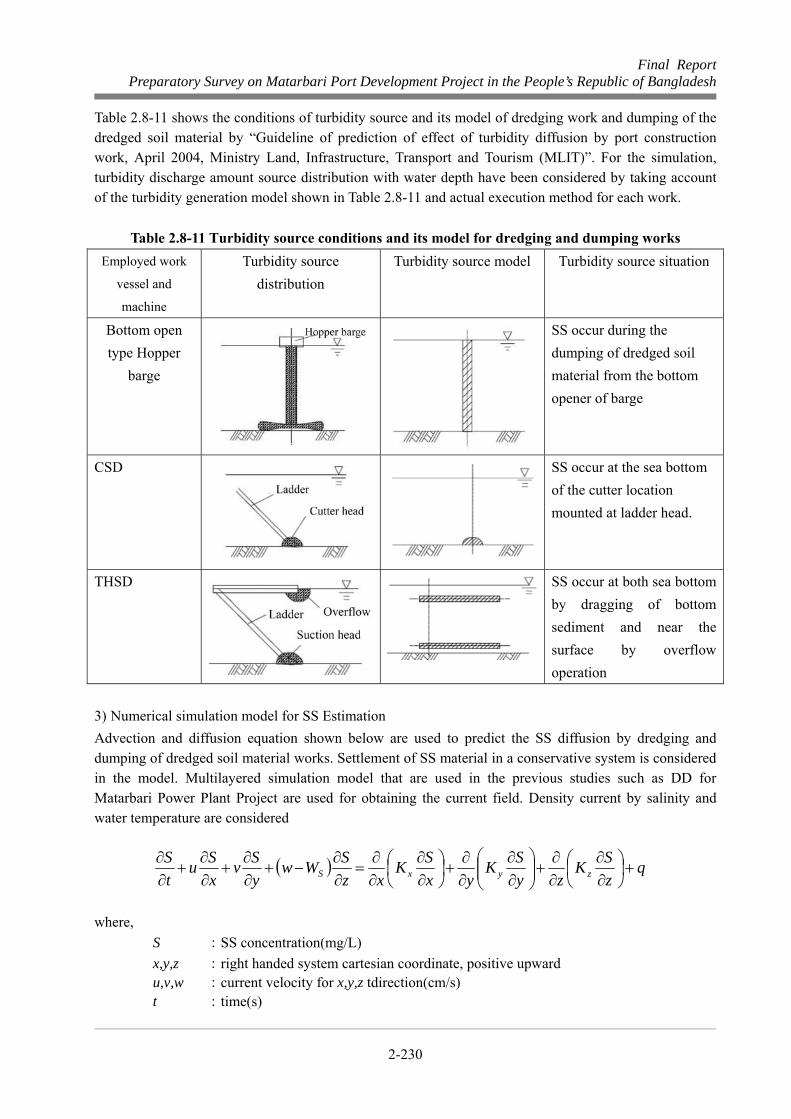
Final Report Preparatory Survey on Matarbari Port Development Project in the People’s Republic of Bangladesh
2-230
Table 2.8-11 shows the conditions of turbidity source and its model of dredging work and dumping of the dredged soil material by “Guideline of prediction of effect of turbidity diffusion by port construction work, April 2004, Ministry Land, Infrastructure, Transport and Tourism (MLIT)”. For the simulation, turbidity discharge amount source distribution with water depth have been considered by taking account of the turbidity generation model shown in Table 2.8-11 and actual execution method for each work.
Table 2.8-11 Turbidity source conditions and its model for dredging and dumping works
Employed work
vessel and
machine
Turbidity source
distribution
Turbidity source model Turbidity source situation
Bottom open
type Hopper
barge
SS occur during the
dumping of dredged soil
material from the bottom
opener of barge
CSD SS occur at the sea bottom
of the cutter location
mounted at ladder head.
THSD SS occur at both sea bottom
by dragging of bottom
sediment and near the
surface by overflow
operation
3) Numerical simulation model for SS Estimation
Advection and diffusion equation shown below are used to predict the SS diffusion by dredging and dumping of dredged soil material works. Settlement of SS material in a conservative system is considered in the model. Multilayered simulation model that are used in the previous studies such as DD for Matarbari Power Plant Project are used for obtaining the current field. Density current by salinity and water temperature are considered
qz
SK
zy
SK
yx
SK
xz
SWw
y
Sv
x
Su
t
SzyxS
where,
S :SS concentration(mg/L)
x,y,z :right handed system cartesian coordinate, positive upward u,v,w :current velocity for x,y,z tdirection(cm/s) t :time(s)

Final Report Preparatory Survey on Matarbari Port Development Project in the People’s Republic of Bangladesh
2-231
Kx,Ky :horizontal eddy viscosity(cm2/s) Kz :vertical eddy viscosity(cm2/s) q :amount of SS(mg/L/s) Ws :Settling velocity(cm/s)
For the calculation of tidal current field, the multilayer model by 7 layers that considers the dry up and submerge by tidal fluctuation, tidal flow, density current and wind-driven current is applied. Basic equations of fluid dynamic (equation of motion, continuity equation and convective-diffusion equation of water temperature and salinity) are solved using, ‘numerical simulation model by difference method’ for obtaining the current field. Basic assumption of the equation of motion is rotating-incompressibility fluid and Boussinesq approximation and hydrostatic approximation are employed. Numerical simulation method that employ the nesting analysis is considered. Figure 2.8-19 shows the simulated area for the case of SS diffusion for dredging works. Nesting grid model of 5 domains are employed for the simulation model. Grid size of 30m for near the dumping site are employed and grid size of 90m, 270m, 810m and 2430m for outer larger domain are employed.
Figure 2.8-19 Simulated Area and Grid size (for Dredging work)
Figure 2.8-20 shows the simulated area for the case of SS diffusion at dumping site. Nesting grid model of 5 domains are employed for the simulation model. Grid size of 90m for near the dumping site are employed and grid size of 270m, 810m and 2430m for outer larger domain are employed.
Δs=90m
Project Site
(Δs=30m)
Δs=810m
Δs=2430m
Δs=270m

Final Report Preparatory Survey on Matarbari Port Development Project in the People’s Republic of Bangladesh
2-232
Figure 2.8-20 Simulated Area and Grid size (for Dumping site)
Vertical grid division has been done by following 8 layers by taking into consideration of the planned channel water depth of DL.-17m.
1 layer:sea surface~3m(MSL-)
2 layer:3~6m
3 layer:6~9m
4 layer:9~13m
5 layer:13~18m
6 layer:18~28m
7 layer:28m or over
Tidal conditions at the boundary are given by the global tidal model with spatial resolution of 0.5 degree by Matsumoto el. al (2000). Amplitude and phase of main 8 constituents are used to determine the boundary conditions. Figure 2.8-21 shows the boundary that the tidal conditions are to be given. Linear interpolation between the computed points is done. Table 2.8-12 shows the 8 major constituents amplitudes and phases. Because constituent of M2 is dominant in this region, M2 constituent is used to simulate the average tidal conditions. Figure 2.8-22 shows the comparison of the tidal current by considering 8 major constituents and by considering M2 constituent as for reference.
Offshore
Dumping Site
(Δs 90m)
Project Site
Δs=270m Δs=810m
Δs=2430m

Final Report Preparatory Survey on Matarbari Port Development Project in the People’s Republic of Bangladesh
2-233
Figure 2.8-21 Computation Area and the Tidal Condition Setting Method at the Boundary
Table 2.8-12 Tidal Amplitude and Phases to determine the Boundary Conditions
constituent period
(hour)
North-West South-West South-East
amplitude
(cm)
phase
angle
(deg)
amplitude
(cm)
phase
angle
(deg)
amplitude
(cm)
phase
angle
(deg)
K2 23.93 17.0 244.7 13.6 243.1 13.8 238.1
O1 25.82 5.0 215.7 5.4 236.0 5.0 228.2
P1 24.07 5.8 251.8 4.3 242.9 4.3 237.1
Q1 26.87 1.8 115.5 0.5 222.3 0.5 233.5
M2 12.42 83.5 109.4 69.8 80.9 80.8 79.3
S2 12.00 41.5 140.4 31.4 111.8 36.2 108.9
2N2 12.91 20.7 98.5 14.7 73.0 16.9 70.3
K2 11.97 12.8 132.9 8.8 107.1 10.1 104.8
1st. Region
Open Boundary Average Average
Linear Interpolation from Endpoints
Linear Interpolation from Endpoints
●:Tide Data by Matsumoto et al. (2000)
E90.25°,N21.75°
E90.25°,N20.75°
E90.25°,N20.25° E92.75°,N20.25°
E92.25°,N20.75°
Project Site
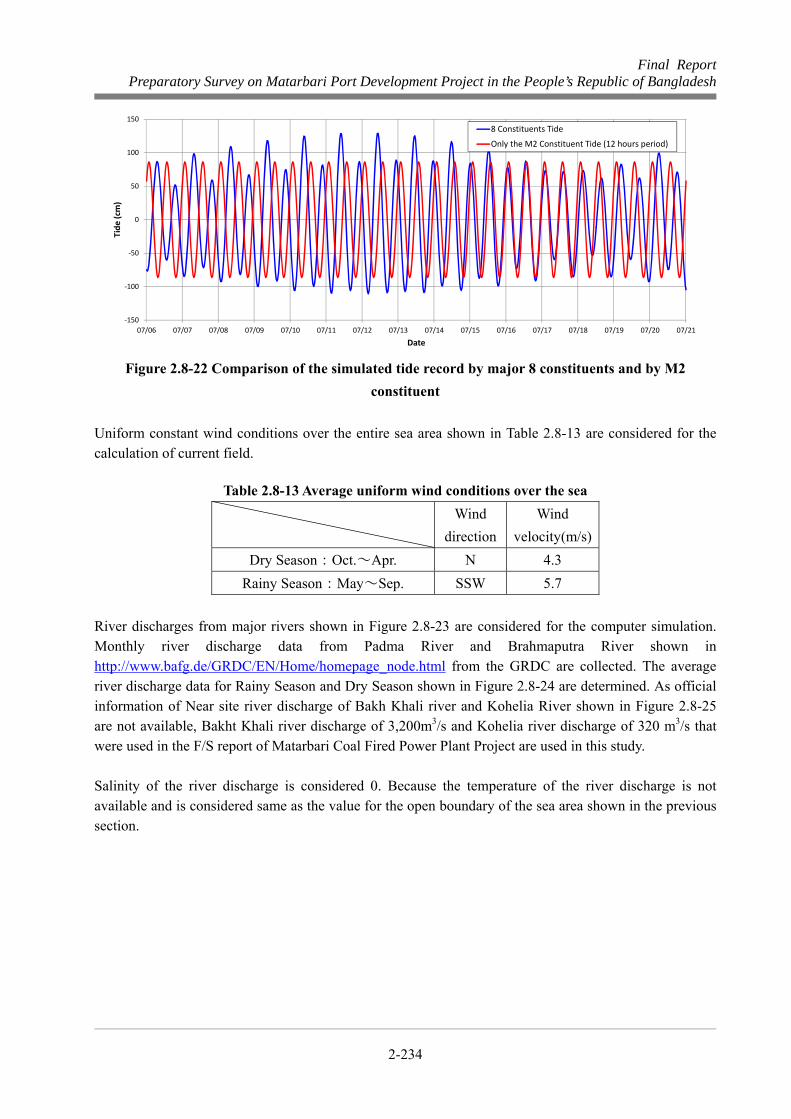
Final Report Preparatory Survey on Matarbari Port Development Project in the People’s Republic of Bangladesh
2-234
‐150
‐100
‐50
0
50
100
150
07/06 07/07 07/08 07/09 07/10 07/11 07/12 07/13 07/14 07/15 07/16 07/17 07/18 07/19 07/20 07/21
Tide (cm
)
Date
8 Constituents Tide
Only the M2 Constituent Tide (12 hours period)
Figure 2.8-22 Comparison of the simulated tide record by major 8 constituents and by M2
constituent
Uniform constant wind conditions over the entire sea area shown in Table 2.8-13 are considered for the calculation of current field.
Table 2.8-13 Average uniform wind conditions over the sea
Wind
direction
Wind
velocity(m/s)
Dry Season:Oct.~Apr. N 4.3
Rainy Season:May~Sep. SSW 5.7
River discharges from major rivers shown in Figure 2.8-23 are considered for the computer simulation. Monthly river discharge data from Padma River and Brahmaputra River shown in http://www.bafg.de/GRDC/EN/Home/homepage_node.html from the GRDC are collected. The average river discharge data for Rainy Season and Dry Season shown in Figure 2.8-24 are determined. As official information of Near site river discharge of Bakh Khali river and Kohelia River shown in Figure 2.8-25 are not available, Bakht Khali river discharge of 3,200m3/s and Kohelia river discharge of 320 m3/s that were used in the F/S report of Matarbari Coal Fired Power Plant Project are used in this study. Salinity of the river discharge is considered 0. Because the temperature of the river discharge is not available and is considered same as the value for the open boundary of the sea area shown in the previous section.
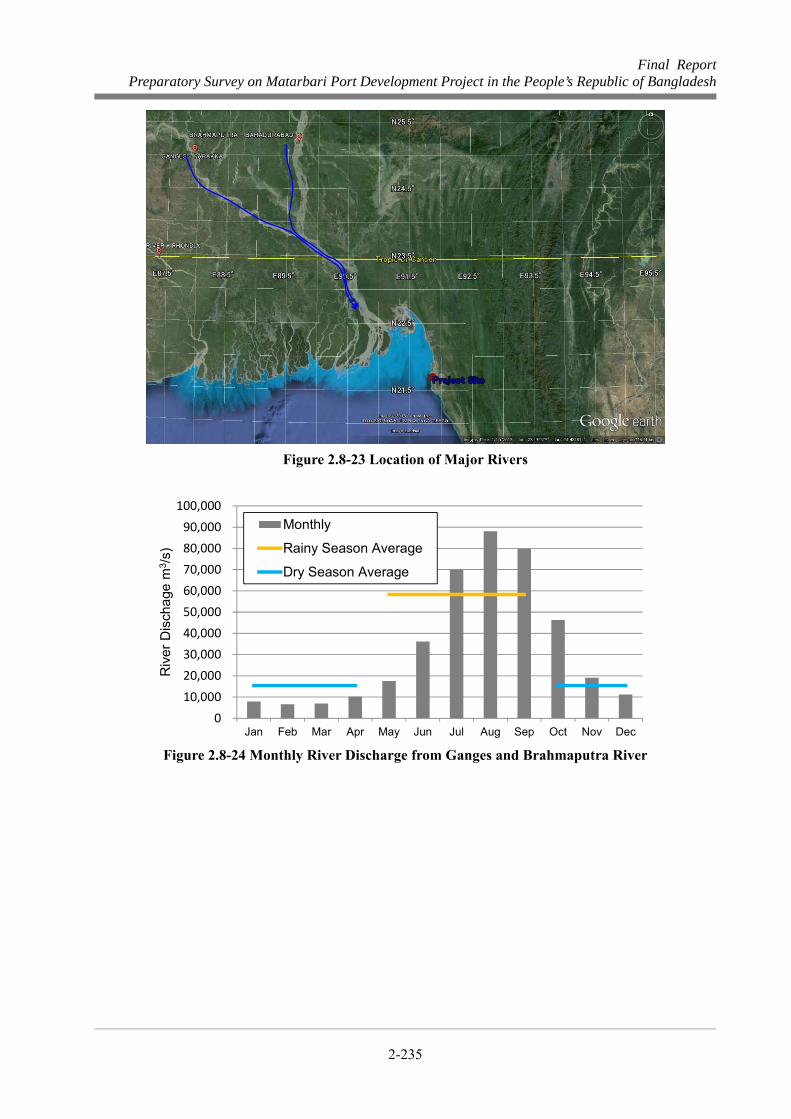
Final Report Preparatory Survey on Matarbari Port Development Project in the People’s Republic of Bangladesh
2-235
Figure 2.8-23 Location of Major Rivers
0
10,000
20,000
30,000
40,000
50,000
60,000
70,000
80,000
90,000
100,000
Jan Feb Mar Apr May Jun Jul Aug Sep Oct Nov Dec
Riv
er
Dis
cha
ge m
3/s
)
Monthly
Rainy Season Average
Dry Season Average
Figure 2.8-24 Monthly River Discharge from Ganges and Brahmaputra River

Final Report Preparatory Survey on Matarbari Port Development Project in the People’s Republic of Bangladesh
2-236
Figure 2.8-25 Rivers near the Project Site
Water temperature and salinity that are shown in the database shown by Japan Ocean Data Center (JODC:http://jdoss1.jodc.go.jp/vpage/scalar_j.html) are used for the determination of the water temperature and salinity conditions for the computational simulation method. Figure 2.8-26 shows the examples of observed vertical profile of the water temperature and salinity data.

Final Report Preparatory Survey on Matarbari Port Development Project in the People’s Republic of Bangladesh
2-237
0
20
40
60
80
100
120
140
160
0 5 10 15 20 25 30 35Dep
th (m)
Temperature (Cdeg)
0
20
40
60
80
100
120
140
160
0 5 10 15 20 25 30 35 40
Dep
th (m)
Salinity (PSU)
(1) Rainy Season (May to September)
0
20
40
60
80
100
120
140
160
0 5 10 15 20 25 30 35
Dep
th (m)
Temperature (Cdeg)
0
20
40
60
80
100
120
140
160
0 5 10 15 20 25 30 35 40
Dep
th (m)
Salinity (PSU)
(2) Dry Season (October to April)
Source:(JODC, http://jdoss1.jodc.go.jp/vpage/scalar_j.html)
Figure 2.8-26 Examples of Observed Vertical Profile of the Water Temperature and Salinity Data
Initial conditions of background SS concentration is considered 0 to identify the range of SS diffusion and resulting change of SS concentration. Horizontal eddy viscosity of 50,000cm2/sec and vertical eddy viscosity of 5cm2/sec are considered. Steady state dumping activity, that is constant continuous SS loading are assumed at SS source. As tidal constituents of M2 are considered for the tidal current simulation, the tidal current varies periodically by 12 hours and accordingly resultant SS concentration fluctuate periodically by 12 hours. 240 hours (10 days) on duration of simulation are employed to obtain the steady state of SS fluctuation.

Final Report Preparatory Survey on Matarbari Port Development Project in the People’s Republic of Bangladesh
2-238
Location of the dumping site of dredged material should be located at the water depth deeper than 30m is considered preferable for ensuring the safe navigation of large ships. As the expected volume of dredged soil material dumping is as much as 7 million m3, necessary area for the dumping site is assumed to be 25,000,000m2 (5km x 5km), that is expected average increase of the area by dumping of the entire material is below 30cm. Figure 2.8-16 show the locations of the deep-sea area which water depth is more than 30m. Location A is the nearest deep-sea area from the site and is located just in front of the Sonadia Island where ECA (Ecologically Critical Area) is located. Location B is the second candidate of the dumping site, approximately 60km from the site to the South
(4) Numerical simulation results and concluding remarks
Figure 2.8-27 shows the calculated daily maximum SS concentration for Dry Season at the surface and bottom layer by offshore dumping for Case1-2 in Table 2.8-6, dumping volume of 24,400m3/day without diffusion protection measures as the most severe condition for the environment. Figure 2.8-28 shows the same results for Rainy Season. Figure 2.8-29 shows the calculated daily maximum SS concentration for Dry Season at the surface and bottom layer by dredging work at Matarbari Port site for Case2-2 in Table 2.8-6, dredging volume of 24,400m3/day without diffusion protection measures as the most severe condition for the environment. Figure 2.8-30 shows the same results for Rainy Season. Numerical simulation results of tidal current field near the dumping site and near the Matarbari port site at the surface and bottom layer during high tide, ebb tide, low tide and flood tide for Rainy Season and Dry Season are presented in Appendix-2.9-1(1). The calculated results of daily average and maximum SS diffusion for other cases, by offshore dumping of Case1-1 with and without diffusion protection measures for Dry and Rainy Seasons and SS diffusion by dredging works of Case1-2 with diffusion protection measures for Dry and Rainy Seasons, are also presented in Appendix-2.9-1(2). Tidal current velocity at the dumping site is rather slow compared with the Matarbari Port construction site. SS diffusion is restricted both at the surface and bottom layer within a short distance area. Because the range of affected area by dredged material dumping is relatively small, employment of diffusion prevention membrane is not considered necessary. Calculated results of SS diffusion by the employment of diffusion prevention membrane are also presented as a reference. Effect of overflow of the dredged material by TSHD are larger than the effect of the suspended soil material by dredging cutter head at the sea bottom. Because the tidal current is faster than with at the offshore dumping site, affected area of SS diffusion by dredging work is relatively larger. Area of daily maximum SS concentration over 2mg/l extend at most several km north and south direction without the diffusion prevention membrane. Considering the background SS concentration often exceeds 1000mg/l even in the Dry Season shown in Figure 2.8-31 as an examples of survey data, effect of SS diffusion by dredging work is very limited.

Final Report Preparatory Survey on Matarbari Port Development Project in the People’s Republic of Bangladesh
2-239
Surface layer
Bottom layer
【Dry Season, daily maximum value, dumping volume of 24,400m3/day】
Figure 2.8-27 SS diffusion by dumping (red box indicate dumping site : case1-2)

Final Report Preparatory Survey on Matarbari Port Development Project in the People’s Republic of Bangladesh
2-240
Surface layer
Bottom layer
【Rainy Season, daily maximum value, dumping volume of 24,400m3/day】
Figure 2.8-28 SS diffusion by dumping (red box indicate dumping site : case1-2)

Final Report Preparatory Survey on Matarbari Port Development Project in the People’s Republic of Bangladesh
2-241
Surface layer
Bottom layer
【Dry Season, daily maximum value, dumping volume of 24,400m3/day】
Figure 2.8-29 SS diffusion by dredging works(case2-2)
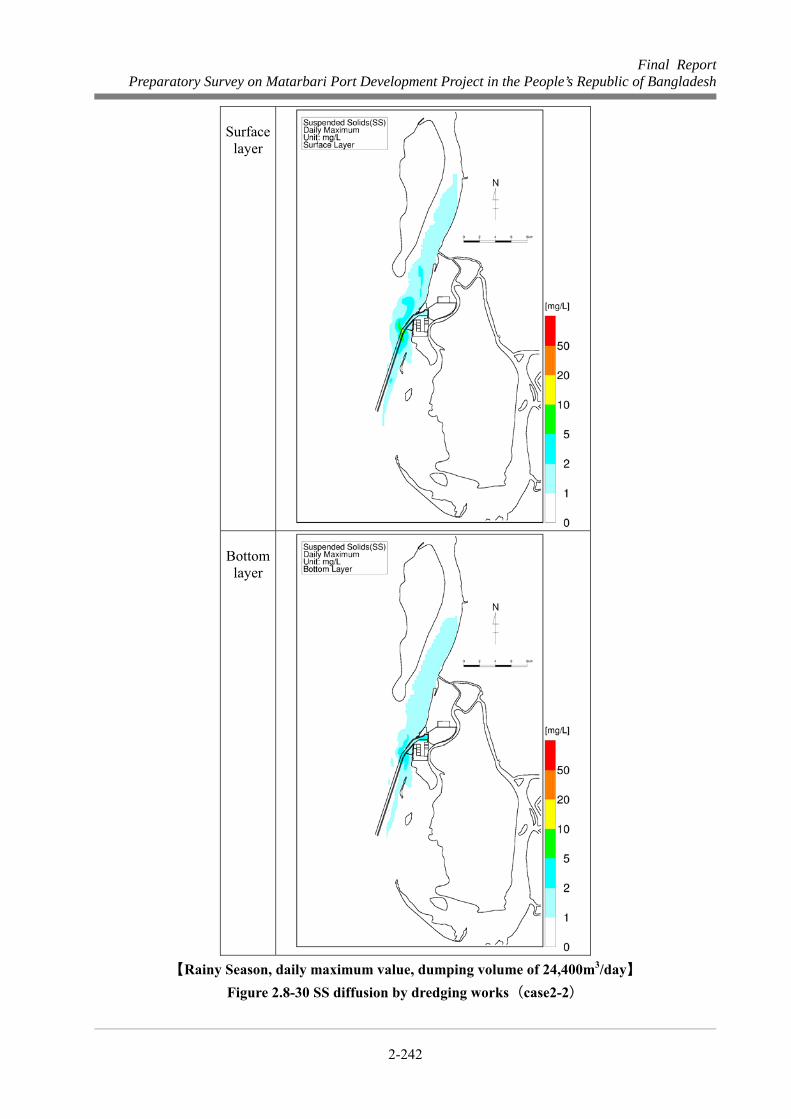
Final Report Preparatory Survey on Matarbari Port Development Project in the People’s Republic of Bangladesh
2-242
Surface layer
Bottom layer
【Rainy Season, daily maximum value, dumping volume of 24,400m3/day】
Figure 2.8-30 SS diffusion by dredging works(case2-2)

Final Report Preparatory Survey on Matarbari Port Development Project in the People’s Republic of Bangladesh
2-243
7
8
9
10
11
12
13
14
15
0
500
1000
1500
2000
2500
3000
3500
4000
24/03/2017
06:00
24/03/2017
12:00
24/03/2017
18:00
25/03/2017
00:00
25/03/2017
06:00
25/03/2017
12:00
25/03/2017
18:00
26/03/2017
00:00
26/03/2017
06:00
26/03/2017
12:00
26/03/2017
18:00
27/03/2017
00:00
27/03/2017
06:00
27/03/2017
12:00
27/03/2017
18:00
28/03/2017
00:00
28/03/2017
06:00
28/03/2017
12:00
28/03/2017
18:00
29/03/2017
00:00
29/03/2017
06:00
29/03/2017
12:00
29/03/2017
18:00
30/03/2017
00:00
30/03/2017
06:00
30/03/2017
12:00
30/03/2017
18:00
31/03/2017
00:00
31/03/2017
06:00
31/03/2017
12:00
31/03/2017
18:00
01/04/2017
00:00
01/04/2017
06:00
01/04/2017
12:00
01/04/2017
18:00
02/04/2017
00:00
02/04/2017
06:00
02/04/2017
12:00
02/04/2017
18:00
03/04/2017
00:00
03/04/2017
06:00
03/04/2017
12:00
Depth (m)
Turbidity(NTU
)
Turbidity (CS‐01) Turbidity (CS‐02) Tubidity (CS‐03) Water Depth (CS‐02)
Location of CS-01,CS-02,CS-03 shown in above figure
Figure 2.8-31 Observed SS record near the site (Mar. 2017 to Apr. 2017)
Final Report Preparatory Survey on Matarbari Port Development Project in the People’s Republic of Bangladesh
2-244
2.8.3 Shoreline Deformation and Countermeasure
(1) Introduction
Construction of the port, together with the dredging of the navigation channel and basin arear will have the potential to affect the wave and tidal current conditions and most typically the long-term coastline changes of the adjacent coast area. In this section, effects of the port construction on wave and tidal current conditions of the adjacent coastal area are evaluated to identify the affected coastal area by comparison of the wave and tidal current distribution before and after construction of the port. 1-line shoreline model is used to predict the long-term coastline changes of the coastal area that are likely to be affected by the construction of the port. Comparison of the long-term shoreline change between with and without the construction of the port are made to see the effect of construction of the port on beach process. About 30 years of past coastline changes by the analysis of satellite images data are used to confirm the validity of the 1-line coastline model and the concerned area for the calculation of the long-term coastline change by 1-line coastline model.
(2) Wave and current condition changes
Figure 2.8-32 shows the bathymetric and topographical conditions before the construction and after construction of the port (Phase2). Energy-averaged wave are used as an input data at the boundary of the numerical simulation model to compare the wave height and wave direction distribution before and after construction of the port (Phase2). Dominant offshore wave direction of SSW and SW at the site for Dry season and Rainy season were considered for the comparison. Numerical simulation method of SWAN that are based on the energy balance equation were used to calculate the wave deformations of the concerned area. Validity of the numerical simulation method of SWAN model were confirmed through the previous studies such as Detailed Design of port facilities for Matarbari Coal Fired Power Plant.
Figure 2.8-33 show the wave height changes before and after the construction of Port for Dry Season and Rainy Season. Calculated wave height and wave direction distribution before and after the construction of Port (Phase2) for Dry Season and Rainy Season are shown in Appendix 2.9-4. According to the results shown above, significant wave height changes are seen within the adjacent area of Port area. We can conclude that the effect of construction of Port on the wave field are very limited in the very vicinity area of the Port area. Numerical simulation method by multi-layered model were used to calculate the tidal current field. Validity of the numerical simulation method are also confirmed through the precious studies such as Detailed Design of port facilities for Matarbari Coal Fired Power Plant. Figure 2.8-34 and Figure 2.8-35 show the depth-averaged tidal current velocity changes before and after the construction of Port (Phase2) for Dry Season and Rainy Season. Depth-averaged tidal current distribution before and after the construction of Port are also shown in Appendix 2.9-4, Major changes in tidal current field occurred within the very vicinity of the port area. Very small changes of the tidal current field can be seen in the entire Kutubdia Channel, north of the port, are due to the tidal current phase changes that occurred by the construction of the dike structure at the south side of Kutbdia Channel. Based on above shown results, we can conclude that the effect of construction of Port on the tidal current field are very limited in the very vicinity area of the Port area .
Final Report Preparatory Survey on Matarbari Port Development Project in the People’s Republic of Bangladesh
2-245
(1)Topography before construction (2)Port Layout Plan (Phase2)
Figure 2.8-32 Topographical condition before and after the construction of Port (Phase2)
Depth
(CDL-)

Final Report Preparatory Survey on Matarbari Port Development Project in the People’s Republic of Bangladesh
2-246
(1) Dry Season; SSW (2) Dry Season; SW
(3) Rainy Season; SSW (4) Rainy Season; SW
Figure 2.8-33 Wave height change due to construction of Port (Phase2)

Final Report Preparatory Survey on Matarbari Port Development Project in the People’s Republic of Bangladesh
2-247
(1) Flood tide (2) High tide
(3) Ebb tide (4) Low tide
Figure 2.8-34 Depth-averaged tidal current change before and after construction of port (Phase2) (Dry Season: red indicate tidal current acceleration and blue indicate tidal current deceleration by
construction of port)

Final Report Preparatory Survey on Matarbari Port Development Project in the People’s Republic of Bangladesh
2-248
(1) Flood tide (2) High tide
(3) Ebb tide (4) Low tide
Figure 2.8-35 Depth-averaged tidal current change before and after construction of port (Phase2)
(Dry Season: red indicate tidal current acceleration and blue indicate tidal current deceleration by
construction of port)

Final Report Preparatory Survey on Matarbari Port Development Project in the People’s Republic of Bangladesh
2-249
(3) Past coastline changes by satellite image data
Satellite image data from Jan. 1989 to Oct. 2017 are collected to see the past coastline changes. Table 2.8-14 show the date and the resolution of collected satellite image data. Figure 2.8-36 indicates the collected image data area by red and blue colored solid line boxed area. Blue colored solid line boxed area covers vast area from north of Project site to Sonadia Island and red colored solid line boxed area covers adjacent area of Project site. Figure 2.8-37 (1) to (3) show the collected satellite image data. There is a clear difference of overall direction of coastline of Sonadia Island (South-East to North-West) and Matarbari Island (South to North). There are two distinct gaps of the continuity of sandy beach by the mouth of river or canal. These two features of coastline indicate the separation of longshore sand transport system of between the coastline of Sonadia Island and that of Matarbari Island, although there is some indication of sand transport mechanism beyond the river mouth or canal mouth.
Table 2.8-14 Collected Satellite Image data
shooting date Collected data area Name of Satellite resolution
7 Jan. 1989 blue colored solid line boxed area SPOT4 10m
16 Nov. 2002 blue colored solid line boxed area SPOT4 10m
24 Dec. 2012 blue colored solid line boxed area SPOT6 1.5m
25 Oct. 2015 red colored solid line boxed area SPOT6 1.5m
26 Jun. 2016 red colored solid line boxed area SPOT7 1.5m
23 Nov. 2016 blue colored solid line boxed area SPOT6 1.5m
14 Feb. 2017 red colored solid line boxed area SPOT7 1.5m
25 May 2017 red colored solid line boxed area SPOT6 1.5m
15 Oct. 2017 Red colored solid line boxed area SPOT6 1.5m
Figure 2.8-36 Data collected area map
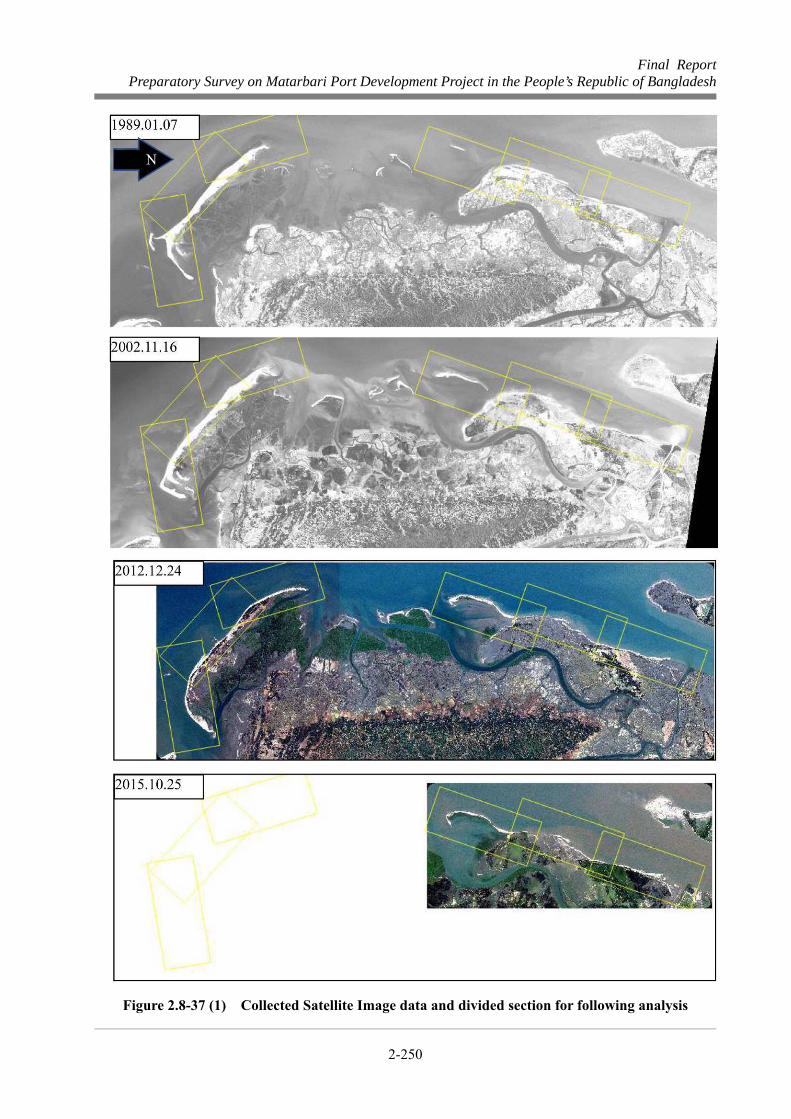
Final Report Preparatory Survey on Matarbari Port Development Project in the People’s Republic of Bangladesh
2-250
Figure 2.8-37 (1) Collected Satellite Image data and divided section for following analysis

Final Report Preparatory Survey on Matarbari Port Development Project in the People’s Republic of Bangladesh
2-251
Figure 2.8-37 (2) Collected Satellite Image data and divided section for following analysis

Final Report Preparatory Survey on Matarbari Port Development Project in the People’s Republic of Bangladesh
2-252
Figure 2.8-37 (3) Collected Satellite Image data and divided section for following analysis
Figure 2.8-38 shows the coastline of Sonadia Island and Figure 2.8-39 shows the closer look of three
separated coastline for the detail analysis. Red broken line in Figure 2.8-39 indicate the latest coastline of Nov. 2016. In Zone 1, sand bar advanced to the north direction, that is toward upstream of the Bakh Khali River, and growth and dissipation of several islands offshore of the coastline of Sonadia Island and the Bakh Khali River mouth were seen. These phenomena indicate the existence of strong on-off shore sand transport and the longshore sand transport to north direction. Chart data near Sonadia Island shown in Figure 2.8-40 shows the shallow water depth area of river mouth terrace that could be the source of the sand supply to the Zone 1 coastline of Sonadia Island. In Zone 2, both advance and retreat of coastline can be seen, but overall coastline changes are small. Growth of sand bar at the center indicate the dominant direction of longshore sand transport is from south to north. In Zone 3, distinct growth of coastline to the north that indicates the dominant longshore sand transport from south to north was seen. Figure 2.8-41 shows the current conditions of the shoreline of Zone2 and Zone3, several sand spit growths can be seen from south to north that clearly support the idea of the dominant longshore sand transport from south to north. Photo 2.9-1 that was taken at Zone 3 shows the current coastline of Sonadia Island that also indicates the dominant longshore sand transport from south to north. Although the dominant longshore sediment transport from south to north can be seen. There is a clear gap between the coastline of north side of the canal and river mouth and direct sediment transport by longshore sediment transport mechanism to the north side coastline seems to be very small. Because the tidal current at the mouth of the river and canal prevent the direct transport of sand across the canal and river mouth from south to north and vice-versa, there should be some other on-offshore sand transport mechanism mainly due to the tidal current at the mouth and off the mouth of the river and canal that transport the sand across the river and canal mouth. Figure 2.8-42 shows the chart data in front of Sonadia Island. Contour line of water depth of -5m indicate the existence of longshore bar that extend from north to south and at the southern end those longshore bars connected to the river mouth terrace of Bakh Khali River. Formation of these longshore bars indicates the effect of the strong tidal current which dominant direction is north to south and vice versa.

Final Report Preparatory Survey on Matarbari Port Development Project in the People’s Republic of Bangladesh
2-253
Figure 2.8-38 Sonadia Island coastline (3 Zone for detail consideration in Figure 1-16)
① ② ③
1989/1/7
2002/11/16
2012/12/24
2016/11/23
N N N
Figure 2.8-39 Detail coastline change of Sonadia Island for each three zone
N
N

Final Report Preparatory Survey on Matarbari Port Development Project in the People’s Republic of Bangladesh
2-254
Figure 2.8-40 Chart data near Sonadia Island (edition of June 2009)
Photo 2.9-1 Current coastline conditions at zone 3 of Sonadia Island (growth of shoreline bar to the
north direction indicate the dominant direction of sand transport)

Final Report Preparatory Survey on Matarbari Port Development Project in the People’s Republic of Bangladesh
2-255
Figure 2.8-41 Detail of the aerial photo of northern part of Sonadia coast
Figure 2.8-42 Chart data in front of Sonadia Island
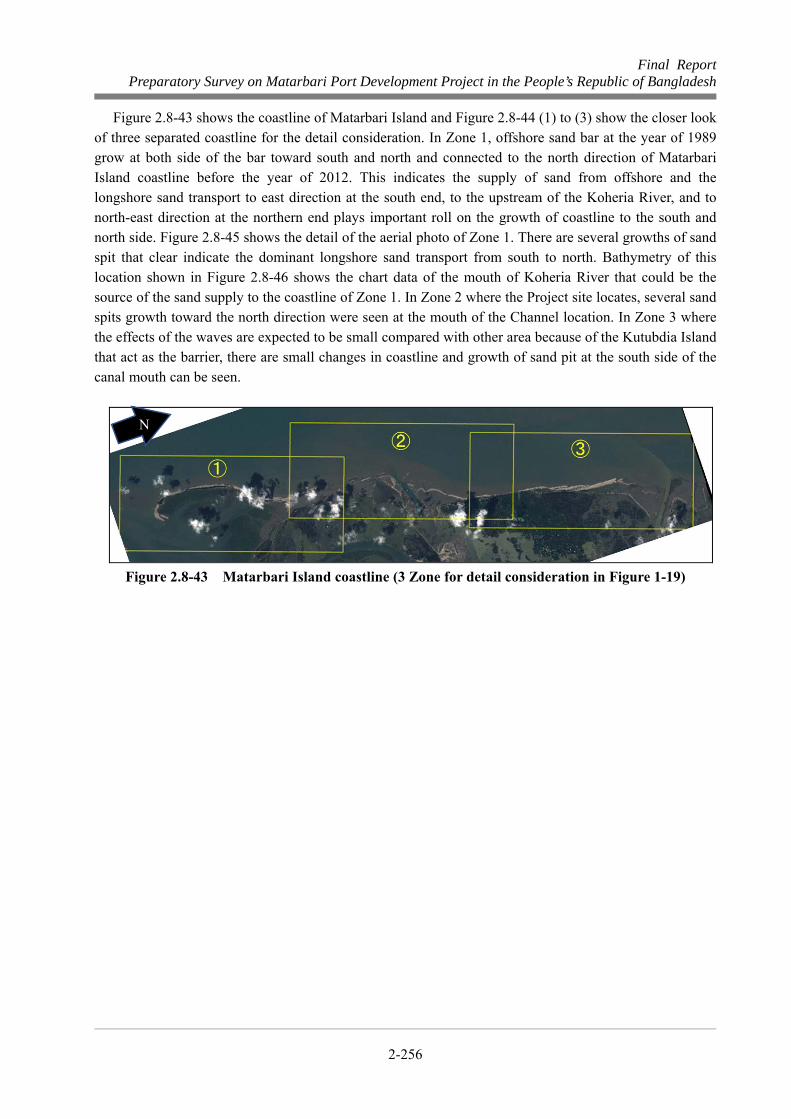
Final Report Preparatory Survey on Matarbari Port Development Project in the People’s Republic of Bangladesh
2-256
Figure 2.8-43 shows the coastline of Matarbari Island and Figure 2.8-44 (1) to (3) show the closer look of three separated coastline for the detail consideration. In Zone 1, offshore sand bar at the year of 1989 grow at both side of the bar toward south and north and connected to the north direction of Matarbari Island coastline before the year of 2012. This indicates the supply of sand from offshore and the longshore sand transport to east direction at the south end, to the upstream of the Koheria River, and to north-east direction at the northern end plays important roll on the growth of coastline to the south and north side. Figure 2.8-45 shows the detail of the aerial photo of Zone 1. There are several growths of sand spit that clear indicate the dominant longshore sand transport from south to north. Bathymetry of this location shown in Figure 2.8-46 shows the chart data of the mouth of Koheria River that could be the source of the sand supply to the coastline of Zone 1. In Zone 2 where the Project site locates, several sand spits growth toward the north direction were seen at the mouth of the Channel location. In Zone 3 where the effects of the waves are expected to be small compared with other area because of the Kutubdia Island that act as the barrier, there are small changes in coastline and growth of sand pit at the south side of the canal mouth can be seen.
Figure 2.8-43 Matarbari Island coastline (3 Zone for detail consideration in Figure 1-19)
N

Final Report Preparatory Survey on Matarbari Port Development Project in the People’s Republic of Bangladesh
2-257
1989/1/7 2016/11/23
2002/11/16 2017/2/14
2012/12/24 2017/5/25
2015/10/25 2017/10/15
2016/6/26
①
Figure 2.8-44 (1) Detail coastline change of Matarbari Island (Zone 1)
N

Final Report Preparatory Survey on Matarbari Port Development Project in the People’s Republic of Bangladesh
2-258
1989/1/7 2016/11/23
2002/11/16 2017/2/14
2012/12/24 2017/5/25
2015/10/25 2017/10/15
2016/6/26
②
Figure 2.8-44 (2) Detail coastline change of Matarbari Island (Zone 2)
N
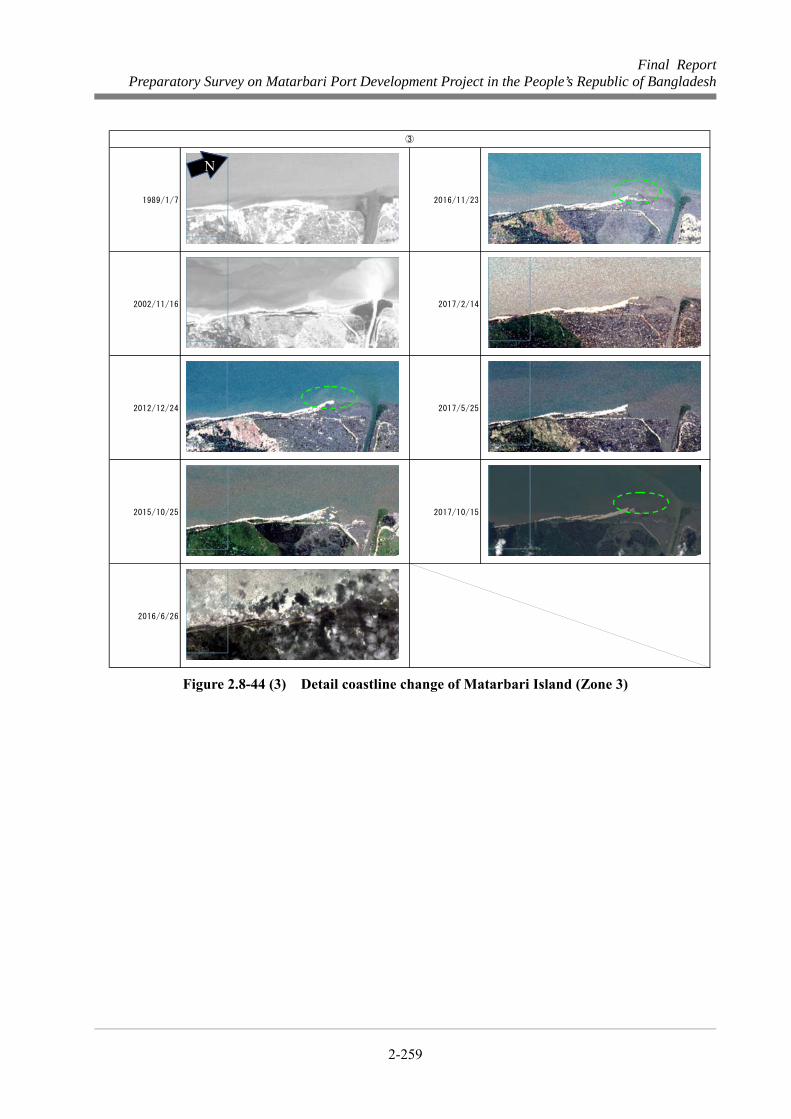
Final Report Preparatory Survey on Matarbari Port Development Project in the People’s Republic of Bangladesh
2-259
1989/1/7 2016/11/23
2002/11/16 2017/2/14
2012/12/24 2017/5/25
2015/10/25 2017/10/15
2016/6/26
③
Figure 2.8-44 (3) Detail coastline change of Matarbari Island (Zone 3)
N
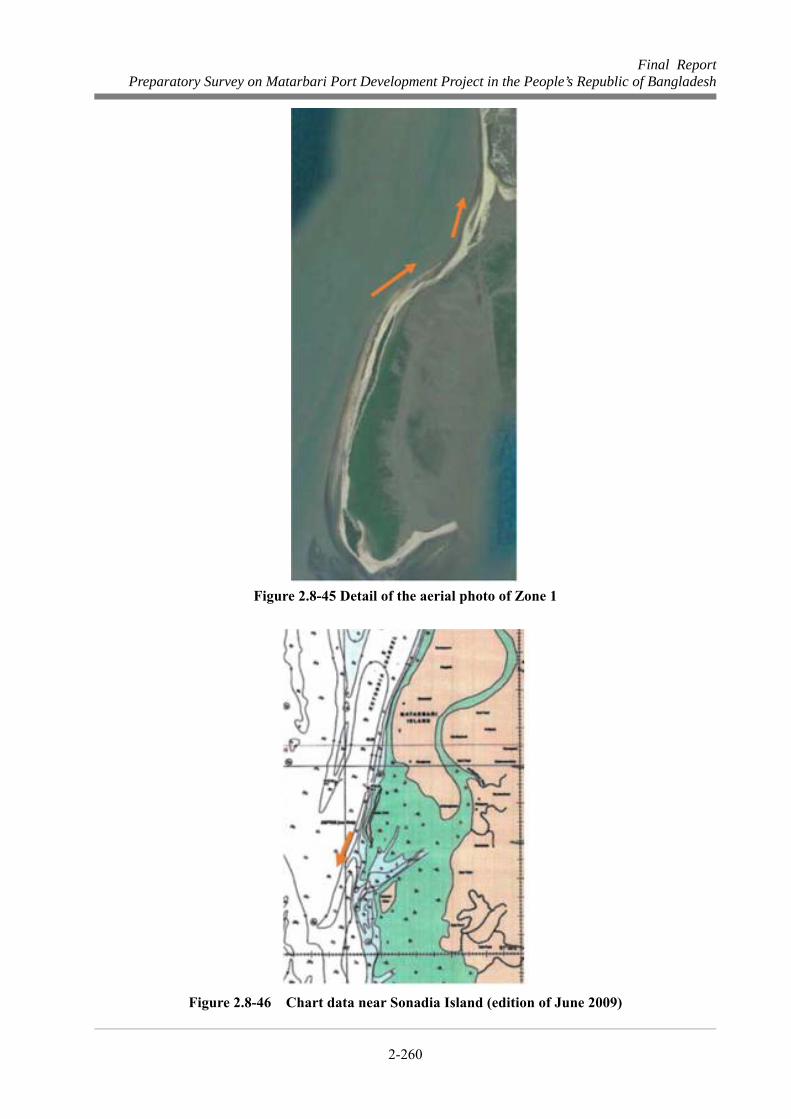
Final Report Preparatory Survey on Matarbari Port Development Project in the People’s Republic of Bangladesh
2-260
Figure 2.8-45 Detail of the aerial photo of Zone 1
Figure 2.8-46 Chart data near Sonadia Island (edition of June 2009)

Final Report Preparatory Survey on Matarbari Port Development Project in the People’s Republic of Bangladesh
2-261
From the comparative study of past coastline changes by satellite image data, overall dominant longshore sand transport from south to north are considered dominant. This correspond the dominant offshore wave direction of SSW and SW, especially during the Monsoon Season. And major source of sand supply to the coastline of Sonadia Island and Matarbari Island are considered from the river and canal mouth terrace area by on-offshore sand transport. There are also upstream sand transports at the river mouth areas. Those sand transport are summarized in Figure 2.8-47. In this figure, yellow arrows indicate the estimated dominant longshore sand transport direction and red arrows indicate the estimated location of major sand supply zone from the river mouth terrace area by on-offshore sand transport.
N
Sonadia Island Matarbari Island
Figure 2.8-47 Overall dominant longshore sand transport (yellow arrows) and assumed location of
major supply of sand by on-off shore sand transport
Because the distance between Sonadia Island beach end and Matarbari Island beach end are far and there exist the river and canal mouth in between, contribution of direct sand transport by longshore sand transportation mechanism on the coastline changes are small. The long-term coastline prediction model such as 1-line model that consider the variation of longshore sand transport along the coastline would be appropriate to apply separately for Matarbari excluding the Sonadia Island area. In other words, Matarbari Island area shown in Figure 2.8-47 are considered for 1-line coastline model to predict the long-term coastline changes by the construction of the port.
(4) Prediction of long-term shoreline change by 1-line shoreline change model
Effect of the construction of port on the shoreline changes are considered by 1-line shoreline change model which can take account of the longshore sand transport variation along the coast. As were discussed in the previous sections, continuity of longshore sand transport between Matarbari Island and Sonadia Island are separated by the existence of river and canal mouth and Matarbari Island coast area shown in Figure 1-16 are considered for the application of 1-line shoreline change model.
Basic idea of 1-line shoreline change model are summarized below.
Coordinate system shown in Figure 2.8-48 are considered to model the shoreline and multi small
cells by grid interval of Δx are introduced along the shoreline
Longshore sand transport volume Qi at i-cell are calculated by the wave height and wave direction at
the wave breaking point that are obtained through wave deformation analysis
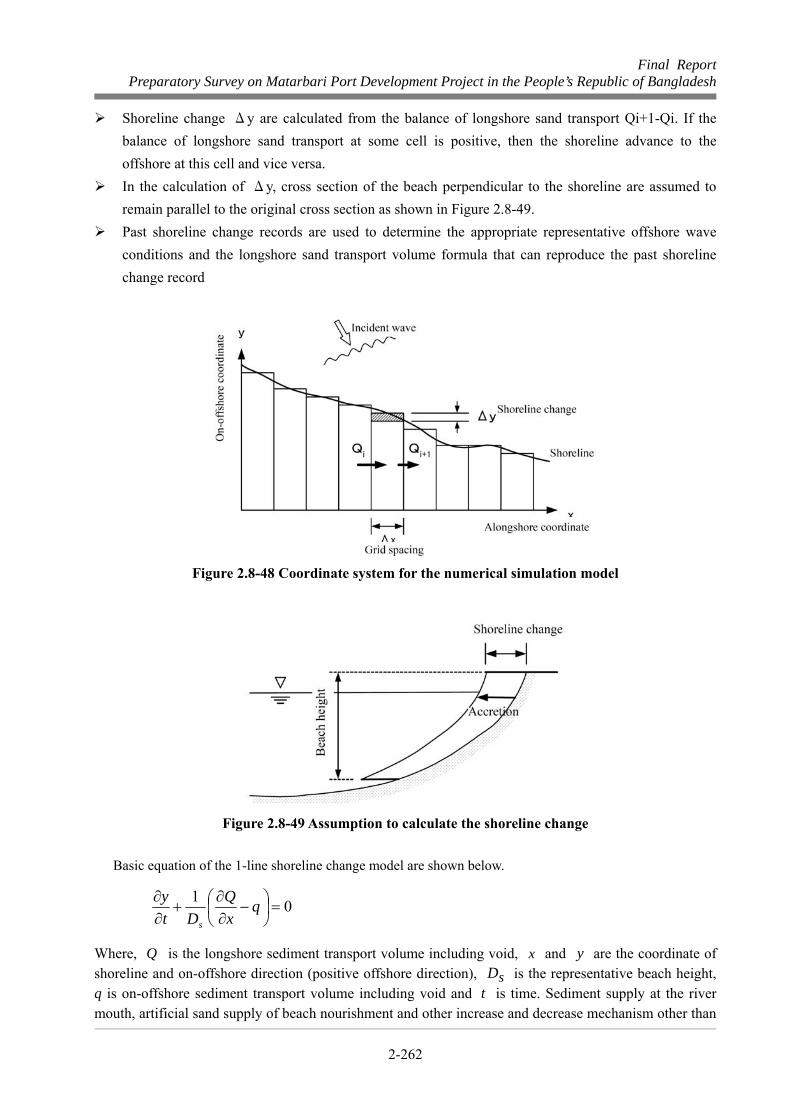
Final Report Preparatory Survey on Matarbari Port Development Project in the People’s Republic of Bangladesh
2-262
Shoreline change Δy are calculated from the balance of longshore sand transport Qi+1-Qi. If the
balance of longshore sand transport at some cell is positive, then the shoreline advance to the
offshore at this cell and vice versa.
In the calculation of Δy, cross section of the beach perpendicular to the shoreline are assumed to
remain parallel to the original cross section as shown in Figure 2.8-49.
Past shoreline change records are used to determine the appropriate representative offshore wave
conditions and the longshore sand transport volume formula that can reproduce the past shoreline
change record
Figure 2.8-48 Coordinate system for the numerical simulation model
Figure 2.8-49 Assumption to calculate the shoreline change
Basic equation of the 1-line shoreline change model are shown below.
01
qx
Q
Dt
y
s
Where, Q is the longshore sediment transport volume including void, x and y are the coordinate of shoreline and on-offshore direction (positive offshore direction), sD is the representative beach height, q is on-offshore sediment transport volume including void and t is time. Sediment supply at the river mouth, artificial sand supply of beach nourishment and other increase and decrease mechanism other than
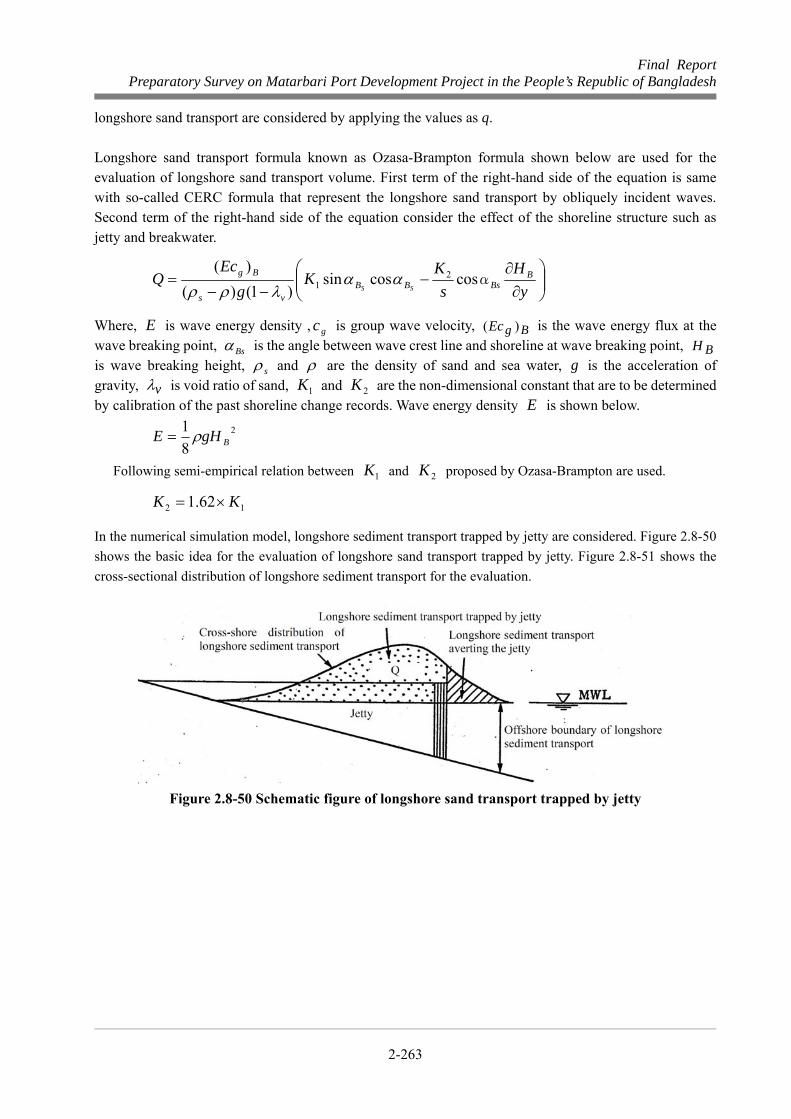
Final Report Preparatory Survey on Matarbari Port Development Project in the People’s Republic of Bangladesh
2-263
longshore sand transport are considered by applying the values as q. Longshore sand transport formula known as Ozasa-Brampton formula shown below are used for the evaluation of longshore sand transport volume. First term of the right-hand side of the equation is same with so-called CERC formula that represent the longshore sand transport by obliquely incident waves. Second term of the right-hand side of the equation consider the effect of the shoreline structure such as jetty and breakwater.
y
H
s
KK
g
EcQ B
BsBBvs
Bg
SSαcoscossin
)1()(
)(2
1
Where, E is wave energy density , gc is group wave velocity, BgEc )( is the wave energy flux at the wave breaking point, Bs is the angle between wave crest line and shoreline at wave breaking point, BH is wave breaking height, s and are the density of sand and sea water, g is the acceleration of gravity, v is void ratio of sand, 1K and 2K are the non-dimensional constant that are to be determined by calibration of the past shoreline change records. Wave energy density E is shown below.
2
8
1BgHE
Following semi-empirical relation between 1K and 2K proposed by Ozasa-Brampton are used.
12 62.1 KK
In the numerical simulation model, longshore sediment transport trapped by jetty are considered. Figure 2.8-50
shows the basic idea for the evaluation of longshore sand transport trapped by jetty. Figure 2.8-51 shows the
cross-sectional distribution of longshore sediment transport for the evaluation.
Figure 2.8-50 Schematic figure of longshore sand transport trapped by jetty

Final Report Preparatory Survey on Matarbari Port Development Project in the People’s Republic of Bangladesh
2-264
Figure 2.8-51 Cross-sectional distribution of longshore sediment transport
As wave height and wave direction at the location of wave breaking point significantly affect the results of 1-line shoreline change model, grid interval of 10m for the numerical simulation model of wave deformation analysis are used. Water depth information at the very shallow beach zone is rare, average beach slope profile of 1/50 are used by referring the beach profile survey data shown in Figure 2.8-52. Detail survey results are shown in latter section.
Figure 2.8-52 Beach profile survey data
5 years estimated global wave database from Jan. 2006 to Dec. 2010 prepared by Japan Weather Association by using the 3rd generation wave forecasting model of “JWA3G” was used to determine the representative offshore wave conditions. Figure 2.8-53 and Figure 2.8-54 show the histogram of wave direction with the information of wave height for Dry and Rainy Seasons. Waves from SSW and SW are the dominant wave direction for both Rainy and Dry Seasons. As for the representative wave direction, wave direction of SSW that represent the waves from SSW, S, SSE and so on and SW that represent the waves from SW, WSW, W and son are considered for the wave direction of representative waves. As for

Final Report Preparatory Survey on Matarbari Port Development Project in the People’s Republic of Bangladesh
2-265
the determination of representative wave height, energy averaged wave height is considered. Because considering the threshold minimum wave height for sand transport, energy average of waves which wave height is higher than 1.0m are considered for the estimation of energy average wave height for wave direction of SSW and SW of Rainy and Dry Seasons. Representative wave periods are determined by averaging the corresponding wave period which wave height is more than 1.0m. For wave deformation analysis, corresponding average constant wind velocities are also considered. Table 2.8-15 and Table 2.8-16 show the energy averaged waves of SSW and SW for Dry Season together with average wind conditions for the wave deformation analysis. In these Tables, energy averaged waves of all data and waves which wave height is more than 0.5m are also shown as a reference. Table 2.8-17 to Table 2.8-18 are the energy averaged waves of SSW and SW for Rainy Season,
0.0
10.0
20.0
30.0
40.0
50.0
60.0
70.0
80.0
N NNE NE ENE E ESE SE SSE S SSW SW WSW W WNW NW NNW CALM
Frequency(%)
Wave Direction
0.0 ~ 0.5
0.5 ~ 1.0
1.0 ~ 1.5
1.5 ~ 2.0
2.0 ~ 2.5
2.5 ~ 3.0
3.0 ~ 4.0
4.0 ~ 5.0
5.0 m ~
Wave Height (m)
Figure 2.8-53 Wave direction histogram for Rainy Season (May to September)
0.0
10.0
20.0
30.0
40.0
50.0
60.0
70.0
80.0
N NNE NE ENE E ESE SE SSE S SSW SW WSW W WNW NW NNW CALM
Frequency(%)
Wave Direction
0.0 ~ 0.5
0.5 ~ 1.0
1.0 ~ 1.5
1.5 ~ 2.0
2.0 ~ 2.5
2.5 ~ 3.0
3.0 ~ 4.0
4.0 ~ 5.0
5.0 m ~
Wave Height (m)
Figure 2.8-54 Wave direction histogram for Dry Season (Oct. to Apr.)

Final Report Preparatory Survey on Matarbari Port Development Project in the People’s Republic of Bangladesh
2-266
Table 2.8-15 Energy average wave with wave direction SSW (Dry Season)
Occurrence
ratio (%)
Duration
(hours/month)
Energy averaged
offshore wave
Average constant wind
field condition
Hs(m) Ts(s) direction velocity(m/s)
All data 73.9 532 0.99 9.1 N 3.8
Waves more than 0.5m 68.7 495 1.02 9.2 N 3.9
Waves higher than 1.0m 23.8 171 1.33 9.5 N 4.1
Table 2.8-16 Energy average wave with wave direction SW (Dry Season)
Occurrence
ratio (%)
Duration
(hours/month)
Energy averaged
offshore wave
Average constant wind
field condition
Hs(m) Ts(s) direction velocity(m/s)
All data 26.1 188 1.15 6.7 N 5.8
Waves more than 0.5m 25.5 184 1.16 6.7 N 5.8
Waves higher than 1.0m 12.5 90 1.41 7.0 N 6.3
Table 2.8-17 Energy average wave with wave direction SSW (Rainy Season)
Occurrence
ratio (%)
Duration
(hours/month)
Energy averaged
offshore wave
Average constant wind
field condition
Hs(m) Ts(s) direction velocity(m/s)
All data 84.7 610 1.92 8.3 SSW 5.6
Waves more than 0.5m 84.7 610 1.92 8.3 SSW 5.6
Waves higher than 1.0m 83.4 600 1.93 8.3 SSW 5.6
Table 2.8-18 Energy average wave with wave direction SW (Rainy Season)
Occurrence
ratio (%)
Duration
(hours/month)
Energy averaged
offshore wave
Average constant wind
field condition
Hs(m) Ts(s) direction velocity(m/s)
All data 15.3 110 2.10 7.5 SW 6.5
Waves more than 0.5m 15.3 110 2.10 7.5 SW 6.5
Waves higher than 1.0m 15.3 110 2.10 7.5 SW 6.5
For applying the Ozasa-Brampton formula to evaluate the longshore sand transport volume, unknown empirical constants K1 and K2 should be determined. Past reliable shoreline change records are usually used to determine these unknown empirical constants to fit the predicted shoreline changes by 1-line shoreline change model for the corresponding duration of time by parametric study. Although the satellite image data shown in Table 2.8-14 that can be used to determine the shoreline have been collected, the reliable tide data are indispensable to determine the reliable shoreline location. No reliable continuous observation of tidal data was found in the nearby location. Following assumption was made for the determination of the shoreline location.
Final Report Preparatory Survey on Matarbari Port Development Project in the People’s Republic of Bangladesh
2-267
Select the section of shoreline where the effect of on-offshore sediment transport on shoreline
changes are negligible and longshore sand transport at both end of the section is balanced. In other
words, average shoreline change of this section is negligible.
Evaluate the on-offshore distance from this baseline to the shoreline of this section for each satellite
aerial photo and calculate the average on-offshore distance of this section.
As we assume the shoreline change in this section is negligible, this average on-offshore distance of
this section photo should be same. In other words, difference of this average distance between two
aerial phots is due to the tide difference and can be evaluate the comparable shoreline location by
adding or extracting this difference of average distance with the shoreline location.
Based on the qualitative analysis of the satellite image aerial photos in the previous section, southern part of Zone2 of Matarbari Island area shown in Figure 2.8-55 is selected for the section of shoreline where the effect of on-offshore sediment transport on shoreline changes are negligible and longshore sand transport at both end of the section is balanced.

Final Report Preparatory Survey on Matarbari Port Development Project in the People’s Republic of Bangladesh
2-268
Figure 2.8-55 Selected section of shoreline where the effect of on-offshore sediment transport on
shoreline changes are negligible and longshore sand transport at both end of the section is balanced

Final Report Preparatory Survey on Matarbari Port Development Project in the People’s Republic of Bangladesh
2-269
Figure 2.8-56 show the comparison of the obtained comparable shoreline. Horizontal axis shows the longshore distance from the south end of each Zone. Longshore distance from 1000m to 2000m in Zone2 are selected as the section as was shown above where the effect of on-offshore sediment transport on shoreline changes are negligible and longshore sand transport at both end of the section is balanced. Average shoreline change in this section is assumed to be constant especially for the period between Dec. 2012 to May. 2017.
Figure 2.8-56 Calculated comparable shoreline after collecting the shoreline location by tide
elevation difference

Final Report Preparatory Survey on Matarbari Port Development Project in the People’s Republic of Bangladesh
2-270
Aerial photos taken from Dec. 2012 to Nov. 2017 are used for the validation of the -line shoreline change model, because the dredging work of the Access channel started from Apr. 2017. Energy average waves over wave height of 1.0m for Dry and Rainy Seasons are used for the model validation analysis. Wave direction of SSW and SW with the duration period of these waves shown in Table 2.8-15 to Table 2.8-18 are used as the representative annual wave conditions. Tide conditions of MSL is considered. Total length of the shoreline is 12.5km. Shoreline is divided by Δx=100m along the shoreline. Time increment of 600 seconds are used for the calculation of shoreline change. Empirical constants K1 and K2 are determined by selecting the K1 and K2 that gave the minimum value of the root mean sum (RMS) of square of errors ([actual shoreline change] – [calculated shoreline change]). Because the effect of on-offshore sand transport on the shoreline change are not negligible at the southern part of Zone1 and the northern part of Zone3, only shoreline change of Zone2, longshore distance from 4,000m to 8,000m, are used for the determination of K1 and K2 shown above. Table 2.8-19 shows the results of parametric validity analysis by changing the empirical constants of K1, K2. Figure 2.8-57 shows the comparison of predicted shoreline changes of cases for each littoral drift constants shown in Table 2.8-19 and the actual shoreline that are shown by blue dotted line. K1 and K2 values that showed the lowest value of RMS of square of errors of ([actual shoreline change] – [calculated shoreline change]) are considered the most appropriate and employed for the prediction of future shoreline changes. Employed constants for littoral drift are given as follows. K1 = 0.12, K2 = 1.62 x K = 0.1944 According to the review of previous study of the Japanese shoreline change by Japan Society of Civil Engineering, range of the constant K1 are between 0.1 to 0.5. The predicted 0f 0.12 of this study is in between these values and considered not to be unrealistic values.
Table 2.8-19 Parametric validity analysis by changing the empirical constants of K1 and K2
Final Report Preparatory Survey on Matarbari Port Development Project in the People’s Republic of Bangladesh
2-271
Figure 2.8-57 Comparison of shoreline changes for validity analysis (longshore distance from 4,000
to 6,000m are used for the analysis)
There is some discrepancy between the calculated shoreline and actual shoreline change in the southern part of Zone1 and northern part of Zone3. Observed shoreline change shows the accretion during Dec. 2012 to Oct. 2017 in southern part of Zone 1 and northern part of Zone3. This discrepancy is considered due to the on-offshore sand transport that are not considered in the calculated shoreline change by 1-line shoreline change model. Shoreline change by the construction of port (case2) are done by using the results of validity analysis shown above. Prediction of shoreline without the construction of port (case1) are also done to see the effect of construction of port clearly. Other conditions for the simulation are the same for the validity analysis of the simulation model. Duration period of 50 years is considered. Shoreline of Oct. 2016, before the start of construction of access channel are considered as the initial shoreline for the prediction of future shoreline.
Figure 2.8-58 shows the difference of the predicted future shoreline without the construction of port and that with construction of port that indicate the effect of the construction of port. According to the results shown in this Figure, shoreline progress of 730m at the southern side of south Sand Protection Dike and shoreline retreat of 850m at the north side of north Training Dike after 50 years are obtained because of dominant longshore sand transport from south to north. Some amount of shoreline advancement is seen in between the south side Dike and north side Dike since some shoreline retreat is predicted for the case of without the port construction and stable shoreline change are predicted for the case of with construction of port at these locations. These results indicate that the effect of accretion of sand at the south side of Dike will affect the channel sedimentation in near future and shoreline retreat at the north side of port occur as far as 2km from the port. To prevent the occurrence of adverse effects on

Final Report Preparatory Survey on Matarbari Port Development Project in the People’s Republic of Bangladesh
2-272
the surrounding atmosphere, sand excavation of accreted sand at southside of dike and/or sand bypass method that transport the accreted sand at the south side to the north side where erosion occur by land transport or by pipe transport are necessary. As for the predicted erosion at adjacent part of northern Training Dike, predicted value of erosion is rather large. Because 1-line shoreline change model consider only the sand transport by longshore current and assume the unlimited existence of the sandy beach, actual phenomenon of shoreline change will be somehow different from the predicted value by several reasons, such as the change of the tidal flow pattern that is another dominant factor of sediment movement of this area and the limited existence of sandy beach. But the loss of sandy beach after completion of the construction of port is expected and some countermeasure such as above-mentioned bypass of sand is necessary in case they need the sandy beach for their daily activity.
Figure 2.8-58 Difference of the predicted future shoreline without the construction of port and that
with construction of port
years
years
years
years
years
Final Report Preparatory Survey on Matarbari Port Development Project in the People’s Republic of Bangladesh
2-273
2.8.4 Beach Profile Survey
Beach profile survey has been conducted in two different seasons (monsoon and non-monsoon season) to understand the seabed profile of each season around Matarbari Area. The survey results were used for basic information of shoreline deformation estimation. The beach profile survey consisted of topographic and bathymetric survey and seabed material sampling. Topographic and bathymetric survey has been carried out on Dec 2017 (Dry Season) and May 2018 (Monsoon Season). The survey was conducted by Real-Time Kinematic (RTK) method and using Total Station (TS). 5 transect lines from north area of Matarbari Island to Sonadia Island were selected at almost equal intervals. The lines were oriented perpendicular to the shore and extended 2km from shoreline. The spatial interval of both survey was 20m. Seabed material sampling has been conducted at same time as the topographic and bathymetric survey. The sampling has been done with 50m interval at near shore area and 100m to 200m interval at offshore area. The sampler consists of cupped jaws that close to trap a sample of bed material. Using the sample, the grain size distribution of bed materials was estimated by sieve analysis. Figure 2.8-59 shows the beach profile survey locations and results during dry season. The seabed gradient at nearshore area of S1, S2 and S3 is relatively gentle. At S4 and S5, the water depth is made deeper at 200m to 600m from shoreline, then shallow area is formed at 600m to 1200m from shoreline. The almost all grain size at S3, S4 and S5 is classified into sand. At S1 and S2, silt were appeared at several locations. The survey result conducted on May 2018 will be updated after completing of data process of the survey.
Figure 2.8-59 Beach Profile Survey Location and Result during Dry Season

Final Report Preparatory Survey on Matarbari Port Development Project in the People’s Republic of Bangladesh
2-274
Figure 2.8-59 shows the beach profile survey locations and results during monsoon season. Figure 2.8-59 shows comparison of beach profile between dry and monsoon season. At nearshore area, there were no significant differences of seabed gradient between the two seasons. At offshore area, there seems to be stable except for S2 section. The water depth at offshore area of S2 section becomes deeper than that of dry season. The result to be due to the effect of dredging works for access channel of Matarbari Coal Fired Power Plant. There were also no significant differences of seabed material distribution between the two seasons at S3, S4 and S5 section. On the other hands, the ratio of silt material increased at nearshore of S1 section, and the ratio of sand material increased at nearshore of S2 section. The result is considered as sand and silt transportation at nearshore area due to high wave during monsoon season.
Figure 2.8-59 Beach Profile Survey Location and Result during Monsoon Season
S1
S2
S3
S4
S5

Final Report Preparatory Survey on Matarbari Port Development Project in the People’s Republic of Bangladesh
2-275
Figure 2.8-59 Comparison of Beach Profile between Dry (Red) and Monsoon (Blue) Season

Final Report Preparatory Survey on Matarbari Port Development Project in the People’s Republic of Bangladesh
2-276
2.9 Port Management and Operation
2.9.1 Port Management
(1) Port Management Body and Port Limit
There are 3 port authorities in Bangladesh, namely, Chittagong Port Authority (CPA), Mongla Port Authority and Pyra Port Authority. In terms of port management, there are 2 options for Matarbari Port. The first option is to establish a new port authority and the second option is for CPA to manage Matarbari Port as well. The Survey Team recommends the latter for the following reasons:
a) The distance between Matarbari Port and Chittagong Port is only 80 km, and their cargo
hinterlands (locations of shippers/consignees) overlap each other. Excessive competition would
occur if two port authorities exist in such a close location.
b) Managing both ports by a single port authority would optimize the advantages of both ports,
namely, Matarbari Port's deep water berths and Chittagong Port's close proximity to
shippers/consignees.
c) CPA also manages Pangaon ICT (river port) near Dhaka. It would be possible to introduce
strategic tariff setting/demand management for CPA's three ports as well as promote integrated
water transportation among Dhaka, Chittagong and Matarbari.
d) CPA’s financial capability, construction and operation capacity as well as its experienced staff can
be utilized during the construction period and the initial stage of operation of Matarbari Port.
The port management body and the port limit for Matarbari Port should be clearly decided prior to land acquisition and the relocation necessary for the development of Matarbari Port. In case that CPA becomes the port management body for Matarbari Port, it is necessary to make a notification on the definition of its port limit in the official Gazette in accordance with article 3 of the Chittagong Port Authority Ordinance of 1976 (amended in 1995). (Note: As of May 2018, it has become clear that CPA will be the port management body for Matarbari Port, and a notification on the definition of its port limit in the official Gazette is currently being prepared.)
(2) Other Port Management Duties
The mission of CPA is as follows:
- To manage, maintain, improve and develop the port
- To maintain adequate and efficient world-class services and facilities in the port or the approaches
to the port.
- To regulate and control vessel berthing, safe movement and navigation within the port and
Karnaphuli Channel.
- To do such acts and things as may be necessary or convenient to be done in connection with, or
incidental or conducive to the performance of its functions under Port Ordinance 1976 (Amended
1995).
- To develop a highly trained and motivated work force to meet the growing demands of the port
industry.
- To take all necessary measures to ensure international standard of environment and port security.
In order to achieve the above, designation of harbor master, tariff setting, etc. need to be carried out before the port enters into service.

Final Report Preparatory Survey on Matarbari Port Development Project in the People’s Republic of Bangladesh
2-277
The tariff level of Matarbari Port should not be higher than that of Chittagong Port since it is necessary to attract users once Matarbari Port begins operations. In addition, it is necessary to set up Matarbari Port Office of CPA for efficient operation, maintenance and management of Matarbari Port. This office should have the functions as shown below, and the staff size should be adjusted in phases (specifically, immediately after the coal terminal operation, immediately after the multi-purpose terminal operation, and few years later).
- Head & Deputy Head
- Administration & Planning
- Account
- Harbor & Marine
- Terminal Manager
- Engineering & Development
- Security
(3) Administration Services of Relevant Organizations
Prior to the commencement of operations at Matarbari Port, it is necessary to coordinate with CIQ (Custom, Immigration, Quarantine), Coast Guard, etc. as these entities will provide key administration services.
(4) Project Implementation System
1) Financial Performance and Budget of CPA
Financial performance of CPA, which will become a project implementation organization for Matarbari Port Development Project, seems to be very satisfactory as mentioned in 2.8.1. The Budget of CPA is shown in Table 2.9-1. Revised Budget Estimation and Actual Capital Expenditure as well as their execution ratio in 2015-2016 are 24.5 billion Taka (USD 295 million), 6.5 billion Taka (USD 79 million) and 27% respectively. Capital Expenditure in 2017-2018 is estimated at 53.4 billion Taka (USD 644 million). Issues such as land acquisition and coordination with various stakeholders need to be addressed since this budget is not only for renewal and replacement of existing facilities but also for new projects such as Bay container terminal (BCT), Patenga container terminal (PCT), Mirsarai port, Laldia bulk terminal (LBT) and Karnaphuli container terminal (KCT).

Final Report Preparatory Survey on Matarbari Port Development Project in the People’s Republic of Bangladesh
2-278
Table 2.9-1 Budget of CPA
(million Taka)
Budget Est.for 2017-2018
Revised Est.for 2016-2017
Revised Est.for 2015-2016
Actual for2015-2016
Actual for2014-2015
A) Total Revenue Income 27,300 25,265 23,515 20,308 18,768
B) Total Revenue Expenditure 21,928 21,107 17,996 15,235 12,970
C) Revenue Surplus 5,372 4,158 5,520 5,073 5,798
D) Capital Expenditure Total 53,395 23,293 24,462 6,552 3,114
1) For New Capital Works & Renewals & Replacement related Works
25,949 18,693 18,384 6,481 3,045
2) Others (including Loan Repayment, House Building & Other Advance)
120 120 125 61 4
3) Self Financed Development Projects 27,326 4,480 5,953 10 66
E) Capital Receipts Total 53,395 23,293 24,462 6,552 3,110
1) Depreciation Reserve Fund (for Renewal & Replacement Works)
2,816 1,455 2,910 1,179 289
2) From Revenue Surplus & Revenue Reserve & Other Pool of Funds
50,509 21,767 21,477 5,312 2,821
3) From Sinking Fund (Loan Principal) 70 70 75 61 -
F) Net Surplus/Deficit (=D-E) 0 0 0 0 4
Source: CPA Annual Report 2015-2016
2) Interim PIU
The Interim PIU for Matarbari Port Development Project was set up based on CPA Order No. 17/2017 dated 22 November 2017.

Final Report Preparatory Survey on Matarbari Port Development Project in the People’s Republic of Bangladesh
2-279
Table 2.9-2 Members of the Interim PIU and their Responsibilities
Name & Designation of Officer(not on seniority basis)
Responsibirity
Mr. Md. Zafar Alam, Joint Secretary & Member(Admin. And Planning)
Project Director
Commander M. Arifur Rahman, Chief Hydrographer Dredging related issues
Mr. Mahmudul Hossain Khan, Chief EngineerCivil engineering issues and breakwater relatedissues
Mr. Mahbub Morshed Chowdhury, Chief PlanningProject planning, processing and approvalprocedure related issues
Captain Mustasim Billah, Assistant Harbor MasterMarine, navigation channel and port limit relatedissues
Mr. Meraz Uddin Arif, Senior Accounts OfficerLoan agreement, sub-loan agreement andamortization related issues
Mr. S.M. Habibullah Azim, Executive Engineer(Mechanique)
Equipment related issues
Source: CPA Order No. 17/2017 dated 22 November 2017
The survey team proposed that members should be appointed to the Interim PIU on a full time basis (rather than increasing the workload of employees with other duties), and that architectural and electrical issues should be covered by this Interim PIU as well.
3) PIC
PIC or Project Implementation Committee will be set up as per GoB rules after DPP or Development Project Proposal for Matarbari Port is approved. Key roles of PIC are to give necessary assistance or suggestions for implementing project activities, and to make necessary decisions for solving any problems that may arise during project implementation. Chairman of CPA will chair the committee, and members of CPA, representative of CPGCPL, representative of RHD and others will be appointed as members of PIC as per GoB rules.
4) PIU
PIU will be set up within CPA after DPP is approved. The survey team proposes the structure of the PIU in the construction phase as shown in Figure 2.9-1. Many qualified engineers, etc. with sufficient knowledge and experience will be required for smooth implementation of the Project.
Final Report Preparatory Survey on Matarbari Port Development Project in the People’s Republic of Bangladesh
2-280
PIU: Excution Control
Sr. AccountsOfficer
Sr. HydrographerExec. Engineer
BreakwaterExec. EngineerBerth/Reclamation
Exec. EngineerChannel
Exec. EngineerConstruction
+ Accounts Officer + Hydrographer + 2 Assistant Eng. + 2 Assistant Eng. + 2 Assistant Eng.+ Architect+ Electrical Eng.
+ Sub-Ass. Eng. + 2 Sub-Ass. Eng. + 2 Sub-Ass. Eng. + 2 Sub-Ass. Eng.
Interim PIUProject Manager
(Civil Engineering)(Harbour Engineering)
Note: Geotechnical expert (1), Environmental and Social Consideration Expert (1) should be included.
Note: Project Manager should undertake Safety & Quality Control with the support of a consultant.
Project Director (Member of CPA)
CPA HQs Matarbari Site Office
Source: JICA Survey Team
Figure 2.9-1 Proposal of PIU of CPA
Final Report Preparatory Survey on Matarbari Port Development Project in the People’s Republic of Bangladesh
2-281
2.9.2 Port Operation
(1) Role Allotment between CPA and Private in Port Operation and Maintenance
The current role allotment between CPA and the private sector in port operation and maintenance at Chittagong Port is shown in Table 2.9-3.
Table 2.9-3 Current Role Allotment between CPA and Private at Chittagong Port
Activity CPA Private
Breakwater, NavigationChannel and Turning Basin
Owner/ Maintenance
Multi-purpose Berth and Container Terminal
Owner/ Maintenance Stevedoring Worker
Cargo Handling EquipmentOwner/ Maintenance
Operator at GCBOperator/ Driver(except at GCB)
CT/CY OperationContainer Planner/ CY Controller
TOS Owner & OperatorStevedoring Worker
Assistant of CPA Staff
Security & SafetyResponsible for
CT SecurityResponsible for
Safety of Workers
Import/Export ProcedureDocumentation
Gate Booth Receptionist/ InspectorAssitant of CPA Staff
Others Container Delivery
Source: JICA Survey Team
There are 3 options in terms of role allotment between CPA and private in port operation and maintenance at Matarbari Port as follows:
Option 1: Similar but more efficient role allotment than in Chittagong Port (Tool Port Model,
Berth Operator System).
Option 2: Long-term concession to private operator based on the PPP Act 2015.
Option 3: Start with Option 1 immediately after entering its operation and then consider
adopting Option 2.
The survey team proposes Option 3 for the first phase of Matarbari Port because:
- It would be difficult to attract cargo to Matarbari Port immediately after entering into operation.
The reasons are; in addition to longer drayage distance to/from Dhaka where
shippers/consignees are concentrated (120 km longer compared with Chittagong Port), there are
uncertainties in the progress of road development for hinterland access, provision of
administration services of relevant organizations, establishment of port related private facilities
such as ICDs, etc. and it would take some time to complete these arrangements.
- Under such a situation, significant uncertainties and risks for a private terminal operator would

Final Report Preparatory Survey on Matarbari Port Development Project in the People’s Republic of Bangladesh
2-282
remain and thus the value of the terminal would be assessed lower than its potential value if CPA
concludes a contract of terminal operation concession with the private terminal operator.
- Therefore, the survey team proposes that the terminal operation concession with a private
terminal operator should be discussed after the cargo volume increases to a certain level, risks
for a private terminal operator decrease and the perceived value of the terminal rises.
- In the meantime, CPA should be responsible for terminal operation with the technical assistance
of Japan on port operation and management as well as a necessary collaboration with private
companies.
As for the second phase of Matarbari Port, Option 2 (Landlord Model, etc.) is proposed. The survey team proposes as well that devanning/unstuffing operations and customs operations, which currently are carried out in the container yard (CY) of Chittagong Port, should not be carried out in CY of Matarbari Port in order to enhance operational efficiency of container terminal. Instead, devanning/unstuffing operations should be carried out at consignee's premises or private Off-Dock facilities (ICDs/CFSs) and customs operations should be carried out at a dedicated customs facility which will be established by the Customs House within Matarbari Port but outside the CY. In this connection, it is necessary to significantly expand the selected items (currently 37 items) which licensed private ICDs/CFSs can handle in import container. It is also necessary to encourage private companies to establish ICDs/CFSs which are indispensable for Matarbari Port.
(2) Technical Assistance on Port Operation and Management
The survey team proposes technical training for CPA staff as shown in Table 2.9-4 as technical assistance on port operation and management.
Table 2.9-4 Proposal on Technical Training for CPA Staff
Training Item Note/Description
Port Planning/Harbor Engineering
including total multi-modal logisticsincluding estimation & control of wave and sedimentation, etc.
Maintenance for Port Facilitiesincluding effective maintenance dredging, breakwater maintenance, countermeasures to steelcorrosion of piers, etc.
Maintenance for Cargo HandlingEquipment
maintaining terminal performance, countermeasure to storm surge, etc.
Terminal Operation andManagement
including introduction and improvement of TOS, terminal performance management /productivitycontrol, identifying and solving problems including gate congestion, etc.
Port Facility Securitycompliance with ISPS code of SOLAS Convention or the International Convention for the Safetyof Life at Sea
Vessel Arrival & DepartureManagement
for larger vessels, operation of vessel traffic system (VTS)
Documentation Planning for simplifying procedures
Demand Management strategic tariff setting of CPA's 3 ports to optimize the networking of the integrated ports system
Concession Arrangementtechnical know-how on the transition to the concession arrangement of container terminaloperation
Regulatory Issues on CPA regulation amendment and hinterland development
Source: JICA Survey Team
Final Report Preparatory Survey on Matarbari Port Development Project in the People’s Republic of Bangladesh
2-283
2.9.3 Port Promotion
Since Matarbari port is a newly developed port, the study team examined measures to promote the utilization of Matarbari port based on interviews with potential port users such as cargo owners and shipping lines.
(1) Interviews to Potential Users
The Study Team conducts interviews in order to capture the needs of potential port users such as cargo owners and shipping lines. The interviewees are the following. Manufacturers of RMG Manufacturers of commodities Shipping lines Freight forwarders Other potential users
The comments are compiled in the following sections with categorized to 1) cargo owners, 2) logistics providers.
1) Cargo owners
The Study Team conducted interviews to some of manufactures and trading companies and obtained the following comments. a) Problems in Chittagong Port Congestion of Chittagong Port makes inventory management quite difficult; therefore, factories
must maintain a lot of inventory of materials (e.g. inventories for 4 months) Uncertainty is more problematic in import of materials than export of products since the incoming
cargo vessels usually wait at outer anchorage of Chittagong Port for a certain period (10 days or 15 days in the worst case)
The delay of incoming vessels causes the delay of outgoing vessels, and estimated departure time is not reliable. When the departure time is delayed, the transshipment at hub ports such as Singapore cannot be done on schedule, and cargos need to wait at the hub port for a week.
Lead-time is an essential factor for RMG manufacturers since buyers are quite strict for deadlines of the arrival of products. If the schedule is more reliable, the amount of production in Bangladesh would be increased more. The current circumstances prevent the expansion of business in Bangladesh.
Logistics in Bangladesh is not matured: bonded transportation of international cargos is almost not allowed; enforcement of laws is sometimes not implemented in a fair manner; improvement of law systems is necessary.
b) Anticipations for Matarbari Port Since the center of RMG manufacturing is around Dhaka, the issue of Matarbari Port is the
location; namely, the distance from Dhaka to Matarbari is 120 km more than that to Chittagong. Road infrastructure is not sufficient even between Dhaka and Chittagong still more between
Chittagong and Matarbari. More transparent and efficient implementation of procedures is anticipated in Matarbari Port.

Final Report Preparatory Survey on Matarbari Port Development Project in the People’s Republic of Bangladesh
2-284
2) Comments from Logistics Providers
The Study Team conducted interviews to some of logistics providers and obtained the following comments. a) Problems in Chittagong Port Container services are usually on a regularly scheduled basis, and container vessels arrive and
depart on designated days in a week while it is impossible to provide such regular service in Chittagong port because of severe congestion.
As a result, all of container services at Chittagong Port are feeder service between Chittagong port and hub ports such as Singapore and Colombo. It is impossible for main line container services to call at Chittagong Port.
The allowed berthing period is 48 hours or 72 hours, and it means that some vessels need to leave quays on a mandatory basis even though cargo handling has not been finished. In this case, some vessels need to wait in outer anchorage for the reentry to Chittagong Port. Congestion in container yards influences the efficiency of loading and unloading of cargos on quay side.
Sometimes, empty containers are loaded to other shipping lines’ vessels because of chaos of the container yards.
Cargo transportation between origins/destinations and Chittagong port is mostly implemented by covered-vans since the facilities for vanning/ devanning of containers are insufficient in Bangladesh, and this function is complemented by ICDs.
Enforcement of procedures is inconsistent and not transparent; it delays the delivery of transportation.
b) Anticipations for Matarbari Port Inland Container Deport (ICD) is necessary in Matarbari Port as well as Chittagong Port since
ICD complements the function of container terminals. Restriction on bonded transportation of cargos should be removed in Matarbari port. More transparent and efficient implementation of procedures is anticipated in Matarbari Port. Potential of Matarbari port is quite large since it is the first port in Bangladesh which has 16 m
water depth. Not only feeder vessels but also services of main lines can be accommodated at the port.
Development of Matarbari port is quite welcome since it becomes possible to provide better services for time-sensitive customers.
Deployment of larger vessels contributes to decrease of operation cost, and there is possibility of price reduction for customers.
Smooth traffic lanes are essential in and around the new port in order to prevent waste of time and inefficiency.
(2) Lessons of Countermeasures for Port Promotion
Port promotion is essential. JICA compiled “useful lessens in new port development,” in “the post-evaluation report, 2016.” The report describes that there are the following three factors when users decide to use the new port from the perspective of government measures. 1. Merits on business are revealed; private entities begin to use the new port. 2. Social merits are explained by governments; private entities understand the necessity to use the new port as their social responsibilities. 3. Governments implement compulsory measures; private entities obey such regulations.

Final Report Preparatory Survey on Matarbari Port Development Project in the People’s Republic of Bangladesh
2-285
In the next section, the Study Team proposes some countermeasures on the standpoint of the first and the third points of the list above since these two approaches are seemed more effective in this case.
(3) Countermeasures for Port Promotion
1) Establishment of Complemental Facilities
The road transportation will be continuously done by covered-vans in the future since the lack of vanning/devanning facilities all around the county could not be solved easily. Therefore, the establishment of Inland Container Depots (ICDs) is essential for Matarbari Port to function well. ICDs have several roles in container logistics in Bangladesh, namely they function as depots of laden containers, storage of empty containers, and vanning/devanning facilities. Different from the current function of ICDs around Chittagong Port, the ICDs around Matarbari Port should play an essential role in devanning of containers. The existing ICDs around Chittagong Port only handle approximately one fourths of imported containers while the large amount of devanning work is implemented in the container yard without roofs, which causes severe traffic congestion in and around the port and damages to imported cargos. It is highly recommended that devanning should be done outside container yard in Matarbari Port in order to enhance more efficient cargo flows. Although the location and roles of ICDs around Matarbari Port should be examined further in the next stage, they should be established in the areas with a certain distance from the Matarbari Port in order to prevent traffic congestions around the port since the location of Matarbari Port is at the end of the access road.
2) Efficient Traffic Lines
According to interview to potential users of Matarbari Port, the congestion in and around Chittagong Port was mentioned as an essential problem. Although the number of trailers and vehicles is a factor of the congestion, the inefficiency of the traffic lines and the lack of proper rules are pointed out as other factors. Since Matarbari Port is a brand-new port without any existing facilities and vested interests, it could be possible to establish efficient and productive traffic lines and proper rules for smooth transportation of vehicles. Also, the sufficient space for trailers and prime movers near the port should be allocated to prevent traffic jams caused by waiting vehicles. The desirable system should be examined carefully under cooperation among CPA and other related entities with referring to advanced practices of ports in other countries. These measures should be examined in the next step of project implementation.
3) Transport to/from Hinterland
The importance of the improvement of road infrastructure was pointed out in interviews, especially from Chittagong to Matarbari. Even though the access road between the new port and the existing National Highway is to be constructed in this project, the improvement of the existing National Highway would be necessary in the long-run to promote the use of Matarbari Port. In short-term, since the number of traffic of covered vans will be increased in the National Highway, the proper countermeasures such as traffic controls should be implemented if necessary. Additionally, the use of inland water transport and railway transport should be considered. Although Pangaon Inland Container Terminal and Dhaka Inland Container Depot are already in operation, most of the export/import cargos are transported by covered vans. The use of inland waterways and railways would contribute to reduce congestions around the new port and in cities along the National Highway.

Final Report Preparatory Survey on Matarbari Port Development Project in the People’s Republic of Bangladesh
2-286
There are several issues in the use of inland waterway. In monsoon seasons, vessels are prevented from voyaging, and it happens in approximately 20% of days in a year. Dredging of inland waterways and introduction of larger vessels are necessary and should be examined with other related entities.
4) Transparent and Efficient Procedures
Most of interviewees described the inconsistency and the lack of sufficient standards in procedures at Chittagong Port. For instance, some cargo owners pointed out that the necessary documents are not the same for all officials and depend on who handle the procedure on the occasion. Such inconsistency causes problems and not user-friendly. Also, the procedures by papers are time-consuming. In order to prevent such inconsistency and inefficiency, it is recommended that ICT technology should be introduced. A lot of counties already start to use computerized systems and implement such procedures fewer or even no documents in a short time period. In Japan, although there were dozens of procedures and a lot of authorities implement those separately with documents; these procedures have been integrated into one interface. Such one stop service should be examined in the future in order to attract more cargo owners and shipping lines to Matarbari Port.
5) Tariff setting
The advantage of Matarbari Port is that this port is operated by CPA together with Chittagong Port; and CPA can implement special tariff setting in order to promote the usage of Matarbari Port. For inistance, regarding to container services, it is expected that some of container services call at Matarbari Port on the way to/from Chittagong Port. As a promotion measure, incentives for such container services are one option. Until the commencement of the port, the strategic tariff should be examined carefully with application of tariff setting theories.
6) Cooperation with Development of Industrial Zones
The development of industrial zones including power plants etc. is expected around the port. The proper coordination between the port and industrial zones are mutually beneficial. The cargos from/to industrial zones will be handled at the new port. The close cooperation and communication are necessary. In long run, the port can be used by factories in industrial zones for import of materials and export of products. In short term, the port can be used for unloading the construction materials.
7) Strategic approach
The location of the port is a disadvantage of Matarbari Port while it is a brand new port without any existing parties’ interest. Efficiency and convenience could be an advantage of the port and offset the disadvantage. CPA and other related entities should establish a proper system as well as necessary infrastructure in order to promote the port and to make this port as the leading port not only in the county but also the whole region on the Bay of Bengal.