


Bahasa
Halaman
Hukum

Hydrol. Earth Syst. Sci., 18, 5271–5288, 2014
www.hydrol-earth-syst-sci.net/18/5271/2014/
doi:10.5194/hess-18-5271-2014
© Author(s) 2014. CC Attribution 3.0 License.
Tracer-based analysis of spatial and temporal variations
of water sources in a glacierized catchment
D. Penna1, M. Engel1,2, L. Mao3, A. Dell’Agnese1, G. Bertoldi2, and F. Comiti1
1Faculty of Science and Technology, Free University of Bozen-Bolzano, piazza Università 5, 39100 Bolzano, Italy2Institute for Alpine Environment, EURAC, viale Druso 1, Bozen-Bolzano, Italy3Department of Ecosystems and Environment, Pontificia Universidad Católica de Chile, Av. Vicuña Mackenna 4860,
Macul, Casilla 306-22, Santiago, Chile
Correspondence to: D. Penna ([email protected])
Received: 17 April 2014 – Published in Hydrol. Earth Syst. Sci. Discuss.: 15 May 2014
Revised: 14 October 2014 – Accepted: 20 November 2014 – Published: 17 December 2014
Abstract. Snow-dominated and glacierized catchments are
important sources of fresh water for biological communities
and for populations living in mountain valleys. Gaining a bet-
ter understanding of the runoff origin and of the hydrological
interactions between meltwater, streamflow and groundwater
is critical for natural risk assessment and mitigation as well
as for effective water resource management in mountain re-
gions. This study is based on the use of stable isotopes of wa-
ter and electrical conductivity as tracers to identify the water
sources for runoff and groundwater and their seasonal vari-
ability in a glacierized catchment in the Italian Alps. Sam-
ples were collected from rainfall, snow, snowmelt, ice melt,
spring and stream water (from the main stream at different
locations and from selected tributaries) in 2011, 2012 and
2013. The tracer-based mixing analysis revealed that, over-
all, snowmelt and glacier melt were the most important end-
members for stream runoff during late spring, summer and
early fall. The temporal variability of the tracer concentration
suggested that stream water was dominated by snowmelt at
the beginning of the melting season (May–June), by a mix-
ture of snowmelt and glacier melt during mid-summer (July–
early August), and by glacier melt during the end of the sum-
mer (end of August–September). The same seasonal pattern
observed in streamflow was also evident for groundwater,
with the highest electrical conductivity and least negative iso-
topic values found during cold or relatively less warm peri-
ods, when the melt of snowpack and ice was limited. Partic-
ularly, the application of a two-component mixing model to
data from different springs showed that the snowmelt contri-
bution to groundwater recharge varied between 21 % (±3 %)
and 93 % (±1 %) over the season, and the overall contri-
bution during the three study years ranged between 58 %
(±24 %) and 72 % (±19 %). These results provided new in-
sights into the isotopic characterization of the study catch-
ment presenting further understanding of the spatio-temporal
variability of the main water sources contributing to runoff.
1 Introduction
High-elevation mountain catchments are environments of
highly economic and social value since they store large vol-
umes of water in the form of snow and ice bodies and re-
lease it on a seasonal basis as meltwater. Large populations
living downstream of glacierized catchments primarily rely
on snow and glacier meltwater for drinking and irrigation
needs (Kriegel et al., 2013). Meltwater also plays an im-
portant role in the aquatic ecology of downstream reaches,
because it regulates summer stream temperatures, maintain-
ing high-quality habitat for fish and cold-water communities
(Grah and Beaulieu, 2013). From a hydrological perspective,
snowmelt and glacier melt are important because they mod-
erate inter-annual variability in streamflow (Stewart, 2009),
and can maintain elevated discharge during the dry season or
relatively dry years (Milner et al., 2009) when water demand
is highest.
High-elevation catchments are complex environmental
systems where different water sources interact to affect
the streamflow regime and the geochemical composition of
stream water. Understanding such a complexity is a first step
Published by Copernicus Publications on behalf of the European Geosciences Union.

5272 D. Penna et al.: Tracer-based analysis of spatial and temporal variations of water sources
towards a better conceptualization of catchment functioning
that is essential for natural risk assessment and mitigation as
well as for effective water resource management in moun-
tain regions. This is made more critical due to the current
changing climatic conditions, to which snow-dominated and
glacierized environments are particularly vulnerable. The ex-
pected future retreat of mountain glaciers and earlier melt
of snowpack is producing marked effects on the water bal-
ance. In future, mean annual runoff is expected to decrease
but peak runoff is likely to increase (Molini et al., 2011), with
seasonal shifts in the runoff regime (Kääb et al., 2007) and
in the relative timing and contribution of the different water
sources to baseflow, peak flow and groundwater. This raises
major concerns about water supply security in mountain re-
gions (Uhlmann et al., 2013).
In order to better predict future hydrological behaviour in
such rapidly changing environments there is an urgent need
to obtain a more detailed understanding of runoff origin and
the dynamic interactions between meltwater and streamflow
in glacierized catchments. A powerful investigation tool use-
ful for this purpose is represented by tracers. Particularly, the
stable isotopes of water (δ2H and δ18O) have been recently
used in high-elevation catchments to quantify post-snowmelt
summer rainfall contributions to streamflow (Dahlke et al.,
2013), estimate the regional water balance (Ohlanders et al.,
2013), compute catchment residence times (Jeelani et al.,
2013; Chiogna et al., 2014) and constrain model parame-
ters (Cable et al., 2011). Moreover, water isotopes, coupled
to other geochemical tracers, such as electrical conductiv-
ity (EC), have the potential to identify end-members (i.e. the
dominant sources to runoff) and compute their contribution
to streamflow (Maurya et al., 2011).
The water input due to snow and glacier meltwater during
spring and summer is relevant for the yearly runoff regime
of streams and groundwater in high-elevation Alpine areas
(Koboltschnig and Schöner, 2011). Particularly, inner val-
leys of the Alps are characterized by relatively low amounts
of liquid precipitation and significantly benefit from the wa-
ter contribution provided by lateral valleys where snowmelt
and/or glacier melt dominate streamflow and feed ground-
water. One clear example is given by the Vinschgau/Venosta
valley, in South Tyrol (Eastern Italian Alps), where most of
the economy is based on the cultivation of apples. Since here
the climate is relatively dry (the mean annual precipitation
for the period 1989–2012 in Laas-Lasa, at 863 m a.s.l. was
480 mm) a large part of water supply derives from stream wa-
ter from the tributaries of the main valley, which are used for
pressurized irrigation and hydropower production. Given the
socio-economic importance of meltwater in this region, we
conducted an experimental research in the glacierized Saldur
catchment, one of the catchments that contributes to water
availability in the upper Vinschgau valley. Importantly, the
glacier in the Saldur catchment is melting at a particularly
fast rate, with 20 % of areal reduction from 2005 to 2013 (Ga-
los and Kaser, 2014). The Saldur catchment has recently been
the subject of different hydrological studies (e.g. Bertoldi et
al., 2014; Della Chiesa et al., 2014; Pasolli et al., 2014) but
an assessment of the runoff water sources and of their spatio-
temporal variability based on an isotopic characterization of
the catchment is still lacking.
In this paper, we take advantage of the combined use of
two tracers, namely stable isotopes of water and EC, sam-
pled from precipitation and different water bodies over three
consecutive years, to
1. define the origin of vapour masses that form precipita-
tion in the study area
2. identify the end-members to streamflow
3. understand the seasonal variability of tracer concentra-
tion in stream water and groundwater
4. quantify the role of snowmelt on groundwater recharge.
2 Study area
The field activities were carried out in the upper Sal-
dur/Saldura catchment (61.7 km2) located in the upper Vin-
schgau/Venosta valley, South Tyrol (Eastern Italian Alps).
Elevations in the catchment range from 1.632 m a.s.l. at the
outlet – chosen at a gauging station upstream of the conflu-
ence with the Etsch/Adige River – to 3.725 m a.s.l. of the
highest peak (Weißkugel/Palla Bianca). The upper part of the
catchment hosts the Matsch/Mazia glacier (extent of 2.2 km2
in 2013, Galos and Kaser, 2014) whose current snout lies
approximately at 2800 m a.s.l. and feeds the Saldur River.
Downstream of the glacier snout, the Saldur River receives
water contributions from various tributaries, most of them
especially on the left side of the valley, originating at ele-
vations above 2900 m a.s.l. and therefore snow-covered ap-
proximately from October/November to May/June. As such,
streamflow during summer and part of spring and fall is no-
ticeably affected by water inputs mainly deriving from melt-
ing of the glacier body and the winter snowpack in differ-
ent portions of the catchment. Glacier erosion formed the
typical U-shape in the upper valley that is partly filled with
sediment from talus, small shallow landslides and large allu-
vial/debris fans from the steep tributaries. The average slope
of the catchment is 31.8◦ and the aspect is predominantly to-
wards the south (Fig. 1 and Table 1).
The study area has a continental climate with low total an-
nual precipitation compared to other mountain areas at the
same elevation. At 1570 m a.s.l., where a weather station is
run by the Province of Bozen-Bolzano, the mean annual air
temperature is 6.6 ◦C and the mean annual precipitation is
569 mm yr−1. The latter is estimated to increase up to 800–
1000 mm yr−1 at 2000 m a.s.l. Precipitation typically occurs
as snowfall from November to late April, while summer pre-
cipitation mainly originates from convective rainfall events.
However, snow storms can also occur during the summer at
Hydrol. Earth Syst. Sci., 18, 5271–5288, 2014 www.hydrol-earth-syst-sci.net/18/5271/2014/
D. Penna et al.: Tracer-based analysis of spatial and temporal variations of water sources 5273
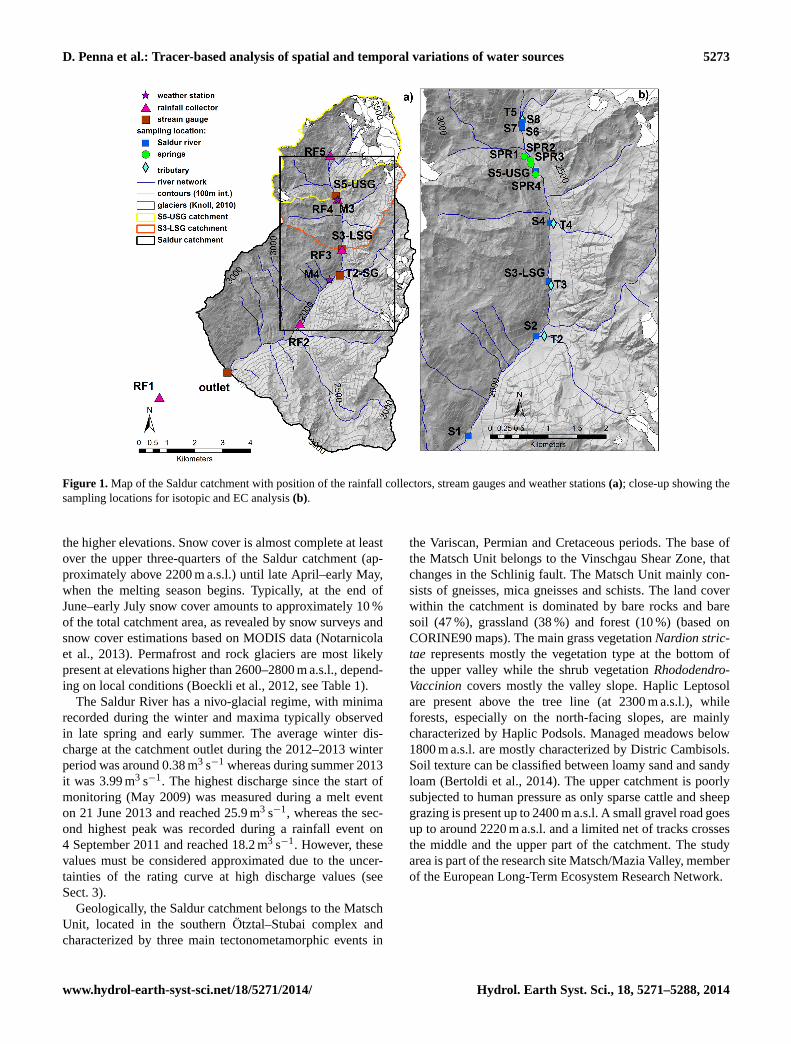
Figure 1. Map of the Saldur catchment with position of the rainfall collectors, stream gauges and weather stations (a); close-up showing the
sampling locations for isotopic and EC analysis (b).
the higher elevations. Snow cover is almost complete at least
over the upper three-quarters of the Saldur catchment (ap-
proximately above 2200 m a.s.l.) until late April–early May,
when the melting season begins. Typically, at the end of
June–early July snow cover amounts to approximately 10 %
of the total catchment area, as revealed by snow surveys and
snow cover estimations based on MODIS data (Notarnicola
et al., 2013). Permafrost and rock glaciers are most likely
present at elevations higher than 2600–2800 m a.s.l., depend-
ing on local conditions (Boeckli et al., 2012, see Table 1).
The Saldur River has a nivo-glacial regime, with minima
recorded during the winter and maxima typically observed
in late spring and early summer. The average winter dis-
charge at the catchment outlet during the 2012–2013 winter
period was around 0.38 m3 s−1 whereas during summer 2013
it was 3.99 m3 s−1. The highest discharge since the start of
monitoring (May 2009) was measured during a melt event
on 21 June 2013 and reached 25.9 m3 s−1, whereas the sec-
ond highest peak was recorded during a rainfall event on
4 September 2011 and reached 18.2 m3 s−1. However, these
values must be considered approximated due to the uncer-
tainties of the rating curve at high discharge values (see
Sect. 3).
Geologically, the Saldur catchment belongs to the Matsch
Unit, located in the southern Ötztal–Stubai complex and
characterized by three main tectonometamorphic events in
the Variscan, Permian and Cretaceous periods. The base of
the Matsch Unit belongs to the Vinschgau Shear Zone, that
changes in the Schlinig fault. The Matsch Unit mainly con-
sists of gneisses, mica gneisses and schists. The land cover
within the catchment is dominated by bare rocks and bare
soil (47 %), grassland (38 %) and forest (10 %) (based on
CORINE90 maps). The main grass vegetation Nardion stric-
tae represents mostly the vegetation type at the bottom of
the upper valley while the shrub vegetation Rhododendro-
Vaccinion covers mostly the valley slope. Haplic Leptosol
are present above the tree line (at 2300 m a.s.l.), while
forests, especially on the north-facing slopes, are mainly
characterized by Haplic Podsols. Managed meadows below
1800 m a.s.l. are mostly characterized by Distric Cambisols.
Soil texture can be classified between loamy sand and sandy
loam (Bertoldi et al., 2014). The upper catchment is poorly
subjected to human pressure as only sparse cattle and sheep
grazing is present up to 2400 m a.s.l. A small gravel road goes
up to around 2220 m a.s.l. and a limited net of tracks crosses
the middle and the upper part of the catchment. The study
area is part of the research site Matsch/Mazia Valley, member
of the European Long-Term Ecosystem Research Network.
www.hydrol-earth-syst-sci.net/18/5271/2014/ Hydrol. Earth Syst. Sci., 18, 5271–5288, 2014
5274 D. Penna et al.: Tracer-based analysis of spatial and temporal variations of water sources
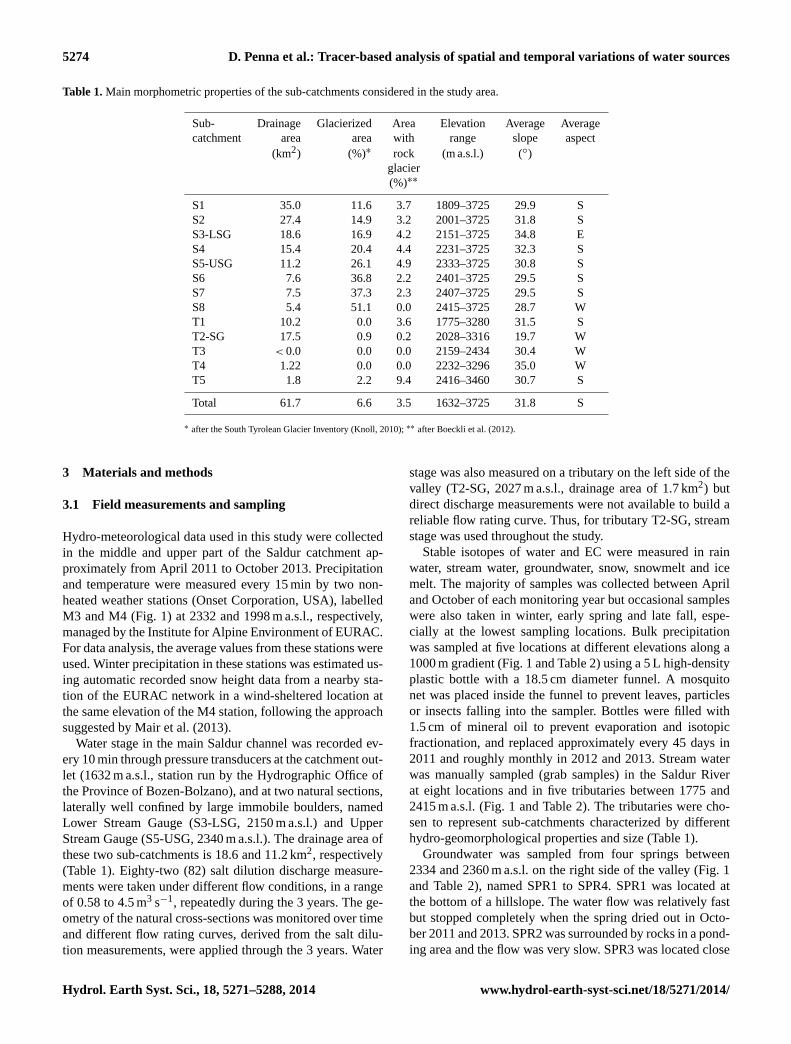
Table 1. Main morphometric properties of the sub-catchments considered in the study area.
Sub- Drainage Glacierized Area Elevation Average Average
catchment area area with range slope aspect
(km2) (%)∗ rock (m a.s.l.) (◦)
glacier
(%)∗∗
S1 35.0 11.6 3.7 1809–3725 29.9 S
S2 27.4 14.9 3.2 2001–3725 31.8 S
S3-LSG 18.6 16.9 4.2 2151–3725 34.8 E
S4 15.4 20.4 4.4 2231–3725 32.3 S
S5-USG 11.2 26.1 4.9 2333–3725 30.8 S
S6 7.6 36.8 2.2 2401–3725 29.5 S
S7 7.5 37.3 2.3 2407–3725 29.5 S
S8 5.4 51.1 0.0 2415–3725 28.7 W
T1 10.2 0.0 3.6 1775–3280 31.5 S
T2-SG 17.5 0.9 0.2 2028–3316 19.7 W
T3 < 0.0 0.0 0.0 2159–2434 30.4 W
T4 1.22 0.0 0.0 2232–3296 35.0 W
T5 1.8 2.2 9.4 2416–3460 30.7 S
Total 61.7 6.6 3.5 1632–3725 31.8 S
∗ after the South Tyrolean Glacier Inventory (Knoll, 2010); ∗∗ after Boeckli et al. (2012).
3 Materials and methods
3.1 Field measurements and sampling
Hydro-meteorological data used in this study were collected
in the middle and upper part of the Saldur catchment ap-
proximately from April 2011 to October 2013. Precipitation
and temperature were measured every 15 min by two non-
heated weather stations (Onset Corporation, USA), labelled
M3 and M4 (Fig. 1) at 2332 and 1998 m a.s.l., respectively,
managed by the Institute for Alpine Environment of EURAC.
For data analysis, the average values from these stations were
used. Winter precipitation in these stations was estimated us-
ing automatic recorded snow height data from a nearby sta-
tion of the EURAC network in a wind-sheltered location at
the same elevation of the M4 station, following the approach
suggested by Mair et al. (2013).
Water stage in the main Saldur channel was recorded ev-
ery 10 min through pressure transducers at the catchment out-
let (1632 m a.s.l., station run by the Hydrographic Office of
the Province of Bozen-Bolzano), and at two natural sections,
laterally well confined by large immobile boulders, named
Lower Stream Gauge (S3-LSG, 2150 m a.s.l.) and Upper
Stream Gauge (S5-USG, 2340 m a.s.l.). The drainage area of
these two sub-catchments is 18.6 and 11.2 km2, respectively
(Table 1). Eighty-two (82) salt dilution discharge measure-
ments were taken under different flow conditions, in a range
of 0.58 to 4.5 m3 s−1, repeatedly during the 3 years. The ge-
ometry of the natural cross-sections was monitored over time
and different flow rating curves, derived from the salt dilu-
tion measurements, were applied through the 3 years. Water
stage was also measured on a tributary on the left side of the
valley (T2-SG, 2027 m a.s.l., drainage area of 1.7 km2) but
direct discharge measurements were not available to build a
reliable flow rating curve. Thus, for tributary T2-SG, stream
stage was used throughout the study.
Stable isotopes of water and EC were measured in rain
water, stream water, groundwater, snow, snowmelt and ice
melt. The majority of samples was collected between April
and October of each monitoring year but occasional samples
were also taken in winter, early spring and late fall, espe-
cially at the lowest sampling locations. Bulk precipitation
was sampled at five locations at different elevations along a
1000 m gradient (Fig. 1 and Table 2) using a 5 L high-density
plastic bottle with a 18.5 cm diameter funnel. A mosquito
net was placed inside the funnel to prevent leaves, particles
or insects falling into the sampler. Bottles were filled with
1.5 cm of mineral oil to prevent evaporation and isotopic
fractionation, and replaced approximately every 45 days in
2011 and roughly monthly in 2012 and 2013. Stream water
was manually sampled (grab samples) in the Saldur River
at eight locations and in five tributaries between 1775 and
2415 m a.s.l. (Fig. 1 and Table 2). The tributaries were cho-
sen to represent sub-catchments characterized by different
hydro-geomorphological properties and size (Table 1).
Groundwater was sampled from four springs between
2334 and 2360 m a.s.l. on the right side of the valley (Fig. 1
and Table 2), named SPR1 to SPR4. SPR1 was located at
the bottom of a hillslope. The water flow was relatively fast
but stopped completely when the spring dried out in Octo-
ber 2011 and 2013. SPR2 was surrounded by rocks in a pond-
ing area and the flow was very slow. SPR3 was located close
Hydrol. Earth Syst. Sci., 18, 5271–5288, 2014 www.hydrol-earth-syst-sci.net/18/5271/2014/
D. Penna et al.: Tracer-based analysis of spatial and temporal variations of water sources 5275
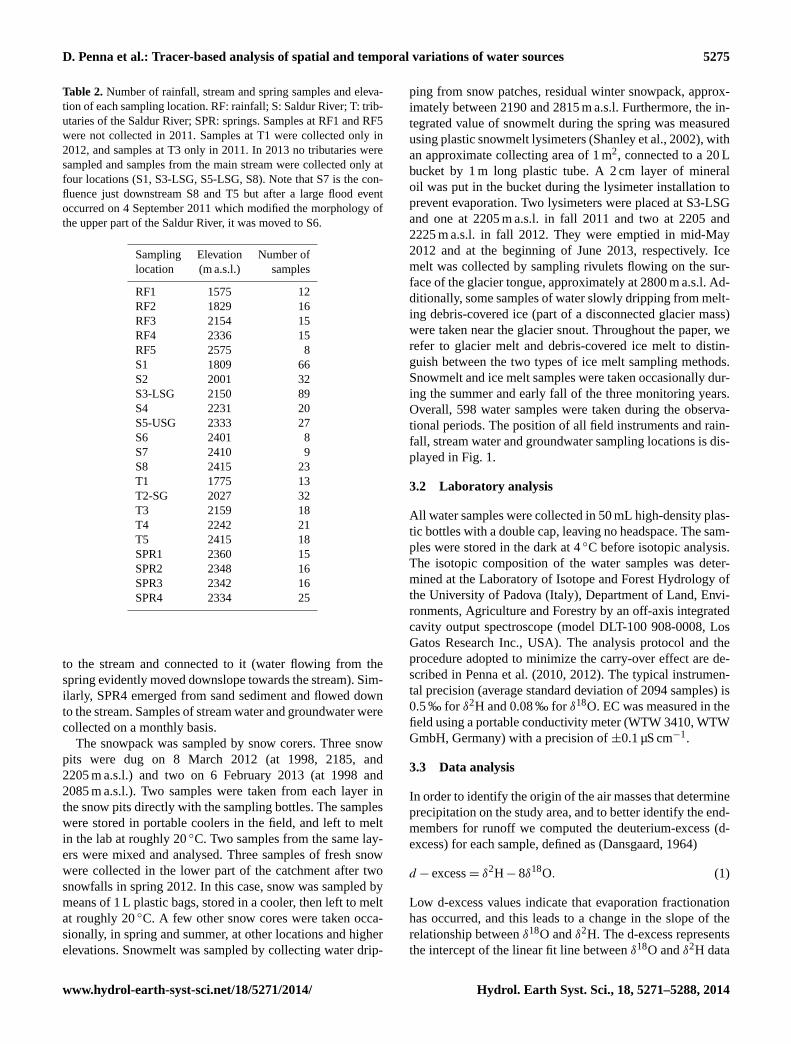
Table 2. Number of rainfall, stream and spring samples and eleva-
tion of each sampling location. RF: rainfall; S: Saldur River; T: trib-
utaries of the Saldur River; SPR: springs. Samples at RF1 and RF5
were not collected in 2011. Samples at T1 were collected only in
2012, and samples at T3 only in 2011. In 2013 no tributaries were
sampled and samples from the main stream were collected only at
four locations (S1, S3-LSG, S5-LSG, S8). Note that S7 is the con-
fluence just downstream S8 and T5 but after a large flood event
occurred on 4 September 2011 which modified the morphology of
the upper part of the Saldur River, it was moved to S6.
Sampling Elevation Number of
location (m a.s.l.) samples
RF1 1575 12
RF2 1829 16
RF3 2154 15
RF4 2336 15
RF5 2575 8
S1 1809 66
S2 2001 32
S3-LSG 2150 89
S4 2231 20
S5-USG 2333 27
S6 2401 8
S7 2410 9
S8 2415 23
T1 1775 13
T2-SG 2027 32
T3 2159 18
T4 2242 21
T5 2415 18
SPR1 2360 15
SPR2 2348 16
SPR3 2342 16
SPR4 2334 25
to the stream and connected to it (water flowing from the
spring evidently moved downslope towards the stream). Sim-
ilarly, SPR4 emerged from sand sediment and flowed down
to the stream. Samples of stream water and groundwater were
collected on a monthly basis.
The snowpack was sampled by snow corers. Three snow
pits were dug on 8 March 2012 (at 1998, 2185, and
2205 m a.s.l.) and two on 6 February 2013 (at 1998 and
2085 m a.s.l.). Two samples were taken from each layer in
the snow pits directly with the sampling bottles. The samples
were stored in portable coolers in the field, and left to melt
in the lab at roughly 20 ◦C. Two samples from the same lay-
ers were mixed and analysed. Three samples of fresh snow
were collected in the lower part of the catchment after two
snowfalls in spring 2012. In this case, snow was sampled by
means of 1 L plastic bags, stored in a cooler, then left to melt
at roughly 20 ◦C. A few other snow cores were taken occa-
sionally, in spring and summer, at other locations and higher
elevations. Snowmelt was sampled by collecting water drip-
ping from snow patches, residual winter snowpack, approx-
imately between 2190 and 2815 m a.s.l. Furthermore, the in-
tegrated value of snowmelt during the spring was measured
using plastic snowmelt lysimeters (Shanley et al., 2002), with
an approximate collecting area of 1 m2, connected to a 20 L
bucket by 1 m long plastic tube. A 2 cm layer of mineral
oil was put in the bucket during the lysimeter installation to
prevent evaporation. Two lysimeters were placed at S3-LSG
and one at 2205 m a.s.l. in fall 2011 and two at 2205 and
2225 m a.s.l. in fall 2012. They were emptied in mid-May
2012 and at the beginning of June 2013, respectively. Ice
melt was collected by sampling rivulets flowing on the sur-
face of the glacier tongue, approximately at 2800 m a.s.l. Ad-
ditionally, some samples of water slowly dripping from melt-
ing debris-covered ice (part of a disconnected glacier mass)
were taken near the glacier snout. Throughout the paper, we
refer to glacier melt and debris-covered ice melt to distin-
guish between the two types of ice melt sampling methods.
Snowmelt and ice melt samples were taken occasionally dur-
ing the summer and early fall of the three monitoring years.
Overall, 598 water samples were taken during the observa-
tional periods. The position of all field instruments and rain-
fall, stream water and groundwater sampling locations is dis-
played in Fig. 1.
3.2 Laboratory analysis
All water samples were collected in 50 mL high-density plas-
tic bottles with a double cap, leaving no headspace. The sam-
ples were stored in the dark at 4 ◦C before isotopic analysis.
The isotopic composition of the water samples was deter-
mined at the Laboratory of Isotope and Forest Hydrology of
the University of Padova (Italy), Department of Land, Envi-
ronments, Agriculture and Forestry by an off-axis integrated
cavity output spectroscope (model DLT-100 908-0008, Los
Gatos Research Inc., USA). The analysis protocol and the
procedure adopted to minimize the carry-over effect are de-
scribed in Penna et al. (2010, 2012). The typical instrumen-
tal precision (average standard deviation of 2094 samples) is
0.5 ‰ for δ2H and 0.08 ‰ for δ18O. EC was measured in the
field using a portable conductivity meter (WTW 3410, WTW
GmbH, Germany) with a precision of ±0.1 µS cm−1.
3.3 Data analysis
In order to identify the origin of the air masses that determine
precipitation on the study area, and to better identify the end-
members for runoff we computed the deuterium-excess (d-
excess) for each sample, defined as (Dansgaard, 1964)
d − excess= δ2H− 8δ18O. (1)
Low d-excess values indicate that evaporation fractionation
has occurred, and this leads to a change in the slope of the
relationship between δ18O and δ2H. The d-excess represents
the intercept of the linear fit line between δ18O and δ2H data
www.hydrol-earth-syst-sci.net/18/5271/2014/ Hydrol. Earth Syst. Sci., 18, 5271–5288, 2014

5276 D. Penna et al.: Tracer-based analysis of spatial and temporal variations of water sources
in precipitation at the global scale, named global meteoro-
logical water line (GMWL, Craig, 1961) and defined as
δ2H(‰)= 8δ18O+ 10. (2)
The d-excess in precipitation is related to humidity and tem-
perature at the moisture source (Dansgaard, 1964) and there-
fore is useful to infer the origin of water vapour that deter-
mines precipitation in the study area (Cui et al., 2009; Wasse-
naar et al., 2011; Hughes and Crawford, 2013). In southwest-
ern Europe, precipitation data that show d-excess close to
that of the GMWL typically indicate an Atlantic origin of
air masses whereas higher d-excess may reflect the influence
of water vapour coming from the Mediterranean basin, for
which the local Mediterranean meteoric water line (MMWL)
is valid (Gat and Carmi, 1970):
δ2H(‰)= 8δ18O+ 22. (3)
The identification of the end-members to surface and subsur-
face runoff was performed by using d-excess coupled to δ2H
data of rainfall, glacier melt and snowmelt, as well as of the
streams and springs, and an end-member plot was built.
The computation of the snowmelt contribution to ground-
water recharge was performed by using a simple two-
component separation model (Pearce et al., 1986), based on
water and tracer mass balance, as follows:
Q1 =Q2+Q3 (4)
Q1C1 =Q2C2+Q3C3 (5)
Q2 =[(C1−C3)/(C2−C3)
]×Q1, (6)
whereQ1,Q2 andQ3 represent three different water compo-
nents (in this case, spring water, snowmelt and rainfall) and
C1, C2 and C3 represent their tracer concentrations. On the
basis of Eq. (6), we quantified the percentage of snowmelt
contribution to groundwater recharge (SNML %) over the
3 study years using δ2H data, as follows (Earman et al., 2006;
Zhang et al., 2009):
SNMLT%=[(CSPR−CRF)/(CSNM−CRF)
]× 100, (7)
where CSPR is the average isotopic composition of all sam-
ples collected from each spring over the three monitoring pe-
riods,CRF is the volume-weighted average isotopic composi-
tion of the 23 rainfall samples collected at the locations RF4
and RF5 (the ones closest and upstream the selected springs,
Table 2 and Fig. 1) and CSNM is the average isotopic compo-
sition of 16 snowmelt samples collected from melting snow
patches at elevations higher than those of the springs. Sim-
ilarly, we assessed the seasonal contribution of snowmelt to
each spring for each sampling date in 2012 and 2013 (2011
was excluded due to the low number of snowmelt samples
available). In this case, CSPR is the isotopic composition of
the spring water sample collected on a certain day, CRF is the
volume-weighted average isotopic composition of the rain-
fall samples collected at the locations RF4 and RF5 during
Figure 2. Box-plot for δ2H (a) and EC (b) of all water samples col-
lected in this study. The whiskers represent the 10th and 90th per-
centiles, the box limits indicate the 25th and 75th percentiles and
the line within the box marks the median. Legend: RAIN: rain-
fall; SNPK: winter snowpack and three samples of fresh snowfall;
SNMLT: snowmelt (from patches of old snow and from snowmelt
samplers); ICEMLT: ice melt (glacier melt and debris-covered ice);
STR: main stream; TRIB: tributaries; SPR: springs. EC data of the
snowpack (SNPK) were not available.
the period previous to the sampling day, and CSNM is the (av-
erage) isotopic composition of the snowmelt sample(s) col-
lected on that day. The 70 % uncertainty in the separation of
the two components was estimated through the method sug-
gested by Genereux (1998) that takes into account the dif-
ference between the isotopic composition of the components
and the variability (expressed by the standard deviation) of
the isotopic composition of each component. The smaller the
difference and the larger the variability, the higher the uncer-
tainty.
Given the covariance between δ2H and δ18O values of all
samples, we report in the paper only δ2H values in cases
where information deriving from both isotopes were redun-
dant.
4 Results and discussion
4.1 Tracer concentration in different waters
The different waters sampled in the Saldur catchment during
this study showed a marked variability in tracer concentra-
tion (Fig. 2). Over the entire data set, δ2H values ranged from
−26.1 to −202.0 ‰ and EC ranged from 1 to 461 µS cm−1.
Rainfall and winter snowpack samples were characterized
by the most positive and the most negative isotopic compo-
Hydrol. Earth Syst. Sci., 18, 5271–5288, 2014 www.hydrol-earth-syst-sci.net/18/5271/2014/

D. Penna et al.: Tracer-based analysis of spatial and temporal variations of water sources 5277
sition, respectively. Overall, snowmelt had values between
rainfall and snowpack whereas ice melt was more enriched
with heavy isotopes. Stream water from the main stream and
the tributaries, and groundwater from the springs had statis-
tically different isotopic compositions (Kruskal–Wallis test
significant at 0.05 level).
The median EC of rainfall (Fig. 2b) was lower than the EC
typically measured in precipitation both in urban catchments
(e.g. Pellerin et al., 2008; Meriano et al., 2011) and in other
mountain catchments in more natural settings (e.g. Lambs,
2000; Zabaleta and Antigüedad, 2013). Low EC in rainfall
indicates low concentration of solutes and suggests a small or
negligible influence of air masses coming from the Mediter-
ranean Sea basin, rich in salts and therefore characterized by
higher EC (see also Sect. 4.2). The median EC of snowmelt
(from patches of old snow and from the snowmelt lysimeters
as a whole) and ice melt (glacier melt and debris-covered
ice melt as a whole) was also low and very low, respec-
tively. Thus, the isotopic composition of rainfall, snowmelt
and ice melt allowed for a clearer separation of these end-
embers than EC. The median EC of stream water in the trib-
utaries and groundwater was similar and higher than that of
the Saldur River which clearly reflected the contribution of
low EC snowmelt and ice melt to streamflow (Sect. 4.7). EC
samples of stream water and groundwater showed statisti-
cal differences even more marked than those shown by δ2H
data (Kruskal–Wallis test significant at 0.01 level). This re-
flects the fact that all expected water sources contributing to
streamflow during rainfall events and melting periods (rain-
fall, snowmelt and ice melt) had low values of EC but con-
trasting isotopic composition that compensated when mixed
in the Saldur River.
4.2 Isotopic composition of rainfall
The linear relationship between δ18O and δ2H composi-
tion of rainfall data collected at different elevations in the
Saldur catchment defined a local meteorological water line
(LMWL), expressed as (Fig. 3)
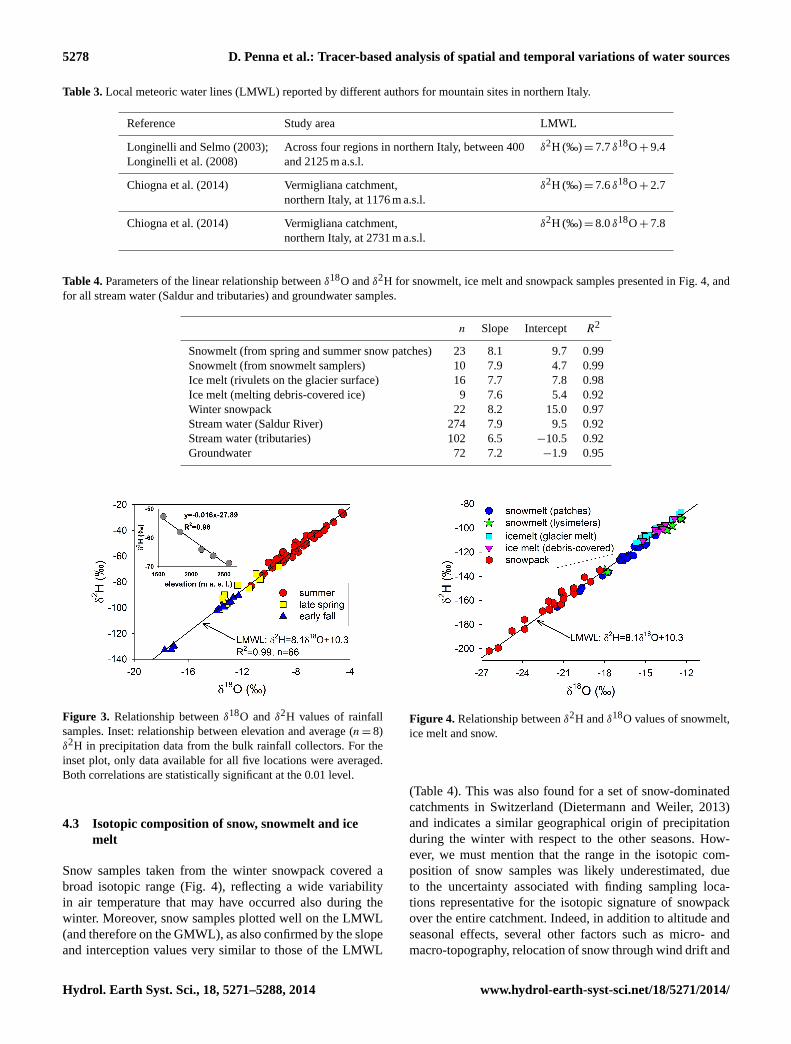
δ2H(‰)= 8.1δ18O+ 10.3, R2= 0.99, n= 66. (8)
This relationship is slightly different from the LMWL of
northern Italy (Longinelli and Selmo, 2003; Longinelli et
al., 2008, Table 3) and also from the LWML found by
Chiogna et al. (2014) for a station at 1176 m a.s.l. in a glacier-
ized Alpine catchment between the Ortles–Cevedale and the
Adamello–Presanella massifs (northern Italy, approximately
44 km south in a straight line from the Saldur catchment,
Table 3). Conversely, the LMWL in the Saldur catchment
is quite similar to the one derived at the highest elevation
(2731 m a.s.l.) reported by Chiogna et al. (2014) in similar
climatic conditions (Table 3). It is evident that the slope of the
Saldur LMWL (8.1) is higher than that of the other northern
Italian sites at lower elevations (7.7 and 7.6, Table 3), but ap-
proximately the same as that in a mountain region at higher
elevation (8.0, Table 3). More interestingly, both the slope
and the d-excess of the Saldur LMWL are nearly identical to
those of the GMWL (Eq. 2) and d-excess is noticeably dif-
ferent from that of the MMWL (Eq. 3). Although a full com-
parison among these relationships cannot be made because
the LMWL at our site did not include samples collected dur-
ing the winter, this reveals that precipitation (at least during
late spring, summer and early fall of the three observation
years) in the Saldur area, and likely in other left-side lateral
valleys of the Upper Vinschgau valley, was predominantly
originated by air masses developing on the Atlantic Ocean,
with limited influence by inflow of water vapour from the
Mediterranean sea. This confirms what was indicated by the
very low EC observed in rainfall (Sect. 4.1). Moreover, these
observations are in agreement with the fact that the complex
topography of South Tyrol leads to the coexistence of many
different microclimates and precipitation patterns (Brugnara
et al., 2012).
Figure 3 also highlights the clear and expected
temperature-dependent seasonality (e.g. Wassenaar et al.,
2011) with heavier isotopic values occurring during the sum-
mer, lighter values occurring during the fall and intermedi-
ate values generally occurring during the spring, and par-
tially overlapping with the most negative summer samples
and the most positive fall samples. In addition, we observed a
marked altitude effect (Araguás-Araguás et al., 2000; inset of
Fig. 3), recognized in almost all mountain ranges worldwide
(Poage and Chamberlain, 2001). Particularly, the linear re-
lationship between the average isotopic composition of rain-
fall samples and elevation in the Saldur catchment yielded an
isotopic depletion rate of −1.6 ‰ for δ2H and −0.23 ‰ for
δ18O per 100 m rise in elevation. This gradient is steeper than
that found by Chiogna et al. (2014), and is gentler than that
in the Kumaon Himalaya, India (Kumar et al., 2010), and
in a snowmelt- and glacier melt-dominated Andean catch-
ment, Chile (Ohlanders et al., 2013). However, the gradient is
fully consistent with that in Kashmir Himalaya (Jeelani et al.,
2013) and with the one reported by Longinelli et al. (2006)
for an Alpine region in northwestern Italy.
Elevation played also a role on the spatial variability of
d-excess in precipitation. Although the relationship was less
strong than the one between elevation and δ2H and δ18O in
rainfall, our data (not reported) showed that d-excess (the av-
erage of data available for all five sampling locations, n= 8)
increased roughly linearly by 0.2 ‰ per 100 m rise in eleva-
tion (R2= 0.69, n= 5, significant at 0.1 level). This effect
was also reported for other mountain areas (Cui et al., 2009;
Kumar et al., 2010; Jeelani et al., 2013). In some cases, the
increase of d-excess with altitude was reported to be mainly
present at high relative humidity (Gonfiantini et al., 2001;
Windhorst et al., 2013) which is not the case of the study
area. In the Saldur catchment, this effect may be attributed to
higher relative humidity at higher elevations due to snow and
ice melting which tends to enhance the kinetic fractionation
process during evaporation (see Peng et al., 2004).
www.hydrol-earth-syst-sci.net/18/5271/2014/ Hydrol. Earth Syst. Sci., 18, 5271–5288, 2014
5278 D. Penna et al.: Tracer-based analysis of spatial and temporal variations of water sources
Table 3. Local meteoric water lines (LMWL) reported by different authors for mountain sites in northern Italy.
Reference Study area LMWL
Longinelli and Selmo (2003); Across four regions in northern Italy, between 400 δ2H (‰)= 7.7 δ18O+ 9.4
Longinelli et al. (2008) and 2125 m a.s.l.
Chiogna et al. (2014) Vermigliana catchment, δ2H (‰)= 7.6 δ18O+ 2.7
northern Italy, at 1176 m a.s.l.
Chiogna et al. (2014) Vermigliana catchment, δ2H (‰)= 8.0 δ18O+ 7.8
northern Italy, at 2731 m a.s.l.
Table 4. Parameters of the linear relationship between δ18O and δ2H for snowmelt, ice melt and snowpack samples presented in Fig. 4, and
for all stream water (Saldur and tributaries) and groundwater samples.
n Slope Intercept R2
Snowmelt (from spring and summer snow patches) 23 8.1 9.7 0.99
Snowmelt (from snowmelt samplers) 10 7.9 4.7 0.99
Ice melt (rivulets on the glacier surface) 16 7.7 7.8 0.98
Ice melt (melting debris-covered ice) 9 7.6 5.4 0.92
Winter snowpack 22 8.2 15.0 0.97
Stream water (Saldur River) 274 7.9 9.5 0.92
Stream water (tributaries) 102 6.5 −10.5 0.92
Groundwater 72 7.2 −1.9 0.95
Figure 3. Relationship between δ18O and δ2H values of rainfall
samples. Inset: relationship between elevation and average (n= 8)
δ2H in precipitation data from the bulk rainfall collectors. For the
inset plot, only data available for all five locations were averaged.
Both correlations are statistically significant at the 0.01 level.
4.3 Isotopic composition of snow, snowmelt and ice
melt
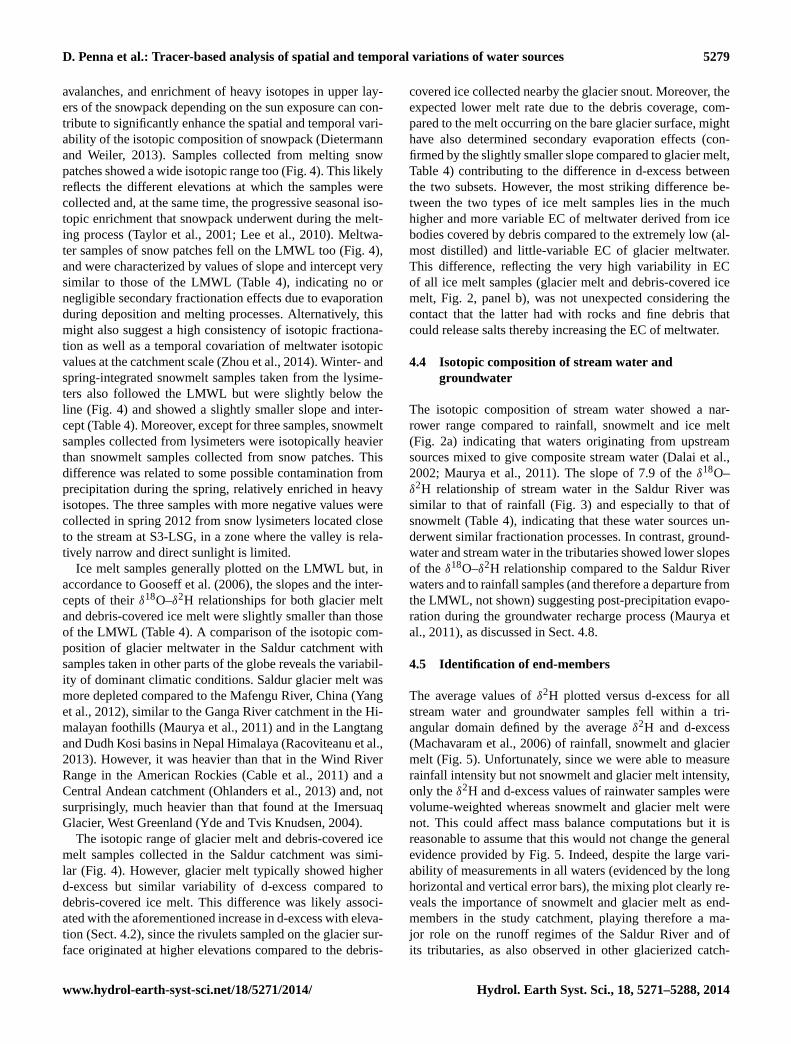
Snow samples taken from the winter snowpack covered a
broad isotopic range (Fig. 4), reflecting a wide variability
in air temperature that may have occurred also during the
winter. Moreover, snow samples plotted well on the LMWL
(and therefore on the GMWL), as also confirmed by the slope
and interception values very similar to those of the LMWL
Figure 4. Relationship between δ2H and δ18O values of snowmelt,
ice melt and snow.
(Table 4). This was also found for a set of snow-dominated
catchments in Switzerland (Dietermann and Weiler, 2013)
and indicates a similar geographical origin of precipitation
during the winter with respect to the other seasons. How-
ever, we must mention that the range in the isotopic com-
position of snow samples was likely underestimated, due
to the uncertainty associated with finding sampling loca-
tions representative for the isotopic signature of snowpack
over the entire catchment. Indeed, in addition to altitude and
seasonal effects, several other factors such as micro- and
macro-topography, relocation of snow through wind drift and
Hydrol. Earth Syst. Sci., 18, 5271–5288, 2014 www.hydrol-earth-syst-sci.net/18/5271/2014/
D. Penna et al.: Tracer-based analysis of spatial and temporal variations of water sources 5279
avalanches, and enrichment of heavy isotopes in upper lay-
ers of the snowpack depending on the sun exposure can con-
tribute to significantly enhance the spatial and temporal vari-
ability of the isotopic composition of snowpack (Dietermann
and Weiler, 2013). Samples collected from melting snow
patches showed a wide isotopic range too (Fig. 4). This likely
reflects the different elevations at which the samples were
collected and, at the same time, the progressive seasonal iso-
topic enrichment that snowpack underwent during the melt-
ing process (Taylor et al., 2001; Lee et al., 2010). Meltwa-
ter samples of snow patches fell on the LMWL too (Fig. 4),
and were characterized by values of slope and intercept very
similar to those of the LMWL (Table 4), indicating no or
negligible secondary fractionation effects due to evaporation
during deposition and melting processes. Alternatively, this
might also suggest a high consistency of isotopic fractiona-
tion as well as a temporal covariation of meltwater isotopic
values at the catchment scale (Zhou et al., 2014). Winter- and
spring-integrated snowmelt samples taken from the lysime-
ters also followed the LMWL but were slightly below the
line (Fig. 4) and showed a slightly smaller slope and inter-
cept (Table 4). Moreover, except for three samples, snowmelt
samples collected from lysimeters were isotopically heavier
than snowmelt samples collected from snow patches. This
difference was related to some possible contamination from
precipitation during the spring, relatively enriched in heavy
isotopes. The three samples with more negative values were
collected in spring 2012 from snow lysimeters located close
to the stream at S3-LSG, in a zone where the valley is rela-
tively narrow and direct sunlight is limited.
Ice melt samples generally plotted on the LMWL but, in
accordance to Gooseff et al. (2006), the slopes and the inter-
cepts of their δ18O–δ2H relationships for both glacier melt
and debris-covered ice melt were slightly smaller than those
of the LMWL (Table 4). A comparison of the isotopic com-
position of glacier meltwater in the Saldur catchment with
samples taken in other parts of the globe reveals the variabil-
ity of dominant climatic conditions. Saldur glacier melt was
more depleted compared to the Mafengu River, China (Yang
et al., 2012), similar to the Ganga River catchment in the Hi-
malayan foothills (Maurya et al., 2011) and in the Langtang
and Dudh Kosi basins in Nepal Himalaya (Racoviteanu et al.,
2013). However, it was heavier than that in the Wind River
Range in the American Rockies (Cable et al., 2011) and a
Central Andean catchment (Ohlanders et al., 2013) and, not
surprisingly, much heavier than that found at the Imersuaq
Glacier, West Greenland (Yde and Tvis Knudsen, 2004).
The isotopic range of glacier melt and debris-covered ice
melt samples collected in the Saldur catchment was simi-
lar (Fig. 4). However, glacier melt typically showed higher
d-excess but similar variability of d-excess compared to
debris-covered ice melt. This difference was likely associ-
ated with the aforementioned increase in d-excess with eleva-
tion (Sect. 4.2), since the rivulets sampled on the glacier sur-
face originated at higher elevations compared to the debris-
covered ice collected nearby the glacier snout. Moreover, the
expected lower melt rate due to the debris coverage, com-
pared to the melt occurring on the bare glacier surface, might
have also determined secondary evaporation effects (con-
firmed by the slightly smaller slope compared to glacier melt,
Table 4) contributing to the difference in d-excess between
the two subsets. However, the most striking difference be-
tween the two types of ice melt samples lies in the much
higher and more variable EC of meltwater derived from ice
bodies covered by debris compared to the extremely low (al-
most distilled) and little-variable EC of glacier meltwater.
This difference, reflecting the very high variability in EC
of all ice melt samples (glacier melt and debris-covered ice
melt, Fig. 2, panel b), was not unexpected considering the
contact that the latter had with rocks and fine debris that
could release salts thereby increasing the EC of meltwater.
4.4 Isotopic composition of stream water and
groundwater
The isotopic composition of stream water showed a nar-
rower range compared to rainfall, snowmelt and ice melt
(Fig. 2a) indicating that waters originating from upstream
sources mixed to give composite stream water (Dalai et al.,
2002; Maurya et al., 2011). The slope of 7.9 of the δ18O–
δ2H relationship of stream water in the Saldur River was
similar to that of rainfall (Fig. 3) and especially to that of
snowmelt (Table 4), indicating that these water sources un-
derwent similar fractionation processes. In contrast, ground-
water and stream water in the tributaries showed lower slopes
of the δ18O–δ2H relationship compared to the Saldur River
waters and to rainfall samples (and therefore a departure from
the LMWL, not shown) suggesting post-precipitation evapo-
ration during the groundwater recharge process (Maurya et
al., 2011), as discussed in Sect. 4.8.
4.5 Identification of end-members
The average values of δ2H plotted versus d-excess for all
stream water and groundwater samples fell within a tri-
angular domain defined by the average δ2H and d-excess
(Machavaram et al., 2006) of rainfall, snowmelt and glacier
melt (Fig. 5). Unfortunately, since we were able to measure
rainfall intensity but not snowmelt and glacier melt intensity,
only the δ2H and d-excess values of rainwater samples were
volume-weighted whereas snowmelt and glacier melt were
not. This could affect mass balance computations but it is
reasonable to assume that this would not change the general
evidence provided by Fig. 5. Indeed, despite the large vari-
ability of measurements in all waters (evidenced by the long
horizontal and vertical error bars), the mixing plot clearly re-
veals the importance of snowmelt and glacier melt as end-
members in the study catchment, playing therefore a ma-
jor role on the runoff regimes of the Saldur River and of
its tributaries, as also observed in other glacierized catch-
www.hydrol-earth-syst-sci.net/18/5271/2014/ Hydrol. Earth Syst. Sci., 18, 5271–5288, 2014

5280 D. Penna et al.: Tracer-based analysis of spatial and temporal variations of water sources
Figure 5. Mixing diagram between δ2H and d-excess of all average
values of samples collected in the Saldur catchment. The error bars
represent half of the standard deviation. The δ2H and d-excess com-
position of rainwater samples was volume-weighted whereas the
snow, snowmelt and glacier melt composition was not. The snow-
pack is excluded from the mixing space because it is not a direct
hydrological input.
ments (Zhang et al., 2009; Dahlke et al., 2013; Olhanders et
al., 2013). However, it must be mentioned that we normally
collected samples during no-rain periods, and therefore the
contribution of rain water to the isotopic and EC composi-
tion of stream water and groundwater was likely underesti-
mated. Although the error bars of samples within the triangu-
lar space largely overlapped, it is interesting to note that sam-
ples taken in the main stream were closer to the glacier melt
end-member than the samples collected in the tributaries, and
samples collected from the springs fell closer to the snowmelt
end-member than stream water samples. This indicates, as
expected, that glacier melt was a more important contribu-
tor to runoff in the main stream compared to the tributaries,
and suggests an important role of snowmelt on groundwater
recharge (Sect. 4.8). Snowpack samples were not included in
the mixing plot because winter snowpack cannot be consid-
ered as a direct hydrological input.
4.6 Temporal hydrological dynamics
The three observational periods considered in this study
showed different hydro-meteorological characteristics
(Fig. 6). The average temperature over the 1 April–31 Octo-
ber period was similar for the 3 years (6.7, 6.5 and 6.3 ◦C for
2011, 2012 and 2013, respectively) but the temporal vari-
ability slightly differed. Most of all, cumulative precipitation
was noticeably different, with 536, 467 and only 380 mm
over the same period in 2011, 2012 and 2013, respectively.
However, although 2013 was the driest year, streamflow and
water stage at the gauging stations, especially at S5-USG,
showed marked responses, suggesting important contribu-
tions of meltwater. At the end of April–beginning of May,
when the melting season started, streamflow in the main
stream (Fig. 6g–l) and water stage in the tributary T2-SG
(Fig. 6m–o) were typically low with values close to the
winter baseflow (below 0.5 m3 s−1 at S5-USG, 1 m3 s−1 at
S3-LSG and 5 cm at T2-SG). Then, streamflow noticeably
increased during the warmer months (June–August) up to
3–4 m3 s−1 at S5-USG, 6–7 m3 s−1 at S3-LSG and 25–30 cm
at T2-SG, and started to recede in September, reflecting the
combination of limited snow cover and incoming radiation
too small to produce important melt. Additionally, stream-
flow showed a marked diurnal variability (Jost et al., 2012;
Uhlmann et al., 2013), particularly in the main stream and
slightly less evident in the tributary, with clear fluctuations
dependent on daily temperature oscillations that triggered
the release of meltwater to the stream network (Fig. 6d–o).
At the seasonal scale, the melting dynamics seemed to
override the role of rainfall on streamflow variability. Typ-
ical rainfall events were characterized by daily cumulative
amounts of less than 10 mm that produced small streamflow
response and limited sediment transport (Mao et al., 2014).
However, the highest streamflow peaks were associated with
relatively intense rainfall events. For example, 19.6 mm of
rain fell in 4 h on 4 September 2011 and produced hourly
streamflow peaks of 5.3 m3 s−1 at S5-USG, 8.0 m3 s−1 at S3-
LSG and a water stage peak of 37 cm at T2-SG, observed
almost simultaneously at all three gauging locations.
4.7 Spatio-temporal dynamics of tracer concentration
in stream water and groundwater
4.7.1 Temporal variability of stream water and
groundwater EC and δ2H
The isotopic composition of stream water (Fig. 6g–o) did not
reflect the seasonal variation of rainfall isotopic composition,
with the less negative values occurring during the warmest
periods (Sect. 4.2) but tended to mirror it (Jeelani et al.,
2013). Indeed, the samples collected in the Saldur River and
its selected tributaries revealed that during the late spring and
the beginning of the summer (June–July) δ2H in stream water
was relatively depleted in heavy isotopes (ranging approxi-
mately between −115 and −110 ‰), then increased during
mid–late summer to values close to the baseflow isotopic
composition (Fig. 6). Similarly, EC was relatively high be-
fore the beginning of the melting period (up to approximately
250 µS cm−1 at S3-LSG), then decreased below 100 µS cm−1
during the melting season and increased to background val-
ues in mid-late October (Fig. 6). Given the very low EC and
the significantly more negative values of snowmelt and ice
melt compared to rainfall (Fig. 2), the general pattern sug-
gests a remarkable contribution of meltwater to runoff in the
Saldur catchment, confirming the results of the end-member
mixing analysis (see Fig. 5 and Sect. 4.7.3).
Hydrol. Earth Syst. Sci., 18, 5271–5288, 2014 www.hydrol-earth-syst-sci.net/18/5271/2014/

D. Penna et al.: Tracer-based analysis of spatial and temporal variations of water sources 5281
Figure 6. Top row panels (a–c): hourly time series of precipitation (average of values from M3 and M4), and δ2H and EC in bulk precipitation
(average of values from RF2, RF3 and RF4). Second row panels (d–f): daily average temperature (average of values from M3 and M4).
Middle row panels (g–i): hourly time series of streamflow at S5-USG, and δ2H and EC of stream water. Fourth row panels (j–l): hourly time
series of streamflow at S3-LSG, and δ2H and EC of stream water. Bottom row panels (m–o): hourly time series of water height at T2-SG,
and δ2H and EC of stream water. On five occasions in 2011 multiple samples were taken within 1 day at S3-LSG; only samples taken in
the morning, at peak flow and before sunset are shown in (j)–(l). All panels refer to the period between 1 April and 31 October, when the
majority of water samples was collected.
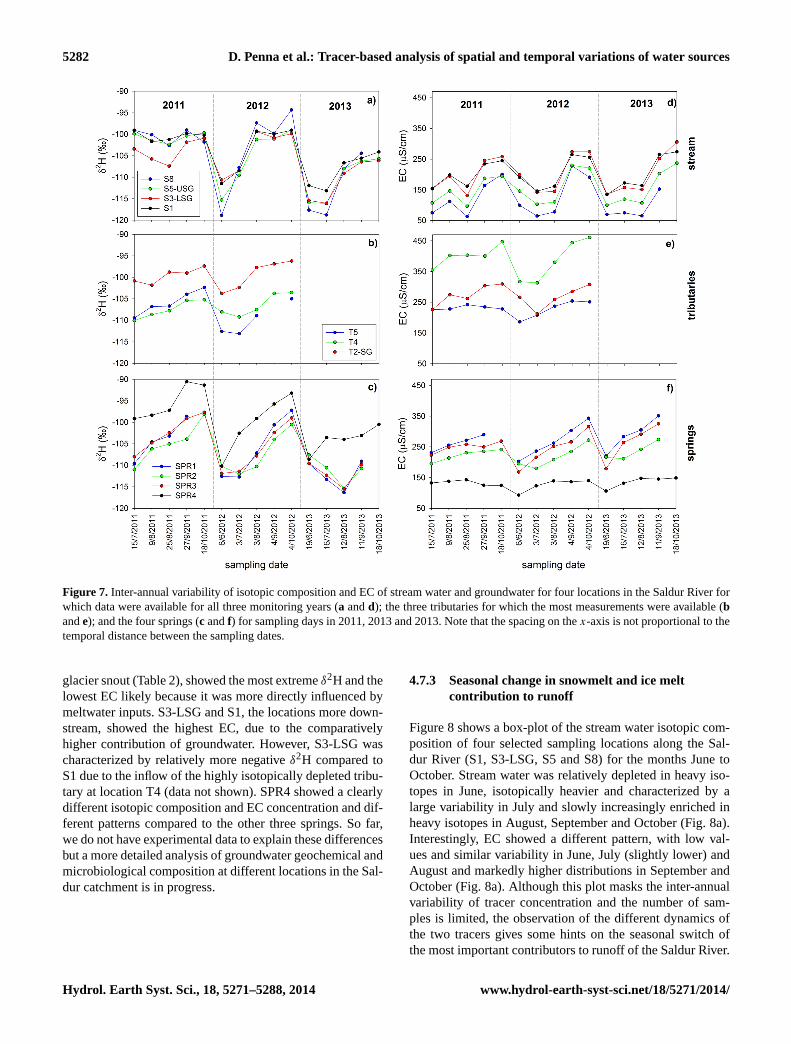
This trend was also revealed by the δ2H and EC of four
locations along the Saldur River, three tributaries and the
four selected springs (Fig. 7). We show here data from the
Saldur locations where we collected samples approximately
monthly during all three monitoring years, and from the three
tributaries for which we have the most numerous measure-
ments. There was an overall pattern of more negative iso-
topes and relatively low EC at the beginning and at the peak
of the melting season. Analogously, less negative isotopes
and higher EC were observed at the end of the season. Over-
all, this pattern was temporally consistent for stream water,
both in the main stream and in the tributaries, and for ground-
water. The increasing trend in isotopic composition and EC
of the springs and the tributaries (generally with a negligible
glacierized area compared to that of the main stream sub-
catchments, see Table 1) likely reflects the decreasing con-
tribution of snowmelt over the season. Isotopes in the Saldur
River in August 2013 (Fig. 7a) were noticeably less negative
compared to the previous sampling time and disagreed with
patterns showed by the isotopic composition of the springs
(Fig. 7c). One reason for this difference could be related to
the lagged arrival of the snowmelt contribution to the springs
but this should be verified by means of additional data and
possibly modelling application.
4.7.2 Spatial variability of stream water and
groundwater EC and δ2H
The consistency of temporal patterns across the different lo-
cations was particularly remarkable for the Saldur River lo-
cations and for springs SPR1-3 (Fig. 7a and c, respectively).
Overall, location S8, higher in elevation and closer to the
www.hydrol-earth-syst-sci.net/18/5271/2014/ Hydrol. Earth Syst. Sci., 18, 5271–5288, 2014
5282 D. Penna et al.: Tracer-based analysis of spatial and temporal variations of water sources
Figure 7. Inter-annual variability of isotopic composition and EC of stream water and groundwater for four locations in the Saldur River for
which data were available for all three monitoring years (a and d); the three tributaries for which the most measurements were available (b
and e); and the four springs (c and f) for sampling days in 2011, 2013 and 2013. Note that the spacing on the x-axis is not proportional to the
temporal distance between the sampling dates.
glacier snout (Table 2), showed the most extreme δ2H and the
lowest EC likely because it was more directly influenced by
meltwater inputs. S3-LSG and S1, the locations more down-
stream, showed the highest EC, due to the comparatively
higher contribution of groundwater. However, S3-LSG was
characterized by relatively more negative δ2H compared to
S1 due to the inflow of the highly isotopically depleted tribu-
tary at location T4 (data not shown). SPR4 showed a clearly
different isotopic composition and EC concentration and dif-
ferent patterns compared to the other three springs. So far,
we do not have experimental data to explain these differences
but a more detailed analysis of groundwater geochemical and
microbiological composition at different locations in the Sal-
dur catchment is in progress.
4.7.3 Seasonal change in snowmelt and ice melt
contribution to runoff
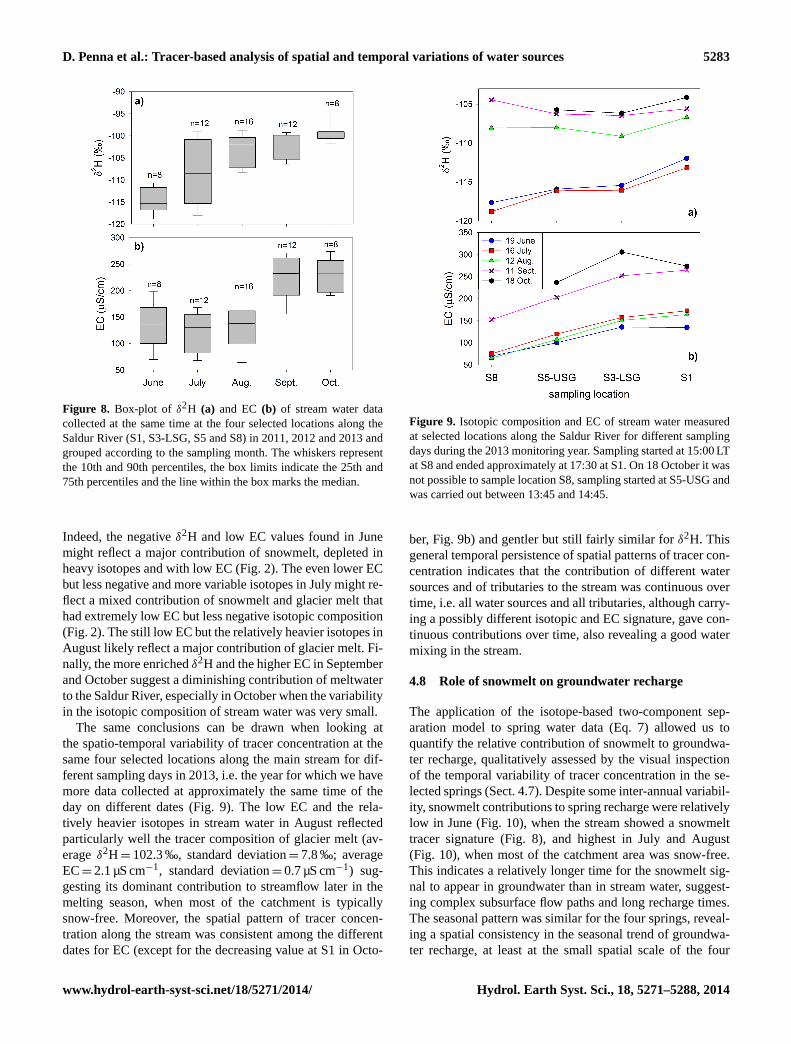
Figure 8 shows a box-plot of the stream water isotopic com-
position of four selected sampling locations along the Sal-
dur River (S1, S3-LSG, S5 and S8) for the months June to
October. Stream water was relatively depleted in heavy iso-
topes in June, isotopically heavier and characterized by a
large variability in July and slowly increasingly enriched in
heavy isotopes in August, September and October (Fig. 8a).
Interestingly, EC showed a different pattern, with low val-
ues and similar variability in June, July (slightly lower) and
August and markedly higher distributions in September and
October (Fig. 8a). Although this plot masks the inter-annual
variability of tracer concentration and the number of sam-
ples is limited, the observation of the different dynamics of
the two tracers gives some hints on the seasonal switch of
the most important contributors to runoff of the Saldur River.
Hydrol. Earth Syst. Sci., 18, 5271–5288, 2014 www.hydrol-earth-syst-sci.net/18/5271/2014/
D. Penna et al.: Tracer-based analysis of spatial and temporal variations of water sources 5283
Figure 8. Box-plot of δ2H (a) and EC (b) of stream water data
collected at the same time at the four selected locations along the
Saldur River (S1, S3-LSG, S5 and S8) in 2011, 2012 and 2013 and
grouped according to the sampling month. The whiskers represent
the 10th and 90th percentiles, the box limits indicate the 25th and
75th percentiles and the line within the box marks the median.
Indeed, the negative δ2H and low EC values found in June
might reflect a major contribution of snowmelt, depleted in
heavy isotopes and with low EC (Fig. 2). The even lower EC
but less negative and more variable isotopes in July might re-
flect a mixed contribution of snowmelt and glacier melt that
had extremely low EC but less negative isotopic composition
(Fig. 2). The still low EC but the relatively heavier isotopes in
August likely reflect a major contribution of glacier melt. Fi-
nally, the more enriched δ2H and the higher EC in September
and October suggest a diminishing contribution of meltwater
to the Saldur River, especially in October when the variability
in the isotopic composition of stream water was very small.
The same conclusions can be drawn when looking at
the spatio-temporal variability of tracer concentration at the
same four selected locations along the main stream for dif-
ferent sampling days in 2013, i.e. the year for which we have
more data collected at approximately the same time of the
day on different dates (Fig. 9). The low EC and the rela-
tively heavier isotopes in stream water in August reflected
particularly well the tracer composition of glacier melt (av-
erage δ2H= 102.3 ‰, standard deviation= 7.8 ‰; average
EC= 2.1 µS cm−1, standard deviation= 0.7 µS cm−1) sug-
gesting its dominant contribution to streamflow later in the
melting season, when most of the catchment is typically
snow-free. Moreover, the spatial pattern of tracer concen-
tration along the stream was consistent among the different
dates for EC (except for the decreasing value at S1 in Octo-
Figure 9. Isotopic composition and EC of stream water measured
at selected locations along the Saldur River for different sampling
days during the 2013 monitoring year. Sampling started at 15:00 LT
at S8 and ended approximately at 17:30 at S1. On 18 October it was
not possible to sample location S8, sampling started at S5-USG and
was carried out between 13:45 and 14:45.
ber, Fig. 9b) and gentler but still fairly similar for δ2H. This
general temporal persistence of spatial patterns of tracer con-
centration indicates that the contribution of different water
sources and of tributaries to the stream was continuous over
time, i.e. all water sources and all tributaries, although carry-
ing a possibly different isotopic and EC signature, gave con-
tinuous contributions over time, also revealing a good water
mixing in the stream.
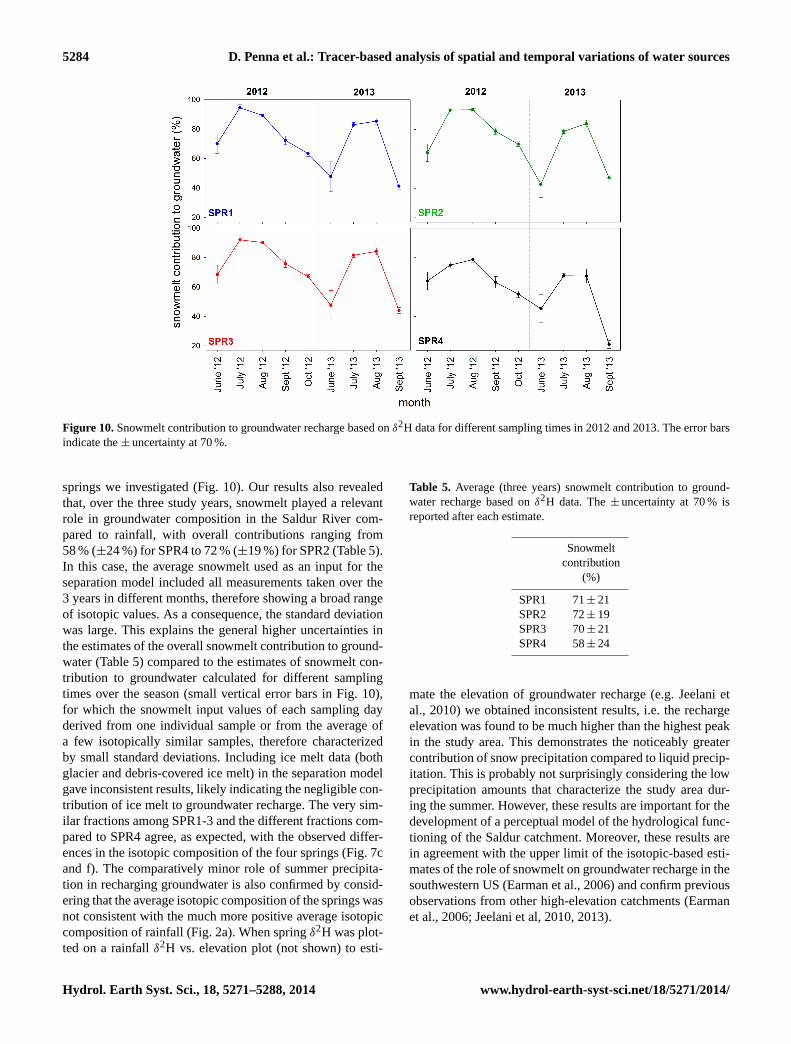
4.8 Role of snowmelt on groundwater recharge
The application of the isotope-based two-component sep-
aration model to spring water data (Eq. 7) allowed us to
quantify the relative contribution of snowmelt to groundwa-
ter recharge, qualitatively assessed by the visual inspection
of the temporal variability of tracer concentration in the se-
lected springs (Sect. 4.7). Despite some inter-annual variabil-
ity, snowmelt contributions to spring recharge were relatively
low in June (Fig. 10), when the stream showed a snowmelt
tracer signature (Fig. 8), and highest in July and August
(Fig. 10), when most of the catchment area was snow-free.
This indicates a relatively longer time for the snowmelt sig-
nal to appear in groundwater than in stream water, suggest-
ing complex subsurface flow paths and long recharge times.
The seasonal pattern was similar for the four springs, reveal-
ing a spatial consistency in the seasonal trend of groundwa-
ter recharge, at least at the small spatial scale of the four
www.hydrol-earth-syst-sci.net/18/5271/2014/ Hydrol. Earth Syst. Sci., 18, 5271–5288, 2014
5284 D. Penna et al.: Tracer-based analysis of spatial and temporal variations of water sources
Figure 10. Snowmelt contribution to groundwater recharge based on δ2H data for different sampling times in 2012 and 2013. The error bars
indicate the ± uncertainty at 70 %.
springs we investigated (Fig. 10). Our results also revealed
that, over the three study years, snowmelt played a relevant
role in groundwater composition in the Saldur River com-
pared to rainfall, with overall contributions ranging from
58 % (±24 %) for SPR4 to 72 % (±19 %) for SPR2 (Table 5).
In this case, the average snowmelt used as an input for the
separation model included all measurements taken over the
3 years in different months, therefore showing a broad range
of isotopic values. As a consequence, the standard deviation
was large. This explains the general higher uncertainties in
the estimates of the overall snowmelt contribution to ground-
water (Table 5) compared to the estimates of snowmelt con-
tribution to groundwater calculated for different sampling
times over the season (small vertical error bars in Fig. 10),
for which the snowmelt input values of each sampling day
derived from one individual sample or from the average of
a few isotopically similar samples, therefore characterized
by small standard deviations. Including ice melt data (both
glacier and debris-covered ice melt) in the separation model
gave inconsistent results, likely indicating the negligible con-
tribution of ice melt to groundwater recharge. The very sim-
ilar fractions among SPR1-3 and the different fractions com-
pared to SPR4 agree, as expected, with the observed differ-
ences in the isotopic composition of the four springs (Fig. 7c
and f). The comparatively minor role of summer precipita-
tion in recharging groundwater is also confirmed by consid-
ering that the average isotopic composition of the springs was
not consistent with the much more positive average isotopic
composition of rainfall (Fig. 2a). When spring δ2H was plot-
ted on a rainfall δ2H vs. elevation plot (not shown) to esti-
Table 5. Average (three years) snowmelt contribution to ground-
water recharge based on δ2H data. The ± uncertainty at 70 % is
reported after each estimate.
Snowmelt
contribution
(%)
SPR1 71± 21
SPR2 72± 19
SPR3 70± 21
SPR4 58± 24
mate the elevation of groundwater recharge (e.g. Jeelani et
al., 2010) we obtained inconsistent results, i.e. the recharge
elevation was found to be much higher than the highest peak
in the study area. This demonstrates the noticeably greater
contribution of snow precipitation compared to liquid precip-
itation. This is probably not surprisingly considering the low
precipitation amounts that characterize the study area dur-
ing the summer. However, these results are important for the
development of a perceptual model of the hydrological func-
tioning of the Saldur catchment. Moreover, these results are
in agreement with the upper limit of the isotopic-based esti-
mates of the role of snowmelt on groundwater recharge in the
southwestern US (Earman et al., 2006) and confirm previous
observations from other high-elevation catchments (Earman
et al., 2006; Jeelani et al, 2010, 2013).
Hydrol. Earth Syst. Sci., 18, 5271–5288, 2014 www.hydrol-earth-syst-sci.net/18/5271/2014/

D. Penna et al.: Tracer-based analysis of spatial and temporal variations of water sources 5285
5 Limitations of the research and concluding remarks
Spatially distributed samples of rainfall, snowmelt, ice melt,
groundwater and stream water were collected over 3 years
in the glacierized Saldur catchment in the eastern Italian
Alps and analysed for stable isotopes of water and EC, al-
lowing us to identify the main end-members and to explore
the spatio-temporal variability of water sources. Data collec-
tion in such a high-elevation and complex terrain proved to
be particularly challenging, and some issues arose. For in-
stance, sampling at higher temporal frequency might have al-
lowed us to explore some short-time responses in tracer con-
centration and detect some finer dynamics (e.g. Neal et al.,
2013). Moreover, samples were not always taken at the same
time of the day over the 3 years, preventing us from making
comparisons on a more extended subset of data. More im-
portantly, we were not able to sample permafrost and winter
precipitation beside snowpack (we experienced snowfall col-
lectors failures for two consecutive winters), likely yielding
an incomplete overview of all potential end-members in the
study catchment. Analogously, as mentioned above, the lack
of sampling during rain periods probably provided an under-
estimation of the role played by rain water in the isotopic and
EC composition of stream water.
Despite these limitations, our study corroborated prelimi-
nary observations (Penna et al., 2013) and provided new in-
sights into the isotopic characterization of waters in high-
elevation Alpine basins, allowing us to take advantage of the
enhanced tracer capability derived from the combined use of
EC and stable isotopes of water for identifying end-members.
Particularly, our results shed new light on the main sources
of water contributing to runoff and their spatio-temporal vari-
ability, information that were still missing in glacierized ar-
eas of South-Tyrol and are still very limited for the entire
southern Alps. From a methodological point of view, this
research provided one of the largest isotopic databases in
glacierized catchments that we are aware of, even larger than
some very robust data sets recently published (e.g. Ohlanders
et al., 2013; Chiogna et al., 2014). Furthermore, our study
was the first one, as far as we know, to provide samples of EC
and isotopic composition of actual glacier melt in the Italian
Alps, i.e. meltwater flowing directly on the glacier surface
and not water discharging from the glacier snout (possibly
mixed with groundwater inflows). This allowed a better char-
acterization of the tracer concentration of this end-member.
Finally, the observation periods that spanned 3 years across
various seasons allowed us to identify temporally invariant
behaviours in tracer concentrations as well as to compare
the inter-annual variability of water source dynamics, provid-
ing a broader idea of hydrological behaviours under different
conditions.
In conclusions, the main results are the following:
– Rainfall samples delineated a LMWL remarkably simi-
lar to the GMWL, suggesting a predominantly oceanic
origin of air masses in the study area. In addition to
the seasonal effect, a clear altitude effect was observed
for rainfall samples, with an isotopic depletion rate of
−1.6 ‰ for δ2H and −0.23 ‰ for δ18O per 100 m rise
in elevation.
– A marked variability in EC and isotopic composition
of all sampled waters was evident, indicating a highly
complex signature of water within the catchment. The
combined signature provided by the two tracers yielded
a clear distinction between input sources to the system,
allowing us to identify snowmelt and glacier melt as the
main end-members for stream water and groundwater,
with a secondary role played by rainfall.
– The temporal dynamics of tracer concentrations and,
particularly, the different dynamics of EC with respect
to δ2H revealed a change in the main water source to
the Saldur River runoff over the season, with snowmelt
being the major contributor to streamflow during the
first and central part of the melting period (June, July),
whereas later in the summer, when most of the snow dis-
appeared from the catchment, glacier melt contributed
significantly. Despite such dynamics being well known
in high-elevation catchments, their clear detection based
on tracers is remarkable from a methodological perspec-
tive.
– The contribution of snowmelt to groundwater recharge,
quantified by using an isotope-based two-component
separation model, generally decreased during the sea-
son, varying between 93 % (±1 %) in August and
21 % (±3 %) in September. The overall contribution of
snowmelt to groundwater over the 3 years ranged be-
tween 58 % (±24 %) and 72 % (±19 %), revealing the
marked importance of snowmelt for subsurface water
storage in the Saldur catchment.
Acknowledgements. This work was financially supported by the
research projects “Effects of climate change on high-altitude
ecosystems: monitoring the Upper Match Valley” (Foundation of
the Free University of Bozen-Bolzano) and “EMERGE: Retreating
glaciers and emerging ecosystems in the Southern Alps” (Dr. Erich-
Ritter- und Dr. Herzog-Sellenberg-Stiftung im Stifterverband für
die Deutsche Wissenschaft). Technical support was provided by
the Dept. of Hydraulic Engineering and Hydrographic Office of the
Autonomous Province of Bozen-Bolzano. The project “HydroAlp”,
financed by Autonomous Province of Bozen-Bolzano, partly
supported the work of G. Bertoldi. G. Niedrist of EURAC is
thanked for his work in maintaining the meteorological stations.
Giulia Zuecco (University of Padova) is warmly thanked for the
laser spectroscopy isotopic analysis. We thank Enrico Buzzi and
www.hydrol-earth-syst-sci.net/18/5271/2014/ Hydrol. Earth Syst. Sci., 18, 5271–5288, 2014
5286 D. Penna et al.: Tracer-based analysis of spatial and temporal variations of water sources
Raffaele Foffa for support in field work. The first author is grateful
to H. J. van Meerveld (University of Zurich) for helping and
discussions during a field trip, and to James W. Kirchner (ETH,
Zurich) for discussions on the preliminary results. Two anonymous
reviewers are thanked for their constructive comments.
Edited by: F. Tian
References
Araguás-Araguás, L., Froehlich, K., and Rozanski, K.: Deu-
terium and oxygen-18 isotope composition of precipitation
and atmospheric moisture, Hydrol. Process., 14, 1341–
1355, doi:10.1002/1099-1085(20000615)14:8<1341::AID-
HYP983>3.0.CO;2-Z, 2000.
Bertoldi, G., Della Chiesa, S., Notarnicola, C., Pasolli, L., Niedrist,
G., and Tappeiner, U.: Estimation of soil moisture patterns in
mountain grasslands by means of SAR RADARSAT 2 im-
ages and hydrological modelling, J. Hydrol., 516, 245–257,
doi:10.1016/j.jhydrol.2014.02.018, 2014.
Boeckli, L., Brenning, A., Gruber, S., and Noetzli, J.: A statistical
approach to modelling permafrost distribution in the European
Alps or similar mountain ranges, The Cryosphere, 6, 125–140,
doi:10.5194/tc-6-125-2012, 2012.
Brugnara, Y., Brunetti, M., Maugeri, M., Nanni, T., and Simolo,
C.: High-resolution analysis of daily precipitation trends in the
central Alps over the last century, Int. J. Climatol., 32, 1406–
1422, doi:10.1002/joc.2363, 2012.
Cable, J., Ogle, K., and Williams, D.: Contribution of glacier melt-
water to streamflow in the Wind River Range, Wyoming, inferred
via a Bayesian mixing model applied to isotopic measurements,
Hydrol. Process., 25, 2228–2236, doi:10.1002/hyp.7982, 2011.
Chiogna, G., Santoni, E., Camin, F., Tonon, A., Majone, B.,
Trenti, A., and Bellin, A.: Stable isotope characterization
of the Vermigliana catchment, J. Hydrol., 509, 295–305,
doi:10.1016/j.jhydrol.2013.11.052, 2014.
Craig, R.: Isotopic variations in meteoric waters, Science, 133,
1702–1703, 1961.
Cui, J., An, S., Wang, Z., Fang, C., Liu, Y., and Yang, H.: Us-
ing deuterium excess to determine the sources of high-altitude
precipitation?: Implications in hydrological relations between
sub-alpine forests and alpine meadows, J. Hydrol., 373, 24–33,
doi:10.1016/j.jhydrol.2009.04.005, 2009.
Dahlke, H., Lyon, S., and Jansson, P.: Isotopic investigation of
runoff generation in a glacierized catchment in northern Sweden,
Hydrol. Process., 28, 1035–1050, doi:10.1002/hyp.9668, 2013.
Dalai, T. K., Bhattacharya, S. K., and Krishnaswami, S.: Stable iso-
topes in the source waters of the Yamuna and its tributaries: sea-
sonal and altitudinal variations and relation to major cations, Hy-
drol. Process., 16, 3345–3364, doi:10.1002/hyp.1104, 2002.
Dansgaard, W.: Stable isotopes in precipitation, Tellus, 16, 436–
468, 1964.
Della Chiesa, S., Bertoldi, G., Niedrist, G., Obojes, N., Endrizzi, S.,
Albertson, J. D., Wohlfahrt, G., Hörtnagl, L., and Tappeiner, U.:
Modelling changes in grassland hydrological cycling along an
elevational gradient in the Alps, Ecohydrology, 7, 1453–1473,
doi:10.1002/eco.1471, 2014.
Dietermann, N. and Weiler, M.: Spatial distribution of stable water
isotopes in alpine snow cover, Hydrol. Earth Syst. Sci., 17, 2657–
2668, doi:10.5194/hess-17-2657-2013, 2013.
Earman, S. and Campbell, A.: Isotopic exchange between snow and
atmospheric water vapor: Estimation of the snowmelt component
of groundwater recharge in the southwestern United States, J.
Geophys., 111, 1–18, doi:10.1029/2005JD006470, 2006.
Earman, S., Campbell, A. R., Phillips, F. M., and Newman, B.
D.: Isotopic exchange between snow and atmospheric water
vapor: Estimation of the snowmelt component of groundwater
recharge in the southwestern United States, J. Geophys. Res.,
111, D09302, doi:10.1029/2005JD006470, 2006.
Galos, S. and Kaser, G.: The Mass Balance of Matscher-
ferner 2012/13, project report, University of Innsbruck, Inns-
bruck, 2014.
Gat, J. R. and Carmi, I.: Evolution of the isotopic composition of
atmospheric waters in the Mediterranean Sea area, J. Geophys.
Res., 75, 3039–3048, 1970.
Genereux, D.: Quantifying uncertainty in tracer-based hy-
drograph separations, Water Resour. Res., 34, 915–919,
doi:10.1029/98WR00010, 1998.
Gonfiantini, R., Roche, M., and Olivry, J.: The altitude effect on the
isotopic composition of tropical rains, Chem. Geol., 181, 147–
167, doi:10.1016/S0009-2541(01)00279-0, 2001.
Gooseff, M. N., Lyons, W., McKnight, D. M., Vaughn, B. H., Foun-
tain, A. G., and Dowling, C.: A stable isotopic investigation of
a polar desert hydrologic system, McMurdo dry valleys, Antarc-
tica, Arct. Antarct. Alp. Res., 38, 60–71, 2006.
Grah, O. and Beaulieu, J.: The effect of climate change on glacier
ablation and baseflow support in the Nooksack River basin and
implications on Pacific salmonid species protection and recovery,
Climatic Change, 120, 657–670, doi:10.1007/s10584-013-0747-
y, 2013.
Hughes, C. E. and Crawford, J.: Spatial and temporal variation in
precipitation isotopes in the Sydney Basin, Australia, J. Hydrol.,
489, 42–55, doi:10.1016/j.jhydrol.2013.02.036, 2013.
Jeelani, G., Bhat, N. A., and Shivanna, K.: Use of δ18O tracer to
identify stream and spring origins of a mountainous catchment:
A case study from Liddar watershed, Western Himalaya, India,
J. Hydrol., 393, 257–264, doi:10.1016/j.jhydrol.2010.08.021,
2010.
Jeelani, G., Kumar, U. S., and Kumar, B.: Variation of δ18O
and δD in precipitation and stream waters across the Kash-
mir Himalaya (India) to distinguish and estimate the sea-
sonal sources of stream flow, J. Hydrol., 481, 157–165,
doi:10.1016/j.jhydrol.2012.12.035, 2013.
Jost, G., Moore, R. D., Menounos, B., and Wheate, R.: Quantify-
ing the contribution of glacier runoff to streamflow in the up-
per Columbia River Basin, Canada, Hydrol. Earth Syst. Sci., 16,
849–860, doi:10.5194/hess-16-849-2012, 2012.
Kääb, A., Chiarle, M., Raup, B., and Schneider, C.: Climate change
impacts on mountain glaciers and permafrost, Global Planet.
Change, 56, vii–ix, doi:10.1016/j.gloplacha.2006.07.008, 2007.
Knoll, C.: A glacier inventory for South Tyrol, Italy, based on air-
borne laser-scanner data, Ann. Glaciol., 50, 46–52, 2010.
Koboltschnig, G. R. and Schöner, W.: The relevance of glacier melt
in the water cycle of the Alps: the example of Austria, Hy-
drol. Earth Syst. Sci., 15, 2039–2048, doi:10.5194/hess-15-2039-
2011, 2011.
Hydrol. Earth Syst. Sci., 18, 5271–5288, 2014 www.hydrol-earth-syst-sci.net/18/5271/2014/
D. Penna et al.: Tracer-based analysis of spatial and temporal variations of water sources 5287
Kriegel, D., Mayer, C., Hagg, W., Vorogushyn, S., Duethmann, D.,
Gafurov, A., and Farinotti, D.: Changes in glacierisation, cli-
mate and runoff in the second half of the 20th century in the
Naryn basin, Central Asia, Global Planet. Change, 110, 51–61,
doi:10.1016/j.gloplacha.2013.05.014, 2013.
Kumar, U. S., Kumar, B., Rai, S. P., and Sharma, S.: Stable isotope
ratios in precipitation and their relationship with meteorological
conditions in the Kumaon Himalayas, India, J. Hydrol., 391, 1–8,
doi:10.1016/j.jhydrol.2010.06.019, 2010.
Lambs, L.: Correlation of conductivity and stable isotope δ18O for
the assessment of water origin in river system, Chem. Geol., 164,
161–170, 2000.
Lee, J., Feng, X., Faiia, A. M., Posmentier, E. S., Kirchner,
J. W., Osterhuber, R., and Taylor, S.: Isotopic evolution of
a seasonal snowcover and its melt by isotopic exchange be-
tween liquid water and ice, Chem. Geol., 270, 126–134,
doi:10.1016/j.chemgeo.2009.11.011, 2010.
Longinelli, A. and Selmo, E.: Isotopic composition of precipitation
in Italy: a first overall map, J. Hydrol., 270, 75–88, 2003.
Longinelli, A., Anglesio, E., and Flora, O.: Isotopic com-
position of precipitation in Northern Italy: reverse effect
of anomalous climatic events, J. Hydrol., 329, 471–476,
doi:10.1016/j.jhydrol.2006.03.002, 2006.
Longinelli, A., Stenni, B., Genoni, L., Flora, O., Defrancesco, C.,
and Pellegrini, G.: A stable isotope study of the Garda lake,
northern Italy: Its hydrological balance, J. Hydrol., 360, 103–
116, 2008.
Longinelli, A., Stenni, B., and Genoni, L.: A stable isotope study of
the Garda Lake, northern Italy: Its hydrological balance, J. Hy-
drol., 360, 103–116, doi:10.1016/j.jhydrol.2008.07.020, 2008.
Machavaram, M. and Whittemore, D.: Precipitation induced stream
flow: An event based chemical and isotopic study of a small
stream in the Great Plains region of the USA, J. Hydrol., 470–
480, doi:10.1016/j.jhydrol.2006.04.004, 2006.
Machavaram, M. V., Whittemore, D. O., Conrad, M. E., and
Miller, N. L.: Precipitation induced stream flow: An event
based chemical and isotopic study of a small stream in the
Great Plains region of the USA, J. Hydrol., 330, 470–480,
doi:10.1016/j.jhydrol.2006.04.004, 2006.
Mair, E., Bertoldi, G., Leitinger, G., Della Chiesa, S., Niedrist, G.,
and Tappeiner, U.: ESOLIP – estimate of solid and liquid pre-
cipitation at sub-daily time resolution by combining snow height
and rain gauge measurements, Hydrol. Earth Syst. Sci. Discuss.,
10, 8683–8714, doi:10.5194/hessd-10-8683-2013, 2013.
Mao, L., Dell’Agnese, A., Huincache, C., Penna, D., Engel,
M., Niedrist, G., and Comiti, F.: Bedload hysteresis in a
glacier-fed mountain river: bedload hysteresis in a glacier-
fed mountain river, Earth Surf. Proc. Land., 39, 964–976,
doi:10.1002/esp.3563, 2014.
Maurya, A. S., Shah, M., Deshpande, R. D., Bhardwaj, R. M.,
Prasad, A., and Gupta, S. K.: Hydrograph separation and pre-
cipitation source identification using stable water isotopes and
conductivity: River Ganga at Himalayan foothills, Hydrol. Pro-
cess., 25, 1521–1530, doi:10.1002/hyp.7912, 2011.
Meriano, M., Howard, K. W. F., and Eyles, N.: The role of midsum-
mer urban aquifer recharge in stormflow generation using iso-
topic and chemical hydrograph separation techniques, J. Hydrol.,
396, 82–93, doi:10.1016/j.jhydrol.2010.10.041, 2011.
Milner, A., Brown, L., and Hannah, D.: Hydroecological response
of river systems to shrinking glaciers, Hydrol. Process., 77, 62–
77, doi:10.1002/hyp.7197, 2009.
Molini, A., Katul, G. G., and Porporato, A.: Maximum discharge
from snowmelt in a changing climate, Geophys. Res. Lett., 38,
1–5, doi:10.1029/2010GL046477, 2011.
Neal, C., Reynolds, B., Kirchner, J. W., Rowland, P., Norris, D.,
Sleep, D., Lawlor, A., Woods, C., Thacker, S., Guyatt, H., Vin-
cent, C., Lehto, K., Grant, S., Williams, J., Neal, M., Wickham,
H., Harman, S., and Armstrong, L.: High-frequency precipitation
and stream water quality time series from Plynlimon, Wales: an
openly accessible data resource spanning the periodic table, Hy-
drol. Process., 27, 2531–2539, doi:10.1002/hyp.9814, 2013.
Notarnicola, C., Duguay, M., Moelg, N., Schellenberger, T., Tet-
zlaff, A., Monsorno, R., Costa, A., Steurer, C., and Zebisch,
M.: Snow Cover Maps from MODIS Images at 250 m Resolu-
tion, Part 1: Algorithm Description, Remote Sensing, 5, 110–
126, 2013.
Ohlanders, N., Rodriguez, M., and McPhee, J.: Stable water iso-
tope variation in a Central Andean watershed dominated by
glacier and snowmelt, Hydrol. Earth Syst. Sci., 17, 1035–1050,
doi:10.5194/hess-17-1035-2013, 2013.
Pasolli, L., Notarnicola, C., Bertoldi, G., Della Chiesa, S., Niedrist,
G., Bruzzone, L., Tappeiner, U., and Zebisch, M.: Soil moisture
monitoring in mountain areas by using high resolution SAR im-
ages: results from a feasibility study, Eur. J. Soil Sci., 65, 852–
864, doi:10.1111/ejss.12189, 2014.
Pearce, A. J., Stewart, M. K., and Sklash, M. G.: Storm runoff gen-
eration in humid headwater catchments, 1, where does the water
come from?, Water Resour. Res., 22, 1263–1271, 1986.
Pellerin, B. and Wollheim, W.: The application of electrical conduc-
tivity as a tracer for hydrograph separation in urban catchments,
Hydrol. Process., 22, 1810–1818, doi:10.1002/hyp.6786, 2008.
Pellerin, B. A., Wollheim, W. M., Feng, X., and Vörösmarty, C.
J.: The application of electrical conductivity as a tracer for hy-
drograph separation in urban catchments, Hydrol. Process., 22,
1810–1818, doi:10.1002/hyp.6786, 2008.
Peng, H., Mayer, B., Harris, S., and Krouse, H. R.: A 10-year record
of stable isotope ratios of hydrogen and oxygen in precipitation
at Calgary, Alberta, Canada, Tellus B, 56, 147–159, 2004.
Penna, D., Stenni, B., Šanda, M., Wrede, S., Bogaard, T. A., Gobbi,
A., Borga, M., Fischer, B. M. C., Bonazza, M., and Chárová,
Z.: On the reproducibility and repeatability of laser absorption
spectroscopy measurements for δ2H and δ18O isotopic analysis,
Hydrol. Earth Syst. Sci., 14, 1551–1566, doi:10.5194/hess-14-
1551-2010, 2010.
Penna, D., Mao, L., Comiti, F., Engel, M., Dell’Agnese, A., and
Bertoldi, G.: Hydrological effects of glacier melt and snowmelt
in a high-elevation catchment, Bodenkultur, 64, 93–98, 2013.
Penna, D., Stenni, B., Šanda, M., Wrede, S., Bogaard, T. A., Miche-
lini, M., Fischer, B. M. C., Gobbi, A., Mantese, N., Zuecco,
G., Borga, M., Bonazza, M., Sobotková, M., Cejková, B., and
Wassenaar, L. I.: Technical Note: Evaluation of between-sample
memory effects in the analysis of δ2H and δ18O of water sam-
ples measured by laser spectroscopes, Hydrol. Earth Syst. Sci.,
16, 3925–3933, doi:10.5194/hess-16-3925-2012, 2012.
www.hydrol-earth-syst-sci.net/18/5271/2014/ Hydrol. Earth Syst. Sci., 18, 5271–5288, 2014
5288 D. Penna et al.: Tracer-based analysis of spatial and temporal variations of water sources
Poage, M. A. and Chamberlain, C. P.: Empirical relationships be-
tween elevation and the stable isotope composition of precipita-
tion and surface waters: considerations for studies of paleoeleva-
tion change, Am. J. Sci., 301, 1–15, 2001.
Racoviteanu, A. E., Armstrong, R., and Williams, M. W.: Evalua-
tion of an ice ablation model to estimate the contribution of melt-
ing glacier ice to annual discharge in the Nepal Himalaya: glacial
contributions to annual streamflow in Nepal Himalaya, Water Re-
sour. Res., 49, 5117–5133, doi:10.1002/wrcr.20370, 2013.
Shanley, J. and Kendall, C.: Controls on old and new water contribu-
tions to stream flow at some nested catchments in Vermont, USA,
Hydrol. Process., 16, 589–609, doi:10.1002/hyp.312, 2002.
Shanley, J. B., Kendall, C., Smith, T. E., Wolock, D. M., and Mc-
Donnell, J. J.: Controls on old and new water contributions to
stream flow at some nested catchments in Vermont, USA, Hy-
drol. Process., 16, 589–609, doi:10.1002/hyp.312, 2002.
Stewart, I.: Changes in snowpack and snowmelt runoff
for key mountain regions, Hydrol. Process., 94, 78–94,
doi:10.1002/hyp.7128, 2009.
Taylor, S., Feng, X., Kirchner, J. W., Osterhuber, R., Klaue,
B., and Renshaw, C. E.: Isotopic evolution of a seasonal
snowpack and its melt. Water Resour. Res., 37, 759–769,
doi:10.1029/2000WR900341, 2001.
Uhlmann, B.: Modelling runoff in a Swiss glacierized catchment
– Part II: daily discharge and glacier evolution in the Findelen
basin, Int. J. Climatol., 33, 1301–1307, doi:10.1002/joc.3516,
2013.
Uhlmann, B., Jordan, F., and Beniston, M.: Modelling runoff in a
Swiss glacierized catchment – Part II: daily discharge and glacier
evolution in the Findelen basin in a progressively warmer cli-
mate, Int. J. Climatol., 33, 1301–1307, doi:10.1002/joc.3516,
2013.
Wassenaar, L. I., Athanasopoulos, P., and Hendry, M. J.: Isotope hy-
drology of precipitation, surface and ground waters in the Okana-
gan Valley , British Columbia, Canada, J. Hydrol., 411, 37–48,
doi:10.1016/j.jhydrol.2011.09.032, 2011.
Windhorst, D., Waltz, T., Timbe, E., Frede, H.-G., and Breuer, L.:
Impact of elevation and weather patterns on the isotopic compo-
sition of precipitation in a tropical montane rainforest, Hydrol.
Earth Syst. Sci., 17, 409–419, doi:10.5194/hess-17-409-2013,
2013.
Yang, Y., Xiao, H., Wei, Y., Zhao, L., Zou, S., Yang, Q., and
Yin, Z.: Hydrological processes in the different landscape zones
of alpine cold regions in the wet season, combining isotopic
and hydrochemical tracers, Hydrol. Process., 26, 1457–1466,
doi:10.1002/hyp.8275, 2012.
Yde, J. C. and Tvis Knudsen, N.: The importance of oxygen isotope
provenance in relation to solute content of bulk meltwaters at
Imersuaq Glacier, West Greenland, Hydrol. Process., 18, 125–
139, doi:10.1002/hyp.1317, 2004.
Zabaleta, A. and Antigüedad, I.: Streamflow response of a small
forested catchment on different timescales, Hydrol. Earth Syst.
Sci., 17, 211–223, doi:10.5194/hess-17-211-2013, 2013.
Zhang, Y. H., Song, X. F., and Wu, Y. Q.: Use of oxygen-18 iso-
tope to quantify flows in the upriver and middle reaches of the
Heihe River, Northwestern China, Environ. Geol., 58, 645–653,
doi:10.1007/s00254-008-1539-y, 2009.
Zhou, S., Wang, Z., and Joswiak, D. R.: From precipitation to
runoff: stable isotopic fractionation effect of glacier melting
on a catchment scale: catchment-scale isotopic fractionation
effect of glacier melting, Hydrol. Process., 28, 3341–3349,
doi:10.1002/hyp.9911, 2014.
Hydrol. Earth Syst. Sci., 18, 5271–5288, 2014 www.hydrol-earth-syst-sci.net/18/5271/2014/
Top Related
Copyright © 2022 FDOKUMEN

