
A tracer-based assessment of hydrological pathways at different spatial scales in a mesoscale...
19
HYDROLOGICAL PROCESSES Hydrol. Process. 17, 759–777 (2003) Published online 2 December 2002 in Wiley InterScience (www.interscience.wiley.com). DOI: 10.1002/hyp.1163 A tracer-based assessment of hydrological pathways at different spatial scales in a mesoscale Scottish catchment C. Soulsby, 1 * P. Rodgers, 1 R. Smart, 2 J. Dawson 3 and S. Dunn 4 1 Department of Geography and Environment, University of Aberdeen, Aberdeen AB24 3UF, UK 2 Department of Environment, University of York, York YO10 5DD, UK 3 Department of Plant and Soil Science, University of Aberdeen, Aberdeen AB24 3UU, UK 4 Macaulay Institute, Craigiebuckler, Aberdeen AB15 8QH, UK Abstract: Geochemically based hydrograph separation techniques were used in a preliminary assessment to infer how runoff processes change with landscape characteristics and spatial scale (1–233 km 2 ) within a mesoscale catchment in upland Scotland. A two-component end-member mixing analysis (EMMA) used Gran alkalinity as an assumed conservative tracer. Analysis indicated that, at all scales investigated, acidic overland flow and shallow subsurface storm flows from the peaty soils covering the catchment headwaters dominated storm runoff generation. The estimated groundwater contribution to annual runoff varied from 30% in the smallest (ca 1 km 2 ) peat-dominated headwater catchment with limited groundwater storage, to >60% in larger catchments (>30 km 2 ) with greater coverage of more freely draining soils and more extensive aquifers in alluvium and other drift. This simple approach offers a useful, integrated conceptualization of the hydrological functioning in a mesoscale catchment, which can be tested and further refined by focused modelling and process-based research. However, even as it stands, the simple conceptualization of system behaviour will have significant utility as a tool for communicating hydrological issues in a range of planning and management decisions. Copyright 2002 John Wiley & Sons, Ltd. KEY WORDS hydrology; runoff processes; flow paths; EMMA; catchment; Scotland INTRODUCTION Recent years have seen a gradual change of emphasis in hydrology as environmental management requires that hydrological understanding gained at the small (<10 km 2 ) experimental catchment scale is applied to solving a range of problems that are manifest at the larger (>100 km 2 ) mesoscale (Falkenmark, 1990; Naiman et al., 1995; Law, 2001). This alignment of scientific research to scales commensurate with environmental planning and management represents a significant challenge to hydrologists, as heterogeneity in catchment characteristics, non-linearities in catchment behaviour, and the scale issue often limits the extrapolations that can be made from traditional reductionist approaches to process understanding (Beven, 2001a; Healy, 2001; Naiman et al., 2001). Consequently, there is a need to develop tools and approaches that are integrative and hierarchical, yet allow the internal functioning and behaviour of catchment systems to be investigated (Kendall and McDonnell, 1998; Beven, 2001b). Moreover, interests in catchment functioning are no longer restricted to traditional hydrological routing issues, such as flood generation or low-flow assessments (Gleick, 1993). The increasingly interdisciplinary nature of catchment science dictates that the hydrological influences on water quality and stream ecosystems need to be understood if catchments are to be managed to meet human needs and maintain ecological integrity in a sustainable manner (He et al., 2000; WCD, 2000; Ward and Tockner, 2001). * Correspondence to: C. Soulsby, Department of Geography and Environment, University of Aberdeen, Elphonstone Road, Aberdeen AB24 3UF, UK. E-mail: [email protected] Received 11 February 2002 Copyright 2002 John Wiley & Sons, Ltd. Accepted 16 May 2002
-
Upload
independent -
Category
Documents
-
view
6 -
download
0
Transcript of A tracer-based assessment of hydrological pathways at different spatial scales in a mesoscale...
HYDROLOGICAL PROCESSESHydrol. Process. 17, 759–777 (2003)Published online 2 December 2002 in Wiley InterScience (www.interscience.wiley.com). DOI: 10.1002/hyp.1163
A tracer-based assessment of hydrological pathways atdifferent spatial scales in a mesoscale Scottish catchment
C. Soulsby,1* P. Rodgers,1 R. Smart,2 J. Dawson3 and S. Dunn4
1 Department of Geography and Environment, University of Aberdeen, Aberdeen AB24 3UF, UK2 Department of Environment, University of York, York YO10 5DD, UK
3 Department of Plant and Soil Science, University of Aberdeen, Aberdeen AB24 3UU, UK4 Macaulay Institute, Craigiebuckler, Aberdeen AB15 8QH, UK
Abstract:
Geochemically based hydrograph separation techniques were used in a preliminary assessment to infer how runoffprocesses change with landscape characteristics and spatial scale (1–233 km2) within a mesoscale catchment in uplandScotland. A two-component end-member mixing analysis (EMMA) used Gran alkalinity as an assumed conservativetracer. Analysis indicated that, at all scales investigated, acidic overland flow and shallow subsurface storm flows fromthe peaty soils covering the catchment headwaters dominated storm runoff generation. The estimated groundwatercontribution to annual runoff varied from 30% in the smallest (ca 1 km2) peat-dominated headwater catchmentwith limited groundwater storage, to >60% in larger catchments (>30 km2) with greater coverage of more freelydraining soils and more extensive aquifers in alluvium and other drift. This simple approach offers a useful, integratedconceptualization of the hydrological functioning in a mesoscale catchment, which can be tested and further refinedby focused modelling and process-based research. However, even as it stands, the simple conceptualization of systembehaviour will have significant utility as a tool for communicating hydrological issues in a range of planning andmanagement decisions. Copyright 2002 John Wiley & Sons, Ltd.
KEY WORDS hydrology; runoff processes; flow paths; EMMA; catchment; Scotland
INTRODUCTION
Recent years have seen a gradual change of emphasis in hydrology as environmental management requiresthat hydrological understanding gained at the small (<10 km2) experimental catchment scale is applied tosolving a range of problems that are manifest at the larger (>100 km2) mesoscale (Falkenmark, 1990; Naimanet al., 1995; Law, 2001). This alignment of scientific research to scales commensurate with environmentalplanning and management represents a significant challenge to hydrologists, as heterogeneity in catchmentcharacteristics, non-linearities in catchment behaviour, and the scale issue often limits the extrapolations thatcan be made from traditional reductionist approaches to process understanding (Beven, 2001a; Healy, 2001;Naiman et al., 2001). Consequently, there is a need to develop tools and approaches that are integrativeand hierarchical, yet allow the internal functioning and behaviour of catchment systems to be investigated(Kendall and McDonnell, 1998; Beven, 2001b). Moreover, interests in catchment functioning are no longerrestricted to traditional hydrological routing issues, such as flood generation or low-flow assessments (Gleick,1993). The increasingly interdisciplinary nature of catchment science dictates that the hydrological influenceson water quality and stream ecosystems need to be understood if catchments are to be managed to meethuman needs and maintain ecological integrity in a sustainable manner (He et al., 2000; WCD, 2000; Wardand Tockner, 2001).
* Correspondence to: C. Soulsby, Department of Geography and Environment, University of Aberdeen, Elphonstone Road, AberdeenAB24 3UF, UK. E-mail: [email protected]
Received 11 February 2002Copyright 2002 John Wiley & Sons, Ltd. Accepted 16 May 2002
760 C. SOULSBY ET AL.
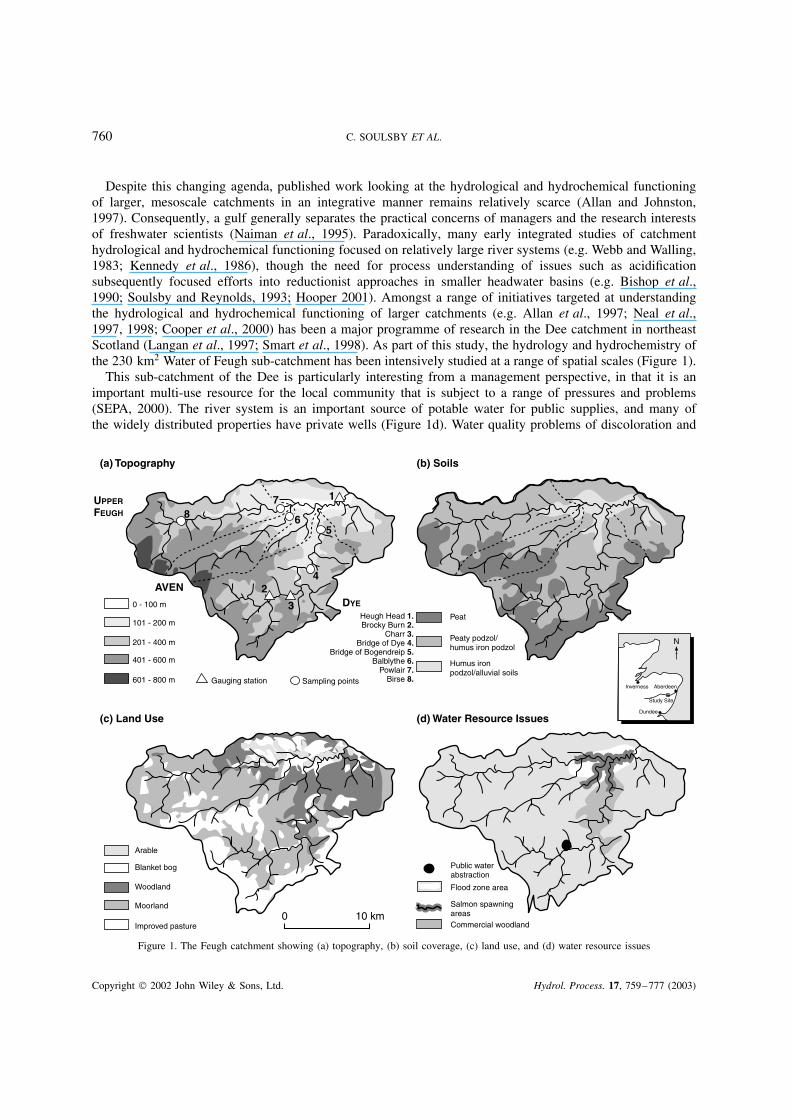
Despite this changing agenda, published work looking at the hydrological and hydrochemical functioningof larger, mesoscale catchments in an integrative manner remains relatively scarce (Allan and Johnston,1997). Consequently, a gulf generally separates the practical concerns of managers and the research interestsof freshwater scientists (Naiman et al., 1995). Paradoxically, many early integrated studies of catchmenthydrological and hydrochemical functioning focused on relatively large river systems (e.g. Webb and Walling,1983; Kennedy et al., 1986), though the need for process understanding of issues such as acidificationsubsequently focused efforts into reductionist approaches in smaller headwater basins (e.g. Bishop et al.,1990; Soulsby and Reynolds, 1993; Hooper 2001). Amongst a range of initiatives targeted at understandingthe hydrological and hydrochemical functioning of larger catchments (e.g. Allan et al., 1997; Neal et al.,1997, 1998; Cooper et al., 2000) has been a major programme of research in the Dee catchment in northeastScotland (Langan et al., 1997; Smart et al., 1998). As part of this study, the hydrology and hydrochemistry ofthe 230 km2 Water of Feugh sub-catchment has been intensively studied at a range of spatial scales (Figure 1).
This sub-catchment of the Dee is particularly interesting from a management perspective, in that it is animportant multi-use resource for the local community that is subject to a range of pressures and problems(SEPA, 2000). The river system is an important source of potable water for public supplies, and many ofthe widely distributed properties have private wells (Figure 1d). Water quality problems of discoloration and
UPPER
FEUGH
(a) Topography
(c) Land Use
(b) Soils
(d) Water Resource Issues
AVEN
0 - 100 m
101 - 200 m
201 - 400 m
401 - 600 m
601 - 800 m Gauging station Sampling points
Heugh Head 1.Brocky Burn 2.
Bridge of Dye 4.Bridge of Bogendreip 5.
Balblythe 6.Powlair 7.
Birse 8.
Charr 3.
Peat
Peaty podzol/humus iron podzol
Humus ironpodzol/alluvial soils
Arable
Blanket bog
Woodland
Moorland
Improved pasture0 10 km
Public waterabstraction
Flood zone area
Salmon spawningareasCommercial woodland
N
Inverness Aberdeen
Study Site
Dundee
DYE
8 65
4
1
3
2
7
Figure 1. The Feugh catchment showing (a) topography, (b) soil coverage, (c) land use, and (d) water resource issues
Copyright 2002 John Wiley & Sons, Ltd. Hydrol. Process. 17, 759–777 (2003)
TRACER-BASED ASSESSMENT OF HYDROLOGICAL PATHWAYS 761
microbiological pollution are common, particularly the former at direct public supply abstractions (Gidney,2001). The lower river has a significant flood problem that inundates agricultural land and blocks transportroutes. A significant salmonid fishery utilizes the river for spawning and juvenile habitat, but there is concernthat acidification and sediment fluxes from commercial forestry may be compromising the fishery (Wade et al.,2001). In many instances these problems are manifest at specific locations, and decisions regarding resourceallocation in management responses are often based on piecemeal and fragmented approaches (SEPA, 2000).These usually lack a catchment context and fail to appreciate how the overall hydrological functioning of thecatchment system underpins many of these problems (see Bellman, 2000). Despite this, such understandingis fundamental to the evolution of sustainable management strategies, and there is growing general awarenessthat environmental scientists need to be more proactive in communicating their knowledge to managers, policymakers, and the wider public (Lubchenco, 1998).
In this paper, the signatures of geochemical tracers are used to examine the varying sources of stream flowin the Feugh catchment at different spatial scales over the hydrological year. The approach is based uponthe relatively simple technique of end-member mixing analysis (EMMA) in order to identify hydrologicalsource areas dominating runoff at different flows (Hooper et al., 1990; Genereux, 1998). The paper has threemain aims: (a) to examine the spatial variability in storm flow and baseflow chemistry within the mesoscaleFeugh catchment; (b) to use this information to identify how the relative importance of hydrological flowpaths varies with scale as consideration moves from the headwater (ca 1 km2) to the whole catchment; and(c) assess the utility of such understanding for management purposes. The paper uses relatively simple dataanalysis techniques, but the methods are underpinned by insights from a series of detailed process studiesundertaken at smaller scales, either within the same catchment (e.g. Reid et al., 1981; Billett and Cresser,1992; Hope, 1995; Aitkenhead et al., 1999; Dawson et al., 2001) or in proximal locations in the Scottishhighlands (e.g. Soulsby et al., 1998, 2000; Soulsby and Dunn, 2003).
STUDY AREA: THE WATER OF FEUGH CATCHMENT
The Water of Feugh drains a 232Ð8 km2 area in northeast Scotland (Figure 1). The catchment is predominantlyupland in character, and the altitude ranges from 70 to 776 m. The climate is cool and wet, with an estimatedmean annual precipitation of 1130 mm, which mainly falls as rain (Table I), though snow does occur duringthe winter months and significant snow pack accumulation can occur in cold years (Soulsby et al., 1997). Thecatchment is mainly (ca 85%) underlain by granite, though the southern edge of the catchment boundary inthe Water of Dye subcatchment is underlain by metamorphic rocks (mainly pelites and schists) (Table I).
The catchment is composed of three main sub-basins: the Water of Dye, the Aven, and the upper Feugh.The sub-basins have different glacial histories (Bremner, 1912) and, therefore, contrasting characteristics,particularly in relation to topography, drift cover, and soil distribution (Figure 1b). The southerly Water ofDye sub-basin comprises an extensive upland plateau with widespread coverage of peat. Even on valley slopesincised into the plateau, peaty podzols predominate. Freely draining humus iron podzols only become morecommon on steeper hillslopes in the lower catchment where the main river valleys become more entrenched.In contrast, the valley of the northerly upper Feugh is less incised, with smaller areas of peat-covered plateau(Figure 1b). The more extensive coverage of steeper hillslopes dictates larger distribution of more freelydraining humus iron podzols. Between these two sub-basins, the Water of Aven has a much more lineardrainage (Figure 1), with an extensive blanket bog in the upper catchment, which drains into a very steeplyincised lower area. Soil coverage changes to freely draining podzols on the more steeply incised slopes.
Downstream of the confluence of the three sub-basins, freely draining podzolic alluvial soils predominate,which have formed on a range of fluvio-glacial and floodplain deposits. Such drift deposits are generallycomposed of freely draining sands and gravels (MacMillan and Aiken, 1981). All three sub-basins exhibitevidence of post-glacial modification by melt waters. The Water of Aven, for example, is largely devoidof drift deposits, presumably due to meltwater erosion. In both the lower parts of the Water of Dye and,
Copyright 2002 John Wiley & Sons, Ltd. Hydrol. Process. 17, 759–777 (2003)
762 C. SOULSBY ET AL.
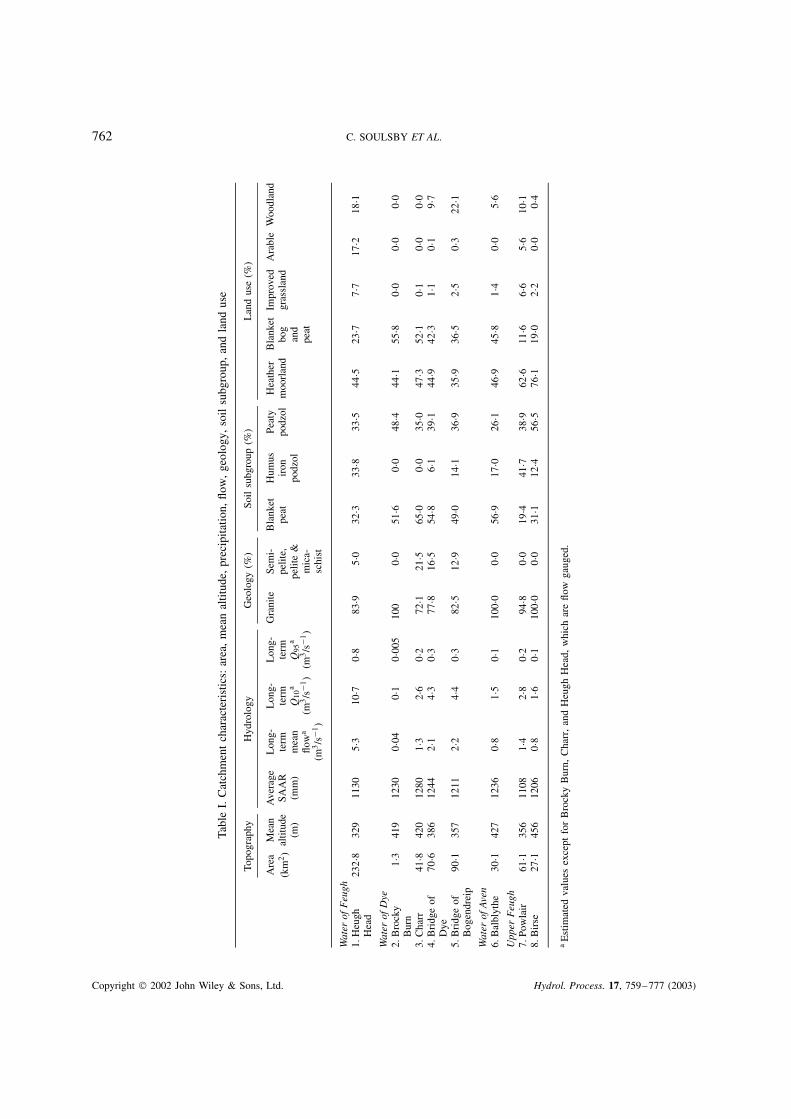
Tabl
eI.
Cat
chm
ent
char
acte
rist
ics:
area
,m
ean
altit
ude,
prec
ipita
tion,
flow
,ge
olog
y,so
ilsu
bgro
up,
and
land
use
Topo
grap
hyH
ydro
logy
Geo
logy
(%)
Soil
subg
roup
(%)
Lan
dus
e(%
)
Are
a(k
m2)
Mea
nal
titud
e(m
)
Ave
rage
SAA
R(m
m)
Lon
g-te
rmm
ean
flow
a
(m3/s
�1)
Lon
g-te
rmQ
10a
(m3/s
�1)
Lon
g-te
rmQ
95a
(m3/s
�1)
Gra
nite
Sem
i-pe
lite,
pelit
e&
mic
a-sc
hist
Bla
nket
peat
Hum
usir
onpo
dzol
Peat
ypo
dzol
Hea
ther
moo
rlan
dB
lank
etbo
gan
dpe
at
Impr
oved
gras
slan
dA
rabl
eW
oodl
and
Wat
erof
Feu
gh1.
Heu
ghH
ead
232Ð8
329
1130
5Ð310
Ð70Ð8
83Ð9
5Ð032
Ð333
Ð833
Ð544
Ð523
Ð77Ð7
17Ð2
18Ð1
Wat
erof
Dye
2.B
rock
yB
urn
1Ð341
912
300Ð0
40Ð1
0Ð005
100
0Ð051
Ð60Ð0
48Ð4
44Ð1
55Ð8
0Ð00Ð0
0Ð0
3.C
harr
41Ð8
420
1280
1Ð32Ð6
0Ð272
Ð121
Ð565
Ð00Ð0
35Ð0
47Ð3
52Ð1
0Ð10Ð0
0Ð04.
Bri
dge
ofD
ye70
Ð638
612
442Ð1
4Ð30Ð3
77Ð8
16Ð5
54Ð8
6Ð139
Ð144
Ð942
Ð31Ð1
0Ð19Ð7
5.B
ridg
eof
Bog
endr
eip
90Ð1
357
1211
2Ð24Ð4
0Ð382
Ð512
Ð949
Ð014
Ð136
Ð935
Ð936
Ð52Ð5
0Ð322
Ð1
Wat
erof
Ave
n6.
Bal
blyt
he30
Ð142
712
360Ð8
1Ð50Ð1
100Ð0
0Ð056
Ð917
Ð026
Ð146
Ð945
Ð81Ð4
0Ð05Ð6
Upp
erF
eugh
7.Po
wla
ir61
Ð135
611
081Ð4
2Ð80Ð2
94Ð8
0Ð019
Ð441
Ð738
Ð962
Ð611
Ð66Ð6
5Ð610
Ð18.
Bir
se27
Ð145
612
060Ð8
1Ð60Ð1
100Ð0
0Ð031
Ð112
Ð456
Ð576
Ð119
Ð02Ð2
0Ð00Ð4
aE
stim
ated
valu
esex
cept
for
Bro
cky
Bur
n,C
harr
,an
dH
eugh
Hea
d,w
hich
are
flow
gaug
ed.
Copyright 2002 John Wiley & Sons, Ltd. Hydrol. Process. 17, 759–777 (2003)
TRACER-BASED ASSESSMENT OF HYDROLOGICAL PATHWAYS 763
particularly, the upper Feugh sub-catchments, the lower hillslopes are covered by a range of drift depositsand the main river valleys have alluvial flood plains and gravel-dominated channels, though in many placesthe bedrock is intermittently exposed.
Given the topography and soil coverage in the catchment, land use is largely restricted to grouse (Lagopuslagopus) and deer (Cervus elaphus) shooting on heather moorland in the upper reaches of all three sub-basins.The moorlands are managed by regular burning to retain the mosaic of habitats required by grouse. The longhistory of burning may have contributed to peat erosion, as the peat is extensively ‘hagged’ in many places(Thompson et al., 2001). This dictates that a high density of ephemeral drainage channels covers the peat,connecting it to the perennial stream channel network. In all three sub-basins, agriculture occupies the betterfloodplain soils, though this mainly comprises livestock grazing (Figure 1c). The more extensive coverage offreely draining soils in the upper Feugh sub-basin and the lower catchment below the tributary confluences isthe main area where arable farming occurs (Table I). Some of the valley hillslopes are forest covered, mostnotably in the lower valleys of the Water of Dye and upper Feugh. In the former case, the forestry is mainlycommercial woodlands, whilst in the latter, semi-natural forests of Scots Pine (Pinus sylvestris) predominate.
The major water resource issues in the watershed include the flood risk area in the lower catchment, thepublic water supply abstraction in the Water of Dye, the main salmon spawning areas, and main area ofcommercial forestry (Figure 1). These have been identified in a catchment management plan for the RiverDee (SEPA, 2000), and strategies for sustainable management objectives are being pursued in a number ofcommunity-based rural development initiatives (BCT, 2000).
DATA SOURCES
Between 1996 and 1997, an extensive hydrochemical sampling programme involved the establishment of eightmonitoring sites in the catchment (Figure 1). The location of these was largely dictated by ease of access, but,in addition to sampling the catchment outfall at Heugh head, included points on the lower Dye, Aven, andupper Feugh at Bogendreip, Balblythe, and Powlair respectively. In addition, sampling points on the upper Dyeat Bridge of Dye and Charr Flume were included, as was Brocky Burn, a 1Ð3 km2 headwater stream, assumedto be characteristic of the peat-dominated upper catchment. Unfortunately, the upper Aven is inaccessible, buta sampling point on the upper Feugh at Birse was included in the study. As detailed by Smart et al. (1998),samples were analysed for pH, Gran alkalinity, major cations, major anions, and total organic carbon (TOC),which was measured in the supernatant solution of settled samples and thus approximates dissolved organiccarbon (DOC). Of particular importance was the determination of Gran alkalinity by acidimetric titration inthe pH ranges 4Ð5–4 and 4–3. This gives approximations of the bicarbonate and organic acid contributions toalkalinity respectively. As described by Wade et al. (1999), Gran alkalinity gives a directly measurable closeapproximation to the chemically conservative parameter acid neutralizing capacity (ANC), which to a firstapproximation can be used as an assumed conservative tracer (Neal, 2001). Strictly, ANC also depends onaluminium and DOC concentrations (Neal et al., 1999), but in the Feugh the aluminium concentrations aregenerally very low (Stutter et al., 2001) and, given the titration to pH 3, the Gran alkalinity and the chargebalance ANC are strongly and linearly correlated within the pH range observed in stream waters.
Stream flow in the catchment was measured at Heugh Head and Charr flume. These sites are part ofthe UK national hydrometric network and are monitored by the Scottish Environment Protection Agency(SEPA). Further flow records were collected from Brocky Burn, where a flume and pressure transducer wereestablished by the University of Aberdeen (Dawson, 1999). This gave accurate flow records for 233 km2,42 km2, and 1Ð3 km2 for the Feugh, Charr, and Brocky Burn respectively. Resources were not available formeasuring flows at other sites, but, as part of a hydrological modelling study for the whole Dee basin, Wade(1999) found that mean daily flows could be predicted to š7% by extrapolating from measured flow data atCharr (for Bridge of Dye, Bogendreip, Balblythe, and Birse) and Heugh Head (for Powlair) and adjusting foraltitudinal influences on precipitation.
Copyright 2002 John Wiley & Sons, Ltd. Hydrol. Process. 17, 759–777 (2003)
764 C. SOULSBY ET AL.
(a)
(b)
0.00
0.05
0.10
0.15
0.20
0.25
0.30
0.35
0.40
01/10/96 01/12/96 01/02/97 01/04/97 01/06/97 01/08/97
Mea
n sp
ecifi
c di
scha
rge
(m3 s
-1/k
m2 )
Brocky Burn Charr Heugh Head
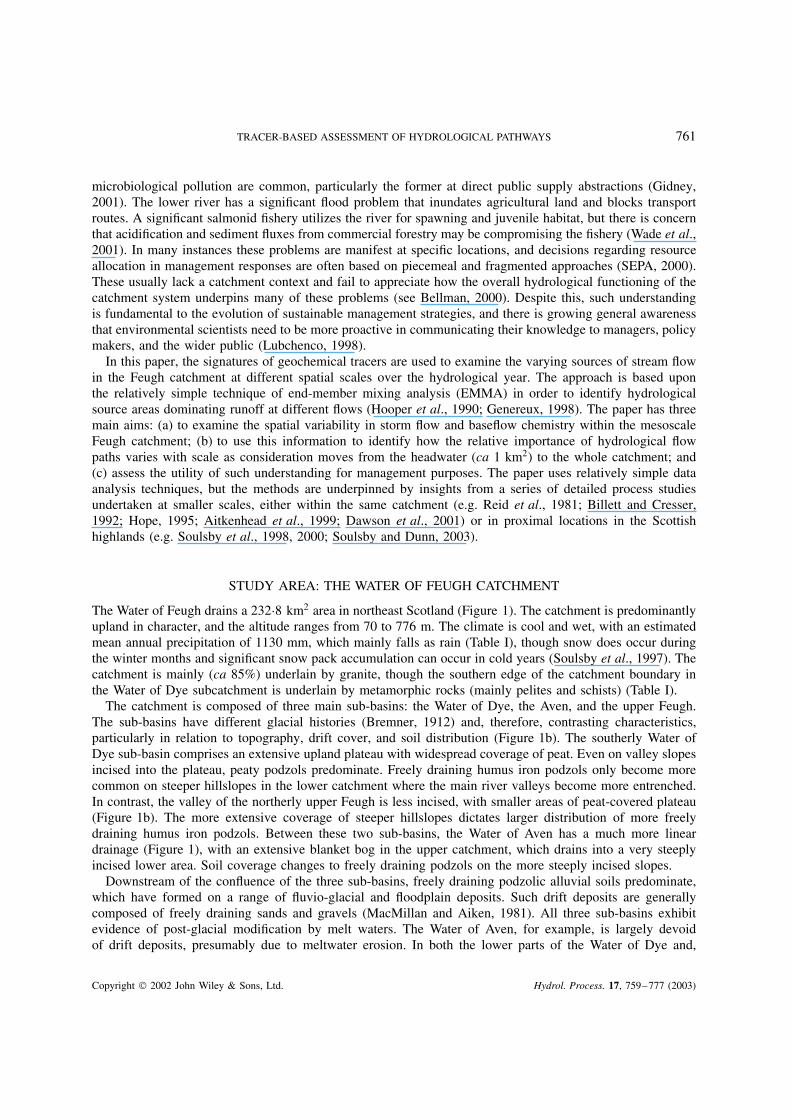
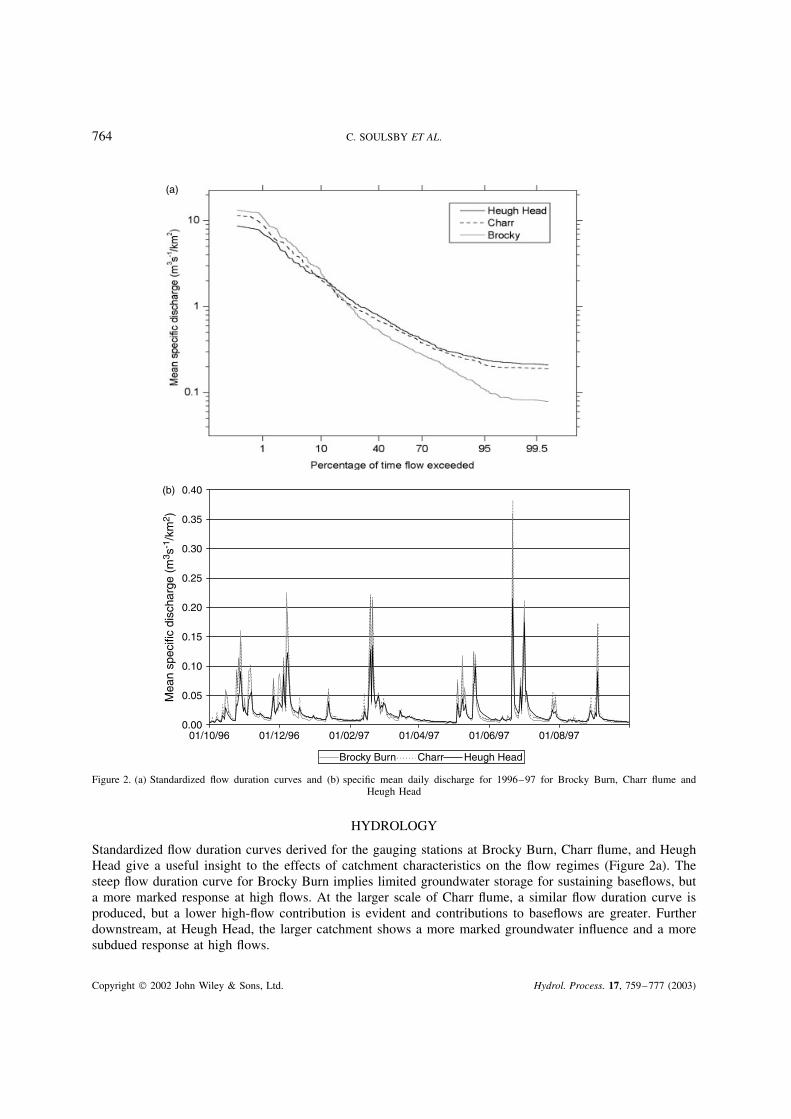
Figure 2. (a) Standardized flow duration curves and (b) specific mean daily discharge for 1996–97 for Brocky Burn, Charr flume andHeugh Head
HYDROLOGY
Standardized flow duration curves derived for the gauging stations at Brocky Burn, Charr flume, and HeughHead give a useful insight to the effects of catchment characteristics on the flow regimes (Figure 2a). Thesteep flow duration curve for Brocky Burn implies limited groundwater storage for sustaining baseflows, buta more marked response at high flows. At the larger scale of Charr flume, a similar flow duration curve isproduced, but a lower high-flow contribution is evident and contributions to baseflows are greater. Furtherdownstream, at Heugh Head, the larger catchment shows a more marked groundwater influence and a moresubdued response at high flows.
Copyright 2002 John Wiley & Sons, Ltd. Hydrol. Process. 17, 759–777 (2003)
TRACER-BASED ASSESSMENT OF HYDROLOGICAL PATHWAYS 765
The same variation is evident when mean daily flows at the three scales are compared in terms of specificdischarge time series (Figure 2b). The dominance of the upper catchment in producing hydrograph peaks isapparent in the time series for Brocky and Charr. However, at both of these sites the hydrograph recession isextremely steep compared with Heugh Head, which has a more gradual and sustained recession to baseflows,implying greater groundwater storage. There appears to be some seasonality in the behaviour of the recessioncurves for Charr. In the summer, recessions are steeper, like Brocky, whereas in winter they are more graduallike Heugh Head, possibly indicating a seasonally replenished groundwater store, most probably in alluvialaquifers in the valley bottom.
This changing hydrological behaviour with scale is not surprising, and it is generally consistent withcatchment characteristics and processes anticipated from other process studies. The blanket peats, whichcover 51Ð6% and 65% of the Brocky and Charr catchments respectively, clearly dominate the storm response,generating storm runoff by saturation overland flow (Reid et al., 1981; Dawson et al., 2001; Soulsby and Dunn,2003). As the soil coverage and topography of these two streams are representative of much of the headwatersof the Feugh system as a whole, the effects propagate downstream to Heugh Head. However, increasingcoverage of more freely draining alluvial gravels and humus iron podzols on extensive drifts, together withthe declining gradient in the lower catchment, dictate lower specific yields during storm events, but facilitatea larger, more slowly responding storage that can control the hydrograph recession and sustain baseflows.
HYDROCHEMISTRY
Spatial variation
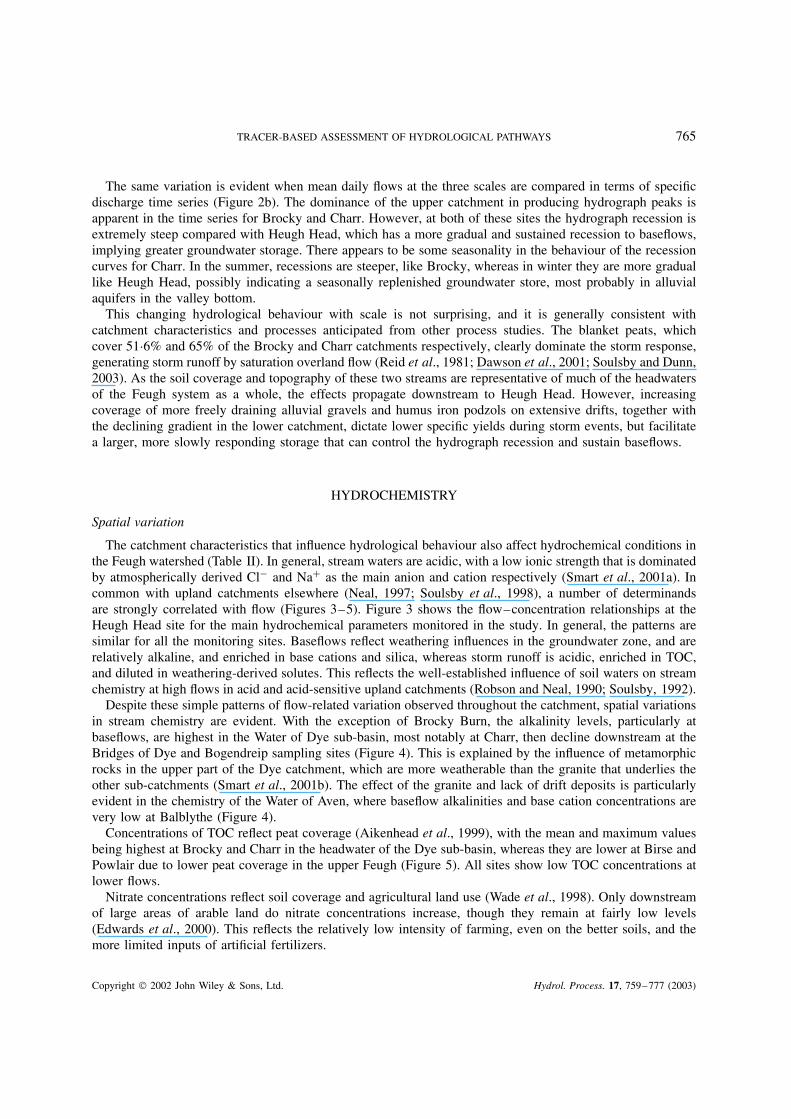
The catchment characteristics that influence hydrological behaviour also affect hydrochemical conditions inthe Feugh watershed (Table II). In general, stream waters are acidic, with a low ionic strength that is dominatedby atmospherically derived Cl� and NaC as the main anion and cation respectively (Smart et al., 2001a). Incommon with upland catchments elsewhere (Neal, 1997; Soulsby et al., 1998), a number of determinandsare strongly correlated with flow (Figures 3–5). Figure 3 shows the flow–concentration relationships at theHeugh Head site for the main hydrochemical parameters monitored in the study. In general, the patterns aresimilar for all the monitoring sites. Baseflows reflect weathering influences in the groundwater zone, and arerelatively alkaline, and enriched in base cations and silica, whereas storm runoff is acidic, enriched in TOC,and diluted in weathering-derived solutes. This reflects the well-established influence of soil waters on streamchemistry at high flows in acid and acid-sensitive upland catchments (Robson and Neal, 1990; Soulsby, 1992).
Despite these simple patterns of flow-related variation observed throughout the catchment, spatial variationsin stream chemistry are evident. With the exception of Brocky Burn, the alkalinity levels, particularly atbaseflows, are highest in the Water of Dye sub-basin, most notably at Charr, then decline downstream at theBridges of Dye and Bogendreip sampling sites (Figure 4). This is explained by the influence of metamorphicrocks in the upper part of the Dye catchment, which are more weatherable than the granite that underlies theother sub-catchments (Smart et al., 2001b). The effect of the granite and lack of drift deposits is particularlyevident in the chemistry of the Water of Aven, where baseflow alkalinities and base cation concentrations arevery low at Balblythe (Figure 4).
Concentrations of TOC reflect peat coverage (Aikenhead et al., 1999), with the mean and maximum valuesbeing highest at Brocky and Charr in the headwater of the Dye sub-basin, whereas they are lower at Birse andPowlair due to lower peat coverage in the upper Feugh (Figure 5). All sites show low TOC concentrations atlower flows.
Nitrate concentrations reflect soil coverage and agricultural land use (Wade et al., 1998). Only downstreamof large areas of arable land do nitrate concentrations increase, though they remain at fairly low levels(Edwards et al., 2000). This reflects the relatively low intensity of farming, even on the better soils, and themore limited inputs of artificial fertilizers.
Copyright 2002 John Wiley & Sons, Ltd. Hydrol. Process. 17, 759–777 (2003)

766 C. SOULSBY ET AL.
Tabl
eII
.M
ean
conc
entr
atio
nan
dra
nge
ofm
ajor
chem
ical
dete
rmin
ands
inth
eFe
ugh
Gra
nal
kali
nity
pHC
once
ntra
tion
(mg
l�1)
(µeq
l�1)
TO
CC
a2CM
g2CSi
O2
Cl�
NaC
SO2� 4
NO
� 3
Wat
erof
Feu
gh1.
Heu
ghH
ead
Mea
n14
1Ð26Ð6
65Ð9
13Ð9
91Ð2
08Ð2
910
Ð246Ð6
96Ð6
10Ð6
5R
ange
28Ð4–
242Ð1
5Ð48
–7Ð4
82Ð0
8–
17Ð61
2Ð61
–5Ð7
10Ð7
8–
1Ð78
4Ð46
–11
Ð798Ð1
4–
11Ð23
4Ð37
–8Ð0
15Ð2
0–
7Ð55
0Ð31
–1Ð2
3
Wat
erof
Dye
2.B
rock
yB
urn
Mea
n74
Ð05Ð9
912
Ð172Ð0
30Ð7
07Ð8
27Ð4
35Ð2
23Ð6
40Ð0
5R
ange
�44Ð7
–18
8Ð14Ð2
4–
6Ð87
5Ð60
–31
Ð051Ð0
4–
3Ð41
0Ð44
–1Ð0
02Ð9
9–
11Ð86
4Ð99
–8Ð7
22Ð7
1–
6Ð32
2Ð30
–5Ð1
0<
0Ð0–
0Ð21
3.C
harr
Mea
n19
6Ð96Ð8
37Ð5
03Ð3
81Ð0
98Ð8
27Ð1
05Ð5
74Ð5
50Ð1
1R
ange
9Ð8–
380Ð3
4Ð77
–7Ð9
62Ð4
1–
29Ð77
1Ð83
–5Ð5
90Ð6
2–
1Ð66
4Ð24
–12
Ð885Ð7
5–
8Ð29
3Ð16
–6Ð7
53Ð3
0–
5Ð77
<0Ð0
–0Ð3
5
4.B
ridg
eof
Dye
Mea
n14
5Ð96Ð6
87Ð5
52Ð9
81Ð0
78Ð4
58Ð4
76Ð0
85Ð0
90Ð1
4
Ran
ge8Ð4
–30
3Ð24Ð8
4–
7Ð74
2Ð85
–19
Ð731Ð8
2–
4Ð98
0Ð61
–1Ð6
04Ð9
2–
12Ð57
6Ð64
–9Ð6
93Ð4
7–
7Ð39
3Ð53
–6Ð1
4<
0Ð0–
0Ð42
5.B
ridg
eof
Bog
endr
eip
Mea
n12
6Ð36Ð6
27Ð7
93Ð0
31Ð1
08Ð4
99Ð3
16Ð5
25Ð7
90Ð2
6
Ran
ge12
Ð9–26
0Ð74Ð8
5–
7Ð76
2Ð91
–19
Ð311Ð7
4–
4Ð48
0Ð74
–1Ð6
75Ð1
0–
12Ð57
7Ð42
–10
Ð484Ð0
7–
7Ð52
4Ð09
–8Ð7
1<
0Ð0–
0Ð51
Wat
erof
Ave
n6.
Bal
blyt
heM
ean
47Ð2
6Ð32
4Ð87
1Ð59
0Ð70
8Ð61
7Ð10
5Ð29
5Ð21
0Ð16
Ran
ge�6
Ð9–99
Ð74Ð6
0–
7Ð28
1Ð86
–15
Ð461Ð1
8–
2Ð97
0Ð42
–0Ð9
54Ð5
8–
12Ð25
5Ð64
–8Ð1
93Ð1
6–
6Ð29
3Ð73
–6Ð1
1<
0Ð0–
0Ð50
Upp
erF
eugh
7.Po
wla
irM
ean
154Ð4
6Ð82
3Ð24
4Ð20
1Ð09
8Ð70
9Ð05
5Ð91
5Ð99
0Ð62
Ran
ge46
Ð5–23
5Ð16Ð0
4–
7Ð19
1Ð11
–10
Ð262Ð8
9–
5Ð97
0Ð68
–1Ð5
46Ð3
9–
10Ð77
8Ð03
–11
Ð494Ð3
7–
7Ð23
4Ð51
–6Ð9
60Ð3
1–
1Ð00
8.B
irse
Mea
n13
2Ð76Ð9
33Ð3
23Ð1
00Ð7
88Ð4
96Ð6
64Ð8
44Ð8
40Ð1
4R
ange
30Ð4–
218Ð1
5Ð81
–7Ð6
81Ð1
8–
10Ð71
2Ð14
–4Ð3
60Ð5
1–
1Ð47
5Ð64
–10
Ð775Ð7
5–
7Ð88
3Ð32
–6Ð4
13Ð4
0–
5Ð72
<0Ð0
–0Ð3
6
Copyright 2002 John Wiley & Sons, Ltd. Hydrol. Process. 17, 759–777 (2003)
TRACER-BASED ASSESSMENT OF HYDROLOGICAL PATHWAYS 767
050
100150200250300
pH
5.05.56.06.57.07.58.0
2.0
3.0
4.0
5.0
6.0
0.50.70.91.11.31.51.71.9
0
5
10
15
20
5.05.56.06.57.07.58.0
0 10 20 30 0 10 20 30
8.08.59.09.5
10.010.511.011.5
4
5
6
7
8
9
4
6
8
10
12
14
0.00.20.40.60.81.01.21.4
Con
cent
ratio
n
Discharge (m3s-1)
Nitrate (mg l-1)Sulphate (mg l-1)
Chloride (mg l-1)
Calcium (mg l-1) Magnesium (mg l-1)
Sodium (mg l-1)
TOC (mg l-1)
Silica (mg l-1)Gran alkalinity (µeq/l)
Figure 3. Concentration–flow relationships for selected determinands at Heugh Head
Temporal variation
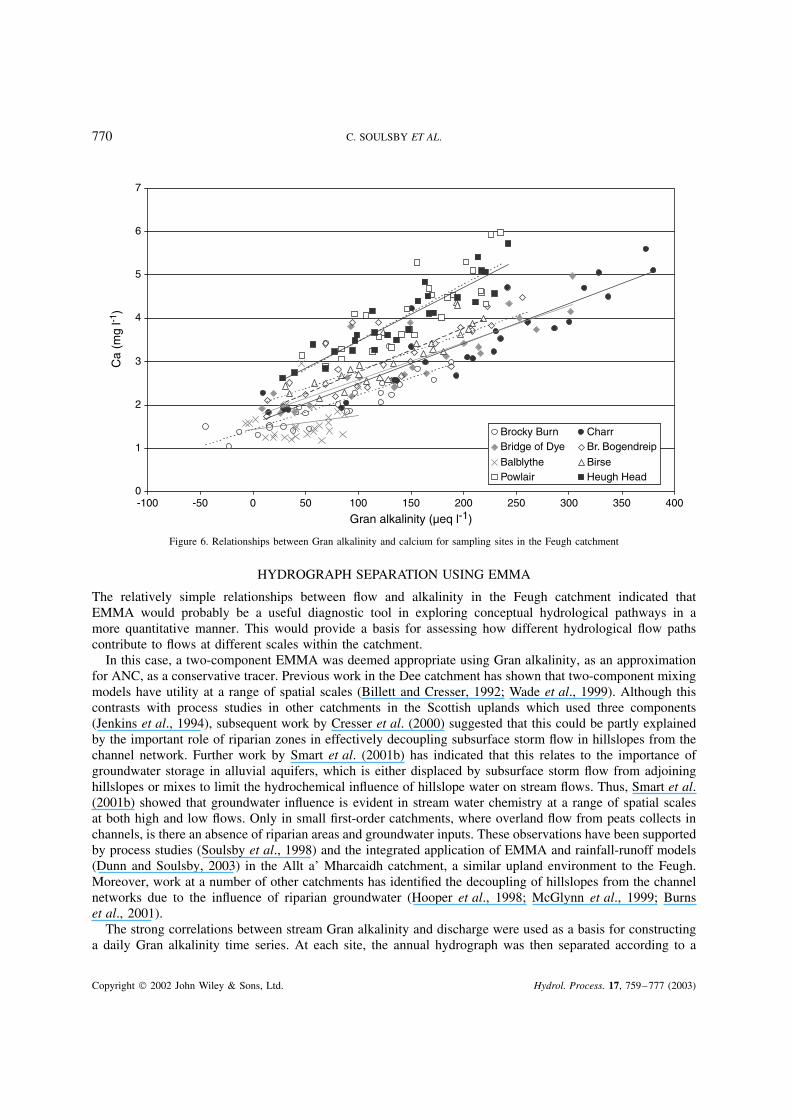
Hydrochemical variations with flow reveal that, despite inter-site variations in baseflow chemistry reflect-ing differences in geology and soil type proportions, storm flow chemistry tends to converge, reflectingthe dominant source area of storm runoff on the peatlands in the catchment headwaters. This is particu-larly evident when two flow-dependent species are plotted together for all of the study sites (Figure 6).Moreover, the shapes of the flow–concentration plots in Figure 4 all reveal roughly linear relationships
Copyright 2002 John Wiley & Sons, Ltd. Hydrol. Process. 17, 759–777 (2003)
768 C. SOULSBY ET AL.
Gra
n al
kalin
ity (
µeq
l-1)
Brocky Burn
-50
0
50
100
150
200
250
0.00 0.10 0.20 0.30
Charr
050
100150200250300350400
0 42 6 8 10
050
100150200250300350
0 4 8 12 160
50
100150
200
250
300
0 5 10 15 20
-200
20406080
100120
0 1 2 3 4 5
Birse
0
50
100
150
200
250
0 2 4 6
Powlair
0
50
100
150
200
250
0 2 4 6 8
Heugh Head
0
50
100
150
200
250
300
0 10 20 30
Discharge (m3s-1)
Balblythe
Bridge of Dye Bridge of Bogendreip
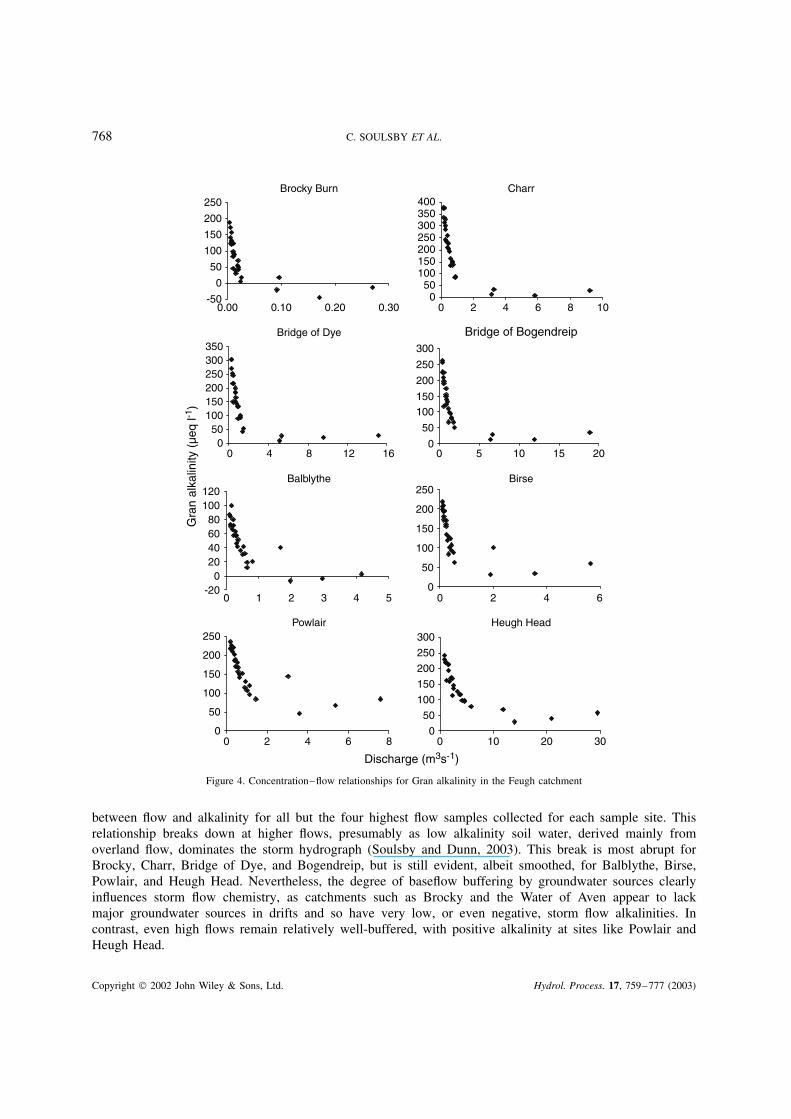
Figure 4. Concentration–flow relationships for Gran alkalinity in the Feugh catchment
between flow and alkalinity for all but the four highest flow samples collected for each sample site. Thisrelationship breaks down at higher flows, presumably as low alkalinity soil water, derived mainly fromoverland flow, dominates the storm hydrograph (Soulsby and Dunn, 2003). This break is most abrupt forBrocky, Charr, Bridge of Dye, and Bogendreip, but is still evident, albeit smoothed, for Balblythe, Birse,Powlair, and Heugh Head. Nevertheless, the degree of baseflow buffering by groundwater sources clearlyinfluences storm flow chemistry, as catchments such as Brocky and the Water of Aven appear to lackmajor groundwater sources in drifts and so have very low, or even negative, storm flow alkalinities. Incontrast, even high flows remain relatively well-buffered, with positive alkalinity at sites like Powlair andHeugh Head.
Copyright 2002 John Wiley & Sons, Ltd. Hydrol. Process. 17, 759–777 (2003)
TRACER-BASED ASSESSMENT OF HYDROLOGICAL PATHWAYS 769
TOC
(m
g l-1
)
Birse
0
2
4
6
8
10
12
0 1 2 3 4 5 6
Balblythe
02468
1012141618
0 1 2 3 4 5
Brocky Burn
5
10
15
20
25
30
35
0.00 0.10 0.20 0.30
Charr
05
101520253035
0 2 4 6 8 10
Bridge of Dye
0
5
10
15
20
25
0 4 8 12 160
5
10
15
20
25
0 5 10 15 20
Powlair
0
2
4
6
8
10
12
0 2 4 6 8
Heugh Head
02468
101214161820
0 10 20 30
Discharge (m3 s-1)
Bridge of Bogendreip
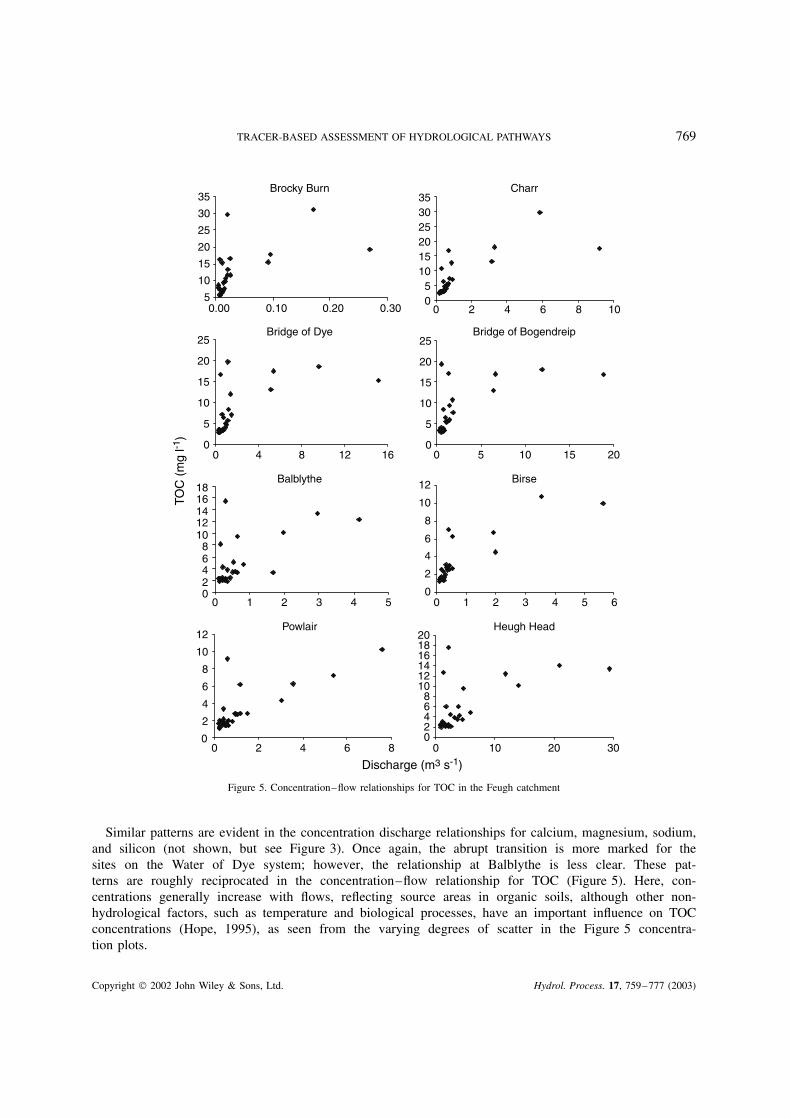
Figure 5. Concentration–flow relationships for TOC in the Feugh catchment
Similar patterns are evident in the concentration discharge relationships for calcium, magnesium, sodium,and silicon (not shown, but see Figure 3). Once again, the abrupt transition is more marked for thesites on the Water of Dye system; however, the relationship at Balblythe is less clear. These pat-terns are roughly reciprocated in the concentration–flow relationship for TOC (Figure 5). Here, con-centrations generally increase with flows, reflecting source areas in organic soils, although other non-hydrological factors, such as temperature and biological processes, have an important influence on TOCconcentrations (Hope, 1995), as seen from the varying degrees of scatter in the Figure 5 concentra-tion plots.
Copyright 2002 John Wiley & Sons, Ltd. Hydrol. Process. 17, 759–777 (2003)
770 C. SOULSBY ET AL.
0
1
2
3
4
5
6
7
-100 -50 0 50 100 150 200 250 300 350 400
Ca
(mg
l-1)
Brocky Burn CharrBridge of Dye Br. Bogendreip
Balblythe BirsePowlair Heugh Head
Gran alkalinity (µeq l-1)
Figure 6. Relationships between Gran alkalinity and calcium for sampling sites in the Feugh catchment
HYDROGRAPH SEPARATION USING EMMA
The relatively simple relationships between flow and alkalinity in the Feugh catchment indicated thatEMMA would probably be a useful diagnostic tool in exploring conceptual hydrological pathways in amore quantitative manner. This would provide a basis for assessing how different hydrological flow pathscontribute to flows at different scales within the catchment.
In this case, a two-component EMMA was deemed appropriate using Gran alkalinity, as an approximationfor ANC, as a conservative tracer. Previous work in the Dee catchment has shown that two-component mixingmodels have utility at a range of spatial scales (Billett and Cresser, 1992; Wade et al., 1999). Although thiscontrasts with process studies in other catchments in the Scottish uplands which used three components(Jenkins et al., 1994), subsequent work by Cresser et al. (2000) suggested that this could be partly explainedby the important role of riparian zones in effectively decoupling subsurface storm flow in hillslopes from thechannel network. Further work by Smart et al. (2001b) has indicated that this relates to the importance ofgroundwater storage in alluvial aquifers, which is either displaced by subsurface storm flow from adjoininghillslopes or mixes to limit the hydrochemical influence of hillslope water on stream flows. Thus, Smart et al.(2001b) showed that groundwater influence is evident in stream water chemistry at a range of spatial scalesat both high and low flows. Only in small first-order catchments, where overland flow from peats collects inchannels, is there an absence of riparian areas and groundwater inputs. These observations have been supportedby process studies (Soulsby et al., 1998) and the integrated application of EMMA and rainfall-runoff models(Dunn and Soulsby, 2003) in the Allt a’ Mharcaidh catchment, a similar upland environment to the Feugh.Moreover, work at a number of other catchments has identified the decoupling of hillslopes from the channelnetworks due to the influence of riparian groundwater (Hooper et al., 1998; McGlynn et al., 1999; Burnset al., 2001).
The strong correlations between stream Gran alkalinity and discharge were used as a basis for constructinga daily Gran alkalinity time series. At each site, the annual hydrograph was then separated according to a
Copyright 2002 John Wiley & Sons, Ltd. Hydrol. Process. 17, 759–777 (2003)
TRACER-BASED ASSESSMENT OF HYDROLOGICAL PATHWAYS 771
classical two-component mixing model:
CtQt D CsQs C CgQg
where Qt is stream flow, Qs and Qg are the contributions of soil water and groundwater respectively, and Cis the concentration of conservative tracer in each component. From this, the groundwater contribution (%g)at any time can be estimated:
%g D 100�Cs � Ct�/�Cs � Cg�
The recorded flows at the three gauging stations and modelled flows at the remaining five were used toreconstruct the stream water time series. Although soil and groundwater samples have been collected in theFeugh catchment, spatial heterogeneity at small scales dictates that surface water samples often give betterintegrated measures of end-member chemistries at the catchment scale (Kendall et al., 1995; Neal, 1997;Wade et al., 1999). Thus, the groundwater end-member Cg was defined as the average Gran alkalinity ofthe three lowest flows recorded at each monitoring point. To define the soil water end member Cs, thechemistry of drainage water from an upland peat bog in the upper part of Brocky Burn was used (Dawson,1999). Bi-weekly sampling over a coinciding 2 year period had collected low-alkalinity storm runoff fromthe peat bog on seven occasions, and the mean (�49 µeq l�1) and standard deviation (18 µeq l�1) were usedto characterize the soil water end member for all the monitoring points. Given the similarity of the peatsoils covering the headwaters of the three main sub-basins within the Feugh catchment, this was deemed areasonable assumption. This has subsequently been confirmed by sampling other first-order streams drainingthe peat. Likewise, since the flows used to define the soil water and groundwater end-member chemistrieswere above and below the respective Q10 and Q95 of mean daily flows, this makes it reasonable to assumethat they are at least characterized to a first approximation. The EMMA hydrograph separation was carriedout for average end-member chemistries and then the soil water end member was varied by one standarddeviation to give some indication of the sensitivity of hydrograph separation to the end-member composition(Foster, 2000). Obviously there is also uncertainty in the groundwater end member as well, though this wasmuch less than for more reactive soil waters (Uhlenbrook and Hoeg, in press).
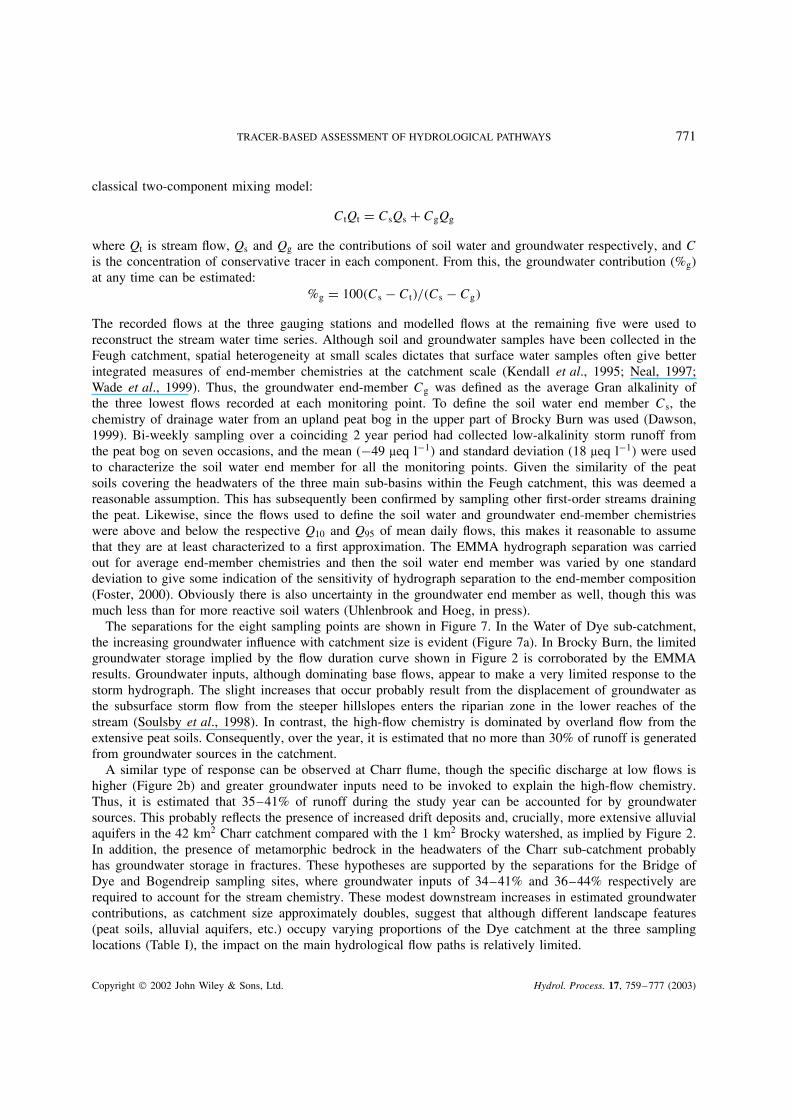
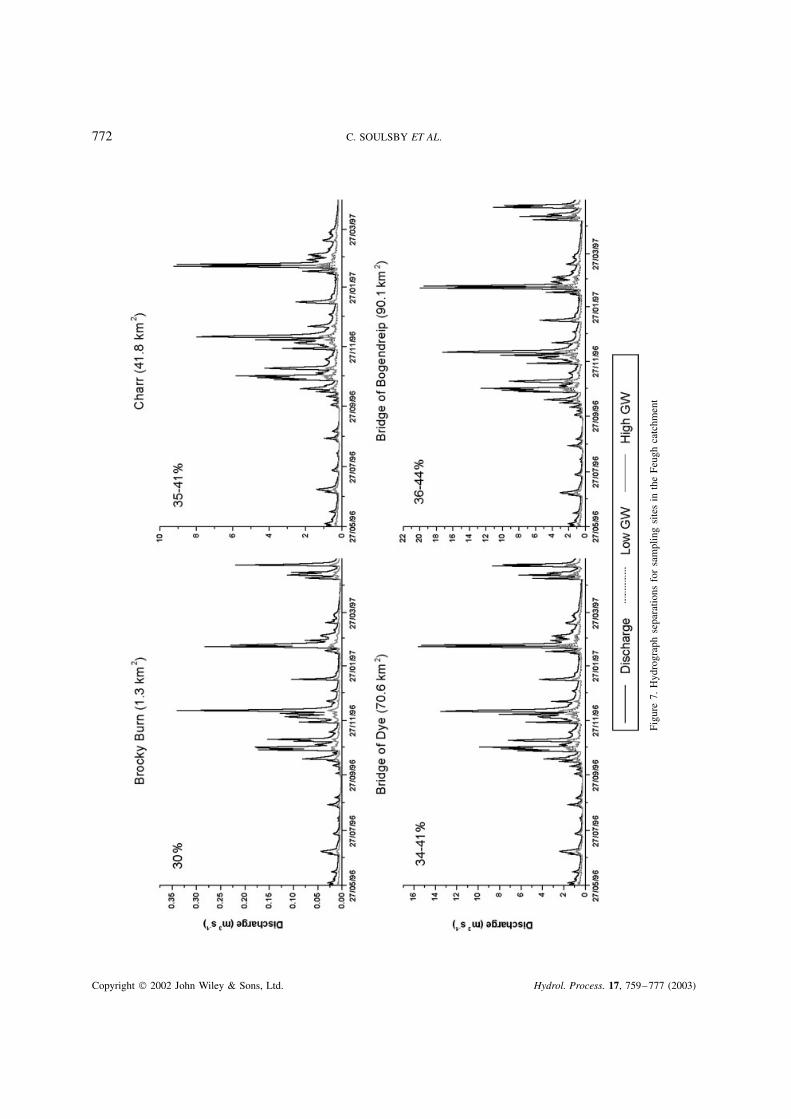
The separations for the eight sampling points are shown in Figure 7. In the Water of Dye sub-catchment,the increasing groundwater influence with catchment size is evident (Figure 7a). In Brocky Burn, the limitedgroundwater storage implied by the flow duration curve shown in Figure 2 is corroborated by the EMMAresults. Groundwater inputs, although dominating base flows, appear to make a very limited response to thestorm hydrograph. The slight increases that occur probably result from the displacement of groundwater asthe subsurface storm flow from the steeper hillslopes enters the riparian zone in the lower reaches of thestream (Soulsby et al., 1998). In contrast, the high-flow chemistry is dominated by overland flow from theextensive peat soils. Consequently, over the year, it is estimated that no more than 30% of runoff is generatedfrom groundwater sources in the catchment.
A similar type of response can be observed at Charr flume, though the specific discharge at low flows ishigher (Figure 2b) and greater groundwater inputs need to be invoked to explain the high-flow chemistry.Thus, it is estimated that 35–41% of runoff during the study year can be accounted for by groundwatersources. This probably reflects the presence of increased drift deposits and, crucially, more extensive alluvialaquifers in the 42 km2 Charr catchment compared with the 1 km2 Brocky watershed, as implied by Figure 2.In addition, the presence of metamorphic bedrock in the headwaters of the Charr sub-catchment probablyhas groundwater storage in fractures. These hypotheses are supported by the separations for the Bridge ofDye and Bogendreip sampling sites, where groundwater inputs of 34–41% and 36–44% respectively arerequired to account for the stream chemistry. These modest downstream increases in estimated groundwatercontributions, as catchment size approximately doubles, suggest that although different landscape features(peat soils, alluvial aquifers, etc.) occupy varying proportions of the Dye catchment at the three samplinglocations (Table I), the impact on the main hydrological flow paths is relatively limited.
Copyright 2002 John Wiley & Sons, Ltd. Hydrol. Process. 17, 759–777 (2003)
772 C. SOULSBY ET AL.
Figu
re7.
Hyd
rogr
aph
sepa
ratio
nsfo
rsa
mpl
ing
site
sin
the
Feug
hca
tchm
ent
Copyright 2002 John Wiley & Sons, Ltd. Hydrol. Process. 17, 759–777 (2003)
TRACER-BASED ASSESSMENT OF HYDROLOGICAL PATHWAYS 773
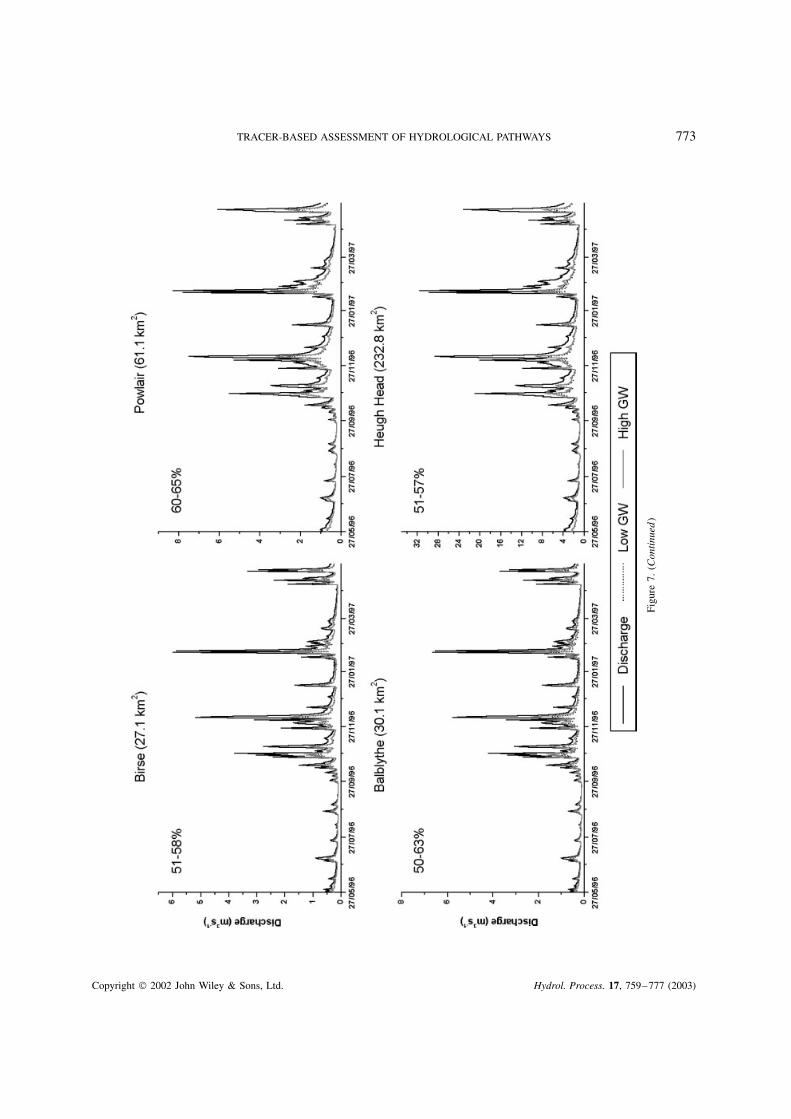
Figu
re7.
(Con
tinu
ed)
Copyright 2002 John Wiley & Sons, Ltd. Hydrol. Process. 17, 759–777 (2003)

774 C. SOULSBY ET AL.
In contrast to the Dye, the EMMA result implies that the greater coverage of freely draining humus ironpodzols in the Water of Aven and upper Feugh sub-basins reduces the influence of overland flow frompeat soils, at the catchment scale, during storm events. The results must be interpreted with caution, asflows are modelled for these sites; nevertheless, storm-flow chemistry implies that, although overland flowis still the dominant source (ca >70%) of storm runoff, more buffered groundwater is displaced into thestream, again probably as a result of an influx of, and mixing with, hillslope water. Thus, estimates ofgroundwater contributions to annual runoff in the upper Feugh sub-basin increase from 51–58% at Birseto 60–65% at Powlair. Separations for the Water of Aven have the greatest uncertainty, probably due tothe less marked differentiation of high- and low-flow chemistry (Figures 4 and 5), with estimated annualgroundwater contributions of 50–61%. Given the absence of alluvial deposits in the incised valley of theAven, this probably reflects the direct influence of hillslope waters on stream chemistry, that is indicated bythe low alkalinity of baseflows (Figure 4).
Notwithstanding the uncertainty over the flow estimates in the ungauged catchments, the separation at HeughHead is consistent with the mixing of water from the surface-water-dominated Water of Dye catchment, themore groundwater-dominated upper Feugh sub-basins, and the intermediate Water of Aven. Groundwatercontributions are estimated at 51–57% of annual flows; again, this larger proportion than Brocky or Charr isconsistent with the hydrological differences evident in Figure 2 and the known groundwater influences in thelower part of the catchment.
Although these separations are exploratory and a first approximation, the resulting groundwater and surfacewater contributions were used to model stream calcium concentrations and those of other weathering-derivedspecies that had linear relationships with Gran alkalinity. As with Gran alkalinity, the groundwater andsoil water calcium concentrations were estimated from baseflow and storm flow samples, and these weremixed according to the EMMA results and compared with measured stream flow samples. Coefficients ofdeterminations ranged between 0Ð71 and 0Ð89, providing additional evidence that the separations predicted byEMMA appear to be feasible.
DISCUSSION
The Feugh catchment comprises three basic topographic units: the plateau peatlands that cover the headwaters,the steep, freely draining slopes on the incised valley sides, and the drift aquifers in the main rivervalleys. Generally, the hydrological and hydrochemical characteristics of the catchment reflect these basicupland–lowland transitions, with the plateau peatlands dominating storm runoff generation at all scales andwith groundwater in valley bottom drifts, fed by hillslope drainage, sustaining baseflows. Implicit in thisconceptual model is the influence of scale on the relative proportion of different landscape units, with theeffect of the plateau peatlands decreasing with catchment size and the influence of aquifers in alluvium andother drifts becoming more marked. However, when individual sub-catchments are considered, catchmentcharacteristics, rather than scale alone also become important.
The hydrograph separations presented here represent a first approximation of the changing groundwaterinfluence with scale, and even the simple sensitivity analysis presented shows considerable uncertainty overthe resulting separations. Nevertheless, the results are broadly consistent with the results of hydrometricinvestigations and modelling studies in the catchment and proximate locations. This basic conceptualizationhighlights the importance of emergent hydrological processes at different scales of enquiry (Neal, 1997). Thussimple behaviour (i.e. two-component mixing) at the catchment scale is underpinned by a myriad of complexprocesses at the hillslope scale that are difficult to elucidate (Barnes, 2001). However, this apparent influenceof different landscape units on runoff generation and stream hydrochemistry in the Feugh catchment offersconsiderable potential for the application of semi-distributed modelling, informed by tracer behaviour, to showhow the catchment response is integrated at different scales (cf. Uhlenbrook and Leibundgut, 1999; Soulsbyand Dunn, 2003).
Copyright 2002 John Wiley & Sons, Ltd. Hydrol. Process. 17, 759–777 (2003)

TRACER-BASED ASSESSMENT OF HYDROLOGICAL PATHWAYS 775
Despite this need for further research, the simple conceptualization of catchment functioning achieved sofar has considerable utility as a tool to communicate the importance of hydrology to different stakeholdersand policy makers concerned with various issues in the catchment. This communication may be simple andqualitative, allowing the hydrological context of many of the water resource problems highlighted earlier tobe more easily understood. Thus, the responsive peat soils in the catchment explain the rapid flood periodresponses; they also account for discoloration problems and the rapid transmission of pathogens (from sheepand deer excrement) into stream channels and water supplies. In addition, to a large extent, the acidic stormrunoff that characterizes the Feugh catchment can largely be ascribed to organic acids generated in thecatchment’s peatlands, rather than atmospherically derived acids. The extremely low alkalinities that occur inacidified sites such as Plynlimon (Neal et al., 1999) are not observed in the Feugh. This presumably reflectsthe influence of strong mineral acids reducing surface water alkalinity at acidified sites. Although in manyways such observations are obvious from basic watershed science, Lubchenco (1998) and Healy (1998) remindscientists that communicating such science is a non-trivial issue.
Not only are these explanations of catchment functioning useful at the interface between science and society,but, by providing a basic understanding of the underpinning hydrological processes, a more formal frameworkis provided for environmental planning and for modelling the possible impacts of a range of environmentalchanges (Bellman, 2000). Hydrological subroutines are increasingly incorporated into integrated decisionsupport system models that can be used in environmental planning (WCD, 2000 Bellman, 2000). Combiningthe simple approach presented here with more comprehensive, processes-based models offers considerablepotential for effectively integrating hydrological knowledge into management strategies for the Feugh and othersimilar mesoscale watersheds. No doubt the influence of spatial scale on the hydrology and hydrochemistryof the Feugh catchment is more complex than presented here. Thus, in addition to modelling, increasing ourunderstanding of the spatial and temporal variability in the hydrological and hydrochemical functioning of theFeugh is also an aim of ongoing research. Particular attention is being given to providing a better resolutionof sampling during storm events at different spatial scales to appreciate how the hydrological functioning ofa mesoscale catchment operates on shorter time steps than the daily ones considered here.
ACKNOWLEDGEMENTS
Funding for this research has been provided by NERC through the Large Scale Processes in Ecology andHydrology Special Topic, the NERC/JIF Catchment Hydrology and Sustainable Management (CHASM)Initiative and a studentship to PR.
REFERENCES
Aitkenhead JA, Hope D, Billett MF. 1999. The relationship between dissolved organic carbon in streamwater and soil organic carbon poolsat different spatial scales. Hydrological Processes 13: 1289–1302.
Allan JD, Johnston LB. 1997. Catchment-scale analysis of aquatic ecosystems. Freshwater Biology 37: 107–111.Allan JD, Erickson DL, Fay J. 1997. The influence of catchment land use on stream integrity across multiple spatial scales. Freshwater
Biology 37: 149–161.Barnes C. 2001. Use of cumulative data for characterising hydrological systems. In Runoff Generation and Implications for River
Basin Modelling , Leibundgut Ch, Uhlenbrook S, McDonnell J (eds). Freiburger Schriften Hydrologie, Band 13, Institute of Hydrology,University of Freiburg i.Br.: Freiburg; 27–42.
BCT (Birse Community Trust). 2000. Birse Community Trust Newsletter No. 3.Bellman K. 2000. Towards a system analytical and modelling approach for integration of ecological, hydrological, economical and social
components of disturbed regions. Landscape and Urban Planning 51: 75–87.Beven KJ. 2001a. How far can we go with distributed modelling? Hydrology and Earth System Sciences 5: 1–12.Beven KJ. 2001b. Rainfall-Runoff Modelling: The Primer . Wiley: Chichester, UK.Billett MF, Cresser MS. 1992. Predicting streamwater quality using catchment and soil chemical characteristics. Environmental Pollution
77: 263–268.Bishop K, Grip H, O’Neill A. 1990. The origins of acid runoff in a hillslope during storm events. Journal of Hydrology 116: 35–61.Bremner A. 1912. The Physical Geology of the Dee Valley . Aberdeen University Press: Aberdeen; 39–42.
Copyright 2002 John Wiley & Sons, Ltd. Hydrol. Process. 17, 759–777 (2003)
776 C. SOULSBY ET AL.
Burns DA, McDonnell JJ, Hooper RP, Peters NE, Freer JE, Kendall K, Beven K. 2001. Quantifying contributions to storm runoff throughend member mixing analysis and hydrologic measurements at the Panola Mountain Research Watershed. Hydrological Processes 15:1903–1924.
Cooper DM, Jenkins A, Skeffington R, Gannon B. 2000. Catchment scale simulation of stream chemistry by spatial mixing: theory andapplication. Journal of Hydrology 251: 121–137.
Cresser MS, Smart RP, Billett MF, Soulsby C, Neal C, Wade A, Langan S, Edwards AC. 2000. Modelling water chemistry for a majorScottish river from catchment attributes. Journal of Applied Ecology 37: 1–15.
Dawson JJ. 1999. The controls on the concentrations and fluxes of gaseous, dissolved and particulate organic carbon in upland peat dominatedcatchments. Unpublished PhD Thesis: University of Aberdeen; 54–57.
Dawson JJ, Bakewell C, Billett MF. 2001. Is in-stream processing an important control on spatial changes in carbon fluxes in headwatercatchments. Science of the Total Environment 265: 153–168.
Edwards AC, Cook Y, Smart RP, Wade A. 2000. Concentrations if N and P in streams draining the mixed land use Dee catchment, NEScotland. Journal of Applied Ecology 37: 159–170.
Falkenmark M. 1990. Environmental management—what is the role of hydrologists? In Proceedings of the International Symposium toCommemorate 25 years of the IHD/IHP . UNESCO: Paris; 61–80.
Foster HJ. 2000. Assessment and modelling of spatio-temporal variability in upland stream chemistry. Unpublished PhD Thesis, Universityof London.
Genereux DP. 1998. Quantifying uncertainty in tracer-based hydrograph separations. Water Resources Research 34: 914–918.Gidney P. 2001. Spatial and temporal variation in the water quality of the Feugh catchment, NE Scotland. Unpublished BSc Dissertation,
University of Aberdeen.Gleick P. 1993. Water in Crisis: A Guide to the World’s Fresh Water Resources . Oxford University Press: Oxford.He C, Malcolm SB, Dahlberg KA, Fu B. 2000. A conceptual framework for integrating hydrological and biological indicators into watershed
management. Landscape and Urban Planning 49: 25–34.Healy MC. 2001. Paradigms, policies and prognostications about the management of watershed ecosystems. In River Ecology and
Management , Naiman RJ, Bilby RE (eds). Academic Press: London; 662–682.Hooper RP. 2001. Applying the scientific method to small catchment studies: a review of the Panola Mountain experience. Hydrological
Processes 15: 2039–2050.Hooper RP, Christophersen N, Peters J. 1990. Modelling stream water chemistry as a mixture of soil water end members: an application to
the Panola Mountain catchment, Georgia, USA. Journal of Hydrology 116: 321–344.Hooper RP, Aulenbach BT, Burns DA, McDonnell J, Freer J, Kendall C, Beven K. 1998. Riparian control of streamwater chemistry;
implications for hydrochemical models. In Hydrology, Water Resources and Ecology in Headwaters , Kova K, Tappeiner NE, Peters NE,Craig RG (eds). IAHS Publication No. 248. International Association of Hydrological Sciences: Wallingford, UK; 451–458.
Hope D. 1995. The role of rivers and lakes in the transport of organic carbon and carbon dioxide. Unpublished PhD Thesis, University ofAberdeen; 186pp.
Jenkins A, Ferrier RC, Harriman R, Ogunkoya O. 1994. A case study in catchment hydrochemistry: conflicting evidence from hydrologicaland chemical observations. Hydrological Processes 8: 335–349.
Kendall C, McDonnell JJ (eds). 1998. Isotope Tracers in Catchment Hydrology . Elsevier: Amsterdam.Kendall C, Sklash MG, Bullen TD. 1995. Isotope tracers of water and solute sources in catchments. In Solute Modelling in Catchment
Systems , Trudgill ST (ed.). Wiley: Chichester, UK; 261–304.Kennedy VC, Kendall C, Zellweger WG, Wyerman TA, Avanzino RJ. 1986. Determination of the components of streamflow using water
chemistry and environmental isotopes, Mattole River basin, California. Journal of Hydrology 84: 107–140.Langan SJ, Wade AJ, Smart R, Edwards AC, Soulsby C, Billett M, Jarvie H, Cresser MS, Owen R, Ferrier RC. 1997. The prediction and
management of water quality in a relatively unpolluted major Scottish catchment: current issues and experimental approaches. Science ofthe Total Environment 194(5): 419–435.
Law FM. 2001. Role of the British Hydrological Society. In Hydrology of the UK , Acreman M (ed.). Routledge: London; 20–42.Lubchenco J. 1998. Entering the century of the environment: a new social contract for science. Science 279: 491–497.MacMillan AA, Aiken AM. 1981. The sand and gravel resources of the area west of Aberdeen. Mineral Assessment Report 58. Institute of
Geological Sciences: Nottingham, UK.McGlynn B, McDonnell JJ, Shanley JB, Kendall C. 1999. Riparian zone flow path dynamics during snowmelt in a small headwater
catchment. Journal of Hydrology 222: 75–92.Naiman RJ, Magnusson JJ, McKnight DM, Stanford JA, Karr JR. 1995. Freshwater ecosystems and their management: a national initiative.
Science 270: 584–585.Naiman RJ, Bisson PA, Lee RG, Turner MG. 2001. Watershed management. In River Ecology and Management , Naiman RJ, Bilby RE
(eds). Academic Press: London; 642–661.Neal C. 1997. A view of water quality from the Plynlimon watershed. Hydrology and Earth Systems Science 1: 743–754.Neal C. 2001. Alkalinity measurements within natural waters: towards a standard approach. Science of the Total Environment 265: 99–113.Neal C, House WA, Leeks GJL, Marker AH. 1997. Conclusions to the Special Volume of Science of the Total Environment concerning UK
fluxes to the North Sea, Land Ocean Interaction Study (LOIS): river basin research the first two years. Science of the Total Environment194(5): 467–478.
Neal C, House WA, Witton BA, Leeks GJL. 1998. Foreword to Special Issue: Water Quality and Biology of UK Rivers Entering the NorthSea: LOIS and Associated Work. Science of the Total Environment 210(1): 1–4.
Neal C, Reynolds B, Robson AJ. 1999. Acid neutralisation capacity within natural waters: towards a standardised approach. Science of theTotal Environment 263(4): 233–241.
Reid JM, MacLeod DA, Cresser MS. 1981. Factors affecting the chemistry of precipitation and stream water in an upland catchment. Journalof Hydrology 50: 129–145.
Copyright 2002 John Wiley & Sons, Ltd. Hydrol. Process. 17, 759–777 (2003)

TRACER-BASED ASSESSMENT OF HYDROLOGICAL PATHWAYS 777
Robson A, Neal C. 1990. Hydrograph separation using chemical techniques: an application to catchments in mid-Wales. Journal of Hydrology116: 345–363.
SEPA. 2000. Dee Catchment Management Plan: Consultation Document. SEPA, Aberdeen.Smart RP, Soulsby C, Neal C, Wade A, Cresser MS, Billet MF, Langan SJ, Edwards AC, Jarvie HP, Owen R. 1998. Factors regulating the
spatial and temporal distribution of solute concentrations in a major river system in NE Scotland. Science of the Total Environment 221:93–110.
Smart RP, White CC, Townend J, Cresser MS. 2001a. A model for predicting chloride concentrations in river water in a relatively unpollutedcatchment in NE Scotland. Science of the Total Environment 265: 131–141.
Smart RP, Soulsby C, Cresser MS, Wade AJ, Townend J, Billet MF, Langan S, Neal C. 2001b. Riparian zone influence on stream waterchemistry at different spatial scales: a GIS based modelling approach. Science of the Total Environment 280: 173–193.
Soulsby C. 1992. Hydrological controls on acid runoff generation in an afforested headwater catchment at Llyn Brianne, mid-Wales. Journalof Hydrology 138: 431–448.
Soulsby C, Dunn SM. 2003. Towards integrating tracer studies with a conceptual rainfall-runoff model; insights from a sub-arctic catchmentin the Cairngorm Mountains, Scotland. Hydrological Processes 17(1): in press.
Soulsby C, Reynolds B. 1993. Influence of soil hydrological pathways on stream aluminium chemistry at Llyn Brianne, mid-Wales.Environmental Pollution 81: 51–60.
Soulsby C, Helliwell RC, Ferrier RC, Jenkins A, Harriman R. 1997. Seasonal snowpack influence on the hydrology of a sub-arctic catchmentin Scotland. Journal of Hydrology 192: 17–32.
Soulsby C, Chen M, Ferrier RC, Helliwell RC, Jenkins A, Harriman R. 1998. Hydrogeochemistry of shallow groundwater in an uplandScottish catchment. Hydrological Processes 12: 1111–1127.
Soulsby C, Malcolm R, Helliwell RC, Ferrier RC, Jenkins A. 2000. Isotope hydrology of the Allt a’ Mharcaidh catchment, Cairngormmountains, Scotland: implications for hydrological pathways and water residence times. Hydrological Processes 14: 747–762.
Stutter M, Smart R, Cresser M, Langan S. 2001. Catchment characteristics controlling the mobilization and potential toxicity of aluminiumfractions in the catchment of the River Dee, northeast Scotland. Science of the Total Environment 281: 121–139.
Thompson DBA, Gordon JE, Horsfield D. 2001. Montane landscapes in Scotland: are these natural, artefacts of complex relics? In EarthScience and the Natural Heritage: Interactions and Integrated Management , Gordon JE, Leys FK (eds). The Stationary Office: Edinburgh,UK; 105–119.
Uhlenbrook S, Hoeg S. In press. Quantifying uncertainties in tracer-based hydrograph separations: a case study for two-, three-, and five-component hydrograph separations in a mountainous catchment. Hydrological Processes .
Uhlenbrook S, Leibundgut C. 1999. Integration of tracer information into the development of a rainfall-runoff model. In Integrated Methodsin Catchment Hydrology—Tracer, Remote Sensing and New Hydrometric Techniques , Leibundgut Ch, McDonnell J, Schuttz G (eds).IAHS Publication No. 258. International Association of Hydrological Sciences: Wallingford, UK; 93–100.
Wade A. 1999. The assessment and modelling of water quality in a large catchment, the River Dee, NE Scotland. Unpublished PhD Thesis,University of Aberdeen.
Wade A, Neal C, Soulsby C, Smart R, Langan S, Cresser M. 1998. Impacts of land use and flow on nitrate concentrations and fluxes inan upland river system in North East Scotland. In Headwaters: Water Resources and Conservation, Haigh M, Krecjek J (eds). IASWC:Merano; 127–136.
Wade AJ, Neal C, Soulsby C, Smart RP, Langan SJ, Cresser MS. 1999. Modelling streamwater quality under varying hydrological conditionsat different spatial scales. Journal of Hydrology 217: 266–283.
Wade AJ, Neal C, Soulsby C, Langan SJ, Smart R. 2001. On modelling the effects of reafforestation in a heterogenous catchment at differentspatial and temporal scales. Journal of Hydrology 250: 149–169.
Ward JV, Tockner K. 2001. Biodiversity: towards a unifying theme for river ecology. Freshwater Biology 46: 807–819.WCD (World Commission on Dams). 2000. Dams and Development: A New Framework for Decision Making . Earthscan: London.Webb BW, Walling DE. 1983. Stream solute behaviour in the river Exe basin, Devon, UK. In Dissolved Loads of Rivers and Surface
Water Quantity/Quality Relationships , Webb BW (ed.). IAHS Publication No. 141. International Association of Hydrological Sciences:Wallingford, UK; 153–169.
Copyright 2002 John Wiley & Sons, Ltd. Hydrol. Process. 17, 759–777 (2003)