


Bahasa
Halaman
Hukum

TitleStudies on Development and Application of High-throughputGenomic and Bioinformatics Tools for Citrus Fruit Physiologyand Breeding( 本文(Fulltext) )
Author(s) 藤井, 浩
Report No.(DoctoralDegree) 博士(農学) 乙第139号
Issue Date 2014-03-13
Type 博士論文
Version ETD
URL http://hdl.handle.net/20.500.12099/49024
※この資料の著作権は、各資料の著者・学協会・出版社等に帰属します。
Studies on Development and Application of High-throughput Genomic
and Bioinformatics Tools for Citrus Fruit Physiology and Breeding
The United Graduate School of Agricultural Science,
Gifu University
FUJII, Hiroshi
CONTENTS
Chapter 1: INTRODUCTION 1
Chapter 2: Oligoarray analysis of gene expression in mature mandarin fruit 6
Section 1: Profiling ethylene-responsive genes in mature mandarin fruit
using a citrus 22K oligoarray 7
Section 2: Profiling gibberellin (GA3)-responsive genes in mature fruit
using a citrus 22K oligoarray 31
Section 3: Conclusion 45
Chapter 3: An algorithm and computer program for the identification of
minimal sets of discriminating DNA markers for efficient cultivar
identification 46
Chapter 4: High-throughput genotyping in citrus accessions using an SNP genotyping
array 70
Chapter 5: GENERAL DISCUSSION 101
SUMMARY 106
ACKNOWLEDGEMENTS 113
REFERENCES 114
1
Chapter 1: INTRODUCTION
Citrus is one of the most economically important fruit species in the world.
During the long history of the natural evolution, the fruits had diversified in the colors,
shapes, fragrances and tastes as well as abundant secondary metabolic elements
possessing great health values. These diversities have been used as the resources for
citrus breeding to obtain attractive fruit. The efforts on breeding have generated the
cultivars with seedless fruit. Along with the development of seedless cultivars, citrus
breeding program has become complicated and difficult to improve through traditional
breeding approaches (Talon and Gmitter, 2008) because the obtaining of hybrids was
interfered by polyembryony, male sterility and self-incompatibility.
In this decade, genomic technology has rapidly advanced. The biological
challenges can now be addressed also in citrus plant to understand genetic and
physiological events on fruit traits (Talon and Gmitter, 2008). For the purposes, many
genome analysis projects have been performed. They included expressed sequence tag
(EST) analysis (Bausher et al., 2003; Shimada et al., 2003; Fujii et al., 2003a; Forment
et al., 2005; Terol et al., 2007), EST database analysis (HarvEST http://harvest.ucr.edu;
Fujii et al., 2003) and development and application of DNA marker. They were
developed by cleaved amplified polymorphic sequences (CAPS) maker analysis (Omura,
2005), simple sequence repeat (SSR) marker analysis (Chen et al., 2006), single
nucleotide polymorphism (SNP) marker analysis (Ollitrault et al., 2012; Distefano et al.,
2013), and applied to the linkage mapping (Omura, 2005), quantitative trait loci (QTL)
analysis (Sugiyama et al, 2011), and cultivar typing (Omura, 2005). EST analysis made
much progress in recent years to microarray technology for gene expression profiling
(Shimada et al, 2005; Terol et al., 2007).
The cataloguing of ESTs has emerged in 1990s as a powerful tool capable of
2
obtaining a large set of expressed genes from genome. The citrus genome analysis team
(CGAT) of the National Institute of Fruit Tree Science (NIFTS), National Agriculture
and Bio-oriented Research Organization of Japan (NARO), started the EST analysis
program in the 1990s (Hisada et al., 1996; Hisada et al., 1997; Moriguchi et al., 1998;
Kita et al., 2000; Shimada et al., 2003; Fujii et al., 2003a). The EST program stimulates
and supports molecular and physiological research on citrus fruit. Through the program,
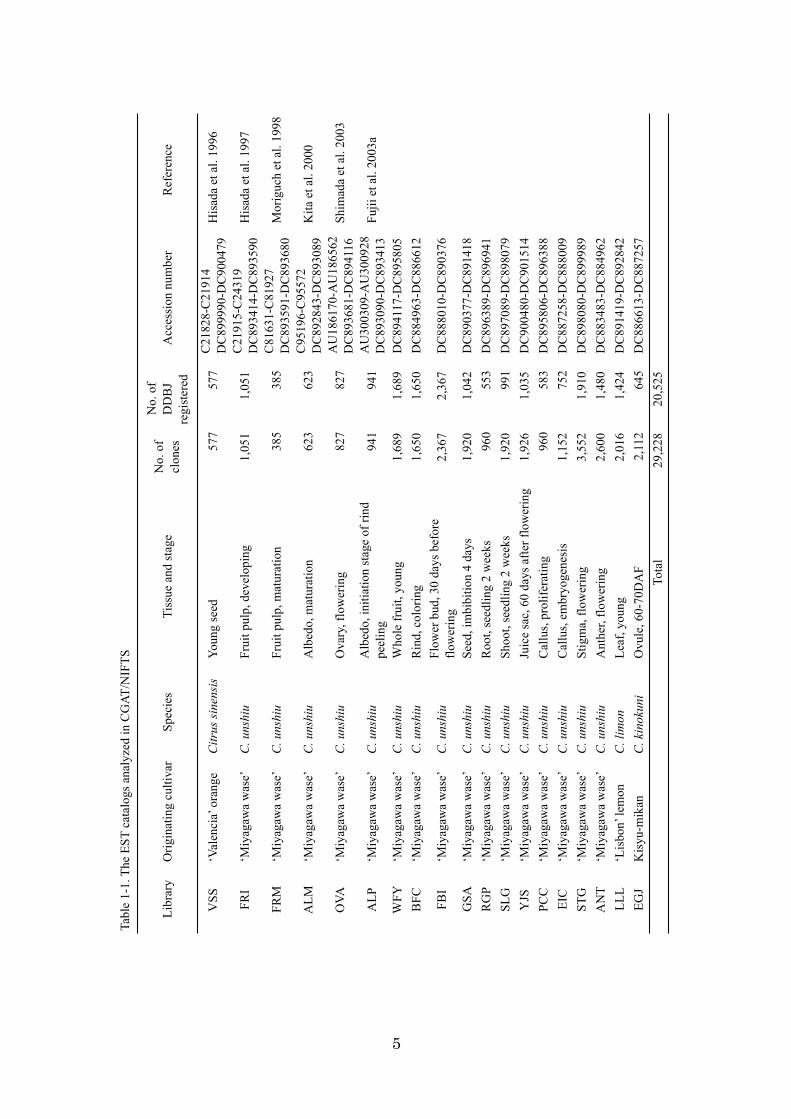
CGAT/NIFTS has collected 29,228 ESTs on 19 cDNA libraries covering different
tissues and developmental stages (Fujii et al., 2006). Among the 19 libraries, 16 were
derived from C. unshiu and the six remaining libraries were derived from C. sinensis, C.
limon, and C. kinokuni hort. ex Tanaka. The 20,525 ESTs of adequate quality were
submitted to the DNA Data Bank of Japan (DDBJ) and released (Table 1-1). Fujii et al.
(2003b) also constructed an in house EST database to manage EST sequences,
accession numbers, and functional annotations as user-friendly database.
The large collection of ESTs has been applied to reveal the gene expression
patterns, gene regulation, and sequence diversity (Brandle et al., 2002), and
development of EST databases have contributed to discover the genes associated with
fragrance (Shimada et al., 2005a; Shimada et al., 2005b; Shimada et al., 2005c) and to
induce the precocious flowering while assaying the gene functions in fruit (Endo et al.,
2005, Endo et al., 2006). The gene repertory analysis indicated that the easy peeling of
citrus fruit rind, which is an important trait for commercial value in citrus, is related
with the gene expression involved in relaxation of the cell wall (Brummell and Harpster,
2001). After a prototype cDNA microarray with 2,213 spots has been produced to
promote the molecular analysis of fruit development and quality using the EST database
(Shimada et al., 2005d), the custom citrus 22K oligoarray had been developed as the
tools for functional genomics (Fujii et al., 2006). In the procedure of EST microarray
3
design, the EST sequences were subjected to clustering. The collection of 29,228 ESTs
grouped into 13,896 putative unigenes. Each unigene was translated into its amino acid
sequence and subjected to a similarity search against amino acid and motif databases
using Fasty, Blastx, and motif search algorithms. Among the 13,986 unigenes, 6,759
(48.6%) showed similarity to genes with known functions and 759 (5.5%) showed
similarity to only functional domains.
In addition to the use of EST information on fruit physiology and molecular
biology, the ESTs have been used to generate DNA makers for genome mapping. The
CAPS markers were used to construct linkage maps of several mapping populations of
citrus and they have been applied to obtain the selection markers for breeding (Omura,
2005). The traits related to fruit quality, such as sugar and acid contents, peel thickness,
rind and pulp color and carotenoid content, and seed characteristics, such as
polyembryony, embryo color, seed number, and seedlessness, were analyzed and
mapped on the CAPS linkage maps as QTLs (Omura, 2005; Sugiyama et al., 2011). The
CAPS markers also provided the molecular tools to identify cultivars (Omura, 2005).
Recently, the international consortium on citrus genome analysis publicly
released the haploid Clementine (Citrus clementina) and the diploid sweet orange (C.
sinensis) genomes (Gmitter et al., 2012; Citrus Genome Database
http://www.citrusgenomedb.org/). Furthermore, the draft genome sequence of the
dihaploid sweet orange has been produced (Xu et al., 2013) and made available to the
global research community (Citrus sinensis annotation project.
http://citrus.hzau.edu.cn/orange/). Despite the challenges of working with citrus,
understanding important characteristics from the gene expression level is insufficient. It
is believed that the important characteristics of citrus fruits are under complex genetic
regulation. In addition, the heterozygosity of the citrus genome makes more difficult to
4
understand genotype-phenotype relation and to identify the key regulatory gene. It is
necessary to make excellent use of the high-throughput genomic tools available to
understand the regulations. In this thesis, high-throughput genomic technology, such as
the oligo-microarray, SNP genotyping array, and analytical software, were developed
and applied to citrus to provide the basis for comprehensive use of citrus genome
information, which has been accumulated quickly. Chapter 2 details a gene expression
analysis using the 22K citrus oligo-microarray that was performed to profile gene
expression in mature mandarin fruit undergoing plant hormone treatment. In Chapter 3,
the development of an algorithm and computer program for efficient cultivar
identification using DNA makers is described. Chapter 4 discusses the development of a
384 SNP genotyping array for high-throughput genotyping and how the array was
applied to 98 citrus accessions and a population. The results obtained in this study, the
expression analysis of many genes related to important characters, the analysis of
genome-wide genotyping among many varieties and the software for efficient cultivar
identification, or the combination of these three analyses will be necessary to
understand important characters of citrus.
5
Libr
ary
Orig
inat
ing
culti
var
Spec
ies
No.
of
clon
es
No.
of
DD
BJ
regi
ster
edR
efer
ence
VSS
‘Val
enci
a’ o
rang
eC
itrus
sine
nsis
Youn
g se
ed57
757
7C
2182
8-C
2191
4D
C89
9990
-DC
9004
79H
isad
a et
al.
1996
FRI
‘Miy
agaw
a w
ase’
C. u
nshi
uFr
uit p
ulp,
dev
elop
ing
1,05
11,
051
C21
915-
C24
319
DC
8934
14-D
C89
3590
His
ada
et a
l. 19
97
FRM
‘Miy
agaw
a w
ase’
C. u
nshi
uFr
uit p
ulp,
mat
urat
ion
385
385
C81
631-
C81
927
DC
8935
91-D
C89
3680
Mor
iguc
h et
al.
1998
ALM
‘Miy
agaw
a w
ase’
C. u
nshi
uA
lbed
o, m
atur
atio
n62
362
3C
9519
6-C
9557
2D
C89
2843
-DC
8930
89K
ita e
t al.
2000
OVA
‘Miy
agaw
a w
ase’
C. u
nshi
uO
vary
, flo
wer
ing
827
827
AU
1861
70-A
U18
6562
DC
8936
81-D
C89
4116
Shim
ada
et a
l. 20
03
ALP
‘Miy
agaw
a w
ase’
C. u
nshi
uA
lbed
o, in
itiat
ion
stag
e of
rind
peel
ing
941
941
AU
3003
09-A
U30
0928
DC
8930
90-D
C89
3413
Fujii
et a
l. 20
03a
WFY
‘Miy
agaw
a w
ase’
C. u
nshi
uW
hole
frui
t, yo
ung
1,68
91,
689
DC
8941
17-D
C89
5805
BFC
‘Miy
agaw
a w
ase’
C. u
nshi
uR
ind,
col
orin
g1,
650
1,65
0D
C88
4963
-DC
8866
12
FBI
‘Miy
agaw
a w
ase’
C. u
nshi
uFl
ower
bud
, 30
days
bef
ore
flow
erin
g2,
367
2,36
7D
C88
8010
-DC
8903
76
GSA
‘Miy
agaw
a w
ase’
C. u
nshi
uSe
ed, i
mbi
bitio
n 4
days
1,92
01,
042
DC
8903
77-D
C89
1418
RG
P‘M
iyag
awa
was
e’C
. uns
hiu
Roo
t, se
edlin
g 2
wee
ks96
055
3D
C89
6389
-DC
8969
41SL
G‘M
iyag
awa
was
e’C
. uns
hiu
Shoo
t, se
edlin
g 2
wee
ks1,
920
991
DC
8970
89-D
C89
8079
YJS
‘Miy
agaw
a w
ase’
C. u
nshi
uJu
ice
sac,
60
days
afte
r flo
wer
ing
1,92
61,
035
DC
9004
80-D
C90
1514
PCC
‘Miy
agaw
a w
ase’
C. u
nshi
uC
allu
s, pr
olife
ratin
g96
058
3D
C89
5806
-DC
8963
88EI
C‘M
iyag
awa
was
e’C
. uns
hiu
Cal
lus,
embr
yoge
nesi
s1,
152
752
DC
8872
58-D
C88
8009
STG
‘Miy
agaw
a w
ase’
C. u
nshi
uSt
igm
a, fl
ower
ing
3,55
21,
910
DC
8980
80-D
C89
9989
AN
T‘M
iyag
awa
was
e’C
. uns
hiu
Ant
her,
flow
erin
g2,
600
1,48
0D
C88
3483
-DC
8849
62LL
L‘L
isbo
n’ le
mon
C. l
imon
Leaf
, you
ng2,
016
1,42
4D
C89
1419
-DC
8928
42EG
JK
isyu
-mik
anC
. kin
okun
iO
vule
, 60-
70D
AF
2,11
264
5D
C88
6613
-DC
8872
57To
tal
29,2
2820
,525
Tabl
e 1-
1. T
he E
ST c
atal
ogs a
naly
zed
in C
GAT
/NIF
TS
Tiss
ue a
nd st
age
Acc
essi
on n
umbe
r
6
Chapter 2: Oligoarray analysis of gene expression in mature mandarin fruit
During fruit development and ripening, complex physiological and biochemical
changes are regulated by hormonal, nutritional, and environmental controls (Giovannoni,
2004). Citrus fruit is generally classified as non-climacteric fruit (Kader, 1992) but can
respond to exogenous ethylene, which stimulates fruit ripening along with chlorophyll
degradation and carotenoid accumulation in peel (Goldschmidt et al., 1993). Many
ripening-related genes have been isolated and characterized in Citrus species, and it is
well documented that ethylene regulates chlorophyll degradation and regulates
carotenoid accumulation at the transcriptional level (Jacob-Wilk et al., 1999; Kato et al.,
2004; Kato et al., 2006; Rodrigo et al., 2004; Rodrigo et al., 2006).
Gibberellin (GA3) delays ethylene-, or sucrose- induced peel color change by the
repression of chlorophyll degradation and by the repression of carotenoid accumulation
(Cooper and Henry, 1968; Trebitsh et al., 1993; Iglesias et al., 2001; Rodrigo and
Zacarias, 2007). Iglesias et al. (2001) consider that GA appears to control the timing of
chlorophyll disappearance by inhibiting or reducing chlorophyll biosynthesis. After the
natural reduction of endogenous GA levels in mature fruit, color change may be
stimulated by the basal level of endogenous ethylene, along with the de novo synthesis
of chlorophyllase. Thus, ethylene and GA are assumed to play important roles in the
endogenous regulation of maturation and senescence in mature citrus fruit, but little is
known about the effects of GA on transcriptional regulation during fruit ripening.
In tomato and Arabidopsis, ethylene-regulated genes were investigated using
microarray analysis, and it was demonstrated that a large number of transcription factors
and some putative signaling components, which were transcriptionally associated with
fruit maturation and ripening, were highly regulated by ethylene, providing a new
insight into the molecular basis of ethylene-mediated ripening (Zhong and Burns, 2003;
7
Alba et al., 2005).
Recently, 2.2K and 12K cDNA microarrays (Shimada et al., 2005) and (Forment
et al., 2005) were developed in Citrus species and applied to the global analysis of
transcriptome dynamics during the development and ripening of citrus fruit. Using 12K
cDNA microarrays, Cercós et al. (2006) identified more than 2,200 putative unigenes
with significant expression changes during fruit development, which were involved in
the metabolism of carbohydrates, acid, secondary, cell expansion, and transcription
regulators.
In this Chapter, the citrus custom 22K oligoarrays were used to understand
complicated transcriptional regulation during fruit development and ripening. It will
provide a new insight of the ethylene or gibberellin regulatory mechanism in citrus.
Section 1. Profiling ethylene-responsive genes in mature mandarin fruit using a
citrus 22K oligoarray
Mature citrus fruit exhibit a relatively low respiration rate and level of ethylene
production and are generally classified as non-climacteric fruit (Kader, 1992). This low
level of exogenous ethylene is assumed to play a role in the endogenous regulation of
maturation and senescence (Goldschmidt, 1998). Ethylene has significant effects on
plant development to regulate germination, senescence, abscission, fruit ripening,
drought, wounding, chilling, and pathogen infection (Abeles et al., 1992). In climacteric
fruit, such as tomato, numerous studies of ethylene biosynthesis and response have been
reported, and ethylene has been shown to control the ripening process through the
regulation of gene transcription (Giovannoni, 2004). However, the ripening mechanism
in non-climacteric fruit remains unclear, and it would appear that a unique program
regulates the development and ripening of citrus fruit.
8
In general, ethylene treatment is ineffective with regard to the ripening of
non-climacteric fruit, such as grape (Brady and Speirs, 1991), strawberry (Atta-Aly et
al., 2000), and cherry (Given et al., 1988), however, citrus fruit responds to exogenous
ethylene, which stimulates fruit ripening by enhancing respiration and changes in peel
color (chlorophyll degradation and carotenoid accumulation) (Goldschmidt et al., 1993).
In addition, some reports have indicated that there have been marked increases in the
endogenous levels of ethylene production following various events, such as wounding
(Hyodo and Nishino, 1981), pathogen attack (Achilea et al., 1985), chilling temperature
(McCollum and McDonald, 1991), and detached young fruit (Katz et al., 2005),
although mature citrus fruit produces only small amounts of ethylene and lacks an
autocatalytic rise in its production. Thus, complex regulations of ethylene production
and perception might exist during fruit development. Recently, ripening-related genes
have been isolated and characterized in Citrus species, which are involved in
chlorophyll degradation (Jacob-Wilk et al., 1999), carotenoid biosynthesis (Kato et al.,
2004; Kato et al., 2006; Rodrigo et al., 2004; Rodrigo et al., 2006), and ethylene
biosynthesis and perception (Katz et al., 2004; Katz et al., 2005). Most of these genes
respond to exogenous ethylene, and their transcriptions are up-regulated in mature fruit.
In contrast, significant transcriptional changes of ethylene biosynthesis and receptor
genes were not detectable against ethylene and propylene treatments in mature fruit
(Katz et al., 2004). Therefore, a full understanding of the ethylene regulatory
mechanism in citrus fruit will be of value.
In this experiment, the ethylene-responsive genes in citrus mature fruit were
investigated using a citrus 22K oligoarray containing 21,495 independent ESTs from
Citrus species. Seventy-two hours after ethylene treatment, 1,493 genes were identified
as ethylene-responsive genes with more than 3-fold expression change; an interesting
9
aspect of gene regulation by ethylene was observed, namely, that more than half of the
ethylene-responsive genes were repressed, and it was assumed that these transcriptional
changes might enhance the ripening process. In addition, transcriptional regulations
related to chlorophyll degradation, carotenoid biosynthesis, and ethylene perception in
the mature fruit were also discussed.
Materials and methods
Plant material and ethylene treatment
Satsuma mandarin (C. unshiu Marcovitch, cv. Miyagawa wase) cultivated at
the Citrus Research Division Okitsu (Shimizu, Shizuoka, Japan) of NIFTS were used as
materials. Samples of fruit at 150 days after anthesis (DAF) were collected. For the
ethylene treatment of fruit, higher concentration of ethylene (100µl·L-1) was applied in
each container in order to complete degreening within 72 h and monitor ethylene
responsive genes during short time period. Both ethylene treatment and air treatment
were conducted at 25°C. The flesh flavedo tissue was excised and immediately frozen
in liquid nitrogen and stored at -80ºC until RNA extraction and the quantification of
carotenoids and chlorophylls.
Carotenoid and chlorophyll quantification in flavedo
Quantification of 6 representative carotenoids, all trans-violaxanthin (trans-Vio),
9-cis-violaxanthin (cis-Vio), lutein (Lut), -cryptoxanthin (B-Cry), -carotene
(A-Car), and phytoene (Phy), was carried out by the method of Kato et al. (2004).
Samples were homogenized in 40% (v/v) methanol containing 10% (w/v) magnesium
carbonate basic. Pigments were extracted from the residues using an acetone : methanol
(7:3 [v/v]) solution containing 0.1% (w/v) 2,6-di-tert-butyl-4-methylphenol and
10
partitioned into diethyl ether. The extracts containing carotenoids esterified to fatty acids
were saponified with 20% (w/v) methanolic KOH. After the saponification,
water-soluble extracts were removed from the extract by adding NaCl-saturated water.
The pigments repartitioned into the diethylether phase were recovered and evaporated to
dryness. Subsequently, the residue was redissolved in 5 mL of an MTBE: methanol (1:1
[v/v]) solution. An aliquot (20 µL) was separated by a reverse-phase HPLC system (Jasco,
Easton, USA) fitted with a YMC Carotenoid S-5 column of 250- x 4.6-mm-i.d. (Waters,
Milford, USA) at a flow rate of 1 mL min–1. The eluent was monitored using a
photodiode array detector (MD-910, Jasco). The peaks were identified by comparing
their specific retention times and absorption spectra with the authentic standards. The
standard curves for the carotenoid quantification were prepared with those of the
authentic standards at 286 nm for Phy and 452 nm for trans-Vio, cis-Vio, Lut, B-Cry,
and A-Car. The carotenoid concentration was estimated by the standard curves and
expressed as milligrams per gram fresh weight. According to the method of Shimada and
Shimokawa et al. (1978), the chlorophyll (a + b) content was determined by measuring
the absorbance at 642 and 662nm. Carotenoid and chlorophyll quantification was
performed in three replications.
RNA isolation and fluorescent labeling of probes
Total RNA was extracted by the methods of Ikoma et al. (1996) from flavedo
tissues of non-treatment at 0 h and at 24 h, 48 h, and 72 h after ethylene treatment or air
treatment. At least three independent RNA extractions were used in probe labeling for
experimental reproducibility. The total RNA (400 ng) of all samples was labeled with
the fluorescence Cy5, while non-treatment at 0 h was labeled with Cy3 according to the
instructions for the Low RNA input linear amplification and labeling kit (Agilent
11
technologies, Santa Clara, USA). Labeled cRNA was purified using the Qiagen RNeasy
mini kit (Qiagen, Hilden, Germany). Hybridization and washing were performed
according to the manufacturer’s instructions. Glass slides were hybridized overnight at
60°C in a hybridization buffer containing a fragment of Cy3- or Cy5-labeled cRNA.
After hybridization, slides were washed in 6×SSC, 0.005% Triton X-100 for 10 min at
room temperature and 0.1×SSC, 0.005% Triton X-100 for 5 min at 4 . After drying
the slides with gaseous nitrogen, hybridized slides were scanned with the use of a
microarray scanner (Agilent technologies). The intensities of the Cy5 and Cy3
fluorescent signals from each spot were automatically normalized, and the ratio value
(Cy5/Cy3) was calculated using Feature Extraction version 7.1 software (Linear &
LOWESS analysis, Agilent technologies). Data analysis was carried out using
GENESPRING 7.00 (Silicon Genetics, Redwood City, USA). Genes with more than a
3-fold expression change between ethylene treatment and air treatment at each
experimental time (24 h, 48 h, and 72 h) were accepted as ethylene-responsive genes in
this experiment.
Northern gel blot analyses
For Northern blot analysis, total RNA was extracted by the methods of Ikoma et al.
(1996) from flavedo tissues at 0 h, 24 h, 48 h, and 72 h after ethylene treatment. Ten
microgram from each RNA sample was subjected to electrophoresis on a 1.2% agarose
gel containing 8% (v/v) formaldehyde and transferred to a nylon membrane
(Hybond-NX, Amersham Pharmacia Biotech, Little Chalfont, UK). The cDNA probes
of 7 representative ethylene-regulated genes identified by microarray analysis were
prepared with the use of a PCR DIG labeling kit (Roche Molecular Biochemicals,
Tokyo, Japan). Hybridization and detection were conducted according to the
12
manufacturer’s directions (Roche Molecular Biochemicals).
Results and discussion
Identification and functional classification of 1,493 ethylene-responsive genes
A citrus 22K oligoarray including 21,495 independent EST probes derived from
Citrus species and 1,080 control spike probes was used in this study to identify
ethylene-responsive genes in mature fruit. The fold change of each gene expression was
calculated based on the mRNA expression ratio between ethylene treatment samples
and air treatment samples at every 24h. In the 72 h after the ethylene treatment, 1,493
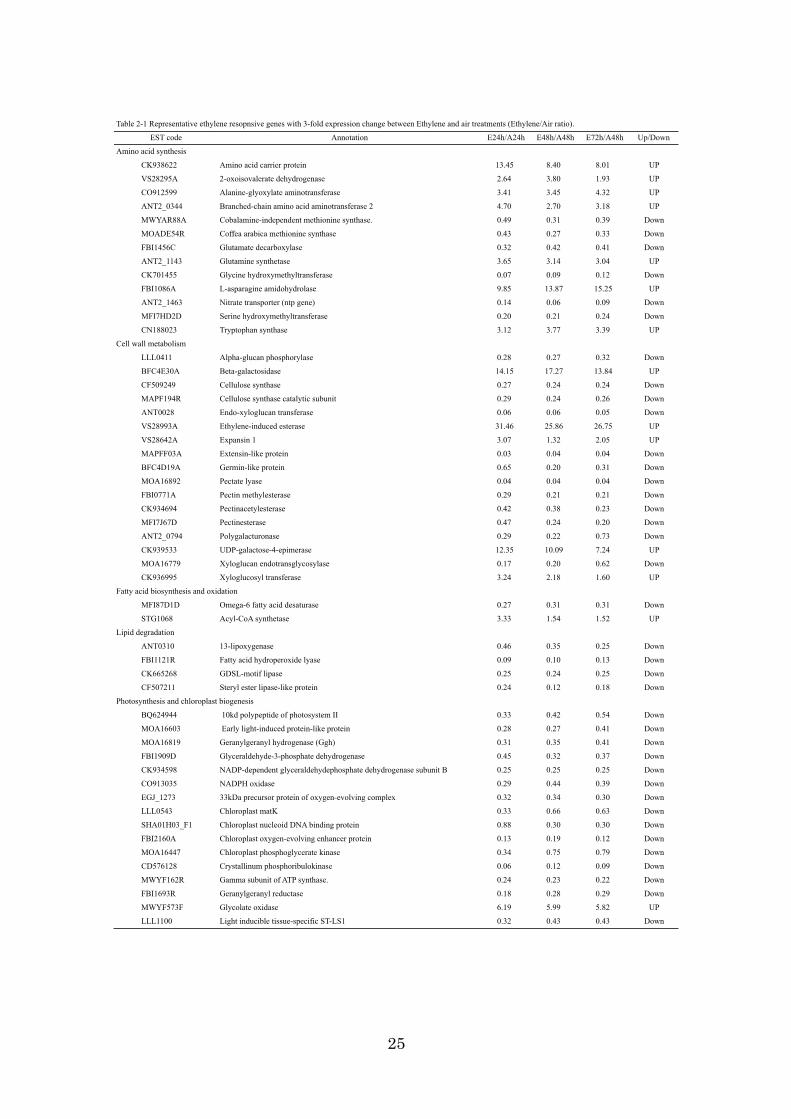
genes showed more than a 3-fold change in the mRNA expression ratio. Table 2-1
showed representative ethylene resopnsive genes with 3-fold expression change
between Ethylene and air treatments. Of 1,493 genes, the expression of 554 genes was
up-regulated, while 939 genes were down-regulated, indicating that ethylene tended to
repress transcription in this fruit stage. Ethylene-induced esterase, pathogenesis-related
(PR) protein, and 9-cis-epoxycarotenoid dioxygenase had high ethylene sensitivity, and
they were radically induced by exogenous ethylene within 24h with more than a 30-fold
change. In contrast, the chlorophyll a/b-binding protein (CAB),
ribulose-1,5-bisphosphate carboxylase (RBC), and extensin-like protein were
down-regulated by more than 30-fold. To confirm the results from the microarray
analysis, 7 representative genes, each with a different responding pattern against
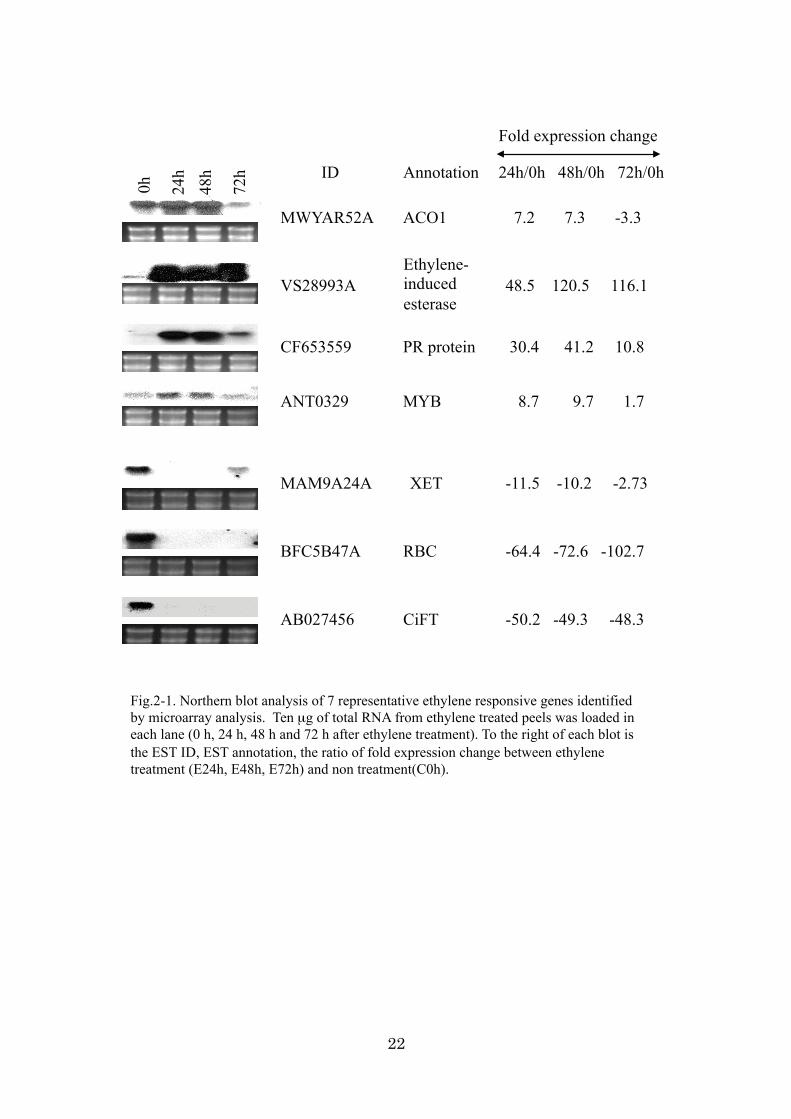
ethylene, were selected and subjected to Northern blot analysis (Fig. 2-1). As shown in
Fig. 2-1, aminocyclopropanecarboxylate (ACC) oxidase 1 (ACO1), ethylene-induced
esterase, and PR protein were significantly induced, and xyloglucan
endotransglycosylase (XET), RBC, and flowering time (FT) genes were suppressed after
exogenous ethylene treatment. The regulation patterns were different among these genes,

13
but the genes were either induced or suppressed by exogenous ethylene or by
constitutive activation of the ethylene-signaling pathway. The signal intensities of each
Northern band visually reflected changes detected in the microarray, demonstrating the
fidelity of the experiments.
A total of 1,493 ethylene-responsive genes were compared by TBLAST X
similarity search (e-value <1e-5) with all cDNAs of Arabidopsis (downloaded from the
TAIR. Since each cDNA of Arabidopsis provided functions according to gene ontology
annotations for Arabidopsis (GOSLIM in TAIR), the genes were assigned the functions
according to GOSLIM on the basis of their similarity with the cDNA of Arabidopsis.
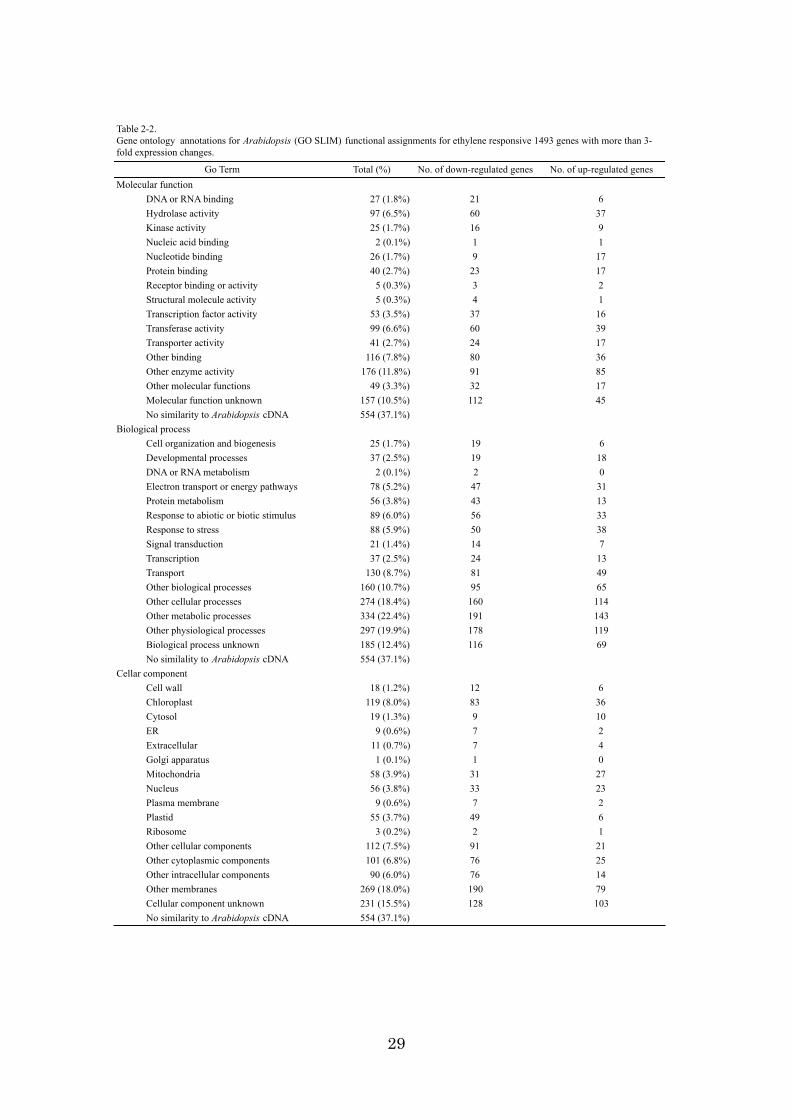
As a result, 939 genes were assigned to three aspects of GOSLIM (Table 2-2). Certain
genes were often assigned to more than one category in each aspect of GOSLIM; thus,
the total did not equal 100%. Among the molecular functions, the category of “other
enzyme activity” was the most affected by ethylene, and 176 genes (11.8% of 1,493
genes) responded to ethylene treatment. Among the biological processes, the categories
of “other metabolic processes” (22.4% of 1,493), “other physiological processes”
(19.9%), and “other cellular processes” (19.9%) were significantly affected by ethylene.
Among the cellular components, the categories of “other membranes” (18.0%),
“chloroplast” (8.0%), and “other cellular components” (7.5%) were affected by ethylene
treatment. Thus, more than one half of the ethylene-responsive genes were repressed in
these Go Term categories. This aspect might suggest that ethylene demotes numerous
biological processes and plays an important role in fruit ripening and senescence.
Hierarchical clustering of 1,493 ethylene-responsive genes
To visualize ethylene-responsive expression patterns in 72 h, the 1,493 genes were
subjected to cluster analysis and divided into 2 major clusters (Fig. 2-2). As shown in
14
Fig. 2-1, ethylene treatment caused drastic transcriptional changes of these genes in
comparisons with air treatment, and most of the genes quickly responded to exogenous
ethylene within 24 h of the treatment. Cluster 1 consisted of 939 genes that were
down-regulated after the ethylene treatment. Many genes related to photosynthesis,
chloroplast biogenesis, sugar metabolism, transcription, and cell wall metabolism were
quite evident. Interestingly, ethylene repressed the transcription of most genes involved
in photosynthesis and chloroplast biogenesis, such as the CAB, the photosystem I
subunit, and RBC. This result indicated that repression of photosynthesis-associated
genes was controlled at the transcriptional level by ethylene. Similar repression of
photosynthesis by ethylene was observed in Arabidopsis (Zhong and Burns, 2003). In
the sugar metabolism, starch synthase, gulcose-6-phosphogluconate dehyrogenase and
hexokinase 2 were down-regulated, while hexose carrier, a sucrose transporter, and
acidic invertase were up-regulated. The expression of genes related to the sugar
metabolism is generally reduced during ripening, although not all of them are similar
(Hennig et al., 2004). In ripening fruit of ‘Fortune’ mandarin, sucrose translocation
rather than sucrose synthesis was considered to play a major role in the maintenance of
the sucrose levels in flavedo due to the low activity of sucrose phosphate synthase
(Holland et al., 1999), and sucrose broken down to hexoses was mediated by sucrose
synthase, acid invertase, and alkaline invertase. Cell wall modification genes were also
regulated by ethylene. Most genes were down-regulated by exogenous ethylene, such as
cellulose synthase, pectate lyase, polygalacturonase, pectinacetylesterase, xyloglucan
and endotransglycosylase. In contrast, expansin, ethylene-induced esterase and
beta-galactosidase, UDP-galactose-4-epimerase, and germin-like protein were
up-regulated. There is less information for the transcriptional regulation of cell wall
genes against ethylene in citrus mature fruit. In grapefruit, arabinosyl and galactosyl

15
residues were most abundant in flavedo tissue, and fruit ripening accelerated softening
through hydrolysis for these galactosidase galactosyl and arabinosyl residues of cell
wall by -galactosidase and UDP-galactose-4-epimerase (Mitcham and McDonald,
1993). However, it was reported that ethylene had no effect on the loss of mature fruit
weight and firmness in ‘Shamouti’ orange (Porat et al., 1999). This result suggested that
drastic cell wall modification was not occurred by ethylene treatment during mature
fruit, unlike climacteric fruits, and unique regulation system of cell wall genes should
exist in citrus mature fruit. Interestingly, divergent effects of ethylene have reported in
peach, so that regulatory activity by ethylene can either be positively and negatively
according to the different genes (Trainotti et al., 2003). In strawberry, exogenous
ethylene decreased pectin esterase in ripe and senescing fruits (Castillejo et al., 2004).
Therefore, it is possible that cell wall genes such as pectate lyase and polygalacturonase
were down-regulated by ethylene in mature fruit. Ethylene activates pathogen defense
and several cell-wall-related genes were also induced by pathogen attack (Maleck et al.,
2000). In orange, expansin was induced by glassy-winged sharpshooter (GWSS) -
derived elicitors (Mozoruk et al., 2006).
Cluster 2 contained 554 genes that were radically up-regulated after ethylene
treatment. There were the genes involved in resistance, defense, stress, amino acid
synthesis, protein degradation, secondary metabolism, protein kinase, and other
signaling components. Cysteine proteases, polyubiquitin, and proteasome were
up-regulated, and these proteins were implicated in the ubiquitin-mediated protein
degradation pathway, which might be associated with the initiation of the fruit senescent
process, as reported by Cercós et al., (2006). Ethylene is known to play a key role in
various aspects of plant defense against abiotic stress, such as wounding and ozone
exposure as well as insect and microbial attack (Kunkel and Brooks, 2002). Genes such

16
as osmotin, beta-glucanase, chitinase, and the PR protein were induced, as well as
oxidative-burst proteins of peroxidase and glutathione S-transferase. Reactive oxygen
molecules were generated in the initial steps of response to pathogen attack (Bolwell
and Wojtaszek, 1997). Recently, the GWSS - derived elicitors induced genes that were
characterized in orange using a nylon filter cDNA microarray, and significant
transcriptional changes occurred for the genes involved in direct defense, defense
signaling, cell wall modification, photosynthesis, and abiotic stress (Mozoruk et al.,
2006). Several ethylene-responsive genes characterized in our experiment were
overlapped in these elicitor-induced genes. Plant defense responses are regulated
through a complex signaling network with a cross talk among salicylic acid (SA),
jasmonic acid (JA), and ethylene-signaling pathways. Some of them might be activated
positively or negatively through this cross talk among plant hormone-signaling
pathways.
Ethylene regulates chlorophyll degradation at the transcriptional level
It is well known that ethylene results in the enhancement of color change by
increasing chlorophyll degradation and the promotion of carotenoid biosynthesis
(Goldschmidt et al., 1993). In this experiment, the application of exogenous ethylene
accelerated chlorophyll breakdown, and degreening was completed within 72 h (data
not shown). The chlorophyll contents and ratio of chlorophylls a to b were investigated
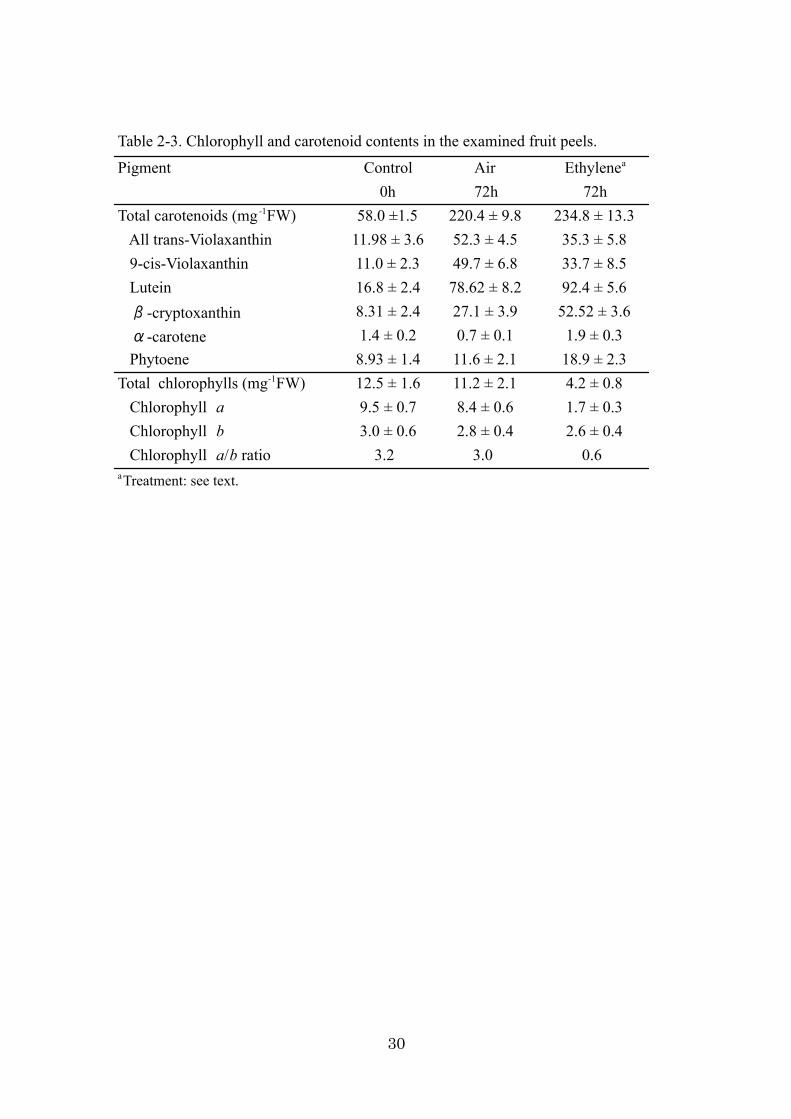
in flavedo tissues at 0 h and 72 h after treatments (Table 2-3). In a comparison of air
treatment, ethylene accelerated the loss of chlorophyll, and the content of chlorophyll
became one-half. The chlorophyll a content in the ethylene-treated fruit decreased along
with chlorophyll degradation, indicating that chlorophyll a was more predominantly
degraded than chlorophyll b. In citrus 22K oligoarrays, 4 chlorophyll-related gene
17
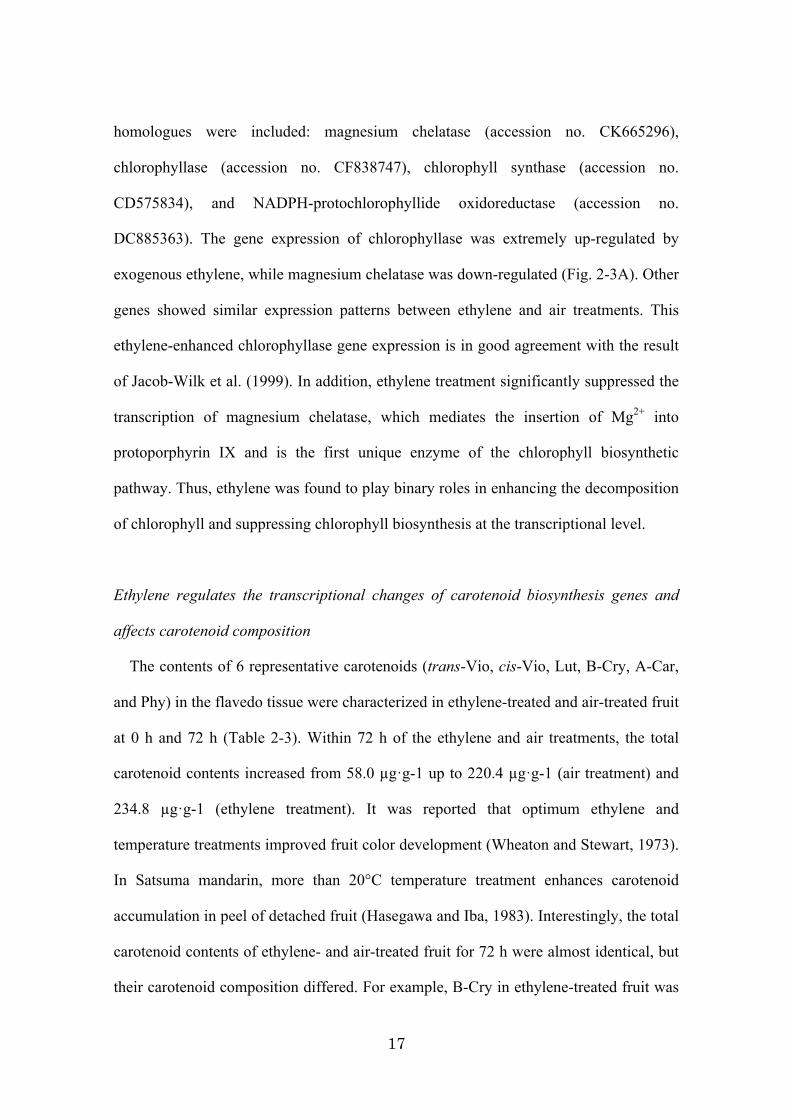
homologues were included: magnesium chelatase (accession no. CK665296),
chlorophyllase (accession no. CF838747), chlorophyll synthase (accession no.
CD575834), and NADPH-protochlorophyllide oxidoreductase (accession no.
DC885363). The gene expression of chlorophyllase was extremely up-regulated by
exogenous ethylene, while magnesium chelatase was down-regulated (Fig. 2-3A). Other
genes showed similar expression patterns between ethylene and air treatments. This
ethylene-enhanced chlorophyllase gene expression is in good agreement with the result
of Jacob-Wilk et al. (1999). In addition, ethylene treatment significantly suppressed the
transcription of magnesium chelatase, which mediates the insertion of Mg2+ into
protoporphyrin IX and is the first unique enzyme of the chlorophyll biosynthetic
pathway. Thus, ethylene was found to play binary roles in enhancing the decomposition
of chlorophyll and suppressing chlorophyll biosynthesis at the transcriptional level.
Ethylene regulates the transcriptional changes of carotenoid biosynthesis genes and
affects carotenoid composition
The contents of 6 representative carotenoids (trans-Vio, cis-Vio, Lut, B-Cry, A-Car,
and Phy) in the flavedo tissue were characterized in ethylene-treated and air-treated fruit
at 0 h and 72 h (Table 2-3). Within 72 h of the ethylene and air treatments, the total
carotenoid contents increased from 58.0 µg·g-1 up to 220.4 µg·g-1 (air treatment) and
234.8 µg·g-1 (ethylene treatment). It was reported that optimum ethylene and
temperature treatments improved fruit color development (Wheaton and Stewart, 1973).
In Satsuma mandarin, more than 20°C temperature treatment enhances carotenoid
accumulation in peel of detached fruit (Hasegawa and Iba, 1983). Interestingly, the total
carotenoid contents of ethylene- and air-treated fruit for 72 h were almost identical, but
their carotenoid composition differed. For example, B-Cry in ethylene-treated fruit was
18
almost twice that of air-treated fruit. On the other hand, the trans-Vio and cis-Vio ratio
(29.39%) of total carotenoids was lower in ethylene-treated fruit than air-treated fruit
(46.42%). Thus, ethylene treatment affected the ratio of B-Cry and violaxanthin (Vio)
content during the 72 h treatment.
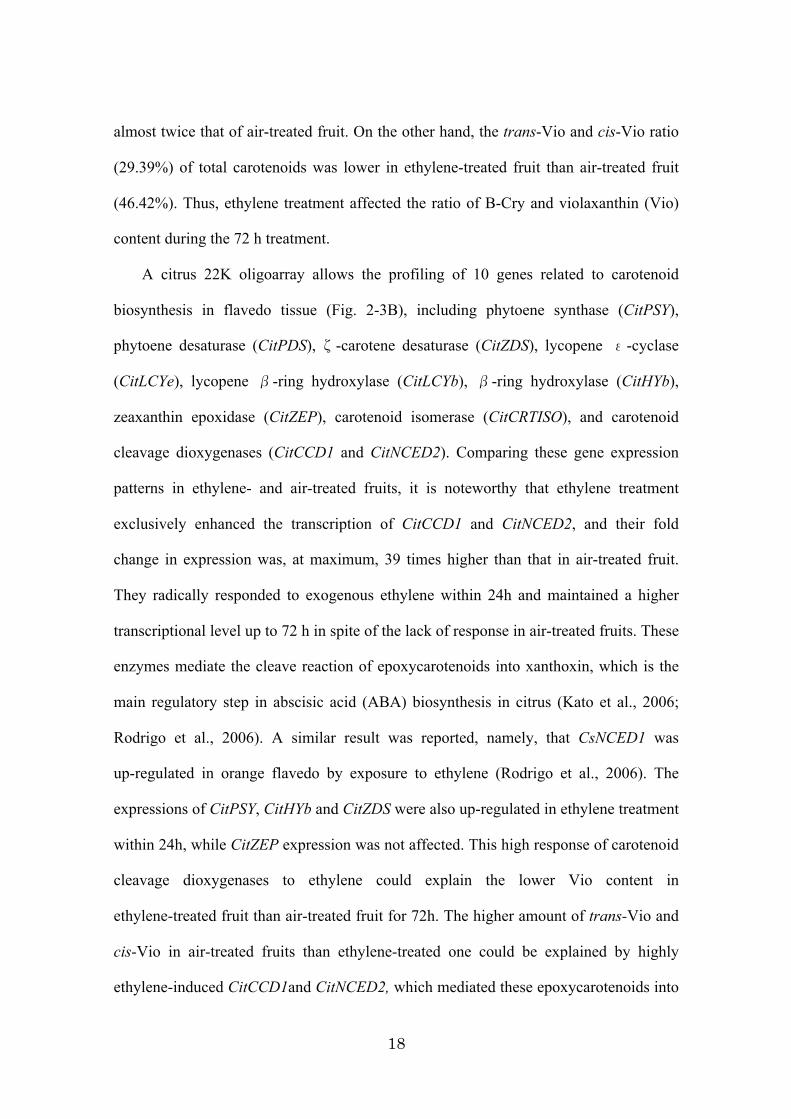
A citrus 22K oligoarray allows the profiling of 10 genes related to carotenoid
biosynthesis in flavedo tissue (Fig. 2-3B), including phytoene synthase (CitPSY),
phytoene desaturase (CitPDS), -carotene desaturase (CitZDS), lycopene -cyclase
(CitLCYe), lycopene -ring hydroxylase (CitLCYb), -ring hydroxylase (CitHYb),
zeaxanthin epoxidase (CitZEP), carotenoid isomerase (CitCRTISO), and carotenoid
cleavage dioxygenases (CitCCD1 and CitNCED2). Comparing these gene expression
patterns in ethylene- and air-treated fruits, it is noteworthy that ethylene treatment
exclusively enhanced the transcription of CitCCD1 and CitNCED2, and their fold
change in expression was, at maximum, 39 times higher than that in air-treated fruit.
They radically responded to exogenous ethylene within 24h and maintained a higher
transcriptional level up to 72 h in spite of the lack of response in air-treated fruits. These
enzymes mediate the cleave reaction of epoxycarotenoids into xanthoxin, which is the
main regulatory step in abscisic acid (ABA) biosynthesis in citrus (Kato et al., 2006;
Rodrigo et al., 2006). A similar result was reported, namely, that CsNCED1 was
up-regulated in orange flavedo by exposure to ethylene (Rodrigo et al., 2006). The
expressions of CitPSY, CitHYb and CitZDS were also up-regulated in ethylene treatment
within 24h, while CitZEP expression was not affected. This high response of carotenoid
cleavage dioxygenases to ethylene could explain the lower Vio content in
ethylene-treated fruit than air-treated fruit for 72h. The higher amount of trans-Vio and
cis-Vio in air-treated fruits than ethylene-treated one could be explained by highly
ethylene-induced CitCCD1and CitNCED2, which mediated these epoxycarotenoids into

19
xanthoxin. In addition to this, most upstream carotenoid biosynthesis genes were
up-regulated by ethylene while CitZEP gene expression was not so induced. These
balance change of these transcription led to the increase of B-Cry.
Thus, ethylene up-regulated the transcription of most carotenoid biosynthesis genes.
The responsive pattern and sensitivity to ethylene were different among these genes.
Their different responding patterns to ethylene would cause a change in the
transcriptional balance of carotenoid biosynthesis genes, directly affecting the
carotenoid composition in the fruit. Similar result was obtained in orange that the
change of carotenoid composition was consistent with the change of related gene
expression caused by ethylene treatment (Rodrigo and Zacarias, 2007).
Ethylene perception signal transduction
Ethylene regulates its own biosynthesis and receptor genes (Wang and Ecker, 2002).
Many components of the ethylene signal transduction pathway have been isolated and
characterized in recent years in Arabidopsis (Bleecker and Schaller, 1996) but little is
known about the transcriptome dynamics of ethylene signal transduction in citrus fruit.
A citrus 22K oligoarray allows the profiling of the following ethylene biosynthesis and
ethylene signal transduction components functionally characterized in plants: ACC
synthase (ACS), ACC oxidase (ACO), the ethylene receptor (ETR), basic leucine
zippers, the carbon catabolite repressor-associated factor (CTR1), mitogen-activated
protein kinases, 14-3-3 proteins, ethylene-responsive factors, and ethylene-responsive
element-binding proteins. Most biosynthesis genes and signal transduction components
did not show any significant expression change (< 2 fold) after exogenous ethylene
treatment (data not shown). Only 2 genes, ACO1 (accession no. DC894173) and
ethylene receptor homologue 2 (ETR2) (accession no. CF931498), showed more than
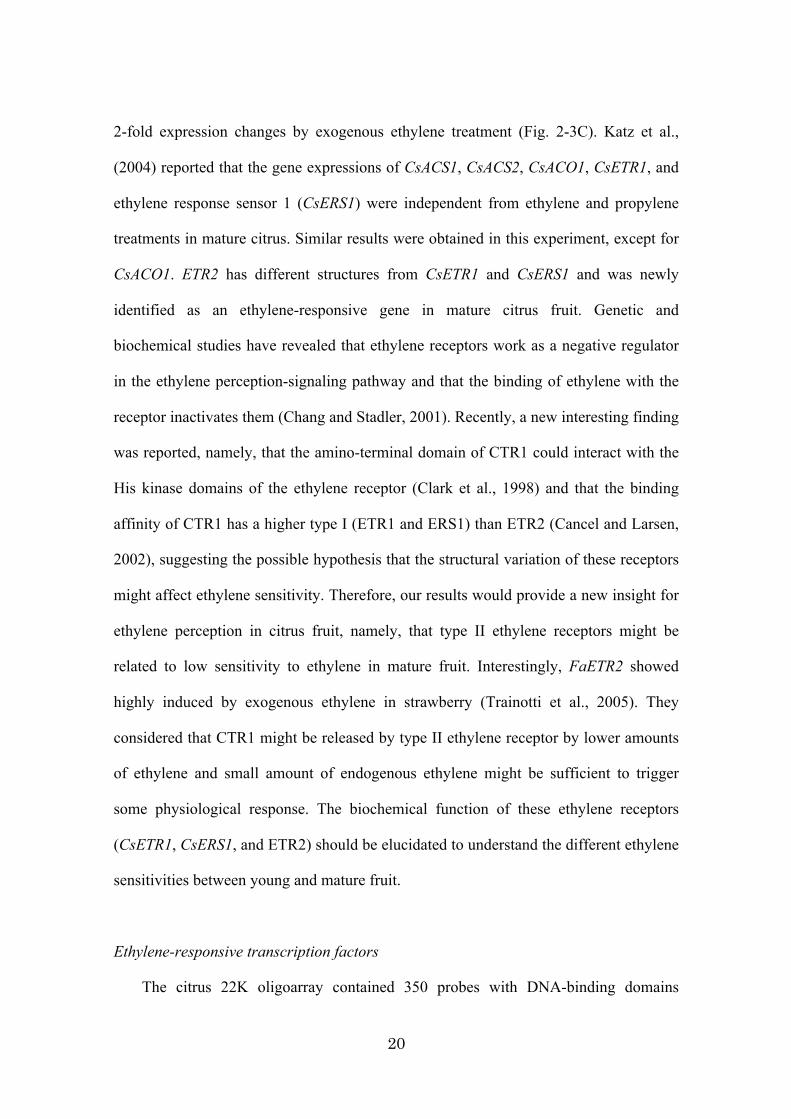
20
2-fold expression changes by exogenous ethylene treatment (Fig. 2-3C). Katz et al.,
(2004) reported that the gene expressions of CsACS1, CsACS2, CsACO1, CsETR1, and
ethylene response sensor 1 (CsERS1) were independent from ethylene and propylene
treatments in mature citrus. Similar results were obtained in this experiment, except for
CsACO1. ETR2 has different structures from CsETR1 and CsERS1 and was newly
identified as an ethylene-responsive gene in mature citrus fruit. Genetic and
biochemical studies have revealed that ethylene receptors work as a negative regulator
in the ethylene perception-signaling pathway and that the binding of ethylene with the
receptor inactivates them (Chang and Stadler, 2001). Recently, a new interesting finding
was reported, namely, that the amino-terminal domain of CTR1 could interact with the
His kinase domains of the ethylene receptor (Clark et al., 1998) and that the binding
affinity of CTR1 has a higher type I (ETR1 and ERS1) than ETR2 (Cancel and Larsen,
2002), suggesting the possible hypothesis that the structural variation of these receptors
might affect ethylene sensitivity. Therefore, our results would provide a new insight for
ethylene perception in citrus fruit, namely, that type II ethylene receptors might be
related to low sensitivity to ethylene in mature fruit. Interestingly, FaETR2 showed
highly induced by exogenous ethylene in strawberry (Trainotti et al., 2005). They
considered that CTR1 might be released by type II ethylene receptor by lower amounts
of ethylene and small amount of endogenous ethylene might be sufficient to trigger
some physiological response. The biochemical function of these ethylene receptors
(CsETR1, CsERS1, and ETR2) should be elucidated to understand the different ethylene
sensitivities between young and mature fruit.
Ethylene-responsive transcription factors
The citrus 22K oligoarray contained 350 probes with DNA-binding domains
21
corresponding to the orthologues of Arabidopsis transcription factors. In the experiment,
24 transcriptional factors were identified as ethylene-responsive transcription factors
with 3-fold expression changes. The functional classification of 24 responsive genes
was conducted in reference to the functional classification of Arabidopsis
transcriptional factors. There are 5 MYB family cDNAs, 2 WRKY family cDNAs, and
2 bHLH family cDNAs, among others. The 6 genes showed low homologies against
Arabidopsis transcription factors. The expression of 13 genes showed down-regulation
in response to exogenous ethylene treatment, and 11 genes showed up-regulation. These
transcription factors are particularly interesting because their transcriptions were
ethylene-regulated and their transcriptional accumulation might be associated with fruit
ripening. Recently, MADS-box factors have been involved in many other aspects of
plant development in addition to the regulation of flowering time. Vrebalov et al. (2002)
revealed that the MADS-box transcriptional factor controlled the tomato never-ripening
phenotype, a ripening inhibitor. In fact, the mRNAs of citrus MADS-box transcription
factors accumulated during fruit development and were assumed to play some roles in
fruit development and ripening (Endo et al., 2006). Causier et al., (2002) proposed that
transcription factors, such as the MADS-box family, might regulate ripening in
non-climacteric fruit, which do not require the ethylene pathway to ripen and act as
global regulators of fruit development. Therefore, some of the identified transcription
factors might play an important role to regulate gene expressions involved in fruit
ripening, such as chlorophyll degradation and carotenoid accumulation. Toward a better
understanding of these actual gene functions, a gene silencing or ectopic expression
experiment will be required.
22
ACO1
Ethylene-induced esterase
CiFT
MYB
PR protein
XET
RBC
0h
24h
48h
72h
CF653559
VS28993A
MWYAR52A
BFC5B47A
MAM9A24A
ANT0329
24h/0h 48h/0h 72h/0h Annotation ID
30.4 41.2 10.8
8.7 9.7 1.7
-11.5 -10.2 -2.73
-64.4 -72.6 -102.7
-50.2 -49.3 -48.3
48.5 120.5 116.1
7.2 7.3 -3.3
AB027456
Fold expression change
Fig.2-1. Northern blot analysis of 7 representative ethylene responsive genes identified by microarray analysis. Ten μg of total RNA from ethylene treated peels was loaded in each lane (0 h, 24 h, 48 h and 72 h after ethylene treatment). To the right of each blot is the EST ID, EST annotation, the ratio of fold expression change between ethylene treatment (E24h, E48h, E72h) and non treatment(C0h).

23
Clu
ster
2
Clu
ster
1
0h 24h 48h 72h 24h 48h 72h
Air Ethylene
Expr
essi
on
5.0
1.0
0.0
Fig. 2-2. Hierarchical cluster analysis of 1439 ethylene responsive genes with more than 3-fold expression changes between ethylene and air treatments (ethylene/air signal intensity ratio). The color scale indicates a signal intensity of each gene. Tree at the left side of the matrix represents gene relationship and upper tree indicates experiment relationship.

24
0
1
10
0h 24h(E/A) 48h(E/A) 72h(E/A)
ACO1ETR2 ACO2ACSACS2CsETR1CsERS1
0.1
1
10
100
0h 24h(E/A) 48h(E/A) 72h(E/A)
CitLCYeCitZEP CitCRTISO CitLCYbCitPDSCitPSYCitHYbCitZDSCitCCD1CitNCED2
A)
B)
0.1
1
10
0h 24h(E/A) 48h(E/A) 72h(E/A)
Mg chelatase
Chlorophyllase
Chlorophyllsynthetase
NADPH-protochlorophyllideoxidoreductase
Fold
exp
ress
ion
chan
ge
Fold
exp
ress
ion
chan
ge
C)
Fold
exp
ress
ion
chan
ge
Fig. 2-3. Expression profiles of chlorophyll (A), carotenoid (B) and ethylene (C) related genes during 72 h after ethylene and air treatments. Fold expression change between ethylene treatment and air treatment (ethylene/air signal intensity ratio) was calculated for each gene. Log scale is applied to the X-axis.
25
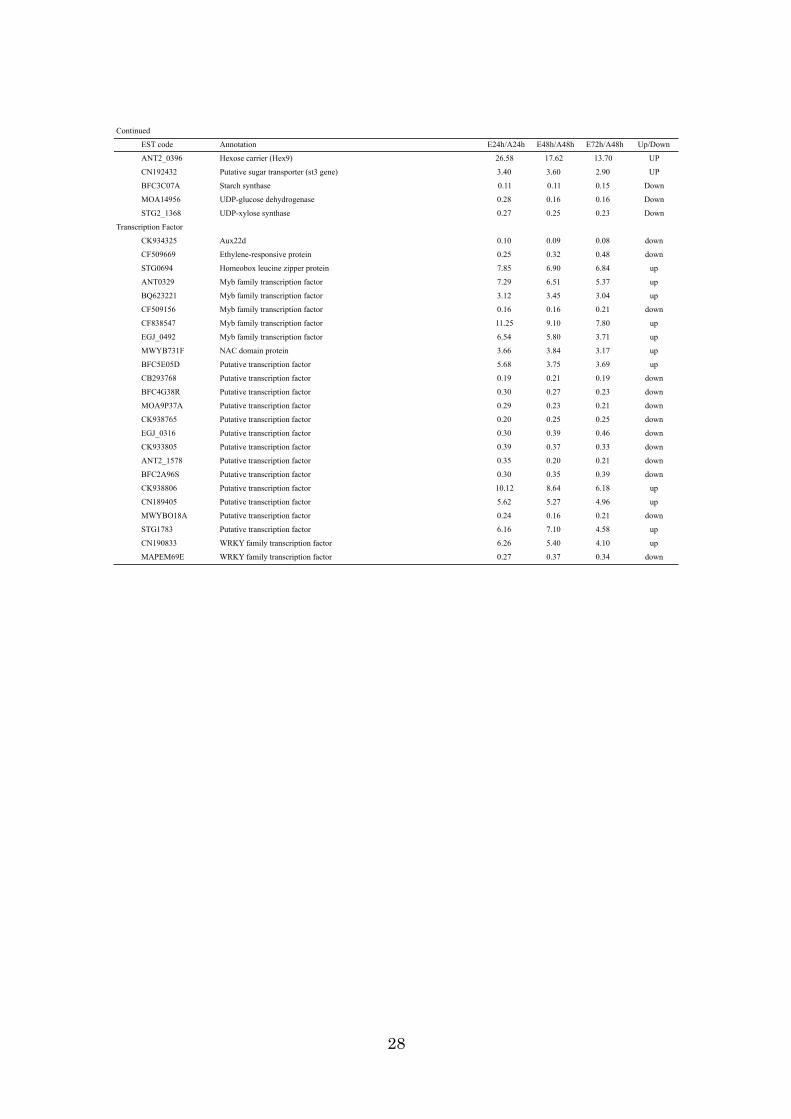
Table 2-1 Representative ethylene resopnsive genes with 3-fold expression change between Ethylene and air treatments (Ethylene/Air ratio).
Annotation E24h/A24h E48h/A48h E72h/A48h Up/Down
Amino acid synthesis
CK938622 Amino acid carrier protein 13.45 8.40 8.01 UP
VS28295A 2-oxoisovalerate dehydrogenase 2.64 3.80 1.93 UP
CO912599 Alanine-glyoxylate aminotransferase 3.41 3.45 4.32 UP
ANT2_0344 Branched-chain amino acid aminotransferase 2 4.70 2.70 3.18 UP
MWYAR88A Cobalamine-independent methionine synthase. 0.49 0.31 0.39 Down
MOADE54R Coffea arabica methionine synthase 0.43 0.27 0.33 Down
FBI1456C Glutamate decarboxylase 0.32 0.42 0.41 Down
ANT2_1143 Glutamine synthetase 3.65 3.14 3.04 UP
CK701455 Glycine hydroxymethyltransferase 0.07 0.09 0.12 Down
FBI1086A L-asparagine amidohydrolase 9.85 13.87 15.25 UP
ANT2_1463 Nitrate transporter (ntp gene) 0.14 0.06 0.09 Down
MFI7HD2D Serine hydroxymethyltransferase 0.20 0.21 0.24 Down
CN188023 Tryptophan synthase 3.12 3.77 3.39 UP
Cell wall metabolism
LLL0411 Alpha-glucan phosphorylase 0.28 0.27 0.32 Down
BFC4E30A Beta-galactosidase 14.15 17.27 13.84 UP
CF509249 Cellulose synthase 0.27 0.24 0.24 Down
MAPF194R Cellulose synthase catalytic subunit 0.29 0.24 0.26 Down
ANT0028 Endo-xyloglucan transferase 0.06 0.06 0.05 Down
VS28993A Ethylene-induced esterase 31.46 25.86 26.75 UP
VS28642A Expansin 1 3.07 1.32 2.05 UP
MAPFF03A Extensin-like protein 0.03 0.04 0.04 Down
BFC4D19A Germin-like protein 0.65 0.20 0.31 Down
MOA16892 Pectate lyase 0.04 0.04 0.04 Down
FBI0771A Pectin methylesterase 0.29 0.21 0.21 Down
CK934694 Pectinacetylesterase 0.42 0.38 0.23 Down
MFI7J67D Pectinesterase 0.47 0.24 0.20 Down
ANT2_0794 Polygalacturonase 0.29 0.22 0.73 Down
CK939533 UDP-galactose-4-epimerase 12.35 10.09 7.24 UP
MOA16779 Xyloglucan endotransglycosylase 0.17 0.20 0.62 Down
CK936995 Xyloglucosyl transferase 3.24 2.18 1.60 UP
Fatty acid biosynthesis and oxidation
MFI87D1D Omega-6 fatty acid desaturase 0.27 0.31 0.31 Down
STG1068 Acyl-CoA synthetase 3.33 1.54 1.52 UP
Lipid degradation
ANT0310 13-lipoxygenase 0.46 0.35 0.25 Down
FBI1121R Fatty acid hydroperoxide lyase 0.09 0.10 0.13 Down
CK665268 GDSL-motif lipase 0.25 0.24 0.25 Down
CF507211 Steryl ester lipase-like protein 0.24 0.12 0.18 Down
Photosynthesis and chloroplast biogenesis
BQ624944 10kd polypeptide of photosystem II 0.33 0.42 0.54 Down
MOA16603 Early light-induced protein-like protein 0.28 0.27 0.41 Down
MOA16819 Geranylgeranyl hydrogenase (Ggh) 0.31 0.35 0.41 Down
FBI1909D Glyceraldehyde-3-phosphate dehydrogenase 0.45 0.32 0.37 Down
CK934598 NADP-dependent glyceraldehydephosphate dehydrogenase subunit B 0.25 0.25 0.25 Down
CO913035 NADPH oxidase 0.29 0.44 0.39 Down
EGJ_1273 33kDa precursor protein of oxygen-evolving complex 0.32 0.34 0.30 Down
LLL0543 Chloroplast matK 0.33 0.66 0.63 Down
SHA01H03_F1 Chloroplast nucleoid DNA binding protein 0.88 0.30 0.30 Down
FBI2160A Chloroplast oxygen-evolving enhancer protein 0.13 0.19 0.12 Down
MOA16447 Chloroplast phosphoglycerate kinase 0.34 0.75 0.79 Down
CD576128 Crystallinum phosphoribulokinase 0.06 0.12 0.09 Down
MWYF162R Gamma subunit of ATP synthase. 0.24 0.23 0.22 Down
FBI1693R Geranylgeranyl reductase 0.18 0.28 0.29 Down
MWYF573F Glycolate oxidase 6.19 5.99 5.82 UP
LLL1100 Light inducible tissue-specific ST-LS1 0.32 0.43 0.43 Down
EST code
26
Continued
EST code Annotation E24h/A24h E48h/A48h E72h/A48h Up/Down
ANT2_0766 Phosphate transporter 0.10 0.10 0.11 Down
EGJ_0860 Phosphate-responsive protein 0.18 0.20 0.22 Down
BFC2E01R Phosphoenolpyruvate carboxykinase 0.30 0.34 0.30 Down
EGJ_0741 Phosphoglycolate phosphatase 0.30 0.34 0.34 Down
EGJ_1317 Photosystem I psaH protein. 0.15 0.18 0.17 Down
BFC3A60D Photosystem I reaction center subunit PSI-N 0.16 0.23 0.26 Down
CK933507 Photosystem I subunit XI 0.08 0.13 0.11 Down
LLL0827 Photosystem II reaction center (PsbW) 0.23 0.19 0.21 Down
BFC3A44A Phototropic-responsive NPH3 family protein 0.35 0.27 0.21 Down
ANT2_0849 Phytochelatin synthetase 0.14 0.12 0.11 Down
MWYF542A Plastidic glucose 6-phoaphate 0.12 0.08 0.09 Down
MWYAR05A Plastocyanin 0.08 0.08 0.10 Down
LLL0930 PSI-K subunit of photosystem I f 0.09 0.09 0.09 Down
LLL1995 Ribulose-1,5-bisphosphate carboxylas 0.08 0.08 0.07 Down
VSSJ011D Rubisco activase beta form precursor (RCA2) 0.08 0.09 0.10 Down
MOAFA81R Type I chlorophyll a/b binding protein 0.20 0.14 0.12 Down
CK934974 Type II chlorophyll a/b binding protein 0.08 0.10 0.10 Down
BFC4A24A Thioredoxin F isoform. 0.38 0.76 0.76 Down
EGJ_1324 Triose phosphate translocator 0.08 0.09 0.08 Down
Plant horomone related
FBI2162E Allene oxide cyclase 0.23 0.32 0.37 Down
BQ625110 ABA-responsive protein 0.21 0.33 0.41 Down
ANT2_1369 Aux/IAA protein 0.17 0.23 0.25 Down
MAPDR18A Auxin-associated protein 0.15 0.45 0.42 Down
FBI1682A Auxin-regulated IAA8 0.20 0.23 0.34 Down
CF931498 Ethylene receptor (ETR2) 4.62 3.77 3.02 UP
FBI1182R Ethylene-inducible protein 4.56 3.74 2.57 UP
CF509669 Ethylene-responsive family protein 0.24 0.32 0.47 Down
CF837667 GH3-like protein 5.74 5.57 7.63 UP
CK933029 Gibberellic acid-induced gene Gasa4 0.29 0.37 0.37 Down
ANT2_0636 Ripening-related protein 6.33 5.02 3.11 UP
Protein degradation
YJS0628 Delta proteasome subunit 5.96 3.63 3.90 UP
ANT2_0868 Fasciclin-like AGP 12 0.37 0.32 0.23 Down
STG1185 Polyubiquitin 3.75 2.16 1.64 UP
BFC4D36S Adenosylhomocysteinase (AHC2) 4.07 3.64 3.04 UP
CK938754 Aspartic proteinase 5 0.22 0.38 0.46 Down
CK934091 Formate dehydrogenase 6.78 2.88 2.06 UP
MWYB720A Phytochelatin synthetase family protein 0.14 0.11 0.12 Down
MAPAT76A Cystein proteinase 1.61 2.61 3.47 UP
MFI6MA5D Small ubiquitin-like modifier 2 3.30 2.92 2.50 UP
MFI6MA0R_2 Urate oxidase 3.13 4.95 3.60 UP
Protein kinase and other signaling components
MWYAV31D Leucine-rich repeat transmembrane protein kinase 3.87 3.23 2.87 UP
CD576318 APS-kinase 3.00 2.14 1.41 UP
MAPF178F CBL-interacting protein kinase 5 (CIPK5) 0.19 0.18 0.39 Down
FBI0632R Cyclin-dependent kinases CDKB 0.27 0.22 0.32 Down
ANT2_0895 Cytokinin signal transduction regulator (RR2) 14.97 6.86 8.95 UP
FBI1751A Leucine-rich repeat transmembrane protein kinase 0.32 0.33 0.31 Down
MOA16936 Protein kinase family protein 3.31 2.33 2.04 UP
MWYBU53F SOS2-like protein kinase 4.35 3.91 3.38 UP
Resistance, defense, stress and PR
MAP9C16R Dehydrin 0.19 0.25 0.27 Down
ANT2_0655 Glutathione S-transferase 0.37 0.29 0.26 Down
CK936454 Peroxidase (POX2) 22.47 9.23 7.17 UP
CN187002 Peroxidase (POX3) 10.62 6.55 4.64 UP
ANT2_1324 Polygalacturonase-inhibitor protein 0.35 0.42 0.29 Down
SHA02H08_F1 Type I proteinase inhibitor-like protein 18.08 47.18 15.07 UP
27
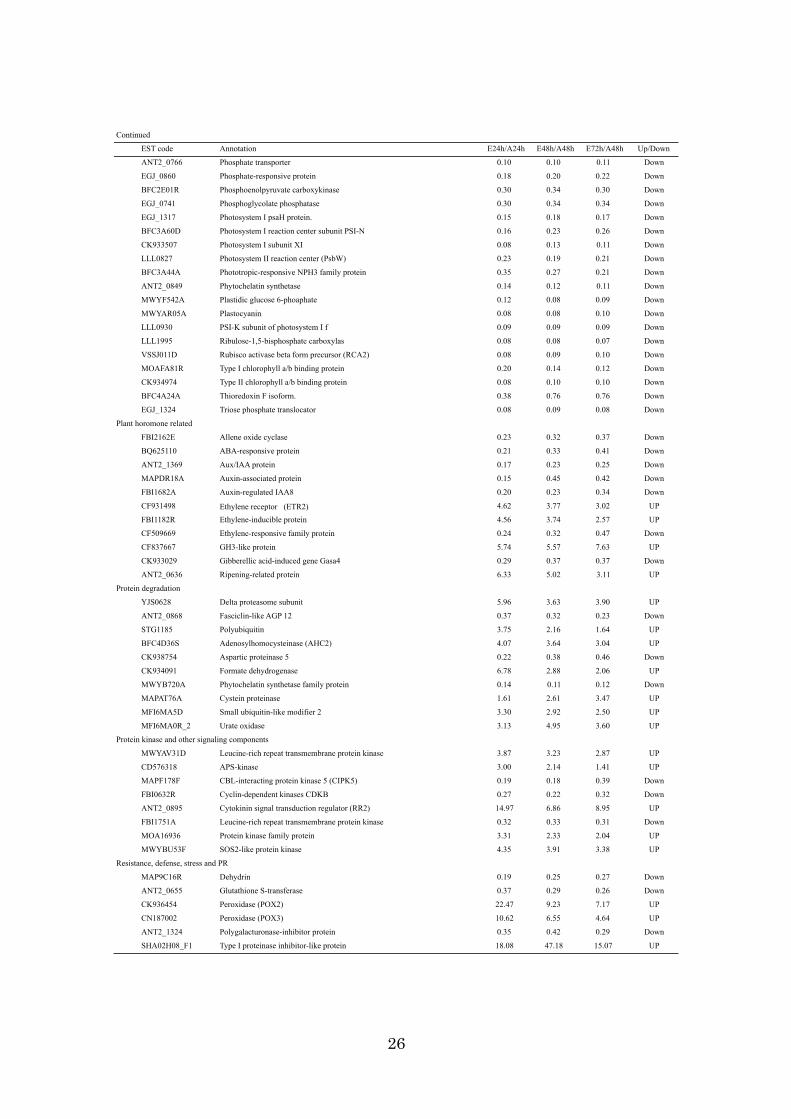
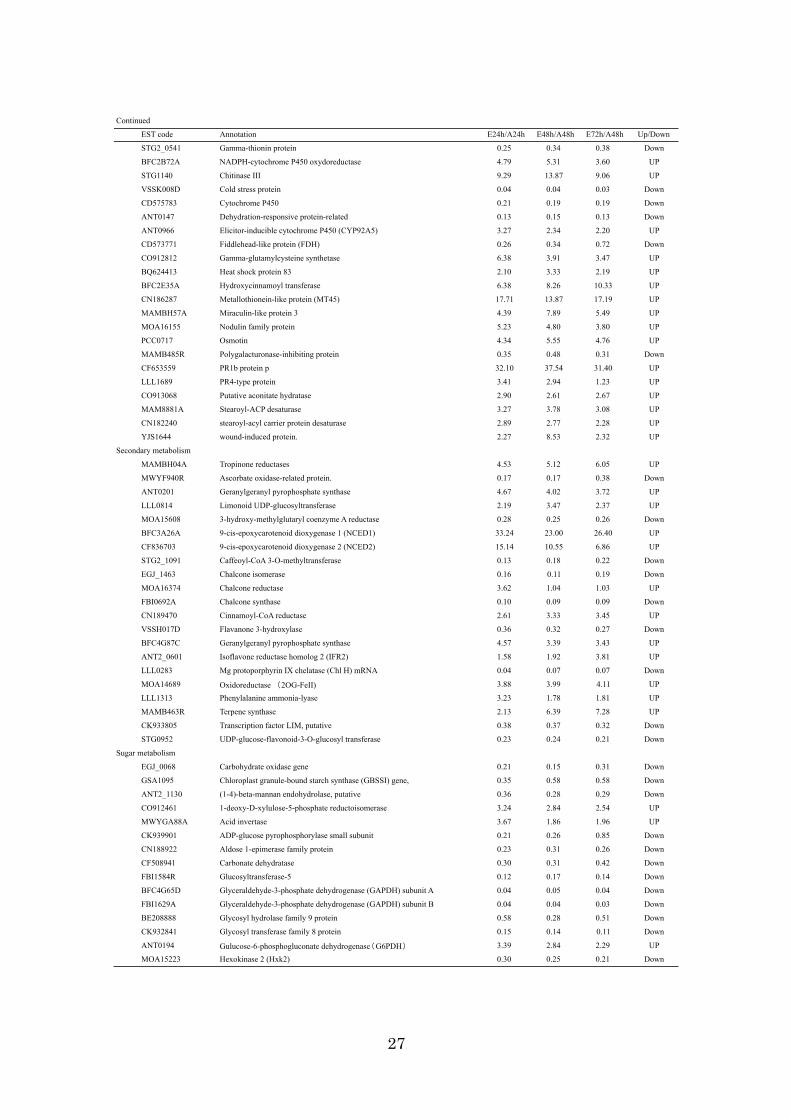
Continued
EST code Annotation E24h/A24h E48h/A48h E72h/A48h Up/Down
STG2_0541 Gamma-thionin protein 0.25 0.34 0.38 Down
BFC2B72A NADPH-cytochrome P450 oxydoreductase 4.79 5.31 3.60 UP
STG1140 Chitinase III 9.29 13.87 9.06 UP
VSSK008D Cold stress protein 0.04 0.04 0.03 Down
CD575783 Cytochrome P450 0.21 0.19 0.19 Down
ANT0147 Dehydration-responsive protein-related 0.13 0.15 0.13 Down
ANT0966 Elicitor-inducible cytochrome P450 (CYP92A5) 3.27 2.34 2.20 UP
CD573771 Fiddlehead-like protein (FDH) 0.26 0.34 0.72 Down
CO912812 Gamma-glutamylcysteine synthetase 6.38 3.91 3.47 UP
BQ624413 Heat shock protein 83 2.10 3.33 2.19 UP
BFC2E35A Hydroxycinnamoyl transferase 6.38 8.26 10.33 UP
CN186287 Metallothionein-like protein (MT45) 17.71 13.87 17.19 UP
MAMBH57A Miraculin-like protein 3 4.39 7.89 5.49 UP
MOA16155 Nodulin family protein 5.23 4.80 3.80 UP
PCC0717 Osmotin 4.34 5.55 4.76 UP
MAMB485R Polygalacturonase-inhibiting protein 0.35 0.48 0.31 Down
CF653559 PR1b protein p 32.10 37.54 31.40 UP
LLL1689 PR4-type protein 3.41 2.94 1.23 UP
CO913068 Putative aconitate hydratase 2.90 2.61 2.67 UP
MAM8881A Stearoyl-ACP desaturase 3.27 3.78 3.08 UP
CN182240 stearoyl-acyl carrier protein desaturase 2.89 2.77 2.28 UP
YJS1644 wound-induced protein. 2.27 8.53 2.32 UP
Secondary metabolism
MAMBH04A Tropinone reductases 4.53 5.12 6.05 UP
MWYF940R Ascorbate oxidase-related protein. 0.17 0.17 0.38 Down
ANT0201 Geranylgeranyl pyrophosphate synthase 4.67 4.02 3.72 UP
LLL0814 Limonoid UDP-glucosyltransferase 2.19 3.47 2.37 UP
MOA15608 3-hydroxy-methylglutaryl coenzyme A reductase 0.28 0.25 0.26 Down
BFC3A26A 9-cis-epoxycarotenoid dioxygenase 1 (NCED1) 33.24 23.00 26.40 UP
CF836703 9-cis-epoxycarotenoid dioxygenase 2 (NCED2) 15.14 10.55 6.86 UP
STG2_1091 Caffeoyl-CoA 3-O-methyltransferase 0.13 0.18 0.22 Down
EGJ_1463 Chalcone isomerase 0.16 0.11 0.19 Down
MOA16374 Chalcone reductase 3.62 1.04 1.03 UP
FBI0692A Chalcone synthase 0.10 0.09 0.09 Down
CN189470 Cinnamoyl-CoA reductase 2.61 3.33 3.45 UP
VSSH017D Flavanone 3-hydroxylase 0.36 0.32 0.27 Down
BFC4G87C Geranylgeranyl pyrophosphate synthase 4.57 3.39 3.43 UP
ANT2_0601 Isoflavone reductase homolog 2 (IFR2) 1.58 1.92 3.81 UP
LLL0283 Mg protoporphyrin IX chelatase (Chl H) mRNA 0.04 0.07 0.07 Down
MOA14689 Oxidoreductase 2OG-FeII) 3.88 3.99 4.11 UP
LLL1313 Phenylalanine ammonia-lyase 3.23 1.78 1.81 UP
MAMB463R Terpene synthase 2.13 6.39 7.28 UP
CK933805 Transcription factor LIM, putative 0.38 0.37 0.32 Down
STG0952 UDP-glucose-flavonoid-3-O-glucosyl transferase 0.23 0.24 0.21 Down
Sugar metabolism
EGJ_0068 Carbohydrate oxidase gene 0.21 0.15 0.31 Down
GSA1095 Chloroplast granule-bound starch synthase (GBSSI) gene, 0.35 0.58 0.58 Down
ANT2_1130 (1-4)-beta-mannan endohydrolase, putative 0.36 0.28 0.29 Down
CO912461 1-deoxy-D-xylulose-5-phosphate reductoisomerase 3.24 2.84 2.54 UP
MWYGA88A Acid invertase 3.67 1.86 1.96 UP
CK939901 ADP-glucose pyrophosphorylase small subunit 0.21 0.26 0.85 Down
CN188922 Aldose 1-epimerase family protein 0.23 0.31 0.26 Down
CF508941 Carbonate dehydratase 0.30 0.31 0.42 Down
FBI1584R Glucosyltransferase-5 0.12 0.17 0.14 Down
BFC4G65D Glyceraldehyde-3-phosphate dehydrogenase (GAPDH) subunit A 0.04 0.05 0.04 Down
FBI1629A Glyceraldehyde-3-phosphate dehydrogenase (GAPDH) subunit B 0.04 0.04 0.03 Down
BE208888 Glycosyl hydrolase family 9 protein 0.58 0.28 0.51 Down
CK932841 Glycosyl transferase family 8 protein 0.15 0.14 0.11 Down
ANT0194 Gulucose-6-phosphogluconate dehydrogenase G6PDH 3.39 2.84 2.29 UP
MOA15223 Hexokinase 2 (Hxk2) 0.30 0.25 0.21 Down
28
Continued
EST code Annotation E24h/A24h E48h/A48h E72h/A48h Up/Down
ANT2_0396 Hexose carrier (Hex9) 26.58 17.62 13.70 UP
CN192432 Putative sugar transporter (st3 gene) 3.40 3.60 2.90 UP
BFC3C07A Starch synthase 0.11 0.11 0.15 Down
MOA14956 UDP-glucose dehydrogenase 0.28 0.16 0.16 Down
STG2_1368 UDP-xylose synthase 0.27 0.25 0.23 Down
Transcription Factor
CK934325 Aux22d 0.10 0.09 0.08 down
CF509669 Ethylene-responsive protein 0.25 0.32 0.48 down
STG0694 Homeobox leucine zipper protein 7.85 6.90 6.84 up
ANT0329 Myb family transcription factor 7.29 6.51 5.37 up
BQ623221 Myb family transcription factor 3.12 3.45 3.04 up
CF509156 Myb family transcription factor 0.16 0.16 0.21 down
CF838547 Myb family transcription factor 11.25 9.10 7.80 up
EGJ_0492 Myb family transcription factor 6.54 5.80 3.71 up
MWYB731F NAC domain protein 3.66 3.84 3.17 up
BFC5E05D Putative transcription factor 5.68 3.75 3.69 up
CB293768 Putative transcription factor 0.19 0.21 0.19 down
BFC4G38R Putative transcription factor 0.30 0.27 0.23 down
MOA9P37A Putative transcription factor 0.29 0.23 0.21 down
CK938765 Putative transcription factor 0.20 0.25 0.25 down
EGJ_0316 Putative transcription factor 0.30 0.39 0.46 down
CK933805 Putative transcription factor 0.39 0.37 0.33 down
ANT2_1578 Putative transcription factor 0.35 0.20 0.21 down
BFC2A96S Putative transcription factor 0.30 0.35 0.39 down
CK938806 Putative transcription factor 10.12 8.64 6.18 up
CN189405 Putative transcription factor 5.62 5.27 4.96 up
MWYBO18A Putative transcription factor 0.24 0.16 0.21 down
STG1783 Putative transcription factor 6.16 7.10 4.58 up
CN190833 WRKY family transcription factor 6.26 5.40 4.10 up
MAPEM69E WRKY family transcription factor 0.27 0.37 0.34 down
29
Total (%) No. of down-regulated genes No. of up-regulated genesMolecular function
DNA or RNA binding 27 (1.8%) 21 6Hydrolase activity 97 (6.5%) 60 37Kinase activity 25 (1.7%) 16 9Nucleic acid binding 2 (0.1%) 1 1Nucleotide binding 26 (1.7%) 9 17Protein binding 40 (2.7%) 23 17Receptor binding or activity 5 (0.3%) 3 2Structural molecule activity 5 (0.3%) 4 1Transcription factor activity 53 (3.5%) 37 16Transferase activity 99 (6.6%) 60 39Transporter activity 41 (2.7%) 24 17Other binding 116 (7.8%) 80 36Other enzyme activity 176 (11.8%) 91 85Other molecular functions 49 (3.3%) 32 17Molecular function unknown 157 (10.5%) 112 45No similarity to Arabidopsis cDNA 554 (37.1%)
Biological processCell organization and biogenesis 25 (1.7%) 19 6Developmental processes 37 (2.5%) 19 18DNA or RNA metabolism 2 (0.1%) 2 0Electron transport or energy pathways 78 (5.2%) 47 31Protein metabolism 56 (3.8%) 43 13Response to abiotic or biotic stimulus 89 (6.0%) 56 33Response to stress 88 (5.9%) 50 38Signal transduction 21 (1.4%) 14 7Transcription 37 (2.5%) 24 13Transport 130 (8.7%) 81 49Other biological processes 160 (10.7%) 95 65Other cellular processes 274 (18.4%) 160 114Other metabolic processes 334 (22.4%) 191 143Other physiological processes 297 (19.9%) 178 119Biological process unknown 185 (12.4%) 116 69No similality to Arabidopsis cDNA 554 (37.1%)
Cellar componentCell wall 18 (1.2%) 12 6Chloroplast 119 (8.0%) 83 36Cytosol 19 (1.3%) 9 10ER 9 (0.6%) 7 2Extracellular 11 (0.7%) 7 4Golgi apparatus 1 (0.1%) 1 0Mitochondria 58 (3.9%) 31 27Nucleus 56 (3.8%) 33 23Plasma membrane 9 (0.6%) 7 2Plastid 55 (3.7%) 49 6Ribosome 3 (0.2%) 2 1Other cellular components 112 (7.5%) 91 21Other cytoplasmic components 101 (6.8%) 76 25Other intracellular components 90 (6.0%) 76 14Other membranes 269 (18.0%) 190 79Cellular component unknown 231 (15.5%) 128 103No similarity to Arabidopsis cDNA 554 (37.1%)
Go Term
Table 2-2.Gene ontology annotations for Arabidopsis (GO SLIM) functional assignments for ethylene responsive 1493 genes with more than 3-fold expression changes.
30
Table 2-3. Chlorophyll and carotenoid contents in the examined fruit peels.
Pigment Control Air Ethylenea
0h 72h 72hTotal carotenoids (mg-1FW) 58.0 ±1.5 220.4 ± 9.8 234.8 ± 13.3 All trans-Violaxanthin 11.98 ± 3.6 52.3 ± 4.5 35.3 ± 5.8 9-cis-Violaxanthin 11.0 ± 2.3 49.7 ± 6.8 33.7 ± 8.5 Lutein 16.8 ± 2.4 78.62 ± 8.2 92.4 ± 5.6 -cryptoxanthin 8.31 ± 2.4 27.1 ± 3.9 52.52 ± 3.6 -carotene 1.4 ± 0.2 0.7 ± 0.1 1.9 ± 0.3 Phytoene 8.93 ± 1.4 11.6 ± 2.1 18.9 ± 2.3Total chlorophylls (mg-1FW) 12.5 ± 1.6 11.2 ± 2.1 4.2 ± 0.8 Chlorophyll a 9.5 ± 0.7 8.4 ± 0.6 1.7 ± 0.3 Chlorophyll b 3.0 ± 0.6 2.8 ± 0.4 2.6 ± 0.4 Chlorophyll a/b ratio 3.2 3.0 0.6aTreatment: see text.
31
Section 2: Profiling gibberellin (GA3)-responsive genes in mature fruit using a
citrus 22K oligoarray
In Section 1,1493 ethylene-responsive genes were identified and found that
ethylene repressed the transcription of most genes involved in photosynthesis and
chloroplast biogenesis, while it induced the transcription of several genes related to
resistance, defense, stress, amino acid synthesis, protein degradation, and secondary
metabolism. Therefore, transcriptional profiling using microarray technology is
expected to provide new insight into the GA regulatory mechanism of citrus fruit. In
this experiment, GA3-responsive genes in mature citrus fruit were investigated using a
citrus 22K oligoarray. 231 genes were identified as GA3-responsive genes; genes that
showed an expression change of 3-fold or greater in the 72 h after GA3 treatment,
compared to expression after air treatment. It was found that GA3 up-regulated the
expression of genes related to photosynthesis and of pathogen-related genes and
repressed the expression of some of the ethylene-inducable genes that are involved in
fruit ripening.
Materials and methods
Plant material and gibberellin treatment
Satsuma mandarin (C. unshiu Marc.), cultivated at the Citrus Research
Division Okitsu of NIFTS, was used. Samples of fruit at 150 DAF were collected. For
the gibberellin treatment of fruit, 60 µM GA3 was sprayed on fruits. Both GA3 treatment
and air treatment were conducted at 25°C. The flavedo tissue was excised and
immediately frozen in liquid nitrogen and stored at -80ºC until RNA extraction.
32
Chlorophyll and carotenoid quantification in flavedo
Chlorophyll (a + b) content was determined by measuring the absorbance at 642
nm and 662 nm according to the method of Shimada and Shimokawa et al. (1978).
Quantification of 6 representative carotenoids (trans-Vio, cis-Vio, Lut, B-Cry, A-Car,
and Phy) was carried out by the method of Kato et al. (2004). An aliquot (20 µL) was
separated by a reverse-phase HPLC system (Jasco) fitted with a YMC Carotenoid S-5
column of 250- x 4.6-mm-i.d. (Waters) at a flow rate of 1 mL min–1. The eluent was
monitored using a photodiode array detector (MD-910, Jasco). Chlorophyll and
Carotenoid quantification was performed in three times.
RNA isolation and microarray analysis
Total RNA was extracted by the methods of Ikoma et al. (1996) from flavedo
tissues of untreated fruit at 0 h and from either GA3-treated or air-treated fruit at 24 h,
48 h, and 72 h after treatment. At least three independent RNA extractions were used in
probe labeling for experimental reproducibility. The total RNA (400 ng) of all samples
was labeled with Cy5, while non-treatment at 0 h was labeled with Cy3 according to the
instructions for the Low RNA input linear amplification and labeling kit (Agilent
technologies). Labeled cRNA was purified using the Qiagen RNeasy mini kit (Qiagen).
Hybridization and washing were performed according to Section 1. The intensities of
the Cy5 and Cy3 fluorescent signals from each spot were automatically normalized, and
the ratio value (Cy5/Cy3) was calculated using Feature Extraction version 7.1 software
(Linear & LOWESS analysis, Agilent technologies). Data analysis was carried out
using GENESPRING 7.3.1 (Silicon Genetics). The fold change of each gene expression
was calculated based on the mRNA ratio between GA3 treatment samples and air
treatment samples at equivalent time points. Genes with a 3-fold or greater expression
33
change between GA3 treatment and air treatment at each experimental time (24 h, 48 h,
and 72 h) were accepted as GA3-responsive genes.
Northern blot analysis
Ten microgram from each RNA sample was subjected to electrophoresis on a 1.2%
agarose gel containing 8% (v/v) formaldehyde and transferred to a nylon membrane
(Hybond-NX, Amersham Pharmacia Biotech). The cDNA probes of 6 representative
GA3-responsive genes identified by microarray analysis were prepared with the use of a
PCR DIG labeling kit (Roche Molecular Biochemicals). Hybridization and detection
were conducted according to the manufacturer’s directions (Roche Molecular
Biochemicals).
Results and discussion
Identification and functional classification of 231 GA3-responsive genes
A citrus 22K oligoarray was employed to identify GA3-responsive genes in mature
fruit. Out of 21,495 independent EST probes, 231 genes showed a 3-fold or greater
change in the ratio of mRNA levels 72 h after GA3 treatment compared to mRNA levels
after 72 h of air treatment. To monitor the results of microarray analysis, the signal
intensity of several representative genes was compared between Northern blot and
microarray analysis. The fidelity of the experiments was confirmed (Fig. 2-4). The 231
GA3-responsive genes were compared by TBLAST X similarity search (e-value <1e-5)
against all cDNAs of Arabidopsis (downloaded from TAIR. Since each Arabidopsis
cDNA entry in TAIR provided functional information (GOSLIM in TAIR), the Satsuma
mandarin genes were assigned functions according to GOSLIM on the basis of their
similarity to cDNAs of Arabidopsis (Table 2-4). GA3 treatment affected genes that had
34
been assigned to the following functional categories: ‘other enzyme activity’ (15.2%),
‘hydorase activity’ (12.1 %) (in the molecular function categories) and ‘other metabolic
processes’ (30.7 %), ‘other physiological processes’ (28.6 %), ‘other cellular processes’
(28.6 %) (in the biological processes categories). In the cellular components catagories,
‘other membranes’ (25.1 %) and ‘chloroplast’ (9.5 %) were affected by GA3 treatment.
Ethylene treatment had the effect of down-regulation on similar categories as shown in
Section 1. GA3 treatment, however, in this fruit stage, had the predominant effect of
up-regulating genes within these categories. 79 genes showed this contrasting response
between ethylene and GA3 treatments. Only 27 genes were functionally annotated and,
of these, most genes were related to ‘secondary metabolism’, ‘photosynthesis and
chloroplast biogenesis’, and ‘resistance, defense, stress and PR’ (Table 2-4). GA3
treatment increased the expression of genes related to ‘photosynthesis and chloroplast
biogenesis’, including 6.1 kDa polypeptide of photosystem II, CAB type I, chloroplast
sedoheptulose-1,7-bisphosphatase (Table 2-5), all of which are down-regulated by
ethylene treatment. The effect of GA on photosynthesis is controversial because
contradictory results have been obtained from different plants, such that GA increased
or decreased photosynthetic capacity and photosynthetic rate (Dijkstra et al, 1990; Yuan
and Xu, 2001; Ashraf et al., 2002). These results indicate that GA3 has a positive effect
on photosynthesis in mature citrus fruit peel.
Clustering analysis of 213 GA3-responsive genes
To visualize GA3-responsive expression patterns 72 h after GA3 treatment, the 231
genes were subjected to cluster analysis and divided into 2 major clusters (Fig. 2-5).
Drastic transcriptional changes of these genes were seen following GA3 treatment
compared to that seen following air treatment. Cluster 1 consisted of 95 genes that were
35
down-regulated after GA3 treatment, listed in Table 2-4. GA3 treatment repressed some
of the genes that had been ethylene-induced in Section 1. For example, NCED1 is one
of the cleave reaction enzymes converting epoxycarotenoids into xanthoxin, which is
the main regulatory step in ABA biosynthesis in citrus (Rodrigo et al., 2006; Kato et al.,
2006). NCED1 was one of the highly inducible genes in mature fruit by ethylene
treatment. GA3 treatment down regulated the mRNA levels of this gene. This would
result in the repression of the metabolic conversion of carotenoids to ABA. In
Arabidopsis seed germination, GA reduced ABA levels by affecting ABA biosynthesis
(Ogawa et al., 2003).
Cysteine proteases have been implicated in the ubiquitin-mediated protein
degradation pathway and might be associated with the initiation of the fruit senescent
process (Cercós et al., 2006). P450, (CF507320), which was down-regulated by GA3,
had high homology to brassinosteroids-6-oxidase of grape, which was a key gene in
brassinosteroid (BR) biosynthesis and mediates the conversion of 6-deoxocastasterone
to castasterone in grape (Symons et al., 2006). They considered that BR level was
associated with ripening in grapes, which is a non-climacteric fruit, as is citrus. Citrus
invertase 1 (CitINV1) is associated with the brake-down of sucrose to hexoses, regulates
sucrose concentration during fruit ripening and regulates sucrose synthase and acid
invertases (Holland et al., 1999; Kubo et al., 2001). In tomato fruit (Jeffery et al, 1984)
and in citrus fruit, ethylene treatment enhanced enzyme activity and gene expression of
invertase. GA3 reduced the transcription of these ethylene-inducable genes, which are
associated with ripening in mature citrus fruit.
Cluster 2 contained 136 genes up-regulated by GA3 treatment, listed in Table 2-5.
Several genes involved in resistance, defense and stress, or cell wall modification were
either up- or down-regulated by GA3 treatment. Some cell wall modification genes are
36
also induced by pathogen attack (Maleck et al., 2000; Mozoruk et al., 2006). Some
genes showed similar patterns of response to ethylene treatment, however, the opposite
response was also observed. Chitinase is a well-known antifungal protein and belongs to
the pathogenesis-related (PR) group of proteins, and its gene expression was markedly
induced by elicitor treatment in flavedo (Porat et al., 2001). GA3 treatment induced
chitinase expression whereas ethylene did not induce chitinase expression. A similar
result was obtained in tomato; chitinase expression was induced by MeJA, GA and
wounding signal, but not by ethylene and ABA (Wu and Bradford, 2003). GA
up-regulated several citrus flavor related genes such as (E)- -ocimene synthase,
gamma-terpinene synthase and HMG-CoA synthase. Monoterpenes play ecological
roles in pollinator attraction, allelopathy, and plant defense. Several monoterpenes and
sesquiterpenes were reported to take part in direct plant defense (Langenheim, 1994). In
addition, citrus miraculin-like protein was reported to have protease inhibitor activities
and defensive function against pathogen (Tsukada et al., 2006). Various WRKY-DNA
binding proteins, belonging to a large group of zinc-finger proteins, are implicated
primarily in defense responses but are also implicated in plant development (Eulgem et
al., 2000). Thus, it was considered that GA3 treatment, directly or indirectly, might
induce the transcription of these genes related to resistance, defense and stress.
Generally, plant defense responses are regulated through a complex signaling network
with cross talk between SA, JA, and ethylene-signaling pathways. Some pathways
might be activated positively or negatively through this cross talk. Therefore, these
results indicate that the GA response pathway takes part in cross talk with the
pathogen-related pathways in mature citrus fruit.
Profiling GA3 regulation of chlorophyll, carotenoids and ethylene biosynthesis
37
It is well known that ethylene promotes chlorophyll degradation and carotenoid
biosynthesis and that GA represses these color changes (Goldschmidt et al., 1993). In
this experiment, chlorophyll contents and 6 representative carotenoids were investigated
in flavedo tissues at 0 h and 72 h after treatments (air or GA3) (Table 2-6). No
significant difference was seen in either chlorophyll content or in Chlorophyll a/b ratios
between fruits at equivalent time points. Total carotenoid content increased from 105.9
µg·g-1 to 217.0 µg·g-1 (air treatment) and 209.1 µg·g-1 (GA3 treatment), 72 h after
treatment, possibly due to moderate temperature (Wheaton and Stewart, 1973). No
significant difference was not observed between carotenoid composition of GA3 and air
treated fruits. Similar results were obtained in orange, where GA3 did not have a
significant effect on total carotenoid content and prevented most of the
ethylene-induced carotenoid changes (Rodrigo and Zacarias, 2007).
Citrus 22K oligoarray enabled the profiling of 4 chlorophyll metabolic genes and
10 carotenoid metabolic genes. Concerning chlorophyll metabolism, GA3 treatment
only affected magnesium chelatase and it up-regulated its transcription (Fig. 2-6A). The
expression levels of chlorophyll synthase, NADPH-protochlorophyllide oxidoreductase,
and chlorophyllase did not significantly change between GA3 and air treated fruits.
Magnesium chelatase is the first unique enzyme of the chlorophyll biosynthetic pathway
and mediates the insertion of Mg2+ into protoporphyrin IX. Ethylene treatment
repressed gene expression of magnesium chelatase and enhanced chlorophyllase gene
expression. Of the genes examined that relate to chlorophyll biosynthesis, GA3 affected
only magnesium chelatase but induced an opposite effect to ethylene. This result agreed
with the hypothesis of Jacob-Wilk et al. (1999), that chlorophyll levels are determined
by the balance between synthesis and breakdown. In carotenoid metabolism, GA3
treatment down-regulates almost all biosynthesis genes (Fig. 2-6B). Particularly, it
38
highly repressed the gene expression of CitCCD1and CitNCED2, CitPSY and CitHYb.
In orange, it was reported that GA reduced the ethylene-induced expression of early
carotenoid biosynthesis genes and the accumulation of Phy, phytofluence and
-citraurin (Rodrigo and Zacarias, 2007). In Satsuma mandarin, the transcriptional
accumulation of carotenoid cleavage dioxygenases was higher compared to orange
(Kato et al., 2006) and their mRNA accumulation results in a natural carotenoid
component (high content of B-Cry) during fruit ripening. Ethylene treatment enhanced
mRNA accumulation of these carotenoid cleavage dioxygenases as well as
accumulation of CitPSY and CitHYb. Thus, GA3 treatment appeared to have a
contrasting effect to ethylene, as it repressed the transcription of carotanoid biosynthesis
genes. Our results are in accord with the hypothesis that GA levels are important in the
formation of peel coloration (Iglesias et al., 2001). GA3 treatment did not cause any
significant expression changes in ethylene biosynthesis genes and signal transduction
components, except for ACO1. There is possibly cross talk between plant hormone and
pathogen-resposne pathways, with regard to the transcriptional regulation of ACO1,
because ACO1 expression also responded to ethylene treatment.
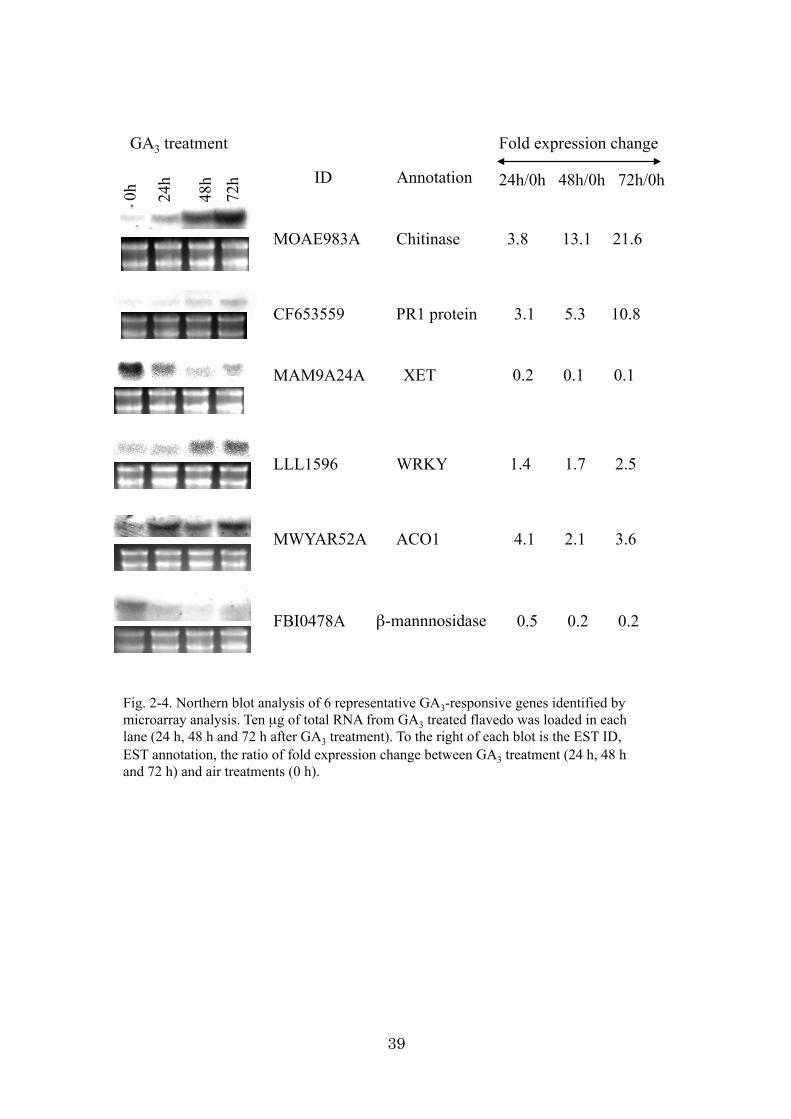
39
ACO1
Chitinase
β-mannnosidase
PR1 protein
XET
WRKY
0h
24h
48h
72h
CF653559
MOAE983A
MWYAR52A
LLL1596
MAM9A24A
24h/0h 48h/0h 72h/0h Annotation ID
3.1 5.3 10.8
0.2 0.1 0.1
1.4 1.7 2.5
0.5 0.2 0.2
3.8 13.1 21.6
4.1 2.1 3.6
FBI0478A
Fold expression change GA3 treatment
Fig. 2-4. Northern blot analysis of 6 representative GA3-responsive genes identified by microarray analysis. Ten μg of total RNA from GA3 treated flavedo was loaded in each lane (24 h, 48 h and 72 h after GA3 treatment). To the right of each blot is the EST ID, EST annotation, the ratio of fold expression change between GA3 treatment (24 h, 48 h and 72 h) and air treatments (0 h).

40
Clu
ster
2
Clu
ster
1
0h 24h 48h 72h 24h 48h 72h
Air GA3
Expr
essi
on
5.0
1.0
0.0
Fig. 2-5. Hierarchical clustering of 213, GA3-responsive, genes that showed a 3-fold or greater expression change between GA3 and air treatments (GA3 / air signal intensity ratio). Two major clusters showed distinctive expression profiles either up- or down-regulated by GA3 treatment. The color scale indicates a signal intensity of each gene. Tree at the left side of the matrix represents gene relationship.
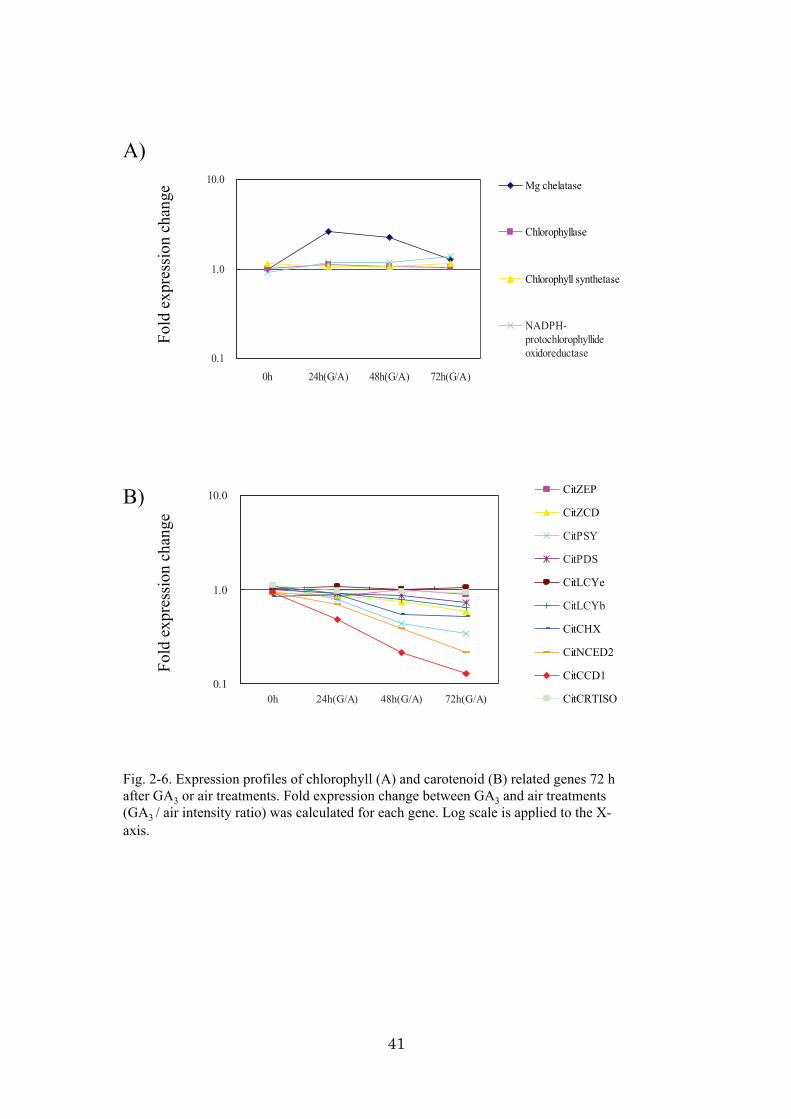
41
A)
B)
Fold
exp
ress
ion
chan
ge
Fold
exp
ress
ion
chan
ge
0.1
1.0
10.0
0h 24h(G/A) 48h(G/A) 72h(G/A)
Mg chelatase
Chlorophyllase
Chlorophyll synthetase
NADPH-protochlorophyllideoxidoreductase
0.1
1.0
10.0
0h 24h(G/A) 48h(G/A) 72h(G/A)
CitZEP
CitZCD
CitPSY
CitPDS
CitLCYe
CitLCYb
CitCHX
CitNCED2
CitCCD1
CitCRTISO
Fig. 2-6. Expression profiles of chlorophyll (A) and carotenoid (B) related genes 72 h after GA3 or air treatments. Fold expression change between GA3 and air treatments (GA3 / air intensity ratio) was calculated for each gene. Log scale is applied to the X-axis.
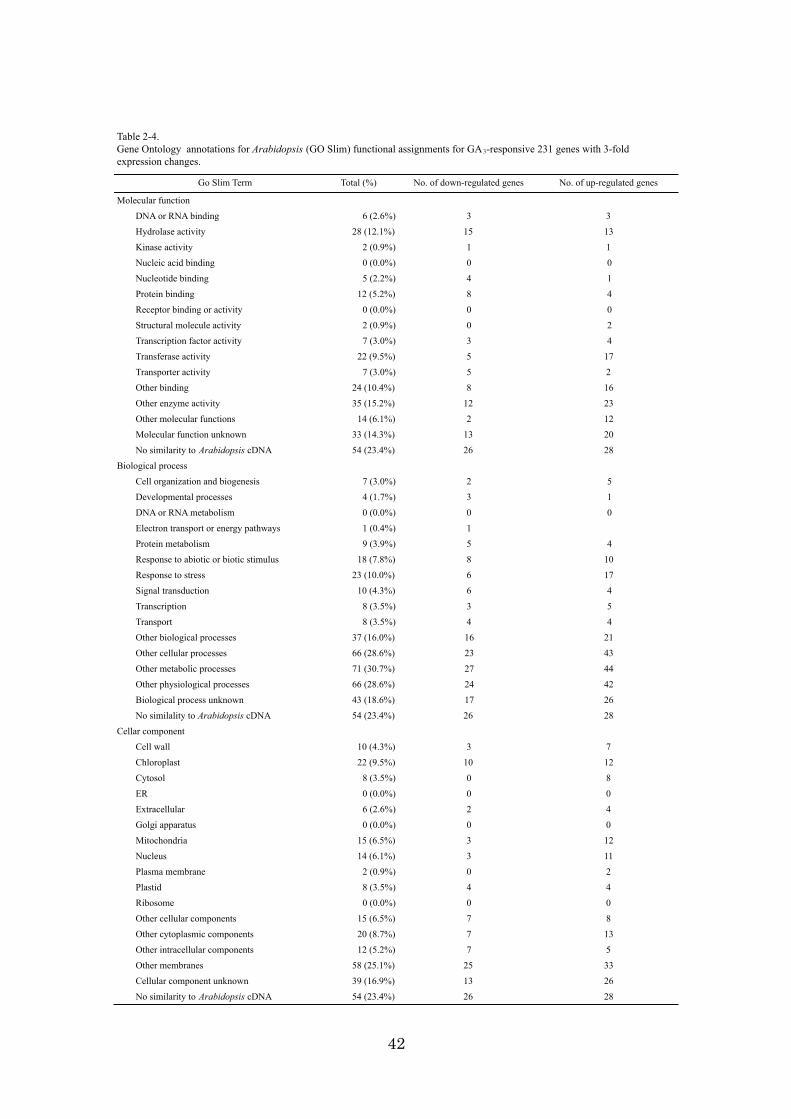
42
Go Slim Term Total (%) No. of down-regulated genes No. of up-regulated genes
Molecular function
DNA or RNA binding 6 (2.6%) 3 3
Hydrolase activity 28 (12.1%) 15 13
Kinase activity 2 (0.9%) 1 1
Nucleic acid binding 0 (0.0%) 0 0
Nucleotide binding 5 (2.2%) 4 1
Protein binding 12 (5.2%) 8 4
Receptor binding or activity 0 (0.0%) 0 0
Structural molecule activity 2 (0.9%) 0 2
Transcription factor activity 7 (3.0%) 3 4
Transferase activity 22 (9.5%) 5 17
Transporter activity 7 (3.0%) 5 2
Other binding 24 (10.4%) 8 16
Other enzyme activity 35 (15.2%) 12 23
Other molecular functions 14 (6.1%) 2 12
Molecular function unknown 33 (14.3%) 13 20
No similarity to Arabidopsis cDNA 54 (23.4%) 26 28
Biological process
Cell organization and biogenesis 7 (3.0%) 2 5
Developmental processes 4 (1.7%) 3 1
DNA or RNA metabolism 0 (0.0%) 0 0
Electron transport or energy pathways 1 (0.4%) 1
Protein metabolism 9 (3.9%) 5 4
Response to abiotic or biotic stimulus 18 (7.8%) 8 10
Response to stress 23 (10.0%) 6 17
Signal transduction 10 (4.3%) 6 4
Transcription 8 (3.5%) 3 5
Transport 8 (3.5%) 4 4
Other biological processes 37 (16.0%) 16 21
Other cellular processes 66 (28.6%) 23 43
Other metabolic processes 71 (30.7%) 27 44
Other physiological processes 66 (28.6%) 24 42
Biological process unknown 43 (18.6%) 17 26
No similality to Arabidopsis cDNA 54 (23.4%) 26 28
Cellar component
Cell wall 10 (4.3%) 3 7
Chloroplast 22 (9.5%) 10 12
Cytosol 8 (3.5%) 0 8
ER 0 (0.0%) 0 0
Extracellular 6 (2.6%) 2 4
Golgi apparatus 0 (0.0%) 0 0
Mitochondria 15 (6.5%) 3 12
Nucleus 14 (6.1%) 3 11
Plasma membrane 2 (0.9%) 0 2
Plastid 8 (3.5%) 4 4
Ribosome 0 (0.0%) 0 0
Other cellular components 15 (6.5%) 7 8
Other cytoplasmic components 20 (8.7%) 7 13
Other intracellular components 12 (5.2%) 7 5
Other membranes 58 (25.1%) 25 33
Cellular component unknown 39 (16.9%) 13 26
No similarity to Arabidopsis cDNA 54 (23.4%) 26 28
Table 2-4.Gene Ontology annotations for Arabidopsis (GO Slim) functional assignments for GA3-responsive 231 genes with 3-foldexpression changes.
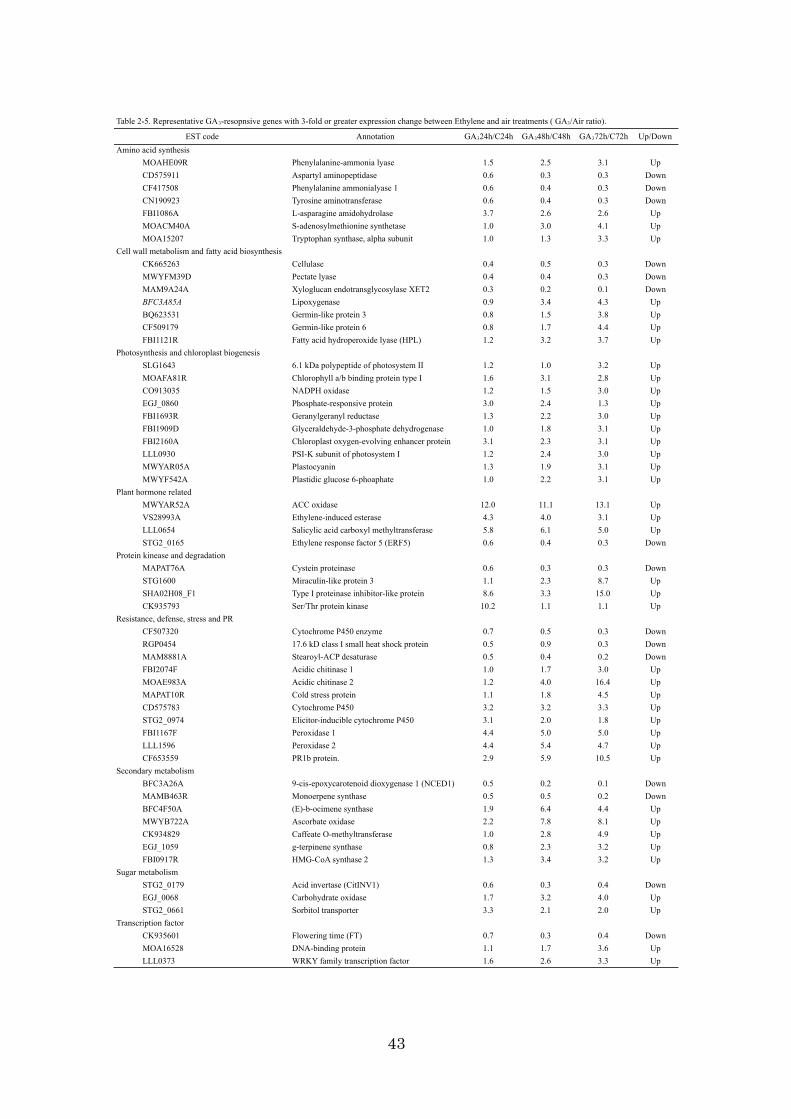
43
Table 2-5. Representative GA3-resopnsive genes with 3-fold or greater expression change between Ethylene and air treatments ( GA3/Air ratio).
Annotation GA324h/C24h GA348h/C48h GA372h/C72h Up/DownAmino acid synthesis
MOAHE09R Phenylalanine-ammonia lyase 1.5 2.5 3.1 UpCD575911 Aspartyl aminopeptidase 0.6 0.3 0.3 DownCF417508 Phenylalanine ammonialyase 1 0.6 0.4 0.3 DownCN190923 Tyrosine aminotransferase 0.6 0.4 0.3 DownFBI1086A L-asparagine amidohydrolase 3.7 2.6 2.6 UpMOACM40A S-adenosylmethionine synthetase 1.0 3.0 4.1 UpMOA15207 Tryptophan synthase, alpha subunit 1.0 1.3 3.3 Up
Cell wall metabolism and fatty acid biosynthesisCK665263 Cellulase 0.4 0.5 0.3 DownMWYFM39D Pectate lyase 0.4 0.4 0.3 DownMAM9A24A Xyloglucan endotransglycosylase XET2 0.3 0.2 0.1 DownBFC3A85A Lipoxygenase 0.9 3.4 4.3 UpBQ623531 Germin-like protein 3 0.8 1.5 3.8 UpCF509179 Germin-like protein 6 0.8 1.7 4.4 UpFBI1121R Fatty acid hydroperoxide lyase (HPL) 1.2 3.2 3.7 Up
Photosynthesis and chloroplast biogenesisSLG1643 6.1 kDa polypeptide of photosystem II 1.2 1.0 3.2 UpMOAFA81R Chlorophyll a/b binding protein type I 1.6 3.1 2.8 UpCO913035 NADPH oxidase 1.2 1.5 3.0 UpEGJ_0860 Phosphate-responsive protein 3.0 2.4 1.3 UpFBI1693R Geranylgeranyl reductase 1.3 2.2 3.0 UpFBI1909D Glyceraldehyde-3-phosphate dehydrogenase 1.0 1.8 3.1 UpFBI2160A Chloroplast oxygen-evolving enhancer protein 3.1 2.3 3.1 UpLLL0930 PSI-K subunit of photosystem I 1.2 2.4 3.0 UpMWYAR05A Plastocyanin 1.3 1.9 3.1 UpMWYF542A Plastidic glucose 6-phoaphate 1.0 2.2 3.1 Up
Plant hormone relatedMWYAR52A ACC oxidase 12.0 11.1 13.1 UpVS28993A Ethylene-induced esterase 4.3 4.0 3.1 UpLLL0654 Salicylic acid carboxyl methyltransferase 5.8 6.1 5.0 UpSTG2_0165 Ethylene response factor 5 (ERF5) 0.6 0.4 0.3 Down
Protein kinease and degradationMAPAT76A Cystein proteinase 0.6 0.3 0.3 DownSTG1600 Miraculin-like protein 3 1.1 2.3 8.7 UpSHA02H08_F1 Type I proteinase inhibitor-like protein 8.6 3.3 15.0 UpCK935793 Ser/Thr protein kinase 10.2 1.1 1.1 Up
Resistance, defense, stress and PRCF507320 Cytochrome P450 enzyme 0.7 0.5 0.3 DownRGP0454 17.6 kD class I small heat shock protein 0.5 0.9 0.3 DownMAM8881A Stearoyl-ACP desaturase 0.5 0.4 0.2 DownFBI2074F Acidic chitinase 1 1.0 1.7 3.0 UpMOAE983A Acidic chitinase 2 1.2 4.0 16.4 UpMAPAT10R Cold stress protein 1.1 1.8 4.5 UpCD575783 Cytochrome P450 3.2 3.2 3.3 UpSTG2_0974 Elicitor-inducible cytochrome P450 3.1 2.0 1.8 UpFBI1167F Peroxidase 1 4.4 5.0 5.0 UpLLL1596 Peroxidase 2 4.4 5.4 4.7 UpCF653559 PR1b protein. 2.9 5.9 10.5 Up
Secondary metabolismBFC3A26A 9-cis-epoxycarotenoid dioxygenase 1 (NCED1) 0.5 0.2 0.1 DownMAMB463R Monoerpene synthase 0.5 0.5 0.2 DownBFC4F50A (E)-b-ocimene synthase 1.9 6.4 4.4 UpMWYB722A Ascorbate oxidase 2.2 7.8 8.1 UpCK934829 Caffeate O-methyltransferase 1.0 2.8 4.9 UpEGJ_1059 g-terpinene synthase 0.8 2.3 3.2 UpFBI0917R HMG-CoA synthase 2 1.3 3.4 3.2 Up
Sugar metabolismSTG2_0179 Acid invertase (CitINV1) 0.6 0.3 0.4 DownEGJ_0068 Carbohydrate oxidase 1.7 3.2 4.0 UpSTG2_0661 Sorbitol transporter 3.3 2.1 2.0 Up
Transcription factorCK935601 Flowering time (FT) 0.7 0.3 0.4 DownMOA16528 DNA-binding protein 1.1 1.7 3.6 UpLLL0373 WRKY family transcription factor 1.6 2.6 3.3 Up
EST code
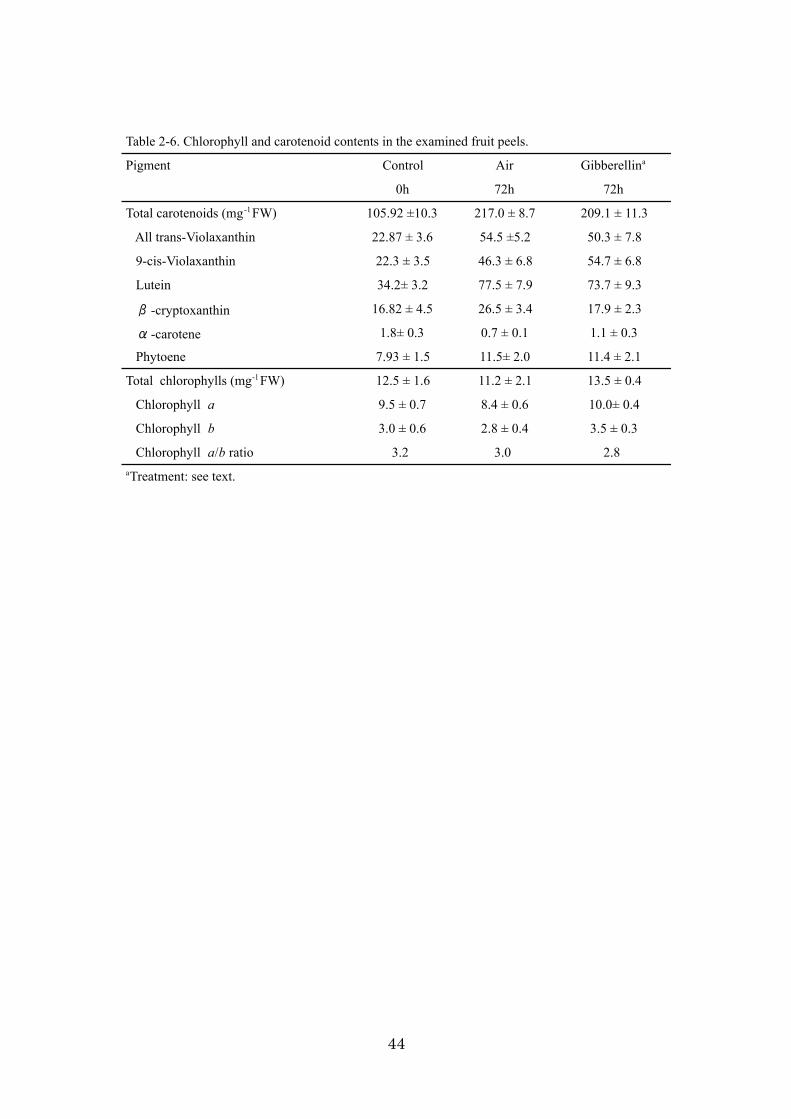
44
Table 2-6. Chlorophyll and carotenoid contents in the examined fruit peels.
Pigment Control Air Gibberellina
0h 72h 72h
Total carotenoids (mg-1FW) 105.92 ±10.3 217.0 ± 8.7 209.1 ± 11.3
All trans-Violaxanthin 22.87 ± 3.6 54.5 ±5.2 50.3 ± 7.8
9-cis-Violaxanthin 22.3 ± 3.5 46.3 ± 6.8 54.7 ± 6.8
Lutein 34.2± 3.2 77.5 ± 7.9 73.7 ± 9.3
-cryptoxanthin 16.82 ± 4.5 26.5 ± 3.4 17.9 ± 2.3
-carotene 1.8± 0.3 0.7 ± 0.1 1.1 ± 0.3
Phytoene 7.93 ± 1.5 11.5± 2.0 11.4 ± 2.1
Total chlorophylls (mg-1FW) 12.5 ± 1.6 11.2 ± 2.1 13.5 ± 0.4
Chlorophyll a 9.5 ± 0.7 8.4 ± 0.6 10.0± 0.4
Chlorophyll b 3.0 ± 0.6 2.8 ± 0.4 3.5 ± 0.3
Chlorophyll a/b ratio 3.2 3.0 2.8aTreatment: see text.

45
Section 3: Conclusion
We have identified 1,493 ethylene-responsive genes and 213 GA3-responsive genes
with more than 3-fold expression change in the ratio of mRNA levels after ethylene and
GA3, respectively using a citrus 22K oligoarray. Although the level of a specific gene
transcript does not necessarily mean a corresponding alteration at the protein level, the
obtained results provide a new insight into the role of ethylene in the chlorophyll and
carotenoid metabolism and the ethylene signal transduction in citrus fruit. GA3
oppositely regulated these gene transcriptions, which were either induced or repressed
by ethylene. Considering that citrus fruit produce tiny amounts of ethylene, the
endogenous level of GA3 might be important for the endogenous regulation of
maturation and senescence in mature citrus fruit. In addition, it was found that the GA
response pathway was likely to take part in cross talk with the pathogen-related pathway
in mature citrus fruit.
More than half of the identified genes are functionally unknown but may also play
significant roles. The identification and determination of the biological function of these
unknown genes will contribute to an understanding of the unique ethylene and GA3
biology in citrus fruits. Further experiments will be required to understand their function.
Meanwhile, it will be necessary to advance the bioinformatics study. Specifically, there
is a possibility that the information of the gene expression is obtained from EST
database and the database of high throughput gene expression data.
46
Chapter 3: An algorithm and computer program for the identification of minimal
sets of discriminating DNA markers for efficient cultivar identification
Development of a new algorithm and software for data mining is one of aspect of
bioinformatics study to obtain newly biological knowledge from data by the experiment.
Fruit tree varieties such as citrus, apple, sweet cherry, peach, Japanese pear
andchestnut are frequently bred in Japan, and more than 1,100 fruit tree varieties are
listed in the Japanese Ministry of Agriculture, Forestry and Fisheries’ most recent
catalog of fruit tree varieties
(http://www.hinsyu.maff.go.jp/tokei/contents/9_2011kaju.pdf). In recent years,
protection of breeders' rights for these varieties has become of central importance to the
fruit tree cultivation industry; at least one infringement case related to a Japanese fruit
tree-breeder’s rights to a specific sweet cherry variety has already made its way through
the courts (Tahira, 2008). Also of key interest to this industry are concerns about the
origins of specific food products resulting from fruit-tree cultivation (e.g. orange juice).
Inadequate identification of specific varieties can hinder governmental food-inspection
and -labeling efforts.
Thus, we suggest that accurate identification of fruit tree varieties at a genetic level
is necessary for both the protection of breeders’ rights and the improved management of
food-inspection mandates. Various types of DNA markers, including restriction
fragment length polymorphism (RFLP), randomly amplified polymorphic DNA
(RAPD), amplified fragment length polymorphism (AFLP) and simple sequence repeat
(SSR), have previously been studied in fruit trees (Wunsch and Hormaza 2002).
Recently, SSRs have become the markers of choice in mapping plant genomes because
of this technique’s co-dominant inheritance, large number of alleles and suitability for
automation (Yamamoto et al., 2003). SSR markers have been used for variety
47
identification of peach (Aranzana et al., 2003), grapevine (This et al., 2004), apple
(Galli et al., 2005), almond (Dangle et al., 2009), olive (Ercisli et al., 2011) and
Japanese pear (Yamamoto et al., 2002) trees, among other fruit tree varieties; this
includes several Japanese fruit tree varieties with documented breeders’ rights (e.g.
sweet cherry (Takashina et al., 2009), Japanese pear (Terakami et al., 2010), peach
(Yamamoto et al., 2003), apple (Moriya et al., 2011) and Japanese chestnut (Yamamoto
et al., 2008). Such genotypic analysis typically results in the creation of
computer-generated variety/marker “summary” tables that list all possible markers for
the studied fruit tree varieties.
In many cases where DNA markers are used, it is not necessary to use all of the
markers listed in such summary tables to differentiate between specific fruit tree
varieties. Thus, we determined that the development of a minimal marker set—a marker
set that can differentiate between all fruit tree varieties shown in a particular summary
table and that is as small as possible—could be expected to simplify and streamline the
marker-identification process. Not only would this aid in determining the genetic
background of specific varieties to help enforce breeders’ rights, but it would also
permit easier inspection of large-quantity fruit imports due to the minimal marker set’s
concomitant reduction in the number of markers required for accurate inspection.
However, as the number of markers or varieties increases in a summary table, it
becomes increasingly difficult to accurately identify a minimal marker set without a
concrete methodology and an appropriate computer program capable of doing so.
Several previous studies have attempted to identify minimal marker sets. The
Minimum SNPs computer program (Robertson et al., 2004) has identified highly
informative sets of single-nucleotide polymorphisms (SNPs) in entire multi-locus
sequence typing (MLST) databases for bacteria (Aanensen and Spratt, 2005). To choose
48
optimum marker sets for grapevines, RAPD primers were evaluated using the
discrimination power parameter (D), as defined from polymorphic information, and
attempts were made to identify the most efficient RAPD primer set for differentiating
between 224 grape varieties (Tessier et al., 1999). In Gerber et al., (2003), 20 SSR
markers were used for 4,370 accessions of grapevine germplasm, with these SSR
markers evaluated by the probability of identity (PI) as computed using the Famoz
software package (Gerber et al., 2003). As a result, a minimal set of nine SSR markers
is now routinely used in the laboratory for identification purposes and for checking the
homogeneity of the accessions (Laucou et al., 2011). However, the intent of these
methods for identifying a minimal marker set was to evaluate the identification
capability of each individual marker statistically by some index, and to select only those
with the highest index value. That is, these methods did not consider the combination of
markers in the first place and thus were unable to provide a solution for accurately
obtaining minimal marker set(s) because the studied subjects were often a wide group of
varieties and genetic resources used for the characterization of germplasms.
Another previous study reported an algorithm and its related GGDS software
program, which was based on an integer-linear programming (ILP) formula (Gale et al.,
2005). This particular program was capable of accurately identifying minimal marker
sets for a given summary table for wheat, but the program is not available at present; in
addition, it was designed exclusively to analyze binary data for dominant markers and
thus was incapable of examining co-dominant markers.
In this study, we designed an algorithm and a related computer program that
identifies with certainty all minimal marker sets for a given summary table using
co-dominant markers. While our research focuses on the practical use of such
technology for the genotypic identification of fruit tree varieties to protect breeders'
49
rights for the fruit tree cultivation industry, we expect that the algorithm and computer
program described here would also prove useful to other fields.
Implementation
Program architecture
Our platform-independent, Perl-based MinimalMarker software is licensed by the
National Agriculture and Food Research Organization, and can be downloaded from
http://fruit.naro.affrc.go.jp/eng/MinimalMarker_en.html. The cost-free program can be
easily run on standard laboratory-type computer systems and does not require access to
high-capacity servers. Successful execution of the program requires a Perl5 (or higher)
environment. The MinimalMarker program operates in the command line and requires
input files in a comma-separated value (CSV) format; results are output to a text file.
Optional features included with the software allow users to obtain optimal
discriminating marker sets by considering the experimental features of particular DNA
markers and by accelerating the computing process.
Algorithm
The goal of this study is to devise an algorithm and an accompanying program that
uses co-dominant markers for the identification of all minimal marker sets for a
summary table such as that shown in Supplemental Table 3-1 (Yamamoto et al., 2003).
As such, we first simulated a testable dataset by producing a “pretend” sample
summary table (Table 3-1). We then used this sample table to test the algorithm against
five DNA markers and five fruit tree varieties for the identification of appropriate
minimal marker sets.
When developing a workable algorithm for accurate identification of a specific
50
marker, the most important principles are as follows:
1) The marker set(s) that can discriminate all varieties in a given summary table is the
marker set(s) that can discriminate between any pair of varieties displayed in a
given summary table.
2) Minimal marker set(s) is (are) the marker set(s) that can discriminate between any
pair of varieties in a given summary table and that is (are) as small as possible. The
algorithm we designed (described below) does just that. Fig. 3-1 shows the flow
diagram for the algorithm. The algorithm shown in Fig. 3-1 involves an exhaustive
method without adding considerable mathematical novelty, and the use of an
improved algorithm (as described later) does not necessarily mean that the new
method can identify minimal marker sets. However, in the past it has been thought
that there was no example of this application to the discrimination of minimal
marker sets for cultivar identification by DNA markers.
Producing the possibility-of-discrimination table
The first step in our algorithm is to calculate whether two or more varieties have
exactly the same genotypes in all markers. If such pair of varieties is found, they are
treated as the same variety following steps because at least one marker type must be
different for each pair of varieties in a given summary table as a principle of this
algorithm. This is not unusual for the fruit tree since there are many bud mutation
varieties. The next step is to produce the possibility-of-discrimination table that serves
as the foundation for all subsequent actions. In our example, Table 3-1 is used to
produce the possibility-of-discrimination between all pairs of varieties for each marker,
shown in Table 3-2.
That is, if the genotypes of a variety pair in Table 3-1 are the same for a particular
51
marker, a value of "0" is assigned to the corresponding position in Table 3-2; this
indicates that the specific marker cannot discriminate between these two varieties. If the
genotypes are different, a value of "1" is assigned, indicating that the marker is capable
of that particular discrimination. For example, in Table 3-1, marker M1 identifies
genotypes “aa” and “ab” in varieties V1 and V2, respectively. As these two genotypes
differ, we conclude that M1 can be used to discriminate between V1 and V2, and thus a
"1" is placed at the intersection of column V1V2 and row M1 in Table 3-2.
Discrimination of minimal marker set
Using the aforementioned possibility-of-discrimination table, we can search for the
minimal marker set. For example, in Table 3-2 the sum of each column is greater than 1
in all combinations of two displayed varieties, which shows that there exists more than
one markers capable of distinguishing between every pair of varieties. Consequently, a
combination of the fewest markers that satisfies all the column sums being at least one
is a minimal marker set. We must therefore examine whether this requirement is met
while concomitantly incrementally increasing the number of markers. In the case of one
marker, no single marker satisfies this condition, as there is a zero in every row in Table
3-2. However, in the subset of combinations of two markers, both M1 with M2 and M2
with M4 meet the condition, as shown in Tables 3-3A and 3-3B; these are each
therefore minimal marker sets.
In general, in our algorithm, let V be the number of varieties and M be the number
of markers in a given summary table, and let n be the number of markers in a subset.
The dimension of the table of discrimination probability is M×vC2. The number of
marker subsets is MCn, where n is increased incrementally from 1. Next, we examined
whether the column sum in all columns is at least one for all subsets that consist of n
52
markers. Thus, the first subset of n markers that meets the condition is defined as a
minimal marker set. As more than one minimal marker set may meet the
aforementioned condition, it is necessary to calculate the column sums for all subsets of
the same size as the first minimal marker set found; this permits accurate identification
of all of the summary-table minimal marker subsets. In the process of the marker
development for variety discrimination, we needed to first develop numerous redundant
markers until we were able to obtain markers that provided adequate discrimination
power to protect breeder’s right. By overviewing markers that compose all minimal
marker sets, we could distinguish essentially important markers. In practice, when the
DNA marker is applied to unknown varieties, the marker type might at times obtain
more than one null result. This may be due to mispriming or non-priming of the primer.
Therefore, it is important that the algorithm provide with two or more minimal marker
sets.
Computational effort
An exhaustive search such as that suggested in the aforementioned algorithm is
generally infeasible or at the very least time consuming (Martin, 2011).
In consideration of the computational cost of the algorithm:
Let m be the number of markers in a minimal marker set. The number of combinations
of two varieties is shown in Eq. (1) below:
(1)
This leads to polynomial time.
The number of subsets that must be checked until all minimal marker sets are found is
VVVVCv21
21
2)1( 2
2 −=−
=
53
shown in Eq. (2) below:
(2)
When M=m, this number is maximized as shown in Eq. (3) below:
(3)
The algorithm is thus likely to be exponential if m is not small enough. The time and
memory required for an algorithm are usually measured in terms of asymptotic notation.
For our present algorithm, the asymptotic notation can be denoted as O(2n). This shows
a possibility that the computing time increases exponentially as the number of markers
increases.
Method of using the largest discrimination power
To avoid the problems of exponential running time when m is too large, we
incorporated into our approach a method using the largest discrimination power as an
optional software feature to accelerate the computation. The
possibility-of-discrimination table such as Table 3-2 can be simplified through
transformation by row subtraction, row and column translocation. Eventually, one will
find the minimal marker set. This procedure is shown below:
1) Search for all the two-variety combination(s) in the table where the sum of the
column is one. If this requirement is met, add the corresponding contributing
marker(s) in the candidate minimal markers set(s).
2) Find the row with the maximum discrimination and move it the first row. Through
∑∑== −
=m
n
m
nnM
nMnMC
11 )!(!!
∑∑==
−=−
=M
n
MM
nnM
nMnMC
11
12)!(!
!
54
column translocation, ensure the upper-left cell to be 1. Subtract all the other rows
with the first row. If a cell has a number -1, it can be redefined as 0. M2 is added as
the candidate minimal markers set(s) in Table 3-4A and 3-4B. This adds up to
(M-1) × vC2 times of subtraction.
3) Find a row excepting the first one to have the maximal discrimination. Through the
table transformation, move it to the second row and make sure the second cell from
the left is 1. Subtract all other rows with this second row, which is M1 in Table 3-4C
and 4D. This should be no more than (M-2) × vC2 times of subtraction.
4) Repeat the above procedure and stop when one cannot find a row with number 1 in
it. All these calculations add up to < (M-1)(M-2)/2× vC2 number of calculations. The
markers corresponding to the first row to the last row containing 1 then constitute the
minimal marker set. In this case, M1 with M2 are obtained as a minimal marker set.
5) Even if the table transformations are considered, the asymptotic notation can be
denoted as O(M2×V2) . We can assume the number of varieties is a constant, even if
it is large. The asymptotic notation can then be denoted as O(M2), polynomial
complexity.
A concrete example demonstrating the method of using the largest discrimination
power to greatly decrease computational effort is shown in below “Results” section. In
this case, the result corresponds to those discovered using the basic algorithm. However,
the method of using the largest discrimination power does not guarantee whether the
marker sets obtained are minimal or whether all minimal marker set(s) are identified for
the given summary table (The acceleration achieved using the option is shown in the
below “Results” section.).
In addition, the program was designed with nine additional options that allow users
to obtain optimal discriminating marker sets by considering the experimental features of
55
particular DNA markers. For example, when the smallest number of markers of
minimal marker set(s) is three, and the –s option defines four markers and the –e option
defines four markers, MinimalMarker searches the marker set composed of four
markers. In practice, this option proves significant in that the required labor might not
change for assessing three or even four of the markers, depending on experimental
conditions. In addition, there are markers that the experimenter may wish to use or to
avoid. In this case, MinimalMarker does not select marker set(s) including redundant
markers. That is, MinimalMarker never selects marker set(s), such as the marker set
composed of three markers (=minimum number of markers), added as an arbitrary
marker. Therefore we opted to use the term “minimal marker set”. Moreover, the –m
option accelerated the computation while providing shielding from potential faults
associated with exponential running time (Table 3-5).
Results
Validation of the identification of minimal marker set(s) with both sample and published
datasets
As described below, our algorithm and the accompanying MinimalMarker program
proved effective in finding minimal marker sets in multiple fruit tree-specific datasets.
When we applied MinimalMarker to the sample data (Table 3-1), two minimal marker
sets that each contained two markers, M1 with M2 and M2 with M4, were discovered.
These results are consistent with those shown in the above description of the algorithm.
For discrimination among grapevine varieties, researchers in a previous study identified
six microsatellite markers with many (13–23) allelic forms (This et al., 2004), and
proposed that these could be used as a standard optimal marker set. In the present study,
we applied MinimalMarker to this grapevine dataset, and found that all varieties could
56
be discriminated using two markers, VVMD27 and VVMD5, which was consistent with
the results in the above-mentioned report (This et al., 2004).
The previous study reported that the GGDS software program (Gale at al. 2005)
provided a variety/marker summary table with 22 dominant markers and 22 varieties,
and showed only one minimal marker sets, {A, C, G, I, S, T, U}, as a concrete example.
We applied MinimalMarker to the dataset, and found 24 minimal marker sets. One of
them was {A, C, G, I, S, T, U}.
We also applied MinimalMarker to a summary table that contained 18 peach
varieties analyzed by 17 SSR markers (Supplemental Table 3-1) (Yamamoto et al.,
2003). However, all the SSR markers for the “Akatsuki” variety and its bud mutation
derivative “Gyosei” were exactly the same in the table. MinimalMarker could consider
“Akatsuki” and “Gyosei” to be the same variety and could thus keep running the
algorithm after outputting the message that “Akatsuki” and “Gyosei” had the same
genotypes in all markers. Accordingly, the following six minimal marker sets each
containing three markers were obtained: {M1a, M4c, MA023a}, {M4c, MA007a,
MA023a}, {M4c, MA007a, MA035a}, {M4c, MA014a, MA023a}, {M4c, MA015a,
MaA027a} and {M4c, MaA027a, MA035a}. We also confirmed that these results were
consistent with those calculated by hand.
The program was also applied to summary tables for sweet cherry (Takashina et al.,
2009), Japanese pear (Terakami et al., 2010), apple (Moriya et al., 2011) and Japanese
chestnut (Yamamoto et al., 2008); results were validated by the researchers who
produced the tables.
Performance test
For the performance test, we applied MinimalMarker to an unpublished dataset of

57
citrus varieties compiled by us in which 98 varieties were analyzed using 256 SNP
markers described in Chapter 4. The entire dataset and seven subsets subsequently
generated from the original dataset by reducing the number of varieties and markers
were tested. The number of varieties in the tested datasets was either 49 or 98, with each
run using 64, 128, 192 and 256 markers (Table 3-6). All varieties in the eight datasets
had different genotypes with the SNP markers. Tests were performed under default
conditions (see Table 3-5) using the method of using the largest discrimination power
option –m2 (Table 3-5) for acceleration on a Macintosh machine (OS: Mac OS X
10.6.8; CPU: 28GHz Intel Core 2 Duo; Memory: 4GB), and the elapsed time was
measured.
Computation times are shown in Table 3-6. Using the default settings, the
computation time increased exponentially with the number of markers, taking 1,322,428
seconds—approximately 15 days—to compute the entire 98-variety/256 SNP-marker
dataset. This increased computation time might thus limit the size of datasets used when
MinimalMarker is run using regular (non-laboratory-grade) personal computers.
Similarly, as the computation time increased as the number of markers in a minimal
marker set increased, the elapsed time might be longer for SNP markers—where the
allele number is four in theory but two in practice—than for SSR markers, which
typically have rich polymorphism.
With the method of using the largest discrimination power option, the elapsed time
was substantially shorter than with the default option, and increased linearly as the
number of markers increased (Table 3-6). As the discrimination power between the
markers often have large overlaps, the algorithm may not take much time, making it
closer to an equation of linear complexity. It took 129 seconds to compute the entire
98-variety/256SNP marker dataset; the ratio between the time required for the 49 and 98
58
variety-datasets was about four, even as the number of markers changed. Therefore, the
elapsed time can be estimated by using the method of the largest discrimination power
option with a subset of the dataset that has a reduced number of markers or varieties.
The reduced number of marker subsets found using the power option was MCm
=256C7= 13,161,885,792,000, representing 97.2% of the number that should be
investigated normally in the entire 98-variety/256 SNP-marker dataset. The reduced
number of combinations of two varieties by the option was 3,045 (= the largest
discrimination power) and it was 64.1% of the total number of combinations of two
varieties (=4,753) in the entire 98-variety/256 SNP-marker dataset.
The number of markers in a minimal marker set was the same for the default
computation and for computation with the method of using the largest discrimination
power option in seven of the eight datasets shown in Table 3-6; in these seven datasets,
the minimal marker sets found using the power option were among those found by the
default computation. Therefore, if identifying a strictly minimal marker set is not
required for a specific task, the option might be useful for faster variety identification of
sufficiently small marker sets.
Discussion
Several approaches using genetic statistics have been attempted for finding minimal
marker sets for the identification of fruit tree varieties (Robertson et al., 2004; Tessier et
al., 1999; Laucou et al., 2011; Martin, 2011). However, these techniques cannot be used
to find marker sets containing the smallest number of markers for discriminating all
varieties in a particular summary table.
The previously reported GGDS software program (Gale et al., 2005) can be used to
identify all minimal marker sets for a given summary table. Yet because GGDS was
59
designed for use with only dominant markers because input data are restricted binary
data, we developed MinimalMarker to use with summary tables containing co-dominant
markers such as the SSR markers that are more commonly used for discriminating
between varieties of fruit tree varieties (Takashina et al., 2009; Terakami et al., 2010;
Moriya et al., 2011; Yamamoto et al., 2008). Incidentally, MinimalMarker also operates
with dominant markers or with both co-dominant markers and dominant markers,
regardless of the number of alleles, because the markers’ genotypes are replaced by
alphabetic characters in the software and subsequently treated via string manipulation.
The method using GGDS (Gale et al., 2005) should combine ILP solvers with GGDS,
therefore the knowledge of ILP would be requested from the researchers. The algorithm
of MinimalMarker is simple does not need other software.
To increase the usability of MinimalMarker, we have added a method of using the
largest discrimination power option (Table 3-5) to accelerate computation speeds,
although this option does not ensure that strictly minimal marker sets will be found. It
should be noted that missing data caused by an inability of the marker primer to
hybridize with a specific variety’s genome cannot be included in MinimalMarker
calculations (i.e. missing data lead to incorrect summing of column figures).
In DNA-marker-based discrimination of fruit tree varieties and other species, a
sample genotype can be evaluated as a different variety if the genotype differs from a
known variety for at least one marker. In contrast, even if all the genotypes for a sample
and a variety are identical, then the varieties are not necessarily the same. When an
unknown sample differs from the known varieties, a minimal marker set can determine
that the sample is different from the varieties listed in a given summary table using the
fewest markers. If the sample is a variety that appears in the table, the minimal marker
set will identify the variety because the minimal marker set discriminates all varieties in
60
the table; in this case, it becomes necessary to apply more markers to prove it to be the
same variety, but MinimalMarker greatly simplifies such analysis. This makes finding a
minimal marker set advantageous when a large number of samples are involved.
Whenever a new variety or a new marker is added, calculation by MinimalMarker is
required.
In Japan, the implementation of MinimalMarker has contributed to the selection of
SSR markers used to establish the official protocol for identifying Japanese pear and
sweet cherry varieties for the protection of breeders’ rights (Takashina et al., 2007);
similarly, the protocol for genotypic identification of apple and Japanese chestnut
(Yamamoto et al., 2008) was prepared using MinimalMarker.
The genotyping process can be costly in terms of laboratory consumables, labor and
time when a large number of samples and SSR markers are involved (Gale et al., 2005),
but establishing a minimal marker set permits efficient discrimination of varieties. Such
concerns led us to devise an algorithm and the accompanying MinimalMarker software
to identify all appropriate minimal marker sets that contain the smallest number of
markers while still discriminating all varieties in a particular summary table.
Although MinimalMarker is currently used primarily for the genotypic
identification of fruit tree varieties, the program is also useful for analyzing other
species’ markers. We similarly expect that this program would prove useful for both
genomics researchers and inspection agencies that perform large-scale analysis of DNA
markers to authenticate food labeling.
Availability and requirements
As previously described, the MinimalMarker computational tool is made available
cost-free to the scientific community and general public by Japan’s b Website

61
(http://www.naro.affrc.go.jp/org/fruit/eng/MinimalMarker_en.html). Successful
execution of the program requires a Perl5 (or higher) environment.

62
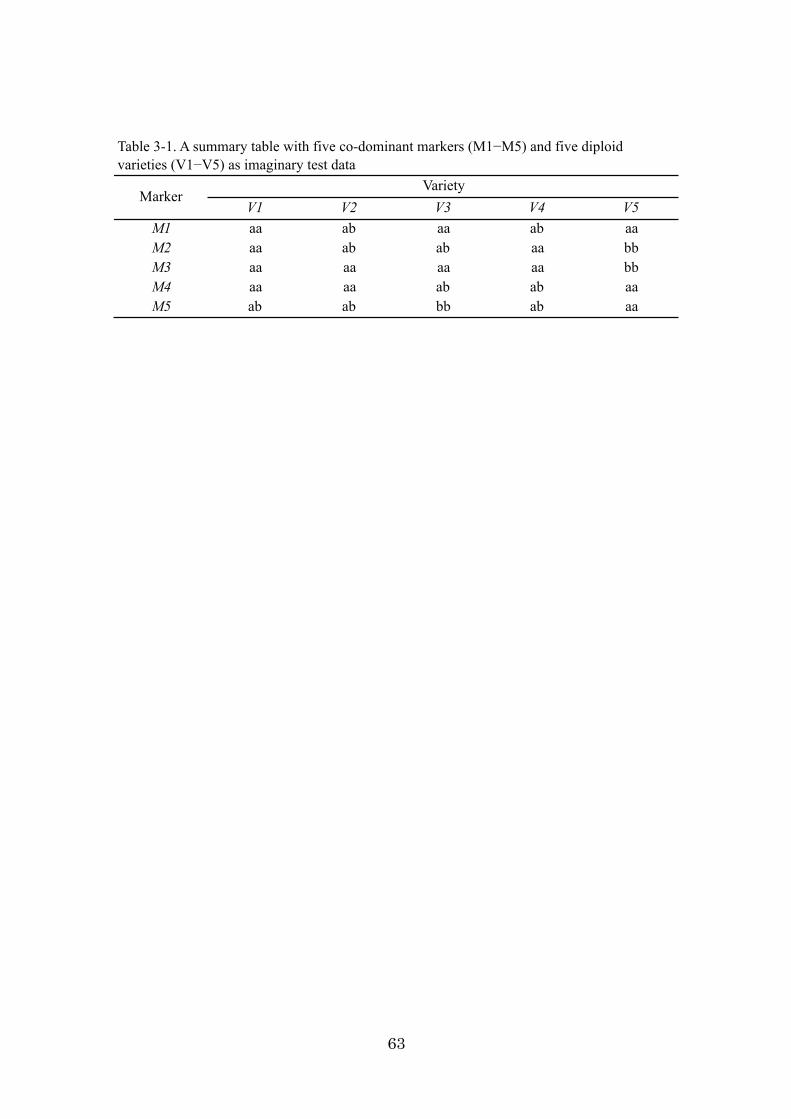
63
V1 V2 V3 V4 V5M1 aa ab aa ab aaM2 aa ab ab aa bbM3 aa aa aa aa bbM4 aa aa ab ab aaM5 ab ab bb ab aa
MarkerVariety
Table 3-1. A summary table with five co-dominant markers (M1−M5) and five diploidvarieties (V1−V5) as imaginary test data
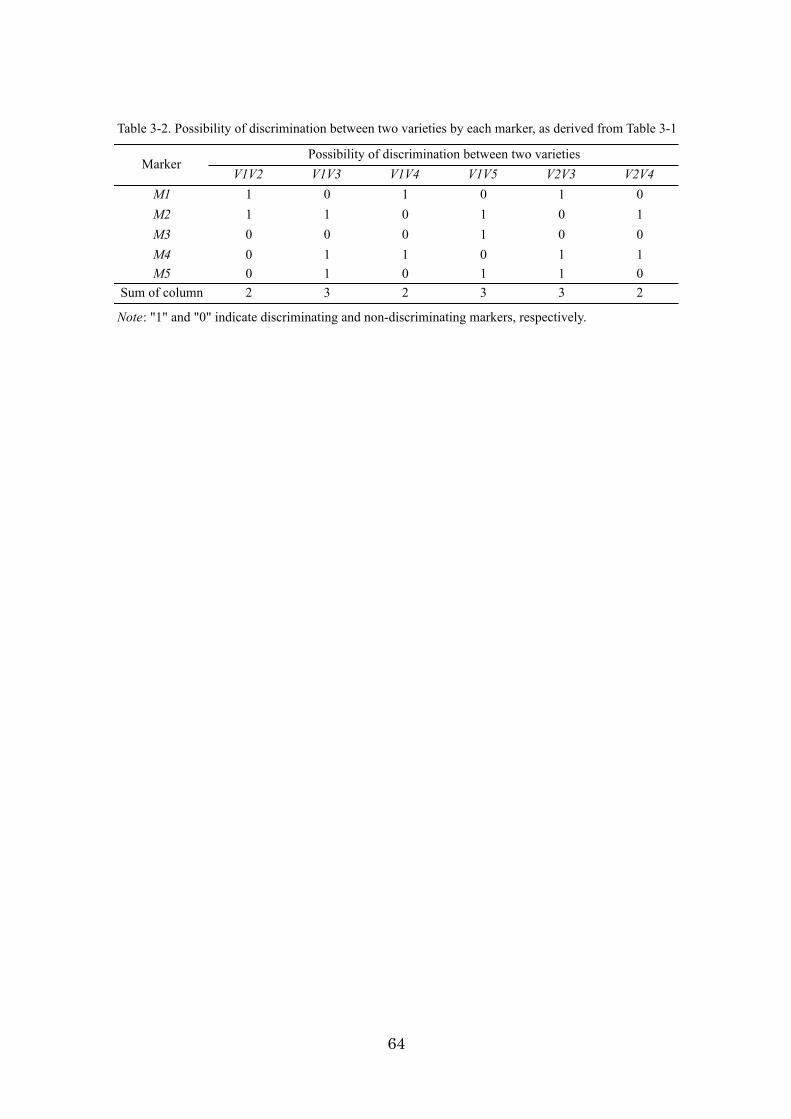
64
Table 3-2. Possibility of discrimination between two varieties by each marker, as derived from Table 3-1
V1V2 V1V3 V1V4 V1V5 V2V3 V2V4M1 1 0 1 0 1 0M2 1 1 0 1 0 1M3 0 0 0 1 0 0M4 0 1 1 0 1 1M5 0 1 0 1 1 0
Sum of column 2 3 2 3 3 2
MarkerPossibility of discrimination between two varieties
Note: "1" and "0" indicate discriminating and non-discriminating markers, respectively.
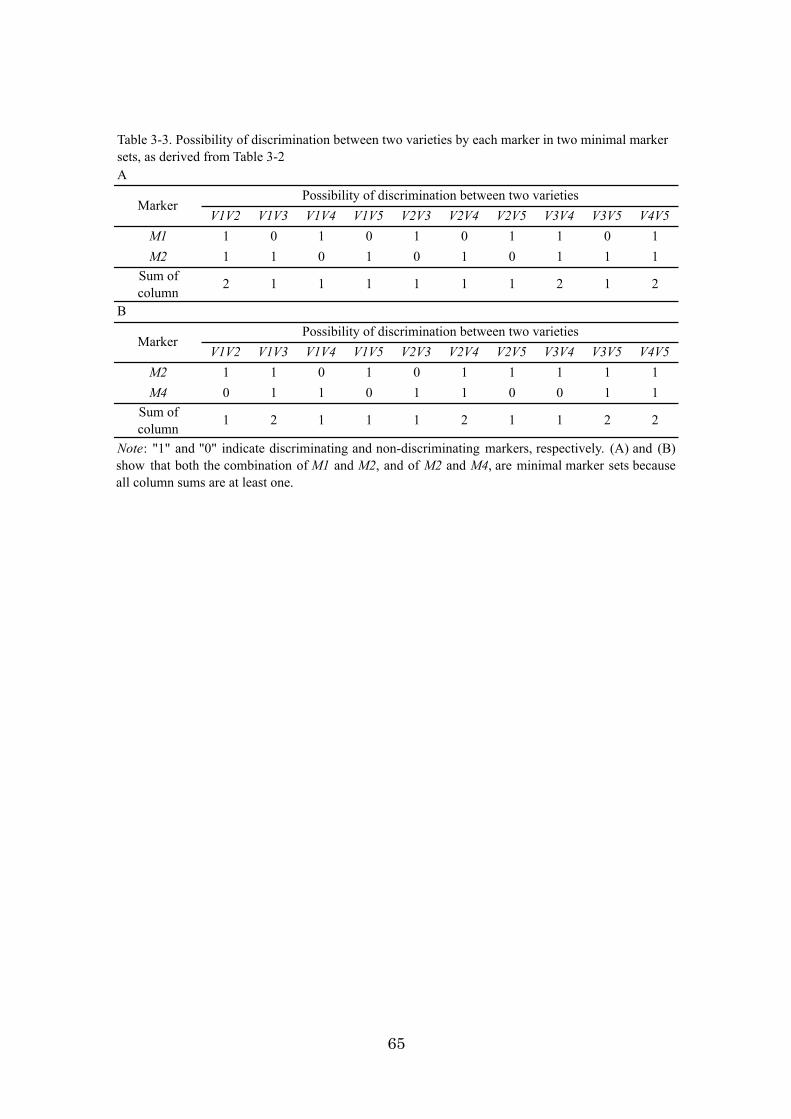
65
A
V1V2 V1V3 V1V4 V1V5 V2V3 V2V4 V2V5 V3V4 V3V5 V4V5M1 1 0 1 0 1 0 1 1 0 1M2 1 1 0 1 0 1 0 1 1 1
Sum ofcolumn
2 1 1 1 1 1 1 2 1 2
B
V1V2 V1V3 V1V4 V1V5 V2V3 V2V4 V2V5 V3V4 V3V5 V4V5M2 1 1 0 1 0 1 1 1 1 1M4 0 1 1 0 1 1 0 0 1 1
Sum ofcolumn
1 2 1 1 1 2 1 1 2 2
Note: "1" and "0" indicate discriminating and non-discriminating markers, respectively. (A) and (B)show that both the combination ofM1 and M2, and of M2 and M4, are minimal marker sets becauseall column sums are at least one.
Table 3-3. Possibility of discrimination between two varieties by each marker in two minimal markersets, as derived from Table 3-2
MarkerPossibility of discrimination between two varieties
MarkerPossibility of discrimination between two varieties
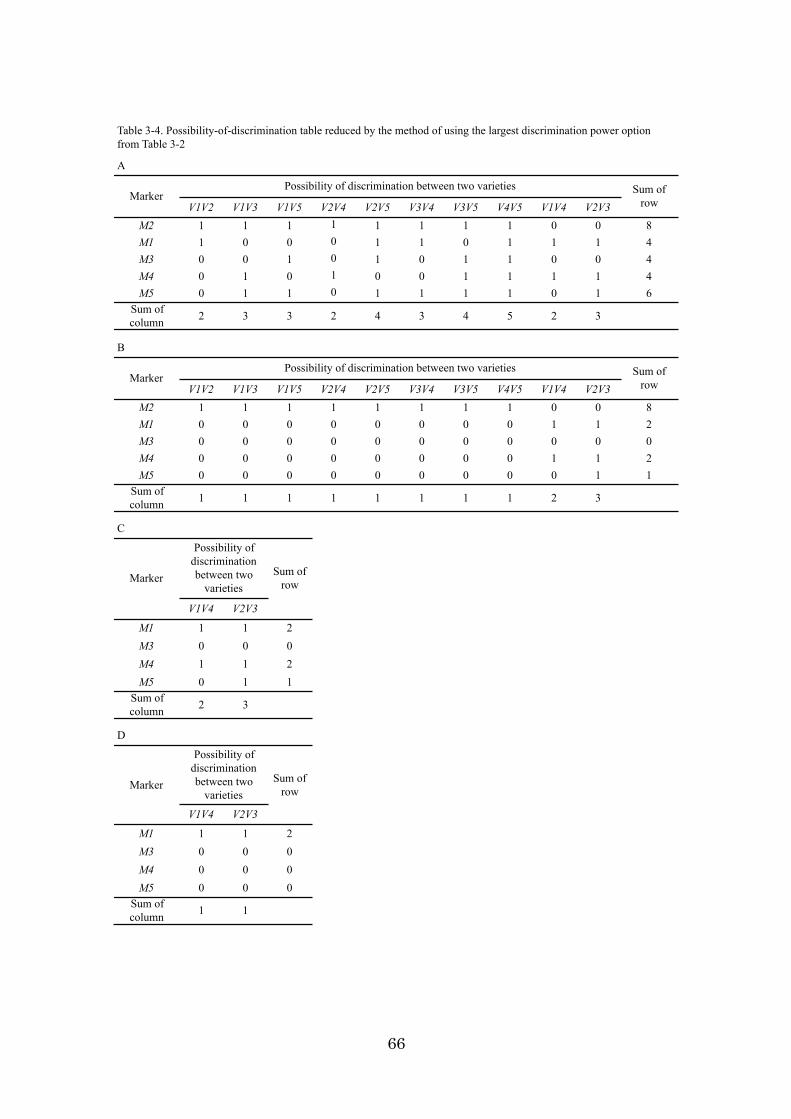
66
A
V1V2 V1V3 V1V5 V2V4 V2V5 V3V4 V3V5 V4V5 V1V4 V2V3M2 1 1 1 1 1 1 1 1 0 0 8M1 1 0 0 0 1 1 0 1 1 1 4M3 0 0 1 0 1 0 1 1 0 0 4M4 0 1 0 1 0 0 1 1 1 1 4M5 0 1 1 0 1 1 1 1 0 1 6
Sum ofcolumn 2 3 3 2 4 3 4 5 2 3
B
V1V2 V1V3 V1V5 V2V4 V2V5 V3V4 V3V5 V4V5 V1V4 V2V3M2 1 1 1 1 1 1 1 1 0 0 8M1 0 0 0 0 0 0 0 0 1 1 2M3 0 0 0 0 0 0 0 0 0 0 0M4 0 0 0 0 0 0 0 0 1 1 2M5 0 0 0 0 0 0 0 0 0 1 1
Sum ofcolumn 1 1 1 1 1 1 1 1 2 3
C
V1V4 V2V3
M1 1 1 2M3 0 0 0M4 1 1 2M5 0 1 1
Sum ofcolumn 2 3
D
V1V4 V2V3
M1 1 1 2M3 0 0 0M4 0 0 0M5 0 0 0
Sum ofcolumn 1 1
Possibility of discrimination between two varieties
Marker
Table 3-4. Possibility-of-discrimination table reduced by the method of using the largest discrimination power optionfrom Table 3-2
Sum ofrow
Possibility of discrimination between two varieties
Marker Sum ofrow
Marker
Marker
Sum ofrow
Sum ofrow
Possibility ofdiscriminationbetween two
varieties
Possibility ofdiscriminationbetween two
varieties
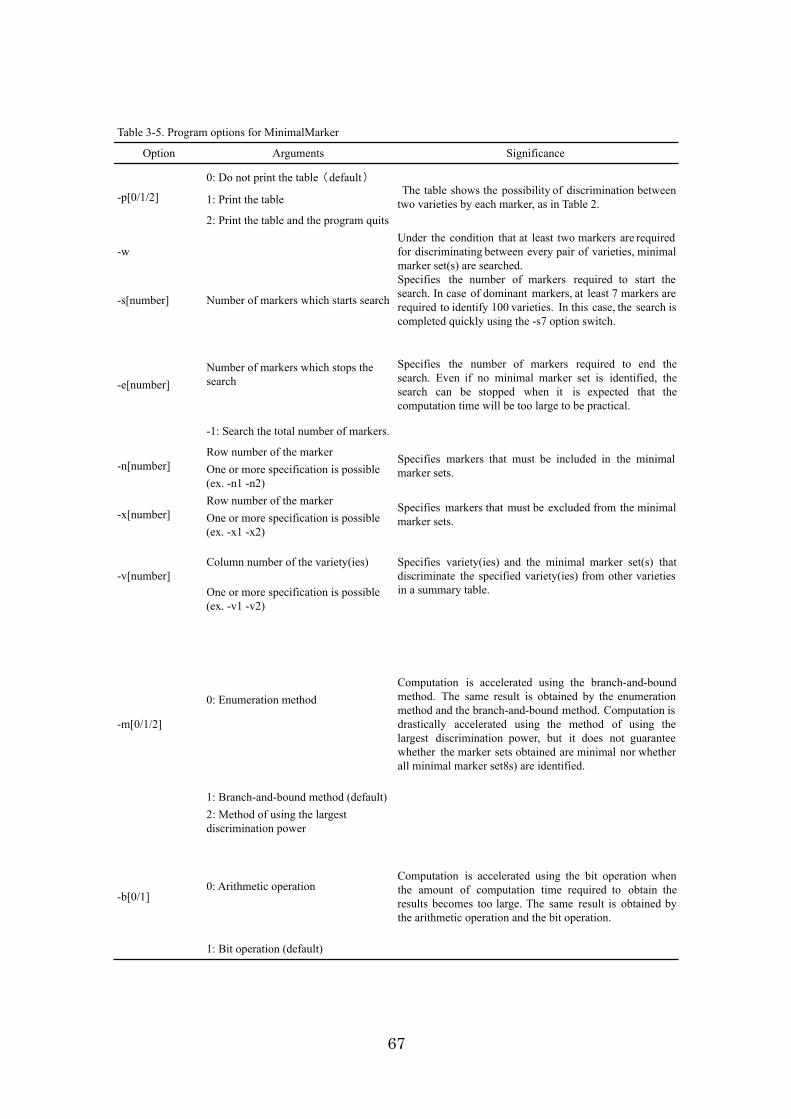
67
Table 3-5. Program options for MinimalMarker
Option Arguments Significance
0: Do not print the table default
1: Print the table
2: Print the table and the program quits
-wUnder the condition that at least two markers are requiredfor discriminating between every pair of varieties, minimalmarker set(s) are searched.
-s[number] Number of markers which starts search
Specifies the number of markers required to start thesearch. In case of dominant markers, at least 7 markers arerequired to identify 100 varieties. In this case, the search iscompleted quickly using the -s7 option switch.
Number of markers which stops thesearch
-1: Search the total number of markers.
Row number of the markerOne or more specification is possible(ex. -n1 -n2)Row number of the markerOne or more specification is possible(ex. -x1 -x2)
Column number of the variety(ies)
One or more specification is possible(ex. -v1 -v2)
0: Enumeration method
1: Branch-and-bound method (default)2: Method of using the largestdiscrimination power
0: Arithmetic operation
1: Bit operation (default)
-b[0/1]
Computation is accelerated using the bit operation whenthe amount of computation time required to obtain theresults becomes too large. The same result is obtained bythe arithmetic operation and the bit operation.
-x[number] Specifies markers that must be excluded from the minimalmarker sets.
-v[number]Specifies variety(ies) and the minimal marker set(s) thatdiscriminate the specified variety(ies) from other varietiesin a summary table.
-m[0/1/2]
Computation is accelerated using the branch-and-boundmethod. The same result is obtained by the enumerationmethod and the branch-and-bound method. Computation isdrastically accelerated using the method of using thelargest discrimination power, but it does not guaranteewhether the marker sets obtained are minimal nor whetherall minimal marker set8s) are identified.
-p[0/1/2] The table shows the possibility of discrimination betweentwo varieties by each marker, as in Table 2.
-e[number]
Specifies the number of markers required to end thesearch. Even if no minimal marker set is identified, thesearch can be stopped when it is expected that thecomputation time will be too large to be practical.
-n[number] Specifies markers that must be included in the minimalmarker sets.
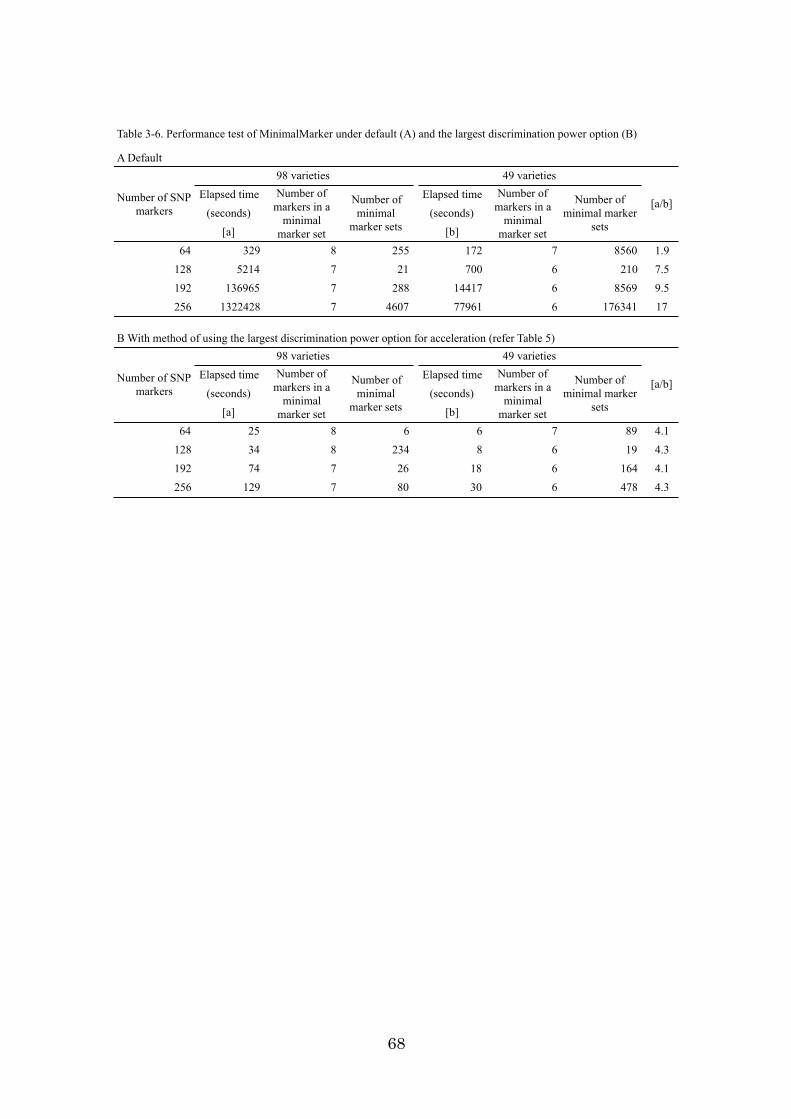
68
Table 3-6. Performance test of MinimalMarker under default (A) and the largest discrimination power option (B)
Elapsed time Elapsed time
(seconds) (seconds)[a] [b]
64 329 8 255 172 7 8560 1.9128 5214 7 21 700 6 210 7.5192 136965 7 288 14417 6 8569 9.5256 1322428 7 4607 77961 6 176341 17
Elapsed time Elapsed time
(seconds) (seconds)[a] [b]
64 25 8 6 6 7 89 4.1128 34 8 234 8 6 19 4.3192 74 7 26 18 6 164 4.1256 129 7 80 30 6 478 4.3
A Default
Number of SNPmarkers
98 varieties 49 varieties
[a/b]Number of
markers in aminimal
marker set
Number ofminimal
marker sets
Number ofmarkers in a
minimalmarker set
Number ofminimal marker
sets
Number ofminimal marker
sets
B With method of using the largest discrimination power option for acceleration (refer Table 5)
Number of SNPmarkers
98 varieties 49 varieties
[a/b]Number of
markers in aminimal
marker set
Number ofminimal
marker sets
Number ofmarkers in a
minimalmarker set

69
Supplemental Table 3-1. The summary table obtained using 17 SSR markers for 18 peach tree varieties from Yamamoto et al. (2003).
Akatsuki Yuuzora Saotome Chiyohime Yoshihime Masahime Akizora Natsutome Hakuhou
M1a 80/84 80/84 84/84 80/84 80/84 80/80 80/80 80/84 80/84
M4c 78/94 78/94 78/88 88/94 80/94 80/94 74/94 80/94 74/78
M6a 193/197 193/197 195/197 195/201 193/197 193/197 193/197 193/197 193/197
M12a 177/195 195/195 177/195 177/177 177/195 177/195 177/195 177/195 177/195
M15a 136/136 136/136 132/136 136/136 136/136 136/136 116/136 136/136 116/136
MA006b 295/295 295/295 295/301 295/301 295/295 295/295 295/295 295/295 295/295
MA007a 111/133 111/133 111/111 111/121 133/133 133/135 133/133 111/133 111/133
MA013a 197/213 197/213 211/227 197/227 197/213 197/213 197/211 197/213 197/211
MA014a 167/167 167/167 150/167 167/167 163/167 167/167 163/167 163/167 163/167
MA015a 178/178 178/263 180/185 178/180 178/178 178/263 178/185 178/178 178/185
MA017a 165/165 165/165 177/177 177/177 165/165 165/165 165/177 165/165 165/177
MA023a 192/214 214/214 192/192 192/206 214/214 214/214 192/192 192/214 192/214
MA024a 245/245 245/245 243/245 243/245 245/245 245/245 245/245 245/245 245/245
MaA027a 147/160 147/160 145/147 147/160 147/191 147/191 147/191 147/160 147/191
MA030a 238/238 238/238 238/238 238/238 238/238 236/238 238/238 238/238 238/238
MA031a 123/131 123/123 123/131 123/123 123/131 123/123 123/131 123/131 123/131
MA035a 167/179 179/179 167/167 167/167 179/179 167/179 167/167 179/179 167/179
Note: The figures in each cell show the length of the SSR fragments.
Hakutou 21-18 Gyosei HikawaHakutou Abe Hakutou Kawanaka
jima HakutouKouyouHakutou
ShimizuHakutou Ookubo
M1a 80/80 80/80 80/84 80/84 80/80 80/80 80/80 80/84 80/84
M4c 78/94 78/80 78/94 80/94 78/80 74/94 80/94 80/94 78/80
M6a 193/197 193/197 193/197 193/201 197/197 197/201 197/201 193/201 197/201
M12a 195/195 195/195 177/195 177/195 177/195 177/195 177/195 177/195 177/195
M15a 136/136 136/136 136/136 116/136 136/136 136/147 136/136 136/136 136/136
MA006b 295/295 295/295 295/295 295/297 295/295 295/295 295/295 295/295 295/295
MA007a 121/133 133/135 111/133 133/135 133/133 121/133 121/121 111/133 111/133
MA013a 197/213 197/213 197/213 197/213 213/213 197/213 197/213 197/197 197/213
MA014a 163/167 163/167 167/167 163/167 163/167 150/167 160/167 163/167 163/167
MA015a 178/263 178/263 178/178 178/263 178/178 178/185 178/263 178/185 178/185
MA017a 165/165 165/165 165/165 173/177 165/165 165/177 165/177 165/177 165/177
MA023a 214/214 214/214 192/214 192/192 192/214 214/214 206/214 206/214 192/216
MA024a 245/245 245/245 245/245 245/245 245/245 245/245 245/245 245/245 245/245
MaA027a 160/191 189/191 147/160 189/191 147/160 147/160 153/160 153/191 147/160
MA030a 238/238 236/238 238/238 236/238 236/238 238/238 236/238 236/238 236/238
MA031a 123/123 123/123 123/131 123/123 123/123 123/123 123/131 123/131 123/123
MA035a 179/179 179/179 167/179 167/167 179/179 167/179 167/179 167/179 167/179
Variety
VarietySSR marker
SSR marker
70
Chapter 4: SNP genotyping by custom genotyping array in citrus accessions
Citrus cultivars contain a variety of secondary metabolites, such as flavonoids
(Murakami et al., 2000), carotenoids (Tsushima et al., 1995), and limonoids (Lam and
Hasegawa 1989; Lam et al., 1989), which have health promoting functions in humans.
Recently, it has become important to breed new cultivars enriched with such substances.
For example, increasing the content of B-Cry, which is a carotenoid component with
cancer preventative activity (Tsushima et al., 1995), is an important breeding objective
for citrus in Japan. However, there are many genetic factors involved in increasing
B-Cry (Kato et al., 2004). Quantitative trait loci (QTL) analysis is a powerful approach
to map the genetic factors for important traits, such as B-Cry content (Sugiyama et al.,
2011). The accuracy in mapping a trait loci, including QTLs, depends on the DNA
marker density and the number of individuals, provided the genetic background of the
mapping population is the same. To improve mapping efficiency and quality,
high-throughput technologies have been required to perform genotyping with a large
number of markers on a large number of progeny. Until now, many genetic maps of
citrus have been constructed by traditional DNA markers such as restriction fragment
length polymorphism (RFLP), cleaved amplified polymorphic sequences (CAPS), or
simple sequence repeats (SSR). However, it was difficult for researchers to map each
target trait locus in the different segregating populations because generating new
linkage maps using traditional markers was a time- and labor-consuming procedure.
Compared with other DNA markers used for genetic mapping, single nucleotide
polymorphisms (SNPs) have two advantages as genotyping markers. First, SNPs are the
most frequently detectable variation in the genome sequences of various organisms. For
example, it has been shown that one SNP occurs per 21 bp in potato (Rickert et al.,
2003), per 78 bp in barley (Russell et al., 2004), per 164 bp in citrus (Jiang et al., 2010),
71
and per 232 bp in rice (Feltus et al., 2004). In comparison one SSR occurs per 8000 bp
in rice (Goff et al., 2002).
Second, several high-throughput technologies utilizing SNPs have been developed
in human genome analysis (Kwok 2001; Steemers et al., 2006; Syvänen 2005) and also
in some crop species such as rice (Masouleh et al., 2009; Tung et al., 2010).
Among the SNP genotyping technologies, the bead array, such as the GoldenGate®
Assay (Illumina Inc.), has been applied successfully to various plant species, including
rice (Oryza sativa L.) (Tung et al., 2010), barley (Hordeum vulgare L.) (Rostoks et al.,
2006), soybean (Glycine max (L.) Merrill) (Hyten et al., 2008), white spruce (Picea
glauca Moench) and black spruce (Picea mariana (Mill.) Britton) (Pavy et al., 2008),
loblolly pine (Pinus taeda L.) (Eckert et al., 2009) and sugi (Cryptomeria japonica D.
Don) (Uchiyama et al., 2011). Because the assay is capable of multiplexing from 96 to
1536 SNPs in a single reaction, applying the high-throughput genotyping system would
quickly create high-density genetic maps for marker-assisted breeding of various
important traits.
There have been attempted to develop arrays for SNP markers in citrus (Close et al.,
2006; Ollitrault et al., 2011). However, a detailed flowchart of the high-throughput SNP
genotyping system, from SNP screening to validation of genotyping results, has not
been established so far in citrus. In this study, we surveyed SNPs by direct sequence
comparison of the sequence tagged site (STS) fragment amplified from genomic DNA
of cultivars representing the genetic diversity of citrus breeding in Japan, and developed
a prototype multiplexed SNP genotyping GoldenGate platform to establish the
high-throughput genotyping system in citrus. The assay using the SNP genotyping
platform was applied to a hybrid population of 88 progeny and 103 citrus accessions.
The reliability of the SNP genotyping call results was confirmed using parentage

72
analysis, since datasets derived from DNA markers often contain missing or
questionable genotype calls (Close et al., 2009).
Development of high-throughput SNP genotyping array, which incorporates the
reliable SNPs, is able to finish the genotyping for any citrus population within a few
months. The technology will actively promote the genetic analysis of citrus, such as
QTL analysis, linkage mapping.
Materials and Methods
PCR primer design for STS sequence comparison
To design PCR primers for SNP discovery in genomic sequences of citrus cultivars,
we evaluated expressed sequence tags (ESTs) in the DNA Data Bank of Japan (DDBJ:
http://www.ddbj.nig.ac.jp/index-e.html), HarvEST (http://harvest.ucr.edu/), and our
private citrus EST database (Fujii et al., 2003b). The EST sequences were clustered by
Visual Bio Clustering software (NTT software, Tokyo, Japan) to select representative
ESTs from redundant sequences. The representative ESTs were used as candidate sites
of STS amplification and SNP discovery. The exon-intron-junction of ESTs were
predicted using software MAEZATO (Fujii et al., 2010a) to design intron spanning
primers as introns are more polymorphic regions. STS primers for amplification and
sequencing were designed using OLIGO primer analysis software (Molecular Biology
Insights Inc., Cascade, USA). In addition to the newly developed STSs, STSs that were
previously developed to generate CAPS markers (Omura, 2005) were also used for
sequence comparisons among cultivars to detect SNPs.
PCR amplification and SNP discovery
PCR was performed on citrus genomic DNA of Clementine (C. clementina hort. ex

73
Tanaka), ‘Miyagawa wase’ (C. unshiu Marc.), ‘Trovita’ orange (C. sinensis Osbeck),
‘Duncan’ grapefruit (C. paradisi Macf.), Kishu mikan (C. kinokuni hort. ex Tanaka),
Ponkan (C. reticulata Blanco), Mediterranean mandarin (C. delicious Tenore), and a
haploid clone derived from Clementine (Oiyama and Kobayashi 1993). The haploid was
used to obtain reference sequences. These eight citrus cultivars cover the majority of
alleles used in citrus breeding programs for table fruits in Japan. The PCR products
were purified by Whatman DNA binding unifilters (Whatman Ltd.) to remove the
excess primers, subjected to direct sequencing by BigDye Terminator v3.1 Cycle
Sequencing Kit (Applied Biosystems Inc.), and sequenced by ABI PRISM® 3100
Genetic Analyzer (Applied Biosystems Inc.). The ABI sequence file obtained was
directly imported to CodonCode Aligner (CodonCode Corporation) to detect mutation
sites. SNPs were discovered using CodonCode Aligner’s “Find Mutation” tool. For
array analysis of candidate SNPs, only those that displayed base substitutions occurring
in more than 2 of the 8 cultivars were selected. To detect SNPs in a shortcut analysis,
the genomic sequence comparison of a subset of STSs was performed on ‘Okitsu 46
Gou’ (‘Sweet Spring’ (‘Ueda unshiu’ (C. unshiu) × Hassaku (C. hassaku hort. ex
Tanaka)) × ‘Trovita’ orange) and ‘Kankitsu Chukanbohon Nou 5 Gou’ (‘Lee’
(Clementine × ‘Orlando’ tangelo (‘Duncan’ grapefruit × ‘Dancy’ tangerine (C.
tangerina hort. ex Tanaka)) × ‘Mukaku-kishu’ (C. kinokuni hort. ex Tanaka), the
parents of the hybrid population for the SNP genotyping assay. In addition, a small
subset of 31 genes was deduced from in silico identification of SNPs in contigs
assembled from EST sequences of C. unshiu and C. sinensis that were downloaded from
DDBJ.
74
SNP selection and bead array construction
The candidate SNPs were used to construct Illumina bead arrays of 384 SNPs for
the GoldenGate Assay. To optimize the SNPs chosen, three conditions were selected:
SNP without any other SNP within 60 bp or less in the sequence; SNP without any
other SNP in the zone located 20 bps downstream; and SNP with an appropriate
designability rank score. A designability rank score, which summarizes a number of
parameters, was given to each SNP by Illumina’s algorithm, with the score ranging
from 0 to 1.0 based on specificity and likelihood of success of genotyping in the
GoldenGate Assay. A rank score of <0.4 had a low success rate, 0.4 to <0.6 had a
moderate success rate, and >0.6 had a high success rate. A total of 384 SNPs with a
designability rank score of 0.8 or higher were selected. In some cases more than one
SNP was chosen in the same gene to allow validation of haplotype mapping.
Annotation of STSs used for SNP analysis
EST sequences used as SNP sources were annotated by a TBLASTX similarity
search against the coding sequence of Arabidopsis in The Arabidopsis Information
Resource (http://www.arabidopsis.org/), and the annotation was assigned (Table 4-1).
Plant materials for genotyping assays
The hybrid population consisted of 88 progeny generated by crossing ‘Okitsu 46
Gou’ and ‘Kankitsu Chukanbohon Nou 5 Gou’. The two parent clones were used to
evaluate the parental genotypes, and the results for SNP genotyping can be compared
with previously performed CAPS genotyping. These plants were cultivated in the
research field of the Citrus Research Division Okitsu of NIFTS. Ninety-seven diverse
genotypes were selected from cultivars bred in Japan with their parents and accessions
75
from NIFTS Citrus Germplasm Collection (Table 4-2). Among them, HF, ‘Kankitsu
Chukanbohon Nou 5 Gou’ and ‘Tamami’ had the duplicated analysis with sample code
of TY9 with TY10 and TY12, TY62 with TY104, and TY48 with TY57, respectively.
All genotypes were cultivated at the Citrus Research Division Okitsu or the Citrus
Research Station Kuchinotsu (Minamishimabara, Nagasaki) of NIFTS. Genomic DNA
of the 88 hybrid progeny and 98 germplasm accessions including the hybrid parents
with replicates (Table 4-2) for breeding was isolated from young leaves. After
freeze-drying, leaf material was ground using a MM 300 Mixer Mill (Retsch Inc.), and
DNA extraction was performed using a QIAmp DNA Mini Kit (Qiagen) according to
the manufacturer’s protocol. A total of 192 samples were adjusted to concentrations of
80 ng/µl using distilled water.
SNP genotyping assay and validation
Based on the description by Fan et al. (2003), Illumina’s GoldenGate Assay
utilizing a bead array platform was performed on the candidate SNPs. The assay was
outsourced for SNP genotyping (Moritex Inc.), performed as per the manufacturer’s
protocol, and genotyping reports were generated.
According to the manufacturer’s description
(http://www.illumina.com/Documents/products/technotes/technote_gencall_data_analys
is_software.pdf), the scores generated by the SNP signal calling system software were
used to validate the SNP genotyping for each DNA sample and for each SNP.
We also examined the parentage analysis as another evaluation step for the
reliability of SNP genotyping, since an SNP genotype should be the allele combination
derived from the parental genotypes according to the co-dominant inheritance mode. As
listed in Table 4-2, 74 germplasm accessions and 88 individuals of the hybrid
76
population genotyped in this assay could be used for parentage analysis. The computer
program MARCO (Fujii et al., 2010b) was used for this lineage test.
Results
Construction of SNP genotyping array
A total of 1497 SNPs in 416 STSs and 18 EST contigs were detected from our three
data sources (Table 4-3). The SNPs, along with the flanking sequences, were screened
by the design rules of the GoldenGate Assay as described in the Materials and Methods,
and 25.7% of all the SNPs detected were selected for the assay (Table 4-3). Using the
384 SNPs selected from 283 independent STSs (Tables 4-2, Table 4-3, Table 4-4), an
Illumina custom GoldenGate Array for citrus was constructed and termed CitSGA-1
hereafter. Among the 384 SNPs set on CitSGA-1, 286 SNPs were selected from the
sequence comparisons among the eight citrus, 82 from comparing between two cultivars,
and the remaining 16 from the in silico analysis (Table 4-3). From the 283 STSs, 199
STSs produced 1 SNP each. From the remaining 84 STSs, 71 STSs produced 2 SNPs
each. In addition, 10 STSs, 2 STSs and 1 STS produced 3 SNPs, 4 SNPs, and 5 SNPs,
respectively (Table 4-1, Table 4-5).
Screening of SNP markers for genotyping
1) Screening of SNPs and DNAs by signal call scores for genotyping on CitSGA-1
One hundred and ninety-two DNA samples (Table 4-2) were genotyped using
CitSGA-1 with 384 SNPs, which resulted in a total of 73,728 individual SNP calls.
However, the results included 2169 (2.9%) “No Calls,” based on the aforementioned
criteria, obtained using the GenCall software. The GenCall scores generated are
primarily designed for ranking and filtering out failed genotypes, sample DNAs, and/or
77
SNPs, and the scores have values from 0 to 1. Scores below 0.2 indicate poor quality of
signal and were termed as No Calls for failed genotypes, while scores above 0.7 usually
indicate well-behaving genotypes.
To evaluate the typing accuracy for each SNP on the array, the call frequency score,
which is the ratio of the number of samples on which the genotyping succeeded among
the total 192 samples, was applied. The call frequency scores over 0.9 indicate valid
SNPs according to the manufacturer’s criteria. Thus, 15 SNPs (SI066, SI087, SI090,
SI121, SI147, SI225, SI249, SI256, SI303, SI310, SI319, SI354, SI364, SI370 and
SI377) were invalid and omitted by the call frequency scores from the following
analyses (Table 4-3).
For evaluation of DNA samples, we used “GC10” and “GC50” scores that are
calculated by taking the 10th and 50th (median) percentile of the GenCall scores. DNA
samples with GC10 ≥0.5 and GC50 ≥0.7 were identified as valid according to the
manufacturer’s criteria. As a result, eight DNA samples, QT18, QT73, QT86, QT87,
QT88, TY50 (‘Osceola’), TY62 (‘Kankitsu Chukanbohon Nou 5 Gou’), and TY99
(‘Kincy’), were excluded using the proceeding analyses. Therefore, a total of 184 DNA
sample calls were selected as reliable DNA samples. The 184 DNA samples included
replicates, three ‘HF9’ (TY009, TY010, and TY012), and two ‘Tamami’ (TY048,
TY057); therefore, the number of independent DNA samples was 181.
The analysis on 184 DNA samples, including the replicates, with 369 SNPs resulted in a
total of 67,896 (92.1%) individual genotyping calls, in which 142 No Calls remained.
2) Exclusion of Monomorphic SNPs
We searched for monomorphic SNPs among the remaining 369 SNPs.
Consequently, 26 SNPs were called termed as the single homozygous genotype across
78
all the DNA samples, and 17 SNPs were also called as the single homozygous genotype
but with No Calls in some DNA samples. Thus, these 43 SNPs were judged as
monomorphic SNPs and were omitted from the following analyses (Table 4-3). A total
of 326 SNPs, including 59,784 individual genotyping calls with 80 No Calls, were used
for further analyses.
Monomorphic rates among the three sources of SNP discovery, the detection from
comparing eight citrus cultivars, the detection by comparing two citrus cultivars and the
detection in silico, were 8.3%, 14.6% and 43.8%, respectively.
3) SNP typing validation by parentage discrepancy
We used the parentage analysis as another evaluation step for evaluating the
reliability of SNP genotyping, since the genotype of an SNP should be the combination
of the parental genotypes according to the co-dominant inheritance mode. In a certain
SNP, if a discrepancy of parentage exists between the parents and progeny, at least one
of the parents or progeny will have been mis-genotyped. Therefore, the analysis
provides important information on the evaluation of accuracy of SNP genotyping and
the omission of the invalid SNPs.
Table 4-2 shows all the 77 combinations of parent-progeny relationships among
cultivars used in SNP genotyping. Among them, TY50, TY62 and TY99 had already
been omitted by the GenCall score-based criteria, and TY2 (No.971594), TY3
(No.971614), TY21 (‘Kuchinotsu 36 Gou’), TY28 (KyEn5-En-6), TY79 (‘Reiko’),
TY47 (‘Encore’), TY56 (‘Setoka’), TY97 (‘Kinnow’), and TY91 (‘Southern Red’) were
omitted from the analysis because they showed mismatches in a previous lineage test
using MARCO (Fujii et al., 2010b). The remaining 65 combinations of parent-progeny,
in which discrepancies had not been detected previously, were used in the genotype
79
assay. However, 382 discrepancies of parentage were detected in 29 SNPs including 35
No Calls. Fifty of 65 combinations of parent–progeny had discrepant SNPs. Therefore,
these discrepancies would be derived from miscalling the genotyping of 29 SNPs but
not from a misunderstanding of lineages. Thus, the 29 SNPs were omitted from the
following analyses. At that point, a total of 297 SNPs, including 54,648 individual
genotyping calls with 45 No Calls remained (Table 4-3).
Re-construction of a set of SNP markers screened by the validation cut-off procedure
1) Reduction of SNPs that have No Call
Previous validation procedures for SNP genotyping lead to the deletion of 2124 No
Calls from a total of 73,728 individuals analyzed. Only 45 No Calls remained in 20
SNPs representing 3680 genotyping calls in 184 DNA samples. We decided to delete
the No Call SNPs to keep the robustness of the SNP markers for many citrus cultivars
and progenies. Consequently, the 20 SNPs were omitted from the following analyses.
Therefore, the 277 SNPs that remained, which included 50,968 individual genotyping
calls, were selected as reliable SNPs (Table 4-3).
2) Reproducible and non-redundant SNP set
Among the remaining 277 SNPs that were selected by previous steps as reliable,
nine SNPs appeared in replicate to check the reproducibility of the genotyping. Those
included pairs of SI15 and SI337, SI19 and SI30, SI28 and SI292, SI95 and SI181,
SI124 and SI284, SI170 and SI302, SI201 and SI252, SI220 and SI315, and SI272 and
SI327. Among the paired SNP markers, no different genotyping were observed.
Therefore, we eliminated the replicates from the 277 SNPs and selected the remaining
268 as independent reliable SNPs in CitSGA-1.

80
Reproducibility was also investigated for the 268 reliable SNPs. The reproducibility
of the assay was evaluated using three sample replicates of HF9 (TY9, TY10, and
TY12) and two sample replicates of ‘Tamami’ (TY48 and TY57) (See Table 4-2). All
genotypes were concordant among replicates in all reliable 268 SNPs. Moreover, the
reproducibility of the assay was evaluated using two SNP replicates from the nine SNP
pairs mentioned above. All genotypes were concordant among replicates in the 184
samples.
3) Source of SNP detection and detection rate of reliable SNPs
The 277 reliable SNPs, including replicates, were classified by the sources of SNP
detection. As described previously, the first class of SNPs were derived from the
comparisons of eight citrus cultivars, and these comparisons provided 212 (77.2%) of
the 286 SNPs placed on CitSGA-1. In the second class, where SNPs were derived from
the comparison of two citrus cultivars, ‘Okitsu 46 Gou’ and ‘Kankitsu Chukanbohon
Nou 5 Gou’, 57 reliable SNPs (69.5%) were observed out of 82 SNPs tested. In the third
class, using the in silico source, the number of reliable SNPs was 8 (50.0%) of 16
assayed SNPs. The success rate of the in silico source was obviously inferior to that of
the wet sequence comparison sources, especially since 7 of 16 (43.7%) assayed SNPs
were monomorphic (Table 4-3).
Evaluation of Applicability of SNP genotyping
1) Ratio of heterozygous loci
The percentage of heterozygous SNP loci in the 268 reliable SNPs varied among 98
cultivars from 8.9% (TY69, ‘Hirado Buntan’ pomelo, C. grandis Osbeck) to 70.7%
(TY59, ‘Trovita’ orange) with an average of 41.2% and a median of 44.7% (Table 4-6).
81
The percentage of heterozygous SNP loci in the 268 reliable SNPs varied from 1.0%
(SI021, SI021, SI074, SI115, SI333, and SI360) to 80.6% (SI202) with a median of
45.9% (Table 4-4).
2) Mapping to Citrus genome of STS that originates SNP
The whole genome sequences for Clementine (C. clementina), as constructed by
JGI, are now available on the Citrus Genome Database
(http://www.citrusgenomedb.org/). The Clementine genome (v. 0.9) is 296 Mb spread
over 1128 scaffolds with 2.3% gaps at 6.5× coverage.
We have mapped STSs that originate SNPs to both scaffolds by BLASTN. Of 384
STSs that originated SNPs, the e-value of 3 in Clementine were larger than 1E-10
(Table 4-4) and scaffolds were not identified between them.
3) Minimal marker sets for cultivar identification
It is sometimes unnecessary to use all the DNA markers listed to discriminate all
the cultivars of a particular crop. That is, if a minimal marker set, a marker set that can
differentiate between all cultivars shown in a cultivar/marker type table and that is as
small as possible, is found, it is possible to discriminate cultivars efficiently both in
terms of labor and time. We attempted to identify SNPs in the present study using the
program, MinimalMarker described in Chapter 3.
We used a genotyping subset consisting of 98 germplasm accessions and 246 SNPs
that showed independent and reliable genotyping results for MinimalMarker. The
program outputted 4607 minimal marker sets containing seven markers, i.e. SI001,
SI006, SI009, SI131, SI191, SI247, and SI259. By using 7 markers, all 98 germplasm
accessions could be discriminated from each others.
82
Discussion
Throughput of SNP genotyping in citrus
In this research, we constructed a prototype 384 SNP citrus array (CitSGA-1) for
the GoldenGate Assay and in addition performed a survey to obtain reliable SNPs using
this system. We successfully applied this array to SNP genotyping in citrus. In total,
SNP genotype data were obtained for 351 (91%) of the 384 SNPs on CitSGA-1 (Table
4-5). The 91% success rate is comparable to the 90% success rate previously reported in
barley (Rostoks et al., 2006), 89% in soybean (Hyten et al., 2008), and 81.6% and
82.0% in white spruce and black spruce, respectively (Pavy et al., 2008).
Marker data sets derived from DNA markers often contain missing or questionable
genotype calls (Close et al., 2009). Therefore, we have eliminated missing or
questionable genotype calls in several steps, such as monomorphic SNPs, that have
discrepancies of parentage or No Calls. Consequently, 268 independent reliable SNPs
have been obtained. Through the analysis, it was recommended to validate the
following procedures: (1) Adoption of SNPs by call frequency scores (over 0.9)
according to the manufacturer’s criteria, (2) Adoption of sample by GC10 and GC50
scores according to the manufacturer’s criteria, (3) Removal of monomorphic SNPs, (4)
Removal of SNPs with discrepancy of parentage, and (5) Removal of No Call SNPs.
Comparison of sources for SNP discovery on reliability of genotyping
To detect SNPs for CitSGA-1 we used three sources, two re-sequencing sources and
an in silico source. As shown in the results, 212 of the 286 (77.2%) reliable SNPs were
from the eight citrus source and 57 of the 82 (69.5%) reliable SNPs were from the two
cultivars source. SNPs from the genomic sequence comparison among the eight citrus
83
cultivars had a higher SNP genotyping success rate than those from the comparison of
the two cultivars. However, SNP success rates were not significantly different. The
reason may be that the cultivars used as the two cultivar sources, ‘Okitsu 46 Gou’ and
‘Kankitsu Chukanbohon Nou 5 Gou’ are hybrids derived from plural sources with
diversified genome sequences. SNPs in genomic sequences from these two cultivars
would widely cover those obtained from the eight cultivars.
Compared with the two re-sequencing sources, the number of reliable SNPs using
the in silico source was 8 of the 16 (50.0%) assayed SNPs. The success rate of the in
silico source was obviously inferior to that of the wet sequence comparison sources,
especially since 7 of the 16 (43.7%) assayed SNPs were monomorphic (Table 4-3). A
similar tendency was also observed in the monomorphic ratios. Among the SNPs
detected by comparisons of two citrus cultivars, the incidence of monomorphism may
be caused by plural targeted genes existing in the genome. The high monomorphic rate
of SNPs detected by the in silico source may be due to the EST sequence errors and the
assembly of ESTs that were derived from different transcript regions. However, the
cause of monomorphisms in SNPs detected from comparing eight citrus cultivars
remains unclear.
Applicability of cultivar genotyping of CitSGA-1
When the number of No Calls of each DNA sample was counted, it was the largest
in TY69 (‘Hirado Buntan’ pomelo) with 20. Five of the 20 No Calls occurred in only
‘Hirado Buntan’. This may be due to mis-priming or non-priming of the primer.
Because pomelo is classified distantly from other mandarins used in this assay by DNA
markers (Federici et al., 1998), it suggested that there were a lot of SNPs in pomelo
germplasms, which were not revealed while comparing the limited cultivars mainly
84
consisting of mandarins and sweet orange. It was considered that the above mentioned
primers would not function only in ‘Hirado Buntan’ for the SNP assay; however,
pomelo is an important breeding parent in Japan so we eliminated SNPs that would be
less available for pomelo. For further analysis, allele or haplotype diversity in pomelo
and mandarins in relation to the lineages of grapefruit or sweet oranges should be
discussed based on detailed data.
Possible application of CitSGA-1
The number of chromosomes in haploid citrus is nine generally, but the number of
SNPs per chromosome is 43 in average when all the 384 SNPs on the genotyping array
were available. Therefore, the prototype 384 SNP array could be useful to roughly map
the breeding trait loci at the marker density depending on the number of heterozygous
loci for each cultivar. However, the information obtained by the prototype analysis
system in the experiment would be applicable to construct a higher multiplex custom
assay such as an over 1500 SNPs system. In addition, since most of the STSs were
mapped on scaffolds by whole genome analysis of clementine, as shown in Table 4-4,
tight mapping could be performed.
Moreover, it was shown that 98 germplasm accessions could be identified by
combining the reliable SNPs obtained in this study. Therefore, these SNPs are
immediately applicable for citrus cultivar identification.

85
STS name SNP namea
DDBJ ESTaccession number
for STS primerdesign
Species of ESTderivedb
AssignedArabidopsis
locusAnnotation of Arabidopsis locus
Al0014 SI058:SI153:SI312 C95210 Cu AT5G25110.1 CIPK25; SnRK3.25
Al0218 SI350 C95269 Cu AT4G11150.1 TUF (VACUOLAR ATP SYNTHASE SUBUNIT E1)
Al0302 SI090:SI311 C95329 Cu AT3G57520.2 AtSIP2 (Arabidopsis thaliana seed imbibition 2)
Al0304 SI259:SI293 C95332 Cu no homology
Al0307 SI029 C95335 Cu AT1G69530.2 ATEXPA1 (ARABIDOPSIS THALIANA EXPANSIN A1)
Al0308 SI045 C95336 Cu AT4G21490.1 NDB3; NADH dehydrogenase
Al0327 SI065:SI344 C95360 Cu AT1G12440.2 zinc finger (AN1-like) family protein
Al0329 SI185 DC892963 Cu no homology
Al0409 SI201:SI252 C95388 Cu AT4G15560.1 CLA1 (CLOROPLASTOS ALTERADOS 1)
Al0413 SI275:SI299 C95392 Cu AT3G23920.1 BAM1 (BETA-AMYLASE 1)
Al0415 SI120:SI310 C95396 Cu AT5G19010.1 MPK16
Al0417 SI244:SI255 C95398 Cu no homology
Al0515 SI178 DC893061 Cu AT2G26330.1 ER (ERECTA)
Al0524 SI043:SI341 C95551 Cu AT5G02290.2 NAK
Al0625 SI329 C95496 Cu AT5G60870.2 regulator of chromosome condensation (RCC1) family protein
Al0633 SI123 C95520 Cu AT1G28520.2 VOZ1 (VASCULAR PLANT ONE ZINC FINGER PROTEIN)
Al0636 SI313 C95540 Cu AT3G13225.1 protein binding
Al0637 SI353 C95541 Cu no homology
Bf0003 SI354 DC884981 Cu AT3G51860.1 CAX3 (CATION EXCHANGER 3)
Bf0004 SI273 DC884983 Cu AT3G49140.1 unknown protein
Bf0005 SI194 DC884984 Cu AT2G33700.1 protein phosphatase 2C putative
Bf0008 SI309 DC885005 Cu AT3G17980.1 C2 domain-containing protein
Bf0011 SI218 DC885033 Cu AT5G20080.1 NADH-cytochrome b5 reductase putative
Bf0024 SI093 DC885129 Cu AT1G43900.1 protein phosphatase 2C putative
Bf0027 SI372 DC885151 Cu AT4G25100.4 FSD1 (FE SUPEROXIDE DISMUTASE 1)
Bf0028 SI001 DC885165 Cu AT1G11720.1 ATSS3 (starch synthase 3); starch synthase
Bf0029 SI193:SI283 DC885170 Cu AT3G25820.1 ATTPS-CIN (terpene synthase-like sequence-18-cineole)
Bf0033 SI356:SI379 DC885228 Cu AT4G30210.2 ATR2 (ARABIDOPSIS P450 REDUCTASE 2)
Bf0103 SI155 DC885333 Cu AT5G08100.1 L-asparaginase
Bf0109 SI233 DC885420 Cu AT2G40490.1 HEME2; uroporphyrinogen decarboxylase
Bf0110 SI297 DC885426 Cu AT3G63520.1 CCD1 (CAROTENOID CLEAVAGE DIOXYGENASE 1)
Bf0115 SI054:SI295 DC885474 Cu AT4G34640.1 SQS1 (SQUALENE SYNTHASE 1)
Bf0116 SI260 DC885486 Cu AT2G13360.2 AGT (ALANINE:GLYOXYLATE AMINOTRANSFERASE)
Bf0123 SI141 DC885557 Cu AT5G01220.1 SQD2 (sulfoquinovosyldiacylglycerol 2
Bf0130 SI063:SI188 DC885666 Cu AT5G51380.1 F-box family protein
Bf0145 SI272:SI327:SI368 DC885769 Cu AT5G02810.1 PRR7 (PSEUDO-RESPONSE REGULATOR 7)
Bf0147 SI165 DC885795 Cu AT4G12320.1 CYP706A6
Bf0150 SI316:SI370 DC885821 Cu AT1G79440.1 ALDH5F1
Bf0158 SI376 DC885888 Cu AT5G51190.1 ERF (ethylene response factor)
Bf0159 SI074 DC885890 Cu AT3G27090.1 unknown protein
Bf0161 SI089:SI348 DC885944 Cu no homology
Bf0164 SI263 DC885962 Cu AT1G76550.1 pyrophosphate-fructose-6-phosphate 1-phosphotransferase alpha subunit putative
Bf0165 SI280 DC885967 Cu AT5G47120.1 ATBI1 (BAX INHIBITOR 1)
Bf0171 SI381 DC886014 Cu no homology
Bf0174 SI282 DC886036 Cu AT5G63120.2 ethylene-responsive DEAD box RNA helicase putative (RH30)
Bf0177 SI060 DC886078 Cu AT1G18640.2 PSP (3-PHOSPHOSERINE PHOSPHATASE)
Bf0183 SI308 DC886132 Cu AT5G59530.1 2-oxoglutarate-dependent dioxygenase putative
Bf0193 SI100:SI109 DC886216 Cu AT5G48150.2 PAT1 (phytochrome a signal transduction 1)
Bf0195 SI369 DC886240 Cu AY607026.1z Citrus reticulata: NHX1 gene
Bf0200 SI335 DC886299 Cu AT1G25350.1 OVA9 (ovule abortion 9)
Bf0204 SI326 DC886340 Cu AT5G67030.1 ABA1 (ABA DEFICIENT 1)
Bf0205 SI236 DC886360 Cu AT2G23320.1 WRKY15; calmodulin binding
Bf0212 SI332 DC886446 Cu AT3G01500.3 CA1 (CARBONIC ANHYDRASE 1)
Bf0213 SI097 DC886474 Cu AT4G12770.1 heat shock protein binding
Bf0229 SI253 DC886577 Cu AT4G14040.1 SBP2 (SELENIUM-BINDING PROTEIN 2)
Bf0233 SI359 DC886598 Cu AT2G45550.1 CYP76C4
Bf1117 SI224 DC885323 Cu no homology
Bf1186 SI245 DC885875 Cu no homology
Table 4-1 Relationship of assigned Arabidopsis loci, and their annotation, to STSs and SNPs on the citrus genotyping array CitSGA-1 .
aItalics indicate ‘Not Reliable’ SNP. bCu: Citrus unshiu Marc., Pt: Poncirus trifoliata (L.) Raf., Cn × Ck: C. nobilis Lour. × C. kinokuni hort. ex Tanaka, Cs: C. sinensis Osbeck, Cl: C.limon (L.) Burm. f.
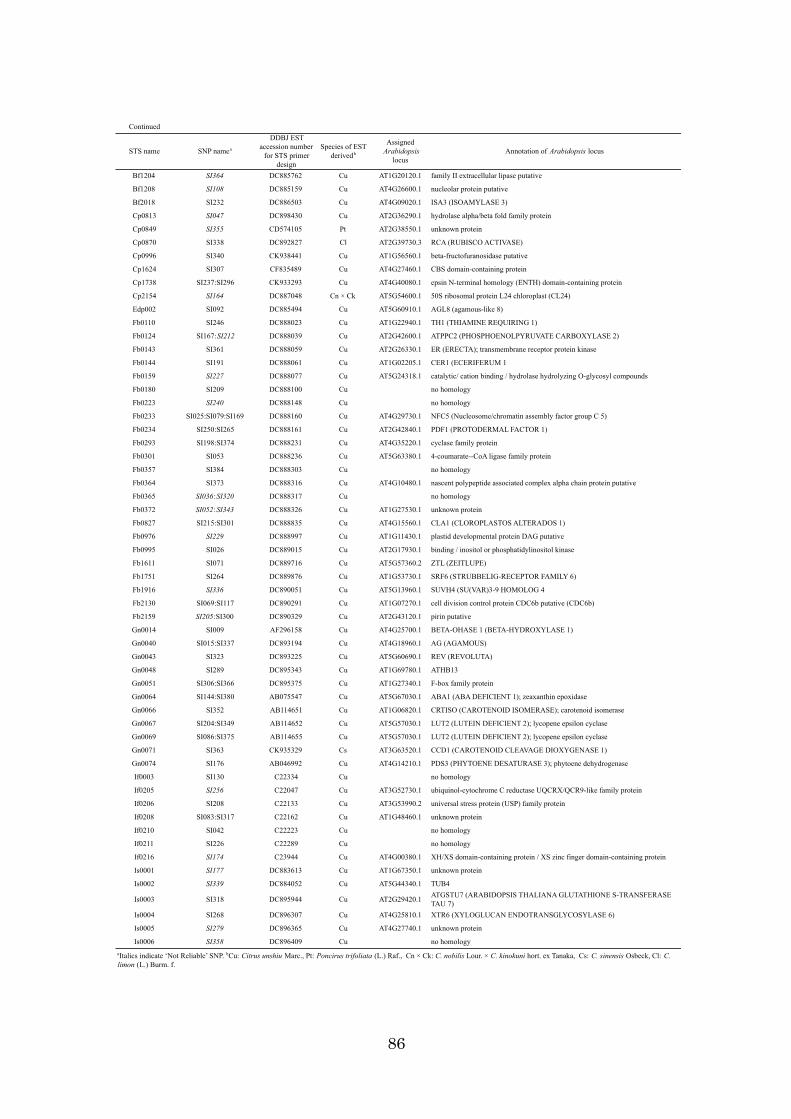
86
Continued
STS name SNP namea
DDBJ ESTaccession number
for STS primerdesign
Species of ESTderivedb
AssignedArabidopsis
locusAnnotation of Arabidopsis locus
Bf1204 SI364 DC885762 Cu AT1G20120.1 family II extracellular lipase putative
Bf1208 SI108 DC885159 Cu AT4G26600.1 nucleolar protein putative
Bf2018 SI232 DC886503 Cu AT4G09020.1 ISA3 (ISOAMYLASE 3)
Cp0813 SI047 DC898430 Cu AT2G36290.1 hydrolase alpha/beta fold family protein
Cp0849 SI355 CD574105 Pt AT2G38550.1 unknown protein
Cp0870 SI338 DC892827 Cl AT2G39730.3 RCA (RUBISCO ACTIVASE)
Cp0996 SI340 CK938441 Cu AT1G56560.1 beta-fructofuranosidase putative
Cp1624 SI307 CF835489 Cu AT4G27460.1 CBS domain-containing protein
Cp1738 SI237:SI296 CK933293 Cu AT4G40080.1 epsin N-terminal homology (ENTH) domain-containing protein
Cp2154 SI164 DC887048 Cn × Ck AT5G54600.1 50S ribosomal protein L24 chloroplast (CL24)
Edp002 SI092 DC885494 Cu AT5G60910.1 AGL8 (agamous-like 8)
Fb0110 SI246 DC888023 Cu AT1G22940.1 TH1 (THIAMINE REQUIRING 1)
Fb0124 SI167:SI212 DC888039 Cu AT2G42600.1 ATPPC2 (PHOSPHOENOLPYRUVATE CARBOXYLASE 2)
Fb0143 SI361 DC888059 Cu AT2G26330.1 ER (ERECTA); transmembrane receptor protein kinase
Fb0144 SI191 DC888061 Cu AT1G02205.1 CER1 (ECERIFERUM 1
Fb0159 SI227 DC888077 Cu AT5G24318.1 catalytic/ cation binding / hydrolase hydrolyzing O-glycosyl compounds
Fb0180 SI209 DC888100 Cu no homology
Fb0223 SI240 DC888148 Cu no homology
Fb0233 SI025:SI079:SI169 DC888160 Cu AT4G29730.1 NFC5 (Nucleosome/chromatin assembly factor group C 5)
Fb0234 SI250:SI265 DC888161 Cu AT2G42840.1 PDF1 (PROTODERMAL FACTOR 1)
Fb0293 SI198:SI374 DC888231 Cu AT4G35220.1 cyclase family protein
Fb0301 SI053 DC888236 Cu AT5G63380.1 4-coumarate--CoA ligase family protein
Fb0357 SI384 DC888303 Cu no homology
Fb0364 SI373 DC888316 Cu AT4G10480.1 nascent polypeptide associated complex alpha chain protein putative
Fb0365 SI036:SI320 DC888317 Cu no homology
Fb0372 SI052:SI343 DC888326 Cu AT1G27530.1 unknown protein
Fb0827 SI215:SI301 DC888835 Cu AT4G15560.1 CLA1 (CLOROPLASTOS ALTERADOS 1)
Fb0976 SI229 DC888997 Cu AT1G11430.1 plastid developmental protein DAG putative
Fb0995 SI026 DC889015 Cu AT2G17930.1 binding / inositol or phosphatidylinositol kinase
Fb1611 SI071 DC889716 Cu AT5G57360.2 ZTL (ZEITLUPE)
Fb1751 SI264 DC889876 Cu AT1G53730.1 SRF6 (STRUBBELIG-RECEPTOR FAMILY 6)
Fb1916 SI336 DC890051 Cu AT5G13960.1 SUVH4 (SU(VAR)3-9 HOMOLOG 4
Fb2130 SI069:SI117 DC890291 Cu AT1G07270.1 cell division control protein CDC6b putative (CDC6b)
Fb2159 SI205:SI300 DC890329 Cu AT2G43120.1 pirin putative
Gn0014 SI009 AF296158 Cu AT4G25700.1 BETA-OHASE 1 (BETA-HYDROXYLASE 1)
Gn0040 SI015:SI337 DC893194 Cu AT4G18960.1 AG (AGAMOUS)
Gn0043 SI323 DC893225 Cu AT5G60690.1 REV (REVOLUTA)
Gn0048 SI289 DC895343 Cu AT1G69780.1 ATHB13
Gn0051 SI306:SI366 DC895375 Cu AT1G27340.1 F-box family protein
Gn0064 SI144:SI380 AB075547 Cu AT5G67030.1 ABA1 (ABA DEFICIENT 1); zeaxanthin epoxidase
Gn0066 SI352 AB114651 Cu AT1G06820.1 CRTISO (CAROTENOID ISOMERASE); carotenoid isomerase
Gn0067 SI204:SI349 AB114652 Cu AT5G57030.1 LUT2 (LUTEIN DEFICIENT 2); lycopene epsilon cyclase
Gn0069 SI086:SI375 AB114655 Cu AT5G57030.1 LUT2 (LUTEIN DEFICIENT 2); lycopene epsilon cyclase
Gn0071 SI363 CK935329 Cs AT3G63520.1 CCD1 (CAROTENOID CLEAVAGE DIOXYGENASE 1)
Gn0074 SI176 AB046992 Cu AT4G14210.1 PDS3 (PHYTOENE DESATURASE 3); phytoene dehydrogenase
If0003 SI130 C22334 Cu no homology
If0205 SI256 C22047 Cu AT3G52730.1 ubiquinol-cytochrome C reductase UQCRX/QCR9-like family protein
If0206 SI208 C22133 Cu AT3G53990.2 universal stress protein (USP) family protein
If0208 SI083:SI317 C22162 Cu AT1G48460.1 unknown protein
If0210 SI042 C22223 Cu no homology
If0211 SI226 C22289 Cu no homology
If0216 SI174 C23944 Cu AT4G00380.1 XH/XS domain-containing protein / XS zinc finger domain-containing protein
Is0001 SI177 DC883613 Cu AT1G67350.1 unknown protein
Is0002 SI339 DC884052 Cu AT5G44340.1 TUB4
Is0003 SI318 DC895944 Cu AT2G29420.1 ATGSTU7 (ARABIDOPSIS THALIANA GLUTATHIONE S-TRANSFERASETAU 7)
Is0004 SI268 DC896307 Cu AT4G25810.1 XTR6 (XYLOGLUCAN ENDOTRANSGLYCOSYLASE 6)
Is0005 SI279 DC896365 Cu AT4G27740.1 unknown protein
Is0006 SI358 DC896409 Cu no homologyaItalics indicate ‘Not Reliable’ SNP. bCu: Citrus unshiu Marc., Pt: Poncirus trifoliata (L.) Raf., Cn × Ck: C. nobilis Lour. × C. kinokuni hort. ex Tanaka, Cs: C. sinensis Osbeck, Cl: C.limon (L.) Burm. f.

87
Continued
STS name SNP namea
DDBJ ESTaccession number
for STS primerdesign
Species of ESTderivedb
AssignedArabidopsis
locusAnnotation of Arabidopsis locus
Is0007 SI032 DC896765 Cu AT2G18370.1 protease inhibitor/seed storage/lipid transfer protein (LTP) family protein
Is0008 SI314 DC896803 Cu AT5G14570.1 ATNRT2.7 (Arabidopsis thaliana high affinity nitrate transporter 2.7)
Is0009 SI162 DC897578 Cu AT3G24200.2 FAD binding / monooxygenase/ oxidoreductase
Is0010 SI206 DC898118 Cu AT5G54160.1 ATOMT1 (O-METHYLTRANSFERASE 1)
Is0011 SI334 DC898183 Cu AT4G30080.1 ARF16 (AUXIN RESPONSE FACTOR 16)
Is0012 SI173 DC899883 Cu AT5G05960.1 protease inhibitor/seed storage/lipid transfer protein (LTP) family protein
Is0013 SI012 DC901296 Cu AT1G68220.1 unknown protein
Lp0024 SI010:SI302 AU300371 Cu AT2G18050.1 HIS1-3 (HISTONE H1-3)
Lp0032 SI286 DC893131 Cu no homology
Lp0102 SI080:SI319:SI360:SI378 AU300902 Cu AT4G25310.1 oxidoreductase 2OG-Fe(II) oxygenase family protein
Lp0105 SI113:SI163:SI254 AU300400 Cu AT2G17820.1 ATHK1 (histidine kinase 1)
Lp0112 SI170 AU300448 Cu AT3G52300.1 ATPQ (ATP SYNTHASE D CHAIN MITOCHONDRIAL)
Lp0119 SI276 AU300466 Cu no homology
Lp0226 SI210 AU300802 Cu AT4G34110.1 PAB2 (POLY(A) BINDING 2)
Mf0003 SI228 C81792 Cu no homology
Mf0010 SI048:SI149 C81689 Cu no homology
Mf0012 SI131 C81631 Cu no homology
Mf0039 SI016:SI147 C81786 Cu no homology
Mf0070 SI017 C81837 Cu AT5G04750.1 F1F0-ATPase inhibitor protein putative
Mf0079 SI067 C81861 Cu AT5G58490.1 cinnamoyl-CoA reductase family
Mf0084 SI383 C81872 Cu AT3G62290.1 ATARFA1E (ADP-ribosylation factor A1E)
Mf0086 SI220:SI315 C81880 Cu AY261671.1 Citrus x paradisi:HSP19 class II
Mf0092 SI138 C81907 Cu AT2G36530.1 LOS2; copper ion binding
Mf0095 SI290 C81912 Cu AT3G57280.1 unknown protein
Mf0096 SI249:SI333 C81915 Cu AT3G18040.2 MPK9 (MAP KINASE 9)
Mf0098 SI235:SI365 C81916 Cu no homology
Ov0002 SI110:SI179 AU186184 Cu AT1G14320.1 SAC52 (SUPPRESSOR OF ACAULIS 52)
Ov0005 SI243:SI331 AU186258 Cu AT5G17920.1 ATMS1
Ov0015 SI304 AU186310 Cu AT4G25150.1 acid phosphatase putative
Ov0020 SI055:SI143:SI213 AU186345 Cu AT3G56940.1 CRD1 (COPPER RESPONSE DEFECT 1)
Ov0104 SI216 AU186385 Cu AT3G19270.1 CYP707A4
Ov0105 SI126 AU186386 Cu AT5G15080.1 protein kinase putative
Ov0106 SI278 DC901398 Cu AT5G25150.1 acid phosphatase ctivity
Ov0109 SI172:SI202 AU186389 Cu AT5G25230.1 elongation factor Tu family protein
Ov0117 SI040 AU186413 Cu no homology
Ov0118 SI357 AU186414 Cu AT2G45440.1 DHDPS2 (DIHYDRODIPICOLINATE SYNTHASE)
Ov0127 SI124:SI284 AU186445 Cu AT5G14670.1 ATARFA1B (ADP-ribosylation factor A1B)
Ov0301 SI078 AU186450 Cu AT5G47390.1 myb family transcription factor
Ov0305 SI028:SI292 AU186464 Cu AT5G58420.1 40S ribosomal protein S4 (RPS4D)
Ov0306 SI382 AU186465 Cu AT4G35550.1 WOX13 (WUSCHEL-RELATED HOMEOBOX 13)
Ov0314 SI107 AU186489 Cu AT2G16600.2 ROC3; peptidyl-prolyl cis-trans isomerase
Ov0403 SI136:SI298 DC893934 Cu AT2G05100.1 LHCB2.1
Ov0412 SI050:SI222:SI325 DC893973 Cu no homology
Ov0426 SI051:SI291:SI351:SI371 DC894006 Cu AT3G44110.1 ATJ3
Ov0429 SI342 AU186558 Cu AT3G13510.1 unknown protein
Ov0508 SI322 DC894044 Cu AT2G39730.3 RCA (RUBISCO ACTIVASE)
Tf0004 SI219:SI330 DC884099 Cu AT1G61140.1 EDA16 (embryo sac development arrest 16
Tf0013 SI161:SI362 DC886674 Cn × Ck AT1G44900.1 ATP binding / DNA binding / DNA-dependent ATPase
Tf0016 SI345 DC886929 Cn × Ck AT3G55730.1 MYB109 (myb domain protein 109)
Tf0017 SI148:SI171:SI217:SI242:SI285 DC886985 Cn × Ck AT5G47390.1 myb family transcription factor
Tf0019 SI056:SI347 DC887091 Cn × Ck AT1G75710.1 zinc finger (C2H2 type) family protein
Tf0020 SI154 DC887181 Cn × Ck AT4G36740.1 ATHB40 (ARABIDOPSIS THALIANA HOMEOBOX PROTEIN 40)
Tf0026 SI111:SI288 DC898171 Cu AT2G17190.1 ubiquitin family protein
Tf0027 SI046 DC898182 Cu AT5G25190.1 ethylene-responsive element-binding protein putative
Tf0028 SI377 DC898260 Cu AT4G09960.3 STK (SEEDSTICK); protein binding / transcription factor
Tf0045 SI303:SI321 DC899852 Cu AT1G27050.1 ATHB54 (ARABIDOPSIS THALIANA HOMEOBOX PROTEIN 54)
Tf0049 SI328 BQ623105 Cs AT3G13350.1 high mobility group (HMG1/2) family protein
Tf0050 SI104:SI346 BQ623221 Cs AT3G47600.1 ATMYB94 (MYB DOMAIN PROTEIN 94)aItalics indicate ‘Not Reliable’ SNP. bCu: Citrus unshiu Marc., Pt: Poncirus trifoliata (L.) Raf., Cn × Ck: C. nobilis Lour. × C. kinokuni hort. ex Tanaka, Cs: C. sinensis Osbeck, Cl: C.limon (L.) Burm. f.

88
Continued
STS name SNP namea
DDBJ ESTaccession number
for STS primerdesign
Species of ESTderivedb
AssignedArabidopsis
locusAnnotation of Arabidopsis locus
Tf0051 SI027:SI214 BQ623496 Cs AT3G48440.1 zinc finger (CCCH-type) family protein
Tf0053 SI305 BQ624296 Cs AT1G53670.1 MSRB1 (methionine sulfoxide reductase B 1)
Tf0054 SI238 BQ624467 Cs AT1G76580.1 transcription factor
Tf0056 SI061:SI137 BQ624834 Cs AT1G66230.1 MYB20 (myb domain protein 20)
Tf0058 SI257 BQ624935 Cs AT3G20740.1 FIE (FERTILIZATION-INDEPENDENT ENDOSPERM)
Tf0059 SI101 BQ624977 Cs AT3G17850.1 protein kinase putative
Tf0061 SI150:SI186 BQ625130 Cs AT5G65670.2 IAA9 (INDOLE-3-ACETIC ACID INDUCIBLE 9)
Tf0062 SI223 CB290239 Cs AT3G09600.1 myb family transcription factor
Tf0065 SI142 CB290624 Cs AT5G62000.3 ARF2 (AUXIN RESPONSE FACTOR 2)
Tf0066 SI221 CB290927 Cs AT1G52890.1 ANAC019 (Arabidopsis NAC domain containing protein 19)
Tf0067 SI033:SI187:SI239 CB291001 Cs AT3G16350.1 myb family transcription factor
Tf0068 SI106 CB291749 Cs AT2G26150.1 ATHSFA2
Tf0069 SI199 CB292181 Cs AT1G43700.1 VIP1 (VIRE2-INTERACTING PROTEIN 1)
Tf0070 SI277 CB292225 Cs AT1G35460.1 basic helix-loop-helix (bHLH) family protein
Tf0071 SI084:SI146 CB292689 Cs AT2G41350.2 unknown protein
Tf0075 SI059:SI248 CB293244 Cs AT3G12020.1 kinesin motor protein-related
Tf0076 SI266 CB293271 Cs AT5G04410.1 NAC2
Tf0077 SI135 CB293496 Cs AT4G30935.1 WRKY32
Tf0079 SI270:SI294 CB293578 Cs AT4G11660.1 AT-HSFB2B
Tf0081 SI038:SI324 CB293768 Cs AT2G31380.1 STH
Tf0083 SI129 CB293916 Cs AT4G22920.1 NYE1 (NON-YELLOWING 1)
Tf0085 SI094:SI211 CD573622 Pt AT5G03415.1 DPB
Tf0087 SI166:SI271:SI287 CD573723 Pt AT4G18020.2 APRR2
Tf0088 SI066 CD573726 Pt AT1G27660.1 ethylene-responsive protein -related
Tf0092 SI099 CD574584 Pt AT4G32880.1 ATHB-8 (HOMEOBOX GENE 8)
Tf0094 SI006 CD574865 Pt AT1G69580.2 transcription factor
Tf0143 SI127 DC885186 Cu AT5G24120.1 SIGE (SIGMA FACTOR E)
Tf0144 SI125:SI189:SI192 DC885340 Cu AT3G19860.2 basic helix-loop-helix (bHLH) family protein
Tf0148 SI119 DC885880 Cu AT5G13080.1 WRKY75
Tf0149 SI128:SI269 DC886255 Cu AT3G04730.1 IAA16
Tf0150 SI262 DC886590 Cu AT1G03840.1 MGP (Magpie)
Tf0151 SI159:SI281 DC888225 Cu AT4G24440.2 transcription initiation factor IIA gamma chain
Tf0164 SI251 DC889433 Cu AT2G19260.1 ELM2 domain-containing protein
Tf0166 SI156 DC890056 Cu AT5G13960.1 SUVH4 (SU(VAR)3-9 HOMOLOG 4)
Tf0167 SI230:SI241:SI247 DC890115 Cu AT1G08540.1 SIG2 (RNA POLYMERASE SIGMA SUBUNIT 2
Tf0168 SI175 DC890126 Cu AT3G43240.1 ARID/BRIGHT DNA-binding domain-containing protein
Tf0170 SI116 DC891569 Cl AT3G12680.1 HUA1 (ENHANCER OF AG-4 1)
Tf0177 SI133 DC900310 Cu AT4G31420.1 zinc finger (C2H2 type) family protein
Tf0199 SI023:SI157 DC900398 Cu AT1G54610.3 protein kinase family protein
Tf0201 SI195 BQ625052 Cu AT1G16060.1 ovule development protein putative
Tf0203 SI121 CB291458 Cu AT5G44180.1 homeobox transcription factor putative
Tf0205 SI274 CB292412 Cu AT1G04850.1 ubiquitin-associated (UBA)/TS-N domain-containing protein
Tf0208 SI181 CX546428 Pt AT3G02380.1 COL2 (constans-like 2)
Tf0210 SI183 CD574434 Pt AT2G02080.1 AtIDD4 (Arabidopsis thaliana Indeterminate(ID)-Domain 4)
Tf0212 SI196 CD574499 Pt AT1G13220.2 LINC2 (LITTLE NUCLEI2)
Tf0214 SI020 CD574660 Pt AT4G00050.1 UNE10 (unfertilized embryo sac 10)
Tf0219 SI076:SI267 CD576023 Pt AT3G57800.2 basic helix-loop-helix (bHLH) family protein
Tf0221 SI057:SI225 CF418134 Cs AT5G66055.1 AKRP (ANKYRIN REPEAT PROTEIN)
Tf0230 SI140 CF509456 Cs AT5G55760.1 SRT1 (sirtuin 1)
Tf0232 SI258:SI261 CF509665 Cs AT2G17900.1 SDG37
Tf0238 SI114 CF653350 Cs AT2G17730.1 zinc finger (C3HC4-type RING finger)
Tf0240 SI184 CF828177 Cs AT1G04600.1 XIA (MYOSIN XI A)
Tf0243 SI231 CF829056 Cs AT2G37060.3 NF-YB8 (NUCLEAR FACTOR Y SUBUNIT B8)
Tf0245 SI021 CF830462 Cs AT3G15510.1 ATNAC2 (ARABIDOPSIS NAC DOMAIN CONTAINING PROTEIN 2)
Tf0251 SI005 CF831040 Cs AT5G23150.1 HUA2 (ENHANCER OF AG-4 2)
Tf0257 SI049 CF832981 Cs AT1G63650.2 EGL3 (ENHANCER OF GLABRA 3)
Tf0258 SI234 CF833637 Cs AT1G19700.2 BEL10 (BEL1-LIKE HOMEODOMAIN 10)
Tf0263 SI013 CF835628 Cs AT3G24520.1 AT-HSFC1
aItalics indicate ‘Not Reliable’ SNP. bCu: Citrus unshiu Marc., Pt: Poncirus trifoliata (L.) Raf., Cn × Ck: C. nobilis Lour. × C. kinokuni hort. ex Tanaka, Cs: C. sinensis Osbeck, Cl: C.limon (L.) Burm. f.
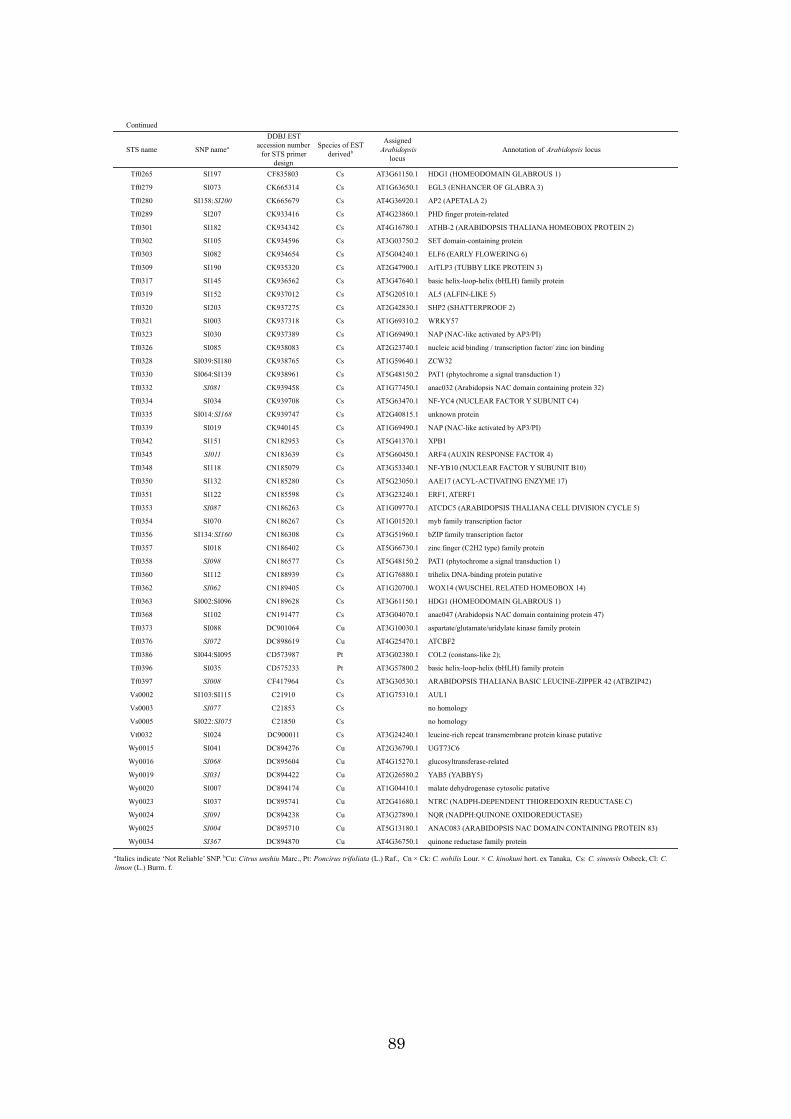
89
Continued
STS name SNP namea
DDBJ ESTaccession number
for STS primerdesign
Species of ESTderivedb
AssignedArabidopsis
locusAnnotation of Arabidopsis locus
Tf0265 SI197 CF835803 Cs AT3G61150.1 HDG1 (HOMEODOMAIN GLABROUS 1)
Tf0279 SI073 CK665314 Cs AT1G63650.1 EGL3 (ENHANCER OF GLABRA 3)
Tf0280 SI158:SI200 CK665679 Cs AT4G36920.1 AP2 (APETALA 2)
Tf0289 SI207 CK933416 Cs AT4G23860.1 PHD finger protein-related
Tf0301 SI182 CK934342 Cs AT4G16780.1 ATHB-2 (ARABIDOPSIS THALIANA HOMEOBOX PROTEIN 2)
Tf0302 SI105 CK934596 Cs AT3G03750.2 SET domain-containing protein
Tf0303 SI082 CK934654 Cs AT5G04240.1 ELF6 (EARLY FLOWERING 6)
Tf0309 SI190 CK935320 Cs AT2G47900.1 AtTLP3 (TUBBY LIKE PROTEIN 3)
Tf0317 SI145 CK936562 Cs AT3G47640.1 basic helix-loop-helix (bHLH) family protein
Tf0319 SI152 CK937012 Cs AT5G20510.1 AL5 (ALFIN-LIKE 5)
Tf0320 SI203 CK937275 Cs AT2G42830.1 SHP2 (SHATTERPROOF 2)
Tf0321 SI003 CK937318 Cs AT1G69310.2 WRKY57
Tf0323 SI030 CK937389 Cs AT1G69490.1 NAP (NAC-like activated by AP3/PI)
Tf0326 SI085 CK938083 Cs AT2G23740.1 nucleic acid binding / transcription factor/ zinc ion binding
Tf0328 SI039:SI180 CK938765 Cs AT1G59640.1 ZCW32
Tf0330 SI064:SI139 CK938961 Cs AT5G48150.2 PAT1 (phytochrome a signal transduction 1)
Tf0332 SI081 CK939458 Cs AT1G77450.1 anac032 (Arabidopsis NAC domain containing protein 32)
Tf0334 SI034 CK939708 Cs AT5G63470.1 NF-YC4 (NUCLEAR FACTOR Y SUBUNIT C4)
Tf0335 SI014:SI168 CK939747 Cs AT2G40815.1 unknown protein
Tf0339 SI019 CK940145 Cs AT1G69490.1 NAP (NAC-like activated by AP3/PI)
Tf0342 SI151 CN182953 Cs AT5G41370.1 XPB1
Tf0345 SI011 CN183639 Cs AT5G60450.1 ARF4 (AUXIN RESPONSE FACTOR 4)
Tf0348 SI118 CN185079 Cs AT3G53340.1 NF-YB10 (NUCLEAR FACTOR Y SUBUNIT B10)
Tf0350 SI132 CN185280 Cs AT5G23050.1 AAE17 (ACYL-ACTIVATING ENZYME 17)
Tf0351 SI122 CN185598 Cs AT3G23240.1 ERF1, ATERF1
Tf0353 SI087 CN186263 Cs AT1G09770.1 ATCDC5 (ARABIDOPSIS THALIANA CELL DIVISION CYCLE 5)
Tf0354 SI070 CN186267 Cs AT1G01520.1 myb family transcription factor
Tf0356 SI134:SI160 CN186308 Cs AT3G51960.1 bZIP family transcription factor
Tf0357 SI018 CN186402 Cs AT5G66730.1 zinc finger (C2H2 type) family protein
Tf0358 SI098 CN186577 Cs AT5G48150.2 PAT1 (phytochrome a signal transduction 1)
Tf0360 SI112 CN188939 Cs AT1G76880.1 trihelix DNA-binding protein putative
Tf0362 SI062 CN189405 Cs AT1G20700.1 WOX14 (WUSCHEL RELATED HOMEOBOX 14)
Tf0363 SI002:SI096 CN189628 Cs AT3G61150.1 HDG1 (HOMEODOMAIN GLABROUS 1)
Tf0368 SI102 CN191477 Cs AT3G04070.1 anac047 (Arabidopsis NAC domain containing protein 47)
Tf0373 SI088 DC901064 Cu AT3G10030.1 aspartate/glutamate/uridylate kinase family protein
Tf0376 SI072 DC898619 Cu AT4G25470.1 ATCBF2
Tf0386 SI044:SI095 CD573987 Pt AT3G02380.1 COL2 (constans-like 2);
Tf0396 SI035 CD575233 Pt AT3G57800.2 basic helix-loop-helix (bHLH) family protein
Tf0397 SI008 CF417964 Cs AT3G30530.1 ARABIDOPSIS THALIANA BASIC LEUCINE-ZIPPER 42 (ATBZIP42)
Vs0002 SI103:SI115 C21910 Cs AT1G75310.1 AUL1
Vs0003 SI077 C21853 Cs no homology
Vs0005 SI022:SI075 C21850 Cs no homology
Vt0032 SI024 DC900011 Cs AT3G24240.1 leucine-rich repeat transmembrane protein kinase putative
Wy0015 SI041 DC894276 Cu AT2G36790.1 UGT73C6
Wy0016 SI068 DC895604 Cu AT4G15270.1 glucosyltransferase-related
Wy0019 SI031 DC894422 Cu AT2G26580.2 YAB5 (YABBY5)
Wy0020 SI007 DC894174 Cu AT1G04410.1 malate dehydrogenase cytosolic putative
Wy0023 SI037 DC895741 Cu AT2G41680.1 NTRC (NADPH-DEPENDENT THIOREDOXIN REDUCTASE C)
Wy0024 SI091 DC894238 Cu AT3G27890.1 NQR (NADPH:QUINONE OXIDOREDUCTASE)
Wy0025 SI004 DC895710 Cu AT5G13180.1 ANAC083 (ARABIDOPSIS NAC DOMAIN CONTAINING PROTEIN 83)
Wy0034 SI367 DC894870 Cu AT4G36750.1 quinone reductase family protein
aItalics indicate ‘Not Reliable’ SNP. bCu: Citrus unshiu Marc., Pt: Poncirus trifoliata (L.) Raf., Cn × Ck: C. nobilis Lour. × C. kinokuni hort. ex Tanaka, Cs: C. sinensis Osbeck, Cl: C.limon (L.) Burm. f.
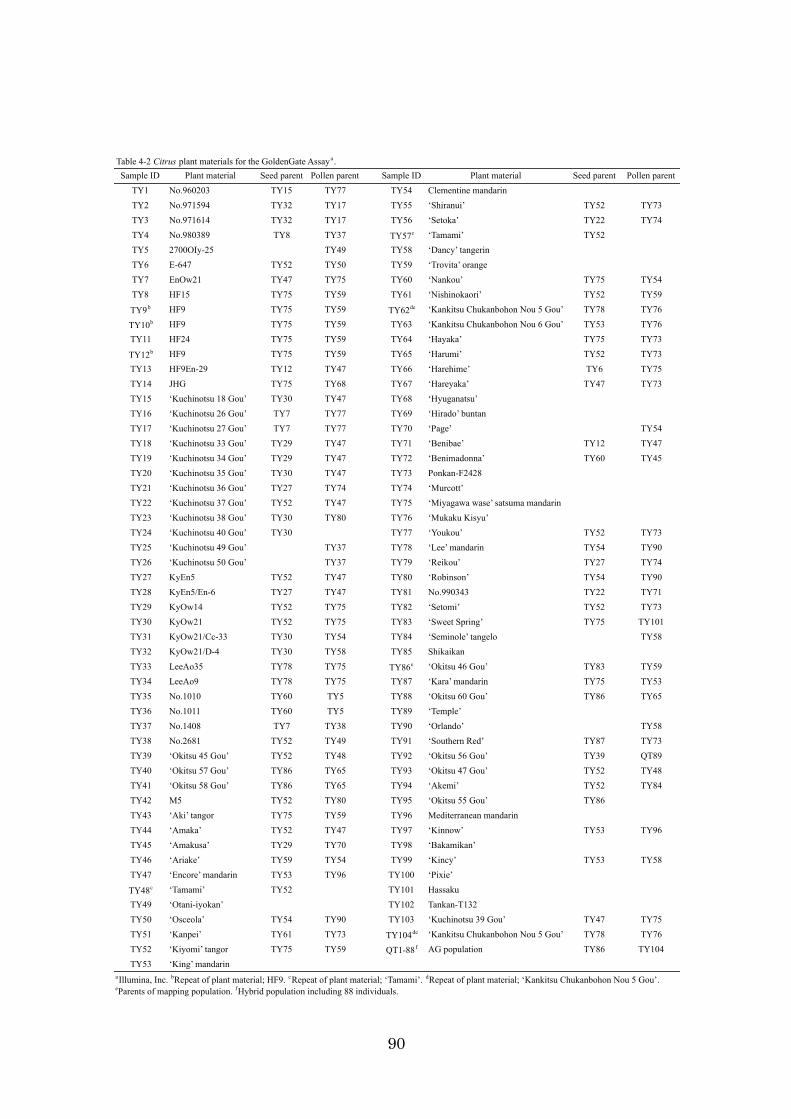
90
Sample ID Plant material Seed parent Pollen parent Sample ID Plant material Seed parent Pollen parentTY1 No.960203 TY15 TY77 TY54 Clementine mandarinTY2 No.971594 TY32 TY17 TY55 ‘Shiranui’ TY52 TY73TY3 No.971614 TY32 TY17 TY56 ‘Setoka’ TY22 TY74TY4 No.980389 TY8 TY37 TY57c ‘Tamami’ TY52TY5 2700OIy-25 TY49 TY58 ‘Dancy’ tangerinTY6 E-647 TY52 TY50 TY59 ‘Trovita’ orangeTY7 EnOw21 TY47 TY75 TY60 ‘Nankou’ TY75 TY54TY8 HF15 TY75 TY59 TY61 ‘Nishinokaori’ TY52 TY59
TY9b HF9 TY75 TY59 TY62de ‘Kankitsu Chukanbohon Nou 5 Gou’ TY78 TY76
TY10b HF9 TY75 TY59 TY63 ‘Kankitsu Chukanbohon Nou 6 Gou’ TY53 TY76TY11 HF24 TY75 TY59 TY64 ‘Hayaka’ TY75 TY73
TY12b HF9 TY75 TY59 TY65 ‘Harumi’ TY52 TY73TY13 HF9En-29 TY12 TY47 TY66 ‘Harehime’ TY6 TY75TY14 JHG TY75 TY68 TY67 ‘Hareyaka’ TY47 TY73TY15 ‘Kuchinotsu 18 Gou’ TY30 TY47 TY68 ‘Hyuganatsu’TY16 ‘Kuchinotsu 26 Gou’ TY7 TY77 TY69 ‘Hirado’ buntanTY17 ‘Kuchinotsu 27 Gou’ TY7 TY77 TY70 ‘Page’ TY54TY18 ‘Kuchinotsu 33 Gou’ TY29 TY47 TY71 ‘Benibae’ TY12 TY47TY19 ‘Kuchinotsu 34 Gou’ TY29 TY47 TY72 ‘Benimadonna’ TY60 TY45TY20 ‘Kuchinotsu 35 Gou’ TY30 TY47 TY73 Ponkan-F2428TY21 ‘Kuchinotsu 36 Gou’ TY27 TY74 TY74 ‘Murcott’TY22 ‘Kuchinotsu 37 Gou’ TY52 TY47 TY75 ‘Miyagawa wase’ satsuma mandarinTY23 ‘Kuchinotsu 38 Gou’ TY30 TY80 TY76 ‘Mukaku Kisyu’TY24 ‘Kuchinotsu 40 Gou’ TY30 TY77 ‘Youkou’ TY52 TY73TY25 ‘Kuchinotsu 49 Gou’ TY37 TY78 ‘Lee’ mandarin TY54 TY90TY26 ‘Kuchinotsu 50 Gou’ TY37 TY79 ‘Reikou’ TY27 TY74TY27 KyEn5 TY52 TY47 TY80 ‘Robinson’ TY54 TY90TY28 KyEn5/En-6 TY27 TY47 TY81 No.990343 TY22 TY71TY29 KyOw14 TY52 TY75 TY82 ‘Setomi’ TY52 TY73TY30 KyOw21 TY52 TY75 TY83 ‘Sweet Spring’ TY75 TY101TY31 KyOw21/Cc-33 TY30 TY54 TY84 ‘Seminole’ tangelo TY58TY32 KyOw21/D-4 TY30 TY58 TY85 ShikaikanTY33 LeeAo35 TY78 TY75 TY86e ‘Okitsu 46 Gou’ TY83 TY59TY34 LeeAo9 TY78 TY75 TY87 ‘Kara’ mandarin TY75 TY53TY35 No.1010 TY60 TY5 TY88 ‘Okitsu 60 Gou’ TY86 TY65TY36 No.1011 TY60 TY5 TY89 ‘Temple’TY37 No.1408 TY7 TY38 TY90 ‘Orlando’ TY58TY38 No.2681 TY52 TY49 TY91 ‘Southern Red’ TY87 TY73TY39 ‘Okitsu 45 Gou’ TY52 TY48 TY92 ‘Okitsu 56 Gou’ TY39 QT89TY40 ‘Okitsu 57 Gou’ TY86 TY65 TY93 ‘Okitsu 47 Gou’ TY52 TY48TY41 ‘Okitsu 58 Gou’ TY86 TY65 TY94 ‘Akemi’ TY52 TY84TY42 M5 TY52 TY80 TY95 ‘Okitsu 55 Gou’ TY86TY43 ‘Aki’ tangor TY75 TY59 TY96 Mediterranean mandarinTY44 ‘Amaka’ TY52 TY47 TY97 ‘Kinnow’ TY53 TY96TY45 ‘Amakusa’ TY29 TY70 TY98 ‘Bakamikan’TY46 ‘Ariake’ TY59 TY54 TY99 ‘Kincy’ TY53 TY58TY47 ‘Encore’ mandarin TY53 TY96 TY100 ‘Pixie’
TY48c ‘Tamami’ TY52 TY101 HassakuTY49 ‘Otani-iyokan’ TY102 Tankan-T132TY50 ‘Osceola’ TY54 TY90 TY103 ‘Kuchinotsu 39 Gou’ TY47 TY75TY51 ‘Kanpei’ TY61 TY73 TY104de ‘Kankitsu Chukanbohon Nou 5 Gou’ TY78 TY76TY52 ‘Kiyomi’ tangor TY75 TY59 QT1-88f AG population TY86 TY104TY53 ‘King’ mandarin
Table 4-2 Citrus plant materials for the GoldenGate Assaya.
aIllumina, Inc. bRepeat of plant material; HF9. cRepeat of plant material; ‘Tamami’. dRepeat of plant material; ‘Kankitsu Chukanbohon Nou 5 Gou’.eParents of mapping population. fHybrid population including 88 individuals.
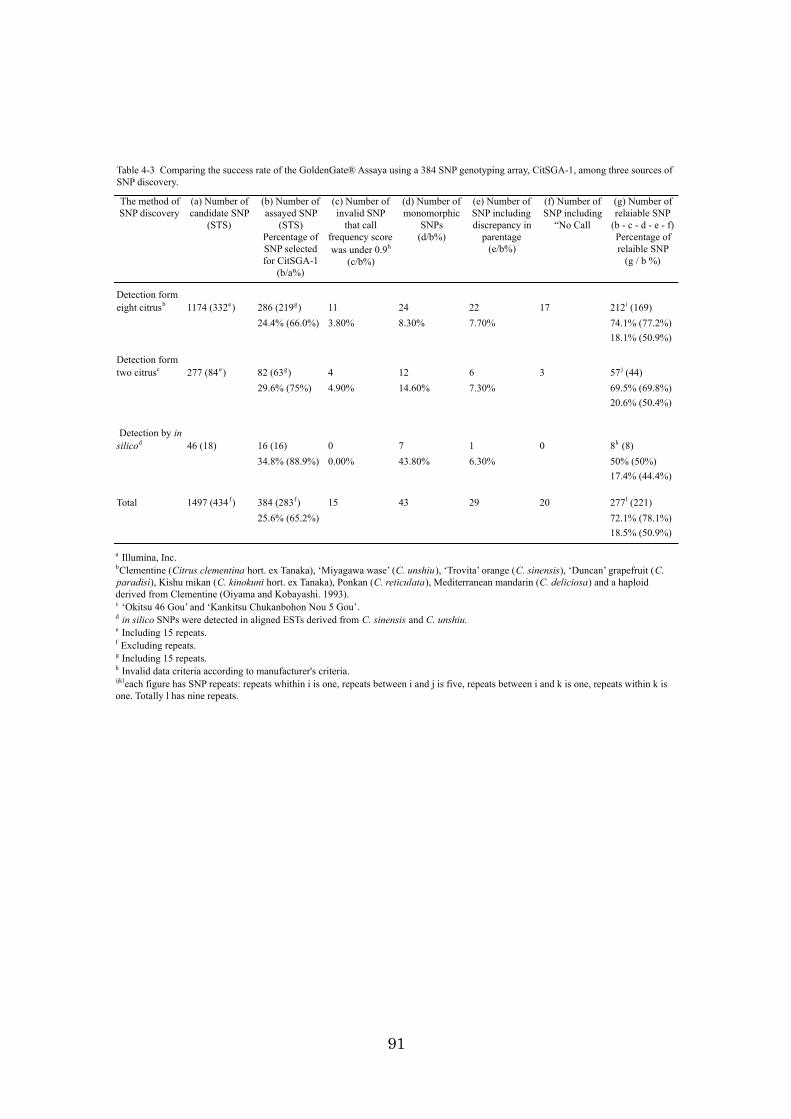
91
The method ofSNP discovery
(a) Number ofcandidate SNP
(STS)
(b) Number ofassayed SNP
(STS)Percentage ofSNP selectedfor CitSGA-1
(b/a%)
(c) Number ofinvalid SNP
that callfrequency scorewas under 0.9h
(c/b%)
(d) Number ofmonomorphic
SNPs(d/b%)
(e) Number ofSNP includingdiscrepancy in
parentage(e/b%)
(f) Number ofSNP including
“No Call
(g) Number ofrelaiable SNP
(b - c - d - e - f)Percentage ofrelaible SNP
(g / b %)
Detection formeight citrusb 1174 (332e) 286 (219g) 11 24 22 17 212i (169)
24.4% (66.0%) 3.80% 8.30% 7.70% 74.1% (77.2%)18.1% (50.9%)
Detection formtwo citrusc 277 (84e) 82 (63g) 4 12 6 3 57j (44)
29.6% (75%) 4.90% 14.60% 7.30% 69.5% (69.8%)20.6% (50.4%)
Detection by insilicod 46 (18) 16 (16) 0 7 1 0 8k (8)
34.8% (88.9%) 0.00% 43.80% 6.30% 50% (50%)17.4% (44.4%)
Total 1497 (434f) 384 (283f) 15 43 29 20 277l (221)25.6% (65.2%) 72.1% (78.1%)
18.5% (50.9%)
Table 4-3 Comparing the success rate of the GoldenGate® Assaya using a 384 SNP genotyping array, CitSGA-1, among three sources ofSNP discovery.
a Illumina, Inc.bClementine (Citrus clementina hort. ex Tanaka), ‘Miyagawa wase’ (C. unshiu), ‘Trovita’ orange (C. sinensis), ‘Duncan’ grapefruit (C.paradisi), Kishu mikan (C. kinokuni hort. ex Tanaka), Ponkan (C. reticulata), Mediterranean mandarin (C. deliciosa) and a haploidderived from Clementine (Oiyama and Kobayashi. 1993).c ‘Okitsu 46 Gou’ and ‘Kankitsu Chukanbohon Nou 5 Gou’.d in silico SNPs were detected in aligned ESTs derived from C. sinensis and C. unshiu.e Including 15 repeats.f Excluding repeats.g Including 15 repeats.h Invalid data criteria according to manufacturer's criteria.ijkleach figure has SNP repeats: repeats whithin i is one, repeats between i and j is five, repeats between i and k is one, repeats within k isone. Totally l has nine repeats.
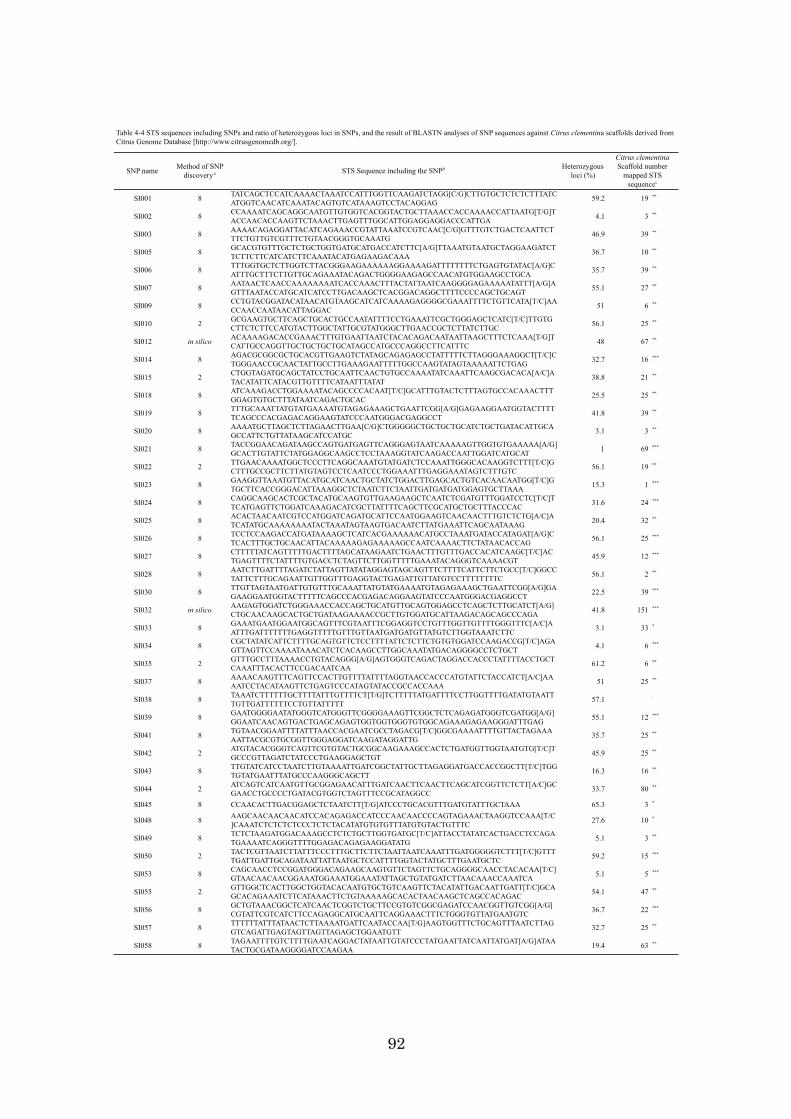
92
SNP name Method of SNPdiscoverya STS Sequence including the SNPb Heterozygous
loci (%)
SI001 8 TATCAGCTCCATCAAAACTAAATCCATTTGGTTCAAGATCTAGG[C/G]CTTGTGCTCTCTCTTTATCATGGTCAACATCAAATACAGTGTCATAAAGTCCTACAGGAG 59.2 19 **
SI002 8 CCAAAATCAGCAGGCAATGTTGTGGTCACGGTACTGCTTAAACCACCAAAACCATTAATG[T/G]TACCAACACCAAGTTCTAAACTTGAGTTTGGCATTGGAGGAGGACCCATTGA 4.1 3 **
SI003 8 AAAACAGAGGATTACATCAGAAACCGTATTAAATCCGTCAAC[C/G]GTTTGTCTGACTCAATTCTTTCTGTTGTCGTTTCTGTAACGGGTGCAAATG 46.9 39 **
SI005 8 GCACGTGTTTGCTCTGCTGGTGATGCATGACCATCTTC[A/G]TTAAATGTAATGCTAGGAAGATCTTCTTCTTCATCATCTTCAAATACATGAGAAGACAAA 36.7 10 **
SI006 8 TTTGGTGCTCTTGGTCTTACGGGAAGAAAAAAGGAAAAGATTTTTTTTCTGAGTGTATAC[A/G]CATTTGCTTTCTTGTTGCAGAAATACAGACTGGGGAAGAGCCAACATGTGGAAGCCTGCA 35.7 39 **
SI007 8 AATAACTCAACCAAAAAAAATCACCAAACTTTACTATTAATCAAGGGGAGAAAAATATTT[A/G]AGTTTAATACCATGCATCATCCTTGACAAGCTCACGGACAGGCTTTTCCCCAGCTGCAGT 55.1 27 **
SI009 8 CCTGTACGGATACATAACATGTAAGCATCATCAAAAGAGGGGCGAAATTTTCTGTTCATA[T/C]AACCAACCAATAACATTAGGAC 51 6 **
SI010 2 GCGAAGTGCTTCAGCTGCACTGCCAATATTTTCCTGAAATTCGCTGGGAGCTCATC[T/C]TTGTGCTTCTCTTCCATGTACTTGGCTATTGCGTATGGGCTTGAACCGCTCTTATCTTGC 56.1 25 **
SI012 in silico ACAAAAGACACCGAAACTTTGTGAATTAATCTACACAGACAATAATTAAGCTTTCTCAAA[T/G]TCATTGCCAGGTTGCTGCTGCTGCATAGCCATGCCCAGGCCTTCATTTC 48 67 **
SI014 8 AGACGCGGCGCTGCACGTTGAAGTCTATAGCAGAGAGCCTATTTTTCTTAGGGAAAGGCT[T/C]CTGGGAACCGCAACTATTGCCTTGAAAGAATTTTTGGCCAAGTATAGTAAAAATTCTGAG 32.7 16 ***
SI015 2 CTGGTAGATGCAGCTATCCTGCAATTCAACTGTGCCAAAATATCAAATTCAAGCGACACA[A/C]ATACATATTCATACGTTGTTTTCATAATTTATAT 38.8 21 **
SI018 8 ATCAAAGACCTGGAAAATACAGCCCCACAAT[T/C]GCATTTGTACTCTTTAGTGCCACAAACTTTGGAGTGTGCTTTATAATCAGACTGCAC 25.5 25 **
SI019 8 TTTGCAAATTATGTATGAAAATGTAGAGAAAGCTGAATTCGG[A/G]GAGAAGGAATGGTACTTTTTCAGCCCACGAGACAGGAAGTATCCCAATGGGACGAGGCCT 41.8 39 **
SI020 8 AAAATGCTTAGCTCTTAGAACTTGAA[C/G]CTGGGGGCTGCTGCTGCATCTGCTGATACATTGCAGCCATTCTGTTATAAGCATCCATGC 3.1 3 **
SI021 8 TACCGGAACAGATAAGCCAGTGATGAGTTCAGGGAGTAATCAAAAAGTTGGTGTGAAAAA[A/G]GCACTTGTATTCTATGGAGGCAAGCCTCCTAAAGGTATCAAGACCAATTGGATCATGCAT 1 69 ***
SI022 2 TTGAACAAAATGGCTCCCTTCAGGCAAATGTATGATCTCCAAATTGGGCACAAGGTCTTT[T/C]GCTTTGCCGCTTCTTATGTAGTCCTCAATCCCTGGAAATTTGAGGAAATAGTCTTTGTC 56.1 19 **
SI023 8 GAAGGTTAAATGTTACATGCATCAACTGCTATCTGGACTTGAGCACTGTCACAACAATGG[T/C]GTGCTTCACCGGGACATTAAAGGCTCTAATCTTCTAATTGATGATGATGGAGTGCTTAAA 15.3 1 ***
SI024 8 CAGGCAAGCACTCGCTACATGCAAGTGTTGAAGAAGCTCAATCTCGATGTTTGGATCCTC[T/C]TTCATGAGTTCTGGATCAAAGACATCGCTTATTTTCAGCTTCGCATGCTGCTTTACCCAC 31.6 24 ***
SI025 8 ACACTAACAATCGTCCATGGATCAGATGCATTCCAATGGAAGTCAACAACTTTGTCTCTG[A/C]ATCATATGCAAAAAAAATACTAAATAGTAAGTGACAATCTTATGAAATTCAGCAATAAAG 20.4 32 **
SI026 8 TCCTCCAAGACCATGATAAAAGCTCATCACGAAAAAACATGCCTAAATGATACCATAGAT[A/G]CTCACTTTGCTGCAACATTACAAAAAGAGAAAAAGCCAATCAAAACTTCTATAACACCAG 56.1 25 ***
SI027 8 CTTTTTATCAGTTTTTGACTTTTAGCATAAGAATCTGAACTTTGTTTGACCACATCAAGC[T/C]ACTGAGTTTTCTATTTTGTGACCTCTAGTTCTTGGTTTTTGAAATACAGGGTCAAAACGT 45.9 12 ***
SI028 8 AATCTTGATTTTAGATCTATTAGTTATATAGGAGTAGCAGTTTCTTTTCATTCTTCTGCC[T/C]GGCCTATTCTTTGCAGAATTGTTGGTTTGAGGTACTGAGATTGTTATGTCCTTTTTTTTC 56.1 2 **
SI030 8 TTGTTAGTAATGATTGTGTTTGCAAATTATGTATGAAAATGTAGAGAAAGCTGAATTCGG[A/G]GAGAAGGAATGGTACTTTTTCAGCCCACGAGACAGGAAGTATCCCAATGGGACGAGGCCT 22.5 39 ***
SI032 in silico AAGAGTGGATCTGGGAAACCACCAGCTGCATGTTGCAGTGGAGCCTCAGCTCTTGCATCT[A/G]CTGCAACAAGCACTGCTGATAAGAAAACCGCTTGTGGATGCATTAAGACAGCAGCCCAGA 41.8 151 ***
SI033 8 GAAATGAATGGAATGGCAGTTTCGTAATTTCGGAGGTCCTGTTTGGTTGTTTTGGGTTTC[A/C]AATTTGATTTTTTTGAGGTTTTTGTTTGTTAATGATGATGTTATGTCTTGGTAAATCTTC 3.1 33 *
SI034 8 CGCTATATCATTCTTTTGCAGTGTTCTCCTTTTATTCTCTTCTGTGTGGATCCAAGACCG[T/C]AGAGTTAGTTCCAAAATAAACATCTCACAAGCCTTGGCAAATATGACAGGGGCCTCTGCT 4.1 6 ***
SI035 2 GTTTGCCTTTAAAACCTGTACAGGG[A/G]AGTGGGTCAGACTAGGACCACCCTATTTTACCTGCTCAAATTTACACTTCCGACAATCAA 61.2 6 **
SI037 8 AAAACAAGTTTCAGTTCCACTTGTTTTATTTTAGGTAACCACCCATGTATTCTACCATCT[A/C]AAAATCCTACATAAGTTCTGAGTCCCATAGTATACCGCCACCAAA 51 25 **
SI038 8 TAAATCTTTTTTGCTTTTATTTGTTTTCT[T/G]TCTTTTTATGATTTTCCTTGGTTTTGATATGTAATTTGTTGATTTTTTCCTGTTATTTTT 57.1 -
SI039 8 GAATGGGGAATATGGGTCATGGGTTCGGGGAAAGTTCGGCTCTCAGAGATGGGTCGATGG[A/G]GGAATCAACAGTGACTGAGCAGAGTGGTGGTGGGTGTGGCAGAAAGAGAAGGGATTTGAG 55.1 12 ***
SI041 8 TGTAACGGAATTTTATTTAACCACGAATCGCCTAGACG[T/C]GGCGAAAATTTTGTTACTAGAAAAATTACGCGTGCGGTTGGGAGGATCAAGATAGGATTG 35.7 25 **
SI042 2 ATGTACACGGGTCAGTTCGTGTACTGCGGCAAGAAAGCCACTCTGATGGTTGGTAATGTG[T/C]TGCCCGTTAGATCTATCCCTGAAGGAGCTGT 45.9 25 **
SI043 8 TTGTATCATCCTAATCTTGTAAAATTGATCGGCTATTGCTTAGAGGATGACCACCGGCTT[T/C]TGGTGTATGAATTTATGCCCAAGGGCAGCTT 16.3 16 **
SI044 2 ATCAGTCATCAATGTTGCGGAGAACATTTGATCAACTTCAACTTCAGCATCGGTTCTCTT[A/C]GCGAACCTGCCCCTGATACGTGGTCTAGTTTCCGCATAGGCC 33.7 80 **
SI045 8 CCAACACTTGACGGAGCTCTAATCTT[T/G]ATCCCTGCACGTTTGATGTATTTGCTAAA 65.3 3 *
SI048 8 AAGCAACAACAACATCCACAGAGACCATCCCAACAACCCCAGTAGAAACTAAGGTCCAAA[T/C]CAAATCTCTCTCTCCCTCTCTACATATGTGTGTTTATGTGTACTGTTTC 27.6 10 *
SI049 8 TCTCTAAGATGGACAAAGCCTCTCTGCTTGGTGATGC[T/C]ATTACCTATATCACTGACCTCCAGATGAAAATCAGGGTTTTGGAGACAGAGAAGGATATG 5.1 3 **
SI050 2 TACTCGTTAATCTTATTTCCCTTTGCTTCTTCTAATTAATCAAATTTGATGGGGGTCTTT[T/C]GTTTTGATTGATTGCAGATAATTATTAATGCTCCATTTTGGTACTATGCTTTGAATGCTC 59.2 15 ***
SI053 8 CAGCAACCTCCGGATGGGACAGAAGCAAGTGTTCTAGTTCTGCAGGGGCAACCTACACAA[T/C]GTAACAACAACGGAAATGGAAATGGAAATATTAGCTGTATGATCTTAACAAACCAAATCA 5.1 5 ***
SI055 2 GTTGGCTCACTTGGCTGGTACACAATGTGCTGTCAAGTTCTACATATTGACAATTGATT[T/C]GCAGCACAGAAATCTTCATAAACTTCTGTAAAAAGCACACTAACAAGCTCAGCCACAGAC 54.1 47 **
SI056 8 GCTGTAAACGGCTCATCAACTCGGTCTGCTTCCGTGTCGGCGAGATCCAACGGTTGTCGG[A/G]CGTATTCGTCATCTTCCAGAGGCATGCAATTCAGGAAACTTTCTGGGTGTTATGAATGTC 36.7 22 ***
SI057 8 TTTTTTATTTATAACTCTTAAAATGATTCAATACCAA[T/G]AAGTGGTTTCTGCAGTTTAATCTTAGGTCAGATTGAGTAGTTAGTTAGAGCTGGAATGTT 32.7 25 **
SI058 8 TAGAATTTTGTCTTTTGAATCAGGACTATAATTGTATCCCTATGAATTATCAATTATGAT[A/G]ATAATACTGCGATAAGGGGATCCAAGAA 19.4 63 **
Table 4-4 STS sequences including SNPs and ratio of heterozygous loci in SNPs, and the result of BLASTN analyses of SNP sequences against Citrus clementina scaffolds derived fromCitrus Genome Database [http://www.citrusgenomedb.org/].
Citrus clementinaScaffold number
mapped STSsequencec
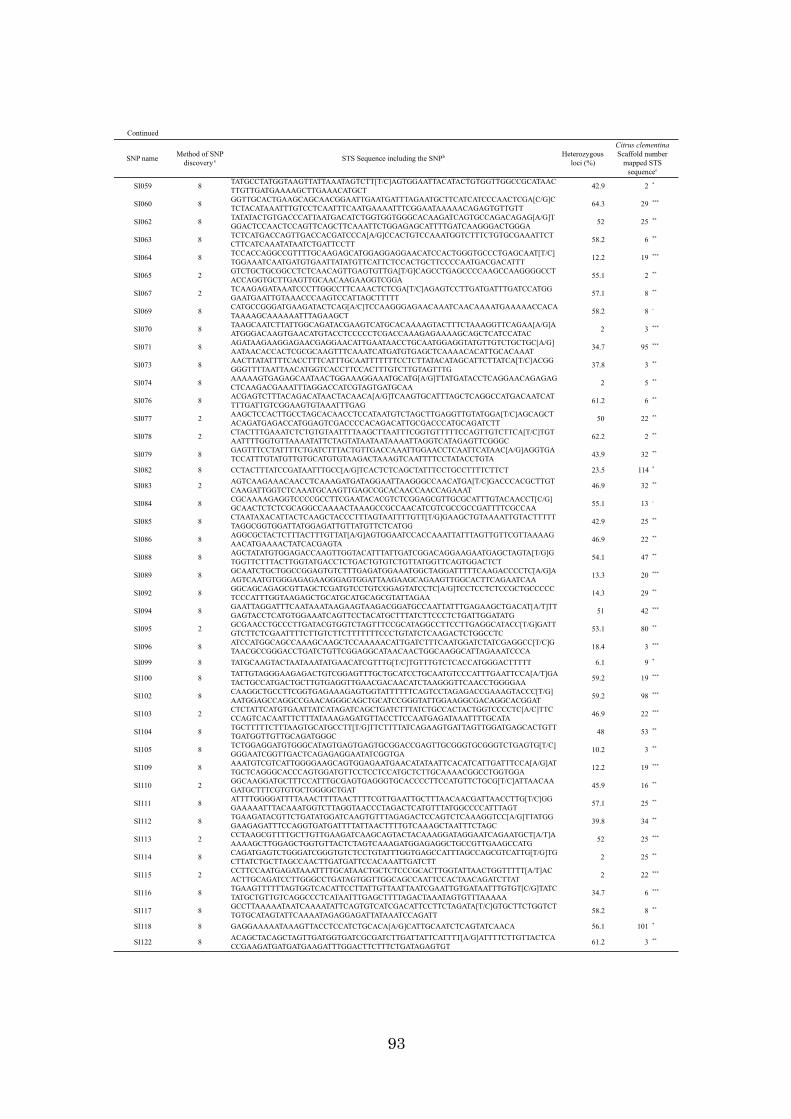
93
Continued
SNP name Method of SNPdiscoverya STS Sequence including the SNPb Heterozygous
loci (%)
SI059 8 TATGCCTATGGTAAGTTATTAAATAGTCTT[T/C]AGTGGAATTACATACTGTGGTTGGCCGCATAACTTGTTGATGAAAAGCTTGAAACATGCT 42.9 2 *
SI060 8 GGTTGCACTGAAGCAGCAACGGAATTGAATGATTTAGAATGCTTCATCATCCCAACTCGA[C/G]CTCTACATAAATTTGTCCTCAATTTCAATGAAAATTTCGGAATAAAAACAGAGTGTTGTT 64.3 29 ***
SI062 8 TATATACTGTGACCCATTAATGACATCTGGTGGTGGGCACAAGATCAGTGCCAGACAGAG[A/G]TGGACTCCAACTCCAGTTCAGCTTCAAATTCTGGAGAGCATTTTGATCAAGGGACTGGGA 52 25 **
SI063 8 TCTCATGACCAGTTGACCACGATCCCA[A/G]CCACTGTCCAAATGGTCTTTCTGTGCGAAATTCTCTTCATCAAATATAATCTGATTCCTT 58.2 6 **
SI064 8 TCCACCAGGCCGTTTTGCAAGAGCATGGAGGAGGAACATCCACTGGGTGCCCTGAGCAAT[T/C]TGGAAATCAATGATGTGAATTATATGTTCATTCTCCACTGCTTCCCCAATGACGACATTT 12.2 19 ***
SI065 2 GTCTGCTGCGGCCTCTCAACAGTTGAGTGTTGA[T/G]CAGCCTGAGCCCCAAGCCAAGGGGCCTACCAGGTGCTTGAGTTGCAACAAGAAGGTCGGA 55.1 2 **
SI067 2 TCAAGAGATAAATCCCTTGGCCTTCAAACTCTCGA[T/C]AGAGTCCTTGATGATTTGATCCATGGGAATGAATTGTAAACCCAAGTCCATTAGCTTTTT 57.1 8 **
SI069 8 CATGCCGGGATGAAGATACTCAG[A/C]TCCAAGGGAGAACAAATCAACAAAATGAAAAACCACATAAAAGCAAAAAATTTAGAAGCT 58.2 8 -
SI070 8 TAAGCAATCTTATTGGCAGATACGAAGTCATGCACAAAAGTACTTTCTAAAGGTTCAGAA[A/G]AATGGGACAAGTGAACATGTACCTCCCCCTCGACCAAAGAGAAAAGCAGCTCATCCATAC 2 3 ***
SI071 8 AGATAAGAAGGAGAACGAGGAACATTGAATAACCTGCAATGGAGGTATGTTGTCTGCTGC[A/G]AATAACACCACTCGCGCAAGTTTCAAATCATGATGTGAGCTCAAAACACATTGCACAAAT 34.7 95 ***
SI073 8 AACTTATATTTTCACCTTTCATTTGCAATTTTTTTCCTCTTATACATAGCATTCTTATCA[T/C]ACGGGGGTTTTAATTAACATGGTCACCTTCCACTTTGTCTTGTAGTTTG 37.8 3 **
SI074 8 AAAAAGTGAGAGCAATAACTGGAAAGGAAATGCATG[A/G]TTATGATACCTCAGGAACAGAGAGCTCAAGACGAAATTTAGGACCATCGTAGTGATGCAA 2 5 **
SI076 8 ACGAGTCTTTACAGACATAACTACAACA[A/G]TCAAGTGCATTTAGCTCAGGCCATGACAATCATTTTGATTGTCGGAAGTGTAAATTTGAG 61.2 6 **
SI077 2 AAGCTCCACTTGCCTAGCACAACCTCCATAATGTCTAGCTTGAGGTTGTATGGA[T/C]AGCAGCTACAGATGAGACCATGGAGTCGACCCCACAGACATTGCGACCCATGCAGATCTT 50 22 **
SI078 2 CTACTTTGAAATCTCTGTGTAATTTTAAGCTTAATTTCGGTGTTTTTCCAGTTGTCTTCA[T/C]TGTAATTTTGGTGTTAAAATATTCTAGTATAATAATAAAATTAGGTCATAGAGTTCGGGC 62.2 2 **
SI079 8 GAGTTTCCTATTTTCTGATCTTTACTGTTGACCAAATTGGAACCTCAATTCATAAC[A/G]AGGTGATCCATTTGTATGTTGTGCATGTGTAAGACTAAAGTCAATTTTCCTATACCTGTA 43.9 32 **
SI082 8 CCTACTTTATCCGATAATTTGCC[A/G]TCACTCTCAGCTATTTCCTGCCTTTTCTTCT 23.5 114 *
SI083 2 AGTCAAGAAACAACCTCAAAGATGATAGGAATTAAGGGCCAACATGA[T/C]GACCCACGCTTGTCAAGATTGGTCTCAAATGCAAGTTGAGCCGCACAACCAACCAGAAAT 46.9 32 **
SI084 8 CGCAAAAGAGGTCCCCGCCTTCGAATACACGTCTCGGAGCGTTGCGCATTTGTACAACCT[C/G]GCAACTCTCTCGCAGGCCAAAACTAAAGCCGCCAACATCGTCGCCGCCGATTTTCGCCAA 55.1 13 -
SI085 8 CTAATAXACATTACTCAAGCTACCCTTTAGTAATTTTGTT[T/G]GAAGCTGTAAAATTGTACTTTTTTAGGCGGTGGATTATGGAGATTGTTATGTTCTCATGG 42.9 25 **
SI086 8 AGGCGCTACTCTTTACTTTGTTAT[A/G]AGTGGAATCCACCAAATTATTTAGTTGTTCGTTAAAAGAACATGAAAACTATCACGAGTA 46.9 22 **
SI088 8 AGCTATATGTGGAGACCAAGTTGGTACATTTATTGATCGGACAGGAAGAATGAGCTAGTA[T/G]GTGGTTCTTTACTTGGTATGACCTCTGACTGTGTCTGTTATGGTTCAGTGGACTCT 54.1 47 **
SI089 8 GCAATCTGCTGGCCGGAGTGTCTTTGAGATGGAAATGGCTAGGATTTTTCAAGACCCCTC[A/G]AAGTCAATGTGGGAGAGAAGGGAGTGGATTAAGAAGCAGAAGTTGGCACTTCAGAATCAA 13.3 20 ***
SI092 8 GGCAGCAGAGCGTTAGCTCGATGTCCTGTCGGAGTATCCTC[A/G]TCCTCCTCTCCGCTGCCCCCTCCCATTTGGTAAGAGCTGCATGCATGCAGCGTATTAGAA 14.3 29 **
SI094 8 GAATTAGGATTTCAATAAATAAGAAGTAAGACGGATGCCAATTATTTGAGAAGCTGACAT[A/T]TTGAGTACCTCATGTGGAAATCAGTTCCTACATGCTTTATCTTCCCTCTGATTGGATATG 51 42 ***
SI095 2 GCGAACCTGCCCTTGATACGTGGTCTAGTTTCCGCATAGGCCTTCCTTGAGGCATACC[T/G]GATTGTCTTCTCGAATTTTCTTGTCTTCTTTTTTTCCCTGTATCTCAAGACTCTGGCCTC 53.1 80 **
SI096 8 ATCCATGGCAGCCAAAGCAAGCTCCAAAAACATTGATCTTTCAATGGATCTATCGAGGCC[T/C]GTAACGCCGGGACCTGATCTGTTCGGAGGCATAACAACTGGCAAGGCATTAGAAATCCCA 18.4 3 ***
SI099 8 TATGCAAGTACTAATAAATATGAACATCGTTTG[T/C]TGTTTGTCTCACCATGGGACTTTTT 6.1 9 *
SI100 8 TATTGTAGGGAAGAGACTGTCGGAGTTTGCTGCATCCTGCAATGTCCCATTTGAATTCCA[A/T]GATACTGCCATGACTGCTTGTGAGGTTGAACGACAACATCTAAGGGTTCAACCTGGGGAA 59.2 19 ***
SI102 8 CAAGGCTGCCTTCGGTGAGAAAGAGTGGTATTTTTTCAGTCCTAGAGACCGAAAGTACCC[T/G]AATGGAGCCAGGCCGAACAGGGCAGCTGCATCCGGGTATTGGAAGGCGACAGGCACGGAT 59.2 98 ***
SI103 2 CTCTATTCATGTGAATTATCATAGATCAGCTGATCTTTATCTGCCACTACTGGTCCCCTC[A/C]TTCCCAGTCACAATTTCTTTATAAAGAGATGTTACCTTCCAATGAGATAAATTTTGCATA 46.9 22 ***
SI104 8 TGCTTTTTCTTTAAGTGCATGCCTT[T/G]TTCTTTTATCAGAAGTGATTAGTTGGATGAGCACTGTTTGATGGTTGTTGCAGATGGGC 48 53 **
SI105 8 TCTGGAGGATGTGGGCATAGTGAGTGAGTGCGGACCGAGTTGCGGGTGCGGGTCTGAGTG[T/C]GGGAATCGGTTGACTCAGAGAGGAATATCGGTGA 10.2 3 **
SI109 8 AAATGTCGTCATTGGGGAAGCAGTGGAGAATGAACATATAATTCACATCATTGATTTCCA[A/G]ATTGCTCAGGGCACCCAGTGGATGTTCCTCCTCCATGCTCTTGCAAAACGGCCTGGTGGA 12.2 19 ***
SI110 2 GGCAAGGATGCTTTCCATTTGCGAGTGAGGGTGCACCCCTTCCATGTTCTGCG[T/C]ATTAACAAGATGCTTTCGTGTGCTGGGGCTGAT 45.9 16 **
SI111 8 ATTTTGGGGATTTTAAACTTTTAACTTTTCGTTGAATTGCTTTAACAACGATTAACCTTG[T/C]GGGAAAAATTTACAAATGGTCTTAGGTAACCCTAGACTCATGTTTATGGCCCCATTTAGT 57.1 25 **
SI112 8 TGAAGATACGTTCTGATATGGATCAAGTGTTTAGAGACTCCAGTCTCAAAGGTCC[A/G]TTATGGGAAGAGATTTCCAGGTGATGATTTTATTAACTTTTGTCAAAGCTAATTTCTAGC 39.8 34 **
SI113 2 CCTAAGCGTTTTGCTTGTTGAAGATCAAGCAGTACTACAAAGGATAGGAATCAGAATGCT[A/T]AAAAAGCTTGGAGCTGGTGTTACTCTAGTCAAAGATGGAGAGGCTGCCGTTGAAGCCATG 52 25 ***
SI114 8 CAGATGAGTCTGGGATCGGGTGTCTCCTGTATTTGGTGAGCCATTTAGCCAGCGTCATTG[T/G]TGCTTATCTGCTTAGCCAACTTGATGATTCCACAAATTGATCTT 2 25 **
SI115 2 CCTTCCAATGAGATAAATTTTGCATAACTGCTCTCCCGCACTTGGTATTAACTGGTTTTT[A/T]ACACTTGCAGATCCTTGGGCCTGATAGTGGTTGGCAGCCAATTCCACTAACAGATCTTAT 2 22 ***
SI116 8 TGAAGTTTTTTAGTGGTCACATTCCTTATTGTTAATTAATCGAATTGTGATAATTTGTGT[C/G]TATCTATGCTGTTGTCAGGCCCTCATAATTTGAGCTTTTAGACTAAATAGTGTTTAAAAA 34.7 6 ***
SI117 8 GCCTTAAAAATAATCAAAATATTCAGTGTCATCGACATTCCTTCTAGATA[T/C]GTGCTTCTGGTCTTGTGCATAGTATTCAAAATAGAGGAGATTATAAATCCAGATT 58.2 8 **
SI118 8 GAGGAAAAATAAAGTTACCTCCATCTGCACA[A/G]CATTGCAATCTCAGTATCAACA 56.1 101 *
SI122 8 ACAGCTACAGCTAGTTGATGGTGATCGCGATCTTGATTATTCATTTT[A/G]ATTTTCTTGTTACTCACCGAAGATGATGATGAAGATTTGGACTTCTTTCTGATAGAGTGT 61.2 3 **
Citrus clementinaScaffold number
mapped STSsequencec
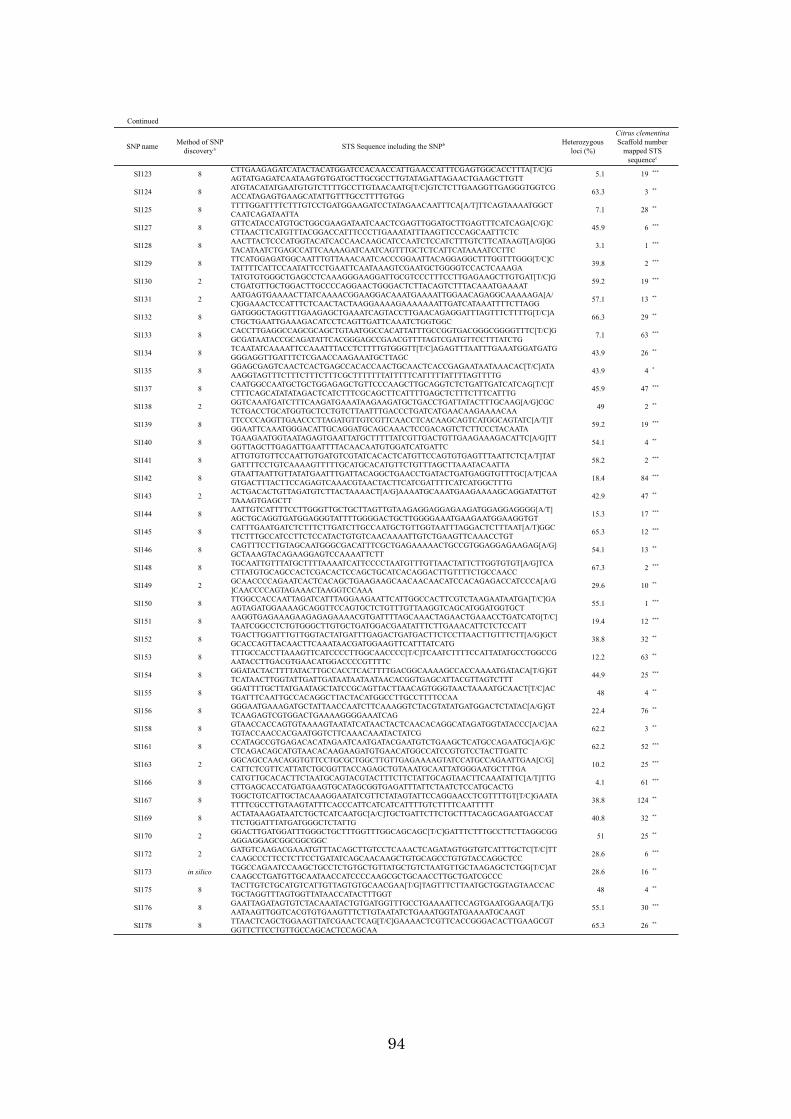
94
Continued
SNP name Method of SNPdiscoverya STS Sequence including the SNPb Heterozygous
loci (%)
SI123 8 CTTGAAGAGATCATACTACATGGATCCACAACCATTGAACCATTTCGAGTGGCACCTTTA[T/C]GAGTATGAGATCAATAAGTGTGATGCTTGCGCCTTGTATAGATTAGAACTGAAGCTTGTT 5.1 19 ***
SI124 8 ATGTACATATGAATGTGTCTTTTGCCTTGTAACAATG[T/C]GTCTCTTGAAGGTTGAGGGTGGTCGACCATAGAGTGAAGCATATTGTTTGCCTTTTGTGG 63.3 3 **
SI125 8 TTTTGGATTTTCTTTGTCCTGATGGAAGATCCTATAGAACAATTTCA[A/T]TTCAGTAAAATGGCTCAATCAGATAATTA 7.1 28 **
SI127 8 GTTCATACCATGTGCTGGCGAAGATAATCAACTCGAGTTGGATGCTTGAGTTTCATCAGA[C/G]CCTTAACTTCATGTTTACGGACCATTTCCCTTGAAATATTTAAGTTCCCAGCAATTTCTC 45.9 6 ***
SI128 8 AACTTACTCCCATGGTACATCACCAACAAGCATCCAATCTCCATCTTTGTCTTCATAAGT[A/G]GGTACATAATCTGAGCCATTCAAAAGATCAATCAGTTTGCTCTCATTCATAAAATCCTTC 3.1 1 ***
SI129 8 TTCATGGAGATGGCAATTTGTTAAACAATCACCCGGAATTACAGGAGGCTTTGGTTTGGG[T/C]CTATTTTCATTCCAATATTCCTGAATTCAATAAAGTCGAATGCTGGGGTCCACTCAAAGA 39.8 2 ***
SI130 2 TATGTGTGGGCTGAGCCTCAAAGGGAAGGATTGCGTCCCTTTCCTTGAGAAGCTTGTGAT[T/C]GCTGATGTTGCTGGACTTGCCCCAGGAACTGGGACTCTTACAGTCTTTACAAATGAAAAT 59.2 19 ***
SI131 2 AATGAGTGAAAACTTATCAAAACGGAAGGACAAATGAAAATTGGAACAGAGGCAAAAAGA[A/C]GGAAACTCCATTTCTCAACTACTAAGGAAAAGAAAAAAATTGATCATAAATTTTCTTAGG 57.1 13 **
SI132 8 GATGGGCTAGGTTTGAAGAGCTGAAATCAGTACCTTGAACAGAGGATTTAGTTTCTTTTG[T/C]ACTGCTGAATTGAAAGACATCCTCAGTTGATTCAAATCTGGTGGC 66.3 29 **
SI133 8 CACCTTGAGGCCAGCGCAGCTGTAATGGCCACATTATTTGCCGGTGACGGGCGGGGTTTC[T/C]GGCGATAATACCGCAGATATTCACGGGAGCCGAACGTTTTAGTCGATGTTCCTTTATCTG 7.1 63 ***
SI134 8 TCAATATCAAAATTCCAAATTTACCTCTTTTGTGGGTT[T/C]AGAGTTTAATTTGAAATGGATGATGGGGAGGTTGATTTCTCGAACCAAGAAATGCTTAGC 43.9 26 **
SI135 8 GGAGCGAGTCAACTCACTGAGCCACACCAACTGCAACTCACCGAGAATAATAAACAC[T/C]ATAAAGGTAGTTTCTTTCTTTCTTTCGCTTTTTTTATTTTTCATTTTTATTTTAGTTTTG 43.9 4 *
SI137 8 CAATGGCCAATGCTGCTGGAGAGCTGTTCCCAAGCTTGCAGGTCTCTGATTGATCATCAG[T/C]TCTTTCAGCATATATAGACTCATCTTTCGCAGCTTCATTTTGAGCTCTTTCTTTCATTTG 45.9 47 ***
SI138 2 GGTCAAATGATCTTTCAAGATGAAATAAGAAGATGCTGACCTGATTATACTTTGCAAG[A/G]CGCTCTGACCTGCATGGTGCTCCTGTCTTAATTTGACCCTGATCATGAACAAGAAAACAA 49 2 **
SI139 8 TTCCCCAGGTTGAACCCTTAGATGTTGTCGTTCAACCTCACAAGCAGTCATGGCAGTATC[A/T]TGGAATTCAAATGGGACATTGCAGGATGCAGCAAACTCCGACAGTCTCTTCCCTACAATA 59.2 19 ***
SI140 8 TGAAGAATGGTAATAGAGTGAATTATGCTTTTTATCGTTGACTGTTGAAGAAAGACATTC[A/G]TTGGTTAGCTTGAGATTGAATTTTACAACAATGTGGATCATGATTC 54.1 4 **
SI141 8 ATTGTGTGTTCCAATTGTGATGTCGTATCACACTCATGTTCCAGTGTGAGTTTAATTCTC[A/T]TATGATTTTCCTGTCAAAAGTTTTTGCATGCACATGTTCTGTTTAGCTTAAATACAATTA 58.2 2 ***
SI142 8 GTAATTAATTGTTATATGAATTTGATTACAGGCTGAACCTGATACTGATGAGGTGTTTGC[A/T]CAAGTGACTTTACTTCCAGAGTCAAACGTAACTACTTCATCGATTTTCATCATGGCTTTG 18.4 84 ***
SI143 2 ACTGACACTGTTAGATGTCTTACTAAAACT[A/G]AAAATGCAAATGAAGAAAAGCAGGATATTGTTAAAGTGAGCTT 42.9 47 **
SI144 8 AATTGTCATTTTCCTTGGGTTGCTGCTTAGTTGTAAGAGGAGGAGAAGATGGAGGAGGGG[A/T]AGCTGCAGGTGATGGAGGGTATTTTGGGGACTGCTTGGGGAAATGAAGAATGGAAGGTGT 15.3 17 ***
SI145 8 CATTTGAATGATCTCTTTCTTGATCTTGCCAATGCTGTTGGTAATTTAGGACTCTTTAAT[A/T]GGCTTCTTTGCCATCCTTCTCCATACTGTGTCAACAAAATTGTCTGAAGTTCAAACCTGT 65.3 12 ***
SI146 8 CAGTTTCCTTGTAGCAATGGGCGACATTTCGCTGAGAAAAACTGCCGTGGAGGAGAAGAG[A/G]GCTAAAGTACAGAAGGAGTCCAAAATTCTT 54.1 13 **
SI148 8 TGCAATTGTTTATGCTTTTAAAATCATTCCCCTAATGTTTGTTAACTATTCTTGGTGTGT[A/G]TCACTTATGTGCAGCCACTCGACACTCCAGCTGCATCACAGGACTTGTTTTCTGCCAACC 67.3 2 ***
SI149 2 GCAACCCCAGAATCACTCACAGCTGAAGAAGCAACAACAACATCCACAGAGACCATCCCA[A/G]CAACCCCAGTAGAAACTAAGGTCCAAA 29.6 10 **
SI150 8 TTGGCCACCAATTAGATCATTTAGGAAGAATTCATTGGCCACTTCGTCTAAGAATAATGA[T/C]GAAGTAGATGGAAAAGCAGGTTCCAGTGCTCTGTTTGTTAAGGTCAGCATGGATGGTGCT 55.1 1 ***
SI151 8 AAGGTGAGAAAGAAGAGAGAAAACGTGATTTTAGCAAACTAGAACTGAAACCTGATCATG[T/C]TAATCGGCCTCTGTGGGCTTGTGCTGATGGACGAATATTTCTTGAAACATTCTCTCCATT 19.4 12 ***
SI152 8 TGACTTGGATTTGTTGGTACTATGATTTGAGACTGATGACTTCTCCTTAACTTGTTTCTT[A/G]GCTGCACCAGTTACAACTTCAAATAACGATGGAAGTTCATTTATCATG 38.8 32 **
SI153 8 TTTGCCACCTTAAAGTTCATCCCCTTGGCAACCCC[T/C]TCAATCTTTTCCATTATATGCCTGGCCGAATACCTTGACGTGAACATGGACCCCGTTTTC 12.2 63 **
SI154 8 GGATACTACTTTTATACTTGCCACCTCACTTTTGACGGCAAAAGCCACCAAAATGATACA[T/G]GTTCATAACTTGGTATTGATTGATAATAATAATAACACGGTGAGCATTACGTTAGTCTTT 44.9 25 ***
SI155 8 GGATTTTGCTTATGAATAGCTATCCGCAGTTACTTAACAGTGGGTAACTAAAATGCAACT[T/C]ACTGATTTCAATTGCCACAGGCTTACTACATGGCCTTGCCTTTTCCAA 48 4 **
SI156 8 GGGAATGAAAGATGCTATTAACCAATCTTCAAAGGTCTACGTATATGATGGACTCTATAC[A/G]GTTCAAGAGTCGTGGACTGAAAAGGGGAAATCAG 22.4 76 **
SI158 8 GTAACCACCAGTGTAAAAGTAATATCATAACTACTCAACACAGGCATAGATGGTATACCC[A/C]AATGTACCAACCACGAATGGTCTTCAAACAAATACTATCG 62.2 3 **
SI161 8 CCATAGCCGTGAGACACATAGAATCAATGATACGAATGTCTGAAGCTCATGCCAGAATGC[A/G]CCTCAGACAGCATGTAACACAAGAAGATGTGAACATGGCCATCCGTGTCCTACTTGATTC 62.2 52 ***
SI163 2 GGCAGCCAACAGGTGTTCCTGCGCTGGCTTGTTGAGAAAAGTATCCATGCCAGAATTGAA[C/G]CATTCTCGTTCATTATCTGCGGTTACCAGAGCTGTAAATGCAATTATGGGAATGCTTTGA 10.2 25 ***
SI166 8 CATGTTGCACACTTCTAATGCAGTACGTACTTTCTTCTATTGCAGTAACTTCAAATATTC[A/T]TTGCTTGAGCACCATGATGAAGTGCATAGCGGTGAGATTTATTCTAATCTCCATGCACTG 4.1 61 ***
SI167 8 TGGCTGTCATTGCTACAAAGGAATATCGTTCTATAGTATTCCAGGAACCTCGTTTTGT[T/C]GAATATTTTCGCCTTGTAAGTATTTCACCCATTCATCATCATTTTGTCTTTTCAATTTTT 38.8 124 **
SI169 8 ACTATAAAGATAATCTGCTCATCAATGC[A/C]TGCTGATTCTTCTGCTTTACAGCAGAATGACCATTTCTGGATTTATGATGGGCTCTATTG 40.8 32 **
SI170 2 GGACTTGATGGATTTGGGCTGCTTTGGTTTGGCAGCAGC[T/C]GATTTCTTTGCCTTCTTAGGCGGAGGAGGAGCGGCGGCGGC 51 25 **
SI172 2 GATGTCAAGACGAAATGTTTACAGCTTGTCCTCAAACTCAGATAGTGGTGTCATTTGCTC[T/C]TTCAAGCCCTTCCTCTTCCTGATATCAGCAACAAGCTGTGCAGCCTGTGTACCAGGCTCC 28.6 6 ***
SI173 in silico TGGCCAGAATCCAAGCTGCCTCTGTGCTGTTATGCTGTCTAATGTTGCTAAGAGCTCTGG[T/C]ATCAAGCCTGATGTTGCAATAACCATCCCCAAGCGCTGCAACCTTGCTGATCGCCC 28.6 16 **
SI175 8 TACTTGTCTGCATGTCATTGTTAGTGTGCAACGAA[T/G]TAGTTTCTTAATGCTGGTAGTAACCACTGCTAGGTTTAGTGGTTATAACCATACTTTGGT 48 4 **
SI176 8 GAATTAGATAGTGTCTACAAATACTGTGATGGTTTGCCTGAAAATTCCAGTGAATGGAAG[A/T]GAATAAGTTGGTCACGTGTGAAGTTTCTTGTAATATCTGAAATGGTATGAAAATGCAAGT 55.1 30 ***
SI178 8 TTAACTCAGCTGGAAGTTATCGAACTCAG[T/C]GAAAACTCGTTCACCGGGACACTTGAAGCGTGGTTCTTCCTGTTGCCAGCACTCCAGCAA 65.3 26 **
Citrus clementinaScaffold number
mapped STSsequencec
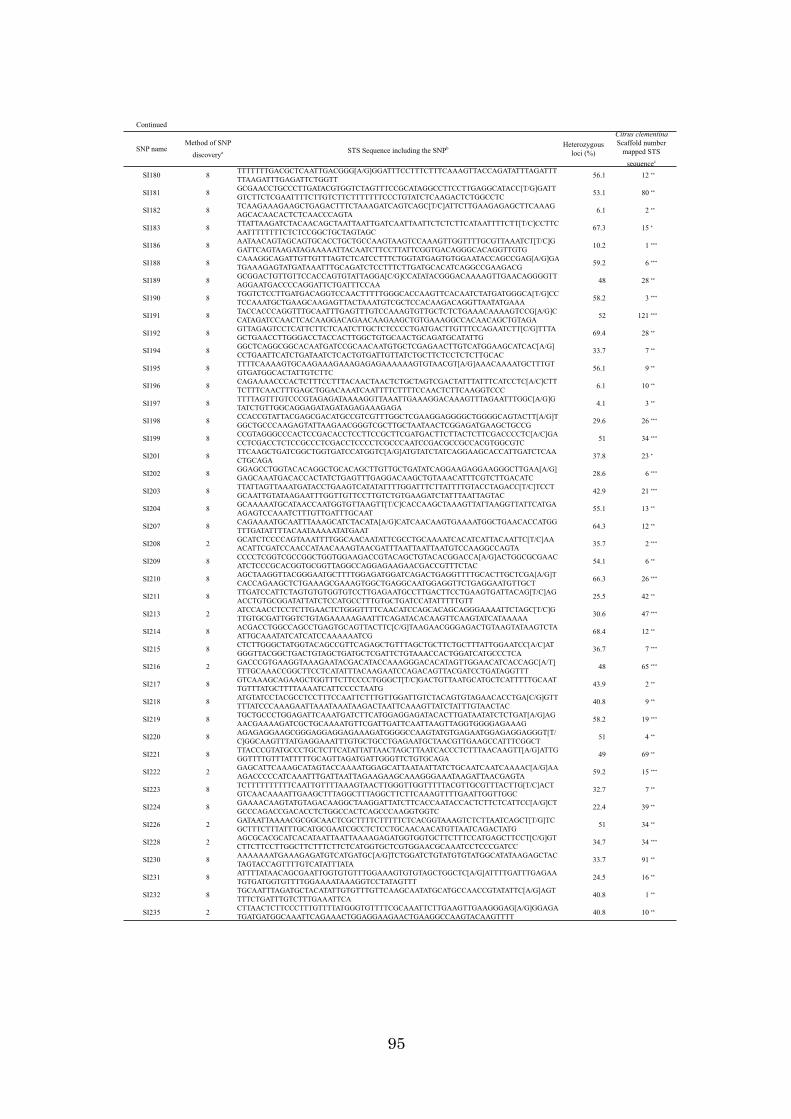
95
Continued
SNP nameMethod of SNP
discoverya STS Sequence including the SNPb Heterozygousloci (%)
SI180 8 TTTTTTTGACGCTCAATTGACGGG[A/G]GGATTTCCTTTCTTTCAAAGTTACCAGATATTTAGATTTTTAAGATTTGAGATTCTGGTT 56.1 12 **
SI181 8 GCGAACCTGCCCTTGATACGTGGTCTAGTTTCCGCATAGGCCTTCCTTGAGGCATACC[T/G]GATTGTCTTCTCGAATTTTCTTGTCTTCTTTTTTTCCCTGTATCTCAAGACTCTGGCCTC 53.1 80 **
SI182 8 TCAAGAAAGAAGCTGAGACTTTCTAAAGATCAGTCAGC[T/C]ATTCTTGAAGAGAGCTTCAAAGAGCACAACACTCTCAACCCAGTA 6.1 2 **
SI183 8 TTATTAAGATCTACAACAGCTAATTAATTGATCAATTAATTCTCTCTTCATAATTTTCTT[T/C]CCTTCAATTTTTTTTCTCTCCGGCTGCTAGTAGC 67.3 15 *
SI186 8 AATAACAGTAGCAGTGCACCTGCTGCCAAGTAAGTCCAAAGTTGGTTTTGCGTTAAATCT[T/C]GGATTCAGTAAGATAGAAAAATTACAATCTTCCTTATTCGGTGACAGGGCACAGGTTGTG 10.2 1 ***
SI188 8 CAAAGGCAGATTGTTGTTTAGTCTCATCCTTTCTGGTATGAGTGTGGAATACCAGCCGAG[A/G]GATGAAAGAGTATGATAAATTTGCAGATCTCCTTTCTTGATGCACATCAGGCCGAAGACG 59.2 6 ***
SI189 8 GCGGACTGTTGTTCCACCAGTGTATTAGGA[C/G]CCATATACGGGACAAAAGTTGAACAGGGGTTAGGAATGACCCCAGGATTCTGATTTCCAA 48 28 **
SI190 8 TGGTCTCCTTGATGACAGGTCCAACTTTTTGGGCACCAAGTTCACAATCTATGATGGGCA[T/G]CCTCCAAATGCTGAAGCAAGAGTTACTAAATGTCGCTCCACAAGACAGGTTAATATGAAA 58.2 3 ***
SI191 8 TACCACCCAGGTTTGCAATTTGAGTTTGTCCAAAGTGTTGCTCTCTGAAACAAAAGTCCG[A/G]CCATAGATCCAACTCACAAGGACAGAACAAGAAGCTGTGAAAGGCCACAACAGCTGTAGA 52 121 ***
SI192 8 GTTAGAGTCCTCATTCTTCTCAATCTTGCTCTCCCCTGATGACTTGTTTCCAGAATCTT[C/G]TTTAGCTGAACCTTGGGACCTACCACTTGGCTGTGCAACTGCAGATGCATATTG 69.4 28 **
SI194 8 GGCTCAGGCGGCACAATGATCCGCAACAATGTGCTCGAGAACTTGTCATGGAAGCATCAC[A/G]CCTGAATTCATCTGATAATCTCACTGTGATTGTTATCTGCTTCTCCTCTCTTGCAC 33.7 7 **
SI195 8 TTTTCAAAAGTGCAAGAAAGAAAGAGAGAAAAAAGTGTAACGT[A/G]AAACAAAATGCTTTGTGTGATGGCACTATTGTCTTC 56.1 9 **
SI196 8 CAGAAAACCCACTCTTTCCTTTACAACTAACTCTGCTAGTCGACTATTTATTTCATCCTC[A/C]CTTTCTTTCAACTTTGAGCTGGACAAATCAATTTTCTTTTCCAACTCTTCAAGGTCCC 6.1 10 **
SI197 8 TTTTAGTTTGTCCCGTAGAGATAAAAGGTTAAATTGAAAGGACAAAGTTTAGAATTTGGC[A/G]GTATCTGTTGGCAGGAGATAGATAGAGAAAGAGA 4.1 3 **
SI198 8 CCACCGTATTACGAGCGACATGCCGTCGTTTGGCTCGAAGGAGGGGCTGGGGCAGTACTT[A/G]TGGCTGCCCAAGAGTATTAAGAACGGGTCGCTTGCTAATAACTCGGAGATGAAGCTGCCG 29.6 26 ***
SI199 8 CCGTAGGGCCCACTCCGACACCTCCTTCCGCTTCGATGACTTCTTACTCTTCGACCCCTC[A/C]GACCTCGACCTCTCCGCCCTCGACCTCCCCTCGCCCAATCCGACGCCGCCACGTGGCGTC 51 34 ***
SI201 8 TTCAAGCTGATCGGCTGGTGATCCATGGTC[A/G]ATGTATCTATCAGGAAGCACCATTGATCTCAACTGCAGA 37.8 23 *
SI202 8 GGAGCCTGGTACACAGGCTGCACAGCTTGTTGCTGATATCAGGAAGAGGAAGGGCTTGAA[A/G]GAGCAAATGACACCACTATCTGAGTTTGAGGACAAGCTGTAAACATTTCGTCTTGACATC 28.6 6 ***
SI203 8 TTATTAGTTAAATGATACCTGAAGTCATATATTTTGGATTTCTTATTTTGTACCTAGACC[T/C]TCCTGCAATTGTATAAGAATTTGGTTGTTCCTTGTCTGTGAAGATCTATTTAATTAGTAC 42.9 21 ***
SI204 8 GCAAAAATGCATAACCAATGGTGTTAAGTT[T/C]CACCAAGCTAAAGTTATTAAGGTTATTCATGAAGAGTCCAAATCTTTGTTGATTTGCAAT 55.1 13 **
SI207 8 CAGAAAATGCAATTTAAAGCATCTACATA[A/G]CATCAACAAGTGAAAATGGCTGAACACCATGGTTTGATATTTTACAATAAAAATATGAAT 64.3 12 **
SI208 2 GCATCTCCCCAGTAAATTTTGGCAACAATATTCGCCTGCAAAATCACATCATTACAATTC[T/C]AAACATTCGATCCAACCATAACAAAGTAACGATTTAATTAATTAATGTCCAAGGCCAGTA 35.7 2 ***
SI209 8 CCCCTCGGTCGCCGGCTGGTGGAAGACCGTACAGCTGTACACGGACCA[A/G]ACTGGCGCGAACATCTCCCGCACGGTGCGGTTAGGCCAGGAGAAGAACGACCGTTTCTAC 54.1 6 **
SI210 8 AGCTAAGGTTACGGGAATGCTTTTGGAGATGGATCAGACTGAGGTTTTGCACTTGCTCGA[A/G]TCACCAGAAGCTCTGAAAGCGAAAGTGGCTGAGGCAATGGAGGTTCTGAGGAATGTTGCT 66.3 26 ***
SI211 8 TTGATCCATTCTAGTGTGTGGTGTCCTTGAGAATGCCTTGACTTCCTGAAGTGATTACAG[T/C]AGACCTGTGCGGATATTATCTCCATGCCTTTGTGCTGATCCATATTTTTGTT 25.5 42 **
SI213 2 ATCCAACCTCCTCTTGAACTCTGGGTTTTCAACATCCAGCACAGCAGGGAAAATTCTAGC[T/C]GTTGTGCGATTGGTCTGTAGAAAAAGAATTTCAGATACACAAGTTCAAGTATCATAAAAA 30.6 47 ***
SI214 8 ACGACCTGGCCAGCCTGAGTGCAGTTACTTC[C/G]TAAGAACGGGAGACTGTAAGTATAAGTCTAATTGCAAATATCATCATCCAAAAAATCG 68.4 12 **
SI215 8 CTCTTGGGCTATGGTACAGCCGTTCAGAGCTGTTTAGCTGCTTCTGCTTTATTGGAATCC[A/C]ATGGGTTACGGCTGACTGTAGCTGATGCTCGATTCTGTAAACCACTGGATCATGCCCTCA 36.7 7 ***
SI216 2 GACCCGTGAAGGTAAAGAATACGACATACCAAAGGGACACATAGTTGGAACATCACCAGC[A/T]TTTGCAAACCGGCTTCCTCATATTTACAAGAATCCAGACAGTTACGATCCTGATAGGTTT 48 65 ***
SI217 8 GTCAAAGCAGAAGCTGGTTTCTTCCCCTGGGCT[T/C]GACTGTTAATGCATGCTCATTTTTGCAATTGTTTATGCTTTTAAAATCATTCCCCTAATG 43.9 2 **
SI218 8 ATGTATCCTACGCCTCCTTTCCAATTCTTTGTTGGATTGTCTACAGTGTAGAACACCTGA[C/G]GTTTTTATCCCAAAGAATTAAATAAATAAGACTAATTCAAAGTTATCTATTTGTAACTAC 40.8 9 **
SI219 8 TGCTGCCCTGGAGATTCAAATGATCTTCATGGAGGAGATACACTTGATAATATCTCTGAT[A/G]AGAACGAAAAGATCGCTGCAAAATGTTCGATTGATTCAATTAAGTTAGGTGGGGAGAAAG 58.2 19 ***
SI220 8 AGAGAGGAAGCGGGAGGAGGAGAAAGATGGGGCCAAGTATGTGAGAATGGAGAGGAGGGT[T/C]GGCAAGTTTATGAGGAAATTTGTGCTGCCTGAGAATGCTAACGTTGAAGCCATTTCGGCT 51 4 **
SI221 8 TTACCCGTATGCCCTGCTCTTCATATTATTAACTAGCTTAATCACCCTCTTTAACAAGTT[A/G]ATTGGGTTTTGTTTATTTTTGCAGTTAGATGATTGGGTTCTGTGCAGA 49 69 **
SI222 2 GAGCATTCAAAGCATAGTACCAAAATGGAGCATTAATAATTATCTGCAATCAATCAAAAC[A/G]AAAGACCCCCATCAAATTTGATTAATTAGAAGAAGCAAAGGGAAATAAGATTAACGAGTA 59.2 15 ***
SI223 8 TCTTTTTTTTTTCAATTGTTTTAAAGTAACTTGGGTTGGTTTTTACGTTGCGTTTACTTG[T/C]ACTGTCAACAAAATTGAAGCTTTAGGCTTTAGGCTTCTTCAAAGTTTTGAATTGGTTGGC 32.7 7 **
SI224 8 GAAAACAAGTATGTAGACAAGGCTAAGGATTATCTTCACCAATACCACTCTTCTCATTCC[A/G]CTGCCCAGACCGACACCTCTGGCCACTCAGCCCAAGGTGGTC 22.4 39 **
SI226 2 GATAATTAAAACGCGGCAACTCGCTTTTCTTTTTCTCACGGTAAAGTCTCTTAATCAGCT[T/G]TCGCTTTCTTTATTTGCATGCGAATCGCCTCTCCTGCAACAACATGTTAATCAGACTATG 51 34 **
SI228 2 AGCGCACGCATCACATAATTAATTAAAAGAGATGGTGGTGCTTCTTTCCATGAGCTTCCT[C/G]GTCTTCTTCCTTGGCTTCTTTCTTCTCATGGTGCTCGTGGAACGCAAATCCTCCCGATCC 34.7 34 ***
SI230 8 AAAAAAATGAAAGAGATGTCATGATGC[A/G]TCTGGATCTGTATGTGTATGGCATATAAGAGCTACTAGTACCAGTTTTGTCATATTTATA 33.7 91 **
SI231 8 ATTTTATAACAGCGAATTGGTGTGTTTGGAAAGTGTGTAGCTGGCTC[A/G]ATTTTGATTTGAGAATGTGATGGTGTTTTGGAAAATAAAGGTCCTATAGTTT 24.5 16 **
SI232 8 TGCAATTTAGATGCTACATATTGTGTTTGTTCAAGCAATATGCATGCCAACCGTATATTC[A/G]AGTTTTCTGATTTGTCTTTGAAATTCA 40.8 1 **
SI235 2 CTTAACTCTTCCCTTTGTTTTATGGGTGTTTTCGCAAATTCTTGAAGTTGAAGGGAG[A/G]GGAGATGATGATGGCAAATTCAGAAACTGGAGGAAGAACTGAAGGCCAAGTACAAGTTTT 40.8 10 **
Citrus clementinaScaffold number
mapped STSsequencec
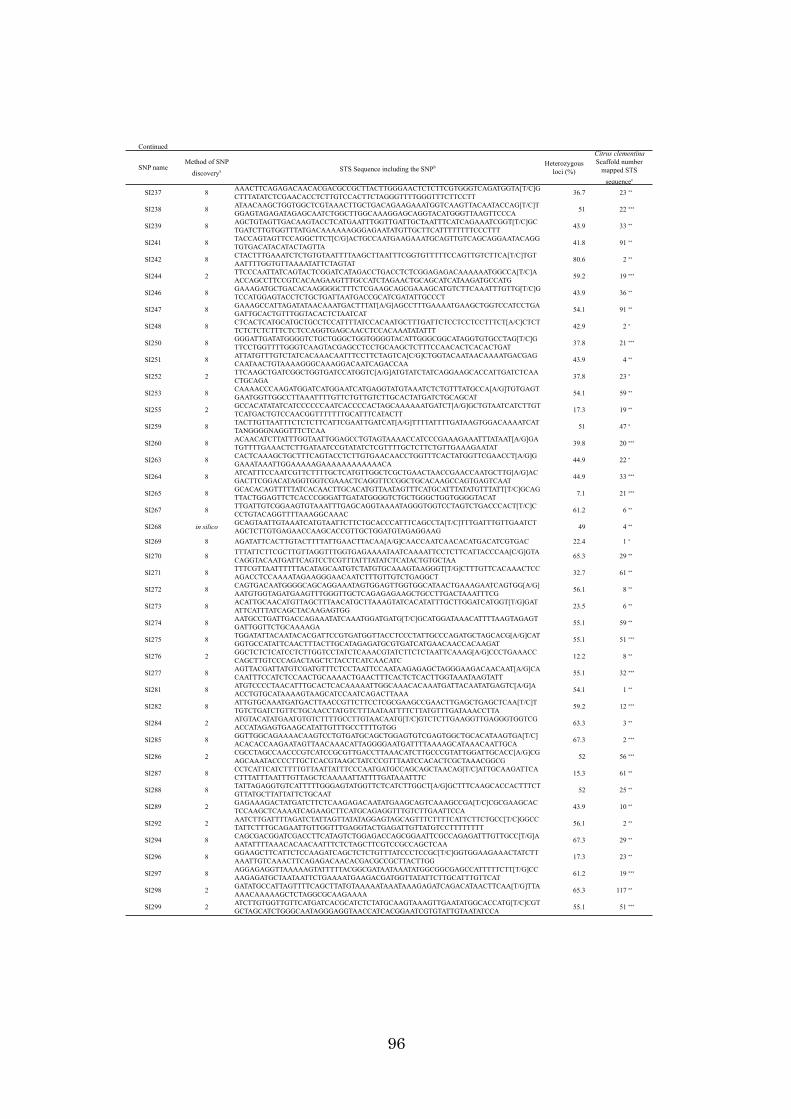
96
Continued
SNP nameMethod of SNP
discoverya STS Sequence including the SNPb Heterozygousloci (%)
SI237 8 AAACTTCAGAGACAACACGACGCCGCTTACTTGGGAACTCTCTTCGTGGGTCAGATGGTA[T/C]GCTTTATATCTCGAACACCTCTTGTCCACTTCTAGGGTTTTGGGTTTCTTCCTT 36.7 23 **
SI238 8 ATAACAAGCTGGTGGCTCGTAAACTTGCTGACAGAAGAAATGGTCAAGTTACAATACCAG[T/C]TGGAGTAGAGATAGAGCAATCTGGCTTGGCAAAGGAGCAGGTACATGGGTTAAGTTCCCA 51 22 ***
SI239 8 AGCTGTAGTTGACAAGTACCTCATGAATTTGGTTGATTGCTAATTTCATCAGAAATCGGT[T/C]GCTGATCTTGTGGTTTATGACAAAAAAGGGAGAATATGTTGCTTCATTTTTTTTCCCTTT 43.9 33 **
SI241 8 TACCAGTAGTTCCAGGCTTCT[C/G]ACTGCCAATGAAGAAATGCAGTTGTCAGCAGGAATACAGGTGTGACATACATACTAGTTA 41.8 91 **
SI242 8 CTACTTTGAAATCTCTGTGTAATTTTAAGCTTAATTTCGGTGTTTTTCCAGTTGTCTTCA[T/C]TGTAATTTTGGTGTTAAAATATTCTAGTAT 80.6 2 **
SI244 2 TTCCCAATTATCAGTACTCGGATCATAGACCTGACCTCTCGGAGAGACAAAAAATGGCCA[T/C]AACCAGCCTTCCGTCACAAGAAGTTTGCCATCTAGAACTGCAGCATCATAAGATGCCATG 59.2 19 ***
SI246 8 GAAAGATGCTGACACAAGGGGCTTTCTCGAAGCAGCGAAAGCATGTCTTCAAATTTGTTG[T/C]GTCCATGGAGTACCTCTGCTGATTAATGACCGCATCGATATTGCCCT 43.9 36 **
SI247 8 GAAAGCCATTAGATATAACAAATGACTTTAT[A/G]AGCCTTTGAAAATGAAGCTGGTCCATCCTGAGATTGCACTGTTTGGTACACTCTAATCAT 54.1 91 **
SI248 8 CTCACTCATGCATGCTGCCTCCATTTTATCCACAATGCTTTGATTCTCCTCCTCCTTTCT[A/C]CTCTTCTCTCTCTTTCTCTCCAGGTGAGCAACCTCCACAAATATATTT 42.9 2 *
SI250 8 GGGATTGATATGGGGTCTGCTGGGCTGGTGGGGTACATTGGGCGGCATAGGTGTGCCTAG[T/C]GTTCCTGGTTTTGGGTCAAGTACGAGCCTCCTGCAAGCTCTTTCCAACACTCACACTGAT 37.8 21 ***
SI251 8 ATTATGTTTGTCTATCACAAACAATTTCCTTCTAGTCA[C/G]CTGGTACAATAACAAAATGACGAGCAATAACTGTAAAAGGGCAAAGGACAATCAGACCAA 43.9 4 **
SI252 2 TTCAAGCTGATCGGCTGGTGATCCATGGTC[A/G]ATGTATCTATCAGGAAGCACCATTGATCTCAACTGCAGA 37.8 23 *
SI253 8 CAAAACCCAAGATGGATCATGGAATCATGAGGTATGTAAATCTCTGTTTATGCCA[A/G]TGTGAGTGAATGGTTGGCCTTAAATTTTGTTCTGTTGTCTTGCACTATGATCTGCAGCAT 54.1 59 **
SI255 2 GCCACATATATCATCCCCCCAATCACCCCACTAGCAAAAAATGATCT[A/G]GCTGTAATCATCTTGTTCATGACTGTCCAACGGTTTTTTTGCATTTCATACTT 17.3 19 **
SI259 8 TACTTGTTAATTTCTCTCTTCATTCGAATTGATCAT[A/G]TTTTATTTTGATAAGTGGACAAAATCATTANGGGGNAGGTTTCTCAA 51 47 *
SI260 8 ACAACATCTTATTTGGTAATTGGAGCCTGTAGTAAAACCATCCCGAAAGAAATTTATAAT[A/G]GATGTTTTGAAACTCTTGATAATCCGTATATCTCGTTTTGCTCTTCTGTTGAAAGAATAT 39.8 20 ***
SI263 8 CACTCAAAGCTGCTTTCAGTACCTCTTGTGAACAACCTGGTTTCACTATGGTTCGAACCT[A/G]GGAAATAAATTGGAAAAAGAAAAAAAAAAAACA 44.9 22 *
SI264 8 ATCATTTCCAATCGTTCTTTTGCTCATGTTGGCTCGCTGAACTAACCGAACCAATGCTTG[A/G]ACGACTTCGGACATAGGTGGTCGAAACTCAGGTTCCGGCTGCACAAGCCAGTGAGTCAAT 44.9 33 ***
SI265 8 GCACACAGTTTTTATCACAACTTGCACATGTTAATAGTTTCATGCATTTATATGTTTATT[T/C]GCAGTTACTGGAGTTCTCACCCGGGATTGATATGGGGTCTGCTGGGCTGGTGGGGTACAT 7.1 21 ***
SI267 8 TTGATTGTCGGAAGTGTAAATTTGAGCAGGTAAAATAGGGTGGTCCTAGTCTGACCCACT[T/C]CCCTGTACAGGTTTTAAAGGCAAAC 61.2 6 **
SI268 in silico GCAGTAATTGTAAATCATGTAATTCTTCTGCACCCATTTCAGCCTA[T/C]TTTGATTTGTTGAATCTAGCTCTTGTGAGAACCAAGCACCGTTGCTGGATGTAGAGGAAG 49 4 **
SI269 8 AGATATTCACTTGTACTTTTATTGAACTTACAA[A/G]CAACCAATCAACACATGACATCGTGAC 22.4 1 *
SI270 8 TTTATTCTTCGCTTGTTAGGTTTGGTGAGAAAATAATCAAAATTCCTCTTCATTACCCAA[C/G]GTACAGGTACAATGATTCAGTCCTCGTTTATTTATATCTCATACTGTGCTAA 65.3 29 **
SI271 8 TTTCGTTAATTTTTTACATAGCAATGTCTATGTGCAAAGTAAGGGT[T/G]CTTTGTTCACAAACTCCAGACCTCCAAAATAGAAGGGAACAATCTTTGTTGTCTGAGGCT 32.7 61 **
SI272 8 CAGTGACAATGGGGCAGCAGGAAATAGTGGAGTTGGTGGCATAACTGAAAGAATCAGTGG[A/G]AATGTGGTAGATGAAGTTTGGGTTGCTCAGAGAGAAGCTGCCTTGACTAAATTTCG 56.1 8 **
SI273 8 ACATTGCAACATGTTAGCTTTAACATGCTTAAAGTATCACATATTTGCTTGGATCATGGT[T/G]GATATTCATTTATCAGCTACAAGAGTGG 23.5 6 **
SI274 8 AATGCCTGATTGACCAGAAATATCAAATGGATGATG[T/C]GCATGGATAAACATTTTAAGTAGAGTGATTGGTTCTGCAAAAGA 55.1 59 **
SI275 8 TGGATATTACAATACACGATTCCGTGATGGTTACCTCCCTATTGCCCAGATGCTAGCACG[A/G]CATGGTGCCATATTCAACTTTACTTGCATAGAGATGCGTGATCATGAACAACCACAAGAT 55.1 51 ***
SI276 2 GGCTCTCTCATCCTCTTGGTCCTATCTCAAACGTATCTTCTCTAATTCAAAG[A/G]CCCTGAAACCCAGCTTGTCCCAGACTAGCTCTACCTCATCAACATC 12.2 8 **
SI277 8 AGTTACGATTATGTCGATGTTTCTCCTAATTCCAATAAGAGAGCTAGGGAAGACAACAAT[A/G]CACAATTTCCATCTCCAACTGCAAAACTGAACTTTCACTCTCACTTGGTAAATAAGTATT 55.1 32 ***
SI281 8 ATGTCCCCTAACATTTGCACTCACAAAAATTGGCAAACACAAATGATTACAATATGAGTC[A/G]AACCTGTGCATAAAAGTAAGCATCCAATCAGACTTAAA 54.1 1 **
SI282 8 ATTGTGCAAATGATGACTTAACCGTTCTTCCTCGCGAAGCCGAACTTGAGCTGAGCTCAA[T/C]TTGTCTGATCTGTTCTGCAACCTATGTCTTTAATAATTTTCTTATGTTTGATAAACCTTA 59.2 12 ***
SI284 2 ATGTACATATGAATGTGTCTTTTGCCTTGTAACAATG[T/C]GTCTCTTGAAGGTTGAGGGTGGTCGACCATAGAGTGAAGCATATTGTTTGCCTTTTGTGG 63.3 3 **
SI285 8 GGTTGGCAGAAAACAAGTCCTGTGATGCAGCTGGAGTGTCGAGTGGCTGCACATAAGTGA[T/C]ACACACCAAGAATAGTTAACAAACATTAGGGGAATGATTTTAAAAGCATAAACAATTGCA 67.3 2 ***
SI286 2 CGCCTAGCCAACCCGTCATCCGCGTTGACCTTAAACATCTTGCCCGTATTGGATTGCACC[A/G]CGAGCAAATACCCCTTGCTCACGTAAGCTATCCCGTTTAATCCACACTCGCTAAACGGCG 52 56 ***
SI287 8 CCTCATTCATCTTTTGTTAATTATTTCCCAATGATGCCAGCAGCTAACAG[T/C]ATTGCAAGATTCACTTTATTTAATTTGTTAGCTCAAAAATTATTTTGATAAATTTC 15.3 61 **
SI288 8 TATTAGAGGTGTCATTTTTGGGAGTATGGTTCTCATCTTGGCT[A/G]GCTTTCAAGCACCACTTTCTGTTATGCTTATTATTCTGCAAT 52 25 **
SI289 2 GAGAAAGACTATGATCTTCTCAAGAGACAATATGAAGCAGTCAAAGCCGA[T/C]CGCGAAGCACTCCAAGCTCAAAATCAGAAGCTTCATGCAGAGGTTTGTCTTGAATTCCA 43.9 10 **
SI292 2 AATCTTGATTTTAGATCTATTAGTTATATAGGAGTAGCAGTTTCTTTTCATTCTTCTGCC[T/C]GGCCTATTCTTTGCAGAATTGTTGGTTTGAGGTACTGAGATTGTTATGTCCTTTTTTTT 56.1 2 **
SI294 8 CAGCGACGGATCGACCTTCATAGTCTGGAGACCAGCGGAATTCGCCAGAGATTTGTTGCC[T/G]AAATATTTTAAACACAACAATTTCTCTAGCTTCGTCCGCCAGCTCAA 67.3 29 **
SI296 8 GGAAGCTTCATTCTCCAAGATCAGCTCTCTGTTTATCCCTCCGC[T/C]GGTGGAAGAAACTATCTTAAATTGTCAAACTTCAGAGACAACACGACGCCGCTTACTTGG 17.3 23 **
SI297 8 AGGAGAGGTTAAAAAGTATTTTTACGGCGATAATAAATATGGCGGCGAGCCATTTTTCTT[T/G]CCAAGAGATGCTAATAATTCTGAAAATGAAGACGATGGTTATATTCTTGCATTTGTTCAT 61.2 19 ***
SI298 2 GATATGCCATTAGTTTTCAGCTTATGTAAAAATAAATAAAGAGATCAGACATAACTTCAA[T/G]TTAAAACAAAAAGCTCTAGGCGCAAGAAAA 65.3 117 **
SI299 2 ATCTTGTGGTTGTTCATGATCACGCATCTCTATGCAAGTAAAGTTGAATATGGCACCATG[T/C]CGTGCTAGCATCTGGGCAATAGGGAGGTAACCATCACGGAATCGTGTATTGTAATATCCA 55.1 51 ***
Citrus clementinaScaffold number
mapped STSsequencec

97
Continued
SNP nameMethod of SNP
discoverya STS Sequence including the SNPb Heterozygousloci (%)
SI300 8 TCTGGGATGCTCTGGTGAATTTGAGC[T/C]CTGGGTTTCAAAGTAAAATCAAGAAACATCGTCGGTGTTCTTGTGTAAACCGGAGACCGG 58.2 87 **
SI301 8 TTACTGTGGAGGAAGGATCAATTGGGGGTTTTGGATCTCATGTTGTTCAGTTCCTCGCTC[A/T]CGATGGTCTTCTTGATGGCAC 26.5 7 **
SI302 2 CTTGGCTTTCTTAGCAGCAGAGGACTTGATGGATTTGGGCTGCTTTGGTTTGGCAGCAGC[T/C]GATTTCTTTGCCTTCTTAGGCGGAGGAGGAGCGGCGGCGGC 29.6 25 **
SI304 8 ATTATTATTGCTTGGAATTAAGATTGTATTCCTCACGGGAAGACCAGAAGATCAGAGAAA[T/C]GTTACAGAAGCTAATTTAAAGCATGCTGGATTCNACACNTGGGAGAAGCTCATCCTCAAG 37 33 **
SI305 8 CAACAGGGTTGATTATGCTTCTATAAGTGATGAAGAGTGGAAA[A/G]GAAGGCTCACAGGGGAGCAATATTACATAACTCGACAAAAAGGGACTGAGAGGGCTTTTA 54.1 17 **
SI306 2 ATTATCCTGTCCAAAGCACTCAAATCTTTCAGCTGATAGCCTTAATAAAGCTCGAAAATA[T/C]TTTGGCGGCATCCTACTCATCTCCACCCACATAATCTTTGAATGATCCAATTCCCAAATT 52 53 ***
SI307 8 ACTCCGACGAGAGCTTCATAAGCGTGTGGGATTGCAATTGTTGTAGCAATCATCGCAAGC[T/C]GGGTGATGCGTGTGAGTGCCAGTGCGTTGGCAAAGTTTGTATGGTTGATGTGATTTGTTA 52 69 ***
SI309 8 CCCCTTTTTCCTTTTGTAATCATTTTTGTGTGTTTAGTTCCAC[T/C]TCTGGCTTCTAGGCTTGCCGAACTTTGAATTTTTTGATGATGTTTTATTTATCTGTTTAT 51 47 **
SI311 8 TTATGTTTGAGAGATGGGCTACATAGGAAAAGCAAATGAAATTGTGCTGATGC[A/G]ATGTATGATTTGCAGAGTTTACACCCAGCTGCAGAGTATCATGGTGCGGCTCGTGCAGTA 55.1 6 **
SI312 8 ATTCCTTCTTCAATTGATCCTTGTTGATCACTTTGATCGCCACGCTCTCCCCTGTCATCA[C/G]CTGCTTCCCGTAATACACTTTCGCGAACGTGCCCTTGCCTAATAACCTCCCCATCTCGTA 45.9 63 ***
SI313 8 TGATTTATAACCTGTTATTGGTTTTGCGGC[T/C]TTTTGCTTTTCTCAATAGTTCGAAACAAAAAGCGGACAGTTGCTGTTGCTCCCTCCTTAA 55.1 4 **
SI314 in silico CGTGAGGCCACCGGCAGCTTGAACGAACACAGAAAACACACACATGACAAGTACAGAACC[C/G]CAAAGCGAGTTAACTCGTCCAAGCAACACACACAGCAACCCGGCCGCCGTCTGCACGGCC 59.2 20 **
SI315 2 AGAGAGGAAGCGGGAGGAGGAGAAAGATGGGGCCAAGTATGTGAGAATGGAGAGGAGGGT[T/C]GGCAAGTTTATGAGGAAATTTGTGCTGCCTGAGAATGCTAACGTTGAAGCCATTTCGGCT 51 4 **
SI316 8 AACGCTTGAGGCTCACACTATTCCAATCCGTCTTCAAAATACAGTTCAAAGGCAGTACTA[A/C]AGGCTCCTTCCTTCTGCATAAAATAAATCATTTAACTTTAAAAACAAATGTTGTCAAATA 27.6 6 ***
SI317 2 TTTCTTCACGACGGGCTTAAAGGTTGTTGCCCCTCTCTTTGCCGTCTATGTAACTTGGCC[A/T]GTGCTTCGACTGCCAGCCTTGGTTGCAGTGCTTCCATTTCTGGTTGGTTGTGCGGCTCAA 46.9 32 ***
SI318 in silico ATAAACAATTGAACCAAACGCTAGGTCCACTAAGCCAATATTGTCTCCATTGAAAAATTT[T/C]TTCTCTCCCAAGCCATGCTCTTCAACGGTTTGTAGCATTTCCAAGGCTTCCTTCATTGTG 2 51 ***
SI322 2 NTTTTTTTGGGTTTGAGGATATGTTTGGTGCGTACTTACTCTGTGATGTTATGATAATGA[A/T]TTTTCAGCCCAATTATGATGAGTGCCGGAGAATTGGAAAGTGGCAATGCTGGAGAACCCG 28.6 16 **
SI323 2 AATCAATCCCCCCACCCCAATTTCATGATAAATATTCAATGAATTAGATGCATGTAGTTG[A/G]CTTCCATAGTCTGGACAAGGTCAATTTCAGTCGCAAAAGAGAGTT 59.2 8 **
SI324 8 GCTTACTGTGTGTCTTATATGATGTTCAGGAAAAGGCAGCTTTCATTTTCTGTGT[T/G]GAAGACAGAGCACTCTTCTGTAAGGACTGTGATGAACCTATCCATTCACCTGGTAGTCTT 58.2 46 **
SI325 2 CGTCGATCGGGAAGGTCACCCTGTTTGCTACAACATTTATGGGGTGTTTGAGAGTGATGA[A/G]CTTTATCAGAAGACTTTTGGTACTGAGGAGAAGCGTGGCCAGTTCTTGAGATGGAGGCTG 53.1 15 ***
SI326 8 TATGACATTTCTTGTGCTGTGCTC[T/G]CTACTCTGATCCTACATTTGTATACAAGGCAGGGCATCAGACTTGCATTAGTGCGCCAAT 46.9 25 **
SI327 in silico CAGTGACAATGGGGCAGCAGGAAATAGTGGAGTTGGTGGCATAACTGAAAGAATCAGTGG[A/G]AATGTGGTAGATGAAGTTTGGGTTGCTCAGAGAGAAGCTGCCTTGACTAAATTTCG 56.1 8 **
SI328 8 TCTGATCTTTTCTGGGCTACTCTCGAAGCATTTCACAAGTCTTTTGGTGACAA[A/G]TTCAAGTTTGTGACTTTTGCTTTTCTTCATGTTTTCTTTTTCCCCCTCCGTAAATTTTGT 54.1 4 **
SI329 8 TATTGATAATTTTCATTTCCTTGATGTTATATGTTGATAATATGCTGATTAGGTCTAGCA[A/G]CATGCATGGCTAGATTCCAGATTAAATTTCAATACAAAGGTTCTAGGAACCGCATAAAAG 40.8 2 ***
SI330 8 TTTTTATCCACTTATATTGGTATTCCATCTGAATTTACTTCC[A/C]ATATTTGATCCTTTTGCGAGTAGGTCTCGGTTATGATTATGTCTTTGAAAGCTGCCAGTC 58.2 19 **
SI333 2 ACATTGTAAAAGAATTGCCTACGACTTTGGGTGATAATGACTCGTCTGGTACTCTTCTAT[T/C]TGTCCCTAAAACGCACTTTTCAGTCGCAATATTTTCCGTTGACACCCACACATTTTGAAG 2 56 ***
SI334 in silico CATCAGATGGGCATTCAGATAAAGTTAAAGCATCTTCTGATGGTTCAGGATCTA[T/C]TCATGAGCAGAGAATTTCAATAGAAAAGTCCTCCAGTTCTGAATTTTTCTGGAATCGAAG 37.8 8 **
SI335 8 AAAATTTATCTAAGTCTGCATGATTTGGCTGCTGCATTTAAGAATTTGAGCTCAAATTTT[C/G]TTTTGGTGACATGTGAAAAGAAGTTTCTGGTTCATGCTAACC 53.1 67 **
SI337 8 CTGGTAGATGCAGCTATCCTGCAATTCAACTGTGCCAAAATATCAAATTCAAGCGACACA[A/C]ATACATATTCATACGTTGTTTTCATAATTTATAT 38.8 21 **
SI338 8 TGTGTGCAAGGGTATCTTCAGGAATGACAATGTGGCTGATGACGACATTGTCAAGCTTGT[T/C]GACACCTTCCCCGGCCAATCCATTGGTAAGTTTCCAGTTCCGTTGATGATGCAAACTCCC 29.6 16 ***
SI340 8 TAAGTGGGATGATCTTGTTGCTCATATGCCTCTTAAGATCTGTTACCCTGCTTTGGAGTA[T/C]GAGGAATGGCGAATAATCACTGGCGGTGACCCAAAGAACACGTGAGGCTCTTGTTTTGTG 35.7 7 ***
SI341 8 TTTTCCTTTTTTGAAGGACATCTAAC[T/C]GCGAAAAGCGATGTGTACAGTTTTGGGGTTGTTCTCCTCGAAATGTTAAG 11.2 16 **
SI342 8 ATGAACGTAGATCATGAAGCGTCGAGCTTCCTGAGCTCTAAGATAGTCTGAATCATCCTC[T/C]GGCCTTTCTGCAGGTTCATATTCACCACTCCTCTTCACCTCCCGATTCCCAAGGCAGAAG 54.1 88 ***
SI344 2 TGCCTCCGCAAAAGCCGCTATGGAGAAATCTCTCAATTTGAAGTCACCGAAGCAAAT[A/C]CATCAGACGCCAGAATTGGAGACTGCCAAGGTGGCTGCTGAGCCCTTTGTGGGTTCCTCG 29.6 2 **
SI345 8 GGCCGAGCAATAATATTTCCGGGTTGTGTTTGAACCCGGGTAGTCCATCTGGATCCGATT[T/C]GAGTGATTCAAGCTTACCCGGTGTGGCTCAGTA 46.9 32 **
SI346 8 GGCCACCTGTTGTGACAAAATTGGTATCAAGAAAGG[A/G]CCATGGACTCCAGAAGAAGATATCATTTTAGTTTCTTATATTCAAGAGCATGGCCCTGGA 53.1 53 **
SI347 8 CCCGTTAATTTTGGATTTACCGCACTAACTTTACTTACTTTTAGCCGAATCGTGCAATGG[T/G]AACACCTCTTCTTTTGATTTTACCTTCAATGGGCCAGTTAGTACAATAATACTACAACTG 48 22 ***
SI348 8 TAAGAAGCAGAAGTTGGCACTTCAGAATCAAAGAGTCAGCATTCAGGCTCAAGCTTTTGA[A/G]CTTGAGAAACAACACTTAAAGTGGCTAAGATATTGCAGCAAGAAAGACCGGGAACTGGAG 30.6 20 ***
SI349 8 CCCTATAATCCAGGTTACCAAGTGGCATATGGAATACTAGCTGAGGTAGAA[C/G]AGCACCCGTTTGATTTAGACAAGATGGTTTTCATGGATTGGAGAGATTCGCATCTGAACA 2 13 **
SI351 2 TGTTTTTGGAGGCTTCCTTAGATAGCTTTATTGATGCAATTTAGCTAGTTTCTTAAGACT[C/G]TTGTCGAAGGCATCATACATGTTGAATTATGTGATGATATGATCTATTCTAGATTCAGAT 14.3 129 ***
SI352 8 TGCCCCTCTGGAGCCAAAGATGAATCAAGAAC[T/C]GTTGGAATGCTTAAAAATATACTTCCATAAGGCTCCTCCAGTCTGTTCCAGTCATCCTAA 61.2 2 **
SI353 8 AGGAGCCAAGCTCTGGGTTCTAATGAAGTCTCAGTTTATTGCAACTCAGTTTCGTGTTCT[T/C]ATCCGAGCAATCGCTACGGCTCTCGACGTTTTTCCATTGGATACAGTGGAXATTTGTGGT 61.2 12 **
SI356 8 ATTTTACTAGTGAGAAGACTCAGGATCAGAAGGATGGTCACCATACATCACG[T/C]AGATACCTGCCAGTCATTTGCAAATTCTTCACCATGCTCTCAGCTTTAGAGCTGTCAAGA 40.8 4 **
Citrus clementinaScaffold number
mapped STSsequencec

98
Continued
SNP nameMethod of SNP
discoverya STS Sequence including the SNPb Heterozygousloci (%)
SI359 8 TCCTCAATTGGATTGCCTTTGCCAATCGTTTGTTCTAACTCTAATCG[T/G]ACTTTTGATAAAATATCTGGGTTGCGAAGTAGTTCTGTCATTGCCCATTCCAATGTACTC 29.6 2 **
SI360 2 GCCAAGCTCGACTTCGCATGCAAAGAATGGGGTTTTTTCCAGGTATAATGCTTTAGCAAA[A/G]TTAGAAAATTGTTTCGCCAGAACATGCTTGTTTGTGAACAAGAATCGAGAAATATGCAAA 1 17 ***
SI361 8 TTAAATTGTTTTCTTTGAATACCGAAGTCTTATGCATTTTGGTATCTCAGGTCCAACAAA[A/G]AAGAAAAAGCTTGACTGGGACACTCGACTGAAAATAGCACTAGGAGCTGCACAAGGGCTA 46.9 4 ***
SI363 8 ACTTCATTCTCAACGACTAACCTCTGACACAAAGAAGGCATGAAATCCGTATGGAACCCT[A/T]TGTGGTAATTCGACAACTGCAACAGGATCAGCTGACATTGTTTTTGCATCAATCACGTTC 41.8 39 ***
SI366 2 GAGGAGGTTAAAAGTGAAGATTATACCCTCATAAACCTCTCAATAGAAAATAAAATGTTA[A/G]GCCCCGAAGCTAAAAATTTCCAGCTCAATAGATGGAAGCATCAAATCTTGGCTCATAAAA 49 53 ***
SI369 8 AAGCGTCCGTGGAGGACAGTGAGAGAAGGAAAACTGTACCATAATTGTAAGTAAACGTGC[A/G]GTGCATTGAAAACAAGCAAGTGCATGGCTGAAAACCTTTTTCATTACTTTTTGTTGAGGC 55.1 1 **
SI371 2 GGTAGTACGGTCTCCAGCATCTTGCACTGGTCTGGGCTCAGTGACTCAGGGAAGTCAACA[C/G]TGAAATGAATGTACAGTTTGCCCCTCATAAATGGCCTCTGATACATAGGCATTCCTTCAT 14.3 129 ***
SI372 8 GTATCCCAAAAACAGGTATATGTGACCATTTCTGAAAAAAAAGGGCGC[A/G]CATAACCATTTTATCAAATCATAAGAGTGCTGCTGTCATTTAT 18.4 84 *
SI373 8 GCCCAACTTCAGCATTGCCTTGCGGCTCTTTTTCTCACTTCTGCTCTGCTTTGAACTCCC[A/T]CCTGCAACTCAGTAACCAATCAAGACTACTTAAATCACTGTAGAAACTACATCCATTGCA 58.2 18 ***
SI374 8 CCGGTACGGCGAGAGGTGTACGAAAACGGC[C/G]AAATTTACGACATCACCCACCGTATTACGAGCGACATGCCGTCGTTTGGCTCGAAGGAGG 65.3 26 **
SI375 8 TAGTTATTGGTTTATGATTTTCTGCATCACACTCTTACTGCATTGCGAATTTACATTTTG[T/C]CCAGATTTGGATTTGCCTACAGTTGTGTATACCACAGAAGTTTTTTTCTTTCTTTTAATT 5.1 22 **
SI376 8 AGCGAAGAAGAGGAGAGAAAAGCCAAGGTGGTGAAAACGGAGTCTGCGGATAC[A/G]GTTAATGAATTTCCTTTGACGCCGGCGAGTTGCGCGGCGTTTTGGGACTTG 64.3 2 **
SI379 8 TCAGGAAAGGTTTGCTCTGAAGGAAGCTGGAACAGAACTGGGACCCTCTCTATTATTTTT[T/C]GGATGCAGGAACCGTAAGATGGTAAGTGCT 39.8 4 **
SI380 8 AGTGATTTCGGTGGGCTTTTTTAAACTAAAAGCAATTCTTGCTCTTGAAGAAGAAAAAGA[A/C]GGAGAAGAACAAGAATCTTTACAAGAGCCCAAGTCTATGAGTGAAGAAGTAGTAGTTGCT 60.2 17 **
SI381 8 GAGTCTTGAAATGATAACAAGACCCTAT[T/C]CTTAATACTTGAAGCGCACGTCATGTTTCTTCCGTGGCTAATTATTGTGTATGAATTATG 53.1 27 **
SI383 2 CAATCAAATATCTAACACAAACAAATACATTCT[A/T]CTGAACGTAGGTAGTAAAGCCCAAAAAGAATCCCCGACAAAATAAACAAAAGCATAGTAA 55.1 72 **
SI384 8 ATTGATCATATGTTGGGATTTTCTAGTTGTGATC[T/C]GTTATGCAAGGGGCAATGCTGTACTTCATGTGTCTTCAATTAGATTCTTTTAAGTGAATT 56.1 32 **
a ‘8’, ‘2’ and ‘in silico’ indicate ‘The SNP is detected from comparison of eight citrus genotypes’, ‘The SNP is detected from comparison of two citrus genotypes’ and ‘The SNP isdetected in silico’, respectively.
bSNP is indicated by ‘[/]’ in the sequence.cNumber of asterisk shows expect of blastn: ***=2.00E-58 (minimam value), ** <1.00E-30, *<1.00E-10, - >1.00E-10.
Citrus clementinaScaffold number
mapped STSsequencec
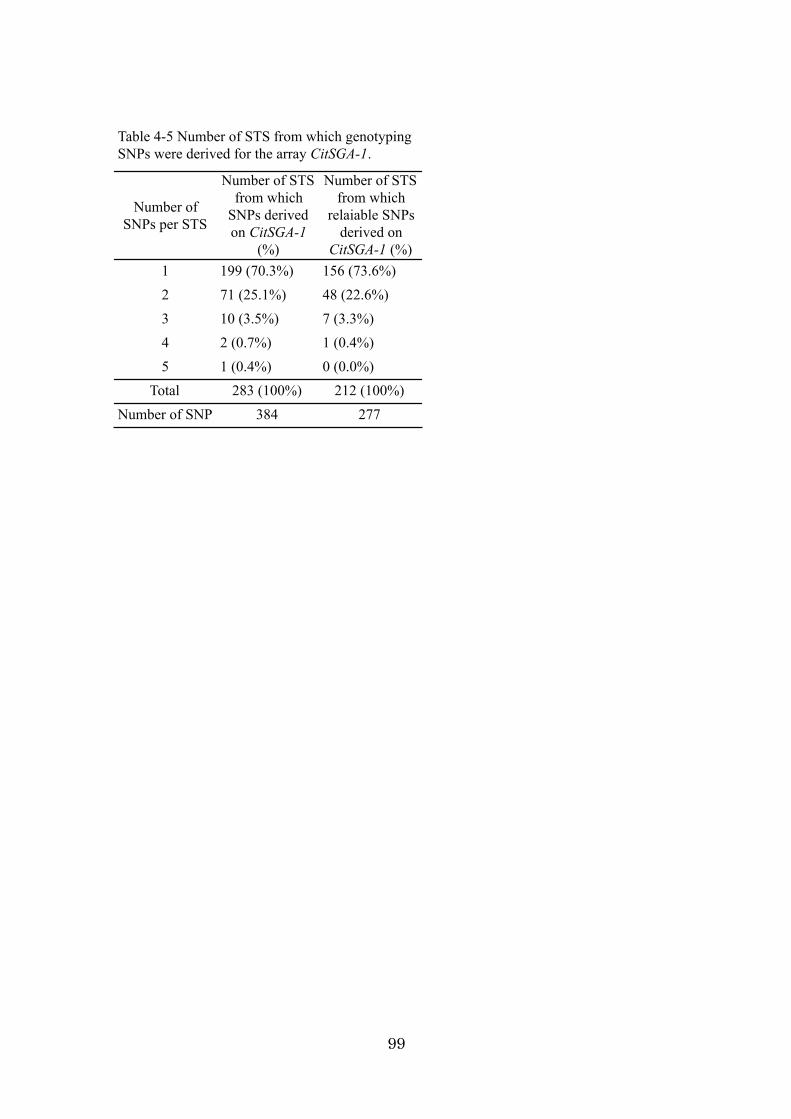
99
Number ofSNPs per STS
Number of STSfrom which
SNPs derivedon CitSGA-1
(%)
Number of STSfrom which
relaiable SNPsderived onCitSGA-1 (%)
1 199 (70.3%) 156 (73.6%)2 71 (25.1%) 48 (22.6%)3 10 (3.5%) 7 (3.3%)4 2 (0.7%) 1 (0.4%)5 1 (0.4%) 0 (0.0%)
Total 283 (100%) 212 (100%)Number of SNP 384 277
Table 4-5 Number of STS from which genotypingSNPs were derived for the array CitSGA-1.

100
Samplename
Heterozygousloci (%)
Samplename
Heterozygousloci (%)
Samplename
Heterozygousloci (%)
Samplename
Heterozygousloci (%)
TY001 44.7 TY028 29.3 TY054 56.5 TY081 35.4TY002 41.5 TY029 49.6 TY055 42.7 TY082 51.2TY003 35.4 TY030 50 TY056 35 TY083 50TY004 50.8 TY031 50 TY058 27.6 TY084 58.9TY005 54.5 TY032 45.1 TY059 70.7 TY085 30.1TY006 45.9 TY033 50.8 TY060 44.7 TY086 58.1TY007 43.9 TY034 45.5 TY061 57.7 TY087 43.9TY008 55.7 TY035 44.7 TY063 42.7 TY088 57.7TY009 43.9 TY036 63.4 TY064 39 TY089 66.7TY011 52.4 TY037 41.9 TY065 42.7 TY090 49.6TY013 39.4 TY038 41.9 TY066 61 TY091 37.4TY014 49.2 TY039 45.1 TY067 30.9 TY092 29.7TY015 45.1 TY040 35.8 TY068 54.5 TY093 43.1TY016 38.6 TY041 44.7 TY069 8.9 TY094 50.8TY017 41.9 TY042 54.9 TY070 49.6 TY095 47.2TY018 50.8 TY043 56.5 TY071 42.7 TY096 21.1TY019 44.7 TY044 39.4 TY072 55.3 TY097 28TY020 39 TY045 54.1 TY073 37.8 TY098 33.3TY021 36.2 TY046 57.3 TY074 38.2 TY100 30.1TY022 40.7 TY047 26 TY075 37.4 TY101 59.8TY023 53.7 TY048 39.8 TY076 37.4 TY102 51.2TY024 50.4 TY049 55.7 TY077 42.7 TY103 32.5TY025 34.1 TY051 48.4 TY078 48.4 TY104 58.5TY026 32.1 TY052 66.3 TY079 43.5TY027 41.5 TY053 48 TY080 37.4
Table 4-6 Ratio of heterozygous loci in citrus germplasm samples.
101
Chapter 5. General Discussion
This thesis describes the development and application of high-throughput
genomics tools, the oligoarray and the SNP genotyping array, based on recent
technologies and the software for efficient use of genotyping result. It was shown that a
large amount of gene expression analysis and the genome structure analysis have been
available in citrus.
The results in Chapter 2 show that the citrus custom oligoarray is an important
tool for profiling gene transcription. An example of its use was the gene transcript
profiling of mature mandarin fruit subjected to plant hormone treatments. Consequently,
a gene encoding a transcription factor of a carotenoid metabolic enzyme gene was
screened. In the further study its function confirmed in recombinant tomato (Endo et al.
2013). Chapter 3 detailed that the software MinimalMarker was effective for producing
a minimal set of DNA markers to identify cultivars when a large amount of genotyping
data are available. Afterward the software has been applied to identify cultivars of
various crops (Takashina et al., 2008; Yamane et al., 2012) and haplotype of allele
among several cultivars. Chapter 4 describes the development of a 384 SNP genotyping
array, and its use for high-throughput genotyping of 98 citrus accessions and one citrus
population. Using this method, a linkage map can be constructed rapidly and SNP
markers can be used to identify cultivars. Consequently, this study has provided
genomic tools and higher-level genomic analyses for citrus. Their applications to citrus
to establish a foundation for advanced genomic analyses. The high-throughput genome
analysis tools will be indispensable for the essential resolution of important traits of
citrus to the gene level.
However, it remains difficult to achieve important breakthroughs, even when
powerful genomic tools are used. For instance, the microarray analyses in Chapter 3
102
identified 24 genes that showed 3-fold changes in transcript levels in response to
ethylene as ethylene-responsive transcription factors. Based only on the results of
microarray analyses, it is difficult to identify which transcription factors might play
important roles in regulating expressions of genes involved in fruit ripening, such as
those associated with chlorophyll degradation and carotenoid accumulation.
Two previous studies serve as references for the limitation of genomic tools.
Sugiyama et al. (2010a) performed an eQTL analysis to quantify expression levels of
genes involved in carotenoid metabolism in citrus fruit. Their aim was to identify
possible cis- and trans-regulating regions to refine selection markers for carotenoid
accumulation. In other eQTL analyses (Jansen and Nap, 2001; Doerge 2002), transcript
levels were analyzed as quantitative traits and their variations were used to map eQTL.
Once eQTL are identified in a population, they provide the necessary information to
identify genes or loci that control quantitative traits. In plants, global eQTL analysis of
gene expression has been used to detect cis-polymorphisms controlling individual genes,
as well as to search for trans-eQTL that regulate individual genes from remote loci
(DeCook et al., 2006; Keurentjes et al., 2007; Potokina et al., 2008; West et al., 2007;
Sugiyama et al., 2014). The eQTL methodology combines two types of genomic data;
the expression levels of genes, and a linkage map composed of DNA markers. Together,
these data provide sufficient information to search for genes related to particular
functions. Nagano et al. (2012) collected transcriptome data using a 461 microarray
from the leaves of rice plants grown in a paddy field, and obtained the corresponding
meteorological data, and used both data sets to develop statistical models to explain the
endogenous and external effects on gene expression. Their models will help to translate
the knowledge amassed in laboratories to solve agricultural problems. Thus, genomic
analyses that combine various data, including genomic data, are required to further
103
research on citrus.
New opportunities have arisen in citrus genome analysis research in recent
years. Three full-length annotated genome assemblies have been produced and made
available to the global research community (Gmitter et al., 2012; Citrus Genome
Database. http://www.citrusgenomedb.org; Xu et al., 2013; Citrus sinensis Annotation
project. http://citrus.hzau.edu.cn/orange/). The first genome assembly, which serves as
the reference genome for citrus, is from a haploid plant derived from ‘Clementine’
mandarin. The sequencing project was the work of the International Citrus Genome
Consortium (ICGC http://www.citrusgenome.ucr.edu/). This version of the assembly
(v1.0) is 301.4 Mb spread over 1,398 scaffolds with 2.1% gaps at 7.0x coverage. Over
96% of the assembly is accounted for by the 9 chromosome pseudo-molecules ~21-51
Mbp in length. The current gene set (clementine1.0) integrates 1.560 M ESTs with
homology and ab initio-based gene predictions (by GenomeScan, Fgenesh, exonerate).
24,533 protein-coding loci have been predicted. Each encodes a primary transcript.
There are an additional 9,396 alternative transcripts encoded on the genome generating
a total of 33,929 transcripts. 16,963 primary transcripts have EST support over at least
50% of their length. A third of the primary transcripts (8,684) have EST support over
100% of their length (http://www.citrusgenomedb.org/species/clementina/genome1.0).
A second genome assembly was produced from the sweet orange clone ‘Ridge
Pineapple’ (Gmitter et al., 2012). This version (v.1) of the assembly is 319 Mb spread
over 12,574 scaffolds. Half the genome is accounted for by 236 scaffolds 251 kb or
longer. The current gene set (orange1.1) integrates 3.8 million ESTs with homology and
ab initio-based gene predictions. 25,376 protein-coding loci have been predicted, each
with a primary transcript. An additional 20,771 alternative transcripts have been
predicted, generating a total of 46,147 transcripts. 16,318 primary transcripts have EST
104
support over at least 50% of their length. Two-fifths of the primary transcripts (10,813)
have EST support over 100% of their length (Citrus Genome Database.
http://www.citrusgenomedb.org/species/sinensis/genome1.0). The third was produced
from a doubled-haploid callus line of sweet orange (Xu et al., 2013). The version was
assembled using SOAP denovo, resulting in 4,811 scaffolds. The total contig length
(320.5 Mb) covers about 87.3% of the sweet orange genome. The scaffolds were
aligned and oriented to the Citrus linkage map and about 80% of the assembled genome
was anchored and organized as nine pseudo-chromosomes (Citrus sinensis Annotation
project. http://citrus.hzau.edu.cn/orange/).
The production of these genome assemblies enabled advanced genome analysis.
For example, it became possible to identify repression after meiotic recombination by
comparing the physical map with the genetic map, and to analyze expression of
individual members of multi-gene families. Moreover, recent rapid developments in
DNA sequencing technologies have dramatically cut both the cost and the time required
for sequencing.
To make the most of these opportunities, it is necessary to advance genomic
analyses of citrus, especially analysis of individual alleles. For example, the carotenoid
metabolism enzyme ZEP is a key regulator of carotenoid accumulation in citrus fruit.
The expression level of alleles of the gene encoding this enzyme, ZEP, accounts for
differences among varieties in their ability to convert zeaxanthin to Vio during fruit
development. The expression levels of ZEP alleles in the fruit of three heterozygous
citrus cultivars were compared using allele-specific RT-PCR. Sugiyama et al. (2012b)
showed that there was a stronger allele and a weaker allele for expression, and
suggested that the difference between the expression levels of the two alleles was at
least partly due to differences in cis-structures located in the 5 - UTR of the ZEP
105
genes. Since eight genes are related to the carotenoid biosynthesis pathway in citrus, it
was proposed that the combination of gene alleles expressed at each step was related to
differences in accumulation of various carotenoid components among cultivars. Most
citrus cultivars and strains cultivated in Japan are derived from only 14 ancestral
cultivars (Imai, personal communication). Hence, each cultivar and strain has two of
only 28 alleles derived from the 14 ancestral cultivars. Sequencing of all these gene
regions in 14 ancestor cultivars and analysis of the data using a SNP genotyping array
would confirm the haplotypes of this gene. This would clarify the allele type in most
citrus cultivars and strains in Japan. Such analyses might be able to explain the
differences in various traits among cultivars based on their combination of alleles.
106
SUMMARY
Citrus is one of the most economically important fruit species in the world. The fruit
is rich in the second metabolites for beneficial for human health, with diverse colors,
fragrances and tastes. In addition, citrus is among the most difficult plants to improve
through cross breeding approaches and to analyze physiologically varietal
characteristics because of its the polyembryony, male sterility or self-incompatibility.
Genome science technologies have advanced rapidly over the last decade, and have
been adapted to address the challenges of the citrus breeding and physiological analysis.
Expressed sequence tag (EST) analysis, DNA markers, linkage mapping and
quantitative trait locus (QTL) analysis have promoted the efficient selection systems
and analysis of gene expression. Remarkably, three genome assemblies have been
released to the public since 2011. Despite the challenges of working with citrus to
understand the important characters of citrus, the result is insufficient. Expression
analysis of many genes related to important characters and analysis of genome-wide
genotyping among many varieties or the combination of these two analyses is necessary
to understand important characters of citrus. This study was performed to provide the
basis for comprehensive use of citrus genome information, which has been accumulated
quickly.
1. 22K citrus oligoarray analysis of gene expression in mature mandarin fruit
1) Profiling ethylene-responsive genes in mature mandarin fruit using a citrus 22K
oligoarray
A comprehensive transcriptome analysis using a citrus 22K oligo-microarray was
performed to identify ethylene-responsive genes and gain an understanding of the
107
transcriptional regulation by ethylene in Satsuma mandarin fruit (Citrus unshiu Marc.).
Seventy-two hours after ethylene treatment of mature fruit, 1,493 genes were identified
as ethylene-responsive, with more than 3-fold expression change. Interestingly, more
than half of the ethylene-responsive genes were repressed after ethylene treatment. This
might suggest that ethylene inhibits various biological processes and plays an important
role in fruit ripening and senescence. Ethylene repressed the transcription of many
genes involved in photosynthesis, chloroplast biogenesis, and sugar metabolism, while
it induced the transcription of several genes related to resistance, defense, stress, amino
acid synthesis, protein degradation, and secondary metabolism.
2) Profiling gibberellin (GA3)-responsive genes in mature fruit using a citrus 22K
oligoarray
Gibberellin3 (GA3)-responsive genes were investigated with a citrus 22K
oligo-miciroarray to gain further the understanding of the transcriptional regulation by
GA3 treatment in Satsuma mandarin fruit. 213 GA3-responsive genes were identified
that showed a 3-fold or greater expression change after 72h of GA3 treatment of
mature fruit, compared with expression after 72 h of air treatment. GA3 treatment
induced the expression of pathogenesis-related (PR) proteins and genes that function
in photosynthesis, chloroplast biogenesis, resistance, defense and stress. Also, GA3
treatment reduced the transcription of several ethylene-inducible genes, such as
carotenoid metabolic genes, which are associated with fruit ripening. Contrasting
effects between GA3 and ethylene were observed. The endogenous GA3 level might be
important for the endogenous regulation of maturation and senescence in mature citrus
fruit.
2. An algorithm and computer program for the identification of minimal sets of
discriminating DNA markers for efficient cultivar identification

108
DNA markers are frequently used to analyze crop varieties, with the coded marker
data summarized in a computer-generated table. Such summary tables often provide
extraneous data about individual crop genotypes, needlessly complicating and
prolonging DNA-based differentiation between crop varieties. At present, it is difficult
to identify minimal marker sets—the smallest sets that can distinguish between all crop
varieties listed in a large marker-summary table—because of the absence of algorithms
capable of such characterization. Here, we describe the development of just such an
algorithm based on combinatorial optimization and the computer program, named
MinimalMarker. MinimalMarker is available for use with both dominant and
co-dominant markers regardless of the number of alleles, including simple sequence
repeat (SSR) markers with numeric notation.
3. High-throughput genotyping in citrus accessions using an SNP genotyping array
A 384 multiplexed single nucleotide polymorphism (SNP) genotyping array, named
CitSGA-1, for the genotyping of citrus cultivars, was developed, and the performance
and reliability of the genotyping were evaluated. SNPs were detected in cultivars
representing the genetic diversity of citrus currently bred in Japan. The assay using
CitSGA-1 was applied to a hybrid population of 88 progeny and 103 citrus accessions
for breeding in Japan. A total of 351 SNPs could call different genotypes among the
DNA samples. To confirm the reliability of SNP genotype calls, parentage analysis was
used, which indicated that the numbers of reliable SNPs were 276. Using 7 SNPs that
were identified by MininalMarker, all germplasm accession could be discriminated
from each other. The SNP genotyping array reported here will be useful for the
efficiently constructing linkage maps, for the detection of markers for marker-assisted
breeding and for the identifying of cultivars.
By developing two genomic tools in this study, comprehensive and

109
high-throughput gene expression analysis and genotyping have become accessible. In
addition, the bioinformatics tool has developed to use the genomic tools thoughtfully.
These tools are available as the research base for detection of regulatory genes which
control trait, linkage mapping and maker aided selection.

110
EST
DNA QTL
2011
itrus unshiu Marc.
22K
72
3 1493
111
2
3 GA3
GA3 GA3 72
3
213 GA3 GA3
GA3
DNA DNA
MinimalMarker MinimalMarker
SSR
112
CitSGA-1 384 SNP SNP
SNP
SNP
CitSGA-1 88 103
351 SNP SNP
276
SNP SNP MinimalMarker
7 SNP
SNP
113
ACKNOWLEDGEMENTS
The author expresses his sincere thanks to Prof. M. Omura (Shizuoka University)
for his great assistance and encouragement in the preparation of this doctoral thesis. I
thank to Prof. T. Suzuki (Gifu University) and Prof. R. Motohashi (Shizuoka
University) for their advices in the preparation of this thesis. I also thank to Mr. H.
Nesumi (the NARO Western Region Agricultural Research Center: WARC), Dr. T.
Kuniga (WARC), Dr. M. Kita (Ministry of Agriculture, Forestry and Fisheries), Dr. S.
Ohta (NIFTS), Dr. K. Nonaka (NIFTS) and Mr. A. Imai (NIFTS) for providing plant
materials. I would like to express my deepest thanks to Dr. T. Shimada (NIFTS), Dr. T.
Endo (NIFTS), Dr. T. Shimizu (NIFTS), Dr. T. Yamamoto (NIFTS), Dr. H. Iketani
(NIFTS), Dr. F. Nishikawa (NIFTS) and Dr. A. Sugiyama (Kyoto University) for their
technical assistance and for many valuable suggestions. Thanks are also due to Ms. Y.
Makita (NIFTS), Ms. C. Ohishi (NIFTS), Ms. A. Aoki (NIFTS) and Ms. Y. Uchida
(NIFTS) for their technical assistance. This work was funded by NARO.
114
REFERENCE
Aanensen, D. M. and B. G. Spratt. (2005). The multilocus sequence typing network:
mlst.net. Nucleic Acids Res. 33: doi:10.1093/nar/gki41.
Abeles, F. B., P. W. Morgan and M. E. Saltveit. Ethylene in plant biology. (1992).
Academic Press, New York.
Achilea, O., Y. Fuchs, E. Chalutz and I. Rot. (1985). The contribution of host and
pathogen to ethylene biosynthesis in Penicillium digitatum-infected citrus fruit.
Physiol. Plant Pathol. 27, 55-63.
Alba, R., P. Payton, Z. Fei, R. McQuinn, P. Debbie, G. B. Martin, S. D. Tanksley and J.
J. Giovannoni. (2005). Transcriptome and selected metabolite analyses reveal
multiple points of ethylene control during tomato fruit development. Plant Cell.
17, 2954-2965.
Aranzana, M. J., J. Carbo and P. Arus. (2003). Microsatellite variability in peach
[Prunus percics (L.)] inferences and population structure. Theor. Appl. Genet.
106, 1341-1352.
Ashraf, M., F. Karim and E. Rasul. (2002). Interactive effects of gibberellic acid (GA3)
and salt stress on growth, ion accumulation and photosynthetic capacity of two
spring wheat (Triticum aestivum L.) cultivars differing in salt tolerance. Plant
Growth Regul. 36, 49-59.
115
Atta-Aly, M. A., J. K. Brecht and D. J. Huber. (2000). Ethylne feedback mechanisms in
tomato and strawberry fruit tissue in relation to fruit ripening and climacteric
patterns. Postharvest Biol. Tech. 20, 151-162.
Bausher, M., R. Shatters, J. Chaparro, P. Dang, W. Hunter and R. Niedz. (2003). An
expressed sequence tag (EST) set from Citrus sinensis L. Osbeck whole seedlings
and the implications of further perennial source investigations. Plant Sci. 165,
415-422.
Bleecker, A. B. and G. E. Schaller. (1996). The Mechanism of Ethylene Perception.
Plant Physiol. 111, 653-660.
Bolwell, G. P. and P. Wojtaszek. (1997). Mechanisms for the generation of reactive
oxygen species in plant defense - a broad perspective. Physiol. Mol. Plant Pathol.
51, 347-366.
Brady, C. J. and J. Speirs. (1991). Ethylene in fruit ontogeny and abscission. In:
Mattoo A. K., and J. C. Suttle (eds.) The plant hormone ethylene. pp.235-258.
CRC Press, Boca Raton.
Brandle, J. E., A. Richman, A. K. Swanson and B. P. Chapman. (2002). Leaf ESTs from
Stevia redaudiana: a resource for gene discovery in diterpene synthesis. Plant Mol.
Biol. 50, 613-622.
116
Brummell, D. A. and M. H. Harpster. (2001). Cell wall metabolism in fruit softening
and quality and its manipulation in transgenic plants. Plant Mol. Biol. 47,
311-340.
Cancel, J. D. and P.B. Larsen. (2001). Loss-of-function mutations in the ethylene
receptor ETR1 cause enhanced sensitivity and exaggerated response to ethylene in
Arabidopsis. Plant Physiol. 129, 1557-1567.
Castillejo, C., J. I. Fuente, P. Iannetta, M. Á. Botella and V. Valpuesta. (2004). Pectin
esterase gene family in strawberry fruit: study of FaPE1, a ripening-specifc
isoform. J. Exp. Bot. 55, 909-918.
Causier, B., M. Kieffer and B. Davies. (2002). MADS-Box genes reach maturity.
Science. 296, 275-276.
Cercós, M., G. Soler, D. J. Iglesias, J. Gadea, J. Forment and M. Talón. (2006). Global
Analysis of Gene Expression During Development and Ripening of Citrus Fruit
Flesh. A Proposed Mechanism for Citric Acid Utilization. Plant Mol. Biol. 62,
513-527.
Chang, C. and R. Stadler. (2001). Ethylene hormone receptor action in Arabidopsis.
Bioessays. 23, 619-627.
Clark, K. L., P. B. Larsen, X. Wang and C. Chang. (1998). Association of the
Arabidopsis CTR1 Raf-like kinase with the ETR1 and ERS ethylene receptors.
117
Proc. Natl. Acad. Sci. U.S.A. 95, 5401-5406.
Close, T. J., S. Wanamaker, M. Lyon, G. Mei, C. Davies and M. L. Roose. (2006). A
GeneChip® For Citrus. In: Plant & Animal Genome XIV Conference, San Diego,
CA. W82.
Close, T. J., P. R. Bhat and S. Lonardi. (2009). Development and implementation of
high-throughput SNP genotyping in barley. BMC Genomics. 10, 582.
Cooper, W.C. and W. H. Henry. (1968). Effect of growth regulators on the coloring and
abscission in citrus fruit. Isr. J. Agr. Res. 18, 161-174.
Dangle, G. S., J. Yang, D. A. Golino, and T. Gradziel. (2009). A practical for almond
cultivar identification and parental analysis using simple sequence repeat markers,
Euphytica. 168, 41–48, 2009.
Dijkstra, P., H. Ter Reegen, and P. J. C. Kuiper. (1990). Relation between relative
growth rate, endogenous gibberellins and the response to applied gibberellic acid
for Plantago major. Physiol. Plant. 79, 629-634.
Distefano, G., A. L. Malfa, A. Gentile and W. Shu-Biao. (2013). EST-SNP genotyping
of citrus species using high-resolution melting curve analysis. Tree Genet.
Genomes. DOI 10.1007/s11295-013-0636-6.
Eckert, A. J., B. Pande and E. S. Ersoz. (2009). High-throughput genotyping and
118
mapping of single nucleotide polymorphisms in loblolly paine (Pinus taeda L.).
Tree Genet. Genomes. 5, 225-234.
Endo, T., T. Shimada, K. Kobayashi, T. Araki, H. Fujii and M. Omura. (2005). Ectopic
Expression of an FT Homolog from Citrus Confers an Early Flowering Phenotype
on Trifoliate Orange (Poncirus trifoliata L. Raf.). Transgenic Res. 4, 703-712.
Endo, T., T. Shimada, H. Fujii and M. Omura. (2006). Cloning and characterization of 5
MADS-box cDNAs isolated from citrus fruit tissue. Sci. Hortic. 109, 315-321.
Endo, T., T. Shimada, H. Fujii, A. Sugiyama, M. Nakano, Y. Ikoma and M. Omura.
(2013). Functional analysis of a citrus transcription factor involved in carotenoid
metabolisms in fruit using transgenic tomato. Hort. Res. (Japan). 12 (Suppl. 2),
266 (in Japanese).
Ercisli, S., A. Ipek and E. Barut. (2011). SSR Marker-Based DNA fingerprinting and
cultivar identification of olive (Olea europaea) . Biochem. Genet. 49, 555-561.
Eulgem, T., P. J. Rushton, S. Robatzek and I. E. Somssich. (2000). The WRKY
superfamily of plant transcription factors. Trends Plant Sci. 5, 199-206.
Fan, J.B., A. Oliphant and R. Shen. (2003). Highly parallel SNP genotyping. Cold
Spring Harb. Symp. Quant. Biol. 68, 69–78.
Favery, B., E. Ryan, J. Foreman, P. Linstead, K. Boudonck, M. Steer, P. Shaw and L.
119
Dolan. (2001). KOJAK encodes a cellulose synthase-like protein required for root
hair cell morphogenesis in Arabidopsis. Genes Dev. 15, 79-89.
Federici, C.T., D. Q. Fang, R. W. Scora and M. L. Roose. (1998). Phylogenetic
relationships within the genus Citrus (Rutaceae) and related genera as revealed by
RFLP and RAPD analysis. Thor. Appl. Genet. 96, 812–822.
Feltus, F. A., J. Wan, S. R. Schulze, J. C. Estill, N. Jiang and A. H. Paterson. (2004). An
SNP resource of rice genetics and breeding based on subspecies indica and
japonica genome alignment. Genome Res. 14, 1812–1819.
Forment, J., J. Gadea, L. Huerta, L. Abizanda, J. Agusti, S. Alamar, E. Alos, F. Andres,
R. Arribas, J. P. Beltran, A. Berbel, M. A. Blazquez, J. Brumos, L. A. Canas, M.
Cercos, J. M. Colmenero-Flores, A. Conesa, B. Estables, M. Gandia, J. L.
Garcia-Martinez, J. Gimeno, A. Gisbert, G. Gomez, L. Gonzalez-Candelas, A.
Granell, J. Guerri, M. T. Lafuente, F. Madueno, J. F. Marcos, M. C. Marques, F.
Martinez, M. A. Martinez-Godoy, S. Miralles, P, Moreno, L. Navarro, V. Pallas,
M. A. Perez-Amador, J. Perez-Valle, C. Pons, I. Rodrigo, P. L. Rodriguez, C.
Royo, R. Serrano, G. Soler, F. Tadeo, M. Talon, J. Terol, M. Trenor, L. Vaello, O.
Vicente, C. H. Vidal, L. Zacarias and V. Conejero. (2005). Development of a
citrus genome-wide EST collection and cDNA microarray as resources for
genomic studies. Plant Mol. Biol. 57, 375-391.
120
Fujii, H., T. Shimada, T. Endo, T. Simizu. M. Kita, T. Moriguchi, H. Hisada and M.
Omura. (2003a). Expressed SequenceTags from Citrus Albedo at the Initiation
Stage of Rind Peeling. Bull. Natl. Inst. Fruit Tree Sci. 2, 127-143.
Fujii, H., T. Shimada, T. Endo and M. Omura. (2003b). Development of relational
database system for citrus ESTs. Bull. Natl. Inst. Fruit Tree Sci. 2, 91-99 (in
Japanese).
Fujii, H., T. Shimada, T. Endo, T. Shimizu and M. Omura. (2006a). 29,228 Citrus
ESTs- Collection And Analysis Toward The Functional Genomics Phase. In:
Plant & Animal Genomes XIV Conference, San Diego, CA, P20.
Fujii, H., T. Shimizu, T. Shimada, T. Endo and M. Omura. (2006b). Development of
citrus 22K oligo-microarray. Research accomplishment report of NARO. 2006,
29-30 (in Japanese).
Fujii, H., T. Ogata, A. Sugiyama, T. Shimada, T. Endo, T. Shimizu and M. Omura.
(2010a). Development of software to improve the design efficiency of the
intron-spanning PCR primer from EST utilizing genomic information of
Arabidopsis thaliana. In: Plant & Animal Genomes XVIII Conference, San Diego,
CA, P860: Software.
.
Fujii, H., H. Yamashita, F. Hosaka, S. Terakami and T. Yamamoto. (2010b).
Development of a software to presume the parent-child relationship using the
result of DNA maker typing. Hort. Res. (Japan) 9 (Suppl.1), 34 (in Japanese).

121
Gale, K., H. Jiang and M. Westcott. (2005). An optimization method for the
identification of minimal sets of discriminating gene markers: application to
cultivar identification in wheat. J. Bioinform. Comput. Biol. 3, 269–279.
Galli, Z., G. Halasz, E. Kiss and L. Heszky. (2005). Molecular identification of
commercial apple cultivars with microsatellite markers. HortScience. 40, 1974–
1977.
Gerber, S., P. Chabrier and A. Kremare. (2003). FAMOZ: a software for parentage
analysis using dominant, codominant and uniparentally inherited markers, Mol.
Ecol. Notes 3, 479–481.
Giovannoni, J. (2004). Genetic regulation of fruit development and ripening. Plant Cell.
16, 170-180.
Given, N. K., M. A. Venis and D. Grierson. (1988). Hormonal regulation of ripening in
the strawberry, a non-climacteric fruit. Planta. 174, 402-406.
Gmitter Jr., F. G., C. Chen, M. A. Machado, A. A. de Souza, P. Ollitrault, Y.
Froehlicher and T. Shimizu. (2012). Citrus genomics. Tree Genet. Genomes. 8,
611-626.
Goff, S.A., D. Ricke and T. H. Lan. (2002). A draft sequence of the rice genome (Oryza
122
sativa L. ssp. japonica). Science. 296, 92–100.
Goldschmidt, E. E., M. Huberman and R. Goren. (1993). Probing the role of
endogenous ethylene in the degreening of citrus fruit with ethylene antagonists.
Plant Growth Reg. 12, 325-329.
Goldschmidt, E. E. (1998). Ripening of citrus and other non-climacteric fruits: a role for
ethylene ? Acta Hort. 463, 335-340.
Guterman, I., M. Shalit, N. Menda, D. Piestun, M. Dafny-Yelin, G. Shalev, E. Bar, O.
Davydov, M. Ovadis, M. Emanuel, J. Wang, Z. Adam, E. Pichersky, E.
Lewinsohn, D. Zamir, A. Vainstein, and D. Weiss. (2002). Rose scent: Genomics
approach to discovering novel floral fragrance-related genes. Plant Cell. 14,
2325-2338.
Hasegawa, Y., and Y. IBA. (1983). The effect of storage temperature on the quality of
citrus fruit. I. Color change of the citrus peel during storage. Bull. Fruit Tree Res.
Stn. B. 10, 119-128.
Hennig, L. W., Gruissem, U. Grossniklaus and C. Köhler. (2004). Transcriptional
programs of early reproductive stages in Arabidopsis. Plant Physiol. 135,
1765-1775.
Hisada, S., T. Moriguchi, T. Hidaka, A. M. Koltunow, T. Akihama and M. Omura.
(1996). Random sequencing of sweet orange (Citrus sinensis Osbeck) cDNA
123
library derived form young seeds. J. Japan. Soc. Hort. Sci. 65, 487-495.
Hisada, S. T. Akihama, T. Endo, T. Moriguchi and M. Omura. (1997). Expressed
sequence tags of citrus fruit during rapid cell development phase. J. Amer. Soc.
Hort. Sci. 122, 808-812.
Holland, N., Sala, J.M., Menezes, H.C., and Lafuente, M.T. (1999). Carbohydrate
content and metabolism as related to maturity and chilling sensitivity of Cv.
Fortune mandarin. J. Agr. food Chem. 47, 2513-2518.
Hyodo, H., and T. Nishino. (1981). Wounding-induced ethylene formation in albedo
tissue of citrus fruit. Plant Physiol. 67, 421-423.
Hyten, D.L., Q. Song, I. Y. Choi et al, (2008). High-throughput genotyping with the
GoldenGate® Assay in the complex genome of soybean. Theor. Appl. Genet. 116,
945–952.
Iglesias, D. J., R. R. Tadeo, F. Legaz, E, Primo-Millo and M. Talon. (2001). In vivo
sucrose stimulation of color change in citrus fruit epicarps: interactions between
nutritional and hormonal signals. Physiol. Plant. 112, 244-250.
Ikoma, Y., M. Yano, K. Ogawa, T. Yoshioka, Z. C. Xu, S. Hisada, M. Omura and T.
Moriguchi. (1996). Isolation and evaluation of RNA from polysaccharide-rich
tissues in fruit for quality by cDNA library construction and RT-PCR. J. Japan.
Soc. Hort. Sci. 64, 809-814.
124
Jacob-wilk, D., D. Holland, E. E. Goldschmidt, J. Riov and Y. Eyal. (1999).
Chlorophyll breakdown by chlorophyyase: isolation and functional expression of
the chlase 1 gene from ethylene treated Citrus fruit and its regulation during
development. The Plant J. 20, 653-661.
Jiang, D., Q. Ye, F. Wang and L. Cao. (2010). The mining of citrus EST-SNP and its
application in cultivar discrimination. Agr. Sci. China. 9, 179-190.
Jeffery, D., C. Smith, P. Goodenough, I. Prosser and D. Grierson. (1984).
Ethylene-independent and ethylene-dependent biochemical changes in ripening
tomatoes. Plant Physiol. 74, 32-38.
Kader, A. A. (1992). Postharvest biology and technology: an overview. In Kader,
A.A.(Ed.), Postharvest Technology of Horticultural Crops. pp. 15-20. Regents of
the University of Carifornia, Division of Agricultural and Natural Resources,
Oakland, CA.
Kato, M., Y. Ikoma, H. Matsumoto, M. Sugiura, H. Hyodo and M. Yano. (2004).
Accumulation of carotenoids and expression of carotenoid biosynthetic genes
during maturation in citrus fruit. Plant Physiol. 134, 824-837.
Kato, M., H. Matsumoto, Y. Ikoma, H. Okuda and M. Yano. (2006). The role of
carotenoid cleavage dioxygenases in the regulation of carotenoid profiles during
maturation in citrus fruit. J. Exp. Bot.57, 2153-2164.

125
Katz, E., P. M. Lagunes, J. R. D. Weiss and E. E. Goldschmidt. (2004). Molecular and
physiological evidence suggests the existence of a system II-like pathway of
ethylene production in non-climacteric Citrus fruit. Planta. 219, 243-252
Katz, E., J. Riov, D. Weiss and E. E. Goldschmidt. (2005). The climacteric-like
behaviour of young, mature and wounded citrus leaves. J. Exp. Bot. 56,
1359-1367.
Kita, M. T. Endo, T. Moriguchi, and M. Omura. (2000). cDNA catalogs expressed in
albedo of Citrus fruit, a comparative analysis of cDNA libraries from pulp and
albedo of satsuma mandarin (Citrus unshiu Marc.). Acta Hort. 521, 179-183.
Kubo, T., I. Hohjo and S. Hiratsuka. (2001). Sucrose accumulation and its related
enzyme activities in the juice sacs of Satsuma mandarin fruit from trees with
different crop loads. Scientia Hort. 91, 215-225.
Kuhara N., Y. Nagamura, K. Yamamoto, Y. Harushima, N. Sue, J. Wu, B.A. Antonio,
Shormura, A., T. Shimizu, S-Y. Lin, T. Inoue, A. Fukuda, T. Shimano, Y. Kuboki,
T. Toyama, Y. Miyamoto, T. Kirihara, K. Hayasaka, A. Miyano, L. Monna, H.S.
Zhong, Y. Tamura, Z-X. Wang, T. Monna, Y. Umehara, M. Yano, T. Sasaki and
Y. Minobe. (1994). A 300 kilobase interval genetic map of rice including 883
expressed sequences. Nature Genet. 8, 365-372.
Kunkel, B. N., and D. M. Brooks. (2002). Cross talk between signaling pathway in
126
pathogen defense. Curr. Opin. Plant Biol. 5, 325-331.
Kuraoka, T. and T. Kikuchi. (1961). Morphological studies on the development of citrus
fruits. I. Satsuma orange. J. Japan. Soc. Hort. Sci. 30, 189-196.
Kwok, P. Y. (2001). Methods for genotyping single nucleotide polymorphisms. Ann.
Rev. Hum. Genet. 2, 235–258.
Lam, L. K. T. and S. Hasegawa. (1989). Inhibition of benzo[ ]pyrene-induced
fore-stomach neoplasia in mice by citrus limonoids. Nutrition and Cancer. 12,
4347.
Lam, L. K. T., Y. Li and S. Hasegawa. (1989). Effects of citrus limonoids on
glutathione S-transferase activity in mice. J. Agric. Food Chem. 37, 878–880.
Langenheim, J. H. (1994). Higher plant terpenoids: a phytocentric overview of their
ecological roles. J. Chem. Ecol. 20, 1223–1280
Laucou, V., T. Lacombe, F. Dechesne, R. Siret, J. P. Bruno, M. Dessup, T. Dessup, P.
Ortigosa, P. Parra, C. Roux, S. Santoni, D. Vare`s, J. P. Pe ́ros, J. M. Boursiquot
and P. This. (2011). High throughput analysis of grape genetic diversity as a tool
for germplasm collection management. Theor. Appl. Genet. 122, 1233–1245.
Maleck, K., A. Levine, T. Eulgem, A. Morgan, J. Schmid, K. A. Lawton, J. L. Dangl
and R. A. Dietrich. (2000). The transcriptome of Arabidopsis thaliana during

127
systematic acquired resistance. Nature Genet. 26, 403-410.
Martin, F. (2011). An application of kernel methods to variety identification based on
SSR markers genetic fingerprinting. BMC Bioinf. 12, 177–183.
Masouleh, A. K., D. L. Waters, R. F. Reinke and R. J. Henry. (2009). A
high-throughput assay for rapid and simultaneous analysis of perfect markers for
important quality and agronomic traits in rice using multiplexed MALDI-TOF
mass spectrometry. Plant Biotechnol. J. 7, 355–363.
McCollum, T.G. and R.E. McDonald. (1991). Electrolyte leakage, respiration, and
ethylene production as indices of chilling injury in grape fruits. HortSci. 26,
1191-1192.
Mitcham, E. J. and R. E. McDonald. (1993). Changes in grapefruit flavedo cell wall
noncellulosic neutral sugar composition. Phytochem. 34, 1235-1239.
Moriguchi, T., M. Kita, S. Hisada, T. Endo and M. Omura. (1998). Characterization of
gene repertories at mature stage of citrus fruits through random sequencing and
analysis of redundant metallothionein-like genes expressed during fruit
development. Gene. 211, 221-227.
Moriya, S., H. Iwanami, K. Okada, T. Yamamoto and K. Abe. (2011). A practical
method for apple cultivar identification and parent-offspring analysis using simple
sequence repeat markers. Euphytica. 177, 135–150.
128
Mozoruk, J., L. E. Hunnicutt, R. D. Cave, W. B. Hunter and M. G. Bausher. (2006).
Profiling transcriptional changes in Citrus sinensis (L.) Osbeck challenged by
herbivory from xylem-feeding leafhopper Homalodisca coagulata (Say) by cDNA
macroarray analysis. Plant Sci. 170, 1068-1080.
Murakami, A., Y. Nakamura, K. Torikai et al. (2000). Inhibitory effect of citrus
nobiletin on phorbol ester-induced skin inflammation, oxidative stress, and
tumor-promotion in mice. Cancer Res. 60, 5059–5066.
Nagano, A. J., Y. Sato, M. Mihara, A. A. Antonio, R. Motoyama, H. Itoh, Y. Nagamura
and T. Izawa. (2012). Deciphering and prediction of transcriptome dynamics
under fluctuating field conditions. Cell. 151, 1358-1369.
Ogawa, M., A. Hanada, Y. Yamauchi, A. Kuwahara, Y. Kamiya and S. Yamaguchi.
(2003). Gibberellin biosynthesis and response during Arabidopsis seed
germination. The Plant Cell. 15, 1591-1604.
Oiyama, I. and S. Kobayashi. (1993). Haploids obtained from diploid X triploid crosses
of citrus. J. Japan Soc. Hort. Sci. 62, 89–93.
Ollitrault, P., J. Terol, A. Garcia-Lor., A. Berard, A. Chauveau, Y. Froelicher, C.
Belzile, R. Morillon, L. Navarro, D. Brunel and M. Talon. (2012). SNP mining in
C. clementine BAC end sequences; transferability in Citrus genus Rutaseae ,
phylogenetic inferances and perspectives for genetic mapping. BMC Genomics.
129
13, 13.
Omura, M. (2005). Genome analysis and breeding in Citrus. Gamma Field Symposia.
44, 25-31.
Pavy, N., B. Pelgas, S. Beauseigle, S. Blais, F. Gagnon, I. Gosselin, M. Lamothe, N.
Isabel and J. Bousquet. (2008). Enhancing genetic mapping of complex genomes
through the design of highly-multiplexed SNP arrays: application to the large and
unsequenced genomes of white spruce and black spruce. BMC Genomics. 9, 21.
Porat, R., B. Weiss, L. Cohen, A. Daus, R. Goren and S. Drobya. (1999). Effects of
ethylene and 1-methylcyclopropene on the postharvest qualities of ‘Shamouti’
oranges. Postharvest Biol. Tech. 15, 155-163.
Porat, R., V. D. Hollandb, T. G. McCollumc and S. Drobya. (2001). Isolation of a citrus
chitinase cDNA and characterization of its expression in response to elicitation of
fruit pathogen resistance. J. Plant Physiol. 158, 1585-1590.
Rickert, A.M., J. H. Kim, S. Meyer, A. Nagel, A. Ballvora, P. J. Oefner and C.
Gebhardt. (2003). First-generation SNP/InDel markers tagging loci for pathogen
resistance in the potato genome. Plant Biotechnol. J. 1, 399–410.
Robertson, G.A., V. Thiruvenkataswamy, H. Shilling, E. P. Price, F. Huygens, F. A.
Henskens and P. M. Giffard. (2004). Identification and interrogation of highly
informative single nucleotide polymorphism sets defined by bacterial multilocus
130
sequence typing databases, J. Med. Microbiol. 53 (Pt 1), 35–45.
Rodrigo, M. J., J. F. Marcos and L. Zacarias. (2004). Biochemical and molecular
analysis of carotenoid biosynthesis in flavedo of orange (Citrus sinensis L.)
during fruit development and maturation. J. Agr. Food Chem. 52, 6724-6731.
Rodrigo, M. J., B. Alquezar and L. Zacarias. (2006). Cloning and characterization of
two 9-cis-epoxycarotenoid dioxygenase genes, differentially regulated during fruit
maturation and under stress conditions, from orange (Citrus sinensis L. Osbeck). J.
Exp. Bot. 57, 633-643.
Rodrigo, M. J. and L. Zacarias. (2007). Effect of postharvest ethylene treatment on
carotenoid accumulation and the expression of carotenoid biosynthetic genes in
the flavedo of orange (Citrus sinensis L. Osbeck) fruit. Posthavest Biol. Tech. 43,
14-22.
Rostoks, N., L. Ramsay, K. Mackenzie et al. (2006). Recent history of artificial
outcrossing facilitates whole-genome association mapping in elite inbred crop
varieties. Proc. Natl. Acad. Sci. USA. 103, 18656–18661.
Russell, J., A. Booth, J. Fuller, B. Horrower, P. Hedley, G. Machery and W. Powell.
(2004). A comparison of sequence-based polymorphism and haplotype content in
transcribed and anonymous regions of the barley genome. Genome. 47, 389–398.
Shimada, S. and K. Shimokawa. (1978). Ethylene-activated chlorophyllase in Satsuma
131
mandarin (Citrus unshiu Marc.) fruit. (In Japanese ). J. Agr. Chem. Soc. Jpn. 52,
489-491.
Shimada, T., M. Kita, T. Endo, H. Fujii, T. Ueda, T. Moriguchi and M. Omura. (2003).
Expressed Sequence Tags of ovary tissue cDNA library in Citrus unshiu Marc.
Plant Sci. 165, 167-168.
Shimada, T., T. Endo, H. Fujii, T. Ueda and M. Omura. (2005a). Isolation and
characterization of the somatic embryogenesis receptor-like kinase gene
homologue (CitSERK1) from Citrus unshiu Marc. Sci. Hortic. 103, 233-238.
Shimada, T., T. Endo, H. Fujii, M. Hara, T. Ueda, T. Kubo and M. Omura. (2005b).
Isolation and characterization of a new d-limonene synthase gene with a
different expression pattern in Citrus unshiu Marc. Sci. Hortic. 105, 507-512.
Shimada, T., T. Endo, H. Fujii, M. Hara and M. Omura. (2005c). Isolation and
characterization of (E)-beta-ocimene and 1,8 cineole synthases in Citrus unshiu
Marc. Plant Sci. 168, 987-995.
Shimada, T., H. Fuiii, T. Endo, J. Yazaki, N. Kishimoto, K. Shimbo, S. Kikuchi and M.
Omura. (2005d). Toward comprehensive expression profiling by microarray
analysis in citrus: monitoring the expression profiles of 2213 genes during fruit
development. Plant Sci. 168, 1383-1385.
Spiegel-Roy, P. and E. E. Goldshomidt. (1996). Biology of Citrus. Cambridge Univerity
132
Press. NewYork.
Steemers, F. J., W. Chang, G. Lee, D. L. Barker, R. Shen and K. L. Gunderson. (2006).
Whole-genome genotyping with the single-base extension assay. Nat. Methods. 3,
31–33.
Sugiyama, A. (2010). Studies on analysis of genome structure of carotenoid synthesis
genes in Citrus. Ph.D. thesis. University of Gifu. Gifu, Japan.
Sugiyama, A., M. Omura, H. Matsumoto, T. Shimada, H. Fujii, T. Endo, T. Shimizu, H.
Nesumi and Y. Ikoma. (2011). Quantitative trait loci (QTL) analysis of carotenoid
content in Citrus fruit. J. Japan Soc. Hort. Sci. 80, 136–144.
Sugiyama, A., M. Omura, T. Shimada, H. Fujii, T. Endo, T. Shimizu, H. Nesumi, K.
Nonaka, Y. Ikoma. (2014). Expression quantitative trait loci analysis of
carotenoid metabolism-related genes in Citrus. J. Japan Soc. Hort. Sci. 83, 32–43.
Syvänen, A. C. (2005). Toward genome-wide SNP genotyping. Nat. Genet. 37 (Suppl):
S5–10.
Symons, G. M., C. Davies, Y. Shavrukov, I. B. Dry and J. B. Reid. (2006). Grapes on
steroids. Brassinosteroids are involved in grape berry ripening. Plant Physiol. 140,
150-158.
Tahira, M. (2008). Infringement cases and support enforcement in the field of
133
Agriculture, Patent. 61, 19–22 (in Japanese).
Talon, M. and F. G. Gmitter Jr. (2008). Citrus Genomics. International Journal of Plant
Genomics. doi:10.1155/2008/528361.
Takashina, T., Y. Tkakahasi, K. Niino, T. Sugisawa and T. Yamamoto. (2009).
Sequence analysis of SSR markers using identification of sweet cherry cultivars
and SSR genotype database of sweet cherry, DNA Polymorphism. 17, 114–117
(in Japanese).
Takashina, T., M. Ishiguro, K. Nishimura and T. Yamamoto. (2007). Generic
identification of imported and domestic sweet cherry varieties using SSR
markers, DNA Polymorphism. 15, 101–104 (in Japanese).
Terol, A., A. Conesa, J. M. Colmenero et al. (2007). Analysis of 13000 unique Citrus
clusters associated with fruit quality, production and salinity tolerance. BMC
Genomics. 8, 1-22.
Terakami, S., Y. Sawamura, T. Saito, C. Nishitani and T. Yamamoto. (2010).
Development of SNP markers and genotyping database in Japanese pear. DNA
Polymorphism. 18, 70–73 (in Japanese).
Tessier, C., J. David, P. This, J. M. Boursiquot and A. Charrier. 1999. Optimization of
the choice of molecular markers for varietal identification in Vitis vinifera L.,
134
Theor. Appl. Genet. 98, 171–177.
This, P., A. Jung, P. Boccacci, J. Borrego, R. Botta, L. Costantini, M. Crespan, G. S.
Dangl, C. Eisenheld, F. Ferreira-Monteiro, S. Grando, J. Ibanez, T. Lacombe, V.
Laucou, R. Magalhaes, C. P. Meredith, N. Milani, E. Peterlunger, F. Regner, L.
Zulini and E. Maul. (2004). Development of a standard set of microsatellite
reference alleles for identification of grape cultivars. Theor. Appl. Genet. 109,
1448–1458.
Trainotti, L., D. Zanin and G. Casadoro. (2003). A cell wall-oriented genomic approach
reveals a new and unexpected complexity for the softening in peaches. J. Exp. Bot.
54, 1821-1832.
Trainotti, L., A. Pavanello and G. Casadoro. (2005). Different ethylene receptors show
an increased expression during the ripening of strawberries: does such an
increment imply a role for ethylene in the ripening of these non-climacteric fruit?
J. Exp. Bot. 56, 2037-2046.
Trebitsh, T., E. E. Goldschmidt and J. Riov. (1993). Ethylene induces de novo synthesis
of chlorophyllase, chlorophyll degrading enzyme, in citrus fruit peel. Proc. Natl.
Acad. Sci. USA. 90, 9441-9445.
Tsukuda, S., K. Gomi, H. Yamamoto and K. Akimitsu (2006). Characterization of
cDNAs encoding two distinct miraculin-like proteins and stress-related
modulation of the corresponding mRNAs in Citrus jambhiri lush. Plant Mol. Biol.
135
60, 125-136.
Tsushima, M., T. Maoka, M. Katsuyama, M. Kozuka, T. Matsuno, H. Tokuda, H.
Nishino and A. Iwashima (1995) Inhibitory effect of natural carotenoids on
Epstein-Barr virus activation activity of a tumor promoter in Raji cells. A
screening study for anti-tumor promoters. Biol. Pharm. Bull. 18, 227–233.
Tung, C.W., K. Zhao, M. H. Wright et al. (2010). Development of a research platform
for dissecting phenotype-genotype associations in rice (Oryza spp.). Rice. 3, 205–
217.
Uchiyama, K., T. Ujino-Ihara, S. Ueno et al. (2012). Single nucleotide polumorphism in
Cryptomeria japonica: their discovery and validation for genome mapping and
diversity studies. Tree Genet. Genomes. 8, 1213-1222.
Vrebalov, J., D. Ruezinsky, V. Padmanabhan, R. White, D. Medrano, R. Drake, W.
Schuch and J. Giovannoni. (2002). A MADS-box gene necessary for fruit
ripening at the tomato ripening-inhibitor (rin) locus. Science. 296, 343-346.
Wang, K. L. C. and J. R. Ecker. (2002). Ethylene biosynthesis and signaling networks.
Plant Cell. 14, 131-151.
Wheaton, T. A. and I. Stewart. (1973). Optimum temperature and ethylene
concentration for postharvest development of carotenoid pigment in Citrus. J.
Amer. Soc. Hort. Sci. 98, 337-340.
136
Wolfsberg, T. G. and D. Landsman. (2001). Expressed sequence tags (ESTs) In:
Baxevanis, A. D. and B. F. F. Quellette (eds.) Bioinformatics 2nd ed. pp.283-302.
Wiley-Interscience. NewYork.
Wu, C. T. and K. J. Bradford. (2003). Class I chitinase and beta-1,3-glucanase are
differentially regulated by wounding, methyl jasmonate, ethylene, and gibberellin
in tomato seeds and leaves. Plant Physiol. 133, 263-273.
Wunsch, A. and J. I. Hormaza. (2002). Cultivar identification and genetic fingerprinting
of temperate fruit tree species using DNA markers. Euphytica. 125, 59–67.
Yamamoto, T., K. Mochida, T. Imai, T. Haji, H. Yaegaki, M. Yamaguchi, N. Matsuta, I.
Ogiwara and T. Hayashi. (2003). Parentage analysis in Japanese peaches using
SSR marker. Breeding Sci. 53, 35-40.
Yamamoto, T., T. Kimura, M. Shoda, Y. Ban, T. Hayashi and N. Matsuta. (2002).
Development of microsatellite markers in Japanese pear (Pyrus pyrifolia Nakai),
Mol. Ecol. Notes. 2, 14–16.
Yamamoto, T., F. Hosaka, S. Terakami, A. Sato, T. Sawamura, N. Takada, E. Ueda, C.
Nishitani, T. Imai and T. Hirabayashi. (2008). DNA fingerprinting of Japanese
chestnut cultivars identified by SSR markers. DNA Polymorphism. 16, 88–90 (in
Japanese).
137
Yuan, L. and Xu, D.Q. (2001). Stimulation effect of gibberellic acid short-term
treatment on leaf photosynthesis related to the increase in Rubisco content in
broad bean and soybean. Photosynth. Res. 68, 39-47.
Xu, Q., L. L. Chen, X. Ruan, D. Chen, A. Zhu, C. Chen et al. (2013). The draft genome
of sweet orange (Citrus sinensis). Nat. Genet. 45, 59-66.
Zhong, G. V. and J. K. Burns. (2003). Profiling ethylene-regulated gene expression in
Arabidopsis thaliana by microarray analysis. Plant Mol. Biol. 53, 117-131.
Top Related

Copyright © 2022 FDOKUMEN

