Draft Title 40 CFR 191 Compliance Certification Application ...
436
DRAFT-DOE/CAO-2056 Draft Title 40 CFR 191 Compliance Certification Application for the Waste Isolation Pilot Plant March 31, 1995 United States Department of Energy Waste Isolation Pilot Plant Carlsbad Area Office Carlsbad, New Mexico ~f-i:- •-:•"-£!--
-
Upload
khangminh22 -
Category
Documents
-
view
1 -
download
0
Transcript of Draft Title 40 CFR 191 Compliance Certification Application ...

DRAFT-DOE/CAO-2056
Draft Title 40 CFR 191 Compliance Certification
Application for the
Waste Isolation Pilot Plant
March 31, 1995
United States Department of Energy Waste Isolation Pilot Plant
Carlsbad Area Office Carlsbad, New Mexico
~f-i:- •-:•"-£!--

DISCLAIMER
Portions of this document may be illegible in electronic image products. Images are produced from the best available original document.

1 2 PREFACE 3 4 The U.S. Department of Energy (DOE) is preparing an application to demonstrate 5 compliance with the requirements outlined in Title 40, Part 191 of the Code of Federal 6 Regulations (CFR) for the permanent disposal of transuranic wastes. As mandated by the 7 Waste Isolation Pilot Plant (WIPP) Land Withdrawal Act of 1992, the U.S. Environmental 8 Protection Agency (EPA) must evaluate this compliance application and provide a 9 determination regarding compliance with the requirements within one year of receiving a
10 complete application. Because the WIPP is a very complex program, the DOE has planned 11 to submit the application as a draft in two parts. This strategy will allow for the DOE and 12 the EPA to begin technical discussions on critical WIPP issues before the one-year 13 compliance determination period begins. Today's submittal is the first of these two draft 14 submittals. The DOE plans to submit the second part of the Draft 40 CFR Part 191 15 Compliance Certification Application (DCCA), providing more details relative to human 16 intrusion scenarios, in the Summer of 1995. 17 18 On January 30, 1995, the EPA issued a proposed rule entitled Criteria for the Certification 19 and Determination of the Waste Isolation Pilot Plant's Compliance with Environmental 20 Standards for the Management and Disposal of Spent Nuclear Fuel, High-level and 21 Transuranic Radioactive Wastes (60 FR 5766). This rule, which will be codified in Title 22 40, Part 194 of the Code of Federal Regulations when it is final, sets forth the 23 requirements that the DOE must follow in applying for certification from the EPA that the 24 WIPP facility will comply with the environmental standards for the disposal of transuranic 25 wastes. Because 40 CFR Part 194 was proposed quite recently, the Department was unable 26 to follow all of the guidance in it in preparing this draft application. The DOE has 27 attempted to identify every instance in this application where it differs from the 28 requirements proposed in Part 194. These differences should not be interpreted as 29 commentary on the proposed regulation. The DOE intends to submit any comments it has 30 on the proposed 40 CFR Part 194 on or before May 1, 1995, the date when the public 31 comment period closes. 32 33 This document is the first of such draft submittals to the EPA. Its focus is upon 34 background repository information, the methodology used to conduct performance 35 assessments, the scenarios that the DOE has determined to be the most likely to occur over 36 the 10,000-year regulatory period, the characteristics of the radioactive wastes to be 37 disposed of in the WIPP repository, the Quality Assurance program implemented by the 38 DOE to support the compliance application, and the DOE's approaches to demonstrating 39 compliance with the assurance requirements of the disposal regulation. The DOE proposes 40 to begin technical discussions in these areas because they are at a level of maturity suitable 41 for in-depth consultations with the EPA.
a cCE!VED
DISTRIBUTION OF THIS DOCMMCMT te > M A Y ° * ^ H ' S ^CUMENT IS UNLIMITEOk̂ h Q g j |
MAY 0 h 1995
MASTER
1 This draft does not provide detailed information on the following topics: 2 3 • Experimental work, engineered alternatives, and additional research needed 4 to support a full-scale prediction (including human intrusion events) for the 5 performance of WIPP 6 • Level of quality of performance assessment software and input data 7 • Detailed designs for long-term monitoring, permanent markers, and active 8 institutional controls 9 • Performance-Based Waste Acceptance Criteria
10 11 Additionally, the EPA will note that today's submittal does not present the complete 12 picture of long-term repository performance. Although the various models, data, and 13 parameters used by the DOE to calculate the Complementary Cumulative Distribution 14 Function (CCDF) contained within this draft application are thought to be reasonable for 15 use in a performance assessment of the disposal system, full justification of this 16 information is not available today. The CCDF presented here is not in final form because 17 sufficient confidence in the models and computer codes has not been established, quality 18 assurance activities have not been completed, and the number of realizations used in its 19 development was restricted. Today's submittal focuses upon undisturbed repository 20 performance only. The effects of human-initiated events have not been considered. 21 22 The DOE plans to submit the second part of the DCCA in the Summer 1995 timeframe. 23 This second part will contain additional information relative to disturbed repository 24 performance. The second part will most likely not detail all remaining aspects of a 25 compliance application. As the DOE finalizes work beyond this second submittal, separate 26 reports describing this work will be transmitted to the EPA for its information. The 27 content of these reports will be incorporated into the final compliance certification 28 application in December 1996. 29 30 The DOE welcomes comments on this document and hopes that observations regarding 31 "missing" areas be given a lower priority at this time. Finally, the DOE recognizes that, by 32 law, the EPA cannot approve any part of this draft document.
DISCLAIMER
This report was prepared as an account of work sponsored by an agency of the United States Government. Neither the United States Government nor any agency thereof, nor any of their employees, makes any warranty, express or implied, or assumes any legal liability or responsibility for the accuracy, completeness, or usefulness of any information, apparatus, product, or process disclosed, or represents that its use would not infringe privately owned rights. Reference herein to any specific commercial product, process, or service by trade name, trademark, manufacturer, or otherwise does not necessarily constitute or imply its endorsement, recommendation, or favoring by the United States Government or any agency thereof. The views and opinions of authors expressed herein do not necessarily state or reflect those of the United States Government or any agency thereof. "-
11

Draft 40 CFR 191 Compliance Certification Application
1 TABLE OF CONTENTS
2 Executive Summary ES-1 3 1.0 Introduction 1-1 4 1.1 (Draft) Certification Application Synopsis 1-1 5 L2 Project Overview 1-2 6 1.3 Site Selection Process 1-3 7 1.4 Regulatory Framework 1-5 8 1.5 Program for Evaluating Long-Term Performance 1-6
9 2.0 Site Characterization 2-1 10 2.1 Geology 2-7 11 2.1.1 Data Sources and Quality 2-8 12 2.1.2 Geologic History 2-11 13 2.1.3 Stratigraphy and Lithology in the Vicinity of the WIPP Site 2-12 14 2.1.4 Physiography and Geomorphology 2-52 15 2.1.5 Tectonic Setting and Site Structural Features 2-56 16 2.1.6 Non-Tectonic Processes and Features 2-63 17 2.2 Surface-Water and Groundwater Hydrology 2-72 18 2.2.1 Groundwater Hydrology 2-82 19 2.2.2 Surface-Water Hydrology 2-108 20 2.2.3 Groundwater Discharge and Recharge 2-110 21 2.3 Resources '. 2-113 22 2.3.1 Extractable Resources 2-117 23 2.3.2 Cultural and Economic Resources 2-119 24 2.4 Background Environmental Conditions 2-124 25 2.4.1 Terrestrial and Aquatic Ecology 2-127 26 2.4.2 Water Quality 2-130 27 2.4.3 Air Quality 2-132 28 2.4.4 Environmental Radioactivity 2-133 29 2.5 Climate and Meteorological Conditions 2-137 30 2.5.1 Historic Climatic Conditions 2-137 31 2.5.2 Current Climatic Conditions 2-140 32 2.6 Seismology 2-143 33 2.7 Rock Geochemistry 2-151
34 3.0 Facility Description 3-1 35 3.1 General Facility Design 3-2 36 3.1.1 DOE Facility Acquisition Process 3-5 37 3.1.2 Configuration Control 3-5 38 3.1.3 Surface Structures 3-5 39 3.2 Repository Configuration 3-6
DRAFT-DOE/CAO-2056 ill March 31, 1995

Draft 40 CFR 191 Compliance Certification Application
1 3.3 Engineered Barriers 3-9 2 3.3.1 Seals and Plugs 3-9 3 3.3.2 Shaft Seals 3-10 4 3.3.3 Borehole Plugs 3-21 5 3.4 Summary 3-25
6 4.0 Waste Description 4-1 7 4.1 Current and To-Be-Generated Waste Inventory 4-2 8 4.1.1 CH TRU Waste 4-2 9 4.1.2 RH TRU Waste 4-3
10 4.1.3 TRU Mixed Waste 4-3 11 4.2 Waste Information Important to the Development of Conceptual Models . . 4-4 12 4.3 Waste Envelope 4-5 13 4.3.1 Waste Acceptance Criteria 4-6 14 4.3.2 Bounding Criteria Based on Projected Disposal System 15 Performance 4-7 16 4.4 Waste Characterization 4-8 17 4.4.1 Plans and Program Summary 4-8 18 4.4.2 Physical Waste Characteristics 4-9 19 4.4.3 Radiological Waste Characteristics 4-12 20 4.4.4 Analytical Methods 4-15 21 4.4.5 Process Knowledge Documentation 4-18
22 5.0 Quality Assurance 5-1 23 5.1 Purpose 5-1 24 5.2 QA Program Management 5-1 25 5.2.1 Organization 5-1 26 5.2.2 QA Program Requirements 5-2 27 5.2.3 Qualification and Training Requirements 5-2 28 5.2.4 Quality Improvement, Nonconformances, and Corrective Action . . . 5-5 29 5.2.5 Documents and Records 5-5 30 5.3 QA Program Implementation 5-5 31 5.3.1 Work Processes 5-5 32 5.3.2 Design 5-5 33 5.3.3 Procurement Control 5-6 34 5.3.4 Inspection and Test Control 5-6 35 5.3.5 Waste Characterization Program 5-6 36 5.3.6 WIPP Site Monitoring Programs 5-7 37 5.4 QA Program Assessment 5-8 38 5.5 Sample Control 5-8 39 5.6 Control of Scientific Investigations 5-8 40 5.6.1 Qualification of Existing Data 5-9 41 5.6.2 Background-Evolving QA Program Requirements 5-9 42 5.7 Computer Software QA 5-10
March 31, 1995 iv DRAFT-DOE/CAO-2056

Draft 40 CFR 191 Compliance Certification Application
1 6.0 Containment Requirements 6-1 2 6.1 Performance Assessment Methodology . / . . . . . . . * •; liA . .-. . . . j . . . . . . 6-3 3 6.1.1 Conceptualization of Risk 6-3 4 6.1.2 Selection of Scenarios 6-17 5 6.1.3 Determination of Scenario Probabilities 6-17 6 6.1.4 Calculation of Scenario Consequences 6-17 7 6.1.5 Monte Carlo Analysis Techniques 6-18 8 6.2 Scenario Developments and Selection 6-23 9 6.2.1 Identification and Screening Features, Events, and Processes . . . . 6-23
10 6.2.2 Farfield Features, Events, and Processes : 6-27 11 6.2.3 Waste- and Repository-Induces FEPs 6-29 12 6.2.4 Human-initiated Events and Processes 6-32 13 6.3 Performance Assessment and Modeling Results 6-33 14 6.3.1 Purpose and Scope 6-33 15 6.3.2 Model Geometry 6-34 16 6.3.3 The Repository 6-37 17 6.3.4 Shafts and Shaft Seals 6-45 18 6.3.5 The Salado Formation 6-46 19 6.3.6 Rustler Formation 6-51 20 6.3.7 Dewey Lake Redbeds 6-55 21 6.3.8 Supra-Dewey Lake Units 6-56 22 6.3.9 Climate Change 6-56 23 6.3.10 Repository and Salado Initial Conditions 6-57 24 6.3.11 Numerical Codes 6-58 25 6.3.12 Performance Assessment Result 6-58
26 7.0 Assurance Requirements 7-1 27 7.1 Active Institutional Controls 7-1 28 7.1.1 Active Institutional Control Requirements 7-2 29 7.1.2 Objectives for Active Institutional Controls 7-3 30 7.1.3 WIPP Active Institutional Control Program 7-3 31 7.1.4 Active Institutional Control Program Review and Oversight 7-7 32 7.2 Monitoring 7-7 33 7.2.1 Disposal System Monitoring Requirements 7-7 34 7.2.2 Objectives of Disposal System Monitoring 7-8 35 7.2.3 Disposal System Monitoring Program 7-8 36 7.2.4 Disposal System Monitoring Program Review and Oversight . . . . 7-13 37 7.3 Passive Institutional Controls 7-13 38 7.3.1 Passive Institutional Control Requirements 7-14 39 7.3.2 Objectives of the Passive Institutional Controls 7-15 40 7.3.3 Passive Institutional Control Implementation 7-16
DRAFT-DOE/CAO-2056 v March 31, 1995

Draft 40 CFR 191 Compliance Certification Application
1 7.4 Multiple Barriers 7-26 2 7.4.1 Multiple Barrier Requirements 7-27 3 7.4.2 Objectives of Multiple Barriers 7-28 4 7.4.3 Multiple Barrier Implementation 7-28 5 7.4.4 Multiple Barrier Review and Oversight 7-28 6 7.5 Resource Characteristics Evaluations 7-28 7 7.5.1 Resource Consideration Requirements 7-28 8 7.5.2 Objectives of Resource Considerations 7-29 9 7.5.3 Resource Consideration Implementation 7-29
10 7.5.4 Resource Considerations Review and Oversight 7-30 11 7.6 Waste Removal 7-30 12 7.6.1 Waste Removal Implementation 7-30 13 7.6.2 Waste Removal Review and Oversight 7-32
14 8.0 Individual and Groundwater Protection Requirements 8-1 15 8.1 Individual Protection Requirements 8-1 16 8.2 Groundwater Protection Requirements 8-3
17 Glossary of Terms GL-1
March 31, 1995 vi DRAFT-DOE/CAO-2056

Draft 40 CFR 191 Compliance Certification Application
LIST OF APPENDICES
2 AAC 3 4 BECR 5 6 BH 7 BIR 8 D&D 9
10 DEF 11 FAC 12 13 14 GCR 15 16 HYDR 17 18 IRD 19 20 LTM 21 NUTS 22 PAR 23 PMR 24 QAPD 25 RBP 26 27 RM 28 SCR 29 SER 30 31 SUM 32 33 34 WRAC
WIPP Active Access Controls after Disposal Design Concept Description AAC-1 Waste Isolation Pilot Plant Biennial Environmental Compliance Report BECR-1 Borehole Data for Southeastern New Mexico BH-1 Waste Isolation Pilot Plant TRU Waste Baseline Inventory Report . . . . BIR-1 Conceptual Decontamination and Decommissioning Plan for the Waste Isolation Pilot Plant D&D-l Section 7.3 of the Test Phase NMVP on Deformation and Dissolution . DEF-1 Facies Variability and Post-Depositional Alteration within the Rustler Formation in the Vicinity of the Waste Isolation Pilot Plant, Southeastern New Mexico FAC-1 Geological Characterization Report, Waste Isolation Pilot Plant (WIPP) Site, Southeastern New Mexico GCR-1 Geohydrology of the Proposed Waste Isolation Pilot Plant Site, Los Medanos Area, Southeastern New Mexico HYDRO-1 Implementation of the Resource Disincentive in 40 CFR 191.14 (e) at the Waste Isolation Pilot Plant IRD-1 Long-Term Monitoring Concept Description LTM-1 NUTS Compute Code NUTS-1 Parameter Sheets PAR-1 Permanent Marker Conceptual Design Report PMR-1 Quality Assurance Program Description QAPD-1 Statistical Summary of the Radiological Baseline Program for the Waste Isolation Pilot Plant RBP-1 Rock Mechanics Position Paper RM-1 Scenario Screening SCR-1 Waste Isolation Pilot Plant (WIPP) Annual Site Environmental Report for Calendar Year 1993 SER-1 Summary of Site-Characterization Studies Conducted from 1983 Through 1987 at the Waste Isolation Pilot Plant (WIPP) Site, Southeastern New Mexico SUM-1 Waste Removal After Closure Technical Feasibility Report WRAC-1
DRAFT-DOE/CAO-2056 vii March 31, 1995

Draft 40 CFR 191 Compliance Certification Application
1 LIST OF FIGURES
2 ES-1 Mean CCDF Showing Probability of Cumulative 10,000-Year ES-5
3 1-1. WIPP Location in Southeastern New Mexico 1-7 4 1-2. Long-Term 40 CFR Part 191 Compliance Program Structure 1-11
5 2-1. WIPP Site Location in Southeastern New Mexico 2-2 6 2-2. Borehole Location Map 2-9 7 2-3. Major Geologic Events-Southeast New Mexico Region 2-13 8 2-4. Site Geological Column 2-15 9 2-5. Cross-Section from Delaware Basin (southeast) through Marginal
10 Reef Rocks to Back-Reef Facies 2-19 11 2-6. Generalized Stratigraphic Cross-Section above Bell Canyon Formation 12 at WIPP Site 2-21 13 2-7. Salado Stratigraphy 2-25 14 2-8. Rustler Stratigraphy 2-31 15 2-9. Halite Margins in the Rustler 2-33 16 2-10. Isopach Map of the Entire Rustler 2-35 17 2-11. Percentage of Natural Fractures in the Culebra Filled with Gypsum . . . . 2-39 18 2-12. Log Character of the Rustler Showing Mudstone-Halite Lateral 19 Relationships 2-43 20 2-13. Isopach of the Dewey Lake 2-47 21 2-14. Isopach of the Santa Rosa 2-49 22 2-15. Physiographic Provinces and Sections 2-53 23 2-16. Site Topographic Map 2-57 24 2-17. Structural Provinces of the Permian Basin Region 2-59 25 2-18. Depth to Base of the Culebra 2-65 26 2-19. Isopach from the Top of the Vaca Triste to the Top of the Salado 2-73 27 2-20. Isopach from the Base of MB 103 to the Top of the Salado 2-75 28 2-21. Isopach from the Base of MB 123-124 to the Base of the Vaca Triste . . . 2-77 29 2-22. Structure Contour Map of Culebra Dolomite Base 2-79 30 2-23. Drainage Pattern and Gauging Stations, Pecos River Basin 2-83 31 2-24. Schematic West-East Cross-Section through the North Delaware Basin . . 2-85 32 2-25. Schematic North-South Cross-Section through the North Delaware Basin . 2-87 33 2-26. Potentiometric Surface Map (composite) of the Delaware Mountain 34 Group and Capitan Aquifer 2-91 35 2-27. Measured Water Levels and Estimated Freshwater Heads of the 36 Unnamed Lower Member and Rustler-Salado Contact Zone 2-97 37 2-28. The Transient Calibrated Log,0 Transmissivities 2-101 38 2-29. Water Levels and Estimated Freshwater Heads in the Magenta 2-105 39 2-30. Location of Reservoirs and Gauging Stations in the Pecos River Basin . . 2-111 40 2-31. Culebra Freshwater-Head Contour Surface 2-115 41 2-32. Mariah Study Archaeological Sites 2-125
March 31, 1995 viii DRAFT-DOE/CAO-2056

Draft 40 CFR 191 Compliance Certification Application
1 2-33. 2 2-34. 3 2-35. 4 2-36.
5 3-1. 6 3-2. 7 3-3. 8 3-4. 9 3-5 10 3-6. 11
1993 Annual Wind Rose 2-141 1993 Mean Monthly, Temperatures at the. WIPP Site ......,.,. ...;., . . . 2-145 1993 Precipitation at the WIPP• Site . ; .-:•-:: •-. -. . ;'•' i-... . 2^147 Regional Earthquake Epicenters Occurring after 1961 2-149
Plan View of WIPP Underground Facility and Panel Closure Systems . . . . 3-3 Spatial View of the WIPP Facility 3-7 Representative WIPP Shaft Seal System 3-11 Near-Surface Seal subsystem ?. . ::''.;'. . . . . 3-13 Salado Formation Subsystem 3-17 Approximate Locations of Boreholds in Relation to the WIPP Underground 3-23
12 5-1. Hierarchy of DOE QA Programs 5-3
Methodology for Performance Assessment of TRU Repositories 6-5 Estimated CCDF for Consequence Result cS 6-7 Example Distribution of CCDFs Obtained by Sampling Imprecisely Known Variables 6-11 Example Summary Curves Derived from an Estimated Distribution of CCDFs 6-15 Distribution Function for an Imprecisely Known Analysis Variable 6-21 Schematic BRAGFLO Model Geometry, Vertical Section . 6-35 Mean CCDF Showing Probability of Cumulative 10,000-Year, Normalized Radionuclide Releases from the WIPP 6-59
13 6-1. 14 6-2. 15 6-3. 16 17 6-4. 18 19 6-5. 20 6-6. 21 6-7. 22
DRAFT-DOE/CAO-2056 ix March 31, 1995

Draft 40 CFR 191 Compliance Certification Application
1 LIST OF TABLES
2 2-1. Issues Related to the Natural Environment that were Evaluated for 3 the WIPP Performance Assessment Scenario Screening 2-2 4 2-2. Culebra Thickness Data Sets 2-38 5 2-3. Hydrologic Characteristics of Rock Units at the WIPP Site 2-89 6 2-4. Capacities of Reservoirs in the Pecos River Drainage 2-109 7 2-5. Current Estimates of Potash Resources at the WIPP Site 2-118 8 2-6. In-Place Oil within Study Area 2-119 9 2-7. In-Place Gas within Study Area 2-119
10 2-8. Ranges of Mean Values Measured for Radioactive Isotopes at Sites 11 at WIPP, 5 Miles from WIPP, and beyond 5 Miles from WIPP 2-135 12 2-9. Mean Values Measured for Radionuclides in Water Wells around 13 the WIPP Site 2-137 14 2-10. Average Monthly Maximum and Minimum Temperatures at the 15 WIPP Site from September 1992 through December 1993 2-143 16 2-11. Chemical Formulas, Distributions, and Relative Abundances of 17 Minerals in Delaware Basin Evaporites 2-152
18 3-1. WIPP Site Features 3-2 19 3-2. Governing Regulations for Borehole Abandonment 3-25
20 4-1. Estimated Quantities of Retrievably Stored and Newly Generated 21 TRU Waste at DOE Sites 4-4 22 4-2. Boundary Conditions and Process Tolerance Limits Established by 23 the DOE 4-6 24 4-3. Radionuclide Inventory 4-13
25 6-1. Release Limits for the Containment Requirements 6-2 26 6-2. Farfield FEPs and their Screening Classifications 6-28 27 6-3. Waste- and Repository-Induced FEPs and their Screening Classifications . 6-30 28 6-4. Parameters for Fluid Flow in the Repository 6-40 29 6-5. Parameter Values Used in the Average Stoichiometry Gas Generation 30 Model 6-43 31 6-6. Parameters for Actinide Source Term 6-44 32 6-7. Parameters for Colloid Source Term 6-44 33 6-8. Shaft Parameter Values 6-46 34 6-9. Salado Halite Parameter Values 6-47 35 6-10. Anhydrite Interbed Parameter Values 6-48 36 6-11. Interbed Fracture Parameter Values 6-49 37 6-12. DRZ Parameter Values 6-49 38 6-13. Brine Storage Parameter values for Brine Outflow 6-50 39 6-14. Culebra Parameter Values for the BRAGFLO Model 6-51 40 6-15. Log Kj Values (m3/g) Used for Retardation of Actinides in the Culebra . . 6-53
March 31, 1995 x DRAFT-DOE/CAO-2056
Draft 40 CFR 191 Compliance Certification Application
1 6-16. Model Parameter values for the Magenta Member of the Rustier 6-55 2 6-17. Dewey Lake Parameters . . » : i •. . 1 . . . . . . . ̂ . •;-. .:... » i.. : . .v 6-56 3 6-18. Supra-Dewey Lake Unite Parameters ". . . .-. . . . . . '. . : 6-56
4 7-1. Proposed Contents of the Long-Term Protection Plan Addressing Active 5 Institutional Controls 7-6
DRAFT-DOE/CAO-2056 XI March 31, 1995

Draft 40 CFR 191 Compliance Certification Application
1 LIST OF ACRONYMS 2. 3 AASHTO American Association of State Highway and Transportation 4 AC Alternating Current 5 ACA Agency for Conservation Archaeology 6 ACGIH American Conference of Governmental Industrial Hygienists 7 ACGLF Adjustable Center-of-Gravity Lift Fixture 8 AEA Atomic Energy Act 9 AEC Atomic Energy Commission
10 AFFF Aqueous Film Forming Foam 11 AIM Agricultural and Industrial Minerals, Inc. 12 AISC American Institute of Steel Construction 13 ALARA As Low As Reasonably Achievable 14 AMS Atmospheric Monitoring Station 15 ANL-E Argonne National Laboratory-East 16 ANL-W Argonne National Laboratory-West 17 ANSI American National Standards Institute 18 AQCR Air Quality Control Regulations 19 ARM Area Radiation Monitoring 20 ASER Annual Site Environmental Report 21 ASME American Society of Mechanical Engineers 22 ASME NQA-1 American Society of Mechanical Engineers' Nuclear Quality Program 23 Requirements for Nuclear Facilities 24 BEAR Backfill Engineering Analysis Report 25 BIR Baseline Inventory Report 26 BLM U.S. Bureau of Land Management 27 BSEP Brine Sampling and Evaluation Program 28 C&C Consultation and Cooperation 29 C&SH Construction and Salt Handling Shaft 30 CAA Clean Air Act 31 CAAA Clean Air Act Amendment 32 CAM Continuous Air Monitor 33 CAMCON Compliance Assessment Methodology Controller 34 CAO Carlsbad Area Office 35 CB Cabin Baby 36 CBP Central Basin Platform 37 CCDF Complementary Cumulative Distribution Function 38 CDF Cumulative Distribution Function 39 CERCLA Comprehensive Environmental Response, Compensation, and Liability Act 40 CFR Code of Federal Regulations 41 CH Contact-Handled 42 CMR Central Monitoring Room 43 COE U.S. Army Corps of Engineers 44 CRS Closure Review Study 45 CWA Clean Water Act
March 31, 1995 xii DRAFT-DOE/CAO-2056

Draft 40 CFR 191 Compliance Certification Application
1 D&D 2 DBE 3 DBT 4 DC 5 DMG 6 DNAG 7 DOE 8 DOI 9 DOL
10 DOP 11 DOT 12 DQO 13 DRZ 14 DZ 15 EATF 16 EEG 17 EFB 18 EM 19 EM 20 EMP 21 EMR 22 EOC 23 EPA 24 EPCRA 25 ERDA 26 ETEC 27 FC 28 FEIS 29 FEP 30 FFCA 31 FIFRA 32 FLPMA 33 FP 34 FR 35 FSAR 36 FWS 37 GEP 38 HAP 39 HBL 40 HEAST 41 HEPA 42 HERE 43 HLW 44 HMTA 45 HPIC
Decontamination and Decommissioning Design Basis Earthquake ..-.., >< - - , . Design Basis Tornado ' ' v "'*•-Direct Current Delaware Mountain Group The Decade of North American Geology by A.R. Palmer U.S. Department of Energy U.S. Department of Interior U.S. Department of Labor Dioctylphthalate U.S. Department of Transportation Data Quality Objective Disturbed Rock Zone Disturbed Zone Engineered Alternatives Task Force Environmental Evaluation Group Exhaust Filter Building Electromagnetic Emergency Management Environmental Monitoring Plan Environmental Monitoring Report Emergency Operations Center U.S. Environmental Protection Agency Emergency Planning and Community Right-to-Know Act U.S. Energy Research and Development Administration Energy Technology Engineering Center Flood Control Final Environmental Impact Statement Feature, Event, and Process Federal Facilities Compliance Act Federal Insecticide, Fungicide, and Rodenticide Act Federal Land Policy and Management Act Future Panel Federal Register Final Safety Analysis Report Fish and Wildlife Service Good Engineering Practice Hazardous Air Pollutant Health-Based Level Health Effects Assessment Summary Tables High Efficiency Particulate Air Horizontal Emplacement and Retrieval Equipment High-Level Waste Hazardous Materials Transportation Act High Pressure Ionization Chamber
DRAFT-DOE/CAO-2056 Xll l March 31, 1995

Draft 40 CFR 191 Compliance Certification Application
1 HSWA 2 HTMR 3 HVAC 4 HWMR 5 HWMU 6 IAEA 7 ICV 8 IDB 9 INEL
10 IR 11 IRIS 12 ISC 13 KAPL 14 LANL 15 LBL 16 LDR 17 LLNL 18 LLW 19 LTM 20 LWA 21 M&O 22 MB 23 MOC 24 MOUND 25 MOU 26 MP 27 MP 28 MCS 29 MDL 30 MSDS 31 MSHA 32 MWIR 33 NAAQS 34 NACEPT 35 NAS-NRC 36 NDA/NDE 37 NEPA 38 NES 39 NESHAP 40 NGS 41 NHPA 42 NID 43 NIOSH 44 NMAC 45 NMAQCB
Hazardous and Solid Waste Amendments High Temperature Metals Recovery Heating, Ventilation, and Air Conditioning Hazardous Waste Management Regulations Hazardous Waste Management Units International Atomic Energy Act Inner Containment Vessel Integrated Database Idaho National Engineering Laboratory Irrigation Integrated Risk Information System Industrial Source Complex Knolls Atomic Power Laboratory Los Alamos National Laboratory Lawrence Berkeley Laboratory Land Disposal Restrictions Lawrence Livermore National Laboratory Low-Level Waste Long-Term Monitoring Land Withdrawal Act Management and Operations Marker Bed Managing and Operating Contractor Mound Laboratory Memorandum of Understanding Markers Panel Monitoring Program Master Control Station Minimum Detection Level Material Safety Data Sheet Mine Safety and Health Act Mixed Waste Inventory Report National Ambient Air Quality Standards National Advisory Council on Environmental Policy and Technology National Academy of Sciences-National Research Council Non-Destructive Assay/Non-Destructive Examination National Environmental Policy Act Nonradiological Environmental Surveillance National Emission Standards for Hazardous Air Pollutant National Geodetic Survey National Historic Preservation Act Nonradionuclide Inventory Database National Institute of Occupational Safety and Health New Mexico Administrative Code New Mexico Air Quality Control Bureau
March 31, 1995 xiv DRAFT-DOE/CAO-2056

Draft 40 CFR 191 Compliance Certification Application
1 NMBMMR 2 NMD 3 NMDG&F 4 NMED 5 NMHWA 6 NMVP. 7 NPDES 8 NRC 9 NRHP
10 NTPO 11 NTS 12 NWPA 13 OCA 14 OEDC 15 OP&R 16 OPRR 17 ORNL 18 OSHA 19 P&P 20 PA 21 PAD 22 PAX 23 PBWAC 24 PCB 25 PDP 26 PDPP 27 PMS 28 PPE 29 PTB 30 QA 31 QARD 32 QA/QC 33 QAPD 34 QAPjP 35 QAPP 36 R 37 RBP 38 RCRA 39 RCS 40 RCSMP 41 RfC 42 RfD 43 RF 44 RFETS 45 RFP
New Mexico Bureau of Mines and Mineral Resources No-Migration Determination .... .. , -New Mexico Department of Gamearid Fish New Mexico Environment Department New Mexico Hazardous Waste Act No-Migration Variance Petition National Pollutant Discharge Elimination System U.S. Nuclear Regulatory Commission National Register of Historic Places National TRU Program Office Nevada Test Site Nuclear Waste Policy Act Outer Containment Assembly Organization for Economic Cooperation and Development Overpack and Repair Overpack and Repair Room Oak Ridge National Laboratory Occupational Safety and Health Administration Planning and Permitting Performance Assessment Paducah Gaseous Diffusion Plant Private Automatic Exchange Performance-Based Waste Acceptance Criteria Polychlorinated Biphenyl Performance Demonstration Program Performance Demonstration Program Plan Permanent Marker System Personal Protective Equipment Project Technical Baseline Quality Assurance QA Requirements Document Quality Assurance/Quality Control Quality Assurance Program Description Quality Assurance Project Plan Quality Assurance Program Plan Recreation Radiological Baseline Program Resource Conservation and Recovery Act Radar Cross-Section Regulatory Compliance Strategy and Management Plan Reference Concentration Reference Dose Radio Frequency Rocky Flats Environmental Technology Site Rocky Flats Plant
DRAFT-DOE/CAO-2056 xv March 31, 1995

Draft 40 CFR 191 Compliance Certification Application
1 RH 2 ROD 3 RTR 4 SAR 5 SARA 6 SARP 7 SB 8 SDD 9 SDS
10 SDWA 11 SEIS 12 SEPM 13 SF 14 SHPO 15 SHS 16 SLO 17 SNL 18 SOP 19 SPDV 20 SPIC 21 SPM 22 SPM-1 23 SQL 24 SRS 25 SSBI 26 SSZ 27 SWB 28 TDS 29 TOC 30 TRAMPAC 31 TRU 32 TRUCON 33 TRUDOCK 34 TRUPACT 35 TSCA 36 TSP 37 TV 38 UBC 39 UCRL 40 U/G 41 UIC 42 UNAMAP 43 UNM 44 UPS 45 URF
Remote-Handled Record of Decision Real-Time Radiography Safety Analysis Report Superfund Amendments and Reauthorization Act Safety Analysis Report for the TRUPACT-II Shipping Package Support Building System Design Description Subsidence Data Study Safe Drinking Water Act Supplement Environmental Impact Statement Society of Economic Paleontologists and Mineralogists Slope Factor State Historic Preservation Officer Salt Handling Shaft State Land Office Sandia National Laboratories Standard Operating Procedure Site Preliminary Design Validation High Pressure Ionization Chamber Systems Prioritization Methodology Systems Prioritization Method-'! Sample Quantitation Limit Savannah River Site Small-Scale Brine Inflow Site Source Zone Standard Waste Box Total Dissolved Solids Total Organic Carbon TRUPACT-II Authorized Methods for Payload Control Transuranic TRUPACT-II Content TRUPACT Dock Transuranic Package Transporter Toxic Substances Control Act Total Suspended Particulates Television Uniform Building Code University of California Research Laboratories Underground Underground Injection Control Users Network for Applied Modeling of Air Pollution University of New Mexico Uninterruptible Power Supply Unit Risk Factor
March 31, 1995 xvi DRAFT-DOE/CAO-2056

Draft 40 CFR 191 Compliance Certification Application
1 USBM 2 use 3 USFWS 4 USGS 5 UST 6 USTR. 7 UTM 8 voc 9 WAC
10 WACCC 11 WHB 12 WID 13 WIPP 14 WMC 15 WQSP 16 WTWBIR 17 WVDP 18
U.S. Bureau of Mines United State Code . U.S. Fish and Wildlife Service U.S. Geological Survey Underground Storage Tank Underground Storage Tank Regulations Universal Transverse Mercator Volatile Organic Compound Waste Acceptance Criteria Waste Acceptance Criteria Certification Committee Waste Handling Building Waste Isolation Division Waste Isolation Pilot Plant Waste Matrix Code Water Quality Sampling Program WIPP Transuranic Waste Baseline Inventory Report West Valley Demonstration Project
DRAFT-DOE/CAO-2056 xvii March 31, 1995

Draft 40 CFR 191 Compliance Certification Application
1 2 3 Ar
LIST OF AB
argon 4 ARM Area Radiation Monitoring 5 arm atmospheres 6 ave average 7 bbl barrels 8 Bq/gm becquerels per gram 9 dBm2/m: ' decibels per square meter per squa
10 cm/s2 centimeters per second per second 11 D/H Ratio of deuterium to hydrogen 12 °F degrees Fahrenheit 13 ft feet 14 ft3 cubic feet 15 g/s grams per second 16 g acceleration due to gravity 17 GHz gigahertz 18 Gpa gigapascals 19 Hz hertz 20 K Kelvin 21 k permeability 22 K potassium 23 K-Ar potassium-argon 24 K/Na ratio of potassium to sodium 25 kg kilograms 26 kg/m3 kilograms per cubic meter 27 kPa kilopascals 28 L/m3 liters per cubic meter 29 m meter 30 MCS Master Control Station 31 m/s meters per second 32 m square meters 33 m cubic meters 34 m3/kg cubic meters per kilogram 35 mVPa cubic meters per Pascal 36 m3/s cubic meters per second 37 max/min maximum/minimum 38 mg/Ca ratio of magnesium to calcium 39 mg/m3 milligrams per cubic meter 40 MHz megahertz 41 min minute 42 mm Hg millimeters of mercury 43 mol moles 44 MPa megaPascals 45 mph miles per hour
March 31, 1995 J xviii DRAFT-DOE/CAO-2056
Draft 40 CFR 191 Compliance Certification Application
1 mrem 2 mrem/hr 3 /iCi/gm 4 Aig/m3
5 Mgfe 6 MTHm 7 MW 8 N/A 9 nCi/g
10 N/S 11 Pa 12 ppmv 13 psf 14 Rb-Sr 15 rem 16 rem/hr 17 RF 18 P 19 s 20 std dev 21
milliroentgen equivalent man milliroentgen equivalent man per hour microcuries per gram micrograms per cubic meter micrograms per gram metric tons of heavy metal molecular weight not applicable nanocuries per gram not specified Pascals parts per million per volume pounds per square foot rubidium-strontium roentgen equivalent man roentgen equivalent man per hour radio frequency density seconds standard deviation
DRAFT-DOE/CAO-2056 xix March 31, 1995
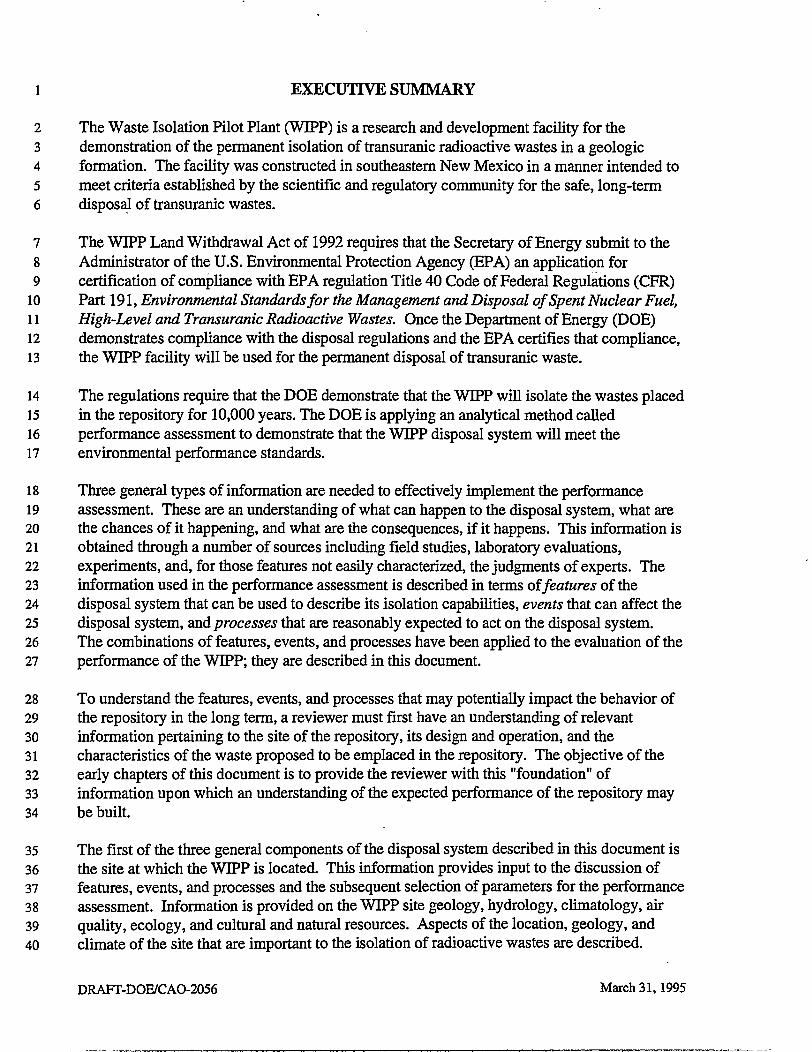
1 EXECUTIVE SUMMARY
2 The Waste Isolation Pilot Plant (WIPP) is a research and development facility for the 3 demonstration of the permanent isolation of transuranic radioactive wastes in a geologic 4 formation. The facility was constructed in southeastern New Mexico in a manner intended to 5 meet criteria established by the scientific and regulatory community for the safe, long-term 6 disposal of transuranic wastes.
7 The WIPP Land Withdrawal Act of 1992 requires that the Secretary of Energy submit to the 8 Administrator of the U.S. Environmental Protection Agency (EPA) an application for 9 certification of compliance with EPA regulation Title 40 Code of Federal Regulations (CFR)
10 Part 191, Environmental Standards for the Management and Disposal of Spent Nuclear Fuel, 11 High-Level and Transuranic Radioactive Wastes. Once the Department of Energy (DOE) 12 demonstrates compliance with the disposal regulations and the EPA certifies that compliance, 13 the WDPP facility will be used for the permanent disposal of transuranic waste.
14 The regulations require that the DOE demonstrate that the WIPP will isolate the wastes placed 15 in the repository for 10,000 years. The DOE is applying an analytical method called 16 performance assessment to demonstrate that the WIPP disposal system will meet the 17 environmental performance standards.
18 Three general types of information are needed to effectively implement the performance 19 assessment. These are an understanding of what can happen to the disposal system, what are 20 the chances of it happening, and what are the consequences, if it happens. This information is 21 obtained through a number of sources including field studies, laboratory evaluations, 22 experiments, and, for those features not easily characterized, the judgments of experts. The 23 information used in the performance assessment is described in terms of features of the 24 disposal system that can be used to describe its isolation capabilities, events that can affect the 25 disposal system, and processes that are reasonably expected to act on the disposal system. 26 The combinations of features, events, and processes have been applied to the evaluation of the 27 performance of the WIPP; they are described in this document.
28 To understand the features, events, and processes that may potentially impact the behavior of 29 the repository in the long term, a reviewer must first have an understanding of relevant 30 information pertaining to the site of the repository, its design and operation, and the 31 characteristics of the waste proposed to be emplaced in the repository. The objective of the 32 early chapters of this document is to provide the reviewer with this "foundation" of 33 information upon which an understanding of the expected performance of the repository may 34 be built.
35 The first of the three general components of the disposal system described in this document is 36 the site at which the WIPP is located. This information provides input to the discussion of 37 features, events, and processes and the subsequent selection of parameters for the performance 38 assessment. Information is provided on the WIPP site geology, hydrology, climatology, air 39 quality, ecology, and cultural and natural resources. Aspects of the location, geology, and 40 climate of the site that are important to the isolation of radioactive wastes are described.
DRAFT-DOE/CAO-2056 March 31,1995

Draft 40 CFR 191 Compliance Certification Application
1 The WIPP disposal horizon is within a rock salt deposit known as the Salado Formation, at a 2 depth of 2,150 feet (650 meters) below the ground surface. The Salado Formation was 3 selected for a variety of reasons, in part because it is regionally extensive, includes continuous 4 beds of salt without complicated structure, is deep enough to reduce the potential for 5 dissolution, and is near enough to the surface to make access reasonable. Due to the plastic 6 nature of the rock, openings in the underground will close with time and encapsulate the 7 waste. In addition, the salt formation may be relatively easily mined using conventional 8 mining techniques.
9 The second general component of the disposal system described here is the WIPP facility. 10 The design and function of those systems at the WIPP facility which are important to the 11 assessment of compliance and in meeting the disposal standards are also presented. 12 Descriptions of surface structures, shafts, underground waste disposal and support facilities, 13 and engineered barriers such as seals are provided to the extent that they are relevant to long-14 term containment.
15 The WIPP facility consists of a 16-square-mile (41.4-square-kilometer) area. The 16 underground waste disposal area of the WIPP facility will ultimately consist of eight panels, 17 each of which contains seven rooms. A 25-year operating time period is estimated to mine 18 and fill all eight panels, the four access drifts, and the crosscuts in the WIPP repository. At 19 the end of the 25-year period, up to 10 years will be required for decontamination and 20 decommissioning and closure activities.
21 The facility is designed to receive up to 6.2 million cubic feet (175,600 cubic meters) of 22 contact-handled transuranic waste and 250,000 cubic feet (7,080 cubic meters) of remote-23 handled transuranic waste. Contact-handled transuranic waste has a surface dose rate of less 24 than 200 millirem per hour; remote-handled transuranic waste has a surface dose rate of 200 25 millirem per hour or greater.
26 The third of the three general components of the disposal system, the waste to be emplaced, is 27 also described. Assessments of the performance of the repository are based in part on 28 assumed characteristics of the wastes including factors such as the levels of radioactivity 29 present in the waste, the amount of moisture in the waste, and the quantities of other materials 30 that might have some affect on the potential for the waste to migrate toward the accessible 31 environment. These characteristics of the wastes are documented. Methods to be employed 32 by the DOE to ensure that only those wastes that are consistent with these descriptions are 33 actually emplaced in the repository are also described. Additional information is provided on 34 the nature of transuranic waste, the sources of the waste, waste inventories, and plans for the 35 further characterization of these wastes.
36 The DOE may only emplace those radioactive wastes in the WIPP that meet both the 37 definition of transuranic waste, as defined in the WIPP Land Withdrawal Act, and which can 38 be certified to the project's waste acceptance criteria. As defined in the Land Withdrawal Act, 39 transuranic waste contains more than 100 nanocuries of alpha-emitting transuranic isotopes 40 per gram of waste, and has a half-life greater than 20 years. In accordance with the Land
March 31, 1995 ES-2 DRAFT-DOE/CAO-2056

Draft 40 CFR191 Compliance Certification Application
1 Withdrawal Act, no remote-handled transuranic waste received at WDPP may have a surface 2 dose rate in excess of 1,000 rem per hour, and no more than 5 percent by volume of the 3 remote-handled transuranic waste may have a surface dose rate in excess of 100 rem per hour.
4 Compliance evaluations and analyses must be of documented quality. DOE quality assurance 5 (QA) policies pertaining to the establishment, maintenance, and implementation of an 6 effective QA program that complies with applicable DOE Orders and EPA requirements are 7 described. It is the DOE's goal to fulfill its mission while ensuring that risks and 8 environmental impacts are identified and minimized, while safety, reliability, and performance 9 are maximized.
10 The results of a preliminary performance assessment of the undisturbed performance of the 11 repository are reported. This analysis will be updated and accompanied by an evaluation of 12 disturbed performance in a revision to this draft document. For comparison with the 13 containment requirements, the DOE has prepared a preliminary mean complementary 14 cumulative distribution function (CCDF) displaying the probability of cumulative 10,000-year 15 normalized radionuclide releases to the accessible environment. This CCDF is shown in 16 Figure ES-1. It is a mean CCDF based on 60 realizations, and it is conditional on an 17 assumption of undisturbed performance. The methodology, modeling system, and parameters 18 used to calculate the CCDF are described.
19 Although the CCDF shown in Figure ES-1 is several orders of magnitude below the release 20 limits stipulated in 40 CFR § 191.13(a), the DOE recognizes that it is insufficient for a 21 demonstration of compliance with 40 CFR Part 191 and cannot be submitted for certification 22 under the proposed 40 CFR Part 194. The CCDF is not in final form because a sufficient 23 level of confidence remains to be established in the modeling system, data, and parameters. In 24 addition, the quality of all of the work supporting the compliance evaluation has not yet been 25 fully documented. Full justification of the models, data, and parameters will be provided in 26 the final application. Analyses of disturbed performance, including consideration of human-27 initiated events and processes, will also be included in the final application.
28 In response to the uncertainties inherent in the prediction of the behavior of the disposal 29 system for a period of 10,000 years, the EPA has established the assurance requirements of 30 40 CFR § 191.14. The assurance requirements are intended to ensure that the level of 31 protection desired by the EPA is achieved. Six assurance requirements addressed in the rule 32 are shown below:
33 • Active institutional controls 34 • Monitoring 35 • Passive institutional controls 36 • Barriers 37 • Resource disincentives 38 • Waste removal.
DRAFT-DOE/CAO-2056 ES-3 March 31,1995

Draft 40 CFR 191 Compliance Certification Application
1 The DOE plans for the implementation of programs to comply with the assurance 2 requirements provisions are described in this document.
3 The quantitative release limits set forth in the containment requirements provisions of 4 40 CFR § 191.13 are one of three long-term numerical performance requirements contained in 5 40 CFR Part 191. The WIPP facility also must comply with numerical performance standards 6 contained in the individual protection requirements and the groundwater protection 7 requirements.
8 Formal dose calculations to evaluate compliance with the individual protection standard have 9 not been performed for the purposes of this Draft Compliance Certification Application. If
10 the final compliance calculations indicate releases to the accessible environment under 11 undisturbed conditions, formal dose calculations will be developed and presented. However, 12 bounding doses for the releases indicated by the prehminary performance assessment are 13 estimated.
14 The bounding analysis is based on the "stock pond-to-cow-to-man" pathway because it is 15 the most important pathway in terms of delivering the maximum exposure to an individual. 16 This pathway consists of a hypothetical well pumping water from the Culebra to a stock water 17 tank. Cattle then drink the water and are subsequently consumed by humans. Under present-18 day conditions for undisturbed performance, this pathway dominates all others by orders of 19 magnitude. A bounding dose of less than 10'8 millirem per year is estimated, based on an 20 analysis of this pathway. This is much lower than the 40 CFR § 191.15 standard of 15 21 millirem per year.
22 To demonstrate compliance with the groundwater protection standard, the DOE must show 23 that releases of radioactivity from the WIPP will not cause levels of radioactivity in any 24 underground source of drinking water to exceed values specified in 40 CFR Part 141. The 25 base-case analysis of the undisturbed performance of the WIPP shows that the total 26 concentration of all radionuclides reaching the accessible environment is 10"3 picocuries per 27 liter, well below the 5 and 15 picocuries per liter standards applicable to underground sources 28 of drinking water.
March 31, 1995 ES-4 DRAFT-DOE/CAO-2056

Draft 40 CFR191 Compliance Certification Application
10°
10'
i i iiiiiii—i i mini—i 11 linn—i i mini—i i mini—i i mini—i i nun,
t l l l l l l l l I I t l l l l l l I I MINI) I t I I Mill I I I HUH I 111 till
2 -m3 10 - 7 icr 6 10' 5 -icr4 i o - 3 icr 2 10'1 100 101 10* 101
Summed Normalized Releases, R
Figure ES-1. Mean CCDF Showing Probability of Cumulative 10,000-year, Normalized Radionuclide Releases from the WTPP.
The CCDF is based on 60 realizations of undisturbed performance. This is a preliminary CCDF based on preliminary models and data,
and does not address all requirements of 40 CFR Part 191 or proposed 40 CFR Part 194.
DRAFT-DOE/CAO-2056 ES-5 March 31, 1995

Draft 40 CFR 191 Compliance Certification Application
l TfflS PAGE INTENTIONALLY LEFT BLANK
March 31, 1995 ES-6 DRAFT-DOE/CAO-2056

1 1.0 INTRODUCTION
2 The U.S. Department of Energy (DOE) is responsible for the disposition of transuranic (TRU) 3 waste generated by the production of nuclear weapons and other defense-related activities. 4 TRU waste is defined as waste that contains more than 100 nanocuries of alpha-emitting 5 transuranic isotopes, with half-lives greater than 20 years, per gram of waste. Some of these 6 radioactive wastes are mixed with hazardous chemicals and are subject to the regulations that 7 apply to the management of hazardous wastes. These wastes are called TRU mixed wastes.
8 Nuclear weapons production began in the 1940s. In 1970, the Atomic Energy Commission 9 (AEC), the predecessor of the DOE, determined that TRU waste required more stringent
10 management and more secure disposal facilities than low-level waste (LLW). Since 1970, 11 DOE has temporarily stored its waste in a manner that will facilitate retrieval and placement 12 in an appropriate disposal facility. Approximately 2.8 million cubic feet (74,500 cubic 13 meters) of these wastes have been generated and are retrievably stored at government 14 installations across the country. It is currently projected that an additional 2.0 million cubic 15 feet (54,400 cubic meters) of these wastes will be generated, although this projection may 16 increase as DOE decontamination and decommissioning and environmental restoration 17 programs progress.
18 The Waste Isolation Pilot Plant (WIPP), located in southeastern New Mexico, was sited and 19 constructed to meet the criteria established by the scientific and regulatory community for the 20 safe, long-term disposal of TRU and TRU mixed wastes. This draft document initiates the 21 process to certify WIPP's compliance with the radioactive waste disposal regulations set forth 22 in Title 40 Code of Federal Regulations (CFR) Part 191, Subparts B and C. The DOE has 23 followed guidance established in Appendix C of 40 CFR Part 191 in drafting this document.
24 Under the authority of the WIPP Land Withdrawal Act (LWA) of 1992, the U.S. 25 Environmental Protection Agency (EPA) recently proposed criteria for certifying and 26 determining WIPP's compliance with the 40 CFR Part 191 disposal standards. This document 27 includes references to the requirements of the proposed rule, 40 CFR Part 194. In addition, 28 the DOE will prepare a separate document to demonstrate compliance with the long-term 29 hazardous waste disposal regulations, as required by the Resource Conservation and Recovery 30 Act (RCRA).
31 1.1 (Draft) Certification Application Synopsis
32 This document contains the following information:
33 Chapter 2 describes the site and surrounding area as it existed prior to construction of the 34 WIPP repository. Geological descriptions include both regional and local geology including 35 structure, subsurface geology, geomorphology, geologic stability, soils, and topography.
36 Chapter 3 describes the facility systems relevant to long-term containment such as location, 37 design, layout, and barriers.
DRAFT-DOE/CAO-2056 March 31,1995
Draft 40 CFR191 Compliance Certification Application
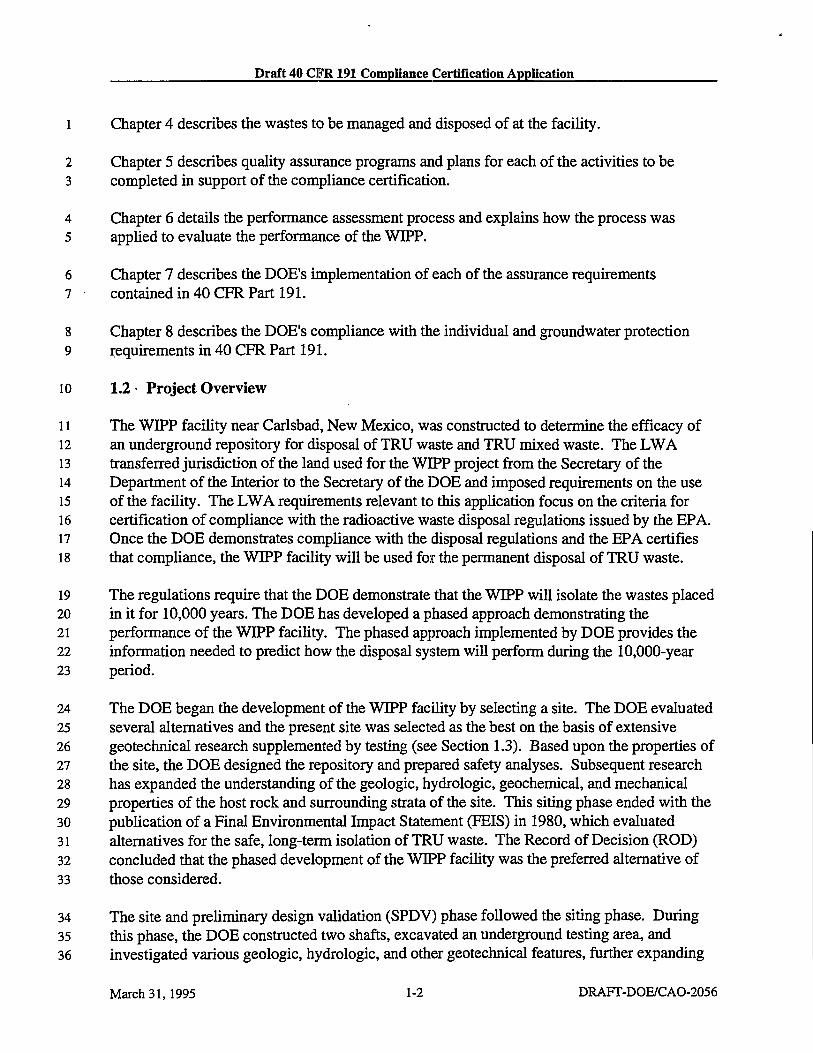
1 Chapter 4 describes the wastes to be managed and disposed of at the facility.
2 Chapter 5 describes quality assurance programs and plans for each of the activities to be 3 completed in support of the compliance certification.
4 Chapter 6 details the performance assessment process and explains how the process was 5 applied to evaluate the performance of the WIPP.
6 Chapter 7 describes the DOE's implementation of each of the assurance requirements 7 contained in 40 CFR Part 191.
8 Chapter 8 describes the DOE's compliance with the individual and groundwater protection
9 requirements in 40 CFR Part 191.
10 1.2 Project Overview
11 The WTPP facility near Carlsbad, New Mexico, was constructed to determine the efficacy of 12 an underground repository for disposal of TRU waste and TRU mixed waste. The LWA 13 transferred jurisdiction of the land used for the WIPP project from the Secretary of the 14 Department of the Interior to the Secretary of the DOE and imposed requirements on the use 15 of the facility. The LWA requirements relevant to this application focus on the criteria for 16 certification of compliance with the radioactive waste disposal regulations issued by the EPA. 17 Once the DOE demonstrates compliance with the disposal regulations and the EPA certifies 18 that compliance, the WIPP facility will be used for the permanent disposal of TRU waste. 19 The regulations require that the DOE demonstrate that the WIPP will isolate the wastes placed 20 in it for 10,000 years. The DOE has developed a phased approach demonstrating the 21 performance of the WIPP facility. The phased approach implemented by DOE provides the 22 information needed to predict how the disposal system will perform during the 10,000-year 23 period.
24 The DOE began the development of the WIPP facility by selecting a site. The DOE evaluated 25 several alternatives and the present site was selected as the best on the basis of extensive 26 geotechnical research supplemented by testing (see Section 1.3). Based upon the properties of 27 the site, the DOE designed the repository and prepared safety analyses. Subsequent research 28 has expanded the understanding of the geologic, hydrologic, geochemical, and mechanical 29 properties of the host rock and surrounding strata of the site. This siting phase ended with the 30 publication of a Final Environmental Impact Statement (FEIS) in 1980, which evaluated 31 alternatives for the safe, long-term isolation of TRU waste. The Record of Decision (ROD) 32 concluded that the phased development of the WIPP facility was the preferred alternative of 33 those considered.
34 The site and prehminary design validation (SPDV) phase followed the siting phase. During 35 this phase, the DOE constructed two shafts, excavated an underground testing area, and 36 investigated various geologic, hydrologic, and other geotechnical features, further expanding
March 31,1995 1-2 DRAFT-DOE/CAO-2056

Draft 40 CFR191 Compliance Certification Application
1 the knowledge of the site's characteristics." Iii addition, the DOE evaluated methods for 2 assessing the long-term performance of the WIPP facility. A series of geologic and 3 hydrologic studies began in 1984 under an^agreeinenfrbetween the DOE and the State of N e w 4 Mexico. The majority of these studies have been completed and site characterization has 5 ended. However, limited geologic and hydrologic studies of the WIPP site continue.
6 The construction phase followed the SPDV, during which the DOE built surface structures for 7 receiving waste and completed underground excavations for waste emplacement. The DOE's 8 decision was reached after all prerequisites for ending construction were met and, documented. 9 These documents used the data collected since 1980 to evaluate the potential short-term and
10 long-term impacts of the WIPP facility.
11 Once the DOE demonstrates compliance with applicable federal and state laws and 12 regulations, the WIPP facility will proceed through three additional phases: a disposal phase, a 13 decommissioning phase, and a post-decommissioning phase. During the disposal phase, 14 expected to last 25 years, the DOE will receive, handle, and emplace TRU and TRU mixed 15 waste in the repository. Additional scientific studies may continue during the disposal phase. 16 The disposal phase will end when the design capacity of the repository is reached.
17 The decommissioning phase will follow the disposal phase. The repository will be prepared 18 for permanent closure during this phase. Surface facilities will be decontaminated and 19 decommissioned, underground excavations will be closed, and shaft seals will be emplaced. 20 The decommissioning phase is expected to last 10 years.
21 Active and passive institutional controls will be implemented during the disposal phase. 22 Active institutional controls include activities such as control of access to the site. Such 23 controls will be implemented consistent with applicable regulations and permit conditions. 24 Only the first 100 years of such controls will be included in the assessment of the disposal 25 system's performance. Passive institutional controls include notification devices such as 26 permanent markers and archives. These controls will be designed to reduce the likelihood of 27 human intrusion to the extent practicable.
28 1.3 Site Selection Process
29 In 1955, the National Academy of Sciences-National Research Council (NAS-NRC) 30 recognized salt as a medium well suited for radioactive waste disposal. Salt has relatively 31 high thermal conductivity (which serves to conduct heat away from waste rapidly) and has 32 favorable plastic (creep) properties, which permit the absorption of significant pressure 33 without fracturing. The existence of large salt deposits demonstrates isolation from 34 circulating groundwaters for long periods of geologic time; the depositional nature and 35 preservation of large salt deposits demonstrate the region has been stable for long periods of 36 time.
DRAFT-DOE/CAO-2056 1-3 March 31,1995

Draft 40 CFR 191 Compliance Certification Application
1 The site selection process for the WIPP began in 1973 with a review of information on 2 potential disposal media. This work focused on salt beds and salt domes. The tentative 3 selection criteria used in the initial stage of the process emphasized radiation and mine safety, 4 hydrologic isolation, and ease of construction. The criteria specified the following conditions: 5 1,000-2,500 feet (305-762 meters) depth to salt, 200 feet (61 meters) minimum of salt 6 thickness, lateral extent of salt sufficient to protect against dissolution, favorable tectonics 7 (low historical seismicity and no salt-flow structures nearby), minimal groundwater, low 8 resource potential, minimum number of existing boreholes, low population density, and 9 maximum use of federal lands. The U.S. Geological Survey (USGS) and the Oak Ridge
10 National Laboratory (ORNL) selected eastern New Mexico as the area which best satisfied the 11 tentative selection criteria from the bedded salt regions surveyed.
12 During the second stage of the selection process, two of the three locations were determined to 13 be inadequate: the Clovis-Portales site, because shallow salt formations had a significant clay 14 content and the purer salt formations were too deep; and the Mescalero Plains area, because of 15 extensive oil field development. After shifting the potential site twice (in order to avoid 16 borehole penetrations of the salt within 2 miles (3.2 kilometers) of the repository border), 17 ORNL selected a site in the Delaware Basin for extensive characterization.
18 In the final stage of the process, eight areas in the Delaware Basin in Eddy and Lea counties 19 were evaluated. The Los Medafios site was determined to be the best site. Eight additional 20 selection criteria were considered at this stage in the process:
21 1. The site should be at least 6 miles (10 kilometers) from the Capitan Limestone, referred to 22 as the "Capitan Reef," a major aquifer, to avoid any possible deformation hazard related to 23 the nearness of the reef.
24 2. To minimize potential conflicts with exploration of mineral resources, the central 4 square 25 miles (10 square kilometers) of the repository itself should not be in the known Potash 26 District, and as little as possible of the surrounding buffer zone should be in the district.
27 3. No part of the central area should be less than 1 mile (1.6 kilometers) away from holes 28 drilled through the Castile Formation into underlying rocks in order to avoid dissolution 29 by water flowing upward through an inadequately plugged borehole.
30 4. Known oil and gas stratigraphic trends should be avoided.
31 5. The nearest dissolution front should be at least 1 mile (1.6 kilometers) from the site.
32 6. The bedding of geological strata should be nearly flat as can be determined by surface 33 geophysical investigations to ensure mine safety and ease of construction and to avoid the 34 need for numerous exploratory holes that could pose a subsequent risk to the integrity of 35 the repository.
March 31, 1995 1-4 DRAFT-DOE/CAO-2056

Draft 40 CFR 191 Compliance Certification Application
1 7. Salt of high purity should be available at depths between 1,000 and 3,000 feet (305 and 2 914 meters) to ensure mine safety and ease of construction. In addition, a salt thickness of 3 200 feet (61 meters) or more is preferred to confine thermal and mechanical effects to the 4 salt.
5 8. The use of state and private land should be minimized, especially in the central area, to 6 simplify land acquisition and to avoid any relocation of residents.
The FEIS provided the basis for making the final decision regarding siting the WIPP facility at the Los Medafios site. This decision weighed the numerous advantages of the location and its suitability against potentially adverse environmental impacts. The WIPP site (Figure 1-1) was selected as the best of the alternatives. The specific horizon in the bedded salt was selected because of its desirable stratigraphic features. The stratigraphy is continuous throughout a large geographic area and clay seams and interbeds of anhydrite or polyhalite are removed from the repository horizon. The facility has been constructed at a horizon such that operational and rock-support problems are minimized. Subsequent validation and construction activities have confirmed that the site's features are suitable for the long-term isolation of radioactive and hazardous wastes. The DOE has concluded that these favorable features offset any enhanced risk of human intrusion associated with resources in the vicinity.
1.4 Regulatory Framework
The EPA is responsible for developing environmental standards for the protection of the public and the environment from radioactivity. The authority for establishing and implementing the regulatory standards applicable to the operation, closure, and long-term performance of the WIPP facility are found in the Atomic Energy Act of 1954, Reorganization Plan Number 3 of 1970, and in the Nuclear Waste Policy Act (NWPA) of 1982. The regulations affecting the radioactive waste disposal operations that will occur at the WIPP are found in 40 CFR Part 191, Environmental Radiation Protection Standards for the Management and Disposal of Spent Nuclear Fuel, High-Level and Transuranic Radioactive Waste.
The EPA is also responsible for establishing criteria to certify if the WIPP complies with the 40 CFR Part 191 Subparts B and C radioactive waste disposal standards. Pursuant to the LWA, the EPA is currently developing these criteria, which will appear in 40 CFR Part 194, Criteria for the Certification and Determination of the Waste Isolation Pilot Plant's Compliance with Environmental Standards for the Management and Disposal of Spent Nuclear Fuel, High-Level and Transuranic Wastes. The EPA recently published the proposed 40 CFR Part 194 rule; the DOE will specifically address the certification criteria when the EPA promulgates the final rule. Once the EPA finalizes 40 CFR Part 194 and the DOE has completed any additional investigations that might be necessary, the DOE will revise this document and prepare a final application for certification.
DRAFT-DOE/CAO-2056 1-5 March 31, 1995
Draft 40 CFR 191 Compliance Certification Application
1 Since the mid-1970s, the EPA has been developing guidance and standards for the 2 management and disposal of radioactive waste. The EPA's final rule, 40 CFR Part 191, was 3 first published on September 19, 1985. This standard was vacated and remanded to the EPA 4 by a Federal Court of Appeals in 1987. The LWA reinstated the 1985 disposal standard 5 except for the aspects of the standard that were specifically questioned by the court (i.e., 6 § 191.15, Individual Protection Requirements, and § 191.16, Ground Water Protection 7 Requirements). On December 20, 1993, the EPA promulgated, effective January 19, 1994, 8 final disposal standards which corrected deficiencies associated with the individual and 9 groundwater protection requirements.
10 40 CFR Part 191 establishes standards and measures of performance for the following aspects 11 of a disposal system:
12 • Waste management and storage 13 • Protection of individuals from radiation exposures for a period of 10,000 years 14 • Protection of groundwater from radioactive contamination for 10,000 years 15 • Isolation of radionuclides sufficient to meet the containment requirements of the disposal 16 system.
17 To demonstrate that a disposal system will comply with 40 CFR Part 191, DOE must 18 demonstrate a reasonable expectation that each performance measure will be satisfied.
19 The assurance requirements, § 191.14, were promulgated in order to provide the confidence 20 needed for long-term compliance with the containment requirements in § 191.13. They 21 include: (1) active and passive institutional controls to preclude or mitigate the potential for 22 human disturbance of the repository for an extended period of time, (2) natural and engineered 23 barriers to ensure the integrity of the containment system, and (3) other measures taken to 24 enhance confidence in the disposal system performance.
25 1.5 Program for Evaluating Long-Term Performance
26 For evaluating compliance with the long-term performance requirements of 40 CFR Part 191, 27 the DOE will collect data and perform analyses. The DOE uses a technique developed 28 especially for predicting the behavior of geologic repositories over the thousands of years 29 required for waste isolation. This technique is performance assessment-a multi-disciplinary, 30 iterative, analytical process that begins by using available information that characterizes the 31 waste and the disposal system (the design of the repository, the repository seals, and the 32 natural barriers provided by the host rock and the surrounding formations). The DOE uses 33 performance assessment to identify the processes (i.e., phenomena that might develop over 34 long periods of time) and events that might affect the system and then examines the effects of 35 these processes and events on the performance of the system. The DOE subsequently uses 36 performance assessment to estimate the releases of radionuclides, based on the probabilities of
March 31, 1995 1-6 DRAFT-DOE/CAO-2056

Draft 40 CFR 191 Compliance Certification Application
ARTESIA'
N
A
Location Map
Q FEDERAL HIGHWAY Q SWE KGKWAY
FAMINE ROAD
Figure 1-1. WIPP Location in Southeastern New Mexico
DRAFT-DOE/CAO-2056 1-7 March 31,1995

Draft 40 CFR 191 Compliance Certification Application
TfflS PAGE INTENTIONALLY LEFT BLANK
March 31, 1995 1-8 DRAFT-DOE/CAO-2056

Draft 40 CFR191 Compliance Certification Application
1 these processes and events occurring and the consequences. Sensitivity analyses are used by 2 the DOE to determine which characteristics of the disposal system exert the greatest effect on 3 performance. The results of sensitivity analyses will be provided in the final application. The 4 results of performance assessment are used by the DOE in the 40 CFR Part 191 compliance 5 program to assess the disposal system's behavior and the possible environmental releases.
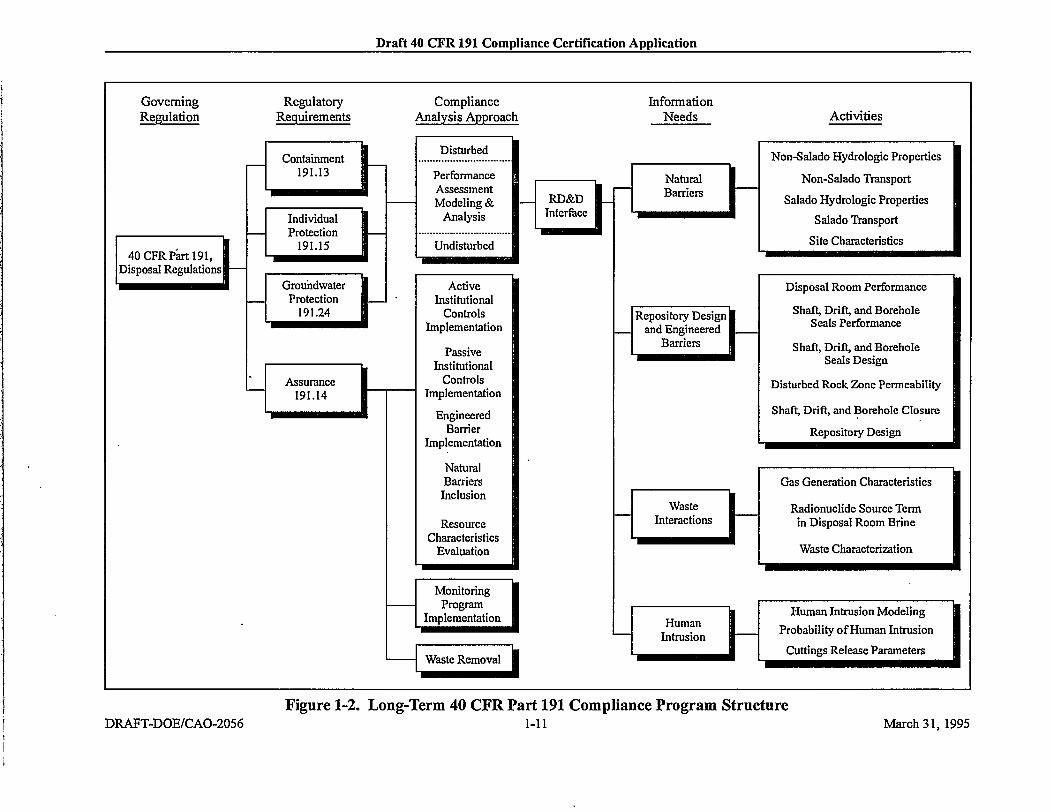
6 The structure of the DOE's program for assessing the ability of the WIPP to satisfy the 7 requirements in 40 CFR Part 191 is illustrated in Figure 1-2. Performance assessment 8 modeling and analyses will provide the quantitative evaluation of long-term radionuclide 9 isolation and containment. Information necessary to simulate long-term performance must
10 adequately represent the repository as well as the interactions of the waste with the disposal 11 system. The DOE must also evaluate the probability of human intrusion and its impacts. The 12 WIPP performance assessment method has been reviewed by the NAS, the Environmental 13 Evaluation Group (EEG), and experts in and outside the United States.
DRAFT-DOE/CAO-2056 1-9 March 31,1995
Draft 40 CFR 191 Compliance Certification Application
l TfflS PAGE INTENTIONALLY LEFT BLANK
March 31,1995 1-10 DRAFT-DOE/CAO-2056
Draft 40 CFR 191 Compliance Certification Application
Governing Regulation
40 CFR Part 191, Disposal Regulations!
Regulatory Requirements
Containment 191.13
Individual Protection
191.15
Groundwater Protection
191.24
Assurance 191.14
Compliance Analysis Approach
h Disturbed
Performance Assessment Modeling &
Analysis
Undisturbed
Active Institutional
Controls Implementation
Passive Institutional
Controls Implementation
Engineered Barrier
Implementation
Natural Barriers Inclusion
Resource Characteristics
Evaluation
Monitoring Program
Implementation
Waste Removal
RD&D Interface
J
Information Needs
Natural Barriers
Repository Design | and Engineered
Barriers
Waste Interactions
Human Intrusion
^
Activities
Non-Salado Hydrologic Properties
Non-Salado Transport
Salado Hydrologic Properties
Salado Transport
Site Characteristics
Disposal Room Performance
Shaft, Drift, and Borehole Seals Performance
Shaft, Drift, and Borehole Seals Design
Disturbed Rock Zone Permeability
Shaft, Drift, and Borehole Closure
Repository Design
Gas Generation Characteristics
Radionuclide Source Term in Disposal Room Brine
Waste Characterization
Human Intrusion Modeling Probability of Human Intrusion
Cuttings Release Parameters
DRAFT-DOE/CAO-2056 Figure 1-2. Long-Term 40 CFR Part 191 Compliance Program Structure
1-11 March 31,1995

Draft 40 CFR 191 Compliance Certification Application
l TfflS PAGE INTENTIONALLY LEFT BLANK
March 31, 1995 1-12 DRAFT-DOE/CAO-2056
Draft 40 CFR191 Compliance Certification Application
1 REFERENCES
2 EPA (U.S. Environmental Protection Agency). 1995.40 CFR Part 194: Criteria for the 3 Certification and Determination of the Waste Isolation Pilot Plant's Compliance with 4 Environmental Standards for the Management and Disposal of Spent Nuclear Fuel, High-5 Level and Transuranic Radioactive Wastes; Proposed Rule. Federal Register, Vol. 60, pp. 6 5765-5791, January 30,1995. Office of Air and Radiation, Washington, D.C.
7 U.S. Congress. 1979. DepartmentofEnergy National Security and Military Applications of 8 Nuclear Energy Authorization Act. Public Law 96-164, December 1979. 96th Congress, 9 Washington, D.C.
10 U.S. Congress. 1992. Waste Isolation Pilot Plant Land Withdrawal Act. Public Law 102-11 579, October 1992. 102nd Congress, Washington, D.C.
1-13 March 31,1995

Draft 40 CFR 191 Compliance Certification Application
l TfflS PAGE INTENTIONALLY LEFT BLANK
March 31, 1995 1-14 DRAFT-DOE/CAO-2056

Draft 40 CFR191 Compliance Certification Application
1 BIBLIOGRAPHY
2 DOE (U.S. Department of Energy). 1980. Final Environmental Impact Statement, Waste 3 Isolation Pilot Plant. DOE/EIS-0026, Vols. 1 and 2. Office of Environmental Restoration 4 and Waste Management, Washington, D.C.
5 DOE (U.S. Department of Energy). 1981. Waste Isolation Pilot Plant: Record of Decision. 6 Federal Register, Vol. 46, No. 18, p. 9162, January 28,1981. Office of Environmental 7 Restoration and Waste Management, Washington D.C.
8 DOE (U.S. Department of Energy). 1990. Final Safety Analysis Report. WP02-9, Rev. 0, 9 May 1990. Westinghouse Electric Corporation, Waste Isolation Division, Carlsbad, NM.
10 EPA (U.S. Environmental Protection Agency). 1985. 40 CFR Part 191: Environmental 11 Standards for the Management and Disposal of Spent Nuclear Fuel, High-Level and 12 Transuranic Radioactive Waste: Final Rule. Federal Register, Vol. 50, No. 182, pp. 13 38066-38089, September 19,1985. Office of Radiation and Air, Washington, D.C.
14 EPA (U.S. Environmental Protection Agency). 1990. Conditional No-Migration 15 Determination for the Department of Energy Waste Isolation Pilot Plant. Federal Register, 16 Vol. 55, No. 220, p. 47700, November 14,1990. Office of Solid Waste and Emergency 17 Response, Washington D.C.
18 EPA (U.S. Environmental Protection Agency). 1993. Environmental Radiation Protection 19 Standards for the Management and Disposal of Spent Nuclear Fuel, High-Level and 20 Transuranic Radioactive Waste. Federal Register, Vol. 58, No. 242, p. 66398, December 20, 21 1993. Office of Radiation and Indoor Air, Washington D.C.
22 NAS-NRC (National Academy of Sciences-National Research Council). 1957. Disposal of 23 Radioactive Wastes on Land. Publication 519. National Academy of Sciences, Washington, 24 D.C.
DRAFT-DOE/CAO-2056 1-15 March 31,1995

1 2.0 SITE CHARACTERIZATION
2 The U.S. Department of Energy (DOE) uses the performance assessment methodology 3 described in Section 6.1 to demonstrate that the Waste Isolation Pilot Plant (WIPP) disposal 4 system will meet the environmental performance standards of Title 40 of the Code of Federal 5 Regulations (CFR) Part 191 Subparts B and C. In order to effectively use performance 6 assessment, three inputs are necessary: what can happen to the disposal system? what are the 7 chances of it happening? and what are the consequences if it happens? The information 8. shaping the substance of these inputs comes from a number of sources including field studies, 9 laboratory evaluations, experiments, and, in the case of those feature not easily characterized,
10 the judgment of experts. The information used in performance assessment is described in 11 terms of features of the disposal system that can be used to describe its isolation capability; 12 events that can affect the disposal system, and processes that are reasonably expected to act on 13 the disposal system. The combinations of features, events, and processes (FEPs) that have 14 been applied to the WIPP are discussed in detail in Section 6.2. This chapter provides the 15 information supporting the Section 6.2 discussion of FEPs and the subsequent selection of 16 parameters for the performance assessment.
17 The DOE's approach in selecting the WIPP site was, in essence, a screening process intended 18 to emphasize selection of an area that possessed as many of the favorable FEPs as possible 19 while excluding the unfavorable FEPs. The actual screening process used by the DOE is 20 discussed in detail in numerous documents such as the Final Environmental Impact Statement 21 (FEIS) which the DOE published in 1980 (DOE 1980 in the bibliography). The details of the 22 DOE's site screening and selection are discussed explicitly in the scenario screening process in 23 Section 6.2.
24 The DOE's site screening and selection and subsequent characterization led to the 25 identification of specific FEPs that required in-depth evaluation in order to form the basis for 26 evaluation in the performance assessment. The DOE dealt with these FEPs, for the most part, 27 with studies identified in an agreement signed by the DOE and the State of New Mexico (see 28 the reference to the Consultation and Cooperation [C&C] agreement in the bibliography). A 29 list of these "issues" is presented in Table 2-1 within the context of the scenario development 30 process in Section 6.2 where these issues are either retained for inclusion in the performance 31 assessment or are rejected for reasons detailed in Section 6.2. Table 2-1 also includes some 32 FEPs that are considered to be human-induced. These are included to the extent they require 33 information about the natural system for their screening and associated scenario development. 34 The DOE's basis for retention or elimination of FEPs in the scenario development process is 35 based on the information presented in this chapter. This information consists of the results of 36 field studies, laboratory studies, and expert judgment.
37 Specifically, in this chapter the DOE describes the WIPP site geology, hydrology, 38 climatology, air quality, ecology, and cultural and natural resources. This chapter's purpose is 39 to provide information on the disposal system's natural FEPs that are relevant to the 40 assessment of the WIPP site as a potential repository for transuranic (TRU) waste and to 41 establish: (1) the favorable characteristics of the site, (2) background environmental quality, 42 and (3) parameters needed to conduct performance assessments.
DRAFT-DOE/CAO-2056 March 31,1995

Draft 40 CFR 191 Compliance Certification Application
1 2
Table 2-1. Issues Related to the Natural Environment that were Evaluated for the WIPP Performance Assessment Scenario Screening
. OFEP Topical Heading : -?-...-v 7-\-''"V "' ;' :JR3PPIssue- . . " '. "Discussion Geological Effects
Regional tectonics Regional uplift § 2.1.5.1 Regional subsidence § 2.1.5.1
Volcanic activity Volcanism §2.1.5.3 Magmatic activity Regional dikes § 2.1.5.3 Fault movement Movements on faults § 2.1.5.2
Fault activation § 2.1.5.2 Formation of new faults § 2.1.5.2
Seismic activity Earthquakes §2.6 Natural seismicity §2.6 Externally induced seismicity §2.6
Salt deformation Deformation §2.1.6.1 Deep dissolution Breccia pipes §2.1.6.2
Castile and Salado § 2.1.6.2 Collapse breccias § 2.1.6.2
Mineralogical changes Fracture mineralization—Culebra § 2.1.3.5.2 Dissolution of fracture fillings—Culebra § 2.1.3.5.2 Natural rock properties—general §2.1.3 Salinity § 2.4.2.1, § 2.7 Changes in sorptive surfaces—Culebra
Climate Effects §2.1.3.5.2
Climate change Climate change—historic and current § 2.5.1, § 2.5.2 Glaciation Glacial and interglacial cycling
Geomorphological Effects § 2.5.1
Erosion and sedimentation Wind erosion §2.1.4.2 Major incision §2.1.4.2 Changes in topography § 2.1.4.2 Surface flow characteristics § 2.1.4.2
Surface and Near-Surface Hydrological Effects Flooding Flooding § 2.1.4.2,
§ 2.2.2 Shallow dissolution and soil Surface-water chemistry § 2.2.2 development Soil properties §2.1.3.10 Infiltration and recharge Variation in groundwater recharge § 2.2.3
Precipitation, temperature and soil/water balance
§ 2.5.2
Surface hydrological change § 2.2.2 Near-surface runoff processes § 2.2.2 Surface flow characteristics § 2.2.2 River flow and lake level changes § 2.2.2 Groundwater discharge to surface-water § 2.2.3 Groundwater discharge to springs
Ecological Effects § 2.2.3
Vegetational changes Land use changes § 2.3.2.2 Terrestrial ecological development
Farfield Flow and Transport § 2.3.2.3
Groundwater flow Rock properties § 2.2.1
March 31, 1995 2-2 DRAFT-DOE/CAO-2056

Draft 40 CFR191 Compliance Certification Application
FEP Topical Heading .WIPP Issue Discussion Groundwater flow Dewatering and water level § 2.2.1.7
(continued) Saturated groundwater flow—Rustler § 2.2.1.5 Groundwater recharge § 2.2.3 Groundwater conditions (saturated and unsaturated)
§ 2.2.1
Changes in geometry of the flow system—Rustler
§ 2.2.1.5
Changes in driving forces of the flow § 2.2.1.5, system—supra-Salado § 2.2.1.6
Changes in groundwater flow direction—Culebra
§ 2.2.1.5.2
Fracture—Culebra § 2.2.1.5.2 Channelling—Culebra § 2.2.1.5.2
Groundwater geochemistry and Groundwater composition § 2.2.1.5.2 radionuclide transport changes—Culebra
Drilling Deep drilling Exploratory boreholes: intrusive NMBMMR
1995 Archeological investigations: intrusive § 2.3.2.3 Geothermal energy investigations Appendix DEL a
Exploratory boreholes: non-intrusive Appendix DEL" Drilling: enhanced oil and gas production NMBMMR (non-intrusive) 1995 Drilling: liquid waste disposal Appendix DEL" Drilling: hydrocarbon storage (non-intrusive)
Appendix DEL"
Drilling: archaeology (non-intrusive) Appendix DEL 3
Shallow drilling Exploratory boreholes (potash, water) NMBMMR 1995
Post -Drilling Events and Processes Fluid extraction Groundwater extraction § 2.2.1.6.1
Ranching § 2.2.1.6.1 Fluid injection Injection wells
Excavations Appendix DEL3
Mining Potash mining § 2.3.1.1 Mining other than potash
Surface Activities § 2.3.1
Irrigation Irrigation—Santa Rosa Explosions
§ 2.2.1.6.2
Underground testing of nuclear Underground weapons testing § 2.3.2.3 devices
"Appendix DEL is in press.
19 The DOE is developing the WIPP as a deep geologic repository for disposal of TRU waste 20 from government defense installations across the country. In order for the DOE to formulate a 21 reasonable expectation of site conditions far into the future, the DOE has characterized the site 22 in detail to provide basic data for a variety of geologic and hydrologic parameters. The DOE 23 uses these parameters in computational models to predict the likelihood and possible
DRAFT-DOE/CAO-2056 2-3 March 31,1995
Draft 40 CFR191 Compliance Certification Application
1 consequences of various scenarios expected to apply to the WIPP site over a 10,000-year 2 period as specified in the regulations. The DOE will also use the computational models to 3 evaluate the efficacy of the natural and man-made barriers in meeting environmental 4 performance standards (Chapter 6). Results of these predictive models will be used by the 5 DOE to demonstrate that the DOE has a reasonable expectation that the waste will not reach 6 the accessible environment in quantities exceeding the regulatory limits.
7 The DOE has prepared this chapter to be consistent with what it believes is necessary to 8 demonstrate compliance with the long-term disposal standards of 40 CFR Part 191. The 9 contents follow, for the most part, recommendations found in regulatory guidance documents
10 as reflected in the DOE's Format and Content Guide for Regulatory Submittals (DOE 1994). 11 Specific guidance is scheduled to be issued by the U.S. Environmental Protection Agency 12 (EPA) as part of the criteria for certification of the DOE's compliance at WIPP. This guidance 13 will be part of 40 CFR Part 194. When the final rule is issued, the DOE may have to adjust 14 the contents of this chapter to include additional topics, to provide greater detail on topics 15 already included, or to reformat the contents in accordance with EPA guidance. These 16 adjustments will be made for the final compliance certification application.
17 The DOE located the WIPP site 26 miles (42 kilometers) east of Carlsbad, New Mexico, in 18 Eddy County (Figure 2-1). The region surrounding the WIPP site has been under study for 19 many years, and exploration of both potash and hydrocarbon deposits has provided extensive 20 knowledge of the geology of the region. Two exploratory holes were drilled by the federal 21 government in 1974 at a location northeast of the present site; that location was abandoned in 22 1975 as a possible repository site after U.S. Energy Research and Development 23 Administration (ERDA)-6 was drilled and unacceptable structure and pressurized brine were 24 encountered. The results of these investigations are reported in Powers et al. (1978, p. 2-6; 25 included in this document as Appendix GCR). During late 1975 and early 1976, the ERDA 26 identified the present site and an initial exploratory hole (ERDA-9) was drilled. By the time 27 an initial phase of site characterization was completed in August 1978,47 holes had been 28 drilled or were in progress for various hydrologic and geologic purposes. Geophysical 29 techniques were applied to augment data collected from boreholes. Since 1978, the DOE has 30 drilled additional holes to support hydrologic programs, geologic programs, and facility 31 design. Geophysical logs, cores, basic data reports, geochemical sampling and testing, and 32 hydrological testing and analyses are reported by the DOE and its scientific advisor, Sandia 33 National Laboratories (SNL), in numerous documents and maintained in reference libraries 34 that are available to the public such as the Sandia WIPP Central File (in Albuquerque, New 35 Mexico). Many of those documents form the basis for the DOE's assertions in this 36 application. Where necessary, specific references from these documents are cited to reinforce 37 the statements being made. Additional sources of information on the various topics in this 38 section are listed in a bibliography at the end of the chapter.
39 Biological studies of the site began in 1975 to gather information for the Environmental 40 Impact Statement. Meteorological studies began in 1976, and economic studies were initiated 41 in 1977. Baseline environmental data were initially reported in 1977 and are now updated 42 annually by the DOE.
March 31, 1995 2-4 DRAFT-DOE/CAO-2056
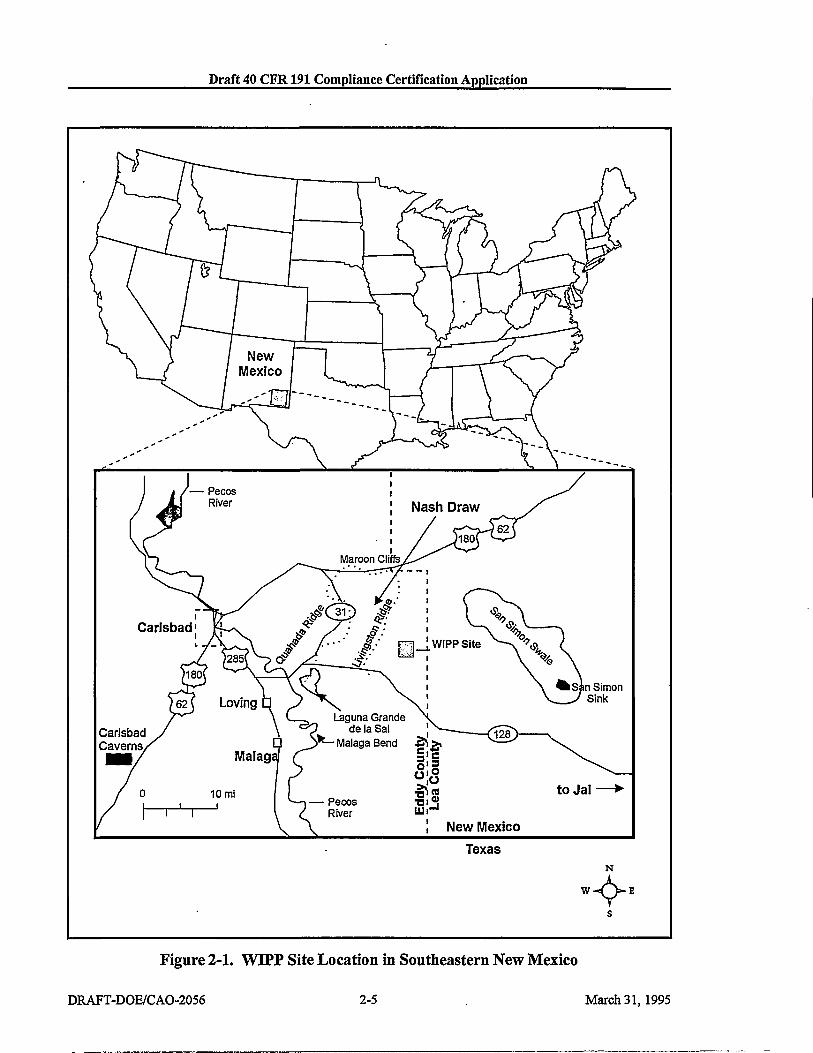
Draft 40 CFR 191 Compliance Certification Application
New Mexico
Texas N
W ^ > ,
Figure 2-1. WIPP Site Location in Southeastern New Mexico
DRAFT-DOE/CAO-2056 2-5 March 31, 1995

Draft 40 CFR 191 Compliance Certification Application
l TfflS PAGE INTENTIONALLY LEFT BLANK
March 31, 1995 2-6 DRAFT-DOE/CAO-2056

Draft 40 CFR 191 Compliance Certification Application
1 The DOE selected the WIPP disposal horizon to be located within a rock salt deposit known 2 as the Salado Formation (hereafter referred to as the Salado) at a depth of 2,150 feet (650 3 meters) below the ground surface. The Salado is regionally extensive; includes continuous 4 beds of salt without complicated structure; is deep with little potential for dissolution; and is 5 near enough to the surface to make access reasonable. Particular site selection criteria 6 narrowed the choices when the present site was located during 1975-76 as discussed in 7 Appendix GCR (p. 2-100.
8 One reason the DOE has for presenting a discussion of site characteristics and other features is 9 to document how the DOE arrived at the various parameters used in the numerical codes to
10 predict disposal system performance. This information is presented in the course of the 11 discussions that are presented in the following chapters. A discussion of the actual values and 12 distributions used for the performance assessment is reserved for Chapter 6. For those 13 parameters that have been determined to be more important in terms of impact on overall 14 system performance evaluation, the DOE is providing additional detail in appendices, such as 15 Appendix PAR. In Appendix PAR, parameters are summarized in the form of parameter 16 sheets. Where necessary, parameter sheets provide probability distribution functions and 17 supporting data values. For this draft application, example parameter sheets are provided. 18 Additional parameters will be included in the final application.
19 2.1 Geology
20 A thorough description of the WIPP facility's natural environmental setting is considered 21 crucial by the DOE for a demonstration of compliance with the disposal standards. In this 22 section, the DOE is addressing environmental factors and long-term environmental changes 23 that are important for assessing the waste isolation potential of the disposal system. The detail 24 provided by the DOE is believed to be sufficient to assess the degree of waste isolation 25 achievable. The first of these environmental factors is the geology of the site and vicinity.
26 Geological data have been collected from the WIPP site and surrounding area for use in 27 evaluating the site's suitability as a radioactive waste repository. These data have been 28 collected principally by the DOE and its predecessor agencies, the United States Geological 29 Survey (USGS), the New Mexico Bureau of Mines and Mineral Resources (NMBMMR), and 30 private organizations engaged in natural resource exploration and extraction. The DOE has 31 analyzed the data provided in the following discussion and believes it supports the DOE's 32 position that the WIPP site is suitable for the long-term isolation of radioactive waste. Many 33 issues have been discussed, investigated, and resolved in order for the DOE to reach the 34 conclusion that the site is suitable. The DOE discusses these issues in the following with 35 emphasis on the resolution of the issues. The majority of the data collected have been 36 reported or summarized in two reports which the DOE has included as Appendix GCR and 37 Appendix SUM.
DRAFT-DOE/CAO-2056 2-7 March 31,1995

Draft 40 CFR191 Compliance Certification Application
1 2.1.1 Data Sources and Quality
2 The geology of southeastern New Mexico has been of great interest for more than a century. 3 The Guadalupe Mountains have become a common visiting and research point for geologists 4 because of the spectacular exposures of Permian-age reef rocks and related facies. (See 5 Shumard [1858], Crandall [1929], Newell et al. [1953], and Dunham [1972] in the 6 bibliography for a historical perspective.) Because of intense interest in both hydrocarbon and 7 potash resources in the region, there exists a large volume of data as potential background for 8 the WIPP site, though some data are proprietary. Finally, there is the geological information 9 developed directly and indirectly by studies sponsored by WIPP; it ranges from raw data to
10 interpretive reports.
11 Elements of the geology of southeastern New Mexico have been discussed or described in 12 professional journals or technical documents from many different sources. These types of 13 articles are an important source of information and, where there is no contrary evidence, the 14 information in these articles is included through reference where subject material is relevant. 15 Implicit rules of professional conduct of research and reporting are assumed to have been 16 applied, and journal and editorial review has normally been applied. Certain elements of the 17 geology presented in such sources have been deemed critical to the WIPP, and have been the 18 subject of specific WIPP-sponsored studies.
19 The geological data which the DOE has developed explicitly for the WIPP project have been 20 produced over a 20-year period by different organizations and contractors, during which time 21 national standards for quality assurance (QA) and documentation have evolved. Early project 22 data, especially, do not have all the same elements of QA that more recent data may have; for 23 at least some studies there is a sufficient record to follow clearly the field programs, 24 objectives, and results. Other data from project records will be incorporated here through 25 specific reference or appendices. The DOE's activities to specifically address the quality of 26 site characterization and other experimental data are described in Chapter 5.0.
27 Geological data have been developed by the DOE through a variety of WIPP-sponsored 28 studies using drilling, mapping or other direct observation, geophysical techniques, and 29 laboratory work. Most of the techniques and statistics of data acquisition will be incorporated 30 by specific discussion. Boreholes are, however, a major source of geological data for the 31 WIPP and surrounding area. From boreholes come raw data (e.g., depth measurements, 32 amount of core, geophysical logs) that provide the basis for point data and interpreted data 33 sets. These data are the base for computing other useful elements such as structure maps for 34 selected stratigraphic horizons or isopachs (thickness) of selected stratigraphic intervals.
35 The borehole data set in Appendix BH is included as reference information. A map of some 36 borehole locations in this data set used in this chapter is provided in Figure 2-2.
March 31, 1995 2-8 DRAFT-DOE/CAO-2056

Draft 40 CFR 191 Compliance Certification Application
R29E R30E
I t WIPPT7
R31E . W I P P 2 8
,WIPP30
,FRDA<;
R32E
,AEC7
0)
p
,AEC8
E«a" nor?.
i l WIPP Site Boundary TwiPPM HjjB-f
- W I P P g „ W I f '33
•*" I WIPP M
, W I P P «
HJUj, » -WIPP21 •—ERDA9~ m «
H2A-» » - H l • ^ H I 5
-WJETJ2 .WIPP29 «as_ «4t-«
I , P 1 8
P
, P17 , H 1 7
#JI12
, H7C
t FRI)A10
, 11SOS4
(0 to
P , H10B
, m r
t nvr.t.F.
N
S , H H
R29E R30E R31E
I 3
R32E
Borehole Location
Figure 2-2. Borehole Location Map
DRAFT-DOE/CAO-2056 2-9 March 31.1995

Draft 40 CFR 191 Compliance Certification Application
l THIS PAGE INTENTIONALLY LEFT BLANK
March 31,1995 2-10 DRAFT-DOE/CAO-2056
Draft 40 CFR191 Compliance Certification Application
1 2.1.2 Geologic History
2 In this section the DOE summarizes the more important points of the geologic history within 3 about 200 miles (320 kilometers) of the WIPP site, with emphasis on more recent or nearby 4 events. Major elements of the geological history from the end of the Precambrian in the 5 vicinity of the WIPP site were compiled in graphic form (Figure 2-3). The geologic time scale 6 that the DOE uses for WIPP is based on the compilation by Palmer (1983, pp. 503-504) for 7 The Decade of North American Geology (DNAG). There are several compiled sources of 8 chronologic data related to different reference sections or methods (see, for example, Harland 9 et al. [1982] and Salvador [1985] in the bibliography). Although most of these sources show
10 generally similar ages for chronostratigraphic boundaries, there is no consensus on either 11 reference boundaries or most-representative ages. The DNAG scale is accepted by the DOE 12 as a standard that is useful and sufficient for WIPP purposes, as no known critical parameters 13 require more accurate or precise dates.
14 The geologic history in this region can conveniently be subdivided into three general phases:
15 • A Precambrian period, represented by metamorpbic and igneous rocks, ranging in age 16 from about 1.5 to 1.0 billion years old 17 • A period principally of erosion from about 1.0 to 0.5 billion years, as there is not known to 18 be any rock record from this time 19 • An interval from 0.5 billion years to the present represented by a more complex set of 20 mainly sedimentary rocks and shorter periods of erosion and dissolution.
21 This latter phase is the main subject of the DOE's detailed discussion of this text.
22 Precambrian crystalline rocks have been penetrated in only a few deep boreholes in the 23 vicinity of the WIPP, and therefore relatively little petrological information is available. 24 Foster (1974, fig. 3) extrapolated the elevation of the Precambrian surface under the area of 25 WIPP as being between 14,500 feet (4.42 kilometers) and 15,000 feet (4.57 kilometers) below 26 sea level; the site surface at WIPP is about 3,400 feet (1,036 meters) above sea level. Keesey 27 (1976, vol. I, exhibit no. 2) projected a depth to the top of Precambrian rocks of about 18,200 28 feet (5,545 meters) based on the geology of the nearby borehole in Section 15, T22S, R3 IE.
29 Precambrian rocks of a variety of types crop out in the following locations: the Sacramento 30 Mountains northwest of WIPP; around the Sierra Diablo and Baylor Mountains near Van 31 Horn, Texas; west of the Guadalupe Mountains at Pump Station Hills; and in the Franklin 32 Mountains near El Paso, Texas. East of the WIPP, a relatively large number of boreholes on 33 the Central Basin Platform have penetrated the top of the Precambrian (Foster 1974, fig. 3). 34 As summarized by Foster (1974, p. 10), Precambrian rocks in the area considered similar to 35 those in the vicinity of the site range in age from about 1.14 to 1.35 billion years.
DRAFT-DOE/CAO-2056 2-11 March 31,1995

Draft 40 CFR 191 Compliance Certification Application
1 For a period of about 500 million years (1.1 to 0.6 billion years ago), there is no certain rock 2 record in the region around the WIPP. The most likely rock record for this period may be the 3 Van Horn sandstone, but there is no conclusive evidence that it represents part of this time 4 period. The region is generally interpreted to have been subject to erosion for much of the 5 period, until the Bliss sandstone began to accumulate during the Cambrian.
6 2.1.3 Stratigraphy and Lithology in the Vicinity of the WIPP Site
7 In this section the DOE presents the stratigraphy and lithology of the Paleozoic and younger 8 rocks underlying the WIPP site and vicinity (Figure 2-4), emphasizing the units nearer the 9 surface. Details begin with the Permian (Guadalupian) Bell Canyon Formation (hereafter
10 referred to as the Bell Canyon)—the upper unit of the Delaware Mountain Group—because 11 this is the uppermost water-bearing formation below the evaporites. The principal 12 stratigraphic data are the chronologic sequence, age, and extent of rock units, including some 13 of the nearby relevant fades changes. Characteristics such as thickness and depth are 14 summarized here from published sources for deeper rocks and are mainly based on data sets 15 presented in Appendix BH for shallower rocks (above the Bell Canyon). The lithologies of 16 upper formations and some formation members are described.
17 2.1.3.1 General Stratigraphy and Lithology below the Bell Canyon Formation
18 As stated previously, the Precambrian basement near the site is projected to be about 18,200 19 feet (5,545 meters) below the surface (Keesey 1976, vol. n, exhibit no. 2), consistent with 20 information presented by Foster in 1974. Ages of similar rock suites in the region range from 21 about 1.14 to 1.35 billion years.
22 The basal units overlying Precambrian rocks are clastic rocks commonly attributed either to 23 the Bliss sandstone or the Ellenberger Group (Foster 1974, p. lQff), considered most likely to 24 be Ordovician in age in this area. The Ordovician system comprises the Ellenberger, 25 Simpson, and Montoya groups in the northern Delaware Basin. Carbonates are predominant 26 in these groups, with sandstones and shales common in the Simpson group. Foster (1974, 27 p. 12) reported 975 feet (297 meters) of Ordovician north of the site area and extrapolated a 28 thicker section of about 1,300 feet (396 meters) at the present site (p. 17). Keesey (1976, vol. 29 n, exhibit no. 2) projected a thickness of 1,200 feet (366 meters) for the Ordovician system 30 within the site boundaries.
31 Silurian-Devonian rocks in the Delaware Basin are not stratigraphically well defined, and 32 there are various notions for extending nomenclature into the basin. Common drilling 33 practice is not to differentiate, though the Upper Devonian Woodford shale at the top of the 34 sequence is frequently distinguished from the underlying dolomite and limestone (Foster 35 1974, p. 18). Foster (p. 21) showed a reference thickness of 1,260 and 160 feet (384 and 49 36 meters) for the carbonates and the Woodford shale, respectively; he estimated thickness of 37 these units at the present WIPP site of about 1,150 feet (351 meters) and 170 feet (52 meters), 38 respectively. Keesey (1976, vol. n , exhibit no. 2) projected 1,250 feet (381 meters) of 39 carbonate and showed 82 feet (25 meters) of the Woodford shale.
March 31,1995 2-12 DRAFT-DOE/CAO-2056

Draft 40 CFR 191 Compliance Certification Application
ERA PERIOD EPOCH
YEARS MAJOR GEOLOGICEVENTS-
SOOTHEASTNEWMEXICO REGION ERA PERIOD EPOCH DURATION BEFORE PRESENT
MAJOR GEOLOGICEVENTS-SOOTHEASTNEWMEXICO REGION
C E N O Z 0 I c
Quaternary Holocene 10,000
1,600,000
66,400,000
144,000,000
208,000,000
245,000,000
286,000,000
320,000,000
360,000,000
408,000,000
438,000,000
505,000,000
570,000,000
Eolian and erosion/solution activity. Development of present landscape. C
E N O Z 0 I c
Quaternary
Pleisto cene
1,590,000 1,600,000
66,400,000
144,000,000
208,000,000
245,000,000
286,000,000
320,000,000
360,000,000
408,000,000
438,000,000
505,000,000
570,000,000
Eolian and erosion/solution activity. Development of present landscape. C
E N O Z 0 I c Tertiary
Pliocene 3,700,000
1,600,000
66,400,000
144,000,000
208,000,000
245,000,000
286,000,000
320,000,000
360,000,000
408,000,000
438,000,000
505,000,000
570,000,000
Deposition of Gatuna fan sediments. Formation of caliche caprock. Regional uplift and east-southeastward tilting; Basin-Range uplift of Sacramento and Guadalupe-Delaware Mountains.
Erosion dominant. No Early to Mid-Tertiary rocks present.
Laramide "revolution" Uplift of Rocky Mountains. Mid tectonism and igneous activity to west and north.
C E N O Z 0 I c Tertiary
Miocene 18,400,000
1,600,000
66,400,000
144,000,000
208,000,000
245,000,000
286,000,000
320,000,000
360,000,000
408,000,000
438,000,000
505,000,000
570,000,000
Deposition of Gatuna fan sediments. Formation of caliche caprock. Regional uplift and east-southeastward tilting; Basin-Range uplift of Sacramento and Guadalupe-Delaware Mountains.
Erosion dominant. No Early to Mid-Tertiary rocks present.
Laramide "revolution" Uplift of Rocky Mountains. Mid tectonism and igneous activity to west and north.
C E N O Z 0 I c Tertiary
Oligocene 12,900,000
1,600,000
66,400,000
144,000,000
208,000,000
245,000,000
286,000,000
320,000,000
360,000,000
408,000,000
438,000,000
505,000,000
570,000,000
Deposition of Gatuna fan sediments. Formation of caliche caprock. Regional uplift and east-southeastward tilting; Basin-Range uplift of Sacramento and Guadalupe-Delaware Mountains.
Erosion dominant. No Early to Mid-Tertiary rocks present.
Laramide "revolution" Uplift of Rocky Mountains. Mid tectonism and igneous activity to west and north.
C E N O Z 0 I c Tertiary
Eocene 21,200,000
1,600,000
66,400,000
144,000,000
208,000,000
245,000,000
286,000,000
320,000,000
360,000,000
408,000,000
438,000,000
505,000,000
570,000,000
Deposition of Gatuna fan sediments. Formation of caliche caprock. Regional uplift and east-southeastward tilting; Basin-Range uplift of Sacramento and Guadalupe-Delaware Mountains.
Erosion dominant. No Early to Mid-Tertiary rocks present.
Laramide "revolution" Uplift of Rocky Mountains. Mid tectonism and igneous activity to west and north.
C E N O Z 0 I c Tertiary
Paleocene 8,600,000
1,600,000
66,400,000
144,000,000
208,000,000
245,000,000
286,000,000
320,000,000
360,000,000
408,000,000
438,000,000
505,000,000
570,000,000
Deposition of Gatuna fan sediments. Formation of caliche caprock. Regional uplift and east-southeastward tilting; Basin-Range uplift of Sacramento and Guadalupe-Delaware Mountains.
Erosion dominant. No Early to Mid-Tertiary rocks present.
Laramide "revolution" Uplift of Rocky Mountains. Mid tectonism and igneous activity to west and north.
M E S O Z 0 I C
Cretaceous 77,600,000
1,600,000
66,400,000
144,000,000
208,000,000
245,000,000
286,000,000
320,000,000
360,000,000
408,000,000
438,000,000
505,000,000
570,000,000
Submergence. Intermittent shallow seas. Thin limestone and elastics deposited.
M E S O Z 0 I C
Jurassic 64,000,000
1,600,000
66,400,000
144,000,000
208,000,000
245,000,000
286,000,000
320,000,000
360,000,000
408,000,000
438,000,000
505,000,000
570,000,000
Emergent conditions. Erosion, formation of rolling terrain.
Deposition of fluvial elastics.
Erosion. Broad flood plain develops.
M E S O Z 0 I C Triassic 37,000,000
1,600,000
66,400,000
144,000,000
208,000,000
245,000,000
286,000,000
320,000,000
360,000,000
408,000,000
438,000,000
505,000,000
570,000,000
Emergent conditions. Erosion, formation of rolling terrain.
Deposition of fluvial elastics.
Erosion. Broad flood plain develops.
P A L E 0 Z O I C
Permian 41,000,000
1,600,000
66,400,000
144,000,000
208,000,000
245,000,000
286,000,000
320,000,000
360,000,000
408,000,000
438,000,000
505,000,000
570,000,000
Deposition of evaporite sequence followed by continental redbeds.
Sedimentation continuous in Delaware, Midland, Val Verde basins and shelf areas.
P A L E 0 Z O I C
Pennsylvanian 34,000,000
1,600,000
66,400,000
144,000,000
208,000,000
245,000,000
286,000,000
320,000,000
360,000,000
408,000,000
438,000,000
505,000,000
570,000,000
Massive deposition of elastics. Shelf, margin, basin pattern of deposition develops.
P A L E 0 Z O I C
Mississippian 40,000,000
1,600,000
66,400,000
144,000,000
208,000,000
245,000,000
286,000,000
320,000,000
360,000,000
408,000,000
438,000,000
505,000,000
570,000,000
Regional tectonic activity accelerates, folding up Central Basin platform. Matador arch, ancestral Rockies.
Regional erosion. Deep, broad basins to east and west of platform develop.
P A L E 0 Z O I C Devonian 48,000,000
1,600,000
66,400,000
144,000,000
208,000,000
245,000,000
286,000,000
320,000,000
360,000,000
408,000,000
438,000,000
505,000,000
570,000,000
Renewed submergence.
Shallow sea retreats from New Mexico; erosion.
Mild epeirogenic movements. Tobosa basin subsiding. Pedernal landmass and Texas Peninsula emergent until Middle Mississippian.
P A L E 0 Z O I C
Silurian 30,000,000
1,600,000
66,400,000
144,000,000
208,000,000
245,000,000
286,000,000
320,000,000
360,000,000
408,000,000
438,000,000
505,000,000
570,000,000
P A L E 0 Z O I C
Ordovician 67,000,000
1,600,000
66,400,000
144,000,000
208,000,000
245,000,000
286,000,000
320,000,000
360,000,000
408,000,000
438,000,000
505,000,000
570,000,000
Marathon-Quachita geosyncline, to south, begins subsiding.
Deepening of Tobosa basin area; shelf deposition of elastics, derived partly from ancestral Central Basin platform and carbonates.
P A L E 0 Z O I C
Cambrian 65,000,000
1,600,000
66,400,000
144,000,000
208,000,000
245,000,000
286,000,000
320,000,000
360,000,000
408,000,000
438,000,000
505,000,000
570,000,000 Clastic sedimentation - Bliss sandstone.
P A L E 0 Z O I C
PRECA1 tfBRIAN Erosion to a nearly level plain.
Mountain building, igneous activity, metamorphism, erosional cycles.
27 Figure 2-3. Major Geologic Events - Southeast New Mexico Region
DRAFT-DOE/CAO-2056 2-13 March 31,1995
Draft 40 CFR 191 Compliance Certification Application
l THIS PAGE INTENTIONALLY LEFT BLANK
March 31, 1995 2-14 DRAFT-DOE/CAO-2056
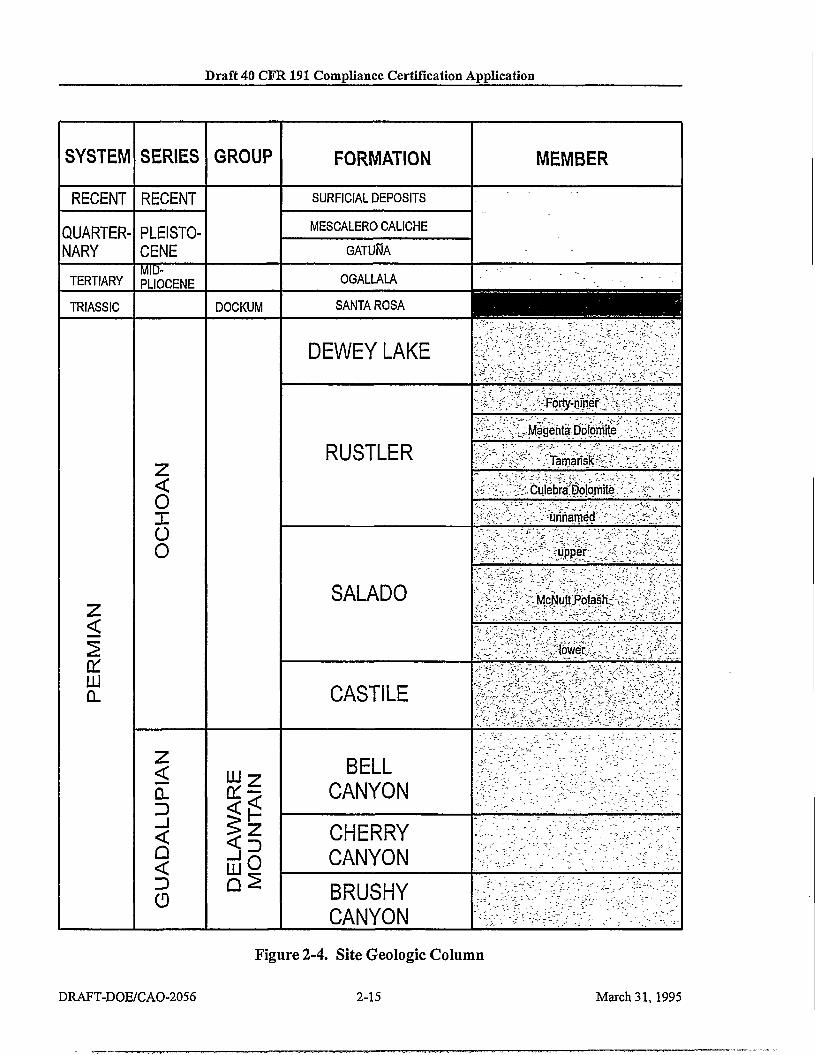
Draft 40 CFR 191 Compliance Certification Application
SYSTEM SERIES GROUP FORMATION MEMBER
RECENT RECENT SURFICIAL DEPOSITS
QUARTER-NARY
PLEISTOCENE
MESCALERO CALICHE QUARTER-NARY
PLEISTOCENE GATURA
TERTIARY MID-PLIOCENE OGALLALA
TRIASSIC DOCKUM H1HHIHHHHH
PE
RM
IAN
OC
HO
AN
DEWEY LAKE
PE
RM
IAN
OC
HO
AN
RUSTLER
Lyyy:ym^^mm:y
PE
RM
IAN
OC
HO
AN
RUSTLER
PE
RM
IAN
OC
HO
AN
RUSTLER
PE
RM
IAN
OC
HO
AN
RUSTLER
#K:@l^sm*f;
PE
RM
IAN
OC
HO
AN
RUSTLER
PE
RM
IAN
OC
HO
AN
SALADO
'--Vs?;-s^ -A &-i(Sk&. ?$T;'& '•&•&?>
PE
RM
IAN
OC
HO
AN
SALADO
PE
RM
IAN
OC
HO
AN
SALADO
PE
RM
IAN
OC
HO
AN
CASTILE PE
RM
IAN
GU
AD
ALU
PIA
N
DE
LAW
AR
E
MO
UN
TAIN
BELL CANYON •..v.v. ~--~ •' "•-".- '-V'-;.. ?-\". '"'"". - v . - v . "
PE
RM
IAN
GU
AD
ALU
PIA
N
DE
LAW
AR
E
MO
UN
TAIN
CHERRY CANYON
PE
RM
IAN
GU
AD
ALU
PIA
N
DE
LAW
AR
E
MO
UN
TAIN
BRUSHY CANYON
ilk -r{i:V'-^V.-.-£-">>:- ' . W i~" •"'••£;
Figure 2-4. Site Geologic Column
DRAFT-DOE/CAO-2056 2-15 March 31, 1995

i i«2>-.
Draft 40 CFR 191 Compliance Certification Application
l TfflS PAGE INTENTIONALLY LEFT BLANK
March 31, 1995 2-16 DRAFT-DOE/CAO-2056

Draft 40 CFR191 Compliance Certification Application
1 The Mississippian system in the northern Delaware Basin is commonly attributed to 2 "Mississippian limestone" and the overlying Barnett shale (Foster 1974, p. 24), but the 3 nomenclature is not consistently used. At the reference well used by Foster (p. 25), the 4 limestone is 540 feet (165 meters) thick and the shale is 80 feet (24 meters); isopachs at the 5 WIPP are 480 feet (146 meters) and less than 200 feet (61 meters). Keesey (1976, vol. II, 6 exhibit no. 2) indicates 511 feet (156 meters) and 164 feet (50 meters), respectively, within the 7 site boundaries.
8 The nomenclature of the Pennsylvanian system applied within the Delaware Basin is both 9 varied and commonly inconsistent with accepted stratigraphic rules. Chronostratigraphic or
10 time-stratigraphic names are applied to these lithologic units: the Morrow, Atoka, and 11 Strawn, from base to top (Foster 1974, p. 31). Foster (p. 34) extrapolated thicknesses of about 12 2,200 feet (671 meters) for the Pennsylvanian at the WIPP site. Keesey (1976, vol. n, exhibit 13 no. 2) reports 2,088 feet (636 meters) for these units. The Pennsylvanian rocks in this area are 14 mixed elastics and carbonates, with carbonates more abundant in the upper half of the 15 sequence.
16 The Permian is the thickest system in the northern Delaware Basin, and it is divided into four 17 series from the base to top: Wolfcampian, Leonardian, Guadalupian, and Ochoan. According 18 to Keesey (1976, vol. II, exhibit no. 2), the three lower series total 8,684 feet (2,647 meters) 19 near the site. Foster (1974, p. 35$) indicates a total thickness for the lower three series of 20 7,665 feet (2,336 meters) for a reference well north of WIPP. Foster's isopach maps of these 21 series indicate about 8,500 feet (2,591 meters) for the WIPP site area. The Ochoan series at 22 the top of the Permian is considered in more detail later because the formations host and 23 surround the WIPP repository horizon. Its thickness at DOE-2, about 2 miles (3.2 kilometers) 24 north of the site center, is 3,938 feet (1,200 meters) according to Mercer et al. (1987, 25 pp. 23-24; this document is appended to the Compliance Certification Application as 26 Appendix HYDRO).
27 The Wolfcampian series is also referred to as the Wolfcamp Formation (hereafter referred to 28 as the Wolfcamp) in the Delaware Basin. In the site area, the lower part of the Wolfcamp is 29 dominantly shale with carbonate and some sandstone according to Foster (1974, p. 38); 30 carbonate increases to the north. Clastics increase to the east toward the margin of the Central 31 Basin Platform. Keesey (1976, vol. II, exhibit no. 2), reports the Wolfcamp to be 1,493 feet 32 (455 meters) thick at a well near the WIPP site.
33 The Leonardian Series is represented by the Bone Spring Limestone or Formation (hereafter 34 referred to as the Bone Spring). According to Foster (1974, p. 39) the lower part of the 35 formation is commonly interbedded carbonate, sandstone, and some shale, while the upper 36 part is dominantly carbonate. Near the site, the Bone Spring is 3,247 feet (990 meters) thick 37 according to Keesey (1976, vol. n, exhibit no. 2).
38 The Guadalupian series is represented in the general area of the site by a number of 39 formations exhibiting complex facies relationships (Figure 2-5). The Guadalupian series is 40 known in considerable detail west of the site from outcrops in the Guadalupe Mountains,
DRAFT-DOE/CAO-2056 2-17 March 31,1995

Draft 40 CFR191 Compliance Certification Application
1 where numerous outcrops and subsurface studies have been undertaken. (See, for example, 2 P.B. King [1948], Newell et al. [1953], and Dunham [1972] in the bibliography). According 3 to Garber et al. (1989, p. 36), similar facies relationships are expected from the site to the 4 north (Figure 2-5).
5 Within the Delaware Basin, the Guadalupian series comprises three formations: Brushy 6 Canyon, Cherry Canyon, and Bell Canyon, from base to top. These formations are dominated 7 by submarine channel sandstones with interbedded limestone and some shale. A limestone 8 (Lamar) generally tops the series, immediately underneath the Castile Formation (hereafter 9 referred to as the Castile). Around the margin of the Delaware Basin, reefs developed during
10 the same time the Cherry Canyon and Bell Canyon formations were being deposited. These 11 massive reef limestones, the Goat Seep and Capitan limestones, are equivalent in time to these 12 basin sandstone formations, but were developed much higher topographically around the basin 13 margin. A complex set of limestone to sandstone and evaporite beds was deposited further 14 away from the basin behind the reef limestones. The Capitan reef limestones are well known 15 because the Carlsbad Caverns are partially developed in these rocks.
16 2.1.3.2 The Bell Canyon Formation
17 The Bell Canyon is known from outcrops on the west side of the Delaware Basin and from 18 subsurface intercepts for oil and gas drilling. Several informal lithologic units are commonly 19 named during such drilling. Mercer et al. (1987, p. 28) stated that DOE-2 penetrated the 20 Lamar limestone, the Ramsey sand, the Ford shale, the Olds sand, and the Hays sand. This 21 informal nomenclature is used for the Bell Canyon in some other WIPP reports.
22 The Clayton Williams Badger Federal borehole near the WIPP (Section 15, T22S, R3 IE) 23 intercepted 961 feet (293 meters) of Bell Canyon, including the Lamar limestone, according to 24 Keesey (1976, vol. n, exhibit no. 2). Reservoir sandstones of the Bell Canyon were deposited 25 in channels that are straight to slightly sinuous. Density currents flowed from shelf regions, 26 cutting channels and depositing the sands which are identified in Harms and Williamson 27 (1988, pp. 299-317).
28 Within the basin, the Bell Canyon (Lamar limestone)-Castile contact is distinctive on 29 geophysical logs because of the contrast in low natural gamma of the basal Castile anhydrite 30 compared to the underlying limestone. Density or acoustic logs are also distinctive because of 31 the massive and uniform lithology of the anhydrite compared to the underlying beds. In cores, 32 the transition is sharp, as described by Mercer et al. (Appendix HYDRO, p. 312) for DOE-2.
33 2.1.3.3 The Castile Formation
34 The Castile is the lowermost lithostratigraphic unit of the Late Permian Ochoan series (Figure 35 2-6). It was originally named by Richardson for outcrops in Culberson County, Texas. The 36 Castile crops out along a lengthy area along the western side of the Delaware Basin. The two 37 distinctive lithologic sequences now known as the Castile and the Salado were separated into 38 the upper and lower Castile by Cartwright. Lang clarified the nomenclature by restricting the
March 31,1995 2-18 DRAFT-DOE/CAO-2056

Draft 40 CFR191 Compliance Certification Application
PDB-04
NW
Seven Rivers
Queen Grayburg
San Andres
WMM/MfW'j?M?£%£& mm UX\"*vsi\
SE
i»Hi«fflIIiiJiH
Delaware Basin
Dolomite ITTTTj Halite PERMIAN - Ochoan i 3 Limestone £33 Sandstone EH PERMIAN - Guadalupian ^ Anhydrite [£^ Siltstone
DRAFT-DOE/CAO-2056
Figure 2-5. Cross-Section from Delaware Basin (southeast) through Marginal Reef Rocks to Back-Reef Facies
2-19 March 31, 1995
Draft 40 CFR 191 Compliance CertiOcation Application
l TfflS PAGE INTENTIONALLY LEFT BLANK
March 31, 1995 2-20 DRAFT-DOE/CAO-2056

Draft 40 CFR 191 Compliance Certification Application
SW
Elevation
1000m
Surficial Deposits Dewey Lake/ Rustler Contact
NE Ground Surface
800m
500m
200m
Sea Level
-200m
-500m -
Gatuna Formation Santa Rosa Formation
Dewey Lake Formation
Rustler Formation
Salado Formation
Castile Formation
» • • * • » V > • • < • • « ' — • " - mi ' — , 1 U 1 — i J . i 1 . - A >.v.i•• •;:v, vvv*.:•.'.-:..'. ...•k ^ i i , r1
,• .• .*.'-• .*;.• .•t-i•• v,•.--• .• .*,• . • : :z ; •- «^-»~— . , t -~f
^ ^ ^ ^ ^ ^ ^ ^
Delaware Mountain Group
Legend ES: : f l Sand and Sandstone
E = = 3 Mudstone and Siltstone
lisTSCSI Anhydrite imm Halite I I Limestone
\ ~ 1 QUATERNARY-Recent
H TRIASSIC - Upper
F ^ v l PERMIAN - Ochoan
i ; -'- -;-l PERMIAN - Guadalupian
V > *"H Dolomite
I^V^ Mudstone/ Siltstone layer in Anhydrite Unit
Not to Scale
Figure 2-6. Generalized Stratigraphic Cross-Section above Bell Canyon Formation at WIPP Site
DRAFT-DOE/CAO-2056 2-21 March 31,1995
Draft 40 CFR 191 Compliance Certification Application
l TfflS PAGE INTENTIONALLY LEFT BLANK
March 31, 1995 2-22 DRAFT-DOE/CAO-2056

Draft 40 CFR191 Compliance Certification Application
1 Castile to the lower unit and naming the upper unit the Salado. By defining an anhydrite 2 resting on the marginal Capitan limestone as part of the Salado, Lang effectively restricted the 3 Castile to the Delaware Basin inside the reef rocks.
4 Through detailed studies of the Castile, Anderson et al. (1972, pp. 59-86) introduced an 5 informal system of names that are widely used and included in many WIPP reports. They 6 named the units from the base as anhydrite 1 (Al), halite 1 (HI), anhydrite 2 (A2), etc. The 7 informal nomenclature varies through the basin from A3 up because of complexity of the 8 depositional system. The Castile consists almost entirely of thick beds of two lithologies: 9 (1) interlaminated carbonate and anhydrite and (2) high-purity halite. The interlaminated
10 carbonate and anhydrite are well known as possible examples of annual layering or varves.
11 In the eastern part of the Delaware basin, the Castile is commonly 1,400-1,500 feet thick 12 (427-457 meters) (derived from Borns and Shaffer 1985, figs. 9,11,16). At DOE-2, the 13 Castile is 989 feet (301 meters) thick. The Castile is thinner in the western part of the 14 Delaware Basin, and it lacks halite units. Anderson and Powers (1978, figs. 1,3,4,5) 15 correlated geophysical logs, interpreting thin zones equivalent to halite units as dissolution 16 residues. Anderson further attributed the lack of halite in the basin to its removal by 17 dissolution.
18 For borehole DOE-2, a primary objective was to ascertain whether a series of depressions in 19 the Salado 2 miles (3.3 kilometers) north of the site was due to dissolution in the Castile as 20 proposed by Davies in his doctoral thesis in 1984. Studies have suggested that these 21 depressions were not due to dissolution but halokinesis in the Castile (see, for example, Borns 22 [1987] and Chaturvedi [1987] in the bibliography). Robinson and Powers (1987, pp. 69-79) 23 analyzed one such unit as partly due to synsedimentary, gravity-driven, clastic deposition and 24 suggested that the extent of dissolution may be overestimated. No Castile dissolution is 25 known to be present in the immediate vicinity of the WIPP site. The process of dissolution 26 and the resulting features are further discussed later in this chapter.
27 In Culberson County, Texas, the Castile hosts major native sulfur deposits. The outcrops of 28 Castile on the Gypsum Plain south of White's City, New Mexico, have been explored for 29 native sulfur without success, and there is no reported indicator of native sulfur anywhere in 30 the vicinity of WIPP.
31 Appendix GCR reports that in part of the area around the WIPP, the Castile has been 32 significantly deformed, and there are pressurized brines associated with the deformed areas; 33 borehole ERDA-6 encountered both. WEPP-12,1 mile (1.6 kilometers) north of the site 34 center, revealed lesser Castile structure, but it also encountered a zone of pressurized brine 35 within the Castile. Castile deformation is described and discussed later in Section 2.1.5 on 36 structural features, and pressurized brines are described in Section 2.2 which details the area's 37 hydrology.
DRAFT-DOE/CAO-2056 2-23 March 31,1995
Draft 40 CFR191 Compliance Certification Application
1 The Castile continues to be an object of research interest unrelated to the WIPP program as an 2 example of evaporites supposedly deposited in "deep water." Anderson (1993, pp. 12-13) 3 discusses alternatives and contradictory evidence. Although these discussions and a 4 resolution might eventually affect some concepts of Castile deposition and dissolution, this 5 issue is largely of academic interest and bears no impact on the suitability of the Los Medanos 6 region for the WIPP site.
7 2.1.3.4 The Salado Formation
8 The Salado is dominated by halite, in contrast to the underlying Castile. The Salado extends 9 well beyond the Delaware Basin, and Lowenstein (1988, pp. 592-608) has termed the Salado
10 a "saline giant." While the Fletcher Anhydrite Member, which is deposited on the Capitan 11 reef rocks, is defined by Lang (1939, pp. 1569-1572; 1942, pp. 63-79) as the base of the 12 Salado, some investigators consider that the Fletcher Anhydrite Member may interfinger with 13 anhydrites normally considered part of the Castile within the basin. The Castile-Salado 14 contact is not uniform across the basin, and whether it is conformable is unresolved. Around 15 the WIPP site, the Castile-Salado contact is commonly placed at the top of a thick anhydrite 16 informally designated A3; the overlying halite is called the infra-Cowden salt and is included 17 within the Salado. Bodine (1978, pp. 28-29) suggests that the clay mineralogy of the infra-18 Cowden in ERDA-9 cores changes at about 15 feet (4.6 meters) above the lowermost Salado 19 and that the lowermost clays are more like Castile clays. The top of the thick anhydrite 20 remains the local contact for differentiating the Salado from the Castile, and there is no known 21 significance to WIPP from these differences.
22 The Salado in the northern Delaware Basin is broadly divided into three informal members 23 used here. Figure 2-7 details the Salado's stratigraphy. The middle member is known locally 24 as the McNutt potash zone or member, and it includes 11 defined potash zones, 10 of which 25 are of economic significance in the Carlsbad Potash District. The lower and upper members 26 remain unnamed. The WIPP repository level is located below the McNutt potash member in 27 the lower member.
28 Within the Delaware Basin, a system is used for numbering the more significant sulfate beds 29 within the Salado, designating these beds as marker beds (MB) from MB 100 (near the top of 30 the formation) to MB 144 (near the base). The system is generally used within the Carlsbad 31 Potash District as well as at and around the WIPP site. The facility horizon is located between 32 MB 139 and MB 138.
33 In the central and eastern part of the Delaware Basin, the Salado is at its thickest ranging up to 34 about 2,000 feet (about 600 meters) thick and consisting mainly of interbeds of sulfate 35 minerals and halite, with halite dominating. The thinnest portions of the Salado consist of a 36 brecciated residue of insoluble material a few tens-of-feet-thick and crop out in parts of the 37 western Delaware Basin. The common sulfate minerals are anhydrite (CaS04), gypsum 38 (CaS0 4 • 2H 20) near the surface, and polyhalite (K 2S0 4 • MgS0 4 • 2CaS0 4 • 2H2()). They 39 form beds and are also found along halite grain boundaries.
March 31, 1995 2-24 DRAFT-DOE/CAO-2056
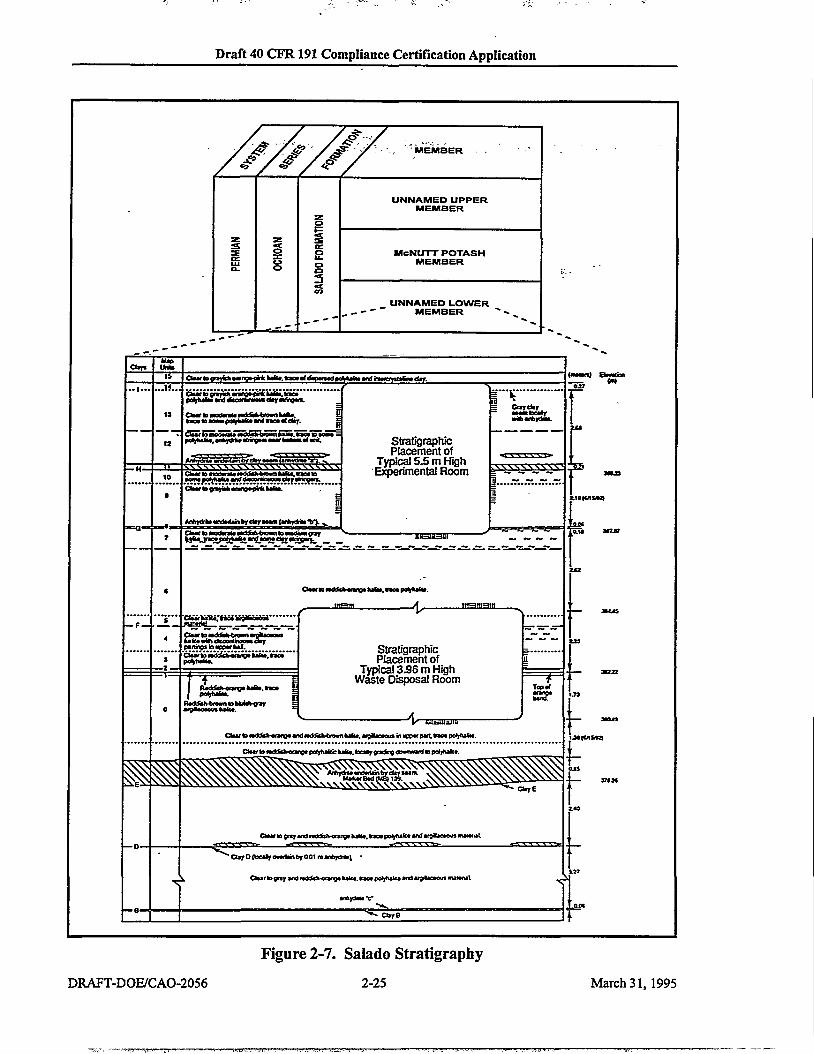
Draft 40 CFR 191 Compliance Certiflcation Application
v~~&"s'4?''/&''-s'-'; "MEMBER
PERM
IAN
i OC
HOAN
» \
SAUD
O FO
RMAT
ION
UNNAMED UPPER MEMBER
PERM
IAN
i OC
HOAN
» \
SAUD
O FO
RMAT
ION
McNUTT POTASH MEMBER PERM
IAN
i OC
HOAN
» \
SAUD
O FO
RMAT
ION
UNNAMED LOWER __-""" MEMBER "* » ̂
CUyi Onto Cto>ft»qr^kliwnp»pMcUft«.l
B O * * * * *
• afdaptiad po%»jfcM •nJJK^onttgntdty^
dsyttnnQws.
* polyMiM and »ae« •( d i f .
€ u r tonb3wa£«3<££fcrawn C S . ' k i o t ' D M . . potjtaiw, • * * ) * * • « i * g * « « M T M M •( art.
e R
Cfear to modwM* wddtstt-bfovn kaita. k i d la
Cbar to g n y i * ««Mto»p«* CwCto.
GtMTto MOMMI M w M v l M l t o aMdaM QfSY
StraUgraphic Placement of
Typical 5.5 m High Experimental Room
"usnsnr
'CU£tV£U;tW*&&*&&''
pattinps in apparfctf. 'c£^*to^«<££tiv«r«^i^te/lno» *
fUdStfc-Ofanot kafto. trao* poll ti tfcto.
RadtfcMmarn to bbathgray
fcaKtt. *aoa polyfcafiit.
1 -
Stratigraphic Placement of
Typical 356 m High Waste Disposal Room
OMfte»w*Jaliofi«V««ndi»dditfc-biuwn>iin.<fBaic»owiiniffP<cpitt>ic»pol|futi<.
CU«floodfclKranotpoynir'elnin.beHygarfngaa*fw«irtPpali*ufc>.
- ^ W W 1EI1 j u n i f c
Cl*ar 10 gray and f*0tfah-or»ngt fcaiu. n o t polyftfiw a«J arg*je»oo» H I M M L
1 *CUyO(Vac*lVowrt»i ibT00tm**i** i l -
CtMrtogrtrandfaddaJi-orv^lt^Ua.MeapelitalM
*nH|dNMier
- curs
(wtoci) Chwatfan
X f i *
DRAFT-DOE/CAO-2056
Figure 2-7. Salado Stratigraphy 2-25 March 31,1995

Draft 40 CFR 191 Compliance Certification Application
l THIS PAGE INTENTIONALLY LEFT BLANK
March 31,1995 2-26 DRAFT-DOE/CAO-2056

Draft 40 CFR191 Compliance Certification Application
1 Early investigators of the Salado recognized a repetitious vertical succession or cycle of beds 2 in the Salado: clay - anhydrite - polyhalite - halite and minor polyhalite - halite. Later 3 investigators described the cyclical units as clay - magnesite - anhydrite, polyhalite or 4 glauberite - halite - argillaceous halite capped by mudstone. Lowenstein (1988, pp. 592-608) 5 defined a depositional cycle (Type I) consisting of (i) basal mixed siliciclastic and carbonate 6 (magnesite) mudstone, (2) laminated to massive anhydrite or polyhalite, (3) halite, and 7 (4) halite with mud. Lowenstein also recognized repetitious sequences of halite and halite 8 with mud as incomplete Type I cycles and termed them Type II cycles. Lowenstein (1988, 9 pp. 592-608) interpreted the Type I cycles as having formed in a shallowing upward,
10 desiccating basin beginning with a perennial lake or lagoon of marine origin and evaporating 11 to saline lagoon and saltpan environments. Type II cycles are differentiated because they do 12 not exhibit features of prolonged subaqueous deposition and also have more siliciclastic influx 13 than do Type I cycles.
14 From detailed mapping of the Salado in the Air Intake Shaft at WIPP, Powers and Holt 15 (1990a, pp. 45-72) constructed a more detailed sedimentological analysis of Salado 16 depositional cycles, similar in broad aspects to the Type I cycle of Lowenstein. The details 17 available from the shaft demonstrated the important role of syndepositional water level to 18 water table changes that created solution pits and pipes within the halitic beds while they were 19 at the surface. Powers and Holt (1990a, app. F, p. 3-26) concluded that passive halite cements 20 filled the pits and pipes, as well as less dramatic voids, as the water table rose (Powers and 21 Holt 1990a, app. F, p. 3-26). Early diagenetic to synsedimentary cements filled the porosity 22 early and rather completely, reducing the porosity to a very small volume according to Casas 23 and Lowenstein. These void-filling halites are commonly clear and coarsely crystalline and 24 might be mistaken for recrystallization textures. Although Holt and Powers did not find it in 25 their 1988 study (which is included as Appendix FAC), other investigators have found much 26 evidence for halite recrystallization (or halite diagenesis) in the Salado.
27 The effects of water-rock interactions resulting in evaporite dissolution in the Salado are 28 observable near the surface in Nash Draw and other localities where gypsum karst is 29 developed and where overlying units such as the Rustler Formation (hereafter referred to as 30 the Rustier), Dewey Lake Redbeds (hereafter referred to as the Dewey Lake), and post-31 Permian rocks have subsided. Physical evidence of water-rock interation (e.g., post-32 depositional accumulation of insoluble residues, brecciation from differential collapse, mass 33 removal) in the Salado is less apparent, especially where it is buried at depths greater than 990 34 feet (300 meters). However, given the susceptibility of evaporite minerals to dissolution by 35 circulating groundwater, geochronological investigations provide a means of determining the 36 approximation time of latest episode of regional recrystallization of the evaporite minerals, 37 which can be inferred as the approximate time of the latest episode of freely circulating 38 groundwater. Radiometric dates for minerals of the Salado are available from several sources 39 (Register and Brookins 1980, pp. 29-31; Brookins 1980, pp. 29-31; Brookins et al. 1980, 40 pp. 635-637; Brookins 1981, pp. 147-152; Brookins and Lambert 1987, pp. 147-152). The 41 distribution of dates shows that rubidium-strontium (Rb-Sr) isochron determinations on 42 evaporite minerals, largely sylvite (179-229 million years ago), are in good agreement with 43 potassium-argon (K-Ar) determinations on pure polyhalites (195-216 million years ago).
DRAFT-DOE/CAO-2056 2-27 March 31,1995

Draft 40 CFR191 Compliance Certification Application
1 The only recrystallization event found younger than Early Jurassic (200 million years ago) 2 was known to be a contact phenomenon associated with emplacement of an Oligocene 3 lamprophyre dike (21 million years ago for polyhalite versus 32-34 million years ago for the 4 dike; see Calzia and Hiss 1978, pp. 39^4-5). Clay minerals have both Rb-Sr isochron and 5 K-Ar ages significantly older (390±77 million years ago) than the evaporites.
6 It has been known that sylvite yields significantly younger K-Ar ages than Rb-Sr ages. This 7 has been explained as loss of radiogenic argon. Radiogenic strontium, as a solid, and thus 8 dating by the Rb-Sr isochron method is not considered as likely to give spurious results, 9 especially if the isochron is well defined. The results of radiometric determinations argue for
10 the absence of pervasive recrystallization of the evaporites in the Salado in the last 200 11 million years ago. This conclusion is supported by the number of replicate determinations, the 12 wide distribution of dated minerals throughout the Delaware Basin, and the concordance of 13 dates obtained by various radiometric methods.
14 Argillaceous halites and halitic mudstone at the top of many depositional cycles were 15 interpreted by Powers and Holt (1990a, pp. 45-78) in terms of modern features such as those 16 at Devil's Golf Course at Death Valley National Monument, California. The evaporative 17 basin was desiccated, and varying amounts of insoluble residues collected on the surface 18 through surficial dissolution, eolian sedimentation, and some clastic sedimentation from 19 temporary flooding caused by runoff from surrounding areas. The surface developed local 20 relief that could be mapped in some cycles, while the action of continuing desiccation and 21 exposure increasingly concentrated insoluble residues. Flooding, most commonly from 22 marine sources, reset the sedimentary cycle by depositing a sulfate bed.
23 Within Nash Draw, Robinson and Lang (1938, pp. 2-64-2-67) recognized a zone equivalent 24 to the upper Salado but lacking halite. Test wells in southern Nash Draw produced brine from 25 this interval, and it has become known as the brine aquifer. Robinson and Lang considered 26 this zone a residuum from dissolution of Salado halite (see Section 2.1.6.2.1 later in this 27 chapter). Jones et al. (1960, p. 25) remarked that the residuum should be considered part of 28 the Salado, though geophysical log signatures may resemble the lower Rustler.
29 At the center of the site, Holt and Powers in their 1984 report recognized clasts of fossil 30 fragments and mapped channeling in siltstones and mudstones above halite; they considered 31 these beds to be a normal part of the transition from shallow evaporative lagoons and 32 desiccated salt pans of the Salado to the saline lagoon of the lower Rustler. Though Salado 33 salt may have been dissolved prior to deposition of Rustler elastics, this process is far 34 removed from the concept of subsurface removal of salt from the Salado in more recent time 35 to develop a residuum and associated "brine aquifer."
36 Based on Salado isopachs (see Section 2.1.6.2.2 later in this chapter), thickness begins to 37 change significantly near Livingston Ridge, the eastern margin of Nash Draw. That should be 38 the approximate eastward limit to the residuum and "brine aquifer," though the normal 39 sedimentary sequence may yield limited fluids east of this margin.
March 31, 1995 2-28 DRAFT-DOE/CAO-2056

Draft 40 CFR191 Compliance Certification Application
1 The DOE believes the Salado is of primary importance to the containment of waste. As the 2 principal natural barrier, many of the properties of the Salado have been characterized by the 3 DOE and numerical codes were developed by the DOE to simulate the natural processes 4 within the Salado that affect the disposal system performance. These properties fall into two 5 categories: physical and hydrological. The physical properties of importance are summarized 6 in Appendix RM and discussed in Chapter 6. The hydrological properties are included in 7 Section 2.2.1. A discussion of the numerical code(s) used to simulate Salado performance is 8 included in Chapter 6.
9 2.1.3.5 The'Rustler Formation ~; : : :~.'
10 The Rustler Formation (hereafter referred to as the Rustler) is the youngest evaporite-bearing 11 formation in the Delaware Basin. It was originally named by Richardson for outcrops in the 12 Rustler Hills of Culberson County, Texas. Adams (1944, p. 1614) first used the names 13 "Culebra member" and "Magenta member" to describe the two carbonates in the formation, 14 indicating that Lang favored the names, though Lang did not use these names in his most 15 recent publication. Vine in his 1963 work described extensively the Rustler in Nash Draw 16 and proposed the four formal names and one informal term for the stratigraphic subdivisions 17 still used for the Rustler (from the base): unnamed lower member, Culebra Dolomite 18 Member, Tamarisk Member, Magenta Dolomite Member, and Forty-niner Member (Figure 19 2-8). (The Culebra Dolomite Member, the Tamarisk Member, the Magenta Dolomite 20 Member, and the Forty-niner Member are hereafter referred to as the Culebra, the Tamarisk, 21 the Magenta, and the Forty-niner.) Though it has been noted by some investigators that the 22 unnamed lower member might be named the Los Medanos Member, this nomenclature has 23 not been formalized.
24 An additional system of informal subdivisions was contributed by Holt and Powers (Appendix 25 FAC, fig. 3.2), based on more detailed lithologic units of the non-carbonate members (Figure 26 2-8). These subdivisions have partially been related to hydrostratigraphic units for the 27 Rustler.
28 Two studies of the Rustler since Vine's 1963 work contribute important information about the 29 stratigraphy, sedimentology, and regional relationships while examining more local details as 30 well. Eager (1983, pp. 273-283) reported on relationships of the Rustler observed in the 31 southern Delaware Basin as part of sulfur exploration in the area. Holt and Powers (Appendix 32 FAC, Section 5.0) reported the details of sedimentologic and stratigraphic studies of WIPP 33 shafts and cores as well as of geophysical logs from about 600 boreholes in southeastern New 34 Mexico.
35 The Rustler is regionally extensive; a similar unit in the Texas panhandle is also called the 36 Rustler. Within the area around WIPP, evaporite units of the Rustler are interbedded with 37 significant siliciclastic beds and the carbonates. Both the Magenta and the Culebra extend 38 regionally beyond areas of direct interest to the WIPP. In the general area of the WIPP, both 39 the Tamarisk and the Forty-niner have similar lithologies: lower and upper sulfate beds and a 40 middle unit that varies principally from mudstone to halite from west to east (Figure 2-8).
DRAFT-DOE/CAO-2056 2-29 March 31,1995
Draft 40 CFR 191 Compliance Certification Application
1 In a general sense, halite in the unnamed lower member broadly persists to the west of the 2 WIPP site, and halite is found east of the center of the WIPP in the Tamarisk and the 3 Forty-niner (Figure 2-9). (Additional detail on the lithologies of these members follow.) Two 4 different explanations have been used to account for the halite distribution. A prominent 5 model in many documents is that halite was originally deposited relatively uniformly in the 6 non-carbonate members across southeastern New Mexico, including the WIPP site area. The 7 modern distribution resulted from dissolution of Rustler halite to the west of the site. As 8 shown in Appendix FAC (p. 6-20,6-22), sedimentary features and textures within WIPP 9 shafts and cores that led them to propose an alternative model of depositional facies for the
10 mudstone-halite units; halite was dissolved syndepositionally from mud flat facies, especially 11 to the west, and was redeposited in a halite pan to the east. Culebra transmissivity shows 12 about six orders of magnitude variation across the area around the site, and the changes have 13 commonly been attributed to deformation resulting from post-depositional dissolution of 14 Rustler halite.
15 In the region around WIPP, the Rustler reaches a maximum thickness of more than 500 feet 16 (152 meters) (Figure 2-10), while it is about 300-350 feet (91-107 meters) thick within most 17 of the WIPP site. Much of the difference in Rustler thickness can be attributed to variations in 18 the amount of halite contained in the formation from place to place. Variation in Tamarisk 19 thickness accounts for a larger part of thickness changes than do variations in either the 20 unnamed lower member or the Forty-niner.
21 Much project-specific information about the Rustler is contained in Appendix FAC. The 22 WIPP shafts were a crucial element in Holt and Power's 1988 study, exposing features not 23 previously reported. Cores were available from several WIPP boreholes, and their lithologies 24 were matched to geophysical log signatures to extend the interpretation throughout a larger 25 area in southeastern New Mexico.
26 2.1.3.5.1 Unnamed Lower Member
27 The unnamed lower member rests on the Salado with apparent conformity at the WIPP site. It 28 consists of significant proportions of bedded and burrowed siliciclastic sedimentary rocks 29 with cross-bedding and fossil remains. These beds record the transition from strongly 30 evaporative environments of the Salado to saline lagoonal environments. The upper part of 31 the unnamed lower member includes halitic and sulfitic beds within elastics. Holt and Powers 32 (in Appendix FAC, p. 9 - 1 ^ interpret these as facies changes within a saline playa 33 environment. The implied model from earlier descriptions is that the non-halitic areas of the 34 upper unnamed lower member are dissolution residues from post-depositional dissolution.
35 As shown in Appendix FAC (Fig. 4.7), the unnamed lower member ranges in thickness from 36 about 96 to 126 feet (29 to 38 meters) within the site boundaries. The maximum thickness 37 recorded during that study was 208 feet (63 meters) southeast of the WIPP site. Halite 38 extends west of most of the site area in this unit (see Figure 2-9 for an illustration of the halite 39 margins). Cross-sections based on geophysical log interpretations in Appendix FAC show the 40 relationship between the thickness of the unit and the presence of halite.
March 31, 1995 2-30 DRAFT-DOE/CAO-2056
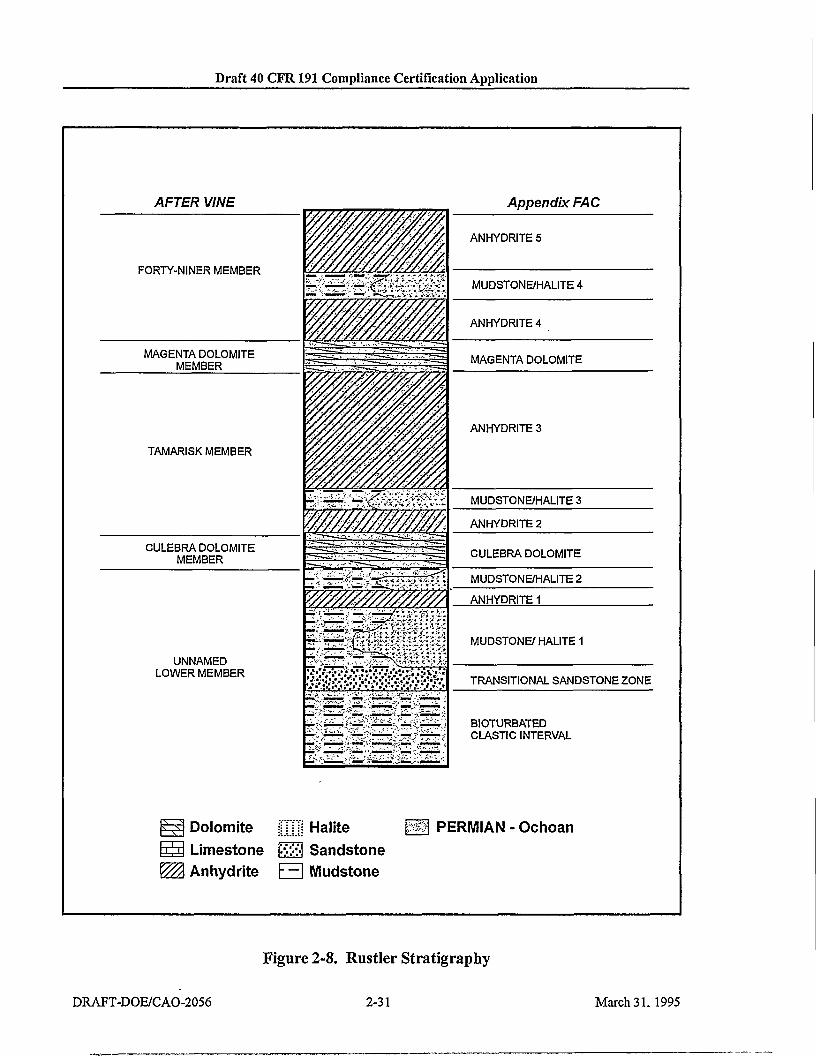
Draft 40 CFR 191 Compliance Certification Application
AFTER VINE
FORTY-NINER MEMBER
Appendix FAC
ANHYDRITE 5
MUDSTONE/HALITE4
ANHYDRITE 4
MAGENTA DOLOMITE MEMBER MAGENTA DOLOMITE
TAMARISK MEMBER
CULEBRA DOLOMITE MEMBER
UNNAMED LOWER MEMBER
ANHYDRITE 3
^mmmmm MUDSTONE/HALITE 3
ANHYDRITE 2
CULEBRA DOLOMITE
MUDSTONE/HALITE 2
ANHYDRITE 1
MUDSTONE/HALITE 1
TRANSITIONAL SANDSTONE ZONE
^rmmmsm. BIOTURBATED CLASTIC INTERVAL
^ g Dolomite ijjjji Halite sS Limestone (J39 Sandstone 7%\ Anhydrite E 3 Mudstone
PERMIAN - Ochoan
Figure 2-8. Rustler Stratigraphy
DRAFT-DOE/CAO-2056 2-31 March 31. 1995
Draft 40 CFR 191 Compliance Certification Application
l THIS PAGE INTENTIONALLY LEFT BLANK
March 31, 1995 2-32 DRAFT-DOE/CAO-2056
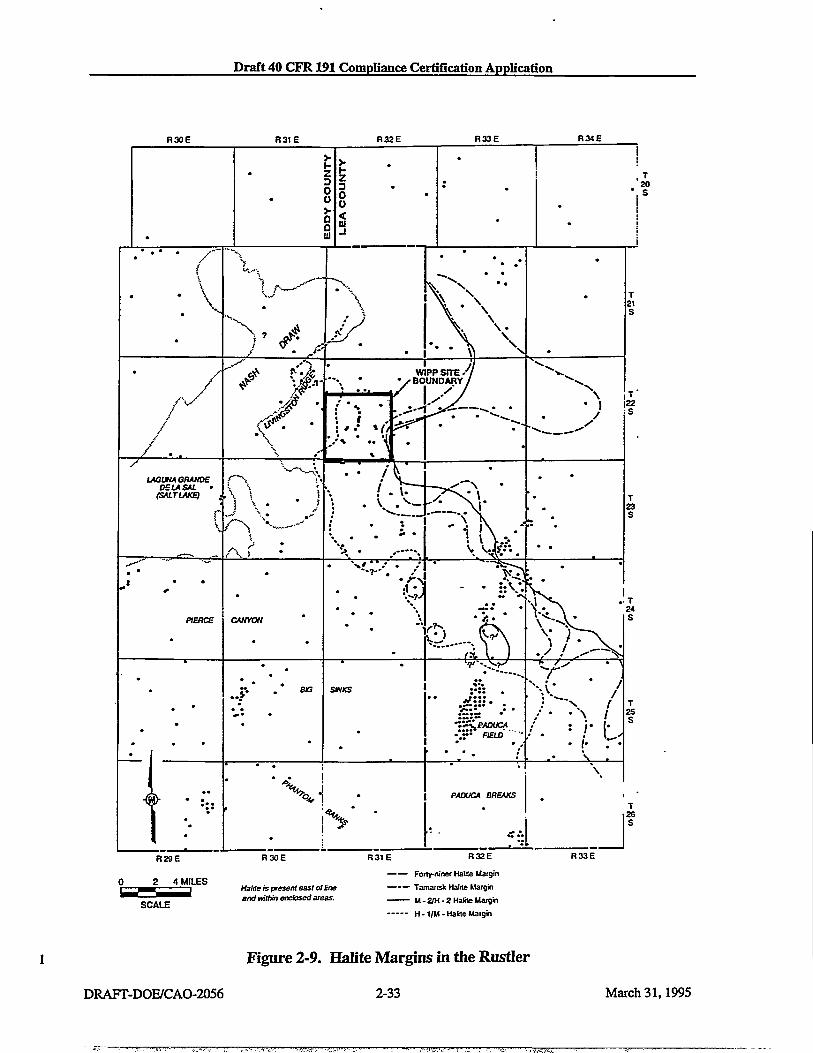
Draft 40 CFR 191 CompUance Certification Application
R30E R31E R32E R33E R34E
SCALE
Halite is present east of line and within enclosed areas.
R31E
Forty-niner Halite Margin Tamarisk Halite Margin M-2/H-Z HaliteMargin H-1 /M- Halite Margin
R33E
Figure 2-9. Halite Margins in the Rustler
DRAFT-DOE/CAO-2056 2-33 March 31,1995
Draft 40 CFR 191 Compliance Certification Application
l THIS PAGE INTENTIONALLY LEFT BLANK
March 31, 1995 2-34 DRAFT-DOE/CAO-2056

Draft 40 CFR 191 Compliance Certification Application
R29E I R30E I R31E i R32E ! R33E I R34E I R29E I R36E ! R37E I R38E
"R28E '" R~29E " R 3 0 E " 1 R31E~ | - R32~E "" R 33 E ' R~34E~ 7 ~ R 3 5 E " ' R36~E "" R37E "
3 0 6 MILES
N
S Contour Interval = 50 feet
Figure 2-10. Isopach Map of the Entire Rustler
DRAFT-DOE/CAO-2056 2-35 March 31. 1995

Draft 40 CFR 191 Compliance Certification Application
l TfflS PAGE INTENTIONALLY LEFT BLANK
March 31, 1995 2-36 DRAFT-DOE/CAO-2056

Draft 40 CFR191 Compliance Certification Application
1 2.1.3.5.2 The Culebra Dolomite Member
2 The Culebra rests with apparent conformity on the unnamed lower member, though the 3 underlying unit ranges from claystone to its lateral halitic equivalent in the site area. West of 4 the WIPP site, in Nash Draw, the Culebra is disrupted in response to dissolution of underlying 5 halite. Holt and Powers (see Appendix FAC, pp. 6-12, 6-13, 8-140 attribute this principally 6 to dissolution of Salado halite, while Snyder (1985, p. 6) indicates that salt was dissolved 7 post-depositionally from the unnamed lower member. These alternative models provide the 8 basis for differing explanations of how the existing Rustier hydrologic system developed and 9 might continue to develop. The regulatory period of concern is short enough and boundaries
10 close enough that these differences will not affect performance assessment.
11 The Culebra was described by Robinson and Lang as a dolomite 35 feet (11 meters) in 12 thickness; Adams (1944, p. 78) noted that oolites are present in some outcrops as well. The 13 Culebra is generally brown, finely crystalline, locally argillaceous and arenaceous dolomite 14 with rare to abundant vugs with variable gypsum and anhydrite filling. Appendix FAC 15 describes the Culebra features in detail, noting that most of the Culebra is microlaminated to 16 thinly laminated while some zones display no depositional fabric. Holt and Powers (1984) 17 described an upper interval of the Culebra consisting of waxy, golden-brown carbonate, dark 18 organic claystone, and some coarser siltstone of probable algal origin. Because of the unique 19 organic composition of this thin layer, Holt and Powers did not include it in the Culebra for 20 thickness computations, and this will be factored into discussions of Culebra thickness. Based 21 on core descriptions from the WIPP project, Holt and Powers (in Appendix FAC, p. 5-11) 22 concluded that there is very little variation of depositional sedimentary features throughout the 23 Culebra.
24 Vugs are an important part of Culebra porosity. They are commonly zoned parallel to 25 bedding. In outcrop, vugs are commonly empty. In the subsurface, vugs may be filled with 26 anhydrite or gypsum, or they may have some clay lining. Lowenstein (1988, pp. 20-21) noted 27 similar features. In Appendix FAC, vugs are attributed partly to syndepositional growth as 28 nodules and partly as later replacive textures. Lowenstein (1988, pp. 592-608) also described 29 textures related to later replacement and alteration of sulfates. Vug or pore fillings vary across 30 the WIPP site and contribute to the porosity structure of the Culebra. Natural fractures filled 31 with gypsum are common east of the WIPP site center and in a smaller area west of the site 32 center (Figure 2-11).
33 After dolomite, Sewards et al. (1991, p. DC-1) report that clay is the second most abundant 34 mineral of the Culebra. Clay minerals include corrensite, illite, serpentine, and chlorite. Clay 35 occurs in bulk rock and in fracture surfaces.
36 In the WTPP site area, the Culebra varies in thickness. Different data sources provide varying 37 estimates (Table 2-2). Holt and Powers (Appendix FAC, p. 4-7) considered the organic-rich 38 layer at the Culebra-Tamarisk contact separately from the Culebra in interpreting geophysical 39 logs.
DRAFT-DOE/CAO-2056 2-37 March 31,1995

Draft 40 CFR 191 Compliance Certification Application
1 Comparing data sets, Holt and Powers, as shown in Appendix FAC, typically interpret the 2 Culebra as being about 3 feet (about 1 meter) thinner than have other sources. In general, this 3 reflects the difference between including or excluding the unit at the Culebra-Tamarisk 4 contact. Each data set shows areal differences in thickness of the Culebra when it is examined 5 township by township.
6 LaVenue et al. (1988, app. B) calculated a mean thickness of 25 feet (7.7 meters) for the 7 Culebra based on thicknesses measured in 78 boreholes. Appendix HYDRO (Appendix 8 HYDRO, table 1) reported a data set similar to LaVenue et al., but without statistics. The 9 borehole database in Appendix BH makes it possible to defend choices of Culebra thicknesses
10 for the area being modeled.
11 Table 2-2. Culebra Thickness Data Sets
12
13 14 15 16 17 18 19 20 21 22 23 24 25
•Source'; .-: -. . " ' , ;i)ata Set Location " • . " ' ' '
•Source'; .-: - /-.322St:R3ffi-- '.''•••. T21-23S,R30.32E ~ ' '' EntireSet ,
n ave std dev n ave std dev n ave std dev
Richey (1989) 7 7.5 m 1.04 m 115 7.9 m 1.45 m 633 7.7 m 1.65 m
Holt and Powers Appendix FAC
35 6.4 m 0.59 m 122 7.0 m 1.26 m 508 6.5 m 1.89 m
LaVenue et al. (1988)
78 7.7 m
V ': „ : JVTO? Potash Prillhbles - ' - . ' : . i ""; •
Jones (1978) 21 7.5 m 0.70 m
Holt and Powers Appendix FAC
21 6.3 m 0.50 m
Key: n = number of boreholes or data points ave = average or mean std dev = standard deviation
26 2.1.3.5.3 The Tamarisk Member
27 Vine (1963, p. B15) named the Tamarisk for outcrops near Tamarisk Flat in Nash Draw. 28 Outcrops of the Tamarisk are distorted, and subsurface information was used to establish 29 member characteristics. Vine reported two sulfate units separated by a siltstone, about 5 feet 30 (1.5 meters) thick, interpreted by Jones et al. in 1960 as a dissolution residue.
31 The Tamarisk is generally conformable with the underlying Culebra. The transition is marked 32 by an organic-rich unit interpreted as being present over most of southeastern New Mexico. 33 The Tamarisk around the site area consists of lower and upper sulfate units separated by a unit 34 that varies from mudstone (generally to the west) to mainly halite (to the east). Near the
March 31,1995 2-38 DRAFT-DOE/CAO-2056

Draft 40 CFR 191 Compliance Certification Application
4 MILES
Explanation • Boreholes Examined
Contour Interval = 10% 5% Line Shown for Clarity
Figure 2-11. Percentage of Natural Fractures in the Culebra Filled with Gypsum
DRAFT-DOE/CAO-2056 2-39 March 31.1995

Draft 40 CFR 191 Compliance Certification Application
l TfflS PAGE INTENTIONALLY LEFT BLANK
-»
March 31, 1995 2-40 DRAFT-DOE/CAO-2056

Draft 40 CFR191 Compliance Certification Application
1 center of the WIPP site, the lower anhydrite was partially eroded during deposition of the 2 middle mudstone unit, as observed by in the WIPP Waste Handling and Exhaust shafts. The 3 lower anhydrite was completely eroded at WIPP-19. Before shaft exposures were available, 4 the lack of the lower Tamarisk anhydrite at WIPP-19 was interpreted as the result of solution 5 and the mudstone was considered a cave filling.
6 Jones interprets halite to be present east of the center of the WIPP site based on geophysical 7 logs and drill cuttings. Based mainly on cores and cuttings records from the WIPP potash 8 drilling program, Snyder prepared a map in 1985 showing the halitic areas of each of the non-9 carbonate Rustler members. A very similar map was prepared independently by Powers based
10 on geophysical log characteristics (see Figure 2-9).
11 Appendix FAC describes the mudstones and halitic facies in the middle of the Tamarisk, and 12 interprets that the unit formed in a salt pan to mudflat system. Holt and Powers cited 13 sedimentary features and the lateral relationships as evidence of syndepositional dissolution of 14 halite in the marginal mudflat areas. In contrast, other investigators interpreted the lateral 15 decrease in thickness and absence of halite to the west as evidence of post-depositional 16 dissolution (see, for example, Jones et al. [1960], Jones [1978], and Snyder [1985] in the 17 bibliography). The differing concepts for halite distribution in the Rustler, and particularly the 18 Tamarisk, have been used in explaining the large changes in hydrologic properties of the 19 Culebra as described in later sections.
20 The Tamarisk thickness varies greatly in southeastern New Mexico, principally as a function 21 of the thickness of halite in the middle unit. Within T22S, R3 IE, Appendix FAC shows a 22 range from 84 to 184 feet (26-56 meters) for the entire Tamarisk and a range from 6 to 110 23 feet (2-34 meters) for the interval of mudstone-halite between lower and upper anhydrites. 24 Expanded geophysical logs with corresponding lithology illustrate some of the lateral 25 relationships for this interval (Figure 2-12).
26 2.13.5.4 The Magenta Dolomite Member
27 Adams (1944, p. 1614) also attributes the name "Magenta member" to Lang, based on a 28 feature north of Laguna Grande de la Sal named Magenta Point. According to Appendix FAC 29 (p. 5-22jf), the Magenta is a gypsiferous dolomite with abundant primary sedimentary 30 structures and well-developed algal features. It does not vary greatly in sedimentary features 31 across the site area.
32 Around the WTPP site, Holt and Powers (Appendix FAC, p. 5-22) reported that the Magenta 33 varies from 23 to 28 feet (7.0 to 8.5 meters); they did not contour the thickness because of 34 limited changes.
DRAFT-DOE/CAO-2056 2-41 March 31,1995

Draft 40 CFR 191 Compliance Certification Application
1 2.1.3.5.5 The Forty-niner Member
2 Vine named the Forty-niner for outcrops at Forty-niner Ridge in eastern Nash Draw, but the 3 outcrops of the Forty-niner are poorly exposed. In the subsurface around the WIPP, the Forty-4 niner consists of basal and upper sulfates separated by a mudstone. It is conformable with the 5 underlying Magenta. As with other members of the Rustler, geophysical log characteristics 6 can be correlated with core and shaft descriptions to extend geological inferences across a 7 large area.
8 The Forty-niner ranges from 43 to 77 feet (13 to 23 meters) thick within T22S, R3 IE. East 9 and southeast of the WIPP, the Forty-niner exceeds 80 feet (24 meters), and some of the
10 geophysical logs from this area indicate halite is present in the beds between the sulfates.
11 Within the Waste Handling Shaft, the Forty-niner mudstone displayed sedimentary features 12 and bedding relationships indicating sedimentary transport. The mudstone has been 13 commonly interpreted as a residue from the dissolution of halitic beds because it is thinner 14 where there is no halite. These beds are not known to have been described in detail prior to 15 mapping in the Waste Handling Shaft at WIPP, and the features found there led Holt and 16 Powers (Appendix FAC, p. i, ii) to re-examine the available evidence for, and interpretations 17 of, dissolution of halite in Rustler units.
18 2.1.3.6 Dewey Lake fRedbeds^
19 The nomenclature for rocks included in the Dewey Lake (or alternatively Redbeds) was 20 introduced during the 1960s to clarify relationships between these rocks assigned to the Upper 21 Permian and the Cenozoic Gatuna Formation (hereafter referred to as the Gatufia).
22 There are three main sources of data about the Dewey Lake in the area around WIPP. Miller 23 reported the petrology of the unit in 1955 and 1966. Schiel described outcrops in the Nash 24 Draw areas and interpreted geophysical logs of the unit in southeastern New Mexico and west 25 Texas to infer the depositional environments and stratigraphic relationships in 1984 and 1994. 26 Powers and Holt (1990a) were able to describe the Dewey Lake in detail at the Air Intake 27 Shaft for WIPP in 1990, confirming much of Schiel's information and adding data regarding 28 the lower Dewey Lake.
29 The Dewey Lake overlies the Rustler conformably though local examples of the contact (e.g., 30 the Air Intake Shaft described by Powers and Holt in 1990) show minor disruption by 31 dissolution of some of the upper Rustler sulfate. The formation is predominantly 32 reddish-brown fine sandstone to siltstone or silty claystone with greenish-gray reduction spots. 33 Thin bedding, ripple cross-bedding, and larger channeling are common features in outcrops, 34 and additional soft sediment deformation features and early fracturing are described from the 35 lower part of the formation by Powers and Holt. Schiel (1988; 1994, p. [5-13]) attributed the 36 Dewey Lake to deposition on "a large, arid fluvial plain subject to ephemeral flood events."
March 31, 1995 2-42 DRAFT-DOE/CAO-2056

Draft 40 CFR 191 Compliance Certification Application
NATURAL ACOUSTIC GAMMA D E P T H TRAVEL TIME
NATURAL ACOUSTIC GAMMA .. D E P T H __ TRAVEL TIME
•DEWEYLAKE
;,;".'";, TAMARISK
FORTY-NINER
MAGENTA
CULEBRA
L£^ ' /TTSEJ! ! : ' ' " ' . ' ' v y'\ UNNAMED .^Xn^^^^^yJ^f. i-'i LOWER MEMBER
i ^W^U^f i - iU
W20 FENIX & SCISSON
WIPP NO. 22 T.22S.-R.31E.
S32 HELBING & PODPECHAN
SHELL STATE NO. 1-B T.22S.- R.33E.
HALITE PERMIAN-Ochoan | = ] MUDSTONE RRR SULFATE f V ^ POLYHALITE
Figure 2-12. Log Character of the Rustler Showing Mudstone-Halite Lateral Relationships
DRAFT-DOE/CAO-2056 2-43 March 31, 1995

Draft 40 CFR 191 Compliance Certification Application
l TfflS PAGE INTENTIONALLY LEFT BLANK
March 31, 1995 2-44 DRAFT-DOE/CAO-2056

Draft 40 CFR191 Compliance Certification Application
1 There is little direct faunal or radiometric evidence of the age of the Dewey Lake. It is 2 assigned to the Ochoan series of late Permian age, and it is regionally correlated with units of 3 similar lithology and stratigraphic position. Schiel in both 1988 and 1994 reviewed the 4 limited radiometric data from lithologically similar rocks (Quartermaster Formation) and 5 concluded that much of the unit could be early Triassic in age.
6 Near the center of the WIPP site, Powers and Holt (1990a, fig. 5) mapped 498 feet (152 7 meters) of the Dewey Lake (Figure 2-13). The formation is thicker to the east (Schiel 1994, 8 p. 6) of the WIPP site, in part because western areas were eroded before the overlying Triassic 9 rocks were deposited.
10 The Dewey Lake contains fractures, which are filled with minerals to varying degrees. Both 11 cements and fracture fillings have been examined and have been used to infer groundwater 12 infiltration. Powers and Holt (1990a, p. 3 -8^ described the Dewey Lake as cemented by 13 carbonate above 164.5 feet (50 meters) in the Air Intake Shaft; some fractures in the lower 14 part of this interval were also filled with carbonate, and the entire interval surface was 15 commonly moist. Below this point, the cement is harder (probably anhydrite), the shaft is dry, 16 and fractures are filled with gypsum. Powers and Holt (1990a, p. 3-11, fig. 16) suggested the 17 cement change might be related to infiltration of meteoric water. They also determined that 18 some of the gypsum-filled fractures are syndepositional. Dewey Lake fractures include 19 horizontal to subvertical trends, some of which were mapped in detail (Holt and Powers 1986, 20 figs. 6-8).
21 Lambert (1991, p. 5-65) analyzed the deuterium/hydrogen (D/H) ratios of gypsum in the 22 Rustler and gypsum veins in the Dewey Lake. He suggests that none of the gypsum formed 23 from evaporitic fluid such as Permian seawater, but that the D/H ratios all show influence of 24 meteoric water. Nonetheless, Lambert (1991, p. 5-66) also infers that the gypsum D/H is not 25 consistent with modern meteoric water; it may be consistent with earlier meteoric fluids. 26 There is no obvious correlation with depth indicating infiltration. Strontium isotope ratios 27 (87Sr/ 8 6Sr) indicate no intermixing or homogenization of fluids between the Rustler and the 28 Dewey Lake, but there may be lateral movement of water within the Dewey Lake. Dewey 29 Lake carbonate vein material shows a broader range of strontium ratios than does surface 30 caliche, and the ratios barely overlap.
31 2.1.3.7 The Santa Rosa
32 There have been different approaches to the nomenclature of rocks of Triassic age in 33 southeastern New Mexico. Bachman generally described the units in 1974 as "Triassic, 34 undivided" or as the Dockum Group, without dividing it. Vine in 1963 used "Santa Rosa 35 Sandstone," and Santa Rosa has become common usage. Lucas and Anderson in 1993 import 36 other formation names that are unlikely to be useful for WIPP.
DRAFT-DOE/CAO-2056 2-45 March 31,1995

Draft 40 CFR 191 Compliance Certification Application
1 The Santa Rosa has been called disconformable over the Dewey Lake by Vine (1963, p. B25). 2 These rocks have more variegated hues than the underlying uniformly colored Dewey Lake. 3 Coarse-grained rocks, including conglomerates are common, and the formation includes a 4 variety of cross-bedding and sedimentary features (Lucas and Anderson 1993, pp. 231-235).
5 Within the WIPP site boundary, the Santa Rosa is relatively thin to absent (Figure 2-14). At 6 the Air Intake Shaft, Powers and Holt (1990a, fig. 5) attributed about 2 feet (0.6 meters) of 7 rock to the Santa Rosa. The Santa Rosa is a maximum of 255 feet (78 meters) thick in potash 8 holes drilled for WIPP east of the site boundary. The Santa Rosa is thicker to the east.
9 2.1.3.8 The Gatuna Formation
10 Lang in 1938 named the Gatuna for outcrops in the vicinity of Gatuna Canyon in the Clayton 11 Basin. Rocks now attributed to the Gatuna in Pierce Canyon were once included in the 12 "Pierce Canyon Formation" with rocks now assigned to the Dewey Lake. The formation has 13 been mapped from the Santa Rosa, New Mexico, area south to the vicinity of Pecos, Texas. It 14 is unconformable with underlying units.
15 Vine in 1963 and Bachman in 1974 provided some limited description of the Gatuna. The 16 DOE's most comprehensive study of the Gatuna is based on WIPP investigations and landfill 17 studies for Carlsbad and Eddy County. Much of the formation is colored light reddish-brown. 18 It is broadly similar to the Dewey Lake and the Santa Rosa, though the older units have more 19 intense hues. The formation is highly variable, ranging from coarse conglomerates to 20 claystones with some highly gypsiferous sections. Sedimentary structures are abundant. 21 Analysis of lithofacies indicates that the formation is dominantly fluvial in origin with areas of 22 low-energy deposits and evaporitic minerals. It was deposited in part over areas actively 23 subsiding in response to dissolution.
24 The thickness of the Gatuna is not very consistent regionally. Thicknesses range up to about 25 300 feet (91 meters) at Pierce Canyon, with thicker areas generally subparallel to the Pecos 26 River. To the east, the Gatuna is thin or absent. Powers and Holt in 1990 reported about 27 9 feet (2.7 meters) of undisturbed Gatuna in the Air Intake Shaft at WIPP.
28 The Gatuna has been considered to be Pleistocene in age based on a volcanic glass in the 29 upper Gatuna that has been identified as the Lava Creek B ash dated at 0.6 million years by 30 Izett and Wilcox (1982). An additional volcanic ash from Gatuna in Texas yields consistent 31 K-Ar and geochemical data, indicating it is about 13 million years (Powers and Holt 1993, 32 p. 272). Thus the Gatuna ranges in age over a period of time that may be greater than the 33 Ogallala Formation (hereafter referred to as the Ogallala) on the High Plains east of WIPP.
34 2.1.3.9 Mescalero Caliche
35 The Mescalero caliche (hereafter referred to as the Mescalero) is an informal stratigraphic unit 36 apparently first differentiated by Bachman in 1974, though Bachman (1973, p. 17) described 37 the "caliche on the Mescalero Plain." He differentiated the Mescalero from the older,
March 31, 1995 2-46 DRAFT-DOE/CAO-2056
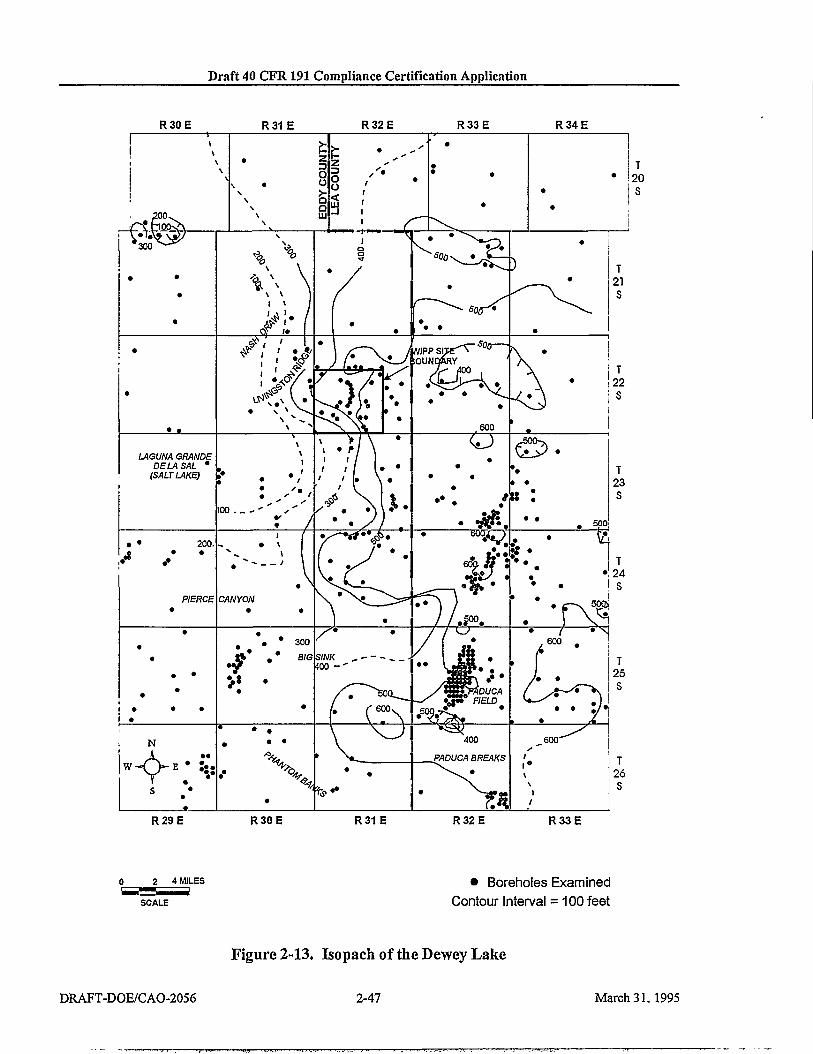
Draft 40 CFR 191 Compliance Certification Application
R30E R31E R32E R33E R34E
R29E R 3 0 E R31E R32E R33E
0 2 4 MILES
SCALE
• Boreholes Examined Contour Interval = 100 feet
Figure 2-13. Isopach of the Dewey Lake
DRAFT-DOE/CAO-2056 2-47 March 31.1995
Draft 40 CFR 191 Compliance Certification Application
l TfflS PAGE INTENTIONALLY LEFT BLANK
March 31, 1995 2-48 DRAFT-DOE/CAO-2056

Draft 40 CFR 191 Compliance Certification Application
R30E R31E R32E R33E R34E
R29E R30E R31E R32E R33E
2 4 MILES
SCALE
• Boreholes Examined Contour Interval = 100 feet
Figure 2-14. Isopach of the Santa Rosa
DRAFT-DOE/CAO-2056 2-49 March 31. 1995
Draft 40 CFR 191 Compliance Certification Application
l TfflS PAGE INTENTIONALLY LEFT BLANK
March 31, 1995 2-50 DRAFT-DOE/CAO-2056

Draft 40 CFR191 Compliance Certification Application
1 widespread Ogallala caliche or caprock on the basis of textures, noting that breccia and 2 pisolitic textures are much more common in the Ogallala caliche. The Mescalero has been 3 noted over significant areas in the Pecos drainage, including the WIPP site area, and it has 4 been formed over a variety of substrates.
5 Bachman described the Mescalero as a two-part unit: (1) an upper dense laminar caprock; and 6 (2) a basal, earthy to firm, nodular calcareous deposit. Machette (1985, p. 5) classified the 7 Mescalero as having Stage V morphologies of a calcic soil (the more mature Ogallala caprock 8 reaches Stage VI).
9 Bachman (1976, p. 148) provided structure contours on the Mescalero caliche for a large area 10 of southeastern New Mexico, including the WIPP site. From the contours and Bachman's 11 discussion of the Mescalero as a soil, it is clear that the Mescalero is expected to be 12 continuous over lyyyarge areas. Explicit WIPP data are limited mainly to boreholes, though some 13 borehole reports do not mention the Mescalero. The unit may be as much as 10 feet (3 14 meters) thick.
15 The Mescalero was inferred by Bachman on basic stratigraphic and climatic grounds as 16 having accumulated during the early to middle Pleistocene. Bachman also reported finding a 17 volcanic ash in the upper Gatuna along Livingston Ridge and underlying the Mescalero. His 18 original report that this was the Pearlette "O" ash was superseded when Izett and Wilcox 19 (1982) reported the ash as Lava Creek B, about 0.6 million years.
20 The Mescalero must therefore be younger. Samples of the Mescalero from the vicinity of the 21 WIPP were studied using uranium-trend methods. Based on early written communication 22 from Rosholt, Bachman (1985, p. 20) reports that the basal Mescalero began to form about 23 510,000 years ago and the upper part began to form about 410,000 years ago; these ages are 24 commonly cited in WIPP literature. The samples are interpreted by Rosholt and McKinney in 25 1980 in the formal report as indicating ages of 570,000 ± 110,000 years for the lower part of 26 the Mescalero and 420,000 ± 60,000 years for the upper part.
27 Based on morphology of caliche along part of the southern rim of Pierce Canyon some of the 28 caliche within the Delaware Basin may be Ogallala caliche instead of Mescalero. This 29 question has not been further addressed.
30 According to Bachman (1985, p. 19), the Mescalero soil is an indicator of stability or integrity 31 of the WIPP site surface. Bachman (1985, p. 27) considered the Mescalero as an impediment 32 to erosion; the discussion by Bachman indicates the Mescalero is an indicator of surface 33 stability over the last 500,000 years.
34 2.1.3.10 Surficial Sediments
35 Soils of the region have developed mainly from Quaternary and Permian parent material. 36 Parent material from the Quaternary system is represented by alluvial deposits of major 37 streams, dune sand, and other surface deposits. These are mostly loamy and sandy sediments
DRAFT-DOE/CAO-2056 2-51 March 31,1995

Draft 40 CFR191 Compliance Certification Application
1 containing some coarse fragments. Parent material from the Permian system is represented by 2 limestone, dolomite, and gypsum bedrock. Soils of the region have developed in a semiarid, 3 continental climate with abundant sunshine, low relative humidity, erratic and low rainfall, 4 and a wide variation in daily and seasonal temperatures. Subsoil colors normally are light 5 brown to reddish brown but are often mixed with lime accumulations (caliche) that result 6 from limited, erratic rainfall and insufficient leaching. A soil association is a landscape with a 7 distinctive pattern of soil types (series). It normally consists of one or more major soils and at 8 least one minor soil. There are three soil associations within 5 miles (8.3 kilometers) of the 9 WIPP site: the Kermit-Berino, the Simona-Pajarito, and the Pyote-Maljamar-Kermit. Of these
10 three associations, only the Kermit-Berino soil series have been mapped across the WIPP site 11 by Chugg et al. (1952, sheet no. 113). These are sandy soils developed on eolian material. 12 The Kermit-Berino soils include active dune areas. The Berino soil has a sandy A horizon; 13 the B horizons include more argillaceous material and weak to moderate soil structures. A 14 and B horizons are described as non-calcareous, and the underlying C horizon is commonly 15 caliche. Bachman in 1980 interpreted the Berino soil as a paleosol that is a remnant B horizon 16 of the underlying Mescalero.
17 Generally, the Berino series, which covers about 50 percent of the site, consists of deep, non-18 calcareous, yellow-red to red sandy soils that developed in wind-worked material of mixed 19 origin. These soils are described as undulating to hummocky and gently sloping (ranging 20 from 0 percent to 3 percent slopes). The soils are the most extensive of the deep, sandy soils 21 in the Eddy County area. Berino soils are subject to continuing wind and water erosion. If the 22 vegetative cover is seriously depleted, the water-erosion potential is slight, but the wind-23 erosion potential is very high. These soils are particularly sensitive to wind erosion in the 24 months of March, April, and May, when rainfall is minimal and winds are highest.
25 The Kermit series consists of deep, light-colored, non-calcareous, excessively drained loose 26 sands, typically yellowish-red fine sand. The surface is undulating to billowy (from 0 to 3 27 percent slopes) and consists mostly of stabilized sand dunes. Kermit soils are slightly to 28 moderately eroded. Permeability is very high, and, if vegetative cover is removed, the water-29 erosion potential is slight but the wind-erosion potential is very high. Rosholt and McKinney 30 applied uranium-trend methods to samples of the Berino soil from the WIPP site area. They 31 interpreted the age of formation of the Berino soil as 330,000 ± 75,000 years.
32 2.1.4 Physiography and Geomorphology
33 In this section the DOE presents a discussion of the physiography and geomorphology of the
34 WIPP site and surrounding area.
35 2.1.4.1 Regional Physiography and Geomorphology
36 The WIPP site is in the Pecos Valley section of the southern Great Plains physiographic 37 province (Figure 2-15), a broad highland belt sloping gently eastward from the Rocky 38 Mountains and the Basin and Range Province to the Central Lowlands Province. The Pecos 39 Valley section itself is dominated by the Pecos River Valley, a long north-south trough that is
March 31,1995 2-52 DRAFT-DOE/CAO-2056
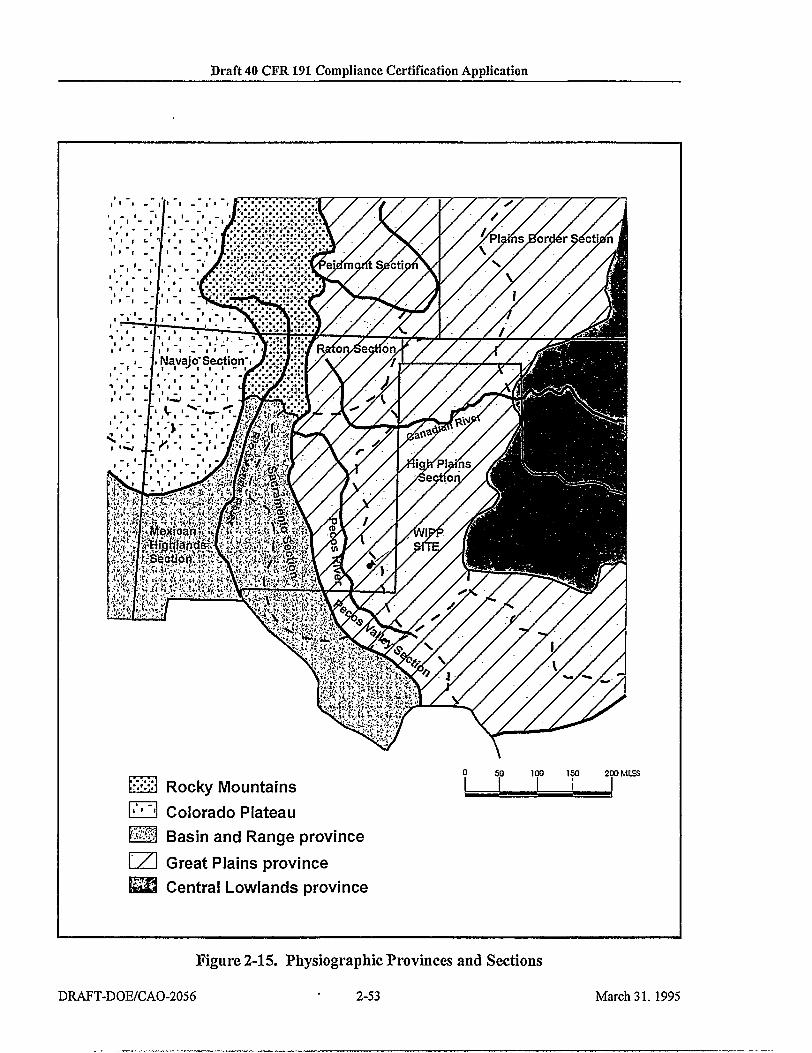
Draft 40 CFR 191 Compliance Certification Application
$>$-\ Rocky Mountains I1'1 "'I Colorado Plateau
200 MILES
Basin and Range province CZ3 Great Plains province HH Central Lowlands province
Figure 2-15. Physiographic Provinces and Sections
DRAFT-DOE/CAO-2056 ' 2-53 March 31. 1995

Draft 40 CFR 191 Compliance Certification Application
l TfflS PAGE INTENTIONALLY LEFT BLANK
March 31, 1995 2-54 DRAFT-DOE/CAO-2056

Draft 40 CFR191 Compliance Certification Application
1 from 5 to 30 miles (8.3 to 50 kilometers) wide and as much as 1,000 feet (305 meters) deep in 2 the north. The Pecos River system has evolved from the south, cutting headward through the 3 Ogallala sediments and becoming entrenched some time after the middle Pleistocene. It 4 receives almost all the surface and subsurface drainage of the region; most of its tributaries are 5 intermittent because of the semiarid climate. The surface locally has a karst terrain containing 6 superficial sinkholes, dolines, and solution-subsidence troughs from both surface erosion and 7 subsurface dissolution. The valley has an uneven rock- and alluvium-covered floor with 8 widespread solution-subsidence features, the result of dissolution in the underlying upper 9 Permian rocks. The terrain varies from plains and lowlands to rugged canyonlands, including
10 such erosional features as scarps, cuestas, terraces, and mesas. The surface slopes gently 11 eastward, reflecting the underlying rock strata. Elevations range from more than 6,000 feet 12 (1,829 meters) in the northwest to about 2,000 feet (610 meters) in the south.
13 The Pecos Valley section is bordered on the east by the Llano Estacado, a virtually uneroded 14 plain formed by river action. The Llano Estacado is part of the High Plains section of the 15 Great Plains physiographic province and is a poorly drained eastward-sloping surface covered 16 by gravels, wind-blown sand, and caliche that has developed since early to middle Pleistocene 17 time. Few and minor topographic features are present in the High Plains section, formed 18 when more than 500 feet (152 meters) of Tertiary silts, gravels, and sands were laid down in 19 alluvial fans by streams draining the Rocky Mountains. In many areas, the nearly flat surface 20 is cemented by a hard caliche layer.
21 To the west of the Pecos Valley section are the Sacramento Mountains and the Guadalupe 22 Mountains, part of the Sacramento section of the Basin and Range Province. The Capitan 23 escarpment along the southeastern side of the Guadalupe Mountains marks the boundary 24 between the Basin and Range and the Great Plains provinces. The Sacramento section has 25 large basinal areas and a series of intervening mountain ranges.
26 2.1.4.2 Site Physiography and Geomorphology
27 The land surface in the area of the WIPP site is a semiarid, wind-blown plain sloping gently to 28 the west and southwest, and is hummocky with sand ridges and dunes. A hard caliche layer 29 (Mescalero caliche) is typically present beneath the sand blanket and on the surface of the 30 underlying Pleistocene Gatuna. Figure 2-16 is a topographic map of the area. Elevations at 31 the site range from 3,570 feet (1,088 meters) in the east to 3,250 feet (990 meters) in the west. 32 The average east-to-west slope is 50 feet per mile (9.4 meters per kilometer).
33 Livingston Ridge is the most prominent physiographic feature near the site. It is a west-facing 34 escarpment that has about 75 feet (23 meters) of topographic relief and marks the eastern edge 35 of Nash Draw, the drainage course nearest to the site. Nash Draw is a shallow 5-mile-wide 36 (8-kilometer-wide) basin, 200-300 feet (61-91 meters) deep and open to the southwest. It 37 was caused, at least in part, by subsurface dissolution and the accompanying subsidence of 38 overlying sediments. Livingston Ridge is the approximate boundary between terrain that has 39 undergone erosion and/or solution collapse and terrain that has been affected very little.
DRAFT-DOE/CAO-2056 2-55 March 31,1995

Draft 40 CFR 191 Compliance Certification Application
1 About 15 miles (24 kilometers) east of the site is the southeast-trending San Simon Swale, a 2 depression due, at least in part, to subsurface dissolution. Between San Simon Swale and the 3 site is a broad, low mesa named "the Divide." Lying about 6 miles (9.7 kilometers) east of the 4 site and about 100 feet (30 meters) above the surrounding terrain, it is a boundary between 5 southwest drainage toward Nash Draw and southeast drainage toward San Simon Swale. The 6 Divide is capped by the Ogallala and the overlying caliche, upon which have formed small, 7 elongated depressions similar to those in the adjacent High Plains section to the east.
8 Surface drainage is intermittent; the nearest perennial stream is the Pecos River, 12 miles 9 (19 kilometers) southwest of the WIPP site boundary. The site's location near a natural divide
10 protects it from flooding and serious erosion caused by heavy runoff. Should the climate 11 become more humid, any perennial streams should follow the present basins, and Nash Draw 12 and San Simon Swale would be the most eroded, leaving the area of the Divide relatively 13 intact.
14 Dissolution-caused subsidence in Nash Draw and elsewhere in the Delaware Basin has caused 15 a search for geomorphic indications of subsidence near the site. One feature that has attracted 16 some attention is a very shallow sink about 2 miles (3 kilometers) north of the center of the 17 site. It is very subdued, about 1,000 feet (305 meters) in diameter, and about 30 feet (9 18 meters) deep. Resistivity studies indicate a very shallow surficial fill within this sink and no 19 disturbance of underlying beds, implying a surface, rather than subsurface, origin. Resistivity 20 surveys in the site area showed an anomaly in Section 17 within the WIPP site boundary. It 21 resembles the pattern over a known sink, a so-called breccia pipe, but drilling showed a 22 normal subsurface structure without breccia, and the geophysical anomaly is assumed to be 23 caused by low-resistivity rock in the Dewey Lake.
24 2.1.5 Tectonic Setting and Site Structural Features
25 The processes and features included in this section are those more traditionally considered 26 part of tectonics, processes that develop the broad-scale features of the earth. Salt dissolution 27 is a different process that can develop some features resembling those of tectonics.
28 Most broad-scale structural elements of the area around the WIPP developed during the late 29 Paleozoic. There is little historical or geological evidence of significant tectonic activity in 30 the vicinity. The entire region has tilted recently, and activity related to Basin and Range 31 tectonics formed major structures southwest of the area. Seismic activity is specifically 32 addressed in a separate section.
33 Broad subsidence began in the area as early as the Ordovician, developing a sag called the 34 Tabosa Basin. By late Pennsylvanian to early Permian time, the Central Basin Platform 35 developed (Figure 2-17), separating the Tabosa Basin into two parts: the Delaware Basin to 36 the west and the Midland Basin to the east. The Permian Basin refers to the collective set of 37 depositional basins in the area during the Permian period. Southwest of the Delaware Basin,
March 31, 1995 2-56 DRAFT-DOE/CAO-2056

Draft 40 CFR 191 Compliance Certification Application
Contour Interval = 10 feet
Figure 2-16. Site Topographic Map
Draft-DOE/CAO-2056 2-57 March 31,1995

Draft 40 CFR 191 Compliance Certification Application
l TfflS PAGE INTENTIONALLY LEFT BLANK
March 31, 1995 2-58 DRAFT-DOE/CAO-2056

Draft 40 CFR 191 Compliance Certification Application
N 50 50 MILES
80 80 KM
Figure 2-17. Structural Provinces of the Permian Basin Region DRAFT-DOE/CAO-2056 2-59 March 31,1995
Draft 40 CFR 191 Compliance Certification Application
l TfflS PAGE INTENTIONALLY LEFT BLANK
March 31, 1995 2-60 DRAFT-DOE/CAO-2056

Draft 40 CFR 191 Compliance Certification Application
1 the Diablo Platform began developing either late in the Pennsylvanian or early Permian. The 2 Marathon Uplift and Ouachita tectonic belt limited the southern extent of the Delaware Basin. 3 Most of these broader scale features surrounding the Delaware Basin formed during the late 4 Paleozoic and have remained relatively constant in their relationships since.
5 2.1.5.1. Basin Tilting
6 According to Brokaw et al. (1972, p. 30) pre-Ochoan sedimentary rocks in the Delaware Basin 7 show evidence of gentle downwarping during deposition, while Ochoan and younger rocks do 8 not. A relatively uniform eastward tilt generally from about 75 to 100 feet per mile (14 to 19 9 meters per kilometer) has been superimposed on the sedimentary sequence. King (1948,
10 p. 108) generally attributes the uplift of the Guadalupe and Delaware mountains along the 11 west side of the Delaware Basin to later Cenozoic, though he also notes that some faults along 12 the west margin of the Guadalupe Mountains have displaced Quaternary gravels.
13 King (1948, p. 144) also infers that the uplift is related to the Pliocene-age deposits of the 14 Llano Estacado. Subsequent studies of the Ogallala of the Llano Estacado show that it ranges 15 in age from Miocene (about 12 million years before present) to Pliocene. This is the most 16 likely range for uplift of the Guadalupes and broad tilting to the east of the Delaware Basin 17 sequence.
18 2.1.5.2 Faulting
19 Fault zones are well known along the Central Basin Platform, east of WIPP, from extensive 20 drilling for oil and gas as reported by Hills (1984, pp. 250-267). Holt and Powers performed 21 a more recent analysis in 1985 of geophysical logs to examine regional geology for the Rustler 22 that showed these faults displaced at least Rustler rocks of late Permian age. The overlying 23 Dewey Lake shows marked thinning along the same trend as the fault line or zone according 24 to Schiel (1988, fig. 21), but the structure contours of the top of the Dewey Lake are not 25 clearly offset. Schiel concluded that the fault was probably reactivated during the Dewey 26 Lake's deposition, but movement ceased at least by the time the Santa Rosa was deposited. 27 No surface displacement or fault has been reported along this trend, indicating movement has 28 not been significant enough to rupture the overlying materials since Permian time.
29 Within the Delaware Basin, there are few examples of faults that may offset part of the 30 evaporite section. At the northern end of the WIPP site, Snyder in Borns et al. (1983, p. \ljf) 31 drew structure contours on the top of the basal anhydrite (Al) of the Castile for boreholes 32 WTPP-11,WIPP-12, andWIPP-13. He interpreted northeast-southwest trending faults 33 displacing this unit both north and south of WIPP-11. Snyder inferred that the Bell 34 Canyon-Castile contact is also faulted and displaced along the same trend. Barrows in Borns 35 et al. (1983, pp. 58-60) interpreted seismic reflection data to indicate, with varying 36 confidence, faults within Castile rocks but not in underlying units.
DRAFT-DOE/CAO-2056 2-61 March 31,1995

Draft 40 CFR191 Compliance Certification Application
1 The faults interpreted by Snyder around WIPP-11 depend on the correct identification of the 2 basal Castile anhydrite (Al) in that borehole. The evaporite structure is complex, and some of 3 the upper units of the Castile and the lower Salado differ from surrounding boreholes. The 4 diagnostic Castile-Bell Canyon contact was not reached by this borehole, and the faults 5 inferred for the Castile-Bell Canyon contact also depend on correct identification of Al and 6 projection of Al thickness by Snyder. Inferred connections with the underlying Bell Canyon 7 or deeper units could signify circulation of fluids to the evaporite section within the site 8 boundaries. This is unlikely, given the Castile geology within boreholes WIPP-13 and DOE-2 9 near the trend of the inferred fault. Drilling for hydrocarbon exploration has been extensive
10 around the north and west boundaries of the site since the mid-1980s.
11 Muehlberger et al. (1978, pp. 337-340) have mapped quaternary fault scarps along the Salt 12 Basin graben west of both the Guadalupe and Delaware mountains. These are the nearest 13 known Quaternary faults of tectonic origin to the V/IPP. Kelley in 1971 inferred the Carlsbad 14 and Barrera faults along the eastern escarpment of the Guadalupe Mountains based mainly on 15 vegetative linaments. Hayes and Bachman re-examined the field evidence for these faults in 16 1979 and concluded that they were nonexistent.
17 On a national basis, Howard et al. (1971, sheets 1-2) assessed the location and potential for 18 activity of young faults. For the region around the WIPP site, Howard et al. (1971, sheet 1) 19 located faults along the western escarpment of the Delaware and Guadalupe mountains trend. 20 These faults were judged to be late Quaternary (approximately the last 500,000 years) or 21 older.
22 In summary, there are no known Quaternary or Holocene faults of tectonic origin offsetting 23 rocks at the surface nearer to the site than the western escarpment of the Guadalupe 24 Mountains. A significant part of the tilt of basin rocks is attributed to a mid-Miocene to 25 Pliocene uplift along the Guadalupe-Sacramento mountains trend that is inferred on the basis 26 of High Plains sediments of the Ogallala. Seismic activity is low and is commonly associated 27 with secondary oil recovery along the Central Basin Platform.
28 2.1.5.3 Igneous Activity
29 Within the Delaware Basin, only one feature of igneous origin is known to have formed since 30 the Precambrian. An igneous dike or series of echelon dikes occurs along a linear trace about 31 75 miles (120 kilometers) long from the Yeso Hills south of White's City to the northeast. At 32 its closest, the dike trend passes about 8 miles (13 kilometers) northwest of the WIPP site 33 center. Evidence for the extent of the dike range from outcroppings at Yeso Hills to 34 subsurface intercepts in boreholes and mines to airborne magnetic responses.
35 An early radiometric determination by Urry (1936, pp. 35-40) for the dike yielded an age of 36 30 ± 1.5 million years. More recent work by Calzia and Hiss (1978, pp. 39-45) on dike 37 samples are consistent with early work, indicating an age of 34.8 ± 0.8 million years. Work 38 by Brookins et al. (1980, pp. 28-31) on dike samples in contact with polyhalite indicated an 39 age of about 21.4 million years.
March 31, 1995 2-62 DRAFT-DOE/CAO-2056

Draft 40 CFR191 Compliance Certification Application
1 Volcanic ashes found in the Gatuiia (Section 2.1.3.8) were airborne from distant sources such
2 as Yellowstone and represent no volcanic activity at WIPP.
3 2.1.5.4 Loading and Unloading
4 The loading and unloading history of the site and surrounding areas may be considered a 5 factor in the development of the hydrological system, including the Culebra, at the WIPP site. 6 The depth to the base of the Culebra in the area (Figure 2-18) indicates the current state of 7 loading for the unit. This depth is a function of regional dip, erosion, and 8 dissolution/subsidence (Section 2.1.6.2.4). 9 Regional geology information has been used to construct a broader view of the loading and
10 unloading history at the site for the Culebra. This information is currently being compiled and 11 interpreted, and will be included in the final application.
12 2.1.6 Non-Tectonic Processes and Features
13 Halite in evaporite sequences is relatively plastic which can lead to the process of 14 deformation; it is also highly soluble which can lead to the process of dissolution. Both 15 processes (deformation and dissolution) can develop structural features similar to those 16 developed by tectonic processes. The features developed by dissolution and deformation can 17 be distinguished from similar-looking tectonic features where the underlying units do not 18 reflect the same feature as do the evaporites. As an example, the evaporite deformation can 19 commonly be shown not to affect the underlying Bell Canyon. The deformation also tends to 20 die out in overlying units, and the Rustler or the Dewey Lake may show little, if any, of the 21 effects of the deformed evaporites. Beds underlying areas of dissolved salt are not affected, 22 but overlying units to the surface may be affected.
23 2.1.6.1 Evaporite Deformation
24 The most recent review of evaporite deformation in the northern Delaware Basin and original
25 work to evaluate deformation is summarized here. More detail is in Appendix DEF.
26 2.1.6.1.1 Basic WIPP History of Deformation Investigations
27 The Castile has been known for many years to be deformed in parts of the Delaware Basin, 28 especially along the northern margin. Jones et al. in 1973 clearly showed thicker isopachs of 29 part of the Castile from the northwestern to northern part of the basin margin, just inside the 30 Capitan Formation (hereafter referred to as the Capitan). A dissertation by Snider (1966, 31 fig. 11,14) and paper by Anderson et al. (1972, pp. 59-86) also presented maps showing 32 some evidence of thicker sections of Castile next to the Capitan. 33 ERDA-6 was drilled during 1975 as part of the program to characterize an initial site for 34 WIPP. The borehole penetrated increasingly deformed beds through the Salado into the 35 Castile, and, at 2,711 feet (826 meters) depth, the borehole began to produce pressurized brine
DRAFT-DOE/CAO-2056 2-63 March 31,1995

Draft 40 CFR 191 Compliance Certification Application
1 and gas. Anderson and Powers (1978, p. 2-83) and Jones (1981) interpreted beds to have been 2 displaced structurally by several hundred feet. Some of the lower beds may have pierced 3 overlying beds. The beds were considered to be too structurally deformed to mine reasonably 4 along single horizons for a repository. Therefore, the site was abandoned in 1975, and the 5 current site was located in 1976 (Appendix GCR). The deformed beds around ERDA-6 were 6 considered part of a deformed zone within about 6 miles (10 kilometers) of the inner margin 7 of the Capitan reef. As a consequence, the preliminary selection criteria prohibited locating a 8 new site within 6 miles (10 kilometers) of the Capitan reef margin.
9 General criteria for the present site for the WIPP appeared to be met based on initial data from 10 drilling (ERDA-9) and geophysical surveys. Beginning in 1977, the new site was more 11 intensively characterized through geophysical surveys, including seismic reflection, and 12 drilling. Extensive seismic reflection work revealed good reflector quality in the southern part 13 of the site and poor quality or "disturbed" reflectors in a sector of the northern part of the site. 14 The area of "disturbed" reflectors became known as the "disturbed zone" (DZ), "the area of 15 anomalous seismic reflectors," or "zone of anomalous seismic reflection data." (The 16 "disturbed zone" based on poor Castile seismic reflectors is completely different from the 17 Disturbed Rock Zone [DRZ] which describes the deformation around mined underground 18 openings at the WIPP.)
19 Powers et al. in Appendix GCR (fig. 4.4-6) generally shows the DZ beginning about 1 mile 20 (1.6 kilometers) north of the WIPP site center. Borns et al. in 1983 included two areas south 21 of the WIPP site as showing the same features of the DZ. Neill et al. also in 1983 summarized 22 the limits to the DZ based on differing interpretations and included the area less than 1 mile 23 (1.6 kilometers) north of the site center where the Castile begins to steepen in dip. WIPP-11 24 was drilled early during 1978 about 3 miles (5 kilometers) north of the site center over part of 25 the DZ where proprietary petroleum company data had also indicated significant seismic 26 anomalies. The borehole encountered highly deformed beds within the Castile and altered 27 thicknesses of halite units, but no pressurized brine and gas were found.
28 Less than 1 mile (1.6 kilometers) north of the site center, seismic data indicated possible 29 faulting of the upper Salado and the lower Rustler over the area of steepening Castile dips. 30 Four boreholes (WIPP-18, -19,-21, -22) were drilled into the upper Salado and demonstrated 31 neither faulting nor significant deformation of the Rustler-Salado contact. Lateral changes in 32 the seismic velocity of the upper sections contributed to the interpretation of a possible fault 33 and thus complicate interpretations of deeper structure.
34 WIPP-12 was located about 1 mile (1.6 kilometers) north of the center of the site and drilled 35 during 1978 to the upper Castile to determine the significance of structure on possible 36 repository horizons. The top of the Castile was encountered at an elevation about 160 feet (49 37 meters) above the same contact in ERDA-9 at the site center.
38 WIPP-12 was deepened during late 1981 to test for possible brine and gas in the deformed 39 Castile. The probability that brine and gas would be found was considered low because 40 ERDA-6 and other known brine reservoirs in the Castile occurred in areas with greater
March 31, 1995 2-64 DRAFT-DOE/CAO-2056

Draft 40 CFR 191 Compliance Certification Application
R29E
R28E R29E
4 MILES
SCALE
I Area of incomplete contouring • Represents Borehole and Data as Reported
in Holt and Powers (1988) or interpreted from additional geophysical log data
x Represents Borehole and Data as Reported in Richey (1989)
Figure 2-18. Depth to Base of the Culebra
DRAFT-DOE/CAO-2056 2-65 March 31, 1995

Draft 40 CFR 191 Compliance Certification Application
l TfflS PAGE INTENTIONALLY LEFT BLANK
March 31, 1995 2-66 DRAFT-DOE/CAO-2056

Draft 40 CFR191 Compliance Certification Application
1 deformation. During drilling, fractured anhydrite in the upper Castile (lower A3) began to 2 yield pressurized brine and gas. The borehole was deepened to the basal anhydrite (Al) of the 3 Castile. Reservoir testing was conducted to estimate reservoir size (see later section on 4 Castile brines).
5 As a consequence of discovering pressurized brine and gas in WIPP-12, the Environmental 6 Evaluation Group (EEG) recommended that the design of the facility be changed and that 7 proposed waste storage areas in the north be moved or re-oriented to the south. After 8 additional drilling of DOE-1, it was agreed by the DOE that the design change had 9 advantages, and the disposal facilities were separated from the experimental area and placed
10 south of the site center.
11 A microgravity survey of the site was designed to try to further delineate the structure within 12 the DZ based on the large density differences between halite and anhydrite. The gravity 13 survey was unsuccessful in yielding any improved resolution of the Castile structure.
14 DOE-2 was the last WIPP borehole to examine structure within the Castile. Salado structure 15 from potash data suggested a low point about 2 miles (3.3 kilometers) north of the site center. 16 It was proposed by Davies (1984, p. 175) that the Salado low might indicate deeper 17 dissolution of Castile halite, somewhat similar to the dissolution causing breccia pipes (see 18 Section 2.1.6.2 on evaporite dissolution). The borehole demonstrated considerable Castile 19 deformation, but there was no indication that halite had been removed by dissolution.
20 2.1.6.1.2 Extent of the Disturbed Zone at the Site
21 Nearby surface drilling, shafts, and underground drilling during early excavations at WIPP 22 showed that the repository horizon varies modestly from the regional structure over the central 23 part of the site; north of the site center the beds dip to the south. Borns in 1987 suggested the 24 south dip is probably related to the dip on the underlying Castile.
25 The upper surface of MB 139, under the repository horizon, exhibited significant relief in the 26 exploratory Salt Handling Shaft. Jarolimek et al. (1983, p. 6-lff) interpreted the relief as 27 mainly due to syndepositional growth of gypsum at the water-sediment interface to form 28 mounds and to subsequent partial crushing. Jarolimek et al. concluded that the MB relief was 29 not due to deformation because the base of the MB showed no comparable relief. Based on 30 concerns of the EEG, MB 139 was re-evaluated. Borns and Shaffer in 1985 found less relief 31 on the upper surface of the MB in the areas they examined; they also concluded that 32 depositional processes were responsible for the relief. In either case, the relief on MB 139 is 33 not considered to have been caused by deformation.
34 A cross-section through the four boreholes from ERDA-9 to WIPP-11 and the cross-section to 35 DOE-1 indicate the general nature of the Castile structure under the WTPP site. Only DOE-1 36 and DOE-2 penetrate the Castile-Bell Canyon contact.
DRAFT-DOE/CAO-2056 2-67 March 31,1995

Draft 40 CFR191 Compliance Certification Application
1 2.1.6.1.3 Deformation Mechanisms
2 In analyzing Castile structure in the northern Delaware Basin, Borns et al. (1983) proposed 3 five processes in 1983 as the principal hypotheses to explain the structure: gravity foundering, 4 dissolution, gravity sliding, gypsum dehydration, and depositional processes. Gravity 5 foundering appears to be the most comprehensive explanation and is in fact the best accepted 6 hypothesis out of the five possibilities. It is based on the fact that anhydrite is much more 7 dense (about 2.9 grams per cubic centimeter) than halite (about 2.15 grams per cubic 8 centimeter), and anhydrite beds should have considerable potential for sinking into underlying 9 halite. Modeling of similar systems suggests a rate of deformation of about 0.02 inches
10 (0.05 centimeters) per year is possible and that, at that rate, the DZ could have developed over 11 about 700,000 years. The principal difficulty with this hypothesis is that there should exist the 12 same potential for foundering over much of the basin, yet the deformation is localized.
13 2.1.6.1.4 Timing of Deformation of the Disturbed Zone at the Site
14 Jones estimated in 1981 that deformation of the Castile and overlying rocks took place before 15 the Ogallala Formation was deposited, as he believes the unit is undeformed. Anderson and 16 Powers (1978, pp. 78-83) inferred that data from ERDA-6 indicate that the Castile was 17 deformed after the basin was tilted. Though these lines of evidence could be consistent with 18 mid-Miocene deformation, there are other interpretations of tilting consistent with older 19 deformation (Madsen and Raup 1988, pp. 1-5,9). There is no known evidence of surface 20 deformation or other features to indicate recent deformation.
21 A regional first-order, Class I baseline for vertical control was established over much of the 22 WJPP site during 1977 and was tied into existing lines of benchmarks in the area. The data 23 along the line from Carlsbad toward El Paso showed vertical movement from Carlsbad 24 consistent with regional geological uplift; relative subsidence over the Salt Flat Graben was 25 consistent also with geological structure as interpreted by Reilinger et al. (1980, pp. 181-184). 26 A resurvey of the WTPP area benchmarks in 1981 showed subsidence averaging about 0.72 27 inches (18 millimeters) total relative to benchmarks at Carlsbad over the 4-year period. 28 Though these short-term results are consistent in direction of relative movement with the 29 geological structure of the area (i.e., uplift on the west, tilting down to the east), the rates of 30 movement are very high or improbable for this area for periods of geological time, given the 31 geological history of the area.
32 The benchmarks can be monitored through resurveys during operation to determine any 33 changes of significance and provide continuing evidence of the stability of the site area.
34 2.1.6.2 Evaporite Dissolution
35 Because evaporites are much more soluble than most other rocks, project investigators have . 36 considered it important to understand the dissolution processes and rates that take place within 37 the site considered for long-term isolation. These dissolution processes and rates constitute 38 the limiting factor in any evaluation of the site. Over the course of the WJPP project,
March 31,1995 2-68 DRAFT-DOE/CAO-2056

Draft 40 CFR191 Compliance Certification Application
1 extensive resources have been committed to identify and study a variety of features in 2 southeastern New Mexico interpreted to have been caused by dissolution. The subsurface 3 distribution of halite for various units has been mapped. Several different kinds of surface 4 features have been attributed to dissolution of salt or karst formation. The processes proposed 5 or identified include point-source (brecciation), "deep" dissolution, "shallow" dissolution, and 6 . karst. The categories are not well defined.?Nonetheless, as discussed in the following
7 sections, dissolution is not considered a threat to isolation of waste at the WIPP.
8 2.1.6.2.1 Brief History of Project Studies
9 Well before the WIPP project, several geologists recognized that dissolution is an important 10 process in southeastern New Mexico and that it contributed to the subsurface distribution of 11 halite and to the surficial features. A number of these are in the bibliography including Lee 12 (1925, pp. 107-121), Maley and Huffington (1953, pp. 539-546), and Olive (1957, pp. 13 351-358). Robinson and Lang identified an area in 1938 under Nash Draw where brine 14 occurred at about the stratigraphic position of the upper Salado-basal Rustier and considered 15 that salt had been dissolved to produce a dissolution residue. Vine mapped Nash Draw and 16 surrounding areas, reporting in 1963 on various dissolution features. Vine reported surficial 17 domal structures later called "breccia pipes" and identified as deep-seated dissolution and 18 collapse features. 19 As the USGS and Oak Ridge National Laboratory (ORNL) began to survey southeastern New 20 Mexico as an area in which to locate a repository site in salt, Brokaw et al. in 1972 prepared a 21 summary of the geology that included solution and subsidence as significant processes in 22 creating the features of southeastern New Mexico. Brokaw et al. also recognized a solution 23 residue at the top of salt in the Salado, and the unit commonly became known as the "brine 24 aquifer" because it yielded brine in the Nash Draw area. Brokaw et al. also interpreted the 25 east-west decrease in thickness of the Rustler to be a consequence of removal of halite and 26 other soluble minerals from the formation by dissolution.
27 During the early 1970s, the basic ideas about shallow dissolution of salt (generally from 28 higher stratigraphic units and within a few hundred feet of the surface) were set out in a series 29 of reports by Bachman, Jones, and collaborators. Piper independently evaluated the 30 geological survey data for ORNL. Claiborne and Gera concluded that salt was being 31 dissolved too slowly from the near-surface units to affect a repository for several million 32 years, at least.
33 By 1978, shallower drilling around the WIPP site to evaluate potash resources was interpreted 34 by Jones (1978, p. 9), and he felt the Rustler included "dissolution debris, convergence of 35 beds, and structural evidence for subsidence." Halite in the Rustler has been re-evaluated by 36 the DOE, but there are only minor differences in inferred distributions among the various 37 investigators. These investigators do have different explanations about how this distribution 38 occurred (see previous section on Rustler stratigraphy): through extensive dissolution of the 39 Rustler's halite after the Rustler was deposited, or through syndepositional dissolution of 40 halite from saline mud flat environments during Rustler deposition.
DRAFT-DOE/CAO-2056 2-69 March 31, 1995

Draft 40 CFR 191 Compliance Certification Application
1 Under contract to SNL, Anderson, in work reported in 1978, re-evaluated halite distribution in 2 deeper units, especially the Castile and Salado formations. He identified local anomalies 3 proposed as features developed after dissolution of halite by water circulating upward from 4 the underlying Bell Canyon. In response to Anderson's developing concepts, ERDA-10 was 5 drilled south of the WIPP area during the latter part of 1977. ERDA-10 is interpreted to have 6 intercepted a stratigraphic sequence without evidence of solution residues in the upper Castile. 7 Anderson mapped geophysical log signatures of the Castile and interpreted lateral thinning 8 and change from halite to non-halite lithology as evidence of lateral dissolution of deeper 9 units (part of "deep dissolution"). Anderson considered that deep dissolution might threaten
10 the WIPP site.
11 A set of annular or ring fractures is evident in the surface around San Simon Sink, about 18 12 miles (30 kilometers) east of the WIPP site. Nicholson and Clebsch (1961, p. 14) suggested 13 that San Simon Sink developed as a result of deep-seated collapse. WIPP-15 was drilled at 14 about the center of the sink to a depth of about 811 feet (245 meters) to obtain samples for 15 paleoclimatic data and stratigraphic data to interpret collapse. Anderson and Bachman both 16 interpret San Simon Sink as dissolution and collapse features, and the annular fractures are not 17 considered evidence of tectonic activity.
18 Following the work by Anderson, Bachman mapped surficial features in the Pecos Valley, 19 especially at Nash Draw, and differentiated between those surface features in the basin which 20 were formed by karst and deep collapse features over the Capitan reef. WIPP-32, WIPP-33, 21 and two boreholes over the Capitan reef were eventually drilled. Their data, which 22 demonstrated the concepts proposed by Bachman, are documented in Snyder and Gard (1982, 23 p. 65).
24 A final program concerning dissolution and karst was initiated following a microgravity 25 survey of a portion of the site during 1980. Based on localized low-gravity anomalies, 26 Barrows et al. in 1983 interpreted several areas within the site as locations of karst. WIPP-14 27 was drilled during 1981 at a low-gravity anomaly. It revealed normal stratigraphy through the 28 zones previously alleged to be affected by karst. As a followup, in 1985 Bachman also 29 re-examined surface features around the WIPP and concluded there was no evidence for active 30 karst within the WIPP site. The nearest karst feature is northwest of the site boundaries at 31 WEPP-33 and is considered inactive.
32 2.1.6.2.2 Extent of Dissolution
33 Within members of the Rustler, the margins of halite have been mapped by different methods, 34 which were summarized by Beauheim in 1987. There are few differences in interpretation, 35 despite the different methods used (Figure 2-9). Lower members of the Rustler are halitic 36 west of the site and higher members generally show halite only further east. Snyder interprets 37 these margins as a consequence of post-depositional dissolution of halite. Holt and Powers in 38 Appendix FAC (pp. 6-8, 6-9) interpret sedimentary structures within the Rustler mudstone as 39 being equivalents to halite in order to indicate that most halite was removed during the 40 depositional process and redeposited in a salt pan in the eastern part of the depositional basin.
March 31, 1995 2-70 DRAFT-DOE/CAO-2056
Draft 40 CFR191 Compliance Certification Application
1 Upper intervals of the Salado thin dramatically west and south of the WIPP site (Figures 2-19 2 and 2-20) compared to deeper Salado intervals (Figure 2-21). There are no cores for further 3 consideration of possible depositional variations. As a consequence, this margin is interpreted 4 as the edge of dissolution of the upper Salado.
5 2.1.6.2.3 Timing of Dissolution
6 The dissolution of Ochoan-Epoch evaporites through the near-surface processes of weathering 7 and groundwater recharge has been studied extensively (Anderson 1981, pp. 133-145; 8 Lambert 1983a; Lambert 1983b, pp. 291-298; Bachman 1984, pp. 1-22; see also Appendix 9 FAC). The work of Lambert (1983a) was specifically mandated by the DOE's agreement with
10 the State of New Mexico in order to evaluate, in detail, the conceptual models of evaporite 11 dissolution proposed by Anderson (1981, pp. 133-145). There was no clear consensus of the 12 volume of rock salt removed. Hence, estimates of the instantaneous rate of dissolution vary 13 significantly. Dissolution may have taken place as early as the Ochoan, during or shortly after 14 deposition. For the Delaware Basin as a whole, Anderson (1981, pp. 133-145) proposed that 15 up to 40 percent of the rock salt in the Castile and Salado formations was dissolved during the 16 past 600,000 years. Lambert (1983b, pp. 291-298) suggested that in many places the 17 variations in salt-bed thicknesses inferred from borehole geophysical logs that were the basis 18 for Anderson's calculation were depositional in origin, compensated by thickening of adjacent 19 non-halite beds, and were not associated with the characteristic dissolution residues. Borns 20 and Shaffer also suggested in 1985 a depositional origin for many apparent structural features 21 attributed to dissolution.
22 Snyder (1985, pp. 85-229), together with earlier workers (e.g., Vine 1963, Lambert 1983b, 23 pp. 291-298; Bachman 1984, pp. 1-22), attributes the variations in thickness in the Rustler, 4 which crops out in Nash Draw, to post-depositional evaporite dissolution. Holt and Powers (in 5 Appendix FAC, pp. 7-1-7-27) have challenged this view and attribute the east-to-west 6 thinning of salt beds in the Rustler to depositional facies variability rather than post-7 depositional dissolution. Bachman (1974, pp. 74-194; 1976, pp. 135-144; 1980, pp. 8 80-1099) envisioned several episodes of dissolution since the Triassic, each dominated by 9 greater degrees of evaporite exhumation and a wetter climate, interspersed with episodes of 0 evaporite burial and/or a drier climate. Evidence for dissolution after deposition of the Salado 1 and before deposition of the Rustler along the western part of the Basin was cited by Adams 2 (1944, pp. 1596-1625). Others have argued that the evaporites in the Delaware Basin were 3 above sea level and therefore subject to dissolution, during the Triassic, Jurassic, Tertiary, and 4 Quaternary periods. Because of discontinuous deposition, not all of these times are separable 5 in the geological record of southeastern New Mexico. Bachman contends that dissolution was 6 episodic during the past 225 million years as a function of regional base level, climate, and 7 overburden.
8 Some investigators have reasoned that wetter climate accelerated the dissolution. Various 9 estimates of middle Pleistocene climatic conditions have indicated that climate was more 0 moist during Gatuiia time than during the Holocene. An example of evidence of mass loss 1 from dissolution since Mescalero time (approximately 500,000 years ago) is found in
DRAFT-DOE/CAO-2056 2-71 March 31, 1995

Draft 40 CFR 191 Compliance Certification Application
1 displacements of the Mescalero caliche as large as 180 feet (55 meters) in collapse features in 2 Nash Draw. However, given the variations in Pleistocene climate, it is unrealistic to apply a 3 calculated average rate of dissolution, determined over 500,000 years ago, to shorter periods, 4 much less extrapolate such a rate into the geological future.
5 There have been several attempts to estimate the rates of dissolution in the basin. Bachman 6 provided initial estimates of dissolution rates in 1974 based on a reconstruction of Nash Draw 7 relationships. Though these rates indicate no hazard to the WIPP related to Nash Draw 8 dissolution, Bachman later reconsidered the Nash Draw relationships and concluded that 9 pre-Cenozoic dissolution had also contributed to salt removal. Thus the initial estimated rates
10 were too high. Anderson concluded in 1978 that the integrity of the WIPP to isolate 11 radioactive waste would not be jeopardized by dissolution within about 1 million years. 12 Anderson and Kirkland (1980, pp. 66-69) expanded on the concept of brine density flow 13 proposed by Anderson in 1978 as a means of dissolving evaporites at a point by circulating 14 water from the underlying Bell Canyon. Wood et al. (1982) examined the mechanism and 15 concluded that, while it was physically feasible, it would not be effective enough in removing 16 salt to threaten the ability of the WIPP to isolate TRU waste.
17 There is local evidence that Cenozoic dissolution occurred at the same time that part of the 18 Gatuiia was being deposited in the Pierce Canyon area. Nonetheless, there is no indicator that 19 the rates of dissolution in the Delaware Basin are sufficient to affect the ability of the WIPP to 20 isolate TRU waste.
21 2.1.6.2.4 Features Related to Dissolution
22 Bachman (1980, p. 97) separated breccia pipes, formed over the Capitan reef by dissolution 23 and collapse of a cylindrical mass of rock, from evaporite karst features that appear similar to 24 breccia pipes. There are surficial features, including sinks and caves, in large areas of the 25 basin. Nash Draw is the result of combined dissolution and erosion. Within the site 26 boundaries, there are no known surficial features due to dissolution or karst.
27 South of the WIPP site, there is a clear relationship between a subsurface structure on the 28 Culebra (Figure 2-22) and dissolution. Salt has been removed from the underlying Salado to 29 create a general anticline from near Laguna Grande de la Sal to the southeast. Beds generally 30 dip to the east, and salt removed to the west created the other limb of the structure. Units 31 below the evaporites do not apparently show the same structure.
32 2.2 Surface-Water and Groundwater Hydrology
33 The DOE believes the hydrological characteristics of the disposal system are important since 34 contaminant transport via fluid flow has the potential of having the greatest impact on the 35 disposal system. At the WIPP site, one of the DOE's selection criterion was to chose a 36 location that would minimize these impacts. This was accomplished when the DOE selected 37 (1) a disposal medium that is essentially devoid of groundwater; (2) a location where the 38 effects of groundwater circulation are minimal and predictable; (3) an area where groundwater
March 31, 1995 2-72 DRAFT-DOE/CAO-2056

No-Migration Variance Petition
R30E R31E R32E R33E R34E
R29E R30E R31E R32E R33E
2 4 MILES
SCALE
• Borehole Location Contour Interval = 50 Feet
Figure 2-19. Isopach from the Top of the Vaca Triste to the Top of the Salado
DOE/CAO-95-2043 2-73 May 31,1995

Draft 40 CFR 191 Compliance Certification Application
l TfflS PAGE INTENTIONALLY LEFT BLANK
March 31, 1995 2-74 DRAFT-DOE/CAO-2056

Draft 40 CFR 191 Compliance Certification Application
R 3 0 E R31E R32E R33E R34E
R29E R 3 0 E R31E R32E R33E
2 4 MILES
SCALE
• Borehole Location Contour Interval = 50 Feet
Figure 2-20. Isopach from the Base of MB 103 to the Top of the Salado
DRAFT-DOE/CAO-2056 2-75 March 31,1995

Draft 40 CFR 191 Compliance Certification Application
l TfflS PAGE INTENTIONALLY LEFT BLANK
March 31, 1995 2-76 DRAFT-DOE/CAO-2056

Draft 40 CFR 191 Compliance Certification Application
R30E R31E R32E R33E R34E
R29E R30E R31E R32E R33E
0 2 4 MILES
SCALE
• Borehole Location Contour Interval = 50 Feet
Figure 2-21. Isopach from the Base of MB 123-124 to the Vaca Triste
DRAFT-DOE/CAO-2056 2-77 March 31,1995

Draft 40 CFR 191 Compliance Certification Application
l TfflS PAGE INTENTIONALLY LEFT BLANK
March 31, 1995 2-78 DRAFT-DOE/CAO-2056

Draft 40 CFR 191 Compliance CertiCcation Application
SCALE
J Marks general areas of incomplete contouring
Dashed Contours Represent Areas Of Limited Stratigraphic Control
R32E
• Represents Borehole and Data as Reported in Holt and Powers (1988) or interpreted from additional geophysical log data
X Represents Borehole and Data as Reported in Richey (1989)
Contour Interval - 100'
Figure 2-22. Structure Contour Map of Culebra Dolomite Base
DRAFT-DOE/CAO-2056 2-79 March 31,1995

Draft 40 CFR 191 Compliance Certification Application
l THIS PAGE INTENTIONALLY LEFT BLANK
March 31, 1995 2-80 DRAFT-DOE/CAO-2056
Draft 40 CFR191 Compliance Certification Application
1 use is virtually non-existent; (4) an area where there are no surface-waters; (5) an area where 2 future groundwater use is unlikely; and (6) a repository host rock that will not likely be 3 affected by anticipated long-term climate changes possible within 10,000 years.
4 The following discussion summarizes the characteristics of the groundwater and surface-water 5 at and around the WIPP site. This summary is based on data collection programs that were 6 initiated at the inception of the WIPP program and which continue to some extent today. 7 These programs have several purposes:
8 • To provide sufficient information to develop predictive models of the groundwater 9 movement within the vicinity of the WIPP site
10 • To collect data to evaluate the predictive models and to adapt them to the specific 11 conditions of the WIPP site 12 • To develop an understanding of the surface-water characteristics and the interaction 13 between surface-waters and groundwater 14 • To develop predictive models of the interaction between surface-water and groundwater 15 during reasonable expected climate changes.
16 In order to provide a comprehensive understanding of the impact of groundwater and surface-17 water on the disposal system, the following are the relevant factors which have been 18 evaluated:
19 Groundwater
20 21 22 23 24 25
27 28 29 30 31 32 33
General flow direction Flow type Horizontal and vertical flow velocities Hydraulic interconnectivity between rock units General groundwater use Chemistry (including, but not limited to, salinity, mineralization, age, Eh, and pH).
26 Surface-Water
Regional precipitation and evapotranspiration rates Location and size of surface-water bodies Water volume, flow rate, and direction Drainage network Hydraulic connection with groundwater Soil hydraulic properties (infiltration) General water chemistry and use.
34 The specifics of groundwater modeling are found in Chapter 6. The hydrological system is 35 divided into three segments for the purposes of modeling and discussion. These are (1) the 36 Salado, which for the most part concerns the undisturbed performance of the disposal system;
DRAFT-DOE/CAO-2056 2-81 March 31,1995

Draft 40 CFR 191 Compliance Certification Application
1 (2) the non-Salado rock units, which essentially are impacted by the disturbed (human 2 intrusion) performance of the disposal system; and (3) the surface-waters, which are impacted 3 by the natural variability of the climate.
4 The WIPP site lies within the Pecos River drainage area (Figure 2-23). The climate is 5 semiarid, with a mean annual precipitation of about 12 inches (0.3 meters), a mean annual 6 runoff of from 0.1 to 0.2 inches (2.5 to 5 millimeters), and a mean annual pan evaporation of 7 more than 100 inches (2.5 meters). Brackish water with total dissolved solids (TDS) 8 concentrations of more than 3,000 parts per million is common in the shallow wells near the 9 WIPP site. Surface-waters (Section 2.2.2) typically have high TDS concentrations,
10 particularly of chloride, sulfate, sodium, magnesium, and calcium.
11 At the WIPP site, the DOE obtains hydrologic data from conventional and special-purpose test 12 configurations in multiple surface boreholes. (Figure 2-2 is a map of borehole locations.) 13 Geophysical logging of the boreholes has provided hydrologic information on the rock strata 14 intercepted. Pressure measurements, fluid samples, and ranges of rock permeability have been 15 obtained for selected formations through the use of standard and modified drill-stem tests.
16 Slug injection or withdrawal tests have provided additional data to aid in the estimation of 17 transmissivity and storage. Also, the hydraulic head of groundwaters within many water-18 bearing zones in the region has been mapped from measured depths to water in the boreholes.
19 2.2.1 Groundwater Hydrology
20 Rock units that are important to WIPP hydrology are the Bell Canyon, the Castile, the Salado, 21 the Rustler, the Dewey Lake, and the Santa Rosa (Figures 2-24 and 2-25).
22 The Bell Canyon is of interest to the DOE because it is the first regionally continuous water-23 bearing unit beneath the WIPP. The Castile provides a hydrologic barrier underlying the 24 Salado, though it may contain pressurized brine.
25 The Culebra is the first laterally continuous unit located above the WIPP underground facility 26 to display hydraulic conductivity sufficient to warrant concern about lateral contaminant 27 transport. Barring a direct breach to the surface, the Culebra provides the most direct pathway 28 between the WIPP underground and the accessible environment. The hydrology and fluid 29 geochemistry of the Culebra are very complex and, as a result, have received a great deal of 30 study in WIPP site characterization (see, for example, La Venue et al. [1988], Haug et al. 31 [ 1987], and Siegel et al. [ 1991 ] in the bibliography).
32 At the site, the Dewey Lake is 60 feet (18 meters) below the surface and about 490 feet (149 33 meters) thick. These units appear to be mostly unsaturated hydrologically in the vicinity of 34 the WIPP shafts and over the waste emplacement panels.
March 31, 1995 2-82 DRAFT-DOE/CAO-2056

Pratt 40 CFR 191 Compliance Certification Application
WIPP SITE AND VICINITY EDDY COUNT*. NEW MEXICO
DRAINAGE TOWARDS PECOS RIVER
Figure 2-23. Drainage Pattern in the Vicinity of the WIPP Facility
DRAFT-DOE/CAO-2056 2-83 March 31, 1995

Draft 40 CFR 191 Compliance Certification Application
l TfflS PAGE INTENTIONALLY LEFT BLANK
March 31,1995 2-84 DRAFT-DOE/CAO-2056
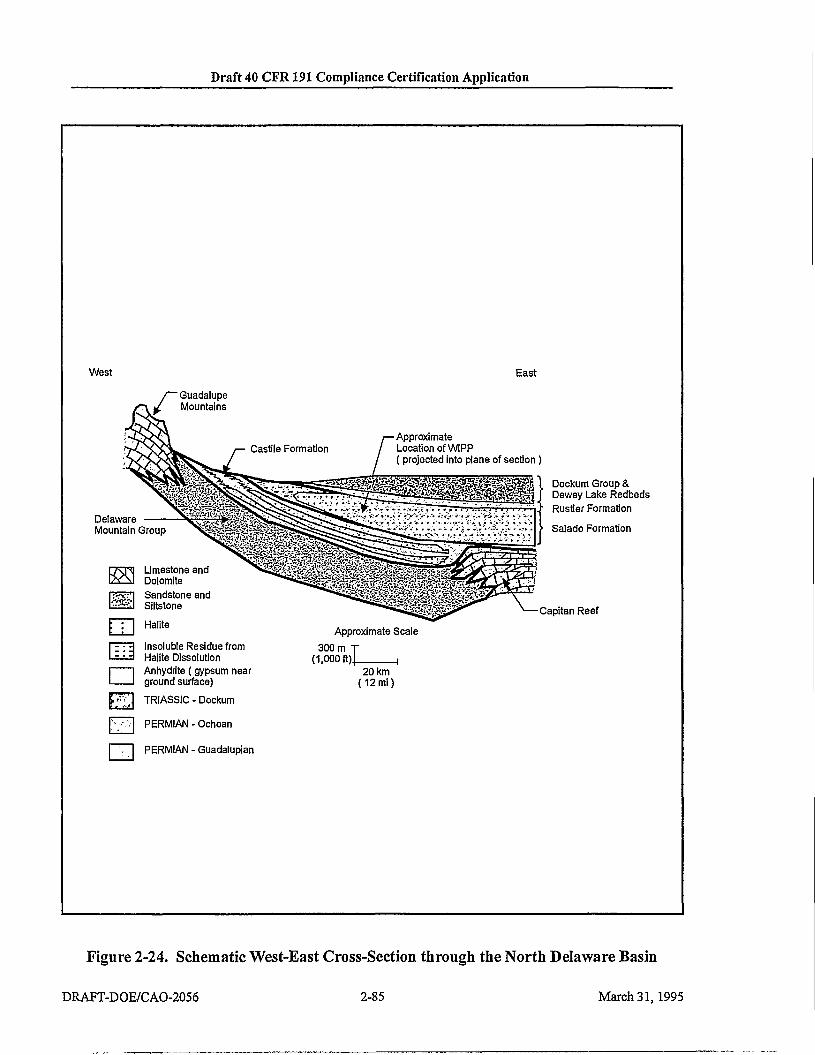
Draft 40 CFR 191 Compliance Certification Application
West
'Guadalupe Mountains
East
Approximate Location of WIPP (projected into plane of section)
m ra •
Delaware Mountain Group
Dockum Group & Dewey Lake Redbeds
Rustler Formation
Salado Formation
Limestone and Dolomite Sandstone and Siltstone
Halite
Insoluble Residue from Halite Dissolution Anhydrite (gypsum near ground surface)
TRIASSIC - Dockum
PERMIAN - Ochoan
PERMIAN - Guadalupian
Capitan Reef
Approximate Scale 300 m T
(1,000 ft)J , 20 km
(12 mi)
Figure 2-24. Schematic West-East Cross-Section through the North Delaware Basin
DRAFT-DOE/CAO-2056 2-85 March 31,1995
Draft 40 CFR 191 Compliance Certification Application
l TfflS PAGE INTENTIONALLY LEFT BLANK
March 31, 1995 2-86 DRAFT-DOE/CAO-2056

Draft 40 CFR 191 Compliance Certification Application
North
Tansill Formation Yates Formation
Seven Rivers Formation
South
Approximate Location of WIPP Dockum Group &
Dewey Lake tti&^^aSHS T- Redbeds
> Rustler Formation
Capitan
Limestone and Dolomite
•v-xM Sandstone and wM Siltstone
m Approximate Scale 0 1 2 3 km I r-' H
0 1 2 ml 2x Vertical Exaggeration
> Salado Formation
• Castile Formation
, Bell Canyon J Formation
r 3 0 0 m |_ (1000 ft)
Halite
Anhydrite with Dolomite Bed ( - - - )
E|f f ] TRIASSIC - Dockum
PERMIAN-Ochoan
PERMIAN - Guadalupian
Figure 2-25. Schematic North-South Cross-Section through the North Delaware Basin
DRAFT-DOE/CAO-2056 2-87 March 31,1995
Draft 40 CFR 191 Compliance Certification Application
l TfflS PAGE INTENTIONALLY LEFT BLANK
March 31, 1995 2-88 DRAFT-DOE/CAO-2056
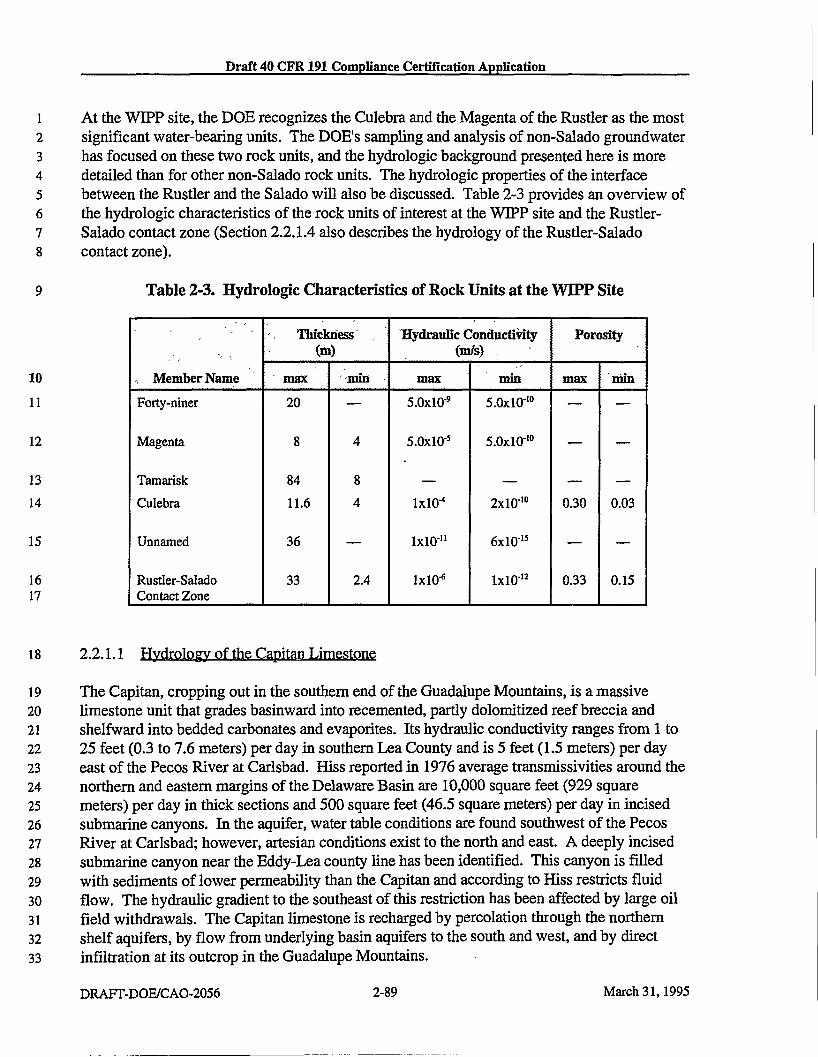
Draft 40 CFR191 Compliance Certification Application
1 At the WIPP site, the DOE recognizes the Culebra and the Magenta of the Rustler as the most 2 significant water-bearing units. The DOE's sampling and analysis of non-Salado groundwater 3 has focused on these two rock units, and the hydrologic background presented here is more 4 detailed than for other non-Salado rock units. The hydrologic properties of the interface 5 between the Rustler and the Salado will also be discussed. Table 2-3 provides an overview of 6 the hydrologic characteristics of the rock units of interest at the WIPP site and the Rustler-7 Salado contact zone (Section 2.2.1.4 also describes the hydrology of the Rustler-Salado 8 contact zone).
9 Table 2-3. Hydrologic Characteristics of Rock Units at the WIPP Site
Member Name
Thickness (m)
'Hydraulic Conductivity (m/s)
Porosity
Member Name max min max min max min Forty-niner
Magenta
Tamarisk Culebra
Unnamed
Rustler-Salado Contact Zone
20
8
84 11.6
36
33
4
8 4
2.4
5.0xl0"9
5.0x10s
lxlO-4
lxlO"11
1x10"*
5.0xl0-10
5.0x10'°
2x10-'°
6xl0 1 5
lxlO 1 2
0.30
0.33
0.03
0.15
18 2.2.1.1 Hydrology of the Capitan Limestone
19 The Capitan, cropping out in the southern end of the Guadalupe Mountains, is a massive 20 limestone unit that grades basinward into recemented, partly dolomitized reef breccia and 21 shelfward into bedded carbonates and evaporites. Its hydraulic conductivity ranges from 1 to 22 25 feet (0.3 to 7.6 meters) per day in southern Lea County and is 5 feet (1.5 meters) per day 23 east of the Pecos River at Carlsbad. Hiss reported in 1976 average transmissivities around the 24 northern and eastern margins of the Delaware Basin are 10,000 square feet (929 square 25 meters) per day in thick sections and 500 square feet (46.5 square meters) per day in incised 26 submarine canyons. In the aquifer, water table conditions are found southwest of the Pecos 27 River at Carlsbad; however, artesian conditions exist to the north and east. A deeply incised 28 submarine canyon near the Eddy-Lea county line has been identified. This canyon is filled 29 with sediments of lower permeability than the Capitan and according to Hiss restricts fluid 30 flow. The hydraulic gradient to the southeast of this restriction has been affected by large oil 31 field withdrawals. The Capitan limestone is recharged by percolation through the northern 32 shelf aquifers, by flow from underlying basin aquifers to the south and west, and by direct 33 infiltration at its outcrop in the Guadalupe Mountains.
DRAFT-DOE/CAO-2056 2-89 March 31,1995

Draft 40 CFR 191 Compliance Certification Application
1 2.2.1.2 Hydrology of the Delaware Mountain Group
2 Formations of the Delaware Mountain Group underlie the Capitan reef and form the floor of 3 the Delaware Basin evaporite sequence. Three separate formations, each about 1,000 feet 4 (305 meters) thick, are assumed to form a single aquifer system, with an average hydraulic 5 conductivity of 0.02 foot (0.065 meters) per day and a calculated transmissivity of about 50 6 square feet (4.6 square meters) per day. Figure 2-26 presents a potentiometric map 7 representing a composite surface for the Delaware Mountain Group and the Capitan aquifer. 8 The data were adjusted for saline density and expressed as freshwater equivalents. The brines 9 in the Delaware Mountain Group flow northeasterly under a hydraulic gradient of from 25 to
10 40 feet per mile (4.7 to 7.6 meters per kilometer) and discharge into the Capitan aquifer. 11 Velocities range from 0.2 to 0.3 feet (0.06 to 0.09 meters) per year, and groundwater yields 12 from wells in the Delaware Mountain Group are from 0.6 to 1.5 gallons (2.3 to 5.8 liters) per 13 minute.
14 2.2.1.3 Hydrology of the Salado and Castile Formations
15 As described in Sections 2.1.3.3 and 2.1.3.4, the Castile and the Salado consist mainly of 16 halite and anhydrite. A considerable amount of information about the hydraulic properties of 17 these rocks has been collected through field and laboratory experiments. Appendix HYDRO 18 compiles and summarizes this information.
19 2.2.1.3.1 Salado Hydrology
20 Hydraulic testing in the Salado halite-rich sections provided quantitative estimates of the 21 hydrauUc properties controlling brine flow through the Salado. The tests are interpreted by 22 Beauheim et al. in 1991 and 1993 using models based on potentiometric flow. The tests 23 influence rock as far as 10 meters distant from the test zone and are not thought to 24 significantly alter the pre-test conditions of the rock. The stratigraphic intervals tested include 25 both pure and impure halite. Because tests close to the repository are within the DRZ, it is 26 reasonable to use the results of the tests farthest from the repository as most representative of 27 undisturbed conditions.
28 Twenty-two hydraulic tests have been performed in impure halite, and two in pure halite. 29 Interpreted permeabilities using a Darcy-flow model range from lxlO"23 to 4xl0' 1 8 m 2 for 30 impure halite intervals. Interpreted formation pore pressures range from 0.3 to 9.7 31 megapascals for impure halite. Tests in pure halite show no observable response, indicating 32 either extremely low permeability (<10"23 square meters), or no flow whatsoever, even though 33 appreciable pressures are applied to the test interval. Appendix PAR contains a summary of 34 the results of field permeability tests to date.
35 Fourteen hydrauUc tests have been performed in anhydrite. Interpreted permeabiUties using a 36 Darcy-flow model range from 2 x 10"20 to 7 x 10"18 square meters for anhydrite intervals. 37 Interpreted formation pore pressures range from atmospheric to 12.5 megapascals for 38 anhydrite intervals. Lower values are caused by depressurization near the excavation.
March 31, 1995 2-90 DRAFT-DOE/CAO-2056
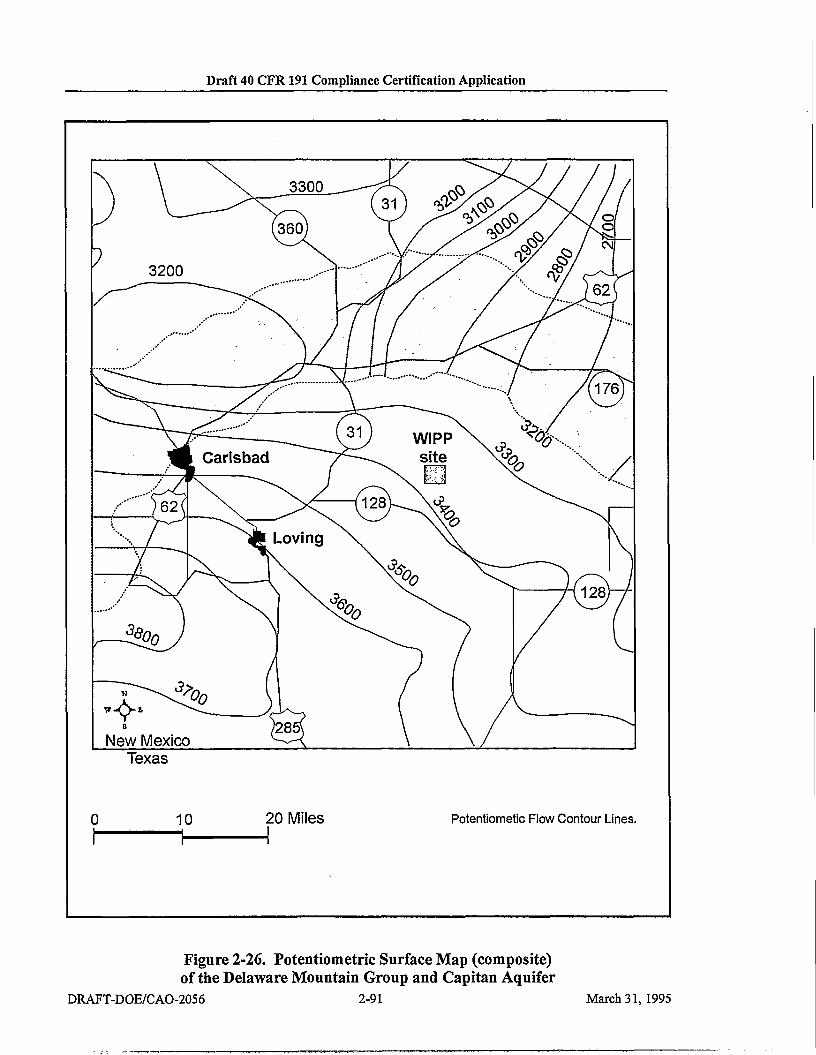
Draft 40 CFR 191 Compliance Certification Application
Figure 2-26. Potentiometric Surface Map (composite) of the Delaware Mountain Group and Capitan Aquifer
DRAFT-DOE/CAO-2056 2-91 March 31,1995

Draft 40 CFR 191 Compliance Certification Application
l TfflS PAGE INTENTIONALLY LEFT BLANK
March 31,1995 2-92 DRAFT-DOE/CAO-2056

Draft 40 CFR191 Compliance Certification Application
1 The properties of anhydrite interbeds have also been investigated in the laboratory. Tests 2 were performed on three groups of core samples from MB 139 as part of the Salado Two-3 Phase Flow Laboratory Program. The laboratory experiments provided porosity, intrinsic 4 permeability, and capillary pressure data. Preliminary analysis of capillary pressure test 5 results indicate a threshold pressure of less than 1 megapascal. The laboratory-measured 6 effective porosity and intrinsic permeability data are shown in Appendix PAR.
7 Fluid pressures that are much higher than hydrostatic is a hydrologic characteristic of the 8 Castile and the Salado that the DOE believes plays a potentially important role in the 9 repository behavior. It is difficult to accurately measure natural pressures in these formations
10 because the boreholes or repository excavations required to access the rocks decrease the 11 stress in the region measured. Stress released instantaneously decreases fluid pressure in the 12 pores of the rock, so measured pressures must be considered as a lower bound of the natural 13 pressures. Stress effects related to test location, and the difficulty of making long-duration 14 tests in lower permeability rocks, results in higher pore pressures being observed to date in 15 anhydrites. The highest observed pore pressure in halite-rich units, near Room Q, is on the 16 order of 9 megapascals, whereas the highest pore pressures observed in anhydrite are 17 12.5 megapascals. It is expected that the farfield pore pressures in halite-rich and anhydrite 18 beds in the Salado at the repository level are similar. The reasons for this expectation are 19 discussed in Chapter 6. For comparison, the hydrostatic pressure at the depth of the repository 20 is about 7 megapascals and the lithostatic pressure calculated from density measurements in 21 ERDA-9 is about 15 megapascals.
22 Fluid pressures in sedimentary basins that are much higher or much lower than hydrostatic are 23 referred to as "abnormal pressures" in the literature of the petroleum industry, where they have 24 received considerable attention. The explanations of how these pressures can be maintained 25 over very long periods of time, perhaps millions of years, generally fall into two categories. 26 The first is based on the concept that the maintenance of abnormal pressures indicates the rock 27 volumes containing the high pressures must be "hydraulically isolated" from normally 28 pressured sediments. The second maintains that all rocks have finite permeability and that 29 abnormal pressures must be viewed as a transient phenomenon. In the absence of a generating 30 method, according to the second category, these pressures would decay away over geologic 31 time even in rocks with extremely low permeability.
32 Except for the pure halites, it has been demonstrated that the rocks of the Castile and the 33 Salado have a small but finite permeability. The high pressures are almost certainly 34 maintained because of the large compressibility and plastic nature of the halite, and to a lesser 35 extent, the anhydrite. The lithostatic pressure at a particular horizon must be supported by a 36 combination of the stress felt by the rock matrix and the pore fluid. In highly deformable 37 rocks, the portion of the stress that must be borne by the fluid exceeds hydrostatic pressure but 38 cannot exceed lithostatic pressure.
DRAFT-DOE/CAO-2056 2-93 March 31,1995

Draft 40 CFR 191 Compliance Certification Application
1 Brine content within the Salado is estimated at 1-2 percent by weight although the thin clay 2 seams have been observed by the Brine Sampling and Evaluation Program (BSEP) reported in 3 1991 by Deal et al. to contain up to 25 percent brine by weight. This brine may move toward 4 areas of low pressure, such as a borehole or mined section of the Salado.
5 Observation of the response of pore fluids in the Salado to changes in pressure boundary 6 conditions at walls in the repository, in boreholes without packers, in packer-sealed boreholes, 7 or in laboratory experiments is complicated by low permeability and low porosity. Flow has 8 been observed to move to walls in the repository, to boreholes without packers, and to packer-9 sealed boreholes. In certain cases, evidence for flow is no longer observed where it once was;
10 in others, flow has begun where it once was not observed. In many cases, observations and 11 experiments must last for months or years to obtain useful results. In part because of design 12 requirements such as duration (experimental period is short relative to the time required for 13 the geological materials to fully respond), few quantitative data have been obtained for certain 14 lithologic units within the Salado. There is much direct, qualitative experience regarding the 15 behavior of flow crossing the walls of the repository.
16 2.2.1.3.2 Castile Hydrology
17 The hydrology of the Castile differs from that of the Salado in that fracturing in the upper 18 anhydrite has generated regions with much greater permeability than the surrounding intact 19 anhydrite. These regions are located in the area of structural deformation as discussed in 20 Section 2.1.6.1.1. The higher permeability regions of the Castile contain brine at pressures 21 greater than hydrostatic and have been referred to as "brine reservoirs." The fluid pressure 22 measured in the WIPP-12 borehole (12.7 megapascals) is greater than the nominal hydrostatic 23 pressure for a column of equivalent brine at that depth (11.1 megapascals). Therefore, under 24 open-hole conditions, brine could flow upward through an intrusion borehole.
25 Hydraulic tests performed in the ERDA-6 and WIPP-12 boreholes suggest that the highly 26 permeable portions of the Castile are limited in extent. The vast majority of brine is thought 27 to be stored in low-permeability microfractures; about 5 percent of the overall brine volume is 28 stored in large open fractures. The volumes of the ERDA-6 and WIPP-12 brine reservoirs 29 were estimated by Popielak et al. in 1983 to be 3.5xl06 cubic feet (100,000 cubic meters) and 30 9.5x 10⁶ cubic feet (2,700,000 cubic meters), respectively.
31 The origin of brine in the Castile has been investigated geochemically. Popielak et al. 32 concluded that the ratios of major and minor element concentrations in the brines indicate that 33 these fluids originated from ancient seawater and that there is no evidence for fluid 34 contribution from present meteoric waters. The gas and brine chemistries of Castile waters 35 from the ERDA-6 and WCPP-12 reservoirs are distinctly different from each other and from 36 local groundwaters. The brines are saturated, or nearly so, with respect to halite and, 37 consequently, have little or no halite dissolution potential.
March 31, 1995 2-94 DRAFT-DOE/CAO-2056
Draft 40 CFR191 Compliance Certification Application
1 2.2.1.4 Hydrology of the Rustler-Salado Contact Zone
2 In the vicinity of the Nash Draw, the contact between the Rustler and the Salado is an 3 unstructured residuum of gypsum, clay, and sandstone created by the dissolution of halite. 4 The residuum is absent under the WIPP site. It is clear that dissolution in Nash Draw 5 occurred after deposition of the Rustler.
6 Brine in the Rustler-Salado contact residuum, immediately above the top of the salt in the 7 vicinity of Nash Draw, was first described by Robinson and Lang in 1938 and referred to as 8 the "brine aquifer." They suggested that the structural conditions that caused the development 9 of Nash Draw might control the occurrence of the brine; thus, the brine aquifer boundary may
10 coincide with the topographic surface expression of Nash Draw. Their studies show the brine 11 to be concentrated along a strip from 2 to 8 miles (3.3 to 13 kilometers) wide and about 26 12 miles (43 kilometers) long. Data from the test holes Robinson and Lang drilled indicate that 13 the residuum (containing the brine) ranges in thickness from 10 to 60 feet (3 to 18 meters) and 14 averages about 24 feet (7 meters). In 1954, hydraulic properties were determined by Hale et 15 al. primarily for the area between Malaga Bend on the Pecos River and Laguna Grande de la 16 Sal. They calculated a value of transmissivity of 8,000 square feet per day (8.6xl0"3 square 17 meters per second) and estimated the potentiometric gradient to be 1.4 feet per mile (0.27 18 meters per kilometer). In this area, the "Rustler-Salado residuum" apparently is part of a 19 continuous hydrologic system as evidenced by the coincident fluctuation of water levels in the 20 test holes (as far away as Laguna Grande de la Sal) with pumping rates in irrigation wells 21 along the Pecos River.
22 In the northern half of Nash Draw, the approximate outline of the brine aquifer (Rustler-23 Salado contact residuum) as described by Robinson and Lang in 1938 has been supported by 24 drilling associated with the WIPP hydrogeologic studies. These studies also indicate that the 25 main differences in areal extent occur along the eastern side where the boundary is very 26 irregular and, in places (test holes P-14 and H-07), extend farther east than previously 27 indicated by Robinson and Lang.
28 Other differences from the earlier studies include the variability in thickness of residuum 29 present in test holes WIPP-25 through WIPP-29. These holes indicate thicknesses ranging 30 from 11 feet (3.3 meters) in WIPP-25 to 108 feet (33 meters) in WIPP-29 in Nash Draw, 31 compared to 8 feet (2.4 meters) in test hole P-14 east of Nash Draw. The specific 32 geohydrologic mechanism that has caused dissolution to be greater in one area than in another 33 is not apparent, although a general increase in chloride concentration in water from the north 34 to the south may indicate the effects of movement down the natural hydraulic gradient in Nash 35 Draw.
36 The average hydraulic gradient within the residuum in Nash Draw is about 10 feet per mile 37 (1.9 meters per kilometer); in contrast, at the WIPP site the average gradient is 39 feet per 38 mile (7.4 meters per kilometer). This difference reflects the changes in transmissivity, which 39 are as much as five orders of magnitude greater in Nash Draw. The transmissivity determined 40 from aquifer tests in test holes completed in the Rustler-Salado contact residuum of Nash
DRAFT-DOE/CAO-2056 2-95 March 31,1995

Draft 40 CFR191 Compliance Certification Application
1 Draw ranges from 2x10^ square feet per day (2. lxlO' 1 0 square meters per second) at WIPP-27 2 to 8 square feet per day (8.6X10"6 square meters per second) at WIPP-29. This is in contrast to 3 the WDPP site proper, where transmissivities range from 3xl0"5 square feet (3.2xl0"n square 4 meters per second) per day at test holes P-18 and H-05c to 5xl0"2 square feet per day (5.4xl0"8
5 square meters per second) at test hole P-14. Locations and estimated hydraulic heads of these 6 wells are illustrated in Figure 2-27.
7 Hale et al. believed the Rustler-Salado contact residuum discharges to the alluvium near 8 Malaga Bend on the Pecos River. Because the confining beds in this area probably are 9 fractured due to dissolution and collapse of the evaporites, the brine (under artesian head)
10 moves up through these fractures into the overlying alluvium and then discharges into the 11 Pecos River.
12 Evidence for very slow groundwater movement is found in the water quality, especially in the 13 magnesium concentrations. Large magnesium concentrations appear to be indicative of an 14 environment in which groundwater flow is extremely slow and there has been extensive 15 interaction between the water and its host rock. Large concentrations of magnesium, ranging 16 from 21,000 milligrams per liter in water from test hole H-06 to 82,000 milligrams per liter in 17 water from test hole H-05, were present in most of the test wells in the eastern part of the 18 WTPP site. Aquifer tests at these test holes were characterized by very low transmissivities. 19 To the west, approaching the more developed part of the flow system of the Rustler-Salado 20 contact residuum in Nash Draw, the magnesium concentrations decreased by one to two 21 orders of magnitude. Magnesium concentrations of 1,200 milligrams per liter in water from 22 test hole P-14 and 350 milligrams per liter in water from test hole P-15 may indicate the 23 eastern boundary of the more developed Rustler-Salado flow system. Magnesium 24 concentrations are as small as 430 milligrams per liter in water from test hole H-08; other 25 values range from 910 milligrams per liter in water from test hole H-07 to 3,200 milligrams 26 per liter in water from test hole WIPP-25.
27 According to Appendix HYDRO, water in the Rustler-Salado contact residuum contains the 28 largest concentrations of dissolved solids in the WIPP area, ranging from 79,800 milligrams 29 per liter in test hole H-07 to 480,000 milligrams per liter in test hole H-01. These waters are 30 classified as brines. The dissolved mineral constituents in the brine largely consist of sulfates 31 and chlorides of calcium, magnesium, sodium, and potassium; the major constituents are 32 sodium and chloride. Concentrations of the other major ions vary according to the spatial 33 location of the sample and probably are directly related to the interaction of the brine and the 34 host rocks and reflect residence time within the rocks. Residence time of the brine depends 35 upon the transmissivity of the rock. For example, the presence of large concentrations of 36 potassium and magnesium in water is correlated with minimal permeability and a relatively 37 undeveloped flow system.
March 31,1995 2-96 DRAFT-DOE/CAO-2056

Draft 40 CFR 191 Compliance Certification Application
Figure 2-27. Measured Water Levels and Estimated Freshwater Heads of the Unnamed Lower Member and Rustler-Salado Contact Zone
DRAFT-DOE/CAO-2056 2-97 March 31,1995

Draft 40 CFR 191 Compliance Certification Application
l TfflS PAGE INTENTIONALLY LEFT BLANK
March 31, 1995 2-98 DRAFT-DOE/CAO-2056

Draft 40 CFR191 Compliance Certification Application
1 2.2.1.5 Hydrology of the Rustler Formation
2 The Rustler is of particular importance for WIPP because it contains the most transmissive 3 units above the repository. The Rustler is divided into four formally named members and an 4 unnamed lower member. These five units are, in ascending order, the unnamed lower 5 member (the oldest), the Culebra, the Tamarisk, the Magenta, and the Forty-niner (the 6 youngest).
7 2.2.1.5.1 Unnamed Lower Member of the Rustler Formation
8 The basal interval of the unnamed lower member is composed of siltstone, mudstone, and 9 claystone and can be considered the water-producing zones of the lowermost Rustier.
10 Transmissivities of 2.7x10^ square feet per day (2.9xl0'1 0 square meters per second) and 11 2.2X10"4 square feet per day (2.4xl0"10 square meters per second) were calculated by Beauheim 12 (1987, p. 50) from tests at well H-16 that included this interval. These transmissivity values 13 correspond to hydraulic conductivities of 4.2x 10"6 feet per day (1.5x 10'11 meters per second) 14 and 3.4X10"6 feet per day (1.2xl0' n meters per second). Hydraulic conductivity in the lower 15 portion of the unnamed lower member is believed by the DOE to increase to the west in and 16 near Nash Draw, where dissolution in the underlying Rustler-Salado contact zone has caused 17 subsidence and fracturing of the sandstone and siltstone.
18 The remainder of the unnamed lower member contains mudstones, anhydrite, and variable 19 amounts of halite. The hydraulic conductivity of these lithologies is extremely low: tests of 20 mudstones and claystones in the Waste Handling Shaft gave hydraulic conductivity values 21 ranging from 2xl0' 9 feet per day (6xl0"15 meters per second) to 3xl0"8 feet per day (lxlO"13
22 meters per second) according to Saulnier and Avis (1988, p. 6-11).
23 2.2.1.5.2 The Culebra Member of the Rustler Formation
24 The Culebra is modeled in the performance assessment as the most likely pathway for the 25 release of radionuclides to the accessible environment because of its relatively high 26 transmissivity near the WIPP site, and hydrologic research activity has concentrated on the 27 unit for over a decade.
28 According to Appendix HYDRO, the transmissivity of the Culebra varies over six orders of 29 magnitude from east to west in the vicinity of the WIPP (Figure 2-28). It ranges from lxlO*3
30 square feet per day (lxlO"9 square meters per second) at well P-18 east of the WIPP site to 31 lxlO 3 square feet per day (lxlO' 3 square meters per second) at well H-7 in Nash Draw (see 32 Figure 2-2 for the locations of these wells).
33 Measured matrix porosities of the Culebra range from 0.03 to 0.30. Fracture porosity values 34 have not been measured directly, but interpreted values from tracer tests at the H-3, H-6, and 35 H-l 1 hydropads range from 5X10"4 to 3xl0' 3. Data are insufficient to map the spatial 36 variability of the porosity.
DRAFT-DOE/CAO-2056 2-99 March 31,1995

Draft 40 CFR191 Compliance Certification Application
1 Variations in transmissivity in the Culebra are believed by many experts to be controlled by 2 the relative abundance of open fractures rather than by primary (i.e., depositional) features of 3 the unit. Lateral variations in depositional environments were small within the mapped 4 region, and primary features of the Culebra show little map-scale spatial variability according 5 to Appendix FAC. Direct measurements of the density of open fractures are not available 6 from core samples because of incomplete recovery and fracturing during drilling, but 7 comparisons with the relatively unfractured exposures in the WIPP shafts suggest that the 8 density of open fractures in the Culebra decreases to the east. Qualitative correlations have 9 been noted between transmissivity and several geologic features possibly related to open-
10 fracture density, including (1) the distribution of overburden above the Culebra; (2) the 11 distribution of halite in other members of the Rustler; (3) the dissolution of halite in the upper 12 portion of the Salado; and (4) the distribution of gypsum fillings in fractures in the Culebra.
13 The distribution of groundwater hydrogeochemical facies is not consistent with the southward 14 flow direction calculated by LaVenue et al. in 1990 from potentiometric data, if one assumes 15 that the ionic strength of a groundwater increases along a flow path. One possible model for 16 the relationship between the facies distribution and the flow paths has been proposed by 17 Chapman in 1986 and 1988, who coupled an extensive compilation of stable and radiogenic 18 isotope ratios of Rustler groundwaters with isotopic data from regional groundwaters and 19 surficial waters. Chapman cited evidence for short times of Culebra groundwaters and 20 postulated that recharge from the surface could account for the less concentrated groundwaters 21 south of the WIPP site. That explanation, however, is not supported by interpretations of 22 isotopic and solute data presented by Lambert, Siegel, and others.
23 Specifically, radiogenic isotopic signatures suggest that the age of the groundwater in the 24 Culebra is on the order of tens of thousands of years (see, for example, Lambert 1987; 25 Lambert and Carter 1987; Lambert and Harvey 1987 in the bibliography). A conceptual 26 model was put forth by Siegel et al. in 1991. Those authors contend that there has been a 27 change in the location and amount of recharge since the last glacial maximum and that the 28 present distribution of solutes and isotopes in the Culebra is a relict of a flow regime of a 29 wetter climate. The current distribution of hydrogeochemical facies, therefore, represents a 30 rock-water system that is still slowly reaching a new chemical and physical equilibrium. 31 However, a conceptual or calculation^ model of how paleoflow could have been to the east 32 has not been presented.
33 Currently, the issue of the relationship between water chemistry and groundwater flow in the 34 Culebra remains unresolved. It is possible that lack of resolution reflects the way the problem 35 has been posed and the relatively simple conceptual models that have been used to represent 36 the hydrology of the system. Previous discussions, for example, have focused on flow 37 directions but not flow rates. Computer models of flow in the Culebra suggest that flow rates 38 are orders of magnitude slower in the region of the halite facies than in the region of the 39 anhydrite facies. It is possible that the geochemical signature of flow from the halite facies to 40 the anhydrite facies is not observed because only minute amounts of water flow along this 41 path. In addition, some of the previous studies have not considered, or have not ruled out, 42 transport of solutes from units above and below the Culebra. For example, the region of the
March 31,1995 2-100 DRAFT-DOE/CAO-2056

Draft 40 CFR 191 Compliance Certification Application
y i i MI i i iifiiiiiimiiiii r
. D*CU
J i i i ' 11Illiniumnli i
8 km
• Observation Well
+ Pilot-Point Location
TransmissK/rties in logiQ rr?/*
Contour Interval: 0.5 (ogjQ m2/*
Figure 2-28. The Transient Calibrated Log10 Transmissivities
DRAFT-DOE/CAO-2056 2-101 March 31,1995

Draft 40 CFR 191 Compliance Certiflcation Application
l TfflS PAGE INTENTIONALLY LEFT BLANK
March 31,1995 2-102 DRAFT-DOE/CAO-2056

Draft 40 CFR191 Compliance Certification Application
1 halite facies correlates well with the extent of halite in strata above and below the Culebra. 2 The possibility that the halite facies results from vertical advective or diffusive transport into a 3 region of extremely slow flow in the Culebra has riot been investigated. Preliminary results of 4 calculations using the groundwater basin approach suggest that addressing these issues as a 5 three-dimensional transport system will facilitate resolution.
6 2.2.1.5.3 The Tamarisk Member of the Rustler Formation
7 Attempts were made in two wells, H-14 and H-16, to test a 7.9-foot (2.4-meter) sequence of 8 the Tamarisk that consists of claystone, mudstone, and siltstone overlain and underlain by 9 anhydrite. Permeability was too low to measure in either well within the time allowed for
10 testing; consequently Beauheim in 1987 estimated the transmissivity of the claystone 11 sequence to be one or more orders of magnitude less than that of the tested interval in the 12 unnamed lower member. Transmissivity in the Tamarisk was estimated to be less than 13 approximately 2.5xl0"5 square feet per day (2.7xl0"n square meters per second), 14 corresponding to a hydraulic conductivity of less than approximately 1.3X10"6 square feet per 15 day (1.4xl0"12 meters per second).
16 2.2.1.5.4 The Magenta Member of the Rustler Formation
17 The Magenta of the Rustler is a fine-grained dolomite that ranges in thickness from 13 to 26 18 feet (4 to 8 meters) and is about 19 feet (6 meters) thick at the WTPP. The Magenta is 19 saturated except near outcrops along Nash Draw, and hydraulic data are available from 15 20 wells. According to Appendix HYDRO, transmissivity ranges over five orders of magnitude 21 from lxlO"3 to 4xl0 2 square feet per day (lxlO' 9 to 4X10"4 square meters per second).
22 The hydraulic transmissivities of the Magenta, based on sparse data, show a decrease in 23 conductivity from west to east, with slight indentations of the contours north and south of the 24 WTPP that correspond to the topographic expression of Nash Draw. In most locations, the 25 hydraulic conductivity of the Magenta is one to two orders of magnitude less than that of the 26 Culebra.
27 No porosity measurements have been made on the Magenta. Beauheim (1987, pp. I l l , 115) 28 assumed a porosity representative of dolomite of 0.20 for the interpretations of well tests. The 29 hydrologic gradient across the site varies from 16 to 20 feet per mile (3 to 4 meters per 30 kilometer) on the eastern side, steepening to about 32 feet per mile (6 meters per kilometer) 31 along the western side near Nash Draw (Figure 2-29).
32 2.2.1.5.5 The Forty-niner Member of the Rustler Formation
33 The uppermost member of the Rustler, the Forty-niner, is about 20 meters (66 feet) thick 34 throughout the WIPP area and consists of low-permeability anhydrite and siltstone. Tests by 35 Beauheim in 1987 in H-14 and H-16 yielded transmissivities of about 3xl0"2 to 7xl0"2 square 36 feet per day (3xl0"8 to 8X10"6 square meters per second) and 5xl0"3 to 6xl0"3 square feet per 37 day (3xl0 9 to 6xl0' 9 square meters per second), respectively.
DRAFT-DOE/CAO-2056 2-103 March 31,1995
Draft 40 CFR191 Compliance Certification Application
1 2.2.1.6 Hydrology of the Supra-Rustier Rocks fthe Dewey Lake and the Santa Rosal
2 The supra-Rustier rocks consist of (in ascending order) the Dewey Lake and the Santa Rosa 3 are comprised of a confining siltstone bed, water-bearing sandstone, and a confining mudstone 4 bed (respectively). The Dewey Lake may retard downward percolation of surface waters 5 while the Santa Rosa provides water for irrigation and livestock.
6 2.2.1.6.1 The Dewey Lake (Redbeds)
7 Hydrologic properties of the Dewey Lake are characterized based on only a few measurements 8 compared to the more extensive data set available for members of the Rustler. As a result, the 9 position of the water table is not well known. The average hydraulic conductivity of the
10 Dewey Lake, assuming saturation, is estimated to be 3xl0"3 feet per day (10"8 meters per 11 second), corresponding to the hydraulic conductivity of fine-grained sandstone and siltstone. 12 Hydraulic properties are somewhat variable as relatively high water production from a 13 fractured zone within the WIPP site boundary was recently observed at Water Quality 14 Sampling Program (WQSP)-6A. However, in the vicinity of the WIPP shafts, the Dewey 15 Lake has not produced water. Several wells operated by the J.C. Mills Ranch south of the 16 WIPP produce sufficient quantities of water from the Dewey Lake to supply livestock.
17 2.2.1.6.2 The Santa Rosa
18 The Santa Rosa is about 140-300 feet (43-91 meters) thick and is present over the eastern 19 half of the WTPP site. It dips gently westward, except in local areas of collapse, and crops out 20 northeast of Nash Draw. As a water-bearing unit, the Santa Rosa near the WIPP site has a 21 saturated thickness of only from 1 to 2 feet (0.3 to 0.61 meters) and occurs in limited extent. 22 It has a porosity of about 13 percent and a specific capacity of 0.14-0.20 gallons per minute 23 per foot (0.029-0.041 liters per second per meter) of drawdown. Lows in the potentiometric 24 surface near the Eddy-Lea county line and the San Simon Swale suggest recharge into 25 underlying rocks, possibly through collapse zones, and a possibility of a groundwater divide 26 (at a surface ridge) between the site and San Simon Swale. In general, groundwater flows 27 south and is of better quality than that found in the Rustler.
28 It is not known at this time what quantities of water, if any, from the Santa Rosa recharge the 29 shallow aquifers along the Pecos River. The groundwater gradient in adjacent Texas along 30 the Pecos River is influenced by a large-scale withdrawal of groundwater, resulting in a net 31 loss of groundwater storage. The declines in water levels have created sizable cones of 32 depression along the river and gradients toward the river. The Santa Rosa aquifer in 33 southwest Texas adjacent to the New Mexico border is not downgradient from the WIPP site. 34 Several reasons for believing that Santa Rosa waters at the WIPP site flow into the Pecos 35 River rather than to the south into Texas are the configuration of the potentiometric head map, 36 the influence of extensive pumping, and a topographic groundwater divide east of the WIPP 37 site. Groundwaters pumped from the Santa Rosa and alluvium deposits are used extensively 38 for irrigation and livestock.
March 31,1995 2-104 DRAFT-DOE/CAO-2056

Draft 40 CFR 191 Compliance Certification Application
V--\r
-WIPP-SITE BOUNDARY
•H-2a. 960 961
LEGEND -WELL TESTED -MEASURED WATER-LEVEL ELEVATION, m amsl
ESTIMATED FRESHWATER-HEAD - ELEVATION, m amsl
6 km
SCALE
_ _ g 5 0 — — FRESHWATER-HEAD ELEVATION CONTOUR
CONTOUR INTERVAL = 5 m
1 2
Figure 2-29. Water Levels and Estimated Freshwater Heads in the Magenta
DRAFT-DOE/CAO-2056 2-105 March 31, 1995

Draft 40 CFR 191 Compliance Certification Application
l TfflS PAGE INTENTIONALLY LEFT BLANK
March 31, 1995 2-106 DRAFT-DOE/CAO-2056

Draft 40 CFR191 Compliance Certification Application
1 2.2.1.7 Groundwater Elevation Measurements in 1991
2 Groundwater levels have been measured continuously in some units in the vicinity of the 3 WJPP site for several decades. These levels can be used to determine the longer term trends 4 in water-level changes, either natural or in response to human activities in the region. The 5 groundwater-level data indicate that there is a gradual trend of rising water-level elevations 6 within the Culebra. Of the surveillance locations, 39 of the 46 showed some increase in 7 water-level elevations within the Culebra. Two anomalous occurrences were noted in the 8 data. The first was a net loss of 8.64 feet (2.62 meters) of groundwater-level elevation at the 9 Cabin Baby (CB)-l well site from January through December 1991, and the second was a gain
10 of 24.77 feet (7.51 meters) of gfoundwater-level elevation at well P-18 (Figure 2-2). The two 11 wells are located within 5 miles (8.3 kilometers) of each other. The suspected cause of the 12 loss of water-level elevation at Cabin Baby is the failure of a bridge plug located between the 13 Culebra and the portion of the hole open to the Salado and the Castile. The anomalous water-14 level elevation increase at P-18 is gradually decreasing from year to year. In 1988, the water 15 level in well P-18 increased approximately 45 feet (14 meters), whereas the increase was 16 approximately 33 and 25 feet (10 and 7.6 meters), respectively, in 1990 and 1991. The 17 smaller increase from year to year indicates that P-18 is trending toward an equilibrium state; 18 however, the magnitude of elevation gains indicates that years may pass before equilibrium is 19 achieved.
20 Freshwater head distribution in the Culebra indicates that the generalized directional flow of 21 groundwater is north to south. However, caution should be used when making assumptions 22 based on groundwater-level data alone. Recent studies in the Culebra have shown that fluid 23 density variations in the Culebra can affect flow direction. One should also be aware that the 24 fractured media of the Culebra, coupled with variable fluid densities, can cause localized flow 25 patterns to have little or no relationship to general flow patterns.
26 Measurements at 11 surveillance locations in the Magenta also indicated an upward trend in 27 water-level elevations. No anomalous losses or gains were noted within the Magenta. Seven 28 of eleven Magenta surveillance locations show a gain in the elevation of groundwater levels 29 from January to December 1991. Four wells showed lower groundwater-level elevations in 30 December than in January 1991. All of the four surveillance locations that indicated a loss of 31 head elevation from January to December were wells that are pumped routinely as part of the 32 WQSP. These locations are H-03bl,H-04c,H-05c, and H-06c. Recovery from these 33 pumping events may have influenced the water-level data collected at these locations.
34 When groundwater elevations taken in 1991 are compared to potentiometric elevation maps 35 produced by Appendix HYDRO, groundwater elevations appear to be below 1983 levels. 36 Mercer's study was performed prior to the onset of the large-scale hydrologic activities that 37 took place in the vicinity of the WJPP site to support site characterization and other 38 hydrologically oriented activities during the mid to late 1980s. Since the end of the 1980s,
DRAFT-DOE/CAO-2056 2-107 March 31,1995
Draft 40 CFR191 Compliance Certification Application
1 only modest amounts of groundwater have been removed from these formations. The 2 possibility exists that the increasing groundwater elevations observed in 1991 represent a 3 natural trend for the recovery of the formations to groundwater elevations near those of the 4 1983 potentiometric elevations.
5 2.2.2 Surface-Water Hydrology
6 The WIPP site is in the Pecos River basin, which contains about 50 percent of the drainage 7 area of the Rio Grande Water Resources Region. The Pecos River headwaters are northeast of 8 Santa Fe, and the river flows to the south through eastern New Mexico and western Texas to 9 the Rio Grande. The Pecos River has an overall length of about 500 miles (805 kilometers), a
10 maximum basin width of about 130 miles (209 kilometers), and a total drainage area of about 11 44,535 square miles (115,301 square kilometers) (about 20,500 square miles [53,075 square 12 kilometers] contained within the basin have no external surface drainage and their surface 13 waters do not contribute to Pecos River flows). Figure 2-23 shows the Pecos River drainage 14 area.
15 The Pecos River is generally perennial, except in the reach below Anton Chico and between 16 Fort Sumner and Roswell, where the low flows percolate into the stream bed. The main stem 17 of the Pecos River and its major tributaries have low flows, and the streams are frequently dry. 18 About 75 percent of the total annual precipitation and 60 percent of the annual flow result 19 from intense local thunderstorms between April and September. The principal tributaries of 20 the Pecos River, in downstream order, are the Gallinas River, Salt Creek, Rio Hondo, Rio 21 Felix, Eagle Creek, Rio Penasco, Black River, and Delaware River.
22 There are no perennial streams at the WIPP site. At its nearest point, the Pecos River is about 23 12 miles (19 kilometers) southwest of the WIPP site boundary. The drainage area of the 24 Pecos River at this location is 19,000 square miles (47,500 square kilometers). A few small 25 creeks and draws are the only westward flowing tributaries of the Pecos River within 20 miles 26 (32 kilometers) north or south of the site. A low-flow investigation has been initiated by the 27 USGS within the Hill Tank Draw drainage area, the most prominent drainage feature near the 28 WIPP site. The drainage area is about 4 square miles (10.3 square kilometers), with an 29 average channel slope of from 1 to 100, and the drainage is westward into Nash Draw. Two 30 years of observations showed only four flow events. The USGS estimates that the flow rate 31 for these events was under 2 cubic feet per second (0.057 cubic meters per second). The 32 Black River (drainage area: 400 square miles [1,035 square kilometers]) joins the Pecos from 33 the west about 16 miles (25 kilometers) southwest of the site. The Delaware River (drainage 34 area: 700 square miles [1,812 square kilometers]) and a number of small creeks and draws 35 also join the Pecos River along this reach. The flow in the Pecos River below Fort Sumner is 36 regulated by storage in Sumner Lake, Brantley Reservoir, Lake Avalon, and several other 37 smaller irrigation dams.
March 31, 1995 2-108 DRAFT-DOE/CAO-2056
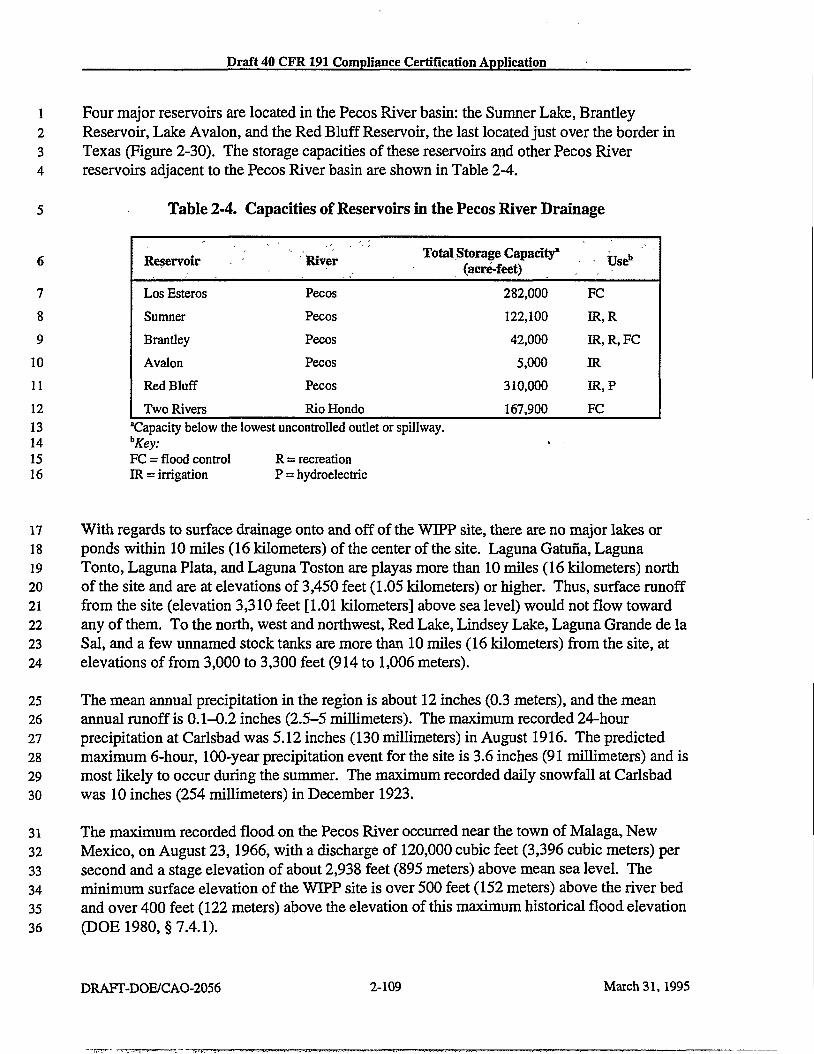
Draft 40 CFR191 Compliance Certification Application
1 Four major reservoirs are located in the Pecos River basin: the Sumner Lake, Brantley 2 Reservoir, Lake Avalon, and the Red Bluff Reservoir, the last located just over the border in 3 Texas (Figure 2-30). The storage capacities of these reservoirs and other Pecos River 4 reservoirs adjacent to the Pecos River basin are shown in Table 2-4.
5 Table 2-4. Capacities of Reservoirs in the Pecos River Drainage
Reservoir River Total Storage Capacity* (acre-feet) - Use"
Los Esteros Pecos 282,000 FC Sumner Pecos 122,100 IR.R Brantley Pecos 42,000 IR, R, FC Avalon Pecos 5,000 IR Red Bluff Pecos 310,000 IR.P Two Rivers Rio Hondo 167,900 FC
13 "Capacity below the lowest uncontrolled outlet or spillway. 14 hKey: 15 FC = flood control R = recreation 16 IR = irrigation P = hydroelectric
17 With regards to surface drainage onto and off of the WIPP site, there are no major lakes or 18 ponds within 10 miles (16 kilometers) of the center of the site. Laguna Gatuna, Laguna 19 Tonto, Laguna Plata, and Laguna Toston are playas more than 10 miles (16 kilometers) north 20 of the site and are at elevations of 3,450 feet (1.05 kilometers) or higher. Thus, surface runoff 21 from the site (elevation 3,310 feet [1.01 kilometers] above sea level) would not flow toward 22 any of them. To the north, west and northwest, Red Lake, Lindsey Lake, Laguna Grande de la 23 Sal, and a few unnamed stock tanks are more than 10 miles (16 kilometers) from the site, at 24 elevations of from 3,000 to 3,300 feet (914 to 1,006 meters).
25 The mean annual precipitation in the region is about 12 inches (0.3 meters), and the mean 26 annual runoff is 0.1-0.2 inches (2.5-5 millimeters). The maximum recorded 24-hour 27 precipitation at Carlsbad was 5.12 inches (130 millimeters) in August 1916. The predicted 28 maximum 6-hour, 100-year precipitation event for the site is 3.6 inches (91 millimeters) and is 29 most likely to occur during the summer. The maximum recorded daily snowfall at Carlsbad 30 was 10 inches (254 millimeters) in December 1923.
31 The maximum recorded flood on the Pecos River occurred near the town of Malaga, New 32 Mexico, on August 23,1966, with a discharge of 120,000 cubic feet (3,396 cubic meters) per 33 second and a stage elevation of about 2,938 feet (895 meters) above mean sea level. The 34 minimum surface elevation of the WIPP site is over 500 feet (152 meters) above the river bed 35 and over 400 feet (122 meters) above the elevation of this maximum historical flood elevation 36 (DOE 1980, § 7.4.1).
DRAFT-DOE/CAO-2056 2-109 March 31, 1995

Draft 40 CFR 191 Compliance Certification Application
1 More than 90 percent of the mean annual precipitation at the site is lost by evapotranspiration. 2 On a mean monthly basis, evapotranspiration at the site greatly exceeds the available rainfall; 3 however, intense local thunderstorms may produce runoff and percolation.
4 Water quality in the Pecos River basin is affected by mineral pollution from natural sources 5 and from irrigation return flows (see Section 2.4.2.2 for surface-water quality). At Santa 6 Rosa, New Mexico, the average suspended-sediment discharge of the river is about 1,650 tons 7 per day. Large amounts of chlorides from Salt Creek and Bitter Creek enter the river near 8 Roswell. River inflow in the Hagerman area contributes increased amounts of calcium, 9 magnesium, and sulfate; and waters entering the river near Lake Arthur are high in chloride.
10 Below Brantley Reservoir, springs flowing into the river are usually submerged and difficult 11 to sample; springs that could be sampled had TDS concentrations of from 3,350 to 4,000 12 milligrams per liter. Concentrated brine entering at Malaga Bend adds an estimated 70 tons 13 per day of chloride to the Pecos River.
14 2.2.3 Groundwater Discharge and Recharge
15 The only documented points of naturally occurring groundwater discharge in the vicinity of 16 the WIPP are the saline lakes in Nash Draw and the Pecos River, primarily near Malaga Bend. 17 Although this is local flow associated with Nash Draw and unrelated to groundwater flow at 18 the WIPP site, it is presented here for completeness. Discharge into one of the lakes from 19 Surprise Spring was measured by Hunter in 1985 at a rate of less than 0.35 cubic feet (0.01 20 cubic meters) per second in 1942. Hunter also estimated total groundwater discharge into the 21 lakes is 24 cubic feet (0.67 cubic meters) per second. According to Appendix HYDRO, 22 discharge from the spring comes from fractured and more transmissive portions of the 23 Tamarisk of the Rustler, and the lakes are hydraulically isolated from the Culebra and lower 24 units.
25 Groundwater discharge into the Pecos River is greater than discharge into the saline lakes. 26 Groundwater discharge into the Pecos River between Avalon Dam north of Carlsbad and a 27 point south of Malaga Bend was no more than approximately 32.5 cubic feet (0.92 cubic 28 meters) per second. Most of this gain in stream flow occurs near Malaga Bend (see Figure 2-29 1) and is the result of groundwater discharge from the residuum at the Rustler-Salado contact 30 zone.
31 The only documented point of groundwater recharge is also near Malaga Bend, where an 32 almost immediate water-level rise has been reported by Hale et al. in 1954 in a Rustler-Salado 33 well following a heavy rainstorm. This location is hydraulically downgradient from the 34 repository, and recharge here has little relevance to flow near the WIPP. Examination of the 35 potentiometric surface map for the Rustler-Salado contact zone (Figure 2-27) indicates that 36 some inflow may occur north of the WIPP, where freshwater equivalent heads are highest. 37 Additional inflow to the contact zone may occur as leakage from overlying units, particularly 38 where the units are close to the surface and under water table conditions.
March 31, 1995 2-110 DRAFT-DOE/CAO-2056

Draft 40 CFR 191 Compliance Certification Application
35°
106°
/ 105°
Pecos R/ver Ajlrj J matPdasWjrff j
/i?r\ X / P I * iX
1 f " " ~ A ^ " " ^ ^ ^L—citonias
104°
34° / d
f **• /Santa"} ^ V - » * ^ ^ / J \ \fcU gh/R o s af V - ^ A
J \ . / "****- k/' -"** A I \ _ L / ""vC** - / l / • ^ w >£ Tt̂ Sumner/̂ W >rona ^ ^ / L r feiLak&/ V s
**-^ "N i -—̂ . FbrtA r—*7 . l
35°
Rio RuHos^
33° / f'\^ * P'c&jft 7 Rpswell T /
/ Two Rivers j£ / / ~^f\ Reservoir \ I f
c x / v ^ y / v~33°
Jf34°
106° „ )! 1 0 5 ° /
32°
j—j-r^ Vpc Branttey V . J J ; j Rese/voir ^ v
_ — - s ^ ^BraftHey Dam ** r—' Carlsbad*-/ / i
^ ^ > - - ^ ^ . f ^-SaltLake Y /
/ A
103°
- WIPP
106° „ )! 1 0 5 ° /
32°
~5\ l\ ""̂ -̂ /
Y /
/ A
103°
- WIPP
31° -J
/ T NearOng ^
I / S«—Pec / Pecosrf y
1 7 ^ ' — ^"~~"n '
/ ] ^ \ 3 2 ° ps River
\ 102°
IGrandFaBs\ /
J ) \ JP' \
31° -J
71 •-'1 / ° , F o l t
/ ] ^ \ 3 2 ° ps River
\ 102°
IGrandFaBs\ /
J ) \ JP' \
30° >
104°
/ / ^ ^ M - ^ l 0
103°
102° •-50* RIO-GRANDE^f,^" Shumla
If
5 Not to Scale 5 5
Figure 2-30. Location of Reservoirs and Gauging Stations in the Pecos River Basin
DRAFT-DOE/CAO-2056 2-111 March 31, 1995

Draft 40 CFR 191 Compliance Certification Application
l TfflS PAGE INTENTIONALLY LEFT BLANK
March 31, 1995 2-112 DRAFT-DOE/CAO-2056

Draft 40 CFR191 Compliance Certification Application
1 No direct evidence exists for the location of either recharge to or discharge from the Culebra. 2 The freshwater-head surface map (Figure 2-31) implies inflow from the north and outflow to 3 the south. Recharge from the surface probably occurs 9-19 miles (15-30 kilometers) 4 northwest of the WIPP in and north of Clayton Basin (Figure 2-27) where the Rustler crops 5 out. An undetermined amount of inflow may also occur as leakage from overlying units 6 throughout the region.
7 The freshwater head contour map (Figure 2-31) indicates that flow in the Culebra is toward 8 the south. Some of this southerly flow may enter the Rustler-Salado contact zone under water 9 table conditions near Malaga Bend and ultimately discharge into the Pecos River. Additional
10 flow may discharge directly into the Pecos River or into alluvium in the Balmorhea-Loving 11 Trough to the south.
12 Recharge to the Magenta may also occur north of the WIPP in Bear Grass Draw and Clayton 13 Basin. The potentiometric surface map indicates that discharge is toward the west in the 14 vicinity of the WIPP, probably into the Tamarisk and the Culebra near Nash Draw. Some 15 discharge from the Magenta may ultimately reach the saline lakes in Nash Draw. According 16 to Brinster in 1991, additional discharge probably reaches the Pecos River at Malaga Bend or 17 the alluvium in the Balmorhea-Loving Trough.
18 Isotopic data from groundwater samples suggest that groundwater travel time from the surface 19 to the Dewey Lake and the Rustler is long and rates of flow are extremely slow. Based on 20 observations by Lambert and Harvey reported in 1987, low tritium levels in all WIPP-area 21 samples indicate minimal contributions from the atmosphere since 1950. Lambert in 1987 22 indicated four modeled radiocarbon ages from Rustler and Dewey Lake groundwater are 23 between 12,000 and 16,000 years. The uranium isotope activity ratios observed require a 24 conservative minimum residence time in the Culebra of several thousands of years and more 25 probably reflect minimum ages of from 10,000 to 30,000 years.
26 Potentiometric data from four wells support the conclusion that little infiltration from the 27 surface reaches the transmissive units of the Rustler. Hydraulic head data are available for a 28 claystone in the Forty-niner from wells DOE-2, H-3, H-4, H-5, and H-6. Beauheim in 1987 29 compared these heads to heads in the surrounding Magenta wells and showed that flow 30 between the units at all four wells may be upward. This observation offers no insight into the 31 possibility of infiltration reaching the Forty-niner, but it rules out the possibility of infiltration 32 reaching the Magenta or any deeper units at these locations.
33 2.3 Resources
34 This section refers to the significance of specific natural resources that lie beneath the WIPP 35 site. Resources are minerals or hydrocarbons that are potentially of economic value. Reserves 36 are the portion of resources that are economic at today's market prices and with existing 37 technology.
DRAFT-DOE/CAO-2056 2-113 March 31,1995

Draft 40 CFR 191 Compliance Certification Application
1 For hydrocarbons, proven reserves can be expected to be recovered from new wells on 2 undrilled acreage or from existing wells where a relatively major expenditure is required to 3 establish production. Probable reserves refer to reserves of hydrocarbons suspected of 4 existing in certain locations based on favorable engineering and/or geologic data. Possible 5 reserves are based on conditions where limited engineering and/or geologic data support 6 recoverable potential.
7 The topic of resources is used to broadly define both economic (mineral and non-mineral) and 8 cultural resources associated with the "VVTPP site. These resources are important since they 9 (1) provide evidence of past uses of the area, and (2) indicate potential future use of the area
10 with the possibility that such use could lead to disruption of the closed repository. Because of 11 the depth of the disposal horizon, it is believed that only the mineral resources are of 12 significance in predicting the long-term performance of the disposal system. However, the 13 non-mineral and cultural resources are presented for completeness.
14 Mineral resource discussions are focused principally on hydrocarbons and potassium salts, 15 both of which have long histories of development in the region and both of which could be 16 disruptive to the disposal system. The information regarding the mineral resources 17 concentrates on the following factors:
18 • Number, location, depth, and present state of development including penetrations through 19 the disposal horizon 20 • Type of resource 21 • Accessibility, quality, and demand 22 • Mineral ownership in the area.
23 The specific impacts of resource development are discussed in Chapter 6 where scenarios 24 related to mineral development are included for evaluation of disposal system performance. A 25 discussion of how these resources were considered during site selection is included in Chapter 26 7 as a demonstration of compliance to the resource considerations mandated by 40 CFR § 27 191.14. A database of Delaware Basin boreholes has been assembled to estimate future 28 impacts of resource development. This database is Appendix DEL (in press) and is associated 29 with the determination of future drilling rates.
30 The discussion of cultural and economic resources is focused on describing past and present 31 land uses unrelated to the development of minerals. The archaeological record supports the 32 observation that changes on land use are principally associated with climate and the 33 availability of forage for wild and domestic animals. In no case does it appear that past or 34 present land use has had an impact on the subsurface beyond the development of shallow 35 groundwater wells to water livestock.
March 31, 1995 2-114 DRAFT-DOE/CAO-2056

Draft 40 CFR 191 Compliance Certification Application
i i i J ' I i I I I I I I I I I I I I I I I I I i r
.IOCS* . USCS1
, v ^ _ *^ *•* «~ *^
i S ^ i 11 i i iniiii i i i i i i / i i il \ \ i
• Observation Well
Freshwater Heads In m amst
Contour Interval: 2m
1 Figure 2-31. Culebra Freshwater-Head Contour Surface
DRAFT-DOE/CAO-2056 2-115 March 31,1995
Draft 40 CFR 191 Compliance Certification Application
l TfflS PAGE INTENTIONALLY LEFT BLANK
March 31,1995 2-116 DRAFT-DOE/CAO-2056
Draft 40 CFR191 Compliance Certification Application
1 2.3.1 Extractdble Resources
2 The geologic studies of the WIPP site have included the investigation of potential natural 3 resources to evaluate the impact of denying access to these resources and other consequences 4 of their occurrence. This study was completed in support of the EEIS to ensure knowledge of 5 natural resources once the impacts of denying access was included in the decision-making 6 process for WIPP. Of the natural resources expected to occur beneath the site, five are of 7 practical concern: the two potassium salts sylvite and langbeinite, which occur in strata above 8 the repository salt horizon; and the three hydrocarbons, crude oil, natural gas, and distillate 9 liquids associated with natural gas, all three of which occur elsewhere in strata below the
10 repository horizon and may occur below the repository. Other mineral resources beneath the 11 site are caliche, salt, gypsum, and lithium; enormous deposits of these minerals near the site 12 and elsewhere in the country are more than adequate (and more economically attractive) to 13 meet future requirements for these materials. In 1995 the NMBMMR performed a 14 reevaluation of the mineral resources at and within 1 mile (1.6 kilometers) around the WIPP 15 site.
16 2.3.1.1 Potash Resources at the WIPP Site
17 Throughout the Carlsbad Potash District, commercial quantities of potassium salts are 18 restricted to the middle portion of the Salado, locally called the McNutt potash zone or 19 member. A total of 11 horizons, or orebeds, have been recognized in the McNutt potash 20 member. Horizon Number 1 is at the base, and Number 11 is at the top. The 11th ore zone is 21 not mined.
22 The USGS uses three established standard grades—low, lease, and high—to quantify the 23 potash resources at the site. The USGS assumes that the "lease" and "high" grades comprise 24 reserves because some lease-grade ore is mined in the Carlsbad Potash District. Most of the 25 potash that is mined, however, is better typified by the high grade. Even the high-grade 26 resources may not be reserves, however, if their properties make processing uneconomic.
27 The NMBMMR 1995 study contains a comprehensive summary of all previous evaluations.
28 Griswold (in NMBMMR 1995, ch. VII) used 40 existing boreholes drilled on and around the 29 WIPP site to perform a re-evaluation of potash resources. He selected holes that were drilled 30 using brine so that the dissolution of potassium salts was inhibited. The results of the 31 chemical analyses of the ore-bearing intervals were adjusted to calculate the percentage 32 equivalent as individual natural mineral species. Only the K 2 0 percentages as either sylvite or 33 langbeinite were used to compute ore reserves. The conclusion reached by Griswold is that 34 only the 4th and 10th ore zones contain economic potash reserves. The quantities are 35 summarized in Table 2-5.
DRAFT-DOE/CAO-2056 2-117 March 31,1995

Draft 40 CFR 191 Compliance Certification Application
Table 2-5. Current Estimates of Potash Resources at the WIPP Site
2 3 4 5
. MiningUnit ,
'-• . * < : "
Frofliictj
Recoverable Ore (10s tons)
WiflaifheWIPP^te Outsidethe.WIPEsite 4th Ore Zone 10th Ore Zone
Langbeinite Sylvite
40.5 @ 6.99% 52.3 @ 13.99%
126.0 @ 7.30% 105.0 @ 14.96%
Source: NMBMMR 1995, ch. VH.
6 2.3.1.2 Hydrocarbon Resources at the WIPP Site
7 In 1974 the NMBMMR conducted a hydrocarbon resource study in southeastern New Mexico 8 under contract to the ORNL. The study included an area of 1,512 square miles (3,914 square 9 kilometers). At the time of that study, the proposed repository site was about 5 miles (8
10 kilometers) northeast of the current site. The NMBMMR evaluation included a more detailed 11 study of a four-township area centered on the old site; the present site is in the southwest 12 quadrant of that area. The NMBMMR hydrocarbon resources study is presented in more 13 detail in the FEIS (DOE 1980, § 9.2.3.5). The reader is referred to the FEIS or the original 14 study (Foster 1974) for additional information.
15 The resource evaluation was based both on the known reserves of crude oil and natural gas in 16 the region and on the probability of discovering new reservoirs in areas where past 17 unsuccessful drilling was either too widely spread or too shallow to have allowed discovery. 18 All potentially productive zones were considered in the evaluation; therefore, the findings may 19 be used for determining the total hydrocarbon resources at the site. A fundamental 20 assumption in this study was that the WIPP area has the same potential for containing 21 hydrocarbons as the much larger region in which the study was conducted and for which 22 exploration data are available. Whether such resources actually exist can be satisfactorily 23 established only by drilling at spacings close enough to give a high probability of discovery.
24 The NMBMMR 1995 mineral resource re-evaluation contains a comprehensive summary of 25 all previous evaluations.
26 Broadhead et al. (NMBMMR 1995, ch. XI) provided a reassessment of hydrocarbon resources 27 within the WIPP site boundary and within the first mile adjacent to the boundary. 28 Calculations were made for resources that are extensions of known, currently productive oil 29 and gas resources that are thought to extend beneath the study area with reasonable certainty 30 (called probable resources in the report). Qualitative estimates are also made concerning the 31 likelihood that oil and gas may be present in undiscovered pools and fields in the area 32 (referred to as possible resources). Possible resources were not quantified in the study. The 33 results of the study are shown in Tables 2-6 and 2-7.
March 31,1995 2-118 DRAFT-DOE/CAO-2056

Draft 40 CFR191 Compliance Certification Application
Table 2-6. In-Place Oil within Study Area
3 4 5 6 7 8
Formation Within WIPP site
<106bbl) Outside WJDPP
site (106bbl)
Total (10«bbl)
Delaware 10.33 20.8 31.13 Bone Spring 0.44 0.8 1.25 Strawn 0.4 0.4 0.8 Atoka 1.1 0.1 0.2
Total 12.3 22.9 35.3 Source: NMBMMR 1995, ch. XI.
Table 2-7. In-Place Gas within Study Area
10
ll 12 13 14 15 16
Formation Gas Reserves (MCF)
Formation Within WIPP Site Adjacent to Boundary WDPPSite
Boundary Delaware 18,176 32,873 Bone Springs 956 1,749 Strawn 9,600 9,875 Atoka 123,336 94,410 Morrow 32,000 28,780
Source: NMBMMR 1995, ch. XI.
17 2.3.2 Cultural and Economic Resources
18 The demographics, land use, and history and archaeology of the WIPP site and its irons are 19 characterized in the sections that follow.
20 2.3.2.1 Demographics
21 The WIPP facility is located 26 miles (42 kilometers) east of Carlsbad in Eddy County in 22 southeastern New Mexico and includes an area of 10,240 acres. The facility is located in a 23 sparsely populated area with fewer than 30 permanent residents living within a 10-mile (16-24 kilometer) radius of the facility. The area surrounding the facility is used primarily for 25 grazing, potash mining, and hydrocarbon production. No resource development that would 26 affect WIPP facility operations or the long-term integrity of the facility is allowed within the 27 10,240 acres that have been set aside for the WIPP project.
DRAFT-DOE/CAO-2056 2-119 March 31,1995

Draft 40 CFR 191 Compliance Certification Application
1 The community nearest to the WIPP site is the town of Loving, New Mexico, 18 miles 2 (29 kilometers) west-southwest of the site center. The population of Loving decreased from 3 1,355 in 1980 to 1,243 in 1990. The nearest population center is the city of Carlsbad, New 4 Mexico, 26 miles (42 kilometers) west of the site. The population of Carlsbad has decreased 5 from 25,496 in 1980 to 24,896 in 1990. Hobbs, New Mexico, 36 miles (58 kilometers) to the 6 east of the site had a 1980 population of 29,153 and a 1990 population of 29,115. Eunice, 7 New Mexico, 40 miles (64 kilometers) east of the site, had a 1980 population of 2,970 and a 8 1990 population of 2,731. Jal, New Mexico, 45 miles (72 kilometers) southeast of the site, 9 had a population of 2,575 in 1980 and of 2,153 in 1990.
10 The WIPP site is located in Eddy County near the border to Lea County, New Mexico. The 11 Eddy County population increased from 47,855 in 1980 to 48,605 in 1990. The Lea County 12 population decreased from 55,993 in 1980 to 55,765 in 1990.
13 2.3.2.2 Land Use
14 At present, land within 10 miles (16 kilometers) of the site is used for potash mining 15 operations, active oil and gas wells, and grazing. This pattern is expected to change little in 16 the future.
17 The Waste Isolation Pilot Plant Land Withdrawal Act (LWA) withdrew certain public lands 18 from the jurisdiction of the BLM. The bill provided for the transfer of the WIPP site lands 19 from the Department of the Interior (DOI) to the DOE and effectively withdraws the lands, 20 subject to existing rights, from entry, sale, or disposition; appropriation under mining laws; 21 and operation of the mineral and geothermal leasing laws. The LWA directed the Secretary of 22 Energy to produce a management plan to provide for grazing, hunting and trapping, wildlife 23 habitat, mining, and the disposal of salt and tailings.
24 There are no producing hydrocarbon wells within the volumetric boundary defined by the land 25 withdrawal (T22S, R3 IE, S15-22,27-34). One active well, referred to as James Ranch 13, 26 was drilled in 1982 to tap gas resources beneath Section 31. This well was initiated in Section 27 6, outside the WIPP site boundary. The well enters Section 31 below a depth of 6,000 feet 28 (1.82 kilometers) beneath ground level.
29 Grazing leases have been issued for all land sections immediately surrounding the WIPP 30 facility. Grazing within the WIPP site lands operates within the authorization of the Taylor 31 Grazing Act of 1934, the Federal Land Policy and Management Act (FLPMA), the Public 32 Rangelands Improvement Act of 1978, and the Bankhead-Jones Farm Tenant Act of 1973. 33 The responsibilities of the DOE include supervision of ancillary activities associated with 34 grazing (e.g., wildlife access to livestock water development); tracking of water developments 35 inside WIPP lands to ensure that they are configured according to the regulatory requirements; 36 and ongoing coordination with respective allottees. Administration of grazing rights is in 37 cooperation with the BLM according to the Memorandum of Understanding (MOU) and the
March 31,1995 2-120 DRAFT-DOE/CAO-2056

Draft 40 CFR191 Compliance Certification Application
1 coinciding Statement of Work through guidance established in the East Roswell Grazing 2 Environmental Impact Statement. The WIPP site is composed of two grazing allotments 3 administered by the BLM: the Livingston Ridge (No.177027) and the Antelope Ridge (No.' 4 77032).
5 2.3.2.3 History and Archaeology
6 The WIPP site boundary consists of a 16-square mile (10,240-acre) area located in 7 southeastern New Mexico. From about 10,000 B.C. to the late 1800s, this region was 8 inhabited by nomadic aboriginal hunters and gatherers who subsisted on various wild plants 9 and animals. From about A.D. 600 onward, as trade networks were established with Puebloan
10 peoples to the west, domesticated plant foods and materials were acquired in exchange for 11 dried meat, hides, and other products from the Pecos Valley and Plains. In the mid-1500s, the 12 Spanish Conquistadors encountered Jumano and Apachean peoples in the region practicing 13 hunting and gathering and engaging in trade with Puebloans. After the Jumanos abandoned 14 the southern Plains region, the Comanches became the major population of the area. 15 Neighboring populations, with whom the Comanches maintained relationships ranging from 16 mutual trade to open warfare, included the Lipan, or Southern Plains Apache; several 17 Puebloan groups; Spaniards; and the Mescalero Apaches.
18 The best documented indigenous culture in the WIPP region is that of the Mescalaro Apaches, 19 who lived west of the Pecos. The lifestyle of the Mescalaro Apaches represents a transition 20 between the full sedentism of the Pueblos and the nomadic hunting and gathering of the 21 Jumanos and Sumas. In 1763 the San Saba expedition encountered and camped with a group 22 of Mescalaros in Los Medaiios. Expedition records indicate the presence of both Lipan and 23 Mescalero Apaches in the region.
24 A peace accord reached between the Comanches and the Spaniards in 1768 resulted in two 25 historically important economic developments: (1) organized buffalo hunting by Hispanic and 26 Puebloan "ciboleros"; and (2) renewal and expansion of the earlier extensive trade networks 27 by Comancheros. These events placed eastern New Mexico in a position to receive a wide 28 array of both physical and ideological input from the Plains culture area to the east and north 29 and from Spanish-dominated regions to the west and south. Comanchero trade began to mesh 30 with the Southwest American trade influence in the early nineteenth century. However, by the 31 late 1860s the importance of Comanchero trade was cut short by Texan influence.
32 The first cattle trail in the area was established along the Pecos River in 1866 by Charles 33 Goodnight and Oliver Loving. By 1868, Texan John Chism dominated much of the area by 34 controlling key springs along the river. Overgrazing, drought, and dropping beef prices led to 35 the demise of open range cattle ranching by the late 1880s.
36 Following the demise of open-range livestock production, ranching developed using fenced 37 grazing areas and production of hay crops for winter use. Herd grazing patterns were 38 influenced by the availability of water supplies as well as by the storage of summer grasses as 39 hay for winter use.
DRAFT-DOE/CAO-2056 2-121 March 31,1995

Draft 40 CFR 191 Compliance Certification Application
1 The town now called Carlsbad was founded as "Eddy" in 1889 as a health spa. In addition to 2 ranching, the twentieth century brought the development of the potash, oil, and gas industries 3 that have increased the population eightfold in the last 50 years.
4 Although technological change has altered some of the aspects, ranching remains an important 5 economic activity in the WIPP region. This relationship between people and the land is still 6 an important issue in the area. Ranch-related sites which date to the 1940s and 50s are 7 common in parts of the WIPP area. These will be considered historical properties within the 8 next several years, and thus will be treated as such under current law.
9 The Natural Historic Preservation Act (NHPA; 16 USC Part 470 et seq.) was enacted to 10 protect the nation's cultural resources in conjunction with the states, local governments, Indian 11 tribes, and private organizations and individuals. The policy of the federal government 12 includes (1) providing leadership in preserving the prehistoric and historic resources of the 13 nation; (2) administering federally owned, administered, or controlled prehistoric resources 14 for the benefit of present and future generations; (3) contributing to the preservation of non-15 federally owned prehistoric and historic resources; and (4) assisting state and local 16 governments and the national trust for historic preservation in expanding and accelerating 17 their historic preservation programs and activities. The act also established the National 18 Register of Historic Places ("National Register"). At the state level, the State Historic 19 Preservation Officer (SHPO) coordinates the state's participation in implementing the NHPA. 20 The NHPA has been amended by two acts: the Archaeological and Historic Preservation Act 21 (16 USC Part 469 et seq.), and the Archaeological Resource Protection Act (16 USC Part 22 470aa et seq.).
23 In order to protect and preserve cultural resources found within the WIPP site boundary, the 24 WIPP submitted a mitigation plan to the New Mexico SHPO describing the steps to be taken 25 to either avoid or excavate archaeological sites. A "site" was defined as a place used and 26 occupied by prehistoric people. In May 1980, the SHPO made a determination of "no adverse 27 effect from WIPP facility activities" on cultural resources. The National Advisory Council on 28 Historic Preservation concurred that the WIPP Mitigation Plan is appropriate to protect 29 cultural resources.
30 Known historical sites (more than 50 years old) in southeastern New Mexico consist primarily 31 of early twentieth century homesteads that failed, or isolated features from late nineteenth 32 century and early twentieth century cattle or sheep ranching and military activities. To date, 33 no Spanish or Mexican conquest or settlement sites have been identified. Historic 34 components are rare but are occasionally noted in the WIPP area. These include features and 35 debris related to ranching.
36 Since 1976, cultural resource investigations have recorded 98 archaeological sites and 37 numerous isolated artifacts within the 16-square mile (41.5-square kilometer) area enclosed by 38 the WIPP site boundary. In the central 4-square mile (10.4-square kilometer) area, 33 sites 39 were determined to be eligible for inclusion on the National Register as an archaeological 40 district. Investigations since 1980 have recorded an additional 14 individual sites outside the
March 31, 1995 2-122 DRAFT-DOE/CAO-2056
Draft 40CFR 191 Compliance Certification Application
1 central 4-square mile (10.4-square kilometer) area that are considered eligible for inclusion on 2 the National Register. The major cultural resource investigations to date are broken out in the 3 following. Additional information can be found in the bibliography.
4 1977 The first survey of the area was conducted in 1977 by Nielson of the Agency for 5 Conservation Archaeology (ACA) for SNL. This survey resulted in the location 6 of 33 sites and 64 isolated artifacts.
7 1979 MacLennan and Schermer of AC A performed the next survey in 1979. It was 8 conducted for access roads and a railroad right-of-way for Bechtel, Inc. The 9 survey encountered two sites and 12 isolated artifacts.
10 1980 Schermer performed another survey in 1980 to relocate the sites originally
11 recorded by Nielson. This survey redescribed 28 of the original 33 sites.
12 1981 Hicks directed the excavation of 9 sites in the WIPP core area in 1981.
13 1982 Bradley in Lord and Reynolds in 1985 recorded one site and four isolated 14 artifacts in an archaeological survey for a proposed water pipeline.
1985 Lord and Reynolds examined three sites in 1985 within the WIPP core area. These sites consisted of two plant-collecting and processing sites and one base camp used between 1000 B.C. and A.D.1400. The artifacts recovered from the excavations have been placed in the Laboratory of Anthropology at the Museum of New Mexico in Santa Fe.
1987 Mariah Associates, Inc. identified 40 sites and 75 isolates in 1987 in an inventory of 2,460 acres in 15 quarter-section units surrounding the WIPP site. In this investigation, 19 of the sites were located within the WIPP site's boundary. Sites encountered in this investigation tended to lack evident or intact features. Of the 40 new sites defined, 14 were considered eligible for inclusion in the National Register, 24 were identified as having insufficient data to determine eligibility, and 2 were determined to be ineligible for inclusion. The eligible and potentially eligible sites have been mapped and are being avoided by the DOE in its current activities at the WIPP site. Figure 2-32 maps out the 40 archaeological sites identified by the Mariah study.
1988-1992 Several archaeological clearance reports have been prepared for seismic testing lines on public lands in Eddy County, New Mexico, during this period.
The Delaware Basin has been used in the past for an isolated nuclear test. This test, Project Gnome, took place in 1961 at a location approximately 8 miles (13 kilometers) southwest of the WIPP. The primary objective of Project Gnome was to study the effects of an underground nuclear explosion in salt. The Gnome experiment involved the detonation of a 3.1-kiloton nuclear device at a depth of 1,200 feet (361 meters) in the bedded salt of the
DRAFT-DOE/CAO-2056 2-123 March 31, 1995

Draft 40 CFR 191 Compliance Certification Application
1 Salado. The explosion created a cavity of approximately 1,000,000 cubic feet (27,000 cubic 2 meters), and caused surface displacements over an area of about a 1,200-foot (360-meter) 3 radius. Fracturing and faulting caused measurable changes in rock permeability and porosity 4 at distances up to approximately 330 feet (100 meters) from the cavity. No earth tremors were 5 reported at distances over 25 miles (40 kilometers) from the explosion. Project Gnome was 6 decommissioned in 1979.
7 2.4 Background Environmental Conditions
8 Background environmental parameters have been assessed at the WIPP site to provide a 9 baseline of existing conditions prior to emplacement of wastes. This assessment includes
10 monitoring existing ecological features and sampling to create a numerical baseline of 11 chemical and radiochemical parameters. This numerical baseline is included as Appendix 12 RBP. Data collected as part of the operational monitoring programs, discussed in Chapter 5 13 of this document, will be compared to the background data. The environmental information is 14 being continually updated and is reported yearly in the Annual Site Environmental Report for 15 WIPP. The most recent of these is included as Appendix SER.
16 Background environmental conditions are provided in this application as part of the complete 17 description of the WIPP and its vicinity. Background environmental conditions form the 18 baseline for determining if releases to the environment have occurred during the operational 19 period or during any post-operational monitoring period. Emphasis is placed on ecological 20 conditions, water quality, and air quality as they currently exist, and on environmental 21 pathways that could lead to exposure of human receptors to radionuclides associated with the 22 waste being managed at the WIPP. This includes the following:
23 Ecological Conditions
24 » Vegetation 25 » Mammals 26 • Reptiles and amphibians 27 • Birds 28 » Arthropods 29 » Aquatic ecology 30 » Endangered species
31 Quality of Environmental A;
32 » Surface-water 33 » Groundwater 34 » Air
March 31, 1995 2-124 DRAFT-DOE/CAO-2056

Draft 40 CFR 191 Compliance Certification Application
ACOE 1986
0 1/2 1 MILE I i
a SITE WITH FIELD NUMBER
19 20 21 22 X
30 29 28 27 26 -25
36 31 32 33 34 36 35 36
, 39 40
11 12
WIPP SITE 30UNDARY
11 12
14 13
_ ^ 2 _
18 17 16 15 14
28 29
13
23 34 ir
10
20 21 22
£? 24
26 30 29 28 27 26 25
R.31E
Figure 2-32. Marian Study Archaeological Sites DRAFT-DOE/CAO-2056 2-125 March 31,1995

Draft 40 CFR 191 Compliance Certificatiop Application
l TfflS PAGE INTENTIONALLY LEFT BLANK
March 31, 1995 2-126 DRAFT-DOE/CAO-2056

Draft 40 CFR191 Compliance Certification Application
1 Pathways
2 • Atmospheric radiation 3 • Ambient radiation 4 • Terrestrial radiation 5 • Hydrologic radiation 6 • Biotic radiation.
7 2.4.1 Terrestrial and Aquatic Ecology
8 The vegetation, mammals, reptiles and amphibians, birds, arthropods, aquatic ecology, and 9 endangered species of the WIPP site and its environs are characterized in the sections that
10 follow.
11 2.4.1.1 Vegetation
12 The WIPP site is in an area characterized by stabilized sand dunes. The vegetation is 13 dominated by shinnery oak, mesquite, sand sage, dune yucca, smallhead snakeweed, three-14 awn, and numerous species of forbs and perennial grasses. The dominant shrubs are deep-15 rooted species with extensive root systems. The shrubs not only stabilize the dune sand but 16 serve as food, shelter, and nesting sites for many species of wildlife inhabiting the area.
17 The vegetation in the vicinity of the WIPP site is not a climax vegetation, at least in part 18 because of past grazing management. The composition of the plant life at the site is 19 heterogeneous because of variations in terrain and in the type and the depth of soil. Shrubs 20 are conspicuous members of all plant communities. The site lies within a region of transition 21 between the northern extension of the Chihuahuan Desert (desert grassland) and the southern 22 Great Plains (Short Grass Prairie); it shares the floral characteristics of both.
23 Grazing, primarily by domestic livestock, and fire control are largely responsible for the 24 shrub-dominated serai communities of much of southeastern New Mexico. A gradual 25 retrogression from the tall- and mid-grass-dominated vegetation of 100 years ago has occurred 26 throughout the region. The cessation of grazing would presumably not alter the domination 27 by shrubs, but it would result in an increase in grasses. Experimental exclosures have been 28 established to study site-specific patterns of succession in the absence of grazing, but long-29 term results are not yet available.
30 The semiarid climate makes water a limiting factor in the entire region. The amount and 31 timing of rainfall greatly influence plant productivity and, therefore, the food supply available 32 for wildlife and livestock. The seeds of desert plants are often opportunistic: they may lie 33 dormant through long periods of drought to germinate in the occasional year of favorable 34 rainfall. Significant fluctuations in the abundance and distribution of plants and wildlife are 35 typical of this region. Several examples of such fluctuations have been documented in the 36 area within 5 miles (8.3 kilometers) of the center of the WIPP site, which has been intensively 37 studied.
DRAFT-DOE/CAO-2056 2-127 March 31,1995

Draft 40 CFR191 Compliance Certification Application
1 Two introduced species of significance in the region are the Russian thistle, or tumbleweed, a 2 common invader in disturbed areas, and the salt cedar, which has proliferated along 3 drainageways.
4 Several distinct biological zones occur on or near the site: the mesa, the central dunes 5 complex, the creosote-bush flats, the Livingston Ridge escarpment, and the Tobosa Flats in 6 Nash Draw west of the ridge. A low, broad mesa named the Divide lies on the eastern edge of 7 the study area and supports a typical desert-grassland vegetation. The dominant shrub and 8 subshrub are mesquite and snakeweed, respectively. The most abundant grasses are black 9 grama, bush muhly, ring muhly, and fluffgrass. Cacti, especially varieties of prickly pear, are
10 present.
11 Where the ground slopes down from the Divide to the central dune plains, the soil becomes 12 deep and sandy. Shrubs like shinnery oak, mesquite, sand sagebrush, snakeweed, and dune 13 yucca are dominant. In some places, all of these species are present; in others, one or more 14 are either missing or very low in density. These differences appear to be due to localized 15 variations in the type and depth of soil. Thus, a number of closely related but distinct plant 16 associations form a "patchwork" complex, or mosaic, across the stabilized dunes in the central 17 area. Hummocky, partially stabilized sand dunes occur, and large, active dunes are also 18 present. The former consist of "islands" of vegetation, primarily mesquite, separated by 19 expanses of bare sand. The mesquite-anchored soil is less susceptible to erosion, mainly by 20 wind, than is the bare sand. The result is a series of valley-like depressions, or blowouts, 21 between vegetated hummocks. Active dunes running east to west are found 10 miles (16 22 kilometers) south and east of the site.
23 To the west and southwest, the soil changes again, becoming more dense and shallow (less 24 than 10 inches [254 millimeters] to caliche) than in the dune area. The composition of the 25 plant life is radically altered, and creosote bushes become dominant. Toward Livingston 26 Ridge to the west and northwest, creosote bushes gradually give way to an acacia-dominated 27 association at the top of the escarpment. The western face of the ridge drops sharply to a 28 valley floor (flats) that is densely populated with tobosa grass, which is rare elsewhere in the 29 study area.
30 2.4.1.2 Mammals
31 The most conspicuous mammals at the site are the black-tailed jack rabbit and the desert 32 cottontail. Common small mammals found at the WTPP site include the Ord's kangaroo rat, 33 the plains pocket mouse, and the northern grasshopper mouse. Big-game species, such as the 34 mule deer and the pronghorn antelope, and carnivores, such as the coyote, are present in small 35 numbers.
March 31,1995 2-128 DRAFT-DOE/CAO-2056

Draft 40 CFR191 Compliance Certification Application
1 2.4.1.3 Reptiles and Amphibians
2 Commonly observed reptiles in the study area are the side-blotched lizard, the western box 3 turtle, the western whiptail lizard, and several species of snakes, including the bullsnake, the 4 prairie rattlesnake, the western diamondback rattlesnake, the coachwhip, the western hognose, 5 and the glossy snake. Of these, only the side-blotched lizard is found in all habitats. The 6 others are mainly restricted to one or two associations within the central dunes area, although 7 the western whiptail lizard and the western diamondback rattlesnake are found in areas 8 dominated by creosote bush as well. The yellow mud turtle is found only in the limited 9 number of aquatic habitats in the study area (i.e., dirt stock ponds and metal stock tanks), but
10 it is common in these locales.
11 Amphibians are similarly restricted by the availability of aquatic habitat. Aquatic habitats 12 near the WIPP site include stock-watering ponds and tanks. These may be frequented by 13 yellow mud turtles, tiger salamanders, and occasional frogs and toads. Fish are sometimes 14 stocked in the ponds and tanks.
15 2.4.1.4 Birds
16 Numerous birds inhabit the area either as transients or year-long residents. Loggerhead 17 shrikes, pyrrhuloxias, and black-throated sparrows are examples of common residents. 18 Migrating or breeding waterfowl species do not frequently occur in the area. Some raptors 19 (e.g., Harris hawks) are residents. The density of large avian predators' nests has been 20 documented as among the highest recorded in the scientific literature.
21 2.4.1.5 Arthropods
22 About 1,000 species of insects have been collected in the study area. Of special interest are 23 subterranean termites. Vast colonies of these organisms are located across the study area; they 24 are detritivores and play an important part in the recycling of nutrients in the study area.
25 2.4.1.6 Aquatic Ecology
26 Aquatic habitats within a 5-mile (8-kilometer) radius of the WIPP site are limited. Stock-27 watering ponds and tanks constitute the only permanent surface waters. Ephemeral surface-28 water puddles form after heavy thunderstorms. At greater distances, seasonally wet, shallow 29 lakes (playas) and permanent salt lakes are found.
30 Laguna Grande de la Sal is a large, permanent salt lake at the south end of Nash Draw. 31 Natural brine springs, effluent brine from nearby potash refineries, and surface and subsurface 32 runoff discharge into the lake. One of the natural brine springs at the northern margin of the 33 lake has been found to support a small population of the Pecos River pupfish. This species is 34 among the species recognized as threatened by the State of New Mexico. The spring, now 35 called Pupfish Spring, is about 11 miles (18 kilometers) west-southwest of the WIPP site.
DRAFT-DOE/CAO-2056 2-129 March 31,1995
Draft 40 CFR191 Compliance Certification Application
1 Several marine organisms are present in the lower Pecos River and in the Red Bluff Reservoir. 2 They include small, shelled protozoans (Foraminifera), a Gulf Coast shrimp, an estuarine 3 oligochaete and a dragonfly, and several species of marine algae. These species have 4 presumably been introduced. Salt-tolerant species of insects, oligochaetes, and nematodes and 5 unusual algal assemblages characterize this stretch of the river. The combination of high 6 salinity, elevated concentrations of heavy metals, and salt-tolerant and marine fauna makes the 7 lower Pecos River a unique system (DOE 1980, § 7.1.2.).
8 2.4.1.7 Endangered Species
9 The DOE consulted with the U.S. Fish and Wildlife Service (FWS) in 1979 to determine the 10 presence of threatened and endangered species at the WIPP site (included in Appendix I of the 11 FEIS). At that time the FWS listed the Lee pincushion cactus, the black-footed ferret, the 12 American peregrine falcon, the bald eagle, and the Pecos gambusia as threatened or 13 endangered and as occurring or having the potential to occur on lands within or outlying the 14 WIPP site. The FWS advised the DOE that the list of species provided in 1979 is still valid 15 except that the black-footed ferret should now be deleted. The DOE believes that the actions 16 described in the 1990 Supplement Environmental Impact Statement (SEIS) will have no 17 impact on any threatened or endangered species because these activities do not involve any 18 ground disturbance that was not already evaluated in the FEIS. In addition, there is no critical 19 habitat for terrestrial species identified as endangered by either the FWS or the New Mexico 20 Department of Game and Fish (NMDG&F) at the site area.
21 Also in 1989, the DOE consulted with the NMDOr&F regarding the endangered species listed 22 by the state in the vicinity of the WIPP site. The NMDG&F currently lists (based on 23 NMDG&F Regulation 657, dated January 9,1988) seven birds and one reptile that are in one 24 of two endangerment categories and that occur or are likely to occur at the site. The 25 NMDG&F agreed in 1989 that the proposed WIPP activities would probably not have 26 appreciable impacts on endangered species listed by the state in the area. A Handbook of Rare 27 and Endemic Plants of New Mexico published by the University of New Mexico lists the 28 plants in New Mexico classified as threatened, endangered, or sensitive, and includes 20 29 species, representing 14 families, that are found in Eddy County and could occur at or near the 30 WIPP site.
31 2.4.2 Water Quality
32 In this section, the DOE presents a discussion of the quality of groundwater and surface-water
33 in the WIPP area.
34 2.4.2.1 Groundwater Quality
35 Based on the major solute compositions described in Siegel et al. (1991), four hydrochemical 36 facies are delineated for the Culebra.
March 31, 1995 2-130 DRAFT-DOE/CAO-2056

Draft 40 CFR191 Compliance Certification Application
1 Zone A. A sodium chloride brine (approximately 3.0 molar) with a magnesium/calcium 2 (Mg/Ca) mole ration between 1.2 and 2.0. This water is found in the eastern third of the 3 WIPP site. The zone is roughly coincident with the region of low transmissivity described by 4 LaVenue et al. in 1988. On the western side of the zone, halite in the Rustler has been found 5 only in the unnamed lower member. In the eastern portion of the zone, halite has been 6 observed throughout the Rustler.
7 Zone B. A dilute anhydrite-rich water (ionic strength < 0.1 molar) occurs in the southern part 8 of the site. The Mg/Ca mole ratios are uniformly low (0.0-0.5). This zone is coincident with 9 a high-transmissivity region and halite is not found in the Rustler in this zone.
10 Zone C. Waters of variable composition with low to moderate ionic strength (0.3-1.6 molar) 11 occur in the western part of the WIPP site and along the eastern side of Nash Draw. Mg/Ca 12 mole ratios range from 0.5 to 1.2. This zone is coincident with a region of variable 13 transmissivity. In the eastern part of this zone, halite is present in the lower member of the 14 Rustler. Halite is not observed in the formation on the western side of the zone. The most 15 halite-rich water is found in the eastern edge of the zone, close to core locations where halite 16 is observed in the Tamarisk member.
17 Zone D. A fourth zone can be defined based on inferred contamination related to potash 18 refining operations in the area. Waters from these wells have anomalously high solute 19 concentrations (3-6 molar) and potassium/sodium (K/Na) weight ratios (0.22) compared to 20 waters from other zones (K/Na = 0.01-0.09). In the extreme southwestern part of this zone, 21 the composition of the Culebra well water has changed over the course of a 7-year monitoring 22 period. The Mg/Ca mole ratio at WIPP-29 is anomalously high, ranging from 10 to 30 during 23 the monitoring period.
24 This zonation is consistent with that described by Ramey in 1985, who defined three zones. 25 The fourth zone (D) was added by Siegel et al. in 1991 to account for the local potash 26 contamination.
27 Together, the variations in solutes and the distribution of halite in the Rustler exhibit a mutual 28 interdependence. Concentrations of solutes are lowest where Rustler halite is less abundant, 29 consistent with the hypothesis that solutes in Rustler groundwaters are derived locally by 30 dissolution of minerals (e.g., halite, gypsum, and dolomite) in adjacent strata.
31 The TDS in the Magenta groundwater ranges in concentration from 5,460 to 270,000 32 milligrams per liter. This water is considered saline to briny. The transmissivity in areas of 33 lower TDS concentrations is very low, thus greatly decreasing its usability, and the Magenta is 34 not considered as a water supply. In general, the chemistry of Magenta water is variable. 35 Groundwater types range from a predominantly sodium chloride type to a calcium-36 magnesium-sodium-sulfate type chemistry. The water chemistry may indicate a general 37 overall increase in TDS concentrations to the south and southwest, away from the WIPP site, 38 and a potential change to a predominantly sodium chloride water in that area.
DRAFT-DOE/CAO-2056 2-131 March 31,1995

Draft 40 CFR191 Compliance Certification Application
1 In the WIPP area, the water quality of the Magenta, is better than that of the Culebra.
2 However, water from the Magenta is not used anywhere in the vicinity of the WIPP.
3 2.4.2.2 Surface-Water Quality
4 The Pecos River is the nearest permanent water source to the WIPP site. It ultimately receives 5 any surface runoff drainage from the site via Laguna Grande de la Sal. Natural brine springs, 6 representing outfalls of the brine aquifers in the Rustier, feed the Pecos River at Malaga Bend, 7 12 miles (19 kilometers) southwest of the site. This natural saline inflow adds approximately 8 70 tons of chloride per day to the Pecos River. Return flow from irrigated areas above Malaga 9 Bend further contributes to the salinity. The concentrations of potassium, mercury, nickel,
10 silver, selenium, zinc, lead, manganese, cadmium, and barium also show significant elevations 11 at Malaga Bend but tend to decrease downstream. The metals presumably are rapidly 12 adsorbed onto the river sediments. Natural levels of certain heavy metals in the Pecos River 13 below Malaga Bend exceed the water quality standards of the World Health Organization, the 14 EPA, and the State of New Mexico. For example, the maximum level for lead is 50 parts per 15 billion, and levels of up to 400 parts per billion have been measured during WIPP-related 16 studies. 17 As it flows into Texas south of Carlsbad, the Pecos River is a major source of dissolved salt in 18 the west Texas portion of the Rio Grande Basin. Natural discharge of highly saline 19 groundwater into the Pecos River in New Mexico keeps TDS levels in the water in and above 20 the Red Bluff Reservoir very high. The TDS levels in this interval exceed 7,500 milligrams 21 per liter 50 percent of the time and, during low flows, can exceed 15,000 milligrams per liter. 22 Additional inflow from saline water-bearing aquifers below the Red Bluff Reservoir, 23 irrigation return flows, and runoff from oil fields continues to degrade water quality between 24 the reservoir and northern Pecos County in Texas. Annual discharge-weighted average TDS 25 concentrations exceed 15,000 milligrams per liter. Water use is varied in the southwest Texas 26 portion of the Pecos River drainage basin. For the most part, water use is restricted to 27 irrigation, mineral production and refining, and livestock. In many instances, surface-water 28 supplies are supplemented by groundwaters that are being depleted and are increasing in 29 salinity.
30 2.4.3 Air Quality
31 Measurement of selected air pollutants at the WIPP site began in 1976 and were reported by 32 DOE in the FEIS. Since the preparation of that document, a more extensive air quality 33 monitoring program has been established. Seven classes of atmospheric gases regulated by 34 the EPA have been monitored at the WTPP site between August 27,1986 and October 30, 35 1994. These gases are carbon monoxide (CO), hydrogen sulfide (H2S), ozone (0 3), nitrogen 36 oxides (NO, N0 2 , NOx), and sulfur dioxide (S0 2). The total suspended particulates (TSPs) are 37 monitored in conjunction with the air-monitoring programs of the WIPP. The results of the 38 monitoring program are detailed in the annual reports for the WIPP Environmental 39 Monitoring Program.
March 31, 1995 2-132 DRAFT-DOE/CAO-2056

Draft 40 CFR191 Compliance Certification Application
1 2.4.4 Environmental Radioactivity
2 The background radiation conditions in the vicihity'of the WIPP site are influenced by natural 3 sources of radiation, fallout from nuclear tests, and one local research project (Project 4 Gnome). Prior to the WIPP project, long-term radiological monitoring programs were 5 established in southeastern New Mexico to determine the widespread impacts of nuclear tests 6 at the Nevada Test Site and to evaluate the effects of Project Gnome. Project Gnome resulted 7 in the underground detonation of a nuclear device on December 10,1961, at a site 7.5 miles 8 (12.5 kilometers) southwest of the WIPP site.
9 The WJJPP Radiological Baseline Program (RBP), which included the Radiological 10 Environmental Surveillance Program, was initiated in July 1985 to describe background levels 11 of radiation and radionuclides in the WIPP environment prior to the underground 12 emplacement of radioactive waste. The RBP consisted of five subprograms: (1) atmospheric 13 baseline; (2) ambient radiation (measuring gamma radiation); (3) terrestrial baseline (sampling 14 soils); (4) hydrologic baseline (sampling surface-water and bottom sediments and 15 groundwater); and (5) biotic baseline (analyzing radiological parameters in key organisms 16 along potential radionuclide migration pathways). The RBP has been succeeded by the 17 Environmental Monitoring Report (EMR), which is described in Chapter 5. The final report 18 on the RBP is included as Appendix RBP.
19 2.4.4.1 Atmospheric Radiation Baseline
20 Historically, most gross alpha activity in airborne particulates has shown little variation and is 21 within the range of from 1 to 3xl0"15 microcuries per milliliter, which is equivalent to 3.7 to 22 1 lxlO' 1 1 becquerels per milliliter. Mean gross beta activity in airborne particulates fluctuates 23 but is typically within the range of from 1 to 4xl0' 1 4 microcuries per milliliter (3.7 to 15xl0"10
24 becquerels per milliliter). A peak of 3.5xlO"13 microcuries per milliliter (1.2xl0"8 becquerels 25 per milliliter) in mean gross beta activity occurred in May 1986 and has been attributed to 26 atmospheric fallout from the Chernobyl incident in the former Soviet Union. The average 27 level of gamma radiation in the environment is approximately 7.5 microroentgens per hour, or 28 approximately 66 millirem per year.
29 For 1993, the mean gross alpha concentrations show limited fluctuation throughout the year 30 and range from 3.40xl0'1 5 to 1.41xl()-14 microcuries per milliliter (1.26xl0"w to 5.22xl0' 1 0
31 becquerels per milliliter). These fluctuations appeared to be consistent among all sampling 32 locations. The mean gross beta concentrations fluctuate throughout the year within the range 33 of 3.32xl0' 1 4 to 2.63xl0' 1 4 microcuries per milliliter (1.23xl0"9 to 9.74xl()-10 becquerels per 34 milliliter). Individual gross alpha and beta concentrations reported for each location are 35 documented in Appendix SER.
36 2.4.4.2 Ambient Radiation Baseline
37 Using the average rate of 7.5 microroentgens per hour, the estimated annual dose is 38 approximately 66 millirem. The fluctuations noted are primarily due to calibration of the
DRAFT-DOE/CAO-2056 2-133 March 31,1995

Draft 40 CFR 191 Compliance Certification Application
1 system and meteorological events such as the high-intensity thunderstorms that frequent this 2 area in late summer. A seasonal rise in ambient radiation has been observed in the first and 3 fourth quarters each year. It is speculated that this fluctuation may be due to variations in the 4 emission and dispersion of radon-222 from the soil around the WIPP site. These variations 5 can be caused by meteorological conditions, such as inversions, which would slow the 6 dispersion of the radon and its progeny.
7 2.4.4.3 Terrestrial Baseline
8 Data were collected as part of the RBP at the WIPP in December 1985 and July 1987. Soil 9 samples were collected and analyzed from a total of 37 locations within a 50-mile (80-
10 kilometer) radius of the WIPP (see Table 2-8). The soil samples were analyzed for 19 11 radionuclides: '"'K, ^Co, ^Sr, 1 3 7Cs, two isotopes of radium, three isotopes of thorium, four 12 isotopes of uranium, 2 3 7Np, four isotopes of plutonium (2 3 9Pu and 2 4 0Pu were measured 13 together), 2 4 1Am, and 2 4 4Cm. Four isotopes (*K, 2 3 4U, 2 3 5U, and 2 3 8U) exhibited significant 14 differences among the three geographic groups, with samples from the outer sites having 15 significantly higher levels of radioactivity than those from the 5-mile (8-kilometer) ring sites 16 (i.e., 16 sampling sites in a ring around the WIPP with a 5-mile [8-kilometer] radius). For 17 2 3 4 U, 2 3 5 U, and 2 3 8 U, the 5-mile (8-kilometer) ring sites also showed higher levels than the 18 WIPP sites. The isotopes 1 3 7Cs, ^Ra , 2 2 8Th, and 2 3 0Th exhibited differences between the outer 19 sites and the other two groups, which were indistinguishable. Again, the outer sites had 20 significantly higher levels of radioactivity than the other two groups. Measured mean values 21 for 4 0K, 1 3 7Cs, ^Ra , the three thorium isotopes, and the three uranium isotopes were above 22 detection limits as shown in Table 2-8. The mean values for ^Co, ^Sr, ^Ra , 2 3 3 U, 2 3 7Np, the 23 plutonium isotopes, 2 4 1Am, and 2 4 4Cm fell below detection limits.
24 2.4.4.4 Hydrologic Radioactivity
25 The hydrologic radioactivity monitoring program is designed to establish characteristic
26 radioactivity levels in surface-water bodies, bottom sediments, and groundwater.
27 2.4.4.4.1 Surface-Water and Sediment Background Radiation Levels
28 Samples of both surface-water and groundwater were collected for the RBP. These samples 29 were analyzed for 19 radionuclides (3H, '"K, ^Co, ^Sr, 1 3 7Cs, two isotopes of radium, three 30 isotopes of thorium, four isotopes of uranium, 2 3 7Np, and four isotopes of plutonium [239Pu 31 and 2 4 0Pu were measured together]). The resulting data from the sampling of surface-water 32 and groundwater were analyzed independently. 33 2.4.4.4.1.1 Surface-Water
34 Samples of surface-water were collected from 12 locations over the course of the RBP. 35 Sampling locations were divided into three groups for an initial analysis of geographic 36 variability. Stock tanks represented the largest group, with five locations; they are located 37 closest to WIPP. Stock tanks in this area are typically man-made earthen catchment basins
March 31, 1995 2-134 DRAFT-DOE/CAO-2056

Draft 40 CFR191 Compliance Certification Application
1 with no surface outflow. The Pecos River represents the next major surface-water group. 2 Four sampling locations were used along the Pecos River, from a northern (up-river) point 3 near the town of Artesia to a southern (down-riverj point near the town of Malaga, New 4 Mexico. The third group, called Laguna Grande de la Sal, represents water from a series of 5 playa lakes at the lower end of Nash Draw.
6 The sample mean radioactivity levels for most radionuclides were below their respective 7 detection limits. Peak levels of "°K from Laguna Grande de la Sal were 2.7xl0"5 microcuries 8 per gram (1.0 becquerels per gram), whereas the mean level at all other sampling locations 9 was less than 2.7xl0"7 microcuries per gram (0.01 becquerels per gram). All four isotopes of
10 uranium exhibited significant differences among the three geographic groups. For all four 11 isotopes, radionuclide levels in the tanks were at least one order of magnitude lower than 12 levels found in the Pecos River and Laguna Grande de la Sal. Similar to ̂ K, levels of 13 uranium were highest in Laguna Grande de la Sal. Only '"Co, 137Cs, ̂ Ra, ^U, and 2 3 8U were 14 found to be above detection limits. (See Appendix RBP for details.)
15 16
Table 2-8. Ranges of Mean Values Measured for Radioactive Isotopes at Sites at WIPP, 5 Miles from WIPP, and beyond 5 Miles from WIPP
17 18 19 20 21 22 23 24 25 26 27 28 29 30 31 32 33 34 35 36 37 38 39 X0
Isotope .
Range of. Mean Values*
Isotope . fiCi/g Bq/g 4 0 K 4.9 to 9.3x10-* 1.8 to 3.4x10-' "Co — 0 "ST — 0
I 3 7Cs 1.3 to 2.2xl0'7 4.7 to 8.1xl0 3
^ R a 2.6 to 5.4xl0"7 9.6 to 20xl0"3
^ R a — *b 2 2 8Th 2.1to4.9xl0"7 7.8 to 18xl0-3
230-Th 2.5 to 52xl0"7 9.1 to 19xl0-3
23 2 Th 3.0xl0"7 l.lxlff 2
233TJ — *b 234TJ 1.5 to 3.3xl0"7 5.4 to 12xl0"3
23STJ 4.4 to 17xl0'9 l.etoe.SxlO"4
238u 1.6to3.0xl0"7 5.7tollxl0" 3
^ N p — *b ^ P u — *b
2 3 9 / 2 4 0 ^ — *b 2 4 1Pu — *b
M 1 Am — *b ^ C m — *b
The ranges of mean values are expressed in terms of microcuries per gram of soil (uCi/gm) and becquerels per gram of soil (Bq/g). bBelow minimum detection limit of 3.7xl03 Bq/g. Source: Appendix RBP.
DRAFT-DOE/CAO-2056 2-135 March 31, 1995

Draft 40 CFR 191 Compliance Certification Application
1 2.4.4.4.1.2 Sediments
2 Sediments were collected for the WIPP RBP from six locations: Hill Tank, Indian Tank, 3 Noye Tank, Laguna Grande de la Sal, and two sites along the Pecos River. These samples 4 were analyzed for 18 radionuclides (tritium, 3H, was not analyzed in the sediments.).
5 In all five cases where differences were found among location groups, the stock tanks had 6 higher concentrations of radionuclides, possibly indicating an accumulation effect from the 7 closed nature of the tanks. Laguna Grande de la Sal sediments contained significantly higher 8 concentrations of 2 3 4 U than did the stock tanks and the Pecos River, which were 9 indistinguishable.
10 2.4.4.4.2 Groundwater Radiological Characterization
11 Groundwater samples were collected from 37 wells: 23 completed in the Culebra, 4 12 completed in the Magenta, and 10 privately owned. The samples were analyzed for the same 13 19 radionuclides as the surface-water samples. Elevated levels of '"'K were found in the 14 Magenta and private wells and in the Culebra (2.0 to 5.4xlO"7 microcuries per gram, or 7.3 to 15 20x10*3 becquerels per gram, respectively) groundwater. The increased levels of 4 0 K can be 16 attributed to the generally high levels of dissolved solids in groundwater in these formations. 17 Only ^Co, 1 3 7Cs, radium, ^ U , and 2 3 8 U were found above detection limits and 2 2 6Ra which 18 was found to have a distinct geographic pattern in the Culebra. Means from individual wells, 19 as shown in Table 2-9, show that levels of this radionuclide increase in concentration from 20 west to east.
21 Groundwater samples were collected in accordance with the written procedures. The primary 22 objective of the WQSP is to obtain representative and repeatable groundwater-quality data 23 from selected wells under rigorous field and laboratory procedures and protocols. At each 24 well site, the well is pumped and the groundwater serially analyzed for specific field 25 parameters. Once the field parameters have stabilized, denoting a chemical steady-state with 26 respect to these parameters, a final groundwater sample is collected to be analyzed for 27 radionuclides.
28 2.4.4.5 Biotic Baseline
29 This subprogram characterizes background radioactivity levels in key organisms along 30 possible food-chain pathways to man. Vegetation, rabbits, quail, beef, and fish are sampled, 31 and palatable tissues are analyzed for concentrations of transuranics and common naturally 32 occurring radionuclides. Because of the small sample sizes in this program, no attempt has 33 been made to interpret these data. The results are presented in total in Appendix RBP.
March 31,1995 2-136 DRAFT-DOE/CAO-2056

Draft 40 C F R 1 9 1 Compliance Certification Application
1 2
Table 2-9. Mean Values Measured for Radionuclides in Water Wells around the WIPP Site
4 5 6 7 8 9 10 11 12 13 14 15 16 17 18 19 20 21 22 23 24
,' _" - Isotope '; Mean Value (10 - 4 Bq/g) 3H Below <MDL (56) 40J, 73 to 200 ^Co 12 "Sr <MDL (7.4)
1 3 7 Cs 7.2 ' 2 2 6 R a 6.9 to 52 "̂
2 2 8 Ra 9.6 " S T * <MDL (3.7) 230TT, <MDL (0.37) ^Th <MDL (0.37) 233U <MDL (0.37) °«U 2.6 a s U <MDL (N/S) »nj 0.72 ^Np <MDL (0.37) ^Pu <MDL(0.11)
2 3 9 / 2 4 0 ^ <MDL (0.74) M 1 P u <MDL C37)
Key: <MDL = Less than the minimum detection level (MDL is shown in parentheses) N/S = MDL not specified Source: Appendix RBP
25 2.5 Climate and Meteorological Conditions
26 The long time periods involved in the isolation of radioactive waste are significant with 27 respect to potential changes in climate. Climate changes are documented through studies of 28 floral, faunal, and geological data and lead to fuller understanding of cyclic effects that may 29 impact the performance of the disposal system. The modeling of future climate changes is 30 presented in Chapter 6. The purpose of this section is to build the basis for the modeling in 31 Chapter 6.
32 2.5.1 Historic Climatic Conditions
33 Data that can be used to interpret paleoclimates in the American Southwest come from a 34 variety of sources and indicate alternating arid and sub-arid to sub-humid climates throughout 35 the Pleistocene. The information included in this section was taken from a paper written by 36 Swift in 1992.
37 Prior to 18,000 years ago, radiometric dates are relatively scarce, and the record is incomplete. 38 From 18,000 years ago to the present, however, the climatic record is relatively well 39 constrained by floral, faunal, and lacustrine data. These data span the transition from the last
DRAFT-DOE/CAO-2056 2-137 March 31,1995

Draft 40 CFR 191 Compliance Certification Application
1 full-glacial maximum to the present interglacial period; given the global consistency of glacial 2 fluctuations described below, they can be taken to be broadly representative of extremes for 3 the entire Pleistocene.
4 Early and middle Pleistocene paleoclimatic data for the southwestern United States are 5 incomplete and permit neither continuous reconstructions of paleoclimates nor direct 6 correlations between climate and glaciation prior to the last glacial maximum, which occurred 7 22,000-18,000 years ago. Stratigraphic and soil data from several locations, however, 8 indicate that cyclical alternation of wetter and drier climates in the Southwest had begun by 9 the early Pleistocene. Fluvial gravels in the Gatufia exposed in the Pecos River Valley of
10 eastern New Mexico indicate wetter conditions 1.4 million years ago and again 600,000 years 11 ago. The Mescalero caliche, exposed locally over much of southeastern New Mexico, 12 suggests drier conditions 510,000 years ago, and loosely dated spring deposits in Nash Draw 13 west of the WIPP imply wetter conditions occurring again later in the Pleistocene. The 14 Blackwater Draw of the southern High Plains of eastern New Mexico and western Texas, 15 correlating in time to both the Gatuiia Formation and the Mescalero caliche, contains 16 alternating soil and eolian sand horizons that show at least six climatic cycles beginning more 17 than 1.4 million years ago and continuing to the present.
18 Data used to construct the more detailed climatic record for the latest Pleistocene and 19 Holocene come from six independent lines of evidence dated using carbon-14 techniques: 20 plant communities preserved in packrat middens throughout the Southwest, including sites in 21 Eddy and Otero counties, New Mexico; pollen assemblages from lacustrine deposits in 22 western New Mexico and other locations in the Southwest; gastropod assemblages from 23 western Texas; ostracod assemblages from western New Mexico; paleolake levels throughout 24 the Southwest; and faunal remains from caves in southern New Mexico.
25 Prior to the last glacial maximum 22,000 to 18,000 years ago, evidence from mid-26 Wisconsinan faunal assemblages in caves in southern New Mexico, including the presence of 27 species such as the desert tortoise that are now restricted to warmer climates, suggests hot 28 summers and mild, dry winters. Lacustrine evidence confirms the interpretation of a relatively 29 dry climate prior to and during the glacial advance. Permanent water did not appear in what 30 was later to become a major lake in the Estancia Valley in central New Mexico until some 31 time before 24,000 years ago, and water depths in lakes at higher elevations in the San 32 Agustin Plains in western New Mexico did not reach a maximum until between 22,000 and 33 19,000 years ago. Ample floral and lacustrine evidence documents cooler, wetter conditions 34 in the Southwest during the glacial peak. These changes were not caused by the immediate 35 proximity of glacial ice. None of the Pleistocene continental glaciations advanced farther 36 southwest than northeastern Kansas, and the most recent, late-Wisconsinan ice sheet reached 37 its limit in South Dakota, approximately 745 miles (roughly 1,200 kilometers) from WIPP. 38 Discontinuous alpine glaciers formed at the highest elevations throughout the Rocky 39 Mountains, but these isolated ice masses were symptoms, rather than causes, of cooler and 40 wetter conditions and had little influence on regional climate at lower elevations. The closest 41 such glacier to WIPP was on the northeast face of Sierra Blanca Peak in the Sacramento 42 Mountains, approximately 135 miles (220 kilometers) to the northwest.
March 31,1995 2-138 DRAFT-DOE/CAO-2056

Draft 40 CFR191 Compliance Certification Application
1 Global climate models indicate that the dominant glacial effect in the Southwest was the 2 disruption and southward displacement of the westerly jet stream by the physical mass of the 3 ice sheet to the north. At the glacial peak, major Pacific storm systems followed the jet stream 4 across New Mexico and the southern Rocky Mountains, and winters were wetter and longer 5 than either at the present or during the previous interglacial period.
6 Gastropod assemblages at Lubbock Lake in western Texas suggest mean annual temperatures 7 5°C below present values. Both floral and faunal evidence indicate that annual precipitation 8 throughout the region was 1.6 to 2.0 times greater than today's values. Floral evidence also 9 suggests that winters may have continued to be relatively mild, perhaps because the glacial
10 mass blocked the southward movement of arctic air. Summers at the glacial maximum were 11 cooler and drier than at present, without a strongly developed monsoon.
12 The jet stream shifted northward following the gradual retreat of the ice sheet after 18,000 13 years ago, and the climate responded accordingly. By the Pleistocene/ Holocene boundary 14 approximately 11,000 years ago, conditions were significantly warmer and drier than 15 previously, although still dominated by winter storms and still wetter than today. Major 16 decreases in total precipitation and the shift toward the modern monsoonal climate did not 17 occur until the ice sheet had retreated into northeastern Canada in the early Holocene.
18 By middle Holocene time, the climate was similar to that of the present, with hot, monsoon-19 dominated summers and cold, dry winters. The pattern has persisted to the present, but not 20 without significant local variations. Soil studies show that the southern High Plains were 21 drier from 6,500 to 4,500 years ago than before or since. Gastropod data from Lubbock Lake 22 indicate the driest conditions from 7,000 to 5,000 years ago (precipitation, 0.89 times present 23 values; mean annual temperature, 2.5°C higher than present values), with a cooler and wetter 24 period 1,000 years ago (precipitation, 1.45 times present values; mean annual temperature, 25 2.5°C lower than present). Plant assemblages from southwestern Arizona suggest steadily 26 decreasing precipitation from the middle Holocene to the present, except for a brief wet period 27 approximately 990 years ago. Stratigraphic work at Lake Cochise shows two mid-Holocene 28 lake stands, one near or before 5,400 years ago and one between or before 3,000 to 4,000 29 years ago; however, both were relatively short-lived, and neither reached the maximum depths 30 of the late Pleistocene high stand that existed before 14,000 years ago.
31 Inferred historical precipitation indicates that during the Holocene, wet periods were relatively 32 drier and shorter in duration than those of the late Pleistocene. Historical records over the last 33 several hundred years indicate numerous lower intensity climatic fluctuations, some too short 34 in duration to affect floral and faunal circulation. Sunspot cycles and the related change in the 35 amount of energy emitted by the sun have been linked to historical climatic changes elsewhere 36 in the world, but the validity of the correlation is uncertain. Correlations have also been 37 proposed between volcanic activity and climatic change. In general, however, causes for past 38 short-term changes are unknown.
DRAFT-DOE/CAO-2056 2-139 March 31,1995

Draft 40 CFR191 Compliance Certification Application
1 The climatic record presented here should be inteipreted with caution because its resolution 2 and accuracy are limited by the nature of the data used to construct it. Floral and faunal 3 assemblages change gradually and show only a limited response to climatic fluctuations that 4 occur at frequencies that are higher than the typical life span of the organisms in question. For 5 long-lived species such as trees, resolution may be limited to hundreds or even thousands of 6 years. Sedimentation in lakes and playas has the potential to record higher frequency 7 fluctuations, including single-storm events, but only under a limited range of circumstances. 8 Once water levels reach a spill point, for example,, lakes show only a limited response to 9 further increases in precipitation.
10 With these observations in mind, three significant conclusions can be drawn from the climatic 11 record of the American Southwest. First, maximum precipitation in the past coincided with 12 the maximum advance of the North American ice sheet. Minimum precipitation occurred 13 after the ice sheet had retreated to its present limits. Second, past maximum long-term 14 average precipitation levels were roughly twice the present levels. Minimum levels may have 15 been 90 percent of the present levels. Third, short-term fluctuations in precipitation have 16 occurred during the present relatively dry, interglacial period, but they have not exceeded the 17 upper limits of the glacial maximum.
18 Too little is known about the relatively short-term behavior of global circulation patterns to 19 accurately predict precipitation levels over the next 10,000 years. The long-term stability of 20 patterns of glaciation and deglaciation, however, do permit the conclusion that future climatic 21 extremes are unlikely to exceed those of the late Pleistocene. Furthermore, the periodicity of 22 glacial events suggests that a return to full-glacial conditions is highly unlikely within the next 23 10,000 years. Additional discussion about the future climate is given in Chapter 6.0.
24 2.5.2 Current Climatic Conditions
25 The climate of the region is semiarid, with generally mild temperatures, low precipitation and 26 humidity, and a high evaporation rate. Winds are mostly from the southeast and moderate. In 27 late winter and spring, there are strong west winds and dust storms. Figure 2-33 depicts the 28 annual wind rose for 1993 for the WIPP site. During the winter, the weather is often 29 dominated by a high-pressure system situated in the central portion of the western United 30 States and a low-pressure system located in north-central Mexico. During the summer, the 31 region is affected by a low-pressure system normally situated over Arizona.
32 Temperatures are moderate throughout the year, although seasonal changes are distinct. The 33 mean annual temperature in southeastern New Mexico is 63 °F. In the winter (December 34 through February), night-time lows average near 23 °F, and average maxima are in the 50s. 35 The lowest recorded temperature at the nearest Class-A weather station in Roswell was -29 °F 36 in February 1905. In the summer (June through August), the day-time temperature exceeds 37 90°F approximately 75 percent of the time. The National Weather Service recently
March 31, 1995 2-140 DRAFT-DOE/CAO-2056
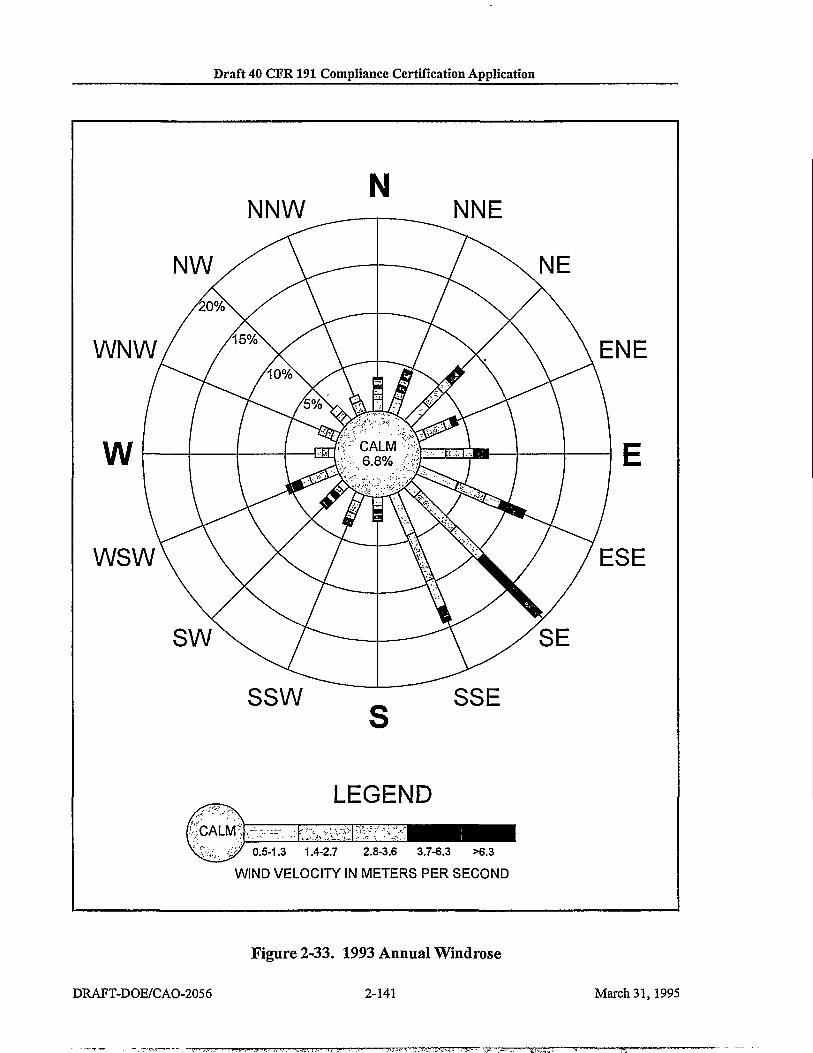
Draft 40 CFR 191 Compliance Certification Application
N NNW _ _ NNE
\ N E n\N//\^~-
\ N E
AQ%\/ \
WNW/ / X \ ^ _ \ENE i i& y?iy \ i /£? jfc</\ ^ ^
w 1 [ ^ y C A L M W ^ , „ . L E w " H ^ -,,6.8% / 4 ^ j E
wswV \ yc /" /ESE
91 I A / V / ^ - — - 4>E o \ ^ / 4>E
SSW ^ SSE S
4>E
LEGEND / cCALM; ,7; ;̂. .y^^t^r^jWI^KK^^M ^^jjy 0.5-1.3 1.4-2.7 2.8-3.6 3.7-6.3 >6.3
WIND VELOCITY IN METERS PER SECOND
Figure 2-33. 1993 Annual Windrose
DRAFT-DOE/CAO-2056 2-141 March 31, 1995

Draft 40 CFR 191 Compliance Certification Application
l TfflS PAGE INTENTIONALLY LEFT BLANK
March 31, 1995 2-142 DRAFT-DOE/CAO-2056

Draft 40 CFR191 Compliance Certification Application
1 documented a measurement of 122°F at the WIPP site as the record high temperature for New 2 Mexico. This measurement occurred on June 27,1994. Table 2-10 shows the average 3 monthly maximum and minimum temperatures, and Figure 2-34 shows the mean monthly 4 temperatures during 1993 at the WIPP site.
5 Precipitation is light and unevenly distributed throughput the year, averaging 12 inches (300 6 millimeters). Figure 2-35 shows the amount of monthly precipitation recorded at the WIPP 7 site during 1993. Winter is the season of least precipitation, averaging less than 0.6 inches (15 8 millimeters) of rainfall per month. Snow averages about 5 inches (127 millimeters) per year 9 at the site and seldom remains on the ground for more than a day at a time because of the
10 typically above-freezing temperatures in the afternoon. Approximately half the annual 11 precipitation comes from frequent thunderstorms in June through September. Rains are 12 usually brief but occasionally intense when moisture from the Gulf of Mexico spreads over 13 the region.
14 15
Table 2-10. Average Monthly Maximum and Minimum Temperatures at the WIPP Site from September 1992 through December 1993
16 17 18 19 20 21 22 23 24 25 26 27 28 29 30 31 32 33
' *' Maximum Minimum Month . (°C) (°F) ,.(°C) > F >
September 1992 31.7 89.06 14.9 58.82 October 1992 26.1 78.98 10.3 50.54 November 1992 16.8 62.24 1.1 33.98 December 1992 14 57.2 -1.8 28.76 January 1993 15 59 1 33.8 February 1993 18 64.4 1 33.8 March 1993 23 73.4 4 39.2 April 1993 28 82.4 8 46.4 May 1993 32 89.6 13 55.4 June 1993 36 96.8 19 66.2 July 1993 38 100.4 22 71.6 August 1993 29 84.2 21 69.8 September 1993 34 93.2 16 60.8 October 1993 28 82.4 9 48.2 November 1993 20 68 1 33.8 December 1993 18 64.4 -1 30.2
Source: WIPP Annual Site Environmental Report for Calendar Year 1992.
34 2.6 Seismology
35 The purpose of the seismic studies is to build a basis from which to predict ground motions 36 that the WIPP repository may be subjected to in the near and distant future. The concern 37 about seismic effects in the near future, during the operational period, pertains mainly to the
DRAFT-DOE/CAO-2056 2-143 March 31,1995

Draft 40 CFR191 Compliance Certification Application
1 design requirements for surface and underground structures for providing containment during 2 seismic events. The concern about effects occurring over the long term, after the repository 3 has been decommissioned and sealed, pertains more to relative motions (faulting) within the 4 repository and possible effects of faulting on the integrity of the salt beds and/or shaft seals.
5 In this discussion, the magnitudes are reported in terms of the Richter scale, and all intensities 6 are based on the modified Mercalli intensity scale. Most of the magnitudes were determined 7 by the New Mexico Institute of Mining and Technology or described in Appendix GCR.
8 Seismic data are presented in two time frames, before and after the time when seismographic 9 data for the region became available. The earthquake record in southern New Mexico dates
10 back only to 1923, and seismic instruments have been in place in the state since 1961. 11 Various records have been examined to determine the seismic history of the area within 180 12 miles (288 kilometers) of the site. With the exception of a weak shock in 1926 at Hope, New 13 Mexico, and shocks in 1936 and 1949 felt at Carlsbad, all known shocks before 1961 occurred 14 to the west and southwest of the site more than 100 miles (160 kilometers) away.
15 The strongest earthquake on record within 180 miles (288 kilometers) of the site was the 16 Valentine, Texas, earthquake of August 16,1931. It has been estimated to have been of 17 magnitude 6.4 on the Richter scale (Modified Mexcalli Intensity of VIII). The Valentine 18 earthquake was 130 miles (208 kilometers) south-southwest of the site. Its Modified Mercalli 19 Intensity at the site is estimated to have been V; this is believed to be the highest intensity felt 20 at the site in this century.
21 In 1887, a major earthquake occurred in northeast Sonora, Mexico. Although about 335 miles 22 (536 kilometers) west-southwest of the site, it is indicative of the size of earthquakes possible 23 in the eastern portion of the Basin and Range Province, west of the province containing the 24 site. Its magnitude was estimated to have been 7.8 (VIII to IX in Modified Mercalli Intensity). 25 It was felt over an area of 0.5 million square miles (1.3 million square kilometers) (as far as 26 Santa Fe to the north and Mexico City to the south); fault displacements near the epicenter 27 were as large as 26 feet (18 meters).
28 Since 1961, instrumental coverage has become comprehensive enough to locate most of the 29 moderately strong earthquakes (local magnitude >3.5) in the region. Instrumentally 30 determined shocks that occurred within 180 miles (288 kilometers) of the site between 1961 31 and 1979 are shown in Figure 2-36. The distribution of these earthquakes may be biased by 32 the fact that seismic stations were more numerous and were in operation for longer periods 33 north and west of the site.
34 Except for the activity southeast of the site, the distribution of epicenters since 1961 differs 35 little from that of shocks before that time. There are two clusters, one associated with the Rio 36 Grande Rift on the Texas-Chihuahua border and another associated with the Central Basin 37 Platform in Texas near the southeastern corner of New Mexico. The latter activity was not
March 31,1995 2-144 DRAFT-DOE/CAO-2056
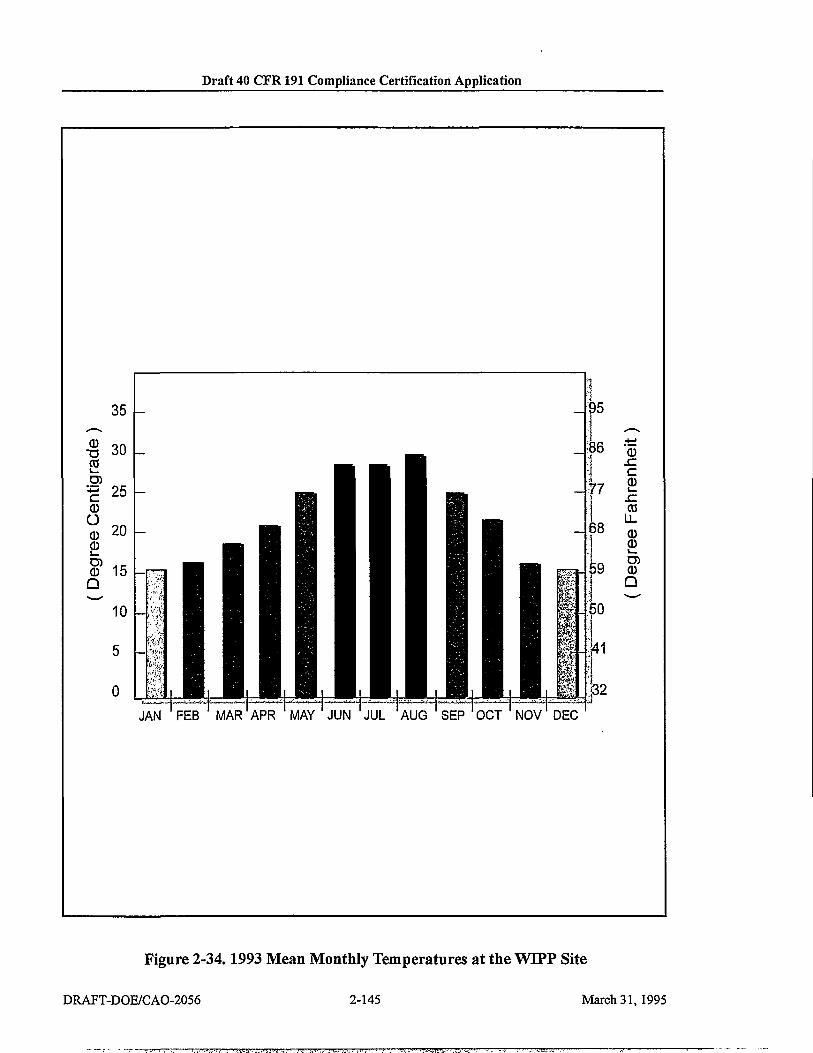
Draft 40 CFR 191 Compliance Certification Application
Figure 2-34.1993 Mean Monthly Temperatures at the WTPP Site
DRAFT-DOE/CAO-2056 2-145 March 31,1995

Draft 40 CFR 191 Compliance Certification Application
l THIS PAGE INTENTIONALLY LEFT BLANK
March 31, 1995 2-146 DRAFT-DOE/CAO-2056

Draft 40 CFR 191 Compliance Certification Application
3 .5 -
3 _
2 .5 -
— 2 -w <u
o 1 .5 -
W 1 \-0.5
- I 8.89
7.62
n,rn JAN "FEB ' MAR"APR 'MAY 'JUN 'JUL AUG SEP OCT NOV" DEC
6 . 3 5 ^ O. ro
5.08 3-3 CD
3.81 CD
2 . 5 4 "
1.27
0
Figure 2-35.1993 Precipitation at the WIPP Site
DRAFT-DOE/CAO-2056 2-147 March 31,1995

Draft 40 CFR 191 Compliance Certification Application
THIS PAGE INTENTIONALLY LEFT BLANK
March 31, 1995 2-148 DRAFT-DOE/CAO-2056

Draft 40 CFR 191 Compliance Certification Application
A 50 0 50 TOO
NOTES: LOCATIONS OF EARTHQUAKES WITHIN 180 Ml. OF THE WPP SITE. EPICENTERS WERE DETERMttlED WSIRUMENIALLY AND COVER THE PERIOD FROM 1962 THROUGH 1993. FOR DRAFTING CLARHY NO EARTHQUAKE WITH A MAGNITUDE LESS THAN 2.0 IS SHOWN. M AREAS WHERE CROWDING OCCURS SOME EPICENTERS ARE SLIGHTLY OFFSET FOR DRAFTING CONVENIENCE.
MAGNITUDE
O > 3 - 5
O <2.5
Figure 2-36. Regional Earthquake Epicenters Occurring after 1961
DRAFT-DOE/CAO-2056 2-149 March 31,1995
Draft 40 CFR 191 Compliance Certification Application
l TfflS PAGE INTENTIONALLY LEFT BLANK
March 31, 1995 2-150 DRAFT-DOE/CAO-2056

Draft 40 CFR191 Compliance Certification Application
1 reported before 1964. It is not clear from the record whether earthquakes were occurring in 2 the Central Basin Platform before 1964, although local historical societies and newspapers 3 tend to confirm their absence before that time.
4 A station operating for 10 months at Fort Stockton, Texas, indicated many small shocks from 5 the Central Basin Platform. Activity was observed at the time the station opened on June 21, 6 1964. This activity may be related to the injection of water underground for oil recovery. In 7 the Ward-Estes North oilfield, operated by the Gulf Oil Corporation, the cumulative total of 8 water injected up to 1970 was over 1 billion barrels. Accounting for 42 percent of the water 9 injected in Ward and Winkler counties, Texas, the quantity is three times the total injected in
10 all the oil fields of southeastern New Mexico during the same period. Water injection has not 11 been used in the region of the WIPP site to stimulate gas production. The nearest oil fields in 12 the Delaware Basin, where secondary recovery might be attempted, are adjacent to the WIPP 13 site boundary in the Delaware Formations.
14 The most recent earthquake to be felt at the WIPP site occurred in January 1992 and is 15 referred to as the Rattlesnake Canyon Earthquake. It occurred 60 miles (100 kilometers) east-16 southeast of the WIPP site. The earthquake was assigned a magnitude of 5.0. This event had 17 no effect on any of the structures at the WIPP as documented by post-event inspections by the 18 WIPP staff and the New Mexico Environment Department. This event was within the 19 parameters used to develop the seismic risk assessment of the WIPP facility for the purposes 20 of construction and operation.
21 The Rattlesnake Canyon event likely was tectonic in origin based on a 12+ 2 kilometers depth. 22 This suggest some uncertainty regarding the origin of earthquakes associated with the Central 23 Basin Platform.
24 2.7 Rock Geochemistry
25 An understanding of the mineralogy and geochemistry of the host repository rock is 26 considered critical to predicting the long-term waste isolation capability of the repository. 27 Chemical composition of the different minerals and any impurities are important to 28 understand and predict waste rock compatibility of the Salado. The interactions of the rock, 29 brines, and waste are discussed in Chapter 6 to the extent that these interactions impact the 30 long-term integrity of the disposal system. This section emphasizes the following topics:
31 • Mineral content and composition 32 • Fluid inclusions 33 • Fracture fillings.
34 The Salado is dominated by various evaporite salts; the dominant mineral is halite (NaCl) of 35 varying purity and accessory minerals. The major accessory minerals are anhydrite (CaS0 4), 36 clays, polyhalite (K 2MgCa 2(S0 4) 4 • 2H 20), and gypsum (CaS0 4 • 2HzO). In the vicinity of the 37 repository, authigenic quartz (Si0 2) and magnesite (MgC03) are also present as accessory 38 minerals. The MBs in the salt are described as anhydrite with seams of clay. The clays within
DRAFT-DOE/CAO-2056 2-151 March 31,1995
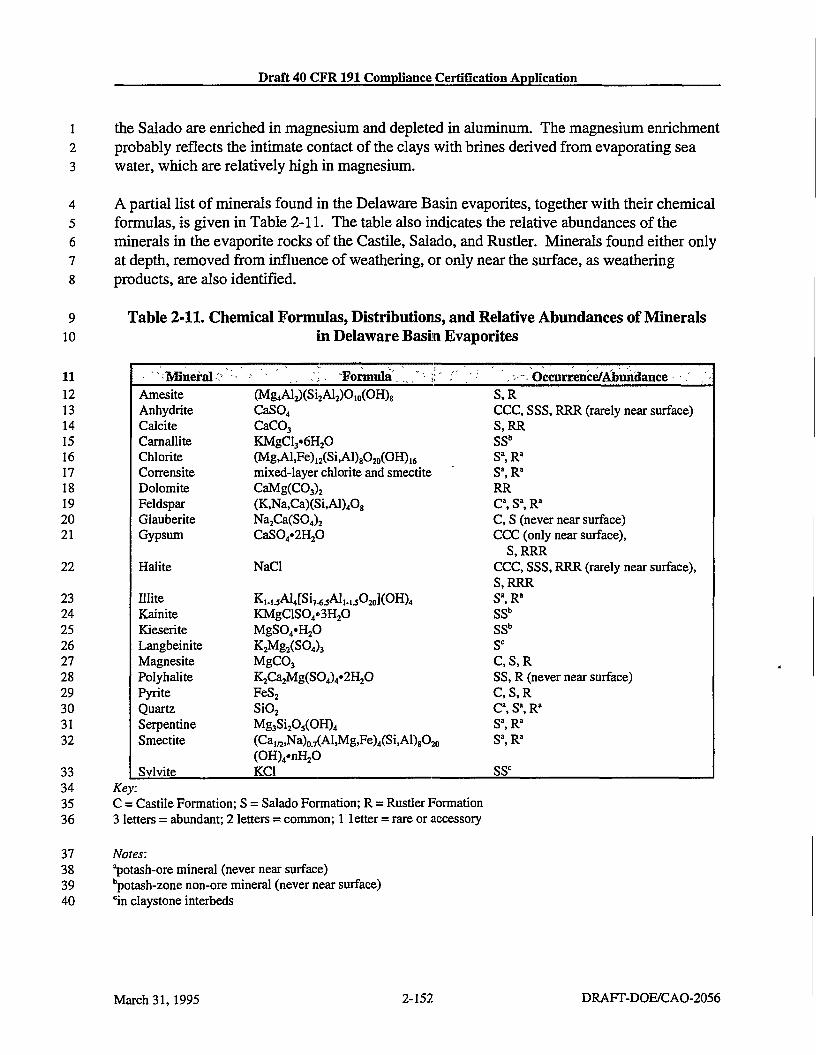
Draft 40 CFR191 Compliance Certification Application
1 the Salado are enriched in magnesium and depleted in aluminum. The magnesium enrichment 2 probably reflects the intimate contact of the clays with brines derived from evaporating sea 3 water, which are relatively high in magnesium.
4 A partial list of minerals found in the Delaware Basin evaporites, together with their chemical 5 formulas, is given in Table 2-11. The table also indicates the relative abundances of the 6 minerals in the evaporite rocks of the Castile, Salado, and Rustler. Minerals found either only 7 at depth, removed from influence of weathering, or only near the surface, as weathering 8 products, are also identified.
9 10
11 12 13 14 15 16 17 18 19 20 21
22
23 24 25 26 27 28 29 30 31 32
33 34 35 36
Table 2-11. Chemical Formulas, Distributions, and Relative Abundances of Minerals in Delaware Basin Evaporites
Mineral? .'; - Formula,. ," ;; :" '.-•-. Occurrence/Abonaance . Amesite (Mg4Al2)(Si2Al2)O10(OH)8 S,R Anhydrite CaS0 4 CCC, SSS, RRR (rarely near surface) Calcite CaC0 3 S.RR Carnallite KMgCl3«6H20 SS b
Chlorite (MgALFe^CSUOsOjoCOH),,; S a,R a
Corrensite mixed-layer chlorite and smectite S a ,R a
Dolomite CaMg(C0 3) 2 RR Feldspar (K,Na,Ca)(Si,Al)408 Ca, S a, R a
Glauberite Na 2Ca(S0 4) 2 C, S (never near surface) Gypsum CaS0 4»2H 20 CCC (only near surface),
S,RRR Halite NaCl CCC, SSS, RRR (rarely near surface),
S.RRR Elite K M 5 AUSi M 5 Al M . J Q 2 B ] (OH) 4 S a ,R a
Kainite KMgClS04»3H20 SS b
Kieserite MgS0 4«H 20 SS b
Langbeinite K 2Mg 2(S0 4) 3 S c
Magnesite MgC0 3 C.S.R Polyhalite KjCajMgCSOA^HjO SS, R (never near surface) Pyrite FeS 2 C,S,R Quartz Si0 2 Ca, S a, R a
Serpentine Mg 3Si 20 5(OH) 4 S a,R a
Smectite (Ca1/2)Na)0.7(Al,Mg,Fe)4(Si,Al)8O20
(OH)4«nH20 S a,R a
Svlvite KC1 SSC
Key: C = Castile Formation; 3 letters = abundant; 2
S = Salado Formation; R = Rustler Formation letters = common; 1 letter = rare or accessory
37 38 39 40
Notes: "potash-ore mineral (never near surface) bpotash-zone non-ore mineral (never near surface) cin claystone interbeds
March 31, 1995 2-152 DRAFT-DOE/CAO-2056

Draft 40 CFR191 Compliance Certification Application
1 Although the most common Delaware Basin evaporite mineral is halite, the presence of less 2 soluble interbeds (dominantly anhydrite, polyhalite, and clay stone) and more soluble 3 admixtures (e.g., sylvite, glauberite, kainite) has,resulted in chemical and physical properties 4 significantly different from those of pure halite. In particular, the McNutt potash member, 5 between MBs 116 and 126, is locally explored and mined for potassium bearing minerals of 6 economic interest. Under differential stress, brittle interbeds (anhydrite, polyhalite, 7 magnesite, dolomite) may fracture while, under the same stress regime, pure halite would 8 undergo plastic deformation. Fracturing of relatively brittle beds, for example, has locally 9 enhanced the permeability, allowing otherwise non-porous rock to carry groundwater (e.g.,
10 fractured doiomite beds in the Rustler). Some soluble minerals incorporated in the rock salt 11 (e.g., polyhalite, sylvite, leonite, langbeinite) can be radiometricaUy dated, and their dates 12 indicate the time of the formation. The survival of such minerals is significant, in that such 13 dating is impossible in pure halite or anhydrite.
14 Liquids were collected from fluid inclusions and from seeps and boreholes within the WIPP 15 drifts. Analysis of these samples indicated that there is compositional variability of the fluids 16 showing the effects of various phase transformations on brine composition. The fluid 17 inclusions belong to a different chemical population than do the fluids emanating from the 18 walls. It was concluded that much of the brine is completely immobilized within the salt and 19 that the free liquid emanating from the walls is present as a fluid film along intergranular 20 boundaries mainly in clays and in fractures in anhydrites. Additional information can be 21 found in Appendix GCR.
DRAFT-DOE/CAO-2056 2-153 March 31,1995

Draft 40 CFR191 Compliance Certification Application
TfflS PAGE INTENTIONALLY LEFT BLANK
Draft 40 CFR 191 Compliance Certification Application
1 Bachman, G.O. 1984. Regional Geology of Ochoan Evaporites, Northern Part of Delaware 2 Basin. Circular 184, pp. 1-22. New Mexico Bureau of Mines and Mineral Resources, 3 Socorro, NM.
i

Draft 40 CFR191 Compliance Certification Application
1 Lambert, S.J. 1991. "Isotopic Constraints on the Rustler and Dewey Lake Groundwater 2 Systems." In Hydrogeochemical Studies of the Rustler Formation and Related Rocks in the -3 Waste Isolation Pilot Plant Area, Southeastern New Mexico, M.D. Siegel, SJ. Lambert, and 4 K.L. Robinson, eds., SAND88-0196, Ch. 5. Sandia National Laboratories, Albuquerque, NM.
5 Lang, W.B. 1939. Salado Formation of the Permian Basin. American Association of 6 Petroleum Geologists Bulletin, Vol. 23, pp. 1569-1572.
7 Lang, W.B. 1942. Basal Beds of Salado Formation in Fletcher Potash Core Test near 8 Carlsbad, New Mexico. American Association of Petroleum Geologists Bulletin, Vol. 26.
9 Lowenstein, T.K. 1988. Origin of Depositional Cycles in a Permian "Saline Giant": The 10 Salado (McNutt Zone) Evaporites of New Mexico and Texas. Geological Society of America 11 Bulletin, Vol. 100, No. 4, pp. 592-608.
12 Lucas, S.G., and Anderson, OJ. 1993. "Triassic Stratigraphy in Southeastern New Mexico 13 and Southwestern Texas." In Geology of the Carlsbad Region, New Mexico and West Texas, 14 D.W. Love et al., eds., Forty-Fourth Annual Field Conference Guidebook. New Mexico 15 Geological Society, Socorro, NM.
16 Machette, M.N. 1985. "Calcic Soils of the Southwestern United States." In Soils and 17 Quaternary Geology of the Southwestern United States, D.L. Werde, and M.L. Fabes, eds., 18 Special Paper Vol. 203, pp. 1-21. Geological Society of America, Denver, CO.
19 Madsen, B.M., and Raup, O.B. 1988. Characteristics of the boundary between the Castile 20 and Salado Formations near the Western Edge of the Delaware Basin, Southeastern New 21 Mexico. New Mexico Geology, Vol. 10, No. 1.
22 McTigue, D.F. 1993. Permeability and Hydraulic Diffusivity of Waste Isolation Pilot Plant 23 Repository Salt Inferred from Small-Scale Brine Inflow Experiments. S AND92-1911. Sandia 24 National Laboratories, Albuquerque, NM.
25 Mercer, J. W. 1983. Geohydrology of the Proposed Waste Isolation Pilot Plant Site, Los 26 Medanos Area, Southeastern New Mexico. Water Resources Investigation Report 83-4016. 27 U.S. Geological Survey, Albuquerque, NM. (This document is included as Appendix 28 HYDRO.)
29 Mercer, J.W., Beauheim, R.L., Snyder, R.P., and Fairer, G.M. 1987. Basic Data Report for 30 Drilling and Hydrologic Testing of Drillhole DOE-2 at the Waste Isolation Pilot Plant 31 (WlPP)Site. SAND86-0611. Sandia National Laboratories, Albuquerque, NM.
32 Muehlberger, W.R., Belcher, R.C., and Goetz, L.K. 1978. Quaternary Faulting on 33 Trans-Pecos, Texas. Geology, Vol. 6, pp. 337-340.
DRAFT-DOE/CAO-2056 2-159 March 31,1995

Draft 40 CFR 191 Compliance Certification Application
1 Nicholson, Jr., A., and Clebsch, Jr., A. 1961. Geology and Ground-Water Conditions in 2 Southern Lea County, New Mexico. Ground-Water Report 6. New Mexico Bureau of Mines 3 and Mineral Resources, Socorro, NM.
4 NMBMMR (New Mexico Bureau of Mines and Mineral Resources). 1995. Evaluation of 5 Mineral Resources at the Waste Isolation Pilot Plant (WIPP) Site, Draft Report. Vol. 1, Ch. 6 I-HJ, December 22,1994.
7 Palmer, A.R. 1983. The Decade of North American Geology 1983 Geologic Time Scale. 8 Geology, Vol. 11, pp. 503-504.
9 Powers, D.W., and Holt, R.M. 1990a. Geologic Mapping of the Air Intake Shaft at the Waste 10 Isolation Pilot Plant. DOE/WIPP 90-051. U.S. Department of Energy, Carlsbad, NM.
11 Powers, D.W., and Holt, R.M. 1990b. "Halite Sequences within the Late Permian Salado 12 Formation in the Vicinity of the Waste Isolation Pilot Plant." In Geological and Hydrological 13 Studies ofEvaporites in the Northern Delaware Basin for the Waste Isolation Pilot Plant 14 (WIPP), New Mexico, D. Powers et al., eds., Field Trip #14. Geological Society of America, 15 Dallas, TX.
16 Powers, D.W., and Holt, R.M. 1993. "The Upper Cenozoic Gatuiia Formation of 17 Southeastern New Mexico." In Geology of the Carlsbad Region, New Mexico and West 18 Texas, D.W. Love et al., eds., Forty-Fourth Annual Field Conference, October 6-9,1993, pp. 19 271-282. New Mexico Geological Society, Roswell, NM.
20 Powers, D.W., Lambert, S.J., Shaffer, S-E., Hill, L.R., and Weart, W.D., eds. 1978. 21 Geological Characterization Report for the Waste Isolation Pilot Plant (WIPP) Site, 22 Southeastern New Mexico. SAND78-1596, Vols. land U. Sandia National Laboratories, 23 Albuquerque, NM. (This document is included as Appendix GCR.)
24 Register, J.K., and Brookins, D.G. 1980. Rb-Sr Isochron Age ofEvaporite Minerals from the 25 Salado Formation (Late Permian), Southeastern New Mexico. Isochron/West (29), pp. 29-31.
26 Reilinger, R., Brown, L., and Powers, D. 1980. New Evidence for Tectonic Uplift in the 27 Diablo Plateau Region, West Texas. Geophysical Research Letters, Vol. 7, No. 3.
28 Robinson, J.Q., and Powers, D.W. 1987. "A Clastic Deposit within the Lower Castile 29 Formation, Western Delaware Basin, New Mexico." In Geology of the Western Delaware 30 Basin, West Texas and Southeastern New Mexico, D.W. Powers and W.C. James, eds., El 31 Paso Geological Society Guidebook 18, pp. 69-79. El Paso Geological Society, El Paso, TX.
32 Saulnier, Jr., G.J., and Avis, J.D. 1988. Interpretation of Hydraulic Tests Conducted in the 33 Waste-Handling Shaft at the Waste Isolation Pilot Plant (WIPP) Site. SAND88-7001. Sandia 34 National Laboratories, Albuquerque, NM.
March 31, 1995 2-160 DRAFT-DOE/CAO-2056

Draft 40 CFR191 Compliance Certification Application
1 Schiel, K.A. 1988. The Dewey Lake Formation: End Stage Deposit of a Peripheral Foreland 2 Basin [M.S. thesis]. University of Texas at El Paso? El Paso, TX-.
3 Schiel, K.A. 1994. A New Look at the Age, Depositional Environment and Paleogeographic 4 Setting of the Dewey Lake Formation (Late Permian). West Texas Geological Society 5 Bulletin, Vol. 33, No. 9, pp. 5-13.
6 Sewards, T., Glenn, R., and Keil, K. 1991. Mineralogy of the Rustler Formation in the 7 WIPP-19Core. SAND97-7036. Sandia National Laboratories, Albuquerque, NM.
8 Snider, H.I. 1966. Stratigraphy and Associated Tectonics of the Upper Permian Castile-9 Salado-Rustler Evaporite Complex, Delaware Basin, West Texas and Southeast New Mexico
10 [Ph.D. dissertation]. University of New Mexico, Albuquerque.
11 Snyder, R.P. 1985. Dissolution of Halite and Gypsum, and Hydration of Anhydrite to 12 Gypsum, Rustler Formation, in the Vicinity of the Waste Isolation Pilot Plant, Southeastern 13 New Mexico. Open-File Report 85-229. U.S. Geological Survey, Denver, CO.
14 Urry, W.E. 1936. Post-Keweenawan Timescale. Exhibit 2, pp. 35-40. National Research 15 Council, Report Committee on Measurement of Geologic Time 1935-36.
16 Vine, J.D. 1963. Surface Geology of the Nash Draw Quadrangle, Eddy County, New 17 Mexico. U.S. Geological Survey Bulletin, 1141-B.
18 Wood, B.J., Snow, R.E., Cosier, D.J., and Haji-Djafari, S. 1982. Delaware Mountain Group 19 (DMG) Hydrology—Salt Removal Potential, Waste Isolation Pilot Plant (WIPP) Project, 20 Southeastern New Mexico. TME3166. U.S. Department of Energy, Albuquerque, NM.
DRAFT-DOE/CAO-2056 2-161 March 31,1995

Draft 40 CFR 191 Compliance Certification Application
THIS PAGE INTENTIONALLY LEFT BLANK
Draft 40 CFR 191 Compliance Certification Application
1 Bachman, G.O. 1974. Geologic Processes and Cenozoic History Related to Salt Dissolution 2 in Southeastern New Mexico. Open-File Report 74-194. U.S. Geological Survey, Denver, 3 CO.
4 Bachman, G.O. 1976. Cenozoic Deposits of Southeastern New Mexico and an Outline of the 5 History of Evaporite Dissolution. Journal of Research, Vol. 4, No. 2, pp. 135-149. U.S. 6 Geological Survey.
7 Bachman, G.O. 1980. Regional Geology and Cenozoic History of Pecos Region, 8 Southeastern New Mexico. Open-File Report 80-1099. U.S. Geological Survey, Denver, CO.
9 Bachman, G.O. 1981. Geology of Nash Draw, Eddy County, New Mexico. Open-File 10 Report 81-31. U.S. Geological Survey, Denver, CO.
11 Bachman, G.O. 1984. Regional Geology ofOchoan Evaporites, Northern Part of Delaware 12 Basin. Circular 184, pp. 1-22. New Mexico Bureau of Mines and Mineral Resources, 13 Socorro, NM.
14 Bachman, G.O. 1985. Assessment of Near-Surface Dissolution at and near the Waste 15 Isolation Pilot Plant (WIPP), Southeastern New Mexico. SAND84-7178. Sandia National 16 Laboratories, Albuquerque, NM.
17 Bachman, G.O., and Johnson, R.B. 1973. Stability of Salt in the Permian Salt Basin of 18 Kansas, Oklahoma, Texas, and New Mexico. Open-File Report 4339-4. U.S. Geological 19 Survey, Denver, CO.
20 Bachman, G.O., and Machette, M. N. 1977. Calcic Soils and Calcretes in the Southwestern 21 United States. Open-File Report 77-794. U.S. Geological Survey.
22 Balazs, E.I. 1978 [undated]. Report on First-Order Leveling Survey for Sandia Laboratories 23 Waste Isolation Pilot Plant (WIPP) Project. Report to Sandia National Laboratories, 24 Albuquerque, NM. National Geodetic Survey, Rockville, MD.
25 Balazs, E.I. 1982. Vertical Movement in the Los Medanos and Nash Draw Areas, New 26 Mexico, as Indicated by 1977 and 1981 Leveling Surveys. NOAA Technical Memorandum 27 NOS NGS 37, National Geodetic Survey, Rockville, MD.
28 Barker, J.M., and Austin, G.S. 1993. "Economic Geology of the Carlsbad Potash District, XT—x*—:— :„ p„ j „k . j Domnn Mow AjT̂ Yirri anrl Wp.st Texas." In Geolosv of the Carlsbad

Draft 40 CFR191 Compliance Certification Application
1 Barrows, L.J., Shaffer, S-E, Miller, W.B., and Fett, J.D. 1983. Waste Isolation Pilot Plant 2 (WIPP) Gravity Survey and Interpretation. S AND82-2922. Sandia National Laboratories, 3 Albuquerque, NM
4 Barrows, L.J., Shaffer, S.E., Miller, W.B., and Fett, J.D. 1983. Waste Isolation Pilot Plant 5 (WIPP) Site Gravity Survey and Interpretation. SAND82-2922. Sandia National 6 Laboratories, Albuquerque, NM.
7 Beauheim, R.L. 1987. Interpretations of Single-Well Hydraulic Tests Conducted at and near 8 the Waste Isolation Pilot Plant (WIPP) Site, 1983-1987. SAND87-0039. Sandia National 9 Laboratories, Albuquerque, NM.
10 Beauheim, R.L. 1987. Analysis of Pumping Tests of the Culebra Dolomite Conducted at the 11 H-3 Hydropad at the [WIPPJ Site. SAND86-2311. Sandia National Laboratories, 12 Albuquerque, NM.
13 Beauheim, R.L. and Holt, R.M. 1990. "Hydrology of the WIPP Site." In Geological and 14 Hydrological Studies ofEvaporites in the Northern Delaware Basin for the Waste Isolation 15 Pilot Plant (WIPP), New Mexico, Geologic Society of America 1990 Annual Meeting Field 16 Trip #14 Guidebook, pp. 131-179. Dallas Geologic Society, Dallas, TX.
17 Beauheim, R.L., Roberts, R.M., Dale, T.F., Fort, M.D., and Stensrud, W.A. 1993. Hydraulic 18 Testing ofSalado Formation Evaporites at the Waste Isolation Pilot Plant Site: Second 19 Interpretive Report. SAND92-0533. Sandia National Laboratories, Albuquerque, NM.
20 Beauheim, R.L., Saulnier, Jr., G.J., and Avis, J.D. 1991. Interpretation of Brine-Permeability 21 Tests of the Salado Formation at the Waste Isolation Pilot Plant Site: First Interim Report. 22 S AND90-0083. Sandia National Laboratories, Albuquerque, NM.
23 Bertram-Howery, S.G., and Hunter, R.L. 1989. Plans for Evaluation of the Waste Isolation 24 Pilot Plant Compliance with EPA Standards for Radioactive Waste Management and 25 Disposal. SAND88-2871. Sandia National Laboratories, Albuquerque, NM.
26 Blaney, H.F., and Hanson, E.G. 1965. Consumptive Use and Water Requirements in New 27 Mexico. Technical Report 32. New Mexico State Engineer's Office.
28 Bodine, Jr., M.W. 1978. "Clay-Mineral Assemblages from Drill Core of Ochoan Evaporites, 29 Eddy County, New Mexico." In Geology and Mineral Deposits of Ochoan Rocks in Delaware 30 Basin and Adjacent Areas, G.S. Austin, ed., Circular 159. New Mexico Bureau of Mines and 31 Mineral Resources, Socorro, NM.
32 Borns, D.J. 1987. The Geologic Structures Observed in Drillhole DOE-2 and Their Possible 33 Origins: Waste Isolation Pilot Plant. SAND86-1495. Sandia National Laboratories, 34 Albuquerque, NM.
DRAFT-DOE/CAO-2056 2-165 March 31,1995

Draft 40 CFR 191 Compliance Certification Application
1 Borns, D.J., Barrows, L.J., Powers, D.W., and Snyder, R.P. 1983. Deformation ofEvaporites 2 Near the Waste Isolation Pilot Plant (WIPP) Site. SAND82-1069. Sandia National 3 Laboratories, Albuquerque, NM.
4 Borns, D.J., and Shaffer, S-E. 1985. Regional Well-Log Correlation in the New Mexico 5 Portion of the Delaware Basin. SAND83-1798. Sandia National Laboratories, Albuquerque, 6 NM.
7 Borns, D.J., and Stormont, J.C. 1987. Delineation of the Disturbed Rock 7x)ne around 8 Excavations in Salt, Waste Isolation Pilot Plant (WIPP), SE New Mexico: Abstracts with 9 Programs. 1987 Annual Meeting and Exposition of the Geological Society of America, Vol.
10 19, No. 7. Geological Society of America, Phoenix, AZ.
11 Brinster, K.F. 1991. Preliminary Geohydrologic Conceptual Model of the Los Medahos 12 Region Near the Waste Isolation Pilot Plant for the Purpose of Performance Assessment. 13 SAND89-7147 and addendum. Sandia National Laboratories, Albuquerque, NM.
14 Brokaw, A.L., Jones, C.L., Cooley, M.E., and Hays, W.H. 1972. Geology and Hydrology of 15 the Carlsbad Potash Area, Eddy and Lea Counties, New Mexico. Open-File Report 4339-1. 16 U.S. Geological Survey, Denver, CO.
17 Brookins, D.G. 1980. Polyhalite K-Ar Radiometric Ages From Southeastern New Mexico. 18 Isochron/West (29), pp. 29-31.
19 Brookins, D.G. 1981. "Geochronologic Studies Near the WIPP Site, Southeastern New 20 Mexico." Environmental Geology and Hydrology in New Mexico. S.G. Wells, and W. 21 Lambert, ed., Special Publication 10, pp. 147-152. New Mexico Geological Society.
22 Brookins, D.G., and Lambert, S.J. 1987. Radiometric Dating ofOchoan (Permian) 23 Evaporites, WIPP site, Delaware Basin, New Mexico, USA. Materials Research Society, ed., 24 Vol. 84, pp.771-780.
25 Brookins, D.G., Lambert, S.J., and Ward, D.B. 1990. Authigenic Clay Minerals in the 26 Rustler Formation, WIPP Site Area, New Mexico. SAND89-1405. Sandia National 27 Laboratories, Albuquerque, NM.
28 Brookins, D.G., Register, J.K., and Krueger, H. 1980. Potassium-Argon Dating ofPolyhalite 29 in Southeast New Mexico. Geochimica et Cosmochimica Acta 44, pp. 635-637.
30 Calzia, J.P., and Hiss, W.L. 1978. "Igneous Rocks in Northern Delaware Basin, New 31 Mexico, and Texas." In Geology and Mineral Deposits ofOchoan Rocks in Delaware Basin 32 and Adjacent Areas, G.S. Austin, ed., Circular 159, pp. 39-45. New Mexico Bureau of Mines 33 and Mineral Resources, Socorro, NM.
March 31,1995 2-166 DRAFT-DOE/CAO-2056

Draft 40 CFR 191 Compliance Certification Application
1 Cartwright, Jr., L.D. 1930. Transverse Section of Permian Basin, West Texas and 2 Southeastern New Mexico. American Association of Petroleum Geologists Bulletin, Vol. 14.
3 Casas, E., and Lowenstein, T.K. 1989. Diagenesis of Saline Pan Halite: Comparison of 4 Petrographic Features of Modern, Quaternary and Permian Halites. Journal of Sedimentary 5 Petrology, Vol. 59.
6 Cauffman, T.L., LaVenue, A.M., and McCord, J.P. 1990. Ground-Water Flow Modeling of 7 the CulebraDolomite. VolumeII: DataBase. SAND89-7068/2. SandiaNational 8 Laboratories, Albuquerque, NM.
9 Chapman, J.B. 1986. Stable Isotopes in the Southeastern New Mexico Groundwater: 10 Implications for Dating Recharge in the WIPP Area. EEG-35, DOE/AL/10752-35. 11 Environmental Evaluation Group, Santa Fe, NM.
12 Chapman, J.B. 1988. Chemical and Radiochemical Characteristics of Groundwater in the 13 Culebra Dolomite, Southeastern NM. EEG-39. Environmental Evaluation Group, Santa Fe, 14 NM.
15 Chaturvedi, L. ed. 1987. The Rustler Formation at the WIPP site, Report of a Workshop on 16 the Geology and Hydrology of the Rustler as it Relates to the WIPP Project. EEG-34, 17 DOE/AL/10752-34. Environmental Evaluation Group, Santa Fe, NM.
18 Chugg, J.C., Anderson, G.W., Kink, D.L., and Jones, L.H. 1952. Soil Survey of Eddy Area, 9 New Mexico. U.S. Department of Agriculture.
0 Claiborne, H.C., and Gera, F. 1974. Potential Containment Failure Mechanisms and Their 1 Consequences at a Radioactive Waste Repository in Bedded Salt in New Mexico. ORNL-TM 2 4639. Oak Ridge National Laboratories, Oak Ridge, TN.
3 Crandall, K.H. 1929. Permian Stratigraphy of Southeastern New Mexico and Adjacent Parts 4 of Western Texas. American Association of Petroleum Geologists Bulletin, Vol. 13.
5 Crawford, J.E., and Wallace, C.S. 1993. "Geology and Mineralization of the Culberson 6 Sulfur Deposit." In Geology of the Carlsbad Region, New Mexico and West Texas, D.W. 7 Love et al., eds., Forty-Fourth Annual Field Conference Guidebook, pp. 301-316. New 8 Mexico Geological Society, Socorro, NM.
9 Crawley, M.E. 1988. Hydrostatic Pressure and Fluid-Density Distribution of the Culebra 0 Dolomite Member of the Rustler Formation Near the Waste Isolation Pilot Plant, 1 Southeastern New Mexico. DOE/WIPP 88-030. U.S. Department of Energy, Carlsbad, NM.
2 Dalrymple, G.B. and Lanphere, M.A. 1969. Potassium-Argon Dating. W.H. Freeman and 3 Company.
DRAFT-DOE/CAO-2056 2-167 March 31, 1995
Draft 40 CFR 191 Compliance Certification Application
1 Davies, P.B. 1984. Deep-Seated Dissolution and Subsidence in Bedded Salt Deposits [Ph.D. 2 Thesis]. Stanford University, Palo Alto, CA.
3 Davies, P.B. 1989. Variable Density Groundwater Flow and Paleohydrology in the Region 4 Surrounding the Waste Isolation Pilot Plant (WIPP), Southeastern New Mexico. Open-File 5 Report 88-490. U.S. Geological Survey, Albuquerque, NM.
6 Deal, D.E., and Case, J.B. 1987. Brine Sampling and Evaluation Program Phase I Report. 7 DOE-WIPP 87-008. Westinghouse Electric Corporation, Carlsbad, NM.
8 Deal, D.E., Abitz, R.J., Myers, J. Case, J.B., Martin, M.L., Roggenthen, W.M., and Belski 9 D.S. 1991. Brine Sampling and Evaluation Program, 1990 Report. DOE-WIPP-91-036.
10 Prepared for U. S. Department of Energy by IT Corporation and Westinghouse Electric 11 Corporation. Westinghouse Electric Corporation, Waste Isolation Division, Carlsbad, NM.
12 DOE (U.S. Department of Energy). 1979. Draft Supplement Environmental Impact 13 Statement Waste Isolation Pilot Plant. DOE/EIS-0026-DS. U.S. Department of Energy, 14 Washington, D.C.
15 DOE (U.S. Department of Energy). 1980. Final Environmental Impact Statement, Waste 16 Isolation Pilot Plant. DOE/EIS-0026, Vols. 1 and 2. Office of Environmental Restoration 17 and Waste Management, Washington, D.C.
18 DOE (U.S. Department of Energy). 1990. Final Supplement, Environmental Impact 19 Statement, Waste Isolation Pilot Plant. DOE/EIS-0026-FS. Office of Environmental 20 Restoration and Waste Management, Washington, D.C.
21 DOE (U.S. Department of Energy). 1993. Waste Isolation Pilot Plant Land Management 22 Plan. DOE/WIPP 93-004. U.S. Department of Energy, Carlsbad Area Office Carlsbad, NM.
23 DOE (U.S. Department of Energy). 1993. RCRA Part B Permit Application for the Waste 24 Isolation Pilot Plant. DOE/WIPP 91-005, Rev. 3, January 1993. U.S. Department of Energy, 25 Carlsbad, NM.
26 DOE (U.S. Department of Energy). 1994. Waste Isolation Pilot Plant Environmental 27 Monitoring Plan. DOE/WIPP 94-024. U.S. Department of Energy, Carlsbad, NM.
28 DOE (U.S. Department of Energy) and State of New Mexico. 1981. Consultation and 29 Cooperation Agreement. App. A to the Stipulated Agreement Resolving Civil Action, 81-30 0363JB, State of New Mexico vs. United States Department of Energy, United States District 31 Court, Albuquerque, NM.
March 31, 1995 2-168 DRAFT-DOE/CAO-2056

Draft 40 CFR191 Compliance Certification Application
1 Doser, D.I., Baker, M.R., Luo, M., Marroquin, P., Ballesteros, L., Kingwell, J., Diaz, H.L., 2 andKaip, G. Undated. The Not So Simple Relationship between Seismicityand Oil 3 Production in the Permian Basin, West Texas. Department of Geological Sciences, 4 University of Texas at El Paso, El Paso, Texas.
5 Dunham, RJ. 1972. Capitan Reef, New Mexico and Texas: Facts and Questions to Aid 6 Interpretation and Group Discussion. Publication 72-14, p. 297. Permian Basin Section, 7 Society of Economic Paleontologists and Mineralogists.
8 Eager, G.P. 1983. Core from the Lower Dewey Lake, Rustler, and Upper Salado Formation, 9 Culberson County, Texas. Permian Basin Cores, R.L. Shaw, and B.J. Pollen, eds., P.B.S.-
10 S.E.P.M. Core Workshop Vol. 2, pp. 273-283. Permian Basin Section, Society of Economic 11 Paleontologists and Mineralogists, Midland, TX.
12 Elliot Geophysical Company. 1976. A Preliminary Geophysical Study of a Trachyte Dike in 13 Close Proximity to the Proposed Los Medanos Nuclear Waste Disposal Site, Eddy and Lea 14 Counties, New Mexico. Elliot Geophysical Company, Tucson, AZ.
15 EPA (U.S. Environmental Protection Agency). 1990. Conditional No-Migration 16 Determination for the Department of Energy Waste Isolation Pilot Plant Federal Register, 17 Vol. 55, No. 220, p. 47700, November 14,1990. Office of Solid Waste and Emergency 18 Response, Washington, D.C.
19 Ferrall, C.C., and Gibbons, J.F. 1980. Core Study of Rustler Formation over the WIPP Site. 20 S AND79-7110. Sandia National Laboratories, Albuquerque, NM.
21 Foster, R.W. 1974. Oil and Gas Potential of a Proposed Site for the Disposal of 'High-Level 22 Radioactive Waste. Open-File Report, Contract No. AF(40-l)-4423. Oak Ridge National 23 Laboratory, Oak Ridge, TN.
24 FWS (U.S. Fish and Wildlife Services). 1989. Letter from John C. Preston, Field Supervisor, 25 Albuquerque, NM, to Jack B. Tillman, Project Manager, U.S. DOE-Carlsbad, May 25,1989.
26 Galley, J.E. 1958. "Oil and Geology in the Permian Basin of Texas and New Mexico." In 27 Habitat of Oil—A Symposium, L. G. Weeks, ed.
28 Garber, R. A., Grover, G. A., and Harris, P.M. 1989. "Geology of the Capitan Shelf 29 Margin—Subsurface Data from the Northern Delaware Basin." In Subsurface and Outcrop 30 Examination of the Capitan Shelf Margin, Northern Delaware Basin, P.M. Harris and G.A 31 Grover, eds., Core Workshop No. 13, p. 3-269. Society of Economic Paleontologists and 32 Mineralogists (SEPM).
33 Griswold, G.B. 1977. Site Selection and Evaluation Studies of the Waste Isolation Pilot 34 Plant (WIPP), Los Medanos, Eddy County, New Mexico. SAND77-0946. Sandia National 35 Laboratories, Albuquerque, NM.
DRAFT-DOE/CAO-2056 2-169 March 31,1995
Draft 40 CFR 191 Compliance Certification Application
1 Guilinger, J.R. 1993. "The Geology and Development of the Phillips Ranch Sulfur Deposit." 2 In Geology of the Carlsbad Region, New Mexico and West Texas, D.W. Love et al., eds., 3 Forty-Fourth Annual Field Conference Guidebook, pp. 21-23. New Mexico Geological 4 Society, Socorro, NM.
5 Hale, W.E., Hughes, L.S., and Cox, E.R. 1954. Possible Improvement of Quality of Water of 6 the Pecos River by Diversion of Brine at Malaga Bend, Eddy County, NM. Pecos River 7 Commission New Mexico and Texas, in cooperation with United States Department of the 8 Interior, Geological Survey, Water Resources Division, Carlsbad, NM.
9 Harding, S.T., Carver, D., Henrisey, R.F., Dart, R.L., and Langer, C.J. 1978. The Scurry 10 County, Texas, Earthquake Series of 1977-1978: Induced Seismicity? Earthquake Notes, 11 Vol. 49, No. 3.
12 Harland, W.B., Cox, A.V., Llewellyn, P.G., Pickton, C.A.G., Smith, A.G., and Walters, R. 13 1982. A Geologic Time Scale. Cambridge Earth Science Series. Cambridge University Press.
14 Harms, J.C., and Williamson, C.R. 1988. Deep-Water Density Current Deposits of Delaware 15 Mountain Group (Permian), Delaware Basin, Texas and New Mexico. American Association 16 of Petroleum Geologists Bulletin, Vol. 72.
17 Haug, A., Kelly, V.A., LaVenue, A.M., and Pickens, J. F. 1987. Modeling of Ground-Water 18 Flow in the Culebra Dolomite at the Waste Isolation Pilot Plant (WIPP) Site: Interim Report. 19 SAND86-7167. Sandia National Laboratories, Albuquerque, NM.
20 Hawley, J.W. 1993. "The Ogallala and Gatuna Formations in the Southeastern New Mexico 21 Region, a Progress Report." In Geology of the Carlsbad Region, New Mexico and West 22 Texas, D.W. Love et al., eds., Forty-Fourth Annual Field Conference Guidebook. New 23 Mexico Geological Society, Socorro, NM.
24 Hayes, P.T., and Bachman, G.O. 1979. Examination and Reevaluation of Evidence for the 25 Barrera Fault, Guadalupe Mountains, New Mexico. Open-File Report 79-1520. U.S. 26 Geological Survey, Denver, CO.
27 Hendrickson, G.E., and Jones, R. S. 1952. Geology and Ground-Water Resources of Eddy 28 County, New Mexico. Ground-Water Report, Vol. 3, p. 169. New Mexico Bureau of Mines 29 and Mineral Resources, Socorro, NM.
30 Hern, J.L., Powers, D.W., and Barrows, L.J. 1979. Seismic Reflection Data Report Waste 31 Isolation Pilot Plant (WIPP) Site, Southeastern New Mexico. SAND79-0264, Vols. 1 and 2. 32 Sandia National Laboratories, Albuquerque, NM.
33 Hicks, P. A. 1981. Mitigative Collection and Testing of Five Archaeological Sites on the 34 Waste Isolation Pilot Project near Carlsbad, New Mexico for Westinghouse, Inc. Agency for 35 Conservation Archaeology, Eastern New Mexico University, Portales, NM.
March 31,1995 2-170 DRAFT-DOE/CAO-2056

Draft 40 CFR191 Compliance Certification Application
1 Hicks, P.A. 1981. Mitigation of Four Archaeological Sites on the Waste Isolation Pilot 2 Project near Carlsbad, New Mexico for Westinghouse, Inc. Agency for Conservation 3 Archeology, Eastern New Mexico University, Portales, NM.
4 Hills, J.M. 1984. Sedimentation, Tectonism, and Hydrocarbon Generation in Delaware Basin, 5 West Texas and Southeastern New Mexico. American Association of Petroleum Geologists 6 Bulletin, Vol. 68.
7 Hills, J.M., and Kottlowski, RE. 1983. Southwest/Southwest Mid-Continent Region. 8 Correlation Chart Series. American Association of Petroleum Geologists.
9 Hiss, W.L. 1976. Structure of the Premium Guadalupian Capitan Aquifer, Southeast New 10 Mexico and West Texas. Resource Map. New Mexico Bureau of Mines and Mineral 11 Resources, Socorro, NM.
12 Holt, R.M. 1993. Sedimentary Textures, Structures, and Lithofacies in the Salado 13 Formation: A Guide for Recognition, Classification, and Interpretation. DOE/WIPP 93-056. 14 U.S. Department of Energy, Carlsbad, NM.
15 Holt, R.M., and Powers, D.W. 1984. Geotechnical Activities in the Waste Handling Shaft 16 Waste Isolation Pilot Plant (WIPP) Project Southeastern New Mexico. WTSD-TME-038. 17 U.S. Department of Energy, Carlsbad, NM.
18 Holt, R.M., and Powers, D.W. 1986. Geotechnical Activities in the Exhaust Shaft. 19 DOE-WJPP-86-008. U.S. Department of Energy, Carlsbad, NM.
20 Holt, R.M., and Powers, D.W. 1988. Fades Variability and Post-Depositional Alteration 21 within the Rustler Formation in the Vicinity of the Waste Isolation Pilot Plant, Southeastern 22 New Mexico. DOE/WIPP 88-004. U.S. Department of Energy, Carlsbad, NM. (This 23 document is included as Appendix FAC.)
24 Holt, R.M., and Powers, D.W. 1993. "Summary of Delaware Basin End-Stage Deposits." In 25 Geology of the Carlsbad Region, New Mexico and West Texas, D.W. Love et al., eds., Forty-26 Fourth Annual Field Conference Guidebook, pp. 90-92. New Mexico Geological Society, 27 Socorro, NM.
28 Howard, K.A., Aaron, J.M., Brabb, E.E., Brock, M.R., Gower, H.D., Hunt, S.J., Milton, D.J., 29 Muehlberger, W.R., Nakata, J.K., Plafker, G., Prowell, D.C., Wallace, R.E., and Witkind, I.J. 30 1971 [reprinted 1991]. Preliminary Map of Young Faults in the United States as a Guide to 31 Possible Fault Activity: Miscellaneous Field Studies Map MF-916,1:5,000,000. 2sheets. 32 U.S. Geological Survey.
33 Hunter, R.L. 1985. A Regional Water Balance for the Waste Isolation Pilot Plant (WIPP) 34 Site and Surrounding Area. SAND84-2233. Sandia National Laboratories, Albuquerque, 35 NM.
DRAFT-DOE/CAO-2056 2-171 March 31,1995

Draft 40 CFR 191 Compliance Certification Application
1 Izett, G.A., and Wilcox, R.E. 1982. Map Showing Localities and Inferred Distribution of the 2 Huckleberry Ridge, Mesa Falls, and Lava Creek Ash Beds in the Western United States and 3 Southern Canada. Misc. Investigations Map 1-1325, scale 1:4,000,000. U.S. Geological 4 Survey.
5 Jarolimek, L., Timmer, M.J., and McKinney, R.F. 1983. Geotechnical Activities in the 6 Exploratory Shaft—Selection of the Facility Interval, Waste Isolation Pilot Plant (WIPP) 7 Project, Southeastern New Mexico. TME3178. U.S. Department of Energy, Albuquerque, 8 NM.
9 Jarolimek, L., Timmer, M.J., and Powers, D.W. 1983. Correlation of Drillhole and Shaft 10 Logs, Waste Isolation Pilot Plant (WIPP) Project, Southeastern New Mexico. TME 3179. 11 U.S. Department of Energy, Albuquerque, NM.
12 John, C.B., Cheeseman, R.J., Lorenz, J.C., and Milligate, M.L. 1978. Potash Ore Reserves in 13 the Proposed [WIPP] Plant Area. Open-File Report for Eddy County, Southeastern NM. 14 U.S. Geological Survey.
15 Johnson, K.S. 1978. "Stratigraphy and Mineral Resources of Guadalupian and Ochoan Rocks 16 in the Texas Panhandle and Western Oklahoma." In Geology and Mineral Deposits of 17 Ochoan Rocks in Delaware Basin and Adjacent Areas, G.S. Austin, ed., Circular 159, 18 pp. 57-62. New Mexico Bureau of Mines and Mineral Resources, Socorro, NM.
19 Jones, C.L. 1954. The Occurrence and Distribution of Potassium Minerals in Southeastern 20 New Mexico. Guidebook to Southeastern New Mexico. New Mexico Geographical Society, 21 Albuquerque, NM.
22 Jones, C.L. 1978. Test Drilling for Potash Resources: Waste Isolation Pilot Plant Site, Eddy 23 County, New Mexico. Open-File Report 78-592. Vols. 1 and 2. U.S. Geological Survey, 24 Denver, CO.
25 Jones, C.L. 1981. Geologic Data for Borehole ERDA-6, Eddy County, New Mexico. 26 Open-File Report 81-468. U.S. Geological Survey, Denver, CO.
27 Jones, C.L. 1981. Geologic Data for Borehole ERDA-9, Eddy County, New Mexico. 28 Open-File Report 81-469. U.S. Geological Survey, Denver, CO.
29 Jones, C.L., Bowles, C.G., and Bell, K.G. 1960. Experimental Drillhole Logging in Potash 30 Deposits of the Carlsbad District, New Mexico. Open-File Report. U.S. Geological Survey, 31 Denver, CO.
32 Jones, C.L., Cooley, M.E., and Bachman, G.O. 1973. Salt Deposits of Los Medanos Area, 33 Eddy and Lea Counties, New Mexico. Open-File Report 4339-7. U.S. Geological Survey, 34 Denver, CO.
March 31,1995 2-172 DRAFT-DOE/CAO-2056

Draft 40 CFR191 Compliance Certification Application
1 Jones, T.L., Kelley, V.A., Pickens, J.T., Upton, D.T., Beauheim, R.L., and Davies, P.B. 1992. 2 Integration of Interpretation Results of Tracer Tests Performed in the Culebra Dolomite at 3 the Waste Isolation Pilot Plant Site. SAND92-1579. Sandia National Laboratories, 4 Albuquerque, NM.
5 Keesey, J. J. 1976. Hydrocarbon Evaluation, Proposed Southeastern New Mexico 6 Radioactive Material Storage Site, Eddy County, New Mexico. Vol. I and II, 1976, Sipes, 7 Williamson and Aycock, Midland, TX.
8 Keesey, J.J. 1977. Hydrocarbon Evaluation, Waste Isolation Pilot Plant Site Area to State 9 and Federal Royalty Interests. Eddy County, NM.
10 Kelley, V.A. 1971. Geology of the Pecos Country, Southeastern New Mexico. Memoir 24. 11 New Mexico Bureau of Mines and Mineral Resources, Socorro, NM.
12 Kelley, V.A., and Saulnier, Jr., G.J. 1990. Core Analyses for Selected Samples from the 13 Culebra Dolomite at the Waste Isolation Pilot Plant Site. SAND90-7011. Sandia National 14 Laboratories, Albuquerque, NM.
15 Kelley, V.A., and Pickens, J.F. 1986. Interpretation of the Convergent-Flow Tracer Tests 16 Conducted in the Culebra Dolomite at the H-3 and H-4 Hydropads at the Waste Isolation 17 Pilot Plant (WIPP) Site. SAND86-7161. Sandia National Laboratories, Albuquerque, NM.
18 King, P.B. 1948. Geology of the Southern Guadalupe Mountains, Texas. Professional Paper 19 215. U.S. Geological Survey, Washington, D.C.
20 King, R.E. 1948. Sedimentation in Permian Castile Sea. American Association of Petroleum 21 Geologists Bulletin, Vol. 31, pp. 470-477.
22 Klemmick, G.F. 1993. "Geology of the Pokorny Sulfur Deposit, Culberson County, Texas." 23 In Geology of the Carlsbad Region, New Mexico and West Texas, D.W. Love et al., eds., 24 Forty-Fourth Annual Field Conference Guidebook, pp. 18-19. New Mexico Geological 25 Society, Socorro, NM.
26 Kunkler, J.L. 1980. Evaluation of the Malaga Bend Salinity Alleviation Project. Open-File 27 Report 80-1111. U.S. Geological Survey, Denver, CO.
28 Lambert, S.J. 1983. Dissolution of Evaporites in and around the Delaware Basin, 29 Southeastern New Mexico and West Texas. SAND82-0461. Sandia National Laboratories, 30 Albuquerque, NM.
31 Lambert, S.J. 1983. "Evaporite Dissolution Relevant to the WIPP Site, Northern Delaware 32 Basin, Southeastern New Mexico." In Materials Research Society Sumposium Proceedings 33 15: Scientific Basis for Nuclear Waste Management VI, D.G. Brookins, ed., pp. 291-298 34 Elsevier Science Publishing Company, New York, NY.
DRAFT-DOE/CAO-2056 2-173 March 31,1995
Draft 40 CFR 191 Compliance Certification Application
1 Lambert, S.J. 1987. Feasibility Study: Applicability of Geochronologic Methods Involving 2 Radiocarbon and other Nuclides to the Groundwater Hydrology of the Rustler Formation, 3 Southeastern New Mexico. SAND86-1054. Sandia National Laboratories, Albuquerque, NM.
4 Lambert, S. J. 1991. "Isotopic Constraints on the Rustler and Dewey Lake Groundwater 5 Systems." In Hydrogeochemical Studies of the Rustler Formation and Related Rocks in the 6 Waste Isolation Pilot Plant Area, Southeastern New Mexico, M.D. Siegel, S.J. Lambert, and 7 K.L. Robinson, eds., SAND88-0196, Ch. 5. Sandia National Laboratories, Albuquerque, NM.
8 Lambert, S.J., and Carter, J.A. 1984. "Uranium-Isotope Disequilibrium in Brine Reservoirs 9 of the Castile Formation." In Principles and Methods, Northern Delaware Basin,
10 Southeastern New Mexico. SAND83-0144. Sandia National Laboratories, Albuquerque, NM.
11 Lambert, S.J., and Carter, J.A. 1987. Uranium-Isotope Systematics in Groundwaters of the 12 Rustler Formation, Northern Delaware Basin, Southeastern New Mexico. I. Principles and 13 Preliminary Results. SAND87-0388. Sandia National Laboratories, Albuquerque, NM.
14 Lambert, S.J., and Harvey, D.M. 1987. Stable-Isotope Geochemistry of Groundwaters in the 15 Delaware Basin of Southeastern New Mexico. SAND87-0138. Sandia National Laboratories, 16 Albuquerque, NM.
17 Lang, W.B. 1935. Upper Permian Formation of Delaware Basin of Texas and New Mexico. 18 American Association of Petroleum Geologists Bulletin, Vol. 19, pp. 262-276.
19 Lang, W.B. 1939. Salado Formation of the Permian Basin. American Association of 20 Petroleum Geologists Bulletin, Vol. 23, pp. 1569-1572.
21 Lang, W.B. 1942. Basal Beds of Salado Formation in Fletcher Potash Core Test near 22 Carlsbad, New Mexico. American Association of Petroleum Geologists Bulletin, Vol. 26.
23 Lappin, A.R., Hunter, R.L., Garber, D.P., Davies, P.B., Beauheim, R.L., Borns, D.J., Brush, 24 L.H., Butcher, B.M., Cauffman, T., Chu, M.S.Y., Gomez, L.S., Guzowski, R.V., Iuzzolino, 25 H.J., Kelley, V., Lambert, S.J., Marietta, M.G., Mercer, J.W., Nowak, E.J., Pickens, J., 26 Rechard, R.P., Reeves, M., Robinson, K.L., and Siegel, M.D., eds. 1989. Systems Analysis, 27 Long-Term Radionuclide Transport, and Dose Assessments, Waste Isolation Pilot Plant 28 (WIPP), Southeastern New Mexico: March 1989. SAND89-0462. Sandia National 29 Laboratories, Albuquerque, NM.
30 LaVenue, A.M., Cauffman, T.L., Pickens, J.F. 1990. Ground-Water Flow Modeling of the 31 Culebra Dolomite. Volume 1: Model Calibration SAND89-7068/1. Sandia National 32 Laboratories, Albuquerque, NM.
33 LaVenue, A.M., Haug, A., and Kelley, V.A. 1988. Numerical Simulation of Ground-Water 34 Flow in the Culebra Dolomite at the Waste Isolation Pilot Plant (WIPP) Site: Second Interim 35 Report. SAND88-7002. Sandia National Laboratories, Albuquerque, NM.
March 31,1995 2-174 DRAFT-DOE/CAO-2056

Draft 40 CFR191 Compliance Certification Application
1 Lee, W.T. 1925. "Erosion by Solution and Fill." In Contributions to Geography in the 2 United States: USGS Bulletin, 160-C.
3 Leslie, A., Kendall, A., and Harwood, G. 1993. "The Castile Formation: A Continuing 4 Paradox." In Geology of the Carlsbad Region, New Mexico and West Texas, D.W. Love et al., 5 eds., Forty-Fourth Annual Field Conference Guidebook. New Mexico Geological Society, 6 Socorro, NM.
7 Long, G.J., and Associates, Inc. 1976. Interpretation of Geophysical Data, LosMedanos and 8 Vicinity, Lea and Eddy Counties, New Mexico. Report to Sandia National Laboratories.
9 Lord, K.J., and Reynolds, W.E., eds. 1985. Archaeological Investigations of Three Sites 10 within the WIPP Core Area. Prepared for the U.S. Army Corps of Engineers (COE), 11 Albuquerque District in NM. Eddy County, NM, Chambers Consultants and Planner, 12 Albuquerque, NM.
13 Lowenstein, T.K. 1988. Origin ofDepositional Cycles in a Permian "Saline Giant": The 14 Salado (McNutt Zone) Evaporites of New Mexico and Texas. Geological Society of America 15 Bulletin, Vol. 100, No. 4, pp. 592-608.
16 Lucas, S.G., and Anderson, O.J. 1993. "Stratigraphy of the Permian-Triassic Boundary in 17 Southeastern New Mexico and West Texas." In Geology of the Carlsbad Region, New Mexico 18 and West Texas, D.W. Love et al., eds., Forty-Fourth Annual Field Conference Guidebook. 19 New Mexico Geological Society, Socorro, NM.
20 Lucas, S.G., and Anderson, O.J. 1993. "Triassic Stratigraphy in Southeastern New Mexico 21 and Southwestern Texas." In Geology of the Carlsbad Region, New Mexico and West Texas, 22 D.W. Love et al., eds., Forty-Fourth Annual Field Conference Guidebook. New Mexico 23 Geological Society, Socorro, NM.
24 Machette, M.N. 1985. "Calcic Soils of the Southwestern United States." In Soils and 25 Quaternary Geology of the Southwestern United States, D.L. Weide, and M.L. Faber, eds., 26 Special Paper Vol. 203, pp. 1-21. Geological Society of America, Denver, CO.
27 MacLennan, R.B., and Schermer, S.C. 1979. An Archaeological Survey for the Waste 28 Isolation Pilot Project: Access Roads and Railroad Right-of-Way. Agency for Conservation 29 Archaeology Report 79-23. Eastern New Mexico University, Portales, NM.
30 Madsen, B.M., and Raup, O.B. 1988. Characteristics of the Boundary between the Castile 31 and Salado Formations near the Western Edge of the Delaware Basin, Southeastern New 32 Mexico. New Mexico Geology, Vol. 10, No. 1.
33 Maley, V.C., and Huffington, R.M. 1953. Cenozoic Fill and Evaporate Solution in the 34 Delaware Basin, Texas and New Mexico. Geological Society of America Bulletin, Vol. 64.
DRAFT-DOE/CAO-2056 2-175 March 31,1995

Draft 40 CFR191 Compliance Certification Application
1 Mariah Associates, Inc. 1987. Report of Class II Survey and Testing of Cultural Resources at 2 the WIPP Site at Carlsbad, NM. Prepared for the U.S. Corps of Engineers, Albuquerque 3 District in NM.
4 McGowen, J.H., and Groat, C.G. 1971. Van Horn Sandstone, West Texas: An Alluvial Fan 5 Model for Mineral Exploration. Report of Investigations No. 72. Bureau of Economic 6 Geology, Austin, TX.
7 McTigue, D.F. 1993. Permeability and Hydraulic Diffusivity of Waste Isolation Pilot Plant 8 Repository Salt Inferred from Small-Scale Brine Inflow Experiments. S AND92-1911. Sandia 9 National Laboratories, Albuquerque, NM.
10 Mercer, J.W. 1987. Compilation of Hydrologic Data From Drilling the Salado and Castile 11 Formations Near the Waste Isolation Pilot Plant (WIPP) Site in Southeastern New Mexico. 12 SAND86-0954. Sandia National Laboratories, Albuquerque, NM.
13 Mercer, J.W., Beauheim, R.L., Snyder, R.P., and Fairer, G.M. 1987. Basic Data Report for 14 Drilling and Hydrologic Testing of Drillhole DOE-2 at the Waste Isolation Pilot Plant 15 (WIPP) Site. SAND86-0611. Sandia National Laboratories, Albuquerque, NM.
16 Mercer, J.W. and Orr, B.R. 1977. Review and Analysis of Hydrogeologic Condition Near the 17 Site of a Potential Nuclear-Waste Repository, Eddy and Lea Counties, New Mexico. USGS 18 Open-File Report 77-123. U.S. Geological Survey, Albuquerque, NM.
19 Mercer, J.W., and Orr, B.R. 1979. Interim Data Report on Geohydrology of Proposed Waste 20 Isolation Pilot Plant Site, Southeast New Mexico. Water Resources Investigations 79-98. 21 U.S. Geological Survey, Albuquerque, NM.
22 Meyer, R.F. 1966. Geology of Pennsylvania and Wolf campion Rocks in Southeast New 23 Mexico. Memoir 17. New Mexico Bureau of Mines and Mineral Resources, Socorro, NM.
24 Miller, D.N. 1955. Petrology of the Pierce Canyon Formation, Delaware Basin, Texas and 25 New Mexico [Ph.D. Dissertation]. University of Texas, Austin.
26 Miller, D.N. 1966. Petrology of Pierce Canyon Redbeds, Delaware Basin, Texas and New 27 Mexico. American Association of Petroleum Geologists Bulletin, Vol. 80.
28 Muehlberger, W.R., Belcher, R.C., and Goetz, L.K. 1978. Quaternary Faulting on 29 Trans-Pecos, Texas. Geology, Vol. 6, No. 6, pp. 337-340.
30 NAS-NRC (National Academy of Science-National Research Council). 1957. Disposal of 31 Radioactive Wastes on Land. Publication 519. National Academy of Sciences, Washington, 32 D.C.
March 31, 1995 2-176 DRAFT-DOE/CAO-2056

Draft 40 CFR191 Compliance Certification Application
1 Neill, R.H., Channell, J.K., Chaturvedi, L., Little, M.S., Rehfeldt, K., and Spiegler, P. 1983. 2 Evaluation of the Suitability of the WIPP Site. EEG-23. Environmental Evaluation Group, 3 Santa Fe.NM.
4 Newell, N.D., et al. 1953. The Permian Reef Complex of the Guadalupe Mountains Region, 5 Texas and New Mexico—A Study in Paleoecology. W.H. Freeman and Co., San Francisco.
6 Nicholson, Jr., A., and Clebsch, Jr., A. 1961. Geology and Ground-Water Conditions in 7 Southern Lea County, New Mexico. Ground-Water Report 6. New Mexico Bureau of Mines 8 and Mineral Resources, Socorro, NM.
9 Nielson, J. 1977. An Archaeological Reconnaissance of a Proposed Site for the Waste 10 Isolation Pilot Plant (WIPP). Sandia National Laboratories, Albuquerque, NM.
11 NMBMMR (New Mexico Bureau of Mines and Mineral Resources). 1995. Evaluation of 12 Mineral Resources at the Waste Isolation Pilot Plant (WIPP) Site, Draft Report. Vol. 1, Ch. 13 I-m, December 22,1994.
14 Olive, W.W. 1957. Solution-Subsidence Troughs, Castile Formation of Gypsum Plain, Texas 15 and New Mexico. Geological Society of America Bulletin, Vol. 68.
16 Palmer, A.R. 1983. The Decade of North American Geology 1983 Geologic Time Scale. 17 Geology, Vol. 11, pp. 503-504.
18 Piper, A.M. 1973. Subrosion in and about the Four-Township Study Area near Carlsbad, 19 New Mexico. Report to Oak Ridge National Laboratories, Oak Ridge, TN.
20 Piper, A.M. 1974. The Four-Township Study Area near Carlsbad, New Mexico: 21 Vulnerability to Future Subrosion. Report to Oak Ridge National Laboratories, Oak Ridge, 22 TN.
23 Popielak, R.S., Beauheim, R.L., Black, S.A., Coons, W.E., Ellingson, C.T., and Olsen, R.L. 24 1983. Brine Reservoirs in the Castile Formation [Waste Isolation Pilot Plant] Project 25 Southeastern New Mexico. SAND78-1596. Vols, land 2. Sandia National Laboratories, 26 Albuquerque, NM.
27 Powers, D.W. 1995. Tracing Early Breccia Pipe Studies, Waste Isolation Pilot Plant, 28 Southeastern New Mexico: A Study of the Documentation Available and Decision-Making 29 during the Early Years of WIPP. SAND94-0091. Sandia National Laboratories, 30 Albuquerque, New Mexico.
31 Powers, D.W., and Holt, R.M. 1990. Geologic Mapping of the Air Intake Shaft at the Waste 32 Isolation Pilot Plant. DOE/WJPP 90-051. U.S. Department of Energy, Carlsbad, NM.
DRAFT-DOE/CAO-2056 2-177 March 31,1995

Draft 40 CFR 191 Compliance Certification Application
1 Powers, D.W., and Holt, R.M. 1990. "Halite Sequences within the Late Permian Salado 2 Formation in the Vicinity of the Waste Isolation Pilot Plant." In Geological and Hydrological 3 Studies ofEvaporites in the Northern Delaware Basin for the Waste Isolation Pilot Plant 4 (WIPP), New Mexico, D. Powers et al., eds., Field Trip #14. Geological Society of America, 5 Dallas, TX.
6 Powers, D.W., and Holt, R.M. 1993. "The Upper Cenozoic Gatuna Formation of 7 Southeastern New Mexico." In Geology of the Carlsbad Region, New Mexico and West 8 Texas, D.W. Love et al., eds., Forty-Fourth Annual Field Conference, October 6-9,1993, pp. 9 271-282. New Mexico Geological Society, Roswell, NM.
10 Powers, D.W., Lambert, S.J., Shaffer, S-E., Hill, L.R., and Weart, W.D., eds. 1978. 11 Geological Characterization Report for the Waste Isolation Pilot Plant (WIPP) Site, 12 Southeastern New Mexico. SAND78-1596, Vols. I and II. Sandia National Laboratories, 13 Albuquerque, NM. (This document is included as Appendix GCR.)
14 Powers, D.W., and LeMone, D.V. 1987. A Summary ofOchoan Stratigraphy, Western 15 Delaware Basin. Guidebook 18, pp. 63-68. El Paso Geological Society.
16 Powers, D.W., and Martin, M.L. 1993. A Select Bibliography with Abstracts of Reports 17 Related to Waste Isolation Pilot Plant (WIPP) Geotechnical Studies (1972-1990). 18 SAND92-7277. Sandia National Laboratories, Albuquerque, NM.
19 Pratt, H.R., Stephenson, D.E., Zandt, G., Bouchon, M., and Hustrulik, W.A. 1979. 20 Earthquake Damage to Underground Facilities. Proceedings of the 1979 RETC, Vol. 1. 21 Aime, Littleton, CO.
22 Ramey, D.S. 1985. Chemistry of Rustler fluids. EEG-31. Santa Fe, New Mexico: New 23 Mexico Environmental Evaluation Group, Santa Fe, NM.
24 Rawson, D., Boardman, C , and Jaffe-Chazan, N. 1965. The Environment Created by a 25 Nuclear Explosion in Salt. PNE-107F. U.S. Atomic Energy Commission Plowshare 26 Program, Project Gnome, Carlsbad, NM.
27 Register, J.K. 1981. Rubidium-strontium and Related Studies of the Salado Formation, 28 Southeastern New Mexico. SAND81-7072. Sandia National Laboratories, Albuquerque, NM.
29 Register, J.K., and Brookins, D.G. 1980. Rb-Sr Isochron Age ofEvaporite Minerals from the 30 Salado Formation (Late Permian), Southeastern New Mexico. Isochron/West (29), pp. 29-31.
31 Reilinger, R., Brown, L., and Powers, D. 1980. New Evidence for Tectonic Uplift in the 32 Diablo Plateau Region, West Texas. Geophysical Research Letters, Vol. 7, No. 3.
33 Richardson, G.B. 1904. Report of a Reconnaissance of Trans-Pecos, Texas North of the 34 Texas and Pacific Railway. Texas University Bulletin, Vol. 23.
March 31,1995 2-178 DRAFT-DOE/CAO-2056

Draft 40 CFR191 Compliance Certification Application
1 Richey, S.F. 1989. Geologic and Hydrologic Data for the Rustler Formation Near the Waste 2 Isolation Pilot Plant, Southeastern New Mexico. Open-File Report 89-32. U.S. Geological 3 Survey, Albuquerque, NM.
4 Robinson, J.Q., and Powers, D.W. 1987. "A Clastic Deposit within the Lower Castile 5 Formation, Western Delaware Basin, New Mexico." In Geology of the Western Delaware 6 Basin, West Texas and Southeastern New Mexico, D.W. Powers, and W.C. James, eds., El 7 Paso Geological Society Guidebook 18, pp. 66-79. El Paso Geological Society, El Paso, TX.
8 Robinson, T.W., and Lang, W.B. 1938. Geology and Ground-Water Conditions of the Pecos 9 River Valley in the Vicinity ofLaguna Grande de la Sal, New Mexico, with Special Reference
10 to the Salt Content of the River Water. Twelfth and Thirteenth Biennial Reports of the State 11 Engineer of New Mexico for the 23rd, 24th, 25th, and 26th Fiscal Years, July 1,1934 to July 12 30,1938. State Engineer, Santa Fe, NM.
13 Rogers, A.M., and Malkiel, A. 1978. A Study of Earthquakes in the Permian Basin, 14 Texas-New Mexico [Draft]. Open-File Report. U.S. Geological Survey.
15 Rosholt, J.N., and McKinney, C.R. 1980. Uranium Series Disequilibrium Investigations 16 Related to the WIPP Site, New Mexico (USA), Part II. Uranium Trend Dating ofSurficial 17 Deposits and Gypsum Spring Deposit Near WIPP Site, New Mexico. Open-File Report 18 80-879. U.S. Geological Survey, Denver, CO.
19 Salvador, A. 1985. Chronostratigraphic and Geochronometric Scales in Colorado SUNA 20 Stratigraphic Correlation Charts of the United States. American Association of Petroleum 21 Geologists Bulletin, Vol. 69.
22 Sandia National Laboratories. 1992. Preliminary Performance Assessment for the Waste 23 Isolation Pilot Plant, December 1992, Volume 3: Model Parameters. SAND92-0700/3. 24 Sandia National Laboratories, Albuquerque, NM.
25 Sandia National Laboratories and D'Appolonia Consulting Engineers. 1982. Basic Data 26 Report for Drillhole WIPP 12 (Waste Isolation Pilot Plant—WIPP). SAND82-2336. Sandia 27 National Laboratories, WIPP Performance Assessment Division, Albuquerque, NM.
28 Sandia National Laboratories and D'Appolonia Consulting Engineers. 1982. Basic Data 29 Report for Drillhole WIPP 14 (Waste Isolation Pilot Plant—WIPP). SAND82-1783. Sandia 30 National Laboratories, Albuquerque, NM.
31 Sandia National Laboratories and D'Appolonia Consulting Engineers. 1983. Basic Data 32 Report for Drillhole ERDA 10 (Waste Isolation Pilot Plant—WIPP). S AND79-0271. Sandia 33 National Laboratories, Albuquerque, NM.
DRAFT-DOE/CAO-2056 2-179 March 31,1995

Draft 40 CFR191 Compliance Certification Application
1 Sandia National Laboratories and UNM (University of New Mexico). 1981. Basic Data 2 Report for Drillhole WIPP 15 (Waste Isolation Pilot Plant—WIPP). SAND79-0274. Sandia 3 National Laboratories, Albuquerque, NM.
4 Sandia National Laboratories and USGS (U.S. Geological Survey). 1979. Basic Data Report 5 for Drillhole WIPP 13 (Waste Isolation Pilot Plant—WIPP). SAND79-0273. Sandia 6 National Laboratories, Albuquerque, NM.
7 Sandia National Laboratories and USGS (U.S. Geological Survey). 1980. Basic Data Report 8 for Drillhole WIPP 18 (Waste Isolation Pilot Plant—WIPP). SAND79-0275. Sandia 9 National Laboratories, Albuquerque, NM.
10 Sandia National Laboratories and USGS (U.S. Geological Survey). 1980. Basic Data Report 11 for Drillhole WIPP 32 (Waste Isolation Pilot Plant—WIPP). SAND80-1102. Sandia 12 National Laboratories, Albuquerque, NM.
13 Sandia National Laboratories and USGS (U.S. Geological Survey). 1981. Basic Data Report 14 for Drillhole WIPP 33 (Waste Isolation Pilot Plant—WIPP). SAND80-2011. Sandia 15 National Laboratories, Albuquerque, NM.
16 Sandia National Laboratories and USGS (U.S. Geological Survey). 1982. Basic Data Report 17 for Drillhole WIPP 11 (Waste Isolation Pilot Plant—WIPP). SAND79-0272. Sandia 18 National Laboratories, Albuquerque, NM.
19 Saulnier, Jr., G.J., and Avis, J.D. 1988. Interpretation of Hydraulic Tests Conducted in the 20 Waste-Handling Shaft at the Waste Isolation Pilot Plant (WIPP) Site. SAND88-7001. Sandia 21 National Laboratories, Albuquerque, NM.
22 Saulnier, Jr., G.J., Domski, P.S., Palmer, J.B., Roberts, R.M., and Stensrud, W.A. 1991. 23 WIPP Salado Hydrology Program Data Report #1. SAND90-7000. Sandia National 24 Laboratories, Albuquerque, NM.
25 Schaller, W.T., and Henderson, E.P. 1932. Mineralogy of Drill Cores from the Potash Field 26 of New Mexico and Texas. U.S. Geological Survey Bulletin, Vol. 833.
27 Schermer, S.C. 1980. A Report on the Archaeological Site Locations in the WIPP Core Area 28 with Mitigation Recommendations for Bechtel National, Inc. Report 80-176. Agency for 29 Conservation Archaeology, Eastern New Mexico University, Portales, NM.
30 Schiel, K.A. 1988. The Dewey Lake Formation: End Stage Deposit of a Peripheral Foreland 31 Basin [M.S. thesis]. University of Texas at El Paso, El Paso, TX.
32 Schiel, K.A. 1994. A New Look at the Age, Depositional Environment and Paleogeographic 33 Setting of the Dewey Lake Formation (Late Permian). West Texas Geological Society 34 Bulletin, Vol. 33, No. 9, pp. 5-13.
March 31,1995 2-180 DRAFT-DOE/CAO-2056

Draft 40 CFR191 Compliance Certification Application
1 Sewards, T., Glenn, R., and Keil, K. 1991. Mineralogy of the Rustler Formation in the 2 WIPP-19Core. SAND97-7036. Sandia National Laboratories, Albuquerque, NM.
3 Shumard, G.G. 1858. "Observations on the Geological Formation of the Country between 4 the Rio Pecos and the Rio Grande, in New Mexico, Near the Line of the 32nd Parallel, Being 5 an Abstract of Portion of the Geological Report of the Expedition Under Capt. John Pope, 6 Corps of Topographical Engineers, U.S. Army, in the Year 1855." In St. Louis Academy of 7 Sciences Transactions, Vol. 1.
8 Siegel, M.D., Lambert, S.J., and Robinson, K.L. eds. 1991. Hydrogeochemical Studies of the 9 Rustler Formation and Related Rocks in the Waste Isolation Pilot Plant Area, Southeastern
10 New Mexico. SAND88-0196. Sandia National Laboratories, Albuquerque, NM.
11 Siemers, W.T., Hawley, J.W., Rautman, C , and Austin, G. 1978. Evaluation of the Mineral 12 Potential (Excluding Hydrocarbons, Potash, and Water) of the Waste Isolation Pilot Plant 13 Site, Eddy County, New Mexico. Open-File Report 87. New Mexico Bureau of Mines and 14 Mineral Resources, Socorro, NM.
15 Snider, H.I. 1966. Stratigraphy and Associated Tectonics of the Upper Permian Castile-Id Salado-Rustler Evaporite Complex, Delaware Basin, West Texas and Southeast New Mexico 17 [Ph.D. dissertation]. University of New Mexico, Albuquerque.
18 Snyder, R.P. 1985. Dissolution of Halite and Gypsum, and Hydration of Anhydrite to 19 Gypsum, Rustler Formation, in the Vicinity of the Waste Isolation Pilot Plant, Southeastern 20 New Mexico. Open-File Report 85-229. U.S. Geological Survey, Denver, CO.
21 Snyder, R.P., and Gard, Jr., L.M. 1982. Evaluation of Breccia Pipes in Southeastern New 22 Mexico and Their Relation to the Waste Isolation Pilot Plant (WIPP) Site, with Section on 23 Drill-Stem Tests. Open-File Report 82-968. U.S. Geological Survey, Denver, CO.
24 Stensrud, W.A., Dale, T.F., Domski, P.S., Palmer, J.B., Roberts, R. M., Fort, M.D., and 25 Saulnier, Jr., G.J. 1992. Waste Isolation Pilot Plant Salado Hydrology Program Data Report 26 #2. SAND92-7072. Sandia National Laboratories, Albuquerque, NM.
27 Swift, P.N. 1992. Long-Term Climate Variability at the Waste Isolation Pilot Plant, 28 Southeastern New Mexico, USA. SAND91-7055. Sandia National Laboratories, 29 Albuquerque, NM.
30 U.S. Congress. 1992. Waste Isolation Pilot Plant Land Withdrawal Act. Public Law 102-31 579, October 1992. 102nd Congress, Washington, D.C.
32 U.S. Department of Commerce. 1980. Census of Population, General Population 33 Characteristics of New Mexico. Bureau of the Census.
DRAFT-DOE/CAO-2056 2-181 March 31, 1995

Draft 40 CFR 191 Compliance Certification Application
1 U.S. Department of Commerce. 1990. Census of Population, General Population 2 Characteristics of New Mexico. Bureau of the Census.
3 UNM (University of New Mexico). 1984. A Handbook of Rare and Endemic Plants of New 4 Mexico. New Mexico Native Plants Protection Advisory Committee, eds. University of New 5 Mexico Press, Albuquerque, NM.
6 Urry, W.E. 1936. Post-Keweenawan Timescale. Exhibit 2, pp. 35-^40. National Research 7 Council, Report Committee on Measurement of Geologic Time 1935-36.
8 USBM (U.S. Bureau of Mines). 1977. Valuation of Potash Occurrences within the [WIPP] 9 Site in Southeastern New Mexico. Prepared for the U.S. Energy Research and Development
10 Administration.
11 Vine, J.D. 1963. Surface Geology of the Nash Draw Quadrangle, Eddy County, New 12 Mexico. U.S. Geological Survey Bulletin, 1141-B.
13 Westinghouse Electric Corporation. 1990. Waste Isolation Pilot Plant No-Migration 14 Variance Petition. DOEAVIPP 89-003. Westinghouse Electric Corporation, Waste Isolation 15 Division, Carlsbad, NM.
16 Westinghouse Electric Corporation. 1990. WIPP Final Safety Analysis Report. WP02-9, 17 Rev. 0. Westinghouse Electric Corporation, Waste Isolation Division, Carlsbad, NM.
18 Westinghouse Electric Corporation. 1991. Waste Isolation Pilot Plant Groundwater 19 Monitoring Program Plan and Procedures Manual. WP02-1. Westinghouse Electric 20 Corporation, Waste Isolation Division, Carlsbad, NM.
21 Westinghouse Electric Corporation. 1992. Waste Isolation Pilot Plant Site Environmental 22 Report for Calendar Year 1991. DOEAVIPP 92-007. Westinghouse Electric Corporation, 23 Waste Isolation Division, Carlsbad, NM.
24 Wolfe, H.G., et al., eds. 1977. An Environmental Baseline Study of the Los Medanos Waste 25 Isolation Pilot Plant (WIPP) Project Area of New Mexico: A Progress Report. 26 SAND77-7017. Sandia National Laboratories, Albuquerque, NM.
27 Wood, B.J., Snow, R.E., Cosier, D.J., and Haji-Djafari, S. 1982. Delaware Mountain Group 28 (DMG) Hydrology—Salt Removal Potential, Waste Isolation Pilot Plant (WIPP) Project, 29 Southeastern New Mexico. TME3166. U.S. Department of Energy, Albuquerque, NM.
March 31,1995 2-182 DRAFT-DOE/CAO-2056

1 3.0 FACILITY DESCRIPTION
2 Chapter 3 provides technical information about those systems at the Waste Isolation Pilot 3 Plant (WIPP) facility that are important in meeting the disposal standards at Title 40 Code of 4 Federal Regulations (CFR) Part 191. Descriptions relevant to long-term containment are 5 provided for surface structures, shafts, underground waste disposal and support facilities, and 6 engineered barriers (such as seals).
7 The WIPP facility is a transuranic (TRU) radioactive waste management facility owned and 8 operated by the U.S. Department of Energy (DOE). The Westinghouse Electric Corporation 9 Waste Isolation Division (WID) is the managing and operating (M&O) contractor. The WIPP
10 facility consists of the 16-square-mile (41.4-square-kilometer) area placed under the 11 jurisdiction of the DOE by the Waste Isolation Pilot Plant Land Withdrawal Act (LWA) (U.S. 12 Congress 1992). The facility has been divided into four functional areas: (1) the property 13 protection area which is surrounded by a chain-link security fence that encloses 35 acres 14 (0.14 square kilometers) and provides security and protection for all major surface structures; 15 (2) Zone n, which represents the maximum extent of allowed underground development; 16 (3) the exclusion zone, which encompasses approximately 1,450 acres (5.9 square kilometers) 17 and defines the area within which no prohibited articles (e.g., firearms) are allowed; and 18 (4) the WIPP site boundary, which is defined on the surface by a 16-section (41.4-square-19 kilometer) federal land area under the jurisdiction of the DOE.
20 The DOE may only emplace those radioactive wastes in the WIPP that meet both the 21 definition of TRU, as defined in the WIPP LWA, and which can be certified to the project's 22 waste acceptance criteria (WAC) (details are in Chapter 4.0). As defined in the LWA, TRU 23 waste means waste containing more than 100 nanocuries of alpha-emitting TRU isotopes per 24 gram of waste with half-lives greater than 20 years. Generally, these wastes fall into two 25 categories: contact-handled (CH) TRU waste, which has a surface dose rate of less than 200 26 millirem per hour, and remote-handled (RH) TRU waste, which has a surface dose rate of 200 27 millirem per hour or greater. In accordance with the LWA, no RH TRU waste received at 28 WIPP may have a surface dose rate in excess of 1,000 rem per hour, and no more than 5 29 percent by volume of the RH TRU may have a surface dose rate in excess of 100 rem per hour 30 (U.S. Congress 1992).
31 The waste disposal area of the WIPP facility consists of eight panels, each of which contains 32 seven rooms (Figure 3-1). At present, a 25-year operating time period is estimated to mine 33 and fill all eight panels, the four access drifts, and the crosscuts in the WIPP repository. At 34 the end of the 25-year period, it is currently estimated that up to 10 years will be required for 35 decontamination and decommissioning and closure activities (see Appendix D&D).
36 The WIPP facility is designed to receive up to 6.2 million cubic feet (175,600 cubic meters) of 37 CH TRU waste and 250,000 cubic feet (7,080 cubic meters) of RH TRU waste. However, the 38 actual amount of waste to be received at WIPP is governed by the LWA, which sets the total 39 volume for CH and RH TRU waste combined at a maximum of 6.2 million cubic feet 40 (175,600 cubic meters). The LWA restricted RH TRU waste to a maximum activity of 23 41 curies per liter and not to exceed a total of 5.1 million curies (U.S. Congress 1992).
DRAFT-DOE/CAO-2056 March 31,1995

Draft 40 CFR191 Compliance Certification Application
1
2
3
4
5
6
7
8
9
10
11
12
13
14 15
16 17
18 19
Table 3-1 delineates pertinent site features of the WIPP facility.
Table 3-1. WIPP Site Features
Facility name Waste Isolation Pilot Plant
EPA ID No. NM 4890139088
Location 26 miles east of Carlsbad, New Mexico
County Eddy
Section 15-22 and 27-34
Township 22S
Range 3 IE
Site area 10,240 acres (41.4 square kilometers)
Facility area 35 acres (0.14 square kilometers)
Depth 2,150 feet (655 meters)
Expected operational life of facility 25 years
Expected closure time (including decontamination and decommissioning)
10 years
Maximum amount of CH TRU waste designed to receive over life of facility
6.2 million cubic feet (175,600 cubic meters)
Maximum amount of RH TRU waste designed to receive over life of facility
250,000 cubic feet (7,080 cubic meters)
20
22 23 24 25 26 27
28 29 30
3.1 General Facility Design
21 The DOE has designed the WIPP facility to accomplish three primary goals:
2. 3.
To receive, handle, and dispose of TRU waste and TRU mixed waste (in this document, the term "TRU waste" is used to describe both TRU and TRU mixed waste unless otherwise noted) To protect the health and safety of workers, the public, and the environment To comply with applicable radiation protection standards, environmental regulations, and requirements of federal, state, and local agencies (as discussed in Appendix BECR).
The surface facilities at the WIPP accommodate the personnel, equipment, and support services required for the receipt, preparation, and transfer of TRU waste from the surface to the underground. The surface structures are located within a perimeter security fence. Access
March 31,1995 3-2 DRAFT-DOE/CAO-2056

Draft 40 CFR 191 Compliance Certification Application
n _ n _ n lU L n
Air Intake Shaft
-Current Excavation
•Planned Excavation
Repository Depth: 2150 feet
Airlock
Panel Closure System \ •& o & <
I cfsCt^-—^-~•$*—"i I" II II II n — rr—ir-^^-Ml ip—~l I ir _ , _ II II II II II II I
Panel 8 n n i ii n I I n II I I i
Disposal Area
Ir- -ii II ii n — IT —i iV*^U •> j j j —
_. , . , i I I n n i Panel 7 H n u i
I I n H n I I H i IL 11 II II LI _ U. _ J V\ /i J I 'I—
CcaD-
Ct=0
Panel 1
M!o»<fr-- - - I I—I?- -n i I I II II II II n i n n II n n n Panel 2
,i ;i n I I I I I I n n I
II II ~t i n — r r —i J****V -j I it— II || || i 1 " "
Panel 6 " " » " " " '! II !! n I I I I n | l II II II U _ L L _ I '/V-»*l "" ' '
II II i fy-^i Jl !L_ I I — i i I I — I I — -n - r r —1i*-*™*̂ -i • . •—
ft. _H_ _R_ JL=aD 1 _ •v^-^Vir— Ti — rt II II II 1 I
Panel 5 I I n II n I I n n II n n II H [ L . - I I II I t .
I II I I II I
.1 II I .-iL-̂ L-dc=<C
II II II II JLJI I
l, i ' " "
-=, 0=0—-J^^-^ J--tzd'^-±i
l I I I I H I I il I I 'I ii I I Panel 3
|i I I I I I I
i 1 i ,i
1J0=O'
I .1 .. JI U
i — n II—II ir-nl I II II II II II I II II II II II
II II II II II Panel 4
100 200
This Illustration for Information Puiposes Only (meters)
Figure 3-1. Plan View of WIPP Underground Facility and Panel Closure Systems
DRAFT-DOE/CAO-2056 3-3 March 31, 1995

Draft 40 CFR 191 Compliance Certiflcation Application
TfflS PAGE INTENTIONALLY LEFT BLANK
March 31, 1995 3-4 DRAFT-DOE/CAO-2056

Draft 40 CFR191 Compliance Certification Application
1 is controlled by security officers 24 hours a day. Four vertical shafts connect the surface 2 facilities to the underground. The underground facilities include the waste disposal area, the 3 shaft pillar area, and associated support facilities. Figure 3-2 provides a spatial view of the 4 WIPP facility.
5 3.1.1 DOE Facility Acquisition Process
6 Federal facility acquisition policies were applied to the design and construction of the WIPP 7 facility, in accordance with DOE Order 4700.1, Project Management System. In addition, 8 WIPP structures were designed to meet DOE design and quality assurance (QA) requirements 9 specified in DOE Order 6430.1, General Design Criteria. Each WIPP facility item was
10 evaluated against the Design Classification System Criteria (see DOE 1990, § 3.0, table 11 3.1.8). Application of these criteria identified no Design Class I items at the WIPP facility. 12 The WIPP Waste Handling Building (WHB) was designed to meet the requirements 13 applicable to Design Class II structures, systems, and components for non-reactor nuclear 14 facilities. The underground area is classified as a Design Class TTTft non-reactor nuclear 15 facility. The design class designations are defined for categorizing structures, systems, and 16 components in accordance with the importance of their function relative to health and safety 17 of the public and on-site personnel during plant operations.
18 3.1.2 Configuration Control
19 The DOE mandates that the configuration control of the WIPP facility is accomplished 20 through written procedures and policies as set forth in DOE Order 4700.1, Project 21 Management Program. For example, the WIPP System Design Descriptions (SDDs) provide 22 a framework for the configuration control. Any changes to the facility, and subsequently 23 configuration documentation (SDDs, as-built drawings, specifications, etc.), must be reviewed 24 and approved by cognizant personnel. These documented reviews are performed to determine 25 if the change will affect the ability of the facility to comply with applicable environmental, 26 safety, and health requirements. The DOE must approve proposed changes that could affect 27 the Final Safety Analysis Report (FSAR), and may elect to conduct an independent review of 28 analyses supporting the change. QA requirements applicable to WIPP facility design and 29 configuration control activities are founded on the basic and supplemental requirements of the 30 American Society of Mechanical Engineers' Quality Assurance Program Requirements for 31 Nuclear Facilities (ASME NQA-1). The DOE implements these requirements through the 32 Carlsbad Area Office's (CAO) Quality Assurance Program Description, which is provided in 33 Appendix QAPD. Design QA elements include: (1) documentation, review, and approval of 34 design inputs, (2) control of design analyses, design verification, and design changes, and 35 (3) institution of design interface controls and records management practices.
36 3.1.3 Surface Structures
37 WIPP surface structures accommodate the personnel, equipment, and support services 38 required for the receipt, preparation, and transfer of waste from the surface to the underground
DRAFT-DOE/CAO-2056 3-5 March 31,1995

Draft 40 CFR191 Compliance Certification Application
1 areas. The surface facilities are located in an area of approximately 35 acres (141,645 square 2 meters) within the perimeter fence. The principal surface structure is the WHB; other surface 3 structures include the following:
4 5 6 7 8 9
10 11 12 13
14
15 16 17 18 19 20
21 22 23 24 25 26 27 28 29
30 31 32 33 34
Hoist Houses Support Building Guard and Security Building Water Pump House TRUPACT Maintenance Building Training Building
Office Trailers Exhaust Filter Building Warehouse and Shops Engineering Building Core Storage Building Safety and Emergency Services Building
In addition to these structures, the DOE has employed a system of berms and ditches to divert storm-water runoff away from the surface facilities. The WIPP facility drainage system is designed so that storm runoff due to the probable maximum precipitation event will not flood the WIPP facility.
3.2 Repository Configuration
The WIPP underground facilities are located on the repository horizon 2,150 feet (655 meters) beneath the surface (Figure 3-1). These facilities include the waste disposal area, the mining area, an experimental area, the shaft pillar area, interconnecting drifts, and associated support facilities. The underground support facilities service and maintain all underground equipment for mining and disposal operations, monitor for radioactive contamination, and allow limited decontamination of personnel and equipment.
There will be eight waste panels with each waste panel consisting of seven rooms. Each room will have nominal dimensions of 300 feet (91 meters) long, 33 feet (10.1 meters) wide, and 13 feet (4.0 meters) high. Pillars between rooms are 100 feet (30 meters) thick. The eight waste panels will be separated from each other and the main entries by nominally 200-foot (61-meter) pillars. Rockbolts, or related types of ground support, are used as necessary. In the panels, this will typically consist of localized bolting on an as-needed basis. The storage rooms and panels will be excavated in stages coordinated with scheduled arrival of waste. The rooms, as well as the drifts and crosscuts in the waste disposal area, are designed for waste disposal.
The underground is connected to the surface by four vertical shafts: the Waste Shaft, the Salt Handling Shaft (SHS), the Exhaust Shaft, and the Air Intake Shaft. The Waste Shaft, SHS, and Air Intake Shaft have permanently installed hoists capable of moving personnel, equipment, and materials between the surface and the repository. All shafts will eventually be sealed using the seal design as described in Section 3.3.2.
March 31,1995 3-6 DRAFT-DOE/CAO-2056

Draft 40 CFR 191 Compliance Certification Application
This Illustration for Information Purposes Only
Figure 3-2. Spatial View of the WEPP Facility
DRAFT-DOE/CAO-2056 3-7 March 31,1995
,.'•!";''.'.' ^A'.vf"^^:; • - i :Tr , w Tj&^y-' . ' - •">•"^-"•" : , ' , i r ' j ' : ''v^*??
Draft 40 CFR 191 Compliance Certification Application
l TfflS PAGE INTENTIONALLY LEFT BLANK
March 31, 1995 3-8 DRAFT-DOE/CAO-2056

Draft 40 CFR191 Compliance Certification Application
1 3.3 Engineered Barriers
2 The DOE's design of the WIPP disposal system includes engineered barriers to significantly 3 delay the migration of waste and waste constituents to the accessible environment. The DOE 4 will rely on seals in shafts to prevent migration through the excavated openings of the 5 repository. If DOE assessments of compliance with regulatory requirements indicate that 6 additional barriers are needed to reduce potential transport of radionuclides or hazardous 7 constituents, modifications can be made to the form of the waste, or to the design of the waste 8 emplacement areas that will enhance long-term performance of the WIPP disposal system.
9 The DOE recognizes that the currently proposed 40 CFR Part 194 requires a study of 10 engineered barrier alternatives and their benefits and costs. As such, the DOE is currently 11 conducting an Engineered Alternatives Cost and Benefit Study which will evaluate the 12 advantages and costs of various engineered alternatives. The results of this study will be 13 provided to the EPA when complete.
14 3.3.1 Seals and Plugs
15 Sealing and plugging of boreholes and closure of underground mined openings are considered 16 an issue under the engineered barriers concept for limiting the entry of water into the site and 17 potential escape of contaminants beyond regulated levels at the site, as required by 18 40 CFR Part 191. The following sections address these issues.
19 3.3.1.1 Disturbed Rock Zone
>0 A key to understanding the discussions about the WIPP facility sealing systems is a >1 knowledge of the disturbed rock zone (DRZ) and its implications for the sealing of a drift or >2 shaft. A DRZ exists around the mine openings where the Salado Formation (hereafter >3 referred to as the Salado) properties have been altered from the undisturbed values. This DRZ >4 generally forms within the first few meters of the repository. Within the DRZ, intrinsic 15 permeability and porosity are increased due to fracturing caused by the excavation of rock to 16 form the repository. Excavation-related stress redistribution may cause variations in the 17 nearfield fluid pressure distribution. Within the DRZ, the dilation, drying, and dissolution of 18 dissolved gas that occurs naturally in Salado brines may cause varying degrees of brine flow. 19 Increased permeability, decreased pore-fluid pressure, and partially saturated conditions 50 within the DRZ all contribute to enhancing potential gas flow pathways between the waste 51 disposal rooms and nearby interbed units. According to Lappin et al. (1989), the DRZ is 52 expected to undergo time-dependent changes in properties, with disturbed halite eventually 53 healing to a final state nearly equivalent to undisturbed halite.
54 The DOE has characterized the DRZ by three approaches: visual observation, geophysical 55 methods, and in situ hydrologic testing. Visual observations in boreholes and underground 56 excavations indicate that fractures are common in the host rock immediately surrounding the 57 underground WIPP facility. Fracturing occurs at many scales. Geophysical studies conducted 58 by the DOE have utilized seismic refraction, seismic tomography, surface wave analysis,
DRAFT-DOE/CAO-2056 3-9 March 31,1995

Draft 40 CFR191 Compliance Certification Application
1 electromagnetic (EM) methods, and direct current (DC) methods. In conjunction with the in 2 situ hydrologic tests, these studies define a DRZ extending to a depth of 3-16 feet (1-5 3 meters) throughout the underground facility. The DC and EM methods indicate that fracture 4 saturation and fracture density vary laterally along the excavations. These in situ studies also 5 demonstrate that microfracturing and desaturation of the pore space have occurred within the 6 DRZ. The dilation that results from the microfracturing in the DRZ is one component of the 7 observed closure. The processes involved in the development of the DRZ are complex, 8 although basically related to stress relief and rapid strain rates. The redistribution of stress 9 around the excavation, along with the development of the DRZ, drives coupled processes such
10 as changes in permeability and porosity in response to fracture growth. In fact, input for a 11 conceptual model of the repository zone requires the quantitative distributions for the 12 porosity, permeability, and initial saturation of the DRZ. At the present time, the fluid flow 13 characteristics of the DRZ have not been described by an experimentally derived conceptual 14 model. While work is in progress on more complex models, work thus far on the DRZ has 15 been limited to constitutive modeling of the structural deformation processes.
16 In summary, the fundamental understanding of the creep process, together with a capable 17 predictive technology, is well developed. This predictive technology is important because 18 continuum creep ultimately determines the time required for closure of the rooms and the 19 eventual encapsulation of the waste, as well as being the force that causes recompaction. 20 Predictive capability facilitates understanding the long-term response of rooms and sealing 21 systems, especially where the DRZ has the potential to form a high-permeability path.
22 3.3.2 Shaft Seals
23 The system for sealing the shafts is designed to prevent water from entering the repository and 24 to prevent gases or liquids from migrating out of the repository. The design has evolved as 25 the DOE has gained experience with sealing openings in WIPP salt. The DOE has been able 26 to add details to the basic design strategy that was developed for the WIPP a decade ago. 27 With its reference seal design, the DOE provides a basis for calculations and analyses so that 28 common input parameters are used for performance calculations. In this section the DOE 29 describes the most current version of the reference seal system. The DOE describes the 30 individual components of the seal system for a representative WIPP shaft and the performance 31 functions assigned to each of the components are identified. The sealing system for a 32 representative WIPP shaft is shown in Figure 3-3.
33 3.3.2.1 Near-Surface Subsystems
34 The near-surface subsystems include the components in the Rustler Formation (hereafter 35 referred to as the Rustler) to separate water-bearing units as shown in Figure 3-4A. Because 36 significant inflows were not seen in the Dewey Lake Redbeds during shaft construction, the 37 near-surface subsystem is not currently required to retard groundwater movement. Its 38 principal function is to prevent subsidence at and around the shafts. There are no limits 39 placed on the effective life of this subsystem. The near-surface subsystem materials include 40 concrete and the existing shaft liner, which is to be filled with earth. The existing shaft collar
March 31,1995 3-10 DRAFT-DOE/CAO-2056

Draft 40 CFR 191 Compliance Certification Application
De a- 1
i i
i i
1
i i
i i
1
i i
i ' i
1
i i
i i
1
i i
i i
1
Stratigraphy
Ground Level 0.0 ft.
500 f t
1000 ft.
Vaca Trista
MB
1500 ft.
2000 ft. MB 134-MB 136-
„ , MB 138-Clay Seam I Anhydrite a-Anhydrite b?
MB 139
MB 103 v y y ^
UP* WW: • i ? V i *tf«!
Surface Deposits Mescalero Caliche Gatuna Formation
Santa Rosa Formation Dewey Lake Redbeds
Upper Member
McNutt Member
Lower Member
2500 ft.
Salado Formation
Seal Arrangement
Existing Shaft
Collar
Earthen -Fill
~P^
Freshwater • Concrete
X
Existing Key >• Bentonite •
Upper Long —> Term Component
(Salt Column > 85% Fractional Density )
Middle Long — • Term Component
( Salt Column > 85% Fractional Density)
Lower Long — Term Component
(Salt Column > 85% Shaft Fractional Density)
Middle Short Term Component
J}
Stations
Sump » >
Lower Short Term Component
Shaft Station Concrete Monolith
Near-Surface Subsystem
Rustler Formation
Subsystem
Salado Formation Subsystem
r~^\ Mudstone = — > andSiltstone
f X ^ j Anhydrite
! • ' • ' • I Dolomite
! • ' . • • I Salado Formation I S / V I Earthen Fill
WSm HaliticSiltstone
j — T | Freshwater n r T i ! Concrete
p m r a Salt Saturated '~ "" I Concrete
Horizontal Scale: None
This Illustration for Information Purposes Only
Figure 3-3. Typical Shaft Seal System
DRAFT-DOE/CAO-2056 3-11 March 31, 1995
Draft 40 CFR 191 Compliance Certification Application
l TfflS PAGE INTENTIONALLY LEFT BLANK
March 31, 1995 3-12 DRAFT-DOE/CAO-2056
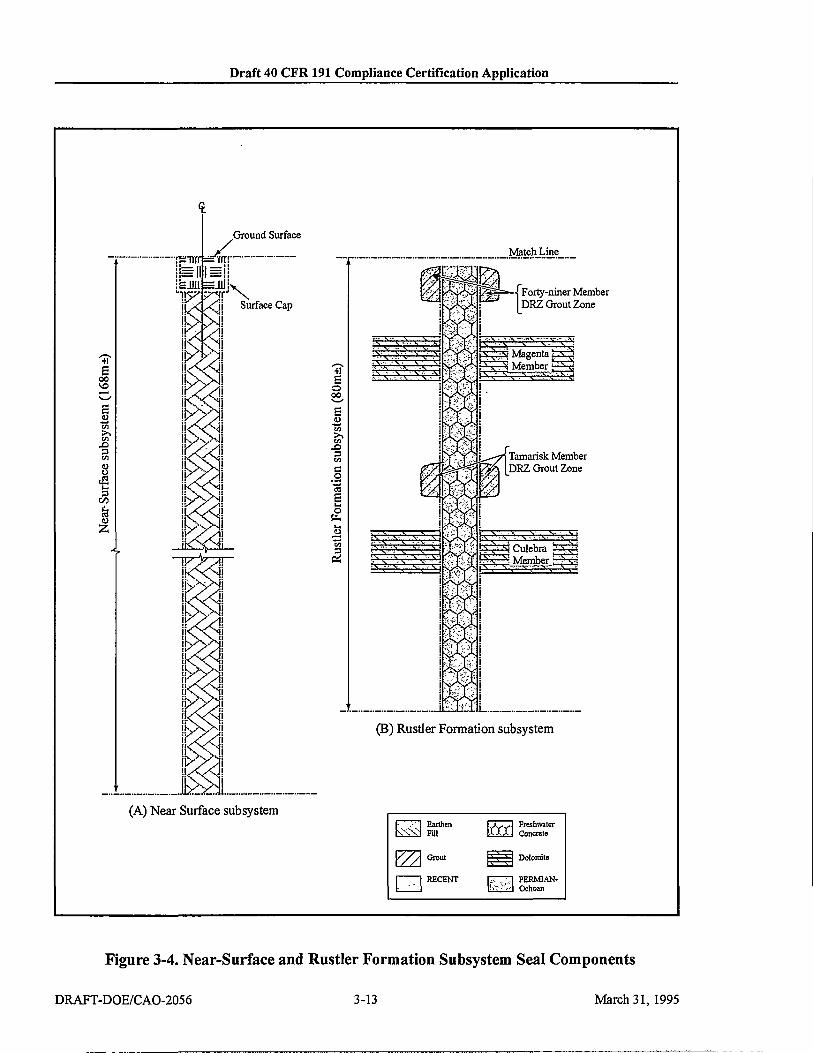
Draft 40 CFR 191 Compliance Certification Application
.Ground Surface Match Line
Forty-niner Member DRZ Grout Zone
(B) Rustler Formation subsystem
(A) Near Surface subsystem s\\N Earthen
Fill &x Freshwater Concrete
V/ Grout =^= Dolomite V/ Grout Dolomite
: • • •
RECENT m PERMIAN-Ochoan
Figure 3-4. Near-Surface and Rustler Formation Subsystem Seal Components
DRAFT-DOE/CAO-2056 3-13 March 31,1995
Draft 40 CFR 191 Compliance CertiJScation Application
THIS PAGE INTENTIONALLY LEFT BLANK
March 31, 1995 3-14 DRAFT-DOE/CAO-2056

Draft 40 CFR191 Compliance Certification Application
1 and shaft liner will likely be retained to minimize the disturbance to the near-surface area. 2 The concrete plug (a monolith that fills the cross-section of the shaft collar) will deter entry 3 into the shaft, and the earthen fill material will be compacted during placement to minimize 4 the potential for subsidence.
5 The principal function of the Rustler seal subsystem (Figure 3-4B) is to assure compliance 6 with the state of New Mexico's groundwater protection requirements. Within the site 7 boundary, the total dissolved solids concentration in the Magenta range from approximately 8 4,000 to 25,000 milligrams per liter; the Culebra groundwaters range from approximately 9 10,000 to greater than 200,000 milligrams per liter; and the Rustler-Salado contact zone
10 groundwaters are approximately 300,000 to 400,000 milligrams per liter. The State of New 11 Mexico regulations require protection of groundwaters that have existing concentrations 12 below 10,000 milligrams per liter total dissolved solids. The DOE satisfies the groundwater 13 protection requirement by casting concrete of lower permeability than the surrounding rock 14 through the entire length (262 feet [80 meters]) shown in Figure 3-4B and by grouting.
15 3.3.2.2 Salado Formation Subsystems
16 The Salado subsystems, shown in Figures 3-5 A and 3-5B, extend from a point just above the 17 top of the Salado to the terminus of each shaft. The air intake shaft and the exhaust shaft 18 terminate at the floors of the drifts intersecting these shafts; the salt-handling shaft and the 19 waste shaft terminate in sumps that extend 112 and 125 feet (34 and 38 meters), respectively, 20 below the floors.
21 The repository is required to meet the standards set forth in 40 CFR Part 191 for undisturbed 22 performance. In the performance assessment calculations, the DOE considers two 23 containment flow paths in the evaluation of the WIPP's undisturbed performance. In the first 24 path, brine or gas may migrate through drifts or the DRZ to the shafts and then upward to the 25 compliance boundary. Transport to the boundary may occur laterally in the Culebra or may go 26 directly to the surface. In the second path, migration may occur laterally toward the 27 subsurface boundary within the anhydrite interbeds of the Salado. The principal function of 28 the Salado subsystem is to provide a barrier to the transport of contaminants from the 29 repository vertically to the compliance boundary.
30 Upper Short-Term Seal. The upper short-term components (shown in Figure 3-5A) are 31 designed to limit the flow of groundwater into the upper salt column. It is believed that within 32 100 years, the crushed salt in the middle salt column will consolidate to nearly the same 33 permeability exhibited by the host rock salt. If the middle salt column becomes saturated, 34 reconsolidation of the crushed salt will be inhibited. For design considerations to date, the 35 design life of the upper short-term components is nominally 100 years.
36 The upper short-term seal comprises eight elements:
37 • Existing key 38 • Upper salt-saturated concrete element
DRAFT-DOE/CAO-2056 3-15 March 31,1995

Draft 40 CFR 191 Compliance Certification Application
1 • Rustler-Salado grout zone 2 • New upper seal ring—either bentonite or chemical 3 • Middle salt-saturated concrete element 4 • New chemical seal ring 5 • Bentonite layer 6 • Lower salt-saturated concrete element.
7 A formal report of the seal design, which includes deliberations leading to the proposed 8 design, is forthcoming from the DOE. The DOE will summarize specifics about each 9 component and other considerations in that report. In addition, a report summarizing
10 materials selection and performance expectations will be prepared by the DOE in support of 11 the proposed seal design. As can be witnessed in seal subsystems, the proposed design 12 includes redundancy in number and use of different component materials. The DOE considers 13 the design to be defensible in today's environment.
14 Upper Salt Column. The upper salt column shown in Figures 3-3,3-4A, and 3-4B does not 15 have any compliance-related requirements. It is referred to as a long-term component because 16 of expected compatibility of emplaced salt with existing salt. The DOE expects creep closure 17 of the shaft to consolidate the emplaced salt (with an initial density being 80 percent of intact 18 WIPP host rock salt) into a material with a permeability approaching that of intact WIPP salt.
19 Middle Short-Term Component The middle short-term component (shown in Figure 3-5B) 20 is designed to limit flow of groundwater. Within 100 years, salt emplaced in the middle salt 21 column is expected to consolidate to nearly the same permeability exhibited by the intact host 22 rock salt. If the middle salt column were to become saturated, reconsolidation of the 23 emplaced salt would be inhibited. Current design life of the middle short-term component is, 24 therefore, nominally 100 years.
25 Two components comprise the middle short-term seal: grout in the DRZ at the Vaca Triste 26 Sandstone and a salt-saturated concrete monolith. Because the concrete component is located 27 approximately 126 feet (412 meters) below the surface, the DOE predicts that creep closure of 28 the Salado will create a seal between this component and the shaft wall rapidly after 29 installation. Creep closure is also expected to heal the DRZ in the halite surrounding the rigid 30 concrete component.
31 Middle Salt Column. The middle salt column (Figures 3-3,3-5B, and 3-5C) is the sole long-32 term barrier in the seal system. The DOE expects it to be fully effective 100 years after 33 emplacement. Creep closure of the shaft is expected to consolidate the high-density salt seal 34 material (with an initial density being greater than 85 percent of intact WIPP host rock salt) 35 into a material whose permeability is essentially equivalent to that of intact WTPP host rock 36 salt. The current design proposes to compact crushed salt dynamically for this seal 37 component. Other salt placement possibilities to achieve high initial density are considered as 38 alternatives, such as stacking quarried salt blocks in the shaft. The engineered column of salt 39 would fill the shaft cross-section for approximately 590 feet (180 meters). In the performance
March 31,1995 3-16 DRAFT-DOE/CAO-2056

Draft 40 CFR 191 Compliance Certification Application
Existing Chemical Seal Rings
Bottom of Key
New Chemical, Seal Ring
S-^JIft ^ Upper Salt Saturated ~ ' ' ' ' I Concrete Element
-Existing Shaft Lines .Rustler/Salado Grout Zone. Existing shaft lines will be removed in Grout Zone
K \ Rustler/Salado
£ i lUJ = = : 7 ^ Mil
lilll '<t,-..
m
New Chemical Seal Ring or Bentonite
Interface
Middle Salt Saturated Concrete Element
Bentonite
'$}}& - ^ Lower Salt-Saturated Concrete Element
fox*xx*>!
Upper Long Term - A n / Component (Salt Column ~''" y^^ a 80% Fractional Density)
J® X?ff<3MB103"^-
(A) Upper short-term components
Upper Long Term Component (Salt Column & 80% Fractional Density)
•VACATrlster-e-
DRZ Grout Zone Salt-Saturated Concrete Element
Middle Long Term Component (Salt Column a 85% Fractional Density)
(B) Middle short-term components
This Illustration for Infomution Puiposes Only
Figure 3-5. Salado Formation Upper and Middle Short-Term Seal Components
DRAFT-DOE/CAO-2056 3-17 March 31,1995

Draft 40 CFR 191 Compliance Certification Application
l TfflS PAGE INTENTIONALLY LEFT BLANK
March 31, 1995 3-18 DRAFT-DOE/CAO-2056

Draft 40 CFR 191 Compliance Certification Application
fr
CO CO • I 2 W
.2 .9 Q. Q-E E
CO CO
Middle Long Term ' Component (Salt Column & 85% Fractional Density)
——••;ff . ^ Lower Shaft Short-Term Component: rrr?l> Salt-Saturated
Concrete Column Lower Long Term
- Component (Salt Column a 85% Fractional Density)
(C) Lower short-term components
MB138
Clay Seam I fcl'-asU"' Anhydrite a
Salt Backfill < AnKv'dn'te'b
7<* ^ ' . ' f . " . » i " ' .w . " j » A Lower Long Term Component (Salt Column 2 85% Fractional Density)
=* =* Salt Backfill 1 , w ,i
^iiii;sig ajs=gr-^.,_. \ , L^^yy^vvyy
faMrfiilfefl lHt ZS2S5^|^S22S2^
. Salt-Saturated Concrete
=s (D) Shaft station concrete monolith
This Illustration for Information Purposes Only
Figure 3-5. Salado Formation Subsystem (continued)
DRAFT-DOE/CAO-2056 3-19 March 31,1995

Draft 40 CFR 191 Compliance Certification Application
TfflS PAGE INTENTIONALLY LEFT BLANK
March 31, 1995 3-20 DRAFT-DOE/CAO-2056

Draft 40 CFR191 Compliance Certification Application
1 assessment, the height that the DOE assumes for this barrier ranges from 98 to 328 feet (30 to 2 100 meters), with a median value of 213 feet (65 meters). Effectiveness of the salt seal is 3 anticipated to initiate at the lowest section and move upward with time; i.e., the effective 4 length increases with time.
5 Lower Short-Term Component. The lower short-term component (shown in Figure 3-5C) is 6 a salt-saturated concrete column. When the middle salt column is fully functional, there will 7 no longer be a need for the lower short-term component or any other short-term components 8 in the Salado. Therefore, the design life of the lower short-term component is nominally 100 9 years. Because the concrete monolith is located approximately 1,981 feet (604 meters) below
10 the surface, creep closure of the Salado is expected to achieve a seal between this component 11 and the shaft wall soon after its installation. The DOE also anticipates that creep closure will 12 heal the DRZ in the halite surrounding this rigid component sufficiently to seal this zone.
13 Lower Salt Column. The DOE predicts that creep closure of the shaft will consolidate the 14 high density (85 percent) salt seal material into a material with permeability that approaches 15 that of intact WIPP host rock salt. The lower salt column adds length to the middle salt 16 column. However, because of uncertainty regarding the marker beds and clay seams in the 17 vicinity of the shaft station, efficient sealing functions are not currently modeled in the 18 performance assessment for either the lower shaft salt component or the shaft station concrete 19 monolith.
20 Shaft Station Concrete Monolith. The principal purpose of the shaft station concrete 21 monolith (shown in Figure 3-5D) is to stabilize the lower portion of the shaft walls and the 22 roof in the vicinity of the shaft station.
23 3.3.3 Borehole Plugs
24 Figure 3-6 identifies where ten existing boreholes overlie the proximate area of the repository 25 footprint. Of these identified boreholes in Figure 3-6, all but ERDA-9 are terminated 26 hundreds of feet above the repository horizon. Only ERDA-9 is drilled to the repository 27 horizon, near the WIPP underground.
28 To mitigate the potential for migration beyond the repository horizon, the DOE has specified 29 that borehole seals be designed to limit the volume of water that could be introduced to the 30 repository from the overlying water-bearing zones and to limit the volume of contaminated 31 brine released from the repository to the surface or water-bearing zones.
32 Borehole plugging activities have been underway since the 1970s, from the early days of the 33 development of the WIPP facility. Early in the exploratory phase of the project, a number of 34 boreholes were sunk in Lea and Eddy counties. After the WIPP site was situated in its current 35 location, an evaluation of all vertical penetrations was made by Christensen and Peterson 36 (1981).
DRAFT-DOE/CAO-2056 3-21 March 31,1995

Draft 40 CFR 191 Compliance Certification Application
1 As an initial criterion, any borehole that connects a fluid-producing zone with the repository 2 horizon becomes a plugging candidate.
3 Grout plugging procedures are routinely performed in standard oil-field operations; however, 4 quantitative measurements of plug performance are rarely obtained. The Bell Canyon Test 5 reported by Christensen and Peterson (1981) was a field test demonstration of the use of 6 cementitious plugging materials and modification of existing industrial emplacement 7 techniques to suit repository plugging requirements. Cement emplacement technology was 8 found to be "generally adequate to satisfy repository plugging requirements." Christensen and 9 Peterson (1981) also report "that grouts can be effective in sealing boreholes, if proper care is
10 exercised in matching physical properties of the local rock with grout mixtures. Further, the 11 reduction in fluid flow provided by even limited length plugs is far in excess of that required 12 by bounding safety assessments for the WIPP." The governing regulations for plugging 13 and/or abandonment of boreholes are summarized in Table 3-2.
March 31, 1995 3-22 DRAFT-DOE/CAO-2056

Draft 40 CFR 191 Compliance Certification Application
Experimental Region _n_n_n_
WIPP-19 o _jT_n_n l U L n
&
Borehole Depth (ft)
ERDA-9 2877 W1PP-19 1038 W1PP-21 1046 W1PP-22 1448 B-25 901 H-1 856 H-2 795 H-3 894 H-16 851 P-3 1676
Repository Depth: 2150 feet
P-3 O
o WIPP-22
W1PP-21
_ B-25
uu H-2
O
IT" -ii II II n - r- n J R J II II II II II ll I II II I I O " l> H l)
ERDA-9 Borehole
n n n n
H I I I I H
H-1
'i it i - r - — _ — - - ' C E Z C ^ M
•-*-=p=o
Disposal Area
l l — I I II II n II II II II II II I II II II II II II lj II II II II II II I |^._JI II II U_LL -JVS—j-»
i m r ii I I ii I I JLJL.
f r - - i i — I I — I I — n — r r II II II II II I II II II i l II i II II II Ii II l |l-_jl__! II U _ U.
njd=0 irnr" II II II n
J l w J L J I — ' I I I I
•>ji ii I . Cx=ft»—'I--l i — I I l i — l i n — n — i V — v - j . j — I II II II II II I " " I II II II II II I I II II II II II I.
| | — I I i i—I I u_ u. _ j U — ^ | t__l l It II U _ U II II J L J L .
!=W=Cr
r=ir0=O-
u—Mi—n —n I I — I I "I--T1 )l I II l l II II II I I I I II li II II 11 II 1 I II II II II II 11
= ̂ 1 0 = C ^ r - ^ ^ r ^ r - ^ r - - - - ^ i
J t --i;v—Crr--n —n—11—11—1(- -TI
| ,1 II II 'I II 11 II I II II II I II II II
II I I II II
II
" "II —*̂ r-"n —n—11—11—II-T! '• 'l II II II II II II
I II I II II II II II II II II II II
A I _ I i t — I I — " - - ' J : J J r ^ - -
H-3
100 2 0 0
This Illustration for Information Purposes Only (meters)
Figure 3-6. Approximate Locations of Boreholes in Relation to the WIPP Underground
DRAFT-DOE/CAO-2056 3-23 March 31,1995

Draft 40 CFR 191 Compliance Certification Application
l TfflS PAGE INTENTIONALLY LEFT BLANK
March 31, 1995 3-24 DRAFT-DOE/CAO-2056

Draft 40 CFR191 Compliance Certification Application
l Table 3-2. Governing Regulations for Borehole Abandonment
Federal o r , State Land
Type of Well or Borehole
Governing , Regulation
Summary of Requirements
Both Groundwater Surveillance
State and federal regulation in effect at time of abandonment
Monitor wells no longer in use shall be plugged in such a manner as to preclude migration of surface runoff or groundwater along the length of the well. Where possible, this shall be accomplished by removing the well casing and pumping expanding cement from the bottom to the top of the well. If the casing cannot be removed, the casing shall be ripped or perforated along its entire length if possible, and grouted. Filling with bentonite pellets from the bottom to the top is an acceptable alternative to pressure grouting.
Federal Oil and Gas Wells
40 CFR Part 3160, §§ 3162.3-4
The operator shall promptly plug and abandon, in accordance with a plan first approved in writing or prescribed by the authorized officer.
Federal Potash 40 CFR Part 3590, § 3593.1
(b) Surface boreholes for development or holes for prospecting shall be abandoned to the satisfaction of the authorizing officer by cementing and/or casing or by other methods approved in advance by the authorized officer. The holes shall also be abandoned in a manner to protect the surface and not endanger any present or future underground operation, any deposit of oil, gas, or other mineral substances, or any aquifer.
State Oil and Gas Well Outside the Oil-Potash Area
State of New Mexico, Oil Conservation Division, Rule 202 (eff. 3-1-91)
B. Plugging (1) Prior to abandonment, the well shall be plugged in a manner to permanently
confine all oil, gas, and water in the separate strata where they were originally found. This can be accomplished by using mud-laden fluid, cement, and plugs singly or in combination as approved by the Division on the notice of intention to plug.
(2) The exact location of plugged and abandoned wells shall be marked by the operator with a steel marker not less than four inches (4") in diameter, set in cement, and extending at least four feet (4') above mean ground level. The metal of the marker shall be permanently engraved, welded, or stamped with the operator name, lease name, and well number and location, including unit letter, section, township, and range.
State Oil and Gas Wells Inside the Oil-Potash Area
State of New Mexico, Oil Conservation Division, Order No.R-lll-P(eff. 4-21-88)
F. Plugging and Abandonment of Wells (1) All existing and future wells that are drilled within the potash area, shall be
plugged in accordance with the general rules established by the Division. A solid cement plug shall be provided through the salt section and any waterbearing horizon to prevent liquids or gases from entering the hole above or below the salt selection.
It shall have suitable proportions—but no greater than three (3) percent of calcium chloride by weight—of cement considered to be the desired mixture when possible.
9 3.4 Summary
10 This chapter has provided the pertinent structures of the WIPP facility which have an impact 11 on the long-term performance of the WIPP. The DOE has configured both the facility and the 12 underground layout, and designed engineered barriers in such a way that will minimize the 13 potential for releases of contaminants to the accessible environment.
DRAFT-DOE/CAO-2056 3-25 March 31, 1995

Draft 40 CFR 191 Compliance Certification Application
l TfflS PAGE INTENTIONALLY LEFT BLANK.
March 31,1995 3-26 DRAFT-DOE/CAO-2056
Draft 40 CFR191 Compliance Certification Application
1 REFERENCES
2 Christensen, C.L., and Peterson, E.W. 1981. "Field-Test Programs of Borehole Plugs in 3 Southeastern New Mexico." In The Technology ofHigh-Level Nuclear Waste Disposal 4 Advantages in the Science and Engineering of the Management ofHigh-Level Nuclear 5 Wastes, P.L. Hofman and JJ . Breslin, eds., SAND79-1634C, DOE/TIC-4621, Vol. 1, pp. 6 354-369. Technical Information Center of the U.S. Department of Energy, Oak Ridge, TN.
7 DOE (U.S. Department of Energy). 1980. Final Environmental Impact Statement, Waste 8 Isolation Pilot Plant. DOE/EIS-0026, Vols. 1 and 2. Office of Environmental Restoration 9 and Waste Management, Washington, D.C.
10 DOE (U.S. Department of Energy). 1991. TRU Waste Acceptance Criteria for the Waste 11 Isolation Pilot Plant. WIPP/DOE-069, Rev. 4. U.S. Department of Energy, Carlsbad, NM.
12 Lappin, A.R., Hunter, R.L., Garber, D.P., Davies, P.B., Beauheim, R.L., Borns, D.J., Brush, 13 L.H., Butcher, B.M., Cauffman, T., Chu, M.S.Y., Gomez, L.S., Guzowski, R.V., Iuzzolino, 14 H.J., Kelley, V., Lambert, S.J., Marietta, M.G., Mercer, J.W., Nowak, E.J., Pickens, J., 15 Rechard, R.P., Reeves, M., Robinson, K.L., and Siegel, M.D., eds. 1989. Systems Analysis, 16 Long-Term Radionuclide Transport, and Dose Assessments, Waste Isolation Pilot Plant 17 (WIPP), Southeastern New Mexico: March 1989. SAND89-0462. Sandia National 18 Laboratories, Albuquerque, NM.
19 Munson, D.E., DeVries, K.L., Schiermeister, D.M., DeYonge, W.F., and Jones, R.L. 1992. 20 Measured and Calculated Closures of Open and Brine Filled Shafts and Deep Vertical 21 Boreholes in Salt. Rock Mechanics Proceedings of the 33rd U.S. Symposium. J.R. Tillerson 22 and W.R. Walversik, eds., SAND91-1869, pp. 439-488. A.A. Balkema, Brookfield, VT.
23 Nowak, E.J., Tillerson, J.R., and Torres, T.M. 1990. Initial Reference Seal System Design: 24 Waste Isolation Pilot Plant. SAND90-0355. Sandia National Laboratories, Albuquerque, 25 NM.
26 NRC (U.S. Nuclear Regulatory Commission). 1974. Guidance on the License Application, 27 Siting, Design, and Plant Protection for an Independent Spent Fuel Storage Installation. 28 Regulatory Guide 3.24.
29 Stormont, J.C. 1984. Plugging and Sealing Program for the Waste Isolation Pilot Plant 30 (WIPP). SAND84-1057. Sandia National Laboratories, Albuquerque, NM.
31 U.S. Congress. 1992. Waste Isolation Pilot Plant Land Withdrawal Act. Public Law 102-32 579. October 1992. 102nd Congress, Washington, D.C.
33 Van Sambeek, L.L., Ratigan, J.L., and Hansen, F.D. 1993. Seal Design Alternatives Study. 34 S AND92-7340. Sandia National Laboratories, Albuquerque, NM.
DRAFT-DOE/CAO-2056 3-27 March 31,1995
Draft 40 CFR191 Compliance Certification Application
1 Wakeley, L.D., Harrington, P.T., and Weiss, Jr., C.A. 1993. Properties of Salt-Saturated 2 Concrete and Group after Six Year In Situ at the Waste Isolation Pilot Plant. SAND93-7019. 3 Sandia National Laboratories, Albuquerque, NM.
4 Westinghouse Electric Corporation. 1988. Closure and Post Closure Plans. Westinghouse 5 Electric Corporation, Waste Isolation Division, Carlsbad, NM.
6 Westinghouse Electric Corporation. 1990. WIPP Final Safety Analysis Report. WP02-9, 7 Rev. 0. Westinghouse Electric Corporation, Waste Isolation Division, Carlsbad, NM.
8 Westinghouse Electric Corporation. 1995. Conceptual Design for Operational Phase Panel 9 Closure System (Draft). DOE/WIPP-Draft-2057. Westinghouse Electric Corporation, Waste
10 Isolation Division, Carlsbad, NM.
March 31, 1995 3-28 DRAFT-DOE/CAO-2056

Draft 40 CFR191 Compliance Certification Application
1 BIBLIOGRAPHY
2 ASME (American Society of Mechanical Engineers). 1989. Quality Assurance Program 3 Requirements for Nuclear Facilities. ASME NQA-1-1989, August 31,1989.
4 Beauheim, R.L., Saulnier, Jr., G.J., and Avis, J.D. 1991. Interpretation of Brine-Permeability 5 Tests of the Salado Formation at the Waste Isolation Pilot Plant Site: First Interim Report. 6 SAND90-0083. Sandia National Laboratories, Albuquerque, NM.
7 Bechtel National. 1986. Interim Geotechnical Field Data Report. DOE/WJPP-221. U.S. 8 Department of Energy, Carlsbad, NM.
9 Borns, D.J. 1985. Marker Bed 139: A Study ofDrillcorefrom a Systematic Array. 10 SAND85-0023. Sandia National Laboratories, Albuquerque, NM.
11 Borns, D.J., and Stormont, J.C. 1988. An Interim Report on Excavation Effect Studies at the 12 Waste Isolation Pilot Plant: The Delineation of the Disturbed Rock Zone. SAND87-1375. 13 Sandia National Laboratories, Albuquerque, NM.
14 Borns, D.J., and Stormont J.C. 1989. The Delineation of the Disturbed Rock Zone 15 Surrounding Excavations in Salt. Rock Mechanics as a Guide for Efficient Utilization of 16 Natural Resources, Proceedings of the 30th U.S. Symposium on Rock Mechanics, June 19-22, 17 1989, A.W. Khair, ed., SAND88-2230c, pp. 353-360. A.A. Balkema, Brookfield, VT.
18 Chan, K.S., Bodner, S.R., Fossum, A.F., and Munson, D.E. 1992. A Constitutive Model for 19 Inelastic Flow and Damage Evolution in Solids Under Triaxial Compression. Mechanics of 20 Materials, SAND92-0546J, Vol.14, No.l, pp.1-14.
21 COE (U.S. Army Corps of Engineers). 1985. Federal Engineering Operating Procedures for 22 Construction of the Waste Isolation Pilot Plant.
23 DOE (U.S. Department of Energy). 1986. Waste Isolation Pilot Plant Design Validation 24 Final Report. DOE/WJPP 86-010. U.S. Department of Energy, Carlsbad, NM.
25 DOE (U.S. Department of Energy). 1988. Geotechnical Field Data Report and Analysis 26 Report. DOE/WJPP 87-017. U.S. Department of Energy, Carlsbad, NM.
27 DOE (U.S. Department of Energy). 1990. Final Safety Analysis Report. WP 02-9, Rev. 0, 28 May, 1990. Westinghouse Electric Corporation, Waste Isolation Division, Carlsbad, NM.
29 DOE (U.S. Department of Energy). 1994. U.S. Department of Energy Carlsbad Area Office 30 Quality Assurance Program Description. CAO-94-1012, Rev. 0, June 1994. U.S. 31 Department of Energy, Carlsbad, NM. (This document is included as Appendix QAPD.)
DRAFT-DOE/CAO-2056 3-29 March 31,1995

Draft 40 CFR191 Compliance Certification Application
1 ERDA (Energy Research and Development Administration). 1976. Management Guideline 2 and Project Executive Assistance, Construction Management Plan.
3 Griswold, G.B. 1977. Site Selection and Evaluation Studies of the Waste Isolation Pilot 4 Plant (WIPP), Los Medanos, Eddy County, New Mexico. SAND77-0946. Sandia National 5 Laboratories, Albuquerque, NM.
6 Nowak, E.J., and McTigue, D.F. 1987. Interim Results of Brine Transport Studies in the 7 Waste Isolation Pilot Plant. SAND87-0880. Sandia National Laboratories, Albuquerque, 8 NM.
9 ORNL (Oak Ridge National Laboratory). 1973. Site Selection Factors for the Embedded Salt 10 Pilot Plant. ORNL-TM-4219. Oak Ridge National Laboratory, Oak Ridge, TN.
11 Pfeifle, T.W., and Brodsky, N.S. 1991. Swelling Pressure Water Uptake and Permeability of 12 70/30 Crushed Salt Bentonite. SAND91-7070. Sandia National Laboratories, Albuquerque, 13 NM.
14 Sandia National Laboratories. 1992. Preliminary Performance Assessment for the Waste 15 Isolation Pilot Plant, December 1992, Volume 3: Model Parameters. SAND92-0700/3. 16 Sandia National Laboratories, WIPP Performance Assessment Division, Albuquerque, NM.
17 Stormont, J.C., Howard, C.L., and Daemen, J. J.K. 1991. In Situ Measurements of Rock Salt 18 Permeability Changes Due to a Nearby Excavation. SAND90-3134. Sandia National 19 Laboratories, Albuquerque, NM.
20 Stormont, J.C., Peterson, E.W., and Langus, P.L. 1987. Summary and Observations about 21 WIPP Facility Horizon Flow Measurements through 1986. SAND87-0176. Sandia National 22 Laboratories, Albuquerque, NM.
23 Westinghouse Electric Corporation. 1988. Closure and Post Closure Plans. Westinghouse 24 Electric Corporation, Waste Isolation Division, Carlsbad, NM.
March 31, 1995 3-30 DRAFT-DOE/CAO-2056

1 4.0 W A S T E D E S C R I P T I O N
2 Compliance evaluations assess the behavior and interactions of natural systems present at the 3 Waste Isolation Pilot Plant (WIPP) site, relevant "man-made" structures and facilities, and the 4 waste emplaced in the repository. Previous chapters have described the site and the 5 repository, the first two of the three general components of the repository system. This 6 chapter describes the waste to be emplaced in the repository. This information is important 7 because it supports the development of conceptual models of the anticipated behavior of the 8 repository.
9 Assessments of the performance of the repository are based on assumed characteristics of the 10 wastes to b e emplaced in the W I P P . Assumed characteristics include factors such as the 11 levels of radioactivity present in the waste , the amount of moisture in the waste , and the 12 quantities of other materials that might have some effect on the potential for the waste to 13 migrate toward the accessible environment. This chapter documents the characteristics of the 14 wastes that are planned to be emplaced in the repository and provides one of the bases for the 15 compliance assessments. It also describes methods to be employed by the U.S . Depar tment of 16 Energy (DOE) to ensure that only those wastes that are consistent with these descriptions are 17 actually emplaced in the repository. Additional information is provided on the nature of 18 transuranic (TRU) waste, the sources of the waste, waste inventories, and plans for the further 19 characterization of these wastes.
20 The D O E has prepared this chapter to support the evaluation of compliance with the 21 provisions of Tit le 4 0 of the Code of Federal Regulations (CFR) Part 191 , as they apply to the 22 W I P P . T h e D O E understands that proposed rule 40 CFR Part 194 may affect this chapter, 23 when the proposed rule is finalized. In particular, § 194.24 of the proposed rule provides that 24 the D O E shall conduct a study of the effects of waste characteristics on the containment of 25 waste in the disposal system. Although the D O E believes that it has established an 26 understanding of this topic, the available information is not currently in the format anticipated 27 by the U.S . Environmental Protection Agency (EPA).
28 T R U waste is contaminated with alpha-emitting radionuclides having atomic numbers greater 29 than 92 , half-lives greater than 20 years, and concentrations of T R U isotopes greater than 100 }0 nanocuries per g ram of waste , at the t ime of assay. There are two categories of T R U waste: 31 contact-handled (CH) and remote-handled (RH). C H T R U wastes are packaged T R U wastes 32 with an external surface dose rate of 200 mill irem per hour or less, while R H T R U wastes are 33 packaged T R U wastes with an external surface dose rate exceeding 200 mil l i rem per hour and 34 less than 1,000 r em per hour.
35 T R U waste management activities (generation, retrievable storage, etc.) are performed at ten 36 major and several minor D O E sites. The major sites are as follows:
37 1. Richland (Hanford) Site, Washington 38 2 . Idaho National Engineering Laboratory (INEL), Idaho 39 3 . Los Alamos National Laboratory (LANL), N e w Mexico 40 4 . Oak Ridge National Laboratory (ORNL), Tennessee
DRAFT-DOE/CAO-2056 March 31,1995

Draft 40 CFR 191 Compliance Certification Application
1 5. Rocky Flats Environmental Technology Site (RFETS), Colorado 2 6. Savannah River Site (SRS), South Carolina 3 7. Argonne National Laboratory-East (ANL-E), Illinois 4 8. Lawrence Livermore National Laboratory (LLNL), California 5 9. Mound Laboratory (Mound), Ohio 6 10. Nevada Test Site (NTS), Nevada.
7 4.1 Current and To-Be-Generated Waste Inventory
8 TRU waste inventories are derived from the Waste Isolation Pilot Plant Transuranic Waste 9 Baseline Inventory Report (BIR), which is included as Appendix BIR. The BIR has been
10 developed from the best available information and process knowledge provided by the DOE 11 TRU waste generator and storage sites.
12 The BIR categorizes waste as either retrievably stored or projected (future generation) waste. 13 The volume (stored plus projected) reported in the BIR for each site that either generates or 14 stores TRU waste represents the anticipated waste inventory. The current anticipated CH 15 TRU inventory (total waste volume of CH TRU waste) for all generator and storage sites is 16 less than the design capacity for TRU waste to be emplaced at the WIPP. Therefore, for 17 purposes of performance assessment, anticipated CH inventory volumes are scaled to meet the 18 full capacity of the WIPP. Since the RH TRU anticipated inventory reported by the generator 19 and storage sites exceeds the WTPP RH inventory limits, the RH TRU waste was not scaled in 20 the BIR. In the future, the DOE will monitor the RH TRU waste generation at the sites and 21 determine which waste streams will be eligible for disposal in the WIPP.
22 It is important to understand that the BIR is not a waste characterization document. It is a 23 database of waste information collected from the waste storage and generation sites for the 24 purpose of preparing this application. As waste characterization programs are instituted at the 25 generator and storage sites, the DOE will update the BIR. The waste characterization program 26 planned by the DOE for waste shipped under any certification issued as the result of this 27 application is described in Section 4.4.
28 4.1.1 CH TRU Waste
29 The greatest percentage of TRU waste emits principally alpha radiation, with some beta and 30 gamma radiation. Alpha particles are dangerous if inhaled or ingested, but they are non-31 penetrating and thus do not represent an external radiation hazard. Beta emissions, like alpha, 32 have limited penetration, and the waste container provides adequate personnel protection. 33 Gamma radiation, however, is more penetrating. It can pass through several inches of lead 34 and must be heavily shielded for safe management and storage. CH TRU waste contains 35 predominately alpha-emitting radioisotopes and is managed in closed containers that provide 36 protection from inhalation or ingestion.
March 31, 1995 4-2 DRAFT-DOE/CAO-2056

Draft 40 CFR 191 Compliance Certification Application
1 The volume limit of TRU waste to be emplaced at the WIPP is 6.2 million cubic feet (175,600 2 cubic meters), as specified in the WIPP Land Withdrawal Act (LWA). The BIR provides 3 estimated volumes of CH TRU waste to be supplied by the DOE waste generator and storage 4 sites. In the past, ten sites have been listed as sources of TRU waste for disposal at WIPP. 5 Activities associated with the Federal Facility Compliance Act (FFCA) have resulted in the 6 identification of several sites which generate TRU wastes in small quantities. These sites are 7 mentioned here for completeness and because their wastes are included in the totals in the 8 BIR.
9 The anticipated volume of the CH TRU waste inventory is the sum of the approximately 2.8 10 million cubic feet (73,300 cubic meters) of currently stored waste, with an additional 1.9 11 million cubic feet (50,700 cubic meters) of waste that the DOE will generate in the future. 12 Estimates of the volume of waste yet to be generated are expected to change in the future as a 13 result of environmental restoration and remediation activities. The CH TRU waste volumes 14 that are retrievably stored and projected to be generated at each site are provided in Table 4-1.
15 4.1.2 RH TRU Waste
16 A small percentage of TRU waste is designated as RH because it contains radioactive isotopes 17 that emit high energy gamma radiation and some neutron radiation, as well as alpha radiation. 18 The LWA prohibits the DOE from placing RH TRU waste in the WIPP that has a surface dose 19 rate in excess of 1,000 rem per hour. The LWA limits the volume such that no more than 5 20 percent of the emplaced RH TRU waste may exhibit a dose rate in excess of 100 rem per 21 hour. The volume of RH TRU waste that may be emplaced in the WIPP is limited by 22 agreement with the State of New Mexico to 250,000 cubic feet (7,080 cubic meters). In 23 addition, the waste is limited to a 5,100,000-curie total under the LWA. The RH TRU waste 24 volumes that are retrievably stored and projected to be generated at each site are provided in 25 Table 4-1.
26 4.1.3 TRU Mixed Waste
27 Hazardous wastes, as defined in 40 CFR Part 261 Subparts C and D, often occur as co-28 contaminants with TRU waste from defense-related operations, resulting in "TRU mixed 29 waste." A significant percentage of the waste to be emplaced in the WIPP is TRU mixed 30 waste, subject to regulation under the Resource Conservation and Recovery Act (RCRA).
DRAFT-DOE/CAO-2056 4-3 March 31,1995
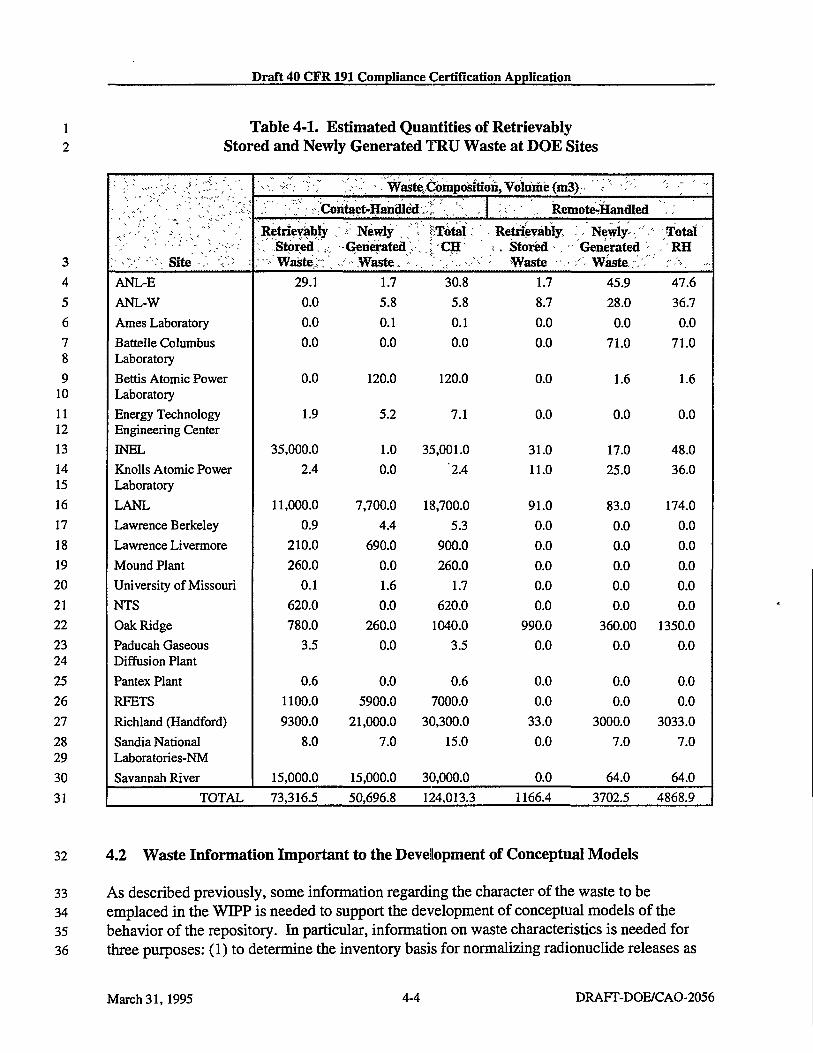
Draft 40 CFR191 Compliance Certification Application
Table 4-1. Estimated Quantities of Retrievably Stored and Newly Generated TRU Waste at DOE Sites
' V V " '. "-. •• "" .•".•-".'."•"'
V , -f\- "r~ • Waste.Cbmposition, Volume (m3) ." ,- ' ' •."' - '; •" ' -
' V V " '. "-. •• "" .•".•-".'."•"' '/: : r:'Coritact-Hanaiedv.;; \ , ' \ .. Remote-Handled
' V V " '. "-. •• "" .•".•-".'."•"' , Retrievabry V Kewly',;">' j:;Tdtal: ' Retrievably . - Newly--."'• Total
- / ' • ' ' • ' - • " " ! / ' : ' - ' •'"Stored?,-. Generated V .; - CH t . Stored Generated RH :• <-•;-'•': S i t e ; -;•:• : "'-•'Waste.:"', ..-'•• Waste. - ., '.' \.}.. •/'•' : Waste -- . . / Waste;, f.\ .„ ANL-E 29.1 1.7 30.8 1.7 45.9 47.6 ANL-W 0.0 5.8 5.8 8.7 28.0 36.7 Ames Laboratory 0.0 0.1 0.1 0.0 0.0 0.0 Battelle Columbus 0.0 0.0 0.0 0.0 71.0 71.0 Laboratory Bettis Atomic Power 0.0 120.0 120.0 0.0 1.6 1.6 Laboratory Energy Technology 1.9 5.2 7.1 0.0 0.0 0.0 Engineering Center INEL 35,000.0 1.0 35,001.0 31.0 17.0 48.0 Knolls Atomic Power 2.4 0.0 '2.4 11.0 25.0 36.0 Laboratory LANL 11,000.0 7,700.0 18,700.0 91.0 83.0 174.0 Lawrence Berkeley 0.9 4.4 5.3 0.0 0.0 0.0 Lawrence Livermore 210.0 690.0 900.0 0.0 0.0 0.0 Mound Plant 260.0 0.0 260.0 0.0 0.0 0.0 University of Missouri 0.1 1.6 1.7 0.0 0.0 0.0 NTS 620.0 0.0 620.0 0.0 0.0 0.0 Oak Ridge 780.0 260.0 1040.0 990.0 360.00 1350.0 Paducah Gaseous 3.5 0.0 3.5 0.0 0.0 0.0 Diffusion Plant Pantex Plant 0.6 0.0 0.6 0.0 0.0 0.0 RFETS 1100.0 5900.0 7000.0 0.0 0.0 0.0 Richland (Handford) 9300.0 21,000.0 30,300.0 33.0 3000.0 3033.0 Sandia National 8.0 7.0 15.0 0.0 7.0 7.0 Laboratories-NM Savannah River 15,000.0 15,000.0 30,000.0 0.0 64.0 64.0
TOTAL 73,316.5 50,696.8 124,013.3 1166.4 3702.5 4868.9
32 4.2 Waste Information Important to the Development of Conceptual Models
33 As described previously, some information regarding the character of the waste to be 34 emplaced in the WIPP is needed to support the development of conceptual models of the 35 behavior of the repository. In particular, information on waste characteristics is needed for 36 three purposes: (1) to determine the inventory basis for normalizing radionuclide releases as
March 31,1995 4-4 DRAFT-DOE/CAO-2056

Draft 40 CFR191 Compliance Certification Application
1 required for comparison with 40 CFR § 191.13(a) (see Section 6.0); (2) to evaluate the 2 potential for gas to be generated in the repository (see Section 6.3); and (3) to estimate the 3 fraction of the actinides in the waste that might become available to migrate away from the 4 waste-emplacement rooms (see Section 6.3). The following information is needed for these 5 purposes:
6 Waste Inventory
7 • Quantities (in curies) of radionuclides to be emplaced in the repository
8 Gas-Generation Potential
9 • Quantities of metals in the waste including steel, steel alloys, aluminum, and aluminum 10 alloys 11 • Quantities of combustible materials such as cellulosics, plastics, and rubber 12 • Quantities of various chemicals including water, cementitious material (calcium oxide and 13 hydroxide), nitrate, sulphate, phosphate, and phosphorous
14 Actinide Inventory and Mobilities
15 • Quantities of the following actinides emplaced in the WIPP: 2 4 1 Am, 252Cf, 2 4 4Cm, 2 4 8Cm, 16 1 3 7Cs, 2 3 7Np, 2 3 IPa, 2 1 0Pb, 1 4 7Pm, 2 3 8Pu, 2 3 9Pu, 2 4 0Pu, ^ P u . ^ P u ^ P u , 2 2 6Ra, 2 2 8Ra, w Sr, 1 4 7Sm, 17 2 2 9Th, 2 3 0Th, 2 3 2Th, 2 3 3U, 2 3 4U, 2 3 5U, 2 3 6U, and 2 3 8 U 18 • Quantities of chelating agents or other organic ligands 19 • Quantities of soil or other humic material.
20 4.3 Waste Envelope
21 Only those wastes that meet established acceptance criteria will be emplaced in the repository. 22 These criteria result from restrictions on waste acceptability from numerous sources which 23 have been implemented by the DOE. In addition, restrictions may result from directions from 24 regulatory authorities. The associated concepts of the "performance-based waste envelope" 25 and "boundary conditions and process tolerance limits" are described in this section. The 26 process for controlling the types of wastes to be sent to the WIPP is also described.
27 The WIPP facility will have boundary conditions and process tolerance limits imposed by the 28 DOE (e.g., no explosives or compressed gases within containers, labeling on containers, etc.) 29 and any boundary conditions established by the EPA and the New Mexico Environment 30 Department (NMED). The DOE's boundary conditions and process tolerance limits are 31 summarized in Table 4-2. Boundary conditions imposed by the EPA and the NMED, 32 including safety-related conditions, are unknown at this time.
DRAFT-DOE/CAO-2056 4-5 March 31,1995

Draft 40 CFR191 Compliance Certification Application
1 2
Table 4-2. Boundary Conditions and Process Tolerance Limits Established by the DOE
4 5
6
7
Determination- :;\:! .'. _- f;̂ Parameter ' „'•;'' '". Boundary Condition
Ignitability, Reactivity, and Corrosivity
Liquids or aqueous waste Residual liquid only with all internal containers well drained (<1% free liquids)
Ignitability, Reactivity, and Corrosivity
Oxidizers No oxidizers Ignitability, Reactivity, and Corrosivity
Explosives No explosives
Ignitability, Reactivity, and Corrosivity
Compressed gases No compressed gases
Ignitability, Reactivity, and Corrosivity
Pyrophoric materials No nonradionuclide pyrophoric materials
Compatibility Waste form Only those waste forms described in Section 4.4.2
Waste Category Waste form Only those waste forms described in Section 4.4.2
8 "Boundary conditions" are defined as the maximum acceptable values for waste properties. 9 (This term is used in Chapter 6 in a different context and has a different meaning; Chapter 6's
10 use of the term is in the context of modeling applications and refers to conditions at the 11 boundaries of the system being modeled.) "Process tolerance limits" are defined as those 12 characteristics that a waste management process can tolerate while maintaining permit 13 compliance. Waste that exceeds boundary conditions or that could lead to process tolerance 14 limits being exceeded will not be certified for shipment to the WIPP facility.
15 4.3.1 Waste Acceptance Criteria
16 The existing waste acceptance criteria are based on transportation and operational safety 17 requirements. The formal document that describes the acceptance criteria for the inventory of 18 DOE TRU wastes to be shipped to WIPP is the Waste Acceptance Criteria for the Waste 19 Isolation Pilot Plant. (WAC) These criteria establish limits for the physical, radiological, and 20 chemical characteristics of the waste, in addition to specifications for the waste packaging. 21 Specific TRU wastes will not be approved for shipment to the WIPP until the wastes have 22 been certified as meeting the WAC. The primary objectives of the WAC are: (1) to ensure 23 that all TRU wastes are packaged so that handling and subsequent disposal can be performed 24 safely, and (2) to maintain the repository's ability to isolate the waste.
25 Criteria that are anticipated to apply to wastes to be emplaced in the WTPP facility (pending 26 final disposal system performance evaluation and permit conditions) will be published and 27 implemented at DOE generator and storage facilities through a future revision of the WAC.
March 31,1995 4-6 DRAFT-DOE/CAO-2056
Draft 40 CFR191 Compliance Certification Application
1 The WAC will guide future waste generation and packaging practices. Wastes currently 2 stored or generated that do not meet the final WAC may require processing until certification 3 can be attained. Any such processing would be the responsibility of the site proposing to ship 4 the waste to the WIPP.
5 The WAC certification programs are overseen by the DOE through periodic audits. The DOE 6 will ensure that TRU waste received at the WEPP facility meet these criteria through 7 implementation of administrative and operational procedures at the generator sites. 8 Implementation of the WAC certification programs at the generator sites results in controlled 9 and consistent chemical and physical waste properties and final packaging.
10 4.3.2 Bounding Criteria Based on Disposal System Performance
11 The current WAC are based on transportation requirements and safe handling and storage 12 criteria. If required, long-term performance-based WAC will be applied to the WIPP 13 inventory baseline when the overall assessment of the disposal system's performance is 14 complete.
15 The criteria that define the acceptable inventory, as determined through the performance 16 assessment, are referred to as the performance-based waste acceptance criteria (PBWAC). 17 The PBWAC identify the bounding characteristics of wastes acceptable for the WIPP based 18 on repository performance. This "envelope" of wastes is based on consideration of only the 19 physical and chemical form of the waste and its potential interaction with the repository. 20 Information used to formulate and identify this envelope includes waste characterization 21 activities and modeling.
22 As performance assessment activities provide insight relative to the importance of specific 23 waste parameters, some parameters may be found to have significant impact on the 24 performance of the overall disposal system. Waste parameters shown to have little or no 25 impact on repository performance will be candidates for reduced characterization. The 26 performance assessment results, combined with directions from state and federal regulators, 27 will provide guidance for future waste generation practices, allowing the DOE to optimize 28 future sampling and analysis programs.
29 The PBWAC will contain the criteria for waste acceptance based on possible effects of wastes 30 on the performance of the repository. There are several other compliance programs that may 31 also impose criteria applicable to waste acceptance at the WIPP. These include criteria 32 required by permit conditions, requirements stemming from the EPA's no-migration 33 determination, transportation and waste certification, and operational safety. The DOE will 34 impose these criteria on all sites that send waste to WIPP through the WAC.
DRAFT-DOE/CAO-2056 4-7 March 31,1995

Draft 40 CFR191 Compliance Certification Application
1 4.4 Waste Characterization
2 Waste characterization refers to the documentation of the contents of a container or containers 3 of waste by sampling and analysis and/or the examination of TRU waste generation 4 documentation and associated records. The TRU waste characterization program has evolved 5 over the past several years as a result of compliance programs and associated waste 6 information requirements.
7 4.4.1 Plans and Program Summary
8 Waste characterization and certification programs are described in this section.
9 4.4.1.1 Waste Characterization Program
10 The waste characterization program consists of testing, sampling, analytical activities, and 11 non-intrusive examination methods used to characterize retrievably stored and newly 12 generated TRU waste at DOE facilities planning to send TRU waste to the WIPP. Objectives 13 of the waste characterization program are to confirm the radionuclide, to verify the physical 14 and chemical waste form inventories on which the performance assessment is based, and to 15 assure that no wastes are placed in the WIPP which are inconsistent with the disposal system's 16 performance limitations.
17 Radioassays will be conducted on waste prior to shipment to the WIPP to confirm the 18 radionuclide inventory. To ensure compliance, the DOE will determine and report the species 19 and curie quantity of radionuclides that can be measured or derived. The DOE must account 20 for more than 1 percent of the total activity in the container, prior to shipment to WIPP.
21 The parameters to be assessed for physical waste form will be determined based on their 22 significance to the disposal system's long-term performance. The assessment of physical 23 waste form parameters that do not affect compliance will be minimized in future waste 24 characterization programs, and the characterization requirements will be revised, as necessary. 25 If specific waste parameters are found to be important to compliance, characterization 26 techniques will be developed to assure proper management. For example, possible load 27 management alternatives may be considered to ensure the proper mix of waste forms on both 28 panel and room scales. Because a large percentage of the waste is not yet generated, the DOE 29 will be in a position to control the types and quantities of waste forms generated in the future.
30 4.4.1.1.1 Waste Streams
31 The identification of waste streams is an important component of the waste characterization 32 process. A waste stream is generated (1) by a process or processes that have well-defined 33 material inputs, processes, and material outputs; (2) by a change in equipment; or (3) in a 34 building that results in a batch of waste containers. Waste streams may be combined for 35 management and characterization if the generation practices, waste profiles, and data quality 36 are similar and if the wastes are compatible.
March 31,1995 4-8 DRAFT-DOE/CAO-2056

Draft 40 CFR191 Compliance Certification Application
1 The method for categorizing wastes into specific streams is based on the premise that the key 2 information necessary for identifying the critical stream parameters is available. These 3 parameters are based on the physical, radiological, and chemical properties of the waste.
4 The consistent application of categorization methods is important to ensure that each 5 generator provides data consistent with those of other facilities. Many TRU waste streams 6 may not be readily characterized by a single TRU waste code; therefore, multiple codes may 7 be used to better describe streams containing more than one contaminant. Multiple profiles 8 may also be required when changes in process knowledge, quality assurance programs, or 9 generation process have occurred over time.
10 The type and quality of support information for the characterization of each waste stream is 11 documented as part of the waste profiling process. The completeness of documentation will 12 determine the uncertainty assigned to process knowledge and the level of sampling and 13 analysis required for each waste stream.
14 The documentation of physical controls and barriers is also considered in the evaluation of 15 process knowledge for each waste stream. Physical controls and barriers are devices that 16 direct waste streams to specific locations and protect the waste stream from constituents that 17 are not part of the waste generating process.
18 4.4.1.1.2 Waste Profiles
19 Waste profiles have been, and will continue to be, developed for each waste stream based on 20 process knowledge, sampling and analysis results, and references to supporting 21 documentation. The waste stream profiles are evaluated to determine the adequacy of the 22 characterization and the level of uncertainty in the profile. This evaluation is used to develop 23 and verify the waste generator's characterization program for certification of the waste stream. 24 The waste streams are documented through profiles consisting of tables listing constituents 25 and associated volumes and weight percentages with uncertainty ranges. Information 26 provided on the profiles includes radioisotopes, such as 2 3 9Pu, and physical and chemical 27 matrix descriptors, such as polyethylene. Application of this profiling and categorization 28 process ensures consistency of the data from different DOE facilities.
29 4.4.2 Physical Waste Characteristics
30 As required by the FFCA, the DOE has prepared the Mixed Waste Inventory Report (MWIR) 31 (DOE 1994a), which provides information relative to the volumes of currently stored wastes 32 and a 5-year forecast of future TRU mixed wastes. TRU wastes are classified in the MWIR 33 according to their physical, chemical, and radiological characteristics. This classification is 34 based on RCRA waste treatability groups. For consistency in reporting, the DOE plans to 35 classify all TRU wastes according to this system. Physical forms of the wastes to be emplaced 36 in the WIPP are described in the following subsections.
DRAFT-DOE/CAO-2056 4-9 March 31,1995

Draft 40 CFR 191 Compliance Certification Application
1 4.4.2.1 CHTRU Waste Forms
2 TRU waste is packaged at the generator sites in a primary confinement barrier (i.e., a 3 Department of Transportation Type 7 A steel drum or a standard waste box) to isolate 4 contaminants from humans and the environment during transportation and handling. This 5 packaging system may include rigid plastic inner liners, several layers of plastic bagging, and 6 absorbents in the void spaces.
7 Pursuant to the WAC, free liquids and pressurized containers are prohibited in shipment of 8 waste to the WIPP facility. Damp combustibles are neutralized, drained, or dried prior to 9 packaging with absorbents (e.g., vermiculite) to prevent the accumulation of condensate.
10 Discarded equipment is disassembled to remove any liquids from fluid reservoirs or lines. 11 Glass waste is dried or drained to remove all free liquids. Pressurized containers are 12 punctured or must have an opening that makes it obvious that the container is no longer 13 pressurized.
14 Categories of wastes to be shipped to the WIPP are described below:
15 Combustibles. Combustible wastes are generated during a variety of processes. These wastes 16 consist of paper, plastics, cloth rags and clothing, and wood resulting from almost all 17 plutonium operations. Cloth and paper wipes are used to clean parts and gloveboxes during 18 most operations. Depending on the operations, damp combustibles are usually used and then 19 wrung out, drained, or dried. A small quantity of non-combustible waste, such as concrete, 20 scrap metal, and equipment, may also be present in this waste category.
21 Non-Combustibles. Non-combustibles consist primarily of glass and metal. Much of this 22 waste is laboratory equipment and glassware from research and development activities.
23 Combustibles and Non-Combustibles. Combustible and non-combustible waste is commonly 24 generated in hot cells and gloveboxes. This waste category contains various mixtures of 25 combustible waste, such as paper, and non-combustible waste, such as metal. The process-26 specific nature of the operations that generate many of the combustibles and non-combustibles 27 makes the detailed segregation of various waste materials unnecessary. Small processes that 28 use specific radionuclides do not require extensive segregation of waste materials for 29 plutonium accountability or recovery.
30 Graphite. Graphite waste is produced from molds that are broken, cleaned, or scraped in 31 gloveboxes to remove excess plutonium. Graphite is a uniform, well-defined material. 32 Plutonium casting operations include the use of solvents from the cleaning of graphite molds, 33 and thus residual spent solvents may be present on the surfaces of graphite pieces. In 34 addition, residual metals may be present from impurities in plutonium metal.
March 31, 1995 4-10 DRAFT-DOE/CAO-2056

Draft 40 CFR191 Compliance Certification Application
1 Filters. This includes the following types of filters:
2 • High-Efficiency Particulate Air (HEPA) filters 3 • Ful-Flo® filters 4 • Filter media 5 • Processed filter media 6 • Prefilters.
7 Prefilters and HEPA filters are used on all ventilation intake and exhaust systems associated 8 with plutonium operations. Filter frames can be either wood, aluminum, or stainless steel; the 9 filter media may be Fiberglass®, Nomex®, or similar material. Fiberglass® is a trade name
10 for a variety of products made of or with glass fibers or glass flakes. Nomex® is a trade name 11 for an aramide fiber commonly derived from p-phenylenediamine and terephthaloyl chloride. 12 Ful-Flo® filters consist of fibrous polypropylene (a synthetic, crystalline, thermoplastic 13 polymer) filter media.
14 Filter media are generated from splitting absolute dry box and HEPA filters apart from their 15 frames in the plutonium process areas. Loose particulate materials that are dislodged from the 16 filters are stabilized and packaged separately from the media. Filter media are packaged in 1-17 gallon plastic bottles or bags. Processed filter media consist of Ful-Flo®, filter media, and 18 whole filters removed from acid and non-acid environments. Filter media may be mixed with 19 portland cement to neutralize residual nitric acid that may be present.
20 Filters are designed to remove and retain specific sizes of particulate materials from air or 21 liquids. Although the filters associated with plutonium operations are not designed to retain 22 organic vapors, they may contain these residues depending on the operations conducted in a 23 glovebox or building. Airborne metals, resulting from grinding or machining operations, also 24 may be trapped in glovebox filters.
25 Benelex® and Plexiglas®. Benelex® consists of approximately 99.5 percent wood, with 26 residual amounts of the phenolic resin. Plexiglas® is a poly methyl methacrylate polymer 27 used for glovebox windows and is generated as waste during the change-out of the glovebox 28 windows. This waste category is composed of well-defined materials that are used as neutron 29 shielding material and in glovebox construction. Organic residues may be present as a result 30 of glovebox cleaning prior to disassembly.
31 Solidified Liquid. Solidified liquid is composed of aqueous waste that is not compatible with 32 the primary aqueous wastewater treatment process because of the presence of complexing 33 chemicals. This liquid waste is excluded from the production liquid waste because of the 34 potential presence of complexing chemicals that would interfere with the recovery of 35 actinides. Complexing chemicals include organic acids, alcohols, or other chelating agents. 36 Batches of this waste may be as little as 1 liter or as much as several hundred liters and may 37 be solidified with portland and magnesium cement. Other nonflammable aqueous waste is 38 solidified with vermiculite.
DRAFT-DOE/CAO-2056 4-11 March 31,1995

Draft 40 CFR 191 Compliance Certification Application
1 Inorganic Process Solids and Soil. This waste category consists of solids that cannot be 2 reprocessed or process residues from evaporator and other types of storage tanks, grit, 3 firebrick fines, ash, salts, metal oxides, and filter sludge. This waste is typically solidified in 4 portland or gypsum-based cements. Contaminated soil, asphalt, and sand are generated from 5 the cleanup of spills, as well as decontamination and decommissioning activities at DOE 6 generator sites, and may also be present in this waste.
7 4.4.2.2 RH TRU Waste Forms
8 RH TRU waste contains mixtures of combustibles (e.g., paper polyvinyl chloride, 9 polypropylene, polyethylene, and neoprene) and non-combustibles (e.g., laboratory
10 equipment, tools, filters, solidified liquids, solid materials, and small electric motors). Some 11 RH TRU wastes are heterogeneous solids consisting of metallographic samples of fuel 12 elements, fines, and combustibles packaged in metal cans and plastic bags or buckets. Free 13 liquid or particulate wastes are not associated with processes that generate RH TRU waste.
14 4.4.2.3 Free Liquid Content
15 The WAC (DOE 1991b) precludes the acceptance of liquid waste and any waste containing 16 free liquids. All internal containers are to be well drained. Residual liquids in well-drained 17 containers are restricted to less than 1 percent of the volume of the internal container. The 18 presence of free liquids is determined through characterization by real-time radiography 19 (RTR). Drums have been excluded from the WIPP program due to non-conformance with the 20 WAC criteria of no free liquids.
21 4.4.3 Radiological Waste Characteristics
22 The CH and RH radionuclide inventories are provided in Table 4-3. This inventory is used in 23 the performance assessment to calculate a waste unit factor (fm) consistent with the 24 instructions in Table 1 of Appendix A of 40 CFR Part 191. The fm is related to the quantity of 25 radionuclides that may be released to the accessible environment.
26 The values presented in Table 4-3 are also used as input to the performance calculations. The 27 values provided in Table 4-3 are based on the most current information available in January 28 1995, the time at which the calculations described in Chapter 6 were initiated. Since January 29 1995, the BIR has been updated. As a result, the values presented in the BIR, which is 30 included as Appendix BIR, are not entirely consistent with those provided in Table 4-3. 31 Because of this inconsistency, the performance calculations presented in Chapter 6 are not 32 based on the most current inventory information. The calculations will be revised to be based 33 on the most current inventory data as the WJJPP compliance program progresses.
March 31, 1995 4-12 DRAFT-DOE/CAO-2056
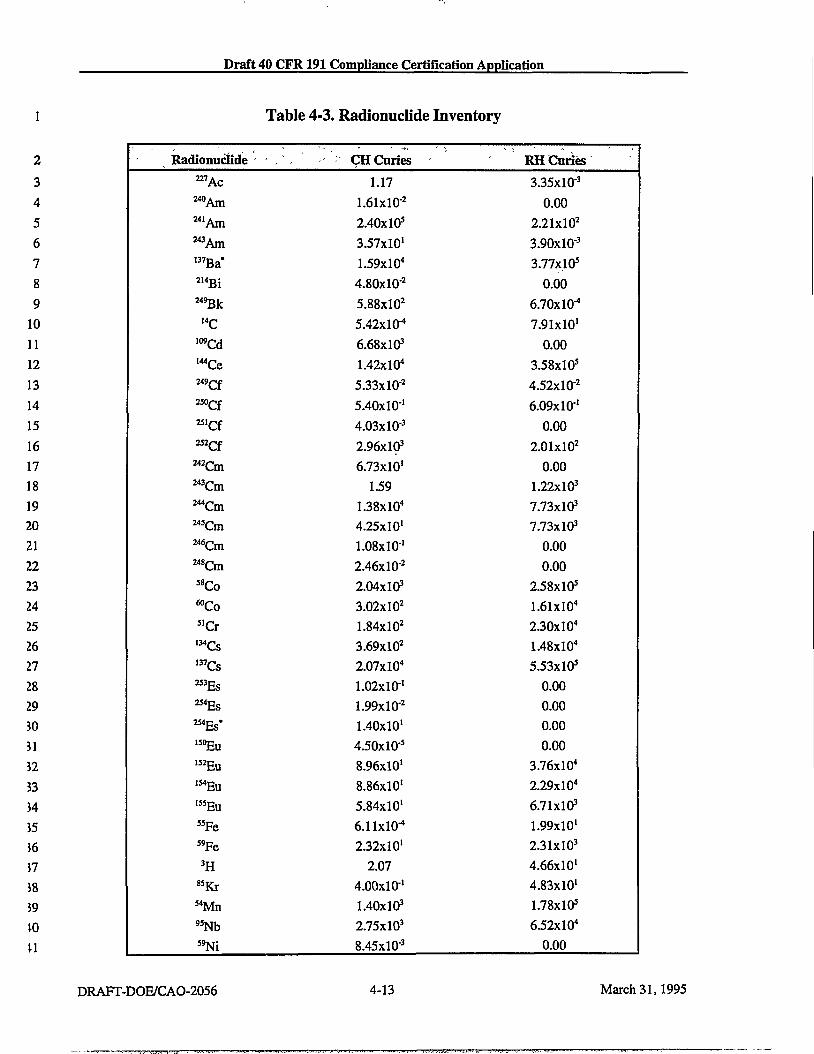
Draft 40 CFR191 Compliance Certification Application
Table 4-3. Radionuclide Inventory
2
3
4
5
6
7
8
9
10
11
12
13
14
15
16
17
18
19
20
21
22
23
24
25
26
27
28
29
30
31
32
33
34
35
36
37
38
39
10
U
Radionuclide . CH Curies RH Curies 2 2 7 A c 1.17 3.35xl0"3
^ A m 1.61xl0"2 0.00 2 4 1 Am 2.40x10s 2.21xl0 2
" A m 3.57x10' 3.90xl0"3
I 3 7Ba* 1.59x10" 3.77x10s
2 1 4 Bi 4.80xl0"2 0.00 2 4 9 Bk 5.88xl02 6.70X10"4
. 4 C 5.42X10"4 7.91x10' 1 0 9 Cd 6.68X10³ 0.00 , 4 4 C e 1.42xl04 3.58x10s
2 4 9 C f 5.33xl0"2 4.52xl0-2
2 5 0 C f 5.40x10-' 6.09x10'' ma 4.03xl0 3 0.00 2 5 2 C f 2.96X10³ 2.01xl0 2
2 4 2 Cm 6.73x10' 0.00 2 4 3 Cm 1.59 1.22X10³
2 4 4 Cm 1.38xl04 7.73X10³
2 4 5 Cm 4.25x10' 7.73x10s
2 4 6 C m 1.08x10-' 0.00 " O n 2.46xl0"2 0.00
S 8Co 2.04x10s 2.58x10s
"Co 3.02xl02 1.61xl04
s 'Cr 1.84xl02 2.30xl04
, 3 4 Cs 3.69xl02 1.48xl04
, 3 7Cs 2.07xl04 5.53x10s
^ E s 1.02x10"' 0.00 ^ E s 1.99x10* 0.00 **&' 1.40x10' 0.00 1 5 0 Eu 4.50x10 s 0.00 1 5 2 E u 8.96x10' 3.76xl04
, 5 4Eu 8.86x10' 2.29xl04
I S 5Eu 5.84x10' 6.71X10³
"Fe 6.11X10"4 1.99x10' s 9 Fe 2.32x10' 2.31xl0 3
3 H 2.07 4.66x10' 8 SKr 4.00x10-' 4.83x10'
5 4Mn 1.40X10³ 1.78x10s
9 SNb 2.75xl03 6.52xl04
S 9Ni 8.45xl0"3 0.00
DRAFT-DOE/CAO-2056 4-13 March 31, 1995
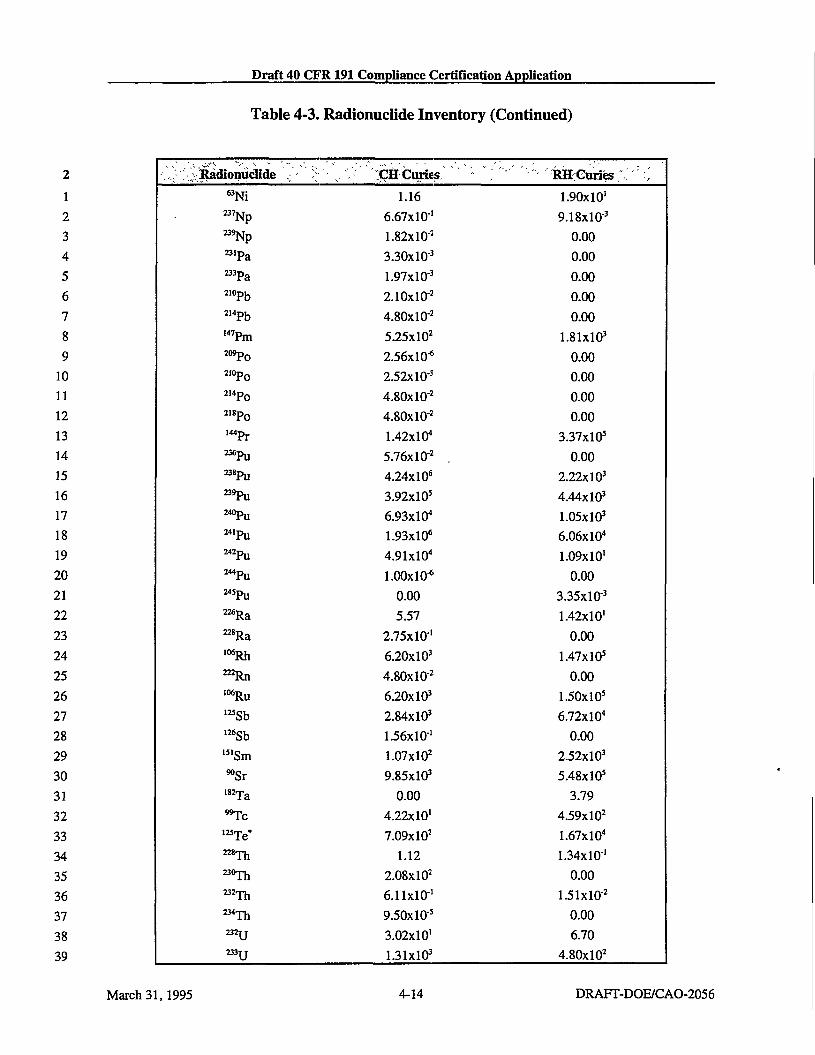
Draft 40 CFR 191 Compliance Certification Application
Table 4-3. Radionuclide Inventory (Continued)
2 1 2 3 4 5 6 7 8 9
10 11 12 13 14 15 16 17 18 19 20 21 22 23 24 25 26 27 28 29 30 31 32 33 34 35 36 37 38 39
,, >; Radionuclide ,; - /•' 0 ".'•''' :CH Cujies, " - ""' "•"' "•'RH'Curies;.;-':; 6 3 Ni 1.16 1.90x10'
a 7 N p 6.67x10"' 9.18x10 s
^Kp 1.82x10* 0.00 2 3 l p a 3.30x10s 0.00 233p a 1.97x10s 0.00 210pD 2.10xl0"2 0.00 2 1 4 p b 4.80xl0"2 0.00 1 4 7 Pm 5.25xl02 1.81x10s
209p Q 2.56X10"6 0.00 2<0p o 2.52x10 s 0.00 2 1 4 P o 4.80xl0"2 0.00 2 1 8 p 0 4.80xl0"2 0.00 1 4 4 Pr 1.42xl04 3.37x10s
a f i Pu 5.76xl0"2 0.00 ^ P u 4.24xl06 2.22x10s
2 S 9 Pu 3.92xl05 4.44x10s
2 4 0 Pu 6.93x10" 1.05x10s
2 4 I P u 1.93xl06 6.06xl04
^ P u 4.91xl04 1.09x10' 2 4 4 Pu l.OOxlO"6 0.00 2 4 5 p u 0.00 3.35X10"3
^ R a 5.57 1.42x10' 2 a R a 2.75x10' 0.00 I 0 6 Rh 6.20x10s 1.47xl05
^ R n 4.80xl0 2 0.00 ! 0 6 R u 6.20X10³ 1.50x10s
1 2 5 Sb 2.84x10s 6.72x10" 1 2 6 Sb 1.56x10-' 0.00
, 5 1 S m 1.07xl02 2.52x10s
"Sr 9.85X10³ 5.48xl05
1 8 2 Ta 0.00 3.79 "Tc 4.22x10' 4.59xl02
1 2 5Te* 7.09xl02 1.67xl04
2 2 8 Th 1.12 1.34x10-' 2 3 0 ^ 2.08xl02 0.00 2 3 2 T h 6.11x10-' 1.51X10'2
2 3 4 ^ 9.50xl0-3 0.00 232u 3.02x10' 6.70 233U 1.31x10s 4.80xl0 2
March 31,1995 4-14 DRAFT-DOE/CAO-2056
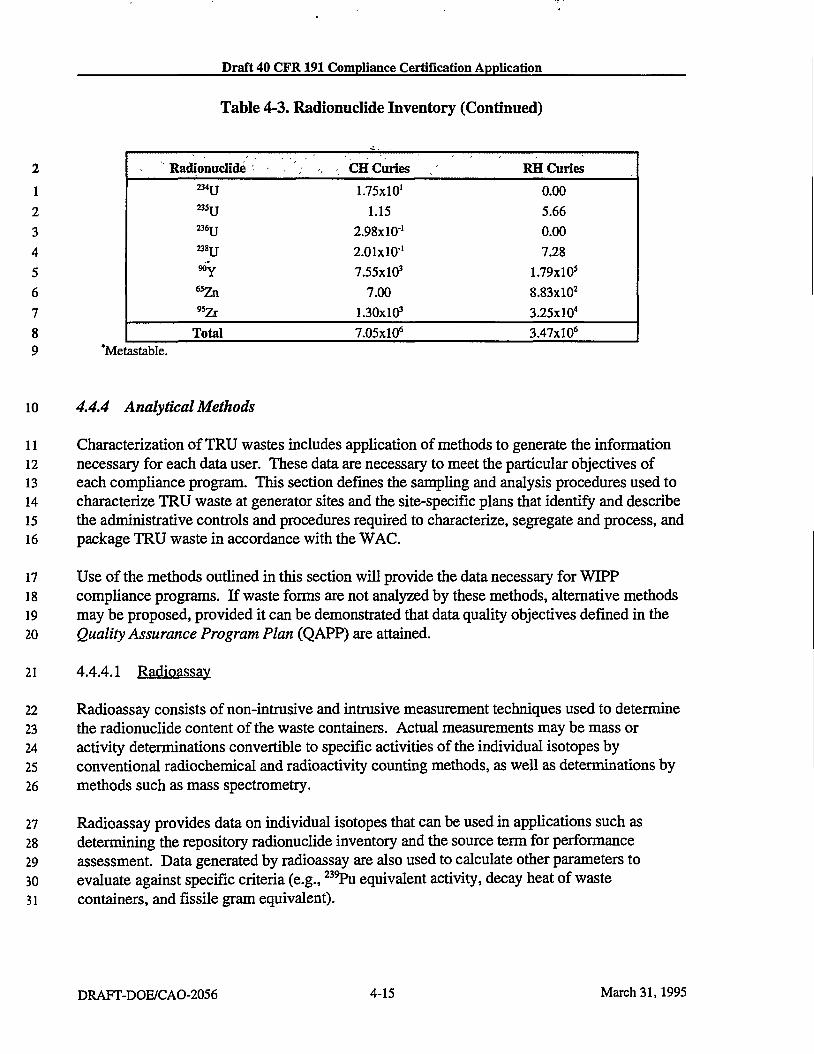
Draft 40 CFR191 Compliance Certification Application
Table 4-3. Radionuclide Inventory (Continued)
Radionuclide CH Curies RH Curies 234TJ 1.75x10' 0.00 2 3 5 u 1.15 5.66 **[J 2.98x10' 0.00 238TJ 2.01x10' 7.28 9 0 y 7.55X10³ 1.79xl05
6 5Zn 7.00 8.83xl02
95Zr 1.30X10³ 3.25xl04
Total 7.05xl06 3.47xl06
9 "Metastable.
10 4.4.4 Analytical Methods
11 Characterization of TRU wastes includes application of methods to generate the information 12 necessary for each data user. These data are necessary to meet the particular objectives of 13 each compliance program. This section defines the sampling and analysis procedures used to 14 characterize TRU waste at generator sites and the site-specific plans that identify and describe 15 the administrative controls and procedures required to characterize, segregate and process, and 16 package TRU waste in accordance with the WAC.
17 Use of the methods outlined in this section will provide the data necessary for WIPP 18 compliance programs. If waste forms are not analyzed by these methods, alternative methods 19 may be proposed, provided it can be demonstrated that data quality objectives defined in the 20 Quality Assurance Program Plan (QAPP) are attained.
21 4.4.4.1 Radioassay
22 Radioassay consists of non-intrusive and intrusive measurement techniques used to determine 23 the radionuclide content of the waste containers. Actual measurements may be mass or 24 activity determinations convertible to specific activities of the individual isotopes by 25 conventional radiochemical and radioactivity counting methods, as well as determinations by 26 methods such as mass spectrometry.
27 Radioassay provides data on individual isotopes that can be used in applications such as 28 determining the repository radionuclide inventory and the source term for performance 29 assessment. Data generated by radioassay are also used to calculate other parameters to 30 evaluate against specific criteria (e.g., 2 3 9 Pu equivalent activity, decay heat of waste 31 containers, and fissile gram equivalent).
DRAFT-DOE/CAO-2056 4-15 March 31,1995
Draft 40 CFR 191 Compliance Certification Application
1 4.4.4.2 Non-Destructive Examination
2 RTR is a radiographic examination technique used at many generator sites. It is a non-3 destructive, non-intrusive examination method that enables a qualitative evaluation of the 4 contents of a waste container. The technique uses X-rays and a video system to inspect the 5 contents of a waste container and allows the operator to view events in progress. 6 Radiographic examination is used to examine and verify the physical form of the waste for 7 certain waste forms, to identify individual waste objects and parts, and to verify the absence of 8 certain noncompliant items, as applicable. For example, radiographic examination can be 9 used to verify that a drum identified as containing solidified waste actually contains solidified
10 waste. Applications also include ensuring that waste containers comply with applicable limits 11 on free liquids by obtaining an estimate of residual liquids in a waste container. The use of 12 radiographic examination in the TRU waste management process and its limitations are 13 documented in the Stored Waste Examination Pilot Plant Sampling Program at the INEL.
14 4.4.4.3 Visual Examination
15 Visual examination consists of examining and sorting the contents of the containers for 16 removal of prohibited items before packaging and for the characterization of variables 17 affecting performance assessment. For example, visual examination can be used to verify 18 packaging.
19 Visual characterization will be implemented in all current waste generation process lines or 20 repackaging programs. The draft TRU Waste Characterization Quality Assurance Program 21 Plan addresses the use of visual examination to verify non-destructive examination data. Data 22 obtained from visual examination are used to determine the percentage of miscertified waste 23 containers. The QAPP specifies that the 90 percent upper confidence level (UCLgo) of the 24 miscertification percentage will be less than 14 percent; however, if 14 percent of the waste 25 containers are shown to be miscertified in any given year, it will be necessary to visually 26 examine a significant percentage, if not all, of the waste containers. Therefore, any 27 noncompliant waste containers will be repackaged to meet the requirements. Experience at 28 the INEL has indicated a miscertification rate of only 2 percent. This miscertification includes 29 all WAC and Transuranic Package Transporter (TRUPACT)-II Authorized Methods for 30 Payload Control (TRAMPAC) criteria, not just the presence of free liquids.
31 4.4.4.4 Supporting Documentation Requirements for Generators
32 Implementation of the TRU Waste Characterization Program at DOE sites requires that all 33 waste characterization activities be conducted in accordance with approved documentation 34 that describes the management, operations, and quality assurance for the program. These 35 documents ensure conformance with all applicable regulatory, programmatic, and operational 36 requirements. The sites may also need to develop other documents (e.g., TRU waste
March 31, 1995 4-16 DRAFT-DOE/CAO-2056

Draft 40 CFR191 Compliance Certification Application
1 management plans, safety analysis reports, and operational safety requirements) that address 2 site-specific programmatic and operational requirements; these documents are not discussed 3 here. The documentat ion requirements critical to the implementation of the T R U Was te 4 Characterization Program at each site are discussed below.
5 Site Characterization Plans. The generator sites must prepare plans which specify h o w the 6 requirements of the W A C will be met. These plans must include the administrative, 7 procedural , and process controls used to determine waste acceptability.
8 Quality Assurance Requirements. All generator sites will ensure that implementat ion of their 9 site-specific waste characterization program meets the quality assurance requirements of D O E
10 Order 5700.6C. The Q A P P describes the specific data quality objectives for the T R U Was te 11 Characterization Program and incorporates the applicable elements of other governing 12 documents , including EPA's Interim Guidelines and Specifications for Preparing Quality 13 Assurance Project Plans. The Q A P P and the associated document, DOE's WIPP Waste 14 Characterization Program Sampling and Analysis Guidance Manual, currently establish 15 analytical methods for meet ing regulatory requirements. Additional discussion on quality 16 assurance is presented in Chapter 5 of this document.
17 Quality Assurance Project Plans (QAPjPs). Prior to initiating waste characterization 18 activities, the sites mus t prepare site-specific Quality Assurance Project Plans (QAPjPs) . 19 These site-specific documents , to be developed in accordance with the applicable 20 requirements in D O E Order 5700.6C and the Q A P P (which is based on EPA Requirements for 21 Quality Assurance Project Plans for Environmental Data Operations, QA/R-5) , define quality 22 management and program elements that provide for planning, implementation, and 23 assessment of the T R U Was te Characterization Program and data collection activities.
24 Standard Operating Procedures (SOPs). The Q A P P requires that each D O E site develop, 25 implement , and control written standard operating procedures (SOPs) that provide detailed 26 descriptions of routine, standardized, or critical waste characterization activities. T h e SOPs 27 serve as the basis for quality assessments of waste characterization activities because they 28 provide detailed descriptions of required activities.
29 Performance Demonstration Program. All facilities characterizing waste for disposal at the 30 W I P P shall successfully participate in the applicable portions of the Performance 31 Demonstrat ion Program (PDP) for the T R U Waste Characterization Program as described in 32 DOE's Performance Demonstration Program Plan (PDPP). The P D P supports the 33 determination of a facility's ability to meet the quality assurance objectives identified in the 34 Q A P P . Facility performance is demonstrated by the successful analysis of blind audit 35 samples. Bl ind audit samples (hereafter referred to as P D P samples) are used to assess facility 36 performance regarding compliance with the Q A P P quality assurance objectives. Acceptable 37 performance will be demonstrated by all participating facilities prior to the initial analysis of 38 T R U waste samples and on a continuing basis. The P D P samples must be analyzed using the 39 same methods the facility anticipates using for the analysis of T R U waste samples. These iO methods will be developed and approved within the specifications of the Q A P P .
DRAFT-DOE/CAO-2056 4-17 March 31,1995

Draft 40 CFR 191 Compliance Certification Application
1 4.4.5 Process Knowledge Documentation
2 Process knowledge is the initial step in the waste characterization program. Process 3 knowledge refers to the knowledge of the processes and materials that generated the waste, 4 along with accompanying records and documentation and the associated administrative, 5 procurement, and quality assurance controls. The application of process knowledge as a waste 6 characterization method is of particular importance in this program (1) to balance the 7 requirements for providing definitive chemical and physical characterization of a waste stream 8 with the need to reduce radiation exposure to personnel and the generation of additional 9 waste; and (2) to address those circumstances where sampling and analysis may not be
10 necessary.
11 Because of complex waste matrices and the potential for radiation exposure to personnel, 12 these wastes have not been routinely sampled and analyzed. Wastes destined for the WIPP 13 facility have been characterized by the DOE through knowledge of the wastes and/or the 14 processes generating them. The requirements of strict product quality and concerns for safety 15 in handling the radioactivity result in highly structured production and research activities. The 16 nature of these activities requires that precise product information be maintained.
17 Process knowledge is a valuable source of information for characterizing waste streams and 18 planning sampling and analysis programs, if it is documented and comes from reliable 19 sources. This documentation, which could be in the form of a process flow diagram, data 20 logs, documented procedures and other administrative controls, etc., will exhibit some 21 attributes which provide evidence of quality. The following list provides some attributes of 22 documentation that would be used to judge quality and evaluate uncertainty of process 23 knowledge:
24 25 26 27 28 29 30
Produced at the time the process was operating and waste was generated and packaged Signed and dated by responsible personnel Co-signed by an oversight organization (i.e., Quality Assurance) Documents are traceable to specific packages Documents are traceable to a group of packages Quality assurance programs were observed Proper training for personnel is documented.
31 Waste currently being generated will be characterized primarily through process knowledge. 32 Sampling and analysis will be required for verification purposes for a portion of all waste 33 streams. Specific guidance for process knowledge collection for current waste generation will 34 be provided by DOE during the Waste Characterization Program implementation process. At 35 a minimum, generators are required to document the process and waste constituent data 36 governed by an approved quality assurance program and a documented management system.
March 31,1995 4-18 DRAFT-DOE/CAO-2056

Draft 40 CFR191 Compliance Certification Application
1 REFERENCES
2 DOE (U.S. Department of Energy). 1991a. Quality Assurance Program Plan for the Waste 3 Isolation Pilot Plant Experimental-Waste Characterization Program. DOE/EM/48063-1, 4 Rev. 1, Washington, D.C.
5 DOE (U.S. Department of Energy). 1991b. Waste Acceptance Criteria for the Waste 6 Isolation Pilot Plant. DOE/WIPP-069, Rev. 4. Westinghouse Electric Corporation, Carlsbad, 7 NM.
8 DOE (U.S. Department of Energy). 1994a. Distribution of the Phase II Mixed Waste 9 Inventory Report Data. Memorandum from Patty Bubar to Distribution (includes data
10 diskette [Version 1.00] the draft User's Guide for National Data Base System for the Final 11 Mixed Waste Inventory Report [May 1994] and Mixed Waste Inventory Report Database 12 System User's Guide). May 17,1994. Washington, D.C.
13 DOE (U.S. Department of Energy). 1994b. Release of Phase I Mixed Waste Inventory Report 14 Data. Memorandum from Patty Bubar to Distribution (includes data diskette [Version .97B] 15 and Mixed Waste Inventory Report Database System User's Guide). April 1,1994. 16 Washington, D.C.
17 DOE (U.S. Department of Energy). 1994c. TRU Waste Characterization Quality Assurance 18 Program Plan (QAPP) [Draft]. CAO-94-1010. U.S. Department of Energy, Carlsbad, NM.
19 DOE (U.S. Department of Energy). 1994d. U.S. Department of Energy Waste Isolation Pilot 20 Plant Transuranic Waste Baseline Inventory Report. DOE/CAO-94-1005, most recent 21 version. U.S. Department of Energy, Carlsbad, NM.
22 U.S. Congress. 1992. Waste Isolation Pilot Plant Land Withdrawal Act. Public Law 102-23 579, October 1992. 102nd Congress, Washington, D.C.
DRAFT-DOE/CAO-2056 4-19 March 31,1995

Draft 40 CFR 191 Compliance Certification Application
l THIS PAGE INTENTIONALLY LEFT BLANK
March 31,1995 4-20 DRAFT-DOE/CAO-2056

Draft 40 CFR191 Compliance Certification Application
1 BIBLIOGRAPHY
2 Clements, T.L., Jr., and Kudera, D.E. 1985. TRU Waste Sampling Program: Volume I -3 Waste Characterization. EEG-UM-6503. Idaho National Engineering Laboratory.
4 Clements, T.L., Jr., and Kudera, D.E. 1985. TRU Waste Sampling Program: Volume II - Gas 5 Generation Studies. EEG-UM-6503. Idaho National Engineering Laboratory.
6 DOE (U.S. Department of Energy). 1980. Final Environmental Impact Statement Waste 7 Isolation Pilot Plant. DOE/EIS-0026. Vols, land 2. Office of Environmental Restoration 8 and Waste Management, Washington, D.C.
9 DOE (U.S. Department of Energy). 1990. Waste Isolation Pilot Plant No-Migration 10 Variance Petition. DOE/WJPP 89-003, Rev. 1, Vol. 1. Westinghouse Electric Corporation, 11 Carlsbad, NM.
12 DOE (U.S. Department of Energy). 1991. Performance Demonstration Program Plan for the 13 WIPP Experimental-Waste Characterization Program. DOE/WJPP 91-016. Carlsbad, NM.
14 DOE (U.S. Department of Energy). 1991. Quality Assurance. DOE Order 5700.6C, August 15 21,1991. Washington, D.C.
16 DOE (U.S. Department of Energy). 1991. Quality Assurance Program Plan for the Waste 17 Isolation Pilot Plant Experimental-Waste Characterization Program. DOE/EM/48063-1, 18 Rev. 1. Washington, D.C.
19 DOE (U.S. Department of Energy). 1991. Waste Characterization Program Plan for WIPP 20 Experimental Waste. DOE/WJPP 89-025, Rev. 1, July 1991. U.S. Department of Energy, 21 Carlsbad, NM.
22 DOE (U.S. Department of Energy). 1991. WIPP Waste Characterization Program Sampling 23 and Analysis Guidance Manual. DOE/WJPP 91-043, current revision. Waste Isolation Pilot 24 Plant, Carlsbad, NM.
25 DOE (U.S. Department of Energy). 1992. TRUPACT-II Content Codes (TRUCON). 26 DOE/WJPP 89-004, Rev. 6.
27 DOE (U.S. Department of Energy). 1993. The Department of Energy Transuranic Waste 28 Characterization Program Plan [Draft]. DOE/WJPP 93-059. WJPP Project Integration 29 Office, Albuquerque, NM.
30 DOE (U.S. Department of Energy). 1993. RCRA Part B Permit Application for the Waste 31 Isolation Pilot Plant. DOE/WJPP 91-005, Rev. 3, January 1993. U.S. Department of Energy, 32 Carlsbad, NM.
DRAFT-DOE/CAO-2056 4-21 March 31,1995

Draft 40 CFR 191 Compliance Certification Application
1 DOE (U.S. Department of Energy). 1993. U.S. Department of Energy Interim Mixed Waste 2 Inventory Report: Waste Streams, Treatment Capacities and Technologies. DOE/NBM-3 1100. 6 Vols., April 1993. U.S. Department of Energy, Washington, D.C.
4 DOE (U.S. Department of Energy). 1994. Integrated Data Base for 1993: U.S. Spent Fuel 5 and Radioactive Waste Inventories, Projections, and Characteristics. DOE/RW-0006, Rev. 6 9, April 1994. U.S. Department of Energy, Washington, D.C.
7 EPA (U.S. Environmental Protection Agency). 1980. A Method for Determining the 8 Compatibility of Hazardous Waste. Office of Solid Waste, Washington, D.C.
9 EPA (U.S. Environmental Protection Agency). 1983. Interim Guidelines and Specification 10 for Preparing Quality Assurance Project Plans. QAMS-005/80, December 29,1983. 11 Washington, D.C.
12 Sandia National Laboratories. 1991. Preliminary Comparison with 40 CFR Part 191, 13 Subpart Bfor the Waste Isolation Pilot Plant, Volume 3: Reference Data. SAND91-0893/3, 14 December 1991. App. A, pp. A-43 to A-53. Sandia National Laboratories, WIPP 15 Performance Assessment Division, Albuquerque, NM.
16 Sandia National Laboratories. 1992. Preliminary Performance Assessment for the Waste 17 Isolation Pilot Plant. SAND92-0700, Vols. 2, 3, and 4. Sandia National Laboratories, WIPP 18 Performance Assessment Division, Albuquerque, NM.
March 31,1995 4-22 DRAFT-DOE/CAO-2056

1 5.0 QUALITY ASSURANCE
2 5.1 Purpose
3 The U.S. Department of Energy (DOE) quality assurance (QA) policy is to establish, 4 maintain, and implement an effective QA program that complies with applicable DOE Orders 5 and requirements and U.S. Environmental Protection Agency (EPA) requirements. It is the 6 DOE's goal to fulfill its mission while ensuring that not only are risks and environmental 7 impacts identified and minimized, but also that safety, reliability, and performance are 8 maximized.
9 QA programs define the management systems to be employed to meet the requirements and 10 guidance described by the Carlsbad Area Office's (CAO's) Quality Assurance Program 11 Description (QAPD), which is included in this document as Appendix QAPD. The purpose of 12 specifying requirements and associated guidance for QA programs is to ensure that all 13 participants develop and implement effective management systems to ensure that items, 14 processes, and services meet or exceed applicable CAO QA requirements.
15 The proposed Title 40 Code of Federal Regulations (CFR) § 194.22, § 194.26, and § 194.27 16 specify requirements regarding QA, expert judgment, and peer review. These requirements 17 are not addressed in this document.
18 5.2 QA Program Management
19 Effective implementation of the CAO QA program depends on the efforts of all levels of the 20 CAO organization (including the CAO Manager, senior management, line management, and 21 the personnel performing work). The CAO organization is structured such that the individual 22 performing the work is responsible for achieving and maintaining quality; line management is 23 responsible for verifying the quality; and independent assessors are responsible for assessing 24 the quality of the work. The CAO QA Manager is responsible for defining, integrating, and 25 ensuring effective implementation of QA activities throughout the CAO.
26 5.2.1 Organization
11 The hierarchy of QA program requirements and the organizational interfaces between the 28 major project participants are illustrated in Figure 5-1. Major responsibilities of project 29 participants are as follows:
30 • The DOE is the controlling organization for Waste Isolation Pilot Plant (WIPP) QA 31 program development, implementation, and assessment
32 • The DOE reviews and approves the QA program documents of the Scientific Advisor 33 (Sandia National Laboratories [SNL]), the Management and Operating (M&O) contractor 34 (Westinghouse Waste Isolation Division [WID]), and the transuranic (TRU) waste 35 generator sites
DRAFT-DOE/CAO-2056 March 31,1995
Draft CFR191 Compliance Certification Application
1 • TRU waste generator sites are responsible for TRU and TRU mixed waste characterization 2 and for the waste certification programs
3 • The WTD is responsible for WIPP site operation and maintenance and for monitoring the 4 site environment
5 • SNL develops, confirms, and validates models used to simulate long-term repository 6 performance; SNL also conducts research, experiments, and tests to collect the data needed 7 for input to the models.
8 5.2.2 QA Program Requirements
9 QA program requirement sources include several federal requirements (10 CFR Part 830,40 10 CFR Part 261,40 CFR Part 264,40 CFR § 268.6, and 10 CFR Part 71), DOE Orders 11 (primarily DOE 5700.6C), and consensus standards (American Society of Mechanical 12 Engineers Quality Assurance Requirements for Nuclear Facilities [ASME NQA-1], NQA-2 13 Part 2.7, and NQA-3). These requirements are directed through the DOE Environmental 14 Management (EM) QA Requirements and Description to the DOE CAO. The CAO QAPD 15 (refer to Appendix QAPD) reflects the QA requirements, lists other sources of program 16 guidance, and describes the project interfaces and responsibilities.
17 Participant QA program descriptions include discussions of how the QA requirements will be 18 satisfied taking into consideration the probability and consequences of risk associated with the 19 work. These discussions include the rationale and methodology used for the compliance 20 determination as well as discussions addressing applicability of the requirements to the work 21 being performed.
22 The rigor of QA controls is commensurate with, but not limited to, the following criteria:
23 24 25 26 27 28 29 30
Function or end-use of the item Importance and end-use of the data generated Probability of failure Complexity or uniqueness of design, fabrication, or implementation Reproducibility of the result History of the item or service quality Necessity for special controls or processes Ability to demonstrate functional compliance.
31 5.2.3 Qualification and Training Requirements
32 Personnel performing work are qualified and capable of performing their assigned tasks. 33 Project participants have established formal methods for the evaluation, selection, 34 indoctrination, training, and qualification of personnel performing work.
March 31,1995 5-2 DRAFT-DOE/CAO-2056

Draft 40 CFR 191 Compliance Certification Application
CFRs, DOE ORDERS N Q A l . 2 , 3
• * " ~ , m " '
EM-QARD
CAO QAPD kV i lii'wiHTif i ir'i TirpTifflnwri rrnr firm
SCIENTIFIC ADVISOR
MANAGEMENT AND OPERATING CONTRACTOR
SNL QAPD
CONTRACTOR QA PLANS
WID QAPD
CONTRACTOR QA PLANS
QA CONSENSUS REQUIREMENTS AND GUIDANCE
DOEHQ REQUIREMENTS
DOE/CAO REQUIREMENTS AND GUIDANCE
TRU WASTE GENERATOR SITES
WASTE CHARACTERIZATION
QAPP
GENERATOR QA PLANS
Figure 5-1. Hierarchy of DOE QA Programs
DRAFT-DOE/CAO-2056 5-3 March 31,1995

Draft CFR 191 Compliance Certification Application
TfflS PAGE INTENTIONALLY LEFT BLANK
March 31, 1995 5-4 DRAFT-DOE/CAO-2056

Draft CFR191 Compliance Certification Application
1 5.2.4 Quality Improvement, Nonconformances, and Corrective Action
2 A culture which promotes continuous improvement is fundamental and integral to the WIPP 3 mission; therefore, each organization's management seeks continuous improvement in the 4 performance and efficiency of work processes and activities.
5 All personnel are responsible for identifying nonconforming items, activities, and processes 6 and are encouraged by management to suggest improvements. Management at all levels 7 strives to foster a "no-fault" attitude to encourage the identification of nonconforming items 8 and processes. Nonconformances are documented, evaluated, and dispositioned. Corrective 9 actions must address the following: root cause; actions to resolve the problem and to preclude
10 recurrence; assessment of the extent of the problem; and scheduled completion dates.
11 5.2.5 Documents and Records
12 Documents and records generated under the CAO QA program are specified, prepared, 13 reviewed, approved, controlled, and maintained in accordance with the CAO QAPD (refer to 14 Appendix QAPD). The CAO QAPD provides a single reference for all project participants in 15 meeting records management requirements as specified in DOE Orders and regulations.
16 5.3 QA Program Implementation
17 This section discusses aspects of implementing the QA Program.
18 5.3.1 Work Processes
19 Work is performed in accordance with established, approved, and documented technical 20 standards and administrative controls. Work is also performed under controlled conditions 21 using approved instructions, procedures, drawings, or other appropriate means. Items are 22 identified and controlled to ensure their proper use. Items are maintained to prevent their 23 damage, loss, or deterioration. Equipment used for process monitoring or data collection is 24 calibrated and maintained. Handling, storage, cleaning, shipping, and other means of 25 preserving, transporting, and packaging of items is conducted in accordance with established 26 work and inspection procedures, shipping instructions, or other specified documents.
27 5.3.2 Design
28 Items and processes are designed using sound engineering and scientific principles and 29 appropriate standards. Design work, including changes, incorporates appropriate 30 requirements such as general design criteria and design bases. Design interfaces are identified 31 and controlled. The adequacy of design products are verified by individuals or groups 32 independent from those who performed the work. Verification is completed prior to approval 33 and implementation of the design.
DRAFT-DOE/CAO-2056 5-5 March 31,1995

Draft CFR191 Compliance Certification Application
1 5.3.2.1 Design of Data Quality Objectives
2 For future work, the concept of designing data quality objectives for environmental data will 3 apply. Project goals will be documented, decisions and inputs identified, the study bounded, 4 and a decision rule developed. Limits on decision errors will determine the degree of 5 confidence necessary for the data to be considered valid.
6 For past work, where data have already been collected, the end-use of the data determines the 7 amount of uncertainty permissible. Existing data undergo a formal qualification process 8 before being used in compliance submittals. Refer to Section 5.6.1 for further discussion on 9 qualification of existing data.
10 5.3.3 Procurement Control
11 Controls are established to ensure that procured items and services meet applicable technical 12 and QA requirements and that they perform as specified. Prospective suppliers are evaluated 13 and selected on the basis of documented criteria. Procurement controls ensure that approved 14 suppliers continue to provide acceptable items and services.
15 5.3.4 Inspection and Test Control
16 Essential parts of work planning processes include the identification of the following:
17 18 19 20 21 22
Items and processes to be inspected or tested Parameters or characteristics to be evaluated Techniques to be used Acceptance criteria Hold points, and Organizations responsible for performing the tests and inspections.
23 Inspection and testing of specified items and processes are conducted using established 24 criteria. The acceptance of an item is documented and approved by qualified and authorized 25 personnel. Equipment used for inspections and tests is calibrated and maintained.
26 5.3.5 Waste Characterization Program
27 QA requirements and program guidance for waste characterization is contained in the DOE 28 TRU Waste Characterization QA Program Plan (QAPP). The Waste Characterization QAPP 29 establishes a single program applying to all DOE TRU waste generator sites that anticipate 30 shipping radioactive and mixed wastes to the WIPP. The comprehensive scope of the Waste 31 Characterization QAPP, encompassing all generator sites, is necessary for achieving a level of 32 consistency in TRU and TRU mixed waste certification. The Waste Characterization QAPP 33 addresses QA requirements from the following sources:
March 31,1995 5-6 DRAFT-DOE/CAO-2056

Draft CFR191 Compliance Certification Application
1 • 10 CFR Part 71 , Packaging and Transportation of Radioactive Materials 2 • 40 CFR Part 268, Land Disposal Restrictions, 3 • 40 CFR Part 264, Standards for Owners arid Operators of Hazardous Waste Treatment, 4 Storage, and Disposal Facilities 5 • 40 CFR Part 191, Environmental Radiation Protection Standards for the Management and 6 Disposal of Spent Nuclear Fuel, High-Level, and Transuranic Radioactive Wastes.
7 The original scope of the Waste Characterization QAPP was developed for the WIPP test 8 phase (the test phase was canceled October 21,1993 prior to implementation). The document 9 is currently being updated to be consistent with the preoperational work scope. The Waste
10 Characterization QAPP uses established quality objectives for determining whether or not 11 waste destined for the WIPP meets acceptance criteria. Flow-down of applicable QA 12 requirements from the Waste Characterization QAPP to each generator site is accomplished 13 through the development of site-specific QA project plans.
14 The QA project plans for each TRU waste generator site establish organizational roles and 15 responsibilities, describe the waste certification process, and reference approved procedures to 16 be used.
17 In addition to non-destructive test methods and waste sampling and analysis, TRU and TRU 18 mixed waste characterization uses process knowledge. QA controls for process knowledge 19 include design documentation (e.g., drawings, specifications), construction and acceptance 20 test records, operating reports, and process stream analyses.
21 5.3.6 WIPP Site Monitoring Programs
22 The environmental monitoring program at WIPP was initially established to acquire 23 preoperational baseline environmental data in accordance with DOE Orders. The current 24 program includes radiological and nonradiological monitoring carried out in accordance with 25 the Environmental Regulatory Guide for Radiological Effluent Monitoring and Environmental 26 Surveillance, DOE/EH-0173T. The guide is based on implementation of DOE Order 5400.1, 27 General Environmental Protection Program and DOE Order 5400.5, Radiation Protection of 28 the Public and the Environment.
29 The radiological portion of the site environmental monitoring program includes liquid and 30 airborne effluents, ambient airborne particulates, biotic samples, soils and sediments, surface 31 and drinking water, and groundwater. Nonradiological monitoring includes local 32 meteorology, ambient volatile organic compounds (VOCs), airborne gases, ecological plots, 33 aerial photography, and salt-impact studies.
34 QA requirements for WIPP environmental data operations are specified in the WID QAPD 35 (Westinghouse 1995, attachment II, p. 2). Specified tolerances for data uncertainty, in terms 36 of data accuracy, precision, and completeness are contained in project-specific plans for air, 37 groundwater, stormwater, VOC, and site effluent monitoring. A series of approved 38 procedures, instructions, and drawings are used to implement the technical and QA
DRAFT-DOE/CAO-2056 5-7 March 31,1995
Draft CFR 191 Compliance Certification Application
1 requirements. Data are assessed routinely and reported in the annual site environmental 2 report. QA plans and procedures have also been issued for hazardous materials management 3 and Resource Conservation and Recovery Act (RCRA) compliance.
4 5.4 QA Program Assessment
5 Oversight authority for QA programs rests with the DOE. Also, each project participant is 6 responsible for conducting assessments and identifying and tracking areas for improvement. 7 The accepted mechanisms for these assessments are management assessment and independent 8 assessment. For specific activities (such as laboratory quality control), performance and 9 system audits may be specified in QA plans or in subcontract work specifications.
10 Managers at all levels periodically assess the performance of their organization. The purpose 11 for management assessment is to identify improvements and to determine how well the 12 integrated QA program is working.
13 Several levels of independent assessments occur within the QA program:
14 • DOE performs independent assessment of major project participant processes and 15 products 16 • All program participants internally assess their programs using personnel independent of 17 the work 18 • Subcontractors undergo source inspections, surveys, and audits performed by other project 19 participants.
20 5.5 Sample Control
21 Samples are controlled and identified in a manner consistent with their intended use. Sample 22 controls define responsibilities such as interfaces between organizations for documenting and 23 tracking sample possession from sample collection and identification through handling, 24 preservation, shipment, transfer, analysis, storage, and final disposition.
25 5.6 Control of Scientific Investigations
26 Scientific investigations are defined, controlled, verified, and documented. Process variables 27 affecting scientific investigations are measured and controlled. Planning determines the 28 criteria to be used for subsequent evaluation of collected data. Scientific investigations are 29 performed and documented in accordance with approved plans. Data are reviewed and 30 validated prior to reporting the results.
March 31, 1995 5-8 DRAFT-DOE/CAO-2056

Draft CFR191 Compliance Certification Application
1 5.6.1 Qualification of Existing Data
2 Qualification of existing data with mdeterminatequal i ty is necessary in cases where evidence 3 does not exist that shows the data to b e used were collected under the formal control of a Q A 4 program. Da ta that were not collected in accordance with the requirements of the C A O 5 Q A P D (refer to Appendix QAPD) shall be qualified for their intended use. A procedure 6 developed for data qualification considers both Q A programmatic and technical criteria.
7 The process for qualifying existing data to be used in performance assessment model ing was 8 joint ly established by C A O and SNL, with observation by the EPA. The process is based on 9 the Nuclear Regulatory Commission 's (NRC's) guidance documents , N U R E G s 1298 and
10 1297.
11 T h e data qualification process begins wi th identification and prioritization of data sets needed 12 for compliance calculations or for settlement of compliance issues. A data package is 13 assembled by a team and is evaluated for completeness. An independent review team reviews 14 the package for adequacy in meet ing equivalent Q A program requirements (evaluating the Q A 15 controls in place at the t ime of data collection). If necessary, alternative methods for 16 qualifying the data are selected (i.e., corroborating data, confirmatory testing, or peer review). 17 Data that cannot b e qualified are abandoned.
18 5.6.2 Background - Evolving QA Program Requirements
19 The current D O E C A O Q A P D (refer to Appendix QAPD) blends Q A requirements and 20 guidance from multiple sources. However , the D O E W I P P project work has been performed 21 under formal Q A programs since 1977 and throughout several project phases.
22 1977-1980 Site Characterization Phase. The earliest W I P P Q A programs were based on 23 the nuclear power plant Q A requirements of the NRC's Title 10 C F R Part 50 , 24 app. B . Late in this phase, the A S M E N Q A - 1 became the preferred Q A 25 standard.
26 1980-1983 Site Preliminary Design Validation Phase. N Q A - 1 requirements, as called for 27 by the D O E Order 5700.6A, were the basis for W I P P Q A programs.
28 1983-1989 Construction Phase. N Q A - 1 continued to be recognized through D O E Orders 29 as the preferred standard for Q A through D O E 5700.6B.
30 1989-1993 Test Phase1. The maturing W I P P Q A programs, based on N Q A - 1 , began to be 31 supplanted by a performance-based Q A standard, D O E Order 5700.6C.
'Tests were canceled October 21,1993 prior to implementation.
DRAFT-DOE/CAO-2056 5-9 March 31,1995

Draft CFR 191 Compliance Certification Application
1 1994-present Preoperational Phase. For environmental data quality, the current 2 requirements are taken from DOE Order 5700.6C and selected EPA guidance 3 documents. The process for qualifying existing data utilizes guidance from 4 NUREGs 1297 and 1298. Tide 10 CFR § 830.120 QA requirements apply to 5 DOE nuclear facility contractors, including WIPP and the TRU waste 6 generator sites.
7 5.7 Computer Software QA
8 The extent to which computer software controls are implemented is commensurate with the 9 application, and their implementation is meant to ensure that the quality of the software meets
10 its intended use. The implementation of specific requirements is prescribed in written plans 11 and procedures.
12 Software determined to be important to regulatory compliance is subject to lifecycle 13 considerations or other approved software QA methodologies as specified in the CAO QAPD 14 (refer to Appendix QAPD). Controlled software is appropriately documented, tested, 15 reviewed, and approved. All phases of the software lifecycle or all associated QA activities 16 are documented.
17 Software QA control includes inventorying those applications that are designated to meet the 18 CAO software requirements. Software essential to the operation of key equipment or systems 19 or to the accomplishment of project objectives is included. Controlled software is catalogued 20 and maintained under configuration management controls.
21 Lifecycle considerations are applied to software identified to be important to regulatory 22 compliance. Lifecycle elements include specification and documentation of requirements, 23 design, verification, installation, testing, validation, maintenance, configuration control, and 24 retirement.
25 Since models and codes to be used for performance assessment were developed by the 26 Scientific Advisor, the SNL WIPP QAPD forms the basis for their management and control. 27 A series of implementing procedures is used to control (1) the development and use of 28 computer software, (2) the selection of values for parameters used in the performance 29 assessment process, (3) the analytical activities, (4) the preparation, review, approval, and 30 issuance of reports, and (5) the use of expert judgment panels for developing as necessary 31 those parameter values where experimental data are either unreasonable or impossible to 32 obtain.
March 31, 1995 5-10 DRAFT-DOE/CAO-2056

Draft CFR 191 Compliance Certification Application
1 REFERENCES
2 Sandia National Laboratories. 1992. Sandia National Laboratories Waste Isolation Pilot 3 Plant Quality Assurance Program Description. Rev. P, October 10, 1992.
4 Westinghouse [Electric Corporation]. 1995. Waste Isolation Division Quality Assurance 5 Program Description. WP 13-1, Rev. 15, January 1995. Waste Isolation Division, Carlsbad, 6 NM.
DRAFT-DOE/CAO-2056 5-11 March 31, 1995
Draft CFR 191 Compliance Certification Application
1 TfflS PAGE INTENTIONALLY LEFT BLANK
March 31, 1995 5-12 DRAFT-DOE/CAO-2056

Draft CFR191 Compliance Certification Application
1 BIBLIOGRAPHY
2 ASME (American Society of Mechanical Engineers). 1989. Quality Assurance Program 3 Requirements for Nuclear Facilities. ASME NQA-1-1989, August 31,1989.
4 ASME (American Society of Mechanical Engineers). 1990. Quality Assurance Program 5 Requirements for the Collection of Scientific and Technical Information for Site 6 Characterization ofHigh-Level Nuclear Waste Repositories. ASME NQA-3-1989, March 23, 7 1990.
8 ASME (American Society of Mechanical Engineers). 1990. Quality Assurance Requirements 9 for Nuclear Facility Applications. ASME NQA-2a-1990, Part 2.7, May 31,1990.
10 DOE (U.S. Department of Energy). 1990. General Environmental Protection Program. 11 DOE Order 5400.1, Rev. 1, June 29,1990. Washington, D.C.
12 DOE (U.S. Department of Energy). 1991. Environmental Regulatory Guide for Radiological 13 Effluent Monitoring and Environmental Surveillance. DOE/EH-0173T, January 1991. 14 Washington, D.C.
15 DOE (U.S. Department of Energy). 1991. Quality Assurance. DOE Order 5700.6C, August 16 21,1991. Washington, D.C.
17 DOE (U.S. Department of Energy). 1991. Quality Assurance Program Plan for the Waste 18 Isolation Pilot Plant Experimental-Waste Characterization Program. DOE/EM/48063-1, 19 Rev. 1. Washington, D.C.
10 DOE (U.S. Department of Energy). 1994. U.S. Department of Energy Carlsbad Area Office »l Quality Assurance Program Description. CAO-94-1012, Rev. 0, June 1994. U.S. '.2 Department of Energy, Carlsbad, NM. (This document is included as Appendix QAPD.)
:3 DOE (U.S. Department of Energy). Draft. Waste Isolation Pilot Plant Waste :4 Characterization Quality Assurance Program Plan. TBI.
:5 EPA (U.S. Environmental Protection Agency). 1983. Interim Guidelines and Specifications :6 for Preparing Quality Assurance Project Plans. QAMS-005/80, December 29, 1983. 7 Washington, D.C.
8 EPA (U.S. Environmental Protection Agency). 1986. Test Methods for Evaluating Solid 9 Waste. SW-846, November 1986. Washington, D.C.
0 EPA (U.S. Environmental Protection Agency). 1987. Industrial Source Complex (ISC) 1 Model User's Guide. EPA-450/4-88-002a and b, 2ed., December 1987.
DRAFT-DOE/CAO-2056 5-13 March 31,1995

Draft CFR 191 Compliance Certification Application
1 NRC (U.S. Nuclear Regulatory Commission). 1988. Peer Review for High-Level Nuclear 2 Waste Repositories. NUREG-1297, February 1988.
3 NRC (U.S. Nuclear Regulatory Commission). 1988. Qualification of Existing Data for High-4 Level Nuclear Waste Repositories. NUREG-1298, February 1988.
5 Sandia National Laboratories. 1994. Qualification of Existing Data. Quality Assurance 6 Procedure QAP 20-3, Rev. 0, September 28,1994. Sandia National Laboratories, 7 Albuquerque, NM.
8 Title 10 CFR Part 71, Subpart H. Packaging and Shipping of Radioactive Materials.
9 Title 10 CFR § 830.120. Nuclear Safety Management, Quality Assurance.
10 Title 40 CFR Part 61, National Emission Standards for Hazardous Air Pollutants 11 (NESHAPS).
12 Title 40 CFR Part 191, Environmental Radiation Protection Standards for the Management
13 and Disposal of Spent Nuclear Fuel, High-Level, and Transuranic Radioactive Wastes.
14 Title 40 CFR Part 261, Identification and Listing of Hazardous Waste.
15 Title 40 CFR Part 264, Standards for Owners and Operators of Hazardous Waste Treatment, 16 Storage, and Disposal Facilities. 17 Title 40 CFR Part 268, Land Disposal Restrictions.
March 31, 1995 5-14 DRAFT-DOE/CAO-2056

1 6.0 C O N T A I N M E N T R E Q U I R E M E N T S
2 The U.S . Environmental Protection Agency (EPA), in Title 4 0 Code of Federal Regulat ions 3 (CFR) Part 191 , specifies the generally applicable environmental standards for the disposal of 4 transuranic (TRU) and high-level radioactive wastes.
5 In this chapter the U.S . Department of Energy (DOE) addresses compliance with the 6 Containment Requirements at 4 0 CFR § 191.13. Furthermore, this chapter considers only 7 undisturbed performance of the disposal system.
8 "Undisturbed performance" is defined at 4 0 C F R § 191.12 as "the predicted behavior of a 9 disposal system, including consideration of the uncertainties in predicted behavior, if the
10 disposal system is not disrupted by human intrusion or the occurrence of unlikely natural 11 events." However , the Containment Requirements specify consideration of "all significant 12 events and processes," and the proposed text of 4 0 C F R § 194.32 explicitly requires 13 consideration of human-initiated processes and events for compliance with the Containment 14 Requirements . Therefore, the DOE's preliminary performance assessment results presented in 15 Section 6.3 that indicate compliance with 4 0 C F R § 191.13(a) must b e considered incomplete . 16 Addit ional analyses of undisturbed performance are in progress, and although results are not 17 available for inclusion here, the essential background material concerning treatment of future 18 human actions is discussed by the D O E .
19 The complete text of the 4 0 C F R § 191.13 Containment Requirements follows:
20 (a) Disposal systems for spent nuclear fuel or high-level or TRU radioactive wastes shall be 21 designed to provide a reasonable expectation, based on performance assessments, that the 22 cumulative releases of radionuclides to the accessible environment for 10,000 years after 23 disposal from all significant processes and events that may affect the disposal system shall:
24 (1) Have a likelihood of less than one chance in 10 of exceeding the 25 quantities calculated according to Table 1 (Appendix A); and
26 (2) Have a likelihood of less than one chance in 1,000 of exceeding ten times 27 the quantities calculated according to Table 1 (Appendix A).
28 (b) Performance assessments need not provide complete assurance that the requirements of 29 191.13(a) will be met. Because of the long time period involved and the nature of the events 30 and processes of interest, there will inevitably be substantial uncertainties in projecting disposal 31 system performance. Proof of the future performance of a disposal system is not to be had in 32 the ordinary sense of the word in situations that deal with much shorter time frames. Instead, 33 what is required is a reasonable expectation, on the basis of the record before the implementing 34 agency, that compliance with 191.13(a) will be met.
35 The term "accessible environment" is defined as: "(1) The atmosphere; (2) land surfaces; 36 (3) surface waters; (4) oceans; and (5) all of the lithosphere that is beyond the controlled area" 37 (40 C F R § 191.12). Further, "controlled area" means: "(1) A surface location, to b e identified 38 by passive institutional controls, that encompasses no more than 100 square kilometers and 39 extends horizontally no more than five kilometers in any direction from the outer boundary of
DRAFT-DOE/CAO-2056 March 31,1995

Draft 40 CFR 191 Compliance Certification Application
1 2 3
4 5
6 7 8 9 10 11 12 13 14 15 16 17 18 19 20 21 22 23 24 25
26 27 28
the original location of the radioactive wastes in a disposal system; and (2) the subsurface underlying such a surface location" (40 CFR § 191.12). The requirements in 40 CFR § 191.13(a) refer to table 1 in appendix A. This table is reproduced here as Table 6-1.
Table 6-1. Release Limits for the Containment Requirements (EPA 1985, appendix A, table 1)
'-."."'" .-•:; X:-\" '" :'\ " : \ \ \ - -i'::'.•.'••' '-r'y'~ \ \ J Rdease'ioiiitL, per 1000 MTHM? '•"•:'--'\'>: ' - Radionuclide^-..-'. .. - . !or other turrit of waste (cnries) •'•'•'-Americium-241 or -243 100 Carbon-14 100 Cesium-135 or -137 1,000 Iodine-129 100 Neptunium-237 100 Plutonium-238, -239, -240, or -242 100 Radium-226 100 Strontium-90 1,000 Technetium-99 10,000 Thorium-230or-232 10 Tin-126 1,000 Uranium-233, -234, -235, -236, or -238 100 Any other alpha-emitting radionuclide with a half-life greater than 20 years 100 Any other radionuclide with a half-life greater than 20 years that does not emit alpha particles 1.000 "Metric tons of heavy metal exposed to a burnup between 25,000 megawatt-days per metric ton of heavy metal (Wd/MTHM) and 40,000 Mwd/MTHM.
For a release to the accessible environment that involves a mix of radionuclides, the limits in Table 6-1 are used to define a normalized release for comparison with the release limits. Specifically, the normalized EPA release nR for TRU waste is defined by
"* = £(e/A)a* 1 0 6 c / / c) (1)
29 where
30 31 32 33
34 35 36 37 38 39
Qi = cumulative release in curies (Ci) of radionuclide into the accessible environment during the 10,000-year period following closure of the repository
Lj = the release limit in curies for radionuclide / given in Table 6-1 C = amount of TRU waste in curies emplaced in the repository.
The text of proposed 40 CFR Part 194 states that the total amount of TRU waste in curies (C in this equation) shall be "the expected curie activity 100 years after disposal of the waste...." Analyses performed by the DOE for this draft application do not follow this approach. Instead, the normalized release is calculated with respect to the inventory at the time of emplacement. If the approach in 40 CFR Part 194 is codified in the final rule, the DOE will perform analyses accordingly.
March 31, 1995 6-2 DRAFT-DOE/CAO-2056
Draft 40 CFR191 Compliance Certification Application
1 As indicated in Note 1(e) to the appendix A table (Table 6-1 in this document) the "other unit 2 of waste" for TRU waste shall be "an amount of transuranic [TRU] wastes containing one 3 million curies of alpha-emitting transuranic radionuclides with half-lives greater than 20 4 years."
5 The remainder of this chapter is organized as follows.
6 In Section 6.1 the DOE presents the overall system performance assessment methodology 7 developed by the Waste Isolation Pilot Plant (WIPP) project to evaluate compliance with the 8 Containment Requirements. The methodology has been developed by the DOE to undertake 9 full system assessments, including the capability to address uncertainties associated with the
10 occurrence of future human actions. Although the full methodology is described, aspects of it 11 have not been exercised in preparing this draft application because analyses are restricted to 12 undisturbed performance.
13 In Section 6.2 the DOE presents the scenario development methodology, including 14 development of a comprehensive list of features, events, and processes (FEPs) that the DOE 15 believes might affect disposal system performance, the screening methodology applied to that 16 list, and the results to date of the screening process. FEPs relevant to both disturbed and 17 undisturbed performance are discussed and screened. However, as noted above, analyses of 18 disturbed performance are not included in this document.
19 In Section 6.3 the DOE presents the conceptual and computational models and parameter 20 values used to estimate performance of the undisturbed disposal system for those FEPs that 21 remain following the screening process. Section 6.3 also contains the results of the 22 preliminary performance assessment calculations performed for this draft application.
23 6.1 Performance Assessment Methodology
24 The DOE's methodology for performance assessment uses relevant information about the 25 disposal system and the waste to simulate performance over the regulatory time periods. This 26 process is schematically represented by the flow diagram in Figure 6-1, which shows how 27 information describing the disposal system is used by the DOE to develop scenarios, scenario -28 probabilities, and the consequence models used to estimate performance. In this section the 29 DOE discusses the methodology in a theoretical framework.
30 6.1.1 Conceptualization of Risk
31 The DOE uses a conceptualization for risk similar to that developed for risk assessments of 32 nuclear power plants. This description provides a structure on which both the representation 33 and calculation of risk can be based.
DRAFT-DOE/CAO-2056 6-3 March 31,1995

Draft 40 CFR191 Compliance Certification Application
1 Kaplan and Garrick (1981) have presented this representation of risk as a set of ordered
2 triples. The DOE uses their representation and defines risk to be a set R of the form
3 R={Si,pSi,cS,),i=l,...,nS} (2)
4 where
5 S,- = a set of similar occurrences 6 pSi = probability that an occurrence in set S;- will take place 7 cSt = a vector of consequences associated with S,-8 nS = number of sets selected for consideration 9 and the sets s,- have no occurrences in common (i.e., the s,- are disjoint sets). This
10 representation formally decomposes risk into what can happen (the s,), how likely things are 11 to happen (the pS,), and the consequences of what can happen (the cS,). The s,- are scenarios 12 in the WIPP performance assessment, the pS, are scenario probabilities, and the vector cSt
13 contains performance measures associated with scenario S,-.
14 As the DOE discusses in the following sections, risk results in R can be summarized with 15 complementary cumulative distribution functions (CCDFs). These functions provide a 16 display of the information contained in the probabilities pS, and the consequences cS ;. The 17 consequence result cS in the vector cS is ordered so that cSs <, c5,+l for i = 1,..., nS-1 and the 18 CCDF for this consequence result is the function F defined by
19 F(x) = probability that cS exceeds a specific consequence value x
- £ PSJ (3) j-t
20 where / is the smallest integer such that cS,->x
21 As illustrated in Figure 6-2, F is a step function that represents the probabilities that 22 consequence values on the abscissa will be exceeded. To avoid a broken appearance, CCDFs 23 are usually plotted with vertical lines added at the discontinuities.
24 The steps in the CCDFs shown in Figure 6-2 result from the discretization of all possible 25 occurrences into the sets S,,...,.^. Unless the underlying processes are inherently disjoint, the 26 use of more sets, S,-, will tend to reduce the size of these steps and, in the limit, will lead to a 27 smooth curve.
March 31,1995 6-4 DRAFT-DOE/CAO-2056

Draft 40 CFR 191 Compliance Certification Application
Waste Characteristics
•>^j - ./:c^»-.w<;ii*!>j<fcu£.jiju..,'-' •. vi.^^^?m1*m&3t4iaamiUfmi^*--K *»- . • . <
f |^EPA^apda^:X^€^R : ,1 ;91^;;| 7 ^ 7 7 $ } i ^ ( G ^ 191.24 (Groundwater Protection)
. "? ^ , ? ; ;
;5EP^^r ida^^4p)e : FR-^^ r ^ J l ^ / ( l n ^ d U a l W
Final Results
\IdfehtifjrMain ; Radionuclides,
v>''Par>meters,£ and Scenarios
Figure 6-1. Methodology for Performance Assessment of TRU Repositories
DRAFT-DOE/CAO-2056 6-5 March 31, 1995

Draft 40 CFR 191 Compliance Certification Application
l TfflS PAGE INTENTIONALLY LEFT BLANK
March 31, 1995 6-6 DRAFT-DOE/CAO-2056

Draft 40 CFR191 Compliance Certification Application
1.0
CO o
_3 ra > o e 0) 3
8*0.5 w c o o o £ !5 a ja o
0.0
I nS I I (cS„ £ pSjJsfcS,,"!)
/ M
pS, nS
cS<
(cS2, ^ PS,)
pS5
nS
(cS3, 2 PS,) • < / > i = 3
pSs
nS
<CSnS-1' 2 PS|> j |=nS-1
P SnS-1
(cS n S ,PS n S )
pS nS
CSo CSfl c S n S . 2 cSpg.-] c S n S
cS: Consequence Value
Figure 6-2. Estimated CCDF for Consequence Result cS. The open and solid circles at the discontinuities indicate the points included on
(solid circles) and excluded from (open circles) the CCDF.
DRAFT-DOE/CAO-2056 6-7 March 31,1995
''s^jy<"l%T£7ttXl'^lJ'r'^"^~/Xr ^^F*?~

Draft 40 CFR 191 Compliance Certification Application
l THIS PAGE INTENTIONALLY LEFT BLANK
March 31, 1995 6-8 DRAFT-DOE/CAO-2056
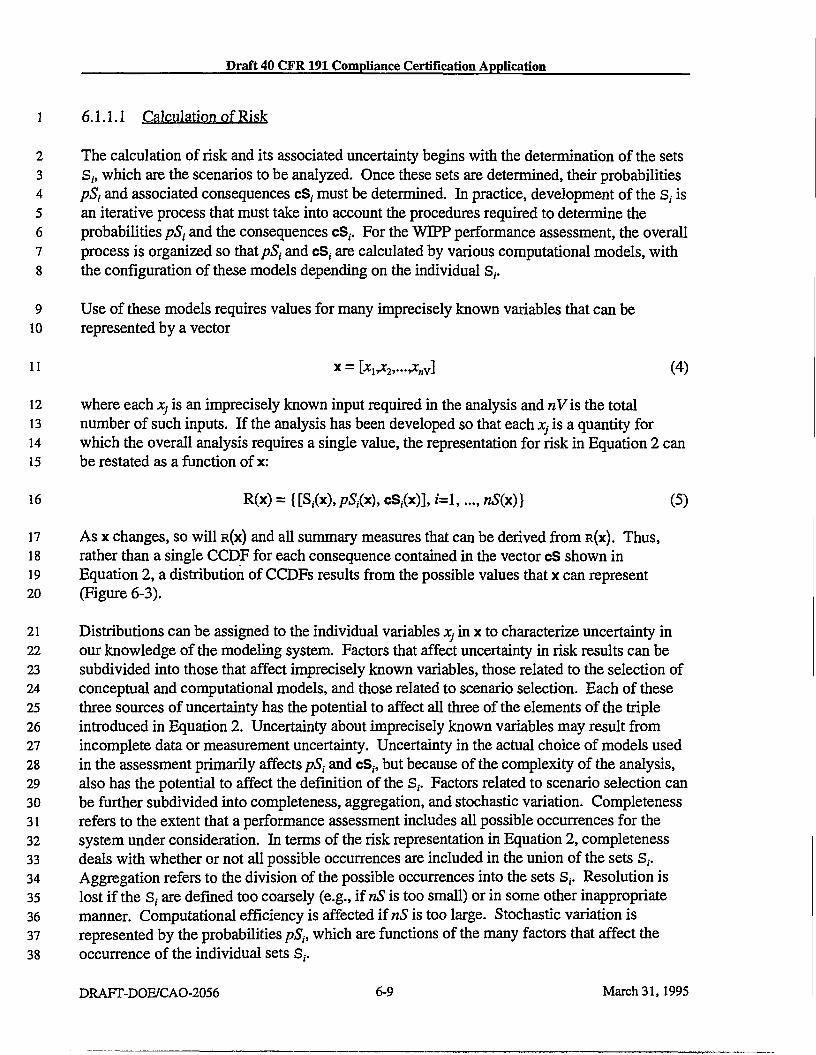
Draft 40 CFR 191 Compliance Certification Application
1 6.1.1.1 Calculation of Risk
2 The calculation of risk and its associated uncertainty begins with the determination of the sets 3 S,-, which are the scenarios to be analyzed. Once these sets are determined, their probabilities 4 pSj and associated consequences cS, must be determined. In practice, development of the S,- is 5 an iterative process that must take into account the procedures required to determine the 6 probabilities pS, and the consequences cS,. For the WIPP performance assessment, the overall 7 process is organized so thatpS,- and cS,- are calculated by various computational models, with 8 the configuration of these models depending on the individual S f.
9 Use of these models requires values for many imprecisely known variables that can be 10 represented by a vector
11 x = [xj^ 2 , . . .^ l V] (4)
12 where each x} is an imprecisely known input required in the analysis and nV is the total 13 number of such inputs. If the analysis has been developed so that each Xj is a quantity for 14 which the overall analysis requires a single value, the representation for risk in Equation 2 can 15 be restated as a function of x:
16 R(x) = {[S,-(x), pSfr), cS,(x)], /=1,... . n5(x)} (5)
17 As x changes, so will R(X) and all summary measures that can be derived from R(X). Thus, 18 rather than a single CCDF for each consequence contained in the vector cS shown in 19 Equation 2, a distribution of CCDFs results from the possible values that x can represent 20 (Figure 6-3).
21 Distributions can be assigned to the individual variables Xj in x to characterize uncertainty in 22 our knowledge of the modeling system. Factors that affect uncertainty in risk results can be 23 subdivided into those that affect imprecisely known variables, those related to the selection of 24 conceptual and computational models, and those related to scenario selection. Each of these 25 three sources of uncertainty has the potential to affect all three of the elements of the triple 26 introduced in Equation 2. Uncertainty about imprecisely known variables may result from 27 incomplete data or measurement uncertainty. Uncertainty in the actual choice of models used 28 in the assessment primarily affects pSt and cS„ but because of the complexity of the analysis, 29 also has the potential to affect the definition of the S,-. Factors related to scenario selection can 30 be further subdivided into completeness, aggregation, and stochastic variation. Completeness 31 refers to the extent that a performance assessment includes all possible occurrences for the 32 system under consideration. In terms of the risk representation in Equation 2, completeness 33 deals with whether or not all possible occurrences are included in the union of the sets S,-. 34 Aggregation refers to the division of the possible occurrences into the sets S,-. Resolution is 35 lost if the S,- are defined too coarsely (e.g., if nS is too small) or in some other inappropriate 36 manner. Computational efficiency is affected if nS is too large. Stochastic variation is 37 represented by the probabilities pSt, which are functions of the many factors that affect the 38 occurrence of the individual sets S,-.
DRAFT-DOE/CAO-2056 6-9 March 31,1995

Draft 40 CFR 191 Compliance Certification Application
1 Individual variables Xj may relate to each of these different types of uncertainty. For example, 2 individual variables might relate to completeness uncertainty (e.g., the value for a cut-off used 3 to drop low-probability occurrences from the analysis), aggregation uncertainty (e.g., a bound 4 on the value for nS), model uncertainty (e.g., a 0-1 variable that indicates which of two 5 alternative models should be used), variable uncertainty (e.g., a solubility limit or a retardation 6 for a specific element), or stochastic uncertainty (e.g., a variable that helps define the 7 probabilities for the individual S,-).
8 6.1.1.2 Characterization of Uncertainty in Risk
9 Characterization of the uncertainty in the results of a performance assessment requires 10 characterization of the uncertainty in x, the vector of imprecisely known variables. This 11 uncertainty can be described with a sequence of probability distributions
12 D„D2,...,Dn V (6)
13 where Dj is the distribution developed for the variable xjt j = 1,2,..., nV, contained in x. The 14 definition of these distributions may also be accompanied by the specification of correlations 15 and various restrictions that further define the possible relations among the xy These 16 distributions and other restrictions probabilistically characterize where the appropriate input to 17 use in the performance assessment would most likely fall, given that the analysis is structured 18 so that only one value can be used for each variable under consideration.
19 Once the distributions in Equation 6 have been developed, Monte Carlo techniques (Helton et 20 al. 1992) can be used to determine the uncertainty in R(X) from the uncertainty in x. First, a 21 sample
22 xk = [xkl, xn,..., xh nV], k=l,..., nK (7)
23 is generated according to the specified distributions and restrictions, where nK is the size of 24 the sample. Performance assessment calculations are then performed for each sample element 25 xk, which yields a sequence of risk results of the form
26 R(x,) = {[Sl.(x*), pSt(xk), cS{(xk) },*=!,..., nS(xk)} (8)
March 31, 1995 6-10 DRAFT-DOE/CAO-2056

Draft 40 CFR 191 Compliance Certification Application
rrq—i i i i i iu j—i i i i n i i | — i i U I I I I | — i i i i i u i j—i i i m u
• J O ' 6 I ' ' • ' " " I • • • ' " " I • ' • ' " " I • • " " i
1 0 s 10"4 10-3 10- 2 10-1 10° cE: Consequence Value
101 10 2 10 3
Figure 6-3. Example Summary Curves Derived from an Estimated Distribution of CCDFs.
DRAFT-DOE/CAO-2056 6-11 March 31, 1995

Draft 40 CFR 191 Compliance Certification Application
TfflS PAGE INTENTIONALLY LEFT BLANK
March 31, 1995 6-12 DRAFT-DOE/CAO-2056
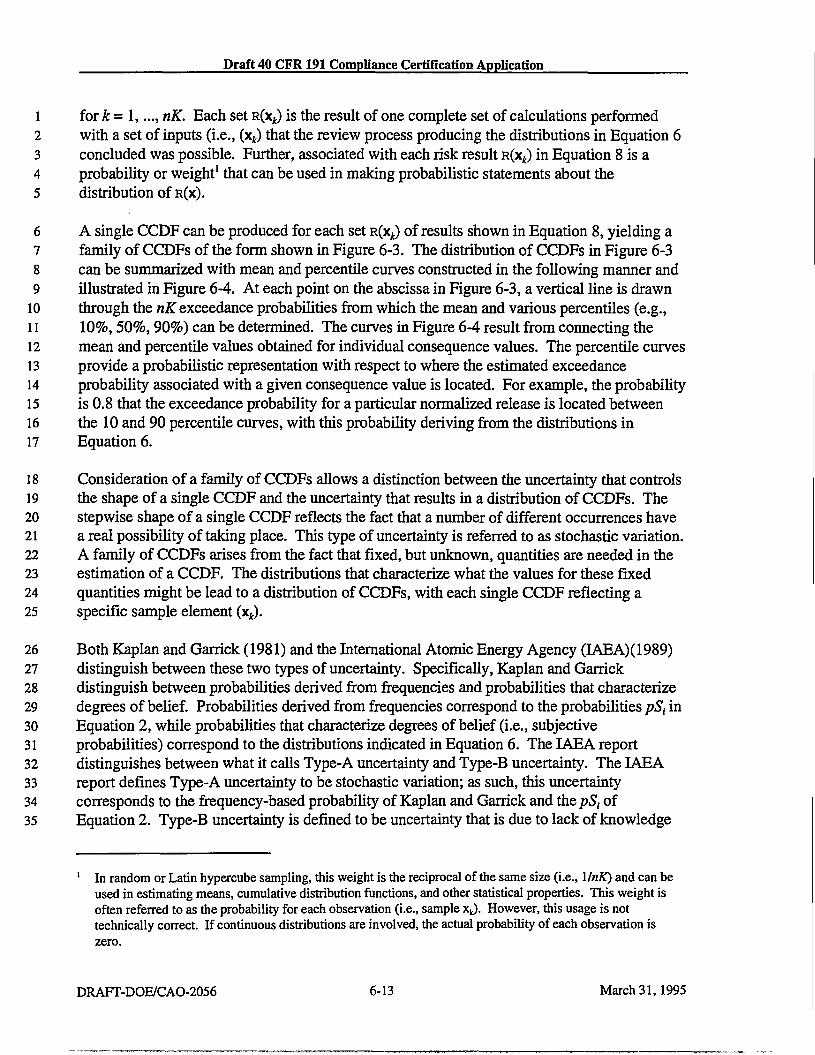
Draft 40 CFR191 Compliance Certification Application
1 for k = 1,..., nK. Each set R(X^) is the result of one complete set of calculations performed 2 with a set of inputs (i.e., (xk) that the review process producing the distributions in Equation 6 3 concluded was possible. Further, associated with each risk result R(X*) in Equation 8 is a 4 probability or weight1 that can be used in making probabilistic statements about the 5 distribution of R(X) .
6 A single CCDF can be produced for each set R(X^) of results shown in Equation 8, yielding a 7 family of CCDFs of the form shown in Figure 6-3. The distribution of CCDFs in Figure 6-3 8 can be summarized with mean and percentile curves constructed in the following manner and 9 illustrated in Figure 6-4. At each point on the abscissa in Figure 6-3, a vertical line is drawn
10 through the nK exceedance probabilities from which the mean and various percentiles (e.g., 11 10%, 50%, 90%) can be determined. The curves in Figure 6-4 result from connecting the 12 mean and percentile values obtained for individual consequence values. The percentile curves 13 provide a probabilistic representation with respect to where the estimated exceedance 14 probability associated with a given consequence value is located. For example, the probabiUty 15 is 0.8 that the exceedance probability for a particular normalized release is located between 16 the 10 and 90 percentile curves, with this probability deriving from the distributions in 17 Equation 6.
18 Consideration of a family of CCDFs allows a distinction between the uncertainty that controls 19 the shape of a single CCDF and the uncertainty that results in a distribution of CCDFs. The 20 stepwise shape of a single CCDF reflects the fact that a number of different occurrences have 21 a real possibility of taking place. This type of uncertainty is referred to as stochastic variation. 22 A family of CCDFs arises from the fact that fixed, but unknown, quantities are needed in the 23 estimation of a CCDF. The distributions that characterize what the values for these fixed 24 quantities might be lead to a distribution of CCDFs, with each single CCDF reflecting a 25 specific sample element (x*).
26 Both Kaplan and Garrick (1981) and the International Atomic Energy Agency (IAEA)(1989) 27 distinguish between these two types of uncertainty. Specifically, Kaplan and Garrick 28 distinguish between probabilities derived from frequencies and probabilities that characterize 29 degrees of belief. Probabilities derived from frequencies correspond to the probabilities pS} in 30 Equation 2, while probabilities that characterize degrees of belief (i.e., subjective 31 probabilities) correspond to the distributions indicated in Equation 6. The IAEA report 32 distinguishes between what it calls Type-A uncertainty and Type-B uncertainty. The IAEA 33 report defines Type-A uncertainty to be stochastic variation; as such, this uncertainty 34 corresponds to the frequency-based probabiUty of Kaplan and Garrick and the pSt of 35 Equation 2. Type-B uncertainty is defined to be uncertainty that is due to lack of knowledge
In random or Latin hypercube sampling, this weight is the reciprocal of the same size (i.e., llnK) and can be used in estimating means, cumulative distribution functions, and other statistical properties. This weight is often referred to as the probability for each observation (i.e., sample x^). However, this usage is not technically correct. If continuous distributions are involved, the actual probability of each observation is zero.
DRAFT-DOE/CAO-2056 6-13 March 31,1995

Draft 40 CFR191 Compliance Certification Application
1 about fixed quantities; thus, this uncertainty corresponds to the subjective probability of the 2 Kaplan and Garrick and the distributions indicated in Equation 6. This distinction has also 3 been made by other authors (for example, see Vesely and Rasmuson [1984], Pate-Cornell 4 [1986], and Parry [1988] in the bibliography).
5 For a given conceptual model in the WIPP performance assessment, subjective uncertainty 6 enters the analysis due to lack of knowledge about quantities such as solubility limits, 7 retardation factors, and flow fields. In previous WIPP performance assessments, stochastic 8 uncertainty entered the analysis through the assumption that future exploratory drilling will be 9 random in time and space (i.e., follows a Poisson process). However, the rate constant in the
10 definition of this Poisson process was assumed to be imprecisely known. Thus, subjective 11 uncertainty can exist in a quantity used to characterize stochastic uncertainty. Because the 12 analysis performed for this draft application considers undisturbed performance, only 13 subjective uncertainty (Type-B) is addressed here.
14 6.1.1.3 Risk and the EPA Limits
15 The EPA expressly identifies the need to consider die impact of uncertainties in calculations 16 performed to show compliance with the Containment Requirements. Specifically, appendix C 17 of 40 CFR Part 191 states that
18 ...whenever practicable, the implementing agency will assemble all of the results of the performance 19 assessments to determine compliance with § 191.13 into a "complementary cumulative distribution 20 function" that indicates the probability of exceeding various levels of cumulative release. When the 21 uncertainties in parameters are considered in a performance assessment, the effects of the uncertainties 22 considered can be incorporated into a single such distribution function for each disposal system 23 considered. The Agency assumes that a disposal system can be considered to be in compliance with 24 § 191.13 if this single distribution function meets the requirements of § 191.13(a).
25 The representation for risk in Equation 2 provides a conceptual basis for the calculation of the 26 CCDF for normalized releases specified in 40 CFR Part 191 Subpart B. Further, this 27 representation provides a structure that can be used for both the incorporation of uncertainties 28 and the representation of the effects of uncertainties.
29 A CCDF in the family of CCDFs that results from Equation 8 could be the appropriate choice 30 for comparison against the EPA release limits, ifxk contained the correct variable values for 31 use in determining the pSt and cS,- and if the assumed conceptual models correctly characterize 32 the disposal system. Increasing the sample size nK will, in general, produce a better 33 approximation of the true distribution of CCDFs, but will not alter the fact that the 34 distribution of CCDFs is conditional on the assumptions of the analysis.
35 If nK is large, displays of the complete family of CCDFs can be difficult to interpret. As 36 discussed in the previous section, mean and percentile curves can be used to summarize the 37 information contained in the family. Appendix C of 40 CFR Part 191 suggests that "the 38 effects of the uncertainties considered can be incorporated into a single [CCDF]," but 40 CFR 39 Part 191 does not contain specific guidance on which curve should be compared to the
March 31,1995 6-14 DRAFT-DOE/CAO-2056

Draft 40 CFR191 Compliance Certification Application
100
10-5
10-«
_I_M mij [_M i IIIIIJ—i i i iinij—i i IIIIIIJ—i i nun \ _
\
i i i nun—i i i nun—i i mm Mean Median 10.0%Quanti!e 90.0% Quantile
EPA Containment
• Requirement (191.13(a))
i i mill i i i mill i i i mill i i i mill \ i i i mill '-i i i mill i i i iiml i > i i IMII
10-5 10-4 10-3 10-2 10-1 1 00 101 102 103
Summed Normalized Releases, R
Figure 6-4. Example Summary Curves Derived from an Estimated Distribution of CCDFs. The curves in this figure were obtained by calculating the mean and the indicated percentiles for each consequence value on the abscissa in
Figure 6-3. The 90th-percentile curve crosses the mean curve due to the highly skewed distributions for exceedance probability. This skewness also
results in the mean curve being above the median curve.
DRAFT-DOE/CAO-2056 6-15 March 31,1995

Draft 40 CFR 191 Compliance Certification Application
l THIS PAGE INTENTIONALLY LEFT BLANK
March 31, 1995 6-16 DRAFT-DOE/CAO-2056

Draft 40 CFR191 Compliance Certification Application
1 Containment Requirements. The mean curve is shown in Section 6.3 for preliminary 2 comparison with the Containment Requirements. This approach is consistent with proposed 3 40 CFR Part 194. The complete distribution of curves, which is also requested in the 4 proposed text of 40 CFR Part 194, is not shown.
5 Replicated Monte Carlo analyses can be used to characterize the uncertainty in a mean CCDF, 6 as required in the proposed text of 40 CFR Part 194. Estimates of the uncertainty in the mean 7 CCDF are not presented in the draft application.
8 6.1.2 Selection of Scenarios
9 The regulation 40 CFR Part 191 does not include the term "scenario" in its definition of 10 performance assessment, referring instead only to events and processes that might affect the 11 disposal system during the next 10,000 years. The various combinations of significant events 12 and processes that could affect the behavior of the disposal system must be considered in a 13 complete analysis. Combinations of events and processes are referred to as scenarios, S ;. The 14 development of scenarios for this performance assessment is discussed in Section 6.2.
15 6.1.3 Determination of Scenario Probabilities
16 The second element of the ordered triples shown in Equation 2 is the scenario probability pSt.
17 Because only undisturbed performance is addressed in this draft application, scenario 18 probabilities do not enter into the analysis. For the purpose of constructing the CCDF shown 19 in Section 6.3, the probability of undisturbed performance has been conditionally assigned a 20 value of 1.0.
21 However, in past preliminary performance assessments, the probabilities pSt have been based 22 on the assumption that drilling into the repository follows a Poisson process (i.e., random in 23 time and space) with a rate constant A. This assumption is consistent with the requirements of 24 proposed 40 CFR Part 194. Derivations of formulas for determining pS( dependent on this 25 assumption are general and include both the stationary (i.e., constant A) and non-stationary 26 (i.e., time-dependent A) cases. Proposed 40 CFR Part 194 contains specifications for the 27 determination of the appropriate value for the rate constant.
28 6.1.4 Calculation of Scenario Consequences
29 The third element of the ordered triples shown in Equation 2 is the scenario consequence, cS,. 30 Estimation of cS, requires a linked system of computational models.
31 The models used in the WIPP performance assessment, as in other complex analyses, exist at 32 four different levels. First, conceptual models provide a framework in which information 33 about the disposal system can be organized and linked to processes that can be simulated with
DRAFT-DOE/CAO-2056 6-17 March 31,1995

Draft 40 CFR 191 Compliance Certification Application
1 quantitative models. An adequate conceptual model is essential for both the development of 2 the scenarios S,- appearing in Equation 2. Alternative conceptual models that are equally 3 consistent with the available information can exist. Consequences for each scenario must be 4 estimated separately for each alternative conceptual model included in the analysis.
5 Second, mathematical models are developed to represent the processes at the site. The 6 conceptual models provide the context within which these mathematical models must operate 7 and define the processes they must characterize. The mathematical models are predictive in 8 the sense that, given known properties of the system and possible perturbations to the system, 9 they predict the response of the system. The following are among the processes represented
10 by these mathematical models: fluid flow, mechanical deformation, radionuclide transport in 11 groundwater, removal of waste through intruding boreholes, and human exposure to 12 radionuclides released to the surface environment.
13 Third, numerical models are developed to approximate the mathematical models. Most 14 mathematical models do not have closed-form solutions, and numerical procedures must be 15 developed to provide approximations to the solutions of the mathematical models. In essence, 16 these approximations.provide "numerical models" that calculate results that approach the 17 solutions of the original mathematical models. For example, Runge-Kutta procedures are 18 often used to solve ordinary differential equations, and finite difference and finite element 19 methods are used to solve partial differential equations. In practice, it is unusual for a 20 mathematical model to have a solution that can be determined without the use of an 21 intermediate numerical model.
22 Fourth, the complexity of the system requires the use of computer codes to implement the 23 numerical models. The implementation of the numerical model in the computer code with 24 specific initial and boundary conditions and parameter values is generally referred to as the 25 computational model.
26 6.1.5 Monte Carlo Analysis Techniques
27 The DOE's performance assessment methodology uses Monte Carlo techniques for 28 uncertainty and sensitivity analyses. Uncertainty analyses evaluate uncertainty in performance 29 estimates that results from both the existence of alternative conceptual models and from the 30 uncertainty about imprecisely known input variables. Sensitivity analyses determine the 31 contribution of individual input variables to the uncertainty in model predictions. As used 32 here, both these types of analyses provide information about the effects of subjective, or 33 Type-B, uncertainty. The effects of stochastic, or Type-A, uncertainty are incorporated into 34 the performance assessment through the scenario probabilities pSt appearing in Equation 2.
35 Monte Carlo analyses involve five steps: (1) selection of the variables to be examined and the 36 ranges and distributions for their possible values; (2) generation of the samples to be analyzed; 37 (3) propagation of the samples through the analysis; (4) uncertainty analysis; and 38 (5) sensitivity analysis. These steps are described briefly in the following sections.
March 31,1995 6-18 DRAFT-DOE/CAO-2056

Draft 40 CFR 191 Compliance Certification Application
1 6.1.5.1 Selection of Variables and Their Ranges and Distributions
2 Monte Carlo analyses use a probabilistic procedure for the selection of model input. 3 Therefore, the first step in a Monte Carlo analysis is the selection of uncertain variables and of 4 ranges and distributions that characterize the uncertainty in their possible values. These 5 variables are typically input parameters to computer models, and the impact of the assigned 6 ranges and distributions can be great: analysis results are controlled in large part by the choice 7 of input. Results of uncertainty and sensitivity analyses, in particular, strongly reflect the 8 characterization of uncertainty in the input data.
9 Information about the ranges and distributions of possible values is drawn from a variety of 10 sources, including field data, laboratory data, literature, and in instances where significant 11 uncertainty exists and site-specific information is unavailable or insufficient at the time of the 12 analyses, subjective expert judgment. In general, data from these sources cannot be examined 13 statistically and incorporated directly in performance assessment, because data are rarely 14 gathered with the specific model application in mind. Spatial and temporal scales over which 15 the data are valid often do not match those of the models' applications, and in many cases, real 16 site-specific data are simply not available and/or are not reasonably obtainable. Data may be 17 sparse or unavailable because measurements are unfeasible (e.g., drilling sufficient boreholes 18 to determine the regional heterogeneity of transmissivity in overlying aquifers), because direct 19 measurements would in themselves create risk (e.g., drilling of boreholes through the 20 repository to determine the extent of an underlying brine reservoir), because measurements are 21 impossible (e.g., future drilling parameters), or for other reasons.
22 A review process leads from the available data to the construction of the cumulative 23 distribution functions (CDFs) used in the performance assessment. In part, because of the 24 nature of the available data and the type of analysis, this review process is unavoidably 25 subjective, and involves some judgment of the investigators and performance assessment 26 analysts.
27 The ultimate outcome of the review process is a distribution function F(x) of the form shown 28 in Figure 6-5 for each independent variable of interest. For a particular variable xjt the 29 function F is defined such that
30 prob(:c < Xj < x+Ax) = F(x+Ax) - F(x). (9)
31 That is, F(x+Ax) - F(x) is equal to the probability that the appropriate value to use for Xj in the
32 particular analysis under consideration falls between x and (x+Ax).
33 6.1.5.2 Generation of the Sample
34 Various techniques are available for generating samples from the assigned distribution 35 functions for the variables, including random sampling, stratified sampling, and Latin 36 hypercube sampling. The DOE's performance assessment for WIPP uses stratified sampling 37 and Latin hypercube sampling.
DRAFT-DOE/CAO-2056 6-19 March 31,1995

Draft 40 CFR191 Compliance Certification Application
1 Stratified sampling is a modification of random sampling in which a systematic coverage of 2 the full range of possible values is forced by subdividing the sample space into strata with 3 assigned probabilities. Stratified sampling provides for the inclusion of low-probability (but 4 possibly high-consequence) scenarios, and is used to incorporate stochastic (Type-A) 5 uncertainty into the WIPP performance assessment.
6 Latin hypercube sampling, in which the full range of each variable is subdivided into intervals 7 of equal probability and samples are drawn from each interval, is used to incorporate 8 subjective (Type-B) uncertainty into the WIPP performance assessment. The restricted 9 pairing techniques of Iman and Conover (1982) is used to prevent spurious correlations within
10 the sample.
11 6.1.5.3 Propagation of the Sample through the Analysis
12 The next step is the propagation of the sample through the analysis. Each element of the 13 sample is supplied to the model as input, and the corresponding model predictions are saved 14 for use in later uncertainty and sensitivity studies. The Compliance Assessment Methodology 15 Controller (CAMCON) has been developed to facilitate the complex calculations and storage 16 of the input and output files from each program. This methodology incorporates databases, 17 sampling procedures, model evaluations, data storage, uncertainty and sensitivity analysis 18 procedures, and plotting capabilities into a unified structure.
19 6.1.5.4 Uncertainty Analysis
20 Once a sample has been generated and propagated through a model, uncertainty in the model 21 predictions can be interpreted directly from the CCDF. Stochastic (Type-A) uncertainty is 22 represented by the steps in an individual CCDF. Subjective (Type-B) uncertainty can be 23 represented either with a family of CCDFs or with a summary diagram showing mean and 24 quantile curves, as shown in Figures 6-3 and 6-4.
25 6.1.5.5 Sensitivity Analysis
26 The final step in a Monte Carlo study is sensitivity analysis, which provides information about 27 the sensitivity of the modeling system to uncertainty in specific input parameters. Sensitivity 28 analyses can identify those parameters for which reductions in uncertainty (i.e., narrowing of 29 the range of values from which the sample used in the Monte Carlo analysis is drawn) have 30 the greatest potential to increase confidence in the estimate of the disposal system's 31 performance. However, because results of these analyses are inherently conditional on the 32 models, data distributions, and techniques used to generate them, the analyses cannot provide 33 insight about the correctness of the conceptual models and data distributions used. Qualitative 34 judgment about the modeling system must be used in conjunction with sensitivity analyses to 35 set priorities for performance assessment data acquisition and model development.
March 31,1995 6-20 DRAFT-DOE/CAO-2056

Draft 40 CFR191 Compliance Certification Application
From Helton et al. 1991
Figure 6-5. Distribution Function for an Imprecisely Known Analysis Variable. For each value* on the abscissa, the corresponding value F(x) on the
ordinate is the probability that the appropriate value to use in the analysis is less than or equal to x.
DRAFT-DOE/CAO-2056 6-21 March 31,1995

Draft 40 CFR 191 Compliance Certification Application
l TfflS PAGE INTENTIONALLY LEFT BLANK
March 31, 1995 6-22 DRAFT-DOE/CAO-2056

Draft 40 CFR191 Compliance Certification Application
1 The DOE will perform a sensitivity analysis consistent with this approach to support 2 preparation of a final application, as needed. The proposed 40 CFR Part 194 contains several 3 requirements where sensitivity analyses will be useful.
4 6.2 Scenario Development and Selection
5 This section discusses the FEPs the DOE believes might affect the disposal system's 6 performance, the screening methodology applied to that list, and the results to date of the 7 screening process.
8 6.2.1 Identification and Screening of Features, Events, and Processes
9 The DOE uses four basic steps in the scenario development procedure as follows:
10 1. Identify and classify all the features, events, and processes (FEPs) potentially relevant to
11 the performance of the disposal system
12 2. Eliminate FEPs according to well-defined screening criteria
13 3. Identify or form scenarios relevant to the performance of the disposal system
14 4. Specify scenarios for consequence analysis.
15 This procedure is similar to that proposed by Cranwell et al. (1990) and used in the 1991 and 16 1992 WIPP performance assessments. The list of FEPs has, however, been extended beyond 17 Cranwell's potentially disruptive events to try to include all FEPs of potential relevance. It is 18 important to be as comprehensive as possible during the initial stage of identifying FEPs, even 19 if some of these FEPs may be eliminated in later stages of the screening process. This assures 20 that interactions between FEPs are not overlooked and that a well-documented response to 21 possible "what if' questions is available, as well as demonstrating comprehensiveness in a 22 compliance application. 23 Catalogs of FEPs are being developed in many national radioactive waste disposal programs 24 (see, for example, Guzowski and Newman [1993], Prij et al. [1993], Stenhouse et al. [1993] in 25 the bibliography) as well as internationally (see, for example, OECD and NEA [1992], [1995] 26 in the bibliography), with the aim of assembling relevant decisions and assumptions 27 concerning the phenomena to be modeled. The catalogs can be used as an aid to organize and 28 track assumptions during the assessment process, and between cycles of an iterative set of 29 assessments to be conducted over several years.
30 In constructing a list of FEPs for the WIPP, the DOE drew on work done for other nuclear 31 repository programs. As a starting point, a comprehensive list of potentially relevant FEPs 32 was developed from a compilation of FEPs developed for the Swedish nuclear waste program. 33 This Swedish list was based on a series of FEP lists developed for other disposal programs. A 34 number of FEPs had been eliminated from the Swedish compilation because they were
DRAFT-DOE/CAO-2056 6-23 March 31, 1995

Draft 40 CFR 191 Compliance Certification Application
1 irrelevant to the particular disposal concept; these FEPs were reinstated, other FEPs specific 2 to the WTPP were added, and several FEPs on the Swedish list were subdivided to facilitate 3 screening. Some duplicate FEPs were eliminated for clarity of presentation, although many 4 other duplicate FEPs were retained if a particular FEP could affect more than one part of the 5 disposal system, or could interact with FEPs in more than one subcategory. The titles of all 6 FEPs on the Swedish list were retained, although some were vague or poorly stated for the 7 situation at the WIPP.
8 6.2.1.1 Criteria for Elimination of FEPs
9 The DOE's process of screening out of FEPs from the main system assessment modeling used 10 explicit criteria to assure that the FEPs screened out are not relevant to the WIPP compliance 11 determination. FEP screening criteria proposed by Cranwell et al. (1990) include physical 12 reasonableness, probability of occurrence, and consequence of the occurrence. Additional 13 screening criteria may be provided in regulatory guidance documents, or may be appropriate 14 for a specific assessment scope or purpose. Four basic criteria are discussed below.
15 Regulation, or, more broadly, scope and purpose of the assessment. Specific screening 16 criteria are supplied within several federal regulations. In particular, 40 CFR Part 191 17 provides a 10,000-year cut-off for quantitative assessment, and the DOE expects that specific 18 guidance on the consideration of future human actions in the assessment will be provided in 19 40 CFR Part 194. The scope and purpose of an assessment may allow particular FEPs to be 20 eliminated from consideration.
21 Potential consequences associated with the occurrence of the FEPs. The DOE uses this 22 criterion in two ways. First, FEPs with similar consequences are grouped together for 23 modeling purposes, provided their probabilities are combined appropriately. Grouping FEPs 24 on consequence grounds has not been done formally within the WIPP project. Second, FEPs 25 are eliminated on the basis of insignificant consequence. Consequence can refer to effects on 26 the repository or site (in the early stages of screening FEPs) or to radiological consequence 27 (when screening scenarios). This screening criterion must be used with caution: potentially 28 important interactions with other FEPs need to be considered when eliminating FEPs on this 29 basis.
30 Physical reasonableness of the FEPs being considered. The DOE uses this criterion to 31 eliminate FEPs that are irrelevant to the disposal concept and site under consideration. For 32 example, any FEP pertinent only to vitrified high-level waste (HLW) can be screened out for 33 WIPP performance assessments, because the DOE does not intend to dispose of HLW at the 34 WIPP.
35 Probability of occurrence of a FEP leading to significant release of radionuclides. Low-36 probability events can be excluded. In 40 CFR § 194.32(b), the EPA indicates that events and 37 processes having a likelihood of occurrence of less than 10"4 over 10,000 years (equivalent to
March 31, 1995 6-24 DRAFT-DOE/CAO-2056

Draft 40 CFR191 Compliance Certification Application
1 an annual probability of less than 10"8) can be excluded. The physical reasonableness criterion 2 can also be considered a subset of the probability criterion, in which the probability is 3 assumed to be zero.
4 Criteria similar to those used for FEPs can be used for screening scenarios. However, care 5 must be taken when screening individual scenarios on the basis of low probability. This is 6 because a large number of scenarios, each with a very small likelihood of occurrence, could, 7 when considered in combination, have a cumulative likelihood of occurrence sufficient to 8 affect the estimation of repository performance. The DOE avoids this potential problem by 9 placing a bound of 10"8 per year on the cumulative probability of all scenarios eliminated on
10 the basis of low probability.
11 6.2.1.2 Screening of FEPs—Detailed Consideration and Classification
12 Because the WIPP FEP list was adapted from the Swedish list, the DOE could screen out 13 many FEPs without further detailed consideration. For example, a FEP may be clearly 14 irrelevant to the WIPP disposal system or potentially irrelevant to a post-closure performance 15 assessment. A range of arguments was developed for further screening and classification of 16 FEPs.
17 Undisturbed Performance FEPs
18 UP FEPs considered in the system modeling for undisturbed performance include those 19 affecting both the nearfield and the farfield environments. The nearfield 20 environment is defined here as the waste, containers, repository structures, shaft seal 21 and panel closure systems, and the host rock formation. The farfield is the region 22 beyond the engineered barriers and beyond the region of disturbed rock around the 23 excavation. The UP FEPs exclude the effects of potentially disruptive future human 24 actions. This allows the evaluation of releases for a determination of compliance 25 with the individual dose criterion in 40 CFR § 191.15andthe groundwater 26 protection requirements in 40 CFR § 191.24. The UP FEPs form part of the 27 modeling system for evaluating compliance with 40 CFR § 191.13.
28 Disturbed-Case FEPs
29 DP FEPs pertaining to human intrusion, including the potential disruptive effects of 30 drilling events that reach the level of the waste in the disposal system, are classified 31 as DP. Consideration of these FEPs, which have an uncertain probability of 32 occurrence, together with those classified as UP, is required to evaluate compliance 33 with 40 CFR § 191.13. Disturbed-case calculations are not included in this draft 34 application but will be in the final.
DRAFT-DOE/CAO-2056 6-25 March 31,1995

Draft 40 CFR191 Compliance Certification Application
1 FEPs Requiring Additional Documentation
2 RB FEPs retained for further consideration prior to documenting a screening decision are 3 classified as RB. The DOE currently has calculation^ or experimental work 4 underway within the project to increase understanding of the potential importance of 5 some of these FEPs, but all are considered to be of low consequence. The basis for 6 exclusion of these FEPs from the performance assessment modeling is not 7 documented, and they are not included in the current system modeling. 8 Documentation will be included in the final application.
9 FEPs Related to Design Changes
10 Two groups of FEPs have been identified that are related to modifications in the design of the 11 disposal system. These FEPs are irrelevant to the performance assessment of the current 12 disposal system design and can be screened out.
13 RD FEPs classified as RD are preclosure events that represent significant deviations 14 from the WIPP design specifications. Quality control procedures will ensure that the 15 repository is constructed, operated, and decommissioned as described in the 16 compliance documentation and within appropriate design tolerances.
17 RE The classification RE is used for design modifications that may be made in the 18 future. Engineering alternatives for the waste form, seal design, or the use and 19 composition of backfill are examples of such design changes that would require a 20 new or modified performance assessment.
21 Potentially Relevant FEPs Screened Out Based on Regulation, Consequence, or 22 Probability
23 A structured approach to screening has established those FEPs that could be defensibly 24 excluded. The criteria used are described earlier in this section. Each FEP was assessed 25 against each criterion in the order presented below. Although many FEPs were excluded on 26 the basis of more than one criterion, the first applicable screening criterion was used for 27 classification.
28 SO-R FEPs that can be screened out on the basis of regulatory guidance concerning the 29 treatment of human actions are classified as SO-R. Defensible screening arguments 30 for these FEPs have been developed and are discussed in the following sections.
31 SO-C FEPs that may occur, but that can be screened out on the basis of insignificant 32 consequence for all scenarios are classified as SO-C. Defensible screening 33 arguments for these FEPs have been developed.
March 31,1995 6-26 DRAFT-DOE/CAO-2056

Draft 40 CFR191 Compliance Certification Application
1 SO-P FEPs that are extremely unlikely to occur and can be screened out on the basis of 2 low probability are classified as SO-R Defensible screening arguments for these 3 FEPs have been developed. In most cases, it is not possible to estimate a 4 probability; in the absence of quantitative estimates, a strong qualitative argument is 5 provided.
6 Screened Out on the Basis of Relevancy
7 NR Where evaluation of disposal system performance clearly does not rely on 8 consideration of a particular FEP, the FEP was screened out, often without further 9 discussion. The classification NR (not relevant) indicates that the FEP is not
10 relevant to the WIPP site and the disposal concept outlined in the compliance 11 application. FEPs with this classification may relate to HLW, long-lived waste 12 containers, alternative host rock geologies, and biosphere evolution. In addition to 13 FEPs that are not relevant to the design concept, there were a small number of FEPs 14 on the Swedish list that were related directly to modeling decisions or whose title 15 was incomprehensible. These FEPs were eliminated from consideration without 16 further discussion.
17 6.2.2 Farfield Features, Events, and Processes
18 This subsection briefly discusses farfield FEPs concerned with radionuclide chemistry, 19 radionuclide transport processes, gas effects and transport, and microbiological and biological 20 activity. Table 6-2 shows the farfield FEPs and their screening classifications. The processes 21 relevant to transport of radionuclides as dissolved species are classified as UP or RB, and 22 modeling capability for these processes has been developed within the WIPP project. The 23 DOE's detailed screening arguments are presented in Appendix SCR for FEPs that could 24 change the present characteristics of the system and that might require changes in the 25 boundary conditions or the parameter values for transport process modeling.
26 The biosphere FEPs discussed are limited to those relevant to the amount of infiltration and 27 recharge that could occur to the Rustler Formation (hereafter referred to as the Rustler) and 28 overlying formations, such as erosion, surface run-off, and land use changes. FEPs relating 29 specifically and only to transport of contaminants within the biosphere are not discussed here. 30 The biosphere may be important for evaluating compliance with the EPA's individual dose 31 criterion in 40 CFR § 191.15. Compliance with this criterion is discussed in Chapter 8.
32 The DOE has screened out several natural FEPs on the basis of a low probability of 33 occurrence at the WIPP site. In general, these are events for which the DOE has determined 34 that there is no geological evidence within the Delaware Basin for at least 0.5 million years. 35 For the purposes of this analysis, the probabilities of these events are assumed to be zero. 36 Quantitative, non-zero probabilities for such events, based on numbers of occurrences, cannot 37 be ascribed without considering regions much larger than the Delaware Basin, thus neglecting 38 established geological understanding of the processes and events that occur within particular 39 geographical provinces. There are also examples, notably deep dissolution, where the
DRAFT-DOE/CAO-2056 6-27 March 31, 1995

Draft 40 CFR191 Compliance Certification Application
1 particular geological setting of the WIPP disposal system (in contrast to other parts of the 2 Delaware Basin) is used to establish a low-probability screening argument. The overall 3 geological setting of the Delaware Basin also is the basis for classifying a number of events 4 and processes as low consequence; the history and setting of the region are such that the DOE 5 believes the processes are likely to continue throughout the next 10,000 years at rates similar 6 to those deduced for the past 0.5 million years. Processes that have had little effect on the 7 characteristics of the region in the past are expected to be of low consequence in the future.
8 Table 6-2. Farfield FEPs and Their Screening Classifications
10 11 12 13 14 15 16 17 18 19 20 21 22 23 24 25 26 27 28 29 30 31 32 33 34 35 36 37 38 39 40 41 42 43 44 45 46 47 48 49 50 51 52 53 54 55 56 57 58 59 60 61 62
}7-:. •.".';..«• v= "•'- i'-V''": : ;!* •• Screehhig ','-''- - - ' ' ,« , " , Screening < \-':-'^s
: : ••• ' V E E P s / - • • " • " , ' • • , - Classification '' '•'•£. " * . ; ' ; . I E E S ' ' . . - . - , - .'-<- .' Classification
Meteorite impact SO-P Major incision SO-P Regional uplift and subsidence SO-P Changes in topography SO-C Metamorphic activity Lake infilling SO-C (e.g., orogenic, isostatic) SO-P Surface flow characteristics:
Volcanisra SO-P sediment transport SO-C Magmatic activity SO-C Surface flow characteristics: Movements at faults SO-P meander migration or other SO-C Fault activation SO-P Surface flow characteristics: Formation of new faults SO-P like formation and sedimentation SO-C Faulting and fracturing: change of Surface-water bodies: water flow SO-C
properties (natural) SO-P Surface-water bodies: suspended Formation of interconnected sediments SO-C
fracture systems UP Surface-water bodies: bottom Earthquakes, sediments SO-C
fluvial response SO-C Surface-water bodies: effects on Natural seismicity SO-C vegetation SO-C Externally induced seismicity SO-C Surface-water bodies: effects of Differential elastic response SO-C fluvial system development SO-C Non-elastic response RB Surface-water mixing SO-C Salt deformation and diapirism SO-P Freshwater sediment transport and Formation of dissolution cavities SO-P deposition SO-C Digenesis SO-C Rivercourse meander SO-C Fracture mineralization SO-C Flooding SO-C Dissolution of fracture fillings, Soil and surface-water chemistry precipitation SO-C (pH,Eh) SO-C
Natural rock property changes Fluid interactions: dissolution, (porosity, permeability. precipitation SO-C fractures, pore blocking) RB Weathering, mineralization SO-C
Salinity: implications of Altered soil or surface-water evaporite deposits and minerals RB chemistry (pH, Eh) SO-C
Changes in sorptive surfaces RB Weathering SO-C Changes in the earth's magnetic field NR Alkali flats SO-C Climate change UP Capillary rise in soil SO-C Anthropogenic climate change Soil properties (type, depth, pore-water drought (greenhouse effect) RB pH, moisture, sorption) SO-C
Greenhouse-induced effects Soil leaching SO-C (e.g., sea level change, Ionic exchange in soil SO-C precipitation, temperature) RB Pedogenesis SO-C
Greenhouse-induced storm Variation in groundwater recharge UP surges RB Precipitation, temperature and soil
Ozone layer (failure) SO-C water balance SO-C Acid rain SO-C Surface hydrological change SO-C Glaciation SO-P Near-surface runoff processes: Erosion: glacial SO-P overland flow, interflow, return Extreme erosion and denudation: glacial- flow, macropore flow SO-C
induced (e.g., coastal and stream erosion) SO-P Near-surface runoff processes: Glacial and interglacial cycling effects variable source area response SO-C (including sea level changes) SO-P Surface flow characteristics:
Permafrost SO-P stream and river flow SO-C Accumulation of gases under River flow and lake level changes SO-C
permafrost SO-P Groundwater discharge (to surface-Snow melt SO-P water) SO-P Erosion: wind SO-C Groundwater discharge (springs) SO-P
March 31,1995 6-28 DRAFT-DOE/CAO-2056
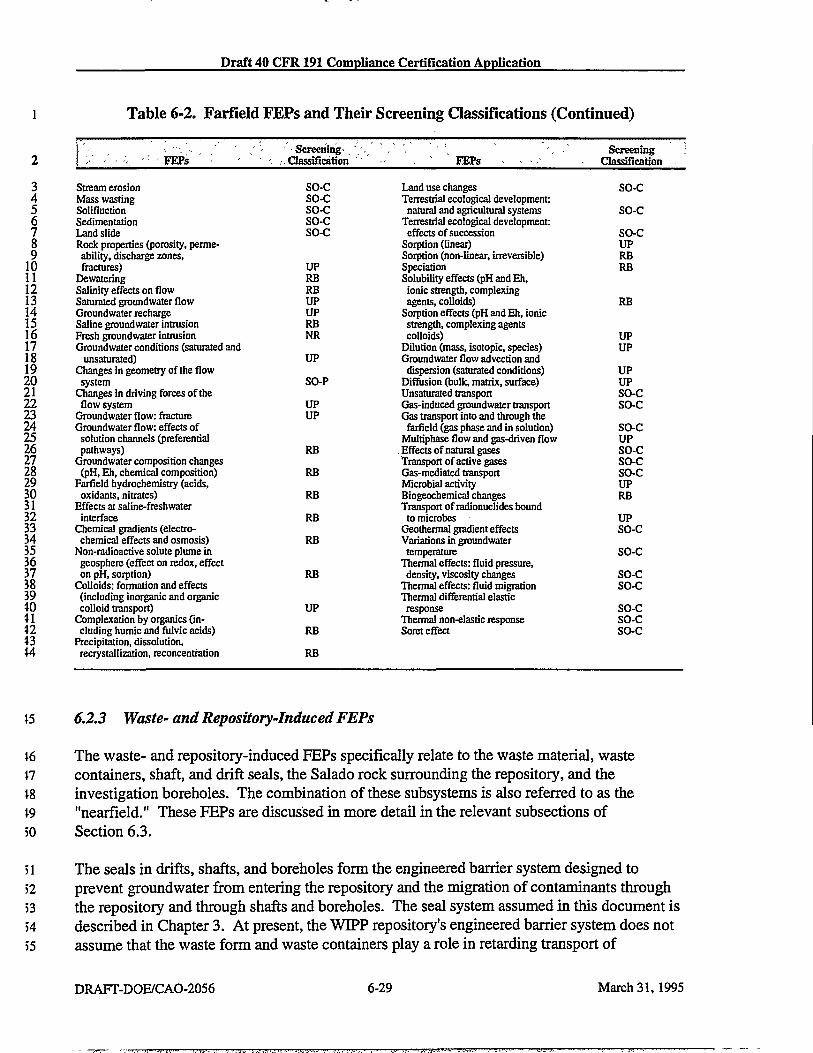
Draft 40 CFR191 Compliance Certification Application
Table 6-2. Farfleld FEPs and Their Screening Classifications (Continued)
FEPs ' - Screening*, Classification " EEPs
Screening Classification
3 4 5 6 7 8 9 10 11 12 13 14 15 16 17 18 19 20 21 22 23 24 25 26 27 28 29 30 31 32 33 34 35 36 37 38 39 40 41 42 43 44
Stream erosion SO-C Mass wasting so-c Solifluction so-c Sedimentation so-c Land slide so-c Rock properties (porosity, permeability, discharge zones, fractures) UP
Dewatering RB Salinity effects on flow RB Saturated groundwater flow UP Groundwater recharge UP Saline groundwater intrusion RB Fresh groundwater intrusion NR Groundwater conditions (saturated and
unsaturated) UP Changes in geometry of the flow
system SO-P Changes in driving forces of the flow system UP
Groundwater flow: fracture UP Groundwater flow: effects of
solution channels (preferential pathways) RB
Groundwater composition changes (pH, Eh, chemical composition) RB
Farfield hydrochemistry (acids, oxidants, nitrates) RB
Effects at saline-freshwater interface RB
Chemical gradients (electrochemical effects and osmosis) RB
Non-radioactive solute plume in geosphere (effect on redox, effect on pH, sorption) RB
Colloids: formation and effects (including inorganic and organic colloid transport) UP
Complexation by organics (including humic and fulvic acids) RB
Precipitation, dissolution, recrystallization, reconcentration RB
Land use changes Terrestrial ecological development:
natural and agricultural systems Terrestrial ecological development:
effects of succession Sorption (linear) Sorption (non-linear, irreversible) Speciation Solubility effects (pH and Eh, ionic strength, complexing agents, colloids)
Sorption effects (pH and Eh, ionic strength, complexing agents colloids)
Dilution (mass, isotopic, species) Groundwater flow advection and
dispersion (saturated conditions) Diffusion (bulk, matrix, surface) Unsaturated transport Gas-induced groundwater transport Gas transport into and through the farfield (gas phase and in solution)
Multiphase flow and gas-driven flow .Effects of natural gases Transport of active gases Gas-mediated transport Microbial activity Biogeochemical changes Transport of radionuclides bound
to microbes Geothermai gradient effects Variations in groundwater temperature
Thermal effects: fluid pressure, density, viscosity changes
Thermal effects: fluid migration Thermal differential elastic
response Thermal non-elastic response Soret effect
SO-C SO-C SO-C UP RB RB
RB
UP UP UP UP SO-C SO-C SO-C UP SO-C SO-C SO-C UP RB UP SO-C SO-C SO-C SO-C SO-C SO-C SO-C
45 6.2.3 Waste- and Repository-Induced FEPs
46 The waste- and repository-induced FEPs specifically relate to the waste material, waste 47 containers, shaft, and drift seals, the Salado rock surrounding the repository, and the 48 investigation boreholes. The combination of these subsystems is also referred to as the 49 "nearfield." These FEPs are discussed in more detail in the relevant subsections of 50 Section 6.3.
51 The seals in drifts, shafts, and boreholes form the engineered barrier system designed to 52 prevent groundwater from entering the repository and the migrat ion of contaminants through 53 the repository and through shafts and boreholes. The seal system assumed in this document is 54 descr ibed in Chapter 3 . A t present, the W I P P repository's engineered barrier sys tem does not 55 a s sume that the was te form and waste containers play a role in retarding transport of
DRAFT-DOE/CAO-2056 6-29 March 31,1995
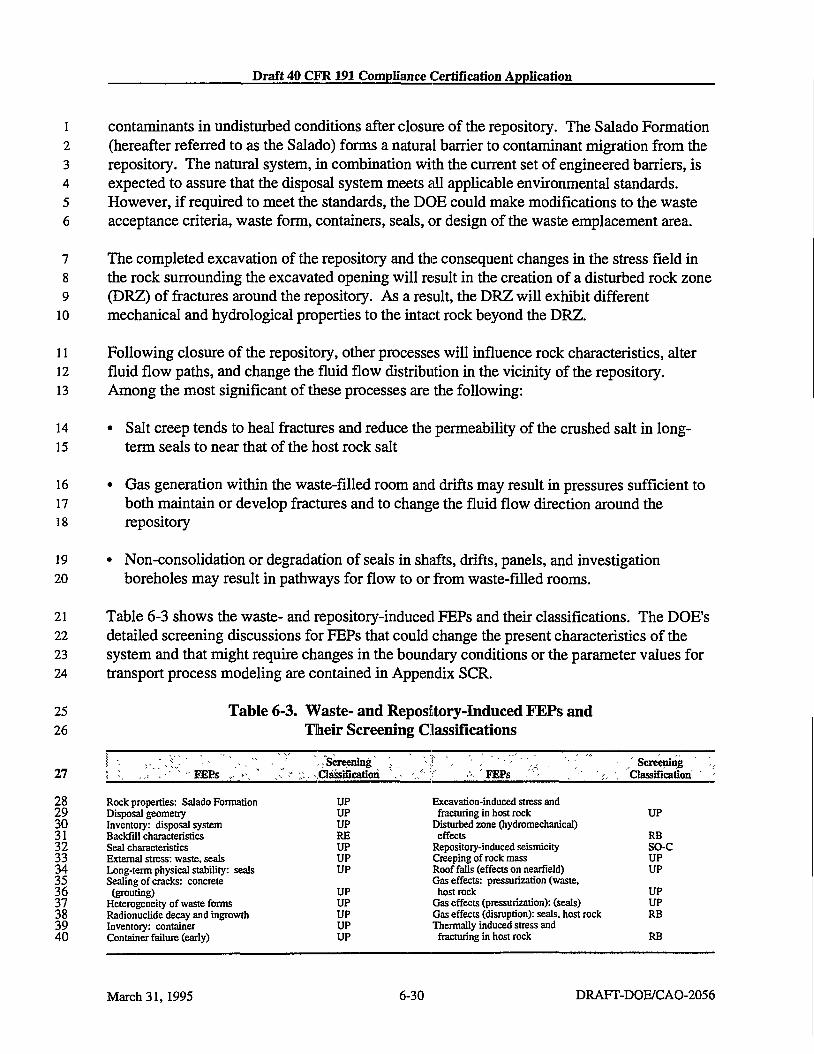
Draft 40 CFR 191 Compliance Certification Application
1 contaminants in undisturbed conditions after closure of the repository. The Salado Formation 2 (hereafter referred to as the Salado) forms a natural barrier to contaminant migration from the 3 repository. The natural system, in combination with the current set of engineered barriers, is 4 expected to assure that the disposal system meets all applicable environmental standards. 5 However, if required to meet the standards, the DOE could make modifications to the waste 6 acceptance criteria, waste form, containers, seals, or design of the waste emplacement area.
7 The completed excavation of the repository and the consequent changes in the stress field in 8 the rock surrounding the excavated opening will result in the creation of a disturbed rock zone 9 (DRZ) of fractures around the repository. As a result, the DRZ will exhibit different
10 mechanical and hydrological properties to the intact rock beyond the DRZ.
11 Following closure of the repository, other processes will influence rock characteristics, alter 12 fluid flow paths, and change the fluid flow distribution in the vicinity of the repository. 13 Among the most significant of these processes are the following:
14 • Salt creep tends to heal fractures and reduce the permeability of the crushed salt in long-15 term seals to near that of the host rock salt
16 • Gas generation within the waste-filled room and drifts may result in pressures sufficient to 17 both maintain or develop fractures and to change the fluid flow direction around the 18 repository
19 • Non-consolidation or degradation of seals in shafts, drifts, panels, and investigation 20 boreholes may result in pathways for flow to or from waste-filled rooms.
21 Table 6-3 shows the waste- and repository-induced FEPs and their classifications. The DOE's 22 detailed screening discussions for FEPs that could change the present characteristics of the 23 system and that might require changes in the boundary conditions or the parameter values for 24 transport process modeling are contained in Appendix SCR.
25 26
Table 6-3. Waste- and Repository-Induced FEPs and Their Screening Classifications
27
28 29 30 31 32 33 34 35 36 37 38 39 40
EEPs . . Screening
. Classification FEPs Screening
Classification
Rock properties: Salado Formation UP Disposal geometry UP Inventory: disposal system UP Backfill characteristics RE Seal characteristics UP External stress: waste, seals UP Long-term physical stability: seals UP Sealing of cracks: concrete
(grouting) UP Heterogeneity of waste forms UP Radionuclide decay and ingrowth UP Inventory: container UP Container failure (early) UP
Excavation-induced stress and fracturing in host rock UP
Disturbed zone (hydromechanical) effects RB
Repository-induced seismicity SO-C Creeping of rock mass UP Roof falls (effects on nearfield) UP Gas effects: pressurization (waste, host rock UP
Gas effects (pressurization): (seals) UP Gas effects (disruption): seals, host rock RB Thermally induced stress and
fracturing in host rock RB
March 31,1995 6-30 DRAFT-DOE/CAO-2056

Draft 40 CFR 191 Compliance Certification Application
1 2
Table 6-3. Waste- and Repository-Induced FEPs and Their Screening Classifications (Continued)
FEPs Screening:
Classification . FEPs Screening
Classification
4 5 6 7 8 9 10 11 12 13 14 15 16 17 18 19 20 21 22 23 24 25 26 27 28 29 30 31 32 33 34 35 36 37 38 39 40 41 42 43 44 45 46 47 48 49 50 51 52 53 54 55 56 57 58 59 60 61 62 63 64 65 66 67 68 69 70
Corrosion: container UP Thermo-hydromechanical effects RB Mechanical container damage Gas effects (explosions): seals, host rock SO-C
(failure) UP Nuclear cridcality (explosions): Design modifications: geometry RE (waste, container, seals, host rock) SO-P Design modifications: backfill Shaft seal failure and degradation RB
(e.g., buffer additives, bentonite) RE Preferential pathways in seals RB Design modifications: seals RE Mechanical effects: local fractures and Design modifications: DRZ(e.g., cracks (preferential pathways) RB
grouting) RE Seals: resaturation and desaturation UP Design modifications: waste (e.g., buffer additives, grouting) RE Cracking: concrete RB
Design modifications: canister RE Uneven swelling of bentonite RB Hydrogen by metal corrosion: Differing thermal expansion (seal-container steel UP host rock) RB
Hydrogen by metal corrosion: Thermal effects on the seal waste UP material (concrete hydration) RB
Microbial degradation of Hydrogen: effects of microbial cellulose and other organic wastes UP growth on concrete RB
Methane and carbon dioxide production: Degradation of bentonite by aerobic degradation UP chemical reactions RB
Methane and carbon dioxide production: Coagulation of bentonite RB anaerobic degradation UP Radiation effects on bentonite RB
Radiolysis RB Erosion of seal RB He production RB Alkali-aggregate reaction RB Gas generation from concrete: Investigation borehole seal failure and short-term seals RB degradation RB
Gas from microbial degradation: Groundwater flow due to gas effects of temperature RB production: host rock UP
Gas from microbial degradation: Groundwater flow due to gas effects of lithostatic pressure RB production: seals UP
Gas from microbial degradation: Repository-induced changes in effects of biofilms RB groundwater flow direction UP
Radioactive decay: heat generation RB Groundwater and gas flow: host rock UP Nuclear criticality (preclosure) SO-R Groundwater and gas flow: seals UP Nuclear criticality: heat generation RB Chemical kinetics RB Rock property changes UP Chemical changes due to metal Formation of cracks UP corrosion: waste, container RB Non-elastic response UP Chemical changes due to gas Convection: seals, host rock RB production RB Repository thermally induced Speciation of corrosion products RB groundwater transport RB Soret effect RB
Source terms UP Thermally induced chemical changes (water chemistry) RB
Release of radionuclides from the failed container UP
Leaching: waste UP Rinse UP Speciation: waste UP Precipitation RB Dissolution: waste UP Reconcentration RB Solubility: waste UP Dissolution: seals, host rock RB Redox front: seals, host rock UP Advection and dispersion: radioSolubility effects (pH and Eh, nuclides (seals, host rock) UP
ionic strength, complexing Recrystallization RB agents, colloids), seals, host rock UP Electrochemical gradients RB
Electrical effects of metal Galvanic coupling RB corrosion RB Waste incompatibility SO-R
Sorption effects (pH and Eh, Advection and dispersion: hazardous ionic strength, complexing constituents (seals, host rock) RB agents, colloids), seals, host rock NR Gas transport in the nearfield as
Speciation: seals, host rock NR gas phase and in solution: Sorption: seals, host rock NR seals, host rock NR Diffusion: seals, host rock NR Unsaturated transport: seals, host rock NR Unsaturated transport: seals, host rock NR Subsidence: farfield RB Transport of radionuclides bound Active methane, carbon dioxide,
to microbes: seals, host rock NR radon, tritiated hydrogen, and Colloid transport UP other gases RB Capillary rise UP
DRAFT-DOE/CAO-2056 6-31 March 31,1995

Draft 40 CFR 191 Compliance Certification Application
1 6.2.4 Human-Initiated Events and Processes
2 In this chapter the DOE addresses compliance with the Containment Requirements in 3 40 CFR § 191.13, which specify consideration of "all significant events and processes," 4 including human-initiated events and processes. The preliminary performance assessment 5 described in this chapter, however, considers only undisturbed performance and does not 6 incorporate human-initiated events and processes. The DOE discusses the events and 7 processes that would need to be included in an analysis of disturbed performance.
8 Both 40 CFR Part 191 and the proposed 40 CFR Part 194 indicate that the consideration of 9 human-initiated events and processes should focus on drilling. The occurrence of drilling
10 within the controlled area is predicated on the assumption that passive institutional control of 11 the site fails at some time in the future, and that knowledge of the location of the repository is 12 lost.
13 Drilling activities associated with resource exploration could inadvertently remove waste and 14 provide direct connections for fluid flow from the repository to the surface or to any 15 intersected hydraulically conductive zones. Boreholes with target depths below the repository 16 horizon could intersect both the repository and, potentially, a pressurized brine pocket beneath 17 the Salado, modifying fluid flow and radionuclide transport out of the repository horizon.
18 Likelihood of drilling. Resource exploration and exploitation are the most common reasons 19 for drilling in the Delaware Basin, and are the most likely incentives for drilling in the future. 20 Natural resources have been evaluated at the WIPP location for their occurrence in economic 21 quantities. Powers et al. (1978a, b) investigated the potential for exploitation of caliche, 22 gypsum, salt, uranium, sulfur, lithium, potash, and hydrocarbons. The extraction of caliche, 23 gypsum, and salt were not considered to be economically viable at the WIPP because of the 24 existence of more easily accessible deposits elsewhere in the region and their widespread 25 occurrence. Uranium was not found to be present in economic quantities, and no sulfur 26 deposits were identified in the northern Delaware Basin. There is no evidence that brine of an 27 appropriate composition and quantity exists near the WIPP for lithium to be a potential 28 resource. However, potash, oil, and gas reserves are currently exploited in the vicinity of the 29 controlled area, and represent potential targets for exploratory drilling.
30 Other activities that potentially involve drilling include enhanced oil and gas production, oil 31 and gas storage, fluid disposal, and archaeological investigations. Secondary and tertiary 32 hydrocarbon production techniques can involve the drilling of additional wells for the 33 injection of fluid to enhance recovery. As indicated by the New Mexico Bureau of Mines and 34 Mineral Resources (NMBMMR) in their 1995 report, secondary production (waterflooding) is 35 employed in the Delaware Basin, and may be employed in the near future in the vicinity of the 36 WIPP site.
37 Oil and gas production byproducts are disposed of underground in the WIPP region. Also, 38 strata elsewhere within the Delaware Basin are used for hydrocarbon storage (see, for 39 example, Burton et al. [1993] in the bibliography). Currently, existing boreholes are used to
March 31, 1995 6-32 DRAFT-DOE/CAO-2056

Draft 40 CFR191 Compliance Certification Application
1 inject fluid for disposal or storage. Assuming the continuation of current practice, however, 2 the rate of drilling associated with these activities is likely to be insignificant by comparison 3 with drilling for resource exploration. Underground storage or disposal of fluids is excluded 4 on the grounds of low probability of occurrence in the immediate vicinity of the WIPP.
5 Archaeological investigations in the WIPP area have involved only minor surface disturbances 6 and have not involved drilling. However, markers emplaced at the WIPP site to deter 7 intrusion into the repository might provide an incentive for archaeological investigation, 8 should knowledge of the markers' purpose be lost. Repository intrusions resulting from such 9 investigations are excluded from performance assessments on regulatory grounds.
10 Potential consequences of drilling. The severity of the impact of drilling on system 11 performance depends on the depth and location of the borehole. If the target drilling depth is 12 below the repository horizon, and the borehole intersects a waste panel, particulate waste 13 would be transported to the ground surface. This includes material intersected by the drill bit 14 ("cuttings") and eroded from the borehole wall by circulating drilling fluid ("cavings"), and 15 material that enters the borehole as the repository depressurizes ("spallings"). Future 16 boreholes may provide direct connections for fluid flow between the repository horizon and 17 the ground surface. Boreholes with degraded casing and plugs may also provide connection to 18 other hydraulically conductive zones. Fluid flow in the borehole might be influenced by the 19 intersection of pressurized fluid in the Castile Formation (hereafter referred to as the Castile)
20 or a deeper formation.
21 6.3 Performance Assessment Modeling and Results
22 This section discusses the conceptual and computational models and parameter values used to 23 estimate performance of the undisturbed disposal system for those FEPs that remain following
24 the screening process.
25 6.3.1 Purpose and Scope
26 Although the various models, data, and parameters used by the DOE to calculate the CCDF 27 are thought to be reasonable for use in a performance assessment of the disposal system, full 28 justification of some aspects of the various models, data, and parameters used is not available 29 at this time. Justification is dependent on the outcomes of certain experiments that are 30 planned to be complete in time to support submittal of the final application. The CCDF 31 presented here is not in final form because sufficient confidence in the conceptual models, 32 process models, numerical codes, data, and model parameters used has not been established, 33 quality assurance has not been completed, and the number of realizations executed was 34 restricted. Furthermore, the CCDF presented here addresses undisturbed performance only. It 35 is a conditional CCDF that does not include a probabilistic analysis of potentially disruptive 36 future events including human-initiated events and processes, as required in 40 CFR Part 191 37 and the proposed 40 CFR Part 194, although that type of analysis will be included in the final 38 application.
DRAFT-DOE/CAO-2056 6-33 March 31,1995

Draft 40 CFR191 Compliance Certification Application
1 A single conceptual model for the disposal system was used to calculate the CCDF presented 2 at the end of this section. This single model, however, can be conveniently described in terms 3 of various submodels with each describing a part of the overall system. This section is 4 organized to provide, for each submodel defined, an integrated, summary description of the 5 conceptual model, process model, numerical model, experimental data, and model parameters 6 used. The geometry used in the performance assessment model, BRAGFLO, will be 7 described first, as this will provide a convenient framework for further discussion and for 8 relating the various submodels to each other and to the whole.
9 For clarity, the following terms are defined. As discussed in Section 6.1, a conceptual model 10 is the aggregate of processes, properties, and geometries considered for a particular part of a 11 performance assessment, based on insight into system behavior obtained by experiment or 12 experience. A process model is a verbal or mathematical description of how the conceptual 13 model will be incorporated in to a performance assessment, and a numerical model is the 14 actual algorithm (computer code, usually) used to numerically evaluate the process model. 15 Data are descriptors of the physical system being considered, normally obtained by 16 experiment or observation. Parameters are values necessary in process or numerical models. 17 The distinction between data and parameters can be subtle, due to formulations of some 18 process and numerical models that use parameters that are directly analogous to data that can 19 be obtained by experiments. Parameters are distinct from data, however, for three reasons. 20 First, data may be evaluated, statistically or otherwise, to generate parameters for a model so 21 that uncertainty in data is accounted for. Second, some parameters have no relation to the 22 physical system whatsoever, such as the parameters in a numerical model specified to 23 determine when an iterative solution scheme has converged. Third, many model parameters 24 are applied at a scale different from that which can be directly observed or measured.
25 6.3.2 Model Geometry
26 The fundamental geometry of the performance assessment model used for calculating the 27 CCDF is shown in Figure 6-6. This geometry is a process model which represents the natural 28 system, for the purposes of most fluid flow calculations, as a two-dimensional, vertical 29 approximation of the three-dimensional physical system. Effects of flow in the third (out-of-30 plane) dimension are approximated with a two-dimensional element configuration that 31 simulates radially convergent or divergent flow, centered on the repository, in intact rocks 32 laterally away from the repository. A separate model of horizontal, confined flow is used to 33 evaluate flow in the Culebra Dolomite Member (hereafter referred to as the Culebra) 34 (Region 17) and is linked to the cross-section in Figure 6-6 via the shaft (Region 5 and 35 Region 6).
36 In Figure 6-6, various regions are indicated which are distinguished from each other by the 37 conceptual models, process and numerical models, or model parameters applied. The 38 repository is represented by an equivalent panel (1), remaining panels (2), non-waste 39 excavated areas (3 and 4), and panel closures (7). The repository is connected to the surface 40 by a shaft (5 and 6), which contains seals of various types (8 and 9). The Salado is composed 41 of halite-rich rocks (15), anhydrite-rich interbeds (12,13, and 14), and areas where rock has
March 31,1995 6-34 DRAFT-DOE/CAO-2056

Draft 40 CFR 191 Compliance Certification Application
Surface
s r ^
WiMem . ^ S f t t , J ^ wmmm&m •::.,,<.• •"•.-.w's:.- ^mmmm
;<%.'.. KV;- ^immrnmim wmmmm:mmmMmt m
xmiMmMmmmmm ^«fc
wmmwMtm '(30/
m^M&^tmk v
s
* # i ^ ; ^ . c & r ?
^*&&j%M - :^^gB:^
m
$ Mi . wVh:.-. >t:
i&m?^K&&m <<\mw<&% •^^gmm%& ^,:'<^^y^-^Z-mmmm wmmmmm m'&m?$mm wmmmmm
§€MMg^^M^ •smmmmMm IS .-??
Siik ̂gfefeitag iiiiiil »oglS»fa -iSi
1 1 Equivalent Panel 2 Remaining Panels 3 Operations Region 4 Experimental Region 5 Lower Shaft 6 Upper Shaft 7 Panel Closures 8 Lower Shaft Seal 9 Upper Shaft Seal
Disturbed Rock Zone
12 MB 139 13 Anhydrite Layers A & B 14 MB 138 15 Intact Halite 16 Rustler (other than Culebra) 17 Culebra 18 Dewey Lake 19 Santa Rosa 20 Castile Brine Pocket 21 Borehole
Figure 6-6. Schematic BRAGFLO Model Geometry, Vertical Section
DRAFT-DOE/CAO-2056 6-35 March 31, 1995
Draft 40 CFR 191 Compliance Certification Application
l TfflS PAGE INTENTIONALLY LEFT BLANK
March 31, 1995 6-36 DRAFT-DOE/CAO-2056
Draft 40 CFR191 Compliance Certification Application
1 been damaged due to excavation effects (10 and 11). The Rustler is represented by the 2 Culebra (17) and other rocks (16). Region 16 is further subdivided in the calculations into the 3 Magenta Dolomite Member (hereafter referred to as the Magenta) above the Culebra and the 4 unnamed lower member below the Culebra. The Rustler is overlain by the Dewey Lake 5 Redbeds (18) and the supra-Dewey Lake formations (19) (hereafter referred to as the Dewey 6 Lake and the supra-Dewey Lake respectively). For the undisturbed case described here, the 7 borehole (21) and the Castile Formation (hereafter referred to as the Castile) (20) regions are 8 inactive. The conceptual models, data, process models, numerical models, and model 9 parameters applied to these regions will be described in later sections.
10 6.3.3 The Repository
11 The repository is represented by regions 1,2,3,4, and 7 in Figure 6-6. A number of 12 submodels have been defined within these areas and will be described in this section. The 13 submodels which have been defined for the repository are Disposal Rooms and Creep Closure 14 (6.3.3.1), Repository Fluid Row (6.3.3.2), Gas Generation (6.3.3.3), Actinide Source Term 15 (6.3.3.4), and Colloid Source Term (6.3.3.5).
16 6.3.3.1 Disposal Rooms and Creep Closure
17 As discussed in Chapter 3, the waste disposal region, in which TRU waste will be 18 permanently emplaced, consists of eight formal panels with seven disposal rooms each, and 19 the access drifts that will be filled with waste and sealed as disposal operations retreat from 20 adjacent panels that have been filled and sealed. North of the disposal region, the operations 21 region and experimental regions will be left as is after waste emplacements ceases and the 22 repository is closed and isolated by shaft seals. For computational purposes, the presence of 23 6804 drums within each disposal room is assumed. Waste properties in the process and 24 numerical models are averaged values.
25 Disposal room closure begins immediately after excavation because loading of the salt is non-26 uniform around the repository due to the excavation. If the rooms were empty, closure would 27 proceed to the point where most of the void volume created by the excavation would be 28 eliminated as the surrounding formation seeks to return to its undisturbed, uniform stress 29 state. This will occur in the operations region and experimental region. In the absence of 30 substantial gas or brine the waste will continue to consolidate until load balance is achieved 31 between waste and surrounding rock. The amount of consolidation and its duration is 32 governed by the properties of the waste, the surrounding rock, and the dimensions and 33 location of the room. Compaction of the waste is assumed to depend only on the applied load 34 at a given time.
35 Liquid or gas in the repository can affect the closure process. Because the waste will not 36 contain significant quantities of liquid upon emplacement, with respect to closure, liquid 37 which might affect closure will be formation fluids entering the repository from the Salado or
DRAFT-DOE/CAO-2056 6-37 March 31,1995

Draft 40 CFR 191 Compliance Certification Application
1 the shafts, depending on properties. In the presence of significant quantities of fluid (liquid or 2 gas) closure and consolidation is slowed when fluid compression increases fluid pressure in 3 the repository to the point where pressure is exerted on the surrounding rock. Load transfer 4 occurs according to the effective stress principle:
5 or=ae+p (10)
6 where a T is the weight of the overlying rock and brine, p is the pressure of the fluids in the 7 pores, and o e is the stress that is applied to the waste skeleton. In this process, the waste is 8 considered a skeleton structure immersed in pore fluids. As the pore pressure increases, the 9 weight of the overburden is transferred to the pore fluids. If the fluid pressure increases to
10 lithostatic pressure, the portion of the load carried by the skeleton, o e , vanishes. Further 11 consolidation ceases at this point, and will not begin again unless some of the pore fluids are 12 released. Brine inflow into the repository is also reduced as pressure increases, and brine can 13 be expelled from the repository if it is mobile and its pressure exceeds brine pressure in the 14 immediately surrounding formation. For the undisturbed case, gas release away from the 15 waste can occur by flow into lower pressure areas, which may include (depending on material 16 properties) disturbed areas surrounding the repository, the interbeds, or the shafts. Gas flow 17 into intact, halite-rich rock is not expected due to its'high expected threshold pressure.
18 In summary, during closure: (1) the volume of the excavation decreases as the formation 19 deforms over time to consolidate and encapsulate the waste, (2) brine may move towards the 20 repository because initially fluid pressure adjacent to it is lower than the equilibrium fluid 21 pressure that existed in the salt prior to excavation, and (3) chemical reactions within the 22 waste generate gas, which may exert pressure which resists closure.
23 The volumetric plasticity model is the process model for room closure and waste 24 consolidation. The experimental data used for the volumetric plasticity model and their 25 interpretation are summarized in Butcher et al. (1991) and Luker et al. (1991). The volumetric 26 plasticity model was numerically implemented in SANTOS, which has the same constitutive 27 relations as the code SANCHO used in previous performance assessments, but has been 28 vectorized for better performance, to calculate the closure of disposal rooms for performance 29 assessment.
30 As a boundary condition, SANTOS requires estimates of the quantity of gas present in a 31 disposal room. These estimates were obtained using the average stoichiometry model of gas 32 generation (Section 6.3.3.3) with, in essence, different assumptions about brine availability in 33 the disposal room. With the volumetric plasticity model and gas quantity boundary condition, 34 SANTOS calculates the closure state of the disposal room through time.
35 In performance assessment, the SANTOS calculated condition of the disposal rooms versus 36 time is linked to the fluid flow code BRAGFLO via a 'porosity surface' (a look-up table) with 37 axes of time after sealing, disposal room pressure, and disposal room porosity. At the 38 beginning of a time step, BRAGFLO evaluates the pressure of the waste-disposal region 39 (which is sensitive to brine and gas flow and the previous compaction state of the room), and
March 31, 1995 6-38 DRAFT-DOE/CAO-2056

Draft 40 CFR191 Compliance Certification Application
1 consults the porosity surface to find the void volume of the waste-disposal regions appropriate 2 for the time and pressure. The porosity surface method of incorporating the dynamic effect of 3 disposal room closure in performance assessment has been compared to more complex 4 techniques that are computationally impractical for use in a performance assessment, and was 5 found to be reasonable. Documentation will be provided with the final application.
6 The operations region and experimental region are to be left unfilled after closure; as these 7 regions will not contain significant quantities of materials which may generate gas, they are 8 expected to rapidly close. These regions, along with panel closures, are represented in 9 performance assessment with constant porosity 7.5 percent and permeability of 10"12 m 2.
10 6.3.3.2 Repository Fluid Flow
11 Fluid flow modeling within the repository is concerned with (1) fluid distribution in the waste 12 within the repository, and (2), depending on material properties, fluid flow to and from the 13 Salado and shafts. These are important in assessing gas generation rates (Section 6.3.3.3) and 14 the mobility of radionuclides in the disposal system.
15 Repository and disposal room flow is conceptually complex due to the varied properties of 16 rooms resulting from creep closure, waste consolidation, reactions which dissolve 17 radionuclides, and other reactions which generate gas. Some aspects of the changing 18 properties of the waste have been evaluated experimentally.
19 The permeability of waste at a given time can influence repository system performance by 20 controlling how rapidly gas or brine can flow through the waste. Tests reported by Luker et 21 al. (1991) on simulated waste have shown material permeabilities on the order of from 10"12 to 22 10' 1 6 m 2 in waste compacted under a lithostatic load.
23 Capillary rise (wicking) is the ability of a material to carry a fluid above the level it would 24 normally seek in response to gravity. Since the average stoichiometry model for gas 25 generation (Section 6.3.3.3) defines different rates depending upon whether the waste is in 26 direct contact with liquid brine or gas containing water vapor, the physical extent of these 27 regions could be important. Capillary rise is described by two-phase properties, which have 28 not been measured for simulated waste. In part due to capillary rise, and also due to 29 heterogeneity present in waste containers (depressions which may collect brine), the waste is 30 expected to have high contact area with brine and high residual saturation, in general. For 31 performance assessment, the DOE assumed brine in the disposal regions is not mobile (i.e., 32 not able to move within or out of the waste-disposal region) unless its saturation is at least 50 33 percent. This value was chosen based on consideration of the heterogeneity of the waste. 34 Brine can flow into the waste disposal region at saturations well below 50 percent.
35 For performance assessment, the intrinsic permeability of the waste is assumed constant at 36 5.58xl0' 1 2 m 2 (Table 6-4) which is conservative because high permeability promotes fluid 37 flow under low-hydraulic gradients.
DRAFT-DOE/CAO-2056 6-39 March 31,1995

Draft 40 CFR191 Compliance Certification Application
Table 6-4. Parameters for Fluid Flow in the Repository
4 5 6 7 8 9
10 11 12 13 14 15 16 17
"'"" : "s- Parameter/;--;" . ^ "Maximum Minimum. , , , MedianorConstant* Permeability, k (m2) — — 5.584xl0"12
Porosity, initial (%) — — 88.1% Compressibility (1/Pa) — — b
Two-Phase Flow: — — 2/3 Brooks/Corey P.ffa) o^io 0 - 5 ^- 3 4 6 0.56xl0"°-5xk^-346 0.56xk-°M
s* 0.8 0.5 0.65 s r 0.2 0 0.1 A 10.0 0.2 5.1 van Genuchten-Parker — — 1/3 s* 0.8 0.5 0.65 S F
0.2 0 0.1 m 0.91 0.17 0.84
"Parameters with no maximum and minimum values are treated as constants in the performance assessment. bThis parameter is dependent on the porosity surface.
18 Because two-phase relationships have not been measured for WIPP materials, including 19 waste, performance assessment captures a range of possible two-phase conditions by sampling 20 on the Brooks and Corey and the van Genuchten-Parker two-phase equations, and by sampling 21 on parameters within the equations. These and other parameters in the disposal room and 22 repository flow model are shown in Table 6-4.
23 6.3.3.3 Gas Generation
24 The processes that will produce gas in WIPP disposal rooms are corrosion, microbial activity, 25 and radiolysis. Gas-consuming processes include reaction with cementitious materials and 26 dissolution in brine.
27 Oxic corrosion (oxidation of metals by molecular 0 2 ) will consume 0 2 and H 2 0 in WIPP 28 disposal rooms. Oxic corrosion of steel waste containers, Fe-based alloys in the waste, and 29 other metals in the waste such as Al and Al-based alloys is, along with aerobic microbial 30 activity, a major process that will consume 0 2 in the repository. Radiolytically induced 31 uptake by plastics and, perhaps, rubbers, and oxidation of dissolved, reduced species such as 32 Fe 2 + produced by dissolution of Fe(II)-bearing corrosion products will also consume 0 2 . 33 These processes are expected to produce anoxic conditions rapidly after panels are sealed.
34 Anoxic corrosion, the oxidation of metals by reaction with H 2 0 or H 2S, will consume H 2 0, 35 C0 2 , and H 2S, and produce H 2. Anoxic corrosion of steels and other Fe-based alloys by 36 intergranular Salado brines with a neutral or nearly neutral pH may produce H 2 at a rate of 37 0.10 mole per square meter of reacting steel per year. The quantity of H 2 produced will 38 depend on (1) the quantity of steels and other Fe-based alloys in the repository, (2) the
March 31,1995 6-40 DRAFT-DOE/CAO-2056
Draft 40 CFR191 Compliance Certification Application
1 quantity of aqueous H 2 0 present, and (3) which corrosion product forms. If sufficient steels, 2 other Fe-based alloys, and H 2 0 are available, C 0 2 and H2S are absent, and (Fe,Mg)(OH)2»H20 3 is the corrosion product, then anoxic corrosion of steels and other Fe-based alloys and 4 concomitant H 2 production will continue until the H 2 fugacity increases to its equilibrium 5 value of about 60 atmospheres. The equilibrium H 2 fugacity for Fe 3 0 4 , the other possible 6 anoxic corrosion product in the absence of C 0 2 and H 2S, is about 400 atmospheres. 7 Therefore, if Fe 3 0 4 forms, anoxic corrosion and H 2 production will continue even if the H 2
8 fugacity increases to its highest possible value of roughly 150 atmospheres (lithostatic 9 pressure at the depth of the repository).
10 If sufficient C 0 2 or H2S is present, anoxic corrosion of steels and other Fe-based alloys may 11 stop prior to the formation of significant quantities of H 2 and consumption of significant 12 quantities of H 2 0, because anoxic corrosion can be impeded by adherent corrosion products 13 FeC0 3 , FeS, or, perhaps, FeS 2.
14 Under humid conditions (water vapor is present, but not liquid water), anoxic corrosion of 15 steels and other Fe-based alloys has not been observed on simulated WIPP waste.
16 Microbial activity in WIPP disposal rooms will consume 0 2 and, perhaps, CO z, and produce 17 C0 2 , N 2 0 , N 2, H 2S, H 2, and CH4. Microbial consumption of cellulosics and, perhaps, plastic 18 and rubber may produce significant quantities of gas if (1) the requisite microorganisms are 19 present when the repository is filled and sealed, (2) these microorganisms persist for a 20 significant fraction of the 10,000-year period of performance of the repository, (3) sufficient 21 H 2 0) is present, (4) sufficient electron acceptors (oxidants) are available, and (5) enough 22 nutrients, especially N and P, are available.
23 Aerobic microbial activity will consume 0 2 and produce C 0 2 and H 2 0 in WIPP disposal 24 rooms. Aerobic microbial metabolism and oxic corrosion of metal are the two major 25 processes contributing to the formation of anoxic conditions in the repository.
26 The most important anaerobic microbial processes will be (1) denitrification, which consumes 27 N0 3" as the electron acceptor and produces C0 2 , N zO, and N 2; (2) S0 4
2" reduction, which 28 consumes S0 4
2 ' as the electron acceptor and produces C 0 2 and H 2S; (3) methanogenesis, 29 which consumes organic acids and produces CH4 and C 0 2 or consumes C 0 2 and H 2 and 30 makes CH4. The rates at which these processes will produce or, perhaps, consume gas will 31 depend on whether or not conditions are humid or inundated, on the concentrations of electron 32 acceptors such as N03", S 0 4
2 \ organic acids or C0 2 , and the concentrations of nutrients such 33 as N and P, and on the dissolved Pu concentration.
34 Radiolysis herein refers to "a radiolysis" (the chemical dissociation of molecules by alpha 35 particles emitted during the radioactive decay of TRU waste) because other types of radiation 36 will be insignificant. Radiolysis of H 2 0 in the waste and brine in WIPP disposal rooms will 37 consume H 2 0 and produce H 2. Some oxidizing species, as well as 0 2 , may also result. Based 38 on calculations using the results of laboratory studies of brine radiolysis, estimates of the 39 quantities of brine that could be present in the repository after filling and sealing, and
DRAFT-DOE/CAO-2056 6-41 March 31,1995

Draft 40 CFR191 Compliance Certification Application
1 estimates of the solubilities of Pu, Am, Np, Th, and U in WIPP brines, radiolysis of H 2 0 will 2 not affect the overall gas or H 2 0 content of the repository significantly. Radiolysis of 3 cellulosics, plastic, and rubber in the waste and, in the case of plastic, the container liners can 4 produce a variety of gases. However, such radiolytic gas production proceeds at lower rates 5 than radiolysis of H 2 0 in the waste and brine, and is insignificant.
6 An average stoichiometry process model is used to implement gas generation in performance 7 assessment calculations. The average stoichiometry model accounts only for C 0 2 and H 2
8 formations. Several assumptions are necessary to predict gas generation in WIPP disposal 9 rooms. These include (1) which corrosion product will form during anoxic corrosion of steels
10 and other Fe-based alloys in the absence of C 0 2 and H 2S; (2) the hydration number x of 11 (Fe,Mg)(OH)2»H20, one of the two more likely corrosion products under C 0 2 free and H2S 12 free conditions; (3) whether microorganisms capable of carrying out potentially significant 13 respiratory pathways will be present when the repository is filled and sealed; (4) whether these 14 microbes will survive for a significant fraction of the 10,000-year period of performance of 15 the repository; (5) whether these microbes will consume significant quantities of plastic and 16 rubber; (6) whether sufficient electron acceptors (oxidants) will be present and available; 17 (7) whether enough nutrients, especially N and P, will be present and available; and (8) the 18 stoichiometry of the overall reaction for each significant respiratory pathway, especially the 19 number of moles of electron acceptors, nutrients, gases, and H 2 0 consumed or produced per 20 mole of substrate consumed. The average stoichiometry model used for this performance 21 assessment limits gas generation only by the quantity and distribution of brine within the 22 disposal regions resulting from initial brine saturation and brine inflow. The disposal region 23 generates gas at sampled rates for brine-inundated conditions commensurate with brine 24 saturation; the rest of the disposal region generates gas at humid rates. A portion of the plastic 25 and rubber in the waste is assumed to degrade by microbial action as part of the cellulosic 26 content of the waste. Parameters used in the model for gas generation are listed in Table 6-5.
March 31, 1995 6-42 DRAFT-DOE/CAO-2056

Draft 40 CFR 191 Compliance Certification Application
1 2
Table 6-5 Parameter Values Used in the Average Stoichiometry Gas Generation Model
4 5 6 7 8 9 10 11 12 13 14 15 16 17 18
'* Parameter; . ' ., - '• Maximum - Minimum Median
Rate of gas generation by corrosion in brine-inundated conditions (mol/m2 steel)
6.4xl0'7 0 a
Rate of gas generation by corrosion in humid conditions (multiplicative factor of inundated rate)
5X10"4 0 a
Rate of gas generation by biodegradation in inundated conditions (mol/kg cellulosics sec)
1.6x10* 0 3.2x10*
Rate of gas generation by biodegradation in humid conditions (multiplicative factor of inundated rate)
0.2 0 0.1
Volume fraction of plastics and rubber that degrade as cellulosics
1 0 0.5
Corrosion stoichiometry (moles H^moles Fe) 4/3 1 7/6 Biodegradation stoichiometry (moles Hj/moles cellulosics)
1.67 0 0.84
Radiolysis 0 0 0 "A constructed distribution between the maximum and minimum values was used.
19 6.3.3.4 Actinide Source Term
20 The concentrations in the brine phase of five actinides have been determined to be important 21 in the performance assessment of the WIPP: Americium (Am), Thorium (Th), Neptunium 22 (Np), Uranium (U), and Plutonium (Pu). These actinides are soluble in four oxidation states: 23 HI through VI. These actinides do not occur in a gas phase under conditions expected in the 24 WIPP.
25 The mobilization of actinides in waste in the disposal rooms is determined by the numerical 26 codes NUTS and PANEL. NUTS is used to transport radionuclides using BRAGFLO flow 27 fields in the disposal system. These codes require actinide oxidation states and solubilities as 28 parameter input; these are presented in Table 6-6.
DRAFT-DOE/CAO-2056 6-43 March 31,1995

Draft 40 CFR 191 Compliance Certification Application
Table 6-6. Parameters for Actinide Source Term
3 4 5 6 7 8
9 10 11 12 13
14 15
16 17
">/-'"'-• "-Parameter . - .• -V" \ Maxunum ' ' Minimum-, •.!. • ' . ' -" ; '.'- '••- Constant*'' ";-Log solubility, molar, oxidation state HI
0 -10 b
Log solubility, molar, oxidation state IV
0 -10 b
Log solubility, molar, oxidation state V
0 -10 b
Log solubility, molar, oxidation state VI
0
Am oxidation state Aiim
Th oxidation state All IV
U oxidation state 0-20% VI Rest equal probability IV, VI
Np oxidation state Equal probability IV, V
Pu oxidation state 0-20% VI Rest equal probability m . IV, V
Parameters with no maximum and minimum values are treated as constants in the performance assessment. A constructed distribution between the maximum and minimum values was used.
18 6.3.3.5 Colloid Source Term
19 The only reasonable source of colloids in the disposal system is the disposal room 20 environment. Because of the presence of soils and cellulosic substrate for microbial action in 21 WIPP waste (see, for example, DOE 1994, table 4-1, Waste Matrix Code Group 4200), humic 22 materials and microbes will be present in disposal room brines. Actinide intrinsic colloids 23 may also form in the disposal rooms due to relatively high actinide concentrations. Processes 24 affecting the transport of colloids are addressed in Section 6.3.6. Parameters for the colloid 25 source terms are shown in Table 6-7.
26 Table 6-7. Parameters for Colloid Source Term
27
28 29
30 31 32
.,; . -.'.o/V.-',: Parameter^ V-\™\,-' ' -';• '.-i' Maximum '--.' Minimum. './] . C o n s t a n t '
Source-term concentration of actinides carried by humic materials (per actinide), moles/liter
Source-term concentration of actinides carried, by microbes (per actinide), moles/liter
2xl0-8
1x10*
"Parameters with no maximum and minimum value are treated as constants in the performance assessment.
March 31, 1995 6-44 DRAFT-DOE/CAO-2056
Draft 40 CFR191 Compliance Certification Application
1 6.3.4 Shafts and Shaft Seals
2 The four shafts connecting the repository to the surface are represented in performance 3 assessment with a single shaft, represented by regions 5,6, 8, and 9 on Figure 6-6. This single 4 shaft has a cross-section and volume equivalent to the four real shafts it represents. Upon 5 closure of the repository following waste emplacement, the shafts will be sealed as discussed 6 in Section 3.3.2. The seals are responsible for short-term restriction of brine flow down the 7 shaft, and long-term restriction of possible gas and brine flow up the shaft if repository 8 pressure becomes high. The backfill components of the shaft system have no role in the 9 performance of the repository.
10 The seal system has been simplified for performance assessment into (1) a short-term seal and 11 (2) a long-term seal. The short-term seal model consists of all of the short-term components, 12 both those at the Salado-Rustler contact designed to keep brine out of the shafts and those 13 nearer the base of the shaft designed to keep gas out of the shafts. The long-term seal 14 represents primarily the middle salt column and its expected behavior from 100 to 10,000 15 years. Shaft parameter values are shown in Table 6-8.
DRAFT-DOE/CAO-2056 6-45 March 31,1995

Draft 40 CFR191 Compliance Certification Application
Table 6-8. Shaft Parameter Values
3 4 5 6 7 8 9 10 11 12 13 14
15 16 17
18 19 20 21 22 23
24 25 26
-*•'.','-= '..' V Parameter' \,>.-v„. ;-."' Maximum,: - ' Minimnm - . Median or Constant*: , Permeability, lower shaft seals (m2) 0-100 years io-» 2
Permeability, lower shaft seals (m2) 100-10,000 years i o - 1 4 i o - 1 9 b
Permeability, upper shaft seals (m2) 0-100 years i o - 1 4 l O " 1 9
b
Permeability, upper shaft seals (m2) 0-100 years 100-10,000 years i o - 1 2
Rest of shaft — — i o - 1 2
Shaft seals porosity (%) — — 5 Rest of shaft porosity (%) — — 7.5 to upper seal, 25 above
upper seal Seals and rest of shaft two-phase flow: Brooks/Corey P, —
—
1.0
0.56x1c-0-346 (seals) 0 (rest of shaft)
0.2 0.2 0.7
Lower seal length (m) — — 60 Upper seal length (m) — — 49 Rest of shaft pore compressibility (1/Pa) — — 1.3xl0-8
4xl0'9 above upper seal Shaft seal pore compressibility (1/Pa) — — 2x10⁻⁸
"Parameters without a maximum and minimum value are treated as constants in the performance assessment. bA constructed distribution for between the maximum and minimum values.
27 6.3.5 The Salado Formation
28 The Salado is the principal natural barrier to fluid flow between the waste disposal panels and 29 the accessible environment. This section will describe features of the natural and modeled 30 Salado system important in performance assessment.
31 For performance assessment, the Salado is conceptualized as a porous medium composed of 32 several rock types arranged in layers, except near the repository where damaged zones 33 crosscut otherwise continuous layers. Two rock types, impure halite and anhydrite interbed, 34 are used to represent the intact Salado. Near the repository a DRZ has increased permeability 35 and porosity, and it serves to allow unimpeded flow between anhydrite interbeds and the 36 repository. Specific information about the major rock types represented in performance 37 assessment is presented in following sections.
March 31, 1995 6-46 DRAFT-DOE/CAO-2056

Draft 40 CFR191 Compliance Certification Application
1 6.3.5.1 Salado Halite
2 A single porous media with spatially constant properties (Region 15 in Figure 6-6) is used in 3 performance assessment to represent the various intact, halite-rich layers present in the Salado 4 and anhydrite interbeds contained within those layers that are not explicitly represented. A 5 comparison has been made between the simplified stratigraphy used in performance 6 assessment and a more detailed stratigraphy amenable in a more complex model; this 7 comparison confirmed that the performance assessment stratigraphic representation is 8 reasonable. This comparison will be available for the final application. The two-phase 9 properties of the halite have not been measured. A wide range of possible two-phase
10 properties is incorporated by sampling between two sets of multiphase equations, and by 11 sampling on parameters within the different equations. Due to small pore size, the halite-rich 12 units are expected to have threshold pressure high enough that waste-generated gas will not 13 penetrate, and halite threshold pressure has accordingly been set arbitrarily high to prevent gas 14 penetration. This assumption enhances gas migration in anhydrite interbeds. Table 6-9 shows 15 parameters used in performance assessment for Salado halite.
16 Table 6-9. Salado Halite Parameter Values
17
18
19
20
21 22 23 24 25 26
27 28 29 30 31 32 33
Parameter •. [ Maximum , Minimum Median or Constant1
Permeability (m2)b 1 0 - 2 0 io - 2 4 c
Porosity (%) 3 0.1 1.5
Specific Storage (1/m) io- 5 io- 7 IO- 6
Two-phase flow: — — 2/3 Brooks/Corey P. 50MPa s b r
0.6 0 0.3 S g r 0.4 0 0.2 X 10.0 0.2 5.1 van Genuchten-Parker — — 1/3 s t a
0.6 0 0.3 Sgr 0.4 0 0.2 m 0.91 0.17 0.836
"Parameters with no maximum and minimum values are treated as constants in the performance assessment. •"Parameter values based on data in Appendix PAR. CA log uniform distribution between the maximum and minimum values was used.
DRAFT-DOE/CAO-2056 6-47 March 31,1995

Draft 40 CFR191 Compliance Certification Application
1 6.3.5.2 Salado Interbeds
2 Performance assessment uses three distinct anhydrite interbeds in the BRAGFLO model, 3 representing Marker Bed 138, anhydrites "a" and "b," and Marker Bed 139. The three 4 interbeds have the same model parameter set assigned to them, and the parameters are 5 spatially constant: the only difference between the interbeds is their position and thickness. 6 Model parameters describing the interbeds are shows in Table 6-10.
7 Table 6-10. Anhydrite Interbed Parameter Values
10 11 12 13 14 15 16 17 18 19 20 21 22 23 24 25
;">-- \ .-/!
; Parameter ,.;-.-, •; ,;. 1 . Maximum • •»' --.' . / Minimum , - Median or Constant?
Permeability (m2)a i o - 1 5 l O " 2 1 b
Porosity (%) 8 0.1 b
Specific storage (1/m) 10* io- 7 10*
Two-phase flow:c
Brooks/Corey P,(Pa)
A
s .exk- 0 3 4 6
0.6 0.4 10.0
s.exio^xk- 0- 3 4 6
0 0
0.2
2/3
b
b
b
5.1 van Genuchten-Parker — — 1/3
m
0.6 0.4 0.91
0 0
0.17
b
b
0.836 "Parameter values are based, on data in Appendix PAR. bA constructed distribution between the maximum and minimum values was used. ^Relative permeability model chosen was identical to that sampled for halite. dParameters wim no maximum and minimum values are treated as constants in the performance assessment.
26 6.3.5.3 Interbed Fracture
27 Repository pressures are not expected to be greater than lithostatic because such pressures 28 would result in negative effective stress in rock near the repository and cause dilation or 29 fracturing. This will allow gas flow out of the repository, which reduces pressure. Field tests 30 and laboratory tests in anhydrite interbeds support the use of a pressure-dependent 31 permeability and porosity, and indicate that such alteration may take place below lithostatic 32 pressure.
33 The model used in performance assessment to represent interbed fracture assigns a fracture 34 initiation pressure such that when this pressure is reached, local fracturing takes place. Below 35 the fracture initiation pressure, an interbed has a constant permeability and compressibility, 36 and the porosity is determined using the standard integral equation. Above the fracture 37 initiation pressure, the local compressibility of the interbed is assumed to increase linearly
March 31,1995 6-48 DRAFT-DOE/CAO-2056

Draft 40 CFR191 Compliance Certification Application
1 with pressure, which dramatically affects how rapidly porosity increases with increasing pore 2 pressure. Additionally, permeability increases by the magnitude of porosity increase raised to 3 a power. The compressibility, porosity, and permeability continue to increase until the full 4 fracture pressure is reached, above which these values cease to change. Table 6-11 shows 5 fracture parameters.
6 Table 6-11. Interbed Fracture Parameter Values
7 8 9
10 11 12
Parameter, units ,_ : Maximnm Minimum Median or Constants Initiation pressure (Pa) 14.8x10s 13.8xl06 14.3xl06
Full fracture pressure (Pa) 17.3xl06 16.3xl06 16.8xl06
Maximum porosity — — initial+1% Maximum permeability (m2) — — io-9
'Parameters with no maximum and minimum values are treated as constants in the performance assessment.
13 6.3.5.4 Disturbed Rock Zone
14 As discussed in Chapter 3, the DRZ is expected to generally increase fluid mobility. Because 15 the increase in fluid mobility is not expected to be completely reversible with creep closure of 16 the disposal rooms, performance assessment increases the permeability of a region around the 17 repository that has constant properties through time. The modeled DRZ extends above and 18 below the repository from the base of Marker Bed 138 to Marker Bed 139. This zone 19 provides a permanent high-permeability region which does not impede flow between the 20 repository and interbeds. Table 6-12 shows parameter values used in the performance 21 assessment representation of the DRZ.
22 Table 6-12. DRZ Parameter Values
23 24 25 26 27 28 29 30 31 32 33 34 35 36 37 38
Parameter, units Maximnm Minimum Median or Constant* Permeability (m2) — — id' 5
Porosity (%)b 3 0.1 1.5 Specific storage (1/m) — — io-5
Two-phase flow: Brooks/Coreyb
— — 2/3
P,
X 10.0 0.2
0 0 0
5.1 van Genuchten-Parkerb — — 1/3
s„ tf
m 0.91 0.17
0 0
0.836 "Parameters with no maximum and minimum values are treated as constants in the performance assessment. bSet same as sampled halite value.
DRAFT-DOE/CAO-2056 6-49 March 31,1995

Draft 40 CFR 191 Compliance Certification Application
1 6.3.5.5 Salado Brine Outflow Model for Performance Assessment
2 The BRAGFLO model implemented for performance assessment could underestimate 3 cumulative release to the accessible environment because it lacks sufficient detail to 4 realistically portray the flow path between the waste disposal panels and the accessible 5 environment. Rather than use BRAGFLO-calculated cumulative release, this performance 6 assessment has implemented an alternative method for determining the quantity of brine 7 reaching the accessible environment and its actinide concentration. This alternative technique 8 is based on a theoretical consideration of the mass of brine that would occupy various possible 9 flow networks for contaminated brine between the waste disposal region and the accessible
10 environment.
11 The model is implemented in performance assessment by first keeping track of how much 12 brine flows into interbeds that has been in areas where it may have become contaminated, and 13 second by comparing that quantity of brine to a sampled parameter that represents the volume 14 of the flow network for contaminated brine between the repository and the accessible 15 environment. If the quantity of contaminated brine flowing into interbeds exceeds the 16 sampled storage volume, the excess is released to the accessible environment.
17 Brine in the waste disposal regions of the repository and in the DRZ below these regions is 18 assumed to be contaminated. The code NUTS is used to track brine flowing through these 19 regions; any of this brine that enters an interbed will be accumulated (numerically) for 20 comparison to the sampled brine storage parameter.
21 The volume of brine stored within a flow network is calculated by multiplying a sampled 22 factor, called C, by a reference volume, set to be the void volume of Marker Bed 139 in a 23 circular annulus between the repository and accessible environmental boundary. The 24 minimum volume of the flow network between the waste disposal region and the accessible 25 environment, accounting for possible channelized flow in fractures and likely associated 26 fingering, is 0.1 percent of the void volume of Marker Bed 139 between the disposal panels 27 and the accessible environment. The minimum value for C is adjusted depending on whether 28 interbeds fracture. Due to the potential for significant storage in adjacent halite units, the 29 maximum value for the volume of brine contained within the disposal system is fixed at twice 30 the void volume for Marker Bed 139. Table 6-13 shows brine outflow parameter values.
31 Table 6-13. Brine Storage Parameter Values for Brine Outflow
32 '- - .'Parameter, milts.;;, ;•' ;.'••'••': Maximum <; .»•, . - Minimum Median or. Constant?
33 Minimum C, no interbed fracturing 0.05 10"3 b
34 Minimum C, with interbed fracturing 0.01 10-3 b
35 Maximum C — — 2
36 MB 139 Pore volume, m 3 1.96xl06 times sampled interbed porosity 37 "Parameters with no maximum and minimum values are treated as constants in the performance assessment. 38 bA constructed distribution between the maximum and minimum values was used.
March 31, 1995 6-50 DRAFT-DOE/CAO-2056

Draft 40 CFR191 Compliance Certification Application
1 6.3.6 Rustler Formation
2 Specific information about the members of the Rustier represented in performance assessment
3 is presented below.
4 6.3.6.1 The Culebra Member
5 In undisturbed conditions, the only potential for contamination of the Culebra is through brine 6 flow up the sealed shafts due to high repository pressure. If this happens, lateral transport of 7 contaminants in the Culebra may occur. As the conceptual basis of the BRAGFLO model is 8 not appropriate for predicting reasonable estimates of contaminant transport through the 9 Culebra, performance assessment uses a different conceptual, process, and numerical model to
10 evaluate Culebra transport. The conceptual model is two-dimensional flow through a 11 horizontal confined aquifer with spatially variant transmissivity. The source flux of 12 contaminants is obtained from BRAGFLO- and NUTS-calculated fluxes into the Culebra 13 from the shaft. Parameter values used in BRAGFLO to describe the Culebra are shown in 14 Table 6-14. 15 Table 6-14. Culebra Parameter Values for the BRAGFLO Model
16 17 18 19 20 21 22 23 24 25 26 27 28 29 30 31 32 33 34
Parameter,. Maximum -,,'. /'./Minimum . Median or Constant* Permeability (m2) — — 2.65xl0-13m2
Porosity (%) — — 14.6 Pore compressibility (1/Pa) — — 1.42x10* Two-phase flow: Brooks/Corey P,(Pa)
A.
1.0 1.25x10"
0.2 0.2 0.7
Thickness (m) — — 7.7 Initial Pressure (Pa) — — 8.52x10s
Microbial colloid free water diffusion coefficient (cmVsec)
— — 0
Humic colloid free water diffusion coefficient (cmVsec)
— — lxlO"7
Microbial colloid release factor (%)
— — 1
Humic colloid release factor (%) — — 1 "Parameters without maximum and minimum values are treated as constants in the performance assessment.
35 The SECO family of codes is used to evaluate fluid flow and transport in the Culebra. These 36 codes capture the spatial variability of transmissivity in the Culebra by assigning different 37 transmissivities to every element. The transmissivities assigned are calculated using an
DRAFT-DOE/CAO-2056 6-51 March 31,1995
Draft 40 CFR 191 Compliance Certification Application
1 automated inverse approach to calibrate the transmissivity fields to both steady-state and 2 transient pressure data. The technique can be broken down into three steps: unconditional 3 simulation, conditional simulation, and automated calibration.
4 An unconditional simulation generates a random Culebra transmissivity field that has the 5 same spatial correlation structure as measured transmissivities, but does not necessarily match 6 measured transmissivities at the location of their measurements. A conditional simulation 7 alters the random field produced during the unconditional simulation so it matches the 8 measured transmissivities at the locations of their measurements. The automated calibration 9 alters the conditionally simulated field so that the pressures computed by the groundwater-
10 flow model (both steady and transient state) agree closely by least-squares with the measured 11 pressures. When calibration is completed, a conditionally simulated transmissivity field is 12 obtained that conforms with all head and transmissivity data at the WIPP site and may be 13 regarded therefore as a plausible, but non-unique, version of the true distribution of 14 transmissivity.
15 This process is repeated to produce the desired number of calibrated, conditionally simulated 16 fields. For each realization executed in performance assessment, a calibrated, conditionally 17 simulated transmissivity field is chosen for the SECO models to represent Culebra 18 transmissivity.
19 6.3.6.2 Chemical Retardation of Actinides in the Culebra
20 Two major minerals considered to be important for adsorption in the Culebra are dolomite, 21 because of the vast amount present in the Culebra, and clay minerals, which are typically quite 22 powerful adsorbents. Most of the clay minerals in the Culebra are detrital in origin, deposited 23 along bedding planes while the evaporite minerals, such as dolomite, were forming. The clay 24 minerals are concentrated in discontinuous lenses or are present as anastomosing networks, 25 but are generally concentrated along sub-horizontal planes. The chemical compositions of 26 some of the clay minerals (e.g., what is now present as corrensite) were diagenetically altered, 27 but their spatial distribution has not changed since deposition. Authigenic clay minerals are 28 not present in appreciable quantities.
29 Performance assessment uses chemical retardation factors (R) calculated using the following
30 equations:
31 R = l + pbKd(l-(J))/(i) (11)
32 where K,, is the distribution coefficient for each radionuclide and (J) and p b are the porosity and 33 bulk density of the rock, respectively. This equation can be derived from the advection-34 dispersion equation assuming local equilibrium for adsorption and a linear relationship 35 between the amount of a solute adsorbed on the unit amount of the solid, S, and the 36 concentration of the solute, C: 37 S = K, C. (12)
March 31, 1995 6-52 DRAFT-DOE/CAO-2056
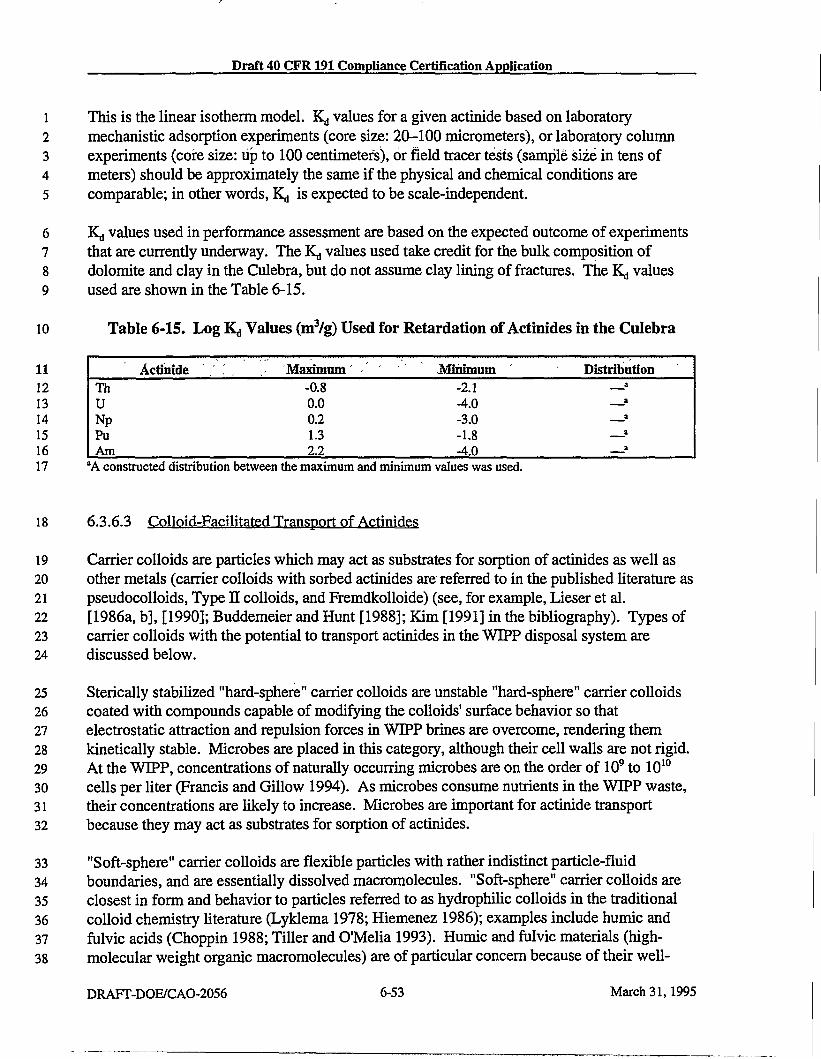
Draft 40 CFR191 Compliance Certification Application
1 This is the linear isotherm model. Kj values for a given actinide based on laboratory 2 mechanistic adsorption experiments (core size: 20-100 micrometers), or laboratory column 3 experiments (core size: up to 100 centimeters), or field tracer tests (sample size in tens of 4 meters) should be approximately the same if the physical and chemical conditions are 5 comparable; in other words, Kj is expected to be scale-independent.
6 Kj values used in performance assessment are based on the expected outcome of experiments 7 that are currently underway. The Kj values used take credit for the bulk composition of 8 dolomite and clay in the Culebra, but do not assume clay lining of fractures. The K,, values 9 used are shown in the Table 6-15.
10 Table 6-15. Log Kj Values (m3/g) Used for Retardation of Actinides in the Culebra
Actinide Maximum Minimum Distribution Th -0.8 -2.1 a
U 0.0 -4.0 a
Np 0.2 -3.0 a
Pu 1.3 -1.8 a
Am 2.2 -4.0 a
17 "A constructed distribution between the maximum and minimum values was used.
18 6.3.6.3 Colloid-Facilitated Transport of Actinides
19 Carrier colloids are particles which may act as substrates for sorption of actinides as well as 20 other metals (carrier colloids with sorbed actinides are referred to in the published literature as 21 pseudocolloids, Type II colloids, and Fremdkolloide) (see, for example, Lieser et al. 22 [1986a, b], [1990]; Buddemeier and Hunt [1988]; Kim [1991] in the bibliography). Types of 23 carrier colloids with the potential to transport actinides in the WIPP disposal system are 24 discussed below.
25 Sterically stabilized "hard-sphere" carrier colloids are unstable "hard-sphere" carrier colloids 26 coated with compounds capable of modifying the colloids' surface behavior so that 27 electrostatic attraction and repulsion forces in WIPP brines are overcome, rendering them 28 kinetically stable. Microbes are placed in this category, although their cell walls are not rigid. 29 At the WIPP, concentrations of naturally occurring microbes are on the order of 109 to 10 1 0
30 cells per liter (Francis and Gillow 1994). As microbes consume nutrients in the WIPP waste, 31 their concentrations are likely to increase. Microbes are important for actinide transport 32 because they may act as substrates for sorption of actinides.
33 "Soft-sphere" carrier colloids are flexible particles with rather indistinct particle-fluid 34 boundaries, and are essentially dissolved macromolecules. "Soft-sphere" carrier colloids are 35 closest in form and behavior to particles referred to as hydrophilic colloids in the traditional 36 colloid chemistry literature (Lyklema 1978; Hiemenez 1986); examples include humic and 37 fulvic acids (Choppin 1988; Tiller and O'Melia 1993). Humic and fulvic materials (high-38 molecular weight organic macromolecules) are of particular concern because of their well-
DRAFT-DOE/CAO-2056 6-53 March 31,1995

Draft 40 CFR191 Compliance Certification Application
1 known capability of complexing with metal cations, including actinides (Choppin 1988; 2 Dearlove et al. 1990; Vlassopoulos et al. 1990; Tipping 1993; van der Lee et al. 1993). The 3 concentrations of humic materials in deep subsurface groundwaters are typically quite small, 4 because of the long periods of time available for oxidation of those materials. Existing 5 information on total organic concentrations (TOCs) in Culebra groundwaters, for example, 6 shows that TOC is on the order of 1 milligram per liter (Myers et al. 1991) which is quite low. 7 The sources of humic materials in the disposal system are soil constituents of the WIPP waste 8 (DOE 1994b, table 4-1, Waste Matrix Code Group 2400), and perhaps products of microbial 9 degradation of cellulosic constituents in the waste.
10 Actinide intrinsic colloids (also known as true colloids, Type I colloids, and Eigenkolloide) 11 are thought to form by condensation reactions for hydrolyzed actinide ions to form 12 macromolecules, or "polymers," of colloidal size. The tendency for formation of one 13 particular actinide intrinsic colloid, the Pu(IV)-poiymer, is enhanced by increased 14 concentrations of Pu(IV), temperature, and basic conditions. Examples can be found in the 15 literature of polymeric species of most of the actinides of importance to the WIPP (see, e.g., 16 Baes and Mesmer [1976]; Kim [1991]). It is important, however, to note the sized of 17 polymers described in the literature. It is well known that as polyvalent metals, the actinides 18 can form lower polymers such as dimers, trimers, tetramers, and hexamers. However, in 19 terms of physical transport behavior, the lower polymers will behave no differently than 20 dissolved monomeric species. In contrast, the higher polymers, such as the Pu(IV)-polymer, 21 may reach colloidal sizes (1 nanometer to 1 micrometer) and will have different 22 hydrodynamic properties than the subcolloidal-sized dissolved species.
23 In summary, sterically stabilized "hard-sphere" carrier colloids (microbes), "soft-sphere" 24 (humic materials) carrier colloids, and actinide intrinsic colloids may be important in transport 25 of actinides in WIPP brines.
26 Because the sizes of colloidal particles are significantly greater than the sizes of dissolved 27 species, colloidal particles are transported differendy. Kelley and Saulnier (1990, p. 4-10) 28 point out that the primary distinction in transported colloid subtypes is whether the sizes of 29 colloidal particles are larger or smaller than the mean pore throat diameter, 0.63 micrometers, 30 of the intercrystalline pores in the Culebra matrix. Colloidal particles that are smaller than the 31 pore throats will move into the rock matrix by physical diffusion, and will be removed from 32 rapid transport in fractures. In contrast, colloidal particles that are larger than pore throats will 33 be excluded from the matrix and will remain in fractures to be transported by advection and 34 diffusion (see, e.g., Vilks [1994]). Actinide intrinsic colloids and "soft-sphere" carrier 35 colloids (humic materials) are small enough to enter the pore throats in the Culebra, but are 36 larger than dissolved species and have relatively reduced physical diffusion rates. Microbes 37 are larger than the mean pore throat diameter in the Culebra, and will not diffuse into the 38 matrix. The effective diffusion constants for the macromolecular colloidal particles have been 39 estimated on the basis of their sizes (the free water diffusion constant for a solute in a liquid is 40 inversely proportional to the radius of the diffusing particle: see Bird et al. [I960]; Hiemenez 41 [1986, p. 81]). Parameters used in performance assessment to describe colloid transport are 42 shown in Table 6-14.
March 31,1995 6-54 DRAFT-DOE/CAO-2056

Draft 40 CFR191 Compliance Certification Application
1 6.3.6.4 Magenta Member
2 The Magenta is described in Section 2.1 Performance assessment models of the Magenta use 3 the BRAGFLO geometry shown in Figure 6-6. The low permeability of the Magenta relative 4 to the Culebra makes significant lateral transport of contaminants in the Magenta unlikely, and 5 therefore a relatively simple model is a reasonable approximation. Magenta input parameters 6 are included in Table 6-16.
7 Table 6-16. Model Parameter Values for the Magenta Member of the Rustler
8 9
10 11 12 13 14 15 16 17 18 19
Parameter Maximum Minimum Median or Constant" Permeability (m2) — — l.lxlO 1 6
Porosity (%) — — 9 Pore compressibility (1/Pa) — — 2.2xl0"9
Two-phase flow: Brooks/Corey P,(Pa)
X
1.0 1.86x10s
0.2 0.2 0.7
Thickness (m) — — 8.5 Initial Pressure (Pa) — — 9x10s
'Parameters without maximum and minimum values are treated as constants in the performance assessment.
20 6.3.6.5 Other Members of the Rustler Formation
21 The supra-Rustier units are discussed in Section 2.1. Within performance assessment, the 22 three non-dolomite units of the Rustler are modeled as a single hydrostratigraphic interval 23 between the Salado and the Culebra. Lateral flow in these units is exceedingly unlikely given 24 the proximity of the Culebra and the Magenta, so properties are assigned to these units in 25 performance assessment such that the small amounts of brine which might enter these units is 26 diverted into the Culebra. This is accomplished by assigning zero permeability to these units 27 in performance assessment which makes other parameters assigned to these units unimportant.
28 6.3.7 Dewey Lake
29 The Dewey Lake is discussed in Section 2.1. In performance assessment, the Dewey Lake is 30 modeled with low permeability because the Dewey Lake does not produce water in the 31 vicinity of the WIPP shafts or above the waste emplacement area. Dewey Lake input 32 parameters are in Table 6-17.
DRAFT-DOE/CAO-2056 6-55 March 31,1995

Draft 40 CFR191 Compliance Certification Application
Table 6-17. Dewey Lake Parameters
2 3 4 5 6 7 8 9
10 11 12
13
•' ~"':' jParameter-,' \>\,-. '••• ;' ' Maximum ; ,-v" Mmhnnm : Median or Constant*
Permeability (m2) — — 9.33xl0-'6
Porosity (%) — — 15
Pore compressibility (1/Pa) — — 6.67xl0"8
Two-phase flow: Brooks/Corey P t(Pa)
X
1.0 0
0.2 0.2 0.7
Thickness (m) — — 149.3
Initial Pressure (Pa) hydrostatic, water table at 980 m, 43.3 m below
top of formation. "Parameters with no maximum and minimum values are treated as constants in the performance assessment.
14 6.3.8 Supra-Dewey Lake Units
15 16 17
18
19 20 21 22 23
24 25 26 27
The units overlying the Dewey Lake are discussed in Section 2.1. For performance assessment, the units overlying the Dewey Lake are represented as a single hydrostratigraphic unit, whose parameters are shown in Table 6-18.
Table 6-18. Supra-Dewey Lake Unit Parameters
. . "'" Parameter" -; •'•- •;, Maximum"'.. J Minimum ;. ; ; Median or Constant"
Permeability (m2) — — lx lO 1 0
Porosity (%) — — 17.5
Pore compressibility (1/Pa) — — 5.71X10"8
Two-phase flow — — same as Dewey Lake (see Table 6-17)
Thickness (m) — — 15.76
Initial pressure, 20% liquid saturation
— — 1 atm
"Parameters with no maximum and minimum values are treated as constants in the performance assessment.
28 6.3.9 Climate Change
29 The historical record of climate change is discussed in Section 2.5.1. In regions with dry 30 climates, such as present-day southeastern New Mexico, the water table (i.e., the top of the 31 saturated zone) is at some depth below the land surface. If the climate were to become cooler 32 and wetter, the amount of moisture that infiltrates to the water table could be somewhat
March 31, 1995 6-56 DRAFT-DOE/CAO-2056

Draft 40 CFR191 Compliance Certification Application
1 greater, and consequently the water table could rise. Maximum gradients of hydraulic head 2 are expected if the infiltration rate is sufficient to raise the water table to the ground surface at 3 all locations. This is because the energy available to move groundwater in a basin depends on 4 the difference in elevation between the highest and lowest positions of the water table, which 5 in general is bounded by the difference in elevation in a groundwater basin, and also in 6 general is only attained if the water table is close to the land surface.
7 For performance assessment, the maximum possible effect of climate change has been 8 incorporated by changing the hydraulic gradient in the Culebra, which increases the rate of 9 flow across the Culebra transmissivity fields. Heads are raised to the land surface along the
10 northern boundary of the Culebra flow field while the head remains fixed at its present value 11 along its southern boundary.
12 6.3.10 Repository and Salado Initial Conditions
13 The start of the long-term simulation occurs when the shaft seals are emplaced and the waste 14 is isolated. Performance assessment uses initial conditions for the repository and Salado 15 consistent with the following: (1) there are no gradients for flow in the Salado; (2) Salado 16 pore pressures are elevated above hydrostatic from the surface but below lithostatic; (3) 17 permeability and porosity are low; and (4) near the repository, excavation and waste 18 emplacement allow partial drainage of the DRZ and Salado and subsequent evaporation of 19 drained brine into mine air, and then removal by air exchanged to the surface.
20 To set the near-repository, partially drained DRZ initial condition for the long-term 21 simulation, a simulation is executed prior to the long-term simulation. This prior calculation 22 simulates 5 years, during which the DRZ partially drains. The initial pressure for this 23 precursor simulation in Salado rock and the DRZ was adjusted from the 12 to 13 megapascals 24 pressure in MB 139 by adding or subtracting a hydraulic head component. Pressure at 5 years 25 before time zero in the excavated regions was atmospheric.
26 Permeability in the DRZ in 10"15 m 2 for all time. Porosity of these regions was set for all time 27 at its sampled value. Porosity in lithologic units is initially liquid-saturated during the start-up 28 simulation; the excavations are gas-saturated.
29 At the end of the start-up period prior to beginning the long-term simulation, waste is 30 emplaced and parameter values for long-term material properties which have been discussed 31 in previous tables are assigned to the waste, shaft, and other excavated areas. Any brine 32 present in the excavated regions resulting from DRZ drainage during the start-up simulation is 33 removed (conceptually corresponding to drying during ventilation). Waste is assigned a 34 sampled initial brine (water) content. Pore volume in other excavated regions( e.g., seals) is 35 set at 25 percent brine saturation.
DRAFT-DOE/CAO-2056 6-57 March 31,1995

Draft 40 CFR191 Compliance Certification Application
1 6.3.11 Numerical Codes
2 Several calculational and database management codes are used to evaluate undisturbed 3 conditions and have been mentioned in the text. BRAGFLO, SECO, and PANEL have been 4 described previously (for example, in Sandia [1992]). These descriptions will be included in 5 appendices in the final application. Appendix NUTS is provided as an example.
6 Proposed 40 CFR § 194.23 has specific documentation requirements for submittal of
7 information regarding models and codes. These are not addressed in this draft application.
8 6.3.12 Performance Assessment Results
9 The CCDF calculated with the modeling system described previously in this section is shown 10 in Figure 6-7. It is a mean CCDF based on 60 realizations, and it is conditional on an 11 assumption of undisturbed performance. Although this CCDF is several orders of magnitude 12 below the release limits stipulated in 40 CFR § 191.13(a), the DOE recognizes that it is 13 insufficient for a demonstration of compliance with 40 CFR Part 191 and the proposed 40 14 CFR Part 194. As discussed in Section 6.3.1, the CCDF is not in final form because a 15 sufficient level of confidence remains to be established in the modeling system, data, and 16 parameters, and quality assurance has not been completed. Full justification of the models, 17 data, and parameters will be provided in the final application. Analyses of disturbed 18 performance, including consideration of human-initiated events and processes, will also be 19 included in the final application. 20 Proposed 40 CFR § 194.34 contains specific requirements regarding the generation and 21 submittal of CCDFs. These requirements are not addressed in this draft application.
March 31, 1995 6-58 DRAFT-DOE/CAO-2056

Draft 40 CFR191 Compliance Certification Application
Figure 6-7. Mean CCDF Showing Probability of Cumulative 10,000-year, Normalized Radionuclide Releases from the WTPP.
The CCDF is based on 60 realizations of undisturbed performance. This is a preliminary CCDF based on preliminary models and data,
and does not address all requirements of 40 CFR Part 191 or proposed 40 CFR Part 194.
DRAFT-DOE/CAO-2056 6-59 March 31,1995

Draft 40 CFR 191 Compliance Certification Application
l TfflS PAGE INTENTIONALLY LEFT BLANK
March 31, 1995 6-60 DRAFT-DOE/CAO-2056

Draft 40 CFR191 Compliance Certification Application
1 6.0 REFERENCES
2 Baes, C.F., Jr., and Mesmer, R.E. 1976. The Hydrolysis of Cations. John Wiley & Sons, 3 New York, NY.
4 Bird, R:B., Stewart, W.E., Lightfoot, E.N. 1960. Transport Phenomena. John Wiley & Sons, 5 New York, NY.
6 Burton, P.L., Adams, J.W., and Engwall, C. 1993. "History of the Washington Ranch, Eddy 7 County, New Mexico." In Carlsbad Region, New Mexico and West Texas, D.W. Love, J.W. 8 Hawley, B.S. Kues, J.W. Adams, G.W. Austin, and J.M. Barker, eds., Forty-Fourth Annual 9 Conference, October 6-9,1993, pp. 65-67. New Mexico Geological Society, Roswell, NM.
10 Butcher, B.M., Thompson, T.W., VanBuskirk, R.G., and Patti, N.C. 1991. Mechanical 11 Compaction of Waste Isolation Pilot Plant Simulated Waste. SAND90-1206. Sandia 12 National Laboratories, Albuquerque, NM.
13 Choppin, G.R. 1988. Humics and Radionuclide Migration. Radiochimica Acta, Vols. 44/45, 14 Pt. 1, pp. 23-28.
15 Cranwell, R.M., Guzowski, R.V., Campbell, J.E., and Ortiz, N.R. 1990. Risk Methodology 16 for Geologic Disposal of Radioactive Waste: Scenario Selection Procedure. NUREG/CR-17 1667, SAND80-1429. Sandia National Laboratories, Albuquerque, NM.
18 Dearlove, J.P.L., Longworth, G., Ivanovich, M., Kim, J.I., Delakowitz, B., and Zeh, P. 1990. 19 "Organic Colloid Transport of Radionuclides at Gorleben, West Germany." Proceedings of 20 the Symposium on Waste Management, Tucson, AZ, February 25-March 1,1990. R.G. Post, 21 ed., pp. 565-569. University of Arizona, Tucson, AZ.
22 DOE (U.S. Department of Energy). 1994. Compliance Status Report for the Waste Isolation 23 Pilot Plant. DOE/WJPP 94-019, Rev. 0. U.S. Department of Energy, Carlsbad Area Office, 24 Carlsbad, NM.
25 EPA (U.S. Environmental Protection Agency). 1985. 40 CFR Part 191: Environmental 26 Standards for the Management and Disposal of Spent Nuclear Fuel, High-Level and 27 Transuranic Radioactive Wastes; Final Rule, Federal Register, Vol. 50, No. 182, pp. 28 38066-38089, September 19,1985. Office of Radiation and Air, Washington, D.C.
29 Francis, A. J., and Gillow, J.B. 1994. Effects of Microbial Processes on Gas Generation 30 Under Expected Waste Isolation Pilot Plant Repository Conditions. SAND93-7036. Sandia 31 National Laboratories, Albuquerque, NM.
32 Helton, J.C., Garner, J.W., McCurley, R.D., and Rudeen, D.K. 1991. Sensitivity Analysis 33 Techniques and Results for Performance Assessment at the Waste Isolation Pilot Plant. 34 S AND90-7103. Sandia National Laboratories, Albuquerque, NM.
DRAFT-DOE/CAO-2056 6-61 March 31,1995
Draft 40 CFR191 Compliance Certification Application
1 Helton, J.C., Gamer, J.W., Rechard, R.P., Rudeen, D.K., and Swift, P.N. 1992. Preliminary 2 Comparison with 40 CFR Part 191, Subpart B for the Waste Isolatlant, December 3 1991. Volume 4: Uncertainty and Sensitivity Analysis Results. SAND91-0893/4. Sandia 4 National Laboratories, Albuquerque, NM.
5 Helton, J.C., Marietta, M.G., and Rechard. R.P. 1993. Conceptual Structure of Performance 6 Assessments Conducted for the Waste Isolation Pilot Plant. SAND92-2285. Sandia National 7 Laboratories, Albuquerque, NM.
8 Hiemenz, P.C. 1986. Principles of Colloid and Surface Chemistry. 2nded. Marcel Dekker, 9 Inc., New York, NY.
10 IAEA (International Atomic Energy Agency). 1989. Evaluating the Reliability of Predictions 11 Made Using Environmental Transfer Models. Safety Series Report No. 100. International 12 Atomic Energy Agency, Vienna.
13 Iman, R.L., and Conover, W.J. 1982. A Distribution-Free Approach to Inducing Rank 14 Correlation Among Input Variables. Communications in Statistics: Simulation and 15 Computation, Vol. B11, No. 3, pp. 311-334.
16 Kaplan, S., and Garrick, BJ. 1981. On the Quantitative Definition of Risk. Risk Analysis, 17 Vol. 1, No. 1, pp. 11-27.
18 Kelley, V.A., and Saulnier, Jr., G.J. 1990. Core Analyses for Selected Samples from the 19 Culebra Dolomite at the Waste Isolation Pilot Plant Site. SAND90-7011. Sandia National 20 Laboratories, Albuquerque, NM.
21 Luker, R.S., Thompson, T.W., and Butcher, B.M. 1991. "Compaction and Permeability of 22 Simulated Waste." In Rock Mechanics as a Multidisciplinary Science: Proceedings of the 23 32nd U.S. Symposium, University of Oklahoma, Norman, OK, July 10-12,1991. J-C. 24 Roegiers, ed., SAND90-2368C, pp. 694-702. A.A. Balkema, Brookfield, VT.
25 Lyklema,J. 1978. "Surface Chemistry of Colloids in Connection with Stability." The 26 Scientific Basis of Flocculation, K.J. Ives, ed., pp. 3-36. Sijthoff and Noordhoff, Dordrecht.
27 Myers, J., Drez, P., and James, P. 1991. "Chapter 6: The Redox State and the Occurrence 28 and Influence of Organics in the Culebra." In Hydrogeochemical Studies of the Rustler 29 Formation and Related Rocks in the Waste Isolation Pilot Plant Area, Southeastern New 30 Mexico. M.D. Siegel, S.J. Lambert, and K.L. Robinson, eds., SAND88-0196. Sandia 31 National Laboratories, Albuquerque, NM.
32 Powers, D.W., Lambert, S.J., Shaffer, S-E., Hill, L.R., and Weart, W.D. 1978. Geological 33 Characterization Report, Waste Isolation Pilot Plant (WIPP) Site, Southeastern New Mexico. 34 SAND78-1596, Volumes I and U. Sandia National Laboratories, Albuquerque, NM. (This 35 document is included as Appendix GCR.)
March 31, 1995 6-62 DRAFT-DOE/CAO-2056

Draft 40 CFR191 Compliance Certification Application
1 Sandia National Laboratories. 1992. Preliminary Performance Assessment for the Waste 2 Isolation Pilot Plant, December 1992. SAND92-0700, Vols. 1-5, Sandia National 3 Laboratories, WIPP Performance Assessment Division, Albuquerque, NM.
4 Tiller, C.L., and O'Melia, C.R. 1993. "Natural Organic Matter and Colloidal Stability: 5 Models and Measurements." In Colloids in the Aquatic Environment. Colloids and Surfaces 6 A: Physicochemical and Engineering Aspects, T.F. Tadros and J. Gregory, eds., pp. 89-102. 7 Elsevier Applied Science, London.
8 Tipping, E. 1993. "Modelling Ion Binding by Humic Acids." In Colloids in the Aquatic 9 Environment. Colloids and Surfaces A: Physicochemical and Engineering Aspects, T.F.
10 Tadros and J. Gregory, eds., pp. 117-131. Elsevier Applied Science, London.
11 van der Lee, J., de Marsily, G., and Ledoux, E. 1993. "Are Colloids Important for Transport 12 Rate Assessment of Radionuclides?" In High Level Radioactive Waste Management, 13 Proceedings of the Fourth Annual International Conference, Las Vegas, NV, April 26-30, 14 1993, pp. 646-652. American Society of Civil Engineers, New York, NY.
15 Vilks, P. 1994. The Role of Colloids and Suspended Particles in Radionuclide Transport in 16 the Canadian Concept for Nuclear Fuel Waste Disposal. AECL-10280. Whiteshell 17 Laboratories, Atomic Energy of Canada, Ltd., Pinawa, Manitoba.
18 Vlassopoulos, D., Wood, S.A., and Mucci, A. 1990. Gold Speciation in Natural Waters: II. 19 The Importance of Organic Complexing—Experiments with Some Simple Model Ligands. 20 Geochimica et Cosmochimica Acta, Vol. 54, No. 6, pp. 1575-1586.
DRAFT-DOE/CAO-2056 6-63 March 31,1995

Draft 40 CFR 191 Compliance Certification Application
l TfflS PAGE INTENTIONALLY LEFT BLANK
March 31,1995 6-64 DRAFT-DOE/CAO-2056

Draft 40 CFR191 Compliance Certification Application
1 6.0 BIBLIOGRAPHY
2 Adams, J.E. 1944. Upper Permian Ochoa Series of Delaware Basin, West Texas and 3 Southeastern New Mexico. American Association of Petroleum Geologists Bulletin, Vol. 28, 4 No. 11, pp. 1596-1625.
5 Anderson, R.Y. 1978. Deep Dissolution of Salt, Northern Delaware Basin, New Mexico. 6 Sandia National Laboratories, Albuquerque, NM.
7 Anderson, R.Y., Dean, Jr., W.E., Kirkland, D.W., and Snider, H.I. 1972. Permian Castile 8 Varved Evaporite Sequence, West Texas and New Mexico. Geological Society of America 9 Bulletin, Vol. 83, No. 1, pp. 59-85.
10 Anderson, R.Y., and Kirkland, D.W. 1980. Dissolution of Salt Deposits by Brine Density 11 Flow. Geology, Vol. 8, No. 2, pp. 66-69.
12 Bachman, G.O. 1973. Surficial Features and Late Cenozoic History in Southeastern New 13 Mexico. Open-File Report 4339-8. U.S. Geological Survey, Reston, VA.
14 Bachman, G.O. 1974. Geologic Processes and Cenozoic History Related to Salt Dissolution 15 in Southeastern New Mexico. Open-File Report 74-194. U.S. Geological Survey, Denver, 16 CO.
17 Bachman, G.O. 1976. Cenozoic Deposits of Southeastern New Mexico and an Outline of the 18 History of Evaporite Dissolution. Journal of Research, Vol. 4, No. 2, pp. 135-149. U.S. 19 Geological Survey.
20 Bachman, G.O. 1980. Regional Geology and Cenozoic History of Pecos Region, 21 Southeastern New Mexico. Open-File Report 80-1099. U.S. Geological Survey, Denver, CO.
22 Bachman, G.O. 1981. Geology of Nash Draw, Eddy County, New Mexico. Open-File Report 23 81-31. U.S. Geological Survey, Denver, CO.
24 Bachman, G.O. 1984. Regional Geology ofOchoan Evaporites, Northern Part of Delaware 25 Basin. Circular 184, pp. 1-22. New Mexico Bureau of Mines and Mineral Resources, 26 Soccoro, NM.
27 Bachman, G.O. 1985. Assessment of Near-Surface Dissolution at and near the Waste 28 Isolation Pilot Plant (WIPP), Southeastern New Mexico. SAND84-7178. Sandia National 29 Laboratories, Albuquerque, NM.
30 Bachman, G.O. 1987. Karst in Evaporites in Southeastern New Mexico. SAND86-7078. 31 Sandia National Laboratories, Albuquerque, NM.
DRAFT-DOE/CAO-2056 6-65 March 31,1995
Draft 40 CFR 191 Compliance Certification Application
1 Bachman, G.O., and Johnson, R.B. 1973. Stability of Salt in the Permian Salt Basin of 2 Kansas, Oklahoma, Texas, and New Mexico. Open-File Report 4339-4. U.S. Geological 3 Survey, Denver, CO.
4 Baes, C.F., Jr., and Mesmer, R.E. 1976. The Hydrolysis of Cations. John Wiley & Sons, 5 New York, NY.
6 Barker, D.S. 1977. Northern Trans-Pecos Magmatic Province: Introduction and Comparison 7 with the Kenya Rift. Geological Society of America Bulletin, Vol. 88, No. 10, pp. 1421-1427.
8 Bear, J. 1988. Dynamics of Fluids in Porous Media. Dover Publications, Inc., New York, 9 NY.
10 Bear, J., Tsang, C-F., and de Marsily, G. 1993. Flow and Contaminant Transport in 11 Fractured Rock. Academic Press, Inc., San Diego, CA.
12 Beauheim, R.L. 1986. Hydraulic-Test Interpretations for Well DOE-2 at the Waste Isolation 13 Pilot Plant (WIPP) Site. SAND86-1364. Sandia National Laboratories, Albuquerque, NM.
14 Beauheim, R.L. 1987. Analysis of Pumping Tests of the Culebra Dolomite Conducted at the 15 H-3 Hydropad at the Waste Isolation Pilot Plant (WIPP) Site. SAND86-2311. Sandia 16 National Laboratories, Albuquerque, NM.
17 Beauheim, R.L. 1987. Interpretations of Single-Well Hydraulic Tests Conducted At and Near 18 the Waste Isolation Pilot Plant (WIPP) Site, 1983-1987. SAND87-0039. Sandia National 19 Laboratories, Albuquerque, NM.
20 Beauheim, R.L. 1987. Interpretation of the WIPP-13 Multipad Pumping Test of the Culebra 21 Dolomite at the Waste Isolation Pilot Plant (WIPP) Site. SAND87-2456. Sandia National 22 Laboratories, Albuquerque, NM.
23 Beauheim, R.L., and Holt, R.M. 1990. "Hydrogeology of theWIPPSite." In Geological and 24 Hydrological Studies ofEvaporites in the Northern Delaware Basin for the Waste Isolation 25 Pilot Plant (WIPP), Southeastern New Mexico. Geological Society of America 1990 Annual 26 Meeting, Field Trip No. 14 Guidebook, pp. 131-179. Dallas Geological Society, Dallas, TX.
27 Beauheim, R.L., Roberts, R.M., Dale, T.F., Fort, M.D., and Stensrud, W.A. 1993. Hydraulic 28 Testing ofSalado Formation Evaporites at the Waste Isolation Pilot Plant Site: Second 29 Interpretive Report. SAND92-0533. Sandia National Laboratories, Albuquerque, NM.
30 Beauheim, R.L., Saulnier, Jr., G.J., and Avis, J.D. 1991. Interpretation of Brine-Permeability 31 Tests of the Salado Formation at the Waste Isolation Pilot Plant Site: First Interim Report. 32 SAND90-0083. Sandia National Laboratories, Albuquerque, NM.
March 31,1995 6-66 DRAFT-DOE/CAO-2056

Draft 40 CFR191 Compliance Certification Application
1 Bechtel National. 1986. Interim Geotechnical Field Data Report. DOEAVTPP-221. U.S. 2 Department of Energy, Carlsbad, NM.
3 Berger, A. 1988. Milankovitch Theory and Climate. Reviews of Geophysics, Vol. 26, No. 4, 4 pp. 624-657.
5 Bertram-Howery, S.G., and Hunter, R.L. 1989. Preliminary Plan for Disposal-System 6 Characterization and Long-Term Performance Evaluation of the Waste Isolation Pilot Plant. 7 SAND89-0178. Sandia National Laboratories, Albuquerque, NM.
8 Bertram-Howery, S.G., Marietta, M.G., Rechard, R.P., Swift, P.N., Anderson, D.R., Baker, 9 B.L., Bean, Jr., J.E., Beyeler, W., Brinster, K.F., Guzowski, R.V., Helton, J.C., McCurley,
10 R.D., Rudeen, D.K., Schreiber, J.D., and Vaughn, P. 1990. Preliminary Comparison with 40 11 CFR Part 191, Subpart Bfor the Waste Isolation Pilot Plant, December 1990. SAND90-12 2347. Sandia National Laboratories, Albuquerque, NM.
13 Bird, R.B., Stewart, W.E., Lightfoot, E.N. 1960. Transport Phenomena. John Wiley & Sons, 14 New York, NY.
15 Borns, D.J., Pfeifer, M.C., Andersen, H.T., Skokan, C.K. 1990. "Electrical Methods to 16 Delineate Fluid Flow In Situ in Bedded Salt." In Society of Exploration Geophysicists 17 Workshop on Permeability, Fluid Pressure and Pressure Seals in the Crust, Denver, CO, 18 August 5-8,1990. SAND90-1685A. Sandia National Laboratories, Albuquerque, NM.
19 Borns, D.J. 1985. Marker Bed 139: Study of Drillcore From A Systematic Array. SAND85-20 0023. Sandia National Laboratories, Albuquerque, NM.
21 Borns, D.J., and Shaffer, S-E. Regional Well-Log Correlation in the New Mexico Portion of 22 the Delaware Basin. SAND83-1798. Sandia National Laboratories, Albuquerque, NM.
23 Borns, D.J., and Stormont, J.C. 1988. An Interim Report on Excavation Effect Studies at the 24 Waste Isolation Pilot Plant: The Delineation of the Disturbed Rock Zone. S AND87-1375. 25 Sandia National Laboratories, Albuquerque, NM.
26 Borns, D.J., and Stormont, J.C. 1989. The Delineation of the Disturbed Rock Zone 27 Surrounding Excavations in Salt. Rock Mechanics as a Guide for Efficient Utilization of 28 Natural Resources, Proceedings of the 30th U.S. Symposium, June 19-22,1989, A.W. Khair, 29 ed., pp. 353-360.. SAND88-2230C. A.A. Balkema, Brookfield, VT.
30 Bredehoeft, J.D., Riley, F.S., and Roeloffs, E.A. 1987 Earthquakes and Groundwater. 31 Earthquakes and Volcanoes, Vol. 19, No. 4, pp. 138-146.
DRAFT-DOE/CAO-2056 6-67 March 31,1995

Draft 40 CFR191 Compliance Certification Application
1 Brush, L.H., and Anderson, D.R. 1989. "Appendix E: Estimates of Gas Production Rates, 2 Potentials, and Periods, and Dissolved Radionuclide Concentrations for the WIPP 3 Supplemental Environmental Impact Statement." In Performance Assessment Methodology 4 Demonstration: Methodology Development for Evaluating Compliance With EPA 40 CFR 5 191, Subpart B, for the Waste Isolation Pilot Plant. M.G. Marietta, S.G. Bertram-Howery, 6 D.R. Anderson, K.F. Brinster, R.V. Guzowski, H. Iuzzolino, and R.P. Rechard, eds., 7 SAND89-2027. Sandia National Laboratories, Albuquerque, NM.
8 Buddemeier, R.W., and Hunt, J.R. 1988. Transport of Colloidal Contaminants in 9 Groundwater: Radionuclide Migration at the Nevada Test Site. Applied Geochemistry, Vol.
10 3, No. 5, pp. 535-548.
11 Burton, P.L., Adams, J.W., and Engwall, C. 1993. "History of the Washington Ranch, Eddy 12 County, New Mexico." In Carlsbad Region, New Mexico and West Texas, D.W. Love, J.W. 13 Hawley, B.S. Kues, J.W. Adams, G.W. Austin, and J.M. Barker, eds., Forty-Fourth Annual 14 Conference, October 6-9,1993, pp. 65-67. New Mexico Geological Society, Roswell, NM.
15 Butcher, B.M., Thompson, T.W., VanBuskirk, R.G., and Parti, N.C. 1991. Mechanical 16 Compaction of Waste Isolation Pilot Plant Simulated Waste. SAND90-1206. Sandia 17 National Laboratories, Albuquerque, NM.
18 Cauffmann, T.L., LaVenue, A.M., and McCord, J.P. 1990. Ground-Water Flow Modeling of 19 the Culebra Dolomite. Volume II: DataBase. SAND89-7068/2. Sandia National 20 Laboratories, Albuquerque, NM.
21 Chapman, J.B. 1986. Stable Isotopes in Southeastern New Mexico Groundwater: 22 Implications for Dating Recharge in the WIPP Area. EEG-35, DOE/AL/10752-35. 23 Environmental Evaluation Group, Santa Fe, NM.
24 Chappell, J., and Shackleton, N.J. 1986. Oxygen Isotopes and Sea Level. Nature, Vol. 324, 25 No. 6093, pp. 137-140.
26 Chaturvedi, L. 1993. "WJPP-Related Geological Issues." la Carlsbad Region, New Mexico 27 and West Texas, D.W. Love, J.W. Hawley, B.S. Kues, J.W. Adams, G.S. Austin, and J.M. 28 Barker, eds., Forty-Fourth Annual Field Conference, October 6-9,1993, pp. 331-338. New 29 Mexico Geological Society, Roswell, NM.
30 Choppin, G.R. 1988. Humics and Radionuclide Migration. Radiochimica Acta, Vols. 44/45, 31 Pt. 1, pp. 23-28.
32 Chugg, J.C., Anderson, G.W., Kink, D.L., and Jones, L.H. 1952. Soil Survey of Eddy Area, 33 New Mexico. U.S. Department of Agriculture.
March 31,1995 6-68 DRAFT-DOE/CAO-2056

Draft 40 CFR191 Compliance Certification Application
1 Coats, K.H. 1989. Implicit Compositional Simulation of Single-Porosity and Dual-Porosity 2 Reservoirs. Proceedings, Tenth SPE Symposium on Reservoir Simulation, Houston, TX, 3 February 6-8,1989, SPE 18427, pp. 239-275. Society of Petroleum Engineers, Richardson, 4 TX.
5 Cooper, J.B., and Glanzman, V.M. 1971. Geohydrology of Project Gnome Site, Eddy 6 County, New Mexico. United States Geological Survey Professional Paper 712-A. U.S. 7 Geological Survey, Washington, D.C.
8 Corbet, T.F., and Wallace, M.G. 1993. "Post-Pleistocene Patterns of Shallow Groundwater 9 Flow in the Delaware Basin, Southeastern New Mexico and West Texas." In Carlsbad
10 Region, New Mexico and West Texas, D.W. Love, J.W. Hawley, B.S. Kues, J.W. Adams, G.S. 11 Austin, and J.M. Barker, eds., Forty-Fourth Annual Field Conference, October 6-9,1993, 12 SAND93-1318J, pp. 321-351. New Mexico Geological Society, Roswell, NM.
13 Cranwell, R.M., Campbell, J.E., Helton, J.C., Iman, R.L., Longsine, D.E., Ortiz, N.R., 14 Runkle, G.E., and Shortencarier, M.J. 1987. Risk Methodology for Geologic Disposal of 15 Radioactive Waste: Final Report. NUREG/CR-2452, SAND81-2573. Sandia National 16 Laboratories, Albuquerque, NM.
17 Cranwell, R.M., Guzowski, R.V., Campbell, J.E., and Ortiz, N.R. 1990. Risk Methodology 18 for Geologic Disposal of Radioactive Waste: Scenario Selection Procedure. NUREG/CR-19 1667, S AND80-1429. Sandia National Laboratories, Albuquerque, NM.
20 Davies, P.B. 1983. "Assessing the Potential for Deep-Seated Salt Dissolution and the 21 Subsidence at the Waste Isolation Pilot Plant (WJPP)." In State of New Mexico 22 Environmental Evaluation Group Conference, WIPP Site Suitability for Radioactive Waste 23 Disposal, Carlsbad, NM, May 12-13,1983. (Copy on file at the Nuclear Waste Management 24 Library, Sandia National Laboratories, Albuquerque, NM.)
25 Davies, P.B. 1989. Variable-Density Ground-Water Flow and Paleohydrology in the Waste 26 Isolation Pilot Plant (WIPP) Region, Southeastern New Mexico. Open-File Report 88-490. 27 U.S. Geological Survey, Albuquerque, NM.
28 Dearlove, J.P.L., Longworth, G., Ivanovich, M., Kim, J.I., Delakowitz, B., and Zeh, P. 1990. 29 "Organic Colloid Transport of Radionuclides at Gorleben, West Germany." In Proceedings of 30 the Symposium on Waste Management, Tucson, AZ, February 25-March 1,1990. R.G. Post, 31 ed., pp. 565-569. University of Arizona, Tucson, AZ.
32 Doctor, P.G., et al. 1992. An Example Postclosure Risk Assessment Using the Potential 33 Yucca Mountain Site. Pacific Northwest Laboratory, Washington.
34 DOE (U.S. Department of Energy). 1980. Final Environmental Impact Statement, Waste 35 Isolation Pilot Plant. DOE/EIS-0026, Vols. 1 and 2. Office of Environmental Restoration 36 Waste Management, Washington, D.C.
DRAFT-DOE/CAO-2056 6-69 March 31,1995
Draft 40 CFR 191 Compliance Certification Application
1 DOE (U.S. Department of Energy). 1990. Final Safety Analysis Report, WP 02-9, Rev. 0, 2 May 1990. Westinghouse Electric Corporation, Waste Isolation Division, Carlsbad, NM.
3 DOE (U.S. Department of Energy). 1990. WIPP Test Phase Plan: Performance Assessment. 4 DOE/WIPP-89-011, Rev. 0. U.S. Department of Energy, Waste Isolation Pilot Plant, 5 Carlsbad, NM.
6 DOE (U.S. Department of Energy). 1991. Evaluation of the Effectiveness and Feasibility of 7 the Waste Isolation Pilot Plant Engineered Alternatives: Final Report of the Engineered 8 Alternatives Task Force. DOEAVIPP 91-007, Rev. 0. Vols. 1 and 2. Waste Isolation Pilot 9 Plant, Carlsbad, NM.
10 DOE (U.S. Department of Energy). 1994. Compliance Status Report for the Waste Isolation 11 Pilot Plant. DOE/WIPP 94-019, Rev. 0. U.S. Department of Energy, Carlsbad Area Office, 12 Carlsbad, NM.
13 DOE (U.S. Department of Energy). 1994. Experimental Program Plan for the Waste 14 Isolation Pilot Plant. DOEAVIPP 94-008, Rev. 0. U.S. Department of Energy, Carlsbad Area 15 Office, Carlsbad, NM.
16 Domski. Personal Memorandum, June 29,1994.
17 Dowding, C.H., and Rozen, A. 1978. Damage to Rock Tunnels from Earthquake Shaking. 18 Journal of the Geotechnical Engineering Division, American Society of Civil Engineers, Vol. 19 104, No. GT2, pp. 175-191.
20 Eager, G.P. 1983. Cores from the Lower Dewey Lake, Rustler, and Upper Salado Formation, 21 Culberson County, Texas. Permian Basin Cores. R.L. Shaw and B.J. Pollan, eds., P.B.S.-22 S.E.P.M. Core Workshop, Vol. 2, pp. 273-283. Permian Basin Section, Society of Economic 23 Paleontologists and Mineralogists, Midland, TX.
24 EPA (U.S. Environmental Protection Agency). 1985. 40 CFR Part 191: Environmental 25 Standards for the Management and Disposal of Spent Nuclear Fuel, High-Level and 26 Transuranic Radioactive Wastes; Final Rule, Federal Register, Vol. 50, No. 182, pp. 27 38066-38089, September 19,1985. Office of Radiation and Air, Washington, D.C.
28 Francis, A.J., and Gillow, J.B. 1994. Effects of Microbial Processes on Gas Generation 29 Under Expected Waste Isolation Pilot Plant Repository Conditions. SAND93-7036. Sandia 30 National Laboratories, Albuquerque, NM.
31 Freeland, M.H. 1982. Basic Data Report for Borehole DOE-1, Waste Isolation Pilot Plant 32 (WIPP) Project, Southeastern New Mexico. TME 3159. U.S. Department of Energy, Waste 33 Isolation Pilot Plant, Albuquerque, NM.
34 Freeze, R.A., and Cherry, J.A. 1979. Groundwater. Prentice-Hall, Englewood Cliffs, NJ.
March 31, 1995 6-70 DRAFT-DOE/CAO-2056

Draft 40 CFR191 Compliance Certification Application
1 Gonzales, M.M. 1989. Compilation and Comparison of Test-Hole Location Surveys in the 2 Vicinity of the Waste Isolation Pilot Plant Site, SAND88-1065. Sandia National 3 Laboratories, Albuquerque, NM.
4 Griswold, G.B. 1977. Site Selection and Evaluation Studies of the Waste Isolation Pilot 5 Plant (WIPP), Los Medanos, Eddy County, New Mexico. SAND77-0946. Sandia National 6 Laboratories, Albuquerque, NM.
7 Guzowski, R.V., and Newman, G. 1993. Preliminary Identification of Potentially Disruptive 8 Scenarios at the Greater Confinement Disposal Facility, Area 5 of the Nevada Test Site. 9 SAND93-7100. Sandia National Laboratories, Albuquerque, NM.
10 Hays, J.D., Imbrie, J., and Shackleton, N.J.. 1976. Variations in the Earth's Orbit: 11 Pacemaker of the Ice Ages. Science, Vol. 194, No. 4270, pp. 1121-1132.
12 Helton, J.C., Garner, J.W., McCurley, R.D., and Rudeen, D.K. 1991. Sensitivity Analysis 13 Techniques and Results for Performance Assessment at the Waste Isolation Pilot Plant. 14 S AND90-7103. Sandia National Laboratories, Albuquerque, NM.
15 Helton, J.C., Garner, J.W., Rechard, R.P., Rudeen, D.K., and Swift, P.N. 1992. Preliminary 16 Comparison with 40 CFR Part 191, Subpart Bfor the Waste Isolation Pilot Plant, December 17 1991. Volume 4: Uncertainty and Sensitivity Analysis Results. SAND91-0893/4. Sandia 18 National Laboratories, Albuquerque, NM.
19 Helton, J.C., Marietta, M.G., and Rechard. R.P. 1993. Conceptual Structure of Performance 20 Assessments Conducted for the Waste Isolation Pilot Plant. S AND92-2285. Sandia National 21 Laboratories, Albuquerque, NM.
22 Hiemenz, P.C. 1986. Principles of Colloid and Surface Chemistry. 2nded. Marcel Dekker, 23 Inc., New York, NY.
24 Hill, A.C., and Thomas, G.W. 1985. A New Approach for Simulating Complex Fractured 25 Reservoirs. Proceedings, Eighth SPE Symposium on Reservoir Simulation, Dallas, TX, 26 February 10-13,1985. L.C. Young, ed., SPE 13537. pp. 429-440. Society of Petroleum 27 Engineers of AIME, Richardson, TX.
28 Hills, J.M., and Kottlowski, F.E. 1983. Southwest/Southwest Mid-Continent Region: 29 Correlation of Stratigraphic Units of North America (COSUNA) Project. Correlation Chart 30 Series 1983. AAPG Bookstore, Tulsa, OK.
31 Holcomb, D.J. 1988. Cross-Hole Measurement of Velocity and Attenuation to Detect a 32 Disturbed Zone in Salt at the Waste Isolation Pilot Plant. Key Questions in Rock Mechanics: 33 Proceedings of the 29th U.S. Symposium, University of Minnesota, Minneapolis, MN, June 34 13-15,1988. Eds. P.A. Cundall, R.L. Sterling, and A.M. Starfield, eds., SAND87-3016C, pp. 35 633-640. A.A. Balkema, Brookfield, VT.
DRAFT-DOE/CAO-2056 6-71 March 31, 1995

Draft 40 CFR191 Compliance Certification Application
1 Holt, R.M., and Powers, D.W. 1984. Geotechnical Activities in the Waste Handling Shaft 2 Waste Isolation Pilot Plant (WIPP) Project Southeastern New Mexico. WTSD-TME-038. 3 U.S. Department of Energy, Carlsbad, NM.
4 Holt, R.M., and Powers, D.W. 1986. Geotechnical Activities in the Exhaust Shaft. 5 DOE/WIPP-86-008. U.S. Department of Energy, Carlsbad, NM.
6 Holt, R.M., and Powers, D.W. 1990. Geologic Mapping of the Air Intake Shaft at the Waste 7 Isolation Pilot Plant. DOE/WIPP 90-051. Westinghouse Electric Corporation, Carlsbad, 8 NM.
9 Hora,S.C. 1992. "Appendix A: Probabilities of Human Intrusion into the WIPP, 10 Methodology for the 1992 Preliminary Comparison." In Preliminary Performance 11 Assessment for the Waste Isolation Pilot Plant, December 1992. Volume 3: Model 12 Parameters. SAND92-0700/3. Sandia National Laboratories, Albuquerque, NM.
13 Hora, S.C., von Winterfeldt, D., and Trauth, K.M. 1991. Expert Judgment on Inadvertent 14 Human Intrusion into the Waste Isolation Pilot Plant. SAND90-3063. Sandia National 15 Laboratories, Albuquerque, NM.
16 Houghton, J.T., Jenkins, G.T., and Ephraums, J.J. 1990. Climate Change: ThelPCC 17 Scientific Assessment. Cambridge University Press, New York, NY.
18 Hunter, R.L. 1985. A Regional Water Balance for the Waste Isolation Pilot Plant (WIPP) 19 Site and Surrounding Area. SAND84-2233. Sandia National Laboratories, Albuquerque, 20 NM.
21 Hunter, R.L., Cranwell, R.M., and Chu, M.S.Y. 1986. Assessing Compliance with the EPA 22 High-Level Waste Standard: An Overview. SAND86-0121, NUREG/CR-4510. Sandia 23 National Laboratories, Albuquerque, NM.
24 IAEA (International Atomic Energy Agency). 1989. Evaluating the Reliability of Predictions 25 Made Using Environmental Transfer Models. Safety Series Report No. 100. International 26 Atomic Energy Agency, Vienna.
27 Iman, R.L., and Conover, WJ. 1982. A Distribution-Free Approach to Inducing Rank 28 Correlation Among Input Variables. Communications in Statistics: Simulation and 29 Computation, Vol. B11, No. 3, pp. 311-334.
30 Imbrie, J. 1985. A Theoretical Framework for the Pleistocene Ice Ages. Journal of the 31 Geological Society, Vol. 142, Pt. 3, pp. 417-432.
March 31,1995 6-72 DRAFT-DOE/CAO-2056

Draft 40 CFR191 Compliance Certification Application
1 Imbrie, J., Hays, J.D., Martinson, D.G., Mclntyre, A., Mix, A.C., Morley, J.J., Pisias, N.G., 2 Prell, W.L., and Shackleton, J.J. 1984. "TheOrbitalTheory of Pleistocene Climate: Support 3 from a Revised Chronology of the Marine 6 1 8 0 Record." In Milankovitch and Climate, 4 Understanding the Response to Astronomical Forcing, Proceedings of the NATO Advanced 5 Research Workshop on Milankovitch and Climate, Palisades, NY, November 30-December 4, 6 1982. A. Berger, J. Imbrie, J. Hays, G. Kukla, and B. Saltzman, eds., Pt. 1, pp. 269-305. D. 7 Reidel, Boston, MA.
8 Imbrie, J., and Imbrie, J.Z. 1980. Modeling the Climatic Response to Orbital Variations. 9 Science, Vol. 207, No. 4434, pp. 943-953.
10 Imbrie, J., Mclntyre, A., and Mix, A. 1989. "Oceanic Response to Orbital Forcing in the Late 11 Quaternary: Observational and Experimental Strategies." Climate and Geo-sciences, A. 12 Berger, S. Schneider, and J.C. Duplessy, eds., pp. 121-164. Kluwer, Boston, MA.
13 Izett, G.A., and Wilcox, R.E. 1982. Map Showing Localities and Inferred Distributions of 14 the Huckleberry Ridge, Mesa Falls, and Lava Creek Ash Beds in the Western United States 15 and Southern Canada. Misc. Investigations Map 1-1325, Scale 1:4,000,000. U.S. Geological 16 Survey.
17 Jensen, A.L., Howard, C.L., Jones, R.L., and Peterson, T.P. 1993. Room Q Data Report: 18 Test Borehole Data from April 1989 through November 1991. SAND92-1172. Sandia 19 National Laboratories, Albuquerque, NM.
20 Jones, C.L. 1978. Test Drilling for Potash Resources: Waste Isolation Pilot Plant Site, Eddy 21 County, New Mexico. Open-File Report 78-592, Vols. 1 and 2. U.S. Geological Survey, 22 Denver, CO.
23 Jung, Y., Ibrahim, A., and Borns, D.J. 1991. Mapping Fracture Zones in Salt; High-24 Resolution, Cross-Gallery Seismic Tomography. Geophysics: The Leading Edge of 25 Exploration, Vol. 10, No. 4, pp. 37-39.
26 Kaplan, S., and Garrick, B.J. 1981. On the Quantitative Definition of Risk. Risk Analysis, 27 Vol. 1, No. 1, pp. 11-27.
28 Kazemi, H., Merrill, Jr., L.S., Porterfield, K.L., and Zeman, P.R. 1976. Numerical 29 Simulation of Water-Oil Flow in Naturally Fractured Reservoirs. Society of Petroleum 30 Engineers Journal, Vol. 16, No. 6, pp. 317-326.
]31 Kelley, V.A. , and Saulnier, Jr., G.J. 1990. Core Analyses for Selected Samples from the 32 Culebra Dolomite at the Waste Isolation Pilot Plant Site. SAND90-7011. Sandia National 33 Laboratories, Albuquerque, NM.
'.34 Kim, J.I. 1991. Actinide Colloid Generation in Groundwater. Radiochimica Acta, Vol. !35 52/53, Pt. 1, pp. 71-81 .
DRAFT-DOE/CAO-2056 6-73 March 31,1995
Draft 40 CFR 191 Compliance Certification Application
1 Lambert, S.J. 1983. Dissolution of Evaporites in and Around the Delaware Basin, 2 Southeastern New Mexico and West Texas. SAND82-0461. Sandia National Laboratories, 3 Albuquerque, NM.
4 Lambert, S.J. 1987. "Stable-Isotope Studies of Groundwaters in Southeastern New Mexico." 5 In The Rustler Formation at the WIPP Site, Report of a Workshop on the Geology and 6 Hydrology of the Rustler Formation as it Relates to the WIPP Project, L. Chaturvedi, ed., 7 SAND85-1978C, EEG-34, pp. 36-57. Environmental Evaluation Group, Santa Fe, NM.
8 Lappin, A.R., Hunter, R.L., Garber, D.P., Davies, P.B., Beauheim, R.L., Borns, D.J., Brush, 9 L.H., Butcher, B.M., Cauffman, T., Chu, M.S.Y., Gomez, L.S., Guzowski, R.V., Iuzzolino,
10 H.J., Kelley, V., Lambert, S.J., Marietta, M.G., Mercer, J.W., Nowak, E.J., Pickens, J., 11 Rechard, R.P., Reeves, M., Robinson, K.L., and Siegel, M.D., eds., 1989. Systems Analysis, 12 Long-Term Radionuclide Transport, and Dose Assessments, Waste Isolation Pilot Plant 13 (WIPP), Southeastern New Mexico: March 1989. SAND89-0462. Sandia National 14 Laboratories, Albuquerque, NM.
15 Lenhardt, W.A. 1988. "Damage Studies at a Deep Level African Gold Mine." In Rockbursts 16 & Seismicity In Mines, Proceeding of the Second International Symposium, Minneapolis, MN, 17 June 8-10,1988. Fairhurst, ed., 1990, pp. 391 -393. A.A. Balkema, Brookfield, VT.
18 Lieser, K.H., Ament, A., Hill, R., Singh, R.N., Stingl, U., and Thybusch, B. 1990. Colloids 19 in Groundwater and Their Influence on Migration of Trace Elements and Radionuclides. 20 Radiochimica Acta, Vol. 49, No. 2, pp. 83-100.
21 Lieser, K.H., Gleitsmann, B., Peschke, S., and Steinkopff, T. 1986. Colloid Formation and 22 Sorption of Radionuclides in Natural Systems. Radiochimica Acta, Vol. 40, No. 1, pp. 39-47.
23 Lieser, K.H., Gleitsmann, B., and Steinkopff, T. 1986. Sorption of Trace Elements or 24 Radionuclides in Natural Systems Containing Groundwater and Sediments. Radiochimica 25 Acta, Vol. 40, No. 1, pp. 33-37.
26 Litvak, B.L. 1986. "Simulation and Characterization of Naturally Fractured Reservoirs." In 27 Reservoir Characterization Technical Conference, Dallas, TX, April 29-May 1, 1985. L.W. 28 Lake and H.B. Carroll, Jr., eds., pp. 561-584. Academic Press, Orlando, FL.
29 Lowenstein, T.K. 1987. Post Burial Alteration of the Permian Rustler Formation 30 Evaporites, WIPP Site, New Mexico: Textural, Stratigraphic and Chemical Evidence. EEG-31 36, DOE/AL/10752-36. Environmental Evaluation Group, Santa Fe, NM.
32 Lowenstein, T.K. 1988. Origin of Depositional Cycles in a Permian "Saline Giant": The 33 Salado (McNutt Zone) Evaporites of New Mexico and Texas. Geological Society of America 34 Bulletin, Vol. 100, No. 4, pp. 592-608.
March 31, 1995 6-74 DRAFT-DOE/CAO-2056

Draft 40 CFR 191 Compliance Certification Application
1 Luker, R.S., Thompson, T.W., and Butcher, B.M. 1991. "Compaction and Permeability of 2 Simulated Waste." In Rock Mechanics as a Multidisciplinary Science: Proceedings of the 3 32nd U.S. Symposium, University of Oklahoma, Norman, OK, July 10-12, 1991. J-C. 4 Roegiers, ed., SAND90-2368C, pp. 694-702. A.A. Balkema, Brookfield, VT.
5 Lyklema, J. 1978. "Surface Chemistry of Colloids in Connection with Stability." The 6 Scientific Basis of Flocculation, KJ. Ives, ed., pp. 3-36. Sijthoff and Noordhoff, Dordrecht.
7 Lyon, M.L. 1989. Annual Water Quality Data Report for the Waste Isolation Pilot Plant. 8 DOE/WTPP 89-001. Westinghouse Electric Corporation, Carlsbad, NM.
9 Machette, M.N. 1985. "Calcic Soils of the Southwestern United States." In Soils and 10 Quaternary Geology of the Southwestern United States. D.L. Weide and M.L. Faber, eds., 11 Special Paper Vol. 203, pp. 1-21. Geological Society of America, Denver, CO.
12 Maiti, T.C., Smith, M.R.,and Laul, J.C. 1989. Colloid Formation Study of U, Th, Ra, Pb, Po, 13 Sr, Rb, and Cs in Briny (High Ionic Strength) Groundwaters: Analog Study for Waste 14 Disposal. Nuclear Technology, Vol. 84, No. 1, pp. 82-87.
15 Mansure, A., and Reiter, M.. 1977. An Accurate Equilibrium Temperature Log in AEC No. 16 8, A Drill Test in the Vicinity of the Proposed Carlsbad Disposal Site. Open File Report 80. 17 New Mexico Bureau of Mines and Mineral Resources, Socorro, NM.
18 Marietta, M.G., Bertram-Howery, S.G., Anderson, D.R., Brinster, K.F., Guzowski, R.V., 19 Izzulino, H. and Rechard, R.P. 1989. Performance Assessment Methodology Demonstration: 0 Methodology Development for Evaluating Compliance with EPA 40 CFR 191, Subpart B, for 1 the Waste Isolation Pilot Plant. SAND89-2027. Sandia National Laboratories, Albuquerque, 2 NM.
3 McGrath, E.J., Basin, S.L., Burton, R.W., Irving, D.C., and Jaquette, S.C. 1975. Techniques 4 for Efficient Monte Carlo Simulation. Volume I. Selecting Probability Distributions. ORNL-5 RSIC-38, Vol. 1. Oak Ridge National Laboratory, Oak Ridge, TN.
6 McGrath, E.J., and Irving, D.C. 1975. Techniques for Efficient Monte Carlo Simulation. 7 Volume II. Random Number Generation for Selected Probability Distributions. ORNL-8 RSIC-38, Vol. 2. Oak Ridge National Laboratory, Oak Ridge, TN.
9 McGrath, E. J., and Irving, D.C. 1975. Techniques for Efficient Monte Carlo Simulation. 0 Volume III. Variance Reduction. ORNL-RSIC-38, Vol. 3. Oak Ridge National Laboratory, 1 Oak Ridge, TN.
2 McKay, M.D., Beckman, R.J., and Conover, W.J. 1979. A Comparison of Three Methods for 3 Selecting Values of Input Variables in the Analysis of Output from a Computer Code. 4 Technometrics, Vol. 21, No. 2, pp. 239-245.
DRAFT-DOE/CAO-2056 6-75 March 31, 1995

Draft 40 CFR 191 Compliance Certification Application
1 Mercer, J.W. 1983. Geohydrology of the Proposed Waste Isolation Pilot Plant Site, Los 2 Medahos Area, Southeastern New Mexico. Water Resources Investigations Report 83-4016. 3 U.S. Geological Survey, Albuquerque, NM. (This document is included as Appendix 4 HYDRO.)
5 Mercer, J.W. 1990. Basic Data Report for Drillholes at the H-11 Complex (Waste Isolation 6 Pilot Plant—WIPP). SAND89-0200. Sandia National Laboratories, Albuquerque, NM.
7 Mercer, J.W., Beauheim, R.L., Snyder, R.P., and Fairer, G.M. 1987. Basic Data Report for 8 Drilling and Hydrologic Testing of Drillhole DOE-2 at the Waste Isolation Pilot Plant 9 (WIPP) Site. SAND86-0611. Sandia National Laboratories, Albuquerque, NM.
10 Mitchell, J.F.B. 1989. The "Greenhouse" Effect and Climate Change." Reviews of 11 Geophysics, Vol. 27, No. 1, pp. 115-139.
12 Molecke, M.A., Argiiello, J.G., and Beraun, R. 1993. Waste Isolation Pilot Plant Simulated 13 RH TRU Waste Experiments: Data and Interpretation Report. SAND88-1314. Sandia 14 National Laboratories, Albuquerque, NM.
15 Muehlberger, W.R., Belcher, R.C., and Goetz, L.K. 1978. Quaternary Faulting on Trans-16 Pecos, Texas. Geology, Vol. 6, No. 6, pp. 337-340.
17 Myers, J., Drez, P., and James, P. 1991. "Chapter 6: The Redox State and the Occurrence 18 and Influence of Organics in the Culebra." In Hydrogeochemical Studies of the Rustler 19 Formation and Related Rocks in the Waste Isolation Pilot Plant Area, Southeastern New 20 Mexico. M.D. Siegel, S.J. Lambert, and K.L. Robinson, eds., SAND88-0196. Sandia 21 National Laboratories, Albuquerque, NM.
22 Nicholson, Jr., A., and Clebsch, Jr., A. 1961. Geology and Ground-Water Conditions in 23 Southern Lea County, New Mexico. Ground-Water Report 6. New Mexico Bureau of Mines 24 and Mineral Resources, Soccoro, NM.
25 Nowak, E.J., Tillerson, J.R., and Torres, T.M. 1990. Initial Reference Seal System Design: 26 Waste Isolation Pilot Plant. SAND90-0355. Sandia National Laboratories, Albuquerque, 27 NM.
28 OECD Nuclear Energy Agency. 1992. Systematic Approaches to Scenario Development. 29 OECD/NEA, Paris.
30 OECD Nuclear Energy Agency. 1995. Assessment of Future Human Actions at Radioactive 31 Waste Disposal Sites. OECD/NEA, Paris.
32 Parry, G.W. 1988. On the Meaning of Probability in Probabilistic Safety Assessment. 33 Reliability Engineering and System Safety, Vol. 23, No. 4, pp. 309-314.
March 31,1995 6-76 DRAFT-DOE/CAO-2056

Draft 40 CFR191 Compliance Certification Application
1 Pate-Comell, M.E. 1986. Probability and Uncertainty in Nuclear Safety Decisions. Nuclear 2 Engineering and Design, Vol. 93, No. 3, pp. 319-327.
3 Pfeifer, M.C., Borns, D.J., Skokan, C.K., Andersen, H.T., and Starett, J.M. 1989. 4 "Geophysical Methods to Monitor the Development of the Disturbed Rock Zone Around 5 Underground Excavations in Bedded Salt." In Proceedings of the Symposium on the 6 Application of Geophysics to Engineering and Environmental Problems, Golden, CO, March 7 13-16,1989. SAND89-7055A, Vol. 2, pp. 400-411.
8 Powers, D.W., and Holt, R.M. 1990. "Sedimentology of the Rustler Formation near the 9 Waste Isolation Pilot Plant (WIPP) Site." In Geological and Hydrological Studies of
10 Evaporites in the Northern Delaware Basin for the Waste Isolation Pilot Plant (WIPP), New 11 Mexico, Field Trip #14 Guidebook, Geological Society of America 1990 Annual Meeting, 12 October 29-November 1,1990, pp. 79-106. Dallas Geological Society, Dallas, TX.
13 Powers, D.W., and Holt, R.M. 1993. "The Upper Cenozoic Gatuna Formation of 14 Southeastern New Mexico." In Carlsbad Region, New Mexico and West Texas, D.W. Love, 15 J.W. Hawley, B.S. Kues, J.W. Adams, G.S. Austin, and J.M. Barker, eds., Forty-Fourth 16 Annual Field Conference, October 6-9,1993, pp. 271-282. New Mexico Geological Society, 17 Roswell, NM.
18 Powers, D.W., Lambert, S.J., Shaffer, S-E., Hill, L.R., and Weart,W.D. 1978. Geological 19 Characterization Report, Waste Isolation Pilot Plant (WIPP) Site, Southeastern New Mexico. 20 SAND78-1596, Volumes I and H Sandia National Laboratories, Albuquerque, NM. (This 21 document is included as Appendix GCR.)
22 Prij, J., Blok, B.M., Laheij, G.M.H., van Rheenen, W., Slagter, W., Uffink, G.J.M., Uijt de 23 Haag, P., Wildenborg, A.F.B., and Zanstra, D.A. 1993. PROSA. Probabilistic Safety 24 Assessment - Final Report. OPLA-1 A. Petten, ECN, Netherlands Energy Research 25 Foundation, Netherlands.
26 Rechard, R.P. 1989. Review and Discussion of Code Linkage and Data Flow in Nuclear 27 Waste Compliance Assessments. SAND87-2833. Sandia National Laboratories, 28 Albuquerque, NM.
29 Rechard, R.P. 1992. User's Reference Manual for CAMCON: Compliance Assessment 30 Methodology Controller Version 3.0. SAND90-1983. Sandia National Laboratories, 31 Albuquerque, NM.
:32 Richey, S.F. 1987. Water-Level Data from Wells in the Vicinity of the Waste Isolation Pilot :33 Plant, Southeastern New Mexico. Open-File Report 87-120. United States Geological :34 Survey, Albuquerque, NM.
DRAFT-DOE/CAO-2056 6-77 March 31,1995
Draft 40 CFR 191 Compliance Certification Application
1 Robinson, T.W., and Lang, W.B. 1938. Geology and Groundwater Conditions of the Pecos 2 River Valley in the Vicinity ofLaguna Grande de la Sal, New Mexico, with Special Reference 3 to the Salt Content of the River Water. Twelfth and Thirteenth Biennial Reports of the State 4 Engineer of New Mexico for the 23rd, 24th, 25th, and 26th Fiscal Years, July 1,1935 to 5 July 30, 1938. State Engineer, Santa Fe, NM.
6 Robinson, J.Q., and Powers, D.W. 1987. "A Clastic Deposit Within the Lower Castile 7 Formation, Western Delaware Basin, New Mexico." In Geology of the Western Delaware 8 Basin, West Texas and Southeastern New Mexico. D.W. Powers and W.C. James, eds., El 9 Paso Geological Society Guidebook 18, pp. 69-79. El Paso Geological Society, El Paso, TX.
10 Rosholt, J.N., and McKinney, C.R. 1980. Uranium Series Disequilibrium Investigations 11 Related to the WIPP Site, New Mexico (USA). Part II. Uranium Trend Dating ofSurftcial 12 Deposits and Gypsum Spring Deposits Near WIPP Site, New Mexico. Open-File Report 80-13 879. U.S. Geological Survey, Denver, CO.
14 Sandia National Laboratories. 1991. Preliminary Comparison with 40 CFR Part 191, 15 Subpart Bfor the Waste Isolation Pilot Plant, December 1991. Vol. 1: Methodology and 16 Results. SAND91-0893/1. Sandia National Laboratories, WIPP Performance Assessment 17 Division, Albuquerque, NM.
18 Sandia National Laboratories. 1992. Long-Term Gas and Brine Migration at the Waste 19 Isolation Pilot Plant: Preliminary Sensitivity Analyses for Post-Closure 40 CFR 268 (RCRA), 20 May 1992. SAND92-1933. Sandia National Laboratories for WJPP Performance Assessment 21 Division, Albuquerque, NM.
22 Sandia National Laboratories. 1992. Preliminary Performance Assessment for the Waste 23 Isolation Pilot Plant, December 1992. SAND92-0700, Vols. 1-5, Sandia National 24 Laboratories, WIPP Performance Assessment Division, Albuquerque, NM.
25 Saulnier, G.J., Jr. 1987. Analysis of Pumping Tests of the Culebra Dolomite Conducted at 26 the H-ll Hydropad at the Waste Isolation Pilot Plant (WIPP) Site. SAND87-7124. Sandia 27 National Laboratories, Albuquerque, NM.
28 Saulnier, Jr., G.J., Domski, P.S., Palmer, J.B., Roberts, R.M., and Stensrud, W.A. 1991. 29 WIPP Salado Hydrology Program Data Report #1. SAND90-7000. Sandia National 30 Laboratories, Albuquerque, NM.
31 Schiel, K.A. 1988. The Dewey Lake Formation; End Stage Deposit of a Peripheral Foreland 32 Basin. [M.S. thesis.] University of Texas at El Paso, El Paso, TX.
33 Schlesinger, M.E., and Mitchell, J.F.B. 1987. Climate Model Simulations of the Equilibrium 34 Climatic Response to Increased Carbon Dioxide. Reviews of Geophysics, Vol. 25, pp. 35 760-798.
March 31,1995 6-78 DRAFT-DOE/CAO-2056

Draft 40 CFR 191 Compliance Certification Application
1 Sewards, T., Glenn, R., and Keil, K. 1991. Mineralogy of the Rustler Formation in the 2 WIPP-19 Core. SAND97-7036. Sandia National Laboratories, Albuquerque, NM.
3 Shinta, A.A., and Kazemi, H. 1993. "Tracer Transport in Characterization of Dual-Porosity 4 Reservoirs." In Reservoir Engineering Proceedings, SPE Annual Technical Conference and 5 Exhibition, Houston, TX, October 3-6, 1993. SPE 26636, pp. 285-299. Society of Petroleum 6 Engineers, Richardson, TX.
7 Silva, M. 1994. Implications of the Presence of Petroleum Resources on the Integrity of the 8 WIPP. EEG-55, DOE/AL/58309-55. Environmental Evaluation Group, Albuquerque, NM.
9 Slezak, S., and Lappin, A. 1990. "Potential for and Possible Impacts of Generation of 10 Flammable and/or Detonable Gas Mixtures during the WIPP Transportation, Test, and 11 Operational Phases." Memorandum to D. Mercer and C. Fredrickson, January 5,1990. 12 Sandia National Laboratories, Albuquerque, NM.
13 Snyder, R.P., and Gard, Jr., L.M. 1982. Evaluation of Breccia Pipes in Southeastern New 14 Mexico and Their Relation to the Waste Isolation Pilot Plant (WIPP) Site. Open-File Report 15 82-968. U.S. Geological Survey, Denver, CO.
Stenhouse, M.J., Chapman, N.A., and Sumerling, T.J. 1993. SITE-94 Scenario Development FEP Audit List Preparation: Methodology and Presentation. SKI Technical Report 93:27. Swedish Nuclear Power Inspectorate, Stockholm.
19 Stensrud, W.A., Bame, M.A., Lantz, K.D., Cauffman, T.L., Palmer, J.B., and Saulnier, Jr., 20 G.J. 1988. WIPP Hydrology Program, Waste Isolation Pilot Plant, Southeastern New 21 Mexico, Hydrologic Data Report #6. SAND87-7166. Sandia National Laboratories, 22 Albuquerque, NM.
23 Stensrud, W.A., Dale, T.F., Domski, P.S.,Palmer, J.B., Roberts, R.M., Fort, M.D., and 24 Saulnier, Jr., G.J. 1992. Waste Isolation Pilot Plant Salado Hydrology Program Data Report 25 #2. SAND92-7072. Sandia National Laboratories, Albuquerque, NM.
6 Stone, CM., Krieg, R.D., and Beisinger, Z.E. 1985. SANCHO, A Finite Element Computer 7 Program for the Quasistatic, Large Deformation, Inelastic Response of Two-Dimensional
28 Solids. SAND84-2618. Sandia National Laboratories, Albuquerque, NM.
29 Stormont, J.C. 1990. Discontinuous Behavior Near Excavations in a Bedded Salt Formation. 30 International Journal of Mining and Geological Engineering, Vol. 8, No. 1, pp. 35-56.
Stormont, J.C, Howard, C.L., and Daemen, J.J.K. 1991. In Situ Measurements of Rock Salt Permeability Changes Due to Nearby Excavation. SAND90-3134. Sandia National Laboratories, Albuquerque, NM.
DRAFT-DOE/CAO-2056 6-79 March 31, 1995
Draft 40 CFR 191 Compliance Certification Application
1 Stormont, J.C., Peterson, E.W., and Lagus, P.L. 1987. Summary of and Observations About 2 WIPP Facility Horizon Flow Measurements Through 1986. SAND87-0176. Sandia National 3 Laboratories, Albuquerque, NM.
4 Swift, P.N. 1992. Long-Term Climate Variability at the Waste Isolation Pilot Plant, 5 Southeastern New Mexico, USA. SAND91-7055. Sandia National Laboratories, 6 Albuquerque, NM.
7 Thome, B.J., and Rudeen, D.K. 1980. Regional Effects ofTRU Repository Heat. 8 SAND80-7161. Sandia National Laboratories, Albuquerque, NM.
9 Tierney, M.S. 1993. "PA Methodology Overview." Initial Performance A ssessment of the 10 Disposal of Spent Nuclear Fuel and High-Level Waste Stored at Idaho National Engineering 11 Laboratory. Volume 1: Methodology and Results. R.P. Rechard, ed., SAND93-2330/1. 12 Sandia National Laboratories, Albuquerque, NM.
13 Tiller, C.L., and O'Melia, C.R. 1993. "Natural Organic Matter and Colloidal Stability: 14 Models and Measurements." In Colloids in the Aquatic Environment. Colloids and Surfaces 15 A: Physicochemical and Engineering Aspects, T.F. Tadros and J. Gregory, eds., pp. 89-102. 16 Elsevier Applied Science, London.
17 Tipping, E. 1993. "Modelling Ion Binding by Humic Acids." In Colloids in the Aquatic 18 Environment. Colloids and Surfaces A: Physicochemical and Engineering Aspects, T.F. 19 Tadros and J. Gregory, eds., pp. 117-131. Elsevier Applied Science, London.
20 Toth, L.M., Friedman, H.A., and Osborne, M.M. 1981. Polymerization of Pu(IV) in Aqueous 21 Nitric Acid Solutions. Journal of Inorganic and Nuclear Chemistry, Vol. 43, No. 11, pp. 22 2929-2934.
23 van der Lee, J., de Marsily, G., and Ledoux, E. 1993. "Are Colloids Important for Transport 24 Rate Assessment of Radionuclides?" In High Level Radioactive Waste Management, 25 Proceedings of the Fourth Annual International Conference, Las Vegas, NV, April 26-30, 26 1993, pp. 646-652. American Society of Civil Engineers, New York, NY.
27 Van Sambeek, L.L., Luo, D.D., Lin, M.S., Ostrowski, W., and Oyenuga, D. 1993. Seal 28 Design Alternatives Study. SAND92-7340. Sandia National Laboratories, Albuquerque, NM.
29 Vesely, W.E., and Rasmuson, D.M. 1984. Uncertainties in Nuclear Probabilistic Risk 30 Analyses. Risk Analysis, Vol. 4, No. 4, pp. 313-322.
31 Vilks, P. 1994. The Role of Colloids and Suspended Particles in Radionuclide Transport in 32 the Canadian Concept for Nuclear Fuel Waste Disposal. AECL-10280. Whiteshell 33 Laboratories, Atomic Energy of Canada, Ltd., Pinawa, Manitoba.
March 31,1995 6-80 DRAFT-DOE/CAO-2056

Draft 40 CFR191 Compliance Certification Application
1 Vine, J.D. 1963. Surface Geology of the Nash Draw Quadrangle, Eddy County, New 2 Mexico. U. S. Geological Survey Bulletin, 1141-B.
3 Vlassopoulos, D., Wood, S.A., and Mucci, A. 1990. Gold Speciation in Natural Waters: II. 4 The Importance of Organic Complexing—Experiments with Some Simple Model Ligands. 5 Geochimica et Cosmochimica Acta, Vol. 54, No. 6, pp. 1575-1586.
6 Wallner, M. 1981. "Critical Examination of Conditions for Ductile Fracture in Rock Salt." In 7 Proceedings of the Workshop on Near-Field Phenomena in Geologic Repositories for 8 Radioactive Waste, Seattle, WA, August 31-September 3,1981, pp. 243-253. Organization 9 for Economic Co-Operation and Development, Paris, France.
10 Warrick, R., and Oerlemans, J. 1990. "Sea Level Rise." In Climate Change: ThelPCC 11 Scientific Assessment. J.T. Houghton, G J . Jenkins, and J.J. Ephraums, eds., pp. 257-281. 12 Intergovernmental Panel on Climate Change, Sweden.
13 Washington, W.M., and Meehl, G.A. 1984. Seasonal Cycle Experiment on the Climate 14 Sensitivity Due to a Doubling of C 0 2 with an Atmospheric General Circulation Model 15 Coupled to a Simple Mixed-Layer Ocean Model. Journal of Geophysical Research, Vol. 89, 16 No. D6, pp. 9475-9503.
17 Weatherby, J.R., Brown, W.T., and Butcher, B.M. 1991. "The Closure of WIPP Disposal 18 Rooms Filled with Various Waste and Backfill Combinations." In Rock Mechanics as a 19 Multidisciplinary Science, Proceedings of the 32nd U.S. Symposium, University of Oklahoma, 20 Norman, OK, July 10-12,1991, J.C. Roegiers, ed., SAND90-2399C, pp. 919-928. A.A. 21 Balkema, Brookfield, VT.
22 Westinghouse Electric Corporation. 1994. Backfill Engineering Analysis Report, Waste 23 Isolation Pilot Plant. Westinghouse Electric Corporation, Waste Isolation Division, Carlsbad, 24 NM.
25 Wilson, C.A., and Mitchell, J.F.B. 1987. A Doubled C 0 2 Climate Sensitivity Experiment 26 with a Global Climate Model Including a Simple Ocean. Journal of Geophysical Research, 11 Vol. 92, No. D l l , pp. 13,315-13,343.
28 Wood, B.J., Snow, R.E., Cosier, D.J., and Haji-Djafari, S. 1982. Delaware Mountain Group 29 (DMG) Hydrology—Salt Removal Potential, Waste Isolation Pilot Plant (WIPP) Project, 30 Southeastern New Mexico. TME 3166. U.S. Department of Energy, Albuquerque, NM.
31 Zoback, M.D., and Zoback, M.L. State of Stress and Intraplate Earthquakes in the United 32 States. Science, Vol. 213, No. 4203, pp. 96-104.
DRAFT-DOE/CAO-2056 6-81 March 31,1995

7.0 ASSURANCE REQUIREMENTS
In the preamble to Title 40 Code of Federal Regulations (CFR) Part 191, the U.S. Environmental Protection Agency (EPA) points out that "there are too many uncertainties in projecting the behavior of natural and engineered components for many thousands of years—and too many opportunities for mistakes or poor judgments in such calculations—for the numerical requirements on overall system performance in Subpart B to be the sole basis to determine the acceptability of disposal systems for these very hazardous wastes." In view of this, the EPA developed assurance requirements to ensure that implementing agencies act cautiously and take steps to reduce these uncertainties. According to the EPA, these assurance requirements are considered to be an "essential complement" to the containment requirements, which, when implemented, should ensure that the level of protection desired by the EPA is achieved.
Contained in 40 CFR § 191.14 are these six separate assurance requirements:
Active institutional controls Monitoring Passive institutional controls Barriers Resource disincentives Waste removal.
The following sections detail the U.S. Department of Energy's (DOE's) compliance with the assurance requirements of 40 CFR Part 191.
The EPA has proposed draft criteria for certification of compliance with 40 CFR Part 194 that include requirements not addressed in this section (EPA 1995). For example, 40 CFR Part 194 requires detailed information and plans which are not currently available. Where appropriate, the areas in this section that may require revision are identified.
7.1 Active Institutional Controls
Section 194.41 of the proposed 40 CFR Part 194 addresses active institutional controls. In particular it requires detailed descriptions of active controls, their locations, the period of time that the controls will remain active, assumptions regarding such controls and the effectiveness of those controls. While the following sections address the regulatory requirements on active controls, they do not provide the level of detail specified in the proposed rule.
Once a facility is decommissioned, positive actions (referred to as "active institutional controls") should be taken to assure proper maintenance and monitoring. The EPA has specified that no more than 100 years of active institutional control can be assumed in predictions of long-term performance. This assumption assures that future protection and control does not rely on positive actions by future generations.
DRAFT-DOE/CAO-2056 March 31,1995

Draft 40 CFR 191 Compliance Certification Application
1 Active institutional controls principally occur following shaft sealing activities, although some 2 related activities may begin sooner. The DOE interprets this requirement to mean that control 3 programs should be implemented as long as such controls are useful and practical, but active 4 institutional controls cannot be considered in the performance assessment for ensuring 5 isolation for more than 100 years. 6 7 The EPA defines active institutional controls (40 CFR § 191.12) as: "(1) controlling access to 8 a disposal site by any means other than passive institutional controls, (2) performing 9 maintenance operations or remedial actions at the site, (3) controlling or cleaning up releases
10 from a site, or (4) monitoring parameters related to disposal system performance." Activities 11 constituting active institutional controls include post-operational monitoring, decontamination 12 and decommissioning (D&D), land reclamation, evaluation of land use in the area, 13 maintenance of fences and buildings, and guarding the facility. There are several objectives to 14 be accomplished by these activities: (1) to do whatever is needed to restore the land surface to 15 as near its original condition as possible so that future generations will not preferentially select 16 the area for some activity that will be detrimental to the disposal of wastes; (2) to provide for a 17 facility and presence at the site during active cleanup; (3) to perform disposal system 18 monitoring; and (4) to limit access to the site. 19 20 Section 13 of the Land Withdrawal Act (LWA) requires the DOE to submit a 21 decommissioning plan and a post-decommissioning management plan to Congress, the state 22 of New Mexico, the Secretary of the Interior, and the EPA Administrator by October 30, 23 1997. Oversight of active institutional control activities with regard to the closure and post-24 closure requirements of the Resource Conservation and Recovery Act (RCRA) and the New 25 Mexico Hazardous Waste Act (NMHWA) would be the responsibility of the New Mexico 26 Environment Department (NMED) and the EPA. 27 28 The state of New Mexico has further involvement in accordance with Section N, 29 "Decontamination and Decommissioning," of Revision 1 of the Working Agreement for 30 Consultation and Cooperation (DOE 1981). 31 32 Land reclamation activities would be conducted in consultation with the U.S. Bureau of Land 33 Management (BLM) and the State Land Office (SLO) to assure that land restoration activities 34 return the Waste Isolation Pilot Plant (WIPP) facility to a condition that is equivalent to that 35 of surrounding lands. Section 4 of the LWA provides that the DOE, in consultation with the 36 Secretary of the Interior and the state of New Mexico, develop a management plan by October 37 30, 1993, for the use of the withdrawal area until the end of the decommissioning phase. This 38 management plan has been developed by DOE (1993b). 39 40 7.1.1 Active Institutional Control Requirements 41 42 In prescribing active institutional controls, the EPA has specified that "active institutional 43 controls over disposal sites should be maintained for as long a period of time as is practicable 44 after disposal" (40 CFR § 191.14[a]). 45
March 31,1995 7-2 DRAFT-DOE/CAO-2056

Draft 40 CFR191 Compliance Certification Application
1 The EPA addresses the effectiveness of these controls and the length of the time period over 2 which any such controls should be considered effective for the purposes of the performance 3 assessment. In accordance with the final rule, the implementing agency should maintain 4 active institutional controls for as long a period of time as is practicable. However, to be 5 conservative, the standards require that the performance assessment should not assume that 6 any benefits derive from active institutional controls for more than 100 years after disposal. 7 The EPA states that assurance of isolation cannot depend on positive actions on the part of 8 future generations; this provides additional assurance that the disposal system will protect 9 human health and the environment in the long term (EPA 1985). This section provides an
10 overview of the program that is currently proposed by the DOE for implementing active 11 institutional control for the WIPP facility. 12 13 7.1.2 Objectives for Active Institutional Controls 14 15 The DOE's active institutional control program has a primary objective of addressing all 16 requirements, including restoring the WIPP site as nearly as possible to its original condition, 17 and thereby equalizing any preference over other areas for development by humans in the 18 future. Restoration of the WIPP site includes any necessary remedial actions or cleanup of 19 releases resulting from decommissioning. In addition, as part of the active institutional 20 control program, the DOE will implement monitoring systems suitable for assessing disposal 21 system performance if such monitoring is feasible. 22 23 7.1.3 WIPP Active Institutional Control Program 24 25 The DOE currently plans to implement the long-term active institutional control program in 26 five steps, each of which are described in more detail below: 27 28 • Step 1 - Identification of active institutional control measures 29 »Step 2 - Preparation of a post-decommissioning land management plan 30 • Step 3 - Gathering of data necessary for implementing active institutional control 31 measures 32 • Step 4 - Preparation of the active institutional control plan 33 • Step 5 - Implementation of active institutional control measures. 34 35 Step 1 - Identification of Active Institutional Control Measures 36 37 The first step in the process of implementing the active institutional control program is to 38 identify measures needed to satisfy the active institutional control requirements. It is 39 anticipated that certain characteristics of active institutional control measures, such as 40 minimizing bias toward the site, warning of potential hazards, providing meaningful data, 41 preserving knowledge, using state-of-the-art technology, implementing such measures for at 42 least 100 years, addressing the standards, and deterring systematic development, will be 43 identified and used to judge the usefulness of active institutional control programs. 44
DRAFT-DOE/CAO-2056 7-3 March 31,1995

Draft 40 CFR 191 Compliance Certification Application
1 Certain active institutional controls are obvious at the outset. These include site access 2 control, site remedial actions, site maintenance, control of releases, and monitoring. 3 Information and specifications useful in implementing these and possibly other controls will 4 be gathered. A detailed explanation of the active institutional controls is provided in 5 Appendix AAC, WIPP Active Access Controls after Disposal, Design Concept Description. 6 This is the DOE's reference design for active institutional controls upon which planning will 7 be based. The reference design will be reviewed periodically and updated as appropriate 8 during WIPP disposal operations. The ongoing review and evaluation ensure that the active 9 institutional controls implemented are appropriate for the conditions that may exist at that
10 time. The DOE will review the reference design prior to implementation and the EPA will be 11 consulted as part of this review. 12 13 The final disposal activity at the repository will be the closing of the waste disposal area and 14 sealing the shafts. Upon completion of this activity, the remaining surface structures will be 15 dismantled. All surface structures, except for the concrete Hot Cell structure and a sufficient 16 quantity of salt tailings to support construction of the permanent marker berm, will be 17 removed and the site regraded and planted to return the site to as near its original condition as 18 practicable and possible. In addition, those structures erected during the disposal phase as part 19 of the permanent marker testing program will also remain in place after decommissioning. 20 This will include a section of the berm and at least one monolithic marker erected as a part of 21 the program for long-term testing of materials planned to be used for the permanent marker 22 system. 23 24 As part of the active institutional controls program, the DOE has developed a set of design 25 criteria upon which the active institutional controls will be based. These design criteria 26 provide a description of how the active institutional controls will be implemented. These are 27 as follows: 28 29 • A fence line shall be established to control access to the repository's footprint area (the 30 waste disposal area projected to the surface). A standard wire fence shall be erected along 31 the perimeter of the repository surface footprint. The fence shall have gates placed 32 approximately midway along each of the four sides. 33 34 • An unpaved roadway along the perimeter of the barbed wire fence shall be constructed to 35 provide ready vehicle access to any point around the fenced perimeter, to facilitate 36 inspection and maintenance of the fence line, and to permit visual observation of the 37 repository footprint to the extent permitted by the lay of the land. This roadway shall 38 connect to the paved south access road. 39 40 • To ensure visual notification, the fence line shall be posted with signs having as a minimum 41 a legend reading "Danger—Unauthorized Personnel Keep Out" and a warning against 42 entering the area without specific permission of the DOE (or other local authority such as 43 the Eddy County Sheriffs Office). 44 45
March 31,1995 7-4 DRAFT-DOE/CAO-2056
Draft 40 CFR191 Compliance Certification Application
1 • Contractual arrangements shall be developed to ensure that periodic inspection and 2 necessary corrective maintenance is conducted on the fence line, its associated warning 3 signs, and the roadway. 4 5 • Through direct DOE staffing support and/or contractual arrangements, procedures shall be 6 established to provide routine periodic patrols and surveillance of the protected area by 7 personnel trained in security surveillance and investigation. 8 9 • Processes will be developed for monitoring and controlling the long-term testing
10 requirements of the permanent marker system. 11 12 • Processes will be developed for implementing the periodic monitoring requirements of the 13 disposal system's monitoring program. 14 15 • Recommendations will be developed for modifications to the active institutional controls 16 appropriate for access control and surveillance upon installation of the permanent marker 17 system. 18 19 • Guidelines will be developed for recommending mitigating actions to be taken to address 20 any abnormal conditions identified during periodic surveillance and inspections. 21 22 • Reports of activities associated with the post-disposal active access controls shall be 23 prepared in accordance with regulatory requirements for submittal to the appropriate 24 regulatory and legislative authority. 25 26 Details on meeting these criteria are found in Appendix AAC. 27 28 Step 2 - Preparation of a Post-Decommissioning Land Management Plan 29 30 Section 13(b) of the LWA requires the DOE to prepare and submit by October 30, 1997, a 31 plan for managing the land withdrawal area after decommissioning of the WIPP facility. This 32 plan will include a description of both the active and passive institutional controls that will be 33 imposed after decommissioning is complete. This plan will be prepared in consultation with 34 the Department of Interior and the state of New Mexico. 35 36 Step 3 - Gathering of Data Necessary for Implementing Active Institutional Control 37 Measures 38 39 Once the active institutional control measures have been identified, it may be useful to gather 0 additional data to support implementation of those measures. This includes an ongoing 1 assessment of conditions that could affect active institutional control. Information regarding 2 land use and population trends gathered during the Disposal Phase will be taken into account 3 in implementing post-decommissioning surveillance. 4
DRAPT-DOE/CAO-2056 7-5 March 31, 1995

Draft 40 CFR 191 Compliance Certification Application
1 2 3 4 5 6 7 8 9
10 11 12 13 14
IS 17 18 19 20 21
22 23 24 25 26
27 28 29 30 31 32 33
34
35
36 37 38 39 40 41 42 43 44 45
Step 4 - Preparation of the Active Institutional Control Plan
An active institutional control plan will be prepared as part of the overall site D&D strategy (see Appendix D&D for the Conceptual Decontamination and Decommissioning Plan for the WIPP). This written plan, which will be initiated prior to actual plant closure, will contain all the information needed to implement the active and passive institutional controls for the WIPP facility. Active institutional control planning will take into account the most current information regarding the facility and its vicinity and will make use of state-of-the-art materials and techniques. This plan will include acceptable decontamination levels, sampling and analysis plans, and Quality Assurance and Quality Control (QA/QC) specifications. It is anticipated that this plan will incorporate the items shown in Table 7-1.
Table 7-1. Proposed Contents of the Long-Term Protection Plan Addressing Active Institutional Controls
Active Control Plans Access control Maintenance Release control Monitoring
Remediation and Reclamation Plans for Site Final salt disposition Borehole plugging or sealing Remedial actions for spills and releases Restoration (roads, pads, etc.)
Final Schedules and Commitments National Environmental Policy Act (NEPA) requirements and commitments RCRA requirements Federal Land Policy and Management Act (FLPMA) requirements Waste Isolation Pilot Plant Land Withdrawal Act (LWA) management responsibilities Other regulatory requirements
Sampling and Analysis Strategies and Protocols
Quality Assurance and Quality Control
Step 5 - Implementation of Active Institutional Control Measures
Most of the active institutional control measures, such as long-term site monitoring and site remedial actions, will be implemented simultaneously with plant closure and decommissioning. However, it may be possible to implement some measures earlier. For example, salt disposal may begin prior to final plant closure. Reclamation and restoration of unused disturbed surface areas has already begun. Guarding and maintenance activities, which are already in place, could evolve into an appropriate type of post-closure activity.
March 31, 1995 7-6 DRAFT-DOE/CAO-2056

Draft 40 CFR191 Compliance Certification Application
1 7.1.4 Active Institutional Control Program Review and Oversight 2 . . 3 The working agreement for consultation and cooperation with the state of New Mexico 4 mandates that the state be given opportunity to review all plans related to decommissioning. 5 In addition, the facility will be operated and closed under the permitting requirements of the 6 RCRA and the NMHWA. Both the RCRA and the NMHWA mandate a formal submittal by 7 the DOE and review by the NMED and the EPA of the Closure and Post-Closure Plan for the 8 facility. Additionally, it is anticipated that any plan developed to satisfy this assurance 9 requirement will be reviewed by the Environmental Evaluation Group (EEG), the BLM, the
10 National Academy of Science (NAS), and the SLO. 11 12 7.2 Monitoring 13 14 Requirements for monitoring of a disposal system1 are included in the standards to the extent 15 such monitoring can be considered meaningful in terms of detecting any detrimental and 16 significant deviation from expected performance. The DOE interprets this standard as a 17 requirement that a monitoring program be used with regard to addressing uncertainties 18 associated with the long-term performance predictions and that the time period over which 19 diagnostic data can be collected be realistic in terms of exercising active institutional control 20 over the site. Monitoring activities at the WIPP facility would most likely include the 21 measurement of subsidence, among other things. In addition, groundwater sampling in the 22 Rustler Formation (hereafter referred to as the Rustler) would continue. 23 24 Disposal system monitoring is addressed in § 194.42 of the proposed 40 CFR Part 194. The 25 proposed requirement requires that a certification application contain a level of detail not 26 currently available. The proposed requirement also requires that specific studies be performed 27 in support of the monitoring program. 28 29 7.2.1 Disposal System Monitoring Requirements 30 31 Regarding disposal system monitoring, 40 CFR Part 191 specifies that: 32 33 Disposal systems shall be monitored after disposal to detect substantial and detrimental deviations from 34 expected performance. This monitoring shall be done with techniques that do not jeopardize the 35 isolation of the wastes and shall be conducted until there are no significant concerns to be addressed by 36 further monitoring (40 Part 191.14[b]). 37 38 Within this context, if determined to be feasible, monitoring becomes one of the measures to 39 be implemented at the WIPP facility during the active institutional control period. 40 41
lnDisposal system" means "any combination of engineered and natural barriers that isolate...radioactive waste after disposal" (40 CFR § 191.12).
DRAFT-DOE/CAO-2056 7-7 March 31,1995

Draft 40 CFR 191 Compliance Certification Application
1 Monitoring a disposal system is intended to address "significant concerns" associated with the 2 performance of the isolation system. The EPA points out that monitoring approaches to 3 address "significant concerns" should be limited to those that could provide meaningful data 4 in a relatively short time. 5 6 The DOE will design a monitoring system that will not jeopardize the integrity of the disposal 7 system. Many different monitoring approaches will be considered to improve confidence that 8 the repository is performing as intended. All of these considerations will be taken into 9 account in the design of the long-term monitoring program for the WIPP facility.
10 11 7.2.2 Objectives of Disposal System Monitoring 12 13 As a result of the specific requirements contained in § 191.14(b), the long-term monitoring 14 program at the WIPP facility shall have the objective of detecting substantial and detrimental 15 deviation from the expected performance of the disposal system. This monitoring will be 16 performed with a variety of techniques designed to detect detrimental deviations without 17 jeopardizing waste isolation. With this objective in mind, selection and specification of 18 monitoring activities will address the four following areas of performance: 19 20 • Hydrological—possibilities for hydrological monitoring include, but are not limited to, a 21 long-term assessment of the assumptions made regarding the movement of fluids through 22 the Rustler 23 • Geological—geological performance can be assessed by monitoring subsidence at the 24 surface 25 • Geochemical—geochemical performance may be assessed to substantiate assumptions 26 regarding waste characteristics, brine characteristics, and waste-rock interactions 27 • Structural—structural performance would include evaluations of man-made features such 28 as shaft seals, plugs, and human intrusion barriers. 29 30 7.2.3 Disposal System Monitoring Program 31 32 The long-term monitoring program at the WIPP facility is, in a broad sense, a continuation of 33 preoperational and operational monitoring activities to the extent that all of these monitoring 34 activities support the general development and refinement of knowledge about the WIPP 35 disposal system. The DOE envisions that the implementation described in the long-term 36 monitoring program in this section will occur in steps. The steps represent the evolution of 37 programs from the operational to the post-operational phases. 38 39 Specific steps anticipated for the disposal system monitoring program include the following, 40 each of which are described in more detail below: 41 42 • Step 1 - Preparation of disposal system monitoring strategic plan 43 • Step 2 - Identification of disposal system monitoring programs 44 • Step 3 - Design and implementation of operational monitoring programs 45
March 31,1995 7-8 DRAFT-DOE/CAO-2056

Draft 40 CFR191 Compliance Certification Application
1 • Step 4 - Design of post-operational monitoring programs 2 • Step 5 - Implementation of post-operational monitoring programs 3 • Step 6 - Operation of the disposal system monitoring program. 4 5 Step 1 - Preparation of Disposal System Monitoring Strategic Plan 6 7 The first step involves the preparation of a planning document that can be used to direct and 8 focus subsequent activities. This strategic plan has been issued (DOE 1993c) and summarizes 9 monitoring requirements as derived from 40 CFR Part 191 and other applicable regulations.
10 The strategic plan discusses the integration required to demonstrate compliance to this portion 11 of the standard. 12 13 Step 2 - Identification of Disposal System Monitoring Programs 14 15 Based on the disposal system monitoring requirements, a conceptual design for a disposal 16 system monitoring system was developed. The details of the system are provided in Appendix 17 LTM. Following an evaluation of current geophysical and experimental technologies, a 18 disposal system monitoring system was conceived composed of a subsidence network, a 19 monitoring program, and a baseline database. The monitoring program is broken down into 20 two subgroups, subsidence and environmental and groundwater monitoring. 21 22 Subsidence Network. Several subsidence studies have been completed and are included in 23 the following documents: 24 25 • Final Environmental Impact Statement (FEIS) 26 • Final Safety Analysis Report (FSAR) 27 • Methodology and Results: Preliminary Comparison with 40 CFR Part 191, Part B for the 28 Waste Isolation Pilot Plant 29 • Backfill Engineering Analysis Report. 30 31 These reports evaluate the potential for and predict the subsidence due to the development of 32 the repository, drifts, and rooms. These calculations account for a range of waste volumes, 33 waste densities, and backfill types. Subsidence was also calculated for conditions where no 34 backfill would be used. The Backfill Engineering Analysis Report (BEAR) contains the most 35 detailed data on subsidence. Contour maps included in this report detail subsidence 36 predictions using Influence Function and National Coal Board Methods with and without 37 backfill. The maximum subsidence was also calculated using the mass conservation method. 38 These studies were not specifically performed to estimate subsidence for monitoring the 39 repository performance in the long term, and they do not account for other factors that may 40 influence subsidence such as local hydrocarbon extraction and local potash mining. A 41 subsidence data study will predict subsidence related to repository performance and will 42 investigate factors that influence subsidence. The goal of the study is to calculate subsidence 43 predictions with respect to time for the repository and define the bounding limits that may 44 indicate poor repository performance. 45
DRAFT-DOE/CAO-2056 7-9 March 31,1995

Draft 40 CFR 191 Compliance Certification Application
1 The Subsidence Data Study (SDS) will define the most favorable positions for any additional 2 benchmarks and oversee their placement in the network. In order to monitor subsidence, a 3 network of benchmarks must be placed over the area of interest. Benchmarks have been 4 installed over and around the general vicinity of the WIPP. These benchmarks are adequate 5 for initial data gathering. However, the current network is too coarse to provide sufficient 6 data points to accurately define subsidence over the repository for the long term. Contour 7 plots of expected subsidence in the BEAR show that the maximum subsidence can occur in a 8 circular area with a radius as small as 1,000 feet (305 meters); most of the current benchmarks 9 are 1,000 feet (305 meters) apart. Powers (1993) has recommended placing a network over
10 the repository footprint that would extend 2,000 feet (610 meters) past the 4-square-mile (10-11 square-kilometer) site boundary. This would encompass the entire predicted subsidence area 12 for angles of draw up to 45 degrees. Additional benchmarks shall be placed to increase the 13 density over the repository. These new benchmarks shall be installed after completion of the 14 SDS. The SDS will evaluate and determine the quantity and placement of the benchmarks to 15 best determine subsidence. 16 17 After establishing the supplemental benchmark locations, benchmarks that meet the National 18 Geodetic Survey (NGS) Class I, first-order standards will be installed and surveyed. All 19 placement and survey data will be documented in the baseline database. Provisions will be 20 made to maintain and replace benchmarks when required and to coordinate benchmark 21 placement with the passive markers design. This coordination has been noted in the 22 Permanent Markers Study which is included as Appendix PMR. 23 24 Subsidence Monitoring Program. The Monitoring Program consists of monitoring the 25 subsidence network and, for a limited period, environmental and groundwater monitoring. 26 Subsidence monitoring is accomplished with a Class I Leveling Survey. The surveys will be 27 performed every 10 years during the operational phase and thereafter in accordance with the 28 Disposal System Monitoring Program schedule. 29 30 The leveling surveys will be performed as described in a QA/QC procedure to ensure the data 31 are documented and validated. The data will be included in the baseline database. A 32 procedure will be developed to implement the monitoring program. 33 34 The Monitoring Program includes the following: 35 36 37 38 39 40 41 42 43 44 45
Management of the Disposal Phase Monitoring Program Maintenance of monitoring procedures and QC/QA documents Performance of all monitoring Maintenance of the subsidence network Maintenance of the monitoring schedule Maintenance and storage of baseline database Review of data and evaluation of performance Eventual decommissioning of the Disposal System Monitoring Program Archiving of monitoring data.
March 31, 1995 7-10 DRAFT-DOE/CAO-2056
Draft 40 CFR191 Compliance Certification Application
1 Baseline Database. Establishment of environmental monitoring baselines for both 2 radiological and nonradiological parameters was completed by compilation and publication bf 3 baseline reports. These programs have transitioned into the disposal phase; pertinent data 4 collection continues and will continue through the life of the project. Implementation of the 5 operational environmental monitoring is contained in the WIPP Environmental Monitoring 6 Plan (BMP) (DOE 1994). 7 8 Preoperational data are contained in the following documents: 9
10 • Statistical Summary of the Radiological Baseline Program for the WIPP 11 • Summary of the Salt Impact Studies at the WIPP, 1984-1990 12 • Study of Disturbed Land Reclamation Techniques for the WIPP 13 • Background Water Quality Characterization Report for the WIPP 14 15 The EMP, which was transitioned from the preoperational programs, includes monitoring a 16 comprehensive set of parameters to detect any potential environmental impact. The ecological 17 portions of the program focus on the immediate area surrounding the facility, whereas 18 radiological surveillance generally covers a broader geographic area, including nearby 19 ranches, villages, and cities. This environmental monitoring will continue throughout the 20 project's disposal and closure phases. Any impacts will be determined by a quantitative 21 analysis comparing operational monitoring results against previously collected data. Data 22 from ongoing environmental monitoring are published annually. 23 24 The SDS will generate subsidence predictions and compile the technical information from 25 experiments performed during the developmental and operational phases of the WIPP. These 26 data will be included in a database. This database will also contain data specific to the 27 repository's geophysical, hydrological, geochemical, and structural nature at the end of the 28 disposal phase when the repository is sealed. 29 30 The database will also contain data from previous monitoring studies and data from specific 31 surveys and monitoring techniques performed immediately after closure of the repository. 32 These surveys will be performed only once after closure to establish the geologic condition of 33 the area at the start of the post-closure phase. An evaluation of geophysical methods was 34 performed to determine which methods should be used to establish a baseline of the repository 35 after closure. The following techniques were chosen because they meet the requirements, they 36 are non-intrusive, they are implemented from the surface, and they provide data that are useful 37 in interpreting the repository's geophysical, structural and hydrological condition. All post-38 closure monitoring techniques that would be physically conducted in the repository were 39 excluded (see Appendix LTM for a discussion on direct repository monitoring). 40 41 The following monitoring technologies were chosen to be evaluated as candidates for disposal 42 system monitoring: 43 44 • Subsidence surveys 45 • Seismic surveys
DRAFT-DOE/CAO-2056 7-11 March 31,1995

Draft 40 CFR 191 Compliance Certification Application
1 • Gravitational surveys 2 • Electromagnetic surveys 3 • Resistivity surveys 4 • Aerial radiological surveys. 5 6 Each of these techniques is evaluated in Appendix LTM. A determination was made to 7 include all past data for geophysical surveys conducted during site selection and operation. At 8 closure, several geophysical surveys will be performed to obtain baseline data on the 9 geophysical condition of the repository and surrounding area. Seismic reflection and
10 refraction, gravitational, electromagnetic, and resistivity surveys will be performed. No 11 baseline environmental surveys are required since a baseline has previously been established. 12 All data and explicit descriptions of the equipment, data reduction techniques, and procedures 13 used will be included in the database. All sensor placements will be surveyed and recorded. 14 Where possible, some of the original survey lines will be used. The Closure Review Study, 15 described in Step 5 below, will also determine specific survey lines to be included. 16 17 Step 3 - Design and Implementation of Operational Monitoring Programs 18 19 Some long-term monitoring programs, such as the subsidence monitoring program, may 20 benefit from data that are collected during operations. These data collection programs will 21 provide data to support the design of post-operational monitoring programs and data to 22 address the uncertainty in long-term performance predictions. 23 24 In addition, proposed 40 CFR § 194.42(b) requires DOE to address preclosure monitoring as 25 part of the certification process. Pre-closure monitoring is not addressed in this draft 26 application. 27 28 Step 4 - Design of Post-Operational Monitoring Programs 29 30 This step includes the detailed design and planning required to implement and operate 31 post-operational monitoring programs. Part of this step may include the identification of data 32 needs relative to monitoring program design and implementation. These data needs will be 33 turned into technical directives to support the long-term monitoring programs. 34 35 Step 5 - Implementation of Post-Operational Monitoring Programs 36 37 This activity involves the actual construction, installation, and checkout of monitoring 38 instruments. This activity also includes procedures for sample collection and analysis, as well 39 as management of data generated by the monitoring instruments. Because the initial disposal 40 system monitoring plan will be written at least 25 years prior to closing the facility, a review 41 of technology, regulations, site management, safety requirements and public opinions will 42 occur prior to implementation to assess advancements and changes over this time period. This 43 review of the Disposal System Monitoring Plan is called the Closure Review Study (CRS) and 44 will occur prior to closure to assure compliance and safety. 45
March 31, 1995 7-12 DRAFT-DOE/CAO-2056

Draft 40 CFR 191 Compliance Certification Application
1 A CRS will be initiated to evaluate the Disposal System Monitoring Plan and update all 2 aspects that are not current. This plan will review the data in the baseline database and all 3 governing regulatory issues associated with long-term monitoring of the facility. The CRS 4 will determine what monitoring is required, what will be monitored, what equipment and 5 techniques will be used, and which area will be monitored. A feasibility study will evaluate 6 technology available at that time that can be used to accomplish this task. 7 8 The CRS will update the schedules, define organizational responsibilities, and provide 9 interface to the active institutional control activities.
10 11 Step 6 - Operation of the Disposal System Monitoring Program 12 13 Operation of monitoring programs may begin during facility operations if appropriate 14 operational monitoring programs are identified. The total scope of the disposal system 15 monitoring program will be included in the active institutional controls plan. The Disposal 16 System Monitoring Program will also be included in the closure and post-closure portion of a 17 No-Migration Determination issued by the EPA pursuant to RCRA. 18 19 7.2.4 Disposal System Monitoring Program Review and Oversight 20 21 Selection and specification of monitoring programs will be reviewed by appropriate regulatory 22 (EPA and NMED) and oversight (NAS and EEG) organizations. Typically, disposal site 23 monitoring becomes an integral part of decommissioning and post-decommissioning 24 activities. 25 26 7.3 Passive Institutional Controls 27 28 Section 194.43 of the proposed 40 CFR Part 194 addresses passive institutional controls. This 29 section requires a level of detail not formerly identified in the regulatory requirements of 30 40 CFR Part 191. Proposed 40 CFR § 194.25 and § 194.26 may also have an impact upon 31 this section. These sections address future state assumptions and expert judgment but are not 32 considered in the following text. 33 34 Passive institutional controls include markers that warn of the presence of buried nuclear 35 waste and identify: (1) the boundary of the disposal area footprint, (2) external records about 36 the WIPP repository, and (3) continued federal ownership. Implementation of passive 37 institutional controls is mandated in the Assurance Requirements provisions of 38 40 CFR Part 191. The EPA intends for the implementing agency to provide comprehensive 39 actions that will increase the likelihood that knowledge and information about the disposal 40 site and its contents are passed on to future generations. For the purposes of compliance with 41 40 CFR Part 191, the EPA does not assume that passive controls will prevent all possibility of 42 intrusion, but such controls will deter any systematic development of a site. The DOE will 43 meet this requirement by installing a series of physical markers and written records to preserve 44 knowledge of the site in perpetuity. The DOE will implement passive institutional controls in 45 a manner that provides defense in depth. That is, the passive institutional control system will
DRAFT-DOE/CAO-2056 7-13 March 31,1995
Draft 40 CFR 191 Compliance Certification Application
Step 1 - Definition of passive institutional controls appropriate for the WIPP Step 2 - Development of a passive institutional control implementation plan Step 3 - Design and implementation ofpre-decommissioning passive controls Step 4 - Implementation of programs to collect needed information Step 5 - Design of post-decommissioning passive institutional controls Step 6 - Implementation of post-decommissioning passive institutional controls.
1 involve multiple types and multiple levels of passive controls to provide the assurance needed 2 that human intrusion into the disposal site is unlikely. To accomplish this, the DOE intends to 3 use several types of monuments and markers, land ownership, and written notations in land 4 records in numerous locations. Written documentation will include information on the site, its 5 use, and its contents, as well as stipulations on allowable land uses. 6 7 Passive institutional controls, as opposed to active institutional controls (see 8 40 CFR § 191.14[a]), are controls that once established, can be expected to remain effective 9 with minimal human surveillance and maintenance, or maintenance resulting from normal
10 governmental activities. Passive controls may be instituted at the site, a remote location, or 11 both. 12 13 The following steps have been identified to support implementation of passive institutional 14 controls for the WIPP: 15 16 17 18 19 20 21 22 23 7.3.1 Passive Institutional Control Requirements 24 25 Unlike the other assurance requirements which provide performance standards for facilities, 26 the EPA describes technical standards by way of specific measures (markers, records, and 27 federal ownership) that it considers to be necessary parts of the passive institutional control 28 program. The DOE interprets the phrase "federal ownership and regulations regarding land or 29 resource use" to mean that the DOE or some successor agency with nuclear waste 30 management expertise will retain administrative control over the land in accordance with 31 Appendix C of 40 CFR Part 191. "Administrative control" means that the federal agency 32 responsible for the land will institute regulations that impose appropriate restriction on land 33 use and development. Regarding the WIPP facility, the DOE interprets the term "markers" to 34 include any on-site structures engineered and constructed as a means of preserving knowledge 35 of the location of the wastes and conveying associated hazards. The DOE interprets "records" 36 to include any written information regarding the site and its contents, which are maintained to 37 preserve knowledge of the site. The DOE intends to use passive institutional controls 38 throughout the entire controlled area. 39 40 The remainder of this section details requirements for passive institutional control. 41 42 In the FEIS, the DOE commits to a final design of record maintenance and site marker 43 systems using state-of-the-art materials and methods prior to decommissioning. The three 44 principal components of the systems are (1) written records, (2) location markers for all shafts, 45 and (3) visible warning markers. The component "written records" involves maintenance of
March 31, 1995 7-14 DRAFT-DOE/CAO-2056

Draft 40 CFR191 Compliance Certification Application
1 written documentation of the WIPP in both federal and local public document depositories. 2 The component "markers" consists of showing the locations of shafts withpermanent 3 surveyor markings engraved with the elevation and coordinates and firmly anchored to the 4 shaft plug. Finally, the component "site monuments" involves a visible site monument that 5 will serve to minimize the possibility of intrusion into the repository during the short term; it 6 may be the most durable record of the repository in the long term. 7 8 In the proposed and final No-Migration Determination for the WIPP facility, the EPA 9 discussed the use of passive controls as part of an overall strategy to protect a land disposal
10 facility and to decrease the likelihood of human disruption. The EPA believes that, in the 11 context of RCRA no-migration variance decisions, the question of human intrusion, either 12 during operations or after closure, is best addressed through a consideration of the likelihood 13 of intrusion, and the imposition of controls to make such intrusions unlikely events. The EPA 14 emphasizes that this approach to human intrusion is consistent with its general approach under 15 RCRA, both in permitting and variances. Under RCRA, the EPA typically relies on 16 institutional controls (both active and passive) imposed through general regulatory standards 17 and site-specific conditions (e.g., in RCRA permits) to ensure that access to a hazardous waste 18 disposal site is appropriately restricted. EPA believes that any permanent no-migration 19 variance for the WIPP will have to impose long-term passive institutional controls, such as 20 land withdrawal, records, and markers—to ensure that the likelihood of human intrusion is 21 appropriately reduced, even after active control of the facility has ceased and any permits at 22 the site may have terminated. 23 24 The DOE is committed to retaining control over the WIPP site for as long as possible. 25 Accordingly, an extensive system of explanatory markers and records will be instituted to 26 warn future generations about the location and dangers of these wastes. It has not been 27 assumed that these passive controls will prevent all possibilities of inadvertent human 28 intrusion, because there will always be a realistic chance that some individuals will overlook 29 or misunderstand the markers and records. (For example, exploratory drilling operations 30 occasionally intrude into areas that clearly would have been avoided if existing information 31 had been obtained and properly evaluated.) However, the agency assumed that society in 32 general will retain knowledge about these wastes and that future societies should be able to 33 deter systematic or persistent exploitation of a disposal site. 34 35 7.3.2 Objectives of the Passive Institutional Controls 36 37 As prescribed by the standards, the objective of the DOE's passive institutional control 38 program for the WIPP is to accomplish the following: 39 40 • Ensure a record of the disposal site and its contents are preserved 41 • Warn those who attempt to enter the disposal site vicinity of the hazards associated with 42 activities that would disturb the subsurface. 43 44
DRAFT-DOE/CAO-2056 7-15 March 31,1995
Draft 40 CFR 191 Compliance Certification Application
1 The DOE believes that passive institutional controls will render human intrusion sufficiently 2 unlikely so that the possibility need not be included in the complementary cumulative 3 distribution function. 4 5 7.3.3 Passive Institutional Control Implementation 6 7 The DOE will implement passive institutional controls in an effort to ensure that knowledge 8 of the presence of the facility is not lost to future generations. Passive institutional controls 9 include: (1) markers warning of the presence of buried nuclear waste and identifying the
10 boundary of the disposal area footprint, (2) external records about the WIPP repository, and 11 (3) continued federal ownership. The disposal area footprint is the underground waste 12 disposal area projected to the surface. The DOE strategy is to design and implement, to the 13 extent practicable, passive controls that will warn future generations of the dangers of 14 intruding. 15 16 A substantial amount of work has been completed in the area of passive controls at the WIPP 17 facility. 18 19 • DOE Ownership. The DOE has been successful in gaining control of the surface of the 20 16-section WIPP site and the subsurface to a depth of 6,000 feet (1,829 meters), including 21 the acquisition of oil, gas, and potash leases. The area now under the control of the DOE 22 includes the following sections in Township 22 South, Range 31 East: 15, 16, 17,18, 19, 23 20,21, 22,27,28,29,30,31,32,33, and 34. 24 25 • Land Use Controls. Land use controls have been implemented addressing allowable uses 26 of the withdrawal area. These are described in Appendix AAC, WIPP Active Access 27 Controls after Disposal, Design Concept Description. 28 29 Beyond land ownership and implementation of use controls, which are the key preclosure 30 passive controls, there are six steps that have been identified for the WTPP passive 31 institutional control program. 32 33 Step 1 - Definition of Passive Institutional Controls Appropriate for the WIPP 34 35 The process of defining the passive institutional controls for the WIPP disposal site is based 36 on the controls identified in 40 CFR § 191.12. This includes items such as records, markers, 37 monuments, legal documentation, federal control, land use restrictions, and other methods of 38 preserving knowledge. 39 40 The current conceptual design for post-closure passive institutional controls is described in 41 Appendix PMR, Permanent Marker Design Report. The design includes: 42 43 • Large surface monuments and earthen structures to mark the repository footprint 44 • One or more on-site buried rooms for the long-term storage of messages describing the 45 nature of the repository
March 31,1995 7-16 DRAFT-DOE/CAO-2056

Draft 40 CFR191 Compliance Certification Application
1 • Small subsurface markers 2 • Off-site archival storage of information pertaining to the WEPP, including its potential 3 hazards. 4 5 Three concepts for configuration of the earthen structures, arrangement of the monument 6 markers, and placement of the archival storage rooms within the perimeter of the repository 7 footprint are under consideration. Diagrams representing these three concepts are provided in 8 Appendix PMR. The diagrams are Figures X-l, X-2, XI-1, and XII-1. 9
10 The first concept consists of a large earthworks configured in the shape of a trefoil centered 11 above the repository surface's footprint center. An Information Center is also placed at the 12 center with large monoliths arranged along the footprint perimeter and outside the trefoil. 13 Two storage rooms are located east and west of the trefoil center. Each of these rooms is 14 buried approximately 20 feet (6 meters) below the footprint surface. A second configuration 15 consists of a large earthen berm enclosing the footprint perimeter. The large monoliths are 16 arranged just inside the berm along the footprint perimeter. The locations of the Information 17 Center and the storage rooms are geographically similar to the trefoil concept with small 18 warning markers buried throughout the footprint surface. The third concept includes several 19 large earthen berm-like structures arranged in a pattern intended to convey a menacing 20 appearance. The structures "radiate" out from the footprint perimeter as outlined by the 21 monoliths. The four corner sections are significantly larger than the other sections. Within 22 each corner section is buried a storage room. The Information Center is located at the 23 footprint center. Again, the small warning markers are buried throughout the footprint surface 24 area. 25 26 The two fundamental aspects of post-closure passive institutional controls will be markers and 27 archived records. Markers include monuments and earthworks whereas records involve long-28 term storage of information. Both of these aspects are discussed in greater detail in the 29 following sections. 30 31 Markers. Two groups of experts were established to examine the issues involved with 32 selecting, designing, and implementing an effective system of permanent markers. Hora et al. 33 (1991) is a report by the Futures Panel (FP) discussing the "underlying physical and societal 34 factors that would influence society and the likely modes of human-intrusion at the WIPP." 35 The FP members also developed probabilities of various alternative futures, of inadvertent 36 human intrusion, and in some cases, of particular modes of intrusion. 37 38 The Hora et al. report was an important reference and source of information for the 39 preparation of Trauth et al. (1993). Trauth et al. (1993) reports the results of the Markers 40 Panel (MP), which considered various concepts of marking the site and conveying to future 41 generations information regarding the presence of dangerous waste material and the potential 42 consequence of intrusion into the waste repository. The MP made estimates of the probability 43 that components of the marker system would survive and that various future societies would 44 comprehend the messages as a function of time. The resulting Permanent Marker Conceptual 45 Design Report (Appendix PMR) is an expansion of the ideas developed by the MP.
DRAFT-DOE/CAO-2056 7-17 March 31,1995

Draft 40 CFR 191 Compliance Certification Application
1 The Permanent Marker Conceptual Design Report (Appendix PMR) sets forth the permanent 2 markers system for the WIPP facility. This system involves the use of surface monuments, 3 small subsurface warning markers, and large earthen structures marking the WIPP repository 4 footprint on the surface. 5 6 The surface monuments are large monoliths erected on the surface. Small warning markers 7 will be buried throughout the repository footprint. To facilitate fabrication and shipping of the 8 monoliths, each monolith will consist of two separate stones connected by a tendon joint. The 9 large monoliths will be engraved with Level II and m messages as described in Appendix
10 PMR. Figure V-l of Appendix PMR provides the dimensional characteristics of the large 11 monoliths. Each monolith will be inscribed with the Level II and HI messages in seven 12 languages, the six official United Nations languages (English, French, Spanish, Chinese, 13 Russian, and Arabic) and Navajo. Trauth et al. (1993) discusses in some detail the selection 14 of these languages by the MP. The Navaho language was chosen because it represents the 15 language of a much larger population of Native Americans indigenous to the Southwest than 16 does the Apache language. 17 18 It is not necessary to specifically inscribe Level I messages. Such messages are conveyed by 19 the physical form of the marker system and the effort expended in constructing it. In addition, 20 each monolith will be inscribed with a diagram (Figures IV-2 and IV-4 of Appendix PMR) 21 depicting two concepts. The first concept is comprised of four frames illustrating the danger 22 of digging or drilling into the repository and releasing the radioactive and toxic waste. The 23 second concept illustrates the decay of the radioactive material (decreasing size of the trefoil 24 and improving disposition of the icon) over many thousands of years by depicting the 25 precession of the earth's north pole through the major constellations (Ursa Minor, Ursa Major, 26 Draco, and Cygnus) and the bright star, Vega. 27 28 The monoliths will be quarried from granite or other dimensional stone and shipped by rail to 29 the WIPP site. Monolith locations will be excavated to at least 5 feet (1.5 meters) into the 30 caliche. After emplacing the base monolith, the upper monolith will be placed over the base 31 tendon and the excavation will be backfilled. This will provide for suitably supporting the 32 base monolith within the caliche deposit or the Gatufia Formation even under conditions in 33 which the overlying layer of sand is removed through erosion or other weathering phenomena. 34 35 The small warning marker is shown in Figure V-2 of Appendix PMR. The Level II message 36 placed on the small subsurface warning markers will also be in the seven languages listed 37 above. However, each marker will have the message in only one of the seven languages. 38 Warning markers will be placed throughout the repository footprint and within the berrn. The 39 warning markers will be made of a diversity of materials and thus improve the likelihood that 40 at least some of the markers will endure for a 10,000-year period. 41 42 The small buried warning markers will be spaced to provide a reasonable expectation of their 43 discovery by any organized effort to explore at depths of the repository footprint; however, 44 they will be buried at a depth below that which would be encountered from deep plowing and 45 the protocol governing amateur archaeologists in New Mexico, but above the caliche. Based
March 31,1995 7-18 DRAFT-DOE/CAO-2056

Draft 40 CFR191 Compliance Certification Application
1 on discussions with local drilling operators, the standard procedure for a drilling crew to 2 follow is to remove the surface soil down to the caliche layer over an area sufficiently large to 3 set up the drilling rig and a mud pit. Nominally this area is 50,000 square feet (4,648 square 4 meters). By placing the small warning markers above the caliche at intervals of a few feet, 5 several of the warning markers should be unearthed during the soil clearing operation. This 6 provides a reasonable likelihood that at least one of the warning markers would be discovered 7 by a drilling crew. 8 9 The inclusion of a berm or berm-like structure in the permanent marker design is based upon
10 the following arguments (see Appendix PMR for more detail): 11 12 • The surface footprint of the repository should be essentially outlined by some enduring 13 structure 14 • The structure should be sufficiently massive to provide reasonable assurance that it will 15 endure for 10,000 years 16 • The structure's profile should niinimize the likelihood that it can become buried by 17 shifting sands or that characteristics of the profile may lead to fabrication stresses affecting 18 the ability of the structure to retain its configuration 19 • It should be constructable without the need for high-tech equipment or processes 20 • Its construction materials should be reasonably available to the WIPP site and have little 21 intrinsic value 22 • Its cost should be competitive with other alternatives, i.e., its cost should not be 23 disproportionately high for the advantages it provides 24 • To the extent practicable, the nature of the structure should lend itself to testing over a 25 period of 2-5 decades. 26 27 A berm-like configuration is proposed to be used to define the repository footprint. A berm 28 satisfies the criteria listed above to a greater extent than any of the other configurations 29 proposed. Each of the conceptual design configurations described below makes use of a berm 30 configuration. Although the individual configurations may have an outwardly different 31 appearance, their construction consists of similar materials and material placement. Figure 32 Vffl-1 of Appendix PMR depicts the general cross-sectional berm construction configuration. 33 The core base material to be used is salt remaining from the excavation of the repository. The 34 design capacity of the repository of 6,200,000 cubic feet (175,600 cubic meters) of waste will 35 provide a significant amount of mined salt remaining after closure. The salt is proposed to be 36 used to form the core of the berm(s). Although the salt would be susceptible to water and 37 wind erosion, using it as a base core material with other material applied over the salt will 38 effectively protect the salt. 39 40 A practical and locally available protective covering for the salt core is the caliche soil found 41 locally up to 15 feet (4.6 meters) below the surface. Large quantities are available. The 42 caliche is reasonably impervious to water penetration in the semiarid environment of the 43 WIPP. Studies of the locale report that even at the height of an ice age, the annual rainfall is 44 not expected to more than double its current 13 inches (33 centimeters) per year average 45 (DOE 1980).
DRAFT-DOE/CAO-2056 7-19 March 31,1995

Draft 40 CFR191 Compliance CertiOcation Application
1 A third layer of berm material will be comprised of riprap quarried near Carlsbad, New 2 Mexico. This will provide protection for the caliche from wind erosion. It will also provide 3 for runoff of rainwater to the surrounding desert without water erosion of the caliche layer. 4 The final layer of berm material will consist of a mixture of riprap and native soil. This 5 should support local vegetation and add another erosion-resistant characteristic to the overall 6 berm configuration. 7 8 During the disposal phase of the WIPP, testing will be conducted to determine what 9 combination of rock sizes, soil types, and vegetation provide the best likelihood of success, at
10 least in the near term (100 years). This will include evaluations of the optimal thicknesses of 11 the various materials used to construct the berms. 12 13 To provide a distinctive magnetic signature for the berm, large permanent magnets buried in 14 the berm can be used. Large strontium ferrite permanent magnets buried within the berm at 15 intervals of 246-328 feet (75-100 meters) would give a signal detectable with current state-16 of-the-art airborne equipment 328 feet (100 meters) above the magnets. The individual 17 magnets would be approximately 3.3 feet (1 meter) in length and 1.5 foot-by-1.5 foot, 18 (0.5 meter-by-0.5 meter) in cross-section. Should future climatic conditions cause sand shifts 19 so extensive that the berm and monoliths become covered (which is not expected), future 20 generations conducting magnetic surveys of the area should still be able to detect a magnetic 21 anomaly resulting from the permanent magnets. The magnetic signal's geometric form will 22 provide strong indication that it could only have been man-made. This should inspire any 23 organization capable of magnetic surveying to investigate this anomaly further prior to 24 initiating any planned drilling activities in the local area enclosed by the magnetic signature. 25 26 Bellus and Eckeman (1994) provides a description of the use of trihedrals fabricated from 27 metal as a means of providing a radar reflective signature unique from the surrounding terrain. 28 Figure VIII-2 of Appendix PMR illustrates the basic trihedral configuration. Current ground-29 penetrating radars operate below 100 megahertz. Much of the communication allocations 30 occupy frequencies below 100 megahertz; therefore, radars operating below this range must 31 use filters to avoid problems with communications bands. Bellus and Eckeman report that 32 recent experience in the Middle East with SeaSat operating at 1.2 gigahertz produced 33 excellent images of roads and structures buried under the desert. 34 35 The dimensional characteristics of a trihedral facet that will give a peak Radar Cross-Section 36 (RCS) are three times the wavelength of the incident radar signal. Assuming a radar operating 37 at 1 gigahertz, a trihedral with facets measuring 3 feet (0.9 meters) on a side will be optimal. 38 This according to Bellus and Eckeman (1994) will provide a peak RCS of 17 decibels per 39 square meter per square meter. The typical peak terrain RCS is -15 decibels per square meter 40 per square meter. The difference in RCS strength operating at 1 gigahertz is 32 decibels per 41 square meter per square meter. This will give a highly visible signal. The trihedrals will be 42 fabricated from stainless steel and placed within the berm at the surface of the salt core. To 43 provide a unique radar signature, the trihedrals will be grouped in sets of four spaced 44 approximately every 300 feet (91 meters) around in the berm as shown in Figure VDI-3 of 45 Appendix PMR. In addition, four trihedrals will be placed around each of the buried rooms to
March 31, 1995 7-20 DRAFT-DOE/CAO-2056
Draft 40 CFR191 Compliance Certification Application
1 provide a unique radar signature at the room location. One trihedral will be placed adjacent to 2 each room exterior wall approximately midway along the wall. During the testing period 3 conducted throughout the disposal phase and for some period after decommissidning, buried 4 bare stainless steel trihedrals and trihedrals encased in concrete should be evaluated for 5 performance of their respective RCS. Encasing the trihedral in concrete reduces the 6 likelihood of its being efficiently salvaged and also may add to the effective lifetime of the 7 trihedral by the protective concrete covering. 8 9 Records. The Permanent Marker Conceptual Design Report (Appendix PMR) sets forth the
10 post-closure records management system for the WIPP facility. The post-closure records 11 management system that will be implemented to preserve information on the WIPP facility 12 involves the use of on-site rooms for long-term storage of messages and archival storage of 13 WIPP information off site. 14 15 The on-site room or rooms for containing the Level IV message and associated diagrams will 16 be designed to endure for the 10,000-year period of the permanent marker system. The 17 design characteristics contributing to this longevity are the material and environmental 18 conditions associated with construction and location. The room or rooms will be made of 19 granite with a minimum number of joints. Individual walls, the floor, and the roof will be 20 comprised of single granite slabs joined only at the perimeter locations. The internal walls 21 will each be made of three sections to provide redundancy of the information provided. 22 Figure VI-1 of Appendix PMR is an isometric view of the planned buried storage room 23 containing the Level IV message. The magnets shown in the figure are to permit locating the 24 rooms magnetically. Figures VI-2 through VI-4 of Appendix PMR show views of the 25 building from the top, the side, and the end. They include overall dimensional characteristics. 26 The configuration minimizes the risk of failure due to chemical interactions between the 27 construction material, the joining materials, and the environment. 28 29 In each of the conceptual design configurations, at least one room is buried. In addition, the 30 Information Center will be located on the surface providing access to the information 31 contained in the buried rooms. This should limit the incentive to excavate the buried rooms 32 by future generations. Details regarding the location of the buried storage rooms containing 33 identical information will be in the Information Center. It is anticipated that distribution of 34 archival information regarding the WIPP site in local, state, federal, and international 35 repositories will also preclude the need for future generations to excavate and enter any of the 36 buried rooms for a significant number of years. If, through societal changes, calamities, or 37 loss of the archival information, society cannot determine what the buried room(s) contain, 38 then it is assumed that at least one of the rooms will be entered and observed. If a decision is 39 made to construct the permanent marker system immediately after closure of the WIPP, active 40 controls established and funded by the U.S. Government should preclude entry into any of the 41 buried rooms for at least 100 years. A delay in construction of the permanent marker system 42 may present a potential risk of the disturbance of the buried rooms. However, a significant 43 effort will be required to fully excavate the rooms, and even occasional surveillance by local 44 law enforcement personnel should thwart any significant damage to the rooms by vandalism 45 or souvenir hunters.
DRAFT-DOE/CAO-2056 7-21 March 31,1995

Draft 40 CFR191 Compliance Certification Application
1 The message texts contained within the buried rooms are to be engraved on the walls in the 2 arrangement similar to that for the Information Center shown in Figure VTI-1 of Appendix 3 PMR. To provide redundancy, additional granite slabs engraved with the message text and 4 the diagrams are held in place against the interior v/alls. The room entrance is a single plug in 5 one wall. The tapered plug weighs approximately 1,600 pounds (727 kilograms). Its removal 6 will require the efforts of more than a single individual in all likelihood. The opening is small 7 so that the room contents cannot be removed easily by an unorganized group or individuals 8 intent on vandalism. Although some damage could be inflicted by vandals, the granite 9 composition of the message carrying materials provides the greatest opportunity for
10 preventing complete destruction of the information contained within the buried room. 11 12 A significant part of the overall system is the archiving of important information remote from 13 the repository. The archived material will include information that is important to defining 14 the location, design, content, and hazards associated with the WIPP. The amount of 15 information will be more extensive than that available within the permanent marker system at 16 the repository footprint location. The information, however, will be widely distributed in a 17 number of locations, including some locations worldwide. 18 19 The initial form of the information should be on archival quality paper and high-quality 20 microfilm. Jensen (1993) describes a specification which prescribes that the archival quality 21 paper contain fibers from cotton, linen, and/or bleached chemical pulp with any other type 22 pulp making up less than 5 percent of the fiber content. In addition the pH is specified as 23 7.5-10 with a minimum 2 percent calcium carbonate alkaline reserve. Microfilm 24 specifications will be consistent with those recommended by recognized authorities such as 25 the National Archives. 26 27 Specific documents which will be included in the archived information portfolio include: 28 29 • Detailed maps describing the exact location of the repository 30 • The FS AR and the addenda which describes the disposal phase of the WIPP 31 • The FEIS for WIPP and the Supplement(s) to the Environmental Impact Statement 32 • The No-Migration Variance Petition and the No-Migration Determination for Disposal 33 • The RCRA Permit 34 • The Certification of Compliance with 40 CFR Part 191 and associated application 35 • Environmental and ecological background data collected during the preoperational phase 36 of WIPP and summaries of data collected during the disposal and decommissioning 37 phases of WIPP 38 • Records of the waste containers' contents and disposal locations within the WIPP 39 repository 40 • Drawings defining the construction and configuration of the repository and shafts 41 • Drawings, procedures, and the design report(s) describing how the waste was emplaced; 42 how the repository was decommissioned, closed and sealed; and how the shafts were 43 backfilled and sealed. 44 45
March 31,1995 7-22 DRAFT-DOE/CAO-2056

Draft 40 CFR191 Compliance Certification Application
1 2 3 4 5 6 7 8 9
10 11 12 13 14 15 16 17 18 19 20 21 22 23 24 25 26 27 28 29 30 31 32 33 34 35 36 37 38 39 40 41 42 43 44
The organization identified as the recordholder responsible for the permanent storage of this information is the National Archives. In addition, other locations for this information will include publicly funded organizations which may expend the resources necessary to preserve the documents in well-controlled environments. However, the most likely strategy for long-term protection of the information is through widespread distribution. The information will be submitted to the following facilities and organizations for archiving:
Library of Congress Within the states of New Mexico and Texas - The state archives - The state library - The city libraries of population centers exceeding 15,000 within 150 miles of Carlsbad The state libraries of the remaining 48 states The local office of the Bureau of Land Management The local office of the Bureau of Mines The local office of the Bureau of Reclamation The national library and national archives of the nations worldwide which possess nuclear weapons and/or operate nuclear power generating plants The archive of the United Nations The national archive and libraries of the signatory nations to the nuclear non-proliferation treaty The U.S. Nuclear Regulatory Commission The 53 federal regional depository libraries The American Nuclear Society.
This list of receiving organizations will be reviewed and expanded, as appropriate, as the time of the actual transfer of the information approaches.
Location and hazards information will be submitted to various federal and state of New Mexico mapping agencies to ensure that the WIPP location and drilling or mining restrictions are identified on widely distributed maps used by almost all public and private organizations. These agencies include:
BLM U.S. Geological Survey Library of Congress National Archives and Records Service Defense Mapping Agency International Boundary Commission Federal Highway Administration New Mexico State Highway Department Planning and Research Division, Cartography Section.
DRAFT-DOE/CAO-2056 7-23 March 31,1995

Draft 40 CFR191 Compliance Certification Application
43 44
The American Congress on Surveying and Mapping The American Society of Cartographers The Commission for the Geological Map of the World The International Cartographic Association The American Geographical Society The Association of American Geographers The International Geographical Union The Society of Women Geographers The American Geological Institute The American Geophysical Union The American Society of Professional Geographers The National Geographic Society The Federal Aviation Administration.
1 To ensure widespread location information of the WIPP site and the hazards associated with 2 the emplaced waste, detailed maps and descriptions of the hazardous material will be sent to 3 national and international professional societies of cartographers and geographers. Weitzberg 4 (1982) suggests the following organizations and societies receive this location and hazards 5 information: 6 7 8 9
10 11 12 13 14 15 16 17 18 19 20 21 Step 2 - Development of a Passive Institutional Control Implementation Plan 22 23 Once the appropriate passive institutional controls have been defined, a strategy will be 24 prepared that includes final design, construction, and implementation. The strategy will 25 identify site-specific information needs and approaches to obtaining needed technical and non-26 technical information. 27 28 There are some passive institutional control activities that can be implemented prior to the end 29 of operations. For example, once wastes are permanently placed in the repository, appropriate 30 notations can be made in land records. 31 32 Step 3 - Design and Implementation of Predecommissioning Passive Controls 33 34 Predecommissioning passive controls, such as land records, will be implemented and 35 evaluated to the extent possible. For example, the effectiveness of DOE's land management 36 plans will be assessed periodically to assure only acceptable land use is in effect. 37 38 Step 4 - Implementation of Programs to Collect Needed Information 39 40 Programs may be necessary to support implementation of passive institutional control 41 activities with site-specific information. These program needs will be identified during the 42 development of a passive institutional control implementation strategy Step 2.
March 31, 1995 7-24 DRAFT-DOE/CAO-2056

Draft 40 CFR191 Compliance Certification Application
1 Planned Evaluations. Upon closure of the W I P P at the conclusion of the Disposal Phase, 2 active controls will be implemented to control access to the site. In addition, monitor ing 3 systems will b e managed to detect significant deviations in repository performance. Wi th 4 active control provided over the site, the schedule for construction of the permanent marker 5 system is a management option which could be extended for decades. In that the design of the 6 permanent marker system has a 10,000-year lifetime goal, it is prudent that the D O E conduct 7 some testing of the construction materials planned for use as permanent marker material . 8 9 Berms. One aspect of the testing is the construction of a section of the berm. The overall size
10 (height and width) of the test section of the be rm will match the design of the permanent 11 marker berm. However , the test be rm length will be shorter than the full-sized berm. A 12 section approximately 164-328 feet ( 50 -100 meters) long will be sufficient to test a number 13 of different configurations. Included within the test section will b e varying thicknesses of the 14 salt core, the caliche layer, and the top layer of riprap and soil material. The D O E will 15 construct a section of the be rm for the purpose of evaluating materials and construction 16 techniques. Actual construction and testing will be initiated during the Disposal Phase to 17 provide sufficient t ime for testing. 18 19 The major subjects to be addressed during this testing program are as follows: 20 21 • Evaluating a system for unloading and moving large quantities of material from the 22 railroad spur to the permanent marker site 23 • Assessing the performance and required maintenance of the railroad spur—this may 24 impact a decision of whether to conduct periodic maintenance of the spur or refurbish it 25 when constructing the permanent marker system 26 • Surveying representative monuments within a 150-mile (240-kilometer) radius of the 27 W I P P to more extensively evaluate the climatic environmental affects on granite 28 • Identifying a suitable local source of caliche and establishing the required contractual and 29 regulatory agreements to obtain and move the caliche in the quantities required 30 • Identifying a suitable local source of riprap and establishing the required contractual and 31 regulatory agreements to obtain and move the riprap in the quantities required 32 • Determining what, if any, configuration changes may have significant impacts on the cost 33 of constructing the large be rm 34 • Evaluat ing various be rm surface materials (e.g., size of rocks, types of soil, types of 35 vegetation) for durability, resistance to animal burrowing, and success in supporting 36 vegetation overgrowth. 37 38 Monuments. Another aspect of passive controls to be evaluated during testing is monuments . 39 T h e major considerations that will b e evaluated include the following: tt) ll • Procuring, shipping, erecting test monuments , and evaluating long-term environmental M effects of wind, rain, and shifting sand for various types of dimensional stone 13 • Evaluat ing the magnet ic signature provided by sample permanent magnets buried within H the be rm to determine opt imum locations and spacing *5
DRAFT-DOE/CAO-2056 7-25 March 31,1995

Draft 40 CFR 191 Compliance Certification Application
1 • Evaluating the affects of various soils used as protective backfill for dimensional stone 2 • Evaluating the effects of chemical interaction with the backfill material 3 • Evaluating the environmental effects on the berm caused by wind, rain, and shifting sand 4 • Evaluating the effects of plant root intrusion into the berm and potential for salt 5 dissolution and berm slumping 6 • Evaluating the effectiveness of sample radar reflectors buried within the berm at various 7 distances 8 • Developing cost estimates for various options of configurations and materials tested. 9
10 Messages. Messages will also need to be evaluated during the testing program. The primary 11 aspects of the messages program to be evaluated include the following: 12 13 • Evaluation of message text by presenting it to groups indigenous to the countries whose 14 language is represented in the message 15 • Evaluation of message text by presenting it to linguists to assess the likelihood that the 16 messages will continue to be understood through time. 17 18 Step 5 - Design of Post-Decommissioning Passive Institutional Controls 19 20 This activity will use results derived from information gathering programs in Step 4 to make 21 final decisions on passive institutional control measures. Passive control implementation 22 plans will be included as a portion of the WIPP long-term protection strategy and will include 23 maintaining federal ownership, markers and monuments, surface modifications and controls, 24 permanent written records, legal records, and land use identification and restriction. 25 26 Step 6 - Implementation of Post-Decommissioning Passive Institutional Controls 27 28 The final step involves constructing and installing the post-decommissioning passive 29 institutional control measures. Additionally, a system for reviewing and approving the 30 markers and other passive measures would be established. 31 32 7.4 Multiple Barriers 33 34 Section 194.44 of the proposed 40 CFR Part 194 addresses the use of barriers. In particular it 35 addresses the use of engineered barriers and imposes additional requirements. It requires that 36 the DOE perform cost-versus-benefit evaluations of potential barriers and dictates the manner 37 in which these evaluations are performed. If the rule is promulgated as proposed, this section 38 will be revised as necessary to reflect the new requirements. 39 40 Section 8(g) of the LWA addresses waste form modifications and the use of natural and 41 engineered barriers. The DOE interprets the term "natural barriers" to include the salt 42 formation, its favorable characteristics, and the geohydrologic setting. Engineered barriers 43 include, for example, the repository, closure systems, and seals that serve to substantially 44 delay the movement of contaminants to the accessible environment. 45
March 31, 1995 7-26 DRAFT-DOE/CAO-2056

Draft 40 CFR 191 Compliance Certification Application
1 The WIPP facility will incorporate multiple engineered barriers, including plugs, seals, and, if 2 appropriate, backfill. The DOE has recently determined that salt backfill emplaced during 3 disposal operations for the purposes of filling voids or mitigating fires is not needed and has 4 deleted this material from the base facility design. In the event that a function is identified for 5 a material around the waste (such as a gas getter, sorbent material, or a pH buffer), the 6 specification and development of this material as an engineered alternative will be subjected 7 to a design development process in which the specific performance criteria are determined and 8 material characteristics are engineered to meet these criteria. As a part of the WIPP's 9 incorporation of multiple barriers, an Engineered Alternatives Task Force (EATF) evaluated
10 optional additional engineering measures for the WIPP facility. The findings of the task force 11 are summarized in the Evaluation of the Effectiveness and Feasibility of the Waste Isolation 12 Pilot Plant Engineered Alternatives, July 1991. The DOE is conducting another review of 13 engineered alternatives, including engineered barriers, as the result of an agreement between 14 the DOE and the EPA. Not all engineered alternatives meet the definition of an engineered 15 barrier, although many do. The review will update the EATF activity and augment it with 16 more in-depth and comprehensive analyses of the relative benefits and detriments of the 17 alternatives. Benefits and detriments at the waste generation and storage sites will be 18 evaluated as well as those at the WIPP. Guidance regarding this study as provided by the EPA 19 in its proposed rule, 40 CFR Part 194, will be followed. This evaluation is due for completion 20 in late 1995; results of the study are planned to be included in the final compliance package. 21 22 7.4.1 Multiple Barrier Requirements 23 24 By requiring the use of both engineered and natural barrier types as an assurance requirement, 25 the EPA intends to ensure that the impacts of the failure of any one barrier type will be 26 minimized. 27 28 Requirements for multiple barriers are as follows: 29 30 • The EPA requires that both engineered and natural barriers be used (40 CFR Part 191). 31 Barriers are designed to impede the movement of radionuclides into the accessible 32 environment. 33 34 • The LWA states that "the Secretary shall use both engineered and natural barriers, and 35 waste form modifications, at WIPP to isolate transuranic waste after disposal to the extent 36 necessary to comply with the final disposal regulations." The DOE interprets this to mean 37 that implementation of any combination of engineered and natural barriers and waste form 38 modifications necessary for containment will be sufficient to comply with this requirement. 39 40 • In the second modification to the Consultation and Cooperation Agreement with the State 41 of New Mexico (DOE 1987), the DOE commits to the use of both engineered and natural 42 barriers. In particular, it states on page 5 that "the barriers shall include, as a minimum, 43 properly designed backfill, plugs and seals in the drifts and at the entries to the panels, and 44 plugs and seals in the shafts and boreholes." 45
DRAFT-DOE/CAO-2056 7-27 March 31,1995
Draft 40 CFR 191 Compliance Certification Application
1 7.4.2 Objectives of Multiple Barriers 2 3 The primary objective for the implementation of multiple barriers at the WIPP facility is to 4 provide a disposal system that isolates the radioactive wastes to the levels required by 5 40 CFR Part 191. This is being accomplished by a design that includes multiple types of 6 barriers. Current research and development programs being conducted by Sandia National 7 Laboratories (SNL) are supporting this design effort. 8 9 7.4.3 Multiple Barrier Implementation
10 11 The baseline design for the WIPP facility includes the concept of multiple barriers for 12 isolation and containment of mixed TRU waste. Barriers considered include natural barriers 13 (hydrological, geological, and geochemical conditions), engineered alternatives barriers (plugs 14 and repository seals), and, if needed, additional engineered barriers such as waste packaging 15 and waste form modifications. The effectiveness of these barriers is being modeled by the 16 performance assessment to demonstrate the ability of the system to meet the EPA standards. 17 18 7.4.4 Multiple Barrier Review and Oversight 19 20 Oversight and review of the WIPP engineered barriers will continue to be performed by the 21 NMED, the EEG, and the NAS. In accordance with the LWA, the EPA will review WIPP 22 engineered barriers as part of its certification of compliance with the standards. 23 24 7.5 Resource Characteristics Evaluations 25 26 The EPA specifies that locations containing recoverable resources should not be used unless it 27 can be shown that the favorable characteristics of the location compensate for the greater 28 likelihood of being disturbed in the future. At the WIPP site, the intent of this assurance 29 requirement was met during site screening and selection. The DOE has issued a finding 30 (Appendix IRD) that the decision-making process adequately considered the likelihood of the 31 location being disturbed in the future for resources. The results of this finding are discussed 32 below. 33 34 7.5.1 Resource Consideration Requirements 35 36 The EPA discourages the location of repositories in areas in which valuable natural resources 37 are present. 38 39 The purpose of the requirement is to provide assurance that site selection actions further 40 reduce the likelihood of future intrusion into the repository by preferring those sites without 41 currently recognized resources. Sites containing resources are acceptable provided the 42 potentially favorable characteristics of the site outweigh any increased risks. 43 44
March 31, 1995 7-28 DRAFT-DOE/CAO-2056
Draft 40 CFR 191 Compliance Certification Application
l 7.5.2 Objectives of Resource Considerations 2 3 The WIPP site selection occurred prior to promulgation of the standards. Resource 4 considerations were included in the site selection process for the WIPP and are documented in 5 the WIPP FEIS. The objective of the program for demonstrating compliance with the 6 resource considerations requirement is to document the rationale used in the decision-making 7 process. 8 9 7.5.3 Resource Consideration Implementation
10 11 The WIPP site was selected prior to promulgation of the standard. Resource considerations 12 were, however, included in the site selection process for the WIPP and are documented in the 13 WIPP FEIS (DOE 1980). The FEIS describes a four-step decision-making process that was 14 applied to siting the repository. This process is summarized below: 15 16 • Step 1 - Bedded salt was selected as the most promising geologic medium, and geographic 17 regions that contain extensive bedded salt formations were identified. This was 18 accomplished by gathering and evaluating existing information concerning rock types and 19 their geographic distribution. Desirable criteria were identified and the most favorable 20 regions were identified. 21 22 • Step 2 - A literature review was performed to narrow the number of regions identified in 23 Step 1. Once a region was selected, candidate sites within the region were chosen. 24 Selection criteria were used to compare the sites. Those sites which satisfied the most 25 criteria were selected for further evaluation. Resource-conflict considerations were 26 applied on a broad scale at this stage of the process. 27 28 • Step 3 - The candidate sites identified in Step 2 were subjected to further investigations 29 covering geology, hydrology, archaeology, demography, and biological resources. The 30 results of all the site evaluations were compared, and the site that best met the selection 31 criteria was selected for additional site characterization. At this stage, the types and 32 quantities of natural resources present at the site were considered in detail. 33 34 • Step 4 - In this final step, a detailed system analysis was performed. This analysis 35 addressed the specific geologic environment, the waste forms, the disposal facility design, 36 and the potential failure modes in respect to radiation safety and environmental impact. 37 38 The rationale for selecting the WIPP site is further documented in a summary report titled 39 Implementation of the Resource Disincentive in 40 CFR Part 191.14(e) at the Waste Isolation 40 Pilot Plant (DOE 1993a). This report, which is included as Appendix IRD, documents that 41 the presence of resources has been considered in major project decisions. 42 43
DRAFT-DOE/CAO-2056 7-29 March 31,1995

Draft 40 CFR 191 Compliance Certification Application
1 Analysis of the performance of the repository is underway to determine what measures (such 2 as engineered alternatives, additional experiments, or waste restrictions), if any, are required 3 to assure that the WIPP will comply with the 40 CFR Part 191 containment requirements, 4 even in the event that inadvertent intrusion into the repository occurs. The results of these 5 analyses will be discussed in the final compliance documentation. 6 7 7.5.4 Resource Considerations Review and Oversight 8 9 The resource considerations report was issued in September 1991 and distributed to the EEG,
10 the EPA, and the NMED. Comments have been addressed and DOE issued a revised report in 11 February 1993. The final report is included in Appendix IRD. 12 13 7.6 Waste Removal 14 15 Assurance is required that it will be technologically feasible to locate and recover the waste 16 for a reasonable period of time after disposal. In promulgating the standards, the EPA stated 17 that "any current concept for a mined geologic repository meets this requirement without any 18 additional procedures or design features" (EPA 1985, p. 38082, emphasis added). 19 20 The WIPP facility is a mined repository. No additional actions other than documentation to 21 meet this assurance requirement are considered necessary. The rationale for this assurance 22 requirement is to preclude use of some disposal technologies that would not permit future 23 generations to recover the wastes should they decide to do so. Recovery need not be easy or 24 inexpensive, but only possible. 25 26 7.6.1 Waste Removal Implementation 27 28 "To meet this assurance requirement, it only need be technologically feasible (assuming 29 current technology levels) to be able to mine the sealed repository and recover the 30 waste—albeit at substantial cost and occupational risk" (EPA 1985). To illustrate that waste 31 removal is feasible, Appendix WRAC describes a system using available mining technologies. 32 33 After determining the existing repository condition, the mining and waste removal operations 34 will be designed to minimize the amount of contamination and exposure to allow limited 35 human access for assessments, equipment retrieval, and repairs. All operations will be 36 designed to reduce or eliminate human involvement. Any radiological work will be 37 performed using standard industry practices and approved procedures. 38 39 Mining operations will use standard equipment to sink the shafts and excavate the drifts and 40 support rooms. Smaller scale mining equipment will be used to perform the removal. Minor 41 modifications to the equipment will enable the vehicles and support equipment to be remotely 42 controlled and handle the waste material not usually associated with mining activities. 43 44
March 31, 1995 7-30 DRAFT-DOE/CAO-2056

Draft 40 CFR191 Compliance Certification Application
1 Sampling will be implemented to ensure that the contact-handled (CH) and remote-handled 2 (RH) wastes are still segregated from one another sufficiently to allow separate removal. If 3 commingling has occurred, then it may be necessary to manage all of the waste as RH. If 4 wastes are not commingled, RH and CH wastes will be retrieved in separate operations. 5 6 The removal concept is composed of the following five phases: 7 8 • Phase 1 - Planning and permitting 9 • Phase 2 - Initial above ground setup and shaft sinking
10 • Phase 3 - Underground excavation and facility setup: setup of underground ventilation, 11 radiation control, packaging areas, decontamination areas, maintenance, remote control 12 center, and personnel support rooms 13 • Phase 4 - Waste location and removal operations: mining waste removal, packaging, 14 package surveying and decontamination, transportation to surface, staging for off-site 15 transportation, and off-site transportation 16 • Phase 5 - Closure: D&D of the facility. 17 18 Each of the five phases is summarized below and described in detail in Appendix WRAC. 19 20 Removal of the waste after the repository is sealed is possible. Since the repository was 21 initially mined to provide the repository rooms, access to the waste can be accomplished using 22 the same mining technologies. Location and removal is also possible using the same 23 equipment modified to operate remotely. The requirement to remove most of the waste 24 eliminates the need to prove that all waste residues have been removed. Packaging the 25 removed waste and decontamination of the containers can be accomplished with standard 26 automation techniques. 27 28 Phase 1 - Planning and Permitting (P&P) 29 30 The need to remove waste would initiate the P&P phase. Permitting requirements will be 31 based on governing regulations at the time removal is authorized. The P&P program will 32 identify all permits and research the available technologies at that time to determine the 33 appropriate removal techniques and the waste and repository conditions. After initial research 34 is completed, a plan will be drafted to itemize and schedule all removal activities. 35 36 Phase 2 - Initial Above Ground Setup and Shaft Sinking 37 38 Aboveground support buildings will be required to house the exhaust fans and filters, 39 administration, maintenance support facilities, control center waste staging and 40 decontamination areas, and warehouse (containers). 41 42 A shielded area will be required to handle and store the RH transuranic (TRU) containers and 43 casks prior to off-site shipment. Shafts will be appropriately located and sunk. 44 45
DRAFT-DOE/CAO-2056 7-31 March 31,1995

Draft 40 CFR191 Compliance Certification Application
l Phase 3 - Underground Excavation and Facility Setup 2 3 After the shafts are completed, drifts will be run and ventilation paths will be established 4 using air control regulators. Support rooms will be excavated for maintenance, control rooms, 5 and packaging areas. Air locks will be constructed to isolate the clean areas from the 6 contaminated areas. All equipment required for removal, packaging, and all related support 7 equipment will be installed. 8 9 Excavation will be in two phases. Initial excavation will not contact waste but will mine
10 support rooms and haulage drifts that provide ventilation and access to the waste panels. The 11 second phase will remove the waste. 12 13 Phase 4 - Waste Location and Removal Operations 14 15 The CH TRU and RH TRU waste removal will be performed in separate operations. The CH 16 TRU waste will be removed by mining the area where this waste was emplaced. The CH 17 TRU waste and all surrounding rock will be removed and transported to the packaging areas 18 without disturbing the RH TRU waste. The CH TRU waste can be removed many ways using 19 standard equipment. Appendix WRAC contains a brief description and feasibility of using 20 various mining techniques for waste removal. 21 22 The RH TRU waste will be removed by excavating the rock salt around the waste and 23 removing it in as intact condition as possible. This waste may be placed in a waste container 24 at the work place and then transported to the packaging area. The RH TRU waste will be 25 removed after the CH TRU waste is excavated. Equipment will be set up to remove and 26 excavate the materials around the waste. Waste will be loaded into a container and moved to 27 the packaging area. The container may be decontaminated at the packaging area, if possible, 28 or overpacked prior to shipment above ground. After decontamination is completed, the RH 29 TRU waste is transported to the surface and is warehoused in a shielded area prior to off-site 30 shipping. Radiation surveying and decontamination procedures will be similar to the CH 31 TRU operations. 32 33 Phase 5 - Closure 34 35 After waste is removed from the repository, the facility will be decommissioned per the 36 current regulations at that time. 37 38 7.6.2 Waste Removal Review and Oversight 39 40 The WIPP is a mined geologic repository and, as such, meets the requirement without any 41 additional design requirements since current technology can be used to retrieve the waste if 42 the need arises. Proposed 40 CFR § 194.46 requires DOE to submit a plan for removal of 43 waste. A plan is not included in this draft application. 44
March 31,1995 7-32 DRAFT-DOE/CAO-2056

Draft 40 CFR191 Compliance Certification Application
1 REFERENCES 2 3 Bellus, P. A., and Eckerman, J. 1994. Airborhe or Spaceborne Surveillance Radar Detection 4 ofWIPPSite. 5 6 DOE (U.S. Department of Energy). 1980. Final Environmental Impact Statement, Waste 7 Isolation Pilot Plant. DOE/EIS-0026. Vols. 1 and 2. Office of Environmental Restoration 8 and Waste Management, Washington, D.C. 9
10 DOE (U.S. Department of Energy). 1981. "Agreement for Consultation and Cooperation" on 11 WIPP by the state of New Mexico and the U.S. Department of Energy. Albuquerque 12 Operations Office, Albuquerque, NM. 13 14 DOE (U.S. Department of Energy). 1987. Second Modification to the July 1,1981 15 "Agreement for Consultation and Cooperation" on WIPP by the State of New Mexico and the 16 U.S. Department of Energy. August 4,1987. Albuquerque Operations Office, Albuquerque, 17 NM. 18 19 DOE (U.S. Department of Energy). 1993a. Implementation of the Resource Disincentive in 20 40 CFR Part 191.14(e) at the Waste Isolation Pilot Plant. DOE/WIPP 91-029, Rev. 1. U.S. 21 Department of Energy, Carlsbad NM. 22 23 DOE (U.S. Department of Energy). 1993b. Waste Isolation Pilot Plant Land Management 24 Plan. DOE/WIPP 93-004. U.S. Department of Energy, Carlsbad Area Office, Carlsbad, NM. 25 26 DOE (U.S. Department of Energy). 1993c. Waste Isolation Pilot Plant Repository 27 Monitoring Program Strategic Plan. DOE/WIPP 93-029, Rev. 0, July 1993. U.S. 28 Department of Energy, Carlsbad NM. 29 30 DOE (U.S. Department of Energy). 1993d. WIPP Project's Comments on EPA's Three 31 Questions to the National Advisory Council in Environmental Policy and Technology 32 (NACEPT) WIPP Subcommittee. September 23,1993. WIPP Project Integration Office, 33 Albuquerque NM. 34 35 DOE (U.S. Department of Energy). 1994. Waste Isolation Pilot Plant Environmental 36 Monitoring Plan. DOE/WIPP 92-024. U.S. Department of Energy, Carlsbad, NM. 37 38 EPA (U.S. Environmental Protection Agency). 1985. 40 CFR Part 191: Environmental 39 Standards for the Management and Disposal of Spent Nuclear Fuel, High-Level and 40 Transuranic Radioactive Waste; Final Rule. Federal Register, Vol. 50, No. 182, pp. 41 38066-38089, September 19,1985. Office of Radiation and Air, Washington, D.C. 42 43
DRAFT-DOE/CAO-2056 7-33 March 31,1995

Draft 40 CFR191 Compliance Certification Application
1 EPA (U.S. Environmental Protection Agency). 1995.40 CFR Part 194: Criteria for the 2 Certification and Determination of the Waste Isolation Pilot Plant's Compliance with 3 Environmental Standards for the Management and Disposal of Spent Nuclear Fuel, High-4 Level and Transuranic Radioactive Wastes; Proposed Rule. Federal Register, Vol. 60, pp. 5 5765-5791, January 30,1995. Office of Air and Radiation, Washington, D.C. 6 7 Hora, S.C., von Winterfeldt, D., and Trauth, K.M. 1991. Expert Judgment on Inadvertent 8 Human Intrusion into the Waste Isolation Pilot Plant. SAND90-3063. Sandia National 9 Laboratories, Albuquerque, NM.
10 11 Jensen, M. 1993. Conservation and Retrieval of Information—Elements of a Strategy to 12 Inform Future Societies about Nuclear Waste Repositories. Final Report of the Nordic 13 Nuclear Safety Research Project KAN -1.3., August 1993. 14 15 Powers, D. W. 1993. Background Report on Subsidence Studies for the Potash Mines and 16 WIPP Site Area, Southeastern New Mexico. IT Corporation, Albuquerque, NM. 17 18 Swift, P.N. 1992. Long-Term Climate Variability at the Waste Isolation Pilot Plant, 19 Southeastern New Mexico, USA. SAND91-7055. Sandia National Laboratories, 20 Albuquerque, NM. 21 22 Trauth, K.M., Hora, S.C., and Guzowski, R.V. 1993. Expert Judgment on Markers to Deter 23 Inadvertent Human Intrusion into the Waste Isolation Pilot Plant. SAND92-1382. Sandia 24 National Laboratories, Albuquerque, NM. 25 26 Weitzberg, A. 1982. Building on Existing Institutions to Perpetuate Knowledge of Waste 27 Repositories. ONWI-379 UC-70. 28
March 31,1995 7-34 DRAFT-DOE/CAO-2056

Draft 40 CFR191 Compliance Certification Application
l BIBLIOGRAPHY 2 3 DOE (U.S. Department of Energy). 1990. Final Safety Analysis Report. WP 02-9, Rev. 0, 4 May 1990. Westinghouse Electric Corporation, Waste Isolation Pilot Plant, Carlsbad, NM. 5 6 DOE (U.S. Department of Energy). 1990. Radionuclide Emission Data Package for the 7 Waste Isolation Pilot Plant. U.S. Department of Energy, Carlsbad, NM. 8 9 DOE (U.S. Department of Energy). 1991. Draft Report: Evaluation of the Effectiveness and
10 Feasibility of the Waste Isolation Pilot Plant Engineered Alternatives: Final Report of the 11 Engineered Alternatives Task Force. DOE/WIPP 91-007, Rev. 0. Westinghouse Electric 12 Corporation, Carlsbad, NM. 13 14 DOE (U.S. Department of Energy). 1991. Environmental Regulatory Guide for Radiological 15 Effluent Monitoring and Environmental Surveillance. DOE/EH-0173T, January 1991. 16 Washington, D.C. 17 18 DOE (U.S. Department of Energy). 1991. A Plan for the Implementation ofAssurance 19 Requirements in Compliance with 40 CFR Part 191.14 at the Waste Isolation Pilot Plant. 20 DOE/WIPP 87-016, Rev. 1. Waste Isolation Pilot Plant, Carlsbad, NM. 21 22 DOE (U.S. Department of Energy). 1992. Statistical Summary of the Radiological Baseline 23 Program for the Waste Isolation Pilot Plant. DOE/WIPP 92-037. U.S. Department of 24 Energy, Carlsbad, NM. 25 26 DOE (U.S. Department of Energy). 1993. Test Phase Plan for the Waste Isolation Pilot 27 Plant. DOE/WIPP 89-011, Rev. 1. WIPP Project Integration Office, Albuquerque, NM. 28 29 DOE (U.S. Department of Energy). 1994. Draft Waste Removal After Closure Technical 30 Feasibility Report. November 16,1994. U.S. Department of Energy, Carlsbad, NM. 31 32 DOE (U.S. Department of Energy). 1994. Permanent Marker Conceptual Design Report 33 Draft. Rev. 2, November 1994. U.S. Department of Energy, Carlsbad, NM. 34 35 DOE (U.S. Department of Energy). 1994. Project Technical Baseline for Regulatory 36 Compliance. WP 02-RC1, Rev. 0, Draft 3, August 5,1994. U.S. Department of Energy, 37 Carlsbad, NM. 38 39 DOE (U.S. Department of Energy). 1994. WIPP Active Access Controls After Disposal 40 Design Concept Description (Draft). Rev. 1, December 1994. U.S. Department of Energy, 41 Carlsbad, NM. 42 43
DRAFT-DOE/CAO-2056 7-35 March 31,1995
Draft 40 CFR191 Compliance Certification Application
1 Jones, T.L., Kelly, V.A., Pickens, J.F., Upton, D.T., Beauheim, R.L., and Davies, P.B. 1992. 2 Integration of Interpretation Results of Tracer Tests Performed in the Culebra Dolomite at 3 the Waste Isolation Pilot Plant Site. SAND92-1579. Sandia National Laboratories, 4 Albuquerque, NM. 5 6 Kaplan, M.F. 1982. Archaeological Data as a Basis for Repository Marker Design. ONWI-7 354 UC-70, October 1982. 8 9 Krefta, M. 1994. Magnetic Field Calculations forWIPP Magnetic Markers. Personal
10 memorandum to T. Mallick. 11 12 Mallick, T. 1994. WIPP Magnetic Markers. Personal Memorandum to J. Iacovino. 13 14 Matalucci, R.V., Christensen, C.L., Hunter, T.O., Molecke, M.A., and Munson, D. 1982. 15 Waste Isolation Pilot Plant (WIPP) Research and Development Program: In Situ Testing 16 Plan. SAND81-2628, March 1982. Sandia National Laboratories, Albuquerque, NM. 17 18 Westinghouse Electric Corporation. 1991. Waste Isolation Pilot Plant Water Quality 19 Sampling Program. WP02-1. Waste Isolation Division, Carlsbad, NM. 20 21 Westinghouse Electric Corporation. 1992. Waste Isolation Pilot Plant Site Environmental 22 Report for Calendar Year 1991. DOE/WJPP 92-007. Waste Isolation Division, Carlsbad, 23 NM.
March 31,1995 7-36 DRAFT-DOE/CAO-2056

1 2
8.0 INDIVIDUAL AND GROUNDWATER PROTECTION REQUIREMENTS
3 The quantitative release limits set forth in the Containment Requirements provisions of Title 4 40 Code of Federal Regulations (CFR) § 191.13 are one of three long-term numerical 5 performance requirements contained in 40 CFR Part 191. The Waste Isolation Pilot Plant 6 (WIPP) must also comply with numerical performance standards contained in the individual 7 and groundwater protection requirements. This section describes the U.S. Department of 8 Energy's (DOE's) demonstration of compliance for the WIPP with both the individual and 9 groundwater protection requirements. A description of undisturbed performance and the
10 conceptual models to support the compliance demonstration associated with these 11 requirements are described in Chapter 6.
12 Some of the requirements of the U.S. Environmental Protection Agency's (EPA's) proposed 13 rule 40 CFR Part 194 that may affect the information presented in the chapter have not been 14 implemented. These areas are identified where appropriate.
15 8.1 Individual Protection Requirements
16 The individual protection requirements are contained in § 191.15 of the long-term disposal 17 regulations. Section 191.15(a) requires that:
18 Disposal systems for waste and any associated radioactive material shall be designed to provide a 19 reasonable expectation that, for 10,000 years after disposal, undisturbed performance of the 20 disposal system shall not cause the annual committed effective does, received through all potential 21 pathways from the disposal system to any member of the public in the accessible environment, to 22 exceed 15 millirems (150 microsieverts).
23 "Undisturbed performance" is defined in 40 CFR Part 191 to mean "the predicted behavior of 24 a disposal system, including consideration of the uncertainties in predicted behavior, if the 25 disposal system is not disrupted by human intrusion or the occurrence of unlikely natural 26 events" (§ 191.12). "Undisturbed performance" is the same as the "base case" for scenario 27 selection purposes.
28 The method used to evaluate compliance with the individual protection requirements is related 29 to that developed for assessing compliance with the containment requirements. The base-case 30 scenario for the containment requirements describes undisturbed conditions. If the evaluation 31 of the base-case behavior shows contaminants will reach the accessible environment, the 32 resulting dose to exposed individuals may be calculated and compared to the 15-millirem 33 annual committed effective dose standard specified in § 191.15.
34 Based on the scenario development process described in Chapter 6, two potential pathways for 35 groundwater flow and radionuclide transport are possible in the undisturbed disposal system:
DRAFT-DOE/CAO-2056 March 31,1995

Draft 40 CFR 191 Compliance Certification Application
1 • In the first path, a pressure gradient between the waste disposal panels and the Culebra 2 Dolomite Member (hereafter referred to as the Culebra) causes brine and radionuclides to 3 migrate from the waste disposal panels to the base of the shafts and up the shafts toward 4 the Culebra.
5 • The second path for brine and radionuclide migration from the undisturbed repository is 6 laterally through anhydrite interbeds toward the subsurface boundary of the accessible 7 environment in the Salado Formation.
8 Although these are possible pathways, the modeling analyses reported in Chapter 6 indicate 9 only the first is a potential pathway during the 10,000-year period of interest specified in the
10 regulation.
11 The proposed 40 CFR Part 194 specifies further requirements. Doses must be estimated for 12 an individual who resides at the location in the accessible environment where that individual 13 would be expected to receive the highest exposure from radionuclide releases from the 14 disposal system (proposed 40 CFR § 194.51). In addition, all potential pathways for exposure 15 associated with the undisturbed performance of the repository must be assessed (proposed 16 40 CFR § 194.52). As provided by the future state assumptions of proposed 40 CFR § 17 194.25, unless otherwise specified, it shall be assumed that current conditions continue into 18 the future.
19 Formal dose calculations, as required by 40 CFR § 191.15, have not been performed for the 20 purposes of this draft Compliance Certification Application. If the final compliance calcu-21 lations indicate releases to the accessible environment under undisturbed conditions, formal 22 dose calculations will be developed and presented. However, using the exposure pathway 23 analyses presented in the Supplemental Environmental Impact Statement (SEIS) for the WIPP 24 (DOE 1990), bounding doses for the releases reported in Chapter 6 may be estimated.
25 The analyses presented in the SEIS identify the "stock pond-to-cow-to-man" pathway as 26 being the most important, in terms of delivering the maximum exposure to an individual. 27 This pathway consists of a hypothetical well pumping water from the Culebra to a stock water 28 tank. Cattle then drink the water and are subsequently consumed by humans. Under present-29 day conditions for undisturbed performance, this pathway dominates all others by orders of 30 magnitude.
31 The SEIS analysis is supported by Sandia National Laboratories (SNL) report Systems 32 Analysis, Long-Term Radionuclide Transport, and Dose Assessments, Waste Isolation Pilot 33 Plant (WIPP) Southeastern New Mexico (Lappin et al. 1990). Lappin et al. (1989) reports 34 concentrations of radionuclides in the Culebra at the stock-well location and lists the resulting 35 dose levels for the "stock pond-to-cow-to-man" pathway. Doses of less than 10"8 millirem 36 per year may be derived by extracting the peak concentrations of radionuclides for the highest 37 release reported in Chapter 6 (the total over all radionuclides is equal to 10"3 picocuries per 38 liter), by assuming that the total concentration is due to plutonium, and by scaling linearly to a 39 dose estimate based on SEIS information.
March 31, 1995 8-2 DRAFT-DOE/CAO-2056
Draft 40 CFR191 Compliance Certification Application
1 The estimated bounding dose of less than 10"8 millirem per year is much lower than the annual 2 dose that is received from background sources, which is about 100 millirem per year. In 3 addition, the bounding dose estimate is based on concentrations expected to occur at the WIPP 4 site boundary and not at the nearest location where present-day potable water is believed to 5 first be available in the Culebra (about 3 miles [5 kilometers] from the WIPP facility). 6 Furthermore, this is not a mean estimate; it is based on the largest release observed in the 60 7 realizations performed. The mean value is about l/60th of the 10"8 millirem-per-year estimate. 8 The bounding dose estimate indicated from the releases reported in Chapter 6 is many orders 9 of magnitude below the background doses and the § 191.15 standard of 15 millirem per year.
10 Based on this bounding analysis (and conditional on the finalization of the Chapter 6 11 analyses), the DOE believes that compliance with the individual protection standard can be 12 demonstrated. The DOE has not yet conducted the formal calculation required in 13 40 CFR § 194.55.
14 8.2 Groundwater Protection Requirements
15 The groundwater protection requirements are contained in Subpart C of 40 CFR Part 191. In 16 particular § 191.24(a) (1) requires that:
17 General. Disposal systems for waste and any associated radioactive material shall be designed to 18 provide a reasonable expectation that 10,000 years of undisturbed performance after disposal shall 19 not cause the levels of radioactivity in any underground source of drinking water, in the accessible 20 environment, to exceed the limits specified in 40 CFR Part 141 as they exist on January 19,1994.
21 The "levels of radioactivity" specified in 40 CFR Part 141, as of January 19,1994 were:
22 1. Combined ^ R a and ^ R a (§ 141.15[a]): 5 picocuries per liter 23 2. Gross alpha particle activity, including ^ R a but excluding radon and uranium 24 (§ 141.15[b]): 15 picocuries per liter
25 The base-case analysis of the undisturbed performance of the WIPP presented in Chapter 6 26 shows that the total concentration of all radionuclides reaching the accessible environment is 27 10"3 picocuries per liter.
28 Information regarding the concentrations of naturally occurring radionuclides in groundwater 29 in the vicinity of the WIPP is presented in Section 2.4.4.4.2 and in Table 2-9. The data in 30 Table 2-9 indicate background concentrations in excess of the levels of radioactivity specified 31 in 40 CFR Part 141. The range of the mean values shown for 2 2 6 Ra is about 19 to 140 32 picocuries per liter (6.9X10"4 to 52x10^ becquerels per gram). The mean 2 2 8 Ra concentration 33 shown in Table 2-9 is about 26 picocuries per liter (9.6X10"4 becquerels per gram).
34 The DOE has not yet performed the formal compliance assessment required by 35 40 CFR § 194.55.
DRAFT-DOE/CAO-2056 8-3 March 31,1995

Draft 40 CFR 191 Compliance Certification Application
1 THIS PAGE INTENTIONALLY LEFT BLANK
March 31, 1995 8-4 DRAFT-DOE/CAO-2056

Draft 40 CFR191 Compliance Certification Application
1 REFERENCES
2 DOE (U.S. Department of Energy). 1990. Final Supplement, Environmental Impact 3 Statement, Waste Isolation Pilot Plant. DOE/EIS-0026-FS. Office of Environmental 4 Restoration and Waste Management, Washington, D.C.
5 Lappin, A.R., Hunter, R.L., Garber, D.P., Davies, P.B., Beauheim, R.L., Borns, D.J., Brush, 6 L.H., Butcher, B.M., Cauffman, T., Chu, M.S.Y., Gomez, L.S., Guzowski, R.V., luzzolino, 7 H.J., Kelley, V., Lambert, S.J., Marietta, M.G., Mercer, J.W., Nowak, E.J., Pickens, J., 8 Rechard, R.P., Reeves, M., Robinson, K.L., and Siegel, M.D., eds. 1989. Systems Analysis, 9 Long-Term Radionuclide Transport, and Dose Assessments, Waste Isolation Pilot Plant
10 (WIPP), Southeastern New Mexico: March 1989. SAND89-0462. Sandia National 11 Laboratories, Albuquerque, NM.
8-5 March 31,1995

1 GLOSSARY OF TERMS
2 40CFRPART 191. Environmental Radiation Protection Standards for Management and 3 Disposal of Spent Nuclear Fuel, High-Level and Transuranic Radioactive Wastes. 4 This regulation sets environmental radiation protection standards for management 5 (Subpart A) and disposal (Subparts B and C) of spent nuclear fuel and high-level and 6 transuranic radioactive wastes.
7 40 CFR PART 194. This regulation, required by the LWA, will provide EPA's criteria for 8 certifying compliance with the final disposal standards.
9 40 CFR PART 261. Identification and Listing of Hazardous Waste. This part identifies those 10 solid wastes which are subject to regulation as hazardous wastes under Parts 262-265, 11 268,270,271, and 124 of Title 40 of the Code of Federal Regulations.
12 40 CFR PART 264. Standards for Owners and Operators of Hazardous Waste Treatment, 13 Storage, and Disposal Facilities. This subpart establishes minimum national 14 standards which define the acceptable management of hazardous waste.
15 40 CFR PART 264. Subpart G. This subpart of 40 CFR Part 264 defines closure and post-16 closure requirements pertaining to hazardous waste management units.
17 40 CFR PART 264. Subpart X. This subpart specifies requirements that apply to owners and 18 operators of facilities that treat, store, or dispose of hazardous waste in miscellaneous 19 hazardous waste management units.
20 40 CFR PART 268. This regulation restricts the land disposal of hazardous waste and specifies 21 treatment standards and/or treatment technologies that must be met or applied before 22 hazardous wastes may be land disposed. Section 268.6 provides for petitioning to 23 allow land disposal of untreated hazardous waste if it can be demonstrated to a 24 reasonable degree of certainty that there will be no migration of hazardous constituents 25 from the disposal unit for as long as the waste remains hazardous.
26 40 CFR PART 270. This regulation establishes provisions for the Hazardous Waste Permitting 27 Program under Subtitle C of RCRA. This regulation and the associated State of New 28 Mexico regulation require the permitting of the WTPP as a hazardous waste 29 management unit.
30 ACCESSIBLE ENVIRONMENT. "(1) [T]he atmosphere, (2) land surfaces, (3) surface waters, (4) 31 oceans, and (5) all of the lithosphere that is beyond the controlled area." (40 CFR 32 § 191.12)
33 ACTINIDE. An element in the actinide series beginning with element 89 and continuing 34 through element 103. All the transuranic nuclides considered in this document are 35 actinides.
DRAFT-DOE/CAO-2056 March 31,1995
Draft 40 CFR 191 Compliance Certiflcation Application
1 ACITNIDE SOURCE TERM. The fraction of the total radionuclide inventory of a disposal room 2 or repository that can be mobilized for tratisport.
3 AcnVE INSTITUTIONAL CONTROL. (1) Controlling access to a disposal site by any means other 4 than passive institutional controls, (2) performing maintenance operations or remedial 5 actions at a site, (3) controlling or cleaning up releases from a site, or (4) monitoring 6 parameters related to disposal system performance. (40 CFR § 191.12)
7 ACTIVITY. A measure of the rate at which a material emits nuclear radiation, usually given in 8 terms of the number of nuclear disintegrations occurring in a given length of time. 9 The unit of activity used in this document is the curie (Ci).
10 ADSORPTION. (1) Bonding, frequently ionic, of a substance to soil or some other medium. A 11 substance is said to be adsorbed if the concentration in the boundary region of a soil 12 particle is greater than in the interior of the continuous phase. (2) Adherence of gas 13 molecules, or of ions or molecules in solution, to the surface of solids with which they 14 are in contact.
15 AIR LOCK. An intermediate chamber between zones of different static pressure.
16 ALARA. As Low As Reasonably Achievable; radiation protection program for minimizing 17 personnel exposures.
18 ALPHA PARTICLE. A positively charged particle emitted in the radioactive decay of certain 19 nuclides. Made up of two protons and two neutrons bound together, it is identical to 20 the nucleus of a helium atom. It is the least penetrating of the three common types of 21 radiation—alpha, beta, and gamma radiation.
22 ALTERNATIVE CONCEPTUAL MODELS. An alternative set of assumptions that describe the 23 same system for the same purpose and are consistent with the existing information.
24 ALTERNATIVE CONTAINER MATERIALS. Container materials, other than mild steel, that reduce 25 and/or eliminate gas generation from corrosion in the range of expected Waste 26 Isolation Pilot Plant environments.
27 ANHYDRITE. A mineral consisting of anhydrous calcium sulfate (CaS0 4). It is gypsum 28 without water but is denser, harder, and less soluble.
29 ANNUAL COMMITTED EFFECTIVE DOSE. The committed effective dose resulting from a 1 -year 30 intake of radionuclides released plus the annual effective dose caused by direct 31 radiation from facilities or activities subject to Subparts B and C of 40 CFR Part 191. 32 (40 CFR §191.12)
March 31,1995 GL-2 DRAFT-DOE/CAO-2056

Draft 40 CFR191 Compliance Certification Application
1 ANOXIC CORROSION. Corrosion of metals in the absence of oxygen by anaerobic bacteria.
2 ANTICLINE. A fold of rocks whose core contains the stratigraphically older rocks; it is convex 3 upward.
4 AQUIFER. An underground geological formation or part of a formation that is capable of
5 yielding a significant amount of water to a well or spring. (40 CFR § 191.12)
6 ARENACEOUS. Of the texture or character of sand.
7 ARGILLACEOUS ROCKS. Rocks containing appreciable amounts of clay, especially shale.
8 ARTESIAN. Refers to water confined underground under pressure so that it will rise in a well. 9 Sometimes the word is used to mean that the water flows out at the surface, but that,
10 strictly speaking, is "flowing artesian." 11 BACKFILL. Material placed around the waste containers, filling the open space in the disposal 12 room.
13 BACKGROUND (RADIATION). Radiation in the human environment from naturally occurring 14 elements, from cosmic radiation, and from fallout.
15 BARRIER. "[A]ny material or structure that prevents or substantially delays movement of 16 water and/or radionuclides toward the accessible environment. For example, a barrier 17 may be a geologic structure, a canister, a waste form with physical and chemical 18 characteristics that significantly decrease the mobility of radionuclides, or a material 19 placed over and around waste, provided that the material or structure substantially 20 delays movement of water or radionuclides." (40 CFR § 191.12) Barriers also prevent 21 or delay the movement of hazardous constituents.
22 BASE CASE. The base case for the Waste Isolation Pilot Plant performance assessment is the 23 behavior of the repository in the absence of human intrusion. Also called the 24 "undisturbed performance" of the repository.
25 BASELINE INVENTORY REPORT. Baseline waste inventory report for all nuclear wastes in the 26 DOE complex.
27 BELL CANYON FORMATION. A sequence of rock strata that form the uppermost formation of 28 the Delaware Mountain Group (Early Permian). It is immediately below the Castile 29 Formation at about 4,000 feet below the surface. May contain some oil and gas.
30 BENTONrTE. A commercial term applied to expansive clay materials containing 31 montmorillonite (smectite) as the essential mineral.
DRAFT-DOE/CAO-2056 GL-3 March 31,1995

Draft 40 CFR191 Compliance Certification Application
1 BETA PARTICLE. A negatively charged particle emitted in the radioactive decay of certain 2 nuclides; a free electron.
3 BIODEGRADATION. The process of consumption by microbial substances—usually organic 4 materials such as cellulosics.
5 BIOLOGICAL HALF-LIFE. The time required for an organism to eliminate half the amount of a 6 radionuclide ingested or inhaled.
7 BOREHOLE. (1) A hole drilled from the surface for purposes of geologic or hydrologic testing, 8 injection, or exploration for resources; sometimes referred to as a drillhole. (2) A 9 man-made hole in the wall, floor, or ceiling of a subsurface room used for verifying
10 geology, making observations, or emplacing canisters of remote-handled transuranic 11 waste.
12 BRAGFLO. The name of the computer model Sandia National Laboratories uses to 13 determine effects of gas on the flow of brine through the repository and up an intrusion 14 borehole.
15 BRINE. Saline water containing calcium (Ca), sodium (Na), potassium (K), chlorides (CI), and
16 minor amounts of other elements located in deep sedimentary basins.
17 BRINE POCKET. See BRINE RESERVOIR.
18 BRINE RESERVOIR. A volume of brine of limited extent trapped within fractures and/or 19 intergranular pore spaces of a host rock and usually pressurized relative to normal 20 formation fluids. Such pockets may exist under various conditions of stress and solute 21 concentration. Pressurized brine pockets have been observed in the Castile Formation. 22 BUFFERED HUMID CONDITIONS. Under long-term conditions, the absolute (and relative) 23 humidities within the Waste Isolation Pilot Plant are expected to be buffered by the 24 activity of water in adjacent portions of the Salado Formation.
25 CALCITE. Calcium carbonate (CaC0 3).
26 CALIBRATE. TO vary parameters of an applied computational model within a reasonable range 27 until differences between observed data and computed values are minimized.
28 CALICHE. A limy material commonly found in layers on or within the surface of stony soils of 29 arid or semiarid regions. It occurs in the form of gravels, sands, silts, and clays 30 cemented together by calcium carbonate (lime) or as crusts at the surface of the soil.
31 CAMBRIAN. The first oldest period of the Paleozoic Era.
March 31, 1995 GL-4 DRAFT-DOE/CAO-2056

Draft 40 CFR191 Compliance Certification Application
1 CANISTER. AS used in this document, a container, usually cylindrical, for remotely handled 2 TRU waste. The waste will remain in this canister during and after burial. A canister 3 affords physical containment but not shielding; shielding is provided during shipment 4 by a cask.
5 CAPITAN REEF. A buried fossil limestone reef of Permian age that rings the Delaware Basin 6 except in the south.
7 CARBONATES. A compound containing the radical C0 3
+ 2 , for example, a calcium and 8 magnesium mineral such as CaMg(C0 3) 2, dolomite.
9 CARLSBAD POTASH DISTRICT. The area east of Carlsbad and north and west of the Los 10 Medanos site formally designated by the U.S. Geological Survey as having potentially 11 economic grades of potash mineralization.
12 CASK. A massive shipping container providing shielding for highly radioactive materials and 13 holding one or more canisters.
14 CASTILE FORMATION. A formation of evaporite rocks (mainly anhydrite with a few halite 15 interbeds) of Permian age that immediately underlies the Salado Formation in which 16 the WTPP disposal level may be built. May contain brine pockets.
17 CAVTNGS. During exploratory drilling, waste that erodes from the borehole wall in response 18 to the upward-flowing drilling fluid within the annulus formed by the drill pipe and the 19 borehole wall.
20 CENTRAL BASIN PLATFORM. The geological region covering an area of several hundreds of 21 square miles separating the Delaware and. Midland basins.
22 CERTIFICATION. Any action taken by the Administrator of the U.S. Environmental Protection 23 Agency under Section 8(d) of the WIPP Land Withdrawal Act.
24 CENTRAL MONITORING ROOM (CMR). A room at the WTPP facility equipped to monitor 25 alarm functions and provide reliable communications.
26 CENTRAL MONITORING SYSTEM (CMS). A computer system that monitors the WIPP facility 27 instrumentation; operated from the Central Monitoring Room.
28 CERTIFIER. In the context of 40 CFR Part 191, the "certifier" is the U.S. Environmental 29 Protection Agency which must certify whether the Department of Energy has 30 demonstrated that the Waste Isolation Pilot Plant is in compliance with the 31 requirements of the standard.
32 CHEMICAL SOURCE TERM. The fraction of the hazardous constituents inventory that can be 33 mobilized for transport.
DRAFT-DOE/CAO-2056 GL-5 March 31,1995

Draft 40 CFR191 Compliance Certification Application
1 COLLOIDAL SOLUTION. A liquid colloidal suspension is often referred to as a solution. Since 2 colloidal particles are larger than molecules, it is technically incorrect to call such 3 "dispersions" solutions; however, this term is used widely in the literature.
4 COMPLEMENTARY CUMULATIVE DISTRIBUTION FUNCTION. A graphical representation of the 5 probability of exceeding the radionuclide release limits specified in 40 CFR Part 191 6 (ordinate) compared to the consequences of exceeding the limits (abscissa). The 7 consequence measure for releases, as defined by the Containment Requirements of 40 8 CFR Part 191, is the normalized sum of releases of individual radionuclides.
9 COMPLIANCE EVALUATION. The assessment of compliance of a mined geologic waste 10 repository. Titles 40 CFR Part 191 and 40 CFR § 268.6 require such evaluations be 11 made to demonstrate that a reasonable degree of certainty (40 CFR § 268.6) or a 12 reasonable expectation (40 CFR Part 191) that the performance standards will be met.
13 COMPUTATIONAL MODEL. The computational model is the implementation of the 14 mathematical model. The implementation may be through analytical or numerical 15 means. Often the analytical solution is numerically evaluated (e.g., numerical 16 integration or evaluation of complex functions); hence, both solution techniques are 17 typically coded on the computer. Consequently, the computational model is often 18 called a computer model.
19 COMPUTER MODEL. A computer code to implement a corresponding mathematical model 20 either by evaluating an analytical solution or by using a numerical technique.
21 CONCEPTUAL MODEL. A set of assumptions, usually qualitative, used to describe and 22 represent a system for some analytical purpose. For a physical system, these 23 assumptions address the system's geometry and dimensionality, initial and boundary 24 conditions, time dependence, material properties, internal processes, and any other 25 characteristics relevant to its behavior. The assumptions should be consistent with one 26 another and with the known properties of the system within the context of its intended 27 analytical purpose.
28 CONDITIONAL DISTRIBUTION FUNCTION. A summary representation of risk. A display of 29 information pertaining to events that may occur, the likelihood of their occurrence, and 30 the consequences of their occurrence. Families of conditional distribution functions 31 are used to display complementary cumulative distribution functions and can be used 32 to infer the relative accuracy of the complementary cumulative distribution function.
33 CONFIRMATION. For the purposes of this document, a term used to indicate support or 34 establishment of certainty and/or validity of models used in reference to specific 35 performance issues of the repository over any specific time frame of interest. In 36 general, laboratory and field experiments at the Waste Isolation Pilot Plant and
March 31, 1995 GL-6 DRAFT-DOE/CAO-2056

Draft 40 CFR191 Compliance Certification Application
1 elsewhere are conducted to provide data in support of this type of activity, such as for 2 the gas generation model. Confirmation is used in a mechanistic sense and is not 3 intended to have specific legal implications {see VALIDATION).
4 CONSERVATIVE. AS a term used with predictions or estimates, "conservative" means leaning 5 on the side of pessimism. A conservative estimate is one in which the uncertain inputs 6 are used in a way that maximizes an adverse impact.
7 CONSULTATION AND COOPERATION AGREEMENT. An agreement that affirms the intent of the 8 Secretary of Energy to consult and cooperate with the State of New Mexico with 9 respect to State public health and safety concerns. The term "Agreement" means the
10 July 1,1981, Agreement for Consultation and Cooperation, as amended by the 11 November 30,1984, "First Modification," the August 4,1987, "Second Modification," 12 and the March 22,1988, modification to the Working Agreement.
13 CONTACT-HANDLED WASTE. Transuranic waste that has a measured radiation dose rate at the 14 container surface of 200 millirems per hour or less and can be safely handled without 15 special equipment when placed in containers.
16 CONTAINMENT. The retention of radioactivity within prescribed boundaries, such as within a 17 waste package. In this document, containment usually refers to retention within a 18 system to exclude its release to the biosphere in unacceptable quantities or 19 concentrations.
20 CONTAMINATION. Undesirable radioactive material present on outside surfaces. This 21 contamination can be either transferable or fixed. Radiation penetrating the walls of a 22 waste package from within is not contamination.
23 CONTROLLED AREA. The controlled area means (1) a surface location, to be identified by 24 passive institutional controls, that encompasses no more than 100 square kilometers 25 and extends horizontally no more than 5 kilometers in any direction from the outer 26 boundary of the original location of the radioactive wastes in a disposal system; and 27 (2) the subsurface underlying such a surface location. (40 CFR § 191.12)
28 CORROSIVTTY. The tendency of a metal to deteriorate by chemical attack.
29 CREEP. A very slow, usually continuous, time-dependent movement of soil or rock; refers to 30 the geologic phenomenon experienced as the gradual flow of salt under compressive 31 loading.
32 CREEP CLOSURE. Closure of underground openings, especially openings in salt, by plastic 33 flow of the surrounding rock under lithostatic pressure.
34 CULEBRA DOLOMITE. The lower of two layers of dolomite within the Rustler Formation that 35 are locally water bearing.
DRAFT-DOE/CAO-2056 GL-7 March 31,1995

Draft 40 CFR191 Compliance Certification Application
1 CULTURAL RESOURCE SITES. Human-associated ruins of archaeologic significance.
2 CURIE. A quantitative measure of radioactivity equal to 3.7 x 10 1 0 disintegrations per second.
3 CUTTINGS. During exploratory drilling, waste contained in the cylindrical volume created by 4 the cutting action of the drill bit through the waste. This volume is approximated by 5 the cross-sectional area of the drill bit multiplied by the repository thickness.
6 DAUGHTER PRODUCT. A nuclide that results from radioactive decay. Thus radium-226 decays 7 to radon-220, which in turn decays to polonium-216. The radon is the daughter of the 8 radium, and polonium is its daughter.
9 DECAY, RADIOACTIVE. The decrease in the number of radioactive nuclei present in a 10 radioactive material due to their spontaneous transmutation. Also, the transmutation 11 of a radionuclide into another nuclide by me emission of a charged particle.
12 DECOMMISSIONING. Actions taken upon abandonment of the repository to reduce potential 13 environmental, health, and safety impacts, including repository sealing as well as 14 activities to stabilize, reduce, or remove radioactive materials or demolish surface 15 structures.
16 DECOMMISSIONING PHASE. The term "decommissioning phase" means the period of time 17 beginning with the end of the disposal phase and ending when all shafts at the Waste 18 Isolation Pilot Plant repository have been backfilled and sealed.
19 DECONTAMINATION. The removal of unwanted material (especially radioactive material) 20 from the surface or from within another material.
21 DEFENSE HIGH-LEVEL WASTE (DHLW). High-level radioactive waste generated as a result of 22 DOE's national defense activities and programs.
23 DEFENSE WASTE. Nuclear waste deriving from the manufacture of nuclear weapons and the 24 operation of naval reactors. Associated activities such as the research carried on in the 25 weapons laboratories also produce defense waste.
26 DELAWARE BASIN. An area in southeastern New Mexico and adjacent parts of Texas where a 27 sea deposited large thicknesses of evaporites some 200 million years ago. It is 28 partially surrounded by the Capitan Reef.
29 DELAWARE MOUNTAIN GROUP. A set of three formations that underlie the Castile Formation 30 at the Los Medanos site. The uppermost of these is the Bell Canyon Formation.
31 DERIVED AIR CONCENTRATION (DAC). Equals the Annual Limit on Intake (ALI) (of a 32 radionuclide) divided by the volume of air inhaled by Reference Man in a working 33 year (i.e., 2.4xl0 3 m 3). The unit of DAC is becquerels per cubic meter.
March 31, 1995 GL-8 DRAFT-DOE/CAO-2056

Draft 40 CFR191 Compliance Certification Application
1 DESATURATE. TO remove liquid from a material to reduce the degree of saturation. If all the 2 liquid is removed from pores and cracks, the material is said to be completely dried.
3 DESIGN BASIS EARTHQUAKE (DBE). An earthquake that is the most severe design basis 4 accident of this type and that produces the vibratory ground motion for which safety 5 class items are designed to remain functional.
6 DESIGN BASIS TORNADO (DBT). A tornado that is the most severe design basis accident of 7 that type applicable to the area under consideration.
8 DEVONIAN WOODFORD SHALE. This is a Devonian-age geological marker about 15,600 feet 9 deep that separates the Silurian era from the Mississippian era.
10 DEWEY LAKE (REDBEDS). Uppermost geologic formation layered on top of the Rustler 11 Formation.
12 DIFFUSION, MOLECULAR. Movement of a contaminant due to the cumulative effect of the 13 random motions of molecules.
14 DISCHARGE POINT (OR AREA). In groundwater hydraulics, the point (or area) where water 15 comes out of an aquifer onto the surface.
16 DISPOSAL. The term "disposal" means permanent isolation of transuranic waste from the 17 accessible environment with no intent of recovery, whether or not such isolation 18 permits the recovery of such waste. Disposal of waste in a mined geologic repository 19 occurs when the waste has been emplaced and all the shafts to the repository are 20 sealed.
21 DISPOSAL FACILITY. A facility or part of a facility into which hazardous waste is intentionally 22 placed and in which hazardous waste will remain after closure.
23 DISPOSAL PHASE. The term "disposal phase" means the period of time during which 24 transuranic waste is disposed of at the Waste Isolation Pilot Plant, beginning with the 25 initial emplacement of transuranic waste underground for disposal and ending when 26 the last container of transuranic waste is emplaced underground for disposal.
27 DISPOSAL ROOM. An excavated cavity in the Waste Isolation Pilot Plant underground in 28 which transuranic waste will be emplaced during disposal operations.
29 DISPOSAL SYSTEM. The disposal system is any combination of engineered and natural barriers 30 that isolate transuranic waste after disposal. For the purposes of the Waste Isolation 31 Pilot Plant, this will include the combination of the repository/shaft system and the 32 controlled area.
DRAFT-DOE/CAO-2056 GL-9 March 31,1995
Draft 40 CFR191 Compliance Certification Application
1 DISSOLUTION. The process whereby a space or cavity in or between rocks is formed by the 2 solution of part of the rock material.
3 DISTURBED ROCK ZONE. That portion of the geologic barrier of which the physical and/or 4 chemical properties may have changed significantly as a result of underground 5 construction activities.
6 DOLOMITE. A sedimentary rock consisting mostly of the mineral dolomite: CaMg(C0 3) 2. It 7 is commonly found with limestone.
8 DOME (BRECCIA PIPE). A type of hill found near the Los Medarios site; under at least a few of 9 these hills lies a roughly cylindrical volume of breccia pipes (rock reconstituted of
10 coarse rock fragments).
11 DOME, SALT. A diapiric or piercement structure with a central, nearly circular salt plug, 12 generally 1-2 kilometers in diameter, that has risen through the enclosing sediments 13 from a deep mother bed of salt. In the continental United States, salt domes are 14 located in the Gulf Coast states.
15 DOSE. A general term indicating the amount of energy adsorbed per unit mass from incident 16 radiation.
17 DOSE CONVERSION FACTOR. A numerical factor used in converting radionuclide uptake 18 (curies) in the body to the resultant radiation dose or dose commitment (rem or man-19 rem).
20 DOSE EQUIVALENT. The product of absorbed dose and appropriate factors to account for 21 differences in biological effectiveness due to the quality of radiation and its spatial 22 distribution in the body; the unit of dose equivalent is the "rem" ("sieverts" in SI 23 units). (40 CFR §191.12)
24 DOSE RATE. The rate at which dose is delivered.
25 DRIFT. A horizontal passageway in a mine.
26 El , E2. These are potential human intrusion scenarios used in computer modeling for 27 compliance purposes.
28 EFFECTIVE DOSE. The sum over specified tissues of the products of the dose equivalent 29 received following an exposure of, or an intake of radionuclides into, specified tissues 30 of the body, multiplied by appropriate weighting factors. This allows the various 31 tissue-specific health risks to be summed into an overall health risk. The method used 32 to calculate effective dose is described in Appendix B of 40 CFR Part 191. (40 CFR 33 § 191.12)
March 31, 1995 GL-10 DRAFT-DOE/CAO-2056

Draft 40 CFR191 Compliance Certification Application
1 EFFLUENT. Wastewater or airborne emissions discharged into the environment.
2 EMPLACEMENT. At the Waste Isolation Pilot Plant, the placing of radioactive wastes in the 3 repository.
4 ENGINEERED ALTERNATIVES. Potential modifications to the design or operation of the WIPP 5 or to waste forms that, if adopted, will provide increased assurance that the WIPP will 6 perform in compliance with environmental protection and safety requirements.
7 ENGINEERED BARRIERS. Backfill, seals, and any other man-made barrier components of the 8 disposal system.
9 EVAPORTTE. A sedimentary rock composed primarily of minerals produced by precipitation 10 from a solution that has become concentrated by the evaporation of a solvent, 11 especially salts deposited from a restricted or enclosed body of seawater or from the 12 water of a salt lake. In addition to halite (NaCl) these salts include potassium, 13 calcium, and magnesium chlorides and sulfates.
14 EVENT. A phenomenon that occurs instantaneously or within a short time interval relative to
15 the time frame of interest.
16 FAULT. A surface or zone of rock fracture along which there has been displacement.
17 FAULT TREE. A tree-like cause-and-effect diagram of hypothetical events. Analysis of fault 18 trees is used to investigate failures in a system or concept. 19 FEDERAL FACILITIES COMPLIANCE ACT. An amendment, promulgated in 1992, to the Solid 20 Waste Disposal Act. Title I of the act grants the U.S. Environmental Protection 21 Agency administrative enforcement authority against any department, agency, or 22 instrumentality of the executive, legislative, or judicial branch of the federal 23 government. In regard to mixed wastes, sovereign immunity for federal agencies is 24 waived, consistent with a schedule provided in the act. In addition, the act requires 25 that the DOE prepare an inventory of mixed wastes and mixed waste treatment 26 capacities and technologies. For those mixed wastes for which treatment capacities or 27 technologies do not exist, the Department must prepare plans for the development of 28 the capacities or technologies.
29 FILTER BANK. An arrangement of air filters in series and/or parallel.
30 FINAL SAFETY ANALYSIS REPORT (FSAR). A safety document providing a concise but 31 complete description and safety evaluation of the site, the design, normal and 32 emergency operations, potential accidents, and predicted consequences of such 33 accidents, and the means proposed to prevent such accidents or to mitigate the
DRAFT-DOE/CAO-2056 GL-11 March 31,1995

Draft 40 CFR191 Compliance Certification Application
1 consequences of such accidents. An FS AR documents the adequacy of safety analysis 2 for a nuclear facility to ensure that the facility can be constructed, operated, 3 maintained, shut down, and decommissioned safely and in compliance with applicable 4 laws and regulations.
5 FISSILE. Describes a nuclide that undergoes fission on absorption of neutrons of any energy.
6 FISSILE MATERIAL. Fissile material means any material consisting of or containing one or 7 more fissile radionuclides. Fissile radionuclides are plutonium-238, plutonium-239, 8 plutonium-241, uranium-233, and uranium-235.
9 FISSION. The splitting of a heavy nucleus into two approximately equal parts, each the 10 nucleus of a lighter element, accompanied by the release of a large amount of energy 11 and generally one or more neutrons. Fission can occur spontaneously, but it usually 12 follows the absorption of neutrons.
13 FISSIONABLE. Describes a nuclide that undergoes fission on absorption of a neutron with 14 energy over some threshold energy.
15 FLOWPATH. The path traveled by a "zero-charged," "floating" particle released into a
16 groundwater flow field.
17 FLUVIAL. Pertaining to streams.
18 FORMATION (GEOLOGIC). The basic rock-stratigraphic unit in the local classification of rocks. 19 It consists of a body of rock (usually sedimentary) generally characterized by some
20 degree of internal lithologic homogeneity or distinctive features.
21 FORTY-NINER MEMBER. Upper anhydrite and mud stone layer of Rustler Formation.
22 GAMMA RAYS. Short wavelength electromagnetic radiation emitted in the radioactive decay 23 of certain nuclides. Gamma rays are the same as gammas or gamma particles. 24 GAS GENERATION MODEL. A computational model that can simulate and/or predict the rate 25 and quantity of gases generated by waste transformation processes in a disposal room 26 of the decommissioned repository. 27 GAS GENERATION RATE. The combined gas production rate from all species of gases produced 28 as a result of transuranic waste transformations such as corrosion, microbial 29 degradation, and/or radiolysis at any given time. The rate of gas production 30 throughout the history of the repository is expected to vary depending on repository 31 conditions with respect to humidity, total or partial brine inundation, competitive 32 reactions that absorb specific gases, and the ability of the repository to retain the gases 33 generated. The term is also applied to individual gases.
March 31, 1995 GL-12 DRAFT-DOE/CAO-2056

Draft 40 CFR 191 Compliance Certification Application
1 GATUNA. A geologic formation covering the Dewey Lake Formation in a wide ranging area. 2 It is basically Pleistocene in age dhd 6f medium to coarse brown soil:
3 GENERATOR AND/OR STORAGE SITES. Refers to the Department of Energy sites nationwide 4 where transuranic wastes are generated and/or stored as a result of activities 5 associated with nuclear weapons production.
6 GEOMORPHOLOGY. The study of landscape development.
7 GETTERS. Substances that sorb gases, such as carbon dioxide (C0 2), and may be added with 8 other potential backfill materials to mitigate the pressure buildup in the repository and 9 radionuclide mobility.
10 GLOVE BOX. A sealed box in which workers, remaining outside and using gloves attached to 11 and passing through openings in the box, can safely handle and work with radioactive 12 materials.
13 GROUNDWATER. Water below the land surface in a zone of saturation. (40 CFR § 191.12)
14 GROUT. A mortar or cement slurry (of high water content) used to plug potential fluid-flow 15 paths in geologic or engineered structures.
16 GUADALUPIAN. Geological group of rocks below the Castile about 4,100 feet to about 8,000 17 feet below the surface. Contains the Bell Canyon, Brushy Canyon, and Cherry Canyon 18 formations.
19 GYPSUM. A mineral consisting of hydrous calcium sulfate: CaS0 4 »2H 2 0. It is soft and, 20 when pure, white.
21 HALF-LIFE. The time required for the activity of a group of identical radioactive nuclei to
22 decay to half its initial value.
23 HALITE. The mineral rock salt: NaCl.
24 HAZARDOUS CONSTITUENT. Those chemicals identified in Appendix VTA of 40 CFR Part 261.
25 HAZARDOUS MATERIAL. Any material that has been determined to be capable of posing a risk
26 to health, safety, or property.
27 HAZARDOUS WASTE. A hazardous waste as defined in 40 CFR § 261.3.
28 HEAD, HYDRAULIC. See HYDRAULIC POTENTIAL.
DRAFT-DOE/CAO-2056 GL-13 March 31,1995

Draft 40 CFR 191 Compliance Certification Application
1 HEADSPACE GASES. The free gas volume at the top of a closed container (between the 2 container lid and the waste inside the container) or containment, such as a drum or bin, 3 containing TRU mixed or simulated waste. The gas may be generated from biological, 4 chemical, or radiolytic processes; this would include contributions from volatile 5 organic compounds (VOCs) present in the waste.
6 HEALTH PHYSICS. The science concerned with the recognition, evaluation, and control of 7 health hazards from ionizing radiation.
8 HEAVY METAL. All uranium, plutonium, or thorium placed into a nuclear reactor. (40 CFR 9 § 191.12)
10 HEP A FILTER. A high-efficiency particulate air filter usually capable of 99.7 percent 11 efficiency as measured by a standard photometric test using 0.3-micron droplets 12 (aerodynamic equivalent diameter) of dioctylphthalate (DOP).
13 HIGH-LEVEL WASTE. Radioactive waste resulting from the reprocessing of spent fuel. 14 Discarded, unreprocessed spent fuel is also high-level waste. It is characterized by 15 intense, penetrating radiation and by high heat-generation rates. Even in protective 16 canisters, high-level waste must be handled remotely.
17 HORIZON. In geology, an interface indicative of a particular position in a stratigraphic 18 sequence. For instance, the waste-emplacement horizon in the Salado Formation at 19 the Waste Isolation Pilot Plant is the level about 650 meters (2,150 feet) deep where 20 openings are mined for waste disposal.
21 HOST ROCK. The rock unit, in this case the Salado Formation, in which the radioactive waste 22 is to be emplaced.
23 HOT CELL. A heavily shielded compartment in which highly radioactive material can be 24 handled, generally by remote control.
25 HUMAN INTRUSION. Inadvertent human disruptions of a mined geologic repository that could 26 result in loss of containment of the waste. The most severe disruption would occur 27 through inadvertent, intermittent intrusion by exploratory drilling (into the repository) 28 for resources (40 CFR Part 191, app. C).
29 HUNDRED-YEAR STORM. A storm that, on a statistical basis, is expected to recur only once 30 every hundred years.
31 HYDRAULIC cONDUcnvrrY. A quantity defined in the study of groundwater hydraulics that 32 • describes the ability of rock to transmit groundwater. It is measured in feet per day or 33 equivalent units. It is equal to the hydraulic transmissivity divided by the thickness of 34 the aquifer.
March 31, 1995 GL-14 DRAFT-DOE/CAO-2056

Draft 40 CFR191 Compliance Certification Application
1 HYDRAULIC GRADIENT. A quantity defined in the study of groundwater hydraulics that 2 describes the rate of change of head with distance.
3 HYDRAULIC POTENTIAL (OR HYDRAULIC HEAD). Hydraulic pressure corrected for the potential 4 energy of elevation. In an aquifer it is equivalent to the highest level of a column of 5 water that the pressure in the aquifer will support. It is measured relative to a specified 6 level, which in this document is sea level.
7 HYDRAULIC TRANSMissrviTY. A measure of the ability of rock to transmit groundwater. It is
8 measured in square feet per day or equivalent units.
9 HYDRAULIC TRANSPORT. The transport of dissolved substances by groundwater.
10 HYDRAULICS, HYDROLOGY. These two terms tend to be used interchangeably, but technically 11 they are not the same. Hydraulics is an engineering discipline; hydrology is the related 12 science. Hydraulics deals with the flow of water. Hydrology deals with water: its 13 properties, circulation, and distribution, from the time it falls as rainwater until it is 14 returned to the atmosphere through evapotranspiration or flows into the ocean. 15 HYDROLOGIC MODELING. The process of using a mathematical representation of a hydrologic 16 system (as embodied in a computer code) to predict the flow of groundwater and the 17 movement of dissolved substances.
18 IMPLEMENTING AGENCY. The Environmental Protection Agency for those implementation 19 responsibilities for the Waste Isolation Pilot Plant Land Withdrawal Act. The 20 Department of Energy is the implementing agency for any other disposal facility and 21 all other implementation responsibilities for the WDPP (under 40 CFR Part 191) not 22 given to the EPA. (40 CFR § 191.12)
23 IN SITU. In the natural or original position. The phrase is used in this document to distinguish 24 in-place experiments, rock properties, and so on, from those measured in the 25 laboratory.
26 INADVERTENT HUMAN INTRUSION. Used in this text to denote an unintentional breach of the
27 repository.
28 INJECTION WELL. A well into which fluids are injected.
29 INSTITUTIONAL CONTROLS. Human actions to control a waste management facility such as the 30 WIPP. Institutional controls are described as "active" and "passive." Active 31 institutional controls are defined in 40 CFR § 191.12 as: (1) controlling access to a 32 disposal site by any means other than passive institutional controls, (2) performing 33 maintenance operations or remedial actions at a site, (3) controlling or cleaning up 34 releases from a site, or (4) monitoring parameters related to disposal system 35 performance. Passive institutional controls are defined in 40 CFR § 191.12 as:
DRAFT-DOE/CAO-2056 GL-15 March 31,1995

Draft 40 CFR191 Compliance Certification Application
1 (1) permanent markers placed at a disposal site, (2) public records and archives, 2 (3) government ownership and regulations regarding land or resource use, and 3 (4) other methods of preserving knowledge about the location, design, and contents of 4 a disposal system.
5 INTENSITY, EARTHQUAKE. A measure of the effects of an earthquake on humans and 6 structures at a particular place. Not to be confused with magnitude.
7 INTERNATIONAL SYSTEM OF UNITS. The version of the metric system which has been 8 established by the International Bureau of Weights and Measures and is administered 9 in the United States by the National Institute of Standards and Technology. The
10 abbreviation for this system is "SI." (40 CFR §191.12)
11 INTERSTITIAL BRINE. Brine distributed in the pore space (voids) of a rock mass.
12 ION EXCHANGE. A phenomenon in which chemical species in one phase or material exchange
13 with similar species in another phase.
14 IRRADIATION. Exposure to any form of radiant energy.
15 ISOTOPE. A species of atom characterized by the number of protons and the number of 16 neutrons in its nucleus. In most instances an element can exist as any of several 17 isotopes, differing in the number of neutrons, but not the number of protons, in their 18 nuclei. Isotopes can be either stable isotopes or radioactive isotopes (also called 19 radioisotopes). 20 KELVIN. A unit of temperature equal to Centigrade degrees. IK = 1 °C. Abbreviated K.
21 LAMBDA FUNCTION (X). X = f(l-p!p2) is a measure of drilling intensity where p, is the 22 probability of markers still being in place and p 2 is the probability that the markers will 23 deter drilling, and f is the frequency of attempted inadvertent intrusions.
24 LAND WITHDRAWAL ACT. Public Law 102-579, which withdraws the land at the Waste 25 Isolation Pilot Plant site from "entry, appropriation, and disposal"; transfers 26 jurisdiction of the land from the Secretary of the Interior to the Secretary of Energy; 27 reserves the land for activities associated with the development and operation of the 28 Waste Isolation Pilot Plant; and includes many other requirements and provisions 29 pertaining to the protection of public health and the environment.
30 LANGBEINITE. A mineral, K 2Mg 2(S0 4) 3, used in the fertilizer industry as a source of 31 potassium sulfate.
32 LATIN HYPERCUBE SAMPLING. A Monte Carlo sampling technique that divides the range of 33 each variable into intervals of equal probability and samples from each interval.
March 31, 1995 GL-16 DRAFT-DOE/CAO-2056

Draft 40 CFR191 Compliance Certification Application
1 LEACHATE. Means any liquid, including any suspended components in the liquid, that has 2 percolated through or drained from hazardous waste.
3 LEACHING. The process of extracting a soluble component from a solid by the percolation of 4 a solvent (in this report, water) through the solid.
5 LEONARDIAN. The geologic formation from 8,000 feet to 11,400 feet below the surface. 6 Middle of the Permian zone.
7 LEVEL-LINE SURVEY. A cross-country survey in which changes in elevation with respect to
8 sea level are very carefully measured.
9 LlTHOLOGY. The study and examination of rocks.
10 LTTHOSTATIC PRESSURE. Subsurface pressure due to the weight of overlying rock or soil.
11 LONG TERM. Refers to the 10,000 years after shaft sealing for which performance assessment 12 calculations and models assess the behavior of the repository with respect to 13 compliance with 40 CFR Part 191 and 40 CFR § 268.6. 14 Los MEDANOS. In this report, the area in southeastern New Mexico surrounding the site 15 proposed for the WDPP repository. In Spanish it means "dune country."
16 LOWER EXPLOSIVE LIMIT. The minimum concentration of gas or vapor in air below which a 17 substance does not burn when exposed to an ignition source.
18 MAGENTA DOLOMITE. The upper of two layers of dolomite within the Rustler Formation that 19 are locally water-bearing.
20 MAGENTA MEMBER. The upper dolomite member that also contains some minor amounts of 21 nonpotable water.
22 MAGNITUDE, EARTHQUAKE. A measure of the total energy released by an earthquake. Not to 23 be confused with intensity.
24 MALAGA BEND. A sharp bend in the Pecos River 20 miles southeast of Carlsbad, New 25 Mexico, and directly east of the town of Malaga. The discharge points of the Rustler 26 aquifers are a series of brine seeps and springs nearby.
27 MAN-REM. A unit of population dose.
28 MARKER BEDS (MB). MBs are well defined layers of rock that mark distinct divisions in 29 major geological strata or geological time frames.
DRAFT-DOE/CAO-2056 GL-17 March 31, 1995

Draft 40 CFR 191 Compliance Certification Application
1 MATHEMATICAL MODEL. The mathematical representation of a conceptual model (i.e., the 2 algebraic, differential or integral equations) that predict quantities of interest of a 3 system and any constitutive equations of the physical material that appropriately 4 approximate system phenomena in a specified domain of the conceptual model.
5 MAXIMALLY EXPOSED PERSON. A hypothetical person who is exposed to a release of 6 radioactivity in such a way that the person receives the maximum possible individual 7 dose or dose commitment. For instance, if the release is a puff of contaminated air, the 8 maximally exposed person is the individual at the point of largest ground-level 9 concentration who stays there during the whole time of the cloud passage. The use of
10 this term is not meant to imply that there is such a person, but only that thought is 11 being given to the maximum exposure a person could receive.
12 MAXIMUM INDIVIDUAL DOSE. The highest dose delivered to the whole body or to an 13 individual organ that a person can receive from a release of radioactivity. The 14 hypothetical person who receives this dose, the maximally exposed person, is one 15 whose location and activities maximize the dose. For instance, the person may be at 16 the point of maximum concentration of a radioactive cloud for the whole time it takes 17 to pass.
18 MEAN. The average value. For a given set of n values, the mean is the sum of their values 19 divided by n.
20 MEDIAN. The median of a set of data is the value such that half of the observations are less
21 than that value and half are greater than that value.
22 MEGAPASCAL (MPA). Pascal times 106.
23 MERCALU INTENSITY. A scale of measurement of earthquake intensity.
24 MESCALERO CALICHE. An informal name for the layer of white calcium containing rock of 25 varying thickness found overlaying the Rustler in the WTPP area. 26 METHANOGENESIS. The generation of methane through the decomposition of organic matter 27 in wastes.
28 MIGRATION. In the context of 40 CFR § 268.6, "migration" means the movement of 29 hazardous constituents beyond the boundary of a hazardous waste management unit in 30 concentrations exceeding applicable regulatory levels.
31 MISCELLANEOUS HAZARDOUS WASTE MANAGEMENT UNIT. A waste management unit where 32 hazardous waste is treated, stored, or disposed of, and that is not a container, tank, 33 surface impoundment, pile, land treatment unit, landfill, incinerator, boiler, industrial 34 furnace, underground injection well, or unit eligible for a research, development, and 35 demonstration permit. (40 CFR § 260.10)
March 31, 1995 GL-18 DRAFT-DOE/CAO-2056
Draft 40 CFR191 Compliance Certification Application
1 MlSSISSIPPlAN. Geologic formation from 15,000 to 15,600 feet. Geologic age when 2 petroleum and natural gas formed about 300 million years ago.
3 MIXED WASTE. Mixed waste contains both radioactive and hazardous components, as defined 4 by the Atomic Energy Act and the Resource Conservation and Recovery Act, 5 respectively.
6 MODEL VALIDATION. The process of ensuring (through sufficient testing of a model using 7 actual site data), that a conceptual model, and corresponding mathematical and 8 computer models, correctly simulate a physical process with sufficient accuracy.
9 MODEL VERIFICATION. The process of ensuring (e.g., through tests on ideal problems) that a 10 computer code (computational model) correctly performs the necessary functional 11 operations (such as solving the mathematical model). Given that a computer code 12 correctly solves the mathematical model, the physical assumptions of the mathematical 13 model must then be checked through validation.
14 MONTE CARLO SAMPLING. A random sampling technique used in computer simulations to 15 obtain approximate solutions to mathematical or physical problems. Monte Carlo 16 sampling is used in conjunction with Latin Hypercube techniques to sample a range of 17 variables. The range is divided into intervals of equal probability, and one value is 18 randomly selected from each interval. The selected values from each interval are 19 combined to generate vectors. The procedure ensures that the distribution tails are 20 sampled; also, it is more efficient than simple random sampling.
21 MUNSON DAWSON MODEL. A simulation model developed to help predict the behavior, 22 particularly the rate of room closure, of Waste Isolation Pilot Plant underground 23 openings.
24 NASH DRAW. A shallow valley, approximately 5 miles wide, open to the southwest located to 25 the west of the WIPP site.
26 NATURAL BACKGROUND RADIATION. Radiation in the human environment from naturally 27 occurring elements and from cosmic radiation.
28 NATURAL BARRIERS. The repository host rock and surrounding geologic structures and 29 formations. The natural barriers extend from the engineered barrier to the compliance 30 boundary.
31 NEUTRON. An elementary particle that has approximately the same mass as the proton but 32 lacks electric charge, and is a constituent of all nuclei having mass number greater 33 than one.
DRAFT-DOE/CAO-2056 GL-19 March 31,1995

Draft 40 CFR191 Compliance Certification Application
1 NEW MEXICO HAZARDOUS WASTE ACT. The New Mexico legislation which establishes the 2 state hazardous waste management program. The state law is no less stringent than the 3 federal law.
4 NEW MEXICO HWMR-7. The New Mexico Hazardous Waste Management Regulations 5 implement the provisions of the New Mexico Hazardous Waste Act. The regulations 6 are consistent with the federal RCRA regulations, 40 CFR Parts 260 through 270.
7 No-MIGRATION. Adequate isolation of RCRA-regulated constituents such that "no-migration" 8 of hazardous-waste constituents beyond the unit boundary occurs for as long as the 9 wastes remain hazardous.
10 No-MtGRATlON DETERMINATION. In the context of the Test Phase, the term "no-migration 11 determination" means the Final Conditional No-Migration Determination for the 12 Department of Energy Waste Isolation Pilot Plant published by the Environmental 13 Protection Agency on November 14,1990 (55 Fed. Reg. 47700), and any amendments 14 thereto, pursuant to the Solid Waste Disposal Act (42 U. S. C. 6901 et seq.). The 15 Department of Energy has decided not to pursue the testing activities in the WTPP 16 underground for which the conditional No-Migration Determination was made.
n NUCLIDE. Isotope.
18 NUCLIDE INVENTORY (RADIONUCLIDE INVENTORY). A list of the kinds and amounts of 19 radionuclides in a container or a source. Amounts are usually expressed in activity 20 units: curies or curies per unit volume.
21 ORDER OF MAGNITUDE. A factor of ten. When a measurement is made with a result such as 22 3xl0 7 , the exponent of 10 (here 7) is the order of magnitude of that measurement. To 23 say that this result is known to "within an order of magnitude" is to say that the true 24 value lies between (in this example) 3xl0 6 and 3xl0 8.
25 ORDOVICIAN. Rock zone between 16,900 feet and 18,200 feet below the surface and also 26 denotes geologic time 425-500 million years ago.
27 OvERPACK. A container put around another container. In the WIPP, overpacks would be 28 used on damaged or otherwise contaminated drums, boxes, and canisters that it would 29 not be practical to decontaminate.
30 OxiC CORROSION. Oxidation of metals by molecular oxygen (0 2 ).
31 PACKAGING. The assembly of components necessary to ensure compliance with packaging 32 requirements. It may consist of one or more receptacles, absorbent materials, spacing 33 structures, thermal insulation, radiation shielding, and devices for cooling or absorbing 34 mechanical shocks. The vehicle, tie-down system, and auxiliary equipment may be 35 designated as part of the packaging.
March 31, 1995 GL-20 DRAFT-DOE/CAO-2056

Draft 40 CFR191 Compliance Certification Application
1 PALEOZOIC Major geological age from 229 million years to 600 million years. Denotes a 2 wide range of geological strata from different subgeological ages, i.e., Permian, 3 Pennsylvania, Mississippi, etc.
4 PANEL. A group of several underground rooms connected by drifts. Within the Waste 5 Isolation Pilot Plant, a panel consists of seven rooms connected by drifts at each end.
6 PANEL. Sandia National Laboratory computer code name for a program which simulates the 7 process of waste mobilization.
8 PASCAL (PA). A unit of pressure obtained by dividing force (in Newtons) by area (in meters 9 squared).
10 PASSIVE INSTITUTIONAL CONTROLS. "(1) [Permanent markers placed at a disposal site, 11 (2) public records and archives, (3) government ownership and regulations regarding 12 land or resource use, and (4) other methods of preserving knowledge about the 13 location, design, and contents of a disposal system." (40 CFR § 191.12)
14 PENNSYLVANIAN. This is a geologic period of approximately 285 million years ago. 15 Pennsylvanian rocks are found about 12,800 to 15,000 feet below the Los Medanos 16 surface. Contains oil and natural gas.
17 PERFORMANCE ASSESSMENT. A term used to denote quantitative activities carried out to 18 evaluate the long-term ability of the Waste Isolation Pilot Plant to effectively isolate 19 the waste, to ensure long-term health and safety of the public by complying with 20 40 CFR Part 191 and 40 CFR § 268.6, and to supply data/information to the 21 compliance analysis for demonstrating regulatory compliance. The final analysis of 22 compliance will consist of a qualitative assessment of the quantitative results of the 23 performance assessment.
24 PERFORMANCE-BASED WASTE ACCEPTANCE CRITERIA. Waste-acceptance criteria based on the 25 results of performance assessment models, operational assessments, and possible 26 conditions which may be imposed as a part of the regulatory process.
27 PERFORMANCE-BASED WASTE ENVELOPE. The bounding characteristics of wastes acceptable 28 for the Waste Isolation Pilot Plant, based on the expected repository performance.
29 PERFORMANCE-BASED WASTE INVENTORY. That portion of the waste inventory which will 30 meet the performance-based waste acceptance criteria.
31 PERMEABILITY. In hydrology, the capacity of a rock sediment or soil to transmit fluids under 32 specified conditions.
DRAFT-DOE/CAO-2056 GL-21 March 31,1995

Draft 40 CFR191 Compliance Certification Application
1 PERMIAN BASIN. A region in the Central United States where, during Permian times 280 to 2 225 million years ago, there were many shallow seas that laid down vast beds of 3 evaporites. The Delaware basin is a part of the Permian basin.
4 pH. A term used to describe the hydrogen-ion activity or concentration of a solution.
5 PHYSIOGRAPHY. A description of the natural features of the surface of the earth.
6 PLUTONIUM. A metallic, radioactive actinide, symbol Pu, atomic number 94, in the 7 transuranium series of elements; used as a nuclear fuel, to produce radioactive nuclides 8 for research, and as the fissile agent in nuclear weapons.
9 PLUTONIUM EQUIVALENT CURIE (PE CI) . A term developed for use at the WIPP to provide a 10 uniform basis among various radioactive wastes to perform comparative human health 11 consequence analyses resulting from inhalation. The PE Ci concept has strict limits of 12 applicability. It is utilized herein as a means of expressing the transuranic activity 13 content of TRU waste packages.
14 POINT SOURCE. A source of effluents that is small enough in dimensions that it can be treated 15 as if it were a point. The converse (not used in this document) is a diffuse source. A 16 point source can be either a continuous source or a source that emits effluents only in 17 puffs or for a short time.
18 POLYHALTTE. An evaporite mineral: K2MgCa2 (S0 4 ) 4 • 2HzO. It is a hard, nearly insoluble 19 mineral with no economic value.
20 POPULATION DOSE. The sum of the radiation doses received by the individual members of a
21 population.
22 POROSITY. The percentage of porous rock that consists of open space.
23 POST-CLOSURE PHASE. A designated period of time beginning with the end of the 24 Decommissioning Phase and extending through the end of the regulatory time frame of 25 10,000 years. Performance assessment modeling of repository behavior will address 26 this time frame with the exception of possible human intrusion events which will not 27 be modeled until 100 years after decommissioning. 28 POTASH. A potassium compound, especially as used in agriculture or industry.
29 POTENTIOMETRIC SURFACE. A subsurface map of the hydraulic potentials of an aquifer. It is 30 usually represented in figures as a contour map, each point estimating how high the 31 water would rise in a well tapping that aquifer at that point.
32 PRECAMBRIAN ROCKS . The deepest rock zone under WIPP (18,000 feet) and the oldest at 33 +600 million years.
March 31, 1995 GL-22 DRAFT-DOE/CAO-2056

Draft 40 CFR191 Compliance Certification Application
1 PROCESS KNOWLEDGE. The detailed knowledge of the processes and materials that generated 2 the wastes in the DOE system.
3 PROJECT TECHNICAL BASELINE. The Project Technical Baseline document includes the 4 technical facts, approaches, and assumptions necessary to support demonstrations of 5 compliance with 40 CFR Part 191 Subparts B and C, 40 CFR § 268.6, and 40 CFR 6 Part 264, Subpart X. As such, the document will serve as a basis for the conceptual 7 model of the WTPP repository by explaining the parameters affecting the performance 8 of the repository. It will include the compliance database consisting of technical data 9 supporting compliance demonstrations.
10 PUBLIC LAW 96-164. The U.S. Department of Energy National Security and Military 11 Applications of Nuclear Energy Act of 1980. Public Law 96-164 directed the 12 Department of Energy to proceed with the design and development of the Waste 13 Isolation Pilot Plant.
14 PUBLIC LAW 102-579. See LAND WITHDRAWAL ACT.
15 QUALITY ASSURANCE. The planned and systematic actions necessary to provide adequate 16 confidence that a structure, system, or component will perform satisfactorily in 17 service.
18 QUALITY ASSURANCE PROJECT PLANS (QAPP). Documents that ensure site-specific waste 19 characterization activities meet the data quality objectives.
20 QUALITY CONTROL. Those quality assurance activities that provide a means to control and 21 measure the characteristics of a structure, system, or component to established 22 requirements.
23 RAD. A unit of absorbed dose. Related to, but not the same as "rem."
24 RADIOACTIVE MATERIAL. Matter composed of or containing radionuclides, with radiological 25 half-lives greater than 20 years, subject to the Atomic Energy Act of 1954, as 26 amended. (40 CFR § 191.12)
27 RADIOGRAPHIC EXAMINATION. The nondestructive technique that enables a qualitative
28 evaluation of the contents of a waste container.
29 RADIOLYSIS. Chemical decomposition by the action of radiation.
30 REAL-TIME RADIOGRAPHY. A nondestructive, nonintrusive examination technique that 31 enables a qualitative (and in some cases semiquantitative) evaluation of the contents of 32 a waste container. Real-Time Radiography utilizes x-rays to inspect the contents of
DRAFT-DOE/CAO-2056 GL-23 March 31,1995

Draft 40 CFR 191 Compliance Certification Application
1 the waste container and allows the operator to view events in progress (real time). 2 Real-Time Radiography is used to examine and verify the physical form of the waste 3 for certain waste forms, identify individual waste components, and verify the absence 4 of certain noncompliant items, as applicable.
5 REASONABLE. (1) Not conflicting with reason, (2) not extreme or excessive, (3) having the 6 faculty of reason, or (4) possessing sound judgment.
7 RECHARGE POINT (OR AREA). In groundwater hydraulics, the point (or area) where surface 8 water enters an aquifer.
9 REGULATORY GUIDE. One of a series of official NRC guides prescribing standards for 10 nuclear facilities. They cover a variety of subjects such as what constitutes acceptable 11 meteorological data or acceptable methods for calculating radiation dose.
12 RET,RASE. Movement of regulated substances into the accessible environment as defined in 13 40 CFR Part 191 or beyond the unit boundary as defined for 40 CFR § 268.6.
14 REM. Roentgen equivalent in man—a special unit of dose equivalent which is the product of 15 absorbed dose, a quality factor which rates the biological effectiveness of the radiation 16 types producing the dose, and other modifying factors (usually equal to one). If the 17 quality and modifying factors are unity, 1 rem is equal to 1 rad: 100 rem = 1 sievert 18 (SI units). Also expressed in terms of millirem (mrem): 1 rem = 1,000 mrem.
19 REMOTE-HANDLED WASTE. Transuranic wastes that have a measured radiation dose rate at 20 the container surface of between 200 mrem per hour and 1,000 rem per hour and, 21 therefore, must be shielded for safe handling.
22 REPOSITORY. The portion of the Waste Isolation Pilot Plant underground system within the 23 Salado Formation, including the access drifts, waste panels, and experimental areas, 24 but excluding the shafts.
25 REPOSITORY/SHAFT SYSTEM. The Waste Isolation Pilot Plant underground workings, 26 including the shafts, all engineered and natural barriers, and the altered zones within 27 the Salado Formation and overlying units resulting from construction of the 28 underground workings.
29 RESERVES. Mineral resources that can be extracted profitably by existing techniques and 30 under present economic conditions.
31 RESISTIVITY. Measure of electrical resistance in a fluid such as brine.
March 31, 1995 GL-24 DRAFT-DOE/CAO-2056

Draft 40 CFR191 Compliance Certification Application
i RESOURCE CONSERVATION AND RECOVERY ACT PERMIT APPLICATION. An application, 2 which is submitted by the owner/operator of a hazardous waste management unit to 3 the state (if authorized by the Environmental Protection Agency) or to the 4 Environmental Protection Agency, for a Resource Conservation and Recovery Act 5 permit to operate the unit.
6 RESOURCES. Mineralization that is concentrated enough, in large enough quantity, and in a 7 physical and chemical forms such that its extraction is currently or potentially feasible 8 and profitable.
9 RETRIEVABLE. Describes storage of radioactive waste in a manner designed for recovery 10 without loss of control or release of radioactivity.
11 ROENTGEN. The international unit of x-radiation or gamma radiation equal to the amount of 12 radiation that produces in 1 cubic centimeter of dry air at 0° and standard atmosphere 13 pressure, ionization of either sign equal to 1 electrostatic unit charge.
14 ROOM. An excavated cavity within a panel in the underground. Within the Waste Isolation 15 Pilot Plant, a room is about 10 meters wide, 4 meters high, and 91 meters long.
16 RUSTLER FORMATION. The evaporite beds, including mudstones, of probable Permian age 17 that immediately overlie the Salado Formation.
18 SALADO FORMATION. A geologic formation of Late Permian age in southeastern New 19 Mexico. At the Waste Isolation Pilot Plant site, it is composed of salt beds with minor 20 amounts of anhydrite (45 numbered anhydrite marker beds: Marker Bed 101 through 21 Marker Bed 145) and clay. It is the host unit for the Waste Isolation Pilot Plant 22 repository.
23 SAN SIMON SINK. The central, most depressed area of San Simon Swale.
24 SAN SIMON SWALE. A broad depression about 15 miles east of the Los Medanos site, open to 25 the southeast.
26 S ANCHO. Sandia National Laboratory computer code name for a program which deals with 27 geomechanical closure of rooms and affects on gas generation.
28 SATURATED. A condition in which all connected pores in a given volume of material contain 29 fluid.
30 SCENARIO. A combination of naturally occurring or human-induced events and processes that 31 represent realistic future changes to the repository, geologic, and geohydrologic 32 systems that could cause or promote the escape of radionuclides and/or hazardous 33 constituents from the repository.
DRAFT-DOE/CAO-2056 GL-25 March 31,1995

Draft 40 CFR191 Compliance Certification Application
1 SEAL. An engineered barrier designed to isolate the waste and to impede groundwater flow in
2 the shafts.
3 SEDIMENTARY. Rocks formed by the accumulation of sediments, usually in ancient seas.
4 SEISMIC RISK ZONE. A designation of a geographic region expressing the maximum intensity 5 of earthquakes that could be expected there. 6 SENSITIVITY ANALYSIS. Methods for computing the effect of changes in the input parameters 7 on the model predictions.
8 SHAFT. A man-made hole, either vertical or steeply inclined, that connects the surface with 9 the underground workings of a mine.
10 SHAFT PILLAR. The cylindrical volume of rock around a shaft from which major underground 11 openings are excluded in order that they not weaken the shaft.
12 SHALLOW-DISSOLUTION ZONE. A zone of residual material at the interface of the Rustler and 13 Salado formations left after dissolution of the salt. It is highly permeable and often 14 contains brine.
15 SI UNIT. A unit of measure in the International System of Units. (40 CFR § 191.12)
16 SIEVERT. The SI unit of effective dose. It is equal to 100 rem or one joule per kilogram. 17 (40 CFR § 191.12)
18 SITE CHARACTERIZATION. The process of making geologic and environmental studies to 19 identify potential sites for mined geologic repositories. Detail site characterization 20 goes further: all additional data are collected that would be necessary if a license 21 application were to be submitted.
22 SLUDGE. Refers to de-watered contact-handled transuranic wastes containing both organic 23 and inorganic constituents that must meet the Waste Acceptance Criteria for shipment 24 and disposal at the Waste Isolation Pilot Plant repository. High sludges are contact-25 handled transuranic waste where the sludge component constitutes 50 percent or more 26 of the waste volume; low sludges are the same type of waste containing less than 50 27 percent by volume of sludge.
28 SOLUBILITY. The ability or tendency of one substance to blend uniformly with another (e.g., 29 solid in liquids, liquid in liquid, gas in liquid, and gas in gas). Solids vary from 0 to 30 100 percent in their degree of solubility in liquids depending on the chemical nature of 31 the substance(s); to the extent that they are soluble, they lose their crystalline form and 32 become molecularly or ionically dispersed in the solvent to form a true solution. 33 Liquids and gases are often said to be miscible in other liquids and gases rather than 34 soluble.
March 31, 1995 GL-26 DRAFT-DOE/CAO-2056
Draft 40 CFR191 Compliance Certification Application
1 SOLUTE. A substance which is dissolved in another substance called the solvent. The solute 2 is uniformly dispersed in the solvent either molecularly or ionicaUy.
3 SOLVENT. A substance capable of dissolving another substance (solute) to form a uniform 4 dispersed mixture (solution) at the molecular or ionic level. Solvents are, accordingly, 5 characterized as either polar or non-polar. Water is strongly polar; hydrocarbon 6 solvents are non-polar.
7 SORPTION. The binding on a microscopic scale of one substance to another, such as by 8 adsorption or ion exchange. In this document, the word is especially used in the 9 sorption of solutes onto aquifer solids.
10 SOURCE TERM. The kinds and amounts of radionuclides that make up the source of a potential 11 release of radioactivity. See NUCLIDE INVENTORY.
12 SPALLINGS. During exploratory drilling, waste surrounding the eroded borehole that is
13 transported by waste-generated gas escaping to the lower pressure borehole.
14 SPECIFIC ACTIVITY. Radioactivity per unit weight of radioactive material.
15 STANDARD WASTE BOX (SWB). A waste container measuring approximately 6 by 4.5 by 3 16 feet high, with rounded ends. 17 STRATA. Geologic term for layering of the earth's crust. The crust was generally laid down in 18 layers during geological epochs.
19 STRATIGRAPHIC. Involves the science and study of the origin, composition, and proper 20 sequence in which various rock strata were layered during various geological ages. 21 Used in this text to describe geological layered formations above and below the WTPP 22 repository and their physical characteristics.
23 STUDY AREA. The region about the Los Medaiios site studied in the evaluation of that site.
24 SWEPE SAMPLES. The presence of radioactive contaminants may be ascertained by applying a 25 Kim-wipe™ or equivalent to the surface of the potentially contaminated item and 26 measuring the radioactivity of the Kim-wipe™.
27 SYLVTTE. A mineral, KC1, used as a fertilizer.
28 TAMARISK MEMBER. Middle anhydrite layer of Rustler Formation.
29 TECTONIC ACTIVITY. Movement of the earth's crust such as uplift and subsidence and the 30 associated folding, faulting, and seismicity.
DRAFT-DOE/CAO-2056 GL-27 March 31,1995

Draft 40 CFR191 Compliance Certification Application
1 THERMAL FIELD. The field or set of temperatures throughout a volume. Use of the term 2 usually connotes temperatures that differ from point to point.
3 THERMAL GRADIENT. The rate of change of temperature in the direction of increasing 4 temperature.
5 TRANSMISSIVITY. For a confined aquifer, the product of hydraulic conductivity and aquifer 6 thickness.
7 TRANSURANIC NUCLIDE. A nuclide with an atomic number greater than that of uranium (92). 8 All transuranic nuclides are produced artificially and are radioactive.
9 TRANSURANIC PACKAGE TRANSPORTER (TRUPACT)-II. Package designed to transport 10 contact-handled TRU mixed waste to the WDPP site. It is a cylinder with a flat bottom 11 and a domed top that is transported in the upright position.
12 TRANSURANIC WASTE. The term "transuranic waste" means waste containing more than 13 100 nanocuries of alpha-emitting transuranic isotopes per gram of waste, with half-14 lives greater than 20 years, except for: (1) high-level radioactive waste, (2) waste that 15 the Secretary has determined, with the concurrence of the Administrator, does not need 16 the degree of isolation required by the disposal regulations, or (3) waste that the 17 Nuclear Regulatory Commission has approved for disposal on a case-by-case basis in 18 accordance with 10 CFR 61.
19 TREATMENT. Means any method, technique, or process, including neutralization, designed to 20 change the physical, chemical, or biological character or composition of any hazardous 21 waste so as to neutralize such waste, or so as to recover energy or material resources 22 from the waste, or as to render such waste non-hazardous, or less hazardous; safe to 23 transport, store, or dispose of; or amenable for recovery, amenable for storage, or 24 reduced in volume.
25 TREND. A general tendency or course of geologic material.
26 TRUE SOLUTION. A uniformly dispersed mixture at the molecular or ionic level, of one or 27 more substances (solute) in one or more substances (solvent). Solutions that exhibit 28 no change of internal energy upon mixing and have complete uniformity of cohesive 29 forces that are true.
30 TYPE A PACKAGING. Means a packaging designed to retain the integrity of containment and 31 shielding required by this part under normal conditions of transport as demonstrated by 32 the tests set forth in 49 CFR § 173.465 or 173.466, as appropriate.
33 UNCERTAINTY ANALYSIS. (1) An evaluation to determine the uncertainty in model predictions 34 that results from imprecisely known input variables. (2) Determination of the degree 35 of uncertainty in the results of a calculation based on uncertainties in the input
March 31, 1995 GL-28 DRAFT-DOE/CAO-2056

Draft 40 CFR191 Compliance Certification Application
1 parameters and underlying assumptions. Such an analysis requires definition of a 2 system, description of the uncertainties in the factors that are to be investigated, and 3 the characteristics of the system that are to be simulated.
4 UNDISTURBED PERFORMANCE. "[T]he predicted behavior of a disposal system, including 5 consideration of the uncertainties in predicted behavior, if the disposal system is not 6 disrupted by human intrusion or the occurrence of unlikely natural events." (40 CFR 7 § 191.12)
8 UNINTERRUPTIBLE POWER SUPPLY (UPS). A power supply that provides automatic, 9 instantaneous power, without delay or transients, on failure of normal power. It can
10 consist of batteries or full-time operating generators. It can be designated as standby 11 or emergency power depending on the application. Emergency installations must meet 12 the requirements specified for emergency.
13 UNIT BOUNDARY. In the context of 40 CFR § 268.6, the unit boundary is that the point at 14 which "migration" occurs if hazardous constituents pass that point in concentrations 15 exceeding health-based levels.
16 VOLATILE ORGANIC COMPOUNDS (VOCS) . RCRA-regulated organic compounds which 17 readily pass into the vapor state and are present in contact-handled transuranic mixed 18 waste.
19 VUGS. Small open cavity in a rock.
20 WASTE ACCEPTANCE CRITERIA. A set of conditions established for permitting transuranic 21 wastes to be packaged, shipped, managed, and disposed of at the Waste Isolation Pilot 22 Plant.
23 WASTE CHARACTERIZATION. Sampling, monitoring, and analysis activities to determine the 24 nature of the waste.
25 WASTE CHARACTERIZATION PROGRAM. The processes of contact-handled transuranic waste 26 analysis to support the No-Migration Determination, Part B of the Resource 27 Conservation and Recovery Act permit application, other permits, transportation 28 requirements, and the experimental program requirements. These analyses include 29 documentation of waste generation processes, visual characterization of waste 30 components, Real-Time Radiography analysis, and passive-active neutron waste assay 31 for radionuclide content. Waste matrix and headspace gas chemical analyses are also 32 part of the characterization program.
33 WASTE FORM. A term used to emphasize the physical and chemical properties of the waste.
DRAFT-DOE/CAO-2056 GL-29 March 31,1995
Draft 40 CFR191 Compliance Certification Application
1 WASTE MATRIX. The material that surrounds and contains the waste and to some extent 2 protects it from being released into the surrounding rock and groundwater. Only 3 material within the canister (or drum or box) that contains the waste is considered part 4 of the waste matrix.
5 WOLFCAMPIAN. Lower member of Permian age in Southeastern New Mexico.
6 WORKING AGREEMENT. Appendix B of the Agreement of Consultation and Cooperation, 7 which sets forth the working details of that Agreement.
8 X-RAY. Any of the electromagnetic radiations of the same nature as visible radiation but of 9 any extremely short wavelength (less than 100 angstroms) that is produced by
10 bombarding a metallic target with fast electrons in vacuum or by transition of atoms to 11 lower energy states, and that has the properties of ionizing a gas upon passage through 12 it, of penetration various thicknesses of all solids, of producing secondary radiations 13 by impinging on materials bodies, of acting on photographic films and plates as light 14 does, and of causing fluorescent screens to emit light.
March 31,1995 GL-30 DRAFT-DOE/CAO-2056