


Bahasa
Halaman
Hukum

ORIGINAL RESEARCHpublished: 12 March 2015
doi: 10.3389/fncel.2015.00072
The pattern of c-Fos expression andits refractory period in the brain ofrats and monkeysVanessa N. Barros 1, Mayara Mundim 2, Layla Testa Galindo 2, Simone Bittencourt 1,Marimelia Porcionatto 2 and Luiz E. Mello 1*
1 Department of Physiology, Universidade Federal de São Paulo, São Paulo, SP, Brazil, 2 Department of Biochemistry,Universidade Federal de São Paulo, São Paulo, SP, Brazil
Edited by:Qi Yuan,
Memorial University, Canada
Reviewed by:Diano F. Marrone,
Wilfrid Laurier University, CanadaHongyu Sun,
University of Pennsylvania, USA
*Correspondence:Luiz E. Mello,
Department of Physiology,Universidade Federal de São Paulo,Pedro de Toledo, 669, St, 3rd floor,
São Paulo, SP 04039-032 [email protected]
Received: 12 October 2014Accepted: 18 February 2015Published: 12 March 2015
Citation:Barros VN, Mundim M, Galindo LT,
Bittencourt S, Porcionatto Mand Mello LE (2015) The pattern
of c-Fos expression and its refractoryperiod in the brain of rats
and monkeys.Front. Cell. Neurosci. 9:72.
doi: 10.3389/fncel.2015.00072
Intense activation of neurons triggers the appearance of immediate expression genes,including c-Fos. This gene is related to various signal cascades involved in biochemicalprocesses such as neuronal plasticity, cell growth and mitosis. Here we investigatethe expression pattern and the refractory period of c-Fos in rats and monkey’s brainsafter stimulation with pentylenetetrazol. Rats and monkeys were sacrificed at varioustimes after PTZ-induced seizure. Here we show that rats and monkeys already showedc-Fos expression at 0.5 h after seizure. Yet, the pattern of protein expression waslonger in monkeys than rats, and also was not uniform (relative intensity) across differentbrain regions in monkeys as opposed to rats. In addition monkeys had a regionalbrain variation with regard to the temporal profile of c-Fos expression, which was notseen in rats. The refractory period after a second PTZ stimulation was also markedlydifferent between rats and monkeys with the latter even showing a summatory effecton c-Fos expression after a second stimulation. However, assessment of c-Fos mRNAin rats indicated a post-transcriptional control mechanism underlying the duration ofthe refractory period. The difference in the protein expression pattern in rodents andprimates characterizes a functional aspect of brain biochemistry that differs betweenthese mammalian orders and may contribute for the more developed primate cognitivecomplexity as compared to rodents given c-Fos involvement in cognitive and learningtasks.
Keywords: c-Fos expression, brain plasticity, marmosets, phylogeny, neuronal activation
Introduction
At the basic functional level, neurons, regardless of whether in rodents or primates show aremarkable similarity in their biochemical and biophysical characteristics. Indeed at the nervoussystem level, the few main differences described between rodents and primates concern mostnotably brain and neuronal size in addition to the distribution of specific neuropeptides(Finlay and Darlington, 1995; Clark et al., 2001; Finlay et al., 2001; Pearce et al., 2013).Therefore, broad differences at the biochemical level that could have wide implications forthe understanding of different brain functioning between rodents and primates have notbeen reported, with the exception of those related to specific neuronal systems (e.g., visual andolfactory).
Frontiers in Cellular Neuroscience | www.frontiersin.org 1 March 2015 | Volume 9 | Article 72
Barros et al. c-Fos expression between species
One of such fundamental biochemical elements is the proto-oncogene c-Fos which encodes a nuclear phosphoprotein Fos,that forms a dimeric complex with another protein named Jun,that exhibits a DNA sequence binding sites for the transcriptionfactor activator protein-1 (AP-1). JUN family and Fos-relatedproteins forms countless possible combinations among itsmembers, controlling other late genes and proteins related tocognition, motor and learning processes (Morgan et al., 1987; daSilveira et al., 2007). Several studies with mice and rats showeda seemingly similar expression of c-Fos in several regions ofthe central nervous system when the animal is exposed to awide range of stimuli (water stress, fear, odors, intraparenchymalinjection of various substances, including convulsing agentsDragunow and Robertson, 1987; Le Gal La Salle, 1988; Simleret al., 1994; Szyndler et al., 2009; Kawashima et al., 2014).
It is well known that rodents express c-Fos after seizure(Dragunow and Robertson, 1987; Le Gal La Salle, 1988; Simleret al., 1994). Preliminary evidence from our laboratory indicatedthat the temporal expression patterns of c-Fos after similarseizure events differed between rats and marmosets. One ofthe potential reasons would be a different seizure profilein terms of its temporal progression or intensity betweenthese 2 different species. Yet our data concerning all of theobservable behavioral features of seizure expression after PTZ(pentylenetetrazol) in rats and marmosets indicate no significantdifferences on that regard (Bachiega et al., 2008; Blanco et al.,2009). Therefore, this paper aims to draw a profile of expressionof c-Fos by stimulation with PTZ in rats and monkeys invarious regions of the central nervous system in order totest the possible differences that may exist between these twospecies.
Material and Methods
SubjectTo determine whether the expression of immediate early geneswould constitute one of such basic functional differences betweenrodents and primates we assessed its expression after seizures inrats and marmosets.
We used 50 marmosets (Callithrix jacchus) and 50 rats(Wistar) males and females weighing 250--400 g aged between8 to 9 weeks in rats and 1--2 years in marmoset. The protocolsused were approved by the Ethical Committee of Use and Care ofAnimals of UNIFESP (CEP No. 0175/12) and by the Ministry ofEnvironment of Brazil. In experiment 1, which aimed to definethe expression pattern of c-Fos in both species, we obtained thefollowing groups (n = 5/group): Control group--correspondingto animals anesthetized and sacrificed without administrationof any vehicle/drug except anesthetics; sal 1 h: correspondingto those animals that were anesthetized and sacrificed withadministration of saline (only rats); PTZ 0.5 h: animals thatreceived PTZ and 30 min after the seizure were sacrificed; PTZ1 h: animals that received PTZ and 1 h after seizure weresacrificed and so on in PTZ 2 h (only in rats), PTZ 3 h (rats andmarmoset), PTZ 6 h (rats and marmosets), PTZ 9 h (marmosets)and PTZ 12 h (marmosets only). In experiment 2 aimed atinvestigating the refractory period the groups were (n = 5/group):
in rats (groups PTZ 1 h/1 h; PTZ 3 h/1 h and PTZ 6 h/1 h) andin marmosets (PTZ 3 h/3 h; PTZ 6 h/3 h and PTZ 12 h/3 h). Thefirst hour refers to the application time of the second dose of PTZafter the first seizure, and the second hour refers to the time thatthey were sacrificed after the second seizure.
In this work (both for Experiment 1 and Experiment 2), weconsidered an animal to have had seizures only if the animalreached stage V of the Racine scale (1972). As for the timeused for composing the different experimental groups, we startedcounting the time just after the animal reached stage V or afteradministration of saline (in case of sal 1 h group). The latencyfor reaching stage V seizures, was in the range of 1--2 min inrats and 1--5 min in monkeys. A detailed report of PTZ-inducedseizures in marmosets can be found elsewhere (Bachiega et al.,2008). For all means the seizures induced in rats and marmosetswere behaviorally similar in latency, intensity and duration.
Immunohistochemistry AnalysisThe animals were subjected to intraperitoneal injections ofPTZ (50 mg/kg) or saline and sacrificed at specific timepoints. All animals were anesthetized with ketamine (60 mg/kg)and xylazine (15 mg/kg) intraperitoneally and subsequentlydecapitated. The right hemisphere was stored −80◦C and laterused for molecular biology procedures. The left hemispherewas placed in Eppendorf tubes (30 mL) containing 4%paraformaldehyde in PBS 0.01 M, pH 7.2, at 4◦C for 5 days andthen dried for 2 or more days in 30% sucrose in PBS 0.01 MpH 7.2 at 4◦C for subsequent immunohistochemical analysis forc-Fos.
After fixation and dehydration the left hemispheres weresectioned in a cryostat in coronal sections of 30 µm thickness.The sections were processed for the immunohistochemicaldetection of c-Fos protein using a conventional avidin--biotin--immunoperoxidase technique to localize an antiserum raisedagainst a synthetic N-terminal fragment of human Fos protein(rabbit polyclonal ab-5, Calbiochem). Briefly, free-floatingsections were pretreated with hydrogen peroxidase for 10 min.Sections were treated with normal goat serum (1:100) and 0.3%Triton X-100 for 2 h and incubated with the primary antiserumat a dilution 1:5000 in KPBS at room temperature for 24 h.Subsequently, the sections were incubated with a secondaryantibody (goat anti-rabbit IgG 1:200---Vector) for 2 h at roomtemperature and treated with avidin--biotin complex (Vector1:100) for 90 min. Sections were submitted to nickel-intensifieddiaminobenzidine reaction. Between steps, the sections wererinsed in KPBS (pH 6.8) 0.05 M. The tissue was agitated ona rotator between each incubation and rinse step. Sectionswere mounted on gelatin-coated slides, dried, dehydrated, andcoverslipped. To avoid eventual bias, at least one animal fromeach group was included in every staining batch. Four sectionsfor each region (cingulate gyrus, piriform and primary motorcortex) were mounted on slides for histological evaluation.Histological counting of cells expressing c-Fos protein in thebrain regions of interest was performed using the ImageJ® 1.45 s(National Institutes of Health USA) (Carnevali et al., 2004).
The number of c-Fos-positive cell nuclei within each areawas counted in four consecutive sections per animal and the
Frontiers in Cellular Neuroscience | www.frontiersin.org 2 March 2015 | Volume 9 | Article 72
Barros et al. c-Fos expression between species
average of them was expressed as number of c-Fos-positive cells× 10−5/µm3. Stereological methods were not employed in thisstudy due to potential bias associated with counts generated inthis manner, such as uncertainties as to the extent to whichantiserum penetrates through the thickness of the tissue sectionsand difficulties in defining the boundaries of the several cellgroups of interest. Moreover, our interest was to make onlyrelative comparisons of the strength of Fos induction as afunction of the treatment status (Li and Sawchenko, 1998;Medeiros et al., 2003).
qPCR AnalysisThe right hemispheres were removed from the −80◦C andhomogenized in TRIzol® Reagent (Invitrogen) (2 mL forrats, 7 mL for marmosets) with the aid of ULTRA80 handhomogenizer (Ultra Stirrer) with stem 10 mm, in solution.The purified RNA (as TRizol protocol) was ressuspended at202 µm of sterile water at 60◦C, and 2 µL of this solutionwas used for quantification in a spectrophotometer (ND-1000NanoDrop Technologies, Wilmington, DE, USA) for subsequentcDNA synthesis. After quantification, 2 µm of total RNA wereused for synthesis of the complementary DNA strand. Tothis was added 1 µL RNA Oligo (dT) 15 primer (Promega,Madison, WI, USA) and RNase free H2O to complete 5 uLvolume. This mixture was incubated for 5 min at 70◦C followedby 5 min at 4◦C. After this incubation period, we added0.5 µL RNasin® Ribonuclease Inhibitor (Promega), 1.0 uL of10 mM deoxynucleotide triphosphate (dNTP Promega), 1.0 uLIMPROM--II Reverse Transcription System (Promega samplesto ), 4.0 µL of enzyme buffer, 2.4 µL of 25 mM MgCl2 and6.1 uL H2O RNase-free. The conditions used for amplificationin a thermocycler (Eppendorf) were: 25◦C for 5 min, 42◦C for60 min, 70◦C for 15 min. After synthesis, the c-DNA sampleswere stored at −20◦C. To verify the efficiency of RT-PCR, areaction of conventional PCR was performed for amplificationof the c-Fos.
The qPCR reaction was performed using Brilliant® IISYBR® Green QPCR Master Mix (Stratagene, La Jolla, CA,USA) in a thermocycler Stratagene Mx3000P QPCR System(Stratagene) (Livak and Schmittgen, 2001). The c-fos primerfor rats is forward 5’ ACGGAGAATCCGAAGGGAAAGGAA3’ and reverse 5’ TCTGCAACGCAGAC TTCTCGTCTT 3’.The hprt gene was used as endogen primer (rats: forward5’ CTCATGGACTGATTATGGACAGGA C 3’ reverse 5’GCAGGTCAGCAAAGAACTTATAGCC 3’). The expressionof c-Fos was normalized to hprt expression and calculated usingthe 2-∆∆Ct method [13]. Data analysis was performed withthe StatView® for Windows software version 5.0.1. Comparisonsbetween data were made by ANOVA followed by Fisher test.The level of significance was set at P < 0.05 and P < 0.001.
Results
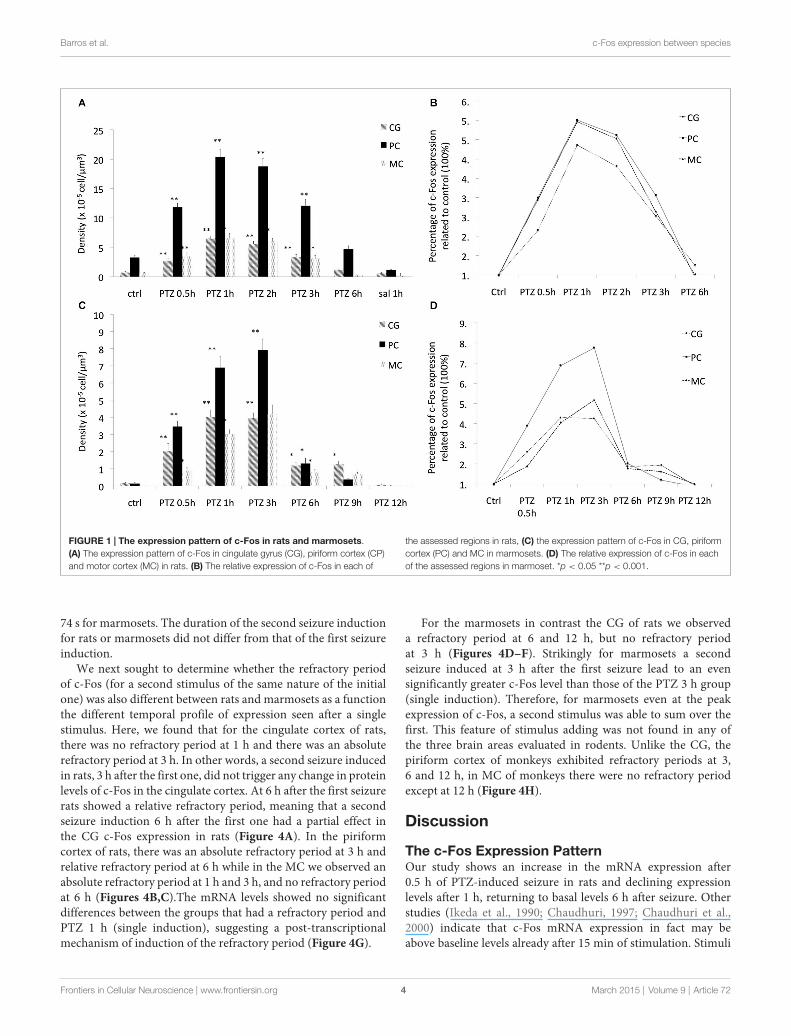
The Expression PatternAs expected seizure induction by means of PTZ lead to increasedexpression of c-Fos at the immunocytochemical level in rodentsalready at 30 min (Szyndler et al., 2009). Maximum expression
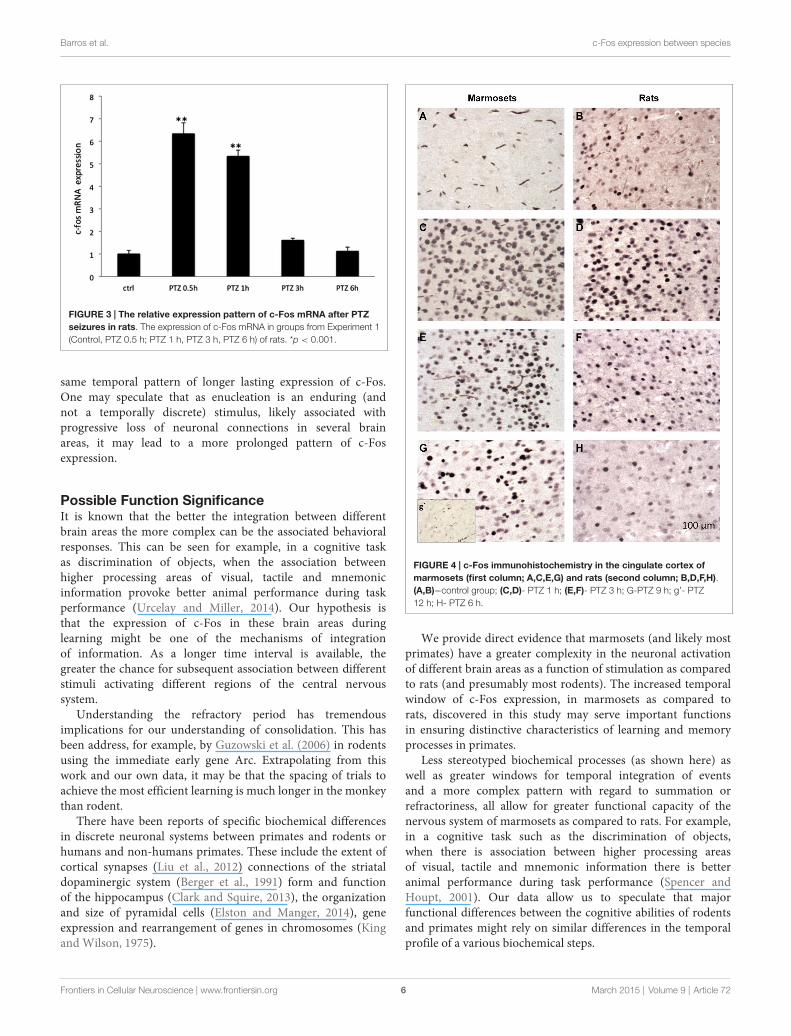
levels were observed at 1 and 2 h after seizure induction,returning to baseline values at 6 h. This same expression patternwas observed in all of the 3 brain regions assessed (Figures 1A,2). c-Fos mRNA levels were at the maximum expression level 30min after seizures, and had returned to baseline values after 3 h(see Figure 3). To this end our results match those previouslyreported after stimulation with metrazol, a similar convulsingagent, and also with PTZ (Sonnenberg et al., 1989; Clark et al.,2001). Our assessment of mRNA for c-Fos in marmosets didnot yield results. It is likely that degradation of the samplesinfluenced our ability to evaluate the marmosets c-Fos mRNA.
To determine whether this pattern would be conserved inprimates we then investigated c-Fos expression in marmosetsunder the same stimulus parameters. As compared to rats,marmosets had expression of c-Fos notably longer than rats inall assessed brain areas. Even though with a similar initial surgeat 30 min after PTZ seizure induction, c-Fos expression wasmarkedly above control levels still at 6 h (Figure 2). Indeed,at 6 h after seizures, when c-Fos had returned to basal levelsin rats, marmosets still exhibited 200% more than basal levels(Figures 1B,D). Return to baseline levels was only seen after9 h in piriform and motor cortex (MC) and after 12 h in thecingulate gyrus (CG; Figures 1C,D, 2).
Unlike rodents, there was a greater topographic specificity ofthe expression pattern of c-Fos in the evaluated brain areas (witheach brain area exhibiting different temporal profile of c-Fosexpression), which allows speculation about a greater complexity(less stereotypy) of the biochemical processes mediated byc-Fos in marmosets as compared to rats. In addition, peakc-Fos expression in marmosets ranged from 400% to 800% ascompared to basal levels while in rats c-Fos peak was ratherhomogeneous for the evaluated brains regions and did not exceed500% (see Figures 1B,D).
The Refractory PeriodAfter an initial stimulus c-Fos expression has been reportedto show refractory period to subsequent stimulation of similarnature (Morgan et al., 1987). For many, this has also beenassociated with c-Fos expression having a link to novelty, i.e.,c-Fos would be also amarker of functional change and adaptation(Hoffman and Lyo, 2002).
The second seizure induced by the second dose of PTZ wasgenerally similar to seizure generated by the first dose of PTZ.However, the time between application of PTZ and the seizure(seizure latency) did show some variation from animal to animaland was shorter in experiment 2 (about 30 s [range 15--120 s] inrats and 1 min [range 45--420 s] in monkeys) in relation to theexperiment 1 (1--2 min [range 50--800 s] in rats and 5 min [range140--720 s] in monkeys). A few marmosets exhibited prolongedseizure in experiment 2 (lasting 1 h or more), these animals wereexcluded from the analysis. The average duration of a stage Vseizure was 46 ± 26 s for rats and 68 ± 23 s for marmosets, aftera single seizure induction. The average duration of the stage Vseizure for a second seizure induction 1, 3 and 6 h after the initialseizure induction ranged from 44 to 62 s for rats. The averageduration of the stage V seizure for a second seizure induction 3,6 and 12 h after the initial seizure induction ranged from 58 to
Frontiers in Cellular Neuroscience | www.frontiersin.org 3 March 2015 | Volume 9 | Article 72
Barros et al. c-Fos expression between species
FIGURE 1 | The expression pattern of c-Fos in rats and marmosets.(A) The expression pattern of c-Fos in cingulate gyrus (CG), piriform cortex (CP)and motor cortex (MC) in rats. (B) The relative expression of c-Fos in each of
the assessed regions in rats, (C) the expression pattern of c-Fos in CG, piriformcortex (PC) and MC in marmosets. (D) The relative expression of c-Fos in eachof the assessed regions in marmoset. *p < 0.05 **p < 0.001.
74 s for marmosets. The duration of the second seizure inductionfor rats or marmosets did not differ from that of the first seizureinduction.
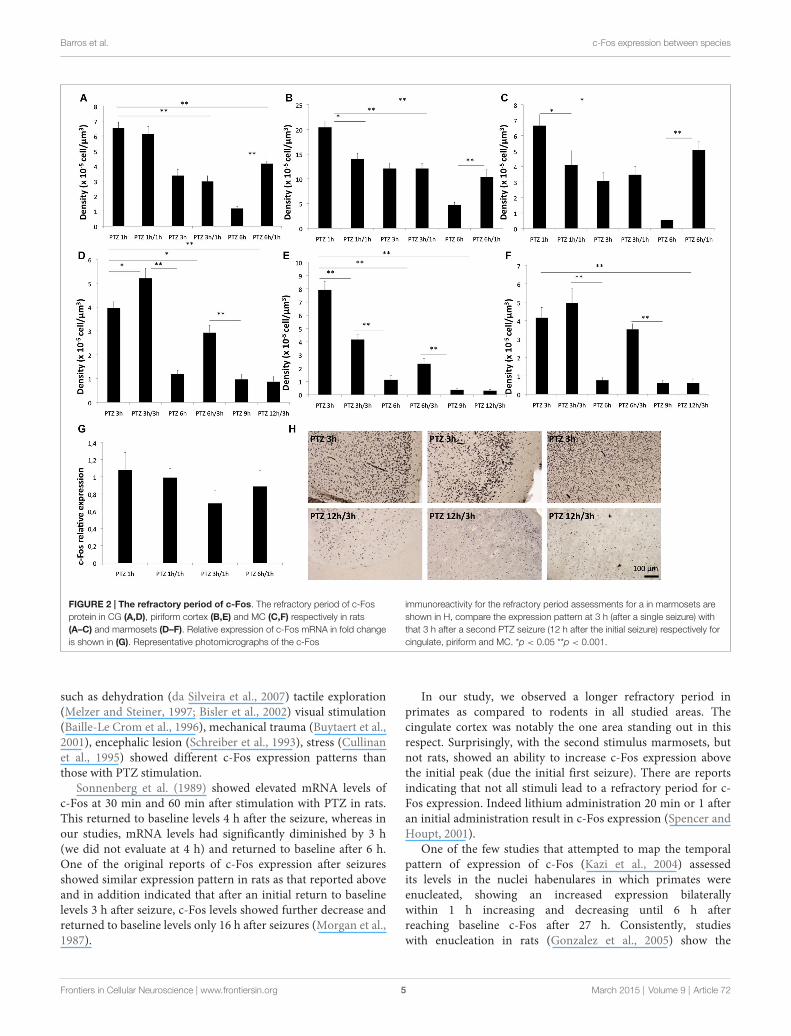
We next sought to determine whether the refractory periodof c-Fos (for a second stimulus of the same nature of the initialone) was also different between rats and marmosets as a functionthe different temporal profile of expression seen after a singlestimulus. Here, we found that for the cingulate cortex of rats,there was no refractory period at 1 h and there was an absoluterefractory period at 3 h. In other words, a second seizure inducedin rats, 3 h after the first one, did not trigger any change in proteinlevels of c-Fos in the cingulate cortex. At 6 h after the first seizurerats showed a relative refractory period, meaning that a secondseizure induction 6 h after the first one had a partial effect inthe CG c-Fos expression in rats (Figure 4A). In the piriformcortex of rats, there was an absolute refractory period at 3 h andrelative refractory period at 6 h while in the MC we observed anabsolute refractory period at 1 h and 3 h, and no refractory periodat 6 h (Figures 4B,C).The mRNA levels showed no significantdifferences between the groups that had a refractory period andPTZ 1 h (single induction), suggesting a post-transcriptionalmechanism of induction of the refractory period (Figure 4G).
For the marmosets in contrast the CG of rats we observeda refractory period at 6 and 12 h, but no refractory periodat 3 h (Figures 4D--F). Strikingly for marmosets a secondseizure induced at 3 h after the first seizure lead to an evensignificantly greater c-Fos level than those of the PTZ 3 h group(single induction). Therefore, for marmosets even at the peakexpression of c-Fos, a second stimulus was able to sum over thefirst. This feature of stimulus adding was not found in any ofthe three brain areas evaluated in rodents. Unlike the CG, thepiriform cortex of monkeys exhibited refractory periods at 3,6 and 12 h, in MC of monkeys there were no refractory periodexcept at 12 h (Figure 4H).
Discussion
The c-Fos Expression PatternOur study shows an increase in the mRNA expression after0.5 h of PTZ-induced seizure in rats and declining expressionlevels after 1 h, returning to basal levels 6 h after seizure. Otherstudies (Ikeda et al., 1990; Chaudhuri, 1997; Chaudhuri et al.,2000) indicate that c-Fos mRNA expression in fact may beabove baseline levels already after 15 min of stimulation. Stimuli
Frontiers in Cellular Neuroscience | www.frontiersin.org 4 March 2015 | Volume 9 | Article 72
Barros et al. c-Fos expression between species
FIGURE 2 | The refractory period of c-Fos. The refractory period of c-Fosprotein in CG (A,D), piriform cortex (B,E) and MC (C,F) respectively in rats(A–C) and marmosets (D–F). Relative expression of c-Fos mRNA in fold changeis shown in (G). Representative photomicrographs of the c-Fos
immunoreactivity for the refractory period assessments for a in marmosets areshown in H, compare the expression pattern at 3 h (after a single seizure) withthat 3 h after a second PTZ seizure (12 h after the initial seizure) respectively forcingulate, piriform and MC. *p < 0.05 **p < 0.001.
such as dehydration (da Silveira et al., 2007) tactile exploration(Melzer and Steiner, 1997; Bisler et al., 2002) visual stimulation(Baille-Le Crom et al., 1996), mechanical trauma (Buytaert et al.,2001), encephalic lesion (Schreiber et al., 1993), stress (Cullinanet al., 1995) showed different c-Fos expression patterns thanthose with PTZ stimulation.
Sonnenberg et al. (1989) showed elevated mRNA levels ofc-Fos at 30 min and 60 min after stimulation with PTZ in rats.This returned to baseline levels 4 h after the seizure, whereas inour studies, mRNA levels had significantly diminished by 3 h(we did not evaluate at 4 h) and returned to baseline after 6 h.One of the original reports of c-Fos expression after seizuresshowed similar expression pattern in rats as that reported aboveand in addition indicated that after an initial return to baselinelevels 3 h after seizure, c-Fos levels showed further decrease andreturned to baseline levels only 16 h after seizures (Morgan et al.,1987).
In our study, we observed a longer refractory period inprimates as compared to rodents in all studied areas. Thecingulate cortex was notably the one area standing out in thisrespect. Surprisingly, with the second stimulus marmosets, butnot rats, showed an ability to increase c-Fos expression abovethe initial peak (due the initial first seizure). There are reportsindicating that not all stimuli lead to a refractory period for c-Fos expression. Indeed lithium administration 20 min or 1 afteran initial administration result in c-Fos expression (Spencer andHoupt, 2001).
One of the few studies that attempted to map the temporalpattern of expression of c-Fos (Kazi et al., 2004) assessedits levels in the nuclei habenulares in which primates wereenucleated, showing an increased expression bilaterallywithin 1 h increasing and decreasing until 6 h afterreaching baseline c-Fos after 27 h. Consistently, studieswith enucleation in rats (Gonzalez et al., 2005) show the
Frontiers in Cellular Neuroscience | www.frontiersin.org 5 March 2015 | Volume 9 | Article 72
Barros et al. c-Fos expression between species
FIGURE 3 | The relative expression pattern of c-Fos mRNA after PTZseizures in rats. The expression of c-Fos mRNA in groups from Experiment 1(Control, PTZ 0.5 h; PTZ 1 h, PTZ 3 h, PTZ 6 h) of rats. *p < 0.001.
same temporal pattern of longer lasting expression of c-Fos.One may speculate that as enucleation is an enduring (andnot a temporally discrete) stimulus, likely associated withprogressive loss of neuronal connections in several brainareas, it may lead to a more prolonged pattern of c-Fosexpression.
Possible Function SignificanceIt is known that the better the integration between differentbrain areas the more complex can be the associated behavioralresponses. This can be seen for example, in a cognitive taskas discrimination of objects, when the association betweenhigher processing areas of visual, tactile and mnemonicinformation provoke better animal performance during taskperformance (Urcelay and Miller, 2014). Our hypothesis isthat the expression of c-Fos in these brain areas duringlearning might be one of the mechanisms of integrationof information. As a longer time interval is available, thegreater the chance for subsequent association between differentstimuli activating different regions of the central nervoussystem.
Understanding the refractory period has tremendousimplications for our understanding of consolidation. This hasbeen address, for example, by Guzowski et al. (2006) in rodentsusing the immediate early gene Arc. Extrapolating from thiswork and our own data, it may be that the spacing of trials toachieve the most efficient learning is much longer in the monkeythan rodent.
There have been reports of specific biochemical differencesin discrete neuronal systems between primates and rodents orhumans and non-humans primates. These include the extent ofcortical synapses (Liu et al., 2012) connections of the striataldopaminergic system (Berger et al., 1991) form and functionof the hippocampus (Clark and Squire, 2013), the organizationand size of pyramidal cells (Elston and Manger, 2014), geneexpression and rearrangement of genes in chromosomes (Kingand Wilson, 1975).
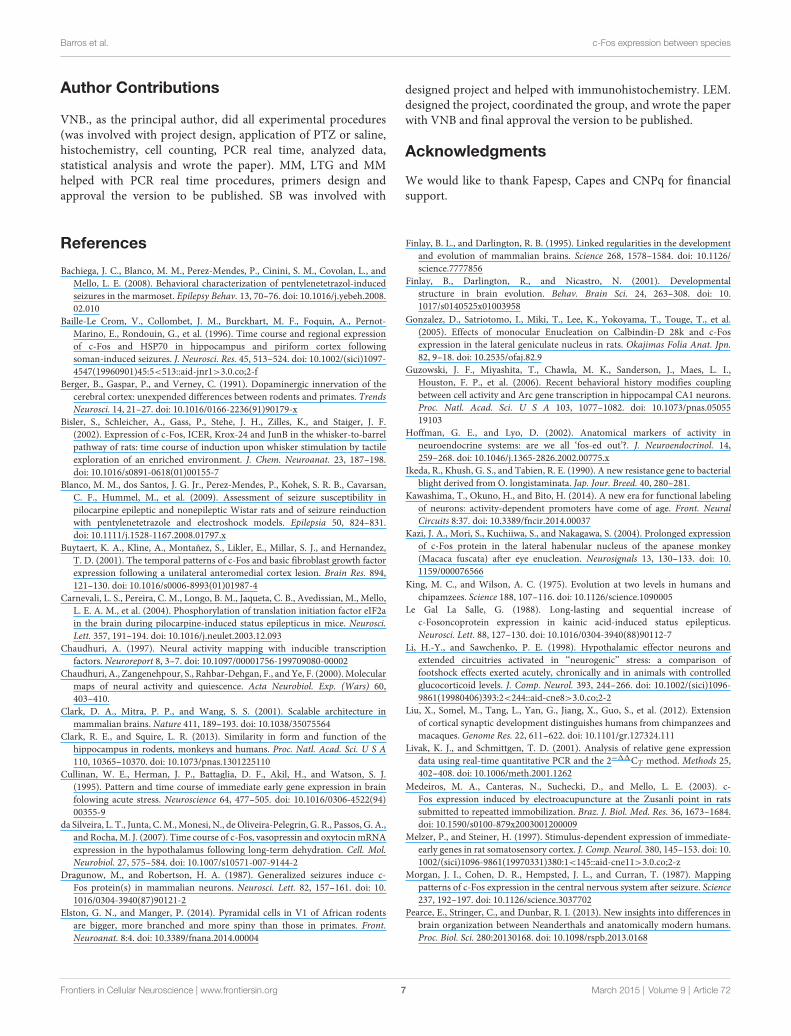
FIGURE 4 | c-Fos immunohistochemistry in the cingulate cortex ofmarmosets (first column; A,C,E,G) and rats (second column; B,D,F,H).(A,B)---control group; (C,D)- PTZ 1 h; (E,F)- PTZ 3 h; G-PTZ 9 h; g’- PTZ12 h; H- PTZ 6 h.
We provide direct evidence that marmosets (and likely mostprimates) have a greater complexity in the neuronal activationof different brain areas as a function of stimulation as comparedto rats (and presumably most rodents). The increased temporalwindow of c-Fos expression, in marmosets as compared torats, discovered in this study may serve important functionsin ensuring distinctive characteristics of learning and memoryprocesses in primates.
Less stereotyped biochemical processes (as shown here) aswell as greater windows for temporal integration of eventsand a more complex pattern with regard to summation orrefractoriness, all allow for greater functional capacity of thenervous system of marmosets as compared to rats. For example,in a cognitive task such as the discrimination of objects,when there is association between higher processing areasof visual, tactile and mnemonic information there is betteranimal performance during task performance (Spencer andHoupt, 2001). Our data allow us to speculate that majorfunctional differences between the cognitive abilities of rodentsand primates might rely on similar differences in the temporalprofile of a various biochemical steps.
Frontiers in Cellular Neuroscience | www.frontiersin.org 6 March 2015 | Volume 9 | Article 72
Barros et al. c-Fos expression between species
Author Contributions
VNB., as the principal author, did all experimental procedures(was involved with project design, application of PTZ or saline,histochemistry, cell counting, PCR real time, analyzed data,statistical analysis and wrote the paper). MM, LTG and MMhelped with PCR real time procedures, primers design andapproval the version to be published. SB was involved with
designed project and helped with immunohistochemistry. LEM.designed the project, coordinated the group, and wrote the paperwith VNB and final approval the version to be published.
Acknowledgments
We would like to thank Fapesp, Capes and CNPq for financialsupport.
References
Bachiega, J. C., Blanco, M. M., Perez-Mendes, P., Cinini, S. M., Covolan, L., andMello, L. E. (2008). Behavioral characterization of pentylenetetrazol-inducedseizures in the marmoset. Epilepsy Behav. 13, 70--76. doi: 10.1016/j.yebeh.2008.02.010
Baille-Le Crom, V., Collombet, J. M., Burckhart, M. F., Foquin, A., Pernot-Marino, E., Rondouin, G., et al. (1996). Time course and regional expressionof c-Fos and HSP70 in hippocampus and piriform cortex followingsoman-induced seizures. J. Neurosci. Res. 45, 513--524. doi: 10.1002/(sici)1097-4547(19960901)45:5<513::aid-jnr1>3.0.co;2-f
Berger, B., Gaspar, P., and Verney, C. (1991). Dopaminergic innervation of thecerebral cortex: unexpended differences between rodents and primates. TrendsNeurosci. 14, 21--27. doi: 10.1016/0166-2236(91)90179-x
Bisler, S., Schleicher, A., Gass, P., Stehe, J. H., Zilles, K., and Staiger, J. F.(2002). Expression of c-Fos, ICER, Krox-24 and JunB in the whisker-to-barrelpathway of rats: time course of induction upon whisker stimulation by tactileexploration of an enriched environment. J. Chem. Neuroanat. 23, 187--198.doi: 10.1016/s0891-0618(01)00155-7
Blanco, M. M., dos Santos, J. G. Jr., Perez-Mendes, P., Kohek, S. R. B., Cavarsan,C. F., Hummel, M., et al. (2009). Assessment of seizure susceptibility inpilocarpine epileptic and nonepileptic Wistar rats and of seizure reinductionwith pentylenetetrazole and electroshock models. Epilepsia 50, 824--831.doi: 10.1111/j.1528-1167.2008.01797.x
Buytaert, K. A., Kline, A., Montañez, S., Likler, E., Millar, S. J., and Hernandez,T. D. (2001). The temporal patterns of c-Fos and basic fibroblast growth factorexpression following a unilateral anteromedial cortex lesion. Brain Res. 894,121--130. doi: 10.1016/s0006-8993(01)01987-4
Carnevali, L. S., Pereira, C. M., Longo, B. M., Jaqueta, C. B., Avedissian, M., Mello,L. E. A. M., et al. (2004). Phosphorylation of translation initiation factor eIF2ain the brain during pilocarpine-induced status epilepticus in mice. Neurosci.Lett. 357, 191--194. doi: 10.1016/j.neulet.2003.12.093
Chaudhuri, A. (1997). Neural activity mapping with inducible transcriptionfactors. Neuroreport 8, 3--7. doi: 10.1097/00001756-199709080-00002
Chaudhuri, A., Zangenehpour, S., Rahbar-Dehgan, F., and Ye, F. (2000).Molecularmaps of neural activity and quiescence. Acta Neurobiol. Exp. (Wars) 60,403--410.
Clark, D. A., Mitra, P. P., and Wang, S. S. (2001). Scalable architecture inmammalian brains. Nature 411, 189--193. doi: 10.1038/35075564
Clark, R. E., and Squire, L. R. (2013). Similarity in form and function of thehippocampus in rodents, monkeys and humans. Proc. Natl. Acad. Sci. U S A110, 10365--10370. doi: 10.1073/pnas.1301225110
Cullinan, W. E., Herman, J. P., Battaglia, D. F., Akil, H., and Watson, S. J.(1995). Pattern and time course of immediate early gene expression in brainfolowing acute stress. Neuroscience 64, 477--505. doi: 10.1016/0306-4522(94)00355-9
da Silveira, L. T., Junta, C.M.,Monesi, N., de Oliveira-Pelegrin, G. R., Passos, G. A.,and Rocha,M. J. (2007). Time course of c-Fos, vasopressin and oxytocinmRNAexpression in the hypothalamus following long-term dehydration. Cell. Mol.Neurobiol. 27, 575--584. doi: 10.1007/s10571-007-9144-2
Dragunow, M., and Robertson, H. A. (1987). Generalized seizures induce c-Fos protein(s) in mammalian neurons. Neurosci. Lett. 82, 157--161. doi: 10.1016/0304-3940(87)90121-2
Elston, G. N., and Manger, P. (2014). Pyramidal cells in V1 of African rodentsare bigger, more branched and more spiny than those in primates. Front.Neuroanat. 8:4. doi: 10.3389/fnana.2014.00004
Finlay, B. L., and Darlington, R. B. (1995). Linked regularities in the developmentand evolution of mammalian brains. Science 268, 1578--1584. doi: 10.1126/science.7777856
Finlay, B., Darlington, R., and Nicastro, N. (2001). Developmentalstructure in brain evolution. Behav. Brain Sci. 24, 263--308. doi: 10.1017/s0140525x01003958
Gonzalez, D., Satriotomo, I., Miki, T., Lee, K., Yokoyama, T., Touge, T., et al.(2005). Effects of monocular Enucleation on Calbindin-D 28k and c-Fosexpression in the lateral geniculate nucleus in rats. Okajimas Folia Anat. Jpn.82, 9--18. doi: 10.2535/ofaj.82.9
Guzowski, J. F., Miyashita, T., Chawla, M. K., Sanderson, J., Maes, L. I.,Houston, F. P., et al. (2006). Recent behavioral history modifies couplingbetween cell activity and Arc gene transcription in hippocampal CA1 neurons.Proc. Natl. Acad. Sci. U S A 103, 1077--1082. doi: 10.1073/pnas.0505519103
Hoffman, G. E., and Lyo, D. (2002). Anatomical markers of activity inneuroendocrine systems: are we all ‘fos-ed out’?. J. Neuroendocrinol. 14,259--268. doi: 10.1046/j.1365-2826.2002.00775.x
Ikeda, R., Khush, G. S., and Tabien, R. E. (1990). A new resistance gene to bacterialblight derived from O. longistaminata. Jap. Jour. Breed. 40, 280--281.
Kawashima, T., Okuno, H., and Bito, H. (2014). A new era for functional labelingof neurons: activity-dependent promoters have come of age. Front. NeuralCircuits 8:37. doi: 10.3389/fncir.2014.00037
Kazi, J. A., Mori, S., Kuchiiwa, S., and Nakagawa, S. (2004). Prolonged expressionof c-Fos protein in the lateral habenular nucleus of the apanese monkey(Macaca fuscata) after eye enucleation. Neurosignals 13, 130--133. doi: 10.1159/000076566
King, M. C., and Wilson, A. C. (1975). Evolution at two levels in humans andchipamzees. Science 188, 107--116. doi: 10.1126/science.1090005
Le Gal La Salle, G. (1988). Long-lasting and sequential increase ofc-Fosoncoprotein expression in kainic acid-induced status epilepticus.Neurosci. Lett. 88, 127--130. doi: 10.1016/0304-3940(88)90112-7
Li, H.-Y., and Sawchenko, P. E. (1998). Hypothalamic effector neurons andextended circuitries activated in ‘‘neurogenic’’ stress: a comparison offootshock effects exerted acutely, chronically and in animals with controlledglucocorticoid levels. J. Comp. Neurol. 393, 244--266. doi: 10.1002/(sici)1096-9861(19980406)393:2<244::aid-cne8>3.0.co;2-2
Liu, X., Somel, M., Tang, L., Yan, G., Jiang, X., Guo, S., et al. (2012). Extensionof cortical synaptic development distinguishes humans from chimpanzees andmacaques. Genome Res. 22, 611--622. doi: 10.1101/gr.127324.111
Livak, K. J., and Schmittgen, T. D. (2001). Analysis of relative gene expressiondata using real-time quantitative PCR and the 2−11CT method. Methods 25,402--408. doi: 10.1006/meth.2001.1262
Medeiros, M. A., Canteras, N., Suchecki, D., and Mello, L. E. (2003). c-Fos expression induced by electroacupuncture at the Zusanli point in ratssubmitted to repeatted immobilization. Braz. J. Biol. Med. Res. 36, 1673--1684.doi: 10.1590/s0100-879x2003001200009
Melzer, P., and Steiner, H. (1997). Stimulus-dependent expression of immediate-early genes in rat somatosensory cortex. J. Comp. Neurol. 380, 145--153. doi: 10.1002/(sici)1096-9861(19970331)380:1<145::aid-cne11>3.0.co;2-z
Morgan, J. I., Cohen, D. R., Hempsted, J. L., and Curran, T. (1987). Mappingpatterns of c-Fos expression in the central nervous system after seizure. Science237, 192--197. doi: 10.1126/science.3037702
Pearce, E., Stringer, C., and Dunbar, R. I. (2013). New insights into differences inbrain organization between Neanderthals and anatomically modern humans.Proc. Biol. Sci. 280:20130168. doi: 10.1098/rspb.2013.0168
Frontiers in Cellular Neuroscience | www.frontiersin.org 7 March 2015 | Volume 9 | Article 72
Barros et al. c-Fos expression between species
Schreiber, S. S., Najm, I., Tocco, G., and Baudry, M. (1993). Co-expression ofHSP72 and c-Fos in rat brain following kainic acid treatment. Neuroreport 5,269--272. doi: 10.1097/00001756-199312000-00022
Simler, S., Hirsch, E., Danober, L., Motte, J., Virgnes, M., and Marescaux,C. (1994). c-Fos expression after single and kindled audiogenic seizuresin Wistar rats. Neurosci. Lett. 175, 58--62. doi: 10.1016/0304-3940(94)91077-4
Sonnenberg, J. L., Rauscher, F. J. 3rd, Morgan, J. I., and Curran, T. (1989).Regulation of proenkephalin by Fos and Jun. Science 246, 1622--1625. doi: 10.1126/science.2512642
Spencer, C. M., and Houpt, T. A. (2001). Dynamics of c-Fos and ICERmRNA expression in rat forebrain following lithium chloride injection.Brain Res. Mol. Brain Res. 93, 113--126. doi: 10.1016/s0169-328x(01)00173-5
Szyndler, J., Maciejak, P., Turszinska, D., Sobolewska, A., Taracha, E., Skórzewska,A., et al. (2009). Mapping of c-Fos expression in the rat brain during the
evolution of pentylenetetrazol-kindled seizures. Epilepsy Behav. 16, 216--224.doi: 10.1016/j.yebeh.2009.07.030
Urcelay, G. P., and Miller, R. R. (2014). The functions of contexts in associativelearning. Behav. Processes. 104, 2--12. doi: 10.1016/j.beproc.2014.02.008
Conflict of Interest Statement: The authors declare that the research wasconducted in the absence of any commercial or financial relationships that couldbe construed as a potential conflict of interest.
Copyright © 2015 Barros, Mundim, Galindo, Bittencourt, Porcionatto and Mello.This is an open-access article distributed under the terms of the Creative CommonsAttribution License (CC BY). The use, distribution and reproduction in other forumsis permitted, provided the original author(s) or licensor are credited and that theoriginal publication in this journal is cited, in accordance with accepted academicpractice. No use, distribution or reproduction is permitted which does not complywith these terms.
Frontiers in Cellular Neuroscience | www.frontiersin.org 8 March 2015 | Volume 9 | Article 72
Top Related
Copyright © 2022 FDOKUMEN

