


Bahasa
Halaman
Hukum


Scientia Pharmaceutica (Sci. Pharm.) 70, 341-351 (2002) 34 1 0 ~sterreichische Apotheker-Verlagsgesellschaft m.b.H., Wien, Printed in Austria
Spectrophotometric Determination of Trimebutine
Through Ion- Pair and Charge- Transfer Complexation
Reactions
Shaban M. Khalil
National Organization for Drug Control and Research
P.O. Box 29 Cairo (NODCAR) Egypt
Summary Two simple and sensitive spectrophotometric methods are
described for the assay of trimebutine. The first method is based on the
interaction of the basic drug in 1,2 dichloroethane with bromocresol green
(BCG); bromophenol blue (BPB) and bromothymol blue (BTB) in the
same solvent to produce a stable yellow ion-pair complexes , which
absorbed at 410,406 and 405nm, respectively. The second method is based
upon the interaction of the basic drug with iodine in 1,2 dichloroethane. The
yellow colour formed due to the formation of charge-transfer complex
showed two maxima absorbed at 292 and 362 nm. Beer's law obeyed for
both methods and the relative standard deviations were found to be less
than 1 %. The two methods can be applied to the analysis of tablets, with no
evidence of interference from excipients. A more detailed investigation on
the complex was made to its composition, association constant and free
energy change.
Keyword : Spectrophotometry ; charge - transfer and ion - pair
complexes; tablets.
Introduction
Trirnebutine, 2-dimethylamino-2-phenylbutyll , 3, 4, 5 trimethoxybenzoate,
is an antispasmodic compound used in various gastrointestinal diseases

S.M. K h a l i l :
and in radiological examination(') . HPLC ('I 3), and colourimetric (4) methods
for its assay have been used. Methods for determination of the drug in
pharmaceutical preparations are not yet available in the literature or in
pharmacopoeias. In the present paper simple and sensitive
spectrophotometric methods for determining the drug, based on the
formation of ion-pair with BCG, BPB, BTB and charge-transfer with l2 in 1.2-
dichloroethane were proposed.The proposed methods have been applied
to assay of the drug in the tablet.
Experimental
Apparatus : A Shimadzu 160A UVIvisible double beem
spectrophotometer with matchedquartz cells of I -cm optical path was used.
Materials Trimebutine (Roussel Uclaf, France) was used as working
standard. Debridat tablet 100 mg 1 tab. (Hoechst Orient Egypt Under
Licence of Roussel Uclaf, France).
Reagents All the reagents and solvents used were of analytical
grade. BCG (Koch-Light Laboratories Ltd), BPB and (Aldrich Chemical Co.
Ltd), and I2 (acf chemie farma nv, maarssen- holland). BCG, BPB, BTB
were prepared as 80 mg in 100 ml 1, 2- dichloroelthane and 12, 0.001 M
in 1, 2 dichloroelthane. The iodine solution must be protected from light.
Preparation of standard solution Trimebutine stock solution was
prepared by dissolving10 mg of trimebutine in 25 ml of 1, 2- dichloroelthane.
Construction of calibration curves: Aliquots of a solution of the drug (in
concentration range cited in table1 ) were transferred into 10 ml measuring
flasks. To each flask, 1 ml of BCG, BPB, BTB or l2 solution was added,
mixed well and allowed to stand at room temperature ( 25 * lo C) for 10
minutes. The solution was diluted to volume with 1,2 dichloroethane. The
absorbances of the resulting complexes were measured at410, 406, 405and
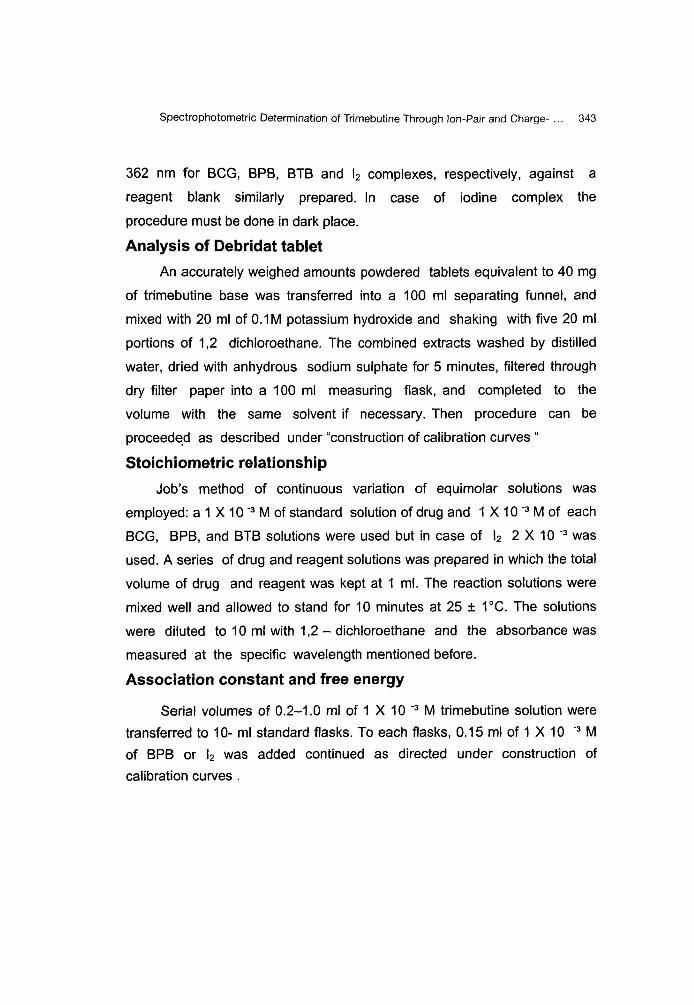
Spectrophotometric Determination of Trimebutine Through lon-Pair and Charge- . . . 343
362 nm for BCG, BPB, BTB and l2 complexes, respectively, against a
reagent blank similarly prepared. In case of iodine complex the
procedure must be done in dark place.
Analysis of Debridat tablet
An accurately weighed amounts powdered tablets equivalent to 40 mg
of trimebutine base was transferred into a 100 ml separating funnel, and
mixed with 20 ml of O.lM potassium hydroxide and shaking with five 20 ml
portions of 1,2 dichloroethane. The combined extracts washed by distilled
water, dried with anhydrous sodium sulphate for 5 minutes, filtered through
dry filter paper into a 100 ml measuring flask, and completed to the
volume with the same solvent if necessary. Then procedure can be
proceeded as described under "construction of calibration curves "
Stoichiometric relationship
Job's method of continuous variation of equimolar solutions was
employed: a 1 X 10 -3 M of standard solution of drug and 1 X 10 -3 M of each
BCG, BPB, and BTB solutions were used but in case of l2 2 X 10 -3 was
used. A series of drug and reagent solutions was prepared in which the total
volume of drug and reagent was kept at I ml. The reaction solutions were
mixed well and allowed to stand for 10 minutes at 25 & 1°C. The solutions
were diluted to 10 ml with 1,2 - dichloroethane and the absorbance was
measured at the specific wavelength mentioned before.
Association constant and free energy
Serial volumes of 0.2-1.0 ml of 1 X 10 -3 M trimebutine solution were
transferred to 10- ml standard flasks. To each flasks, 0.1 5 ml of 1 X 10 '3 M
of BPB or l2 was added continued as directed under construction of
calibration curves .

S.M. K h a l i l :
Results and discussion Ion pair method: The absorption spectra of the ion-pair complexes formed
between trimebutine or BCG, BPB, or BTB were measured in the range
300- 500 nm against the blank reagent (Fig.1) which exhibit a broad
absorption maximum at 410,406 and 405 nm for BCG, BPB and BTB ion - pair complexes, respectively. These dyes belong to the family of
sulphonephthalin dyes, and have different ionic forms. The yellow spices HL
are present in aqueous solutions. On acidification, they can turn purple ( H2L
as an ampholyte ) ; this colour change corresponds to protonation of the
quinoid oxygen. The second symmetric resonance structure ( L2) arises
by splitting of a proton from the hydroxy group, accompanied by
bathochromic shift''). Since the reaction product in 1,2 dichloroethan is
yellow, so, it may be considered that HL is the form of the BCG, BPB or
BTB involved in the reaction with the chosen drug. This may lead to an
assumption that, by the interaction of BCG, BPB, and BTB to the basic
center of the drug takes place. The obtained ion-pair salt is dissociated to
the yellow HL anion.
CT method: The reaction of l2 with basic nitrogenated drugs results in the
formation of an intense yellow colour product which exhibits absorption
maxima at 292 and 362 nm (Fig.1 ).
0.0 25 0 50 0
W a v e l e n g t h nm
Fig.11 1 Absorpt ion s p e c t r a o f ( 1 ) t r i m e b u t t n e - B C G r e a c t t o n
I 8 p g ml"), ( 2 1 t r imebut iq e -0PB 1 8 UCJ ml-'1,
( 3 ) t r l m e b u t i n e - B T B ( 8 u g m l ' l l a n d 1 4 1 t r i m e b u t l n e -
1 2 ( 6 0 ~9 m!" 1

Spectrophotometric Determination of Trimebutine Through Ion-Pair and Charge- . . . 345
These bands may be attributed to the formation of the iodine radical
anion. As described in the literature@)the formation of l3 anion which is
measurable spices, is due to the transformation of an " outer complex"
to an " inner complex " liberating I- ions which react with the free molecular
iodine. In other words, the interaction between trimebutine and iodine is a
charge-transfer complexation reaction between n-donor and the 6-acceptor
iodine followed by the formation of a radical ion according to the following
scheme.
D + I 2 .D-l2 ( outer complex )
D - l2 .[ D - I' I ' ] ( inner complex )
[D-11'1- + I2 - [ D - I ] ' I;
where D is the drug under investigation.
Regarding the third step in the above scheme, iodine alone does not absorb
at the wavelength of the maximum absorption, hence the stoichiometry will
show only the iodine ion released in the second step as a result of one mole
of iodine being consumed in the third step. Although the complex was
formed rapidly,constant absorbance reading were obtained after1 0 minutes
on standing in the dark at 25 + 1 "C, and remained constant for more than
24 h, i.e. the complex is stable.
The effect of solvent on the formation of ion - pair complexes were
studied using acetonitrile, 1, 2 - dichloroethane, dichloromethane and
chloroform. The I, 2 - dichloroethane was preferred because of the
higher molar absorptivities and stabilities of the complexes formed in it.
The same solvent was considered to be an ideal solvent for the colour
reaction and it offers excellent solvent capacity for iodine CT complex and
gives the highest yield of the radical. The effect of reagents concenteration
has been studied. It was found that, 0.4 ml of (400 p g ml -l) of BCG, BPB
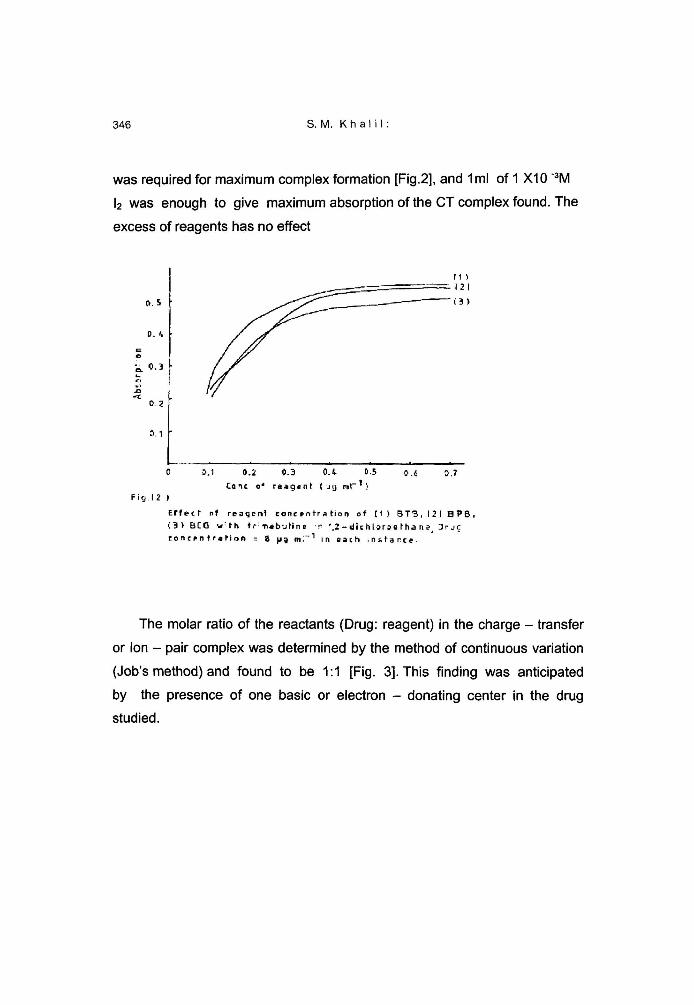
S.M. K h a l i l :
was required for maximum complex formation [Fig.2], and I ml of 1 X I 0 -3M
l2 was enough to give maximum absorption of the CT complex found. The
excess of reagents has no effect
E f f e c t n f reaqcn l c o n e s n t r a tron of [I ) B T 3 , 11 1 E P B . i 3 BCG w ' t h t i m o b v t i n e . r ' . 2 - d i c h l ~ r ~ e b h a n a 3 J r J C
r o n c p n t r a t i o n = 8 p p m.-' I n each , n s t a r c e .
The molar ratio of the reactants (Drug: reagent) in the charge - transfer
or Ion - pair complex was determined by the method of continuous variation
(Job's method) and found to be ?:I [Fig. 31. This finding was anticipated
by the presence of one basic or electron - donating center in the drug
studied.

Spectrophotometric Determination of Trimebutine Through Ion-Pair and Charge- . . . 347
Conlinueous v d r ~ a t run p l o t 01: f r mcbu1.i nc!
w i t h I11 B C T r , l 2 ) 6 P B , i 3 1 8 T B and
I , f ~ r a ' co r c i . n t r . a l ~ o ~ 1 t ~ 1 0 - ' ~ 'I.
A more detailed examination was made for the drug - BPB or the drug l2
complex . The absorbance of the complex was used to calculate the
association constant using the Benesi - Hildebrand equatiod7).
Where [AO] and [DO] are the total concentration of the interacting species, Ah AD
and are the absorbance and the molar absorptivity of the complex at 406 constant of the complex. On plotting the values of [AO] I AAAD vs I1 [DO], a line was obtained (Fig.4,5) that is described by the following equation:

348 S .M. K h a l i l :
(2) (for BPB complex)
(3) (for l 2 complex)
: 2 3 C 'l
t w 1 0 - f 4 ;:!: 1
F l g I C 1 8 c n w 1 - Hlldebr.iqd p!ol fur t r tme3i1t1ne - B P H c o - > l e x . A : L O 6 n m .
Fig.1 5 Benesi - Hi[ d e b r a r?d p l o t f o r t r i m e b u t i n e - 1 c o m p l e x .
X . 3 6 2 n m

Spectrophotometric Determ~nat~on of Trimebutine Through Ion-Pa~r and Charge- . . . 3.29
The intercept of this line with the ordinate is (EA )ADw1, the slope equals
( EhAD KC*' ) -l. From the equation (2) and (3) the association
constants are 1.21 X 1 o5 and 1.15 x 1 o4 L. mol -l and the standard free
energies of complexation A Go are - 6.976 and - 5.572 K. cal. For BPB and
l2 complexes,respectively. The molar absorptivities are equal to 26.1 X 1 O3
and 42.5 X lo3 L mol cm -' for BPB and l2 - trimebutine complexes
respectively. which are comparable with those obtained from the regression
line equation of Beer's Law (table 1).
Table (1) Quantitative parameters for the complexation of
trimebutine with BCG, BPB, BTB and l2
I Parameters I BCG I BPB I BTB 1 12 1 Beer's Law limits (pg. ml-l) Molar absorptivity ( I .mol'l
cm'' ) Sandell sensitivity ( pg. cm9 )
Slope* Intercept*
Correlation coefficient * Standard error
I I I 1 I I
* n = 5 all instances.
Quantification, accuracy and precision: The reproducibility and accuracy
of the suggested methods were assessed using different concentrations. The
validity was checked occasionally during the work by assaying standards.
Calibration curves for trimebutine was prepared by taking series of different
concentrations and applying the suggested procedures with BCG, BPB,BTB
and I*. Beer's Law is valid within microgram concentration range of
trimebutine (table1)for each reagent. The regression equation of these
calibration graphs were utilized or determination of unknown concentration of

350 S.M. K h a l i l :
trimebutine in tablets.The results obtained were of good accuracy and
precision. The produced results were reproducible with low standard
deviations (table2).
Table (2) Statistical analysis of results obtained for tablets
Proposed methods.
Table (3) Statistical analysis of results obtained using the
proposed methods and reference method [8] for
analysis of authentic sample.
Statistic
Mean % recovery + S. D. N Variance
Statistic
Mean % recovery (p=5) + S. D.
N Variance t - test F - test
Reference method
BCG
98.24 09.0026
5 0.00001
BCG I BPB I BTB 1 12 1
1 3.652 / 5.094 / 2.049 / 3.308 1 Values of parentheses are the tabulated values o f t and fa t p=5
BPB
98.18 0.1 1 09
5 0.01 23
For comparison, the non-aqueous titrimetric method (*) (based on the
titration of trimebutine dissolved in glacial acetic acid with perchloric acid)
was applied. The results agreed well with those of the suggested methods
since the calculated t - and F - values did not exceed the theoretical
values (table3).
The non - aqueous method required high concentration of the drug to
permit the titrimetric process, in comparison with the suggested methods
BTB
98.05 0.1033
5 0.1068
12
98.22 0.0537
5 0.002

Spectrophotometric Determination of Trimebutine Through Ion-Pair and Charge- ... 351
which applied successfully for microgram amounts. The methods described
are simple and sensitive. No interference was found due to the foreign
excipients.The proposed methods can be used as a control methods for
production lots.
References
( I ) M.F. Moshal , j. Int. Med. Res., 7 (1979) 232.
(2) A. Astier and A. M. Deutsh , J. Chromatogr. , 224 (1 981) 149.
(3) E. H. Joo, W. I. Chab , I. Oh, S.C. Shin, H. K. Na, Y.B .Lee,J.
Chromatogr, -B, Biomed-Appl. 723(1-2) (1 999) 239 - 246.
(4) F.M. Abdel-Gawad, J. Pharm-Biomed-Anal 16 (5) (1 998)793-799.
(5) K. Vytras, H. Batova and . Janousek. Analyst 11 4 (1 989) 479 - 483
(6) A.I. Popov and W. Deskin; J.Am. Chem.Soc. 80, (1 958) 2976-2979
(7) H.A. Benesi and J. Hildebrand, J.Am. Chem. Soc.71(1949)2703 - 2707.
(8) The specifications and quality control of Roussel Uclaf company.
Received December 28'" 200 7 Accepted October Pd, 2002
Top Related
Copyright © 2022 FDOKUMEN

