Spectrophotometric and spectrodensitometric determination of Clopidogrel Bisulfate with kinetic...
11
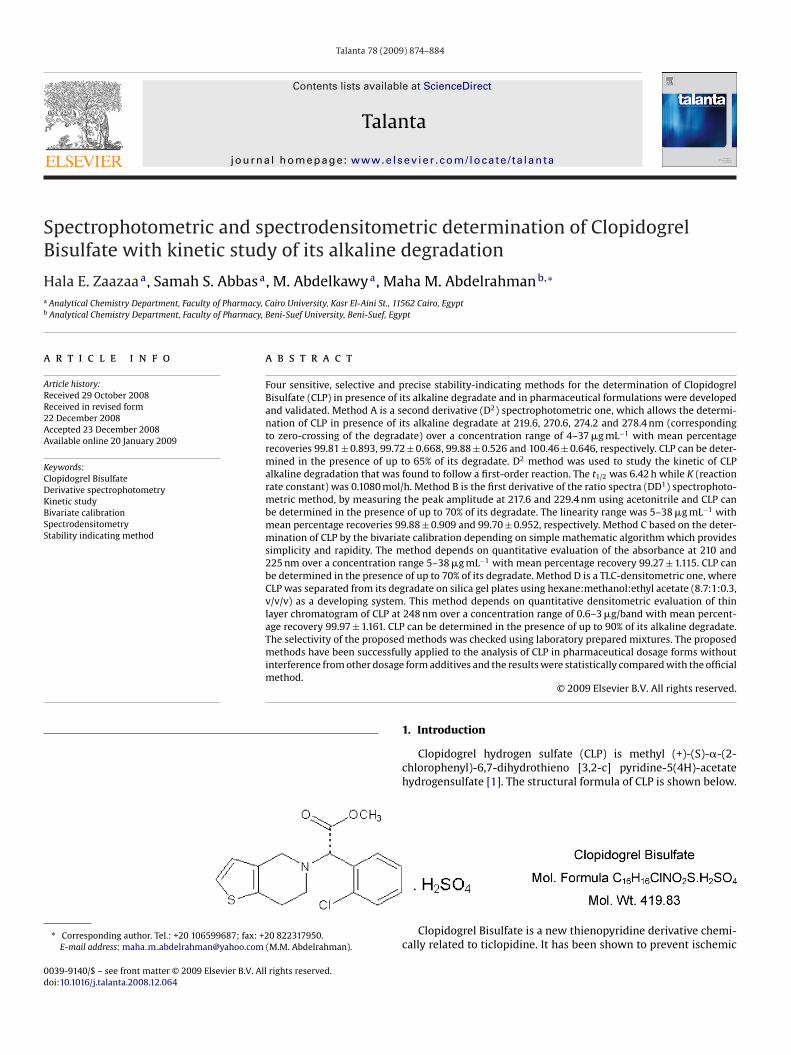
Talanta 78 (2009) 874–884 Contents lists available at ScienceDirect Talanta journal homepage: www.elsevier.com/locate/talanta Spectrophotometric and spectrodensitometric determination of Clopidogrel Bisulfate with kinetic study of its alkaline degradation Hala E. Zaazaa a , Samah S. Abbas a , M. Abdelkawy a , Maha M. Abdelrahman b,∗ a Analytical Chemistry Department, Faculty of Pharmacy, Cairo University, Kasr El-Aini St., 11562 Cairo, Egypt b Analytical Chemistry Department, Faculty of Pharmacy, Beni-Suef University, Beni-Suef, Egypt article info Article history: Received 29 October 2008 Received in revised form 22 December 2008 Accepted 23 December 2008 Available online 20 January 2009 Keywords: Clopidogrel Bisulfate Derivative spectrophotometry Kinetic study Bivariate calibration Spectrodensitometry Stability indicating method abstract Four sensitive, selective and precise stability-indicating methods for the determination of Clopidogrel Bisulfate (CLP) in presence of its alkaline degradate and in pharmaceutical formulations were developed and validated. Method A is a second derivative (D 2 ) spectrophotometric one, which allows the determi- nation of CLP in presence of its alkaline degradate at 219.6, 270.6, 274.2 and 278.4nm (corresponding to zero-crossing of the degradate) over a concentration range of 4–37 g mL −1 with mean percentage recoveries 99.81 ± 0.893, 99.72 ± 0.668, 99.88 ± 0.526 and 100.46 ± 0.646, respectively. CLP can be deter- mined in the presence of up to 65% of its degradate. D 2 method was used to study the kinetic of CLP alkaline degradation that was found to follow a first-order reaction. The t 1/2 was 6.42 h while K (reaction rate constant) was 0.1080mol/h. Method B is the first derivative of the ratio spectra (DD 1 ) spectrophoto- metric method, by measuring the peak amplitude at 217.6 and 229.4nm using acetonitrile and CLP can be determined in the presence of up to 70% of its degradate. The linearity range was 5–38 g mL −1 with mean percentage recoveries 99.88 ± 0.909 and 99.70 ± 0.952, respectively. Method C based on the deter- mination of CLP by the bivariate calibration depending on simple mathematic algorithm which provides simplicity and rapidity. The method depends on quantitative evaluation of the absorbance at 210 and 225 nm over a concentration range 5–38 g mL −1 with mean percentage recovery 99.27 ± 1.115. CLP can be determined in the presence of up to 70% of its degradate. Method D is a TLC-densitometric one, where CLP was separated from its degradate on silica gel plates using hexane:methanol:ethyl acetate (8.7:1:0.3, v/v/v) as a developing system. This method depends on quantitative densitometric evaluation of thin layer chromatogram of CLP at 248nm over a concentration range of 0.6–3 g/band with mean percent- age recovery 99.97 ± 1.161. CLP can be determined in the presence of up to 90% of its alkaline degradate. The selectivity of the proposed methods was checked using laboratory prepared mixtures. The proposed methods have been successfully applied to the analysis of CLP in pharmaceutical dosage forms without interference from other dosage form additives and the results were statistically compared with the official method. © 2009 Elsevier B.V. All rights reserved. ∗ Corresponding author. Tel.: +20 106599687; fax: +20 822317950. E-mail address: maha m [email protected] (M.M. Abdelrahman). 1. Introduction Clopidogrel hydrogen sulfate (CLP) is methyl (+)-(S)--(2- chlorophenyl)-6,7-dihydrothieno [3,2-c] pyridine-5(4H)-acetate hydrogensulfate [1]. The structural formula of CLP is shown below. Clopidogrel Bisulfate is a new thienopyridine derivative chemi- cally related to ticlopidine. It has been shown to prevent ischemic 0039-9140/$ – see front matter © 2009 Elsevier B.V. All rights reserved. doi:10.1016/j.talanta.2008.12.064
Transcript of Spectrophotometric and spectrodensitometric determination of Clopidogrel Bisulfate with kinetic...
SB
Ha
b
a
ARR2AA
KCDKBSS
0d
Talanta 78 (2009) 874–884
Contents lists available at ScienceDirect
Talanta
journa l homepage: www.e lsev ier .com/ locate / ta lanta
pectrophotometric and spectrodensitometric determination of Clopidogrelisulfate with kinetic study of its alkaline degradation
ala E. Zaazaaa, Samah S. Abbasa, M. Abdelkawya, Maha M. Abdelrahmanb,∗
Analytical Chemistry Department, Faculty of Pharmacy, Cairo University, Kasr El-Aini St., 11562 Cairo, EgyptAnalytical Chemistry Department, Faculty of Pharmacy, Beni-Suef University, Beni-Suef, Egypt
r t i c l e i n f o
rticle history:eceived 29 October 2008eceived in revised form2 December 2008ccepted 23 December 2008vailable online 20 January 2009
eywords:lopidogrel Bisulfateerivative spectrophotometryinetic studyivariate calibrationpectrodensitometrytability indicating method
a b s t r a c t
Four sensitive, selective and precise stability-indicating methods for the determination of ClopidogrelBisulfate (CLP) in presence of its alkaline degradate and in pharmaceutical formulations were developedand validated. Method A is a second derivative (D2) spectrophotometric one, which allows the determi-nation of CLP in presence of its alkaline degradate at 219.6, 270.6, 274.2 and 278.4 nm (correspondingto zero-crossing of the degradate) over a concentration range of 4–37 �g mL−1 with mean percentagerecoveries 99.81 ± 0.893, 99.72 ± 0.668, 99.88 ± 0.526 and 100.46 ± 0.646, respectively. CLP can be deter-mined in the presence of up to 65% of its degradate. D2 method was used to study the kinetic of CLPalkaline degradation that was found to follow a first-order reaction. The t1/2 was 6.42 h while K (reactionrate constant) was 0.1080 mol/h. Method B is the first derivative of the ratio spectra (DD1) spectrophoto-metric method, by measuring the peak amplitude at 217.6 and 229.4 nm using acetonitrile and CLP canbe determined in the presence of up to 70% of its degradate. The linearity range was 5–38 �g mL−1 withmean percentage recoveries 99.88 ± 0.909 and 99.70 ± 0.952, respectively. Method C based on the deter-mination of CLP by the bivariate calibration depending on simple mathematic algorithm which providessimplicity and rapidity. The method depends on quantitative evaluation of the absorbance at 210 and225 nm over a concentration range 5–38 �g mL−1 with mean percentage recovery 99.27 ± 1.115. CLP canbe determined in the presence of up to 70% of its degradate. Method D is a TLC-densitometric one, whereCLP was separated from its degradate on silica gel plates using hexane:methanol:ethyl acetate (8.7:1:0.3,
v/v/v) as a developing system. This method depends on quantitative densitometric evaluation of thinlayer chromatogram of CLP at 248 nm over a concentration range of 0.6–3 �g/band with mean percent-age recovery 99.97 ± 1.161. CLP can be determined in the presence of up to 90% of its alkaline degradate.The selectivity of the proposed methods was checked using laboratory prepared mixtures. The proposedmethods have been successfully applied to the analysis of CLP in pharmaceutical dosage forms withoutosage
interference from other d method.∗ Corresponding author. Tel.: +20 106599687; fax: +20 822317950.E-mail address: maha m [email protected] (M.M. Abdelrahman).
039-9140/$ – see front matter © 2009 Elsevier B.V. All rights reserved.oi:10.1016/j.talanta.2008.12.064
form additives and the results were statistically compared with the official
© 2009 Elsevier B.V. All rights reserved.
1. Introduction
Clopidogrel hydrogen sulfate (CLP) is methyl (+)-(S)-�-(2-chlorophenyl)-6,7-dihydrothieno [3,2-c] pyridine-5(4H)-acetatehydrogensulfate [1]. The structural formula of CLP is shown below.
Clopidogrel Bisulfate is a new thienopyridine derivative chemi-cally related to ticlopidine. It has been shown to prevent ischemic
H.E. Zaazaa et al. / Talanta 78 (2009) 874–884 875
sulfate
sspabd
SaImaiarph
lsa
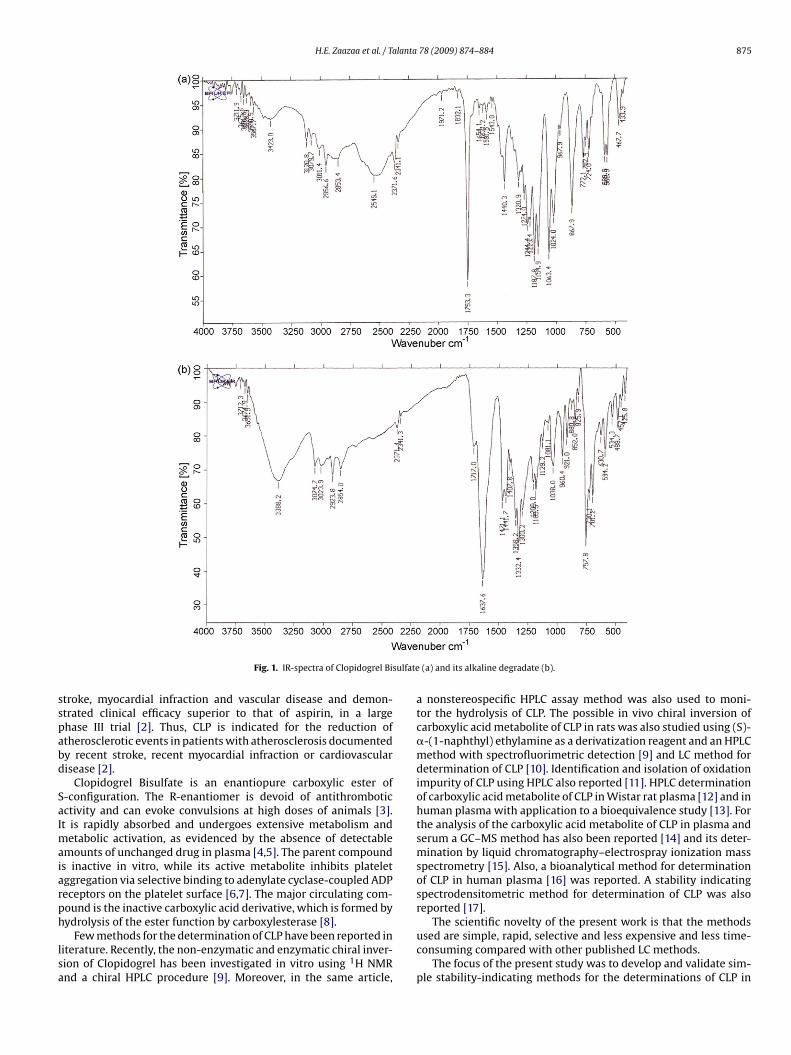
Fig. 1. IR-spectra of Clopidogrel Bi
troke, myocardial infraction and vascular disease and demon-trated clinical efficacy superior to that of aspirin, in a largehase III trial [2]. Thus, CLP is indicated for the reduction oftherosclerotic events in patients with atherosclerosis documentedy recent stroke, recent myocardial infraction or cardiovascularisease [2].
Clopidogrel Bisulfate is an enantiopure carboxylic ester of-configuration. The R-enantiomer is devoid of antithromboticctivity and can evoke convulsions at high doses of animals [3].t is rapidly absorbed and undergoes extensive metabolism and
etabolic activation, as evidenced by the absence of detectablemounts of unchanged drug in plasma [4,5]. The parent compounds inactive in vitro, while its active metabolite inhibits plateletggregation via selective binding to adenylate cyclase-coupled ADPeceptors on the platelet surface [6,7]. The major circulating com-ound is the inactive carboxylic acid derivative, which is formed by
ydrolysis of the ester function by carboxylesterase [8].Few methods for the determination of CLP have been reported initerature. Recently, the non-enzymatic and enzymatic chiral inver-ion of Clopidogrel has been investigated in vitro using 1H NMRnd a chiral HPLC procedure [9]. Moreover, in the same article,
(a) and its alkaline degradate (b).
a nonstereospecific HPLC assay method was also used to moni-tor the hydrolysis of CLP. The possible in vivo chiral inversion ofcarboxylic acid metabolite of CLP in rats was also studied using (S)-�-(1-naphthyl) ethylamine as a derivatization reagent and an HPLCmethod with spectrofluorimetric detection [9] and LC method fordetermination of CLP [10]. Identification and isolation of oxidationimpurity of CLP using HPLC also reported [11]. HPLC determinationof carboxylic acid metabolite of CLP in Wistar rat plasma [12] and inhuman plasma with application to a bioequivalence study [13]. Forthe analysis of the carboxylic acid metabolite of CLP in plasma andserum a GC–MS method has also been reported [14] and its deter-mination by liquid chromatography–electrospray ionization massspectrometry [15]. Also, a bioanalytical method for determinationof CLP in human plasma [16] was reported. A stability indicatingspectrodensitometric method for determination of CLP was alsoreported [17].
The scientific novelty of the present work is that the methodsused are simple, rapid, selective and less expensive and less time-consuming compared with other published LC methods.
The focus of the present study was to develop and validate sim-ple stability-indicating methods for the determinations of CLP in
876 H.E. Zaazaa et al. / Talanta 78 (2009) 874–884
isulfa
pt
2
2
23
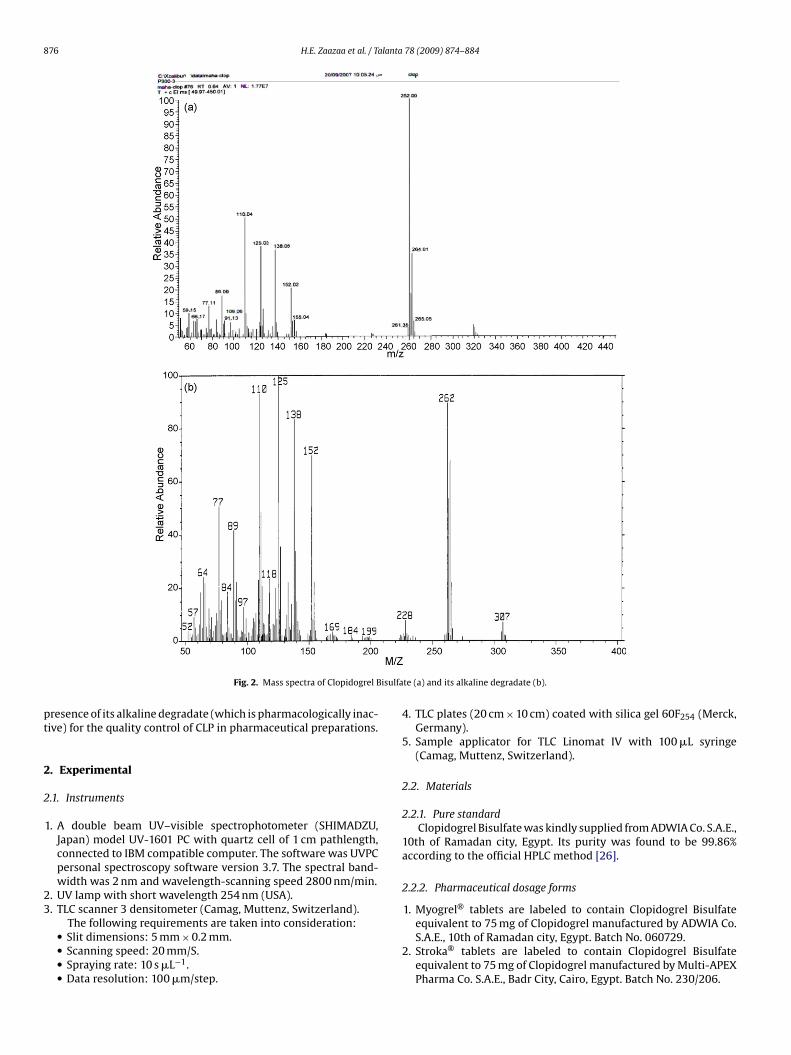
Fig. 2. Mass spectra of Clopidogrel B
resence of its alkaline degradate (which is pharmacologically inac-ive) for the quality control of CLP in pharmaceutical preparations.
. Experimental
.1. Instruments
1. A double beam UV–visible spectrophotometer (SHIMADZU,Japan) model UV-1601 PC with quartz cell of 1 cm pathlength,connected to IBM compatible computer. The software was UVPCpersonal spectroscopy software version 3.7. The spectral band-width was 2 nm and wavelength-scanning speed 2800 nm/min.
. UV lamp with short wavelength 254 nm (USA).
. TLC scanner 3 densitometer (Camag, Muttenz, Switzerland).
The following requirements are taken into consideration:• Slit dimensions: 5 mm × 0.2 mm.• Scanning speed: 20 mm/S.• Spraying rate: 10 s �L−1.• Data resolution: 100 �m/step.
te (a) and its alkaline degradate (b).
4. TLC plates (20 cm × 10 cm) coated with silica gel 60F254 (Merck,Germany).
5. Sample applicator for TLC Linomat IV with 100 �L syringe(Camag, Muttenz, Switzerland).
2.2. Materials
2.2.1. Pure standardClopidogrel Bisulfate was kindly supplied from ADWIA Co. S.A.E.,
10th of Ramadan city, Egypt. Its purity was found to be 99.86%according to the official HPLC method [26].
2.2.2. Pharmaceutical dosage forms
1. Myogrel® tablets are labeled to contain Clopidogrel Bisulfate
equivalent to 75 mg of Clopidogrel manufactured by ADWIA Co.S.A.E., 10th of Ramadan city, Egypt. Batch No. 060729.2. Stroka® tablets are labeled to contain Clopidogrel Bisulfateequivalent to 75 mg of Clopidogrel manufactured by Multi-APEXPharma Co. S.A.E., Badr City, Cairo, Egypt. Batch No. 230/206.
lanta 78 (2009) 874–884 877
2
flNy(teeds
2
g
2
3
2
•
•
2
am1
2
do
3
3m
eomowfazsc
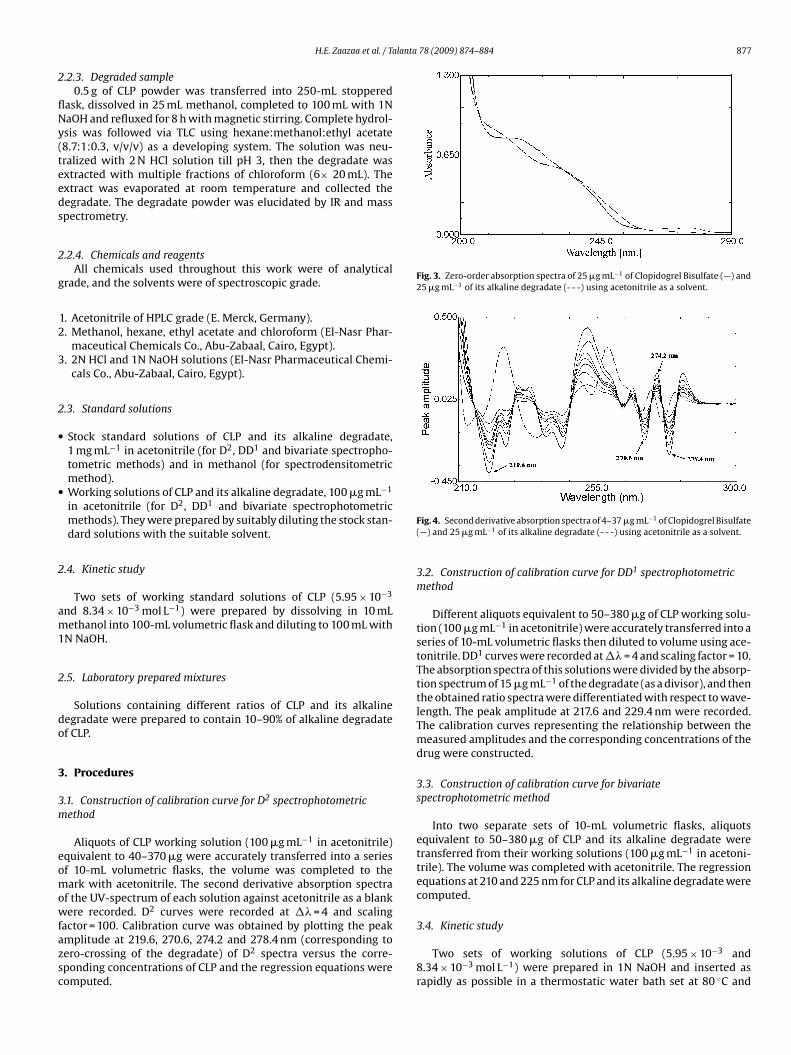
Fig. 3. Zero-order absorption spectra of 25 �g mL−1 of Clopidogrel Bisulfate (—) and25 �g mL−1 of its alkaline degradate (- - -) using acetonitrile as a solvent.
H.E. Zaazaa et al. / Ta
.2.3. Degraded sample0.5 g of CLP powder was transferred into 250-mL stoppered
ask, dissolved in 25 mL methanol, completed to 100 mL with 1NaOH and refluxed for 8 h with magnetic stirring. Complete hydrol-sis was followed via TLC using hexane:methanol:ethyl acetate8.7:1:0.3, v/v/v) as a developing system. The solution was neu-ralized with 2 N HCl solution till pH 3, then the degradate wasxtracted with multiple fractions of chloroform (6× 20 mL). Thextract was evaporated at room temperature and collected theegradate. The degradate powder was elucidated by IR and masspectrometry.
.2.4. Chemicals and reagentsAll chemicals used throughout this work were of analytical
rade, and the solvents were of spectroscopic grade.
1. Acetonitrile of HPLC grade (E. Merck, Germany).. Methanol, hexane, ethyl acetate and chloroform (El-Nasr Phar-
maceutical Chemicals Co., Abu-Zabaal, Cairo, Egypt).. 2N HCl and 1N NaOH solutions (El-Nasr Pharmaceutical Chemi-
cals Co., Abu-Zabaal, Cairo, Egypt).
.3. Standard solutions
Stock standard solutions of CLP and its alkaline degradate,1 mg mL−1 in acetonitrile (for D2, DD1 and bivariate spectropho-tometric methods) and in methanol (for spectrodensitometricmethod).Working solutions of CLP and its alkaline degradate, 100 �g mL−1
in acetonitrile (for D2, DD1 and bivariate spectrophotometricmethods). They were prepared by suitably diluting the stock stan-dard solutions with the suitable solvent.
.4. Kinetic study
Two sets of working standard solutions of CLP (5.95 × 10⁻³
nd 8.34 × 10⁻³ mol L−1) were prepared by dissolving in 10 mLethanol into 100-mL volumetric flask and diluting to 100 mL with
N NaOH.
.5. Laboratory prepared mixtures
Solutions containing different ratios of CLP and its alkalineegradate were prepared to contain 10–90% of alkaline degradatef CLP.
. Procedures
.1. Construction of calibration curve for D2 spectrophotometricethod
Aliquots of CLP working solution (100 �g mL−1 in acetonitrile)quivalent to 40–370 �g were accurately transferred into a series
f 10-mL volumetric flasks, the volume was completed to theark with acetonitrile. The second derivative absorption spectraf the UV-spectrum of each solution against acetonitrile as a blankere recorded. D2 curves were recorded at �� = 4 and scaling
actor = 100. Calibration curve was obtained by plotting the peakmplitude at 219.6, 270.6, 274.2 and 278.4 nm (corresponding toero-crossing of the degradate) of D2 spectra versus the corre-ponding concentrations of CLP and the regression equations wereomputed.
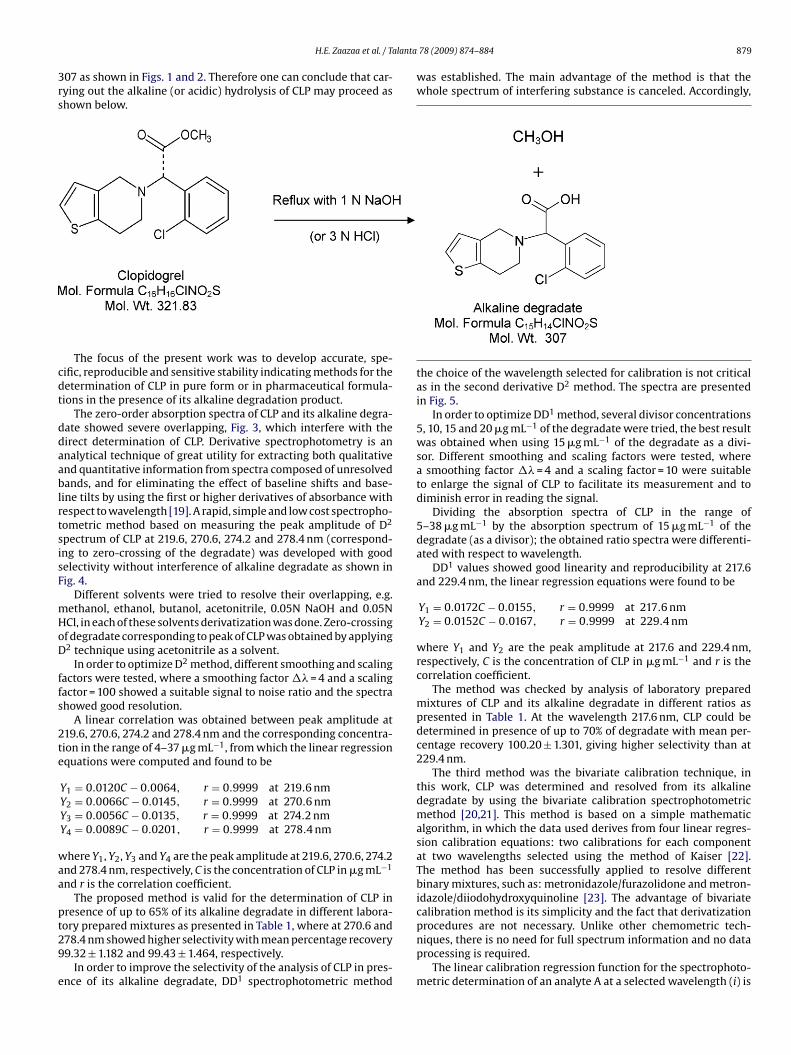
Fig. 4. Second derivative absorption spectra of 4–37 �g mL−1 of Clopidogrel Bisulfate(—) and 25 �g mL−1 of its alkaline degradate (- - -) using acetonitrile as a solvent.
3.2. Construction of calibration curve for DD1 spectrophotometricmethod
Different aliquots equivalent to 50–380 �g of CLP working solu-tion (100 �g mL−1 in acetonitrile) were accurately transferred into aseries of 10-mL volumetric flasks then diluted to volume using ace-tonitrile. DD1 curves were recorded at �� = 4 and scaling factor = 10.The absorption spectra of this solutions were divided by the absorp-tion spectrum of 15 �g mL−1 of the degradate (as a divisor), and thenthe obtained ratio spectra were differentiated with respect to wave-length. The peak amplitude at 217.6 and 229.4 nm were recorded.The calibration curves representing the relationship between themeasured amplitudes and the corresponding concentrations of thedrug were constructed.
3.3. Construction of calibration curve for bivariatespectrophotometric method
Into two separate sets of 10-mL volumetric flasks, aliquotsequivalent to 50–380 �g of CLP and its alkaline degradate weretransferred from their working solutions (100 �g mL−1 in acetoni-trile). The volume was completed with acetonitrile. The regressionequations at 210 and 225 nm for CLP and its alkaline degradate werecomputed.
3.4. Kinetic study
Two sets of working solutions of CLP (5.95 × 10⁻³ and8.34 × 10−3 mol L−1) were prepared in 1N NaOH and inserted asrapidly as possible in a thermostatic water bath set at 80 ◦C and

878 H.E. Zaazaa et al. / Talanta 78 (2009) 874–884
Table 1Determination of Clopidogrel Bisulfate in presence of its alkaline degradate in laboratory prepared mixtures by the proposed methods.
Degradate% Recovery%a of CLP
D2 spectrophotometric method DD1 spectrophotometric method Bivariate calibrationmethod
TLC-densitometricmethod
219.6 nm 270.6 nm 274.2 nm 278.4 nm 217.6 nm 229.4 nm
10 101.28 98.17 100.50 98.94 99.83 100.89 97.61 98.8520 99.25 98.25 100.50 99.50 101.31 101.00 101.00 99.1430 99.07 97.93 99.57 98.00 98.29 98.21 97.57 99.8040 101.92 100.00 100.00 97.42 101.92 100.25 100.25 101.3150 104.58b 100.30 102.00 101.70 100.20 101.20 100.40 97.9360 107.88b 99.75 104.77b 99.92 101.00 104.31b 99.75 100.8965 108.92b 100.86 106.20b 100.50 100.57 105.93b 102.21 101.9870 110.45b 104.12b 108.57b 95.88b 98.44 108.11b 100.67 102.0080 115.11b 107.75b 110.32b 92.17b 103.88b 111.78b 94.22b 97.1790 120.32b 110.15b 115.55b 89.80b 108.60b 117.50b 90.45b 101.55
M 10
01cidivo
3r
i
3m
tsponaafta2csw
3
ppsafcfitp
and a new broad band at 3388.2 cm−1 indicating the presence ofa hydroxyl group of carboxylic acid (due to hydrolysis). The elec-tron impact showed mass ion peak at m/z 321 corresponding to theintact drug, while the mass ion peak of the degradate was at m/z
ean ± S.D. 100.38 ± 1.435 99.32 ± 1.182 100.51 ± 0.917 99.43 ± 1.464
a Average of three experiments.b Rejected values.
.1 mL from the reflux solutions were quantitatively transferred into0-mL volumetric flask for 8 h at 1 h time interval. The flasks wereompleted to volume with acetonitrile and measured. By apply-ng in the previously described D2 method at 278.4 nm for theetermination of the remaining intact CLP from its correspond-
ng regression equation, a plot of log the remaining concentrationersus time in hours was then performed to determine the kineticrder of alkaline degradation process.
.4.1. Effect of sodium hydroxide concentration on the reactionate
The mentioned procedure was followed using 0.5N and 1N NaOHn the degradation of 8.34 × 10⁻³ mol L−1 of CLP.
.5. Construction of calibration curve for TLC-densitometricethod
Into a series of 10-mL volumetric flasks, aliquots equivalento 6–30 �g were accurately transferred from the standard stockolution of CLP (1 mg mL−1 in methanol), then the volume was com-leted with methanol. 10 �L of each solution was spotted as bandsf 5 mm width on TLC plates (20 cm × 10 cm with 250 �m thick-ess) using a Camag Linomat IV applicator. The bands were appliedt 5 mm interval and 15 mm from the bottom and sides. Linearscending chromatogram developing to a distance of 8 cm was per-ormed in a chromatographic tank previously saturated for 1 h withhe developing mobile phase consisted of hexane:methanol:ethylcetate (8.7:1:0.3, v/v/v) at room temperature. CLP was scanned at48 nm. The peak area was recorded and the calibration curve wasonstructed by plotting the integrated peak area versus the corre-ponding concentrations of the drug and the regression equationas computed.
.6. Application to pharmaceutical formulations
Ten tablets of each of Myogrel® tablets and Stroka® tablets wereowdered and mixed well; an accurately weighed amount of theowder equivalent to 0.1 g of CLP of each was transferred into twoeparate 100-mL volumetric flasks, 75 mL of the appropriate solvent
dded (acetonitrile for D2, DD1 and bivariate methods and methanolor spectrodensitometric method), stirred well then cooled andompleted to the volume to obtain 1 mg mL−1 stock solutions, thenltered. The solutions were diluted to the same concentrations ofhe appropriate working solutions and proceeded according to therocedure of each method mentioned above.0.20 ± 1.301 100.31 ± 1.227 99.93 ± 1.612 100.06 ± 1.738
4. Results and discussion
Following an oral administration in human, the plasma levels ofCLP are very low due to extensive metabolism. The main circulatingmetabolite is the carboxylic acid derivative which is pharmacolog-ically inactive [8].
Clopidogrel Bisulfate was subjected to oxidation using hydrogenperoxide, giving many oxidative degradation products which weredifficult to be separated.
Upon refluxing CLP with acid or alkali, the carboxylic acid degra-date was obtained, and being inactive. So the determination of CLPin presence of its alkaline (or acidic) degradate was essential.
The International Conference on Harmonization (ICH) guidelineentitled “stability testing of new drugs substances and products”requires the stress testing to be carried out to elucidate the inher-ent stability characteristics of the active substance [18]. An idealstability indicating method is one that quantifies the standard drugalone and also resolves its degradation products.
The structure of the alkaline (also obtained by acid hydrolysis)degradate was elucidated by IR and mass spectrometry, where IRspectrum of CLP showed a characteristic band at 1753.3 cm−1 indi-cating the presence of carbonyl group. While the IR spectrum ofthe degradate showed the same band but shifted to 1637.6 cm−1
Fig. 5. First derivative of the ratio spectra of 5–38 �g mL−1 of Clopidogrel Bisulfate(—) and 25 �g mL−1 of its alkaline degradate (- - -) using 15 �g mL−1 of the degradateas a divisor and acetonitrile as a blank.
lanta
3rs
cdt
ddaablrtsisF
mHoD
ffs
2te
waa
pt29
e
H.E. Zaazaa et al. / Ta
07 as shown in Figs. 1 and 2. Therefore one can conclude that car-ying out the alkaline (or acidic) hydrolysis of CLP may proceed ashown below.
The focus of the present work was to develop accurate, spe-ific, reproducible and sensitive stability indicating methods for theetermination of CLP in pure form or in pharmaceutical formula-ions in the presence of its alkaline degradation product.
The zero-order absorption spectra of CLP and its alkaline degra-ate showed severe overlapping, Fig. 3, which interfere with theirect determination of CLP. Derivative spectrophotometry is annalytical technique of great utility for extracting both qualitativend quantitative information from spectra composed of unresolvedands, and for eliminating the effect of baseline shifts and base-
ine tilts by using the first or higher derivatives of absorbance withespect to wavelength [19]. A rapid, simple and low cost spectropho-ometric method based on measuring the peak amplitude of D2
pectrum of CLP at 219.6, 270.6, 274.2 and 278.4 nm (correspond-ng to zero-crossing of the degradate) was developed with goodelectivity without interference of alkaline degradate as shown inig. 4.
Different solvents were tried to resolve their overlapping, e.g.ethanol, ethanol, butanol, acetonitrile, 0.05N NaOH and 0.05NCl, in each of these solvents derivatization was done. Zero-crossingf degradate corresponding to peak of CLP was obtained by applying2 technique using acetonitrile as a solvent.
In order to optimize D2 method, different smoothing and scalingactors were tested, where a smoothing factor �� = 4 and a scalingactor = 100 showed a suitable signal to noise ratio and the spectrahowed good resolution.
A linear correlation was obtained between peak amplitude at19.6, 270.6, 274.2 and 278.4 nm and the corresponding concentra-ion in the range of 4–37 �g mL−1, from which the linear regressionquations were computed and found to be
Y1 = 0.0120C − 0.0064, r = 0.9999 at 219.6 nmY2 = 0.0066C − 0.0145, r = 0.9999 at 270.6 nmY3 = 0.0056C − 0.0135, r = 0.9999 at 274.2 nmY4 = 0.0089C − 0.0201, r = 0.9999 at 278.4 nm
here Y1, Y2, Y3 and Y4 are the peak amplitude at 219.6, 270.6, 274.2nd 278.4 nm, respectively, C is the concentration of CLP in �g mL−1
nd r is the correlation coefficient.The proposed method is valid for the determination of CLP in
resence of up to 65% of its alkaline degradate in different labora-
ory prepared mixtures as presented in Table 1, where at 270.6 and78.4 nm showed higher selectivity with mean percentage recovery9.32 ± 1.182 and 99.43 ± 1.464, respectively.In order to improve the selectivity of the analysis of CLP in pres-nce of its alkaline degradate, DD1 spectrophotometric method
78 (2009) 874–884 879
was established. The main advantage of the method is that thewhole spectrum of interfering substance is canceled. Accordingly,
the choice of the wavelength selected for calibration is not criticalas in the second derivative D2 method. The spectra are presentedin Fig. 5.
In order to optimize DD1 method, several divisor concentrations5, 10, 15 and 20 �g mL−1 of the degradate were tried, the best resultwas obtained when using 15 �g mL−1 of the degradate as a divi-sor. Different smoothing and scaling factors were tested, wherea smoothing factor �� = 4 and a scaling factor = 10 were suitableto enlarge the signal of CLP to facilitate its measurement and todiminish error in reading the signal.
Dividing the absorption spectra of CLP in the range of5–38 �g mL−1 by the absorption spectrum of 15 �g mL−1 of thedegradate (as a divisor); the obtained ratio spectra were differenti-ated with respect to wavelength.
DD1 values showed good linearity and reproducibility at 217.6and 229.4 nm, the linear regression equations were found to be
Y1 = 0.0172C − 0.0155, r = 0.9999 at 217.6 nmY2 = 0.0152C − 0.0167, r = 0.9999 at 229.4 nm
where Y1 and Y2 are the peak amplitude at 217.6 and 229.4 nm,respectively, C is the concentration of CLP in �g mL−1 and r is thecorrelation coefficient.
The method was checked by analysis of laboratory preparedmixtures of CLP and its alkaline degradate in different ratios aspresented in Table 1. At the wavelength 217.6 nm, CLP could bedetermined in presence of up to 70% of degradate with mean per-centage recovery 100.20 ± 1.301, giving higher selectivity than at229.4 nm.
The third method was the bivariate calibration technique, inthis work, CLP was determined and resolved from its alkalinedegradate by using the bivariate calibration spectrophotometricmethod [20,21]. This method is based on a simple mathematicalgorithm, in which the data used derives from four linear regres-sion calibration equations: two calibrations for each componentat two wavelengths selected using the method of Kaiser [22].The method has been successfully applied to resolve differentbinary mixtures, such as: metronidazole/furazolidone and metron-idazole/diiodohydroxyquinoline [23]. The advantage of bivariatecalibration method is its simplicity and the fact that derivatization
procedures are not necessary. Unlike other chemometric tech-niques, there is no need for full spectrum information and no dataprocessing is required.The linear calibration regression function for the spectrophoto-metric determination of an analyte A at a selected wavelength (i) is
880 H.E. Zaazaa et al. / Talanta 78 (2009) 874–884
Table 2Application of the method of Kaiser for the selection of the wavelength set for the determination of Clopidogrel Bisulfate.
�1/�2 205 210 215 220 225 230 235 245
205 0 16.53 7.79 8.57 13.06 15.25 5.83 10.47210 0 7.56 14.35 21.64 11.25 4.19 9.20215 0 11.64 12.34 5.40 6.59 5.50220 0 3.72 3.50 8.10 9.58225 0 6.05 9.80 10.04230 0 3.90 6.1022
T nts th
g
A
wab(
T(
C
Ttdrtts
p2
TK
C
58
(
F5
3545
he absolute values of determinants of sensitivity (K × 10−5). The bold value represe
iven by
Ai = mAi · CA + eAi
here mAi is the slope of linear regression, CA is the concentration ofnalyte A and eAi is the intercept value. If the measurements of theinary mixture (A, B) are performed at two selected wavelengths�1, �2), we have a two equations set:
AAB1 = mA1CA + mB1CB + eAB1AAB2 = mA2CA + mB2CB + eAB2
he resolution of such equations set allows the evaluation of CBconcentration of CLP) value:
B = mA2(AAB1 − eAB1) + mA1(eAB1 − AAB2)mA2mB1 − mA1mB2
hese simple mathematic algorithms allows the resolution of thewo components by measuring the absorbance of CLP and degra-ate at the two wavelengths and using the parameters of the linearegression functions evaluated individually for each component athe same wavelengths. The method of Kaiser [22] was used for
he selection of optimum wavelength set which assured the bestensitivity for the quantitative determination of the cited drug.In order to apply this method, select the signals of the two com-onents located at eight wavelengths: 205, 210, 215, 220, 225, 230,35 and 245 nm.
able 3inetic data of Clopidogrel Bisulfate—alkaline degradation.
oncentration (mol L−1) K (mol/h) t1/2 (h) Regression equationa
.95 × 10−3 0.1085 6.39 Y = −0.0471C − 9.2724r = 0.9937
.34 × 10−3 0.1080 6.42 Y = −0.0469C − 8.9475r = 0.9933
a Y = the peak amplitude at 278.4 nm. C = the remaining CLP concentrationmol L−1).
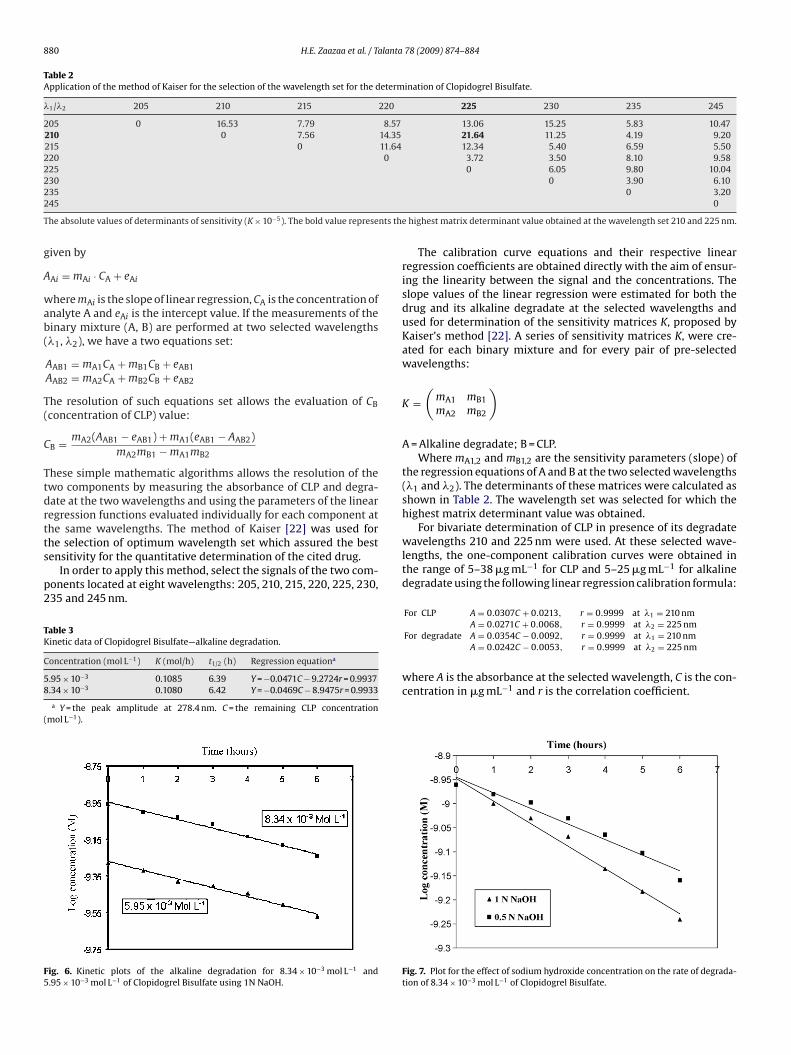
ig. 6. Kinetic plots of the alkaline degradation for 8.34 × 10⁻³ mol L−1 and.95 × 10−3 mol L−1 of Clopidogrel Bisulfate using 1N NaOH.
0 3.200
e highest matrix determinant value obtained at the wavelength set 210 and 225 nm.
The calibration curve equations and their respective linearregression coefficients are obtained directly with the aim of ensur-ing the linearity between the signal and the concentrations. Theslope values of the linear regression were estimated for both thedrug and its alkaline degradate at the selected wavelengths andused for determination of the sensitivity matrices K, proposed byKaiser’s method [22]. A series of sensitivity matrices K, were cre-ated for each binary mixture and for every pair of pre-selectedwavelengths:
K =(
mA1 mB1mA2 mB2
)
A = Alkaline degradate; B = CLP.Where mA1,2 and mB1,2 are the sensitivity parameters (slope) of
the regression equations of A and B at the two selected wavelengths(�1 and �2). The determinants of these matrices were calculated asshown in Table 2. The wavelength set was selected for which thehighest matrix determinant value was obtained.
For bivariate determination of CLP in presence of its degradatewavelengths 210 and 225 nm were used. At these selected wave-lengths, the one-component calibration curves were obtained inthe range of 5–38 �g mL−1 for CLP and 5–25 �g mL−1 for alkalinedegradate using the following linear regression calibration formula:
For CLP A = 0.0307C + 0.0213, r = 0.9999 at �1 = 210 nmA = 0.0271C + 0.0068, r = 0.9999 at �2 = 225 nm
For degradate A = 0.0354C − 0.0092, r = 0.9999 at �1 = 210 nmA = 0.0242C − 0.0053, r = 0.9999 at �2 = 225 nm
where A is the absorbance at the selected wavelength, C is the con-centration in �g mL−1 and r is the correlation coefficient.
Fig. 7. Plot for the effect of sodium hydroxide concentration on the rate of degrada-tion of 8.34 × 10⁻³ mol L−1 of Clopidogrel Bisulfate.
H.E. Zaazaa et al. / Talanta 78 (2009) 874–884 881
FRv
4
tw
Table 4Parameters of system suitability of the developed TLC-densitometric method for thedetermination of Clopidogrel Bisulfate.
Parameters Clopidogrel Bisulfate Alkaline degradate
Symmetry factor 0.98 0.92Resolution (Rs)a 5.32
TQ
T
D
D
M
B
M
T
M
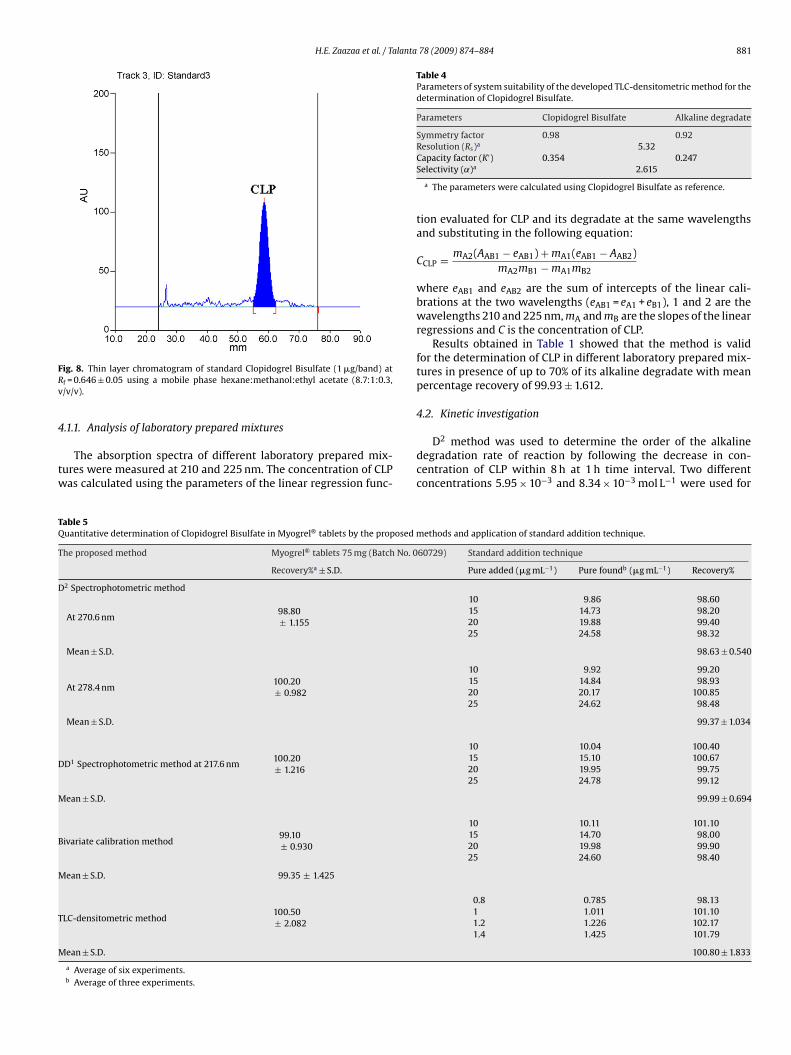
ig. 8. Thin layer chromatogram of standard Clopidogrel Bisulfate (1 �g/band) atf = 0.646 ± 0.05 using a mobile phase hexane:methanol:ethyl acetate (8.7:1:0.3,/v/v).
.1.1. Analysis of laboratory prepared mixtures
The absorption spectra of different laboratory prepared mix-ures were measured at 210 and 225 nm. The concentration of CLPas calculated using the parameters of the linear regression func-
able 5uantitative determination of Clopidogrel Bisulfate in Myogrel® tablets by the proposed m
he proposed method Myogrel® tablets 75 mg (Batch No. 0
Recovery%a ± S.D.
2 Spectrophotometric method
At 270.6 nm98.80± 1.155
Mean ± S.D.
At 278.4 nm100.20± 0.982
Mean ± S.D.
D1 Spectrophotometric method at 217.6 nm100.20± 1.216
ean ± S.D.
ivariate calibration method99.10± 0.930
ean ± S.D. 99.35 ± 1.425
LC-densitometric method100.50± 2.082
ean ± S.D.
a Average of six experiments.b Average of three experiments.
Capacity factor (K′) 0.354 0.247Selectivity (˛)a 2.615
a The parameters were calculated using Clopidogrel Bisulfate as reference.
tion evaluated for CLP and its degradate at the same wavelengthsand substituting in the following equation:
CCLP = mA2(AAB1 − eAB1) + mA1(eAB1 − AAB2)mA2mB1 − mA1mB2
where eAB1 and eAB2 are the sum of intercepts of the linear cali-brations at the two wavelengths (eAB1 = eA1 + eB1), 1 and 2 are thewavelengths 210 and 225 nm, mA and mB are the slopes of the linearregressions and C is the concentration of CLP.
Results obtained in Table 1 showed that the method is validfor the determination of CLP in different laboratory prepared mix-tures in presence of up to 70% of its alkaline degradate with meanpercentage recovery of 99.93 ± 1.612.
4.2. Kinetic investigation
D2 method was used to determine the order of the alkalinedegradation rate of reaction by following the decrease in con-centration of CLP within 8 h at 1 h time interval. Two differentconcentrations 5.95 × 10⁻³ and 8.34 × 10⁻³ mol L−1 were used for
ethods and application of standard addition technique.
60729) Standard addition technique
Pure added (�g mL−1) Pure foundb (�g mL−1) Recovery%
10 9.86 98.6015 14.73 98.2020 19.88 99.4025 24.58 98.32
98.63 ± 0.540
10 9.92 99.2015 14.84 98.9320 20.17 100.8525 24.62 98.48
99.37 ± 1.034
10 10.04 100.4015 15.10 100.6720 19.95 99.7525 24.78 99.12
99.99 ± 0.694
10 10.11 101.1015 14.70 98.0020 19.98 99.9025 24.60 98.40
0.8 0.785 98.131 1.011 101.101.2 1.226 102.171.4 1.425 101.79
100.80 ± 1.833
882 H.E. Zaazaa et al. / Talanta
F0a
tsal
ratios were tried for separation, e.g. chloroform–ethyl acetate
TQ
T
D
M
D
M
B
M
T
M
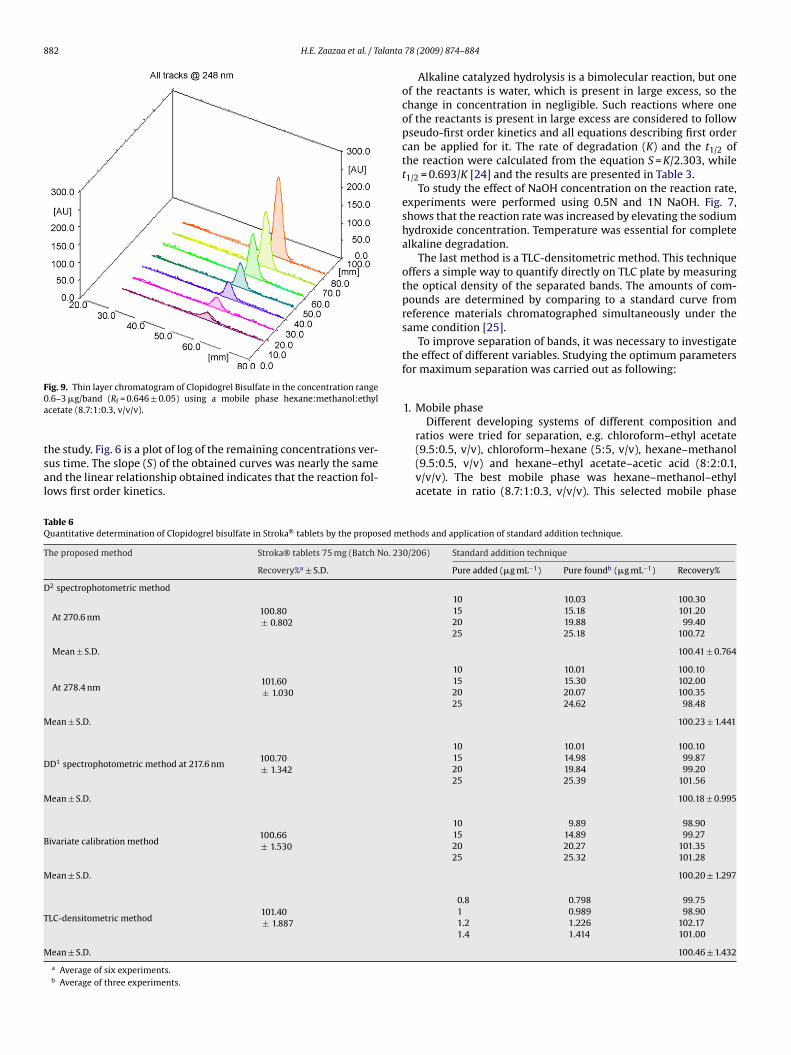
ig. 9. Thin layer chromatogram of Clopidogrel Bisulfate in the concentration range.6–3 �g/band (Rf = 0.646 ± 0.05) using a mobile phase hexane:methanol:ethylcetate (8.7:1:0.3, v/v/v).
he study. Fig. 6 is a plot of log of the remaining concentrations ver-us time. The slope (S) of the obtained curves was nearly the samend the linear relationship obtained indicates that the reaction fol-ows first order kinetics.
able 6uantitative determination of Clopidogrel bisulfate in Stroka® tablets by the proposed m
he proposed method Stroka® tablets 75 mg (Batch No. 23
Recovery%a ± S.D.
2 spectrophotometric method
At 270.6 nm100.80± 0.802
Mean ± S.D.
At 278.4 nm101.60± 1.030
ean ± S.D.
D1 spectrophotometric method at 217.6 nm100.70± 1.342
ean ± S.D.
ivariate calibration method100.66± 1.530
ean ± S.D.
LC-densitometric method101.40± 1.887
ean ± S.D.
a Average of six experiments.b Average of three experiments.
78 (2009) 874–884
Alkaline catalyzed hydrolysis is a bimolecular reaction, but oneof the reactants is water, which is present in large excess, so thechange in concentration in negligible. Such reactions where oneof the reactants is present in large excess are considered to followpseudo-first order kinetics and all equations describing first ordercan be applied for it. The rate of degradation (K) and the t1/2 ofthe reaction were calculated from the equation S = K/2.303, whilet1/2 = 0.693/K [24] and the results are presented in Table 3.
To study the effect of NaOH concentration on the reaction rate,experiments were performed using 0.5N and 1N NaOH. Fig. 7,shows that the reaction rate was increased by elevating the sodiumhydroxide concentration. Temperature was essential for completealkaline degradation.
The last method is a TLC-densitometric method. This techniqueoffers a simple way to quantify directly on TLC plate by measuringthe optical density of the separated bands. The amounts of com-pounds are determined by comparing to a standard curve fromreference materials chromatographed simultaneously under thesame condition [25].
To improve separation of bands, it was necessary to investigatethe effect of different variables. Studying the optimum parametersfor maximum separation was carried out as following:
1. Mobile phaseDifferent developing systems of different composition and
(9.5:0.5, v/v), chloroform–hexane (5:5, v/v), hexane–methanol(9.5:0.5, v/v) and hexane–ethyl acetate–acetic acid (8:2:0.1,v/v/v). The best mobile phase was hexane–methanol–ethylacetate in ratio (8.7:1:0.3, v/v/v). This selected mobile phase
ethods and application of standard addition technique.
0/206) Standard addition technique
Pure added (�g mL−1) Pure foundb (�g mL−1) Recovery%
10 10.03 100.3015 15.18 101.2020 19.88 99.4025 25.18 100.72
100.41 ± 0.764
10 10.01 100.1015 15.30 102.0020 20.07 100.3525 24.62 98.48
100.23 ± 1.441
10 10.01 100.1015 14.98 99.8720 19.84 99.2025 25.39 101.56
100.18 ± 0.995
10 9.89 98.9015 14.89 99.2720 20.27 101.3525 25.32 101.28
100.20 ± 1.297
0.8 0.798 99.751 0.989 98.901.2 1.226 102.171.4 1.414 101.00
100.46 ± 1.432
H.E. Zaazaa et al. / Talanta 78 (2009) 874–884 883
Table 7Assay parameters and method validation obtained by applying the proposed methods for the determination of Clopidogrel Bisulfate.
Parameters D2 spectrophotometric method DD1 spectrophotometricmethod at 217.6 nm
Bivariate calibration TLC-densitometricmethod
At 270.6 nm At 278.4 nm At 210 nm At 225 nm
Range 4–37 �g mL−1 5–38 �g mL−1 5–38 �g mL−1 0.6–3 �g/band
LinearitySlope 0.0066 0.0089 0.0172 0.0307 0.0271 0.1867 × 10⁴Intercept −0.0145 −0.0201 −0.0155 0.0213 0.0068 0.1153 × 10⁴
Correlation coefficient (r) 0.9999 0.9999 0.9999 0.9999 0.9999 0.9996
Accuracy (mean ± S.D.) 99.73 ± 0.634 100.38 ± 1.101 99.90 ± 0.914 100.20 ± 1.058 100.29 ± 1.041 99.97 ± 1.161
Specificity 99.32 ± 1.182 99.43 ± 1.464 100.20 ± 1.301 99.93 ± 1.612 100.06 ± 1.738
Precision (R.S.D.%)Repeatabilitya 0.512 0.457 0.788 0.994 1.322Intermediate precisionb 0.882 0.799 1.003 1.11 1.624LODc 0.81 �g mL−1 0.75 �g mL−1 1.30 �g mL−1 1.2 �g mL−1 1.4 �g mL−1 0.04 �g/bandLOQc 2 �g mL−1 2.2 �g mL−1 3.50 �g mL−1 3.2 �g mL−1 3 �g mL−1 0.4 �g/band
a The intraday (n = 3), average of three different concentrations repeated three times within day.b The interday (n = 3), average of three different concentrations repeated three times in three successive days.c Limit of detection and limit of quantitation are determined experimentally for TLC-densitometric method and via calculations for the other methods.
Table 8Statistical comparison of the results obtained by the proposed methods and the official method.
Parameters The proposed methods Official methoda
D2 spectrophotometric method DD1 spectrophotometricmethod at 217.4 nm
Bivariate calibration TLC-densitometricmethod
At 270.6 nm At 278.4 nm
Mean 99.72 100.46 99.88 99.27 99.97 99.86S.D. 0.668 0.646 0.909 1.115 1.161 1.116R.S.D.% 0.670 0.643 0.910 1.123 1.161 1.118n 8 8 10 8 7 7Variance 0.446 0.418 0.826 1.243 1.347 1.246Student’s t-test 0.299 (2.160)b 1.288 (2.160)b 0.050 (2.131)b 1.020 (2.160)b 0.178 (2.179)b
F b b b b b
d UVand F
2
3
4
5
(F
-Value 2.79 (3.87) 2.98 (3.87) 1.51 (3.37)
a Official HPLC method USP (RP-HPLC using acetonitrile:0.05 M KH2PO4 25:75, anb Figures between parentheses represent the corresponding tabulated values of t
allows the determination of CLP without interference from itsalkaline degradate and without tailing of the separated bands,Fig. 8.
. Band dimensionsDifferent band dimensions were tested in order to obtain sharp
and symmetrical separated peaks. The optimum band width cho-sen was 5 mm and the inter-space between bands was 5 mm.
. Scanning wavelengthDifferent scanning wavelengths were tried, although peaks
at 220 nm (�max of CLP) gave higher sensitivity, but at 248 nm,peaks were more sharp and symmetrical and minimum noisewas obtained.
. Slit dimensions of scanning light beamThe slit dimensions of the scanning light beam should ensure
complete coverage of band dimensions on the scanned trackwithout interference of adjacent bands. Different slit dimensionswere tried, where 5 mm × 0.2 mm proved to be the slit dimensionof choice which provides highest sensitivity.
. System suitabilityParameters including resolution (Rs), peak symmetry, capac-
ity factor (K′) and selectivity factor (˛) were calculated using1 �g/band of CLP. The resolution is always above two, the selec-tivity more than one and an accepted value for symmetry factor
was obtained, as shown in Table 4.This method is based on the difference in the Rf values of CLPRf = 0.646 ± 0.05) and degradate (Rf = 0.247 ± 0.03), as shown inig. 9.
1.00 (3.87) 1.08 (4.28)
detection at 220 nm, flow rate 1 mL/min).at P = 0.05.
The calibration curve was constructed by plotting the integratedpeak area versus the corresponding concentration in the range of0.6–3 �g/band for CLP. The regression equation was calculated andfound to be
A = 0.1867 × 10⁴C + 0.1153 × 10⁴, r = 0.9996
where Y is the integrated peak area, C is the concentration of CLP in�g/band and r is the correlation coefficient.
Results described in Table 1, showed that this method is spe-cific, valid and applicable for determination of CLP in presence ofup to 90% of its alkaline degradate with mean percentage recovery100.06 ± 1.738.
As the method could effectively separate the drug from its degra-dation product, it can be employed as a stability indicating one.
The suggested methods are valid and applicable for the analysisof CLP in Myogrel® and Stroka® tablets. The validity of the proposedmethods was assessed by applying the standard addition technique,which showed accurate results and there is no interference fromexcipients as shown in Tables 5 and 6.
Method validation was performed according to USP guidelines[26] for all the proposed methods. Table 7 shows results of accuracy,repeatability and intermediate precision of the methods.
Table 8 shows statistical comparison of the results obtained
by the proposed methods and the official HPLC method [26].The calculated t and F values are less than the theoreticalones indicating that there is no significant difference betweenthe proposed methods and the official method with respect toaccuracy and precision. One-way ANOVA was applied for the
8 alanta
ceF
5
iaf
oiddt
tbso
iIB
m
spa
coct
msoa
[
[
[
[
[
[Febiger, Philadelphia, 1983, pp. 359–360.
[25] N. Grinberg, Modern Thin-layer Chromatography, Marcel Dekker Inc., New York,
84 H.E. Zaazaa et al. / T
omparison of these methods where There is no significant differ-nce between the proposed methods and the official method ascalculated(2.330) < Ftabulated(1.061).
. Conclusion
The present work is concerned with the determination of CLPn presence of its alkaline degradate. In this paper simple, sensitivend rapid methods are described for determination of CLP in pureorm or in pharmaceutical formulations.
Reviewing literature in hand no other spectrophotometric meth-ds concerned with the determination of CLP in presence ofts alkaline degradate which is pharmacologically inactive whileegradation product was not identified in other published TLC-ensitometric method and no synthetic mixtures were preparedo check the specificity of the method.
D2 and DD1 spectrophotometric methods are well-establishedechniques that are able to enhance the resolution of overlappingands. These methods are simple, more convenient, less time con-uming and economic stability indicating methods compared tother published LC methods.
Kinetic studies of the decomposition of drugs using stability test-ng techniques are essential for the quality control of such products.n this work, a kinetic investigation of alkaline degradation of CLPisulfate was done.
Bivariate calibration method provided simple and rapid deter-ination of CLP with minimal sample and data manipulation.The advantages of TLC-densitometric method is that several
amples can be run simultaneously using a small quantity of mobilehase unlike HPLC, thus lowering analysis time and cost per analysisnd provides high sensitivity and selectivity.
High values of correlation coefficients and small values of inter-epts validated the linearity of the calibration graphs and thebedience to Beer’s law. The R.S.D. values, the slopes and the inter-epts of the calibration graphs indicated the high reproducibility ofhe proposed methods.
From the results obtained, we concluded that the suggestedethods showed high sensitivity, accuracy, reproducibility and
pecificity and can be used as stability indicating methods. More-ver, these methods are simple and inexpensive, permitting theirpplication in quality control laboratories.
[
78 (2009) 874–884
References
[1] The Merck Index, in: S. Budavaried (Ed.), An Encyclopedia of Chemicals, Drugsand Biologicals, 13th edn., Merck & Co., Inc., 2002.
[2] K. Moshfegh, M. Redondo, F. Julmy, W.A. Wuillemin, M.U. Gebauer, A. Haeberli,B.J. Meyer, J. Am. Coll. Cardiol. 36 (2000) 699.
[3] S.J. Gardell, Perspect. Drug Disc. Des. 1 (1993) 521.[4] J. McEwen, G. Strauch, P. Perles, G. Pritchard, T.E. Moreland, J. Necciari, J.P. Dick-
inson, Thromb. Haemost. 25 (1999) 45.[5] H. Caplain, F. Donat, C. Gaud, J. Necciari, Thromb. Haemost. 25 (1999) 25.[6] P. Savi, J. Combalbert, C. Gaich, M.C. Rouchon, J.P. Maffrand, Y. Berger, J.M. Her-
bert, Thromb. Haemost. 72 (1994) 313.[7] P. Savi, P. Nurden, A.T. Nurden, S. Levy-Toledano, J.M. Herbert, Platelets 9 (1998)
251.[8] J.M. Herbert, D. Frehel, E. Vallee, G. Kieffer, D. Gouy, Y. Berger, J. Necciati, G.
Defreyn, I.P. Maffrad, Cardiovasc. Drug Rev. 11 (1993) 180.[9] M. Reist, M. Roy-de Vos, J.P. Montseny, J.M. Mayer, P.A. Carrupt, Y. Berger, B.
Testa, Drug Metab. Dispos. 28 (2000) 1405.[10] A. Mitakos, I. Panderi, J. Pharm. Biomed. Anal. 28 (2002) 431.[11] A. Mohan, M. Hariharan, E. Vikraman, G. Subbaiah, B.R. Venkataraman, D. Sar-
avanan, J. Pharm. Biomed. Anal. 47 (2008) 183.12] S.S. Singh, R. Sharma, D. Barot, P.R. Mohan, V.B. Lohray, J. Chromatogr. B 821
(2005) 173.[13] G. Bahrami, B. Mohammadi, S. Siskhtnezhad, J. Chromatogr. B 864 (2008)
168.[14] P. Lagorce, Y. Perez, J. Ortiz, J. Necciari, F. Bressole, J. Chromatogr. B: Biomed.
Appl. 720 (1998) 107.[15] A. Mitakos, I. Panderi, Anal. Chim. Acta 505 (2004) 107.[16] A. Robinson, J. Hillis, C. Neal, A.C. Leary, J. Chromatogr. B 848 (2007) 344.[17] H. Agrawal, N. Kaul, A.R. Paradkar, K.R. Mahadik, Talanta 61 (2003)
581.[18] ICH, Stability Testing of New Drug Substances and Products International Con-
ference on Harmonization, Geneva, 1993.[19] J.J. Berzas Nevado, J. Rodriguez Flores, M.J. Villasenor Lierena, Anal. Lett. 27
(1994) 1009.20] P.L. López-de-Alba, L.L. Martinez, K.W. Kaczmarmarzyc, K. Wróbel, J.A. Hernan-
dez, J. Anal. Lett. 29 (1996) 487.21] P.L. López-de-Alba, L.L. Martinez, K.W. Kaczmarmarzyc, K. Wróbel, J.A. Hernán-
dez, Bol. Soc. Chilena Quim. 41 (1996) 111.22] D.L. Massart, B.G.M. Vandeginste, S.N. Deming, Y. Michotte, L. Kaufman, Chemo-
metrics, Elsevier, Amsterdam, 1988, p. 124.23] P.L. López-de-Alba, L.L. Martinez, K.W. Kaczmarmarzyc, K. Wróbel, M.L.Y.
Murrieta, M.L.Y. Murrieta, J.A. Hernandez, J. Pharm. Biomed. Anal. 16 (1997)349.
24] A. Martin, J. Swarbrick, A. Cammarata, Physical Pharmacy, 3rd edn., Lea and
1990, p. 249.26] The United States Pharmacopeia and National Formulary, The Official Compen-
dia of Standards, Asian Edition, USP 30-NF 25 The United States PharmacopeialConvention Inc., Rockvill, MD, 2007.