Determination of polyphenols content and antioxidant activity of some red wines by differential...
9
Analytical Methods Determination of polyphenols content and antioxidant activity of some red wines by differential pulse voltammetry, HPLC and spectrophotometric methods Marijan Šeruga * , Ivana Novak, Lidija Jakobek Department of Applied Chemistry and Ecology, Faculty of Food Technology, University of Osijek, Franje Kuhac ˇa 20, HR 31000 Osijek, Croatia article info Article history: Received 26 May 2009 Received in revised form 16 July 2010 Accepted 16 July 2010 Keywords: Polyphenols Antioxidant activity Red wines DPV HPLC Spectrophotometry abstract Red wines produced in three different wine growing regions of Croatia were analysed for total polyphe- nols (TP) content, concentration of individual polyphenols and antioxidant activity (AA). TP content was measured by differential pulse voltammetry (DPV), Folin–Ciocalteu (FC) and HPLC methods. Individual polyphenols were measured by HPLC and AA was determined by ABTS and DPPH methods. The results showed that DPV is a very sensitive method for the determination of TP. A very high correlation was obtained between the TP content determined by DPV, FC and HPLC. The major polyphenols in the wines were gallic acid and (+)-catechin. TP, individual polyphenols and AA varied among wines from different regions. Wines from the Dalmatia region had the highest TP content, the highest concentration of impor- tant antioxidants and significantly higher AA. There was a very high correlation between AA and TP in all of the wines tested. Ó 2010 Published by Elsevier Ltd. 1. Introduction Wine, especially red wine, is a very rich source of polyphenols, such as flavanols (catechin, epicatechin, etc.), flavonols (quercetin, rutin, myricetin, etc.), anthocyanins (the most abundant is malvi- din-3-O-glucoside), oligomeric and polymeric proanthocyanidins, phenolic acids (gallic acid, caffeic acid, p-coumaric acid, etc.), stilb- enes (trans-resveratrol) and many others polyphenols. Many of these compounds (e.g. resveratrol, quercetin, rutin, catechin and their oligomers and polymers proanthocyanidins) have been re- ported to have multiple biological activities, including cardiopro- tective, anti-inflammatory, anti-carcinogenic, antiviral and antibacterial properties (King, Bomser, & Min, 2006; Santos-Buelga & Scalbert, 2000). These biological properties are attributed mainly to their powerful antioxidant and antiradical activity. The results of many published epidemiological studies suggest that regular, moderate consumption of red wine has reduced the incidence of many diseases such as risk of coronary heart disease (CHD), atherosclerosis, cancers, etc. (Cooper, Chopra, & Thurnham, 2004; Teissedre, Frankel, Waterhouse, Peleg, & German, 1996). The most intriguing are the studies which reported the possible associ- ation between red wine consumption and decrease in risk, and some suppression and inhibition of cancers (Briviba, Pan, & Rechkemmer, 2002). Currently, chemoprevention is being used in medicine as a new strategy to prevent cancers. Natural phyto- chemicals, including red wine polyphenols, appear to be very promising substances to block, reverse, retard or prevent the pro- cess of carcinogenesis (Russo, 2007). Many epidemiological studies have found that regular intake of red wine or red wine polyphenols has positive effects on human health. Therefore, determination of the chemical composition, polyphenols content and antioxidant activity of red wine could be very useful for the interpretation of epidemiological studies. Many different methods, including high-performance liquid chromatography (HPLC) and capillary electrophoresis (CE) in com- bination with different detectors, UV–Vis, photo diode array (PDA), mass spectrometry (MS), and electrochemical (EC) detectors, have been used to investigate the polyphenolic content and chemical composition of wine. Mass spectrometry (MS), especially, is responsible for great progress in the identification and character- isation of polyphenols in wine (Escarpa & Gonzalez, 2001). In recent times, different electrochemical methods have been proposed for the characterisation of polyphenols in wine on the ba- sis that practically all polyphenolic molecules present in wine are electrochemically active. Cyclic voltammetry (CV) was the first electrochemical method used for characterisation of polyphenols and determination of total polyphenols (TP) content in wines (De Beer et al., 2004; Kilmartin, Zou, & Waterhouse, 2001, 2002). Flow injection analysis with electrochemical detection (FIA–ED) has also been used for determination of TP in wines (Blasko, Rogerio, Gonz- alez, & Escarpa, 2005). Differential pulse voltammetry (DPV) has also been explored in the analytical detection of polyphenols in foods. Thus, Blasko, 0308-8146/$ - see front matter Ó 2010 Published by Elsevier Ltd. doi:10.1016/j.foodchem.2010.07.047 * Corresponding author. Tel.: +385 31 224 325; fax: +385 31 207 115. E-mail address: [email protected] (M. Šeruga). Food Chemistry 124 (2011) 1208–1216 Contents lists available at ScienceDirect Food Chemistry journal homepage: www.elsevier.com/locate/foodchem
-
Upload
independent -
Category
Documents
-
view
0 -
download
0
Transcript of Determination of polyphenols content and antioxidant activity of some red wines by differential...

Food Chemistry 124 (2011) 1208–1216
Contents lists available at ScienceDirect
Food Chemistry
journal homepage: www.elsevier .com/locate / foodchem
Analytical Methods
Determination of polyphenols content and antioxidant activity of some red winesby differential pulse voltammetry, HPLC and spectrophotometric methods
Marijan Šeruga *, Ivana Novak, Lidija JakobekDepartment of Applied Chemistry and Ecology, Faculty of Food Technology, University of Osijek, Franje Kuhaca 20, HR 31000 Osijek, Croatia
a r t i c l e i n f o a b s t r a c t
Article history:Received 26 May 2009Received in revised form 16 July 2010Accepted 16 July 2010
Keywords:PolyphenolsAntioxidant activityRed winesDPVHPLCSpectrophotometry
0308-8146/$ - see front matter � 2010 Published bydoi:10.1016/j.foodchem.2010.07.047
* Corresponding author. Tel.: +385 31 224 325; faxE-mail address: [email protected] (M. Šeruga).
Red wines produced in three different wine growing regions of Croatia were analysed for total polyphe-nols (TP) content, concentration of individual polyphenols and antioxidant activity (AA). TP content wasmeasured by differential pulse voltammetry (DPV), Folin–Ciocalteu (FC) and HPLC methods. Individualpolyphenols were measured by HPLC and AA was determined by ABTS and DPPH methods. The resultsshowed that DPV is a very sensitive method for the determination of TP. A very high correlation wasobtained between the TP content determined by DPV, FC and HPLC. The major polyphenols in the wineswere gallic acid and (+)-catechin. TP, individual polyphenols and AA varied among wines from differentregions. Wines from the Dalmatia region had the highest TP content, the highest concentration of impor-tant antioxidants and significantly higher AA. There was a very high correlation between AA and TP in allof the wines tested.
� 2010 Published by Elsevier Ltd.
1. Introduction
Wine, especially red wine, is a very rich source of polyphenols,such as flavanols (catechin, epicatechin, etc.), flavonols (quercetin,rutin, myricetin, etc.), anthocyanins (the most abundant is malvi-din-3-O-glucoside), oligomeric and polymeric proanthocyanidins,phenolic acids (gallic acid, caffeic acid, p-coumaric acid, etc.), stilb-enes (trans-resveratrol) and many others polyphenols. Many ofthese compounds (e.g. resveratrol, quercetin, rutin, catechin andtheir oligomers and polymers proanthocyanidins) have been re-ported to have multiple biological activities, including cardiopro-tective, anti-inflammatory, anti-carcinogenic, antiviral andantibacterial properties (King, Bomser, & Min, 2006; Santos-Buelga& Scalbert, 2000). These biological properties are attributed mainlyto their powerful antioxidant and antiradical activity.
The results of many published epidemiological studies suggestthat regular, moderate consumption of red wine has reduced theincidence of many diseases such as risk of coronary heart disease(CHD), atherosclerosis, cancers, etc. (Cooper, Chopra, & Thurnham,2004; Teissedre, Frankel, Waterhouse, Peleg, & German, 1996). Themost intriguing are the studies which reported the possible associ-ation between red wine consumption and decrease in risk, andsome suppression and inhibition of cancers (Briviba, Pan, &Rechkemmer, 2002). Currently, chemoprevention is being used inmedicine as a new strategy to prevent cancers. Natural phyto-
Elsevier Ltd.
: +385 31 207 115.
chemicals, including red wine polyphenols, appear to be verypromising substances to block, reverse, retard or prevent the pro-cess of carcinogenesis (Russo, 2007).
Many epidemiological studies have found that regular intake ofred wine or red wine polyphenols has positive effects on humanhealth. Therefore, determination of the chemical composition,polyphenols content and antioxidant activity of red wine couldbe very useful for the interpretation of epidemiological studies.
Many different methods, including high-performance liquidchromatography (HPLC) and capillary electrophoresis (CE) in com-bination with different detectors, UV–Vis, photo diode array (PDA),mass spectrometry (MS), and electrochemical (EC) detectors, havebeen used to investigate the polyphenolic content and chemicalcomposition of wine. Mass spectrometry (MS), especially, isresponsible for great progress in the identification and character-isation of polyphenols in wine (Escarpa & Gonzalez, 2001).
In recent times, different electrochemical methods have beenproposed for the characterisation of polyphenols in wine on the ba-sis that practically all polyphenolic molecules present in wine areelectrochemically active. Cyclic voltammetry (CV) was the firstelectrochemical method used for characterisation of polyphenolsand determination of total polyphenols (TP) content in wines (DeBeer et al., 2004; Kilmartin, Zou, & Waterhouse, 2001, 2002). Flowinjection analysis with electrochemical detection (FIA–ED) has alsobeen used for determination of TP in wines (Blasko, Rogerio, Gonz-alez, & Escarpa, 2005).
Differential pulse voltammetry (DPV) has also been explored inthe analytical detection of polyphenols in foods. Thus, Blasko,
M. Šeruga et al. / Food Chemistry 124 (2011) 1208–1216 1209
Gonzalez, and Escarpa (2004) used DPV for characterisation offlavonoids and phenolic acids in fruit juices.
There is no report in the literature about the application of DPVfor the determination of total polyphenols (TP) content in wines.Therefore, the aims of this study were: (i) to use DPV for the deter-mination of TP content in some Croatian red wines; (ii) to comparethe results obtained by DPV with those obtained by spectroscopicFolin–Ciocalteu (FC) method and HPLC method; (iii) to identify andquantify the major polyphenolic compounds in wines by HPLC; (iv)to determine antioxidant activity (AA) of investigated red wines bytwo different methods: DPPH and ABTS methods; and (v) to eval-uate any correlation between the TP content and the AA of thered wines investigated in this study.
2. Materials and methods
2.1. Chemicals
Gallic acid monohydrate (398225), caffeic acid (C0625), p-cou-maric acid (C9008), (+)-catechin hydrate (C1251), (�)-epicatechin(E1753), quercetin dihydrate (Q0125), 2,2-diphenyl-1-picryl-hydrazyl radical (DPPH�) (D9132) and 2,20-azino-bis (3-ethyl-ben-zothiazoline-6-sulfonic acid) diammonium salt (ABTS) (A1888)were purchased from Sigma–Aldrich (St. Louis, MO, USA). Trolox((±)-6-hydroxy-2,5,7,8-tetramethyl-chromane-2-carboxylic acid)(56510), ammonium peroxodisulfate (09915) and phosphoric acid(85% HPLC grade) were purchased from Fluka (Buchs, Germany).Methanol (HPLC grade) was obtained from Merck (Darmstadt, Ger-many). Acetic acid (99.7%) was obtained from Panreac, Barcelona,Spain. Sodium acetate, sodium carbonate, sodium dihydrogenphosphate, disodium hydrogen phosphate and Folin–Ciocalteu re-agent were obtained from Kemika (Zagreb, Croatia). Alumina pow-der was obtained from Buehler (USA).
2.2. Wine samples
Eleven widely consumed, commercially produced Croatian redwines, made from red grape varieties (Vitis vinifera L.) grown inthree different wine-producing regions of Croatia (Dalmatia, Istriaand Slavonia), were chosen as follows: (i) five brands (Plavac Hvar,Ivan Dolac, Dingac, Babic and Kaštelet) from the Dalmatia region(south and central Adriatic coast); (ii) two brands (Teran andMerlot) from the Istria region (north Adriatic coast); and (iii) fourbrands (Klikun Noir, Pinot Noir, Zweigelt and Frankovka) fromthe Slavonia region (continental part of Croatia). The wines, packedin glass bottles and made in the vintage year 2005–2006, were pur-chased from local supermarkets and stored at room temperatureuntil analysed. Before analysis, wine samples were filtered through0.45 lm polytetrafluoroethylene (PTFE) filters (Varian, USA).
2.3. Standards
(+)-Catechin and gallic acid were chosen as standards for mea-surement of the TP content. The stock solutions of (+)-catechin(3 g/L) and gallic acid (5 g/L) were prepared in methanol (HPLCgrade). These stock solutions, protected from light with aluminiumfoil and kept in refrigerator, were stable for at least 1 month. Theworking standards were prepared freshly from the stock solutionsfor each new measurement.
2.4. Differential pulse voltammetry (DPV)
The DPV measurements were performed using a potentiostat(model 273A, Princeton Applied Research EG&G, USA) runningwith electrochemical software (model 270/250, EG&G PAR, USA).
Voltammetric measurements were carried out in a standardthree-electrode electrochemical cell with a glassy-carbon (GC)electrode of 3 mm diameter (model MF-2012, Bioanalytical Sys-tems, USA) as the working electrode, a saturated calomel electrode(SCE) as the reference electrode and platinum gauze as the counterelectrode. Before each measurement, the surface of the GC workingelectrode was carefully polished with 0.3–0.05 lm alumina pow-der and then thoroughly rinsed with doubly distilled water. Imme-diately before the DPV measurements, the GC electrode wascleaned electrochemically by cyclic voltammetry, scanning 5–10cycles in the potential range between �0.2 and 1.0 V at a scan rateof 50 mV s�1, in supporting electrolyte (0.1 mol dm�3 sodium ace-tate–acetic acid buffer pH 3.6). The samples in the electrochemicalcell were de-aerated by purging with high purity argon during theelectrochemical measurements.
After electrochemical cleaning of the GC electrode, the requiredvolume of sample (solution of catechin or wine) was added bymicropipette into the supporting electrolyte in the electrochemicalcell and the differential pulse voltammograms were recordedimmediately to minimise adsorption of polyphenols (or otherselectrochemical active species) onto the GC electrode surface.DPV conditions were: scans range, from 0.0 to +1.0 V; pulse ampli-tude, 50 mV; pulse width, 70 ms; scan rate, 5 mV s�1. All measure-ments were done in, at least, triplicate.
Wine samples were diluted 1/100, 1/200, 1/400, 1/600 and1/800 (v/v) by 0.1 mol dm�3 sodium acetate–acetic acid buffer(pH 3.6) in order to obtain a linear correlation between anodic peakcurrent density and volume fraction of wine. The 400-fold dilutionwas found to be the optimum and electrochemical parameters ob-tained for this dilution were used for quantification of TP contentin wine.
The catechin standard calibration curve was constructed byplotting the peak current density of the first anodic peak (P1) ofcatechin vs. the corresponding concentration of catechin. TPDPV,the TP content in wine determined by the DPV method, was calcu-lated using the catechin calibration curve and expressed as mg cat-echin equivalents per litre of undiluted wine (mg CE/L).
2.5. Spectrophotometric determination of TP content
Spectrophotometric determination of the TP content was donewith the Folin–Ciocalteu micro method as adapted for wine analy-sis (Waterhouse, 2009) using gallic acid or catechin as the stan-dard. The calibration curve of absorbance vs. concentration ofstandard was used to quantify TPFC content. Results were ex-pressed as mg catechin equivalents per litre of wine (mg CE/L) ormg gallic acid equivalents per litre of wine (mg GAE/L).
2.6. HPLC analysis of wine composition and polyphenols content
Polyphenol standards (gallic acid, (+)-catechin, (�)-epicatechin,caffeic acid, p-coumaric acid and quercetin) were used for charac-terisation of the phenolics in wine. Calibration curves were madeby diluting stock solutions with methanol to give concentrationof the standard in the range 1–100 mg/L for gallic acid, (�)-epicat-echin), caffeic acid, p-coumaric acid and quercetin, and 1–125 mg/Lfor (+)-catechin. The calibration curves were constructed fromchromatograms as peak area vs. concentration of standard. Allphenolic standards gave linear calibration curves within theconcentration range studied (r = 0.9988–0.9990). The limits ofdetections (LOD) were calculated from the parameters obtainedfrom calibration curves, using the formula LOD = 3 sa/b, where sa
is the standard deviation of the y-intercept of the regression lineand b is the slope of the calibration curve (Ribani, Collins, & Bottoli,2007). The calculated LOD was 1.3 mg/L for gallic acid, 0.3 mg/L for

1210 M. Šeruga et al. / Food Chemistry 124 (2011) 1208–1216
caffeic acid, 0.6 mg/L for p-coumaric acid, 0.5 mg/L for quercetin,0.6 mg/L for (+)-catechin and 0.4 mg/L for (�) epicatechin.
The content of individual wine polyphenols (flavonols, flavan-3-ols and phenolic acids), responsible for the anodic voltammetricpeaks of wines in DPV measurements (see Figs. 2 and 3.), weredetermined by the RP-HPLC method. The HPLC apparatus consistedof a Varian LC system (USA) equipped with a ProStar 230 solventdelivery module, and a ProStar 330 PDA detector. The separationof phenolic compounds was performed on an OmniSpher C18 col-umn (25 cm � 4.6 mm, Varian, USA) equipped with ChromSepguard-column (1 cm � 3 mm, Varian, USA).
The flavonols, flavan-3-ols and phenolic acids present in wineswere separated using phosphoric acid (0.1%) as solvent A and 100%methanol (HPLC grade) as solvent B. The elution conditions were:0–30 min from 5% B to 80% B; 30–33 min 80% B; 33–35 min from80% B to 5% B; flow rate = 0.8 mL/min. The operating conditionswere: column temperature, 20 �C; injection volume, 10 lL. A re-equilibration period of 10 min was used between individual runs.UV–Vis spectra were recorded in the wavelength range 190–600 nm. The detection wavelength was 280 nm for gallic acid,(+)-catechin and (�)-epicatechin, 320 nm for caffeic acid andp-coumaric acid and 360 nm for quercetin.
The identification and peak assignment of flavonols, flavan-3-ols and phenolic acids in wine was based on comparison of reten-tion times and spectral data in the wavelength range 190–600 nmwith those of authentic standards. Spiking the wine samples withphenolic standards was done for additional identification of indi-vidual polyphenols. Identified flavonols, flavan-3-ols and phenolicacids were quantified using calibration curves of authentic stan-dards. The TP content was determined from the total area of theRP-HPLC chromatograms at 280 nm and expressed as mg GAE/Lof wine (TPHPLC).
2.7. Determination of antioxidant activity (AA)
The AA of wines was investigated by the ABTS and DPPH methods.The ABTS assay is based on the scavenging ability of antioxidants tothe long-life ABTS�+ radical cation (Villano, Fernandez-Pachon,Troncoso, & Garcia-Parrilla, 2004). The DPPH method is based onthe measurements of the scavenging ability of antioxidants towardsthe stable free radical DPPH� (Brand-Williams, Cuvelier, & Berset,1995).
2.7.1. ABTS methodFive different dilutions of each wine sample were analysed by
the ABTS method. A stock solution of the ABTS�+ radical cationwas generated chemically by mixing 0.2 mL of ammonium perox-odisulfate solution (65 mmol dm�3) with 50 mL of ABTS solution(1 mmol dm�3, prepared in 0.1 mol dm�3 phosphate buffer pH7.4). The mixture was left overnight and then 0.5 mL of ABTS�+ rad-ical cation stock solution was mixed with 2 mL of phosphate buffer(pH 7.4) in a cuvette and the absorbance at 734 nm (AABTS) wasmeasured. Subsequently, 0.1 mL of diluted wine was added inthe cuvette, the solution was mixed quickly, and the absorbanceat 734 nm (Awine) was measured after 60 s. The decrease in absor-bance (DA = AABTS � Awine) after 60 s was calculated for each di-luted wine sample. The decrease in absorbance caused by theaddition of Trolox as the standard was measured by the same pro-cedure for each concentration of Trolox (50–400 lmol/L) and thecalibration curve for the decrease in absorbance (DA = AABTS �ATrolox) of Trolox vs. Trolox concentration was constructed by linearregression. AA of each diluted wine sample was calculated on thebasis of the Trolox calibration curve and expressed in mmol/L ofTrolox equivalents (mmol TE/L); i.e. as TEAC values. Additionally,the percentage inhibition of ABTS�+ radical cation caused by theaddition of each diluted wine sample was calculated as:
%Inhibition ¼ ½ðAABTS � AwineÞ=AABTSÞ� � 100
The percentage of inhibition of ABTS�+ radical caused by each di-luted wine sample was plotted against the volume of undilutedwine in the reaction mixture. Using the curve obtained, AA was ex-pressed as the volume (lL) of wine needed to reduce the initialABTS�+ radical concentration by 50% (i.e. as the Efficient Concentra-tion, EC50).
2.7.2. DPPH methodFive dilutions of each wine were analysed by the DPPH method.
A 50 lL of each diluted wine was mixed with 120 lL of methanolicDPPH� solution (1 mmol dm�3) and 1880 lL of methanol to attain afinal concentration of DPPH� in the reaction mixture of 5.85 � 10�5
mol dm�3. The reaction mixture was kept in the dark at room tem-perature for 15 min and then the absorbance at 517 nm of thismixture (Awine) was measured against the blank sample (50 lL ofdiluted wine, 2000 lL of methanol). The DPPH� blank solutionwas prepared fresh each day (120 lL of 1 mmol dm�3 DPPH�,1930 lL of methanol) and its absorbance at 517 nm (ADPPH) wasmeasured daily. Trolox standards with final concentration 0–2550 lmol/L in methanol were assayed under the same conditionsas those used for the diluted wine samples; i.e. 50 lL of Trolox wasmixed with 120 lL of methanolic 1 mmol/L DPPH� solution and1880 lL of methanol. After 15 min, the absorbance at 517 nm(ATrolox) against the prepared blank sample was measured. The cal-ibration curve for Trolox, constructed by linear regression of absor-bance value (ATrolox) vs. Trolox concentration, was used to calculatethe AA of each diluted wine sample and to express their AA inmmol of Trolox equivalents (mmol TE/L); i.e. as TEAC values. TEACvalues were determined as described above for the ABTS method.The percentage inhibition of the initial concentration of DPPH� rad-ical caused by each diluted wine sample was calculated as:
%Inhibition ¼ ½ðADPPH � AwineÞ=ADPPHÞ� � 100
The percentage inhibition of DPPH� radical caused by each di-luted wine sample was plotted against the volume of undilutedwine in the reaction mixture. Using the curve obtained, AA was ex-pressed as the volume (lL) of wine needed to reduce the initialconcentration of DPPH� radical by 50% (i.e. as Efficient Concentra-tion, EC50).
2.8. Statistical analysis
All measurements were done in triplicate and the results werepresented as mean value ± standard error (standard deviation,SD). Correlation and regression analyses were done with the Stat-istica 7.1 (StatSoft Inc., Tulsa, USA) and OriginPro 7.5 (OriginLabCorporation, Northampton, USA) software packages. The directionand magnitude of the correlation between the variables was quan-tified by the correlation coefficient, r. Correlations were consideredstatistically significant at p < 0.05.
3. Results and discussion
3.1. Differential pulse voltammetry measurements
Differential pulse voltammetry (DPV) was used to characterisepolyphenols in red wines and (+)-catechin was used as the stan-dard to express the TP content.
The differential pulse voltammograms of (+)-catechin exhibitedtwo well-defined anodic oxidation peaks (Fig. 1). The first oxida-tion peak (P1) was observed in the potential range 0.440–�0.475 V vs. SCE and is shifted to more positive values withincreasing concentration of catechin. According to the literature(Janeiro & Oliveira Brett, 2004; Kilmartin et al., 2001, 2002) this
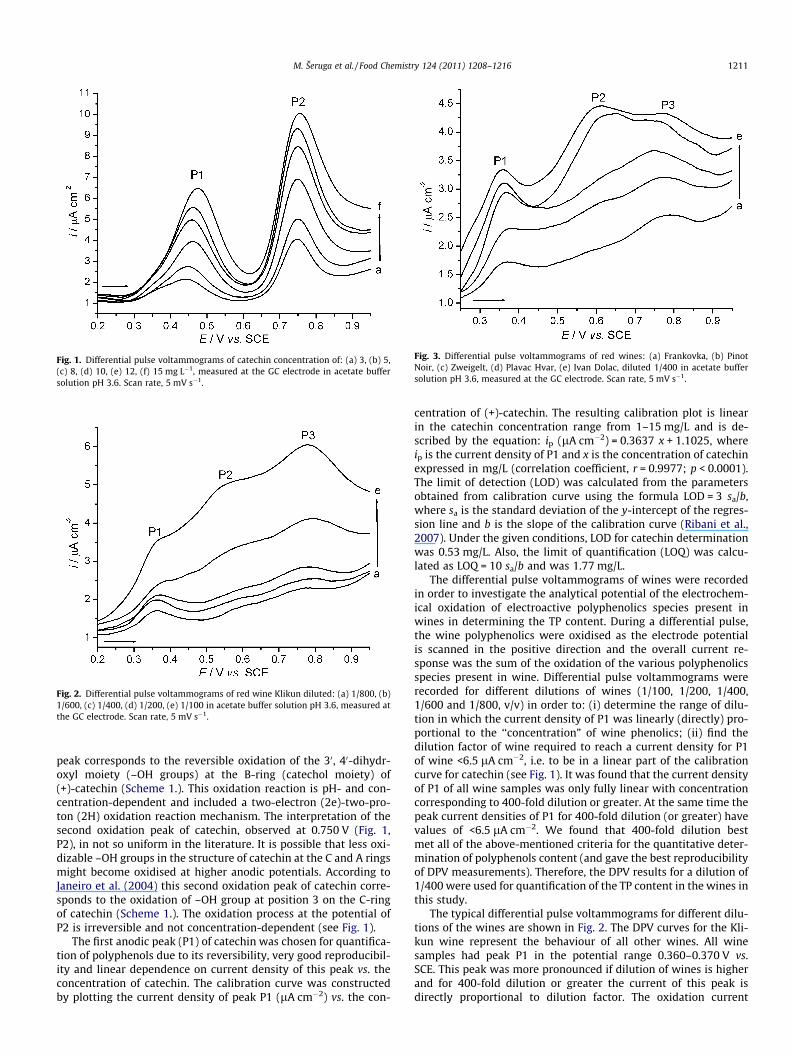
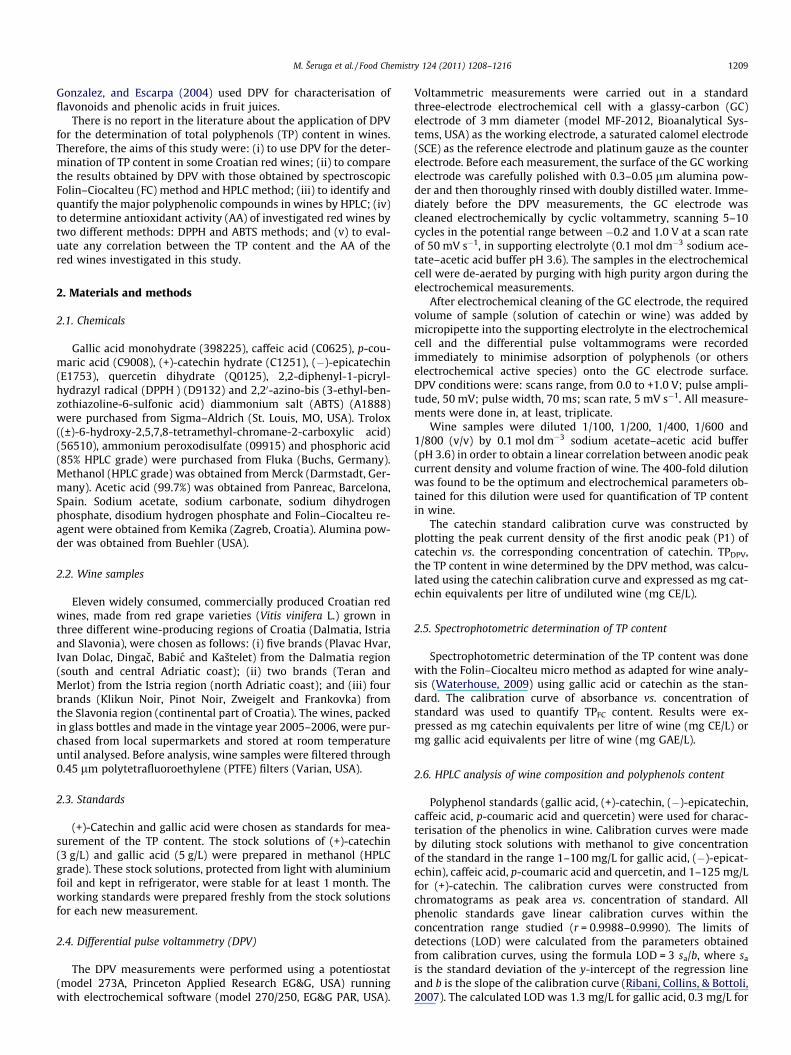
Fig. 1. Differential pulse voltammograms of catechin concentration of: (a) 3, (b) 5,(c) 8, (d) 10, (e) 12, (f) 15 mg L�1, measured at the GC electrode in acetate buffersolution pH 3.6. Scan rate, 5 mV s�1.
Fig. 2. Differential pulse voltammograms of red wine Klikun diluted: (a) 1/800, (b)1/600, (c) 1/400, (d) 1/200, (e) 1/100 in acetate buffer solution pH 3.6, measured atthe GC electrode. Scan rate, 5 mV s�1.
Fig. 3. Differential pulse voltammograms of red wines: (a) Frankovka, (b) PinotNoir, (c) Zweigelt, (d) Plavac Hvar, (e) Ivan Dolac, diluted 1/400 in acetate buffersolution pH 3.6, measured at the GC electrode. Scan rate, 5 mV s�1.
M. Šeruga et al. / Food Chemistry 124 (2011) 1208–1216 1211
peak corresponds to the reversible oxidation of the 30, 40-dihydr-oxyl moiety (–OH groups) at the B-ring (catechol moiety) of(+)-catechin (Scheme 1.). This oxidation reaction is pH- and con-centration-dependent and included a two-electron (2e)-two-pro-ton (2H) oxidation reaction mechanism. The interpretation of thesecond oxidation peak of catechin, observed at 0.750 V (Fig. 1,P2), in not so uniform in the literature. It is possible that less oxi-dizable –OH groups in the structure of catechin at the C and A ringsmight become oxidised at higher anodic potentials. According toJaneiro et al. (2004) this second oxidation peak of catechin corre-sponds to the oxidation of –OH group at position 3 on the C-ringof catechin (Scheme 1.). The oxidation process at the potential ofP2 is irreversible and not concentration-dependent (see Fig. 1).
The first anodic peak (P1) of catechin was chosen for quantifica-tion of polyphenols due to its reversibility, very good reproducibil-ity and linear dependence on current density of this peak vs. theconcentration of catechin. The calibration curve was constructedby plotting the current density of peak P1 (lA cm�2) vs. the con-
centration of (+)-catechin. The resulting calibration plot is linearin the catechin concentration range from 1–15 mg/L and is de-scribed by the equation: ip (lA cm�2) = 0.3637 x + 1.1025, whereip is the current density of P1 and x is the concentration of catechinexpressed in mg/L (correlation coefficient, r = 0.9977; p < 0.0001).The limit of detection (LOD) was calculated from the parametersobtained from calibration curve using the formula LOD = 3 sa/b,where sa is the standard deviation of the y-intercept of the regres-sion line and b is the slope of the calibration curve (Ribani et al.,2007). Under the given conditions, LOD for catechin determinationwas 0.53 mg/L. Also, the limit of quantification (LOQ) was calcu-lated as LOQ = 10 sa/b and was 1.77 mg/L.
The differential pulse voltammograms of wines were recordedin order to investigate the analytical potential of the electrochem-ical oxidation of electroactive polyphenolics species present inwines in determining the TP content. During a differential pulse,the wine polyphenolics were oxidised as the electrode potentialis scanned in the positive direction and the overall current re-sponse was the sum of the oxidation of the various polyphenolicsspecies present in wine. Differential pulse voltammograms wererecorded for different dilutions of wines (1/100, 1/200, 1/400,1/600 and 1/800, v/v) in order to: (i) determine the range of dilu-tion in which the current density of P1 was linearly (directly) pro-portional to the ‘‘concentration” of wine phenolics; (ii) find thedilution factor of wine required to reach a current density for P1of wine <6.5 lA cm�2, i.e. to be in a linear part of the calibrationcurve for catechin (see Fig. 1). It was found that the current densityof P1 of all wine samples was only fully linear with concentrationcorresponding to 400-fold dilution or greater. At the same time thepeak current densities of P1 for 400-fold dilution (or greater) havevalues of <6.5 lA cm�2. We found that 400-fold dilution bestmet all of the above-mentioned criteria for the quantitative deter-mination of polyphenols content (and gave the best reproducibilityof DPV measurements). Therefore, the DPV results for a dilution of1/400 were used for quantification of the TP content in the wines inthis study.
The typical differential pulse voltammograms for different dilu-tions of the wines are shown in Fig. 2. The DPV curves for the Kli-kun wine represent the behaviour of all other wines. All winesamples had peak P1 in the potential range 0.360–0.370 V vs.SCE. This peak was more pronounced if dilution of wines is higherand for 400-fold dilution or greater the current of this peak isdirectly proportional to dilution factor. The oxidation current

Scheme 1. Chemical structure and reaction of oxidation of (+)-catechin.
1212 M. Šeruga et al. / Food Chemistry 124 (2011) 1208–1216
generated in this potential range can be ascribed to wine poly-phenolics with high reducing capacity, i.e. with low oxidation po-tential. According to the literature (Kilmartin et al., 2001, 2002),peak P1 could be ascribed to the oxidation of different polypheno-lic compounds present in wines that have a structure with ortho-diphenol (catechol) groups at B-ring, like flavonoids catechin, epi-catechin, quercetin, and some phenolic acids like gallic, caffeic, andtannic acids.
Second oxidation peak (P2) was observed in the potential range0.550–0.630 V. This peak was more pronounced at lower dilutions(1/100 and 1/200), while at higher dilutions (1/400 and greater) P2was observed mainly as a shoulder on the DPV curves (see Fig. 2).P2 is more pronounced in wines with a very high TP content (espe-cially in red wines reach in anthocyanins), such as the famous redwines from Dalmatia (Ivan Dolac, Dingac and Plavac Hvar, seeFig. 3). This is in accordance with statements in the literature(Kilmartin et al., 2001, 2002) that the oxidation peak in this poten-tial region can be ascribed to the oxidation of wine anthocyanins;e.g. malvidin anthocyanins. Oxidation of trans-resveratrol andsome phenolic acids (e.g. ferulic acid) would also contribute toP2 (Kilmartin et al., 2001).
A third oxidation peak (P3) was observed between 0.760 and0.780 V (Figs. 2 and 3). This peak is relatively well pronounced inall of the wines in this study, but was more pronounced at lowerdilution factors. With dilution, the profile of P3 is unchanged butthe peak current was decreases (see Fig. 2). According to the liter-ature (Kilmartin et al., 2001, 2002), an oxidation peak in this poten-tial range can be the result of the oxidation of polyphenols withhigher oxidation potentials, such as some phenolic acids (p-couma-ric and vanillic acids), and the second oxidation of some flavonoids,like catechin, epicatechin quercetin, etc. (due to the oxidation of –OH group at position 3 on the C-ring of flavonoid structure). Inwine samples, this peak is somewhat broadened compared to thecorresponding P2 peak of catechin (Fig. 1), which is understandable
Table 1Total polyphenols (TP) content of some Croatian red wines measured by differential pulse vdetermined by ABTS and DPPH methods.
Wine TPDPV
(mg CE/L)TPFC
(mg CE/L)TPFC
(mg GAE/L)TPHPLC
(mg GAE/L)
Ivan Dolac 2491 ± 99 3013 ± 45 3264 ± 49 2760 ± 93Dingac 2413 ± 105 2872 ± 56 3111 ± 60 2677 ± 42Plavac Hvar 2223 ± 79 2675 ± 59 2898 ± 64 2430 ± 71Zweigelt 1859 ± 102 1971 ± 81 2135 ± 87 1975 ± 48Pinot Noir 1654 ± 87 1685 ± 71 1825 ± 77 1812 ± 20Babic 1606 ± 88 1625 ± 72 1759 ± 73 1746 ± 25Kaštelet 1505 ± 100 1589 ± 74 1721 ± 78 1645 ± 14Teran 1497 ± 71 1530 ± 18 1657 ± 19 1574 ± 17Klikun Noir 1224 ± 94 1343 ± 25 1455 ± 27 1346 ± 93Merlot 1081 ± 65 1163 ± 21 1260 ± 23 1174 ± 41Frankovka 851 ± 76 934 ± 34 1012 ± 37 1002 ± 79
Results represent mean values ± standard deviation (SD) of three independent measurem
because this peak in wine is the result of the combined effects ofthe oxidation of several wine polyphenolics with slightly differentoxidation potentials.
The TP content in the wines was determined by the use of elec-trochemical parameters obtained from the DPV voltammograms ofwines. Some of DPV voltammograms for different wines are shownin Fig. 3. All of the wines in this study showed a very well pro-nounced first oxidation peak (P1), and the current density of thispeak was used for quantification of the TP content. The second oxi-dation peak (P2) was more pronounced for wines from the Dalma-tia region (Dolac, Dingac, Plavac, Babic, etc.), and the thirdoxidation peak (P3) was more pronounced for wines from the Sla-vonia and Istria regions (Zweigelt, Pinot, Frankovka, Merlot, etc.).
The electrochemical parameters of DPV measurements weredetermined for all dilution factors (1/100, 1/200, 1/400, 1/600and 1/800) of the 11 investigated wines but the electrochemicalparameters of DPV measurements for the 400-fold diluted winesamples were used for quantification of polyphenols content. TheTP content (TPDPV) was calculated from the current density of thefirst oxidation peak, ip (P1), using the calibration curve for catechinas the standard, and expressed as mg catechin equivalents per litreof wine (mg CE/L) (Table 1). The results were expressed asmean ± SD of three independent analyses.
Table 1 shows that each of the wines had a high or very high TPcontent. The red wines from the Dalmatia region had the highestTP content (Ivan Dolac, Dingac, Plavac Hvar, 2491–2223 mg CE/L), while those from the continental part of Croatia (Slavonia re-gion) had a significantly lower TP content (e.g. Frankovka, Merlot,Klikun Noir, 851–1224 mg CE/L).
We compared our results with TP content of red wines thatwere also measured by an electrochemical method (CV) and werereported in papers of other authors. Piljac, Martinez, Stipcevic,Petrovic & Metikoš-Hukovic (2004) and Piljac-Zegarac, Martinez,Valek, Stipcevic, and Kovacevic-Ganic (2007) reported the TP
oltammetry (DPV), Folin–Ciocalteu (FC) and HPLC, and their antioxidant activity (AA)
AAABTS-TEAC(mmol TE/L)
AAABTS-EC50
(lL of wine)AADDPH-TEAC(mmol TE/L)
AADPPH-TC50
(lL of wine)
24.2 ± 0.8 1.6 ± 0.1 37.8 ± 2.8 2.4 ± 0.122.9 ± 0.6 1.9 ± 0.1 32.0 ± 3.1 2.5 ± 0.122.2 ± 0.5 1.9 ± 0.1 31.5 ± 0.9 2.5 ± 0.116.1 ± 0.6 2.6 ± 0.1 19.7 ± 2.5 4.3 ± 0.112.8 ± 0.3 3.2 ± 0.1 19.5 ± 2.7 4.3 ± 0.212.5 ± 0.7 3.2 ± 0.2 16.6 ± 0.5 4.9 ± 0.111.7 ± 0.4 3.4 ± 0.2 15.3 ± 1.9 5.2 ± 0.111.0 ± 0.6 3.9 ± 0.2 14.1 ± 0.3 5.3 ± 0.110.0 ± 0.2 4.1 ± 0.1 12.8 ± 2.7 7.6 ± 0.49.2 ± 0.1 4.6 ± 0.1 10.8 ± 0.3 8.5 ± 0.27.9 ± 0.4 5.1 ± 0.2 9.2 ± 0.6 8.9 ± 0.3
ents.
M. Šeruga et al. / Food Chemistry 124 (2011) 1208–1216 1213
content of 449–4884 mg CE/L for some Croatian red wines, and DeBerr et al. (2004) reported a TP content of 752–4819 mg CE/L inCalifornian red wines.
3.2. Folin–Ciocalteu measurements
The TP content of the wines was determined by the conven-tional spectrophotometric Folin–Ciocalteu (FC) method, whichgave TPFC expressed as mg of catechin equivalents (mg CE/L) ormg of gallic acid equivalents (mg GAE/L). In Table 1 were reportedTPFC values as mean value ± SD. The TPFC values, which were in therange 934–3013 mg CE/L or 1012–3264 mg GAE/L, were 1–20%higher (dependent on the brand of wines) than those obtained bythe DPV method (TPDPV, Table 1). Such differences in the TP contentof red wines obtained by FC and some electrochemical methodshave also been reported by others, who used CV as the methodfor characterisation of polyphenols in red wines (Kilmartin et al.,2001, 2002; De Berr et al., 2004; Piljac et al., 2004, 2007) The high-er values obtained by FC method can be explained by the fact thatFC reagent is not specific only to phenolic compounds; it can be re-duced also by non-phenolic compounds, including ascorbate, sul-phite and reducing sugars.
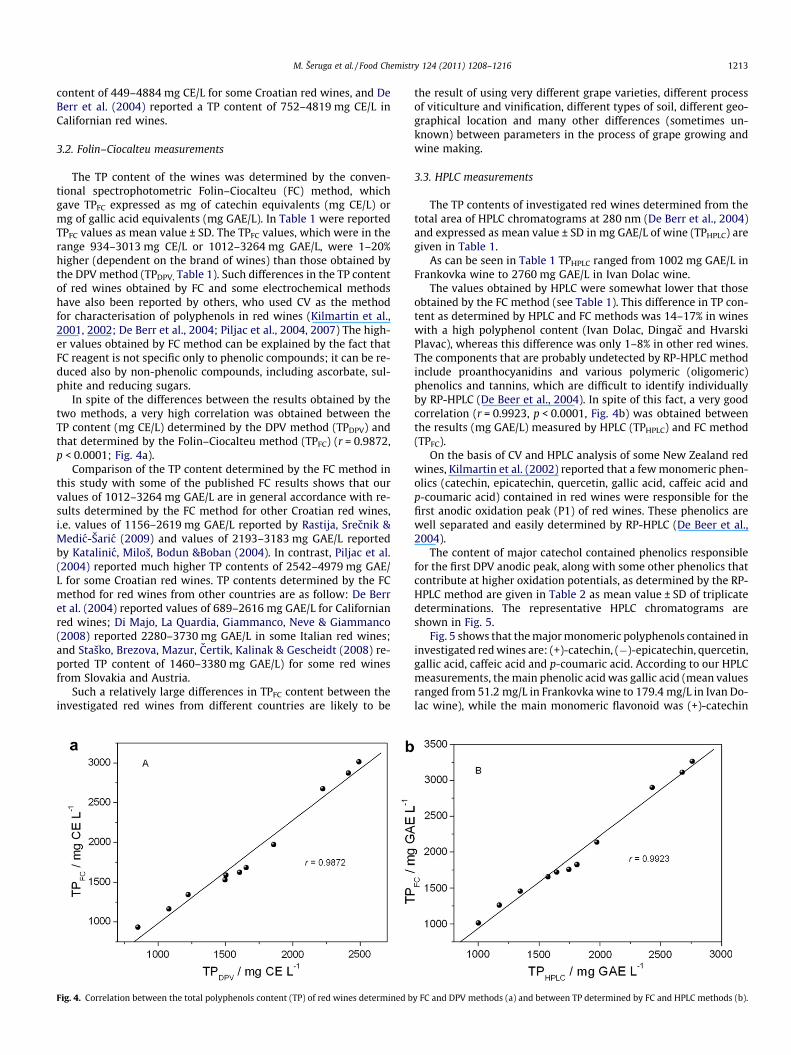
In spite of the differences between the results obtained by thetwo methods, a very high correlation was obtained between theTP content (mg CE/L) determined by the DPV method (TPDPV) andthat determined by the Folin–Ciocalteu method (TPFC) (r = 0.9872,p < 0.0001; Fig. 4a).
Comparison of the TP content determined by the FC method inthis study with some of the published FC results shows that ourvalues of 1012–3264 mg GAE/L are in general accordance with re-sults determined by the FC method for other Croatian red wines,i.e. values of 1156–2619 mg GAE/L reported by Rastija, Srecnik &Medic-Šaric (2009) and values of 2193–3183 mg GAE/L reportedby Katalinic, Miloš, Bodun &Boban (2004). In contrast, Piljac et al.(2004) reported much higher TP contents of 2542–4979 mg GAE/L for some Croatian red wines. TP contents determined by the FCmethod for red wines from other countries are as follow: De Berret al. (2004) reported values of 689–2616 mg GAE/L for Californianred wines; Di Majo, La Quardia, Giammanco, Neve & Giammanco(2008) reported 2280–3730 mg GAE/L in some Italian red wines;and Staško, Brezova, Mazur, Certik, Kalinak & Gescheidt (2008) re-ported TP content of 1460–3380 mg GAE/L) for some red winesfrom Slovakia and Austria.
Such a relatively large differences in TPFC content between theinvestigated red wines from different countries are likely to be
Fig. 4. Correlation between the total polyphenols content (TP) of red wines determined b
the result of using very different grape varieties, different processof viticulture and vinification, different types of soil, different geo-graphical location and many other differences (sometimes un-known) between parameters in the process of grape growing andwine making.
3.3. HPLC measurements
The TP contents of investigated red wines determined from thetotal area of HPLC chromatograms at 280 nm (De Berr et al., 2004)and expressed as mean value ± SD in mg GAE/L of wine (TPHPLC) aregiven in Table 1.
As can be seen in Table 1 TPHPLC ranged from 1002 mg GAE/L inFrankovka wine to 2760 mg GAE/L in Ivan Dolac wine.
The values obtained by HPLC were somewhat lower that thoseobtained by the FC method (see Table 1). This difference in TP con-tent as determined by HPLC and FC methods was 14–17% in wineswith a high polyphenol content (Ivan Dolac, Dingac and HvarskiPlavac), whereas this difference was only 1–8% in other red wines.The components that are probably undetected by RP-HPLC methodinclude proanthocyanidins and various polymeric (oligomeric)phenolics and tannins, which are difficult to identify individuallyby RP-HPLC (De Beer et al., 2004). In spite of this fact, a very goodcorrelation (r = 0.9923, p < 0.0001, Fig. 4b) was obtained betweenthe results (mg GAE/L) measured by HPLC (TPHPLC) and FC method(TPFC).
On the basis of CV and HPLC analysis of some New Zealand redwines, Kilmartin et al. (2002) reported that a few monomeric phen-olics (catechin, epicatechin, quercetin, gallic acid, caffeic acid andp-coumaric acid) contained in red wines were responsible for thefirst anodic oxidation peak (P1) of red wines. These phenolics arewell separated and easily determined by RP-HPLC (De Beer et al.,2004).
The content of major catechol contained phenolics responsiblefor the first DPV anodic peak, along with some other phenolics thatcontribute at higher oxidation potentials, as determined by the RP-HPLC method are given in Table 2 as mean value ± SD of triplicatedeterminations. The representative HPLC chromatograms areshown in Fig. 5.
Fig. 5 shows that the major monomeric polyphenols contained ininvestigated red wines are: (+)-catechin, (�)-epicatechin, quercetin,gallic acid, caffeic acid and p-coumaric acid. According to our HPLCmeasurements, the main phenolic acid was gallic acid (mean valuesranged from 51.2 mg/L in Frankovka wine to 179.4 mg/L in Ivan Do-lac wine), while the main monomeric flavonoid was (+)-catechin
y FC and DPV methods (a) and between TP determined by FC and HPLC methods (b).
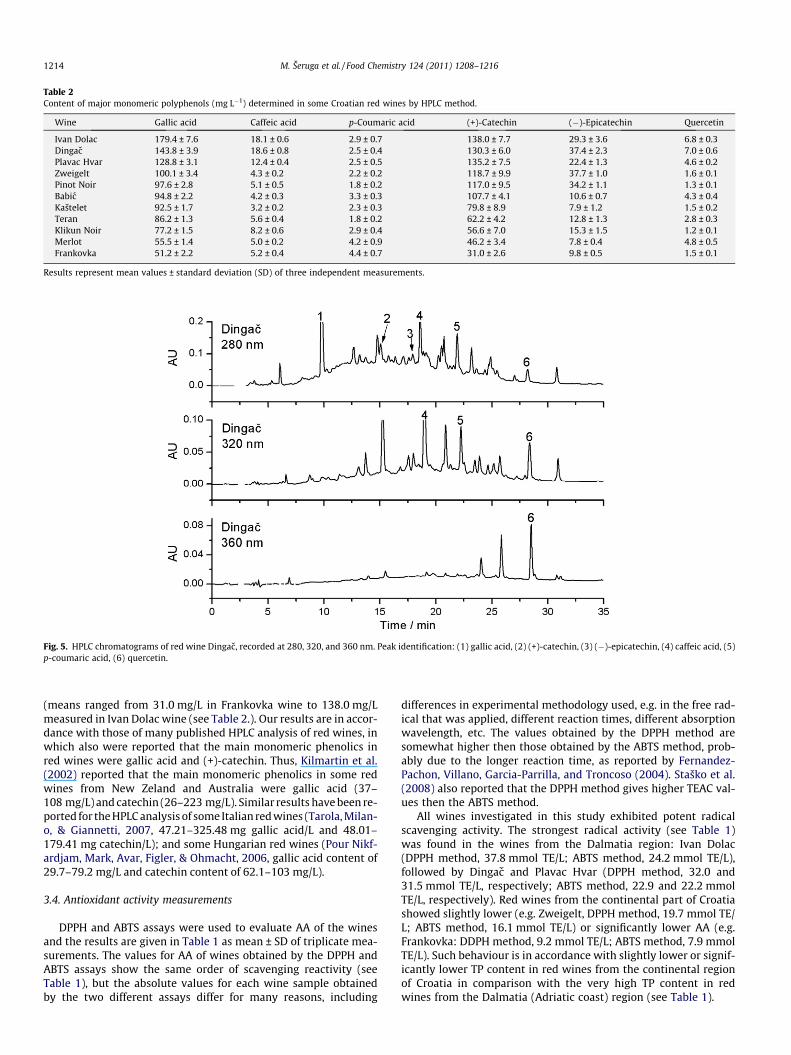
Table 2Content of major monomeric polyphenols (mg L�1) determined in some Croatian red wines by HPLC method.
Wine Gallic acid Caffeic acid p-Coumaric acid (+)-Catechin (�)-Epicatechin Quercetin
Ivan Dolac 179.4 ± 7.6 18.1 ± 0.6 2.9 ± 0.7 138.0 ± 7.7 29.3 ± 3.6 6.8 ± 0.3Dingac 143.8 ± 3.9 18.6 ± 0.8 2.5 ± 0.4 130.3 ± 6.0 37.4 ± 2.3 7.0 ± 0.6Plavac Hvar 128.8 ± 3.1 12.4 ± 0.4 2.5 ± 0.5 135.2 ± 7.5 22.4 ± 1.3 4.6 ± 0.2Zweigelt 100.1 ± 3.4 4.3 ± 0.2 2.2 ± 0.2 118.7 ± 9.9 37.7 ± 1.0 1.6 ± 0.1Pinot Noir 97.6 ± 2.8 5.1 ± 0.5 1.8 ± 0.2 117.0 ± 9.5 34.2 ± 1.1 1.3 ± 0.1Babic 94.8 ± 2.2 4.2 ± 0.3 3.3 ± 0.3 107.7 ± 4.1 10.6 ± 0.7 4.3 ± 0.4Kaštelet 92.5 ± 1.7 3.2 ± 0.2 2.3 ± 0.3 79.8 ± 8.9 7.9 ± 1.2 1.5 ± 0.2Teran 86.2 ± 1.3 5.6 ± 0.4 1.8 ± 0.2 62.2 ± 4.2 12.8 ± 1.3 2.8 ± 0.3Klikun Noir 77.2 ± 1.5 8.2 ± 0.6 2.9 ± 0.4 56.6 ± 7.0 15.3 ± 1.5 1.2 ± 0.1Merlot 55.5 ± 1.4 5.0 ± 0.2 4.2 ± 0.9 46.2 ± 3.4 7.8 ± 0.4 4.8 ± 0.5Frankovka 51.2 ± 2.2 5.2 ± 0.4 4.4 ± 0.7 31.0 ± 2.6 9.8 ± 0.5 1.5 ± 0.1
Results represent mean values ± standard deviation (SD) of three independent measurements.
Fig. 5. HPLC chromatograms of red wine Dingac, recorded at 280, 320, and 360 nm. Peak identification: (1) gallic acid, (2) (+)-catechin, (3) (�)-epicatechin, (4) caffeic acid, (5)p-coumaric acid, (6) quercetin.
1214 M. Šeruga et al. / Food Chemistry 124 (2011) 1208–1216
(means ranged from 31.0 mg/L in Frankovka wine to 138.0 mg/Lmeasured in Ivan Dolac wine (see Table 2.). Our results are in accor-dance with those of many published HPLC analysis of red wines, inwhich also were reported that the main monomeric phenolics inred wines were gallic acid and (+)-catechin. Thus, Kilmartin et al.(2002) reported that the main monomeric phenolics in some redwines from New Zeland and Australia were gallic acid (37–108 mg/L) and catechin (26–223 mg/L). Similar results have been re-ported for the HPLC analysis of some Italian red wines (Tarola, Milan-o, & Giannetti, 2007, 47.21–325.48 mg gallic acid/L and 48.01–179.41 mg catechin/L); and some Hungarian red wines (Pour Nikf-ardjam, Mark, Avar, Figler, & Ohmacht, 2006, gallic acid content of29.7–79.2 mg/L and catechin content of 62.1–103 mg/L).
3.4. Antioxidant activity measurements
DPPH and ABTS assays were used to evaluate AA of the winesand the results are given in Table 1 as mean ± SD of triplicate mea-surements. The values for AA of wines obtained by the DPPH andABTS assays show the same order of scavenging reactivity (seeTable 1), but the absolute values for each wine sample obtainedby the two different assays differ for many reasons, including
differences in experimental methodology used, e.g. in the free rad-ical that was applied, different reaction times, different absorptionwavelength, etc. The values obtained by the DPPH method aresomewhat higher then those obtained by the ABTS method, prob-ably due to the longer reaction time, as reported by Fernandez-Pachon, Villano, Garcia-Parrilla, and Troncoso (2004). Staško et al.(2008) also reported that the DPPH method gives higher TEAC val-ues then the ABTS method.
All wines investigated in this study exhibited potent radicalscavenging activity. The strongest radical activity (see Table 1)was found in the wines from the Dalmatia region: Ivan Dolac(DPPH method, 37.8 mmol TE/L; ABTS method, 24.2 mmol TE/L),followed by Dingac and Plavac Hvar (DPPH method, 32.0 and31.5 mmol TE/L, respectively; ABTS method, 22.9 and 22.2 mmolTE/L, respectively). Red wines from the continental part of Croatiashowed slightly lower (e.g. Zweigelt, DPPH method, 19.7 mmol TE/L; ABTS method, 16.1 mmol TE/L) or significantly lower AA (e.g.Frankovka: DDPH method, 9.2 mmol TE/L; ABTS method, 7.9 mmolTE/L). Such behaviour is in accordance with slightly lower or signif-icantly lower TP content in red wines from the continental regionof Croatia in comparison with the very high TP content in redwines from the Dalmatia (Adriatic coast) region (see Table 1).
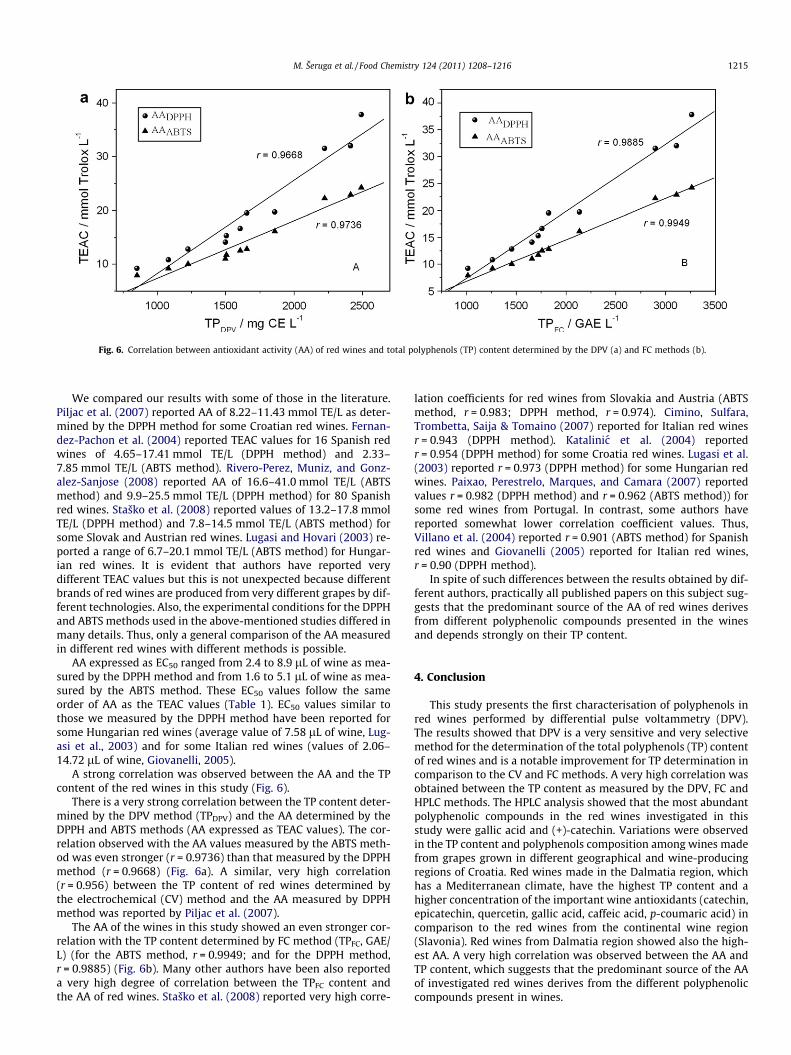
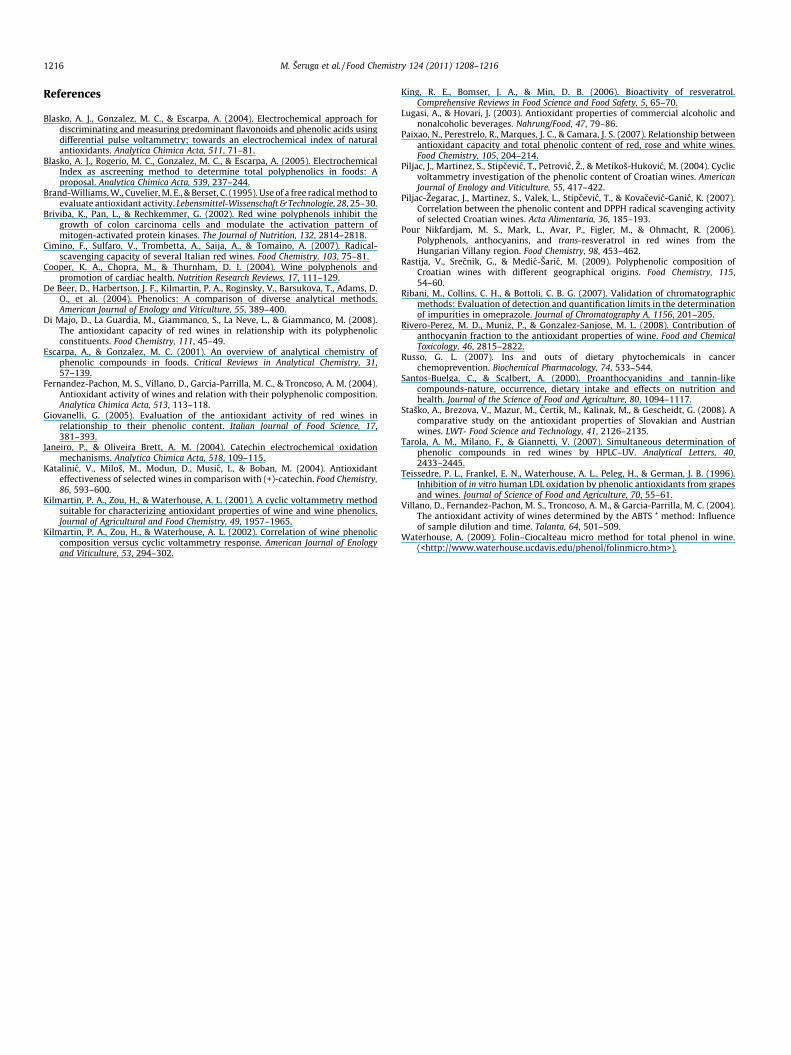
Fig. 6. Correlation between antioxidant activity (AA) of red wines and total polyphenols (TP) content determined by the DPV (a) and FC methods (b).
M. Šeruga et al. / Food Chemistry 124 (2011) 1208–1216 1215
We compared our results with some of those in the literature.Piljac et al. (2007) reported AA of 8.22–11.43 mmol TE/L as deter-mined by the DPPH method for some Croatian red wines. Fernan-dez-Pachon et al. (2004) reported TEAC values for 16 Spanish redwines of 4.65–17.41 mmol TE/L (DPPH method) and 2.33–7.85 mmol TE/L (ABTS method). Rivero-Perez, Muniz, and Gonz-alez-Sanjose (2008) reported AA of 16.6–41.0 mmol TE/L (ABTSmethod) and 9.9–25.5 mmol TE/L (DPPH method) for 80 Spanishred wines. Staško et al. (2008) reported values of 13.2–17.8 mmolTE/L (DPPH method) and 7.8–14.5 mmol TE/L (ABTS method) forsome Slovak and Austrian red wines. Lugasi and Hovari (2003) re-ported a range of 6.7–20.1 mmol TE/L (ABTS method) for Hungar-ian red wines. It is evident that authors have reported verydifferent TEAC values but this is not unexpected because differentbrands of red wines are produced from very different grapes by dif-ferent technologies. Also, the experimental conditions for the DPPHand ABTS methods used in the above-mentioned studies differed inmany details. Thus, only a general comparison of the AA measuredin different red wines with different methods is possible.
AA expressed as EC50 ranged from 2.4 to 8.9 lL of wine as mea-sured by the DPPH method and from 1.6 to 5.1 lL of wine as mea-sured by the ABTS method. These EC50 values follow the sameorder of AA as the TEAC values (Table 1). EC50 values similar tothose we measured by the DPPH method have been reported forsome Hungarian red wines (average value of 7.58 lL of wine, Lug-asi et al., 2003) and for some Italian red wines (values of 2.06–14.72 lL of wine, Giovanelli, 2005).
A strong correlation was observed between the AA and the TPcontent of the red wines in this study (Fig. 6).
There is a very strong correlation between the TP content deter-mined by the DPV method (TPDPV) and the AA determined by theDPPH and ABTS methods (AA expressed as TEAC values). The cor-relation observed with the AA values measured by the ABTS meth-od was even stronger (r = 0.9736) than that measured by the DPPHmethod (r = 0.9668) (Fig. 6a). A similar, very high correlation(r = 0.956) between the TP content of red wines determined bythe electrochemical (CV) method and the AA measured by DPPHmethod was reported by Piljac et al. (2007).
The AA of the wines in this study showed an even stronger cor-relation with the TP content determined by FC method (TPFC, GAE/L) (for the ABTS method, r = 0.9949; and for the DPPH method,r = 0.9885) (Fig. 6b). Many other authors have been also reporteda very high degree of correlation between the TPFC content andthe AA of red wines. Staško et al. (2008) reported very high corre-
lation coefficients for red wines from Slovakia and Austria (ABTSmethod, r = 0.983; DPPH method, r = 0.974). Cimino, Sulfara,Trombetta, Saija & Tomaino (2007) reported for Italian red winesr = 0.943 (DPPH method). Katalinic et al. (2004) reportedr = 0.954 (DPPH method) for some Croatia red wines. Lugasi et al.(2003) reported r = 0.973 (DPPH method) for some Hungarian redwines. Paixao, Perestrelo, Marques, and Camara (2007) reportedvalues r = 0.982 (DPPH method) and r = 0.962 (ABTS method)) forsome red wines from Portugal. In contrast, some authors havereported somewhat lower correlation coefficient values. Thus,Villano et al. (2004) reported r = 0.901 (ABTS method) for Spanishred wines and Giovanelli (2005) reported for Italian red wines,r = 0.90 (DPPH method).
In spite of such differences between the results obtained by dif-ferent authors, practically all published papers on this subject sug-gests that the predominant source of the AA of red wines derivesfrom different polyphenolic compounds presented in the winesand depends strongly on their TP content.
4. Conclusion
This study presents the first characterisation of polyphenols inred wines performed by differential pulse voltammetry (DPV).The results showed that DPV is a very sensitive and very selectivemethod for the determination of the total polyphenols (TP) contentof red wines and is a notable improvement for TP determination incomparison to the CV and FC methods. A very high correlation wasobtained between the TP content as measured by the DPV, FC andHPLC methods. The HPLC analysis showed that the most abundantpolyphenolic compounds in the red wines investigated in thisstudy were gallic acid and (+)-catechin. Variations were observedin the TP content and polyphenols composition among wines madefrom grapes grown in different geographical and wine-producingregions of Croatia. Red wines made in the Dalmatia region, whichhas a Mediterranean climate, have the highest TP content and ahigher concentration of the important wine antioxidants (catechin,epicatechin, quercetin, gallic acid, caffeic acid, p-coumaric acid) incomparison to the red wines from the continental wine region(Slavonia). Red wines from Dalmatia region showed also the high-est AA. A very high correlation was observed between the AA andTP content, which suggests that the predominant source of the AAof investigated red wines derives from the different polyphenoliccompounds present in wines.
1216 M. Šeruga et al. / Food Chemistry 124 (2011) 1208–1216
References
Blasko, A. J., Gonzalez, M. C., & Escarpa, A. (2004). Electrochemical approach fordiscriminating and measuring predominant flavonoids and phenolic acids usingdifferential pulse voltammetry; towards an electrochemical index of naturalantioxidants. Analytica Chimica Acta, 511, 71–81.
Blasko, A. J., Rogerio, M. C., Gonzalez, M. C., & Escarpa, A. (2005). ElectrochemicalIndex as ascreening method to determine total polyphenolics in foods: Aproposal. Analytica Chimica Acta, 539, 237–244.
Brand-Williams, W., Cuvelier, M. E., & Berset, C. (1995). Use of a free radical method toevaluate antioxidant activity. Lebensmittel-Wissenschaft & Technologie, 28, 25–30.
Briviba, K., Pan, L., & Rechkemmer, G. (2002). Red wine polyphenols inhibit thegrowth of colon carcinoma cells and modulate the activation pattern ofmitogen-activated protein kinases. The Journal of Nutrition, 132, 2814–2818.
Cimino, F., Sulfaro, V., Trombetta, A., Saija, A., & Tomaino, A. (2007). Radical-scavenging capacity of several Italian red wines. Food Chemistry, 103, 75–81.
Cooper, K. A., Chopra, M., & Thurnham, D. I. (2004). Wine polyphenols andpromotion of cardiac health. Nutrition Research Reviews, 17, 111–129.
De Beer, D., Harbertson, J. F., Kilmartin, P. A., Roginsky, V., Barsukova, T., Adams, D.O., et al. (2004). Phenolics: A comparison of diverse analytical methods.American Journal of Enology and Viticulture, 55, 389–400.
Di Majo, D., La Guardia, M., Giammanco, S., La Neve, L., & Giammanco, M. (2008).The antioxidant capacity of red wines in relationship with its polyphenolicconstituents. Food Chemistry, 111, 45–49.
Escarpa, A., & Gonzalez, M. C. (2001). An overview of analytical chemistry ofphenolic compounds in foods. Critical Reviews in Analytical Chemistry, 31,57–139.
Fernandez-Pachon, M. S., Villano, D., Garcia-Parrilla, M. C., & Troncoso, A. M. (2004).Antioxidant activity of wines and relation with their polyphenolic composition.Analytica Chimica Acta, 513, 113–118.
Giovanelli, G. (2005). Evaluation of the antioxidant activity of red wines inrelationship to their phenolic content. Italian Journal of Food Science, 17,381–393.
Janeiro, P., & Oliveira Brett, A. M. (2004). Catechin electrochemical oxidationmechanisms. Analytica Chimica Acta, 518, 109–115.
Katalinic, V., Miloš, M., Modun, D., Music, I., & Boban, M. (2004). Antioxidanteffectiveness of selected wines in comparison with (+)-catechin. Food Chemistry,86, 593–600.
Kilmartin, P. A., Zou, H., & Waterhouse, A. L. (2001). A cyclic voltammetry methodsuitable for characterizing antioxidant properties of wine and wine phenolics.Journal of Agricultural and Food Chemistry, 49, 1957–1965.
Kilmartin, P. A., Zou, H., & Waterhouse, A. L. (2002). Correlation of wine phenoliccomposition versus cyclic voltammetry response. American Journal of Enologyand Viticulture, 53, 294–302.
King, R. E., Bomser, J. A., & Min, D. B. (2006). Bioactivity of resveratrol.Comprehensive Reviews in Food Science and Food Safety, 5, 65–70.
Lugasi, A., & Hovari, J. (2003). Antioxidant properties of commercial alcoholic andnonalcoholic beverages. Nahrung/Food, 47, 79–86.
Paixao, N., Perestrelo, R., Marques, J. C., & Camara, J. S. (2007). Relationship betweenantioxidant capacity and total phenolic content of red, rose and white wines.Food Chemistry, 105, 204–214.
Piljac, J., Martinez, S., Stipcevic, T., Petrovic, Z., & Metikoš-Hukovic, M. (2004). Cyclicvoltammetry investigation of the phenolic content of Croatian wines. AmericanJournal of Enology and Viticulture, 55, 417–422.
Piljac-Zegarac, J., Martinez, S., Valek, L., Stipcevic, T., & Kovacevic-Ganic, K. (2007).Correlation between the phenolic content and DPPH radical scavenging activityof selected Croatian wines. Acta Alimentaria, 36, 185–193.
Pour Nikfardjam, M. S., Mark, L., Avar, P., Figler, M., & Ohmacht, R. (2006).Polyphenols, anthocyanins, and trans-resveratrol in red wines from theHungarian Villany region. Food Chemistry, 98, 453–462.
Rastija, V., Srecnik, G., & Medic-Šaric, M. (2009). Polyphenolic composition ofCroatian wines with different geographical origins. Food Chemistry, 115,54–60.
Ribani, M., Collins, C. H., & Bottoli, C. B. G. (2007). Validation of chromatographicmethods: Evaluation of detection and quantification limits in the determinationof impurities in omeprazole. Journal of Chromatography A, 1156, 201–205.
Rivero-Perez, M. D., Muniz, P., & Gonzalez-Sanjose, M. L. (2008). Contribution ofanthocyanin fraction to the antioxidant properties of wine. Food and ChemicalToxicology, 46, 2815–2822.
Russo, G. L. (2007). Ins and outs of dietary phytochemicals in cancerchemoprevention. Biochemical Pharmacology, 74, 533–544.
Santos-Buelga, C., & Scalbert, A. (2000). Proanthocyanidins and tannin-likecompounds-nature, occurrence, dietary intake and effects on nutrition andhealth. Journal of the Science of Food and Agriculture, 80, 1094–1117.
Staško, A., Brezova, V., Mazur, M., Certik, M., Kalinak, M., & Gescheidt, G. (2008). Acomparative study on the antioxidant properties of Slovakian and Austrianwines. LWT- Food Science and Technology, 41, 2126–2135.
Tarola, A. M., Milano, F., & Giannetti, V. (2007). Simultaneous determination ofphenolic compounds in red wines by HPLC–UV. Analytical Letters, 40,2433–2445.
Teissedre, P. L., Frankel, E. N., Waterhouse, A. L., Peleg, H., & German, J. B. (1996).Inhibition of in vitro human LDL oxidation by phenolic antioxidants from grapesand wines. Journal of Science of Food and Agriculture, 70, 55–61.
Villano, D., Fernandez-Pachon, M. S., Troncoso, A. M., & Garcia-Parrilla, M. C. (2004).The antioxidant activity of wines determined by the ABTS�+ method: Influenceof sample dilution and time. Talanta, 64, 501–509.
Waterhouse, A. (2009). Folin–Ciocalteau micro method for total phenol in wine.(<http://www.waterhouse.ucdavis.edu/phenol/folinmicro.htm>).