Quantification of polyphenols with potential antioxidant properties in wines using reverse phase...
10
J. Sep. Sci. 2008, 31, 2189 – 2198 N. Paixa ˜o et al. 2189 Neuza Paix¼o Vanda Pereira JosØ C. Marques JosØ S. Câmara Universidade da Madeira, Departamento de Quȷmica, Centro de Quȷmica da Madeira, Campus UniversitƁrio da Penteada, Funchal, Portugal Original Paper Quantification of polyphenols with potential antioxidant properties in wines using reverse phase HPLC A RP-HPLC method with photodiode array detection (DAD) was developed to sepa- rate, identify and quantify simultaneously the most representative phenolic com- pounds present in Madeira and Canary Islands wines. The optimized chromato- graphic method was carefully validated in terms of linearity, precision, accuracy and sensitivity. A high repeatability and a good stability of phenolics retention times (a 3%) were obtained, as well as relative peak area. Also high recoveries were achieved, over 80.3%. Polyphenols calibration curves showed a good linearity (r 2 A0.994) within test ranges. Detection limits ranged between 0.03 and 11.5 lg/mL for the different polyphenols. A good repeatability was obtained, with intra-day varia- tions less than 7.9%. The described method was successfully applied to quantify sev- eral polyphenols in 26 samples of different kinds of wine (red, rosȖ and white wines) from Madeira and Canary Islands. Gallic acid was by far the most predominant acid. It represents more than 65% of all phenolics, followed by p-coumaric and caffeic acids. The major flavonoid found in Madeira wines was trans-resveratrol. In some wines, ( – )-epicatechin was also found in highest amount. Canary wines were shown to be rich in gallic, caffeic and p-coumaric acids and quercetin. Keywords: Antioxidants / HPLC-photodiode array detection / Polyphenols / Wines / Received: January 11, 2008; revised: February 29, 2008; accepted: February 29, 2008 DOI 10.1002/jssc.200800021 1 Introduction Phenolic compounds are secondary metabolites that are synthesized by plants [1] during normal development and in response to stress conditions. They are widely found in vegetables, fruits, seeds, juices, tea, coffee, choc- olate, vinegar and wines [2, 3] and consequently are com- mon components of the human diet [2]. Although struc- turally diverse, phenolics are classified into two groups: the flavonoids and the nonflavonoids. The flavonoid fam- ily includes the flavonols, like myricetin, quercetin and kaempferol, which exist both as aglycons and sugar con- jugates; the flavan-3-ols, as (+)-catechin and ( – )-epicate- chin; and the anthocyanins such as malvidin-3-glucoside. The nonflavonoids encompass hydroxybenzoic acids such as gallic acid; hydroxycinnamates, including p-cou- maric, caffeic and caftaric acids; and the stilbenes, like trans-resveratrol and cis-resveratrol [4]. Polyphenols are the principal compounds related to the wine consumption benefits due to antioxidant and free radical scavenging properties. These physiological effects are especially associated to flavonoids and stil- benes [5, 6], namely quercetin, (+)-catechin, gallic acid and trans-resveratrol [7]. Flavonoids have shown the inhibition of lower density lipoprotein (LDL) oxidation by macrophages and cupric ions [8], as increasing eviden- ces shows that oxidized LDL and very LDL (VLDL) may be involved in the pathogenesis of atherosclerosis [9 – 11]. Phenolic acids and flavonoid-like compounds also acted as antioxidants in LDL oxidation by peroxyl radicals gen- erated by an azo-initiator [12]. The stilbene trans-resvera- trol has gained great attention and a number of scientific papers have appeared related to the moderate consump- tion of red wine, the ability to inhibit platelet aggrega- tion and LDL oxidation and its beneficial effects in health. Soleas et al. [7] had related that trans-resveratrol may be the most effective anticancer polyphenol present in red wine. Flavanols, such as ( – )-epicatechin have many beneficial health effects such as anti-tumorgenic, anti- Correspondence: Professor JosȖ CȦmara, Universidade da Ma- deira, Departamento de Quȷmica, Centro de Quȷmica da Ma- deira, Campus UniversitƁrio da Penteada, 9000-390 Funchal, Portugal E-mail: [email protected] Fax: +351 291705149 Abbreviations: DAD, photodiode array detection; FC, Folin – Cio- calteu; GAEs, gallic acid equivalents; LDL, low density lipopro- tein; PC, principal components i 2008 WILEY-VCH Verlag GmbH & Co. KGaA, Weinheim www.jss-journal.com
Transcript of Quantification of polyphenols with potential antioxidant properties in wines using reverse phase...

J. Sep. Sci. 2008, 31, 2189 –2198 N. Paixao et al. 2189
Neuza Paix¼oVanda PereiraJos� C. MarquesJos� S. C�mara
Universidade da Madeira,Departamento de Qu�mica,Centro de Qu�mica da Madeira,Campus Universit�rio daPenteada, Funchal, Portugal
Original Paper
Quantification of polyphenols with potentialantioxidant properties in wines using reversephase HPLC
A RP-HPLC method with photodiode array detection (DAD) was developed to sepa-rate, identify and quantify simultaneously the most representative phenolic com-pounds present in Madeira and Canary Islands wines. The optimized chromato-graphic method was carefully validated in terms of linearity, precision, accuracyand sensitivity. A high repeatability and a good stability of phenolics retentiontimes (a3%) were obtained, as well as relative peak area. Also high recoveries wereachieved, over 80.3%. Polyphenols calibration curves showed a good linearity (r2
A0.994) within test ranges. Detection limits ranged between 0.03 and 11.5 lg/mL forthe different polyphenols. A good repeatability was obtained, with intra-day varia-tions less than 7.9%. The described method was successfully applied to quantify sev-eral polyphenols in 26 samples of different kinds of wine (red, ros� and white wines)from Madeira and Canary Islands. Gallic acid was by far the most predominant acid.It represents more than 65% of all phenolics, followed by p-coumaric and caffeicacids. The major flavonoid found in Madeira wines was trans-resveratrol. In somewines, (– )-epicatechin was also found in highest amount. Canary wines were shownto be rich in gallic, caffeic and p-coumaric acids and quercetin.
Keywords: Antioxidants / HPLC-photodiode array detection / Polyphenols / Wines /
Received: January 11, 2008; revised: February 29, 2008; accepted: February 29, 2008
DOI 10.1002/jssc.200800021
1 Introduction
Phenolic compounds are secondary metabolites that aresynthesized by plants [1] during normal developmentand in response to stress conditions. They are widelyfound in vegetables, fruits, seeds, juices, tea, coffee, choc-olate, vinegar and wines [2, 3] and consequently are com-mon components of the human diet [2]. Although struc-turally diverse, phenolics are classified into two groups:the flavonoids and the nonflavonoids. The flavonoid fam-ily includes the flavonols, like myricetin, quercetin andkaempferol, which exist both as aglycons and sugar con-jugates; the flavan-3-ols, as (+)-catechin and (– )-epicate-chin; and the anthocyanins such as malvidin-3-glucoside.The nonflavonoids encompass hydroxybenzoic acids
such as gallic acid; hydroxycinnamates, including p-cou-maric, caffeic and caftaric acids; and the stilbenes, liketrans-resveratrol and cis-resveratrol [4].
Polyphenols are the principal compounds related tothe wine consumption benefits due to antioxidant andfree radical scavenging properties. These physiologicaleffects are especially associated to flavonoids and stil-benes [5, 6], namely quercetin, (+)-catechin, gallic acidand trans-resveratrol [7]. Flavonoids have shown theinhibition of lower density lipoprotein (LDL) oxidationby macrophages and cupric ions [8], as increasing eviden-ces shows that oxidized LDL and very LDL (VLDL) may beinvolved in the pathogenesis of atherosclerosis [9–11].Phenolic acids and flavonoid-like compounds also actedas antioxidants in LDL oxidation by peroxyl radicals gen-erated by an azo-initiator [12]. The stilbene trans-resvera-trol has gained great attention and a number of scientificpapers have appeared related to the moderate consump-tion of red wine, the ability to inhibit platelet aggrega-tion and LDL oxidation and its beneficial effects inhealth. Soleas et al. [7] had related that trans-resveratrolmay be the most effective anticancer polyphenol presentin red wine. Flavanols, such as (– )-epicatechin have manybeneficial health effects such as anti-tumorgenic, anti-
Correspondence: Professor Jos� C�mara, Universidade da Ma-deira, Departamento de Qu�mica, Centro de Qu�mica da Ma-deira, Campus Universit�rio da Penteada, 9000-390 Funchal,PortugalE-mail: [email protected]: +351 291705149
Abbreviations: DAD, photodiode array detection; FC, Folin – Cio-calteu; GAEs, gallic acid equivalents; LDL, low density lipopro-tein; PC, principal components
i 2008 WILEY-VCH Verlag GmbH & Co. KGaA, Weinheim www.jss-journal.com
2190 N. Paixao et al. J. Sep. Sci. 2008, 31, 2189 – 2198
mutagenic, anti-pathogenic and anti-oxidative proper-ties and has attracted interest because their concentra-tions in red wine are higher than other flavonoids [13].
Wine is an excellent natural source of various polyphe-nol families [14]. They play a number of important rolesin viticulture and oenology including UV protection, dis-ease resistance, pollination, color, and defence againstpredation in plants [15], as well as haze formation, hue,and taste in wines [16]. In particular, tannins conferastringency and structure to the beverage by the forma-tion of complexes with the proteins of saliva. Theirknowledge is very important to predict wine ageing atti-tude and attempting to solve problems about color stabil-ity, namely in the case of red wines that are destined tolong ageing periods [17]. Their presence and structuresare affected by several factors including grape variety,sun exposure, vinification techniques and ageing. Thewine ageing also changes the phenolic composition, asthese compounds can suffer diverse transformations,like oxidation processes, condensation and polymeriza-tion reactions and extraction from wood, usually associ-ated to the changes in color and colloidal stability [18],flavor, bitterness and astringency [19]. The polyphenolicfingerprint can be useful for the classification of wines,since it can give us information about the variety, thegeographic and winery origin and even the applied wine-making technology [2, 20–24].
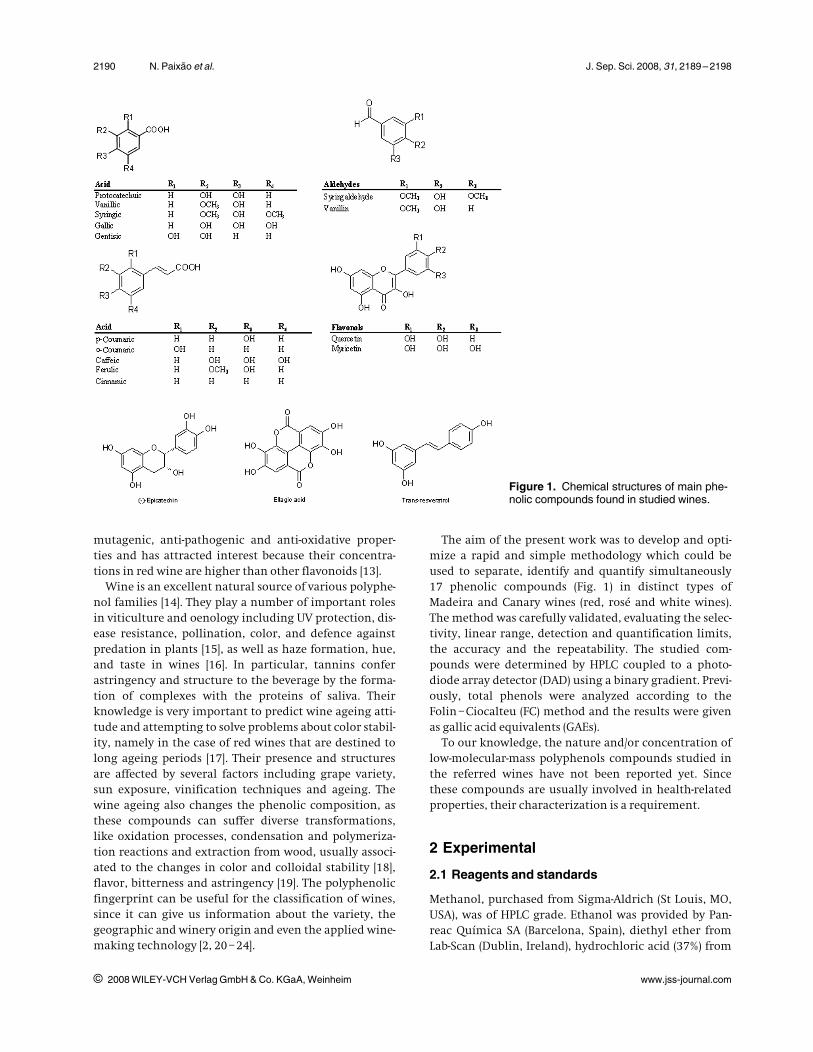
The aim of the present work was to develop and opti-mize a rapid and simple methodology which could beused to separate, identify and quantify simultaneously17 phenolic compounds (Fig. 1) in distinct types ofMadeira and Canary wines (red, ros� and white wines).The method was carefully validated, evaluating the selec-tivity, linear range, detection and quantification limits,the accuracy and the repeatability. The studied com-pounds were determined by HPLC coupled to a photo-diode array detector (DAD) using a binary gradient. Previ-ously, total phenols were analyzed according to theFolin –Ciocalteu (FC) method and the results were givenas gallic acid equivalents (GAEs).
To our knowledge, the nature and/or concentration oflow-molecular-mass polyphenols compounds studied inthe referred wines have not been reported yet. Sincethese compounds are usually involved in health-relatedproperties, their characterization is a requirement.
2 Experimental
2.1 Reagents and standards
Methanol, purchased from Sigma-Aldrich (St Louis, MO,USA), was of HPLC grade. Ethanol was provided by Pan-reac Qu�mica SA (Barcelona, Spain), diethyl ether fromLab-Scan (Dublin, Ireland), hydrochloric acid (37%) from
i 2008 WILEY-VCH Verlag GmbH & Co. KGaA, Weinheim www.jss-journal.com
Figure 1. Chemical structures of main phe-nolic compounds found in studied wines.
J. Sep. Sci. 2008, 31, 2189 –2198 Liquid Chromatography 2191
Riedel-de-H�en (Seelze, Germany) and glacial acetic acidwas supplied by Merck (Darmstadt, Germany). Tartaricacid (Riedel-de-H�en) and sodium hydroxide (PanreacQu�mica SA) were used to prepare synthetic wine.
Polyphenols standards: gallic acid, gentisic acid, vanil-lic acid, caffeic acid, p-coumaric acid, ferulic acid, m-cou-maric acid, sinapic acid, o-coumaric acid, ellagic acid,cinnamic acid, (+)-catechin, (– )-epicatechin and myrice-tin, were supplied by Fluka Biochemika AG (Buchs, Swit-zerland), protocatechuic acid, vanillin, syringic acid, FCreagent and trans-resveratrol by Sigma-Aldrich, whilesyringaldehyde was acquired from Acros Organics (Geel,Belgium) and quercetin from Riedel-de Ha�n. HPLC gradewater (Milli Q-System, Millipore, Bedford, MA, USA) wasused during the preparation of mobile phases.
Stock solutions at concentration of 1000 mg/L for eachpolyphenol were prepared by dissolving the appropriateamount of the compounds in ethanol. These solutionswere stored at 48C and used to make working-strengthsolutions in synthetic wine, prepared with 12% v/v etha-nol and 3.5 g/L tartaric acid and pH adjusted to 3.2 withHCl 1 M. The working standard solutions were preparedby dilution of the respective stock solutions and keptunder similar conditions. After extraction with diethylether, these standards were injected to determine indi-vidual retention times (tR) and for linearity range, preci-sion, accuracy and detection limit tests. All preparedsamples and extracts were filtered through a 0.45 lm
membranes (Acrodiscm CR PTFE, Ann Arbor, SOM, USA)and degassed in an ultrasonic bath (Sonorex SuperRK102H, Berlin, Germany) before use.
2.2 Wine samples
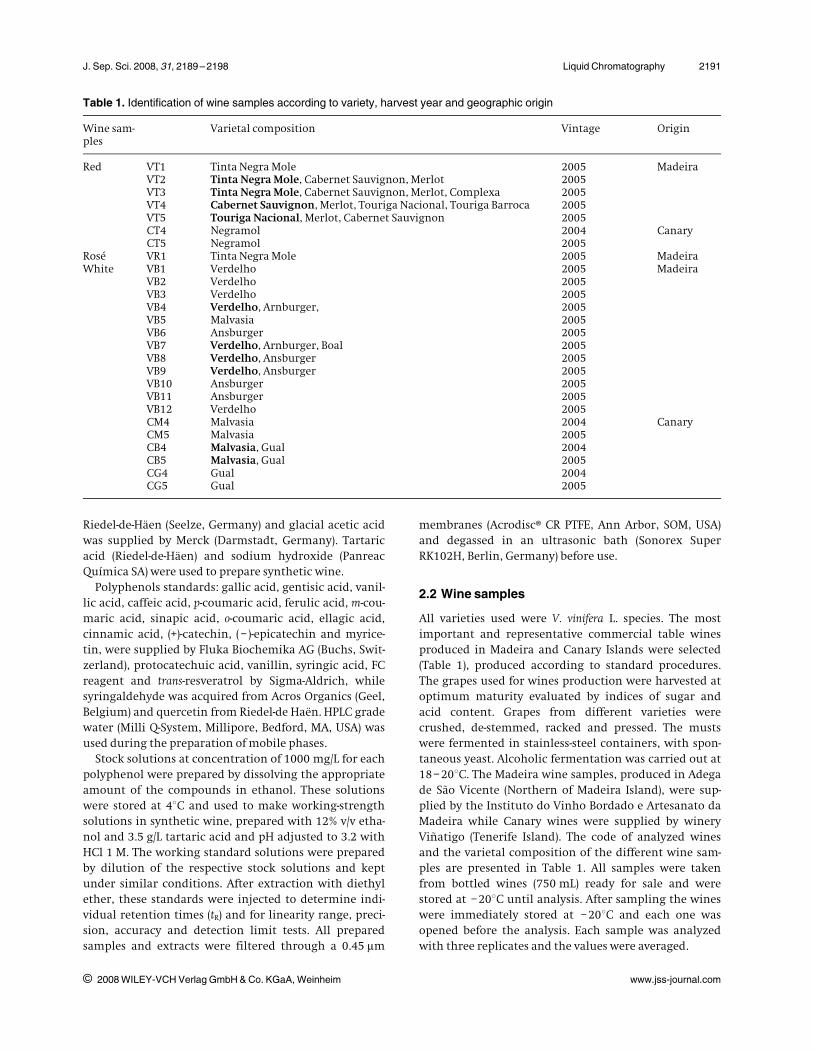
All varieties used were V. vinifera L. species. The mostimportant and representative commercial table winesproduced in Madeira and Canary Islands were selected(Table 1), produced according to standard procedures.The grapes used for wines production were harvested atoptimum maturity evaluated by indices of sugar andacid content. Grapes from different varieties werecrushed, de-stemmed, racked and pressed. The mustswere fermented in stainless-steel containers, with spon-taneous yeast. Alcoholic fermentation was carried out at18–208C. The Madeira wine samples, produced in Adegade S¼o Vicente (Northern of Madeira Island), were sup-plied by the Instituto do Vinho Bordado e Artesanato daMadeira while Canary wines were supplied by wineryVi�atigo (Tenerife Island). The code of analyzed winesand the varietal composition of the different wine sam-ples are presented in Table 1. All samples were takenfrom bottled wines (750 mL) ready for sale and werestored at –208C until analysis. After sampling the wineswere immediately stored at –208C and each one wasopened before the analysis. Each sample was analyzedwith three replicates and the values were averaged.
i 2008 WILEY-VCH Verlag GmbH & Co. KGaA, Weinheim www.jss-journal.com
Table 1. Identification of wine samples according to variety, harvest year and geographic origin
Wine sam-ples
Varietal composition Vintage Origin
Red VT1 Tinta Negra Mole 2005 MadeiraVT2 Tinta Negra Mole, Cabernet Sauvignon, Merlot 2005VT3 Tinta Negra Mole, Cabernet Sauvignon, Merlot, Complexa 2005VT4 Cabernet Sauvignon, Merlot, Touriga Nacional, Touriga Barroca 2005VT5 Touriga Nacional, Merlot, Cabernet Sauvignon 2005CT4 Negramol 2004 CanaryCT5 Negramol 2005
Ros� VR1 Tinta Negra Mole 2005 MadeiraWhite VB1 Verdelho 2005 Madeira
VB2 Verdelho 2005VB3 Verdelho 2005VB4 Verdelho, Arnburger, 2005VB5 Malvasia 2005VB6 Ansburger 2005VB7 Verdelho, Arnburger, Boal 2005VB8 Verdelho, Ansburger 2005VB9 Verdelho, Ansburger 2005VB10 Ansburger 2005VB11 Ansburger 2005VB12 Verdelho 2005CM4 Malvasia 2004 CanaryCM5 Malvasia 2005CB4 Malvasia, Gual 2004CB5 Malvasia, Gual 2005CG4 Gual 2004CG5 Gual 2005
2192 N. Paixao et al. J. Sep. Sci. 2008, 31, 2189 – 2198
2.3 Determination of total polyphenol content
The content of total phenolic compounds in wine sam-ples was determined by the FC reagent [25] using gallicacid as standard. This method is based on the reductionof a phosphowolframate-phophomolybdate complex byphenolics to blue reaction products. For the preparationof calibration curve, 1 mL aliquots of 5, 10, 20, 25 and50 mg/L aqueous gallic acid solutions were mixed with0.025 mL FC reagent. One milliliter of wine sample(adequately diluted) was added to 0.25 mL of carbonate-tartarate solution (20 g of Na2CO3 and 1.2 g ofNa2C4H4O6 N H2O in 100 mL of deionized water) and0.025 mL of FC reagent. The absorbance of analytes wasmeasured in a Perkin-Elmer Lambda 2 spectrophotome-ter (Perkin-Elmer, Germany) at 700 nm after 30 min ofreaction at room temperature. The results wereexpressed as milligram of GAE/L. High reproducibleresults for standards (r2 A0.9993) and samples wereobtained. All determinations were performed in tripli-cate.
2.4 Analytical procedure and RP HPLC-DADanalysis
The pH of the wine and standards was adjusted to 2.0adding small amounts of a hydrochloric acid solution(1 M). Then, an aliquot of 5 mL of wine/standard wasextracted twice with 2.5 mL of diethyl ether for 20 min.The organic layer was separated and evaporated to dry-ness using a slow nitrogen stream. The dry residue wasre-dissolved in a methanol-water (1:1, v/v) mixture and fil-tered through a 0.45 lm membrane prior to injectioninto HPLC system.
A Waters High Performance Liquid Chromatographysystem (Ann Arbor) equipped with a Waters 1525 BinaryHPLC Pump, a Waters 996 DAD and a Waters 717 PlusAutosampler was used for the chromatographic determi-nation of the studied phenolics. A Millenium 32 chroma-tography manager software, version 3.2, was used foranalysis and data acquisition. Polyphenolic compoundswere separated on a Nova-Pak C18 column(150 mm63.9 mm id, 4 lm) from Waters.
Phenolic compounds were eluted using a binary elu-tion system that constitute the mobile phase: eluent A(water-acetic acid-methanol, 88:2:10, v/v) and eluent B,prepared with the same solvents but with the followingcomposition 8:2:90 v/v. The gradient elution began at100% A to 85% A in 15 min, down to 50% A in 10 min, fol-lowed by a reduction to 30% A in 9 min and finally thecolumn was regenerated in 12 min. The mobile phasesused were previously filtered through a 0.45 lm mem-brane disc filter (Pall Corporation, Ann Arbor) and weredegassed before use. The flow rate was 0.7 mL/min, theinjection volume was set to 20 lL and column was at
room temperature. The spectrophotometric detectionoperated at a wavelength range of 240–390 nm and wasperformed with a resolution of 1.2 nm. Polyphenols weremonitored and quantified at 270 nm (hydroxyl benzoicacids, flavan-3-ols and flavanones), 307 nm (hydroxycin-namic acids) and 360 nm (flavonols and flavones). Phe-nolic compounds were identified and quantified by com-parison of their retention time with UV-Vis spectral dataand the standards previously injected.
2.5 Method validation
The method was validated in terms of linearity, preci-sion, accuracy, sensitivity and detection and quantifica-tion limits. Linearity was studied injecting mixtures ofphenolic compounds at different concentration levels, inorder to cover the working range. Calibration curves forevery compound with the respective correlation coeffi-cient were calculated by least-squares linear regressionanalysis of the peak area of each analyte. The polyphe-nols concentration was determined using the arearesponse of each individual wine compound by interpo-lation in the corresponding calibration graphs. The cal-culation for the LODs were based on the SD of y-inter-cepts of regression analysis (r) and the slope (S) using thefollowing equation: LOD = 3.3 r/S. LOQs were calculatedby the equation LOQ = 10 r/S. The precision of themethod based on within-day repeatability was assessedby replicate (n = 10) measurements from samples. Accu-racy was expressed as the recovery of analytes in compar-ison to the added amounts. Selectivity was assessed bythe absence of interferences in the same retention timeas examined polyphenols in the respective wine samples.
2.6 Statistical treatment
Significant differences between Madeira and Canarywine varieties for each of the phenolic constituents weredetermined by one-way analysis of variance using a SPSSProgram, version 15.0 (SPSS, 2006). Principal componentanalysis and stepwise linear discriminant analysis wereperformed using the same SPSS program. These tech-niques were applied to the normalized relative amountsof the wine volatile compounds [26, 27].
3 Results and discussion
3.1 Total polyphenol content
The phenolic amount varies considerably in the differentwine types, depending on the grape variety, environmen-tal factors in the vineyard and the wine processing tech-niques. The results obtained for the wine samples testedconfirm this variation and also are in agreement withthose available in literature [28, 29]. The presence of high
i 2008 WILEY-VCH Verlag GmbH & Co. KGaA, Weinheim www.jss-journal.com
J. Sep. Sci. 2008, 31, 2189 –2198 Liquid Chromatography 2193
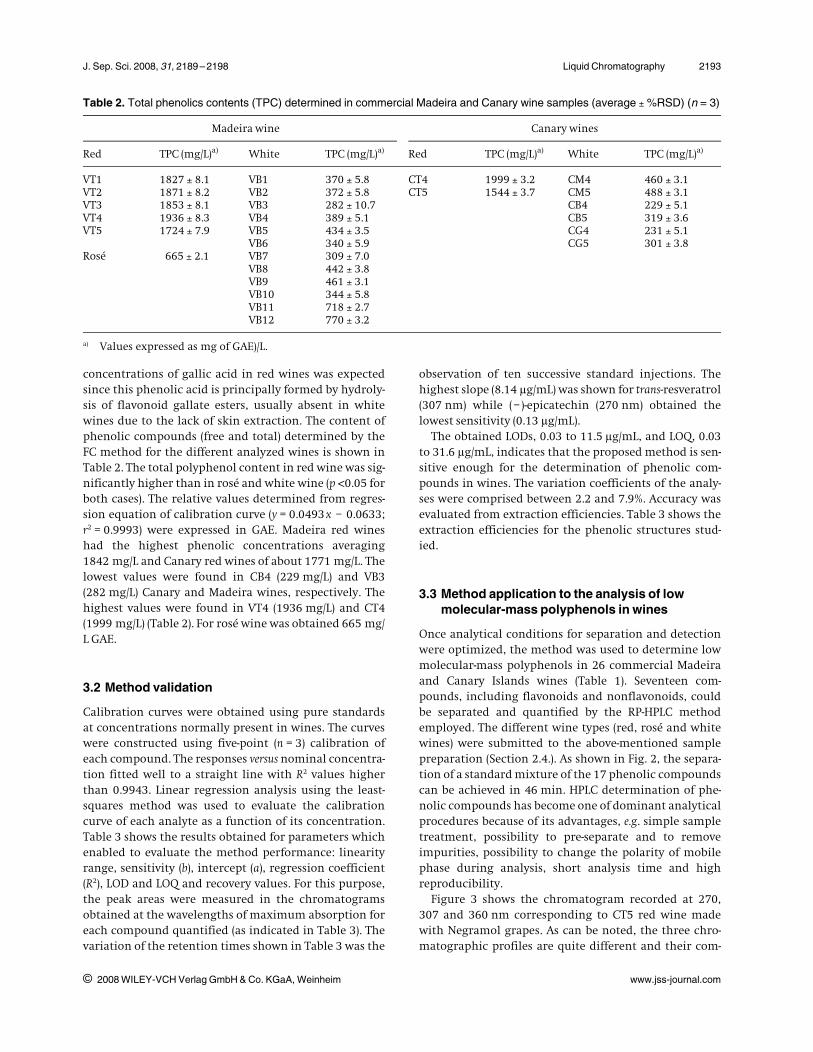
concentrations of gallic acid in red wines was expectedsince this phenolic acid is principally formed by hydroly-sis of flavonoid gallate esters, usually absent in whitewines due to the lack of skin extraction. The content ofphenolic compounds (free and total) determined by theFC method for the different analyzed wines is shown inTable 2. The total polyphenol content in red wine was sig-nificantly higher than in ros� and white wine (p a0.05 forboth cases). The relative values determined from regres-sion equation of calibration curve (y = 0.0493x – 0.0633;r2 = 0.9993) were expressed in GAE. Madeira red wineshad the highest phenolic concentrations averaging1842 mg/L and Canary red wines of about 1771 mg/L. Thelowest values were found in CB4 (229 mg/L) and VB3(282 mg/L) Canary and Madeira wines, respectively. Thehighest values were found in VT4 (1936 mg/L) and CT4(1999 mg/L) (Table 2). For ros� wine was obtained 665 mg/L GAE.
3.2 Method validation
Calibration curves were obtained using pure standardsat concentrations normally present in wines. The curveswere constructed using five-point (n = 3) calibration ofeach compound. The responses versus nominal concentra-tion fitted well to a straight line with R2 values higherthan 0.9943. Linear regression analysis using the least-squares method was used to evaluate the calibrationcurve of each analyte as a function of its concentration.Table 3 shows the results obtained for parameters whichenabled to evaluate the method performance: linearityrange, sensitivity (b), intercept (a), regression coefficient(R2), LOD and LOQ and recovery values. For this purpose,the peak areas were measured in the chromatogramsobtained at the wavelengths of maximum absorption foreach compound quantified (as indicated in Table 3). Thevariation of the retention times shown in Table 3 was the
observation of ten successive standard injections. Thehighest slope (8.14 lg/mL) was shown for trans-resveratrol(307 nm) while (– )-epicatechin (270 nm) obtained thelowest sensitivity (0.13 lg/mL).
The obtained LODs, 0.03 to 11.5 lg/mL, and LOQ, 0.03to 31.6 lg/mL, indicates that the proposed method is sen-sitive enough for the determination of phenolic com-pounds in wines. The variation coefficients of the analy-ses were comprised between 2.2 and 7.9%. Accuracy wasevaluated from extraction efficiencies. Table 3 shows theextraction efficiencies for the phenolic structures stud-ied.
3.3 Method application to the analysis of lowmolecular-mass polyphenols in wines
Once analytical conditions for separation and detectionwere optimized, the method was used to determine lowmolecular-mass polyphenols in 26 commercial Madeiraand Canary Islands wines (Table 1). Seventeen com-pounds, including flavonoids and nonflavonoids, couldbe separated and quantified by the RP-HPLC methodemployed. The different wine types (red, ros� and whitewines) were submitted to the above-mentioned samplepreparation (Section 2.4.). As shown in Fig. 2, the separa-tion of a standard mixture of the 17 phenolic compoundscan be achieved in 46 min. HPLC determination of phe-nolic compounds has become one of dominant analyticalprocedures because of its advantages, e.g. simple sampletreatment, possibility to pre-separate and to removeimpurities, possibility to change the polarity of mobilephase during analysis, short analysis time and highreproducibility.
Figure 3 shows the chromatogram recorded at 270,307 and 360 nm corresponding to CT5 red wine madewith Negramol grapes. As can be noted, the three chro-matographic profiles are quite different and their com-
i 2008 WILEY-VCH Verlag GmbH & Co. KGaA, Weinheim www.jss-journal.com
Table 2. Total phenolics contents (TPC) determined in commercial Madeira and Canary wine samples (average l %RSD) (n = 3)
Madeira wine Canary wines
Red TPC (mg/L)a) White TPC (mg/L)a) Red TPC (mg/L)a) White TPC (mg/L)a)
VT1 1827 l 8.1 VB1 370 l 5.8 CT4 1999 l 3.2 CM4 460 l 3.1VT2 1871 l 8.2 VB2 372 l 5.8 CT5 1544 l 3.7 CM5 488 l 3.1VT3 1853 l 8.1 VB3 282 l 10.7 CB4 229 l 5.1VT4 1936 l 8.3 VB4 389 l 5.1 CB5 319 l 3.6VT5 1724 l 7.9 VB5 434 l 3.5 CG4 231 l 5.1
VB6 340 l 5.9 CG5 301 l 3.8Ros� 665 l 2.1 VB7 309 l 7.0
VB8 442 l 3.8VB9 461 l 3.1VB10 344 l 5.8VB11 718 l 2.7VB12 770 l 3.2
a) Values expressed as mg of GAE)/L.
2194 N. Paixao et al. J. Sep. Sci. 2008, 31, 2189 – 2198
plexity decreases as wavelength increases. At 270 nm(gallic, vanillic, syringic and (– )-epicatechin) and 307 nm(caffeic, p-coumaric and ferulic acids and trans-resvera-trol) four phenolic acids were detected based on theirretention times and UV-Vis spectra compared with stand-ards. At 360 nm, only two compounds were identified:myricetin and quercetin.
Table 4 presents analytically the content of the individ-ual polyphenols found in wines produced in different geo-graphic regions–Madeira and Canary Islands. The highestcontent of polyphenols was found in red wines, asexpected. The highest values were found in CT5 wine fromNegramol grapes (835 mg/L) and VT4 wine from CabernetSauvignon, Merlot, Touriga Nacional and Touriga Barrocagrapes (742 mg/L), and the lowest in wines from Verdelho(35 mg/L) and Arnsburger (41 mg/L) grapes.
In Madeira red wines, the polyphenol content variedfrom 519 mg/L (VT3 wine; Tinta Negra Mole, CabernetSauvignon, Merlot and Complexa grapes) to 742 mg/L(VT4 wine), being the average value of 608 mg/L, while inwhite wines the levels ranged between 34 mg/L (VB2wine) and 175 mg/L (VB12 wine). In red wines, gallic acid(in average 397.1 mg/L) was by far the most predominantphenolic acid and accounted for 65–66% of all phenolics.(–)-Epicatechin was the second most abundant found(mean 105.6 mg/L) followed by quercetin (mean 55.7 mg/L). Vanillic, syringic and p-coumaric acids, were found inall red wine samples. On the other hand, either protoca-techuic, gentisic, o-coumaric, ellagic and cinnamic acids,or vanillin and syringaldehyde were found at detectablelevels in any wine sample. Trans-resveratrol usually
appears in low concentrations in studied wines, but VT4and VT5 wines contained a considerable level, 57.7 l 0.9and 30.8 l 1.2 mg/L, respectively. Baptista et al. [30] foundtrans-resveratrol amounts in Portuguese red winesbetween 0.63–5.21 mg/L, and in Italian red wines the lev-els of trans-resveratrol have been reported between 0.56–2.86 mg/L [31].
In Madeira white wines the predominant phenolicconstituents were gallic acid (mean value 17.1 mg/L). Sub-stantial amounts of caffeic (average value 13.5 mg/L) andp-coumaric acid (mean value 8.2 mg/L) were also found.(– )-Epicatechin average levels were higher in red wines,namely in VT2 wine (159.5 mg/L). These results showgreat similarity to those previously reported by Minussiet al. [25]. Gambuti et al. [32] found in Spanish red winesconcentrations of (– )-epicatechin between 42.4 and46.6 mg/L and in young red wines 2.02–3.02 mg/L.
In Canary red wines (Table 4) the polyphenol contentwas much higher than those determined in Madeira redwines (i. e. 819 mg/L (CT4 wine; Negramol grapes) and835 mg/L (CT5 wine; Negramol grapes)). Gallic acid(376.5 l 8.2 mg/L in CT5 wines) followed by caffeic acid(182.3 l 4.7 mg/L in CT4 wines) and quercetin(96.9 l 0.1 mg/L in CT4 wines) were the principal phe-nolic compounds found in these wines. Cinnamic acidwas only measurable in CT4 wines and (– )-epicatechinjust in CT5 wines.
In Canary white wines (Table 4) the levels of phenolicsvaried from 60 mg/L (CB4 wine; Malvasia and Gualgrapes) to 150 mg/L (CM4 wine; Malvasia grapes). Themost predominant compound was caffeic acid
i 2008 WILEY-VCH Verlag GmbH & Co. KGaA, Weinheim www.jss-journal.com
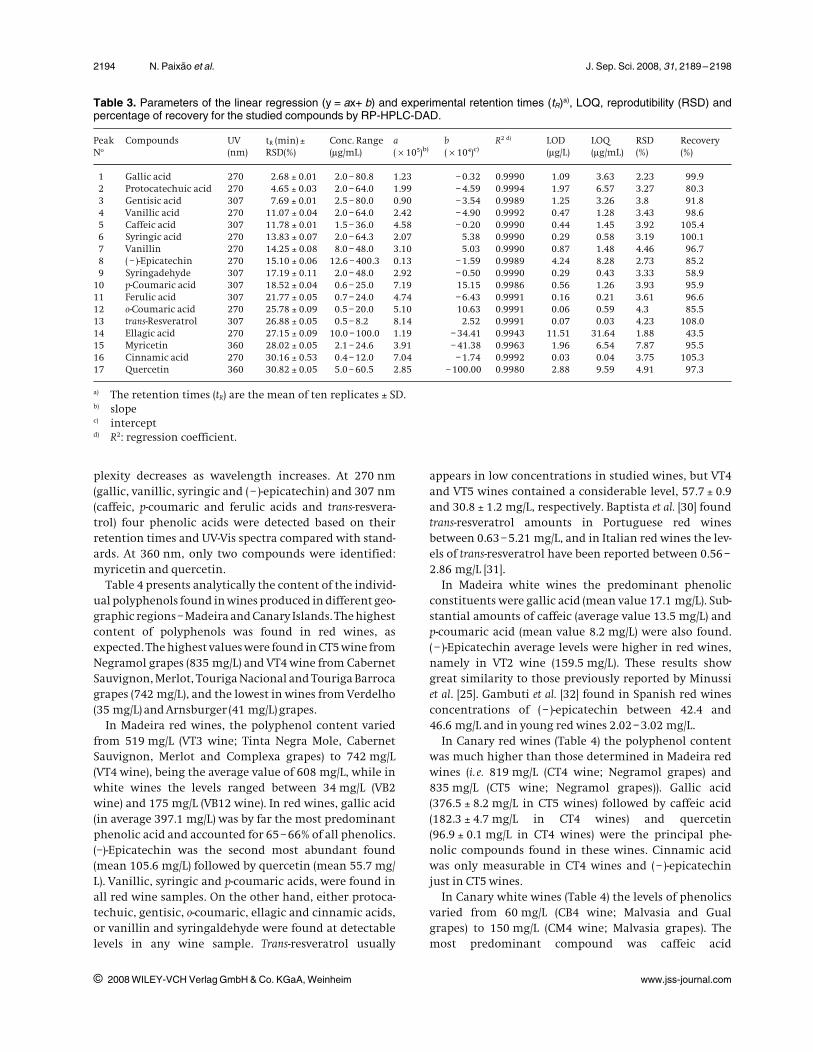
Table 3. Parameters of the linear regression (y = ax+ b) and experimental retention times (tR)a), LOQ, reprodutibility (RSD) andpercentage of recovery for the studied compounds by RP-HPLC-DAD.
PeakNo
Compounds UV(nm)
tR (min) lRSD(%)
Conc. Range(lg/mL)
a(6105)b)
b(6104)c)
R2 d) LOD(lg/L)
LOQ(lg/mL)
RSD(%)
Recovery(%)
1 Gallic acid 270 2.68 l 0.01 2.0 – 80.8 1.23 – 0.32 0.9990 1.09 3.63 2.23 99.92 Protocatechuic acid 270 4.65 l 0.03 2.0 – 64.0 1.99 – 4.59 0.9994 1.97 6.57 3.27 80.33 Gentisic acid 307 7.69 l 0.01 2.5 – 80.0 0.90 – 3.54 0.9989 1.25 3.26 3.8 91.84 Vanillic acid 270 11.07 l 0.04 2.0 – 64.0 2.42 – 4.90 0.9992 0.47 1.28 3.43 98.65 Caffeic acid 307 11.78 l 0.01 1.5 – 36.0 4.58 – 0.20 0.9990 0.44 1.45 3.92 105.46 Syringic acid 270 13.83 l 0.07 2.0 – 64.3 2.07 5.38 0.9990 0.29 0.58 3.19 100.17 Vanillin 270 14.25 l 0.08 8.0 – 48.0 3.10 5.03 0.9990 0.87 1.48 4.46 96.78 ( – )-Epicatechin 270 15.10 l 0.06 12.6 – 400.3 0.13 – 1.59 0.9989 4.24 8.28 2.73 85.29 Syringadehyde 307 17.19 l 0.11 2.0 – 48.0 2.92 – 0.50 0.9990 0.29 0.43 3.33 58.9
10 p-Coumaric acid 307 18.52 l 0.04 0.6 – 25.0 7.19 15.15 0.9986 0.56 1.26 3.93 95.911 Ferulic acid 307 21.77 l 0.05 0.7 – 24.0 4.74 – 6.43 0.9991 0.16 0.21 3.61 96.612 o-Coumaric acid 270 25.78 l 0.09 0.5 – 20.0 5.10 10.63 0.9991 0.06 0.59 4.3 85.513 trans-Resveratrol 307 26.88 l 0.05 0.5 – 8.2 8.14 2.52 0.9991 0.07 0.03 4.23 108.014 Ellagic acid 270 27.15 l 0.09 10.0 – 100.0 1.19 – 34.41 0.9943 11.51 31.64 1.88 43.515 Myricetin 360 28.02 l 0.05 2.1 – 24.6 3.91 – 41.38 0.9963 1.96 6.54 7.87 95.516 Cinnamic acid 270 30.16 l 0.53 0.4 – 12.0 7.04 – 1.74 0.9992 0.03 0.04 3.75 105.317 Quercetin 360 30.82 l 0.05 5.0 – 60.5 2.85 – 100.00 0.9980 2.88 9.59 4.91 97.3
a) The retention times (tR) are the mean of ten replicates l SD.b) slopec) interceptd) R2: regression coefficient.

J. Sep. Sci. 2008, 31, 2189 –2198 Liquid Chromatography 2195
(114.9 l 3.4 mg/L; CM5 wines), while good levels of quer-cetin (mean value 21.4 mg/L), gallic acid (mean value20.7 mg/L), p-coumaric acid (mean value 15.2 mg/L) andferulic acid (mean value 5.1 mg/L), were also found inCanary white wines. The total concentrations of low-molecular-mass polyphenols determined from the anal-ysis of Madeira and Canary wines are depicted in Fig. 4
The results obtained confirm a variation in the phe-nolic content among wine samples tested. It is irrefut-able that the amounts as well as the various species ofphenolics that occur in wines depend on a wide range offactors, including cultural practices, local climate condi-tions and vinification techniques.
3.4 Principal component analysis
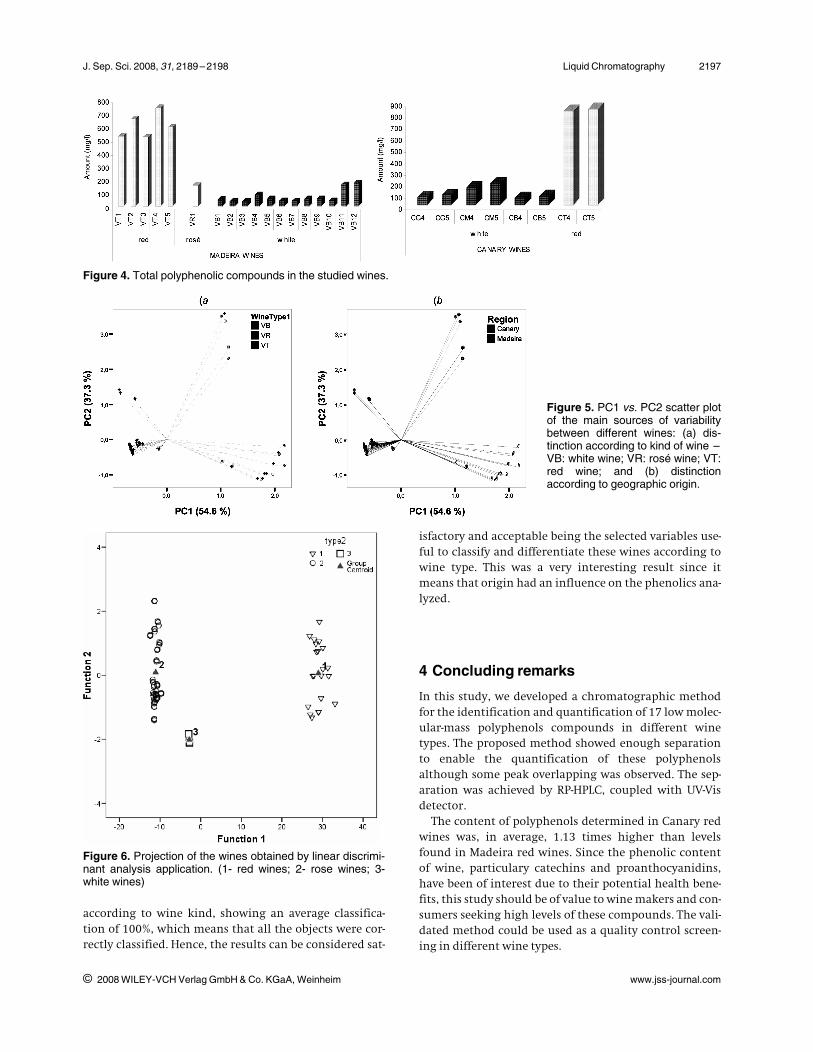
Principal components analyis was applied to theobtained data in order to achieve any differentiationbased on their phenolic content. Figure 5 shows the dis-tribution of wines according to the two first principalcomponents (PC) which explained 91.9% of the total var-
iance. As shown in Fig. 5(a), some grouping could beobserved in the space formed by the two first compo-nents, according to wine kind. The cluster correspondingto white wine is clearly separated from the other ones. Inthe case of red wine, all clusters are well separated. Thered wines were located on the positive side of PC1 axis,characterized by vanillic (0.981), gallic (0.971) and syrin-gic (0.892) acids. The white wines were mostly centred onnegative side of PC2, while ros� wine is located on thenegative side of PC1 and PC2 axis. Figure 5(b) shows thatMadeira and Canary wines were grouped separately onthe basis of their origin. The second extracted principalcomponent, correlated with caffeic and p-coumaricacids, discriminates primarily between Canary andMadeira wines.
This measuring system permits us to classify the sig-nals in separate clusters and to discriminate one set from
i 2008 WILEY-VCH Verlag GmbH & Co. KGaA, Weinheim www.jss-journal.com
Figure 2. RP-HPLC chromatographic separation of a mix-ture of phenolic standards registered at three different wave-lengths. For peak identification, see Table 3.
Figure 3. RP-HPLC chromatograms and representative on-line DAD/UV-Vis spectra of a CT5 red wine extract moni-tored at different wavelengths. Peak identification: 270 nm:(1) gallic acid, (4) vanillic acid, (6) syringic acid, (8) (– )-epi-catechin; 307 nm: (5) caffeic acid; (10) p-coumaric acid, (11)ferulic acid, (13) trans-resveratrol; 360 nm: (15) myricetin,(17) quercetin.

2196 N. Paixao et al. J. Sep. Sci. 2008, 31, 2189 – 2198
the others (Fig. 6). It was also observed that red and whitewines were grouped on the basis of their origin and kindof wine. The first two discriminant functions (roots) wereeffective in the discrimination between the wine types
(red, white and rose). The prediction capacity of the SLDAmodel was evaluated by the “leave-one-out” cross valida-tion. Table 5 summarizes the results of the classificationmatrix of the LDA model obtained for all the samples
i 2008 WILEY-VCH Verlag GmbH & Co. KGaA, Weinheim www.jss-journal.com
Table 4. Content (mg/L) of phenolic compounds identified in Madeira and Canary commercial table wine samplesa), b)
Compounds Canary white winesc)
CM4 CM5 CB4 CB5 CG4 CG5
Gallic acid nd 30.95 l 0.12 nd 18.55 l 0.17 11.79 l 0.09 20.56 l 0.74Protocatechuic acid 92.33 l 1.84 nd nd nd nd ndGentisic acid nd nd nd nd nd ndVanillic acid 3.85 l 0.12 3.62 l 0.03 1.91 l 0.06 nd 1.94 l 0.03 2.89 l 0.01Caffeic acid 65.08 l 0.23 114.99 l 3.40 27.47 l 0.27 31.04 l 0.08 15.76 l 0.25 21.43 l 0.41Syringic acid 3.30 l 0.11 2.09 l 0.15 nd nd nd ndVanillin nd nd nd nd nd nd(-)-Epicatechin nd nd nd nd nd ndSyringaldehyde nd nd nd nd nd ndp-Coumaric acid 33.83 l 0.09 26.76 l 0.34 8.29 l 0.11 3.52 l 0.06 10.02 l 0.13 7.58 l 0.04Ferulic acid 6.93 l 0.08 5.25 l 0.02 4.56 l 0.14 2.65 l 0.03 6.30 l 0.13 5.95 l 0.28o-Coumaric acid nd nd nd nd nd ndTrans-resveratrol 6.29 l 0.07 3.78 l 0.06 nd 1.55 l 0.06 0.71 l 0.05 5.85 l 0.04Ellagic acid nd nd nd nd nd ndMyricetin nd nd nd nd nd ndCinnamic acid nd nd nd nd nd ndQuercetin 30.53 l 0.09 nd 18.24 l 0.01 18.61 l 0.01 19.27 l 0.02 20.50 l 0.07
Madeira red winesc) Canary red winesc) Ros� winec)
VT1 VT2 VT3 VT4 VT5 CT4 CT5 VR1
Gallic acid 429.02 l 1.54 392.17 l 6.82 341.16 l 8.44 416.40 l 5.82 411.66 l 8.41 347.49 l 9.60 376.23 l 8.15 86.69 l 1.70Protocatechuic acid nd nd nd nd nd nd nd ndGentisic acid nd nd nd nd nd nd nd ndVanillic acid 16.77 l 0.23 28.02 l 1.45 28.04 l 0.78 31.22 l 2.20 31.42 l 2.13 18.91 l 0.56 20.20 l 0.27 7.87 l 0.65Caffeic acid 10.47 l 0.81 nd nd 12.87 l 0.26 17.86 l 1.27 182.32 l 4.70 145.61 l 7.13 19.18 l 0.39Syringic acid 4.80 l 0.04 21.74 l 0.92 28.59 l 0.87 16.78 l 0.14 21.11 l 1.26 26.41 l 0.09 27.67 l 1.61 5.45 l 0.12Vanillin nd nd nd nd nd nd nd nd(-)-Epicatechin nd 159.50 l 9.21 113.10 l 1.10 98.06 l 3.84 nd nd 85.57 l 2.58 20.55 l 1.73Syringadehyde nd nd nd nd nd nd nd ndp-Coumaric acid 1.48 l 0.11 4.88 l 0.41 4.49 l 0.14 16.06 l 1.21 6.79 l 0.64 73.07 l 1.96 61.17 l 3.27 11.62 l 0.16Ferulic acid nd nd nd nd nd 3.13 l 0.22 1.97 l 0.04 ndo-Coumaric acid nd nd nd nd nd nd nd ndTrans-resveratrol nd 4.81 l 0.19 4.50 l 0.08 57.74 l 0.95 30.82 l 1.17 27.68 l 0.09 6.42 l 0.14 7.28 l 0.04Ellagic acid nd nd nd nd nd nd nd ndMyricetin 14.83 l 0.46 9.43 l 0.30 nd 16.87 l 0.79 17.39 l 0.22 42.93 l 0.43 49.12 l 1.47 ndCinnamic acid nd nd nd nd nd 8.01 l 0.08 7.74 l 0.45 ndQuercetin 50.02 l 0.85 35.95 l 1.54 nd 79.15 l 2.63 57.67 l 2.14 96.95 l 0.14 61.41 l 1.22 nd
Madeira white winesc)
VB1 VB2 VB3 VB4 VB5 VB6 VB7 VB8 VB9 VB10 VB11 VB12
Gallic acid 8.69 l 0.30 8.89 l 0.14 8.41 l 1.70 21.06 l 0.24 30.10 l 0.24 19.43 l 0.70 11.27 l 0.69 9.46 l 0.50 9.66 l 0.18 8.55 l 0.59 34.76 l 1.62 35.17l1.34Protocatechuic acid nd nd nd nd nd nd nd nd nd nd nd ndGentisic acid nd nd nd nd nd nd nd nd nd nd nd ndVanillic acid nd nd nd nd nd nd nd nd nd nd nd ndCaffeic acid 14.62 l 0.47 14.78 l 0.38 12.28 l 0.4515.60 l 0.67 14.30 l 0.25 13.77 l 0.99 11.86 l 0.66 16.16 l 0.88 12.87 l 0.31 7.65l0.33 13.38 l 0.26 14.95l0.17Syringic acid nd nd nd nd nd nd nd nd nd nd nd ndVanillin nd nd nd nd nd nd nd nd nd nd nd nd(-)-Epicatechin nd nd nd 35.32 l 1.97 nd nd nd 19.55 l 0.99 19.03 l 0.44 19.33l0.22 78.33 l 3.34 89.36l2.52Syringadehyde nd nd nd nd nd nd nd nd nd nd nd ndp-Cumaric acid 6.64 l 0.40 6.81 l 0.85 8.75 l 0.40 9.34 l 0.28 6.31 l 0.11 5.27 l 0.31 7.38 l 0.32 9.36 l 0.55 12.40 l 0.18 5.19l0.34 11.23 l 0.20 9.17l0.38Ferulic acid nd 3.33 l 0.14 3.17 l 0.15 nd 1.31 l 0.11 1.48 l 0.04 3.24 l 0.14 nd nd nd 1.86 l 0.14 4.38l0.08o-Coumaric acid nd nd nd nd nd nd nd nd nd nd nd ndTrans-resveratrol nd nd 2.15 l 0.14 2.32 l 0.03 1.18 l 0.07 0.84 l 0.07 3.91 l 0.20 0.10 l 0.03 2.30 l 0.09 nd 2.94 l 0.13 1.94l0.13Ellagic acid nd nd nd nd nd nd nd nd nd nd nd ndMyricetin nd nd nd nd nd nd nd nd nd nd nd ndCinnamic acid nd nd nd nd nd nd nd nd nd nd nd ndQuercetin 20.18 l 0.12 nd nd nd nd nd nd nd nd nd 19.14 l 0.04 19.72l0.18
a) Values are means of triplicate determination (n = 3) l SD.b) nd – not detectable and/or found in amount lower than quantification limitc) each value is the mean of three replicates l RSD
J. Sep. Sci. 2008, 31, 2189 –2198 Liquid Chromatography 2197
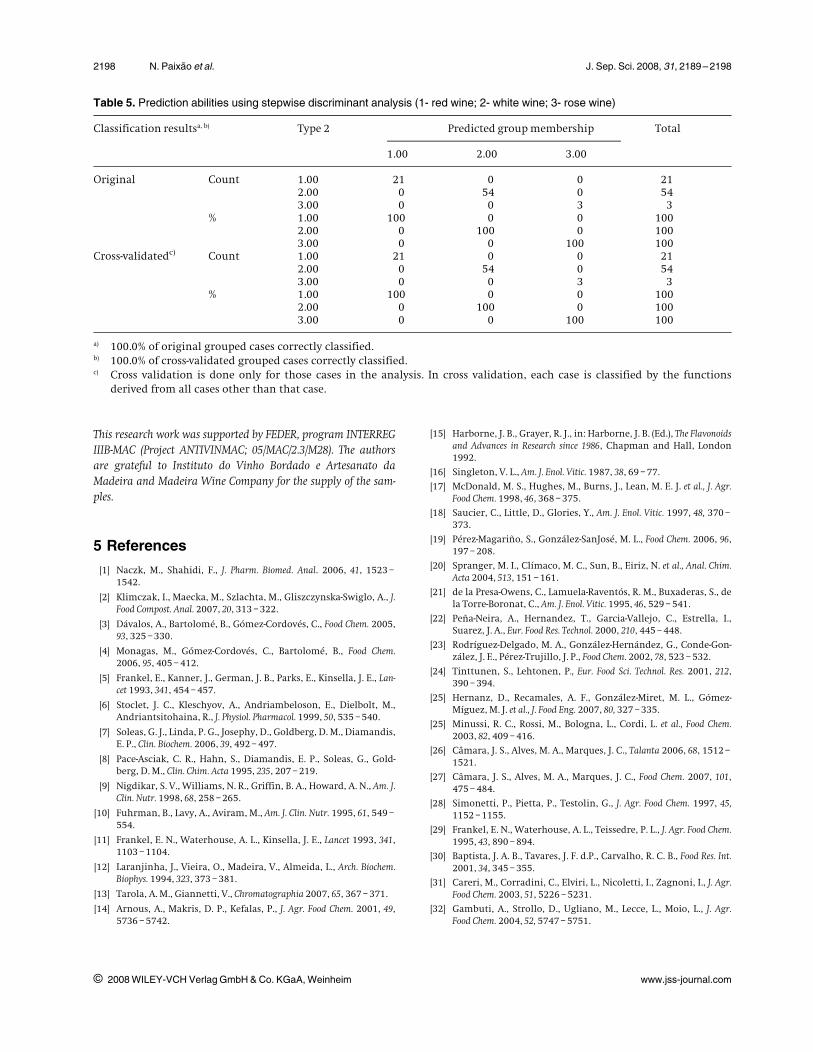
according to wine kind, showing an average classifica-tion of 100%, which means that all the objects were cor-rectly classified. Hence, the results can be considered sat-
isfactory and acceptable being the selected variables use-ful to classify and differentiate these wines according towine type. This was a very interesting result since itmeans that origin had an influence on the phenolics ana-lyzed.
4 Concluding remarks
In this study, we developed a chromatographic methodfor the identification and quantification of 17 low molec-ular-mass polyphenols compounds in different winetypes. The proposed method showed enough separationto enable the quantification of these polyphenolsalthough some peak overlapping was observed. The sep-aration was achieved by RP-HPLC, coupled with UV-Visdetector.
The content of polyphenols determined in Canary redwines was, in average, 1.13 times higher than levelsfound in Madeira red wines. Since the phenolic contentof wine, particulary catechins and proanthocyanidins,have been of interest due to their potential health bene-fits, this study should be of value to wine makers and con-sumers seeking high levels of these compounds. The vali-dated method could be used as a quality control screen-ing in different wine types.
i 2008 WILEY-VCH Verlag GmbH & Co. KGaA, Weinheim www.jss-journal.com
Figure 4. Total polyphenolic compounds in the studied wines.
Figure 5. PC1 vs. PC2 scatter plotof the main sources of variabilitybetween different wines: (a) dis-tinction according to kind of wine –VB: white wine; VR: ros� wine; VT:red wine; and (b) distinctionaccording to geographic origin.
Figure 6. Projection of the wines obtained by linear discrimi-nant analysis application. (1- red wines; 2- rose wines; 3-white wines)
2198 N. Paixao et al. J. Sep. Sci. 2008, 31, 2189 – 2198
This research work was supported by FEDER, program INTERREGIIIB-MAC (Project ANTIVINMAC; 05/MAC/2.3/M28). The authorsare grateful to Instituto do Vinho Bordado e Artesanato daMadeira and Madeira Wine Company for the supply of the sam-ples.
5 References
[1] Naczk, M., Shahidi, F., J. Pharm. Biomed. Anal. 2006, 41, 1523 –1542.
[2] Klimczak, I., Maecka, M., Szlachta, M., Gliszczynska-Swiglo, A., J.Food Compost. Anal. 2007, 20, 313 – 322.
[3] D�valos, A., Bartolom�, B., G�mez-Cordov�s, C., Food Chem. 2005,93, 325 – 330.
[4] Monagas, M., G�mez-Cordov�s, C., Bartolom�, B., Food Chem.2006, 95, 405 – 412.
[5] Frankel, E., Kanner, J., German, J. B., Parks, E., Kinsella, J. E., Lan-cet 1993, 341, 454 – 457.
[6] Stoclet, J. C., Kleschyov, A., Andriambeloson, E., Dielbolt, M.,Andriantsitohaina, R., J. Physiol. Pharmacol. 1999, 50, 535 – 540.
[7] Soleas, G. J., Linda, P. G., Josephy, D., Goldberg, D. M., Diamandis,E. P., Clin. Biochem. 2006, 39, 492 – 497.
[8] Pace-Asciak, C. R., Hahn, S., Diamandis, E. P., Soleas, G., Gold-berg, D. M., Clin. Chim. Acta 1995, 235, 207 – 219.
[9] Nigdikar, S. V., Williams, N. R., Griffin, B. A., Howard, A. N., Am. J.Clin. Nutr. 1998, 68, 258 – 265.
[10] Fuhrman, B., Lavy, A., Aviram, M., Am. J. Clin. Nutr. 1995, 61, 549 –554.
[11] Frankel, E. N., Waterhouse, A. L., Kinsella, J. E., Lancet 1993, 341,1103 – 1104.
[12] Laranjinha, J., Vieira, O., Madeira, V., Almeida, L., Arch. Biochem.Biophys. 1994, 323, 373 – 381.
[13] Tarola, A. M., Giannetti, V., Chromatographia 2007, 65, 367 – 371.
[14] Arnous, A., Makris, D. P., Kefalas, P., J. Agr. Food Chem. 2001, 49,5736 – 5742.
[15] Harborne, J. B., Grayer, R. J., in: Harborne, J. B. (Ed.), The Flavonoidsand Advances in Research since 1986, Chapman and Hall, London1992.
[16] Singleton, V. L., Am. J. Enol. Vitic. 1987, 38, 69 – 77.
[17] McDonald, M. S., Hughes, M., Burns, J., Lean, M. E. J. et al., J. Agr.Food Chem. 1998, 46, 368 – 375.
[18] Saucier, C., Little, D., Glories, Y., Am. J. Enol. Vitic. 1997, 48, 370 –373.
[19] P�rez-Magari�o, S., Gonz�lez-SanJos�, M. L., Food Chem. 2006, 96,197 – 208.
[20] Spranger, M. I., Cl�maco, M. C., Sun, B., Eiriz, N. et al., Anal. Chim.Acta 2004, 513, 151 – 161.
[21] de la Presa-Owens, C., Lamuela-Ravent�s, R. M., Buxaderas, S., dela Torre-Boronat, C., Am. J. Enol. Vitic. 1995, 46, 529 – 541.
[22] Pe�a-Neira, A., Hernandez, T., Garcia-Vallejo, C., Estrella, I.,Suarez, J. A., Eur. Food Res. Technol. 2000, 210, 445 – 448.
[23] Rodr�guez-Delgado, M. A., Gonz�lez-Hern�ndez, G., Conde-Gon-z�lez, J. E., P�rez-Trujillo, J. P., Food Chem. 2002, 78, 523 – 532.
[24] Tinttunen, S., Lehtonen, P., Eur. Food Sci. Technol. Res. 2001, 212,390 – 394.
[25] Hernanz, D., Recamales, A. F., Gonz�lez-Miret, M. L., G�mez-M�guez, M. J. et al., J. Food Eng. 2007, 80, 327 – 335.
[25] Minussi, R. C., Rossi, M., Bologna, L., Cordi, L. et al., Food Chem.2003, 82, 409 – 416.
[26] C�mara, J. S., Alves, M. A., Marques, J. C., Talanta 2006, 68, 1512 –1521.
[27] C�mara, J. S., Alves, M. A., Marques, J. C., Food Chem. 2007, 101,475 – 484.
[28] Simonetti, P., Pietta, P., Testolin, G., J. Agr. Food Chem. 1997, 45,1152 – 1155.
[29] Frankel, E. N., Waterhouse, A. L., Teissedre, P. L., J. Agr. Food Chem.1995, 43, 890 – 894.
[30] Baptista, J. A. B., Tavares, J. F. d.P., Carvalho, R. C. B., Food Res. Int.2001, 34, 345 – 355.
[31] Careri, M., Corradini, C., Elviri, L., Nicoletti, I., Zagnoni, I., J. Agr.Food Chem. 2003, 51, 5226 – 5231.
[32] Gambuti, A., Strollo, D., Ugliano, M., Lecce, L., Moio, L., J. Agr.Food Chem. 2004, 52, 5747 – 5751.
i 2008 WILEY-VCH Verlag GmbH & Co. KGaA, Weinheim www.jss-journal.com
Table 5. Prediction abilities using stepwise discriminant analysis (1- red wine; 2- white wine; 3- rose wine)
Classification resultsa, b) Type 2 Predicted group membership Total
1.00 2.00 3.00
Original Count 1.00 21 0 0 212.00 0 54 0 543.00 0 0 3 3
% 1.00 100 0 0 1002.00 0 100 0 1003.00 0 0 100 100
Cross-validatedc) Count 1.00 21 0 0 212.00 0 54 0 543.00 0 0 3 3
% 1.00 100 0 0 1002.00 0 100 0 1003.00 0 0 100 100
a) 100.0% of original grouped cases correctly classified.b) 100.0% of cross-validated grouped cases correctly classified.c) Cross validation is done only for those cases in the analysis. In cross validation, each case is classified by the functions
derived from all cases other than that case.