Molecular Effects of Polyphenols in Experimental Type 2 ...
231
Molecular Effects of Polyphenols in Experimental Type 2 Diabetes Mellitus and Metabolic Syndrome DISSERTATION zur Erlangung des naturwissenschaftlichen Doktorgrades der Julius-Maximilians-Universität Würzburg vorgelegt von Stoyan Dinkov Dirimanov aus Sofia Würzburg 2019
-
Upload
khangminh22 -
Category
Documents
-
view
1 -
download
0
Transcript of Molecular Effects of Polyphenols in Experimental Type 2 ...

Molecular Effects of Polyphenols in Experimental Type 2 Diabetes
Mellitus and Metabolic Syndrome
DISSERTATION
zur Erlangung
des naturwissenschaftlichen Doktorgrades
der Julius-Maximilians-Universität Würzburg
vorgelegt von
Stoyan Dinkov Dirimanov
aus Sofia
Würzburg
2019

Eingereicht bei der Fakultät für Chemie und Pharmazie am: ...........................................
Gutachter der schriftlichen Arbeit:
1. Gutachter: .................................................................
2. Gutachter: .................................................................
Prüfer des öffentlichen Promotionskolloquiums:
1. Prüfer: ..................................................................
2. Prüfer: ..................................................................
3. Prüfer: ..................................................................
Datum des öffentlichen Promotionskolloquiums:
..................................................................
Doktorurkunde ausgehändigt am:
..................................................................
3
3
Die vorliegende Arbeit wurde auf Anregung von
Frau Professor Dr. Petra Högger
am Lehrstuhl für Pharmazeutische Chemie
des Instituts für Pharmazie und Lebensmittelchemie
der Julius-Maximilians-Universität Würzburg angefertigt.
Meiner Eltern
4
Poster Presentations
Dirimanov S., Xiao J., Högger P.
Role of polyphenols in vascular health
ISPMF 2015, 2nd International Symposium on Phytochemicals in Medicine
and Food, June 26-29, 2015, Shanghai, China
Dirimanov S., Xiao J., Högger P.
The protective role of polyphenols in diabetes related vascular complications
ICNPU 2015, 2nd International Conference on Natural Products Utilization:
from Plant to Pharmacy Shelf, October 14-17, 2015, Plovdiv, Bulgaria
5
5
„Nicht durch die kraft höhlet der tropfen den stein,
sondern durch häufiges fallen.”
„Gutta cavat lapidem, non vi, sed saepe cadendo.”
Ovid

6
Acknowledgments
First of all, I would like to express my sincere gratitude to Prof. Dr. Petra Högger for
accepting me as a doctoral student and giving me the opportunity to get involved in a
project regarding intriguing and socially significant topic. In addition, I am very grateful
for her awesome supervision, original ideas, understanding and readiness to discuss openly
every challenge that occurred during the project.
I would like to thank Prof. Ing. Zdeňka Ďuračková (Comenius University in Bratislava)
and the Horphag Research for organizing and carrying out the clinical study and for kindly
providing volunteers’ samples for the present investigations.
Special thanks are due to Prof. Dr. Christoph Sotriffer for the opportunity to collaborate
with his working group and to learn a lot about in silico models. I am very grateful to Mr.
Mathias Diebold for his time, support, discussions, and also for supplying me with several
compound databases for virtual screenings.
I would like to gratefully acknowledge the organizations BAYHOST and FAZIT-Stiftung
for providing me a financial support, and thus making the completion of this work
possible. Furthermore, I would like to thank the persons who positively assessed my
progress and supported me for obtaining and prolonging my funding: Prof. Dr. Petra
Högger, Prof. Dr. Michael Decker, and PD Dr. med. Asparouh Iliev.
Moreover, I would like to thank to:
• The present and former members from the working groups of Prof. Högger
(Roswitha Scheblein, Dr. Frederic Vollmers, Dr. Martin Haas, Dr. Melanie Mülek,
Dr. Steffen Jeßberger, Dr. Maike Scherf-Clavel, Dr. Jianbo Xiao, Dr. Hui Cao, Dr.
Lisa Schaaf, Andreas Pospiech, Linda Volpp, Florian Lang, Charlotte Beier,
Theresa Häfner, Arthur Felker, Jasmin Bayer) and Prof. Scherf-Clavel (Prof. Dr.
Oliver Scherf-Clavel, Bettina Friedl, Sebastian Zimmermann, Maximilian Stapf)
for the positive attitude, friendship, and helpfulness. Danke für alles!
• Prof. Dr. Jianbo Xiao for providing me the opportunity to present parts of my work
on the ISPMF 2015 conference in China
• The colleagues from the Chair for Drug Formulation and Delivery (working group
Prof. Meinel) who readily shared their equipment and discussed intriguing
scientific issues with me, especially: Dr. Marcus Gutmann, Dr. Gabriel Jones, Dr.
Fang Wu, and Dr. Alexandra Braun.
• My colleagues for the pleasant time during the teaching activities (5. Semester):
Theresa, Christine, Klaus, Daniela, Maike, Melanie, Felix, David and Frederic.
• Dr. Stefan Ivanov, Vania Dirimanova and Eng. Liubomir Bambov who checked
some parts of the present thesis for spelling. Special thanks to Stefan for our talks
and his expert opinion regarding a variety of scientific topics.

7
7
Furthermore, I am very thankful to my family and friends who supported me and
encouraged me all the time. Last but not least, I would like to thank you Giovanna for
staying by my side and for sharing every single moment of sadness and joy during the
years of my study.

Table of Contents
A Introduction ........................................................................................... 14
1 Diabetes mellitus .................................................................................................. 14
1.1 Background ........................................................................................................... 14
1.2 Types of diabetes .................................................................................................. 14
1.2.1 Type 1 diabetes ..................................................................................................... 14
1.2.2 Type 2 diabetes ..................................................................................................... 15
1.2.3 Further types of diabetes ....................................................................................... 15
1.3 Prediabetes ............................................................................................................ 15
1.4 Insulin resistance .................................................................................................. 16
1.5 Endothelial dysfunction and vascular complications ........................................... 17
1.6 Management of T2DM ......................................................................................... 17
2 Diabetes and cell signaling ................................................................................... 19
2.1 PI3K/Akt ............................................................................................................... 19
2.1.1 Protein structure of Akt kinase ............................................................................. 20
2.1.2 Akt isoforms ......................................................................................................... 21
2.1.3 Regulation of Akt activity .................................................................................... 21
2.1.4 Akt substrates ....................................................................................................... 23
2.1.5 Akt and the cardiovascular system ....................................................................... 25
2.1.6 Akt inhibitors ........................................................................................................ 26
2.2 AMPK ................................................................................................................... 27
2.2.1 AMPK – protein structure and regulation ............................................................ 27
2.2.2 AMPK – cellular functions and substrates ........................................................... 28
2.3 MAPK ................................................................................................................... 30
3 Polyphenolic compounds ...................................................................................... 31
3.1 Background ........................................................................................................... 31
3.2 Classification ........................................................................................................ 31
3.3 Beneficial effects .................................................................................................. 33
3.3.1 Polyphenols and diabetes...................................................................................... 34
3.3.2 Polyphenols and cardiovascular diseases ............................................................. 36
3.4 Safety of polyphenols ........................................................................................... 38
3.5 Pycnogenol® ......................................................................................................... 41
3.5.1 Pycnogenol® – beneficial effects .......................................................................... 41
3.5.2 Pycnogenol® – pharmacokinetics ......................................................................... 42
3.5.3 Pycnogenol® – pharmacodynamics ...................................................................... 42
4 Aims of the thesis ................................................................................................. 44

Table of Contents
9
B Results and Discussion ........................................................................ 45
1 Cellular effects of Pycnogenol® in healthy individuals ........................................ 45
1.1 Pycnogenol® effects on active GLP-1, DPP IV, relaxin-2, and adiponectin ........ 45
1.2 Effects of Pycnogenol® on GLP-1 (active) ........................................................... 46
1.2.1 Background: GLP-1 (active) serum levels ............................................................ 46
1.2.2 Results: Effects of Pycnogenol® on GLP-1 (active) serum concentrations .......... 48
1.2.3 Discussion: Effects of Pycnogenol® on GLP-1 (active) serum levels .................. 51
1.2.4 Conclusions: Effects of Pycnogenol® on GLP-1 (active) serum levels ................ 53
1.3 Effects of Pycnogenol® on DPP IV serum levels and activities ........................... 53
1.3.1 Background: DPP IV serum concentration and activity ....................................... 53
1.3.2 Results: Effects of Pycnogenol® on DPP IV serum levels and activities ............. 53
1.3.3 Discussion: Effects of Pycnogenol® on DPP IV serum levels and activities ....... 57
1.3.4 Conclusions: Effects of Pycnogenol® on DPP IV serum levels and activities ..... 59
1.4 Effects of Pycnogenol® on relaxin-2 serum concentrations ................................. 60
1.4.1 Background: Relaxin-2 serum levels .................................................................... 60
1.4.2 Results: Effects of Pycnogenol® on relaxin-2 serum levels ................................. 60
1.4.3 Discussion: Effects of Pycnogenol® on relaxin-2 serum levels ............................ 60
1.4.4 Conclusions: Effects of Pycnogenol® on relaxin-2 serum levels ......................... 60
1.5 Effects of Pycnogenol® on serum adiponectin ..................................................... 61
1.5.1 Background: Adiponectin serum levels ................................................................ 61
1.5.2 Results: Effects of Pycnogenol® on adiponectin serum levels ............................. 61
1.5.3 Discussion: Effects of Pycnogenol® on serum adiponectin .................................. 65
1.5.4 Conclusions: Effects of Pycnogenol® on serum adiponectin ................................ 65
2 Effects of polyphenols on Akt-kinase-phosphorylation ....................................... 66
2.1 Effects of polyphenols on Akt-phosphorylation – pilot study .............................. 66
2.1.1 Background ........................................................................................................... 66
2.1.2 Results: Pilot study ............................................................................................... 67
2.1.3 Discussion: Pilot study .......................................................................................... 68
2.2 Effects of polyphenols on Akt-phosphorylation – primary screening .................. 69
2.2.1 Background: Primary screening ............................................................................ 69
2.2.2 Results: Primary screening ................................................................................... 69
2.2.3 Discussion: Primary screening .............................................................................. 71
2.2.1 Conclusion: Primary screening ............................................................................. 73
2.3 Effects of polyphenols on Akt-phosphorylation – secondary screening .............. 75
2.3.1 Background: Secondary screening ........................................................................ 75
2.3.2 Results: Secondary screening ............................................................................... 76
2.3.3 Discussion: Secondary screening .......................................................................... 77
2.3.4 Conclusion: Secondary screening ......................................................................... 79
2.4 Semi-quantitative structure-activity-relationship (SAR) ...................................... 79
2.4.1 Structure-activity-relationship: Key features ........................................................ 79
2.4.2 Discusion: SAR ..................................................................................................... 82
2.4.3 Conclusion: SAR .................................................................................................. 84
Table of Contents
10
2.5 Pharmacophore-based model for Akt-inhibition .................................................. 84
2.5.1 Compounds selection ............................................................................................ 84
2.5.2 Flexible alignments............................................................................................... 84
2.5.3 Pharmacophore-based model establishment ......................................................... 86
2.5.4 Validation and improvement of the model ........................................................... 87
2.5.5 Virtual screening ................................................................................................... 89
2.5.6 Post-screening-analysis ........................................................................................ 90
2.5.7 Summarized results (in silico) .............................................................................. 91
2.5.8 Discussion: In silico analysis ................................................................................ 92
2.5.9 Limitations of the study ........................................................................................ 93
2.5.10 Proof of concept – results ..................................................................................... 93
2.5.11 Proof of concept – discussion ............................................................................... 94
2.6 Investigation of the effect of bio-activation of polyphenols ................................. 96
2.6.1 Background: Bio-activation of polyphenols ......................................................... 96
2.6.2 Results: Effect of bio-activation ........................................................................... 97
2.6.3 Discussion: Effect of bio-activation ..................................................................... 98
2.7 “Metformin-like” effects of polyphenols ............................................................. 98
2.7.1 Background: “Metformin-like” effects of polyphenols ........................................ 98
2.7.2 Results: “Metformin-like” effects of polyphenols ................................................ 98
2.7.3 Discussion: “Metformin-like” effects of polyphenols .......................................... 99
2.8 Influence of glucose on the effects of polyphenols on pAkt in vitro ................. 100
2.8.1 Background: Influence of glucose concentrations on pAkt in vitro ................... 100
2.8.2 Results: Influence of glucose concentrations on pAkt in vitro ........................... 100
2.8.3 Discussion: Influence of glucose concentrations on pAkt in vitro ..................... 103
2.8.4 Conclusions: Influence of glucose concentrations on pAkt in vitro ................... 104
3 Effects of polyphenols on DPP IV activity and expression ................................ 105
3.1 Effects of polyphenols on the enzymatic activity of DPP IV ............................. 105
3.1.1 Background: Polyphenols and DPP IV activity ................................................. 105
3.1.2 Results: Polyphenols and DPP IV activity in vitro............................................. 105
3.1.3 Discussion: Polyphenols and DPP IV activity in vitro ....................................... 107
3.2 Effects of polyphenols on the expression of DPP IV/ CD26 ............................. 108
3.2.1 Background: DPP IV/CD26 Expression ............................................................. 108
3.2.2 Results: Polyphenols and DPP IV Expression ................................................... 110
3.2.3 Discussion: Polyphenols and DPP IV Expression .............................................. 112
3.2.4 Conclusion: Polyphenols and DPP IV Expression ............................................. 114
4 Fluorescence interactions of polyphenols in different environments ................. 115
4.1 Background: Fluorescence interactions .............................................................. 115
4.2 Results: Fluorescence interactions ...................................................................... 116
4.3 Discussion: Fluorescence interactions ................................................................ 120
4.4 Conclusions: Fluorescence interactions .............................................................. 122
Table of Contents
11
C Experimental Setup ............................................................................. 123
1 Effects of Pycnogenol® on active GLP-1, DPP IV, relaxin-2 and adiponectin .. 123
1.1 Clinical study ...................................................................................................... 123
1.2 Chemicals and reagents ...................................................................................... 123
1.2.1 Specific chemicals and reagents for ELISA measurements ............................... 123
1.2.2 Specific chemicals and reagents for DPP IV serum enzymatic activity assay ... 123
1.3 Materials and devices .......................................................................................... 124
1.3.1 Specific materials und devices for ELISA measurements .................................. 124
1.4 Serum levels of GLP-1, DPP IV, relaxin-2, adiponectin.
Serum enzymatic activities of DPP IV ............................................................... 124
1.4.1 GLP-1 (active) serum concentrations ................................................................. 125
1.4.2 DPP IV serum concentrations ............................................................................. 126
1.4.3 Relaxin-2 serum concentrations .......................................................................... 128
1.4.4 Total adiponectin serum concentrations ............................................................. 129
1.4.5 DPP IV serum enzymatic activities .................................................................... 131
1.5 Statistical analysis ............................................................................................... 133
1.5.1 Standard curve fitting .......................................................................................... 133
1.5.2 Descriptive statistics and normality .................................................................... 133
1.5.3 Outliers detection and exclusion ......................................................................... 133
1.5.4 Statistical significance ........................................................................................ 133
2 Effects of polyphenols on protein phosphorylation ............................................ 135
2.1 Cells, chemicals and reagents ............................................................................. 135
2.1.1 Cells used in in vitro models ............................................................................... 135
2.1.2 Specific chemicals and reagents for cell culture ................................................. 135
2.1.3 Specific chemicals and reagents for Western blot analysis ................................ 138
2.1.4 Specific chemicals and reagents for ELISA measurements ............................... 139
2.1.5 Specific chemicals and reagents for BCA-Assay for protein concentration....... 139
2.1.6 Specific chemicals and reagents for mycoplasma test ........................................ 140
2.2 Materials and devices .......................................................................................... 140
2.2.1 Specific materials and devices for cell culture ................................................... 140
2.2.2 Specific materials and devices for Western blot analysis ................................... 141
2.2.3 Specific materials and devices for ELISA measurements .................................. 141
2.2.4 Specific materials and devices for protein determination ................................... 141
2.3 Frequently used solutions ................................................................................... 142
2.3.1 Solutions used for sample preparation and Western blot analysis ...................... 142
2.3.2 Solutions used for polyacrylamide gel cast ........................................................ 142
2.3.3 Stripping solutions .............................................................................................. 143
2.3.4 Staining solutions ................................................................................................ 143
2.3.5 Coating solution for cell culture flasks (HUVEC) .............................................. 143
2.3.6 Solutions for mycoplasma test ............................................................................ 143
2.4 Experimental design ........................................................................................... 144
2.4.1 In vitro cell culture model – routine methods ..................................................... 144
Table of Contents
12
2.4.2 Cell lysis and sample preparation ....................................................................... 146
2.4.3 Determination of sample protein concentrations ................................................ 147
2.4.4 Western blot analysis .......................................................................................... 148
2.4.5 Quantitative analysis of Akt-phosphorylation status .......................................... 152
2.4.6 Mycoplasma test ................................................................................................. 152
2.5 In silico modeling ............................................................................................... 153
3 Effects of polyphenols on DPP IV activity and expression ................................ 155
3.1 Effects of polyphenols on the enzymatic activity of DPP IV ............................. 155
3.1.1 Chemicals and reagents ...................................................................................... 155
3.1.2 Materials and devices ......................................................................................... 155
3.1.3 Experimental design ........................................................................................... 155
3.2 Effects of polyphenols on the DPP IV-Expression ............................................ 156
3.2.1 Cells, chemicals and reagents ............................................................................. 156
3.2.2 Materials and devices ......................................................................................... 158
3.2.3 Experimental set-up: cell culture model ............................................................. 158
3.2.4 Oil Red O staining protocol ................................................................................ 161
3.2.5 Experimental set-up: ELISA analysis ................................................................. 161
4 Interactions of polyphenols with fluorescence ................................................... 163
4.1 Chemicals and reagents ...................................................................................... 163
4.2 Materials and devices ......................................................................................... 163
4.3 Fluorescence interactions analysis ...................................................................... 163
D Supplement .......................................................................................... 164
1 Section 1 – Clinical study ................................................................................... 164
1.1 GLP-1 (active) serum concentrations ................................................................. 164
1.1.1 GLP-1 (active) – before outlier exclusion .......................................................... 164
1.1.2 Serum concentrations of GLP-1 (active) - outliers excluded ............................. 165
1.1.3 Individual change in GLP-1 (active) between T1-T3 and T2-T4 ....................... 166
1.2 DPP IV ................................................................................................................ 167
1.2.1 DPP IV serum concentrations ............................................................................. 167
1.2.2 DPP IV serum enzymatic activities .................................................................... 170
1.3 Relaxin ................................................................................................................ 172
1.4 Adiponectin ........................................................................................................ 173
1.4.1 Serum concentrations of adiponectin (ADN) before outliers exclusion............. 173
1.4.2 Serum concentrations of adiponectin (ADN) in volunteers - outliers excluded . 174
2 Section 2 – Akt ................................................................................................... 178
2.1 Pilot study – normalized values .......................................................................... 178
2.2 Primary screening – normalized values .............................................................. 178
2.2.1 pAkt Ser473 ........................................................................................................ 178
2.2.2 pAkt Thr308 ....................................................................................................... 179
2.3 Secondary screening (pAkt Ser473) – normalized values .................................. 179
2.4 Metformin’s effects on pAkt Ser473 in EA.hy926, normalized values ............. 181
3 Section 3 – Virtual screening.............................................................................. 182
Table of Contents
13
4 Section 4 – DPP IV activity and expression ....................................................... 197
4.1 DPP IV activity inhibition by polyphenols ......................................................... 197
5 Section 5 – Fluorescent interactions ................................................................... 198
E Summary .............................................................................................. 201
1 Summary ............................................................................................................. 201
2 Zusammenfassung .............................................................................................. 204
F Abbreviations in alphabetical order .................................................. 207
G References ........................................................................................... 211

A Introduction
1 Diabetes mellitus
1.1 Background
Diabetes mellitus is characterized by chronically increased blood glucose levels due to
absolute or relative deficiency of insulin. It is highly prevalent and along with its
complications it is among the leading causes of death. Presently, according to the latest
global report on diabetes of the World Health Organization (WHO), in 2014,
approximately 8.5 % of people worldwide were diabetics. This number was 4.7 % in 1980,
indicating a worrying trend of increasing morbidity over the last three decades [1]. Recent
data (2015) from the American Diabetes Association show that diabetes prevalence among
adults in the U.S. is 9.4 % [2], while in the European Union it was reported that 6.9 % of
the population (2014) suffer from this disease [3]. Diabetes is considered a socially
significant morbidity because of its considerable negative impact on the patients’ duration
and quality of life. Therefore, research activities are focused on developing novel and more
effective therapies, aiming to improve glucose homeostasis and alleviate insulin resistance.
Two main types of diabetes according to its pathogenesis can be distinguished – diabetes
mellitus type 1 (T1DM) and type 2 (T2DM). However, novel diabetic subgroups based on
additional factors for the disease’s occurrence, such as body-mass index, age, β-cell
function, insulin resistance, and presence of autoantibodies aim at a more precise and
individualized therapeutic handling [4].
1.2 Types of diabetes
1.2.1 Type 1 diabetes
Type 1 diabetes mellitus (T1DM) typically has a sudden onset and is caused by a pancreas
dysfunction resulting in insufficient or completely abolished insulin production and
secretion. Common symptoms are frequent urination (polyuria), excessive thirstiness
(polydipsia), hunger (polyphagia), fatigue, blurry vision, unexpected weight loss, and
delayed wound healing. This form of diabetes is caused by autoimmune processes
targeting insulin producing β-cells [5]. It usually occurs at a young age. However, a form
of T1DM manifesting later in adulthood also exists – latent autoimmune diabetes of adults
(LADA) [5]. It can be falsely diagnosed as T2DM. The risk of short- and long-term
complications necessitates tight blood glucose control. Novel medical devices which have
1 Diabetes mellitus 15
15
recently been approved or are undergoing clinical trials may contribute to improving
diabetics’ quality of life. Such devices are insulin pumps, closed-loop glucose monitoring
systems, and artificial bionic pancreases [6]. Type 1 diabetes is managed by insulin
replacement treatment.
1.2.2 Type 2 diabetes
Type 2 diabetes mellitus (T2DM) is commonly described as a lifestyle-related condition. It
represents around 95 % of all diabetes cases [7]. As the symptoms of T2DM are not
specific, it can remain latent and undiagnosed over a long period of time. Obesity and
increased insulin levels are forewarnings of insulin resistance. A chronic pro-inflammatory
state is present as well. Aging, oversupply of nutrients, and lack of physical activity are
key factors in diabetes pathogenesis and development of insulin resistance. In order to
compensate for the latter, β-cells are continuously stimulated to produce insulin and in
spite of high blood levels (hyperinsulinemia) increased postprandial glucose levels are not
normalized. As a result of the permanent stress, β-cells deteriorate and may undergo
apoptosis. Therefore, in the advanced stage of uncontrolled T2DM, insulin production can
be insufficient and patients require insulin treatment. Being a complex disorder, T2DM is
often accompanied with metabolic syndrome including insulin resistance, obesity,
dyslipidemia, and hypertension [5, 7].
1.2.3 Further types of diabetes
Gestational diabetes is characterized by increased blood glucose levels occurring in healthy
pregnant women due to insulin resistance, likely caused by certain pregnancy-related
hormones. Gestational diabetes usually resolves after childbirth. It represents a very little
risk for the mother (rarely development of T2DM), but a huge threat for the baby, as it can
contribute to a number of negative consequences, such as postnatal low blood glucose,
increased body size, and disrupted organogenesis. Thus, this condition should be managed
properly [7].
Maturity onset diabetes of the young (MODY) is a very rare form of diabetes mellitus
different from T1DM and T2DM. It is caused by single gene mutations related to insulin
production and can be inherited [7].
Steroid diabetes may occur due to long-term use of corticosteroids, which antagonize
insulin’s action and may cause increase in blood sugar levels [7].
1.3 Prediabetes
Prediabetes (borderline diabetes) is a transitional pathological state which is characterized
by increased blood glucose levels, which are not high enough for diabetes to be diagnosed
[1]. It may frequently, but not always advance to T2DM. Prediabetes can be subdivided
16 A Introduction
16
into two types. Impaired fasting glucose (IFG) is characterized by permanently increased
fasting glucose levels. Impaired glucose tolerance (IGT) can be described as a failure of
the organism to restore its blood sugar to normal concentrations within two hours after an
oral challenge of 75 g glucose (oral glucose tolerance test – OGTT). Hyperglycemia is a
hallmark sign of a metabolic disorder. Therefore, glucose levels are of both
pathophysiological and diagnostic importance and can provide a hint as to the progress and
state of diabetes (Table 1).
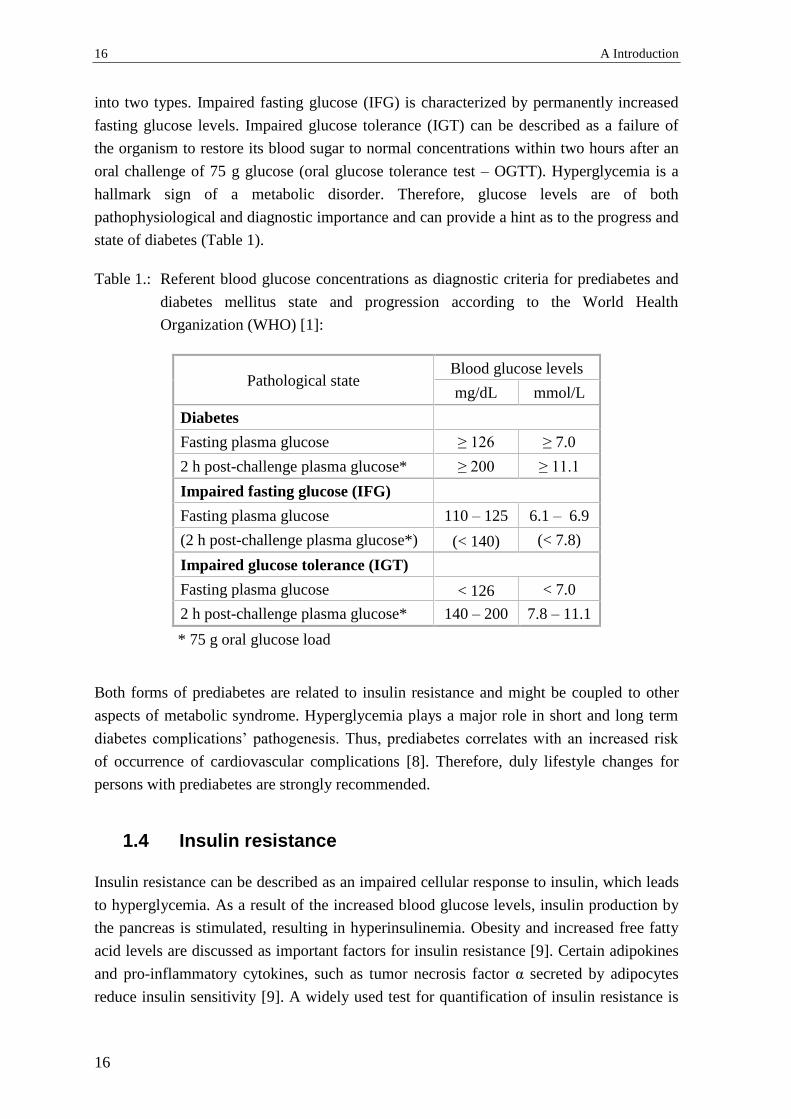
Table 1.: Referent blood glucose concentrations as diagnostic criteria for prediabetes and
diabetes mellitus state and progression according to the World Health
Organization (WHO) [1]:
Pathological state Blood glucose levels
mg/dL mmol/L
Diabetes
Fasting plasma glucose ≥ 126 ≥ 7.0
2 h post-challenge plasma glucose* ≥ 200 ≥ 11.1
Impaired fasting glucose (IFG)
Fasting plasma glucose 110 – 125 6.1 – 6.9
(2 h post-challenge plasma glucose*) (< 140) (< 7.8)
Impaired glucose tolerance (IGT)
Fasting plasma glucose < 126 < 7.0
2 h post-challenge plasma glucose* 140 – 200 7.8 – 11.1
* 75 g oral glucose load
Both forms of prediabetes are related to insulin resistance and might be coupled to other
aspects of metabolic syndrome. Hyperglycemia plays a major role in short and long term
diabetes complications’ pathogenesis. Thus, prediabetes correlates with an increased risk
of occurrence of cardiovascular complications [8]. Therefore, duly lifestyle changes for
persons with prediabetes are strongly recommended.
1.4 Insulin resistance
Insulin resistance can be described as an impaired cellular response to insulin, which leads
to hyperglycemia. As a result of the increased blood glucose levels, insulin production by
the pancreas is stimulated, resulting in hyperinsulinemia. Obesity and increased free fatty
acid levels are discussed as important factors for insulin resistance [9]. Certain adipokines
and pro-inflammatory cytokines, such as tumor necrosis factor α secreted by adipocytes
reduce insulin sensitivity [9]. A widely used test for quantification of insulin resistance is
1 Diabetes mellitus 17
17
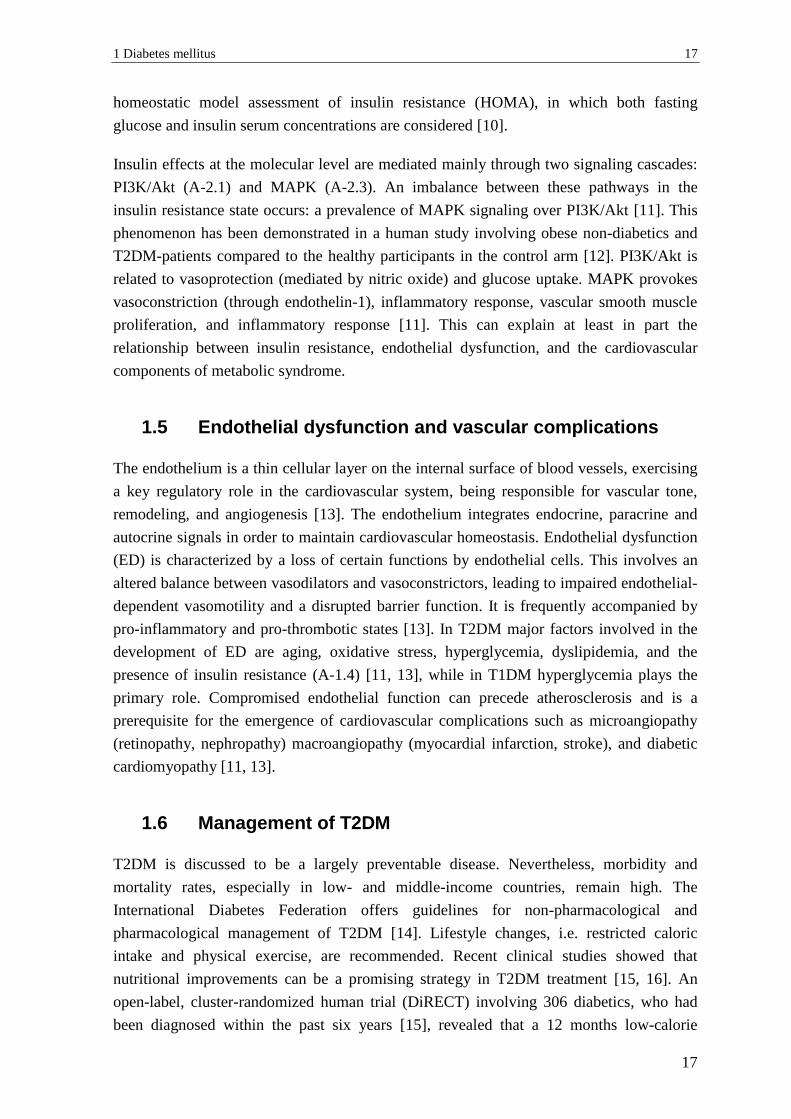
homeostatic model assessment of insulin resistance (HOMA), in which both fasting
glucose and insulin serum concentrations are considered [10].
Insulin effects at the molecular level are mediated mainly through two signaling cascades:
PI3K/Akt (A-2.1) and MAPK (A-2.3). An imbalance between these pathways in the
insulin resistance state occurs: a prevalence of MAPK signaling over PI3K/Akt [11]. This
phenomenon has been demonstrated in a human study involving obese non-diabetics and
T2DM-patients compared to the healthy participants in the control arm [12]. PI3K/Akt is
related to vasoprotection (mediated by nitric oxide) and glucose uptake. MAPK provokes
vasoconstriction (through endothelin-1), inflammatory response, vascular smooth muscle
proliferation, and inflammatory response [11]. This can explain at least in part the
relationship between insulin resistance, endothelial dysfunction, and the cardiovascular
components of metabolic syndrome.
1.5 Endothelial dysfunction and vascular complications
The endothelium is a thin cellular layer on the internal surface of blood vessels, exercising
a key regulatory role in the cardiovascular system, being responsible for vascular tone,
remodeling, and angiogenesis [13]. The endothelium integrates endocrine, paracrine and
autocrine signals in order to maintain cardiovascular homeostasis. Endothelial dysfunction
(ED) is characterized by a loss of certain functions by endothelial cells. This involves an
altered balance between vasodilators and vasoconstrictors, leading to impaired endothelial-
dependent vasomotility and a disrupted barrier function. It is frequently accompanied by
pro-inflammatory and pro-thrombotic states [13]. In T2DM major factors involved in the
development of ED are aging, oxidative stress, hyperglycemia, dyslipidemia, and the
presence of insulin resistance (A-1.4) [11, 13], while in T1DM hyperglycemia plays the
primary role. Compromised endothelial function can precede atherosclerosis and is a
prerequisite for the emergence of cardiovascular complications such as microangiopathy
(retinopathy, nephropathy) macroangiopathy (myocardial infarction, stroke), and diabetic
cardiomyopathy [11, 13].
1.6 Management of T2DM
T2DM is discussed to be a largely preventable disease. Nevertheless, morbidity and
mortality rates, especially in low- and middle-income countries, remain high. The
International Diabetes Federation offers guidelines for non-pharmacological and
pharmacological management of T2DM [14]. Lifestyle changes, i.e. restricted caloric
intake and physical exercise, are recommended. Recent clinical studies showed that
nutritional improvements can be a promising strategy in T2DM treatment [15, 16]. An
open-label, cluster-randomized human trial (DiRECT) involving 306 diabetics, who had
been diagnosed within the past six years [15], revealed that a 12 months low-calorie
18 A Introduction
18
dietary intervention induced diabetes remission in almost half of the participants.
Furthermore, around 90 % of the individuals with weight loss of 15 kg or more achieved
remission [15].
International Diabetes Federation guidelines also describe diabetes treatment with
approved drugs [14]. Metformin is proposed as first-line therapy. Alternatively,
sulfonylureas (possibly with low risk for hypoglycemia) or dipeptidyl peptidase 4
inhibitors can be prescribed. A detailed recent review by Marín-Peñalver et al. is focused
on diabetes pharmacotherapy [17], which is outside the scope of the present work. Herein,
a brief overview of certain approved drugs and their molecular effects on two signaling
pathways with high relevance to diabetes: Akt (A-2.1) and AMPK (A-2.2), is presented
(Table 2).
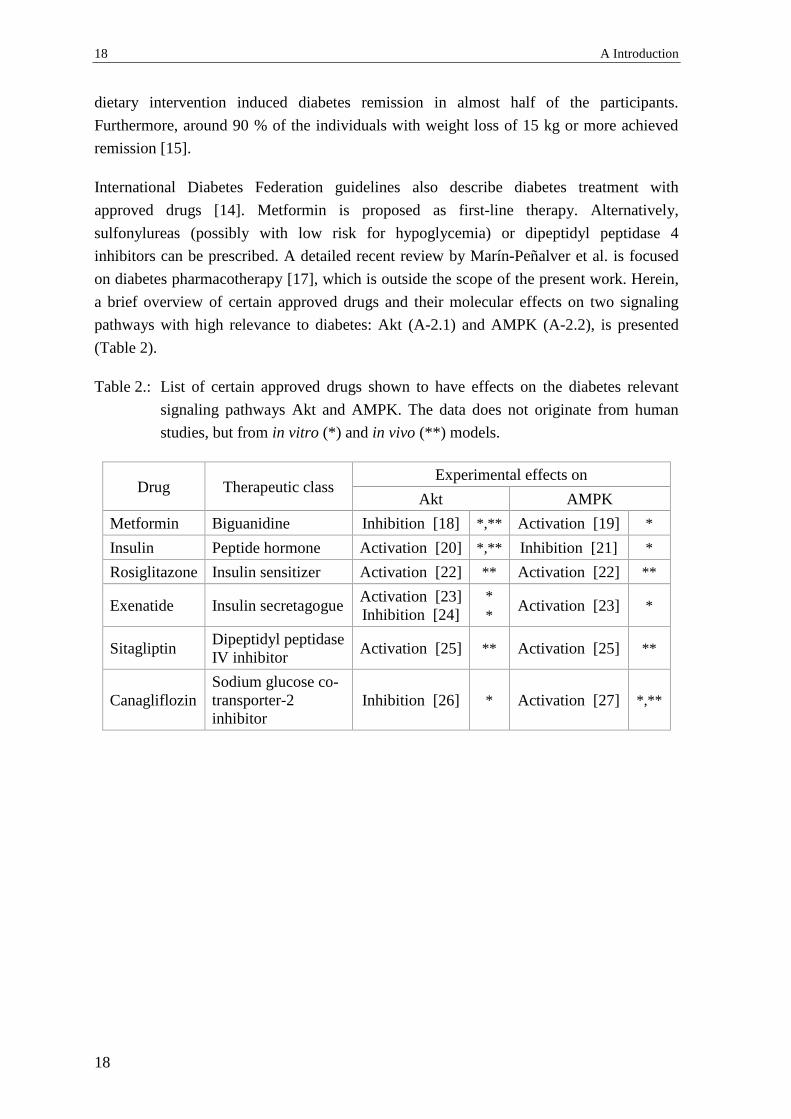
Table 2.: List of certain approved drugs shown to have effects on the diabetes relevant
signaling pathways Akt and AMPK. The data does not originate from human
studies, but from in vitro (*) and in vivo (**) models.
Drug Therapeutic class Experimental effects on
Akt AMPK
Metformin Biguanidine Inhibition [18] *,** Activation [19] *
Insulin Peptide hormone Activation [20] *,** Inhibition [21] *
Rosiglitazone Insulin sensitizer Activation [22] ** Activation [22] **
Exenatide Insulin secretagogue Activation [23]
Inhibition [24]
*
* Activation [23] *
Sitagliptin Dipeptidyl peptidase
IV inhibitor Activation [25] ** Activation [25] **
Canagliflozin
Sodium glucose co-
transporter-2
inhibitor
Inhibition [26] * Activation [27] *,**

2 Diabetes and cell signaling 19
19
2 Diabetes and cell signaling
2.1 PI3K/Akt
PI3K/Akt is a key signaling pathway responsible for fundamental cellular processes, such
as protein synthesis, glucose uptake and metabolism, proliferation and cell survival [28].
This pathway mediates the insulin metabolic effects on the cellular level and includes a
cascade of kinases: insulin receptor, insulin receptor substrates, phosphoinositide-3-kinase
(PI3K), phosphoinositide-dependent kinase 1 (PDK1), and protein kinase B (Akt/PKB,
Figure 1).
Figure 1: Simplified scheme of PI3K/Akt signaling pathway. Peptide ligands,
such as insulin or insulin-like growth factor-1 (IGF) can bind and
activate receptor tyrosine kinases (RTK; i.e. insulin receptor). In turn it
further activates a cascade of several enzymes: insulin receptor
substrate-1/2 (IRS-1/2), phosphoinositide-3-kinase (PI3K), phospho-
inositide-dependent kinase 1 (PDK1) and Akt/PKB.
PI3K activation is triggered by receptor tyrosine kinases (RTKs) such as the insulin
receptor or by G-protein coupled receptors, e.g. angiotensin II receptor. In response, PI3K
produces a lipid second messenger PIP3 (phosphatidylinositol-(3,4,5)-trisphosphate) which
activates downstream pathways like Akt or atypical protein kinase C [29] (Figure 2).

20 A Introduction
20
Figure 2: Different stimuli from receptor tyrosine kinase (RTK) or G-protein
coupled receptor (GPCR) can trigger an activation of phosphoinositide-3-
kinase (PI3K). In turn, PI3K phosphorylates phosphatidylinositol (4,5)-
bisphosphate (PIP2) and produces a lipid second messenger
phosphatidylinositol (3,4,5)-trisphosphate (PIP3), which in turn activates
downstream kinases such as PDK1 and Akt/PKB, involved in regulation of
diverse cellular processes.
2.1.1 Protein structure of Akt kinase
Akt is a serine/threonine protein kinase from the AGC kinase family (AMP/GMP-kinases
and PKC), indicating its homology with protein kinases A and C. Akt is composed of three
main conserved domains (Figure 3): an N-terminal pleckstrin homology domain, a central
catalytic domain, and a C-terminal extension.
Figure 3: Schematic illustration of the Akt/PKB protein structure. Main structural
domains are the pleckstrin homology domain (PH) linked to the highly
conserved central catalytic kinase domain (CAT) through the linker
region (LINK), and the C-terminal extension (EXT). The most important
phosphorylation sites – serine (Ser473) and threonine (Thr308) – are
shown as well; numbers indicate amino acid position in the Akt kinase
sequence.
In addition, a short linker region connects the pleckstrin homology domain and the central
catalytic one [30]. Each of these regions has distinct functions. The pleckstrin homology
domain is responsible for binding of Akt to second messengers (phosphatidylinositols) and
2 Diabetes and cell signaling 21
21
for trafficking of the protein to different membrane compartments. Interactions between
the pleckstrin homology domain and phospholipids are charge-charge driven. The central
catalytic domain includes sites important for kinase activity: the ATP-binding site and the
substrate-binding site. A hydrophobic motif belongs to the C-terminal extension and has
regulatory functions for kinase activity.
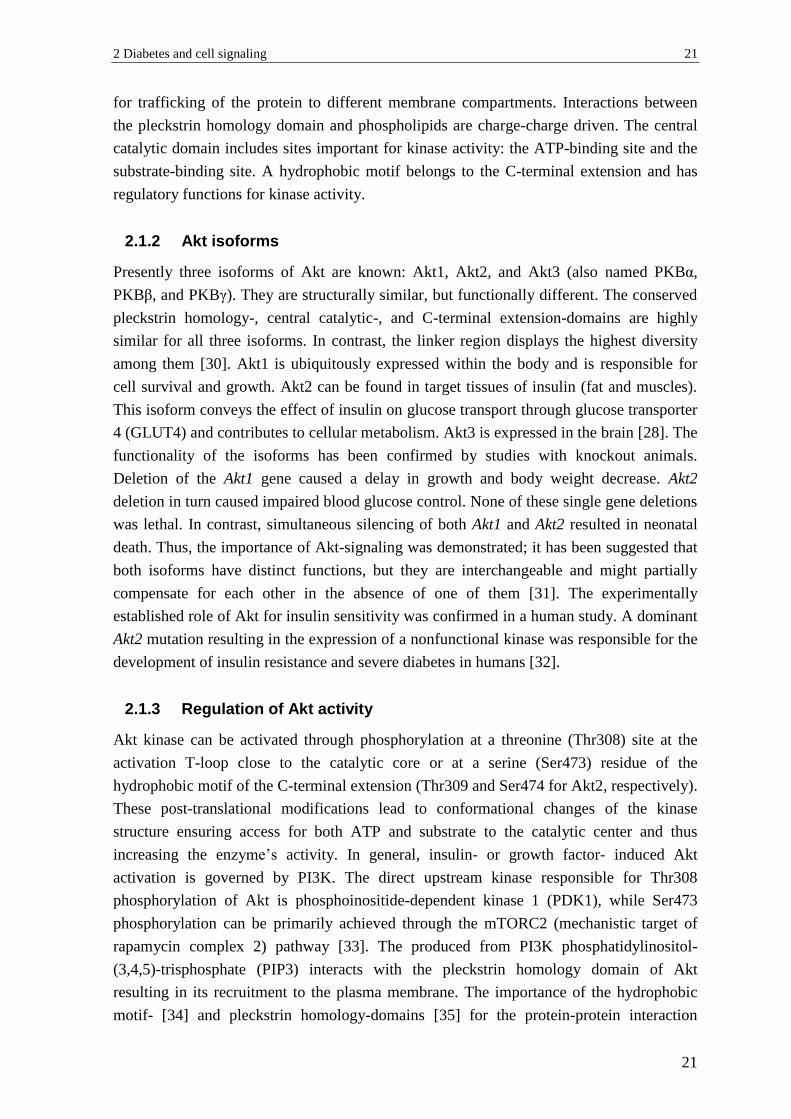
2.1.2 Akt isoforms
Presently three isoforms of Akt are known: Akt1, Akt2, and Akt3 (also named PKBα,
PKBβ, and PKBγ). They are structurally similar, but functionally different. The conserved
pleckstrin homology-, central catalytic-, and C-terminal extension-domains are highly
similar for all three isoforms. In contrast, the linker region displays the highest diversity
among them [30]. Akt1 is ubiquitously expressed within the body and is responsible for
cell survival and growth. Akt2 can be found in target tissues of insulin (fat and muscles).
This isoform conveys the effect of insulin on glucose transport through glucose transporter
4 (GLUT4) and contributes to cellular metabolism. Akt3 is expressed in the brain [28]. The
functionality of the isoforms has been confirmed by studies with knockout animals.
Deletion of the Akt1 gene caused a delay in growth and body weight decrease. Akt2
deletion in turn caused impaired blood glucose control. None of these single gene deletions
was lethal. In contrast, simultaneous silencing of both Akt1 and Akt2 resulted in neonatal
death. Thus, the importance of Akt-signaling was demonstrated; it has been suggested that
both isoforms have distinct functions, but they are interchangeable and might partially
compensate for each other in the absence of one of them [31]. The experimentally
established role of Akt for insulin sensitivity was confirmed in a human study. A dominant
Akt2 mutation resulting in the expression of a nonfunctional kinase was responsible for the
development of insulin resistance and severe diabetes in humans [32].
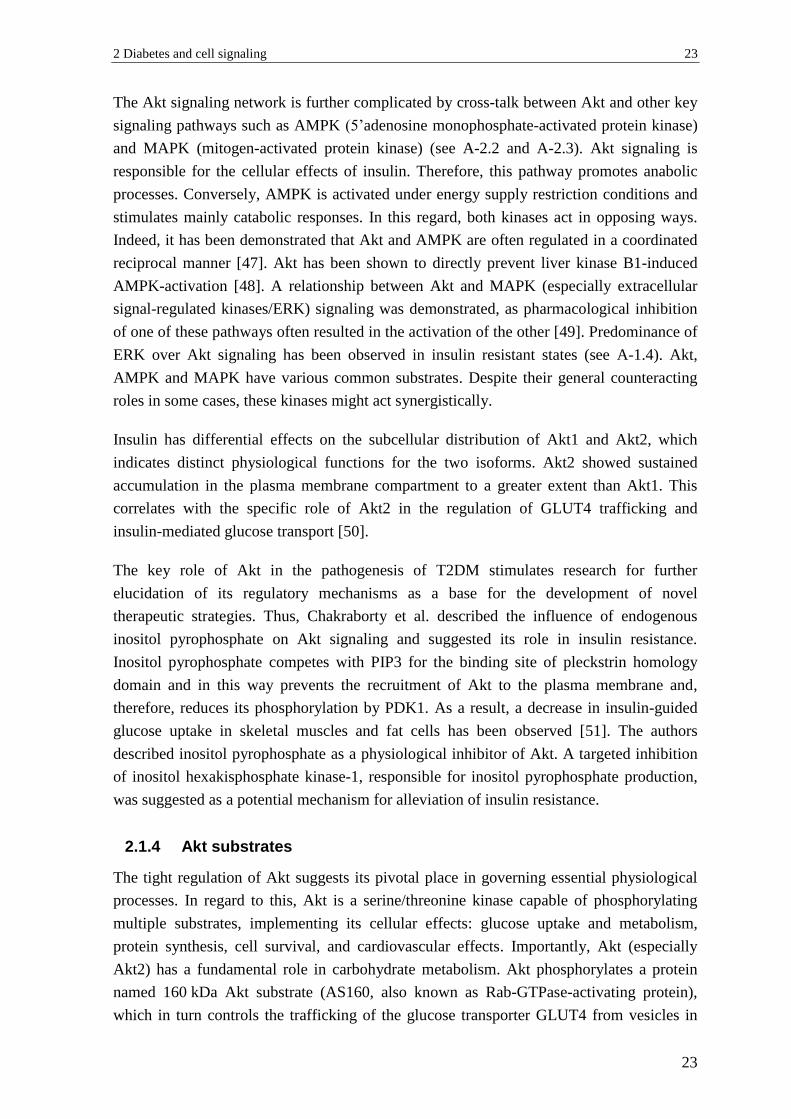
2.1.3 Regulation of Akt activity
Akt kinase can be activated through phosphorylation at a threonine (Thr308) site at the
activation T-loop close to the catalytic core or at a serine (Ser473) residue of the
hydrophobic motif of the C-terminal extension (Thr309 and Ser474 for Akt2, respectively).
These post-translational modifications lead to conformational changes of the kinase
structure ensuring access for both ATP and substrate to the catalytic center and thus
increasing the enzyme’s activity. In general, insulin- or growth factor- induced Akt
activation is governed by PI3K. The direct upstream kinase responsible for Thr308
phosphorylation of Akt is phosphoinositide-dependent kinase 1 (PDK1), while Ser473
phosphorylation can be primarily achieved through the mTORC2 (mechanistic target of
rapamycin complex 2) pathway [33]. The produced from PI3K phosphatidylinositol-
(3,4,5)-trisphosphate (PIP3) interacts with the pleckstrin homology domain of Akt
resulting in its recruitment to the plasma membrane. The importance of the hydrophobic
motif- [34] and pleckstrin homology-domains [35] for the protein-protein interaction

22 A Introduction
22
between Akt and its upstream PDK1 needed for the Thr308 phosphorylation has been
demonstrated. Several studies show that the kinase responsible for Ser473 phosphorylation
– mTORC2 – can be activated in both a PI3K-dependent [36] and independent manner
[37].
Alternatively, Akt can be phosphorylated in a PDK1-independent manner by integrin-
linked kinase-1, Ca2+/calmodulin-dependent kinase kinase or protein kinase A [34]. Non-
canonical activation of Akt can be achieved through phosphorylation by different non-
receptor tyrosine kinases such as activated CDC42 kinase 1 [38] and protein tyrosine
kinase 6 [39]. A novel activation mechanism involving phosphorylation at Ser477 and
Thr479 at the extreme C-terminus of Akt by cyclin-dependent kinase 2 under special
conditions has been recently discovered [40]. In addition, various potential
phosphorylation positions were characterized by phosphorylation site mapping [41].
Further post-translational modifications shown to regulate Akt activity are acetylation,
glycosylation in the catalytic center, and ubiquitilation [28].
In order to adjust the duration and strength of insulin-triggered signals, negative regulators
of PI3K/Akt exist. They can be classified in two main groups: lipid phosphatases and
protein phosphatases. The first group includes phosphatase and tensin homolog (PTEN)
which directs the second messenger PIP3 and dephosphorylates it, thus preventing
recruitment of Akt to membranes and its activation [42]. Protein phosphatases such as
protein phosphatase 2A directly dephosphorylate the Akt protein [43]. These enzymes
antagonize PI3K/Akt signaling. Therefore, decreased expression or activity of these
phosphatases is associated with over-activation of this pro-survival pathway and
malignancies [42].
In addition to upstream kinases and phosphatases, Akt activity is regulated through
feedback loop mechanisms. Some of the downstream targets of Akt are capable of
negatively regulating Akt phosphorylation through influencing on upstream kinases, thus
dynamically adjusting the signal transduction process. For instance, Akt’s downstream
targets mechanistic target of rapamycin complex 1 (mTORC1) and ribosomal protein S6
kinase beta-1 (S6K1) were shown to deactivate insulin receptor substrate 1 through
phosphorylation, further inducing its degradation [28]. As insulin receptor substrate 1 is
upstream of PI3K and Akt, this decreases their activity. This negative feedback loop can
contribute to insulin resistance [44, 45]. In addition, prolonged inhibition of the PI3K/Akt
pathway led to up-regulated expression of receptor tyrosine kinases and enhanced
susceptibility to insulin and growth factors. This feedback regulation was mediated by
other Akt substrates: forkhead box O family transcription factors (FoxO) [46]. Thus,
sustained activation or inhibition of PI3K/Akt might contribute to a manifestation of the
opposite effect.
2 Diabetes and cell signaling 23
23
The Akt signaling network is further complicated by cross-talk between Akt and other key
signaling pathways such as AMPK (5’adenosine monophosphate-activated protein kinase)
and MAPK (mitogen-activated protein kinase) (see A-2.2 and A-2.3). Akt signaling is
responsible for the cellular effects of insulin. Therefore, this pathway promotes anabolic
processes. Conversely, AMPK is activated under energy supply restriction conditions and
stimulates mainly catabolic responses. In this regard, both kinases act in opposing ways.
Indeed, it has been demonstrated that Akt and AMPK are often regulated in a coordinated
reciprocal manner [47]. Akt has been shown to directly prevent liver kinase B1-induced
AMPK-activation [48]. A relationship between Akt and MAPK (especially extracellular
signal-regulated kinases/ERK) signaling was demonstrated, as pharmacological inhibition
of one of these pathways often resulted in the activation of the other [49]. Predominance of
ERK over Akt signaling has been observed in insulin resistant states (see A-1.4). Akt,
AMPK and MAPK have various common substrates. Despite their general counteracting
roles in some cases, these kinases might act synergistically.
Insulin has differential effects on the subcellular distribution of Akt1 and Akt2, which
indicates distinct physiological functions for the two isoforms. Akt2 showed sustained
accumulation in the plasma membrane compartment to a greater extent than Akt1. This
correlates with the specific role of Akt2 in the regulation of GLUT4 trafficking and
insulin-mediated glucose transport [50].
The key role of Akt in the pathogenesis of T2DM stimulates research for further
elucidation of its regulatory mechanisms as a base for the development of novel
therapeutic strategies. Thus, Chakraborty et al. described the influence of endogenous
inositol pyrophosphate on Akt signaling and suggested its role in insulin resistance.
Inositol pyrophosphate competes with PIP3 for the binding site of pleckstrin homology
domain and in this way prevents the recruitment of Akt to the plasma membrane and,
therefore, reduces its phosphorylation by PDK1. As a result, a decrease in insulin-guided
glucose uptake in skeletal muscles and fat cells has been observed [51]. The authors
described inositol pyrophosphate as a physiological inhibitor of Akt. A targeted inhibition
of inositol hexakisphosphate kinase-1, responsible for inositol pyrophosphate production,
was suggested as a potential mechanism for alleviation of insulin resistance.
2.1.4 Akt substrates
The tight regulation of Akt suggests its pivotal place in governing essential physiological
processes. In regard to this, Akt is a serine/threonine kinase capable of phosphorylating
multiple substrates, implementing its cellular effects: glucose uptake and metabolism,
protein synthesis, cell survival, and cardiovascular effects. Importantly, Akt (especially
Akt2) has a fundamental role in carbohydrate metabolism. Akt phosphorylates a protein
named 160 kDa Akt substrate (AS160, also known as Rab-GTPase-activating protein),
which in turn controls the trafficking of the glucose transporter GLUT4 from vesicles in

24 A Introduction
24
the cytosol to the cell surface. Thus, in response to insulin stimulation, Akt intensifies the
glucose uptake into cells [52]. Another main function of Akt is a regulation of glycogen
synthase kinase-3β (GSK-3β) activity through a phosphorylation event having an
inactivating effect. GSK-3β phosphorylates and, thus, inhibits the enzyme activity of
glycogen synthase [53]. Therefore, activation of Akt leads to increased glycogen synthesis,
mediating insulin-stimulated storage of excess glucose. This determines the relevance of
GSK-3β in T2DM. Indeed, pharmacological inhibition of this kinase alleviated insulin
resistance and reduced glucose levels in an in vivo diabetic model [54]. In addition to
glycogen synthesis, GSK-3β is involved in regulation of multiple signaling pathways (e.g.
Wnt) and gene expression [53]. A graphic overview of the Akt signaling network is shown
on the Figure 4.
Figure 4: Akt signaling network – an overview. The activated receptor tyrosine
kinase (RTK) activates insulin receptor substrate (IRS) and
phosphoinositide 3-kinase (PI3K) promoting a second messenger
production – phosphatidylinositol (3,4,5)-trisphosphate (PIP3). Sub-
sequently activated phosphoinositide-dependent kinase 1 (PDK1)
phosphorylates Akt at a threonine 308 residue (T308). mTORC2 is
responsible for a serine 473 site phosphorylation (S473). In turn, Akt
phosphorylates following substrates: 160 kDa Akt substrate (AS160)
regulating glucose transporter 4 (GLUT4), glycogen synthase kinase 3
(GSK3), endothelial nitric oxide synthase (eNOS), forkhead box O family
transcription factors (FOXO), tuberous sclerosis complex 2/ mechanistic
target of rapamycin complex 1/ ribosomal protein S6 kinase beta-1
pathway (TSC-2/mTORC1/S6K1). Feedback control mechanisms: the
downstream target of Akt S6K1 inhibits upstream IRS; Prolonged
inhibition of FOXO leads to up-regulation of RTK expression.
2 Diabetes and cell signaling 25
25
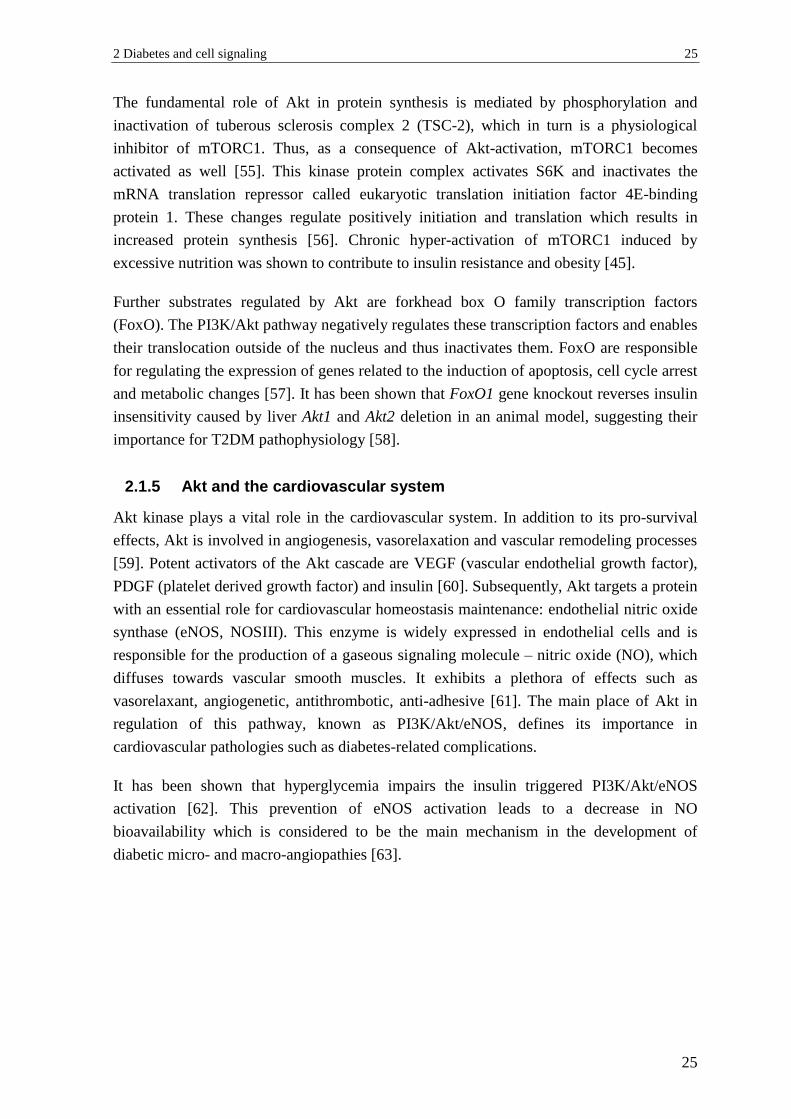
The fundamental role of Akt in protein synthesis is mediated by phosphorylation and
inactivation of tuberous sclerosis complex 2 (TSC-2), which in turn is a physiological
inhibitor of mTORC1. Thus, as a consequence of Akt-activation, mTORC1 becomes
activated as well [55]. This kinase protein complex activates S6K and inactivates the
mRNA translation repressor called eukaryotic translation initiation factor 4E-binding
protein 1. These changes regulate positively initiation and translation which results in
increased protein synthesis [56]. Chronic hyper-activation of mTORC1 induced by
excessive nutrition was shown to contribute to insulin resistance and obesity [45].
Further substrates regulated by Akt are forkhead box O family transcription factors
(FoxO). The PI3K/Akt pathway negatively regulates these transcription factors and enables
their translocation outside of the nucleus and thus inactivates them. FoxO are responsible
for regulating the expression of genes related to the induction of apoptosis, cell cycle arrest
and metabolic changes [57]. It has been shown that FoxO1 gene knockout reverses insulin
insensitivity caused by liver Akt1 and Akt2 deletion in an animal model, suggesting their
importance for T2DM pathophysiology [58].
2.1.5 Akt and the cardiovascular system
Akt kinase plays a vital role in the cardiovascular system. In addition to its pro-survival
effects, Akt is involved in angiogenesis, vasorelaxation and vascular remodeling processes
[59]. Potent activators of the Akt cascade are VEGF (vascular endothelial growth factor),
PDGF (platelet derived growth factor) and insulin [60]. Subsequently, Akt targets a protein
with an essential role for cardiovascular homeostasis maintenance: endothelial nitric oxide
synthase (eNOS, NOSIII). This enzyme is widely expressed in endothelial cells and is
responsible for the production of a gaseous signaling molecule – nitric oxide (NO), which
diffuses towards vascular smooth muscles. It exhibits a plethora of effects such as
vasorelaxant, angiogenetic, antithrombotic, anti-adhesive [61]. The main place of Akt in
regulation of this pathway, known as PI3K/Akt/eNOS, defines its importance in
cardiovascular pathologies such as diabetes-related complications.
It has been shown that hyperglycemia impairs the insulin triggered PI3K/Akt/eNOS
activation [62]. This prevention of eNOS activation leads to a decrease in NO
bioavailability which is considered to be the main mechanism in the development of
diabetic micro- and macro-angiopathies [63].
26 A Introduction
26
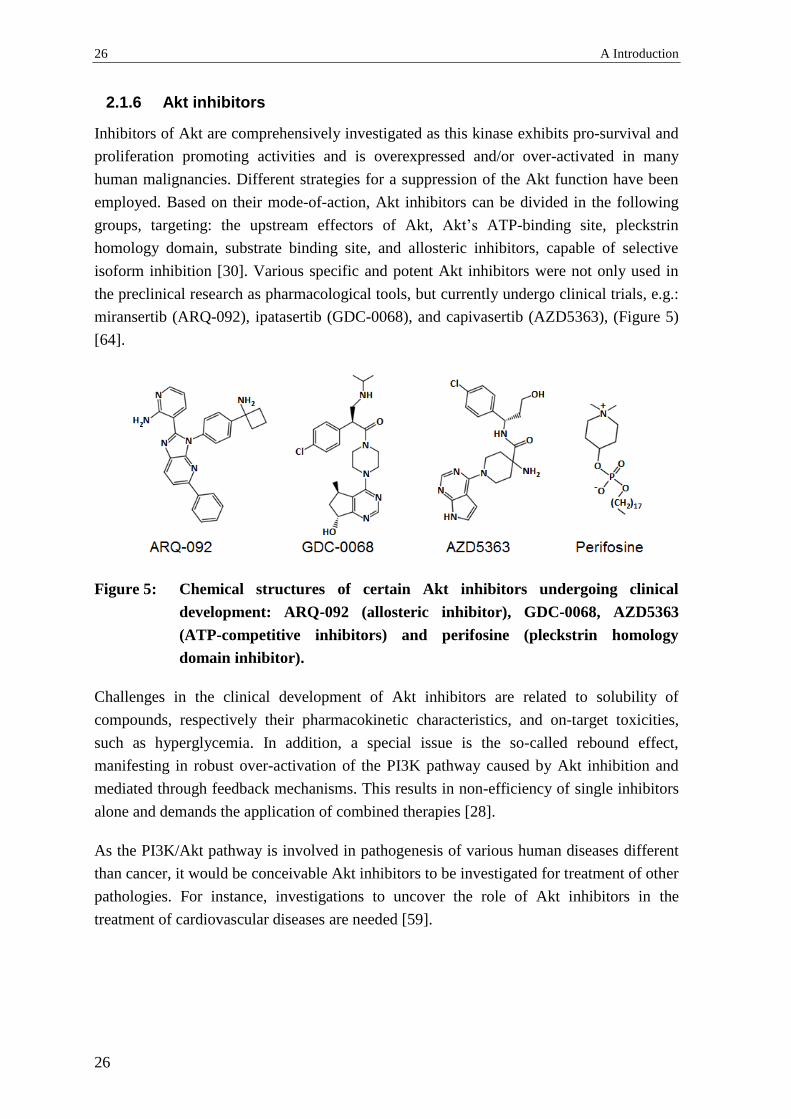
2.1.6 Akt inhibitors
Inhibitors of Akt are comprehensively investigated as this kinase exhibits pro-survival and
proliferation promoting activities and is overexpressed and/or over-activated in many
human malignancies. Different strategies for a suppression of the Akt function have been
employed. Based on their mode-of-action, Akt inhibitors can be divided in the following
groups, targeting: the upstream effectors of Akt, Akt’s ATP-binding site, pleckstrin
homology domain, substrate binding site, and allosteric inhibitors, capable of selective
isoform inhibition [30]. Various specific and potent Akt inhibitors were not only used in
the preclinical research as pharmacological tools, but currently undergo clinical trials, e.g.:
miransertib (ARQ-092), ipatasertib (GDC-0068), and capivasertib (AZD5363), (Figure 5)
[64].
Figure 5: Chemical structures of certain Akt inhibitors undergoing clinical
development: ARQ-092 (allosteric inhibitor), GDC-0068, AZD5363
(ATP-competitive inhibitors) and perifosine (pleckstrin homology
domain inhibitor).
Challenges in the clinical development of Akt inhibitors are related to solubility of
compounds, respectively their pharmacokinetic characteristics, and on-target toxicities,
such as hyperglycemia. In addition, a special issue is the so-called rebound effect,
manifesting in robust over-activation of the PI3K pathway caused by Akt inhibition and
mediated through feedback mechanisms. This results in non-efficiency of single inhibitors
alone and demands the application of combined therapies [28].
As the PI3K/Akt pathway is involved in pathogenesis of various human diseases different
than cancer, it would be conceivable Akt inhibitors to be investigated for treatment of other
pathologies. For instance, investigations to uncover the role of Akt inhibitors in the
treatment of cardiovascular diseases are needed [59].
2 Diabetes and cell signaling 27
27
2.2 AMPK
AMPK (5’adenosine monophosphate-activated protein kinase) is known to be the cellular
metabolic master switch which determines its pivotal role in T2DM. AMPK regulates
glucose and fatty acids uptake, mitochondrial β-oxidation, and glycogen synthesis. Recent
studies revealed that AMPK-signaling is dysregulated in T2DM [65, 66], and it has been
proposed that its stimulation can be advantageous in diabetes and its related co-morbidities
like obesity and metabolic syndrome because of an improvement of glucose homeostasis
and insulin sensitivity.
2.2.1 AMPK – protein structure and regulation
This kinase is a conserved and ubiquitously expressed heterotrimer composed of one
catalytic (α) and two regulatory (β and γ) subunits. Binding of AMP to γ causes
conformational changes of the protein complex resulting in activation of AMPK through
phosphorylation of Thr172 of the α catalytic subunit by the upstream liver kinase B1.
Conversely, binding of ATP to γ leads to a decrease in AMPK activity. Furthermore, ADP-
binding to γ leads to protected and sustained phosphorylation [67]. Apart from liver kinase
B1, further upstream regulators able to activate AMPK are transforming growth factor-β
activated protein kinase-1 and Ca2+/calmodulin-dependent protein kinase kinase β [66]. As
a response of increased calcium intracellular levels, the latter kinase can phosphorylate
AMPK which is a mechanism independent from AMP/ATP- and ADP/ATP-ratios [68].
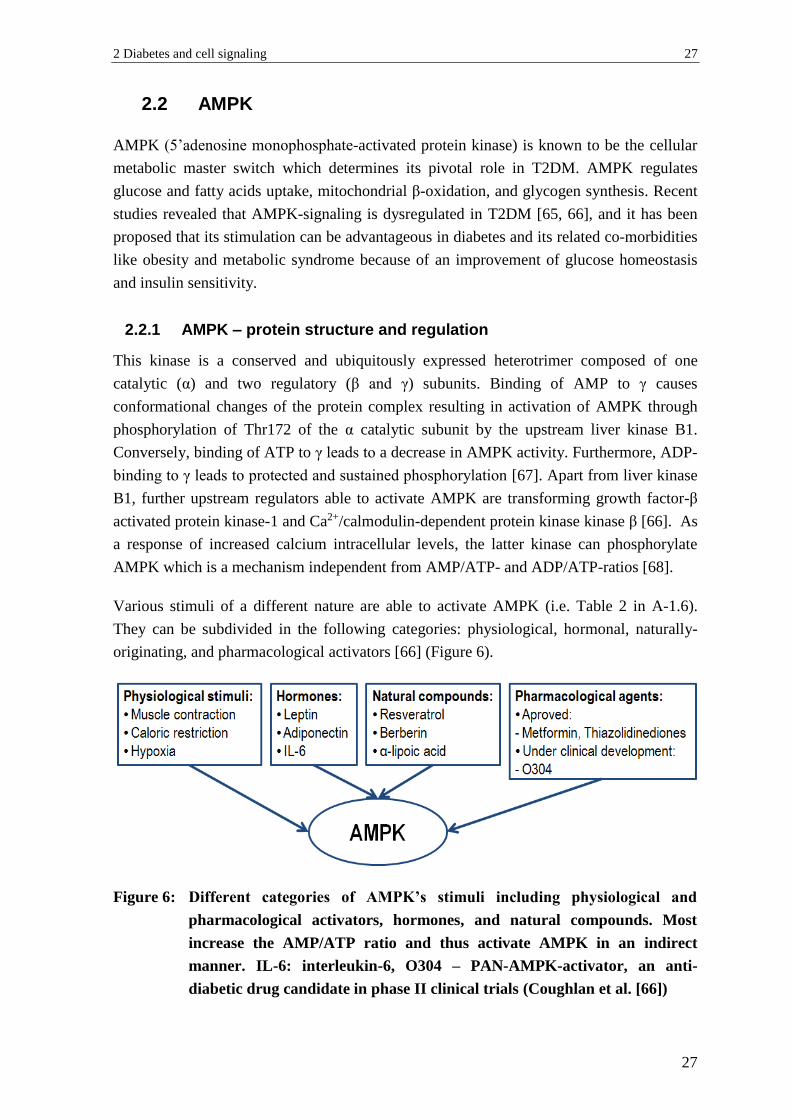
Various stimuli of a different nature are able to activate AMPK (i.e. Table 2 in A-1.6).
They can be subdivided in the following categories: physiological, hormonal, naturally-
originating, and pharmacological activators [66] (Figure 6).
Figure 6: Different categories of AMPK’s stimuli including physiological and
pharmacological activators, hormones, and natural compounds. Most
increase the AMP/ATP ratio and thus activate AMPK in an indirect
manner. IL-6: interleukin-6, O304 – PAN-AMPK-activator, an anti-
diabetic drug candidate in phase II clinical trials (Coughlan et al. [66])

28 A Introduction
28
Physiological ones are muscle contractions, hypoxia, and caloric restriction. They
represent a rationale for physical exercise and strict diet in T2DM management. It has been
demonstrated that AMPK reacts to the available cellular nutrients’ levels, including
glucose. In line with this, low glucose levels (3 mM or 54 mg/dL) activate AMPK through
Thr172 phosphorylation, whereas high glucose levels (25 mM or 451 mg/dL) contribute to
reduced AMPK phosphorylation and activity [69]. In addition, shear stress was also shown
to activate AMPK in endothelial cells [70].
Hormones which can regulate AMPK are leptin, interleukin-6, and adiponectin [66].
Further details about the functions of the latter can be found under B-1.5.1. Certain natural
compounds as the polyphenol resveratrol [71], and the alkaloid berberine [72] activate
AMPK in an indirect manner by inhibiting mitochondrial ATP production, thus increasing
the AMP/ATP ratio. In addition, α-lipoic acid used as a supplement or as a drug for the
treatment of diabetes neuropathy in certain countries was also shown to activate AMPK
[73]. Furthermore, many other approved anti-diabetic drugs exhibit additional beneficial
effects through the same mechanism. For instance, it was conjectured that metformin
activates AMPK indirectly through inhibition of the mitochondrial respiratory complex 1,
similarly to berberine and resveratrol [19]. Metformin’s main glucose lowering mechanism
- inhibition of hepatic glucose production - is not likely to be AMPK-mediated, but it has
been suggested that the kinase activation might contribute to increased insulin sensitivity
[66].
2.2.2 AMPK – cellular functions and substrates
Along with the important functions of AMPK in organs, such as the liver and skeletal
muscles, this kinase appears to have a key role in adipose tissue and in promoting
processes that can be targeted by potential therapies of T2DM: AMPK increases browning
of white adipose tissue, improves glucose uptake, and mitochondrial function of
thermogenic brown adipose tissue resulting in elevated energy expenditure [74].
AMPK plays an important protective role for the cardiovascular system. It has been shown
that activation of this kinase in endothelial and vascular smooth muscle cells contributes to
vasodilation and reduces blood pressure [75]. AMPK is extensively investigated as a target
for reduction of diabetes-related cardiovascular co-morbidities. A possible protective role
can be explained with AMPK-mediated eNOS activation and release of NO [70].
Phosphorylation of downstream substrates is responsible for the catabolic effects of AMPK
(Figure 7).
2 Diabetes and cell signaling 29
29
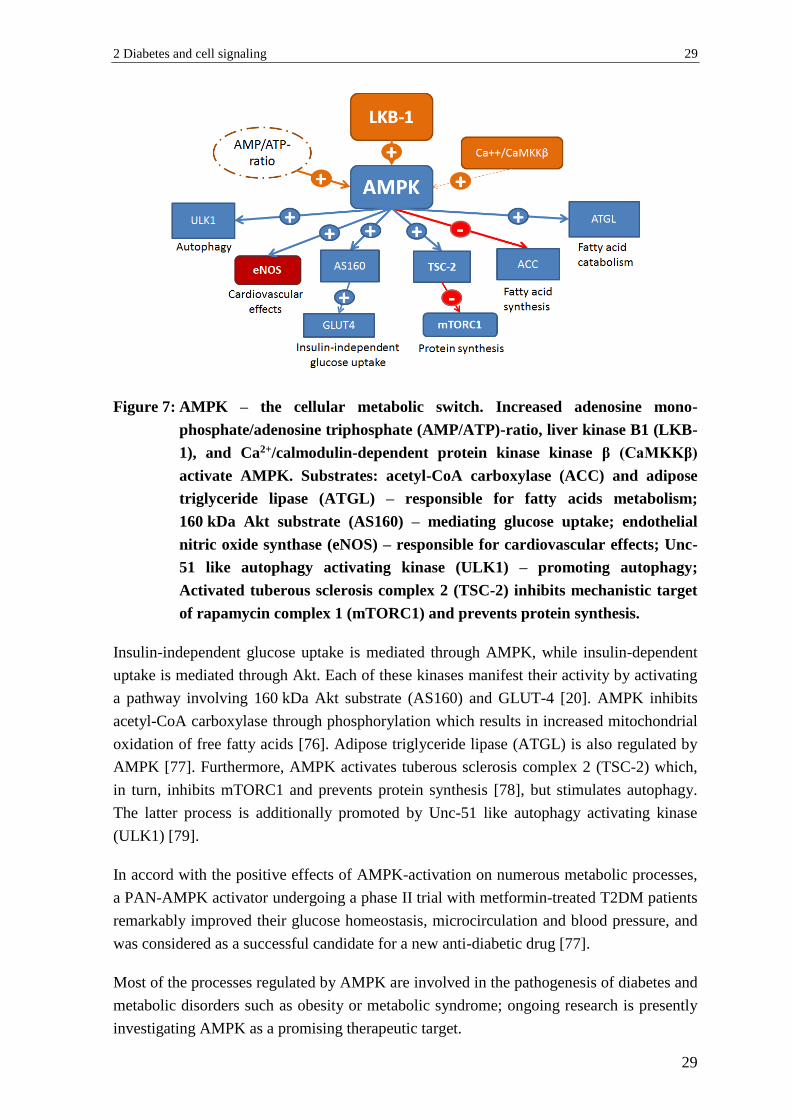
Figure 7: AMPK – the cellular metabolic switch. Increased adenosine mono-
phosphate/adenosine triphosphate (AMP/ATP)-ratio, liver kinase B1 (LKB-
1), and Ca2+/calmodulin-dependent protein kinase kinase β (CaMKKβ)
activate AMPK. Substrates: acetyl-CoA carboxylase (ACC) and adipose
triglyceride lipase (ATGL) – responsible for fatty acids metabolism;
160 kDa Akt substrate (AS160) – mediating glucose uptake; endothelial
nitric oxide synthase (eNOS) – responsible for cardiovascular effects; Unc-
51 like autophagy activating kinase (ULK1) – promoting autophagy;
Activated tuberous sclerosis complex 2 (TSC-2) inhibits mechanistic target
of rapamycin complex 1 (mTORC1) and prevents protein synthesis.
Insulin-independent glucose uptake is mediated through AMPK, while insulin-dependent
uptake is mediated through Akt. Each of these kinases manifest their activity by activating
a pathway involving 160 kDa Akt substrate (AS160) and GLUT-4 [20]. AMPK inhibits
acetyl-CoA carboxylase through phosphorylation which results in increased mitochondrial
oxidation of free fatty acids [76]. Adipose triglyceride lipase (ATGL) is also regulated by
AMPK [77]. Furthermore, AMPK activates tuberous sclerosis complex 2 (TSC-2) which,
in turn, inhibits mTORC1 and prevents protein synthesis [78], but stimulates autophagy.
The latter process is additionally promoted by Unc-51 like autophagy activating kinase
(ULK1) [79].
In accord with the positive effects of AMPK-activation on numerous metabolic processes,
a PAN-AMPK activator undergoing a phase II trial with metformin-treated T2DM patients
remarkably improved their glucose homeostasis, microcirculation and blood pressure, and
was considered as a successful candidate for a new anti-diabetic drug [77].
Most of the processes regulated by AMPK are involved in the pathogenesis of diabetes and
metabolic disorders such as obesity or metabolic syndrome; ongoing research is presently
investigating AMPK as a promising therapeutic target.
30 A Introduction
30
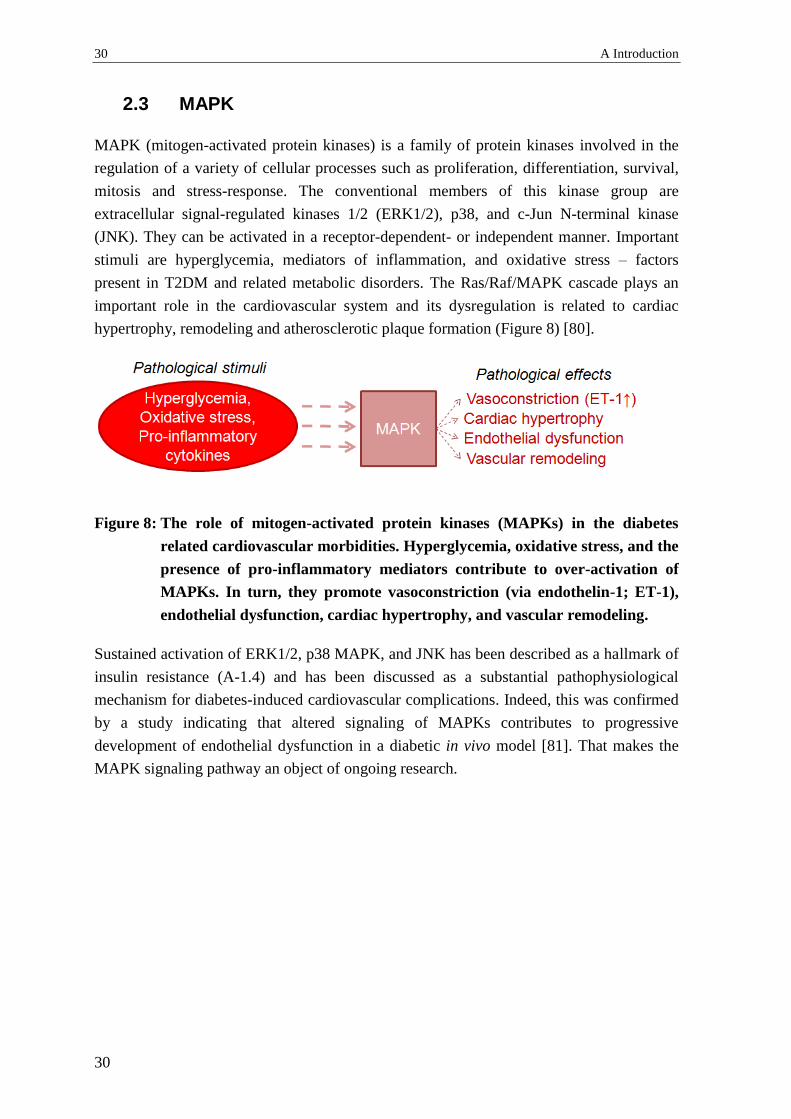
2.3 MAPK
MAPK (mitogen-activated protein kinases) is a family of protein kinases involved in the
regulation of a variety of cellular processes such as proliferation, differentiation, survival,
mitosis and stress-response. The conventional members of this kinase group are
extracellular signal-regulated kinases 1/2 (ERK1/2), p38, and c-Jun N-terminal kinase
(JNK). They can be activated in a receptor-dependent- or independent manner. Important
stimuli are hyperglycemia, mediators of inflammation, and oxidative stress – factors
present in T2DM and related metabolic disorders. The Ras/Raf/MAPK cascade plays an
important role in the cardiovascular system and its dysregulation is related to cardiac
hypertrophy, remodeling and atherosclerotic plaque formation (Figure 8) [80].
Figure 8: The role of mitogen-activated protein kinases (MAPKs) in the diabetes
related cardiovascular morbidities. Hyperglycemia, oxidative stress, and the
presence of pro-inflammatory mediators contribute to over-activation of
MAPKs. In turn, they promote vasoconstriction (via endothelin-1; ET-1),
endothelial dysfunction, cardiac hypertrophy, and vascular remodeling.
Sustained activation of ERK1/2, p38 MAPK, and JNK has been described as a hallmark of
insulin resistance (A-1.4) and has been discussed as a substantial pathophysiological
mechanism for diabetes-induced cardiovascular complications. Indeed, this was confirmed
by a study indicating that altered signaling of MAPKs contributes to progressive
development of endothelial dysfunction in a diabetic in vivo model [81]. That makes the
MAPK signaling pathway an object of ongoing research.
3 Polyphenolic compounds 31
31
3 Polyphenolic compounds
3.1 Background
Polyphenols are plant secondary metabolites and are prominently present in many human
food sources, such as fruits, vegetables, nuts, spices and beverages [82]. This makes them
important micronutrients in the human diet. In spite of their diversity these phytochemicals
can typically be described as organic compounds with phenolic structural features in their
molecules. More than 8000 structurally unique polyphenols with a plant origin have been
identified so far [83]. In nature they most commonly occur as conjugates with sugar
residues (i.e. D-glucose, L-rhamnose, D-galactose, L-arabinose, D-xylose) called
glycosides.
Over the last 80 years polyphenols have been the subject of scientific interest because of
their beneficial effects for different aspects of the human health [84]. Various
epidemiological studies show the protective role of polyphenols against diseases, such as
diabetes [85], cancer [86], cardiovascular [87], and neurodegenerative morbidities [88].
Ongoing research activities mainly engage in structure identification and quantitative
analysis, pharmacokinetic characteristics and biological activities of polyphenols. Their
spread use as food supplements demands strict guidelines and regulations for the quality
and safety of these products [83]. Thus, interventional clinical studies with polyphenols are
needed to verify their beneficial effects for humans, define optimal dosage regimens, and
identify potential adverse effects.
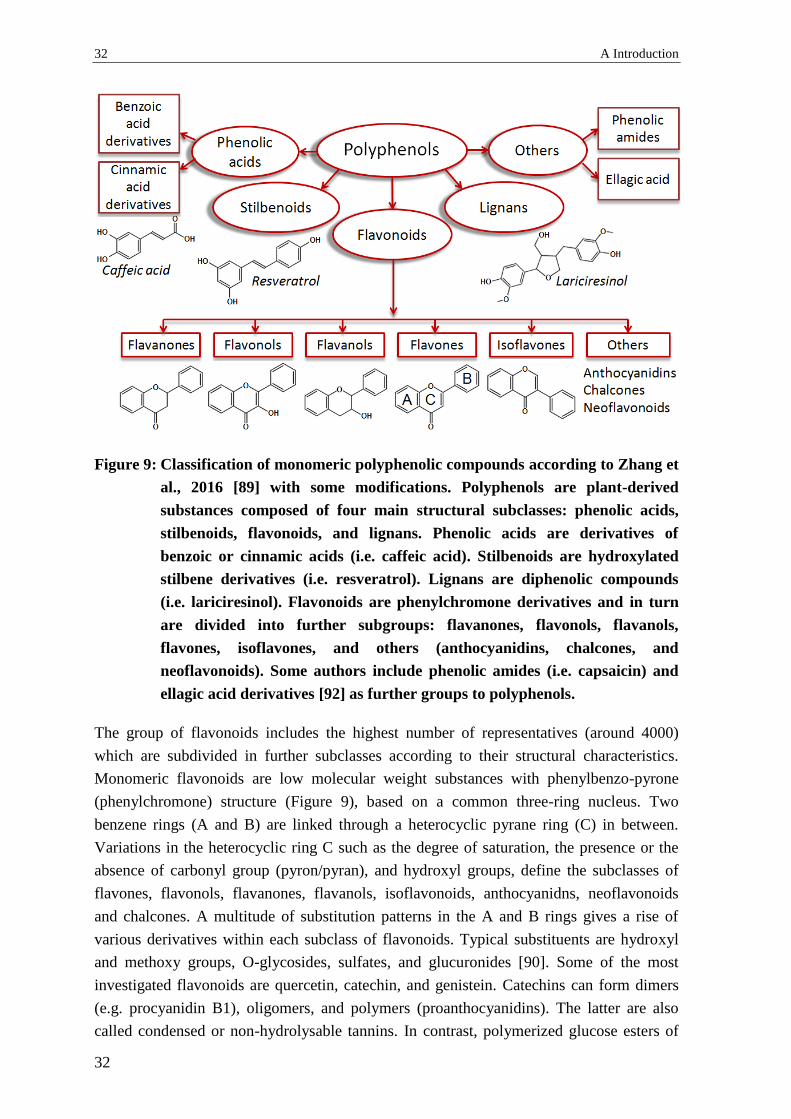
3.2 Classification
The large number of already identified polyphenols and their structural diversity impose
the use of a well-organized and descriptive classification. This is based on the number of
phenol rings and the structural linkage between them. According to their scaffolds,
polyphenols can be divided into the main subclasses of flavonoids, stilbenoids, lignans,
and phenolic acids (Figure 9) [89-91]. An additional group including polyphenolic amides
has also been suggested [92].
32 A Introduction
32
Figure 9: Classification of monomeric polyphenolic compounds according to Zhang et
al., 2016 [89] with some modifications. Polyphenols are plant-derived
substances composed of four main structural subclasses: phenolic acids,
stilbenoids, flavonoids, and lignans. Phenolic acids are derivatives of
benzoic or cinnamic acids (i.e. caffeic acid). Stilbenoids are hydroxylated
stilbene derivatives (i.e. resveratrol). Lignans are diphenolic compounds
(i.e. lariciresinol). Flavonoids are phenylchromone derivatives and in turn
are divided into further subgroups: flavanones, flavonols, flavanols,
flavones, isoflavones, and others (anthocyanidins, chalcones, and
neoflavonoids). Some authors include phenolic amides (i.e. capsaicin) and
ellagic acid derivatives [92] as further groups to polyphenols.
The group of flavonoids includes the highest number of representatives (around 4000)
which are subdivided in further subclasses according to their structural characteristics.
Monomeric flavonoids are low molecular weight substances with phenylbenzo-pyrone
(phenylchromone) structure (Figure 9), based on a common three-ring nucleus. Two
benzene rings (A and B) are linked through a heterocyclic pyrane ring (C) in between.
Variations in the heterocyclic ring C such as the degree of saturation, the presence or the
absence of carbonyl group (pyron/pyran), and hydroxyl groups, define the subclasses of
flavones, flavonols, flavanones, flavanols, isoflavonoids, anthocyanidns, neoflavonoids
and chalcones. A multitude of substitution patterns in the A and B rings gives a rise of
various derivatives within each subclass of flavonoids. Typical substituents are hydroxyl
and methoxy groups, O-glycosides, sulfates, and glucuronides [90]. Some of the most
investigated flavonoids are quercetin, catechin, and genistein. Catechins can form dimers
(e.g. procyanidin B1), oligomers, and polymers (proanthocyanidins). The latter are also
called condensed or non-hydrolysable tannins. In contrast, polymerized glucose esters of

3 Polyphenolic compounds 33
33
ellagic and gallic acids are known as hydrolysable tannins (ellagitannins and gallotannins)
and are used as astringents [92].
Stilbenoids are hydroxylated derivatives of stilbene. Their scaffolds contain two phenyl
rings connected by a two-carbon methylene linker. In contrast to flavonoids they are not
that widely-spread and are often synthesized by plants in a response to abiotic stress. They
can be found in grapes, red wine, peanuts and berries. Although a structural variety exists
(i.e. oligostilbenoids), an object of scientific interest are mostly monomeric compounds,
such as resveratrol and combretastatin A-4, because of their biological activities [93].
Lignans can be described as diphenolic compounds which are cinnamic acid derivatives.
This group is characterized by a high structural diversity. Main dietary sources of lignans
are flax and sesame seeds. After ingestion these polyphenols undergo extensive and rapid
metabolism by intestinal microbiota resulting in compounds called enterolignans. Lignans
act as phytoestrogens and possess some advantageous protective effects on cardiovascular
system [94]. Typical representatives from this group are enterolactone, pinoresinol, and
lariciresinol.
Phenolic acids are aromatic compounds having carboxyl functional group which are
structurally relatively simple and can be divided into two subgroups: derivatives of benzoic
acid and derivatives of cinnamic acid [90]. They are presented in many foods with plant
origin, such as berries, grapes, nuts, black tee, and wheat. Extensively investigated
representatives from this group are i.e. gallic, ferulic, and caffeic acid [91].
3.3 Beneficial effects
Epidemiological studies coupled and preclinical in vitro and in vivo investigations suggest
that polyphenols exhibit plenty of health-promoting qualities. Their protective effects are
considered pleiotropic, which means that they are not due to a single mechanism, but
influence multiple signaling pathways and a variety of molecular targets. The most studied
biological activities of polyphenols are related, but not limited to the following effects:
anti-oxidant, cardio-protective, vasorelaxant, anti-thrombotic, anti-diabetic, anti-
inflammatory, anti-proliferative, and neuroprotective. These activities are often not
independent from each other, but might have overlapping underlying mechanisms. The
mentioned effects in conjunction with low toxicity explain the polyphenols’ role in
prophylaxis and management of several diseases. The bioactivity of polyphenols in
humans is determined by their pharmacokinetics. It is likely that metabolized forms of
compounds available at the site of action are responsible for the observed effects rather
than their chemically unchanged forms. This fact has often been disregarded.

34 A Introduction
34
3.3.1 Polyphenols and diabetes
Traditionally many medicinal plants were used for diabetes treatment. Polyphenols might
be responsible, at least in part, for impacting different disease endpoints, such as glucose-
lowering, insulin sensitizing, insulin secretion promoting, and inhibition of advanced
glycation end products (AGE) formation. Polyphenolic compounds’ protective effects on
the β-cells have also been demonstrated [85]. Polyphenols exert benefits regarding late
diabetes complications and therefore are comprehensively investigated as prophylactic
tools and adjuvants for T2DM management (Figure 10).
Figure10: Multiple aspects of antidiabetic properties of polyphenols (according to
Xiao and Högger, 2014 [85] with some modifications).
Several epidemiological and interventional studies indicate that polyphenol-rich diet or
intake of individual polyphenols can help preventing diabetes occurrence and to reduce its
morbidity and mortality [95-97], although not all studies support this statement [98]. In
addition, high polyphenol consumption influences obesity which is related to metabolic
disorders and is a leading risk factor for insulin resistance and T2DM development,
respectively [99]. Coffee is well-known as a source of dietary phenolics such as caffeic and
chlorogenic acids. A systematic review with meta-analysis of 30 prospective studies
showed that the coffee consumption is related with T2DM prevention and this effect
appeared to be independent of caffeine [100]. As it has been suggested that dietary
prevention of T2DM can be cost-effective approach, functional foods containing
polyphenols may represent such an option [101].
The anti-hyperglycemic effect of polyphenolic compounds has been demonstrated in
human studies. For instance, a randomized, placebo-controlled clinical investigation
revealed that 12 week ingestion of apple polyphenols (600 mg/day) improved
hyperglycemia after glucose challenge in the treated group of borderline subjects, while
3 Polyphenolic compounds 35
35
placebo did not cause any effect [95]. Metformin in combination with a supplement called
Emulin™ containing chlorogenic acid, myricetin, and quercetin showed superior anti-
hyperglycemic effects compared to metformin alone in a placebo-controlled study with
T2DM patients (n= 10 for each group). This suggests that certain polyphenols might be
useful as an adjuvant anti-diabetic therapy [102].
The glucose-lowering effect of polyphenols is multifunctional, depending on the
polyphenols’ structure. Firstly, polyphenols may influence the carbohydrate digestion and
the glucose absorption in the gastro-intestinal tract. Two key enzymes involved have been
reported to be inhibited by polyphenols: α-amylase and α-glucosidase. As carbohydrates in
food are the main source of blood glucose, inhibiting these enzymes is a promising strategy
for blood glucose levels’ regulation [103]. It has been reported that the length and
complexity of polymer chain of tannins is favorable for α-amylase inhibition [85].
In addition, some polyphenolic compounds may improve an existing insulin resistance. A
randomized, placebo-controlled, cross-over study showed that polyphenol-rich
pomegranate juice consumption statistically significantly reduced fasting plasma insulin
and alleviated insulin resistance (HOMA) in individuals with high cardiovascular risk
[104]. A consumption of flavanol-rich chocolate statistically significantly decreased insulin
resistance in impaired glucose tolerance patients, while flavanol-free chocolate had no
effect (n= 19) [105]. However, chronic consumption of epigallocatechin gallate (EGCG,
400 mg/day) did not influence insulin resistance in overweight male subjects [106]. A
basic research study pointed out that quercetin and resveratrol might mitigate insulin
resistance in adipocytes in vitro through various mechanisms, such as attenuation of tumor
necrosis factor-α- (TNF-α)-induced pro-inflammatory interleukins’ gene expression,
inhibition of MAPK-phosphorylation, promotion of peroxisome proliferator-activated
receptor-γ (PPAR-γ) signaling, and prevention of TNF-α-induced insulin receptor substrate
1 serine phosphorylation [107].
Advanced glycation end products (AGEs) play a major role in diabetes complications
development and progression. They originate from non-enzymatic reactions between
plasma proteins and reducing sugars. Thus, increased glucose levels in diabetes promote
increased AGE-formation. After binding to respective receptors (RAGE), these covalent
adducts activate pro-inflammatory processes, induce oxidative stress in endothelial cells
[108], and reduce NO bioavailability [109]. Polyphenols might antagonize the negative
effects of AGE on the cardiovascular system and thus delay late diabetes complications
and disease progression. This protective effect can be achieved at different levels, such as
scavenging of reactive oxygen species during glycation, inhibition of AGE-formation,
blocking of RAGE-binding. Each polyphenolic subclass was reported to influence one or
more of these processes [110].
36 A Introduction
36
3.3.2 Polyphenols and cardiovascular diseases
Cardiovascular diseases (CVD) are among the leading causes of death worldwide [91]. A
strong relationship between the pathogenesis of T2DM and CVD has been established.
Endothelial dysfunction, chronic pro-inflammatory state, insulin resistance, and
hypertension are among the aspects defining cardiometabolic risk [111]. These factors
favor atherosclerotic plaque formation and progression of CVD. A promising research field
is polyphenols’ effects on the cardiovascular system.
Various epidemiological studies showed an inverse association between polyphenol intake
and occurrence of cardiovascular diseases [87, 112-114], including myocardial infarction
[115, 116] and stroke [87, 117]. However, the mechanism of action of these nutraceuticals
is complex and not fully clarified. The advantages of polyphenol-rich diet are
demonstrated by so-called “French Paradox” – a lower incidence of cardiovascular
mortality among the Mediterranean population in association with red wine consumption
in spite of a diet high in saturated fats [118]. The latter is a well-known major risk factor
for coronary disease [119]. In particular, red wine polyphenols as well as individual
polyphenolic compounds found in red wine, such as quercetin, resveratrol, and catechin,
attenuated the progression of atherosclerotic lesions in vivo, playing an important role in
the development of several cardiovascular diseases [120]. Interestingly, quercetin’s
metabolite quercetin-3-O-glucuronide was shown to accumulate specifically in the foam
cells in the injury site of blood vessels [121]. Ongoing clinical research focusses on the
improved assessment of the impact of the polyphenols’ intake on cardiovascular diseases
[122, 123]. A current randomized, double-blinded trial investigates resveratrol’s potential
as an agent in heart failure management [124].
An interventional human randomized control parallel group study involving individuals
with increased cardiovascular risk (n= 78) showed that consumption of polyphenols from
different subclasses can promote cardiometabolic health [125]. The results revealed that
the increase in flavone-intake had the strongest and statistically significant potential to
improve post-challenge glucose response. In addition, postprandial lipid response was
statistically significantly and inversely associated with intake of flavanones. Flavan-3-ols
promoted early insulin secretion [125].
Many human studies attest that both individual polyphenols and polyphenol-rich foods
exhibit mild anti-hypertensive effects [126-129]. A meta-analysis of ten randomized
controlled clinical trials showed that flavanol-rich cocoa food exert slight blood pressure
lowering effects in healthy and pre-hypertensive individuals. The mean change of the
systolic blood pressure in the active treatment arms versus controls was –4.5 mmHg and
for the diastolic one –2.5 mmHg. This reduction was statistically significant [126]. A
double-blind, placebo-controlled cross-over study (n= 93) revealed that six weeks
ingestion of the dietary polyphenol quercetin (150 mg/day) slightly, but statistically
significantly decreased the systolic blood pressure (–2.6 mmHg) in treated individuals with

3 Polyphenolic compounds 37
37
metabolic syndrome traits, when compared to the matched placebo arm [127]. However,
the data for resveratrol’s influence on the blood pressure in humans is controversial. A
meta-analysis considering 17 randomized, controlled trials found that resveratrol had
significant beneficial effects on hypertension only when applied in high doses (≥ 300
mg/day) and in diabetic patients [130].
Various flavonoids have been discussed to be capable of reducing blood pressure:
flavonols, anthocyanidins, proanthocyanidins, flavones, flavanones, isoflavones and
flavan-3-ols [131]. The improvement of flow mediated dilution (FMD, a non-invasive
technique for measurement of endothelial function) caused by polyphenols was frequently
reported [129]. This suggests that the amelioration of endothelial dysfunction by
polyphenols is at least in part responsible for their beneficial effects on cardiovascular
homeostasis, as demonstrated in animal models [132, 133].
Many in vitro and in vivo studies aimed to uncover the molecular mechanisms responsible
for the mild vasorelaxant effect of these phytochemicals. An in vitro study with human
aortic endothelial cells showed that polyphenols can potentiate insulin-triggered eNOS
activation and NO release, causing a vasorelaxant effect [128]. Various studies also
suggested Akt/eNOS pathway (see A-2.1.5) stimulation and NO production by
polyphenols as a possible mechanism responsible for their vascular activity [134, 135].
Polyphenols were discussed to increase NO bioavailability due to their antioxidant effects
[136]. Other possible targets of polyphenols investigated for their vasorelaxant effects
include calcium channels in vascular smooth muscles [137], expression of the potent
vasoconstrictor endothelin-1 [138], and inhibition of the angiotensin converting enzyme
[139].
Polyphenols affect the inflammation involved in vascular diabetic complications and
atherosclerotic lesions formation. It has been shown that polyphenols inhibit enzymes with
key roles in inflammation, such as cyclooxigenase (COX), lipoxygenase (LOX), and
inducible nitric oxide synthase (iNOS) [140, 141]. In addition, some polyphenolic
compounds such as resveratrol reduce inflammatory mediators’ levels of tumor necrosis
factor-α (TNF-α), interleukin-6 (IL-6), and vascular cell adhesion molecule-1 (VCAM-1)
[141]. On the cellular level this can be realized through interaction with pro-inflammatory
pathways (p38 MAPK) and transcription factors [nuclear factor kappa-light-chain-
enhancer of activated B cells (NF-κB), nuclear transcription factor erythroid-2 related
factor-2 (Nrf-2)] [142]. These activities add another aspect to cardiometabolic health
promotion qualities of polyphenols.
Another pronounced activity of some polyphenols related to cardiovascular health is the
antithrombotic one. In a pilot dietary intervention study with healthy individuals (n= 6), a
single ingestion of 150 mg quercetin or 300 mg quercetin-4’-O-β-D-glucoside resulted in
4.66 µM, respectively 9.72 µM, peak plasma concentrations of quercetin after 30 minutes.
38 A Introduction
38
This intervention inhibited the platelet aggregation. The suggested mechanism involved
inhibition of tyrosine phosphorylation within thrombocytes [143]. The use of flavonoids as
templates for design of drugs with anti-thrombotic activity has also been discussed [144].
Further proposed mechanisms involved in anti-platelet effects of polyphenolic compounds
are promotion of NO bioavailability, reactive oxygen species scavenging, cell-membrane
binding, and antagonizing effects of pro-thrombotic mediators [144].
In addition, early research revealed that defined flavonoids ameliorated capillary fragility
and tone – an action known as vitamin P-like effect. This property was used in a scurvy
treatment [145]. Nowadays standardized polyphenolic extracts are available on the market
for management of varicose veins and chronic venous insufficiency [146].
Pathological neovascularisation is a process described to occur in metabolic syndrome and
leading to progression of diabetic nephropathy and retinopathy complications [147, 148]. It
is responsible for unstable and leaky vessels. The usage of anti-angiogenic agents in the
treatment of these complications has been proposed [148]. Polyphenols have been
described to have anti-angiogenic properties and might be investigated in regard with this
issue.
3.4 Safety of polyphenols
The wide use of polyphenols and their increased marketing as supplements raise the
question about their potential harmful effects and safety profiles in general. In addition,
presently no regulatory recommendations and no reference dietary doses for polyphenolic
compounds have been suggested [149]. The consumption of polyphenol-rich fruits and
vegetables is undoubtedly beneficial for the human health. However, intake of chemically
pure substances or extracts should not be always expected to exhibit the same health
effects or to be as harmless as the polyphenol-rich diet. Commonly, herbal dietary
supplements are considered as safe which in some cases can be misleading and can result
in wrong application or overdosage of these products [83]. Recently, it has been reported
that approximately 20 % of medication-related liver injuries in U.S.A. were caused by food
supplements, many of which containing polyphenols [150]. The shelf instability of certain
compounds further complicates this issue. The main concerns regarding the consumption
of polyphenols are related to potential carcinogenicity and mutagenicity, hepatotoxicity,
nephrotoxicity, estrogen-like effects, and interactions with prescribed drugs.
Endeavors in preclinical and safety pharmacology research are aiming to assess potential
toxicities of polyphenols and to reveal respective molecular mechanisms accountable for
possible adverse effects. Among the most investigated substances are resveratrol,
quercetin, catechins, and complex polyphenolic extracts.
3 Polyphenolic compounds 39
39
Under certain conditions, such as excessive concentrations of phenolic antioxidants,
presence of trace metal ions, and high pH-values, dietary polyphenols might exert harmful
effects due to complex toxicodynamics. These compounds can easily get oxidized and thus
can act as pro-oxidants, as demonstrated in in vitro and some in vivo studies [151, 152].
Resveratrol was shown to act as pro-oxidant in vitro causing the following negative
effects: lipid peroxidation, DNA-damage, and mutagenesis [152]. Oxidized intermediates
semiquinones can be involved in this process. Similar phenomenon was related to
quercetin toxicity. “Quercetin paradox” denotes chemical conversion of the flavonol into
oxidized products after scavenging of free radicals, i.e. ortho-quinone or quinone methide
intermediates [153]. These species are highly reactive and can modulate proteins causing
loss of their functions. Thus, initially quercetin is capable of protecting cells from
oxidative stress, but the following formation of its toxic oxidized products can lead to
glutathione depletion, covalent protein binding, lactate dehydrogenase leakage and cell
dead [153]. Therefore, although seemingly controversial, polyphenols can act either as
anti- or pro-oxidants, depending on the cellular environment and applied concentrations.
Polyphenols can act as antioxidants at low concentrations, while high concentrations can
be potential prerequisite for toxicities [151, 152]. Similar pro-oxidative activities in vitro
have been described for flavan-3-ols as well [151]. Considering the results from in vitro
studies, investigations aiming to establish if these findings are valid in vivo have been
performed [152, 154]. Outcomes from animal studies revealed maximal tolerated doses for
some polyphenols in rat models by oral administration. A two years long intake of
quercetin at a dose of 500 mg/kg body weight (b.w.)/day was considered safe [154]. No
adverse effects following 28 day resveratrol consumption (1000 mg/kg b.w./day) were
observed [152]. Nephrotoxic effects for both polyphenols were registered after higher dose
intake (>2000 mg/kg b.w./day). However such doses are corresponding to a daily intake of
over 140 g pure substance and are not expected to be ingested by humans.
In addition, certain polyphenolic subclasses act as phytoestrogens due to their structural
features [152]. These effects are most pronounced for isoflavones, stilbenoids and lignans
[155]. Phytoestrogens can act as either agonist or antagonist of estrogen receptors and thus
can influence key cellular processes. This raises some safety concerns related to the
embryonal development, estrogen-sensitive cancer occurrence and growth, and
gynecomastia [83]. Based on recent epidemiological studies, the European Food Safety
Authority stated that the intake of isoflavone-containing supplements is secure for peri-
and post-menopausal women [156]. However, possible issues related to estrogen-like
effects of polyphenols should not be disregarded.
A growing body of evidence gained by case studies and interventional clinical trials for
consumption of polyphenols contributes to critical evaluation of their safety profiles in
humans. A comprehensive literature review described 19 cases of hepatotoxicity related to
the catechin-rich green tea supplementation with different severity of side effects [157]. It
had been suggested that patient susceptibility and liver disease history might contribute to
40 A Introduction
40
negative events, but the mechanism of the hepatic injuries remains largely unclear. A more
recent report of the European Food Safety Authority also addressed the issue for green tea
catechins [158]. The consumption of green tea supplements was considered safe, and the
rare cases of liver injury were suggested to be due to idiosyncratic type adverse reactions.
Importantly, the intake of over 800 mg/day EGCG was related to statistically significant
increase of serum transaminase activities [158]. Thus, green tea supplements should be
preferably taken after careful risk-benefit assessment and under medical surveillance,
especially for patients with previous liver injuries.
Clinical studies performed with quercetin gave insights for its safety [127, 143]. In a
double-blind, placebo-controlled cross-over study the ingestion of 150 mg/day of the
flavanol for six weeks was explored. The biochemical and hematology parameters
investigated as secondary outcomes did not show any side effects of quercetin on the liver
and kidneys [127]. In a phase I clinical trial with quercetin Ferry et al. studied the maximal
tolerated doses of the parenterally applied flavonoid through i.v. bolus either weekly or in a
three-week interval in cancer patients (n= 51) [159]. At a low dose (~10 mg/kg b.w.) only
mild adverse effects were observed, e.g. moderate local pain, flushing and sweating. When
~50 mg/kg b.w. quercetin was applied, dose-limiting toxicities included: acute renal
failure, clinically significant nephrotoxicity and renal impairment. In addition, dyspnea,
nausea and vomiting, but not myelosuppression have been reported [159].
Likewise, resveratrol was tested in clinical studies which revealed its low toxicity in
humans [130, 152]. Doses of 5 g/day for up to one month were described as safe and well-
tolerated in healthy individuals [152]. A randomized, double-blind, placebo-controlled trial
of the effects of resveratrol at a dose up to 1000 mg twice daily for 52 weeks in moderate
Alzheimer disease patients revealed some mild adverse events. The most common ones
were nausea, diarrhea, and weight loss [160].
Another potential risk related to the intake of polyphenols might be their interactions with
some drug-metabolizing systems or drug transporters. This can decrease or increase
bioavailability of drugs and possibly result in serum concentrations outside their
therapeutic windows. Indeed, quercetin was reported to inhibit cytochrome P-450 CYP2A6
and P-glycoprotein in vivo which potentially can cause drug interactions [161]. Resveratrol
has been described to inhibit CYP3A4 in vivo and in vitro [152]. A potential interaction
between quercetin and tamsulosin on the pharmacodynamic level resulting in increased
vasorelaxation has been suggested based on the results from an ex vivo model employing
rat mesenteric arteries [162]. Therefore, administration of polyphenols should always be
checked for compatibility with assigned therapies.
Another general concern is related to unspecific molecular effects of phenolic compounds.
Polyphenols have been described to cause perturbations of membrane phospholipid
bilayers and in this way to modify certain membrane protein functions in a promiscuous

3 Polyphenolic compounds 41
41
manner [163]. Such effects were registered for resveratrol and genistein at concentrations
higher than 10 µM [163]. In addition, some representatives (e.g. quercetin) have been
shown to be large panel kinase inhibitors [164]. Thus, in contrast to many approved drugs
designed to affect selectively and specifically a define target within the body, polyphenols
are capable of influencing multiple signaling pathways and expression of different genes
simultaneously. This particularity should be taken into consideration in approaches aiming
at the increased bioavailability of polyphenols over the dietary consumption, i.e. use of
prodrugs or drug delivery systems.
In summary, polyphenols are unlikely to cause severe adverse events in humans in case of
proper preparation, storage, and consumption.
3.5 Pycnogenol®
Pycnogenol® (PYC) is a standardized extract of French maritime pine bark which contains
65-70 % oligomeric procyanidins, polyphenolic monomers, and phenolic acids [165]. It
complies with a monography of the United States Pharmacopeia (USP) and is widely
marketed as a food supplement. Monomeric compounds include bioflavonoids catechin
and taxifolin, and phenolic acids, such as caffeic, ferulic, and cinnamic ones, which are
present as both aglycones and glycosides. Inorganic ions, such as calcium, potassium and
iron are presented in the extract as well [166].
3.5.1 Pycnogenol® – beneficial effects
PYC consumption has been shown to promote cardiometabolic health in humans. Various
clinical studies indicate beneficial actions of this extract in patients with T2DM and
metabolic syndrome, especially: anti-hyperglycemic, glycosylated hemoglobin-lowering
[167, 168], and α-glucosidase inhibiting effects [169]. Human studies showed that PYC
can improve diabetic late complications such as microangiopathy [170] and rethinopathy
[171, 172]. Additionally, PYC was shown to beneficially influence T2DM-related
metabolic disorder parameters such as blood pressure, total cholesterol, fasting glucose
[173], triglyceride levels and HDL (high density lipoprotein) [174] which had also been
confirmed in clinical trials. Recent studies demonstrated that PYC can prevent recurrent
venous thrombosis and post-thrombotic syndrome, and can successfully be used in the
management of chronic venous insufficiency [146, 175].
A recent review summarized additional advantageous effects of PYC regarding aging-
related diseases, such as osteoarthritis, cognitive dysfunctions, climacteric symptoms, etc.
[176].
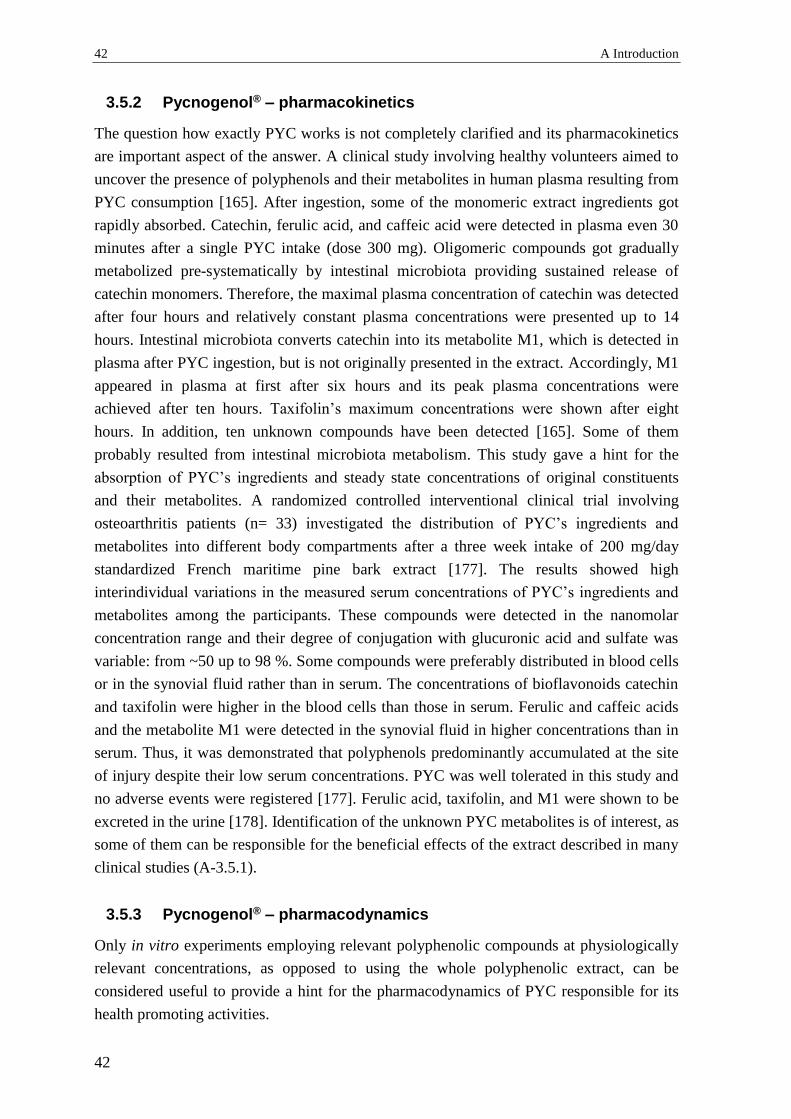
42 A Introduction
42
3.5.2 Pycnogenol® – pharmacokinetics
The question how exactly PYC works is not completely clarified and its pharmacokinetics
are important aspect of the answer. A clinical study involving healthy volunteers aimed to
uncover the presence of polyphenols and their metabolites in human plasma resulting from
PYC consumption [165]. After ingestion, some of the monomeric extract ingredients got
rapidly absorbed. Catechin, ferulic acid, and caffeic acid were detected in plasma even 30
minutes after a single PYC intake (dose 300 mg). Oligomeric compounds got gradually
metabolized pre-systematically by intestinal microbiota providing sustained release of
catechin monomers. Therefore, the maximal plasma concentration of catechin was detected
after four hours and relatively constant plasma concentrations were presented up to 14
hours. Intestinal microbiota converts catechin into its metabolite M1, which is detected in
plasma after PYC ingestion, but is not originally presented in the extract. Accordingly, M1
appeared in plasma at first after six hours and its peak plasma concentrations were
achieved after ten hours. Taxifolin’s maximum concentrations were shown after eight
hours. In addition, ten unknown compounds have been detected [165]. Some of them
probably resulted from intestinal microbiota metabolism. This study gave a hint for the
absorption of PYC’s ingredients and steady state concentrations of original constituents
and their metabolites. A randomized controlled interventional clinical trial involving
osteoarthritis patients (n= 33) investigated the distribution of PYC’s ingredients and
metabolites into different body compartments after a three week intake of 200 mg/day
standardized French maritime pine bark extract [177]. The results showed high
interindividual variations in the measured serum concentrations of PYC’s ingredients and
metabolites among the participants. These compounds were detected in the nanomolar
concentration range and their degree of conjugation with glucuronic acid and sulfate was
variable: from ~50 up to 98 %. Some compounds were preferably distributed in blood cells
or in the synovial fluid rather than in serum. The concentrations of bioflavonoids catechin
and taxifolin were higher in the blood cells than those in serum. Ferulic and caffeic acids
and the metabolite M1 were detected in the synovial fluid in higher concentrations than in
serum. Thus, it was demonstrated that polyphenols predominantly accumulated at the site
of injury despite their low serum concentrations. PYC was well tolerated in this study and
no adverse events were registered [177]. Ferulic acid, taxifolin, and M1 were shown to be
excreted in the urine [178]. Identification of the unknown PYC metabolites is of interest, as
some of them can be responsible for the beneficial effects of the extract described in many
clinical studies (A-3.5.1).
3.5.3 Pycnogenol® – pharmacodynamics
Only in vitro experiments employing relevant polyphenolic compounds at physiologically
relevant concentrations, as opposed to using the whole polyphenolic extract, can be
considered useful to provide a hint for the pharmacodynamics of PYC responsible for its
health promoting activities.
3 Polyphenolic compounds 43
43
Without a doubt, the antioxidant properties of PYC’s ingredients contribute to its health
benefits and protective effects. A placebo-controlled study revealed that the intake of
50 mg PYC daily over eight weeks reduced statistically significantly reactive oxygen
species in vivo in healthy smokers (n= 78) in comparison to the matched control group (n=
77) [179]. This outcome approved results from in vitro study showing antioxidant potential
of PYC’s ingredients and metabolites [180]. In addition, the French maritime pine bark
extract has been shown to modulate some enzymes with important role in the inflammatory
response. An ex vivo study with serum obtained from volunteers 30 min after treatment
with PYC showed inhibition of cyclooxigenases (COX-1 and COX-2), influencing
prostaglandin-generation inflammatory pathway [181]. Likewise, similar ex vivo approach
showed that human plasma probes after PYC ingestion inhibited NF-κB signaling pathway
and decreased metalloproteinase-9 secretion by human monocytes. These studies suggest
that bioavailable and bioactive compounds associated with the PYC’s intake are
responsible for the documented anti-inflammatory effects of PYC in humans. Additional
metalloproteinases and iNOS are possible targets of the extract’s active principles [140,
180]. An extensive review further discussed pharmacodynamical mechanisms and
implications of PYC’s antioxidant and anti-inflammatory effects in the management of
metabolic syndrome and its related disorders [182].
44 A Introduction
44
4 Aims of the thesis
The aim of the present work was the characterization of cellular effects of variety of
individual polyphenols and of polyphenol rich extract PYC, which may have importance in
the prevention and management of T2DM and its late complications.
The effects of PYC on diabetes relevant targets, such as intact glucagon-like peptide-1,
dipeptidyl peptidase IV (DPP IV), relaxin-2, and adiponectin were to be investigated in an
interventional clinical trial (B-1.1).
The elucidation of the in vitro activities of individual ingredients of PYC and their
metabolites on DPP IV were of interest and aimed to characterize more accurately the
polyphenol’s effects at the molecular level. This investigation involved two aspects:
Firstly, the inhibitory potentials of polyphenolics on the enzymatic activity of DPP IV were
to be analyzed (B-3.1). Secondly, the impact of these compounds on the total protein
expression of DPP IV in vitro was to be elucidated (B-3.2).
Akt-kinase plays an essential role in T2DM and its vascular long term complications (as
already described under A-2.1). Therefore, how polyphenols influence the phosphorylation
of Akt in endothelial cells was of interest. It was aimed to develop and validate an assay
for investigation of the phosphorylation status of Akt-kinase (B-2.1). For this purpose,
quercetin and resveratrol were used as model compounds, as evidence suggested them as
beneficial for cardiovascular health [183-185] and abundant ingredients in the human diet
[186].
A following study (B-2.2) aimed to investigate the effects of bigger group of polyphenols
from different structural subclasses on the phosphorylation of Akt at Ser473 and Thr308.
Afterwards, in a comprehensive screening (B-2.3) a detailed investigation of numerous
polyphenols for their effects on the phosphorylation of Akt at Ser473 in endothelial cells
by high-throughput and quantitative method (C-2.4.5) was to be performed. Thereby a
basis of subsequent structure-activity-relationship studies (SAR) was to be created.
Possible effect of bio-activation through bio-transformation was studied as a part of the
screening. Thus, the in vitro activities of precursor substances on endothelial Akt-
phosphorylation were compared with those of their intestinal microbiota generated
metabolites (B-2.6).
As Akt is a target with relevance to T2DM, it was investigated whether certain
polyphenols have a differential effect on the Akt-phosphorylation under physiological and
hyperglycemic conditions (B-2.8). In addition, the effects of polyphenols were compared
with those of the anti-diabetic drug metformin to determine if these compounds might
possess “metformin-like” activities on endothelial cells mediated through Akt-inhibition
(B-2.7).
B Results and Discussion
1 Cellular effects of Pycnogenol® in healthy individuals
As PYC possesses glucose-lowering effects in diabetics (A-3.5.1) it was of interest in
relation to its safety whether the extract can influence blood glucose levels and some
diabetes related target molecules in healthy individuals. In order to clarify the role of the
described α-glucosidase inhibition for PYC’s effects on glucose homeostasis, a comparison
between responses of healthy participants to oral glucose tolerance test with glucose and
one with boiled rice as a source of complex carbohydrates was performed.
1.1 Pycnogenol® effects on active GLP-1, DPP IV, relaxin-2,
and adiponectin
The impact of PYC on intact GLP-1 (glucagon-like peptide-1), DPP IV (dipeptidyl
peptidase IV), relaxin-2 and total adiponectin serum concentrations, as well as on DPP IV
serum enzymatic activities was investigated in serum samples obtained in a clinical study
performed at the cooperating Comenius University, Bratislava. Twenty (n= 20, ten male
and ten female) healthy participants were included into this interventional clinical study
(Figure 11). The study consisted of a run-in period (14 days) and an intervention period (14
days). During the intervention period PYC was taken at a dose of 100 mg/day. On the days
of oral glucose tolerance test (OGTT), PYC was administered 30 minutes before the start
of the carbohydrate challenge. OGTT-1-G was the first OGTT performed with 75 g
anhydrous glucose per os at time point T1 at the end of the run-in period. Likewise,
OGTT-1-R was the first oral glucose tolerance test performed with 200 g boiled rice,
corresponding to 50 g of glucose at time point T2, which was also at the end of the run-in
phase. OGTT-2-G was the second oral glucose tolerance test performed with glucose at
time point T3 after the intervention period. Accordingly, OGTT-2-R was the second oral
glucose tolerance test performed with rice at time point T4.
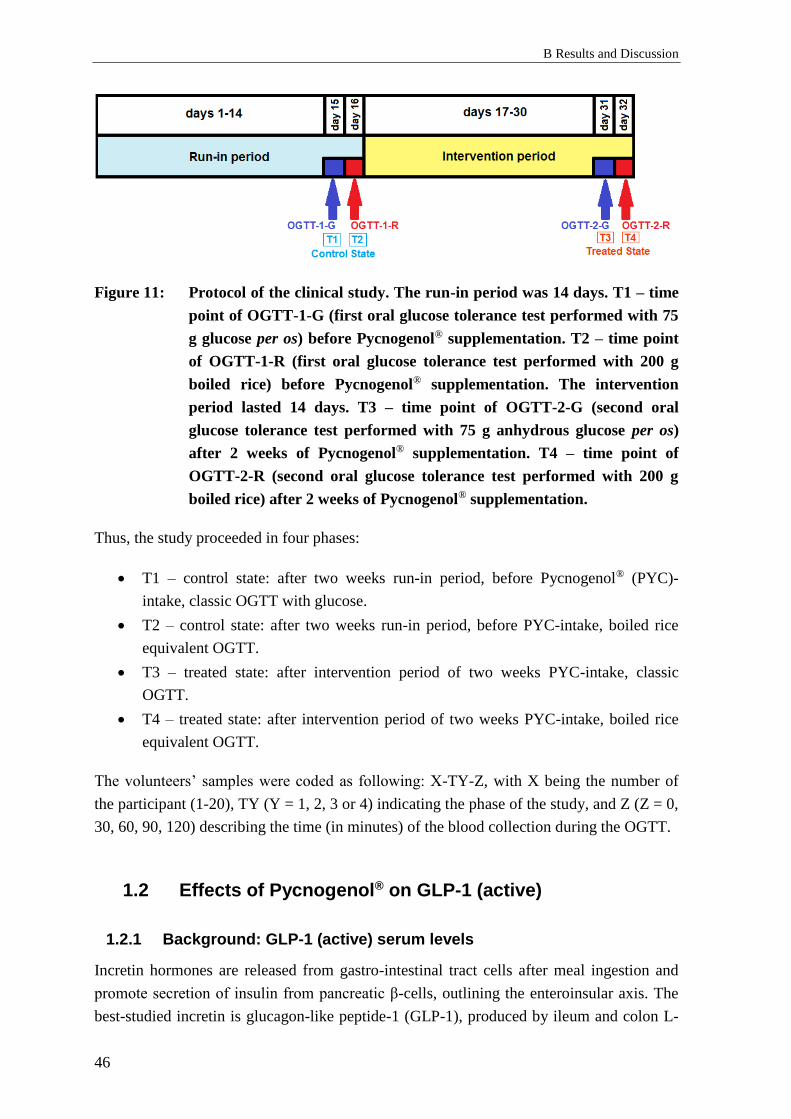
B Results and Discussion
46
Figure 11: Protocol of the clinical study. The run-in period was 14 days. T1 – time
point of OGTT-1-G (first oral glucose tolerance test performed with 75
g glucose per os) before Pycnogenol® supplementation. T2 – time point
of OGTT-1-R (first oral glucose tolerance test performed with 200 g
boiled rice) before Pycnogenol® supplementation. The intervention
period lasted 14 days. T3 – time point of OGTT-2-G (second oral
glucose tolerance test performed with 75 g anhydrous glucose per os)
after 2 weeks of Pycnogenol® supplementation. T4 – time point of
OGTT-2-R (second oral glucose tolerance test performed with 200 g
boiled rice) after 2 weeks of Pycnogenol® supplementation.
Thus, the study proceeded in four phases:
• T1 – control state: after two weeks run-in period, before Pycnogenol® (PYC)-
intake, classic OGTT with glucose.
• T2 – control state: after two weeks run-in period, before PYC-intake, boiled rice
equivalent OGTT.
• T3 – treated state: after intervention period of two weeks PYC-intake, classic
OGTT.
• T4 – treated state: after intervention period of two weeks PYC-intake, boiled rice
equivalent OGTT.
The volunteers’ samples were coded as following: X-TY-Z, with X being the number of
the participant (1-20), TY (Y = 1, 2, 3 or 4) indicating the phase of the study, and Z (Z = 0,
30, 60, 90, 120) describing the time (in minutes) of the blood collection during the OGTT.
1.2 Effects of Pycnogenol® on GLP-1 (active)
1.2.1 Background: GLP-1 (active) serum levels
Incretin hormones are released from gastro-intestinal tract cells after meal ingestion and
promote secretion of insulin from pancreatic β-cells, outlining the enteroinsular axis. The
best-studied incretin is glucagon-like peptide-1 (GLP-1), produced by ileum and colon L-
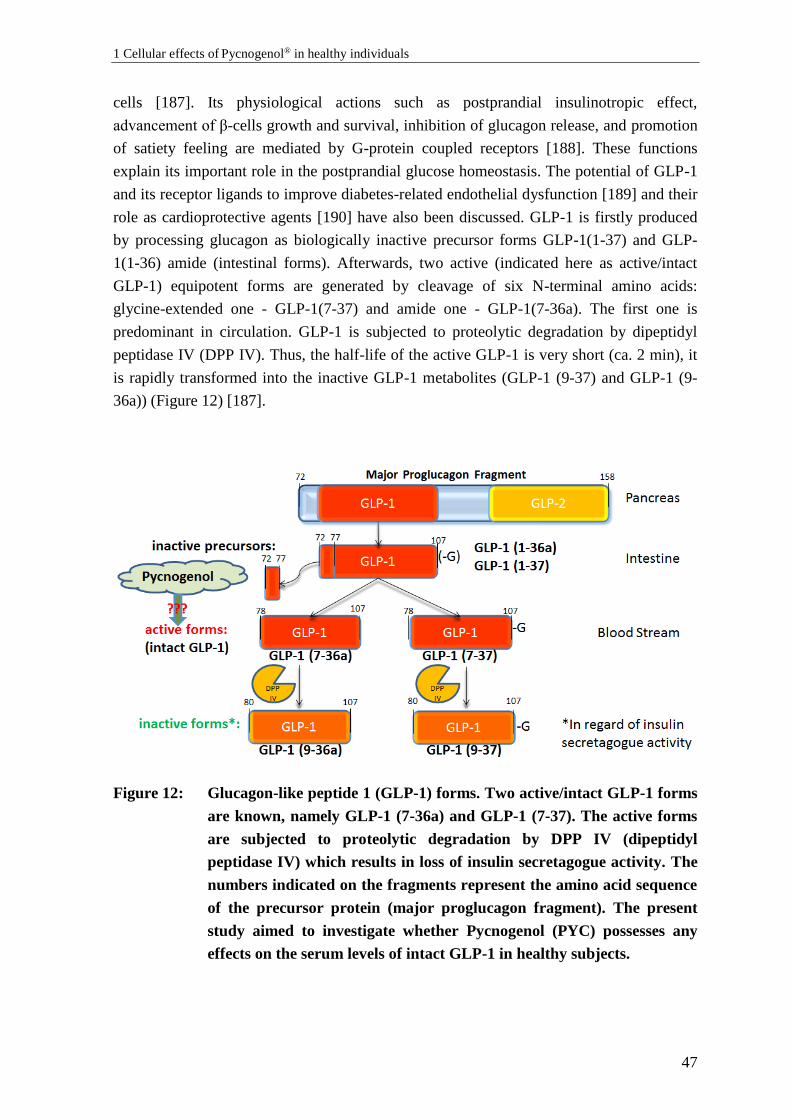
1 Cellular effects of Pycnogenol® in healthy individuals
47
cells [187]. Its physiological actions such as postprandial insulinotropic effect,
advancement of β-cells growth and survival, inhibition of glucagon release, and promotion
of satiety feeling are mediated by G-protein coupled receptors [188]. These functions
explain its important role in the postprandial glucose homeostasis. The potential of GLP-1
and its receptor ligands to improve diabetes-related endothelial dysfunction [189] and their
role as cardioprotective agents [190] have also been discussed. GLP-1 is firstly produced
by processing glucagon as biologically inactive precursor forms GLP-1(1-37) and GLP-
1(1-36) amide (intestinal forms). Afterwards, two active (indicated here as active/intact
GLP-1) equipotent forms are generated by cleavage of six N-terminal amino acids:
glycine-extended one - GLP-1(7-37) and amide one - GLP-1(7-36a). The first one is
predominant in circulation. GLP-1 is subjected to proteolytic degradation by dipeptidyl
peptidase IV (DPP IV). Thus, the half-life of the active GLP-1 is very short (ca. 2 min), it
is rapidly transformed into the inactive GLP-1 metabolites (GLP-1 (9-37) and GLP-1 (9-
36a)) (Figure 12) [187].
Figure 12: Glucagon-like peptide 1 (GLP-1) forms. Two active/intact GLP-1 forms
are known, namely GLP-1 (7-36a) and GLP-1 (7-37). The active forms
are subjected to proteolytic degradation by DPP IV (dipeptidyl
peptidase IV) which results in loss of insulin secretagogue activity. The
numbers indicated on the fragments represent the amino acid sequence
of the precursor protein (major proglucagon fragment). The present
study aimed to investigate whether Pycnogenol (PYC) possesses any
effects on the serum levels of intact GLP-1 in healthy subjects.

B Results and Discussion
48
1.2.2 Results: Effects of Pycnogenol® on GLP-1 (active) serum
concentrations
1.2.2.1 Classic OGTT protocol
Both before and after the intervention period, the glucose charge caused an increase in the
intact GLP-1 levels, compared to the fasting state: T1-30 mean (9.98 ± 2.80 pM) > T1-0
mean (8.93 ± 2.97 pM) and T3-30 mean (9.95 ± 3.34 pM) > T3-0 mean (8.70 ± 3.23 pM).
However, these differences were not statistically significant (p= 0.45, one-way ANOVA).
The basal mean concentration of intact GLP-1 was slightly (but not statistically
significantly) decreased by 0.23 pM after two weeks Pycnogenol-intake period (Figure
13.1).
Figure 13.1: Serum concentrations of GLP-1 (active) in healthy individuals before
(T1-0, T1-30) and after 2 weeks of PYC supplementation (100 mg/day)
(T3-0, T3-30). Columns represent means and standard deviation.
Classic OGTT caused slight, but not statistically significant increase in
GLP-1 (active) levels, compared to the fasting levels. No significant
changes in GLP-1 (active) levels were induced by PYC (p= 0.45, n= 19).
The mean values, standard deviations (S.D.), medians, mean deviation (Mean Dev.) are
indicated in the Supplement, Section D-1.1).
Four values (8-T1-0, 8-T1-30, 8-T3-0, 8-T3-30) were identified as outliers (as described in
C-1.5.3) and were excluded from further data analysis. The values of all measured
individual concentrations can be found as a supplementary attachment (Supplement,
Section D-1.1).
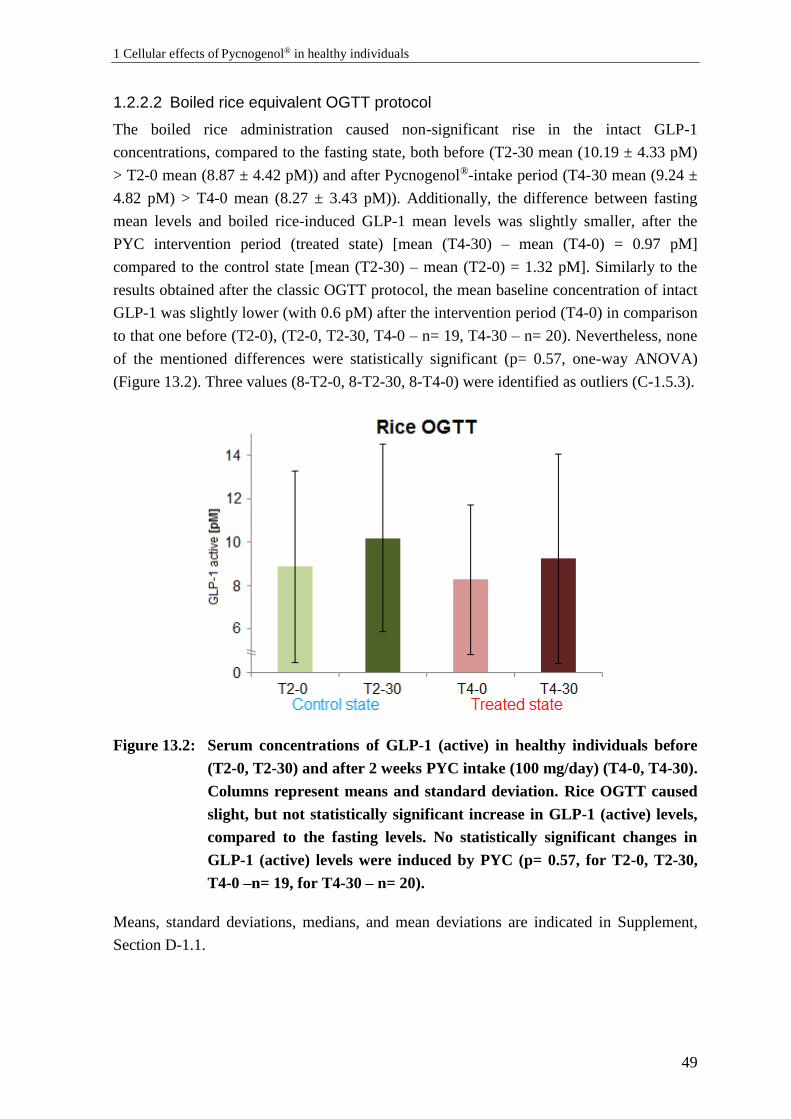
1 Cellular effects of Pycnogenol® in healthy individuals
49
1.2.2.2 Boiled rice equivalent OGTT protocol
The boiled rice administration caused non-significant rise in the intact GLP-1
concentrations, compared to the fasting state, both before (T2-30 mean (10.19 ± 4.33 pM)
> T2-0 mean (8.87 ± 4.42 pM)) and after Pycnogenol®-intake period (T4-30 mean (9.24 ±
4.82 pM) > T4-0 mean (8.27 ± 3.43 pM)). Additionally, the difference between fasting
mean levels and boiled rice-induced GLP-1 mean levels was slightly smaller, after the
PYC intervention period (treated state) [mean (T4-30) – mean (T4-0) = 0.97 pM]
compared to the control state [mean (T2-30) – mean (T2-0) = 1.32 pM]. Similarly to the
results obtained after the classic OGTT protocol, the mean baseline concentration of intact
GLP-1 was slightly lower (with 0.6 pM) after the intervention period (T4-0) in comparison
to that one before (T2-0), (T2-0, T2-30, T4-0 – n= 19, T4-30 – n= 20). Nevertheless, none
of the mentioned differences were statistically significant (p= 0.57, one-way ANOVA)
(Figure 13.2). Three values (8-T2-0, 8-T2-30, 8-T4-0) were identified as outliers (C-1.5.3).
Figure 13.2: Serum concentrations of GLP-1 (active) in healthy individuals before
(T2-0, T2-30) and after 2 weeks PYC intake (100 mg/day) (T4-0, T4-30).
Columns represent means and standard deviation. Rice OGTT caused
slight, but not statistically significant increase in GLP-1 (active) levels,
compared to the fasting levels. No statistically significant changes in
GLP-1 (active) levels were induced by PYC (p= 0.57, for T2-0, T2-30,
T4-0 –n= 19, for T4-30 – n= 20).
Means, standard deviations, medians, and mean deviations are indicated in Supplement,
Section D-1.1.

B Results and Discussion
50
1.2.2.3 Individual Changes in GLP-1 (active) serum concentrations before and
after Pycnogenol® intake
Individual changes in active GLP-1 levels for each participant between states T1-T3 and
T2-T4 were calculated. As it was no difference in the conditions before the performance of
OGTT (or rice OGTT) at time point 0’ the data before PYC-intake (T1-0, T2-0) were
combined as a control state and the phases after PYC-intake (T3-0, T4-0) were combined
as a treated state. The absolute values were normalized to the mean of the control state
(100 %), (Figure 13.3).
Figure 13.3: Individual changes of GLP-1 (active) levels (at time point 0’) in healthy
subjects before and after 2 weeks PYC-intake (100 mg/day). Data were
normalized to the values before PYC-intake and before OGTT (T1-0,
T2-0). The mean of individual changes indicated a minor and non-
statistically significant decrease in fasting GLP-1 (active) levels of
2.55 % after PYC-intake compared to the control state (p= 0.71, two
tailed paired Student’s t-test, n= 35).
The mean of the individual changes of all of the samples included into the analysis
indicated a slight decrease of 2.55 % in the intact GLP-1 concentrations after PYC intake
(at 0’), compared to the control state. This change was not statistically significant (p= 0.71,
two tailed paired Student’s t-test, n= 35). Five values (absolute values: 8-T1-0, 8-T3-0, 8-
T2-0, 8-T4-0, and normalized ratios: respectively 8-T1-0/T3-0, 8-T2-0/T4-0, and 10-T2-0/
T4-0, 11-T1-0/T3-0, 14-T2-0/T4-0) were identified as outliers by Grubbs’ test and box plot
tests [191, 192] and were excluded from the analyzed data. (The values of individual
change for each participant are shown in the Supplement, Section D-1.1).

1 Cellular effects of Pycnogenol® in healthy individuals
51
1.2.3 Discussion: Effects of Pycnogenol® on GLP-1 (active) serum levels
The data from the present study showed an expected tendency for rapid increase in intact
GLP-1 levels upon OGTT performed with glucose or a boiled rice equivalent. Probably
due to the small sample size and the high data variability this tendency was not statistically
significant. The increases in GLP-1 concentrations are characteristic for previously
described meal-triggered GLP-1 postprandial response [193]. Generally, an increase of
GLP-1 concentrations in response to a glucose challenge was expected as oral nutrients
such as glucose and fat have been proven to be rapid and potent triggers of GLP-1
secretion [194]. The mean concentrations of active GLP-1 measured in the present study
(8.27 – 10.19 pM) were comparable to the concentrations reported for healthy participants
in other studies. Ryskjær et al. (2006) and Vilsboll et al. (2001) reported similar fasting
levels of intact GLP-1 of 9.0 ± 3.5 pM [195] and 9.0 ± 1 pM, respectively [196]. Slightly
lower intact GLP-1 concentrations were published as well: 5.2 pM (median with an
interquartile range 3.1 – 8.4 pM) [197]. The present data showed that the levels of GLP-1
(active) were not elevated in healthy participants after consumption of PYC compared to
the control state, and thus a potential GLP-1-mediated hypoglycemia [198] should not be
expected. However, in prediabetes and T2DM patients a different response to PYC-
treatment might be observed. In the present study GLP-1 (active) serum levels in healthy
individuals tended to increase after 30 minutes minimally by 11.7 % and maximally by
16.06 % as a response to OGTTs in all trial phases (B-1.2.2.1and B-1.2.2.2). The outcome
of a longitudinal risk-stratified cohort study including 525 personals with prediabetes and
774 healthy controls suggested that GLP-1 secretion response to OGTT is reduced in
prediabetes: 18-25 % lower in women with prediabetes, compared with normal glucose
tolerance (NGT) women, and 16 % lower in men with prediabetes, compared with NGT
men [199]. Another human study investigating male patients with obesity and T2DM (n=
10) revealed no significant variation in intact GLP-1 forms after glucose challenge as
opposed to obese, but non-diabetic controls (n= 20) [200]. This suggests significant
differences in serum GLP-1 levels between healthy volunteers, prediabetic and diabetic
patients and probability that the GLP-1 secretion response to glucose is related to the stage
and progression of the disease. PYC can be considered as safe in healthy humans regarding
postprandial reactive hyperglycemia risk. Its glucose-lowering action in T2DM patients is
further to be investigated.
There was no significant difference between the mean fasting intact GLP-1 concentrations
before (T1-0 and T2-0) and after the 2-weeks PYC-intake period (T3-0 and T4-0). This
result is consistent with the results for insulin and glucose levels from the same study (data
from Prof. Ďuračková) with no significant increases in the insulin levels after 30 minutes
upon OGTT being observed between control and treated state after 2 weeks PYC-intake.
This is consistent with the study of Liu X et al. [168] suggesting that the glucose-lowering
effect of PYC in T2DM patients probably is not due to enhanced insulin secretion.
B Results and Discussion
52
A minor and non-significant decrease (–0.23 pM and –0.6 pM for T1/T3 and T2/T4,
respectively) was observed in the mean GLP-1 (active) levels after PYC-intake
intervention period in comparison to the control state before PYC-intake in the investigated
volunteer group. This difference was probably due to large interindividual variations.
The slightly smaller increase of intact GLP-1 in boiled rice-equivalent protocol after PYC-
intake (T4 phase) in response to OGTT in comparison to all other phases might be due to
α-glucosidase inhibitory effect of PYC [169]. Such a reduction of GLP-1 response was not
observed after PYC-intake in classic OGTT protocol performed with glucose. Thereby, the
release of glucose from rice starch might be decreased and therefore the secretion of
GLP-1 could be reduced or delayed. However, the glucose time course from this study
(data from Prof. Ďuračková) does not support such an α-glucosidase inhibitory effect. A
likely explanation is that α-glucosidase inhibitors (such as acarbose, voglibose) should be
taken simultaneously with the meal in order to achieve a maximal effect [201]. In contrast,
PYC was taken 30 minutes before the OGTTs, which might contribute to a different
outcome.
The available data on effects of polyphenols on intact GLP-1 levels in humans is generally
sparse. Berries considered as a rich source of polyphenols were investigated in a small
human study with 12 healthy volunteers (randomized, placebo-controlled, crossover) who
took part in two single meal tests on different days. The outcome showed modest
enhancement on the GLP-1 response to sucrose, which was not statistically significant
[193]. Another small study (double blind, placebo-controlled, crossover), with 8 T2DM
individuals investigated the acute effects of standardized bilberry extract and reported a
significant decrease in blood glucose concentrations, but no change in GLP-1 [202]. A
study with 9 healthy participants (randomized, crossover) investigated the effects of a
single intake of beverages containing chlorogenic acid on GLP-1 secretion and found no
significant increase after 30 minutes compared to the controls. In this study it was not
specified whether total or active GLP-1 was measured [203]. The outcomes from the
studies investigating the effects of the polyphenols on the GLP-1 postprandial secretion
responses are controversial, probably due to diverse design and experimental conditions:
sample size, presence of disease and its stage, meal used to trigger GLP-1 secretory
response (quantity and type of the utilized carbohydrates), and way of administration of
polyphenols. Further studies will be needed to elucidate the potential of polyphenols to
modulate GLP-1 food-triggered secretion response as their possible antidiabetic
mechanism of action.

1 Cellular effects of Pycnogenol® in healthy individuals
53
1.2.4 Conclusions: Effects of Pycnogenol® on GLP-1 (active) serum
levels
A clear tendency for the expected increased active GLP-1’s concentrations between 0 and
30 minutes upon both OGTTs was observed. This tendency was not statistically significant
probably due to high data variability.
Intake of PYC for two weeks affected neither the fasting intact GLP-1 serum levels, nor
those at 30 minutes upon glucose or boiled rice-equivalent charge.
1.3 Effects of Pycnogenol® on DPP IV serum levels and
activities
1.3.1 Background: DPP IV serum concentration and activity
Dipeptidyl peptidase IV (DPP IV, CD26, ADCP2) is a serine exopeptidase that cleaves N-
terminal dipeptides from diverse substrates, among which are some important signaling
molecules. These include the incretin hormones GLP-1 and GIP, which, as mentioned
before, play a major role in the regulation of insulin secretion and respectively the glucose
metabolism. DPP IV is expressed in varieties of organs and tissues, e.g. in brush-border
membranes of small intestine, liver, pancreas, endothelium of the capillaries. DPP IV
exists both as a membrane-bound enzyme, and as a soluble form in blood plasma, the latter
lacking the cytoplasmic and transmembrane domains of the protein [204]. DPP IV cleaves
GLP-1 and thereby terminates its effect on insulin release. This is clinically important
especially in type II diabetes mellitus patients (T2DM) because a positive correlation
between the HbA1c levels and DPP IV activity has been established [195]. For this reason,
DPP IV inhibition is a promising strategy in diabetes treatment. Multiple DPP IV inhibitors
(sitagliptin, saxagliptin, vildagliptin) have already been approved as drugs [205]. Briefly,
the capability of DPP IV to deactivate the incretin hormones coupled with DPP IV-induced
impairment of insulin sensitivity and signaling make the enzyme an important target for
treatment of T2DM. There is an extensive ongoing research for discovery and development
of novel molecules that decrease secretion, plasma levels, and inhibit activity of this
enzyme.
1.3.2 Results: Effects of Pycnogenol® on DPP IV serum levels and
activities
1.3.2.1 Serum concentrations of DPP IV in healthy individuals
As described in B-1.2.2.3 the samples of T1-0 and T2-0 were combined as a “control
state”, and T3-0 and T4-0 represented a “treated state”. There was a decrease in the mean
levels of soluble serum DPP IV in treated state (T3, T4; n= 38) compared to the control
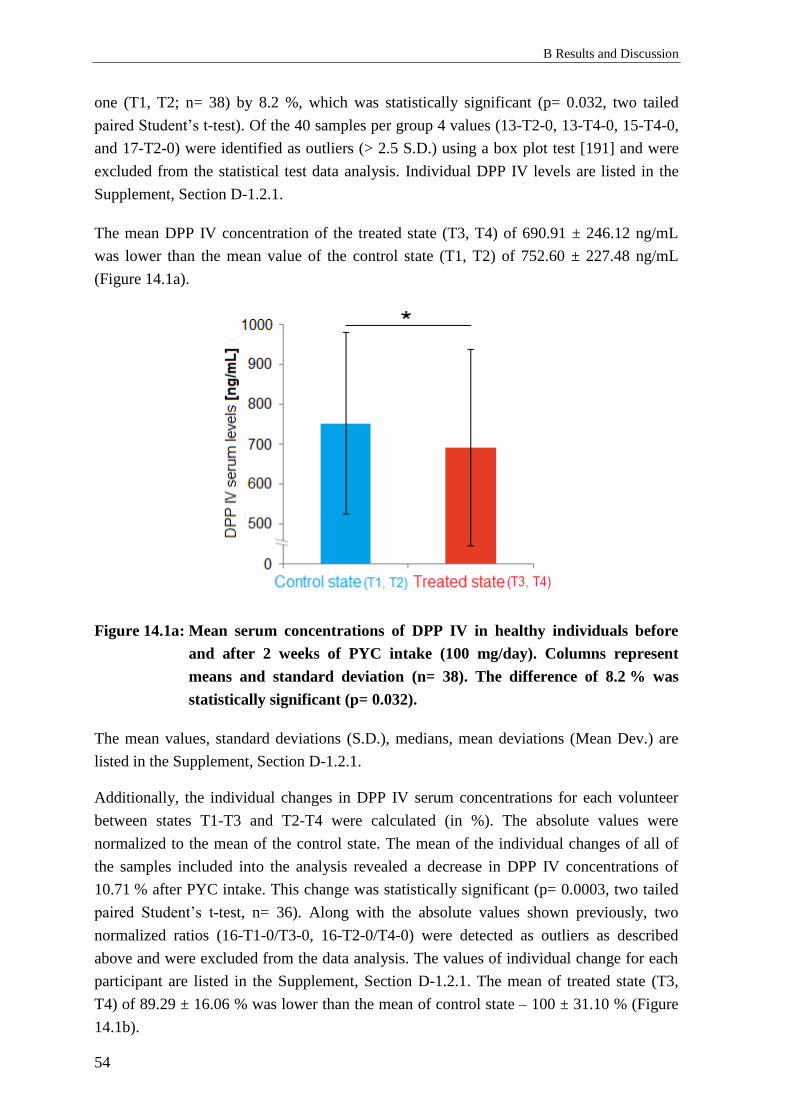
B Results and Discussion
54
one (T1, T2; n= 38) by 8.2 %, which was statistically significant (p= 0.032, two tailed
paired Student’s t-test). Of the 40 samples per group 4 values (13-T2-0, 13-T4-0, 15-T4-0,
and 17-T2-0) were identified as outliers (> 2.5 S.D.) using a box plot test [191] and were
excluded from the statistical test data analysis. Individual DPP IV levels are listed in the
Supplement, Section D-1.2.1.
The mean DPP IV concentration of the treated state (T3, T4) of 690.91 ± 246.12 ng/mL
was lower than the mean value of the control state (T1, T2) of 752.60 ± 227.48 ng/mL
(Figure 14.1a).
Figure 14.1a: Mean serum concentrations of DPP IV in healthy individuals before
and after 2 weeks of PYC intake (100 mg/day). Columns represent
means and standard deviation (n= 38). The difference of 8.2 % was
statistically significant (p= 0.032).
The mean values, standard deviations (S.D.), medians, mean deviations (Mean Dev.) are
listed in the Supplement, Section D-1.2.1.
Additionally, the individual changes in DPP IV serum concentrations for each volunteer
between states T1-T3 and T2-T4 were calculated (in %). The absolute values were
normalized to the mean of the control state. The mean of the individual changes of all of
the samples included into the analysis revealed a decrease in DPP IV concentrations of
10.71 % after PYC intake. This change was statistically significant (p= 0.0003, two tailed
paired Student’s t-test, n= 36). Along with the absolute values shown previously, two
normalized ratios (16-T1-0/T3-0, 16-T2-0/T4-0) were detected as outliers as described
above and were excluded from the data analysis. The values of individual change for each
participant are listed in the Supplement, Section D-1.2.1. The mean of treated state (T3,
T4) of 89.29 ± 16.06 % was lower than the mean of control state – 100 ± 31.10 % (Figure
14.1b).
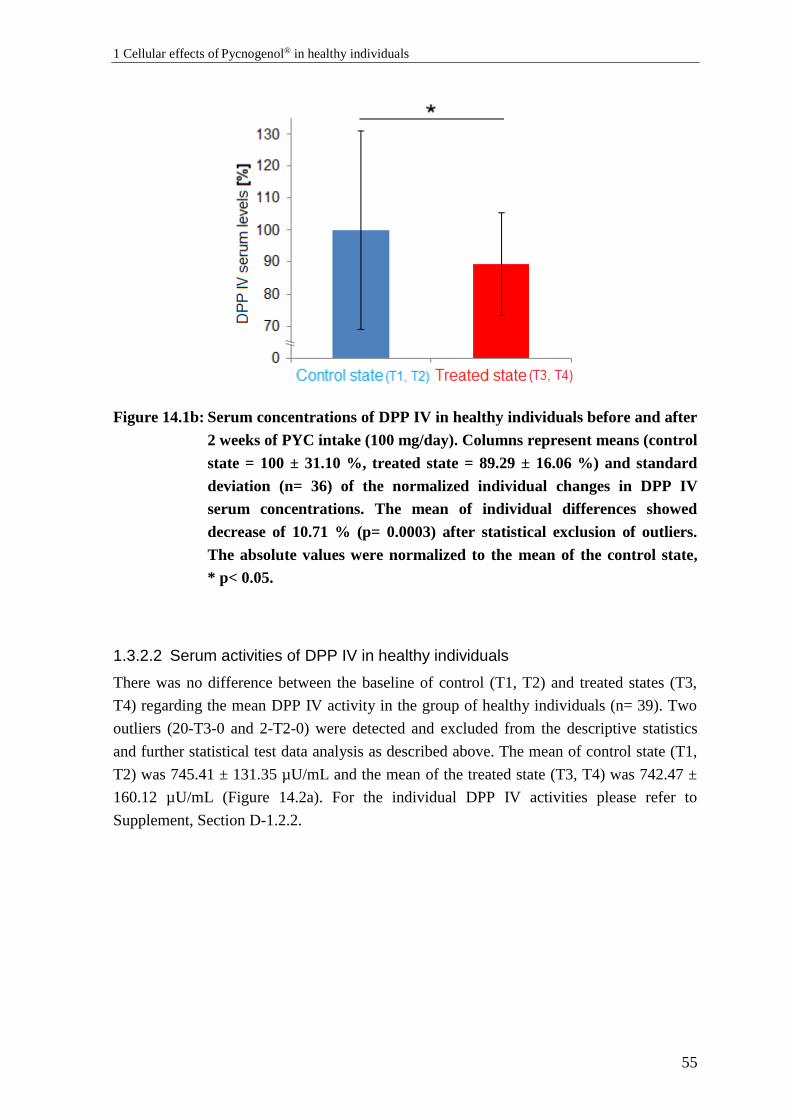
1 Cellular effects of Pycnogenol® in healthy individuals
55
Figure 14.1b: Serum concentrations of DPP IV in healthy individuals before and after
2 weeks of PYC intake (100 mg/day). Columns represent means (control
state = 100 ± 31.10 %, treated state = 89.29 ± 16.06 %) and standard
deviation (n= 36) of the normalized individual changes in DPP IV
serum concentrations. The mean of individual differences showed
decrease of 10.71 % (p= 0.0003) after statistical exclusion of outliers.
The absolute values were normalized to the mean of the control state,
* p< 0.05.
1.3.2.2 Serum activities of DPP IV in healthy individuals
There was no difference between the baseline of control (T1, T2) and treated states (T3,
T4) regarding the mean DPP IV activity in the group of healthy individuals (n= 39). Two
outliers (20-T3-0 and 2-T2-0) were detected and excluded from the descriptive statistics
and further statistical test data analysis as described above. The mean of control state (T1,
T2) was 745.41 ± 131.35 µU/mL and the mean of the treated state (T3, T4) was 742.47 ±
160.12 µU/mL (Figure 14.2a). For the individual DPP IV activities please refer to
Supplement, Section D-1.2.2.
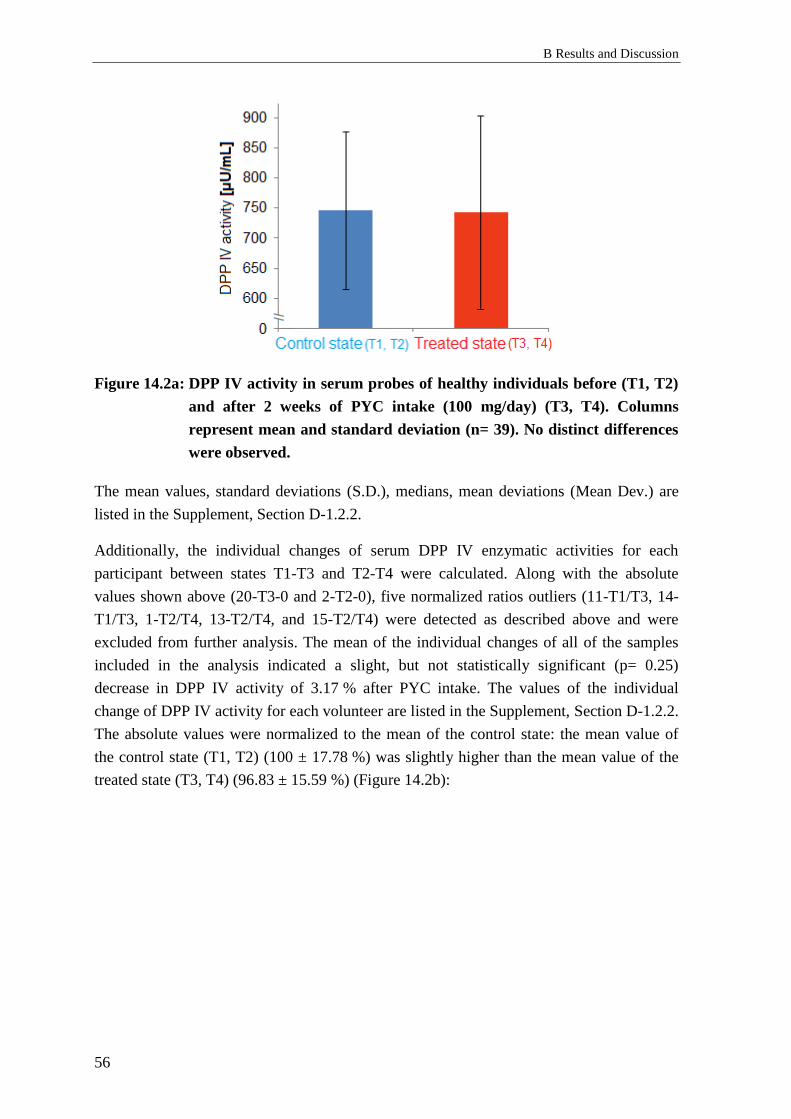
B Results and Discussion
56
Figure 14.2a: DPP IV activity in serum probes of healthy individuals before (T1, T2)
and after 2 weeks of PYC intake (100 mg/day) (T3, T4). Columns
represent mean and standard deviation (n= 39). No distinct differences
were observed.
The mean values, standard deviations (S.D.), medians, mean deviations (Mean Dev.) are
listed in the Supplement, Section D-1.2.2.
Additionally, the individual changes of serum DPP IV enzymatic activities for each
participant between states T1-T3 and T2-T4 were calculated. Along with the absolute
values shown above (20-T3-0 and 2-T2-0), five normalized ratios outliers (11-T1/T3, 14-
T1/T3, 1-T2/T4, 13-T2/T4, and 15-T2/T4) were detected as described above and were
excluded from further analysis. The mean of the individual changes of all of the samples
included in the analysis indicated a slight, but not statistically significant (p= 0.25)
decrease in DPP IV activity of 3.17 % after PYC intake. The values of the individual
change of DPP IV activity for each volunteer are listed in the Supplement, Section D-1.2.2.
The absolute values were normalized to the mean of the control state: the mean value of
the control state (T1, T2) (100 ± 17.78 %) was slightly higher than the mean value of the
treated state (T3, T4) (96.83 ± 15.59 %) (Figure 14.2b):

1 Cellular effects of Pycnogenol® in healthy individuals
57
Figure 14.2b: DPP IV activity in serum samples of healthy individuals before (T1, T2)
and after 2 weeks of PYC intake (100 mg/day). Columns represent
mean and standard deviation of the normalized individual values of
DPP IV serum activities (control state = 100 ± 17.78 %, treated state =
96.83 ± 15.59 %) (n = 34). The mean of individual differences showed
small and not statistically significant decrease of 3.17 % after PYC-
intake (p= 0.25) after statistical exclusion of outliers. The absolute
values were normalized to the mean of the control state.
1.3.3 Discussion: Effects of Pycnogenol® on DPP IV serum levels and
activities
To the best of our knowledge, the present study is the first one that investigated the effects
of a plant-derived extract (namely PYC) on the serum concentrations of soluble DPP IV/
CD26 and its serum enzymatic activity in humans. The data indicated that two weeks of
PYC intake (100 mg/day) statistically significantly (p= 0.0003, n= 36) decreased serum
concentrations of DPP IV by 10.71 % in healthy individuals. The mean serum
concentrations of DPP IV ranged from 653.79 to 755.82 ng/mL and were similar to the
concentrations obtained in other studies with healthy participants. For instance, Lamers et
al. reported DPP IV concentrations in healthy individuals of 200 ng/mL to 600 ng/mL
[206]. Cordero OJ et al. observed serum concentrations of 590 ± 81 ng/mL in healthy
participants [207, 208]. Higher concentrations in individuals without presence of a disease
were also found (median 1427 (1080-1620) ng/mL) [209]. These variances can be
explained with differences in cohorts’ characteristics and with different immunoassays
utilized.
B Results and Discussion
58
Surprisingly, despite lower DPP IV serum concentrations after 2-weeks long PYC-intake
no difference between the mean of DPP IV activities between control and treated states
was detected. The mean of individual changes revealed only slight and statistically non-
significant decrease of 3.17 %. It appears to be contradictory that the decrease in serum
concentrations of the enzyme is not paralleled by a decrease in DPP IV activity. Indeed,
there is a report on positive correlations between DPP IV/CD26 serum concentrations and
activities [210]. However, other authors discussed a lack of direct correlation between
serum concentrations and activities of DPP IV and suggested various reasons [208].
Briefly, some other circulating enzymes different than DPP IV possess the same activity
and are called DASH (DPP IV activity and/or structure homologs) proteins [211].
Additionally, neutral endopeptidase 24.11 was shown to degrade GLP-1 in vivo, but its
importance was shown to be secondary [212]. Therefore, activities of the enzymes
mimicking DPP IV should be taken into consideration. However, in the present assay,
sample blanks (C-1.4.5), considering such non-DPP IV activities, were included and
subtracted from the respective values. In addition, posttranslational modifications as
hypersialylation might inhibit DPP IV activity. Thus, another explanation of the present
results might be the presence of an inactive form of DPP IV that contributed to the serum
concentrations, but not to the enzymatic activity. A further possibility would be that
probably the reduction in serum concentrations of the enzyme is not sufficient to influence
notably its activity. However, still the observed decrease of DPP IV concentrations might
also be important per se as DPP IV was recently identified as a novel signaling molecule
(adipokine), which is capable to impair insulin signaling and probably plays an important
role in metabolic syndrome pathophysiology [206].
The present data indicated a slight but statistically significant decrease in DPP IV
concentrations in healthy individuals, while the activities of the enzyme remained
unchanged. The decrease in the concentrations is not expected to contribute to adverse
events, such as hypoglycemia, as studies suggested that the application of the DPP IV
inhibitor sitagliptin in healthy humans is safe with no reported significant impact on fasting
plasma glucose or glucose tolerance [213].
However, in contrast to healthy humans the DPP IV activity in serum from T2DM is
elevated [195, 214]. Thus, if PYC is capable to decrease serum concentrations or activity
of DPP IV in T2DM patients, this might be beneficial and contribute to antidiabetic effects.
Although there are various in silico an in vitro studies investigating the potential of plant
extracts and their constituent polyphenols to inhibit DPP IV activity [215-217], the results
should be interpreted carefully. In order to evaluate the applicability of the studies in
humans, the physiological relevance of plasma concentrations and bioavailability, along
with the biotransformation of the polyphenolic compounds must be considered. Typically,
plasma concentrations of total (active and inactive) metabolites of a given polyphenol after
ingestion of 50 mg of its aglycone equivalents are in range 0 to 4 µM (often not more than
1 Cellular effects of Pycnogenol® in healthy individuals
59
2 µM) [218]. In accordance, in a pharmacokinetic study of PYC constituents (A-3.5.2) and
metabolites have been detected in nM range (i.e. catechin 60 ng/mL (0.21 nM), ferulic acid
10-15 ng/mL (0.051 – 0.077 nM), and caffeic acid 5-10 ng/mL (0.028 – 0.056 nM)) [165].
Such concentrations are characteristic and physiologically relevant in humans.
The concentrations used in in vitro approaches are usually much higher than that detected
in human plasma [219, 220]. Anyway, some in vitro biochemical assays revealed that
certain polyphenols inhibited DPP IV at low micromolar concentrations, e.g. cirsimaritin
(IC50 = 0.43 ± 0.07 μM), hispidulin (IC50 = 0.49 ± 0.06 μM), and naringenin (IC50 = 2.5 ±
0.29 μM) [221]. Combined in vitro/in silico approaches reported inhibition of DPP IV by
resveratrol (IC50 = 0.6 ± 0.4 nM), luteolin (IC50 = 0.12 ± 0.01 μM), apigenin (IC50 =
0.14 ± 0.02 μM), flavone (IC50 = 0.17 ± 0.01 μM) [215], and cyanidin 3, 5-diglucoside (IC50
= 5.5 μM) [222]. The results from the latter studies indicated that some polyphenols might
have a potential as DPP IV inhibitors.
The findings from in silico, in vitro, and in vivo studies for inhibitory effect of some
polyphenols and plant extracts on the enzymatic activity and expression of DPP IV
demand interventional clinical studies in order to confirm or disapprove their therapeutic
potential.
The lack of a significant decrease in DPP IV activity after PYC supplementation is
consistent with the results for intact GLP-1 levels B-1.2.2, where no significant influence
of PYC on the serum levels of the incretin hormone was detected. Clinical studies
investigating the effects of PYC on DPP IV concentrations and activity within T2DM
patients would be helpful to confirm the role of DPP IV in the antidiabetic effect of PYC.
1.3.4 Conclusions: Effects of Pycnogenol® on DPP IV serum levels and
activities
The mean DPP IV serum concentrations after PYC-intake period (T3, T4) were lower than
the mean concentrations determined at the control state (T1, T2) and this difference was
statistically significant (p= 0.032). However, there was no indication that PYC
significantly decreased the serum enzyme activity of DPP IV in the investigated
participants.

B Results and Discussion
60
1.4 Effects of Pycnogenol® on relaxin-2 serum
concentrations
1.4.1 Background: Relaxin-2 serum levels
Relaxin-2, a representative of the insulin superfamily hormones, has been investigated for
its potential to improve β-cells’ function and insulin sensitivity in T2DM models and
human patients [223]. In this respect the present study aimed to investigate, whether PYC-
intake might influence the serum concentrations of relaxin-2 in human volunteers. As no
evidence exists that relaxin-2 is impacted by food intake all of the measurements have been
performed with serum samples obtained at 120 minutes after OGTT.
1.4.2 Results: Effects of Pycnogenol® on relaxin-2 serum levels
In the present study serum relaxin-2 concentrations have also been measured, using one of
the most sensitive and specific (utilizing monoclonal antibody) immunoassay kits available
on the market (C-1.2.1). All of the measured samples had concentrations below the lowest
standard, 7.8 pg/mL and most of them were even beneath the minimum detectable
concentration (1.00 pg/mL). Thus they were considered below the limit of detection
(Supplement, Section D-1.3).
1.4.3 Discussion: Effects of Pycnogenol® on relaxin-2 serum levels
Zhang et al. [224] reported relaxin-2 concentrations in healthy individuals in the range of
around 50 pg/mL, which was not confirmed in the present study. Possible explanation for
the remarkably different previous result [224] can be the specificity of the employed
antibodies. Indeed, Whittaker et al. warned about the possibility that some immunological
assays may be detecting relaxin-like substances different than the supposed human relaxin-
2 antigen, leading to readouts higher than the real ones [225].
1.4.4 Conclusions: Effects of Pycnogenol® on relaxin-2 serum levels
Relaxin-2 serum levels in the serum samples of the investigated participants were beneath
the limit of detection (< 7.8 pg/mL). No conclusions could be drawn.
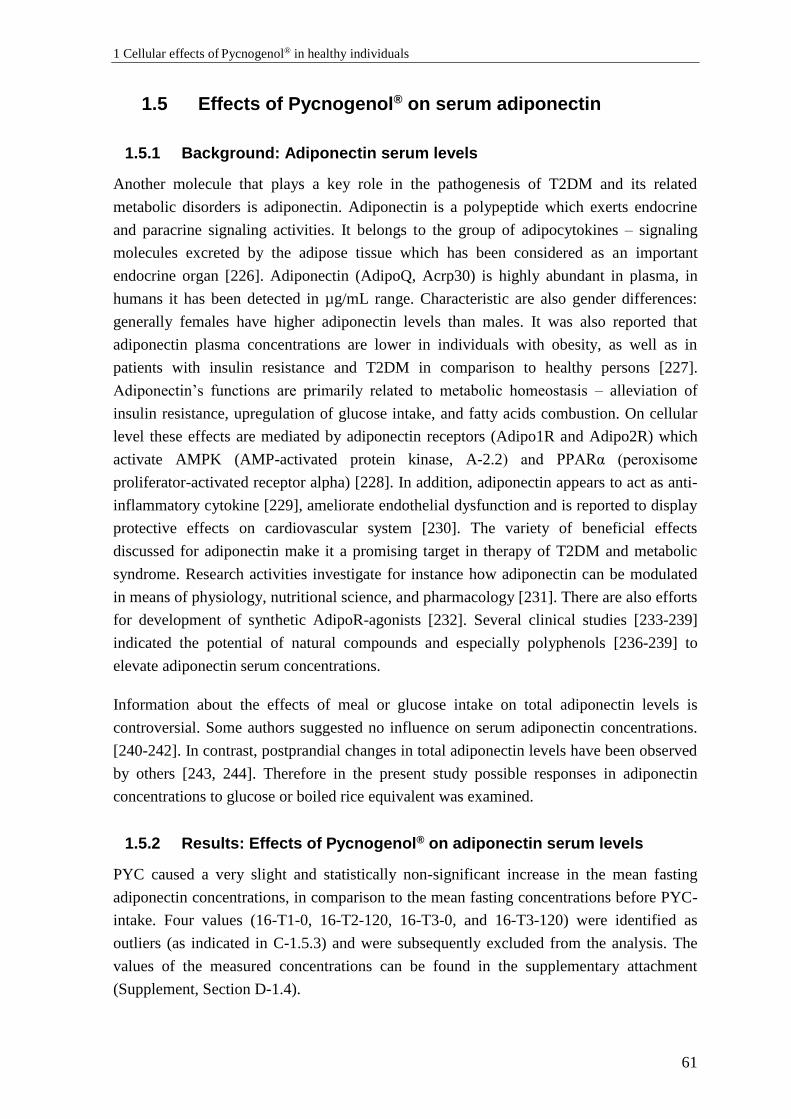
1 Cellular effects of Pycnogenol® in healthy individuals
61
1.5 Effects of Pycnogenol® on serum adiponectin
1.5.1 Background: Adiponectin serum levels
Another molecule that plays a key role in the pathogenesis of T2DM and its related
metabolic disorders is adiponectin. Adiponectin is a polypeptide which exerts endocrine
and paracrine signaling activities. It belongs to the group of adipocytokines – signaling
molecules excreted by the adipose tissue which has been considered as an important
endocrine organ [226]. Adiponectin (AdipoQ, Acrp30) is highly abundant in plasma, in
humans it has been detected in µg/mL range. Characteristic are also gender differences:
generally females have higher adiponectin levels than males. It was also reported that
adiponectin plasma concentrations are lower in individuals with obesity, as well as in
patients with insulin resistance and T2DM in comparison to healthy persons [227].
Adiponectin’s functions are primarily related to metabolic homeostasis – alleviation of
insulin resistance, upregulation of glucose intake, and fatty acids combustion. On cellular
level these effects are mediated by adiponectin receptors (Adipo1R and Adipo2R) which
activate AMPK (AMP-activated protein kinase, A-2.2) and PPARα (peroxisome
proliferator-activated receptor alpha) [228]. In addition, adiponectin appears to act as anti-
inflammatory cytokine [229], ameliorate endothelial dysfunction and is reported to display
protective effects on cardiovascular system [230]. The variety of beneficial effects
discussed for adiponectin make it a promising target in therapy of T2DM and metabolic
syndrome. Research activities investigate for instance how adiponectin can be modulated
in means of physiology, nutritional science, and pharmacology [231]. There are also efforts
for development of synthetic AdipoR-agonists [232]. Several clinical studies [233-239]
indicated the potential of natural compounds and especially polyphenols [236-239] to
elevate adiponectin serum concentrations.
Information about the effects of meal or glucose intake on total adiponectin levels is
controversial. Some authors suggested no influence on serum adiponectin concentrations.
[240-242]. In contrast, postprandial changes in total adiponectin levels have been observed
by others [243, 244]. Therefore in the present study possible responses in adiponectin
concentrations to glucose or boiled rice equivalent was examined.
1.5.2 Results: Effects of Pycnogenol® on adiponectin serum levels
PYC caused a very slight and statistically non-significant increase in the mean fasting
adiponectin concentrations, in comparison to the mean fasting concentrations before PYC-
intake. Four values (16-T1-0, 16-T2-120, 16-T3-0, and 16-T3-120) were identified as
outliers (as indicated in C-1.5.3) and were subsequently excluded from the analysis. The
values of the measured concentrations can be found in the supplementary attachment
(Supplement, Section D-1.4).
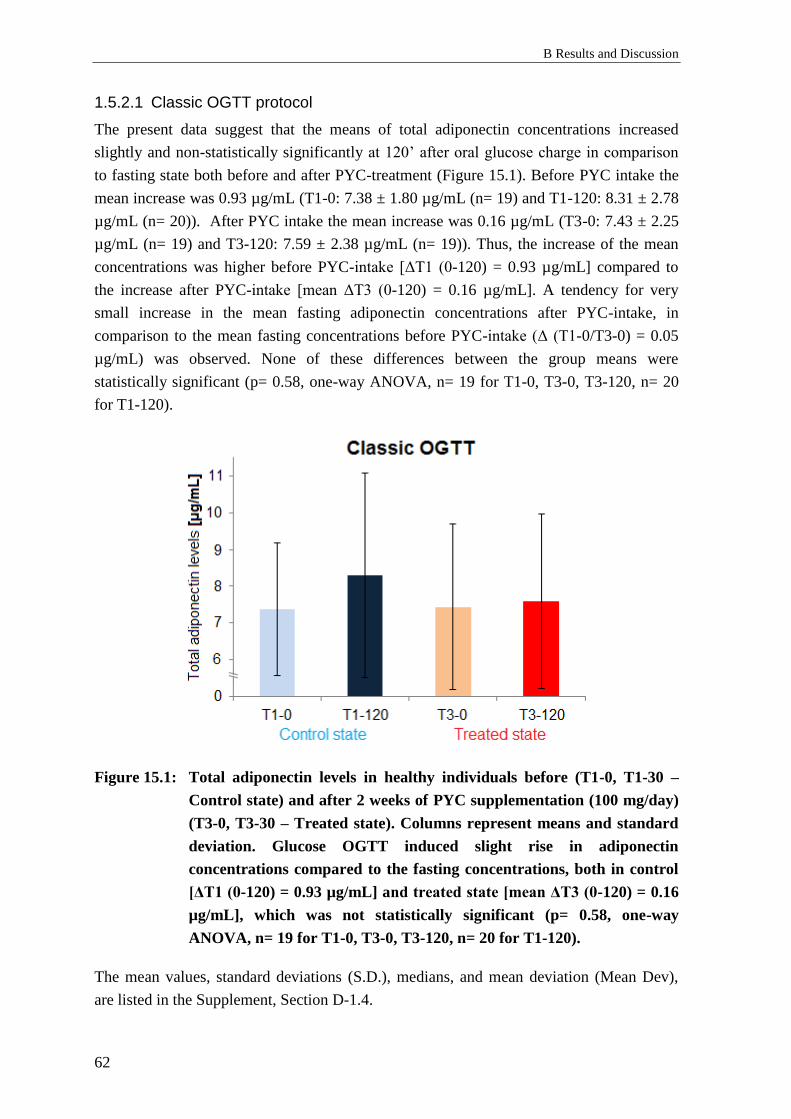
B Results and Discussion
62
1.5.2.1 Classic OGTT protocol
The present data suggest that the means of total adiponectin concentrations increased
slightly and non-statistically significantly at 120’ after oral glucose charge in comparison
to fasting state both before and after PYC-treatment (Figure 15.1). Before PYC intake the
mean increase was 0.93 µg/mL (T1-0: 7.38 ± 1.80 µg/mL (n= 19) and T1-120: 8.31 ± 2.78
µg/mL (n= 20)). After PYC intake the mean increase was 0.16 µg/mL (T3-0: 7.43 ± 2.25
µg/mL (n= 19) and T3-120: 7.59 ± 2.38 µg/mL (n= 19)). Thus, the increase of the mean
concentrations was higher before PYC-intake [ΔT1 (0-120) = 0.93 µg/mL] compared to
the increase after PYC-intake [mean ΔT3 (0-120) = 0.16 µg/mL]. A tendency for very
small increase in the mean fasting adiponectin concentrations after PYC-intake, in
comparison to the mean fasting concentrations before PYC-intake (Δ (T1-0/T3-0) = 0.05
µg/mL) was observed. None of these differences between the group means were
statistically significant (p= 0.58, one-way ANOVA, n= 19 for T1-0, T3-0, T3-120, n= 20
for T1-120).
Figure 15.1: Total adiponectin levels in healthy individuals before (T1-0, T1-30 –
Control state) and after 2 weeks of PYC supplementation (100 mg/day)
(T3-0, T3-30 – Treated state). Columns represent means and standard
deviation. Glucose OGTT induced slight rise in adiponectin
concentrations compared to the fasting concentrations, both in control
[ΔT1 (0-120) = 0.93 µg/mL] and treated state [mean ΔT3 (0-120) = 0.16
µg/mL], which was not statistically significant (p= 0.58, one-way
ANOVA, n= 19 for T1-0, T3-0, T3-120, n= 20 for T1-120).
The mean values, standard deviations (S.D.), medians, and mean deviation (Mean Dev),
are listed in the Supplement, Section D-1.4.
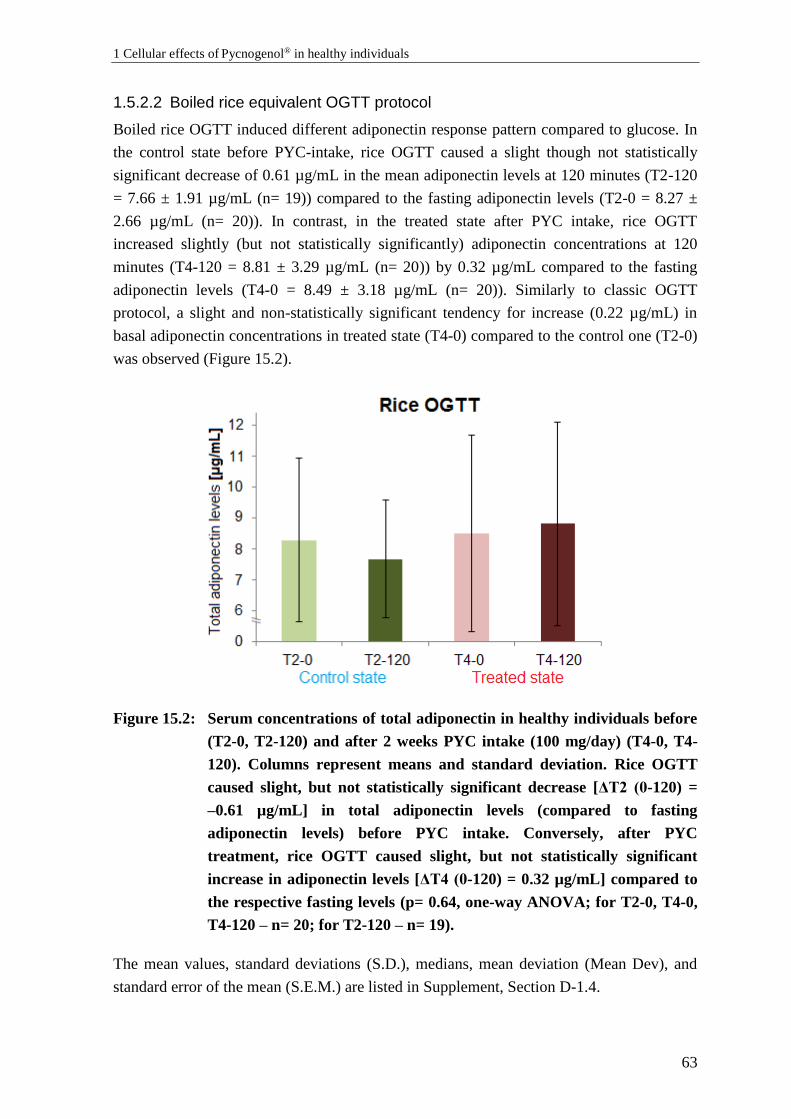
1 Cellular effects of Pycnogenol® in healthy individuals
63
1.5.2.2 Boiled rice equivalent OGTT protocol
Boiled rice OGTT induced different adiponectin response pattern compared to glucose. In
the control state before PYC-intake, rice OGTT caused a slight though not statistically
significant decrease of 0.61 µg/mL in the mean adiponectin levels at 120 minutes (T2-120
= 7.66 ± 1.91 µg/mL (n= 19)) compared to the fasting adiponectin levels (T2-0 = 8.27 ±
2.66 µg/mL (n= 20)). In contrast, in the treated state after PYC intake, rice OGTT
increased slightly (but not statistically significantly) adiponectin concentrations at 120
minutes (T4-120 = 8.81 ± 3.29 µg/mL (n= 20)) by 0.32 µg/mL compared to the fasting
adiponectin levels (T4-0 = 8.49 ± 3.18 µg/mL (n= 20)). Similarly to classic OGTT
protocol, a slight and non-statistically significant tendency for increase (0.22 µg/mL) in
basal adiponectin concentrations in treated state (T4-0) compared to the control one (T2-0)
was observed (Figure 15.2).
Figure 15.2: Serum concentrations of total adiponectin in healthy individuals before
(T2-0, T2-120) and after 2 weeks PYC intake (100 mg/day) (T4-0, T4-
120). Columns represent means and standard deviation. Rice OGTT
caused slight, but not statistically significant decrease [ΔT2 (0-120) =
–0.61 µg/mL] in total adiponectin levels (compared to fasting
adiponectin levels) before PYC intake. Conversely, after PYC
treatment, rice OGTT caused slight, but not statistically significant
increase in adiponectin levels [ΔT4 (0-120) = 0.32 µg/mL] compared to
the respective fasting levels (p= 0.64, one-way ANOVA; for T2-0, T4-0,
T4-120 – n= 20; for T2-120 – n= 19).
The mean values, standard deviations (S.D.), medians, mean deviation (Mean Dev), and
standard error of the mean (S.E.M.) are listed in Supplement, Section D-1.4.

B Results and Discussion
64
1.5.2.3 Individual changes of adiponectin
Additionally, the individual changes of serum adiponectin concentrations for each
participant between the study phases T1-T3 and T2-T4 were calculated (Figure 15.3).
Figure 15.3: Individual changes of basal adiponectin concentrations in healthy
volunteers before (T1-0, T2-0) and after 2 weeks PYC intake (100
mg/day) (T3-0, T4-0). Columns represent means and standard
deviation. The mean of the individual changes indicated no differences
before and after PYC-intake period (n= 38). The absolute values were
normalized to the mean of the control state.
The samples of T1-0 and T2-0 were combined as a “control state” and those of T3-0 and
T4-0 were combined as a “treated state” (as in B-1.2.2.3). The absolute values were
normalized to the mean of the control state (100 %). Along with 16-T1-0 and 16-T3-0,
their normalized ratio 16-T1-0/T3-0 and 8-T2-0/T4-0, were detected as outliers as
described above and were excluded from further data analysis. The mean of individual
changes revealed no difference between control and treated state. The mean of control state
of 100 ± 29.61 % did not significantly differ from the mean of the treated state 100.19 ±
15.63 % (n= 38, p= 0.94, two tailed paired Student’s t-test). The values of individual
changes are documented in the Supplement, Section D-1.4.
Individual changes of adiponectin upon OGTTs
In order to evaluate the individual adiponectin response to glucose or rice load in healthy
participants, the individual changes between fasting concentrations at 0 and 120 were
analyzed. The individual changes revealed no statistically significant adiponectin responses
to glucose/rice challenges, neither before nor after PYC-intake. The single values of the
individual changes are documented in the Supplement, Section D-1.4.

1 Cellular effects of Pycnogenol® in healthy individuals
65
1.5.3 Discussion: Effects of Pycnogenol® on serum adiponectin
The obtained results revealed slight and non-statistically significant changes in adiponectin
levels as a response to glucose or boiled rice charge. The mean total adiponectin
concentrations ranged between 7.38 and 8.81 µg/mL were similar to the ones reported in
previous studies with healthy participants 10.34 ± 4.59 µg/mL – females; 8.04 ±
5.10 µg/mL – males [245], 8.81 ± 3.43 µg/mL [246]. The difference in serum
concentrations between men and women in the present study were not evaluated because
there was no information about the gender of the volunteers available.
As mentioned before the information about postprandial changes in adiponectin levels is
controversial. In the present study there were only slight and not statistically significant
variations in total adiponectin levels as responses to classic and rice OGTT. The present
study confirmed the statement from previous investigations that there is no statistically
significant serum adiponectin response to glucose/rice challenges.
The mean values of basal adiponectin levels (T1-0, T2-0) tended to increase after PYC
intake (T3-0, T4-0), which was observed both in classic OGTT protocol (7.38 to 7.43
µg/mL) and in the boiled rice one (8.27 to 8.49µg/mL). These changes were minor and not
statistically significant. Although the mean of individual changes revealed no difference
between control and treated states, bigger sample size might be useful to detect whether
these differences are consistent or not. Increase in adiponectin levels are generally desired,
as this adipokine exerts various beneficial effects in metabolic syndrome and diabetes,
such as anti-inflammatory, anti-atherosclerotic, and alleviating insulin resistance [247].
1.5.4 Conclusions: Effects of Pycnogenol® on serum adiponectin
The adiponectin concentrations responded slightly, but not statistically significantly to the
glucose and boiled rice-equivalent challenge, but not to the intake of PYC. Bigger sample-
size might reveal whether these changes have any clinical significance.
2 Effects of polyphenols on Akt-kinase-
phosphorylation
2.1 Effects of polyphenols on Akt-phosphorylation – pilot
study
2.1.1 Background
Akt-kinase (also known as Protein Kinase B, PKB) plays a crucial role in mediating the
insulin effects on the intracellular level and is therefore important in the pathophysiology
of diabetes and its vascular complications [20]. There is evidence that the Akt-signaling
pathway might be altered in T2DM and this might contribute to insulin resistance [248]. In
addition, this kinase can affect further processes associated with T2DM and its long-term
consequences. These include glucose transport, glycogen synthesis [249], apoptosis [34],
endothelial dysfunction [11], and angiogenesis [250]. Therefore, modulators of Akt-
phosphorylation and respectively activity are extensively investigated as pharmacological
tools [59]. They can be advantageous for basic and translational research addressing
diabetes mellitus and its vascular complications.
As already described under A-2.1.3, Akt can be activated through phosphorylation at
various sites among which the most important are the amino acids threonine 308 (Thr308)
and serine 473 (Ser473).
Akt has a key role in the cardiovascular system. In general, Akt1 isoform is predominantly
expressed in the endothelium. It has been reported that the activation of Akt-kinase in
endothelial cells (EC) contributes to the cardio-metabolic homeostasis by subsequent
activation of eNOS and release of NO, and possesses protective properties in relation to
long-term vascular complications of T2DM [63] (see also A-2.1.5).
Various in vitro [138], in vivo [251-253], and clinical studies [254-256] suggested that
polyphenols might have beneficial effects on diabetes-induced late complications on the
cardiovascular system. In certain cases it was described that these effects are mediated
through Akt-kinase [251, 252].
The potential relationship between the beneficial health promoting properties of
polyphenolic compounds and their capability to modulate insulin signal transduction
demanded a comprehensive study regarding the effects of individual polyphenols on the
phosphorylation of Akt-kinase.
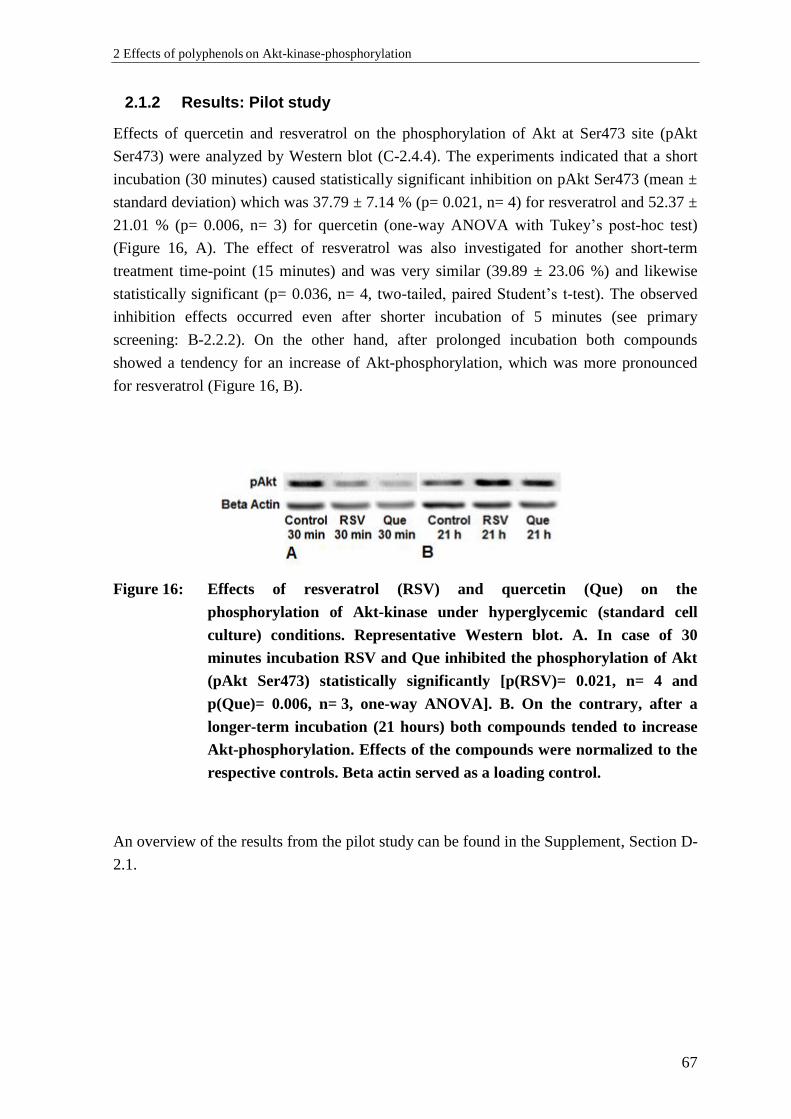
2 Effects of polyphenols on Akt-kinase-phosphorylation
67
2.1.2 Results: Pilot study
Effects of quercetin and resveratrol on the phosphorylation of Akt at Ser473 site (pAkt
Ser473) were analyzed by Western blot (C-2.4.4). The experiments indicated that a short
incubation (30 minutes) caused statistically significant inhibition on pAkt Ser473 (mean ±
standard deviation) which was 37.79 ± 7.14 % (p= 0.021, n= 4) for resveratrol and 52.37 ±
21.01 % (p= 0.006, n= 3) for quercetin (one-way ANOVA with Tukey’s post-hoc test)
(Figure 16, A). The effect of resveratrol was also investigated for another short-term
treatment time-point (15 minutes) and was very similar (39.89 ± 23.06 %) and likewise
statistically significant (p= 0.036, n= 4, two-tailed, paired Student’s t-test). The observed
inhibition effects occurred even after shorter incubation of 5 minutes (see primary
screening: B-2.2.2). On the other hand, after prolonged incubation both compounds
showed a tendency for an increase of Akt-phosphorylation, which was more pronounced
for resveratrol (Figure 16, B).
Figure 16: Effects of resveratrol (RSV) and quercetin (Que) on the
phosphorylation of Akt-kinase under hyperglycemic (standard cell
culture) conditions. Representative Western blot. A. In case of 30
minutes incubation RSV and Que inhibited the phosphorylation of Akt
(pAkt Ser473) statistically significantly [p(RSV)= 0.021, n= 4 and
p(Que)= 0.006, n= 3, one-way ANOVA]. B. On the contrary, after a
longer-term incubation (21 hours) both compounds tended to increase
Akt-phosphorylation. Effects of the compounds were normalized to the
respective controls. Beta actin served as a loading control.
An overview of the results from the pilot study can be found in the Supplement, Section D-
2.1.
B Results and Discussion
68
2.1.3 Discussion: Pilot study
It was previously described that resveratrol [257-259] and quercetin [260, 261] are capable
of improving an existing endothelial dysfunction which in some cases involved an
activation of the Akt/eNOS signaling pathway [257, 261]. Contrary to the expectations, the
present results revealed that the investigated model compounds at a 10 µM concentration
statistically significantly (p< 0.05) reduced Akt-phosphorylation after 30 minutes
compared to the untreated controls in the employed cell-based model.
On the other hand, quercetin had been reported to inhibit PI3K [262] and tyrosine kinase
[159]. These kinases are up-stream of Akt and can regulate its phosphorylation [263]. In
accordance with that it had been reported that 10 µM quercetin inhibited eNOS activity by
inhibiting Akt-signaling in bovine aortic endothelial cells (BAEC) [264]. Likewise,
resveratrol was reported to inhibit PI3K/Akt-pathway [265]. However, the information
about effects of resveratrol on Akt-phosphorylation in endothelial cells is limited. Kanavi
et al. [266] reported that 100 µM resveratrol downregulated the phosphorylation of Akt in
choroidal endothelial cells. In et al. [267] described that high concentrations of resveratrol
(also 100 µM) inhibited Akt/eNOS signaling, and therefore it was considered as a potent
anti-angiogenic substance. In F-2 endothelial cells 100 µM resveratrol activated eNOS,
while lower concentrations (20 µM) did not induce activation, but antagonized VEGF-
induced eNOS-phosphorylation [268]. The activation of eNOS by VEGF is described to be
Akt-dependent process [269]. There are contradicting reports that demonstrated Akt-
activation by resveratrol and quercetin [257, 261, 270, 271], others indicated Akt-
inhibition by both polyphenols [264, 266]. Possible reasons for these discrepancies might
be differences in experimental models and conditions: i.e. use of immortalized cell line
versus primary cells, intact endothelial monolayer, or employment of in vivo or ex vivo
models. The pilot experiments were performed with immortalized endothelial cells, which
are widely used as a standard in vitro model. Prior the treatments cells were serum-
deprived, as the presence of growth factors might mask some activator effects on the
protein phosphorylation. Another important factor for the outcome seemed to be the
duration of treatments. The results from the pilot experiments indicated differences in the
effects of the investigated compounds: for short incubation polyphenols inhibited Akt-
phosphorylation (Figure 16 A), while they showed a tendency to increase Akt-phos-
phorylation during prolonged incubations (21 h) (Figure 16 B). Possible reasons for this
difference might be the chemical instability of the compounds [272] or the fact that they
might undergo biotransformation under cell culture conditions [273, 274].
2 Effects of polyphenols on Akt-kinase-phosphorylation
69
2.2 Effects of polyphenols on Akt-phosphorylation –
primary screening
2.2.1 Background: Primary screening
After establishment of the assay which enabled investigations of the phosphorylation status
of proteins in vitro under normo- and hyperglycemic-like conditions and defining the
activity of the model compounds in the pilot study (B-2.1.2), the effects of a higher number
of polyphenols with different structures on Akt-kinase were to be characterized. The aim
was to identify subclasses and representatives of polyphenols that modulate this signaling
pathway and thus might be effective in the prevention and management of T2DM late
complications. As inhibitory effects after a short exposure were observed in the pilot study
(B-2.1.2), cells were not serum-deprived in order to check if polyphenols were capable to
antagonize the growth-factors-induced Akt-phosphorylation and to possibly mimic
conditions close to the physiological ones. Due to the chemical instability of polyphenols
[272] a short incubation time of 5 minutes was used. Physiologically relevant
concentrations (10 µM) [275] were employed. In the primary screening step eight
compounds were involved.
2.2.2 Results: Primary screening
The results obtained from the primary screening using Western blot analysis showed that
four of eight of the tested polyphenols were able to influence the phosphorylation status of
Akt at Ser473 and Thr308 residues in endothelial cells (EA.hy926) under hyperglycemic
conditions (25.0 mM glucose). Representatives from three diverse structural subclasses
revealed a capability to cause a statistically significant decrease (p< 0.01, one-way
ANOVA with Tukey HSD test) of Akt-phosphorylation level after short-term treatment (5
minutes) compared to controls.
The compounds with most prominent inhibitory effects on pAkt Ser473 (mean inhibition ±
standard deviation) were quercetin (40.46 ± 4.83 %), luteolin (29.96 ± 11.06 %),
resveratrol (25.85 % ± 5.72 %) and apigenin (22.57 ± 10.30 %). The following
polyphenols caused only a small and statistically non-significant reduction in the
phosphorylation of Akt at Ser473 compared to the negative control: genistein (6.77 ±
18.98 %), 3,4’,5-trimethoxy-trans-stilbene (3-MS) (8.32 ± 14.16 %). Taxifolin (0.56 ±
17.96 %) did not seem to have any activity (Figure 17).
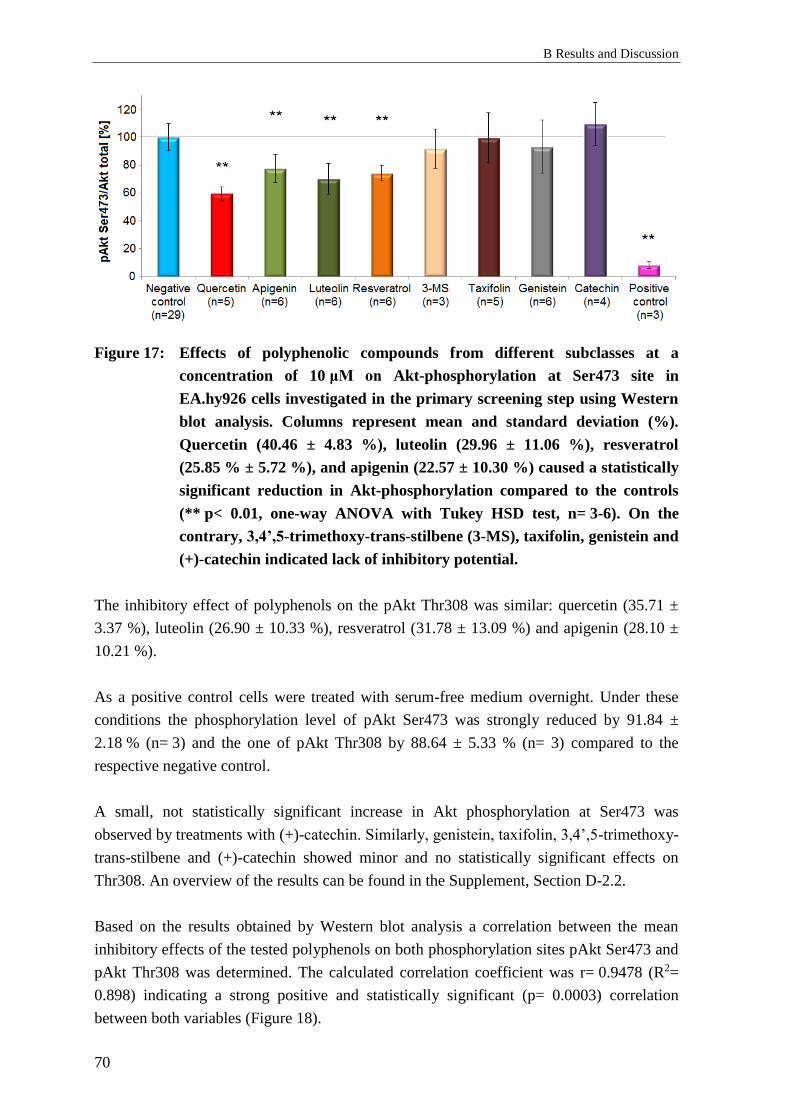
B Results and Discussion
70
Figure 17: Effects of polyphenolic compounds from different subclasses at a
concentration of 10 μM on Akt-phosphorylation at Ser473 site in
EA.hy926 cells investigated in the primary screening step using Western
blot analysis. Columns represent mean and standard deviation (%).
Quercetin (40.46 ± 4.83 %), luteolin (29.96 ± 11.06 %), resveratrol
(25.85 % ± 5.72 %), and apigenin (22.57 ± 10.30 %) caused a statistically
significant reduction in Akt-phosphorylation compared to the controls
(** p< 0.01, one-way ANOVA with Tukey HSD test, n= 3-6). On the
contrary, 3,4’,5-trimethoxy-trans-stilbene (3-MS), taxifolin, genistein and
(+)-catechin indicated lack of inhibitory potential.
The inhibitory effect of polyphenols on the pAkt Thr308 was similar: quercetin (35.71 ±
3.37 %), luteolin (26.90 ± 10.33 %), resveratrol (31.78 ± 13.09 %) and apigenin (28.10 ±
10.21 %).
As a positive control cells were treated with serum-free medium overnight. Under these
conditions the phosphorylation level of pAkt Ser473 was strongly reduced by 91.84 ±
2.18 % (n= 3) and the one of pAkt Thr308 by 88.64 ± 5.33 % (n= 3) compared to the
respective negative control.
A small, not statistically significant increase in Akt phosphorylation at Ser473 was
observed by treatments with (+)-catechin. Similarly, genistein, taxifolin, 3,4’,5-trimethoxy-
trans-stilbene and (+)-catechin showed minor and no statistically significant effects on
Thr308. An overview of the results can be found in the Supplement, Section D-2.2.
Based on the results obtained by Western blot analysis a correlation between the mean
inhibitory effects of the tested polyphenols on both phosphorylation sites pAkt Ser473 and
pAkt Thr308 was determined. The calculated correlation coefficient was r= 0.9478 (R2=
0.898) indicating a strong positive and statistically significant (p= 0.0003) correlation
between both variables (Figure 18).

2 Effects of polyphenols on Akt-kinase-phosphorylation
71
Figure 18: Correlation between the means of Ser473 (blue) and Thr308 (red)
phosphorylation statuses of Akt-kinase after treatment with eight different
polyphenols included in the primary screening (mean ± S.D.). The tested
compounds exhibited similar inhibitory effects on both phosphorylation
sites. In accordance with that a strong statistically significant correlation
was established (r= 0.9478, p= 0.0003, n= 3-6). 3-MS: 3,4’,5-trimethoxy-
trans-stilbene
2.2.3 Discussion: Primary screening
Some of the analyzed compounds had moderate, but statistically significant and
reproducible effects on the phosphorylation status of Akt. In particular, quercetin, luteolin,
apigenin, resveratrol, tested at a physiologically relevant concentration (10 µM) inhibited
the phosphorylation of Akt at both amino-acid residues: pAkt Ser473 and pAkt Thr308.
This is consistent with results from previously published studies. It was described that
quercetin (concentration not shown) [276] and resveratrol (100 µM) reduced Akt-
phosphorylation in endothelial cells (also see B-2.1.3). Likewise, luteolin (10 – 50 µM)
[277] and apigenin (1 µM) [278] were reported to reduce Akt-phosphorylation. No reports
for the effects of taxifolin and 3,4’,5-trimethoxy-trans-stilbene on Akt-phosphorylation in
endothelial cells were found. Effects of genistein on the same target were investigated
mostly in the context of cancer. However, in a diabetes-relevant study, genistein showed
opposite effects on the insulin signaling: either capability to activate or to inhibit Akt.
Under normal conditions genistein reduced Akt-phosphorylation in endothelial cells.
Conversely, under palmitate-induced insulin resistant conditions genistein promoted
B Results and Discussion
72
Akt/eNOS activity, probably due to pro-inflammatory pathways suppression. This
indicated that the outcome is probably highly dependent on the experimental conditions
[279]. To our best knowledge, the present study is the first one to compare (semi-)
quantitatively the short-term effects of polyphenols with different structure on Akt-
phosphorylation in endothelial cells.
In contrast to most of the published papers, both phosphorylation forms of Akt (Ser473 and
Thr308) were investigated in the present study, as both sites are important for the full
activation of this enzyme [33]. The mean inhibition effects for each compound on both
phosphorylation sites were similar with a strong correlation which had not previously been
described. It was therefore conceivable that the polyphenols’ effects were achieved by a
coordinated mechanism involving both phosphorylation sites, rather than affecting
independent up-stream pathways. Vincent et al. postulated that pAkt Thr308 is the more
important predictor for the Akt-activity and should preferably be analyzed rather than pAkt
Ser473 [280]. The strong correlation found in the present study suggested that both
phosphorylation sites were similarly influenced by polyphenols in the utilized in vitro
model.
Moderate inhibitory effects of polyphenols as observed in the present study might be
beneficial in case endothelial dysfunction. It has been described that the hyperactive S6K1
(ribosomal protein S6 kinase beta-1) in senescent endothelial cells might contribute to an
increased oxidative stress and decreased NO levels. S6K1 is a downstream target of Akt
and its over-activation was reported to contribute to insulin resistance (Figure 19) [281]. It
was shown that resveratrol (10 µM) inhibited Akt/S6K1-signaling and reversed endothelial
dysfunction and hallmarks of aging [282]. Shew et al. proposed that high-glucose-induced
apoptosis in human endothelial cells might involve PI3K/Akt-signaling and blocking of
this pathway might attenuate this process [283]. In addition, vascular calcification in
diabetes model was also mediated by O-GlcNAcylation-activated Akt-kinase and the
osteogenic transcription factor [284].
Akt-kinase has been described as a major regulator of angiogenesis [250, 285] and it was
reported that abnormal excessive angiogenesis may contribute to the pathogenesis of
microvascular diabetes complications (nephropathy and retinopathy) as well as to
atherosclerotic plaque formation [286]. Therefore, it is possible that an over-activation of
Akt might play a role in the pathogenesis of these processes. Indeed, Phung et al. reported
that sustained activation of endothelial Akt1 may cause aberrant and pathological
angiogenesis as well as vascular morphological changes [287]. Furthermore, increased
glucose levels were shown contribute to neovascularization in diabetic retinopathy in vivo,
which was mediated through elevated basal Akt-phosphorylation and inhibition of the
latter seemed to prevent the process [288].

2 Effects of polyphenols on Akt-kinase-phosphorylation
73
According to the literature, Akt-signaling dysregulation is related to diabetes-induced
pathological transformations of kidneys. It was proposed that renal hypertrophy and
fibrosis as complications of diabetes resulted from high-glucose-activated PI3K/Akt and
their downstream target protein p21 (cyclin-dependent kinase inhibitor) [289]. Bai et al.
claimed that anti-angiogenic approaches involving VEGF/Akt-inhibition might be
successful in the treatment of early diabetic nephropathy [290]. Other researchers proposed
Akt-inhibition to be nephroprotective in T2DM [291, 292] and resveratrol was described as
a preventive agent [292]. Thus, because of their inhibitory potentials the above-mentioned
polyphenols could possess similar advantageous effects.
In addition to the cardiovascular complications a development of cancer has been
described as further long-term consequence of T2DM [293]. In the presence of
hyperinsulinemia, the Akt-signaling pathway is permanently activated, which contributes
to overproduction of reactive oxygen species (ROS) and DNA damage [294, 295].
Metformin, the first-line medication drug for T2DM patients (A-1.6) was described to
inhibit Akt-phosphorylation and thereby to prevent insulin-induced overproduction of ROS
and the associated with it DNA-toxicity [18]. In this regard, the observed effects of
polyphenols on Akt-kinase also might be beneficial in this context (also see B-2.7).
Potential beneficial effects of polyphenolic compounds that might be achieved through
their inhibitory activity are summarized on Figure 19.
2.2.1 Conclusion: Primary screening
For the first time a study that (semi-)quantitatively compared the influence of polyphenols
from six different subclasses on Akt-phosphorylation in endothelial cells was conducted. In
addition, both phosphorylated forms Ser473 and Thr308 have been studied since both sites
contribute for the complete activation of the kinase. This fact had often been disregarded in
papers previously published on similar topics. Quercetin, resveratrol, apigenin and luteolin
statistically significantly inhibited the phosphorylation of both Akt Ser473 and Akt
Thr308. The inhibitory potential of polyphenols on Akt might be advantageous in case of
some T2DM-complications, especially involving pathological neovascularization.
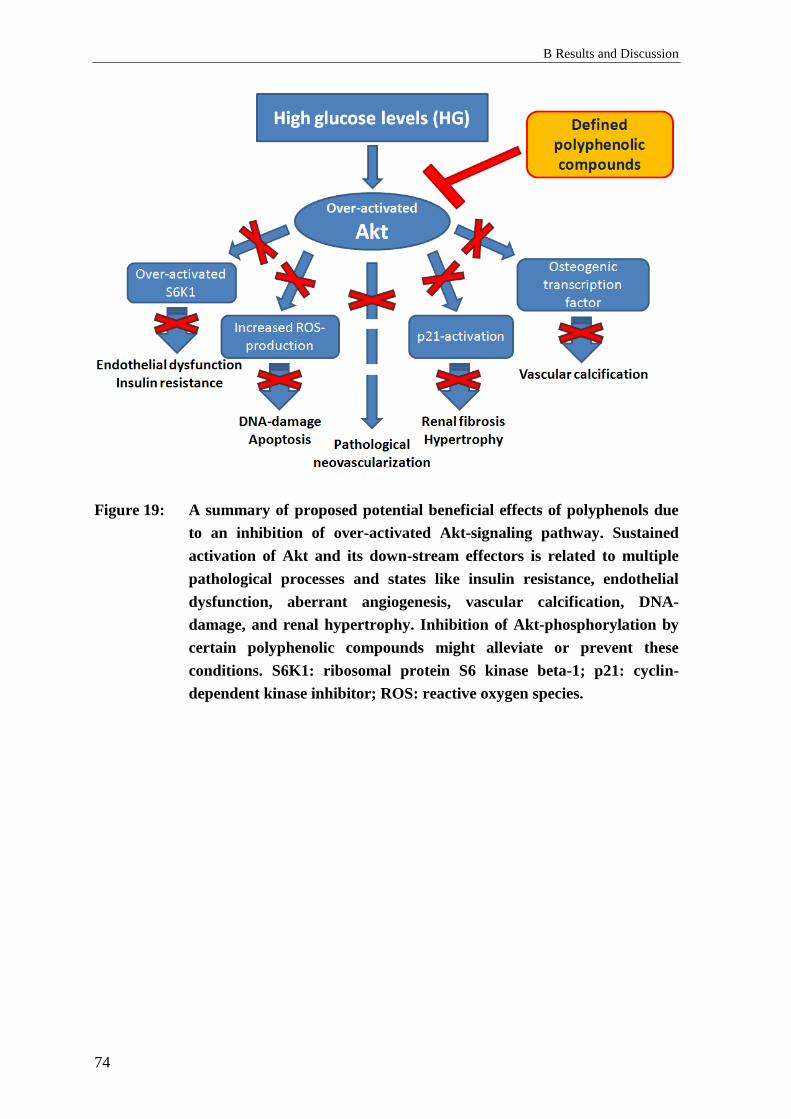
B Results and Discussion
74
Figure 19: A summary of proposed potential beneficial effects of polyphenols due
to an inhibition of over-activated Akt-signaling pathway. Sustained
activation of Akt and its down-stream effectors is related to multiple
pathological processes and states like insulin resistance, endothelial
dysfunction, aberrant angiogenesis, vascular calcification, DNA-
damage, and renal hypertrophy. Inhibition of Akt-phosphorylation by
certain polyphenolic compounds might alleviate or prevent these
conditions. S6K1: ribosomal protein S6 kinase beta-1; p21: cyclin-
dependent kinase inhibitor; ROS: reactive oxygen species.

2 Effects of polyphenols on Akt-kinase-phosphorylation
75
2.3 Effects of polyphenols on Akt-phosphorylation –
secondary screening
2.3.1 Background: Secondary screening
The primary screening found inhibitory activity on Akt-phosphorylation among the
investigated compounds. The most active substances were representatives from the
subclasses of flavones, flavone-3-ols, and stilbenoids. A secondary screening was to
involve an extended investigation including further representatives of these structural
groups, among them glycosylated and methylated derivatives. Additionally, polyphenols
and intestinal microbiota-generated metabolites from subclasses that have not been
analyzed in the first step were also included (Table 3). The compounds underwent
quantitative determination of their effects on the phosphorylation of Akt in endothelial
cells in vitro.
Table 3.: Polyphenolic compounds and intestinal microbiota-generated metabolites of
polyphenols grouped by their chemical structure in subclasses which were
included in the secondary screening regarding their in vitro inhibitory potential
on the phosphorylation of Akt at Ser473 site. In bold are indicated subclasses
and representatives which had already been involved in the primary screening
process. For the classification’s source see A-3.2.
Chemical subclass Individual compounds Number
Flavones
luteolin, apigenin, flavone, 6-hydroxyflavone,
3-hydroxyflavone, 6-methoxyflavone,
7-methoxyflavone, 7,8-dihydroxyflavone, chrysin,
baicalein, baicalin, 3-methoxyflavone,
3,4’-dihydroxyflavone, 3-hydroxy-4’-methoxyflavone,
vitexin, wogonoside
16
Flavon-3-ols
(Flavonols) quercetin, fisetin, kaempferol, myricetin, morin 5
Stilbenoids resveratrol, pinostilbene, pterostilbene,
3,4’,5-trimethoxy-trans-stilbene, piceatannol 5
Flavan-3-ols
(Flavanols)
(+)-catechin, taxifolin, (-)-epicatechin, (-)-epicatechin
gallate, (-)-epigallocatechin gallate, (-)-gallocatechin
gallate
6
Isoflavones genistein 1
Flavanones naringenin 1
Phenolic acids caffeic acid, trans-ferulic acid, chlorogenic acid 3
Catechin metabolites M1, M2 2
Ellagic acid and its
metabolites ellagic acid, urolithin A, B, C, D 5
B Results and Discussion
76
2.3.2 Results: Secondary screening
The previous results (B-2.1.2 and B-2.2.2) obtained by Western blot revealed that the
polyphenols resveratrol, quercetin, apigenin, and luteolin were able to statistically
significantly inhibit the phosphorylation of Akt. These inhibitory effects were re-examined
by a quantitative analysis through ELISA. The study confirmed their potential to reduce
the phosphorylation level of Akt-kinase after a short-term treatment of 5 minutes.
The comprehensive screening regarding inhibitory potentials of other polyphenols and
their metabolites on the phosphorylation level of Akt at Ser473 site involved 44
compounds (Table 3). Overall, 26 substances demonstrated some inhibitory potential.
Among them 11 substances were characterized to possess pronounced (> 20 %), 10
compounds lower but still distinguishable (between 10 % and 20 %) and 5 substances
weak (less than 10 %) inhibitory activity. All other 18 substances caused no inhibition.
Flavones and flavon-3-ols caused the clearest reduction of Akt-phosphorylation. The most
active compound was luteolin, followed by quercetin and apigenin. The subclass of
flavanols possessed no inhibitory effects with the exception of (-)-gallocatechin gallate.
The representatives of flavanones (naringenin), isoflavones (genistein), and flavanonols
(taxifolin) showed no considerable inhibition and were not further investigated. Among the
group of stilbenoids resveratrol and pinostilbene were active, unlike pterostilbene, 3,4’,5-
trimethoxy-trans-stilbene and piceatannol which caused no reduction of Akt-
phosphorylation. All three structural analogues from the subclass of phenolic acids
(caffeic, ferulic and chlorogenic acids) showed no inhibitory effects. Only urolithin A from
the group of ellagic acid’s metabolites induced an inhibition.
(+)-Catechin, (-)-epicatechin, ferulic acid, M2, naringenin and all investigated glycosides
(vitexin, wogonoside, baicalin) exhibited a non-statistically significant tendency to slightly
augment Akt-phosphorylation. Detailed information about the effects for all investigated
compounds on Akt-phosphorylation is summarized in Supplement, Section D-2.3.
The inhibitory potential of polyphenols was expressed as percentage in comparison to the
vehicle-treated negative controls ± standard deviation (100 % – residual phosphorylation).
The substances which possessed the most prominent inhibitory effects were luteolin (44.31
± 17.95 %), quercetin (35.71 ± 8.33 %), urolithin A (35.28 ± 11.80 %), apigenin (31.79 ±
6.16 %), fisetin (28.09 ± 9.09 %), 6-hydroxyflavone (26.86 ± 7.78 %), resveratrol (26.04 ±
5.58 %), 6-methoxyflavone (24.89 ± 10.29 %), flavone (22.24 ± 2.88 %) (n= 6 for
quercetin, luteolin, urolithin A, n= 5 for resveratrol and apigenin, n= 3 for fisetin, n= 2 for
flavone, 6-hydroxyflavone and 6-methoxyflavone; Figure 20).
A statistical significance for the effects of luteolin, urolithin A, apigenin, quercetin, fisetin,
and resveratrol (p= 0.001) was calculated by one-way ANOVA with Tukey HSD test. The

2 Effects of polyphenols on Akt-kinase-phosphorylation
77
statistical analysis revealed that the difference between the effect of luteolin and resveratrol
was statistically significant as well (p= 0.008; Figure 20).
Figure 20: Effects of the polyphenolic compounds from different subclasses at a
concentration of 10 μM on Akt-phosphorylation (pAkt Ser473) in
EA.hy926 cells, determined by quantitative ELISA. The columns
represent the means of the residual phosphorylation and standard
deviations (S.D.) (in %). A statistically significant inhibition was
determined for the following compounds (mean inhibition ± S.D.):
luteolin (44.31 ± 17.95 %), urolithin A (35.28 ± 11.80 %), fisetin (28.09 ±
9.09 %), apigenin (31.79 ± 6.16 %), quercetin (35.71 ± 8.33 %), and
resveratrol (26.04 ± 5.58 %) (n = 3-6), ** p< 0.01. The difference between
the effects of luteolin and resveratrol was statistically significant as well, ## p< 0.01 (one-way ANOVA with Tukey HSD test).
2.3.3 Discussion: Secondary screening
The results from the secondary screening for the effects of polyphenols on the pAkt Ser473
are consistent with the outcome from the primary investigation. The inhibitory potential of
the substances already found to be active (quercetin, apigenin, luteolin, resveratrol) was
confirmed and compounds that were determined to lack inhibitory effect were only slightly
active or inactive. Careful comparison of the results revealed that the values obtained in
both approaches were very similar for quercetin (primary vs. secondary screening: 40.46 ±
4.83 % vs. 35.71 ± 8.33 %) and resveratrol (25.85 ± 5.72 % vs. 26.04 ± 5.58 %). On the
contrary, differences between the effects established through both methods were observed
for luteolin (29.96 ± 11.06 % vs. 44.31 ± 17.95 %) and apigenin (22.57 ± 10.30 % vs.
31.79 ± 6.16 %).
B Results and Discussion
78
Possibly this difference is due to the fact that Western blot analysis is a complex procedure
and multiple steps (transfer, stripping, and chemiluminescent detection) can contribute to
variations in results. This technique was used for the primary screening and is generally
considered as a semi-quantitative method [296], while ELISA employed for the secondary
screening is a quantitative method [297]. For this reason only the results obtained from the
secondary screening were considered in following investigations. Furthermore, the analysis
revealed that the inhibitory effect of luteolin was statistically significantly stronger than the
one of resveratrol (Figure 20). This finding might be important for a quantitative structure-
activity-relationship study and a lead structure optimization because the compared
compounds belong to different structural groups.
A literature search did not come across any information about any previously performed
comprehensive screening for the effects of polyphenols on Akt in endothelial cells.
However, some similar studies were found. Various flavonoids were investigated in
adipocytes for their activities on multiple targets related to insulin-signaling, among which
was Akt-kinase [298]. In this study including 24 flavonoids, it was shown that luteolin and
kaempferol statistically significantly reduced the activity of Akt in comparison to the
untreated controls. In addition, quercetin, fisetin and apigenin tended to decrease Akt-
activity, although their effects were not statistically significant. The authors proposed the
insulin receptor and PI3K as direct targets of flavonoids. Among the tested compounds
luteolin inhibited the phosphorylation of the insulin receptor β-subunit statistically
significantly. This is generally in accordance with the outcome of the present investigation
showing that some flavonoids are capable to inhibit Akt and that luteolin displayed the
highest activity. The scope of the present study in regard to Akt was broader, including
representatives from additional chemical classes as stilbenoids, urolithins, and phenolic
acids, and investigating the effects of methylation and glycosylation.
In another study employing macrophages the effects of stilbenoids and their semi-synthetic
derivatives on the PI3K/Akt-pathway were examined [299]. The results pointed out that
piceatannol, monomethylpinosylvin and pinosylvin were the most potent inhibitors of Akt-
phosphorylation. Synthetic ethers of pynosilvin (i.e. monoethyl, monopropyl, monoallyl)
caused weak or no inhibition on the phosphorylation on Akt, indicating that probably
space-demanding residues are not favorable for the activity. Similarly to the present results
10 µM resveratrol exhibited clear activity, while its dimethylated derivative pterostilbene
was not active at the same concentration.
2 Effects of polyphenols on Akt-kinase-phosphorylation
79
As Akt is considered as a major downstream effector of PI3K [300], works investigating
the relationships between flavonoid structure and the inhibition of this kinase were also
studied. Agullo et al. investigated the effects of 14 flavonoids from different groups on the
enzymatic activities of purified PI3K in vitro [301]. The most active compounds were
myricetin, luteolin, apigenin, quercetin, and fisetin, which corresponds well with the data
obtained in the present secondary screening (B-2.3.2). Likewise, flavan-3-ols, flavanones,
isofalvones and morin were shown to be inactive. This might suggest that PI3K is a major
molecular target of the investigated polyphenols. Some differences, as for instance stronger
effects of luteolin compared to myricetin in the cell-based model, can be explained with a
chemical stability as myricetin is known to be very unstable in cell culture media [272]. An
additional reason can be the complex regulation of Akt, in which additional upstreaming
pathways might be involved along with PI3K. Cell-membrane permeability of the tested
substances is also playing a role in cell-based models. Another study investigating the
inhibitory activity of flavonoids against specific class I isoforms of PI3K reported similar
results [302]. In addition, a recent study linked the inhibitory potential of flavonoids to
their binding with the pleckstrin homology domain of phosphoinositide-dependent kinase 1
(PDK1), which was also described to be an upstream regulator of Akt [303]. Thus, the
literature search gave an overview for relevant upstream targets which might mediate the
observed activities of polyphenols in the present study.
2.3.4 Conclusion: Secondary screening
The secondary screening confirmed the outcome of the primary screening and re-examined
the effects of the active polyphenols quantitatively and found further molecules possessing
activities higher than 20 % which might serve as a base for structure-activity relationship
studies (SAR).
Four compounds that to our best knowledge were not previously described to inhibit the
phosphorylation of Akt were detected during screening: 6-hydroxyflavone, 6-
methoxyflavone, 7-methoxyflavone, and pinostilbene.
2.4 Semi-quantitative structure-activity-relationship (SAR)
2.4.1 Structure-activity-relationship: Key features
Based on the results of the comprehensive screening, a first assumption for the structural
differences of polyphenols’ molecules that might influence their inhibitory activities on the
phosphorylation of Akt at Ser473 was made (Figure 21).
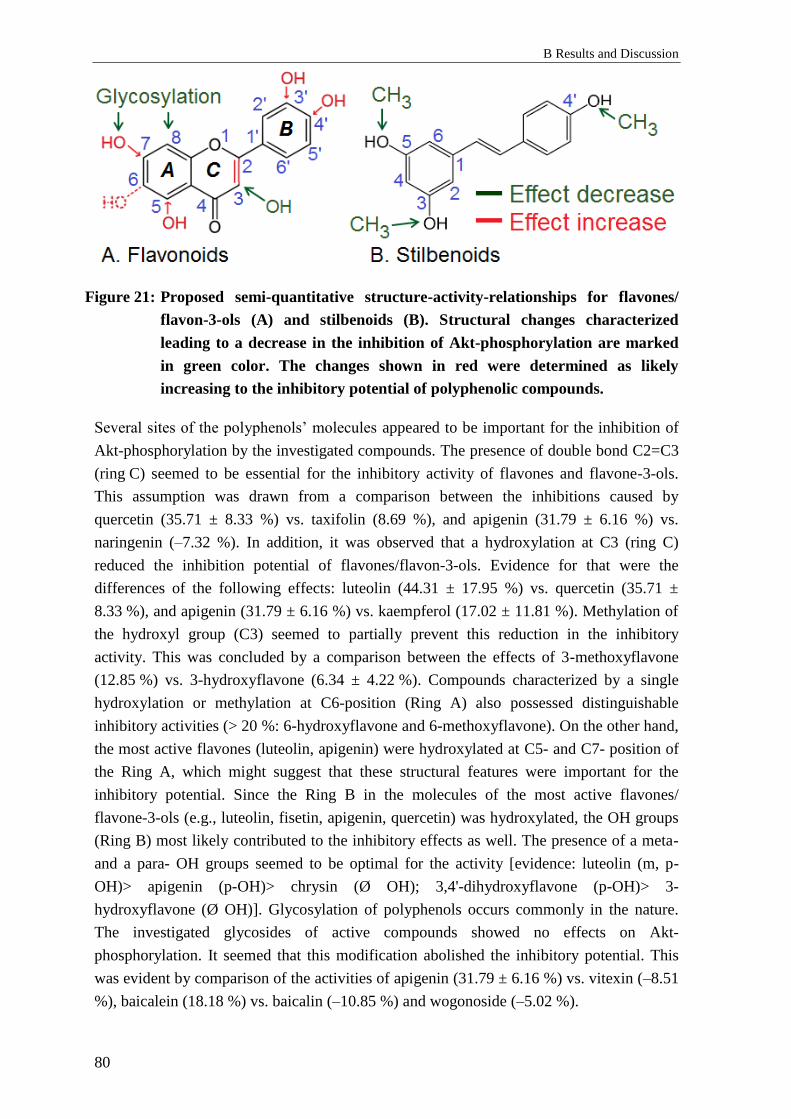
B Results and Discussion
80
Figure 21: Proposed semi-quantitative structure-activity-relationships for flavones/
flavon-3-ols (A) and stilbenoids (B). Structural changes characterized
leading to a decrease in the inhibition of Akt-phosphorylation are marked
in green color. The changes shown in red were determined as likely
increasing to the inhibitory potential of polyphenolic compounds.
Several sites of the polyphenols’ molecules appeared to be important for the inhibition of
Akt-phosphorylation by the investigated compounds. The presence of double bond C2=C3
(ring C) seemed to be essential for the inhibitory activity of flavones and flavone-3-ols.
This assumption was drawn from a comparison between the inhibitions caused by
quercetin (35.71 ± 8.33 %) vs. taxifolin (8.69 %), and apigenin (31.79 ± 6.16 %) vs.
naringenin (–7.32 %). In addition, it was observed that a hydroxylation at C3 (ring C)
reduced the inhibition potential of flavones/flavon-3-ols. Evidence for that were the
differences of the following effects: luteolin (44.31 ± 17.95 %) vs. quercetin (35.71 ±
8.33 %), and apigenin (31.79 ± 6.16 %) vs. kaempferol (17.02 ± 11.81 %). Methylation of
the hydroxyl group (C3) seemed to partially prevent this reduction in the inhibitory
activity. This was concluded by a comparison between the effects of 3-methoxyflavone
(12.85 %) vs. 3-hydroxyflavone (6.34 ± 4.22 %). Compounds characterized by a single
hydroxylation or methylation at C6-position (Ring A) also possessed distinguishable
inhibitory activities (> 20 %: 6-hydroxyflavone and 6-methoxyflavone). On the other hand,
the most active flavones (luteolin, apigenin) were hydroxylated at C5- and C7- position of
the Ring A, which might suggest that these structural features were important for the
inhibitory potential. Since the Ring B in the molecules of the most active flavones/
flavone-3-ols (e.g., luteolin, fisetin, apigenin, quercetin) was hydroxylated, the OH groups
(Ring B) most likely contributed to the inhibitory effects as well. The presence of a meta-
and a para- OH groups seemed to be optimal for the activity [evidence: luteolin (m, p-
OH)> apigenin (p-OH)> chrysin (Ø OH); 3,4'-dihydroxyflavone (p-OH)> 3-
hydroxyflavone (Ø OH)]. Glycosylation of polyphenols occurs commonly in the nature.
The investigated glycosides of active compounds showed no effects on Akt-
phosphorylation. It seemed that this modification abolished the inhibitory potential. This
was evident by comparison of the activities of apigenin (31.79 ± 6.16 %) vs. vitexin (–8.51
%), baicalein (18.18 %) vs. baicalin (–10.85 %) and wogonoside (–5.02 %).

2 Effects of polyphenols on Akt-kinase-phosphorylation
81
For the subclass of stilbenoids, the presence of the three free OH groups on the 3-,4’-, 5-
positions was probably optimal for the inhibitory effects. Methylation of these groups
seemed to reduce or even to completely eliminate the inhibitory effects (resveratrol (26.04
± 5.58 %) > pinostilbene (19.34 ± 14.45 %) > pterostilbene (–5.96 ± 1.59 %) ≈ 3,4’,5-
trimethoxy-trans-stilbene (0.93 ± 9.99 %)).
The conclusions about the relationship between the structural features and their influence
on the inhibitory potential of polyphenols, along with the respective evidence are
summarized in the Table 4.
Table 4.: Summary of the semi-quantitative structure-activity-relationships of
flavones/ flavonoles and stilbenoids (3-MS: 3,4’,5-trimethoxy-trans-
stilbene):
№ Structural
features
Possible
effect
Evidence
Flavones/Flavon-3-ols
1 C2=C3 double
bound (Ring C) Essential
Quercetin/Taxifolin;
Apigenin/Naringenin
2 OH-groups
(Ring B) (m-, p-) Contribution
Luteolin (m, p) > Apigenin (p) >
Chrysin (Ø)
3 3-p. (Ring C):
hydroxylation Reduction
Luteolin/Quercetin;
Apigenin/Kaempferol
4 Glycosylation Abolishment
Apigenin/Vitexin;
Baicalein/Baicalin
Stilbenoids
1 Three free OH-
groups Optimal
Resveratrol > Pinostilben >
Pterostilben ≈ 3-MS 2 Methylation of
OH-groups Abolishment
Regarding the subclass of urolithins (see also B-2.6), although its representatives were
structurally related, clear differences in their inhibitory effects were observed (Figure 22).

B Results and Discussion
82
Figure 22: Urolithin A with OH-groups at C3 and C8 was the only active
representative among the group of urolithins regarding pAkt-inhibition.
Further hydroxylation at C4 or C9 as well as lack of OH-group at C8 was
not favorable for the activity.
It seemed that two OH-groups at the C3 and C8 positions of the molecule and lack of
further substituents were important for the activity. Thus, only minor changes, such as an
addition or elimination of a hydroxyl group were responsible for a remarkable change in
the inhibition. Similar observation was valid for flavonols: active quercetin and slightly
active morin – analogs, differing only by the position of one phenolic OH-group in the B-
ring.
All these assumptions were considered for the creation of a pharmacophore-based model
(see B-2.5).
2.4.2 Discusion: SAR
Many studies investigated the relationship between polyphenol structure characteristics
and molecular effects contributing to advantageous impact of these compounds on human
health. For instance, assumptions were made for antioxidant activity [304], various enzyme
inhibition [305], and cytotoxicity [306].
The results from the present screening involving multiple polyphenols revealed some
differences in the activities of compounds on Akt-phosphorylation, which might be related
to particular structural characteristics. Generally, most active compounds belonged to the
subclass of flavones, followed by flavonols. For these two groups the structural hallmarks
were double bound between C2 and C3 of the ring C, preferable lack of substitution at the
C3 of the ring C, and 3’,4’-catechol group in the ring B. The most active compounds were
those with unsubstituted OH-groups (no methylation or glycosylation) which indicated that
the formation of hydrogen bounds between the scaffold and hypothesized receptor
molecule was favorable. The double bound C2=C3 was required for the co-planarity of the
heteroring C. Such molecular geometry may facilitate a docking to a binding pocket of a
protein.
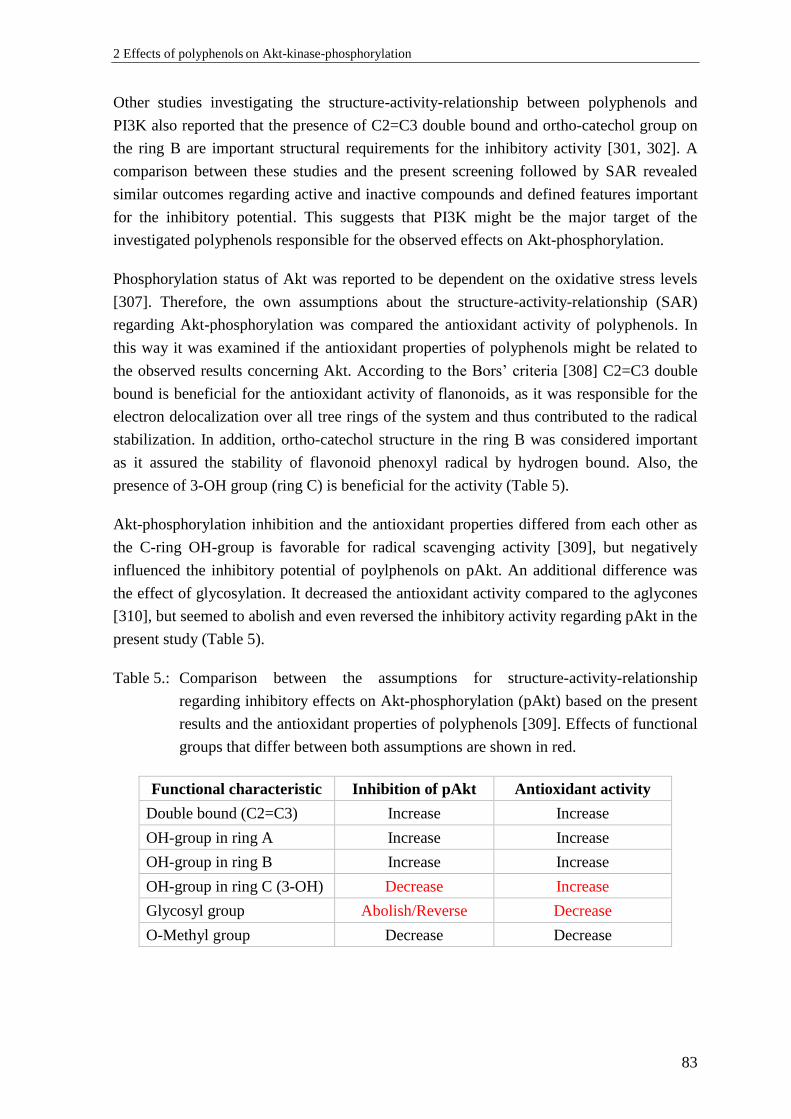
2 Effects of polyphenols on Akt-kinase-phosphorylation
83
Other studies investigating the structure-activity-relationship between polyphenols and
PI3K also reported that the presence of C2=C3 double bound and ortho-catechol group on
the ring B are important structural requirements for the inhibitory activity [301, 302]. A
comparison between these studies and the present screening followed by SAR revealed
similar outcomes regarding active and inactive compounds and defined features important
for the inhibitory potential. This suggests that PI3K might be the major target of the
investigated polyphenols responsible for the observed effects on Akt-phosphorylation.
Phosphorylation status of Akt was reported to be dependent on the oxidative stress levels
[307]. Therefore, the own assumptions about the structure-activity-relationship (SAR)
regarding Akt-phosphorylation was compared the antioxidant activity of polyphenols. In
this way it was examined if the antioxidant properties of polyphenols might be related to
the observed results concerning Akt. According to the Bors’ criteria [308] C2=C3 double
bound is beneficial for the antioxidant activity of flanonoids, as it was responsible for the
electron delocalization over all tree rings of the system and thus contributed to the radical
stabilization. In addition, ortho-catechol structure in the ring B was considered important
as it assured the stability of flavonoid phenoxyl radical by hydrogen bound. Also, the
presence of 3-OH group (ring C) is beneficial for the activity (Table 5).
Akt-phosphorylation inhibition and the antioxidant properties differed from each other as
the C-ring OH-group is favorable for radical scavenging activity [309], but negatively
influenced the inhibitory potential of poylphenols on pAkt. An additional difference was
the effect of glycosylation. It decreased the antioxidant activity compared to the aglycones
[310], but seemed to abolish and even reversed the inhibitory activity regarding pAkt in the
present study (Table 5).
Table 5.: Comparison between the assumptions for structure-activity-relationship
regarding inhibitory effects on Akt-phosphorylation (pAkt) based on the present
results and the antioxidant properties of polyphenols [309]. Effects of functional
groups that differ between both assumptions are shown in red.
Functional characteristic Inhibition of pAkt Antioxidant activity
Double bound (C2=C3) Increase Increase
OH-group in ring A Increase Increase
OH-group in ring B Increase Increase
OH-group in ring C (3-OH) Decrease Increase
Glycosyl group Abolish/Reverse Decrease
O-Methyl group Decrease Decrease
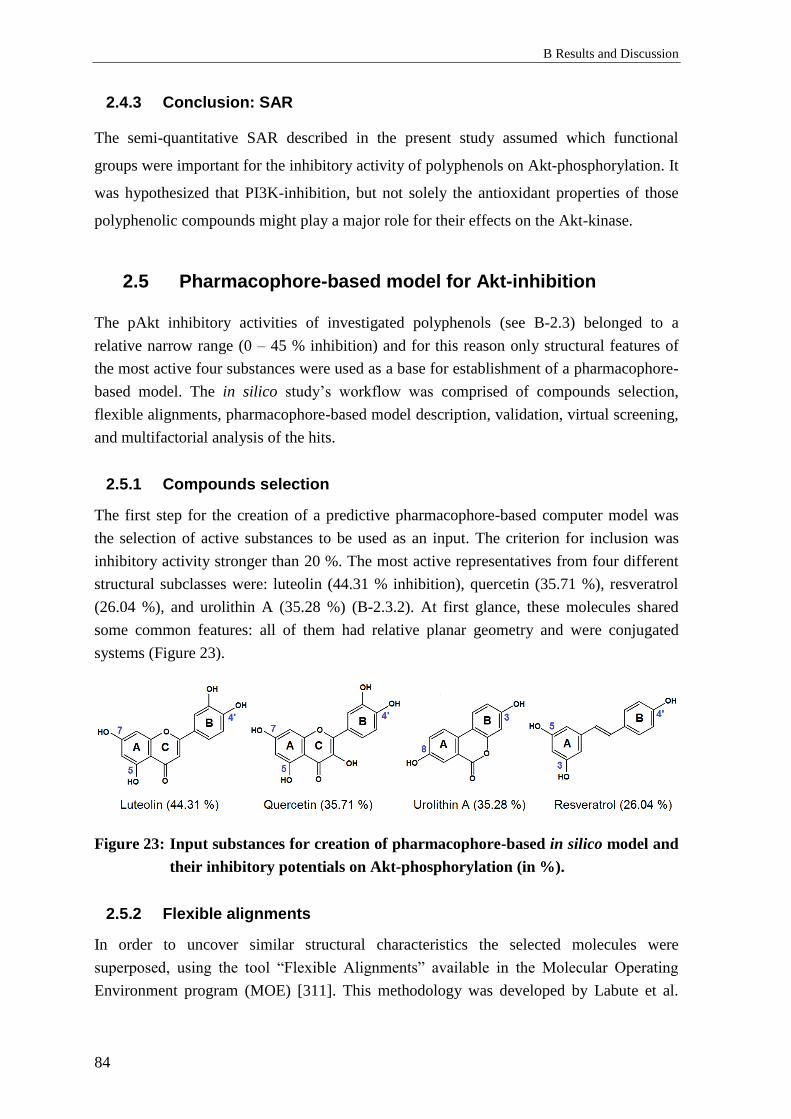
B Results and Discussion
84
2.4.3 Conclusion: SAR
The semi-quantitative SAR described in the present study assumed which functional
groups were important for the inhibitory activity of polyphenols on Akt-phosphorylation. It
was hypothesized that PI3K-inhibition, but not solely the antioxidant properties of those
polyphenolic compounds might play a major role for their effects on the Akt-kinase.
2.5 Pharmacophore-based model for Akt-inhibition
The pAkt inhibitory activities of investigated polyphenols (see B-2.3) belonged to a
relative narrow range (0 – 45 % inhibition) and for this reason only structural features of
the most active four substances were used as a base for establishment of a pharmacophore-
based model. The in silico study’s workflow was comprised of compounds selection,
flexible alignments, pharmacophore-based model description, validation, virtual screening,
and multifactorial analysis of the hits.
2.5.1 Compounds selection
The first step for the creation of a predictive pharmacophore-based computer model was
the selection of active substances to be used as an input. The criterion for inclusion was
inhibitory activity stronger than 20 %. The most active representatives from four different
structural subclasses were: luteolin (44.31 % inhibition), quercetin (35.71 %), resveratrol
(26.04 %), and urolithin A (35.28 %) (B-2.3.2). At first glance, these molecules shared
some common features: all of them had relative planar geometry and were conjugated
systems (Figure 23).
Figure 23: Input substances for creation of pharmacophore-based in silico model and
their inhibitory potentials on Akt-phosphorylation (in %).
2.5.2 Flexible alignments
In order to uncover similar structural characteristics the selected molecules were
superposed, using the tool “Flexible Alignments” available in the Molecular Operating
Environment program (MOE) [311]. This methodology was developed by Labute et al.

2 Effects of polyphenols on Akt-kinase-phosphorylation
85
[312] and is widely used for a pharmacophore elucidation. A force field suitable for small
molecules (MMFF9x) was selected and was used for all further actions in the MOE.
A collection of alignments was generated and evaluated using a special scoring quantifying
the quality of the overlay [313] (for details refer to C-2.5). The best five molecular
superpositions were investigated as a base for the creation of a pharmacophore model.
Besides the scoring, the number of common structural features defined (see the next point)
indicated that the first alignment (Figure 24) was superior.
Figure 24: The best-scored flexible alignment generated by the Molecular Operating
Environment (MOE) program, based on the molecules of luteolin (yellow),
quercetin (green), resveratrol (blue), and urolithin A (red), which were the
most active representatives from the chemical subclasses they belong. The
overlay indicated that all four compounds shared multiple common
structural characteristics and molecular geometry.
In addition, distances between of the hydroxyl groups of the polyphenols were measured:
- Luteolin (5- to 4’- OH): 10.78 Å
- Quercetin (5- to 4’-OH): 10.80 Å
- Urolithin A (3 to 8’-OH): 9.77 Å
- Resveratrol (3 to 4’-OH): 10.77 Å
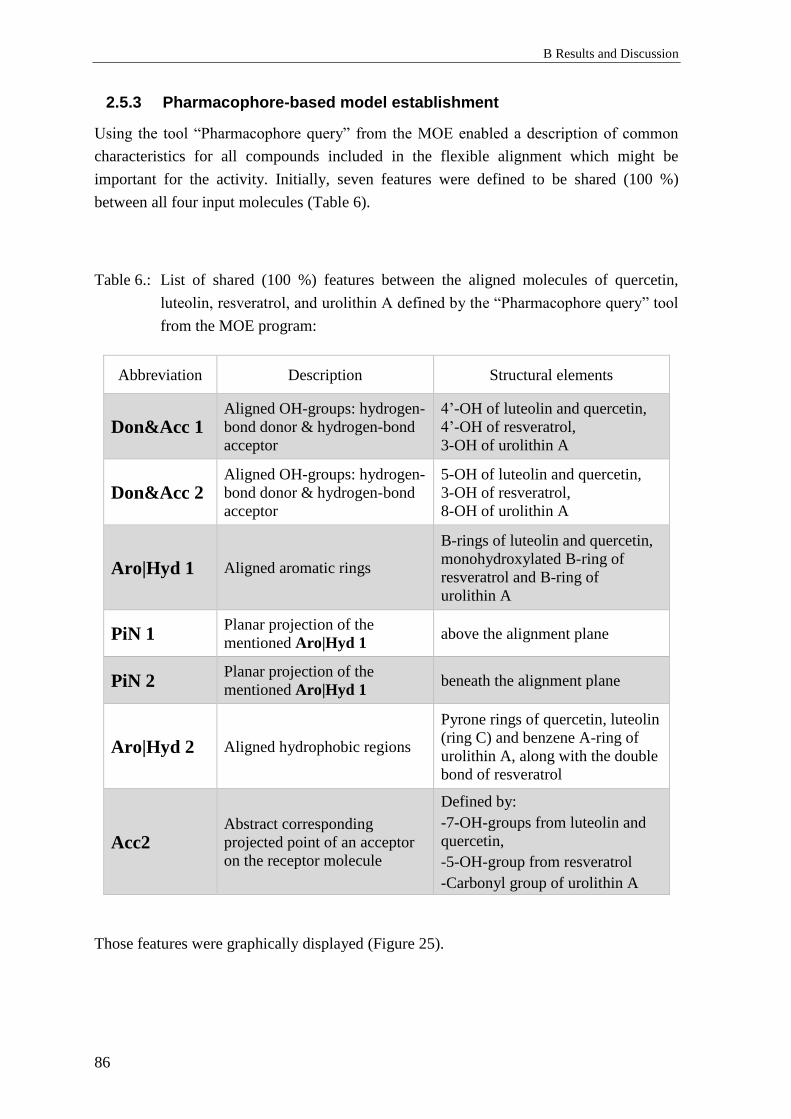
B Results and Discussion
86
2.5.3 Pharmacophore-based model establishment
Using the tool “Pharmacophore query” from the MOE enabled a description of common
characteristics for all compounds included in the flexible alignment which might be
important for the activity. Initially, seven features were defined to be shared (100 %)
between all four input molecules (Table 6).
Table 6.: List of shared (100 %) features between the aligned molecules of quercetin,
luteolin, resveratrol, and urolithin A defined by the “Pharmacophore query” tool
from the MOE program:
Abbreviation Description Structural elements
Don&Acc 1 Aligned OH-groups: hydrogen-
bond donor & hydrogen-bond
acceptor
4’-OH of luteolin and quercetin,
4’-OH of resveratrol,
3-OH of urolithin A
Don&Acc 2 Aligned OH-groups: hydrogen-
bond donor & hydrogen-bond
acceptor
5-OH of luteolin and quercetin,
3-OH of resveratrol,
8-OH of urolithin A
Aro|Hyd 1 Aligned aromatic rings
B-rings of luteolin and quercetin,
monohydroxylated B-ring of
resveratrol and B-ring of
urolithin A
PiN 1 Planar projection of the
mentioned Aro|Hyd 1 above the alignment plane
PiN 2 Planar projection of the
mentioned Aro|Hyd 1 beneath the alignment plane
Aro|Hyd 2 Aligned hydrophobic regions
Pyrone rings of quercetin, luteolin
(ring C) and benzene A-ring of
urolithin A, along with the double
bond of resveratrol
Acc2 Abstract corresponding
projected point of an acceptor
on the receptor molecule
Defined by:
-7-OH-groups from luteolin and
quercetin,
-5-OH-group from resveratrol
-Carbonyl group of urolithin A
Those features were graphically displayed (Figure 25).

2 Effects of polyphenols on Akt-kinase-phosphorylation
87
Figure 25: Representation of the pharmacophore-based model of the most active
polyphenols from four subclasses, inhibiting Akt-phosphorylation,
generated by the MOE. Totally seven structural features were defined as
common for all molecules included: Don&Acc 1, 2 (hydrogen bond donor
and acceptor), Aro|Hyd 1, 2 (aromatic or hydrophobic region), PiN 1, 2
(aromatic ring projection), and Acc2 (abstract acceptor projection).
2.5.4 Validation and improvement of the model
To validate the established model a database consisting of 44 compounds with conformers
of all molecules included in the in vitro screening process (B-2.3) for inhibitory potential
on Akt-phosphorylation (active and inactive) was generated. Again, compounds possessing
inhibitory potential around 20 % or more were considered active. This database was
screened in order to validate that the created in silico model was capable to recognize only
active molecules in the process of virtual screening. As many of the compounds had
similar structures, the pharmacophore query search found some molecules without
activities according to the in vitro results. This demanded further optimization of the
model. Initially the radiuses of the spheres describing common features (Don&Acc 1,
Don&Acc 2, PiN 1, PiN 2, Table 6) were varied and thereby many inactive compounds
were sorted out. Further two different strategies were used to improve the model: the
exclusive (B-2.5.4.1) and the planar (B-2.5.4.2) pharmacophore-based models.

B Results and Discussion
88
2.5.4.1 Exclusive pharmacophore-based model
As some active compounds differed structurally from the inactive ones only by a
substituent or by the presence/absence of a hydroxyl group (urolithins C and D, morin),
these residues were extra excluded by the “volume exclusion” option of the MOE. Bulky
groups were not favorable for the activity and were additionally excluded as well (gallic
acid from EGCG and (–)-quinic acid from chlorogenic acid, Figure 26).
Figure 26: Exclusive pharmacophore-based model (MOE). In gray are shown the
volumes of bulky groups and hydroxyl groups which were excluded in
order to eliminate the respective inactive molecules ((-)-EGCG,
chlorogenic acid, urolithin C, D, morin) during the validation process.
2.5.4.2 Planar pharmacophore-based model
This strategy was based on the observation that all four input molecules possessed
relatively planar geometry and that probably the hypothetic target might have only a
narrow binding pocket. For this reason the volumes above and beneath the superposed
molecules were excluded. The distance in between was approximately 4.2 Å (“excluded
volume”). This limited the appearance of inactive molecules with large substituents ((-)-
EGCG, chlorogenic acid, glycosides) in the output during the validation. Morin could not
be eliminated and its additional hydroxyl group was specially excluded from the model
(V4, V6). The planar pharmacophore-based model is represented on the Figure 27.
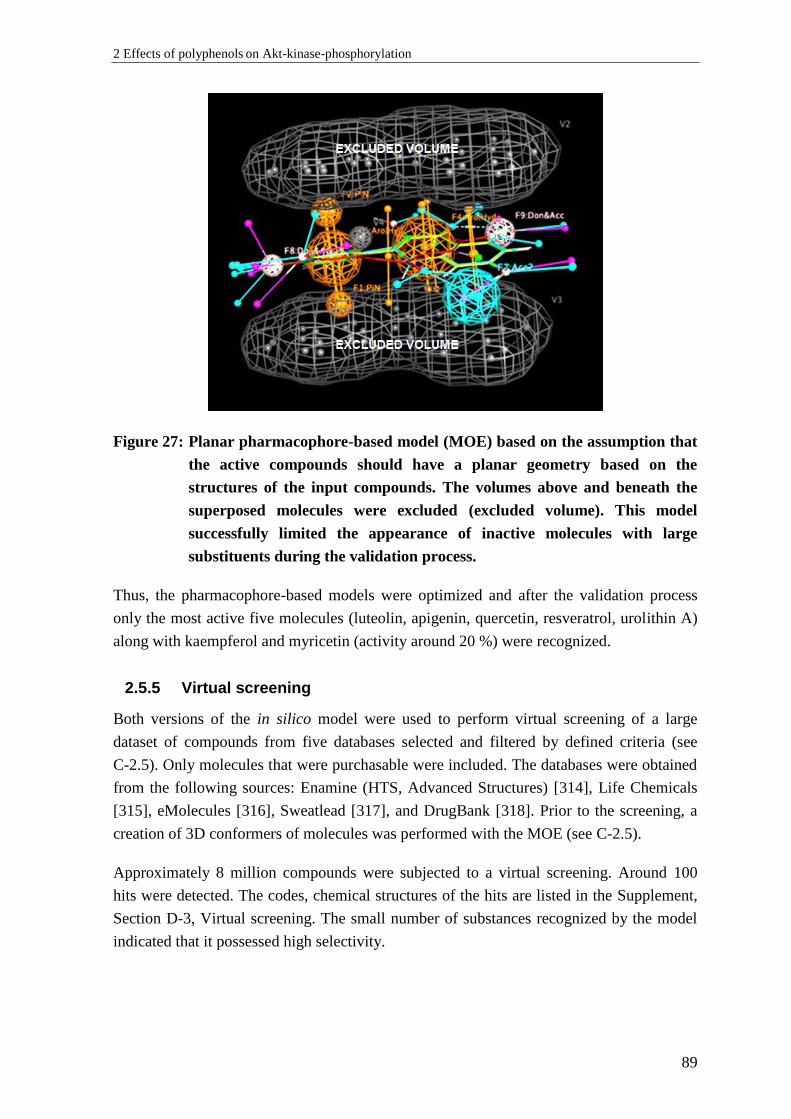
2 Effects of polyphenols on Akt-kinase-phosphorylation
89
Figure 27: Planar pharmacophore-based model (MOE) based on the assumption that
the active compounds should have a planar geometry based on the
structures of the input compounds. The volumes above and beneath the
superposed molecules were excluded (excluded volume). This model
successfully limited the appearance of inactive molecules with large
substituents during the validation process.
Thus, the pharmacophore-based models were optimized and after the validation process
only the most active five molecules (luteolin, apigenin, quercetin, resveratrol, urolithin A)
along with kaempferol and myricetin (activity around 20 %) were recognized.
2.5.5 Virtual screening
Both versions of the in silico model were used to perform virtual screening of a large
dataset of compounds from five databases selected and filtered by defined criteria (see
C-2.5). Only molecules that were purchasable were included. The databases were obtained
from the following sources: Enamine (HTS, Advanced Structures) [314], Life Chemicals
[315], eMolecules [316], Sweatlead [317], and DrugBank [318]. Prior to the screening, a
creation of 3D conformers of molecules was performed with the MOE (see C-2.5).
Approximately 8 million compounds were subjected to a virtual screening. Around 100
hits were detected. The codes, chemical structures of the hits are listed in the Supplement,
Section D-3, Virtual screening. The small number of substances recognized by the model
indicated that it possessed high selectivity.

B Results and Discussion
90
2.5.6 Post-screening-analysis
To predict the activity and relevance of the hits for further investigations, important
structural features, conformations, physicochemical properties and similarity to already
investigated molecules from the in vitro screening study were considered.
According to the primary semi-quantitative SAR (B-2.4.1) glycosides possessed no in vitro
inhibitory activity at all. For this reason all hits containing sugar-residues were excluded
from the analysis. The exclusive pharmacophore-based model recognized some conformers
from catechins and they were not studied further as well. Molecules that were quite similar
to some of the active ones (i.e. additional hydroxyl or methyl group) were also not of
interest.
A further step in the post-screening-analysis was the calculation of descriptors defining the
relevance of substances for in vitro analysis in cell-based assays. These included acid-base
properties (pKa- and pKb-values) of the compounds and respectively their charges
(protonated/deprotonated form) under cell culture conditions (pH= 7.4 – 7.6), along with
their water solubility (partition coefficient o/w: LogD7.4). These parameters were
calculated using the MoKa software [319]; (C-2.5). Possible tautomerization was also
predicted and chiral centers were considered.
The pKa- and LogD-values and charges were calculated for the input compounds in order
to serve as a base for comparison with those properties of the hits (Table 7).
Table 7.: Predicted strongest acidic pKa-, LogD-, LogP-values, and charges of the input
compounds by MoKa software; qp – quality of prediction, qp= 0 corresponds to
a good prediction. The bigger is the absolute value of qp, the lower is the quality
of predictions.
Substance LogD7.4 LogPo/w Strongest
acidic pKa
predicted charge
at pH 7.4 qp
Quercetin –0.9 2.0 4.48 (–) 0.00
Resveratrol 1.8 2.9 6.20 (–) 0.00
Urolithin A 3.2 3.2 8.29 (neutral) 0.00
Luteolin 0.5 2.4 5.34 (–) 0.00
Accordingly, these parameters were also calculated for the hits. Hits having predominantly
positive charged species or high values of LogD7.4 (indicating poor solubility) were
excluded from further analysis.
Lastly, a systematic conformational search was performed for short-listed compounds. All
3D-conformers generated were studied for their eligibility to satisfy the pharmacophore
models and whether the matches were energetically favorable. Molecular conformations,
having relative conformer energy dE < 3 kcal/mol were considered stable.

2 Effects of polyphenols on Akt-kinase-phosphorylation
91
2.5.7 Summarized results (in silico)
After the post-screening analysis of the hits obtained from the virtual screening (B-2.5.5),
four compounds with possibly suitable properties were chosen for an experimental “proof
of concept”, respectively in vitro validation of the predictive model (Table 8).
Table 8.: List of hits, along with their vendor codes (from Enamine store), structures,
pKa-, LogD-values, and relative conformational energy dE (regarded to the most
stable conformer) selected for the in vitro validation of the model; qp – quality
of pKa-value predictions, qp= 0 corresponds to a good prediction. The bigger is
the absolute value of qp, the lower is the quality of predictions (MoKa):
No Code Chemical structure of the hits LogD
Strongest
acidic pKa-
value,
predicted
charge
Energetically
favourable
conformation
(dE)
[kcal/mol]
1 Z2752916184
1.3 6.84 (–)
qp= –0.28 2.62
2 Z1567937963
–2.0 2.78 (–)
qp= –2.61 0.00
3 Z1621797376
2.6
8.07
(neutral)
qp= 0.00
2.31
4 Z2329004358
0.5
9.79
(neutral)
qp= –0.02
7.78

B Results and Discussion
92
2.5.8 Discussion: In silico analysis
After model generation and validation four molecules were suggested to have a potential
Akt-inhibitory activity. The selected compounds had physicochemical characteristics close
to those of the input substances, according to the predicted values (MoKa), with some
exceptions. The results obtained from the program for pKa-values were different than the
experimentally established ones found in the literature. The strongest acidic OH-groups of
resveratrol, luteolin, and quercetin were predicted to have pKa-values of 6.20, 5.34, and
4.48, while the experimentally determined values were 8.8 [320], 6.9 [321], and 7.1 [322].
These differences might be due to the training set and algorithm used by MoKa [323]. As
all predicted pKa-values were lower than the experimentally established, a systematic error
could be assumed. Thus, charges of the hits were not expected to differ much from the
input substances’ ones at pH 7.5, except for Z1567937963 (compound 2, Table 8) which
was expected to be strongly deprotonated and negatively charged, because of its carboxyl
group. This might compromise the cell-membrane permeability of this compound in in
vitro experiments.
The energies of the conformers of the hits matching the pharmacophore model were
considered. Compound 2 (Table 8) had energetically very favorable conformations which
satisfied the pharmacophore-based model and molecular structure close to this of
resveratrol. Compound 4 was to a big extent non-charged, but the relative energy of its
model-matching conformations was probably too high, and respectively required
conformations too unstable. Anyway, it was considered as a compound with a different
structure from the input compounds to test.
Compound 1 was a stilbene analogue, having predicted pKa-value similar to this of
resveratrol and stable model-matching conformers. A very important factor to consider was
an existing tautomerization defined by MoKa (Supplement, Section D-3). Compound 3 had
a hydroxylated benzo-coumarin fragment, similar to urolithin A. Its conformers matched
both pharmacophore models. Matches of the exclusive model were with more favorable
energies than those matching the planar model. This might help to distinguish if the active
compounds should necessarily have a planar structure.
The multifactorial analysis indicated that among the selected compounds there was no one
which perfectly fulfilled all parameters (charge, conformer stability, absence of
tautomerization and chiral centers) of criteria for relevance and applicability to in vitro
studies.

2 Effects of polyphenols on Akt-kinase-phosphorylation
93
2.5.9 Limitations of the study
The strategy used in the pharmacophore-based modeling assumed that the input
compounds had similar mechanism of action and their shared structural features were
involved in it. In addition it was supposed that the mode-of-action is ligand-target based.
Despite the fact that the direct target of polyphenols affecting Akt-phosphorylation was
unknown, it was conceivable that the active compounds might interact with upstream
pathways of Akt-kinase. As discussed under B-2.4.2 it was suggested that polyphenols
interacted directly with PI3K. Indeed, in the literature was reported that quercetin [262],
resveratrol [324], luteolin [325], and urolithin A [326] are capable to inhibit PI3K,
indicating that the selected polyphenols might have similar mode of action regarding
inhibition of Akt-phosphorylation. Thus, the assumption about the planar model
(B-2.5.4.2) might be correct.
An additional limitation was that the model might have been too restrictive, as it did not
recognize some compounds that possess activity greater than 20 % (B-2.3.2: i.e.
6-hydroxyflavone, 6-methoxyflavone) in the validation process. However, the model was
validated and optimized for virtual screening and based on the hits found and an in vitro
validation of their activity it could be expanded and further improved. Furthermore, the
established pharmacophore-based model might be connected to the binding site of PI3K or
other relevant up-stream kinases of Akt and might be re-examined and advanced
(B-2.5.11).
2.5.10 Proof of concept – results
In order to verify that the in silico model is able to predict the inhibitory activity on Akt-
phosphorylation of novel compounds, the selected hits listed in Table 8 (Compounds 1–4)
were tested in vitro in the experimental set-up used for the initial screening of polyphenolic
compounds (C-2.4.1.4) under the same conditions.
The results from independent experiments (n= 5 – 10) indicated that all four tested
compounds did not exhibit any significant effects on the phosphorylation of Akt in
endothelial cells. After treatment with each substance, the phosphorylation of Akt
remained unchanged compared to vehicle-treated negative controls (Figure 28).
Detailed information about the descriptive statistics for the effects of the virtual screening
hits on Akt-phosphorylation can be found in the Supplement, Section D-3. In addition, the
phosphorylation status of Akt on Thr308 position remained likewise unaffected after
treatment (data not shown).
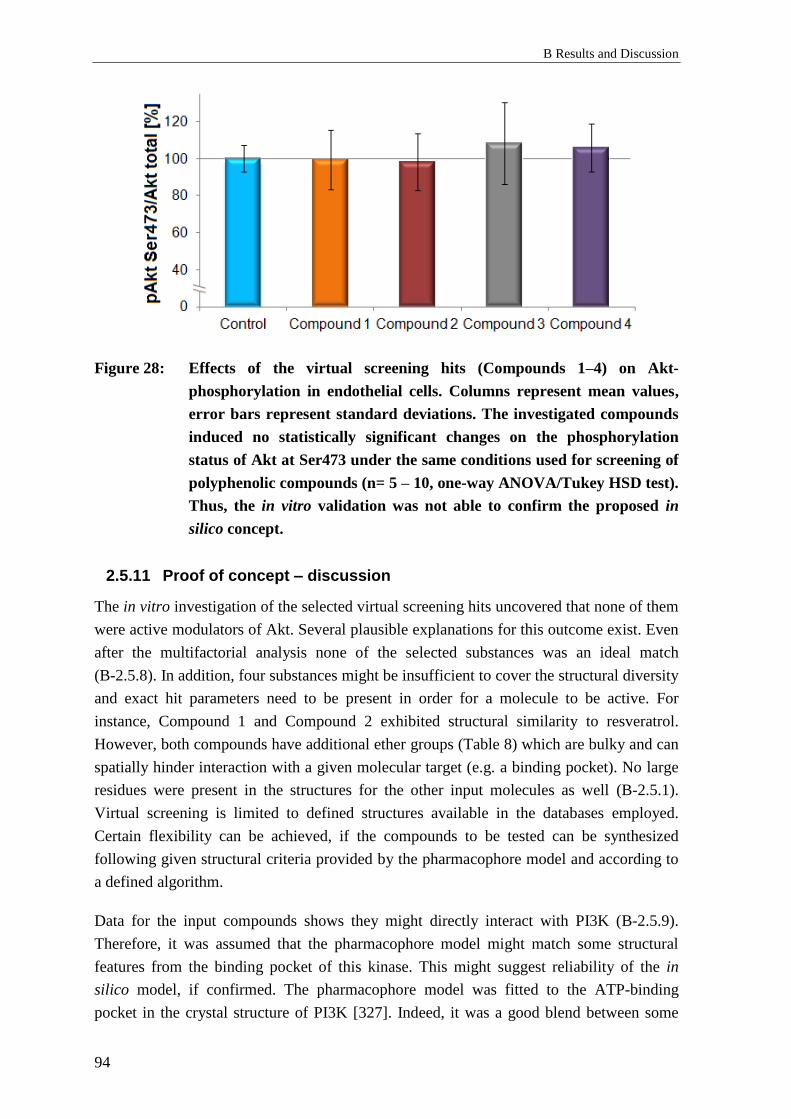
B Results and Discussion
94
Figure 28: Effects of the virtual screening hits (Compounds 1–4) on Akt-
phosphorylation in endothelial cells. Columns represent mean values,
error bars represent standard deviations. The investigated compounds
induced no statistically significant changes on the phosphorylation
status of Akt at Ser473 under the same conditions used for screening of
polyphenolic compounds (n= 5 – 10, one-way ANOVA/Tukey HSD test).
Thus, the in vitro validation was not able to confirm the proposed in
silico concept.
2.5.11 Proof of concept – discussion
The in vitro investigation of the selected virtual screening hits uncovered that none of them
were active modulators of Akt. Several plausible explanations for this outcome exist. Even
after the multifactorial analysis none of the selected substances was an ideal match
(B-2.5.8). In addition, four substances might be insufficient to cover the structural diversity
and exact hit parameters need to be present in order for a molecule to be active. For
instance, Compound 1 and Compound 2 exhibited structural similarity to resveratrol.
However, both compounds have additional ether groups (Table 8) which are bulky and can
spatially hinder interaction with a given molecular target (e.g. a binding pocket). No large
residues were present in the structures for the other input molecules as well (B-2.5.1).
Virtual screening is limited to defined structures available in the databases employed.
Certain flexibility can be achieved, if the compounds to be tested can be synthesized
following given structural criteria provided by the pharmacophore model and according to
a defined algorithm.
Data for the input compounds shows they might directly interact with PI3K (B-2.5.9).
Therefore, it was assumed that the pharmacophore model might match some structural
features from the binding pocket of this kinase. This might suggest reliability of the in
silico model, if confirmed. The pharmacophore model was fitted to the ATP-binding
pocket in the crystal structure of PI3K [327]. Indeed, it was a good blend between some

2 Effects of polyphenols on Akt-kinase-phosphorylation
95
features from the pharmacophore model and the protein structure (Figure 29 A). The
hydrophobic feature Aro|Hyd 1 (C-ring) (B-2.5.3) corresponded well to methionine
residues from both sites with approximate distances of 3.90 and 5.30 Å. A possible
interaction between sulfur atom from methionine and an aromatic ring’s π-system has been
described for distance < 6 Å [328]. Aro|Hyd 2 (B-ring) complies with the hydrophobic
isoleucine rest. PiN 1 and 2 could be also considered relevant because of the planarity of
the binding pocket. Don&Acc 1 (OH-group) interacts with an aspartate carboxyl group. In
addition, excluded volumes (because of inactive compounds, such as morin; V4, V6)
indicate that OH-groups there might not be favorable for the activity because of the
proximity of hydrophobic isoleucine rests (distance around 2Å). Don&Acc 2 does not
seem to interact with any of the amino acids from the ATP-binding pocket of PI3K. On the
contrary, a feature (Acc) based on the carbonyl functions of quercetin and luteolin (but
then not fully considering determinants of urolithin A and resveratrol) can also be
considered relevant as it potentially can interact with a NH2-group of valine. It seems that
the pharmacophore model matches well the shape, the hydrophilic (purple) and
hydrophobic (green) regions of the PI3K’s binding pocket surface (Figure 29 B).
Figure 29: Fitting of the pharmacophore model into the PI3K binding pocket, where
quercetin had been docked (Walker et al. [327]). A: The interactions
giving reliability of the model are: OH-group (Don&Acc 1) with aspartate
carboxyl group; Pyrone ring (Aro|Hyd 1) with two methionine residues
(yellow; distance: 5.30 and 3.90 Å); B-benzene ring (Aro|Hyd 2) with
isoleucine rest; Excluded volumes (V4, V6) for OH-groups – vicinity to
hydrophobic isoleucine residues: special hindrance. B: Pharmacophore
model matches well the shape and polarity (hydrophilic (purple) and
hydrophobic (green) regions) of the PI3K’s binding pocket surface.
A. B.
B Results and Discussion
96
Despite the inactivity of the selected hits, it cannot be concluded that the pharmacophore
model is not reliable. Conversely, the proposed in silico model complies well with the
protein structure of a kinase upstream of Akt – PI3K. The model can be further improved
and testing of further compounds in vitro is needed to verify its relevance.
2.6 Investigation of the effect of bio-activation of
polyphenols
2.6.1 Background: Bio-activation of polyphenols
Recently the impact of intestinal microbiota on the human health is of increasing interest
and object of extensive research activities [329, 330]. Various clinical and epidemiological
studies indicated an inverse relationship between the intact gut microflora and T2DM and
its related metabolic syndrome [331-333]. Among the variety of mechanisms proposed to
be responsible for the health benefits the microbial transformation of nutrient precursors
into bioactive metabolites plays a significant role. Such metabolites are for example short
chain fatty acids and trimethylamine N-oxide [334]. An important group of nutrients are
polyphenols. Evidence exists that some polyphenolic compounds can be likewise
metabolized and thus can undergo bio-activation. In particular, gut-microbiota-generated
metabolites of lignans were shown to reduce the risk of T2DM [335].
In addition to lignans, further polyphenolic compounds described to undergo bio-activation
are ellagotanins and ellagic acid which can be bio-transformed by intestinal microbiota into
urolithins, which were shown to exhibit various pharmacological effects [330, 336].
Urolithins exhibit stronger biological activities than ellagic acid and are up to 80-fold more
bioavailable in human plasma than their precursor [337].
Catechin metabolites M1 and M2 were shown to occur in blood plasma of individuals after
intake of French maritime pine bark extract [165]. Eggerthella lenta and Flavonifractor
plautii bacterial strains were described to convert catechin and its oligomers to delta-(3,4-
dihydroxy-phenyl)-gamma-valerolactone (M1) [338]. This compound was capable to
statistically significantly inhibit inducible nitric oxide synthase (iNOS), while in contrast
its precursor (+)-catechin had a minor effect [140]. In addition, another study revealed that
bacterial metabolites M1 and M2 were more potent inhibitors of matrix metalloproteinases
(MMP-I, MMP-II and MMP-IX) than (+)-catechin [180].
Thus, polyphenolic compounds may undergo bio-activation through metabolic conversion
by intestinal microbiota.
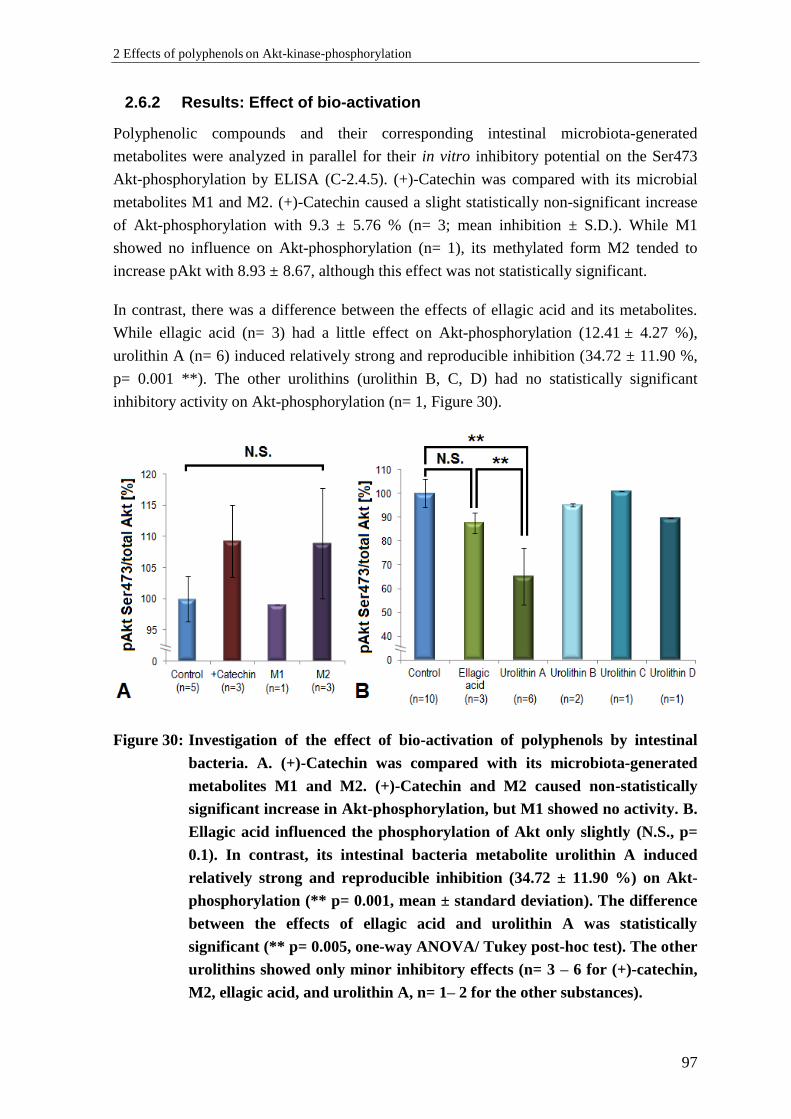
2 Effects of polyphenols on Akt-kinase-phosphorylation
97
2.6.2 Results: Effect of bio-activation
Polyphenolic compounds and their corresponding intestinal microbiota-generated
metabolites were analyzed in parallel for their in vitro inhibitory potential on the Ser473
Akt-phosphorylation by ELISA (C-2.4.5). (+)-Catechin was compared with its microbial
metabolites M1 and M2. (+)-Catechin caused a slight statistically non-significant increase
of Akt-phosphorylation with 9.3 ± 5.76 % (n= 3; mean inhibition ± S.D.). While M1
showed no influence on Akt-phosphorylation (n= 1), its methylated form M2 tended to
increase pAkt with 8.93 ± 8.67, although this effect was not statistically significant.
In contrast, there was a difference between the effects of ellagic acid and its metabolites.
While ellagic acid (n= 3) had a little effect on Akt-phosphorylation (12.41 ± 4.27 %),
urolithin A (n= 6) induced relatively strong and reproducible inhibition (34.72 ± 11.90 %,
p= 0.001 **). The other urolithins (urolithin B, C, D) had no statistically significant
inhibitory activity on Akt-phosphorylation (n= 1, Figure 30).
Figure 30: Investigation of the effect of bio-activation of polyphenols by intestinal
bacteria. A. (+)-Catechin was compared with its microbiota-generated
metabolites M1 and M2. (+)-Catechin and M2 caused non-statistically
significant increase in Akt-phosphorylation, but M1 showed no activity. B.
Ellagic acid influenced the phosphorylation of Akt only slightly (N.S., p=
0.1). In contrast, its intestinal bacteria metabolite urolithin A induced
relatively strong and reproducible inhibition (34.72 ± 11.90 %) on Akt-
phosphorylation (** p= 0.001, mean ± standard deviation). The difference
between the effects of ellagic acid and urolithin A was statistically
significant (** p= 0.005, one-way ANOVA/ Tukey post-hoc test). The other
urolithins showed only minor inhibitory effects (n= 3 – 6 for (+)-catechin,
M2, ellagic acid, and urolithin A, n= 1– 2 for the other substances).
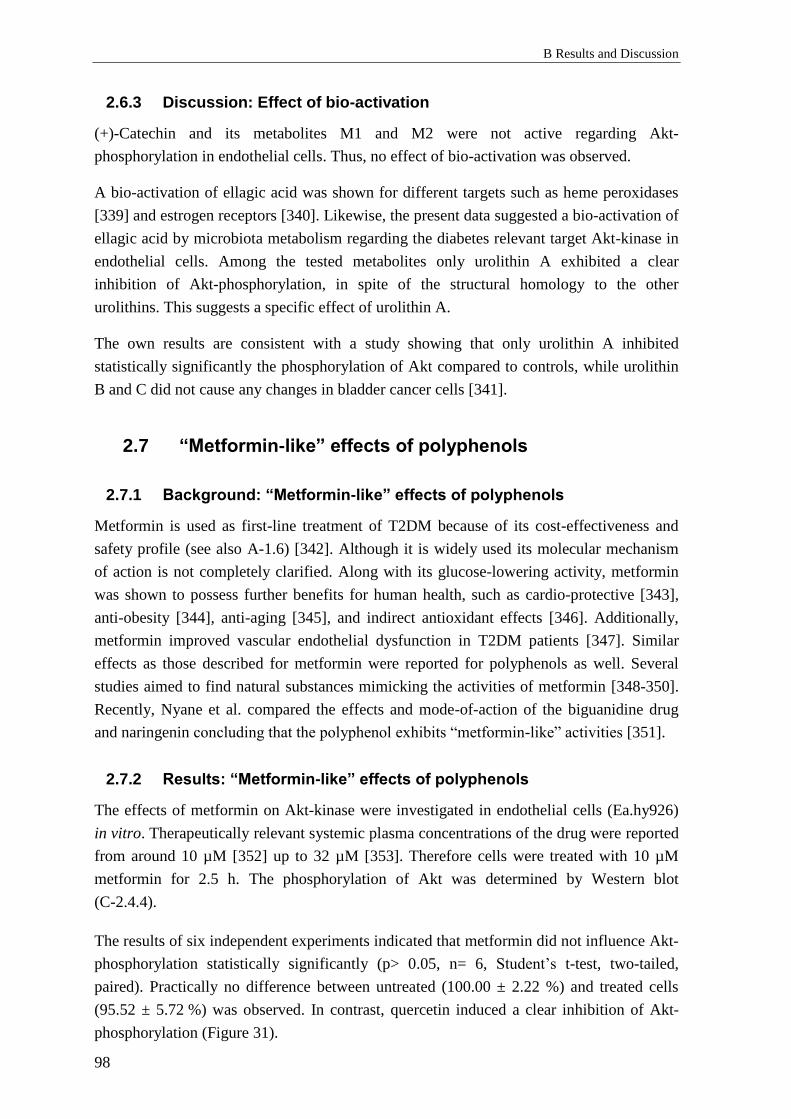
B Results and Discussion
98
2.6.3 Discussion: Effect of bio-activation
(+)-Catechin and its metabolites M1 and M2 were not active regarding Akt-
phosphorylation in endothelial cells. Thus, no effect of bio-activation was observed.
A bio-activation of ellagic acid was shown for different targets such as heme peroxidases
[339] and estrogen receptors [340]. Likewise, the present data suggested a bio-activation of
ellagic acid by microbiota metabolism regarding the diabetes relevant target Akt-kinase in
endothelial cells. Among the tested metabolites only urolithin A exhibited a clear
inhibition of Akt-phosphorylation, in spite of the structural homology to the other
urolithins. This suggests a specific effect of urolithin A.
The own results are consistent with a study showing that only urolithin A inhibited
statistically significantly the phosphorylation of Akt compared to controls, while urolithin
B and C did not cause any changes in bladder cancer cells [341].
2.7 “Metformin-like” effects of polyphenols
2.7.1 Background: “Metformin-like” effects of polyphenols
Metformin is used as first-line treatment of T2DM because of its cost-effectiveness and
safety profile (see also A-1.6) [342]. Although it is widely used its molecular mechanism
of action is not completely clarified. Along with its glucose-lowering activity, metformin
was shown to possess further benefits for human health, such as cardio-protective [343],
anti-obesity [344], anti-aging [345], and indirect antioxidant effects [346]. Additionally,
metformin improved vascular endothelial dysfunction in T2DM patients [347]. Similar
effects as those described for metformin were reported for polyphenols as well. Several
studies aimed to find natural substances mimicking the activities of metformin [348-350].
Recently, Nyane et al. compared the effects and mode-of-action of the biguanidine drug
and naringenin concluding that the polyphenol exhibits “metformin-like” activities [351].
2.7.2 Results: “Metformin-like” effects of polyphenols
The effects of metformin on Akt-kinase were investigated in endothelial cells (Ea.hy926)
in vitro. Therapeutically relevant systemic plasma concentrations of the drug were reported
from around 10 µM [352] up to 32 µM [353]. Therefore cells were treated with 10 µM
metformin for 2.5 h. The phosphorylation of Akt was determined by Western blot
(C-2.4.4).
The results of six independent experiments indicated that metformin did not influence Akt-
phosphorylation statistically significantly (p> 0.05, n= 6, Student’s t-test, two-tailed,
paired). Practically no difference between untreated (100.00 ± 2.22 %) and treated cells
(95.52 ± 5.72 %) was observed. In contrast, quercetin induced a clear inhibition of Akt-
phosphorylation (Figure 31).
2 Effects of polyphenols on Akt-kinase-phosphorylation
99
Figure 31: Representative Western blot comparing the effects of metformin and
quercetin on the phosphorylation level of Akt at Ser473 (pAkt). Both
substances were tested on Ea.hy926 endothelial cells at a concentration of
10 µM. In accordance with the previous results from the screening of
polyphenols on Akt-phosphorylation quercetin caused a remarkable
reduction of pAkt, while metformin induced no statistically significant
changes.
As the biguanidine derivative did not influence Akt-phosphorylation in the present in vitro
model, additional experiments with different treatment time points (i.e. 30 minutes) or with
primary endothelial cells (HUVEC) were performed. However, metformin induced no
statistically significant inhibition under any of the tested conditions (data not shown).
2.7.3 Discussion: “Metformin-like” effects of polyphenols
The influence of metformin on Akt-phosphorylation in vitro in endothelial cells revealed
no inhibitory effects in the cell model used. The present work did not confirm the
inhibitory potential of the anti-diabetic drug described in previous studies [18, 354].
However, preclinical data for metformin actions should be interpreted carefully. Multiple
in vitro and in vivo studies were performed with supra-pharmacological concentrations
which might yield misleading conclusions about the mode-of-action and effects of the drug
[355]. Indeed, metformin between 10 and 60 mM was shown to exhibit anti-proliferative
effects, mediated through an inhibition of Akt-phosphorylation [356, 357]. These
concentrations were around 1000 times higher than the typical in vivo serum levels.
Othman et al. reported that 3 µM metformin protected kidney cells from insulin-induced
DNA-damage through Akt-inhibition [18]. This finding could not be reproduced in
endothelial cells model used in the present study, probably due to differences in the
signaling between both cell lines and differences in the experimental design.
Another study claimed that 20 µM metformin antagonized short high-glucose-triggered
Akt-activation in cultured human vascular endothelial cells isolated from saphenous veins
[354]. In spite of varying the experimental conditions (cell type: HUVEC instead of
Ea.hy926, metformin concentrations used: 10 and 20 µM, duration of treatment: from 10
min up to 3 h, stimulus used: growth factors, insulin, and 30 mmol/l glucose) the outcome
of that study could not be confirmed in the own experimental setting.
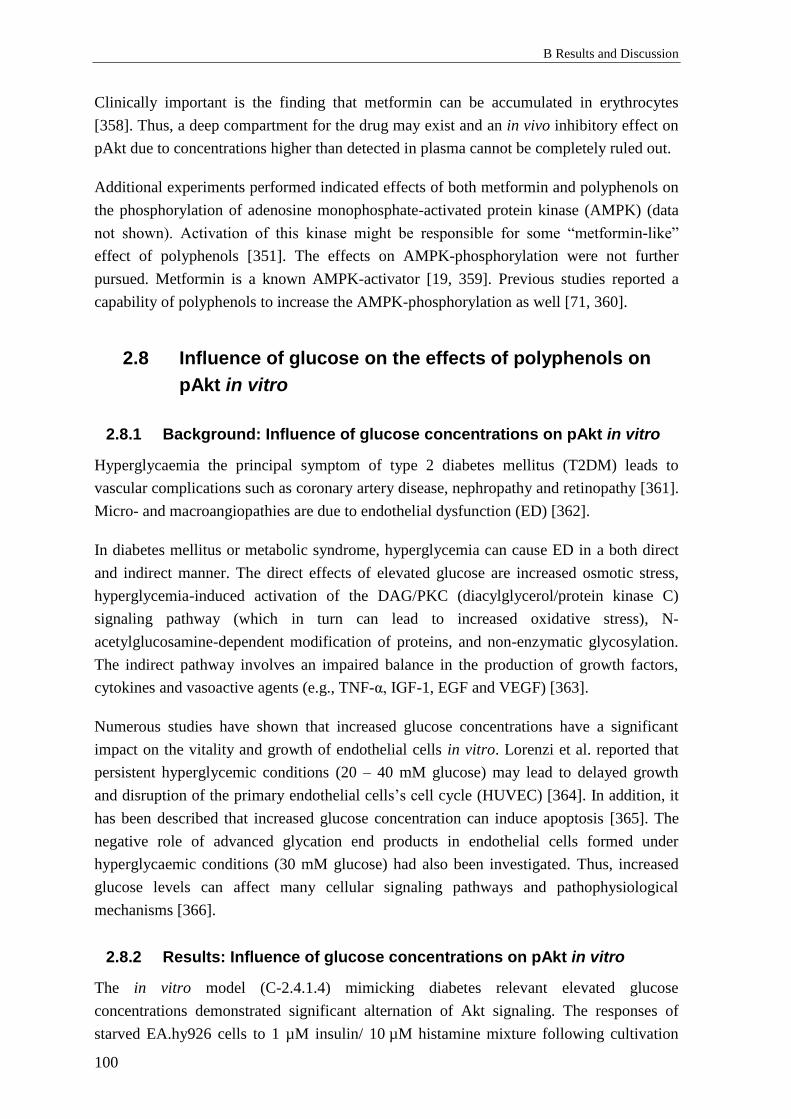
B Results and Discussion
100
Clinically important is the finding that metformin can be accumulated in erythrocytes
[358]. Thus, a deep compartment for the drug may exist and an in vivo inhibitory effect on
pAkt due to concentrations higher than detected in plasma cannot be completely ruled out.
Additional experiments performed indicated effects of both metformin and polyphenols on
the phosphorylation of adenosine monophosphate-activated protein kinase (AMPK) (data
not shown). Activation of this kinase might be responsible for some “metformin-like”
effect of polyphenols [351]. The effects on AMPK-phosphorylation were not further
pursued. Metformin is a known AMPK-activator [19, 359]. Previous studies reported a
capability of polyphenols to increase the AMPK-phosphorylation as well [71, 360].
2.8 Influence of glucose on the effects of polyphenols on
pAkt in vitro
2.8.1 Background: Influence of glucose concentrations on pAkt in vitro
Hyperglycaemia the principal symptom of type 2 diabetes mellitus (T2DM) leads to
vascular complications such as coronary artery disease, nephropathy and retinopathy [361].
Micro- and macroangiopathies are due to endothelial dysfunction (ED) [362].
In diabetes mellitus or metabolic syndrome, hyperglycemia can cause ED in a both direct
and indirect manner. The direct effects of elevated glucose are increased osmotic stress,
hyperglycemia-induced activation of the DAG/PKC (diacylglycerol/protein kinase C)
signaling pathway (which in turn can lead to increased oxidative stress), N-
acetylglucosamine-dependent modification of proteins, and non-enzymatic glycosylation.
The indirect pathway involves an impaired balance in the production of growth factors,
cytokines and vasoactive agents (e.g., TNF-α, IGF-1, EGF and VEGF) [363].
Numerous studies have shown that increased glucose concentrations have a significant
impact on the vitality and growth of endothelial cells in vitro. Lorenzi et al. reported that
persistent hyperglycemic conditions (20 – 40 mM glucose) may lead to delayed growth
and disruption of the primary endothelial cells’s cell cycle (HUVEC) [364]. In addition, it
has been described that increased glucose concentration can induce apoptosis [365]. The
negative role of advanced glycation end products in endothelial cells formed under
hyperglycaemic conditions (30 mM glucose) had also been investigated. Thus, increased
glucose levels can affect many cellular signaling pathways and pathophysiological
mechanisms [366].
2.8.2 Results: Influence of glucose concentrations on pAkt in vitro
The in vitro model (C-2.4.1.4) mimicking diabetes relevant elevated glucose
concentrations demonstrated significant alternation of Akt signaling. The responses of
starved EA.hy926 cells to 1 µM insulin/ 10 µM histamine mixture following cultivation
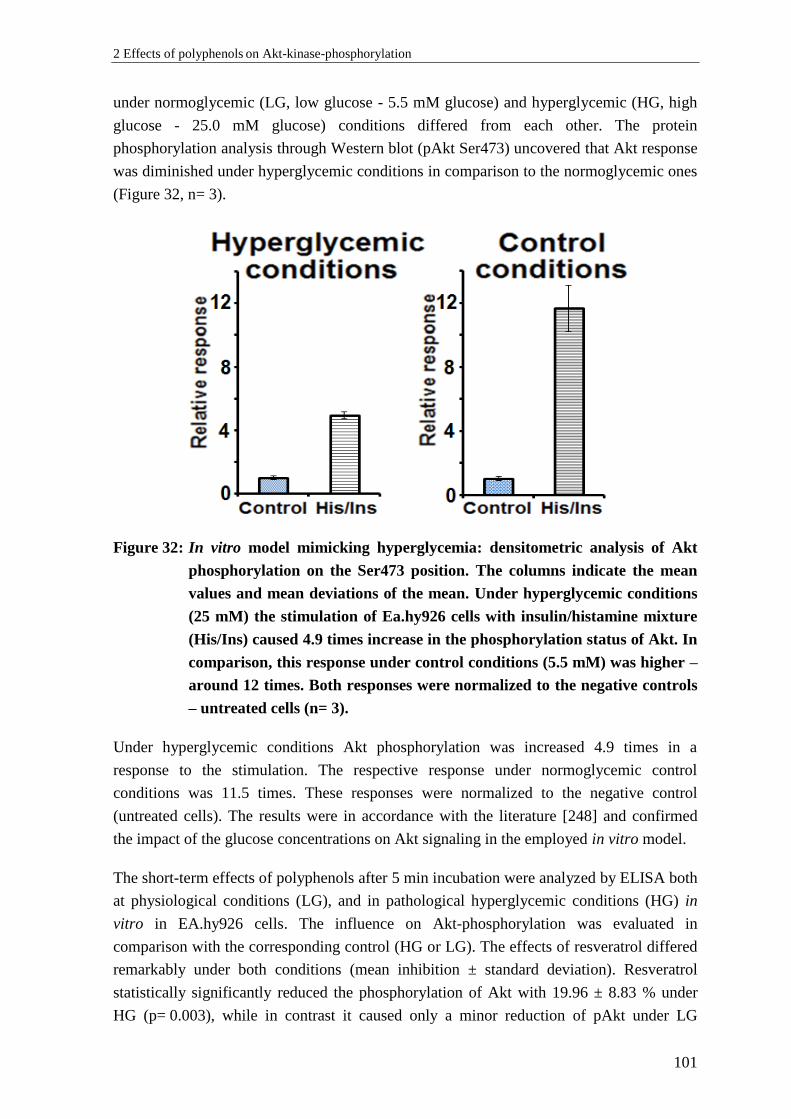
2 Effects of polyphenols on Akt-kinase-phosphorylation
101
under normoglycemic (LG, low glucose - 5.5 mM glucose) and hyperglycemic (HG, high
glucose - 25.0 mM glucose) conditions differed from each other. The protein
phosphorylation analysis through Western blot (pAkt Ser473) uncovered that Akt response
was diminished under hyperglycemic conditions in comparison to the normoglycemic ones
(Figure 32, n= 3).
Figure 32: In vitro model mimicking hyperglycemia: densitometric analysis of Akt
phosphorylation on the Ser473 position. The columns indicate the mean
values and mean deviations of the mean. Under hyperglycemic conditions
(25 mM) the stimulation of Ea.hy926 cells with insulin/histamine mixture
(His/Ins) caused 4.9 times increase in the phosphorylation status of Akt. In
comparison, this response under control conditions (5.5 mM) was higher –
around 12 times. Both responses were normalized to the negative controls
– untreated cells (n= 3).
Under hyperglycemic conditions Akt phosphorylation was increased 4.9 times in a
response to the stimulation. The respective response under normoglycemic control
conditions was 11.5 times. These responses were normalized to the negative control
(untreated cells). The results were in accordance with the literature [248] and confirmed
the impact of the glucose concentrations on Akt signaling in the employed in vitro model.
The short-term effects of polyphenols after 5 min incubation were analyzed by ELISA both
at physiological conditions (LG), and in pathological hyperglycemic conditions (HG) in
vitro in EA.hy926 cells. The influence on Akt-phosphorylation was evaluated in
comparison with the corresponding control (HG or LG). The effects of resveratrol differed
remarkably under both conditions (mean inhibition ± standard deviation). Resveratrol
statistically significantly reduced the phosphorylation of Akt with 19.96 ± 8.83 % under
HG (p= 0.003), while in contrast it caused only a minor reduction of pAkt under LG
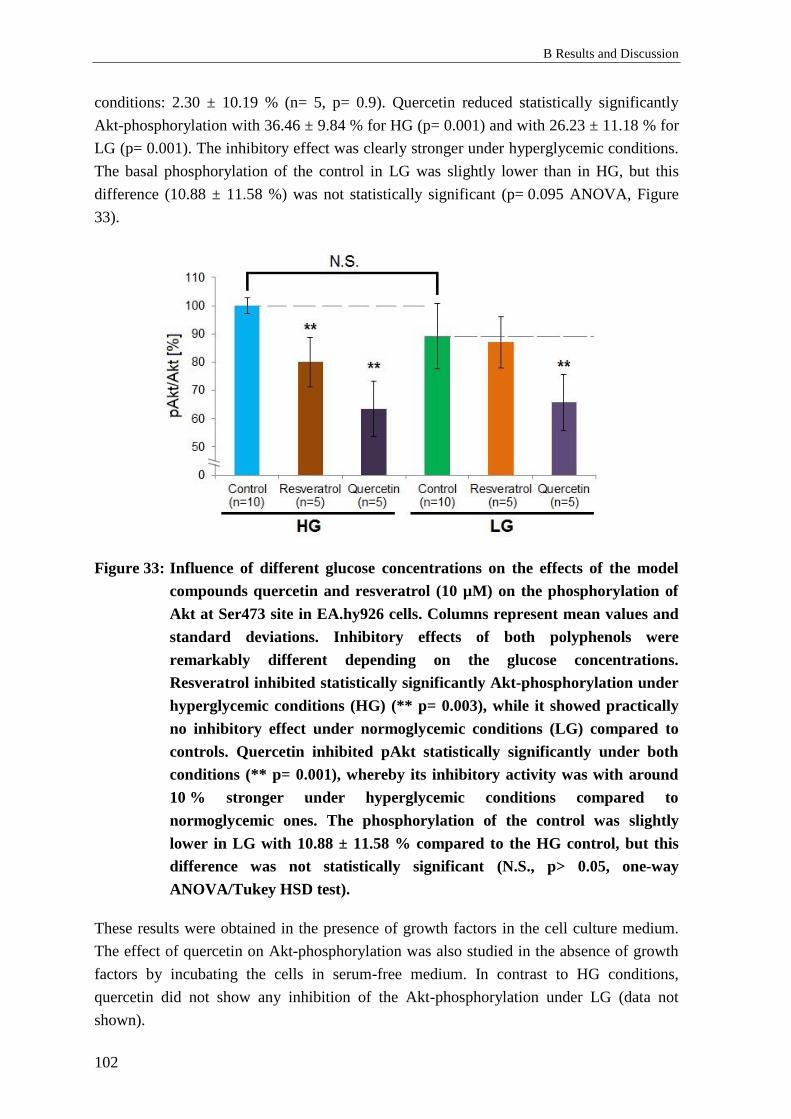
B Results and Discussion
102
conditions: 2.30 ± 10.19 % (n= 5, p= 0.9). Quercetin reduced statistically significantly
Akt-phosphorylation with 36.46 ± 9.84 % for HG (p= 0.001) and with 26.23 ± 11.18 % for
LG (p= 0.001). The inhibitory effect was clearly stronger under hyperglycemic conditions.
The basal phosphorylation of the control in LG was slightly lower than in HG, but this
difference (10.88 ± 11.58 %) was not statistically significant (p= 0.095 ANOVA, Figure
33).
Figure 33: Influence of different glucose concentrations on the effects of the model
compounds quercetin and resveratrol (10 µM) on the phosphorylation of
Akt at Ser473 site in EA.hy926 cells. Columns represent mean values and
standard deviations. Inhibitory effects of both polyphenols were
remarkably different depending on the glucose concentrations.
Resveratrol inhibited statistically significantly Akt-phosphorylation under
hyperglycemic conditions (HG) (** p= 0.003), while it showed practically
no inhibitory effect under normoglycemic conditions (LG) compared to
controls. Quercetin inhibited pAkt statistically significantly under both
conditions (** p= 0.001), whereby its inhibitory activity was with around
10 % stronger under hyperglycemic conditions compared to
normoglycemic ones. The phosphorylation of the control was slightly
lower in LG with 10.88 ± 11.58 % compared to the HG control, but this
difference was not statistically significant (N.S., p> 0.05, one-way
ANOVA/Tukey HSD test).
These results were obtained in the presence of growth factors in the cell culture medium.
The effect of quercetin on Akt-phosphorylation was also studied in the absence of growth
factors by incubating the cells in serum-free medium. In contrast to HG conditions,
quercetin did not show any inhibition of the Akt-phosphorylation under LG (data not
shown).
2 Effects of polyphenols on Akt-kinase-phosphorylation
103
Subsequently, the effects of quercetin were tested on HUVEC cells in order to check if
these findings are translatable for primary endothelial cells, which are considered a more
realistic model reflecting the physiological state of organisms better compared to the
immortalized cell lines (C-2.1.1).
Similar to the results obtained with EA.hy926, quercetin caused statistically significant
reduction of Akt-phosphorylation under both HG (p= 0.001) and LG (p= 0.001) conditions
in the presence of growth factors (one-way ANOVA/Tukey HSD test). No statistically
significant difference between the controls of both conditions was detected, although Akt-
phosphorylation seemed to be higher under LG than HG (Figure 34).
Figure 34: Effects of quercetin on Akt-phosphorylation in HUVEC cells under
both hyperglycemic-like (HG) and normoglycemic-like (LG)
conditions. Columns represent mean values and standard deviations.
The polyphenolic compound reduced the phosphorylation of Akt
with 42.47 ± 5.08 % (HG), respectively 43.84 ± 6.11 % (LG)
compared to controls. These effects were statistically significant
(** p= 0.001, one-way ANOVA/Tukey HSD test). The difference
between HG- and LG- controls was not statistically significant (N.S.).
2.8.3 Discussion: Influence of glucose concentrations on pAkt in vitro
The comparison of the in vitro effects of quercetin and resveratrol on Akt-phosphorylation
under hyperglycemic-like (HG) and euglycemic-like conditions (LG) suggested a possible
influence of the elevated glucose concentrations on the effects of polyphenols on pAkt.
The basal phosphorylation status of Akt (corresponding to untreated cells) was higher
under HG-conditions compared to LG in Ea.hy926 immortalized cells. In contrast, in
primary HUVEC cells the basal Akt-phosphorylation under LG conditions tended to be
B Results and Discussion
104
higher than this under HG. Both differences were not statistically significant. It has been
reported that elevated glucose can either increase or decrease pAkt depending on the cell
type. For instance, a study employing HUVEC cells showed that the activity of PI3K/Akt-
pathway was reduced by exposure to HG (20 – 40 mM glucose) compared to LG (5 mM),
which seemed to be in accordance with the present results obtained within the same type
[367]. However, another investigation revealed that Akt-phosphorylation was higher under
HG conditions (40.7 mM) in comparison to LG (5.7 mM) in retinal endothelial cells, due
to increased Src-signaling (a non-receptor tyrosine kinase) [368]. Thus, different
endothelial cells might react differently to elevated glucose concentrations which might
contribute to different effects of polyphenols tested under HG and LG. Further reasons for
the divergent results could be different concentrations and composition of growth factors
(see C-2.1.2.1) in the media, passage dependence, and duration of the HG-exposure.
Possible diversity of cellular signaling between the primary and immortalized cells cannot
be ruled out as well.
Differential effects of the model polyphenols quercetin and resveratrol on pAkt observed in
Ea.hy 926 cells still can be considered intriguing, although not confirmed for the tested
compound quercetin in primary HUVEC cells. A previous study likewise showed that
resveratrol exhibited more pronounced effects on Akt under HG than under LG [257]. In
contrast to the present study authors investigated long term effects (12 h) and reported an
activation of pAkt. In the present study short term effects were of interest. According to
own results, long exposure of cells to resveratrol tended to increase Akt-phosphorylation as
shown previously (see pilot study; B-2.1.2). The authors of that work [257] confirmed
experimentally the involvement of PTEN (phosphatase and tensin homolog) and discussed
a possible role of AMPK in the observed effects which may be applied to the present
results as well. To our best knowledge the present study appeared to be the first one
comparing the effects of quercetin on the phosphorylation status of Akt in endothelial cells
under different glucose levels.
2.8.4 Conclusions: Influence of glucose concentrations on pAkt in vitro
The data from the present study revealed differential effects of polyphenols on the Akt-
phosphorylation under different glucose concentrations in vitro and may broaden the
understanding for the importance of these nutrients and their mechanisms of action in
T2DM and support their role in alleviating HG-induced endothelial dysfunction and
consequent diabetic complications. Further research has to be conducted to verify the
physiological relevance and to elucidate the underlying mechanisms responsible for these
results.
The outcome from the presented investigation might give some insights about the rationale
for using polyphenols as nutraceuticals in management of T2DM and its co-morbidities
[369].
3 Effects of polyphenols on DPP IV activity and expression
105
3 Effects of polyphenols on DPP IV activity and
expression
3.1 Effects of polyphenols on the enzymatic activity of
DPP IV
3.1.1 Background: Polyphenols and DPP IV activity
As already mentioned (B-1.2.1), DPP IV is an enzyme responsible for the inactivation of
incretin hormones (as GLP-1) and therefore has an important clinical significance as a
target for treatment of T2DM [187]. In addition to the approved DPP IV inhibitors (i.e.
sitagliptin) it was described that some natural compounds are capable to reduce the activity
of DPP IV [370]. An extensive literature research indicated that various polyphenols are
reported as potent DPP IV inhibitors [215, 370, 371].
The in vitro studies published so far show that some polyphenols act as DPP IV inhibitors
in the micromolar and nanomolar concentration range. This was discussed in detail under
B-1.3.3.
Considering results from the literature review and the known outcome from the clinical
study for the action of PYC (B-1.3.2) on DPP IV, the effects of individual monomeric
ingredients of the extract and their metabolites on the enzymatic activity of purified
DPP IV was investigated. The inhibitory potential of various polyphenols was additionally
examined in an in vitro model.
3.1.2 Results: Polyphenols and DPP IV activity in vitro
Initially, a comprehensive screening regarding the in vitro inhibitory potential on the
activity of DPP IV of polyphenols with diverse structure was performed. Thirty
representatives from the following subclasses were included in the study: flavanones,
flavones, flavonols, flavanonols, flavan-3-ols (catechins), isoflavones, stilbenoids and
phenolic acids. In addition, five microbiota-generated metabolites of polyphenols were
investigated.
The results indicated no or only a minor reduction in the activity of DPP IV by the
investigated polyphenols at a concentration of 5 µM compared to the initial 100 % enzyme
activity in the approach utilizing purified human recombinant DPP IV (Figure 35).
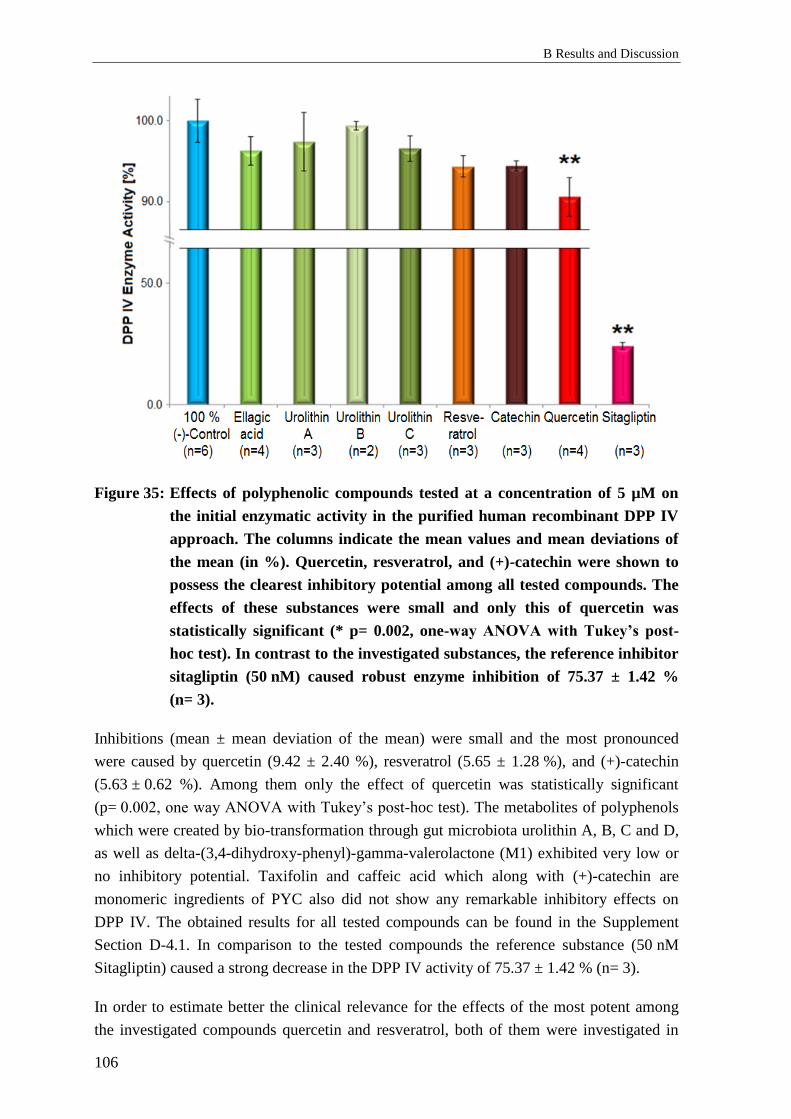
B Results and Discussion
106
Figure 35: Effects of polyphenolic compounds tested at a concentration of 5 µM on
the initial enzymatic activity in the purified human recombinant DPP IV
approach. The columns indicate the mean values and mean deviations of
the mean (in %). Quercetin, resveratrol, and (+)-catechin were shown to
possess the clearest inhibitory potential among all tested compounds. The
effects of these substances were small and only this of quercetin was
statistically significant (* p= 0.002, one-way ANOVA with Tukey’s post-
hoc test). In contrast to the investigated substances, the reference inhibitor
sitagliptin (50 nM) caused robust enzyme inhibition of 75.37 ± 1.42 %
(n= 3).
Inhibitions (mean ± mean deviation of the mean) were small and the most pronounced
were caused by quercetin (9.42 ± 2.40 %), resveratrol (5.65 ± 1.28 %), and (+)-catechin
(5.63 ± 0.62 %). Among them only the effect of quercetin was statistically significant
(p= 0.002, one way ANOVA with Tukey’s post-hoc test). The metabolites of polyphenols
which were created by bio-transformation through gut microbiota urolithin A, B, C and D,
as well as delta-(3,4-dihydroxy-phenyl)-gamma-valerolactone (M1) exhibited very low or
no inhibitory potential. Taxifolin and caffeic acid which along with (+)-catechin are
monomeric ingredients of PYC also did not show any remarkable inhibitory effects on
DPP IV. The obtained results for all tested compounds can be found in the Supplement
Section D-4.1. In comparison to the tested compounds the reference substance (50 nM
Sitagliptin) caused a strong decrease in the DPP IV activity of 75.37 ± 1.42 % (n= 3).
In order to estimate better the clinical relevance for the effects of the most potent among
the investigated compounds quercetin and resveratrol, both of them were investigated in

3 Effects of polyphenols on DPP IV activity and expression
107
the modified approach of DPP IV inhibition assay utilizing human serum probes as a
source of the enzyme and the assay was validated with the reference substance sitagliptin
(C-3.1.3.2).
After consideration of the initial fluorescence of the serum spiked with quercetin and
resveratrol, the results indicated that both compounds have minor effects on the DPP IV
activity, respectively mean decrease and mean deviation of 4.21 ± 2.32 % and 2.93 ±
0.86 % (n= 2).
3.1.3 Discussion: Polyphenols and DPP IV activity in vitro
The experiments performed with human recombinant DPP IV showed that the investigated
compounds at a concentration of 5 µM had only weak effects on DPP IV activity.
Quercetin, resveratrol and (+)-catechin were the substances with the clearest effects, but
among them only the inhibition by quercetin was statistically significant. However,
quercetin and resveratrol exhibited only a minor influence on the activity of the enzyme in
the serum sample approach.
The obtained results are in contradiction with the data published so far. Previous studies
claim that many monomeric polyphenols are capable to inhibit DPP IV potently (B-3.1.1,
B-1.3.3). It was reported the IC50 values of the most potent polyphenolic compounds are in
the low micromolar or nanomolar concentration range. To compare, in the present study
substances at a 5 µM concentration were tested. Although this concentration was much
higher (> 8000 to 2 fold) than the described ones for a 50 % inhibition of the enzyme
activity (IC50) in the published investigations [215, 221], it was not possible to observe an
inhibition stronger than 10 %. A conceivable reason for the difference between the current
and the published results could be the use of different type of enzyme (i.e. porcine DPP IV
[215, 221]) instead of human recombinant one used in the present study as despite the high
homology some functional differences between both were observed [372]. In addition, the
determined IC50 might be strongly dependent on the enzyme and substrate concentrations
[373]. Indeed, in the study of Fan et al. [215] a porcine DPP IV enzyme at a final
concentration of 1 ng/mL was used. This value is clearly lower than the mean
physiological concentration (753 ng/mL) and the individual serum concentrations of
DPP IV, which were detected in the performed clinical study (B-1.3.2.1). Likewise, other
studies reported DPP IV concentrations in the similar range, which had already been
discussed (B-1.3.3). Another possible reason for the contradictory results could be a
neglect of potential interactions of polyphenols with the experimental setup, for instance
coupled luciferase [374] (luminescent assays) or fluorescent signal (fluorescence-based
assays). Evidence is available in the literature that polyphenols might reduce the intrinsic
fluorescence of some serum proteins [375]. That can influence the result of such in vitro
studies and must be considered. In this regard, investigations for the impact of polyphenols
B Results and Discussion
108
on the fluorescence readouts and presence of eventual methodological artifacts were
carried out (B-4.2).
The contradiction between the results from previous studies and the present one along with
the discussed reasons about that rise a question for the clinical significance of polyphenols
as DPP IV inhibitors.
The results obtained from the in vitro screening does not support the results from previous
studies, but confirms the outcome of the performed clinical study (B-1.3.2.2) that the
investigated extract did not possess any DPP IV inhibitory effects as well as its ingredients
and their metabolites indicated in vitro. Although the slight reduction caused by the dietary
flavonoid quercetin was statistically significant this effect was way too small (< 10 %)
compared to the one of the referent substance sitgliptin which indicated around 75 %
reduction of the initial DPP IV activity at much lower nanomolar concentrations. Thus, it is
not likely that quercetin possess any clinically relevant inhibitory potential.
As a conclusion, the results indicated that the investigated compounds are not likely to be
direct inhibitors of DPP IV enzymatic activity neither in vitro nor in human subjects.
3.2 Effects of polyphenols on the expression of DPP IV/
CD26
3.2.1 Background: DPP IV/CD26 Expression
Dipeptidyl peptidase IV (DPP IV, also named CD26) is considered a pleiotropic molecule.
Along with being protease it exhibits further enzymatic activities, paracrine and endocrine
functions and thus might influence multiple cellular targets and pathophysiological
processes [204].
Changes in serum levels or expression of DPP IV were investigated with reference to
different morbidities, including cancer, inflammatory, autoimmune, and cardiovascular
diseases. Accumulating knowledge from recent years indicated a straightforward
relationship between the development of T2DM and its associated metabolic syndrome and
dysregulation in DPP IV serum levels [376]. In particular it was demonstrated that serum
DPP IV concentrations were elevated in insulin resistant and obese patients in comparison
to healthy individuals [206, 377]. A positive correlation between DPP IV expression levels
in adipocytes and body mass index (BMI) of participants was established. In addition, a
recent studies showed the crucial role of DPP IV in human adipocytes’ metabolism and
identified adipose tissue as a relevant source of circulating DPP IV in serum [206, 377,
378]. Also, it had been suggested that glucose concentrations might influence in vitro
production of DPP IV by adipocytes or CaCo-2 cells [379, 380]. These observations were

3 Effects of polyphenols on DPP IV activity and expression
109
relevant for the present study as all experiments were performed under high glucose
conditions (25 mM glucose).
In addition to adipocytes, T-cells were described to express DPP IV and were characterized
to be responsible for elevated serum concentrations in diabetic patients. Furthermore,
DPP IV levels were found to be associated with the status of glycemic control of T2DM
individuals [381].
Studies investigating DPP IV expression also considered diabetes-related pathological
states. For instance, myocardial infarction may occur as a severe consequence of T2DM
macroangiopathy. A translational study showed that down-regulated expression of DPP IV
can ameliorate cardiac function after myocardial infarction [382]. In a diabetes relevant
cell-based model it was demonstrated that hyperglycemia can induce expression of DPP IV
in glomerular endothelial cells [383].
As several studies indicated that DPP IV serum levels and expression are increased in
T2DM and its co-morbidities it was conceivable that down-regulation of DPP IV-
expression and/or reduction of its release might be beneficial and a successful therapeutic
strategy.
The regulation of DPP IV on pre-transcriptional and transcriptional level was not fully
clarified. It was suggested to be complex and probably cell type specific [376]. It was
shown that the DPP IV promoter can be influenced by various DNA-binding elements and
transcription factors and the regulation mechanism may vary among different tissues [384].
Multiple transcription factors were shown to be involved in the process. Hepatocyte
nuclear factor-1α (HNF-1α) was described to mediate at least at part the effect of glucose
on the DPP IV gene expression in vitro [380]. Mutants of HNF-1α and HNF-1β that occur
in maturity onset diabetes of the young (MODY) can down-regulate DPP IV levels in a
cell-based model [385]. Additional transcription factors participating in the regulation of
DPP IV are NF-κB (nuclear factor kappa-light-chain-enhancer of activated B cells), SP-1
(specificity protein 1), STAT (signal transducer and activator of transcription), AP-1
(activator protein-1) factor [386]. As hypoxia altered the expression of DPP IV in pre-
adipocytes an important role of hypoxia-inducible factor (HIF-1α) was also suggested
[387].
Due to the involvement of DPP IV in several cellular process and pathologies the
modulation of its expression by pharmacological agents is of high interest. Discovery of
novel agents capable to influence DPP IV expression might uncover new physiological
mechanisms, signaling pathways, and target molecules involved in the gene transcription
and thus to expand the basic knowledge. And vice versa: defined targets taking part in the
regulation of DPP IV expression can be advantageous for development of lead structures
of active compounds. In this regard, it was shown that interferons (α, β, γ) and all-trans-
retinoic acid (ATRA) can up-regulate DPP IV levels in B-cells. The molecular mechanism
B Results and Discussion
110
proposed by the authors included STAT-1-alpha activation followed by nuclear
translocation and binding to the GAS (gamma interferon-activated site)-response element
of the DPP IV promoter [388].
DPP IV exists not only as a membrane-bound, but also as a soluble (serum) form [204].
The latter can be released from the cell membrane by shedding. TNF-α and insulin were
described as agents promoting liberation of DPP IV from adipocytes [206, 379].
The surface expression of DPP IV might also be important for its serum levels. In this
regard adenosine was described to reduce the DPP IV surface expression in HT-29 colon
cancer cells [389, 390]. Forskolin influenced cellular trafficking and caused internalization
of already membrane expressed DPP IV [391]. This process was shown to be cAMP-
independent although forskolin is well-known activator of adenylate cyclase [392]. In
addition, the cytokine TGF-β1 downregulated the CD26/DPP IV surface expression in T-
cells.[393].
In summary the described processes of gene expression, intracellular transport, cell surface
expression and release of DPP IV appear to be important for its serum levels and
enzymatic activities.
Since dietary polyphenols may contribute to the prevention and treatment of T2DM, the
potential of polyphenols to influence the release/secretion and expression of DPP IV is of
high interest. It was suggested that polyphenols might modulate the expression of DPP IV
by interaction with the transcription factor HNF-1α [394].
Since the clinical study described in the present work (B-1.3.2) revealed the effects of
French maritime pine bark extract (PYC) on the serum levels of DPP IV in humans this
effect was investigated in more detail.
3.2.2 Results: Polyphenols and DPP IV Expression
Effects of three groups of compounds on the total protein expression of DPP IV were
analyzed in an in vitro model of 3T3-L1 adipocytes (C-3.2.3). The mean level of DPP IV
in differentiated, but untreated cells was 17.05 ± 3.35 ng DPP IV/mg protein (n= 24). In
comparison, DPP IV expression in undifferentiated 3T3-L1 fibroblasts was around 2 ng
DPP IV/mg protein. All compounds were tested at a concentration of 10 µM for 72 hours,
the cell culture medium containing the respective substance or vehicle was changed every
24 hours.
The first group included ingredients and metabolites of the French maritime pine bark
extract (PYC). There was no statistically significant influence on the total protein
expression of DPP IV in murine adipocytes neither by PYC-constituents nor by their
microbiotia-generated metabolites (n= 6 – 15; Table 9A).

3 Effects of polyphenols on DPP IV activity and expression
111
Table 9.: Descriptive statistics for the effects of different natural compounds on the
DPP IV protein expression: A. Ingredients and metabolites of Pycnogenol®.
B. Dietary polyphenols. C. Ellagic acid and urolithins. D. Other natural
compounds. Abbreviations: S.D. – standard deviation, PMA – Phorbol ester,
ATRA – All-trans-retinoic acid.
Ingredients and metabolites of Pycnogenol®
A Mean [%] S.D. [%] Median [%] n Statistical
significance
Control 100.00 2.62 100.00 29 -
Taxifolin 111.06 10.49 113.46 12 n.s.
(+)-Catechin 103.16 7.85 104.42 8 n.s.
M1 95.02 8.14 96.10 15 n.s.
M2 100.90 17.72 102.14 6 n.s.
Caffeic acid 100.94 7.12 99.59 8 n.s.
Ferulic acid 90.63 12.43 91.73 6 n.s.
Dietary polyphenols
B Mean [%] S.D. [%] Median [%] n Statistical
significance
Control 100.00 6.55 101.76 19 -
Apigenin 90.33 8.45 89.23 7 n.s.
Luteolin 91.94 13.74 90.25 8 n.s.
Quercetin 98.11 9.11 95.54 4 n.s.
Naringenin 101.99 3.77 101.78 3 n.s.
Genistein 108.38 17.51 108.62 4 n.s.
Resveratrol 100.67 2.07 100.07 4 n.s.
Ellagic acid and urolithins
C Mean [%] S.D. [%] Median [%] n Statistical
significance
Control 100.00 6.16 102.27 18 -
Ellagic acid 96.47 0.32 96.47 2 n.s.
Urolithin A 101.64 8.73 101.08 8 n.s.
Urolithin B 92.20 2.74 92.20 2 n.s.
Urolithin C 95.40 16.35 88.09 6 n.s.
Urolithin D 88.16 11.31 92.54 5 n.s.
Other natural compounds
D Mean [%] S.D. [%] Median [%] n Statistical
significance
PMA 79.54 8.57 82.25 7 p< 0.01
ATRA 115.57 18.06 112.79 7 p< 0.01
B Results and Discussion
112
Only M1 and ferulic acid showed slight tendencies to reduce DPP IV expression by 4.98 ±
8.14 %, respectively 9.37 ± 12.43 % compared to the controls. Taxifolin tended to increase
the protein expression of DPP IV. One-way ANOVA with Tukey HSD test revealed that
these effects were not statistically significant.
Another group that underwent analysis for any influence on the expression of DPP IV was
dietary polyphenols with different structures. Flavones luteolin and apigenin, flavonol
quercetin, flavanone naringenin, isoflavone genistein and stilbenoid resveratrol were
described to be often administrated with food [82, 395]. For this reason, their effects on the
DPP IV expression were investigated, but they showed no prominent effects on DPP IV
levels in vitro (Table 9B). Among these compounds only apigenin and luteolin tended to
reduce the expression of DPP IV with respectively 9.67 ± 8.45 % and 8.06 ± 13.74 %,
while in contrast genistein-treatment caused a slight increase of 8.38 ± 17.51 % compared
to the control. None of the mentioned effects was statistically significant (n= 3 – 7).
Ellagic acid and its bacterial metabolites urolithins did not induce any statistically
significant changes of the enzyme’s expression in vitro (n= 2 – 8). Slight tendencies for a
reduction of the DPP IV levels were shown for urolithin B (7.80 ± 2.74 %), C (4.60 ±
16.35 %), and D (11.84 ± 11.31 %). In contrast, ellagic acid and urolithin A did not cause
any effect on the expression of DPP IV on the protein level (Table 9C).
Phorbol ester (PMA) at a 1 µM concentration caused a statistically significant down-
regulation of the DPP IV protein expression by 20.46 ± 8.57 % (n= 7). As the effects of
PMA were statistically significant and reproducible in independent experiments, it was
considered as a positive control in the experimental set-up. Along with that the effects of
all-trans retinoic acid (ATRA) (10 µM, 48 hours) were investigated as it had been
described to increase the intracellular and surface expression of DPP IV in tumor B cells
[388]. The results showed statistically significant up-regulation (mean increase of 15.57 ±
18.06 in regard to the control, n= 7) of the total DPP IV expression (p< 0.01, one-way
ANOVA) (Table 9D).
The DPP IV release by 3T3-L1 adipocytes in conditioned medium was also investigated.
After cell culture supernatants were concentrated and dialysed (C-3.2.3) the DPP IV
concentration was measured. The concentration of released DPP IV was estimated to be
around 4 pg/mL – a value below the limit of quantification of the ELISA. As this value
was lower than expected the model was considered as inappropriate for further
investigation of the impact of polyphenols on DPP IV liberation on a cellular level.
3.2.3 Discussion: Polyphenols and DPP IV Expression
Regarding the benefits of polyphenols in T2DM their potential influence on the expression
of DPP IV is of considerable interest [371, 396-398]. The present work investigated the
effects of 17 individual polyphenols and their metabolites on the total protein expression of

3 Effects of polyphenols on DPP IV activity and expression
113
DPP IV in 3T3-L1 differentiated adipocytes. The compounds with slight, but non-
statistically significant tendencies for reduction of DPP IV levels compared to controls
were urolithins C and D, apigenin, luteolin, and ferulic acid. In addition to their minor
activities urolithin D had never been detected in human plasma [399] and therefore these
effects cannot be expected to be clinically relevant.
In general the present data is in discordance with the results from some already published
articles claiming that polyphenols can down-regulate DPP IV expression [371, 396] and in
accordance with other ones revealing respectively no activity of polyphenolic compounds
[397, 398]. Any discrepancies might be due to e.g. differences in the experimental set-up
and diversity in the regulation of DPP IV gene transcription among different tissues and
cell types.
In the present work effects of individual compounds were investigated in contrast to
previously published studies testing mainly complex polyphenolic extracts. Along with
effects of either anthocyanins or proanthocyanidins on the protein expression of DPP IV
the individual compound resveratrol was investigated in CaCo-2 cells [371]. In accordance
with the present results resveratrol was inactive. Anthocyanin and proanthocyanidin
fractions reduced the DPP IV protein levels statistically significantly [371, 396]. On the
contrary, two studies reported no effects of a polyphenol extract of hibiscus on the DPP IV
protein level in HK-2 cells [397, 398].
Proanthocyanidins were not included in the present screening as its object was an
investigation of monomeric compounds. Furthermore the interpretation of in vitro results
regarding extracts’ effects can be challenging due to their complex and not always fully-
defined content and low or missing serum concentrations of their ingredients upon intake.
The data from the present screening suggested that the investigated monomeric
components of PYC did not cause any statistically significant changes on the DPP IV total
protein expression in adipocytes. Therefore, the in vivo effects of PYC might be due to
other so far unknown metabolites or constituents of the extract. A possible synergistic
effect between the compounds on the expression of DPP IV cannot be excluded.
Alternatively, the mechanism of PYC’s action might not include an impact on the
intracellular DPP IV levels, but rather influence on its surface expression and shedding.
A study showing that apigenin modulated the membrane expression of DPP IV in HT-29
cell based model suggested that the DPP IV surface expression might be a possible target
of polyphenols [400].
Presently there is no information in the literature that polyphenols might affect the process
of DPP IV release. However, the membrane proteins’ shedding is mediated by the ADAM
family of metalloproteinases [401]. In particular, the liberation of DPP IV was described to
be mediated by matrix metalloproteinases (i.e. MMP I, MMP IX) [402]. PYC and its

B Results and Discussion
114
metabolites were reported to reduce the expression and/or activity of some MMPs and
ADAM members [180, 403]. In addition, a study showed that the release of DPP IV can be
increased under oxidative stress conditions, although the mechanism of this process in not
completely clarified [404]. As polyphenols are described as antioxidants [310] they might
modulate the process of shedding.
The in vitro model utilizing 3T3-L1 adipocytes did not appear to be suitable for
investigation of DPP IV shedding process in the present study. Concentrations of DPP IV
released by 3T3-L1 adipocytes into cell culture medium were estimated around 4 pg/mL
which is in conflict with the previously published data claiming concentrations of
approximately 20 – 60 pg/mL in cell culture supernatant of the same cell type [379]. This
might be explained with the low expression of DPP IV on the surface of the used cells. An
appropriate in vitro model capable to reflect the process of shedding of DPP IV on cellular
level is demanded. Apart from adipocytes described as a major source of soluble DPP IV it
has been shown that T-lymphocytes can release DPP IV and can significantly contribute to
the serum circulating DPP IV exists [381, 405-407]. Recently the role of T-cells as a
source of soluble DPP IV was investigated in T2DM related studies [381, 407].
The published information about modulators of DPP IV expression is sparse, but ATRA
(all-trans-retinoic acid) was shown to increase the protein expression of DPP IV in tumor B
cells [388]. In the present study employing adipocytes DPP IV protein levels were
statistically significant increased by ATRA in comparison to controls. This result is in
accordance with the result described in the cited study.
PMA (phorbol ester) induced statistically significant downregulation of the total protein
expression of DPP IV in adipocytes around 20 %. To the best of our knowledge such an
effect for this compound has not been described before. A previous study showed that
phorbol ester was inefficient in influencing the gene transcription and DPP IV mRNA
(messenger RNA) level in human glomerular epithelial cells [408]. The outcome from the
present work might stimulate further research about the signaling pathways involved in the
regulation of DPP IV gene transcription.
3.2.4 Conclusion: Polyphenols and DPP IV Expression
The present results indicated that the monomeric components of PYC and its metabolites
are not likely to contribute to the reduction of DPP IV serum concentrations in vivo
through down-regulation of total protein expression of DPP IV in adipocytes. Further
research is needed to establish if polyphenolic compounds can influence the surface
expression and release of DPP IV.

4 Fluorescence interactions of polyphenols in different environments
115
4 Fluorescence interactions of polyphenols in
different environments
4.1 Background: Fluorescence interactions
Polyphenols are object of comprehensive research programs. Such an investigation is
quite challenging because of the chemical instability of these compounds [272] and
their potential to interact with the assay set-ups which might result in misleading
conclusions [409, 410].
In order to verify the DPP IV inhibitory potential of polyphenols as described in the
literature and to estimate the activity of further compounds of interest, in vitro
investigations involving 35 compounds were conducted (B-3.1). During the screening
some unusual results were observed. For instance, the flavones 6-methoxyflavone, 6-
hydroxyflavone, 7-methoxyflavone, 3-hydroxyflavone, 3-hydroxy-4’-methoxyflavone,
and genistein indicated increased fluorescence values (Supplement Section D-4.1).
Anyway, an in vitro activation of the enzyme through those compounds was unlikely
and not described in the literature so far. In addition, quercetin seemed to decrease the
fluorescence in human serum at the starting point of the measurement, even before
addition of the DPP IV substrate (H-Gly-Pro-AMC). Therefore, it was assumed that
some polyphenols might interact with the fluorescent signal and thus to alter the results
of the assay. Respective fluorescence measurements were performed in order to confirm
this suspicion. Quercetin, 6-methoxyflavone, urolithin A and B seemed to interfere with
the fluorescent readouts in the strongest way among the investigated 35 compounds and
therefore were chosen for further analysis in order to quantify these effects under
defined conditions and to determine if they are reproducible and statistically significant.
Fluorescence measurements were conducted in experimental environments which were
possibly closest to those of the classic and modified DPP IV inhibitor screening assay
(C-3.1), listed under C-4.3. Thus, it was possible to compare the effects of polyphenols
and to conclude if they are universal or specific attribute due to any of the matrices.
Additionally, investigations were performed both in the presence or absence of the
fluorescent product AMC in order to elucidate, whether effects of polypehnols were
dependent or independent from it. Last but not least the fluorescence was measured
before (0 min) and after (30 min) incubation at 37 °C, corresponding to the starting and
ending points of the assay and revealed whether the temperature influenced readouts
and whether it changed interactions, i.e. by influencing the compounds’ stability.
B Results and Discussion
116
4.2 Results: Fluorescence interactions
The measurements performed before (0 min) and after (30 min) incubation at 37 °C
were overall similar. Shown are results after 30 min incubation corresponding to the
endpoint of the assay. Results for the initial time point are represented in the
Supplement, Section D-5. Effects on fluorescence were investigated in assay buffer,
DPP IV solution, and human serum. Different conditions were signed as following: no
AMC, 0 min – the absence of AMC, before incubation, AMC, 0 min – the presence of
AMC, before incubation, no AMC, 30 min and AMC, 30 min – the absence and the
presence of AMC, respectively, both after incubation.
Quercetin
Fluorescence effects in assay buffer
In the presence of AMC, quercetin at a 5 µM concentration quenched the AMC-
fluorescence and slightly reduced its value in relation to the blank by 3.92 ± 2.85 % and
this change was statistically significant (p< 0.05) (Figure 36, Quercetin, Buffer). In the
absence of AMC, quercetin did not have any effect on the fluorescence (Figure 37,
Quercetin, Buffer).
Fluorescent effects in DPP IV solution
Quercetin (5 µM) slightly reduced the fluorescent signal by 2.78 ± 2.31 % at 30 min,
AMC and by 1.88 ± 1.55 % at 30 min, no AMC. Although this reduction was not
statistically significant, it persisted under all investigated conditions (Figure 36,
Quercetin, DPP IV; Figure 37, Quercetin, DPP IV, and Supplement, Section D-5, Table
1.2).
Fluorescent effects in human serum
At 30 min, AMC quercetin decreased fluorescence by 6.75 ± 2.78 % (p< 0.01)
(Figure 36, Quercetin, Serum), and at 30 min, no AMC by 5.72 ± 1.99 % (p< 0.01)
(Figure 37, Quercetin, Serum). As obvious, in presence of AMC this quenching effect
was slightly bigger compared to the one established in the absence of AMC. It also
seemed that incubation at 37 °C for 30 minutes decreased the quenching effect of
quercetin to only a small extent (Supplement, Section D-5, Table 1.3).
Urolithin B
Fluorescent effects in assay buffer
Urolithin B did not cause any changes under any of the tested conditions in assay buffer
(Figure 36, Urolithin B, Buffer; Figure 37, Urolithin B, Buffer).
4 Fluorescence interactions of polyphenols in different environments
117
Fluorescent effects in DPP IV solution
Urolithin B in the tested concentration did not cause any significant changes in
fluorescence in the presence of purified DPP IV overall (Figure 36, Urolithin B,
DPP IV; Figure 37, Urolithin B, DPP IV).
Fluorescent effects in human serum
Urolithin B strongly interfered with the fluorescence in human serum. Under all tested
conditions 5 µM urolithin B exhibited statistically significant increase (p< 0.01) of the
fluorescence in comparison to the experimental blank: 9.83 ± 2.10 % at 30 min, AMC
(Figure 36, Urolithin B, Serum); 12.98 ± 2.97 % at 30 min, no AMC (Figure 37,
Urolithin B, Serum). It seemed that before the exposure to temperature these effects
were to some extent stronger (Supplement, Section D-5, Table 1.3).
Urolithin A
Fluorescent effects in assay buffer
In the presence of AMC there were no differences between urolithin A and the blank’s
fluorescence (Supplement, Section D-5, Table 1.1). Without AMC urolithin A slightly
increased the fluorescence compared to the control with 4.35 ± 1.29 %. Nonetheless this
change was not statistically significant.
Fluorescent effects in DPP IV solution
As the structurally related urolithin B, urolithin A did not cause any significant changes
in fluorescence in the presence of purified DPP IV overall (Supplement, Section D-5,
Table 1.2).
Fluorescent effects in human serum
Urolithin A also showed interference with the fluorescent signal in serum, although its
effects were not as strong and as those of urolithin B (Supplement, Section D-5,
Table 1.3). In the presence of AMC (30 min, AMC) urolithin A tended to increase the
fluorescence compared to the blank by 2.67 ± 1.29 %, although not statistically
significantly. In the absence of AMC (30 min, no AMC), it was a statistically significant
increase of the fluorescence by Urolithinn A by 4.43 ± 2.81 % (p< 0.05).
6-Methohyflavone
Fluorescent effects in assay buffer
In buffer, under all tested conditions in the presence or in the absence of AMC, the
fluorescence of 6-MF (6-methoxyflavone) at a concentration of 5 µM was statistically
significantly higher than the blank (p< 0.01). The fluorescence was increased by 6-MF
as following: by 5.44 ± 2.17 % at 30 min, AMC (Figure 36, 6-MF, Buffer); by 10.94 ±
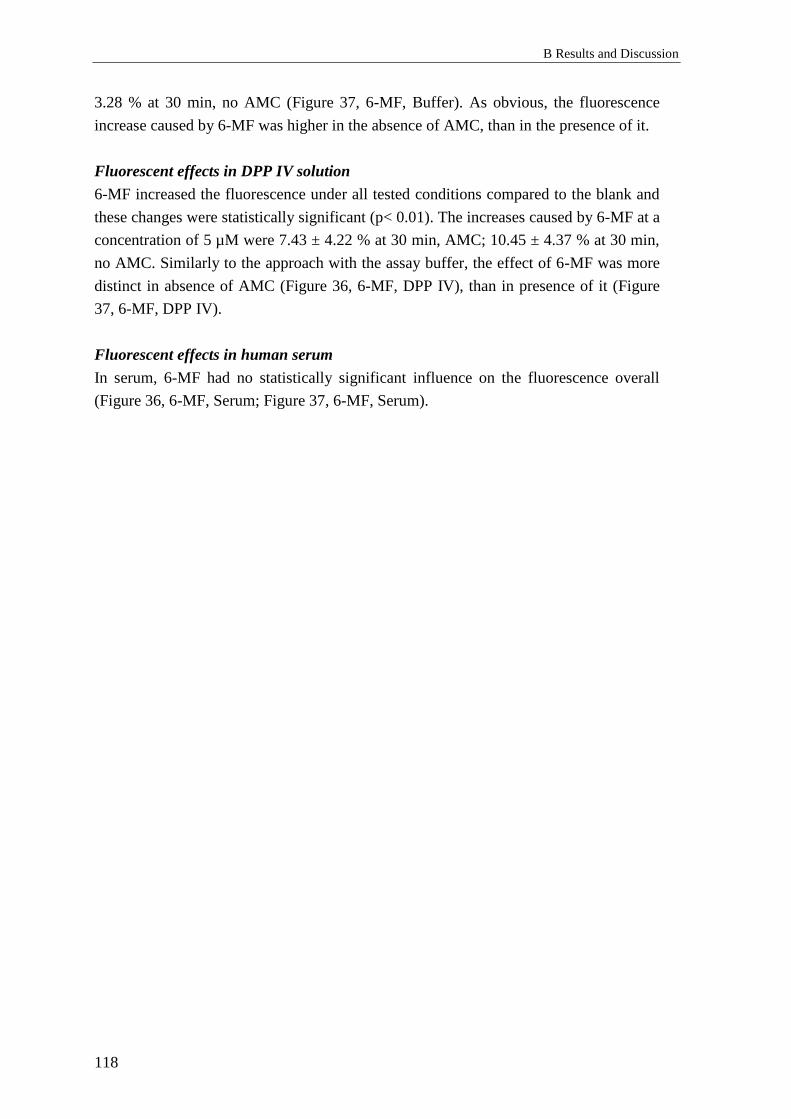
B Results and Discussion
118
3.28 % at 30 min, no AMC (Figure 37, 6-MF, Buffer). As obvious, the fluorescence
increase caused by 6-MF was higher in the absence of AMC, than in the presence of it.
Fluorescent effects in DPP IV solution
6-MF increased the fluorescence under all tested conditions compared to the blank and
these changes were statistically significant (p< 0.01). The increases caused by 6-MF at a
concentration of 5 µM were 7.43 ± 4.22 % at 30 min, AMC; 10.45 ± 4.37 % at 30 min,
no AMC. Similarly to the approach with the assay buffer, the effect of 6-MF was more
distinct in absence of AMC (Figure 36, 6-MF, DPP IV), than in presence of it (Figure
37, 6-MF, DPP IV).
Fluorescent effects in human serum
In serum, 6-MF had no statistically significant influence on the fluorescence overall
(Figure 36, 6-MF, Serum; Figure 37, 6-MF, Serum).

4 Fluorescence interactions of polyphenols in different environments
119
Figure 36: Comparison of the influence of quercetin, urolithin B and
6-methoxyflavone at a concentration of 5 µM on the fluorescence
(λexcitation/emission = 360 nm/460 nm) in different environments (buffer,
DPP IV, and serum) in the presence of AMC. Columns represent
means and standard deviations obtained from eight experiments (*
p< 0.05, ** p< 0.01, n= 8). Quercetin quenched the fluorescence in all
three cases. This effect was strongest in human serum – statistically
significant decrease by 6.75 ± 2.78 % (p< 0.01) regarding the control.
Urolithin B statistically significantly increased the fluorescence in
serum by 9.83 ± 2.10 % (p< 0.01). 6-Methoxyflavone caused
statistically significant rises (p< 0.01) in the fluorescence both in
assay buffer and in the presence of DPP IV (respectively with 5.44 ±
2.17 % and 7.43 ± 4.22 % regarding the control).
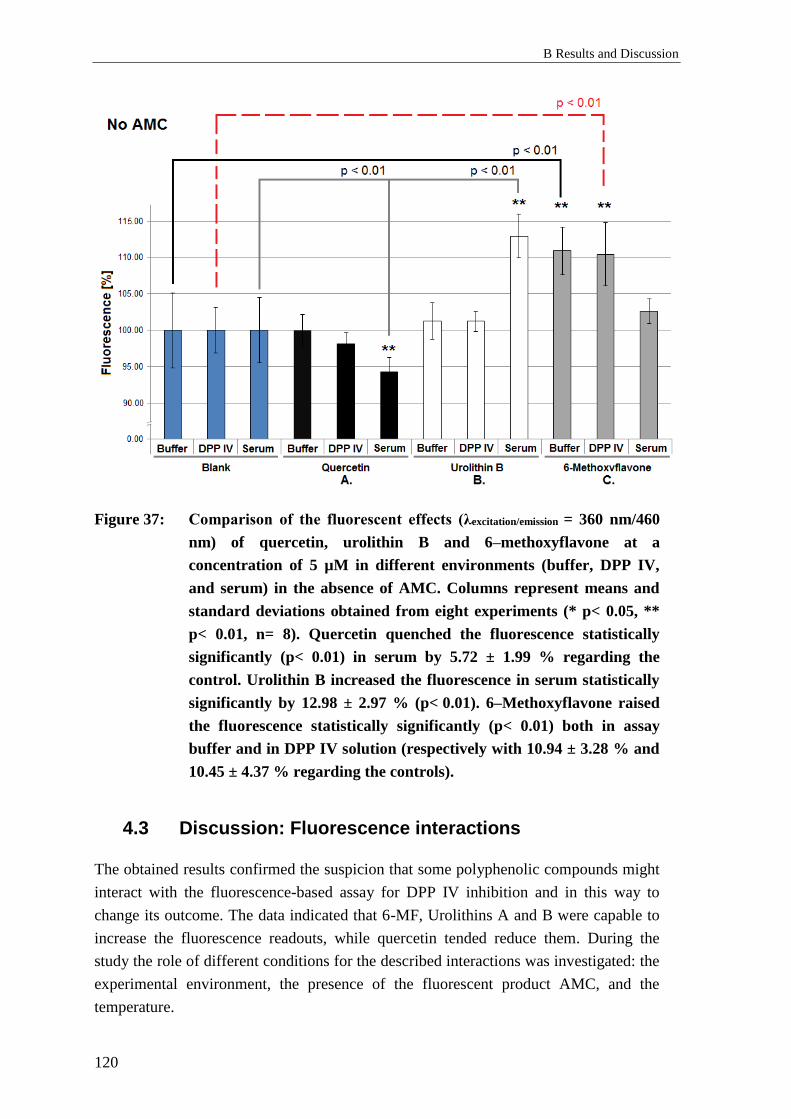
B Results and Discussion
120
Figure 37: Comparison of the fluorescent effects (λexcitation/emission = 360 nm/460
nm) of quercetin, urolithin B and 6–methoxyflavone at a
concentration of 5 µM in different environments (buffer, DPP IV,
and serum) in the absence of AMC. Columns represent means and
standard deviations obtained from eight experiments (* p< 0.05, **
p< 0.01, n= 8). Quercetin quenched the fluorescence statistically
significantly (p< 0.01) in serum by 5.72 ± 1.99 % regarding the
control. Urolithin B increased the fluorescence in serum statistically
significantly by 12.98 ± 2.97 % (p< 0.01). 6–Methoxyflavone raised
the fluorescence statistically significantly (p< 0.01) both in assay
buffer and in DPP IV solution (respectively with 10.94 ± 3.28 % and
10.45 ± 4.37 % regarding the controls).
4.3 Discussion: Fluorescence interactions
The obtained results confirmed the suspicion that some polyphenolic compounds might
interact with the fluorescence-based assay for DPP IV inhibition and in this way to
change its outcome. The data indicated that 6-MF, Urolithins A and B were capable to
increase the fluorescence readouts, while quercetin tended reduce them. During the
study the role of different conditions for the described interactions was investigated: the
experimental environment, the presence of the fluorescent product AMC, and the
temperature.
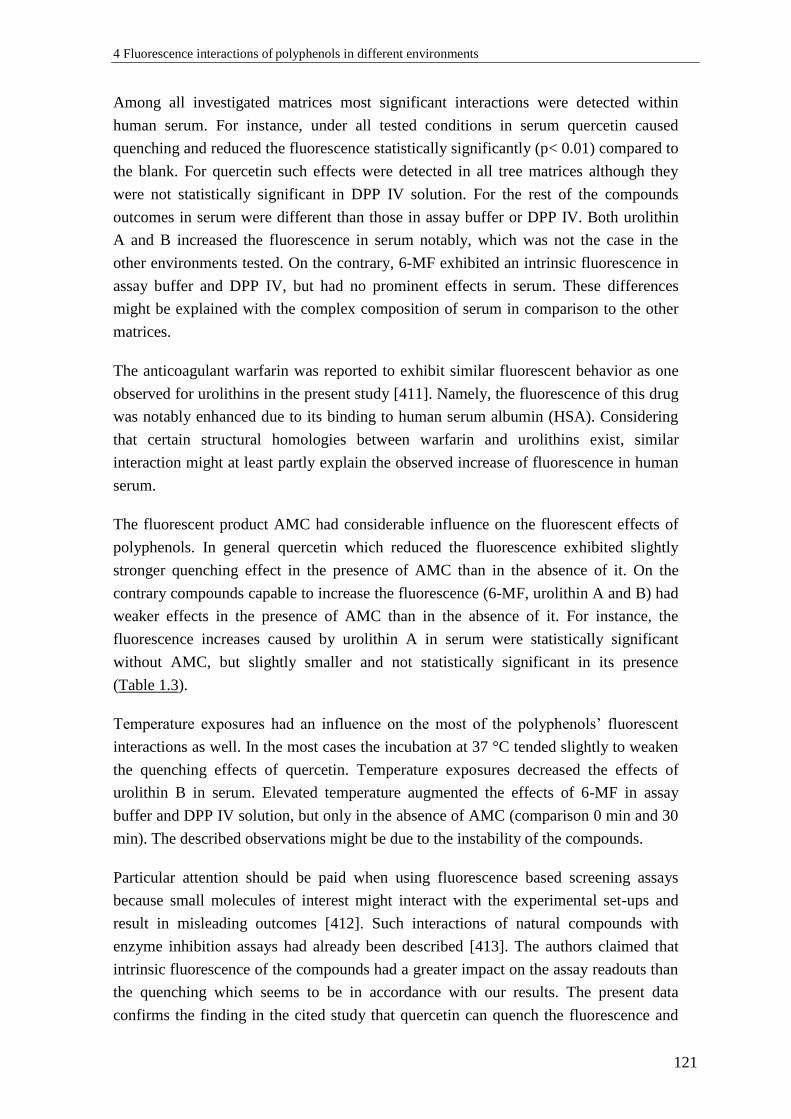
4 Fluorescence interactions of polyphenols in different environments
121
Among all investigated matrices most significant interactions were detected within
human serum. For instance, under all tested conditions in serum quercetin caused
quenching and reduced the fluorescence statistically significantly (p< 0.01) compared to
the blank. For quercetin such effects were detected in all tree matrices although they
were not statistically significant in DPP IV solution. For the rest of the compounds
outcomes in serum were different than those in assay buffer or DPP IV. Both urolithin
A and B increased the fluorescence in serum notably, which was not the case in the
other environments tested. On the contrary, 6-MF exhibited an intrinsic fluorescence in
assay buffer and DPP IV, but had no prominent effects in serum. These differences
might be explained with the complex composition of serum in comparison to the other
matrices.
The anticoagulant warfarin was reported to exhibit similar fluorescent behavior as one
observed for urolithins in the present study [411]. Namely, the fluorescence of this drug
was notably enhanced due to its binding to human serum albumin (HSA). Considering
that certain structural homologies between warfarin and urolithins exist, similar
interaction might at least partly explain the observed increase of fluorescence in human
serum.
The fluorescent product AMC had considerable influence on the fluorescent effects of
polyphenols. In general quercetin which reduced the fluorescence exhibited slightly
stronger quenching effect in the presence of AMC than in the absence of it. On the
contrary compounds capable to increase the fluorescence (6-MF, urolithin A and B) had
weaker effects in the presence of AMC than in the absence of it. For instance, the
fluorescence increases caused by urolithin A in serum were statistically significant
without AMC, but slightly smaller and not statistically significant in its presence
(Table 1.3).
Temperature exposures had an influence on the most of the polyphenols’ fluorescent
interactions as well. In the most cases the incubation at 37 °C tended slightly to weaken
the quenching effects of quercetin. Temperature exposures decreased the effects of
urolithin B in serum. Elevated temperature augmented the effects of 6-MF in assay
buffer and DPP IV solution, but only in the absence of AMC (comparison 0 min and 30
min). The described observations might be due to the instability of the compounds.
Particular attention should be paid when using fluorescence based screening assays
because small molecules of interest might interact with the experimental set-ups and
result in misleading outcomes [412]. Such interactions of natural compounds with
enzyme inhibition assays had already been described [413]. The authors claimed that
intrinsic fluorescence of the compounds had a greater impact on the assay readouts than
the quenching which seems to be in accordance with our results. The present data
confirms the finding in the cited study that quercetin can quench the fluorescence and
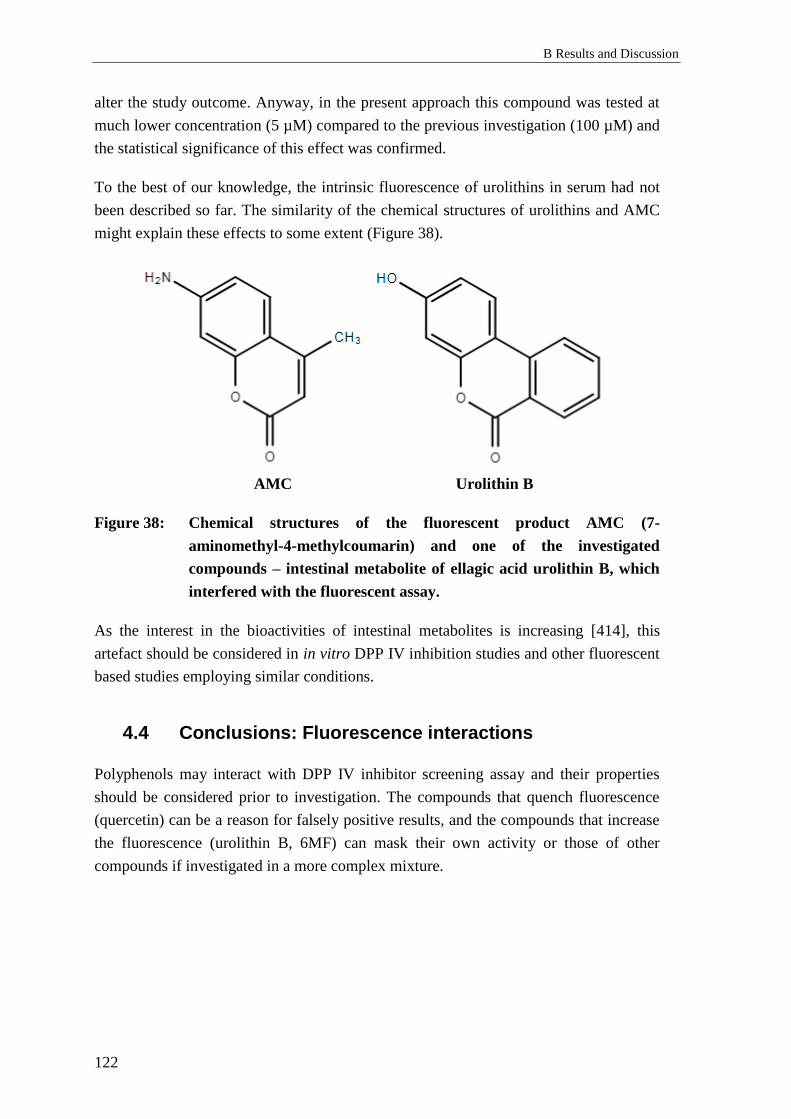
B Results and Discussion
122
alter the study outcome. Anyway, in the present approach this compound was tested at
much lower concentration (5 µM) compared to the previous investigation (100 µM) and
the statistical significance of this effect was confirmed.
To the best of our knowledge, the intrinsic fluorescence of urolithins in serum had not
been described so far. The similarity of the chemical structures of urolithins and AMC
might explain these effects to some extent (Figure 38).
AMC Urolithin B
Figure 38: Chemical structures of the fluorescent product AMC (7-
aminomethyl-4-methylcoumarin) and one of the investigated
compounds – intestinal metabolite of ellagic acid urolithin B, which
interfered with the fluorescent assay.
As the interest in the bioactivities of intestinal metabolites is increasing [414], this
artefact should be considered in in vitro DPP IV inhibition studies and other fluorescent
based studies employing similar conditions.
4.4 Conclusions: Fluorescence interactions
Polyphenols may interact with DPP IV inhibitor screening assay and their properties
should be considered prior to investigation. The compounds that quench fluorescence
(quercetin) can be a reason for falsely positive results, and the compounds that increase
the fluorescence (urolithin B, 6MF) can mask their own activity or those of other
compounds if investigated in a more complex mixture.
C Experimental Setup
1 Effects of Pycnogenol® on active GLP-1, DPP
IV, relaxin-2 and adiponectin
1.1 Clinical study
The Ethical committee of the Medical School, Bratislava, Slovak Republic, approved the
study, and all of the participants had given written informed consent. The volunteers were
asked to keep a regular diet without additional antioxidants. Dietary sources of
polyphenols, such as tea, coffee, fruit juice, marmalade were temporary avoided during the
whole course of the study.
1.2 Chemicals and reagents
Sitagliptin Sigma-Aldrich, USA
Liquid Nitrogen Tyczka Industrie-Gase GmbH, Würzburg
1.2.1 Specific chemicals and reagents for ELISA measurements
Glucagon-Like Peptide-1 (active) ELISA Kit EMD Millipore, Missouri, USA
Human DPP IV/CD26 ELISA Kit Sigma-Aldrich, USA
Human Relaxin-2 Quantikine ELISA Kit R&D Systems, Inc., USA
Human Total Adiponectin/Acrp30 Quantikine
ELISA Kit
1.2.2 Specific chemicals and reagents for DPP IV serum enzymatic
activity assay
DPP IV Activity Assay Kit Sigma-Aldrich, USA

C Experimental Setup
124
1.3 Materials and devices
Sterile vials of 2 mL Sarstedt AG & Co., Nümbrecht,
Germany Sterile tubes 15, 50 mL
Rack for tubes 15 mL
Plate shaker, Type Mini-Rocker, 200 x 200 mm Hartenstein GmbH, Würzburg,
Germany Polystyrene storage box
Cryobox
Eppendorf Research® Plus micropipettes:
0.5 – 10 µL; 10 – 100 µL; 100 – 1000 µL Eppendorf AG, Germany
Eppendorf Research® 8-channel Pipette
(Pipette volume: 10 – 100 µL) Megafuge 1.0 R
Thermo Fisher Scientific, Waltham,
MA, USA
Multiskan Ascent, Plate-reader, filter 450 nm
Ascent Software, Version 2.6
HeraCell 240i, CO2-Incubator
Vortex Reax 1, Type 54111 Heidolph Instruments, Germany
Unimax 1010, Horizontal Shaker
Plate sealer, Easy seal sealer clear, 80 x 140 mm
676001
Greiner Bio-One International,
Austria
Ice generator ZIEGRA Eismachinen GmbH,
Germany
Microfuge 22R Centrifuge Beckman Coulter GmbH, Krefeld
1.3.1 Specific materials und devices for ELISA measurements
PerkinElmer Luminescence
Spectrometer LS 50 B PerkinElmer Inc., USA
FL WinLabTM
1.4 Serum levels of GLP-1, DPP IV, relaxin-2, adiponectin.
Serum enzymatic activities of DPP IV
For detection of target molecules’ levels and activities in human serum respective
commercially-available “sandwich”-principle ELISA (C-1.2.1) and enzymatic activity
assay (C-1.2.2) kits were used.
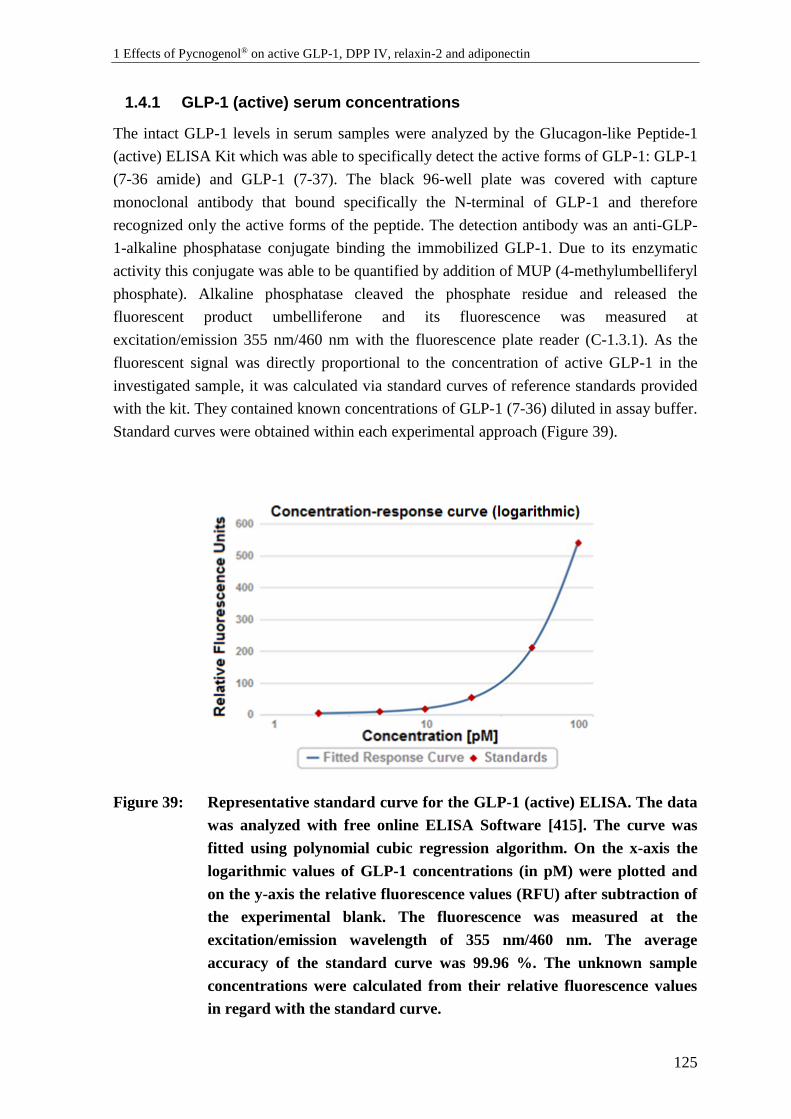
1 Effects of Pycnogenol® on active GLP-1, DPP IV, relaxin-2 and adiponectin
125
1.4.1 GLP-1 (active) serum concentrations
The intact GLP-1 levels in serum samples were analyzed by the Glucagon-like Peptide-1
(active) ELISA Kit which was able to specifically detect the active forms of GLP-1: GLP-1
(7-36 amide) and GLP-1 (7-37). The black 96-well plate was covered with capture
monoclonal antibody that bound specifically the N-terminal of GLP-1 and therefore
recognized only the active forms of the peptide. The detection antibody was an anti-GLP-
1-alkaline phosphatase conjugate binding the immobilized GLP-1. Due to its enzymatic
activity this conjugate was able to be quantified by addition of MUP (4-methylumbelliferyl
phosphate). Alkaline phosphatase cleaved the phosphate residue and released the
fluorescent product umbelliferone and its fluorescence was measured at
excitation/emission 355 nm/460 nm with the fluorescence plate reader (C-1.3.1). As the
fluorescent signal was directly proportional to the concentration of active GLP-1 in the
investigated sample, it was calculated via standard curves of reference standards provided
with the kit. They contained known concentrations of GLP-1 (7-36) diluted in assay buffer.
Standard curves were obtained within each experimental approach (Figure 39).
Figure 39: Representative standard curve for the GLP-1 (active) ELISA. The data
was analyzed with free online ELISA Software [415]. The curve was
fitted using polynomial cubic regression algorithm. On the x-axis the
logarithmic values of GLP-1 concentrations (in pM) were plotted and
on the y-axis the relative fluorescence values (RFU) after subtraction of
the experimental blank. The fluorescence was measured at the
excitation/emission wavelength of 355 nm/460 nm. The average
accuracy of the standard curve was 99.96 %. The unknown sample
concentrations were calculated from their relative fluorescence values
in regard with the standard curve.

C Experimental Setup
126
Serum samples were investigated undiluted. They were thawed at room temperature and
were gently vortexed and shaken. Afterwards, they were aliquoted and spiked with 100 nM
sitagliptin (final concentration). The addition of a DPP IV inhibitor and cooling the
samples in an ice bath for prevention of enzymatic degradation of the active GLP-1 forms
had previously been suggested [416]. Subsequently the assay was performed according to
the manufacturer’s protocol with one deviation. Apart from the original protocol the plate
was incubated with assay buffer for 30 minutes before the addition of reference standards
and the investigated samples in order to block the unspecific binding sites. Quality controls
(QC1= 5.1 – 11 pM and QC2= 30 – 63 pM) were added to the plate randomly between the
wells with samples. Assay characteristics of the Glucagon-like Peptide-1 (active) ELISA
Kit are listed in Table 10.
Table 10.: Assay Characteristics of the Glucagon-Like Peptide-1 (active) ELISA Kit
according to the manufacturer:
Sensitivity Limit of detection: 2 pM (by 100 µL sample size)
Specificity
100 % for the active forms: GLP-1 (7-36 amide) and GLP-1 (7-37). Cross–
reactivity with other forms of GLP-1 [such as GLP-1 (9-36 amide)], GLP-2
or glucagon has not been detected
Intra-Assay Variation 6 – 9 % (by concentration range 4 – 76 pM)
Inter-Assay Variation < 1 – 13 % (by concentration range 4 – 76 pM)
1.4.2 DPP IV serum concentrations
DPP IV serum concentrations were analyzed by the Human DPPIV/CD26 ELISA Kit
which was an indirect “sandwich” ELISA. Briefly, the antibody against human DPP IV
covering the wells captured and immobilized DPP IV-molecules from serum samples
which afterwards were recognized by the biotinylated secondary antibody. Antibody-
linked biotin bound to streptavidin-horseradish peroxidase (HRP) conjugate with high
specificity and affinity [417]. The latter enzyme catalyzed color reaction which was
terminated by addition of acid stop solution. The optical density (O.D.) was immediately
determined by a colorimetric detection at 450 nm.
All samples were diluted 500- to 750-fold to fall into the dynamic range of the assay
(32.77 – 8000 pg/mL). All samples from individual participants were measured during the
same experimental approach to avoid the inter-assay variations. The assay was performed
according to the standard protocol provided by the manufacturer. As the O.D. was directly
proportional to the concentration of human DPP IV in the investigated sample, it was
calculated through standard curves of reference standards with known concentrations
obtained by dilution of the recombinant human DPP IV/CD26 protein from the kit in assay

1 Effects of Pycnogenol® on active GLP-1, DPP IV, relaxin-2 and adiponectin
127
buffer before use. All of the standard curves were fitted using 5-parameter logistic (5-PL)
regression (Figure 40). Assay characteristics of the Human DPPIV/CD26 ELISA Kit are
shown in Table 11.
Table 11.: Characteristics of the Human DPPIV/CD26 ELISA Kit according to the
manufacturer:
Sensitivity Limit of detection: 25 pg/mL (by 100 µL sample size)
Specificity The ELISA kit showed no cross-reactivity with 56 diverse cytokines
Intra-Assay Variation < 10 %
Inter-Assay Variation < 12 %
Figure 40: Representative standard curve for the Human DPP IV/CD26 ELISA.
The data was analyzed with free online ELISA Software [415]. The
curve was fitted using 5-parameter logistic regression. On the x-axis the
logarithmic values of DPP IV concentrations (in pg/mL) were plotted
and on the y-axis the optical density values (O.D.) after subtraction of
the experimental blank. The absorbance was measured at the
wavelength of 450 nm. The average accuracy of the standard curve was
102.4 %. The unknown sample concentrations were calculated from
their optical density values in regard with the standard curve.
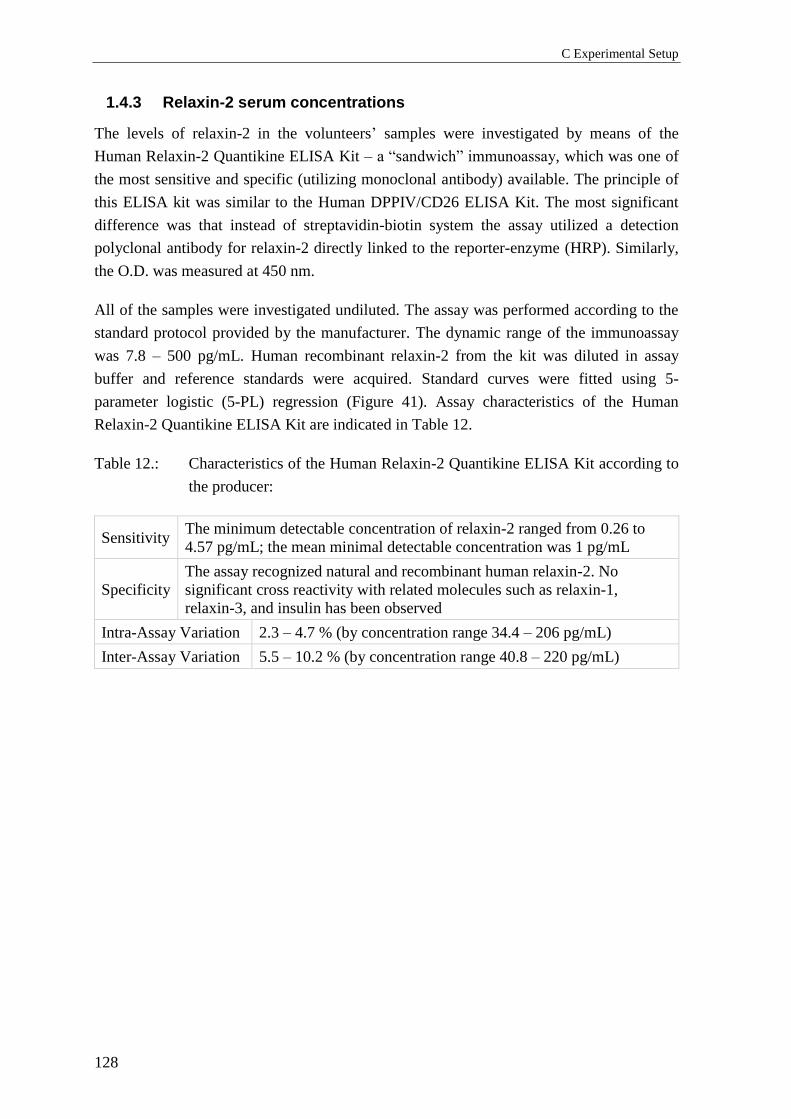
C Experimental Setup
128
1.4.3 Relaxin-2 serum concentrations
The levels of relaxin-2 in the volunteers’ samples were investigated by means of the
Human Relaxin-2 Quantikine ELISA Kit – a “sandwich” immunoassay, which was one of
the most sensitive and specific (utilizing monoclonal antibody) available. The principle of
this ELISA kit was similar to the Human DPPIV/CD26 ELISA Kit. The most significant
difference was that instead of streptavidin-biotin system the assay utilized a detection
polyclonal antibody for relaxin-2 directly linked to the reporter-enzyme (HRP). Similarly,
the O.D. was measured at 450 nm.
All of the samples were investigated undiluted. The assay was performed according to the
standard protocol provided by the manufacturer. The dynamic range of the immunoassay
was 7.8 – 500 pg/mL. Human recombinant relaxin-2 from the kit was diluted in assay
buffer and reference standards were acquired. Standard curves were fitted using 5-
parameter logistic (5-PL) regression (Figure 41). Assay characteristics of the Human
Relaxin-2 Quantikine ELISA Kit are indicated in Table 12.
Table 12.: Characteristics of the Human Relaxin-2 Quantikine ELISA Kit according to
the producer:
Sensitivity The minimum detectable concentration of relaxin-2 ranged from 0.26 to
4.57 pg/mL; the mean minimal detectable concentration was 1 pg/mL
Specificity
The assay recognized natural and recombinant human relaxin-2. No
significant cross reactivity with related molecules such as relaxin-1,
relaxin-3, and insulin has been observed
Intra-Assay Variation 2.3 – 4.7 % (by concentration range 34.4 – 206 pg/mL)
Inter-Assay Variation 5.5 – 10.2 % (by concentration range 40.8 – 220 pg/mL)
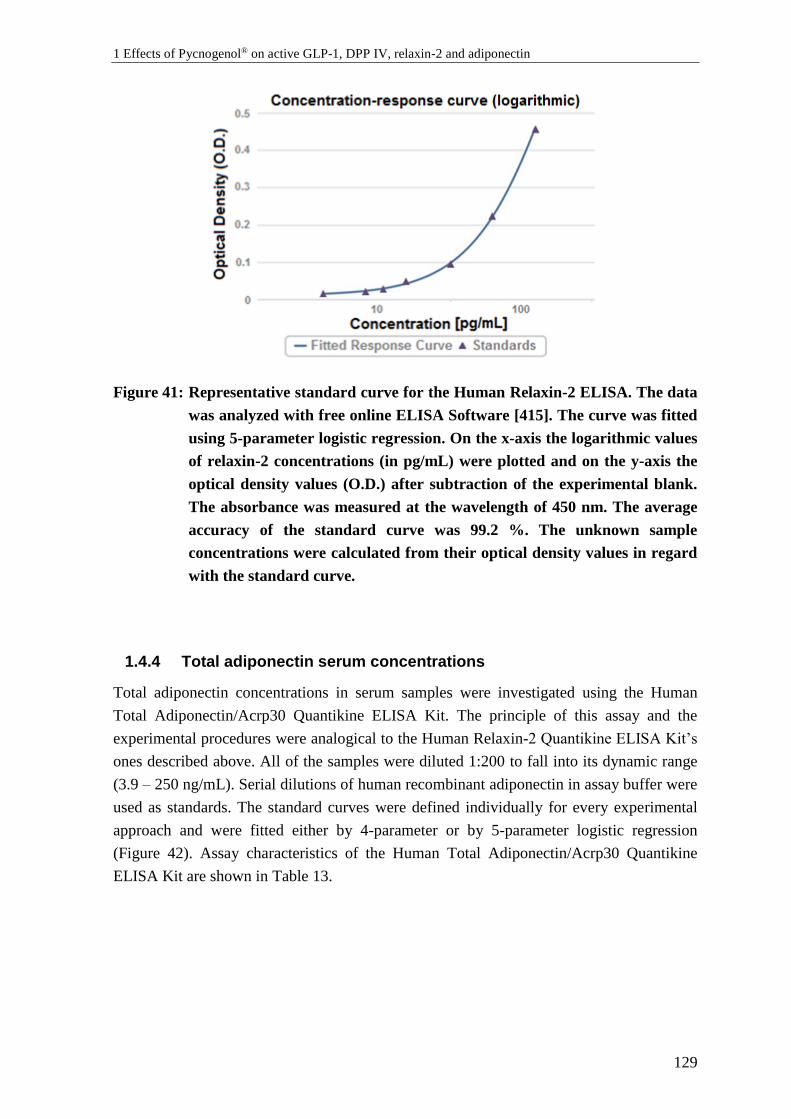
1 Effects of Pycnogenol® on active GLP-1, DPP IV, relaxin-2 and adiponectin
129
Figure 41: Representative standard curve for the Human Relaxin-2 ELISA. The data
was analyzed with free online ELISA Software [415]. The curve was fitted
using 5-parameter logistic regression. On the x-axis the logarithmic values
of relaxin-2 concentrations (in pg/mL) were plotted and on the y-axis the
optical density values (O.D.) after subtraction of the experimental blank.
The absorbance was measured at the wavelength of 450 nm. The average
accuracy of the standard curve was 99.2 %. The unknown sample
concentrations were calculated from their optical density values in regard
with the standard curve.
1.4.4 Total adiponectin serum concentrations
Total adiponectin concentrations in serum samples were investigated using the Human
Total Adiponectin/Acrp30 Quantikine ELISA Kit. The principle of this assay and the
experimental procedures were analogical to the Human Relaxin-2 Quantikine ELISA Kit’s
ones described above. All of the samples were diluted 1:200 to fall into its dynamic range
(3.9 – 250 ng/mL). Serial dilutions of human recombinant adiponectin in assay buffer were
used as standards. The standard curves were defined individually for every experimental
approach and were fitted either by 4-parameter or by 5-parameter logistic regression
(Figure 42). Assay characteristics of the Human Total Adiponectin/Acrp30 Quantikine
ELISA Kit are shown in Table 13.
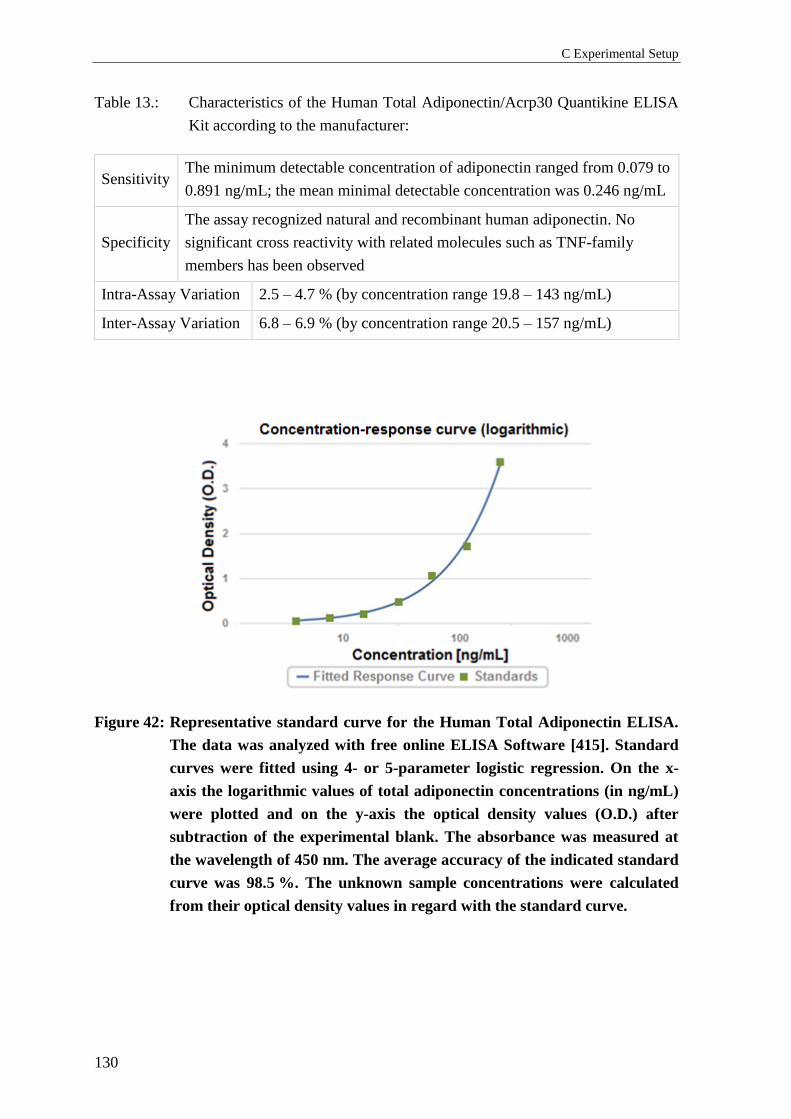
C Experimental Setup
130
Table 13.: Characteristics of the Human Total Adiponectin/Acrp30 Quantikine ELISA
Kit according to the manufacturer:
Sensitivity The minimum detectable concentration of adiponectin ranged from 0.079 to
0.891 ng/mL; the mean minimal detectable concentration was 0.246 ng/mL
Specificity
The assay recognized natural and recombinant human adiponectin. No
significant cross reactivity with related molecules such as TNF-family
members has been observed
Intra-Assay Variation 2.5 – 4.7 % (by concentration range 19.8 – 143 ng/mL)
Inter-Assay Variation 6.8 – 6.9 % (by concentration range 20.5 – 157 ng/mL)
Figure 42: Representative standard curve for the Human Total Adiponectin ELISA.
The data was analyzed with free online ELISA Software [415]. Standard
curves were fitted using 4- or 5-parameter logistic regression. On the x-
axis the logarithmic values of total adiponectin concentrations (in ng/mL)
were plotted and on the y-axis the optical density values (O.D.) after
subtraction of the experimental blank. The absorbance was measured at
the wavelength of 450 nm. The average accuracy of the indicated standard
curve was 98.5 %. The unknown sample concentrations were calculated
from their optical density values in regard with the standard curve.
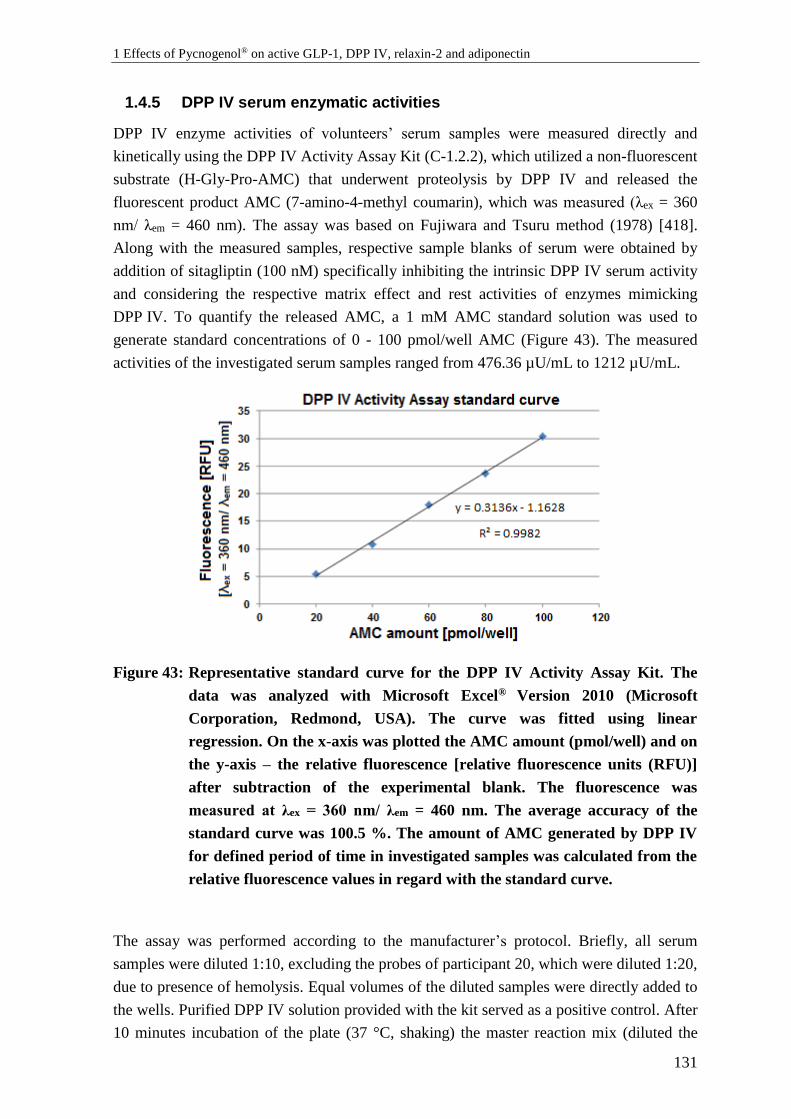
1 Effects of Pycnogenol® on active GLP-1, DPP IV, relaxin-2 and adiponectin
131
1.4.5 DPP IV serum enzymatic activities
DPP IV enzyme activities of volunteers’ serum samples were measured directly and
kinetically using the DPP IV Activity Assay Kit (C-1.2.2), which utilized a non-fluorescent
substrate (H-Gly-Pro-AMC) that underwent proteolysis by DPP IV and released the
fluorescent product AMC (7-amino-4-methyl coumarin), which was measured (λex = 360
nm/ λem = 460 nm). The assay was based on Fujiwara and Tsuru method (1978) [418].
Along with the measured samples, respective sample blanks of serum were obtained by
addition of sitagliptin (100 nM) specifically inhibiting the intrinsic DPP IV serum activity
and considering the respective matrix effect and rest activities of enzymes mimicking
DPP IV. To quantify the released AMC, a 1 mM AMC standard solution was used to
generate standard concentrations of 0 - 100 pmol/well AMC (Figure 43). The measured
activities of the investigated serum samples ranged from 476.36 µU/mL to 1212 µU/mL.
Figure 43: Representative standard curve for the DPP IV Activity Assay Kit. The
data was analyzed with Microsoft Excel® Version 2010 (Microsoft
Corporation, Redmond, USA). The curve was fitted using linear
regression. On the x-axis was plotted the AMC amount (pmol/well) and on
the y-axis – the relative fluorescence [relative fluorescence units (RFU)]
after subtraction of the experimental blank. The fluorescence was
measured at λex = 360 nm/ λem = 460 nm. The average accuracy of the
standard curve was 100.5 %. The amount of AMC generated by DPP IV
for defined period of time in investigated samples was calculated from the
relative fluorescence values in regard with the standard curve.
The assay was performed according to the manufacturer’s protocol. Briefly, all serum
samples were diluted 1:10, excluding the probes of participant 20, which were diluted 1:20,
due to presence of hemolysis. Equal volumes of the diluted samples were directly added to
the wells. Purified DPP IV solution provided with the kit served as a positive control. After
10 minutes incubation of the plate (37 °C, shaking) the master reaction mix (diluted the
C Experimental Setup
132
DPP IV substrate in assay buffer) was added to each sample’s and sample blank’s well, but
not to the standards’ wells. The plate was protected from light and incubated at 37 °C on
horizontal shaker. After 5 minutes the initial fluorescence measurement was performed.
Afterwards, the plate was incubated further and a kinetic measurement was performed
every 5 minutes, usually up to 20 minutes. Practically, the measurements continued until
the most active sample exceeded the fluorescence value of the highest standard (100
pmol/well). Typically, the penultimate measurement (15 min) was used as a final one. The
differences in fluorescence (FLU) between the initial (Tinitial) and the final (Tfinal) time
point were determined for every sample and sample blank:
ΔFLU = (FLU)final – (FLU)initial
The sample blank value (ΔFLUsample blank) was subtracted from the sample value
(ΔFLUsample):
ΔFLU’ = ΔFLUsample – ΔFLUsample blank
The amount of AMC (B) released by the DPP IV in each sample between Tinitial and Tfinal
was determined by ΔFLU’ using a standard curve (Figure 43).
The DPP IV activity of each sample was determined as following:
𝐷𝑃𝑃 𝐼𝑉 𝐴𝑐𝑡𝑖𝑣𝑖𝑡𝑦 =𝐵 × (𝑆𝑎𝑚𝑝𝑙𝑒 𝐷𝑖𝑙𝑢𝑡𝑖𝑜𝑛 𝐹𝑎𝑐𝑡𝑜𝑟)
(𝑅𝑒𝑎𝑐𝑡𝑖𝑜𝑛 𝑇𝑖𝑚𝑒)×𝑉 , where:
B represents the amount of AMC released between the initial (Tinitial) and the final (Tfinal)
time point [pmol];
Sample dilution factor represents dilution of the serum sample. Typically, its value was
10 (or 20 for participant No. 20);
Reaction time is the time period between the initial and the final time point:
Reaction time = Tfinal – Tinitial [min];
V is the sample volume added to well [mL];
DPP IV Activity is calculated in the following units: [pmol/min/mL] = [µU/mL];
1 Effects of Pycnogenol® on active GLP-1, DPP IV, relaxin-2 and adiponectin
133
1.5 Statistical analysis
1.5.1 Standard curve fitting
The fitting of standard curves was performed using linear [Microsoft Excel® Version 2010
(Microsoft Corporation, Redmond, USA)] or non-linear regression (4-PL, 5-PL,
polynomial cubic regression) as calculated by the free online tool for analysis of ELISA
(Elisaanalysis.com, Crux Biolab Pty Ltd., Australia) [415] as indicated above.
1.5.2 Descriptive statistics and normality
The mean values, standard deviations (S.D.), medians, and mean deviation (Mean Dev.)
were calculated with Microsoft Excel® Version 2010. The normality of the distribution of
the data was checked by the Shapiro-Wilk test [419], using the freely available Real
Statistics Add-in© (2013-2016, Charles Zaiontz) of Excel [420].
1.5.3 Outliers detection and exclusion
Values bigger than 2.5 S.D. were identified as outliers by the Box Plot test [191].
Additionally, outliers were detected by the two-sided Grubbs’ test [192] which defined
outliers as values meeting the following requirement:
G > Gcrit, where
𝐺 =max |𝑥𝑖−�̅�|
𝑆.𝐷. and Gcrit can be calculated as following:
𝐺𝑐𝑟𝑖𝑡 =(𝑁−1)
√𝑁√
(𝑡𝛼 /(2𝑁),𝑁−2)2
𝑁−2+(𝑡𝛼/(2𝑁),𝑁−2)2, where
𝑡𝛼/(2𝑁),𝑁−2 is the critical value of the t-distribution, with N-2 degrees of freedom and a
significance level of 𝛼 /(2𝑁).
For this purpose the Real Statistics Add-in© (2013-2016, Charles Zaiontz) of Excel was
used [420].
1.5.4 Statistical significance
The statistical significance of the differences between DPP IV concentrations and activities
of control and treated state was examined using a two tailed paired Student’s t-test. The
statistical significance of the differences between GLP-1 (active) and total adiponectin
serum levels were investigated by one-way ANOVA. The significance level α was set to be
0.05 for all statistical significance tests performed. The tests were performed with the Real
Statistics Add-in© (2013-2016, Charles Zaiontz) of Excel [420]. Alternatively, the freely
available online statistical web calculator Astatsa (2016, Navendu Vasavada) performing

C Experimental Setup
134
Tukey HSD (honestly significant difference) test for multiple group comparison was used
[421].
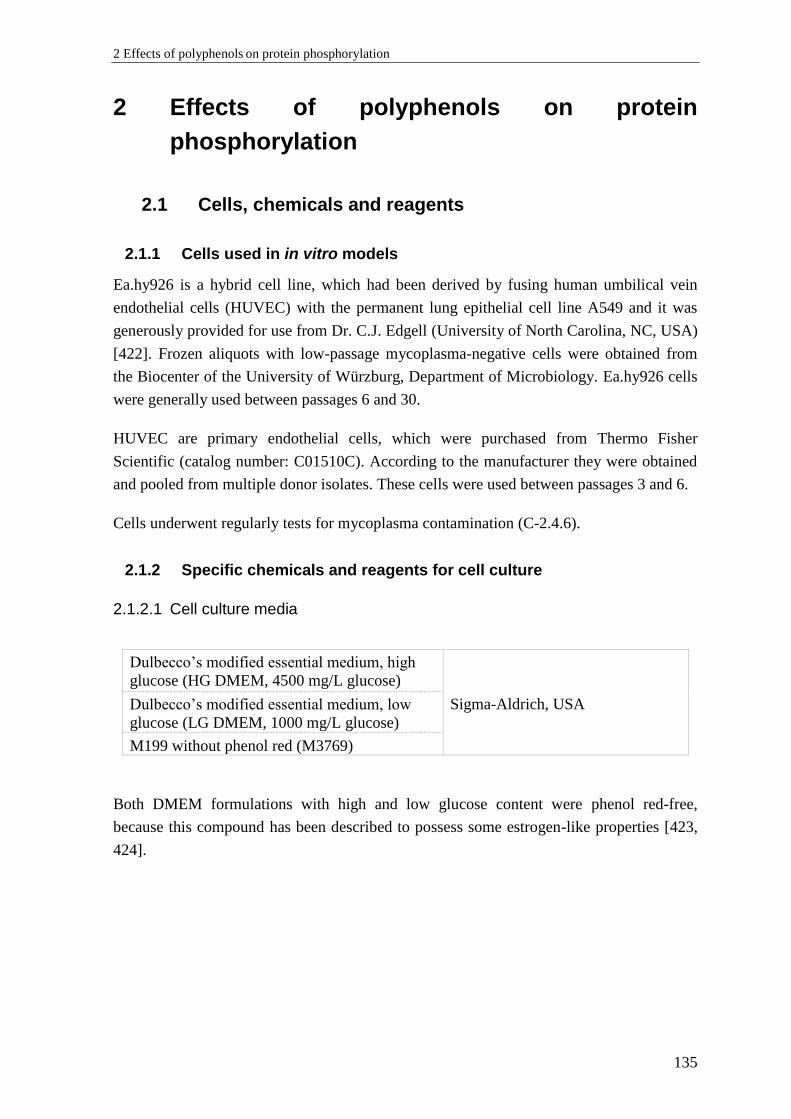
2 Effects of polyphenols on protein phosphorylation
135
2 Effects of polyphenols on protein
phosphorylation
2.1 Cells, chemicals and reagents
2.1.1 Cells used in in vitro models
Ea.hy926 is a hybrid cell line, which had been derived by fusing human umbilical vein
endothelial cells (HUVEC) with the permanent lung epithelial cell line A549 and it was
generously provided for use from Dr. C.J. Edgell (University of North Carolina, NC, USA)
[422]. Frozen aliquots with low-passage mycoplasma-negative cells were obtained from
the Biocenter of the University of Würzburg, Department of Microbiology. Ea.hy926 cells
were generally used between passages 6 and 30.
HUVEC are primary endothelial cells, which were purchased from Thermo Fisher
Scientific (catalog number: C01510C). According to the manufacturer they were obtained
and pooled from multiple donor isolates. These cells were used between passages 3 and 6.
Cells underwent regularly tests for mycoplasma contamination (C-2.4.6).
2.1.2 Specific chemicals and reagents for cell culture
2.1.2.1 Cell culture media
Dulbecco’s modified essential medium, high
glucose (HG DMEM, 4500 mg/L glucose)
Sigma-Aldrich, USA
Dulbecco’s modified essential medium, low
glucose (LG DMEM, 1000 mg/L glucose)
M199 without phenol red (M3769)
Both DMEM formulations with high and low glucose content were phenol red-free,
because this compound has been described to possess some estrogen-like properties [423,
424].
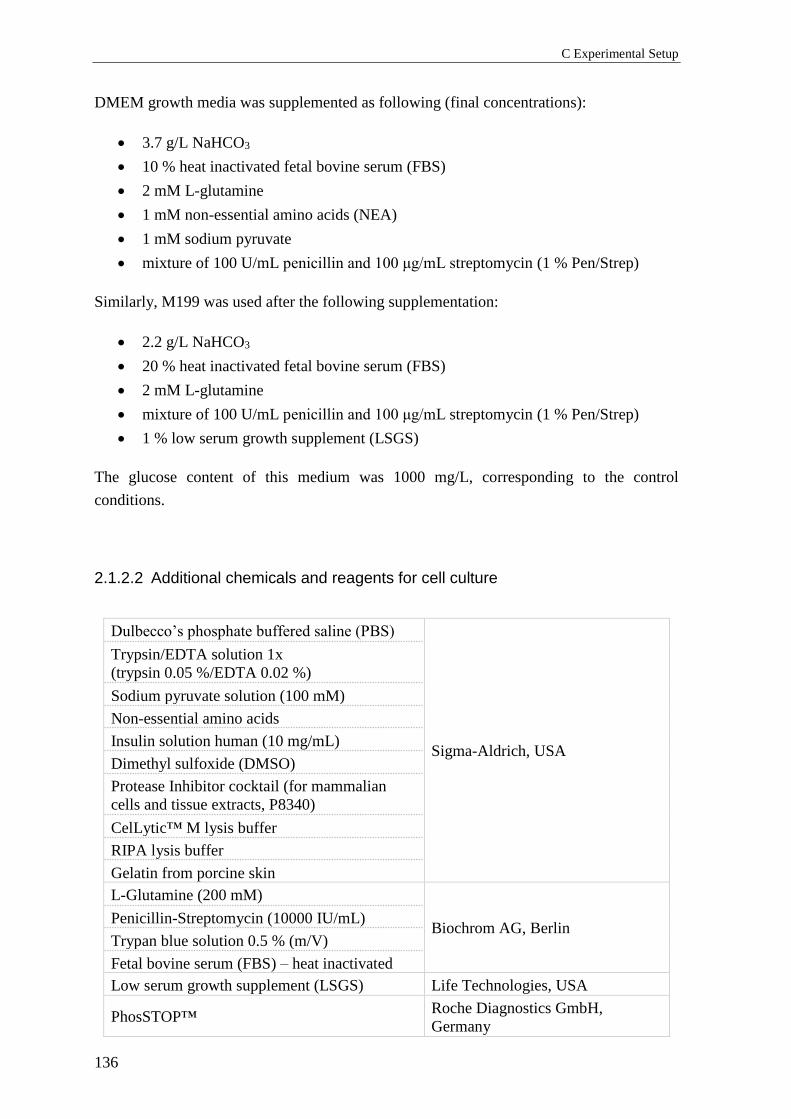
C Experimental Setup
136
DMEM growth media was supplemented as following (final concentrations):
• 3.7 g/L NaHCO3
• 10 % heat inactivated fetal bovine serum (FBS)
• 2 mM L-glutamine
• 1 mM non-essential amino acids (NEA)
• 1 mM sodium pyruvate
• mixture of 100 U/mL penicillin and 100 μg/mL streptomycin (1 % Pen/Strep)
Similarly, M199 was used after the following supplementation:
• 2.2 g/L NaHCO3
• 20 % heat inactivated fetal bovine serum (FBS)
• 2 mM L-glutamine
• mixture of 100 U/mL penicillin and 100 μg/mL streptomycin (1 % Pen/Strep)
• 1 % low serum growth supplement (LSGS)
The glucose content of this medium was 1000 mg/L, corresponding to the control
conditions.
2.1.2.2 Additional chemicals and reagents for cell culture
Dulbecco’s phosphate buffered saline (PBS)
Sigma-Aldrich, USA
Trypsin/EDTA solution 1x
(trypsin 0.05 %/EDTA 0.02 %)
Sodium pyruvate solution (100 mM)
Non-essential amino acids
Insulin solution human (10 mg/mL)
Dimethyl sulfoxide (DMSO)
Protease Inhibitor cocktail (for mammalian
cells and tissue extracts, P8340)
CelLytic™ M lysis buffer
RIPA lysis buffer
Gelatin from porcine skin
L-Glutamine (200 mM)
Biochrom AG, Berlin Penicillin-Streptomycin (10000 IU/mL)
Trypan blue solution 0.5 % (m/V)
Fetal bovine serum (FBS) – heat inactivated
Low serum growth supplement (LSGS) Life Technologies, USA
PhosSTOP™ Roche Diagnostics GmbH,
Germany

2 Effects of polyphenols on protein phosphorylation
137
Histamine dihydrochloride Fluka BioChemika, Switzerland
Histamine base
Millipore water Water processing system,
Millipore, Schwalbach, Germany
Isopropanol
Inventory at the Faculty of
Chemistry and Pharmacy
(University of Würzburg)
2.1.2.3 Polyphenolic compounds
Stock solutions (10-2 M) of the investigated polyphenols in DMSO were prepared and
stored at – 80 °C. Compounds and their purities are indicated below:
Compound Purity
(%) Producer Compound
Purity (%)
Producer
Resveratrol > 98
Tokyo
Chemical
Industry
(TCI)
Co., Ltd.,
Japan
7,8-Dihydroxy-
flavone > 98
Tokyo Chemical
Industry (TCI)
Co., Ltd., Japan
Pinostilbene > 97
Pterostilbene, > 98 (-)-Epigallocatechin
gallate > 98
3,4’,5-Trimethoxy-
trans-stilbene > 96
Flavanone > 98
Piceatannol > 98 Urolithin A N/A Newchem
Technologies Ltd,
UK
Oxyresveratrol > 95 Urolithin C N/A
Naringenin > 93 Urolithin D N/A
Apigenin > 98 Urolithin B ≥ 95
Sigma-Aldrich,
USA
Taxifolin ≥ 85 Flavone ≥ 99
Genistein > 96 Chlorogenic acid > 95
3-Hydroxyflavone > 98 Morin > 85
3-Methoxyflavone > 98 Quercetin > 98
7-Methoxyflavone
> 98
> 98 Caffeic acid ≥ 98
3,4’-Dihydroxy-
flavone > 97
(+)-Catechin > 99
Ellagic acid > 95
3-Hydroxy-4’-
methoxyflavone > 98
Luteolin ≥ 98
Aladdin,
Shanghai, China
Trans-ferulic > 99
Kaempferol > 97 (-)-Epicatechin ≥ 98
Myricetin > 97 Baicalin > 95
Chrysin > 97 Wogonoside ≥ 98
Fisetin > 96 (-)-Gallocatechin
gallate ≥ 98
Baicalein > 98
6-Hydroxyflavone > 98 (-)-Epigalocatechin ≥ 98
6-Methoxyflavone > 98 Vitexin ≥ 98 TAUTO®, China
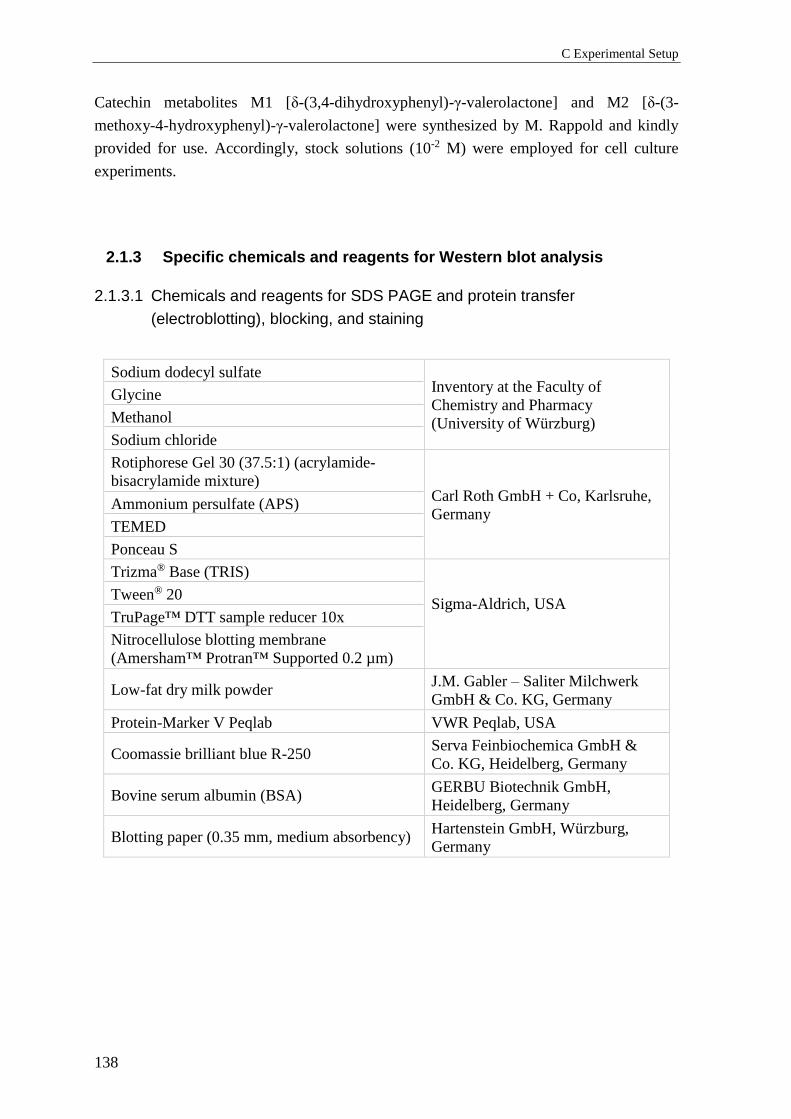
C Experimental Setup
138
Catechin metabolites M1 [δ-(3,4-dihydroxyphenyl)-γ-valerolactone] and M2 [δ-(3-
methoxy-4-hydroxyphenyl)-γ-valerolactone] were synthesized by M. Rappold and kindly
provided for use. Accordingly, stock solutions (10-2 M) were employed for cell culture
experiments.
2.1.3 Specific chemicals and reagents for Western blot analysis
2.1.3.1 Chemicals and reagents for SDS PAGE and protein transfer
(electroblotting), blocking, and staining
Sodium dodecyl sulfate Inventory at the Faculty of
Chemistry and Pharmacy
(University of Würzburg)
Glycine
Methanol
Sodium chloride
Rotiphorese Gel 30 (37.5:1) (acrylamide-
bisacrylamide mixture) Carl Roth GmbH + Co, Karlsruhe,
Germany Ammonium persulfate (APS)
TEMED
Ponceau S
Trizma® Base (TRIS)
Sigma-Aldrich, USA
Tween® 20
TruPage™ DTT sample reducer 10x
Nitrocellulose blotting membrane
(Amersham™ Protran™ Supported 0.2 µm)
Low-fat dry milk powder J.M. Gabler – Saliter Milchwerk
GmbH & Co. KG, Germany
Protein-Marker V Peqlab VWR Peqlab, USA
Coomassie brilliant blue R-250 Serva Feinbiochemica GmbH &
Co. KG, Heidelberg, Germany
Bovine serum albumin (BSA) GERBU Biotechnik GmbH,
Heidelberg, Germany
Blotting paper (0.35 mm, medium absorbency) Hartenstein GmbH, Würzburg,
Germany
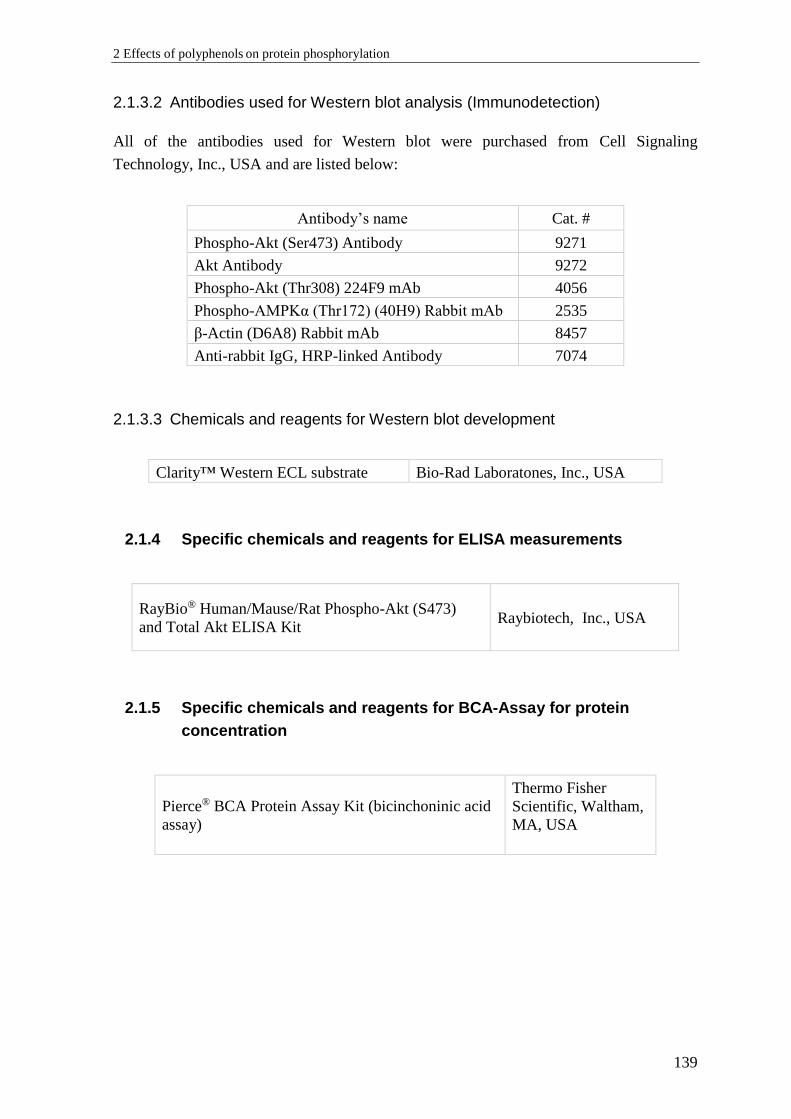
2 Effects of polyphenols on protein phosphorylation
139
2.1.3.2 Antibodies used for Western blot analysis (Immunodetection)
All of the antibodies used for Western blot were purchased from Cell Signaling
Technology, Inc., USA and are listed below:
Antibody’s name Cat. #
Phospho-Akt (Ser473) Antibody 9271
Akt Antibody 9272
Phospho-Akt (Thr308) 224F9 mAb 4056
Phospho-AMPKα (Thr172) (40H9) Rabbit mAb 2535
β-Actin (D6A8) Rabbit mAb 8457
Anti-rabbit IgG, HRP-linked Antibody 7074
2.1.3.3 Chemicals and reagents for Western blot development
Clarity™ Western ECL substrate Bio-Rad Laboratones, Inc., USA
2.1.4 Specific chemicals and reagents for ELISA measurements
RayBio® Human/Mause/Rat Phospho-Akt (S473)
and Total Akt ELISA Kit Raybiotech, Inc., USA
2.1.5 Specific chemicals and reagents for BCA-Assay for protein
concentration
Pierce® BCA Protein Assay Kit (bicinchoninic acid
assay)
Thermo Fisher
Scientific, Waltham,
MA, USA
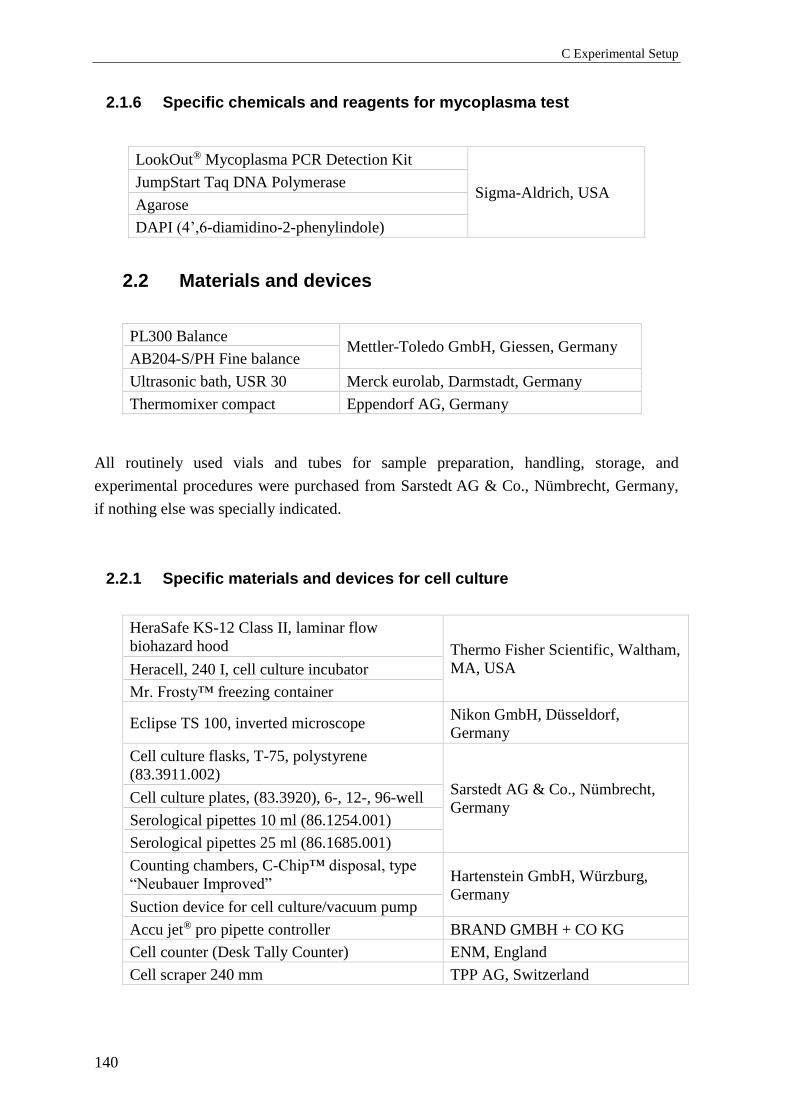
C Experimental Setup
140
2.1.6 Specific chemicals and reagents for mycoplasma test
LookOut® Mycoplasma PCR Detection Kit
Sigma-Aldrich, USA JumpStart Taq DNA Polymerase
Agarose
DAPI (4’,6-diamidino-2-phenylindole)
2.2 Materials and devices
PL300 Balance Mettler-Toledo GmbH, Giessen, Germany
AB204-S/PH Fine balance
Ultrasonic bath, USR 30 Merck eurolab, Darmstadt, Germany
Thermomixer compact Eppendorf AG, Germany
All routinely used vials and tubes for sample preparation, handling, storage, and
experimental procedures were purchased from Sarstedt AG & Co., Nümbrecht, Germany,
if nothing else was specially indicated.
2.2.1 Specific materials and devices for cell culture
HeraSafe KS-12 Class II, laminar flow
biohazard hood Thermo Fisher Scientific, Waltham,
MA, USA Heracell, 240 I, cell culture incubator
Mr. Frosty™ freezing container
Eclipse TS 100, inverted microscope Nikon GmbH, Düsseldorf,
Germany
Cell culture flasks, T-75, polystyrene
(83.3911.002) Sarstedt AG & Co., Nümbrecht,
Germany Cell culture plates, (83.3920), 6-, 12-, 96-well
Serological pipettes 10 ml (86.1254.001)
Serological pipettes 25 ml (86.1685.001)
Counting chambers, C-Chip™ disposal, type
“Neubauer Improved” Hartenstein GmbH, Würzburg,
Germany Suction device for cell culture/vacuum pump
Accu jet® pro pipette controller BRAND GMBH + CO KG
Cell counter (Desk Tally Counter) ENM, England
Cell scraper 240 mm TPP AG, Switzerland
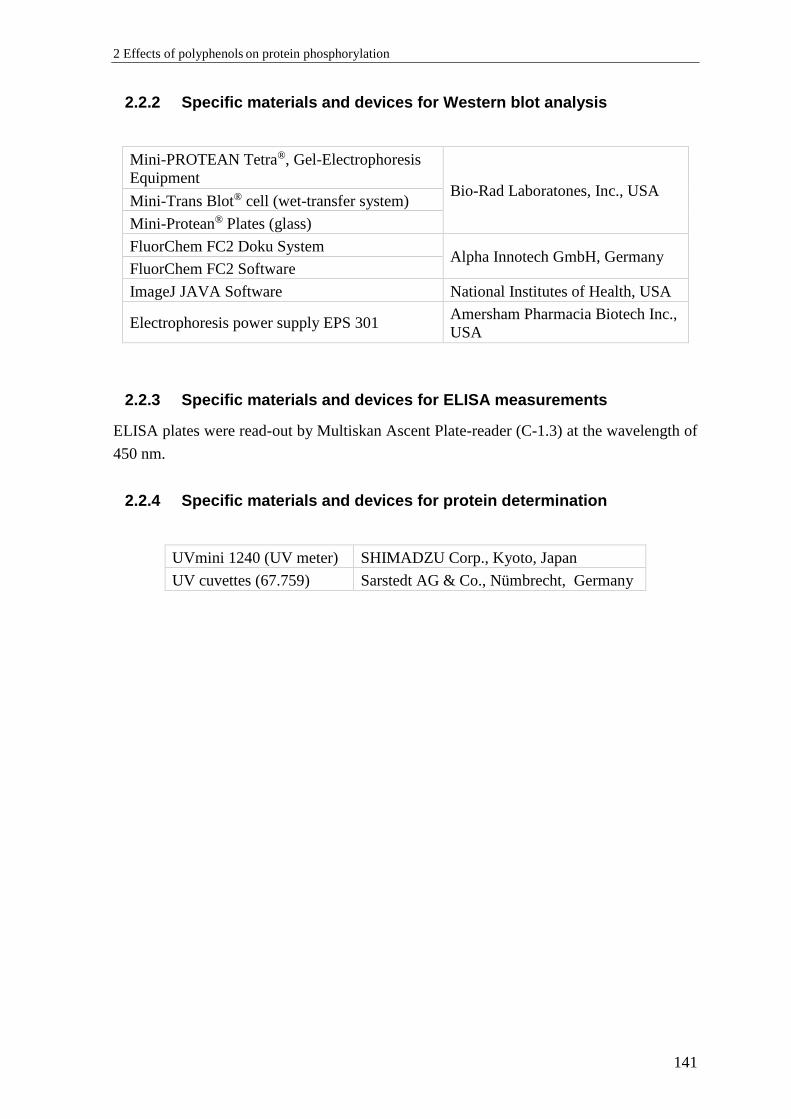
2 Effects of polyphenols on protein phosphorylation
141
2.2.2 Specific materials and devices for Western blot analysis
Mini-PROTEAN Tetra®, Gel-Electrophoresis
Equipment Bio-Rad Laboratones, Inc., USA
Mini-Trans Blot® cell (wet-transfer system)
Mini-Protean® Plates (glass)
FluorChem FC2 Doku System Alpha Innotech GmbH, Germany
FluorChem FC2 Software
ImageJ JAVA Software National Institutes of Health, USA
Electrophoresis power supply EPS 301 Amersham Pharmacia Biotech Inc.,
USA
2.2.3 Specific materials and devices for ELISA measurements
ELISA plates were read-out by Multiskan Ascent Plate-reader (C-1.3) at the wavelength of
450 nm.
2.2.4 Specific materials and devices for protein determination
UVmini 1240 (UV meter) SHIMADZU Corp., Kyoto, Japan
UV cuvettes (67.759) Sarstedt AG & Co., Nümbrecht, Germany

C Experimental Setup
142
2.3 Frequently used solutions
2.3.1 Solutions used for sample preparation and Western blot analysis
Buffer/Solution Substance
Final
concentration Quantity
Loading buffer
(4 x Laemmli without β-
mercaptoethanol)
Glycerol (100 %) 40 % (v/v) 4.0 mL
TRIS 1M (pH = 6.8) 240 mM 2.4 mL
SDS 8 % (w/v) 0.8 g
Bromphenol blue 0.04 % (w/v) 4.0 mg
Millipore water 3.1 mL
Running buffer
(10 x SDS buffer)
(pH= 8.3)
TRIS base 250 mM 30.3 g
Glycin 1.92 M 144.0 g
SDS 1 % (w/v) 10.0 g
Millipore water ad 1.0 L
Running buffer
(1 x SDS buffer)
10 x SDS Buffer 10 % (v/v) 0.1 L
Millipore water ad 1.0 L
Transfer buffer
(pH= 8.1 – 8.5)
TRIS base 20 mM 2.40 g
Glycin 150 mM 11.24 g
Methanol 20 % (v/v) 200.00 mL
Millipore water ad 1.0 L
Modified transfer buffer 0.037 % SDS in transfer buffer
TRIS-Buffered Saline +
Tween® 20 (TBST)
(1 x Washing buffer)
(pH= 7.6)
TRIS 1M (pH = 7.6) 20 mM 20.0 mL
NaCl 150 mM 75.0 mL
Tween® 20 0.05 % (v/v) 500.0 µL
Millipore water ad 1.0 L
Blocking buffer 5 % Low-fat dry milk in TBST (w/v)
BSA buffer 5 % BSA in TBST (w/v)
NaN3 solution 10 % NaN3 in Millipore water (w/v)
2.3.2 Solutions used for polyacrylamide gel cast
APS solution (10 %) 10 % APS in water (w/v)
SDS solution (10 %) 10 % SDS in water (w/v)
TRIS (stacking gel) 1.5 M TRIS, pH= 6.8
TRIS (resolving gel) 1.5 M TRIS, pH= 8.8

2 Effects of polyphenols on protein phosphorylation
143
2.3.3 Stripping solutions
Soft stripping buffer
(pH= 2.2)
Glycin 200 mM 15.0 g
SDS 0.1 % (w/v) 1.0 g
Tween 20 1.0 % (v/v) 10.0 mL
Millipore water ad 1.0 L
2.3.4 Staining solutions
Coomassie Blue staining
solution
Methanol 45.0 % (v/v) 450 mL
Glacial acetic acid 10.0 % (v/v) 100 mL
Coomassie blue R-250 0.25 % (w/v) 2.5 g
Millipore water ad 1.0 L
Ponceau S reversible
staining solution
Ponceau S 0.1 % (w/v) 1.0 g
Glacial acetic acid 5.0 % (v/v) 50 mL
Millipore water ad 1.0 L
Destaining Solution
Methanol 5.0 % (v/v) 50 mL
Glacial acetic acid 7.5 % (v/v) 75 mL
Millipore water ad 1.0 L
2.3.5 Coating solution for cell culture flasks (HUVEC)
Gelatin Solution 1 %
(autoclaved)
Gelatin from porcine skin 1.0 % (w/v) 1.0 g
Millipore water ad 0.1 L
2.3.6 Solutions for mycoplasma test
10 x TBE
(pH= 8.4)
Tris 890 mM 108.0 g
Boric acid 890 mM 55.0 g
Na2EDTA 25 mM 9.3 g
Millipore water ad 0.5 L
1 x TBE 10 x TBE 10 % (v/v) 0.1 L
Millipore water ad 1.0 L
DAPI stock solution DAPI 14.3 mM 5 mg
Millipore water ad 1.0 mL
C Experimental Setup
144
2.4 Experimental design
2.4.1 In vitro cell culture model – routine methods
2.4.1.1 Cultivation, subcultivation, and medium change
Immortalized human endothelial cell line Ea.hy926 was cultured according to a standard
protocol [425] in phenol red-free DMEM cell culture medium with different glucose
content [low glucose (LG) – 1000 mg/L, high glucose (HG) – 4500 mg/L] supplemented as
indicated above (C-2.1.2.1). Briefly, cells were seeded into 75 cm2 flasks at a density of
2000 – 2500 cells/cm2. The medium was changed every second day. When cells reached
90 % confluence they were passaged. For this purpose, they were rinsed three times with
warm PBS and treated with trypsin. Afterwards, detached cells were resuspended in a fresh
warm medium. Cell suspension was either seeded into flasks for further cultivation or into
6-well plates at a density of 0.3 x 10⁶ cells per well for experiments.
Primary endothelial cells HUVEC were cultivated according to the protocol described
above with some deviations. Instead of DMEM, M 199 supplemented as indicated in
C-2.1.2.1 was used. All flasks and wells used for HUVECs were coated with a sterile 1 %
gelatin solution. After trypsinization cells were mixed with growth medium and pelleted by
centrifugation (7 min, 25 °C 1200 g) in order to remove the proteolytic enzyme. Then the
cells were resuspended in a fresh warm M 199 and counted, passaged or seeded for an
experiment as indicated.
2.4.1.2 Cellular cryopreservation and thawing
In order to cryopreserve endothelial cells, they were grown to confluence and treated with
trypsin. They were suspended in a few milliliters of serum-supplemented DMEM in order
to stop the action of the enzyme and then the cell suspension was centrifuged for 7 minutes
at 25 °C, at 1200 g. The cell pellet was mixed with 4 mL fresh medium to obtain a cell
suspension free of trypsin. Cells were counted and one part of the cell suspension was
mixed with one part precooled freezing medium, containing 80 % FBS and 20 % DMSO.
Thus, 0.5 – 1 x 10⁶ cells pro vial were cryopreserved in medium containing 10 % DMSO
and 45 % FBS (final concentration v/v). As such DMSO concentrations are cytotoxic at
room temperature aliquots were put immediately into precooled freezing container
(described under C-2.1.1) filled with isopropanol and was left at – 80 °C for 24 hours. This
device ensured gradual cooling of cells at a rate of 1 °C per minute, which is optimal for
their vitality. For long terms cell aliquots were stored in a liquid nitrogen tank (– 196 °C).
2 Effects of polyphenols on protein phosphorylation
145
When needed, the cryopreserved cells were removed from the storage tank and the vial
was warmed in a water bath (37 °C) under continuous shaking. When crystals almost
disappeared, the cell suspension was gently mixed by a pipette tip and was transferred to a
cell culture flask with warm (37 °C) growth medium. After 4 hours the majority of the
cells was attached to the bottom of the flask and the medium was changed to remove
residuals of DMSO. For HUVECs the rests of DMSO were removed through
centrifugation and replacement with pre-warmed medium even before inoculation in the
flask. This was crucial for their good viability.
2.4.1.3 Counting of the cells and vitality test
25 µL of the well-homogenized cell suspension obtained after trypsin treatment were either
directly pipetted into the Neubauer chamber (for cell counting, C-2.2.1) or firstly mixed
with trypan blue solution (for vitality test) at a ratio 1:1 and then pipetted into the
Neubauer chamber. Cells from four fields of the chamber grid were counted under the
microscope in a meandering manner, and upper and left edges of the fields were omitted to
avoid the double counting. The total number of the cells was calculated as following:
Number of cells/mL = (M/4) x F x 10000, where
M was the total number of cells counted,
F was the dilution factor: F= 1, for cell count without trypan blue; F= 2, for the vitality test.
Trypan blue staining was routinely performed to determine the vitality of cells. Intact cells
were not permeable for the stain and remained brighter on a blue background. In contrast,
dead cells were stained in dark blue, because of the impaired integrity of the cellular
membrane and increased permeability of the stain.
2.4.1.4 Analysis of the effects of polyphenols on signaling pathways in vitro
After seeding cells were grown with 3 mL medium/well and left to reach confluence. Then
they were serum deprived and thereby growth arrested for 18-20 hours. Afterwards, they
were treated with the compounds of interest at a concentration of 10 µM for a defined time.
Such polyphenol concentrations were considered as physiologically relevant [218, 275]. As
a positive control was used histamine (known AMPK/eNOS-activatior) at a final
concentration of 20 µM [426]. For Akt-activation insulin (1 µM) was utilized as a positive
control [427] (Figure 44).
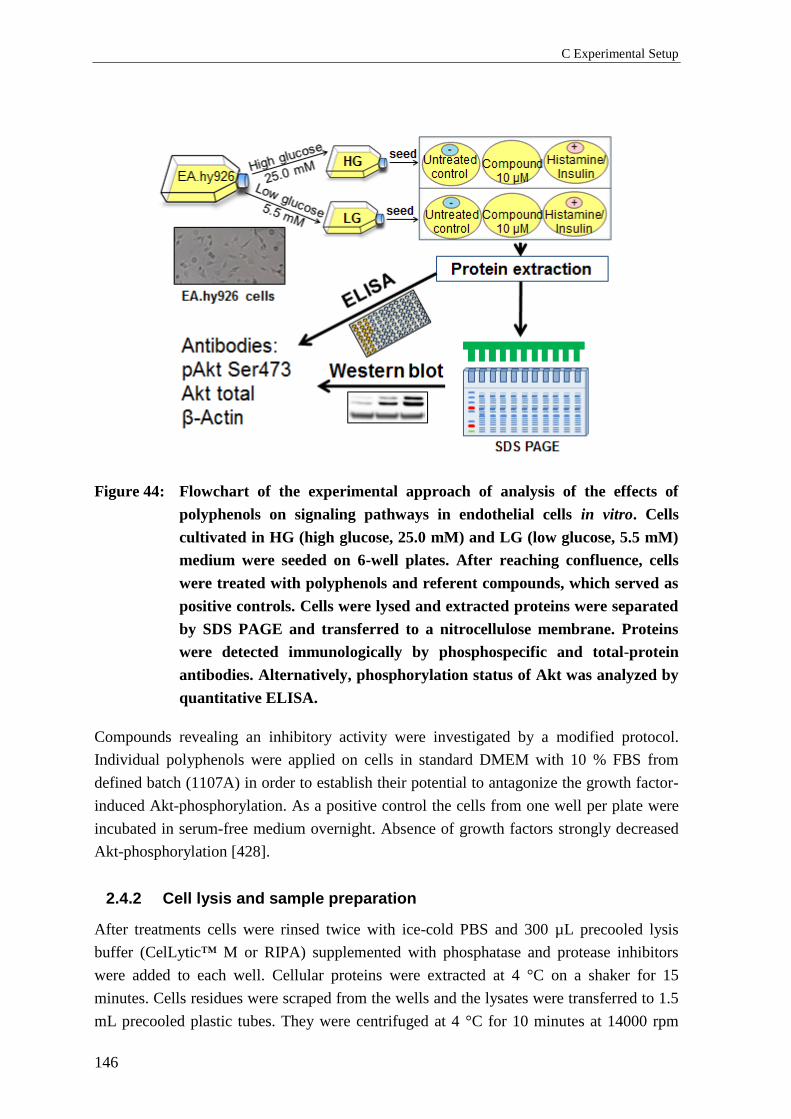
C Experimental Setup
146
Figure 44: Flowchart of the experimental approach of analysis of the effects of
polyphenols on signaling pathways in endothelial cells in vitro. Cells
cultivated in HG (high glucose, 25.0 mM) and LG (low glucose, 5.5 mM)
medium were seeded on 6-well plates. After reaching confluence, cells
were treated with polyphenols and referent compounds, which served as
positive controls. Cells were lysed and extracted proteins were separated
by SDS PAGE and transferred to a nitrocellulose membrane. Proteins
were detected immunologically by phosphospecific and total-protein
antibodies. Alternatively, phosphorylation status of Akt was analyzed by
quantitative ELISA.
Compounds revealing an inhibitory activity were investigated by a modified protocol.
Individual polyphenols were applied on cells in standard DMEM with 10 % FBS from
defined batch (1107A) in order to establish their potential to antagonize the growth factor-
induced Akt-phosphorylation. As a positive control the cells from one well per plate were
incubated in serum-free medium overnight. Absence of growth factors strongly decreased
Akt-phosphorylation [428].
2.4.2 Cell lysis and sample preparation
After treatments cells were rinsed twice with ice-cold PBS and 300 µL precooled lysis
buffer (CelLytic™ M or RIPA) supplemented with phosphatase and protease inhibitors
were added to each well. Cellular proteins were extracted at 4 °C on a shaker for 15
minutes. Cells residues were scraped from the wells and the lysates were transferred to 1.5
mL precooled plastic tubes. They were centrifuged at 4 °C for 10 minutes at 14000 rpm
2 Effects of polyphenols on protein phosphorylation
147
(rcf around 18000 g) in order to remove cellular debris. The supernatants were transferred
into new tubes, vortexed, and briefly ultra-sonicated in order to homogenize obtained cell
lysates. If needed, protein extracts underwent protein concentration determination (C-
2.4.3). In order to reduce and denature proteins and thus to prepare samples for SDS PAGE
and Western blot, Laemmli buffer (4X) without β-mercaptoethanol was added to the
cellular extracts. Instead, DTT (Dithiothreitol) reducing agent (C-2.1.3.1) was added
separately to the samples. They were incubated in the Thermomixer for 7 minutes at 70 °C
under shaking (1000 rpm) and were vortexed and shortly spun. Then they were directly
analyzed or stored at -20 °C. During the handling all of the samples were held on ice.
2.4.3 Determination of sample protein concentrations
Protein concentrations of cell lysates were quantified employing a bicinchoninic acid assay
kit (BCA Assay, C-2.1.5). This approach utilized a modified colorimetric detection based
on the method developed by Lowry [429]. The assay was performed according to
manufacturer’s instructions (test tube procedure, standard protocol) with some minor
deviations. A blank and seven protein standards ranging from 62.5 to 2000 µg/mL were
used. All investigated samples were diluted 1:3 with PBS. 30 µL of standards or diluted
samples were mixed well with 600 µL working reagent (instead of 100 µL sample and 2
mL working reagent) and were incubated for 30 minutes at 37 °C. After cooling the
absorbance of each blank, sample or standard was measured by UVmini 1240
spectrophotometer (C-2.2.4) at 562 nm. Unknown sample concentrations were determined
by a standard curve obtained with every measurement (Figure 45). All samples were
adjusted by addition of respective volume lysis buffer to them so that their protein
concentrations were equal. Alternatively, the assay was carried out in 96-well plates
according to manufacturer’s protocol and absorbance was measured by Multiskan plate
reader (C-1.3).
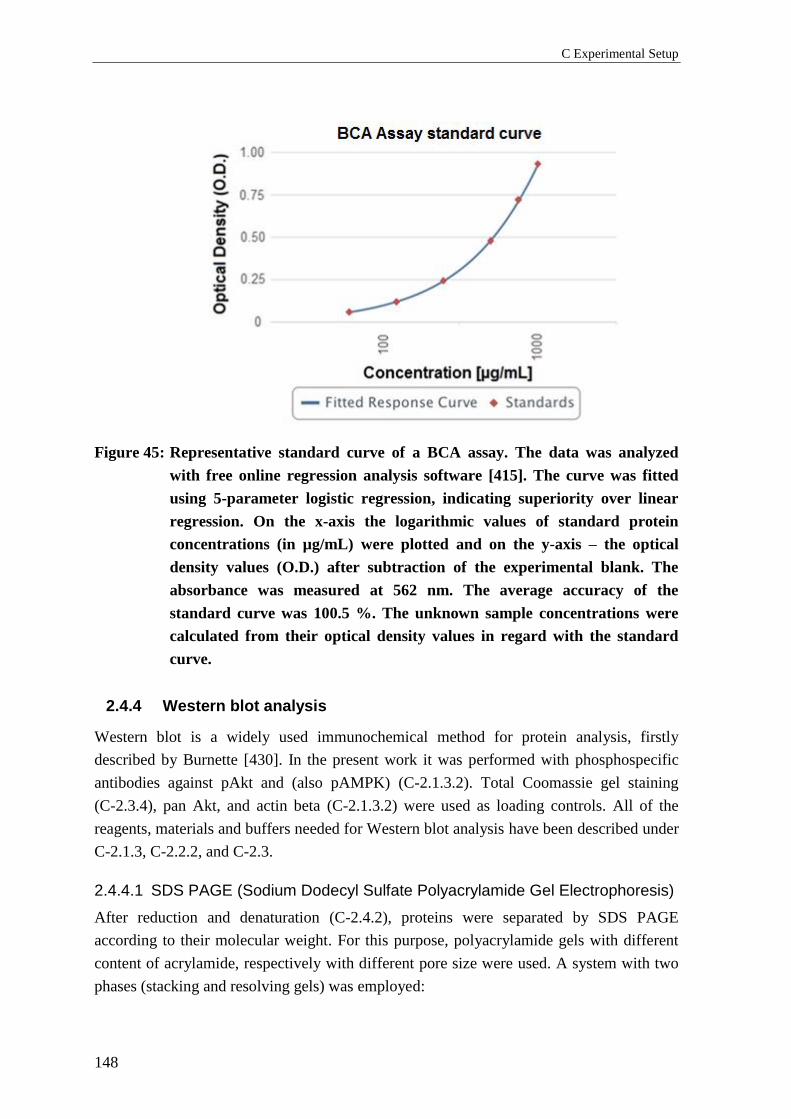
C Experimental Setup
148
Figure 45: Representative standard curve of a BCA assay. The data was analyzed
with free online regression analysis software [415]. The curve was fitted
using 5-parameter logistic regression, indicating superiority over linear
regression. On the x-axis the logarithmic values of standard protein
concentrations (in µg/mL) were plotted and on the y-axis – the optical
density values (O.D.) after subtraction of the experimental blank. The
absorbance was measured at 562 nm. The average accuracy of the
standard curve was 100.5 %. The unknown sample concentrations were
calculated from their optical density values in regard with the standard
curve.
2.4.4 Western blot analysis
Western blot is a widely used immunochemical method for protein analysis, firstly
described by Burnette [430]. In the present work it was performed with phosphospecific
antibodies against pAkt and (also pAMPK) (C-2.1.3.2). Total Coomassie gel staining
(C-2.3.4), pan Akt, and actin beta (C-2.1.3.2) were used as loading controls. All of the
reagents, materials and buffers needed for Western blot analysis have been described under
C-2.1.3, C-2.2.2, and C-2.3.
2.4.4.1 SDS PAGE (Sodium Dodecyl Sulfate Polyacrylamide Gel Electrophoresis)
After reduction and denaturation (C-2.4.2), proteins were separated by SDS PAGE
according to their molecular weight. For this purpose, polyacrylamide gels with different
content of acrylamide, respectively with different pore size were used. A system with two
phases (stacking and resolving gels) was employed:
2 Effects of polyphenols on protein phosphorylation
149
Stacking gel 5 % acrylamide (mixture for 4 mini-gels)
Reagent Volume (mL)
Millipore water 5.50
Rotiphorese Gel 30 (37.5:1) 1.30
TRIS 1.5 M, pH= 6.8 1.00
APS solution (10 %) 0.08
SDS solution (10 %) 0.08
TEMED 0.006
Resolving gel 10 % acrylamide (mixture for 4 mini-gels)
Reagent Volume (mL)
Millipore water 7.90
Rotiphorese Gel 30 (37.5:1) 6.70
TRIS 1.5 M, pH= 8.8 5.00
APS solution (10 %) 0.20
SDS solution (10 %) 0.20
TEMED 0.008
Resolving gel 8 % acrylamide (mixture for 4 mini-gels)
Reagent Volume (mL)
Millipore water 9.26
Rotiphorese Gel 30 (37.5:1) 5.34
TRIS 1.5 M, pH= 8.8 5.00
APS solution (10 %) 0.20
SDS solution (10 %) 0.20
TEMED 0.02
Different pore-sized resolving gels were used in order to analyze proteins with different
molecular weight. Resolving gels with higher acrylamide content (10 %) and respectively
smaller pore-size were typically used for separation and by subsequent analysis of proteins
under 100 kDa (i.e. Akt, AMPK, and β-Actin). Bigger pore-sized resolving gels (8 %)
were used by analysis of proteins with molecular weight above 100 kDa (i.e eNOS).
Stacking (5 % acrylamide) gels were always used to pre-concentrate the sample proteins
before resolving, which resulted in sharper bands by Western blot detection.
The resolving gel was always casted first. Before its polymerization occurred, it was
overlaid with Millipore water, which resulted in a smooth and regular interfacial
C Experimental Setup
150
separation. Upon removal of the water, the stacking gel was casted over the resolving one.
After complete polymerization, the formed upper gel pockets were rinsed multiple times
with 1 x running buffer in order to eliminate any residual acrylamide, which had not been
polymerized.
Typically up to nine pockets were loaded with samples with equal protein concentrations
(20-30 µg/lane) and one pocket was loaded with pre-stained protein standard (C-2.1.3.1).
For the electrophoresis performance the gel-electrophoresis equipment (described under
C-2.2.2) and 1 x running buffer (C-2.3.1) were used. A direct current power supply
provided constantly 180 V and the process continued until the protein standards were well
separated from each other (typically 1 – 1.5 h).
2.4.4.2 Total protein staining of gels
If necessary, polyacrylamide gels underwent total protein staining after separation for
normalization as a loading control. Its superiority in comparison to housekeeping proteins
(i.e. β-actin) has previously been suggested [431]. Briefly, the gel was washed with
demineralized water, placed in Coomassie Blue staining solution (indicated under C-2.3.4)
and incubated on the shaker for 1 hour. In order to remove the background and make
protein bands clear, the gel was washed with destaining solution (C-2.3.4), which was
renewed several times (for minimally 2 hours). Stained gels were digitalized employing a
high definition camera and were used for evaluation of protein content per lane which
served for data normalization. These gels were not further used for protein transfer.
2.4.4.3 Protein transfer (blotting)
After separation of the proteins, gels (C-2.4.4.1) were equilibrated in transfer buffer
(C-2.3.1). Wet/tank blotting indicated superior protein transfer, in comparison to semi-dry
technique during the method development, and was therefore used for all further
experiments. It was performed with the Mini-Trans Blot® cell (C-2.2.2). Pre-soaked gels
and nitrocellulose membranes (C-2.1.3.1) were placed between foam pads and blotting
papers, air bubbles were eliminated by abundance of buffer and careful pressing the gel
against the membrane manually. This “blotting sandwich” was placed into the tank with
transfer buffer and cooling pad. The membrane was orientated to the positive pole and the
gel to the negative one, as proteins were negatively charged. According to the molecular
weight of the protein of interest, the process lasted 1 hour for proteins under 100 kDa and 1
hour and 30 minutes for proteins over 100 kDa and was always performed at 4 °C. The
voltage used was 100 V and the current had been limited to 375 mA.
As the blotting step was crucial for the analysis, the protein transfer onto the nitrocellulose
membrane was visualized and checked by reversible staining with Ponceau S.
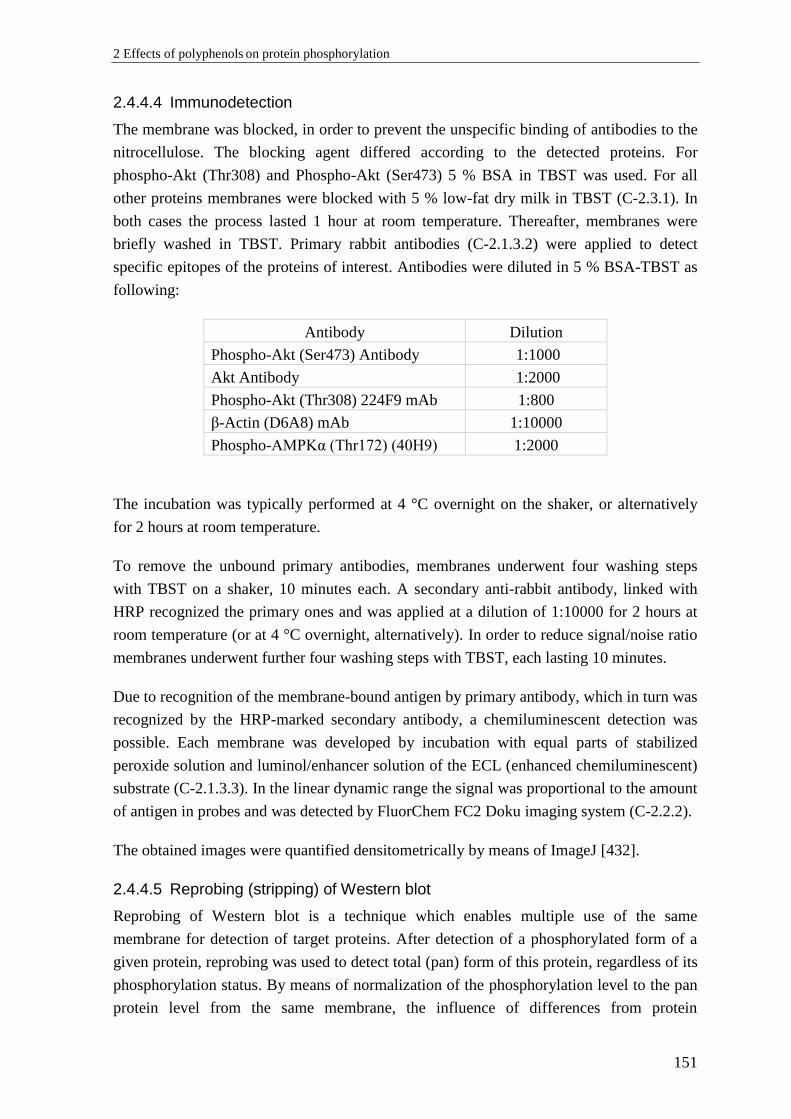
2 Effects of polyphenols on protein phosphorylation
151
2.4.4.4 Immunodetection
The membrane was blocked, in order to prevent the unspecific binding of antibodies to the
nitrocellulose. The blocking agent differed according to the detected proteins. For
phospho-Akt (Thr308) and Phospho-Akt (Ser473) 5 % BSA in TBST was used. For all
other proteins membranes were blocked with 5 % low-fat dry milk in TBST (C-2.3.1). In
both cases the process lasted 1 hour at room temperature. Thereafter, membranes were
briefly washed in TBST. Primary rabbit antibodies (C-2.1.3.2) were applied to detect
specific epitopes of the proteins of interest. Antibodies were diluted in 5 % BSA-TBST as
following:
Antibody Dilution
Phospho-Akt (Ser473) Antibody 1:1000
Akt Antibody 1:2000
Phospho-Akt (Thr308) 224F9 mAb 1:800
β-Actin (D6A8) mAb 1:10000
Phospho-AMPKα (Thr172) (40H9) 1:2000
The incubation was typically performed at 4 °C overnight on the shaker, or alternatively
for 2 hours at room temperature.
To remove the unbound primary antibodies, membranes underwent four washing steps
with TBST on a shaker, 10 minutes each. A secondary anti-rabbit antibody, linked with
HRP recognized the primary ones and was applied at a dilution of 1:10000 for 2 hours at
room temperature (or at 4 °C overnight, alternatively). In order to reduce signal/noise ratio
membranes underwent further four washing steps with TBST, each lasting 10 minutes.
Due to recognition of the membrane-bound antigen by primary antibody, which in turn was
recognized by the HRP-marked secondary antibody, a chemiluminescent detection was
possible. Each membrane was developed by incubation with equal parts of stabilized
peroxide solution and luminol/enhancer solution of the ECL (enhanced chemiluminescent)
substrate (C-2.1.3.3). In the linear dynamic range the signal was proportional to the amount
of antigen in probes and was detected by FluorChem FC2 Doku imaging system (C-2.2.2).
The obtained images were quantified densitometrically by means of ImageJ [432].
2.4.4.5 Reprobing (stripping) of Western blot
Reprobing of Western blot is a technique which enables multiple use of the same
membrane for detection of target proteins. After detection of a phosphorylated form of a
given protein, reprobing was used to detect total (pan) form of this protein, regardless of its
phosphorylation status. By means of normalization of the phosphorylation level to the pan
protein level from the same membrane, the influence of differences from protein
C Experimental Setup
152
concentrations, uneven gel loading or transfer was minimized, which lead to better
reproducibility of data.
After development of the membrane, it was incubated in stripping buffer (20 minutes,
room temperature) (C-2.3.3) in order to remove primary and secondary antibodies from it.
Afterwards, the membrane underwent four washing steps with TBST, each for 10 minutes,
to ensure complete removal of the stripping buffer. Then, unspecific binding sites of the
membrane were blocked with milk-containing buffer for 2 hours at room temperature.
Further immunodetection with appropriate antibodies was performed as described above
(C-2.4.4.4).
2.4.5 Quantitative analysis of Akt-phosphorylation status
For a screening of the effects of polyphenols on Akt-signaling, quantitative analysis of the
phosphorylation status of this kinase in cell lysates was carried out employing a
commercially available “sandwich”-ELISA (C-2.1.4). The previously described standard
protocol (C-2.4.1.4) was slightly modified: cells were not incubated in a serum-free
medium (starved) before treatment with polyphenols. In this way it was investigated
whether the substances of interest were capable to antagonize the elevated Akt-
phosphorylation by the growth factors contained in the standard medium supplemented
with 10 % fetal bovine serum from the same batch 1107A. Due to the chemical instability
of polyphenols [272] their effects were determined for short incubation times (5 minutes)
at a concentration of 10 µM. Cells were lysed using 300 µL (1x) lysis buffer/well. The
latter was provided within the ELISA-kit and was supplemented with protease and
phosphatase inhibitors (listed under C-2.1.2.2).
The immunoassay was performed according to the manufacturer’s protocol with some
deviations. Lysates were diluted 1:3 with (1x) assay diluent and were added to assay wells
and incubated overnight at 4 °C. In each experiment the lysate from DMSO-treated cells
(corresponding to the 100 % control) and its further 1:1 dilution (50 % control) were used
as reference standards. Detection antibody against phospho-Akt (Ser473) was diluted 1:55
in (1x) assay diluent as suggested by manufacturer, while pan Akt antibody was diluted
1:220 in order to avoid high readouts outside the linear range of the assay. After obtaining
of optical densities and subtraction of blanks, the values (in %) for phospho-Akt (Ser473)
and pan Akt were calculated using the reference standards. Then data for phospho-Akt
(Ser473) were normalized to those of pan Akt for the respective lysates.
2.4.6 Mycoplasma test
Mycoplasma tests were regularly performed in order to verify that the cells were free of
contamination. Therefore, the LookOut® Mycoplasma PCR Detection Kit (C-2.1.6) was
utilized. This assay was based on polymerase chain reaction (PCR) and possessed high
sensitivity regarding detection of bright spectrum of mycoplasma species, which had been

2 Effects of polyphenols on protein phosphorylation
153
described as common cell culture contaminants. Samples were acquired from supernatants
of confluent cell cultures. The kit’s primer set was specific for a defined highly conserved
coding region in the mycoplasma genome. Samples underwent a PCR according to the
producer’s protocol. Products of the reaction along with negative and positive controls
supplied in the kit were pipetted into a 1 % agarose gel with 0.02 % DAPI. Electrophoresis
was conducted for 1 hour at 140 V in 1 x TBE buffer (C-2.3.6). The amplified DNA
fragments were visualized with DAPI-stain under UV-light (Figure 46).
Figure 46: Representative image of polymerase chain reaction (PCR)-based
mycoplasma test. Samples derived from cell culture supernatants
underwent amplification and agarose gel electrophoresis. The first lane
was a negative control for mycoplasma species and the second one was
a positive control. Accordingly, both of the samples were negative.
2.5 In silico modeling
For the in silico modeling described under B-2.5 the Molecular Operating Environment
program (MOE), version 2018.01 was used [96]. The functionality “Flexible Alignments”
is based on a feature probability density of input molecules’ conformations and the
generation of overlays takes place in three stages: perturbation, optimization and
comparison [312]. A scoring was used to evaluate the quality of the created superpositions,
among which the most important measures were average strain energy (U), similarity of
shape (F), and ground alignment score (S; dependent on U and F). The lower is the value
of S the better is the alignment’s quality [313]. For the similarity following features of
input molecules were considered: acid/base properties, partial charges, H-bound
donors/acceptors, hydrophobicity, molecular volumes, etc. Default settings were used.
Certain limits were set: Attempts to create new alignment ≤ 20 times, the potential energy
of alignment to < 7 kcal/mol, number of alignments in collection < 100.
All databases used for virtual screening were prepared by Mr. Mathias Diebold, MSc
(research group of Prof. Dr. Sotriffer). Initially, databases were lead-like- (criteria similar
to Lipinski’s 5 rule) filtered. Important properties to consider were: number of N and O
atoms that are H-bound donors (must be five or less); cut-off for molecular weight: ≤ 450 –
accepted; good solubility (logP); the number of rotatable bounds (must be 10 or less);
number of rings. Other filters applied were non-reactive (sorting out molecules with
C Experimental Setup
154
reactive groups such as aldehydes, thiols, epoxides, etc.) and smallring (excluding
compounds with rings of size nine or more atoms). Afterwards, 3D-conformers of the
molecules were generated using default settings and limiting the potential energy to 10
kcal/mol. To establish if the pharmacophore-model-matching conformations are
energetically favorable (B-2.5.6), a 3D systematic conformational search was performed
and the relative conformer energy was set to be less than 7 kcal/mol.
The solubility (LogP, LogD7.4), acid-base character (pKa and pKb-values), ionization states,
and tautomerization, relevant for the post-screening analysis (B-2.5.6) were predicted by
MoKa software, version 3.1.3 [99].

3 Effects of polyphenols on DPP IV activity and expression
155
3 Effects of polyphenols on DPP IV activity and
expression
3.1 Effects of polyphenols on the enzymatic activity of
DPP IV
3.1.1 Chemicals and reagents
DPP IV-Inhibitor-Screening-Kit Cayman Chemicals, USA
3.1.2 Materials and devices
All fluorescent measurements were performed with the same equipment as described in
C-1.3.1.
3.1.3 Experimental design
3.1.3.1 Classic protocol
The potential of polyphenols to inhibit the enzymatic activity of DPP IV was analyzed
using the DPP IV-Inhibitor-Screening-Kit. The method has been developed by Fujiwara
and Tsuru (1978) [418], which has already been described (see C-1.4.5). The fluorescent
signal of the proteolytic reaction product (AMC) was directly proportional to the enzyme
activity. The initial enzyme activity (100 %) was assumed to be the activity of defined
amount purified human recombinant DPP IV without presence of any inhibitor. The
activity after addition of a given polyphenolic compound or referent DPP IV-inhibitor at a
defined concentration was compared to the initial enzyme activity (100 %) and thus the
inhibitor activity of the compound of interest was defined, using the following formula:
% Inhibition = [(F100 % – FInhibitor)/F100 %] x 100, where
F100 % represents the fluorescence measured by the enzyme without any inhibitors added,
while FInhibitor was the fluorescence measured in presence of any investigated inhibitor.
50 nM sitagliptin (final concentration) was used as a positive control. Each experiment was
performed in triplicate.
3.1.3.2 Modified protocol
In order to improve the clinical relevance of the investigation of DPP IV in human serum,
a modified approach which better reflected physiological conditions was developed. For
this purpose, the endogenous DPP IV activity of human serum (pooled from three donors,

C Experimental Setup
156
n= 3) was used to perform the screening. The serum was diluted 10 times with assay
buffer, in order to reduce its matrix effect. This assay was validated using the reference
substance sitagliptin in the nanomolar concentration range (Figure 47).
Figure 47: Concentration-Response curve of the inhibitory effect of sitagiliptin on the
serum DPP IV activity in the modified approach of DPP IV inhibitor assay
(n= 2). The data was analyzed with Graph Pad Prism v 6.0. The curve was
fitted using non-linear regression.
3.2 Effects of polyphenols on the DPP IV-Expression
3.2.1 Cells, chemicals and reagents
3T3-L1 is a murine embryonal fibroblast cell line which has pre-adipocyte properties and
can differentiate into adipocytes under defined conditions. These cells are named after
known cultivation protocol “3-day transfer, inoculum 3×10⁵ cells” and were derived
through a clonal isolation [433, 434]. Mature fat cells are morphologically different than
pre-adipocytes and during the maturation the number and the size of lipid droplets is
increasing. An aliquot of these cells with passage 21 was purchased from Sigma-Aldrich
and obtained from the ECACC collection of Public Health England.
3.2.1.1 Specific reagents for cell culture and media
FBS i. (fetal bovine serum – heat-
inactivated) Gibco/Thermo Fisher Scientific, USA
FBS n.i. (non-inactivated)
Sigma-Aldrich, USA Insulin solution human (10 mg/mL)
Dexamethasone
IBMX (3-isobutyl-1-methylxanthine) Fluka BioChemika, Switzerland
Rosiglitazone Alexis Biochemicals, Switzerland
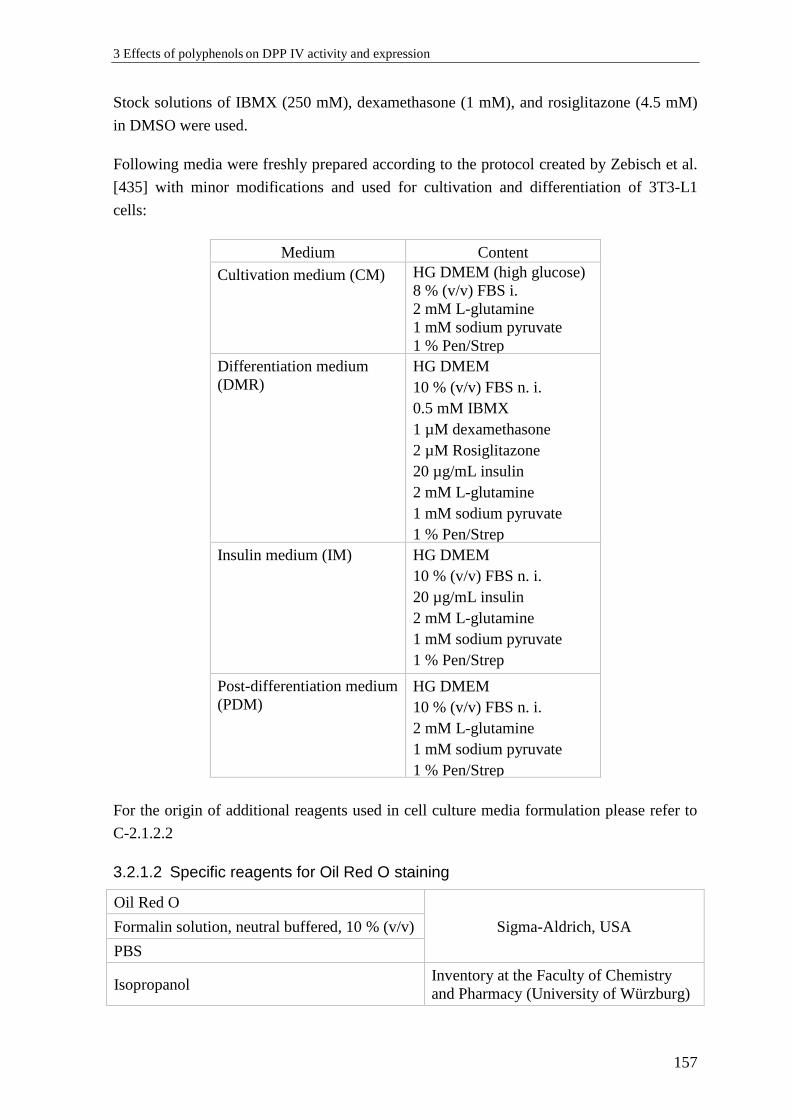
3 Effects of polyphenols on DPP IV activity and expression
157
Stock solutions of IBMX (250 mM), dexamethasone (1 mM), and rosiglitazone (4.5 mM)
in DMSO were used.
Following media were freshly prepared according to the protocol created by Zebisch et al.
[435] with minor modifications and used for cultivation and differentiation of 3T3-L1
cells:
Medium Content
Cultivation medium (CM)
HG DMEM (high glucose)
8 % (v/v) FBS i.
2 mM L-glutamine
1 mM sodium pyruvate
1 % Pen/Strep
Differentiation medium
(DMR)
HG DMEM
10 % (v/v) FBS n. i.
0.5 mM IBMX
1 µM dexamethasone
2 µM Rosiglitazone
20 µg/mL insulin
2 mM L-glutamine
1 mM sodium pyruvate
1 % Pen/Strep
Insulin medium (IM)
HG DMEM
10 % (v/v) FBS n. i.
20 µg/mL insulin
2 mM L-glutamine
1 mM sodium pyruvate
1 % Pen/Strep
Post-differentiation medium
(PDM)
HG DMEM
10 % (v/v) FBS n. i.
2 mM L-glutamine
1 mM sodium pyruvate
1 % Pen/Strep
For the origin of additional reagents used in cell culture media formulation please refer to
C-2.1.2.2
3.2.1.2 Specific reagents for Oil Red O staining
Oil Red O
Sigma-Aldrich, USA Formalin solution, neutral buffered, 10 % (v/v)
PBS
Isopropanol Inventory at the Faculty of Chemistry
and Pharmacy (University of Würzburg)
C Experimental Setup
158
3.2.1.3 Specific reagents for ELISA analysis
Mouse DPPIV/CD26 DuoSet ELISA
R&D Systems, Inc., USA DuoSet ELISA Ancillary Reagent Kit
2
3.2.2 Materials and devices
3.2.2.1 Materials and devices for cell culture
Slide-a-lyzer™, cut-off: 10 kDa, 0.5 – 2 mL Thermo Fisher Scientific, Waltham, MA,
USA
Freeze dryer Alpha 1-2 LDplus Analis, Belgium
Further materials and devices used for cell culture model were described under C-2.2.1.
3.2.2.2 Materials and devices for Oil Red O staining
Round paper filter MN615 Macherey-Nagel GmbH, Germany
0.2 µm cellulose acetate membrane filter VWR International, NY, USA
High definition camera (8 MP) Lenovo Group Ltd., Beijing, China
3.2.2.3 Materials and devices for ELISA
The equipment used for ELISA measurements is described under C-2.2.3.
3.2.3 Experimental set-up: cell culture model
A potential influence of polyphenolic compounds on the expression of DPP IV was
investigated in vitro in a cell culture model. For this purpose 3T3-L1 cells were
differentiated into mature adipocytes. Cells were grown and induced using an established
protocol [435] with some modifications, aiming maximal conversion rate. Briefly, cells
were thawed as previously described (C-2.4.1.2) and cultivated in medium containing 8 %
heat-inactivated FBS (CM; see C-3.2.1.1). Once they reached 70 % confluence they were
splitted at a ratio of 1:8. This procedure was repeated every third day to keep the cells in
the proliferative state. This was essential as reaching confluence during cultivation caused
growth inhibition and influenced differentiation negatively. For differentiation cells were
seeded on gelatin-coated 6-well plates and grown to confluence. After two days they were
treated with induction medium containing adipogenic cocktail of IBMX, insulin and
dexamethasone (DMR; see C-3.2.1.1). Since the purchased cells were from a high passage
(21) additionally the differentiation-enhancing compound rosiglitazone (PPARγ-agonist
and insulin sensitizer) was added at a concentration of 2 µM. Deviating from the original
protocol cells were incubated in DMR not for 48, but for 96 hours to achieve a good
differentiation rate. The DMSO concentration was kept as low as possible (0.35 % v/v).
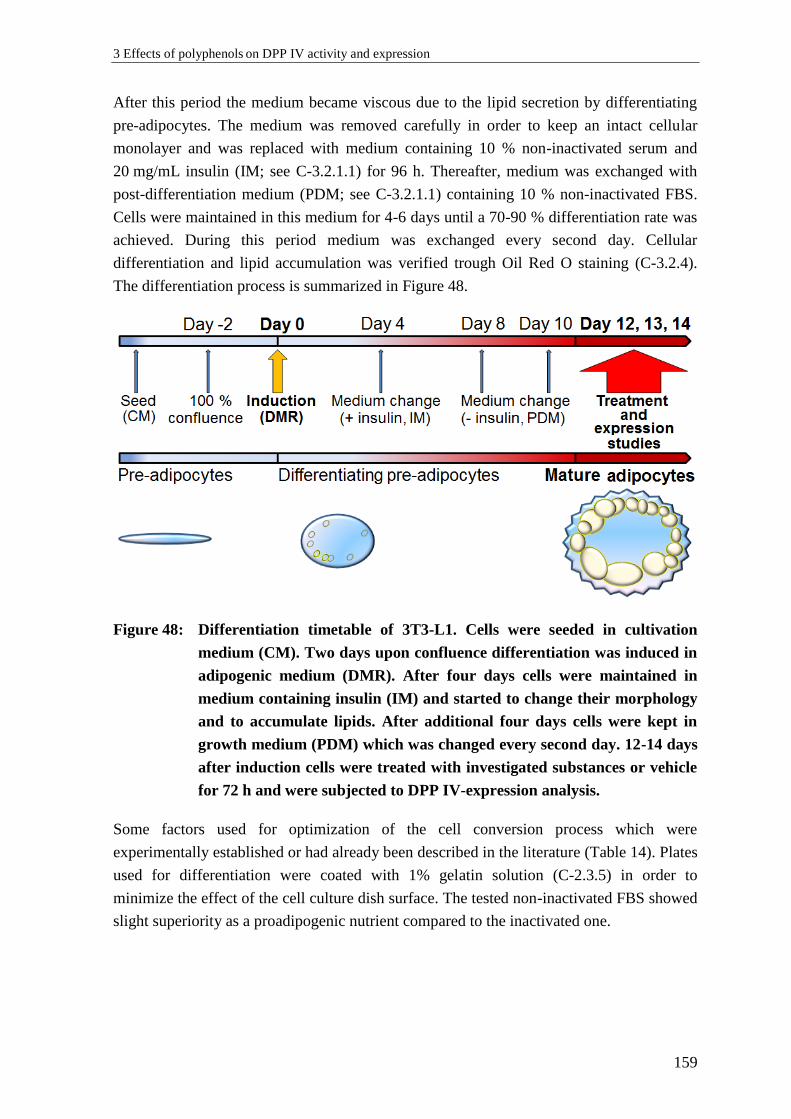
3 Effects of polyphenols on DPP IV activity and expression
159
After this period the medium became viscous due to the lipid secretion by differentiating
pre-adipocytes. The medium was removed carefully in order to keep an intact cellular
monolayer and was replaced with medium containing 10 % non-inactivated serum and
20 mg/mL insulin (IM; see C-3.2.1.1) for 96 h. Thereafter, medium was exchanged with
post-differentiation medium (PDM; see C-3.2.1.1) containing 10 % non-inactivated FBS.
Cells were maintained in this medium for 4-6 days until a 70-90 % differentiation rate was
achieved. During this period medium was exchanged every second day. Cellular
differentiation and lipid accumulation was verified trough Oil Red O staining (C-3.2.4).
The differentiation process is summarized in Figure 48.
Figure 48: Differentiation timetable of 3T3-L1. Cells were seeded in cultivation
medium (CM). Two days upon confluence differentiation was induced in
adipogenic medium (DMR). After four days cells were maintained in
medium containing insulin (IM) and started to change their morphology
and to accumulate lipids. After additional four days cells were kept in
growth medium (PDM) which was changed every second day. 12-14 days
after induction cells were treated with investigated substances or vehicle
for 72 h and were subjected to DPP IV-expression analysis.
Some factors used for optimization of the cell conversion process which were
experimentally established or had already been described in the literature (Table 14). Plates
used for differentiation were coated with 1% gelatin solution (C-2.3.5) in order to
minimize the effect of the cell culture dish surface. The tested non-inactivated FBS showed
slight superiority as a proadipogenic nutrient compared to the inactivated one.
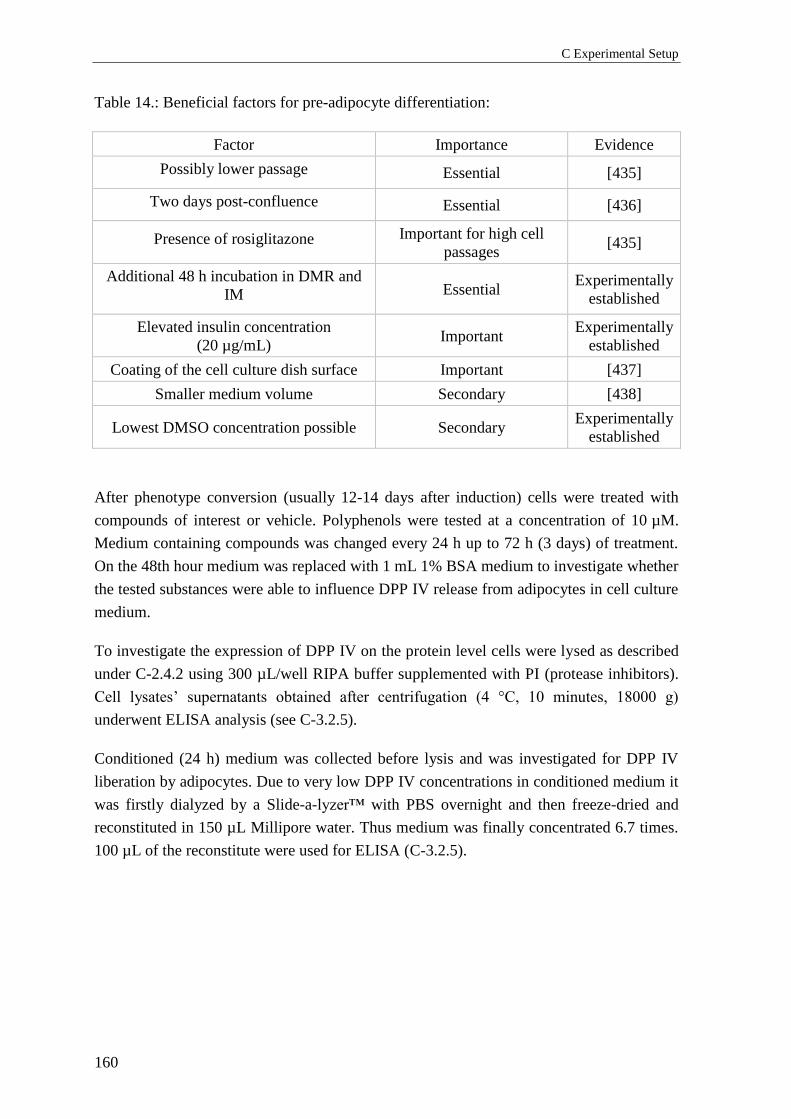
C Experimental Setup
160
Table 14.: Beneficial factors for pre-adipocyte differentiation:
Factor Importance Evidence
Possibly lower passage Essential [435]
Two days post-confluence Essential [436]
Presence of rosiglitazone Important for high cell
passages [435]
Additional 48 h incubation in DMR and
IM Essential Experimentally
established
Elevated insulin concentration
(20 µg/mL) Important
Experimentally
established
Coating of the cell culture dish surface Important [437]
Smaller medium volume Secondary [438]
Lowest DMSO concentration possible Secondary Experimentally
established
After phenotype conversion (usually 12-14 days after induction) cells were treated with
compounds of interest or vehicle. Polyphenols were tested at a concentration of 10 µM.
Medium containing compounds was changed every 24 h up to 72 h (3 days) of treatment.
On the 48th hour medium was replaced with 1 mL 1% BSA medium to investigate whether
the tested substances were able to influence DPP IV release from adipocytes in cell culture
medium.
To investigate the expression of DPP IV on the protein level cells were lysed as described
under C-2.4.2 using 300 µL/well RIPA buffer supplemented with PI (protease inhibitors).
Cell lysates’ supernatants obtained after centrifugation (4 °C, 10 minutes, 18000 g)
underwent ELISA analysis (see C-3.2.5).
Conditioned (24 h) medium was collected before lysis and was investigated for DPP IV
liberation by adipocytes. Due to very low DPP IV concentrations in conditioned medium it
was firstly dialyzed by a Slide-a-lyzer™ with PBS overnight and then freeze-dried and
reconstituted in 150 µL Millipore water. Thus medium was finally concentrated 6.7 times.
100 µL of the reconstitute were used for ELISA (C-3.2.5).
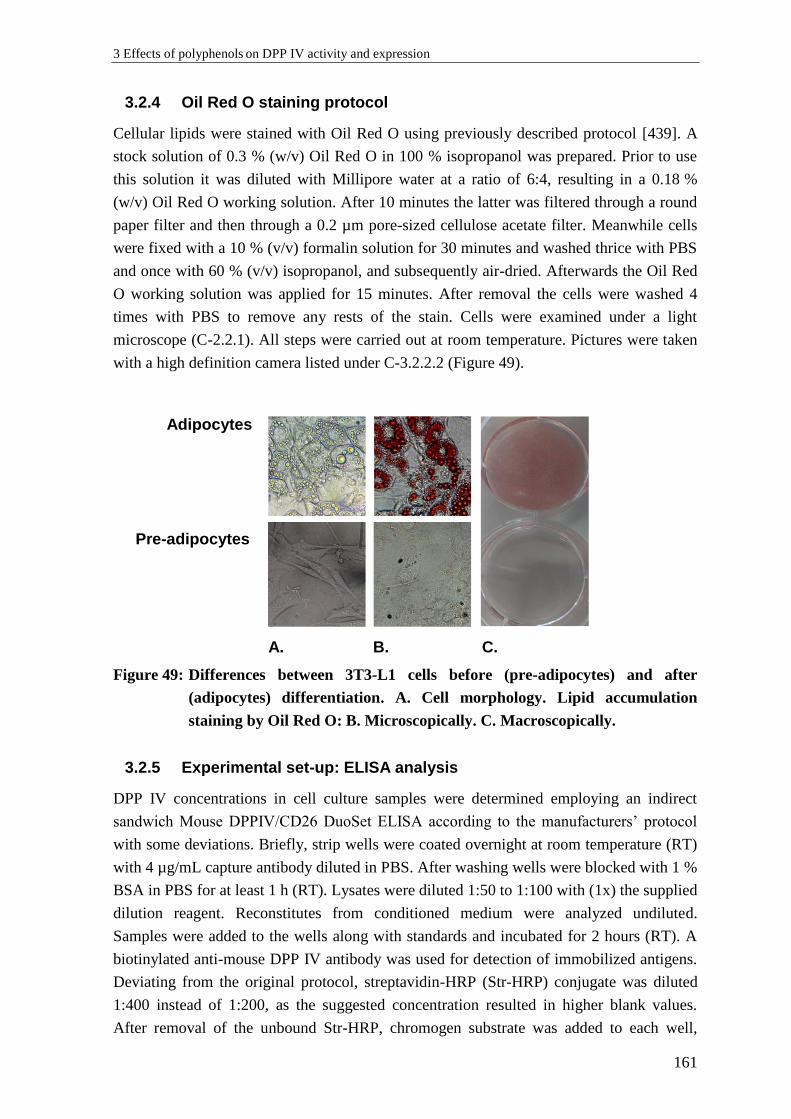
3 Effects of polyphenols on DPP IV activity and expression
161
3.2.4 Oil Red O staining protocol
Cellular lipids were stained with Oil Red O using previously described protocol [439]. A
stock solution of 0.3 % (w/v) Oil Red O in 100 % isopropanol was prepared. Prior to use
this solution it was diluted with Millipore water at a ratio of 6:4, resulting in a 0.18 %
(w/v) Oil Red O working solution. After 10 minutes the latter was filtered through a round
paper filter and then through a 0.2 µm pore-sized cellulose acetate filter. Meanwhile cells
were fixed with a 10 % (v/v) formalin solution for 30 minutes and washed thrice with PBS
and once with 60 % (v/v) isopropanol, and subsequently air-dried. Afterwards the Oil Red
O working solution was applied for 15 minutes. After removal the cells were washed 4
times with PBS to remove any rests of the stain. Cells were examined under a light
microscope (C-2.2.1). All steps were carried out at room temperature. Pictures were taken
with a high definition camera listed under C-3.2.2.2 (Figure 49).
Adipocytes
Pre-adipocytes
A. B. C.
Figure 49: Differences between 3T3-L1 cells before (pre-adipocytes) and after
(adipocytes) differentiation. A. Cell morphology. Lipid accumulation
staining by Oil Red O: B. Microscopically. C. Macroscopically.
3.2.5 Experimental set-up: ELISA analysis
DPP IV concentrations in cell culture samples were determined employing an indirect
sandwich Mouse DPPIV/CD26 DuoSet ELISA according to the manufacturers’ protocol
with some deviations. Briefly, strip wells were coated overnight at room temperature (RT)
with 4 µg/mL capture antibody diluted in PBS. After washing wells were blocked with 1 %
BSA in PBS for at least 1 h (RT). Lysates were diluted 1:50 to 1:100 with (1x) the supplied
dilution reagent. Reconstitutes from conditioned medium were analyzed undiluted.
Samples were added to the wells along with standards and incubated for 2 hours (RT). A
biotinylated anti-mouse DPP IV antibody was used for detection of immobilized antigens.
Deviating from the original protocol, streptavidin-HRP (Str-HRP) conjugate was diluted
1:400 instead of 1:200, as the suggested concentration resulted in higher blank values.
After removal of the unbound Str-HRP, chromogen substrate was added to each well,
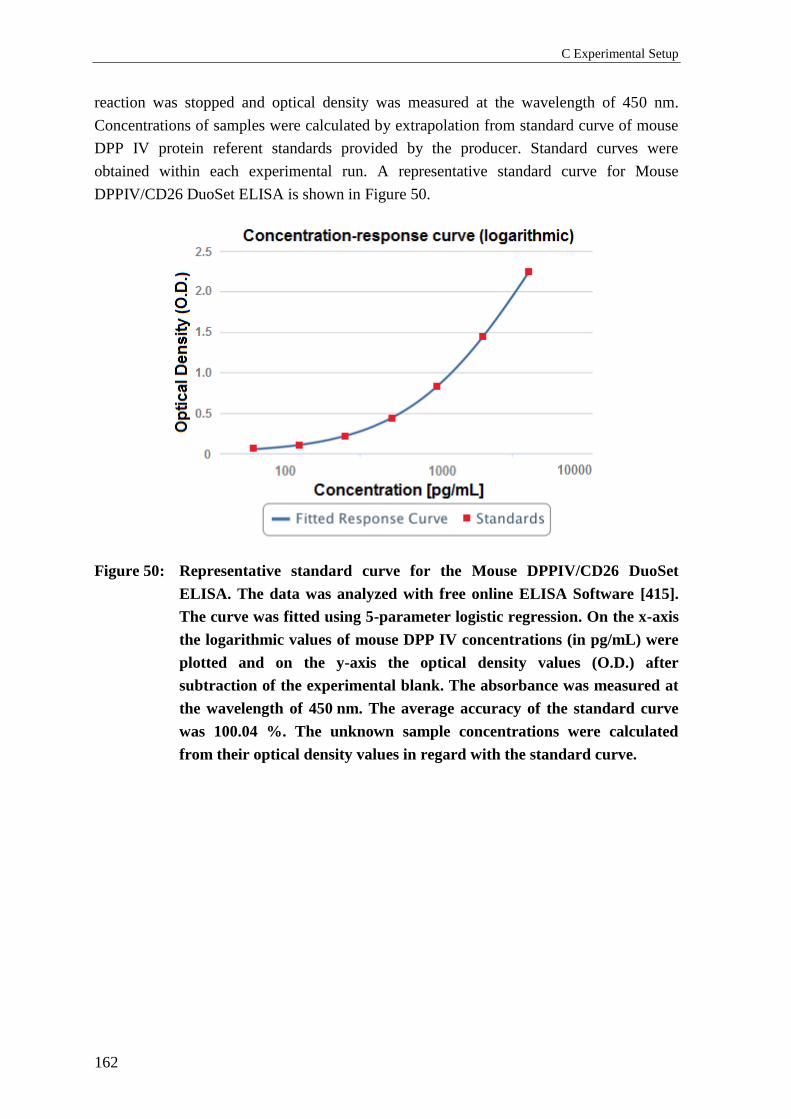
C Experimental Setup
162
reaction was stopped and optical density was measured at the wavelength of 450 nm.
Concentrations of samples were calculated by extrapolation from standard curve of mouse
DPP IV protein referent standards provided by the producer. Standard curves were
obtained within each experimental run. A representative standard curve for Mouse
DPPIV/CD26 DuoSet ELISA is shown in Figure 50.
Figure 50: Representative standard curve for the Mouse DPPIV/CD26 DuoSet
ELISA. The data was analyzed with free online ELISA Software [415].
The curve was fitted using 5-parameter logistic regression. On the x-axis
the logarithmic values of mouse DPP IV concentrations (in pg/mL) were
plotted and on the y-axis the optical density values (O.D.) after
subtraction of the experimental blank. The absorbance was measured at
the wavelength of 450 nm. The average accuracy of the standard curve
was 100.04 %. The unknown sample concentrations were calculated
from their optical density values in regard with the standard curve.

4 Interactions of polyphenols with fluorescence
163
4 Interactions of polyphenols with fluorescence
4.1 Chemicals and reagents
Assay Buffer
NaCl 100 mM
EDTA 1 mM
Tris-HCl 20 mM
pH= 8.0
Human
recombinant
DPP IV
Obtained from DPP IV-
Inhibitor-Screening-Kit,
Cayman Chemicals, USA,
C-3.1.1
Human serum See C-3.1.3.2
6-methoxyflavone
Quercetin
Urolithin A
Urolithin B
For the origin of compounds
refer to C-2.1.2.3
4.2 Materials and devices
All fluorescent measurements were performed with the same equipment as described in
C-1.3.1. Heracell, 150I, cell culture incubator and horizontal mini shaker (listed under
C-1.3) were used as well.
4.3 Fluorescence interactions analysis
Possible interactions of given compounds with fluorescence were analyzed under relevant
conditions close to those of experimental approaches investigating DPP IV inhibition
potential employing DPP IV-Inhibitor-Screening-Kit (C-3.1.3.1) and the modified method
(C-3.1.3.2). Fluorescent measurements were conducted at λexcitation/emission = 360 nm/460 nm
and were registered before (0 min) and after (30 min) incubation at 37 °C (shaking) and in
the presence and absence of the fluorescent compound AMC. Fluorescent properties of the
given compounds were investigated respectively in three different environments: assay
buffer, DPP IV dissolved in assay buffer (referred as DPP IV) and human serum diluted in
assay buffer (1:10). As a negative control a vehicle (DMSO) was used at a concentration of
0.5 % (v/v).

164 D Supplement
164
D Supplement
1 Section 1 – Clinical study
1.1 GLP-1 (active) serum concentrations
1.1.1 GLP-1 (active) – before outlier exclusion
GLP-1 (active) concentrations [pM]
Volunteer T1-0 T1-30 T3-0 T3-30 T2-0 T2-30 T4-0 T4-30
1 7.80 7.09 9.46 9.59 11.54 7.76 9.95 6.87
2 9.66 11.29 8.91 11.38 16.69 17.06 12.24 7.56
3 10.41 7.66 10.16 9.84 3.15 6.66 4.52 2.51
4 7.52 12.29 7.57 14.17 8.21 9.92 2.80 6.25
5 10.32 9.53 5.00 4.50 6.82 4.79 4.60 0.86
6 12.81 14.02 10.38 12.21 9.69 8.16 2.83 2.15
7 9.55 7.17 14.05 13.57 3.52 3.63 4.93 6.05
8 31.76 23.66 28.13 27.01 24.92 24.01 23.45 19.18
9 12.32 9.67 7.75 11.52 9.57 8.25 10.41 11.18
10 10.33 9.79 10.14 9.05 3.28 5.58 8.43 13.25
11 3.48 9.28 11.14 5.58 6.33 10.57 7.26 10.04
12 3.53 8.14 5.11 5.24 3.46 5.44 6.21 10.34
13 7.39 8.62 12.11 7.06 10.40 9.47 8.64 7.28
14 7.74 12.82 0.82 13.03 6.53 11.13 13.59 12.86
15 10.16 11.95 11.03 12.01 12.88 16.06 10.48 11.59
16 10.82 11.92 10.03 12.59 10.36 11.54 11.01 14.85
17 9.18 13.64 9.22 14.05 10.89 16.09 10.88 16.38
18 7.14 7.85 11.99 12.25 12.22 15.84 7.06 6.69
19 4.82 3.34 4.68 5.08 4.69 9.06 7.19 6.56
20 14.76 13.56 5.76 6.25 18.35 16.62 14.18 12.29

1 Section 1 – Clinical study 165
165
Descriptive statistical parameters of GLP-1 (active) classic and rice OGTT protocol data (n
for each experimental state shown in the table), outliers detection and exclusion
Phase Mean (pM) S.D. Median Mean Dev. S.E.M. n
T1-0 10.07 5.87 9.61 3.30 1.31 20
T1-30 10.66 4.10 9.73 2.92 0.92 20
T3-0 9.67 5.36 9.75 3.24 1.20 20
T3-30 10.80 5.01 11.45 3.50 1.12 20
T2-0 9.67 5.60 9.63 4.12 1.25 20
T2-30 10.88 5.22 9.70 4.13 1.17 20
T4-0 9.03 4.76 8.54 3.49 1.06 20
T4-30 9.24 4.82 8.80 3.96 1.08 20
Criteria: Outlier > 2.5 S.D., Grubbs' Test Outliers: 8-T1-0, 8-T1-30, 8-T2-0, 8-T2-30, 8-T3-0, 8-T3-30, 8-T4-0
Statistical significance: n.s.
1.1.2 Serum concentrations of GLP-1 (active) - outliers excluded
GLP-1 (active) concentrations [pM]
Volunteer T1-0 T1-30 T3-0 T3-30 T2-0 T2-30 T4-0 T4-30
1 7.80 7.09 9.46 9.59 11.54 7.76 9.95 6.87
2 9.66 11.29 8.91 11.38 16.69 17.06 12.24 7.56
3 10.41 7.66 10.16 9.84 3.15 6.66 4.52 2.51
4 7.52 12.29 7.57 14.17 8.21 9.92 2.80 6.25
5 10.32 9.53 5.00 4.50 6.82 4.79 4.60 0.86
6 12.81 14.02 10.38 12.21 9.69 8.16 2.83 2.15
7 9.55 7.17 14.05 13.57 3.52 3.63 4.93 6.05
8 Outlier Outlier Outlier Outlier Outlier Outlier Outlier 19.18
9 12.32 9.67 7.75 11.52 9.57 8.25 10.41 11.18
10 10.33 9.79 10.14 9.05 3.28 5.58 8.43 13.25
11 3.48 9.28 11.14 5.58 6.33 10.57 7.26 10.04
12 3.53 8.14 5.11 5.24 3.46 5.44 6.21 10.34
13 7.39 8.62 12.11 7.06 10.40 9.47 8.64 7.28
14 7.74 12.82 0.82 13.03 6.53 11.13 13.59 12.86
15 10.16 11.95 11.03 12.01 12.88 16.06 10.48 11.59
16 10.82 11.92 10.03 12.59 10.36 11.54 11.01 14.85
17 9.18 13.64 9.22 14.05 10.89 16.09 10.88 16.38
18 7.14 7.85 11.99 12.25 12.22 15.84 7.06 6.69
19 4.82 3.34 4.68 5.08 4.69 9.06 7.19 6.56
20 14.76 13.56 5.76 6.25 18.35 16.62 14.18 12.29
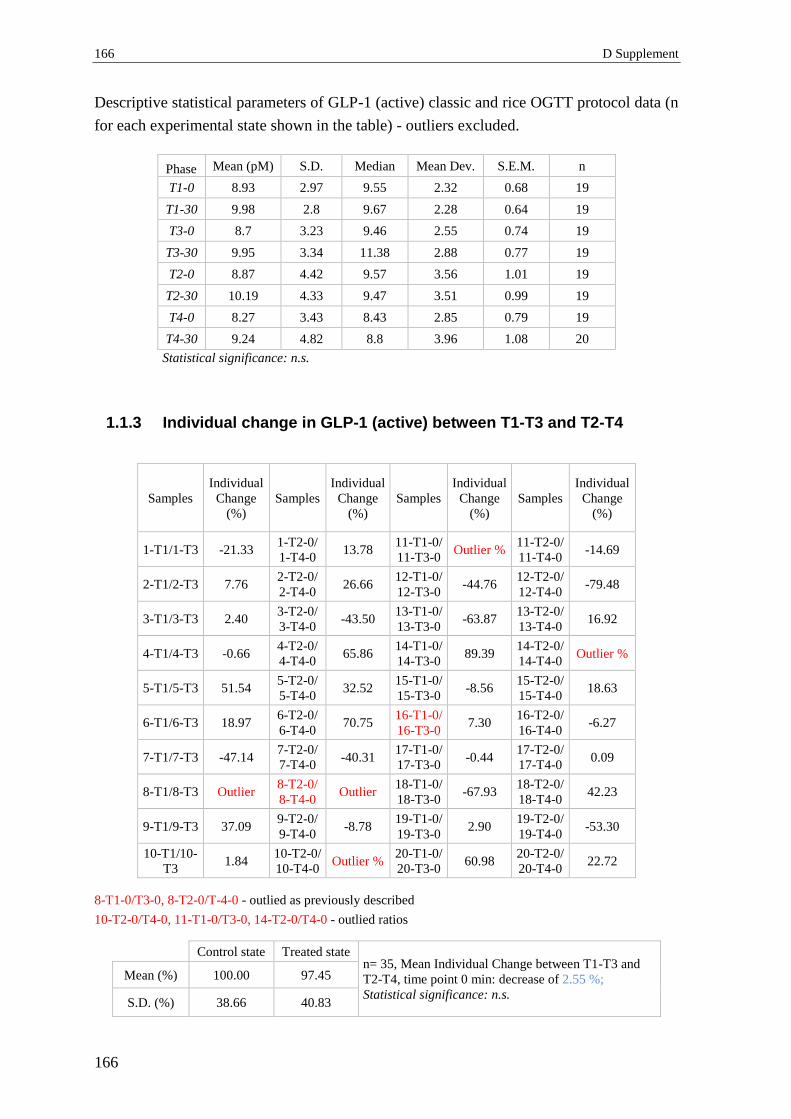
166 D Supplement
166
Descriptive statistical parameters of GLP-1 (active) classic and rice OGTT protocol data (n
for each experimental state shown in the table) - outliers excluded.
Phase Mean (pM) S.D. Median Mean Dev. S.E.M. n
T1-0 8.93 2.97 9.55 2.32 0.68 19
T1-30 9.98 2.8 9.67 2.28 0.64 19
T3-0 8.7 3.23 9.46 2.55 0.74 19
T3-30 9.95 3.34 11.38 2.88 0.77 19
T2-0 8.87 4.42 9.57 3.56 1.01 19
T2-30 10.19 4.33 9.47 3.51 0.99 19
T4-0 8.27 3.43 8.43 2.85 0.79 19
T4-30 9.24 4.82 8.8 3.96 1.08 20
Statistical significance: n.s.
1.1.3 Individual change in GLP-1 (active) between T1-T3 and T2-T4
Samples
Individual
Change
(%)
Samples
Individual
Change
(%)
Samples
Individual
Change
(%)
Samples
Individual
Change
(%)
1-T1/1-T3 -21.33 1-T2-0/
1-T4-0 13.78
11-T1-0/
11-T3-0 Outlier %
11-T2-0/
11-T4-0 -14.69
2-T1/2-T3 7.76 2-T2-0/
2-T4-0 26.66
12-T1-0/
12-T3-0 -44.76
12-T2-0/
12-T4-0 -79.48
3-T1/3-T3 2.40 3-T2-0/
3-T4-0 -43.50
13-T1-0/
13-T3-0 -63.87
13-T2-0/
13-T4-0 16.92
4-T1/4-T3 -0.66 4-T2-0/
4-T4-0 65.86
14-T1-0/
14-T3-0 89.39
14-T2-0/
14-T4-0 Outlier %
5-T1/5-T3 51.54 5-T2-0/
5-T4-0 32.52
15-T1-0/
15-T3-0 -8.56
15-T2-0/
15-T4-0 18.63
6-T1/6-T3 18.97 6-T2-0/
6-T4-0 70.75
16-T1-0/
16-T3-0 7.30
16-T2-0/
16-T4-0 -6.27
7-T1/7-T3 -47.14 7-T2-0/
7-T4-0 -40.31
17-T1-0/
17-T3-0 -0.44
17-T2-0/
17-T4-0 0.09
8-T1/8-T3 Outlier 8-T2-0/
8-T4-0 Outlier
18-T1-0/
18-T3-0 -67.93
18-T2-0/
18-T4-0 42.23
9-T1/9-T3 37.09 9-T2-0/
9-T4-0 -8.78
19-T1-0/
19-T3-0 2.90
19-T2-0/
19-T4-0 -53.30
10-T1/10-
T3 1.84
10-T2-0/
10-T4-0 Outlier %
20-T1-0/
20-T3-0 60.98
20-T2-0/
20-T4-0 22.72
Control state Treated state n= 35, Mean Individual Change between T1-T3 and
T2-T4, time point 0 min: decrease of 2.55 %;
Statistical significance: n.s.
Mean (%) 100.00 97.45
S.D. (%) 38.66 40.83
8-T1-0/T3-0, 8-T2-0/T-4-0 - outlied as previously described
10-T2-0/T4-0, 11-T1-0/T3-0, 14-T2-0/T4-0 - outlied ratios

1 Section 1 – Clinical study 167
167
1.2 DPP IV
1.2.1 DPP IV serum concentrations
1.2.1.1 DPP IV serum concentrations before outlier exclusion
Control
State, T1
DPP IV
conc.
Control
State, T2
DPP IV
conc.
Treated
State, T3
DPP IV
conc.
Treated
State, T4
DPP IV
conc.
Sample [ng/mL] Sample [ng/mL] Sample [ng/mL] Sample [ng/mL]
1-T1-0 369.08 1-T2-0 726.19 1-T3-0 432.76 1-T4-0 493.83
2-T1-0 535.77 2-T2-0 426.38 2-T3-0 397.99 2-T4-0 390.21
3-T1-0 420.07 3-T2-0 421.87 3-T3-0 281.61 3-T4-0 302.13
4-T1-0 451.29 4-T2-0 751.41 4-T3-0 404.1 4-T4-0 480.995
5-T1-0 891.12 5-T2-0 892.70 5-T3-0 773.99 5-T4-0 587.89
6-T1-0 810.47 6-T2-0 635.65 6-T3-0 691.26 6-T4-0 589.93
7-T1-0 1024.10 7-T2-0 669.36 7-T3-0 877.36 7-T4-0 620.27
8-T1-0 760.23 8-T2-0 604.90 8-T3-0 687.3 8-T4-0 722.35
9-T1-0 761.06 9-T2-0 720.91 9-T3-0 547.57 9-T4-0 694.02
10-T1-0 610.99 10-T2-0 546.38 10-T3-0 613.495 10-T4-0 588.7
11-T1-0 561.96 11-T2-0 510.95 11-T3-0 543.99 11-T4-0 545.78
12-T1-0 871.71 12-T2-0 601.85 12-T3-0 774.297 12-T4-0 517.11
13-T1-0 1022.92 13-T2-0 1545.67 13-T3-0 1174.96 13-T4-0 1511.26
14-T1-0 991.04 14-T2-0 862.20 14-T3-0 1143.26 14-T4-0 592.76
15-T1-0 980.98 15-T2-0 1066.09 15-T3-0 1063.9 15-T4-0 1583.66
16-T1-0 735.99 16-T2-0 821.16 16-T3-0 1066.09 16-T4-0 1264.25
17-T1-0 1128.67 17-T2-0 1449.74 17-T3-0 813.83 17-T4-0 1029.32
18-T1-0 522.73 18-T2-0 786.74 18-T3-0 518.51 18-T4-0 779.62
19-T1-0 1261.77 19-T2-0 1177.31 19-T3-0 790.32 19-T4-0 989.27
20-T1-0 876.29 20-T2-0 788.53 20-T3-0 767.24 20-T4-0 702.195
Descriptive statistics of the data, outliers detection and exclusion - DPP IV concentrations
Phase Mean
(ng/mL) S.D. Median Mean Dev. S.E.M. n
Control State
(T1, T2) 789.86 276.15 760.65 212.32 43.66 40
Treated State
(T3,T4) 733.73 305.41 689.28 233.14 48.29 40
Criteria:
Outlier > 2.5 S.D.
Outliers: 13-T2-0, 13-T4-0, 15-T4-0, 17-T2-0

168 D Supplement
168
1.2.1.2 Serum concentrations of DPP IV in volunteers - outliers excluded
Control State (T1, T2) Treated State (T3,T4)
1-T1-0/1-T3-0 369.08 432.76
2-T1-0/2-T3-0 535.77 397.99
3-T1-0/3-T3-0 420.07 281.61
4-T1-0/4-T3-0 451.29 404.1
5-T1-0/5-T3-0 891.12 773.99
6-T1-0/6-T3-0 810.47 691.26
7-T1-0/7-T3-0 1024.10 877.36
8-T1-0/8-T3-0 760.23 687.3
9-T1-0/9-T3-0 761.06 547.57
10-T1-0/10-T3-0 610.99 613.495
11-T1-0/11-T3-0 561.96 543.99
12-T1-0/12-T3-0 871.71 774.297
13-T1-0/13-T3-0 1022.92 1174.96
14-T1-0/14-T3-0 991.04 1143.26
15-T1-0/15-T3-0 980.98 1063.9
16-T1-0/16-T3-0 735.99 1066.09
17-T1-0/17-T3-0 1128.67 813.83
18-T1-0/18-T3-0 522.73 518.51
19-T1-0/19-T3-0 1261.77 790.32
20-T1-0/20-T3-0 876.29 767.24
1-T2-0/1-T4-0 726.19 493.83
2-T2-0/2-T4-0 426.38 390.21
3-T2-0/3-T4-0 421.87 302.13
4-T2-0/4-T4-0 751.41 480.995
5-T2-0/5-T4-0 892.70 587.89
6-T2-0/6-T4-0 635.65 589.93
7-T2-0/7-T4-0 669.36 620.27
8-T2-0/8-T4-0 604.90 722.35
9-T2-0/9-T4-0 720.91 694.02
10-T2-0/10-T4-0 546.38 588.7
11-T2-0/11-T4-0 510.95 545.78
12-T2-0/12-T4-0 601.85 517.11
13-T1-0/13-T3-0 Outlied Outlied
14-T2-0/14-T4-0 862.20 592.76
15-T2-0/15-T4-0 see 15-T2/17-T4 Outlied
15-T2-0/17-T4-0 1066.09 1029.32
16-T2-0/16-T4-0 821.16 1264.245
17-T2-0/17-T4-0 Outlied see 15-T2/17-T4
18-T2-0/18-T4-0 786.74 779.62
19-T2-0/19-T4-0 1177.31 989.27
20-T2-0/20-T4-0 788.53 702.195
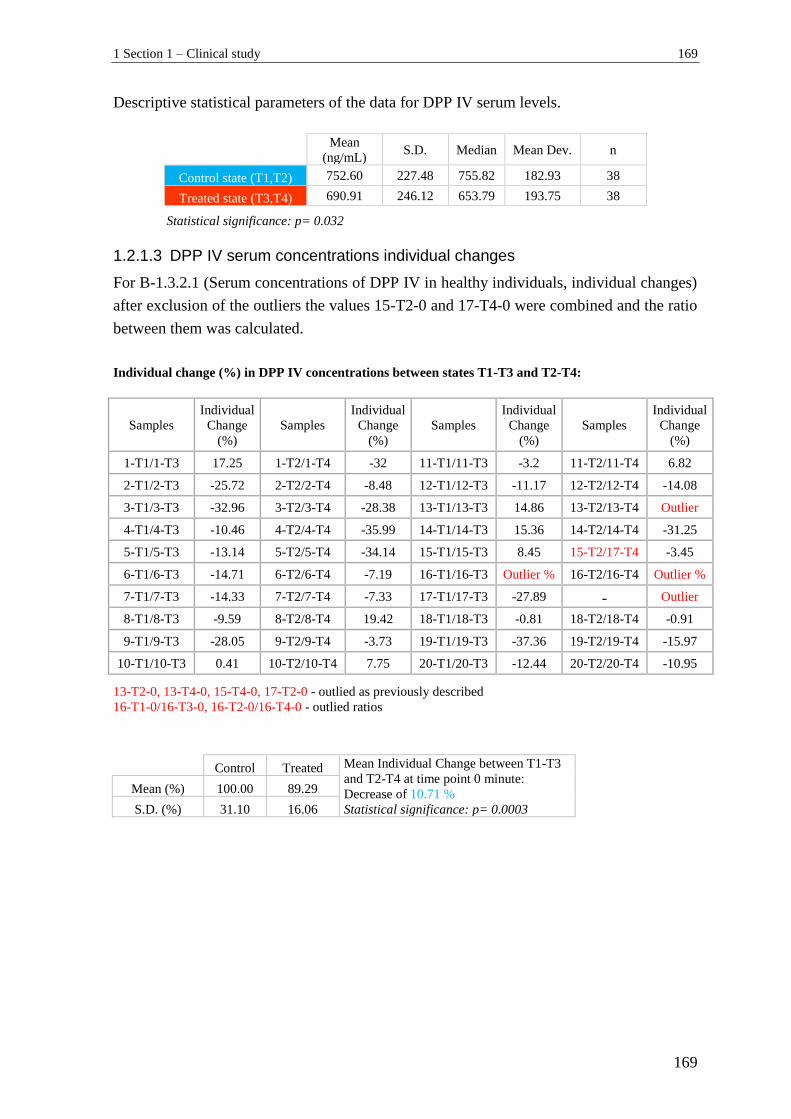
1 Section 1 – Clinical study 169
169
Descriptive statistical parameters of the data for DPP IV serum levels.
Mean
(ng/mL) S.D. Median Mean Dev. n
Control state (T1,T2) 752.60 227.48 755.82 182.93 38
Treated state (T3,T4) 690.91 246.12 653.79 193.75 38
Statistical significance: p= 0.032
1.2.1.3 DPP IV serum concentrations individual changes
For B-1.3.2.1 (Serum concentrations of DPP IV in healthy individuals, individual changes)
after exclusion of the outliers the values 15-T2-0 and 17-T4-0 were combined and the ratio
between them was calculated.
Individual change (%) in DPP IV concentrations between states T1-T3 and T2-T4:
Samples
Individual
Change
(%)
Samples
Individual
Change
(%)
Samples
Individual
Change
(%)
Samples
Individual
Change
(%)
1-T1/1-T3 17.25 1-T2/1-T4 -32 11-T1/11-T3 -3.2 11-T2/11-T4 6.82
2-T1/2-T3 -25.72 2-T2/2-T4 -8.48 12-T1/12-T3 -11.17 12-T2/12-T4 -14.08
3-T1/3-T3 -32.96 3-T2/3-T4 -28.38 13-T1/13-T3 14.86 13-T2/13-T4 Outlier
4-T1/4-T3 -10.46 4-T2/4-T4 -35.99 14-T1/14-T3 15.36 14-T2/14-T4 -31.25
5-T1/5-T3 -13.14 5-T2/5-T4 -34.14 15-T1/15-T3 8.45 15-T2/17-T4 -3.45
6-T1/6-T3 -14.71 6-T2/6-T4 -7.19 16-T1/16-T3 Outlier % 16-T2/16-T4 Outlier %
7-T1/7-T3 -14.33 7-T2/7-T4 -7.33 17-T1/17-T3 -27.89 - Outlier
8-T1/8-T3 -9.59 8-T2/8-T4 19.42 18-T1/18-T3 -0.81 18-T2/18-T4 -0.91
9-T1/9-T3 -28.05 9-T2/9-T4 -3.73 19-T1/19-T3 -37.36 19-T2/19-T4 -15.97
10-T1/10-T3 0.41 10-T2/10-T4 7.75 20-T1/20-T3 -12.44 20-T2/20-T4 -10.95
Control Treated Mean Individual Change between T1-T3
and T2-T4 at time point 0 minute:
Decrease of 10.71 % Statistical significance: p= 0.0003
Mean (%) 100.00 89.29
S.D. (%) 31.10 16.06
13-T2-0, 13-T4-0, 15-T4-0, 17-T2-0 - outlied as previously described
16-T1-0/16-T3-0, 16-T2-0/16-T4-0 - outlied ratios
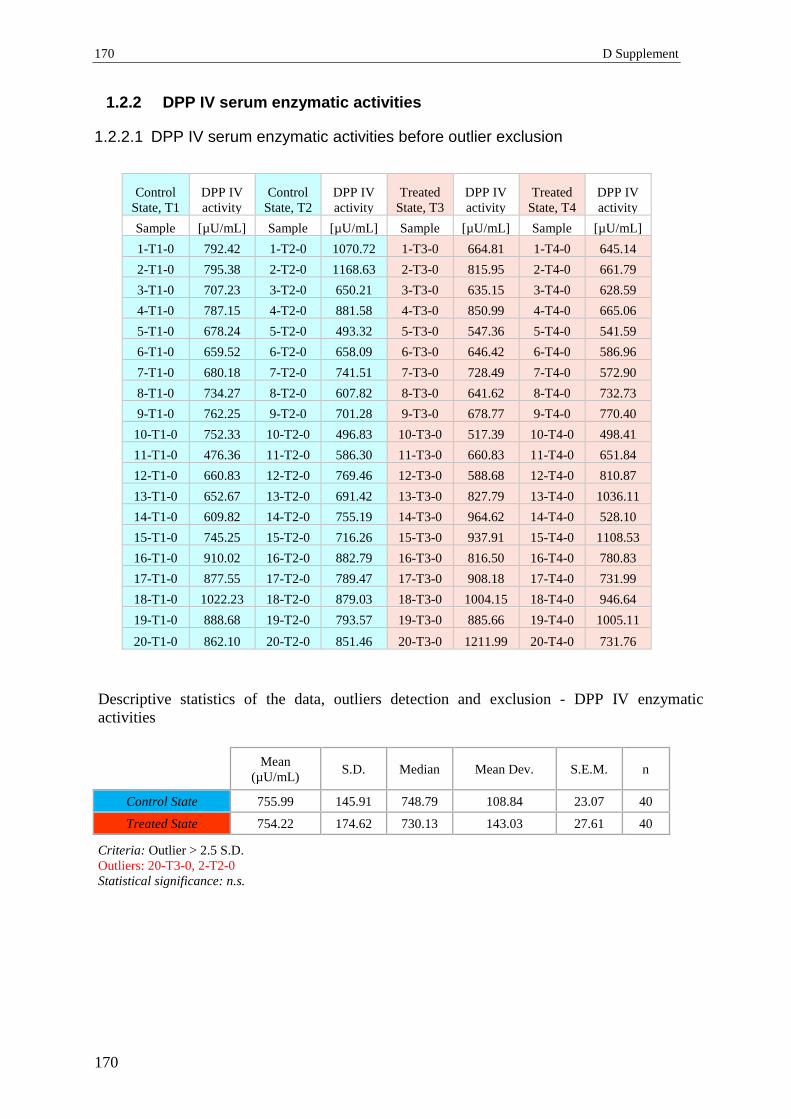
170 D Supplement
170
1.2.2 DPP IV serum enzymatic activities
1.2.2.1 DPP IV serum enzymatic activities before outlier exclusion
Control
State, T1
DPP IV
activity
Control
State, T2
DPP IV
activity
Treated
State, T3
DPP IV
activity
Treated
State, T4
DPP IV
activity
Sample [µU/mL] Sample [µU/mL] Sample [µU/mL] Sample [µU/mL]
1-T1-0 792.42 1-T2-0 1070.72 1-T3-0 664.81 1-T4-0 645.14
2-T1-0 795.38 2-T2-0 1168.63 2-T3-0 815.95 2-T4-0 661.79
3-T1-0 707.23 3-T2-0 650.21 3-T3-0 635.15 3-T4-0 628.59
4-T1-0 787.15 4-T2-0 881.58 4-T3-0 850.99 4-T4-0 665.06
5-T1-0 678.24 5-T2-0 493.32 5-T3-0 547.36 5-T4-0 541.59
6-T1-0 659.52 6-T2-0 658.09 6-T3-0 646.42 6-T4-0 586.96
7-T1-0 680.18 7-T2-0 741.51 7-T3-0 728.49 7-T4-0 572.90
8-T1-0 734.27 8-T2-0 607.82 8-T3-0 641.62 8-T4-0 732.73
9-T1-0 762.25 9-T2-0 701.28 9-T3-0 678.77 9-T4-0 770.40
10-T1-0 752.33 10-T2-0 496.83 10-T3-0 517.39 10-T4-0 498.41
11-T1-0 476.36 11-T2-0 586.30 11-T3-0 660.83 11-T4-0 651.84
12-T1-0 660.83 12-T2-0 769.46 12-T3-0 588.68 12-T4-0 810.87
13-T1-0 652.67 13-T2-0 691.42 13-T3-0 827.79 13-T4-0 1036.11
14-T1-0 609.82 14-T2-0 755.19 14-T3-0 964.62 14-T4-0 528.10
15-T1-0 745.25 15-T2-0 716.26 15-T3-0 937.91 15-T4-0 1108.53
16-T1-0 910.02 16-T2-0 882.79 16-T3-0 816.50 16-T4-0 780.83
17-T1-0 877.55 17-T2-0 789.47 17-T3-0 908.18 17-T4-0 731.99
18-T1-0 1022.23 18-T2-0 879.03 18-T3-0 1004.15 18-T4-0 946.64
19-T1-0 888.68 19-T2-0 793.57 19-T3-0 885.66 19-T4-0 1005.11
20-T1-0 862.10 20-T2-0 851.46 20-T3-0 1211.99 20-T4-0 731.76
Descriptive statistics of the data, outliers detection and exclusion - DPP IV enzymatic
activities
Mean
(µU/mL) S.D. Median Mean Dev. S.E.M. n
Control State 755.99 145.91 748.79 108.84 23.07 40 Treated State 754.22 174.62 730.13 143.03 27.61 40
Criteria: Outlier > 2.5 S.D.
Outliers: 20-T3-0, 2-T2-0
Statistical significance: n.s.
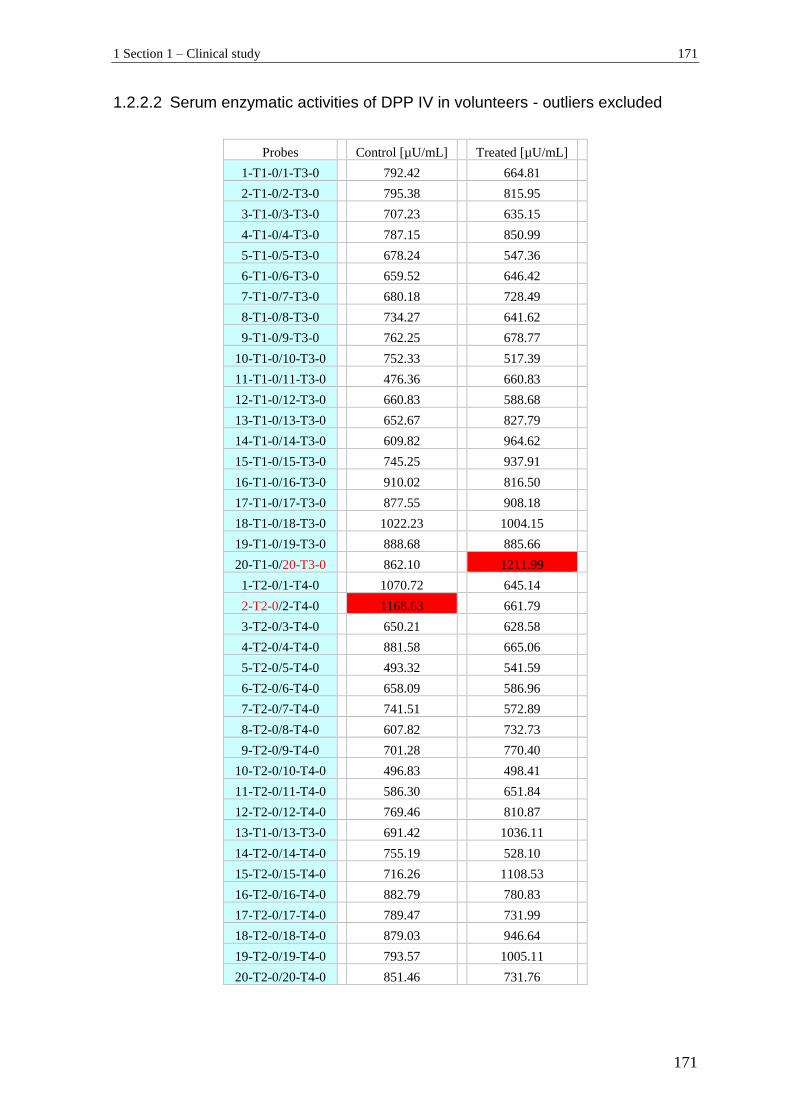
1 Section 1 – Clinical study 171
171
1.2.2.2 Serum enzymatic activities of DPP IV in volunteers - outliers excluded
Probes Control [µU/mL] Treated [µU/mL]
1-T1-0/1-T3-0 792.42 664.81
2-T1-0/2-T3-0 795.38 815.95
3-T1-0/3-T3-0 707.23 635.15
4-T1-0/4-T3-0 787.15 850.99
5-T1-0/5-T3-0 678.24 547.36
6-T1-0/6-T3-0 659.52 646.42
7-T1-0/7-T3-0 680.18 728.49
8-T1-0/8-T3-0 734.27 641.62
9-T1-0/9-T3-0 762.25 678.77
10-T1-0/10-T3-0 752.33 517.39
11-T1-0/11-T3-0 476.36 660.83
12-T1-0/12-T3-0 660.83 588.68
13-T1-0/13-T3-0 652.67 827.79
14-T1-0/14-T3-0 609.82 964.62
15-T1-0/15-T3-0 745.25 937.91
16-T1-0/16-T3-0 910.02 816.50
17-T1-0/17-T3-0 877.55 908.18
18-T1-0/18-T3-0 1022.23 1004.15
19-T1-0/19-T3-0 888.68 885.66
20-T1-0/20-T3-0 862.10 1211.99
1-T2-0/1-T4-0 1070.72 645.14
2-T2-0/2-T4-0 1168.63 661.79
3-T2-0/3-T4-0 650.21 628.58
4-T2-0/4-T4-0 881.58 665.06
5-T2-0/5-T4-0 493.32 541.59
6-T2-0/6-T4-0 658.09 586.96
7-T2-0/7-T4-0 741.51 572.89
8-T2-0/8-T4-0 607.82 732.73
9-T2-0/9-T4-0 701.28 770.40
10-T2-0/10-T4-0 496.83 498.41
11-T2-0/11-T4-0 586.30 651.84
12-T2-0/12-T4-0 769.46 810.87
13-T1-0/13-T3-0 691.42 1036.11
14-T2-0/14-T4-0 755.19 528.10
15-T2-0/15-T4-0 716.26 1108.53
16-T2-0/16-T4-0 882.79 780.83
17-T2-0/17-T4-0 789.47 731.99
18-T2-0/18-T4-0 879.03 946.64
19-T2-0/19-T4-0 793.57 1005.11
20-T2-0/20-T4-0 851.46 731.76
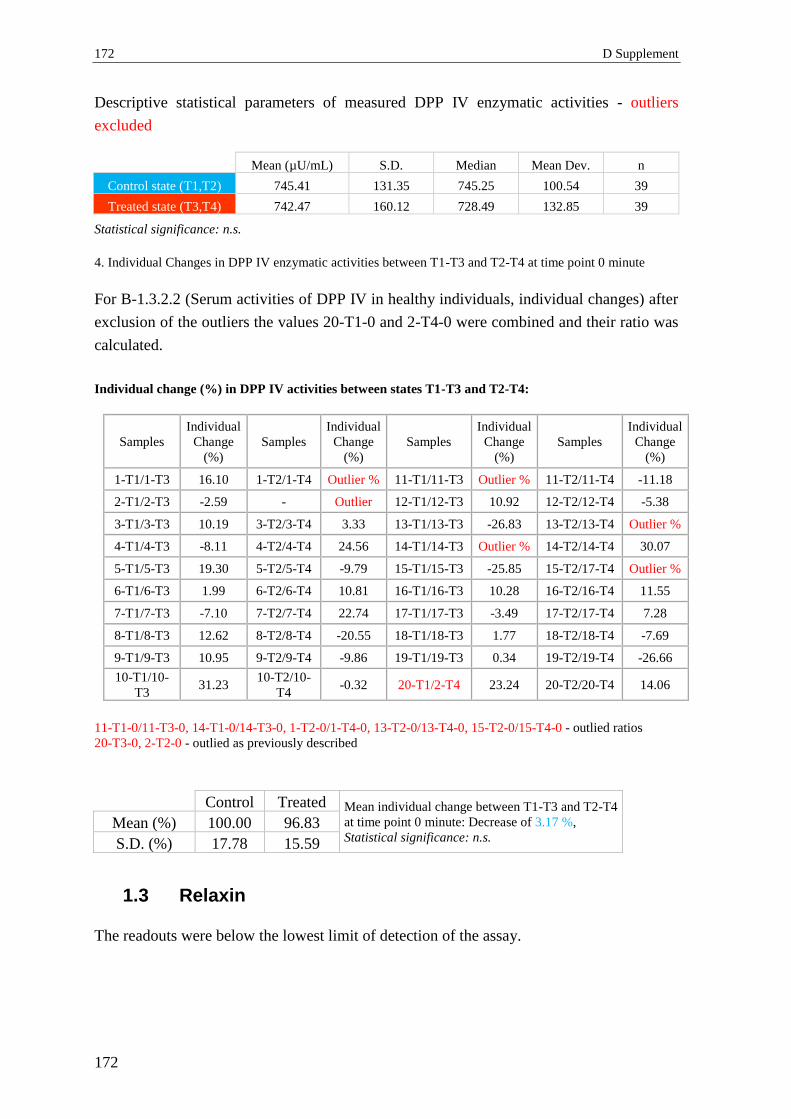
172 D Supplement
172
Descriptive statistical parameters of measured DPP IV enzymatic activities - outliers
excluded
Mean (µU/mL) S.D. Median Mean Dev. n
Control state (T1,T2) 745.41 131.35 745.25 100.54 39
Treated state (T3,T4) 742.47 160.12 728.49 132.85 39
Statistical significance: n.s.
4. Individual Changes in DPP IV enzymatic activities between T1-T3 and T2-T4 at time point 0 minute
For B-1.3.2.2 (Serum activities of DPP IV in healthy individuals, individual changes) after
exclusion of the outliers the values 20-T1-0 and 2-T4-0 were combined and their ratio was
calculated.
Individual change (%) in DPP IV activities between states T1-T3 and T2-T4:
Samples
Individual
Change
(%)
Samples
Individual
Change
(%)
Samples
Individual
Change
(%)
Samples
Individual
Change
(%)
1-T1/1-T3 16.10 1-T2/1-T4 Outlier % 11-T1/11-T3 Outlier % 11-T2/11-T4 -11.18
2-T1/2-T3 -2.59 - Outlier 12-T1/12-T3 10.92 12-T2/12-T4 -5.38
3-T1/3-T3 10.19 3-T2/3-T4 3.33 13-T1/13-T3 -26.83 13-T2/13-T4 Outlier %
4-T1/4-T3 -8.11 4-T2/4-T4 24.56 14-T1/14-T3 Outlier % 14-T2/14-T4 30.07
5-T1/5-T3 19.30 5-T2/5-T4 -9.79 15-T1/15-T3 -25.85 15-T2/17-T4 Outlier %
6-T1/6-T3 1.99 6-T2/6-T4 10.81 16-T1/16-T3 10.28 16-T2/16-T4 11.55
7-T1/7-T3 -7.10 7-T2/7-T4 22.74 17-T1/17-T3 -3.49 17-T2/17-T4 7.28
8-T1/8-T3 12.62 8-T2/8-T4 -20.55 18-T1/18-T3 1.77 18-T2/18-T4 -7.69
9-T1/9-T3 10.95 9-T2/9-T4 -9.86 19-T1/19-T3 0.34 19-T2/19-T4 -26.66
10-T1/10-
T3 31.23
10-T2/10-
T4 -0.32 20-T1/2-T4 23.24 20-T2/20-T4 14.06
Control Treated Mean individual change between T1-T3 and T2-T4
at time point 0 minute: Decrease of 3.17 %,
Statistical significance: n.s. Mean (%) 100.00 96.83
S.D. (%) 17.78 15.59
1.3 Relaxin
The readouts were below the lowest limit of detection of the assay.
11-T1-0/11-T3-0, 14-T1-0/14-T3-0, 1-T2-0/1-T4-0, 13-T2-0/13-T4-0, 15-T2-0/15-T4-0 - outlied ratios
20-T3-0, 2-T2-0 - outlied as previously described
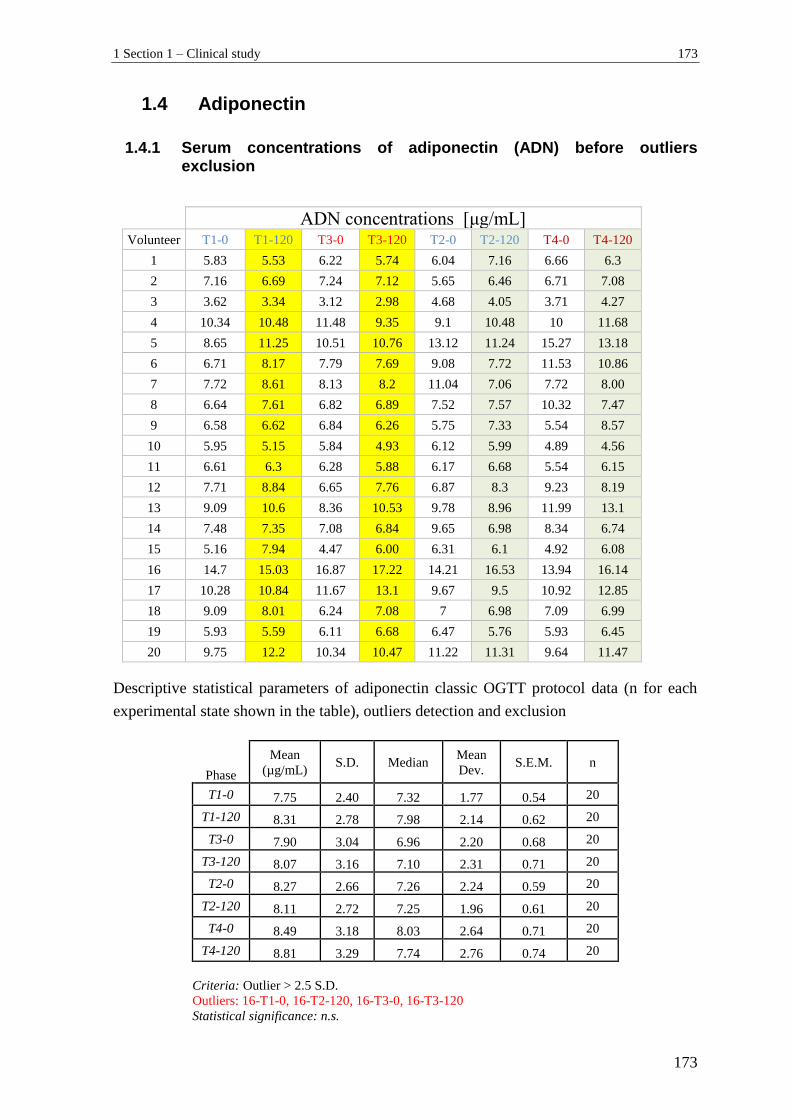
1 Section 1 – Clinical study 173
173
1.4 Adiponectin
1.4.1 Serum concentrations of adiponectin (ADN) before outliers exclusion
ADN concentrations [μg/mL] Volunteer T1-0 T1-120 T3-0 T3-120 T2-0 T2-120 T4-0 T4-120
1 5.83 5.53 6.22 5.74 6.04 7.16 6.66 6.3
2 7.16 6.69 7.24 7.12 5.65 6.46 6.71 7.08
3 3.62 3.34 3.12 2.98 4.68 4.05 3.71 4.27
4 10.34 10.48 11.48 9.35 9.1 10.48 10 11.68
5 8.65 11.25 10.51 10.76 13.12 11.24 15.27 13.18
6 6.71 8.17 7.79 7.69 9.08 7.72 11.53 10.86
7 7.72 8.61 8.13 8.2 11.04 7.06 7.72 8.00
8 6.64 7.61 6.82 6.89 7.52 7.57 10.32 7.47
9 6.58 6.62 6.84 6.26 5.75 7.33 5.54 8.57
10 5.95 5.15 5.84 4.93 6.12 5.99 4.89 4.56
11 6.61 6.3 6.28 5.88 6.17 6.68 5.54 6.15
12 7.71 8.84 6.65 7.76 6.87 8.3 9.23 8.19
13 9.09 10.6 8.36 10.53 9.78 8.96 11.99 13.1
14 7.48 7.35 7.08 6.84 9.65 6.98 8.34 6.74
15 5.16 7.94 4.47 6.00 6.31 6.1 4.92 6.08
16 14.7 15.03 16.87 17.22 14.21 16.53 13.94 16.14
17 10.28 10.84 11.67 13.1 9.67 9.5 10.92 12.85
18 9.09 8.01 6.24 7.08 7 6.98 7.09 6.99
19 5.93 5.59 6.11 6.68 6.47 5.76 5.93 6.45
20 9.75 12.2 10.34 10.47 11.22 11.31 9.64 11.47
Descriptive statistical parameters of adiponectin classic OGTT protocol data (n for each
experimental state shown in the table), outliers detection and exclusion
Phase
Mean
(µg/mL) S.D. Median
Mean
Dev. S.E.M. n
T1-0 7.75 2.40 7.32 1.77 0.54 20
T1-120 8.31 2.78 7.98 2.14 0.62 20
T3-0 7.90 3.04 6.96 2.20 0.68 20
T3-120 8.07 3.16 7.10 2.31 0.71 20
T2-0 8.27 2.66 7.26 2.24 0.59 20
T2-120 8.11 2.72 7.25 1.96 0.61 20
T4-0 8.49 3.18 8.03 2.64 0.71 20
T4-120 8.81 3.29 7.74 2.76 0.74 20
Criteria: Outlier > 2.5 S.D.
Outliers: 16-T1-0, 16-T2-120, 16-T3-0, 16-T3-120
Statistical significance: n.s.
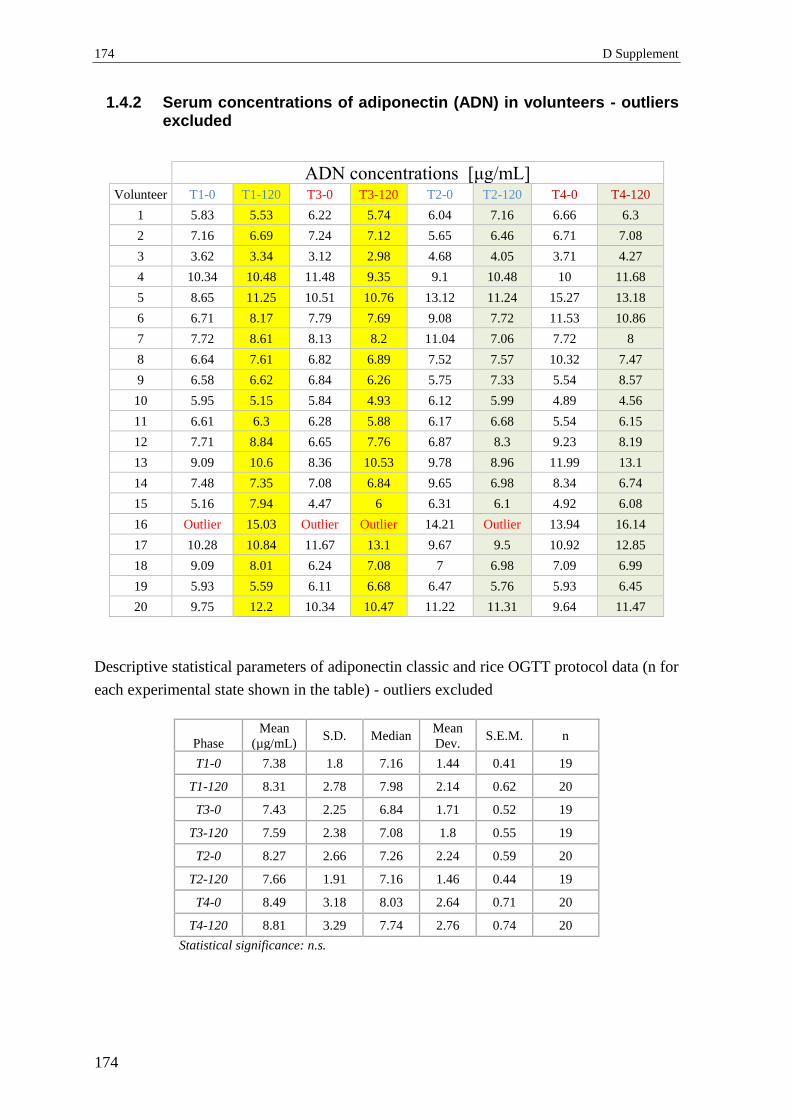
174 D Supplement
174
1.4.2 Serum concentrations of adiponectin (ADN) in volunteers - outliers excluded
ADN concentrations [μg/mL] Volunteer T1-0 T1-120 T3-0 T3-120 T2-0 T2-120 T4-0 T4-120
1 5.83 5.53 6.22 5.74 6.04 7.16 6.66 6.3
2 7.16 6.69 7.24 7.12 5.65 6.46 6.71 7.08
3 3.62 3.34 3.12 2.98 4.68 4.05 3.71 4.27
4 10.34 10.48 11.48 9.35 9.1 10.48 10 11.68
5 8.65 11.25 10.51 10.76 13.12 11.24 15.27 13.18
6 6.71 8.17 7.79 7.69 9.08 7.72 11.53 10.86
7 7.72 8.61 8.13 8.2 11.04 7.06 7.72 8
8 6.64 7.61 6.82 6.89 7.52 7.57 10.32 7.47
9 6.58 6.62 6.84 6.26 5.75 7.33 5.54 8.57
10 5.95 5.15 5.84 4.93 6.12 5.99 4.89 4.56
11 6.61 6.3 6.28 5.88 6.17 6.68 5.54 6.15
12 7.71 8.84 6.65 7.76 6.87 8.3 9.23 8.19
13 9.09 10.6 8.36 10.53 9.78 8.96 11.99 13.1
14 7.48 7.35 7.08 6.84 9.65 6.98 8.34 6.74
15 5.16 7.94 4.47 6 6.31 6.1 4.92 6.08
16 Outlier 15.03 Outlier Outlier 14.21 Outlier 13.94 16.14
17 10.28 10.84 11.67 13.1 9.67 9.5 10.92 12.85
18 9.09 8.01 6.24 7.08 7 6.98 7.09 6.99
19 5.93 5.59 6.11 6.68 6.47 5.76 5.93 6.45
20 9.75 12.2 10.34 10.47 11.22 11.31 9.64 11.47
Descriptive statistical parameters of adiponectin classic and rice OGTT protocol data (n for
each experimental state shown in the table) - outliers excluded
Phase
Mean
(µg/mL) S.D. Median
Mean
Dev. S.E.M. n
T1-0 7.38 1.8 7.16 1.44 0.41 19
T1-120 8.31 2.78 7.98 2.14 0.62 20
T3-0 7.43 2.25 6.84 1.71 0.52 19
T3-120 7.59 2.38 7.08 1.8 0.55 19
T2-0 8.27 2.66 7.26 2.24 0.59 20
T2-120 7.66 1.91 7.16 1.46 0.44 19
T4-0 8.49 3.18 8.03 2.64 0.71 20
T4-120 8.81 3.29 7.74 2.76 0.74 20
Statistical significance: n.s.
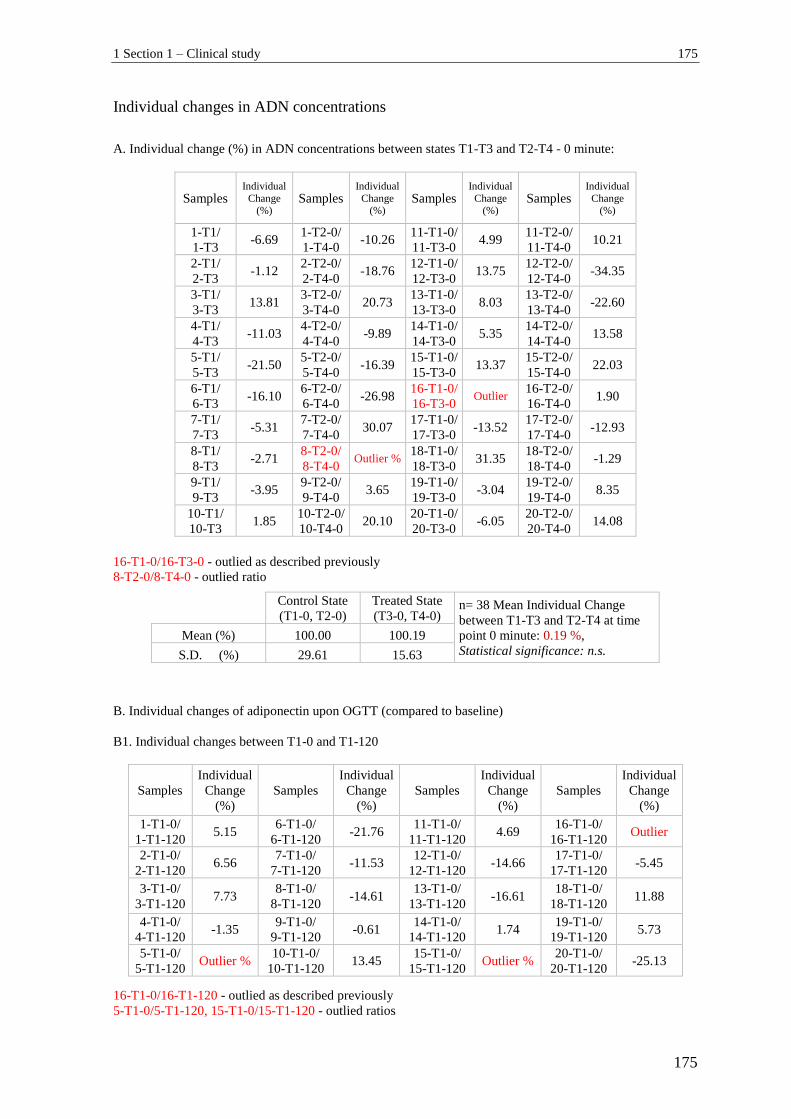
1 Section 1 – Clinical study 175
175
Individual changes in ADN concentrations
A. Individual change (%) in ADN concentrations between states T1-T3 and T2-T4 - 0 minute:
Samples Individual
Change (%)
Samples Individual
Change (%)
Samples Individual
Change (%)
Samples Individual
Change (%)
1-T1/
1-T3 -6.69
1-T2-0/
1-T4-0 -10.26
11-T1-0/
11-T3-0 4.99
11-T2-0/
11-T4-0 10.21
2-T1/
2-T3 -1.12
2-T2-0/
2-T4-0 -18.76
12-T1-0/
12-T3-0 13.75
12-T2-0/
12-T4-0 -34.35
3-T1/
3-T3 13.81
3-T2-0/
3-T4-0 20.73
13-T1-0/
13-T3-0 8.03
13-T2-0/
13-T4-0 -22.60
4-T1/
4-T3 -11.03
4-T2-0/
4-T4-0 -9.89
14-T1-0/
14-T3-0 5.35
14-T2-0/
14-T4-0 13.58
5-T1/
5-T3 -21.50
5-T2-0/
5-T4-0 -16.39
15-T1-0/
15-T3-0 13.37
15-T2-0/
15-T4-0 22.03
6-T1/
6-T3 -16.10
6-T2-0/
6-T4-0 -26.98
16-T1-0/
16-T3-0 Outlier
16-T2-0/
16-T4-0 1.90
7-T1/
7-T3 -5.31
7-T2-0/
7-T4-0 30.07
17-T1-0/
17-T3-0 -13.52
17-T2-0/
17-T4-0 -12.93
8-T1/
8-T3 -2.71
8-T2-0/
8-T4-0 Outlier %
18-T1-0/
18-T3-0 31.35
18-T2-0/
18-T4-0 -1.29
9-T1/
9-T3 -3.95
9-T2-0/
9-T4-0 3.65
19-T1-0/
19-T3-0 -3.04
19-T2-0/
19-T4-0 8.35
10-T1/
10-T3 1.85
10-T2-0/
10-T4-0 20.10
20-T1-0/
20-T3-0 -6.05
20-T2-0/
20-T4-0 14.08
Control State
(T1-0, T2-0)
Treated State
(T3-0, T4-0) n= 38 Mean Individual Change
between T1-T3 and T2-T4 at time
point 0 minute: 0.19 %,
Statistical significance: n.s. Mean (%) 100.00 100.19
S.D. (%) 29.61 15.63
B. Individual changes of adiponectin upon OGTT (compared to baseline)
B1. Individual changes between T1-0 and T1-120
Samples
Individual
Change
(%)
Samples
Individual
Change
(%)
Samples
Individual
Change
(%)
Samples
Individual
Change
(%)
1-T1-0/
1-T1-120 5.15
6-T1-0/
6-T1-120 -21.76
11-T1-0/
11-T1-120 4.69
16-T1-0/
16-T1-120 Outlier
2-T1-0/
2-T1-120 6.56
7-T1-0/
7-T1-120 -11.53
12-T1-0/
12-T1-120 -14.66
17-T1-0/
17-T1-120 -5.45
3-T1-0/
3-T1-120 7.73
8-T1-0/
8-T1-120 -14.61
13-T1-0/
13-T1-120 -16.61
18-T1-0/
18-T1-120 11.88
4-T1-0/
4-T1-120 -1.35
9-T1-0/
9-T1-120 -0.61
14-T1-0/
14-T1-120 1.74
19-T1-0/
19-T1-120 5.73
5-T1-0/
5-T1-120 Outlier %
10-T1-0/
10-T1-120 13.45
15-T1-0/
15-T1-120 Outlier %
20-T1-0/
20-T1-120 -25.13
16-T1-0/16-T3-0 - outlied as described previously
8-T2-0/8-T4-0 - outlied ratio
16-T1-0/16-T1-120 - outlied as described previously
5-T1-0/5-T1-120, 15-T1-0/15-T1-120 - outlied ratios

176 D Supplement
176
T1-0 T1-120 n= 17, Mean Individual Change
between T1-0 and T1-120:
Increase of 3.22 % Mean (%) 100.00 103.22
S.D. (%) 24.18 12.01
B2. Individual changes between T2-0 and T2-120
Samples
Individual
Change
(%)
Samples
Individual
Change
(%)
Samples
Individual
Change
(%)
Samples
Individual
Change
(%)
1-T2-0/
1-T2-120 -18.54
6-T2-0/
6-T2-120 14.98
11-T2-0/
11-T2-120 -8.27
16-T2-0/
16-T2-120 Outlier
2-T2-0/
2-T2-120 -14.34
7-T2-0/
7-T2-120 Outlier %
12-T2-0/
12-T2-120 -20.82
17-T2-0/
17-T2-120 1.76
3-T2-0/
3-T2-120 13.46
8-T2-0/
8-T2-120 -0.66
13-T2-0/
13-T2-120 8.38
18-T2-0/
18-T2-120 0.29
4-T2-0/
4-T2-120 -15.16
9-T2-0/
9-T2-120 -27.48
14-T2-0/
14-T2-120 27.67
19-T2-0/
19-T2-120 10.97
5-T2-0/
5-T2-120 14.33
10-T2-0/
10-T2-120 2.12
15-T2-0/
15-T2-120 3.33
20-T2-0/
20-T2-120 -0.80
T2-0 T2-120 n= 18, Mean Individual Change
between T2-0 and T2-120: 0.49 %
Statistical significance: n.s. Mean (%) 100.00 100.49
S.D. (%) 29.02 14.59
B3. Individual changes between T3-0 and T3-120
Samples
Individual
Change
(%)
Samples
Individual
Change
(%)
Samples
Individual
Change
(%)
Samples
Individual
Change
(%)
1-T3-0/
1-T3-120 7.72
6-T3-0/
6-T3-120 1.28
11-T3-0/
11-T3-120 6.37
16-T3-0/
16-T3-120 Outlier
2-T3-0/
2-T3-120 1.66
7-T3-0/
7-T3-120 -0.86
12-T3-0/
12-T3-120 -16.69
17-T3-0/
17-T3-120 -12.25
3-T3-0/
3-T3-120 4.49
8-T3-0/
8-T3-120 -1.03
13-T3-0/
13-T3-120 Outlier %
18-T3-0/
18-T3-120 -13.46
4-T3-0/
4-T3-120 18.55
9-T3-0/
9-T3-120 8.48
14-T3-0/
14-T3-120 3.39
19-T3-0/
19-T3-120 -9.33
5-T3-0/
5-T3-120 -2.38
10-T3-0/
10-T3-120 15.58
15-T3-0/
15-T3-120 Outlier %
20-T3-0/
20-T3-120 -1.26
T3-0 T3-120 n= 17, Mean Individual Change
between T3-0 and T3-120:
Decrease of 0.60 %
Statistical significance: n.s.
Mean (%) 100.00 99.40 S.D. (%) 29.84 9.67
16-T1-0/16-T1-120 - outlied as described previously
7-T2-0/7-T2-120 - outlied ratio
16-T3-0/16-T3-120 -outlied as described previously
13-T3-0/13-T3-120, 15-T3-0/15-T3-120 - outlied ratios
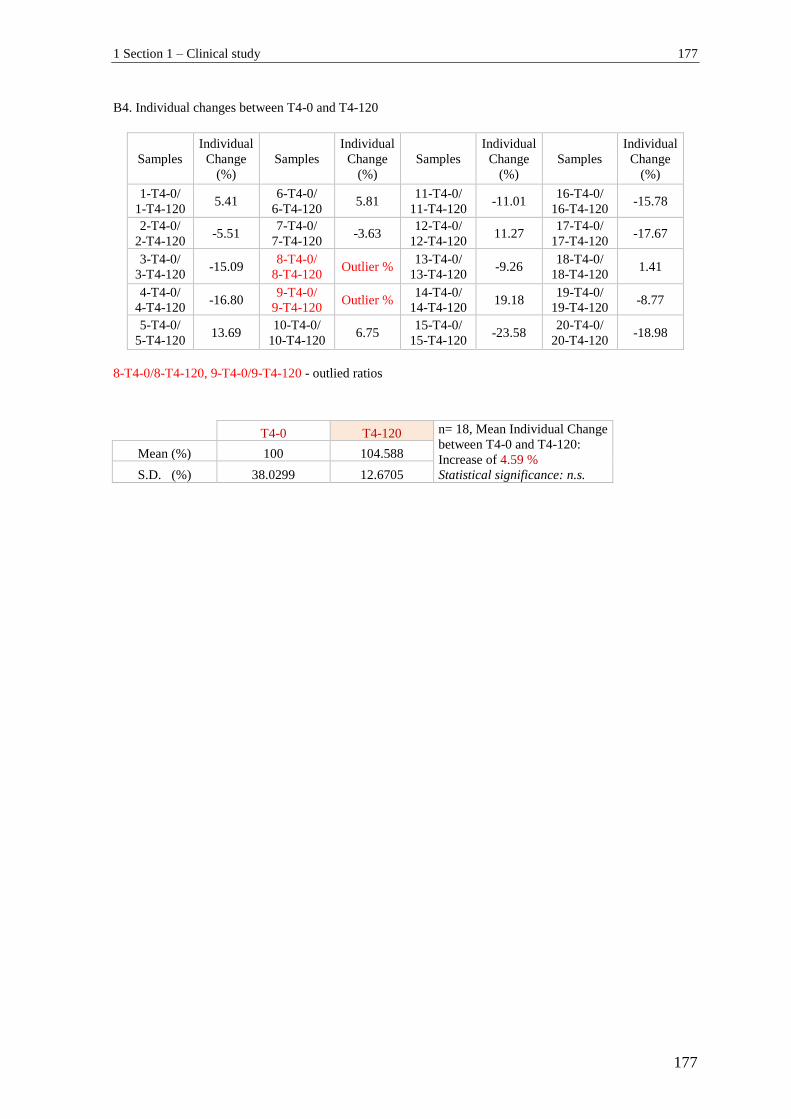
1 Section 1 – Clinical study 177
177
B4. Individual changes between T4-0 and T4-120
Samples
Individual
Change
(%)
Samples
Individual
Change
(%)
Samples
Individual
Change
(%)
Samples
Individual
Change
(%)
1-T4-0/
1-T4-120 5.41
6-T4-0/
6-T4-120 5.81
11-T4-0/
11-T4-120 -11.01
16-T4-0/
16-T4-120 -15.78
2-T4-0/
2-T4-120 -5.51
7-T4-0/
7-T4-120 -3.63
12-T4-0/
12-T4-120 11.27
17-T4-0/
17-T4-120 -17.67
3-T4-0/
3-T4-120 -15.09
8-T4-0/
8-T4-120 Outlier %
13-T4-0/
13-T4-120 -9.26
18-T4-0/
18-T4-120 1.41
4-T4-0/
4-T4-120 -16.80
9-T4-0/
9-T4-120 Outlier %
14-T4-0/
14-T4-120 19.18
19-T4-0/
19-T4-120 -8.77
5-T4-0/
5-T4-120 13.69
10-T4-0/
10-T4-120 6.75
15-T4-0/
15-T4-120 -23.58
20-T4-0/
20-T4-120 -18.98
8-T4-0/8-T4-120, 9-T4-0/9-T4-120 - outlied ratios
T4-0 T4-120 n= 18, Mean Individual Change
between T4-0 and T4-120:
Increase of 4.59 %
Statistical significance: n.s.
Mean (%) 100 104.588
S.D. (%) 38.0299 12.6705
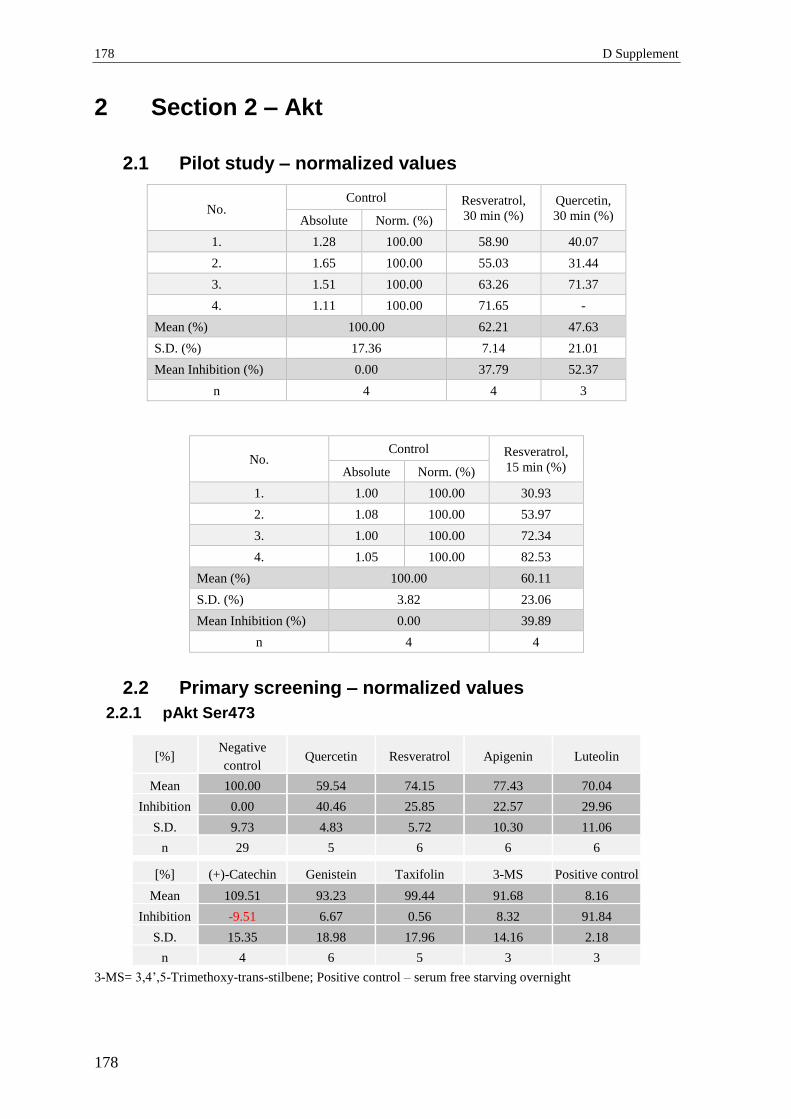
178 D Supplement
178
2 Section 2 – Akt
2.1 Pilot study – normalized values
No. Control Resveratrol,
30 min (%)
Quercetin,
30 min (%) Absolute Norm. (%)
1. 1.28 100.00 58.90 40.07
2. 1.65 100.00 55.03 31.44
3. 1.51 100.00 63.26 71.37
4. 1.11 100.00 71.65 -
Mean (%) 100.00 62.21 47.63
S.D. (%) 17.36 7.14 21.01
Mean Inhibition (%) 0.00 37.79 52.37
n 4 4 3
No. Control Resveratrol,
15 min (%) Absolute Norm. (%)
1. 1.00 100.00 30.93
2. 1.08 100.00 53.97
3. 1.00 100.00 72.34
4. 1.05 100.00 82.53
Mean (%) 100.00 60.11
S.D. (%) 3.82 23.06
Mean Inhibition (%) 0.00 39.89
n 4 4
2.2 Primary screening – normalized values
2.2.1 pAkt Ser473
[%] Negative
control Quercetin Resveratrol Apigenin Luteolin
Mean 100.00 59.54 74.15 77.43 70.04
Inhibition 0.00 40.46 25.85 22.57 29.96
S.D. 9.73 4.83 5.72 10.30 11.06
n 29 5 6 6 6
[%] (+)-Catechin Genistein Taxifolin 3-MS Positive control
Mean 109.51 93.23 99.44 91.68 8.16
Inhibition -9.51 6.67 0.56 8.32 91.84
S.D. 15.35 18.98 17.96 14.16 2.18
n 4 6 5 3 3
3-MS= 3,4’,5-Trimethoxy-trans-stilbene; Positive control – serum free starving overnight
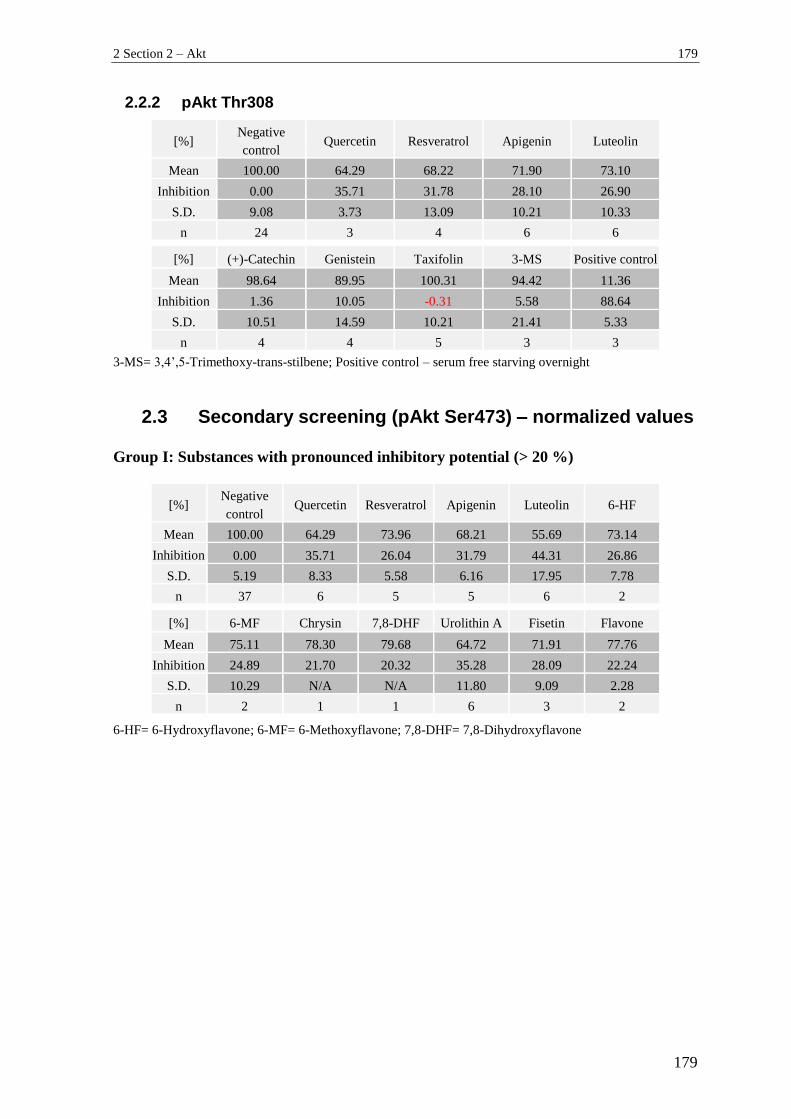
2 Section 2 – Akt 179
179
2.2.2 pAkt Thr308
[%] Negative
control Quercetin Resveratrol Apigenin Luteolin
Mean 100.00 64.29 68.22 71.90 73.10
Inhibition 0.00 35.71 31.78 28.10 26.90
S.D. 9.08 3.73 13.09 10.21 10.33
n 24 3 4 6 6
[%] (+)-Catechin Genistein Taxifolin 3-MS Positive control
Mean 98.64 89.95 100.31 94.42 11.36
Inhibition 1.36 10.05 -0.31 5.58 88.64
S.D. 10.51 14.59 10.21 21.41 5.33
n 4 4 5 3 3
3-MS= 3,4’,5-Trimethoxy-trans-stilbene; Positive control – serum free starving overnight
2.3 Secondary screening (pAkt Ser473) – normalized values
Group I: Substances with pronounced inhibitory potential (> 20 %)
[%] Negative
control Quercetin Resveratrol Apigenin Luteolin 6-HF
Mean 100.00 64.29 73.96 68.21 55.69 73.14 Inhibition 0.00 35.71 26.04 31.79 44.31 26.86
S.D. 5.19 8.33 5.58 6.16 17.95 7.78 n 37 6 5 5 6 2
[%] 6-MF Chrysin 7,8-DHF Urolithin A Fisetin Flavone Mean 75.11 78.30 79.68 64.72 71.91 77.76
Inhibition 24.89 21.70 20.32 35.28 28.09 22.24 S.D. 10.29 N/A N/A 11.80 9.09 2.28
n 2 1 1 6 3 2 6-HF= 6-Hydroxyflavone; 6-MF= 6-Methoxyflavone; 7,8-DHF= 7,8-Dihydroxyflavone
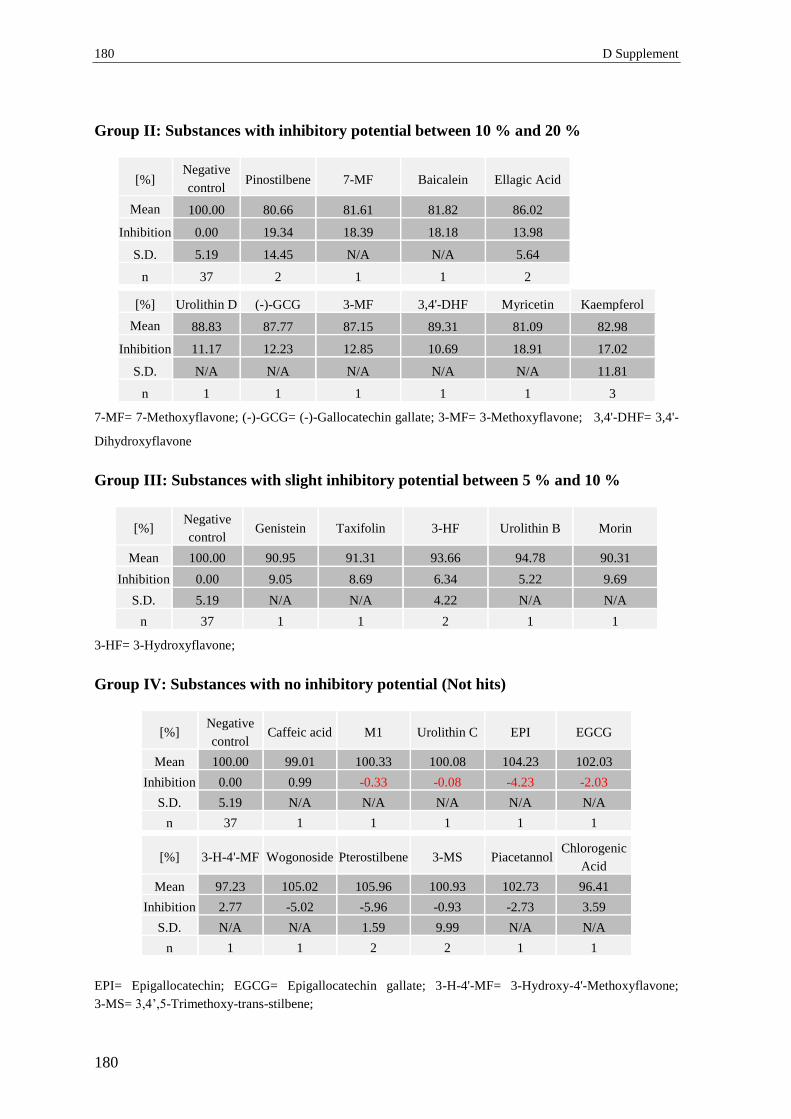
180 D Supplement
180
Group II: Substances with inhibitory potential between 10 % and 20 %
[%] Negative
control Pinostilbene 7-MF Baicalein Ellagic Acid
Mean 100.00 80.66 81.61 81.82 86.02
Inhibition 0.00 19.34 18.39 18.18 13.98
S.D. 5.19 14.45 N/A N/A 5.64
n 37 2 1 1 2
[%] Urolithin D (-)-GCG 3-MF 3,4'-DHF Myricetin Kaempferol
Mean 88.83 87.77 87.15 89.31 81.09 82.98
Inhibition 11.17 12.23 12.85 10.69 18.91 17.02
S.D. N/A N/A N/A N/A N/A 11.81
n 1 1 1 1 1 3
7-MF= 7-Methoxyflavone; (-)-GCG= (-)-Gallocatechin gallate; 3-MF= 3-Methoxyflavone; 3,4'-DHF= 3,4'-
Dihydroxyflavone
Group III: Substances with slight inhibitory potential between 5 % and 10 %
[%] Negative
control Genistein Taxifolin 3-HF Urolithin B Morin
Mean 100.00 90.95 91.31 93.66 94.78 90.31 Inhibition 0.00 9.05 8.69 6.34 5.22 9.69
S.D. 5.19 N/A N/A 4.22 N/A N/A n 37 1 1 2 1 1
3-HF= 3-Hydroxyflavone;
Group IV: Substances with no inhibitory potential (Not hits)
[%] Negative
control Caffeic acid M1 Urolithin C EPI EGCG
Mean 100.00 99.01 100.33 100.08 104.23 102.03 Inhibition 0.00 0.99 -0.33 -0.08 -4.23 -2.03
S.D. 5.19 N/A N/A N/A N/A N/A n 37 1 1 1 1 1
[%] 3-H-4'-MF Wogonoside Pterostilbene 3-MS Piacetannol Chlorogenic
Acid
Mean 97.23 105.02 105.96 100.93 102.73 96.41
Inhibition 2.77 -5.02 -5.96 -0.93 -2.73 3.59
S.D. N/A N/A 1.59 9.99 N/A N/A
n 1 1 2 2 1 1
EPI= Epigallocatechin; EGCG= Epigallocatechin gallate; 3-H-4'-MF= 3-Hydroxy-4'-Methoxyflavone;
3-MS= 3,4’,5-Trimethoxy-trans-stilbene;
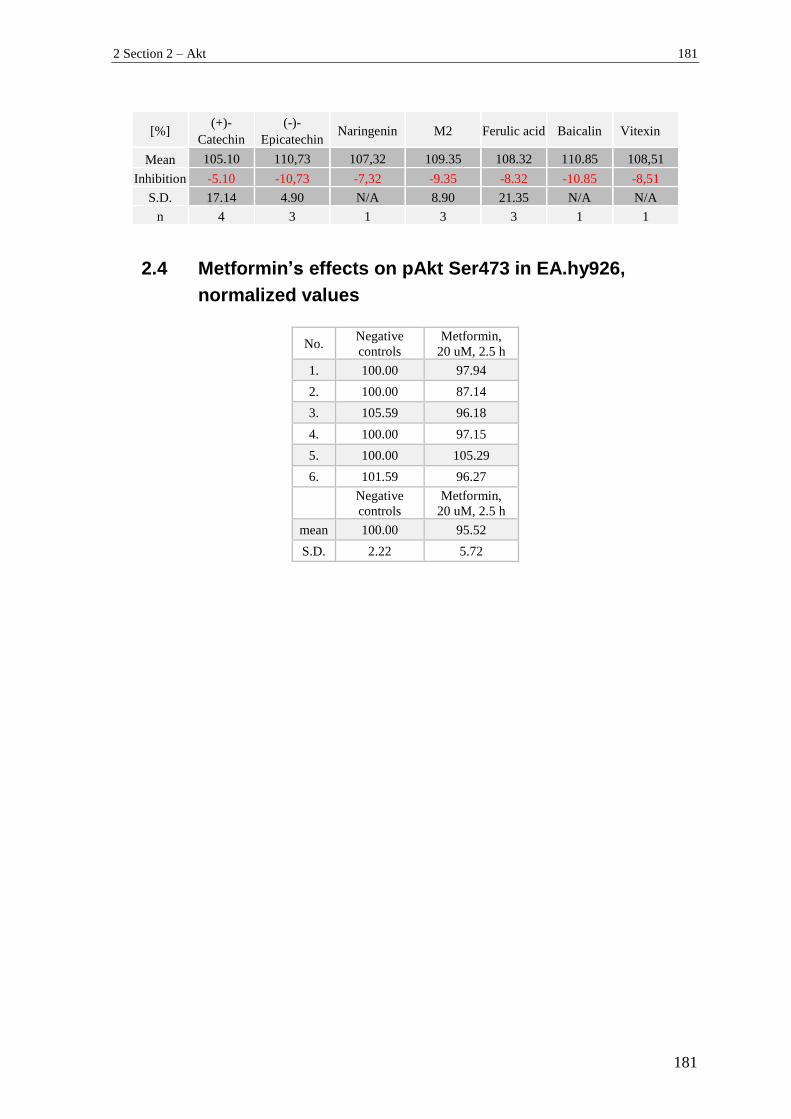
2 Section 2 – Akt 181
181
[%] (+)-
Catechin (-)-
Epicatechin Naringenin M2 Ferulic acid Baicalin Vitexin
Mean 105.10 110,73 107,32 109.35 108.32 110.85 108,51 Inhibition -5.10 -10,73 -7,32 -9.35 -8.32 -10.85 -8,51
S.D. 17.14 4.90 N/A 8.90 21.35 N/A N/A n 4 3 1 3 3 1 1
2.4 Metformin’s effects on pAkt Ser473 in EA.hy926,
normalized values
No. Negative
controls
Metformin,
20 uM, 2.5 h
1. 100.00 97.94
2. 100.00 87.14
3. 105.59 96.18
4. 100.00 97.15
5. 100.00 105.29
6. 101.59 96.27
Negative
controls
Metformin,
20 uM, 2.5 h
mean 100.00 95.52
S.D. 2.22 5.72
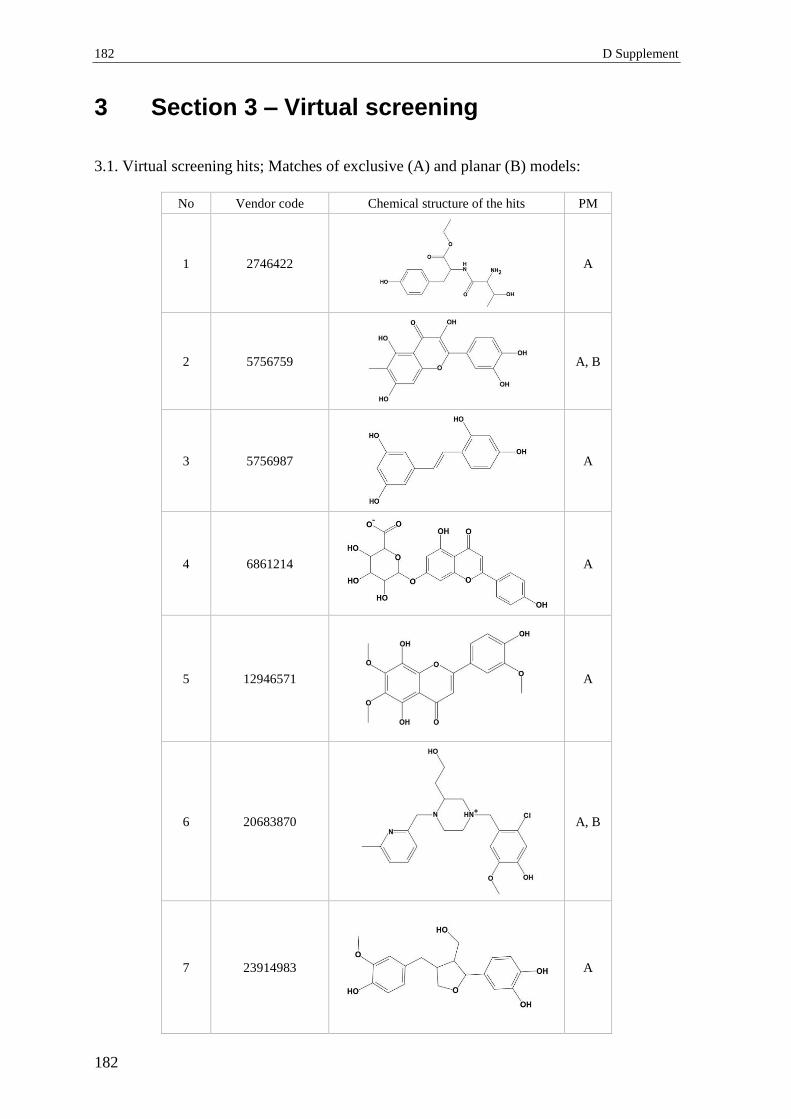
182 D Supplement
182
3 Section 3 – Virtual screening
3.1. Virtual screening hits; Matches of exclusive (A) and planar (B) models:
No Vendor code Chemical structure of the hits PM
1 2746422
A
2 5756759
A, B
3 5756987
A
4 6861214
A
5 12946571
A
6 20683870
A, B
7 23914983
A
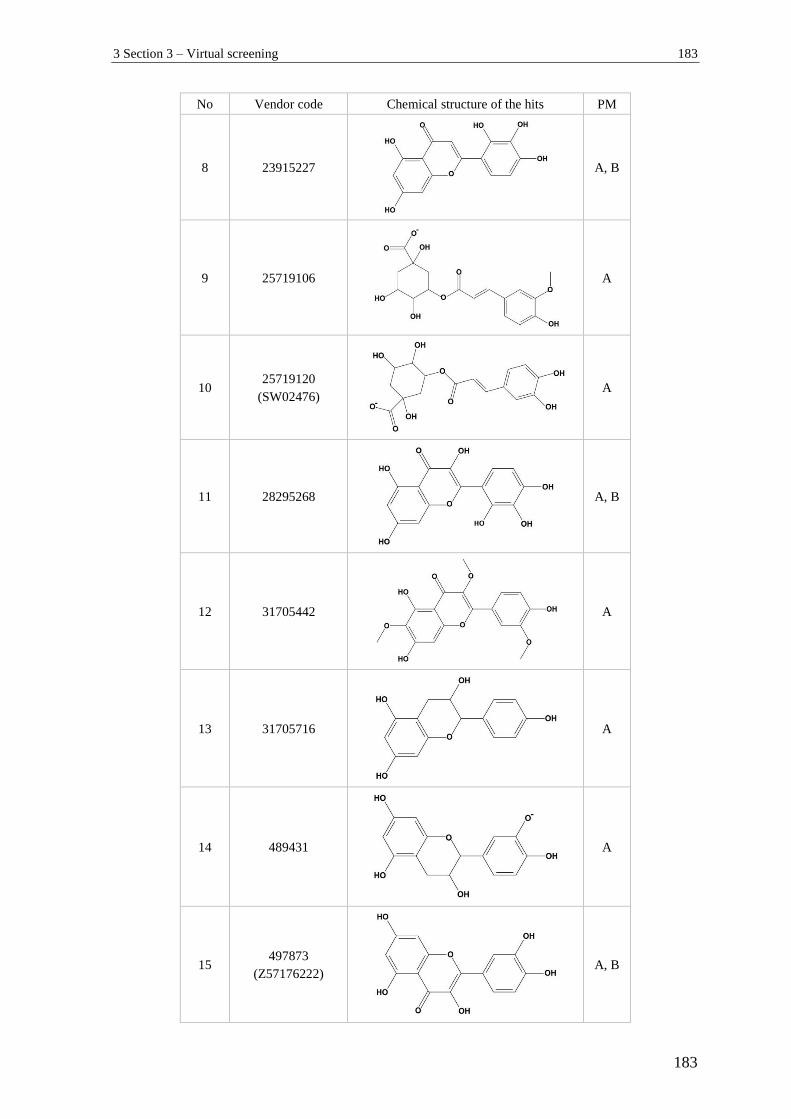
3 Section 3 – Virtual screening 183
183
No Vendor code Chemical structure of the hits PM
8 23915227
A, B
9 25719106
A
10 25719120
(SW02476)
A
11 28295268
A, B
12 31705442
A
13 31705716
A
14 489431
A
15 497873
(Z57176222)
A, B
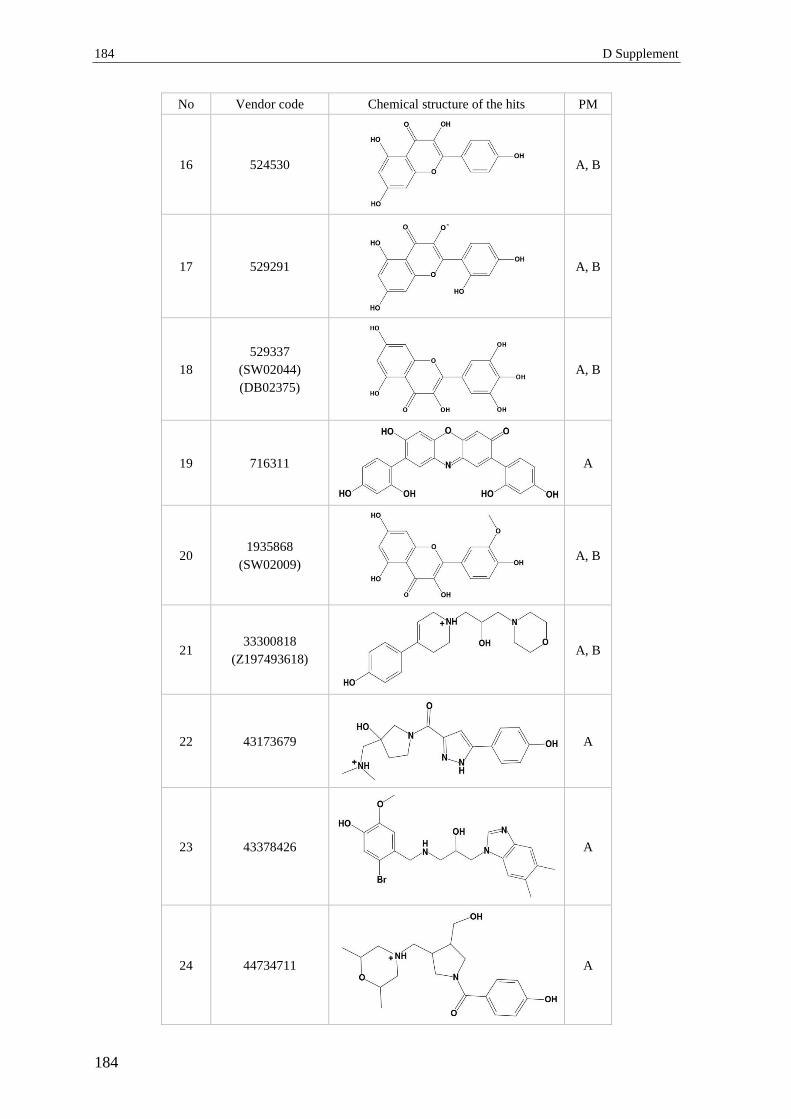
184 D Supplement
184
No Vendor code Chemical structure of the hits PM
16 524530
A, B
17 529291
A, B
18
529337
(SW02044)
(DB02375)
A, B
19 716311
A
20 1935868
(SW02009)
A, B
21 33300818
(Z197493618)
A, B
22 43173679
A
23 43378426
A
24 44734711
A

3 Section 3 – Virtual screening 185
185
No Vendor code Chemical structure of the hits PM
25 44746389
A
26 44843457
A
27 49401106
A, B
28 20412015
B
29 26016190
B
30 26407805
B
31 55663566
B
32 Z1567937963
A, B

186 D Supplement
186
No Vendor code Chemical structure of the hits PM
33 Z2329004358
A
34 Z2752916184
A, B
35 Z2936916050
A
36 F2721-0733
A, B
37 F2721-0110
A, B
38 F2721-0728
A, B
39 F2721-0737
A, B
40 F1124-0003
A, B

3 Section 3 – Virtual screening 187
187
No Vendor code Chemical structure of the hits PM
41 F1278-0316
A
42 F2721-0115
A, B
43 F2721-0112
A, B
44 F2721-0109
A, B
45 F2721-0726
A, B
46 F2721-0727
A, B
47 F2721-0111
A, B

188 D Supplement
188
No Vendor code Chemical structure of the hits PM
48 F2721-0729
A, B
49 F1278-0303
A, B
50 F2721-0118
A, B
51 Z2573054171
B
52 Z184743814
A
53 Z198619234
A
54 Z1621797376
A
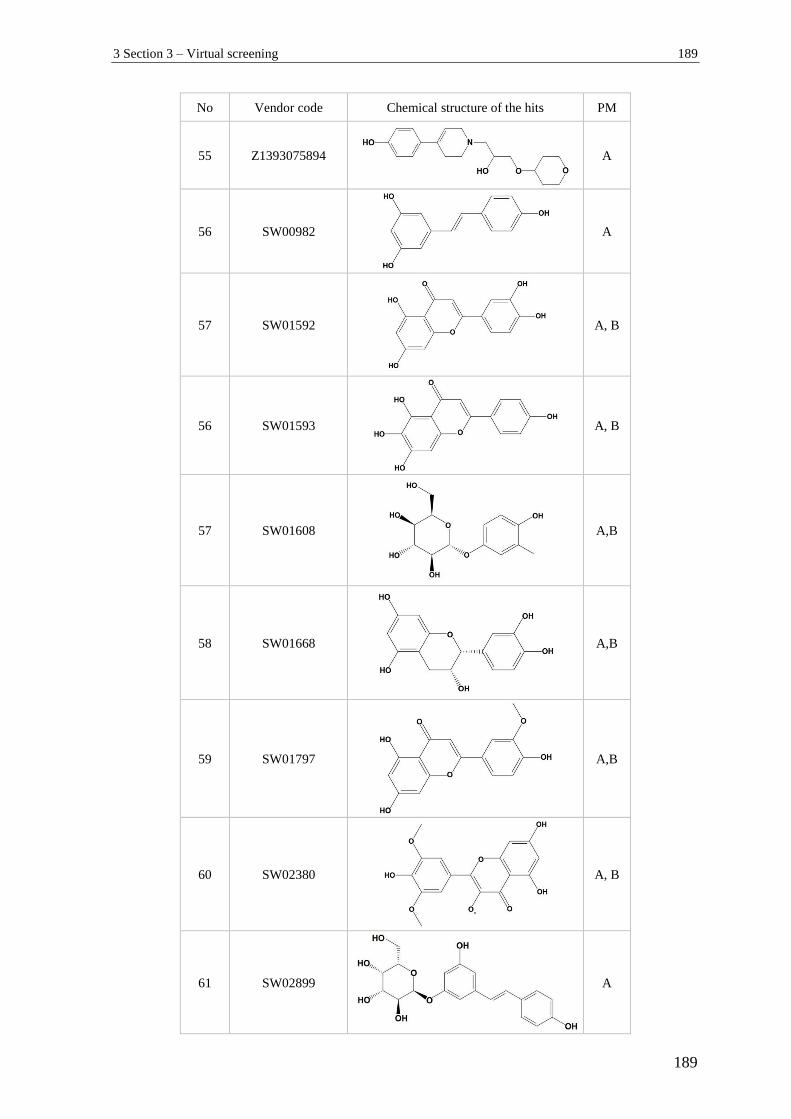
3 Section 3 – Virtual screening 189
189
No Vendor code Chemical structure of the hits PM
55 Z1393075894
A
56 SW00982
A
57 SW01592
A, B
56 SW01593
A, B
57 SW01608
A,B
58 SW01668
A,B
59 SW01797
A,B
60 SW02380
A, B
61 SW02899
A
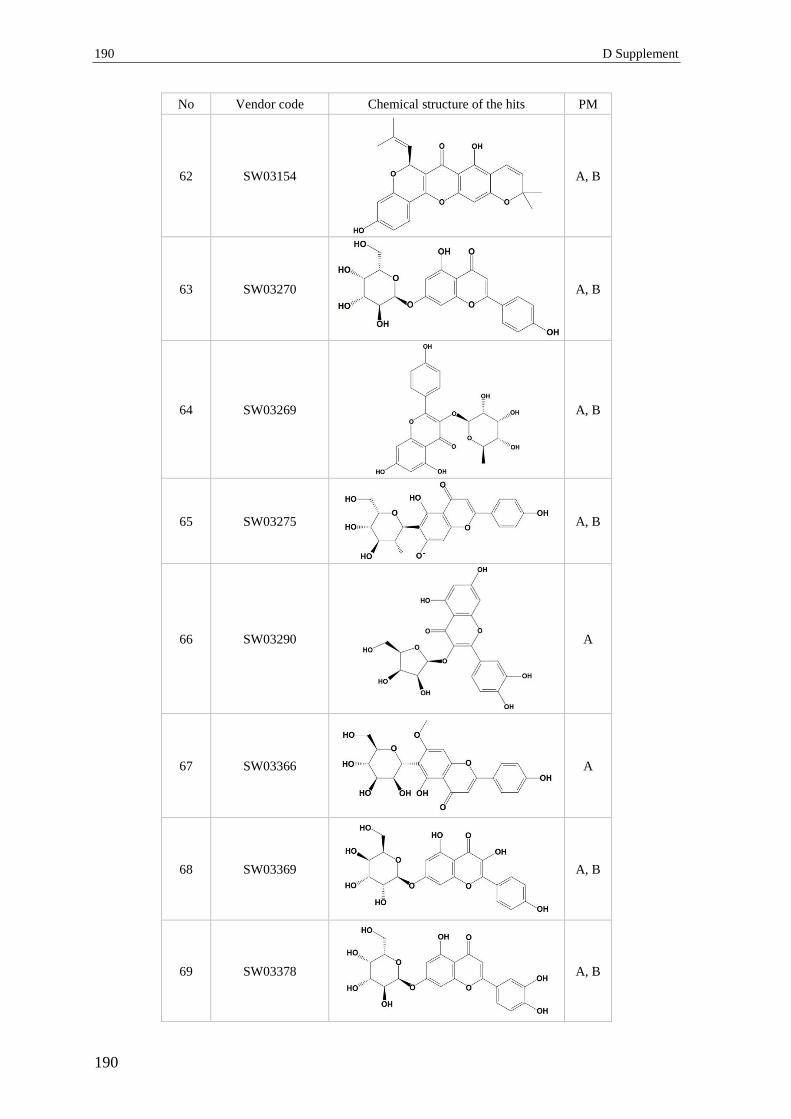
190 D Supplement
190
No Vendor code Chemical structure of the hits PM
62 SW03154
A, B
63 SW03270
A, B
64 SW03269
A, B
65 SW03275
A, B
66 SW03290
A
67 SW03366
A
68 SW03369
A, B
69 SW03378
A, B
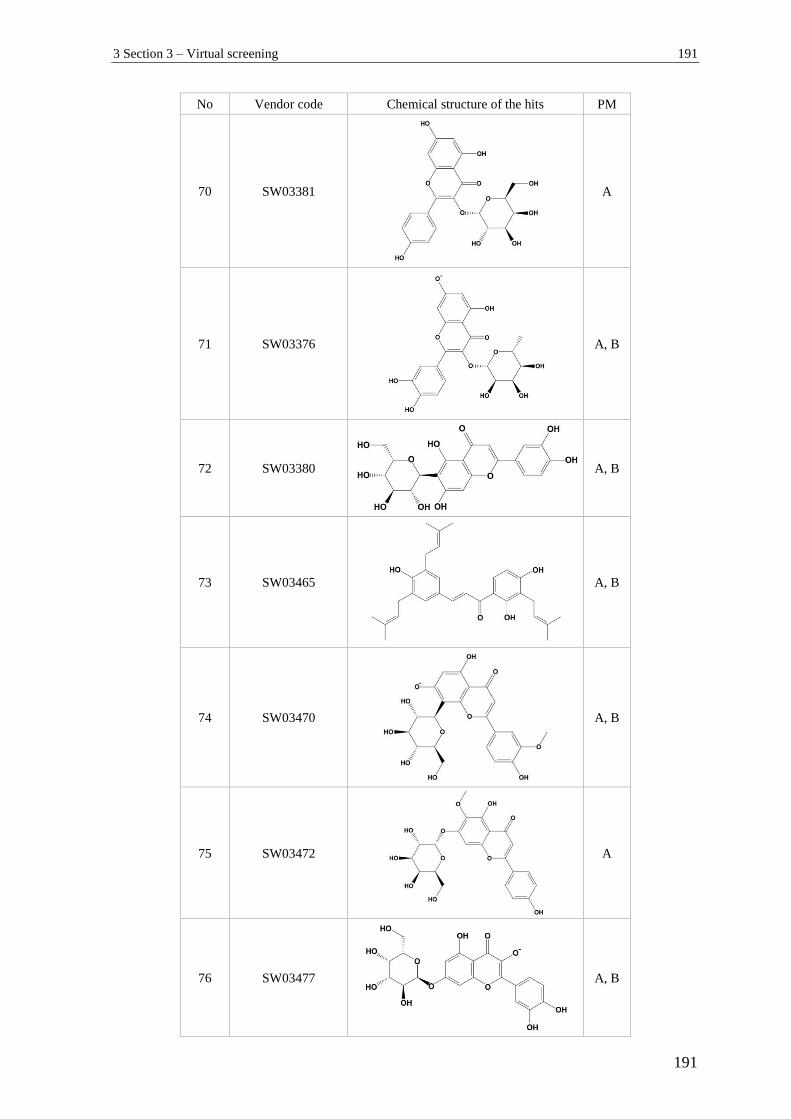
3 Section 3 – Virtual screening 191
191
No Vendor code Chemical structure of the hits PM
70 SW03381
A
71 SW03376
A, B
72 SW03380
A, B
73 SW03465
A, B
74 SW03470
A, B
75 SW03472
A
76 SW03477
A, B
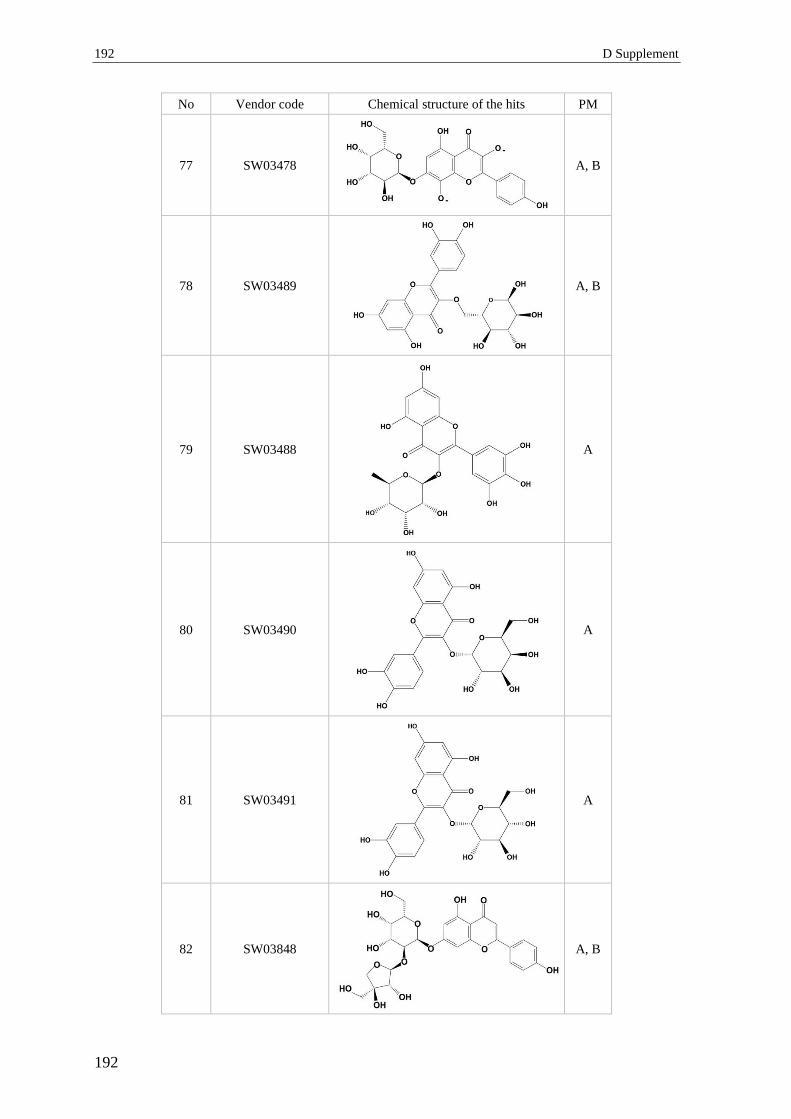
192 D Supplement
192
No Vendor code Chemical structure of the hits PM
77 SW03478
A, B
78 SW03489
A, B
79 SW03488
A
80 SW03490
A
81 SW03491
A
82 SW03848
A, B

3 Section 3 – Virtual screening 193
193
No Vendor code Chemical structure of the hits PM
83 SW03878
A
84 SW03923
A
85 SW03922
A, B
86 SW03921
A, B
87 SW03925
A
88 SW03935
A, B

194 D Supplement
194
No Vendor code Chemical structure of the hits PM
89 SW04037
A
90 SW04086
A, B
91 SW01285
B
92 SW02045
B
93 SW02190
B
94 SW02667
B
95 SW03179
B

3 Section 3 – Virtual screening 195
195
No Vendor code Chemical structure of the hits PM
96 SW03271
B
97 DB01102
A
98 DB01288
A
99 DB03823
A
3.2. Tautomerization of two of the hits Compound 1 (A) and Compound 2 (B) from
Table 8, B-2.5.7 defined by MoKa software.
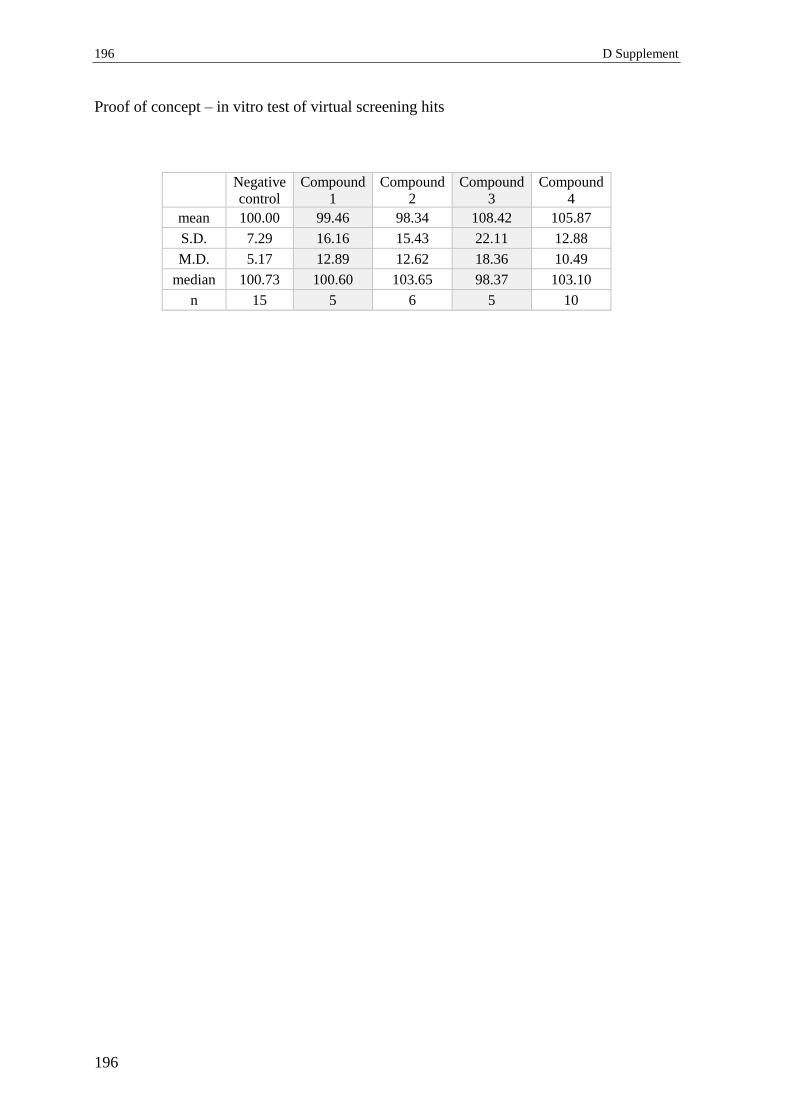
196 D Supplement
196
Proof of concept – in vitro test of virtual screening hits
Negative
control
Compound
1
Compound
2
Compound
3
Compound
4
mean 100.00 99.46 98.34 108.42 105.87
S.D. 7.29 16.16 15.43 22.11 12.88
M.D. 5.17 12.89 12.62 18.36 10.49
median 100.73 100.60 103.65 98.37 103.10
n 15 5 6 5 10

4 Section 4 – DPP IV activity and expression 197
197
4 Section 4 – DPP IV activity and expression
4.1 DPP IV activity inhibition by polyphenols
No. Compound Mean
Inhibition (%)
Mean Dev
(%) n Notes
1. Quercetin 9.42 2.40 4 ** p< 0.01
2. Catechin 5.63 0.62 3 n.s.
3. Resveratrol 5.65 1.28 3 n.s.
4. Elagic Acid 3.74 1.75 4 n.s.
5. Urolithin A 2.60 3.61 3 n.s.
6. Urolithin B 0.61 0.57 2 n.s.
7. Urolithin C 3.45 1.60 3 n.s.
8. Urolithin D 6.15 0.0 1 n.s.
9. Apigenin 6.04 3.03 4 n.s.
10. Luteolin 6.21 0.56 2 n.s.
11. Taxifolin 0.15 0.0 1 n.s.
12. Naringenin 2.08 0.0 1 n.s.
13. Fisetin 3.52 0.0 1 n.s.
14. Rutin 0.54 0.0 1 n.s.
15. Kaempferol 5.79 0.0 1 n.s.
16. Morine 5.26 0.0 1 n.s.
17. Baicalein 7.99 0.0 1 n.s.
18. 7,8-
Dihidroxyflavone 7.02 0.0 1 n.s.
19. M1 Valerolactone 2.89 0.0 1 n.s.
20. Pinostilbene 2.86 0.0 1 n.s.
21. Pterostilbene 1.82 0.0 1 n.s.
22. 3,4,5-trimethoxy-
trans-stilbene 1.32 0.0 1 n.s.
23. Picetannol 5.60 0.0 1 n.s.
24. Isorhapontigenin 5.04 0.0 1 n.s.
25. Oxyresveratrol 3.67 0.0 1 n.s.
26. Piceid 3.39 0.0 1 n.s.
27. Caffeic Acid 4.70 0.0 1 n.s.
28. Chrysin 0.00 0.0 1 n.s.
29. Genistein -1.80 0.0 1
Assay interaction
possible: intrinsic
fluorescence
30. 3-Hydroxyflavone -5.29 0.0 1
31. 3-Hydroxy-4'-
methoxyflavone -6.93 0.0 1
32. 6-Hydroxyflavone -21.00 0.0 1
33. 6-Methoxyflavone -11.15 0.0 1
34. 7-Methoxyflavone -10.20 0.0 1
35. Myricetin 15.32 0.0 1
Assay interaction
possible: sudden
color change

198 D Supplement
198
5 Section 5 – Fluorescent interactions
Table 1.1.: Descriptive statistical parameters of normalized fluorescent values of
blanks, quercetin, urolithin A, urolithin B and 6-MF in assay buffer under
the tested experimental conditions (n= 8).
0 min, no AMC, assay buffer 30 min, no AMC, assay buffer
Mean
[%]
S.D.
[%]
Median
[%]
p Mean
[%]
S.D.
[%]
Median
[%]
p
Blank 100.00 5.63 102.85 - 100.00 5.16 100.92 -
Quercetin 99.86 4.13 99.53 > 0.05 99.95 2.26 99.86 > 0.05
Urolithin A 102.77 2.73 101.92 > 0.05 104.35 1.29 104.39 > 0.05
Urolithin B 100.35 3.47 99.43 > 0.05 101.29 2.51 100.55 > 0.05
6-MF 108.17 5.17 107.15 < 0.01 110.94 3.28 111.33 < 0.01
0 min, AMC, assay buffer 30 min, AMC, assay buffer
Mean
[%]
S.D.
[%]
Median
[%]
p Mean
[%]
S.D.
[%]
Median
[%]
p
Blank 100.00 3.74 100.86 - 100.00 3.04 101.15 -
Quercetin 96.83 2.71 97.68 > 0.05 96.08 2.85 96.23 < 0.05
Urolithin A 99.77 3.64 99.64 > 0.05 100.91 2.74 100.85 > 0.05
Urolithin B 99.77 2.01 100.26 > 0.05 99.65 2.55 98.82 > 0.05
6-MF 105.08 1.99 105.23 < 0.05 105.44 2.17 105.97 < 0.01

5 Section 5 – Fluorescent interactions 199
199
Table 1.2.: Descriptive statistical parameters of normalized fluorescent values of
blanks, quercetin, urolithin A, urolithin B and 6-MF in DPP IV-containing
assay buffer under the tested experimental conditions (n= 8).
0 min, no AMC, DPP IV 30 min, no AMC, DPP IV
Mean
[%]
S.D.
[%]
Median
[%]
p Mean
[%]
S.D.
[%]
Median
[%]
p
Blank 100.00 3.20 100.76 - 100.00 3.14 100.59 -
Quercetin 96.76 1.99 97.25 > 0.05 98.12 1.55 98.19 > 0.05
Urolithin A 99.34 2.38 99.35 > 0.05 101.31 1.50 101.65 > 0.05
Urolithin B 99.78 1.68 100.22 > 0.05 101.25 1.41 101.72 > 0.05
6-MF 109.17 5.01 110.04 < 0.01 110.45 4.37 112.76 < 0.01
0 min, AMC, DPP IV 30 min, AMC, DPP IV
Mean
[%]
S.D.
[%]
Median
[%]
p Mean
[%]
S.D.
[%]
Median
[%]
p
Blank 100.00 3.97 100.71 - 100.00 4.65 98.65 -
Quercetin 96.76 2.19 97.17 > 0.05 97.22 2.31 96.63 > 0.05
Urolithin A 102.38 1.83 102.46 > 0.05 101.54 2.83 100.78 > 0.05
Urolithin B 101.46 3.25 101.84 > 0.05 100.92 2.81 100.90 > 0.05
6-MF 107.85 4.93 105.40 < 0.01 107.43 4.22 107.74 < 0.01

200 D Supplement
200
Table 1.3.: Descriptive statistical parameters of normalized fluorescent values of
blanks, quercetin, urolithin A, urolithin B and 6-MF in serum under the
tested experimental conditions (n= 8).
0 min, no AMC, serum 30 min, no AMC, serum
Mean
[%]
S.D.
[%]
Median
[%]
p Mean
[%]
S.D.
[%]
Median
[%]
p
Blank 100.00 3.32 100.28 - 100.00 4.50 101.52 -
Quercetin 93.22 2.16 94.01 < 0.01 94.28 1.99 94.22 < 0.01
Urolithin A 104.58 1.43 104.34 < 0.01 104.43 2.81 104.43 < 0.05
Urolithin B 116.70 1.81 116.47 < 0.01 112.98 2.97 112.98 < 0.01
6-MF 102.43 2.09 102.98 > 0.05 102.61 1.70 102.61 > 0.05
0 min, AMC, serum 30 min, AMC, serum
Mean
[%]
S.D.
[%]
Median
[%]
p Mean
[%]
S.D.
[%]
Median
[%]
p
Blank 100.00 4.30 100.01 - 100.00 4.51 100.05 -
Quercetin 92.86 2.03 93.02 < 0.01 93.25 2.78 94.61 < 0.01
Urolithin A 104.06 3.34 104.56 > 0.05 102.67 1.29 103.01 > 0.05
Urolithin B 113.69 2.38 113.53 < 0.01 109.83 2.10 110.08 < 0.01
6-MF 101.12 1.53 101.03 > 0.05 101.25 1.34 101.09 > 0.05
E Summary
1 Summary
The growing prevalence of type 2 diabetes mellitus (T2DM) demands novel therapeutic
and adjuvant strategies. Polyphenols (PPs) are plant secondary metabolites.
Epidemiological studies demonstrate an inverse relationship between their increased intake
and the risk of development of T2DM and cardiovascular complications. However, the
PPs’ mechanism of action remains largely unknown. The present work aimed to expand
knowledge regarding the effects of PPs on diabetes relevant molecular targets.
Pycnogenol (PYC) is a standardized pine bark extract which consists of oligomeric and
monomeric PPs. Its anti-diabetic effects have been demonstrated in clinical trials. As a part
of a human study involving 20 healthy volunteers, the extract’s effects on dipeptidyl
peptidase IV (DPP IV) were investigated. This protease terminates the insulin secretagogue
action of incretins. Its inhibition is a promising strategy in T2DM treatment. This study
uncovered that PYC-intake of 100 mg daily over 14 days statistically significantly reduced
DPP IV serum concentrations by 8.2 % (n= 38, p= 0.032). Contrary to expectations, this
decrease was not paralleled by a reduction in the serum DPP IV enzymatic activity. To the
best of our knowledge, the present study was the first investigating the effects of PPs on
DPP IV serum concentrations and activities in humans. The finding that PYC is capable of
reducing DPP IV serum concentrations might be important with regard to diabetes, where
DPP IV levels are increased.
Screenings for PPs’ in vitro effects on DPP IV activity were performed employing a
purified enzyme. The effects of tested PPs (among which PYC ingredients) at a
physiologically relevant concentration of 5 µM were weak (< 10 %) and too small
compared to the reference compound sitagliptin, and thus not likely to be clinically
relevant. This result is in discordance with some published data, but consistent with the
outcome from the present human study. In addition, fluorescence interactions with the
experimental setup were registered: under certain conditions urolithin B exhibited an
autofluorescence which might mask eventual inhibitory activity. Quercetin quenched the
fluorescence slightly which might contribute to false positive results. No statistically
significant effects of selected constituents and metabolites of PYC on the total DPP IV
protein expression were observed in 3T3-L1 adipocytes. Thus, the lower DPP IV in vivo
concentrations after intake of PYC cannot be explained with down-regulation of the
DPP IV expression in adipocytes.
202 E Summary
202
Akt kinase is responsible for the transmission of insulin signals and its dysregulation is
related to insulin resistance and plays an important role in development of cardiovascular
complications in T2DM. Thus, the modulation of the phosphorylation status of endothelial
Akt-kinase, respectively its activity, might be a promising strategy in the management of
these pathologies. This work aimed to uncover the effects of PPs from different structural
subclasses on Akt-phosphorylation (pAkt) in endothelial cells (Ea.hy926). Short-term
effects (5 – 30 min) were investigated at a concentration of 10 µM. In a pilot study two
model PPs induced a moderate, but reproducible inhibition of pAkt Ser473 of 52.37 ±
21.01 % (quercetin; p= 0.006, n= 3) and 37.79 ± 7.14 % (resveratrol; p= 0.021, n= 4)
compared to the negative control. A primary screening with Western blot analysis
investigated the effects of eight compounds from different subclasses on pAkt Ser473 and
Thr308 to reveal whether the observed inhibition PPs a group effect or specific to certain
compounds. In addition to resveratrol and quercetin, statistically significant inhibitions of
pAkt Ser473 were induced by luteolin (29.96 ± 11.06 %, p< 0.01, n= 6) and apigenin
(22.57 ± 10.30 %, p< 0.01, n= 6). In contrast, genistein, 3,4,5-trimethoxystilbene, taxifolin
and (+)-catechin caused no inhibition. A strong positive and statistically significant
correlation between the mean inhibitory effects of the tested PPs on both Akt-residues
Ser473 and Thr308 (r= 0.9478, p= 0.0003) was determined. A comprehensive secondary
screening via ELISA involving 44 compounds from nine structural groups quantified the
effects of PPs on pAkt Ser473 to uncover potential structure-activity features. The most
potent inhibitors were luteolin (44.31 ± 17.95 %), quercetin (35.71 ± 8.33 %), urolithin A
(35.28 ± 11.80 %), apigenin (31.79 ± 6.16 %), fisetin (28.09 ± 9.09 %), and resveratrol
(26.04 ± 5.58 %). These effects were statistically significant (p< 0.01, n= 3 to 6). Further
lead structure optimization might be based on the fact that the effects of luteolin and
resveratrol also differed statistically significantly from each other (p= 0.008).
To the best of our knowledge, the present study is the first to compare quantitatively the
short term effects of PPs from different subclasses on pAkt in endothelial cells. Basic
structure-activity relationships revealed that for flavones and flavonols the presence of a
C2=C3 double bound (ring C) was essential for inhibitory activity and hydroxylation on
the m- and p- positions in the ring B contributed to it. For stilbenoids, three free OH-groups
appeared to be optimal. The comparison of the inhibitory potentials of ellagic acid and its
microbial metabolites showed that urolithin A was statistically significantly more effective
than its progenitor compound. Despite their structural similarities, the only active
compound among all urolithins tested was urolithin A, hydroxylated at the C3 and C8
positions. This suggested a specific effect for urolithin A. Based on the common structural
determinants and molecular geometry of the most active PPs a pharmacophore model
regarding Akt-inhibition was proposed.
In summary, the effects of a wide variety of PPs from diverse structural subclasses on the
in vitro phosphorylation of endothelial Akt were quantitatively analyzed for the first time,
the effects of previously undescribed compounds were determined and structure activity
2 Zusammenfassung 203
203
relationships were elucidated. The inhibitory potential of individual PPs might be
beneficial in cases of sustained over-activation of Akt-kinase and its substrates such as S6
kinase as reported for certain T2DM-related pathological states, such as insulin resistance,
endothelial dysfunction, excessive angiogenesis, vascular calcification, and insulin
triggered DNA-damage. The results of the present work suggest potential molecular
mechanisms of action of PP involving Akt-inhibition and DPP IV-down-regulation and
thus contribute to the understanding of anti-diabetic effects of these compounds on the
molecular level.
204 E Summary
204
2 Zusammenfassung
Diabetes mellitus Typ 2 (DMT2) und seine Spätkomplikationen sind ein maßgeblicher
Grund für Morbidität und Mortalität. Die steigende Prävalenz der Krankheit erfordert die
Entwicklung neuer therapeutischer und prophylaktischer Strategien. Publizierte Daten
deuten darauf hin, dass diätetische Polyphenole (PP) sowohl zur Prävention des Diabetes
beitragen als auch therapiebegleitend sinnvoll eingesetzt werden können. Allerdings sind
ihre Wirkmechanismen nicht vollständig aufgeklärt. Das Ziel der Arbeit war die
Charakterisierung zellulärer Wirkungen von PP, die eine Relevanz in der unterstützenden
Behandlung von DMT2 und denen Spätkomplikationen haben könnten.
Pycnogenol® (PYC) ist ein standardisierter Kiefernrindenextrakt, der oligomere und
monomere PP enthält. PYC hat in klinischen Studien mit Diabetikern viele vorteilhafte
anti-diabetische und protektive Effekte gezeigt. Die Wirkungen des Extraktes auf die
Serumkonzentration und die enzymatische Aktivität der Dipeptidylpeptidase IV (DPP IV)
wurden im Rahmen einer klinischen Studie mit 20 gesunden Probanden untersucht. DPP
IV ist eine Serin-Exopeptidase, die Inkretinhormone spaltet und damit deren Wirkung auf
die Insulin-Freisetzung beendet. Nach PYC-Einnahme zeigte sich im Vergleich zu dem
Kontrollzustand eine statistisch signifikante (p= 0,032, n= 38) Abnahme der DPP-IV-
Konzentration von 8.2 %. Allerdings wurden keine deutlichen Änderungen der mittleren
DPP-IV-Aktivität durch die PYC-Behandlung hervorgerufen. Nach unserem Wissensstand
war die klinische Studie die erste ihrer Art, welche die Effekte von PP auf die
Serumkonzentration und die enzymatischen Aktivität von DPP IV im Menschen
untersuchte. Da die Serumspiegel von DPP IV bei diabetischen Patienten im Vergleich zu
gesunden Menschen erhöht sind, könnte der beobachtete Effekt vorteilhaft sein.
Als Nächstes sollten die Effekte von einzelnen PP und ihren Metaboliten auf die
enzymatische Aktivität der DPP IV in vitro untersucht werden. Die Ergebnisse zeigten nur
eine geringe Hemmung (< 10 %) der DPP IV Aktivität durch die PP (auch Inhaltsstoffe
von PYC und deren Metaboliten) in einer Konzentration von 5 µM, verglichen zur initialen
100 %-igen Enzymaktivität. Die Positivkontrolle (50 nM Sitagliptin) verursachte hingegen
eine starke Senkung der Aktivität von DPP IV. Es ist daher unwahrscheinlich, dass die
Effekte der PP eine klinische Relevanz haben. Die Ergebnisse stehen im Widerspruch zu
bisher veröffentlichten Daten, unterstützen aber die Resultate aus der vorliegenden
Humanstudie. Zusätzlich durchgeführte Fluoreszenzmessungen deuten darauf hin, dass
Quercetin und Urolithin B unter definierten Bedingungen in der Lage sind, die Ergebnisse
des DPP IV-Inhibitoren-Screening-Assays unspezifisch zu beeinflussen. In-vitro-
Experimente in 3T3-L1 differenzierten Adipozyten zeigten zudem keine statistisch
signifikanten Effekte auf die Proteinexpression von DPP IV – weder für einzelne
2 Zusammenfassung 205
205
Bestandteile noch für Metabolite von PYC. Somit konnte die beobachtete Abnahme der
DPP-IV-Konzentrationen in vivo nach der Einnahme von PYC nicht durch eine
Herunterregulierung der DPP-IV-Expression in Adipozyten erklärt werden.
Die Akt-Kinase/PKB (Protein Kinase B) spielt eine wesentliche Rolle bei der Vermittlung
der Effekte des Insulins auf intrazellulärer Ebene bzw. bei der Pathophysiologie von
DMT2 sowie dessen vaskulären Spätfolgen. Die Modulation von Akt in Endothelzellen ist
ein vielversprechender Ansatz, um pathophysiologische Veränderungen zu beeinflussen,
die für diabetische kardiovaskuläre Spätkomplikationen verantwortlich sind. Daher sollte
in der vorliegenden Arbeit der Einfluss von PP aus verschiedenen strukturellen Subklassen
auf die Akt-Phosphorylierung (pAkt) an Ser 473 und Thr 308 in Endothelzellen
(EA.hy926) in vitro untersucht werden (10 µM, 5 – 30 min). In der Pilotstudie hemmten
beide Modellverbindungen die Akt-Phosphorylierung (pAkt Ser473) statistisch signifikant
mit 52,37 ± 21,01 % (Quercetin; p= 0,006, n= 3) und 37,79 ± 7,14 % (Resveratrol; p=
0,021, n= 4). Im Primärscreening wurden acht Verbindungen verschiedener Subklassen
einbezogen. Die Substanzen, welche neben Quercetin und Resveratrol die stärksten
Hemmungsaktivitäten auf pAkt Ser473 (Mittelwert ± Standardabweichung) hatten, waren
Luteolin (29,96 ± 11,06 %, p< 0,01, n= 6) und Apigenin (22,57 ± 10,30 %, p< 0,01, n= 6).
Im Gegensatz dazu zeigten Genistein, 3,4,5-Trimethoxy-trans-stilben, Taxifolin und (+)-
Catechin keine Hemmung. Die inhibierenden Effekte der PP auf pAkt Thr308 und pAkt
Ser473 korrelierten positiv und statistisch signifikant miteinander (r= 0,9478, p= 0,0003).
In einem sekundären Screening sollten die Effekte diverser PP auf die Phosphorylierung
von Akt an Ser 473 in Endothelzellen mittels quantitativen ELISA detailliert untersucht
werden. Die Verbindungen mit den größten Hemmungseffekte waren Luteolin (44,31 ±
17,95 %), Quercetin (35,71 ± 8,33 %), Urolithin A (35,28 ± 11,80 %), Apigenin (31,79 ±
6,16 %), Fisetin (28,09 ± 9,09 %), und Resveratrol (26,04 ± 5,58 %). Diese Hemmungen
waren statistisch signifikant (p< 0,01, n= 3 - 6). Zusätzlich war die Wirkung von Luteolin
und Resveratrol statistisch signifikant verschieden (p= 0,008), was einer weiteren
Leitstrukturoptimierung dienen kann.
Der quantitative Vergleich der Substanzaktivitäten war die Grundlage für nachfolgende
Struktur-Wirkungsuntersuchungen (SAR). Die Doppelbindung C2=C3 (Ring C) war für
die Inhibitionseffekte bei Flavonen und Flavon-3-olen von wesentlicher Bedeutung. Die
Anwesenheit einer meta- und einer para- OH-Gruppe (Ring B) trug sehr wahrscheinlich zu
den Hemmeffekten bei. Bei den Stilbenoiden hingegen waren drei freie OH-Gruppen (bei
Resveratrol) optimal für die Aktivität. Der mikrobielle Metabolit der Ellagsäure, Urolithin
A, hemmte im Vergleich zur Muttersubstanz die Akt-Phosphorylierung statistisch
signifikant. Im Gegensatz dazu zeigten die anderen Urolithine trotz der strukturellen
Ähnlichkeit nur geringe Effekte. Dies deutet auf einen spezifischen Effekt von Urolithin A
hin. Basierend auf den gemeinsamen Merkmalen, die für die Aktivität wichtig sein können
206 E Summary
206
und der molekularen Geometrie der aktivsten PP, wurde ein Pharmakophormodell für die
Akt-Hemmung vorgeschlagen.
Zusammengefasst ist die vorliegende Studie nach unserem Wissensstand die erste, welche
die Auswirkungen einer Vielzahl von PP verschiedener struktureller Subklassen auf die
Akt-Phosphorylierung in Endothelzellen quantitativ verglich. Es wurden Effekte von zuvor
nicht beschriebenen Verbindungen und Struktur-Aktivitäts-Beziehungen ermittelt. Die
hemmenden Eigenschaften einzelner PP auf die Akt-Kinase könnten im Fall einer
anhaltenden Überaktivierung der Akt-Kinase und ihren Substraten wie die S6-Kinase
vorteilhaft sein. Dieser Zustand wurde bei bestimmten DMT2-verwandten pathologischen
Prozessen, wie Insulinresistenz, endotheliale Dysfunktion, übermäßige Angiogenese,
vaskuläre Calcifizierung und Insulin-induzierte-DNA-Schäden beobachtet. Die Ergebnisse
der vorliegenden Arbeit deuten darauf hin, dass die Wirkmechanismen von PP die Akt-
Inhibierung und DPP IV-Herunterregulierung umfassen könnten, was zum Verständnis der
anti-diabetischen und protektiven Wirkungen dieser Verbindungen auf molekularer Ebene
beitragen kann.

F Abbreviations in alphabetical order
3-MS - 3,4’,5-trimethoxy-trans-stilbene
6-MF - 6-methoxyflavone
ADAM - A disintegrin and metalloproteinase
ADCP2 - Adenosine deaminase complexing protein 2 (see DPP IV)
ADN - Adiponectin
AGE - Advanced glycation end products
AMC - 7-aminomethyl-4-methylcoumarin
AMP - Adenosine monophosphate
AMPK - 5’adenosine monophosphate-activated protein kinase
ANOVA - Analysis of variance
Aro|Hyd 1 - Aromatic or hydrophobic regions
AS160 - 160 kDa Akt substrate
ATP - Adenosine triphosphate
ATRA - All-trans-retinoic acid
BCA - Bicinchoninic acid
BSA - Bovine serum albumin
CaMKKβ - Ca2+/calmodulin-dependent protein kinase kinase β
CAT - central catalytic kinase domain
CD26 - Cluster of differentiation 26 (see DPP IV)
COX - Cyclooxigenase
CVD - Cardiovascular diseases
DASH - DPP IV activity and/or structure homologs
DMEM - Dulbecco’s modified essential medium
DMSO - Dimethyl sulfoxide
DNA - Deoxyribonucleic acid
Don & Acc - Hydrogen bond donor & hydrogen bond acceptor
DPP IV - Dipeptidyl peptidase IV
DTT - Dithiothreitol
EC - Endothelial cells
ED - Endothelial dysfunction
208 F Abbreviations in alphabetical order
208
EGCG - Epigallocatechin gallate
EGF - Epidermal growth factor
ELISA - Еnzyme-linked immunosorbent assay
eNOS, NOSIII - Endothelial nitric oxide synthase
ERK - Extracellular signal-regulated kinases
ET-1 - Endothelin-1
EXT - C-terminal extension
FBS - Fetal bovine serum
FLU - Fluorescence
FoxO - Forkhead box O family transcription factors
GLP-1 - Glucagon-like peptide-1
GLUT4 - Glucose transporter 4
Gly - Glycine
GPCR - G-protein coupled receptor
GSK-3β - Glycogen synthase kinase-3β
HbA1c - Hemoglobin A1C (Glycated Hemoglobin)
HDL - High density lipoprotein
HG - High glucose - 25.0 mM glucose
HNF-1α - Hepatocyte nuclear factor-1α
HOMA - Homeostatic model assessment of insulin resistance
HRP - Horseradish peroxidase
HSD - Honestly significant difference
HUVEC - Human umbilical vein endothelial cells
IBMX - 3-isobutyl-1-methylxanthine
IGT - Impaired glucose tolerance
IGF-1 - Insulin-like growth factor-1
IFG - Impaired fasting glucose
iNOS, NOS II - Inducible nitric oxide synthase
IL-6 - Interleukin-6
IRS - Insulin receptor substrate
JNK - c-Jun N-terminal kinase
LADA - Latent autoimmune diabetes of adults
2Zusammenfassung 209
209
LG - Low glucose - 5.5 mM glucose
LINK - Linker region
LKB-1 - Liver kinase B1
MAPK - Mitogen-activated protein kinase
MMP - Matrix metalloproteinases
MOE - Molecular Operating Environment
MODY - Maturity onset diabetes of the young
mTORC1- Mechanistic target of rapamycin complex 1
mTORC2 - Mechanistic target of rapamycin complex 2
NF-κB - Nuclear factor kappa-light-chain-enhancer of activated B cells
NO - Nitric oxide
Nrf-2 - Nuclear transcription factor erythroid-2 related factor-2
N.S. - Non statistically significant
O.D. - Optical density
OGTT - Oral glucose tolerance test
OGTT-1(2)-G – OGTT performed with glucose
OGTT-1(2)-R – OGTT performed with rice
pAkt - Akt-phosphorylation
PCR - Polymerase chain reaction
PDGF - platelet derived growth factor
PDK1 - Phosphoinositide-dependent kinase 1
PH - pleckstrin homology domain
PI - Protease Inhibitor cocktail
PI3K - Phosphoinositide-3-kinase
PiN - Planar projection of an aromatic ring
PIP2 - Phosphatidylinositol-(4,5)-bisphosphate
PIP3 - Phosphatidylinositol-(3,4,5)-trisphosphate
pKa/b-value - Logarithmic acid/base dissociation constant
PKB - Protein kinase B
PKC - Protein kinase C
PMA - Phorbol ester
PPs - Polyphenols

210 F Abbreviations in alphabetical order
210
PPAR-γ - Peroxisome proliferator-activated receptor-γ
Pro - Proline
PTEN - Phosphatase and tensin homolog
PYC - Pycnogenol®
QC - Quality controls
qp - Quality of prediction
Que - Quercetin
RNA - Ribonucleic acid
ROS - Reactive oxygen species
RSV - Resveratrol
RTK - Receptor tyrosine kinases
S6K1 - Ribosomal protein S6 kinase beta-1
SAR - Structure-activity relationship studies
S.D. - Standard deviation
SDS - Sodium dodecyl sulfate
Ser - Serine
T1DM - Type 1 diabetes mellitus
T2DM (DMT2) - Type 2 diabetes mellitus (Diabetes mellitus Typ 2)
TEMED - Tetramethylethylenediamine
Thr - Threonine
TNF-α - Tumor necrosis factor-α
TRIS - Tris(hydroxymethyl)aminomethane
TSC-2 - Tuberous sclerosis complex 2
VEGF - Vascular endothelial growth factor
WHO - World Health Organization
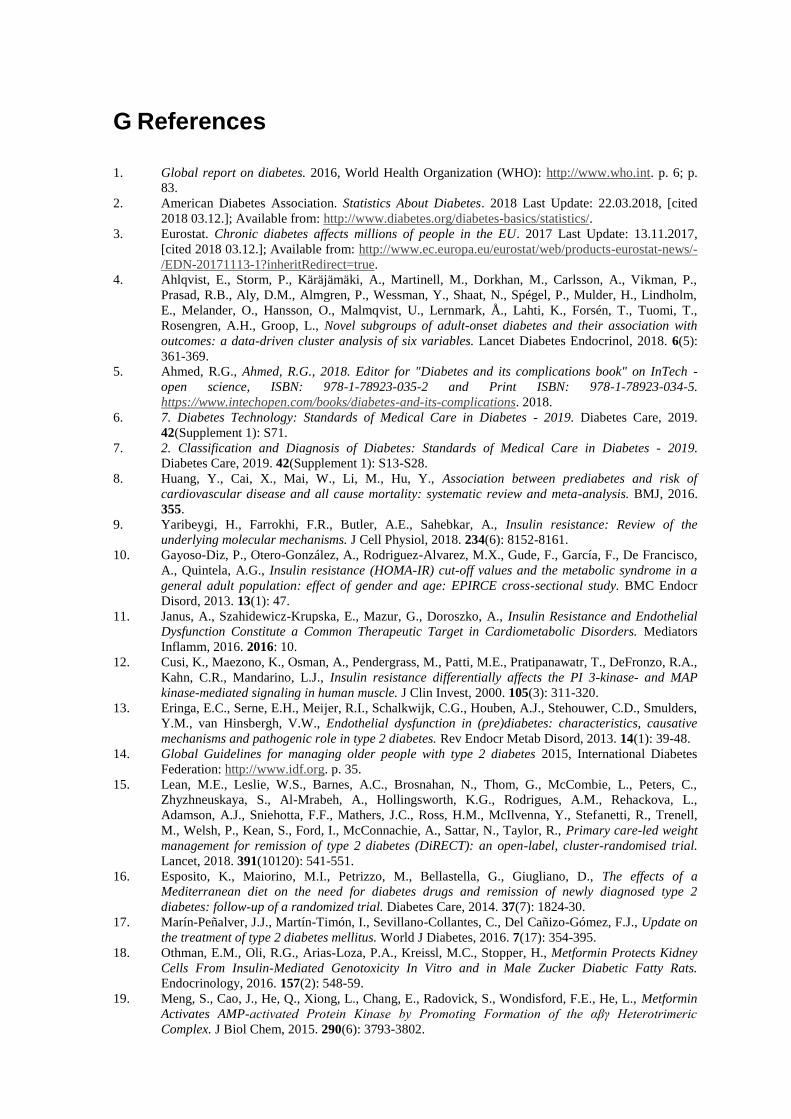
G References
1. Global report on diabetes. 2016, World Health Organization (WHO): http://www.who.int. p. 6; p.
83.
2. American Diabetes Association. Statistics About Diabetes. 2018 Last Update: 22.03.2018, [cited
2018 03.12.]; Available from: http://www.diabetes.org/diabetes-basics/statistics/.
3. Eurostat. Chronic diabetes affects millions of people in the EU. 2017 Last Update: 13.11.2017,
[cited 2018 03.12.]; Available from: http://www.ec.europa.eu/eurostat/web/products-eurostat-news/-
/EDN-20171113-1?inheritRedirect=true.
4. Ahlqvist, E., Storm, P., Käräjämäki, A., Martinell, M., Dorkhan, M., Carlsson, A., Vikman, P.,
Prasad, R.B., Aly, D.M., Almgren, P., Wessman, Y., Shaat, N., Spégel, P., Mulder, H., Lindholm,
E., Melander, O., Hansson, O., Malmqvist, U., Lernmark, Å., Lahti, K., Forsén, T., Tuomi, T.,
Rosengren, A.H., Groop, L., Novel subgroups of adult-onset diabetes and their association with
outcomes: a data-driven cluster analysis of six variables. Lancet Diabetes Endocrinol, 2018. 6(5):
361-369.
5. Ahmed, R.G., Ahmed, R.G., 2018. Editor for "Diabetes and its complications book" on InTech -
open science, ISBN: 978-1-78923-035-2 and Print ISBN: 978-1-78923-034-5.
https://www.intechopen.com/books/diabetes-and-its-complications. 2018.
6. 7. Diabetes Technology: Standards of Medical Care in Diabetes - 2019. Diabetes Care, 2019.
42(Supplement 1): S71.
7. 2. Classification and Diagnosis of Diabetes: Standards of Medical Care in Diabetes - 2019.
Diabetes Care, 2019. 42(Supplement 1): S13-S28.
8. Huang, Y., Cai, X., Mai, W., Li, M., Hu, Y., Association between prediabetes and risk of
cardiovascular disease and all cause mortality: systematic review and meta-analysis. BMJ, 2016.
355.
9. Yaribeygi, H., Farrokhi, F.R., Butler, A.E., Sahebkar, A., Insulin resistance: Review of the
underlying molecular mechanisms. J Cell Physiol, 2018. 234(6): 8152-8161.
10. Gayoso-Diz, P., Otero-González, A., Rodriguez-Alvarez, M.X., Gude, F., García, F., De Francisco,
A., Quintela, A.G., Insulin resistance (HOMA-IR) cut-off values and the metabolic syndrome in a
general adult population: effect of gender and age: EPIRCE cross-sectional study. BMC Endocr
Disord, 2013. 13(1): 47.
11. Janus, A., Szahidewicz-Krupska, E., Mazur, G., Doroszko, A., Insulin Resistance and Endothelial
Dysfunction Constitute a Common Therapeutic Target in Cardiometabolic Disorders. Mediators
Inflamm, 2016. 2016: 10.
12. Cusi, K., Maezono, K., Osman, A., Pendergrass, M., Patti, M.E., Pratipanawatr, T., DeFronzo, R.A.,
Kahn, C.R., Mandarino, L.J., Insulin resistance differentially affects the PI 3-kinase- and MAP
kinase-mediated signaling in human muscle. J Clin Invest, 2000. 105(3): 311-320.
13. Eringa, E.C., Serne, E.H., Meijer, R.I., Schalkwijk, C.G., Houben, A.J., Stehouwer, C.D., Smulders,
Y.M., van Hinsbergh, V.W., Endothelial dysfunction in (pre)diabetes: characteristics, causative
mechanisms and pathogenic role in type 2 diabetes. Rev Endocr Metab Disord, 2013. 14(1): 39-48.
14. Global Guidelines for managing older people with type 2 diabetes 2015, International Diabetes
Federation: http://www.idf.org. p. 35.
15. Lean, M.E., Leslie, W.S., Barnes, A.C., Brosnahan, N., Thom, G., McCombie, L., Peters, C.,
Zhyzhneuskaya, S., Al-Mrabeh, A., Hollingsworth, K.G., Rodrigues, A.M., Rehackova, L.,
Adamson, A.J., Sniehotta, F.F., Mathers, J.C., Ross, H.M., McIlvenna, Y., Stefanetti, R., Trenell,
M., Welsh, P., Kean, S., Ford, I., McConnachie, A., Sattar, N., Taylor, R., Primary care-led weight
management for remission of type 2 diabetes (DiRECT): an open-label, cluster-randomised trial.
Lancet, 2018. 391(10120): 541-551.
16. Esposito, K., Maiorino, M.I., Petrizzo, M., Bellastella, G., Giugliano, D., The effects of a
Mediterranean diet on the need for diabetes drugs and remission of newly diagnosed type 2
diabetes: follow-up of a randomized trial. Diabetes Care, 2014. 37(7): 1824-30.
17. Marín-Peñalver, J.J., Martín-Timón, I., Sevillano-Collantes, C., Del Cañizo-Gómez, F.J., Update on
the treatment of type 2 diabetes mellitus. World J Diabetes, 2016. 7(17): 354-395.
18. Othman, E.M., Oli, R.G., Arias-Loza, P.A., Kreissl, M.C., Stopper, H., Metformin Protects Kidney
Cells From Insulin-Mediated Genotoxicity In Vitro and in Male Zucker Diabetic Fatty Rats.
Endocrinology, 2016. 157(2): 548-59.
19. Meng, S., Cao, J., He, Q., Xiong, L., Chang, E., Radovick, S., Wondisford, F.E., He, L., Metformin
Activates AMP-activated Protein Kinase by Promoting Formation of the αβγ Heterotrimeric
Complex. J Biol Chem, 2015. 290(6): 3793-3802.
212 G References
212
20. Mackenzie, R.W.A., Elliott, B.T., Akt/PKB activation and insulin signaling: a novel insulin
signaling pathway in the treatment of type 2 diabetes. Diabetes Metab Syndr Obes, 2014. 7: 55-64.
21. Valentine, R.J., Coughlan, K.A., Ruderman, N.B., Saha, A.K., Insulin inhibits AMPK activity and
phosphorylates AMPK Ser(4)(8)(5)/(4)(9)(1) through Akt in hepatocytes, myotubes and incubated
rat skeletal muscle. Arch Biochem Biophys, 2014. 562: 62-9.
22. Morrison, A., Yan, X., Tong, C., Li, J., Acute rosiglitazone treatment is cardioprotective against
ischemia-reperfusion injury by modulating AMPK, Akt, and JNK signaling in nondiabetic mice. Am
J Physiol Heart Circ Physiol, 2011. 301(3): H895-902.
23. Wei, R., Ma, S., Wang, C., Ke, J., Yang, J., Li, W., Liu, Y., Hou, W., Feng, X., Wang, G., Hong, T.,
Exenatide exerts direct protective effects on endothelial cells through the AMPK/Akt/eNOS pathway
in a GLP-1 receptor-dependent manner. Am J Physiol Endocrinol Metab, 2016. 310(11): E947-57.
24. Gallego-Colon, E., Klych-Ratuszny, A., Kosowska, A., Garczorz, W., Aghdam, M.R.F., Wozniak,
M., Francuz, T., Exenatide modulates metalloproteinase expression in human cardiac smooth
muscle cells via the inhibition of Akt signaling pathway. Pharmacol Rep, 2018. 70(1): 178-183.
25. Al-Damry, N.T., Attia, H.A., Al-Rasheed, N.M., Al-Rasheed, N.M., Mohamad, R.A., Al-Amin,
M.A., Dizmiri, N., Atteya, M., Sitagliptin attenuates myocardial apoptosis via activating LKB-
1/AMPK/Akt pathway and suppressing the activity of GSK-3beta and p38alpha/MAPK in a rat
model of diabetic cardiomyopathy. Biomed Pharmacother, 2018. 107: 347-358.
26. Kaji, K., Nishimura, N., Seki, K., Sato, S., Saikawa, S., Nakanishi, K., Furukawa, M., Kawaratani,
H., Kitade, M., Moriya, K., Namisaki, T., Yoshiji, H., Sodium glucose cotransporter 2 inhibitor
canagliflozin attenuates liver cancer cell growth and angiogenic activity by inhibiting glucose
uptake. Int J Cancer, 2018. 142(8): 1712-1722.
27. Hawley, S.A., Ford, R.J., Smith, B.K., Gowans, G.J., Mancini, S.J., Pitt, R.D., Day, E.A., Salt, I.P.,
Steinberg, G.R., Hardie, D.G., The Na+/Glucose Cotransporter Inhibitor Canagliflozin Activates
AMPK by Inhibiting Mitochondrial Function and Increasing Cellular AMP Levels. Diabetes, 2016.
65(9): 2784-2794.
28. Manning, B.D., Toker, A., AKT/PKB Signaling: Navigating the Network. Cell, 2017. 169(3): 381-
405.
29. Farese, R.V., Sajan, M.P., Standaert, M.L., Insulin-sensitive protein kinases (atypical protein kinase
C and protein kinase B/Akt): actions and defects in obesity and type II diabetes. Exp Biol Med
(Maywood), 2005. 230(9): 593-605.
30. Kumar, C.C., Madison, V., AKT crystal structure and AKT-specific inhibitors. Oncogene, 2005.
24(50): 7493-501.
31. Peng, X.D., Xu, P.Z., Chen, M.L., Hahn-Windgassen, A., Skeen, J., Jacobs, J., Sundararajan, D.,
Chen, W.S., Crawford, S.E., Coleman, K.G., Hay, N., Dwarfism, impaired skin development,
skeletal muscle atrophy, delayed bone development, and impeded adipogenesis in mice lacking Akt1
and Akt2. Genes Dev, 2003. 17(11): 1352-65.
32. George, S., Rochford, J.J., Wolfrum, C., Gray, S.L., Schinner, S., Wilson, J.C., Soos, M.A.,
Murgatroyd, P.R., Williams, R.M., Acerini, C.L., Dunger, D.B., Barford, D., Umpleby, A.M.,
Wareham, N.J., Davies, H.A., Schafer, A.J., Stoffel, M., O’Rahilly, S., Barroso, I., A Family with
Severe Insulin Resistance and Diabetes Mellitus due to a Missense Mutation in AKT2. Science,
2004. 304(5675): 1325-1328.
33. Scheid, M.P., Marignani, P.A., Woodgett, J.R., Multiple phosphoinositide 3-kinase-dependent steps
in activation of protein kinase B. Mol Cell Biol, 2002. 22(17): 6247-60.
34. Franke, T.F., Hornik, C.P., Segev, L., Shostak, G.A., Sugimoto, C., PI3K/Akt and apoptosis: size
matters. Oncogene, 2003. 22(56): 8983-98.
35. Calleja, V., Laguerre, M., Parker, P.J., Larijani, B., Role of a novel PH-kinase domain interface in
PKB/Akt regulation: structural mechanism for allosteric inhibition. PLoS Biol, 2009. 7(1): e17.
36. Huang, J., Dibble, C.C., Matsuzaki, M., Manning, B.D., The TSC1-TSC2 Complex Is Required for
Proper Activation of mTOR Complex 2. Mol Cell Biol, 2008. 28(12): 4104-4115.
37. Ebner, M., Sinkovics, B., Szczygiel, M., Ribeiro, D.W., Yudushkin, I., Localization of mTORC2
activity inside cells. J Cell Biol, 2017. 216(2): 343-353.
38. Mahajan, K., Coppola, D., Challa, S., Fang, B., Chen, Y.A., Zhu, W., Lopez, A.S., Koomen, J.,
Engelman, R.W., Rivera, C., Muraoka-Cook, R.S., Cheng, J.Q., Schönbrunn, E., Sebti, S.M., Earp,
H.S., Mahajan, N.P., Ack1 Mediated AKT/PKB Tyrosine 176 Phosphorylation Regulates Its
Activation. PLoS One, 2010. 5(3): e9646.
39. Zheng, Y., Peng, M., Wang, Z., Asara, J.M., Tyner, A.L., Protein Tyrosine Kinase 6 Directly
Phosphorylates AKT and Promotes AKT Activation in Response to Epidermal Growth Factor. Mol
Cell Biol, 2010. 30(17): 4280-4292.
40. Liu, P., Begley, M., Michowski, W., Inuzuka, H., Ginzberg, M., Gao, D., Tsou, P., Gan, W., Papa,
A., Kim, B.M., Wan, L., Singh, A., Zhai, B., Yuan, M., Wang, Z., Gygi, S.P., Lee, T.H., Lu, K.P.,
Toker, A., Pandolfi, P.P., Asara, J.M., Kirschner, M.W., Sicinski, P., Cantley, L., Wei, W., Cell-

213
cycle-regulated activation of Akt kinase by phosphorylation at its carboxyl terminus. Nature, 2014.
508(7497): 541-5.
41. Guo, H., Gao, M., Lu, Y., Liang, J., Lorenzi, P.L., Bai, S., Hawke, D.H., Li, J., Dogruluk, T., Scott,
K.L., Jonasch, E., Mills, G.B., Ding, Z., Coordinate phosphorylation of multiple residues on single
AKT1 and AKT2 molecules. Oncogene, 2014. 33(26): 3463-72.
42. Leslie, N.R., Longy, M., Inherited PTEN mutations and the prediction of phenotype. Semin Cell
Dev Biol, 2016. 52: 30-38.
43. Kuo, Y.C., Huang, K.Y., Yang, C.H., Yang, Y.S., Lee, W.Y., Chiang, C.W., Regulation of
phosphorylation of Thr-308 of Akt, cell proliferation, and survival by the B55alpha regulatory
subunit targeting of the protein phosphatase 2A holoenzyme to Akt. J Biol Chem, 2008. 283(4):
1882-92.
44. Zhang, J., Gao, Z., Yin, J., Quon, M.J., Ye, J., S6K Directly Phosphorylates IRS-1 on Ser-270 to
Promote Insulin Resistance in Response to TNF-α Signaling through IKK2. J Biol Chem, 2008.
283(51): 35375-35382.
45. Um, S.H., Frigerio, F., Watanabe, M., Picard, F., Joaquin, M., Sticker, M., Fumagalli, S., Allegrini,
P.R., Kozma, S.C., Auwerx, J., Thomas, G., Absence of S6K1 protects against age- and diet-
induced obesity while enhancing insulin sensitivity. Nature, 2004. 431(7005): 200-5.
46. Chandarlapaty, S., Sawai, A., Scaltriti, M., Rodrik-Outmezguine, V., Grbovic-Huezo, O., Serra, V.,
Majumder, P.K., Baselga, J., Rosen, N., AKT inhibition relieves feedback suppression of receptor
tyrosine kinase expression and activity. Cancer Cell, 2011. 19(1): 58-71.
47. King, T.D., Song, L., Jope, R.S., AMP-activated protein kinase (AMPK) activating agents cause
dephosphorylation of Akt and glycogen synthase kinase-3. Biochem Pharmacol, 2006. 71(11): 1637-
47.
48. Hawley, S.A., Ross, F.A., Gowans, G.J., Tibarewal, P., Leslie, N.R., Hardie, D.G., Phosphorylation
by Akt within the ST loop of AMPK-alpha1 down-regulates its activation in tumour cells. Biochem
J, 2014. 459(2): 275-87.
49. Mendoza, M.C., Er, E.E., Blenis, J., The Ras-ERK and PI3K-mTOR Pathways: Cross-talk and
Compensation. Trends Biochem Sci, 2011. 36(6): 320-328.
50. Gonzalez, E., McGraw, T.E., Insulin-modulated Akt subcellular localization determines Akt
isoform-specific signaling. Proc Natl Acad Sci U S A, 2009. 106(17): 7004-9.
51. Chakraborty, A., Koldobskiy, M.A., Bello, N.T., Maxwell, M., Potter, J.J., Juluri, K.R., Maag, D.,
Kim, S., Huang, A.S., Dailey, M.J., Saleh, M., Snowman, A.M., Moran, T.H., Mezey, E., Snyder,
S.H., Inositol pyrophosphates inhibit Akt signaling, thereby regulating insulin sensitivity and weight
gain. Cell, 2010. 143(6): 897-910.
52. Peck, G.R., Chavez, J.A., Roach, W.G., Budnik, B.A., Lane, W.S., Karlsson, H.K.R., Zierath, J.R.,
Lienhard, G.E., Insulin-stimulated Phosphorylation of the Rab GTPase-activating Protein TBC1D1
Regulates GLUT4 Translocation. J Biol Chem, 2009. 284(44): 30016-30023.
53. Jope, R.S., Johnson, G.V.W., The glamour and gloom of glycogen synthase kinase-3. Trends
Biochem Sci, 2004. 29(2): 95-102.
54. Meijer, L., Flajolet, M., Greengard, P., Pharmacological inhibitors of glycogen synthase kinase 3.
Trends Pharmacol Sci, 2004. 25(9): 471-480.
55. Saxton, R.A., Sabatini, D.M., mTOR Signaling in Growth, Metabolism, and Disease. Cell, 2017.
168(6): 960-976.
56. Zoncu, R., Sabatini, D.M., Efeyan, A., mTOR: from growth signal integration to cancer, diabetes
and ageing. Nat Rev Mol Cell Biol, 2011. 12(1): 21-35.
57. Webb, A.E., Brunet, A., FOXO transcription factors: key regulators of cellular quality control.
Trends Biochem Sci, 2014. 39(4): 159-69.
58. Lu, M., Wan, M., Leavens, K.F., Chu, Q., Monks, B.R., Fernandez, S., Ahima, R.S., Ueki, K.,
Kahn, C.R., Birnbaum, M.J., Insulin regulates liver metabolism in vivo in the absence of hepatic Akt
and Foxo1. Nat Med, 2012. 18(3): 388-95.
59. Abeyrathna, P., Su, Y., The critical role of Akt in cardiovascular function. Vascul Pharmacol, 2015.
74: 38-48.
60. Ruan, G.-X., Kazlauskas, A., VEGF-A engages at least three tyrosine kinases to activate PI3K/Akt.
Cell Cycle, 2012. 11(11): 2047-2048.
61. Förstermann, U., Sessa, W.C., Nitric oxide synthases: regulation and function. Eur Heart J, 2012.
33(7): 829-837.
62. Federici, M., Menghini, R., Mauriello, A., Hribal, M.L., Ferrelli, F., Lauro, D., Sbraccia, P.,
Spagnoli, L.G., Sesti, G., Lauro, R., Insulin-dependent activation of endothelial nitric oxide
synthase is impaired by O-linked glycosylation modification of signaling proteins in human
coronary endothelial cells. Circulation, 2002. 106(4): 466-72.
63. Yu, H., Littlewood, T., Bennett, M., Akt isoforms in vascular disease. Vascul Pharmacol, 2015. 71:
57-64.
214 G References
214
64. Brown, J.S., Banerji, U., Maximising the potential of AKT inhibitors as anti-cancer treatments.
Pharmacol Ther, 2017. 172: 101-115.
65. Ruderman, N.B., Carling, D., Prentki, M., Cacicedo, J.M., AMPK, insulin resistance, and the
metabolic syndrome. J Clin Invest, 2013. 123(7): 2764-2772.
66. Coughlan, K.A., Valentine, R.J., Ruderman, N.B., Saha, A.K., AMPK activation: a therapeutic
target for type 2 diabetes? Diabetes Metab Syndr Obes, 2014. 7: 241-253.
67. Oakhill, J.S., Scott, J.W., Kemp, B.E., AMPK functions as an adenylate charge-regulated protein
kinase. Trends Endocrinol Metab, 2012. 23(3): 125-32.
68. Stahmann, N., Woods, A., Carling, D., Heller, R., Thrombin Activates AMP-Activated Protein
Kinase in Endothelial Cells via a Pathway Involving Ca(2+)/Calmodulin-Dependent Protein Kinase
Kinase β. Mol Cell Biol, 2006. 26(16): 5933-5945.
69. Garcia-Haro, L., Garcia-Gimeno, M.A., Neumann, D., Beullens, M., Bollen, M., Sanz, P., Glucose-
dependent regulation of AMP-activated protein kinase in MIN6 beta cells is not affected by the
protein kinase A pathway. FEBS Lett, 2012. 586(23): 4241-4247.
70. Zhang, Y., Lee, T.S., Kolb, E.M., Sun, K., Lu, X., Sladek, F.M., Kassab, G.S., Garland, T., Jr.,
Shyy, J.Y., AMP-activated protein kinase is involved in endothelial NO synthase activation in
response to shear stress. Arterioscler Thromb Vasc Biol, 2006. 26(6): 1281-7.
71. Price, N.L., Gomes, A.P., Ling, A.J.Y., Duarte, F.V., Martin-Montalvo, A., North, B.J., Agarwal,
B., Ye, L., Ramadori, G., Teodoro, J.S., Hubbard, B.P., Varela, A.T., Davis, J.G., Varamini, B.,
Hafner, A., Moaddel, R., Rolo, A.P., Coppari, R., Palmeira, C.M., de Cabo, R., Baur, J.A., Sinclair,
D.A., SIRT1 is required for AMPK activation and the beneficial effects of resveratrol on
mitochondrial function. Cell Metab, 2012. 15(5): 675-690.
72. Lee, Y.S., Kim, W.S., Kim, K.H., Yoon, M.J., Cho, H.J., Shen, Y., Ye, J.-M., Lee, C.H., Oh, W.K.,
Kim, C.T., Hohnen-Behrens, C., Gosby, A., Kraegen, E.W., James, D.E., Kim, J.B., Berberine, a
Natural Plant Product, Activates AMP-Activated Protein Kinase With Beneficial Metabolic Effects
in Diabetic and Insulin-Resistant States. Diabetes, 2006. 55(8): 2256.
73. Lee, W.J., Song, K.H., Koh, E.H., Won, J.C., Kim, H.S., Park, H.S., Kim, M.S., Kim, S.W., Lee,
K.U., Park, J.Y., Alpha-lipoic acid increases insulin sensitivity by activating AMPK in skeletal
muscle. Biochem Biophys Res Commun, 2005. 332(3): 885-91.
74. Desjardins, E.M., Steinberg, G.R., Emerging Role of AMPK in Brown and Beige Adipose Tissue
(BAT): Implications for Obesity, Insulin Resistance, and Type 2 Diabetes. Curr Diab Rep, 2018.
18(10): 80.
75. Greig, F.H., Ewart, M.-A., McNaughton, E., Cooney, J., Spickett, C.M., Kennedy, S., The
hypotensive effect of acute and chronic AMP-activated protein kinase activation in normal and
hyperlipidemic mice. Vascul Pharmacol, 2015. 74: 93-102.
76. Galic, S., Loh, K., Murray-Segal, L., Steinberg, G.R., Andrews, Z.B., Kemp, B.E., AMPK signaling
to acetyl-CoA carboxylase is required for fasting- and cold-induced appetite but not thermogenesis.
eLife, 2018. 7: e32656.
77. Steneberg, P., Lindahl, E., Dahl, U., Lidh, E., Straseviciene, J., Backlund, F., Kjellkvist, E.,
Berggren, E., Lundberg, I., Bergqvist, I., Ericsson, M., Eriksson, B., Linde, K., Westman, J.,
Edlund, T., Edlund, H., PAN-AMPK activator O304 improves glucose homeostasis and
microvascular perfusion in mice and type 2 diabetes patients. JCI Insight, 2018. 3(12).
78. Inoki, K., Zhu, T., Guan, K.L., TSC2 mediates cellular energy response to control cell growth and
survival. Cell, 2003. 115(5): 577-90.
79. Hardie, D.G., AMPK and autophagy get connected. EMBO J, 2011. 30(4): 634-635.
80. Muslin, A.J., MAPK Signaling in Cardiovascular Health and Disease: Molecular Mechanisms and
Therapeutic Targets. Clin Sci (Lond), 2008. 115(7): 203-218.
81. Huang, A., Yang, Y.-M., Yan, C., Kaley, G., Hintze, T.H., Sun, D., Altered MAPK Signaling in
Progressive Deterioration of Endothelial Function in Diabetic Mice. Diabetes, 2012. 61(12): 3181-
3188.
82. Manach, C., Scalbert, A., Morand, C., Rémésy, C., Jiménez, L., Polyphenols: food sources and
bioavailability. Am J Clin Nutr, 2004. 79(5): 727-747.
83. Cory, H., Passarelli, S., Szeto, J., Tamez, M., Mattei, J., The Role of Polyphenols in Human Health
and Food Systems: A Mini-Review. Front Nutr, 2018. 5(87).
84. Williamson, G., Kay, C.D., Crozier, A., The Bioavailability, Transport, and Bioactivity of Dietary
Flavonoids: A Review from a Historical Perspective. Compr Rev Food Sci Food Saf, 2018. 17(5):
1054-1112.
85. Xiao, J.B., Hogger, P., Dietary polyphenols and type 2 diabetes: current insights and future
perspectives. Curr Med Chem, 2015. 22(1): 23-38.
86. Sharma, A., Kaur, M., Katnoria, J.K., Nagpal, A.K., Polyphenols in Food: Cancer Prevention and
Apoptosis Induction. Curr Med Chem, 2017.
215
87. McCullough, M.L., Peterson, J.J., Patel, R., Jacques, P.F., Shah, R., Dwyer, J.T., Flavonoid intake
and cardiovascular disease mortality in a prospective cohort of US adults. Am J Clin Nutr, 2012.
95(2): 454-64.
88. Elmann, A., Wang, C.-K., Vauzour, D., Polyphenols Targeting Brain Cells Longevity, Brain's
Redox Status, and Neurodegenerative Diseases. Oxid Med Cell Longev, 2018. 2018: 7402795-
7402795.
89. Zhang, H., Tsao, R., Dietary polyphenols, oxidative stress and antioxidant and anti-inflammatory
effects. Curr Opin Food Sci, 2016. 8: 33-42.
90. Pandey, K.B., Rizvi, S.I., Plant polyphenols as dietary antioxidants in human health and disease.
Oxid Med Cell Longev, 2009. 2(5): 270-8.
91. Goszcz, K., Duthie, G.G., Stewart, D., Leslie, S.J., Megson, I.L., Bioactive polyphenols and
cardiovascular disease: chemical antagonists, pharmacological agents or xenobiotics that drive an
adaptive response? Br J Pharmacol, 2017. 174(11): 1209-1225.
92. Tsao, R., Chemistry and Biochemistry of Dietary Polyphenols. Nutrients, 2010. 2(12): 1231-1246.
93. Shen, T., Xie, C.-F., Wang, X.-N., Lou, H.-X., Stilbenoids, in Natural Products: Phytochemistry,
Botany and Metabolism of Alkaloids, Phenolics and Terpenes, K.G. Ramawat and J.-M. Mérillon,
Editors. 2013, Springer Berlin Heidelberg: Berlin, Heidelberg. p. 1901-1949.
94. Peterson, J., Dwyer, J., Adlercreutz, H., Scalbert, A., Jacques, P., McCullough, M.L., Dietary
lignans: physiology and potential for cardiovascular disease risk reduction. Nutr Rev, 2010. 68(10):
571-603.
95. Shoji, T., Yamada, M., Miura, T., Nagashima, K., Ogura, K., Inagaki, N., Maeda-Yamamoto, M.,
Chronic administration of apple polyphenols ameliorates hyperglycaemia in high-normal and
borderline subjects: A randomised, placebo-controlled trial. Diabetes Res Clin Pract, 2017. 129: 43-
51.
96. Rienks, J., Barbaresko, J., Oluwagbemigun, K., Schmid, M., Nothlings, U., Polyphenol exposure
and risk of type 2 diabetes: dose-response meta-analyses and systematic review of prospective
cohort studies. Am J Clin Nutr, 2018. 108(1): 49-61.
97. Cao, H., Ou, J., Chen, L., Zhang, Y., Szkudelski, T., Delmas, D., Daglia, M., Xiao, J., Dietary
polyphenols and type 2 diabetes: Human study and clinical trials. Crit Rev Food Sci Nutr, 2018: 1-
19.
98. Song, Y., Manson, J.E., Buring, J.E., Sesso, H.D., Liu, S., Associations of dietary flavonoids with
risk of type 2 diabetes, and markers of insulin resistance and systemic inflammation in women: a
prospective study and cross-sectional analysis. J Am Coll Nutr, 2005. 24(5): 376-84.
99. Castro-Barquero, S., Lamuela-Raventós, R., Doménech, M., Estruch, R., Relationship between
Mediterranean Dietary Polyphenol Intake and Obesity. Nutrients, 2018. 10(10): 1523.
100. Carlstrom, M., Larsson, S.C., Coffee consumption and reduced risk of developing type 2 diabetes: a
systematic review with meta-analysis. Nutr Rev, 2018. 76(6): 395-417.
101. Alkhatib, A., Tsang, C., Tiss, A., Bahorun, T., Arefanian, H., Barake, R., Khadir, A., Tuomilehto, J.,
Functional Foods and Lifestyle Approaches for Diabetes Prevention and Management. Nutrients,
2017. 9(12): 1310.
102. Ahrens, M.J., Thompson, D.L., Effect of emulin on blood glucose in type 2 diabetics. J Med Food,
2013. 16(3): 211-5.
103. Rasouli, H., Hosseini-Ghazvini, S.M., Adibi, H., Khodarahmi, R., Differential alpha-amylase/alpha-
glucosidase inhibitory activities of plant-derived phenolic compounds: a virtual screening
perspective for the treatment of obesity and diabetes. Food Funct, 2017. 8(5): 1942-1954.
104. Tsang, C., Smail, N.F., Almoosawi, S., Davidson, I., Al-Dujaili, E.A., Intake of polyphenol-rich
pomegranate pure juice influences urinary glucocorticoids, blood pressure and homeostasis model
assessment of insulin resistance in human volunteers. J Nutr Sci, 2012. 1: e9.
105. Grassi, D., Desideri, G., Necozione, S., Lippi, C., Casale, R., Properzi, G., Blumberg, J.B., Ferri, C.,
Blood pressure is reduced and insulin sensitivity increased in glucose-intolerant, hypertensive
subjects after 15 days of consuming high-polyphenol dark chocolate. J Nutr, 2008. 138(9): 1671-6.
106. Brown, A.L., Lane, J., Coverly, J., Stocks, J., Jackson, S., Stephen, A., Bluck, L., Coward, A.,
Hendrickx, H., Effects of dietary supplementation with the green tea polyphenol epigallocatechin-3-
gallate on insulin resistance and associated metabolic risk factors: randomized controlled trial. Br J
Nutr, 2009. 101(6): 886-94.
107. Chuang, C.C., Martinez, K., Xie, G., Kennedy, A., Bumrungpert, A., Overman, A., Jia, W.,
McIntosh, M.K., Quercetin is equally or more effective than resveratrol in attenuating tumor
necrosis factor-{alpha}-mediated inflammation and insulin resistance in primary human adipocytes.
Am J Clin Nutr, 2010. 92(6): 1511-21.
108. Rhee, S.Y., Kim, Y.S., The Role of Advanced Glycation End Products in Diabetic Vascular
Complications. Diabetes Metab J, 2018. 42(3): 188-195.

216 G References
216
109. Xu, B., Ji, Y., Yao, K., Cao, Y.X., Ferro, A., Inhibition of human endothelial cell nitric oxide
synthesis by advanced glycation end-products but not glucose: relevance to diabetes. Clin Sci
(Lond), 2005. 109(5): 439-46.
110. Yeh, W.J., Hsia, S.M., Lee, W.H., Wu, C.H., Polyphenols with antiglycation activity and
mechanisms of action: A review of recent findings. J Food Drug Anal, 2017. 25(1): 84-92.
111. Fontana, L., Interventions to promote cardiometabolic health and slow cardiovascular ageing. Nat
Rev Cardiol, 2018. 15(9): 566-577.
112. Wang, X., Ouyang, Y.Y., Liu, J., Zhao, G., Flavonoid intake and risk of CVD: a systematic review
and meta-analysis of prospective cohort studies. Br J Nutr, 2014. 111(1): 1-11.
113. Tresserra-Rimbau, A., Rimm, E.B., Medina-Remon, A., Martinez-Gonzalez, M.A., de la Torre, R.,
Corella, D., Salas-Salvado, J., Gomez-Gracia, E., Lapetra, J., Aros, F., Fiol, M., Ros, E., Serra-
Majem, L., Pinto, X., Saez, G.T., Basora, J., Sorli, J.V., Martinez, J.A., Vinyoles, E., Ruiz-
Gutierrez, V., Estruch, R., Lamuela-Raventos, R.M., Inverse association between habitual
polyphenol intake and incidence of cardiovascular events in the PREDIMED study. Nutr Metab
Cardiovasc Dis, 2014. 24(6): 639-47.
114. Pedret, A., Fernandez-Castillejo, S., Valls, R.M., Catalan, U., Rubio, L., Romeu, M., Macia, A.,
Lopez de Las Hazas, M.C., Farras, M., Giralt, M., Mosele, J.I., Martin-Pelaez, S., Remaley, A.T.,
Covas, M.I., Fito, M., Motilva, M.J., Sola, R., Cardiovascular Benefits of Phenol-Enriched Virgin
Olive Oils: New Insights from the Virgin Olive Oil and HDL Functionality (VOHF) Study. Mol Nutr
Food Res, 2018. 62(16): e1800456.
115. Hertog, M.G., Feskens, E.J., Hollman, P.C., Katan, M.B., Kromhout, D., Dietary antioxidant
flavonoids and risk of coronary heart disease: the Zutphen Elderly Study. Lancet, 1993. 342(8878):
1007-11.
116. Cassidy, A., Mukamal, K.J., Liu, L., Franz, M., Eliassen, A.H., Rimm, E.B., High anthocyanin
intake is associated with a reduced risk of myocardial infarction in young and middle-aged women.
Circulation, 2013. 127(2): 188-96.
117. Cassidy, A., Rimm, E.B., O'Reilly, E.J., Logroscino, G., Kay, C., Chiuve, S.E., Rexrode, K.M.,
Dietary flavonoids and risk of stroke in women. Stroke, 2012. 43(4): 946-51.
118. Davies, J.M.S., Cillard, J., Friguet, B., Cadenas, E., Cadet, J., Cayce, R., Fishmann, A., Liao, D.,
Bulteau, A.-L., Derbré, F., Rébillard, A., Burstein, S., Hirsch, E., Kloner, R.A., Jakowec, M.,
Petzinger, G., Sauce, D., Sennlaub, F., Limon, I., Ursini, F., Maiorino, M., Economides, C., Pike,
C.J., Cohen, P., Salvayre, A.N., Halliday, M.R., Lundquist, A.J., Jakowec, N.A., Mechta-Grigoriou,
F., Mericskay, M., Mariani, J., Li, Z., Huang, D., Grant, E., Forman, H.J., Finch, C.E., Sun, P.Y.,
Pomatto, L.C.D., Agbulut, O., Warburton, D., Neri, C., Rouis, M., Cillard, P., Capeau, J.,
Rosenbaum, J., Davies, K.J.A., The Oxygen Paradox, the French Paradox, and age-related
diseases. GeroScience, 2017. 39(5-6): 499-550.
119. Stoclet, J.C., Chataigneau, T., Ndiaye, M., Oak, M.H., El Bedoui, J., Chataigneau, M., Schini-Kerth,
V.B., Vascular protection by dietary polyphenols. Eur J Pharmacol, 2004. 500(1-3): 299-313.
120. Auger, C., Teissedre, P.L., Gerain, P., Lequeux, N., Bornet, A., Serisier, S., Besancon, P.,
Caporiccio, B., Cristol, J.P., Rouanet, J.M., Dietary wine phenolics catechin, quercetin, and
resveratrol efficiently protect hypercholesterolemic hamsters against aortic fatty streak
accumulation. J Agric Food Chem, 2005. 53(6): 2015-21.
121. Yoshichika, K., Understanding metabolic conversions and molecular actions of flavonoids in
vivo:toward new strategies for effective utilization of natural polyphenols in human health. J Med
Invest, 2018. 65(3.4): 162-165.
122. Itsiopoulos, C., Kucianski, T., Mayr, H.L., van Gaal, W.J., Martinez-Gonzalez, M.A., Vally, H.,
Kingsley, M., Kouris-Blazos, A., Radcliffe, J., Segal, L., Brazionis, L., Salim, A., Tierney, A.C.,
O'Dea, K., Wilson, A., Thomas, C.J., The AUStralian MEDiterranean Diet Heart Trial (AUSMED
Heart Trial): A randomized clinical trial in secondary prevention of coronary heart disease in a
multiethnic Australian population: Study protocol. Am Heart J, 2018. 203: 4-11.
123. Noad, R.L., Rooney, C., McCall, D., Young, I.S., McCance, D., McKinley, M.C., Woodside, J.V.,
McKeown, P.P., Beneficial effect of a polyphenol-rich diet on cardiovascular risk: a randomised
control trial. Heart, 2016. 102(17): 1371-9.
124. Malik, A., Netticadan, T., Cordova, F., Resveratrol: a Potential Anti-remodeling Agent in Heart
Failure, From Bench to Bedside. 2016, St. Boniface General Hospital Research Centre:
https://clinicaltrials.gov/ct2/show/NCT01914081 (ClinicalTrials.gov).
125. Vetrani, C., Vitale, M., Bozzetto, L., Della Pepa, G., Cocozza, S., Costabile, G., Mangione, A.,
Cipriano, P., Annuzzi, G., Rivellese, A.A., Association between different dietary polyphenol
subclasses and the improvement in cardiometabolic risk factors: evidence from a randomized
controlled clinical trial. Acta Diabetol, 2018. 55(2): 149-153.

217
126. Desch, S., Schmidt, J., Kobler, D., Sonnabend, M., Eitel, I., Sareban, M., Rahimi, K., Schuler, G.,
Thiele, H., Effect of Cocoa Products on Blood Pressure: Systematic Review and Meta-Analysis. Am
J Hypertens, 2010. 23(1): 97-103.
127. Egert, S., Bosy-Westphal, A., Seiberl, J., Kurbitz, C., Settler, U., Plachta-Danielzik, S., Wagner,
A.E., Frank, J., Schrezenmeir, J., Rimbach, G., Wolffram, S., Muller, M.J., Quercetin reduces
systolic blood pressure and plasma oxidised low-density lipoprotein concentrations in overweight
subjects with a high-cardiovascular disease risk phenotype: a double-blinded, placebo-controlled
cross-over study. Br J Nutr, 2009. 102(7): 1065-74.
128. Biesinger, S., Michaels, H.A., Quadros, A.S., Qian, Y., Rabovsky, A.B., Badger, R.S., Jalili, T., A
combination of isolated phytochemicals and botanical extracts lowers diastolic blood pressure in a
randomized controlled trial of hypertensive subjects. Eur J Clin Nutr, 2016. 70(1): 10-6.
129. Barona, J., Aristizabal, J.C., Blesso, C.N., Volek, J.S., Fernandez, M.L., Grape polyphenols reduce
blood pressure and increase flow-mediated vasodilation in men with metabolic syndrome. J Nutr,
2012. 142(9): 1626-32.
130. Fogacci, F., Tocci, G., Presta, V., Fratter, A., Borghi, C., Cicero, A.F.G., Effect of resveratrol on
blood pressure: A systematic review and meta-analysis of randomized, controlled, clinical trials.
Crit Rev Food Sci Nutr, 2018: 1-14.
131. Hugel, H.M., Jackson, N., May, B., Zhang, A.L., Xue, C.C., Polyphenol protection and treatment of
hypertension. Phytomedicine, 2016. 23(2): 220-31.
132. Perez-Vizcaino, F., Duarte, J., Jimenez, R., Santos-Buelga, C., Osuna, A., Antihypertensive effects
of the flavonoid quercetin. Pharmacol Rep, 2009. 61(1): 67-75.
133. Suganya, N., Dornadula, S., Chatterjee, S., Mohanram, R.K., Quercetin improves endothelial
function in diabetic rats through inhibition of endoplasmic reticulum stress-mediated oxidative
stress. Eur J Pharmacol, 2018. 819: 80-88.
134. Zhang, X.-H., Yokoo, H., Nishioka, H., Fujii, H., Matsuda, N., Hayashi, T., Hattori, Y., Beneficial
effect of the oligomerized polyphenol oligonol on high glucose-induced changes in eNOS
phosphorylation and dephosphorylation in endothelial cells. Br J Pharmacol, 2010. 159(4): 928-
938.
135. Ramirez-Sanchez, I., Aguilar, H., Ceballos, G., Villarreal, F., (-)-Epicatechin-induced calcium
independent eNOS activation: roles of HSP90 and AKT. Mol Cell Biochem, 2012. 370(1-2): 141-50.
136. Engler, M.B., Engler, M.M., The emerging role of flavonoid-rich cocoa and chocolate in
cardiovascular health and disease. Nutr Rev, 2006. 64(3): 109-18.
137. Nishida, S., Satoh, H., Possible Involvement of Ca Activated K Channels, SK Channel, in the
Quercetin-Induced Vasodilatation. Korean J Physiol Pharmacol, 2009. 13(5): 361-5.
138. Storniolo, C.E., Rosello-Catafau, J., Pinto, X., Mitjavila, M.T., Moreno, J.J., Polyphenol fraction of
extra virgin olive oil protects against endothelial dysfunction induced by high glucose and free fatty
acids through modulation of nitric oxide and endothelin-1. Redox Biol, 2014. 2: 971-7.
139. Hettihewa, S., Hemar, Y., Rupasinghe, H., Flavonoid-Rich Extract of Actinidia macrosperma (A
Wild Kiwifruit) Inhibits Angiotensin-Converting Enzyme In Vitro. Foods, 2018. 7(9): 146.
140. Uhlenhut, K., Hogger, P., Facilitated cellular uptake and suppression of inducible nitric oxide
synthase by a metabolite of maritime pine bark extract (Pycnogenol). Free Radic Biol Med, 2012.
53(2): 305-13.
141. Hussain, T., Tan, B., Yin, Y., Blachier, F., Tossou, M.C.B., Rahu, N., Oxidative Stress and
Inflammation: What Polyphenols Can Do for Us? Oxid Med Cell Longev, 2016. 2016: 7432797-
7432797.
142. Tangney, C.C., Rasmussen, H.E., Polyphenols, inflammation, and cardiovascular disease. Curr
Atheroscler Rep, 2013. 15(5): 324-324.
143. Hubbard, G.P., Wolffram, S., Lovegrove, J.A., Gibbins, J.M., Ingestion of quercetin inhibits platelet
aggregation and essential components of the collagen-stimulated platelet activation pathway in
humans. J Thromb Haemost, 2004. 2(12): 2138-45.
144. Wright, B., Spencer, J.P., Lovegrove, J.A., Gibbins, J.M., Insights into dietary flavonoids as
molecular templates for the design of anti-platelet drugs. Cardiovasc Res, 2013. 97(1): 13-22.
145. Sokoloff, B., Eddy, W.H., Redd, J.B., The Biological Activity of a Flavonoid (Vitamin “P”)
Compound. J Clin Invest, 1951. 30(4): 395-400.
146. Belcaro, G., Dugall, M., Luzzi, R., Corsi, M., Ledda, A., Ricci, A., Pellegrini, L., Cesarone, M.R.,
Hosoi, M., Errichi, B.M., Cornelli, U., Cotellese, R., Agus, G., Feragalli, B., Management of
Varicose Veins and Chronic Venous Insufficiency in a Comparative Registry with Nine Venoactive
Products in Comparison with Stockings. Int J Angiol, 2017. 26(3): 170-178.
147. Tahergorabi, Z., Khazaei, M., Imbalance of angiogenesis in diabetic complications: the
mechanisms. Int J Prev Med, 2012. 3(12): 827-838.
148. Soares, R., Costa, C., Oxidative Stress, Inflammation and Angiogenesis in the Metabolic Syndrome.
2009: Springer Netherlands. 85-99.

218 G References
218
149. Williamson, G., Holst, B., Dietary reference intake (DRI) value for dietary polyphenols: are we
heading in the right direction? Br J Nutr, 2008. 99 Suppl 3: S55-8.
150. Navarro, V.J., Khan, I., Björnsson, E., Seeff, L.B., Serrano, J., Hoofnagle, J.H., Liver injury from
herbal and dietary supplements. Hepatology, 2017. 65(1): 363-373.
151. Martin, K., L Appel, C., Polyphenols as dietary supplements: A double-edged sword. Nutr Diet
Suppl, 2009. 2: 1-12.
152. Salehi, B., Mishra, A.P., Nigam, M., Sener, B., Kilic, M., Sharifi-Rad, M., Fokou, P.V.T., Martins,
N., Sharifi-Rad, J., Resveratrol: A Double-Edged Sword in Health Benefits. Biomedicines, 2018.
6(3): 91.
153. Boots, A.W., Li, H., Schins, R.P., Duffin, R., Heemskerk, J.W., Bast, A., Haenen, G.R., The
quercetin paradox. Toxicol Appl Pharmacol, 2007. 222(1): 89-96.
154. Harwood, M., Danielewska-Nikiel, B., Borzelleca, J.F., Flamm, G.W., Williams, G.M., Lines, T.C.,
A critical review of the data related to the safety of quercetin and lack of evidence of in vivo toxicity,
including lack of genotoxic/carcinogenic properties. Food Chem Toxicol, 2007. 45(11): 2179-205.
155. Bacciottini, L., Falchetti, A., Pampaloni, B., Bartolini, E., Carossino, A.M., Brandi, M.L.,
Phytoestrogens: food or drug? Clin Cases Miner Bone Metab, 2007. 4(2): 123-130.
156. Risk assessment for peri- and post-menopausal women taking food supplements containing isolated
isoflavones. EFSA J, 2015. 13(10): 4246.
157. Mazzanti, G., Di Sotto, A., Vitalone, A., Hepatotoxicity of green tea: an update. Arch Toxicol,
2015. 89(8): 1175-91.
158. Younes, M., Aggett, P., Aguilar, F., Crebelli, R., Dusemund, B., Filipič, M., Frutos, M.J., Galtier,
P., Gott, D., Gundert-Remy, U., Lambré, C., Leblanc, J.-C., Lillegaard, I.T., Moldeus, P.,
Mortensen, A., Oskarsson, A., Stankovic, I., Waalkens-Berendsen, I., Woutersen, R.A., Andrade,
R.J., Fortes, C., Mosesso, P., Restani, P., Arcella, D., Pizzo, F., Smeraldi, C., Wright, M., Scientific
opinion on the safety of green tea catechins. EFSA J, 2018. 16(4): e05239.
159. Ferry, D.R., Smith, A., Malkhandi, J., Fyfe, D.W., deTakats, P.G., Anderson, D., Baker, J., Kerr,
D.J., Phase I clinical trial of the flavonoid quercetin: pharmacokinetics and evidence for in vivo
tyrosine kinase inhibition. Clin Cancer Res, 1996. 2(4): 659-68.
160. Turner, R.S., Thomas, R.G., Craft, S., van Dyck, C.H., Mintzer, J., Reynolds, B.A., Brewer, J.B.,
Rissman, R.A., Raman, R., Aisen, P.S., A randomized, double-blind, placebo-controlled trial of
resveratrol for Alzheimer disease. Neurology, 2015. 85(16): 1383-91.
161. Liu, Y., Luo, X., Yang, C., Yang, T., Zhou, J., Shi, S., Impact of quercetin‑induced changes in
drug‑metabolizing enzyme and transporter expression on the pharmacokinetics of cyclosporine in
rats. Mol Med Report, 2016. 14(4): 3073-3085.
162. Vrolijk, M.F., Haenen, G.R., Opperhuizen, A., Jansen, E.H., Schiffers, P.M., Bast, A., The
supplement-drug interaction of quercetin with tamsulosin on vasorelaxation. Eur J Pharmacol, 2015.
746: 132-7.
163. Ingolfsson, H.I., Thakur, P., Herold, K.F., Hobart, E.A., Ramsey, N.B., Periole, X., de Jong, D.H.,
Zwama, M., Yilmaz, D., Hall, K., Maretzky, T., Hemmings, H.C., Jr., Blobel, C., Marrink, S.J.,
Kocer, A., Sack, J.T., Andersen, O.S., Phytochemicals perturb membranes and promiscuously alter
protein function. ACS Chem Biol, 2014. 9(8): 1788-98.
164. Boly, R., Gras, T., Lamkami, T., Guissou, P., Serteyn, D., Kiss, R., Dubois, J., Quercetin inhibits a
large panel of kinases implicated in cancer cell biology. Int J Oncol, 2011. 38(3): 833-42.
165. Grimm, T., Skrabala, R., Chovanova, Z., Muchova, J., Sumegova, K., Liptakova, A., Durackova, Z.,
Hogger, P., Single and multiple dose pharmacokinetics of maritime pine bark extract (pycnogenol)
after oral administration to healthy volunteers. BMC Clin Pharmacol, 2006. 6: 4.
166. Packer, L., Rimbach, G., Virgili, F., Antioxidant activity and biologic properties of a procyanidin-
rich extract from pine (Pinus maritima) bark, pycnogenol. Free Radic Biol Med, 1999. 27(5-6): 704-
24.
167. Liu, X., Zhou, H.J., Rohdewald, P., French maritime pine bark extract Pycnogenol dose-
dependently lowers glucose in type 2 diabetic patients. Diabetes Care, 2004. 27(3): 839.
168. Liu, X., Wei, J., Tan, F., Zhou, S., Wurthwein, G., Rohdewald, P., Antidiabetic effect of Pycnogenol
French maritime pine bark extract in patients with diabetes type II. Life Sci, 2004. 75(21): 2505-13.
169. Schafer, A., Hogger, P., Oligomeric procyanidins of French maritime pine bark extract
(Pycnogenol) effectively inhibit alpha-glucosidase. Diabetes Res Clin Pract, 2007. 77(1): 41-6.
170. Cesarone, M.R., Belcaro, G., Rohdewald, P., Pellegrini, L., Ledda, A., Vinciguerra, G., Ricci, A.,
Gizzi, G., Ippolito, E., Fano, F., Dugall, M., Cipollone, G., Acerbi, G., Cacchio, M., Del Boccio, G.,
Di Renzo, A., Stuard, S., Corsi, M., Improvement of diabetic microangiopathy with pycnogenol: A
prospective, controlled study. Angiology, 2006. 57(4): 431-6.

219
171. Steigerwalt, R., Belcaro, G., Cesarone, M.R., Di Renzo, A., Grossi, M.G., Ricci, A., Dugall, M.,
Cacchio, M., Schonlau, F., Pycnogenol improves microcirculation, retinal edema, and visual acuity
in early diabetic retinopathy. J Ocul Pharmacol Ther, 2009. 25(6): 537-40.
172. Spadea, L., Balestrazzi, E., Treatment of vascular retinopathies with Pycnogenol. Phytother Res,
2001. 15(3): 219-23.
173. Cesarone, M.R., Belcaro, G., Stuard, S., Schonlau, F., Di Renzo, A., Grossi, M.G., Dugall, M.,
Cornelli, U., Cacchio, M., Gizzi, G., Pellegrini, L., Kidney flow and function in hypertension:
protective effects of pycnogenol in hypertensive participants--a controlled study. J Cardiovasc
Pharmacol Ther, 2010. 15(1): 41-6.
174. Belcaro, G., Cornelli, U., Luzzi, R., Cesarone, M.R., Dugall, M., Feragalli, B., Errichi, S., Ippolito,
E., Grossi, M.G., Hosoi, M., Cornelli, M., Gizzi, G., Pycnogenol(R) supplementation improves
health risk factors in subjects with metabolic syndrome. Phytother Res, 2013. 27(10): 1572-8.
175. Belcaro, G., Dugall, M., Hu, S., Feragalli, B., Cotellese, R., Ledda, A., Corsi, M., Ricci, A.,
Ippolito, E., Errichi, B.M., Cornelli, U., Cesarone, M.R., Hosoi, M., Prevention of recurrent venous
thrombosis and post-thrombotic syndrome. Minerva Cardioangiol, 2018. 66(3): 238-245.
176. Rohdewald, P., Pleiotropic Effects of French Maritime Pine Bark Extract to Promote Healthy
Aging. Rejuvenation Res, 2018.
177. Mülek, M., Seefried, L., Genest, F., Högger, P., Distribution of Constituents and Metabolites of
Maritime Pine Bark Extract (Pycnogenol®) into Serum, Blood Cells, and Synovial Fluid of Patients
with Severe Osteoarthritis: A Randomized Controlled Trial. Nutrients, 2017. 9(5): 443.
178. Duweler, K.G., Rohdewald, P., Urinary metabolites of French maritime pine bark extract in
humans. Pharmazie, 2000. 55(5): 364-8.
179. Belcaro, G., Hu, S., Cesarone, M.R., Dugall, M., A controlled study shows daily intake of 50 mg of
French Pine Bark Extract (Pycnogenol(R)) lowers plasma reactive oxygen metabolites in healthy
smokers. Minerva Med, 2013. 104(4): 439-46.
180. Grimm, T., Schafer, A., Hogger, P., Antioxidant activity and inhibition of matrix metalloproteinases
by metabolites of maritime pine bark extract (pycnogenol). Free Radic Biol Med, 2004. 36(6): 811-
22.
181. Schafer, A., Chovanova, Z., Muchova, J., Sumegova, K., Liptakova, A., Durackova, Z., Hogger, P.,
Inhibition of COX-1 and COX-2 activity by plasma of human volunteers after ingestion of French
maritime pine bark extract (Pycnogenol). Biomed Pharmacother, 2006. 60(1): 5-9.
182. Gulati, O.P., Pycnogenol® in Metabolic Syndrome and Related Disorders. Phytother Res, 2015.
29(7): 949-968.
183. Providencia, R., Cardiovascular protection from alcoholic drinks: scientific basis of the French
Paradox. Rev Port Cardiol, 2006. 25(11): 1043-58.
184. Lekakis, J., Rallidis, L.S., Andreadou, I., Vamvakou, G., Kazantzoglou, G., Magiatis, P.,
Skaltsounis, A.L., Kremastinos, D.T., Polyphenolic compounds from red grapes acutely improve
endothelial function in patients with coronary heart disease. Eur J Cardiovasc Prev Rehabil, 2005.
12(6): 596-600.
185. Rodrigo, R., Gil, D., Miranda-Merchak, A., Kalantzidis, G., Antihypertensive role of polyphenols.
Adv Clin Chem, 2012. 58: 225-54.
186. de Brito Alves, J.L., de Sousa, V.P., Cavalcanti Neto, M.P., Magnani, M., Braga, V.A., da Costa-
Silva, J.H., Leandro, C.G., Vidal, H., Pirola, L., New Insights on the Use of Dietary Polyphenols or
Probiotics for the Management of Arterial Hypertension. Front Physiol, 2016. 7: 448.
187. Lim, G.E., Brubaker, P.L., Glucagon-Like Peptide 1 Secretion by the L-Cell: The View From
Within. Diabetes, 2006. 55(Supplement 2): S70-S77.
188. Campbell, J.E., Drucker, D.J., Pharmacology, physiology, and mechanisms of incretin hormone
action. Cell Metab, 2013. 17(6): 819-37.
189. Oyama, J., Higashi, Y., Node, K., Do incretins improve endothelial function? Cardiovasc Diabetol,
2014. 13(1): 1-8.
190. Ban, K., Noyan-Ashraf, M.H., Hoefer, J., Bolz, S.S., Drucker, D.J., Husain, M., Cardioprotective
and Vasodilatory Actions of Glucagon-Like Peptide 1 Receptor Are Mediated Through Both
Glucagon-Like Peptide 1 Receptor–Dependent and –Independent Pathways. Circulation, 2008.
117(18): 2340-2350.
191. Frigge, M., Hoaglin, D.C., Iglewicz, B., Some Implementations of the Boxplot. Am Stat, 1989.
43(1): 50-54.
192. Grubbs, F.E., Procedures for Detecting Outlying Observations in Samples. Technometrics, 1969.
11(1): 1-21.
193. Torronen, R., Sarkkinen, E., Niskanen, T., Tapola, N., Kilpi, K., Niskanen, L., Postprandial
glucose, insulin and glucagon-like peptide 1 responses to sucrose ingested with berries in healthy
subjects. Br J Nutr, 2012. 107(10): 1445-51.

220 G References
220
194. Elliott, R.M., Morgan, L.M., Tredger, J.A., Deacon, S., Wright, J., Marks, V., Glucagon-like
peptide-1 (7-36)amide and glucose-dependent insulinotropic polypeptide secretion in response to
nutrient ingestion in man: acute post-prandial and 24-h secretion patterns. J Endocrinol, 1993.
138(1): 159-66.
195. Ryskjær, J., Deacon, C.F., Carr, R.D., Krarup, T., Madsbad, S., Holst, J., Vilsbøll, T., Plasma
dipeptidyl peptidase-IV activity in patients with type-2 diabetes mellitus correlates positively with
HbAlc levels, but is not acutely affected by food intake. Eur J Endocrinol, 2006. 155(3): 485-493.
196. Vilsboll, T., Krarup, T., Deacon, C.F., Madsbad, S., Holst, J.J., Reduced postprandial
concentrations of intact biologically active glucagon-like peptide 1 in type 2 diabetic patients.
Diabetes, 2001. 50(3): 609-13.
197. Hillman, M., Eriksson, L., Mared, L., Helgesson, K., Landin-Olsson, M., Reduced levels of active
GLP-1 in patients with cystic fibrosis with and without diabetes mellitus. J Cyst Fibros, 2012. 11(2):
144-9.
198. Holst, J.J., The physiology of glucagon-like peptide 1. Physiol Rev, 2007. 87(4): 1409-39.
199. Faerch, K., Torekov, S.S., Vistisen, D., Johansen, N.B., Witte, D.R., Jonsson, A., Pedersen, O.,
Hansen, T., Lauritzen, T., Sandbaek, A., Holst, J.J., Jorgensen, M.E., GLP-1 Response to Oral
Glucose Is Reduced in Prediabetes, Screen-Detected Type 2 Diabetes, and Obesity and Influenced
by Sex: The ADDITION-PRO Study. Diabetes, 2015. 64(7): 2513-25.
200. Mannucci, E., Ognibene, A., Cremasco, F., Bardini, G., Mencucci, A., Pierazzuoli, E., Ciani, S.,
Fanelli, A., Messeri, G., Rotella, C.M., Glucagon-like peptide (GLP)-1 and leptin concentrations in
obese patients with Type 2 diabetes mellitus. Diabet Med, 2000. 17(10): 713-9.
201. Seifarth, C., Bergmann, J., Holst, J.J., Ritzel, R., Schmiegel, W., Nauck, M.A., Prolonged and
enhanced secretion of glucagon-like peptide 1 (7-36 amide) after oral sucrose due to alpha-
glucosidase inhibition (acarbose) in Type 2 diabetic patients. Diabet Med, 1998. 15(6): 485-91.
202. Hoggard, N., Cruickshank, M., Moar, K.M., Bestwick, C., Holst, J.J., Russell, W., Horgan, G., A
single supplement of a standardised bilberry (Vaccinium myrtillus L.) extract (36 % wet weight
anthocyanins) modifies glycaemic response in individuals with type 2 diabetes controlled by diet
and lifestyle. J Nutr Sci, 2013. 2: e22.
203. Johnston, K.L., Clifford, M.N., Morgan, L.M., Coffee acutely modifies gastrointestinal hormone
secretion and glucose tolerance in humans: glycemic effects of chlorogenic acid and caffeine. Am J
Clin Nutr, 2003. 78(4): 728-33.
204. Lambeir, A.M., Durinx, C., Scharpe, S., De Meester, I., Dipeptidyl-peptidase IV from bench to
bedside: an update on structural properties, functions, and clinical aspects of the enzyme DPP IV.
Crit Rev Clin Lab Sci, 2003. 40(3): 209-94.
205. Deacon, C.F., Lebovitz, H.E., Comparative review of dipeptidyl peptidase-4 inhibitors and
sulphonylureas. Diabetes Obes Metab, 2016. 18(4): 333-347.
206. Lamers, D., Famulla, S., Wronkowitz, N., Hartwig, S., Lehr, S., Ouwens, D.M., Eckardt, K.,
Kaufman, J.M., Ryden, M., Muller, S., Hanisch, F.G., Ruige, J., Arner, P., Sell, H., Eckel, J.,
Dipeptidyl peptidase 4 is a novel adipokine potentially linking obesity to the metabolic syndrome.
Diabetes, 2011. 60(7): 1917-25.
207. Cordero, O.J., Salgado, F.J., Mera-Varela, A., Nogueira, M., Serum interleukin-12, interleukin-15,
soluble CD26, and adenosine deaminase in patients with rheumatoid arthritis. Rheumatol Int, 2001.
21(2): 69-74.
208. Cordero, O.J., Salgado, F.J., Nogueira, M., On the origin of serum CD26 and its altered
concentration in cancer patients. Cancer Immunol Immunother, 2009. 58(11): 1723-47.
209. Chang, X.Y., Yang, Y., Jia, X.Q., Wang, Y., Peng, L.N., Ai, X.H., Jiang, C.Y., Guo, J.H., Wu, T.T.,
Expression and Clinical Significance of Serum Dipeptidyl Peptidase IV Chronic Obstructive
Pulmonary Disease. Am J Med Sci, 2016. 351(3): 244-52.
210. Buljevic, S., Detel, D., Pucar, L.B., Mihelic, R., Madarevic, T., Sestan, B., Varljen, J., Levels of
dipeptidyl peptidase IV/CD26 substrates neuropeptide Y and vasoactive intestinal peptide in
rheumatoid arthritis patients. Rheumatol Int, 2013. 33(11): 2867-74.
211. Durinx, C., Lambeir, A.M., Bosmans, E., Falmagne, J.B., Berghmans, R., Haemers, A., Scharpe, S.,
De Meester, I., Molecular characterization of dipeptidyl peptidase activity in serum: soluble
CD26/dipeptidyl peptidase IV is responsible for the release of X-Pro dipeptides. Eur J Biochem,
2000. 267(17): 5608-13.
212. Plamboeck, A., Holst, J.J., Carr, R.D., Deacon, C.F., Neutral endopeptidase 24.11 and dipeptidyl
peptidase IV are both mediators of the degradation of glucagon-like peptide 1 in the anaesthetised
pig. Diabetologia, 2005. 48(9): 1882-90.
213. Rhee, N.A., Ostoft, S.H., Holst, J.J., Deacon, C.F., Vilsboll, T., Knop, F.K., The impact of dipeptidyl
peptidase 4 inhibition on incretin effect, glucose tolerance, and gastrointestinal-mediated glucose
disposal in healthy subjects. Eur J Endocrinol, 2014. 171(3): 353-62.

221
214. Mannucci, E., Pala, L., Ciani, S., Bardini, G., Pezzatini, A., Sposato, I., Cremasco, F., Ognibene, A.,
Rotella, C.M., Hyperglycaemia increases dipeptidyl peptidase IV activity in diabetes mellitus.
Diabetologia, 2005. 48(6): 1168-72.
215. Fan, J., Johnson, M.H., Lila, M.A., Yousef, G., de Mejia, E.G., Berry and Citrus Phenolic
Compounds Inhibit Dipeptidyl Peptidase IV: Implications in Diabetes Management. Evid Based
Complement Alternat Med, 2013. 2013: 479505.
216. Bansal, P., Paul, P., Mudgal, J., Nayak, P.G., Pannakal, S.T., Priyadarsini, K.I., Unnikrishnan, M.K.,
Antidiabetic, antihyperlipidemic and antioxidant effects of the flavonoid rich fraction of Pilea
microphylla (L.) in high fat diet/streptozotocin-induced diabetes in mice. Exp Toxicol Pathol, 2012.
64(6): 651-8.
217. Kosaraju, J., Dubala, A., Chinni, S., Khatwal, R.B., Satish Kumar, M.N., Basavan, D., A molecular
connection of Pterocarpus marsupium, Eugenia jambolana and Gymnema sylvestre with dipeptidyl
peptidase-4 in the treatment of diabetes. Pharm Biol, 2014. 52(2): 268-71.
218. Manach, C., Williamson, G., Morand, C., Scalbert, A., Remesy, C., Bioavailability and bioefficacy
of polyphenols in humans. I. Review of 97 bioavailability studies. Am J Clin Nutr, 2005. 81(1
Suppl): 230s-242s.
219. Adolpho, L.O., Marin, D., Puigpinos, A., Mendieta, L., Tarrago, T., Morel, A.F., Giralt, E., Dalcol,
II, In vitro evaluation of caffeoyl and cinnamoyl derivatives as potential prolyl oligopeptidase
inhibitors. Planta Med, 2013. 79(16): 1531-5.
220. Roškar, I., Štrukelj, B., Lunder, M., Screening of Phenolic Compounds Reveals Inhibitory Activity of
Nordihydroguaiaretic Acid Against Three Enzymes Involved in the Regulation of Blood Glucose
Level. Plant Foods Hum Nutr, 2016. 71(1): 88-89.
221. Bower, A.M., Real Hernandez, L.M., Berhow, M.A., de Mejia, E.G., Bioactive compounds from
culinary herbs inhibit a molecular target for type 2 diabetes management, dipeptidyl peptidase IV. J
Agric Food Chem, 2014. 62(26): 6147-58.
222. Kozuka, M., Yamane, T., Nakano, Y., Nakagaki, T., Ohkubo, I., Ariga, H., Identification and
characterization of a dipeptidyl peptidase IV inhibitor from aronia juice. Biochem Biophys Res
Commun, 2015. 465(3): 433-6.
223. Szepietowska, B., Gorska, M., Szelachowska, M., Plasma relaxin concentration is related to beta-
cell function and insulin sensitivity in women with type 2 diabetes mellitus. Diabetes Res Clin Pract,
2008. 79(3): e1-3.
224. Zhang, X., Zhu, M., Zhao, M., Chen, W., Fu, Y., Liu, Y., Liu, W., Zhang, B., Yin, X., Bai, B., The
plasma levels of relaxin-2 and relaxin-3 in patients with diabetes. Clin Biochem, 2013. 46(16-17):
1713-6.
225. Whittaker, P.G., Edwards, J.R., Randolph, C., Bullesbach, E.E., Schwabe, C., Steinetz, B.G.,
Abnormal relaxin secretion during pregnancy in women with type 1 diabetes. Exp Biol Med
(Maywood), 2003. 228(1): 33-40.
226. Wiecek, A., Kokot, F., Chudek, J., Adamczak, M., The adipose tissue--a novel endocrine organ of
interest to the nephrologist. Nephrol Dial Transplant, 2002. 17(2): 191-5.
227. Ukkola, O., Santaniemi, M., Adiponectin: a link between excess adiposity and associated
comorbidities? J Mol Med (Berl), 2002. 80(11): 696-702.
228. Yamauchi, T., Kadowaki, T., Physiological and pathophysiological roles of adiponectin and
adiponectin receptors in the integrated regulation of metabolic and cardiovascular diseases. Int J
Obes (Lond), 2008. 32 Suppl 7: S13-8.
229. Ouchi, N., Kihara, S., Arita, Y., Okamoto, Y., Maeda, K., Kuriyama, H., Hotta, K., Nishida, M.,
Takahashi, M., Muraguchi, M., Ohmoto, Y., Nakamura, T., Yamashita, S., Funahashi, T.,
Matsuzawa, Y., Adiponectin, an adipocyte-derived plasma protein, inhibits endothelial NF-kappaB
signaling through a cAMP-dependent pathway. Circulation, 2000. 102(11): 1296-301.
230. Zoccali, C., Mallamaci, F., Tripepi, G., Benedetto, F.A., Cutrupi, S., Parlongo, S., Malatino, L.S.,
Bonanno, G., Seminara, G., Rapisarda, F., Fatuzzo, P., Buemi, M., Nicocia, G., Tanaka, S., Ouchi,
N., Kihara, S., Funahashi, T., Matsuzawa, Y., Adiponectin, metabolic risk factors, and
cardiovascular events among patients with end-stage renal disease. J Am Soc Nephrol, 2002. 13(1):
134-41.
231. Swarbrick, M.M., Havel, P.J., Physiological, pharmacological, and nutritional regulation of
circulating adiponectin concentrations in humans. Metab Syndr Relat Disord, 2008. 6(2): 87-102.
232. Okada-Iwabu, M., Iwabu, M., Ueki, K., Yamauchi, T., Kadowaki, T., Perspective of Small-
Molecule AdipoR Agonist for Type 2 Diabetes and Short Life in Obesity. Diabetes Metab J, 2015.
39(5): 363-72.
233. Lee, C.Y., Jan, M.S., Yu, M.C., Lin, C.C., Wei, J.C., Shih, H.C., Relationship between adiponectin
and leptin, and blood lipids in hyperlipidemia patients treated with red yeast rice. Forsch
Komplementmed, 2013. 20(3): 197-203.

222 G References
222
234. Lozano, A., Perez-Martinez, P., Marin, C., Tinahones, F.J., Delgado-Lista, J., Cruz-Teno, C.,
Gomez-Luna, P., Rodriguez-Cantalejo, F., Perez-Jimenez, F., Lopez-Miranda, J., An acute intake of
a walnut-enriched meal improves postprandial adiponectin response in healthy young adults. Nutr
Res, 2013. 33(12): 1012-8.
235. Aronis, K.N., Vamvini, M.T., Chamberland, J.P., Sweeney, L.L., Brennan, A.M., Magkos, F.,
Mantzoros, C.S., Short-term walnut consumption increases circulating total adiponectin and
apolipoprotein A concentrations, but does not affect markers of inflammation or vascular injury in
obese humans with the metabolic syndrome: data from a double-blinded, randomized, placebo-
controlled study. Metabolism, 2012. 61(4): 577-82.
236. Sone, T., Kuriyama, S., Nakaya, N., Hozawa, A., Shimazu, T., Nomura, K., Rikimaru, S., Tsuji, I.,
Randomized controlled trial for an effect of catechin-enriched green tea consumption on
adiponectin and cardiovascular disease risk factors. Food Nutr Res, 2011. 55.
237. Tome-Carneiro, J., Gonzalvez, M., Larrosa, M., Yanez-Gascon, M.J., Garcia-Almagro, F.J., Ruiz-
Ros, J.A., Tomas-Barberan, F.A., Garcia-Conesa, M.T., Espin, J.C., Grape resveratrol increases
serum adiponectin and downregulates inflammatory genes in peripheral blood mononuclear cells: a
triple-blind, placebo-controlled, one-year clinical trial in patients with stable coronary artery
disease. Cardiovasc Drugs Ther, 2013. 27(1): 37-48.
238. Wu, A.H., Spicer, D., Stanczyk, F.Z., Tseng, C.C., Yang, C.S., Pike, M.C., Effect of 2-month
controlled green tea intervention on lipoprotein cholesterol, glucose, and hormone levels in healthy
postmenopausal women. Cancer Prev Res (Phila), 2012. 5(3): 393-402.
239. Liu, C.Y., Huang, C.J., Huang, L.H., Chen, I.J., Chiu, J.P., Hsu, C.H., Effects of green tea extract on
insulin resistance and glucagon-like peptide 1 in patients with type 2 diabetes and lipid
abnormalities: a randomized, double-blinded, and placebo-controlled trial. PLoS One, 2014. 9(3):
e91163.
240. Yamauchi, J., Osawa, H., Takasuka, T., Ochi, M., Murakami, A., Nishida, W., Onuma, H., Takata,
Y., Tabara, Y., Miki, T., Ohashi, J., Makino, H., Serum resistin is reduced by glucose and meal
loading in healthy human subjects. Metabolism, 2008. 57(2): 149-56.
241. Karlsson, F.A., Engstrom, B.E., Lind, L., Ohrvall, M., No postprandial increase of plasma
adiponectin in obese subjects. Obes Res, 2004. 12(6): 1031-2; author reply 1032-4.
242. Ozeki, N., Hara, K., Yatsuka, C., Nakano, T., Matsumoto, S., Suetsugu, M., Nakamachi, T.,
Takebayashi, K., Inukai, T., Haruki, K., Aso, Y., Serum high-molecular weight adiponectin
decreases abruptly after an oral glucose load in subjects with normal glucose tolerance or impaired
fasting glucose, but not those with impaired glucose tolerance or diabetes mellitus. Metabolism,
2009. 58(10): 1470-6.
243. Rubin, D., Helwig, U., Nothnagel, M., Lemke, N., Schreiber, S., Folsch, U.R., Doring, F.,
Schrezenmeir, J., Postprandial plasma adiponectin decreases after glucose and high fat meal and is
independently associated with postprandial triacylglycerols but not with -- 11388 promoter
polymorphism. Br J Nutr, 2008. 99(1): 76-82.
244. Esposito, K., Nappo, F., Giugliano, F., Di Palo, C., Ciotola, M., Barbieri, M., Paolisso, G.,
Giugliano, D., Meal modulation of circulating interleukin 18 and adiponectin concentrations in
healthy subjects and in patients with type 2 diabetes mellitus. Am J Clin Nutr, 2003. 78(6): 1135-40.
245. Horakova, D., Azeem, K., Benesova, R., Pastucha, D., Horak, V., Dumbrovska, L., Martinek, A.,
Novotny, D., Svagera, Z., Total and High Molecular Weight Adiponectin Levels and Prediction of
Cardiovascular Risk in Diabetic Patients. J Endocrinol, 2015. 2015: 545068.
246. Bluher, M., Brennan, A.M., Kelesidis, T., Kratzsch, J., Fasshauer, M., Kralisch, S., Williams, C.J.,
Mantzoros, C.S., Total and high-molecular weight adiponectin in relation to metabolic variables at
baseline and in response to an exercise treatment program: comparative evaluation of three assays.
Diabetes Care, 2007. 30(2): 280-5.
247. Han, S.H., Sakuma, I., Shin, E.K., Koh, K.K., Antiatherosclerotic and anti-insulin resistance effects
of adiponectin: basic and clinical studies. Prog Cardiovasc Dis, 2009. 52(2): 126-40.
248. Zdychova, J., Komers, R., Emerging role of Akt kinase/protein kinase B signaling in
pathophysiology of diabetes and its complications. Physiol Res, 2005. 54(1): 1-16.
249. Kohn, A.D., Summers, S.A., Birnbaum, M.J., Roth, R.A., Expression of a constitutively active Akt
Ser/Thr kinase in 3T3-L1 adipocytes stimulates glucose uptake and glucose transporter 4
translocation. J Biol Chem, 1996. 271(49): 31372-8.
250. Shiojima, I., Walsh, K., Role of Akt signaling in vascular homeostasis and angiogenesis. Circ Res,
2002. 90(12): 1243-50.
251. Taguchi, K., Hida, M., Hasegawa, M., Matsumoto, T., Kobayashi, T., Dietary polyphenol morin
rescues endothelial dysfunction in a diabetic mouse model by activating the Akt/eNOS pathway. Mol
Nutr Food Res, 2016. 60(3): 580-8.

223
252. Jang, H.J., Ridgeway, S.D., Kim, J.A., Effects of the green tea polyphenol epigallocatechin-3-
gallate on high-fat diet-induced insulin resistance and endothelial dysfunction. Am J Physiol
Endocrinol Metab, 2013. 305(12): E1444-51.
253. Yang, D.K., Kang, H.S., Anti-Diabetic Effect of Cotreatment with Quercetin and Resveratrol in
Streptozotocin-Induced Diabetic Rats. Biomol Ther (Seoul), 2018. 26(2): 130-8.
254. Mellor, D.D., Madden, L.A., Smith, K.A., Kilpatrick, E.S., Atkin, S.L., High-polyphenol chocolate
reduces endothelial dysfunction and oxidative stress during acute transient hyperglycaemia in Type
2 diabetes: a pilot randomized controlled trial. Diabet Med, 2013. 30(4): 478-83.
255. Choi, E.Y., Lee, H., Woo, J.S., Jang, H.H., Hwang, S.J., Kim, H.S., Kim, W.S., Kim, Y.S., Choue,
R., Cha, Y.J., Yim, J.E., Kim, W., Effect of onion peel extract on endothelial function and
endothelial progenitor cells in overweight and obese individuals. Nutrition, 2015. 31(9): 1131-5.
256. Li, D., Zhang, Y., Liu, Y., Sun, R., Xia, M., Purified anthocyanin supplementation reduces
dyslipidemia, enhances antioxidant capacity, and prevents insulin resistance in diabetic patients. J
Nutr, 2015. 145(4): 742-8.
257. Li, J., Huang, W., Tu, R., Zhong, G., Luo, B., He, Y., Resveratrol rescues hyperglycemia-induced
endothelial dysfunction via activation of Akt. Acta Pharmacol Sin, 2017. 38(2): 182-91.
258. Zhang, H., Zhang, J., Ungvari, Z., Zhang, C., Resveratrol Improves Endothelial Function: Role of
TNFα and Vascular Oxidative Stress. Arterioscler Thromb Vasc Biol, 2009. 29(8): 1164-1171.
259. Xia, N., Forstermann, U., Li, H., Resveratrol and endothelial nitric oxide. Molecules, 2014. 19(10):
16102-21.
260. Sanchez, M., Galisteo, M., Vera, R., Villar, I.C., Zarzuelo, A., Tamargo, J., Perez-Vizcaino, F.,
Duarte, J., Quercetin downregulates NADPH oxidase, increases eNOS activity and prevents
endothelial dysfunction in spontaneously hypertensive rats. J Hypertens, 2006. 24(1): 75-84.
261. Guo, X.D., Zhang, D.Y., Gao, X.J., Parry, J., Liu, K., Liu, B.L., Wang, M., Quercetin and
quercetin-3-O-glucuronide are equally effective in ameliorating endothelial insulin resistance
through inhibition of reactive oxygen species-associated inflammation. Mol Nutr Food Res, 2013.
57(6): 1037-45.
262. Matter, W.F., Brown, R.F., Vlahos, C.J., The inhibition of phosphatidylinositol 3-kinase by
quercetin and analogs. Biochem Biophys Res Commun, 1992. 186(2): 624-31.
263. Kampa-Schittenhelm, K.M., Heinrich, M.C., Akmut, F., Rasp, K.H., Illing, B., Döhner, H., Döhner,
K., Schittenhelm, M.M., Cell cycle-dependent activity of the novel dual PI3K-MTORC1/2 inhibitor
NVP-BGT226 in acute leukemia. Mol Cancer, 2013. 12(1): 1-18.
264. Jackson, S.J., Venema, R.C., Quercetin inhibits eNOS, microtubule polymerization, and mitotic
progression in bovine aortic endothelial cells. J Nutr, 2006. 136(5): 1178-84.
265. Shakibaei, M., Harikumar, K.B., Aggarwal, B.B., Resveratrol addiction: to die or not to die. Mol
Nutr Food Res, 2009. 53(1): 115-28.
266. Kanavi, M.R., Darjatmoko, S., Wang, S., Azari, A.A., Farnoodian, M., Kenealey, J.D., van Ginkel,
P.R., Albert, D.M., Sheibani, N., Polans, A.S., The Sustained Delivery of Resveratrol or a Defined
Grape Powder Inhibits New Blood Vessel Formation in a Mouse Model of Choroidal
Neovascularization. Molecules, 2014. 19(11): 17578-603.
267. In, K., Park, J., Park, H., Resveratrol at high doses acts as an apoptotic inducer in endothelial cells.
Cancer Res Treat, 2006. 38(1): 48-53.
268. Takahashi, S., Uchiyama, T., Toda, K., Differential effect of resveratrol on nitric oxide production
in endothelial f-2 cells. Biol Pharm Bull, 2009. 32(11): 1840-3.
269. Dimmeler, S., Dernbach, E., Zeiher, A.M., Phosphorylation of the endothelial nitric oxide synthase
at Ser-1177 is required for VEGF-induced endothelial cell migration. FEBS Lett, 2000. 477(3):
258-262.
270. Pektas, M.B., Turan, O., Ozturk Bingol, G., Sumlu, E., Sadi, G., Akar, F., High glucose causes
vascular dysfunction through Akt/eNOS pathway: reciprocal modulation by juglone and resveratrol.
Can J Physiol Pharmacol, 2018: 1-8.
271. Simão, F., Pagnussat, A.S., Seo, J.H., Navaratna, D., Leung, W., Lok, J., Guo, S., Waeber, C.,
Salbego, C.G., Lo, E.H., Pro-angiogenic effects of resveratrol in brain endothelial cells: nitric
oxide-mediated regulation of vascular endothelial growth factor and metalloproteinases. J Cereb
Blood Flow Metab, 2012. 32(5): 884-95.
272. Xiao, J., Hogger, P., Stability of dietary polyphenols under the cell culture conditions: avoiding
erroneous conclusions. J Agric Food Chem, 2015. 63(5): 1547-57.
273. Wilsher, N.E., Arroo, R.R., Matsoukas, M.T., Tsatsakis, A.M., Spandidos, D.A., Androutsopoulos,
V.P., Cytochrome P450 CYP1 metabolism of hydroxylated flavones and flavonols: Selective
bioactivation of luteolin in breast cancer cells. Food Chem Toxicol, 2017. 110: 383-394.
274. Potter, G.A., Patterson, L.H., Wanogho, E., Perry, P.J., Butler, P.C., Ijaz, T., Ruparelia, K.C., Lamb,
J.H., Farmer, P.B., Stanley, L.A., Burke, M.D., The cancer preventative agent resveratrol is

224 G References
224
converted to the anticancer agent piceatannol by the cytochrome P450 enzyme CYP1B1. Br J
Cancer, 2002. 86(5): 774-8.
275. Castillo-Pichardo, L., Martínez, E.J., Inhibition of mammary tumor growth and metastases to bone
and liver by dietary grape polyphenols. Clin Exp Metastasis, 2009. 26(6): 505-516.
276. Huang, S., Zhu, X., Huang, W., He, Y., Pang, L., Lan, X., Shui, X., Chen, Y., Chen, C., Lei, W.,
Quercetin Inhibits Pulmonary Arterial Endothelial Cell Transdifferentiation Possibly by Akt and
Erk1/2 Pathways. Biomed Res Int, 2017. 2017: 8.
277. Bagli, E., Stefaniotou, M., Morbidelli, L., Ziche, M., Psillas, K., Murphy, C., Fotsis, T., Luteolin
inhibits vascular endothelial growth factor-induced angiogenesis; inhibition of endothelial cell
survival and proliferation by targeting phosphatidylinositol 3'-kinase activity. Cancer Res, 2004.
64(21): 7936-46.
278. Erdogan, A., Most, A.K., Wienecke, B., Fehsecke, A., Leckband, C., Voss, R., Grebe, M.T.,
Tillmanns, H., Schaefer, C.A., Kuhlmann, C.R., Apigenin-induced nitric oxide production involves
calcium-activated potassium channels and is responsible for antiangiogenic effects. J Thromb
Haemost, 2007. 5(8): 1774-81.
279. Gao, X., Liu, K., Huang, F., Zhang, D., Guo, X., Wang, M., Liu, B., Positive and negative
regulation of insulin action by genistein in the endothelium. J Nutr Biochem, 2013. 24(1): 222-30.
280. Vincent, E.E., Elder, D.J.E., Thomas, E.C., Phillips, L., Morgan, C., Pawade, J., Sohail, M., May,
M.T., Hetzel, M.R., Tavaré, J.M., Akt phosphorylation on Thr308 but not on Ser473 correlates with
Akt protein kinase activity in human non-small cell lung cancer. Br J Cancer, 2011. 104(11): 1755-
61.
281. Tremblay, F., Krebs, M., Dombrowski, L., Brehm, A., Bernroider, E., Roth, E., Nowotny, P.,
Waldhäusl, W., Marette, A., Roden, M., Overactivation of S6 Kinase 1 as a Cause of Human Insulin
Resistance During Increased Amino Acid Availability. Diabetes, 2005. 54(9): 2674-2684.
282. Rajapakse, A.G., Yepuri, G., Carvas, J.M., Stein, S., Matter, C.M., Scerri, I., Ruffieux, J., Montani,
J.P., Ming, X.F., Yang, Z., Hyperactive S6K1 mediates oxidative stress and endothelial dysfunction
in aging: inhibition by resveratrol. PLoS One, 2011. 6(4): e19237.
283. Sheu, M.L., Ho, F.M., Yang, R.S., Chao, K.F., Lin, W.W., Lin-Shiau, S.Y., Liu, S.H., High glucose
induces human endothelial cell apoptosis through a phosphoinositide 3-kinase-regulated
cyclooxygenase-2 pathway. Arterioscler Thromb Vasc Biol, 2005. 25(3): 539-45.
284. Heath, J.M., Sun, Y., Yuan, K., Bradley, W.E., Litovsky, S., Dell’Italia, L.J., Chatham, J.C., Wu,
H., Chen, Y., Activation of AKT by O-GlcNAcylation Induces Vascular Calcification in Diabetes.
Circ Res, 2014. 114(7): 1094-1102.
285. Jiang, B.H., Liu, L.Z., AKT signaling in regulating angiogenesis. Curr Cancer Drug Targets, 2008.
8(1): 19-26.
286. Costa, P.Z., Soares, R., Neovascularization in diabetes and its complications. Unraveling the
angiogenic paradox. Life Sci, 2013. 92(22): 1037-45.
287. Phung, T.L., Ziv, K., Dabydeen, D., Eyiah-Mensah, G., Riveros, M., Perruzzi, C., Sun, J., Monahan-
Earley, R.A., Shiojima, I., Nagy, J.A., Lin, M.I., Walsh, K., Dvorak, A.M., Briscoe, D.M., Neeman,
M., Sessa, W.C., Dvorak, H.F., Benjamin, L.E., Pathological angiogenesis is induced by sustained
Akt signaling and inhibited by rapamycin. Cancer Cell, 2006. 10(2): 159-70.
288. Kim, Y., Lim, H., Lee, S., Shin, M., Kim, C., Yang, H.J., Betaine inhibits vascularization via
suppression of Akt in the retinas of streptozotocin-induced hyperglycemic rats. Mol Med Rep, 2015.
12(2): 1639-44.
289. Price, P.M., Diabetes: Caught in the Akt? Kidney Int, 2007. 71(9): 839-841.
290. Bai, X., Li, X., Tian, J., Zhou, Z., Antiangiogenic Treatment Diminishes Renal Injury and
Dysfunction via Regulation of Local AKT in Early Experimental Diabetes. PLoS One, 2014. 9(4):
e96117.
291. Chen, Z., Yuan, Y., Zou, X., Hong, M., Zhao, M., Zhao, Y., Liu, Y., Li, G., Zhu, Y., Luo, L., Bao,
B., Bu, S., Radix Puerariae and Fructus Crataegi mixture inhibits renal injury in type 2 diabetes via
decreasing of AKT/PI3K. BMC Complement Altern Med, 2017. 17: 454.
292. Xu, F., Wang, Y., Cui, W., Yuan, H., Sun, J., Wu, M., Guo, Q., Kong, L., Wu, H., Miao, L.,
Resveratrol Prevention of Diabetic Nephropathy Is Associated with the Suppression of Renal
Inflammation and Mesangial Cell Proliferation: Possible Roles of Akt/NF-kappaB Pathway. Int J
Endocrinol, 2014. 2014: 289327.
293. Lega, I.C., Wilton, A.S., Austin, P.C., Fischer, H.D., Johnson, J.A., Lipscombe, L.L., The temporal
relationship between diabetes and cancer: A population-based study. Cancer, 2016. 122(17): 2731-
8.
294. Othman, E.M., Hintzsche, H., Stopper, H., Signaling steps in the induction of genomic damage by
insulin in colon and kidney cells. Free Radic Biol Med, 2014. 68: 247-57.
295. Habib, S.L., Liang, S., Hyperactivation of Akt/mTOR and deficiency in tuberin increased the
oxidative DNA damage in kidney cancer patients with diabetes. Oncotarget, 2014. 5(9): 2542-50.

225
296. Mollica, J.P., Oakhill, J.S., Lamb, G.D., Murphy, R.M., Are genuine changes in protein expression
being overlooked? Reassessing Western blotting. Anal Biochem, 2009. 386(2): 270-5.
297. Olive, D.M., Quantitative methods for the analysis of protein phosphorylation in drug development.
Expert Rev Proteomics, 2004. 1(3): 327-41.
298. Nomura, M., Takahashi, T., Nagata, N., Tsutsumi, K., Kobayashi, S., Akiba, T., Yokogawa, K.,
Moritani, S., Miyamoto, K., Inhibitory mechanisms of flavonoids on insulin-stimulated glucose
uptake in MC3T3-G2/PA6 adipose cells. Biol Pharm Bull, 2008. 31(7): 1403-9.
299. Erasalo, H., Hamalainen, M., Leppanen, T., Maki-Opas, I., Laavola, M., Haavikko, R., Yli-
Kauhaluoma, J., Natural Stilbenoids Have Anti-Inflammatory Properties in Vivo and Down-
Regulate the Production of Inflammatory Mediators NO, IL6, and MCP1 Possibly in a PI3K/Akt-
Dependent Manner. J Nat Prod, 2018. 81(5): 1131-1142.
300. Fruman, D.A., Chiu, H., Hopkins, B.D., Bagrodia, S., Cantley, L.C., Abraham, R.T., The PI3K
Pathway in Human Disease. Cell, 2017. 170(4): 605-635.
301. Agullo, G., Gamet-Payrastre, L., Manenti, S., Viala, C., Remesy, C., Chap, H., Payrastre, B.,
Relationship between flavonoid structure and inhibition of phosphatidylinositol 3-kinase: a
comparison with tyrosine kinase and protein kinase C inhibition. Biochem Pharmacol, 1997. 53(11):
1649-57.
302. Kong, D., Zhang, Y., Yamori, T., Duan, H., Jin, M., Inhibitory activity of flavonoids against class I
phosphatidylinositol 3-kinase isoforms. Molecules, 2011. 16(6): 5159-67.
303. Kang, Y., Kim, B.-G., Kim, S., Lee, Y., Yoon, Y., Inhibitory potential of flavonoids on
PtdIns(3,4,5)P3 binding with the phosphoinositide-dependent kinase 1 pleckstrin homology domain.
Bioorg Med Chem Lett, 2017. 27(3): 420-426.
304. Ali, H.M., Abo-Shady, A., Sharaf Eldeen, H.A., Soror, H.A., Shousha, W.G., Abdel-Barry, O.A.,
Saleh, A.M., Structural features, kinetics and SAR study of radical scavenging and antioxidant
activities of phenolic and anilinic compounds. Chem Cent J, 2013. 7(1): 53.
305. Nile, S.H., Ko, E.Y., Kim, D.H., Keum, Y.-S., Screening of ferulic acid related compounds as
inhibitors of xanthine oxidase and cyclooxygenase-2 with anti-inflammatory activity. Rev Bras
Farmacogn, 2016. 26(1): 50-55.
306. Ahmed, H., Moawad, A., Owis, A., AbouZid, S., Ahmed, O., Flavonoids of Calligonum
polygonoides and their cytotoxicity. Pharm Biol, 2016. 54(10): 2119-26.
307. Lahair, M.M., Howe, C.J., Rodriguez-Mora, O., McCubrey, J.A., Franklin, R.A., Molecular
pathways leading to oxidative stress-induced phosphorylation of Akt. Antioxid Redox Signal, 2006.
8(9-10): 1749-56.
308. Bors, W., Heller, W., Michel, C., Saran, M., Flavonoids as antioxidants: determination of radical-
scavenging efficiencies. Methods Enzymol, 1990. 186: 343-55.
309. Crasci, L., Lauro, M.R., Natural antioxidant polyphenols on inflammation management: Anti-
glycation activity vs metalloproteinases inhibition. Crit Rev Food Sci Nutr, 2018. 58(6): 893-904.
310. Amic, D., Davidovic-Amic, D., Beslo, D., Rastija, V., Lucic, B., Trinajstic, N., SAR and QSAR of
the antioxidant activity of flavonoids. Curr Med Chem, 2007. 14(7): 827-45.
311. Molecular Operating Environment (MOE), 2013.08;. 2018, Chemical Computing Group ULC: 1010
Sherbooke St. West, Suite #910, Montreal, QC, Canada,.
312. Labute, P., Williams, C., Feher, M., Sourial, E., Schmidt, J.M., Flexible alignment of small
molecules. J Med Chem, 2001. 44(10): 1483-90.
313. Chan, S.L., Labute, P., Training a Scoring Function for the Alignment of Small Molecules. J Chem
Inf Model, 2010. 50(9): 1724-35.
314. Enamine. Enamine Store. 2018 [cited 2018 24.07.]; Available from:
https://www.enaminestore.com.
315. Life chemicals Inc. Life chemicals - Synthesis and sales of novel organic compounds. 2003 2018;
Available from: http://www.lifechemicals.com/.
316. eMolecules Inc. eMolecules: empowering drug discovery. 2018 [cited 2018 24.07.]; Available
from: https://www.emolecules.com/.
317. Novick, P.A., Ortiz, O.F., Poelman, J., Abdulhay, A.Y., Pande, V.S., SWEETLEAD: an In Silico
Database of Approved Drugs, Regulated Chemicals, and Herbal Isolates for Computer-Aided Drug
Discovery. PLoS One, 2013. 8(11): e79568.
318. Wishart, D.S., Knox, C., Guo, A.C., Shrivastava, S., Hassanali, M., Stothard, P., Chang, Z.,
Woolsey, J., DrugBank: a comprehensive resource for in silico drug discovery and exploration.
Nucleic Acids Res, 2006. 34(Database issue): D668-D672.
319. MOKA. 2018, Molecular Discovery: Unit 501 Centennial Park, Centennial Avenue Elstree, WD6
3FG, Borehamwood, Hertfordshire, UNITED KINGDOM.
320. López-Nicolás, J.M., García-Carmona, F., Aggregation State and pKa Values of (E)-Resveratrol As
Determined by Fluorescence Spectroscopy and UV−Visible Absorption. J Agric Food Chem, 2008.
56(17): 7600-7605.
226 G References
226
321. Amat, A., Clementi, C., De Angelis, F., Sgamellotti, A., Fantacci, S., Absorption and Emission of
the Apigenin and Luteolin Flavonoids: A TDDFT Investigation. J Phys Chem A, 2009. 113(52):
15118-15126.
322. Herrero-Martinez, J.M., Sanmartin, M., Roses, M., Bosch, E., Rafols, C., Determination of
dissociation constants of flavonoids by capillary electrophoresis. Electrophoresis, 2005. 26(10):
1886-95.
323. Milletti, F., Storchi, L., Sforna, G., Cruciani, G., New and Original pKa Prediction Method Using
Grid Molecular Interaction Fields. J Chem Inf Model, 2007. 47(6): 2172-2181.
324. Fröjdö, S., Cozzone, D., Vidal, H., Pirola, L., Resveratrol is a class IA phosphoinositide 3-kinase
inhibitor. Biochem J, 2007. 406(3): 511.
325. Kim, H.Y., Jung, S.K., Byun, S., Son, J.E., Oh, M.H., Lee, J., Kang, M.J., Heo, Y.S., Lee, K.W.,
Lee, H.J., Raf and PI3K are the molecular targets for the anti-metastatic effect of luteolin. Phytother
Res, 2013. 27(10): 1481-8.
326. Srinivasan, S., Jala, V., Honnenahally, K., Castellanos, J., Vermula, P.K., VanSaun, M., Merchant,
N., Nagathihalli, N., Abstract 5259: Urolithin A prevents pancreatic tumor growth and increases
survival by inhibiting PI3K/PDK1 and STAT3 signaling. Cancer Res, 2017. 77(13 Supplement):
5259.
327. Walker, E.H., Pacold, M.E., Perisic, O., Stephens, L., Hawkins, P.T., Wymann, M.P., Williams,
R.L., Structural determinants of phosphoinositide 3-kinase inhibition by wortmannin, LY294002,
quercetin, myricetin, and staurosporine. Mol Cell, 2000. 6(4): 909-19.
328. Beno, B.R., Yeung, K.-S., Bartberger, M.D., Pennington, L.D., Meanwell, N.A., A Survey of the
Role of Noncovalent Sulfur Interactions in Drug Design. J Med Chem, 2015. 58(11): 4383-4438.
329. Valdes, A.M., Walter, J., Segal, E., Spector, T.D., Role of the gut microbiota in nutrition and health.
BMJ, 2018. 361: k2179.
330. Högger, P., Nutrition-derived bioactive metabolites produced by gut microbiota and their potential
impact on human health. Nutr Med, 2013. 1(1): 1.
331. Elena, R.M., Gabriela, G.D., Arnulfod, G.C., Enrique, C.A., Studying the Gut Microbiome of Latin
America and Hispanic/Latino populations. Insight into Obesity and Diabetes. Systematic Review.
Curr Diabetes Rev, 2018.
332. Kassaian, N., Feizi, A., Aminorroaya, A., Amini, M., Probiotic and synbiotic supplementation could
improve metabolic syndrome in prediabetic adults: A randomized controlled trial. Diabetes Metab
Syndr, 2018.
333. Puddu, A., Sanguineti, R., Montecucco, F., Viviani, G.L., Evidence for the Gut Microbiota Short-
Chain Fatty Acids as Key Pathophysiological Molecules Improving Diabetes. Mediators Inflamm,
2014. 2014: 9.
334. Li, D., Kirsop, J., Tang, W.H., Listening to Our Gut: Contribution of Gut Microbiota and
Cardiovascular Risk in Diabetes Pathogenesis. Curr Diab Rep, 2015. 15(9): 63.
335. Sun, Q., Wedick, N.M., Pan, A., Townsend, M.K., Cassidy, A., Franke, A.A., Rimm, E.B., Hu, F.B.,
van Dam, R.M., Gut microbiota metabolites of dietary lignans and risk of type 2 diabetes: a
prospective investigation in two cohorts of U.S. women. Diabetes Care, 2014. 37(5): 1287-95.
336. Duda-Chodak, A., Tarko, T., Satora, P., Sroka, P., Interaction of dietary compounds, especially
polyphenols, with the intestinal microbiota: a review. Eur J Nutr, 2015. 54(3): 325-41.
337. Seeram, N.P., Zhang, Y., McKeever, R., Henning, S.M., Lee, R.P., Suchard, M.A., Li, Z., Chen, S.,
Thames, G., Zerlin, A., Nguyen, M., Wang, D., Dreher, M., Heber, D., Pomegranate juice and
extracts provide similar levels of plasma and urinary ellagitannin metabolites in human subjects. J
Med Food, 2008. 11(2): 390-4.
338. Kutschera, M., Engst, W., Blaut, M., Braune, A., Isolation of catechin-converting human intestinal
bacteria. J Appl Microbiol, 2011. 111(1): 165-75.
339. Saha, P., Yeoh, B.S., Singh, R., Chandrasekar, B., Vemula, P.K., Haribabu, B., Vijay-Kumar, M.,
Jala, V.R., Gut Microbiota Conversion of Dietary Ellagic Acid into Bioactive Phytoceutical
Urolithin A Inhibits Heme Peroxidases. PLoS One, 2016. 11(6): e0156811.
340. Larrosa, M., González-Sarrías, A., García-Conesa, M.T., Tomás-Barberán, F.A., Espín, J.C.,
Urolithins, Ellagic Acid-Derived Metabolites Produced by Human Colonic Microflora, Exhibit
Estrogenic and Antiestrogenic Activities. J Agric Food Chem, 2006. 54(5): 1611-1620.
341. Liberal, J., Carmo, A., Gomes, C., Cruz, M.T., Batista, M.T., Urolithins impair cell proliferation,
arrest the cell cycle and induce apoptosis in UMUC3 bladder cancer cells. Invest New Drugs, 2017.
35(6): 671-681.
342. Good, C.B., Pogach, L.M., Should metformin be first-line therapy for patients with type 2 diabetes
and chronic kidney disease? Informed patients should decide. JAMA Intern Med, 2018. 178(7):
911-912.
343. Driver, C., Bamitale, K.D.S., Kazi, A., Olla, M., Nyane, N.A., Owira, P.M.O., Cardioprotective
Effects of Metformin. J Cardiovasc Pharmacol, 2018. 72(2): 121-127.

227
344. van der Aa, M.P., Elst, M.A., van de Garde, E.M., van Mil, E.G., Knibbe, C.A., van der Vorst,
M.M., Long-term treatment with metformin in obese, insulin-resistant adolescents: results of a
randomized double-blinded placebo-controlled trial. Nutr Diabetes, 2016. 6(8): e228.
345. Barzilai, N., Crandall, J.P., Kritchevsky, S.B., Espeland, M.A., Metformin as a Tool to Target
Aging. Cell Metab, 2016. 23(6): 1060-1065.
346. Chukwunonso Obi, B., Chinwuba Okoye, T., Okpashi, V.E., Nonye Igwe, C., Olisah Alumanah, E.,
Comparative Study of the Antioxidant Effects of Metformin, Glibenclamide, and Repaglinide in
Alloxan-Induced Diabetic Rats. J Diabetes Res, 2016. 2016: 1635361.
347. Hu, Y., Liu, J., Wang, G., Xu, Y., The Effects of Exenatide and Metformin on Endothelial Function
in Newly Diagnosed Type 2 Diabetes Mellitus Patients: A Case-Control Study. Diabetes Ther, 2018.
9(3): 1295-1305.
348. Aliper, A., Jellen, L., Cortese, F., Artemov, A., Karpinsky-Semper, D., Moskalev, A., Swick, A.G.,
Zhavoronkov, A., Towards natural mimetics of metformin and rapamycin. Aging (Albany NY),
2017. 9(11): 2245-2268.
349. Lima, C.F., Azevedo, M.F., Araujo, R., Fernandes-Ferreira, M., Pereira-Wilson, C., Metformin-like
effect of Salvia officinalis (common sage): is it useful in diabetes prevention? Br J Nutr, 2006. 96(2):
326-33.
350. Algariri, K., Meng, K.Y., Atangwho, I.J., Asmawi, M.Z., Sadikun, A., Murugaiyah, V., Ismail, N.,
Hypoglycemic and anti-hyperglycemic study of Gynura procumbens leaf extracts. Asian Pac J Trop
Biomed, 2013. 3(5): 358-66.
351. Nyane, N.A., Tlaila, T.B., Malefane, T.G., Ndwandwe, D.E., Owira, P.M.O., Metformin-like
antidiabetic, cardio-protective and non-glycemic effects of naringenin: Molecular and
pharmacological insights. Eur J Pharmacol, 2017. 803: 103-111.
352. Lee, S.H., Kwon, K.I., Pharmacokinetic-pharmacodynamic modeling for the relationship between
glucose-lowering effect and plasma concentration of metformin in volunteers. Arch Pharm Res,
2004. 27(7): 806-10.
353. Christensen, M.M., Brasch-Andersen, C., Green, H., Nielsen, F., Damkier, P., Beck-Nielsen, H.,
Brosen, K., The pharmacogenetics of metformin and its impact on plasma metformin steady-state
levels and glycosylated hemoglobin A1c. Pharmacogenet Genomics, 2011. 21(12): 837-50.
354. Isoda, K., Young, J.L., Zirlik, A., MacFarlane, L.A., Tsuboi, N., Gerdes, N., Schonbeck, U., Libby,
P., Metformin inhibits proinflammatory responses and nuclear factor-kappaB in human vascular
wall cells. Arterioscler Thromb Vasc Biol, 2006. 26(3): 611-7.
355. He, L., Wondisford, Fredric E., Metformin Action: Concentrations Matter. Cell Metab, 2015. 21(2):
159-162.
356. Liu, Y., Zhang, Y., Jia, K., Dong, Y., Ma, W., Metformin inhibits the proliferation of A431 cells by
modulating the PI3K/Akt signaling pathway. Exp Ther Med, 2015. 9(4): 1401-1406.
357. Li, Z., Wang, L., Luo, N., Zhao, Y., Li, J., Chen, Q., Tian, Y., Metformin inhibits the proliferation
and metastasis of osteosarcoma cells by suppressing the phosphorylation of Akt. Oncol Lett, 2018.
15(5): 7948-7954.
358. Lalau, J.D., Lacroix, C., Measurement of metformin concentration in erythrocytes: clinical
implications. Diabetes Obes Metab, 2003. 5(2): 93-8.
359. Zhou, G., Myers, R., Li, Y., Chen, Y., Shen, X., Fenyk-Melody, J., Wu, M., Ventre, J., Doebber, T.,
Fujii, N., Musi, N., Hirshman, M.F., Goodyear, L.J., Moller, D.E., Role of AMP-activated protein
kinase in mechanism of metformin action. J Clin Invest, 2001. 108(8): 1167-1174.
360. Dhanya, R., Arya, A.D., Nisha, P., Jayamurthy, P., Quercetin, a Lead Compound against Type 2
Diabetes Ameliorates Glucose Uptake via AMPK Pathway in Skeletal Muscle Cell Line. Front
Pharmacol, 2017. 8: 336.
361. Cade, W.T., Diabetes-Related Microvascular and Macrovascular Diseases in the Physical Therapy
Setting. Phys Ther, 2008. 88(11): 1322-1335.
362. Jansson, P.A., Endothelial dysfunction in insulin resistance and type 2 diabetes. J Intern Med, 2007.
262(2): 173-83.
363. Schalkwijk, C.G., Stehouwer, C.D., Vascular complications in diabetes mellitus: the role of
endothelial dysfunction. Clin Sci (Lond), 2005. 109(2): 143-59.
364. Lorenzi, M., Cagliero, E., Toledo, S., Glucose toxicity for human endothelial cells in culture.
Delayed replication, disturbed cell cycle, and accelerated death. Diabetes, 1985. 34(7): 621-7.
365. Ho, F.M., Lin, W.W., Chen, B.C., Chao, C.M., Yang, C.-R., Lin, L.Y., Lai, C.C., Liu, S.H., Liau,
C.S., High glucose-induced apoptosis in human vascular endothelial cells is mediated through NF-
κB and c-Jun NH2-terminal kinase pathway and prevented by PI3K/Akt/eNOS pathway. Cell Signal,
2006. 18(3): 391-399.
366. Giardino, I., Edelstein, D., Brownlee, M., BCL-2 expression or antioxidants prevent hyperglycemia-
induced formation of intracellular advanced glycation endproducts in bovine endothelial cells. J
Clin Invest, 1996. 97(6): 1422-8.

228 G References
228
367. Varma, S., Lal, B.K., Zheng, R., Breslin, J.W., Saito, S., Pappas, P.J., Hobson, R.W., Durán, W.N.,
Hyperglycemia alters PI3k and Akt signaling and leads to endothelial cell proliferative dysfunction.
Am J Physiol Heart Circ Physiol, 2005. 289(4): H1744-H1751.
368. Huang, Q., Sheibani, N., High glucose promotes retinal endothelial cell migration through
activation of Src, PI3K/Akt1/eNOS, and ERKs. Am J Physiol Cell Physiol, 2008. 295(6): C1647-
C1657.
369. Bahadoran, Z., Mirmiran, P., Azizi, F., Dietary polyphenols as potential nutraceuticals in
management of diabetes: a review. J Diabetes Metab Disord, 2013. 12: 43-43.
370. Morikawa, T., Ninomiya, K., Akaki, J., Kakihara, N., Kuramoto, H., Matsumoto, Y., Hayakawa, T.,
Muraoka, O., Wang, L.B., Wu, L.J., Nakamura, S., Yoshikawa, M., Matsuda, H., Dipeptidyl
peptidase-IV inhibitory activity of dimeric dihydrochalcone glycosides from flowers of Helichrysum
arenarium. J Nat Med, 2015. 69(4): 494-506.
371. Gonzalez-Abuin, N., Martinez-Micaelo, N., Blay, M., Pujadas, G., Garcia-Vallve, S., Pinent, M.,
Ardevol, A., Grape seed-derived procyanidins decrease dipeptidyl-peptidase 4 activity and
expression. J Agric Food Chem, 2012. 60(36): 9055-61.
372. Bar, J., Weber, A., Hoffmann, T., Stork, J., Wermann, M., Wagner, L., Aust, S., Gerhartz, B.,
Demuth, H.U., Characterisation of human dipeptidyl peptidase IV expressed in Pichia pastoris. A
structural and mechanistic comparison between the recombinant human and the purified porcine
enzyme. Biol Chem, 2003. 384(12): 1553-63.
373. Cer, R.Z., Mudunuri, U., Stephens, R., Lebeda, F.J., IC(50)-to-K(i): a web-based tool for converting
IC(50) to K(i) values for inhibitors of enzyme activity and ligand binding. Nucleic Acids Res, 2009.
37(Web Server issue): W441-5.
374. Bakhtiarova, A., Taslimi, P., Elliman, S.J., Kosinski, P.A., Hubbard, B., Kavana, M., Kemp, D.M.,
Resveratrol inhibits firefly luciferase. Biochem Biophys Res Commun, 2006. 351(2): 481-4.
375. Soares, S., Mateus, N., Freitas, V., Interaction of different polyphenols with bovine serum albumin
(BSA) and human salivary alpha-amylase (HSA) by fluorescence quenching. J Agric Food Chem,
2007. 55(16): 6726-35.
376. Röhrborn, D., Wronkowitz, N., Eckel, J., DPP4 in Diabetes. Front Immunol, 2015. 6: 386.
377. Sell, H., Bluher, M., Kloting, N., Schlich, R., Willems, M., Ruppe, F., Knoefel, W.T., Dietrich, A.,
Fielding, B.A., Arner, P., Frayn, K.N., Eckel, J., Adipose dipeptidyl peptidase-4 and obesity:
correlation with insulin resistance and depot-specific release from adipose tissue in vivo and in
vitro. Diabetes Care, 2013. 36(12): 4083-90.
378. Zilleßen, P., Celner, J., Kretschmann, A., Pfeifer, A., Racké, K., Mayer, P., Metabolic role of
dipeptidyl peptidase 4 (DPP4) in primary human (pre)adipocytes. Sci Rep, 2016. 6: 23074.
379. Das, S.S., Hayashi, H., Sato, T., Yamada, R., Hiratsuka, M., Hirasawa, N., Regulation of dipeptidyl
peptidase 4 production in adipocytes by glucose. Diabetes Metab Syndr Obes, 2014. 7: 185-94.
380. Gu, N., Tsuda, M., Matsunaga, T., Adachi, T., Yasuda, K., Ishihara, A., Tsuda, K., Glucose
regulation of dipeptidyl peptidase IV gene expression is mediated by hepatocyte nuclear factor-
1alpha in epithelial intestinal cells. Clin Exp Pharmacol Physiol, 2008. 35(12): 1433-9.
381. Lee, S.A., Kim, Y.R., Yang, E.J., Kwon, E.J., Kim, S.H., Kang, S.H., Park, D.B., Oh, B.C., Kim, J.,
Heo, S.T., Koh, G., Lee, D.H., CD26/DPP4 levels in peripheral blood and T cells in patients with
type 2 diabetes mellitus. J Clin Endocrinol Metab, 2013. 98(6): 2553-61.
382. Post, S., van den Broek, A.J., Rensing, B.J., Pasterkamp, G., Goumans, M.J., Doevendans, P.A.,
Reduced CD26 expression is associated with improved cardiac function after acute myocardial
infarction: insights from the REPERATOR study. J Mol Cell Cardiol, 2012. 53(6): 899-905.
383. Pala, L., Mannucci, E., Pezzatini, A., Ciani, S., Sardi, J., Raimondi, L., Ognibene, A., Cappadona,
A., Vannelli, B.G., Rotella, C.M., Dipeptidyl peptidase-IV expression and activity in human
glomerular endothelial cells. Biochem Biophys Res Commun, 2003. 310(1): 28-31.
384. Gum, J.R., Erickson, R.H., Hicks, J.W., Rius, J.L., Kim, Y.S., Analysis of dipeptidyl peptidase IV
gene regulation in transgenic mice: DNA elements sufficient for promoter activity in the kidney, but
not the intestine, reside on the proximal portion of the gene 5′-flanking region. FEBS Lett, 2000.
482(1): 49-53.
385. Gu, N., Adachi, T., Matsunaga, T., Takeda, J., Tsujimoto, G., Ishihara, A., Yasuda, K., Tsuda, K.,
Mutant HNF-1α and mutant HNF-1β identified in MODY3 and MODY5 downregulate DPP-IV gene
expression in Caco-2 cells. Biochem Biophys Res Commun, 2006. 346(3): 1016-1023.
386. Bohm, S.K., Gum, J.R., Jr., Erickson, R.H., Hicks, J.W., Kim, Y.S., Human dipeptidyl peptidase IV
gene promoter: tissue-specific regulation from a TATA-less GC-rich sequence characteristic of a
housekeeping gene promoter. Biochem J, 1995. 311 ( Pt 3): 835-43.
387. Chowdhury, H.H., Velebit, J., Radi, #x107, , N., #x161, Fran, #x10d, #x10d, , V., Kreft, M., Zorec,
R., Hypoxia Alters the Expression of Dipeptidyl Peptidase 4 and Induces Developmental
Remodeling of Human Preadipocytes. J Diabetes Res, 2016. 2016: 9.
229
388. Bauvois, B., Djavaheri-Mergny, M., Rouillard, D., Dumont, J., Wietzerbin, J., Regulation of
CD26/DPPIV gene expression by interferons and retinoic acid in tumor B cells. Oncogene, 2000.
19(2): 265-72.
389. Tan, E.Y., Mujoomdar, M., Blay, J., Adenosine down-regulates the surface expression of dipeptidyl
peptidase IV on HT-29 human colorectal carcinoma cells: implications for cancer cell behavior.
Am J Pathol, 2004. 165(1): 319-30.
390. Tan, E.Y., Richard, C.L., Zhang, H., Hoskin, D.W., Blay, J., Adenosine downregulates DPPIV on
HT-29 colon cancer cells by stimulating protein tyrosine phosphatase(s) and reducing ERK1/2
activity via a novel pathway. Am J Physiol Cell Physiol, 2006. 291(3): C433-44.
391. Baricault, L., Fransen, J.A., Garcia, M., Sapin, C., Codogno, P., Ginsel, L.A., Trugnan, G., Rapid
sequestration of DPP IV/CD26 and other cell surface proteins in an autophagic-like compartment
in Caco-2 cells treated with forskolin. J Cell Sci, 1995. 108(5): 2109.
392. Seamon, K.B., Padgett, W., Daly, J.W., Forskolin: unique diterpene activator of adenylate cyclase
in membranes and in intact cells. Proc Natl Acad Sci U S A, 1981. 78(6): 3363-7.
393. Uematsu, T., Tanaka, H., Yamaoka, M., Furusawa, K., Effects of oral squamous cell carcinoma-
derived TGF-beta1 on CD26/DPPIV expression in T cells. Anticancer Res, 2004. 24(2b): 619-24.
394. Real Hernandez, L.M., Fan, J., Johnson, M.H., Gonzalez de Mejia, E., Berry Phenolic Compounds
Increase Expression of Hepatocyte Nuclear Factor-1alpha (HNF-1alpha) in Caco-2 and Normal
Colon Cells Due to High Affinities with Transcription and Dimerization Domains of HNF-1alpha.
PLoS One, 2015. 10(9): e0138768.
395. Han, X., Shen, T., Lou, H., Dietary Polyphenols and Their Biological Significance. Int J Mol Sci,
2007. 8(9): 950-988.
396. Johnson, M.H., de Mejia, E.G., Phenolic Compounds from Fermented Berry Beverages Modulated
Gene and Protein Expression To Increase Insulin Secretion from Pancreatic β-Cells in Vitro. J
Agric Food Chem, 2016. 64(12): 2569-2581.
397. Peng, C.-H., Yang, Y.-S., Chan, K.-C., Wang, C.-J., Chen, M.-L., Huang, C.-N., Hibiscus sabdariffa
Polyphenols Alleviate Insulin Resistance and Renal Epithelial to Mesenchymal Transition: A Novel
Action Mechanism Mediated by Type 4 Dipeptidyl Peptidase. J Agric Food Chem, 2014. 62(40):
9736-9743.
398. Huang, C.-N., Wang, C.-J., Yang, Y.-S., Lin, C.-L., Peng, C.-H., Hibiscus sabdariffa polyphenols
prevent palmitate-induced renal epithelial mesenchymal transition by alleviating dipeptidyl
peptidase-4-mediated insulin resistance. Food Funct, 2016. 7(1): 475-482.
399. Cerda, B., Espin, J.C., Parra, S., Martinez, P., Tomas-Barberan, F.A., The potent in vitro antioxidant
ellagitannins from pomegranate juice are metabolised into bioavailable but poor antioxidant
hydroxy-6H-dibenzopyran-6-one derivatives by the colonic microflora of healthy humans. Eur J
Nutr, 2004. 43(4): 205-20.
400. Lefort, E.C., Blay, J., The dietary flavonoid apigenin enhances the activities of the anti-metastatic
protein CD26 on human colon carcinoma cells. Clin Exp Metastasis, 2011. 28(4): 337-49.
401. Moss, M.L., Lambert, M.H., Shedding of membrane proteins by ADAM family proteases. Essays
Biochem, 2002. 38: 141-53.
402. Rohrborn, D., Eckel, J., Sell, H., Shedding of dipeptidyl peptidase 4 is mediated by metalloproteases
and up-regulated by hypoxia in human adipocytes and smooth muscle cells. FEBS Lett, 2014.
588(21): 3870-7.
403. Jessberger, S., Hogger, P., Genest, F., Salter, D.M., Seefried, L., Cellular pharmacodynamic effects
of Pycnogenol(R) in patients with severe osteoarthritis: a randomized controlled pilot study. BMC
Complement Altern Med, 2017. 17(1): 537.
404. Ishibashi, Y., Matsui, T., Maeda, S., Higashimoto, Y., Yamagishi, S., Advanced glycation end
products evoke endothelial cell damage by stimulating soluble dipeptidyl peptidase-4 production
and its interaction with mannose 6-phosphate/insulin-like growth factor II receptor. Cardiovasc
Diabetol, 2013. 12: 125.
405. Uematsu, T., Urade, M., Yamaoka, M., Decreased expression and release of dipeptidyl peptidase IV
(CD26) in cultured peripheral blood T lymphocytes of oral cancer patients. J Oral Pathol Med,
1998. 27(3): 106-10.
406. Nargis, T., Chakrabarti, P., Significance of circulatory DPP4 activity in metabolic diseases. IUBMB
Life, 2018. 70(2): 112-119.
407. Nargis, T., Kumar, K., Ghosh, A.R., Sharma, A., Rudra, D., Sen, D., Chakrabarti, S.,
Mukhopadhyay, S., Ganguly, D., Chakrabarti, P., KLK5 induces shedding of DPP4 from circulatory
Th17 cells in type 2 diabetes. Mol Metab, 2017. 6(11): 1529-1539.
408. Stefanovic, V., Ardaillou, N., Vlahovic, P., Placier, S., Ronco, P., Ardaillou, R., Interferon-gamma
induces dipeptidylpeptidase IV expression in human glomerular epithelial cells. Immunology, 1993.
80(3): 465-70.

230 G References
230
409. Jean Leandro dos, S., Chung Man, C., Pan-Assay Interference Compounds (PAINS): Warning Signs
in Biochemical-Pharmacological Evaluations. Biochem Pharmacol, 2015. 4(02): 1000e173.
410. Atanasov, A.G., Waltenberger, B., Pferschy-Wenzig, E.-M., Linder, T., Wawrosch, C., Uhrin, P.,
Temml, V., Wang, L., Schwaiger, S., Heiss, E.H., Rollinger, J.M., Schuster, D., Breuss, J.M.,
Bochkov, V., Mihovilovic, M.D., Kopp, B., Bauer, R., Dirsch, V.M., Stuppner, H., Discovery and
resupply of pharmacologically active plant-derived natural products: A review. Biotechnol Adv,
2015. 33(8): 1582-1614.
411. Otagiri, M., Otagiri, Y., Perrin, J.H., Some fluorescent investigations of the interaction between the
enantiomers of warfarin and human serum albumin. Int J Pharm, 1979. 2(5): 283-294.
412. Gul, S., Gribbon, P., Exemplification of the challenges associated with utilising fluorescence
intensity based assays in discovery. Expert Opin Drug Discov, 2010. 5(7): 681-90.
413. Zou, L., Harkey, M.R., Henderson, G.L., Effects of intrinsic fluorescence and quenching on
fluorescence-based screening of natural products. Phytomedicine, 2002. 9(3): 263-7.
414. Les, F., Arbones-Mainar, J.M., Valero, M.S., Lopez, V., Pomegranate polyphenols and urolithin A
inhibit alpha-glucosidase, dipeptidyl peptidase-4, lipase, triglyceride accumulation and
adipogenesis related genes in 3T3-L1 adipocyte-like cells. J Ethnopharmacol, 2018.
415. Elisakit.com Pty Ltd., A. ELISA Analysis. 2012 [cited 2015, 30.09.]; Available from:
http://elisaanalysis.com/.
416. Wewer Albrechtsen, N.J., Bak, M.J., Hartmann, B., Christensen, L.W., Kuhre, R.E., Deacon, C.F.,
Holst, J.J., Stability of glucagon-like peptide 1 and glucagon in human plasma. Endocr Connect,
2015. 4(1): 50-7.
417. DeChancie, J., Houk, K.N., The origins of femtomolar protein-ligand binding: hydrogen-bond
cooperativity and desolvation energetics in the biotin-(strept)avidin binding site. J Am Chem Soc,
2007. 129(17): 5419-29.
418. Fujiwara, K., Tsuru, D., New chromogenic and fluorogenic substrates for pyrrolidonyl peptidase. J
Biochem, 1978. 83: 1145-1149.
419. Shapiro, S.S., Wilk, M.B., An analysis of variance test for normality (complete samples)†.
Biometrika, 1965. 52(3-4): 591-611.
420. Zaiontz, C. Real Statistics Using Excel. 2016 [cited 2016, 26.03.]; Available from: http://www.real-
statistics.com/tests-normality-and-symmetry/statistical-tests-normality-symmetry/shapiro-wilk-test/.
421. Vasavada, N. Online Web Statistical Calculators 2016 [cited 2018, 26.03.]; Available from:
http://astatsa.com/OneWay_Anova_with_TukeyHSD/.
422. Edgell, C.J., McDonald, C.C., Graham, J.B., Permanent cell line expressing human factor VIII-
related antigen established by hybridization. Proc Natl Acad Sci U S A, 1983. 80(12): 3734-7.
423. Berthois, Y., Katzenellenbogen, J.A., Katzenellenbogen, B.S., Phenol red in tissue culture media is
a weak estrogen: implications concerning the study of estrogen-responsive cells in culture. Proc
Natl Acad Sci U S A, 1986. 83(8): 2496-500.
424. Glover, J.F., Irwin, J.T., Darbre, P.D., Interaction of phenol red with estrogenic and antiestrogenic
action on growth of human breast cancer cells ZR-75-1 and T-47-D. Cancer Res, 1988. 48(13):
3693-7.
425. Uhlenhut, K., Hogger, P., Pitfalls and limitations in using 4,5-diaminofluorescein for evaluating the
influence of polyphenols on nitric oxide release from endothelial cells. Free Radic Biol Med, 2012.
52(11-12): 2266-75.
426. Chen, Z.P., Mitchelhill, K.I., Michell, B.J., AMP-activated protein kinase phosphorylation of
endothelial NO synthase. FEBS Lett, 1999. 443(3): 285-289.
427. Montagnani, M., Chen, H., Barr, V.A., Quon, M.J., Insulin-stimulated activation of eNOS is
independent of Ca2+ but requires phosphorylation by Akt at Ser(1179). J Biol Chem, 2001.
276(32): 30392-8
428. Nim, T.H., Luo, L., White, J.K., Clément, M.-V., Tucker-Kellogg, L., Non-canonical Activation of
Akt in Serum-Stimulated Fibroblasts, Revealed by Comparative Modeling of Pathway Dynamics.
PLoS Comput Biol, 2015. 11(11): e1004505.
429. Lowry, O.H., Rosebrough, N.J., Farr, A.L., Randall, R.J., Protein measurement with the Folin
phenol reagent. J Biol Chem, 1951. 193(1): 265-75.
430. Burnette, W.N., "Western blotting": electrophoretic transfer of proteins from sodium dodecyl
sulfate--polyacrylamide gels to unmodified nitrocellulose and radiographic detection with antibody
and radioiodinated protein A. Anal Biochem, 1981. 112(2): 195-203.
431. Taylor, S.C., Posch, A., The Design of a Quantitative Western Blot Experiment. Biomed Res Int,
2014. 2014: 8.
432. ImageJ, Image Processing and Analysis in Java. 2017 [cited 2017, 22.06.]; Available from:
https://imagej.nih.gov/ij/download.html.
433. Todaro, G.J., Green, H., Quantitative studies of the growth of mouse embryo cells in culture and
their development into established lines. J Cell Biol, 1963. 17: 299-313.

231
434. Green, H., Meuth, M., An established pre-adipose cell line and its differentiation in culture. Cell,
1974. 3(2): 127-133.
435. Zebisch, K., Voigt, V., Wabitsch, M., Brandsch, M., Protocol for effective differentiation of 3T3-L1
cells to adipocytes. Anal Biochem, 2012. 425(1): 88-90.
436. Public Health England, U.K. ECACC, Health Protection Agency culture collections. 2018
[cited 2018, 28.05.]; Available from:
http://www.hpacultures.org.uk/products/celllines/generalcell/detail.jsp?refId=86052701&collection
=ecacc_gc.
437. Mehra, A., Macdonald, I., Pillay, T.S., Variability in 3T3-L1 adipocyte differentiation depending on
cell culture dish. Anal Biochem, 2007. 362(2): 281-3.
438. Sheng, X., Tucci, J., Malvar, J., Mittelman, S.D., Adipocyte differentiation is affected by media
height above the cell layer. Int J Obes (Lond), 2014. 38(2): 315-20.
439. Sato, T., Kotake, D., Hiratsuka, M., Hirasawa, N., Enhancement of inflammatory protein expression
and nuclear factor Kappab (NF-Kappab) activity by trichostatin A (TSA) in OP9 preadipocytes.
PLoS One, 2013. 8(3): e59702.