Molecular Frameworks
262
Dissertation zur Erlangung des Doktorgrades der Fakultat fur Chemie und Pharmazie der Ludwig-Maximilians- Universitat Munchen Molecular Frameworks – From Morphological Control to Electronic Properties Julian Markus Rotter aus Munchen, Deutschland 2020
-
Upload
khangminh22 -
Category
Documents
-
view
0 -
download
0
Transcript of Molecular Frameworks

Dissertation zur Erlangung des
Doktorgrades der Fakulta t fu r Chemie und
Pharmazie der Ludwig-Maximilians-
Universita t Mu nchen
Molecular Frameworks – From
Morphological Control to Electronic
Properties
Julian Markus Rotter
aus
Mu nchen, Deutschland
2020


I
Erkla rung:
Diese Dissertation wurde im Sinne von § 7 der Promotionsordnung vom 28. November
2011 von Herrn Prof. Dr. Thomas Bein betreut.
Eidesstattliche Versicherung
Diese Dissertation wurde eigensta ndig und ohne unerlaubte Hilfe bearbeitet.
Mu nchen, den 06.01.2020 ________________________________
Julian Rotter
Dissertation eingereicht am 09.01.2020
1. Gutachter: Prof. Dr. Thomas Bein
2. Gutachter: Prof. Dr. Stefan Wuttke
Mu ndliche Pru fung am 06.02.2020


III
Meinen Eltern.


V
Acknowledgement
After a good four years of Ph.D. time, there are many people who have contributed in
various ways to the creation of this work. I would like to thank them here.
First of all, I would like to thank my supervisor Prof. Thomas Bein. Many thanks for the
exciting and challenging topic of my dissertation. It was great to be able to work on
different projects with so much freedom and to be able to realize my own interests. Thank
you for the many exciting discussions, the always motivating words, the support in
attending international conferences and the provision of such exceptional laboratory
equipment.
Many thanks also to Professor Stefan Wuttke for the excellent and exciting cooperation in
our projects and also for the fact that you were willing to judge my work as a second
reviewer in faraway Spain.
I would also like to thank Dana Medina in particular. It was great to work together and
realize our many projects. Without you, this dissertation would undoubtedly have been a
completely different one. Thanks a lot for all the uplifting words, especially when I ever
lost faith in science. I fondly remember our crazy working hours and review rounds and
how we sometimes got on each other's nerves, but in the end, we were always proud of
our joint achievements.
I would also like to thank my collaboration partners. Many thanks to my external partners
Prof. Menny Shalom, Prof. Adelheid Godt and Tobias von Zons, and Prof. Vladimir
Dyakonov, Michael Auth and Andreas Sperlich, Alexander Biewald und Prof. Achim
Hartschuh. Also, many thanks to all the people I was working with within the group. I
would especially like to thank Andre, Erika, Maria, Roman, Simon, and Torben, with whom
I was able to work on great projects. But also to the rest of the COF/MOF Subgroup a big
thank you for the many discussions and the mutual support over the years. In general, it
was great to work with so many talented and motivated people from the AK Bein and to
learn something from all of them.
Special thanks also go to Corinna, Regina, and Tina for their great support during my time
at AK Bein. Thanks to Markus, Steffen and Michi for all your efforts in electron microscopy,

VI
the many pictures and for the fact that with your support, I could use the SEM so
extensively at times.
Thanks to my F-interns Andre, Alex, Sarah, Roman, Tabea, and Christian for their support
and enthusiasm. I am glad that you, Andre, Roman and Tabea had so much fun and passion
for continuing your career here.
I would like to thank the people from the AK not only for the scientific cooperation but
also for the many hours I spent together with them at barbecues, after-work beers or
coffee breaks. It is nice to be able to work with so many people who are not only colleagues
but friends. A special cheers goes to the Augustiner crew and a meal-time to the coffee-
kitchen-lunch-people. Thank you for the many crazy but fun conversations we had. Very
special thanks also to Team Starbein, Michi and Joni, for all the coffee and raspberry pi
nonsense we did.
Special thanks also to Alex for the fantastic supply of great espresso on the second floor,
as well as to SFBeer for the parties together.
Thanks also to all my friends who have accompanied me in the last years, both through
my studies and my Ph.D., and who have given me many wonderful memories. Thank you
for your patience and understanding, in case it suddenly didn't work out to see each other
in the evening, because an experiment took again longer than planned.
Marci, I would like to thank you especially for your support during the last stressful
months, during which I wrote my thesis and started looking for a new professional
perspective. I believe that this time has not always been easy, but you have not let this
deter you.
Renate, I am incredibly grateful for all your support over the past years. Thank you for
being so involved in my studies and for being there for me and helping me wherever you
could.
Lastly, I would like to thank my parents. You have supported me over all these years, have
always stood behind me and have never doubted me. Without you, this would not have
been possible.

VII
Abstract
Molecular frameworks are materials that are available through bottom-up synthesis from
organic or inorganic building blocks. The intrinsic properties of the materials can be
systematically designed through the use of specially constructed building blocks, while
physical properties, such as porosity or pore shape, can be additionally tailored through
the means of reticular chemistry. This thesis is focusing on two emerging classes of
molecular frameworks, namely covalent organic frameworks (COFs) and metal-organic
frameworks (MOFs).
COFs are a class of highly ordered, crystalline polymers, which possess high surface areas
and defined pore sizes. They are typically synthesized by covalently linking two organic
building blocks through a condensation reaction. By tailoring and adjusting the organic
linkers, a variety of structural, physical and chemical properties can be encoded in the
resulting COFs. This allows COFs to be used as materials for many (including potential)
applications, such as gas storage, chemical sensing, catalysis, charge storage, charge
transport or optoelectronics. The ability to grow covalent organic frameworks as films
allows for studying their properties as solid layers and enables the incorporation of these
materials into a variety of functional devices. In the introduction of this thesis, a
comprehensive overview of the techniques for fabricating COF films is given, along with
different examples for applications.
The incorporation of sterically demanding or highly insoluble building blocks often
requires the introduction of special side groups into the organic linker. In the third chapter
of this thesis, the effects of incorporating ethoxy side chains into a 2D π-stacked
benzodithiophene-based (BDT) COF are studied. The resulting BDT-OEt COF is a
crystalline mesoporous material featuring high surface area and accessible hexagonal
pores. Furthermore, a series of COFs was studied, containing both BDT and BDT-OEt
building units at different ratios. The impact of the gradual incorporation of the BDT-OEt
building units into the COF backbone on the crystallinity and porosity was investigated.
Furthermore, molecular dynamics simulations shed light on the possible processes
governing the COF assembly from molecular building blocks.
In the fourth chapter, a new concept of depositing COFs onto surfaces is studied, based on
electrophoretic deposition (EPD). It is demonstrated that the EPD technique is suitable

VIII
for depositing COFs featuring two- and three-dimensional structures linked by imine or
boronate ester bonds, namely, BDT-ETTA COF, COF-300, and COF-5. For the deposition,
COF nanoparticle suspensions were prepared by dispersing the as-synthesized bulk
materials in solvents with low dielectric constants. Subsequently, two electrodes were
immersed into the COF particle suspensions, and upon inducing electric fields ranging
from 100 to 900 V cm–1, COFs were deposited as films on the positively charged electrode.
Through EPD, within 2 min large-area films of up to 25 cm2 were obtained on smooth or
corrugated surfaces. COF films prepared by EPD feature an inherent textural porosity and
tunable thickness, demonstrated from 400 nm to 24 μm. By controlling the deposition
parameters such as duration, particle concentration, and applied potential, deposits of
precise thickness could be produced. Furthermore, co-depositions of different COFs, as
well as COF/Pt nanoparticles from mixed suspensions, were demonstrated. The film
morphologies obtained by EPD were shown to be advantageous for catalysis, as
demonstrated for sacrificial agent-free photoelectrochemical water reduction. Here, BDT-
ETTA COF photocathodes showed a strongly increased photocurrent density compared to
the respective dense and oriented films. Typical BDT-ETTA COF/Pt nanoparticle hybrid
films exhibited photocurrent densities of over 100 μA cm–2. The rapid and scalable
deposition of COF particles as films and coatings through EPD is a versatile addition to the
toolbox of COF film fabrication techniques, allowing for tailoring COF film architectures
for desired functionalities.
The fifth chapter describes a study of the intrinsic electrical conductivities of two COFs
and how chemical doping affects their properties. For the incorporation of COFs into
optoelectronic devices, efficient charge carrier transport and intrinsic conductivity are
essential. Here, we report the synthesis of WTA and WBDT, two imine-linked COFs,
featuring a redox-active Wurster-type motif based on the twisted tetragonal N,N,N’,N’-
tetraphenyl-1,4-phenylenediamine node. By condensing this unit with either
terephthalaldehyde (TA) or benzodithiophene dialdehyde (BDT), COFs were obtained as
highly crystalline materials with large specific surface areas and a mesoporous dual-pore
topology. In addition, the experimental high conduction band energies of both COFs
render them suitable candidates for oxidative doping. The incorporation of a
benzodithiophene linear building block into the COF allowed for high intrinsic
macroscopic conductivity. Both the anisotropic and average conductivities were probed
by van-der-Pauw measurements using oriented films and pressed pellets, respectively.

IX
Furthermore, the impact of different dopants such as F4TCNQ, antimony pentachloride
and iodine on the conductivity of the resulting doped COFs was studied. By using the
strong organic acceptor F4TCNQ, long-term stable electrical conductivity as high as 3.67 S
m−1 was achieved for the anisotropic transport in an oriented film, the highest for any
doped COF to date. Interestingly, no significant differences between isotropic and
anisotropic charge transport were found in films and pressed pellets. This work expands
the list of possible building nodes for electrically conducting COFs from solely highly
planar systems to twisted geometries. The achievement of high and stable electrical
conductivity may ultimately promote the use of COFs in organic (opto-)electronics.
The sixth chapter is focused on the on-surface synthesis of metalorganic frameworks
(MOFs) as thin films. Similar to COFs, MOFs are synthesized from molecular precursors
but in this case, from inorganic metal salts and organic molecules. These interconnect
through coordination bonds forming extended, mostly 3D frameworks, featuring high
crystallinity and porosity. In this part, the synthesis of thin zirconium-based MOF films by
vapor-assisted conversion (VAC) is presented. Synthesis protocols were established for
the growth of UiO-66, UiO-66(NH2), UiO-67, and UiO-68(NH2), as well as the porous,
interpenetrated Zr-organic framework, PPPP-PIZOF-1, as highly oriented thin films.
Through the VAC approach, precursors in a cast solution layer on a bare gold surface
reacted to form a porous continuous MOF film, oriented along the [111] crystal axis, by
exposure to a solvent vapor at elevated temperature of 100 °C and 3 h reaction time. It
was found that the concentration of dicarboxylic acid, the modulator, the liquid volume
and the reaction time are vital parameters to be controlled for obtaining oriented MOF
films. Using VAC for the MOF film growth on gold surfaces modified with thiol SAMs and
on a bare silicon surface yielded oriented MOF films, rendering the VAC process robust
toward chemical surface variations. Ethanol sorption experiments showed that a
substantial part of the material pores is accessible. Thereby, the practical VAC method is
an important addition to the toolbox of synthesis methods for thin MOF films. It is
expected that the VAC approach will open new horizons in the formation of highly defined
functional thin MOF films for numerous applications.


XI
Table of Contents
ACKNOWLEDGEMENT V
ABSTRACT VII
1. INTRODUCTION 1
1.1. Metal-Organic Frameworks 1
1.2. Covalent Organic Frameworks (COFs) 4
1.3. References 7
1.4. Thin Covalent Organic Framework Films 11
1.4.1. Introduction 11
1.4.2. Solvothermal, in-situ, growth 12
1.4.3. Direct deposition of COF thin films 18
2. ANALYTICAL TECHNIQUES 25
2.1. X-Ray Diffraction 25
2.2. Electron microscopy 29
2.2.1. Scanning electron microscopy (SEM) 29
2.2.2. Transmission electron microscopy 32
2.3. Physisorption 33
2.4. UV-vis-NIR spectroscopy and photoluminescence 36
2.5. Cyclic voltammetry (CV) 37
3. FROM BENZODITHIOPHENE TO DIETHOXY-BENZODITHIOPHENE COVALENT
ORGANIC FRAMEWORKS - STRUCTURAL INVESTIGATIONS 39
3.1. Abstract 39
3.2. Introduction 40
3.3. Results 42
3.4. Conclusions 49
3.5. References 49
3.6. Supporting Information 53
4. COVALENT ORGANIC FRAMEWORK FILMS THROUGH ELECTROPHORETIC
DEPOSITION - CREATING EFFICIENT MORPHOLOGIES FOR CATALYSIS 79
4.1. Abstract 79
4.2. Introduction 80
4.3. Results and Discussion 86
4.4. Conclusion 96
4.5. References 96
4.6. Supporting Information 102
XII
5. HIGH ELECTRICAL CONDUCTIVITIES IN DOPED WURSTER-TYPE COVALENT
ORGANIC FRAMEWORKS AND THEIR THIN FILMS 117
5.1. Abstract 117
5.2. Introduction 118
5.3. Results and Discussion 120
5.4. Conclusion 131
5.5. References 132
5.6. Supporting Information 136
6. ON-SURFACE SYNTHESIS OF HIGHLY ORIENTED THIN METAL-ORGANIC
FRAMEWORK FILMS THROUGH VAPOR-ASSISTED CONVERSION 165
6.1. Abstract 165
6.2. Introduction 166
6.3. Results and discussion 167
6.4. Conclusion 176
6.5. References 177
6.6. Supporting Information 180
7. CONCLUSION 241
8. CURRICULUM VITAE 245
9. LIST OF PUBLICATIONS 247

Introduction
1
Introduction
Porous materials have become an indispensable part of modern life. Zeolites, in particular,
are widely used today, whether in the petrochemical industry for the separation of
hydrocarbons, for the catalysis of chemical reactions or in domestic use as ion exchangers
for water softening.1–4 Besides zeolites, other highly porous materials such as aerogels,
composed of silica or metal oxides, as well as porous carbons are used as adsorbers,
catalysts, thermal isolation or energy storage.5–7 The wide range of possible applications
and their commercial success has also motivated research into new, nanoporous classes
of materials, such as porous organic polymers, metal-polymer hybrid materials and
porous liquids.7,8 Of particular interest are materials that exhibit a high order or
crystallinity, which allow for high specific areas and precisely defined pore sizes. By
incorporating organic building blocks into the porous framework of such materials,
particularly high specific surfaces and a wide range of physical and chemical properties
can be achieved. In the following, two such material classes are presented.
1.1. Metal-Organic Frameworks
In 1999 Yaghi and coworkers coined the term of metal-organic frameworks (MOFs).9
MOFs are coordination polymers consisting of metal ions or metal clusters (often called
secondary building units (SBU)), which are connected by coordinative bonds of organic
building blocks in two or three dimensions. The resulting networks can have a variety of
different topologies that affect pore sizes and specific surface areas.10 The first MOFs were
based on metal cation carboxylate coordination chemistry, in which metal oxo clusters
were cross-linked three-dimensionally via two- or multi-dentate organic building blocks
via carboxyl groups. Crystalline structures could be generated that had high surface areas
(> 2000 m2 g−1) due to open and accessible micro- or mesopores. An example is the cubic
MOF-5, which consists of tetrahedral Zn4O6+ clusters that are octahedrally bridged by
coordination with 1,4-benzodicarboxylic acid (Figure 1.1).9

Introduction
2
Figure 1.1: Structure of the cubic MOF-5 with the Zn4O6+ metal-oxo clusters displayed as
coordination tetrahedra and a yellow sphere indicating the open pore volume of the structure.
Figure adapted from reference 9.
The topology of MOFs can often be systematically predicted by the so-called principle of
reticular synthesis. This allows for predicting pore shape and size by taking into account
the connectivity of organic linkers and metal centers.11 A class of MOFs which is
particularly well suited to describe reticular synthesis is the UiO series (University of
Oslo) with UiO-66 as the prototypical representative.12 This cubic MOF consists of an
octahedral centric cage that is connected to eight corner tetrahedral cages through
triangular windows. The SBUs of the MOF are zirconium-oxo-clusters of the formula
Zr6O4(OH)4, interconnected by 1,4-benzodicarboxylic acid (Figure 1.2).13,14 Thereby, two
pores, namely an octahedral one with 12.0 A and a tetragonal one with 7.5 A diameter are
generated, which give a Langmuir surface area of 1187 m2 g−1.12

Introduction
3
Figure 1.2: Presentation of the UiO-66 structure in ball-and-stick form. The pores formed by the
octahedral and tetrahedral cages are highlighted as orange or yellow spheres, respectively. (a, b)
show the spatial arrangement of multiple pores, while (c, d) show the arrangement of the
octahedral and tetrahedral cages in more detail. Figure adapted from reference 14.
The isoreticular expansion of the UiO-series is done by increasing the length of the organic
linker. By expanding the benzene-based UiO-66 linker to a biphenyl one, UiO-67 is
obtained, with pore sizes of 12.0 A and 16.0 A and an increased BET surface area of about
3000 m2 g−1. Consequently, a further elongation to terphenyl gives UiO-68, however, this
MOF is only accessible by side functionalizations of the terphenyl building block.15 Further
elongation of the organic building block still retains the coordination arrangement, but
the MOF forms as a two-fold interpenetrated network, a so-called porous-interpenetrated
zirconium-organic framework (PIZOF) (Figure 1.3).16 Frameworks based on the UiO, or
PIZOF structure, respectively, often show remarkable stability, which is mainly caused by
the high oxygen affinity of the zirconium ions, rendering them especially suitable for
applications such as catalysis or adsorption.17

Introduction
4
Figure 1.3: Isoreticular expansion of the UiO-series. a) different organic linkers forming the non-
interpenetrated UiO-topology or the twofold interpenetrated PIZOF-topology. b) presentation of
the Zr6O4(OH)4(CO2) SBU (C in black, O in red, Zr in the center of the polyhedra. c) framework
topology of UiO-66. d) framework topology of PEPEP-PIZOF. The yellow sphere represents empty
space within the framework, while the blue sphere indicates the space-filling of the second,
interpenetrating SBU. e) the full structure of PEPEP-PIZOF with the interpenetrating network
marked in blue. Figure adapted from reference 16.
1.2. Covalent Organic Frameworks (COFs)
In 2005, the fully organic equivalent of the MOF, the so-called covalent organic framework
(COF), was introduced by Yaghi and coworkers.18 COFs consist of organic building blocks
(which typically contain heteroatoms), and therefore they are mainly formed from light
elements such as carbon, nitrogen, hydrogen, oxygen, sulfur, and boron. The organic
building blocks interconnect through covalent bonds and form, predetermined by the
functionalization and geometry of the building blocks, porous 2D or 3D materials. While
3D COFs feature covalent bonds extending in all three dimensions, 2D COFs consist of 2D
layers, which stack on top of each other in the third dimension by dispersive forces. By
changing the connectivities and sizes of the building blocks, pore sizes, geometries and
surface areas of the resulting COFs can be rationally designed .19,20

Introduction
5
Figure 1.4: Examples of linker topologies and the resulting pore shapes for 2D COFs. Figure
adapted from reference 21.
The covalent bonds between the respective building blocks are typically formed through
condensation reactions and the elimination of water. Common condensation reactions
used for the formation of COFs are based on the condensation of boronic-acids, forming
boroxines of boronate esters,18 Schiff-base condensations,22 hydrazone formation,23
imide-formation24 or Michael addition-elimination reactions.25 More recently, several
non-condensation-based reactions were used for the synthesis of crystalline COFs, such
as triazine-linkages or C-C-coupling reactions (Figure 1.5), which made highly π-
conjugated systems accessible.19,21,26,27

Introduction
6
Figure 1.5: Overview of the various linkage motifs used for the synthesis of COFs. Figure adapted
from reference 21.
Ideally, the condensation reactions are carried out under solvothermal, near equilibrium
conditions, so that the reversible bond formations allow for error correction during
framework synthesis. Establishing these reaction conditions is a major task in the
synthesis of new COFs. Several parameters, such as the solvent system and polarity,
temperature, and the concentration of potential catalysts, have to be adjusted to obtain
highly ordered materials with few defects.19 Typically, the solvent system plays the most
crucial role in adjusting parameters for COF synthesis. It does not only influence the
solubility of the building blocks but is also essential in governing the organization of the
aromatic 2D layers for 2D COFs or the intercalation behavior for 3D systems.28 Under
optimal conditions, COFs are obtained as powdered materials of high crystallinity and
large accessible surface areas with defined pore sizes. One of the prototypical and
intensely studied COFs is COF-5, a boronic ester-based framework, in which benzene-1,4-
diboronic acid (BDBA) and hexahydroxytriphenylene (HHTP) condense into hexagonal 2D
sheets which stack on top of each other through dispersive forces.18,29 The AA-type,
eclipsed stacking of the 2D layers creates 1D pore channels oriented perpendicular to the

Introduction
7
2D layers and endows the COF with high permanent porosity (BET surface area 1590 m2
g−1) and high thermal stability (> 300 °C as determined by TGA).18,30
By varying the organic building blocks and linkages, different properties can be
incorporated into the frameworks. Therefore, COFs can be optimized for diverse
applications such as gas storage and separation,31,32 catalysis,33–36 energy storage,37,38 or
optoelectronics.19,39–41
1.3. References
(1) Funke, H. H.; Kovalchick, M. G.; Falconer, J. L.; Noble, R. D. Separation of Hydrocarbon Isomer
Vapors with Silicalite Zeolite Membranes. Ind. Eng. Chem. Res. 1996, 35, 1575–1582.
(2) Ma, Y.; Tong, W.; Zhou, H.; Suib, S. L. A review of zeolite-like porous materials. Microporous
Mesoporous Mater. 2000, 37, 243–252.
(3) Seike, T.; Matsuda, M.; Miyake, M. Preparation of FAU type zeolite membranes by
electrophoretic deposition and their separation properties. J. Mater. Chem. 2002, 12, 366–368.
(4) Ennaert, T.; van Aelst, J.; Dijkmans, J.; Clercq, R. D.; Schutyser, W.; Dusselier, M.; Verboekend,
D.; Sels, B. F. Potential and challenges of zeolite chemistry in the catalytic conversion of biomass.
Chem. Soc. Rev. 2016, 45, 584–611.
(5) Lamy-Mendes, A.; Silva, R. F.; Durães, L. Advances in carbon nanostructure–silica aerogel
composites: a review. J. Mater. Chem. A 2018, 6, 1340–1369.
(6) Barrios, E.; Fox, D.; Li Sip, Y. Y.; Catarata, R.; Calderon, J. E.; Azim, N.; Afrin, S.; Zhang, Z.; Zhai,
L. Nanomaterials in Advanced, High-Performance Aerogel Composites: A Review. Polymers
2019, 11.
(7) Wuttke, S.; Medina, D. D.; Rotter, J. M.; Begum, S.; Stassin, T.; Ameloot, R.; Oschatz, M.;
Tsotsalas, M. Bringing Porous Organic and Carbon-Based Materials toward Thin-Film
Applications. Adv. Funct. Mater. 2018, 28, 1801545.
(8) Giri, N.; Pópolo, M. G. D.; Melaugh, G.; Greenaway, R. L.; Rätzke, K.; Koschine, T.; Pison, L.;
Gomes, M. F. C.; Cooper, A. I.; James, S. L. Liquids with permanent porosity. Nature 2015, 527,
216–220.
(9) Li, H.; Eddaoudi, M.; O’Keeffe, M.; Yaghi, O. M. Design and synthesis of an exceptionally stable
and highly porous metal-organic framework. Nature 1999, 402, 276–279.
(10) Li, M.; Li, D.; O’Keeffe, M.; Yaghi, O. M. Topological analysis of metal-organic frameworks
with polytopic linkers and/or multiple building units and the minimal transitivity principle.
Chem. Rev. 2014, 114, 1343–1370.

Introduction
8
(11) Yaghi, O. M.; O’Keeffe, M.; Ockwig, N. W.; Chae, H. K.; Eddaoudi, M.; Kim, J. Reticular
synthesis and the design of new materials. Nature 2003, 423, 705–714.
(12) Cavka, J. H.; Jakobsen, S.; Olsbye, U.; Guillou, N.; Lamberti, C.; Bordiga, S.; Lillerud, K. P. A
new zirconium inorganic building brick forming metal organic frameworks with exceptional
stability. JACS 2008, 130, 13850–13851.
(13) Hajek, J.; Caratelli, C.; Demuynck, R.; Wispelaere, K. de; Vanduyfhuys, L.; Waroquier, M.; van
Speybroeck, V. On the intrinsic dynamic nature of the rigid UiO-66 metal-organic framework.
Chem. Sci. 2018, 9, 2723–2732.
(14) Biswas, S.; Zhang, J.; Li, Z.; Liu, Y.-Y.; Grzywa, M.; Sun, L.; Volkmer, D.; van der Voort, P.
Enhanced selectivity of CO2 over CH4 in sulphonate-, carboxylate- and iodo-functionalized UiO-
66 frameworks. Dalton Trans. 2013, 42, 4730–4737.
(15) Schaate, A.; Roy, P.; Godt, A.; Lippke, J.; Waltz, F.; Wiebcke, M.; Behrens, P. Modulated
Synthesis of Zr-Based Metal–Organic Frameworks: From Nano to Single Crystals. Chem. Eur. J.
2011, 17, 6643–6651.
(16) Lippke, J.; Brosent, B.; Zons, T. von; Virmani, E.; Lilienthal, S.; Preuße, T.; Hülsmann, M.;
Schneider, A. M.; Wuttke, S.; Behrens, P.; et al. Expanding the Group of Porous Interpenetrated
Zr-Organic Frameworks (PIZOFs) with Linkers of Different Lengths. Inorg. Chem. 2017, 56, 748–
761.
(17) Zou, D.; Liu, D. Understanding the modifications and applications of highly stable porous
frameworks via UiO-66. Mater. Today Chem. 2019, 12, 139–165.
(18) Côté, A. P.; Benin, A. I.; Ockwig, N. W.; O’Keeffe, M.; Matzger, A. J.; Yaghi, O. M. Porous,
crystalline, covalent organic frameworks. Science 2005, 310, 1166–1170.
(19) Lohse, M. S.; Bein, T. Covalent Organic Frameworks: Structures, Synthesis, and
Applications. Adv. Funct. Mater. 2018, 355, 1705553.
(20) Diercks, C. S.; Yaghi, O. M. The atom, the molecule, and the covalent organic framework.
Science 2017, 355.
(21) Medina, D. D.; Sick, T.; Bein, T. Photoactive and Conducting Covalent Organic Frameworks.
Adv. Energy Mater. 2017, 7, 1700387.
(22) Uribe-Romo, F. J.; Hunt, J. R.; Furukawa, H.; Klöck, C.; O’Keeffe, M.; Yaghi, O. M. A crystalline
imine-linked 3-D porous covalent organic framework. JACS 2009, 131, 4570–4571.
(23) Uribe-Romo, F. J.; Doonan, C. J.; Furukawa, H.; Oisaki, K.; Yaghi, O. M. Crystalline covalent
organic frameworks with hydrazone linkages. JACS 2011, 133, 11478–11481.
(24) Fang, Q.; Zhuang, Z.; Gu, S.; Kaspar, R. B.; Zheng, J.; Wang, J.; Qiu, S.; Yan, Y. Designed
synthesis of large-pore crystalline polyimide covalent organic frameworks. Nat Commun, 5, 1–8.
(25) Rao, M. R.; Fang, Y.; Feyter, S. de; Perepichka, D. F. Conjugated Covalent Organic
Frameworks via Michael Addition-Elimination. JACS 2017, 139, 2421–2427.
(26) Kuhn, P.; Antonietti, M.; Thomas, A. Porous, Covalent Triazine-Based Frameworks Prepared
by Ionothermal Synthesis. Angewandte Chemie International Edition 2008, 47, 3450–3453.

Introduction
9
(27) Jin, E.; Asada, M.; Xu, Q.; Dalapati, S.; Addicoat, M. A.; Brady, M. A.; Xu, H.; Nakamura, T.;
Heine, T.; Chen, Q.; et al. Two-dimensional sp2 carbon–conjugated covalent organic frameworks.
Science 2017, 357, 673–676.
(28) Ma, X.; Scott, T. F. Approaches and challenges in the synthesis of three-dimensional
covalent-organic frameworks. Commun. Chem., 1, 1–15.
(29) Evans, A. M.; Parent, L. R.; Flanders, N. C.; Bisbey, R. P.; Vitaku, E.; Kirschner, M. S.; Schaller,
R. D.; Chen, L. X.; Gianneschi, N. C.; Dichtel, W. R. Seeded growth of single-crystal two-
dimensional covalent organic frameworks. Science 2018, 361, 52–57.
(30) Calik, M.; Sick, T.; Dogru, M.; Döblinger, M.; Datz, S.; Budde, H.; Hartschuh, A.; Auras, F.; Bein,
T. From Highly Crystalline to Outer Surface-Functionalized Covalent Organic Frameworks—A
Modulation Approach. JACS 2016, 138, 1234–1239.
(31) Fan, H.; Mundstock, A.; Feldhoff, A.; Knebel, A.; Gu, J.; Meng, H.; Caro, J. Covalent Organic
Framework-Covalent Organic Framework Bilayer Membranes for Highly Selective Gas
Separation. JACS 2018, 140, 10094–10098.
(32) Li, Z.; Feng, X.; Zou, Y.; Zhang, Y.; Xia, H.; Liu, X.; Mu, Y. A 2D azine-linked covalent organic
framework for gas storage applications. Chemical communications (Cambridge, England) 2014,
50, 13825–13828.
(33) Ding, S.-Y.; Gao, J.; Wang, Q.; Zhang, Y.; Song, W.-G.; Su, C.-Y.; Wang, W. Construction of
covalent organic framework for catalysis: Pd/COF-LZU1 in Suzuki-Miyaura coupling reaction.
JACS 2011, 133, 19816–19822.
(34) Aiyappa, H. B.; Thote, J.; Shinde, D. B.; Banerjee, R.; Kurungot, S. Cobalt-Modified Covalent
Organic Framework as a Robust Water Oxidation Electrocatalyst. Chem. Mater. 2016, 28, 4375–
4379.
(35) Lin, C.-Y.; Zhang, D.; Zhao, Z.; Xia, Z. Covalent Organic Framework Electrocatalysts for Clean
Energy Conversion. Advanced materials (Deerfield Beach, Fla.) 2018, 30.
(36) Sick, T.; Hufnagel, A. G.; Kampmann, J.; Kondofersky, I.; Calik, M.; Rotter, J. M.; Evans, A.;
Döblinger, M.; Herbert, S.; Peters, K.; et al. Oriented Films of Conjugated 2D Covalent Organic
Frameworks as Photocathodes for Water Splitting. JACS 2018, 140, 2085–2092.
(37) Chandra, S.; Roy Chowdhury, D.; Addicoat, M.; Heine, T.; Paul, A.; Banerjee, R. Molecular
Level Control of the Capacitance of Two-Dimensional Covalent Organic Frameworks: Role of
Hydrogen Bonding in Energy Storage Materials. Chem. Mater. 2017, 29, 2074–2080.
(38) DeBlase, C. R.; Silberstein, K. E.; Truong, T.-T.; Abruña, H. D.; Dichtel, W. R. β-Ketoenamine-
linked covalent organic frameworks capable of pseudocapacitive energy storage. JACS 2013,
135, 16821–16824.
(39) Calik, M.; Auras, F.; Salonen, L. M.; Bader, K.; Grill, I.; Handloser, M.; Medina, D. D.; Dogru, M.;
Löbermann, F.; Trauner, D.; et al. Extraction of photogenerated electrons and holes from a
covalent organic framework integrated heterojunction. JACS 2014, 136, 17802–17807.

Introduction
10
(40) Medina, D. D.; Werner, V.; Auras, F.; Tautz, R.; Dogru, M.; Schuster, J.; Linke, S.; Döblinger,
M.; Feldmann, J.; Knochel, P.; et al. Oriented thin films of a benzodithiophene covalent organic
framework. ACS Nano 2014, 8, 4042–4052.
(41) Guo, J.; Xu, Y.; Jin, S.; Chen, L.; Kaji, T.; Honsho, Y.; Addicoat, M. A.; Kim, J.; Saeki, A.; Ihee, H.;
et al. Conjugated organic framework with three-dimensionally ordered stable structure and
delocalized π clouds. Nat. Commun., 4, 2736.

Introduction
11
1.4. Thin Covalent Organic Framework Films
This chapter is based on the following publication:
Wuttke, S.; Medina, D. D.; Rotter, J. M.; Begum, S.; Stassin, T.; Ameloot, R.; Oschatz, M.;
Tsotsalas, M. Bringing Porous Organic and Carbon-Based Materials toward Thin-Film
Applications. Adv. Funct. Mater. 2018, 28, 1801545.
1.4.1. Introduction
Covalent organic frameworks (COFs) are a class of hierarchical porous material formed by
a covalent attachment of organic building units through reversible chemical reactions.[1-2]
This mode of assembly allows for a self-repair mechanism thereby endows COFs with the
outstanding feature of structural long-range order.[3] The synthesis of COFs is modular,
and a careful selection of building units dictates their crystalline structure, the pore shape
and size, and functionality.[4] For instance, combining subunits of distinct planar character
results in the formation of extended two-dimensional polymer layers that undergo self-
organization guided by weak interactions to form defined molecular columnar stacks
yielding one-dimensional ordered channels, so called two-dimensional covalent-organic
frameworks (2D COFs).[3, 5] Employing building blocks of spatial character such as a
tetrahedral carbon or silicon results in the formation of three-dimensional extended
networks.
Commonly, COFs are synthesized under solvothermal conditions namely through
condensation reactions in a solvent of high boiling point at elevated temperatures.[3]
Under these conditions, COFs are precipitated as an insoluble powder of intergrown
crystallite microstructures. Therefore, COFs immobilization onto a surface involves
meeting the strict synthesis requirements ensuring appropriate reaction rates permitting
long-range order and permanent porosity in the process of a film growth.[6] In this context,
exploring the reaction paths under which COFs are formed has a great potential to assist
in developing advanced procedures for the synthesis of COF thin films. An important
aspect in the deposition of 2D COF films is the orientation of the COF crystallites on the
surface.[7-8] For applications requiring charge percolation and high pore accessibility a
precise positioning of the COF layers parallel to the surface enabling a direct path thought

Introduction
12
the overlapped π-system and beneficial open porous channels perpendicular to the
surface.[9-11] To date, a number of methods were reported for the growth of 2D COF on a
verity of surfaces. However, some of these methods were reported for COF structures
obtained by specific type of covalent link type. Here, we will briefly overview the
developed methods for COF films on a substrate. We will discuss the different deposition
approaches with respect to the COF chemical compositions, and crystal structures and
crystallites orientation on the surface and their utilization in different device platforms.
In addition, we will present the preparation of free-standing COF films and their
application.
1.4.2. Solvothermal, in-situ, growth
In a typical solvothermal synthesis, the respective COF precursors are added to a mixture
of organic solvents, producing homogeneous or heterogeneous reaction mixtures. Then,
the reaction vessel is sealed and placed in a preheated oven for several days. At the end of
the reaction, COF powder material precipitates. The deposition of COFs as thin films under
solvothermal conditions was first reported by Dichtel and coworkers. In that report, the
bulk COF synthesis conditions were used without alterations for producing COF thin films.
Immersing substrates decorated with a single layer of graphene (SLG) into the different
synthesis mixtures, resulted in a thin COF deposit on the SLG along with COF powder
precipitation in the reaction tube (Figure 1). Using this method, several boronic ester-
based COFs, such as the well-known hexagonal COF-5,[12] consisting of 2,3,6,7,10,11-
hexahydroxytriphenylene (HHTP) and 1,4-benzenediboronic acid, and a tetragonal,
nickel-coordinated phthalocyanine containing NiPc-COF, were deposited on different SLG
supported substrates such as fused silica, SiC or copper. Grazing incidence X-ray
diffraction (GIXRD) studies revealed that the COF crystallites in the film were oriented
with the layers deposited parallel to the substrate (Figure 1.6). The films exhibited high
uniformity namely, a large area substrate coverage and thicknesses ranging from about
220 nm down to 70 nm. Using the COF films grown on optically transparent SLG/ fused
silica allowed additional access to higher resolved optical absorption and emission
spectra of the COFs compared to previous diffuse reflectance measurements of bulk
material.[7]

Introduction
13
Figure 1.6. Left: Solvothermal synthesis of COF-5 thin films by submerging a substrate-supported
SLG surface into the reaction. Thereby, a film on the surface, as well as powder, is obtained. Right:
(A) PXRD data as obtained from COF-5 powder. (B) GIXRD data of an oriented COF-5 film grown
on SLG/Cu. (C) Projections of (A) (top/blue) and (B) (middle/red) near Q⊥= 0, and the simulated
powder diffraction spectrum (bottom/black) for COF-5.[7]
In subsequent reports Dichtel and coworkers generalized the in-situ epitaxy synthesis
route by transferring it to several other tetragonal and hexagonal COFs. Different zinc
containing pthalocyanine (ZnPc) COFs were synthesized on SLG/SiO2 with pore sizes
ranging from 2.7 nm to 4.4 nm and the hexagonal HHTP-DPB COF, comprising 4,4'-
diphenylbutadiynebis(boronic acid) (DPB), with a pore size of 4.7 nm was
demonstrated.[13]
Later, Dichtel and coworkers illustrated the selective growth of COF films on
lithographically patterned SLG/fused silica. Employing the general solvothermal
synthesis protocol developed for oriented thin film synthesis of boronate ester COFs,
namely performing the COF film synthesis in the appropriate solvent mixture
dimetheylacetoimide and o-dichlorobenzene, film formation occurs unselectively on all
exposed surfaces e.g. SLG functionalized and non-functionalized fused silica substrates.
By employing a different solvent mixture for the film synthesis, namely methanol and 1,4-
dioxane, a selective growth of the COF film on the SLG modified fused silica was achieved.
The authors postulate that without the addition of an aromatic solvent, the large π -
systems containing precursors readily adhere to the SLG from whereon film formation is
promoted.[14]
Bein and coworkers demonstrated the growth of an electron-donor consisting of boronic
acid-based benzodithiophene, BDT-COF, as highly oriented films on non-modified,

Introduction
14
polycrystalline surfaces, such as gold, indium-doped tin oxide (ITO) or glass by the
solvothermal in-situ synthesis route. Here, the pore accessibility of the COF films was
assessed for the first time by krypton sorption measurements, giving a surface area of
175 cm2 cm-2. Subsequently, the porous BDT-COF films were infiltrated with acceptor
molecules, such as [C70]PCBM and the successful incorporation was illustrated by a
significant photoluminescence (PL) quenching. The dynamics of photo-generated hole-
polarons was further studied by transient absorption spectroscopy showing an elongation
of the radical cation life-times upon the incorporation of acceptor phase into the thin COF
films. Additionally, insights into the film growth process were provided by halting the film
synthesis at different times. Ending the synthesis prematurely revealed that film
formation occurs through an island growth mode, the formed COF island continue to grow
with progressing synthesis time to form a continuous film (Figure 1.7).[6]
Figure 1.7. Left: Reaction scheme for the synthesis of BDT-COF and COF-5 used for the vapor-
assisted conversion approach. Right: (A) SEM micrographs of BDT-COF grown on ITO. (B) X-ray
diffraction pattern of BDT-COF film grown on ITO-coated glass at a low incident angle. (C) SEM
micrographs of BDT-COF films synthesized at shortened reaction times in cross-section and (D)
top view.[6]
In a subsequent study, highly oriented thin BDT-COF films were grown on semiconducting
substrates allowing for studying the directional charge-carrier transport along the
molecular columns of the π-stacked COF layers and in transverse direction. Hole-mobility
for the BDT-COF columnar stacks was evaluated by constructing hole-only devices (HOD)
in diode configuration where the BDT-COF film served as an active layer between hole-
selective MoOx layers (Figure 1.8). I-V characteristics of the HODs revealed that the hole-

Introduction
15
mobility along the stacked COF layers is dependent on film thickness with a two order of
magnitude increase in hole-mobility towards thinner films (3 × 10⁻⁷ cm2 V−1 s−1). Using
the well aligned COF layers parallel to the surface, in-plane electrical conductivity
measurements of BDT-COF grown on glass modified with interdigitated gold electrodes
showed a conductivity value of 5 × 10⁻⁷ S cm−1, where the large resistance was attributed
to the non-conjugated boronate ester linkage. Nevertheless, the measured in-plane
conductivity value for BDT-COF thin films is three orders of magnitude higher than the
value measured for BDT-COF in a pressed pellet.[15]
Bein and coworkers reported on the synthesis of boronate-ester linked thienothiophene-
based TT-COF showing an efficient charge transfer to an infiltrated fullerene acceptor
phase. The TT-COF films were integrated into a photovoltaic device with ITO/TT-
COF:PCBM/Al architecture. A power conversion efficiency of 0.053 % and an external
quantum efficiency of 3.4 % were measured for this device. Later, TP-COF consisting of
linear porphyrin and HHTP building blocks forming a donor-acceptor stacks segregated
by the non-conjugated boronate ester bond resulting in a COF integral heterojunction was
synthesized as an oriented thin film. In the oriented film, the donor-acceptor stacks are
arranged in an optimal way to transport charge carriers to the respective selective
electrodes. Using a ITO/MoOx/COF/ZnO/Al device layout charge carriers were extracted,
and the successful design was proven by an external quantum efficiency of 30 % upon
applying an external bias.[9]
Dichtel and coworkers expanded the in-situ COF film synthesis to the chemically stable β-
ketoenamine linkage motif. A DAAQ-TFP COF, containing highly redox-active
anthraquinone moieties and 1,3,5-triformylphloroglucinol (TFP) was grown as an
oriented film on gold electrodes for charge-storage application. The oriented COF film
featured a 400 % increase in capacitance compared to electrodes functionalized with bulk
COF material,[16] which was attributed to the improved interfacing between the electrode
and the film. A high capacitance value of 3.0 mF cm-1 was measured for the DAAQ-TFP COF
and galvanostatic charge-discharge experiments showed the high cycling stability of the
COF films in electrochemical storage applications. [17]
Multi-layered structures consisting of oriented β-ketoenamine linked COF thin films and
conducting electrodes were fabricated by Lu and coworkers. For the multilayered
structure, oriented β-ketoenamine linked COF film was grown on an ITO substrate
subsequently the exposed COF film was coated with platinum metal via sputtering and an

Introduction
16
additional COF layer was grown on the new exposed platinum layer under solvothermal
conditions featuring an alternating stacked of metal/COF structure.[18]
The in-situ approach was found to be another suitable route for the synthesis of stable
imine-linked COFs. Liu and coworker synthesized oriented thin imine-linked
tetrathiafulvalene containing COF. The conductivity for this COF was assessed by growing
oriented COF films on non-conductive glass substrates decorated with two gold
electrodes. Two-point probe in-plane conductivity measurements were carried out on the
oriented TTF-COF film revealing conductivity values of 1.2 × 10⁻⁶ S cm-1 for the pristine
material which increased by two orders of magnitude, upon iodine doping, to 2.8 × 10⁻⁴ S
cm-1.[19]
A vertical field effect transistor using a COF consisting of pyrene and terephthalaldehyde
was constructed by growing an oriented thin film on a SLG/SiO2/ Si substrate. The
transistor device was completed by evaporating two gold electrodes serving as the source
and drain on top of the COF films (Figure 1.8). The device showed ambipolar transport
and high on-current densities of over 4.1 A cm-2. Since the device performance was found
to be strongly linked to film thickness, thin films of 50 nm and less were used to create
short channel lengths. The COF measured behaved as p-type transistor with high on-
current densities for holes of 6.8 A cm-2 and 4.1 A cm-2 for electron transport.[11]
Figure 1.8. (A) Schematic representation of BDT-COF hole-only device layout and the
corresponding energy diagram (B). (C) Vertical field effect transistor layout for a COF/SLG/SiO2/Si
device.[11, 15]
Very recently, Bein and co-workers reported the synthesis of oriented PyTII COF films
containing of near-infrared (NIR) dyes isoindigo or thieno-isoindigo, and a central pyrene
building block. These films were used to construct a photodetector with invertible
spectral sensitivity. A device layout of ITO/MoOx/COF:[C71]PCBM/PFN/Ag was chosen,

Introduction
17
upon applying an external bias, the spectral sensitivity towards incident light could be
changed from blue and red to an enhanced responsiveness in the green and NIR
absorption regions.[20]
An imine-linked COF thin film, containing photoactive benzodithiophene and
tetraohenylethylene building blocks, was used as a novel type of photoelectrode by Bein
and coworkers. The high absorbance of visible light allowed the generation of photo-
excited electrons which were used for proton reduction and hydrogen evolution in
aqueous electrolytes. The COF photocathode showed high corrosion stability and steady
performance over several hours of operation.[21]
In the context of electrocatalytical performance of COFs Yaghi and coworkers introduced
a series of cobalt porphyrin containing COFs for the electrocatalytic reduction of CO2 to
CO. Here, the growth of the oriented frameworks directly on the substrate showed a
significant advantage over bulk material, deposited on a conductive carbon fabric,
attributed to the enhanced electrochemical contact between the electrodes and COFs. The
reduction reactions showed high selectivity and current densities and could be performed
at low overpotentials.[22-23]
Very recently Yaghi and coworkers employed a different strategy for the fabrication of a
weaving COF, COF-112, using a protected building block in homogeneous conditions. The
in situ deprotection of the BOC protecting groups by trifluoroacetic acid slowed down the
imine condensation reaction and facilitate the crystallization of COF-112. Adapting this
approach for the thin film synthesis, oriented films of the imine-linked LZU-1 framework,
consisting of 1,3,5-triformylbenzene and 1,4-diaminobenzene, were grown from the
homogeneous precursor solutions yielding uniform films of 190 nm in thickness within
2 h. Optical characterizations via ellipsometry were carried out for the first time on a COF
where a high refractive index of 1.83 at 632.8 nm was found, which hints to a strong in-
plane conductivity of the obtained films.[24]
A systematic study of thin imine-linked LZU-1 COF films growth by the solvothermal
approach was conducted by Liu and coworkers. The formation of crystalline COF films was
studied with relation to the COF precursor concentrations and duration of the film
synthesis reactions. Systematic GIXRD studies showed that film formation occurs through
two main steps. First, oriented material is deposited on the substrate and subsequently a
disoriented phase from solution adheres on top. The non-oriented phase then reorganizes

Introduction
18
through an interface-initialized templating effect between the formerly deposited,
oriented crystallites and the non-oriented material. The reorientation step is considered
by the authors as the majorly contributing mechanism of COF film growth. Time-
dependent studies showed an almost linear increase in film thickness up to the first 48 h
of the film synthesis and that the rate of growth is highly dependent on COF precursor
concentration. High precursor concentrations lead to significantly faster reaction rates
and growth of film thickness when compared to lower concentrations. Additionally, a
more pronounced disoriented phase could be observed during film formation at higher
concentrations, indicating a kinetically formed, metastable phase (Figure 1.9).[8]
Figure 1.9. Illustration of the different film growth stages. (a) Surface adsorption of precursor
molecules and nucleation. (b) Surface layer growth. (c) Solution crystallite growth and deposition
on top of previous surface layers. (d) Reorientation of solution deposited crystallite layers and
further growth. The green double-headed arrows indicate reactions between different species.[8]
1.4.3. Direct deposition of COF thin films
1.4.3.1. Vapor-assisted conversion
The in-situ thin film synthesis paves the way for the study of COF film in form of a device.
However, a few aspects such as scalability, control over the film morphology, preventing
undesired secondary nucleation from solution are still challenging. To address these
issues, several other film synthesis methods have been developed mainly aiming at a
direct deposit COF material onto a surface.

Introduction
19
Bein and coworkers developed the vapor-assisted conversion (VAC) protocol to
synthesize COF films at room temperature. In a typical VAC synthesis, the respective COF
building blocks are dissolved in a mixture of polar low boiling point solvents and drop-
cast onto various substrates. Then, the cast substrates are transferred into a reactor
equipped with a vessel containing low vapor pressure solvents such as mesitylene and
1,4-dioxane. Upon a tight sealing of the reactor, the arising vapor atmosphere of the
solvents in the reactor assist the conversion of the drop-cast precursor solutions into a
crystalline COF phase within reaction times of 3 h. Through VAC, highly crystalline COF
films of boronic ester and boroxine linkages were obtained with random COF crystallite
orientation in the film and homogeneous growth and coverage over the whole substrate.
By altering the drop-cast precursor solution volumes and concentrations in the droplet
film thicknesses ranging from 300 nm to 7.5 µm were obtained. Additionally, a thickness
dependent morphology of the films was found in which thin films show a dense
morphology of intergrown COF crystallites suitable for device fabrication and thicker
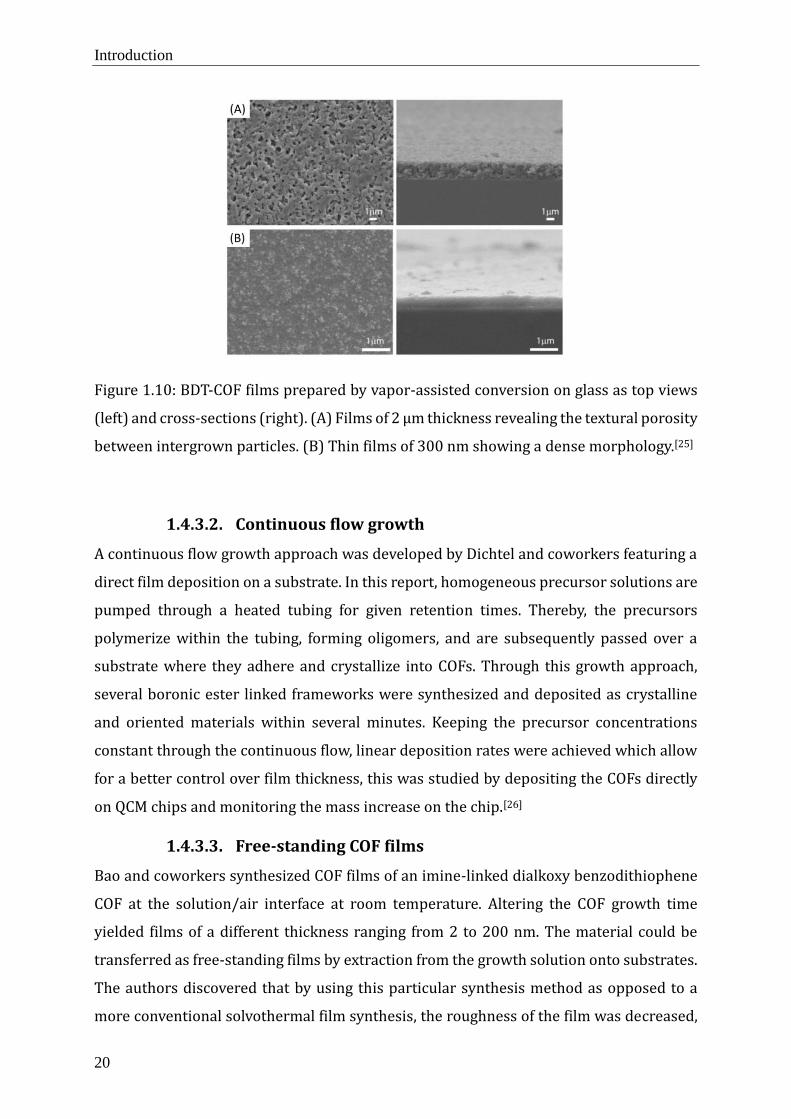
films feature an additional textural porosity between COF particles (Figure 1.10). The VAC
synthesis route illustrates the direct deposition of COF building blocks on a surface and
quantitative conversion into the respective crystalline frameworks.[25]
Introduction
20
Figure 1.10: BDT-COF films prepared by vapor-assisted conversion on glass as top views
(left) and cross-sections (right). (A) Films of 2 µm thickness revealing the textural porosity
between intergrown particles. (B) Thin films of 300 nm showing a dense morphology.[25]
1.4.3.2. Continuous flow growth
A continuous flow growth approach was developed by Dichtel and coworkers featuring a
direct film deposition on a substrate. In this report, homogeneous precursor solutions are
pumped through a heated tubing for given retention times. Thereby, the precursors
polymerize within the tubing, forming oligomers, and are subsequently passed over a
substrate where they adhere and crystallize into COFs. Through this growth approach,
several boronic ester linked frameworks were synthesized and deposited as crystalline
and oriented materials within several minutes. Keeping the precursor concentrations
constant through the continuous flow, linear deposition rates were achieved which allow
for a better control over film thickness, this was studied by depositing the COFs directly
on QCM chips and monitoring the mass increase on the chip.[26]
1.4.3.3. Free-standing COF films
Bao and coworkers synthesized COF films of an imine-linked dialkoxy benzodithiophene
COF at the solution/air interface at room temperature. Altering the COF growth time
yielded films of a different thickness ranging from 2 to 200 nm. The material could be
transferred as free-standing films by extraction from the growth solution onto substrates.
The authors discovered that by using this particular synthesis method as opposed to a
more conventional solvothermal film synthesis, the roughness of the film was decreased,

Introduction
21
however, this in turn resulted in the crystallinity and crystallite orientation being reduced.
The synthesized COF film was characterized in a top-contact transistor device and showed
characteristics of organic FET behavior with measured hole mobilities of 3.0 x 10⁻⁶ cm2 V-
1 s-1.[27]
Banerjee and coworkers introduced a new strategy for the preparation of β-ketoenamine
linked COFs as free-standing porous COF membranes. In this scalable process, a paste of
molecular precursors is ground and knife-casted onto substrates and subsequently baked
in an oven. Thereby, flexible, thick free-standing COF films of 200 – 700 µm were
synthesized as defect- and crack-free membranes. The obtained films were used for
molecular sieving applications where they exhibited high permeance for polar organic
solvents.[28]
A further development to use COFs for the construction of membranes was subsequently
demonstrated by Banerjee and coworkers. Here, COFs were grown as films at a liquid /
liquid interface between water and an organic solvent. By dissolving one precursor in the
organic phase and introducing the second one as an ammonium salt through the water
phase, β-ketoenamine linked COFs could be synthesized as free-standing thin films in
thicknesses ranging from 50 – 200 nm which were readily transferable to substrates and
could be used as selective molecular sieves for organic solvents.[29]
Following up on the liquid / liquid interface growth, Dichtel and coworkers synthesized
imine-linked COF films by using a scandium triflate catalyst in the aqueous phase and the
organic linkers dissolved in an organic phase. Thereby, films thicknesses from 2.5 nm to
100 µm were fabricated, depending on the initial concentration of precursors in the
organic phase.[30]
1.4.3.4. Spin-coating and drop-casting COF suspensions
In addition to the direct synthesis as substrate-supported or free-standing films, COF thin
films were also fabricated through a post-synthesis direct casting of COF suspensions in
organic solvent on a surface. Using this method, boronic ester based porphyrin COF films
of 1.5 µm thickness were prepared as an active material on ITO and contacted to Al
electrode. For these films, the number of photoinduced charge carriers was assessed via
time-of-flight (TOF) measurements. The frameworks showed charge carrier generation
yields in the range of 10-5 in respect of generated charge carriers per incident photon and
TOF transient current integration measurements gave hole mobility values of 100 cm2 V-1
Introduction
22
s-1. Using this deposition method in combination with TOF measurements, charge carrier
generation and hole mobilities were measured for a several boronic ester and imine-
linked frameworks.[31-33] Furthermore, a photovoltaic device was constructed by Jiang and
coworkers using COF powder combined with [C60]PCBM, which was spin-coated as a
100 nm thin film onto ITO. The evaporation of an electron selective Al layer on top of the
COF@[C60]PCBM completed a solar devices featuring a power conversion efficiency of
0.9% and a large open-circuit voltage of 0.98 V.[34]
Dichtel and coworkers showed the fabrication of free-standing COF films of COF-5 with
preferential crystallite orientation by solution casting of stable colloidal COF particles. The
material was deposited in the form of a colloidal mixture of crystalline COF particles in an
organic solvent onto a substrate. Upon solvent removal at elevated temperature, the
particles aggregated, resulting in a free-standing film, which readily cleaves from the
substrate. The COF crystallites in the film show a preferential orientation in which the COF
layer stacking direction is perpendicular to the substrate.[35]
[1] N. Huang, P. Wang, D. Jiang, Nat. Rev. Mater. 2016, 1, 16068.
[2] D. D. Medina, T. Sick, T. Bein, Adv. Energy Mater. 2017, 7, 1700387.
[3] P. J. Waller, F. Ga ndara, O. M. Yaghi, Acc. Chem. Res. 2015, 48, 3053.
[4] C. S. Diercks, O. M. Yaghi, Science 2017, 355.
[5] L. M. Salonen, D. D. Medina, E. Carbo-Argibay, M. G. Goesten, L. Mafra, N. Guldris, J.
M. Rotter, D. G. Stroppa, C. Rodriguez-Abreu, Chem. Commun. 2016, 52, 7986.
[6] D. D. Medina, V. Werner, F. Auras, R. Tautz, M. Dogru, J. Schuster, S. Linke, M.
Do blinger, J. Feldmann, P. Knochel, T. Bein, ACS Nano 2014, 8, 4042.
[7] J. W. Colson, A. R. Woll, A. Mukherjee, M. P. Levendorf, E. L. Spitler, V. B. Shields, M.
G. Spencer, J. Park, W. R. Dichtel, Science 2011, 332, 228.
[8] H. Wang, B. He, F. Liu, C. Stevens, M. A. Brady, S. Cai, C. Wang, T. P. Russell, T. W. Tan,
Y. Liu, J. Mater. Chem. C 2017, 5, 5090.

Introduction
23
[9] M. Dogru, M. Handloser, F. Auras, T. Kunz, D. Medina, A. Hartschuh, P. Knochel, T.
Bein, Angew. Chem., Int. Ed. 2013, 52, 2920.
[10] M. Calik, F. Auras, L. M. Salonen, K. Bader, I. Grill, M. Handloser, D. D. Medina, M.
Dogru, F. Lo bermann, D. Trauner, A. Hartschuh, T. Bein, J. Am. Chem. Soc. 2014, 136, 17802.
[11] B. Sun, C.-H. Zhu, Y. Liu, C. Wang, L.-J. Wan, D. Wang, Chem. Mater. 2017, 29, 4367.
[12] A. P. Co te , A. I. Benin, N. W. Ockwig, M. O'Keeffe, A. J. Matzger, O. M. Yaghi, Science
2005, 310, 1166.
[13] E. L. Spitler, J. W. Colson, F. J. Uribe-Romo, A. R. Woll, M. R. Giovino, A. Saldivar, W. R.
Dichtel, Angew. Chem., Int. Ed. 2012, 51, 2623.
[14] J. W. Colson, J. A. Mann, C. R. DeBlase, W. R. Dichtel, J. Polym. Sci., Part A: Polym. Chem.
2015, 53, 378.
[15] D. D. Medina, M. L. Petrus, A. N. Jumabekov, J. T. Margraf, S. Weinberger, J. M. Rotter,
T. Clark, T. Bein, ACS Nano 2017, 11, 2706.
[16] C. R. DeBlase, K. E. Silberstein, T.-T. Truong, H. D. Abrun a, W. R. Dichtel, J. Am. Chem.
Soc. 2013, 135, 16821.
[17] C. R. DeBlase, K. Herna ndez-Burgos, K. E. Silberstein, G. G. Rodrí guez-Calero, R. P.
Bisbey, H. D. Abrun a, W. R. Dichtel, ACS Nano 2015, 9, 3178.
[18] X. Gou, Q. Zhang, Y. Wu, Y. Zhao, X. Shi, X. Fan, L. Huang, G. Lu, RSC Adv. 2016, 6,
39198.
[19] S.-L. Cai, Y.-B. Zhang, A. B. Pun, B. He, J. Yang, F. M. Toma, I. D. Sharp, O. M. Yaghi, J.
Fan, S.-R. Zheng, W.-G. Zhang, Y. Liu, Chem. Sci. 2014, 5, 4693.
[20] D. Bessinger, L. Ascherl, F. Auras, T. Bein, J. Am. Chem. Soc. 2017, 139, 12035.
[21] T. Sick, A. G. Hufnagel, J. Kampmann, I. Kondofersky, M. Calik, J. M. Rotter, A. Evans,
M. Do blinger, S. Herbert, K. Peters, D. Bo hm, P. Knochel, D. D. Medina, D. Fattakhova-
Rohlfing, T. Bein, J. Am. Chem. Soc. 2018, 140, 2085.
[22] S. Lin, C. S. Diercks, Y.-B. Zhang, N. Kornienko, E. M. Nichols, Y. Zhao, A. R. Paris, D.
Kim, P. Yang, O. M. Yaghi, C. J. Chang, Science 2015, 349, 1208.

Introduction
24
[23] C. S. Diercks, S. Lin, N. Kornienko, E. A. Kapustin, E. M. Nichols, C. Zhu, Y. Zhao, C. J.
Chang, O. M. Yaghi, J. Am. Chem. Soc. 2018, 140, 1116.
[24] Y. Zhao, L. Guo, F. Ga ndara, Y. Ma, Z. Liu, C. Zhu, H. Lyu, C. A. Trickett, E. A. Kapustin,
O. Terasaki, O. M. Yaghi, J. Am. Chem. Soc. 2017, 139, 13166.
[25] D. D. Medina, J. M. Rotter, Y. Hu, M. Dogru, V. Werner, F. Auras, J. T. Markiewicz, P.
Knochel, T. Bein, J. Am. Chem. Soc. 2015, 137, 1016.
[26] R. P. Bisbey, C. R. DeBlase, B. J. Smith, W. R. Dichtel, J. Am. Chem. Soc. 2016, 138,
11433.
[27] J. I. Feldblyum, C. H. McCreery, S. C. Andrews, T. Kurosawa, E. J. G. Santos, V. Duong,
L. Fang, A. L. Ayzner, Z. Bao, Chem. Commun. 2015, 51, 13894.
[28] S. Kandambeth, B. P. Biswal, H. D. Chaudhari, K. C. Rout, S. Kunjattu H, S. Mitra, S.
Karak, A. Das, R. Mukherjee, U. K. Kharul, R. Banerjee, Adv. Mater. 2017, 29, 1603945.
[29] M. A. Khayum, S. Kandambeth, S. Mitra, S. B. Nair, A. Das, S. S. Nagane, R. Mukherjee,
R. Banerjee, Angew. Chem., Int. Ed. 2016, 55, 15604.
[30] M. Matsumoto, L. Valentino, G. M. Stiehl, H. B. Balch, A. R. Corcos, F. Wang, D. C.
Ralph, B. J. Marin as, W. R. Dichtel, Chem 2017, 4, 308.
[31] X. Feng, L. Chen, Y. Honsho, O. Saengsawang, L. Liu, L. Wang, A. Saeki, S. Irle, S. Seki,
Y. Dong, D. Jiang, Adv. Mater. 2012, 24, 3026.
[32] X. Feng, L. Liu, Y. Honsho, A. Saeki, S. Seki, S. Irle, Y. Dong, A. Nagai, D. Jiang, Angew.
Chem., Int. Ed. 2012, 51, 2618.
[33] S. Dalapati, M. Addicoat, S. Jin, T. Sakurai, J. Gao, H. Xu, S. Irle, S. Seki, D. Jiang, Nat.
Commun. 2015, 6, 7786.
[34] J. Guo, Y. Xu, S. Jin, L. Chen, T. Kaji, Y. Honsho, M. A. Addicoat, J. Kim, A. Saeki, H. Ihee,
S. Seki, S. Irle, M. Hiramoto, J. Gao, D. Jiang, Nat. Commun. 2013, 4, 2736.
[35] B. J. Smith, L. R. Parent, A. C. Overholts, P. A. Beaucage, R. P. Bisbey, A. D. Chavez, N.
Hwang, C. Park, A. M. Evans, N. C. Gianneschi, W. R. Dichtel, ACS Cent. Sci. 2017, 3, 58.

Analytical Techniques
25
2. Analytical Techniques
This chapter contains the theoretical foundations of the analytical methods used to obtain
the scientific results presented in this thesis.
2.1. X-Ray Diffraction
X-ray diffraction (XRD) is an important method in materials science to examine the
internal structure of solids by diffraction. It is a rapid, non-destructive technique, which
allows for the study of ordered structural motifs inside of materials, the composition of
materials and the degree of crystallinity. Due to the high sensitivity of the method and the
use of modern X-ray detectors, only small amounts of sample, often in the form of
powders, are needed. By observing the interaction of incident X-ray photons with the
lattices of a crystalline material, it is possible to determine atomic positions and thereby
phases, lattice parameters and geometries of molecules inside a solid. X-ray photons are
generated in a vacuum tube in which electrons are accelerated from a heated cathode
towards an anode by applying a high electric potential between the electrodes. Upon
impact of the accelerated electron onto the anode (typical materials are copper or
molybdenum), these electrons can remove orbital electrons from inner shells of the atoms
of the anode material. The resulting vacancies are filled up by an electron from a more
energetic outer shell. The energy difference of these orbitals during the recombination
process is then emitted as an X-ray photon. This results in X-rays of characteristic, material
dependent wavelengths since orbital energy differences can only be of discrete values.
Further X-ray radiation is generated by the scattering of the high-velocity electrons with
the strong electric field of the metal nuclei upon impact onto the anode. In this case, the
emitted X-rays have a continuous spectrum with a maximum energy corresponding to the
potential of the tube.
For XRD experiments, it is desirable to use X-rays of specific wavelengths only. This is
achieved by using a monochromator. To resolve atomic positions, it is important that the
used wavelength is shorter than the interatomic distances in the lattice.
XRD analysis is based on the scattering of X-ray radiation. The incoming photon transfers
its energy to an electron of the crystalline material. Therefore, the electron of the
crystalline material is excited and starts to emit radiation at the same frequency as the

Analytical Techniques
26
incoming photon but the emission originating from the electron is spherical. This effect is
called Thomson scattering. If the scattering occurs at different atoms in a system, the
resulting waves can interfere constructively or destructively. Constructive interference
occurs when the path length difference is an integer number of the wavelength (AB + BC
= nλ) (Figure 2.1).
Figure 2.1: Bragg diffraction of parallel beams at two different atoms.1
This interference is furthermore described by the Bragg equation (1), where d is the
distance between lattice planes, θ is the angle of incidence of the X-ray photons, n is an
integer number and λ is the wavelength of the incident X-ray photons.
2 d sin θ = n λ (1)
The effect of constructive interference is maximized when each scattering atom on a series
of planes parallel to the one with indices hkl at a distance nd is diffracting in phase.
Reflection positions and intensities give characteristic diffraction patterns that allow for
database-assisted crystal identification or structure determination. Furthermore, peak
shape and width can be used to calculate crystalline domain sizes.
Powder XRD (PXRD) is an effective method for the analysis of microcrystalline samples.
Due to the random orientation of the crystallites in the powdered samples, the diffraction
spots are averaged into cones. This loss of information complicates the structure solution
and modern, computer-assisted methods need to be employed for structure refinement.
X-ray diffraction was carried out in reflection mode using a Bruker D8 Discover
instrument with Ni-filtered Cu Kα-radiation (1.54 A ) and a position-sensitive detector
(Bruker LynxEye).

Analytical Techniques
27
Grazing-incidence X-ray diffraction (GIXRD) is a technique used to analyze the crystallinity
of very thin layers of material on a surface. Here, a very small X-ray incidence angle is used
to illuminate the sample across an extended area parallel to the photon path and therefore,
to maximize the potential interaction area of the film with the X-ray photons. This small
angle is generally chosen to be close, but below the critical angle (in which total reflection
of the X-rays occurs) of the studied material. A typical geometry for a GIXRD measurement
is shown in Figure 2.2. Here, the angle of the incident beam is defined as αI and the
reflected beam as αF. The sample plane is defined by x and y, where x is parallel to the
incident X-ray beam and y is perpendicular to it. Consequently, the z-axis is defined
perpendicular to the xy-plane. The corresponding scattering vectors are defined as qx, qy
and qz (Figure 2.2). Depending on the grid spacing, or the 2 theta ranges, GIXRD
experiments differentiate between GIWAXS and GISAXS. GIWAXS experiments typically
consider 2 theta ranges between 1.5° and 40°, while GISAXS experiments consider angles
<1.5° (for Cu Kα radiation).
Figure 2.2: Scheme of the geometry of a GIWAXS / GIWAXS measurement.
GIXRD data is often recorded using 2D detectors. Therefore, in addition to the standard
XRD data, information about the orientation of crystal lattices is obtained. By analyzing
the diffuse scattering of the film, insights can be gathered into the morphology and
roughness of the film.

Analytical Techniques
28
GIXRD was carried out using an Anton-Paar SAXSPACE system equipped with a Cu Kα X-
ray microfocus source and a beamwidth of 50 µm. A Dectris EIGER R 1M detector was used
to collect 2D X-ray scattering data.

Analytical Techniques
29
2.2. Electron microscopy
Electron microscopy is a well-suited method for the characterization of materials
featuring properties in the nanometer regime. Microscopes that use light in the visible
regime are limited by diffraction to a resolution of about 200 nm. Electron microscopy
uses accelerated electrons that can have 100,000 times shorter wavelengths for imaging
and therefore, much smaller structures can be resolved, up to the atomic level. The
electron beam for electron microscopy is generated under high vacuum (typically 10−7
mbar) using a field emission gun (pin-shaped tungsten filament) or a thermal emitter
(heated tungsten or lanthanum hexaboride filament). Subsequently, the electrons are
accelerated using high potentials and focused onto the sample by electromagnetic lens
systems.
2.2.1. Scanning electron microscopy (SEM)
SEM is a method for the characterization of morphologies of surfaces of materials with
high resolution (up to about 0.6 nm). Here, the image is generated by scanning the sample
line by line with an electron beam. This electron beam is generated thermoionically in a
vacuum by a hot filament or, nowadays, often by a field emission gun and by applying
voltages of 0.1 to 30 kV (a typical SEM design is shown in Figure 2.3).

Analytical Techniques
30
Figure 2.3: Schematic presentation of an SEM.1
The interactions of the focused beam with the sample are subsequently measured as
secondary signals by various detectors, which allows for the analysis of the morphology,
as well as the chemical composition of the sample. Depending on the acceleration voltage,
the electron beam penetrates the sample volume at different depths and different
secondary signals can be detected. For SEM analysis, the most important signals are
secondary electrons (SE), backscattered electrons (BSE) and characteristic X-rays for
energy-dispersive X-ray spectroscopy (EDX) (Figure 2.4).

Analytical Techniques
31
Figure 2.4: Scheme of the interaction of the incident electron beam with the sample, the interaction
volume and the different resulting signals.2
Generally, imaging is carried out by collecting the secondary, low-energy (<50 eV)
electrons with a scintillator-photomultiplier system. Because of their low energy, only
electrons originating from the first layers of the surface can be collected at the detector.
The resulting image can be seen as an intensity map of the detected secondary electrons,
resulting in images that can often be interpreted similarly to light micrographs. Beam
electrons that strike the surface perpendicularly produce similar amounts of secondary
electrons, rendering flat areas similarly bright. Tilted areas appear brighter since the path
for secondary electrons through the material is shortened. BSE are high energy electrons
resulting from elastic scattering at the atomic nuclei. Different elements can be
distinguished by the number and nature of backscatter events, thereby creating a contrast
depending on the atomic number Z. This allows for studying the chemical composition
and elemental distribution throughout a sample by analyzing differences in contrast. EDX
is used to determine the elemental composition of a sample precisely. The incident
electron beam may excite and eject an electron from the inner shell of an atom of the
sample. Thereby, an electron-hole is generated, which is filled by a higher-energy outer-
shell electron. The energy difference between the outer shell and the inner shell orbital is

Analytical Techniques
32
subsequently released in the form of element-characteristic X-rays, which can be
measured by an EDX detector.
SEM images were recorded using a JEOL JSM-6500F or an FEI Helios NanoLab G3 UC
microscope at acceleration voltages of 1−30 kV.
2.2.2. Transmission electron microscopy
The transmission electron microscope (TEM) uses elastically scattered or transmitted
electrons that penetrate the sample for imaging. Therefore, thin samples and highly
accelerated electrons (60−300 kV) are needed. The TEM images can be obtained, for
example, by illuminating a fluorescent screen and recording the resulting fluorescence
with a digital camera. The images in the TEM are contrast maps resulting from the ratio of
inelastically to elastically scattered electrons at the sample. More precisely, the contrast is
generated by the number of electrons reaching the detector. This number of recorded
electrons can be reduced by the objective aperture, which removes electrons depending
on their scattering angles, and an energy filter, which removes electrons that lost most of
their energy by sample interaction. Therefore, the detector signal is highly dependent on
the density and thickness of the sample. For bright field imaging, the objective aperture is
centered around the primary beam, and electrons that are scattered to high angles are
removed. In darkfield mode, this low angle scattering region is excluded, and only strongly
scattered electrons are recorded, which allows for an additional Z-contrast due to stronger
electron-atom scattering intensity at higher atomic Z-numbers.
In high-resolution TEM, the images are generated by the elastically scattered electrons.
Prior to sample interaction, the electrons are in phase. Subsequently, depending on the
crystallinity and crystal orientations within the sample, the phases of the electrons
interfere through Bragg diffraction. This is then translated into different intensities on the
detector, creating the contrast within the image.
TEM images were recorded using an FEI Titan Themis 60 – 300 microscope at an
acceleration voltage of 120 − 300 kV.

Analytical Techniques
33
2.3. Physisorption
Gas physisorption is a widely used technique for the characterization of porous materials.
It allows for obtaining information about surface areas, pores sizes and pore volumes. The
method uses chemically inert gases (adsorptives), such as nitrogen or argon, and studies
the reversible interactions, such as van-der-Waals or dispersive forces, with the substrate.
More specifically, physisorption is used to study the adsorption and desorption of the
gases under isothermal conditions. The behavior of materials during physisorption is
described with sorption isotherms, in which the adsorbed volume is plotted against the
relative pressure. This relative pressure is the ratio of the equilibrium pressure p and the
saturated vapor pressure p0 of the pure adsorptive. A sorption isotherm is typically
obtained from a sample that was activated under a high vacuum and at elevated
temperatures to remove any guest molecules prior to the measurements. Subsequently,
the sample is exposed to increased gas pressures at predefined relative pressures p/p0
until a relative pressure close to 1 is reached. Thereby, the adsorption branch of the
isotherm is obtained. Afterward, the desorption branch is determined by decreasing the
relative pressure p/p0 to predefined pressure points.
The shape of the resulting sorption isotherms is dependent on the pore sizes and shapes
of the materials. Pore sizes are typically divided into three classes: micropores with <2
nm, mesopores with 2−50 nm and macropores with >50 nm. To standardize and classify
sorption isotherms, IUPAC classified eight typical isotherm shapes (Figure 2.5).
Type I isotherms are generally observed for microporous materials. The small pore
diameter allows only for limited adsorption where the adsorbate layer can only become a
few layers thick. The attractive potential results in a complete pore condensation, the so-
called micropore filling. Characteristic for this isotherm is the high uptake at low partial
pressures.
Type II and III isotherms are typical for large meso-, or macroporous materials or for
materials with no porosity. The reversible type II isotherm is the most typical one and
represents an unrestricted monolayer-multilayer adsorption process. The arrow indicates
the partial pressure region, in which monolayer coverage is complete and the multilayer
adsorption starts.
A type III isotherm indicates that interactions between the adsorbate and the absorbent
are weak, and adsorbate-adsorbate interactions are favored.

Analytical Techniques
34
Type IV isotherms describe mesoporous materials. In type IV(a), a hysteresis loop occurs
due to capillary condensation inside the mesopore. Type IV(b) describes an isotherm of a
mesoporous material in which no capillary condensation takes place. The existence of a
hysteresis loop depends on the stability of the adsorbed multilayer during adsorption and
on the nucleation barrier for creating a liquid phase in the pores. This depends on the pore
shape, interface energies and the temperature. A highly stable adsorbate multilayer
results in a pore condensation at higher partial pressures during the adsorption, while the
desorption process is a reversible liquid-vapor transition under near equilibrium
conditions, which occurs at lower partial pressures. Additionally, the form of the
hysteresis can give further information on pore shapes and openings.
Type V isotherms are similar to type III isotherms, but for porous materials.
Type VI isotherms are very rare and indicate a multi-step, layer-by-layer adsorption on a
uniform, non-porous surface.

Analytical Techniques
35
Figure 2.5: Isotherm shapes as classified by IUPAC.3
Surface areas are mostly calculated by the Brunauer-Emmett-Teller theory (BET), which
explains the adsorption of gases onto surfaces of porous materials. Here, the capacity of
the monolayer is derived by transforming the physisorption isotherm into a BET plot.
Then the BET plot is used to calculate the adsorptive capacity of the monolayer, and
subsequently the BET surface area is calculated from the BET capacity and the cross-
sectional area of the adsorptive.

Analytical Techniques
36
Although several adsorptives are used for physisorption, nitrogen has become the
standard, mainly due to its availability and low cost. BET calculations are generally quite
accurate (as long as pore sizes are not too small), but often overestimate surface areas for
highly polar pore environments.4 This is caused by the diatomic nature of the molecule,
which results in a quadrupole moment and therefore an additional partial charge that can
increase molecular interactions. To overcome these limitations, it is possible to use argon
at liquid argon temperature for sorption, since it has no quadrupolar moment. It is
furthermore possible to use argon at liquid nitrogen temperature. This leads to cooling
argon 6.5 K below its bulk triple point, resulting in questionable values for the reference
properties. By using a lower saturation pressure for the supercooled liquid argon (p0 =
230 torr) it is possible to carry out surface area measurements. However, since calculation
models for nitrogen are so far superior to argon, nitrogen sorption remains the more
accurate method for most measurements.5
Pore size distributions are calculated using density functional theory (DFT) simulations.
Here, the interactions of adsorptives with different pore geometries and surface polarities
were simulated and based on this, various models, so-called kernels, were developed.
Based on these kernels, theoretical isotherms can be modeled and fitted against the
experimentally obtained one by changing pore widths. This modeling is either done with
the non-local density functional theory (NLDFT), or the more recent quenched-solid
density functional theory (QSDFT), as NLDFT neglects surface roughness and
heterogeneity.5
2.4. UV-vis-NIR spectroscopy and photoluminescence
The interaction of UV-vis-NIR electromagnetic radiation with matter can be studied by
absorption spectroscopy. The absorption of radiation in this range results in electronic
transitions within the material, and electrons are excited from the ground state to higher
excited energy states, leaving an electron-hole. This allows for studying the energy
difference between the HOMO-LUMO orbitals, or the valence band and conduction band.6
If the electron is excited to energies higher than the lowest-energy excited state, the
electron first relaxes non-radiatively, until the vibrational ground state of the excited state
is reached. Subsequently, the energy difference to the ground state is released by the
emission of a photon and the excited electron recombines with the electron-hole.7

Analytical Techniques
37
The kinetics of this recombination process, and thereby the lifetime of the excited states,
can be assessed by time-correlated single-photon counting (TCSPC). Here, the sample is
excited by a short laser pulse of known duration and subsequently, the time between the
end of the laser pulse and the detection of a photon is measured. Using laser pulse
frequencies in the kHz or MHz range allows for statistical analysis of the lifetimes of the
excited states. The collected decay data can then be fitted with an exponential function to
gain information about the half-life time of the excited states and the number of different
relaxation pathways.8
2.5. Cyclic voltammetry (CV)
CV is an electrochemical analysis method in which the potential of an electrode is changed
linearly against time, and the resulting current is recorded. The potential is scanned
cyclically between two predefined vertex potentials at linear, fixed rates. The resulting
current is subsequently plotted against the applied potential. CV is commonly used to
probe electron transfer in redox-active systems. Upon reaching a specific potential at the
working electrode, a current starts to flow, indicating the start of an electron transfer
between the electrode and the redox-active substance. An oxidation will occur when the
potential energy of the energetically highest electron in the substance is higher than the
energy of the electrons in the working electrode. Accordingly, a reduction will occur when
the potential energy of the electrons in the working electrode is higher than the energy of
accessible electronic levels in the substance. Therefore, the driving force of the electron
transfer is the minimization of the potential energy difference between the electrode and
the substance. By referencing the potential at which this electron transfer occurs against
a known redox-system, such as Ag/AgCl (used within the reference electrode), the
absolute energies can be determined at which an oxidation or reduction takes place.9
CV measurements are conducted in a solution of a solvent and an electrolyte. Typically, an
electrochemical cell for CV consists of three electrodes, namely the working electrode, the
counter electrode, and the reference electrode. The current is measured between the
working electrode and the counter electrode, while the potential is measured between the
working electrode and the reference electrode.
Analytical Techniques
38
References
(1) Monospektra. SEM Scheme.
https://www.monospektra.com/positioning/applications/drives-positioning-systems-
electron-microscopes/ (accessed December 13, 2019).
(2) Claudionico. Electron Interaction with Matter.
https://commons.wikimedia.org/wiki/File:Electron_Interaction_with_Matter.svg
(accessed December 13, 2019).
(3) Thommes, M.; Kaneko, K.; Neimark, A. V.; Olivier, J. P.; Rodriguez-Reinoso, F.;
Rouquerol, J.; Sing, K. S.W. Physisorption of gases, with special reference to the
evaluation of surface area and pore size distribution (IUPAC Technical Report). Pure
Appl. Chem. 2015, 87, 1051–1069.
(4) Galarneau, A.; Desplantier, D.; Dutartre, R.; Di Renzo, F. Micelle-templated silicates as
a test bed for methods of mesopore size evaluation. Microporous and Mesoporous
Materials 1999, 27, 297–308.
(5) Lowell, S.; Shields, J. E.; Thomas, M. A.; Thommes, M. Characterization of porous solids
and powders: surface area, pore size and density; Particle Technology Series 16; Springer:
Dordrecht, 2004.
(6) Clark, B. J.; Frost, T.; Russell, M. A., Eds. UV spectroscopy: Techniques, instrumentation,
data handling, 1. ed.; Techniques in visible and ultraviolet spectrometry 4; Chapman &
Hall: London, 1993.
(7) Lakowicz, J. R. Principles of fluorescence spectroscopy, 3. ed.; Springer
Science+Business Media LLC: Boston, MA, 2006.
(8) Phillips, D.; Drake, R. C.; O’Connor, D. V.; Christensen, R. L. Time Correlated Single-
Photon Counting (Tcspc) Using Laser Excitation. Instrumentation Science & Technology
1985, 14, 267–292.
(9) Elgrishi, N.; Rountree, K. J.; McCarthy, B. D.; Rountree, E. S.; Eisenhart, T. T.; Dempsey,
J. L. A Practical Beginner’s Guide to Cyclic Voltammetry. J. Chem. Educ. 2018, 95, 197–
206.

From Benzodithiophene to Diethoxy-Benzodithiophene Covalent Organic Frameworks –
Structural Investigations
39
3. From Benzodithiophene to Diethoxy-Benzodithiophene
Covalent Organic Frameworks - Structural Investigations
This chapter is based on the following publication:
Lohse, M. S.; ‡ Rotter, J. M.; ‡ Margraf, J. T.; Werner, V.; Becker, M.; Herbert, S.; Knochel, P.;
Clark, T.; Bein, T.; Medina, D. D. From benzodithiophene to diethoxy-benzodithiophene
covalent organic frameworks – structural investigations. CrystEngComm 2016, 18, 4295–
4302.
3.1. Abstract
The incorporation of side groups into a covalent organic framework (COF) backbone can
be of significant importance for developing new frameworks with enhanced properties.
Here we present a novel π-stacked thiophene-based COF containing a benzodithiophene
building unit modified with ethoxy side chains. The resulting BDT-OEt COF is a crystalline
mesoporous material featuring high surface area and accessible hexagonal pores. We
further synthesized a series of COFs containing both BDT and BDT-OEt building units at
different ratios. The impact of the gradual incorporation of the BDT-OEt building units into
the COF backbone on the crystallinity and porosity was investigated. Furthermore,
molecular dynamic simulations shed light on the possible processes governing the COF
assembly from molecular building blocks.

From Benzodithiophene to Diethoxy-Benzodithiophene Covalent Organic Frameworks –
Structural Investigations
40
3.2. Introduction
The self-organization of π-stacked organic layers into highly ordered three-dimensional
porous structures endows covalent organic frameworks (2D COFs) with interesting
properties for diverse applications, including chemical separations, catalysis and
optoelectronics.1-7 The extended organic layers constituting a 2D COF are generally
obtained by the copolymerization of rigid building units having complimentary
geometries through the formation of strong yet reversible covalent bonds. Boroxines and
boronic esters, obtained by condensation reactions of boronic acids and diols, are
commonly utilized as integral COF assembly motifs and thereby enable the growth of
planar two-dimensional layers.8 Along with the condensation reactions, stacking of the
formed organic layers takes place through dispersive forces.9 Therefore, 2D COFs
connected through boronate esters feature an assembly of organic building units (or
linkers) in a columnar fashion. This permits the formation of supramolecular structures
having long-range order, one-dimensional channels and high surface areas.10-15
Tuning the structural and physical properties of a COF while maintaining its key features,
namely porosity and crystallinity, can pose significant synthetic challenges. For example,
incorporating building units having a large conjugated π-system into a framework can be
highly desirable for enhanced light absorption properties.11, 16 However, such attractive
building units tend to exhibit poor solubility under the reaction conditions, often leading
to poor crystallinity of the resulting COF.17 To overcome solubility limitations, a
modification of the building units with solubilizing agents such as alkyl side chains can be
considered. In the final COF structure, the solubilizing side chains are oriented
orthogonally to the COF pore walls and therefore need to be compatible with the stacking
of the COF layers. In addition, these groups can play an important role in defining the
electronic properties of the COF. Electron donating or electron withdrawing side groups
can have a strong impact on the COF optical bandgap, and they can affect the fine balance
between the Coulomb repulsion and the weak attractive London dispersion interactions
holding the COF layers together.
In an early study, Lavigne and co-workers reported the synthesis of a boronate ester-
linked COF-18 series where the catechol building units were modified with linear alkyl
side chains ranging from methyl to propyl groups. The impact of the integrated alkyl side
chains on guest molecule uptake was investigated.18 In a later study, enhanced stability

From Benzodithiophene to Diethoxy-Benzodithiophene Covalent Organic Frameworks –
Structural Investigations
41
towards humidity of the propyl modified COF structure was shown within the COF-18
series.19 However, the overall long-range order of the COF-18 series was significantly
diminished with the elongation of the side groups. Jiang and co-workers introduced an
azide-modified benzo diboronic acid (BDBA) for the purpose of COF backbone post-
modification.
In that report, the overall crystallinity of the modified COF-5 was maintained as the azide
units having a planar configuration were extended along the plane of the COF layers.20
Dichtel and co-workers introduced an effective crystallization route for boronate ester
linked COFs starting from saturated homogenous precursor solutions.9, 21 Applying this
method, COF structures having high surface area and long-range order were obtained.
This crystallization route illustrates the importance of the COF precursor’s solubility
under reaction conditions.
Recently, we reported the synthesis under solvothermal conditions of oriented thin films
of an electron donor COF based on benzodithiophene units, BDT COF.22 We also introduced
a novel vapor-assisted conversion approach for the direct deposition of BDT COF films
under mild thermal conditions.23
Herein, we describe the synthesis of a highly porous boronate ester linked BDT-OEt COF
containing (4,8-diethoxybenzo[1,2-b:4,5-b']dithiophene-2,6-diyl)diboronic acid. The BDT
core is modified with electron-donating ethoxy side chains thereby expanding the family
of thiophene-based COFs.7, 22, 24, 25 We synthesized a series of COFs consisting of BDT and
BDT-OEt building unit mixtures and studied their structural properties (Scheme 3.1). The
impact of the gradual layer perturbation imposed by the increased fraction of
incorporated BDT-OEt building units into the COF backbone on the crystallinity and
porosity was investigated. Furthermore, molecular dynamic simulations shed light on the
possible processes governing the COF assembly from molecular building units.

From Benzodithiophene to Diethoxy-Benzodithiophene Covalent Organic Frameworks –
Structural Investigations
42
Scheme 3.1: Schematic representation of the synthesis of BDT COF (left), BDT:BDT-OEt 1:1 COF
(middle), and BDT-OEt COF (right).
3.3. Results
A novel BDT-OEt COF featuring a BDT core decorated with ethoxy side chains was
synthesized through the co-condensation of (4,8-diethoxybenzo[1,2-b:4,5-
b']dithiophene-2,6-diyl)diboronic acid and HHTP (2,3,6,7,10,11-
hexahydroxytriphenylene) under solvothermal conditions (for more details see
experimental section).
Figure 3.1: (a) XRD patterns of BDT-OEt COF: experimental (red), Pawley refinement (black),
simulated pattern (blue), and difference plot (green). (b) Nitrogen sorption isotherm of BDT-OEt
COF. Full symbols: adsorption, empty symbols: desorption.
Powder X-ray diffraction data of the newly synthesized BDT-OEt COF clearly indicate the
formation of a crystalline framework. The diffraction pattern reveals an intensive
reflection at 2.78° corresponding to the (100) plane. Additional reflections observed at

From Benzodithiophene to Diethoxy-Benzodithiophene Covalent Organic Frameworks –
Structural Investigations
43
4.85°, 5.58° and 7.38°, 9.71° and ~25.7° (broad) are attributed to the (110), (200), (120),
(220) and (001) planes, respectively (Figure 3.1a). The obtained d-values correspond to
lattice parameters of a = b =3.66 nm for an ideal hexagonal BDT-OEt COF structure.
Effective crystallite domain sizes of 21 nm in diameter for BDT-OEt COF were calculated
using the Scherrer equation for reflection broadening. Molecular mechanics simulations
for the possible COF layer arrangements were carried out using Materials Studio software
and the Forcite module. Assuming a hexagonal symmetry, the BDT-OEt COF unit cell was
constructed in the P6 space group corresponding to an ideal eclipsed AA COF layer
arrangement and featuring a completely open pore system (Figure S3.1). To obtain the
final unit cell parameters and the crystallite domain sizes, Pawley refinement was
employed. For this purpose, the geometry optimized BDT-OEt COF unit cell was refined
against the experimental powder X-ray diffraction pattern. Lattice parameters of a = b =
3.65 nm, c = 0.365 nm and crystallite sizes of 20 nm in diameter were obtained. The
simulated powder diffraction pattern corrected for reflection broadening is in very good
agreement with the experimentally observed pattern with regard to reflection positions
and relative intensities (Figure 3.1a). Additionally, we simulated the BDT-OEt COF unit cell
in the triclinic P1 space group where no symmetry constraints are imposed. After
geometry optimization and Pawley refinement, the refined unit cell reveals an eclipsed
configuration with tilted COF layers.36 This layer configuration produced a nearly identical
simulated diffraction pattern, and therefore the exact eclipsed layer arrangement cannot
be determined based on the experimental diffraction pattern (see Figure S3.5). To confirm
the eclipsed layer arrangement for the BDT-OEt COF, we also simulated the X-ray
diffraction pattern for an alternative hexagonal unit cell with P63 space group
corresponding to a staggered, AB layer arrangement (Figure S3.8). Based on the
comparison of the simulated AA and AB patterns with the experimentally obtained
pattern, we conclude that BDT-OEt crystalizes with an eclipsed layer arrangement
allowing for an open pore system.
In previous reports, the side groups decorating the pore walls were considered as an
amorphous contribution to the X-ray scattering data, having no preferred orientation in
the pore due to their free rotation.18, 20, 37 To investigate the preferred orientation of the
ethoxy groups in the pores, several separate molecular dynamics simulations were carried
out (Figure S3.10). Independent of the initial orientation of the groups, which can either
face the adjacent hydrogen or sulfur atom of the BDT core or alternate between these two

From Benzodithiophene to Diethoxy-Benzodithiophene Covalent Organic Frameworks –
Structural Investigations
44
cases, nearly all ethoxy-groups rotated to face the sulfur atom within less than 1 ns. The
ethoxy groups retained their position, indicating that the groups can in principle rotate at
room temperature, and that the sulfur-facing position is favoured in the crystal (Figure
S3.10). This was confirmed by DFT calculations at the PBE+D level, which indicate that the
sulfur-facing geometry is more stable by 0.2 eV (corresponding to a Boltzmann population
ratio of approx. 4×10⁻⁴ for the hydrogen-facing geometry at room temperature). This
preference can be attributed to the electrostatic attraction between the sulfur lone-pairs
and the ethoxy hydrogen atoms.
Nitrogen sorption analysis of an activated BDT-OEt COF powder reveals a type IV sorption
isotherm, with a distinct nitrogen uptake at relative low partial pressures, typical for a
mesoporous material (Figure 3.1b). The Brunauer-Emmett-Teller (BET) surface area was
calculated to be as high as 1844 m²/g (p/p0 = 0.05-0.13 in the adsorption branch) and the
pore volume to be 1.07 cm³/g. These values are in good agreement with the simulated
Connolly surface area of 2075 m²/g and calculated pore volume of 1.06 cm³/g for a BDT-
OEt COF with an eclipsed layer arrangement. BDT-OEt COF exhibits a narrow pore size
distribution as derived from the sorption isotherm with a pore size of 2.9 nm
corresponding to a defined mesoporous structure (Figure S12).
An aggregation process of COF crystallites into larger domains was discussed as a crucial
non-reversible step for the formation of COF precipitates.9 Scanning electron microscopy
(SEM) micrographs of BDT-OEt COF bulk material indicate that the small BDT-OEt COF
crystallites aggregate into micrometer spherical agglomerates upon COF powder
precipitation (Figure S13). Transmission electron microscopy (TEM) images reveal an
Figure 3.2: Transmission electron microscopy image of BDT-OEt COF showing polycrystalline
domains and the COF channels.

From Benzodithiophene to Diethoxy-Benzodithiophene Covalent Organic Frameworks –
Structural Investigations
45
intergrowth of small BDT-OEt COF crystallites into larger polycrystalline domains. In
contrast to the BDT COF, less regular fairly short COF channels can be observed (Figure
3.2). These observations are in accordance with the reflection broadening observed in the
X-ray analysis and suggest that the incorporation of ethoxy side chains can influence the
COF growth process in both the ab-plane and the stacking direction.
Thermogravimetric analysis (TGA) of the COF powder displays a major mass loss at 400°C
that is attributed to framework decomposition (Figure S3.19).
The formation of a boronate ester motif in the COF framework was confirmed by FT-IR
and solid-state NMR spectroscopy. IR-bands at 1346 and 1238 cm−1 are attributed to the
B−O and C−O vibrational modes of the ester formed (Figure S3.20). In the 11B solid-state
NMR spectrum of BDT-OEt COF, a strong peak at 20.9 ppm confirms the presence of a
trigonal-planar boron atom of a boronate ester (Figure S3.22). In the 13C solid-state NMR
spectrum, the signals at 13.2 ppm and 67.7 ppm are attributed to the methyl and
methylene carbon atoms in the ethoxy side chain (Figure S3.23).
Boronate ester linked COFs consisting of building unit mixtures have been introduced in
a series of COF-5 structures modified with azide side chains as a platform for a gradual
post synthetic modification via click chemistry.20 Herein, we aim at investigating the
structural changes imposed by ethoxy groups on a well-defined and highly crystalline COF
structure such as the BDT COF. For this purpose, we synthesised a series of COFs where
both building units BDT and BDT-OEt are randomly distributed within the COF backbone
at different ratios. The BDT:BDT-OEt COF series was synthesised under solvothermal
conditions similarly to the synthesis of BDT-OEt COF, with BDT:BDT-OEt building unit
ratios of 1:0, 3:1, 1:1, 1:3 and 0:1 (for more information see experimental section).

From Benzodithiophene to Diethoxy-Benzodithiophene Covalent Organic Frameworks –
Structural Investigations
46
Figure 3.3: PXRD patterns of BDT COF, BDT:BDT-OEt COFs, and BDT-OEt COF.
Powder X-ray diffraction patterns of the obtained BDT:BDT-OEt COFs confirmed the
formation of a series of crystalline frameworks (Figure 3.3). Upon the incorporation of
ethoxy side chains into the BDT COF backbone, gradual changes in the BDT:BDT-OEt COF
diffraction patterns were observed. The relative intensities of the (110) and the (200)
planes change with the increased fraction of BDT-OEt building units. This is in excellent
agreement with the simulated diffraction patterns of BDT and BDT-OEt COFs and further
confirms the successful incorporation of BDT-OEt into the frameworks (Figure S3.9). A
broadening of the X-ray reflections is evident in BDT-OEt-rich COFs. The effective
crystallite domain sizes calculated for BDT:BDT-OEt 3:1 and BDT:BDT-OEt 1:3 COFs are 95
nm and 47 nm, respectively. Therefore, we attribute the reflection broadening to a regular
decrease in the crystallite domain sizes with increasing the BDT-OEt building unit content.
A gradual small shift of the reflections corresponding to the ab plane to higher 2 theta
values with the higher integrated fraction of BDT-OEt building units is observed as well
(Figure S3.21). Interestingly, the broad reflection at ~25.7°, attributed to the layer
stacking, maintained its position and its relative intensity. The gradual shift to higher 2
theta values implies that the incorporation of ethoxy groups into the frameworks induced
structural modifications expressed in the unit cell parameters. This can be either
attributed to a gradual shrinkage of the hexagonal unit cell or to a gradual increase of layer
dynamics resulting in a P1 like structure (Figure S3.4).36
Molecular dynamics simulations regarding the layer interactions provided further
insights into the effect of the ethoxy groups on the dynamics and order of the system. A
comparison of the sulfur-sulfur radial distribution functions gSS(r) for the ethoxy

From Benzodithiophene to Diethoxy-Benzodithiophene Covalent Organic Frameworks –
Structural Investigations
47
substituted and pristine BDT COF reveals a significant increase in short-range disorder in
the former COF (Figure S3.11). This is evident from the broadening and shifted position
towards larger distances of the first peak in gSS(r) corresponding to the closest sulfur-
sulfur distance between adjacent layers. The increased short-range disorder is attributed
mainly to increased movement of the layers in the ab-plane, since more displaced
geometries are stabilized by the interactions between the ethoxy groups. Interestingly, the
average interlayer distance in the simulations increases when the ethoxy groups are
present, which might be expected due to the spatial demands of the ethyl groups. However,
this trend regarding the interlayer distances is not observed in the experimental pattern.
Figure 3.4: Detail of the pore size distributions of BDT COF, mixed BDT:BDT-OEt COFs and BDT-
OEt COF showing the decrease of the main pore diameter upon the incorporation of ethoxy side
chains into the COF structure.
The impact of the gradual incorporation of the ethoxy side chains on the pore accessibility
of the frameworks was investigated by nitrogen sorption. The BDT:BDT-OEt COF series
retained the typical type IV isotherms for mesoporous materials. The relative partial
pressure of the slope of the nitrogen uptake is shifted to lower values as expected for the
gradually increasing pore occupancy with ethoxy side chains. Pore size distribution
evaluation revealed a gradual decrease of the pore size upon the incorporation of ethoxy
side chains. In all the BDT:BDT-OEt COF structures only one type of pore is present,
indicating a random integration of the ethoxy groups into the frameworks, as opposed to
the formation of phase-separated domains. High surface areas were calculated for the
BDT:BDT-OEt COF series. This clearly illustrates that the incorporation of BDT-OEt
building units into the framework does not affect the accessible surface areas and pores
of the BDT:BDT-OEt COF (Figure 3.4, S3.12).

From Benzodithiophene to Diethoxy-Benzodithiophene Covalent Organic Frameworks –
Structural Investigations
48
The solubility of the respective building units under the reaction conditions plays an
important role regarding their incorporation into the COF backbone. If a significant
solubility difference would exist, their ratio in the frameworks might deviate from the
initial stoichiometric mixture. To determine the final BDT:BDT-OEt ratio incorporated into
the frameworks, samples of the respective BDT:BDT-OEt COF series were hydrolysed in
wet DMSO-d6 for 1H NMR spectroscopy. Integrating the proton signals of the building
units showed that the observed intensities are in very good agreement with the intended
stoichiometric ratios of BDT, BDT-OEt and HHTP building units for all COFs. Therefore,
defects in the form of precursor deficiencies within the frameworks are not observed
(Figure 3.5 and Section 9 in the SI).
Figure 3.5: 1H-NMR spectra of the hydrolyzed COFs showing the stoichiometric incorporation of
BDT and BDT-OEt linkers into the respective frameworks.
SEM micrographs reveal a similar overall morphology for all investigated COFs. Small
unevenly shaped particles form large aggregates, comparable with the morphology we
observed for BDT-OEt COF (Figure S3.13). In TEM images, BDT-rich COFs show intergrown
cauliflower morphology. Depending on the crystallite orientation, ordered channels or the
typical honeycomb structure are visible. BDT-OEt-rich COFs feature smaller crystallite
domain sizes and shorter COF channels (Figure S3.14). TGA traces were recorded to
determine the thermal stability of the COF series. For all COFs, the major mass loss
attributed to the decomposition of the framework takes place at 400°C, showing a similar
thermal stability of all investigated frameworks (Figure S3.15-S3.19).
These analyses confirm that with BDT and BDT-OEt building units, COFs can be formed
from freely selected ratios of the respective boronic acids. While mixing these building

From Benzodithiophene to Diethoxy-Benzodithiophene Covalent Organic Frameworks –
Structural Investigations
49
units in a COF leads to structural changes in the framework, a highly porous, crystalline
and thermally stable framework is generated in all cases.
3.4. Conclusions
In conclusion, a novel ethoxy-functionalized benzodithiophene based COF, namely BDT-
OEt COF, was synthesized under solvothermal conditions. BDT-OEt COF features
crystallinity, mesoporosity and high surface area. A series of COFs consisting of both BDT
and BDT-OEt building units in different ratios was synthesized. Highly crystalline,
mesoporous frameworks were obtained for all BDT:BDT-OEt COFs. A nearly linear
evolution from BDT to BDT-OEt COF was observed with regard to pore size and crystallite
domain sizes upon the gradual incorporation of BDT-OEt building unit into the COF
backbone. Furthermore, we show that the final building unit ratios in the framework can
be predetermined prior to the COF synthesis. Therefore, the COF backbones and chemical
pore environment can be finely tuned towards desired properties while an eclipsed layer
arrangement is retained. Molecular dynamics simulations and DFT calculations shed light
on the preferred orientation of the ethoxy groups in the pore. Furthermore, the
simulations illustrate that the incorporation of ethoxy chains facilitates a subtle lateral
displacement of the BDT COF layers relative to each other.
3.5. References
1. A. P. Co te , A. I. Benin, N. W. Ockwig, M. O'Keeffe, A. J. Matzger and O. M. Yaghi, Science,
2005, 310, 1166-1170.
2. N. Huang, X. Chen, R. Krishna and D. Jiang, Angewandte Chemie International
Edition, 2015, 54, 2986-2990.
3. H. Xu, J. Gao and D. Jiang, Nat Chem, 2015, 7, 905-912.
4. S. Lin, C. S. Diercks, Y.-B. Zhang, N. Kornienko, E. M. Nichols, Y. Zhao, A. R. Paris, D.
Kim, P. Yang, O. M. Yaghi and C. J. Chang, Science, 2015, 349, 1208-1213.
5. C. R. DeBlase, K. E. Silberstein, T.-T. Truong, H. D. Abrun a and W. R. Dichtel, Journal
of the American Chemical Society, 2013, 135, 16821-16824.

From Benzodithiophene to Diethoxy-Benzodithiophene Covalent Organic Frameworks –
Structural Investigations
50
6. M. S. Lohse, T. Stassin, G. Naudin, S. Wuttke, R. Ameloot, D. De Vos, D. D. Medina and
T. Bein, Chemistry of Materials, 2016, 28, 626-631.
7. M. Dogru, M. Handloser, F. Auras, T. Kunz, D. Medina, A. Hartschuh, P. Knochel and
T. Bein, Angewandte Chemie International Edition, 2013, 52, 2920-2924.
8. J. W. Colson and W. R. Dichtel, Nat Chem, 2013, 5, 453-465.
9. B. J. Smith and W. R. Dichtel, Journal of the American Chemical Society, 2014, 136,
8783-8789.
10. L. Chen, K. Furukawa, J. Gao, A. Nagai, T. Nakamura, Y. Dong and D. Jiang, Journal of
the American Chemical Society, 2014, 136, 9806-9809.
11. S. Jin, X. Ding, X. Feng, M. Supur, K. Furukawa, S. Takahashi, M. Addicoat, M. E. El-
Khouly, T. Nakamura, S. Irle, S. Fukuzumi, A. Nagai and D. Jiang, Angewandte Chemie
International Edition, 2013, 52, 2017-2021.
12. S. Jin, K. Furukawa, M. Addicoat, L. Chen, S. Takahashi, S. Irle, T. Nakamura and D.
Jiang, Chemical Science, 2013, 4, 4505-4511.
13. J. Guo, Y. Xu, S. Jin, L. Chen, T. Kaji, Y. Honsho, M. A. Addicoat, J. Kim, A. Saeki, H. Ihee,
S. Seki, S. Irle, M. Hiramoto, J. Gao and D. Jiang, Nat Commun, 2013, 4, 2736.
14. E. L. Spitler, J. W. Colson, F. J. Uribe-Romo, A. R. Woll, M. R. Giovino, A. Saldivar and
W. R. Dichtel, Angewandte Chemie International Edition, 2012, 51, 2623-2627.
15. H. Yang, Y. Du, S. Wan, G. D. Trahan, Y. Jin and W. Zhang, Chemical Science, 2015, 6,
4049-4053.
16. M. Calik, F. Auras, L. M. Salonen, K. Bader, I. Grill, M. Handloser, D. D. Medina, M.
Dogru, F. Lo bermann, D. Trauner, A. Hartschuh and T. Bein, Journal of the American
Chemical Society, 2014, 136, 17802-17807.
17. S. Jin, M. Supur, M. Addicoat, K. Furukawa, L. Chen, T. Nakamura, S. Fukuzumi, S. Irle
and D. Jiang, Journal of the American Chemical Society, 2015, 137, 7817-7827.
18. R. W. Tilford, S. J. Mugavero, P. J. Pellechia and J. J. Lavigne, Advanced Materials, 2008,
20, 2741-2746.

From Benzodithiophene to Diethoxy-Benzodithiophene Covalent Organic Frameworks –
Structural Investigations
51
19. L. M. Lanni, R. W. Tilford, M. Bharathy and J. J. Lavigne, Journal of the American
Chemical Society, 2011, 133, 13975-13983.
20. A. Nagai, Z. Guo, X. Feng, S. Jin, X. Chen, X. Ding and D. Jiang, Nat Commun, 2011, 2,
536.
21. B. J. Smith, N. Hwang, A. D. Chavez, J. L. Novotney and W. R. Dichtel, Chemical
Communications, 2015, 51, 7532-7535.
22. D. D. Medina, V. Werner, F. Auras, R. Tautz, M. Dogru, J. Schuster, S. Linke, M.
Do blinger, J. Feldmann, P. Knochel and T. Bein, ACS Nano, 2014, 8, 4042-4052.
23. D. D. Medina, J. M. Rotter, Y. Hu, M. Dogru, V. Werner, F. Auras, J. T. Markiewicz, P.
Knochel and T. Bein, Journal of the American Chemical Society, 2015, 137, 1016-1019.
24. G. H. V. Bertrand, V. K. Michaelis, T.-C. Ong, R. G. Griffin and M. Dinca , Proceedings of
the National Academy of Sciences, 2013, 110, 4923-4928.
25. S. Duhovic and M. Dinca , Chemistry of Materials, 2015, 27, 5487-5490.
26. D. W. Slocum and P. L. Gierer, J. Org. Chem., 1976, 41, 3668-3673.
27. S. L. Mayo, B. D. Olafson and W. A. Goddard, The Journal of Physical Chemistry, 1990,
94, 8897-8909.
28. O. Alexiadis and V. G. Mavrantzas, Macromolecules, 2013, 46, 2450-2467.
29. A. K. Rappe and W. A. Goddard, The Journal of Physical Chemistry, 1991, 95, 3358-
3363.
30. J. Clark Stewart, D. Segall Matthew, J. Pickard Chris, J. Hasnip Phil, I. J. Probert Matt,
K. Refson and C. Payne Mike, Journal, 2005, 220, 567.
31. J. P. Perdew, K. Burke and M. Ernzerhof, Physical Review Letters, 1996, 77, 3865-
3868.
32. S. Grimme, Journal of Computational Chemistry, 2006, 27, 1787-1799.
33. E. R. McNellis, J. Meyer and K. Reuter, Physical Review B, 2009, 80, 205414.
34. D. Vanderbilt, Physical Review B, 1990, 41, 7892-7895.
35. H. J. Monkhorst and J. D. Pack, Physical Review B, 1976, 13, 5188-5192.

From Benzodithiophene to Diethoxy-Benzodithiophene Covalent Organic Frameworks –
Structural Investigations
52
36. E. L. Spitler, B. T. Koo, J. L. Novotney, J. W. Colson, F. J. Uribe-Romo, G. D. Gutierrez, P.
Clancy and W. R. Dichtel, Journal of the American Chemical Society, 2011, 133, 19416-
19421.
37. H. Xu, X. Chen, J. Gao, J. Lin, M. Addicoat, S. Irle and D. Jiang, Chemical
Communications, 2014, 50, 1292-1294.

From Benzodithiophene to Diethoxy-Benzodithiophene Covalent Organic Frameworks –
Structural Investigations
53
3.6. Supporting Information
Materials: All materials (if not otherwise noted) were purchased from Aldrich,
Fluka, Acros or TCI Europe in the common purities purum and puriss. All materials
were used as received without further purification. Benzo[1,2-b:4,5-
b’]dithiophene-4,8-dione was prepared following a literature procedure.26
Synthesis of 4,8-diethoxybenzo[1,2-b:4,5-b’]dithiophene (1). The reaction was
performed based on a literature procedure. A mixture of benzo[1,2-b:4,5-b’]dithiophene-
4,8-dione (1.10 g, 4.99 mmol, 1.0 equiv), zinc dust (0.981 g, 15.0 mmol, 3.0 equiv), NaOH
(10 mL) and EtOH (10 mL) was stirred at 95 °C for 2h. Ethyl p-toluenesulfonate (3.00 g,
15.0 mmol, 3.0 equiv) was added and the resulting solution was stirred at 95 °C for
additional 3 h. The reaction mixture was allowed to cool down to room temperature and
was diluted with dichloromethane (DCM) (70 mL). The aqueous layer was extracted with
DCM (4 × 100 mL) and the combined organic fractions were dried over Na2SO4. After
filtration, the solvents were evaporated in vacuo. The crude product was purified by flash
column chromatography (silica, isohexane/DCM = 3:1) to affod 1 as a colorless solid
(0.675 g, 49%). Mp: 96.9 – 102.6 °C. 1H NMR (400 MHz, CDCl3) δ/ppm = 7.46 (d, J = 5.5 Hz,
2H), 7.35 (d, J = 5.5 Hz, 2H), 4.35 (q, J = 7.0 Hz, 4H), 1.47 (t, J = 7.0 Hz, 6H). 13C NMR (100
MHz, CDCl3) δ/ppm = 144.3, 131.8, 130.4, 126.0, 120.3, 69.4, 16.1. IR (cm-1): ṽ = 3100,
2980, 2873, 1892, 1515, 1477, 1436, 1372, 1347, 1199, 1106, 1085, 1029, 977, 873, 810,
752, 736, 695, 661. MS (70 eV, EI) m/z (%) = 278 (27, M+), 223 (11), 222 (13), 221 (100),
111 (37), 44 (31), 43 (80). HRMS for C14H14O2S2 (278.0435) found: 278.0428.
Synthesis of 2,6-dibromo-4,8-diethoxybenzo[1,2-b:4,5-b’]dithiophene (2). In a dry argon
flushed Schlenk-flask, equipped with a magnetic stirring bar and septum, 1 (1.39 g, 5.0
mmol, 1.0 equiv) was dissolved in N,N-dimethylformamide (25 mL) and cooled down to 0
°C. N-bromosuccinimide (1.78 g, 10.0 mmol, 2.0 equiv) was added in one portion and the
resulting solution was warmed to room temperature and stirred for 4 h. The reaction
mixture was diluted with water (100 mL) and extracted with Et2O (3 × 30 mL).
The combined organic layers were washed with water (6 × 100 mL) and dried over
Na2SO4. After filtration, the solvents were evaporated in vacuo. The crude product was
purified by flash column chromatography (silica, isohexane) to give 2 as a colorless solid
(1.50 g, 69%). Mp: 158.7 - 161.9 °C. 1H NMR (400 MHz, CDCl3) δ/ppm = 7.41 (s, 2H), 4.26
(q, J = 7.0 Hz, 4H), 1.44 (t, J = 7.0 Hz, 6H). 13C NMR (100 MHz, CDCl3) δ/ppm = 142.3, 131.4,

From Benzodithiophene to Diethoxy-Benzodithiophene Covalent Organic Frameworks –
Structural Investigations
54
131.1, 123.2, 115.0, 69.7, 16.0. IR (cm-1): ṽ = 2980, 2927, 2886, 1905, 1520, 1479, 1442,
1370, 1350, 1265, 1170, 1104, 1042, 999, 935, 894, 873, 809, 689, 668. MS (70 eV, EI) m/z
(%) = 434 (23, M+), 409 (25), 407 (44), 405 (22), 381 (54), 380 (18), 379 (100), 378 (14),
377 (47), 300 (30), 298 (28), 191 (16), 189 (11), 109 (11), 61 (12), 45 (11), 43 (70). HRMS
for C14H12O2Br2S2 (433.8640) found: 433.8649.
Synthesis of 4,8-diethoxybenzo[1,2-b:4,5-b’]dithiophene-2,6-diyldiboronic acid (3). In a
dry argon flushed Schlenk-flask, equipped with a magnetic stirring bar and septum, 2 (434
mg, 1.00 mmol, 1.0 equiv) was dissolved in tetrahydrofuran (THF) (8 mL) and cooled
down to -40 °C. n-BuLi (1.06 mL, 2.5 mmol, 2.5 equiv, 2.35 M in hexane) was added and
the resulting solution was stirred for 1.5 h and cooled down to -85 °C. Then, triisopropyl
borate (0.69 mL, 3.0 mmol, 3.0 equiv) was added and the reaction mixture was allowed to
warm to room temperature and stirred overnight. The solution was diluted with half-
concentrated aq NH4Cl solution (25 mL). The alkaline solution was acidified to pH 6 (with
2.0 M HCl) and extracted with a 3:1 THF:diethyl ether mixture (3 × 150 mL). The combined
organic layers were dried over Na2SO4. After filtration, the solvents were evaporated in
vacuo. The crude product was suspended in isohexane (70 mL) and the mixture was
stirred at room temperature for 5 h. The precipitate was filtered off and dried in vacuo. 3
was obtained as green solid (184 mg, 50%) and was used without further purification.
Mp: 271.9 – 274.3 °C. 1H NMR (400 MHz, acetone-d6) δ/ppm = 8.14 (s, 2H), 4.39 (q, J = 7.2
Hz, 4H), 1.47 (t, J = 7.2 Hz, 6H). 13C NMR (75 MHz, acetone-d6) δ/ppm = 145.5, 135.1,
134.5, 130.3, 70.4, 16.8. IR (cm-1): ṽ = 3209, 2978, 1532, 1445, 1373, 1344, 1320, 1161,
1084, 1046, 989, 959, 850, 788, 700. HRMS for C14H15O6B2S2 (365.0496) found: 365.0501.
COF synthesis. A 25 mL Schott Duran glass bottle with a teflon sealed polybutylene
terephthalate cap was equipped with 2,3,6,7,10,11-hexahydroxytriphenylene, HHTP (11
mg, 0.034 mmol) and a total of 0.051 mmol of BDT:BDT-OEt linkers in molar ratios of 1:0,
3:1, 1:1, 1:3, and 0:1. The reaction mixture was suspended in 1.5 mL of a 1:1 (v/v) solution
of mesitylene/dioxane and heated for 72 h at 100 °C. Afterwards, the green precipitate
was isolated by filtration and dried in vacuo for 72 h at 150 °C.
Computational details. The models were defined as periodic supercells containing ten COF
layers. MD simulations were performed in the isothermal-isobaric ensemble (at 25 °C and
1 atm), using the Dreiding forcefield as implemented in Forcite Plus and a timestep of 1
fs.27 This forcefield has been shown to provide high quality descriptions of polythiophenes

From Benzodithiophene to Diethoxy-Benzodithiophene Covalent Organic Frameworks –
Structural Investigations
55
in the condensed phase.28 The average temperature was kept constant using the Andersen
thermostat during equilibration and the Nose -Hoover-Langevin thermostat during
production runs. Isotropic pressure was kept constant using the Berendsen barostat.
Charges for the periodic COF network were calculated using the QEq scheme.29 Long range
electrostatic and van der Waals interactions were treated via the Ewald summation
method, with a 6 A cutoff on the repulsive contribution to the van der Waals energy. In all
dynamics runs, the system was equilibrated for 0.1 ns and results were collected over
10 ns. DFT calculations were performed with CASTEP,30 using the PBE functional and the
D2 dispersion correction as implemented in the DFT-SEDC code.31-33 We used a plane wave
basis set with a 340 eV cutoff and ultrasoft pseudopotentials.34 k-point sampling was
performed with a 1x1x6 Monkhorst-Pack grid.35
Characterization. Fourier-transform infrared spectra were measured with a Bruker
Equinox 55 equipped with a PIKE MIRacle ATR-unit at room temperature in the scan range
650-4000 cm-1. Nitrogen sorption was measured with 20-25 mg sample using a
Quantachrome AUTOSORB-1 station at 77.3 K after degassing the sample for at least 12 h
under vacuum at 150 °C. The Brunauer−Emmett−Teller (BET) surface areas were
calculated from the adsorption branch in the range of p/p0 = 0.05-0.13. Pore sizes were
calculated with a QSDFT adsorption model of N2 on carbon (cylindrical, adsorption
branch). Powder X-ray diffraction (PXRD) measurements were carried out in reflection
mode on a Bruker D8 Discover diffractometer with Ni-filtered Kα-radiation (λ=1.54060
A ) and a position-sensitive detector (LynxEye). Molecular geometry optimization was
performed with Accelrys MS Modeling 4.4 using the universal and Dreiding forcefield
method. The final hexagonal unit cell was calculated with the geometric parameters from
the optimized structure. For the Pawley refinement and simulation of the PXRD patterns
the Reflex module was used (a software package implemented in MS Modeling 4.4).
Scanning electron microscopy (SEM) was performed on a JEOL 6500F instrument at an
acceleration voltage of 2-5 kV. The samples were coated with a thin carbon layer by carbon
fiber flash evaporation at high vacuum. Transmission electron microscopy (TEM) data
were obtained with a FEI Titan Themis 60-300 microscope at an acceleration voltage of
300 kV. Cross-polarized 11B and 13C solid-state NMR (ssNMR) measurements were
performed on a Bruker Avance III-500 spectrometer in a 4 mm ZrO2 rotor with a spinning
rate of 10 kHz. Thermogravimetric analyses (TGA) were recorded on a Netzsch STA 440 C
TG/DSC. The measurements proceeded at a heating rate of 10 °C/min up to 900 °C, in a

From Benzodithiophene to Diethoxy-Benzodithiophene Covalent Organic Frameworks –
Structural Investigations
56
stream of synthetic air of about 25 mL/min. Hydrolyzed COF 1H NMR solution spectra
were recorded on a Bruker Avance III-400 MHz spectrometer. 5 mg of COF powder was
dissolved in DMSO-d6 containing 5% D2O in every case. A relaxation delay of 8 s was
employed to increase the precision of aromatic signal integration.
BDT-OEt COF simulated structures
Molecular mechanics simulations for the BDT-OEt COF unit cell were carried out using
Materials Studio software 4.4 and the Forcite module. First, we constructed a bare
hexagonal P6 space group unit cell with lattice parameters reported for the BDT-COF.
Based on the functional groups and the geometry of the BDT-OEt COF precursor
molecules, the repeating unit was constructed and placed in the bare hexagonal unit cell
to obtain the complete unit cell. The geometry of the BDT-OEt COF layer was optimized in
the unit cell using the Dreiding forcefield and the QEq correction for weak interactions.
The Reflex package in the Materials Studio software allows for Pawley refinement for the
simulated unit cell parameters according to the experimental PXRD. The simulated unit
cell parameters were refined against the experimental PXRD. The refinement parameters
Rp and Rwp are 3.37% and 4.95%, respectively, the final unit cell parameters are
a = b = 36.56±0.04 A , c = 3.65±0.04 A .
Table S3.1. Refined crystal data.
Formula C78 O18 B6 S6 H48
Formula weight 1530.49 g/mol
Crystal system Hexagonal
Space group P6
Unit cell dimensions a = b = 36.56 Å
c = 3.65 Å
Cell Volume 4234.14 Å3

From Benzodithiophene to Diethoxy-Benzodithiophene Covalent Organic Frameworks –
Structural Investigations
57
Table S2. Fractional atomic coordinates.
Atom Wyck. x y z
C1 6d 0.58577 0.36594 0.44433
C2 6d 0.58777 0.32954 0.44062
C3 6d 0.49211 0.45890 0.47547
C4 6d 0.56198 0.47912 0.46663
C5 6d 0.54195 0.53395 0.48791
C6 6d 0.66044 0.40711 0.44743
C7 6d 0.62166 0.40426 0.44828
O8 6d 0.55181 0.37005 0.44579
B9 6d 0.56817 0.41435 0.45221
O10 6d 0.61299 0.43536 0.45323
C11 6d 0.54370 0.43609 0.45827
C12 6d 0.53300 0.49234 0.47430
S13 6d 0.48972 0.41092 0.45743
C14 6d 0.66425 0.37067 0.44362
C15 6d 0.62683 0.33073 0.44244
H16 6d 0.55974 0.30310 0.43696
H17 6d 0.59341 0.49907 0.46773
H18 6d 0.68480 0.43656 0.45058
O19 6d 0.58285 0.56389 0.51939
C20 6d 0.60015 0.60358 0.69692
C21 6d 0.64333 0.61313 0.83124
H22 6d 0.58033 0.60202 0.92893
H23 6d 0.60269 0.62792 0.50983
H24 6d 0.66339 0.61603 0.59942
H25 6d 0.63977 0.58737 1.00418
H26 6d 0.65821 0.64193 0.99045

From Benzodithiophene to Diethoxy-Benzodithiophene Covalent Organic Frameworks –
Structural Investigations
58
Figure S3.1. Simulation of BDT-OEt COF unit cells calculated in an eclipsed arrangement in the P6
space group. Top: top view on ab plane, bottom: four BDT-OEt COF unit cells fused to form the
hexagonal pore.

From Benzodithiophene to Diethoxy-Benzodithiophene Covalent Organic Frameworks –
Structural Investigations
59
Figure S3.2. Simulation of BDT-OEt COF unit cell in an eclipsed arrangement in the P6 space group
viewed along the c-axis with an interlayer distance of 3.65 A .

From Benzodithiophene to Diethoxy-Benzodithiophene Covalent Organic Frameworks –
Structural Investigations
60
Figure S3.3. Simulation of BDT-OEt COF unit cells calculated in an eclipsed arrangement in the P1
space group. Top: top view on ab plane, bottom: four BDT-OEt COF unit cells fused to form the
hexagonal pore.

From Benzodithiophene to Diethoxy-Benzodithiophene Covalent Organic Frameworks –
Structural Investigations
61
Figure S3.4. Simulation of the BDT-OEt COF unit cell in the P1 space group viewed along the c-axis.
Figure S3.5. XRD patterns of BDT-OEt COF in P1 space group: experimental (red), Pawley
refinement (black), simulated pattern corrected for crystallite size (blue), and simulated pattern
(green). For Pawley refinement: The refinement parameters Rp and Rwp are 2.87% and 2.16%,
respectively, the refined unit cell parameters are a = 37.15A ±0.04 , b = 37.17 ±0.04 A ,
c = 3.58±0.04 A ; α=90.31°, β=77.44°, γ =120.35°.

From Benzodithiophene to Diethoxy-Benzodithiophene Covalent Organic Frameworks –
Structural Investigations
62
Figure S3.6. Simulation of BDT-OEt COF unit cells calculated in a staggered arrangement with P63
space group. Top: top view on ab plane, bottom four BDT-OEt COF unit cells fused to form the pore
system.

From Benzodithiophene to Diethoxy-Benzodithiophene Covalent Organic Frameworks –
Structural Investigations
63
Figure S3.7. Simulation of the BDT-OEt COF unit cell in a staggered arrangement, viewed along the
c-axis.

From Benzodithiophene to Diethoxy-Benzodithiophene Covalent Organic Frameworks –
Structural Investigations
64
Figure S3.8. XRD patterns of BDT-OEt COF: experimental (red), simulated AA eclipsed
arrangement (black), and simulated AB staggered arrangement (blue).
Figure S3.9. Comparison of simulated XRD patterns of BDT COF (green) and BDT-OEt COF (red).

From Benzodithiophene to Diethoxy-Benzodithiophene Covalent Organic Frameworks –
Structural Investigations
65
Molecular dynamics simulations
Figure S3.10. Left: Molecular structure of the ethoxy-substituted BDT unit. The possible initial
orientations for the dihedral angle are shown in red (facing hydrogen, 180°) and green (facing
sulfur, 0°). Right: Probability distribution of the dihedral angle sampled over 10 ns. Almost all
dihedrals reorient to face the sulfur atom within the equilibration period of 0.1 ns, independent of
the starting orientation (s = sulfur, h = hydrogen, sh = mixed).
Figure S3.11. Sulfur-sulfur radial distribution functions of the ethoxy substituted (black) and
pristine (red) BDT-COF. The vertical, dotted lines indicate the respective average interlayer
distance.

From Benzodithiophene to Diethoxy-Benzodithiophene Covalent Organic Frameworks –
Structural Investigations
66
Nitrogen sorption
Figure S3.12. Nitrogen sorption isotherms of the COF powders (left) and pore size distributions
(right).

From Benzodithiophene to Diethoxy-Benzodithiophene Covalent Organic Frameworks –
Structural Investigations
67
SEM micrographs
Figure S3.13. SEM micrographs of (a) BDT COF, (b) BDT:BDT-OEt 3:1 COF, (c) BDT:BDT-OEt 1:1
COF, (d) BDT:BDT-OEt 1:3 COF, (e) BDT-OEt COF, respectively.

From Benzodithiophene to Diethoxy-Benzodithiophene Covalent Organic Frameworks –
Structural Investigations
68
TEM micrographs
Figure S3.14. TEM micrographs of (a) BDT COF, (b) BDT:BDT-OEt 3:1 COF, (c) BDT:BDT-OEt 1:1
COF, (d) BDT:BDT-OEt 1:3 COF, respectively.

From Benzodithiophene to Diethoxy-Benzodithiophene Covalent Organic Frameworks –
Structural Investigations
69
Thermogravimetric analysis
Figure S3.15. TGA trace of BDT COF.
Figure S3.16. TGA trace of BDT:BDT-OEt 3:1 COF.

From Benzodithiophene to Diethoxy-Benzodithiophene Covalent Organic Frameworks –
Structural Investigations
70
Figure S3.17. TGA trace of BDT:BDT-OEt 1:1 COF.
Figure S3.18. TGA trace of BDT:BDT-OEt 1:3 COF.

From Benzodithiophene to Diethoxy-Benzodithiophene Covalent Organic Frameworks –
Structural Investigations
71
Figure S3.19. TGA trace of BDT-OEt COF.

From Benzodithiophene to Diethoxy-Benzodithiophene Covalent Organic Frameworks –
Structural Investigations
72
FT-IR spectra
Figure S3.20. FT-IR plots of BDT COF, BDT:BDT-OEt COFs and BDT-OEt COF.

From Benzodithiophene to Diethoxy-Benzodithiophene Covalent Organic Frameworks –
Structural Investigations
73
PXRD small angle region
Figure S3.21. PXRD patterns of BDT COF, BDT:BDT-OEt COFs, and BDT-OEt COF: small angle region
showing a gradual shift of the reflections corresponding to the ab plane to higher 2 theta values
with the higher integrated fraction of BDT-OEt building units.

From Benzodithiophene to Diethoxy-Benzodithiophene Covalent Organic Frameworks –
Structural Investigations
74
Solid state NMR spectra of BDT-OEt COF
Figure S3.22. 11B ssNMR spectrum of BDT-OEt COF showing a boronic ester peak at 20.9 ppm. The
shoulder peak at 15 ppm is attributed to free boronic acid groups present as terminal moieties of
the framework. Asterisks indicate spinning side bands.
Figure S3.23. 13C ssNMR spectrum of BDT-OEt COF. Asterisks indicate spinning side bands.

From Benzodithiophene to Diethoxy-Benzodithiophene Covalent Organic Frameworks –
Structural Investigations
75
NMR spectra of hydrolysed COFs
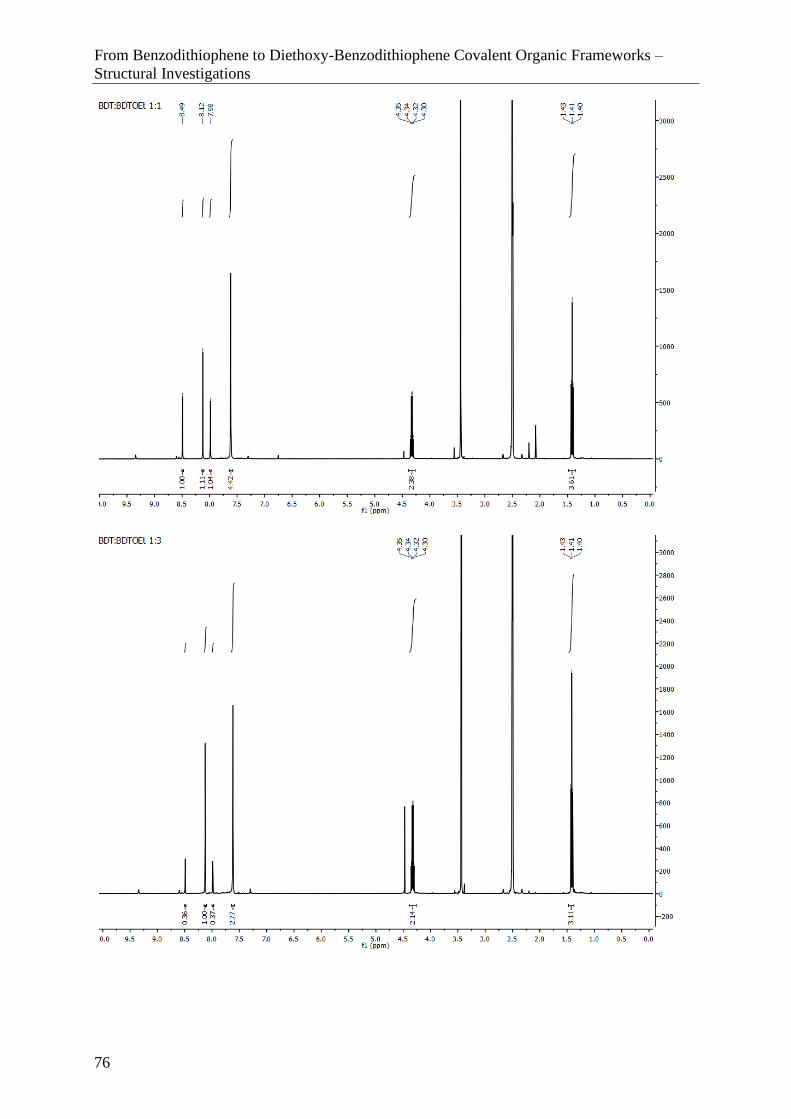
From Benzodithiophene to Diethoxy-Benzodithiophene Covalent Organic Frameworks –
Structural Investigations
76

From Benzodithiophene to Diethoxy-Benzodithiophene Covalent Organic Frameworks –
Structural Investigations
77


Covalent Organic Framework Films through Electrophoretic Deposition – Creating Efficient
Morphologies for Catalysis
79
4. Covalent Organic Framework Films through
Electrophoretic Deposition - Creating Efficient
Morphologies for Catalysis
This chapter is based on the following publication:
Rotter, J. M.; ‡ Weinberger, S.; ‡ Kampmann, J.; Sick, T.; Shalom, M.; Bein, T.; Medina, D. D.
Covalent Organic Framework Films through Electrophoretic Deposition—Creating
Efficient Morphologies for Catalysis. Chem. Mater. 2019, 31, 10008–10016.
4.1. Abstract
The ability to grow covalent organic framework (COF) films allows for studying their
properties as solid layers and enables the incorporation of these materials into a variety
of functional devices. Here, we report on the fabrication of COF films and coatings by
electrophoretic deposition (EPD). We demonstrate that the EPD technique is suitable for
depositing COFs featuring two- and three-dimensional structures linked by imine- or
boronate ester-bonds, namely BDT-ETTA COF, COF-300 and COF-5. For the deposition, COF
nanoparticle suspensions are prepared by dispersing the as-synthesized bulk materials in
solvents with low dielectric constants. Subsequently, two electrodes are immersed into
the COF particle suspensions and upon inducing electric fields ranging from 100-900 V
cm−1, COFs are deposited as films on the positively charged electrode. Through EPD, within
two minutes, large-area films of up to 25 cm2 are obtained on both smooth and corrugated
surfaces. COF films prepared by EPD feature an inherent textural porosity and tunable
thickness, demonstrated from 400 nm to 24 µm. By governing the deposition parameters
such as duration, particle concentration and applied potential, deposits of precise
thickness can be produced. Furthermore, co-depositions of several different COFs as well
as COF/Pt nanoparticle suspensions are demonstrated. The film morphologies obtained
by EPD are shown to be advantageous for catalysis, as demonstrated for sacrificial agent
free photoelectrochemical water reduction. Here, BDT-ETTA COF photocathodes show a
drastic increased photocurrent density compared to the respective dense and oriented
surface-grown films. Typical BDT-ETTA COF/Pt nanoparticle hybrid films exhibit

Covalent Organic Framework Films through Electrophoretic Deposition – Creating Efficient
Morphologies for Catalysis
80
photocurrent densities of over 100 µA cm−2. The rapid and highly scalable deposition of
COF particles as films and coatings through EPD is a versatile addition to the toolbox of
COF film fabrication techniques, allowing for the tailoring of COF film architectures for
desired functionalities.
4.2. Introduction
Covalent organic frameworks (COFs) are a novel class of ordered, light-weight organic
polymers exhibiting great structural and chemical diversity. COFs are constructed by
connecting rigid molecular organic building blocks through condensation polymerization
reactions under slightly reversible conditions. Depending on the geometry of the
respective COF building blocks, COFs form 2D or 3D porous solids, featuring long-range
order, permanent porosity and high surface areas.1,2 Due to their structural and chemical
versatility, COFs have been examined for various applications, such as gas storage,3
separation,4–6 catalysis,7–12 photovoltaics and optoelectronics13–15 or energy storage.16–19
The deposition of COFs onto surfaces as homogenous coatings or as thin films is an
important step towards the incorporation of this novel class of materials into a variety of
functional platforms.20 Commonly, COFs are synthesized under solvothermal conditions
and precipitate as intergrown nanocrystalline bulk materials, which are difficult to
process and to convert into high-quality COF films on surfaces.21 Exploring routes for
processing COF powders and developing techniques which allow for the direct deposition
of COFs on substrates as films is hence of great importance. To date, the growth of thin
COF films onto surfaces is based mainly on “bottom-up” approaches where the substrates
are exposed to a reactive precursor solution. Oriented thin COF films, featuring open
channels orthogonal to the substrate surface, are accessible by this so-called in-situ
approach, where COF powders and films are often forming simultaneously. However, this
approach provides limited control over the resulting film thickness.22–24 In this context, a
continuous flow setup was reported, which allowed for a finer tuning of film thickness.25
A major drawback of the in-situ approach is the overall low synthesis yield, defined by the
mass ratio of the deposited COF material and the COF bulk precipitate. Facing this
challenge, we developed the vapor-assisted conversion (VAC) approach for the deposition
of boronate-ester COFs as films exclusively on surfaces. In contrast to the in-situ approach,
in VAC, precursors in a thin precursor solution layer react to form a COF film on a surface.

Covalent Organic Framework Films through Electrophoretic Deposition – Creating Efficient
Morphologies for Catalysis
81
This allows for control over the film thickness and morphology, ranging from dense thin
films to thick coatings consisting of intergrown particles and interstitial voids.26 For
applications such as catalysis, COF films featuring additional textural porosity and a large
interface can be highly beneficial for rapid diffusion of reactants and products in and out
of the film and thereby enhancing the catalytic performance.27 However, a rapid
fabrication of such film morphologies applicable to the different COF types in high yields
is still lacking.
Electrophoretic deposition (EPD) is an efficient method for the deposition of particles
bearing an intrinsic surface charge on an electrode by creating an external electric field.28
In general, the electric field between two electrodes immersed into a particle suspension
in a non-conducting solvent induces a migration of charged particles towards the
electrode of opposite charge. The EPD method was adopted for various inorganic and
hybrid materials, such as silica,29 zeolites,30 metal oxides,31 quantum dots,32 carbon
nitrides,33 carbon nanotubes34 and conducting organic polymers, such as polythiophene
or polyanilines.35,36 Additionally, metal-organic frameworks as well as a covalent-ionic-
organic framework, containing a ligand especially tailored with cationic functional groups
for the deposition, were reported.37–40
Here, we expand the paradigm of EPD into a highly general method for the rapid
fabrication of COF films featuring a high textural porosity on conductive surfaces. For the
deposition, we utilize various well-characterized bulk COF materials namely COF-5,41
BDT-ETTA COF42 and COF-300.43 Thereby, we demonstrate the versatility of EPD as being
applicable for the deposition of both 2D and 3D frameworks of different particle sizes and
morphologies, linked by imine or boronate ester bonds. Prior to the deposition, stable COF
particle suspensions were prepared by COF powder attrition or simply by immersion in a
non-conducting solvent. Through EPD, COF films and coatings were deposited within
minutes with control over the film thicknesses ranging from hundreds of nanometers to
several micrometers. Furthermore, co-depositions of two different COF materials, as well
as a COF/Pt nanoparticle mixture are demonstrated, yielding homogeneous hybrid films.
Additionally, the catalytic performance of BDT-ETTA COF and BDT-ETTA COF/Pt films,
prepared by EPD, was evaluated for the light-driven electrochemical production of
hydrogen and compared to state-of-the-art dense and oriented BDT-ETTA COF films.42
Covalent Organic Framework Films through Electrophoretic Deposition – Creating Efficient
Morphologies for Catalysis
82
Experimental Section
Chemicals. All materials were purchased from Aldrich, Fluka, Acros, Activate Scientific or
TCI Europe in the common purities purum, puriss or reagent grade. Materials were used
as received without additional purification and handled under air unless denoted. All
solvents used were anhydrous and purged with inert gas. 4,4’,4”,4”’-(1,1,2,2-
ethylenetetrayl)tetrakisaniline (ETTA) and 2,6-benzo[1,2-b:4,5-b’]dithiophene
dialdehyde (BDT) were synthesized as reported in literature.42
BDT-ETTA COF. Under argon atmosphere BDT (benzo[1,2-b:4,5-b’]dithiophene-2,6-
dicarboxaldehyde, 74 mg, 0.30 mmol) and ETTA (1,1,2,2-tetra(p-aminophenyl)ethylene,
58.6 mg, 0.15 mmol) were suspended in a mixture of benzyl alcohol and mesitylene (V/V
9:1, 5 mL) in a 25 mL Schott-Duran vial. Acetic acid (6 M, 500 µL) was added to the vessel
and the mixture was placed in a pre-heated oven at 120 °C for 3 days. The resulting orange
precipitate was suction filtered, soxhlet-extracted with dry THF and dried at reduced
pressure.
COF-300. Tetrakis(4-aminophenyl)methane (100 mg, 0.26 mmol) and
terephthalaldehyde (60 mg, 0.44 mmol) were suspended in a mixture of 1,4-dioxane (5
mL) and acetic acid (6 M, 500 µL) in a 25 mL Schott-Duran vial. The mixture was subject
to a short sonication and placed in a preheated oven at 120 °C for 3 days. The yellow
precipitate was suction filtered, soxhlet-extracted with dry THF and dried at reduced
pressure.
COF-5. Benzene-1,4-diboronic acid (18.7 mg, 0.113 mmol) and 2,3,6,7,10,11-
hexahydroxytriphenylene hydrate (24.3 mg, 0.075 mmol) were placed in a 5 mL
microwave vial and 4 mL of a 1,4-dioxane and mesitylene 1:1 mixture was added. The vial
was sonicated for 5 min and then placed in the microwave and heated for 3 h at 100 °C.
The grey precipitate was suction filtered, subsequently washed with anhydrous acetone
and dried at reduced pressure.
COF-300 and COF-5 suspension preparation. COF particle suspensions were prepared
by adding the amount to deposit (0.5 mg for COF-5 and, depending on the desired
thickness of COF-300 films 0.05 – 0.5 mg of COF-300 (Figure S4.10) of the respective COF
into ethyl acetate (10 mL). A brief sonication in an ultrasonic bath was then applied to
homogeneously disperse the particles in the solvent. After the treatment, homogeneous
COF dispersions colored yellow or grey for COF-300 or COF-5, respectively, were obtained.

Covalent Organic Framework Films through Electrophoretic Deposition – Creating Efficient
Morphologies for Catalysis
83
For COF-5, we observed a severe impact on crystallinity if sonication times exceeded 15
seconds.
BDT-ETTA COF particle attrition and suspension preparation. Prior to deposition,
BDT-ETTA COF was subjected to an ultrasound-based attrition process to break up large,
intergrown agglomerates. Therefore 5 mg of COF was suspended in 25 mL of deposition
solvent and a sonication amplitude of 70% for 30 min was chosen. During the process, the
particle suspension was cooled using an ice bath. After the treatment, the suspension was
centrifuged at a relative centrifugal force of 7000 g after which the supernatant was used
for deposition. Using this process, particle size could be greatly reduced and suspensions
stable for more than one week were obtained. The concentration of the produced BDT-
ETTA COF suspension was determined by subtracting the weight of the centrifuge COF
residue from the initial COF mass. A BDT-ETTA COF concentration of 0.74 mg per 25 mL
ethyl acetate, or 0.03 mg mL−1, was determined.
Electrophoretic Deposition. In a typical EPD experiment, two conductive substrates
were contacted by alligator clamps to the potentiostat parallel and with the conducting
sides facing each other, and with a horizontal distance of 1 cm between the electrodes.
Subsequently, the electrodes were dipped into the COF particle suspension (10 mL). The
electrode area submerged in the suspension was 1 cm × 1 cm. Then, the desired potential
was applied between the electrodes for the respective deposition time (e.g. 900 V for 2
min). After deposition, the applied potential was set to zero and the electrodes were
removed from the solvent and subsequently dried under nitrogen flow. For the COF-5
deposition as depicted in Figure 4.1 of the manuscript, 0.5 mg material was used. For the
preparation of the large area films two FTO (fluorine-doped tin oxide) substrates (8 cm ×
5 cm) were used, where the submerged area used for deposition was 5 cm × 5 cm. For the
co-deposition of COF-300 and BDT-ETTA COF, 2 mL of the ultrasound attrited BDT-ETTA
COF particle suspension was diluted with 8 mL of ethyl acetate. Then, 0.2 mg of COF-300
was added and the mixture was sonicated in a sonication bath for 1 min for
homogenization. The subsequent deposition was carried out on an ITO (indium doped tin
oxide) coated glass substrate at 900 V for 2 min. Assuming a complete suspension
depletion and employing defined concentrations of both samples afford a ratio of 0.06:0.2
mg/mg for the BDT-ETTA COF and COF-300 codeposition film.

Covalent Organic Framework Films through Electrophoretic Deposition – Creating Efficient
Morphologies for Catalysis
84
Photoelectrochemical hydrogen production. For the 3 µm thick BDT-ETTA COF films
used in PEC-based hydrogen production, 15 mL (7.5 mL for the 1.5 µm thick film) of the
BDT-ETTA COF suspension in ethyl acetate, fabricated as described before, were used and
deposited on a 1 cm × 1 cm large area of FTO (total dimensions of FTO electrode was 1 cm
× 4 cm). Pt nanoparticles were synthesized as reported in literature.44 A zeta potential of
−24.3 mV in water was recorded for the synthesized particles. Subsequently, Pt
nanoparticles were isolated through lyophilization under dynamic vacuum. Hereby, Pt
nanoparticles of 2−4 nm in diameter were obtained, as measured from TEM micrographs
(Figure S4.16). Additionally, the hydrodynamic radii of the citrate capped nanoparticles
were determined by dynamic light scattering (DLS) and sizes ranging from 4–9 nm were
found (Figure S4.17). For the codeposition, 10 mL of the BDT-ETTA suspension were used,
to which 0.15 mg of Pt nanoparticles were added. Then, the mixed suspension was
subjected to an additional sonication step (as described in BDT-ETTA COF suspension
preparation) for 10 min to homogenize the mixture. The deposition was carried out at 900
V for 2 min on an ITO coated glass substrate. During the deposition, additional Pt particles
(0.10 mg in 2 mL ethyl acetate) were steadily added to the deposition suspension by a
syringe.
Characterization Methods. PXRD and film XRD patterns were measured on a Bruker D8
Discover instrument equipped with a Lynx Eye detector in Bragg-Brentano geometry and
Ni-filtered Cu Kα X-ray radiation. Scanning electron microscopy (SEM) images were
recorded on a FEI Helios Nanolab G3 UC microscope at an acceleration voltage of 2.5 kV.
Energy dispersive X-ray spectra (EDX) were recorded at 20 kV. Prior to analysis, the
samples were coated with carbon. TEM micrographs were obtained from a FEI Titan
Themis 60-300 TEM at an acceleration voltage of 300 kV. Electrochemical measurements
were performed on a Methrom µAutolabIII/FRA2 instrument. Fourier-transformed
infrared (FT-IR) spectra were recorded on a Thermo Scientific Nicolet iN10 FT-IR
microscope in reflection on a steel substrate. FT-IR spectra of the films were acquired by
scratching-off the respective COF deposits. Microwave based COF synthesis was carried
out using a Biotage Initiator microwave. Ultrasonic particle attrition was carried out using
a Bandelin Sonopuls HD 4100 homogenizer with a TS113 13 mm tip. For electrophoretic
deposition (EPD), a Heinzinger LNC 3000 potentiostat was used. Dynamic light scattering
(DLS) and zeta potential measurements were recorded using a Malvern Zetasizer
instrument at room temperature using 10 mm path length cuvettes. Nitrogen

Covalent Organic Framework Films through Electrophoretic Deposition – Creating Efficient
Morphologies for Catalysis
85
physisorption data was recorded using a Quantachrome Autosorb iQ system. Prior to the
measurement, samples were heated at 120 °C for 6 h under high vacuum. Measurements
were performed at 77.35 K. For sorption measurements, the respective materials were
obtained by scratching-off the COF deposits from five films.

Covalent Organic Framework Films through Electrophoretic Deposition – Creating Efficient
Morphologies for Catalysis
86
4.3. Results and Discussion
The central aspect addressed in this study is the development of a general COF film
fabrication method, applicable for a variety of structures, providing tunable film
thicknesses and textural porosity. Therefore, we established a processing protocol
utilizing COF particle suspensions and subsequently EPD for obtaining the desired
deposit. We chose well-characterized and -known structures to validate the developed
EPD-based protocol as a structure-independent approach. For this purpose, we
synthesized highly crystalline 2D and 3D COF bulk materials under solvothermal
conditions, namely the imine-linked BDT-ETTA COF and the COF-300, and the boronate
ester-based COF-5. 41–43 The isolated COF powders were suspended in a non-conducting
and low dielectric constant solvent and subsequently deposited by EPD onto a conductive
substrate serving as an electrode. For the deposition, the external electric field between
two electrodes allowed for the migration of COF nanoparticles, bearing an intrinsic
surface charge, to the electrode of opposite charge.
Scheme 4.1: COF building blocks and structures of the resulting frameworks used in the
EPD. Schematic presentation of the EPD set-up with a typical COF film SEM cross-section
as an inset.
In the EPD setup, two conductive substrates (1 cm x 1 cm), such as FTO, ITO or titanium
foil were submerged into a COF particle suspension (Scheme 4.1, Figure S4.1). Untreated
COF-5 agglomerates, nanoparticles of BDT-ETTA COF as well as almost micrometer-sized
COF-300 single crystallites were suspended in an adequate organic solvent and
subsequently deposited using the same deposition protocol. Aprotic, organic solvents of

Covalent Organic Framework Films through Electrophoretic Deposition – Creating Efficient
Morphologies for Catalysis
87
low polarity, such as ethyl acetate, toluene or anisole (Figure S4.2), were found to be
suitable media for the preparation of stable COF particle suspensions and for effective
electrophoresis. While COF-5 and COF-300 particles were suspended in the respective
solvents without further treatment, the robust BDT-ETTA COF was subjected to an
ultrasonic attrition process to disassociate intergrown and agglomerated COF crystals
using a 20 kHz ultrasonic disintegrator at high amplitudes. Dynamic light scattering (DLS)
measurements of the obtained suspension revealed average particle sizes of about
200 nm (Figure S4.3). This shows that the ultrasonic treatment provided sufficient
mechanical force for separating the COF agglomerates into isolated and well-suspended
nanocrystals.
The EPD COF films were produced by inducing an electric field of 900 V cm−1 between the
electrodes for two minutes. Under these conditions, the particles of the different COFs
readily migrate to the positively charged electrode, indicating that the COF particles,
regardless of their linkage-type, bear an intrinsic negative surface charge. Within seconds,
a colored deposit formed on the surface of the submerged electrode and within two
minutes a complete discoloration of the suspension was observed, indicating a
quantitative deposition of the suspended material. After the deposition, the obtained COF
films were dried under an air stream, revealing a continuous, colored deposit on the
substrate (Figure 4.1).
Top view scanning electron microscopy (SEM) micrographs of all the examined EPD COF
films revealed uniform deposits on the immersed conducting electrode surfaces (Figure
4.1). The deposits consist of closely packed particles of similar size creating interstitial
voids. Cross-section SEM micrographs revealed continuous COF deposits on the
substrates featuring an even thickness throughout the respective films. Using the
deposition conditions of 900 V cm−1 and 2 minutes deposition time, a film thickness of 2
µm was obtained for the BDT-ETTA COF suspension. In the cases of the untreated COF-5
and COF-300 suspensions, thicknesses of 14 µm and 6 µm were determined, respectively.
Notably, interstitial voids between the particles are apparent throughout the films and
therefore, textural porosity is characteristic for all the examined samples. X-ray diffraction
(XRD) measurements confirmed that all the deposited films consist of crystalline COF
particles, and the obtained diffraction patterns are in excellent agreement with the
respective bulk materials (Figure 4.1). Transmission electron microscopy (TEM) analysis
of a BDT-ETTA COF film powder removed from the substrate revealed crystalline domains

Covalent Organic Framework Films through Electrophoretic Deposition – Creating Efficient
Morphologies for Catalysis
88
of about 100 nm without traces of an amorphous phase (Figure S4.4). This observation
confirms that the milling process applied to the BDT-ETTA COF suspension is vigorous
enough to dissociate the COF aggregates into individual particles without causing
structural degradation.
Figure 4.1: (A) XRD of BDT-ETTA COF as EPD film and as bulk material. (B) SEM cross-section and
(C) top-view of BDT-ETTA COF film and a photograph of the film as an inset. (D) XRD of COF-300
as EPD film and as bulk material. (E) SEM cross-section and (F) top-view of COF-300 film and a
photograph of the film as an inset. (G) XRD of COF-5 as EPD film and as bulk material. (H) SEM
cross-section and (I) top-view of COF-5 and a photograph of the film as an inset.
In contrast, the non-treated COF-300 powder consists of relatively uniform individual
crystallites of about 500 nm in size. Here, the COF powder was suspended in ethyl acetate
without the need for particle attrition to form a stable suspension. Therefore, films
deposited from such COF suspensions consist of single COF crystallites and feature
structural characteristics of the bulk material (Figure S4.5). These observations indicate
that with the COF-300 particles no significant agglomeration occurred in the course of the
film deposition. In the case of EPD COF-5 films, intergrown crystallite agglomerates
exceeding 100 nm are visible, nevertheless forming a continuous deposit (Figure S4.6).
Importantly, the XRD and TEM analyses of the films illustrate the compatibility of the
different COF materials with the electrophoretic process, as no electrochemical reaction

Covalent Organic Framework Films through Electrophoretic Deposition – Creating Efficient
Morphologies for Catalysis
89
or degradation of the framework is observed. Nitrogen physisorption experiments of
scratched-off COF film material showed the respective isotherm shapes and confirmed the
retention of porosity for all deposited frameworks (Figure S4.7). Additionally, Fourier-
transform infrared (FT-IR) spectra of the deposited materials match those of the bulk COF
powders. This further indicates that no chemical alteration of the framework occurred
during the deposition and emphasizes the compatibility of COFs with the EPD process
(Figure S4.8).
The migration of the COF particles to the respective electrode is driven by their intrinsic
surface potential. Interestingly, independent of their structure and chemical composition,
COFs readily migrate to the positive electrode, indicating negative surface potential. Zeta-
potential measurements performed for COF-300 suspensions in ethyl acetate confirmed
this observation and revealed a negative particle surface potential of −21 mV. To invert the
surface potential through protonation of the terminal amine groups, glacial acetic acid was
added to suspensions of COF-300 particles in ethyl acetate. Zeta-potential measurements
of the protonated COF-300 particle suspensions revealed a change in the surface potential
to 11.9 mV. Notably, acetic acid treated COF-300 particles readily migrated to the opposite,
negatively charged electrode during electrophoretic depositions, illustrating the
significant role of the terminal functional groups in the EPD process.
To further study the parameters governing the EPD of COF films, we focused our following
investigations on COF-300 as the first representative for 3D COF films on conducting
substrates and on the photoactive BDT-ETTA COF, serving as a representative for 2D
COFs.42,43 Achieving control of the COF film thickness is essential for applications such as
sieving, sensing or optimizing photocatalytic performance.45 Furthermore, film deposition
techniques providing COF film thicknesses of more than several hundred nanometers are
rare.20,24,45 In EPD, the amount of the deposited material is directly proportional to
deposition time and the mass of the suspended material.46 Accordingly, the film thickness
can be easily predetermined and systematically adjusted by varying parameters such as
deposition time and particle concentrations, thus, enabling a fine control over film
thickness. For the deposition of BDT-ETTA COF, we found that adjusting the deposition
time allows for controlling and predetermining the film thickness.
To determine the film deposition rate, we fabricated a series of BDT-ETTA COF films using
different EPD deposition times, ranging from 5 s to 120 s. The XRD patterns of the film
Covalent Organic Framework Films through Electrophoretic Deposition – Creating Efficient
Morphologies for Catalysis
90
series showed a linear increase in the COF (100) reflection intensity, relative to a constant
FTO reflection intensity (observed at 25.9° 2θ) serving as an internal reference. We
attribute this steady intensity increase to a linear increase in film thickness (Figure 4.2A).
SEM cross-section analysis revealed a film thickness of about 2 μm corresponding to a
deposition time of two minutes. Remarkably, we observed a complete surface coverage
and a film thickness of about 400 nm already within 10 s (Figure 4.2B). To calculate the
deposition rate, the BDT-ETTA COF film thicknesses, obtained from the SEM analysis, were
plotted against the deposition times (Figure S4.9). After an initial time of about 10 seconds
during which steady-state conditions are established, we observed a linear dependence of
the film thickness on the deposition time with a calculated deposition rate of 16 nm s−1.
Additionally, we investigated the effect of the applied voltage on the growth rate and film
homogeneity. For this purpose, BDT-ETTA COF particles were deposited using potentials
of 100, 200, 300, 600 and 900 V while keeping the deposition time constant at 2 min. Using
these deposition parameters, a steady increase in the COF (100) reflection intensity in the
XRD pattern relative to the FTO reflection intensity was observed. This is attributed to the
applied higher deposition voltages, indicating a higher mass transfer rate from the
suspension to the electrode (Figure S4.10). SEM top-view micrographs of the films
deposited at 100, 200 and 300 V cm−1 reveal randomly scattered COF particles only
partially covering the electrode surface. At 600 V cm−1 a nearly continuous film was
observed, but in contrast to the film fabricated under the optimal conditions of 900 V cm−1,
large cracks protruding the film were still visible (Figure S4.10).
Recently, advanced synthesis approaches for growing single crystals of COFs, in some
cases even exhibiting sizes suitable for single crystal XRD analysis, were reported.47 For
boronate ester COFs, such as COF-5, in the form of larger single crystals, size-dependent
effects such as prolonged lifetimes of excitons were observed by transient absorption
spectroscopy.48 So far, COF film synthesis methods have not been successfully used for the
preparation of films comprising single crystal domains. Here, we found that the as-
synthesized near micrometer-sized COF-300 particles are directly dispersible as
individual crystallites in the deposition solvent and therefore, a quantitative deposition of
COF-300 crystals from the suspension is feasible. For a quantitative deposition, we found
that up to 1 mg of COF-300 powder in 10 mL of ethyl acetate yields a stable suspension.
The suspended crystallites can directly be deposited on 1 cm2 of electrode area within 2
minutes at 900 V cm−1, resulting in a film thickness of 24 µm. Assuming a complete

Covalent Organic Framework Films through Electrophoretic Deposition – Creating Efficient
Morphologies for Catalysis
91
depletion of the particles in the suspension, we can establish a film deposition formula
suitable for predetermining film thickness, e.g. 24 µm film thickness per mg COF powder
and cm2 electrode area (24 µm mg−1 cm−2) for COF-300 (Figure S4.11).
Figure 4.2: (A) XRD film patterns of BDT-ETTA COF films resulting from different deposition times
(deposition voltage 900 V). (B) Corresponding SEM cross-sections of BDT- ETTA COF films
(deposition voltage 900 V). (C) XRD patterns of BDT-ETTA COF films deposited at different
electrode potentials.
The scalability of the EPD process is a central advantage for obtaining coatings on conductive
surfaces. To the best of our knowledge, a process that allows for the direct preparation of COF films
on surfaces larger than a few cm2 has yet to be reported. To probe the scalability of EPD for COF
films, we fabricated a BDT-ETTA COF film on a 5 cm × 5 cm large FTO substrate by increasing the
COF and solvent quantities used for the deposition on a 1 cm2 substrate by 25 times, while keeping
the deposition time and potential constant at 2 min and 900 V cm−1, respectively. The obtained
film features a macroscopic homogeneous deposit similar to deposits on smaller substrates. This
confirms that the established COF EPD protocol is indeed highly scalable and applicable to the
rapid deposition of COF crystals on large surface (Figure S4.12). In the context of COF film

Covalent Organic Framework Films through Electrophoretic Deposition – Creating Efficient
Morphologies for Catalysis
92
Figure 4.3: (A) XRD pattern of co-deposited COF-300 and BDT-ETTA COF materials compared with
the respective bulk PXRD patterns of the individual COFs, and (B) the corresponding SEM cross-
section. (C) Deposition of COF-300 on a stainless-steel mesh.
preparation, this versatile deposition technique constitutes a significant improvement
over other state-of-the-art methods in terms of deposition yield, growth time, scalability
and thickness control. We conclude that COFs are especially suitable for EPD due to faster
growth rates and homogeneous film coverages, compared to related materials.40,49
The EPD of COF materials opens new perspectives regarding the facile production of films
and coatings for applications such as sensing, catalysis or molecular sieving. Here, we
demonstrate the feasibility of using EPD for the preparation of COF-based membranes
supported by a porous grid. For this purpose, a stainless-steel grid featuring a mesh size
of 270 (53 µm pore size) was used as the deposition electrode for COF-300 (Figure 4.3C).
Adjusting the mass of the suspended COF and applying EPD for 2 minutes at 900 V cm−1
resulted in the formation of a homogeneous coating covering the grid and its cavities, the
permeable areas. The deposition on such a mesh demonstrates that EPD can be used for
the fabrication of COF coatings not only on flat surfaces but also on corrugated 3D surfaces
(Figure 4.3 and S4.13). Harnessing the ability to prepare COF suspensions from
synthesized COF powders and developing a deposition formula for high yields, we
explored the simultaneous deposition of two structurally distinct COF particles featuring
different pore shapes and sizes from a mixed COF crystallite suspension. To this end, we
produced a suspension consisting of BDT-ETTA COF and COF-300 particles in ethyl acetate
and deposited this COF particle mixture onto FTO at 900 V cm−1 and 2 minutes deposition
time (for more details see supporting information). The XRD pattern of the obtained film
shows the characteristic (100) and the (111) reflections for BDT-ETTA COF and COF-300
at 2.26° and 8.89° 2θ, respectively. Furthermore, higher-order reflections of both COFs
with relative intensities similar to the bulk powder are visible, indicating that the COF

Covalent Organic Framework Films through Electrophoretic Deposition – Creating Efficient
Morphologies for Catalysis
93
long-range order remained intact. This demonstrates the deposition of a mixed 2D/3D
COF film consisting of crystallites featuring three pore types (micropores and mesopores
in BDT-ETTA COF and micropores in COF-300), exhibiting different chemical
environments and dimensions (Figure 4.3A). The homogeneous mixing of the two COFs
was confirmed by SEM cross-section micrographs, where both COF morphologies, namely
large, oval COF-300 particles and BDT-ETTA COF nanocrystallites, are evenly distributed
throughout the film (Figure 4.3B).
Photocatalytic water reduction has become a major interest for potential COF
applications. Typically, COF powder is used in combination with a sacrificial agent to
facilitate or enable the solar driven hydrogen evolution.45 Recently, we demonstrated the
use of highly oriented thin films of BDT-ETTA COF as photocathodes for the sacrificial
agent free photoelectrochemical hydrogen production and provided a detailed
characterization of the catalytic properties of the material as a dense and oriented film.42
This allows for studying the impact of morphology on the performance of EPD BDT-ETTA
COF films on the photoelectrochemical (PEC) catalysis performance, already shown for
this type of COF. Therefore, we measured light-induced photocurrent generation for these
films in a water-splitting setup. A three-electrode setup was used with a BDT-ETTA COF
film supported by FTO as the photocathode working electrode, a platinum mesh counter-
electrode and a reverse hydrogen electrode (RHE) as a reference electrode. A BDT-ETTA
COF film of 3 µm thickness, in a 0.1 M Na2SO4 aqueous, nitrogen-purged electrolyte, was
measured by linear sweep voltammetry either in the dark or under illumination through
Figure 4.4: (A) PEC linear sweep voltammograms of electrodes coated with BDT-ETTA COF as a
dense and oriented film, a 3 µm thick film prepared by EPD, and a COF/Pt nanoparticle hybrid film
prepared via EPD. Illumination at AM1.5G. (B) Dynamic hydrogen evolution measurement under
chopped AM1.5G illumination of a BDT-ETTA COF electrode at 0.2 V vs. RHE. (C) SEM cross-section
generation, a linear potential sweep was carried out in the dark to quantify non-PEC of
BDT-ETTA COF and the corresponding EDX elemental mapping of Pt recorded at an electron
acceleration voltage of 20 kV.

Covalent Organic Framework Films through Electrophoretic Deposition – Creating Efficient
Morphologies for Catalysis
94
the substrate by simulated sunlight (AM1.5G, 100 mW cm−2). The measurements were
carried out at potentials ranging from 0.6 V to 0 V vs. RHE. Prior to measuring PEC current
related electrochemical reactions and film capacitance. PEC measurements of the pristine
BDT-ETTA COF film under illumination showed a photocurrent onset at 0.25 V vs. RHE
and a high photocurrent density of 21.1 µA cm−2 at 0.1 V vs. RHE (Figure 4.4A). The
recorded photocurrent density is 19-times higher compared to the value previously
reported on dense and oriented thin BDT-ETTA COF films at the same potential.42
Furthermore, we performed a dynamic hydrogen evolution experiment under chopped
illumination with an interval time of two minutes. Here, the dissolved hydrogen gas was
quantified using a microsensor, equipped with a hydrogen selective silicone membrane.
The measurement was carried out at 0.2 V vs. RHE, close to the photocurrent onset
potential, to prove that the observed photocurrent is indeed generated by proton
reduction. Upon illumination, an instant current response was observed followed by a
typical photocurrent transient. This photocurrent is directly correlated with an increase
in the simultaneously recorded hydrogen concentration. In the dark, the recorded current
density regresses rapidly and the hydrogen concentration simultaneously declines. This
light-on and -off sequence was repeated several times and showed stable current and
hydrogen concentration responses over the recorded course of 30 minutes (Figure 4.4B).
Subsequently, XRD analysis of this film proved the retention of crystallinity of the active
material (Figure S4.15). To investigate whether charge carrier transport efficiently occurs
throughout the whole EPD COF film thickness, a film of half the thickness, about 1.5 µm,
was used in the same experimental setup. Here, a reduced photocurrent density of 16.7
µA cm−2 at 0.1 V vs. RHE was observed (Figure S4.14). This reduction in photocurrent
correlates with the reduction of the film thickness, indicating that PEC activity is indeed
thickness-dependent, and charge carriers are sufficiently transported throughout the
porous film morphology. Furthermore, it illustrates that a tight contact and continuous
interface between the active COF material and the electrode are not necessarily
prerequisites for effective electrocatalysis. We attribute the overall enhanced
performance of the BDT-ETTA COF film prepared by EPD to the greatly enlarged interface
between the photoabsorber and medium provided by the textural porosity. This
compensates for the decreased areal interaction of the COF with the electrode, obtained
by using a dense film. Besides the textural porosity, the inherent porosity of the COF can
contribute to its catalytic performance. A stabilized current density output under constant

Covalent Organic Framework Films through Electrophoretic Deposition – Creating Efficient
Morphologies for Catalysis
95
illumination was recorded for the 1.5 µm thick film by chronoamperometric
measurements at 0.1 V vs. RHE, which showed a constant photocurrent density of 14.3 µA
cm−2 over the course of 10 minutes (Figure S4.14). Next, we focused on the co-deposition
of BDT-ETTA COF and an inorganic co-catalyst to facilitate electron charge transfer from
the COF photoabsorber towards the aqueous electrolyte, whereby a further improvement
of the PEC performance is expected.50 Platinum nanoparticles sized 2−4 nm were included
into the BDT-ETTA COF particle suspension prior to the EPD (Figure S4.16 and S4.17). To
prevent a premature depletion of the Pt nanoparticles during deposition, due to their
higher mobility under electrophoretic conditions, additional Pt nanoparticle suspension
was continuously added to the COF/Pt deposition medium in the course of the deposition
process. Hereby, a homogeneous distribution of Pt in the COF film was achieved,
confirmed by elemental mapping analysis using energy-dispersive X-ray spectroscopy on
a film cross-section in the SEM (Figure 4.4C). Subsequently, the exact same linear potential
sweeps measurements were repeated for this COF/Pt hybrid film. Strikingly, a PEC
photocurrent density of 128.9 µA cm−2 was recorded at 0.1 V vs. RHE for the COF/Pt films,
which is an additional 6.1-fold increase with respect to the pristine COF EPD film and 29-
times higher than the current density previously reported for dense and oriented thin
BDT-ETTA COF film decorated with Pt nanoparticles on the surface.42 An additional
valuable effect of the incorporation of the platinum co-catalyst is an earlier photocurrent
onset, which is shifted from 0.25 V to 0.45 V vs. RHE. Moreover, the dark current was
strongly reduced. These results show that the COF film morphology plays a pivotal role in
determining device performance. We postulate that the nanostructured film exhibiting a
large interfacial area allows for an efficient charge separation and transport paths
attributed to a direct transfer of electrons from the COF/Pt catalytic center to the
surrounding water while holes can travel through the aggregated COF particle pathways
towards the transparent conductive oxide (TCO) substrate.42,51 These separated charge
carrier transport pathways enable the use of even thicker COF films. In the case of a dense
film, electrons and holes are generated in the bulk film and travel throughout the whole
film thickness to reach a catalytic center or the TCO support. Therefore, charge carriers
may be more likely to recombine, thus providing an overall limited effective film thickness
and photocurrent density. According to these results, we conclude that film morphologies
must be carefully chosen and tailored towards the respective application.

Covalent Organic Framework Films through Electrophoretic Deposition – Creating Efficient
Morphologies for Catalysis
96
4.4. Conclusion
In conclusion, we demonstrate the preparation of COF films and coatings by depositing
COF particles on conducting substrates in an electric field through EPD. Hereby, 2D and
3D imine and boronate-ester linked COFs of different particle sizes and morphologies
were deposited on metal, transparent conducting metal oxides or steel meshes. By
adjusting the EPD parameters, such as deposition times, particle concentrations, and
electrode potentials, film thicknesses could be tuned and predetermined. The obtained
films feature an inherent textural porosity with interstitial voids between the deposited
particles, thereby allowing for an increased contact to active media for applications such
as catalysis. In addition, we showed that through EPD, film composites consisting of mixed
COFs can be straightforwardly prepared, enabling encoded functionalities such as multi-
pore COF films. Finally, a BDT-ETTA COF film as well as a COF/Pt nanoparticle hybrid film
were examined regarding their PEC performance, where a 19- and 117-fold catalytical
improvement, respectively, was found over our previously reported dense and oriented
BDT-ETTA COF films. To put these results in perspective, it shows that film morphology
plays a crucial role for different applications and should be considered in combination
with the inherent properties of the COFs. This, as well as the simplicity and generality of
the approach, underlines the importance of EPD as an addition to the field of COF film
preparation methods. Therefore, we believe that this work will assist in designing high-
performance devices for specific applications.
4.5. References
(1) Diercks, C. S.; Yaghi, O. M. The atom, the molecule, and the covalent organic framework.
Science 2017, 355.
(2) Jin, Y.; Hu, Y.; Zhang, W. Tessellated multiporous two-dimensional covalent organic
frameworks. Nat. Rev. Chem. 2017, 1, 56.
(3) Furukawa, H.; Yaghi, O. M. Storage of hydrogen, methane, and carbon dioxide in highly
porous covalent organic frameworks for clean energy applications. J. Am. Chem. Soc. 2009,
131, 8875–8883.

Covalent Organic Framework Films through Electrophoretic Deposition – Creating Efficient
Morphologies for Catalysis
97
(4) Sharma, A.; Malani, A.; Medhekar, N. V.; Babarao, R. CO 2 adsorption and separation in
covalent organic frameworks with interlayer slipping. CrystEngComm 2017, 19, 6950–
6963.
(5) Fan, H.; Mundstock, A.; Feldhoff, A.; Knebel, A.; Gu, J.; Meng, H.; Caro, J. Covalent Organic
Framework-Covalent Organic Framework Bilayer Membranes for Highly Selective Gas
Separation. J. Am. Chem. Soc. 2018, 140, 10094–10098.
(6) Zhang, S.; Zheng, Y.; An, H.; Aguila, B.; Yang, C.-X.; Dong, Y.; Xie, W.; Cheng, P.; Zhang, Z.;
Chen, Y. et al. Covalent Organic Frameworks with Chirality Enriched by Biomolecules for
Efficient Chiral Separation. Angew. Chem. Int. Ed. 2018, 57, 16754–16759.
(7) Ding, S.-Y.; Gao, J.; Wang, Q.; Zhang, Y.; Song, W.-G.; Su, C.-Y.; Wang, W. Construction of
covalent organic framework for catalysis: Pd/COF-LZU1 in Suzuki-Miyaura coupling
reaction. J. Am. Chem. Soc. 2011, 133, 19816–19822.
(8) Sun, Q.; Aguila, B.; Ma, S. A bifunctional covalent organic framework as an efficient
platform for cascade catalysis. Mater. Chem. Front. 2017, 1, 1310–1316.
(9) Lin, S.; Diercks, C. S.; Zhang, Y.-B.; Kornienko, N.; Nichols, E. M.; Zhao, Y.; Paris, A. R.;
Kim, D.; Yang, P.; Yaghi, O. M. et al. Covalent organic frameworks comprising cobalt
porphyrins for catalytic CO₂ reduction in water. Science 2015, 349, 1208–1213.
(10) Aiyappa, H. B.; Thote, J.; Shinde, D. B.; Banerjee, R.; Kurungot, S. Cobalt-Modified
Covalent Organic Framework as a Robust Water Oxidation Electrocatalyst. Chem. Mater.
2016, 28, 4375–4379.
(11) Thote, J.; Aiyappa, H. B.; Deshpande, A.; Dí az Dí az, D.; Kurungot, S.; Banerjee, R. A
covalent organic framework-cadmium sulfide hybrid as a prototype photocatalyst for
visible-light-driven hydrogen production. Chemistry 2014, 20, 15961–15965.
(12) Wang, X.; Chen, L.; Chong, S. Y.; Little, M. A.; Wu, Y.; Zhu, W.-H.; Clowes, R.; Yan, Y.;
Zwijnenburg, M. A.; Sprick, R. S. et al. Sulfone-containing covalent organic frameworks for
photocatalytic hydrogen evolution from water. Nat. Chem. 2018, 10, 1180–1189.
(13) Dogru, M.; Handloser, M.; Auras, F.; Kunz, T.; Medina, D.; Hartschuh, A.; Knochel, P.;
Bein, T. A photoconductive thienothiophene-based covalent organic framework showing
charge transfer towards included fullerene. Angew. Chem. Int. Ed. 2013, 52, 2920–2924.

Covalent Organic Framework Films through Electrophoretic Deposition – Creating Efficient
Morphologies for Catalysis
98
(14) Bessinger, D.; Ascherl, L.; Auras, F.; Bein, T. Spectrally Switchable Photodetection with
Near-Infrared-Absorbing Covalent Organic Frameworks. J. Am. Chem. Soc. 2017, 139,
12035–12042.
(15) Guo, J.; Xu, Y.; Jin, S.; Chen, L.; Kaji, T.; Honsho, Y.; Addicoat, M. A.; Kim, J.; Saeki, A.;
Ihee, H. et al. Conjugated organic framework with three-dimensionally ordered stable
structure and delocalized π clouds. Nat. Commun., 4, 2736.
(16) DeBlase, C. R.; Silberstein, K. E.; Truong, T.-T.; Abrun a, H. D.; Dichtel, W. R. β-
Ketoenamine-linked covalent organic frameworks capable of pseudocapacitive energy
storage. J. Am. Chem. Soc. 2013, 135, 16821–16824.
(17) Chandra, S.; Roy Chowdhury, D.; Addicoat, M.; Heine, T.; Paul, A.; Banerjee, R.
Molecular Level Control of the Capacitance of Two-Dimensional Covalent Organic
Frameworks: Role of Hydrogen Bonding in Energy Storage Materials. Chem. Mater. 2017,
29, 2074–2080.
(18) Halder, A.; Ghosh, M.; Khayum M, A.; Bera, S.; Addicoat, M.; Sasmal, H. S.; Karak, S.;
Kurungot, S.; Banerjee, R. Interlayer Hydrogen-Bonded Covalent Organic Frameworks as
High-Performance Supercapacitors. J. Am. Chem. Soc. 2018, 140, 10941–10945.
(19) Wang, D.-G.; Li, N.; Hu, Y.; Wan, S.; Song, M.; Yu, G.; Jin, Y.; Wei, W.; Han, K.; Kuang, G.-C.
et al. Highly Fluoro-Substituted Covalent Organic Framework and Its Application in
Lithium-Sulfur Batteries. ACS Appl. Mater. Interfaces 2018.
(20) Wuttke, S.; Medina, D. D.; Rotter, J. M.; Begum, S.; Stassin, T.; Ameloot, R.; Oschatz, M.;
Tsotsalas, M. Bringing Porous Organic and Carbon-Based Materials toward Thin-Film
Applications. Adv. Funct. Mater. 2018, 28, 1801545.
(21) Beuerle, F.; Gole, B. Covalent Organic Frameworks and Cage Compounds: Design and
Applications of Polymeric and Discrete Organic Scaffolds. Angew. Chem. Int. Ed. 2018, 57,
4850–4878.
(22) Colson, J. W.; Woll, A. R.; Mukherjee, A.; Levendorf, M. P.; Spitler, E. L.; Shields, V. B.;
Spencer, M. G.; Park, J.; Dichtel, W. R. Oriented 2D covalent organic framework thin films
on single-layer graphene. Science 2011, 332, 228–231.

Covalent Organic Framework Films through Electrophoretic Deposition – Creating Efficient
Morphologies for Catalysis
99
(23) Medina, D. D.; Werner, V.; Auras, F.; Tautz, R.; Dogru, M.; Schuster, J.; Linke, S.;
Do blinger, M.; Feldmann, J.; Knochel, P. et al. Oriented thin films of a benzodithiophene
covalent organic framework. ACS Nano 2014, 8, 4042–4052.
(24) Wang, H.; He, B.; Liu, F.; Stevens, C.; Brady, M. A.; Cai, S.; Wang, C.; Russell, T. P.; Tan, T.-
W.; Liu, Y. Orientation transitions during the growth of imine covalent organic framework
thin films. J. Mater. Chem. C 2017, 5, 5090–5095.
(25) Bisbey, R. P.; DeBlase, C. R.; Smith, B. J.; Dichtel, W. R. Two-dimensional Covalent
Organic Framework Thin Films Grown in Flow. J. Am. Chem. Soc. 2016, 138, 11433–11436.
(26) Medina, D. D.; Rotter, J. M.; Hu, Y.; Dogru, M.; Werner, V.; Auras, F.; Markiewicz, J. T.;
Knochel, P.; Bein, T. Room temperature synthesis of covalent-organic framework films
through vapor-assisted conversion. J. Am. Chem. Soc. 2015, 137, 1016–1019.
(27) Zhao, X.; Pachfule, P.; Li, S.; Langenhahn, T.; Ye, M.; Schlesiger, C.; Praetz, S.; Schmidt,
J.; Thomas, A. Macro/Microporous Covalent Organic Frameworks for Efficient
Electrocatalysis. J. Am. Chem. Soc. 2019, 141, 6623–6630.
(28) BESRA, L.; LIU, M. A review on fundamentals and applications of electrophoretic
deposition (EPD). Prog. Mater Sci. 2007, 52, 1–61.
(29) Castro, Y.; Ferrari, B.; Moreno, R.; Dura n, A. Coatings produced by electrophoretic
deposition from nano-particulate silica sol–gel suspensions. Surf. Coat. Technol. 2004,
182, 199–203.
(30) Seike, T.; Matsuda, M.; Miyake, M. Preparation of FAU type zeolite membranes by
electrophoretic deposition and their separation properties. J. Mater. Chem. 2002, 12, 366–
368.
(31) Limmer, S. J.; Seraji, S.; Wu, Y.; Chou, T. P.; Nguyen, C.; Cao, G. Z. Template-Based Growth
of Various Oxide Nanorods by Sol–Gel Electrophoresis. Adv. Funct. Mater. 2002, 12, 59.
(32) Salant, A.; Shalom, M.; Hod, I.; Faust, A.; Zaban, A.; Banin, U. Quantum dot sensitized
solar cells with improved efficiency prepared using electrophoretic deposition. ACS Nano
2010, 4, 5962–5968.
(33) Xu, J.; Shalom, M. Electrophoretic Deposition of Carbon Nitride Layers for
Photoelectrochemical Applications. ACS Appl. Mater. Interfaces 2016, 8, 13058–13063.

Covalent Organic Framework Films through Electrophoretic Deposition – Creating Efficient
Morphologies for Catalysis
100
(34) Casagrande, T.; Imin, P.; Cheng, F.; Botton, G. A.; Zhitomirsky, I.; Adronov, A. Synthesis
and Electrophoretic Deposition of Single-Walled Carbon Nanotube Complexes with a
Conjugated Polyelectrolyte. Chem. Mater. 2010, 22, 2741–2749.
(35) Garate, J.-A.; English, N. J.; Singh, A.; Ryan, K. M.; Mooney, D. A.; MacElroy, J. M. D.
Electrophoretic deposition of poly(3-decylthiophene) onto gold-mounted cadmium
selenide nanorods. Langmuir 2011, 27, 13506–13513.
(36) Li, G.; Martinez, C.; Semancik, S. Controlled electrophoretic patterning of polyaniline
from a colloidal suspension. J. Am. Chem. Soc. 2005, 127, 4903–4909.
(37) Han, H.; Yuan, X.; Zhang, Z.; Zhang, J. Preparation of a ZIF-67 Derived Thin Film
Electrode via Electrophoretic Deposition for Efficient Electrocatalytic Oxidation of
Vanillin. Inorg. Chem. 2019, 58, 3196–3202.
(38) Feng, J.-F.; Yang, X.; Gao, S.-Y.; Shi, J.; Cao, R. Facile and Rapid Growth of Nanostructured
Ln-BTC Metal-Organic Framework Films by Electrophoretic Deposition for Explosives
sensing in Gas and Cr 3+ Detection in Solution. Langmuir 2017, 33, 14238–14243.
(39) Wang, L.; Zeng, C.; Xu, H.; Yin, P.; Chen, D.; Deng, J.; Li, M.; Zheng, N.; Gu, C.; Ma, Y. A
highly soluble, crystalline covalent organic framework compatible with device
implementation. Chem. Sci. 2019, 10, 1023–1028.
(40) Hod, I.; Bury, W.; Karlin, D. M.; Deria, P.; Kung, C.-W.; Katz, M. J.; So, M.; Klahr, B.; Jin, D.;
Chung, Y.-W. et al. Directed growth of electroactive metal-organic framework thin films
using electrophoretic deposition. Adv. Mater. 2014, 26, 6295–6300.
(41) Co te , A. P.; Benin, A. I.; Ockwig, N. W.; O'Keeffe, M.; Matzger, A. J.; Yaghi, O. M. Porous,
crystalline, covalent organic frameworks. Science 2005, 310, 1166–1170.
(42) Sick, T.; Hufnagel, A. G.; Kampmann, J.; Kondofersky, I.; Calik, M.; Rotter, J. M.; Evans,
A.; Do blinger, M.; Herbert, S.; Peters, K. et al. Oriented Films of Conjugated 2D Covalent
Organic Frameworks as Photocathodes for Water Splitting. J. Am. Chem. Soc. 2018, 140,
2085–2092.
(43) Uribe-Romo, F. J.; Hunt, J. R.; Furukawa, H.; Klo ck, C.; O'Keeffe, M.; Yaghi, O. M. A
crystalline imine-linked 3-D porous covalent organic framework. J. Am. Chem. Soc. 2009,
131, 4570–4571.

Covalent Organic Framework Films through Electrophoretic Deposition – Creating Efficient
Morphologies for Catalysis
101
(44) Wu, G.-W.; He, S.-B.; Peng, H.-P.; Deng, H.-H.; Liu, A.-L.; Lin, X.-H.; Xia, X.-H.; Chen, W.
Citrate-capped platinum nanoparticle as a smart probe for ultrasensitive mercury sensing.
Anal. Chem. 2014, 86, 10955–10960.
(45) Wang, H.; Zeng, Z.; Xu, P.; Li, L.; Zeng, G.; Xiao, R.; Tang, Z.; Huang, D.; Tang, L.; Lai, C. et
al. Recent progress in covalent organic framework thin films: fabrications, applications
and perspectives. Chem. Soc. Rev. 2019, 48, 488–516.
(46) Hamaker, H. C. Formation of a deposit by electrophoresis. Trans. Faraday Soc. 1940,
35, 279.
(47) Ma, T.; Kapustin, E. A.; Yin, S. X.; Liang, L.; Zhou, Z.; Niu, J.; Li, L.-H.; Wang, Y.; Su, J.; Li,
J. et al. Single-crystal x-ray diffraction structures of covalent organic frameworks. Science
2018, 361, 48–52.
(48) Evans, A. M.; Parent, L. R.; Flanders, N. C.; Bisbey, R. P.; Vitaku, E.; Kirschner, M. S.;
Schaller, R. D.; Chen, L. X.; Gianneschi, N. C.; Dichtel, W. R. Seeded growth of single-crystal
two-dimensional covalent organic frameworks. Science 2018, 361, 52–57.
(49) Safaei, J.; Mohamed, N. A.; Mohamad Noh, M. F.; Soh, M. F.; Ludin, N. A.; Ibrahim, M. A.;
Roslam Wan Isahak, W. N.; Mat Teridi, M. A. Graphitic carbon nitride (g-C 3 N 4 ) electrodes
for energy conversion and storage: a review on photoelectrochemical water splitting,
solar cells and supercapacitors. J. Mater. Chem. A 2018, 6, 22346–22380.
(50) Kemppainen, E.; Bodin, A.; Sebok, B.; Pedersen, T.; Seger, B.; Mei, B.; Bae, D.; Vesborg,
P. C. K.; Halme, J.; Hansen, O. et al. Scalability and feasibility of photoelectrochemical H 2
evolution: the ultimate limit of Pt nanoparticle as an HER catalyst. Energy Environ. Sci.
2015, 8, 2991–2999.
(51) Medina, D. D.; Petrus, M. L.; Jumabekov, A. N.; Margraf, J. T.; Weinberger, S.; Rotter, J.
M.; Clark, T.; Bein, T. Directional Charge-Carrier Transport in Oriented Benzodithiophene
Covalent Organic Framework Thin Films. ACS Nano 2017, 11, 2706–2713.

Covalent Organic Framework Films through Electrophoretic Deposition – Creating Efficient
Morphologies for Catalysis
102
4.6. Supporting Information
Deposition of BDT-ETTA COF on FTO, ITO and titanium foil
Figure S4.1: Deposition of BDT-ETTA COF on different conducting surfaces, namely titanium foil,
glass coated with FTO and glass coated with ITO. All depositions were carried out using 10 mL of
BDT-ETTA COF suspension in ethyl acetate at 900 V for 2 min.
5 10 15 20 25 30 35 40
Inte
nsity (
a.u
.)
2 (degree)
Titanium foil
FTO
ITO

Covalent Organic Framework Films through Electrophoretic Deposition – Creating Efficient
Morphologies for Catalysis
103
Deposition of BDT-ETTA COF in anisole, ethyl acetate and toluene
Figure S4.2: Deposition of BDT-ETTA COF from different solvents, namely anisole, ethyl acetate
and toluene. All depositions were carried out using 10 mL of the respective BDT-ETTA COF
suspension at 900 V for 2 min.
DLS Data for ultrasound treated BDT-ETTA COF
Figure S4.3: Particle size distribution of BDT-ETTA COF after the ultrasonic milling process.
5 10 15 20 25 30 35 40 45
Ethylacetate
Anisole
Toluene
In
ten
sity (
a.u
.)
2 (degree)

Covalent Organic Framework Films through Electrophoretic Deposition – Creating Efficient
Morphologies for Catalysis
104
Transmission electron micrographs
Figure S4.4: TEM image of deposited BDT-ETTA COF particles after the ultrasonic milling
process.

Covalent Organic Framework Films through Electrophoretic Deposition – Creating Efficient
Morphologies for Catalysis
105
Figure S4.5: TEM image of deposited COF-300 particles.

Covalent Organic Framework Films through Electrophoretic Deposition – Creating Efficient
Morphologies for Catalysis
106
Figure S4.6: TEM image of deposited COF-5.

Covalent Organic Framework Films through Electrophoretic Deposition – Creating Efficient
Morphologies for Catalysis
107
COF EPD film physisorption
Figure S4.7: Nitrogen physisorption isotherms of scratched-off powder from the respective COF
EPD films. Due to the low mass of the scratched-off powders, quantitative nitrogen uptake could
not be accurately determined.

Covalent Organic Framework Films through Electrophoretic Deposition – Creating Efficient
Morphologies for Catalysis
108
Fourier-transform infrared spectroscopy
Figure S4.8: FT-IR spectra of the as-synthesized bulk material and as scratched-off EPD film
materials. In all three cases IR vibrations are preserved. This indicates that no chemical
degradation occurred during the EPD process.

Covalent Organic Framework Films through Electrophoretic Deposition – Creating Efficient
Morphologies for Catalysis
109
BDT-ETTA COF time-dependent thickness plot
Figure S4.9: Time-dependent thickness plot of BDT-ETTA COF deposited from ethyl acetate at
900 V. Thicknesses obtained from SEM cross-sections.
0 20 40 60 80 100 120
500
1000
1500
2000
2500
Th
ick
ness
(n
m)
Deposition time (s)

Covalent Organic Framework Films through Electrophoretic Deposition – Creating Efficient
Morphologies for Catalysis
110
Voltage dependent deposition of BDT-ETTA COF
Figure S4.10: SEM top-view images of BDT-ETTA COF deposited at different voltages for 2 min
from ethyl acetate.

Covalent Organic Framework Films through Electrophoretic Deposition – Creating Efficient
Morphologies for Catalysis
111
Mass-dependent deposition of COF-300
Figure S4.11: SEM cross-section images of depositions of COF-300 using different masses in 10
mL suspension and the resulting film thicknesses. Depositions were carried out at 900 V for 2
min from ethyl acetate.

Covalent Organic Framework Films through Electrophoretic Deposition – Creating Efficient
Morphologies for Catalysis
112
Large area deposition of BDT-ETTA COF
Figure S4.12: Photograph of an EPD of BDT-ETTA COF on 5 cm × 5 cm electrode area as well as a
1 cm × 1 cm film. Both depositions were carried out on FTO at 900 V for 2 min.

Covalent Organic Framework Films through Electrophoretic Deposition – Creating Efficient
Morphologies for Catalysis
113
SEM Micrographs of BDT-ETTA COF deposited on a porous mesh
Figure S4.13: SEM top view micrographs of BDT-ETTA COF depositions on a porous steel mesh
(mesh size 270). (A) Image of the bare mesh prior to deposition. (B) High magnification of BDT-
ETTA COF particles deposited on the mesh. (C) Deposition of BDT-ETTA COF in high concentration
on a steel mesh, revealing the complete coverage of the pores. (D) Corresponding back-scattered
electron micrograph at 30 kV acceleration voltage, revealing the underlying mesh structure.

Covalent Organic Framework Films through Electrophoretic Deposition – Creating Efficient
Morphologies for Catalysis
114
Thickness dependent PEC current measurements and
chronoamperometry
Figure S4.14: (A) Thickness dependent PEC linear sweep voltammograms of electrodes coated
with BDT-ETTA COF. Illumination at AM1.5G. (B) Chronoamperometric current density
measurement of BDT-ETTA COF under illumination.
Stability of BDT-ETTA COF after PEC catalysis
Figure S4.15: Stability of BDT-ETTA COF after 30 minutes of chopped illumination at 0.1 V vs. RHE.

Covalent Organic Framework Films through Electrophoretic Deposition – Creating Efficient
Morphologies for Catalysis
115
Pt nanoparticles size characterization
Figure S4.16: TEM micrograph of Pt nanoparticles after lyophilization.
Figure S4.17: DLS profile of Pt nanoparticles after lyophilization.


High Electrical Conductivities in Doped Wurster-type Covalent Organic Frameworks and
Their Thin Films
117
5. High Electrical Conductivities in Doped Wurster-type
Covalent Organic Frameworks and Their Thin Films
Julian M. Rotter, Michael Auth, Roman Guntermann, Andre Ma hringer, Andreas Sperlich,
Vladimir Dyakonov, Dana D. Medina, Thomas Bein, to be submitted.
5.1. Abstract
Covalent organic frameworks (COFs) are a versatile platform combining attractive
properties such as crystallinity, porosity, and chemical and structure modularity which
are valuable for various applications. For the incorporation of COFs into optoelectronic
devices, high charge carrier transport and intrinsic conductivity are essential. Here, we
report the synthesis of WTA and WBDT, two imine-linked COFs, featuring a redox-active
Wurster-type motif based on the twisted tetragonal N,N,N’,N’-tetraphenyl-1,4-
phenylenediamine node. By condensing this unit with either terephthalaldehyde (TA) or
benzodithiophene dialdehyde (BDT), COFs featuring a dual-pore structure were obtained
as highly crystalline materials with large specific surface areas and a mesoporous dual-
pore topology. In addition, the experimental high conduction band energies of both COFs
render them suitable candidates for oxidative doping. The incorporation of a
benzodithiophene linear building block into the COF allowed for high intrinsic
macroscopic conductivity. The anisotropic conductivities and isotropic conductivities
were probed by van-der-Pauw measurements using oriented films and pressed pellets,
respectively. Furthermore, the impact of different dopants such as F4TCNQ, antimony
pentachloride and iodine on the conductivities of the resulting doped COFs was studied.
By using the strong organic acceptor F4TCNQ, long-term stable electrical conductivities as
high as 3.67 S m−1 were achieved for the anisotropic transport in an oriented film, the
highest for any doped COF to date. Interestingly, no significant differences between
isotropic and anisotropic charge transport were found in films and pressed pellets. This
work expands the list of possible building nodes for electrically conducting COFs from
solely highly planar systems to twisted geometries. The achievement of high and stable
electrical conductivities extends the range of applications of new COFs in optoelectronics
and may ultimately promote the use of COFs in organic (opto-)electronics.

High Electrical Conductivities in Doped Wurster-type Covalent Organic Frameworks and
Their Thin Films
118
5.2. Introduction
Covalent organic frameworks (COFs) have attracted great interest in materials science and
polymer chemistry due to their highly modular construction principle and the resulting
intriguing properties.1 COFs emerge from condensation reactions of organic molecular
building blocks, whereby the resulting covalent bonds form highly cross-linked porous
frameworks.2,3 They feature high crystallinity, high surface areas, and defined pore
systems. By adhering to the principles of reticular synthesis, framework geometry and
dimensionality, connectivity and porosity can be predetermined.1 As a result of this
modularity, various functionalities can be introduced into these frameworks through the
design of their building blocks, thereby offering access to many different applications such
as gas storage,4,5 sensing,6,7 catalysis,8–10 charge storage,11–13 or optoelectronics.14–17
Besides the intrinsic structure of the building blocks, the type of linkage between them is
of great significance. By varying the linkage, either electronically separated or highly
conjugated systems can be designed.2,18,19
Recently, several two-dimensional (2D) COFs with enhanced electrical conductivity were
reported.20–22 A common feature of these frameworks is the cross-linking of the building
blocks with either sp2-hybridized carbon-carbon or carbon-nitrogen bonds. The π-
conjugation of these linkages facilitates the through-bond charge transport by allowing
for an increased charge delocalization, and therefore, in-plane conductivity is improved.23
Another postulated design criterion for conducting COFs is the use of planar π-system
geometries enabling a large area π-orbital overlap between successive COF layers. Here,
the strong π-system interaction is expected to facilitate the through-space charge
transport perpendicular to the layers.18,21 However, while various orientation-dependent
studies of electrical conductivity have been carried out, there is no in-depth systematic
investigation of isotropic versus anisotropic conductivity. The previously described two
design strategies have been implemented for constructing 2D COF systems based on
planar linkers such as pyrene,10 tetrathiafulvalene,22 phthalocyanine21 or fully aromatic
pyrazine systems.24 In these cases, intrinsic conductivities ranging from 10−5 to 10−3 S m−1
were observed. Chemical doping of these systems with oxidants serving as guest-
molecules in the pores led to a further increase in electrical conductivity. Remarkably,
iodine so far appears to be the most suitable dopant, whereby the conductivity of the
reported COFs was increased by two to three orders of magnitude.22
High Electrical Conductivities in Doped Wurster-type Covalent Organic Frameworks and
Their Thin Films
119
We recently reported on photoactive COFs consisting of sterically demanding building
blocks bearing significantly out-of-plane rotated phenyl groups such as in
tetraphenylethylene. These types of COFs were shown to be suitable for charge transport
in photoelectrochemical water splitting catalysis.8,25 To expand the paradigm of non-
planar, electrically conducting COFs, additional features, such as specific doping sites in
sterically demanding linker are of high interest. Here, we realize such a geometry with a
Wurster-type motif, to obtain COFs based on N,N,N’,N’-tetraphenyl-1,4-phenylenediamine
(W), as a tetragonal node.
Wurster-type compounds are electron-rich molecules derived from N,N,N’,N’-tetramethyl-
1,4-phenylenediamine (TMPD).26 They can be easily oxidized, generating stabilized
radical cations within their π-systems.27 The doping of this motif through oxidation is a
well-studied feature, and the hereby generated radical cations show promising stability
as conductive organic materials for charge transport or storage.28–30 Organic salts based
on TMPD as the electron donor and tetracyanoquinodimethane (TCNQ) as the electron
acceptor show high electrical conductivities.31
Herein, we demonstrate that the Wurster motif can be embedded into different COFs,
defined by using two different linear linker molecules. We also investigate the intrinsic
conductivity of the two resulting Wurster-COFs. By condensing W with either
terephthalaldehyde (TA) or the linear dialdehyde of benzodithiophene (BDT), conjugated,
highly crystalline and porous imine-linked materials were obtained. We discuss the
incorporation of the Wurster-type motif, structural aspects of the COF geometries, the
resulting electronic properties, and study the effect of different dopants on the electrical
conductivity of these novel frameworks.

High Electrical Conductivities in Doped Wurster-type Covalent Organic Frameworks and
Their Thin Films
120
5.3. Results and Discussion
Synthesis. The Wurster-type COFs were synthesized under solvothermal conditions by
condensing N,N,N',N'-tetra(4-aminophenyl)benzene-1,4-diamine (W) with the linear
aldehydes terephthalaldehyde (TA) or benzodithiophene dialdehyde (BDT) to form imine-
linked COFs, namely WTA and WBDT (Figure 5.1a). To this end, the respective building
blocks were suspended in a mixture of mesitylene and benzyl alcohol and a catalytic
amount of 6 M acetic acid was added to the mixture. The reaction vessel was sealed and
heated for three days at 100 °C. Subsequently, the red precipitates were isolated by
filtration and washed with the pure solvent mixture used in the reaction. The COFs were
then purified using our recently reported supercritical CO2 extraction protocol to remove
residual guest molecules from the pores.32
Figure 5.1: a) Schematic presentation of the synthesis of WTA and WBDT from the molecular
building blocks. b) PXRD and Pawley refinement of WTA. c) Nitrogen physisorption isotherms of
WTA and WBDT. d) PXRD and Pawley refinement of WBDT.
Structural Investigations. Powder X-ray diffraction (PXRD) analysis revealed the
formation of highly crystalline materials with well-resolved reflections up to about 22° 2θ
(Figure 5.1b, d). To determine the framework topologies of the obtained COFs, several
structural models for WTA and WBDT were developed. The combination of the tetragonal
W building block with TA or BDT should either lead to a tetragonal topology or to a dual-
pore, kagome-like topology.33 Recent reports on tetragonal linkers with similar
geometries, like tetraphenylethylene, have shown that kagome-type topologies are

High Electrical Conductivities in Doped Wurster-type Covalent Organic Frameworks and
Their Thin Films
121
generally preferred.33,34 Therefore, both structural models were simulated starting with
an AA-type, eclipsed layer stacking arrangement, and the associated theoretical PXRD
patterns were compared to the experimentally obtained ones. The simulations were
carried out using the Forcite module of Materials Studio with the universal force field.
Subsequently, the PXRD patterns of the simulated COFs were predicted using the reflex
module. The simulations show that the dual-pore kagome structure model is in good
agreement with the experimental patterns, and therefore we focused on this model for
further modeling (Figure 5.1b, d, and S5.2 and S5.3).
To refine our structure model of the COFs and to gain a deeper understanding of the
geometric arrangement of the sterically demanding W unit within the framework, we
synthesized a molecular fragment by condensing W with four monofunctional
benzo[b]thiophene-2-carboxaldehyde units. Single crystal X-ray analysis of the resulting
molecule revealed a counter-clockwise rotation of the triphenylamine moieties, resulting
in a chair-like configuration of the molecular fragment (Figure S5.1). This building block
geometry is in contrast to the typically propeller-shaped geometries needed for kagome-
type structures with hexagonal symmetry. Next, we constructed framework models of
WTA and WBDT based on a hexagonal P6 space group, where the W linker adopts a
propeller-like geometry, and the respective triclinic P-1 symmetric frameworks, where the
W geometry is adapted from the single-crystal data. All geometries were optimized using
the density functional tight binding plus (DFTB+) code and the 3ob parameter set.35–37 For
both WTA and WBDT it was found that the P-1 symmetry is indeed energetically favored
by −27.9 or −31.2 kcal/cell, respectively, compared to the hexagonal kagome structures.
We can conclude that an apparent kagome, dual-pore structure is present, namely a 2D
trihexagonal tiling but only on a higher level of hierarchy, where the atoms are not
arranged in hexagonal symmetry. On closer examination, this hexagonal symmetry
condition is not preserved on the atomic level, and therefore, according to the symmetry
constraints the structures can be only described as kagome-like.
Using the P-1 structures, the simulated unit cells were Pawley-refined to match with the
experimental ones with very low fitting errors. Additionally, the diffraction patterns were
indexed, and the reflections attributed to hkl 100, 110, 200, 210, 300, 220, 310, 400, 500
and 001 (by order of appearance) for both COFs (the five strongest reflections for WTA
and WBDT are at 2.378, 4.159, 4.795, 6.353, 8.675 ° 2θ and 2.039, 3.586, 4.137, 5.505,
6.215 ° 2θ, respectively). The observed 001 reflections can be directly attributed to the π-

High Electrical Conductivities in Doped Wurster-type Covalent Organic Frameworks and
Their Thin Films
122
π-stacking distances with d-spacing values of 4.00 A and 3.93 A for WTA and WBDT,
respectively (Figure 5.1b, d).
Physisorption. To determine the internal surface area of the COFs, nitrogen physisorption
isotherms were measured. Both COFs exhibit sorption isotherms featuring a mixture of
type I and type IVb with two steep nitrogen uptake steps (Figure 5.1c). Here, the first step,
at low partial pressure, is characteristic for microporous materials, whereas the second
step at higher relative partial pressures reveals additional capillary condensation,
indicating the presence of mesopores. The calculated Brunauer, Emmett, Teller (BET)
surface areas are 1509 m2 g−1 and 1706 m2 g−1 for WTA and WBDT, respectively. Pore sizes
were calculated from the nitrogen isotherms using the quenched solid density functional
theory (QSDFT) model for 1D cylindrical pores and carbon surfaces. For the COFs, two
pore sizes were calculated with 1.76 nm and 2.89 nm (1.78 nm and 2.99 nm from
structural simulations) for WTA and 1.79 nm and 3.51 nm (2.12 nm and 3.89 nm from
structural simulations) for WBDT (Figure S5.6, S5.7). Additionally, total pore volumes of
1.02 cm3 g−1 and 1.17 cm3 g−1 for WTA and WBDT were calculated, respectively. These
results confirm the existence of a dual-pore system and strongly support the predicted
structures and linker arrangements for WTA and WBDT.

High Electrical Conductivities in Doped Wurster-type Covalent Organic Frameworks and
Their Thin Films
123
Figure 5.2: a) SEM image of WTA bulk material. b) SEM image of WBDT bulk material. c) TEM
image of WTA bulk material. d) TEM image of WBDT bulk material.
Particle Morphology. The morphology of the obtained COFs was assessed by scanning
electron microscopy (SEM). WTA powder consists of microparticles of a rosebud-like
structure in which platelets intergrow to form larger spherical aggregates of about 2 to 3
µm (Figure 5.2a). In contrast, WBDT powder consists of spherical particles of about 1 µm
in size, which intergrow into larger connected structures (Figure 5.2b). Transmission
electron microscopy (TEM) clearly shows the channel structures of the two COFs. Domain
sizes of about 200 nm and 100 nm can be observed for WTA and WBDT, respectively
(Figure 5.2c, d). In both cases, crystal domains where the c-zone axis is oriented parallel
to the incident electron beam were detected. This visualises the pseudo-hexagonal pattern
generated by the dual-pore arrangement, in excellent agreement with the PXRD and
simulation data.

High Electrical Conductivities in Doped Wurster-type Covalent Organic Frameworks and
Their Thin Films
124
Figure 5.3: a) GIWAXS 2D diffraction pattern of a WTA thin film on glass. b) SEM cross-section
image of a WTA thin film with c), the corresponding top-view. d) GIWAXS 2D diffraction pattern of
a WBDT thin film on glass. e) SEM cross-section of a WBDT thin film with f), the corresponding
top-view.
COF Films. In addition to bulk synthesis, the surface growth of the Wurster-type COFs
WTA and WBDT was investigated. In a typical thin film synthesis, a glass substrate was
placed horizontally in the COF reaction vessel, and the COF powder synthesis procedure
was carried out.38 After 24 h, the substrate was recovered from the reaction vessel, and
the respective COF was obtained as a transparent yet iridescent film on the bottom side of
the substrate. To examine the crystallinity of the films, grazing incidence wide-angle X-ray
scattering (GIWAXS) images were recorded using an incident angle of 0.22° and a 2D
detector. For both COFs, strong X-ray reflections were observed, and the q-values of the
respective signals match the ones from the bulk PXRD data (Figure 5.3a, d) (WTA: qy-
values: 1.69, 2.98, 3.41, 4.55, 6.18 nm−1; qz-value: 15.7 nm−1. WBDT: qy-values: 1.44, 2.56,
2.90, 3.91, 4.42 nm−1; qz-value: 16.0 nm−1). Furthermore, the low arching of the in-plane
reflections at low qy-values from 2 – 8 nm−1 and the out-of-plane π-stacking reflection at
a larger qz of about 15 nm−1 reveal that the COFs deposit as preferentially oriented
materials on the substrate, with many of the 1D pores positioned perpendicular to the

High Electrical Conductivities in Doped Wurster-type Covalent Organic Frameworks and
Their Thin Films
125
substrate. SEM cross-sections of the films show thicknesses of about 80 nm for WTA and
210 nm for WBDT (Figure 5.3b, e). Both materials deposit as dense films without
interstitial voids on the substrate. Additionally, thin platelet crystallites sized 100 to 200
nm emerge from the surface of the WTA film. The SEM top-view images reveal densely-
packed films covering large areas without apparent cracks. For WTA, thin platelets are
visible on the surface, while for WBDT, the film surface is composed of spherical grains of
about 50 nm in size (Figure 5.3c, f).
Figure 5.4: UV-vis absorption and PL emission spectra of WTA and WBDT thin films. b) Waveplots
of the frontier molecular orbital localizations for WTA and WBDT.
Photophysical Properties. The photophysical properties of the Wurster-type COF films
were investigated by means of UV-vis absorption spectroscopy, photoluminescence (PL)
and time-correlated single-photon counting (TCSPC) (Figure 5.4a and Figure S5.10,
S5.11). Both COFs are red-colored materials and show similar light absorption
characteristics with a strong absorption in the visible spectrum. While WTA COF has an
absorption onset at about 660 nm, the incorporation of the BDT building block into the
COF causes a 40 nm red-shift (Figure 5.4a). Assuming direct optical transitions for both
materials, optical band gaps of 1.96 eV and 1.87 eV for WTA and WBDT COFs were
calculated using Tauc plots (Figures S5.8, S5.9). PL spectra of the COFs were recorded by
exciting the materials with a 378 nm laser light source. The resulting spectra show large
stoke-shifts of about 110 nm with PL emission maxima at 641 nm and 673 nm for WTA

High Electrical Conductivities in Doped Wurster-type Covalent Organic Frameworks and
Their Thin Films
126
and WBDT, respectively, and overall broad emissions ranging from 550 – 850 nm (Figure
5.4a). Fluorescence lifetime decays were obtained by TCSPC using a 378 nm excitation
wavelength. The decay curves were subsequently deconvoluted using the instrument
response function (IRF) and a biexponential fit. TCSPC data were recorded at the
respective PL maxima of the COFs under a nitrogen atmosphere. Here, very short lifetimes
of the photoexcited states can be observed. In WTA and WBDT, the major components,
87.6% and 86.5%, decay within 100 ps and 130 ps, respectively, while the minor
components decay within 750 ps and 740 ps, respectively (Figures S5.10, S5.11). These
very short-lived excited states point to the presence of a push-pull system in the COF, in
which electron-donating and -accepting motifs are separated. To probe whether such
localization is present, we constructed theoretical model pore systems roughly the size of
four unit cells for WTA (924 atoms) and WBDT (1032 atoms) using one layer of their
refined structure models. Hydrogen atoms were used to terminate the lattice, and the
hydrogen geometries were refined at the same DFTB+ (3ob) level while keeping the
remainder of the structure restrained. Subsequently, orbital energies and localizations
were calculated using density functional theory (DFT) at the PBE0-def2SVP level.39 By
plotting the localization of the highest occupied molecular orbitals (HOMOs) and lowest
unoccupied molecular orbitals (LUMOs) for WTA and WBDT COFs, sharp spatial
separations of the respective HOMOs and LUMOs can be observed. For both WTA and
WBDT, the HOMO is strongly localized on the six central Wurster-type motifs while the
LUMO spans along the inner linear linkers, which form the hexagonal pore (Figure 5.4b).
From these calculations, we can conclude that the electron-donating property of the
Wurster-motif is preserved within the model systems. Consequently, we propose that the
electron-donating- and -accepting parts are partially separated within the imine-linked
frameworks, creating a push-pull system as indicated by the TCSPC data.

High Electrical Conductivities in Doped Wurster-type Covalent Organic Frameworks and
Their Thin Films
127
Figure 5.5: Cyclic voltammograms of a) WTA and b) WBDT.
The retention of the electron-rich property of the Wurster-motif in the COFs should lead
to valence band edges with high energies. Consequently, the COFs should undergo
oxidation at relatively low potentials. Here, we used cyclic voltammetry (CV) to determine
the oxidation potentials of WTA and WBDT electrochemically. To this end, we grew the
COFs as films on gold-coated glass substrates (modified with a 40 nm thick, conductive
gold coating). CV measurements of the respective films were subsequently carried out in
a typical three-electrode setup using tetraethylammonium tetrafluoroborate as the
electrolyte in argon-purged, anhydrous acetonitrile. The measurements were referenced
against the ferrocene/ferrocenium (Fc/Fc+) redox couple. For WTA, two redox couples
were found – at 0.82 V and 1.33 V vs. Fc/Fc+. Here, the narrow peak separations of 20 mV
for the first and 62 mV for the second redox couple show that the oxidation of WTA is a
highly reversible process and that the redox properties typical for Wurster-compounds
are retained in the COF (Figure 5.5a).30
WBDT shows two redox couples as well, the first at 0.62 V and the second at 0.97 V vs
Fc/Fc+. With oxidation-reduction peak separations of 170 mV for the first oxidation step
and 220 mV for the second oxidation step, both oxidation steps can be described as quasi-
reversible (Figure 5.5b).
With the CV data at hand, the absolute energy of the valence band edge against the vacuum
scale can be determined by comparing the oxidation onset potential against the HOMO
energy of ferrocene.40 Consequently, the energy of the conduction band edge can then be
assessed by adding the optical band gap energy to the absolute energy of the valence band.
The absolute valence band energy is determined by using the first oxidation onset
potential and correlating this to the vacuum energy of the ferrocene HOMO energy at 4.8
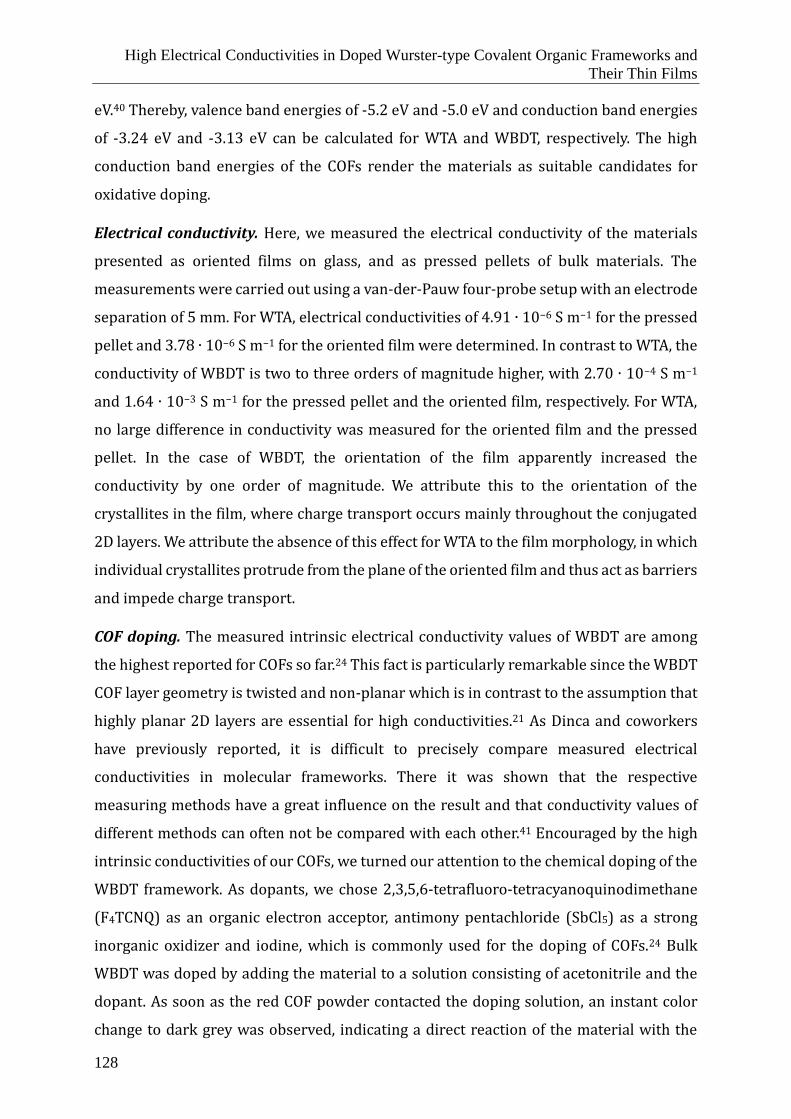
High Electrical Conductivities in Doped Wurster-type Covalent Organic Frameworks and
Their Thin Films
128
eV.40 Thereby, valence band energies of -5.2 eV and -5.0 eV and conduction band energies
of -3.24 eV and -3.13 eV can be calculated for WTA and WBDT, respectively. The high
conduction band energies of the COFs render the materials as suitable candidates for
oxidative doping.
Electrical conductivity. Here, we measured the electrical conductivity of the materials
presented as oriented films on glass, and as pressed pellets of bulk materials. The
measurements were carried out using a van-der-Pauw four-probe setup with an electrode
separation of 5 mm. For WTA, electrical conductivities of 4.91 ∙ 10−6 S m−1 for the pressed
pellet and 3.78 ∙ 10−6 S m−1 for the oriented film were determined. In contrast to WTA, the
conductivity of WBDT is two to three orders of magnitude higher, with 2.70 ∙ 10−4 S m−1
and 1.64 ∙ 10−3 S m−1 for the pressed pellet and the oriented film, respectively. For WTA,
no large difference in conductivity was measured for the oriented film and the pressed
pellet. In the case of WBDT, the orientation of the film apparently increased the
conductivity by one order of magnitude. We attribute this to the orientation of the
crystallites in the film, where charge transport occurs mainly throughout the conjugated
2D layers. We attribute the absence of this effect for WTA to the film morphology, in which
individual crystallites protrude from the plane of the oriented film and thus act as barriers
and impede charge transport.
COF doping. The measured intrinsic electrical conductivity values of WBDT are among
the highest reported for COFs so far.24 This fact is particularly remarkable since the WBDT
COF layer geometry is twisted and non-planar which is in contrast to the assumption that
highly planar 2D layers are essential for high conductivities.21 As Dinca and coworkers
have previously reported, it is difficult to precisely compare measured electrical
conductivities in molecular frameworks. There it was shown that the respective
measuring methods have a great influence on the result and that conductivity values of
different methods can often not be compared with each other.41 Encouraged by the high
intrinsic conductivities of our COFs, we turned our attention to the chemical doping of the
WBDT framework. As dopants, we chose 2,3,5,6-tetrafluoro-tetracyanoquinodimethane
(F4TCNQ) as an organic electron acceptor, antimony pentachloride (SbCl5) as a strong
inorganic oxidizer and iodine, which is commonly used for the doping of COFs.24 Bulk
WBDT was doped by adding the material to a solution consisting of acetonitrile and the
dopant. As soon as the red COF powder contacted the doping solution, an instant color
change to dark grey was observed, indicating a direct reaction of the material with the

High Electrical Conductivities in Doped Wurster-type Covalent Organic Frameworks and
Their Thin Films
129
respective dopant. To ensure homogeneous doping of the framework, the material was
stirred in the solution for one hour. The optimal dopant concentration was determined by
using different amounts of F4TCNQ and recording the resulting conductivities of pressed
powder pellets. Thereby, a concentration of 0.3 equivalents of dopant, compared to the
calculated number of Wurster-moieties, was determined as the ideal doping level, which
was subsequently used for the doping experiments (Figure S5.12). Successful doping was
observed with all three dopants, as illustrated by a strong increase in conductivity. While
doping with antimony pentachloride and iodine showed an increase in conductivity by
two orders of magnitude to 3.09 ∙ 10−2 S m−1 and 4.72 ∙ 10−2 S m−1, respectively, doping
with F4TCNQ proved to be even more effective, with an increase to 3.67 ∙ 100 S m−1. Thin
films of WBDT were doped at a level similar to the bulk material by placing them into the
solution of the respective dopant. For these experiments, comparable increases in
conductivity were observed (see Table 5.1). In addition, bulk WTA was doped with
F4TCNQ to assess whether a similar increase in conductivity can also be observed. Here,
the doping caused only a minor increase in conductivity from 4.91 ∙ 10−6 S m−1 to 1.51 ∙
10−5 S m−1. Therefore, we postulate that, although both COFs feature a Wurster-type motif,
the efficiency of doping is also highly dependent on the linear building block. The
integration of the electroactive BDT building block apparently facilitates charge transport,
resulting in increased electrical conductivity and allowing for effective doping. Due to the
large difference in doping behavior between WTA and WBDT, in the following we focus on
the WBDT system.
Table 5.1: Overview of the electrical conductivities measured for WTA and WBT pressed pellets
and thin films.
COF system Pressed pellet Oriented film
WTA, pristine 4.91 ∙ 10−6 S m−1 3.78 ∙ 10−6 S m−1
WTA / F4TCNQ 1.51 ∙ 10−5 S m−1 7.35 ∙ 10−5 S m−1
WBDT, pristine 2.70 ∙ 10−4 S m−1 1.64 ∙ 10−3 S m−1
WBDT / F4TCNQ 3.67 ∙ 100 S m−1 2.18 ∙ 100 S m−1
WBDT / SbCl5 3.09 ∙ 10−2 S m−1 6.86 ∙ 10−2 S m−1
WBDT / Iodine 4.72 ∙ 10−2 S m−1 1.33 ∙ 10−2 S m−1

High Electrical Conductivities in Doped Wurster-type Covalent Organic Frameworks and
Their Thin Films
130
For a doping to be meaningfully used for increasing conductivity, the resulting doping
must be permanent and stable. While iodine has been successfully used to increase
conductivities by several orders of magnitude for various COFs, the high vapor pressure
of iodine hinders long-term doping and the measured conductivities decreased within 24
h after doping.22 To assess the stability of the doping effect on the WBDT, we conducted
time-dependent conductivity measurements of the respective pellets after 1 day, 3 days
and 7 days (Figure 5.6a). Here, COFs doped with iodine and antimony pentachloride
showed a decline of conductivity within the first 24 h after doping. Subsequently, the
conductivity of the iodine-doped material stabilized at about one order of magnitude
higher than the pristine COF pellet. In contrast to iodine, the conductivities of antimony
pentachloride-doped WBDT continued to decline and fell below the values of the pristine
COF pellet within 3 days. Using the organic F4TCNQ acceptor molecule proved to create
doped COFs with stable conductivity over the whole course of the measurement (Figure
5.6a), while also retaining the crystallinity of the COF (Figure S5.13). This result shows
that the use of a strong electron acceptor that does not chemically react with the host
material is the ideal dopant to generate a highly conductive, stable doped COF.
Figure 5.6: a) Time-dependent stability measurements of the conductivity of WBDT with different
dopings. b) EPR data of WTA, WBDT and the respective dopings. c) UV-vis-NIR absorption spectra
of doped WBDT.
To compare the efficiency of radical charge carrier generation, electron paramagnetic
resonance (EPR) spectra were recorded for the doped and pristine WTA and WBDT bulk
materials (Figure 5.6b). For the pristine COFs, only minimal amounts of paramagnetic
WTA∙+ and WBDT∙+ were found, which can be attributed to weakly doped as-synthesized
COFs. The existence of a small number of radicals within the pristine materials can be
attributed to linker impurities or the oxidation of the COFs in air. Upon doping WTA with
F4TCNQ, an increase by one order of magnitude in paramagnetic intensity can be

High Electrical Conductivities in Doped Wurster-type Covalent Organic Frameworks and
Their Thin Films
131
observed. For the doping of WBDT, the signal intensity increases by three to four orders
of magnitude for iodine and F4TCNQ, respectively, while antimony pentachloride doping
generates only a small amount of paramagnetic species. These observed relative EPR
signal intensities are in direct correlation with the changes in the electrical conductivity
recorded upon doping. Interestingly, two different species of WBDT∙+ radical centers are
found in the EPR data. The pristine COF, as well as the antimony pentachloride- and
F4TCNQ-doped WBDT, feature a paramagnetic center at g = 2.0044, while the iodine-
induced WBDT∙+ signal appears at g = 2.005 (Figure 5.6b). This suggests that the doped
species differ from each other, and that different WBDT∙+ radical populations are created.
As described previously, the doping is not only reflected in the conductivity but also in a
change of color. Therefore, UV-vis-NIR absorption spectra were recorded for the doped
WBDT films. A strong bathochromic shift extends the absorption of all doped WBDT
materials into the NIR up to 1500 nm (Figure 5.6c). This red-shift is accompanied by
significant bleaching in the visible range as compared to the pristine material. Upon
doping, very broad absorption bands at around 700 nm emerge, which extend to 900 nm
for iodine and F4TCNQ and to more than 1000 nm for antimony pentachloride. This is in
line with the observed immediate and strong color change for the COFs. The new
absorption in the NIR is strongest for antimony pentachloride and weakest for F4TCNQ.
The resulting broad and low-intensity NIR absorption is typical for conjugated and doped
COFs, where free radical charge carriers are delocalized and generate a mixed-valence
state between doped and undoped sites which can be related to the enhanced electrical
conductivity.22
5.4. Conclusion
We report two novel, 2D imine-linked COFs based on the electron-rich Wurster-motif,
named WTA and WBDT. The highly crystalline materials were analyzed by PXRD
refinement and structure modeling. Nitrogen physisorption revealed the existence of
dual-pore systems with high surface areas. Additionally, oriented thin films of the COFs
were synthesized, which were subsequently used to study the optical properties and
electronic energy levels. The macroscopic electrical conductivity of the COFs was studied
by means of van-der-Pauw measurements on pressed pellets and oriented thin films
grown on glass substrates. Depending on the linear linker in the COF, conductivities of the

High Electrical Conductivities in Doped Wurster-type Covalent Organic Frameworks and
Their Thin Films
132
pristine materials as high as 1.64 ∙ 10−3 S m−1 were determined. Furthermore, different
dopants, as well as different doping concentrations, were investigated to create the radical
cation forms of the COFs, and their long-term effect on the electrical conductivity was
assessed. The use of F4TCNQ as a strong electron acceptor yielded conductivities as high
as 3.67 ∙ 100 S m−1, the highest value for doped imine-linked COFs reported so far.
Moreover, the impact of doping on the optical absorption and the formation of radicals in
the COF could be correlated with the changes in conductivity. In contrast to previous work
in the field of conductive COFs, it could be shown that the high conductivities resulting
from doping are stable over time for the organic acceptor molecule F4TCNQ. This stability
is of central importance in order to be able to exploit high conductivities by doping
permanently.
In the context of electrical conductivity, we discovered that the geometry of the linker can
deviate from planarity and show high values. In addition, non-planar COFs have the added
value of high-crystallinity and robustness achieved through molecular docking sites.
Encoding electrical conductivity in these non-planar systems requires the selection of
electroactive building blocks. Increasing the electrical conductivity in these systems
through doping is highly dependent on the dopant and we can attribute the long-term
stability to a combination of factors e.g., a robust framework and a chemically innocent
dopant. We believe that these results will contribute to the development of new strategies
for the design of COFs for various applications, such as sensors or optoelectronics.
5.5. References
(1) Diercks, C. S.; Yaghi, O. M. The atom, the molecule, and the covalent organic framework.
Science 2017, 355.
(2) Lohse, M. S.; Bein, T. Covalent Organic Frameworks: Structures, Synthesis, and Applications.
Adv. Funct. Mater. 2018, 355, 1705553.
(3) Huang, N.; Wang, P.; Jiang, D. Covalent organic frameworks: a materials platform for
structural and functional designs. Nat. Rev. Mater., 1, 1–19.
(4) Fan, H.; Mundstock, A.; Feldhoff, A.; Knebel, A.; Gu, J.; Meng, H.; Caro, J. Covalent Organic
Framework-Covalent Organic Framework Bilayer Membranes for Highly Selective Gas
Separation. JACS 2018, 140, 10094–10098.
(5) Li, Z.; Feng, X.; Zou, Y.; Zhang, Y.; Xia, H.; Liu, X.; Mu, Y. A 2D azine-linked covalent organic
framework for gas storage applications. Chemical communications (Cambridge, England) 2014,
50, 13825–13828.

High Electrical Conductivities in Doped Wurster-type Covalent Organic Frameworks and
Their Thin Films
133
(6) Ding, S.-Y.; Dong, M.; Wang, Y.-W.; Chen, Y.-T.; Wang, H.-Z.; Su, C.-Y.; Wang, W. Thioether-
Based Fluorescent Covalent Organic Framework for Selective Detection and Facile Removal of
Mercury(II). JACS 2016, 138, 3031–3037.
(7) Li, Z.; Zhang, Y.; Xia, H.; Mu, Y.; Liu, X. A robust and luminescent covalent organic framework
as a highly sensitive and selective sensor for the detection of Cu(2+) ions. Chemical
communications (Cambridge, England) 2016, 52, 6613–6616.
(8) Sick, T.; Hufnagel, A. G.; Kampmann, J.; Kondofersky, I.; Calik, M.; Rotter, J. M.; Evans, A.;
Döblinger, M.; Herbert, S.; Peters, K.; et al. Oriented Films of Conjugated 2D Covalent Organic
Frameworks as Photocathodes for Water Splitting. JACS 2018, 140, 2085–2092.
(9) Wang, X.; Chen, L.; Chong, S. Y.; Little, M. A.; Wu, Y.; Zhu, W.-H.; Clowes, R.; Yan, Y.;
Zwijnenburg, M. A.; Sprick, R. S.; et al. Sulfone-containing covalent organic frameworks for
photocatalytic hydrogen evolution from water. Nat. Chem. 2018, 10, 1180–1189.
(10) 2D sp2 Carbon-Conjugated Covalent Organic Frameworks for Photocatalytic Hydrogen
Production from Water. Chem 2019, 5, 1632–1647.
(11) DeBlase, C. R.; Silberstein, K. E.; Truong, T.-T.; Abruña, H. D.; Dichtel, W. R. β-Ketoenamine-
linked covalent organic frameworks capable of pseudocapacitive energy storage. JACS 2013,
135, 16821–16824.
(12) Chandra, S.; Roy Chowdhury, D.; Addicoat, M.; Heine, T.; Paul, A.; Banerjee, R. Molecular
Level Control of the Capacitance of Two-Dimensional Covalent Organic Frameworks: Role of
Hydrogen Bonding in Energy Storage Materials. Chem. Mater. 2017, 29, 2074–2080.
(13) Halder, A.; Ghosh, M.; Khayum M, A.; Bera, S.; Addicoat, M.; Sasmal, H. S.; Karak, S.;
Kurungot, S.; Banerjee, R. Interlayer Hydrogen-Bonded Covalent Organic Frameworks as High-
Performance Supercapacitors. JACS 2018, 140, 10941–10945.
(14) Wang, H.; Zeng, Z.; Xu, P.; Li, L.; Zeng, G.; Xiao, R.; Tang, Z.; Huang, D.; Tang, L.; Lai, C.; et al.
Recent progress in covalent organic framework thin films: fabrications, applications and
perspectives. Chem. Soc. Rev. 2019, 48, 488–516.
(15) Medina, D. D.; Petrus, M. L.; Jumabekov, A. N.; Margraf, J. T.; Weinberger, S.; Rotter, J. M.;
Clark, T.; Bein, T. Directional Charge-Carrier Transport in Oriented Benzodithiophene Covalent
Organic Framework Thin Films. ACS Nano 2017, 11, 2706–2713.
(16) Medina, D. D.; Werner, V.; Auras, F.; Tautz, R.; Dogru, M.; Schuster, J.; Linke, S.; Döblinger,
M.; Feldmann, J.; Knochel, P.; et al. Oriented thin films of a benzodithiophene covalent organic
framework. ACS Nano 2014, 8, 4042–4052.
(17) Medina, D. D.; Sick, T.; Bein, T. Photoactive and Conducting Covalent Organic Frameworks.
Adv. Energy Mater. 2017, 7, 1700387.
(18) Guo, J.; Xu, Y.; Jin, S.; Chen, L.; Kaji, T.; Honsho, Y.; Addicoat, M. A.; Kim, J.; Saeki, A.; Ihee, H.;
et al. Conjugated organic framework with three-dimensionally ordered stable structure and
delocalized π clouds. Nat. Commun., 4, 2736.

High Electrical Conductivities in Doped Wurster-type Covalent Organic Frameworks and
Their Thin Films
134
(19) Calik, M.; Auras, F.; Salonen, L. M.; Bader, K.; Grill, I.; Handloser, M.; Medina, D. D.; Dogru, M.;
Löbermann, F.; Trauner, D.; et al. Extraction of photogenerated electrons and holes from a
covalent organic framework integrated heterojunction. JACS 2014, 136, 17802–17807.
(20) Li, H.; Chang, J.; Li, S.; Guan, X.; Li, D.; Li, C.; Tang, L.; Xue, M.; Yan, Y.; Valtchev, V.; et al.
Three-Dimensional Tetrathiafulvalene-Based Covalent Organic Frameworks for Tunable
Electrical Conductivity. JACS 2019, 141, 13324–13329.
(21) Meng, Z.; Stolz, R. M.; Mirica, K. A. Two-Dimensional Chemiresistive Covalent Organic
Framework with High Intrinsic Conductivity. JACS 2019, 141, 11929–11937.
(22) Cai, S.-L.; Zhang, Y.-B.; Pun, A. B.; He, B.; Yang, J.; Toma, F. M.; Sharp, I. D.; Yaghi, O. M.; Fan,
J.; Zheng, S.-R.; et al. Tunable electrical conductivity in oriented thin films of tetrathiafulvalene-
based covalent organic framework. Chem. Sci. 2014, 5, 4693–4700.
(23) DeBlase, C. R.; Dichtel, W. R. Moving Beyond Boron: The Emergence of New Linkage
Chemistries in Covalent Organic Frameworks. Macromolecules 2016, 49, 5297–5305.
(24) Kim, S.; Choi, H. C. Light-promoted synthesis of highly-conjugated crystalline covalent
organic framework. Commun. Chem., 2, 1–8.
(25) Rotter, J. M.; Weinberger, S.; Kampmann, J.; Sick, T.; Shalom, M.; Bein, T.; Medina, D. D.
Covalent Organic Framework Films through Electrophoretic Deposition—Creating Efficient
Morphologies for Catalysis. Chem. Mater. 2019, 31, 10008–10016.
(26) Yamashita, Y.; Tomura, M. Highly polarized electron donors, acceptors and donor–acceptor
compounds for organic conductors. J. Mater. Chem. 1998, 8, 1933–1944.
(27) Zhang, J.; Guo, S.-Z.; Dong, Y.-B.; Rao, L.; Yin, J.; Yu, G.-A.; Hartl, F.; Liu, S. H. Multistep
Oxidation of Diethynyl Oligophenylamine-Bridged Diruthenium and Diiron Complexes. Inorg.
Chem. 2017, 56, 1001–1015.
(28) Ghalsasi, P. S.; Cage, B.; Yarger, J. L. Studies on TMPD:TCNB; a donor-acceptor with room
temperature paramagnetism and n-pi interaction. Molecules (Basel, Switzerland) 2004, 9, 808–
814.
(29) CHen, C.-J.; Yen, H.-J.; Chen, W.-C.; Liou, G.-S. Novel high-performance polymer memory
devices containing (OMe)2tetraphenyl-p-phenylenediamine moieties. J. Polym. Sci., Part A:
Polym. Chem. 2011, 49, 3709–3718.
(30) EL-Mahdy, A. F. M.; Mohamed, M. G.; Mansoure, T. H.; Yu, H.-H.; Chen, T.; Kuo, S.-W.
Ultrastable tetraphenyl-p-phenylenediamine-based covalent organic frameworks as platforms
for high-performance electrochemical supercapacitors. Chem. Commun. [Online early access].
DOI: 10.1039/C9CC08107K. https://pubs.rsc.org/en/content/articlepdf/2019/cc/c9cc08107k.
(31) Staab, H. A.; Hinz, R.; Knaus, G. H.; Krieger, C. Elektron-Donor-Acceptor-Verbindungen,
XXXII. Ein Elektron-Donor-Acceptor-Paracyclophan mitN,N,N′,N′-Tetramethyl-p-
phenylendiamin- und 7,7,8,8-Tetracyanchinodimethan-Untereinheiten. Ber. 1983, 116, 2835–
2847.

High Electrical Conductivities in Doped Wurster-type Covalent Organic Frameworks and
Their Thin Films
135
(32) Sick, T.; Rotter, J. M.; Reuter, S.; Kandambeth, S.; Bach, N. N.; Döblinger, M.; Merz, J.; Clark,
T.; Marder, T. B.; Bein, T.; et al. Switching On and Off Interlayer Correlations and Porosity in 2D
Covalent Organic Frameworks. JACS [Online early access]. DOI: 10.1021/jacs.9b02800.
(33) Ascherl, L.; Sick, T.; Margraf, J. T.; Lapidus, S. H.; Calik, M.; Hettstedt, C.; Karaghiosoff, K.;
Döblinger, M.; Clark, T.; Chapman, K. W.; et al. Molecular docking sites designed for the
generation of highly crystalline covalent organic frameworks. Nat. Chem. 2016, 8, 310–316.
(34) Dalapati, S.; Jin, E.; Addicoat, M.; Heine, T.; Jiang, D. Highly Emissive Covalent Organic
Frameworks. JACS 2016, 138, 5797–5800.
(35) Aradi, B.; Hourahine, B.; Frauenheim, T. DFTB+, a sparse matrix-based implementation of
the DFTB method. The journal of physical chemistry. A 2007, 111, 5678–5684.
(36) Gaus, M.; Goez, A.; Elstner, M. Parametrization and Benchmark of DFTB3 for Organic
Molecules. Journal of chemical theory and computation 2013, 9, 338–354.
(37) Gaus, M.; Lu, X.; Elstner, M.; Cui, Q. Parameterization of DFTB3/3OB for Sulfur and
Phosphorus for Chemical and Biological Applications. Journal of chemical theory and
computation 2014, 10, 1518–1537.
(38) Wuttke, S.; Medina, D. D.; Rotter, J. M.; Begum, S.; Stassin, T.; Ameloot, R.; Oschatz, M.;
Tsotsalas, M. Bringing Porous Organic and Carbon-Based Materials toward Thin-Film
Applications. Adv. Funct. Mater. 2018, 28, 1801545.
(39) Biswal, B. P.; Vignolo-González, H. A.; Banerjee, T.; Grunenberg, L.; Savasci, G.; Gottschling,
K.; Nuss, J.; Ochsenfeld, C.; Lotsch, B. V. Sustained Solar H2 Evolution from a Thiazolo5,4-
dthiazole-Bridged Covalent Organic Framework and Nickel-Thiolate Cluster in Water. JACS
2019, 141, 11082–11092.
(40) Cardona, C. M.; Li, W.; Kaifer, A. E.; Stockdale, D.; Bazan, G. C. Electrochemical
considerations for determining absolute frontier orbital energy levels of conjugated polymers
for solar cell applications. Advanced materials (Deerfield Beach, Fla.) 2011, 23, 2367–2371.
(41) Sun, L.; Park, S. S.; Sheberla, D.; Dincă, M. Measuring and Reporting Electrical Conductivity
in Metal-Organic Frameworks: Cd2(TTFTB) as a Case Study. JACS 2016, 138, 14772–14782.

High Electrical Conductivities in Doped Wurster-type Covalent Organic Frameworks and
Their Thin Films
136
5.6. Supporting Information
Chemicals
All materials were purchased from Aldrich, Fluka, Acros or TCI Europe in the common purities
purum, puriss or reagent grade. Materials were used as received without additional purification
and handled under air unless denoted. All solvents used were anhydrous and purged with inert
gas.
Methods and Instruments
Nuclear magnetic resonance spectra were recorded on Bruker AV 400 and AV 400 TR
spectrometers. Proton chemical shifts are expressed in parts per million (δ scale) and are
calibrated using residual non-deuterated solvent peaks as an internal reference (e.g., DMSO-d6:
2.50).
Powder X-ray diffraction measurements were performed on a Bruker D8 Discover
diffractometer using Ni-filter Cu Kα radiation and a position sensitive LynxEye detector in
Bragg-Brentano geometry.
Nitrogen sorption isotherms were recorded on a Quantachrome Autosorb 1 instrument at 77 K
within pressure ranges of p/p0 = 0.001 to 0.98. Samples for physisorption were directly taken
from supercritical CO2 activation. Prior to the measurements, the samples were heated for 12 h
at 100 °C under high vacuum. For the evaluation of the surface area the BET method was
applied within a p/p0 range of 0.05 to 0.3. Pore size distributions were calculated using the
QSDFT absorption model with a carbon kernel for cylindrical pores.
Ultraviolet–Vis–infrared absorption spectra were recorded on a Perkin-Elmer Lambda 1050
spectrometer equipped with a 150 mm integration sphere.
Photoluminescence and time-correlated single photon counting measurements were
carried out using a FluoTime 300 from PicoQuant GmbH. Samples were excited using a 378
nm laser source pulsed at 40 MHz and a fluence of 300 nJ cm−2 / pulse.
Scanning electron microscopy images were recorded with an FEI Helios NanoLab G3 UC
scanning electron microscope equipped with a field emission gun operated at 3 kV. Prior to the
measurements, the samples were sputtered with carbon.
Transmission electron microscopy were recorded with an FEI Titan Themis 60 - 300
equipped with a field emission gun operated at 300 kV.
Electrochemical measurements were performed on a Methrom µAutolabIII/FRA2 instrument
using a three-electrode setup with a Pt-wire counter-electrode and a silver wire as a pseudo
reference electrode under argon atmosphere. Measurements were carried out in dry acetonitrile

High Electrical Conductivities in Doped Wurster-type Covalent Organic Frameworks and
Their Thin Films
137
with tetrabutyl ammonium tetrafluoro borate (1 M) as the electrolyte. After recording CV data,
the measurement was repeated after a small amount of ferrocene was added to the sample. The
position of the redox couple from Fc/Fc+ was then used as the reference system.
Van-der-Pauw measurements were carried out using an ECOPIA Model HMS 3000 setup. The
samples were contacted with gold plated spring electrodes with an electrode separation of
5 mm. Powder pellets were pressed by using 20 mg of COF material and pressing into a
cylindrical pellet with a circle diameter of 1 cm under a pressure of 8000 kPa.
Theoretical Calculations
The initial structures of the COFs were initially built using the Forcite module of Accelrys
Material Studio 6.0 using the Universal Force Field as implemented. Pawley refinements were
carried using the Reflex module of PXRD using the Howard-profile fitting function. DFTB+
calculations were carried out using the DFTB+ code with the 3ob parameter set.1 DFT
calculations on the model pore systems were carried out using Gaussian 16 with the PBE0
functional and the def2SVP basis set on standard convergence criteria.
Synthesis of WTA
In a 5 mL culture tube, a solid mixture of terephthalaldehyde (TA, 0.025 mmol, 3.4 mg) and
N,N,N’,N’-tetrakis(4-aminophenyl)-1,4-phenylenediamine (W, 0.013 mmol, 6.0 mg) was
suspended in 1 mL mesitylene and benzyl alcohol (1:1 V:V). The loading of the culture tube
was carried out in an argon filled glovebox. Subsequently, 50 µL of acetic acid (6M) was added.

High Electrical Conductivities in Doped Wurster-type Covalent Organic Frameworks and
Their Thin Films
138
Then, the culture tube was tightly sealed and heated at 100 ◦C for 72 h in an oven. The resulting
dark red suspension was filtrated hot and the isolated powder was washed with 10 mL of
tetrahydrofuran (THF). The obtained red microcrystalline product was dried under vacuum and
subsequently activated with supercritical CO2 at 110 bar and 40 °C for 1 hour.
Synthesis of WBDT
In a 5 mL culture tube, a solid mixture of benzodithiophene-2,6-dicarboxaldehyde (BDT, 0.025
mmol, 6.26 mg) and N,N,N’,N’-tetrakis(4-aminophenyl)-1,4-phenylenediamine (W, 0.013
mmol, 6.0 mg) was suspended in 1 mL mesitylene and benzyl alcohol (1:1 V:V). The loading
of the culture tube was carried out in an argon filled glovebox. Subsequently, 50 µL of acetic
acid (6M) was added. Then, the culture tube was tightly sealed and heated at 100 ◦C for 72 h in
an oven. The resulting dark red suspension was filtrated hot and the isolated powder was washed
with 10mL of tetrahydrofuran (THF). The obtained red microcrystalline product was dried
under vacuum and subsequently activated with supercritical CO2 at 110 bar and 40 °C for 1
hour.
Synthesis of WTA thin films
In a 25 mL Schott duran glass bottle, a solid mixture of terephthalaldehyde (TA, 0.1 mmol, 13.6
mg) and N,N,N’,N’-tetrakis(4-aminophenyl)-1,4-phenylenediamine (W, 0.052 mmol, 24.0 mg)
was suspended in 4 mL mesitylene and benzyl alcohol (1:1 V:V). The loading of the reaction
vessel was carried out in an argon filled glovebox. 200 µL of acetic acid (6 M) was added. A
substrate holder with two horizontally orientated substrates (1.5 cm × 1.5 cm) was placed into
the suspension. The reaction vessel was tightly sealed and heated at 100 ◦C for 12 h in an oven.
Then, the substrate holder was taken from the vessel and the substrates from the holder. The

High Electrical Conductivities in Doped Wurster-type Covalent Organic Frameworks and
Their Thin Films
139
upper sides of the substrates were cleaned from COF precipitates by wiping the surface with an
aceton wetted cotton tip. Subsequently, the bottom sides of the subtrates were washed with THF
and dried under vacuum.
Synthesis of WBDT thin films
In a 25 mL Schott duran glass bottle, a solid mixture of benzodithiophene-2,6-dicarboxaldehyde
(BDT, 0.1 mmol, 25.04 mg) and N,N,N’,N’-tetrakis(4-aminophenyl)-1,4-phenylenediamine
(W, 0.052 mmol, 24.0 mg) was suspended in 4 mL mesitylene and benzyl alcohol (1:1 V:V).
The loading of the reaction vessel was carried out in an argon filled glovebox. 200 µL of acetic
acid (6M) was added. A substrate holder with two horizontally orientated substrates (1.5 cm ×
1.5 cm) was placed into the suspension. The reaction vessel was tightly sealed and heated at
100 ◦C for 12 h in an oven. Then, the substrate holder was taken from the vessel and the
substrates from the holder. The upper sides of the substrates were cleaned from COF precipitates
by wiping the surface with an aceton wetted cotton tip. Subsequently, the bottom sides of the
subtrates were washed with THF and dried under vacuum.
Synthesis of the WBDT molecular fragment and single crystal growth
In a 5 mL culture tube, a solid mixture of benzothiophene-2-carboxaldehyde (0.25 mmol, 62.6
mg) and N,N,N’,N’-tetrakis(4-aminophenyl)-1,4-phenylenediamine (W, 0.05 mmol, 23.0 mg)
was suspended in 4 mL of CHCl3. The culture tube was sealed and heated for 24 h at 60 °C.
Subsequently, the reaction was cooled to room temperature and the resulting precipitate was
collected by filtration and washed with methanol (20 mL). The dark red material was dried
under vacuum.

High Electrical Conductivities in Doped Wurster-type Covalent Organic Frameworks and
Their Thin Films
140
1H NMR (400 MHz, DMSO-d6) δ (ppm): 8.50 (4H), 7.79 (8H), 7.45 (8H), 7.32 (8H), 7.30 (4H),
7.18 (8H), 7.14 (4H).
MS-EI: calculated (m/z): C66H44N6S4 1048.2510, found 1048.2478.
Single crystals were grown by dissolving 5 mg of the WBDT molecular fragment in
dichloromethane (10 mL) in a 25 mL screw-capped vial equipped with a septum. A needle was
pierced through the septum to allow a slow evaporation of the solvent at room temperature.
After 5 days, red platelet-like crystals were obtained, which were removed from solution
directly prior to single-crystal analysis.

High Electrical Conductivities in Doped Wurster-type Covalent Organic Frameworks and
Their Thin Films
141
Figure S5.1: The molecular arrangement of the WBDT molecular fragment, obtained from single
crystal data in ORTEP and stick-ball representation.
Table S5.1: Summary of the single crystal data of the WBDT molecular fragment.
net formula C67.55H47.10Cl3.09N6S4
Mr/g mol−1 1180.73
crystal size/mm 0.090 × 0.070 × 0.020
T/K 106.(2)
radiation Mo Kα
diffractometer 'Bruker D8 Venture TXS'
crystal system triclinic
space group 'P -1'
a/Å 13.8855(6)
b/Å 17.9904(7)
c/Å 19.1860(7)

High Electrical Conductivities in Doped Wurster-type Covalent Organic Frameworks and
Their Thin Films
142
α/° 77.1720(10)
β/° 78.2210(10)
γ/° 69.1000(10)
V/Å3 4324.4(3)
Z 3
calc. density/g cm−3 1.360
μ/mm−1 0.357
absorption correction Multi-Scan
transmission factor range 0.96–0.99
refls. measured 58603
Rint 0.0538
mean σ(I)/I 0.0600
θ range 2.337–25.350
observed refls. 10556
x, y (weighting scheme) 0.1012, 10.3561
hydrogen refinement Constr.
Refls. in refinement 15789
parameters 1321
restraints 406
R(Fobs) 0.0811
Rw(F2) 0.2308
S 1.023
shift/errormax 0.001
max electron density/e Å−3 1.274

High Electrical Conductivities in Doped Wurster-type Covalent Organic Frameworks and
Their Thin Films
143
min electron density/e Å−3 −1.050
There are several disordered parts in this structure. All methylene chloride molecules are
disordered. Split models have been applied. SADI instructions have been used to restrain all C-
Cl and all Cl-Cl distances to similar values. All but one of the CH2Cl2 moieties have been
refined isotropically. The SIMU restraint has been used to refine the Uij of adjacent atoms (to a
distance of 0.8 A) similarly. The SAME instruction has been applied to obtain good bond
geometries in two disordered branches of the macromolecules using well-refined branches as
model. ISOR and FLAT restraints have been used to improve vibration ellipsoids and geometry,
respectively.
The figure above does not show the methylene chloride molecules and the minor parts of
disordered sections.
Symmetry code i = 2-x, 1-y, 1-z.

High Electrical Conductivities in Doped Wurster-type Covalent Organic Frameworks and
Their Thin Films
144
Simulated tetragonal structure of WTA
Figure S5.2: Simulated tetragonal structure of WTA and the corresponding calculated PXRD
pattern vs. the experimentally obtained one.
Simulated tetragonal structure of WBDT
Figure S5.3: Simulated tetragonal structure of WBDT and the corresponding calculated PXRD
pattern vs. the experimentally obtained one.

High Electrical Conductivities in Doped Wurster-type Covalent Organic Frameworks and
Their Thin Films
145
Hexagonal kagome vs. kagome-like arrangement of WTA
Figure S5.4: Representation of the geometric arrangement of the central W unit in WTA in a
hexagonal P6 symmetry and in P-1 symmetry.
Hexagonal kagome vs. kagome-like arrangement of WBDT
Figure S5.5: Representation of the geometric arrangement of the central W unit in WBDT in a
hexagonal P6 symmetry and in P-1 symmetry.

High Electrical Conductivities in Doped Wurster-type Covalent Organic Frameworks and
Their Thin Films
146
Pore size distribution of WTA
Figure S5.6: Pore size distribution and cumulative pore volume profiles of WTA obtained by QSDFT
calculations on the N2 adsorption curve.

High Electrical Conductivities in Doped Wurster-type Covalent Organic Frameworks and
Their Thin Films
147
Pore size distribution of WBDT
Figure S5.7: Pore size distribution and cumulative pore volume profiles of WBDT obtained by QSDFT
calculations on the N2 adsorption curve.

High Electrical Conductivities in Doped Wurster-type Covalent Organic Frameworks and
Their Thin Films
148
Tauc plot of WTA
Figure S5.8: Tauc plot of the UV-vis absorption data of WTA.

High Electrical Conductivities in Doped Wurster-type Covalent Organic Frameworks and
Their Thin Films
149
Tauc plot of WBDT
Figure S5.9: Tauc plot of the UV-vis absorption data of WBDT.

High Electrical Conductivities in Doped Wurster-type Covalent Organic Frameworks and
Their Thin Films
150
TCSPC decay data for WTA
Parameter Value Conf. Lower Conf. Upper Conf. Estimation
A1 [Cnts] 1066 -103 +103 Fitting
τ1 [ns] 0.7495 -0.0496 +0.0496 Fitting
A2 [Cnts] 55350 -1660 +1660 Fitting
τ2 [ns] 0.10168 -0.00197 +0.00197 Fitting
Bkgr. Dec [Cnts] 110.0 --- --- <none>
Bkgr. IRF [Cnts] 18.9 --- --- <none>
Shift IRF [ns] 0.345887 -0.000602 +0.000602 Fitting
A Scat [Cnts] 641580 -6740 +6740 Fitting
Average Lifetime:
τ Av.1=0.1822 ns (intensity weighted)
τ Av.2=0.1139 ns (amplitude weighted)
Fractional Intensities of the Positive Decay Components:
Fractional Amplitudes of the Positive Decay Components:
τ 1 (0.7495 ns) : 12.43%
τ 2 (0.10168 ns) : 87.57%
τ 1 (0.7495 ns) : 1.89%
τ 2 (0.10168 ns) : 98.11%

High Electrical Conductivities in Doped Wurster-type Covalent Organic Frameworks and
Their Thin Films
151
Figure S5.10: Fitted Decay and Exponential Components for WTA.

High Electrical Conductivities in Doped Wurster-type Covalent Organic Frameworks and
Their Thin Films
152
TCSPC PL decay data for WBDT
Parameter Value Conf. Lower Conf. Upper Conf. Estimation
A1 [Cnts] 1066 -103 +103 Fitting
τ1 [ns] 0.7495 -0.0496 +0.0496 Fitting
A2 [Cnts] 55350 -1660 +1660 Fitting
τ2 [ns] 0.10168 -0.00197 +0.00197 Fitting
Bkgr. Dec [Cnts] 110.0 --- --- <none>
Bkgr. IRF [Cnts] 18.9 --- --- <none>
Shift IRF [ns] 0.345887 -0.000602 +0.000602 Fitting
A Scat [Cnts] 641580 -6740 +6740 Fitting
Average Lifetime:
τ Av.1=0.1822 ns (intensity weighted)
τ Av.2=0.1139 ns (amplitude weighted)
Fractional Intensities of the Positive Decay Components:
Fractional Amplitudes of the Positive Decay Components:
τ 1 (0.7495 ns) : 12.43%
τ 2 (0.10168 ns) : 87.57%
τ 1 (0.7495 ns) : 1.89%
τ 2 (0.10168 ns) : 98.11%

High Electrical Conductivities in Doped Wurster-type Covalent Organic Frameworks and
Their Thin Films
153
Figure S5.11: Fitted Decay and Exponential Components for WTA.

High Electrical Conductivities in Doped Wurster-type Covalent Organic Frameworks and
Their Thin Films
154
F4TCNQ dopant concentration
Figure S5.12: F4TCNQ concentration-dependent electrical conductivities of WBDT.

High Electrical Conductivities in Doped Wurster-type Covalent Organic Frameworks and
Their Thin Films
155
PXRD of pristine WBDT vs. F4TCNQ-doped WBDT
Figure S5.13: PXRD of pristine WBDT in comparison to F4TCNQ-doped WBDT.

High Electrical Conductivities in Doped Wurster-type Covalent Organic Frameworks and
Their Thin Films
156
Structural parameters of WTA
Unit Cell Parameters (P-1)
a = 42.12, b = 42.82, c = 4.00 A
α = 91.3°, β = 86.7°, γ = 118.8°
Table S5.2: Fractional coordinates for WTA.
N1 N 0.56807 100.117 0.47259
C2 C 0.53414 100.065 0.48675
C3 C 0.50375 0.97391 0.66456
H4 H 0.50603 0.95338 0.80155
C5 C 0.47045 0.97327 0.67718
H6 H 0.44783 0.95221 0.82277
N7 N 0.57398 0.87287 0.50853
C8 C 0.56912 0.96878 0.47503
C9 C 0.54211 0.93803 0.32626
H10 H 0.52029 0.93912 0.19965
C11 C 0.54268 0.90605 0.33261
H12 H 0.52125 0.88312 0.20962
C13 C 0.57069 0.90348 0.48614
C14 C 0.5979 0.93435 0.63096
H15 H 0.61969 0.9329 0.75493
C16 C 0.59712 0.9662 0.62746
H17 H 0.61844 0.98932 0.74836
C18 C 0.55091 0.84221 0.39954
H19 H 0.52575 0.83712 0.27411
C20 C 0.39932 0.96613 0.53681
C21 C 0.36758 0.96295 0.70525
H22 H 0.36795 0.98565 0.83773
C23 C 0.33546 0.93107 0.70855
H24 H 0.31119 0.92925 0.84221
C25 C 0.33339 0.90089 0.54395
C26 C 0.36533 0.90376 0.38211
H27 H 0.3654 0.88103 0.2532
C28 C 0.39746 0.9357 0.37839
H29 H 0.42153 0.93696 0.24628
N30 N 0.29973 0.87024 0.56212
C31 C 0.29195 0.84209 0.38907
H32 H 0.31153 0.83958 0.20396
N33 N 0.56395 0.567 0.48736
C34 C 0.53201 0.53359 0.49375

High Electrical Conductivities in Doped Wurster-type Covalent Organic Frameworks and
Their Thin Films
157
C35 C 0.46968 0.49584 0.34229
H36 H 0.44645 0.49326 0.21118
C37 C 0.50088 0.5286 0.33649
H38 H 0.50093 0.55047 0.20148
N39 N 0.30219 0.43331 0.55131
C40 C 0.40189 0.43175 0.52473
C41 C 0.39694 0.45865 0.68764
H42 H 0.41926 0.48021 0.81528
C43 C 0.36381 0.45817 0.69159
H44 H 0.3606 0.47931 0.82062
C45 C 0.33404 0.4309 0.53396
C46 C 0.33865 0.40346 0.37841
H47 H 0.31631 0.38147 0.25431
C48 C 0.37189 0.40404 0.37326
H49 H 0.37461 0.38266 0.24415
C50 C 0.27393 0.41352 0.38746
H51 H 0.2721 0.3922 0.21113
C52 C 0.24218 0.41882 0.42695
C53 C 0.2441 0.44806 0.60843
C54 C 0.21416 0.45334 0.64861
H55 H 0.21614 0.47615 0.79332
C56 C 0.1812 0.42968 0.50774
C57 C 0.17929 0.40049 0.32536
C58 C 0.20925 0.39517 0.28567
H59 H 0.20728 0.37236 0.141
C60 C 0.56117 0.59855 0.49227
C61 C 0.58769 0.62956 0.32652
H62 H 0.6109 0.62966 0.18808
C63 C 0.58488 0.66048 0.33234
H64 H 0.60561 0.68398 0.1957
C65 C 0.55477 0.66114 0.49619
C66 C 0.52771 0.63 0.65446
H67 H 0.50436 0.6302 0.78744
C68 C 0.53133 0.59961 0.65921
H69 H 0.51028 0.57618 0.79328
N70 N 0.54956 0.69079 0.48322
C71 C 0.57435 0.72227 0.54939
H72 H 0.60122 0.72778 0.6412
C73 C 0.56827 0.75276 0.51297
C74 C 0.53712 0.74889 0.3638
C75 C 0.53154 0.77787 0.32634
H76 H 0.50726 0.77438 0.2061
C77 C 0.55682 0.81171 0.43806
C78 C 0.58791 0.81552 0.58827
C79 C 0.59361 0.7866 0.62375

High Electrical Conductivities in Doped Wurster-type Covalent Organic Frameworks and
Their Thin Films
158
H80 H 0.61792 0.79007 0.74324
N81 N 0.00549 0.56852 0.52085
C82 C 0.00281 0.53436 0.51062
C83 C 0.02825 0.52794 0.32203
H84 H 0.05046 0.54926 0.17518
C85 C 0.02549 0.49443 0.31146
H86 H 0.04564 0.49075 0.15642
N87 N 0.14367 0.69002 0.45561
C88 C 0.04004 0.59919 0.50487
C89 C 0.07015 0.59901 0.6395
H90 H 0.06712 0.57512 0.76159
C91 C 0.10417 0.62885 0.61926
H92 H 0.12706 0.62815 0.72885
C93 C 0.10898 0.6606 0.47822
C94 C 0.0791 0.66103 0.3429
H95 H 0.08254 0.68501 0.21822
C96 C 0.04542 0.63068 0.3514
H97 H 0.023 0.63165 0.2354
C98 C 0.14971 0.72113 0.54655
H99 H 0.12786 0.72613 0.66572
C100 C 0.19336 0.78465 0.64917
C101 C 0.18599 0.75181 0.50591
C102 C 0.21408 0.74922 0.32187
H103 H 0.20856 0.72385 0.20647
C104 C 0.24832 0.77851 0.28171
C105 C 0.25583 0.81126 0.42841
C106 C 0.22774 0.81378 0.61346
H107 H 0.23332 0.83913 0.72998
C108 C 0.02644 0.42832 0.45812
C109 C 0.02764 0.3996 0.2922
H110 H 0.00379 0.37937 0.17051
C111 C 0.05909 0.39671 0.276
H112 H 0.0594 0.37425 0.14391
C113 C 0.09077 0.42226 0.42357
C114 C 0.08981 0.45138 0.58384
H115 H 0.1137 0.47222 0.70061
C116 C 0.0583 0.45413 0.60195
H117 H 0.05851 0.47682 0.73349
N118 N 0.12111 0.41718 0.39226
C119 C 0.14995 0.43565 0.55347
H120 H 0.15284 0.45693 0.73506
H121 H 0.26959 0.46655 0.72058
H122 H 0.15385 0.38198 0.21265
H123 H 0.51734 0.72269 0.27437
H124 H 0.60763 0.84171 0.67857

High Electrical Conductivities in Doped Wurster-type Covalent Organic Frameworks and
Their Thin Films
159
H125 H 0.17183 0.78714 0.79505
H126 H 0.26976 0.77609 0.13374
Structural parameters of WBDT
Unit Cell Parameters (P-1)
a = 50.55, b = 49.64, c = 3.93 A
α = 102.3°, β = 82.2°, γ = 120.8°
Table S5.3: Fractional coordinates for WBDT.
N1 N 0.55374 0.99687 -0.60032
C2 C 0.52694 0.99856 -0.55079
C3 C 0.50431 0.9766 -0.37176
H4 H 0.50775 0.95834 -0.26936
C5 C 0.47802 0.97806 -0.32231
H6 H 0.4611 0.96102 -0.17751
S7 S 0.56531 0.84115 -0.48225
N8 N 0.55291 0.88478 -0.64731
C9 C 0.55336 0.96869 -0.61445
C10 C 0.52759 0.94343 -0.72101
H11 H 0.50758 0.94559 -0.79244
C12 C 0.5273 0.91583 -0.7372
H13 H 0.50692 0.89656 -0.81845
C14 C 0.55252 0.91227 -0.64593
C15 C 0.57803 0.93733 -0.53323
H16 H 0.59771 0.93479 -0.45944
C17 C 0.57861 0.96509 -0.52136

High Electrical Conductivities in Doped Wurster-type Covalent Organic Frameworks and
Their Thin Films
160
H18 H 0.59869 0.98428 -0.43224
C19 C 0.53669 0.86342 -0.82589
H20 H 0.52182 0.86542 -1.00479
C21 C 0.53994 0.83649 -0.77446
C22 C 0.52782 0.80856 -0.89572
H23 H 0.51147 0.80152 -1.07651
C24 C 0.41887 0.97625 -0.34965
C25 C 0.39763 0.97539 -0.15227
H26 H 0.40252 0.99595 -0.03827
C27 C 0.3711 0.94893 -0.09736
H28 H 0.35549 0.94916 0.05724
C29 C 0.36489 0.92251 -0.23177
C30 C 0.38506 0.92317 -0.43853
H31 H 0.38111 0.90359 -0.56207
C32 C 0.41181 0.9496 -0.49561
H33 H 0.42776 0.95014 -0.65923
S34 S 0.2414 0.8349 0.32396
N35 N 0.31609 0.88778 0.0643
C36 C 0.2983 0.86168 -0.0272
H37 H 0.30467 0.85348 -0.23181
C38 C 0.2683 0.83701 0.06684
C39 C 0.25625 0.81046 -0.08154
H40 H 0.26749 0.80476 -0.24972
N41 N 0.55388 0.55424 -0.49343
C42 C 0.52687 0.52702 -0.49671
C43 C 0.47469 0.49789 -0.36069
H44 H 0.45507 0.49603 -0.24683

High Electrical Conductivities in Doped Wurster-type Covalent Organic Frameworks and
Their Thin Films
161
C45 C 0.5014 0.52471 -0.3578
H46 H 0.50272 0.54391 -0.24176
S47 S 0.28988 0.45744 0.32772
N48 N 0.33435 0.44555 0.49764
C49 C 0.41826 0.44603 0.49583
C50 C 0.41405 0.4695 0.35706
H51 H 0.4328 0.48814 0.24117
C52 C 0.38624 0.46891 0.36173
H53 H 0.38306 0.48715 0.25415
C54 C 0.36183 0.44526 0.50778
C55 C 0.3661 0.42192 0.64671
H56 H 0.34755 0.40313 0.75992
C57 C 0.39377 0.42232 0.64061
H58 H 0.39708 0.40427 0.75278
C59 C 0.31278 0.42949 0.67778
H60 H 0.31472 0.41507 0.86249
C61 C 0.28571 0.43224 0.62199
C62 C 0.25781 0.41973 0.74669
H63 H 0.25118 0.40335 0.92866
C64 C 0.23872 0.43064 0.60577
C65 C 0.25341 0.45192 0.36921
C66 C 0.2386 0.46534 0.20682
H67 H 0.24976 0.48158 0.02454
C68 C 0.20907 0.45786 0.27955
C69 C 0.19442 0.43661 0.51632
C70 C 0.20916 0.42306 0.67776
H71 H 0.198 0.40686 0.86042
C72 C 0.55294 0.58182 -0.49046
C73 C 0.57562 0.60613 -0.33761
H74 H 0.59343 0.60302 -0.21865
C75 C 0.57538 0.63351 -0.33323
H76 H 0.59341 0.65192 -0.21386
C77 C 0.55242 0.63763 -0.48156
C78 C 0.52974 0.61335 -0.63476
H79 H 0.51176 0.61633 -0.7501
C80 C 0.52982 0.58584 -0.63782
H81 H 0.51199 0.56724 -0.76009

High Electrical Conductivities in Doped Wurster-type Covalent Organic Frameworks and
Their Thin Films
162
S82 S 0.53925 0.70892 -0.67797
N83 N 0.55166 0.66488 -0.49642
C84 C 0.56703 0.68657 -0.31776
H85 H 0.58113 0.68494 -0.12895
C86 C 0.5641 0.71344 -0.38114
C87 C 0.57644 0.74152 -0.2628
H88 H 0.59258 0.74843 -0.08024
C89 C 0.56572 0.76043 -0.41147
C90 C 0.5447 0.74543 -0.64619
C91 C 0.53144 0.76003 -0.81534
H92 H 0.5154 0.74858 -0.9964
C93 C 0.53896 0.78974 -0.7516
C94 C 0.56007 0.80474 -0.51755
C95 C 0.57336 0.79018 -0.34886
H96 H 0.58939 0.80158 -0.16763
C97 C 0.02094 0.52108 0.69036
H98 H 0.0371 0.53714 0.84593
C99 C 0.02231 0.49469 0.64116
H100 H 0.03943 0.4902 0.75515
S101 S 0.15423 0.70685 -0.125
N102 N 0.09957 0.66077 -0.10778
C103 C 0.02281 0.58013 -0.32738
C104 C 0.05129 0.5873 -0.43623
H105 H 0.05352 0.57185 -0.58489
C106 C 0.07644 0.6139 -0.36165
H107 H 0.09834 0.61897 -0.44748
C108 C 0.07402 0.63416 -0.17333
C109 C 0.04549 0.62711 -0.06862

High Electrical Conductivities in Doped Wurster-type Covalent Organic Frameworks and
Their Thin Films
163
H110 H 0.04269 0.64247 0.07407
C111 C 0.02038 0.60069 -0.14267
C112 C 0.10041 0.67784 0.10428
H113 H 0.08156 0.6719 0.25709
C114 C 0.12833 0.70534 0.12721
C115 C 0.13851 0.73048 0.2955
H116 H 0.12464 0.73349 0.45343
C117 C 0.16848 0.75241 0.22041
C118 C 0.18027 0.74227 -0.00739
C119 C 0.20902 0.76011 -0.11437
H120 H 0.21769 0.75207 -0.29008
C121 C 0.22653 0.78857 0.00259
C122 C 0.21478 0.79878 0.2277
C123 C 0.1859 0.78078 0.33872
H124 H 0.17683 0.78853 0.51371
C125 C 0.03143 0.44681 0.4072
C126 C 0.03419 0.42138 0.51286
H127 H 0.01429 0.40148 0.59831
C128 C 0.0618 0.42149 0.51472
H129 H 0.06382 0.40174 0.5978
C130 C 0.08748 0.44668 0.40428
C131 C 0.08487 0.47222 0.30341
H132 H 0.10473 0.49238 0.22577
C133 C 0.05736 0.47233 0.30539
H134 H 0.05555 0.49236 0.2245
S135 S 0.15826 0.43169 0.56375
N136 N 0.11454 0.44552 0.41008
C137 C 0.13589 0.46102 0.22625
H138 H 0.13391 0.4757 0.04395
C139 C 0.16253 0.45727 0.27273
C140 C 0.19018 0.46922 0.14302
H141 H 0.19686 0.48574 -0.03768
N142 N 0.99684 1.55341 0.59983
C143 C 0.99869 1.52683 0.55075
H144 H 0.99841 1.59543 0.9461 References
(1) Aradi, B.; Hourahine, B.; Frauenheim, T. DFTB+, a sparse matrix-based implementation
of the DFTB method. J. Phys. Chem. A 2007, 111, 5678–5684.


On-Surface Synthesis of Highly Oriented Thin Metal-Organic Framework Films through
Vapor-Assisted Conversion
165
6. On-Surface Synthesis of Highly Oriented Thin Metal-
Organic Framework Films through Vapor-Assisted
Conversion
This chapter is based on the following publication:
Virmani, E.; ‡ Rotter, J. M.; ‡ Ma hringer, A.; ‡ Zons, T. von; Godt, A.; Bein, T.; Wuttke, S.;
Medina, D. D. On-Surface Synthesis of Highly Oriented Thin Metal-Organic Framework
Films through Vapor-Assisted Conversion. JACS 2018, 140, 4812–4819.
6.1. Abstract
Controlled on-surface film growth of porous and crystalline frameworks is a central
requisite for incorporating these materials into functional platforms and operational
devices. Here, we present the synthesis of thin zirconium-based metal-organic framework
(MOF) films by vapor-assisted conversion (VAC). We established protocols adequate for
the growth of UiO-66, UiO-66(NH2), UiO-67, and UiO-68(NH2) as well as the porous
interpenetrated Zr-organic framework (PPPP-PIZOF-1) as highly oriented thin films.
Through the VAC approach, precursors in a cast solution layer on a bare gold substrate are
reacting to form a porous continuous MOF film, oriented along the [111] crystal axis by an
exposure to a solvent vapor under elevated temperatures of 100 °C and 3 h reaction times.
It was found that the concentration of dicarboxylic acid, and modulator, the droplet
volume and the reaction time are vital parameters to be controlled for obtaining oriented
MOF films. Using VAC for the MOF film growth on gold surfaces modified with thiol SAMs
as well as on a bare silicon surface yielded oriented MOF films rendering the VAC process
robust towards chemical surface variations. Ethanol sorption experiments show that a
substantial part of the material pores is accessible. Thereby, the practical VAC method is
an important addition to the tool-box of thin MOF film synthesis methods. We expect that
the VAC approach will provide new horizons in the formation of highly defined functional
thin MOF films for numerous applications.

On-Surface Synthesis of Highly Oriented Thin Metal-Organic Framework Films through
Vapor-Assisted Conversion
166
6.2. Introduction
Recent advances in the fabrication of porous thin films have enabled significant progress
in a variety of fields including catalysis, sensor technology, sieving platforms and
electronics. Metal-organic frameworks (MOFs) are particularly intriguing candidates for
the growth of crystalline porous films.1-5 MOFs consist of a periodic array of inorganic
nodes connected by organic units featuring well-defined structures, precise chemical
compositions, surface areas and pore sizes.6-11 Due to their crystalline nature, the growth
of thin films of these materials permits, in principle, a specific crystal orientation and,
thereby, an oriented pore system relative to a surface.12 This oriented growth mainly relies
on the use of chemically modified surfaces13 and conditions that support reversible crystal
assembly, hence allowing the growing crystal to anneal as it moves towards the energy
minimum in the structure-energy landscape.
Several methods have been reported for the growth of oriented thin MOF films.12, 14-21
However, to date, these methods are suitable only for the synthesis of a small number of
MOF topologies. Among these methods, the liquid-phase epitaxy (SURMOF) approach17-18
stands out offering some degree of structural and chemical diversity for oriented thin MOF
films while maintaining the lattice type.22 That being said, the synthesis of oriented thin
films, applicable to a large variety of MOFs while maintaining porosity and crystallinity as
main features, is still a challenge.
Here, we report the preparation of oriented thin MOF films using vapor-assisted
conversion (VAC). This method is a variation of the well-known,23 dry-gel conversion
(DGC) and steam-assisted conversion (SAC) reported for the bulk and film syntheses of
zeolites and other related compounds such as zeolitic imidazolate frameworks.24-30
Recently, VAC has been introduced as a gentle and efficient way to obtain covalent organic
framework (COF) films.31 This method is based on the conversion of precursors in a cast
solution layer into a continuous crystalline and porous film by exposure to a vapor of
specific composition at moderate temperatures. Adding to this portfolio, we seek to prove
that VAC is a powerful MOF film synthesis approach by showing that a series of Zr-based
MOFs are grown on-surface as thin and highly oriented films. The well-known isoreticular
series of zirconium-based UiO-type (Universitetet i Oslo) frameworks was selected for this
study due to the diversity in the organic units which can be integrated into the framework
such as phenyl, biphenyl and terphenyl dicarboxylate.32-33 Further elongation of the linker

On-Surface Synthesis of Highly Oriented Thin Metal-Organic Framework Films through
Vapor-Assisted Conversion
167
to quaterphenyl dicarboxylate results in a structure-type consisting of two UiO-
frameworks that interpenetrate each other, the so called porous interpenetrated Zr-
organic framework (PIZOF).34-35 To the best of our knowledge, no film of an
interpenetrated MOF has ever been reported. Controlling the orientation of UiO as well as
PIZOF crystals adds a new level of surface control to the target design of thin MOF films.
6.3. Results and discussion
Oriented thin films of UiOs. We started the thin film syntheses through VAC with Zr-
based MOFs consisting of linkers without and with amino groups as substituents, namely
UiO-66, UiO-66(NH2), UiO-67, and UiO-68(NH2). For the experiments, ZrOCl2, the
dicarboxylic acid, and the modulator acetic acid were dissolved in DMF giving the
precursor solution (for details see SI). In a glass vessel containing, as the vapor source, a
mixture of DMF and acetic acid (5.25:1 v/v), a substrate (1.0 cm × 1.3 cm and 2.5 cm × 2.5
cm), providing a bare gold surface, was placed on a glass platform (Figure 6.1). A droplet
(50 μL) of the precursor solution was deposited on the gold surface. Then, the vessel was
sealed and placed in an oven preheated to 100 °C. After keeping the vessel at this
temperature for 3 h, it was removed from the oven. The substrate was taken out of the
vessel and dried under reduced pressure, revealing an iridescent film on the gold surface
(Figure S6.60-62).
The operation of a VAC process was confirmed by a series of control experiments on the
formation of UiO-66(NH2) films in the absence of a vapor source and with DMF or acetic
acid as the sole vapor sources. These experiments revealed that for the UiO topology a
Figure 6.1. Schematic representation of the vapor-assisted conversion process for the fabrication
of oriented MOF films.

On-Surface Synthesis of Highly Oriented Thin Metal-Organic Framework Films through
Vapor-Assisted Conversion
168
vapor source of a particular composition is necessary for the formation of highly
crystalline films. All synthesis attempts in the absence of a vapor source resulted in films
of low or moderate crystallinity (Figure S6.5).
The films obtained by VAC were studied with X-ray diffraction (XRD) analysis and
scanning electron microscopy (SEM). Strikingly, the diffraction patterns (Figures 6.2a-c,
S3a) show only a few reflections which are in very good agreement with the reported XRD
data of the UiO structures.32-33, 36 The observed reflections indicate a high degree of
crystallite orientation with the [111] axes aligned normal to the gold surface and
rotational freedom around these axes. To gain further information on the degree of
crystallite orientation across the substrate, we applied 2D grazing-incidence wide-angle
X-ray scattering (GIWAXS) at different positions of the UiO-66(NH2) film. Using this
technique, the displayed in- and out-of-plane reflections up to the fourth order (Figure
6.2e and S57) confirm a high degree of crystallite orientation throughout the film. Top-
view SEM images of the oriented UiO-66, -66(NH2), -67, -68(NH2) films reveal a high
surface coverage with MOF crystallites (Figures 6.3a and c, S6.18, S6.3–S6.4). High
magnifications show densely packed intergrown octahedral crystallites of uniform size
forming a continuous film. In the case of UiO-68(NH2) films, we find sporadic MOF
octahedrons on top of the thin film (Figure S6.4). This is ascribed to a secondary
nucleation process. Furthermore, the SEM images of UiO-66, -66(NH2) and -67 show
highly oriented crystallites exposing almost exclusively the facets attributed to the (111)
plane. Low magnification SEM Z-contrast imaging of the UiO-66(NH2) film reveals full
surface coverage extending to the edge of the substrate (Figure S6.53). Cross-section SEM
analyses show densely-packed films with thicknesses of about 200 nm, 235 nm, 440 nm
and 1.3 µm for UiO-66, -66(NH2), -67 and -68(NH2), respectively (Figures 6.3b and d,
S6.18, S6.3–S6.4). In all cases, the films display good contact to the gold layer indicating
favorable interactions with the substrate. SEM cross-section analysis of the UiO-66(NH2)
film revealed similar thicknesses in the central and edge areas, which establishes an even
coverage of the MOF film across the whole substrate (Figure S6.56).

On-Surface Synthesis of Highly Oriented Thin Metal-Organic Framework Films through
Vapor-Assisted Conversion
169
Figure 6.2. (a−d) XRD of UiO-66(NH2), -67, -68(NH2) and PPPP-PIZOF-1 films obtained by VAC,
plotted in color together with the simulated diffraction patterns of unsubstituted MOFs plotted in
black. The structural formulae of the used dicarboxylates are also indicated. (e) and (f) 2D GIWAXS
patterns of UiO-66(NH2) and PPPP-PIZOF-1 reveal a high degree of orientation (in red the Miller
indexes according to the set of planes). Photographs of the respective MOF films are shown as
insets.

On-Surface Synthesis of Highly Oriented Thin Metal-Organic Framework Films through
Vapor-Assisted Conversion
170
Moreover, atomic force microscopy (AFM) surface scans of the UiO-66(NH2) film (Figure
S6.2) indicate a smooth faceted surface topography of oriented crystallites with a similar
RMS roughness of 7.4 nm at the edge and center of the substrate. These observations
demonstrate the power of the VAC deposition method, providing highly homogenous,
macroscopic coverage and oriented thin UiO films across the entire substrate.
Oriented thin films of a PIZOF. Next, we turned our attention to the synthesis of a thin
film of the MOF PPPP-PIZOF-1 using VAC. The synthesis was carried out using the protocol
developed for the preparation of oriented UiO thin films. However, no acetic acid in the
precursor solution was present to achieve sufficient solubility of the linkers and, thereby,
a suitable reactivity for the MOF formation (Figure S6.6). Similar to the UiO films, the XRD
pattern of the PPPP-PIZOF-1 film reveals a high degree of crystallite orientation with the
111 set of crystal planes being parallel to the surface (Figure 6.2d). GIWAXS investigations
of the film confirm the formation of PPPP-PIZOF-1, a MOF with two-fold interpenetration
(Figure 6.2f) which is, to the best of our knowledge, the first report on an oriented film of
an interpenetrated MOF. In addition, the GIWAXS patterns reveal a high degree of
crystallite orientation and the investigations obtained at different sites of the film show
the homogeneity of the crystallite orientation over the area examined (Figure S6.57). The
SEM micrographs of the PPPP-PIZOF-1 film (Figures 6.3e and S6.20) show a high areal
coverage with large, intergrown octahedral crystals. The oriented octahedral crystals of
Figure 6.3. (a) Top-view SEM micrograph of UiO-66(NH2) film depicting the dense surface
coverage. (b) Cross-section SEM image of UiO-66(NH2) presenting the uniform film thickness (see
also Figure S6.18). (c) Top-view SEM micrograph of UiO-67 film depicting the dense surface
morphology. (d) Cross-section SEM image of UiO-67 presenting the uniform film thickness (see
also Figure S6.3). (e) Top-view SEM micrograph of PPPP-PIZOF-1 film showing large intergrown
crystallites. (f) Cross-section SEM image of the PPPP-PIZOF-1 crystal layer (see also Figure S6.20).

On-Surface Synthesis of Highly Oriented Thin Metal-Organic Framework Films through
Vapor-Assisted Conversion
171
uniform size expose well-defined facets with an edge length of about 5.4 µm. In contrast
to the continuous surface coverage in case of the UiO films, here the large crystals yielded
a loosely packed layer. A homogenous packing of the PPPP-PIZOF-1 crystals is obtained
within 200 µm from the edge of the substrate. By calculating the exposed gold area, we
obtained a total surface coverage of about 93% (for further details see SI, Figures S6.54,
6.55). Cross-section SEM images illustrate a PPPP-PIZOF-1 layer exhibiting a film
thickness of about 2.5 µm (Figures 6.3f and S6.20). The single PPPP-PIZOF-1 layer features
individual crystals that are well connected to the substrate.
With respect to our previous report on the growth of 2D COF films by VAC,31 here the
additional important aspect of crystallite orientation on the surface was realized.
Although, VAC was applied for related framework classes, MOF and COF, the different
crystal growth mechanisms and crystal interactions with the substrate can strongly affect
the final film properties. In contrast to other solution-based thin film deposition
technologies such as dip-coating and in-situ growth, where only a small fraction of the
precursor solution is ultimately deposited on the surface as the final film, in the VAC
process all of the precursor molecules in the precursor solution cast on the surface, under
conditions allowing for high reaction yields, convert to the desired MOF film (Figure
S6.58). This is a striking and unique feature of the VAC method, which renders it extremely
attractive when dealing with precious linker molecules.
The impact of the precursor and modulator concentrations on the MOF film
growth. To attain further insight into and control over film formation via VAC, we
investigated the impact of precursor and modulator concentrations on the crystallinity,
crystallite size and orientation by conducting alterations in the synthesis. Control over the
MOF crystallite orientation in films is crucial for expanding the scope of their applications.
Previous reports emphasized the beneficial role of a modulator for obtaining highly
crystalline MOF materials35, 37 and preferential crystallite orientation in films.38-39 To
this end, we focused on the synthesis of UiO-66(NH2) and PPPP-PIZOF-1 films as model
systems for the different topologies.

On-Surface Synthesis of Highly Oriented Thin Metal-Organic Framework Films through
Vapor-Assisted Conversion
172
In the VAC process, control over crystallite orientation in UiO-66(NH2) films was achieved
by simply changing the precursor and modulator concentrations (Figure 6.4). Overall,
densely packed non-oriented UiO-66(NH2) films with no preferential orientation formed
at a precursor concentration of 8.7 mmol L-1 (Figures 6.4a−e and S6.7−S6.12), whereas
oriented thin films were obtained by applying a much lower precursor concentration of
2.9 mmol L-1 in combination with high modulator amounts of at least 20 eq. (Figures
Figure 6.4. XRD patterns and cross-section SEM images of UiO-66(NH2) films obtained for (a−e)
high (see also Figures S6.7−S6.12) and (f−j) low (see also Figures S6.13−S6.18) precursor
concentrations with amounts of acetic acid ranging from 0−80 molar equivalents relative to the
precursor.

On-Surface Synthesis of Highly Oriented Thin Metal-Organic Framework Films through
Vapor-Assisted Conversion
173
6.4f−j and S13−S18). Interestingly, a combination of the high precursor concentration of
8.7 mmol L-1 with a high modulator amount of 80 eq. yielded a dense thin UiO-66(NH2)
film of 300 nm thickness with a thick layer of randomly distributed crystals on top of it
(Figures 6.4e and S6.12). This indicates that two individual processes are taking place
under these conditions, namely homogenous nucleation in the droplet volume, along with
a heterogeneous nucleation initiated by the gold surface. The amount of acetic acid in the
precursor solution also influences the crystallite size. With more equivalents of acetic acid
the crystal size increased as revealed by the X-ray reflection widths (Figures 6.4a, f, S6.7
and S6.13). These results point to the importance of controlled nucleation and crystal
growth obtained by including a modulator under the VAC conditions for achieving highly
crystalline and oriented UiO films.
In the case of PPPP-PIZOF-1, the film growth is highly precursor concentration dependent,
and a decrease from 8.7 to 2.9 mmol L-1 hinders the crystallization process and thereby
the formation of an ordered MOF film, regardless of the presence or absence of acetic acid
in the precursor solution (Figures S6.19−S6.22). Furthermore, in contrast to the synthesis
of UiO films, acetic acid in the precursor solution is detrimental to crystallization (Figure
S6.19). However, the presence of acetic acid in the vapor source is needed (Figure S6.6). A
slow diffusion of acetic acid from the vapor into the reaction droplet is apparently
necessary to allow the formation of highly oriented MOF films (Figure S6.6). This hints
Figure 6.5. (a−c) Shows cross-section SEM images of UiO-66(NH2) films obtained with different
droplet volumes, showing the increase of the film thickness with increasing droplet volume (see
also Figures S6.18, S6.24–S6.25). (d−f) Shows top-view SEM images of PPPP-PIZOF-1 films
obtained with different droplet volumes, showing the increase of the crystal size and increase in
surface coverage with increasing droplet volume (see also Figures S6.27–S6.29).

On-Surface Synthesis of Highly Oriented Thin Metal-Organic Framework Films through
Vapor-Assisted Conversion
174
towards a link between the MOF crystallization rate and the degree of crystallinity and
crystallite orientation in the films. Tuning the rates of nucleation and crystal growth to a
certain degree by acetic acid as a modulator enables, in principle, the formation of a
crystalline, highly oriented film.33, 37, 39
The impact of the droplet volume on the MOF film growth. Tuning of the UiO-
66(NH2) film thickness was achieved by casting droplet volumes of 10, 50 and 100 µL onto
the gold surface (Figures 6.5a−c and S6.18, S6.23−S6.25). Uniformly oriented films with
thicknesses of 110, 235 and 390 nm were obtained, respectively (Figure 6.5a−c). In the
case of PPPP-PIZOF-1 (Figures 6.5d−f and S6.26−S6.29), the droplet volume of 10 µL led
to a low surface coverage with loosely packed but well-defined octahedral crystals with
3.0 µm edge length adhering to the surface through the (111) facet (Figures 6.5d and
S6.27) whereas the larger droplet volumes of 50 µL and 100 µL led to the formation of a
densely packed film consisting of oriented octahedral single crystals with edge lengths of
4.6 µm and 6.5 µm, respectively (Figures 6.5e−f and S6.28–S6.29). These results are
consistent with a larger reservoir of building units in the larger droplet allowing for larger
crystal sizes and thicker films.
The impact of reaction temperature and reaction time on the MOF film
growth. The MOF films discussed so far were synthesized at 100 °C. A temperature
increase to 120 °C resulted in randomly distributed and non-oriented PPPP-PIZOF-1
crystallites (Figures S6.35–S6.36). In contrast, the UiO-66(NH2) film obtained at 120 °C
features oriented crystallites (Figures S6.30–S6.31).
We found that a reaction time of only 3 h is sufficient for the formation of the MOF films,
whereas reaction times shorter than 3 h led to the formation of non-crystalline deposit
(Figures S6.33–S6.34, S6.39–S6.40). The combination of lower temperatures and longer
reaction times were studies as well. In the case of PPPP-PIZOF-1 (Figure S6.35–S6.38) a
lower temperature of 80 °C in combination with a reaction time of 12 h yielded oriented
films, however, with a broader crystallite size distribution than in the films obtained at
100 °C. A further temperature decrease to 60 °C continued the trend of increasing
crystallite size distribution and a decrease in surface coverage and orientation was
observed. Similar experiments for UiO-66(NH2) at 80 °C and 12 h resulted in non-oriented
material with considerably decreased crystallinity (Figure S6.30–S6.32).

On-Surface Synthesis of Highly Oriented Thin Metal-Organic Framework Films through
Vapor-Assisted Conversion
175
MOF film growth on different surfaces. To further illustrate the potential of MOF film
synthesis via VAC, we included other surfaces but bare gold in our study: gold surfaces
modified with different thiol-SAMs featuring −COOH, −CH2OH and −CH3 as terminal
functional groups as indicated by contact angle measurements (Figure S6.1), and a bare
silicon surface. Interestingly, on all substrates, regardless of their chemical character, UiO-
66(NH2) and PPPP-PIZOF-1 films with a high degree of crystallite orientation with the
alignment of the [111] axis normal to the surface were obtained (Figures S6.41−S6.50).
The UiO-66(NH2) films are homogeneous and dense (Figures S6.42−S6.45) whereas the
PPPP-PIZOF-1 films exhibit loosely-packed, large crystals (Figures S6.47−S6.50).
Interestingly, on a silicon surface both, UiO-66(NH2) and PPPP-PIZOF-1, feature film
morphology (Figures S6.45 and S6.50): in the case of UiO-66(NH2) (Figure S6.45) a layer
of randomly distributed crystals are found on top of a dense film, whereas in the case of
PPPP-PIZOF-1 large crystals with a good areal coverage are formed. For these cubic MOF
systems, the adhesion energy of the nuclei apparently selectively favors nucleation and
growth via the (111) facet at all of the interfaces investigated, in a similar fashion as for
the oriented growth of MOF crystals on SAM modified surfaces.12, 14, 16
Accessible pores of the MOF films. Pore accessibility is a key feature of porous thin
films. It is of paramount significance for applications such as on-chip molecular
confinement and host-guest interactions. To determine the porosity, UiO-66(NH2) and
PPPP-PIZOF-1 were grown as oriented films on quartz crystal microbalance (QCM) chips
Figure 6.6. Ethanol sorption isotherms of activated MOF films: (a) UiO-66(NH2) and (b) PPPP-
PIZOF-1.

On-Surface Synthesis of Highly Oriented Thin Metal-Organic Framework Films through
Vapor-Assisted Conversion
176
(Figures S6.51–S6.52). Physisorption studies were carried out using ethanol as the
sorptive at 25 °C. Prior to sorption analysis, the MOF films were activated by heating the
substrates to 120 °C for 12 h under nitrogen flow. The UiO-66(NH2) film featured a
microporous characteristic Type I(a) isotherm (Figure 6.6a) with a steep ethanol uptake
at low relative pressures (p/p0 = 0−0.02) indicating a highly defined microporous
structure. Sorption analysis of a PPPP-PIZOF-1 film showed a Type IV(b) isotherm (Figure
6.6b), which is typical for structures classified to be at the transition between micro- and
mesoporosity, with a pronounced pore filling step at higher partial pressure (p/p0 =
0.14−0.16) featuring a narrow pore size distribution and an overall higher uptake as
compared to UiO-66(NH2). Here, the adsorbed amount of ethanol at a relative pressure of
p/p0 = 0.99 for UiO-66(NH2) and PPPP-PIZOF-1 was calculated to be 0.17 cm3 g−1 and
0.47 cm3 g−1, respectively, based on the density of liquid ethanol at room temperature.
Additionally, we determined the volumetric EtOH sorption at 20 ºC of highly crystalline
UiO-66(NH2) and PPPP-PIZOF-1 powders (Figure S6.59). For both MOFs, highly defined
EtOH isotherms were obtained whose shapes are in very good agreement with that of the
isotherms obtained for the thin films. This validates our conclusion regarding well-defined
accessible pores and a narrow pore size distribution in the MOF films This demonstrates
that the thin MOF films obtained via VAC exhibit accessible pores, making them well suited
to accommodate guest molecules.
6.4. Conclusion
Summarizing, we report the growth of highly oriented thin films of UiO-66(NH2), UiO-67,
UiO-68(NH2) and even of an interpenetrated MOF, the PPPP-PIZOF-1, on a variety of
substrates - bare gold, gold surface modified with thiol SAMs, and bare silicon - by
applying vapor-assisted conversion (VAC). The obtained MOF films exhibit a high degree
of crystallinity and crystal orientation and extend to large area where the MOF crystallites
are intergrown, forming almost flawless tile patterns. A detailed study regarding the
parameters governing the MOF film formation, including modulator equivalents,
precursor concentration, temperature and reaction time reveals a link between the rate of
the crystallization and the formation of the oriented MOF films. Tuning the crystallization
process by including a modulator led to highly crystalline and oriented films. Remarkably,
only a reaction time of 3 h and a temperature of 100 °C are required for the formation of
the oriented MOF films. Both, UiO-66(NH2) and PPPP-PIZOF-1 films show considerable

On-Surface Synthesis of Highly Oriented Thin Metal-Organic Framework Films through
Vapor-Assisted Conversion
177
ethanol uptake at room temperature, rendering these MOF films as functional materials
suitable for on-chip host-guest studies. Based on the above, we introduce the VAC process
as a versatile, gentle, and efficient method for the synthesis of highly crystalline and
oriented thin MOF films. Based on the work presented here, we envision that VAC
protocols will be generated for many further MOF topologies, which so far were not
deposited as homogenous, porous, thin films and macroscopic coatings. As such, VAC is an
important addition to the tool-box of film deposition technologies for porous frameworks.
6.5. References
(1) Stassen, I.; Styles, M.; Grenci, G.; Van Gorp, H.; Vanderlinden, W.; De Feyter, S.;
Falcaro, P.; De Vos, D.; Vereecken, P.; Ameloot, R., Nat. Mater. 2016, 15 (3), 304-310.
(2) Falcaro, P.; Okada, K.; Hara, T.; Ikigaki, K.; Tokudome, Y.; Thornton, A. W.; Hill, A. J.;
Williams, T.; Doonan, C.; Takahashi, M., Nat Mater 2017, 16 (3), 342-348.
(3) Liu, J.; Zhou, W.; Liu, J.; Howard, I.; Kilibarda, G.; Schlabach, S.; Coupry, D.; Addicoat,
M.; Yoneda, S.; Tsutsui, Y.; Sakurai, T.; Seki, S.; Wang, Z.; Lindemann, P.; Redel, E.; Heine, T.;
Wo ll, C., Angew. Chem. Int. Ed. 2015, 54 (25), 7441-5.
(4) Lausund, K. B.; Nilsen, O., Nat. Commun. 2016, 7, 13578.
(5) Uzarevic, K.; Wang, T. C.; Moon, S. Y.; Fidelli, A. M.; Hupp, J. T.; Farha, O. K.; Friscic, T.,
Chem. Commun. 2016, 52 (10), 2133-6.
(6) Furukawa, H.; Cordova, K. E.; O'Keeffe, M.; Yaghi, O. M., Science 2013, 341 (6149),
1230444.
(7) Fe rey, G., Chem. Soc. Rev. 2008, 37 (1), 191-214.
(8) Meek, S. T.; Greathouse, J. A.; Allendorf, M. D., Adv. Mater. 2011, 23 (2), 249-267.
(9) Seoane, B.; Castellanos, S.; Dikhtiarenko, A.; Kapteijn, F.; Gascon, J., Coord. Chem. Rev.
2016, 307, 147-187.
(10) Jiang, J.; Zhao, Y.; Yaghi, O. M., J. Am. Chem. Soc. 2016, 138 (10), 3255-3265.
(11) Cook, T. R.; Zheng, Y.-R.; Stang, P. J., Chem. Rev. 2013, 113 (1), 734-777.
(12) Biemmi, E.; Scherb, C.; Bein, T., J. Am. Chem. Soc. 2007, 129 (26), 8054-8055.
(13) Zhuang, J.-L.; Terfort, A.; Wo ll, C., Coord. Chem. Rev. 2016, 307, 391-424.

On-Surface Synthesis of Highly Oriented Thin Metal-Organic Framework Films through
Vapor-Assisted Conversion
178
(14) Zacher, D.; Baunemann, A.; Hermes, S.; Fischer, R. A., J. Mater. Chem. 2007, 17 (27),
2785-2792.
(15) Hermes, S.; Schro der, F.; Chelmowski, R.; Wo ll, C.; Fischer, R. A., J. Am. Chem. Soc.
2005, 127 (40), 13744-13745.
(16) Schoedel, A.; Scherb, C.; Bein, T., Angew. Chem. Int. Ed. 2010, 49 (40), 7225-7228.
(17) Shekhah, O.; Wang, H.; Kowarik, S.; Schreiber, F.; Paulus, M.; Tolan, M.; Sternemann,
C.; Evers, F.; Zacher, D.; Fischer, R. A.; Wo ll, C., J. Am. Chem. Soc. 2007, 129 (49), 15118-
15119.
(18) Shekhah, O.; Wang, H.; Zacher, D.; Fischer, R. A.; Wo ll, C., Angew. Chem. Int. Ed. 2009,
48 (27), 5038-5041.
(19) Makiura, R.; Motoyama, S.; Umemura, Y.; Yamanaka, H.; Sakata, O.; Kitagawa, H., Nat.
Mater. 2010, 9 (7), 565-571.
(20) Makiura, R.; Kitagawa, H., Eur. J. Inorg. Chem. 2010, 2010 (24), 3715-3724.
(21) Motoyama, S.; Makiura, R.; Sakata, O.; Kitagawa, H., J. Am. Chem. Soc. 2011, 133 (15),
5640-5643.
(22) Liu, J.; Lukose, B.; Shekhah, O.; Arslan, H. K.; Weidler, P.; Gliemann, H.; Brase, S.;
Grosjean, S.; Godt, A.; Feng, X.; Mullen, K.; Magdau, I. B.; Heine, T.; Woll, C., Sci. Rep. 2012,
2, 921.
(23) Xu, W.; Dong, J.; Li, J.; Li, J.; Wu, F., J. Chem. Soc. Chem. Commun. 1990, (10), 755-
756.
(24) Matsukata, M.; Ogura, M.; Osaki, T.; Hari Prasad Rao, P. R.; Nomura, M.; Kikuchi, E.,
Top. Catal. 1999, 9 (1), 77-92.
(25) Mo ller, K.; Yilmaz, B.; Jacubinas, R. M.; Mu ller, U.; Bein, T., J. Am. Chem. Soc. 2011,
133 (14), 5284-5295.
(26) Majano, G.; Mintova, S.; Ovsitser, O.; Mihailova, B.; Bein, T., Microporous Mesoporous
Mater. 2005, 80 (1–3), 227-235.
(27) Tatsumi, T.; Jappar, N., J. Phy. Chem. B 1998, 102 (37), 7126-7131.
(28) Rao, P. R. H. P.; Matsukata, M., Chem. Commun. 1996, (12), 1441-1442.

On-Surface Synthesis of Highly Oriented Thin Metal-Organic Framework Films through
Vapor-Assisted Conversion
179
(29) Changjean, W.-C.; Chiang, A. S. T.; Tsai, T.-C., Thin Solid Films 2013, 529, 327-332.
(30) Shi, Q.; Chen, Z.; Song, Z.; Li, J.; Dong, J., Angew. Chem. Int. Ed. 2011, 50 (3), 672-675.
(31) Medina, D. D.; Rotter, J. M.; Hu, Y.; Dogru, M.; Werner, V.; Auras, F.; Markiewicz, J. T.;
Knochel, P.; Bein, T., J. Am. Chem. Soc. 2015, 137 (3), 1016-1019.
(32) Cavka, J. H.; Jakobsen, S.; Olsbye, U.; Guillou, N.; Lamberti, C.; Bordiga, S.; Lillerud, K.
P., J. Am. Chem. Soc. 2008, 130 (42), 13850-13851.
(33) Schaate, A.; Roy, P.; Godt, A.; Lippke, J.; Waltz, F.; Wiebcke, M.; Behrens, P., Chem. -
Eur. J. 2011, 17 (24), 6643-6651.
(34) Lippke, J.; Brosent, B.; von Zons, T.; Virmani, E.; Lilienthal, S.; Preuße, T.; Hu lsmann,
M.; Schneider, A. M.; Wuttke, S.; Behrens, P.; Godt, A., Inorg. Chem. 2017, 56 (2), 748-761.
(35) Schaate, A.; Roy, P.; Preuße, T.; Lohmeier, S. J.; Godt, A.; Behrens, P., Chem. - Eur. J.
2011, 17 (34), 9320-9325.
(36) Garibay, S. J.; Cohen, S. M., Chem. Commun. 2010, 46 (41), 7700-7702.
(37) Wißmann, G.; Schaate, A.; Lilienthal, S.; Bremer, I.; Schneider, A. M.; Behrens, P.,
Microporous Mesoporous Mater. 2012, 152, 64-70.
(38) Zhang, C.; Zhao, Y.; Li, Y.; Zhang, X.; Chi, L.; Lu, G., Chem. - Asian J. 2016, 11 (2), 207-
210.
(39) Miyamoto, M.; Kohmura, S.; Iwatsuka, H.; Oumi, Y.; Uemiya, S., CrystEngComm 2015,
17 (18), 3422-3425.

On-Surface Synthesis of Highly Oriented Thin Metal-Organic Framework Films through
Vapor-Assisted Conversion
180
6.6. Supporting Information
a. X-ray diffraction (XRD)
X-ray diffraction analyses were performed on a Bruker D8 diffractometer in Bragg-
Brentano geometry with Ni-filtered Cu Kα(λ = 1.54060 A ) radiation operating at 40 kV and
30 mA with a position-sensitive detector (LynxEye).
Two-dimensional grazing-incident wide angle X-ray scattering (2D GIWAXS) data were
collected using an Anton-Paar Saxspace system equipped with a Cu Kα microfocus source
operated at 50 kV and 1 mA and an Eiger Dectris R 1M 2D detector.
b. Scanning electron microscopy (SEM)
SEM images were recorded on a FEI Helios NanoLab G3 UC electron microscope with an
acceleration voltage of 2 kV from a field emission gun for morphological investigations
and 5 kV for Z-contrast imaging. For the cross-section analysis, substrates were partially
cut and broken manually to reveal fresh cross-section. Prior to SEM analysis all the
samples were coated with a thin carbon layer by carbon fiber flash evaporation at high
vacuum. EDX spectra were recorded using an Oxford Instruments X-Max 80 detector.
c. Quartz crystal microbalance (QCM)
The samples were activated prior to the measurement by heating the QCM-chips to 120
°C for 12 h under a nitrogen flow of 600 mL min-1. QCM experiments were performed using
a flow controlling system. For dosing the gases a gas flow controller (F-201-C-RBA-33-V,
Bronkhorst Hi-Tec) was used. The liquid was dosed by a liquid mass flow controller (L01-
RBA-11-O, Bronkhorst Hi-Tec), which was connected to an ethanol reservoir and through
a nitrogen flow the ethanol was directed to the controlled evaporation mixer. The
controllers were connected to a controlled evaporation mixer (W-101A-110-P, Bronkhorst
Hi-Tec), where the carrier gas and the ethanol were combined and heated above the
boiling point of the ethanol. For the calculation of the individual vapor pressures and
settings of the flow controller Bronkhorst’s Fluidat software was used.1

On-Surface Synthesis of Highly Oriented Thin Metal-Organic Framework Films through
Vapor-Assisted Conversion
181
d. Contact angle measurements
Contact angle measurements were performed on an attension from Biolin Scientific. A
droplet of water was placed on the substrate, while recording the images. The image
analysis was carried out with the software “one attension” using a Young-Laplace analysis
mode and an air-to-water interface.
e. Atomic force microscopy (AFM)
AFM measurements were performed using a NANOINK atomic force microscope in
tapping mode with a scan rate of 0.2 Hz, a proportional gain of 50 and an integral gain of
32.
f. Volumetric EtOH sorption
Volumetric EthOH sorption experiments were carried out using a Quantachrome autosorb
iQ instrument. Measurements were performed at 20 °C. The bulk material was activated
under dynamic vacuum at 120 °C for 6 h prior to the analysis.
Synthetical Details
a. General
Acetic acid (analytical grade, Sigma-Aldrich), acetone (technical grade), terephthalic acid
(P diacid, 99%, Sigma-Aldrich), 2-aminoterephthalic acid (P(NH2) diacid; 99%, Sigma-
Aldrich), biphenyl-4,4′-dicarboxylic acid (PP diacid; 97%, Sigma-Aldrich), N,N-
dimethylformamide (anhydrous, synthesis grade, Fischer Scientific), ethanol (absolute,
technical grade), gold pellets (Au; 99.99%, Kurt J. Leske Company Ltd), Hellmanex III
(Hellma, Sigma-Aldrich), hexadecane-1-thiol (99%, Fluka), 16-mercaptohexadecanoic
acid (99%, Sigma-Aldrich), 16-mercaptohexadecan-1-ol (99%, Frontier Scientific)
methanol (technical grade), 2-propanol (technical grade and Chromasolv, Sigma-Aldrich),
titanium pellets (Ti; 99.99%, Neyco), zirconyl dichloride octahydrate (ZrOCl2•8H2O;
≥99.5%, Sigma-Aldrich).

On-Surface Synthesis of Highly Oriented Thin Metal-Organic Framework Films through
Vapor-Assisted Conversion
182
2′-Amino-1,1′:4′,1′′-terphenyl-4,4′′-dicarboxylic acid (PP(NH2)P diacid)2 and 2',3''-
dimethyl-[1,1′:4′,1″:4″,1‴]-quaterphenyl-4,4‴-dicarboxylic acid (PP(2-Me)P(3-Me)P
diacid)3 were prepared as reported.
b. Substrates
The preparation of the gold-substrates is based on the procedure described by
Hinterholzinger et al.4 Seven microscope glass slides (Menzel, 76 mm x 26 mm) in a
support made of Teflon were cleaned by ultrasonic treatment in acetone, followed by
sequential washing steps with 2-propanol, a 1:100 mixture of Hellmanex III and water,
water and finally 2-propanol (Chromasolv). Oxygen plasma cleaning (Diener electronic,
Plasma-Surface-Technology) for 30 min was conducted, previous to the mounting of the
glass slides in a vacuum deposition unit installed in a glove box (MBraun Labmaster Pro
SP) equipped with an Inficon SQC-310C deposition controller. A layer of 10 nm of titanium
and then a layer of 100 nm of gold were thermally deposited under high vacuum onto the
microscope glass slides. Afterwards, the microscope slides were cut into 1.3 cm x 1 cm
pieces. These substrates were either directly used for MOF film preparation or were used
to prepare surface modified substrates. For surface modification the cut substrates were
cleaned for 10 min in an ultrasonic bath, first in ethanol and then in methanol. Six pieces
were immersed in a solution of a thiol (50 mmol) - 16-mercaptohexadecanoic acid (14.4
mg) or 16-mercaptohexadecan-1-ol (13.7 mg) or 1-hexadecanethiol (12.9 mg) - in ethanol
(50 mL) at room temperature for 3 days. The SAM-functionalized substrates were washed
with ethanol and afterwards stored in ethanol until their utilization in MOF film synthesis.
Before film synthesis, the SAM-functionalized substrates were dried under a stream of
nitrogen. The surface modification was proven by contact angle measurements (Figure
S6.1).
The silicon-wafers (Si[100]; Ø 20 cm; 0.6 cm thick) from Siegert Wafer were cut into 1.3
cm x 1.0 cm pieces. The 10.000015 MHz QCM-chips (quartz XA 1600 with gold contacts)
were purchased from KVG Quartz Crystal Technology GmbH and used without further
cleaning.
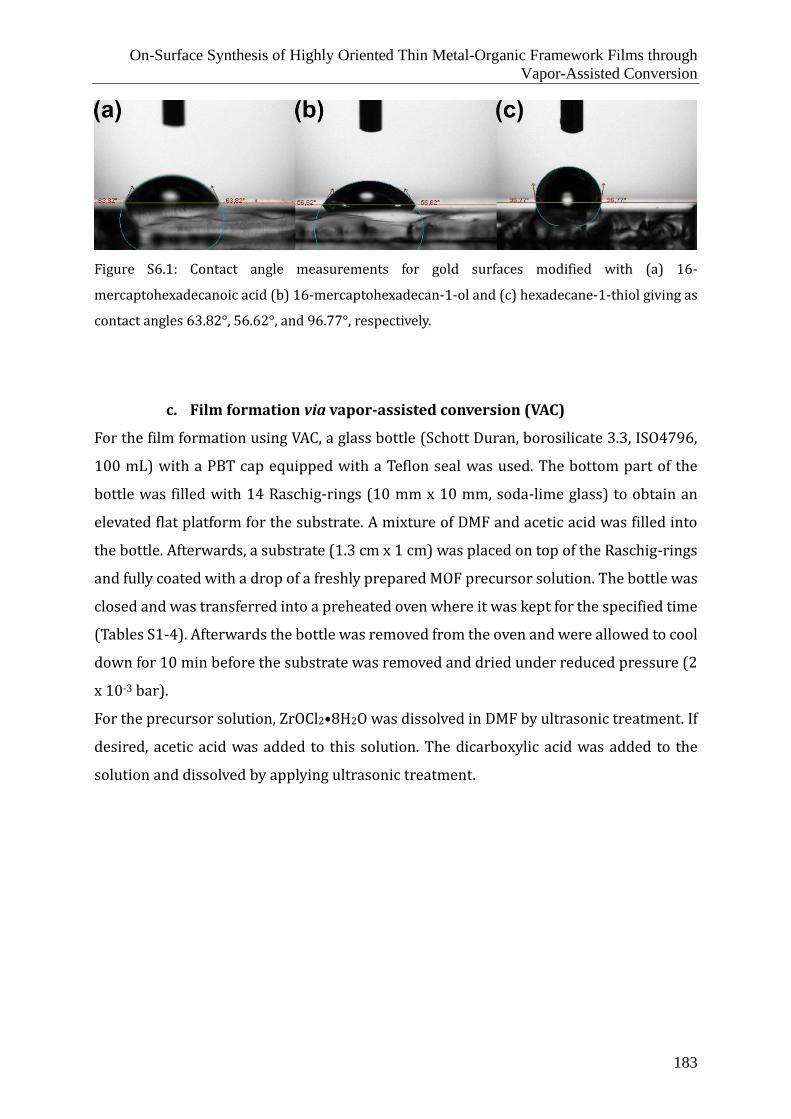
On-Surface Synthesis of Highly Oriented Thin Metal-Organic Framework Films through
Vapor-Assisted Conversion
183
Figure S6.1: Contact angle measurements for gold surfaces modified with (a) 16-
mercaptohexadecanoic acid (b) 16-mercaptohexadecan-1-ol and (c) hexadecane-1-thiol giving as
contact angles 63.82°, 56.62°, and 96.77°, respectively.
c. Film formation via vapor-assisted conversion (VAC)
For the film formation using VAC, a glass bottle (Schott Duran, borosilicate 3.3, ISO4796,
100 mL) with a PBT cap equipped with a Teflon seal was used. The bottom part of the
bottle was filled with 14 Raschig-rings (10 mm x 10 mm, soda-lime glass) to obtain an
elevated flat platform for the substrate. A mixture of DMF and acetic acid was filled into
the bottle. Afterwards, a substrate (1.3 cm x 1 cm) was placed on top of the Raschig-rings
and fully coated with a drop of a freshly prepared MOF precursor solution. The bottle was
closed and was transferred into a preheated oven where it was kept for the specified time
(Tables S1-4). Afterwards the bottle was removed from the oven and were allowed to cool
down for 10 min before the substrate was removed and dried under reduced pressure (2
x 10-3 bar).
For the precursor solution, ZrOCl2•8H2O was dissolved in DMF by ultrasonic treatment. If
desired, acetic acid was added to this solution. The dicarboxylic acid was added to the
solution and dissolved by applying ultrasonic treatment.

On-Surface Synthesis of Highly Oriented Thin Metal-Organic Framework Films through Vapor-Assisted Conversion
184
Table S6.1: Conditions for the synthesis of UiO-66(NH2) films.
Exp. Precursor solution Droplet volume Substrate Temperature Reaction time Vapor source
ZrOCl2•8H2O P(NH2) diacid acetic acid DMF DMF acetic acid
variation of
precursor
and
modulator
concentration
1 2.8 mg
8.7 mmol L-1
1.6 mg
8.7 mmol L-1
0 µL
0 mmol L-1
1 mL 50 µL gold 100 °C 3 h 4.2 mL 0.8 mL
2 2.8 mg
8.7 mmol L-1
1.6 mg
8.7 mmol L-1
2 µL
35 mmol L-1
1 mL 50 µL gold 100 °C 3 h 4.2 mL 0.8 mL
3 2.8 mg
8.7 mmol L-1
1.6 mg
8.7 mmol L-1
10 µL
175 mmol L-1
1 mL 50 µL gold 100 °C 3 h 4.2 mL 0.8 mL
4 2.8 mg
8.7 mmol L-1
1.6 mg
8.7 mmol L-1
20 µL
350 mmol L-1
1 mL 50 µL gold 100 °C 3 h 4.2 mL 0.8 mL
5 2.8 mg
8.7 mmol L-1
1.6 mg
8.7 mmol L-1
40 µL
700 mmol L-1
1 mL 50 µL gold 100 °C 3 h 4.2 mL 0.8 mL
6 0.93 mg
2.9 mmol L-1
0.52 mg
2.9 mmol L-1
0 µL
0 mmol L-1
1 mL 50 µL gold 100 °C 3 h 4.2 mL 0.8 mL
7 0.93 mg
2.9 mmol L-1
0.52 mg
2.9 mmol L-1
0.7 µL
12 mmol L-1
1 mL 50 µL gold 100 °C 3 h 4.2 mL 0.8 mL
8 0.93 mg
2.9 mmol L-1
0.52 mg
2.9 mmol L-1
3.3 µL
58 mmol L-1
1 mL 50 µL gold 100 °C 3 h 4.2 mL 0.8 mL
9 0.93 mg
2.9 mmol L-1
0.52 mg
2.9 mmol L-1
6.6 µL
116 mmol L-1
1 mL 50 µL gold 100 °C 3 h 4.2 mL 0.8 mL
10 0.93 mg
2.9 mmol L-1
0.52 mg
2.9 mmol L-1
13.3 µL
232 mmol L-1
1 mL 50 µL gold 100 °C 3 h 4.2 mL 0.8 mL
variation of
droplet
11 0.93 mg
2.9 mmol L-1
0.52 mg
2.9 mmol L-1
13.3 µL
232 mmol L-1
1 mL 10 µL gold 100 °C 3 h 4.2 mL 0.8 mL

On-Surface Synthesis of Highly Oriented Thin Metal-Organic Framework Films through Vapor-Assisted Conversion
185
volume 12 0.93 mg
2.9 mmol L-1
0.52 mg
2.9 mmol L-1
13.3 µL
232 mmol L-1
1 mL 50 µL gold 100 °C 3 h 4.2 mL 0.8 mL
13 0.93 mg
2.9 mmol L-1
0.52 mg
2.9 mmol L-1
13.3 µL
232 mmol L-1
1 mL 100 µL gold 100 °C 3 h 4.2 mL 0.8 mL
variation of
the type of
substrate
14 0.93 mg
2.9 mmol L-1
0.52 mg
2.9 mmol L-1
13.3 µL
232 mmol L-1
1 mL 50 µL HS-(CH2)15-
CO2H
100 °C 3 h 4.2 mL 0.8 mL
15 0.93 mg
2.9 mmol L-1
0.52 mg
2.9 mmol L-1
13.3 µL
232 mmol L-1
1 mL 50 µL HS-(CH2)16-
OH
100 °C 3 h 4.2 mL 0.8 mL
16 0.93 mg
2.9 mmol L-1
0.52 mg
2.9 mmol L-1
13.3 µL
232 mmol L-1
1 mL 50 µL HS-(CH2)15-
CH3
100 °C 3 h 4.2 mL 0.8 mL
17 0.93 mg
2.9 mmol L-1
0.52 mg
2.9 mmol L-1
13.3 µL
232 mmol L-1
1 mL 50 µL Si-wafer 100 °C 3 h 4.2 mL 0.8 mL
18 0.93 mg
2.9 mmol L-1
0.52 mg
2.9 mmol L-1
13.3 µL
232 mmol L-1
1 mL 50 µL QCM-chip 100 °C 3 h 4.2 mL 0.8 mL

On-Surface Synthesis of Highly Oriented Thin Metal-Organic Framework Films through Vapor-Assisted Conversion
186
variation of
the reaction
temperature
19 0.93 mg
2.9 mmol L-1
0.52 mg
2.9 mmol L-1
13.3 µL
232 mmol L-1
1 mL 50 µL gold 120 °C 3 h 4.2 mL 0.8 mL
20 0.93 mg
2.9 mmol L-1
0.52 mg
2.9 mmol L-1
13.3 µL
232 mmol L-1
1 mL 50 µL gold 80 °C 12 h 4.2 mL 0.8 mL
variation of
the reaction
time
21 0.93 mg
2.9 mmol L-1
0.52 mg
2.9 mmol L-1
13.3 µL
232 mmol L-1
1 mL 50 µL gold 100 °C 1 h 4.2 mL 0.8 mL
control
experiments
22 2.8 mg
8.7 mmol L-1
1.6 mg
8.7 mmol L-1
13.3 µL
232 mmol L-1
1 mL 50 µL gold 100 °C 3 h 4.2 mL 0.8 mL
23 2.8 mg
8.7 mmol L-1
1.6 mg
8.7 mmol L-1
0 µL
0 mol L-1
1 mL 50 µL gold 100 °C 3 h 4.2 mL 0.8 mL
24 2.8 mg
8.7 mmol L-1
1.6 mg
8.7 mmol L-1
13.3 µL
232 mmol L-1
1 mL 50 µL gold 100 °C 3 h 5.0 mL -
25 2.8 mg
8.7 mmol L-1
1.6 mg
8.7 mmol L-1
0 µL
0 mol L-1
1 mL 50 µL gold 100 °C 3 h 5.0 mL -
26 2.8 mg
8.7 mmol L-1
1.6 mg
8.7 mmol L-1
13.3 µL
232 mmol L-1
1 mL 50 µL gold 100 °C 3 h - 5.0 mL
27 2.8 mg
8.7 mmol L-1
1.6 mg
8.7 mmol L-1
13.3 µL
232 mmol L-1
1 mL 50 µL gold 100 °C 3 h - -

On-Surface Synthesis of Highly Oriented Thin Metal-Organic Framework Films through Vapor-Assisted Conversion
187
Table S6.2: Conditions for the synthesis of PPPP−PIZOF-1 films.
Exp. Precursor solution Droplet
volume Substrate Temperature Reaction time Vapor source
ZrOCl2•8H2O PP(2-Me)P(3-Me)P
diacid acetic acid DMF DMF
acetic
acid
variation of
precursor
and
modulator
concentration
28 2.8 mg
8.7 mmol L-1
3.7 mg
8.7 mmol L-1
0 µL
0 mmol L-1
1 mL 50 µL gold 100 °C 3 h 4.2 mL 0.8 mL
29 2.8 mg
8.7 mmol L-1
3.7 mg
8.7 mmol L-1
2 µL
35 mmol L-1
1 mL 50 µL gold 100 °C 3 h 4.2 mL 0.8 mL
30 2.8 mg
8.7 mmol L-1
3.7 mg
8.7 mmol L-1
10 µL
175 mmol L-1
1 mL 50 µL gold 100 °C 3 h 4.2 mL 0.8 mL
31 2.8 mg
8.7 mmol L-1
3.7 mg
8.7 mmol L-1
20 µL
350 mmol L-1
1 mL 50 µL gold 100 °C 3 h 4.2 mL 0.8 mL
32 2.8 mg
8.7 mmol L-1
3.7 mg
8.7 mmol L-1
40 µL
700 mmol L-1
1 mL 50 µL gold 100 °C 3 h 4.2 mL 0.8 mL
33 0.93 mg
2.9 mmol L-1
1.2 mg
2.9 mmol L-1
0 µL
0 mmol L-1
1 mL 50 µL gold 100 °C 3 h 4.2 mL 0.8 mL
34 0.93 mg
2.9 mmol L-1
1.2 mg
2.9 mmol L-1
0.7 µL
12 mmol L-1
1 mL 50 µL gold 100 °C 3 h 4.2 mL 0.8 mL
35 0.93 mg
2.9 mmol L-1
1.2 mg
2.9 mmol L-1
3.3 µL
58 mmol L-1
1 mL 50 µL gold 100 °C 3 h 4.2 mL 0.8 mL
36 0.93 mg
2.9 mmol L-1
1.2 mg
2.9 mmol L-1
6.6 µL
116 mmol L-1
1 mL 50 µL gold 100 °C 3 h 4.2 mL 0.8 mL
37 0.93 mg
2.9 mmol L-1
1.2 mg
2.9 mmol L-1
13.3 µL
232 mmol L-1
1 mL 50 µL gold 100 °C 3 h 4.2 mL 0.8 mL

On-Surface Synthesis of Highly Oriented Thin Metal-Organic Framework Films through Vapor-Assisted Conversion
188
variation of
droplet
volume
38 2.8 mg
8.7 mmol L-1
3.7 mg
8.7 mmol L-1
0 µL
0 mmol L-1
1 mL 10 µL gold 100 °C 3 h 4.2 mL 0.8 mL
39 2.8 mg
8.7 mmol L-1
3.7 mg
8.7 mmol L-1
0 µL
0 mmol L-1
1 mL 50 µL gold 100 °C 3 h 4.2 mL 0.8 mL
40 2.8 mg
8.7 mmol L-1
3.7 mg
8.7 mmol L-1
0 µL
0 mmol L-1
1 mL 100 µL gold 100 °C 3 h 4.2 mL 0.8 mL

On-Surface Synthesis of Highly Oriented Thin Metal-Organic Framework Films through Vapor-Assisted Conversion
189
variation of
the type of
substrate
41 2.8 mg
8.7 mmol L-1
3.7 mg
8.7 mmol L-1
0 µL
0 mmol L-1
1 mL 50 µL HS-(CH2)15-CO2H 100 °C 3 h 4.2 mL 0.8 mL
42 2.8 mg
8.7 mmol L-1
3.7 mg
8.7 mmol L-1
0 µL
0 mmol L-1
1 mL 50 µL HS-(CH2)16-OH 100 °C 3 h 4.2 mL 0.8 mL
43 2.8 mg
8.7 mmol L-1
3.7 mg
8.7 mmol L-1
0 µL
0 mmol L-1
1 mL 50 µL HS-(CH2)15-CH3 100 °C 3 h 4.2 mL 0.8 mL
44 2.8 mg
8.7 mmol L-1
3.7 mg
8.7 mmol L-1
0 µL
0 mmol L-1
1 mL 50 µL Si-wafer 100 °C 3 h 4.2 mL 0.8 mL
45 2.8 mg
8.7 mmol L-1
3.7 mg
8.7 mmol L-1
0 µL
0 mmol L-1
1 mL 50 µL QCM-chip 100 °C 3 h 4.2 mL 0.8 mL
variation of
the reaction
temperature
46 2.8 mg
8.7 mmol L-1
3.7 mg
8.7 mmol L-1
0 µL
0 mmol L-1
1 mL 50 µL gold 120 °C 3 h 4.2 mL 0.8 mL
47 2.8 mg
8.7 mmol L-1
3.7 mg
8.7 mmol L-1
0 µL
0 mmol L-1
1 mL 50 µL gold 80 °C 12 h 4.2 mL 0.8 mL
48 2.8 mg
8.7 mmol L-1
3.7 mg
8.7 mmol L-1
0 µL
0 mmol L-1
1 mL 50 µL gold 60 °C 12 h 4.2 mL 0.8 mL
variation of
the reaction
time
49 2.8 mg
8.7 mmol L-1
3.7 mg
8.7 mmol L-1
0 µL
0 mmol L-1
1 mL 50 µL gold 100 °C 1 h 4.2 mL 0.8 mL
control
experiments
50 2.8 mg
8.7 mmol L-1
3.7 mg
8.7 mmol L-1
40 µL
700 mmol L-1
1 mL 50 µL gold 100 °C 3 h 4.2 mL 0.8 mL
51 2.8 mg
8.7 mmol L-1
3.7 mg
8.7 mmol L-1
0 µL
0 mol L-1
1 mL 50 µL gold 100 °C 3 h 4.2 mL 0.8 mL
52 2.8 mg
8.7 mmol L-1
3.7 mg
8.7 mmol L-1
40 µL
700 mol L-1
1 mL 50 µL gold 100 °C 3 h 5.0 mL -
53 2.8 mg
8.7 mmol L-1
3.7 mg
8.7 mmol L-1
0 µL
0 mol L-1
1 mL 50 µL gold 100 °C 3 h 5.0 mL -
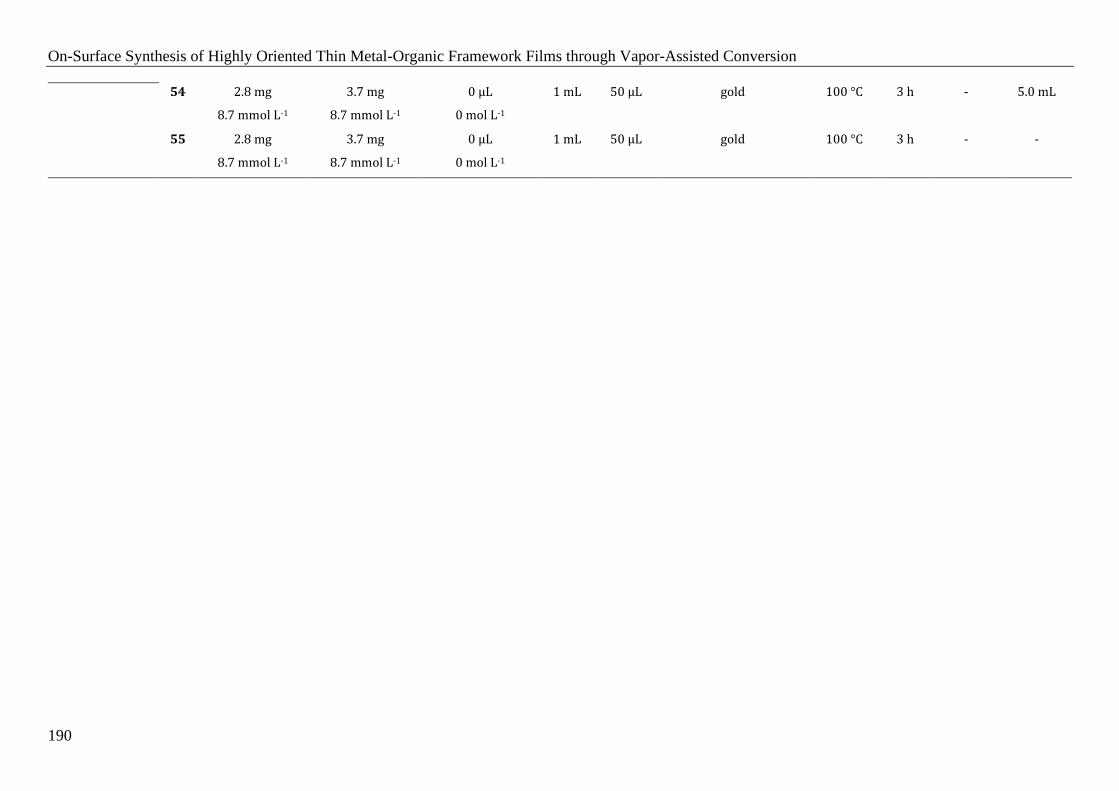
On-Surface Synthesis of Highly Oriented Thin Metal-Organic Framework Films through Vapor-Assisted Conversion
190
54 2.8 mg
8.7 mmol L-1
3.7 mg
8.7 mmol L-1
0 µL
0 mol L-1
1 mL 50 µL gold 100 °C 3 h - 5.0 mL
55 2.8 mg
8.7 mmol L-1
3.7 mg
8.7 mmol L-1
0 µL
0 mol L-1
1 mL 50 µL gold 100 °C 3 h - -

On-Surface Synthesis of Highly Oriented Thin Metal-Organic Framework Films through Vapor-Assisted Conversion
191
Table S6.3: Conditions for the synthesis of UiO-67 film.
Exp. Precursor solution Droplet volume Substrate Temperature Reaction time Vapor source
ZrOCl2•8H2O PP diacid acetic acid DMF DMF acetic acid
56 0.71 mg
2.2 mmol L-1
0.53 mg
2.2 mmol L-1
24.5 µL
427 mmol L-1
1 mL 50 µL gold 100 °C 3 h 4.2 mL 0.8 mL
Table S6.4: Conditions for the synthesis of UiO-68(NH2) film.
Exp. Precursor solution Droplet volume Substrate Temperature Reaction time Vapor source
ZrOCl2•8H2O PP(NH2)P diacid acetic acid DMF DMF acetic acid
57 5.6 mg
17.4 mmol L-1
5.8 mg
17.4 mmol L-1
98 µL
1.7 mol L-1
1 mL 50 µL gold 100 °C 3 h 4.2 mL 0.8 mL
Table S6.5: Conditions for the synthesis of UiO-66 film.
Exp. Precursor solution Droplet volume Substrate Temperature Reaction time Vapor source
ZrOCl2•8H2O P diacid acetic acid DMF DMF acetic acid
58 0.93 mg
2.9 mmol L-1
0.475 mg
2.9 mmol L-1
13.3 µL
232 mmol L-1
1 mL 50 µL gold 100 °C 3 h 4.2 mL 0.8 mL

On-Surface Synthesis of Highly Oriented Thin Metal-Organic Framework Films through
Vapor-Assisted Conversion
192
2. AFM analysis of an oriented UiO-66(NH2) film
Figure S6.2: AFM topological images of 5.2 × 5.2 µm at 0.5 mm from edge (a) and (b) and of the
center (c) area of a UiO-66(NH2) film (Exp. 10). (d) and (e) magnified 3 × 3 µm area as topological
and phase images of (c).
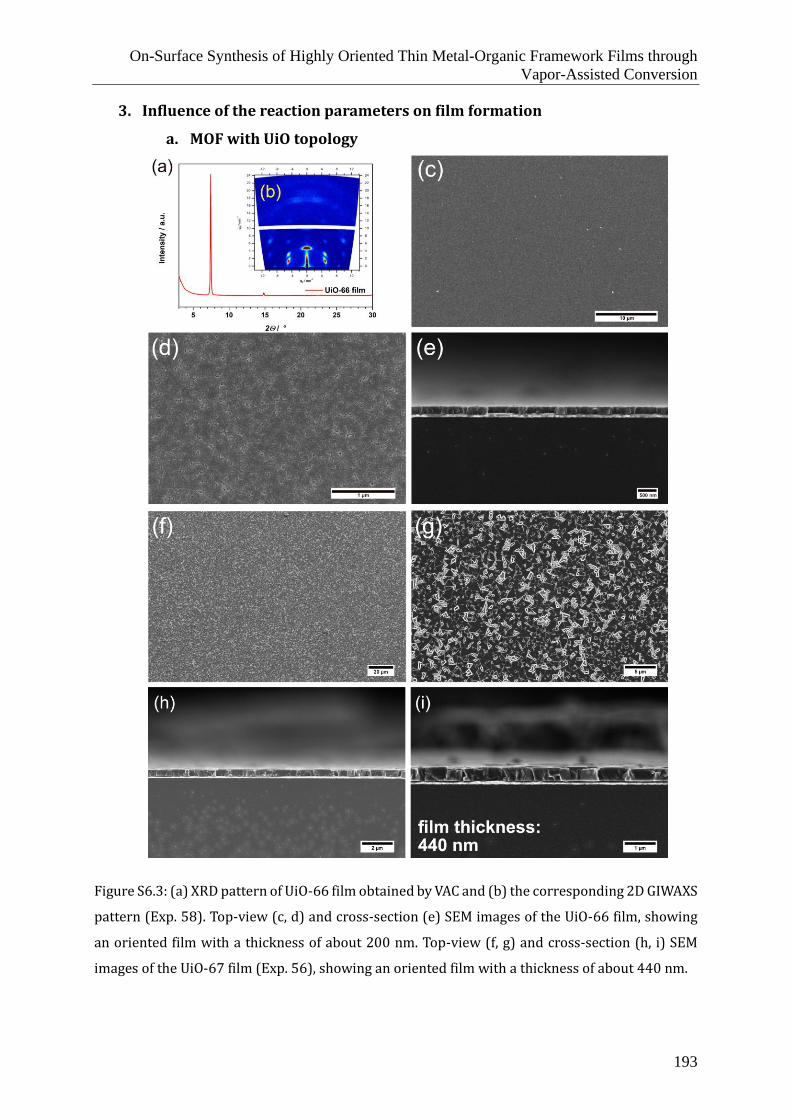
On-Surface Synthesis of Highly Oriented Thin Metal-Organic Framework Films through
Vapor-Assisted Conversion
193
3. Influence of the reaction parameters on film formation
a. MOF with UiO topology
Figure S6.3: (a) XRD pattern of UiO-66 film obtained by VAC and (b) the corresponding 2D GIWAXS
pattern (Exp. 58). Top-view (c, d) and cross-section (e) SEM images of the UiO-66 film, showing
an oriented film with a thickness of about 200 nm. Top-view (f, g) and cross-section (h, i) SEM
images of the UiO-67 film (Exp. 56), showing an oriented film with a thickness of about 440 nm.

On-Surface Synthesis of Highly Oriented Thin Metal-Organic Framework Films through
Vapor-Assisted Conversion
194
Figure S6.4: Top-view (a, b) and cross-section (c) SEM images of the UiO-68(NH2) film (Exp. 57),
showing a film with a thickness of about 1.3 µm and randomly distributed crystals on top of this
film.
.

On-Surface Synthesis of Highly Oriented Thin Metal-Organic Framework Films through
Vapor-Assisted Conversion
195
b. Control experiments
i. UiO-66(NH2)
Figure S6.5: XRD patterns of UiO-66(NH2) films that were obtained under different synthesis
conditions and the PXRD pattern calculated for UiO-66 (black): (a) acetic acid and DMF as
components of the vapor source and the precursor solution (Exp. 22); (b) acetic acid present only
in the vapor source (Exp. 23); (c) acetic acid present only in the precursor solution (Exp. 24); (d)
no acetic acid present at all (Exp. 25); (e) acetic acid as the only vapor source component (Exp.
26); (f) without any vapor source (Exp. 27).

On-Surface Synthesis of Highly Oriented Thin Metal-Organic Framework Films through
Vapor-Assisted Conversion
196
ii. PPPP−PIZOF-1
Figure S6.6: XRD patterns of PPPP−PIZOF-1 films that were obtained under different synthesis
conditions and the PXRD pattern calculated for PPPP−PIZOF-1 (black): (a) acetic acid and DMF as
components of the vapor source and precursor solution (Exp. 50); (b) acetic acid present only in
the vapor source (Exp. 51) or (c) acetic acid present only in the precursor solution (Exp. 52); (d)
no acetic acid present at all (Exp. 53); (e) acetic acid as the only vapor source component (Exp.
54); (f) without any vapor source (Exp. 55).

On-Surface Synthesis of Highly Oriented Thin Metal-Organic Framework Films through
Vapor-Assisted Conversion
197
c. The impact of the precursor and modulator concentrations on the MOF film
growth
i. UiO-66(NH2)
Figure S6.7: Calculated PXRD pattern of UiO-66 and XRD patterns of the UiO-66(NH2) films
obtained from solutions with a precursor concentration of 8.7 mmol L-1 at acetic acid
concentrations in the precursor solution ranging from 0−700 mmol L-1 which correspond to 0, 4,
20, 40 and 80 mol. equiv. related to ZrOCl2•8H2O (Exp. 1-5). The corresponding SEM images are
shown in Figures S6.8-S6.12.

On-Surface Synthesis of Highly Oriented Thin Metal-Organic Framework Films through
Vapor-Assisted Conversion
198
Figure S6.8: Top-view (a, b) and cross-section (c, d) SEM images of the UiO-66(NH2) film obtained
without acetic acid in the precursor solution (Exp. 1) showing a dense film with a thickness of
about 2.0 µm consisting of MOF nanoparticles. The corresponding XRD is provided in Figure S6.7.

On-Surface Synthesis of Highly Oriented Thin Metal-Organic Framework Films through
Vapor-Assisted Conversion
199
Figure S6.9: Top-view (a, b) and cross-section (c, d) SEM images of the UiO-66(NH2) film obtained
with 35 mmol L-1 acetic acid in the precursor solution (Exp. 2) showing a dense film with a
thickness of about 1.2 µm consisting of MOF nanoparticles. The corresponding XRD is provided in
Figure S6.7.

On-Surface Synthesis of Highly Oriented Thin Metal-Organic Framework Films through
Vapor-Assisted Conversion
200
Figure S6.10: Top-view (a, b) and cross-section (c, d) SEM images of the UiO-66(NH2) film obtained
with 175 mmol L-1 acetic acid in the precursor solution (Exp. 3) showing a dense film with a
thickness of about 1.8 µm consisting of MOF nanoparticles. The corresponding XRD is provided in
Figure S7.

On-Surface Synthesis of Highly Oriented Thin Metal-Organic Framework Films through
Vapor-Assisted Conversion
201
Figure S6.11: Top-view (a, b) and cross-section (c, d) SEM images of the UiO-66(NH2) film obtained
with 350 mmol L-1 acetic acid in the precursor solution (Exp. 4) showing a dense film with a
thickness of about 750 nm consisting of MOF nanoparticles. The corresponding XRD is provided
in Figure S6.7.

On-Surface Synthesis of Highly Oriented Thin Metal-Organic Framework Films through
Vapor-Assisted Conversion
202
Figure S6.12: Top-view (a, b) and cross-section (c, d) SEM images of the UiO-66(NH2) film obtained
with 700 mmol L-1 acetic acid in the precursor solution (Exp. 5) showing a dense film with a
thickness of about 2.3 µm consisting of MOF crystals and underneath a MOF film of about 300 nm
thickness. The corresponding XRD is provided in Figure S6.7.

On-Surface Synthesis of Highly Oriented Thin Metal-Organic Framework Films through
Vapor-Assisted Conversion
203
Figure S6.13: Calculated PXRD pattern of UiO-66 and XRD patterns of the UiO-66(NH2) films
obtained from solutions with a precursor concentration of 2.9 mmol L-1 at acetic acid
concentrations in the precursor solution ranging from 0−232 mmol L-1 which correspond to 0, 4,
20, 40 and 80 mol. equiv. related to ZrOCl2•8H2O (Exp. 6-10). The corresponding SEM images are
shown in Figures S6.14-S6.18.

On-Surface Synthesis of Highly Oriented Thin Metal-Organic Framework Films through
Vapor-Assisted Conversion
204
Figure S6.14: Top-view (a, b) and cross-section (c, d) SEM images of the UiO-66(NH2) film,
obtained without acetic acid in the precursor solution (Exp. 6) showing a dense film with a
thickness of about 1.0 µm consisting of MOF nanoparticles. The corresponding XRD is provided in
Figure S6.13.

On-Surface Synthesis of Highly Oriented Thin Metal-Organic Framework Films through
Vapor-Assisted Conversion
205
Figure S6.15: Top-view (a, b) and cross-section (c, d) SEM images of the UiO-66(NH2) film obtained
with 12 mmol L-1 acetic acid in the precursor solution (Exp. 7) showing a dense film with a
thickness of about 690 nm consisting of MOF nanoparticles. The corresponding XRD is provided
in Figure S6.13.

On-Surface Synthesis of Highly Oriented Thin Metal-Organic Framework Films through
Vapor-Assisted Conversion
206
Figure S6.16: Top-view (a, b) and cross-section (c, d) SEM images of the UiO-66(NH2) film obtained
with 58 mmol L-1 acetic acid in the precursor solution (Exp. 8) showing a dense film with a
thickness of about 280 nm consisting of MOF crystallites. The corresponding XRD is provided in
Figure S6.13.

On-Surface Synthesis of Highly Oriented Thin Metal-Organic Framework Films through
Vapor-Assisted Conversion
207
Figure S6.17: Top-view (a, b) and cross-section (c, d) SEM images of the UiO-66(NH2) film obtained
with 116 mmol L-1 acetic acid in the precursor solution (Exp. 9) showing a dense film with a
thickness of about 175 nm consisting of MOF crystallites and randomly distributed MOF crystals
on top of the film. The corresponding XRD is provided in Figure S6.13.

On-Surface Synthesis of Highly Oriented Thin Metal-Organic Framework Films through
Vapor-Assisted Conversion
208
Figure S6.18: Top-view (a-d) and cross-section (e, f) SEM images of the UiO-66(NH2) film obtained
with 232 mmol L-1 acetic acid in the precursor solution (Exp. 10) showing a dense film with a
thickness of about 235 nm consisting of MOF crystallites. The corresponding XRD is provided in
Figure S6.13.

On-Surface Synthesis of Highly Oriented Thin Metal-Organic Framework Films through
Vapor-Assisted Conversion
209
ii. PPPP−PIZOF-1
Figure S6.19: Calculated PXRD pattern of PPPP−PIZOF-1 and XRD patterns of the PPPP−PIZOF-1
films obtained from solutions with a precursor concentration of 8.7 mmol L-1 at acetic acid
concentrations in the precursor solution ranging from 0−700 mmol L-1 which correspond to 0, 4,
20, 40 and 80 mol. equiv. related to ZrOCl2•8H2O (Exp. 28-32). The corresponding SEM images
are shown in Figures S6.20, S6.21.

On-Surface Synthesis of Highly Oriented Thin Metal-Organic Framework Films through
Vapor-Assisted Conversion
210
Figure S6.20: Top-view (a-d) and cross-section (e, f) SEM images of the PPPP−PIZOF-1 film
obtained without acetic acid in the precursor solution (Exp. 28) showing a film with a thickness
of about 2.5 µm consisting of MOF crystals. The corresponding XRD is provided in Figure S6.19.

On-Surface Synthesis of Highly Oriented Thin Metal-Organic Framework Films through
Vapor-Assisted Conversion
211
Figure S6.21: Top-view (a) and cross-section (b) SEM images of the PPPP−PIZOF-1 film obtained
with 35 mmol L-1 acetic acid in the precursor solution (Exp. 29) showing a layer of randomly
distributed MOF crystallites with a thickness of about 10 µm. The corresponding XRD is provided
in Figure S6.19.
Figure S6.22: Calculated PXRD pattern of PPPP−PIZOF-1 and XRD patterns of the PPPP−PIZOF-1
films obtained from solutions with a precursor concentration of 2.9 mmol L-1 at acetic acid
concentrations in the precursor solution ranging from 0−232 mmol L-1 which correspond to 0, 4,
20, 40 and 80 mol. equiv. related to ZrOCl2•8H2O (Exp. 33-37).

On-Surface Synthesis of Highly Oriented Thin Metal-Organic Framework Films through
Vapor-Assisted Conversion
212
d. The impact of the droplet volume on the MOF film growth
i. UiO-66(NH2)
Figure S6.23: Calculated PXRD pattern of UiO-66 and XRD patterns of the UiO-66(NH2) films
obtained by using droplet volumes ranging from 10−100 µL (Exp. 11-13). The corresponding SEM
images are shown in Figures S6.18, S6.24, S6.25.
.
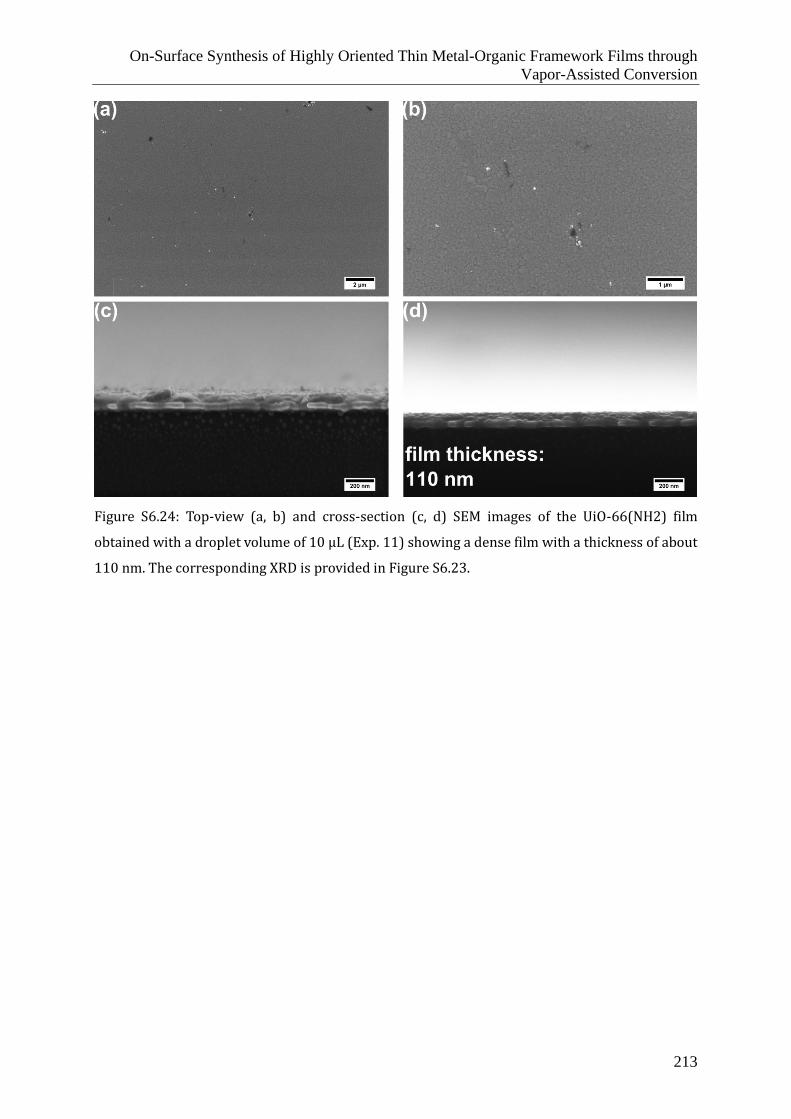
On-Surface Synthesis of Highly Oriented Thin Metal-Organic Framework Films through
Vapor-Assisted Conversion
213
Figure S6.24: Top-view (a, b) and cross-section (c, d) SEM images of the UiO-66(NH2) film
obtained with a droplet volume of 10 µL (Exp. 11) showing a dense film with a thickness of about
110 nm. The corresponding XRD is provided in Figure S6.23.

On-Surface Synthesis of Highly Oriented Thin Metal-Organic Framework Films through
Vapor-Assisted Conversion
214
Figure S6.25: Top-view (a, b) and cross-section (c, d) SEM images of the UiO-66(NH2) film
obtained with a droplet volume of 100 µL (Exp. 13) showing a dense film with a thickness of about
390 nm. The corresponding XRD is provided in Figure S6.23.

On-Surface Synthesis of Highly Oriented Thin Metal-Organic Framework Films through
Vapor-Assisted Conversion
215
ii. PPPP−PIZOF-1
Figure S6.26: Calculated PXRD pattern of PPPP−PIZOF-1 and XRD patterns of the PPPP−PIZOF-1
films obtained by using droplet volumes ranging from 10−100 µL (Exp. 38-40). The corresponding
SEM images are shown in Figures S6.27-S6.29.

On-Surface Synthesis of Highly Oriented Thin Metal-Organic Framework Films through
Vapor-Assisted Conversion
216
Figure S6.27: Top-view SEM images of the PPPP−PIZOF-1 film obtained with a droplet volume of
10 µL (Exp. 38) showing oriented crystals with an edge length of about 3.0 µm. The corresponding
XRD is provided in Figure S6.26.

On-Surface Synthesis of Highly Oriented Thin Metal-Organic Framework Films through
Vapor-Assisted Conversion
217
Figure S6.28: Top-view SEM images of the PPPP−PIZOF-1 film obtained with a droplet volume of
50 µL (Exp. 39) showing oriented crystals with an edge length of about 4.6 µm. The corresponding
XRD is provided in Figure S6.26.
Figure S6.29: Top-view SEM images of the PPPP−PIZOF-1 film obtained with a droplet volume of
100 µL (Exp. 40) showing oriented crystals with an edge length of about 6.5 µm. The
corresponding XRD is provided in Figure S6.26.

On-Surface Synthesis of Highly Oriented Thin Metal-Organic Framework Films through
Vapor-Assisted Conversion
218
e. Impact of reaction temperature and reaction time on the MOF film growth
i. UiO-66(NH2)
Figure S6.30: Calculated PXRD pattern of UiO-66 and XRD patterns of UiO-66(NH2) films obtained
at a reaction temperature of 120 °C (Exp. 19), 100 °C (Exp. 10), and 80 °C (Exp. 20). The
corresponding SEM images are shown in Figure S6.18, S6.31 and S6.32.

On-Surface Synthesis of Highly Oriented Thin Metal-Organic Framework Films through
Vapor-Assisted Conversion
219
Figure S6.31: Top-view (a, b) and cross-section (c, d) SEM images of the UiO-66(NH2) film
obtained at a reaction temperature of 120 °C (Exp. 19) showing a dense film with a thickness of
about 415 nm consisting of MOF nanoparticles. The corresponding XRD is provided in Figure
S6.30.
Figure S6.32: Top-view (a, b) SEM images of the UiO-66(NH2) film obtained at a reaction
temperature of 80 °C (Exp. 20) showing a dense film. The corresponding XRD is provided in Figure
S6.30.

On-Surface Synthesis of Highly Oriented Thin Metal-Organic Framework Films through
Vapor-Assisted Conversion
220
Figure S6.33: Calculated PXRD pattern of UiO-66 and XRD patterns of UiO-66(NH2) films obtained
with a reaction time of 1 h (Exp. 21) or 3 h (Exp. 10). The corresponding SEM images are shown
in Figures S6.18 and S6.34.
Figure S6.34: Top-view (a) and cross-section (b) SEM images of the UiO-66(NH2) film obtained
with a reaction time of 1 h (Exp. 21), showing a film with a thickness of about 300 nm. The
corresponding XRD is provided in Figure S6.32.

On-Surface Synthesis of Highly Oriented Thin Metal-Organic Framework Films through
Vapor-Assisted Conversion
221
ii. PPPP−PIZOF-1
Figure S6.35: Calculated PXRD pattern of PPPP−PIZOF-1 and XRD patterns of PPPP−PIZOF-1 films
obtained at a reaction temperature of 120 °C (Exp. 46), 100 °C (Exp. 28), 80 °C (Exp. 47), and 60
°C (Exp. 48). The corresponding SEM images are shown in Figures S6.20, S6.36-S6.38.
Figure S6.36: Top-view (a) and cross-section (b) SEM images of the PPPP−PIZOF-1 film obtained
at a reaction temperature of 120 °C (Exp. 46), showing crystals loosely distributed on the surface.
The corresponding XRD is provided in Figure S6.35.

On-Surface Synthesis of Highly Oriented Thin Metal-Organic Framework Films through
Vapor-Assisted Conversion
222
Figure S6.37: Top-view (a, b) SEM images of the PPPP−PIZOF-1 film obtained at a reaction
temperature of 80 °C (Exp. 47), showing crystals distributed on the surface. The corresponding
XRD is provided in Figure S6.35.
Figure S6.38: Top-view (a, b) SEM images of the PPPP−PIZOF-1 film obtained at a reaction
temperature of 60 °C (Exp. 48), showing crystals distributed on the surface. The corresponding
XRD is provided in Figure S6.35.

On-Surface Synthesis of Highly Oriented Thin Metal-Organic Framework Films through
Vapor-Assisted Conversion
223
Figure S6.39: Calculated PXRD pattern of PPPP−PIZOF-1 and XRD patterns of PPPP−PIZOF-1 films
obtained at a reaction time of 1 h (Exp. 49) or 3 h (Exp. 28). The corresponding SEM images are
shown in Figures S6.20 and S6.40.
Figure S6.40: Top-view (a) and cross-section (b) SEM images of the PPPP−PIZOF-1 film obtained
with a reaction time of 1 h (Exp. 49) showing an amorphous film with a thickness of about 145
nm. The corresponding XRD is provided in Figure S6.39.

On-Surface Synthesis of Highly Oriented Thin Metal-Organic Framework Films through
Vapor-Assisted Conversion
224
f. MOF film growth on different substrates
i. UiO-66(NH2)
Figure S6.41: Calculated PXRD pattern of UiO-66 and XRD patterns of UiO-66(NH2) films obtained
on SAM-modified gold surfaces (Exp. 14-16) and bare silicon surface (Exp. 17). The formulas of
the thiols used for the formation of the SAMs are shown in the Figure. The corresponding SEM
images are shown in Figures S6.42-S6.45.
Figure S6.42: Top-view (a) and cross-section (b) SEM images of the UiO-66(NH2) film obtained on
a gold surface modified with HS-(CH2)15-CO2H (Exp. 14). The images reveal an oriented film with
a thickness of about 160 nm. The corresponding XRD is provided in Figure S6.41.

On-Surface Synthesis of Highly Oriented Thin Metal-Organic Framework Films through
Vapor-Assisted Conversion
225
Figure S6.43: Top-view (a) and cross-section (b) SEM images of the UiO-66(NH2) film obtained on
a gold surface modified with HS-(CH2)16-OH (Exp. 15). The images reveal an oriented film with a
thickness of about 160 nm. The corresponding XRD is provided in Figure S6.41.
Figure S6.44: Top-view (a) and cross-section (b) SEM images of the UiO-66(NH2) film obtained on
a gold surface modified with HS-(CH2)15-CH3 (Exp. 16). The images reveal an oriented film with a
thickness of about 350 nm. The corresponding XRD is provided in Figure S6.41.
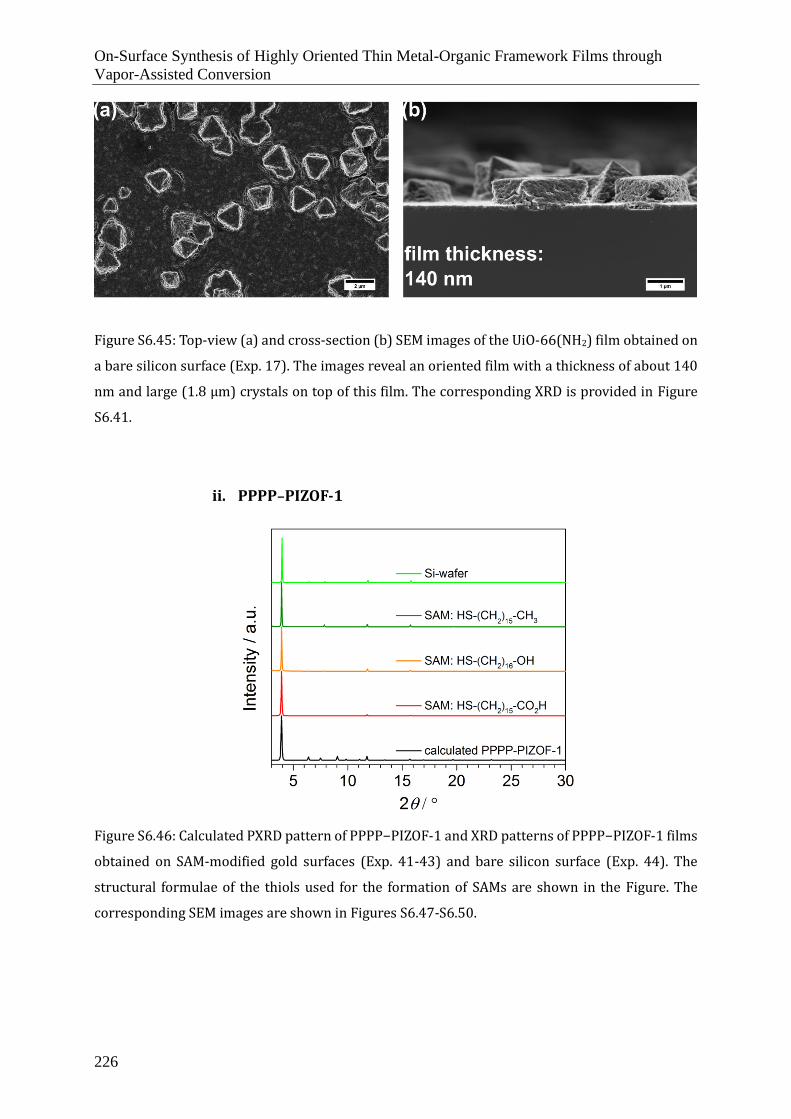
On-Surface Synthesis of Highly Oriented Thin Metal-Organic Framework Films through
Vapor-Assisted Conversion
226
Figure S6.45: Top-view (a) and cross-section (b) SEM images of the UiO-66(NH2) film obtained on
a bare silicon surface (Exp. 17). The images reveal an oriented film with a thickness of about 140
nm and large (1.8 µm) crystals on top of this film. The corresponding XRD is provided in Figure
S6.41.
ii. PPPP−PIZOF-1
Figure S6.46: Calculated PXRD pattern of PPPP−PIZOF-1 and XRD patterns of PPPP−PIZOF-1 films
obtained on SAM-modified gold surfaces (Exp. 41-43) and bare silicon surface (Exp. 44). The
structural formulae of the thiols used for the formation of SAMs are shown in the Figure. The
corresponding SEM images are shown in Figures S6.47-S6.50.

On-Surface Synthesis of Highly Oriented Thin Metal-Organic Framework Films through
Vapor-Assisted Conversion
227
Figure S6.47: Top-view SEM images of the PPPP−PIZOF-1 film obtained on a gold surface modified
with HS-(CH2)15-CO2H (Exp. 41). The images reveal oriented crystals with an edge length of about
3.6 µm. The corresponding XRD is provided in Figure S6.46.

On-Surface Synthesis of Highly Oriented Thin Metal-Organic Framework Films through
Vapor-Assisted Conversion
228
Figure S6.48: Top-view SEM images of the PPPP−PIZOF-1 film obtained on a gold surface modified
with HS-(CH2)16-OH (Exp. 42). The images reveal oriented crystals with an edge length of about
4.9 µm. The corresponding XRD is provided in Figure S6.46.

On-Surface Synthesis of Highly Oriented Thin Metal-Organic Framework Films through
Vapor-Assisted Conversion
229
Figure S6.49: Top-view SEM images of the PPPP−PIZOF-1 film obtained on a gold surface modified
with HS-(CH2)15-CH3 (Exp. 43). The images reveal oriented crystals with an edge length of about
4.8 µm. The corresponding XRD is provided in Figure S6.46.

On-Surface Synthesis of Highly Oriented Thin Metal-Organic Framework Films through
Vapor-Assisted Conversion
230
Figure S6.50: Top-view (a, b) and cross-section (c, d) SEM images of the PPPP−PIZOF-1 film
obtained on a bare silicon surface (Exp. 44) showing oriented crystals with an edge length of about
22.5 µm on top of a film with a thickness of about 9.2 µm. The corresponding XRD is provided in
Figure S6.46.

On-Surface Synthesis of Highly Oriented Thin Metal-Organic Framework Films through
Vapor-Assisted Conversion
231
g. Accessible pores of MOF films
i. UiO-66(NH2)
Figure S6.51: Calculated PXRD pattern of UiO-66 and XRD patterns of UiO-66(NH2) films obtained
on a QCM-chip (Exp. 18) and on a bare gold surface (Exp. 10).
ii. PPPP−PIZOF-1
Figure S6.52: Calculated PXRD pattern of PPPP−PIZOF-1 and XRD patterns of PPPP−PIZOF-1 films
obtained on a QCM-chip (Exp. 45) and on a bare gold surface (Exp. 28).

On-Surface Synthesis of Highly Oriented Thin Metal-Organic Framework Films through
Vapor-Assisted Conversion
232
4. Homogeneity of UiO-66(NH2) and the PPPP−PIZOF-1 films
a. Coverage
Figure S6.53: SEM images of UiO-66(NH2) films grown on 1.0 cm x 1.3 cm gold coated substrates
(Exp.10). (a) Low magnification image taken at the edge of the substrate showing the film using
secondary electron detection. (b) A corresponding Z-contrast image reveals a homogenous
coverage of the gold layer to the very edge of the substrate. (c-d) An image of the middle part of
the UiO-66(NH2) film taken at higher magnification and with Z-contrast showing the complete
coverage of the surface.
An often-observed phenomenon in film preparation through solution-based processes is
a decrease in surface coverage at the edges of the substrate due to various effects such as
drying. In the case of PPPP−PIZOF-1 we detect loosely packed MOF crystals in an area
within 200 µm from the edges of the substrate as revealed by SEM micrographs using Z-
contrast imaging (Figure S6.54), in addition to surface coverage throughout the remainder
of the substrate. These results demonstrate a homogenous PPPP−PIZOF-1 film coverage
of 93%.

On-Surface Synthesis of Highly Oriented Thin Metal-Organic Framework Films through
Vapor-Assisted Conversion
233
Calculations with the image processing software revealed that within the area of the
homogenous PPPP−PIZOF-1 film 1.3% of the gold surface is not covered by the film
(Figure S6.55). Combining the two coverage factors, we calculate a total covered area of
91.7%.
Figure S6.54: SEM images of PPPP−PIZOF-1 films grown on 1.0 cm x 1.3 cm gold substrates (Exp.
28). (a) Low magnification image taken at the edge of the substrate showing the film using
secondary electron detection. (b) The corresponding Z-contrast image reveals a gradient in film
coverage of the gold at the substrate edge. (c) An image taken at the middle part of the film at
higher magnification and with Z-contrast, shows the homogenous coverage of the surface. (d)
Schematic illustration of the coverage calculation.

On-Surface Synthesis of Highly Oriented Thin Metal-Organic Framework Films through
Vapor-Assisted Conversion
234
Figure S6.55: SEM image of PPPP-PIZOF-1 film with Z-contrast (a) showing the long-range
coverage obtained with the PPPP−PIZOF-1 film, with the bright area representing the gold surface,
and (b) showing the negative image of (a), with black areas representing the gold surface.
b. Thickness
Figure S6.56: SEM cross-section images of UiO-66(NH2) taken at (a) the middle and (b) the edge
of the film revealing a uniform film.

On-Surface Synthesis of Highly Oriented Thin Metal-Organic Framework Films through
Vapor-Assisted Conversion
235
c. Crystallinity and Orientation
To assess the degree of crystallinity and the degree of orientation of the MOF films, 2.5 cm
× 1.0 cm films were studied using 2D grazing-incidence wide-angle X-ray scattering
(GIWAXS) measurements at five different sites of the film going from one edge of the
substrate to the other, as indicated with red lines (Figure S6.57). Using a 50 μm wide X-
ray beam which covered the whole substrate length of 1.0 cm at grazing incidence angle,
allowed for high spatial resolution. The obtained 2D diffraction data for the five different
sites reveal very high homogeneity in terms of coverage, crystallinity as well as degree of
crystallite orientation within the films of both UiO-66(NH2) and PPPP−PIZOF-1.
Figure S6.57: Top: illustration of the 2D GIWAXS line scan experiment. 2D GIWAXS patterns of UiO-
66(NH2) (upper line) and of PPPP−PIZOF-1 (lower line) reveal a high degree of orientation along
the substrate.

On-Surface Synthesis of Highly Oriented Thin Metal-Organic Framework Films through
Vapor-Assisted Conversion
236
d. Energy-dispersive X-ray (EDX) spectroscopy
Figure S6.58: EDX spectra of oriented (a) UiO-66 and (b) PPPP−PIZOF-1 films grown on silicon
substrates. Chlorine Kα and Kβ lines are marked as blue insets. The absence of these lines indicates
that the ZrOCl2 precursor was consumed quantitatively. Note that the film were not washed, but
solely dried under dynamic vacuum.

On-Surface Synthesis of Highly Oriented Thin Metal-Organic Framework Films through
Vapor-Assisted Conversion
237
6. EtOH physisorption
Figure S6.59: XRD patterns of activated bulk (a) PPPP−PIZOF-1 and (b) UiO-66(NH2) prior to the
sorption experiments. (c) and (d) Ethanol sorption isotherms of the respective bulk materials at
293 K. Prior to the analysis the MOFs were activated at 120 °C for 6 h under high vacuum.

On-Surface Synthesis of Highly Oriented Thin Metal-Organic Framework Films through
Vapor-Assisted Conversion
238
7. Macroscopic photographs of UiO-66(NH2) and the PPPP−PIZOF-1 films
Figure S6.60: Macroscopic images of (a) gold substrate (1.3 cm x 1.0 cm) cast with the precursor
solution prior to the synthesis. (b) Gold substrates retrieved from the reactor after synthesis
without further drying under reduced pressure.
Figure S6.61: Macroscopic photographs of UiO-66(NH2) films grown on a) 1.0 cm x 1.3 cm and b)
2.5 cm x 2.5 cm gold coated substrates. c) A bare gold coated substrate as a reference. d) XRD
pattern of the film on the large substrate.

On-Surface Synthesis of Highly Oriented Thin Metal-Organic Framework Films through
Vapor-Assisted Conversion
239
Figure S62. Macroscopic photographs of PPPP−PIZOF-1 films grown on a) 1.0 cm x 1.3 cm and b)
2.5 cm x 2.5 cm gold coated substrates. c) A bare gold surface as a reference. d) XRD pattern of the
film on the large substrate.
8. References
1. Bronkhorst, www.fluidat.com 2017.
2. Schaate, A.; Roy, P.; Godt, A.; Lippke, J.; Waltz, F.; Wiebcke, M.; Behrens, P., Chem. - Eur. J. 2011, 17 (24), 6643-
6651.
3. Lippke, J.; Brosent, B.; von Zons, T.; Virmani, E.; Lilienthal, S.; Preuße, T.; Hülsmann, M.; Schneider, A. M.;
Wuttke, S.; Behrens, P.; Godt, A., Inorg. Chem. 2017, 56 (2), 748-761.
4. Hinterholzinger, F. M.; Wuttke, S.; Roy, P.; Preuße, T.; Schaate, A.; Behrens, P.; Godt, A.; Bein, T., Dalton Trans.
2012, 41 (14), 3899-3901.


Conclusion
241
7. Conclusion
This thesis is focussed on studying molecular frameworks, how the morphology of
materials can be controlled and how it influences the properties of the materials, and how
structural modifications change electronic properties.
In the third chapter, we discuss a novel ethoxy-functionalized benzodithiophene based
COF, namely BDT-OEt COF, which was synthesized under solvothermal conditions. BDT-
OEt COF features crystallinity, mesoporosity, and high surface area. A series of COFs
consisting of both BDT and BDT-OEt building units in different ratios was synthesized.
Highly crystalline, mesoporous frameworks were obtained for all BDT : BDT-OEt COFs. A
nearly linear evolution from BDT to BDT-OEt COF was observed with regard to pore size
and crystallite domain size upon the gradual incorporation of BDT-OEt building units into
the COF backbone. Furthermore, we show that the final building unit ratios in the
framework can be predetermined prior to the COF synthesis. Therefore, the COF
backbones and chemical pore environment can be finely tuned towards desired properties
while an eclipsed layer arrangement is retained. Molecular dynamics simulations and DFT
calculations shed light on the preferred orientation of the ethoxy groups in the pores.
Furthermore, the simulations illustrate that the incorporation of ethoxy chains causes a
subtle lateral displacement of the BDT COF layers relative to each other.
In the following chapter, we demonstrate the preparation of COF films and coatings by
depositing COF particles on conducting substrates in an electric field through
electrophoretic deposition (EPD). Hereby, 2D and 3D imine and boronate ester-linked
COFs of different particle sizes and morphologies were deposited on metal, transparent
conducting metal oxides, or steel meshes. By adjusting the EPD parameters, such as
deposition times, particle concentrations, and electrode potentials, film thicknesses could
be tuned and predetermined. The obtained films feature an inherent textural porosity
with interstitial voids between the deposited particles, thereby allowing for increased
contact to active media for applications such as catalysis. In addition, we showed that
through EPD, film composites consisting of mixed COFs can be straightforwardly
prepared, enabling encoded functionalities such as multipore COF films. Finally, a BDT-
ETTA COF film as well as a COF/Pt nanoparticle hybrid film were examined regarding their
performance in photoelectrochemical (PEC) water splitting, where a 19- and 117-

Conclusion
242
fold improvement of the photocurrent, respectively, was found over our previously
reported dense and oriented BDT-ETTA COF films. To put this work in perspective, it
shows that film morphology plays a crucial role for different applications and should be
considered in combination with the inherent properties of the COFs. This, as well as the
simplicity and generality of the approach, underlines the importance of EPD as an addition
to the toolbox of COF film preparation methods. Therefore, we believe that this work will
assist in designing high-performance devices for specific applications.
In the fifth chapter, we report two novel, 2D imine-linked COFs based on the electron-rich
Wurster-motif, named WTA and WBDT. The highly crystalline materials were analyzed by
PXRD refinement and structure modeling. Nitrogen physisorption revealed the existence
of dual-pore systems with high surface areas. Additionally, oriented thin films of the COFs
were synthesized, which were subsequently used to study the optical properties and
electronic energy levels. The macroscopic electrical conductivity of the COFs was studied
by means of van-der-Pauw measurements on pressed pellets and oriented thin films
grown on glass substrates. Depending on the linear linker in the COF, conductivities of the
pristine materials as high as 1.64 ∙ 10−3 S m−1 were determined. Furthermore, different
dopants, as well as different doping concentrations, were investigated to create the radical
cation forms of the COFs, and their long-term effect on the electrical conductivity was
assessed. The use of F4TCNQ as a strong electron acceptor yielded conductivities as high
as 3.67 ∙ 100 S m−1, the highest value for doped imine-linked COFs reported so far.
Moreover, the impact of doping on the optical absorption and the formation of radicals in
the COF could be correlated with the changes in conductivity. In contrast to previous work
in the field of conductive COFs, it could be shown that the high conductivities resulting
from doping are stable over time for the organic acceptor molecule F4TCNQ. This stability
is of central importance in order to be able to exploit high conductivities by doping
permanently.
In the context of electrical conductivity, we discovered that the geometry of the linker can
deviate from planarity and still show high conductivity values. In addition, non-planar
COFs have the added value of high-crystallinity and robustness achieved through
molecular docking sites. Encoding electrical conductivity in these non-planar systems
requires the selection of suitable electroactive building blocks. Increasing the electrical
conductivity in these systems through doping is highly dependent on the dopant, and we
can attribute the long-term stability to a combination of factors, e.g., a robust framework

Conclusion
243
and a chemically innocent dopant. We believe that these results will contribute to the
development of new strategies for the design of COFs for various applications, such as
sensors or optoelectronics.
The sixth chapter is about the growth of highly oriented thin films of UiO-66, UiO-66(NH2),
UiO-67, UiO-68(NH2), and even of an interpenetrated MOF, the PPPP–PIZOF-1, on a variety
of surfaces—bare gold, gold surfaces modified with thiol SAMs, and bare silicon—by
applying vapor-assisted conversion (VAC). The obtained MOF films exhibit a high degree
of crystallinity and crystal orientation extending to large areas where the MOF crystallites
are intergrown, forming almost flawless tile patterns. A detailed study regarding the
parameters governing the MOF film formation, including modulator equivalents,
precursor concentration, temperature, and reaction time reveals a link between the rate
of the crystallization and the formation of the oriented MOF film. Tuning the
crystallization process by including a modulator led to highly crystalline and oriented
films. Remarkably, a reaction time of only 3 h and a temperature of 100 °C are required for
the formation of oriented MOF films. Both UiO-66(NH2) and PPPP–PIZOF-1 films show
considerable ethanol uptake at room temperature, rendering these MOF films functional
materials suitable for on-chip host–guest studies. On the basis of the above, we introduce
the VAC process as a versatile, gentle, and efficient method for the synthesis of highly
crystalline and oriented thin MOF films. We envision that VAC protocols will be generated
for many additional MOF topologies, which so far were not deposited as homogeneous,
porous thin films and macroscopic coatings. As such, VAC is an important addition to the
toolbox of film deposition technologies for porous frameworks.


Curriculum Vitae
245
8. Curriculum Vitae
EDUCATION
04/2013 – 03/2015 Ludwig-Maximilians-Universität München
Master of Science in Chemistry
Title of Master Thesis (Prof. Bein Research Group): “Room Temperature
Synthesis of Covalent Organic Framework Films through Vapor Assisted
Conversion and the Synthesis of Pyromellitic Diimide Derivatives for Pore
Functionalization”
08/2013 – 12/2013 Cornell University, Ithaca, New York, USA
Visiting Researcher, Prof. Dichtel Research Group
10/2009 – 02/2013 Ludwig-Maximilians-Universität München
Bachelor of Science in Chemistry and Biochemistry
10/2008 – 09/2009 Technische Universität München (Technical University of Munich)
Chemical Engineering
1999 – 2008 Gymnasium Bad Aibling
Abitur (A-levels)
Name Julian Markus Rotter
Date of birth 25. July 1988 in Munich
Nationality German
PHD
since 06/2015 Ludwig-Maximilians-Universität München (University of Munich)
Research group Prof. Bein, Physical Chemistry
„Molecular Frameworks - from morphological and structural control to
electronic properties“


List of Publications
247
9. List of Publications
(1) Keller, N.; Sick, T.; Bach, N. N.; Koszalkowski, A.; Rotter, J. M.; Medina, D. D.; Bein, T.
Dibenzochrysene enables tightly controlled docking and stabilizes photoexcited states in
dual-pore covalent organic frameworks. Nanoscale 2019, 11, 23338–23345.
(2) Rotter, J. M.; Weinberger, S.; Kampmann, J.; Sick, T.; Shalom, M.; Bein, T.; Medina, D. D.
Covalent Organic Framework Films through Electrophoretic Deposition—Creating
Efficient Morphologies for Catalysis. Chem. Mater. 2019, 31, 10008–10016.
(3) Ma hringer, A.; Jakowetz, A. C.; Rotter, J. M.; Bohn, B. J.; Stolarczyk, J. K.; Feldmann, J.;
Bein, T.; Medina, D. D. Oriented Thin Films of Electroactive Triphenylene Catecholate-
Based Two-Dimensional Metal-Organic Frameworks. ACS Nano 2019, 13, 6711–6719.
(4) Ma hringer, A.; Rotter, J.; Medina, D. D. Nanostructured and Oriented Metal-Organic
Framework Films enabling Extreme Surface Wetting Properties. Beilstein J. Nanotechnol.
2019, 10, 1994–2003.
(5) Sick, T.; Rotter, J. M.; Reuter, S.; Kandambeth, S.; Bach, N. N.; Do blinger, M.; Merz, J.; Clark,
T.; Marder, T. B.; Bein, T.; et al. Switching On and Off Interlayer Correlations and Porosity in
2D Covalent Organic Frameworks. JACS [Online early access]. DOI: 10.1021/jacs.9b02800.
(6) Wuttke, S.; Medina, D. D.; Rotter, J. M.; Begum, S.; Stassin, T.; Ameloot, R.; Oschatz, M.;
Tsotsalas, M. Bringing Porous Organic and Carbon-Based Materials toward Thin-Film
Applications. Adv. Funct. Mater. 2018, 28, 1801545.
(7) Virmani, E.; Rotter, J. M.; Ma hringer, A.; Zons, T. von; Godt, A.; Bein, T.; Wuttke, S.;
Medina, D. D. On-Surface Synthesis of Highly Oriented Thin Metal-Organic Framework
Films through Vapor-Assisted Conversion. JACS 2018, 140, 4812–4819.
(8) Sick, T.; Hufnagel, A. G.; Kampmann, J.; Kondofersky, I.; Calik, M.; Rotter, J. M.; Evans, A.;
Do blinger, M.; Herbert, S.; Peters, K.; et al. Oriented Films of Conjugated 2D Covalent
Organic Frameworks as Photocathodes for Water Splitting. JACS 2018, 140, 2085–2092.
(9) Medina, D. D.; Petrus, M. L.; Jumabekov, A. N.; Margraf, J. T.; Weinberger, S.; Rotter, J. M.;
Clark, T.; Bein, T. Directional Charge-Carrier Transport in Oriented Benzodithiophene
Covalent Organic Framework Thin Films. ACS Nano 2017, 11, 2706–2713.

List of Publications
248
(10) Lohse, M. S.; Rotter, J. M.; Margraf, J. T.; Werner, V.; Becker, M.; Herbert, S.; Knochel, P.;
Clark, T.; Bein, T.; Medina, D. D. From benzodithiophene to diethoxy-benzodithiophene
covalent organic frameworks – structural investigations. CrystEngComm 2016, 18, 4295–
4302.
(11) Salonen, L. M.; Medina, D. D.; Carbo -Argibay, E.; Goesten, M. G.; Mafra, L.; Guldris, N.;
Rotter, J. M.; Stroppa, D. G.; Rodrí guez-Abreu, C. A supramolecular strategy based on
molecular dipole moments for high-quality covalent organic frameworks. Chem. Commun.
2016, 52, 7986–7989.
(12) Medina, D. D.; Rotter, J. M.; Hu, Y.; Dogru, M.; Werner, V.; Auras, F.; Markiewicz, J. T.;
Knochel, P.; Bein, T. Room temperature synthesis of covalent-organic framework films
through vapor-assisted conversion. JACS 2015, 137, 1016–1019.
(13) DeBlase, C. R.; Herna ndez-Burgos, K.; Rotter, J. M.; Fortman, D. J.; dos S. Abreu, D.;
Timm, R. A.; Dio genes, I. C. N.; Kubota, L. T.; Abrun a, H. D.; Dichtel, W. R. Cation-Dependent
Stabilization of Electrogenerated Naphthalene Diimide Dianions in Porous Polymer Thin
Films and Their Application to Electrical Energy Storage. Angew. Chem. 2015, 127, 13423–
13427.