


Bahasa
Halaman
Hukum


< _ FN - _ - _ _ -_N
> ~ ~~~~~ _ - -_~ - - ' -r_r -
C*
/~~~~~~~/
Pub
lic D
iscl
osur
e A
utho
rized
Pub
lic D
iscl
osur
e A
utho
rized
Pub
lic D
iscl
osur
e A
utho
rized
Pub
lic D
iscl
osur
e A
utho
rized
Pub
lic D
iscl
osur
e A
utho
rized
Pub
lic D
iscl
osur
e A
utho
rized
Pub
lic D
iscl
osur
e A
utho
rized
Pub
lic D
iscl
osur
e A
utho
rized
Research Observer
EDITORShantayanan Devarajan, World Bank
COEDITORSGershon Feder, World BankShahid Yusuf, World Bank
EDITORIAL BOARDPaul Collier, World Bank
Susan Collins, Georgetown UniversityAngus Deaton, Princeton University
Barry Eichengreen, University of California-BerkeleyEmmanuel Jimenez, World BankDanny M. Leipziger, World Bank
Howard Pack, University of PennsylvaniaMichael Walton, World Bank
The World Batik Research Observer is intended for anyone who has a professional interest indevelopment. Observer articles are written to be accessible to nonspecialist readers: con-tributors examine key issues in development economics, survey the literature and the lat-est World Bank research, and debate issues of development policy. Articles are reviewed byan editorial board drawn from across the Bank and the international community of econo-mists. Inconsistency with Bank policy is not grounds for rejection.
The journal welcomes editorial comments and responses, which will be considered for pub-lication to the extent that space permits. On occasion the Observer considers unsolicitedcontributions. Any reader interested in preparing such an article is invited to submit aproposal of not more than two pages to the Editor. Please direct all editorial correspon-dence to the Editor, The World Bank Research Observer. 1818 H Street, NW, Washington, DC2 04 33, UISA.
The views and interpretations expressed in this journal are those of the authors and do notnecessarily represent the views and policies of the World Bank or of its Executive Directorsor the countries they represent. The World Bank does not guarantee the accuracy of dataincluded in this publication and accepts no responsibility whatsoever for any consequencesof their use. When maps are used, the boundaries, denominations, and other informationdo not imply on the part of the World Bank Group any judgment on the legal status of anyterritory or the endorsement or acceptance of such boundaries.
For more information, pLease visit the Web sites of the Research Observer atwww.wbro.oupjourna[s.org, the WorLd Bank at www.worldbank.org,
and Oxford University Press at www.oup.com/us.
I * I :
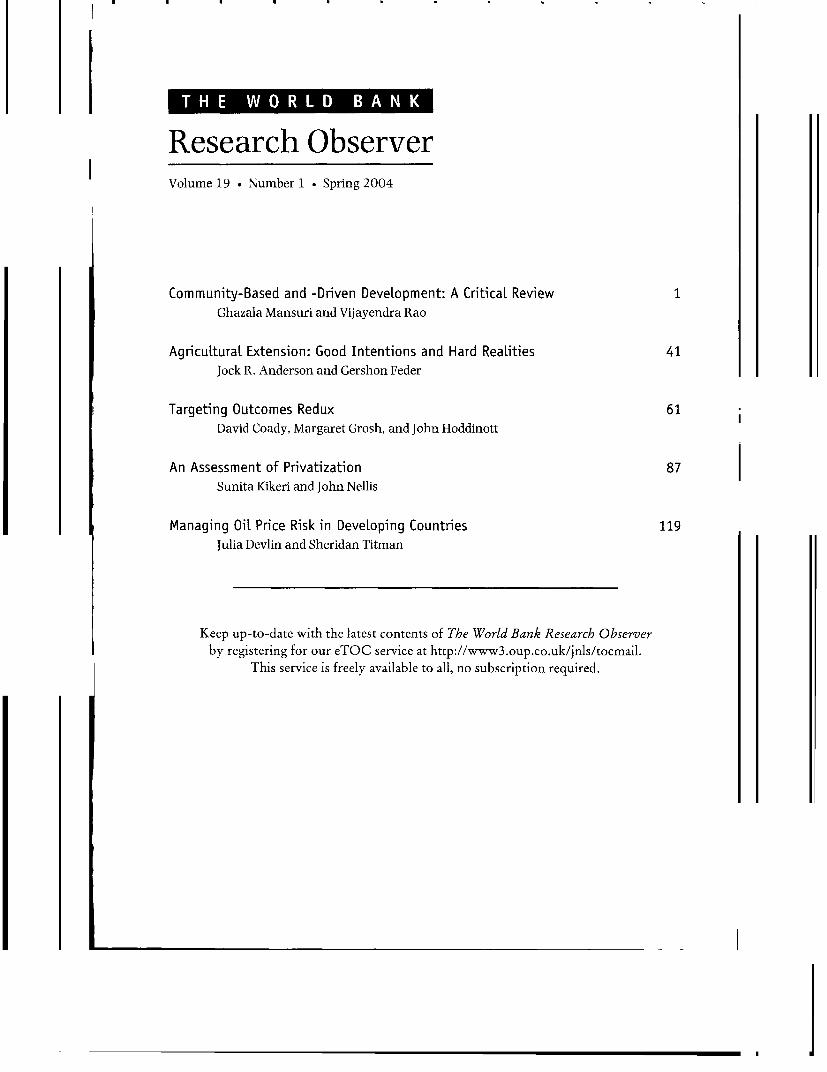
Research ObserverVolume 19 . Number 1 . Spring 2004
Community-Based and -Driven DeveLopment: A CriticaL Review 1Ghazala Mansuri and Vijayendra Rao
AgricuLturaL Extension: Good Intentions and Hard ReaLities 41Jock R. Anderson and Gershon Feder
Targeting Outcomes Redux 61David Coady, Margaret Grosh, and John Hoddinott
An Assessment of Privatization 87Sunita Kikeri and John Nellis
Managing OiL Price Risk in DeveLoping Countries 119Julia Devlin and Sheridan Titman
Keep up-to-date with the latest contents of The World Bank Research Observerby registering for our eTOC service at http://www3.oup.co.uk/jnls/tocmail.
This service is freely available to all, no subscription required.
SubscriptionsA subscription to The World Bank Research Observer (ISSN 0257-3032) comprises 2 issues. Prices include postage; forsubscribers outside the Americas, issues are sent air freight.Annual Subscription Rate (Volume 19, 2 issues, 2004)Academic librariesP'rint edition and site-wide online access: US$98/f67Print editioo only: US$9 3/f64Site-wide online access only: US$88/£61Corporate
Print edition and site-wide online access: US$121 /ft 8Print edition only: US$115/E 77Site-wide online access only: US$109/t 73Personal
Print edition and individual online access: US$ 36/t28Please note: C Sterling rates apply in Europe, 11S$ elsewhere.Readers with mailing addresses in non-OECD countries and in socialist economies in transition are eligible to receive comnplimen-tary subscriptions on request by writing to the UK address below.There may be other subscription rates available: for a complete listing, please visit www.wbro.oupjournals.org/subscriptions.Full prepayment in the correct currency is required for all orders. Orders are regarded as firm, and payments are not refund-able. Subscriptions are accepted and entered on a complete volume basis. Claims cannot be considered more than fourmonths after publication or date of order, whichever is later. All subscriptions in Canada are subject to GST. Subscriptions inthe EU may be subject to European VAT. If registered. please supply details to avoid unnecessary charges. For subscriptionsthat include online versions, a proportion of the subscription price may be subject to tJK VAT. Personal rates are applicableonly when a subscription is for individual use and are not available if delivery is made to a corporate address.Back issues: The current year and two previous years' issues are available from Oxford University Press. Previousvolumes can be obtained from the Periodicals Service Company, 11 Main Street, Germantown, NY 12526, USA. E-mail:[email protected]. Tel: 1518) 537-47 70. Fax: (5181 5 37-5899.Contact information: Journals Customer Service Department, Oxford UJniversity Press, Great Clarendon Street,Oxford OX2 6DP, UK. E-mail: jnls.cust.servCoupjournals.org. Tel: +44 01865 353907. Fax: +44 (0)1865 353485.In the Americas, please contact: Journals Customer Service Department, Oxford University Press, 2(0)1 Evans Road,Cary. NC 27513, tJSA. E-mail: jnlorders(w,ioupjournals.org. Tel: (800) 852-7323 (toll-free in USA/Canada) or (919)677-()977. Fax: (919) 677-1714. In Japan, please contact: journals Customer Service Department, Oxford UniversityPress, 1-1-17-5F, Mukogaoka. Bunkyo-ku, Tokyo. 113-0023, Japan. E-mail: okudaoup@,po.iijnet.or.jp. Tel: (03) 38131461.Fax: (03) 3818 1522.Postal information: The World Bank Researchi Observer (ISSN ()257-3032) is published by Oxford University Press forthe International Bank for Reconstruction and Development/TI WtOR5LD BASNK. Send address changes to The W(orld BankResearch Observer, Journals Customer Service Department. Oxford University Press, 2001 Evans Road, Cary, NC 27513-2009. Communications regarding original articles and editorial management should be addressed to The Editor, TheIWorld Barik Researcih Observer. The World Bank, 1818 H Street. NW, Washington, D.C. 20433. USA.Permissions: For information on how to request permissions to reproduce articles or information from this journal,please visit www.oupjournals.org/permissions.Advertising: Inquiries about advertising should be sent to Helen Pearson, Oxford Journals Advertising. PO Box 347,Abingdon OX14 1 GJ, UK. E-mail: helenCtioxfordads.com. Tel/Fax: +44 (0)1235 201904.Disclaimer: Statements of fact and opinion in the articles in The World Bank Research Observer are those of the respectiveauthors and contributors and not of the International Bank for Reconstruction and Development/rite WORLD BANK orOxlford University Press. Neither Oxford UJniversity Press nor the International Bank for Reconstruction and Develop-ment/TIlE WORD BSANK make any representation, express or implied, in respect of the accuracy of the material in this jour-nal and cannot accept any legal responsibility or liability for any errors or omissions that may be made. The readershould make her or his own evaluation as to the appropriateness or otherwise of any experimental technique described.Paper used: Thle World Batik Research Observer is printed on acid-free paper that meets the minimum requirements ofANSI Standard Z39.48-1984 (Permanence of Paper).Indcxing and abstracting: The Wt7orld Banik Researchi Observer is indexed and/or abstracted by ABI/I'N1 ORM, CAs .bstrracts,Current Contents/Social and Behavioral Sciences, Journal of Econoiuic Literature/EconLit, PAIS International, RePEc (Researchin Economic Papers), Social Services Citation Index, and WilsonI Businiess Abstracts.
Copyright @: The International Bank for Reconstruction and Development/ortt, WORDI BANK 2 0(14All rights reserved: no part of this publication may be reproduced, stored in a retrieval system. or transmitted in any form or byany means, electronic. mechanical, photocopying, recording, or otherwise without prior written permission of the publisheror a license permitting restricted copying issued in the UK by the Copyright Licensing Agency Ltd, 9( Tottenham Court Road.London WIP 9HE, orin the USA by the Copyright Clearance Center 222 Rosewood Drive. Danvers, MA 011923.
Community-Based and -DrivenDevelopment: A Critical Review
Ghazala Mansuri * Vijayendra Rao
Community-based and -driven development projects have become an important form ofdevelopment assistance, with the World Bank's portfolio alone approximating $7 billion.A review of their conceptual foundations and evidence on their tufc lil fi t s\ shows that
projects that rely on community participation have not been particularly effective at targetingthe poor. There is some evidence that such projects create effective comnmunity infrastructure,but not a single study establishes a causal relationship between any outcome and participatoryelements of a community-based development project. Most such projects are dominated byelites, and both targeting and project quality tend to be markedly worse in more unequalcommunities. A distinction between potentially "benevolent" forms of elite domination andmorepernicious types of capture is likely to be importantfor understandingproject dynamnicsand outcomes. Several qualitative studies indicate that the sustainability of community-basedinitiatives depends crucially on an enabling institutional environment, which requiresgovernment commitment, and on accountability of leaders to their community to avoid"supply-driven demand-driven" development. External agents strongly influence projectsuccess, but facilitators are often poorly trained, particularly in rapidly scaled-up programs.The naive application of complex contextual concepts like participation, social capital, andempowerment is endemic among project implementers and contributes to poor design andimplementation. The evidence suggests that community-based and -driven developmentprojects are best undertakenz in a context-specific manner, with a long time horizon andwith careful and well-designed monitoring and evaluation systemns.
Community-based development and its more recent variant, community-drivendevelopment, are among the fastest-growing mechanisms for channeling develop-ment assistance. Community-based development is an umbrella term for projects thatactively include beneficiaries in their design and management, and community-driven development refers to community-based development projects in which
The World Bank Research Observer, vol. 19, no. 1,c The International Bank for Reconstruction and Development / TIHE WORLD BANK 2004: all rights reserved.DOI: 10.1093/wbro/lkh012 19:1-39
communities have direct control over key project decisions, including managementof investment funds.
By conservative calculations. the World Bank's lending for such projects has risenfrom US$ 32 5 million in 1996 to $2 billion in 2003-or from $ 3 billion in 1996 to$7 billion in 2003 when lending for an enabling environment for such projects isincluded.' The World Bank's Poverty Reduction Strategy Paper Sourcebook (Dongierand others 2001) views community-driven development as a mechanism for enhan-cing sustainability, improving efficiency and effectiveness, allowing poverty reductionefforts to be taken to scale, making development more inclusive, empowering poorpeople, building social capital, strengthening governance, and complementing mar-ket and public sector activities. Community-driven development is said to achieve allthis by reducing information problems (by eliciting development priorities directlyfrom target communities and allowing communities to identify projects and eligiblerecipients of private benefits), expanding the resources available to the poor(through credit, social funds, capacity building, and occupational training), andstrengthening the civic capacities of communities by nurturing organizations thatrepresent them.
The potential gains from community-driven development are large. It has theexplicit objective of reversing power relations in a manner that creates agency andvoice for poor people, allowing them to have more control over development assis-tance. This is expected to make the allocation of development funds more responsiveto their needs, improve the targeting of poverty programs, make government moreresponsive, improve the delivery of public goods and services, and strengthen thecapabilities of the citizenry to undertake self-initiated development activities.
This vision has become one of the cornerstones of the World Bank's Comprehen-sive Development Framework, with its increasing emphasis on empowerment(Dongier and others 2001; Narayan 2002). This vision is not universally shared,however. Skeptics have misgivings about the basic precepts of the approach andmore practical concerns with the challenges of implementing such projects. Sum-mers (2001), for example, is concerned that local institutions promoted under theaegis of such projects could undermine democratically elected governments. Harriss(2001), Mosse (2001), Cooke and Kothari (2001), and others have focused on whathappens when complex and contextual concepts like commutnity, empowerment andcapacity for collective actiorn are applied to the needs of large development projects ontight timelines. Project implementers, whose incentives are often poorly alignedwith the needs of the project. may choose to gloss over differences within targetgroups that underscore local power structures and to short-change the more diffi-cult task of institution building in favor of more easily deliverable and measurableoutcomes.
Many critics note that evidence on community-driven development initiativeslags well behind the rate at which projects are being implemented and scaled up.
2 The Wo7orld Bank Research Observer, vol. 1 9, no. 1 (Spring 2004)
However, the diversity of views and the intensity of their expression make a review
of the available evidence both necessary and timely. Because of the considerable
overlap between community-based and community-driven development projects,
evaluation evidence is reviewed for any project with community participation as
a crucial element of its design. Using this broader definition, there is enough credible
research to glean some useful insights about specific facets of these programs. That is
the purpose of this review.The article focuses on several questions for which reliable information could be
found: Does community participation improve the targeting of private benefits? Are
the public goods created by community participation projects better targeted to the
poor? Are they of higher quality, or better managed, than similar public goods
provided by the government? Does participation lead to the empowerment of margin-
alized groups-does it lessen exclusion, increase the capacity for collective action, or
reduce the possibility that locally powerful elites will capture project benefits? Do the
characteristics of external agents-donors, governments, nongovernmental organi-
zations (NGOS), and project facilitators-affect the quality of participation or project
success or failure? Finally, can community participation projects be sustainably
scaled up?The literature reviewed includes two main types of studies: impact evaluations,
which use statistical or econometric techniques to assess the causal impact of specific
project outcomes, and ethnographic or case studies, which use anthropological
methods, such as participant observation, in-depth interviews, and focus group
discussions. Although case studies cannot attribute impact, they often provide a
more nuanced picture of projects in particular contexts and yield insights that can
be difficult to generate with quantitative techniques.The focus is on studies that have either undergone the test of peer-reviewed
publication, or have been conducted by independent researchers. This allows
the use of an exogenous rule that improves the quality and reduces the level of
potential bias while casting a wide enough net to let in research from a variety of
disciplinary perspectives on different types of community-based development
projects.The article looks first at the history of participatory development and the
move toward community-based development as a key mechanism for channeling
development assistance. The second section examines the literature on participatory
development and collective action to clarify what is meant by participation and
social capital, what constitutes a community, and what are the likely constraints on
community participation. The third section reviews the evidence on the effectiveness
of community participation and attempts to answer some of the questions raised.
The fourth section focuses on the feasibility of sustainably scaling up projects,
and the final section highlights the main findings and identifies the gaps in
knowledge.
Ghazala Manisuri and Vijayendra Rao 3
Participatory Development and Development AssistanceThere is a long history of community-based forms of development. Clearly significantwere the cooperative movement and Gandhian (Gandhi 1962) notions of villageself-reliance and small-scale development, which Gandhi saw as an antidote to thecorrosive effects of modernization and colonial rule. Another influential perspectivewas that of Paulo Freire (1970), whose Pedagogy of the Oppressed argues that the"oppressed" needed to unite to find a way to improve their own destinies. These ideasled to a first-wave of participatory development in the 1950s, which by 1960 hadspread to more than 60 countries in Africa, Asia, and Latin America, largelythrough the efforts of the U.S. Agency for International Development (USAID; White1999). Funding for these programs dried up in the early 1960s, and within a decademost were shut down. White (1999:111) notes that one important lesson from thefirst wave was "fadism" among development agencies, which "build up anapproach-to the extent that it is virtually a requirement that a country have sucha program in order to receive aid-and then lose interest, leaving the program tocollapse."
Economists long remained skeptical of the approach. The early literature ondevelopment policy was strongly influenced by the work of Olson (1973) and RussellHardin (1982) on collective action to achieve a common goal or pursue a commoninterest.2 Olson argued that without coercion or some other special device to makeindividuals act in their common interest, "rational self-interested individuals willnot act to achieve their common or group interests." Olson was concerned with"exploitation of the great by the small," because those with smaller interests ina public good would tend to free-ride on the efforts of those with greater interests.Garrett Hardin's (1992) "tragedy of the commons" also acquired metaphoricalpower-particularly as environmental concerns became more important-but hasmuch broader implications that impinge on a range of economic problems, includ-ing the domain of the public and the private, decentralization of power to local gov-ernments, and the provision and management of a host of goods and services thatare to some degree public or are common-pool resources. Like Hardin, propertyrights theorists such as Demsetz (1970) and North (1990) argued that commonproperty resources would be overexploited as demand rose unless the commonswere enclosed or protected by strong state regulation. This view generated a greatdeal of pessimism in multilateral development institutions about the viability of localcollective action in the provision of public goods and created a strong impetus forstate provision of public goods, state regulation of common-pool resources, and anemphasis on development of private property rights.
By the mid-1980s, critics of "big development" were complaining that manylarge-scale, government-initiated development programs, from schooling to healthto credit to irrigation systems, were performing poorly, while rapidly degrading
4 The World Bank Research Observer, vol. 19. no. 1 (Spring 2004)
common-pool resources were creating significant negative environmental and poverty
impacts. These complaints reawakened interest in the local management of
resources and decisions. The participatory development movement led by Chambers
(1983) and others was important in applying these ideas to small-scale development
in ways that would allow the poor to be informed participants in development, with
external agents acting mainly as facilitators and sources of funds. Further support
came from the increasingly strong critique of development from academic social
scientists, such as Escobar (1995) and Scott (1998), who argued that top-down per-
spectives were both disempowering and ineffective. Meanwhile, projects like the
Self-Employed Women's Association in India, the Orangi slum improvement project
in Pakistan, and the Iringa Nutrition project in Tanzania were generating interest as
highly successful instances of community-driven development (Krishna, Uphoff,
and Esman 1997) that could provide important lessons for large donors.
Thinking in mainstream development circles was also significantly affected by the
work of Hirschman (1970, 1984), Cernea (198 5), and Ostrom (1990). Hirschman's
(1970) notions of "voice" and "exit" provided a way for development practitioners to
understand how collective agency could improve well-being, views that were bol-
stered by Hirschman's (1984) own attempts to apply these ideas to participatory
development. Cernea (1985) showed how large organizations like the World Bank
could "put people first" by working systematically at the local level.
Ostrom's (1990) work on the management of common-pool resources shifted per-
ceptions on the potential for collective action in poor communities. Ostrom argued
that what made Olson's and Hardin's work most powerful also made it dangerous.
She considered the use of these models as a foundation for policy troubling because
their results depended on a set of constraints imposed for purposes of analysis. Their
relevance in empirical settings, she argued, was an open question rather than a fore-
gone conclusion. In the real world, after all, the capabilities of those involved can be
changed, thus altering the constraints themselves. Ostrom and others assembled
considerable evidence from case studies to show that endogenous institutions often
managed common-pool resources-often very successfully. Thus, Hardin's "open
access" was not the universal model for managing common-pool resources and
"remorseless tragedies" were not an inevitable outcome.
Sen's (1985, 1999) influential effort to shift the focus of development from material
well-being to a broad-based "capability" approach also deeply influenced the devel-
opment community. Central to this approach were strategies to "empower" poor
people, an agenda taken on by the World Bank and other donors as part of their
response to critiques of top-down development. Arguments for "participatory devel-
opment," as advocated by Chambers (1983) and others, led to the inclusion of
participation as a crucial means of allowing the poor to have control over decisions.
The inclusion of participatory elements in large-scale development assistance
came quickly at the World Bank, in social investment funds (Narayan and Ebbe
Ghazala XMansziri and VlijaHyendra Rao 5

1997) and other forms of assistance. Initially focusing on targeting, these projectshave moved toward a more holistic attempt at inducing participation through insti-tutions that organize the poor and build their capabilities to act collectively in theirown interest (Narayan 2002). The World Bank's (2001) World Development Report2000/2001: Attacking Poverty focused on empowerment as a key priority of develop-ment policy. This has led to a broad-based effort at the World Bank to scale up com-munity-based development and to make it an important element of programs thatseek to improve the delivery of public services (World Bank 2003).
With this second wave of interest in community-based approaches to develop-ment,3 a movement that originated in revolutionary goals that were anti-colonialand anti-modernization has been absorbed into the mainstream of development.This transformation has required a new vocabulary to describe its objectives andprocesses. The next section reviews the key terms and ideas briefly.
Participation, Community, and Social Capital
Community-based development relies on communities to use their social capital toorganize themselves and participate in development processes. Thus, concepts suchas participation, community, and social capital are critical to how communityparticipation is conceptualized and implemented. Handbooks, guidelines, andterms of reference all use the concepts uncritically, assuming that they are widelyand uniformly understood. What each of these concepts implies, however, is quitecontroversial.
Participation
The cornerstone of community-based development initiatives is the active involve-ment of members of a defined community in at least some aspects of project designand implementation. Although participation can occur at many levels, a key objectiveis the incorporation of local knowledge into the project's decision-making processes.When potential beneficiaries also make key project decisions, participation becomesself-initiated action-what has come to be known as the exercise of voice and choiceor empowerment. Participation is expected to lead to better designed projects, bettertargeted benefits, more cost-effective and timely delivery of project inputs, and moreequitably distributed project benefits with less corruption and other rent-seekingactivity.
This idealized transformatory capacity of participation has been challenged onseveral grounds. First, the exercise of voice and choice can be costly under certainconditions. At the most basic level, it may involve real or imputed financial lossesdue to the time commitments required for adequate participation. In addition,
6 The W4orld Bank Research Observer, vol. 19, no. I (Spring 2004)
participation may lead to psychological or physical duress for the most socially and
economically disadvantaged, because genuine participation may require taking
positions that are contrary to the interests of powerful groups. Although the premise
of participatory approaches is that the potential benefits outweigh such costs, this is
by no means certain.Second, mainstreaming participation has made it an instrument for promoting
pragmatic policy interests, such as cost-effective delivery or low-cost maintenance,
rather than a vehicle for radical social transformation. This may simply shift some of
the costs of service delivery to potential beneficiaries. Indeed, in both Asia (Bowen
1986) and Africa (Ribot 1995), participation has been described as a form of forced
or corvee labor, with the poor pressured into making far more substantial contribu-
tions than the rich.Third, the belief that exposure to participatory experiences will transform the
attitudes and implementation styles of authoritarian bureaucracies (governments or
donors) may be naive. The routinization of participatory planning exercises into the
work of public sector implementation agencies puts new pressures on resources
while leaving implementers unclear about the potential gain to themselves from this
new accountability.In an examination of several participatory projects, Mosse (2001) finds that even
in projects with high levels of participation, what was labeled "local knowledge" was
often a construct of the planning context and concealed the underlying politics of
knowledge production and use. He identifies four aspects of this. First, participatory
exercises are often public events and open-ended regarding target groups and pro-
gram activities. This makes such events inherently political, and what is reflected is
often strongly shaped by local relations of power, authority, and gender. Second,
outside agendas get expressed as local knowledge. Project facilitators shape and
direct participatory exercises, and villager "needs" are often shaped by perceptions of
what the project can deliver. Third, there is local collusion in the planning exercise.
People concur in the process of problem definition and planning because it creates
space within which they can manipulate the program to serve their own interests.
Although this can benefit both project staff and project beneficiaries, it clearly places
consensus and action above detailed planning. Fourth, the concept of participation
is used to legitimize the project's previously established priorities and the needs of
donors to include such processes in their projects. Because such projects have little
real support from the community or the project staff, operational demands eventu-
ally take over and participatory objectives and goals are sidelined.
The upshot seems to be that a project may deliver many things that both recipients
and project implementers consider beneficial, but what can actually be ascribed to
participation is unclear. A convincing evaluation would need to validate (or invali-
date) the participatory model itself and the relationship between project process and
impact.
Ghazala Mansuri and 17ijayendra Rao 7
Community
Participatory projects are typically implemented in a unit referred to as a community.Most of the literature on development policy uses the term community without muchqualification to denote a culturally and politically homogeneous social system orone that at least implicitly is internally cohesive and more or less harmonious, suchas an administratively defined locale (tribal area or neighborhood) or a commoninterest group (community of weavers or potters). This notion of community is prob-lematic at two levels. First, defining the geographic or conceptual boundaries ofa community is not always straightforward. Administrative boundaries can bemeaningless where settlement patterns are distinct from such boundaries or whereincreasing mobility or temporary migrations have transformed community boundaries.In many cases, factional, ethnic, or religious identities may further complicate thepicture. Second, an unqualified use of the term often obscures local structures ofeconomic and social power that are likely to strongly influence project outcomes.
Recent studies have shown that the uncritical adoption of the term commzlunity isparticularly problematic for participatory projects that seek to empower people whoare excluded or without voice (see, for example, Guijit and Shah 1998: Cooke andKothari 2001; Mosse 2001). What is labeled a community is often an endogenousconstruct defined by the parameters of a project, by project facilitators, or by thenature of administrative or identity boundaries rather than an organic form.4 Also,the effectiveness of participatory strategies may hinge on an explicit understandingof local structures of power, which both limit and enhance prospects for parti-cipatory development.
Social Capital
The third key concept in the literature on implementation of community participationprojects is social capital. This term, which entered the literature on participatory develop-ment in Robert Putnam's (1993) work on northern Italian communities, has stronglyaffected mainstream thinking on community-based and -driven development (seeWoolcock 1998 for a review). It has become common, for example, to refer to suchprojects as building social capital (Dongier and others 2003), or creating "assets forpoor people" (World Bank 2000). Putnam (1993:167) describes social capital as the"features of organization, such as trust, norms, and networks, that can improve theefficiency of society by facilitating coordinated actions." It refers to the ability of individu-als to build "bonds" within their own group and "bridges" to other groups and is deeplytied to the belief that the quality and quantity of group activity are key sources of acommunity's strength and its ability to work for its own betterment. Social capital isthus a stock from which people can draw to improve their incomes and which can be"built" to facilitate economic growth and development (Grootaert 1998).
8 The World Bank Research Observer, vol. 19. no. I (Spring 2004)

This version of social capital has been criticized on many grounds, among them
for not being concerned enough with issues of class distinction and power (Fine
2001; Harriss 2001); for ignoring reverse causality, with the link going from wealth
to more group activity rather than the other way (Portes 1998: Durlauf 2001): and
for not recognizing that it can be destructive as well as constructive (Portes 1998).
The operationalization of Putnam's ideas has recognized neither the complex strategic,
informational, and relational choices that underpin the endogeneity of community
formation nor the fact that community is itself an abstract social construct. Policy
recommendations thus focus on building communities to facilitate processes of com-
munity participation, without recognizing that investing in social capital may not be
as straightforward as investing in physical capital and may be considerably more
complex than investing in human capital. Returns to investments in social capital
can be realized only in concert with other members of a group and are thus likely to
be subject to all the concerns about collective action.
The delinking of power and social relationships has been criticized as one of the
main problems with the World Bank's application of Putnamian social capital
(Harriss 2001). A more nuanced understanding sees social capital as part of the
relations of power within a social system and recognizes that different groups within
a social system can have different types of social capital. It also recognizes that social
capital must be viewed contextually because it is embedded within structures of
power and can be used to facilitate collective action for the common good or to
perpetuate symbolic or actual violence against others. The rich may have better
internal and external networks than the poor and may use these networks to repro-
duce unequal systems of domination, as explored in the work of the sociologist
Bourdieu (1984, 1990, 1998), whose ideas precede Putnam's by at least two
decades. The poor have less powerful networks that may help them cope with the
vicissitudes of life but also restrict their chances for mobility. To the extent that such
capital can be bequeathed, it can contribute to the perpetuation of inequality.
Lately, social scientists associated with the World Bank have argued that social
capital is less an original theoretical concept and more an umbrella term that has
facilitated the insertion of social relations into the thinking of development insti-
tutions dominated by economists (Bebbington and others forthcoming). However,
now that social capital has made such powerful inroads into development thinking,
its value as a so-called Trojan umbrella may have passed and it may be time to
bring in all the complexity of thought on society and culture to inform the design
of development practice-as the best community participation projects already
do. Notions such as trust and norms are not generalizable, and that means that
social capital has to be understood within its cultural and political context
(Krishna 2002; Rao 2001), with Bourdieu supplanting Putnam as the main
theorist in the area. Building the capacity for collective action cannot be divorced
from a deep sense of the structures of power within which the poor attempt to
Ghazala Mansuiri and Vijayendra Rao 9
cope (Harriss 2001; Appadurai 2004; Rao and Walton 2004). The question thatremains is whether large development organizations can apply these complexnotions of the capacity for collective action in the everyday practice of projectimplementation.
In sum, precisely because community-based and -driven development turns thepyramid of development mechanisms upside down, by giving beneficiaries voice andchoice, it cannot ignore the social and cultural context within which beneficiarieslive and organize themselves. One possible consequence is that universalisticnotions, such as social capital or community, may have to be viewed as deeply con-textual and endogenous constructs. This implies that terms such as best practiceshould be retired to the archives of development and much greater emphasis shouldbe placed on contextualized project design.
Evidence on the Impact of Community-DrivenDevelopment Initiatives
This section examines the impact of community participation projects, looking atwhether they improve targeting, public service delivery, and project sustainabilityand reduce the risk of capture by elites. It also looks at the role of external agents andthe state.
Does Community Involvement Improve Targeting?
Selecting beneficiaries. Community involvement in selecting the beneficiaries ofanti-poverty programs has become increasingly common.5 Incorporating localknowledge, it is argued, can improve targeting, lower the informational costs ofdelivering anti-poverty programs, and ensure higher-quality monitoring of programimplementation (Chambers 1993; Ostrom, Lam, and Lee 1994; Uphoff 1986;Narayan 1998). But such informational advantages are likely to be realized onlywhen there are institutions and mechanisms to ensure local accountability. Someargue that such institutions are more likely to emerge in societies that are highlymobile, with a tendency toward homogeneous neighborhoods (see, for example,Seabright's 1996 analysis in the context of political decentralization). Where mobil-ity is low, communities are more likely to reflect social orderings with long historiesand deeply entrenched power hierarchies-just where poverty programs are mostneeded.6 Consequently, local inequality in relations of power and authority maywell allow program benefits to be captured by nontarget groups. In the extreme, thedecentralization of poverty programs in such contexts could worsen local inequalityand perpetuate local power relations.
10 The World Bantk Research Observer, vol. 19. no. I (Spring 2004)
Conning and Kevane's (2002) recent review of community-based targeting high-
lights this potential tradeoff. They find that although community groups are likely to
have better information on who the poor are, only communities that have relatively
egalitarian preferences, relatively open and transparent systems of decision-making,
or clear rules for determining who is poor will tend to be more effective than outside
agencies in targeting programs to the poor within those communities. Hetero-
geneous communities, where people have multiple and conflicting identities, may pose
a challenge because of competing incentives. They also note that communities vary
in their ability to mobilize information and monitor disbursements. This could affect
cost-efficiency and create further opportunities for corruption and capture by elites.
What do evaluations of community-based targeting mechanisms say on this issue?
Galasso and Ravallion (forthcoming) examine the targeting performance of a decen-
tralized poverty program in Bangladesh, the Food for Education program.7 First
participating Union Parishads (which typically have about 15 villages) were iden-
tified by the center, and then eligible households were identified at the community
level. Using both household and community data, Galasso and Ravallion examine
how much of the program's performance in reaching poor families was due to the
center's efforts to reach poor communities and how much to the communities'
efforts to reach their own poor. They also look at the factors that influenced target-
ing at both levels. They are specifically interested in the role of village institutions
and land inequality within villages as determinants of targeting performance.
Although they find a positive targeting differential (the difference in optimal
spending on the poor and the nonpoor), with more poor people than nonpoor people
receiving the program. the size of the effect is small and most of the targeting differ-
ential arises from targeting within villages. They find no evidence that the center is
targeting villages at all. The program's eligibility criteria for selecting participating
Union Parishads, for example, cannot account for any of the variation in the target-
ing differential or in allocations to the poor. If anything, the intervillage component
of the targeting differential tends to worsen the overall differential in participating
villages.8 In contrast, they find that structural features of the village are significant
predictors of targeting performance across villages. Villages that were more isolated
or had higher levels of land inequality tended to have poorer targeting performance.
The evidence thus indicates that the performance of decentralized targeting programs
can be substantially constrained by local inequality.
Alderman (2002) evaluates an Albanian economic support program (the Ndihme
Ekonomika) that provided social assistance to some 20 percent of the population. The
program provided a block grant to communes and allowed local officials to determine
eligibility and the amount of the transfer to beneficiary households. Alderman finds
that local officials were able to target recipients better than the center could have
done using proxy entitlement indicators. He surmises that communities were able to
improve targeting by using specialized information unavailable to the center.
Gliazala Mansuri and V'ijayJendra Rao 11
Other studies suggest that the center can identify poor communities reasonablywell, but does much less well at identifying the poor within communities. For example,Coady (2001) finds that PROGRESA, an anti-poverty program in Mexico that selectedpoor households on the basis of census data without any community involvement,was more effective at targeting poor communities than at targeting poor householdswithin them.
A series of studies on social funds, which have become a popular mechanism forpublic service delivery, also provide evidence on the targeting performance of anti-poverty programs. In a typical social fund, community infrastructure is built withlocal participation in the selection and management of facilities. In most cases,community representatives send project proposals to a central public agency, whichallocates funds on the basis of such criteria as extent of community involvement,community capacity for collective action, and other factors affecting the feasibility ofthe proposed project. Social fund rules almost always require that funds be targetedto poor communities, in accordance with specific targeting criteria, and oftenrequire some cofinancing from fund recipients. Most social funds restrict the menu offeasible projects to a limited number of public goods, usually schools, clinics, roads,and water and sanitation facilities.
Paxson and Schady (2002) assess poverty targeting in the Peruvian social fundFoncodes using district-level data on expenditures and poverty. They find that thefund, which emphasized geographic targeting. successfully reached the poorest dis-tricts but not the poorest households in those districts-better-off households wereslightly more likely than poor households to benefit. Using propensity score matching,Chase (2002) compares targeted communities in the Armenia Social Fund withcommunities that had not received projects but were in the pipeline for them. Hefinds that although the social fund was targeted to areas with the poorest infrastructure,these were not always the poorest areas. The fund was also slightly regressive in tar-geting households in rural areas. Like other social funds, the Armenia fund requireda community contribution. Chase reports some anecdotal evidence that this mayhave led to a selection bias against the poorest communities, which are often unwillingor unable to contribute. Using similar techniques to evaluate the Nicaragua SocialFund, Pradhan and Rawlings (2002) find that some social fund investments werewell targeted to poor communities and households. The World Bank's OperationsEvaluation Department, in reviewing these and other evaluations of social funds,concludes that although social funds' geographic targeting has been mildly progressive,social funds were less effective in targeting poor households (World Bank 2002).
In evaluating the success of Argentina's Trabajar 2 program, introduced in 1997with World Bank support, Jalan and Ravallion (2003) and Ravallion (2000) findthat it significantly expanded an earlier workfare program to provide short-termwork to poor households and to locate socially useful projects in poor areas. Thecentral government allocated funds to the provinces, making an effort to provide
12 The World Bank Research Observer, vol. 19. no. I (Spring 2004)
more program funding to poorer provinces. Provincial governments then allocated
funds to projects within the provinces. Projects were proposed by local governments
and NGOS, which bore the nonwage costs of the projects.
Jalan and Ravallion (2003) show that program participants were overwhelm-
ingly drawn from among the poorest households, reflecting successful self-targeting
based on the low program wage. Ravallion (2000) finds a marked improvement in
central government targeting of poorer provinces. He also finds some improvement
in reaching poorer areas within provinces. About a third of the overall improvement
in targeting poor areas came from better targeting of provinces, and the rest from
better targeting of poor areas within provinces. However, despite higher provincial
allocations to poorer provinces, provinces were initially less able to target their poor
areas. possibly because wealthier areas were better able to propose and cofinance
good projects. In response to this, project monitoring tools were set up that conti-
nuously updated targeting performance within provinces. Ravallion (2000) has shown
that this simple but powerful tool, which could be put in place as part of regular
project monitoring and evaluation, was able to substantially improve targeting of
the poor within provinces. This project demonstrates how targeting of poor areas
within a decentralized system can be improved by providing stronger incentives
from the center for pro-poor targeting by local governments.
Preference targeting. Because one of the theorized advantages of participation is
that it makes development demand-driven, participation should improve the match
between what a community needs and what it obtains-what can be called prefer-
ence targeting. There is little reliable evidence on preference targeting, which
ideally requires panel data with baseline information on major problems faced by
the community and postproject followup in experimental and control communities.
Rao and Ibanez (2003) present evidence on the Jamaica Social Investment Fund.
Sampled communities were asked to answer retrospective questions on their assess-
ment of major problems in the community before the social fund had been intro-
duced. These authors find that the overall match between the project and the
problems identified was poor. Only in two of the five communities studied did the
project match the preferences of a majority in that community. Better-educated and
better-networked people were more likely to obtain projects that matched their pref-
erences. Thus, overall preference targeting was poor, and preference targeting was
worse for the most deprived within the community. Despite that, some 80 percent of
respondents were satisfied with the chosen projects. This suggests that despite weak
initial targeting, a broad majority of beneficiaries were satisfied with the public good
provided.
Mechanisms for identifying who benefits. The literature also assumes that a com-
munity's definition of who is poor and vulnerable would be similar to that of social
Glhazala Manstiri and Vijayendra Rao 13

planners. This may not always be the case. Harragin (2004), in a case study offamine relief efforts in southern Sudan, finds that local notions of how food shouldbe distributed differed from those of aid workers, resulting in a poorly designedproject. Because what the community perceives as fair and just may be at variance withthe preferences of project supervisors, how should the effectiveness of targeting incommunity-based projects be evaluated-whose preferences should count?
Political economy considerations and perverse incentives created by projectperformance requirements can also result in poor targeting. Galasso and Ravallion(forthcoming) and Ravallion (2000) note that a desire to ensure a broad geographicspread of participants can weaken pro-poor geographic targeting by the center.Jalan and Ravallion (2003), in their evaluation of the Trabajar 2 program, also notethat social networks were a crucial determinant of who benefited from the workfareprogram. They argue that this can be corrected in the design of the program by offer-ing a wage low enough to discourage wealthier members of the community fromparticipating.
Schady (2000) shows that community support for then-President AlbertoFujimori affected the allocation of projects in the Peruvian social fund, Foncodes.Specifically, districts with a smaller share of pro-Fujimoro votes than in the previouselection received more funding-presumably to increase Fujimoro's popularity. Thisassociation was strongest in wealthier districts-again suggestive of a political link.Thus, programs that attempt to elicit community participation and meet commu-nity demand may be no less immune to political manipulation than strictly top-down programs.
Morris and others (1999), in their study of the Plandero anti-poverty program toincrease the incomes of the rural poor in western Honduras, find that better-off areaswere the most likely to receive program assistance, and the most deprived areaswere the least likely. They argue that the weak targeting was due to the project'simplementation schedule, its rate of return criteria, and an evaluation strategy thatemphasized economic results for beneficiary farmers. These jointly created an incen-tive to select areas that were easily reached-which typically tended to be better-offareas-and to target project benefits to better-off households within these areasbecause they tended to be the most creditworthy and most able to absorb projectfunds.
These ethnographic and case studies suggest that the mechanisms used to identifybeneficiaries are crucial in determining how pro-poor decentralized targeting willbe, especially when community members have unequal access to project imple-menters. The center's ability to target benefits to poor households may be con-strained by information gaps or political economy concerns. Although decentralizedtargeting can improve outcomes, it does not automatically solve the targetingproblem. Under certain conditions, local inequality can even worsen when targetingis decentralized.
14 The World Bank Research Observer, vol. 19. no. I (Spring 2004)

Does Community Involvement Improve Public Service Delivery?
Most large-scale community-based development projects supported by aid organiza-
tions aim to improve access to public services in one of two ways. The project either
produces the public good itself or enhances a community's capacity to act collec-
tively to obtain the public good from other providers, usually through social mobil-
ization activities.Assessing whether projects that produce public goods with community involvement
are more effective than those that supply public goods produced by others, typically
by governments, would focus on whether such projects were more consistent with
the preferences of target groups, better designed, more sustainable, and delivered public
services better. Assessments would ideally compare similar projects developed in
these two ways. But few evaluations do this in a completely satisfactory way. Most of
the evidence reviewed here compares community-driven development project areas
with communities that are otherwise similar but have no projects or have projects of
unclear method and provenance. One exception is Khwaja's (2001) evaluation of
community-driven projects funded by the Agha Khan Rural Support Program in
northern Pakistan. Khwaja compares a random sample of these projects with other
projects in the same village that involved no community participation. Khwaja finds
that community-managed projects are better maintained than projects managed by
the local government. He also finds that community participation in technical deci-
sions reduced the quality of maintenance, whereas community participation in non-
technical decisions significantly improved maintenance.
In a meta-analysis of reports on 52 USAID projects with participatory elements,
Finsterbusch and Van Wincklin (1989) conclude that less technically complex and
smaller projects were more effective than others. They also find that participatory
projects were more effective in more developed economies than in less developed
economies-suggesting that the broader institutional environment may play an
important supportive role. Although this appears to suggest that institutional
reform is required before participatory projects are introduced, the question is actually
quite difficult to answer because institutional reform probably makes all types of
development initiatives more effective.
Facilities constructed with community involvement tend to improve access to
public services. Paxson and Schady (2002) find that the Peruvian social fund Foncodes
increased school attendance, particularly for younger children. Chase and Sherburne
Benz (2001) reach a similar conclusion for the Zambia Social Fund. They also find
that household education expenditures rose where there was a school constructed by
the social fund and that use of primary care services and the prevalence of child vacci-
nations increased where there was a health facility constructed by the social fund.
Newman and others (2002), using both panel data and random assignment
approaches to evaluate the Bolivian Social Fund, find a significant reduction in
Ghazala Mansuri and Vijayendra Rao 15
under-age-five mortality due to the provision of health clinics but little change ineducation outcomes with the provision of education projects. The reason, they surmise,is that investments in health went beyond providing infrastructure to providingmedicine, furniture, and other necessary inputs. Newman and others (2002) alsofind that water projects improved water quality and access to water only whencommunity-level training was also provided. These findings suggest that to succeed,participatory projects need to go beyond construction of facilities and may requirethe continuing involvement of external agencies in providing marginal inputs andtraining.
King and Ozler (2000) evaluate the impact of school autonomy on student perfor-mance in Nicaragua, comparing participating and nonparticipating schools. Parti-cipating public schools acquired de jure responsibility for a range of functionspreviously managed centrally, including the right to hire and fire the director andmaintain the school's physical and academic quality. School management boardswere set up to handle these tasks, drawing their membership from among schoolstaff, parents, and students. King and Ozler find that students in schools with both dejure and de facto autonomy performed better on standardized tests than students inschools that did not have autonomy or that had only de jure autonomy. Their worksuggests that school effectiveness could be increased by decentralizing certainaspects of school management.
Jimenez and Sawada (1999) report that community-managed schools in El Salvadorhad fewer absences than comparable centrally managed schools. Jimenez andPaqueo (1996) find that schools in the Philippines that relied more on communitycontributions used their resources more efficiently. This literature, though not aboutcommunity-driven development in the strict sense but about the impact of participationon the provision of schooling services, unambiguously supports the idea of increasingschool autonomy to improve the quality of public schools.
Although these studies provide a positive impression of the impact of participationon project effectiveness, other studies are more ambiguous. Gugerty and Kremer(2000) use random assignments to evaluate the impact of a participatory programto provide agricultural inputs that was designed to build social capital amongwomen in western Kenya. They find that the costs of inputs were greater than thebenefits (increased agricultural output).
Hoddinott and others (2001) look at the relationship between participation andproject employment outcomes using data on public works programs from SouthAfrica's Western Cape Province and attempt to isolate the impact of de jure and defacto participation on each outcome using an instrumental variable strategy. Theirinstruments for participation are measures of community fractionalization (percentageof adults who are divorced, a measure of racial fractionalization, an index of politicalfractionalization). They find that participation has no effect on any of their outcomevariables. When they interact the participation variable with project type, the effects
16 The World Blnk Research Observer. vol. 19. nio. I (Sprinag 2004)
of participation are somewhat stronger but still quite weak. However, it is unclear
whether their instrument set is valid for the outcome variables they analyze, and
their results are also based on a small set of projects.In addition to impact evaluations, there are other types of studies that define the
causal effects less clearly but that are nevertheless interesting. Katz and Sara ( 19 9 7),
who analyze the performance of water systems in a variety of countries, find that
performance was markedly better in communities where households were able to
make informed choices about the type of system and the level of service they
required and where decision-making was democratic and inclusive. Projects
constructed without community supervision or management tended to be poorly
constructed by private contractors. Where construction was of poor quality despite
community participation, the reason was often inadequate technical support-similar
to Khwaja's (2001) findings on communities faring worse on technical decisions.
Katz and Sara also report that community members were more willing to pay for
investment costs when they had control over the funds. When government staff or
contractors controlled the funds, communities viewed their contribution as a tax
rather than a fee for service. 9
Isham and Kahkonen, in analyses of water projects in Indonesia (1999b) and
India and Sri Lanka (1999a), confirm that greater community participation is asso-
ciated with better water supply and that well-designed community-based water services
lead to improvements in health outcomes. Differences in project effectiveness are
explained largely by a community's ability to engage in collective action, with high
levels of "social capital" improving participation in design and monitoring. This is
also the conclusion of Rao and Ibanez (2003), who find that a community's capacity
for collective action influences its ability to successfully apply for funds from the
Jamaica Social Investment Fund. Poorly organized communities are not only less
likely to obtain projects but are also more likely to mismanage projects that are allo-
cated to them.
Does Community Involvement Improve Project Sustainability or the Capacityfor Collective Action?
Few studies have examined the relationship between community-based develop-
ment projects and capacity for collective action. Finsterbusch and Van Wincklin
(1989), in their review of USAID projects, claim without ambiguity that projects with
participatory elements increased the overall effectiveness of projects particularly in
building capacity for collective action. They make no attempt, however, to identify
the causal direction of this claim, which they assert largely on the basis of an anec-
dotal assessment of project reviews. In a study of incentives for collective action in
a district in south India, Wade (1987) reports that some villages had what he calls
a "public realm," with well functioning institutional arrangements for managing
Ghazala Mansuri and Vijayendra Rao 17
common-pool resources, while others had virtually no public realm. Accountingfor the difference, he argues, are economic factors that gave rise to differentialcollective benefits from organization. This suggests that stimulating participationby forming community organizations such as water user groups may require morethan educating people about their common interests or promoting communalvalues. It may also require helping them to understand the collective benefits ofparticipation.
Rao and Ibanez (2003) use propensity scores and qualitative methods in con-structing a survey with a contextualized, project-specific set of variables to explainselection into the program, thereby minimizing unobserved heterogeneity. Theythen match on observable differences to examine whether the Jamaica Social Invest-ment Fund increased the ability to engage in collective action and build trust. Theanswer is yes, but the effect was greater for more educated, better networked membersof the community. Gugerty and Kremer (2000), in their random assignment study,also find that bringing in outside assistance may change the composition of bene-ficiary groups. The formation and training of village groups attracted wealthier andmore educated men and women into leadership positions within the group becauseof the outside funding.
Does participation increase project sustainability? Here again the evidence is limitedbut instructive. Khwaja's (2001) study suggests that projects managed by commu-nities are more sustainable than projects managed by local governments because ofbetter maintenance. Katz and Sara (1997) and Isham and Kahkbhnen (1999a, b)also find strong associations between participation and sustainability, although theydo not establish causal direction. In an in-depth anthropological study of the sus-tainability of participatory projects, Kleemeier (2000) examines a Malawi ruralpiped water project and finds that half the schemes are performing poorly, with thenewest ones performing best. The weak sustainability, she argues, stems largelyfrom the lack of institutional support from external agencies-echoing the conclu-sions of Katz and Sara (1997) and Newman and others (2002).
For water projects in Sub-Saharan Africa, Cleaver (1999) finds that even if com-munities are initially successful in creating the project, they may lack the materialresources and connections to sustain their efforts. Mosse (1997a) comes to similarconclusions in an in-depth examination of tank management in south India. Hefinds that maintenance of community infrastructure is often crucially dependent onexternal agents. Thus, the need for a well-functioning state apparatus does not dis-appear with active community involvement.
Though community participation projects have the potential to be more sustainablethan top-down projects, they also appear to suffer from neglect by line ministriesonce they are completed. Several studies suggest that unless communities can lobbyfor continuing support for marginal inputs and training, their ability to sustain suchprojects may be limited.
18 The World Bank Research Observer, vol. 19, no. 1 (Spring 2004)
Economic and Social Heterogeneity and the Risk of Capture by Elites
Previous discussion suggested that a naive understanding of the concepts of
community, participation, and social capital can obscure differences that crit-
ically influence outcomes. Such differences may be driven by local structures
of power; by social divides based on gender, caste, race, or ethnic identities;
by uneven interest in the particular public good; or by economic inequality and
uneven resource distribution. How do such differences shape outcomes? When
is heterogeneity good for collective action, and when does it constrain true
participation.
Heterogeneity and inequality. There is a substantial and varied theoretical literature
on collective action and coordination by economists, sociologists, and anthro-
pologists that examines the relationship between heterogeneity and the capacity for
collective action. The literature identifies several constraints to collective action and
the types of environments that favor or disfavor coordination, offering a broad set of
hypotheses for empirical work.' 0
In a classic study, Olson (1973) argues that certain types of inequality might
favor the provision of public goods. In particular, Olson holds that collective action is
difficult to mobilize in large homogeneous groups in which no individual could make
a significant difference in the level of provision of the good. In contrast, smaller and
more unequal groups might do better, although there would be free-riding by those
with a smaller interest in the public good.Several other theoretical studies also suggest that inequality can be conducive to
the provision of pure public goods. For example, Bergstrom, Blume, and Varian
(1986) demonstrate that when individual preferences over private goods are identical
and distributional changes are mean-preserving, a redistribution of wealth can
leave the supply of the public good unchanged or even increase it. Itaya, Meza, and
Myles (1997) show that income inequality that is so great that only the rich contribute
to the public good increases welfare relative to the case in which all individuals con-
tribute. Baland and Platteau (1998) show that inequality in entitlements to
resource use is associated with greater conservation when there are decreasing
returns to effort for the resource-use technology.There have been several critiques of Olson's group-size paradox. Oliver, Marwell,
and Teixeira (19 8 5) argue that the probability, extent, and effectiveness of collective
action depend on the relation between contributions and levels of the public good
and on the extent and type of heterogeneity in the population. They show that
inequality of interest can increase the level of collective action. Because inequality
of interest is more likely in larger groups, public goods may be provided at higher
levels in large groups. However, free-riding remains a problem, and suboptimal
levels of collective action and provision of public goods are possible in large groups.
Ghazala Mansuri and Vijayiendra Rao 19
Oliver and colleagues also show that a strong positive correlation between interestand resource heterogeneity increases the probability of collective action.
Heckathorn (1993) argues that the polarizing effect of heterogeneity depends onhow collective action is organized. The key issue is that collective action can imposedifferential costs and benefits on members of a heterogeneous community. If all costs arecovered by voluntary contributions, there is no polarization. If the collective actionimposes negative net benefits on some members, polarization and conflict are likely.
The literature on collective action related to common-pool resources has alsofocused considerable attention on heterogeneity."1 Russel Hardin's (1982) pris-oner's dilemma outcome for common-pool resources with open access argues thatindividually rational strategies can lead to collectively irrational outcomes. Morerecently, Dayton-Johnson and Bardhan (2002) show that the relationship betweeninequality and levels of collective action in conservation can be U-shaped. In theor-etical work based on fisheries, they show that if fishers have earnings opportunitiesoutside the commons that are concave functions of wealth, increased inequality hasa negative effect on conservation. However, as inequality increases, levels of conser-vation can rise and perfect conservation is possible under perfect inequality.
The dominant economic approach to collective action on a common-propertyresource focuses on individual incentives to contribute, as determined by the privatebenefits and costs of participation. Baland and Platteau (forthcoming) show thatwhen collective action involves conservation, users' time preferences are also likelyto be important. Specifically, people with a shorter time horizon are more likely toadopt strategies that yield immediate results and neglect longer-term consider-ations. However, variations in time horizons are likely to be related to the initial dis-tribution of wealth. The poorest users may have wealth levels that are so low thatcollective action may violate their survival constraint. Thus, the poor may face parti-cular barriers to collective action.
The role of economic inequality is similarly conditioned by other factors. Balandand Platteau (1999) argue that the interactions among multiple dimensions of inequ-ality need to be considered to understand how they affect collective action. Forinstance, economic inequality can have very different effects when it is combinedwith caste or ethnic polarization than when it occurs within a more mobile socialstructure. When regulatory agencies have the power to enforce fines and sanctions,collect fees, and impose rules, inequality is less likely to constrain collective action(Baland and Platteau 1998).
Wade ( 198 7) notes that cultural forces often shape collective action by providingconventions or norms that act as implicit or informal equivalents of all-or-nothingcontracts (or assurance games) in resolving collective action dilemmas. He reportsthat effective village bodies are often composed of elites who can exercise authoritywith little or no pretense at representation. Thus, he argues, it may be necessary toorganize around existing structures of authority, with a major role for village elites.
20 The World Bank Research Observer, vol. 19, no. I (Spring 2004)
More recently. Chwe (1999. 2001) builds on this idea of regulatory authority.He argues that most models of collective action implicitly assume the preexistence of"common knowledge." This common knowledge permits games of strategy to beplayed with a common understanding of the rules of the game-everyone knowswhat everyone else is playing. The common knowledge assumption is arguably thecore concept behind amorphous notions such as trust and social capital that figureprominently in the discourse on collective action. Rao (200 3) builds on this to arguethat mechanisms for generating common knowledge, which he calls symbolic publicgoods, are precursors to the possibility of collective action in community develop-ment because they may mitigate the effects of heterogeneity. People who belong tothe community abide by the rules of the community both because they internalize itsideology and because they face sanctions if they violate the rules. The incentiveswork not just as exogenous constraints but as what can be called "constraining pref-erences" (Rao and Walton 2004). Thus. studying the ideology and beliefs under-lying collective action is key to understanding how it interacts with inequality andheterogeneity.
Empirical work on heterogeneity and collective action has focused mostly on eco-nomic or social (race, caste, ethnicity) heterogeneity. Social heterogeneity is themore difficult concept to measure because it is usually more than a matter of creatingan index that weighs the number of identifiable groups in the community by the sizeof their populations-though most of the economics literature does precisely this.
Alesina and La Ferrara (2000) examine the influence of heterogeneity on partici-pation using survey data on group membership in the United States and data on U.S.localities. They find, after controlling for many individual characteristics, that par-ticipation in social activities is significantly lower in more economically unequal ormore racially or ethnically fragmented communities. They also show that heterogeneityhas the most significant impact on participation in groups where excludability is lowand significant interaction among members is necessary. The study attempts to dealwith the possible endogeneity of the income inequality measure. It is unclear fromtheir study. however, what the marginal impact is of any given heterogeneity meas-ure. In particular, it is unclear how much racial or ethnic heterogeneity mattersonce economic inequality has been controlled for.
In a similar study. La Ferrara (2002) looks at the influence of inequality on groupparticipation using data from rural Tanzania. She also finds that higher levels ofvillage inequality reduce the probability of participation in any group. She reportsthat groups in more unequal communities were less likely to take decisions by vote,were more likely to report misuse of funds and poor group performance, and weremore likely to split up into homogeneous ethnic and income groups. interact lessfrequently, and to less motivated to participate.
In a random assignment evaluation of community-managed schools in Kenya,Gugerty and Miguel (2000) show that ethnic diversity results in fewer social sanctions
Ghazala Niansuri anti V ijatiendra Rao 21
against nonparticipants. This leads to low parental participation in school activitiesand poor attendance by teachers, which in turn reduce the funds available to theschool and worsen school quality.
Bardhan and Dayton-Johnson (2001), in a survey of the evidence on community-driven water projects in India. Mexico, and Nepal, conclude that heterogeneity hasa negative impact on cooperation and commons management and weakens thecohesive effect of social norms and the application of sanctions for violating cooperativebehavior and collective agreements. Bardhan (2000), examining the factors affectingirrigation maintenance in south India, also finds that inequality has a negativeeffect. Work by Ostrom, Lam, and Lee (1994) and Ostrom (1990) shows thatfarmer-managed irrigation schemes had more equitable water distribution. How-ever, these studies can say little about the impact of community heterogeneity onproject choice or on the distribution of benefits since they have little to say aboutnonparticipants.
Not all quantitative studies, however, find that economic inequality has a mono-tonically negative impact. Somanathan, Prabhakar. and Mehta (2002) analyze theeffect of collective action on forest conservation in India using matched-comparisondifference-in-difference techniques. They find that communities with more equalland ownership conserved pine forests somewhat better than other communities.However, they find no impact of caste heterogeneity on conservation efforts. Theyalso find that more equal land ownership does not translate into better conservationof broadleaf forests, which are of much greater importance to villagers for firewoodand fodder. Some in-depth case studies of participatory projects using qualitativemethods also suggest a more complex role for social heterogeneity (see, for example,Vedeld 2000).
Dayton-Johnson (2000) develops a model of cooperation in small irrigationsystems and tests the model with data from a survey of Mexican irrigation societies.He finds that social heterogeneity is consistently and significantly associated withlower levels of maintenance. Landholding inequality and the proportional sharing ofwater in accordance with landholding size also tend to decrease maintenance, but ina nonmonotonic way. Khwaja (2001) finds empirical evidence for a U-shaped rela-tionship between land inequality and project maintenance, with both highly equaland highly unequal communities performing better than moderately equal ones.
Capture by local elites. The frequent tendency for participatory projects to bedominated if not captured by local elites is highlighted by several case studies. Katzand Sara (1997), in a global review of water projects, find numerous cases of projectbenefits being appropriated by community leaders and little attempt to includehouseholds at any stage. They find that training community members was crucialfor informed choice and for maintenance of projects and willingness to pay for them.Although well-trained project staff were critical for ensuring inclusiveness and
22 The World Bank Research Observer, vol. 19, no. I (Spring 2004)
providing information on options, Katz and Sara note that even well-trained staff arenot always effective in overcoming entrenched norms of exclusion. In a study ofcommunity forestry projects in India and Nepal that worked reasonably well, Agarwal
(2001) reports that women were systematically excluded from the participatory pro-cess because of their weak bargaining power. Rao and Ibanez (2003) find that in theparticipatory projects in their Jamaican case study, wealthier and better-networkedindividuals dominated decision-making. In a similar case-based evaluation of socialfunds in Jamaica, Malawi, Nicaragua, and Zambia, the World Bank (2002) OperationsEvaluation Department concludes that the process was dominated by "prime movers."
Abraham and Platteau (2004) present evidence on community participation pro-cesses in Sub-Saharan Africa based largely on anecdotal evidence from their work incommunity-based development and on secondary sources. They argue that ruralAfrican communities are often dominated by dictatorial leaders who can shape theparticipation process to benefit themselves because of the poor flow of information.Thus, participatory development can be very difficult and may require slow, carefulefforts to make communities more receptive.
The related body of literature on decentralization also provides insights. Bardhanand Mookherjee (2000) theoretically evaluate the hypothesis that local govern-ments have better information but are less accountable and thus are more prone tocapture. They show that the probability of capture increases with local inequalityand that it is unlikely that local governments are universally more prone to capture.
Some degree of elite domination may be inevitable in community participationprojects, particularly in rural areas, where the elites are often leaders who embodymoral and political authority. Often these elites are the only ones who can effectivelycommunicate with outsiders, read project documents, keep accounts and records,and write proposals. This domination may, however, work against the kind ofbroad-based democratic participation envisioned by advocates of community-drivendevelopment because an awareness that project rules have been crafted by the elitemay discourage community participation in the project (Bardhan 2000).
Rao and Ibanez (2003) argue, however, that elite domination is not always elitecapture. In their case study, they find a potentially more benevolent form of elitedomination, with more than 80 percent of beneficiaries ultimately expressing satis-faction with the project. Substantiating this point, Khwaja (2001) finds that parti-cipation by hereditary leaders tends to improve maintenance.
Finally, social cohesion may facilitate collective action, but community participationprojects do not necessarily perform better in communities with a high score on someindex of social capital. Mosse (1997b), in a study of tank management in southIndia, shows that a traditionally cohesive village will not necessarily have gooddevelopment projects, whereas communities with low levels of cohesion could havegood development projects. Indigenous systems of social organization have very dif-ferent moral claims, depending on the public good around which they are organized.
Gltazala Mansuri and Vijayendra Rao 23
A festival or a temple embodies motives and constraints toward collective action thatare considerably different from those of a development project, and the logic of socialrelations in indigenous societies may be quite contrary to the egalitarian principlesthat a community-based or -driven project is trying to propagate. Abraham andPlatteau (2004) make a similar argument for Sub-Saharan Africa. External agenciesand programs change incentives and can change the political and social dynamic.Done naively, this can disrupt the social equilibrium by introducing a new elementinto already contested domains of power and meaning (Mosse 199 7b).
Summary. The social role of heterogeneity within a group is complex. Heterogene-ity can increase or decrease social cooperation and can polarize or strengthen groupidentity. The success of community-driven development may also be affected by howwell heterogeneity is "managed"-by the resources and strategies that are used tobring communities together and by how effectively differences are discussed andsolutions achieved. Every time an external agent interacts with a group of people, itcreates competition between different interests and incentives. The success ofa project may thus depend on how those incentives are aligned-whether by per-suasion, ideology, consensus, good governance, domination by greedy elites, orsheer hard work by a group of altruistic individuals.
The Role of Extemal Agents and the State
Community initiatives are usually designed by a central authority that sets the basicparameters and the mechanisms for disbursing funds. Project implementers are alsoextremely important to the effectiveness of projects. Frontline staff who work directlywith beneficiary groups are especially critical actors in building participatory pro-cesses. They are expected to mobilize communities, build the capacity for collectiveaction, ensure adequate representation and participation, and, where necessary,break through elite domination. They must be culturally and politically sensitive.charismatic leaders, trainers, anthropologists, engineers, economists, and account-ants. Despite their centrality, however, there is virtually no generalizable evidenceon their role. What evidence there is comes from case studies, which present a some-what dismal picture.
Jackson's (1997) analysis of field worker diaries in India indicates that field stafftend to be driven by the incentives they face, which are often not well aligned withthe needs of the project. In particular, Jackson notes that field workers tend to glossover local power relations in a rush to show results. Vasan (2002) shows how facili-tators in the forest management projects she examined overlooked project goalswhen their personal incentives were not aligned with them. Botchway (2001),studying participatory projects in Ghana. notes that project facilitators, who are typ-ically young, inexperienced, and poorly paid, are often vulnerable to manipulation
24 7The World lBatik Research ()Oserver, vol. 1 9. no. 1 (Spring 20U4)
by locally powerful elites. Michener (1998) echoes this and points out that seniormembers of the implementing agency are often former bureaucrats with little experi-ence in community empowerment. Their vision of development, guided by a lifetime ofwork with line ministries, is closer to "supply driven demand driven development"(Serrano-Berthet 1996: Tendler 2000; Tendler and Serrano-Berthet 1999).
Both beneficiaries and facilitators have an incentive to present the impression ofa successful project to outsiders and may collude for this purpose. NGOS often avoidworking in difficult communities, where quick results may be harder to demonstrate.The community may also use participation as a bargaining chip to extract resourcesfrom the outside agency-and may even construct a version of events that gets themthe maximum benefit. All this adversely effects project quality and sustainability.
The state is another strategic actor in this context. Beneficiary communities, oftentoo poor to fund their own teachers, doctors, desks, and medicine (Cleaver 1999;Kleemeier 2000), remain in need of government support for inputs, maintenanceinvestment, and trained staff to sustain project benefits. Thus, the need for a responsivestate apparatus may increase when community participation projects are imple-mented. But some states may manipulate project allocations to satisfy political ends(Schady 2000) or may try to use community participation programs to shift certaincosts to community groups. Mosse (199 7a) has an extended discussion of this moti-vation in the context of irrigation infrastructure.
Some studies claim that centralized bureaucracies tend to inhibit project effective-ness, although the evidence is generally weak. Finsterbusch and Van Wincklin (1989),in their review of community-managed USAID projects, hold that for such projects tobe effective, the organizations that implement them also need to be decentralizedand nonauthoritarian. White (199 6) notes that power relations in the wider societywithin which participation occurs have to be taken into consideration. In somecases, the state may have to support broad-based redistributions of power forcommunity projects to be really successful. This suggests that community-basedand -driven development projects must be seen as part of a shift toward a broad-based participatory and decentralized system of governance.
It is unclear, however, how this is to be achieved. Several writers have pointed outthe potential for conflict between local political interests and community organizations.Thomass-Slayter (1994) notes that as communities get stronger, they often posea challenge to local political interests, leading to competitive relations between thestate and community organizations and a withdrawal of state support. Das Gupta,Grandvoinnet, and Romani (2000) find that community development efforts can befragile in such circumstances.
What kind of state creates the right kind of enabling environment for communitydevelopment efforts? An extreme example is the Indonesian government's appro-priation of the concepts of mutual assistance (gotonig royong) and self-reliance (svadaya)as central tenets of its nationalist ideology. During the long period of military rule,
Ghazala Mansuri and Vijayendra Rao 25
participation was imposed by a strong state on the local population (Bowen 1986).Sukarno tried to use the notions of mutual assistance and self-reliance to unify thediverse groups in the new country and to provide a form of cultural legitimacy tostate control. The state had to be strongly authoritarian and development had toproceed in a cooperative and collaborative manner.
Sullivan (1992) in his detailed ethnography of local development in a Javanesecommunity, demonstrates that the combination of an autocratic state and the prin-ciples of mutual assistance and self-reliance resulted in a form of forced labor: Beinga good Indonesian meant contributing labor and cash for development projects.Collective action was the norm. Grants received by the village headman assumed, inthe mismatch between the size of the funds and expected cost of the project, thatmost funds would be locally mobilized. Contributions from the community weremobilized by the ward leaders. Everyone was expected to contribute free labor-orface social, political, material, and even physical sanctions. There was no choice butto participate.
Ribot (1999) makes a similar argument for how participatory ideologies wereimplemented in Sahelian forestry. Powers were devolved to village chiefs, who wereaccountable upward to admininstrative authorities rather than downward to theirconstituents. Participation was essentially another form of enforcing central rule.Another mode was the Indian experiment with local democracy, instituted througha series of constitutional amendments enfranchising and enabling the Panchayatsystem of regularly elected village councils. But although many Panchayats have strongdownward accountability, they often lack the resources and the links with higherlevels of the state to effectively deliver public services (Matthew and Buch 2000).
Thus, the key to making participation work is to create forms of downwardaccountability and simultaneously to maintain close links between the higher levelsof government and the community-a kind of upward commitment. Participationin the absence of state facilitation can result in a closed village economy, which limitsthe possibility for improved public action.
Scaling Up Community-Based and -Driven Development
Can community-based and -driven development projects be scaled up? This questioncannot be answered unequivocally. There is little generalizable evidence on the optimalpace of scaling up or on the marginal benefits of increasing community involve-ment. But there are stories of successful initiatives that offer some grounds for opti-mism. One of the most inspiring is the experience of the Self-Employed Women'sAssociation (SEWA), inspired by Gandhian notions of self-reliance (Rose 1993). SEWA,
which provides inexpensive credit and insurance to poor women workers, hassuccessfully unionized its members, enabling them to negotiate for minimum wages,
26 The l7orld Bank Research Observer. vol. 1 9, no. 1 (Sprin,q 2004)
legal protection, and other equitable treatment. Although there has never been animpact evaluation of SEWA, it is widely regarded as successful. Similarly, the Amulmovement in India has created a cooperative that has been remarkably successful increating new markets and achieving higher incomes for dairy farmers across India(Kurien 199 7).12
Is Rapid Replication Possible-or Desirable?
One question is whether such movements can be rapidly replicated through externalinterventions led by large bureaucracies, as the World Bank and several otherdonors are attempting to do. One problem is that it is difficult to replicate the successof a highly motivated group of charismatic individuals who are able to sustaina long-term vision of structural transformation through dedication, patience, andcreativity. When tasks are handed over to salaried professionals, motivated by moremundane preoccupations such as wages and promotions, incentives change.
Given the pivotal role that facilitators play in the community-based developmentprocess, the effort can be doomed from the start, especially when the facilitatorswork for a large bureaucracy, such as a line ministry or the World Bank (Pritchettand Woolcock 2002). They begin "seeing like a state" (Scott 1998). The complicatedprocess of building community participation becomes routinized and subject to theimperatives of short time horizons and the need for quick results.
Failure is not inevitable. But the mechanical application of best practice guidelines,without attention to local context and adequate monitoring, can easily result inpoor community-based projects. There are generalizable lessons from the successesand failures of community-based projects (Binswanger and Aiyer 200 3), but the lessonsneed to be adapted to the historical, political, and social environment where theproject is to be implemented.1 3
Social and cultural inequities create several challenges for the poor. Appadurai(2004) argues that to break structural inequities in social relations and achieveequitable development it is important to build the "capacity [of the poor] to aspire."This often requires organization to realize collectively what individuals cannotaspire to alone-a way out of the culture of domination and poverty. Rao and Walton(2004) describe this as building "equality of agency," creating environments toequalize the relational and group-based structures that influence individual aspira-tions, capabilities, and agency. This is the kind of empowerment that advocates ofcommunity-based development envisage.
Can a structurally transforming, aspiration-building, agency-equalizing, community-empowering project result from a rapid scaling-up process? As Trawick (2001)points out, this is unlikely. Community-based development requires the transformationof a social equilibrium in which traditional systems of social organization haveevolved to manage resources in a manner that serves the purposes of entrenched
Gl:tzala Mansuiri anid V'ijayendra Rao 27

elites. Breaking this up is a slow and gradual process. If external agencies try tochange the political and social dynamic without fully understanding it, the socialequilibrium can be severely disrupted, with nothing to take its place (Mosse 199 7b).This may sometimes be necessary, but it needs to be done with full knowledge of theimpact-and it cannot be done quickly. Effective community-based developmentrequires slow, gradual, persistent learning by doing, with a project design that grad-ually adapts to local conditions by learning from the false starts and mistakes thatare endemic to all complex interventions.
Effective learning by doing requires effective monitoring and evaluation. Phillipsand Edwards (2000) show that the culture and incentives of large bureaucraciesmake this difficult. Task managers, facilitators, beneficiaries, and evaluationconsultants all have incentives aligned to present a favorable impression, a mindsetthat hampers learning and encourages the replication of bad design and practice(see Pritchett 2002 for an economists' version of this argument). The vast majorityof community-based interventions, including those funded by the World Bank, havenot had reliable evaluations, based on representative samples with treatment andcontrol groups and baseline and follow-up data. If the development community isgoing to embark on a major change in development strategy, surely it should beconcerned about how well it might work.14
Community-based approaches are particularly difficult to get right in the initialstages. Thus, successful community participation projects rely much more thanother types of projects on learning by doing, which requires careful evaluations coupledwith phased-in scaling up with constant adaptation. Therefore, evaluations shouldbe a central part of the project design from the start and not merely a method tojudge the effectiveness of projects after they are completed.
How to Scale Up Community Participation Projects
Community participation projects can be scaled up in several ways. One is to testdifferent approaches and methodologies in a carefully selected set of pilots. Learningfrom this experiment can then lead to improved project designs applied to a muchlarger set of communities, in a process of piloted scaling up. Another method is toapply a design in a limited but large set of communities, say, in one province in thecountry. The lessons from this large test can be applied to projects expanded ina phased manner to the entire country, in a process of phased scaling up. A thirdpossibility is to start with wide national coverage, in a process of untested scaling up.In ideal circumstances, the evidence seems to favor a mix of piloted approachesfollowed by phased scaling up. But sometimes, untested scaling up is called for-todeal with an economic emergency, for instance. The evidence suggests that untestedexpansion should be applied with extreme caution, particularly in countries withlittle experience with community-based development.
28 The World Bank Researelh Observer, vol. 19, no. 1 (Spring 2004)
What, then, are the preconditions for successfully scaling up community-basedprojects (also see Binswanger and Aiyer 2003 on this point)? As argued, the processhas to be gradual. Because of the contextual complexities involved, initial designsbased on best practices are bound to be imperfect. Rapidly scaling these up, particu-larly in countries with little experience with community-based projects, will likelyresult in failed projects. A historical, political, and social analysis of the country iscritical, in addition to the usual economic analysis, to carefully assess whether thegovernment has the capacity to support community-based development in a mannerconsistent with both upward commitment and downward accountability.
Second, scaling up requires a strong ethic of learning by doing. with rigorousevaluations and reliable monitoring systems to provide constant feedback. Ideally,both qualitative and quantitative methods should be used to provide reliableestimates of impact and an in-depth examination of context and process (Rao andWoolcock 2003). Lessons should be incorporated into the next phases of projectdesign to correct mistakes, which are inevitable.
Third, careful attention should be paid to the training of a core cadre of facilitators,who are pivotal to successful community-based interventions. Inexperienced facili-tators should be given a chance to learn and grow, under the supervision andleadership of more experienced individuals, as part of a gradual learning by doingprocess.
Fourth, there should be a commitment by the country to a cultural change in theinstitutional environment, which has to be become more participatory, responsive,and transparent, with downward accountability. These are not just buzzwords.As Uphoff, Esman, and Krishna (1998:202) argue, "If the expansion is occurringbecause the government or donor sources are promoting it, this is less persuasivethan if there is a spontaneous joining of the program or if local governments takeover responsibility." There also has to be a strong upward connection to higherlevels of government and line ministries to facilitate the flow of resources.
Finally, changing from top-down to bottom-up development in a manner that issensitive to local context and culture requires a long time horizon. This also meansthat community-based development projects should not be judged hastily. Initialevaluations may well be unfavorable. The key is to fix the problems and worktoward incremental improvements.
Conclusion
One important question on the effectiveness of community-based and -driven devel-opment initiatives is the extent to which they successfully target the poor. Evidencesuggests that decentralized targeting has not always been effective, especially intargeting projects to the poor within communities. In addition, the evidence, though
GIhazala aiinsuri and Vijayetdr(a Rao 29
thin, suggests poor preference targeting-the preferences of the poor have not beenadequately considered in project selection. Finally, political economy considerationsand perverse incentives created by project performance requirements also constraintargeting, although evidence suggests that decentralized targeting can be mademore effective by monitoring projects to improve performance incentives.
Another important question is the extent to which participatory developmentinitiatives improve project quality and performance. Here, there is some evidencethat participatory projects create effective community infrastructure and improvewelfare outcomes, but the evidence does not establish that it is the participatoryelements that are responsible for improving project outcomes. Few studies comparecommunity-based projects with centralized mechanisms of service delivery, so it isdifficult to tell whether alternate project designs would have produced betteroutcomes.
Evidence on the impact of economic and social heterogeneity on project out-comes, and on collective action capacity more broadly, suggests that the relation-ship is complex. Although theoretical work by economists has shown that economicinequality need not constrain collective action, empirical work has shown mixedresults. The targeting of poor communities and poor households within communitiesis markedly worse in more unequal communities, particularly when the distributionof power is concentrated within elites. A number of studies find a U-shaped relationshipbetween inequality and project outcomes. The role of social heterogeneity is morecomplex to measure. However, most econometric studies that have attempted todevise measures of social fractionalization have shown that fractionalization tendsto inhibit collective activity, but there is also qualitative evidence in the oppositedirection.
Even in the most egalitarian societies, however, community involvement inchoosing, constructing, and managing a public good will almost always be domi-nated by elites, who tend to be better educated, have fewer opportunity costs on theirtime, and therefore have the greatest net benefit from participation. It is not clear,however, that this always represents "capture," in the sense of elites appropriatingall the benefits from the public good. It may be useful to distinguish between extremeforms of capture, such as outright theft and corruption, and what might be calledbenevolent capture. However, when local cultures and systems of social organizationresult in tight control of community decisions by elites, malevolent forms of capturebecome likely. It is important therefore to understand what types of checks and balan-ces are most effective in reducing capture and the systematic exclusion of the poorand of discriminated-against minorities. The problem in assessing elite capture isthat there are no studies that look at an appropriate counterfactual. This remains animportant area for future work.
Several case studies suggest that the success of participatory projects may also beaffected by how well heterogeneity is managed, by what resources and strategies are
30 The World Bank Research Observer, vol. 19, no. I (Spring 2004)
used to bring communities together. and by how effectively differences are debated.
The involvement of external agents creates competition among different interests
and incentives, and the success of projects may depend on how these incentives arealigned-whether by persuasion, ideology, consensus, good governance, dominationby greedy elites, or sheer hard work by a group of altruistic individuals. This is
another area where more research would be useful.The level of community cohesion, or social capital, is also expected to improve the
quality and sustainability of projects. Some studies have shown an association
between the level of some index of participation and project effectiveness, but the
direction of causality is unclear. Though community-based development seemslikely to be more effective in more cohesive and better managed communities.
evidence also indicates that better-networked or better-educated groups within a
community may be better able to organize and thus benefit most from projects.There is virtually no reliable evidence on community participation projects actually
increasing a community's capacity for collective action. This is clearly an area forfurther research.
Several qualitative studies indicate that the sustainability of community-basedinitiatives depends crucially on an enabling institutional environment. Line ministries
need to be responsive to the needs of communities, and national governments need
to be committed to transparent, accountable, and democratic governance, throughupward commitment. To avoid "supply-driven demand-driven development." it is
important that community leaders also be downwardly accountable, answerableprimarily to beneficiaries rather than to political and bureaucratic superiors.
Qualitative evidence also suggests the importance of external agents. such as
project facilitators, to project success. Projects often work with young, inexperiencedfacilitators whose incentives may not be aligned with the best interests of the
community. Knowledge of their impact on the success of projects is limited and
requires more investigation. This lack of evidence also relates to the question of howrapidly participatory projects can be scaled up, because rapid scaling up may rely on
especially inexperienced facilitators.Overall, because the success of community-based development is crucially condi-
tioned by local cultural and social systems, projects are best done with careful learning
by doing. Although successful projects in any context provide a tremendous learning
opportunity, any wholesale application of best practices in unlikely to be useful. Ina similar vein, key concepts that underpin community-based initiatives, such as
participation, community, and social capital, must be adequately detailed in a context-specific manner. Case study evidence indicates that any naive application of thesenotions by project implementers can lead to poor project design and to outcomes
that are at odds with the stated intentions of projects.Finally, it is important to realize that community-based development is not neces-
sarily empowering in practice. A less fervent and more analytical approach by both
Ghtmdla A lansuri titd Vijazjeundra Rto 31
proponents and opponents would be extremely beneficial. This requires a long timehorizon and programs that are well monitored (to enable learning from mistakes)and carefully evaluated. Little is known about the impact of community-basedprojects, largely because most such projects lack careful evaluations with good treat-ment and control groups and with baseline and follow-up data. This situationurgently needs to be remedied.
Notes
Ghazala Mansuri is economist in the Development Economics Research Group at the World Bank: here-mail address is [email protected]. Vijayendra Rao is senior economist in the DevelopmentResearch Group at the World Bank: his e-mail address is [email protected]. The authors are gratefulfor excellent research assistance from Evan Dennis and Lupin Rahman and valuable comments fromHans Binswanger, Rob Chase, Monica Das Gupta, Gershon Feder, Emanuela Galasso, Keith McLean,David Mosse, Dan Owen, Berk Ozler, Jean-Philippe Platteau, Menno Pradhan, Martin Ravallion, JesseRibot, Tara Vishwanath, David Warren, Howard White, Michael Woolcock, three anonymous referees,and several colleagues at seminars and informal discussions at the International Food Policy ResearchInstitute and the World Bank. The article was cosponsored by the Development Economics ResearchGroup and the Social Development Anchor of the World Bank.
1. There is considerable potential for measurement error in these numbers, and there is no authori-tative estimate of the World Bank's portfolio of such projects.
2. A key issue in the literature is that the goods or services produced through collective action mustbe nonexcludable, jointly produced, and costly.
3. White (1999) identifies a second wave in the 1970s and 1980s. initiated by the United Nationssystem, but it seems more a ripple than a wave because it had little influence on large lending agencies.He calls the current interest in community-driven development "a third-wave which has engulfed theWorld Bank."
4. In essence, the word cornnunity need not describe an object as much as it is describes a concept.It may thus be more useful to see it as an analytical rather than an empirical concept (Gusfield 1975).
5. The word communitiy is typically used in the evaluation literature to indicate different types oftarget groups or the larger context in which they live. This section often uses the word in an uncriticalway because it follows the literature being reviewed.
6. See also Agarwal and Gibson (1999), in the context of the literature on natural resource mobilization.7. Ravallion and Wodon (1999) show that the program accounted for some 13 percent of primary
school enrollment.8. Note, however, that because the center identified Union Parishads while the analysis is done at
the village level, variation in eligibility criteria across villages within Union Parishads may be partlyresponsible for this result.
9. A long report by Zyl. Sonn, and Costa (2000) on the Northeast Rural Development Program and theRural Poverty Alleviation Program in northeast Brazil summarizes the results of several studies and findsthat the combined impact of these projects was "impressive" and that the projects were well targeted andextremely beneficial to poor communities. Though their methodology and analysis are never clearly out-lined, the article suggests that none of the studies had an adequate counterfactual or control group,though they sometimes had a baseline. Thus, it is difficult to judge how "impact" was calculated.
10. It is impossible to do justice here to the rich body of literature on heterogeneity and collectiveaction. For a review of the literature in economics, in the context of environmental resources, seeBaland and Platteau (2003).
32 The WlVorld Bank Research Obserter, vol. 19, no. I (Spring 2004i
11. All public goods have the property that many people can use them at once, thus exclusion is dif-ficult. Some public goods yield infinite benefits. but not all. Common-pool resources are public goodswith finite or subtractive benefits-they are thus potentially subject to congestion, depletion, or degra-dation (Blomquist and Ostrom 1985).
12. Uphoff, Esman, and Krishna (1998) document several such "reasons for hope. " Binswanger andAiyer (2003) review the gray literature, highlighting examples of successful community-driven develop-ment interventions. Uphoff and Wijeratna (2000) also find evidence to argue that there was a strongcorrelation between social capital building initiatives in improved efficiency in water management inthe Gal Oya irrigation project in Sri Lanka.
13. The World Bank, for instance, tends to borrow the social fund design from activities in Indonesiaor Zambia and drop them into very different settings. This is particularly undesirable in the Indonesiancase, because of the historical role of a strong state in community development.
14. Several evaluations of community-based development projects have recently begun at theWorld Bank, and much should be learned from them during the next few years.
References
Abraham, Anita, and Jean-Phillippe Platteau. 2004. "Participatory Development: When CultureCreeps." In V. Rao and M. Walton, eds., Culture and Public Action: A Cross-Disciplinary Dialogue onDevelopmnent Policy. Palo Alto, Calif.: Stanford University Press.
Agarwal, A., and C. Gibson. 1999. "Enchantment and Disenchantment: The Role of Community inNatural Resource Conservation." World Development 27(4):629-50.
Agarwal. Bina. 2001. "Participatory Exclusions, Community Forestry, and Gender: An Analysis forSouth Asia and a Conceptual Framework." World Development 29(10):1623-48.
Alderman, Harold. 2002. "Do Local Officials Know Something We Don't, Decentralization of TargetedTransfers in Albania." Journal of Public Economics 83(3):3 75-40)4.
Alesina. Alberto, and Eliana La Ferrara. 2000. "Participation in Heterogeneous Communities."Quarterly Journal of Economics 11 5(3):847-904.
Appadurai, Arjun. 2004. "The Capacity to Aspire: Culture and the Terms of Recognition." In V. Raoand M. Walton, eds., Culture and Public Action: A Cross-Disciplinary Dialogue on Development Policy.Palo Alto, Calif.: Stanford University Press.
Baland, Jean Marie. and Jean-Philippe Platteau. 1998. "Wealth Inequality and Effeciency in the Com-mons, Part II: The Regulated Case." Oxjbrd Economic Papers 50(1):1-22.
.1999. "The Ambiguous Impact of Inequality on Local Resource Management." World Development27(5):773-88.
.2003. "Institutions and the Efficient Management of Environmental Resources." In K.-G. Mahlerand J. R. Vincent, eds., Handbook of Environmental Economics. Vol. 1. Amsterdam: Elsevier North-Holland.
-Forthcoming. "Collective Action and the Commons: The Role of Inequality." In J. M. Baland,P. Bardhan, and S. Bowles, eds., Inequality. Cooperation and Environmental Sustainability. Princeton.N.J.: Princeton University Press.
Bardhan, Pranab. 2000. "Irrigation and Cooperation: An Empirical Analysis of 48 Irrigation Commu-nities in South India." Economic Developmenit and Cultural Clange 48(4):847-65.
Bardhan, Pranab, and Jeff Dayton-Johnson. 2001. "Unequal Irrigators: Heterogeneity and CommonsManagement in Large-Scale Multivariate Research." Working paper, University of California, Berkeley.
Bardhan, Pranab, and Dilip Mookherjee. 2000. "Capture and Governance at Local and NationalLevels." American Econornic Review 90(2): 135-39.
Ghazala Mansuri and Vijayendra Rao 33

Bebbington, Anthony, Scott Guggenheim, Elizabeth Olson, and Michael Woolcock. Forthcoming."Exploring Social Capital Debates at the World Bank." Journal of Development Studies.
Bergstrom, T. C.. L. Blume, and H. Varian. 1986. "On the Private Provision of Public Goods." Journal ofPublic Economics 29(1):25-49.
Binswanger, Hans, and Swaminathan Aiyer. 2003. "Scaling Up Community Driven Development:Theoretical Underpinnings and Program Design Implications." World Bank, Washington, D.C.
Blomquist, W., and E. Ostrom. 1985. "Institutional Capacity and the Resolution of a CommonsDilemma." Policy Studies Review 5(2): 383-93.
Botchway. Karl. 2001. "Paradox of Empowerment: Reflections on a Case Study from NorthernGhana." WorldDevelopment29(1):135-53.
Bourdieu, Pierre. 1984. Distinctiont: A Social Critique of the Judgement of Taste. Trans. Richard Nice.Cambridge, Mass.: Harvard University Press.
1990. The Logic of Practice. Trans. Richard Nice. Palo Alto. Calif: Stanford University Press.
1998. Practical Reason: On the Thleory of Action. Trans. Randal Johnson. Palo Alto, Calif.:Stanford IJniversity Press.
Bowen, John R. 1986. "On the Political Construction of Tradition: Gotong Royong in Indonesia."Journal of Asian Studies 4 5(3): 545-61.
Cernea, Michael, ed. 1985. Puttinig People First: Sociological Variables in Rural Development. New York:Oxford University Press and World Bank.
Chambers. Robert. 198 3. Rural Dcvelopment: Puttinig thle First Last. London: Longman.
Chase, Robert S. 2002. "Supporting Communities in Transition: The Impact of the Armenian SocialInvestment Fund." World Bank Economic Review 16(2 ):219-40.
Chase, Robert S., and Lynn Sherburne Benz. 2001. "Household Effects of Community Education andHealth Initiatives: Evaluating the Impact of the Zambia Social Fund." World Bank, Washington,D.C.
Chwe, Michael Suk-Young. 1999. "Structure and Strategy in Collective Action." American Journal ofSociology 105(1):128-56.
-2001. Rational Ritual: Cultuire, Coordinationz and Common Knowledge. Princeton, N.J.: PrincetonUniversity Press.
Cleaver, Frances. 1999. "Paradoxes of Participation: Questioning Participatory Approaches to Devel-opment. " Journal of International Development 11(4):5 9 7-612 .
Coady, David. 2001. "An Evaluation of the Distributional Power of PROGRESA'S Cash Transfers inMexico." FCND Discussion Paper 117. International Food Policy Research Institute, Food Consump-tion and Nutrition Division, Washington, D.C.
Conning, Jonathan, and Michael Kevane. 2002. "Community Based Targeting Mechanisms for SocialSafety Nets: A Critical Review." World Development 30(3): 375-94
Cooke, Bill, and Uma Kothari. 2001. Participation: The New Tyranny? London: Zed Books.
Das Gupta. Monica, Helene Grandvoinnet. and Mattia Romani. 2000. "State-Community Synergies inDevelopment: Laying the Basis for Collective Action." Policy Research Working Paper 2439. WorldBank, Development Research Group, Washington, D.C.
Dayton-Johnson, Jeff. 2000. "Determinants of Collective Action on the Local Commons: A Model withEvidence from Mexico." Journal of Development Economics 62(1):181-208.
Dayton-Johnson, Jeff, and Pranab Bardhan. 2002. "Inequality and Conservation on the LocalCommons: A Theoretical Exercise." EconomicJournial 112(481):577-602.
Demsetz, Harold. 1971). "The Private Production of Public Goods." Journal of Law and Economics13(2):29 3-306.
34 The WVorld Bank Research Observer, vol. 19, no. I (Spring 2004)
Dongier, Philip, Julie Van Domelen, Elinor Ostrom, Andrea Ryan, Wendy Wakeman, Anthony
Bebbington, Sabina Alkire, Talib Esmail, and Margatet Polski. 2001. "Community Driven Develop-
ment. " In World Bank, Poverty Reduction Strategy Paper Sourcebook. Vol. 1. Washington, D.C.
Durlauf, Steven N. 2001. "On the Empirics of Social Capital." Working paper, University of Wisconsin-
Madison, Department of Economics.
Escobar, Arturo. 1995. EncounteringDevelopmiient: The Making and Unmaking of the Third World. Princeton,
N.J.: Princeton University Press.
Fine. Ben. 2001. Social Capital versus Social Theory: Political Economy and Social Science at the Turn of the
Millenniumn. London: Routledge.
Finsterbusch, Kurt, and Warren Van Wicklin III. 1989. "Beneficiary Participation in Development
Projects: Empirical Tests of Popular Theories." Economnic Development and Cultural Change
37(3): 573-93.
Freire, Paulo. 1970. Pedagogy of the Oppressed. Trans. Myra Bergman Ramos. New York: Herder and
Herder.
Galasso, Emanuela, and Martin Ravallion. Forthcoming. "Decentralized Targeting of an Anti-Poverty
Program," Journal of Public Economrlics.
Gandhi, Mohandas Karamchand. 1962. Village Swaraj. Ahmedabad, India: Navjivan Press.
Grootaert, Christiaan. 1998. "Social Capital: The Missing Link?" sci Working Paper 3. World Bank,
Environmentally and Socially Sustainable Development Network, Washington, D.C.
Gugerty, Mary Kay, and Michael Kremer. 2000. "Outside Funding of Community Organizations: Bene-
fiting or Displacing the Poor?" NBER Working Paper 7896. National Bureau for Economic Research,
Cambridge, Mass.
Gugerty. Mary Kay, and Edward Miguel. 2000. "Community Participation and Social Sanctions in Ken-
yan Schools." Harvard University, Program of Political Economy and Government. Cambridge, Mass.
Guijit, Irene, and Meera Kaul Shah. 1998. The Mythi of Comrlmuntity: Gender Issues in Participatory Devel-
opment. Colchester, U.K.: Intermediate Technology Development Group Publishing.
Gusfield, Joseph R. 1975. Community: A Critical Response. Oxford: Basil Blackwell.
Hardin. Garrett. 1992. "Tragedy of the Commons." In Anil Markandya and Julie Richardson, eds.,
Environnental Economnics: A Reader. New York: St. Martin's Press.
Hardin, Russell. 1982. Collective Action. Baltimore. Md.: Johns Hopkins University Press.
Harragin, Simon. 2004. "Relief and an Understanding of Local Knowledge: The Case of Southern
Sudan." In V. Rao and M. Walton, eds., Culture and Public Action: A Cross-Disciplinary Dialogue on
Development Policy. Palo Alto. Calif.: Stanford University Press.
Harriss, John. 200(1. Depoliticizing Development: The World Bank and Social Capital. New Delhi: LeftWord
Books.
Heckathorn, D. 1993. "Collective Action and Group Heterogeneity: Voluntary Provision versus Selec-
tive Incentives." Arnerican Sociological Review 58( 3): 329-50.
Hirschman, Albert 0. 1970. Exit, Voice, and Loyalty: Responses to Decline in Firms, Organizations, and
States. Cambridge, Mass.: Harvard University Press.
.1984. Getting Ahead Collectively: Grassroots Experiences in Latin America. New York: Pergamon Press.
Hoddinott, John, M. Adato, T. Besley. and L. Haddad. 20)01. "Participation and Poverty Reduction:
Issues. Theory, and New Evidence from South Africa." FCND Discussion Paper 98. International Food
Policy Research Institute. Food Consumption and Nutrition Division, Washington, D.C.
Isham, Jonathan, and Satu Kahkonen. 1999a. "Institutional Determinants of the Impact of Commu-
nity-Based Water Services: Evidence from Sri-Lanka and India." Working Paper 236. University of
Maryland, Center for Institutional Reform and the Informal Sector, College Park. Md.
Ghazala Mansuri and Vijayendra Rao 35
.11999b. "What Determines the Effectiveness of Community-Based Water Projects? Evidencefrom Central Java, Indonesia, on Demand Responsiveness, Service Rules, and Social Capital."sci Paper 14. World Bank, Environmentally and Socially Sustainable Development Network,Washington, D.C.
Itaya, J.. D. de Meza, and G. D. Myles. 1997. "In Praise of Inequality: Public Good Provision and IncomeDistribution." Economic Letters 57(3):289-96.
Jackson, Cecile. 1997. "Sustainable Development at the Sharp End: Fieldworker Agency in a Participa-tory Project." Development in Practice 7(1):237-47.
Jalan, Jyotsna. and Martin Ravallion. 2003. "Estimating the Benefit Incidence of an Anti-povertyProgram by Propensity-Score Matching." Journal of Business andEconomic Statistics 21(1):19-30.
Jimenez, Emmanuel, and Vicente Paqueo. 1996. "Do Local Contributions Affect the Efficiency of PublicPrimary Schools?" Economics of Education Review 15(4): 377-86.
Jimenez, Emmanuel, and Yasuyuki Sawada. 1999. "Do Community-Managed Schools Work? An Eval-uation of El Salvador's EDUCO Program." World Bank Economic Review 1 3(3):415-41.
Katz, Travis, and Jennifer Sara. 1997. "Making Rural Water Supply Sustainable: Recommendationsfrom a Global Study." Water and Sanitation Program. Washington, D.C.
Khwaja, Asim Ijaz. 2001. "Can Good Projects Succeed in Bad Communities? Collective Action in theHimalayas." Harvard University. Department of Economics, Cambridge, Mass.
King, Elizabeth, and Berk Ozler. 2000. "What's Decentralization Got to Do with Learning? EndogenousSchool Quality and Student Performance in Nicaragua." World Bank. Development ResearchGroup, Washington, D.C.
Kleemeier, Elizabeth. 2000. "The Impact of Participation on Sustainability: An Analysis of the MalawiRural Piped Scheme Program." World Development 28(5):929-44.
Krishna, Anirudh. 2002. "Global Truths and Local Realities: Traditional Institutions in a ModernWorld." Duke University, Durham, N.C.
Krishna, Anirudh, Norman Uphoff, and Milton J. Esman, eds. 1997. Reasons for Hope: InstructiveExperiences in Rural Development. West Hartford, Conn.: Kumarian Press.
Kurien, V. 1997, "The AMUL Dairy Cooperatives: Putting the Means of Development into the Handsof Small Producers in India." In Anirudh Krishna, Norman Uphoff. and Milton J. Esman, eds.,Reasons for Hope: Instructive Experiences in Rural Development. West Hartford, Conn.: KumarianPress.
La Ferrara, Eliana. 2002. "Inequality and Group Participation: Theory and Evidence from Rural Tanzania."Journal of Public Economics 85(2):2 35-73.
Matthew, George. and Nirmala Buch, eds. 200f). Status of Panchlayati Raj in the States and Union Territoriesof India 2000. New Delhi: Concept Publishing.
Michener, Victoria. 1998. "The Participatory Approach: Contradiction and Co-option in BurkinaFaso." World Development 26(12):2105-18.
Morris, S., J. Hoddinott, J. M. Medina, and G. Begeron. 1999. "Will Rural Development EnhanceFood Security: A Case Study of Western Honduras." International Food Policy Research Institute,Washington, D.C.
Mosse, David. 199 7a. "Colonial and Contemporary Ideologies of Community Management: The Case ofTank Irrigation Development in South India." Modern Asian Studies 33(2):303-38.
.1997b. "The Symbolic Making of a Common Property Resource: History, Ecology, and Localityin a Tank-Irrigated Landscape in South India." Development and Change 28(3):467-504.
.2001." 'People's Knowledge.' Participation and Patronage: Operations and Representations inRural Development." In Bill Cooke and Uma Kothari, eds., Participation: The Newv Tyranny. London:Zed Books.
36 The World Bank Research Observer, vol. 19, no. I (Spring 2004)
Narayan, Deepa. 1998. "Participatory Rural Development." In E. Lutz, H. Binswanger. P. Hazell. andA. McCalla, eds., Agricultuire and the Environment. Washington D.C.: World Bank.
Narayan, Deepa, ed. 2002. Empowerment and Poverty Reduction: A Sourcebook. Washington, D.C.: WorldBank.
Narayan, Deepa. and Katrinka Ebbe. 1997. "Design of Social Funds: Participation, Demand Orientationand Local Organizational Capacity." World Bank Discussion Paper 375. Washington, D.C.
Newman, John, Menno Pradhan, Laura Rawlings. Geert Ridder. Ramiro Coa. and Jose Luis Evia. 2002."An Impact Evaluation of Education, Health and Water Supply Investments by the Bolivian SocialInvestment Fund." World Bank Economnic Review 16(2):241-74.
North, Douglass. 1990. Institutionis, Institutional Change and Economic Performance. Cambridge: Cam-bridge University Press.
Oliver. P.. G. Marwell, and R. Teixeira. 1985. "A Theory of the Critical Mass I. Interdependence, GroupHeterogeneity. and the Production of Collective Action." American Journal oJ Sociology 91(3):522-56.
Olson, Mancur. 1973. The Logic of Collective Action: Public Goods and the Theory oJ Groups. Cambridge.Mass.: Harvard University Press.
Ostrom, Elinor. 1990. Governinlg the Commons: The Evolution of Institutions for Collective Action. NewYork: Cambridge University Press.
Ostrom. E., W. Lam, and M. Lee. 1994. "The Performance of Self-Governing Irrigation Systems inNepal." Humani Systems Managemenzt 13(3):197-207.
Paxson, Christina, and Norbert Schady. 2002. "The Allocation and Impact of Social Funds: Spendingon School Infrastructure in Peru." World Bank Economic Review 16(2):297-319.
Phillips, Sue, and Richard Edwards. 2000. "Development, Impact Assessment and the Praise Culture."Critique of Anthropology 20(1):47-66
Portes, Alejandro. 1978. "Social Capital: Its Origins, and Applications in Modern Society." AnnualReview of Sociology 98(6):1320-50.
Pradhan, Menno, and Laura B. Rawlings. 2002. "The Impact and Targeting of Social InfrastructureInvestments: Lessons from the Nicaraguan Social Fund." World Bank Economic Review 16(2):2 7 5-9 5.
Pritchett, Lant. 2002. "It Pays to Be Ignorant: A Simple Political Economy Model of Rigorous ProgramEvaluation." Harvard University, Kennedy School of Government, Cambridge, Mass.
Pritchett, Lant, and Michael Woolcock. 2002. "Solutions When the Solution Is the Problem:Arraying the Disarray in Development." Working Paper 10. Center for Global Development,Washington, D.C.
Putnam, Robert D., with Robert Leonardi and Raffaella Y. Nanetti. 1993. Making Democracy Work:Civic Traditions in lodern Italy. Princeton, N.J.: Princeton University Press
Rao, Vijayendra. 2001. "Celebrations as Social Investments: Festival Expenditures, Unit Price Varia-tion and Social Status." Journal of Development Studies 38(1): 71-97.
- 2003. "Symbolic Public Goods and the Coordination of Collective Action: A Comparison ofCommunity Based Development in Indonesia and India." World Bank, Development ResearchGroup, Washington. D.C.
Rao. Vijayendra, and Ana Maria Ibanez. 2003. "The Social Impact of Social Funds in Jamaica:A Mixed-Methods Analysis of Participation, Targeting and Collective Action in Community DrivenDevelopment." Policy Research Working Paper 29 70). World Bank, Development Research Group.Washington. D.C.
Rao, Vijayendra, and Michael Walton. 2004. "Culture and Public Action: An Introduction." In V. Raoand M. Walton, eds., Culture anld Public Action: A Cross-Disciplinary Dialogue on Development Policy.Palo Alto, Calif.: Stanford University Press.
Ghazala Mansuiri and Vijayendra Rao 37
Rao, Vijayendra, and Michael Woolcock. 2003. "Integrating Qualitative and Quantitative Approachesin Program Evaluation." In Francois Bourguignon and Luiz Pereira Da Silva, eds.. Evaluating thePoverty and Distributionial Iimpact of Economic Policies: A General Introduction. Washington. D.C.:World Bank and Oxford University Press.
Ravallion, Martin. 2000. "Monitoring Targeting Performance When Decentralized Allocations to thePoor Are Unobserved." WVorld Bank Economic Review 14(2): 331-45.
Ravallion, M., and Q. Wodon. 1999. "Poor Areas or Only Poor People." Journal of Regionlal Science39(4):689-711.
Ribot. Jesse C. 1995. "From Exclusion to Participation: Turning Senegal's Forestry Policy Around?"World Development 23(9):1587-99.
. 1999. "Decentralization. Participation and Accountability in Sahelian Forestry: Legal Instru-ments of Political-Adminisitrative Control." Africa 69(1):23-65.
Rose, Kalima. 1993. Where Women Are Leaders: The SE tA Movement in Inidia. London: Zed Books.
Schady, Norbert R. 2000. "Political Economy of Expenditures by the Peruvian Social Fund." AmericatiPolitical Science Review 94X2):289-304
Scott, James. 1998. Seeing Like a State: How Certain Schemnes to Irnprove thze Humnma Condition Have Failed.New Haven. Conn.: Yale University Press.
Seabright, Paul. 1996. "Accountability and Decentralization in Government: An Incomplete ContractsModel." European Economic Review 40)(1):61-89.
Sen, Amartya K. 1985. Comm70odities and Capabilities. Amsterdam: Elsevier.
.1999. Developmen1t as Freedom. New York: Knopf.
Serrano-Berthet, Rodrigo. 1996. "Who Knows What's Best for the Poor: Demand-Driven Policies andRural Poverty in Northeast Brazil-Mrn/State of Ceara Project It." Master's thesis. MassachusettsInstitute of Technology. Department of Urban Studies and Planning, Cambridge. Mass.
Somanathan. E., R. Prabhakar. and Bhupendra Singh Mehta. 200)2. "Collective Action for Forest Con-servation: Does Heterogeneity Matter?" Discussion Paper in Economics t)2-01. Indian StatisticalInstitute, Planning tJnit. New Delhi.
Sullivan. John. 1992. Local Government and Communli1litlj in Java: An Urbani Case-Study. Singapore: OxfordUniversity Press.
Summers. Lawrence. 20t1. Speech at World Bank Country Director's Retreat. Washington D.C.
Tendler, Judith. 2000. "Why Are Social Funds So Popular?" In Shahid Yusuf. Weiping Wu, and SimonEvenett, eds., Local Dynamnics in an Era of Globalization: 21 st Century Catalysts Jor Development. NewYork: Oxford University Press.
Tendler, Judith, and Rodrigo Serrano-Berthet. 1999. "The Rise of Social Funds: What Are Theya Model Of?" Massachusetts Institute of Technology, Department of Urban Studies and Planning,Cambridge, Mass.
Thomass-Slayter, Barbara P. 1994. "Structural Change. Power Politics, and Community Organiza-tions in Africa-Challenging the Patterns, Puzzles, and Paradoxes." World Development22(10):1479-90.
Trawick, Paul. 20)01. "Successfully Governing the Commons: Principles of Social Organization in anAndean Irrigation System." Human Ecology 29(1):] -25.
Uphoff, Norman. 1986. Improving Interniationial Irrigationi Management with Farmer Participation: Gettingthe Process Right. Boulder. Colo.: Westview Press.
tJphoff, Norman. and C. M. Wijayratna. 2000). "Demonstrated Benefits from Social Capital: TheProductivity of Farmer Based Organizations in Gal Oya. Sri Lanka." WVorld Development 28(11):1875-90.
38 Tlh e WIlorld Bozilk Resear0h Observer, lol. 299. no. I (Sprin0 2004)
tUphoff, Norman, Milton J. Esman. and Anirudh Krishna. 1998. Reasons for Success: Learninigfrom
Instructive Experiences in Rural Development. West Harford. Conn.: Kumarian Press.
Vasan, Sudha. 2002. "Ethnography of the Forest Guard: Contrasting Discourses, Conflicting Roles and
Policy Implementation." Economnic and Political Weekly 5 October. Available online at
www.epw.org.in/showArticles.php?root = 2002&leaf= 1)&filename = 5()16&filetype = html.
Vedeld, Trond. 2000. "Village Politics: Heterogeneity, Leadership and Collective Action." Jouirnial of
Developmnent Studies 36(5): 10 5-34.
Wade, R. 1987. "The Management of Common Property Resources: Finding a Cooperative Solution."
World Bank Researchi Observer 2(3):219-34.
White, Howard. 1999. "Politicising Development. The Role of Participation in the Activities of Aid
Agencies." In Ken Gupta, ed.. Foreign Aid: Newv Perspectives. Boston: Kluwer Academic Press.
White, Sarah. 1996. "Depoliticizing Development: The IJses and Abuses of Participation." Developmnent
in Practice 6(1):6-15.
Woolcock, Michael. 1998. "Social Capital and Economic Development: Toward a Theoretical Synthesis
and Policy Framework." Theory and Society 27(2): 151-208.
World Bank. 2()00. "New Paths to Social Development: Community and Global Networks in Action."
Social Development Department. Environmentally and Socially Sustainable Development Network,
Washington, D.C.
.2001. Wo70rld Developmlenit Report 2000/2001: Attackin5g Poverty. New York: Oxford tJniversity
Press.
.2()2. Social Funlds: Assessing .' it, .;. Operations Evaluations Department. Washington,
D.C.
. 2003. World Developmnent Report 2004 Making Services Work for the Poor. Washington D.C.:
World Bank and Oxford University Press,
Zyl, Johan Van. Loretta Sonn, and Alberto Costa. 20(0(0. "Decentralized Rural Development, Enhanced
Community Participation. and Local Government Performance: Evidence from North-East Brazil."
Ghazala Alansuri anld Viijayendra Rao 39

AgricuLtural Extension: Good Intentionsand Hard ReaLities
Jock R. Anderson . Gershon Feder
Whzat considerations lead policymakers to invest in agricultural extension as a key public
responsibility, and whatfactors and agency incenitives explain differences in extension system
performance? To help answer these questions, this article provides a framework outlining
farmers' demandfor information, the public goods character of extension services, and the
organizational and political attributes affecting the performance of extension systems. This
conceptual framework is used to analyze several extension modalities and their likely and
actual effectiveness. The analysis highlights the efficiency gains that can comefrom locally
decentralized delivery systems with incentive structures based on largely private provision,
although in most poorer countries extension services will remain publiclyfunded.
The goals of agricultural extension include transferring information from the global
knowledge base and from local research to farmers, enabling them to clarify their
own goals and possibilities, educating them on how to make better decisions, and
stimulating desirable agricultural development (van der Ban and Hawkins 1996).
Thus extension services provide human capital-enhancing inputs, including infor-
mation flows that can improve rural welfare-an important outcome long recognized
in the development dialogue (Leonard 1977: Garforth 1982; Jarrett 1985; Feder,
Just, and Zilberman 1986; Roberts 1989). That interest continues in contemporary
dialogue, as evident in the workshop on public extension services convened by the
World Bank, the U.S. Agency for International Development, and the Neuchatel
Group to review recent approaches to revitalizing extension services (World Bank
2002).Investments in extension services have the potential to improve agricultural
productivity and increase farmers' incomes, especially in developing economies,where more than 90 percent of the world's nearly 1 million extension personnelare located. Yet the impact of extension on farm performance is varied, reflecting
The World Bank Research Observer, vol. 19, no. 1,© The International Bank for Reconstruction and Development / THE WORLD BANK 2004: all rights reserved.
DOI: 10.1093/wbro/lkhO13 19:41-60
differences in how extension services are delivered and in the circumstances ofservice recipients.
Effective extension involves adequate and timely access by farmers to relevantadvice, with appropriate incentives to adopt the new technology if it suits theirsocioeconomic and agroecological circumstances. Critical to adoption are the avail-ability of improved technology, access to modern inputs and resources, and profit-ability at an acceptable level of risk. Farmers get information from many sources.Public extension is one source, but not necessarily the most efficient. Thus, althoughextension can improve the productive efficiency of the agricultural sector, the vir-tues and limitations of alternative mechanisms need to be considered in assessingthe cost-effectiveness of delivering information (Byerlee 19 9 8; van den Ban 1999).
Extension usually has its greatest impact in the early stages of dissemination ofa new technology, when the information disequilibrium (and the productivity differ-ential) is greatest. As more farmers become aware of the new technology, the impactof extension diminishes until the need for more information-intensive technologiesarises (Byerlee 1998). The dynamic resolution of the information disequilibriaassociated with specific extension messages makes observing the impact of extensiondifficult.
The analysis here looks at what leads policymakers to invest in extension servicesand what factors and incentives explain differences in extension system perfor-mance. The following section provides a conceptual framework of farmers' demandfor information, the public goods character of extension services, and the organiza-tional and political attributes that affect the performance of extension systems.The second section analyzes several extension modalities and their effectiveness.The third looks at the methodological issues in assessing extension outcome andreviews the empirical literature on extension impacts. The final section notes thepolitical economy implications of the difficulty of attributing outcomes to extensionactivities and the importance of internalizing the lessons of experience in the designof effective extension programs.
Conceptual Framework
Extension, broadly defined, focuses on the delivery of information inputs to farmers.Information can be of many types, from estimates of future prices for farm productsto new research products, such as improved crop cultivars and knowledge abouthow to use particular inputs, such as the timing and intensity of fertilizer use (Byerlee1998). Farmers have a demand for information and may be prepared to pay for it asthey do for other inputs according to how productive they perceive it to be (Dinar 1996).Demand for information delivery systems supporting farming should be increasingif. as agricultural analysts argue, farming is becoming more information-intensive
42 The World Bank Research Observer, vol. 19, no. I (Spring 2004)
(Byerlee 1998). How that demand is met varies greatly, depending on market and
institutional conditions. Gautam (2000), for instance, concludes that there is signi-
ficant unmet demand in Kenya for general agricultural extension services. How
different types of information are best delivered depends crucially on the nature of
the information and the circumstances of the farmer.
A Welfare Economics Context: Extension Services as Public Goods
In considering whether extension services are mainly public or private goods, the
usual focus has been on market imperfections, relating in particular to excludability
and rivalry (Umali and Schwartz 1994). On this basis, extension services are mixed
public and private goods. Some services, such as tailor-made farm management
advice, are excludable in that farmers who are not willing to pay for the advice can
be excluded from its benefits. Services embodied in commercial products exhibit
rivalry in that one farmer's use reduces availability to others.
Knowledge delivered by extension may be information embodied in products
(improved seed, machinery) or it may be more abstract, disembodied information on
agricultural practice. There are two broadly applicable types of disembodied agricultural
information: general, nonexcludable information (market information or cropping
patterns), which tends to be a public good, and specialized, excludable information
(fertilizer recommendations for a specific field or farm operation), which tends to be
a toll good, with high excludability and low rivalry-some farmers can be excluded
from access, even though the value to other users is not diminished by one farmer's
use (Umali-Deininger 1996).Various mechanisms are available for coordinating the supply of services-
private sector markets, public sector hierarchies with state authority, and collective
action by civil society (Wolf and Zilberman 2001). Table 1 illustrates the alternative
arrangements possible in the financing and provision of extension services, from trad-
itional public sector extension services to fully private services and public-private
partnerships. Whether services are best supplied or financed by the private, public,
or voluntary sectors or through joint efforts depends on the characteristics of the
information service (Schwartz and Zijp 1994; Umali-Deininger 1997).
These observations have several implications (Picciotto and Anderson 1997):
. Information closely associated with market goods (purchased inputs) is gener-
ally best left to the private sector.. Information associated with toll goods can be effectively provided by combined
public and private sector efforts.. Information on the management of common pool goods, with low excludability
and high rivalry (forests, common grazing lands, water), is usually best provided
by cooperative or voluntary institutions.
lock R. Anderson and Gershoii Feder 43
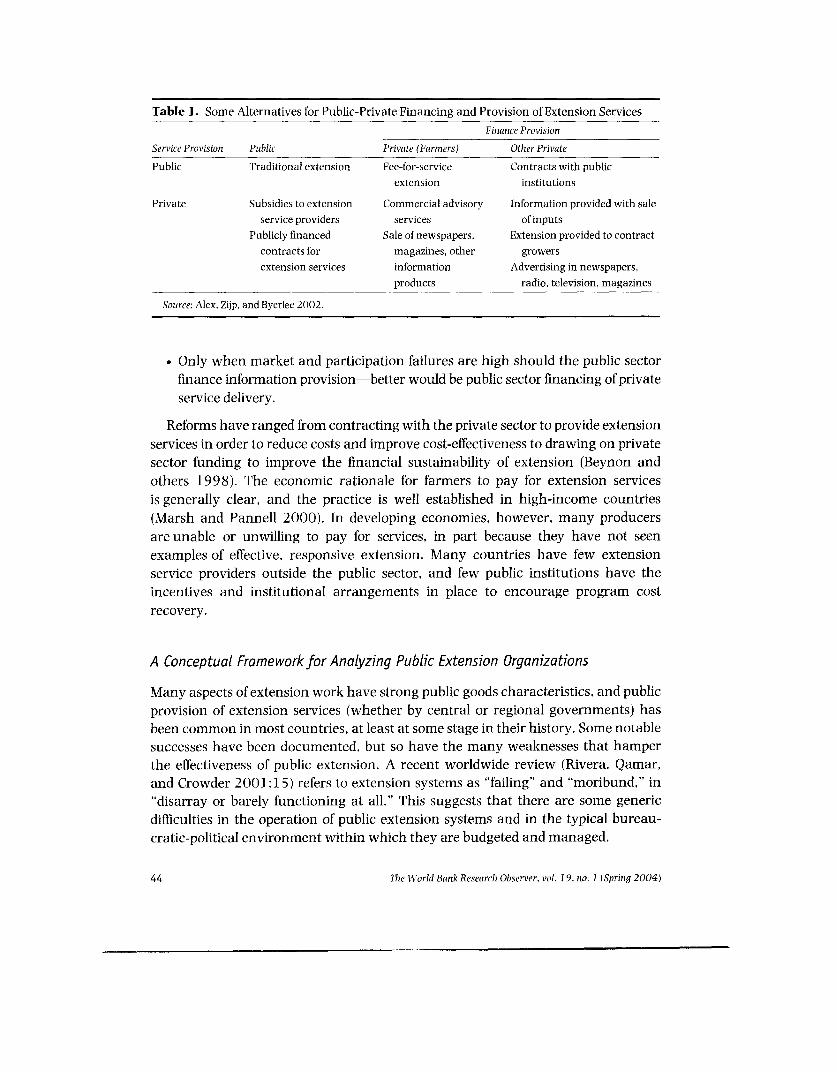
Table 1. Some Alternatives for Public-Private Financing and Provision of Extension Services
Finance ProvisionService Provision Public Private (Farmers) Other Private
Public Traditional extension Fee-for-service Contracts with publicextension institutions
Private Subsidies to extension Commercial advisory Information provided with saleservice providers services of inputs
Publicly financed Sale of newspapers, Extension provided to contractcontracts for magazines, other growersextension services information Advertising in newspapers,
products radio, television, magazines
Source: Alex, Zijp, and Byerlee 2002.
Only when market and participation failures are high should the public sectorfinance information provision-better would be public sector financing of privateservice delivery.
Reforms have ranged from contracting with the private sector to provide extensionservices in order to reduce costs and improve cost-effectiveness to drawing on privatesector funding to improve the financial sustainability of extension (Beynon andothers 1998). The economic rationale for farmers to pay for extension servicesis generally clear, and the practice is well established in high-income countries(Marsh and Pannell 2000). In developing economies, however, many producersare unable or unwilling to pay for services, in part because they have not seenexamples of effective, responsive extension. Many countries have few extensionservice providers outside the public sector, and few public institutions have theincentives and institutional arrangements in place to encourage program costrecovery.
A Conceptual Framework for Analyzing Public Extension Organizations
Many aspects of extension work have strong public goods characteristics, and publicprovision of extension services (whether by central or regional governments) hasbeen common in most countries, at least at some stage in their history. Some notablesuccesses have been documented, but so have the many weaknesses that hamperthe effectiveness of public extension. A recent worldwide review (Rivera, Qamar,and Crowder 2001:15) refers to extension systems as "failing" and "moribund," in"disarray or barely functioning at all." This suggests that there are some genericdifficulties in the operation of public extension systems and in the typical bureau-cratic-political environment within which they are budgeted and managed.
44 The WVorld Bank Researc h Observer, vol. 19, no. I (Spring 2004)
Feder, Willett, and Zijp (2001) identify eight interrelated characteristics of public
extension systems that jointly result in deficient performance, low staff morale, and
financial stress. These characteristics provide a framework for analyzing the performance
of different levels of extension personnel, the system as a whole, and the underpin-
nings of different organizational forms and for predicting their likely performance.
Scale and complexity. In countries with large numbers of farmers working rela-
tively small plots (as is common in most developing areas), the potential clients of
extension services live in geographically dispersed communities. Underdeveloped
transport links add to the cost and difficulty of reaching these farmers. High rates of
illiteracy and limited connections to electronic mass media rule out reaching these
clients through means that do not require face-to-face interaction (written materials,
radio, television, the Internet).Thus, the number of clients who need to be covered by extension services is large,
and the cost of reaching them is high. Adding to the challenge, farmers' information
needs vary even within a given geographical area because of variations in soil,
elevation, microclimate, and farmers' means and capabilities. The large size of the
clientele means that only a small number of farmers can interact directly with extension
agents. Because direct contacts are rationed, agents often select the farmers they will
interact with, preferring larger-scale, better-endowed, and more innovative farmers
who can provide some in-kind payment and are likely to exhibit better performance
(Feder and Slade 199 3). This sort of supply-side rationing is exacerbated by self-
selection by farmers. Those who attach a higher value to (larger demand for)
information tend to be large-scale farmers with better opportunities for taking
advantage of information.This selectivity of contacts has ramifications for the diffusion of information
through farmer-to-farmer communications. Because the farmers who tend to have
more extension contacts are often not typical of the farming population, other farm-
ers are less inclined to follow the example of contact farmers or to seek their advice
(despite some positive experiences, such as in Israel: Keynan, Olin, and Dinar 1997).
On the supply side, the reaction to the large clientele is to deploy large numbers
of extension agents, which presents a management challenge for national organiza-
tions or organizations managed by large geographical administrative units (states
or provinces). When there are large numbers of field personnel, there is a tendency to
adopt a centralized, hierarchical, top-down management system. Such bureaucracies
are not generally receptive to participatory approaches to information delivery and
priority setting (Fleischer, Waibel, and Walter-Echols 2002), and by distancing
decisionmaking from the field level, they often lead to suboptimal decisions.
Dependence on the broader policy environment. The effectiveness of extension work
is crucially dependent on complementary policies and institutional actions over
jock R. Andersonz and Gershionr Feder 45
which extension management has limited influence. These involve credit, inputsupplies, price incentives, marketing channels, and human resource constraints, amongothers. Although extension agents can adjust their advice to the overall policy andinstitutional climate, the value of the information is diminished when the terms oftrade are tilted against agriculture, rural infrastructure investment is inadequate,and input supplies are irregular due to imperfections in input markets. Coordinationbetween the agencies that influence these complementary factors and extensionmanagement is costly and difficult, and extension agencies generally have littleleverage. Particularly detrimental are the weak linkages to the knowledge genera-tion system, especially the national agricultural research system.
Interaction with knowledge generation. In contrast to the situation in the UnitedStates. where the cooperative extension service is embedded in the universitysystem, in most developing economies the information on which extension advice isbased is not generated within the extension organization itself but in separatesystems (national agricultural research institutes and universities and, increasingly,private research firms). Under separate management structures and incentive struc-tures, research systems give little weight to the extension service's opinions andpriorities. Because the performance of research systems is often assessed accordingto the recognition it receives within the scientific community, research priorities arenot necessarily aligned with those of extension managers or the farmers they comein contact with.
Public research and extension organizations often compete for budgets.Researchers typically enjoy a higher status (they are often better educated andhave greater independence), and this produces tension in interactions with exten-sion services that is not conducive to two-way feedback or to effective extensionservices (see Mureithi and Anderson forthcoming on the situation in Kenya).A World Bank review (Purcell and Anderson 199 7) of a large portfolio of extensionprojects found that research-extension links were generally weak and that neitherresearch nor extension was sufficiently conscious of the need to understand theconstraints and potentials of different farming systems as a basis for determiningrelevant technology and technology-development requirements. These inade-quate research-extension links led to undesirable outcomes in a large proportion ofthe projects reviewed. More recent World Bank extension operations, building onthe lessons of experience (including the importance of support for business devel-opment services for small and medium-size enterprises), have had more positiveoutcomes.
Difficulty in attributing impoct. Because many factors affect the performance ofagriculture in complex ways, it is difficult to attribute specific impacts at the farmlevel to extension services. This difficulty weakens political support and exacerbates
46 TlheJ IW'orld Baiki Research Olbserver. vol. 19. no. I (Sprinqg 2004)
problems of budget allocation and staff incentives and accountability. both upward
(to managers) and downward (to clients).Evaluating the impact of extension involves measuring the relations between
extension and farmers' knowledge, adoption of better practices, and use of inputs:
farm productivity and profitability; and related improvements in farmers' welfare.
But farmers' decisions and performance are influenced by many other systematic
and random effects (prices, credit constraints, weather, other sources of information),
so distinguishing the impact of extension advice requires careful use of econometric
and quasi-experimental methods.The inability to attribute impact unambiguously undermines the incentives of
extension staff to reach out to farmers or even update their skills and knowledge.
Instead of assessing outcomes and performance, time is spent collecting and reporting
on input indicators, which are easier to obtain and measure.
Weak accountability. Because the effectiveness of extension activities cannot be
easily established and performance is measured in terms of input indicators, field
staff are generally not held accountable for the quality of their extension work and
are often able to shirk on quantity as well. The same impact attribution problems
mean that higher-level managers, though nominally accountable for extension
performance to the political level, are monitored mainly in terms of budget spent,
staffing levels, and other bureaucratic indicators. Accountability to clients is only
nominal, as typically there are neither mechanisms nor incentives to make extension
services accountable to farmers-who are the only ones who can easily observe the
quality and effectiveness of extension services. Little attention is given to systematic
participation by the farming community in problem definition, problem solving, and
extension programming. Without mechanisms for accountability to farmers, incent-
ives are distorted. Extension agents divert time and energy to other activities, which
earn them extra remuneration, such as promoting inputs for which they earn a
commission, or helping farmers access credit.
Weak political commitment and support. Even in countries where agriculture is still
a large economic sector, public policies and investments have traditionally favored
urban areas (Binswanger and Deininger 199 7). Within agriculture, extension tends
to be a weak claimant on agricultural budgets. In nearly half the extension projects
examined in a mid-1990s World Bank study, lack of commitment and support by
senior government officials adversely affected implementation and funding (Purcell
and Anderson 199 7). Feder, Willett, and Zijp (2001) posit that a plausible reason for
the lack of adequate support (and the resulting limited funding) by politicians and
senior officials to extension investments is the absence of the kind of political payoffs
that can be earned from other public outlays that have visible impacts, such as the
Jock R. Anzderson; tiaid Gershlon Feder 47
double cropping that follows from an irrigation investment or the reduction in trans-port cost following construction of a bridge or road.
Public duties other than knowledge transfer. Because extension services typicallyemploy large numbers of public servants at the rural community level, governmentsare often inclined to assign other duties to extension staff, such as collecting statis-tics, administering loan paperwork and input distribution (for government-providedinputs), implementing special programs (such as erosion control), and performingregulatory duties (Feder and Slade 1993; Purcell and Anderson 1997). Many ofthese duties are easier than extension services for supervisors to monitor, as thereare clear and quantifiable performance criteria (number of loan applications returned,number of statistical reports submitted). As mentioned, there may also be monetaryincentives for performing some of these other activities (such as input distribution)that have a clear cash value to farmers. This misallocation of extension agents' timeat the expense of information dissemination can go undetected because the out-comes of core extension duties are so difficult to attribute and because accountabilityto farmers is weak or absent.
Fiscal sustainability. An outcome of many of the shortcomings of public extensionsystems is persistent funding difficulties. The public goods nature of many extensionservices makes cost recovery at the individual beneficiary level difficult, whereas thedependence on public funding is problematic because of weak political commitment.When budgets shrink, fixed staff costs claim a large share of available funds, andfield operations are curtailed, along with other recurrent costs (such as vehiclepurchase and maintenance). Scaling down field operations reduces not only thequantity of extension inputs but also their quality, as feedback from farmers isreduced and with it timely follow-up on farmers' issues.
Fiscal inadequacy and the unsustainability of extension operations are commonthemes in the extension literature (see Feder, Willett, and Zijp 2001: Hanson andJust 2001). More than 70 percent of extension projects in a sample of World Bank-supported operations faced "unlikely" or "uncertain" sustainability (Purcell andAnderson 199 7). More recently, this shortcoming has received critical attention inthe wider agricultural development literature (Kydd and others 2001).
Extension Modalities as Induced InstitutionaL InnovationsThis section applies the framework developed in the previous section to analyze sev-eral extension modalities that have emerged in the past three decades. These newerapproaches, which depart from the traditional public service model, reflect attemptsto overcome some of the weaknesses inherent in the public extension systems of
48 The World Baiikt Research Observer, vol. 19, no. I (Sprinql 2004)
recent decades (Anderson, Clement, and Crowder 1999; Anderson 1999: FAO and
World Bank 2000).
Training and Visit Extension
The training and visit model of extension organization was promoted by the World
Bank during 1975-95 in more than 70 countries (Umali and Schwartz 1994).
The system stressed a single line of command, with several levels of field and super-
visory staff; in-house subject matter specialists to provide training to staff and tackle
technical issues reported by field staff; exclusive dedication to technical information
dissemination; a strict and predetermined schedule of village visits over a two-week
cycle, with contacts with selected "contact farmers"; mandatory biweekly training
emphasizing the key set of messages for the forthcoming two-week cycle; a seasonal
workshop with research personnel; and better remuneration and transport for
extension staff. Although the training and visit design attempted to tackle some of
the weaknesses of the public extension service, it also exacerbated other weaknesses.
In the end, most of these new structures collapsed.The problems of scale and complexity were tackled by a heavy reliance on for-
mally selected contact farmers within an identifiable farming group. By working
with a small number of contact farmers, who were expected to pass on what they
learned to the rest of the farming group, agents were to maximize coverage. But the
required staff-farmer ratios implied a significantly larger extension staff, and thus
the training and visit extension systems cost some 25-40 percent more than the
systems they replaced (Feder and Slade 1993: Antholt 1994). The design intended
to deal with accountability by improving management's ability to monitor staff
activities, taking advantage of the strict visit schedule, identifiable contact farmers,
intensive hierarchy of supervisory staff, and other quantifiable measures. The moni-
torable daily schedule also eliminated most activities other than information dissem-
ination. The interaction with research was improved through seasonal meetings,
but little influence was gained over research priorities.
Several features of the design could not stand up to practical realities, however.
The quality of extension services remained mostly unmonitorable, and the lack of
accountability to farmers was not resolved. Biases in the selection of contact farmers
led to diminished diffusion as contact farmers were often replaced by "contact
groups." The strict biweekly visit schedule could not be maintained because agents
often lacked new messages to convey and farmers had limited interest in frequent
visits. The training and visit system appeared to have little impact over time.
Although a 1986 study by Feder and Slade (1993) found a positive impact on yields
in Haryana, India, three years after project initiation, studies in Pakistan (Hussain,
Byerlee, and Heisey 1994) and Kenya (Gautam 2000) found no significant impact
after a longer period.
jock R. Anderson and Gershon Feder 49
Many observers, including early skeptics such as Moore (1984), agree that whateventually brought about the dismantling of the training and visit extension systemwas lack of financial sustainability, a general problem of large public extension sys-tems made worse by the higher cost of the training and visit structure. As the abilityto demonstrate impact was not improved, there was no significant change in thepolitical commitment to support extension. In country after country, once the WorldBank ceased funding (assuming that the new system had been "mainstreamed"),funding returned to the lower levels of the past, which could not sustain the trainingand visit system. Hard-pressed governments have struggled with downsizingoptions, in some cases supported by bilateral donors and inevitably coupled withother extension reforms (Sulaiman and Hall 2002).
Decentralization
Decentralization retains the public delivery and public funding characteristics oftraditional centralized extension but transfers responsibility for delivery to localgovernments (district, county). This approach was tried by several Latin Americangovernments in the 1980s and 1990s (Wilson 1991) and by Uganda (Crowder andAnderson 2002) and other African countries later. Decentralization is intended toimprove accountability by moving services closer to the people who use them. Localgovernments (if democratically elected) are eager to receive positive feedback on ser-vices from the clientele-electorate. This was expected to improve extension agents'incentives and induce better service. The costs of coordination with the activities ofother agencies are also generally lower for local agencies operating in smaller geo-graphical areas. Political commitment may be stronger as well because the clienteleis closer to the political leadership.
But decentralized extension agencies also face a multitude of additional problems.There is greater potential for political interference and the use of extension staff forother activities (such as election campaigns). Economies of scale in updating staffskills can be lost, and extension-research links are more difficult to organize. Analysisof Colombia's experience with the decentralization of extension confirms these con-cerns and documents a significant increase in the number of staff and thus in costs(Garfield, Guadagni, and Moreau 1996). Problems of financial sustainability, ratherthan being resolved, may merely have been transferred to the local level.
A related reform was the devolution of extension functions to farmers associa-tions rather than to local governments, a strategy pursued in several West Africancountries with some notable successes (Guinea). This approach is likely to havea greater impact on accountability, because the employer is even closer to the clientele.There is also greater potential for financial sustainability, because the farmers' asso-ciation that provides the public good is better able to recover costs from its members(through general membership fees, for example), although government funding is
50 The WVorld Bank Research Observer, vol. 1 9. no. 1 (Spring 2004)
generally also provided to the associations. Extension agents may be permanentemployees of the associations or contract employees of private entities, nongovern-mental organizations, or universities. Conceptually, their incentives for better ser-vice are fairly similar regardless of their standing. Remaining problems includedifficulties maintaining agent quality due to loss of economies of scale in training
and more difficult linkages with research.
Fee for Service and Privatized Extension
Fee for service extension programs in developing economies can reduce the fiscalburden of public extension services, though they usually entail considerable publicfunding even when the provider is private. Government-funded vouchers or otherpublic support is common (Keynan, Olin, and Dinar 1997; Dinar and Keynan2001). Small groups of farmers typically contract for extension services to address
their specific information needs. Because this solves the accountability problem, thequality of service is likely to be higher. Farmers determine the type of information
that is important to them, so the impact of extension advice is likely to be high (Lindner1993). Defining the public good at the small group level and having the whole groupshare in the cost resolve the free-rider and nonrivalry problems. Tracing extensionimpact is much less of a problem than in other types of extension service provision,although issues of asymmetric knowledge of the value of information and identifi-ability of benefits remain and raise design challenges (Hanson and Just 2001).Another drawback is the loss of economies of scale in agent training, because agentswill generally have to update their skills individually.
An important role for public extension policy is to facilitate the development ofprivate provision of extension services and the gradual withdrawal of the publicsector (Keynan. Olin, and Dinar 1997; van den Ban 2000; Dinar and Keynan 2001;Holloway and Ehui 2001). The potential for conflict of interest in contractingarrangements may warrant public regulation and monitoring backed by publicinformation for checking on the quality of the information supplied (Mullen,
Vernon, and Fishpool 2000; Rivera and Zijp 2002).A key drawback of fee for service modes of extension is that less commercial
farmers-poorer farmers, women farmers, farmers with smaller or less favorable
plots-for whom the value of information is lower, may purchase fewer extensionservices, because the price of the service will tend to be market-determined. This
may have undesirable social implications and may also be an inefficient outcome ifpoor farmers undervalue information because they have less ability to prejudge itsvalue. One way around this problem is stratification of extension systems by types of
clients (Sulaiman and Sadamate 2000). Smaller-scale and poorer farmers may beserved by public extension or by subsidized contracted extension services (for example.an association of small-scale farmers would receive public funds to hire extension
Jock R. Aniderson and Gershon Feder 51

staff). Commercial farmers, meanwhile, would be expected to pay a higher share ofextension costs in a fee for service system (Wilson 1991; Dinar and Keynan 2001).A fully privatized extension system may result in inefficiencies, however, if there areexternalities, such as concerns about soil conservation (Hanson and Just 2001).
Farmer Field Schools
Farmer field schools were originally introduced to teach irrigated-rice farmers inAsia about integrated pest management. After being implemented in Indonesia andthe Philippines, the programs were replicated in other countries and for other crops,usually with significant donor funding. A typical farmer field school educates farmerson agro-ecosystems analysis, including practical aspects of "plant health, watermanagement, weather, weed density, disease surveillance, plus observation andcollection of insect pests and beneficials" (Indonesian National IPM Program Secre-tariat 1991:5). The approach uses participatory training methods to educate fieldschool participants to make farmer pest observers into "confident [integrated pestmanagement] experts, self-teaching experimenters, and effective trainers of farmersand extension workers" (Wiebers 1993:32).
A program consists of 9-12 half-day sessions of hands-on farmer experimentationand informal training to a group of 20-25 farmers during a single crop-growing season.Initially, paid trainers lead this village-level program, delivering diagnostics andpractical solutions for overall good crop management practices. Through groupinteractions, attendees sharpen their decisionmaking abilities and their leadership,communication, and management skills (van de Fliert 1993). Some participatingfarmers are selected to receive additional training that qualifies them as farmer-trainers, with official backup support, such as training materials.
The farmer field school approach seeks to rectify the problem of accountability.The trainers who conduct the field school are bound by a strict timetable of sessionsand a prespecified curriculum, which can be easily verified by supervisors. Continuousinteraction with a cohesive group of trainees creates accountability to the group,which is enhanced by the participatory nature of the training methods. Later, whenthe training is administered by farmer-trainers who are members of the community,accountability to farmers is presumed to be even greater.
A key drawback of the former field school approach is its cost, which is likely toraise problems of financial sustainability. The intense training activities are expensiveper farmer trained (Quizon, Feder, and Murgai 2001a,b), so the amount of serviceactually delivered (the number of farmers trained) on a national level would besmall. Cost-effectiveness and financial sustainability could be improved if farmer-trainers were to become the main trainers, perhaps with significant communityfunding, and if informal farmer-to-farmer communications were used to facilitateknowledge diffusion.
52 The World Bank Research Observer, vol. 19, no. 1 (Spring 2004)

In practice, however, farmer-trainers have been a minor factor in national farmer
field school initiatives in Indonesia and the Philippines (Quizon. Feder, and Murgai
2001a). A study in the Philippines found little diffusion of knowledge from trained
farmers to other farmers, presumably because the content of the training is difficult
to transmit in casual, nonstructured communications (Rola, Jamias, and Ouizon
2002). Recent analysis of field farmer schools in Indonesia found no significant
impact on yields and pesticide use by trained farmers or members of their communities
(Feder, Murgai, and Quizon 2004). This suggests that both the curriculum and the
training approach need to be rethought.
The Impact of Extension
Over the past four decades, extension operations have been one of the largest institu-
tional development efforts the world has ever known. Hundreds of thousands of
technicians have been trained, and hundreds of millions of farmers have had contact
with extension services. As countries struggle with declining public budgets, a key
question must wonder how effective these extension investments have been. Many
studies have analyzed the impact of extension and reported impressive results, but
the data challenges and econometric difficulties in the analyses suggest that many of
the results must be interpreted with caution.
In principle, the economic analysis of extension projects is similar to that of any
investment appraisal (see Belli and others 2001, for example), but inevitably
challenges arise in appropriately valuing and attributing benefits. For projects that
deliver agricultural knowledge products to producers, effectiveness in enhancing
productivity can be quantified by estimating the economic benefits to producers
(or consumers) and computing a rate of return to the investment (Maredia. Byerlee,
and Anderson 2001). Rates of return can be estimated econometrically by relating
productivity changes to investment in research and extension or by applying the
economic surplus method, which builds benefits from the bottom up based on esti-
mated productivity changes at the field level and adoption rates for each technology.
More comprehensive studies may also seek to trace the wider economic benefits of
research and extension through factor and product markets. Economic analysts are
increasingly being asked to address objectives beyond efficiency, such as equity and
poverty alleviation, environmental quality, food safety, and nutrition (see, for example,
Alston, Norton, and Pardey 1995). But there is still no consensus on how far
research and extension organizations should depart from their traditional efficiency
objective to guide policy analysts concerned with the relevance and effectiveness of
investment in research and extension.In econometric studies, a production function, cost function, or total factor
productivity analysis is used to estimate the change in productivity resulting from
lock R. Arzderson aid (iershon Fedcr 53
an investment in extension. A production function incorporates conventionalinputs (land, labor), nonconventional inputs (education, infrastructure), and thestock of technical knowledge (perhaps represented by investment in extension).Recent efforts have expanded the specification to include resource quality variables(soil erosion, nutrient status) and weather variables. The estimated coefficients onextension (measuring marginal product) are then used to calculate the value ofadditional output attributable to the respective expenditures (holding other inputsconstant) and to derive marginal rates of return to the investments.
There are many technical areas of debate in the literature on econometric methods,such as the length and shape of time-lag structures, the appropriate method of deter-mining the rate of return from the estimations, and the quality of indices used as thedependent variable (Alston, Norton, and Pardey 1995). However, the main con-straints on the wider application of econometric approaches in developing economiesare data availability and quality. The econometric approach requires good-qualitytime-series data, which are difficult to obtain below the national or state level inmost developing economies. Therefore, this approach is generally best for ex postevaluations of entire agricultural research and extension systems over a long period(say, 25-30 years), if the quantity and quality of data allow the use of statisticalmethods. Much of the work in this area in developing economies was pioneered byRobert Evenson (see, for example, Evenson and Pray 19 91 )).
One good approach is to use panel data to capture both cross-sectional and time-series variability (Gautam 2000). Secondary panel data are increasingly availablefor many variables at the district level, especially production and input data, andsome recent studies have even included districtwide data on resource quality (for areview of such studies, see Maredia, Byerlee, and Anderson 2001). Most of the studieshave focused on the impact of research rather than extension. Indeed, in studiesbased on time-series data, it is often difficult to separate the effects of research fromthose of extension. As panel data become more widely available, the use of econo-metric analysis of extension impact will expand.
Birkhaeuser, Evenson, and Feder (1991) provided an early review of studies ofextension impact and found few studies that systematically compared costs and benefitswith and without an extension project. Although early evaluations of extensioninvestments criticized the observed low levels of efficiency and frequent lack ofequity in service provision, they reported relatively high benefit-cost ratios (seePerraton and others 1983). More recent studies have also found significant andpositive effects (Bindlish, Evenson. and Gbetibouo 1993: Bindlish and Evenson1993), with internal rates of return on extension investments in developing econo-mies ranging from 5 percent to more than 50 percent (Bindlish and Evenson 1997;Evenson 199 7).
The overriding lesson of Evenson's (1997) review of 57 studies of the economicimpact of agricultural extension is, however, that impacts vary widely-many programs
54 The World Bank Research Observer, vol. 19. no. 1 (Spring 2004)
have been highly effective, whereas others have not. A recent meta-analysis of 289
studies of economic returns to agricultural research and extension found median
rates of return of 5 8 percent for extension investments, 49 percent for research, and
36 percent for combined investments in research and extension (Alston and others
2000).1 Similar economic performance has been documented for Sub-Saharan
Africa alone (Oehmke, Anandajayasekeram, and Masters 1997).
However, although economic analysis seems to provide fairly strong justification
for many past extension investments, it does not tell the full story. Concern about data
quality and difficult methodological issues of causality and quantification of benefits
must be important qualifiers to the prevailing evidence of good economic returns
from extension. In Kenya, perhaps the most closely studied case in developing areas
(from Leonard 1977 to Gautam 2000), early evaluations had indicated remarkably
high positive economic returns to extension investments, but a comprehensive
evaluation based on new and improved data found disappointing performance-an
ineffective, inefficient, and unsustainable training and visit system and no measur-
able impact on farmer efficiency or crop productivity (Gautam 2000). Such findings
do little to dispel the skepticism of policymakers (reinforced by observations such as
those of Hassan, Karanja, and Mulamula 1998) about the returns to investment in
public extension. More evaluative work is clearly called for to assist policymaking
and investment decisions.
ConcLusion
Agricultural extension can play an important role in development. The public goods
character of much extension work underpins the extensive public investment in
extension services. But although public extension organizations are common in
developing economies, they are often inadequately funded and their effectiveness is
limited by many administrative and design deficiencies and challenges. Chief among
these are the large scale and complexity of extension operations, the important
influence of the broader policy environment, weak links between extension and
knowledge generation institutions, difficulties tracing extension impact, problems of
accountability, weak political commitment and support, the frequent encumbrance
of extension agents with public duties beyond those related to knowledge transfer,
and severe difficulties of fiscal unsustainability.Among these general problems of extension organization, the difficulty of attrib-
uting impact weakens political support, leading to small budgets and problems of fiscal
sustainability. Ironically, this same difficulty may explain why international devel-
opment agencies continue to heavily support extension activities, financing some
$10 billion in public extension projects over the past five decades. The economic jus-
tification for the project is rarely based on solid ex ante cost-benefit analysis, because
Jock R. Amiersoni and Gerslion Feder 55
parameters are typically not available from past projects because of the difficulties ofattributing impact. Attribution problems also imply that it will be difficult to estab-lish failure once a project is completed (completion is the artificial point in time whendonor funding is fully disbursed but farming and extension activities continue).
Several other factors also account for the popularity of extension projects amongdonors. Extension projects are relatively easy to design, typically involving a smallnumber of recipient government agencies, often just the ministry of agriculture.This reduces bureaucratic complexity. The activities funded by the project are well-defined inputs: constructing and refurbishing extension offices, training agents, pro-viding transport and budgets for field operations, and funding additional personnel.If the project is national in scale, it is easy for donors to build its budget to a signifi-cant size-a positive attribute for a development agency striving to maintain its owncost-effectiveness per dollar granted or loaned.
There is thus some tension between domestic decisionmakers, who are reluctantto invest heavily in extension, and development agencies, which enthusiasticallypromote investment in extension. The availability of external funds minimizes theneed for tradeoffs between investments in extension and investments in more politi-cally rewarding undertakings, such as irrigation systems. But it also simply post-pones the day of reckoning. Once the externally funded project is over, the lack ofpolitical support resurfaces and extension budgets are again cut. The more expen-sive features of the foreign-funded effort are abandoned, and the size of the extensionservice is cut way back (Purcell and Anderson 19 9 7).
Several lessons for future extension systems emerged from this review, includingsome reflections on the pros and cons of different models of extension delivery thatwere developed in the past few decades. Each situation calls for suitable extensionprovision methods, but this review emphasizes the efficiency gains that can comefrom locally decentralized delivery and incentive structures based on largely privateprovision. Most extension services will remain largely publicly funded, however,especially in impoverished developing economies.
Much remains to be done to bring appropriate extension services to poor farmersaround the world. But investors need to be cautious in designing public extensionsystems and to draw lessons from experience. Informed by these lessons, govern-ments should be able to increase the returns to their investment and successfullyassist farmers in boosting their productivity and income, thereby contributing tostronger economic growth.
Notes
Jock R. Anderson was an adviser and is presently a consultant in the Agriculture and Rural Develop-ment Department at the World Bank: his e-mail address is janderson(0worldbank.org. Gershon
56 Thet, 17orld Baizk Research Obsenxer vwol. 19, nio. I (Spruin,g 2004)
Feder is research manager in the Development Research Group at the World Bank; his e-mail address
is gfedergworldbank.org. The authors have drawn on the considerable World Bank experience
with extension, including the work of many of their colleagues, notably Gary Alex, Derek Byerlee,
Ariel Dinar, David Nielson, Dina Umali-Deininger, and Willem Zijp. Seniority of authorship is not
assigned.1. The sample of studies was strongly oriented toward research. Only 18 of 1 128 estimates of rates
of return were for "extension only," whereas 598 were for "research only" and 512 for "research and
extension combined."
References
Alex, G., W. Zijp, and D. Byerlee, with input from the AKIs Thematic Team. 2002. Rural Extension and
Advisory Services: New Directions. Rural Development Strategy Background Paper 9. World Bank,
Agriculture and Rural Development Department, Washington, D.C.
Alston, J. M., C. Chan-Kang, M. C. Marra. P. G. Pardey, and T. J. Wyatt. 2000. A Meta-Analysis of Rates
of Return to Agricultural R&D: Ex Pede Herculem? International Food Policy Research Report 113.
Washington, D.C.
Alston, J. M., G. W. Norton, and P. G. Pardey. 1995. Science under Scarcity: Principles and Practicefor
Agricultural Research Evaluation and Priority Setting. Ithaca, N.Y.: Cornell University Press. Reprint,
1998, Wallingford, United Kingdom: CABI.
Anderson, J. R. 1999. "Institutional Reforms for Getting an Agricultural Knowledge System to Play Its
Role in Economic Growth." Pakistan Development Review 38(4):333-54.
Anderson, J.. I. Clement, and L. V. Crowder. 1999. "Pluralism and Sustainable Forestry and Rural
Development: An Overview of Concepts, Approaches and Future Steps." In Food and Agriculture
Organization. Pluralism and Sustainable Forestry and Rural Development. Rome.
Antholt. C. H. 1994. Getting Ready for the Twenty-First Century: Technical Change and Institutional
Modernization in Agriculture. World Bank Technical Paper 217. Asia Technical Department Series,
Washington, D.C.
Belli, P., J. R. Anderson, H. N. Barnum, J. A. Dixon, and J. P. Tan. 2001. Economic Analysis of Investment
Operations: Analytical Tools and Practical Applications. Washington, D.C.: World Bank.
Beynon, J., S. Akroyd, A. Duncan, and S. Jones. 1998. Financing the Future: Options for Agricultural
Research and Extension in Sub-Saharan Africa. Oxford Policy Management, Oxford, UNITED
KINGDOM.
Bindlish, V., and R. Evenson. 1993. Evaluation of the Performance of T&V Extension in Kenya. World
Bank Technical Paper 208. Washington, D.C.
.1997. "The Impact of T&V Extension in Africa: The Experience of Kenya and Burkina Faso."
World Bank Research Observer 12(2): 183-201.
Bindlish, V., R. Evenson, and M. Gbetibouo. 1993. Evaluation of T&V-Based Extension in Burkina Faso.
World Bank Technical Paper 226. Washington, D.C.
Binswanger, H. P., and K. Deininger. 1997. "Explaining Agricultural and Agrarian Policies in Develop-
ing Countries." Journal of Economic Literature 35(4):1958-2001.
Birkhaeuser, D., R. E. Evenson, and G. Feder. 1991. "The Economic Impact of Agricultural Extension:
A Review." Economic Development and Cultural Change 39(3):607-50.
Byerlee, D. 1998. "Knowledge Intensive Crop Management Technologies: Concepts, Impacts, and
Prospects in Asian Agriculture." In P. Pingali, ed., Impacts of Rice Research. Bangkok: Thailand
Development Research Institute; Los Bafios, Philippines: International Rice Research Institute.
Jock R. Anderson and Gershon Feder 57
Crowder, L. V.. and J. Anderson. 2002. "Uganda: Private Sector Secondment of Government ExtensionAgents." In W. M. Rivera and W. Zijp, eds., Contractingfor Agricultural Extension: International CaseStudies and Emerging Practices. Wallingford, United Kingdom: CABI.
Dinar, A. 1996. "Extension Commercialization: How Much to Charge for Extension Services. " AmnericanJournal of Agricultural Economics 78(1):1-12.
Dinar, A., and G. Keynan. 2001. "Economics of Paid Extension: Lessons from Experience in Nicaragua."American Journal of Agricultural Economics 83(3): 769-76.
Evenson, R. 1997. "The Economic Contributions of Agricultural Extension to Agricultural and RuralDevelopment." In B. Swanson, R. Bentz, and A. Sofranko, eds., Improving Agricultural Extension:A Reference Manual. Rome: Food and Agriculture Organization.
Evenson, R., and C. Pray, eds. 1991. Research and Productivity in Asian Agriculture. Ithaca, N.Y.: CornellUniversity Press.
Food and Agriculture Organization and World Bank. 2000. Agricultural Knowledge and InformationSystemfor Rural Development: Strategic Vision and Guiding Principles. Rome.
Feder, G., and R. H. Slade. 1 993. "Institutional Reform in India: The Case of Agricultural Extension.In K. Hoff, A. Braverman, and J. E. Stiglitz, eds., The Economics of Rural Organization: Theory Practiceand Policy. New York: Oxford University Press.
Feder. G., R. E. Just, and D. Zilberman. 1986. "Adoption of Agricultural Innovations in DevelopingCountries: A Survey." Economic Development and Cultural Change 33(2):255-98.
Feder, G., R. Murgai, and J. B. Quizon. 2004. "Sending Farmers Back to School: The Impact of FarmerField Schools in Indonesia." Review of Agricultural Economics 26(1):45-62.
Feder, G.. A. Willett. and W. Zijp. 2001. "Agricultural Extension: Generic Challenges and the Ingredi-ents for Solutions." In S. Wolf and D. Zilberman, eds., Knowledge Generation and Technical Change:Institutional Innovation in Agriculture. Boston. Mass.: Kluwer.
Fleischer, G., H. Waibel, and G. Walter-Echols. 2002. "How Much Does It Cost to Introduce Participa-tory Extension Approaches in Public Extension Services? Some Experiences from Egypt." A casestudy prepared for the workshop on Extension and Rural Development: A Convergence of Views onInstitutional Approaches, convened by the World Bank and the U.S. Agency for InternationalDevelopment, Washington, D.C. 12-15 November 2002. Available online at http://lnwebl8.worldbank.org/ESSD/ardext.nsf/26ByDocName/AKISResearchExtensionExtensionNewApproachestoExtensionWorkshop-ProceedingsandCaseStudies.
Garfield, E., M. Guadagni, and D. Moreau. 1996. "Colombia: Decentralization of Agricultural ExtensionServices." Presented to Extension Workshop, Alternative Mechanisms for Funding and DeliveringExtension. World Bank, Washington. D.C.
Garforth, C. 1982. "Reaching the Rural Poor: A Review of Extension Strategies and Methods." In G. E.Jones and M. J. Rolls, eds., Progress in Rural Extension and Community Developmenit. Vol. 1. New York:Wiley.
Gautam, M. 2000. Agricultural Extension: The Kenya Experience: An Impact Evaluation. Washington,D.C.: World Bank, Operations Evaluation Department.
Hanson, J., and R. Just. 20)1. "The Potential for Transition to Paid Extension: Some Guiding EconomicPrinciples. " American Journal of Agricultural Economics 83(3): 777-84.
Hassan. R. M., D. Karanja, and L. Mulamula. 1998. "Availability and Effectiveness of AgriculturalExtension Services for Maize Farmers in Kenya." In R. M. Hassan. ed., Maize Technology Develop-ment and Transfer: A (;Is Application for Research Planning in Kenya. Wallingford, United Kingdom:CABI.
Holloway, G. J., and S. K. Ehui. 20)01. "Demand, Supply and Willingness-to-Pay for ExtensionServices in an Emerging Market Setting." American Journzal of Agricultural Econonrmics 83(3):764-68.
58 The I lorld Bank Research Obsenrer, vol. 19. no. I (Spring 2004)
Hussain, S. S., D. Byerlee, and P. W. Heisey. 1994. "Impacts of the Training and Visit Extension System
on Farmers' Knowledge and Adoption of Technology: Evidence from Pakistan." Agricultural Economics
10(1):39-47.
Indonesian National iPMI Program Secretariat. 1991. "Farmers as Experts: The Indonesian National IPM
Program." Indonesian National IPM Program. Jakarta.
Jarrett, F. G. 1985. "Sources and Models of Agricultural Innovation in Developed and Developing
Countries." Agricultural Administration 18(4):217- 34.
Keynan, G., M. Olin, and A. Dinar. 1997. "Cofinanced Public Extension in Nicaragua." World Bank
Research Observer 12(2):225-47.
Kydd. J., A. Dorward, J. Morrison, and G. Cadisch. 2001. "The Role of Agriculture in Pro Poor Eco-
nomic Growth in Sub-Saharan Africa." Produced for Department for International Development.
Imperial College of Science, Technology and Medicine at Wye, London.
Leonard, D. K. 1977. Reachinig the Peasant Farmer: Organization Theory and Practice in Kenya. Chicago:
University of Chicago Press.
Lindner, R. K. 1993. "Privatising the Production of Knowledge: Promise and Pitfalls for Agricultural
Research and Extension." Australial Journal of Agricultural Econornics 37(3) :205-25.
Maredia, M., D. Byerlee, and J. R. Anderson. 2001. "Ex Post Evaluation of Economic Impacts of Agricul-
tural Research Programs: A Tour of Good Practice." In The Future of Impact Assessment in CGIAR:
Needs, Constraints and Options. Proceedings of a Workshop Organized by the Standing Panel on
Impact Assessment of the Technical Advisory Committee. 3-6 May 2000, Rome.
Marsh, S. P., and D. J. Pannell. 2000. "Agricultural Extension Policy in Australia: The Good, the Bad
and the Misguided." Australian Journal of Agricultural and Resource Economics 44(4):605-27.
Moore, M. 1984. "Institutional Development, the World Bank. and India's New Agricultural Extension
Program." Journal of Development Studies 20(4):303-17.
Mullen, J. D., D. Vernon, and K. I. Fishpool. 200t). "Agricultural Extension Policy in Australia: Public
Funding and Market Failure." Australian Journal of Agricultural and Resource Economics 44(4):
629-4 5.
Mureithi, J., and J. R. Anderson. Forthcoming. "Farmer-Extension-Research Interfaces." In C. Ndiritu.
A. Mbabu, and J. Lynam, eds.. Transformrlinig the Agricultural Research System in Kenya: Lessons for
Africa. East Lansing: Michigan State University Press.
Oehmke. J. F.. P. Anandajayasekeram, and W. A. Masters. 1997. Agricultural Technology Developmnent
and Transfer in Africa: Impacts Achieved and Lessons Learned. uISAID Technical Paper 77. Office of
Sustainable Development, Bureau for Africa, Washington, D.C.
Perraton, H., D. T. Jamison, J. Jenkins, F. Orivel, and L. Wolff. 1983. Basic Education and Agricultural
Extension: Costs, Effects, and Alternatives. Staff Working Paper 564. Washington, D.C.: World Bank.
Picciotto, R., and J. R. Anderson. 1997. "Reconsidering Agricultural Extension." World Bank Research
Observer 12(2):249-59.
Purcell, D. L., and J. R. Anderson. 1997. Agricultural Extenlsionl and Research: Achieveriemits and Problems
in National Systems. Washington, D.C.: World Bank.
Quizon, I., G. Feder. and R. Murgai. 2001 a. "Fiscal Sustainability of Agricultural Extension: The Case of
the Farmer Field School Approach." Journal of Initerinationial Agricultural and Extension Education
8(1):13-24.
- 2001b. "Fiscal Sustainability of Agricultural Extension: The Case of the Farmer Field School
Approach: Supplementary Remarks." Journial of Internationial Agricultural and Extension Education
8(2):73-6.
Rivera, W. M., and W. Zijp, eds. 2002. Contracting for Agricultural Extension: Interniational Case Studies
and Emerging Practices. Wallingford, tJnited Kingdom: CABI.
lock R. Anderson and Gershlon Feder 59
Rivera, W. M.. M. Kalim Qamar, and L. Van Crowder.2001. Agricultural and Rural Extension Worldwide:Optionisfor Institutional ReJorrn in Developing Countries. Rome: Food and Agriculture Organization.
Roberts. N., ed. 1989. Agricultural Extension in Africa. Proceedings of a World Bank Symposium.Eldoret, Kenya, 20 June 1984. Washington, D.C.: World Bank.
Rola, Agnes C., Serlie B. Jamias. and Jaime B. Quizon. 2002. "Do Farmer Field School Graduates Retainand Share What They Learn?: An Investigation in Iloilo, Philippines." Journal of InternationalAgricultural and Extension Education 9(1):65-76.
Schwartz, L. A., and W. Zijp. 1994. "Public and Private Roles in the Delivery of Extension Services."In Inter-American Institute for Cooperation on Agriculture, Public and Private Sector Roles in theProvision of Agricultural Support Services, Proceedings of the International Symposium. Coronado,Costa Rica.
Sulaiman, R., and A. Hall. 2002. Beyond Technology Dissemination: Can Indian Agricultural ExtensionRe-invent Itselj? Policy Brief 16. New Delhi: National Centre for Agricultural Economics and PolicyResearch.
Sulaiman, R., and V. V. Sadamate. 2000. Privatising Agricultural Extension in India. Policy Paper 10.New Delhi: National Centre for Agricultural Economics and Policy Research.
Umali, D. L., and L. Schwartz. 1994. Public and Private Agricultural Extension: Beyond TraditionalFrontiers. World Bank Discussion Paper 236. Washington, D.C.
Umali-Deininger, D. 1996. "New Approaches to an Old Problem: The Public and Private Sector inExtension." Presented at the Extension Workshop, Alternative Mechanisms for Funding and Deliver-ing Extension. World Bank, Washington, D.C.
.1997. "Public and Private Agricultural Extension: Partners or Rivals?" World Bank ResearchObserver 12(2):203-24.
van de Fliert, E. 1993. "Integrated Pest Management: Farmer Field Schools Generate SustainablePractices. A Case Study in Central Java Evaluating IPM Training." PhD diss., Wageningen Agricul-tural University Papers 9 3-3. Wageningen, Netherlands.
van den Ban, A. W. 1999. "Agricultural Development: Opportunities and Threats for Farmers andImplications for Extension Organizations." lournal of Agricultural Education and Extension 6(3): 145-56.
.2000). Dijferent Ways of Financing Agricultural Extension. Agricultural Research and ExtensionNetwork Paper 106b. London: Overseas Development Institute.
van den Ban, A. W., and H. S. Hawkins. 1996. Agricultural Extension, 2nd ed. Oxford: Blackwell.Wiebers, Uwe-Carsten. 1993. Integrated Pest Management and Pesticide Regulation in Developing Asia.
World Bank Technical Paper Number 211. Washington, D.C.Wilson, M. 1991. "Reducing the Costs of Public Extension Services: Initiatives in Latin America." In
W. M. Rivera and D. J. Gustafson, eds., Agricultural Extension: Worldwide Institutional Evolution andForcesfor Changes. Amsterdam: Elsevier.
Wolf. S.. and D. Zilberman, eds. 2001. Knowledge Generation and Technical Change, Institutional Innova-tion in Agriculture. Boston, Mass.: Kluwer.
World Bank. 200)2. "New Approaches to Extension: A Workshop for Practitioners." Proceedings andcase studies of the workshop convened by World Bank, U.S. Agency for International Development,and the Neuchatel Group, Washington, D.C. 11-15 November 2002. Available online at http://Inwebl 8.worldbank.org/ESSD/ardext.nsf/26ByDocName/AKISResearchExtensionExtensionNewApproachestoExtensionWorkshop-ProceedingsandCaseStudies.
60 The World Bank Research Observer, vol. 19, no. 1 (Spring 2004)
Targeting Outcomes Redux
David Coady * Margaret Grosh . John Hoddinott
A newvly constructed comnprehensive database of 122 targeted antipoverty interventionis in
48 countries is used to examine thre contested issue of the efficacy of targeting interventions
in developing counltries. Though the median program transfers 25 percent more to poor
individuals (those in the bottom two quintiles) than would universal allocation, a quarter
of the interventionzs are regressive. Targeting is better in richer counrtries, in countries
where governmrlenits are more likely to be held accountable, andt in counltries where inequal-
ity is higlher. Intervenltions that use means testing, geographic targeting, and self-selection
based on a ivork requiriement are all associated with an increased share of benefits going to
poor people. Proxy-mrleanis testing, commrzunity-based selection, and demnographiic targeting
to children show good results on average but with wide variation. Self-selection based on
consumrlption, demographic targeting to the elderly, and community bidding show limited
potential for good targeting. The substanitial variation in targeting performance within
spl , Ml, program types and speciJic targeting methods suggests that differences in implemrlent-
ation are also imnportant factors in deterrniiiing the success of targeting to poor individuals.
In the past two decades a consensus has emerged that social safety nets designed to
raise and protect the consumption levels of poor households can play a crucial role
in development (World Bank 1990, 1997, 2000). Implementing this agenda for
reducing poverty requires methods for reaching poor people. This can be accomp-
lished by broad targeting through programs that reach a wide swath of society,
including poor people (for example, universal primary education, an extensive net-
work of basic health care), or by narrow targeting through programs that identify
the poor more specifically to confer benefits disproportionately on this group (for
example, income transfer programs).' The case for narrow targeting rests on the
existence of a budget constraint.2 The overall poverty impact of a program depends
on the number of poor households covered and the level of benefits they receive.
With a fixed poverty alleviation budget, the opportunity cost of transfers "leaking" to
nonpoor households is a lower impact on poverty reduction, reflecting less coverage
The World Bank Research Observer. vol. 1 9, no. 1,C, The International Bank for Reconstruction and Development / THE WVORLD B.ANK 2004: all rights reserved.
DOI: 10.1093/wbro/lkh()16 19:61-85
of poor households or lower benefit levels. Targeting transfers to poor householdsmeans that more benefits can go to them.
Divergent views on the efficacy of narrowly targeted interventions are based ondiffering assessments of three questions: Are such methods likely to achieve bettertargeting outcomes? Are they cost-effective? Do they raise the living standards of poorpeople? This article addresses the first question. 3 The fairly extensive literature on thistopic is dominated by descriptions of individual, sometimes idiosyncratic programs.Even comparative analyses tend to cover a single region (Grosh 1994 for Latin Americaand the Caribbean; Braithwaite, Grootaert, and Milanovic 2000 for Eastern Europeand Central Asia), method (Bigman and Fofack 2000 on geographic targeting), orintervention (Rawlings, Sherburne-Benz, and van Domelen 2001 on social funds).This partial coverage frustrates efforts to make broader assessments about the effect-iveness of different targeting methods or to draw policy-relevant lessons.
To rectify this weakness, this article draws on a newly constructed database of122 targeted antipoverty interventions in 48 countries in Latin America and theCaribbean, Europe and Central Asia (including the former Soviet Union), the MiddleEast and North Africa, Sub-Saharan Africa, and South and East Asia. These data areused to address three questions: What are the targeting outcomes? Are there system-atic differences in targeting performance by targeting method or other factors? Whatare the implications of any such systematic differences for the design and implement-ation of targeted interventionsi
The analysis shows that the median targeted program is progressive in that it trans-fers 2 5 percent more to poor individuals-persons and households in the bottom twoincome quintiles-than would be the case with a universal allocation. However, for astaggering quarter of the programs, outcomes are regressive. Countries with higherincome, here taken to imply better capacity for program implementation, do better atdirecting benefits toward poorer members of the population, as do countries wheregovernments are more likely to be held accountable for their behavior, as suggestedby better measures of voice. Targeting is also better in countries where inequality ismore pronounced. This is consistent with higher welfare gains from targeting wheninequality is high as well as lower costs in identifying poor beneficiaries.
Subject to several caveats, interventions that use means testing, geographic tar-geting, and self-selection based on a work requirement are all associated with anincreased share of benefits going to the bottom two quintiles. Proxy-means testing,community-based selection of individuals, and demographic targeting to childrenshow good results on average but with wide variation. Self-selection based on con-sumption, demographic targeting to the elderly, and community bidding show limitedpotential for good targeting. That said, examination of experiences with specific pro-gram types and specific targeting methods shows considerable variation in targetingperformance. This partly reflects heterogeneity across the interventions assessed-some, like means-tested transfers, have poverty reduction as their sole objective.
62 The W47orld Bank Research Observer, vol. 19, no. I (Spritig 2004)
whereas others, such as social funds, have multiple objectives. However, substantial
variation in targeting performance by specific program types and specitic targeting
methods suggests that differences in implementation are also important factors in
whether targeting to poor individuals is successful or not.
Data Construction and Description
The first step in the analysis was a review of the extensive literature on targeted pro-
grams and the construction of a database of targeted antipoverty interventions. 4 To
our knowledge, this work represents the most extensive attempt to construct such a
database.
Database Construction
There were five criteria for inclusion in this database:
. The intervention is in a low- or middle-income country.
. A principal objective of the intervention is poverty reduction, defined in terms of
income or consumption.. The intervention involves a transfer of resources to the beneficiary.
. Documentation on the intervention contains information on the type of targeting
method, its implementation, and outcomes.
. The intervention is relatively recent (generally during 198 5-2003).
Included in the data are cash transfers (including welfare and social assistance pay-
ments, child benefits, and noncontributory pensions), near-cash transfers (such as
quantity-rationed subsidized food and food stamps), food transfers, universal food
subsidies, nonfood subsidies, public works, and social funds.
Two observations should be made on these criteria for inclusion. First, some interven-
tions have broad objectives that may go beyond direct poverty reduction. Social funds
are a good example. Although short-term poverty reduction can be an important com-
ponent of these interventions, so can be the construction of physical assets valued by the
poor and the development of local capacity to design, implement, and maintain infra-
structure. The heterogeneity of objectives within broadly defined '"antipoverty" inter-
ventions demands caution in interpreting comparisons across types of interventions.
Second, focusing the review in this way necessarily means excluding some inter-
ventions that may be targeted and may have some impact on poverty. Thus, excluded
are occupationally based transfer schemes, such as formal sector unemployment
insurance or occupational old age or disability pensions (the principal mechanism
determining eligibility and benefit levels are employment and contributions history
rather than poverty status): credit and microcredit schemes (although often targeted,
Dawid Coadiy. A\larqarvt Grosh, atnd Johlrn H,oddinott 63
they are largely motivated by credit market failures and do not necessarily involve atransfer of resources to participants);5 supplementary feeding programs (mainlybecause the vast literature on this type of intervention did not yield studies that satis-fied the criteria described); and most short-term emergency aid (because despite theclear poverty focus and targeting by need, the time scale on which it operates typi-cally precludes an assessment of the distribution of the benefits).
Because most studies of targeting do not appear in peer-reviewed journals,searches were conducted of the gray literature using Web search engines of theWorld Bank, Eldis, and the International Food Policy Research Institute using thefollowing key words: safety nets, targeting, social funds, pensions, public works, andsubsidies. Additional studies were found by canvassing colleagues about work thathad not yet been catalogued. Searches were also undertaken in the following aca-demic journals for 1990-2003: Econ,omic Development and Cultural Cliainig. Journalof Development Economics, Journ,al of Development Studies, Journial of Public Economics,World Bank Economic Review, World Bank Research Observer, World Developmnent, andEconomic and Political Weekly. Existing compilations, such as Grosh (1994) andBraithwaite, Grootaert, and Milanovic (2000), were also reviewed.
The sample of interventions is not necessarily reflective of the distribution ofprograms around the world but rather of programs that have some measurement oftargeting outcomes and that have been written up in the catalogued English languageliterature that was accessed in this study. A program is more likely to be written up thisway if one or more of the following features apply: It is from a country with a householdsurvey that measures consumption and participation in government programs, it is in acountry with a culture of evaluation as part of decision-making, it receives fundingfrom an international agency that requires measurement of outcomes, and it appeals toanalysts and editors because of its methods or setting. This suggests, for example, thatprograms using community-based methods and agents are underrepresented. Commu-nity-based methods are often locally funded and chosen when data and administrativecapacity are weak, features that reduce the likelihood of an evaluation being done andfinding its way into the international literature. The literature on public works in Sub-Saharan Africa is probably also underrepresented. By contrast, proxy-means tests arewell represented, with a large share of all such programs showing up in the sample.
Database Description
Based on the criteria described, information was collected on 122 interventions in48 countries.
Intervention type. The distribution of these interventions shows fairly broad coverageby region and by intervention type (table 1). In some regions a particular interventiontype dominates: cash transfers in Europe and Central Asia, universal food subsidies in
64 The IVorld Bank Research Observer, vol. 19, rio. I (Spring 2004)
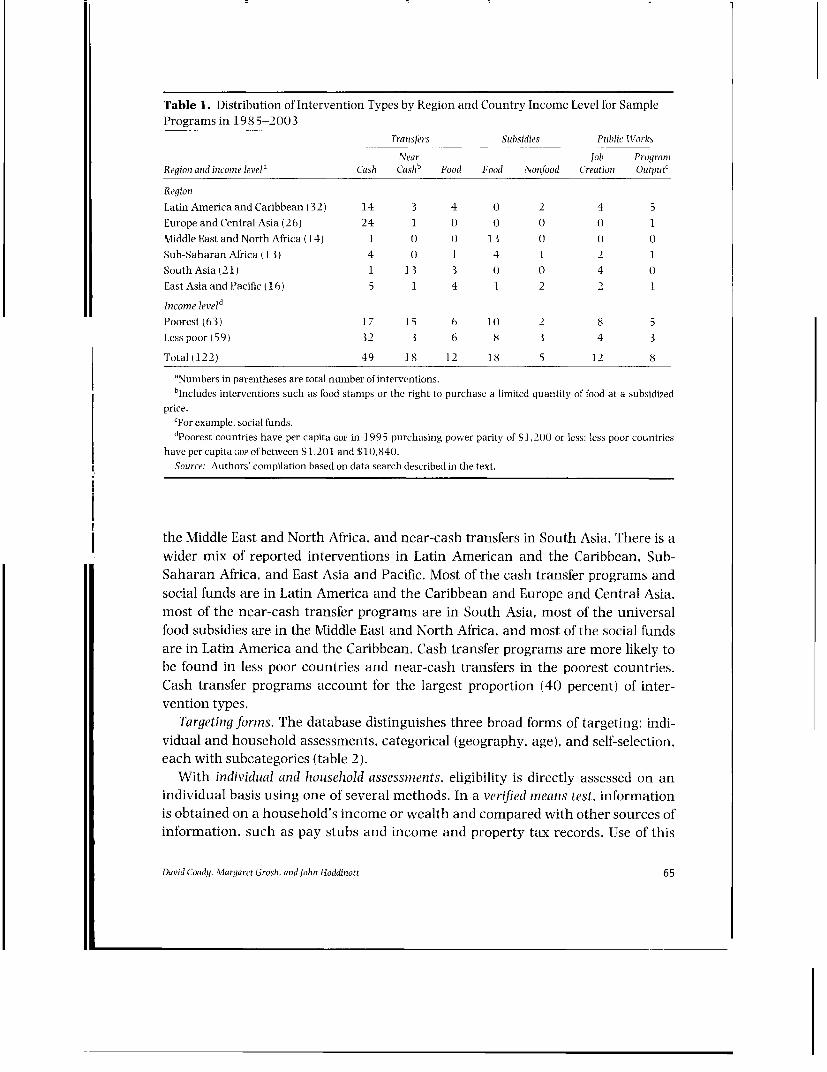
Table 1. Distribution of Intervention Types by Region and Country Income Level for Sample
Programs in 1985-2003TransJers Subsidies Pulblic WVorks
Near Job ProgranmRegion and income level' Cash Cashb Food Food Nonfood Creationi Output'
Region
LatinAmericaandCaribbean(32) 14 3 4 0 2 4 5
Europe and Central Asia (26) 24 1 0 0 0 I
Middle East and North Africa (14) 1 0 0 13 0 0 0
Sub-Saharan Africa ( 13) 4 0 1 4 1 2 1
South Asia (21) 1 13 3 0 0 4 0
East Asia and Pacific (16) 5 1 4 1 2 2 1
Income leveld
Poorest (63) 17 15 6 10 2 8 5
Less poor (59) 32 3 6 8 3 4 3
Total(122) 49 18 12 18 5 12 8
aNumbers in parentheses are total number of interventions.blncludes interventions such as food stamps or the right to purchase a limited quantity of food at a subsidized
price.cFor example, social funds.dPoorest countries have per capita GDP in 1 995 purchasing power parity of $1,2(00 or less: less poor countries
have per capita GDP of between $1.201 and $10,840.Source: Authors' compilation based on data search described in the text.
the Middle East and North Africa, and near-cash transfers in South Asia. There is awider mix of reported interventions in Latin American and the Caribbean, Sub-Saharan Africa, and East Asia and Pacific. Most of the cash transfer programs and
social funds are in Latin America and the Caribbean and Europe and Central Asia,most of the near-cash transfer programs are in South Asia, most of the universalfood subsidies are in the Middle East and North Africa, and most of the social fundsare in Latin America and the Caribbean. Cash transfer programs are more likely tobe found in less poor countries and near-cash transfers in the poorest countries.Cash transfer programs account for the largest proportion (40 percent) of inter-vention types.
Targeting formns. The database distinguishes three broad forms of targeting: indi-vidual and household assessments, categorical (geography, age), and self-selection,each with subcategories (table 2).
With individual and household assessments, eligibility is directly assessed on anindividual basis using one of several methods. In a verified ineans test, informationis obtained on a household's income or wealth and compared with other sources ofinformation, such as pay stubs and income and property tax records. Use of this
David Coady, Margaret Grosh, and John lloddinott 65
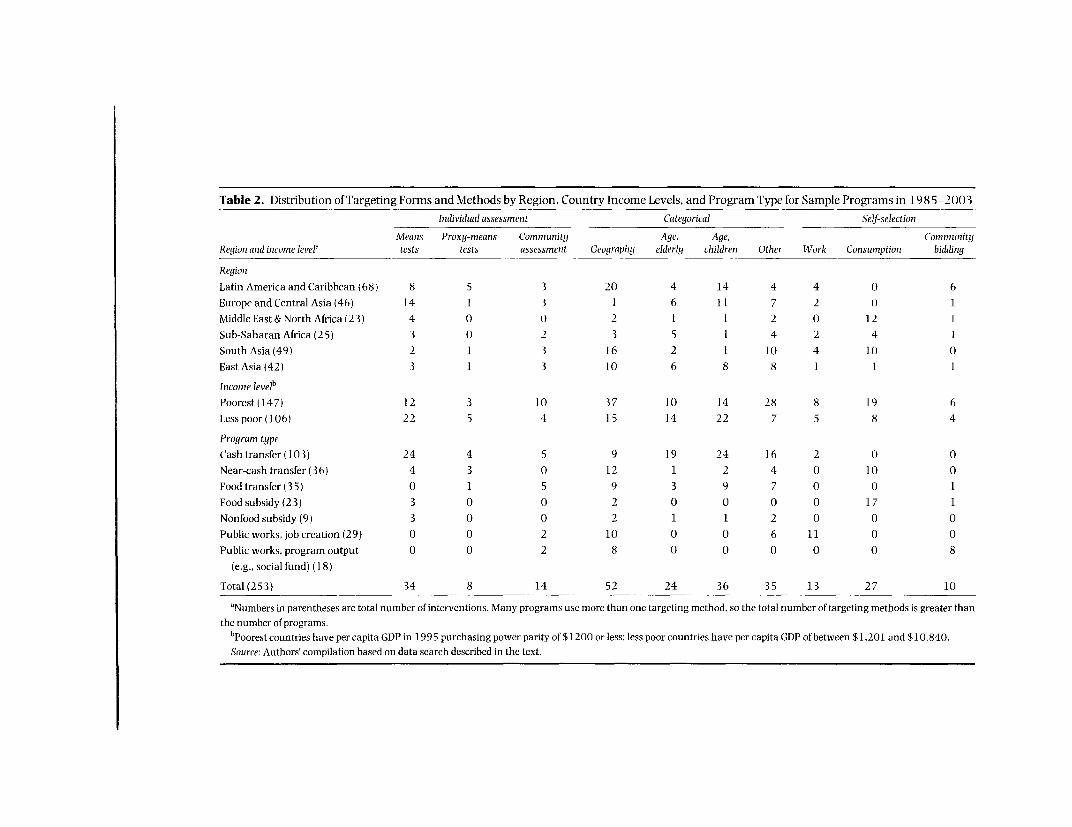
Table 2. Distribution of TargetingForms andMethods by Region. Country IncomeLevels, and ProgramType forSample Programs in 1985-2003Individual assessment Categorical Self-selection
Means Proxy-means Community Age, Age, CommunityRegion and income level' tests tests assessment Geography elderly children Other Work Consumption bidding
Region
LatinAmericaandCaribbean(68) 8 5 3 20 4 14 4 4 0 6Europe and Central Asia (46) 14 1 3 1 6 11 7 2 0 1MiddleEast&NorthAfrica(23) 4 0 0 2 1 1 2 0 12 1Sub-SaharanAfrica(25) 3 0 2 3 5 1 4 2 4 1South Asia (49) 2 1 3 16 2 1 10 4 10 0EastAsia (42) 3 1 3 10 6 8 8 1 1 1Income levelb
Poorest (147) 12 3 10 37 10 14 28 8 19 6Less poor (106) 22 5 4 1 5 14 22 7 5 8 4Program type
Cashtransfer(103) 24 4 5 9 19 24 16 2 0 0Near-cash transfer (36) 4 3 0 12 1 2 4 0 10 0Food transfer (35) 0 1 5 9 3 9 7 0 0 1Food subsidy (23) 3 0 0 2 0 0 0 0 17 1Nonfood subsidy (9) 3 0 0 2 1 1 2 0 0 0Publicworks, jobcreation(29) 0 0 2 10 0 0 6 11 0 0Public works, program output 0 0 2 8 0 0 0 0 0 8
(e.g., social fund) (18)
Total(253) 34 8 14 52 24 36 35 13 27 10
'Numbers in parentheses are total number of interventions. Many programs use more than one targeting method, so the total number of targeting methods is greater thanthe number of programs.
bPoorest countries have per capita GDP in 1995 purchasing power parity of $12()() or less; less poor countries have per capita GDP of between $1,201 and $10,840.Source: Authors' compilation based on data search described in the text.

method requires the existence of verifiable records in the target population and the
administrative capacity to process the information and update it regularly.
A simple means test, with no independent verification of income, can be conducted
by visiting the household to verify qualitatively that visible standards of living
(reflecting income or wealth) are generally consistent with reported figures. Proxy-
means tests involve generating a score for applicants based on fairly easy to observe
characteristics of the household, such as location and quality of dwelling, ownership
of durable goods, demographic structure of the household, and the education of
adult members. The indicators used in calculating this score and their weights are
derived from statistical analysis of data from detailed household surveys.
An increasingly popular approach to individual assessment has been to decent-
ralize the selection process to local communities. A group of community members or
a community leader whose principal functions in the community are not related to
the transfer program then decides whom in the community should benefit and
whom should not-hence the term community-based targeting.
Categorical targeting, also referred to as statistical targeting, tagging, or group
targeting, involves defining eligibility in terms of individual or household character-
istics that are considered easy to observe, hard to falsely manipulate. and correlated
with poverty. Age, gender, ethnicity, land ownership, and household demographic
composition or location are common methods of targeting. Geographic targeting is
often used in tandem with other methods.Some interventions rely on self-selection. These interventions, with nominally uni-
versal eligibility, are designed with dimensions intended to encourage the poorest to
use the program and the nonpoor not to do so.6 This is accomplished by recognizing
differences in the private participation costs of poor and nonpoor households. Exam-
ples include the use of low wages on public works schemes so that only those with a
low opportunity cost of time due to low wages or limited hours of employment will
present themselves for work; time restrictions on transfers, requiring applicants to
queue; and location of points of service delivery in areas where the poor are highly
concentrated so that the nonpoor have higher (private and social) costs of access. In
social fund-type interventions self-selection occurs at the community level (community
bidding), with targeting occurring as a result of differences in private participation
costs between poor and nonpoor communities. '
Universalfood subsidies (with or without quantity rationing) can be viewed as a form
of self-selection because they are universally available and households receive benefits
by deciding to consume the commodity. Households can often determine not just
whether to participate but also the intensity of their participation. The more income
elastic are the expenditures on these items, the more effective is the targeting. Food
transfers often involve commodities with "inferior" characteristics (for example,
low-quality wheat or rice), and households often substitute away from such com-
modities as their incomes rise.8
David Coady. Margaret Groslh, and Jolzr- Hoddi,iott 67
Targeting methods. Within this broad taxonomy of targeting forms, interventions relyon various targeting methods and often on several methods (see table 2). The 122 inter-ventions used 2 5 3 different targeting methods, for an average of just over two targetingmethods per intervention. Although 48 interventions used a single targeting method,42 used two methods, 21 used three methods, and 11 used four or more methods.
Thus, although certain intervention types typically rely on specific targeting meth-ods, most use a combination of methods, presumably because there is a synergybetween them that results in greater targeting efficiency. Public works programs typi-cally use a combination of geographic targeting and self-selection based on low wagesand a work requirement. If demand exceeds supply at the wage paid, public works alsooften require additional rationing of employment using categorical targeting. Similarly,social funds are partly demand driven and therefore have an element of community self-selection. Food subsidies are self-targeted based on consumption patterns. Cash trans-fers are most likely to have some form of individual assessment but are also often condi-tioned on other characteristics (such as age in the case of pensions or child benefit).
There are some marked differences in targeting methods by region. Most interven-tions using means and proxy-means testing are concentrated in Europe and CentralAsia and Latin America and the Caribbean. A legacy of the central planning era inEurope and Central Asia is an extensive administrative system suited to individualassessment using some form of means or proxy-means testing. This, together with adistribution of income that at least at the time of transition was relatively equal, hasmeant that targeting is based either on individual assessment or some individualcharacteristic, such as age. A reliance on food subsidies explains why self-targetingbased on consumption patterns is the dominant targeting method in the Middle Eastand North Africa. South Asia is notable for extensive use of geographic targetingand for relatively high reliance on self-selection based on work or consumption.Latin American and Caribbean countries also use geographic targeting extensively,along with means or proxy-means testing or targeting to children. Interventions inSub-Saharan Africa and East Asia show more mixed patterns. There are also broad dif-ferences across income levels. Generally, poorer countries rely more on self-selectionand categorical targeting, whereas individual assessments are relatively more com-mon in less poor countries. The one exception to these general patterns is categoricaltargeting by age, which is used relatively less frequently in poor countries.
Assessing Targeting EffectivenessThis section outlines the methodology used to compare targeting performance acrossinterventions by creating an indicator of targeting performance. It also identifies someimportant caveats to be kept in mind when interpreting this indicator and brieflydescribes targeting outcomes in terms of this indicator of targeting performance.
68 The Wlorld Bank Research Observer, vol. 19, no. 1 (Spring 2004)

Measures of Targeting Effectiveness
There is a growing body of literature on measuring targeting effectiveness (Ravallion
and Chao 1989; Ravallion 1993; Cornia and Stewart 1995; Coady and Skoufias
2001). Comparing the performance of the targeting methods used in the range of
programs considered in this meta-analysis requires a comparable performance indi-
cator for each program. The definitions, methods, and presentations in the original
studies vary in ways that make it difficult to assemble a single summary perfor-
mance indicator. Incidence and participation rates may be reported over the full wel-
fare distribution; for the poorest 10, 20, or 40 percent of the population; or for a poor
and nonpoor classification that differs by country. Other studies report none of these
measures but use other, less common ones. Of course, the measures of welfare used
are not always strictly comparable. The problem is how best to compare targeting per-
formance outcomes using data that are not strictly comparable.
Most studies catalogued in the database provide information on at least one of the
following indices:
. The proportion of total transfers received by individuals or households falling
within the bottom 40, 20, or 10 percent of the national income distribution. 9
. The proportion of beneficiaries falling within the bottom 40, 20, or 10 percent
of the national income distribution.. The proportion of total transfers going to poor households or individuals,
defined in terms of some specified part of the welfare distribution (for example,
falling in the bottom 3 5 percent of the income distribution).
Ideally, information would be available on the proportion of total transfers
received by households falling within different deciles (40th, 20th, 10th, and so on)
of the national income distribution. This is a better measure than the proportion of
beneficiaries by decile, which says nothing about variations in the levels of transfers.
These two measures-proportion of total transfers and proportion of beneficiaries-
are only equivalent when transfer levels are uniform across beneficiaries.
Because the studies did not use a single common measure of targeting perfor-
mance, a uniform measure of targeting effectiveness was constructed based on a
comparison of actual performance and a common reference outcome: the outcome
that would result from neutral (as opposed to progressive or regressive) targeting.
A neutral targeting outcome means that each decile receives 10 percent of the
transfer budget or that each decile accounts for 10 percent of the program benefici-
aries. Neutral targeting can be thought to arise either from the random allocation of
benefits across the population or from a universal intervention in which all indivi-
duals receive identical benefits.The indicator is constructed by dividing the actual outcome by the appropriate
neutral outcome. For example, if people or households in the bottom 40 percent of
David Coacdy, Margaret Grosli. arid jolrn Hoddinott 69
the income distribution receive 60 percent of the benefits, the indicator of perform-ance is calculated as 60/40(=1. 5, meaning that targeting has resulted in the targetgroup (here, people in the bottom two quintiles) receiving 50 percent more thanthey would have received under a universal intervention. A value greater than oneindicates progressive targeting, and a value less than one regressive targeting (unitydenotes neutral targeting).
The performance indicator used in the analysis that follows is based on a lexico-graphic selection process among the available incidence indicators, as follows. Prefer-ence is given to a measure of the share of benefits accruing to a target group ratherthan to a measure based on a portion of beneficiaries in the target group. Withinthat, preference is giving to the proportion accruing to the bottom two quintiles. Ifthat information is not available, then to the bottom quintile, and if that is not avail-able, then to the poorest decile. Such a performance indicator could be calculated for85 of the 122 programs (table 3).
Descriptive Results
There is enormous variation in targeting performance, with scores ranging from4 for the Trabajar public works program in Argentina to 0.28 for value-added taxexemptions on fresh milk in South Africa. The median value is 1.25, so that the"typical" program transfers 2 5 percent more to households in the bottom quintilesor below the poverty line than would be the case with a universal allocation. How-ever, a staggering 21 of the 8 5 programs-2 5 percent-are regressive, with a per-formance index of less than 1, suggesting that in these cases a random selection ofbeneficiaries would provide greater benefits to the poor.
It is instructive to focus on the 10 worst and 10 best programs. The 10 worst havescores ranging from 0.28 to 0.78 with a median score of 0.60. Five are food subsidyprograms and three involve cash transfers. Median performance rises from 1.25 to1.3 if interventions using self-selection based on consumption are withdrawn fromthe sample, and the proportion of regressive interventions drops from 2 5 percent to16 percent. Only one of the poorly performing programs uses either means or proxy-means targeting methods, none use geographic targeting, and the countries comefrom across the income spectrum. Scores for the top 10 programs range from 2.02 to4.(00, with a median score of 2.15, and all but one are in either Latin America andthe Caribbean or Europe and Central Asia. Of these 10, 9 involve cash transfers;9 use means, proxy-means, or geographic targeting: and 7 are in less poor countries.
Cash transfers show up in both the 10 best and 10 worst programs, highlightingthe possibility that variations in targeting performance may reflect poor implement-ation rather than poor program potential. However, public works programs are allin the top half of the performance table, and social funds are nearly all in the bottomhalf. This is consistent with there being a tradeoff between the objective of reducing
70 The Wovid Bmik Research Observer. vol. 1 9, no. I (Sprilngf 2004)
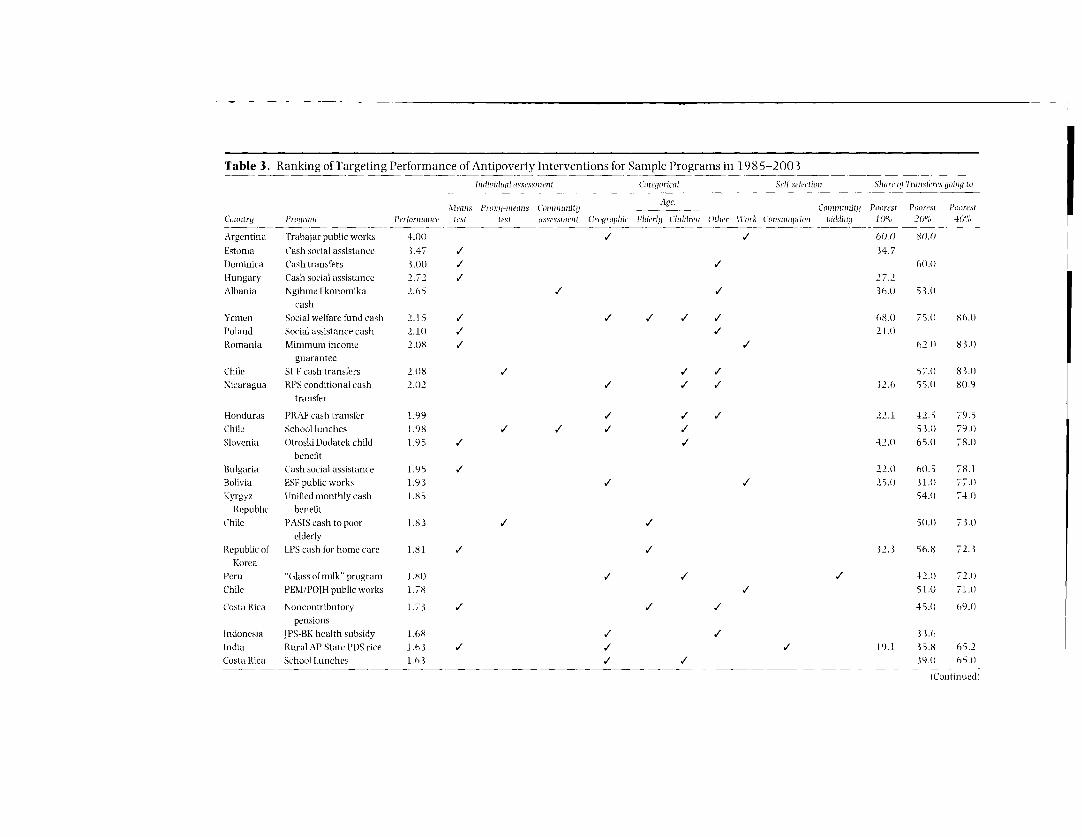
Table 3. Ranking of Talrgeting Performance of Antipoverty Interventions for Sample Plrograms in 1985-2003
sndividiial .Isesstnent Categorical Self selr tioti Sia r otf rfrantshres foing to
A1ge..Xcttans Proxp-tieans C('1istitisity - ConitninttaityJ Poorest Poorest Poorest
Colistitt Profqanol Perforinanine test test assessinent Geoi aplife tjderhJ Chiild ren titer lltork Consitnptioit hidditif I Wi .20%l 40)%'f
Argentina Trabajar public works 4.0)0) / / 60.0 80.0
Estonia Cash social assistance 1.47 / 34.7
Dominica Cash trainsfers 3.(( / / 60).)
Hungary Cash social assistance 2.72 / 27.2
Albania NgihmeEkonomika 2.65 / / 30(0) 53.(
cash
Yemen Social wellare fund cash 2.15 / / / / / 68.1) 7.1) 8f6.1)
Polaitd Social assistance cash 2.1() / V 21.1)
Romania Minimum income 2.()8 / / 62.1) 83.t)
guarantee
Chile SI[F casti transfers 2.1)8 / / / 57.11 83.1)
Nicairagua RPS conditional cash 2.0)2 / / / 32.6 55.(1 8().9
transfer
Honduras PRAF casi transfer 1.99 / / / 22.1 42.5 79.5
Chile School lunches 1.98 / / / / 3.1) 79.()
Slovenia Otroski Dodatek child 1.95 / / 42.0) 65.1) 78.0)
benefit
Bulgaria Cash social assistance 1.95 / 22.1) W).S 78.1
Bolivia ESF public works 1.93 / / 25.() 31.1) 77.1)
Kyrgyz llnifiedmonthlycash 1.85 54.11 74.1)
Republic benefit
Chile l'ASIS cashtopoor 1.83 / 1 51)1( 73.1)
elderly
Republic of LPS cash for home care 1.81 / / 12.3 S6.8 72.3
Korea
Peru 'Glassrofmilk program 1.8(1 / / / 42.)) 72.0)
Chile PEM/POIH public works 1.78 / 51.() 71.1)
Costa Rica Noncontributory 1.7 3 / / / 45.11 69.1)
pensions
Indonesia JPS-BK health subsidy 1.68 / 31.6
India RurdlAP State PDS rice 1.63 / / / 19.1 35.8 65.2
CostaRica Schooll.unches l.h3 / / 39.0 65.)
iConitinued)

Table 3. (Continued)
Individuial assessnment Categorical Self-selention ShIare of Trainisferes going to
Means Proxy-rneans Commirnurnity Age, Corninunity Poorest Poorest PoorestCountry Program Performanice test test assessment Geographic Elderly Children Other Work Corisumnption bidding 10% 20% 40%Mexico LICONSA milk subsidy 1.60 / / / 64.0India PDS-subsidized jowar 1.58 6/ / 3.0Hungary Child cash allowance 1.57 / 23.5 39.5 62.6Mexico PROGRESAconditional 1.56 /
22.0 39.5 62.4cashColombia Housing subsidy 1.50 /
35.0 60.0Colombia ICBF day care/school 1.50 / / 28.0 60.0foodIndonesia JPS-PDK public works 1.48 / / / 29.6Jamaica Food stamps - MCH 1.45 / / 29.0 58.0Indonesia JPS education subsidy 1.44 / / / / 28.8India RuralMh.StatePPDS 1.36 / / 10.4 26.3 54.5Zambia Housing subsidy 1.35 /
28.0 54.0Uzbekistan Child allowance 1.35 / / / / 28.4 54.0Latvia Family child allowance 1.33 / 15.( 29.0 53.0India PDS-subsidizedrice 1.33 / / 53.0Indonesia JPS-OPK rice subsidy 1.32 / / / 26.4Bolivia Social investment fund 1.30 / / 11.0 24.5 52.0Jamaica Food stamps program 1.30 / / / 31.0 52.0Honduras Social fund program 1.25 / / 19.( 32.0 50.0Chile Viviendas Basicas 1.25 /
28.0 50.0mortgageIndia PDS-subsidized oil 1.25 / / 511.0Sri Lanka Food stamps 1.25 /
28.0 50.()South Africa Maize VAT exemption 1.23 3Vietnam SGF food transfers 1.22 / / / / 24.4India PDS-subsidized kerosene 1.20) / / 48.0)Bangladesh Food for education 1.21) / / / /Morocco Food subsidies, flour 1.18
/ 23.1) 47.0India PDS-subsidized sugar 1.13 , V 45.0Armenia Family cash benefit 1.13 / 14.0) 25.0 45.0Peru Social fund program 1.10 / / 23.0 44.0
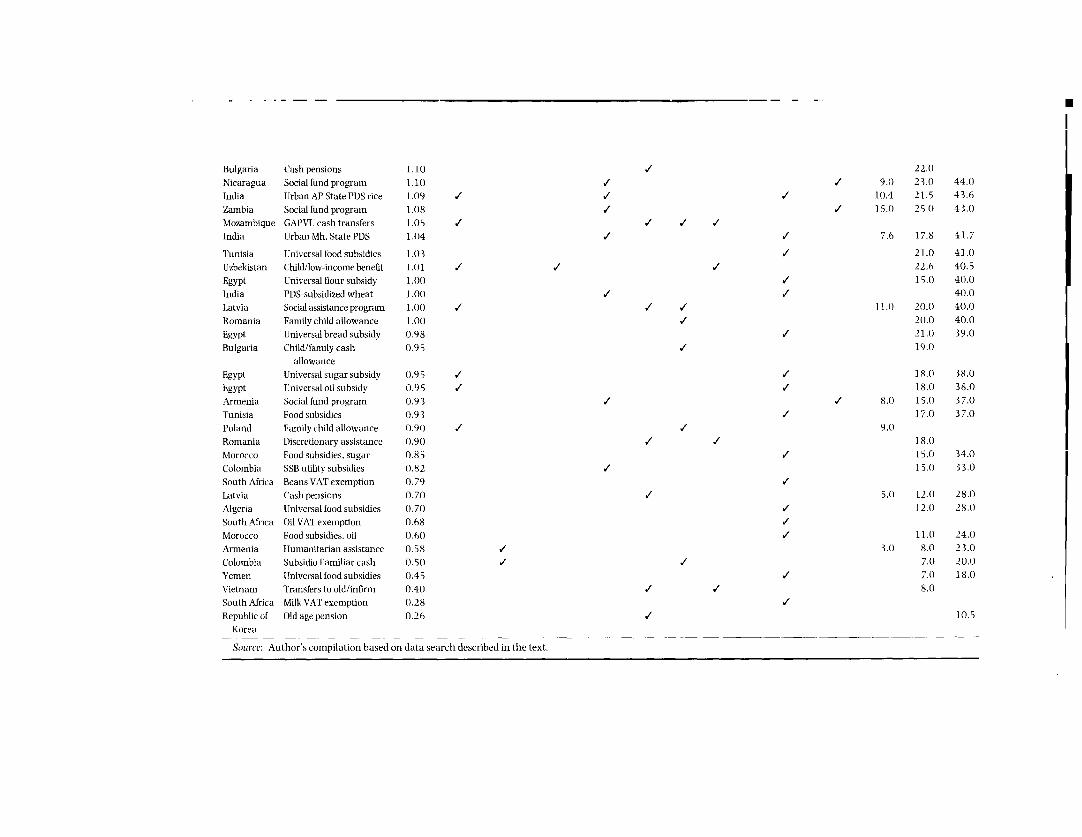
Bulgaria Cash pensions 1.10 / 22.0
Nicaragua Social fund program 1.1() / / 9.0 23.0 44.0
India tlJrbanAPStatePDSrice 1.09 / / / 10.4 21.5 43.6
Zambia Social fund program 1.08 / 1 15.0 25.0 43.0
Mozambique GAPVU cash transfers 1.05 / / V /
India UrbanMh.StatePDS 1.04 / / 7.6 17.8 41.7
Tunisia IJniversal food subsidies 1.03 / 21.1) 41.0
Uzbekistan Child/low-income benefit 1.01 / / / 22.6 40.5
Egypt Universal flour subsidy 1.(0 / 15.0 40.0
India PDS-subsidized wheat 1.0() / / 40.0
Latvia Social assistance program 1.()() / // 11.() 20.0 40.0
Romania Family child allowance 1.0() / 20.0 40.0
Egypt Universal bread subsidy 0.98 / 21.0 39.0
Bulgaria Child/family cash 0.95 / 19.0
allowance
Egypt Universal sugar subsidy 0.95 / / 18.0 38.1)
Egypt Universal oil subsidy 0.95 / / 18.0 38.0
Armenia Social fund program 0.93 / / 8.1) 15.0 37.0
Tunisia Food subsidies 0.93 / 17.0 37.0
Poland Family child allowance 0.9() / / 9.(1
Romania Discretionary assistance 0.90 / / 18.0
Morocco Food subsidies, sugar 0.85 / 15.0 34.0
Colombia SSB utility subsidies 0.82 / 15.0 33.0
South Africa Beans VAT exemption 0.79 /
Latvia Cash pensions 0.70 / 5.( 12.0 28.0
Algeria tJniversal food subsidies 0.71) / 12.0 28.0
South Africa Oil VAT exemption 0.68 /
Morocco Food subsidies, oil 0.61) / 11.0 24.0
Armenia Humanitarian assistance 0.58 / 3.11 8.0 23.0
Colombia Subsidio Familiar cash 0.51) / / 7.0 20.0
Yemen lJniversal food subsidies 0.45 / 7.0 18.0
Vietnam Transfers to old/infirm 0.40) 1 / 8.0
South Africa Milk VAT exemption 0.28 /
Republic of Old age pension 0.26 / 10.5
Korea
Source: Author's compilation based on data search described in the text.
current poverty (through public works wage transfers) and the objective of reducingfuture poverty through developmental public investments (through the assets cre-ated by social fund programs). Also, the predominance of less poor countries amongthe top half of the table suggests that characteristics correlated with income, such asadministrative capacity, are important to targeting performance.
Summary statistics on targeting performance-sample size, median, inter-quartilerange, and the inter-quartile range as a percentage of the median-by targeting formand method initially suggest a clear hierarchy of targeting performance (table 4). Asmight be expected, interventions using individual assessments outperform interven-tions relying on categorical targeting, which in turn outperform interventions relyingon self-selection.
Closer inspection, however, reveals that such impressions are too general to beuseful. First, there is considerable heterogeneity within these broad methods of tar-geting. Most notably, self-selection includes interventions that have the highestmedian performance (those using a work requirement) and those that have the lowestmedian performance (self-selection based on consumption). Second, self-selectioninterventions based on consumption and community bidding for interventions havelower median values than other interventions and relatively low variations in thesevalues as measured by the inter-quartile range as a percentage of the median. This
Table 4. Targeting Performance by Targeting Form and Method for Sample Programs in1985-2003
InterquartileAledian targeting Interquartile range asTargetingform and methiod Sample size performance range % of median
All methods 85 1.25 0.68 54.4Any individual assessment 37 1.S) 0.75 50.0Means testing 26 1.55 0.90 58.1Proxy-means testing 7 1.50 0.58 38.7Community assessment 6 1.40 0.78 55.7Any categorical nethod 58 1.32 0.64 48.5Geographic 33 1.33 0.51 36.9Age, elderly 12 1.16 0.81 69.8Age,young 26 1.53 0.65 42.5Other categorical 1 7 1.35 0.48 35.6Any self-selection method 38 1.10 ).41 37.2Work 6 1.89 0.30 15.9Consumption 2S 1.(0 0.35 35.0Community bidding 7 1.10 0.22 20.0
Source: Authors' compilation based on data search described in the text.
74 The W4orld Bank Research Observer, vol. 1 9, no. 1 (Spring 2004)
suggests that other things being equal, even the best examples of these targeting
methods produce relatively small targeting gains. By contrast, whereas other
methods report higher median values, they also tend to have proportionately higher
variations in targeting effectiveness. So although these methods offer potentially
large gains, there is no guarantee they will improve targeting performance.
One way to explore the source of variation in targeting outcomes is with a Theil
inequality index. An attractive feature of the Theil index is that it is subgroup decom-
posable. When the data are grouped by some characteristic, variations in targeting
can be allocated across these programs into two categories: targeting variations due
to variations within each group and targeting variations due to variations across
groups. When programs are grouped by region, variations in average performance
across continents explain only about 2 8 percent of total variation. When programs
are grouped by type, variations in average performance between programs explain
3 6 percent of the total variation. Grouping by targeting method (geographic, means
or proxy-means, both, or other targeting methods) explains only 20 percent of the
total variation.One way of interpreting these large variations is to consider implementation effect-
iveness. No matter how good the choice among methods or programs, effectiveness
of implementation is a key factor determining targeting performance. This point is
further strengthened by noting that raising the performance of all programs with
the same targeting method and with performance below the method median to the
median for that method increases mean targeting performance from 1.3 8 to 1. 5 5, a
return of 17 percentage points. This issue is picked up again in the section on the
regression analysis.
Caveats and Limitations
Before reporting on the regression analysis, it is important to make explicit several
caveats for interpreting the performance measure and, thus, the analysis based on it.
First, the performance measure is a combination of various measures as already
discussed, although the measure used for the vast majority of the interventions (80
percent) is the percentage of benefits accruing to the bottom 40 percent or 20 per-
cent of the national income distribution. This raises concerns about comparability.
For example, it may be more difficult to target the poorest 20 percent than the poorest
40 percent, so programs assessed using the 20 percent measure may appear relat-
ively ineffective solely because of the performance indicator used.
This issue was addressed in a number of ways. A second performance measure
was calculated that gives, through its lexicographic ordering, priority to the propor-
tion of resources flowing to the bottom 10 percent, then the bottom 20 percent, then
the bottom 40 percent. There are no meaningful changes to the results reported in
tables 3 and 4 using this performance measure. All regressions were also run
David Coady, Margaret Grosh, and John Hoddinott 75
(reported later) using both measures of targeting performance, and again there wereno meaningful changes to the results. This is not completely surprising given thatthe performance measure and the alternative have correlation coefficients of 0.94(for levels) and 0.97 (for ranks). As a further check, the multivariate regressionsalways include variables that control for the performance measure used.
Second, focusing on the benefits accruing to the bottom of the income distributionignores where in the remaining parts of the distribution the leaked benefits aregoing. For example, finding that a program is very ineffectively targeted at the bottom20 percent is less worrying if the leaked benefits accrue mostly to people just abovethis income cut-off. This is partly why priority is given to the 40 percent measure ofperformance in constructing the performance index. It is also arguable that a focusof the bottom 40 percent coincides more closely with the objectives of most targetedprograms. In any case, the fact that the results are extremely insensitive to theordering is at least suggestive that where the cut-off point is drawn between 20 per-cent and 40 percent is somewhat inconsequential.
Third, recall that the data collated are only a sample of the hundreds of antipovertyinterventions and that the performance indicator could be calculated only for two-thirds of this sample. These observations point to the possibility of sample selectionbias-the possibility that certain characteristics of these programs (such as the factthat they were evaluated and documented) are themselves associated with the meas-ures of targeting performance. A good example of this possibility relates to commu-nity targeting. The sample is only a fraction of the studies in Conning and Kevane(2001): it could well be that only successful interventions using community targetinghave been well documented.
Fourth, some of the mistargeting observed here arises because households thatwere poor when the program admission decision was made were better off at thetime of assessment or vice versa. This has implications for the design of targetedinterventions. When there is considerable movement of households in and out ofpoverty and no mechanism for updating eligibility, methods that rely on static indi-cators of living standards (such as proxy-means tests) are likely to perform less wellthan methods that rely on self-selection.
Finally, the performance index focuses solely on the benefit side of the equationand ignores cost, which may be extremely important in selecting targeting methodsor programs. For example, it is often argued that well-designed public works pro-grams can be effective at concentrating benefits in the hands of the poor. But thehigh nontransfer costs associated with such programs (including nonwage costsand forgone income) substantially reduce their cost effectiveness.
Neglect of the cost side largely reflects data restrictions. Evidence on administra-tive costs was scant. Some cost data were available for 32 programs, but both costand performance indicator data were available for only 20. Moreover, the cost datasuffer from a severe lack of comparability. Most of the data for Latin America are
76 The World Banik Research Observer, vol. 19, no. I (Spring 20041
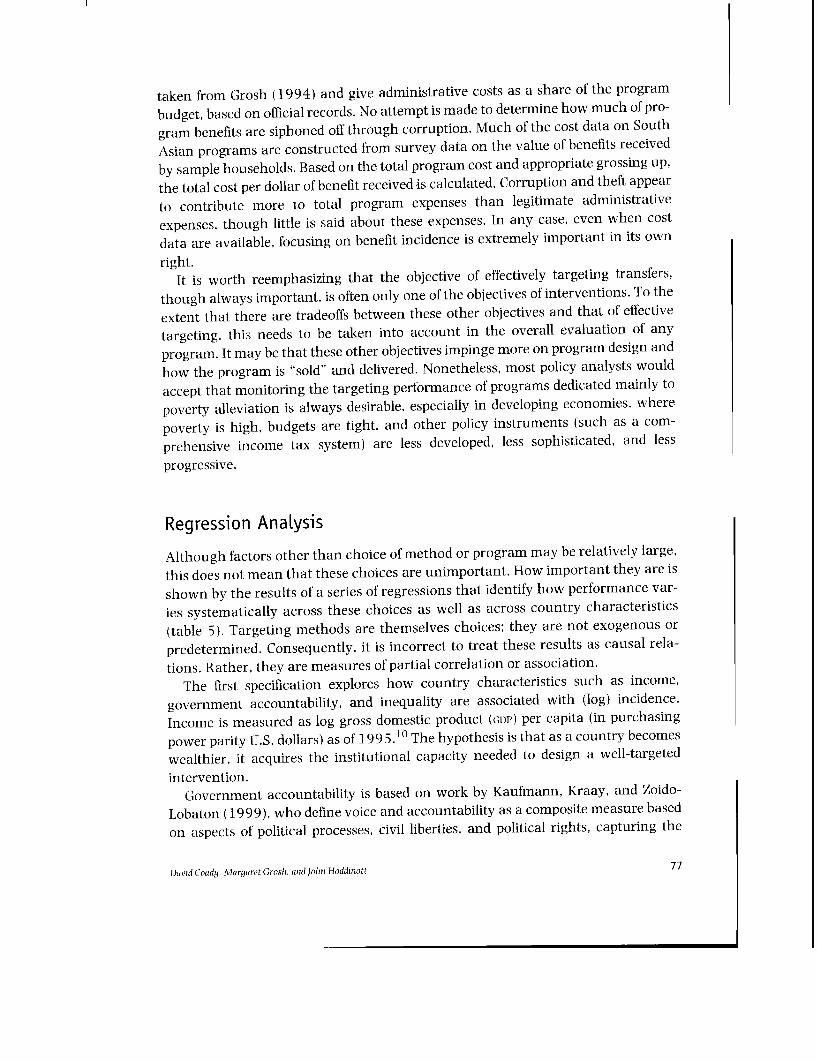
taken from Grosh (1994) and give administrative costs as a share of the program
budget, based on official records. No attempt is made to determine how much of pro-
gram benefits are siphoned off through corruption. Much of the cost data on South
Asian programs are constructed from survey data on the value of benefits received
by sample households. Based on the total program cost and appropriate grossing up,
the total cost per dollar of benefit received is calculated. Corruption and theft appear
to contribute more to total program expenses than legitimate administrative
expenses, though little is said about these expenses. In any case, even when cost
data are available, focusing on benefit incidence is extremely important in its own
right.It is worth reemphasizing that the objective of effectively targeting transfers,
though always important, is often only one of the objectives of interventions. To the
extent that there are tradeoffs between these other objectives and that of effective
targeting, this needs to be taken into account in the overall evaluation of any
program. It may be that these other objectives impinge more on program design and
how the program is "sold" and delivered. Nonetheless, most policy analysts would
accept that monitoring the targeting performance of programs dedicated mainly to
poverty alleviation is always desirable, especially in developing economies, where
poverty is high, budgets are tight, and other policy instruments (such as a com-
prehensive income tax system) are less developed, less sophisticated, and less
progressive.
Regression Analysis
Although factors other than choice of method or program may be relatively large,
this does not mean that these choices are unimportant. How important they are is
shown by the results of a series of regressions that identify how performance var-
ies systematically across these choices as well as across country characteristics
(table 5). Targeting methods are themselves choices; they are not exogenous or
predetermined. Consequently, it is incorrect to treat these results as causal rela-
tions. Rather, they are measures of partial correlation or association.
The first specification explores how country characteristics such as income,
government accountability, and inequality are associated with (log) incidence.
Income is measured as log gross domestic product (GDP) per capita (in purchasing
power parity U.S. dollars) as of 1995.10 The hypothesis is that as a country becomes
wealthier. it acquires the institutional capacity needed to design a well-targeted
intervention.Government accountability is based on work by Kaufmann, Kraay, and Zoido-
Lobaton (1999), who define voice and accountability as a composite measure based
on aspects of political processes, civil liberties, and political rights, capturing the
David Coady. Margaret Groshi, and John Hoddinott 77
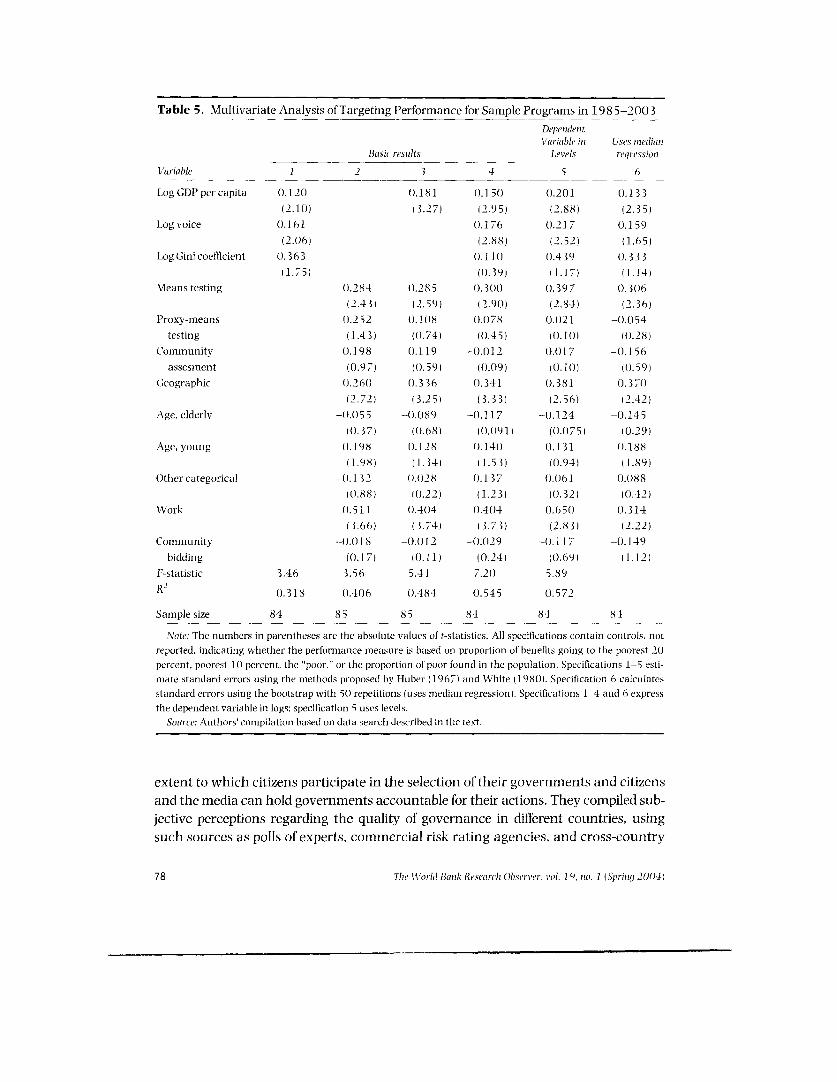
Table 5. Multivariate Analysis of Targeting Performance for Sample Programs in 1985-2003
DependentV7ariable in Uses medianl
Basic results Levels reqressioniVIariable I 2 3 4 5 6Log GDP per capita 0.120 (.181 0.1 5( 0.201 0.133
(2.10) (3.27) (2.95) (2.88) (2.35)Log voice (.1]61 0.176 0.21 7 0.159
(2.06) (2.88) (2.52) (1.65)Log Gini coefficient 0. 363 (.1 1( 0.4 39 0. 3 3 3
(1.75) (0.39) (1.17) ( .14)Means testing (0.284 0.285 0.300 0. 397 0.306
(2.43) (2.59) (2.90) (2.84) (2.36)Proxy-means 0.252 0.108 0.078 0.021 -(0.054
testing (1.43) (1).74) (().45) ((.10() ((1.28)Coommunity 0.1]98 (1.119 -0(.12 -0.017 -0.156
assesment (0.97) ((1.59) ((.09) (( i.0) ((.59)Geographic ().260( ().336 (0.341 (0.381 0.3,7()
(2.72) (3.2 5) (.3 33) (2.56) (2.42)Age, elderly -0.(055 -0..089 -0.117 -().124 -().145
(0.37) ((1.68) ((.(91) ((1.1175) (0.29)Age,young (1.198 (0.128 0.140 0.131 0.188
(1.98) (1.34) (1.53) ((0.94) (1.89)Other categorical -().132 (0).28 (1.137 0(.(61 0.()88
((1.88) ((1.22) (1.23) ((0.32) (0.42)Work ().511 ).4(04 (0.4(14 ().65() 0.314
(3.66) (3.74) (3.73) (2.83) (2.22)Community -(.()1 8 -(0.012 -0.(029 -0.117 -().149
bidding (().17) ((1.11) (0.24) ((1.69) (1.12)F-statistic 3.46 3.56 5.41 7.20) 5.89R2
(0.318 0.4(06 1).484 0.545 (0.572Sample size 84 8 5 85 84 84 84
Note: The numbers in parentheses are the absolute values of t-statistics. All specifications contain controls. notreported, indicating whether the performance measure is based on proportion of benefits going to the poorest 2(0percent, poorest 10 percent, the 'poor., or the proportion of poor found in the population. Specifications 1-5 esti-mate standard errors using the methods proposed by Huber (1 967) and White (19811). Specification 6 calculatesstandard errors using the bootstrap with 5() repetitions (uses median regression). Specifications 1-4 and 6 expressthe dependent variable in logs; specification 5 uses levels.
Source: Authors' compilation based on data search described in the text.
extent to which citizens participate in the selection of their governments and citizensand the media can hold governments accountable for their actions. They compiled sub-jective perceptions regarding the quality of governance in different countries, usingsuch sources as polls of experts, commercial risk rating agencies, and cross-country
78 Tlte (V'orl() Bank Researchi Observ'er, ol. 1 9, to. I (Spring 2004)
surveys. The analysis here used countries' rankings, which provide an easier way of
interpreting the estimated coefficients. In the sample, Vietnam has the lowest per-
centile rank for voice (6) and Costa Rica the highest (8 8).11
Country-specific Gini coefficients are included on the grounds that it might be easier
to identify potential beneficiaries when income or consumption differences across
individuals are greater. Also included (but not reported) are controls indicating
whether the performance measure is based on the proportion of benefits going to the
poorest 20 percent, the poorest 10 percent, the "poor" defined with reference to a
poverty line, or the proportion of poor in the population. Doing so takes into account
confounding effects arising from the use of different measures of poverty incidence in
the studies on which this analysis is based. Standard errors are computed using the
methods proposed by Huber (1967) and White (1980).12
The results shown in specification 1 show that as country income rises and as
inequality rises, so does the targeting performance of antipoverty interventions (see
table 5). Targeting is also better in countries where government accountability is
better.Specification 2 looks solely at the impact of choice of targeting method. Dummy
variables are included for the nine targeting methods described: three kinds of individual
assessment (means testing, proxy-means testing, community selection of individual
beneficiaries), four kinds of categorical targeting (geographic, the elderly, the young,
others), and two kinds of selection (work requirement, community bidding for
projects). The omitted category is self-selection based on consumption. This was
chosen as the base category for two reasons. Some argue that this form of targeting
is a transition tool. to be used only until the capacity for more precise mechanisms-
such as means testing-is developed.1 3Others see self-selection based on the con-
sumption of food as the preferred targeting mechanism and have expressed skepti-
cism about the comparative ability of alternative targeting methods to reach the
poor.'14 Hence, an attractive feature of this specification is that the coefficients on
these methods should be interpreted relative to self-selection based on consumption.
Specification 2 shows that means testing, geographic targeting, and self-selection
based on a work requirement are all associated with an increased share of program
resources going to the poorest 20 percent relative to self-selection based on con-
sumption. Proxy-means testing and targeting the young are also associated with
improved incidence, though these are measured with larger standard errors. Targeting
the elderly, community assessment. other methods of categorical targeting. and
selection based on community bidding are not associated with better incidence rela-
tive to the base category of self-targeting based on consumption.
Countries with greater capacity for program implementation may do better at
directing benefits toward poorer members of the population either by choosing finer
targeting methods or by implementing their choices more effectively. In such cases.
the associations in specification 2 may be misleading. merely reflecting correlation
David toadyj. Miryarct Grosh., iiid oitin Hoddinott 79
between unobserved implementation capacity and observed targeting methods. Thispossibility is explored in specifications 3 and 4. Controlling for country income level(specification 3) or income, voice, and inequality (specification 4) does not appear toeliminate the positive association-relative to self-selection based on consumption-between means testing, geographic targeting, and self-selection based on a workrequirement and targeting performance. Targeting performance is better in count-ries with higher levels of income and where governments are held accountable fortheir actions. Specifically, a 10 percent increase in income is associated with a 1.8 per-cent increase in targeting performance. Raising the voice rank from 37 (Pakistan'srank) to 67 (India's rank) would be associated with about a 30 percent improve-ment in targeting performance.' 5 It is possible, however, that geographic targetingwill also be more effective in countries with marked inequalities. Indeed when geo-graphic targeting is dropped from the specification (but all other methods areretained), the parameter estimate for the log Gini coefficient is almost identical tothat reported in specification 1.
Several additional specific checks were performed to investigate the robustness ofthis result. Specification 5 uses the same sample and regressors as specification 4,but the dependent variable is expressed in levels instead of logs. Basic results remainunchanged: means testing, geographic targeting, and targeting based on a workrequirement improve targeting performance relative to the omitted category, self-selection based on consumption. There is no meaningful change in any of the otherresults. Specification 6 estimates median regressions, which express differences inperformance in terms of differences in medians.' 6 This is an attractive check onrobustness because the median is considerably less sensitive to outliers, an especiallyimportant consideration when working with small sample sizes. The results arebroadly similar to those for specification 4-which uses an identical set of regressors,sample, and dependent variable-with the one exception being a markedly largercoefficient on the log Gini coefficient. l,
The discussion has focused largely on the association between different target-ing methods and targeting performance relative to self-selection based onconsumption and conditioning on country characteristics. Also explored is theassociation between combinations of targeting methods and targeting perform-ance (table 6) . In addition to controls for income, voice, governance, inequality,and how the performance measure is constructed, the number of targeting methodsused is added to specification 1. The results show that use of more methods isassociated with improved targeting, each additional method improving perform-ance by 1 5 percent. When a series of dummy variables is used in specification 2 torepresent the number of targeting methods, the findings are similar. The samplesize is too small to explore the association between specific groups of methods andtargeting performance, but these results suggest that combining methods improvestargeting.
80 Thle Wlorld Banik Researchl Observer, vol. 19, no. I (Sprinq 2004)
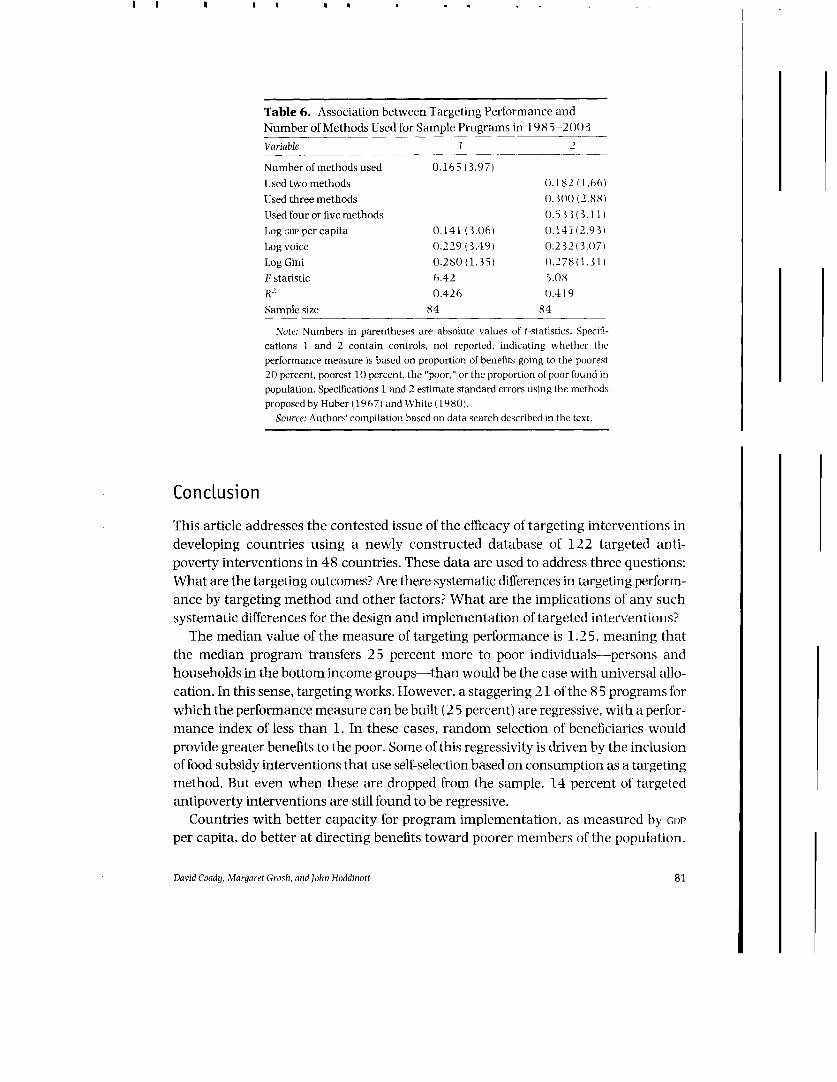
Table 6. Association between Targeting Performance and
Number of Methods Used for Sample Programs in 19 8 5-200 3
Variable I 2
Number of methods used 0.165 (3.97)
Used two methods 0.182 (1.66)
Used three methods 0.300 (2.88)
Used four or five methods 0.533 (3.11)
Log c)ppercapita (0.141 (3.06) (0.141(2.93)
Log voice 0.229 (3.49) 0.232(3.07)
LogGini 0.280(1.35) (0.278(1.31)
F statistic 6.42 5.08
R2 0.426 0.419
Sample size 84 84
Note: Numbers in parentheses are absolute values of t-statistics. Specifi-
cations 1 and 2 contain controls, not reported, indicating whether the
performance measure is based on proportion of benefits going to the poorest
20 percent, poorest 10 percent. the "poor," or the proportion of poor found in
population. Specifications 1 and 2 estimate standard errors using the methods
proposed by Huber (1967) and White ((980).
Source: Authors' compilation based on data search described in the text.
ConcLusion
This article addresses the contested issue of the efficacy of targeting interventions in
developing countries using a newly constructed database of 122 targeted anti-
poverty interventions in 48 countries. These data are used to address three questions:
What are the targeting outcomes? Are there systematic differences in targeting perform-
ance by targeting method and other factors? What are the implications of any such
systematic differences for the design and implementation of targeted interventions?
The median value of the measure of targeting performance is 1.2 5, meaning that
the median program transfers 25 percent more to poor individuals-persons and
households in the bottom income groups-than would be the case with universal allo-
cation. In this sense, targeting works. However, a staggering 21 of the 8 5 programs for
which the performance measure can be built (2 5 percent) are regressive, with a perfor-
mance index of less than 1. In these cases, random selection of beneficiaries would
provide greater benefits to the poor. Some of this regressivity is driven by the inclusion
of food subsidy interventions that use self-selection based on consumption as a targeting
method. But even when these are dropped from the sample, 14 percent of targeted
antipoverty interventions are still found to be regressive.
Countries with better capacity for program implementation, as measured by GDP
per capita, do better at directing benefits toward poorer members of the population.
David Coady, Margaret Grosh. and John Hoddinott 81
Countries where governments are more likely to be held accountable for theirbehavior-where "voice" is stronger-also appear to implement interventions withbetter targeting performance. Targeting is also better in countries where inequalityis more pronounced and differences in economic well-being are presumably easier toidentify.
Mindful of caveats, interventions that use means testing, geographic targeting,and self-selection based on a work requirement are all associated with an increasedshare of benefits going to the poorest 40 percent. Proxy-means testing, community-based selection of individuals, and demographic targeting to children show goodresults on average, but with wide variation. Self-selection based on consumption,demographic targeting to the elderly, and community bidding show limited poten-tial for good targeting.
That said, there is considerable variation in targeting performance when experi-ences with specific program types and targeting methods are examined. This partlyreflects heterogeneity across the interventions assessed because some have multi-ple objectives whereas others are focused solely on poverty reduction. But whentargeting by specific method or program type is considered, there is considerableintra-group variability. Thus, it is not surprising that although community assess-ment generally performs no better than self-targeting based on consumption,Alderman's (2002) study of community targeting in Albania describes a highlysuccessful example of this form of targeting. Similarly, Case and Deaton (1998)and Duflo (2000) show that in South Africa targeting the elderly is an effectivemethod for reaching poor children, even though targeting the elderly generallyperforms relatively poorly when compared with other methods for reaching poorpeople.
Thus, although the patterns observed are instructive, they should not beinterpreted as a lexicographic ranking of methods. Differences in individualcountry characteristics and implementation are also important determinants ofoutcomes and must be considered carefully in making targeting decisions. Forexample, in countries where illiteracy is high, it makes little sense to requirepotential beneficiaries to fill out forms as part of a means test. Such requirementsdiscourage otherwise eligible beneficiaries from applying, as Munro (2003)illustrates for Zimbabwe. This suggests that work on targeting should extendbeyond simple quantitative comparisons of methods to consider more detailed andoften qualitative issues of comparisons within methods. How does and shouldimplementation differ in different settings, and how can constraints of politicaleconomy, poor information, or low administrative capacity best be accommo-dated or reduced? In a companion article, Coady, Grosh, and Hoddinott (forth-coming) provide a more detailed discussion of the merits, limitations, andoptions for implementing individual targeting methods in an attempt to move inthis direction.
82 The World Bank Research Observer, vol. 19, no. 1 (Spring 2004)
Notes
David Coady is research fellow in the Food Consumption and Nutrition Division at the International Food
Policy Research Institute; his e-mail address is [email protected]. Margaret Grosh is lead economist in
the Social Protection Anchor Unit at the World Bank; her e-mail address is mgrosh(worldbank.org.
John Hoddinott is senior research fellow in the Food Consumption and Nutrition Division at the Inter-
national Food Policy Research Institute; his e-mail address is j.hoddinottGcgiar.org. The authors
thank Akhter Ahmed, Harold Alderman, John Blcrmquist. Stephen Devereux, Lant Pritchett, Kalanidhi
Subbarao, and Salman Zaidi for comments and reference materials; two anonymous referees for helpful
comments; Yisgedu Amde and Sanjukta Mukherjee for research assistance: and Manorama Rani for
document processing. They also thank participants in seminars at the International Food Policy
Research Institute and the World Bank, a conference on Chronic Poverty and Development Policy at
the University of Manchester in April 2 00 3, and the North Eastern Universities Development Consortium
Conference 2004 at Yale University for useful remarks. The study was commissioned by the World
Bank's Social Protection Anchor Unit for the Safety Nets Primer series. Other papers are available
online at www.worldbank.org/safetynets.1. Van de Walle (1998) contains a useful discussion of these approaches.
2. General discussions of the principles underlying narrow targeting are found in Atkinson (1995), Besley
and Kanbur (199 3), Grosh (1994), van de Walle (1998), and Coady, Grosh, and Hoddinott (forthcoming).
3. This focus is conditioned by three factors. First, if targeting is largely ineffective, the answers to the
remaining questions are moot. Second, there are simply not enough studies with cost data, and the cost
data that are available suffer severely from lack of comparability. Third, assessment of impact requires care-
ful attention to the counterfactual or what beneficiaries would have done in the absence of these interven-
tions. Few studies of transfer programs in developing countries do that with any care; exceptions are Datt
and Ravallion (1994). Ravallion and Datt (1995), Jalan and Ravallion (1999), and Skoufias (2001).
4. The database is available in the form of an annotated bibliography (Coady, Grosh, and Hoddinott
200 3) that includes details on the study itself (title, authors, reference details, year of publication, study
objective), background information on the intervention (program name, year implemented, program
description. type of benefit, program coverage and budget, transfer levels), targeting method (what
criteria were used to determine eligibility, targeting mechanism), how the intervention operated,
targeting performance (who benefited), and descriptions of impact on welfare and costs of targeting.
5. Also, the microcredit literature is vast. Attempting to construct a database comparable to that
developed here is a major undertaking beyond the scope of this analysis.
6. Strictly speaking, all programs are self-targeted to some degree, because there are always some
actions (and therefore costs) required of beneficiaries to register for and collect a benefit.
Social funds also use other mechanisms, such as geographical targeting. Differences in access to infor-
mation or capacity for demanding social funds also account for differential access to these interventions.
8. Alderman and Lindert (1998) provide a recent review of the potential and limitations of self-
targeted food subsidies.9. How these rankings are calculated varies by study. In general, they are based on nationally
representative household survey data that estimate the share of transfers that accrue to individuals in
the bottom deciles of the consumption distribution. Such estimates do not take into account changes in
private transfer behavior or labor supply. Coady, Grosh. and Hoddinott (2003) provide a description of
these calculations by intervention as well as references to the original source material.
1t). Income and inequality data are from the World Bank's World Development Indicators database.
11. Preliminary work included a measure of government effectiveness also drawn from Kaufmann.
Kraay, and Zoido-Lobaton (1999). However, it is never statistically significant, quite possibly because it
is highly correlated with log per capita income.12. Following the suggestion of an anonymous referee, we explored whether the studies from
which data were drawn for this analysis had been published in a refereed journal, a book. or was
unpublished work undertaken by World Bank staff, International Food Policy Research Institute (IFPRI)
David Coadij. Margaret Grosh. and Johlin Hoddinott 83
staff, or individuals based in other institutions. These controls can be thought of in two ways. Arguably,work published in journals (and possibly books) has been more rigorously reviewed, so those studieswill be less dogged by measurement error. On the other hand, there may be publishing biases in thatonly studies with 'significant results" are submitted and accepted by journals. Of the 85 estimates oftargeting performance used here, 17 come from refereed journals, 17 from books, 37 from unpub-lished work by World Bank staff, 8 from unpublished work by IFPRI staff, and 6 from unpublished workby researchers based at other institutions. When dummy variables for type of publication are includedas additional controls, they are not found to be jointly statistically significant and hence are notreported here. But coefficients on dummy variables for unpublished studies by World Bank staff orby individuals based in other institutions tend to be negative, consistent with the publishing biashypothesis.
13. See, for example, Pinstrup-Andersen (1988) and Alderman and Lindert (1998).14. Such implicit concern is found, for example, in Cornia and Stewart (1995).15. Kaufmann. Kraay, and Zoido-Lobaton (1999) caution that these composite measures are likely
to be measured with error. As such, they are likely to provide lower-bound estimates of the impact ofthese characteristics.
16. More precisely, a quartile regression was estimated centered at the median with standard errorsobtained via bootstrap resampling with 50 repetitions to correct for heteroscedasticity. Increasing thenumber of repetitions does not appreciably alter the standard errors.
1 7. As a further specification check, specification 4 was reestimated, but the sample was restricted inthree ways: including only studies reporting the share of benefits accruing to the bottom 40 percent,including only studies reporting the share of benefits accruing to the poorest 40 percent or the poorest 20percent, and including only studies that report the share of benefits accruing to the poorest 40 percent,the poorest 20 percent, or the poorest 10 percent. The results, available on request, are comparable tothose reported in specification 4.
References
Alderman, Harold. 2002. "Do Local Officials Know Something We Don't, Decentralization of TargetedTransfers in Albania." Journal of Public Economics 83(3):375-404.
Alderman. Harold, and Kathy Lindert. 1998. "The Potential and Limitations of Self-targeted FoodSubsidies." World Bank Research Observer 13(2):213-29.
Atkinson, Anthony. 1995. "On Targeting Social Security: Theory and Western Experience with FamilyBenefits." In Dominique van de Walle and Kimberly Nead, eds., Public Spending anrd the Poor. Baltimore,Md.: Johns Hopkins University Press.
Besley, Timothy. and Ravi Kanbur. 1993. "Principles of Targeting." In M. Lipton and J. van der Gaag,eds., Including the Poor. Washington D.C.: World Bank.
Bigman, David, and Hippolte Fofack. 2000. "Geographic Targeting for Poverty Alleviation: An Intro-duction to the Special Issue." World Bank Economic Review 14(1): 129-46.
Braithwaite, Jeanine, Christiaan Grootaert, and Branko Milanovic. 2000. Poverty and Social Assistancein Transitioni Countries. New York: St. Martin's Press.
Case. Anne, and Angus Deaton. 1998. "Large Cash Transfers to the Elderly in South Africa." EconornicJournal 108(4):13 3()-61.
Coady, David, and Emmanuel Skoufias. 2001. "On the Targeting and Redistributive Efficiencies ofAlternative Transfer Programs." FCND Discussion Paper 100. International Food Policy ResearchInstitute, Washington, D.C.
Coady, David, Margaret Grosh, and John Hoddinott. 2003. "Targeted Anti-poverty Interventions: ASelected Annotated Bibliography." International Food Policy Research Institute, Washington, D.C.
84 The World Bank Research Observer, vol. 19. no. I (Spring 2004)
Forthcoming. Thle T .. r'i-i of Transjers in Developinig Countries: Revietv of Experience and Lessonis.
Regional and Sectoral Studies Series. Washington. D.C.: World Bank.
Conning, Jonathan. and Michael Kevane. 2001. "Community Based Targeting Mechanisms for Social
Safety Nets." Social Protection Discussion Paper 102. World Bank, Washington. D.C.
Cornia. Giovanni. and Frances Stewart. 1995. "Two Errors of Targeting." In Dominique van de Walle
and Kimberly Nead, eds., Public Spending and the Poor. Baltimore. Md.: Johns Hopkins University
Press.
Datt, Gaurav, and Martin Ravallion. 1994. "Transfer Benefits from Public-Works Employment:
Evidence for Rural India." Economnic Joutrnal 104(427): 1346-69.
Duflo. Esther, 2t)00. "Child Health and Household Resources in South Africa: Evidence from the Old
Age Pension Program." Americanii Economic Review} 9(1(2): 393-98.
Grosh. Margaret. 1994. Adminiisterinig Targeted Social Programs in Latin Anmerica: From Platittudes to
Practice. Washington D.C.: World Bank.
Huber, Peter. 1967. "The Behavior of Maximum Likelihood Estimates under Non-standard Condi-
tions." In Lucien M. LeCam and Jerzy Neyman, eds.. Proceedings of the Fifth Berkeley Symposiumll in
Mlathiemiatical Statistics anid Probability. Vol. 1. Berkeley, Calif.: tUniversity of California Press.
Jalan, Jyotsna, and Martin Ravallion. 1999. "Income Gains to the Poor from Workfare: Estimates for
Argentina's Trabajar Program." Policy Research Working Paper 2149. World Bank, Development
Research Group. Poverty and Human Resources, Washington, D.C.
Kaufmann. Daniel. Aart Kraay, and Pablo Zoido-Lobaton. 1999. "Aggregating Governance Indicators."
Policy Research Working Paper 2195. World Bank, Development Research Group, Macroeconomics
and Growth, and World Bank Institute, Governance. Regulation, and Finance, Washington. D.C.
Munro, Lauchlan. 2(03. "A Social Safety Net for the Chronically Poor? Zimbabwe's Public Assistance
in the 1990s." Fordham University, Department of Policy, Planning, and Development. New York.
Pinstrup-Andersen. Per. ed. 1988. Food Subsidies in Developinig Couintries: Costs. B. ti and Policy
Options. Baltimore. Md.: Johns Hopkins University Press.
Ravallion. Martin. 1 993. "Poverty Alleviation through Regional Targeting: A Case Study for Indone-
sia." In Karla Hoff. Avishay Braverman, and Joseph Stiglitz. eds.. The Economriics of Rural Organiza-
tion: Theory Practice anld Policy. New York: Oxford University Press.
Ravallion, Martin, and Kalvin Chao. 1989. "Targeted Policies for Poverty Alleviation under Imperfect
Information: Algorithms and Applications." Jouirnal of Policy Modelinig 11(2):213-24.
Ravallion, Martin, and Gaurav Datt. 1995. "Is Targeting through a Work Requirement Efficient?" In
Dominique van de Walle and Kimberly Nead. eds., Public Spending and the Poor. Baltimore. Md.:
Johns Hopkins UJniversity Press.
Rawlings. Laura. Lynne Sherburne-Benz. and Julie Van Domelen. 2001. "Letting Communities Take
the Lead: A Cross-Country Evaluation of Social Fund Performance." World Bank, Washington, D.C.
Skoufias, Emmanuel. 2()01. "PROGRESA and Its Impacts on the Human Capital and Welfare of Households
in Rural Mexico: A Synthesis of the Results of an Evaluation by IFPRI." International Food Policy
Research Institute. Washington, D.C.
van de Walle. Dominique. 1998. "Targeting Revisited." World Bank Research Observer 1 3(2):2 31-48.
White. Halbert. 1981). "A Heteroscedasticity-Consistent Covariance Matrix and a Direct Test for
Heteroscedasticity.' Economtietrica 4814):817-38.
World Bank. 1990). World Development Report 1990: Poverty. New York: Oxford University Press.
- 1997. WVorld Developmnent Report 1997: The State in a Changinig World. New York: Oxford Uni-
versity Press.
20()1. World Developmnent Report 200012001: Attacking Poverty. New York: Oxford University Press.
David Coad.ij. Margaret Grosh. and lohn Hoddliriott 85

An Assessment of Privatization
Sunita Kikeri * John Nellis
Moun2tinig empirical evidence of privatization's benefits coincides withi increasinig dissatis-
faction and opposition among citizen2s an2d policymnakers. This dissatisfaction irfl,( 1 the
growing questioning of the benefits of privatization, the general dowvnituirnz of global nitarkets
in the past few years and the resulting swing of the penidulumzxn back tolward inicreased
governmental supervision, the overselling of privatization as a panlaceai for all economic
problems, and the conzcern that privatizationi does not produce macroeconomic anld
distributional gains equivalent to its tnicroeconornic beneJits. This article takes stock of the
empirical eviden2ce and shows that in comrlpetitive sectors privatization has beeii a resournd-
irlg success in improving firm performance. In i'IfiXi IlL iII" sectors, privatization
improves welfare, a broader anzd crucial objective, when it is accompaniied by proper policy
and regulatory franrieworks. The article argues that despite the growinzg conicernls pri vatiza-
tionz should be neithier abandoned nor reversed. Rather, there should be a strengtheniing of
efforts to privatize correctly: by better tailorinig privatization to local conditions, deepeniing
effoirts to promote comrlpetition and regulatory frameworks, enforcing transparency in sales
processes, and introducing mechanisms to enisure that the poor have access to affordable
essential services.
Almost every country is divesting some or all of its state enterprises to the private
sector or involving the private sector in managing and financing activities previ-
ously owned and operated by the state. The reasons for privatization are well estab-
lished. Especially in developing economies and in infrastructure and network
industries, state enterprises have proved wasteful and inefficient, producing low-
quality goods and services at high cost. Sheltered from competition, state enterprises
were often overstaffed and required to set prices below costs, resulting in financial
losses that in acute cases amounted to as much as 5 to 6 percent of gross domesticproduct (GDP) annually. Bailouts and fiscal strains resulted. Covering state enterprise
losses through fiscal transfers required governments to finance larger fiscal deficits
and increase tax revenues or reduce public spending in other areas, or both. Financing
The World Bank Research Observer, vol. 19, no. 1,© The International Bank for Reconstruction and Development /'II IE WORID BANK 200)(4 all rights reserved.DOI: ]().1093/wbro/lkhOI4 19:87-118
losses through the state banking system reduced the private sector's access to creditand threatened the viability of the financial sector. Many governments became incap-able of providing capital to their state enterprises, even profitable ones, for main-tenance and repair, much less for badly needed expansion and renewal.
Attempts through the 197(0s and early 1980s to impose hard budget constraints,expose state enterprises to competition, and introduce institutional and managerialchanges yielded meager improvements in performance. Some effects looked promis-ing (for example, in New Zealand) but proved unsustainable. Backsliding was com-mon, and the poorer the country, the quicker and deeper the reversal. By the middleof the 1980s, following the powerful lead of the Thatcherite revolution in the UnitedKingdom, government ownership itself came to be seen as a principal reason for theinability to effect major and enduring state enterprise reform. In industrial coun-tries, the shift to private ownership was motivated in equal parts by the failures ofreforms short of ownership change, a sea change in ideology, and the short-term fis-cal attractions of selling state assets. In developing economies, the impetus wasmuch more financial and fiscal. With the international financial institutions leadingthe way, privatization was vigorously promoted as a tool to reduce the budgetaryburden caused by state enterprise inefficiencies and, in the case of infrastructure,to improve performance and access to investment capital for modernization andexpansion of networks.
Despite the widespread adoption of privatization and the positive economic assess-ments of what privatization could do, a number of critics-sometimes including thegeneral public-have expressed strong reservations about privatization's fairnessand sometimes its efficiency impact. Fueled by some recent problematic and highlyvisible cases, this skepticism continues, despite the growing number of empiricalassessments concluding that in the main privatization improves profitability andefficiency and increases returns to shareholders, particularly for firms in competitiveor potentially competitive markets.
What are the strands of the antiprivatization argument? First, opponents contestthat privatization has produced financial and operational benefits, or at leastenough to offset the social dislocation it causes. Some who acknowledge perform-ance improvements attribute them to increased competition rather than change ofownership, with the implication that less painful instruments could effect neededfinancial and efficiency gains. Second, there is fear that privatization leads to layoffsand a worsening in labor conditions, in the short term in the divested firms and inthe longer run in the economy at large. Third, some argue that even if privatizationenhances enterprise efficiency, the bulk of the benefits accrue to a privileged few-shareholders, managers, domestic or foreign investors, those connected to the politicalelite-whereas the costs are borne by the many, particularly taxpayers, consumers, andworkers, thus reducing overall welfare. In addition, many are concerned that the oftenperceived corruption and lack of transparency in privatization transactions have
88 Thre lI'orlid Banik Research Obsenrve,r vol. 19, no. I (Spring 2004)
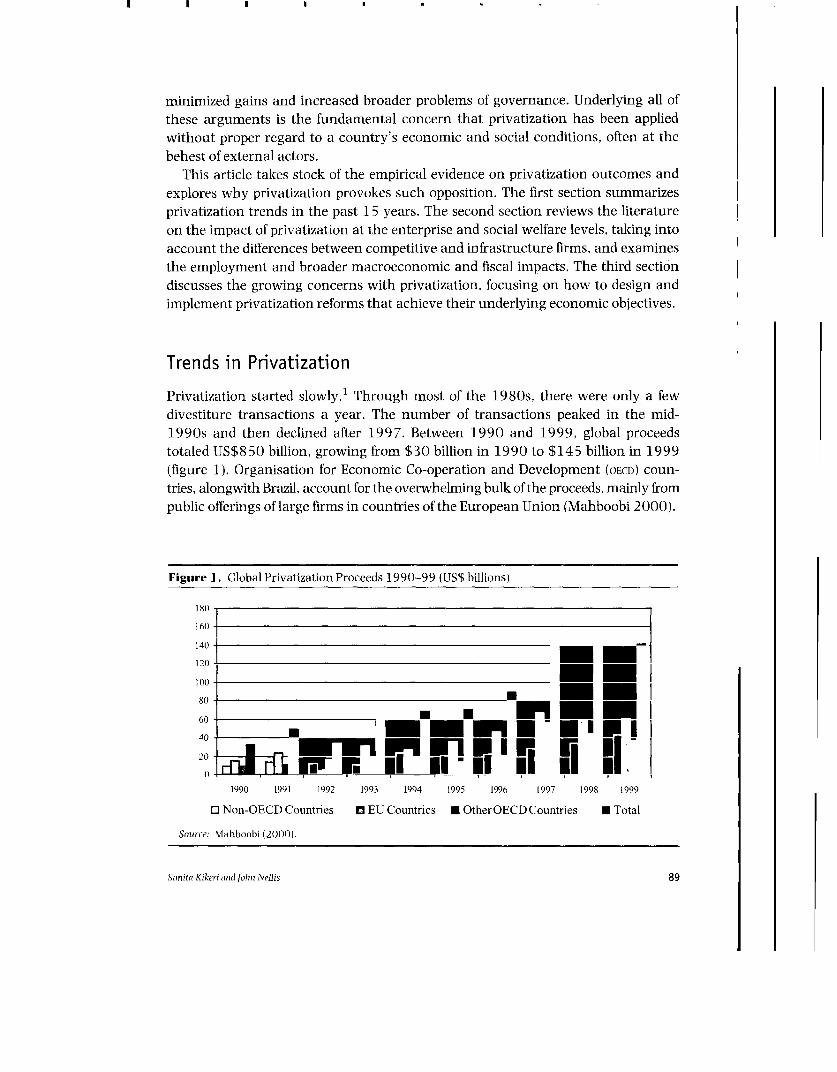
minimized gains and increased broader problems of governance. Underlying all of
these arguments is the fundamental concern that privatization has been applied
without proper regard to a country's economic and social conditions, often at the
behest of external actors.This article takes stock of the empirical evidence on privatization outcomes and
explores why privatization provokes such opposition. The first section summarizes
privatization trends in the past 15 years. The second section reviews the literature
on the impact of privatization at the enterprise and social welfare levels, taking into
account the differences between competitive and infrastructure firms, and examines
the employment and broader macroeconomic and fiscal impacts. The third section
discusses the growing concerns with privatization, focusing on how to design and
implement privatization reforms that achieve their underlying economic objectives.
Trends in Privatization
Privatization started slowly.1 Through most of the 1980s, there were only a few
divestiture transactions a year. The number of transactions peaked in the mid-
1990s and then declined after 1997. Between 1990 and 1999, global proceeds
totaled US$8 50 billion, growing from $ 30 billion in 1990 to $14 5 billion in 1999
(figure 1). Organisation for Economic Co-operation and Development (OECD) coun-
tries, alongwith Brazil, account for the overwhelming bulk of the proceeds, mainly from
public offerings of large firms in countries of the European Union (Mahboobi 2000).
Figure 1. Global Privatization Proceeds 1990-99 (US$ billions)
180
160
140--120- - -100_
60 -
40 -
20 -i I-1990 1991 1992 1993 1994 1995 1996 1997 1998 1999
0 Non-OECD Countries M EU Countries * OtherOECDCountries * Total
Source: Mahboobi (2000).
Suinita Kikeri and Joliui Nellis 89
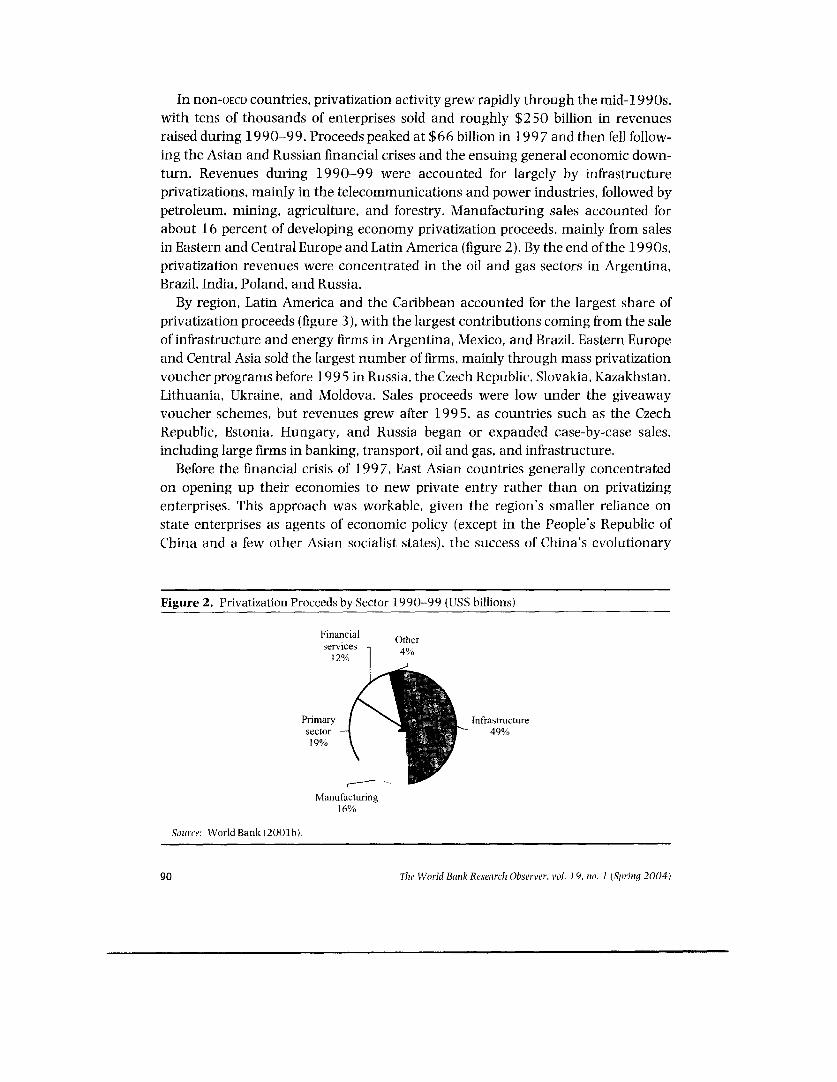
In non-OECD countries, privatization activity grew rapidly through the mid-1 990s,with tens of thousands of enterprises sold and roughly $250 billion in revenuesraised during 1990-99. Proceeds peaked at $66 billion in 199 7 and then fell follow-ing the Asian and Russian financial crises and the ensuing general economic down-turn. Revenues during 1990-99 were accounted for largely by infrastructureprivatizations, mainly in the telecommunications and power industries, followed bypetroleum, mining, agriculture, and forestry. Manufacturing sales accounted forabout 16 percent of developing economy privatization proceeds, mainly from salesin Eastern and Central Europe and Latin America (figure 2). By the end of the 1990s,privatization revenues were concentrated in the oil and gas sectors in Argentina,Brazil, India, Poland, and Russia.
By region, Latin America and the Caribbean accounted for the largest share ofprivatization proceeds (figure 3), with the largest contributions coming from the saleof infrastructure and energy firms in Argentina, Mexico, and Brazil. Eastern Europeand Central Asia sold the largest number of firms, mainly through mass privatizationvoucher programs before 199 5 in Russia. the Czech Republic, Slovakia, Kazakhstan,Lithuania, Ukraine, and Moldova. Sales proceeds were low under the giveawayvoucher schemes, but revenues grew after 1995, as countries such as the CzechRepublic, Estonia, Hungary, and Russia began or expanded case-by-case sales,including large firms in banking, transport, oil and gas, and infrastructure.
Before the financial crisis of 1997, East Asian countries generally concentratedon opening up their economies to new private entry rather than on privatizingenterprises. This approach was workable, given the region's smaller reliance onstate enterprises as agents of economic policy (except in the People's Republic ofChina and a few other Asian socialist states), the success of China's evolutionary
Figure 2. Privatization Proceeds by Sector 1990-99 (US$ billions)
Financial Otherservices 40/
12%
Primary Infrastructuresector 49%19%
Manufacturing16%
Source: World Bank (2001b).
90 The World Banik Researcih Observer. vol. 1 9, no. 1 (Sprizg 2004)
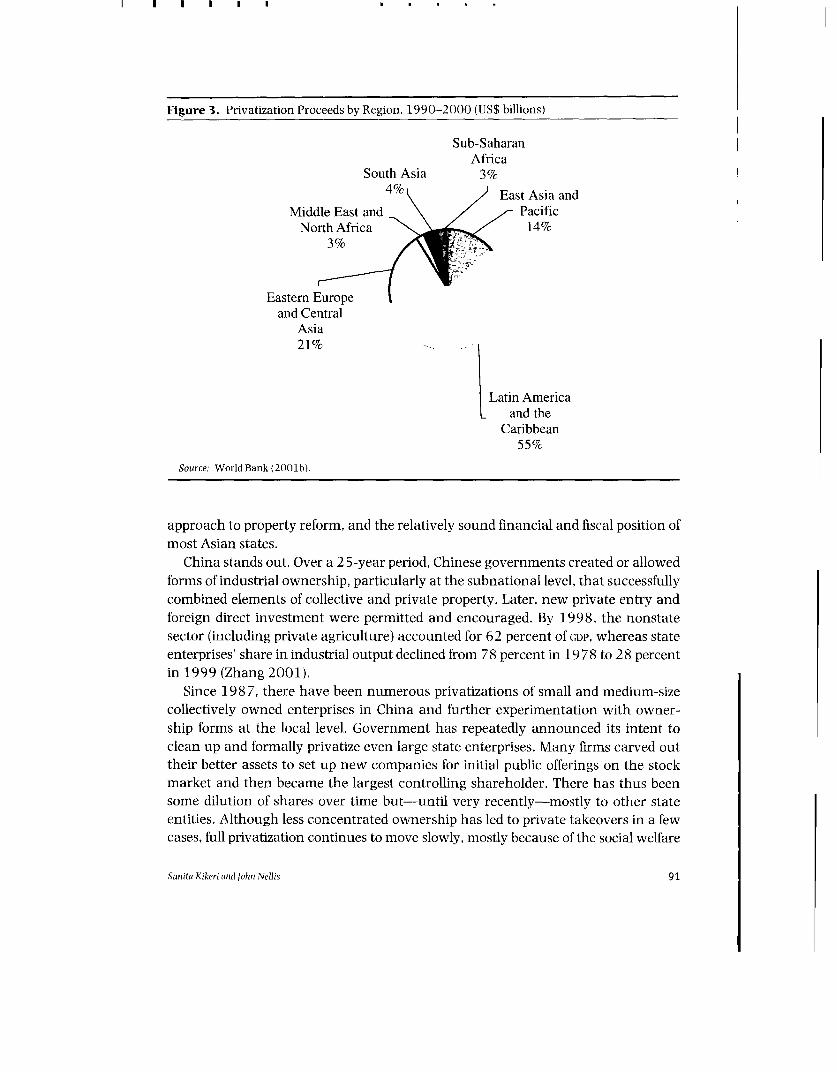
Figure 3. Privatization Proceeds by Region. 1990-2000 (US$ billions)
Sub-SaharanAfrica
South Asia 3%
4% 9 2 East Asia and
Middle East and PacificNorth Afnca 14%
Eastern Europeand Central
Asia21%
Latin Americaand the
Caribbean55%
Source: WorldBank(2001b).
approach to property reform, and the relatively sound financial and fiscal position of
most Asian states.China stands out. Over a 2 5-year period, Chinese governments created or allowed
forms of industrial ownership, particularly at the subnational level, that successfully
combined elements of collective and private property. Later, new private entry and
foreign direct investment were permitted and encouraged. By 1998, the nonstate
sector (including private agriculture) accounted for 62 percent Of GDP, whereas state
enterprises' share in industrial output declined from 78 percent in 19 78 to 28 percent
in 1999 (Zhang 2001).Since 1987, there have been numerous privatizations of small and medium-size
collectively owned enterprises in China and further experimentation with owner-
ship forms at the local level. Government has repeatedly announced its intent to
clean up and formally privatize even large state enterprises. Many firms carved out
their better assets to set up new companies for initial public offerings on the stock
market and then became the largest controlling shareholder. There has thus been
some dilution of shares over time but-until very recently-mostly to other state
entities. Although less concentrated ownership has led to private takeovers in a few
cases, full privatization continues to move slowly, mostly because of the social welfare
Sunita Kikeri audJohri Nellis 91
responsibilities of state enterprises. But the need to face the burgeoning financialproblems of the largest state enterprises has led to a renewed emphasis on privatiza-tion. Initial reviews indicate a positive impact on firm performance, with higher wagesfor workers but starkly lower overall employment (Jefferson and others 2003).
In Sub-Saharan Africa, sales rose from 175 in 1990 to more than 400 in 1996 andthen jumped to more than 2,200 by 1998,2 with sales concentrated in Mozambique,Angola, Ghana, Zambia, Kenya. Tanzania, and Guinea (Campbell White and Bhatia1998: Nellis 2003). But the small size of most divested firms limited the financialimpact: African sales accounted for 3 percent of total developing country proceedsduring 1990-99. Estimated revenues over the decade for 37 Sub-Saharan statestotaled $9 billion, less than the amount raised by sales in New Zealand alone (Nellis2003) and about a third of the value of two Brazilian telecommunications auctionsin the mid-1990s.
In the Middle East and North Africa, privatization revenues have been modest,below even those of Sub-Saharan Africa. Revenues grew in the late 1990s, largelyas a result of Morocco's telecommunications sale and the privatization of cementand other large and medium-size companies in Egypt.
In South Asia, Sri Lanka has had an active privatization program covering virtu-ally all sectors (including infrastructure), but India has accounted for the bulk ofregional proceeds through sales of minority shares in large companies and therecent sale of controlling stakes in a few large firms.
Impact of Privatization
In many ways privatization in the early years was a leap of faith. Few dispute thatstate enterprise performance had not lived up to expectations and that reforms shortof ownership change had had modest effects. Still, there was neither great theoreti-cal justification nor hard evidence at the beginning of the 1980s that the perform-ance problems of state enterprises could be altered by change in ownership. Thus, thebulk of privatizations before 1992-93 took place in the absence of empirical support.
Then, during the 1990s. the privatization assessment industry grew rapidly.Assessments analyzed types of impacts and differences between enterprises in com-petitive markets and those in monopoly sectors. Most of the 100-plus assessmentsnow available cover competitive enterprises, focusing on performance and compar-ing productivity and profitability and changes in output, investments, and capacityutilization before and after sale. The studies conclude that privatization improvesperformance and increases returns to new owners and shareholders, with morerobust findings in high- and middle-income countries than in low-income countries.
In infrastructure sectors, the more crucial issue is the broader welfare effects ofprivatization-the net addition to or subtraction from societal wealth produced by
92 The World Bark Research Observer, vol. 19, no. 1 (Spring 2004)
privatization, based on an assessment of the gains and losses to stakeholders. Given
the daunting data and methodological demands of this approach, the few studies of
the strict welfare type that have been done tend to cover middle-income or developed
economies. They generally indicate that in the proper policy and regulatory settings,
privatization substantially improves welfare compared with what would have hap-
pened had the enterprise remained under public ownership. As will be discussed,
these findings are supported by more recent partial or limited welfare-type work,
concentrated largely in Latin America.
There has been much concern about the employment and broader distributional
impacts of privatization. Studies show large-scale job reductions in highly protected
infrastructure sectors, though the number of workers dismissed as a result of divesti-
ture is generally small relative to the total labor force. Analysts conclude that pri-
vatization is not a prime contributor to the large recent increases in general
unemployment rates in developing economies. Wider income distribution issues are
only beginning to receive analytical attention. Finally, the few available analyses of
the fiscal and macroeconomic effects of privatization show fiscal benefits and a posi-
tive correlation between privatization and growth.
Enterprise Performance
Studies for a wide range of countries show that privatization improves enterprise
performance. For firms in competitive markets (infrastructure firms are treated in
the next section on welfare effects), profitability usually increases, often substan-
tially, as do efficiency (measured by real sales per employee), output, and invest-
ment. These outcomes are seen in cross-cutting studies covering both developed and
developing economies, as well as in case studies of developing and transition econo-
mies, but they are generally more robust for high- and middle-income countries
than for low- or lower-middle-income countries.
Cross-cutting studies. Megginson and Netter (2001) survey cross-cutting studies
that evaluate the impact of privatization on firm performance. The most comprehen-
sive studies use a similar methodology to compare performance measures before and
after privatization (over at least three-year periods) for large numbers of companies
in developed and developing countries, privatized mainly through public share offerings
(Megginson, Nash. and van Randeborgh 1994; Boubakri and Cosset 1998; D'Souza,
Nash, and Megginson 2000). These studies find similar results. Weighted averages
of the mean values show that profitability, defined as net income divided by sales,
increases from an average of 8.6 percent before privatization to 12.6 percent after-
ward. Efficiency rises from an average of 96.9 percent in the year of privatization to
12 3.3 percent in the period after privatization. Between 79 and 86 percent of firms
see increases in output per worker. Most firms achieve economically and statistically
Suluita Kikeri antid Jolti Nellis 93
significant increases in output (real sales) after privatization and significantdecreases in leverage. Capital investment spending increases slightly, whereasemployment changes are ambiguous (see later discussion). Accounting for most ofthe performance improvements are changes in the incentive and managementstructure, along with improved corporate governance.
One concern is that such cross-cutting studies suffer from selection bias. Firmssold by public offering might be the cream of the crop, because to meet stockexchange listing requirements they will have to have been profitable for some time,possess up-to-date and accurate accounts, and in general be among the largest andbest-performing firms privatized. That might mean that performance improves notbecause of privatization but because firms with the highest potential are privatized.Selection bias may be intensified by the overrepresentation of developed economiesin the samples of early studies, because of data limitations. Comparing accountinginformation across countries and at different points in time is also risky. Most of thestudies do not account for exogenous changes in the macroeconomic or businessenvironment, which can influence the outcomes of privatization. Finally, there isconcern that using profitability as an indicator of improved performance is flawedbecause the private sector is by definition profit maximizing, whereas profit is not assalient a goal in the public sector.
Some studies address these methodological drawbacks. Boubakri and Cossett(1998) analyze the performance of 79 newly privatized firms in 21 developingeconomies between 1980 and 1992. Their sample is well diversified, with widegeographical coverage, countries of different levels of development, and firms ofdifferent sizes and in different industries and market structures. They find significantincreases in profitability ( 124 percent higher on average after privatization), operat-ing efficiency (real sales per employee up 2 5 percent on average and net income peremployee up by 63 percent). capital investment spending (up 126 percent), andemployment (up 1.3 percent) and a decline in leverage. The changes in profitabilityand efficiency were larger in middle-income countries than in low-incomecountries. One study that looks at the incidence and importance of selection biasfinds no evidence of it in a set of privatizations in Central Europe (Frydman andothers 1997).
There is also the possibility that performance improvements would have hap-pened without a change of ownership-if general economic conditions improvedand boosted all firms, or if public sector managers and owners were able to put inplace and sustain reform measures. Omran (2001) reviews indicators in privatizedand remaining state-owned firms in Egypt in the 1990s and finds that all firmsimproved, regardless of ownership type or change. He concluded that general liber-alization was more important than privatization in explaining firm behavior. 3 Fewstudies evaluate the counterfactual in any systematic way, however, the most notablebeing Galal and others (1994; discussed later).
94 T'lie World Banivk Reseuarch Observer, vol. 1 9, no. I Sporin 2004)
Another issue is timing. Dewenter and Malatesta (1997) and Hodge (2000),
although agreeing that ownership change produces positive effects, argue that
many performance improvements occur well before privatization. while enterprises
are still under state ownership. But these improvements are generally motivated by
the "announcement" effects of divestiture. From Mexico to the United Kingdom,
many long-avoided reforms were made in the run-up to privatization, including
change of management, layoffs and other cost-cutting measures, and enhanced
competition through changes in trade regime and pricing. The issue is whether
these improvements could have been initiated and sustained had they not been pre-
cursors to divestiture. Proponents of privatization view it as necessary to "lock-in"
the gains and prevent backsliding (World Bank 199 5).
Developing country studies. In developing economies, most of the growing body of
work assessing performance before and after privatization concludes that privatization
improves enterprise performance. La Porta and L6pez-de-Silanes ( 199 7), in a study
of 218 nonfinancial firms privatized in Mexico during 19 8 3-91, conclude that state
enterprises went from being highly unprofitable before privatization to being profit-
able thereafter, closing the performance gap with control groups of similar firms in
the private sector. Output (inflation-adjusted) increased 54.3 percent. sales per
employee roughly doubled, and profitability increased 24 percent. Controlling for
changes in the macroeconomic environment, they find that improvements were due
mainly to productivity gains resulting from better incentives and management asso-
ciated with private ownership and partly to lower employment costs resulting from
labor reductions.In Brazil, privatization also improved the efficiency and profitability of state enter-
prises (Macedo 2000). During 1981-94, before privatization, the ratio of profits to
net assets was negative, averaging -2.5 percent and falling to -5.4 percent toward
the end. Significant gains were achieved after privatization. The large steel mill,
which had been incurring heavy losses, became profitable, and investments
increased dramatically. Higher profits brought more tax revenues to the govern-
ment. and the company began paying dividends. Using a similar methodology to
analyze the performance of 50 Brazilian state enterprises before and after privatiza-
tion, Pinheiro (1996) concludes that privatization significantly improved perform-
ance, particularly when there was a change of control rather than a sale of only a
minority stake. Results were stronger for companies that had been recently sold,
indicating that privatization works better when combined with liberalization meas-
ures that remove barriers to entry and exit, result in positive interest rates, and
reduce access to budget resources.More-and more robust-success stories come from high- or middle-income
countries than from low-income countries faced with difficult market conditions and
wary investors. A study of 16 African firms (10 from North Africa) privatized through
Suiiita Kiikeri al(il John Neilis 9 5
public share offering during 1989-96 finds a significant increase in capital spendingby privatized firms-but only insignificant changes in profitability, efficiency, out-put, and leverage (Boubakri and Cossett 1999). Still, a number of privatized compa-nies in Sub-Saharan Africa increased capacity utilization through new investments,introduced new technology, and expanded markets (Campbell White and Bhatia1998). Several recent examinations of country privatization programs-in Ghana(Appiah-Kubi 2001), Mozambique (Andreasson 1998), and Tanzania (Due andTemu 2002; Temu and Due 1998)-report strong performance improvements inprivatized manufacturing, industrial, and service firms.
Transition economies. Assessing privatization's impact in transition economies ismore difficult. Concurrent sweeping economic and social changes compound theproblem of separating privatization's effects from other factors. Information andanalytical shortcomings are particularly acute, especially for economies that wereformerly part of the Soviet Union. Djankov and Murrell (2002). in reviewing empiricalstudies of enterprise restructuring and ownership change, conclude that privateownership produces more restructuring than state ownership in most transitioneconomies. But regional differences are acute: The privatization effect in Central andEastern European countries is more than twice that in former Soviet countries. Inthe enormously important case of Russia, they find little if any difference in perform-ance between privatized and state firms.
Different sales methods and the types of owners they produce seem to account formuch of this variance in outcomes. The Central and Eastern European countriesthat privatized largely through trade sales on a case-by-case basis (Estonia, Hungary,Poland) ended up with concentrated strategic owners, often foreigners, who tend tobe more productive than diffused domestic shareholders. Firms in former Sovietcountries, which relied mainly on mass privatization through vouchers, tended tohave less positive results. Mass privatizations led to insider ownership (by managersand employees) and widely diffused shareholding among small, first-time equityholders-as evidenced most acutely in Russia, where 70 percent of the 13,000enterprises privatized by vouchers in 1992-94 became insider-owned.
The hope was that these inside owners, supported by newly formed investmentfunds, would soon open their firms to outsiders with money and expertise. But insidersproved reluctant to give up control, and outside investors were wary of the unsettledcircumstances of early transition Russia. The upshot of this failure to concentrateownership through the secondary market was, for a time, limited restructuring.Subsequent nontransparent cash sales of the larger enterprises-exemplified bythe notorious loans-for-shares program-helped create kleptocracy, as manyhigh-potential firms were transferred to a small group of investors at very low prices(Black, Kraakman, and Tarassova 2000). Although some prominent economists (mostnotably Stiglitz 1999) condemned the process, others concluded that privatization,
96 The W17orld BLInk Research Observer, vol. 19, ro. I (Slyring 2004)
unfair as it was, still led to performance improvements in Russia and other in tran-
sition economies. at least in firms where outsiders succeeded in securing control
(Barberis and others 1996; Earle 1998; Earle and Estrin 1998; Aslund 2001). The
argument is one of political economy: "Privatization in Russia worked considerably
better than its politically feasible alternative: doing nothing" (Shleifer and Tresiman
2000: 38).Method of sale and concentration of ownership do not explain all the variation in
performance. Another important part of the explanation is differences in levels of
institutional development and in policy approaches to new entry and hard budget
constraints (discussed further later). In transition economies everywhere, the best
performers were new private entrants-firms that were never in state hands.
Welfare Effects
Privatized infrastructure firms also recorded performance improvements. A recent
survey shows that the introduction of incentives helped reduce costs and improve
revenue collection in infrastructure firms (Harris 2003). Although gains were most
dramatic in the telecommunications sector, in large part because of increased com-
petition, substantial improvements took place in less competitive sectors such as
power and water as well. Losses in the Chilean electricity sector, for example, more
than halved after privatization and similar gains took place under more difficult cir-
cumstances in Georgia and Namibia.
But for infrastructure sectors, with their monopoly or network characteristics, the
ultimate test for assessing privatization's impact is not simply firm performance, as it is
for competitive firms, but the difference in economic welfare relative to what would
have happened had the enterprise remained state-owned. Better financial and opera-
tional performance at the firm level is part of the story, but a transaction can benefit a
firm and its owners without benefiting other stakeholders and society at large.
Selling an inefficient public sector monopoly to an unregulated private owner will
almost certainly result in increased firm profitability and higher returns to the new
shareholders and perhaps in higher salaries and expanded job opportunities for
workers and greater returns to government. But these gains can easily be out-
weighed by the welfare losses imposed on consumers and the economy as a whole
from inadequate access to products and services, their suboptimal supply, or their
excessively high price.Despite the recognized importance, only a few studies of the broader welfare
effects have been undertaken. One problem is the heavy data demands. To estimate
the counterfactual. analysts need detailed information on firm performance before
and after the sale and equally detailed information on the policy climate, social out-
comes, and myriad other factors. Even in the most data-rich settings, such as the
United Kingdom, analysts readily admit that construction of the counterfactual. the
Suizrita Kikeri and Jolhn Nellis 97

"what if," is inevitably based on a more than normal amount of "crystal ball gazing"(Newbery and Pollitt 19 9 7).
A seminal study by Galal and others (1994) estimates the welfare consequencesof privatization in 12 (mostly) infrastructure enterprises in one developed and threemiddle-income countries, looking at the effects on enterprise efficiency, subsequentinvestment, and consumer welfare. Employing a modified form of cost-benefit analy-sis, the study examines the impact on all actors, compares performance before andafter privatization, and contrasts performance after privatization with a hypotheticalscenario of reformed state ownership, with new technology and more rational pro-cedures. The conclusion: Divestiture substantially improved economic welfare in 11 ofthe 12 cases, mainly due to a dramatic increase in investment, improved produc-tivity, more rational pricing policies, and increased competition and effective regulation(figure 4).
In a study of the welfare effects of privatization of the electricity sector in theUnited Kingdom, Newbery and Pollitt (1997) argue that efficiency improved signifi-cantly in the first years following privatization. But from their counterfactual ana-lysis, they conclude that the new private shareholders captured the bulk of thefinancial gains at the expense of government and taxpayers. Consumers/taxpayersdid reap some benefits: It was not a case of winners and losers, but of huge winners
Figure 4. Welfare Effects of Divesting 12 State Enterprises
Chilgener
Enersis155
Chile Telecom
Mexican Airline
Aeromexico
Mexico Telmex
Sports Toto
Malaysian Airline System
Kelang Container Terminal
British Airways
National Freight
British Telecom
-10 0 10 20 30 40 50 60Percent
Note: Welfare gains are presented as a percentage of annual sales in the last year before privatization.Source: Galal and others (i1994).
98 The tlorld Banlk Research Observer, vol. 19. no. 1 (Spring 2004)
and very small winners. Domah and Pollitt (2000) look at the welfare consequences
of privatizing regional electricity supply and distribution in England and Wales and
estimate large welfare gains, first to the seller and then to consumers.
There has been just one application of the strict welfare methodology in low-
income countries, Jones, Jammal, and Gokgur's (1998) study of 81 privatizations in
Cote d'Ivoire. The analysis covers not just infrastructure firms but also a range of
firms already operating in competitive markets (in agriculture, agro-industries,
and tradable and nontradable sectors). For the entire privatized sector, they con-
clude that there were substantial benefits: Firms performed better after privatiza-
tion than before, they performed better than they would have had they remained
under public ownership, and the set of transactions as a whole contributed posi-
tively to economic welfare, with annual net welfare benefits equivalent to about
2 5 percent of predivestiture sales. These results stemmed from a number of effects,
including increases in output, investment, labor productivity, and intermediate
input productivity.In recent years, several partial or limited welfare analyses of privatization have
been conducted, most focusing on Latin America. One set of studies sponsored by the
World Institute for Development Economics Research of the United Nations University
developed less elaborate counterfactual constructions in an effort to measure the
social effects of privatization of infrastructure and network industries.4 The Bolivia
study (Barja and Urquiola 2001) simply compares performance before and after
privatization, looking for breaks in trend lines at the time of sale and for differences
in the economic and political frameworks in the two periods, and estimates the pos-
sible effects on performance after privatization. In Peru. T6rero and Pasc6-Font
(2001) limit themselves to estimating the effects of infrastructure privatization
on different income groups, using a rudimentary counterfactual that assumes no
change of ownership and the continuation of preprivatization pricing policies.
A similar study for Argentina (Delfino and Casarin 2001) finds varying social out-
comes depending on which of three price elasticity of demand figures is used, that all
three show increases in production, quality, and access following divestiture.
Almost all the studies conclude that on the whole, consumer surplus expanded after
privatization. even though in most cases prices also increased.
Another recent set of Latin American studies-covering Argentina, Bolivia, Mexico,
and Nicaragua-examines the distributive impact of privatization. Based on the
country studies, McKenzie and Mookherjee (2002) calculate the welfare impact on
consumers from changes in price, access, and quality of service, taking into account
changes for different expenditure groups. They find that in all cases privatization
resulted in increased access to services, especially for poorer consumers, who had
less access to begin with. Prices fell in half the cases and rose in half. though the posi-
tive distributional gains from access outweighed the impact of increased prices.
Privatization was generally followed by an improvement in service quality. In
Suriita Kikeri and John Nellis 99
almost no cases was there evidence that changes in price or access led to increasedpoverty.
Regarding access, Harris (2003) confirms a positive impact in such sectors aswater and power in countries at various levels of development, as increased invest-ment leads to expanded coverage and access and as sales contracts often require thatmuch of the expansion benefit previously unfavored groups or regions. Clarke andWallsten (2002) use household data from around the world to examine the perform-ance of public utilities in meeting universal service obligations and the impacts ofreform. They find that state monopolies everywhere except in Eastern Europe failedto provide service to poor and rural households and that privatization reforms didnot harm poor and rural consumers and in many cases improved their access to utilityservices. Prices, as noted, often rise following privatization to offset prices that havelong been well below cost. In many instances this has a negative distributionalimpact-but in addition to being outweighed by access. these effects can be mutedby regulatory frameworks or subsidies aimed at protecting the less favored. Chile, forexample, subsidized telephone costs in rural regions. (For a general discussion ofmitigating measures, see Estache, Foster, and Wodon 2002; Clarke and Wallsten2002; and Estache, Gomez-Lobo, and Leipziger 2000.)
The welfare studies conclude that privatization generally increases the resourcesavailable in the economy, including those available to governments. The studiesalso conclude that although few privatizations result in gains for all stakeholders(sellers, buyers, consumers, workers, and competitors), most produce gains for someand losses for others, depending on how the transaction is structured, the policyframework, and the institutional development and competence in the economy.Although the distribution of gains and losses varies in the studies, in almost no casedo the new private owners come out on the losing side. The variance is larger forother stakeholders, including consumers, workers, and sellers. Even in cases ofincreased consumer surplus, the distribution of gains varies by income decile.
What is clear from the studies is that the aggregate gains are greatest when priva-tization is combined with proper competition policies and regulatory frameworks.The welfare effects have been shown to depend crucially on the fairness and capacityof the regulatory system. Chisari, Estache, and Romero (1999:376) conclude that"how serious governments are about the fair distribution of gains from privatizationreform is revealed by how serious they are about regulation." (Regulatory issues aretreated in greater detail later.)
Employment and Distributional Effects
State enterprises tend to be overstaffed. Consider these examples. In Sri Lanka in1992, estimated redundancy in eight of the largest firms (in electricity, railways,shipping, sugar, cement, and petroleum) averaged 53 percent (Salih 2000). Prior to
100 Thie Wlorld Banlk Researchl Observer, vol. l 9, no. 1 (Spring 2004)
privatization, Argentine railways, with more than 90,000 employees, had a
wage bill equivalent to 160 percent of the firm's total revenues (Ramamurti
1997). Such levels of overstaffing contributed to the financial weakness of state
enterprises.Excess labor is one of the first cost areas addressed by reforming governments or
new private owners. A recent survey of 308 privatized firms shows worker reduc-
tions in close to 80 percent of firms after privatization (Chong and L6pez-de-Silanes
2002). An earlier review of 17 privatizations found job increases in 4 (averaging
2 3 percent), no change in 6. and job losses in 7 (averaging a substantial 44 percent
of the workforce before privatization), predominantly in tobacco, water supply, and
electricity (Van der Hoeven and Sziracki 1997).
A number of highly protected and deeply politicized enterprises have seen huge
declines in net employment, often before but also after privatization: 80 percent in
Argentina's railways, 72 percent in petroleum, and 50 percent in electricity enter-
prises: 82 percent in Brazil's railroads; 42 percent in Manila water: and 50 percent
in a study of Mexican firms. Moreover, although D'Souza and Megginson's (1999)
study of 78 privatized firms in 25 countries finds insignificant employment declines
for the group as a whole, reductions were substantial for a subgroup of noncompeti-
tive firms. Much of this labor shedding was required to bring employment and labor
costs in line with that in competitor or similar firms.
Some firms in competitive sectors, with relatively efficient staffing levels before
privatization, and firms in high-demand sectors, such as telecommunications,
experienced little decline in employment (Galal and others 1994; Megginson, Nash,
and van Randenborgh 1994; Boubakri and Cosset 1998; Kikeri 1998). The general
expectation is that downsizing will be temporary and that growth in restructured
private firms will rebound. In some cases, this has happened. In a set of Eastern
European countries, employment declined just before and during privatization, but
subsequently increased (Estrin and Svejnar 1998). Jones, Jammal, and Gokgur
(1998) confirm labor shedding before privatization in their study of Cote d'Ivoire.
But they find that firms slated for privatization shed less than the economy as a
whole, suggesting that layoffs were a response to weak economic conditions rather
than to privatization itself. Indeed, they argue that privatization may have resulted
in less labor shedding, possibly to minimize workers' opposition to privatization.
Moreover, the privatized sector did significantly better than enterprises as a whole
in terms of job generation.Several studies report that employees who retain their jobs in privatized firms
receive the same or higher wages than they did before. In Brazil, for example,
employment reductions were sizable in large firms privatized in the 1990s (48 percent
on average), but productivity improvements resulting from restructuring led to
higher wages and performance-based incentives for workers who remained (Macedo
2000). Similar evidence is found in Argentina (Ramamurti 1997), C6te d'Ivoire
Sunita Kikcri aidJlohn Nellis 101
(Jones. Jammal, and Gokgur 1998), Malaysia (Galal and others 1994), and Mexico(La Porta and L6pez-de-Silanes 199 7).
There is a widespread public perception that privatization is the main cause ofthe large increases in unemployment in many regions in the last decade and thusa prime contributor to a number of social ills, including increased poverty andinequality. Recent research suggests a more nuanced picture. Privatization has con-tributed to general unemployment levels, but only slightly. It is rarely a principal oreven important cause of rising unemployment, poverty. or inequality. The evidencecomes mainly from Latin American studies that argue that while privatization hasresulted in job losses, the aggregate numbers are small relative to the nationalworkforce (Barja and Urquiola 2002; L6pez-Calva and Rosellon 2002; Ennis andPinto 2002; Freije and Rivas 2002, with findings summarized in McKenzie andMookherjee 2002). They conclude that privatization is not a main cause of overallincreases in unemployment and wage differentials, even where both have risendramatically.
Other studies support this view. Data from Argentina suggest that privatizationwas not a major contributor to the rise in unemployment between 1993 and 1995but that the interest rate shock from regional instability was (Chisari, Estache,Romero 1999). In the early 1990s in Hungary and Poland, despite the slow pace ofprivatization, official unemployment grew rapidly, reaching 14.1 percent in Hungaryin 1993 and 16.7 percent in Poland in 199 3-94 (Nellis 1999). Behrman. Birdsall, andSzekely (2000), in an econometric study of the impact of economic liberalizationon wage differentials in Latin America, conclude that privatization was negativelycorrelated with the growing wage inequality in reforming Latin American econo-mies. Rather, privatization was mitigating the "disequalizing effects" of liberalizingreforms in the financial sector, the tax regime, and capital markets.
Finally, what of the broader distributional effects? Despite innovations aimed atspreading equity holdings-such as voucher schemes in transition economies and"capitalization" in Bolivia-there is a widespread perception, even among observerssympathetic to privatization, that privatization has had negative effects on wealthdistribution, with upper-income groups gaining far more in equity shares thanlower-income groups, at least in the short run.
Birdsall and Nellis (2002) review the available studies and conclude that mostprivatization programs have, at least in the short run, worsened the distribution ofassets (very likely) and incomes (likely). This is far more evident in transition econo-mies than in Latin America, and less clear for utilities-where the poor have tendedto benefit from greater access-than for banks and oil companies and other naturalresource producers. In the best-studied cases from Latin America, the conclusion isthat privatization has contributed little or nothing to the growing inequality in theregion and that it either reduces poverty or has no effect (McKenzie and Mookherjee2002).
102 T7le World 1Bank Research Observer, vol. 1 9Y no. I (Spiring 2004)
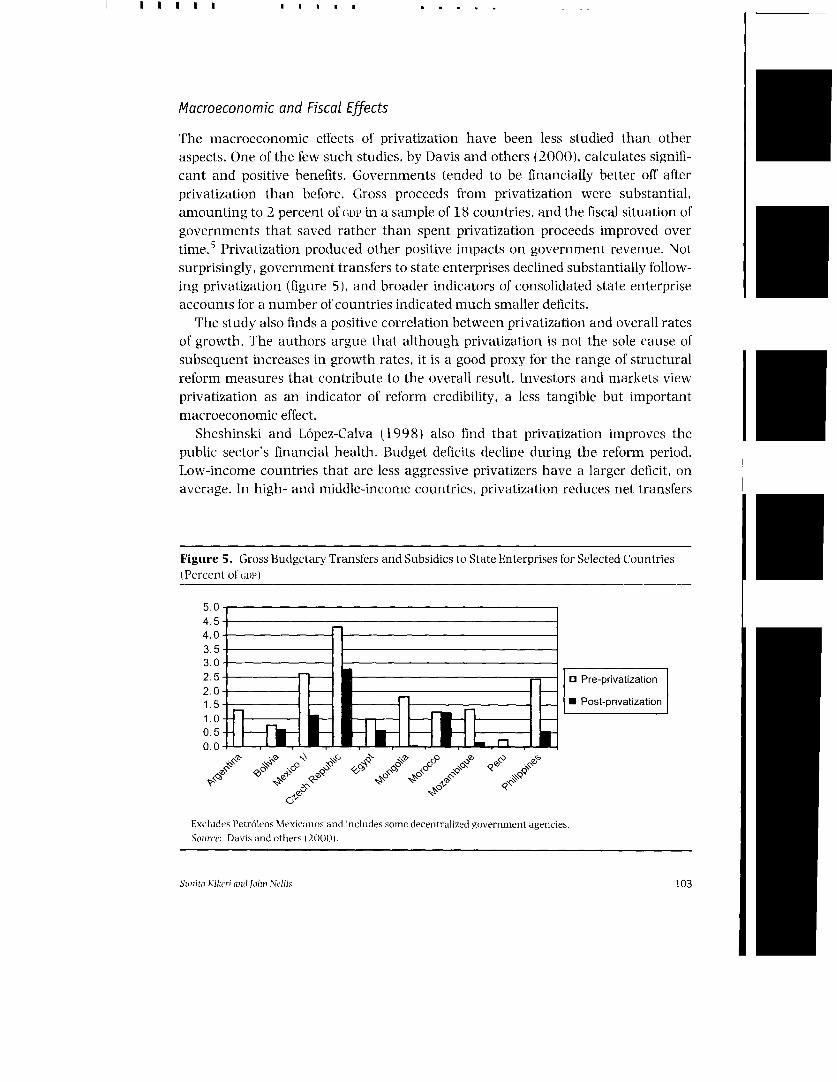
Macroeconomic and Fiscal Effects
The macroeconomic effects of privatization have been less studied than other
aspects. One of the few such studies, by Davis and others (2000). calculates signifi-
cant and positive benefits. Governments tended to be financially better off after
privatization than before. Gross proceeds from privatization were substantial,
amounting to 2 percent of GDP in a sample of 18 countries, and the fiscal situation of
governments that saved rather than spent privatization proceeds improved over
time.5 Privatization produced other positive impacts on government revenue. Not
surprisingly, government transfers to state enterprises declined substantially follow-
ing privatization (figure 5), and broader indicators of consolidated state enterprise
accounts for a number of countries indicated much smaller deficits.
The study also finds a positive correlation between privatization and overall rates
of growth. The authors argue that although privatization is not the sole cause of
subsequent increases in growth rates, it is a good proxy for the range of structural
reform measures that contribute to the overall result. Investors and markets view
privatization as an indicator of reform credibility, a less tangible but important
macroeconomic effect.Sheshinski and L6pez-Calva (1998) also find that privatization improves the
public sector's financial health. Budget deficits decline during the reform period.
Low-income countries that are less aggressive privatizers have a larger deficit, on
average. In high- and middle-income countries, privatization reduces net transfers
Figure 5. Gross Budgetary Transfers and Subsidies to State Enterprises for Selected Countries
(Percent of GOP)
5.04.5-4.0 -3.5-3.0-2.5 -
0 Pre-privatization
2.0-1.5 _ Post-privatization
1. 0 0.5-0.0 dLi L _ooS E ,tG -
Excludes Petr6leos Mexicanos and includes somc decentralized government agencies.
Source: Davis and others (2000).
Saupzita Kikcri aisi olion Nellis 103
to state enterprises, and transfers become positive when the government startscollecting taxes from privatized firms-another contributor to positive macro-economic effects. Despite concerns about the difficulties of tax collection. there is evi-dence of increased downstream revenues to governments through higher taxes inAfrica (Campbell White and Bhatia 1988), Argentina (Shaikh and others 1996), Brazil(Macedo 2000), and Mexico (La Porta and L6pez-de-Silanes 199 7), among others.
On the use of net proceeds from privatization, the conventional wisdom is that themore they are devoted to retiring debt, the better. Debt reduction lowers interestrates, reduces further borrowing and inflation, and boosts overall growth. Fourcountries in the study by Davis and others (2000)-Argentina, Egypt, Hungary, andMexico-had an initial stock of registered public debt ranging from 40 percent to1 30 percent of GDP. Privatization proceeds contributed to a sharp decline in publicdebt between the year before the period of most active privatization and the last yearof active privatization, helping strengthen and stabilize the economy. One problem isthat there are strong claimants to the proceeds other than debt relief, and politiciansoften are obliged to balance the economic ideal with the politically feasible. Manygovernments (Argentina, Bolivia, Estonia, Hungary) have devoted a portion ofprivatization proceeds to covering pension costs (a form of debt retirement, becausethey are obligations of the state) or-a much more risky use-to the restructuring ofsome key state enterprises before or even instead of privatization (in Poland and theCzech Republic). Experience cautions against the use of proceeds to finance currentexpenditures, given the one-time nature of the proceeds and the risk that spendingmay become entrenched at unsustainable levels.
Emerging Issues
Despite the largely positive economic assessments, privatization is increasinglydisliked-in general and in network industries in particular. Public opinion surveysfrom Western Europe, Latin America, South Asia, and Russia reveal that large andgrowing percentages of citizens view privatization as a harmful policy, often imposedby external agencies without due consideration for the economic and social context.Protests of higher prices, corrupt transactions, alienation of national assets to for-eign investors, and job losses have become common-and in several cases, deadly-in Latin America, Sub-Saharan Africa, and India. Even in the United States, troubledpartial privatizations (water in Atlanta) and flawed liberalization (associated in thepublic mind with privatization, such as electricity in California) have led many tooppose further reductions of state involvement, particularly in sectors such as waterand power. Journalists in both developing and industrial countries often portrayprivatization in a negative light (see, for example, Finnegan 2002). Nongovern-mental organization activists and analysts, supported by such noted economists
104 The World Banki Researci Observer. vol. 19, no. 1 (Spring 2004)
as Joseph Stiglitz. question both the manner in which privatization has been
implemented (without adequate regard for local conditions) and, at times, its essen-
tial rationale.The causes of this discontent are several. First, when done badly, privati-
zations have simply gone wrong. In Russia and other economies in transition,
hundreds of firms were more or less given away to a small group of agile or well-
connected insiders. Many of the highest potential assets were sold at very low
prices. Even when ordinary citizens obtained shares (in exchange for vouchers),
this equity quickly lost most of its value. The bad outcomes may be few com-
pared with the total number of privatization transactions,6 but they are highly
visible and have helped mobilize popular opposition-failed privatized toll roads
in Mexico; troubled or canceled infrastructure concessions in Bolivia, Costa
Rica, Hungary, India, Indonesia, Senegal, Ukraine, and half a dozen other
countries; a privatized mine in Zambia that failed to obey the law on severance
payments.Second, and related, the process is political dynamite. The benefits of privatiza-
tion tend to be diffused among consumers or citizens as a whole, small for each
affected individual, and slow to materialize. To illustrate, a 10 percent reduction in
electricity tariffs amounts to a large sum in the aggregate but might be of little sig-
nificance to individual consumers. It normally takes some time before the other
possible benefits of privatized electricity generation-less pollution, more reliable
service that might stimulate private investment elsewhere in the economy-are
discernible. The costs of privatization, however, are likely to be concentrated
(dismissed workers, increased charges). large for each individual affected, and
rapidly apparent. Politically, losses are felt more intensely than gains, with proreform
consumers generally unorganized, silent, and nearly invisible politically, and anti-
reform workers, civil servants, and antimarket intellectuals frequently organized
and vocal. The political process naturally responds to the intense and those with
"voice."Third, privatization may have been oversold, particularly in countries with weak
institutional capacity. Proponents underplayed the costs, predicted quick and widely
shared gains, insisted on speed, and often claimed that ownership change was critical
to a general economic turnaround. With the benefits overplayed, it is not surprising
that privatization is blamed when general economic conditions fail to improve or
when competitive markets and regulatory frameworks are not sufficiently developed
to support privatization.Going forward, what can be done to address these concerns? There is still much
debate about ownership and competition that needs to be addressed. Equally import-
ant is improving the privatization process itself, taking measures to promote com-
petition, putting in place proper regulatory frameworks, ensuring transparency,
mitigating social costs, and tailoring privatization to local conditions.
Suiiita Kikeri aid Joihn Nellis 105
Ownership or Competition?
Two decades of experience have not settled the debate over how much ownershipmatters. Neoclassical economic theory is somewhat agnostic on the effects of owner-ship. It regards market structure and the degree of competition to be of equal orgreater importance. Empirically, some analysts conclude that increased exposure tocompetition accounts for most of the positive changes seen in privatized firms.7Indeed, some studies suggest strongly that competition has been more importantthan ownership change in bringing about efficiency gains. 8
But the question remains: If enhanced competition and market restructuring areso efficacious on their own, why do the efficiency effects rarely occur or persist in theabsence of ownership change? The poor experience with state enterprise reform inthe 1980s and before shows the difficulties and limited results of reforms short ofownership change (see Shirley 1983; Nellis and Shirley 1991). Governments foundit difficult to apply the full package of reforms needed (exposing state enterprises tocompetition, requiring them to access private capital markets for investment funds,creating a market for managers, isolating the process from political interference)and to leave the package in place long enough to change incentives and behaviors.Even where performance improved, 9 reforms did not endure, usually because ofrenewed political interference (World Bank 1995; Majumdar 1998; Shirley and Xu2000). Governments almost never allowed insolvent state enterprises to fail and goout of business. Soft budgets continued, and in the absence of exit options, there waslittle pressure on government officials, managers, and workers to reform.
The difficulty of reforming state enterprises without privatization and the gener-ally improved performance after privatization support the importance of ownershipbut do not conclusively prove it. Those who look at the issue statistically rather thancausally argue that ownership change is associated with effective and enduringcompetition. For example, Shirley and Walsh (2000) sum up the ownership orreform debate based on a review of some 50 empirical studies covering a variety ofcountries and sectors. They find greater ambiguity about ownership in the theoreti-cal literature than in the empirical literature. The clear majority of empirical studiesconcluded that privatized-and private-firms perform better than state enterprises,a finding that is robust across sectors and market structures and across developedand developing countries. Although a few studies find better performance by stateenterprises in infrastructure sectors in developed economies, no studies find betterperformance by state enterprise in any sector or market situation in developingeconomies. Shirley and Walsh find that private firms do better in fully competitivemarkets. This advantage persists but is less pronounced in monopolistic markets,and the evidence is less conclusive.
The issue is less one of privatization versus competition. Rather, privatization andprocompetition policies appear to be mutually reinforcing. Sachs, Zinnes, and Eilat
106 The World Bank Research Observer, vol. 19, no. I (Spring 2004)
(2000) examine the empirical evidence across 24 transition economies and conclude
that ownership change is not enough to generate improvements in economic perform-
ance. But when ownership change is combined with institutional reforms-aimed at
removing barriers to entry and exit, improving prudential regulation and corporate
governance, hardening budget constraints, and developing capital markets-progress
is much greater. Maximum impact is achieved when market competitiveness, hard-
ened budget constraints, and improved regulatory frameworks coincide with priva-
tization. The higher the level of institutional reforms, the more positive the economic
performance impact from a change of ownership. But institutional reforms do not
guarantee performance improvements unless there is a minimum level of ownership
change: The key finding is that economies must have private ownership and pro-
competition policies to progress. So, again: Ownership matters, but policies and
institutions matter just as much.
Promoting Competition
Privatized firms perform better than state enterprises, but new private firms perform
better than both. Promoting competition by removing entry and exit barriers and by
linking privatization with financial sector reforms is crucial for the development of a
dynamic and competitive private sector and thus for successful privatization.
Entry and exit. Particularly in infrastructure firms, economic benefits are maximized
when privatization is combined with new entry. the break-up of large entities. price
deregulation, and the development of effective regulatory frameworks-with the
last being critical for equity as well as efficiency. Competitive markets and good regu-
lation reinforce the benefits of private ownership. Divesting into competitive markets
may reduce the revenues from sale, but efficiency, not revenues, should be the
primary objective of privatization. A recent report (World Bank 2004) shows that
earlier privatizations that granted long exclusivity periods to investors increased the
sales price but led to problems as exclusivity reduced competition and thereby incen-
tives for investment. In telecommunications, for instance, exclusivity reduced network
expansion by 10-40 percent and the annual growth rate of the network by more
than 2 percent. As countries have learned from experiences, exclusivity periods have
grown shorter and some privatizations have taken place without any exclusivity.
Competition is equally important in tradable sectors. It requires eliminating
import restrictions, deregulating prices, and simplifying procedures for starting a
business. Removing entry barriers is particularly important in transition economies,
where state enterprises dominated all markets and where restrictions on private par-
ticipation and entry were powerful. For example, privatization of large state enter-
prises in Poland initially proceeded slowly, though most small firms were sold off
quickly. Entry was permitted and vigorously encouraged, and harder budgets were
Suniita Kikeri and John Nellis 107
at least temporarily imposed on most state enterprises that remained. Competitionincreased in all sectors of the economy, and asset stripping was minimized. However,the long and increasingly expensive delay in dealing with some large, overstaffed,loss-making firms, which are still in state hands, is a major contributor to Poland'srecent economic difficulties. China's success is also in good part due to opening entryto domestic quasi-private enterprises and to foreign investment. In changing thepublic-private mix, privatization was for a long time less important than the emer-gence of new private businesses, although here, too, privatization of the larger firmsis gaining ground and made easier by the presence of a competitive private sector.
Ultimately, competition means freedom to fail. Closure signals mismanagement,so governments have seldom allowed even obviously nonviable firms to go under.Privatization facilitates the liquidation or exit of nonviable firms. When purchasershave incorrectly estimated the market or their ability to restructure firms, closureshave resulted: private owners have been able to do what public owners could not.Critics point to high liquidation rates after privatization (in places as different asArmenia and Guinea) as evidence that privatization is a failure. But closures do notnecessarily indicate that privatization was misguided. Had these firms remained instate hands, they would likely have continued to receive subsidies, using scarceresources with high opportunity costs. Given the political difficulties associated withshutting down state enterprises, privatization may allow the liberation and transferof assets from problematic management in the public sector to better managementand more productive use in the private sector.
Linkages to financial sector reforms. Competition is engendered by the quality,pace, and scope of financial sector reforms, which in turn affect privatization out-comes. For example, the poor performance of privatized firms in many transitioncountries, including the Czech Republic, Slovakia, and Russia, resulted partlybecause insiders obtained control of the assets, but also because of the absence offinancial sector reforms that would have forced even bad managers to take the rightsteps-or leave the way clear for other owners.
In the Czech Republic. the state continued to dominate commercial bankingthroughout the 1990s, maintaining essentially a controlling interest. Pressure fromgovernment allowed weak firms to borrow to stay in business. Little of the credit wasapplied to restructuring and much of the debt was nonperforming, with a fair per-centage of it stolen (Cull, Matesova, and Shirley 2001). This severely weakenedcommercial banks and resulted in an enormous bailout. The Czech economy haslargely recovered, but at a great cost. By contrast. Estonia and Hungary had lessproblematic privatizations because they implemented their bank restructuring andprivatization programs early; dealt rapidly with the bad debt problems: tackled diffi-cult legal and institutional reforms, such as bankruptcy and protection of minorityshareholders; and partly as a consequence, received more inflows of foreign direct
108 The World Banrik Research Observer, vol. 19, nto. I (Spring 2004)

investment in the 1990s than their regional competitors. These factors, added to
sales methods favoring concentrated ownership, produced more positive privatiza-
tion outcomes.A World Bank (2001a) report on finance and growth finds that the lower the
income of a country, the higher the proportion of its bank assets that are state-
owned. The theory was that state-owned banks would distribute capital to more pro-
ductive investments, provide greater access to credit for deserving sections of society,
and be less prone to crises. In practice, it has proven difficult to design incentives to
guide either pubic or private banks toward efficient resource allocation. With state-
owned banks, incentives are often especially weak, for political and other reasons,
and the results are usually worse. State-owned banks have incurred some of the
largest losses of recent times. State ownership tends to reduce competition through
higher spreads on interest rates, leads to less stock exchange activity and nonbank
credit, and results in greater concentration of credit, usually to the largest 20 firms,
often inefficient state enterprises.
Privatization of banks is thus part of the solution. But experience in Argentina,
Chile, and Mexico, among others, shows that bank privatization is a special case,
more akin to infrastructure transactions than to privatizations in competitive sec-
tors. As in infrastructure, good policy, monitoring, and enforcement are key. In
weak regulatory environments, poorly designed and implemented bank privatiza-
tions have provoked major financial crises (Chile in the late 1970s, Mexico in the
early 1990s). Although these rapid, insufficiently thought-out privatizations were
mistakes, extended state ownership or control can have an equally detrimental
impact, as the Czech case illustrates. Just as hasty privatization in weak environ-
ments can lead to problems, so can excessive delays, which undermine real sector
reforms and impose high costs. Bank privatization remains the preferred strategy,
but it requires caution and far more preparation than privatizations of ordinary
commercial firms. Experience shows the need to sequence the phasing out of state
ownership with the opening up of entry for private banks and improvements in the
regulatory environment (World Bank 2001 a).
Regulation
Successful privatization of natural monopolies requires development of regulatory
frameworks and institutions that are independent, accountable, and resistant to
capture by the private provider or the state. Such frameworks are essential to protect
consumers against abuses of monopoly power, assure investors that they will be
fairly treated, and address broader equity concerns.
Alexander and Estache (19 9 9) find that Latin American countries, such as Chile,
that devised regulatory frameworks up front and developed reasonable capacity to
implement and enforce regulations had better success with privatization. Guasch,
Suiiiitta Kikeri aind Jolin Nellis 109
Laffont, and Straub (200(3) also find that having well-defined regulations and a regu-latory agency at the time of privatization lessens the need for subsequent renegotia-tions of contracts. The regulatory framework reduces the scope for error and theneed for subsequent modifications that are time-consuming, disruptive, and signalwavering commitment. Wallsten (2002). in one of the few empirical studies onsequencing regulation and privatization, finds that establishing a regulatory author-ity before privatization of the telecommunications sector in Latin America andAfrica was correlated with increased telephone penetration, investment, and mobilecellular subscriptions. Attention to the regulatory framework before privatizationalso increases the price investors are willing to pay for the firm.
There is widespread acceptance of the key elements of a good regulatory frame-work, including the need for coherent policies, transparency and public disclosure,predictability in the rules of the game, a proper balance between autonomy andaccountability, and adequate institutional capacity. During the 1990s, developingeconomies created some 200 regulatory agencies with these elements in mind aspart of infrastructure restructuring (Estache and others 2 00 3). How have these regu-latory frameworks and agencies worked in practice?
A recent assessment concludes that experience has been mixed (World Bank2004). The report acknowledges progress in establishing independent regulatoryagencies and notes that some agencies work well. But it argues that the technicaland political complexities. with often conflicting objectives and tradeoffs, have maderegulationi one of the most challenging aspects of privatization. Political interferenceoccurred at many levels-most critically in the sensitive area of service charges, butalso in funding, the appointment of civil servants to regulatory boards, and the staff-ing of regulatory agencies. These factors weakened the independence and effective-ness of regulatory agencies, which in extreme cases became mere extensions of theirministries.
Lack of transparency is another problem. Citing surveys of regulators in sectorssuch as telecommunications and power, the report suggests that some agencieshave no statutory obligation to explain their decisions, and some that do still fail toopen meetings to the public. Also contributing to poor regulatory perf'ormance areinadequate data collection processes and the absence of quantitative models to esti-mate the impact of regulatory decisions on key financial and economic indicatorsaffecting operators, consumers, and the government (Estache and others 200 3).
Regulation has proven particularly difficult in low-income countries with weakoverall institutional capacity. Governments in these countries have found it particu-larly difficult to regulate powerful economic actors fairly and effectively, to the detri-ment of privatization efforts. Among the problems they face are inexperience dealingwith complex technical, legal, and financial issues: few if any precedents to build on;little or no reliable information on cost and performance; no watchdog groups; andno experience with independent agencies (Smith 2000).
110 7lthe Wtzorild Baink Research Observer, vol. 1 9. nio. 7 (s/-ring 2004)
Repeated efforts by governments and donors to build regulatory capacity. particu-
larly in very poor countries, have produced few successes (urban water supply in
C6te d'lvoire is one). One reason is the attempt to transfer models and approaches
from developed economies into developing economies without taking into account
their differing political, legal, and institutional circumstances. Another is that
changing ownership takes much less time than developing regulatory capacity, and
the lower the income level, the slower the developmental process. Newbery (2001)
points out that it took regulators in the United Kingdom five years to distribute to
consumers some of the substantial efficiency gains produced by privatization of the
electricity industry. Quick results should not be expected in developing economies,
particularly in low-income countries.
The strongest lesson of experience is that there is no universal model: Regulatory
frameworks need to take into account each country's unique political, legal, and
institutional context (World Bank 2004). Better design and sustainability of regula-
tory frameworks are equally important. Alexander and Estache (1999) note that
this generally involves creating clear and reasonable incentives; establishing compe-
tit ion, which drives incentives for efficiency and simplifies regulation; addressing the
details of regulation (average changes, quality levels and penalties for not meeting
them, interconnection rules) early in the process; and putting in place clear rules to
ensure that all information is available in a timely and consistent manner. Estache
and others (2003) highlight two additional steps to improve regulatory perform-
ance. One is to develop quantitative models that take into account the initial condi-
tion of the service, the objectives, and the regulatory instruments, thus allowing
regulators to analyze sensitivities and simulate scenarios while minimizing subjec-
tivity. The second is to do a better job of educating the general public, particularly on
the tradeoffs between efficiency and fairness of service charges, which are the most
acute and politically visible issues.
Transparency
Along with fears of increased unemployment and concerns about selling national
assets to foreigners, a leading political concern in privatization is fear of nontrans-
parent and corrupt transactions. Lack of transparency leads to allegations-and
documented cases-of corruption, provides ammunition to opponents, creates back-
lash from investors and the public at large, and threatens to halt or even reverse
privatization and liberalizing reform in general. In Latin America and elsewhere.
surveys documenting the continuing decline of support for privatization reveal deep
dissatisfaction with the perceived incidence and severity of corruption (Lora and
Panizza 2002).Strengthening transparency requires a host of measures. Especially important is
ensuring that transactions occur without special privileges for insiders or other
Suiita Kikeri aiid Jolhnt Nellis 111

favored purchasers. Among other measures, that requires adhering strictly to stand-ard, well-publicized procedures: vetting actions by the press or other outsiders (suchas Transparency International): opening bids on TV or in public sessions: and publi-cizing the terms of the transaction or the privatization contracts. Promoting compe-tition in the privatization transaction-from the selection of advisers to the selectionof the final buyer-may be the most effective way to support transparency-and italso yields the maximum economic and financial benefits.
Although in some cases negotiated sales may be the only option, in general thegreater the openness and competition in the selection process, the greater the num-ber of bidders, the higher the price paid-and the higher the level of public accept-ance and satisfaction. In Mexico, La Porta and L6pez-de-Silanes (1997) found thatan additional bidder participating in a tender increases the net revenues to govern-ment by 12 percent. Public offerings are widely regarded as the most transparentsales method, but most developing economies do not possess the capital markets,quality firms, or business environments required to apply this method.
Although enhancing transparency takes time, delays in privatization entail costs.Evidence from Bulgaria, Mexico, South Africa, and elsewhere indicates that once afirm is slated for privatization, delays in completing the transaction lead to decliningoperations, asset stripping, and lower sales price. La Porta and L6pez-de-Silanes(199 7) found in Mexico that net revenues to the government dropped 24 percent foreach year that privatization was delayed. Ultimately, few bidders may come forth tobuy the diminished assets, creating pressure on government to make special andcostly concessions. But selling firms, particularly infrastructure firms, without firstenhancing competition and regulation, and thus transparency, has proven evenmore costly. The general rule should be to move swiftly in privatizing firms operat-ing in competitive or potentially competitive markets, but to take the time to get themarket and regulatory structures right when privatizing infrastructure firms orbanks.
Social Safety Nets
The extensive labor force reductions that usually accompany the restructuring oflarge state enterprises often lead to political backlash. One way to reduce tensions isto engage in dialogue with employees early on and to jointly work out acceptablesolutions. Generally, this involves compensation payments, free or low-priced sharesin the privatized firm, and augmented retirement and severance benefits to encouragevoluntary departures in place of layoffs. Voluntary departures are often consideredmore politically and socially acceptable, and the financial and economic returns can behigh. But such programs can be quite costly in the short run and can result inadverse selection (the best, most mobile workers apply to leave) and, in the case ofearly retirement payments. heavy financial burdens on the social security system
112 The World Batink Research observer, vol. 1 9, no. I (Spring 2004)
(Kikeri 1998; Rama 1999). For these reasons. Chong and L6pez-de-Silanes (2002)
argue that the optimal economic approach for governments to follow in any labor
restructuring is simply not to intervene.
Compensation packages have often been combined with retraining to help work-
ers reintegrate into the labor market. Although retraining programs are popular
with governments and donors alike, the few available evaluations question their
cost effectiveness (Dar and Tzannatos 1999). Targeting training to those who
request it and who possess characteristics that increase the likelihood of putting the
training to use improves the chance of success. Counseling and job search assistance
have been found to be more cost effective than training (Dar and Tzannatos 1999).
Contracting or outsourcing arrangements are another option. In Argentina, 5,000
surplus workers in the privatized oil company started 200 private businesses con-
tracting with the oil company (Kikeri 19 9 8). This approach has been tried in a num-
ber of other countries and sectors as well.
Concluding Comments
Mounting empirical evidence of privatization's benefits coincides with increasing
dissatisfaction and opposition among citizens and policymakers. This dissatisfaction
reflects the growing questioning of the benefits of privatization, particularly of large
infrastructure and network industries, among large segments of aff'ected popula-
tions. It reflects the general downturn of global markets in the past few years-and
the collapse of several iconic firms-and the resulting swing of the economic pendu-
lum back toward stability and accountability, and thus increased governmental
supervision. It reflects the overselling of privatization as a panacea for all of a coun-
try's economic problems. It reflects the concern that privatization does not produce
macroeconomic and distributional gains equivalent to its microeconomic benefits
and that the transactions will be handled corruptly, with the proceeds lost or stolen.
On the other side of the ledger. we know that ownership change in productive
firms, as well as private involvement in a less than full ownership capacity, usually
improves the financial situation of the firm and the fiscal position of the selling gov-
ernment, increases returns to shareholders, and in the right policy circumstances,
generates significant welfare benefits as well. These are major achievements. But
they have not been able to offset the negative views of privatization, the fears that it
creates or adds to injustice, inequity, and instability.
The evidence suggests that renewed efforts to reform state enterprises by methods
short of ownership change or private involvement will not prove effective. The costs
of no or slow privatization can be high. Thus, despite the problems, privatization
should be neither abandoned nor reversed. Rather, there should be a strengthening
and redoubling of efforts to privatize correctly. This means more advance analyses
Suinita Kikeri and John Nellis 113
and better tailoring of privatization to local conditions. In countries with weakcapacities, it also means emphasizing the policy and institutional underpinnings ofmarket operations rather than focusing solely on privatization transactions. Thisinvolves developing and protecting competitive forces, creating proper regulatoryframeworks (essential for both efficiency and equity) before privatization, introduc-ing and enforcing transparency in sales processes, developing social safety nets forthe adversely affected, and introducing innovative pricing and subsidy mechanismsto ensure that the poor have access to affordable essential services.
Notes
Sunita Kikeri is advisor in the Investment Climate Department at the World Bank; her e-mail address [email protected]. John Nellis is senior fellow at the Center for Global Development. Washington,D.C.; his e-mail address is [email protected]. The authors would like to thank Michael Klein andNeil Roger for their comments on an earlier draft on which this article is based. Anonymous reviewersprovided valuable comments.1. This section uses data on global privatization proceeds from the World Bank's Global DevelopmentFinance 2001 (World Bank 2001b). Data on privatization revenues must be viewed cautiously becausethey can be concentrated in a few large public offerings and thus do not reflect the scope or progress of acountry's overall program.2. Those numbers include small retail units and sales of minority shares.3. However, previous liberalization reforms that did not include privatization had accomplished lit-tle in Egypt. It could be argued that only when privatization was a realistic option and credible threatdid the remaining state enterprise managers take seriously the calls for reform.4. The project, titled "Impact of Infrastructure Reforms in Latin America." produced papers onArgentina, Bolvia, Chile, Peru, and Spain and on various aspects of measurement and assessment ofthe social impact of utility privatization.5. Most of the countries covered in the study had an International Monetary Fund program in place,with limitations on the deficit that may have influenced this finding.6. Less than 2 percent of infrastructure concessions have been canceled (Harris and others 2003).7. Tandon (1995) argues that there are many cases where privatization appears to have "resulted"in efficiency improvement, but that in most of the cases privatization was contemporaneous withderegulation or other types of competition-enhancing measures.8. In reviewing the liberalization and privatization of the British electricity sector, Newberry andPollitt (1997) argue that competition rather than privatization improved performance. They show thatthe efficiency gains were considerably less in the parts of the sector that were privatized but not liberal-ized than in other parts..9. China is a rare case of evolutionary success, and even in China the problem of poorly performingcore state enterprises has been postponed, not resolved.
References
Alexander, Ian, and Antonio Estache. 1999. "Infrastructure Restructuring and Regulation-Buildinga Base for Sustainable Growth." Background paper prepared for Conference on the Role of RegulatoryReform and Growth: Lessons from Latin America. September 1999. Johannesburg, South Africa.
114 The WA'orld Bank Research Observer, vol. 1 9, n1o. I (Spring 2004)

Andreasson. Bo. 1998. "Privatization in Sub-Saharan Africa: Has It Worked and What Lessons Can Be
Learnt?" Swedish Development Advisers. Gothenburg, Sweden.
Appiah-Kubi, K. 2001. "State-Owned Enterprises and Privatization in Ghana." Journal of Modern African
Studies 39 (2:197-229.
Aslund, Anders. 2001. "Think Again: Russia." Foreign Policy July/August.
Barberis, Nicholas. Maxim Boycko, Andrei Shleifer, and Natalia Tsukanova. 1996. "How Does Privati-
zation Work? Evidence from the Russian Shops." Journal of Political Economy 104(4):764-90.
Barja. Gover. and Miguel Urquiola. 2001. "Capitalization, Regulation and the Poor: Access to Basic
Services in Bolivia." WIDER Discussion Paper 2001/34. United Nations University, World Institute for
Development Economics Research, Helsinki.
Behrman, Jere R.. Nancy Birdsall, and Miguel Szekely. 2000. "Economic Reforms and Wage Differ-
entials in Latin America." Working Paper Series 435. Inter-American Development Bank,
Washington, D.C.
Birdsall. Nancy, and John Nellis. 2002, "Winners and Losers: Assessing the Distributional Impact of
Privatization." Working Paper 6. Center for Global Development, Washington, D.C.
Black, Bernard, Reiner Kraakman, and Anna Tarassova. 2000. "Russian Privatization and Corporate
Governance: What Went Wrong?" Staniford Law Revie"w 52(6):1731-808.
Boubakri, Narjess, and Jean-Claude Cosset. 1998. "The Financial and Operating Performance of
Newly-Privatized Firms: Evidence from Developing Countries." Journal of Finance 53(3): 1081-110.
1999. "Does Privatization Meet the Expectations? Evidence from African Countries." Paper
presented at Plenary on Privatization and Corporate Governance sponsored by the African
Economic Research Consortium, 4-9 December, Nairobi.
Campbell-White, Oliver, and Anita Bhatia. 1998. Privatizationi in Africa. Washington D.C.: World Bank.
Chisari, Omar, Antonio Estache, and Carlos Romero. 1999. "Winners and Losers from Utility Privatiza-
tion in Argentina: Lessons from a General Equilibrium Model." Working Paper 3. Centro de Estudios
Econ6micos de la Regulaci6n, Buenos Aires.
Chong, Alberto, and Florencio L6pez-de-Silanes. 2002. "Privatization and Labor Force Restructuring
around the World." Policy Research Working Paper 2884. World Bank, Development Research
Group. Washington, D.C.
Clarke, George, and Scott Wallsten. 2002. "Universal(ly Bad) Service: Providing Infrastructure Ser-
vices to Rural and Poor Urban Consumers." Policy Research Working Paper 2868. World Bank,
Washington D.C.
Cull, Robert. Jana Matesova. and Mary Shirley. 2001. "Ownership Structure and the Temptation to
Loot: Evidence from Privatized Firms in the Czech Republic." Policy Research Working Paper 2568.
World Bank, Washington, D.C.
Dar. Amit, and Zafiris Tzannatos. 1999. "Active Labor Market Programs: A Review of Evidence from
Evaluations." Social Protection Discussion Paper 9901. World Bank, Washington, D.C.
Davis, Jeffrey, Rolando Ossowski, Thomas Richardson, and Steven Barnett. 2000. "Fiscal and Macroeco-
nomic Aspects of Privatization." LAF Occasional Paper 194. International Monetary Fund, Washington
Washington, D.C.
Delfino, Jose A., and Ariel A. Casarin. 2001. "The Reform of the Utilities Sector in Argentina." WIDER
Discussion Paper 2001/74. United Nations University, World Institute for Development Economics
Research, Helsinki.
Dewenter, Kathryn, and Paul H. Malatesta. 1997. "Public Offerings of State-Owned and Privately-
Owned Enterprises: An International Comparison." Journal oJfFinance. 52(4):1659-79.
Djankov, Simeon. and Peter Murrell. 2002. Enterprise Restructuirinig in Transition: A Quantitative Survey.
Journal of Economic Literature 40(3): 739-92.
Sunita Kikeri and Jolhii Nellis 115
Domah. Preetum, and Michael G. Pollitt. 2()00. "The Restructuring and Privatization of Electricity Dis-tribution and Supply Businesses in England and Wales: A Social Cost Benefit Analysis." WorkingPaper 0007. TJniversity of Cambridge, Department of Applied Economics.
D'Souza, Juliet, and William L. Megginson. 1999. "The Financial and Operational Performance ofNewly Privatized Firms in the 1990s." Journal of Finance 54:1 397.
D'Souza, Juliet, Robert Nash, and William L. Megginson. 2000). "Determinants of PerformanceImprovement in Newly-Privatized Firms: Does Restructuring and Corporate Governance Matter?"Working Paper. University of Oklahoma, Norman.
Due, Jean M.. and Andrew Temu. 2)02. "Changes in Employment by Gender and Business Organiza-tion in Newly Privatized Companies in Tanzania." Cana(idiani Journzal of Developmnenit Sttidies23(2):31 7-33.
Earle, John. 1998. "Post-Privatization Ownership and Productivity in Russian Industrial Enterprises."SITE Working Paper 127. Stockholm Institute of Transition Economics, Stockholm.
Earle, John, and Saul Estrin. 1998. "Privatization, Competition, and Budget Constraints: Disciplining Enter-prises in Russia." s7F. Working Paper 128. Stockholm Institute of Transition Economics, Stockholm.
Ennis, Huberto M., and Santiago M. Pinto. 20(02. "Privatization and Income Distribution in Argentina."Paper delivered at a conference at Universidad de las Americas, May, Puebla, Mexico.
Estache, Antonio, Vivien Foster. and Quentin Wodon. 2(002. Accounting Jor Poverty in InzfrastructureReformi. Washington. D.C.: World Bank.
Estache, Antonio. Andres Gomez-Lobo, and Danny Leipziger. 20(00. "UJtility Privatization and the Needs ofthe Poor in Latin America: Have We Learned Enough to Get it Right?" Paper delivered at World Bankconference tnfrastructure for Development: Private Solutions and the Poor, 31 May-2 June, London.
Estache, Antonio. Martin Rodriguez Pardina, Jose Maria Rodriguez, and German Sember. 2003. "AnIntroduction to Financial and Economic Modeling for Utility Regulators." Policy Research WorkingPaper 3001. World Bank. Washington, D.C.
Estrin, Saul, and Jan Svejnar. 1998. "Effects of Output, Ownership, and Legal Form on Employmentand Wages: Central European Firms before and during Transition." In Simon Commander. ed..Enterprise Restructuring anId Unemnploytinetnt in Models of Tranlsitioni. Cambridge, Mass.: MIT Press.
Finnegan, William. 2002. "Letter from Bolivia: Leasing the Rain." Nnew Yorker S April.Freije, Samuel. and Luis Rivas. 2002. "Privatization, Inequality and Welfare: Evidence from Nicaragua."
Paper delivered at a conference at Universidad de las Americas, May. Puebla, Mexico.Frydman, Roman, Cheryl Gray, Marek Flessel, and Andrej Rapaczynski. 1997 . "Private Ownership and
Corporate Performance: Some Lessons from Transition Economies." Policy Research Working Paper1830. World Bank, Washington Washington. D.C.
Galal, Ahmed, Leroy Jones, Pankaj Tandon, and Ingo Vogelsang. 1994. Welfare Consequenices of SellingPublic Enterprises: Al Eninpirical Anialysis. New York: Oxford tJniversity Press.
Guasch, J. Luis. Jean-Jacques Laffont. and Stephane Straub. 2(103. "Renegotiation of Concession Con-tracts in Latin America." Working Paper 3)1 1. World Bank, Washington, D.C.
Harris, Clive. 2003. "Private Participation in Infrastructure in Developing Countries: Trends, Impacts,and Policy Lessons." World Bank Working Paper 5. World Bank, Washington, D.C.
Harris, Clive. John Hodges. Michael Schur. and Padmesh Shukla. 20)03. "Infrastructure Projects:A Review of Cancelled Private Projects." Public Policy for the Private Sector Note 252. World Bank,Washington. D.C.
Hodge, Graeme A. 200)0. "Reviewing the Effectiveness of Privatization as Enterprise Sales," in Privatiza-tion: An Interniationial Review of Performanice. Melbourne: Westview Press.
Jefferson, Gary, Su Jian, Jiang Yuan, and Yu Xinhua. 2(103. "The Impact of Ownership Reform in ChineseIndustry: 1995-2001." Unpublished manuscript. Brandeis tJniversity, Waltham, Mass.
116 The World Banik Research Observer. vol. 19, no. 1 (Spring 20)04)
Jones, Leroy P.. Yahya Jammal, and Nilgun Gokgur. 1998. "Impact of Privatization in Cote d'lvoire.
Draft Final Report." Boston Institute for Developing Economies, Boston, Mass.
Kikeri, Sunita. 1998. "Privatization and Labor: What Happens to Workers When Governments
Divesti" World Bank Technical Paper 396. World Bank. Washington, D.C.
La Porta, Rafael, and Florencio L6pez-de-Silanes. 1997. "The Benefits of Privatization: Evidence from
Mexico." NBER Working Paper 6215. National Bureau of Economic Research. Cambridge, Mass.
L6pez-Calva, Luis Felipe. and Juan Rosellon. 2002. "Privatization and Inequality in Mexico." Paper
delivered at a conference at Universidad de las Americas, May, Puebla, Mexico.
Lora, Eduardo, and tJgo Panizza. 2002. "Structural Reforms in Latin America under Scrutiny." Inter-
American Development Bank, Research Department, Washington. D.C.
Macedo. Roberto. 2000. "Privatization and the Distribution of Assets and Income in Brazil." Working
Paper 14. Carnegie Endowment for International Peace, Washington. D.C.
Mahboobi. Ladan. 2000. "Recent Privatization Trends." Working Paper. Organisation for Economic
Co-operation and Development, Paris.
Majumdar. Sumit K. 1998. "Assessing Comparative Efficiency of the State-Owned, Mixed, and Private
Sectors in Indian Industry." Puiblic Cloice 9611-2):1-24.
McKenzie. David. and Dilip Mookherjee. 2002. "The Distributive Impact of Privatization in Latin America:
An Overview of Evidence from Four Countries." Paper delivered at a conference at Universidad de
las Americas. May 2002, Puebla, Mexico.
Megginson, William L.. and Jeffry M. Netter. 2001. "From State to Market: A Survey of Empirical Stud-
ies on Privatization." Journal oJ Economic Literature 39(2): 321-89.
Megginson, William, Robert Nash, and Matthias van Randenborgh. 1994. "The Financial and Operat-
ing Performance of Newly Privatized Firms: An International Empirical Analysis." Jouirnial li l ".m.
49(2):40)3-52.
Nellis. John. 1999. "Time to Rethink Privatization in Transition Economies?" lFC Discussion Paper 38.
International Finance Corporation, Washington Washington, D.C.
.2003. "Privatization in Africa: What Has Happened? What Is to Be Donei" Working Paper 25.
Center for Global Development. Washington. D.C.
Nellis. John. and Mary Shirley. 1991. Pu1blic Enterprise Reforrn: The Lessorns of Experience. Washington,
D.C.: World Bank.
Newbery, David M. 2001. "Issue and Options for Restructuring the ESI." Citizens Network on Essential
Services. Takoma Park, Md.
Newbery, David M., and Michael G. Pollitt. 1997. "The Restructuring and Privatisation of Britain's
CEGB-Was It Worth Iti" Journlal of Indulstrial Economics 4513):269-303.
Omran, Mohammed. 20)01. "Detecting the Performance Consequences of Privatizing Egyptian State-
Owned Enterprises: Does Ownership Structure Really Matter?" Arab Academy for Science and Tech-
nology. College of Management and Technology, Alexandria, Egypt.
Pinheiro, Armando Castelar. 1996. "Impactos microeconomicos da privatizacao no Brasil." Pesquisa
e Planejainento Econoirico 26(3): 357-98.
Rama. Martin. 1999. "Public Sector Downsizing: An Introduction. A Symposium Issue on Efficient
Public Sector Downsizing." WVorld Bank Econorrmic Re0iew 1 3(1):1-22.
Ramamurti. Ravi. 1997. "Testing the Limits of Privatization: Argentine Railroads." World Developtnent
25(12):1973-93.
Sachs, Jeffrey. Clifford Zinnes, and Yair Eilat. 2000. "The Gains from Privatization in Transition Econo-
mies: Is 'Change of Ownership' Enoughi" Consulting Assistance on Economic Reform II Discussion
Paper 63. Harvard University, Center for International Development, Cambridge. Mass.
Suniita Kikeri tndJohnl Nellis 117
Salih. Rozana. 2000. "Privatization in Sri Lanka." In Gopal Joshi, ed., Privatization in Southt Asia: Mini-mizinig Social I Ii. . i Hr .*,.1h Restructuring. New Delhi: International Labour Organization.
Shaikh, Hafeez, Manuel Angel Abdala, Christina Kappaz, Peter Lauter, and Alfredo Visintini. 1996..1, ,,i i.- Privatization Program: A Review of Five Cases. Washington, D.C.: World Bank.
Sheshinski. Eytan. and Luis Felipe Lopez-Calva. 1998. "Privatization and Its Benefits: Theory and Evi-dence." Consulting Assistance on Economic Reform II Discussion Paper 35. Harvard tJniversity,Center for International Development, Cambridge, Mass.
Shirley, Mary M. 1983. "Managing State-Owned Enterprises." Working Paper 577. World Bank,Washington. D.C.
Shirley, Mary, and Patrick Walsh. 2000). "Public versus Private Ownership: The Current State ofDebate." Policy Research Working Paper 2420. World Bank, Washington, D.C.
Slhirley, Mary, and Lixin Colin Xu. 2000. "Empirical Effects of Performance Contracts: Evidence fromChina." Paper presented at a senior experts meeting on Corporate Governance of State-ownedEnterprises in China, 18-19 January, Beijing.
Shleifer, Andrei, and Daniel Tresiman. 2000. Without a Map: Political Tactics and Economnic ReJorm inRussiai. Cambridge, Mass.: MIr Press.
Smith, Warrick. 2()00. "Regulating Utilities: Thinking about Location Questions." Discussion Draft.World Bank Summer Workshop on Market Institutions. July, Washington D.C.
Stiglitz. Joseph E. 1999. "Whither Reform: Ten Years of Transition?" In Boris Pleskovic and JosephE. Stiglitz. eds.. Annlual World Bank Conqfrence on Developmnent Economnics 1999. Washington. D.C.:World Bank.
Tandon, Pankaj. 1995. "Welfare Effects of Privatization: Some Evidence from Mexico." Boston Univer-sity Interniatiornal LafwJournal 13(2): 329-30.
Temu. Andrew. and Jean M. Due. 1998. "The Success of Newly Privatized Companies: New Evidencefrom Tanzania." Canadiani Journal of Developmenit Studies 19(2): 31 5-41.
T6rero. Maximo, and Alberto Pasc6-Font. 200)1. "The Social Impact of Privatization and the Regula-tion of Utilities in Peru." WIDER Discussion Paper 2001/17. United Nations University, World Insti-tute for Development Economics Research, Helsinki.
Van der Hoeven, Rolph, and Gyorgy Sziraczki. eds. 1997. Lessons from Privatization: Labour Issues inDeveloping anid Tranlsitionla Counltries. Geneva: International Labour Organization.
Walisten, Scott. 2)02. "Does Sequencing Matter, Regulation and Privatization in TelecommunicationsReform." World Bank. Washington. D.C.
World Bank. 1995. Private Sector- Development in Low-Income Countries. Washington. D.C..20)01a. "Finance for Growth: Policy Choices in a Volatile World." New York: Oxford University
Press.
200 lb. Global Developmnent Finanice. Washington, D.C..2(004. "Reforming Infrastructure: Privatization, Regulation, and Competition." Washington D.C.
Zhang, Chunlin. 2)01. "Privatization in China." World Bank, Washington, D.C.
118 The World Bank Research Observer. vol 19. nio. I (Spring 2004)
Managing OiL Price Riskin Developing Countries
Julia DevLin * Sherdan Titman
This article presents a simnpleframeworkfor unlderstanzding the imtipact of oil dependenice on
growvth in termns of an optimal savings and iniestment strategy. Amonig the miore imnportant
factors unlderlying this strategy is the extent to wlhich oil price chianiges are temnporairy or
permnanent. This in turni determinles whether a countr,y slhouild rely on stabilization and
sav,ings funds or the use offinancial instrum1lents to rnaniage oil revenuties-or both. Country
experiences with stabilization and savinigsfuinds are surveyed, annd the case is presented for
using finanicial instrumrnernt to manage oil price risk. Policy irmplications for enlhanicinig the
use of financial instruments are explored, incluiding an expanded role for internzationial
financial institutions.
Beginning with Hotelling's seminal paper in 1931, a large body of literature in eco-
nomics has focused on exhaustible resources and the special problems they pose for
development. Between 1960 and 1990, resource-rich countries grew three to four
times more slowly than resource-poor countries, and this gap in growth rates has
widened considerably since the 19 70s (Ranis 1991: Sachs and Warner 1995). Among
the factors underlying this phenomenon is the impact of commodity price volatility on
macroeconomic aggregates, particularly investment spending and the adjustment
costs associated with rapid changes in expenditure (Ramey and Ramey 1 99 5).
The problems of oil dependence are no less severe for oil importers, but they are
dealt with less explicitly in this article. Among African oil-importing countries, in
particular, unexpected increases in oil prices adversely affect government budgets
and domestic currency and contribute to a deterioration in rural-urban terms of trade,
particularly in countries that export primary agricultural commodities (Rutten 2001).
This article surveys country strategies in managing oil dependence, particularly
the strategies of oil-exporting developing countries, rather than analyzing the problems
associated with oil dependence, on which there is already a large body of literature.
The World Bank Research Observer, vol. 19. no. 1,Cc The International Bank for Reconstruction and Development / TIIE IN'ORLI) A\NK 2004: all rights reserved.
DOI: 10.109 3/wbro/lkh0l 5 19:119-139
The article presents a simple framework for understanding the impact of oildependence on growth and surveys countries' use of stabilization and savings funds,fiscal rules, and hedging programs to respond to the problems of the volatility andexhaustibility of oil revenues. Although the country examples look at issues ofmanaging oil price risk, many of the lessons apply to other minerals.
The first section briefly discusses an optimal savings and investment strategy foroil-exporting countries and the rationale for implementing savings and stabilizationfunds. The second section surveys country experiences with stabilization andsavings funds. The third section explores the potential benefits of using financialinstruments to manage oil price risk. The fourth section examines why so fewdeveloping economies use financial instruments to manage price risk and looks atsome problems and mechanisms to mitigate the shortcomings of this approach. Thefinal section presents some policy implications.
The Optimal Savings and Investment PolicyThe main problems of oil dependence are associated with volatility in oil prices andexhaustibility of oil wealth. For a country where oil represents roughly 20 percent ofgross domestic product (GDP), a one-standard-deviation shock to the price of oil rep-resents an income shock equivalent to 6 percent of GDP (Hausmann and Rigobon2003). Both volatility and exhaustibility can be incorporated into a simple frame-work for dealing with oil dependence in a developing country context.
Consider a hypothetical economy with substantial oil resources but lacking basicinfrastructure, such as roads, schools, and telecommunications equipment. Supposethat the country has relatively benevolent leaders who would like to embark ona sustainable level of infrastructure investment funded by commodity revenues. Inthis context, sustainability implies that the expected present value of investmentexpenditures cannot exceed the expected present value of oil revenues. Because ofborrowing constraints, investment must be funded from current oil revenues orfrom past oil revenues that have accumulated in a savings or stabilization fund.A savings fund is designed to create a store of wealth for future generations byconverting a depletable revenue stream into a perpetual income flow. A stabilizationfund is designed to stabilize revenue flows and, implicitly, expenditure.
An important component of this argument is that fluctuations in the rate of infra-structure investment reduce the efficiency of the investment program for severalreasons. Building roads, schools, and hospitals requires a reasonably skilled work-force, and it is costly to train new workers when investment levels unexpectedlyincrease and to lay off workers when investment levels are unexpectedly cut. Thesetraining and lay-off costs are considered investment adjustment costs.
120 The lA'orld Bank Research Obserecr. vol. 19. no. I (Spring 2004)

If commodity prices were certain and there were no political constraints, deter-
mining a country's optimal level of infrastructure investment would be straight-
forward. Infrastructure investment should increase smoothly over time in a way
that minimizes investment adjustment costs. In this case, savings and stabilization
funds serve simply as a place to bank excess commodity revenues until they can be
efficiently invested.If a country's revenues are generated from a commodity with a very volatile price,
implementing an investment plan that increases slowly and smoothly over time
becomes much more challenging. One of the roles of savings and stabilization funds
is to allow the country to smooth out investment expenditures and thus increase the
efficiency of investment by minimizing adjustment costs. As will be discussed, the
extent to which savings and stabilization funds can smooth out investment depends
on the random process generating the commodity prices.
An Example
Consider an economy that has a substantial amount of oil that can be extracted
relatively quickly, say, over 10 years. Because of the costs associated with quickly
increasing the level of investment, the economy should optimally invest its oil reve-
nues over a time horizon that is substantially longer than the time it takes to extract
the oil. Thus. the economy will need some sort of savings plan that allows it to bank
the excess oil revenues, enabling it to continue to invest after the oil is depleted.
When oil prices are certain, the optimal investment and savings choice can be
solved using dynamic programming. The optimal investment and savings levels at
each date depend on current and future oil prices, current investment levels. mar-
ginal productivity of capital, and costs associated with increasing and decreasing the
rate of investment. In general, the optimal solution involves an investment level that
increases slowly until it reaches a steady-state level and then tapers off as oil reve-
nues are exhausted.Now consider the case of uncertain oil prices. Assuming that the oil price risk is
not hedged, the optimal level of investment in each period will fluctuate as oil prices
iluctuate. Intuitively, when the price of oil increases. the economy becomes richer,
allowing a higher investment level. However, because investment fluctuations due
to oil price fluctuations diminish the average efficiency of the investment program
(because of the adjustment costs), the optimal rate of investment should fluctuate
substantially less than the price of oil.To understand this, consider an economy that is investing US$2 billion a year on
infrastructure. Now suppose that because of an increase in oil prices, the country
has $ 3 billion a year in revenues that can be invested. It would not make economic
sense to immediately increase investment to this higher level because this would
require that the country quickly hire and train a large number of construction workers
jiliai Devlitu azd Sheridan Tittina 121
and find supplies of building materials, a process that is not likely to result in the useof the best workers and suppliers. Moreover, if the price of oil subsequently falls to itsprevious level, infrastructure investments would need to be cut, forcing the countryto lay off the new construction workers and perhaps bankrupt its new suppliers.
These arguments suggest that savings and stabilization funds can contributesubstantially to economic development by dampening the effect of oil price volatilityon investment volatility. The next subsection looks deeper into the economics of oilprice uncertainty to provide insights about conditions in which savings and stabili-zation funds provide the greatest benefits and conditions in which they can onlypartially reduce investment volatility. Under these second conditions, hedging offerssubstantial benefits.
The Random Process Generating Oil Prices
The choice of a country's stabilization or savings plan depends on the temporary andpermanent factors that influence the random process that determines oil prices(Deaton and Laroque 1992; Arrau and Claessens 2001; Cashin and McDermott2002). Oil prices fluctuate from month to month because of temporary changes inglobal economic and political conditions that affect the supply and demand for oil.For example, political problems in Venezuela may temporarily disrupt oil supplies,causing prices to rise. Prices subsequently fall again as the problem is resolved or asother producers step up their production to offset the shortfall. Similarly, a recessionmay lead to a temporary oversupply that generates temporary price declines. Long-term or permanent factors can also affect oil prices. Permanent changes can arisebecause of longer-lasting changes in demand arising from the emergence of substi-tute fuels or stronger incentives for conservation as well as technological changesand new discoveries that increase the supply of oil.
The distinction between the temporary and permanent components of pricechanges is important for understanding the optimal investment and savings strat-egy in an economy with a savings or stabilization fund. When prices are stronglymean-reverting, as when price changes are largely temporary, the present value offuture revenues is not very sensitive to changes in spot prices. This implies that thelong-term sustainable level of investment is not likely to be substantially affected bya change in spot prices. Savings and stabilization funds serve a useful purpose in thiscase, because they allow a country to maintain an investment strategy with verylittle variation in an environment where revenues vary substantially.
When price changes are mainly permanent (less mean-reverting and resemblinga random walk), the present value of future revenues is strongly affected by changesin spot prices. Savings and stabilization funds cannot be used to smooth out investmentexpenditures, and oil price volatility will significantly affect the efficiency of thecountry's infrastructure investment program.
122 Thie TA7orld Bank Researei Observer, vol. 19. to. I (Spring 2004)
A savings or stabilization fund can serve a useful purpose when commodity prices
are strongly mean-reverting, but it cannot substantially smooth the effect of price
changes over time when prices follow a random walk. In this second case, substan-
tial gains are associated with reducing the variance of revenues by using financial
instruments to deal with price risk.The evidence on the statistical properties of oil prices tends to show more support
for mean-reversion (Pindyck 1999; Barnett and Vivanco 2003) than for persistence
(Cashin, Liang. and McDermott 2000; Engel and Valdes 2000), using unit root tests,
although much depends on the time interval under scrutiny. This is underscored by
the behavior of futures markets, which suggests that markets expect price shocks to
be largely temporary. One way to evaluate the relative importance of the temporary
and permanent components is to compare the fluctuations in futures and forward
prices of various maturities with spot price changes. If price changes are largely
temporary, long-term futures prices will have substantially less volatility than either
short-term futures prices or spot prices. Evidence indicates that the long-term
futures prices of oil are about half as volatile as the short-term futures prices (Barnett
and Vivanco 2003; Schwartz and Smith 2000).
How Effective Are Savings and Stabilization Funds in Theory?
The effectiveness of a stabilization or savings fund depends on the relation between a
country's initial oil revenues and its investment needs and whether oil price changes
are temporary or permanent.Consider the case of an oil-exporting developing country that expects to generate
enough revenue on average to fund its investment plans but may have a surplus or
a shortfall in some years because of price volatility. This is a fairly typical scenario
for small-population, high oil-resource countries, such as East Timor, Kuwait, and
Sao Tome and Principe. Suppose the country plans to invest $2 billion a year in
health care and education and expects oil revenues to be sufficient to fund this
investment. However, in years when oil prices are high, revenues greatly exceed
$2 billion, and in years when oil prices are low, there is a shortfall.
When oil revenues greatly exceed the planned investment allocation and most of
the price volatility is temporary. a savings or stabilization fund can eliminate most of
the negative effects of fluctuating oil prices. Because most of the volatility in this case
represents temporary changes, the present value of future oil revenues is not sub-
stantially affected by month-to-month changes in oil prices. Moreover, when oil rev-
enues exceed investment plans, the surplus can be used to offset future shortfalls
resulting from temporary price declines. However, when either of these conditions is
violated, a savings or stabilization fund will not be sufficient to offset the potential
negative effect on investment of fluctuations in oil prices. In this case, there will be
gains to using market-based financial instruments.
Julia DeWlin and Sheridan Titnan 123
Now consider the case in which planned investment is close to expected oil reve-nues and there is a smaller expected surplus from oil revenues. This is more typicalin countries with large populations and moderate to declining oil revenues, such asIran, Russia, and Venezuela. If prices are volatile and if the country saves very little,the savings fund may be fully drained before the first decline in prices.
Issues relating to the importance of temporary and permanent components of oilprice volatility are more subtle and require additional explanation but can be easilyunderstood through examination of the polar cases of those that are 100 percenttemporary and those that are 100 percent permanent. When price changes aremean-reverting, the present value of all future oil revenues is not very sensitive tochanging current oil prices, implying that the country's long-term ability to meet itsinvestment plans is not likely to be impaired as long as the savings or stabilizationfund is sufficiently funded to meet the temporary shortfall. Changes in current oilprices should have little influence on the level of investment. In contrast, when oilprices follow a random walk, changes in spot prices are permanent, implying largechanges in the present value of future oil revenues. The sustainable level of futureinvestment will also change when oil prices change, so volatile prices are likely toresult in substantial year-to-year changes in the level of investment, even with asavings or stabilization fund.
Optimal Investment and Savings Plans When Oil Prices Are Uncertain
The optimal funding of investment and savings funds thus depends on the followingfactors:
. The rate at which oil reserves can be extracted. If oil reserves are extractedquickly, the country should amass a substantial fund that allows it to continueto build up infrastructure when oil revenues start to decline.
. The costs associated with increasing and decreasing the level of investment.When there are substantial costs associated with altering the level of infra-structure investment, the benefits from smoothing investment are greater,implying a greater need for a fund that acts as a buffer when oil pricesdecline.
. The productivity of the investment. If the investment contributes substantiallyto productivity, the country should invest more initially and take the risks asso-ciated with subsequently having less of a buffer in the event of a decline in oilrevenues.
. The random process that determines oil price changes. When oil prices arestrongly mean-reverting, a relatively modest fund will be an adequate bufferagainst oil price declines. However, as the tendency to mean-revert declines,savings and stabilization funds will become less effective.
124 Thie World Bank Research Observer, vol. 19, no. I (Spring 2004)
How Effective Are Stabilization and Savings Funds in Practice?
During the 1990s, the number of stabilization and savings funds proliferated, with
the addition of Algeria, Azerbaijan, Ecuador, Iran, Kazakhstan. Mexico. Nigeria,
Norway, Venezuela, and others based on the successes and failures of such pioneers
as Alaska. Alberta, Kiribati, and Papua New Guinea in the 1960s and 1970s. Empir-
ically, the effectiveness of funds appears to be limited, although data limitations have
prevented rigorous analysis in this regard. Time-series analysis suggests that in
countries with such funds, fiscal spending is less correlated with changes in the price
of the resource, although it is difficult to separate the effects of the fund from the
impact of prudent expenditure policies (Davis and others 2001 ).
More recent analysis using pooled cross-section and time-series data for 71 countries
for 1970-2000 suggests that although funds appear to have a dampening effect on
government spending as a percentage of GDP, this effect is offset by a deterioration in
the fiscal balance as the size of the fund increases. However. implementing a fund
appears to raise fixed capital investments as a share of GDP by nearly 3 percentage
points, and there is a positive relationship between the balances held in the fund and
fixed capital investment, suggesting that funds may have some impact on adjust-
ment costs related to investment. In some countries, however-Chile, Norway, and
Oman. for example'-funds appear to deliver a number of favorable outcomes: less
volatility in government spending, lower government spending. and higher shares
of gross fixed capital investment. This suggests that country-specific circumstances
matter a lot, in particular the use of fiscal rules and targets to guide spending decisions
over a longer time horizon.
Funds and Fiscal Rules
Funds are clearly not a guarantor of fiscal stability. Many countries have erred by
assuming that expenditures will automatically be stabilized and fiscal restraint
encouraged by using a stringent accumulation rule to stabilize revenue flows.
Accumulation rules have been price contingent (accumulation of revenues greater
than a target price), as in the case of the Chile Copper Stabilization Fund; revenue
contingent (a set percentage of oil revenues), as in the case of the Alaska Permanent
Fund; and both (a set percentage of oil revenue above a reference price, as in the case
of the Venezuela Stabilization Fund). The crucial link is the one between oil prices and
fiscal expenditure (Devlin and Lewin 2002).In countries where funds work well, there tend to be strong mechanisms that
break the link between oil price behavior and fiscal expenditure, generally in
the form of a fiscal rule. For example, Norway's Norges Fund income is treated as
central government net cash flow and transferred to the treasury to finance the nonoil
deficit. Linking fund accumulation to fiscal surpluses avoids the problem of an overall
iiulita Dcvlini and Shcridan Titnian 125
deterioration in the government's net asset position as a result of fund accumula-tion. In the case of Chile, withdrawals from the fund are subject to the fiscal rule,with the structural balance calculated by factoring out the cyclical component of thecopper price and other cyclical factors (Perry 2002: Fiess 2002).
A related issue is how to determine a benchmark price for forecasting fiscal needs.Many countries (such as Chile and Russia) have engaged in prolonged discussionand dispute over forecasting methods, a process that is vulnerable to politicalpressure. In Chile, the copper benchmark price was traditionally determined annuallyby a group of experts in a largely nontransparent fashion. An alternative is to usewidely available and generally unbiased estimates provided by futures markets, suchas the price of a five-year swap, for longer term fiscal planning.
There are two important caveats about the effectiveness of fiscal rules and opera-tional guidelines in developing economies. First, in a perfect Barro world, privateborrowing by domestic firms could potentially offset government savings with afiscal rule. However, the empirical evidence is not conclusive, and most oil-exportingcountries tend to be more affected by private capital flight than by private borrowingabroad. This suggests that expectations are more likely influenced by fundamentalissues of institutional weaknesses characteristic of oil-exporting economies, particu-larly with respect to property rights and the functioning of the judicial system.
A second caveat is that informal norms and practices tend to have a greater effecton fiscal behavior in developing economies than formal rules and medium-termexpenditure frameworks (Schick 1998), especially in oil-exporting countries wherethe "rentier" nature of oil revenues tends to weaken formal mechanisms of revenueaccountability (Eifert, Gelb, and Tallroth 2003). Thus, in weak fiscal environments,the effectiveness of funds may also be influenced by the level of financial and incomeincentives in the government overall.
Funds and Managing Windfalls
Prudent use of windfalls requires appropriate governance structures based ontransparency and accountability, and funds can provide an opportunity for develop-ing economies to import better governance mechanisms to deal with windfalls. InBotswana during the 1970s and 1980s, for example, recurrent and investmentspending were based on estimates of long-run diamond revenues and during wind-falls reserves were accumulated in the Central Bank. This provided leeway for usingwindfall revenues to target investments in areas of major bottlenecks to economicdevelopment by the second half of the 1980s (Hill 1991).
Although there are no guarantees against the possibility that by allowing bettersaving of windfalls, funds will transfer resources from good governments to bad (Collier2002), the experience of relatively effective funds suggests that a system of checks
126 Tlie 1World Btailk Research Observer. vol. 199, no. I ISpring 2004)
and balances both internal and external to the fund can provide a mechanism
for "padlocking" the fund's resources. Ideally, funds should have vertical account-
ability to an oversight board of representatives of the central bank or ministry of
finance and horizontal accountability to agencies in the state and outside observ-
ers, such as the media and civil society, particularly environmental groups and
traditional exporters (Karl 2000; Bates 1997). Specifically, there must be built-in
mechanisms for control, reporting, and evaluation of fund resources and opera-
tions (Heilbrunn 2002). In addition, funds should be professionally managed, with
oversight by the ministry of finance or central bank. In Norway, the Ministry of
Finance supervises the activities of the fund and sets guidelines for investments and
reporting requirements. Transfers to and from the fund require parliamentary
approval.
Transparent Design of Funds
The institutional design of the funds can also make the earnings and use of resource
revenues more visible (Bjerkholt 2002). In the case of the Alaska Permanent Fund.
for example, which uses invested oil revenues to distribute annual dividends to all
Alaskan citizens, the population can check the monthly earnings and expenditures
of the fund to determine the exact amount of dividend checks (table 1). One proposal
along these lines is to deposit surplus commodity revenues into pension accounts to
encourage more public scrutiny of fund resources (Hannesson 2001).
Information on the fund's activities should be publicly available and widely dis-
seminated. Where private oil companies produce most of the oil and natural gas,
public disclosure of tax records and revenue transfers to the government is another
alternative for improving the transparency of commodity revenues. Electronic
tracking of oil market sales worldwide may help increase the transparency of these
revenue flows.
Optimal Size of Funds
Another lesson is that the size of the fund matters. For economic and political rea-
sons, larger funds tend to be more inefficient and to create more distortions. The
optimal size of a fund tends to be much smaller than expected, with the determining
factor being the statistical properties of oil prices rather than rules for accumulation
and withdrawal of funds (Arrau and Claessens 2001; Crain and Devlin 2002).
Larger funds (or fiscal surpluses) are also more vulnerable to political economy pres-
sures-as evidenced by the Indonesian government's decision during the 19 70s to
hide fiscal surpluses.
Julia Devlin auid Slheridanii Tirtian 127
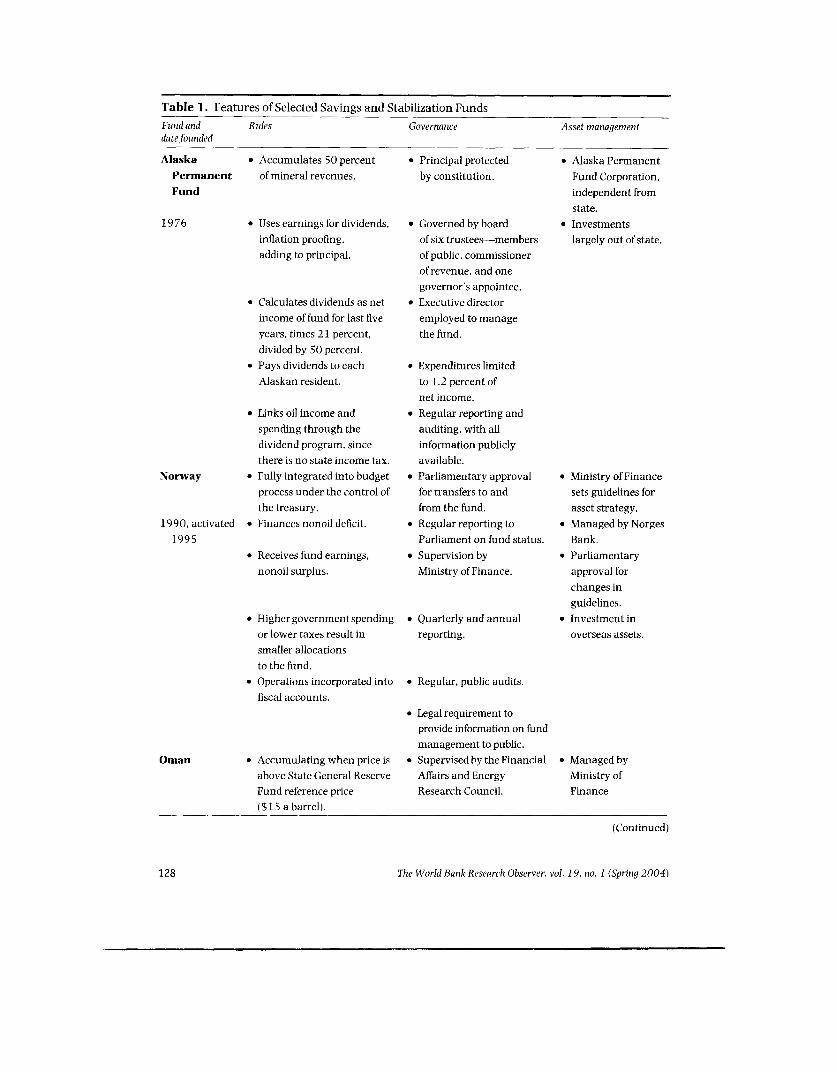
Table 1. Features of Selected Savings and Stabilization FundsFund and Rules Governance Asset managementdatefounded
Alaska * Accumulates 50 percent * Principal protected * Alaska PermanentPermanent of mineral revenues. by constitution. Fund Corporation,Fund independent from
state.19 76 * Uses earnings for dividends, * Governed by board * Investments
inflation proofing. of six trustees-members largely out of state.adding to principal. of public, commissioner
of revenue, and onegovernor's appointee.
* Calculates dividends as net * Executive directorincome of fund for last five employed to manageyears, times 21 percent, the fund.divided by 50 percent.
* Pays dividends to each * Expenditures limitedAlaskan resident. to 1.2 percent of
net income.* Links oil income and * Regular reporting and
spending through the auditing, with alldividend program, since information publiclythere is no state income tax. available.
Norway * Fully integrated into budget * Parliamentary approval * Ministry of Financeprocess under the control of for transfers to and sets guidelines forthe treasury. from the fund. asset strategy.
1990. activated * Finances nonoil deficit. * Regular reporting to * Managed by Norges199 5 Parliament on fund status. Bank.
* Receives fund earnings, * Supervision by * Parliamentarynonoil surplus. Ministry of Finance. approval for
changes inguidelines.
* Higher government spending * Quarterly and annual * Investment inor lower taxes result in reporting. overseas assets.smaller allocationsto the fund.
* Operations incorporated into * Regular, public audits.fiscal accounts.
* Legal requirement toprovide information on fundmanagement to public.
Oman * Accumulating when price is * Supervised by the Financial * Managed byabove State General Reserve Affairs and Energy Ministry ofFund reference price Research Council. Finance($15 a barrel).
(Continued)
128 The World Bank Research Observer, vol. 19, no. 1 (Spring 2004)
Table 1. (Continued)
Fund and Rules Governance Asset management
date founded
1980 . Accumulation of * Executive Committee * Guidelines from
privatization proceeds. supervises fund Financial Affairs
investments. and EnergyResearch Council.
* Discretionary transfers * Monthly internal * Short-term account
to budget. audit and review. manages cash flowover two-yearhorizon.
* Withdrawal to fund budget * Monthly reporting to . Long-term fund
gap when oil price below Executive Committee. invests in higher
reference price ($15 a barrel). return assets.
* Quarterly external audit.
* Biannual portfolioperformance review.
Source: Davis, Ossowski, and Fedelino 200 3.
The Case for Using Market-Based Instruments to ManageOiL Price Risk
When oil revenues lag behind initial investment expenditures and prices are mean-
reverting, there may be strong efficiency gains from using financial instruments to
manage oil price risk. The use of market-based financial instruments has long been
proposed as the first-best solution for dealing with oil price volatility, but risk man-
agement programs are rarely implemented (Engel and Mellor 1993; Larson and
Varangis 1996; Claessens and Duncan 1993; World Bank 1999).
Benefits of Using Financial Market Instruments
Instruments such as swaps, futures, and options make it possible to lock in a known
price for a given period, thus eliminating price uncertainty, and they allow a coun-
try to transfer commodity price risk to the market, rather than self-insuring. A risk
management strategy can also make credible the promise not to spend windfall
income (Hausmann 1999). To mitigate the effects of permanent price components,
small savings or stabilization funds can be combined with financial instruments to
avoid paying risk premiums or depleting the fund (Larson and Varangis 1996;
Shimko 1995; Humphreys 2000).Instruments for managing commodity price risk are becoming more sophisticated
with the development of derivatives and are being traded on capital markets.
Julia Devlin and Sheridan Titman 129
For example, futures and options for crude oil and natural gas are traded on theNew York Mercantile Exchange, whereas forward and swap contracts are traded onover-the-counter markets.
Exchange-traded instruments are usually more transparent, easier to monitor, andmore liquid than over-the-counter instruments, such as swaps and forwards. Optionsare one way to protect against volatility in oil prices. With a put option, a governmentbuys the right to sell a certain quantity of oil at a specific price for a specific period,effectively establishing a price floor. If prices fall below this floor, the value of the strikeprice increases and the option can be exercised or sold for a profit, To help offset thecost of the premium on a put option, the government can sell call options or the rightto buy oil at a specific price over a given period, effectively establishing a price ceiling.Various combinations of puts and calls enable a government to benefit from the upsidepotential as well-for example, with a "costless collar," a government can sell a calloption and use the premiums to purchase a put option. The state of Texas is using thisstrategy to hedge the 2 5-30 percent of state revenues tied to oil revenues.
An adequate assessment of basis risk-the difference between the benchmarkprice used to hedge and the realized price in the exporting country-is important forusing futures and options. Although in practice the basis risk for oil tends to be muchsmaller than the overall price risk, the benefits and costs of using risk managementinstruments are clearly affected by basis risk. For Alaskan oil, for example, priceshave ranged fronm $9 to $41, whereas the basis difference has ranged from $0.80 to$4.20 (Lindahl 1996).
Over-the-counter instruments, such as swaps and forward contracts, are moreflexible than exchange-traded instruments because they are customized transac-tions between the government and the financial intermediary. They can mitigatebasis risk, are available in large volumes for single transactions, and frequentlycover longer periods. Initial deposits and margin calls are also avoided. In a swaptransaction, the oil-producing government contracts with a private bank to lock in aprice (say, $20 a barrel) for a long period, say, two to three years. The governmentthen sells the oil on the open market, and both parties calculate an average salesprice every six months. If the average price that the country receives is less than $20a barrel, the bank pays the difference. If oil prices rise, the payment flows in thereverse direction. There are several variations on this approach. A country couldalso use a swap to establish a price floor and could sell a cap (say, $2 5 a barrel) tohelp cover the cost of the floor. The country would pay the bank any oil revenuesreceived over the $2 5-a-barrel cap.
A forward contract is like a futures contract except that it is an agreementbetween a buyer and a seller directly (not on an exchange), and forward contractsgenerally give rise to physical deliveries.
Using both exchange-traded commodities and over-the-counter instruments, oil-producing governments can sell their production forward or buy insurance against
130 Thie Wolorld Banik Research Observer. vol. 1 9, io. 1 (Sprinig 2004)
large price declines. A good time to start risk management is when prices are high
relative to trend. During a high price period, a producing country can lock in reven-
ues at the high price through swaps and protect against low price scenarios with put
options.
Global Extemalities from Using Financial Markets to Manage Oil Price Risk
There are likely to be favorable externalities for the global economy from greater use
of financial markets to manage oil price risk. When prices fall, a constrained
producer may want to increase (rather than reduce, as microeconomic theory
would predict) its production to generate sufficient revenues to meet its investment
needs. Thus, because of the tendency of some producers to increase production and
contribute to an oil glut, what would otherwise be a temporary price decline can be
both amplified and extended.Although consumers benefit from the decline in oil prices, the increased volatility
created by this perverse incentive to increase production as prices fall creates
substantial inefficiencies in consuming countries as well as in producing countries.
When oil prices are very volatile, consuming countries are likely to find it difficult to
sustain fuel efficiency and conservation efforts, whereas producing countries are
likely to experience greater political instability.
When a country is able to hedge a large portion of its oil revenues, it no longer
tends to increase production as prices decline. Indeed, the country will be able to
benefit by timing its oil production to coincide with higher oil prices. Oil producers
will generate higher revenues on average, and oil prices will be less volatile.
Why Few Developing Country Govemments Use Financial Instruments
to Manage Oil Price Risk
Despite the expansion of markets to absorb commodity risk, there is little evidence
that developing economies are using market-based instruments to manage oil price
risk. This appears to result mainly from two causes: the status quo problem and the
lack of coordination in international financial markets.
The Status Quo Problem and the State of Texas Hedging Program
Although the use of financial instruments reduces risk and increases efficiency,
there may be some risk for government officials who implement such a policy.
Policymakers are likely to be evaluated by how well market-based instruments work
relative to the status quo with no use of hedging.
Officials must be concerned not only with the volatility of prices but also with the
possibility that the country will end up worse off as a result of the risk management
jzilia Deviin and Sheridan Titman 131
decisions. Although policymakers will benefit politically from the use of risk man-agement instruments if commodity prices decline, the political costs may outweighthe benefits if prices rise. Because there is close to a 50 percent chance that any givenrisk management decision will lose money relative to the status quo of no risk man-agement, it is not surprising that government officials do not generally consider riskmanagement a viable alternative.
Finally, the effectiveness of risk management strategies needs to be evaluatedfrom the vantage point of fiscal stability, an important area for further research.Recent evidence suggestions that when market-based instruments are not used,government will realize the highest portion of expected revenue but also will experi-ence the highest level of revenue volatility and more frequent budget deficits.Exchange-based risk management can effectively manage extreme downside riskand stop large budget deficits from occurring (Buttimer, Shaw, and Swidler 1999).
Many of these issues came into play in the oil price risk management program ofthe state of Texas, one of the few examples of using market-based instruments tohedge a state budget. 2 Texas collects about half a billion dollars from a 4.6 percentproduction tax on crude oil, and in 1991 the Texas Senate introduced a bill autho-rizing a two-year pilot risk management program, with expanded legislation passedin 19 9 3. To avoid opposition, the program was initiated in a quiet, unobtrusive wayas part of existing treasury operations with program support financed by unclaimedroyalties. Political support for the risk management program was created andmaintained through continuing efforts to educate legislators and their staffs and toaddress fears about risk management operations. In addition, the program hadwell-defined safety mechanisms, including board oversight, use of exchange-tradedoptions, monthly and quarterly reporting, and a system of internal and externalchecks and balances. The State Depository Board, which had a strong reputationfor technical competence, was selected to supervise the program. Guidelines andoperating procedures, drawn up in consultation with an advisory committee, coveredauthorization to trade, decision-making responsibilities, position limitations, brokerconstraints, daily monitoring, separation of responsibilities, and internal reportingto both fiscal authorities and the oversight board.
In addition, a system of checks and balances was established to monitor the activ-ities of the risk management program, incorporating treasury supervision, oversightboard supervision, Risk Management Group trading, banking functions, accountingfunctions, broker and clearing agents, and external audit. Treasury staff familiarwith exchange and fiscal spending transactions were included in the auditing of therisk management program-staff checked the daily activities of the program andwired the money to be used in purchasing options on behalf of the Risk ManagementGroup. Other controls included stop-loss limits on the amount of money that couldbe placed at risk in one day ($500,000) and a total amount that could be lostthroughout the program ($2.5 million-the program would stop immediately if that
132 The World Bank Research Observer, vol. 19, no. I (Spring 2004)
limit was reached). Limiting risk management instruments to exchange-traded
options (no futures or swaps) offered additional security because no open-ended losses
could be incurred (as they could be with futures), options are more liquid and easier to
understand, and trades would be subject to greater scrutiny in a well-regulated market.
At the end of two years, the program would be assessed and either closed down or
continued.This experience shows that to implement an effective risk management program,
governments need to identify a clear objective (such as risk management) to deal
with fears of speculation. Ideally, risk management programs would be the responsi-
bility of existing treasury operations, not a new unit, and would rely on existing staff
with high levels of technical expertise in commodity markets. Clear operational
guidelines should be developed, including authorization to trade, decision-making
responsibilities, position (stop-loss) limitations, broker constraints, daily monitoring,
separation of responsibilities, and internal reporting. Alternative risk management
strategies (options, swaps, futures) should be evaluated on paper first, and the
selected strategy should be introduced as a pilot program with a sunset provision if
the program loses too much money. The program should have clear opportunities
for upside potential.
Coordination Failures in Intemational Financial Markets
Low use of financial instruments by developing country governments also stems
from a coordination failure in international financial markets. Suppose that major
oil corporations and major sovereign producers simultaneously decide to hedge their
oil price exposure. This would of course solve the status quo problem. But there is a
second problem that would need to be overcome before these risk management
strategies can be implemented. Selling the equivalent of billions of barrels of oil in
financial markets requires buyers who are willing to purchase these amounts.
Who are such potential counter-parties? In general, they come from two groups.
The first group consists of institutions and individuals with an incentive to take the
other side of these transactions to hedge their own risks. For example, power produc-
ers with gas-fired generators have an incentive to lock in gas prices to hedge the
costs of generating power. Similarly, large purchasers of oil, such as airlines, plastics,
and chemical companies, can serve as natural counter-parties for oil producers. The
amount of oil such companies consume is likely to be relatively small, however.
Most oil is consumed by individuals, in the form of gasoline and heating oil. But few
individuals find it practical to buy oil futures and forward contracts to hedge future
expenses.The second major counter-party group is made up of large pension funds, individ-
ual investors, and hedge funds. Because individuals in developed economies, who
are the largest oil consumers, are unlikely to hedge, there is likely to be a substantial
Julia DexWlin and Sheridan Titman 133
gap between the amount of oil that producers should in theory sell forward and theamount of oil that consumers can be expected to buy forward. That means thatthere should be a positive risk premium associated with holding oil price risk thatshould make such investments attractive to institutional investors. But mostpension funds and other institutional investors lack the expertise to invest in thesecommodities, and learning that skill will likely take many years. Although there arehedge funds that can take the other side in these transactions, these funds tend to bethinly capitalized and can likely take on only a small part of the necessary exposure.
With the amount of capital that can plausibly be used to take the other side in riskmanagement transactions so small relative to the aggregate oil price risk, prices onfutures and forward markets would decline substantially if producers tried to hedgea significant amount of the oil price risk. Markets are liquid enough to absorb smalltrades by small producers but not yet deep enough to allow large producers to hedgeas much as they would like. Anecdotal evidence suggests that large oil companiestend to hedge only the gap between current production levels and the minimumamounts needed to keep facilities going.
A RoLe For International Financial InstitutionsThere are likely to be substantial benefits associated with developing markets thatallow oil-producing governments to hedge their oil price exposure. As a result, thereis a role for international financial institutions to address the status quo and coordi-nation problems just outlined.
With respect to the status quo problem, the key to developing deeper markets formanaging oil price risk is to educate government officials on the use of market-basedinstruments to deal with oil price risk. International financial institutions can alsoencourage the involvement of investment banks to develop the counter-party side ofthe financial market for oil price exposure.
Ultimately, if oil producers hedge a significant amount of their oil price risk, thelargest fraction of the risk will need to be held by international institutional inves-tors, because relatively little oil price exposure will be taken by petroleum users.However, this will require the development of securities that are tailored to the needsof international institutional investors, in addition to the removal of various regulatoryand legal impediments.
This points to a potential third role for international financial institutions in facili-tating securitization of oil resources. One possibility would be to develop an interna-tional agency. resembling Fannie Mae or Freddie Mac, to act as a conduit for banksthat initiate loans with interest payments tied to oil prices. These loans could then bepackaged. securitized, and divided into tranches to appeal to various investor clienteles.For example, a senior AAA tranche could be sold to pension funds and insurance
134 Tlhe llordl Ban1k Research Observer, eol. 1 9, no. 1 (Sprin0 2004)
companies. A BBB tranche could be sold to more adventurous institutions, like uni-
versity endowments, that would like to have some oil exposure but are prohibited in
their charters from holding derivatives. Hedge funds and other more specialized
investors could hold the riskier junior tranches.
International financial institutions could play a role by helping originate the
transaction and working to ensure that the developing country gets the best possible
terms for financing. In addition, international financial institutions can provide
guarantees and insurance against the risk of default, analogous to the role that
Freddie Mac played in developing a market for mortgage-backed securities. In the
initial development of the residential mortgage-backed securities market, Freddie
Mac acted as a conduit between the savings and loan institutions that initiated the
mortgages and the investment banks that offered the securities. As a conduit, an
international financial institution might need a few billion dollars to initially hold
some of the loans while they are being securitized and might want to set aside funds
to insure the loans. 3Thus, international financial institutions may be able to facilitate the develop-
ment of a market for securitized oil-linked loans by dealing with legal and regulatory
issues related to the introduction of new securities, addressing concerns about politi-
cal risk, and marketing these securities to countries that import a substantial
amount of oil to help them hedge oil consumption risk.
There are likely to be favorable externalities for the global economy as a result of
the greater use of financial markets for managing oil price risk. When prices decline,
a constrained producer may want to increase its production (rather than reduce it,
as microeconomic theory would predict) to generate sufficient revenues to meet its
investment needs. As a result, what would otherwise be a temporary price decline
can be both amplified and prolonged because of the tendency of some producers to
increase production and contribute to an oil glut.
Although oil consumers benefit from the decline in oil prices in these situations,
the excess volatility resulting from this perverse incentive to increase production as
prices fall creates substantial inefficiencies in consuming countries as well as in pro-
ducers. For example, it is likely to be more difficult to maintain fuel efficiency efforts
and to increase conservation efforts when oil prices are very volatile. In addition, oil
price volatility is likely to contribute to political instability in oil producing countries.
When a country hedges a significant portion of its oil revenues, its tendency to
increase production as prices decline can be eliminated. Indeed. the country will be
able to benefit by timing its oil production to coincide with higher oil prices. By doing
this, the oil producers will generate higher revenues on average, and oil prices will
be less volatile.Finally, international financial institutions can work more closely with major
international oil companies in sharing oil price risk with developing country govern-
ments. Major oil companies are already exposed to substantial amounts of oil price
Ju'lia Dex'lin anid Sheridan Tittrlan 135
risk. The largest international oil companies-British Petroleum, Exxon Mobil,Royal Dutch Shell, and Total Fina Elf-produce about eight to nine million barrels ofoil a day. This amount exceeds the total production of non-oPEc South American andAfrican producers-in other words, the production from developing economies thatwould benefit the most from hedging. What this means is that the major oil compa-nies can take a significant amount of the oil price exposure of the smaller producerswithout substantially increasing their own exposure. The oil companies can do thiseither by buying the securities described or by structuring their contracts with theexporting countries in ways that shift the price risk to them.
ConcLusion
To deal with oil price volatility and exhaustibility, countries have set up stabilizationand savings funds. Although the funds have helped manage windfalls and turndepletable wealth into productive assets, their performance has been much weakerin reducing the effect of volatile oil prices on government revenues and spending.Especially important have been a sound fiscal framework and accountability andtransparency in fund structure.
Two limiting influences on the effectiveness of oil funds are oil price processes,which are almost entirely beyond the control of policymakers, and political economyfactors. Both tend to put downward pressure on the optimal size of funds and raisethe efficiency gains from the use of market-based financial instruments.
In theory, the first-best strategy to deal with commodity price volatility is the useof market-based risk instruments. In practice, however, policymakers in developingareas are deterred by the status quo problem and by coordination failures in thedevelopment of international financial markets. On the status quo problem, Texas'sexperience suggests that government hedging of oil price risk is challenging but notimpossible when the program has the clear objective of insurance and is introducedgradually, preferably as a pilot program by extending existing responsibilities fortreasury operations rather than by creating a new, stand-alone program. Clearoperational guidelines for the program, with appropriate layers of authorization fortrades, automatic stop-loss provisions, separation of responsibilities, and internalreporting are critical to avoid speculation.
There is also a potential role for international financial institutions in promotingthe use of market-based instruments to manage oil price risk, given coordinationfailures in international financial markets. Education, publicity, and technical assis-tance in working with oil-producing and -importing governments to manage oilprice risk are possibilities. International financial institutions can also work todevelop instruments to facilitate securitization of oil proceeds an can encourage oilcompanies to work with developing economies in sharing oil price risk. There are
136 The World Bank Research Observer, vol. 19, no. 1 (Spring 2004)
likely to be significant externalities for the global economy associated with this
role-namely, reduced volatility in oil prices.
Notes
Julie Devlin is senior private sector development specialist at the World Bank: her e-mail address is
jdevlinCaworldbank.org. Sheridan Titman is professor of finance, McAllister Centennial Chair in Finan-
cial Services, University of Texas at the University of Texas, Austin; his e-mail address is titman@
mail.utexas.edu.1. In Chile and Norway, commodity revenues as a percentage of overall government revenues
are significantly lower than in most oil-exporting countries, implying that the impact of a volatile
revenue stream is significantly lower. Copper prices are also less volatile than oil prices, lessening
the degree of potential fiscal volatility. These effects were taken into account in Crain and Devlin
(20)02).2. This discussion is based on Patterson (2001).
3. However. the proposed hedging strategy need not put very large amounts of much money at risk.
First. it is assumed that the oil-producing country would put significant amounts of money on deposit
at the banks to serve as partial collateral for the volumetric loans. Second. the loans would also be
collateralized by oil, which presumably can be seized if the defaulting country tries to export the oil.
It should be emphasized that the oil exporter will have an incentive to renege on the loan agreement
only when oil prices are substantially higher than the contracted price. However, if the oil-importing
countries agree to recognize these contracts, the exporting countries will not be able to renege and sell
their oil at the higher market price. Of course, there is still political risk associated with political events
that result in a disruption in the country's ability to produce oil.
References
Arrau, Patricio, and Stijn Claessens. 20t)1. "Commodity Stabilization Funds." World Bank, Washington, D.C.
Barnett, Steven, and Alvaro Vivanco. 2003. In I.M. Davis, R. Ossowoski, and Al Fedelino, eds., Fiscal Policy
Fornation and Inplementationi in Oil-Producing Countries. Washington, D.C.: International Monetary Fund.
Bates, Robert. 1997. Open-Econiomy Politics. The Political Economy of the World Coffee Trade. Princeton,
N.J.: Princeton University Press.
Bjerkholt, Olav. 2002. "Fiscal Rule Suggestions for Economies with Non-Renewable Resources." Paper
presented at the iFs/World Bank Conference on Rules-Based Fiscal Policy in Emerging Market
Economies, 14-16 February, Oaxaca. Mexico.
Buttimer, Richard. Ron Shaw, and Steve Swidler. 1999. "Government Risk Management: Motivation.
Implementation." Public Budgeting & Finanice 19(4):75-90.
Cashin, Paul, and C. John McDermott. 2002. "The Long-Run Behavior of Commodity Prices: Small
Trends and Big Variability." IMF Staff Papers 49(2): 175-99.
Cashin. Paul, Hong Liang, and C. John McDermott, 2000. "How Persistent Are Shocks to World
Commodity Prices? " INIu Staff Papers 47(2): 177-217.
Claessens, Stijn, and Ronald C. Duncan, eds. 1993. Managinig Cornmodity Price Risk in Developing
Counltries. Baltimore. Md.: Johns Hopkins University Press.
Collier, Paul. 2002. "Best Practice in Diversification Strategies for Mineral-Exporting Countries."
Presentation for the Managing Volatility Thematic Group Workshop, 7 January. Washington, D.C.
Julia D(v"in arid Slheridan Titrnan 137
Crain. Mark, and Julia Devlin. 2002. "Nonrenewable Resource Funds: A Red Herring for FiscalStability?" Draft working paper. World Bank, Washington, D.C.
Davis, Jeffrey. Rolando Ossowski. James Daniel, and Steven Barnett. 2001 . "Stabilization and SavingsFunds for Nonrenewable Resources: Experience and Fiscal Policy Implications." IMF OccasionalPaper 205. International Monetary Fund, Washington. D.C.
Davis, Jeffrey. Rolando Ossowski, and A. Fedelino. 200)3. Fiscal Policy Formlll(1atio2 anld lmnplemrlenitatioll inOil-Producing Countries. Washington, D.C.: International Monetary Fund.
Deaton, Angus, and Guy Laroque. 1992. "On the Behavior of Commodity Prices." Revieur of EconomicStudies 59:1-2 3.
Devlin, Julia, and Michael Lewin. 2(002. "Issues in Oil Revenue Management." Presentation for theWorld Bank E'SNIAP Workshop on Petroleum Revenue Management, 23-24 October, Washington, D.C.
Eifert, Ben, Alan Gelb, and Nils Borje Tallroth. 20)03. "The Political Economy of Fiscal Policy andEconomic Management in Mineral Exporting Countries." In Jeffery Davis, Rolando Ossowski. andA. Fedelino, eds., Fiscal Policy Formulationi and Implemnentation in Oil-Producinig Counltries. Washington,D.C.: International Monetary Fund.
Engel, Eduardo, and Patricio Meller. eds. 199 3. External Slhocks and Stabilizationi Mlechlaniismtis. Baltimore.Md.: Johns Hopkins University Press.
Engel, Eduardo, and Rodrigo Valdes. 2)00. "Optimal Fiscal Strategy for Mineral Exporting Countries."IMP Working Paper ()0/118. International Monetary Fund, Washington. D.C.
Fiess, N. 2002. "Chile's New Fiscal Rule." Draft. World Bank, Washington, D.C.Hannesson, Rognvaldur. 2001. Investing for Sutstainability: Thze Managemiienit of Mineral W17ealtlh. Boston,
Mass.: Kluwer.
Hausmann, Ricardo. 1999. "Managing Terms of Trade Volatility." PREMnotes 18. Poverty Reductionand Economic Policy Group, World Bank, Washington. D.C.
Hausmann, Ricardo, and Roberto Rigobon.2 )1) 3. "An Alternative Explanation of the Resource Curse."In Jeffery Davis, Rolando Ossowski, and A. Fedelino, eds.. Fiscal Policy Formulllation and Implemlenita-tion in Oil-Producing Counltries. Washington, D.C.: International Monetary Fund.
Heilbrunn. John R. 201)2. "Governance and Mineral Funds." Working Paper. Colorado School ofMines, Golden, Colo.
Hill. Catherine. 1991 "Managing Commodity Booms in Botswana." World Development 19(9):118 5-96.Humphreys, Brett. 2001. "Commodity Stabilization Funds and Risk Management." Presentation for
the World Bank Managing Volatility Thematic Group, 16 November, Washington, D.C.Karl. Terry Lynn. 2000. Presentation at the Managing Volatility Thematic Group Workshop on Volatility
and the Political Economy of Reform. 20 June. Washington, D.C.Larsen, Don, and Panos Varangis. 1996, "Dealing with Commodity Price UJncertainty." Policy
Research Working Paper 1667. World Bank, Washington, D.C.Lindahl, Mary. 1996. "A Risk Management Strategy for Alaska: Learning from the Texas Experience?"
Journial of Energrj, Finanice a Development 1 (1): 1-8.Patterson, Linda. 20)0)1. "The State of Texas Risk Management Program: A Long Position and Long
Perspective." Presentation for the World Bank Managing Volatility Thematic Group, 25 June,Washington, D.C.
Perry. G. 200)2. "Can Fiscal Rules Help Reduce Macroeconomic Volatility in LAC?" Paper presented atthe IMF/World Bank Conference on Fiscal Rules and Institutions, Oaxaca. Mexico.
Pyndick R. 1999, "The Long-Run Evolution of Energy Prices." Energy Journal 20(2): 12 7.Ramey, Garey, and Valerie A. Ramey. 1995. "Cross-Country Evidence on the Link Between Volatility
and Growth." American Economnic Revie"w 8 5:1138-52.
138 7'The IVorld Bank Research Observer. vol. 19, no. I (Spring 2004)
Ranis, G. 1991. "Towards a model of development." In L.B. Krause and K. Kihwan. eds.. Liberalization
in thie Process oJ Econot?ic Developipment. Berkeley. CA: UJniversity of California Press.
Rutten. Lamon. 2001. "Risk Management Strategies for Mineral Importers." Presentation for the
World Bank Managing Volatility Thematic Group. 20 March, Washington, D.C.
Sachs, J.. and A. Warner. 199 5. "Economic Convergence and Economic Policy." NBER Working Paper
5) 39. National Bureau of Economic Research, Cambridge, Mass.
Schick. Allen 1998. "Why Most Developing Countries Should Not Try New Zealand Reforms." World
Banlk Research Observer 1 3(1):12 3-31.
Schwartz, Eduardo, and James Smith. 20)0). "Short-Term Variations and Long-Term Dynamics in
Commodity Prices." Nlatnagenmenit Scienice 46( 7):89 3-911.
Shimko, David. 199 5. "Long Term Energy Risk Management in the Alaskan Context." Paper prepared
for the Risk Management Workshop, October, UJniversity of Alaska-Anchorage. Anchorage, Alaska.
World Bank 1999. "Commodity Price Risk Management in Developing Countries: Proposal for a
Market Based Approach." International Task Force on Commodity Risk Management in Developing
Countries, Washington DC.
Julia Devlin aiid Slieridari Titrmaii 139
Does your library-subscribe-to this journal?uKr rr - - ,.
FET -qCiM li!W-- Em= _ 7 .. - _ ii-_woe~ _ -s7;;l,-; --- --~SWlYSwIwxnc use fiMi tyt ttbvutwtuifihtrtr t-O -
r -~~~~~~~ - ~~~- hJWUIG I c mwi3 cup.c*cj-i/n*iflrsc, hli in yfr detadl re~ a.j'submtui. and the tonn ral auireatiranly be urw" ;dec to tu it hbrar it
L.all iaC ?7'11 L9 US
L- cRMu NECO ENDAT ON PORN- E, tIOD&.Z7321
LniAW.a or : d.iIwB zr Dear Litrerlarr,L.0r3r, Ac qu.a.fion toamr,tee-1¶Ef 09?O ? I mouic like. cio nrmmerd a s.bsc'tpt'xr. IJx..tiaUSA. .a E dn 1 I
IDeel;Uj..i.e.a C re# op I%-
Telephone-44 -n 1801 30300? Positron:.. .. . .. i
Fax: -e44 1865 353405 Department: .... _.....Emil.°
l s, Ior -g eS1,,tr, _ . ............ ......... :ust. e;'... po...s , S g ...
-lford, OX2.6 U h Na m e:nsu o t-ou orna s ore
! it.,.;., -- ' ^-ww V &O *j A J--O lln a2 OX02CFORI) E
i ~~~~~~~~UNIVERSITY PR£5SS

I ., . ., Mi,I, AM
CD -+ 0 > > 0
Q 2 i ,-cr + -H O >Un>0 O < m er_ CD 3 DCD X 0C C- CDD -. > 0 Xo -c n c~ o -- cn =
C:) a+C M CD < t
0~~) Oz c 3 oC 0 0 D
o o X tQ
. 0CD~~~~~~DU
O CD)

I
i
Top Related
Copyright © 2022 FDOKUMEN

