


Bahasa
Halaman
Hukum

Food Chemistry 141 (2013) 3034–3041
Contents lists available at SciVerse ScienceDirect
Food Chemistry
journal homepage: www.elsevier .com/locate / foodchem
Optimisation of aqueous two-phase extraction of anthocyanins frompurple sweet potatoes by response surface methodology
0308-8146/$ - see front matter � 2013 Elsevier Ltd. All rights reserved.http://dx.doi.org/10.1016/j.foodchem.2013.05.119
⇑ Corresponding author. Tel./fax: +86 10 62815541.E-mail address: [email protected] (T. Mu).
Xingli Liu, Taihua Mu ⇑, Hongnan Sun, Miao Zhang, Jingwang ChenInstitute of Agro-Products Processing Science and Technology, Chinese Academy of Agricultural Sciences, Key Laboratory of Agro-Products Processing, Ministry of Agriculture, No.2 Yuan Ming Yuan West Road, Haidian District, P.O. Box 5109, Beijing 100193, China
a r t i c l e i n f o a b s t r a c t
Article history:Received 11 March 2013Received in revised form 14 May 2013Accepted 25 May 2013Available online 4 June 2013
Keywords:AnthocyaninsPurple sweet potatoAqueous two-phaseResponse surface methodology
Aqueous two-phase extraction (ATPE) method was investigated for extraction of anthocyanins from pur-ple sweet potatoes using response surface methodology (RSM). Results showed that the optimal condi-tions for anthocyanin extraction were that, 45:1 (mL/g) liquid–solid ratio, 25% (W/W) ethanol, 22%(W/W) concentration of ammonium sulphate and pH3.3; the anthocyanin yield and partition coefficientunder the optimal conditions were 90.02% and 19.62, respectively. The result of HPLC-ESI-MS analysisrevealed eight kinds of compounds, and the major anthocyanins as cyanidi-caffeoy-fumaroy-sophoro-side-3-O-glucoside, peonidin-caffeoyl-hydroxybenzoyl-3-O-glucoside, peonidin-caffeoyl-sophoroside-3-O-glucoside, and peonidin-caffeoyl-fumaroyl-sophorosid-3-O-glucoside. Meanwhile, we found acompound as a dimer of galloyl procyanin. These results suggest that ATPE is efficient in extractinganthocyanins and has the potential to be used in natural anthocyanin extraction industry.
� 2013 Elsevier Ltd. All rights reserved.
1. Introduction
In recent years, interest in natural pigments has increased con-siderably, mainly because of their apparent non-teratogeneses,non-carcinogenicity, non-mutation, and eco-friendliness charac-teristics. As a natural pigment, anthocyanins belong to the groupof flavonoids and are responsible for the orange, red, and blue col-ours of flowers, fruits and vegetables. These pigments are expectedto substitute synthetic pigments because of their attractive colorand physiological functionality (He & Giusti, 2010).
Purple sweet potato contains a high level of anthocyanins com-pared to white, yellow, and orange ones. Anthocyanins in purplesweet potato are mono-acylated or di-acylated forms of cyanidinand peonidin (Montilla et al., 2010). Purple sweet potato anthocy-anins (PSPAs) have good heat stability compared to other sourcesof anthocyanins, and recent studies showed that PSPAs have manyphysiological functions, such as the antioxidant (Zhang et al.,2009), hepato-protection (Hwang et al., 2011), and memoryenhancing (Lu et al., 2012).
It is well known that anthocyanins are soluble in polar solventsand commonly extracted by aqueous mixtures of organic solventssuch as ethanol, methanol or acetone (Kano, Takayanagi, Harada,Makino, & Ishikawa, 2005). The addition of a small amount ofhydrochloric acid or formic acid is recommended to preventthe degradation of the non-acylated compounds. Besides the
conventional solvent extraction, new methods based on more ad-vanced extraction techniques were reported, such as microwave(Yang & Zhai, 2010; Sun et al., 2007) (Yang, Fan, Gu, Han, and Chen(2008)) and ultrasonic methods (Ghafoor, Choi, Jeon, & Jo, 2009;Ghafoor, Hui, & Choi, 2011). However, these methods havedrawbacks due to the higher cost, special equipment and stringentoperating condition.
Aqueous two-phase extraction (ATPE) has been widely appliedto the separation of biomacro molecules, such as proteins (Klomk-lao, Benjakul, Visessanguan, Simpson, & Kishimura, 2005) and anti-biotics (Paula, Rosa, & Azevedo, 2007), because of its mildconditions and high capacity. Up until now, most ATPE was basedeither on polyethylene glycol (PEG)/salt or polymer/polymer (e.g.,PEG/dextran) systems. However, because of the high cost of thepolymers and difficulty in isolating the extracted molecules fromthe polymer phase by back extraction, these systems can be hardlyused for large-scale production (Ozlem, Emine, & UIku, 2011).
Recently, short-chain alcohol/inorganic salt systems have beenused as a novel ATPE system to purify natural compounds (Jiang,Li, Dai, Zhang, & Xiu, 2009). This ATPE system has many advantagessuch as low cost, low interfacial tension, good resolution, highyield, high capacity, and simple scale-up (Rito-Palomares, 2004).Moreover, because of its structure, these are suitable for hydro-philic compounds. Short-chain alcohols (ethanol, methanol, and2-propanol) could form stable and adjustable ATPE system withinorganic salts (e.g., phosphate and sulfate) (Gunduz, 2000). Thismight be because of the salting-out effect and the low solubilityof inorganic salt in alcohols (Albertsson, 1986). When an ATPE
X. Liu et al. / Food Chemistry 141 (2013) 3034–3041 3035
system is formed, the top phase is rich in alcohol and the bottomphase is rich in inorganic salt, two phases are both with water con-tent of 80% or more and show very low surface tension (Yuan, Raza,Huang, & Shen, 2011). Ethanol–ammonium sulphate is a commonand an economic ATPE system, which has been applied to extractof anthocyanins from Mulberry (Wu et al., 2011) and piceid, emo-din, resveratrol (Wang, Dong, & Xiu, 2008).
Response Surface Methodology (RSM) is an effective statisticaltool for the optimisation of multiple variables for the predictionof best performance conditions with a minimum number of exper-iments, which has been widely applied for optimizing conditions infood industry.
In the present study, the applicability of ATPE formed by etha-nol–ammonium sulphate to the extraction of PSPAs was investi-gated using the Box–Behnken design combined with the RSMand the structures were measured by the HPLC-ESI-MS. To the bestof our knowledge, ATPE of PSPAs and its further optimisation usingRSM models have not been previously reported elsewhere.
2. Materials and methods
2.1. Materials
Purple sweet potatoes (Ipomoea batatas Lam) (variety YAN No.176) were offered by the academy of agricultural and forestry sci-ences in Hebei province. They were harvested in the early Octoberand then stored at 10–14 �C. Within 2 weeks after harvest, the en-tire batch of purple sweet potatoes was washed, cut; freeze driedand then smashed for getting purple sweet potato powders; andthen stored in dark place at 4 �C. Deionized water was usedthroughout all experiments. Ammonium sulphate [(NH4)2SO4],ethanol (CH3CH2OH), potassium chloride (KCl), sodium acetate(CH3COONa) are analytical grade. Trifluoroacetic acid (TFA) andacetonitrile (C2H3N) are HPLC grade.
2.2. Chemical analysis of purple sweet potato powders
The purple sweet potato powders were analysed for ash, fat,protein, starch, crude fiber and anthocyanin content. The ash con-tent was determined by placing the sample in a muffle furnace setat 550 �C for 8 h (AOAC method 923.03). Proteins were analysedaccording to the Kjeldahl procedure, a factor of 6.25 was used forconversion of the nitrogen content to crude protein values (AOACmethod 955.04). The starch content was determined using theamyloglucosidase and a-amylase method (AOAC method 996.11).Crude fiber was determined according to the AOAC method991.43. The anthocyanin content was determined according toLee, Durst, and Wrolstad (2005).
2.3. Aqueous two-phase extraction (ATPE)
An aqueous two-phase system was prepared according to Li,Teng, and Xiu (2010). A predetermined quantity of ammonium sul-phate was dissolved in water, and then certain volumes of ethanoland purple sweet potato powders were added to the ammoniumsulphate solution, and mixed well to form two phases. The mixturewas mingled thoroughly and held until the two phases were com-pletely separated. The PSPAs concentrations in both the top andbottom phases were analyzed and residues accumulated at theinterface of two phases were discarded.
The yield (Y1) was the ratio of the PSPAs partitioned in the topphase to the total amount of PSPAs. It was calculated using the fol-lowing equations:
Y1 ¼ Ct � Vt=Mtotal ð1Þ
where Ct and Cb were the equilibrium concentrations of PSPAs in thetop phase and bottom phase, respectively, Mtotal was the totalamount of PSPAs. The partition coefficient (Y2) of the PSPAs was cal-culated using the equation:
Y2 ¼ Ct=Cb ð2Þ
2.4. Estimation of purple sweet potato anthocyanins
The total anthocyanin content was determined according to thespectrophotometric pH-differential method (Hosseinian, Li, & Beta,2008). Briefly, an aliquot (1 mL) of the extract was mixed with0.025 M potassium chloride buffer (pH 1.0, 4 mL) and 0.4 M so-dium acetate buffer (pH 4.5, 4 mL), respectively. The absorbanceof the mixture was measured at 520 and 700 nm using an UV-Visspectrophotometer model UI-trospec 2000 (Amersham PharmaciaBiotech, Dubendorf, Switzerland). Absorbance was calculated asA = [(A520 � A700) at pH 1.0] � [(A520 � A700) at pH 4.5] with a molarextinction coefficient of 26,900 for anthocyanins. The total antho-cyanin content was calculated as cyanidin-3-glucoside equivalentsas Eq. (3):
C ¼ Af=ðeLÞ � 103 �MW ð3Þ
where A is absorbance, MW is the molecular weight of cyanidin-3-glucoside (449.2 Da), f is the dilution factor, e is the cyanindin-3-glucoside molar absorbance (26,900), L is the cell path length(1 cm).
2.5. Experimental design for selection of extraction parameters
The purple sweet potato powder was treated by various tem-peratures (20–60 �C), concentrations of ethanol (20–30% w/w)and concentrations of ammonium sulfate [(NH4)2SO4, 17–22%w/w], with a ratio of liquid–solid (mL/g) (ranging from 10:1 to100:1 v/w), for a given time (from 20 to 120 min), while the pHvalue of deionized water ranged from 1 to 5. The anthocyanin yield(Y1) and the partition coefficient (Y2) were indexes for evaluatingthe effects of different parameters.
2.6. Experimental design for optimisation of extraction parameters
Response surface methodology was applied to determine theworking conditions of anthocyanin extraction from purple sweetpotato based on the single-factor experiment results. Box–Behnkendesign with four independent factors (X1, liquid–solid ratio; X2,ethanol concentration; X3, ammonium sulphate concentration;X4, pH) set at three variation levels was carried out (Table 1). Thecorrespondence between the coded and uncoded values was ob-tained using the following equation:
Xi ¼ ðXi � X0Þ=DXi ð4Þ
where xi is the coded value of the variable; Xi the actual value ofvariable; X0 the actual value of Xi at the centre point; and DXi thestep change value.
The complete design consisted of 27 experiments including 24factorial experiments and three replicates at the centre point.Experiments at the centre of the design were undertaken to esti-mate the possibility of pure error. All the experiments were carriedout in random to minimize the effect of unexplained variability inthe observed responses owing to systematic errors. The experi-mental results were fitted to the second-order regression (Eq. (5)):
Y ¼ b0 þ b1X1 þ b2X2 þ b3X3 þ b4X4 þ b11X211 þ b22X2
22
þ b33X233 þ b44X2
44 þ b12X1X2 þ b13X1X3 þ b14X1X4
þ b23X2X3 þ b24X2X4 þ b34X3X4 ð5Þ
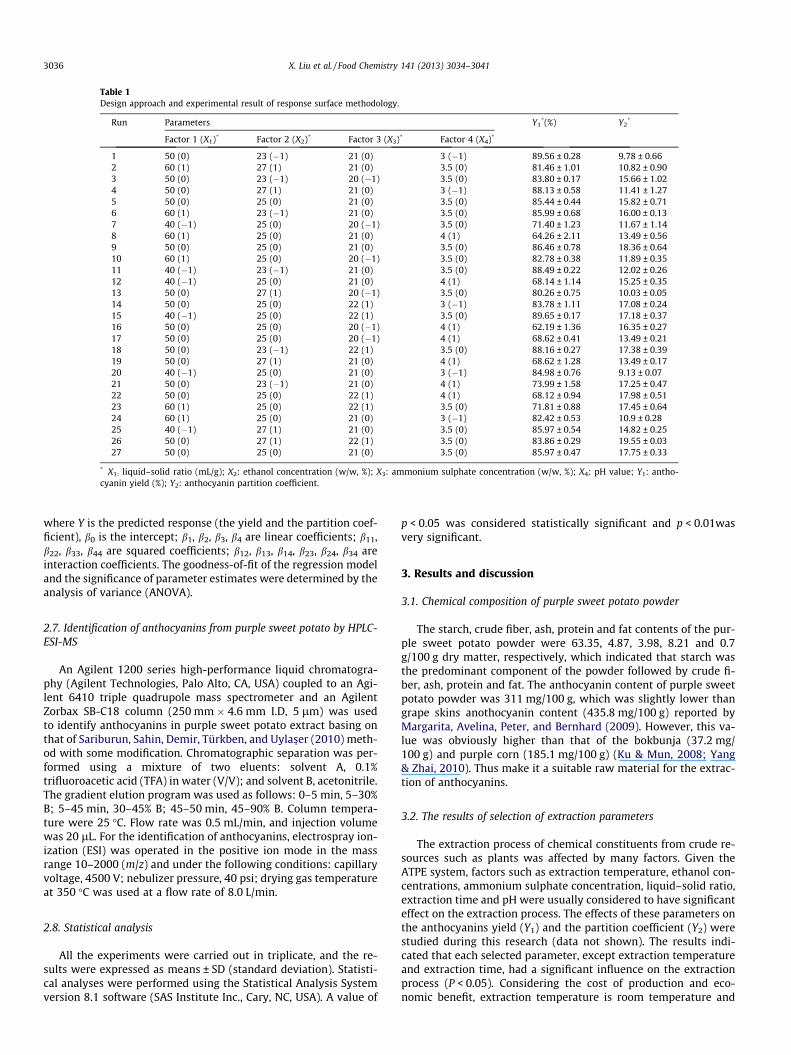
Table 1Design approach and experimental result of response surface methodology.
Run Parameters Y1*(%) Y2
*
Factor 1 (X1)* Factor 2 (X2)* Factor 3 (X3)* Factor 4 (X4)*
1 50 (0) 23 (�1) 21 (0) 3 (�1) 89.56 ± 0.28 9.78 ± 0.662 60 (1) 27 (1) 21 (0) 3.5 (0) 81.46 ± 1.01 10.82 ± 0.903 50 (0) 23 (�1) 20 (�1) 3.5 (0) 83.80 ± 0.17 15.66 ± 1.024 50 (0) 27 (1) 21 (0) 3 (�1) 88.13 ± 0.58 11.41 ± 1.275 50 (0) 25 (0) 21 (0) 3.5 (0) 85.44 ± 0.44 15.82 ± 0.716 60 (1) 23 (�1) 21 (0) 3.5 (0) 85.99 ± 0.68 16.00 ± 0.137 40 (�1) 25 (0) 20 (�1) 3.5 (0) 71.40 ± 1.23 11.67 ± 1.148 60 (1) 25 (0) 21 (0) 4 (1) 64.26 ± 2.11 13.49 ± 0.569 50 (0) 25 (0) 21 (0) 3.5 (0) 86.46 ± 0.78 18.36 ± 0.6410 60 (1) 25 (0) 20 (�1) 3.5 (0) 82.78 ± 0.38 11.89 ± 0.3511 40 (�1) 23 (�1) 21 (0) 3.5 (0) 88.49 ± 0.22 12.02 ± 0.2612 40 (�1) 25 (0) 21 (0) 4 (1) 68.14 ± 1.14 15.25 ± 0.3513 50 (0) 27 (1) 20 (�1) 3.5 (0) 80.26 ± 0.75 10.03 ± 0.0514 50 (0) 25 (0) 22 (1) 3 (�1) 83.78 ± 1.11 17.08 ± 0.2415 40 (�1) 25 (0) 22 (1) 3.5 (0) 89.65 ± 0.17 17.18 ± 0.3716 50 (0) 25 (0) 20 (�1) 4 (1) 62.19 ± 1.36 16.35 ± 0.2717 50 (0) 25 (0) 20 (�1) 4 (1) 68.62 ± 0.41 13.49 ± 0.2118 50 (0) 23 (�1) 22 (1) 3.5 (0) 88.16 ± 0.27 17.38 ± 0.3919 50 (0) 27 (1) 21 (0) 4 (1) 68.62 ± 1.28 13.49 ± 0.1720 40 (�1) 25 (0) 21 (0) 3 (�1) 84.98 ± 0.76 9.13 ± 0.0721 50 (0) 23 (�1) 21 (0) 4 (1) 73.99 ± 1.58 17.25 ± 0.4722 50 (0) 25 (0) 22 (1) 4 (1) 68.12 ± 0.94 17.98 ± 0.5123 60 (1) 25 (0) 22 (1) 3.5 (0) 71.81 ± 0.88 17.45 ± 0.6424 60 (1) 25 (0) 21 (0) 3 (�1) 82.42 ± 0.53 10.9 ± 0.2825 40 (�1) 27 (1) 21 (0) 3.5 (0) 85.97 ± 0.54 14.82 ± 0.2526 50 (0) 27 (1) 22 (1) 3.5 (0) 83.86 ± 0.29 19.55 ± 0.0327 50 (0) 25 (0) 21 (0) 3.5 (0) 85.97 ± 0.47 17.75 ± 0.33
* X1: liquid–solid ratio (mL/g); X2: ethanol concentration (w/w, %); X3: ammonium sulphate concentration (w/w, %); X4: pH value; Y1: antho-cyanin yield (%); Y2: anthocyanin partition coefficient.
3036 X. Liu et al. / Food Chemistry 141 (2013) 3034–3041
where Y is the predicted response (the yield and the partition coef-ficient), b0 is the intercept; b1, b2, b3, b4 are linear coefficients; b11,b22, b33, b44 are squared coefficients; b12, b13, b14, b23, b24, b34 areinteraction coefficients. The goodness-of-fit of the regression modeland the significance of parameter estimates were determined by theanalysis of variance (ANOVA).
2.7. Identification of anthocyanins from purple sweet potato by HPLC-ESI-MS
An Agilent 1200 series high-performance liquid chromatogra-phy (Agilent Technologies, Palo Alto, CA, USA) coupled to an Agi-lent 6410 triple quadrupole mass spectrometer and an AgilentZorbax SB-C18 column (250 mm � 4.6 mm I.D, 5 lm) was usedto identify anthocyanins in purple sweet potato extract basing onthat of Sariburun, Sahin, Demir, Türkben, and Uylas�er (2010) meth-od with some modification. Chromatographic separation was per-formed using a mixture of two eluents: solvent A, 0.1%trifluoroacetic acid (TFA) in water (V/V); and solvent B, acetonitrile.The gradient elution program was used as follows: 0–5 min, 5–30%B; 5–45 min, 30–45% B; 45–50 min, 45–90% B. Column tempera-ture were 25 �C. Flow rate was 0.5 mL/min, and injection volumewas 20 lL. For the identification of anthocyanins, electrospray ion-ization (ESI) was operated in the positive ion mode in the massrange 10–2000 (m/z) and under the following conditions: capillaryvoltage, 4500 V; nebulizer pressure, 40 psi; drying gas temperatureat 350 �C was used at a flow rate of 8.0 L/min.
2.8. Statistical analysis
All the experiments were carried out in triplicate, and the re-sults were expressed as means ± SD (standard deviation). Statisti-cal analyses were performed using the Statistical Analysis Systemversion 8.1 software (SAS Institute Inc., Cary, NC, USA). A value of
p < 0.05 was considered statistically significant and p < 0.01wasvery significant.
3. Results and discussion
3.1. Chemical composition of purple sweet potato powder
The starch, crude fiber, ash, protein and fat contents of the pur-ple sweet potato powder were 63.35, 4.87, 3.98, 8.21 and 0.7g/100 g dry matter, respectively, which indicated that starch wasthe predominant component of the powder followed by crude fi-ber, ash, protein and fat. The anthocyanin content of purple sweetpotato powder was 311 mg/100 g, which was slightly lower thangrape skins anothocyanin content (435.8 mg/100 g) reported byMargarita, Avelina, Peter, and Bernhard (2009). However, this va-lue was obviously higher than that of the bokbunja (37.2 mg/100 g) and purple corn (185.1 mg/100 g) (Ku & Mun, 2008; Yang& Zhai, 2010). Thus make it a suitable raw material for the extrac-tion of anthocyanins.
3.2. The results of selection of extraction parameters
The extraction process of chemical constituents from crude re-sources such as plants was affected by many factors. Given theATPE system, factors such as extraction temperature, ethanol con-centrations, ammonium sulphate concentration, liquid–solid ratio,extraction time and pH were usually considered to have significanteffect on the extraction process. The effects of these parameters onthe anthocyanins yield (Y1) and the partition coefficient (Y2) werestudied during this research (data not shown). The results indi-cated that each selected parameter, except extraction temperatureand extraction time, had a significant influence on the extractionprocess (P < 0.05). Considering the cost of production and eco-nomic benefit, extraction temperature is room temperature and
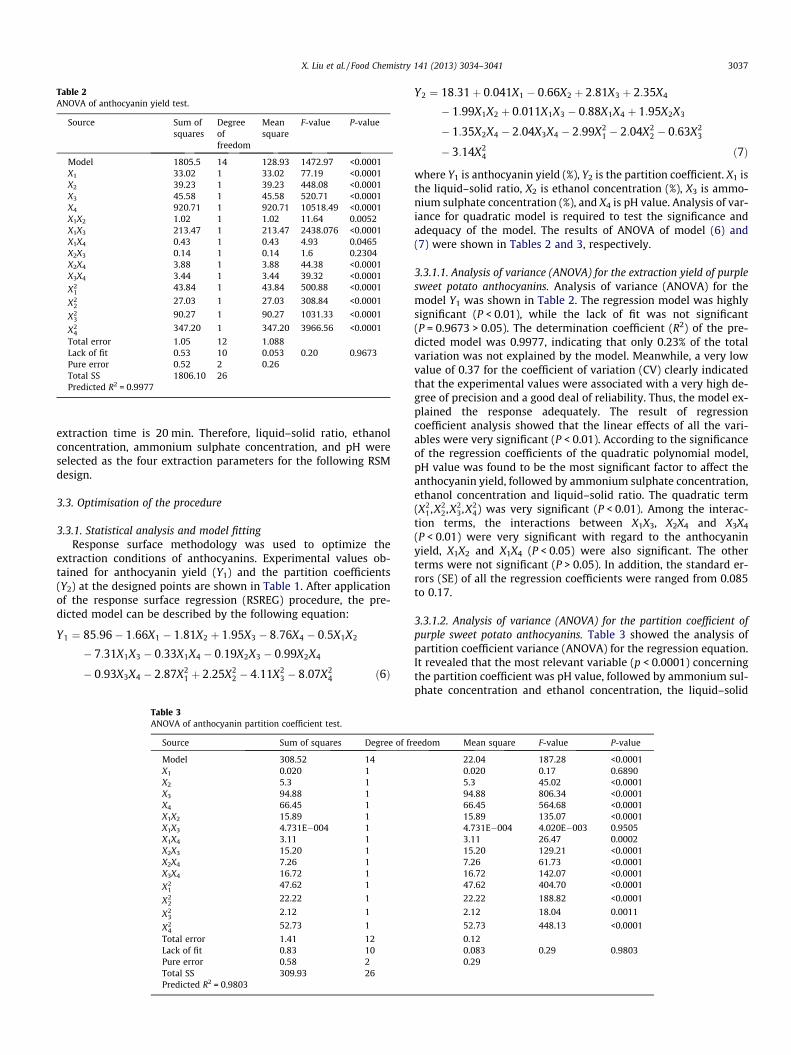
Table 2ANOVA of anthocyanin yield test.
Source Sum ofsquares
Degreeoffreedom
Meansquare
F-value P-value
Model 1805.5 14 128.93 1472.97 <0.0001X1 33.02 1 33.02 77.19 <0.0001X2 39.23 1 39.23 448.08 <0.0001X3 45.58 1 45.58 520.71 <0.0001X4 920.71 1 920.71 10518.49 <0.0001X1X2 1.02 1 1.02 11.64 0.0052X1X3 213.47 1 213.47 2438.076 <0.0001X1X4 0.43 1 0.43 4.93 0.0465X2X3 0.14 1 0.14 1.6 0.2304X2X4 3.88 1 3.88 44.38 <0.0001X3X4 3.44 1 3.44 39.32 <0.0001
X21
43.84 1 43.84 500.88 <0.0001
X22
27.03 1 27.03 308.84 <0.0001
X23
90.27 1 90.27 1031.33 <0.0001
X24
347.20 1 347.20 3966.56 <0.0001
Total error 1.05 12 1.088Lack of fit 0.53 10 0.053 0.20 0.9673Pure error 0.52 2 0.26Total SS 1806.10 26Predicted R2 = 0.9977
X. Liu et al. / Food Chemistry 141 (2013) 3034–3041 3037
extraction time is 20 min. Therefore, liquid–solid ratio, ethanolconcentration, ammonium sulphate concentration, and pH wereselected as the four extraction parameters for the following RSMdesign.
3.3. Optimisation of the procedure
3.3.1. Statistical analysis and model fittingResponse surface methodology was used to optimize the
extraction conditions of anthocyanins. Experimental values ob-tained for anthocyanin yield (Y1) and the partition coefficients(Y2) at the designed points are shown in Table 1. After applicationof the response surface regression (RSREG) procedure, the pre-dicted model can be described by the following equation:
Y1 ¼ 85:96� 1:66X1 � 1:81X2 þ 1:95X3 � 8:76X4 � 0:5X1X2
� 7:31X1X3 � 0:33X1X4 � 0:19X2X3 � 0:99X2X4
� 0:93X3X4 � 2:87X21 þ 2:25X2
2 � 4:11X23 � 8:07X2
4 ð6Þ
Table 3ANOVA of anthocyanin partition coefficient test.
Source Sum of squares Degree of fr
Model 308.52 14X1 0.020 1X2 5.3 1X3 94.88 1X4 66.45 1X1X2 15.89 1X1X3 4.731E�004 1X1X4 3.11 1X2X3 15.20 1X2X4 7.26 1X3X4 16.72 1
X21
47.62 1
X22
22.22 1
X23
2.12 1
X24
52.73 1
Total error 1.41 12Lack of fit 0.83 10Pure error 0.58 2Total SS 309.93 26Predicted R2 = 0.9803
Y2 ¼ 18:31þ 0:041X1 � 0:66X2 þ 2:81X3 þ 2:35X4
� 1:99X1X2 þ 0:011X1X3 � 0:88X1X4 þ 1:95X2X3
� 1:35X2X4 � 2:04X3X4 � 2:99X21 � 2:04X2
2 � 0:63X23
� 3:14X24 ð7Þ
where Y1 is anthocyanin yield (%), Y2 is the partition coefficient. X1 isthe liquid–solid ratio, X2 is ethanol concentration (%), X3 is ammo-nium sulphate concentration (%), and X4 is pH value. Analysis of var-iance for quadratic model is required to test the significance andadequacy of the model. The results of ANOVA of model (6) and(7) were shown in Tables 2 and 3, respectively.
3.3.1.1. Analysis of variance (ANOVA) for the extraction yield of purplesweet potato anthocyanins. Analysis of variance (ANOVA) for themodel Y1 was shown in Table 2. The regression model was highlysignificant (P < 0.01), while the lack of fit was not significant(P = 0.9673 > 0.05). The determination coefficient (R2) of the pre-dicted model was 0.9977, indicating that only 0.23% of the totalvariation was not explained by the model. Meanwhile, a very lowvalue of 0.37 for the coefficient of variation (CV) clearly indicatedthat the experimental values were associated with a very high de-gree of precision and a good deal of reliability. Thus, the model ex-plained the response adequately. The result of regressioncoefficient analysis showed that the linear effects of all the vari-ables were very significant (P < 0.01). According to the significanceof the regression coefficients of the quadratic polynomial model,pH value was found to be the most significant factor to affect theanthocyanin yield, followed by ammonium sulphate concentration,ethanol concentration and liquid–solid ratio. The quadratic term(X2
1,X22,X2
3,X24) was very significant (P < 0.01). Among the interac-
tion terms, the interactions between X1X3, X2X4 and X3X4
(P < 0.01) were very significant with regard to the anthocyaninyield, X1X2 and X1X4 (P < 0.05) were also significant. The otherterms were not significant (P > 0.05). In addition, the standard er-rors (SE) of all the regression coefficients were ranged from 0.085to 0.17.
3.3.1.2. Analysis of variance (ANOVA) for the partition coefficient ofpurple sweet potato anthocyanins. Table 3 showed the analysis ofpartition coefficient variance (ANOVA) for the regression equation.It revealed that the most relevant variable (p < 0.0001) concerningthe partition coefficient was pH value, followed by ammonium sul-phate concentration and ethanol concentration, the liquid–solid
eedom Mean square F-value P-value
22.04 187.28 <0.00010.020 0.17 0.68905.3 45.02 <0.000194.88 806.34 <0.000166.45 564.68 <0.000115.89 135.07 <0.00014.731E�004 4.020E�003 0.95053.11 26.47 0.000215.20 129.21 <0.00017.26 61.73 <0.000116.72 142.07 <0.000147.62 404.70 <0.0001
22.22 188.82 <0.0001
2.12 18.04 0.0011
52.73 448.13 <0.0001
0.120.083 0.29 0.98030.29
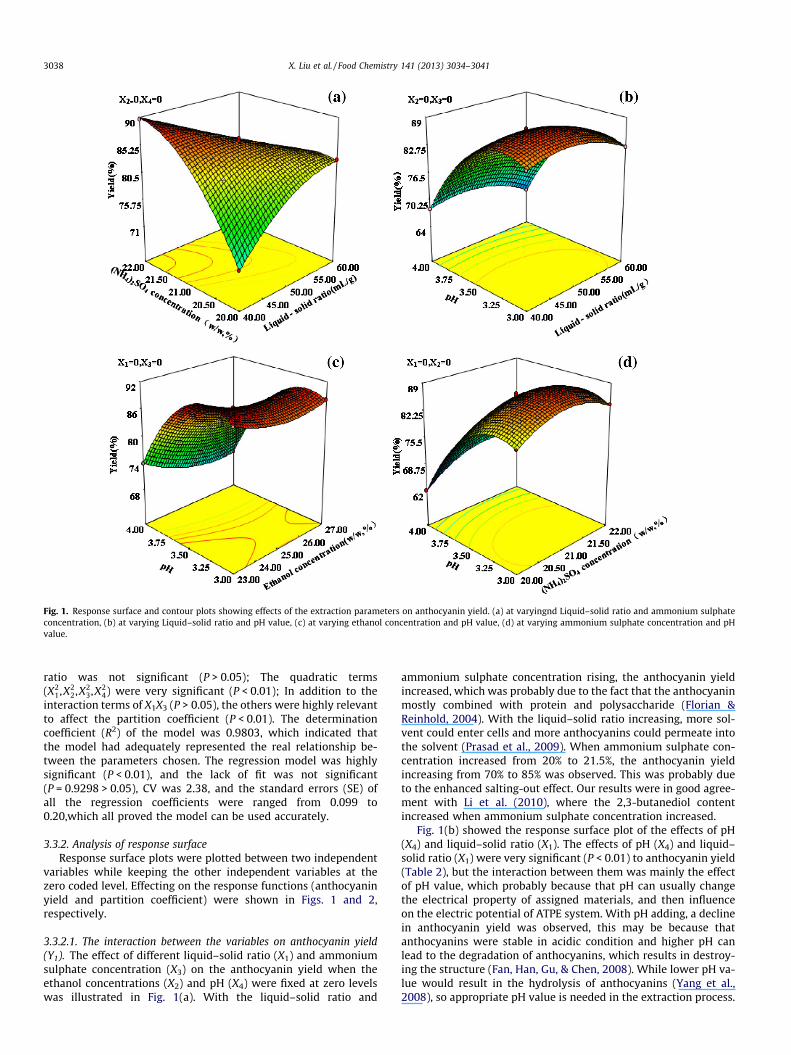
Fig. 1. Response surface and contour plots showing effects of the extraction parameters on anthocyanin yield. (a) at varyingnd Liquid–solid ratio and ammonium sulphateconcentration, (b) at varying Liquid–solid ratio and pH value, (c) at varying ethanol concentration and pH value, (d) at varying ammonium sulphate concentration and pHvalue.
3038 X. Liu et al. / Food Chemistry 141 (2013) 3034–3041
ratio was not significant (P > 0.05); The quadratic terms(X2
1,X22,X2
3,X24) were very significant (P < 0.01); In addition to the
interaction terms of X1X3 (P > 0.05), the others were highly relevantto affect the partition coefficient (P < 0.01). The determinationcoefficient (R2) of the model was 0.9803, which indicated thatthe model had adequately represented the real relationship be-tween the parameters chosen. The regression model was highlysignificant (P < 0.01), and the lack of fit was not significant(P = 0.9298 > 0.05), CV was 2.38, and the standard errors (SE) ofall the regression coefficients were ranged from 0.099 to0.20,which all proved the model can be used accurately.
3.3.2. Analysis of response surfaceResponse surface plots were plotted between two independent
variables while keeping the other independent variables at thezero coded level. Effecting on the response functions (anthocyaninyield and partition coefficient) were shown in Figs. 1 and 2,respectively.
3.3.2.1. The interaction between the variables on anthocyanin yield(Y1). The effect of different liquid–solid ratio (X1) and ammoniumsulphate concentration (X3) on the anthocyanin yield when theethanol concentrations (X2) and pH (X4) were fixed at zero levelswas illustrated in Fig. 1(a). With the liquid–solid ratio and
ammonium sulphate concentration rising, the anthocyanin yieldincreased, which was probably due to the fact that the anthocyaninmostly combined with protein and polysaccharide (Florian &Reinhold, 2004). With the liquid–solid ratio increasing, more sol-vent could enter cells and more anthocyanins could permeate intothe solvent (Prasad et al., 2009). When ammonium sulphate con-centration increased from 20% to 21.5%, the anthocyanin yieldincreasing from 70% to 85% was observed. This was probably dueto the enhanced salting-out effect. Our results were in good agree-ment with Li et al. (2010), where the 2,3-butanediol contentincreased when ammonium sulphate concentration increased.
Fig. 1(b) showed the response surface plot of the effects of pH(X4) and liquid–solid ratio (X1). The effects of pH (X4) and liquid–solid ratio (X1) were very significant (P < 0.01) to anthocyanin yield(Table 2), but the interaction between them was mainly the effectof pH value, which probably because that pH can usually changethe electrical property of assigned materials, and then influenceon the electric potential of ATPE system. With pH adding, a declinein anthocyanin yield was observed, this may be because thatanthocyanins were stable in acidic condition and higher pH canlead to the degradation of anthocyanins, which results in destroy-ing the structure (Fan, Han, Gu, & Chen, 2008). While lower pH va-lue would result in the hydrolysis of anthocyanins (Yang et al.,2008), so appropriate pH value is needed in the extraction process.
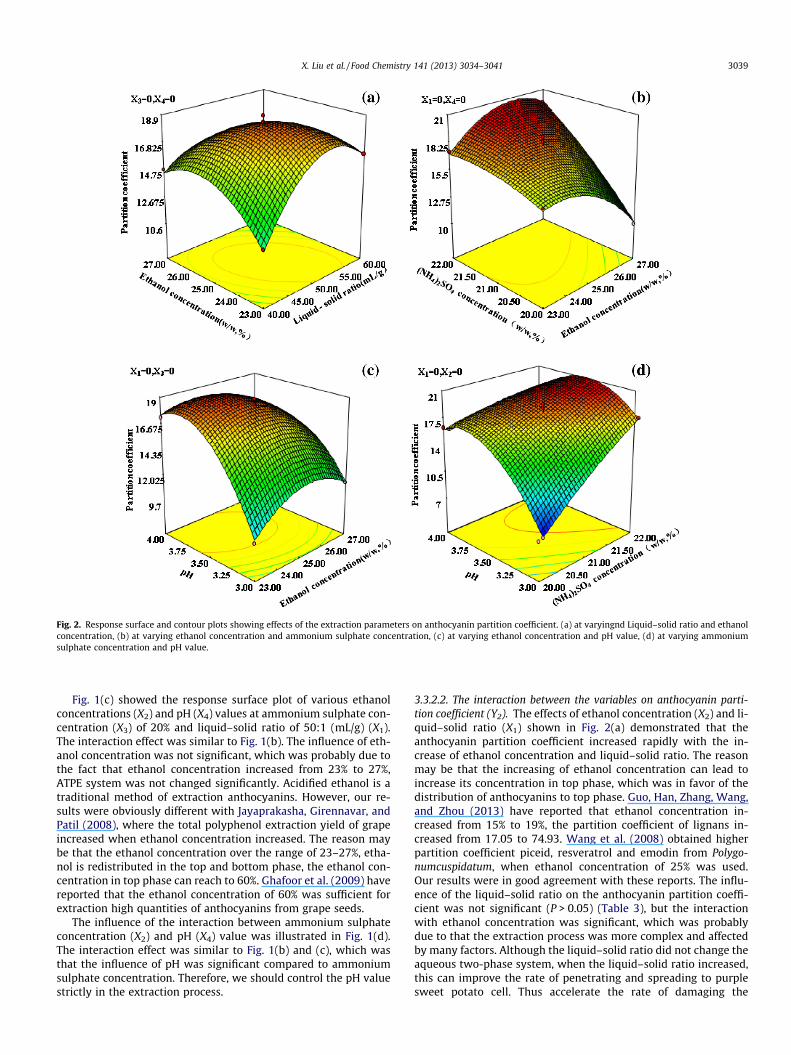
Fig. 2. Response surface and contour plots showing effects of the extraction parameters on anthocyanin partition coefficient. (a) at varyingnd Liquid–solid ratio and ethanolconcentration, (b) at varying ethanol concentration and ammonium sulphate concentration, (c) at varying ethanol concentration and pH value, (d) at varying ammoniumsulphate concentration and pH value.
X. Liu et al. / Food Chemistry 141 (2013) 3034–3041 3039
Fig. 1(c) showed the response surface plot of various ethanolconcentrations (X2) and pH (X4) values at ammonium sulphate con-centration (X3) of 20% and liquid–solid ratio of 50:1 (mL/g) (X1).The interaction effect was similar to Fig. 1(b). The influence of eth-anol concentration was not significant, which was probably due tothe fact that ethanol concentration increased from 23% to 27%,ATPE system was not changed significantly. Acidified ethanol is atraditional method of extraction anthocyanins. However, our re-sults were obviously different with Jayaprakasha, Girennavar, andPatil (2008), where the total polyphenol extraction yield of grapeincreased when ethanol concentration increased. The reason maybe that the ethanol concentration over the range of 23–27%, etha-nol is redistributed in the top and bottom phase, the ethanol con-centration in top phase can reach to 60%. Ghafoor et al. (2009) havereported that the ethanol concentration of 60% was sufficient forextraction high quantities of anthocyanins from grape seeds.
The influence of the interaction between ammonium sulphateconcentration (X2) and pH (X4) value was illustrated in Fig. 1(d).The interaction effect was similar to Fig. 1(b) and (c), which wasthat the influence of pH was significant compared to ammoniumsulphate concentration. Therefore, we should control the pH valuestrictly in the extraction process.
3.3.2.2. The interaction between the variables on anthocyanin parti-tion coefficient (Y2). The effects of ethanol concentration (X2) and li-quid–solid ratio (X1) shown in Fig. 2(a) demonstrated that theanthocyanin partition coefficient increased rapidly with the in-crease of ethanol concentration and liquid–solid ratio. The reasonmay be that the increasing of ethanol concentration can lead toincrease its concentration in top phase, which was in favor of thedistribution of anthocyanins to top phase. Guo, Han, Zhang, Wang,and Zhou (2013) have reported that ethanol concentration in-creased from 15% to 19%, the partition coefficient of lignans in-creased from 17.05 to 74.93. Wang et al. (2008) obtained higherpartition coefficient piceid, resveratrol and emodin from Polygo-numcuspidatum, when ethanol concentration of 25% was used.Our results were in good agreement with these reports. The influ-ence of the liquid–solid ratio on the anthocyanin partition coeffi-cient was not significant (P > 0.05) (Table 3), but the interactionwith ethanol concentration was significant, which was probablydue to that the extraction process was more complex and affectedby many factors. Although the liquid–solid ratio did not change theaqueous two-phase system, when the liquid–solid ratio increased,this can improve the rate of penetrating and spreading to purplesweet potato cell. Thus accelerate the rate of damaging the
Table 4Molecular structure of purple sweet potato anthocyanin identified by HPLC-ESI-MS.
Peak number tR (min) [M+] (m/z) Compounds References
1 16.02 471 Cyanidin-3-glucoside Grant & Helleur (2008)2 19.07 730 Galloyl procyanin dimer Sandhu & Gu (2010)3 21.43 907 Peonidin-3-p-hydroxybenzoyl-sophoroside-5-O-glucoside Kim et al. (2012)4 34.19 516 Peonidin-3-glucoside Grant & Helleur (2008)5 36.07 1111 Cyanidin-caffeoyl-fumaroyl-sophoroside-3-O-glucoside Harada et al. (2004)6 39.83 949 Peonidin-caffeoyl-sophoroside-3-O-glucoside Harada et al. (2004)7 43.66 1069 Peonidin-caffeoyl-hydroxybenzoyl-3-O-glucoside Harada et al. (2004)8 46.26 1125 Peonidin-caffeoyl-fumaroyl-sophoroside-3-O-glucoside Harada et al. (2004)
3040 X. Liu et al. / Food Chemistry 141 (2013) 3034–3041
hydrophobic bond and diffusing to the top phase, thereby affectedthe anthocyanin partition coefficient.
Fig. 2(b) showed the effect of ammonium sulphate concentra-tion (X3) and ethanol concentration (X2) on the anthocyanin parti-tion coefficient. The anthocyanin partition coefficient increasedfrom 13.29 to 19.05 with the increase of ammonium sulphate con-centration from 20% to 22%. This is probably due to that the ‘‘iondipole’’ between salt ions and water molecules, which can reducethe quantity of free water in bottom phase, thus crowd out ethanoland target objects to assign to top phase (Wang, Han, Xu, Hu, &Yan, 2010). Our results were consentience with Li et al. (2010),with the ammonium sulphate concentration from 20% to 28%,the partition coefficient of 2,3-butanediol increased from 4 to8.29. In a certain range, with the increase of ethanol concentration(23–26%), anthocyanin partition coefficient increased, which wasidentical to Fig. 2(a). However, with the further increase in ethanolconcentration, a decline in the partition coefficient was discovered(Fig. 2(b)). This may be because that the content of anthocyanins intop phase was closed to saturation, and the distribution in bottomphase was more than top phase, which reduced the anthocyaninpartition coefficient.
With the increase pH (3–4) (X4) and ethanol concentration(23–27%) (X2), the partition coefficient increased from 9 to 17.The impact of ethanol concentration was similar to Fig. 2(a). WhenpH changed from 3 to 4, the partition coefficient improved from9.52 to 17.46, which was possibly due to that with the decreaseof pH, anthocyanins gradually combined with H+, and weakenedthe binding force of the top phase; which lessened the partitioncoefficient. However, the increase in pH can increase the electricpotential (Rito-Palomares, 2004), while the electric potential wasproportional to partition coefficient (Cisneros, Benavides, Brenes,& Rito-Palomares, 2004), but the impact of this effect was not dom-inant. Our results were supported by the results of Wu et al. (2011)and Guo, Han, Zhang, Wang, and Zhou (2012).
Fig. 2(d) showed the effect of pH and ammonium sulphate con-centration to anthocyanin partition coefficient, and with the in-crease in ammonium sulphate concentration, the partitioncoefficient added from 7 to 18, which was resembled to Fig. 2(b)and (c).
3.3.3. Optimisation of extraction condition and results of methodvalidation
The optimum extraction condition was determined by thecanonical analysis of response surface, which predicted that theconditions of 47.34:1 liquid–solid ratio, 23.20% ethanol concentra-tion, 21.56% ammonium sulphate concentration and 3.33 pHwould lead to the maximum anthocyanin yield (Eq. (6)), and43.29:1 liquid–solid ratio, 27.00% ethanol concentration, 22.00%ammonium sulphate concentration and 3.34 pH would result inthe maximum anthocyanin partition coefficient (Eq. (7)). Accord-ing to Eqs. (6) and (7), and considering the cost and processrequirements comprehensively, we chose the best conditions for
PSPAs were 45:1 liquid–solid ratio, 25% ethanol, 22% concentrationof ammonium sulphate and pH 3.3. The verification experimentwas performed using the selected optimal conditions. The experi-mental anthocyanin yield was 90.02 ± 0.01%, and anthocyanin par-tition coefficient was 19.62 ± 0.02, which was in agreement withthe predicted value (90.12%, 19.73) using the equation; which indi-cating that the model was adequate for describing the extractionprocess.
3.4. Anthocyanins compound identification
According to the HPLC chromatogram of purple sweet potatoanthocyanins extracted by ATPE (figure not shown), a total of eightcompounds was identified by their rentention times (tR), UV-Visspectra and mass spectra as compared with reported data in theliterature (Table 4).cyanidin-caffeoyl-fumaroyl-sophoroside-3-O-glucoside (Peak 5) was the major compound followed bypeonidin-caffeoyl-hydroxybenzoyl-3-O-glucoside (Peak 7), thenpeonidin-caffeoyl-sophoroside-3-O-glucoside (Peak 6), peonidin-caffeoyl-fumaroyl-sophoroside-3-O-glucoside (Peak 8), whichcoincided with that found in previous studies (Harada, Kano,Takayanagi, Yamakawa, & Ishikawa, 2004). Peak 1 and Peak 4 cor-responded to cyanidin-3-glucoside, peonidin-3-glucoside (Grant &Helleur, 2008), respectively. Peak 3 was associated with peonidinacylated with p-hydroxybenzoic acid (Kim et al., 2012). One ofthe original contributions of our work to the purple sweet potatoextraction was the identification of Peak 2 as galloyl procyanin di-mer which was isolated from Vitisrotundifolia (Muscadine Grapes)(Sandhu & Gu, 2010) but not reported in the purple sweet potatoanthocyanins.
4. Conclusions
Response surface methodology is a useful tool for determiningthe optimal extraction conditions of anthocyanins from purplesweet potato. The optimal anthocyanin yield and partition coeffi-cient of 90.02%, 19.62 were obtained when the optimum extractionconditions of anthocyanins were as follows, 45:1 liquid–solid ratio,25% ethanol concentration, 22% ammonium sulphate concentra-tion and pH3.3. Under these conditions, the experimental yieldagreed closely with the predicted yield of 90.12% and 19.73.HPLC-ESI-MS/MS analysis results showed that the PSPAs weremainly composed of peonidins and cyanidins acidylated by caffeicacid, fumaric acid and hydroxy benzoic acid. The composition ofPSPAs was not altered obviously, which were consistent with theprevious research results of PSPAs structure. Aqueous two-phaseextraction was a mild method compared to conventional solventextraction. Meanwhile, this method can keep the original composi-tion and structure. These results demonstrated the successfulextraction of anthocyanins with aqueous two-phase extraction,providing potential benefits for industrial extraction of anthocya-nins from purple sweet potato.
X. Liu et al. / Food Chemistry 141 (2013) 3034–3041 3041
Acknowledgements
The authors gratefully acknowledge the earmarked fund for theChina Agriculture Research System (CARS-11-B-19). We also thankthe Support Plan of National Science and Technology, the Suitabil-ity Evaluation and Special Varieties Screening of Sweet Potato(2012BAD29B03-03).
References
Albertsson, P. A. (1986). Partition of cell particles and macromolecules (3rd ed.). NewYork: Wiley.
Cisneros, M., Benavides, J., Brenes, C. H., & Rito-Palomares, M. (2004). Recovery inaqueous two-phase systems of lutein produced by the green microalgaChlorella prototheeoides. Journal of Chromatography B, 807(1), 105–110.
Fan, G. J., Han, Y. B., Gu, Z. X., & Chen, D. M. (2008). Optimizing conditions foranthocyanins extraction from purple sweet potato using response surfacemethodology (RSM). LWT - Food Science and Technology, 41, 155–160.
Florian, C. S., & Reinhold, C. (2004). Functional properties of athocyaninsandbetalains in plants, food, and in human nutrition. Trends in Food Scienceand Technology, 15, 19–38.
Ghafoor, K., Choi, Y. H., Jeon, J. Y., & Jo, I. H. (2009). Optimization of ultrasound-assisted extraction of phenolic compounds, antioxidants, and anthocyaninsfrom grape (Vitisvinifera) seeds. Journal of Agriculture and Food Chemistry, 57(11),4988–4994.
Ghafoor, K., Hui, T., & Choi, Y. H. (2011). Optimization of ultrasound-assistedextraction of total anthocyanins from grape peel using response surfacemethodology. Journal of Food Biochemistry, 35, 735–746.
Grant, D. C., & Helleur, R. J. (2008). Rapid screening of anthocyanins in berry samplesby surfactant-mediated matrix-assisted laser desorption/ionization time-of-flight mass spectrometry. Rapid Communications in Mass Spectrometry, 22(2),156–164.
Gunduz, U. (2000). Partitioning of bovine serum albumin in an aqueous two-phasesystem: Optimization of partition coefficient. Journal of Chromatography B, 743,259–262.
Guo, Y. X., Han, J., Zhang, D. Y., Wang, L. H., & Zhou, L. L. (2012). An ammoniumsulfate/ethanol aqueous two-phase system combined with ultrasonication forthe separation and purification of lithospermic acid B from Salvia miltiorrhizaBunge. Ultrasonics Sonochemistry, 19(4), 719–724.
Guo, Y. X., Han, J. D., Zhang, D. Y., Wang, L. H., & Zhou, L. L. (2013). Aqueous two-phase system coupled with ultrasound for the extraction of lignans from seedsof Schisandrachinensis (turcz.) Baill. Ultrasonics Sonochemistry, 20(1), 125–132.
Harada, K., Kano, M., Takayanagi, T., Yamakawa, O., & Ishikawa, F. (2004).Absorption of acylated anthocyanins in rats and humans after ingesting anextraction of Ipomoea batatas purple sweet potato tuber. Bioscience,Biotechnology and Biochemisry, 68(7), 1500–1507.
He, J., & Giusti, M. M. (2010). Anthocyanins: Natural colorants with health-promoting properties. Food Science and Technology, 1, 163–187.
Hosseinian, F. S., Li, W. D., & Beta, T. (2008). Measurement of anthocyanins andother phytochemicals in purple wheat. Food Chemistry, 109(4), 916–924.
Hwang, Y. P., Choi, J. H., Yun, H. J., Han, E. H., Kim, H. G., Kim, J. Y., et al. (2011).Anthocyanins from purple sweet potato attenuate dimethylnitrosamine-induced liver injury in rats by inducing Nrf2-mediated antioxidant enzymesand reducing COX-2 and iNOS expression. Food and Chemical Toxicology, 49,93–99.
Jayaprakasha, G. K., Girennavar, B., & Patil, B. S. (2008). Radical scavenging activitiesof Rio Red grapefruits and sour orange fruit extracts in different in vitro modelsystems. Bioresource Technology, 99, 4484–4494.
Jiang, B., Li, Z. G., Dai, J. Y., Zhang, D. J., & Xiu, Z. L. (2009). Aqueous two-phaseextraction of 2,3-butanediol from fermentationbroths using an ethanol–phosphate system. Process Biochemistry, 44(1), 112–117.
Kano, M., Takayanagi, T., Harada, K., Makino, K., & Ishikawa, F. (2005). Antioxidativeactivity of anthocyanins from purple sweet potato, Ipomoerabatatas cultivarayamurasaki. Bioscience, Biotechnology and Biochemistry, 69(5), 979–988.
Kim, H. W., Kim, J. B., Cho, S. M., Chung, M. N., Lee, Y. M., Chu, S. M., et al. (2012).Anthocyanin changes in the Korean purple-fleshed sweet potato, Shinzami, asaffected by steaming and baking. Food Chemistry, 130(4), 966–972.
Klomklao, S., Benjakul, S., Visessanguan, W., Simpson, B. K., & Kishimura, H. (2005).Partitioning and recovery of proteinase from tuna spleen by aqueous two-phasesystems. Process Biochemistry, 40, 3061–3067.
Ku, C. S., & Mun, S. P. (2008). Optimization of the extraction of anthocyanin fromBokbunja (RubuscoreanusMiq.) marc produced during traditional wineprocessing and characterization of the extracts. Bioresource Technology, 99,8325–8330.
Lee, J., Durst, R. W., & Wrolstad, R. E. (2005). Determination of total monomericanthocyanin pigment content of fruit juices, beverages, natural colorants, andwines by the pH differential method collaborative study. Journal of AOACInternational, 88(5), 1269–1278.
Li, Z. G., Teng, H., & Xiu, Z. L. (2010). Aqueous two-phase extraction of 2,3-butanediol from fermentation broths using an ethanol/ammonium sulfatesystem. Process Biochemistry, 45(5), 731–737.
Lu, J., Wu, D. M., Zheng, Y. L., Hu, B., Cheng, W., & Zhang, Z. F. (2012). Purple sweetpotato color attenuates domoic acid-induced cognitive deficits by promotingestrogen receptor-a-mediated mitochondrial biogenesis signaling in mice. FreeRadical Biology and Medicine, 52, 646–659.
Margarita, C., Avelina, F. G., Peter, B., & Bernhard, T. (2009). Extraction ofanthocyanins from grape skins assisted by high hydrostaticpressure. Journal ofFood Engineering, 90(4), 415–421.
Montilla, E. C., Hillebrand, S., Butschbach, D., Baldermann, S., Watanabe, N., &Winterhalter, P. (2010). Preparative isolation of anthocyanins from Japanesepurple sweet potato (Ipomoea batatas L.) varieties by high-speed countercurrentchromatography. Journal of Agriculture of Food Chemistry, 58(18), 9899–9904.
Ozlem, A., Emine, B., & UIku, M. (2011). Aqueous two-phase extraction of lactic acid:Optimation by response surface methodology. Separation Science andTechnology, 46, 1164–1171.
Paula, A. J., Rosa, A. M., & Azevedo, M. (2007). Application of central compositedesign to the optimisation of aqueous two-phase extraction of humanantibodies. Journal of Chromatography A, 11(41), 50–60.
Prasad, K. N., Yang, B., Shi, J., Yu, C., Zhao, M., Xue, S., et al. (2009). Effects of highpressure on the extraction yield, total phenolic content and antioxidant activityof longan fruit pericarp. Innovative Food Science and Emerging Technologies,10(2), 155–159.
Rito-Palomares, M. (2004). Practical application of aqueous two-phase partition toprocess development for the recovery of biogical products. Journal ofChromatography B, 807(1), 3–11.
Sandhu, A. K., & Gu, L. (2010). Antioxidant capacity, phenolic content, and profilingof phenolic compounds in the seeds, skin, and pulp of Vitisrotundifolia(Muscadine Grapes) as determined by HPLC-DAD-ESI-MS(n). Journal ofAgriculture and Food Chemistry, 58, 4681–4692.
Sariburun, E., Sahin, S., Demir, C., Türkben, C., & Uylas�er, V. (2010). Phenolic contentand antioxidant activity of raspberry and blackberry cultivars. Journal of FoodScience, 4(75), C328–C335.
Sun, Y. Z., Liao, X. J., Wang, Z. F., Hu, X. S., & Chen, F. (2007). Optimization ofmicrowave-assisted extraction of anthocyanins in red raspberries andidentification of anthocyanin of extracts using high-performance liquidchromatography-mass spectrometry. European Food Research Technology,22(5), 511–523.
Wang, H., Dong, Y. S., & Xiu, Z. L. (2008). Microwave-assisted aqueous two-phaseextraction of piceid, resveratrol and emodin from Polygonumcuspidatum byethanol/ammonium sulphate systems. Biotechnology Letters, 30(12),2079–2084.
Wang, Y., Han, J., Xu, X. H., Hu, S. P., & Yan, Y. S. (2010). Partition behavior andpartition mechanism of antibiotics in ethanol/2-propanol-ammonium sulfateaqueous two-phase systems. Separation and Purifition Technology, 75(3),352–357.
Wu, X. Y., Liang, L. H., Zou, Y., Zhao, T., Zhao, J. L., Li, F., et al. (2011). Aqueous two-phase extraction, identification and antioxidant activity of anthocyanins frommulberry (MorusatropurpureaRoxb.). Food Chemistry, 129(2), 443–453.
Yang, Z. D., Fan, G. J., Gu, Z. X., Han, Y. B., & Chen, Z. G. (2008). Optimizationextraction of anthocyanins from purple corn(Zea mays L.) cob usingtristimuluscolorimetry. European Food Research and Technology, 227, 409–415.
Yang, Z. D., & Zhai, W. W. (2010). Optimization of microwave-assisted extraction ofanthocyanins from purple corn (Zea mays L.) cob and identification with HPLC-MS. Innovative Food Science and Emerging Technologies, 11(3), 470–476.
Yuan, J., Raza, W., Huang, Q., & Shen, Q. R. (2011). Quantification of the antifungallipopeptide iturin A by high performance liquid chromatography coupled withaqueous two-phase extraction. Journal of Chromatography B, 879, 2746–2750.
Zhang, Z. F., Fan, S. H., Zheng, Y. L., Lu, J., Wu, D. M., Shan, Q., et al. (2009). Purplesweet potato color attenuates oxidative stress and inflammatory responseinduced by D-galactose in mouse liver. Food and Chemical Toxicology, 47,496–501.
Top Related
Copyright © 2022 FDOKUMEN

