


Bahasa
Halaman
Hukum

Acta Astronautica 60 (2007) 899–905www.elsevier.com/locate/actaastro
On the utilization of ENVISATAATSR data forgeological/hydrological applicationsT.J. Majumdar∗, R. Bhattacharyya, S. Chatterjee
Earth Sciences and Hydrology Division, Marine and Earth Sciences Group, Remote Sensing Applications & Image Processing Area,Space Applications Centre (ISRO), Ahmedabad 380 015, India
Received 28 February 2006; accepted 15 November 2006Available online 4 January 2007
Abstract
ENVISAT AATSR data over the Indian subcontinent have been procured from ESA and preprocessed with DESCW andBEAM 2.2 software for extraction of our area of interest. Two intensive test sites have been chosen, including a part of theHimalayan region and the Sundarban Delta. Calibration of AATSR thermal IR data for surface temperature modelling has beenattempted over the Sundarban Delta region. Later, the surface temperature maps have been utilized to generate the momentaryand daily evapotranspiration patterns over the area of interest which have been further used for broad land use/crop classifications.A simplified model suggested by Soer [Estimation of regional evapotranspiration and soil moisture conditions using remotelysensed crop surface temperatures, Remote Sensing of Environment 9 (1980) 27–45] has been used to estimate evapotranspirationover the area of interest. The results match with the earlier observation in this region. Further processing of AATSR data hasbeen performed over the Himalayan region to extract two minor faults across the main thrust belts.© 2006 Elsevier Ltd. All rights reserved.
Keywords: ENVISAT AATSR; Calibration; Surface temperature; Evapotranspiration modelling; Sundarban Delta; Bhutan Himalaya; Majorand minor faults
1. Introduction
Advanced Along Track Scanning Radiometer(AATSR) on-board ENVISAT-1 satellite senses bothvisible and infrared energy of the earth. These datacan be used to generate the surface albedo and surfacetemperature which are essential for the estimation ofevaporation of a particular region of interest. Crop sur-face temperature gives information on the evaporationrate and on soil moisture conditions [1]. Estimationof evaporation on a regional scale is useful in variousways. Firstly, latent heat of evaporation is used for
∗ Corresponding author. Tel.: +91 079 2691 4304;fax: +91 079 2691 5825.
E-mail address: [email protected] (T.J. Majumdar).
0094-5765/$ - see front matter © 2006 Elsevier Ltd. All rights reserved.doi:10.1016/j.actaastro.2006.11.006
solving energy balance equations and has implicationsin micrometeorological and agroclimatological studies.Secondly, it is useful in hydrology for estimation ofwater balances. ENVISAT AATSR data have also beenused in forest fire mapping over a part of Mizoram,India [2].
Several authors have used different models for esti-mation of daily evapotranspiration. Soer [1] has usedTergra simulation model to generate an overall estimateof evapotranspiration where crop surface temperatureand soil moisture pressure are used as input param-eters. Price [3] has used HCMM data for estimationof regional ET over USA. Caselles and Delegido [4]have generated a simple model for estimation of dailyevaporation using satellite-derived temperature valuesand albedo images. Similar attempts are also made by
900 T.J. Majumdar et al. / Acta Astronautica 60 (2007) 899–905
Camillo et al. [5], Rambal et al. [6], Serafini [7], andothers.
There are other processes of estimation of ET byhydrological methods [8]. Probably it is too tediousand costly approach to make an attempt of regionalestimation of ET by the hydrological methods becauseof non-availability of different data sets in differenthydrologically uniform sub-areas. The measurementof regional ET by remote sensing method has becomesimpler because of the availability of surface temper-ature and albedo information over the areas of interest[1,9]. A simplified model is used for the derivation ofsurface temperatures on various land-based features[10–12]. This work has been carried out as a part of thejoint ISRO–ESA Project for utilization of ENVISAT-1AATSR data [13].
2. Objectives
Surface temperature modelling using thermal infrared(TIR) radiations can be quite useful in demarcatingthermal anomalous zones over the Indian landmass.The study can be supported by ground-based measure-ments for physical validation of AATSR sensors. Sur-face temperature modelling over a part of Bakreswar,
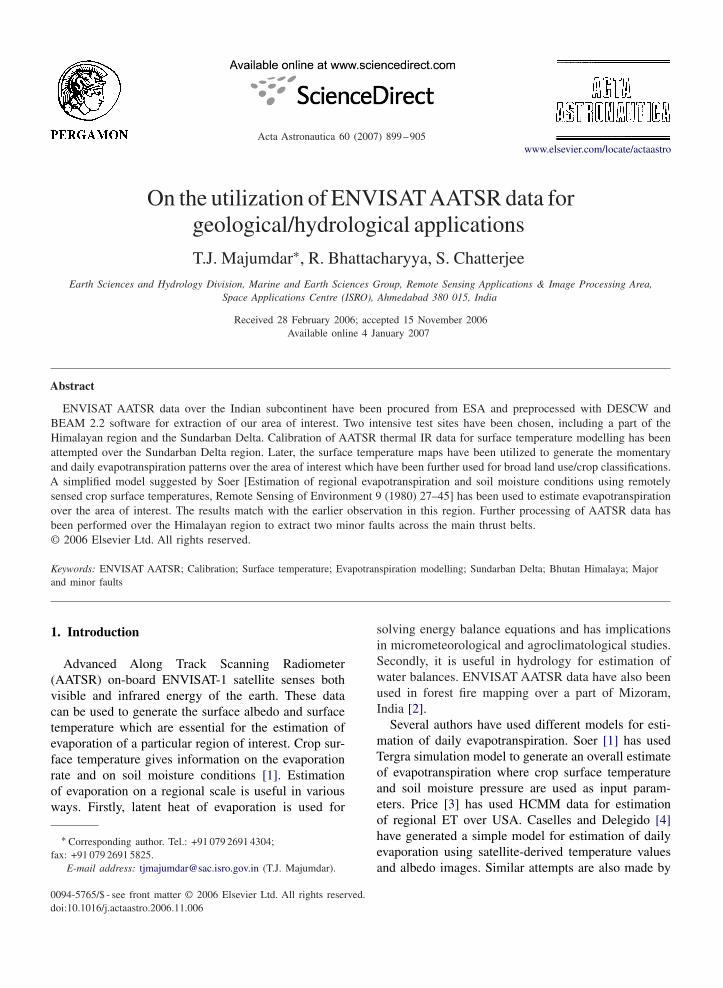
Fig. 1. (Color online) Surface temperature image over the study area as generated using AATSR data.
West Bengal, India, has already been attempted byMajumdar and Mohanty [11] using MOS-1 VTIR dataand split-window channel computation technique. Also,Majumdar and Bhattacharya [10] have used INSATVHRR data for derivation of land surface temperaturesover India after due correction for atmospheric watervapor. Coll et al. [14] have recently given a simplifiedmodel for surface temperature estimation from EN-VISAT AATSR data over land. Major study includes:(a) estimation of land surface temperature after due cor-rection for atmospheric parameters using TIR data withstandard models [15], (b) comparison and physical veri-fication/validation of the sensors (AATSR), and (c) gen-eration of momentary and daily evapotranspiration mapsover the Sundarban Delta region using AATSR data.
In addition, AATSR TIR daytime data have been uti-lized to extract the major geological features/anomaliesover a part of the Himalayan region.
3. Data sources and the area of interest
ENVISAT AATSR data over Sundarban region,India Orbit: 8832, (Local time 0945 h IST) as collectedon November 8, 2003 have been used in this study.Fig. 1 shows the surface temperature image over the
T.J. Majumdar et al. / Acta Astronautica 60 (2007) 899–905 901
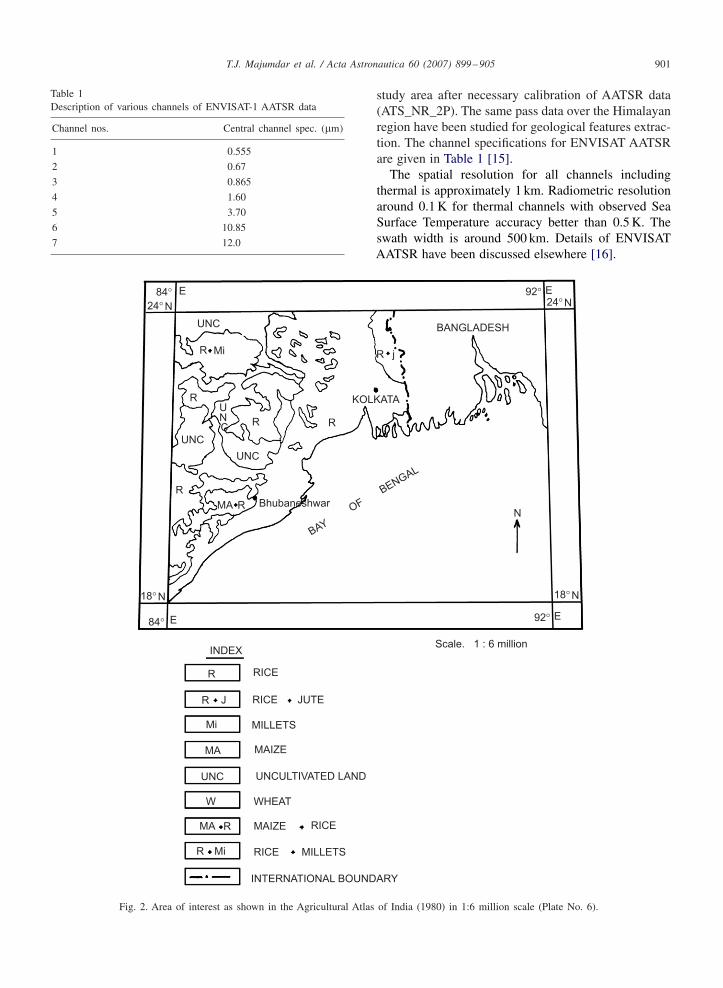
Table 1Description of various channels of ENVISAT-1 AATSR data
Channel nos. Central channel spec. (�m)
1 0.555
2 0.67
3 0.865
4 1.60
5 3.70
6 10.85
7 12.0
84°24° N
E 92°24° NE
92°
18° N18° N
84° E
INDEX
RICE
Scale. 1 : 6 million
RICE
RICE
RICE JUTE
MILLETS
MILLETS
INTERNATIONAL BOUNDARY
MAIZE
MAIZE
UNCULTIVATED LAND
WHEAT
E
UNC
R
R
R R
BhubaneshwarMAN
R
BANGLADESH
KOLKATA
BAY
OF
BENGAL
j
R
R
Mi
R
Mi
MA
UNC
W
R
R
MA
Mi
R J
UNC
UNC
UNC
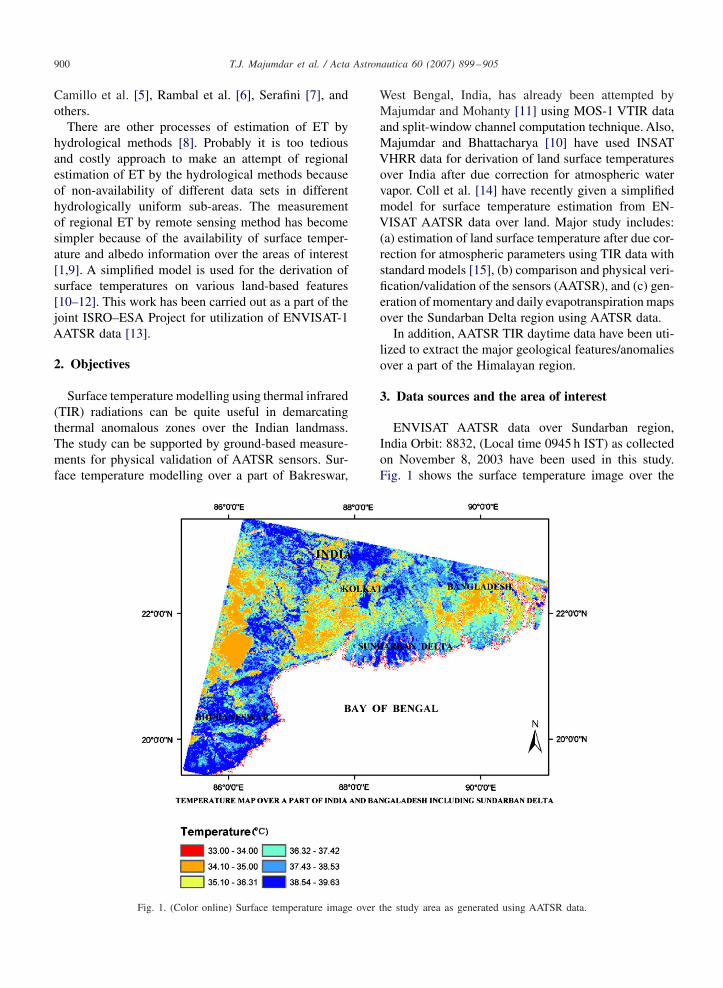
Fig. 2. Area of interest as shown in the Agricultural Atlas of India (1980) in 1:6 million scale (Plate No. 6).
study area after necessary calibration of AATSR data(ATS_NR_2P). The same pass data over the Himalayanregion have been studied for geological features extrac-tion. The channel specifications for ENVISAT AATSRare given in Table 1 [15].
The spatial resolution for all channels includingthermal is approximately 1 km. Radiometric resolutionaround 0.1 K for thermal channels with observed SeaSurface Temperature accuracy better than 0.5 K. Theswath width is around 500 km. Details of ENVISATAATSR have been discussed elsewhere [16].
902 T.J. Majumdar et al. / Acta Astronautica 60 (2007) 899–905
Fig. 2 is the area of interest as shown in a map inapproximately at 1:6 million scale. The area of inter-est includes Sundarban forest, Gangetic bay, Kolkataand Bhubaneswar cities, the Ganges river, and a part ofBangladesh, etc. The corresponding meteorological dataand agricultural information are obtained from WeatherBulletin [17] and Agricultural Atlas of India [18].
4. Theory
Validation of surface temperature data has been per-formed using data from IMD Weather Bulletin [17].Maximum temperature as obtained from Weather Bul-letin over Kolkata and Bhubaneswar cities is 32 ◦C,whereas temperatures as obtained after calibration ofAATSR surface temperatures are 34.35 ◦ and 36.37 ◦C,respectively. However, two important points to be keptin mind: firstly, the maximum temperature in a diurnalcycle occurs near 1400 h IST (Indian Standard Time)whereas the AATSR pass is around 1000 h IST. Sec-ondly, what IMD (India Meteorological Department)observes is the ambient air temperature near surfacewhereas AATSR TIR sensor directly measures the skintemperature on the surface and at times there is a dif-ference of around ±6.8 ◦C during these observationsin the peak hours of the day [10]. Environmental con-ditions were just normal during the AATSR pass withcloud-free sky over the Gangetic West Bengal andOrissa.
The Energy Budget Equation at the surface may begiven as [1]
R + G + H + LE = 0 (1)
where R is the net radiation flux (W/m2), G is the heatflux into the soil (W/m2), H is the sensible heat flux(W/m2) and LE is the latent heat flux (W/m2) whichis the energy equivalent of the evapotranspiration flux E
(kg/m2/s). Details of all the parameters are discussedelsewhere [1,3,19–21].
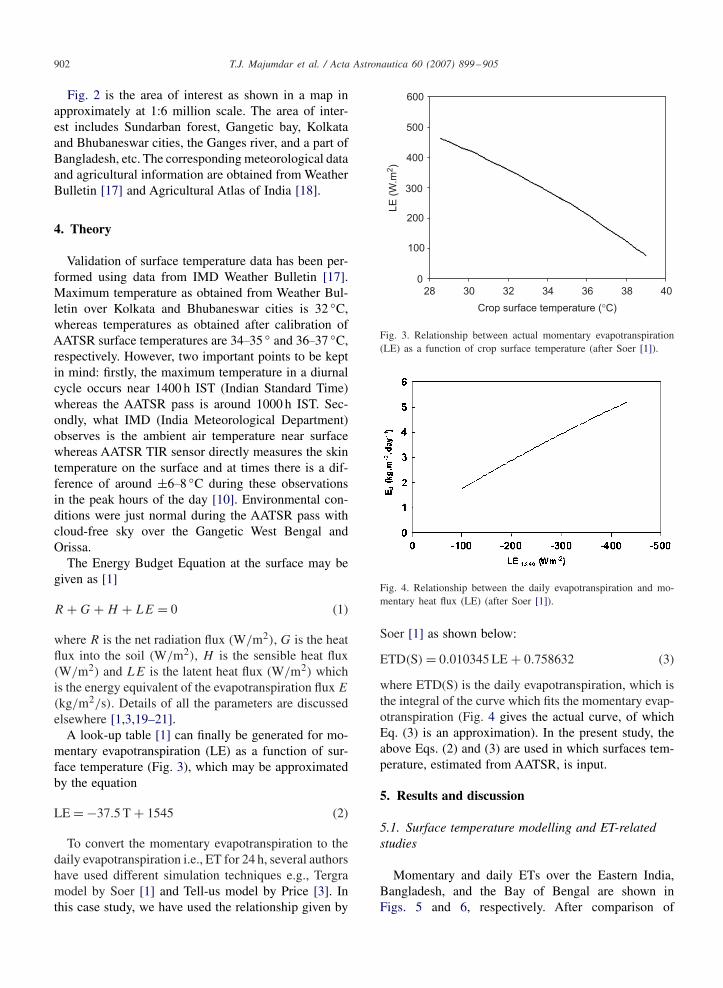
A look-up table [1] can finally be generated for mo-mentary evapotranspiration (LE) as a function of sur-face temperature (Fig. 3), which may be approximatedby the equation
LE = −37.5 T + 1545 (2)
To convert the momentary evapotranspiration to thedaily evapotranspiration i.e., ET for 24 h, several authorshave used different simulation techniques e.g., Tergramodel by Soer [1] and Tell-us model by Price [3]. Inthis case study, we have used the relationship given by
600
500
400
300
200
100
028 30 32
Crop surface temperature (°C)
34 36 38 40
LE
(W
.m2)
Fig. 3. Relationship between actual momentary evapotranspiration(LE) as a function of crop surface temperature (after Soer [1]).
Fig. 4. Relationship between the daily evapotranspiration and mo-mentary heat flux (LE) (after Soer [1]).
Soer [1] as shown below:
ETD(S) = 0.010345 LE + 0.758632 (3)
where ETD(S) is the daily evapotranspiration, which isthe integral of the curve which fits the momentary evap-otranspiration (Fig. 4 gives the actual curve, of whichEq. (3) is an approximation). In the present study, theabove Eqs. (2) and (3) are used in which surfaces tem-perature, estimated from AATSR, is input.
5. Results and discussion
5.1. Surface temperature modelling and ET-relatedstudies
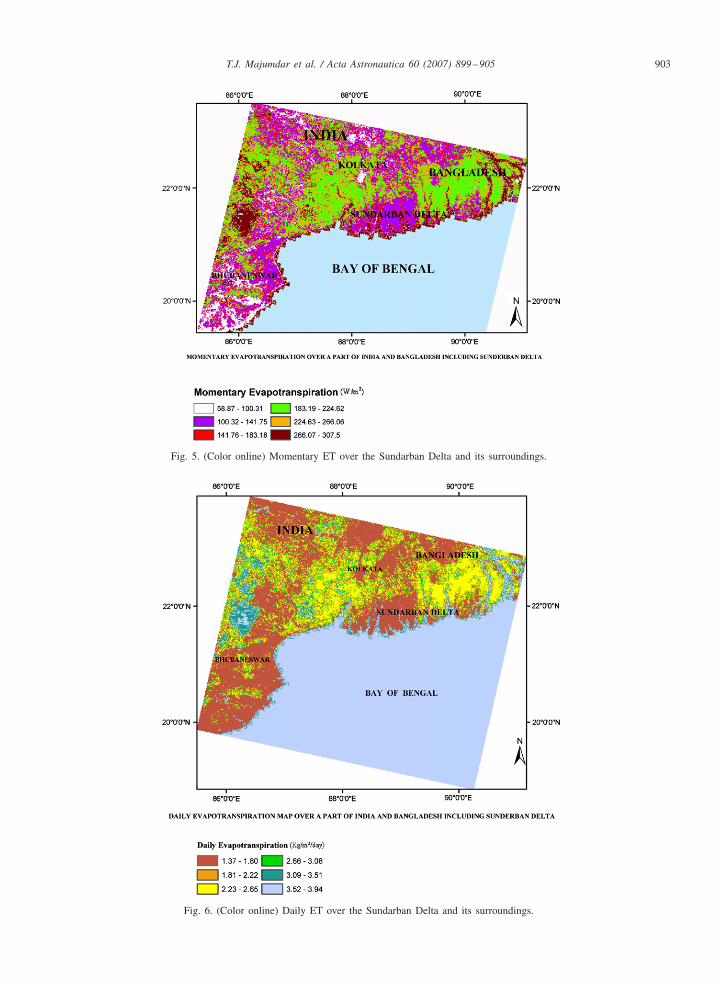
Momentary and daily ETs over the Eastern India,Bangladesh, and the Bay of Bengal are shown inFigs. 5 and 6, respectively. After comparison of
T.J. Majumdar et al. / Acta Astronautica 60 (2007) 899–905 903
Fig. 5. (Color online) Momentary ET over the Sundarban Delta and its surroundings.
Fig. 6. (Color online) Daily ET over the Sundarban Delta and its surroundings.
904 T.J. Majumdar et al. / Acta Astronautica 60 (2007) 899–905
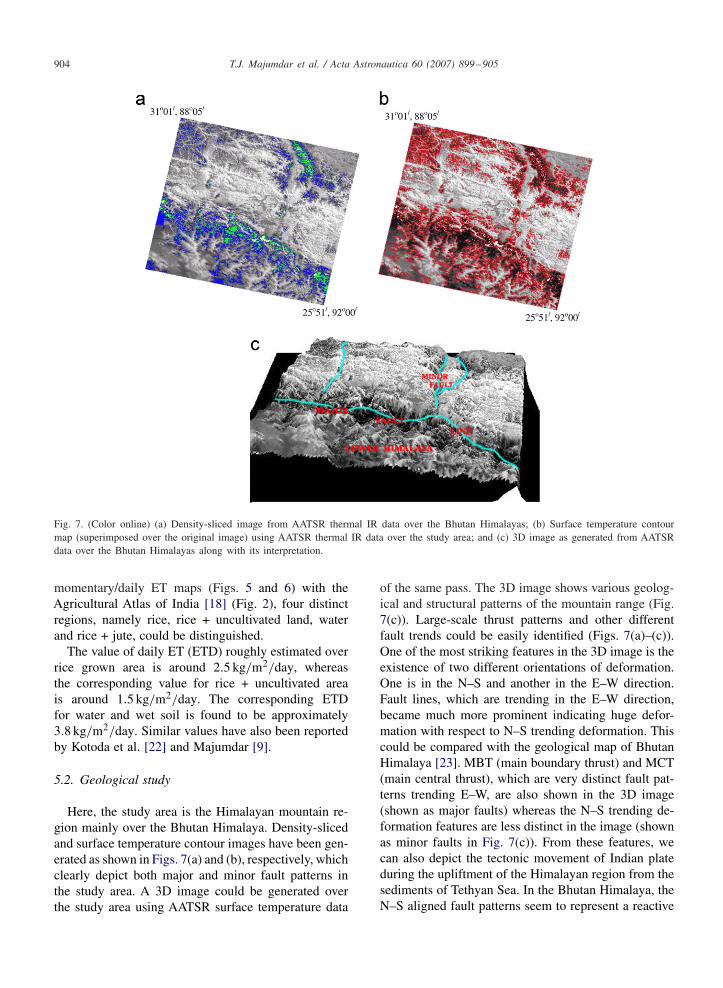
Fig. 7. (Color online) (a) Density-sliced image from AATSR thermal IR data over the Bhutan Himalayas; (b) Surface temperature contourmap (superimposed over the original image) using AATSR thermal IR data over the study area; and (c) 3D image as generated from AATSRdata over the Bhutan Himalayas along with its interpretation.
momentary/daily ET maps (Figs. 5 and 6) with theAgricultural Atlas of India [18] (Fig. 2), four distinctregions, namely rice, rice + uncultivated land, waterand rice + jute, could be distinguished.
The value of daily ET (ETD) roughly estimated overrice grown area is around 2.5 kg/m2/day, whereasthe corresponding value for rice + uncultivated areais around 1.5 kg/m2/day. The corresponding ETDfor water and wet soil is found to be approximately3.8 kg/m2/day. Similar values have also been reportedby Kotoda et al. [22] and Majumdar [9].
5.2. Geological study
Here, the study area is the Himalayan mountain re-gion mainly over the Bhutan Himalaya. Density-slicedand surface temperature contour images have been gen-erated as shown in Figs. 7(a) and (b), respectively, whichclearly depict both major and minor fault patterns inthe study area. A 3D image could be generated overthe study area using AATSR surface temperature data
of the same pass. The 3D image shows various geolog-ical and structural patterns of the mountain range (Fig.7(c)). Large-scale thrust patterns and other differentfault trends could be easily identified (Figs. 7(a)–(c)).One of the most striking features in the 3D image is theexistence of two different orientations of deformation.One is in the N–S and another in the E–W direction.Fault lines, which are trending in the E–W direction,became much more prominent indicating huge defor-mation with respect to N–S trending deformation. Thiscould be compared with the geological map of BhutanHimalaya [23]. MBT (main boundary thrust) and MCT(main central thrust), which are very distinct fault pat-terns trending E–W, are also shown in the 3D image(shown as major faults) whereas the N–S trending de-formation features are less distinct in the image (shownas minor faults in Fig. 7(c)). From these features, wecan also depict the tectonic movement of Indian plateduring the upliftment of the Himalayan region from thesediments of Tethyan Sea. In the Bhutan Himalaya, theN–S aligned fault patterns seem to represent a reactive
T.J. Majumdar et al. / Acta Astronautica 60 (2007) 899–905 905
old structural grain of the Indian shield. On the new tec-tonic map of China (1:4,000,000) published in 1979, themarked N–S directed fault and fracture belt just to theNE of Bhutan is shown to be seismically active with alarge earthquake in 1941 [23]. Since the region is struc-turally very complex and difficult to study by field ob-servations, AATSR images have been found useful toexplore the tectonic and the structural patterns over thisHimalayan region.
6. Conclusions
ENVISAT AATSR data have been processed and uti-lized to generate a surface temperature map over a partof the Sundarban Delta and its surrounding region. Thesurface temperature map has, in turn, been utilized togenerate the momentary and ETD maps over the area ofinterest using Soer [1] model. Comparison of ET mapsas obtained from AATSR data shows similarity with theearlier results and could classify few land cover/majorcrop classes. In addition, AATSR data utilization overa part of the Himalayas could detect two major crossfaults across the main Himalayan thrust belt which de-serves further attention.
Acknowledgments
The authors are thankful to Dr. R.R. Navalgund, Di-rector, SAC, Dr. K.L. Majumder, Dy. Director, RESIPAand Dr. Ajai, Group Director, MESG for their keen in-terest in this study. They are also thankful to ESA forsupply of ENVISAT AATSR data over the Indian sub-continent and its surroundings and the related softwarefor data preprocessing.
References
[1] J.R. Soer, Estimation of regional evapotranspiration andsoil moisture conditions using remotely sensed crop surfacetemperatures, Remote Sensing of Environment 9 (1980) 27–45.
[2] K.V.S. Badarinath, K. Madhavi Latha, T.R. Kiran Chand, Forestfires monitoring using ENVISAT AATSR data, Photonirvachak(Journal of the Indian Society of Remote Sensing) 32 (2004)317–322.
[3] J.C. Price, Estimation of regional scale evapotranspirationthrough analysis of satellite thermal infrared data, IEEETransactions on Geoscience and Remote Sensing GE-20 (1982)286–292.
[4] V. Caselles, J. Delegido, A simple model to estimate the dailyvalue of the regional maximum evapotranspiration from satellitetemperature and albedo images, International Journal of RemoteSensing 8 (1987) 1151–1162.
[5] P.J. Camillo, R.J. Gurney, T.J. Schmugge, A soil andatmospheric boundary layer model for evapotranspiration and
soil moisture studies, Water Resources Research 19 (1983)371–380.
[6] S. Rambal, B. Lacaze, H. Mazurek, G. Debussche,Comparison of hydrologically simulated and remotely sensedactual evapotranspiration from some Mediterranean vegetationformations, International Journal of Remote Sensing 6 (1985)1475–1481.
[7] Y.V. Serafini, Estimation of the evapotranspiration using surfaceand satellite data, International Journal of Remote Sensing 8(1987) 1547–1562.
[8] C.T. Haan, H.P. Johnson, D.L. Brakensick, HydrologicModeling of Small Watersheds, American Society ofAgricultural Engineers Publishers, 1982, p. 533.
[9] T.J. Majumdar, Regional mapping of evapotranspiration ratesusing MOS-1 VTIR data, ITC Journal 2 (1991) 86–89.
[10] T.J. Majumdar, B.B. Bhattacharya, Derivation of surfacetemperature on land after correction due to atmospheric watervapor—a case study with INSAT VHRR data, Remote Sensingof Environment 26 (1988) 185–191.
[11] T.J. Majumdar, K.K. Mohanty, Derivation of land surfacetemperatures from MOS-1 VTIR data using split-windowchannel computation technique, International Journal of RemoteSensing 19 (1998) 287–294.
[12] T.J. Majumdar, Regional thermal inertia mapping over theIndian subcontinent using INSAT-1D VHRR data and itspossible geological applications, International Journal ofRemote Sensing 24 (2003) 2207–2220.
[13] ENVISAT AO, Estimation of land surface temperatures/validation of AATSR sensors and generation of temporalevapotranspiration maps over the Indian landmass, ENVISATAO ID-885, 1999, p. 9.
[14] C. Coll, V. Caselles, J.M. Galve, E. Valor, R. Niclo‘s, J.M.Sanchez, R. Rivas, Ground measurements for the validation ofland surface temperatures derived from AATSR and MODISdata, Remote Sensing of Environment 97 (2005) 288–300.
[15] F. Becker, The impact of spectral emissivity on the measurementof land surface temperature from a satellite, InternationalJournal of Remote Sensing 8 (1987) 1509–1522.
[16] European Space Agency, ENVISAT-1: Mission & SystemSummary, The Netherlands, 1998, p. 84.
[17] Weather Bulletin, India Meteorological Department, New Delhi,2003.
[18] Agricultural Atlas of India, Plate No. 6, National Atlas andThematic Mapping Organisation, Department of Science &Technology, Government of India, Calcutta, 1980.
[19] A.B. Kahle, A simple thermal model of the Earth’s surface forgeologic mapping by remote sensing, Journal of GeophysicalResearch 82 (1977) 1673–1680.
[20] A.P. Cracknell, Y. Xue, Estimation of ground heat fluxusing AVHRR data from advanced thermal inertia model,International Journal of Remote Sensing 17 (3) (1996)637–642.
[21] P. Nasipuri, D.S. Mitra, T.J. Majumdar, Generation of thermalinertia image over a part of Gujarat: a new tool for geologicalmapping, International Journal of Applied Earth Observationand Geoinformation 7 (2005) 129–139.
[22] K. Kotoda, S. Nakagawa, K. Kai, M.M. Yoshino, K. Takeda, K.Seki, Applications of equilibrium evaporation model to estimateevapotranspiration by remote sensing technique, in: RemoteSensing of Snow and Evapotranspiration, NASA ConferencePublication 2363, 1983, pp. 115–127.
[23] A. Gansser, Geology of the Bhutan Himalaya, Birkhauser VerlagSwitzerland, 1983, p. 181.
Top Related
Copyright © 2022 FDOKUMEN

