


Bahasa
Halaman
Hukum

LUND UNIVERSITY
PO Box 117221 00 Lund+46 46-222 00 00
Institutional Repository of Lund UniversityFound at http://lup.lub.lu.se
http://dx.doi.org/10.1007/s11051-013-2052-0
1
Nano-objects emitted during maintenance of common particle generators
– Direct chemical characterization with aerosol mass spectrometry and
implications for risk assessments
Patrik T. Nilsson1*
, Christina Isaxon1, Axel C. Eriksson
2, Maria E. Messing
3,4, Linus
Ludvigsson1,3
, Jenny Rissler
1, Maria Hedmer
5, Håkan Tinnerberg
5, Anders Gudmundsson
1, Knut
Deppert3, Mats Bohgard
1 and Joakim H. Pagels
1
1Ergonomics and Aerosol Technology, Lund University, P.O. Box 118, SE-22100, Lund, Sweden
2Nuclear Physics, Lund University, P.O. Box 118 SE 22100, Lund Sweden
3Solid State Physics, Lund University, P.O. Box 118, SE-22100, Lund, Sweden
4Synchrotron Radiation Research, Lund University, P.O. Box 118, SE-22100, Lund, Sweden
5Division of Occupational and Environmental Medicine, Department of Laboratory Medicine,
Lund University, P.O. Box 118, SE-22100, Lund, Sweden
*Corresponding author email: [email protected]
Keywords: engineered nanoparticles, occupational, risk, dosimetry, AMS, emission
2
Abstract
Nanotechnology gives us materials with enhanced or completely new properties. At the same time inhalation of
manufactured nano-objects has been related to an array of adverse biological effects. We characterized particle
emissions, which occurred during maintenance of common metal nanoparticle generators and contrasted the
properties of the emitted particles with those originally produced by the generators. A new approach using online
aerosol mass spectrometry, for time and size resolved measurements of the particle chemical composition, was
applied in combination with more conventional techniques for particle sampling and analysis, including electron
microscopy. Emissions during maintenance work, in terms of mass and surface area concentration in the size range
of 0.02-10 µm, were dominated by large agglomerates (1-5 µm). With aerosol mass spectrometry we show that the
particle composition depends on both generator type and maintenance task being performed and that the instrument
can be used for highly time resolved selective studies of metal nanoparticle emissions. The emitted agglomerates
have a relatively high probability to be deposited in the lower respiratory tract, since the mean particle diameter
coincided with a peak in the lung deposition curve. Each of these agglomerates consisted of a very high number (103-
105 /agglomerate) of nanometer sized primary particles originating from the particle synthesis process. This made
them possess large surface areas, one of the key properties in nanotoxicology. Similar agglomerates may be emitted
in a wide range of processes when nanoparticles are manufactured or handled. The fate of such agglomerates, once
deposited in the respiratory tract, is unknown and should therefore be considered in future particle toxicological
studies. Our results highlight the importance of including micrometer sized particles in exposure and emission
assessments.
Introduction
In line with an increased production and usage of nanoparticles the risk for unintentional human exposure to
manufactured nano-objects (MNOs) may arise (Abbott and Maynard 2010). Compared to materials in bulk form,
particles in the nanometer size range often exhibit enhanced properties in terms of for instance mechanical strength,
conductivity and reactivity (Alvarez et al. 2009; Lee et al. 2010). These factors make nanoparticles possess huge
technological and economical potentials, but may also result in new health risks for workers and end users. Because
of the changed particle properties in the nanometer-size range it is argued that other characteristics than those
3
conventionally used in occupational hygiene (e.g. respirable particle mass concentration) would be better metrics to
use in inhalation exposure assessments (Abbott and Maynard 2010). For nanoparticles the dose of more biological
relevant properties, like reactivity and particle surface area, can be high even when the concentration in terms of
mass is relatively low (Abbott and Maynard 2010; Rivera Gil et al. 2010). With a fast growing industry, producing
and developing nanomaterials, the research covering possible exposures and effects of MNOs should with care
follow the development of novel materials containing nanoparticles (Seaton and Donaldson 2005; Stebounova et al.
2012).
Exposure to MNOs can occur anytime during the life cycle of the particles, or of the material that incorporates the
particles. Workers, e.g. technicians and researchers, are probably those that are at the highest risk for inhalation of
MNOs (Woskie 2010). They come in contact with both new products, that are being developed, and products that
already exist in commercial manufacturing but where potential health effects are not fully known. Several studies
have identified emissions of nanoparticles to air during production or handling of MNOs (Demou et al. 2009; Park et
al. 2009b; Johnson et al. 2010; Tsai et al. 2011; Koivisto et al. 2012a). Many of the previous studies regarding
emissions and potential exposure to particles formed in different workplaces, as summarized by Kuhlbusch et al.
(2011) focus on particles below 1 µm. Maintenance and cleaning of nanoparticle generators and production
equipment may be an important source of MNOs since such emissions often are difficult to control because they
often have to take place outside any enclosed environment. Large agglomerates (>1 µm) with nanosized structures
have been observed during mechanical cleaning or processing of engineered nanomaterials (Bello et al. 2009; Peters
et al. 2009; Koivisto et al. 2012b; Zimmermann et al. 2012). A deeper discussion regarding lung deposition and the
fate of emitted nanoparticles in the respiratory tract is to a large extent absent but is covered by Koivisto et al.
(2012a); (2012b) through calculations of deposited dose. The fate of particles that have deposited in the respiratory
system can be expected to depend on several factors including particle size, morphology, surface chemistry and
protein corona formation. Some particles may enter the bloodstream and translocate to other organs (Oberdorster et
al. 2004; Elder et al. 2006) or de-agglomerate in the lung fluid (Bohgard et al. 1979; Wong et al. 2009).
New measurement techniques to assess exposures and emissions to air are needed to be able to follow the growing
production of nanoparticles. Data from such measurements can together with toxicological studies be applied to
identify and assess the risks in different types of occupational environments (Maynard et al. 2006; Park et al. 2009a;
4
Biskos and Schmidt-Ott 2012). Often portable and easy-to-use instruments are emphasized for exposure assessments
(Asbach et al. 2012) but the relationship between MNO characteristics and instrument responses is not well
established, especially when it comes to fibers and agglomerates (Dahm et al. 2012). With the nanoparticle emission
assessment technique (NEAT), as described and put to practice by Methner et al. (2010a); (2010b), a condensation
particle counter (CPC) in combination with an optical particle counter (OPC) is used in a first stage to identify
possible sources of nanoparticle emissions. Once processes or locations where emissions occur are identified, off-
line filter measurements are carried out. To fully understand different exposure situations, and to identify more
relevant exposure metrics, more complex instruments are however required (Abbott and Maynard 2010). Emissions
of potentially harmful particles may for instance occur at concentrations below the background concentration.
Common size or time resolved direct reading particle monitors, like CPCs, OPCs and Scanning mobility particle
sizers (SMPS) may in such cases be troublesome to use for identification of particle emissions. Time-resolved on-
line chemical analysis would resolve many of the problems with background particles and non-MNO emissions as it
would allow selective studies of emissions of materials used in the process. Aerosol mass spectrometry (AMS) has
evolved to a powerful tool within atmospheric research (Jimenez et al. 2003; Canagaratna et al. 2007) and this
technique may also be implemented within nanotechnology. Aerosol MS techniques are the only option when it
comes to characterizing airborne particles in terms of both size and chemical content online and it may be an ideal
instrument for detailed characterization of workplace exposures (Kuhlbusch et al. 2011). Another possible
application is direct analysis of for instance purity, in terms of coatings and oxidation degree, of synthesized
nanoparticles while they are still airborne. The introduction of a laser vaporization technique in the AMS system
further broadens the field of applications as it gives a possibility to detect soot and metal containing particles (Cross
et al. 2012; Onasch et al. 2012).
The aim with this work was to identify and characterize particle emissions during maintenance work of commonly
used particle generators. Measurement techniques, ranging from handheld devices to a state-of-the-art aerosol mass
spectrometer, were used to characterize the emissions of airborne MNO particles. Time-integrated filter sampling
was carried out to collect MNOs for scanning electron microscopy (SEM) analysis and to serve as a basis for
discussion. We contrast the nanometer sized “as-produced” particles with the particles emitted during maintenance
of the particle generators and discuss the important contribution of large agglomerates regarding total particle surface
5
area concentration. The emission measurements presented can contribute to increase general awareness that
emissions of potentially hazardous particles may occur during maintenance of particle synthesis equipment.
Methods
Nanoparticle generator system and maintenance procedure
Emission measurements were carried out during maintenance of a setup (Messing et al. 2012) that consists of two
generators, a spark discharge generator (SDG) and a high temperature furnace (HT). Downstream both generators a
sintering furnace and a differential mobility analyzer (DMA) are used for particle processing and particle size
selection, respectively. A schematic of the setup being maintained is given in Fig. S1. The spark discharge generator
(GFG 1000, Palas) consists of a chamber that houses two electrodes and an electric circuit to control a spark in
between the electrodes. The material of the electrodes determines the base material of the particles generated. The
SDG aerosol particle synthesizing system is described in detail by Messing et al. (2009). In a HT furnace particles
are produced by placing the desired particle material in a crucible inside a graphite tube and by heating the material
to a desired temperature. When this temperature is reached, material evaporates and particles are formed by
subsequent nucleation and condensation as the temperature decreases downstream the furnace. The particles
produced by the generators are aggregates and the sintering furnace is used in the system to make the particles
compact. In most cases a sintering process gives near spherical particles but can in some cases lead to hexagonal or
cubic like shapes. Applications of sintered metal particles, synthesized with the described generator system, includes
for instance nanowire production in the gas-phase using aerotaxy (Heurlin et al. 2012). A DMA is included in the
system downstream the sintering furnace. A DMA is a common instrument in aerosol science, used to select particles
of a given mobility diameter.
The whole particle generator setup was placed in a ventilated cabinet in a clean room laboratory (ISO 7). The
dimension of the clean room was 6×3×3 m and was ventilated with an air exchange rate of 37 h-1
. The ventilated
cabinet had the dimensions 2.2×1×2 m and was connected to an exhaust fan with a total exhaust rate of 1000 m3/h,
giving an air exchange rate of 227 h-1
in the cabinet. The maintenance of the particle generator setup was carried out
by dismantling every part of the system one at a time in the order given in Table 1. The cleaning of the SDG, the HT
and the tubing upstream and downstream the generators was carried out inside the open cabinet in which the system
was placed. Cleaning of the DMA was performed outside the cabinet. All procedures were manually performed.
6
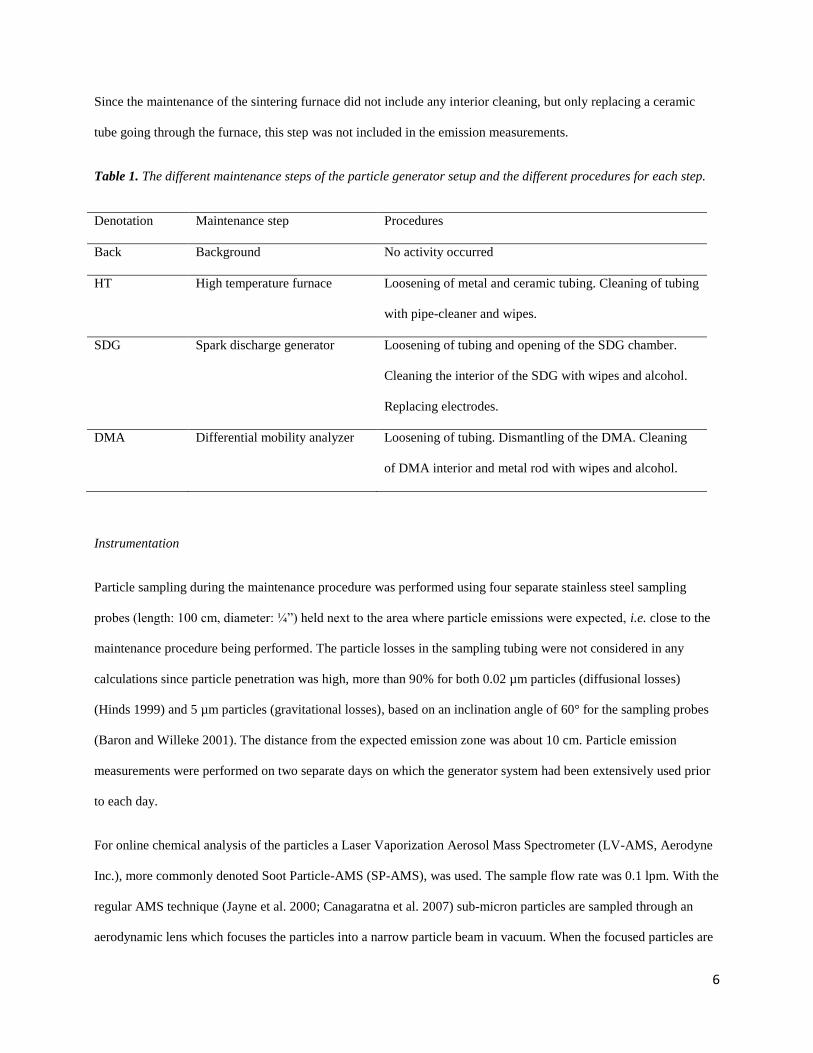
Since the maintenance of the sintering furnace did not include any interior cleaning, but only replacing a ceramic
tube going through the furnace, this step was not included in the emission measurements.
Table 1. The different maintenance steps of the particle generator setup and the different procedures for each step.
Denotation Maintenance step Procedures
Back Background No activity occurred
HT High temperature furnace Loosening of metal and ceramic tubing. Cleaning of tubing
with pipe-cleaner and wipes.
SDG Spark discharge generator Loosening of tubing and opening of the SDG chamber.
Cleaning the interior of the SDG with wipes and alcohol.
Replacing electrodes.
DMA Differential mobility analyzer Loosening of tubing. Dismantling of the DMA. Cleaning
of DMA interior and metal rod with wipes and alcohol.
Instrumentation
Particle sampling during the maintenance procedure was performed using four separate stainless steel sampling
probes (length: 100 cm, diameter: ¼”) held next to the area where particle emissions were expected, i.e. close to the
maintenance procedure being performed. The particle losses in the sampling tubing were not considered in any
calculations since particle penetration was high, more than 90% for both 0.02 µm particles (diffusional losses)
(Hinds 1999) and 5 µm particles (gravitational losses), based on an inclination angle of 60° for the sampling probes
(Baron and Willeke 2001). The distance from the expected emission zone was about 10 cm. Particle emission
measurements were performed on two separate days on which the generator system had been extensively used prior
to each day.
For online chemical analysis of the particles a Laser Vaporization Aerosol Mass Spectrometer (LV-AMS, Aerodyne
Inc.), more commonly denoted Soot Particle-AMS (SP-AMS), was used. The sample flow rate was 0.1 lpm. With the
regular AMS technique (Jayne et al. 2000; Canagaratna et al. 2007) sub-micron particles are sampled through an
aerodynamic lens which focuses the particles into a narrow particle beam in vacuum. When the focused particles are
7
allowed to enter a high vacuum chamber they acquire a size dependent velocity due to the acceleration into the
vacuum. The accelerated particles are impacted on a heated tungsten plate (600 oC) and flash vaporized. Ionization of
the formed vapors is achieved by electron ionization (70 eV) and the ions are extracted into a high resolution time of
flight mass spectrometer (HR-ToFMS). The total number of ions formed due to electron impact ionization can be
related to the total mass of the sampled particles. The procedure to calculate the total mass concentration for specific
chemical species is given in the supplemental information.
In addition to the heated tungsten plate for vaporization the LV-AMS uses a 1064 nm intra-cavity Nd:YAG laser
(Onasch et al. 2012). This makes it possible to detect not only non-refractory species, which vaporize below 600 oC,
but also the refractory species that absorb the laser radiation at this wavelength. Examples of such particles are soot
particles (carbon black), metal containing particles and selected metal oxides. Within this work the LV-AMS was
used for selective detection of metal particles that were emitted during specific steps in the maintenance of the
particle generators. It was operated in two different modes, Mass Spectrum mode (MS) and Particle Time of Flight
mode (PToF). In MS mode average mass spectra of all the sampled particles in the air are achieved. The averaging
time for each mass spectrum was 10 s which made it possible to identify particles also during very short emission
events. In contrast to the Mass Spectra mode (MS), PToF modes gives the means for also size resolved chemical
information of the sampled particles. In this sampling mode the particle beam is modulated upon transfer to vacuum
and the vacuum aerodynamic equivalent diameter (dva) is determined from the transit time (time of flight) for a
particle to travel from the modulator to the detector. During PToF sampling the averaging time was 5 s. Data analysis
was performed using SQUIRREL (Sequential Igor Data Retrieval, version 1.51C) and PIKA (Peak Integration by
Key Analysis, version 1.10C)
An Aerodynamic Particle Sizer (APS 3321, TSI Inc.) was used to measure the total particle number concentration
and size distributions in the aerodynamic size range of 0.5-20 µm. The APS has been shown to accurately describe
particle size distributions in the coarse range even in the presence of high concentrations of fine mode particles
(Pagels et al. 2005). The APS sampling flow rate was 1 lpm and the averaging time was set to 5 s. A photometer
(Dusttrak, model 8520, TSI Inc.), operated at 1.6 lpm, was used with a sampling inlet that eliminated particles larger
than 2.5 µm to assess total particle mass concentrations of the emitted particles (PM2.5). It should be pointed out that
the Dusttrak does not directly measure the particle mass. Mass concentrations reported here are equivalent mass
8
concentrations assuming the response of the calibration aerosol (Arizona test dust). The Dusttrak was included here
as it is a commonly used work place exposure monitor and its response is expected to better correlate with the AMS
signals than number based techniques. A condensation particle counter (P-Trak, model 8525, TSI inc.), with a
measureable size range from 0.02 µm, was used to determine the emissions of particles in terms of total number
concentration. The Ptrak flow rate was 0.7 lpm. Recently published work has shown that the upper cut-off for
condensation particle counters may occur well above 2.5 µm (Yli-Ojanpera et al. 2012).
Particle emissions were segregated into five different size intervals (0.02-0.5, 0.5-1.0, 1.0-2.5, 2.5-10 µm). The
concentration in the size interval 0.02-0.5 µm was derived by subtracting the particle concentration from the APS in
the size interval of 0.5-10 µm from the P-trak concentration. The concentrations in the remaining size intervals were
directly measured with the APS. With the APS, equivalent aerodynamic diameters are determined, thus the size
intervals reported are based on aerodynamic diameters, which is the relevant equivalent size describing the
deposition probabilities of particles throughout the respiratory tract for particles larger than about 0.5 µm. It should
be pointed out that the counting efficiency of the APS 3321 is below 1 for particles in approximately the 0.5 – 0.7
µm diameter interval.
The Geometric Mean Diameter (GMD) within each size interval was used to calculate the hypothetical surface area
concentrations (given in Fig. 2b) that each size interval contributed with. Spherical particles were assumed and the
GMD for the size interval of 0.02-0.5 µm was assumed to be 0.3 µm to provide an upper estimate of the surface area
contribution of particles in the smallest interval. Since the shapes of emitted particles were typically not spherical the
calculated surface areas are only indicative, but can still serve as a guide to show the impact of larger particles (>1
µm) on the particle surface area compared to smaller particles.
Open-face filter sampling of released airborne total dust during maintenance work was performed in the emission
zone. The dust samples were collected on 37-mm polycarbonate filters (0.4 µm pore size, Nuclepore) mounted in
plastic three piece filter cassettes. A Leland Legacy Sample Pump (SKC Inc.) set at 2.9 l/min provided sample flow,
which was checked with a primary calibrator (TSI Model 4199, TSI Inc.). The sampling time was 20 min. The filter
samples were analyzed off-line for particle morphology with scanning electron microscopy (SEM, Nova Nanolab
600) and composition by energy dispersive X-ray spectroscopy (EDX).
9
In parallel to the emissions measurements a CPC (model 3022, TSI Inc.) was monitoring the total number
concentration in the background with a sampling flow rate of 0.3 lpm. The background site was located in one of the
corners of the clean room, 2 m away from the ventilated cabinet in which most of the maintenance procedure
occurred.
Particle size distributions of as-produced particles, sampled directly from the synthesizing process, were determined
with a DMPS consisting of a DMA (Vienna type, 11 cm long) and an electrometer. The DMA was operated with a
sheath flow rate of 10 lpm and an aerosol flow rate of 1.7 lpm. A size interval of 10-100 nm was used. As-produced
particles are defined as the particles being synthesized with the particle synthesizing setup and include both the
aggregates, generated directly from the generators, and the spherical sintered particles. The DMPS was not applied in
the emission measurements. This is due to its insufficient time resolution (minutes) in applications like these where
emission peaks were often of the order of seconds.
10
Results and discussion
Time and size resolved physical characterization of emissions
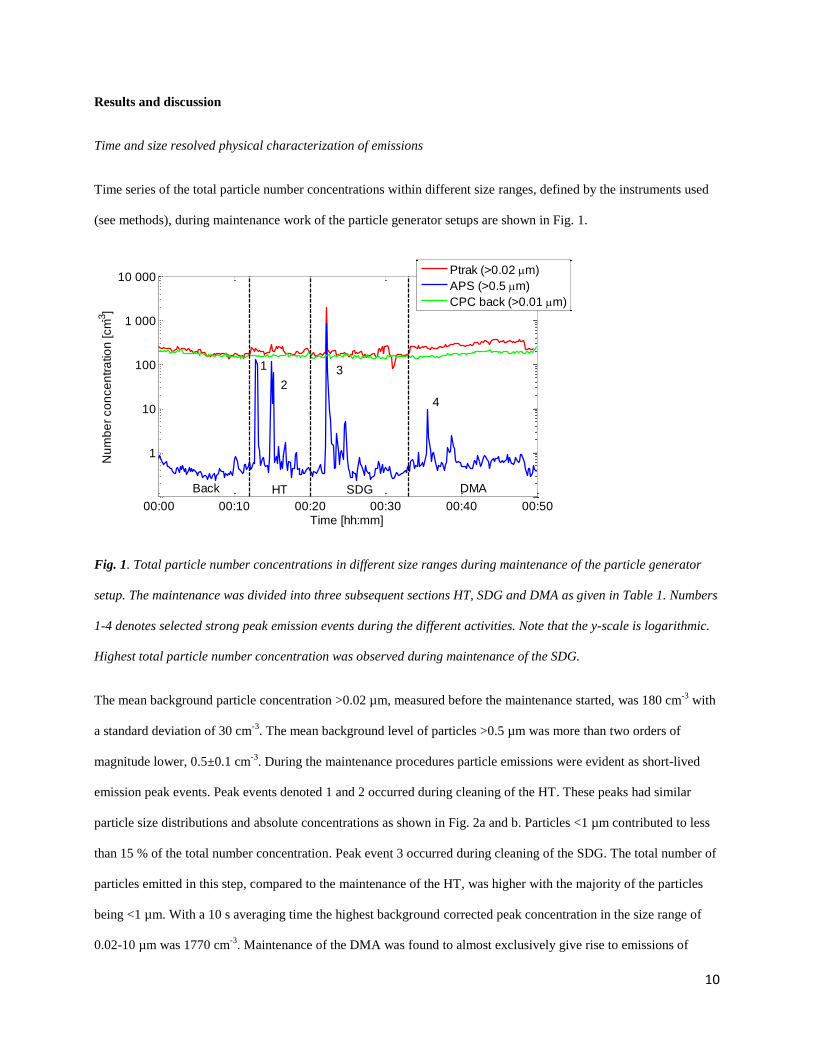
Time series of the total particle number concentrations within different size ranges, defined by the instruments used
(see methods), during maintenance work of the particle generator setups are shown in Fig. 1.
Fig. 1. Total particle number concentrations in different size ranges during maintenance of the particle generator
setup. The maintenance was divided into three subsequent sections HT, SDG and DMA as given in Table 1. Numbers
1-4 denotes selected strong peak emission events during the different activities. Note that the y-scale is logarithmic.
Highest total particle number concentration was observed during maintenance of the SDG.
The mean background particle concentration >0.02 µm, measured before the maintenance started, was 180 cm-3
with
a standard deviation of 30 cm-3
. The mean background level of particles >0.5 µm was more than two orders of
magnitude lower, 0.5±0.1 cm-3
. During the maintenance procedures particle emissions were evident as short-lived
emission peak events. Peak events denoted 1 and 2 occurred during cleaning of the HT. These peaks had similar
particle size distributions and absolute concentrations as shown in Fig. 2a and b. Particles <1 µm contributed to less
than 15 % of the total number concentration. Peak event 3 occurred during cleaning of the SDG. The total number of
particles emitted in this step, compared to the maintenance of the HT, was higher with the majority of the particles
being <1 µm. With a 10 s averaging time the highest background corrected peak concentration in the size range of
0.02-10 µm was 1770 cm-3
. Maintenance of the DMA was found to almost exclusively give rise to emissions of
00:00 00:10 00:20 00:30 00:40 00:50
1
10
100
1 000
10 000
Time [hh:mm]
Nu
mb
er
co
nce
ntr
atio
n [cm
-3]
Ptrak (>0.02 m)
APS (>0.5 m)
CPC back (>0.01 m)
2
4
1
Back
3
HT SDG DMA
11
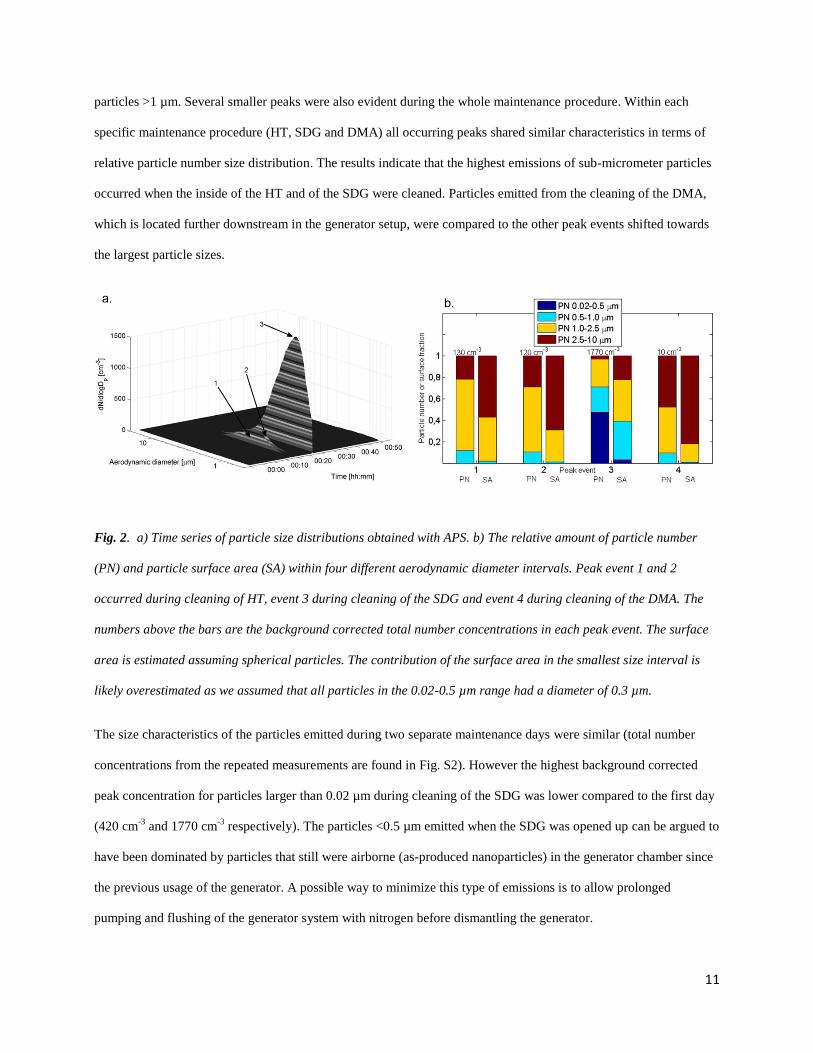
particles >1 µm. Several smaller peaks were also evident during the whole maintenance procedure. Within each
specific maintenance procedure (HT, SDG and DMA) all occurring peaks shared similar characteristics in terms of
relative particle number size distribution. The results indicate that the highest emissions of sub-micrometer particles
occurred when the inside of the HT and of the SDG were cleaned. Particles emitted from the cleaning of the DMA,
which is located further downstream in the generator setup, were compared to the other peak events shifted towards
the largest particle sizes.
Fig. 2. a) Time series of particle size distributions obtained with APS. b) The relative amount of particle number
(PN) and particle surface area (SA) within four different aerodynamic diameter intervals. Peak event 1 and 2
occurred during cleaning of HT, event 3 during cleaning of the SDG and event 4 during cleaning of the DMA. The
numbers above the bars are the background corrected total number concentrations in each peak event. The surface
area is estimated assuming spherical particles. The contribution of the surface area in the smallest size interval is
likely overestimated as we assumed that all particles in the 0.02-0.5 µm range had a diameter of 0.3 µm.
The size characteristics of the particles emitted during two separate maintenance days were similar (total number
concentrations from the repeated measurements are found in Fig. S2). However the highest background corrected
peak concentration for particles larger than 0.02 µm during cleaning of the SDG was lower compared to the first day
(420 cm-3
and 1770 cm-3
respectively). The particles <0.5 µm emitted when the SDG was opened up can be argued to
have been dominated by particles that still were airborne (as-produced nanoparticles) in the generator chamber since
the previous usage of the generator. A possible way to minimize this type of emissions is to allow prolonged
pumping and flushing of the generator system with nitrogen before dismantling the generator.
12
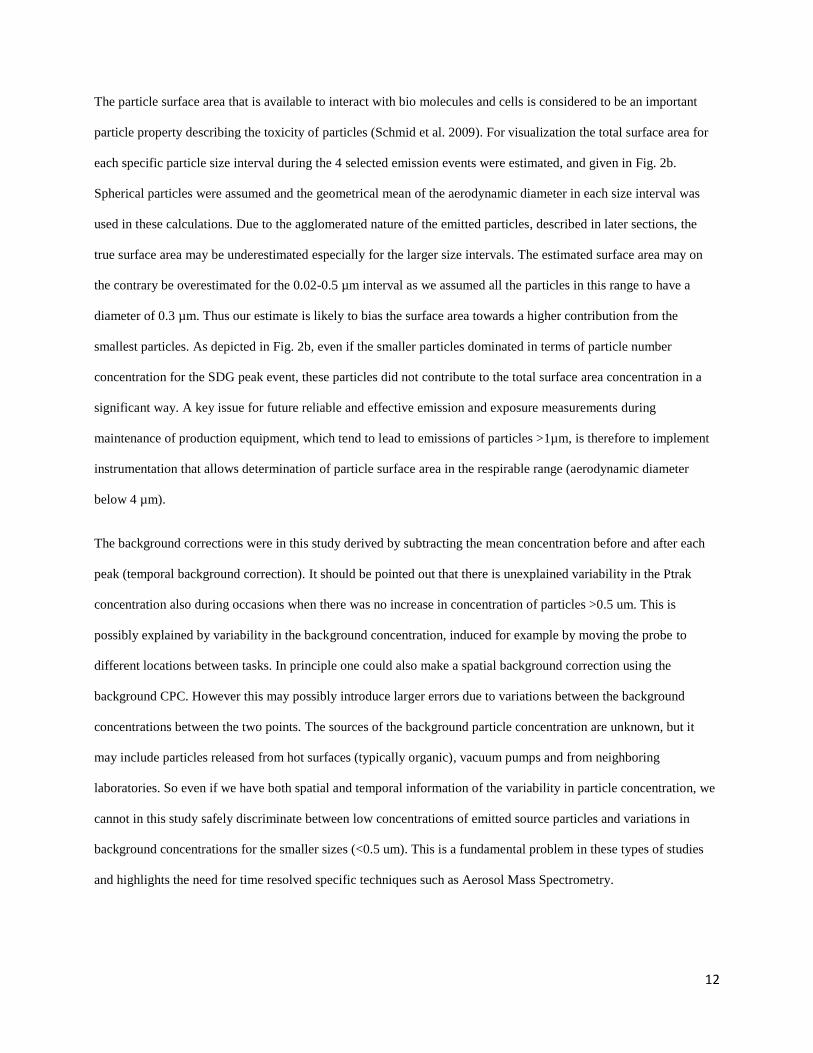
The particle surface area that is available to interact with bio molecules and cells is considered to be an important
particle property describing the toxicity of particles (Schmid et al. 2009). For visualization the total surface area for
each specific particle size interval during the 4 selected emission events were estimated, and given in Fig. 2b.
Spherical particles were assumed and the geometrical mean of the aerodynamic diameter in each size interval was
used in these calculations. Due to the agglomerated nature of the emitted particles, described in later sections, the
true surface area may be underestimated especially for the larger size intervals. The estimated surface area may on
the contrary be overestimated for the 0.02-0.5 µm interval as we assumed all the particles in this range to have a
diameter of 0.3 µm. Thus our estimate is likely to bias the surface area towards a higher contribution from the
smallest particles. As depicted in Fig. 2b, even if the smaller particles dominated in terms of particle number
concentration for the SDG peak event, these particles did not contribute to the total surface area concentration in a
significant way. A key issue for future reliable and effective emission and exposure measurements during
maintenance of production equipment, which tend to lead to emissions of particles >1µm, is therefore to implement
instrumentation that allows determination of particle surface area in the respirable range (aerodynamic diameter
below 4 µm).
The background corrections were in this study derived by subtracting the mean concentration before and after each
peak (temporal background correction). It should be pointed out that there is unexplained variability in the Ptrak
concentration also during occasions when there was no increase in concentration of particles >0.5 um. This is
possibly explained by variability in the background concentration, induced for example by moving the probe to
different locations between tasks. In principle one could also make a spatial background correction using the
background CPC. However this may possibly introduce larger errors due to variations between the background
concentrations between the two points. The sources of the background particle concentration are unknown, but it
may include particles released from hot surfaces (typically organic), vacuum pumps and from neighboring
laboratories. So even if we have both spatial and temporal information of the variability in particle concentration, we
cannot in this study safely discriminate between low concentrations of emitted source particles and variations in
background concentrations for the smaller sizes (<0.5 um). This is a fundamental problem in these types of studies
and highlights the need for time resolved specific techniques such as Aerosol Mass Spectrometry.
13
Time resolved chemical characterization of particle emissions
A Laser Vaporization Aerosol Mass Spectrometer (LV-AMS) was used for highly time-resolved chemical
composition measurements. This allowed selective determination of metal particle emissions. The high resolution
mass spectrum that the instrument makes it possible to differentiate between metallic and organic ion fragments even
if they are located at the same nominal mass-to-charge ratio (Fig. S3). The determined isotopic abundance of the
identified metals can be compared to literature values to further verify the identification of the metals. Obtained
isotopic abundances for Pd and Ag are shown as examples in the supporting information.
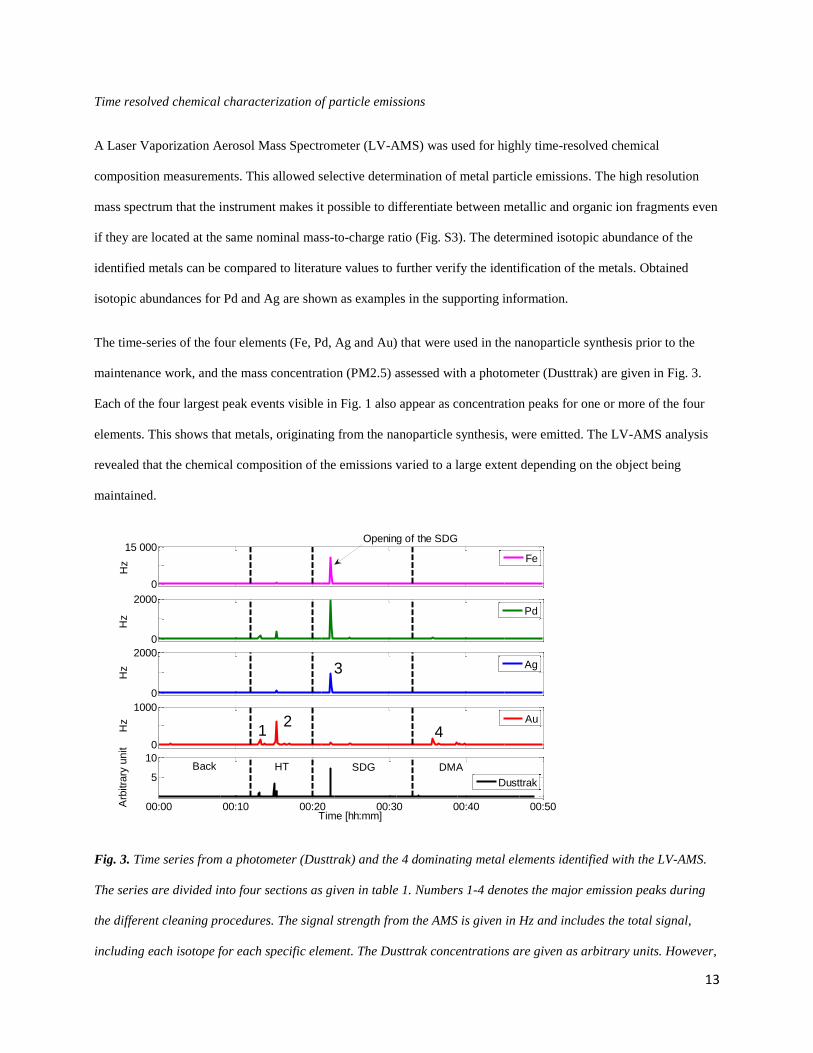
The time-series of the four elements (Fe, Pd, Ag and Au) that were used in the nanoparticle synthesis prior to the
maintenance work, and the mass concentration (PM2.5) assessed with a photometer (Dusttrak) are given in Fig. 3.
Each of the four largest peak events visible in Fig. 1 also appear as concentration peaks for one or more of the four
elements. This shows that metals, originating from the nanoparticle synthesis, were emitted. The LV-AMS analysis
revealed that the chemical composition of the emissions varied to a large extent depending on the object being
maintained.
Fig. 3. Time series from a photometer (Dusttrak) and the 4 dominating metal elements identified with the LV-AMS.
The series are divided into four sections as given in table 1. Numbers 1-4 denotes the major emission peaks during
the different cleaning procedures. The signal strength from the AMS is given in Hz and includes the total signal,
including each isotope for each specific element. The Dusttrak concentrations are given as arbitrary units. However,
0
15 000
Hz
Fe
0
2000
Hz
Pd
0
2000
Hz
Ag
0
1000
Hz
Au
00:00 00:10 00:20 00:30 00:40 00:50
5
10
Time [hh:mm]
Arb
itra
ry u
nit
Dusttrak
Back HT SDG DMA
Opening of the SDG
3
42
1
14
the units correspond to mg/m3 if the instrument response were the same for this aerosol as the calibration aerosol
(Arizona test dust).
The SDG had been used to generate several types of particles by using different types of electrodes. During particle
synthesis the chamber of the SDG was cleaned every time electrodes were switched to other materials. However, this
cleaning was not as strict as a full maintenance and deposited material could still be present on the generator interior
walls and in the connectors downstream the instrument. The DMA were typically not cleaned between material
switching. Fe electrodes were the ones used closest to the emission measurements preceded by Cu. A Pd electrode
had also been used earlier in the SDG together with an Ag electrode to produce PdAg nanoalloy particles. Those
metal compounds, generated in the previous sessions prior to the emission measurements, were the ones determined
with the LV-AMS to be the dominant species that were emitted. The signal strength of Fe (10 800 Hz in peak 3) was
about an order of magnitude higher than that of Pd (1890 Hz in peak 3) and Ag (970 Hz in peak 3). The signal
strength for Cu (170 Hz) was not as prominent as the others but still clearly distinguishable in the high resolution
mass spectra. When the DMA was cleaned the emission gave the strongest signal for Au (160 Hz in peak 4).
During maintenance of the HT Au (620 Hz in peak 2) was found to be the main emitted constituent along with Pd
(400 Hz in peak 2) and Fe (380 Hz in peak 2). The HT was strictly used to synthesize Au nanoparticles which make
the presence of Pd and Fe in the HT emission events unexpected. As for the determination of particle number
concentrations (Fig. 1) several smaller peaks within each maintenance period were identified with the LV-AMS.
Peak events within the same maintenance periods shared similar chemical content.
To be able to translate the LV-AMS signal strength (Hz) to a PM1 mass concentration (µg/m3) the ionization
efficiency for each species has to be known (described in supplemental information). Since the main intention here
was to use the LV-AMS for qualitative measurements the determination of the ionization efficiencies is not covered
in this paper. The detection limit of the instrument is expressed as 3σ of the noise level at each mass to charge ratio.
For 56
Fe the detection limit with a 10s sampling was 8 Hz, while for 197
Au it was 0.4 Hz. This means that emission
levels three orders of magnitude lower than the highest peak emissions found during the maintenance procedure can
be identified for these elements.
15
SEM characterization of particle morphology and chemical composition
SEM analysis combined with EDX was used to determine the morphology and composition of emitted particles
sampled on polycarbonate membrane filters (Nuclepore, 0.4 µm). The sampling was performed close to the emission
zone during a session that included maintenance of both the HT and the SDG.
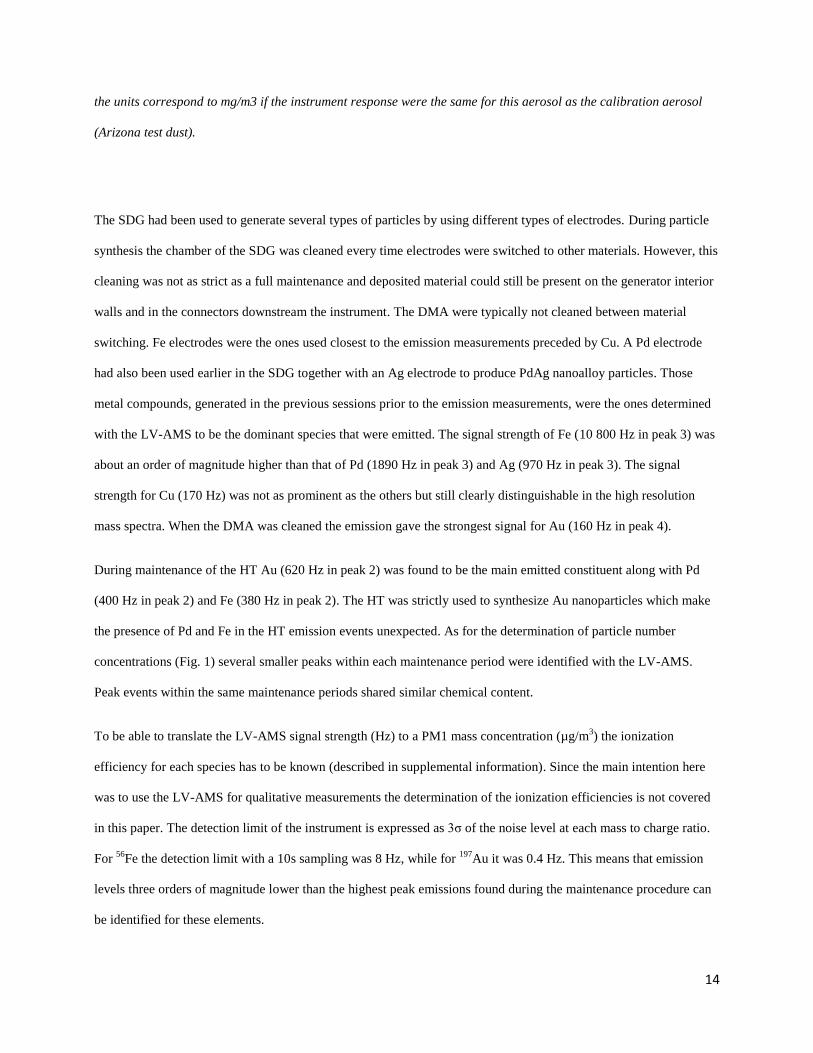
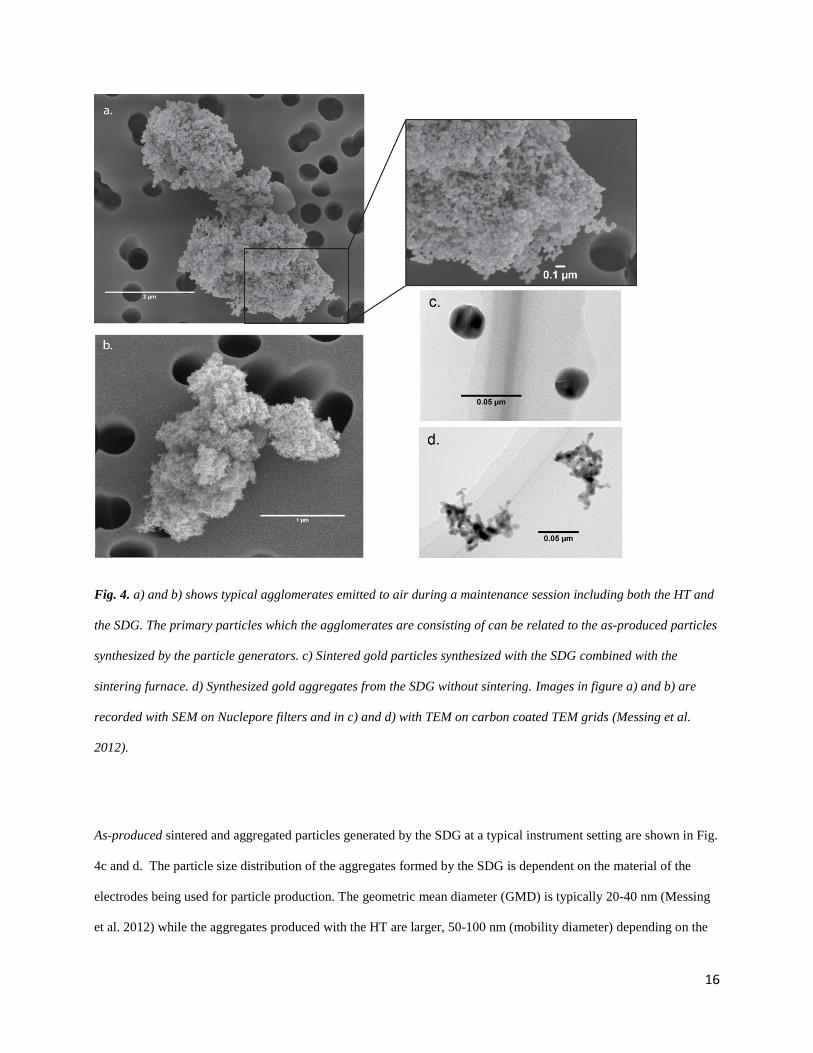
Fig. 4a and b shows typical particle types found on the filters. The collected particles all showed a highly
agglomerated morphology with different degree of partial sintering. Most particles of this type had lengths and
widths in the range 0.5-3 µm, consistent with the APS size distribution analysis. We denote these particles “super-
agglomerates” as they have length and widths one to two orders of magnitude larger than the “as-produced”
particles. The smallest visible structures of the super-agglomerate in Fig. 4a are consisting of near spherical shapes
with an average diameter of 38±8 nm. The primary particles of the agglomerate shown in Fig. 4b are smaller and
measured to 13±3 nm. The latter size classification of primary particles was, due to the available resolution of the
SEM instrument, only possible to perform at the edges of the agglomerate.
16
Fig. 4. a) and b) shows typical agglomerates emitted to air during a maintenance session including both the HT and
the SDG. The primary particles which the agglomerates are consisting of can be related to the as-produced particles
synthesized by the particle generators. c) Sintered gold particles synthesized with the SDG combined with the
sintering furnace. d) Synthesized gold aggregates from the SDG without sintering. Images in figure a) and b) are
recorded with SEM on Nuclepore filters and in c) and d) with TEM on carbon coated TEM grids (Messing et al.
2012).
As-produced sintered and aggregated particles generated by the SDG at a typical instrument setting are shown in Fig.
4c and d. The particle size distribution of the aggregates formed by the SDG is dependent on the material of the
electrodes being used for particle production. The geometric mean diameter (GMD) is typically 20-40 nm (Messing
et al. 2012) while the aggregates produced with the HT are larger, 50-100 nm (mobility diameter) depending on the
17
temperature used. The primary particle size of the aggregates, formed by both generators, is 5-15 nm. Sintering is
used to reshape the synthesized airborne particles into more compact and near spherical shapes. Typical as-produced
spherical particle sizes achieved when the sintering furnace is active during particle production is 20-40 nm for the
SDG and around 40-60 nm when the HT is used.
Sintering may occur of the as-produced aggregates if they deposit on the walls in, or downstream, the generators
where the temperature is high enough. This will lead to compaction of the particles. The smallest visible structures in
the super-agglomerate found in Fig. 4a share similar characteristics in size and shape as sintered particles produced
with the HT. The particle in Fig. 4b consists of primary particles with a size (13 nm) which can be related to the
synthesized aggregates. These particles have not been sintered and can be argued to have originated from a
deposition site where the temperature has been too low for any sintering to take place.
The surface characteristics of particles emitted during maintenance of the particle synthesizing equipment are in this
case dependent on the site of deposition. Deposition at sites that are hot enough to allow the particle material to
sinter, either before or after deposition, will lead to compaction of the deposited material, thus lowering the surface
area of the particles that may be emitted from the deposition site. When no sintering occurs, the surface area of the
super-agglomerates will be at its highest since the primary particle size is kept intact. The surface area per mass will
then be comparative to the originally synthesized particles.
SEM-EDX was used for off-line assessment of the composition of individual particles larger than about 1 µm.
Similar to the LV-AMS analysis on the preceding measurement day the dominating species identified were Au, Pd
and Ag. EDX revealed that most of the particles were homogeneous in composition, typically containing one (e.g.
Au) or two (e.g. Pd and Ag) components. However, a few examples of heterogeneous particles with parts dominated
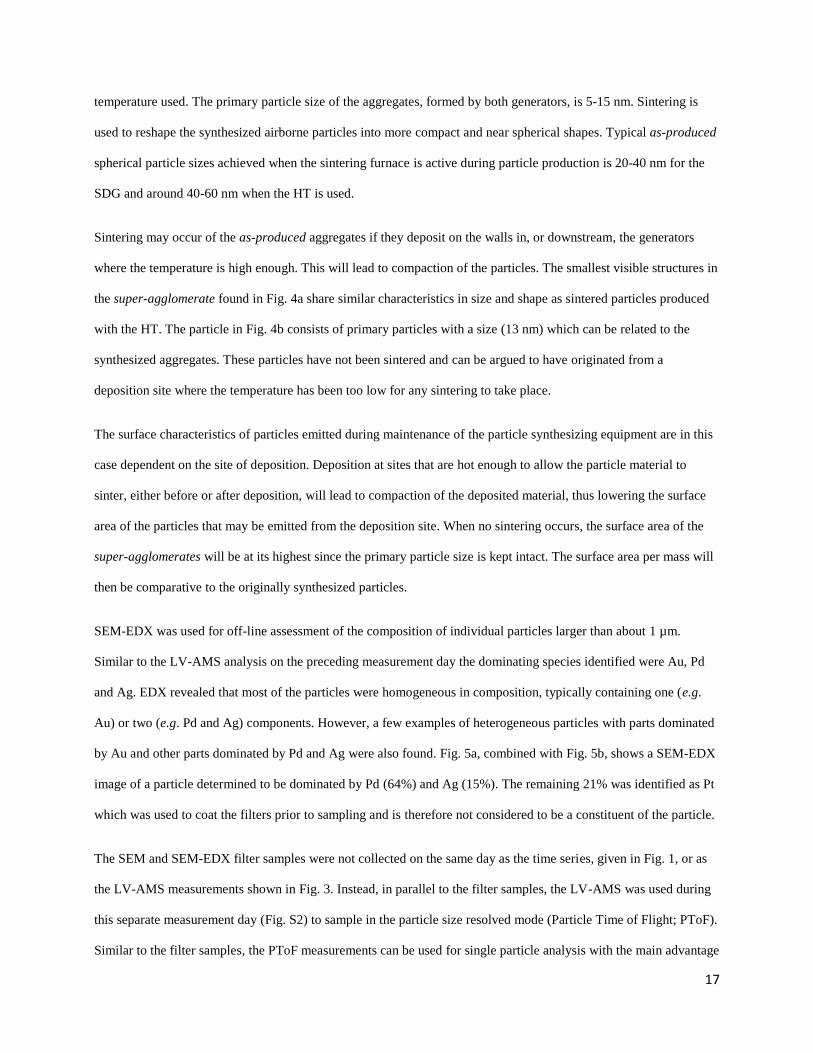
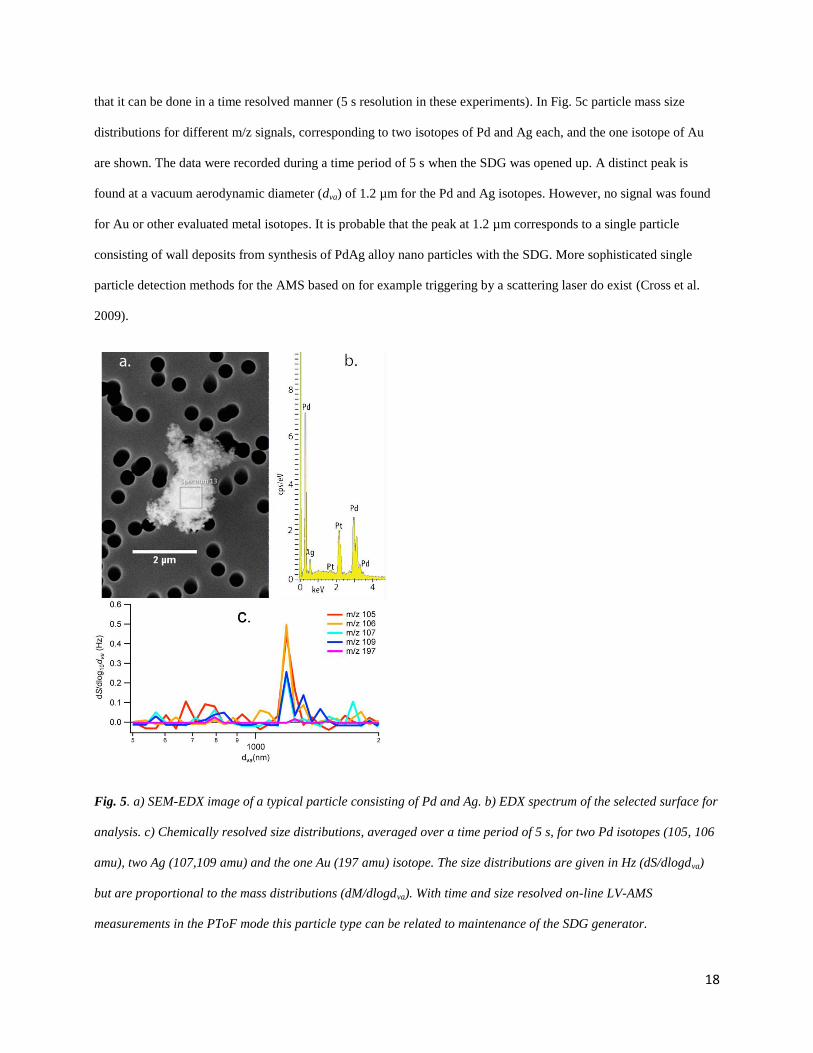
by Au and other parts dominated by Pd and Ag were also found. Fig. 5a, combined with Fig. 5b, shows a SEM-EDX
image of a particle determined to be dominated by Pd (64%) and Ag (15%). The remaining 21% was identified as Pt
which was used to coat the filters prior to sampling and is therefore not considered to be a constituent of the particle.
The SEM and SEM-EDX filter samples were not collected on the same day as the time series, given in Fig. 1, or as
the LV-AMS measurements shown in Fig. 3. Instead, in parallel to the filter samples, the LV-AMS was used during
this separate measurement day (Fig. S2) to sample in the particle size resolved mode (Particle Time of Flight; PToF).
Similar to the filter samples, the PToF measurements can be used for single particle analysis with the main advantage
18
that it can be done in a time resolved manner (5 s resolution in these experiments). In Fig. 5c particle mass size
distributions for different m/z signals, corresponding to two isotopes of Pd and Ag each, and the one isotope of Au
are shown. The data were recorded during a time period of 5 s when the SDG was opened up. A distinct peak is
found at a vacuum aerodynamic diameter (dva) of 1.2 µm for the Pd and Ag isotopes. However, no signal was found
for Au or other evaluated metal isotopes. It is probable that the peak at 1.2 µm corresponds to a single particle
consisting of wall deposits from synthesis of PdAg alloy nano particles with the SDG. More sophisticated single
particle detection methods for the AMS based on for example triggering by a scattering laser do exist (Cross et al.
2009).
Fig. 5. a) SEM-EDX image of a typical particle consisting of Pd and Ag. b) EDX spectrum of the selected surface for
analysis. c) Chemically resolved size distributions, averaged over a time period of 5 s, for two Pd isotopes (105, 106
amu), two Ag (107,109 amu) and the one Au (197 amu) isotope. The size distributions are given in Hz (dS/dlogdva)
but are proportional to the mass distributions (dM/dlogdva). With time and size resolved on-line LV-AMS
measurements in the PToF mode this particle type can be related to maintenance of the SDG generator.
19
The size resolved PToF measurements give an opportunity to relate certain particle types that have been collected on
filter samples to specific tasks in the maintenance procedure. Although one can carry out multiple serial filter
samples for a set of tasks, it becomes non-practical to change filter cassettes each time a new work task is carried out,
for example in situations when multiple instruments are maintained/cleaned and maintenance of each instrument
requires several steps. A combination of aerosol mass spectrometry and off-line SEM analysis makes it possible to,
not only characterize particles in terms of size, morphology and composition in a wide particle size range, but also to
determine exactly at which step in the maintenance procedure, different particle types were emitted. In this study a
lens that efficiently allows penetration of particles smaller than 1 µm was used. To further optimize the LV-AMS for
analyzing particle emissions of the type studied here, a lens that allows larger particles to be efficiently focused into
the AMS vacuum chamber can be used. Lenses, which allow penetration and focusing of particles up to 3-4 µm,
have been implemented (Poschl et al. 2010).
As-produced aggregates vs. emitted super-agglomerates – Implications for exposure assessment, dosimetry and
toxicology
In this section we contrast the properties of typical particles synthesized with the nanoparticle generators (which we
denote “as-produced” particles) with the emitted agglomerated particles during maintenance of the generators.
Similar large-scale agglomerates with nanostructured surfaces, as the ones found in this paper, have also been
observed by others during different types of mechanical processing of nanomaterials (Peters et al. 2009; Methner et
al. 2010a; Zimmermann et al. 2012). Such agglomerates may share similar structures to particles studied during
powder dustiness tests (Evans et al. 2013). Since studies of different processes have been reported in the literature
(reactor cleanout, cleaning of deposition equipment, handling of powder etc.) the results of this work can be put into
a general sense and shows that highly agglomerated particles can be expected during maintenance work, disregarding
of the type of equipment being maintained. Methner et al. (2010a) mention de-agglomeration as a possible fate for
the agglomerated particles once deposited in lung fluid and the importance of measuring particle concentrations,
even above respirable size ranges, is stated.
20
The alveolar region of the lung has been pointed out as a target region in nanotoxicology, partly due to the rather
poor defense mechanisms in this part of the lung towards deposited particles (Schmid et al. 2009). Since the
dimensions of the large super-agglomerates are in the range of thousands of nanometer (GMD =1.8 µm), they
contain a very large number of primary particles. It can therefore be argued that they share particle properties, such
as specific surface area (surface area per mass unit), with the much smaller as-produced particles, which typically
contain primary particles with a size of ~10 nm for the aggregates and ~40 nm for the sintered spherical particles. To
give an order of magnitude estimate it can be shown that a 2 µm agglomerate formed by diffusion limited cluster
aggregation (DCLA) in the continuum regime, with primary particles of 10 nm in diameter, would consist of about
30.000 primary particles (Sorensen 2011). This is most likely an underestimation as our SEM images show particles
that appear to be more compact than true DLCA aggregates. The total surface area of one 2 µm super-agglomerate
with 30 000 primary particles would then be more than about 1000 times larger than that of one 30 nm as-produced
aggregate with about 10 primary particles of the same size.
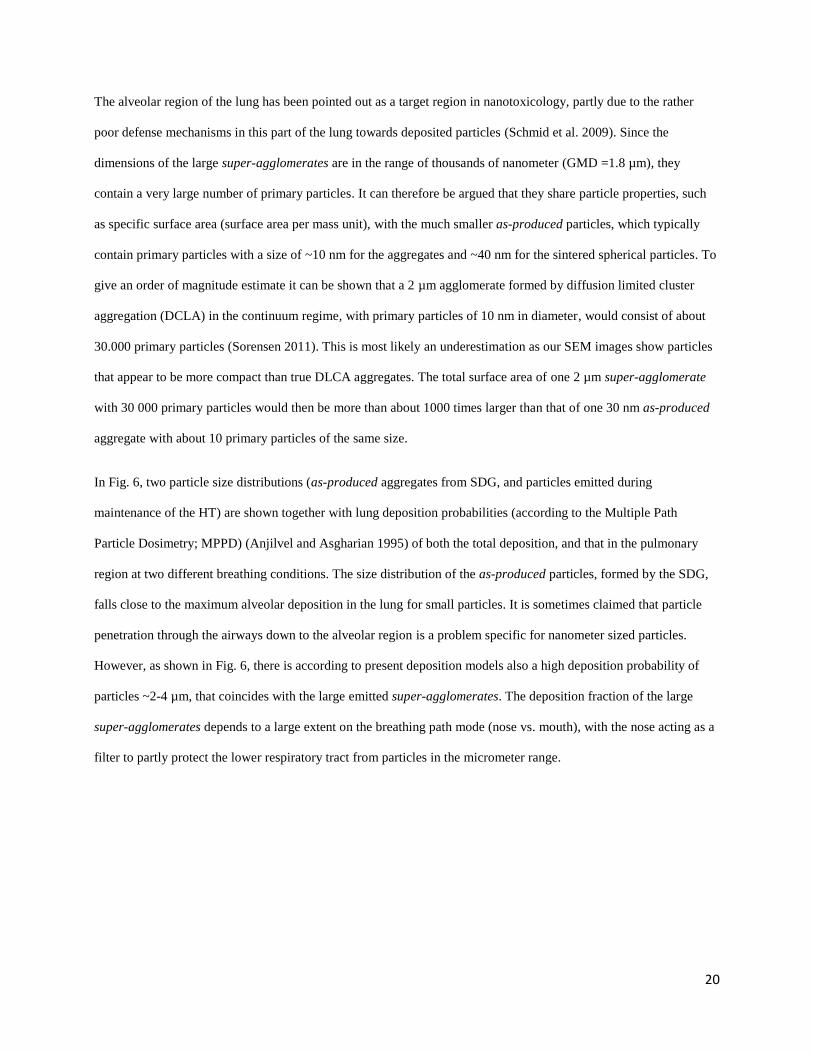
In Fig. 6, two particle size distributions (as-produced aggregates from SDG, and particles emitted during
maintenance of the HT) are shown together with lung deposition probabilities (according to the Multiple Path
Particle Dosimetry; MPPD) (Anjilvel and Asgharian 1995) of both the total deposition, and that in the pulmonary
region at two different breathing conditions. The size distribution of the as-produced particles, formed by the SDG,
falls close to the maximum alveolar deposition in the lung for small particles. It is sometimes claimed that particle
penetration through the airways down to the alveolar region is a problem specific for nanometer sized particles.
However, as shown in Fig. 6, there is according to present deposition models also a high deposition probability of
particles ~2-4 µm, that coincides with the large emitted super-agglomerates. The deposition fraction of the large
super-agglomerates depends to a large extent on the breathing path mode (nose vs. mouth), with the nose acting as a
filter to partly protect the lower respiratory tract from particles in the micrometer range.
21
Fig. 6. MPPD model for total and pulmonary deposition during sitting position and exercise. The deposition models
are shown together with the normalized number weighted particle size distributions (dN/dlogDp) of particles
sampled from particle synthesizing with the SDG (DMPS measurements based on mobility equivalent diameter ) and
the particles emitted during cleaning of the HT (APS measurements based on aerodynamic equivalent diameter).
Aerosol particle deposition in different parts of the respiratory system is determined by different physical transport
mechanisms in air which are dependent on particle size. It is important to note that particles below about 500 nm
deposit mostly due to their diffusivity, which is controlled by the equivalent mobility diameter (Rissler et al. 2012),
while larger particles deposit mostly due to sedimentation (and to a smaller extent due to impaction), which is
described by the equivalent aerodynamic diameter. Mobility diameter (dm) depends on particle volume and
morphology, while aerodynamic diameter (dae) in addition depends on the material density (i.e. particle mass) (Park
et al. 2008). The relationship between the two diameters is determined by the effective density (ρeff). For example,
the smaller “as-produced” particles can be synthesized either as highly aggregated or as sintered spheres, with up to
a factor of 10 in difference in their effective density (Messing et al. 2012). The measurement techniques used to
determine size distributions in this work (differential mobility particle sizer, DMPS, below 100 nm and Aerodynamic
particle sizer, APS, above 500 nm) measure the equivalent diameter, which accurately describes the deposition in the
lung of each size range. Therefore the uncertainty from particle morphology and effective density on the assessed
respiratory deposition is minor. Larger uncertainties would have to be taken into account if a major fraction of the
particles were in the 0.3-0.5 µm range.
22
Toxicological studies often examine the possible health outcomes by using particles that can be classified “as-
produced”, i.e. small nanoparticles of uniform size synthesized in the gas phase or in suspensions. These model
particles are then commonly added to conventional toxicological assays under submerged conditions or in recently
developed, more realistic systems, with particle samples taken directly from an aerosol particle generator and
deposited on respiratory cells at the air liquid interface (Savi et al. 2008). The agglomerated particles emitted during
maintenance work consist of the small primary particles that are formed during the synthesizing phase and that have
coagulated and deposited on the generator system walls and tubing. This fact has implications when considering the
possible health outcomes from repeated inhalation of particles emitted during equipment maintenance. If the
numerous as-produced aggregates or spherical particles, which the super-agglomerates mainly consist of, are held
together only by weak van der Waals forces (Seipenbusch et al. 2007) it is possible that the super-agglomerates may
de-agglomerate once deposited in lung fluids (Bohgard et al. 1979). Aggregates are often stable structures but
agglomerates can be fragmented by relatively weak forces depending on the interparticle bond (Seipenbusch et al.
2010). Thus in future studies it will be highly important to contrast the fate of the particles in the lung fluid, the
biokinetic transport properties and toxicological responses of both as-produced particles and of the larger emitted
super-agglomerates. The proteins attaching to the different particles upon deposition in the respiratory tract are a
major determinant of particle translocation to organs and penetration into cells (Cedervall et al. 2007).
The lung deposited surface area of particles smaller than 400 nm has been suggested as a relevant dose metric for
health exposure studies (Oberdorster 2000; Asbach et al. 2009). Time-resolved instruments, based on diffusion
charger techniques, which determines the lung deposited particle surface area within this size interval exists. The
active surface area can also be obtained by integrating size distributions obtained with mobility analyzers (e.g.
SMPS). It is not trivial however to extend such techniques towards larger sizes, nor towards complex particles such
as agglomerates, both in the nano- and micrometer size range. Portable methods such as diffusion chargers have the
highest sensitivities to sub-micrometer particles. Until methods for on-line measurements of the surface area of the
super-agglomerates have become available, there is clearly a need to supplement existing techniques with for
example simple optical devices with a lower cut-point close to the upper range of the diffusion chargers (about 400
nm). Also, more reliable methods to estimate the number of primary particles and the total accessible surface area
available to interact with biological tissues for the super-agglomerates needs to be developed. Such information
would be vital for an improved understanding of the toxicological effects of these particles. It is important to note
23
that we suggest a future focus on the release of both small aggregates, primary particles in the nanometer size range
and the larger super-agglomerates found in this study. There are some possible risks that may be specific for particles
in the nanometer size range, for example translocation into certain organs upon deposition in the respiratory tract.
Conclusions
This work highlights the fact that mechanical work, for example different cleaning and maintenance procedures,
gives rise to emissions of both sub-micrometer particles and highly agglomerated particles >1 µm. To carry out
future risk assessments for workplace exposures to these types of particles we recommend that biokinetic and
toxicological studies of nanomaterials in detail contrast the as-produced with the emitted super-agglomerates using
relevant dose metrics (such as surface area). Issues of importance include de-agglomeration of super-agglomerates in
biofluids, interaction with proteins (protein corona) and toxicological responses.
We have shown that the LV-AMS can be used for highly time- and size resolved selective emission measurements of
MNOs emitted to air during handling of nanoparticle synthesizing equipment. Such information is especially vital in
environments in which high background levels of particles can cause difficulties in separating the particles of interest
from the background. Further, in many occupational environments different processes which occur simultaneously
generate particles that may lead to difficulties in the interpretation of the emission and exposure measurements. The
AMS technique can be used to overcome such problems. Also, online aerosol mass spectrometry can help identifying
unexpected emissions during different types of processes. The presence of Pd and Fe in the emissions during
maintenance of the HT could for instance not be foreseen based on the prior usage of the furnace. These results show
that by implementing online aerosol mass spectrometry, emissions can be chemically identified and the risk for
misclassifying emitted particles is greatly reduced.
24
Acknowledgment
The authors acknowledge the Swedish Research Council (FAS), Grant nr. 2009-1291, the Nanometer Structure
Consortium at Lund University (nmC@LU) and the FAS-centre METALUND for supplying the funding. The
European Commission 7th
Framework Programme (NANoREG), grant agreement number 310584, is also
acknowledged.
Supporting Information
Supporting Information Available: The material includes a schematic of the particle generator system that was being
maintained during the described emission measurements. Particle emission time series for total number
concentrations obtained during the measurements when filter samples for SEM analysis were collected is included.
The material also includes isotopic abundances for Pd and Ag and a description of quantitative analysis with the
AMS technique.
25
References
Abbott LC, Maynard AD (2010) Exposure Assessment Approaches for Engineered Nanomaterials. Risk Anal 30
(11):1634-1644. doi:DOI 10.1111/j.1539-6924.2010.01446.x
Alvarez PJJ, Colvin V, Lead J, Stone V (2009) Research Priorities to Advance Eco-Responsible Nanotechnology.
Acs Nano 3 (7):1616-1619. doi:Doi 10.1021/Nn9006835
Anjilvel S, Asgharian B (1995) A Multiple-Path Model of Particle Deposition in the Rat Lung. Fund Appl Toxicol
28 (1):41-50. doi:DOI 10.1006/faat.1995.1144
Asbach C, Fissan H, Stahlmecke B, Kuhlbusch TAJ, Pui DYH (2009) Conceptual limitations and extensions of lung-
deposited Nanoparticle Surface Area Monitor (NSAM). J Nanopart Res 11 (1):101-109. doi:DOI
10.1007/s11051-008-9479-8
Asbach C, Kaminski H, Von Barany D, Kuhlbusch TAJ, Monz C, Dziurowitz N, Pelzer J, Vossen K, Berlin K,
Dietrich S, Gotz U, Kiesling HJ, Schierl R, Dahmann D (2012) Comparability of Portable Nanoparticle
Exposure Monitors. Ann Occup Hyg 56 (5):606-621. doi:10.1093/annhyg/mes033
Baron PA, Willeke K (2001) Aerosol Measurement: principles, techniques and applications. 2nd edn. John Wiley &
Sons, USA
Bello D, Wardle BL, Yamamoto N, deVilloria RG, Garcia EJ, Hart AJ, Ahn K, Ellenbecker MJ, Hallock M (2009)
Exposure to nanoscale particles and fibers during machining of hybrid advanced composites containing
carbon nanotubes. J Nanopart Res 11 (1):231-249. doi:DOI 10.1007/s11051-008-9499-4
Biskos G, Schmidt-Ott A (2012) Airborne Engineered Nanoparticles: Potential Risks and Monitoring Challenges for
Assessing their Impacts on Children. Paediatr Respir Rev 13 (2):79-83. doi:DOI 10.1016/j.prrv.2011.05.011
Bohgard M, Jangida BL, Akselsson KR (1979) Analytical Procedure for Determining Chromium in Samples of
Airborne Dust. Ann Occup Hyg 22 (3):241-&. doi:DOI 10.1093/annhyg/22.3.241
Canagaratna MR, Jayne JT, Jimenez JL, Allan JD, Alfarra MR, Zhang Q, Onasch TB, Drewnick F, Coe H,
Middlebrook A, Delia A, Williams LR, Trimborn AM, Northway MJ, DeCarlo PF, Kolb CE, Davidovits P,
Worsnop DR (2007) Chemical and microphysical characterization of ambient aerosols with the aerodyne
aerosol mass spectrometer. Mass Spectrom Rev 26 (2):185-222. doi:Doi 10.1002/Mas.20115
26
Cedervall T, Lynch I, Lindman S, Berggard T, Thulin E, Nilsson H, Dawson KA, Linse S (2007) Understanding the
nanoparticle-protein corona using methods to quantify exchange rates and affinities of proteins for
nanoparticles. P Natl Acad Sci USA 104 (7):2050-2055. doi:DOI 10.1073/pnas.0608582104
Cross ES, Onasch TB, Canagaratna M, Jayne JT, Kimmel J, Yu XY, Alexander ML, Worsnop DR, Davidovits P
(2009) Single particle characterization using a light scattering module coupled to a time-of-flight aerosol
mass spectrometer. Atmos Chem Phys 9 (20):7769-7793
Cross ES, Sappok A, Fortner EC, Hunter JF, Jayne JT, Brooks WA, Onasch TB, Wong VW, Trimborn A, Worsnop
DR, Kroll JH (2012) Real-Time Measurements of Engine-Out Trace Elements: Application of a Novel Soot
Particle Aerosol Mass Spectrometer for Emissions Characterization. J Eng Gas Turb Power 134 (7).
doi:Artn 072801
Doi 10.1115/1.4005992
Dahm MM, Evans DE, Schubauer-Berigan MK, Birch ME, Deddens JA (2012) Occupational Exposure Assessment
in Carbon Nanotube and Nanofiber Primary and Secondary Manufacturers: Mobile Direct-Reading
Sampling. The Annals of Occupational Hygiene:1-17
Demou E, Stark WJ, Hellweg S (2009) Particle Emission and Exposure during Nanoparticle Synthesis in Research
Laboratories. Ann Occup Hyg 53 (8):829-838. doi:DOI 10.1093/annhyg/mep061
Elder A, Gelein R, Silva V, Feikert T, Opanashuk L, Carter J, Potter R, Maynard A, Finkelstein J, Oberdorster G
(2006) Translocation of inhaled ultrafine manganese oxide particles to the central nervous system. Environ
Health Persp 114 (8):1172-1178. doi:Doi 10.1289/Ehp.9030
Evans DE, Turkevich LA, Roettgers CT, Deye GJ, Baron PA (2013) Dustiness of Fine and Nanoscale Powders. Ann
Occup Hyg 57 (2):261-277. doi:DOI 10.1093/annhyg/mes060
Heurlin M, Magnusson MH, Lindgren D, Ek M, Wallenberg LR, Deppert K, Samuelson L (2012) Continuous gas-
phase synthesis of nanowires with tunable properties. Nature 492 (7427):90-+. doi:Doi
10.1038/Nature11652
Hinds WC (1999) Aerosol Technology: Properties, Behavior and Measurements of Airborne Particles. 2 edn. John
Wiley & Sons, USA
27
Jayne JT, Leard DC, Zhang XF, Davidovits P, Smith KA, Kolb CE, Worsnop DR (2000) Development of an aerosol
mass spectrometer for size and composition analysis of submicron particles. Aerosol Sci Tech 33 (1-2):49-
70
Jimenez JL, Jayne JT, Shi Q, Kolb CE, Worsnop DR, Yourshaw I, Seinfeld JH, Flagan RC, Zhang XF, Smith KA,
Morris JW, Davidovits P (2003) Ambient aerosol sampling using the Aerodyne Aerosol Mass Spectrometer.
J Geophys Res-Atmos 108 (D7). doi:Artn 8425
Doi 10.1029/2001jd001213
Johnson DR, Methner MM, Kennedy AJ, Steevens JA (2010) Potential for Occupational Exposure to Engineered
Carbon-Based Nanomaterials in Environmental Laboratory Studies. Environ Health Persp 118 (1):49-54.
doi:Doi 10.1289/Ehp.0901076
Koivisto AJ, Aromaa M, Makela JM, Pasanen P, Hussein T, Hameri K (2012a) Concept To Estimate Regional
Inhalation Dose of Industrially Synthesized Nanoparticles. Acs Nano 6 (2):1195-1203. doi:Doi
10.1021/Nn203857p
Koivisto AJ, Lyyranen J, Auvinen A, Vanhala E, Hameri K, Tuomi T, Jokiniemi J (2012b) Industrial worker
exposure to airborne particles during the packing of pigment and nanoscale titanium dioxide. Inhal Toxicol
24 (12):839-849. doi:Doi 10.3109/08958378.2012.724474
Kuhlbusch TAJ, Asbach C, Fissan H, Gohler D, Stintz M (2011) Nanoparticle exposure at nanotechnology
workplaces: A review. Part Fibre Toxicol 8. doi:Artn 22
Doi 10.1186/1743-8977-8-22
Lee J, Mahendra S, Alvarez PJJ (2010) Nanomaterials in the Construction Industry: A Review of Their Applications
and Environmental Health and Safety Considerations. Acs Nano 4 (7):3580-3590. doi:Doi
10.1021/Nn100866w
Maynard AD, Aitken RJ, Butz T, Colvin V, Donaldson K, Oberdorster G, Philbert MA, Ryan J, Seaton A, Stone V,
Tinkle SS, Tran L, Walker NJ, Warheit DB (2006) Safe handling of nanotechnology. Nature 444
(7117):267-269. doi:Doi 10.1038/444267a
Messing ME, Dick KA, Wallenberg LR, Deppert K (2009) Generation of size-selected gold nanoparticles by spark
discharge - for growth of epitaxial nanowires. Gold Bull 42 (1):20-26
28
Messing ME, Svensson CR, Pagels J, Meuller BO, Deppert K, Rissler J (2012) Gas-borne particles with tunable and
highly controlled characteristics for nanotoxicology studies. Nanotoxicology:1-12
Methner M, Hodson L, Dames A, Geraci C (2010a) Nanoparticle Emission Assessment Technique (NEAT) for the
Identification and Measurement of Potential Inhalation Exposure to Engineered Nanomaterials-Part B:
Results from 12 Field Studies. J Occup Environ Hyg 7 (3):163-176. doi:Doi 10.1080/15459620903508066
Methner M, Hodson L, Geraci C (2010b) Nanoparticle Emission Assessment Technique (NEAT) for the
Identification and Measurement of Potential Inhalation Exposure to Engineered Nanomaterials - Part A. J
Occup Environ Hyg 7 (3):127-132. doi:Doi 10.1080/15459620903476355
Oberdorster G (2000) Toxicology of ultrafine particles: in vivo studies. Philos T Roy Soc A 358 (1775):2719-2739.
doi:DOI 10.1098/rsta.2000.0680
Oberdorster G, Sharp Z, Atudorei V, Elder A, Gelein R, Kreyling W, Cox C (2004) Translocation of inhaled
ultrafine particles to the brain. Inhal Toxicol 16 (6-7):437-445. doi:Doi 10.1080/08958370490439597
Onasch TB, Trimborn A, Fortner EC, Jayne JT, Kok GL, Williams LR, Davidovits P, Worsnop DR (2012) Soot
Particle Aerosol Mass Spectrometer: Development, Validation, and Initial Application. Aerosol Sci Tech 46
(7):804-817. doi:Doi 10.1080/02786826.2012.663948
Pagels J, Gudmundsson A, Gustavsson E, Asking L, Bohgard M (2005) Evaluation of aerodynamic particle sizer and
electrical low-pressure impactor for unimodal and bimodal mass-weighted size distributions. Aerosol Sci
Tech 39 (9):871-887. doi:Doi 10.1080/02786820500295677
Park J, Kwak BK, Bae E, Lee J, Choi K, Yi J, Kim Y (2009a) Exposure assessment of engineered nanomaterials in
the workplace. Korean J Chem Eng 26 (6):1630-1636. doi:DOI 10.1007/s11814-009-0238-z
Park J, Kwak BK, Bae E, Lee J, Kim Y, Choi K, Yi J (2009b) Characterization of exposure to silver nanoparticles in
a manufacturing facility. J Nanopart Res 11 (7):1705-1712. doi:DOI 10.1007/s11051-009-9725-8
Park K, Dutcher D, Emery M, Pagels J, Sakurai H, Scheckman J, Qian S, Stolzenburg MR, Wang X, Yang J,
McMurry PH (2008) Tandem measurements of aerosol properties - A review of mobility techniques with
extensions. Aerosol Sci Tech 42 (10):801-816. doi:Doi 10.1080/02786820802339561
Peters TM, Elzey S, Johnson R, Park H, Grassian VH, Maher T, O'Shaughnessy P (2009) Airborne Monitoring to
Distinguish Engineered Nanomaterials from Incidental Particles for Environmental Health and Safety. J
Occup Environ Hyg 6 (2):73-81. doi:Doi 10.1080/15459620802590058
29
Poschl U, Martin ST, Sinha B, Chen Q, Gunthe SS, Huffman JA, Borrmann S, Farmer DK, Garland RM, Helas G,
Jimenez JL, King SM, Manzi A, Mikhailov E, Pauliquevis T, Petters MD, Prenni AJ, Roldin P, Rose D,
Schneider J, Su H, Zorn SR, Artaxo P, Andreae MO (2010) Rainforest Aerosols as Biogenic Nuclei of
Clouds and Precipitation in the Amazon. Science 329 (5998):1513-1516. doi:DOI 10.1126/science.1191056
Rissler J, Swietlicki E, Bengtsson A, Boman C, Pagels J, Sandstrom T, Blomberg A, Londahl J (2012) Experimental
determination of deposition of diesel exhaust particles in the human respiratory tract. J Aerosol Sci 48:18-
33. doi:DOI 10.1016/j.jaerosci.2012.01.005
Rivera Gil P, Oberdorster G, Elder A, Puntes V, Parak WJ (2010) Correlating Physico-Chemical with Toxicological
Properties of Nanoparticles: The Present and the Future. Acs Nano 4 (10):5527-5531. doi:Doi
10.1021/Nn1025687
Savi M, Kalberer M, Lang D, Ryser M, Fierz M, Gaschen A, Ricka J, Geiser M (2008) A novel exposure system for
the efficient and controlled deposition of aerosol particles onto cell cultures. Environ Sci Technol 42
(15):5667-5674. doi:Doi 10.1021/Es703075q
Schmid O, Moller W, Semmler-Behnke M, Ferron GA, Karg E, Lipka J, Schulz H, Kreyling WG, Stoeger T (2009)
Dosimetry and toxicology of inhaled ultrafine particles. Biomarkers 14:67-73. doi:Doi
10.1080/13547500902965617
Seaton A, Donaldson K (2005) Nanoscience, nanotoxicology, and the need to think small. Lancet 365 (9463):923-
924
Seipenbusch M, Rothenbacher S, Kirchhoff M, Schmid HJ, Kasper G, Weber AP (2010) Interparticle forces in silica
nanoparticle agglomerates. J Nanopart Res 12 (6):2037-2044. doi:DOI 10.1007/s11051-009-9760-5
Seipenbusch M, Toneva P, Peukert W, Weber AP (2007) Impact fragmentation of metal nanoparticle agglomerates.
Part Part Syst Char 24 (3):193-200. doi:DOI 10.1002/ppsc.200601089
Sorensen CM (2011) The Mobility of Fractal Aggregates: A Review. Aerosol Sci Tech 45 (7):765-779. doi:Pii
934334352
Doi 10.1080/02786826.2011.560909
Stebounova LV, Morgan H, Grassian VH, Brenner S (2012) Health and safety implications of occupational exposure
to engineered nanomaterials. Wires Nanomed Nanobi 4 (3):310-321. doi:Doi 10.1002/Wnan.174
30
Tsai CJ, Huang CY, Chen SC, Ho CE, Huang CH, Chen CW, Chang CP, Tsai SJ, Ellenbecker MJ (2011) Exposure
assessment of nano-sized and respirable particles at different workplaces. J Nanopart Res 13 (9):4161-4172.
doi:DOI 10.1007/s11051-011-0361-8
Wong BA, Nash DG, Moss OR (2009) Generation of Nanoparticle Agglomerates and their Dispersion in Lung
Serum Simulant or Water. J Phys Conf Ser 151. doi:Artn 012036
Doi 10.1088/1742-6596/151/1/012036
Woskie S (2010) Workplace practices for engineered nanomaterial manufacturers. Wires Nanomed Nanobi 2
(6):685-692. doi:Doi 10.1002/Wnan.101
Yli-Ojanpera J, Sakurai H, Iida K, Makela JM, Ehara K, Keskinen J (2012) Comparison of Three Particle Number
Concentration Calibration Standards Through Calibration of a Single CPC in a Wide Particle Size Range.
Aerosol Sci Tech 46 (11):1163-1173. doi:10.1080/02786826.2012.701023
Zimmermann E, Derrough S, Locatelli D, Durand C, Fromaget JL, Lefranc E, Ravanel X, Garrione J (2012) Results
of potential exposure assessments during the maintenance and cleanout of deposition equipment. J Nanopart
Res 14 (10). doi:Artn 1209
Doi 10.1007/S11051-012-1209-6
Top Related
Copyright © 2022 FDOKUMEN

