


Bahasa
Halaman
Hukum


Regenesys etd – Ravhutulu, V (2011)
i
MANAGING WORKPLACE CONFLICTS:
A CASE STUDY IN THE CITY OF
JOHANNESBURG
by
VULEDZANI RAVHUTULU
A dissertation submitted in partial fulfilment of the requirement for the degree of
MASTER OF PUBLIC MANAGEMENT
At the
Department of Public Management
Regenesys Business School
Johannesburg: South Africa
2011

Regenesys etd – Ravhutulu, V (2011)
ii
DECLARATION
I declare that this dissertation on: ‗Managing Workplace Conflicts: A Case Study in
the City Of Johannesburg‘, submitted to the Regenesys University for the partial
fulfilment of requirements for the degree Masters in Public Management, is my own
work and that it has not been submitted for any degree at any university, nor has it
been submitted as part of the requirements for a degree, except as fully
acknowledged within the text.
Vuledzani Ravhutulu
2011

Regenesys etd – Ravhutulu, V (2011)
iii
ACKNOWLEDGEMENTS
Firstly, I would like to thank God for giving me strength to do this research study. I
would also like to express thanks to all the people who have supported me in
completing this task; colleagues and friends who have always encouraged me to
work hard on accomplishing my goals and finishing the study.
Finally, I would like to thank my wife, Sylvia, and my two beautiful kids, Tsireledzo
and Khalirendwe, for their understanding, support and patience during the period I
was occupied with this study.
May God bless you all.

Regenesys etd – Ravhutulu, V (2011)
iv
ABSTRACT
The primary research objective of this study was to investigate the strategies for
managing workplace conflicts in the City of Johannesburg, so that appropriate
measures could be suggested to deal effectively with conflict related issues. The
secondary research objectives for this study, all focussed on and concerning
workplace conflicts in the City of Johannesburg, were: to determine the types of
conflicts occurring; to examine their causes; to establish the impact of workplace
conflicts on workers‘ performance; to assess the procedures for dealing with these
events; and to evaluate the effectiveness of measures for dealing with these
workplace conflicts in the City of Johannesburg.
The research questions for this study, all focussed on and pertaining to workplace
conflicts in the City of Johannesburg, were as follows:
What are the types of workplace conflicts occurring in the City of
Johannesburg?
What are their causes?
How do these workplace conflicts impact on workers‘ performance in the City
of Johannesburg?
What are the procedures for dealing with these conflicts and are they
appropriate?
Are the measures for dealing with workplace conflicts in the City of
Johannesburg effective?
This study was considered justifiable, in that it was anticipated to lead to a review of
the current approaches to managing workplace conflicts in the City of Johannesburg.
It was expected that, if such reviews were undertaken, they would lead to the
reduction of workplace conflicts, along with more effective remedies and their

Regenesys etd – Ravhutulu, V (2011)
v
improved management. Other significant and positive impacts of the reduction of
workplace conflicts were also anticipated, including improved communication within
the organisation; increased job satisfaction, commitment and morale; subsequently
leading to enhanced employee performance and fulfilment. The expected overall
effects of this study anticipated an improved performance and a more efficient
functioning of the entire City of Johannesburg, as an organisation.
The study review consists of six chapters. These comprise:
Chapter One: Introduction.
Chapter Two: Literature Review.
Chapter Three: Research Design and Methodology.
Chapter Four: Findings.
Chapter Five: Discussions.
Chapter Six: Conclusions and Recommendations.
A quantitative research method was utilised for primary data collection – comprising
questionnaires based and designed on the Likert Scale, containing five options and
personally administered to 100 respondents. The options were: Strongly Agree – 1;
Agree – 2; Unsure – 3; Disagree – 4 and Strongly Disagree – 5. The respondents,
comprised of ordinary and senior employees of the City of Johannesburg, were
required to provide their responses according to these indicated scales. The raw
data obtained from the questionnaires was analysed using SPSS software. The
hypothesis analysis was conducted by implementing the formula:

Regenesys etd – Ravhutulu, V (2011)
vi
The correlation analysis of the relationship between two variables was achieved by
utilising Pearson‘s Co-efficient Correlation formula:
* ( ), ( )-+
√ * ( ) , ( ) √ ⌈ ⟨ ( ) ⟩⌉-+
The findings revealed the most common causes of workplace conflicts in the City of
Johannesburg relate to goal conflicts; conflicting roles; task inter-dependency;
competition among employees; communication failures; individual, personal and
personality clashes or differences; leadership and control issues; specialisation;
inequity; and external changes or threats. Although the secondary research revealed
that certain minor or nominal workplace conflicts may produce a positive impact, it
was clearly apparent that, in the majority of situations, conflicts have been
undesirable, irrespective of their significance or magnitude. The majority of conflicts
were found to have undesirable consequences, most frequently impacting with
detrimental and negative effects on motivation, job satisfaction, morale and
increased operational costs. Despite such adverse impacts, it was found that very
little had been undertaken by the Management of the City of Johannesburg to reduce
conflicts. Effectively, the study conclusions and outcomes advocate and advise that
the City of Johannesburg Management must make constructive policy changes and
take major steps to limit and reduce workplace conflicts.
Suggestions for practical and beneficial approaches to reducing and remedying
conflicts, for the Management of the City of Johannesburg include the adoption of
proper job design; improved communication; development of grievance discussion
forums; establishing union dispute resolution procedures and non-union conflict
management systems. The suggested area for further studies would be:
―Investigating the Causes of Workplace Conflicts in the City of Johannesburg.‖

Regenesys etd – Ravhutulu, V (2011)
vii
TABLE OF CONTENTS
DECLARATION .................................................................................................................................................. II
ACKNOWLEDGEMENTS ...................................................................................................................................III
ABSTRACT ...................................................................................................................................................... IV
TABLE OF CONTENTS ..................................................................................................................................... VII
LIST OF TABLES .......................................................................................................................................................... xii LIST OF FIGURES ....................................................................................................................................................... xiii
CHAPTER 1: INTRODUCTION ............................................................................................................................ 2
1.1 INTRODUCTION ..................................................................................................................................... 2
1.2 BACKGROUND INFORMATION .............................................................................................................. 3
1.3 RESEARCH PROBLEM ............................................................................................................................. 3
1.4 RESEARCH OBJECTIVES .......................................................................................................................... 4
1.4.1 Primary Research Objective ............................................................................................................. 4
1.4.2 Secondary Research Objectives ........................................................................................................ 5
1.5 RESEARCH QUESTIONS .......................................................................................................................... 5
1.6 RESEARCH HYPOTHESES ........................................................................................................................ 6
1.7 JUSTIFICATION OF THE STUDY ............................................................................................................... 6
1.8 OVERVIEW OF THE STUDY ..................................................................................................................... 6
1.9 CONCLUSION ......................................................................................................................................... 8
CHAPTER 2: LITERATURE REVIEW ..................................................................................................................... 9
2.1 INTRODUCTION ..................................................................................................................................... 9
2.2 THE CONCEPT OF WORKPLACE CONFLICT ............................................................................................. 9
2.3 TYPES OF WORKPLACE CONFLICTS ...................................................................................................... 10
2.3.1 Vertical and Horizontal Conflicts .................................................................................................... 11
2.3.2 Organised and Un-Organised Conflicts .......................................................................................... 11
2.2.3 Rights and Interest Conflicts .......................................................................................................... 11
2.3.4 Group Conflicts ............................................................................................................................... 12
2.4 CAUSES OF WORKPLACE CONFLICTS ................................................................................................... 13
2.4.1 Goal Conflicts ................................................................................................................................. 13
2.4.2 Role Conflict ................................................................................................................................... 13
2.4.3 Task Inter-Dependency .................................................................................................................. 14
2.4.4 Competition.................................................................................................................................... 14
2.4.5 Communication Failures ................................................................................................................ 15
2.4.6 Individual and Personality Differences ........................................................................................... 15
2.4.7 Leadership and Control .................................................................................................................. 15
2.4.8 Specialisation ................................................................................................................................. 16
2.4.9 Inequity .......................................................................................................................................... 16
2.4.10 Violation of Territory .................................................................................................................. 16
2.4.11 External Changes or Threats ....................................................................................................... 16
2.5 THE IMPACTS OF WORKPLACE CONFLICTS ON WORKER PERFORMANCE ........................................... 17
2.5.1 Negative Effects on Motivation ..................................................................................................... 17
2.5.2 Increased Job Dissatisfaction ......................................................................................................... 18
2.5.3 Declined Employee Morale ............................................................................................................ 18

Regenesys etd – Ravhutulu, V (2011)
viii
2.5.4 Employee Performance .................................................................................................................. 19
2.5.6 Increased Operational Costs .......................................................................................................... 21
2.6 STRATEGIES FOR MANAGING CONFLICTS ............................................................................................ 22
2.6.1 Changing Situational Factors ......................................................................................................... 22
2.6.2 Promoting Subordinate Goals ........................................................................................................ 23
2.7 OTHER POSSIBLE APPROACHES FOR MANAGING CONFLICTS ............................................................. 24
2.7.1 Profit-Sharing ................................................................................................................................. 24
2.7.2 Co-Partnership ............................................................................................................................... 25
2.7.3 Inter-Personal Techniques .............................................................................................................. 25
2.8 PATTERNS OF UTILISATION OF WORKPLACE CONFLICT MANAGEMENT ............................................. 27
2.8.1 Union Dispute Resolution Procedures ............................................................................................ 27
2.8.2 Non-Union Conflict Management Systems .................................................................................... 28
2.9 INTERNAL CONFLICT MANAGEMENT SYSTEMS .................................................................................. 28
2.9.1 Open Door Policy Models ............................................................................................................... 29
2.9.2 Ombudsman ................................................................................................................................... 29
2.9.4 Managerial Mediation ................................................................................................................... 30
2.9.5 Peer Review Boards ........................................................................................................................ 30
2.9.6 Executive Panel .............................................................................................................................. 31
2.10 CONCLUSIONS ..................................................................................................................................... 31
CHAPTER 3: RESEARCH DESIGN AND METHODOLOGY ................................................................................... 32
3.1 INTRODUCTION ................................................................................................................................... 32
3.2 QUANTITATIVE RESEARCH................................................................................................................... 32
3.3 SAMPLING STRATEGY .......................................................................................................................... 33 Table 3.1: Population Sample Sizes ........................................................................................................................... 34
3.4 DATA COLLECTION PROCESS ............................................................................................................... 35
3.4.1 A Mailed Questionnaire ................................................................................................................. 36
3.4.2 Pilot Testing ................................................................................................................................... 37
3.4.3 Data Collection Process .................................................................................................................. 38
3.5 DATA ANALYSIS ................................................................................................................................... 38
3.6 VALIDITY AND RELIABILITY .................................................................................................................. 39
3.7 LIMITATIONS OF THE STUDY ................................................................................................................ 41
3.8 ETHICAL CONSIDERATIONS ................................................................................................................. 41
3.9 CONCLUSION ....................................................................................................................................... 42
CHAPTER 4: FINDINGS .................................................................................................................................... 43
4.1 INTRODUCTION ................................................................................................................................... 43
4.2 SECTION A: .......................................................................................................................................... 43
THE TYPES OF WORKPLACE CONFLICTS PREVALENT IN THE CITY OF JOHANNESBURG ..................................... 43
4.2.1 Question 1: ..................................................................................................................................... 44
Vertical and Horizontal Conflicts Characterise the City of Johannesburg .................................................... 44 Figure 4.1:.................................................................................................................................................................. 44 Vertical and Horizontal Conflicts Characterise the City of Johannesburg ................................................................. 44
4.2.2 Question 2: ..................................................................................................................................... 45
Organised and Un-Organised Conflicts Characterise the City of Johannesburg .......................................... 45 Figure 4.2:.................................................................................................................................................................. 45 Organised and Un-Organised Conflicts Characterise the City of Johannesburg ........................................................ 45
4.2.3 Question 3: ..................................................................................................................................... 46
Rights and Interest Conflicts Characterise the City of Johannesburg ........................................................... 46 Figure 4.3:.................................................................................................................................................................. 46

Regenesys etd – Ravhutulu, V (2011)
ix
Rights and Interest Conflicts Characterise the City of Johannesburg ........................................................................ 46 4.2.4 Question 4: ..................................................................................................................................... 47
Group Conflicts Characterise the City of Johannesburg ............................................................................... 47
4.3 SECTION B:........................................................................................................................................... 48
THE CAUSES OF WORKPLACE CONFLICTS IN THE CITY OF JOHANNESBURG ..................................................... 48
4.3.1 Question 5: ..................................................................................................................................... 48
Conflicts in the City of Johannesburg are Due to Goal Conflicts .................................................................. 48
4.3.2 Question 6: ..................................................................................................................................... 49
Conflicting Roles are the Causes of Conflicts in the City of Johannesburg ................................................... 49
4.3.3 Question 7: ..................................................................................................................................... 50
Task Inter-Dependency is the Main Cause of Conflicts in the City of Johannesburg .................................... 50
4.3.4 Question 8: ..................................................................................................................................... 51
Competition among Employees is the Main Cause of Conflicts in the City of Johannesburg ....................... 51
4.3.5 Question 9: ..................................................................................................................................... 52
Communication Failures are the Main Causes of Conflicts in the City of Johannesburg .............................. 52
4.3.6 Question 10: ................................................................................................................................... 53
Individual and Personality Differences are the Main Causes of Conflicts in the City of Johannesburg ........ 53
4.3.7 Question 11: ................................................................................................................................... 54
Leadership and Control are the Main Causes of Conflicts in the City of Johannesburg ............................... 54
4.3.8 Question 12: ................................................................................................................................... 55
Specialisation is the Main Cause of Conflicts in the City of Johannesburg ................................................... 55
4.3.9 Question 13: ................................................................................................................................... 56
Inequity is the Main Cause of Conflicts in the City of Johannesburg ............................................................ 56
4.3.10 Question 14: ............................................................................................................................... 57
External Changes or Threats ........................................................................................................................ 57
4.4 SECTION C: ........................................................................................................................................... 58
THE IMPACTS OF WORKPLACE CONFLICTS ON WORKERS PERFORMANCE IN THE CITY OF JOHANNESBURG ... 58
4.4.1 Question 15: ................................................................................................................................... 58
Conflicts Have Led to Increased Negative Effects on Motivation ................................................................. 58
4.4.2 Question 16: ................................................................................................................................... 59
Conflicts Have Increased Job Dissatisfaction ............................................................................................... 59
4.4.3 Question 17: ................................................................................................................................... 60
Conflicts Have Led to Declined Employee Morale ........................................................................................ 60
4.4.4 Question 18: ................................................................................................................................... 61
Conflicts Have Negatively Affected Employee Performance ........................................................................ 61
4.4.5 Question 19: ................................................................................................................................... 62
Conflicts Have Led to Increased Operational Costs ...................................................................................... 62
4.4.6 Question 20: ................................................................................................................................... 63
Workplace Conflicts have led to Increased Labour Turnover in the City of Johannesburg........................... 63
4.5 SUMMARY ........................................................................................................................................... 63
4.5.1 SECTION A: ..................................................................................................................................... 64
THE TYPES OF WORKPLACE CONFLICTS PREVALENT IN THE CITY OF JOHANNESBURG ............................... 64
4.5.2 SECTION B: ..................................................................................................................................... 65
THE CAUSES OF WORKPLACE CONFLICTS PREVALENT IN THE CITY OF JOHANNESBURG ............................ 65
4.5.3 SECTION C: ..................................................................................................................................... 66
THE IMPACTS OF WORKPLACE CONFLICTS PREVALENT IN THE CITY OF JOHANNESBURG .......................... 66
4.5.4 SECTION D: ..................................................................................................................................... 67
AVAILABILITY OF RESOLUTION TECHNIQUES FOR RESOLVING WORKPLACE CONFLICTS IN THE CITY OF
JOHANNESBURG .......................................................................................................................................... 67

Regenesys etd – Ravhutulu, V (2011)
x
4.6 CONCLUSION ....................................................................................................................................... 68
CHAPTER 5: DISCUSSIONS .............................................................................................................................. 69
5.1 INTRODUCTION ................................................................................................................................... 69
5.2 SECTION A: .......................................................................................................................................... 69
THE TYPES OF WORKPLACE CONFLICTS PREVALENT IN THE CITY OF JOHANNESBURG ..................................... 69
5.2.1 Question 1: ..................................................................................................................................... 70
Vertical and Horizontal Conflicts Characterise the City of Johannesburg .................................................... 70
5.2.2 Question 2: ..................................................................................................................................... 71
Organised and Un-Organised Conflicts Characterise the City of Johannesburg .......................................... 71
5.2.3 Question 3: ..................................................................................................................................... 72
Rights and Interest Conflicts Characterise the City of Johannesburg ........................................................... 72
5.2.4 Question 4: ..................................................................................................................................... 72
Group Conflicts Characterise the City of Johannesburg ............................................................................... 72
5.3 HYPOTHESIS ANALYSIS ........................................................................................................................ 73
5.3.1 H0: Workplace Disputes in the City of Johannesburg are Characterised by Horizontal; Vertical;
Organised; and Un-Organised Conflicts ....................................................................................................... 73
5.3.2 H1: Workplace Disputes in the City of Johannesburg are Not Characterised by Horizontal;
Vertical; Organised; and Un-Organised Conflicts ......................................................................................... 73
5.4 SECTION B:........................................................................................................................................... 74
THE CAUSES OF WORKPLACE CONFLICTS IN THE CITY OF JOHANNESBURG ..................................................... 74
5.4.1 Question 5: ..................................................................................................................................... 75
The Conflicts in the City of Johannesburg are Due to Goal Conflicts ............................................................ 75
5.4.2 Question 6: ..................................................................................................................................... 75
Conflicting Roles are the Causes of Conflicts in the City of Johannesburg ................................................... 75
5.4.3 Question 7: ..................................................................................................................................... 76
Task Inter-Dependency is the Main Cause of Conflicts in the City of Johannesburg .................................... 76
5.4.4 Question 8: ..................................................................................................................................... 76
Competition among Employees is the Main Cause of Conflicts in the City of Johannesburg ....................... 76
5.4.5 Question 9: ..................................................................................................................................... 77
Communication Failures are the Main Causes of Conflicts in the City of Johannesburg .............................. 77
5.4.6 Question 10: ................................................................................................................................... 78
Individual and Personality Differences are the Main Causes of Conflicts in the City of Johannesburg ........ 78
5.4.7 Question 11: ................................................................................................................................... 78
Leadership and Control are the Main Causes of Conflicts in the City of Johannesburg ............................... 78
5.4.8 Question 12: ................................................................................................................................... 79
Specialisation is the Main Cause of Conflicts in the City of Johannesburg ................................................... 79
5.4.9 Question 13: ................................................................................................................................... 79
Inequity is the Main Cause of Conflicts in the City of Johannesburg ............................................................ 79
5.4.10 Question 14: ............................................................................................................................... 80
External Changes or Threats ........................................................................................................................ 80
5.5 CORRELATION BETWEEN THE CAUSES AND DIFFERENT TYPES OF WORKPLACE CONFLICT ................. 80
5.6 HYPOTHESIS TESTING .......................................................................................................................... 82
5.6.1 H0: The Main Causes of Workplace Conflicts are Not Individual and Organisational Factors ....... 82
5.6.2 H1: The Main Causes of Workplace Conflicts are Individual and Organisational Factors ............. 82
5.7 SECTION C: ........................................................................................................................................... 84
THE IMPACTS OF WORKPLACE CONFLICTS ON WORKER PERFORMANCE IN THE CITY OF JOHANNESBURG..... 84
5.7.1 Question 15: ................................................................................................................................... 84
Conflicts Have Led to Increased Negative Effects on Motivation ................................................................. 84

Regenesys etd – Ravhutulu, V (2011)
xi
5.7.2 Question 16: ................................................................................................................................... 85
Conflicts Have Increased Job Dissatisfaction ............................................................................................... 85
5.7.3 Question 17: ................................................................................................................................... 85
Conflicts Have Led to Declined Employee Morale ........................................................................................ 85
5.7.4 Question 18: ................................................................................................................................... 86
Conflicts Have Negatively Affected Employee Performance ........................................................................ 86
5.7.5 Question 19: ................................................................................................................................... 86
Conflicts Have Led to Increased Operational Costs ...................................................................................... 86
5.7.6 Question 20: ................................................................................................................................... 87
Workplace Conflicts Have Led to Increased Labour Turnover in the City of Johannesburg ......................... 87
5.8 HYPOTHESIS TESTING .......................................................................................................................... 87
5.8.1 H0: Workplace Conflicts Impact Positively on Employee Performance .......................................... 87
5.8.2 H1: Workplace Conflicts Have Negative Impacts on Employee Performance. ............................... 87
5.9 CORRELATION BETWEEN DIFFERENT TYPES OF WORKPLACE CONFLICT AND THE IMPACT ON
ORGANISATIONAL PERFORMANCE .................................................................................................................. 89
5.10 CONCLUSIONS ..................................................................................................................................... 90
CHAPTER 6: CONCLUSIONS AND RECOMMENDATIONS ................................................................................. 91
6.1 INTRODUCTION ................................................................................................................................... 91
6.2 THE STUDY FINDINGS .......................................................................................................................... 91
6.3 CONCLUSION ....................................................................................................................................... 93
6.4 THE CONCEPT OF WORKPLACE CONFLICTS ......................................................................................... 93
6.5 CAUSES OF WORKPLACE CONFLICTS ................................................................................................... 94
6.6 THE IMPACTS OF WORKPLACE CONFLICT ON WORKER PERFORMANCE ............................................. 95
6.7 STRATEGIES FOR MANAGING CONFLICTS ............................................................................................ 95
6.8 PATTERNS OF UTILISATION OF WORKPLACE CONFLICT MANAGEMENT ............................................. 96
6.9 RECOMMENDATIONS .......................................................................................................................... 97
6.9.1 SECTION A: ..................................................................................................................................... 97
THE TYPES OF WORKPLACE CONFLICTS PREVALENT IN THE CITY OF JOHANNESBURG ............................... 97 6.9.1.1 Adopt Proper Job Design and Improve Communication ........................................................................ 97 6.9.1.2 Develop Grievance Discussions Forum .................................................................................................. 97
6.9.2 SECTION B: ..................................................................................................................................... 98
THE CAUSES OF WORKPLACE CONFLICTS IN THE CITY OF JOHANNESBURG ................................................ 98 6.9.2.1 Promoting Subordinate Goals ................................................................................................................ 98 6.9.2.2 Profit-Sharing ......................................................................................................................................... 98 6.9.2.3 Co-Partnership ....................................................................................................................................... 99 6.9.2.4 Inter-Personal Techniques ..................................................................................................................... 99 6.9.2.5 Union Dispute Resolution Procedures ................................................................................................. 100 6.9.2.6 Non-Union Conflict Management Systems .......................................................................................... 100
6.10 CONCLUSIONS ............................................................................................................................... 101
LIST OF REFERENCES .................................................................................................................................... 102
QUESTIONNAIRE .......................................................................................................................................... 108
APPENDIX 1: ................................................................................................................................................ 111
DATA ANALYSIS SPSS OUTPUT ........................................................................................................................ 111
DATA ANALYSIS - DESCRIPTIVES ..................................................................................................................... 119

Regenesys etd – Ravhutulu, V (2011)
xii
LIST OF TABLES
PAGE
Table 3.1 Population Sample Sizes 34
Table 4.1 Prevalent Types Of Workplace Conflicts in Johannesburg City
64
Table 4.2 Major Causes of Workplace Conflicts in Johannesburg City 65
Table 4.3 Main Impacts of Workplace Conflicts in Johannesburg City 66
Table 4.4 Availability of Resolution Mechanisms to Resolve Workplace Conflicts 67
Table 5.1 Hypothesis Analysis 74
Table 5.2 Correlation between the Causes and Different Types of Workplace Conflicts 81
Table 5.3 Hypothesis Analysis 83
Table 5.4 Hypothesis Analysis 88
Table 5.5 Correlation Assessment 89

Regenesys etd – Ravhutulu, V (2011)
xiii
LIST OF FIGURES
PAGE
Figure 4.1: Vertical and Horizontal Conflicts Characterise the City of Johannesburg 44
Figure 4.2: Organised and Un-Organised Conflicts Characterise the City of Johannesburg 45
Figure 4.3: Rights and Interest Conflicts Characterise the City of Johannesburg 46
Figure 4.4: Group Conflicts Characterise the City of Johannesburg 47
Figure 4.5: Conflicts in the City of Johannesburg are Due to Goal Conflicts 48
Figure 4.6: Conflicting Roles are the Causes of Conflicts in the City of Johannesburg 49
Figure 4.7: Task Inter-Dependency is the Main Cause of Conflicts 50
Figure 4.8: Competition among Employees is the Main Cause of Conflicts
51
Figure 4.9: Communication Failures are the Main Causes of Conflicts
52
Figure 4.10: Individual and Personality Differences are the Main Causes of Conflicts 53
Figure 4.11: Leadership and Control are the Main Causes of Conflicts 54
Figure 4.12: Specialisation is the Main Cause of Conflicts in the City of Johannesburg 55
Figure 4.13: Inequity is the Main Cause of Conflicts in the City of Johannesburg 56
Figure 4.14: External Changes or Threats 57
Figure 4.15: Conflicts Have Led to Increased Negative Effects on Motivation 58
Figure 4.16: Conflicts Have Increased Job Dissatisfaction 59
Figure 4.17: Conflicts Have Led to Declined Employee Morale 60
Figure 4.18: Conflicts Have Negatively Affected Employee Performance 61
Figure 4.19: Conflicts Have Led to Increased Operational Costs 62
Figure 4.20: Workplace Conflicts Have Led to Increased Labour Turnover 63
Figure 4.21: Prevalent Types Of Workplace Conflicts 64
Figure 4.22: Major Causes of Workplace Conflicts 66
Figure 4.23: Main Impacts of Workplace Conflicts 67
Figure 4.24: Availability of Resolution Mechanisms to Resolve Workplace Conflicts 68

Regenesys etd – Ravhutulu, V (2011)
2
CHAPTER 1: INTRODUCTION
1.1 INTRODUCTION
Simmons and Peterson (2000) argue that workplace conflicts can prove to be
productive and augment team performance. This premise posits that, through
workplace conflicts, employees are able to engage in the best decision making
processes. Passos and Caetano (2005) suggest that disagreements over resource
distribution; procedures; guidelines and the interpretation of facts are the keys to the
best decision making and organisational success. Dipaola and Hoy (2001) note,
however, that studies have shown that there is no ideal relationship between
workplace conflict and organisational performance. Workplace conflicts often have
negative impacts leading to low job satisfaction, inhibiting commitment and morale,
and subsequently, to poor general organisational performance. Passos and Caetano
(2005) add that there must be a balance between conflicts with positive effects and
the need to avoid conflicts, which may have serious negative effects on
performance. Obtaining and maintaining such a balance is a major difficulty most
organisations face. Organisations may go to extremes - management may over-
react, avoiding conflicts completely; or completely neglect conflict management
measures, justifying the adoption of this policy by emphasising the fact that
workplace conflicts may breed positive results.
In the City of Johannesburg there has been a complete neglect of workplace conflict
management strategies, leading, consequently, to increased negative feelings
among employees. The effect of these negative perceptions often culminates in
distrust between employees, physical violence, job dissatisfaction, low morale and
reduced motivation. This study, therefore, investigates strategies for managing
workplace conflicts. This chapter includes discussions relating to the context of the
research; background information; the research problem; the research objectives
and questions. This chapter also encompasses the research hypothesis, the
significance and the overview of the study.

Regenesys etd – Ravhutulu, V (2011)
3
1.2 BACKGROUND INFORMATION
The present day City of Johannesburg Municipal Council was created from eleven
existing local authorities, seven of which were ‗White‘ and the remaining four ‗Black
or Coloured‘. The first post-apartheid City Council was created in 1995. In order to
highlight its primary goal of addressing unequal tax revenue distribution the council
adopted the slogan ―One City, One Taxpayer‖. The City Council was divided into four
regions, each with a substantially autonomous local regional authority, overseen by a
Central Metropolitan Council. The municipal boundaries were also expanded to
incorporate wealthy satellite towns, including Sandton and Randburg; along with
poorer neighbouring townships, such as Soweto, Alexandra, and Orange Farm.
In 1999 Johannesburg appointed a City Manager to reshape the city‘s ailing financial
situation. The City Manager, together with the Municipal Council, drew up a blueprint
called iGoli 2002. This was a three year plan, which called for the government to sell
non-core assets, restructure certain utilities and required that the others became
self-sufficient. This plan took the City of Johannesburg from near insolvency to an
operating surplus of R153 million. This restructuring also meant the City of
Johannesburg would have to increase its workforce, in order to serve its population
effectively. Johannesburg is a multi-cultural society, which is reflected in the
demographic profile of its municipal workforce. The diversity of the municipal
workforce could lead to an increased potential for high workplace conflict. Despite
this likelihood for conflict, efforts to develop effective conflict management strategies
have been minimal, as reflected in the following problem statement.
1.3 RESEARCH PROBLEM
The City of Johannesburg has no proper mechanisms for dealing with workplace
conflicts. Once a dispute occurs it frequently persists until it becomes a grudge,
regardless of whether it transpires between managers, employees or a combination
thereof. These disputes may escalate to a level where employees refuse to speak to

Regenesys etd – Ravhutulu, V (2011)
4
each other, thereby affecting communication, which is usually essential for effective
work performance. Increased feelings of resentment may lead to malicious gossip,
rancour and work hours being wasted. Retaliations and repercussions may result in
physical violence. The embarrassment, remorse and other adverse consequences of
physical or verbal hostility often leads to increased job dissatisfaction, low
commitment and decaying morale among employees. Employees may resort to
fabricating sickness, to avoid contact in the workplace or may leave the organisation
for other employment opportunities. This places an additional burden on the City of
Johannesburg, as constantly recruiting and training new employees to acclimatise to
the job, is inefficient and a waste of resources. Additionally, where conflicts have
escalated into grudges and severe hostility, employees have also resorted to acts of
sabotage against their antagonist. The Employment Equity Plan of the City of
Johannesburg (2008) only prescribes for a disciplinary process, which is rarely used.
Counter-measures and techniques for resolving disputes, including educating
employees on how to deal with workplace conflicts; arbitration; or mediation are
lacking. Workplace conflicts are, therefore, seemingly considered an intrinsic
element of employment in the City of Johannesburg. This study seeks to assess the
current measures being used, and to evaluate and suggest appropriate means and
methods for dealing with this problem.
1.4 RESEARCH OBJECTIVES
The primary and secondary research objectives for this study are outlined below, as
follows:
1.4.1 Primary Research Objective
The primary research objective of this study was to investigate the strategies for
workplace conflict management in the City of Johannesburg, so that appropriate
measures could be suggested to deal effectively with conflict related issues.

Regenesys etd – Ravhutulu, V (2011)
5
1.4.2 Secondary Research Objectives
The secondary research objectives for this study were:
To determine the types of workplace conflicts occurring in the City of
Johannesburg.
To examine the causes of workplace conflicts in the City of Johannesburg.
To establish the impact of these conflicts on workers‘ performance in the City
of Johannesburg.
To assess the procedures for dealing with workplace conflicts and their
consequences in the City of Johannesburg.
To assess the effectiveness of measures for dealing with workplace conflicts
in the City of Johannesburg.
1.5 RESEARCH QUESTIONS
The research questions for this study were:
What are the types of workplace conflicts occurring in the City of
Johannesburg?
What are the causes of workplace conflicts in the City of Johannesburg?
How do these workplace conflicts impact on workers‘ performance in the City
of Johannesburg?
Are the procedures for dealing with workplace conflicts in the City of
Johannesburg appropriate?
Are the measures for dealing with workplace conflicts in the City of
Johannesburg effective?

Regenesys etd – Ravhutulu, V (2011)
6
1.6 RESEARCH HYPOTHESES
The research hypotheses for this study were:
The main causes of workplace conflicts are:
H0: Not individual and organisational factors.
H1: Individual and Organisational factors.
Workplace conflicts impact:
H0: Positively on employees‘ performance.
H1: Negatively on employees‘ performance.
1.7 JUSTIFICATION OF THE STUDY
This study is justifiable in that it will lead to the review of the current approaches to
managing workplace conflicts at Johannesburg City. It is anticipated that if such
reviews are undertaken, they may reduce workplace conflicts. Reduction of
workplace conflicts may also significantly and positively impact on improved
communication within the organisation, job satisfaction, commitment, morale and
subsequently enhance employee performance. The overall effect would be improved
performance of the entire City of Johannesburg as an organisation.
1.8 OVERVIEW OF THE STUDY
This research report is divided into six chapters.
Chapter One: Introduction
This chapter contains discussions about the research context; background
information; research problem; research objectives and questions. The research

Regenesys etd – Ravhutulu, V (2011)
7
hypothesis; the justifications of the study and an overview of the study are also
covered.
Chapter Two: Literature Review
This chapter reviews several theories relevant to workplace conflict resolution. The
discussions are structured according to the issues outlined in the research questions
and objectives for the study. These include: types of workplace conflicts; the causes
of workplace conflicts; the impact of workplace conflicts on workers‘ performance;
procedures for dealing with workplace conflicts; and the effectiveness of measures
for dealing with these conflicts.
Chapter Three: Research Design and Methodology
The research design and methodology used for primary data collection in this study
is discussed in this chapter. The chapter contents include: quantitative research;
sample population; questionnaire; pilot study; collection process; validity and
reliability.
Chapter Four: Findings
The findings of the primary research are presented in this chapter. The presentation
of the findings is according to the issues outlined the research questions, objectives
and hypothesis. These are:
Section A: The types of workplace conflicts occurring in the City of Johannesburg.
Section B: The causes of workplace conflicts in the City of Johannesburg.
Section C: The impact of workplace conflicts on workers‘ performance in the City
of Johannesburg.
Section D: The procedures for dealing with workplace conflicts in the City of
Johannesburg.
Section E: The effectiveness of measures for dealing with workplace conflicts in
the City of Johannesburg

Regenesys etd – Ravhutulu, V (2011)
8
Chapter Five: Discussions
The findings of the primary research, indicated above, are discussed in this chapter.
The discussions followed similar sections to the previous chapter.
Chapter Six: Conclusions and Recommendations
The conclusions and recommendations of the study are discussed in this chapter.
1.9 CONCLUSION
This chapter explains the nature, necessity and purpose of this research. Chapter
Two, which follows, contains the literature review.

Regenesys etd – Ravhutulu, V (2011)
9
CHAPTER 2: LITERATURE REVIEW
2.1 INTRODUCTION
Managing workplace conflict is an essential elemental prerequisite for improving
employee productivity and general organisational performance. Effective conflict
management strategies creates a more favourable work environment and is
conducive to improving employee job satisfaction, morale, motivation, and
commitment to the allocated job (Dipaola and Hoy, 2001:238). The City of
Johannesburg has been shown to have inadequate or insufficient dispute resolution
mechanisms and despite the increase of discord among the workforce, has not
undertaken the development of a system to control, manage and resolve conflicts.
Several studies, conducted within Johannesburg City, concentrated on employee
participation, pay and performance management. None of these studies featured
specific discussions relating to the implications and consequences of workplace
conflicts, especially regarding employee performance. To address these deficiencies
this study, therefore, accentuates and highlights the importance of having effective
workplace management strategies. Several theories relevant to workplace conflict
resolutions are reviewed within this chapter. Discussions are structured according to
the issues outlined within the study research questions and objectives. These
incorporate the types and causes of workplace conflicts; their impact on workers‘
performance; and procedures for dealing with these disputes, along with the
effectiveness of the suggested measures.
2.2 THE CONCEPT OF WORKPLACE CONFLICT
The Association of Business Executives (ABE) (2008:254) describes a conflict as a
condition arising whenever the perceived interests of an individual or group clash
with those of another individual, or group, in such a way that strong emotions are
aroused and compromise is not considered an option. Disputes and conflicts arise
when one or more people attempt to ensure the achievement of their favoured

Regenesys etd – Ravhutulu, V (2011)
10
outcome, to the detriment or loss of the outcome preferred by the other involved
participants. Devine (2008:1) posits that workplace conflicts involve the perceived, or
actual, clash of expectations between individuals or groups. These expectations may
involve issues concerning how people should behave, how and when they should
work or how much they should be paid and for what. The expectations of all parties
in the workplace are interrelated and associated, and the extent to which these
expectations differ, clash or combine may impact on or cause conflicts.
These expectations, regardless of where the power lies in the relationship between
people, must be factored into the design of any strategy to minimise the risks and
maximise the opportunities associated with workplace conflict. ABE (2008:254)
reiterates that all organisations, individuals and groups experience conflict at some
time during the day-to-day business activities. ABE (2008:254) indicates that studies
have shown that dealing with conflict can take as much as 20% of management‘s
time. The study elaborated that some experts argue that conflict is good, because it
challenges the status quo and encourages individuals and groups to air their views.
Despite this, dangerous and counterproductive conflicts should not be allowed to
arise in the first place. The latter is considered the traditional view and assumes that
all conflict is bad, inefficient and dysfunctional. Devine (2008:1) and Lewin
(2004:403) reveal that workplace conflicts may be categorised as inter-personal
conflicts between individuals and groups, as well as alleged breaches of human
rights protected by law – which include freedom from racial, sex, disability, age,
sexual-preference and marital status discrimination. Workplace conflicts may also
include alleged breaches of other rights protected by law, including issues like terms
and conditions of employment, awards, workplace agreements and regulations.
These different forms of workplace conflicts are discussed below.
2.3 TYPES OF WORKPLACE CONFLICTS
The following are some of the specific types of workplace conflicts:
Regenesys etd – Ravhutulu, V (2011)
11
2.3.1 Vertical and Horizontal Conflicts
Gosline, Stallworth, Adams, Brand, Hallberin, and Honk (2001:119) note that
conflicts in organisations may also be classified according to the organisational
structure - i.e. vertical and horizontal structures. Vertical conflicts refer to disputes
between people at different levels of authority. Horizontal conflicts deal with the
disputes between people of approximately equal status. A classic case of vertical
conflict is a dispute between management and labour, because it involves a division
between those who make the decisions and those who have to carry them out.
Vertical conflict may, however, also arise between one level of employee and
another, or between different levels of management. Horizontal conflicts arise
between individuals and groups at similar levels within an organisation.
2.3.2 Organised and Un-Organised Conflicts
Conflicts classification may also based on how the dispute takes place. Organised
conflict refers to actions of one group, which express collective dissatisfaction
against another (Estreicher, 2001:70). These conflicts are usually undertaken via
recognised channels for complaints or disputes. Examples may include disputes
between employees and employer. Unorganised conflict takes place on an informal,
usually individual basis, though in certain instances groups may be involved. These
tend to focus around areas of dissatisfaction(s) in the workplace, and may be
expressed as grievances or inappropriate behaviour, possibly giving rise to
disciplinary problems.
2.2.3 Rights and Interest Conflicts
Lipsky, Seeber, Avgar and Scanza (2007:129) reveal that an alternative approach to
workplace conflict is to distinguish between the issues on which the conflict may be
based i.e. rights or interests. A conflict of right arises from alleged violations of rights

Regenesys etd – Ravhutulu, V (2011)
12
which have been established by a contract of employment. These are not considered
as being questions of right or wrong, and therefore, resolving these involves
bargaining, not adjudication. In circumstances where bargaining cannot resolve the
issue a recourse to adjudication may be necessary. According to Stone (1996:50),
this distinction is important, since it has implications for the way in which the conflict
is handled. Where a grievance is about rights, such as being required to undertake a
job which is allegedly outside of a person‘s job description, it may be settled by
management at a relatively low level, by referencing the relevant rules or contract
agreement. Grievances may also be about interests, an example of an interest
dispute could occur if individuals or groups consider that their rate of pay is unfair,
compared to what others in the organisation receive for the same or similar work.
2.3.4 Group Conflicts
Wheeler, Klaas and Mahony (2004) note that conflicts within, or between, groups are
also quite common. In any situation where roles and powers are allocated to
individuals, or in which different rights and expectations are identified with different
groups, there is the potential for opposition, resistance and conflict. This usually
occurs where competition is often rewarded, within and between groups. Such
incentives may comprise rewards of power and prestige, or appropriate proportions
of the profits or total remuneration package offered by the organisation. Zack
(1999:94) state that group conflicts may be destructive, as they may generate poor
working relationships, lack of communication, delays and disaffection. They may also
be positive, however, by revealing problems and, thus, leading to innovation and
change, in pursuit of effective methods of resolution. These conflicts may enhance
group cooperation and cohesion, where the group itself is in conflict with other
groups. A degree of conflict is, therefore, considered desirable. Reasons for these
different conflicts emerging in an organisation are discussed below.

Regenesys etd – Ravhutulu, V (2011)
13
2.4 CAUSES OF WORKPLACE CONFLICTS
According to Schmedemann (1987:523) and ABE 92008:166), the following are the
most common causes of conflicts within organisations:
2.4.1 Goal Conflicts
Shafritz (2001:90) notes that goal conflicts arise when individuals or groups pursue
different or conflicting goals from other individuals, or groups. Individuals and groups
commonly have their own goals, which are distinct from those of the organisation.
Where the pursuit of the latter does not result in the satisfaction of personal or group
goals, these individual goals may take precedence. Work conflict is also brought
about by competition, whereby at least one party loses, or suffers the frustration of,
their goals. These can arise on at individual, team or group level and may have their
roots in the organisational practices or the informal organisation.
2.4.2 Role Conflict
Mossier (1990: 63) indicates that role conflict is defined as an expected pattern of
behaviours associated with individuals occupying a particular position within an
organisational structure. Role conflict may arise when it is unclear what an
individual‘s role is, or from a lack of understanding of the role, or where two or more
people perceive themselves as carrying out the same role. In theory this should not
arise in the formal structure of organisations. In actuality, however, these conflicts
occur in practice, particularly in times of change, and are more common in informal
group relationships. There may even be competition between individuals for
particular roles, where the potential for conflict increases with the desirability of the
rewards attached to those roles, and the differences in perceptions of how those
roles should be carried out. The most significant of these roles is that of leader, but

Regenesys etd – Ravhutulu, V (2011)
14
other group roles may also be particularly important at different times, especially
during work on group tasks.
2.4.3 Task Inter-Dependency
Colvin (2003:375) reveals that all organisations involve people working together and
relying on each other to fulfil their tasks. Where this is frustrated, conflict may arise
between the inter-dependent workers. There are two types of conflicts in this
situation: Sequential Inter-dependence and Reciprocal Inter-dependence. Sequential
inter-dependence occurs when an individual or group is dependent upon the
performance of tasks by another individual or group. Examples of this would be an
assembly line where the pace of work is dedicated by the slowest member; or a
building site where the bricklayer is dependent upon the supply of mortar from the
person mixing the cement. Reciprocal inter-dependence occurs when both parties
rely on each other to get to the task completed. An example of this is when a
purchasing department needs to receive a specification of goods required, but the
practitioner needs the purchasing department to supply details of the goods
available.
2.4.4 Competition
Cochan, Katz and Mckersie (1994:68) contend that competition can take many forms
in organisations. Competition may involve individuals or groups, and can arise from
multiple factors, including scarce resources; promotions; and rewards - in terms of
recognition or monetary incentives. If the outcome of competition is unfavourable to
a particular party, conflict may develop from the perceived injustice or sense of
grievance. Competition may lead to the frustration of organisational goals, as a result
of inappropriate rewards systems and lack of cooperation. An illustration of this is the
tying of bonuses to individual performance, rather than the accomplishments of the
group, or organisation, as a whole.

Regenesys etd – Ravhutulu, V (2011)
15
2.4.5 Communication Failures
A breakdown of communication processes, or a lack of communication, may lead to
a variety of problems in organisations. Unclear instructions or directives, to an
individual or group, may result in frustration in task inter-dependency; a lack of clarity
or understanding of goals and objectives; and feelings of alienation. Individuals may
perceive events or situations in different ways and without comprehensible and
unambiguous communication different perceptions may lead to conflicting
interpretation and reactions, resulting in conflicts or disputes (Bryans and Smith,
2000:34).
2.4.6 Individual and Personality Differences
Dipaola and Hoy (2001:238) assert that when people work closely together
personality clashes, jealousies and other personal animosities - either permanent or
transitory - are inevitable. When people don‘t know each other these issues tend to
be more severe or abrasive, but tolerance, understanding and acceptance increases
as working relationships are built over time. Personality conflicts may also occur from
clashes due to different styles of interactions or differing values or beliefs.
2.4.7 Leadership and Control
Poor or inappropriate leadership of individuals and groups may result in a lack of
direction, causing goal and role conflicts where a lack of organisation or group
consensus leaves a void which individual perceptions may fill. Leadership and
control conflicts may occur within the formal and informal organisations, due to
indecisive or poor management (Lira, Ripoll and Gonzalez, 2006).

Regenesys etd – Ravhutulu, V (2011)
16
2.4.8 Specialisation
A highly specialised departmental structure tends to lead to inward-looking attitudes,
which hinder inter-departmental cooperation and cause conflicts (Colvin, 2004b:581).
2.4.9 Inequity
An individual's perception of discriminatory, unjust or unfair treatment may result in
conflict, as they will feel motivated to restore the balance (Colvin, 2004a:95).
2.4.10 Violation of Territory
According to Colvin (2003:375), individuals tend to establish ‗property rights‘ over
their work areas, parking spaces and perks. They tend to respond with conflict when
they perceive these areas are being violated or invaded. Poor organisational
structures may cause other forms of this type of conflict, especially where people feel
alienated or isolated, leading to a climate of intense competitiveness and a lack of
cooperation.
2.4.11 External Changes or Threats
Block, Beck and Olson (1996:54) state that the business environment is subject to
constant changes, whether from competitors in the marketplace, or more generally
from technological changes or government policies. A lot of poorly managed
changes within the organisation may lead to frustration and anger, which in turn
affects employee willingness, mood and cooperation.

Regenesys etd – Ravhutulu, V (2011)
17
Workplace conflicts, irrespective of the cause can have a serious impact on
organisational performance. These consequence and impacts are discussed in the
next section.
2.5 THE IMPACTS OF WORKPLACE CONFLICTS ON WORKER PERFORMANCE
Klein (2003:90), McCraken and Wallace (2000: 467), along with and Moller,
Benscoter and Rohrer-Murphy (2000: 95), suggest that workplace conflicts can
impact on the organisation in the following ways:
2.5.1 Negative Effects on Motivation
McCraken and Wallace (2000: 467) state that conflicts among employees, or
between management and employees, can have significant negative effects on
employee motivation. Ghosh (2007:131) defines motivation as the act of stimulating
someone to take a desired course of action, by ‗pushing the right button‘ in order to
get a sought reaction. Motivation concerns itself with the will to work and includes a
stimulus and desired result. Effective motivation involves discovering the reasons for
performance and work behaviour, and creating measures and channels to help and
encourage the realisation of organisational, or other, goals. Every manager is thus
responsible for motivating his immediate direct sub-ordinates, as well as all indirect
sub-ordinates, down the organisational supervisory tree. It is widely believed that
workplace conflicts may affect employee job satisfaction, productivity and
commitment (Bhatti and Qureshi 2007:54). In the Association of Business Executives
(ABE) (2008:246), Abraham Maslow indicates that the satisfaction of the need for
affiliation is an important element of generating employee motivation. Conflict
between employees destroys the potential for such need fulfilment, resulting in low
levels of commitment and motivation.

Regenesys etd – Ravhutulu, V (2011)
18
2.5.2 Increased Job Dissatisfaction
Low motivation and limited or lacking rewards are bound to result in job
dissatisfaction, with subsequently increased labour turnover. ABE (2008:47) defines
job satisfaction as positive feelings an employee has about their employment and job
dissatisfaction as negative feelings which stem from employee perceptions
concerning their occupation or position. Drafke and Kossen (2002:315) suggest that
the causes of such positive or negative feelings regarding employment are often
linked to multiple factors. These dynamics include: the nature of job design; work
environment; nature of management style; nature of employee participation in
organisational decision-making; and conflict amid employees, or between staff and
manager. Issues originating from the nature of management style can relate to lack
of dispute resolution mechanisms or deficits in managemental objectivity when
resolving problems. All of these elements can instigate employee dissatisfaction.
Cushway (2004:356) indicates that conflict resolution and its effect on employee job
dissatisfaction or satisfaction is usually reflected in specific ways. Conflict resolution
effectiveness and the consequences thereof include: increased or decreased labour
turnover; conflict or absence of conflict between staff; underperformance or effective
performance; and declining or increasing staff productivity, with subsequent declined
or improved product or service quality. Swanepoel, Erasmus, Van Wyk, and Schenk
(2003:175), along with ABE (2008:120), reveal that measures for dealing with job
dissatisfaction in organisations may constitute the undertaking of decentralisation
and the delegation of authority, to ensure that conflicts are resolved at the lowest
level possible.
2.5.3 Declined Employee Morale
Bhattacharyya (2002:409) and Ghauri (2005:68) note that workplace conflict in an
organisation is linked directly to employee morale. Ghauri (2005:68) defines

Regenesys etd – Ravhutulu, V (2011)
19
employee morale as positive attitudes and feelings which drive employees to
accomplish their allocated tasks. The factors which usually influence employee
morale are associated with the degree of employee participation in decision making;
remuneration; work conditions; nature of leadership styles; and the effectiveness of
communication in organisations, along with the existence of conflict resolution
mechanisms. Dessler (2002:315) notes, however, that lack of dispute resolution
mechanisms usually leads to an increase of unresolved conflicts and subsequent low
morale, resulting in low productivity and generally poor organisational performance.
ABE (2008:76) contends that the ‗morale of the workforce‘ is a concept often
discussed, but is difficult to measure objectively. The level of morale and the
individual attitudes which personnel bring to bear on workplace performance and
relationships affect the functioning of the entire organisation, as well as their
particular section or department. Short, Bing, and Kehrhahn (2003: 239) state that
when low morale is present, in conjunction with a general sense of frustration and
dissatisfaction, management must initiate immediate measures to identify and
eliminate the causes. A primary goal of staff motivation is to build morale, by
maximising job satisfaction and minimising workplace frustration and stress. Gerber,
Van Dyk, Haasbroek, Schultz, Sono, and Werner, (2001:390) indicate that an
important method of building motivation and morale stems from appropriate job
design and progressively, more attention is being concentrated on alternative
patterns of working. These unconventional options concentrate on increased
personal responsibility, personnel development and participation in the organisation.
The most critical element significantly affecting employee morale is, however,
notably the manner in which disputes, divergence and disagreements are resolved.
2.5.4 Employee Performance
Khan, Afzal and Rehman (2009:480) propose that task conflict can prove to be
productive, augmenting team performance and leading to better decisions. Simons
and Peterson (2000) contend that task conflict promotes and enhances team
Regenesys etd – Ravhutulu, V (2011)
20
member ability and perceptions, especially concerning decision-making efficacy and
value. There seems to be no perfect ratio or relationship between task conflict and
performance. Stephen and Julia (1995:56), along with Bingham (2007:104), agree
that task conflict tends to reduce team member satisfaction and commitment. Task
conflict and performance may constitute a positive relationship aspect, however,
when all team members possess a superior cognitive understanding of the issue
being discussed, making it probable that all participants may, potentially, voice their
individual perspectives.
Khan, et al (2009:480) added that workplace conflict is major global organisational
expense. Some of these costs are obvious, and continue to rise, especially when
employees react angrily instead of cooperatively and other costs are implicit, hidden
and affect decision making. Three different points are advanced in the study of
conflicts in organisations - viz. the traditional; human relation and international views
of conflict. The traditional view of conflict, as Dipaola and Hoy (2001:238) contend, is
that conflicts must always be avoided. The human relation view asserts that conflict
is a natural and inevitable outcome of normal operation and function within an
organisation. It may inflict negative effects, but also has the potential to be a positive
force, leading to effective performance. The international perspective illuminates
conflict as being a positive force necessary for effective performance. Newstrom and
Davis (1993) noted that organisations, when competitively challenged, try to improve
their goods and services, along with consumer satisfaction. Large stakeholders may
benefit from, and affect, the transfer of human resources from one institution to the
other, allowing for better opportunity and services. This is becoming a common
practice, driving organisations to operate with improved performance, however,
these transfers, changes and stresses may create tension among employees,
culminating in organisational performance being compromised by destructive
elements.

Regenesys etd – Ravhutulu, V (2011)
21
2.5.6 Increased Operational Costs
ABE (2008:259), along with Medina, Munduate, Dorado and Guerra (2005:219),
suggest that conflicts are often perceived as having an extremely negative impact on
organisations. Undesirable outcomes indisputably and invariably transpire, often
resulting in the frustration of organisational goals, with individuals and groups
performing ineffectively and inefficiently.
The problems and impacts of workplace conflicts include:
Inter-personal or inter-group hostility, arguments, aggression and lack of
cooperation.
Not attaining performance targets or goals.
Stress among individuals.
Low morale, with a lack of commitment and involvement, leading to
absenteeism, high labour turnover, poor performance, alienation and
dissatisfaction.
Withholding information and procedures.
Increasing costs and delays.
Positive aspects of conflicts, as Lira, Ripoll and Gonzalez (2006) and Lusch and
Serkenci (1990:85) note, may include:
Better decision-making or problem solving, arising from a team or individual
questioning the status quo or established method.
Stimulation of creative solutions, along with resourceful and ingenious
thinking.
Tension being released and issues being aired - elements which could
otherwise fester and result in a reduction enthusiasm and motivation.

Regenesys etd – Ravhutulu, V (2011)
22
Individuals being prompted to assess their own feelings and choose between
options.
Challenging familiar and accepted situations, perhaps leading to a change in
the existing power base within the team, acting as a catalyst for
transformation.
Creation of competition and acting as a motivator for improved performance.
Despite the positive effects of workplace disputes, several theories have been
designed to deal with the negative impacts of workplace conflicts. The following
section discusses these strategies.
2.6 STRATEGIES FOR MANAGING CONFLICTS
Jehn and Mannix (2001:238), and Jehn, Thatcher, and Zanutoo (2003:241) observe
that when conflict occurs various strategies exist for its resolution. Two major
approaches and solutions are discussed below, they encompass changing the
situation from which the conflict arises or deflecting the conflict by re-orientating the
goals of the participants.
2.6.1 Changing Situational Factors
According to Amazon and Sapienza (1997:495) there is a large potential for action
by management to affect and change the factors which give rise to conflict situations.
Management action and procedure may include:
Increasing resources to reduce perceived inequities in their allocation.
Re-organising the rewards system to ensure a more consistent, clear
relationship with performance or other indicators of value.

Regenesys etd – Ravhutulu, V (2011)
23
Re-designing tasks and roles to ensure compatibility with staff aptitudes and
abilities, and to reduce task inter-dependencies.
Re-deploying staff, including managers, to new jobs more compatible with
their aptitude and abilities.
Training and development of managers to improve their ability to lead and
motivate staff through appropriate non-monetary rewards and improved
communication.
Training and development of staff to enable them to perform more effectively
and meet their objectives, as well as to provide them with opportunities for
advancement.
Improving communication systems by removing barriers to effective
communication and increasing information flow.
2.6.2 Promoting Subordinate Goals
Guetzkow and Gyr (1954:81) describe this technique as being designed to reduce or
resolve goal conflict by refocusing the goals that individuals, or groups, pursue. The
aim is to promote the organisational goals ahead of those of the individual or group.
It may not be appropriate to specifically emphasise these goals themselves,
however, since it is possible that they have already been rejected or superseded by
the individual or group goals. Jehn (1994:39) and Jehn (1995:82) note it is necessary
to establish agreement on specific goals, perceived as being more important than
those currently being pursued and which require the support and effort of all parties.
An example of this approach is when an organisation or group is under threat from
outside. The danger may stem from increasing competition or changes in the
environment with possible risk to the organisation or group‘s survival. This would
generally unite individuals with the common goal of protecting the organisation or
group, resulting in improved performance in the pursuit of the objectives required for
survival.

Regenesys etd – Ravhutulu, V (2011)
24
2.7 OTHER POSSIBLE APPROACHES FOR MANAGING CONFLICTS
Amason (1996:123) comments on the developments of reward systems which
emphasis company, rather than individual, performance - principally profit-sharing
and co-partnership schemes. The study also mentions the development of
participative management and empowerment processes throughout the organisation.
These approaches are discussed below.
2.7.1 Profit-Sharing
Amazon and Sapienza (1997:495) note that some organisations in the business
sector give their staff a share in the profits of the company, in addition to their normal
wages, in order to blur the distinction between the two sides to the industry. The firm
usually pays its staff a fixed share of the profits, which is divided among the
employees on the basis of seniority, length of service and other agreed criteria.
Profit-sharing schemes aim to bridge the gap between capital and labour, and tend
to increase morale in the organisation. These may reduce labour turnover as
employees have an incentive to stay, building a long service record in order to
increase their share of profits. Ayoko and Hartel (2006:345) add that such schemes
give an incentive to increase output and cut costs and wastes. The principle of those
who have helped to create profits being given a share of them allows workers to feel
they are an important part of the firm. There are certain drawbacks to profit-sharing,
including the following scenarios: Should employees have to pay towards deficit if
the firm makes a loss? Does some of the incentive value from profit-sharing get lost
due to the time lag between effort put into work and the reward from the profits?
What percentage of the profit-share should each employee receive?

Regenesys etd – Ravhutulu, V (2011)
25
2.7.2 Co-Partnership
De Dreu and Weingart (2003:741) observe that in cooperation schemes shares in
the company are distributed, instead of a cash portion of the profits. There is often a
clause which forbids the sale of these shares while the worker remains in the
company‘s employ. Some of the most advanced co-partnership schemes allow the
share-holding employees to elect representatives to the board of directors. This
gives the employees similar advantages to profit-sharing and adds a sense of
ownership in the organisation. Where worker directors are elected, the employees,
additionally, have some say in the running of the business. However, De Dreu and
Weingart (2003:741) note that the actual extent of employee share ownership may
constitute so minimal a proportion of the total shares of the firm as to be negligible in
terms of share ownership power. The income from the shares held by each worker
may be very small. Some workers resent not being able to sell their shares
whenever they wish. There may be so few worker representatives on the board that
they comprise only a token presence and can be outvoted by other board members
on any major issue. Some critics of co-partnership schemes argue that having
employees on the board of directors complicates union negotiations.
2.7.3 Inter-Personal Techniques
Friedman, Tidd, Currall and Tsai (2003:32) stress that managers need to have the
skills to reduce or resolve conflicts at an inter-personal level, both between
themselves and sub-ordinates, and between individuals and groups, within their
purview. The basis of such techniques is an assessment of the causes and
outcomes of the conflict and, for successful resolution, managers are required to be
both involved and detached. Involvement requires managers to listen and explore
the views of all parties involved. Detachment necessitates managers to undertake an
objective assessment of the causes and positions taken.
Thomas (1997) identified five conflict handling modes, which may be used by
managers:

Regenesys etd – Ravhutulu, V (2011)
26
Avoidance:
This assumes that the conflict can be solved or reduced by ignoring the
problem, presuming that the problem will disappear or not be too disruptive.
This is an assertive response, as one party is avoided, preventing immediate
or direct conflict, but is also creates a lack of collaboration and teamwork
between the two parties, resulting in a win - lose or lose - lose situation. This
mode can be used when the issue is trivial or time is needed for the issue to
cool or diminish.
Accommodation:
This involves allowing the other party to win, and have their own way. This is
unassertive and cooperative since self-interest is sacrificed to appease the
other party. This mode may be used when one party is in the wrong or the
issue is more important to one side.
Competition:
This entails allowing the participants to ‗battle the conflict out‘ in an attempt to
win it, though each party must accept the risk that they may be lose. This is
assertive, uncooperative and uses power to win. This mode can be used
because decisive resolution is required or the consequences of losing are
unpalatable.
Compromise:
This entails seeking a midpoint between both desired outcomes by bargaining
and both parties giving up specific objectives to achieve the satisfaction of
others, resulting in two winners or losers. This mode can be used where time
is short and the parties are equally wrong.
Collaboration:
This requires seeking to satisfy the desired outcomes of both parties, by being
assertive and cooperative, often by changing the situation itself. Both parties
must, however, want to participate. This mode can be used where future

Regenesys etd – Ravhutulu, V (2011)
27
relationships are deemed important or both parties are needed for successful
implementation.
However, not all approaches are appropriate in every situation. The managers must
assess the situation before applying a chosen approach. Organisations have also
been known to deploy different patterns for managing workplace conflicts, these are
examined below.
2.8 PATTERNS OF UTILISATION OF WORKPLACE CONFLICT MANAGEMENT
The common approaches to managing workplace conflicts are outlined and
discussed below.
2.8.1 Union Dispute Resolution Procedures
Goldberg (2005) comments that grievance mediation, as a prelude to arbitration, can
serve as an effective means of resolving many workplace disputes in a unionised
setting. Although labour arbitration has been widely used since the 1940s, it has
been the subject of criticism for many years. It was intended to be fast, inexpensive
and informal, especially when compared to the traditional court litigation. However,
according to Goldberg (2005), over time much arbitration has grown into a slow,
expensive and formal process. Many labour management professionals feel that the
decision and outcome from arbitration is often irrelevant to the problem that caused
the grievance to be filed in the first place. Goldberg adds that many labour
management professionals consider that the arbitration process is abused at times,
by both management and labour.
Goldberg (2005) reiterates that mediation, as an alternative to arbitration, has the
potential to overcome many problems and limitations imposed in the process of
arbitration. Studies of the grievance mediation process in various labour

Regenesys etd – Ravhutulu, V (2011)
28
management relationships over past years have proven this potential. Studies
indicate that cost savings can be achieved in a grievance mediation process, since
there is no need for extensive preparation and presentation by attorneys. Nor is
there any need for transcripts, post-hearing briefs or written decision. Studies also
demonstrate that mediation is quicker than arbitration, due to the informality of the
process. There is no need for the use of subpoenas and discovery or the elaborate
development of strategies by counsel. Neither is a protracted selection process an
issue, as there is no perceived bias in mediators, as opposed to arbitrators.
2.8.2 Non-Union Conflict Management Systems
Colvin (2006) and Lewin (2004) put forward that over half of non-union organisations
have some type of formal dispute resolution and/or conflict management process.
They added, however, that contrary to the rather limited forms found in union
settings, these mechanisms are diverse and fluid with a variety of forms and
structures. Before embarking on an analysis of these processes, it is important to
make a critical distinction in their respective functions. One category of procedures is
known as determination procedures and involves an Alternative Dispute Resolution
actor who facilitates the resolution of a dispute. Arbitration is a typical determination
procedure, whereas mediation involves a facilitation procedure. According to Lipsky
(2003), there are two main conflict management systems - viz. internal and external
processes. Internal processes include: open door policies; ombudsmen; managerial
mediation; and peer review boards. The main external processes encompass
external mediation and arbitration. External processes are more expensive and are
usually utilised later in a dispute.
2.9 INTERNAL CONFLICT MANAGEMENT SYSTEMS
The common internal conflict management systems are:

Regenesys etd – Ravhutulu, V (2011)
29
2.9.1 Open Door Policy Models
Goldberg (2005) states that the open door policy is probably one of the most
common features of workplace systems, however, Lipsky (2003) notes that the
concept has become almost stale in many organisational cultures. It implies that the
supervisor or manager believes in open dialogue with employees and encourages
them to talk through their differences or issues that may arise. In order to be
effective, an open door policy must be broadly disseminated and reinforced as a
core element of the organisational culture. The arguments surrounding the success
of open door policies are mixed. Some observers suggest open door policy is
overrated as an appropriate mechanism for conflict resolution, because supervisors
are not properly trained to problem-solve with employees and are too busy to
effectively deal with these issues. Employees also perceive a high risk of retaliation
when utilising the process. Many experts believe that, despite these obstacles, the
open door model still resolves about 90% of all employee issues and complaints. As
in most employment policies, the key to a successful open door policy requires the
provision of sufficient training to supervisors, who must receive coaching in conflict
resolution and communication skills.
2.9.2 Ombudsman
According to Friedman et al (2003:32) another option in the design of the ADR
programmes, especially for larger organisations, is the organisational ombudsman.
An ombudsman is a neutral or impartial official within an organisation who facilitates
informal and confidential assistance for employees to address work related
concerns, and who may also recommend systematic organisational changes based
upon issues which arise. In order to be effective, the ombudsman‘s position must be
located outside the ordinary line management structures. Studies from several large
organisations have found that the ombudsman process is cost effective in reducing
employee litigation and turnover.

Regenesys etd – Ravhutulu, V (2011)
30
2.9.4 Managerial Mediation
Lipsky (2003) states that many organisations are beginning to provide basic
mediation training to managers and line supervisors, designing conflict resolution as
a key supervisory competency. In managerial mediation, the manager convenes
disputing employees and attempts to explore mutually acceptable solutions to all
forms of workplace conflicts. An increasing range of progressive organisations are
providing basic conflict resolution training to supervisors and managers as part of
their toolkit.
2.9.5 Peer Review Boards
Lewin (2004) describes this process as being used for a number of years in many
blue collar manufacturing organisations, often for union avoidance purposes.
Depending on how the process is structured, decisions of the peer tribunal may be
final and binding, or only advise employees or management. Participating employees
are pre-selected and trained by human resource personnel or an outside consultant.
The basic assumption in peer review is that employee disputes should be resolved
through internal mechanisms, not litigation. Another assumption is that resolution of
disputes by peers is a more credible and acceptable process for the aggrieved
employee. This model assumes that peers can be capably trained as fact-finders
and decision makers. Opponents of this process argue that due to the increased
complexity of workplace disputes, it is no longer feasible. It can also be viewed as
difficult to administer, due to employee turnover and resultant retaining. It requires
staff resources to manage the process and many claimants desire an external forum.
Nevertheless, it remains a valid problem solving model.

Regenesys etd – Ravhutulu, V (2011)
31
2.9.6 Executive Panel
Friedman et al (2003:32) further notes that executive panels provide opportunities for
employees to present their disputes to a panel of the organisation's senior
executives and managers. The assumption is that employees feel the upper
executives will be objective and potentially sympathetic to their claims. These panels
typically have three to five executives, usually at vice presidential level, not directly
connected to the employee whose claim is being presented either operationally or
geographically. It has been found to be effective in a variety of settings, but is most
common in smaller organisations with accessible executives.
2.10 CONCLUSIONS
This chapter reviewed the literature relevant to this study. The discussions were
structured according to the issues contained in the research questions and
objectives for the study. These included: types; causes; and impacts of workplace
conflicts on workers‘ performance; procedures for dealing with workplace conflicts;
and the effectiveness of measures for dealing with these conflicts. The next chapter
discusses the research design and methodology used in the primary data collection
process for the study.

Regenesys etd – Ravhutulu, V (2011)
32
CHAPTER 3: RESEARCH DESIGN AND
METHODOLOGY
3.1 INTRODUCTION
This chapter describes the research design and methodology used in the primary
data collection process for this study. The principal research method used was a
quantitative approach. Other details contained in the chapter include: sampling
strategies; questionnaire; pilot study; data collection process; validity and reliability;
and ethical considerations.
3.2 QUANTITATIVE RESEARCH
Because of the large amount of raw data involved, this study opted for a quantitative
approach during the primary data collection. Abawi (2008:19) defines a quantitative
research method as a process of inquiry based on testing a theory composed of
variables, measured with numbers and analysed using statistical techniques. The
goal of the quantitative research method is to determine whether the predictive
generalisation of a theory hold true.
The assumptions underlying quantitative research methods are:
Truth is objective and independent of the researcher, and therefore,
actualities can be studied objectively.
The researcher must remain detached and independent of what is being
researched.
The research is based primarily on deductive forms of logic; theories and
hypotheses are tested in a cause - effect order.
The goal is to develop generalisations that contribute to the theory, which
enables the researcher to predict, explain, and understand a phenomenon.

Regenesys etd – Ravhutulu, V (2011)
33
Qualitative research is concerned with what and why? Abawi (2008:19) further states
the common methods of a quantitative research are: randomised; cohort; and case
control study. Quantitative research collects numerical data in order to explain,
predict and/or control the phenomena of interest. Quantitative research is concerned
with numbers and quantifiable data, asking statistical questions, which include: How
much? How many? How often? To what extent? It is categorised with descriptive
research; correlational research; causal comparative research; and experimental
research. The results of quantitative research are presented in numerical form or a
series of numbers, displayed and laid out in tables, graphs or other forms of
statistics. In this study, a questionnaire was designed based on the Likert Scale, and
containing five options comprising of: Strongly Agree — 1; Agree — 2; Unsure — 3;
Disagree — 4; Strongly Disagree — 5. The questionnaires were personally
administered to the respondents in the City of Johannesburg. The respondents were
required to provide answers according to the indicated scales. When data collection
was complete, it was analysed using SPSS and presented in tables containing
percentages, the mean and the standard deviation. The researcher also performed
validity and reliability tests using Cronbach Alpha. Using the findings the researcher
tested hypotheses and performed the correlation analysis to determine the link
between variables. In this regard, it is manifestly clear that this study was
quantitative. Quantitative research was preferable, as it allows for greater precision
in analysis, summarizing data and making inferences. It is also objective and
controlled. The details are presented below.
3.3 SAMPLING STRATEGY
The target population for this study was 6500 employees comprising of: senior
managers; ordinary managers; and employees of the City of Johannesburg. In order
to determine a valid sample, simple random sampling was used. Yamane
(1967:886)‘s formulae:
( ) was used. In the formulae; n is the sample size, N
is the population size and e is the level of precision.

Regenesys etd – Ravhutulu, V (2011)
34
Using this formula, where N = 6500, the target population for this study, n = the
desired sample size and e = ±10%, the level of precision, the calculation for the
study is:
( ) .
Israel (2007:14) states that the same formula was used in the calculation of the
sample sizes, contained in Table 3.1.
Table 3.1: Population Sample Sizes
Sample Size for ±3%, ±5%, ±7% and ±10% Precision Levels where
Confidence Level is 95% and P = .5
Size of Population Sample Size (n) for Precision (e) of:
±3% ±5% ±7% ±10%
500 A 222 145 83
600 A 240 152 86
700 A 255 158 88
800 A 267 163 89
900 A 277 166 90
1,000 A 286 169 91
2,000 714 333 185 95
3,000 811 353 191 97
4,000 870 364 194 98
5,000 909 370 196 98
6,000 938 375 197 98
7,000 959 378 198 99
8,000 976 381 199 99
9,000 989 383 200 99
10,000 1,000 385 200 99
15,000 1,034 390 201 99
20,000 1,053 392 204 100
25,000 1,064 394 204 100
50,000 1,087 397 204 100
100,000 1,099 398 204 100
>100,000 1,111 400 204 100
A = Assumption of the normal population is poor (Yamane, 1967), ∴ the entire population should be sampled.
Source: Adopted from Yamane (1976) as cited in Israel (2007:14)

Regenesys etd – Ravhutulu, V (2011)
35
In observing Yamane‘s (1975) Table, the desired sample size, for a population falling
between 6000 and 7000, is 98 respondents. The population for this study is 6500 -
between 6000 and 7000, obtaining n = 99.9, proving the sample sufficient and valid.
This is confirmed and validated using an alternative formula from Cochran
(1963:75):
. This is valid where n0 is the sample size, Z2 is the abscissa of
the normal curve that cuts off an area at the tails - 1 is equivalent to the desired
confidence level e.g. 95% 1; e is the desired level of precision; p is the estimated
proportion of an attribute that is present in the population; and q is 1- p. The value of
Z is found in statistical tables, which contain the area under the normal curve. P is
assumed = .5 and q = 1- .5; resulting in Z = 95% confidence level and e = ±10%
precision. Using these figures the calculation for this study is: ( ) ( )( )
( ) = 96.
It is demonstrated above that using the two formulas and table produce similar
figures for the sample size. However, according to Israel (2007:14), the sample size
formulas only provide the number of responses that need to be obtained. Many
researchers commonly add 10% to the sample size to compensate for un-
contactable respondents. The sample size also is often increased by 30% to
compensate for non-response. Thus, the number of mailed surveys or planned
interviews can be substantially larger than the number required for a desired level of
confidence and precision. In this study a round up of 100 respondents is used to
compensate for non-responses.
In order also to ensure that the sample size chosen is representative of the total
population, respondents of different race, age, positions, experience and gender
were also included.
3.4 DATA COLLECTION PROCESS
Data collection was by use of a questionnaire and the process explained below.

Regenesys etd – Ravhutulu, V (2011)
36
3.4.1 A Mailed Questionnaire
A questionnaire was used in this study because it is cheaper and easier to have
primary data collected as quickly and efficiently as possible. The questionnaire was
designed along Likert Scale and containing five options: Strongly Agree — 1; Agree
— 2; Unsure — 3; Disagree — 4; Strongly Disagree — 5. The respondents were
therefore merely required to indicate their opinion according to the provided
responses, without explaining anything. This rendered the data collection process
easier, as respondents are usually known for being less inclined to participate in
research that demands lengthy explanations. The researcher took into consideration
the research questions and objectives of the study during the design of the
questionnaire. Consequently, the questionnaire contained 20 items presented under
five sections, aligned with the research questions and objectives of the study. These
five divisions were:
Section A - which examined the types of workplace conflicts occurring in the
City of Johannesburg.
Section B – which assessed the causes of workplace conflicts in the City of
Johannesburg.
Section C - which assessed the impact of workplace conflicts on workers‘
performance in the City of Johannesburg.
Section D - which examined the procedures for dealing with workplace
conflicts in the City of Johannesburg.
Section E - which assessed the effectiveness of measures for dealing with
workplace conflicts in the City of Johannesburg.
The set hypotheses of the study were also taken into consideration during
questionnaire design. A Cronbach Alpha test was carried out to determine the
validity and reliability of the instrument. Gliem and Gliem (2003:87) describe the
Cronbach Alpha reliability co-efficient as normally ranging between 0 and 1. There is

Regenesys etd – Ravhutulu, V (2011)
37
usually no lower limit to the co-efficient. The closer the Cronbach Alpha co-efficient is
to 1.0, the greater the internal consistency of the items in the scale. Based upon the
formula:
, ( ) , where k is the number of items considered and r is the mean
of the inter-item correlations, the size of alpha is determined by both the number of
items in the scale and inter-item correlations. The result was .8, which indicates a
strong validity and reliability of the research instrument used for this study. George
and Mallery (2003) state that if the result is:
>.9 >.8 >.7 >.6 >.5 <.5
excellent good acceptable questionable poor unacceptable
Since the result, which was also confirmed by SPSS calculation, was .8, it is
concluded that the research instrument is valid and reliable in testing the elements
that the researcher intended to.
3.4.2 Pilot Testing
Prior to the actual data collection, a pilot study was conducted utilising 10
respondents from the City of Johannesburg, in order to determine whether the
research was feasible and enough respondents were interested. This pilot
programme was to enable the researcher to put in place the necessary measures to
ensure that the research is a success, fortunately the results of the pilot study
indicated that the researcher would not face any difficulty during the data collection
process. The pilot study was also intended to examine whether the research
instrument was properly structured, and whether the statements contained therein
could easily be understood by the majority of the respondents. As a result problem
areas were identified as most of the respondents could not understand the meaning
of certain words or phrases, viz. Question 17 - ‗concerted effort‘; Question 18 - the
word ‗configure‘; and Question 20 - ‗performance measurement‘. The researcher
then had to review these elements to make them more understandable to the
respondents. The pilot study, also allowed the researcher to assess whether

Regenesys etd – Ravhutulu, V (2011)
38
personal administration, as a data collection method, would be a success, which was
confirmed.
3.4.3 Data Collection Process
After the management of the City of Johannesburg had consented that a research
project could be conducted, the researcher personally administered the
questionnaire, going from one office to another. During the exercise, the researcher
explained to the respondents the purpose of the study, stating that it was merely an
academic exercise. The researcher also explained to the respondents how the
questionnaires were to be completed. The researcher asked the respondents
whether there was anything that needed clarification or explanation before
completing the questionnaire could be commenced. When they said nothing,
questionnaires were handed over to them for completion. It was also explained to the
respondents that they need not fill in their names, as the required anonymity would
be guaranteed. The respondents were informed that they could take their time to
complete the questionnaire, but requested them to avoid consulting each other about
any issue therein. The respondents were also cautioned against fabricating. Within
two weeks in the month of March 2011, all questionnaires had been returned.
3.5 DATA ANALYSIS
When all the questionnaires had been received back, the researcher checked if all
questionnaires had been properly completed. It was discovered that five
questionnaires were incorrectly completed as the respondents marked ‗Unsure — 3‘
and ‗Disagree – 4‘, another had three questions uncompleted, another marked only
one question, leaving the rest of the questions unanswered, and a final two marked
each and every option. In order to remedy this defect, the researcher sent five more
questionnaires out, which were returned within four days. Once all were in order, the
raw data was captured into a Microsoft Excel Spreadsheet. The number running
vertically on the left hand side of the sheet represented the number of the

Regenesys etd – Ravhutulu, V (2011)
39
respondents and the alphabetical labels running horizontally on top of the sheet
represented the questions. A Cronbach Alpha was first performed with a result of .8,
which, as shown above, indicated validity and reliability of the research instrument
for this study. The frequency analysis resulted in percentages for each variable
contained in each question and is presented in Tables 1 - 20. Descriptive statistical
analysis gave the mean and the standard deviation for the variables. (See attached
appendix 3 and 4.) The percentage mean and standard deviations were used in
making necessary interpretations. A hypothesis analysis was also performed using
SPSS and confirmed manually, using the formula test statistic:
√
.
The result was used in the analysis of assumptions made. In order to determine
correlation between variables and different data sets, the researcher utilised the
Pearson Correlation Co-efficient formula: * ( ), ( )-+
√ * ( ) , ( ) √ ⌈ ⟨ ( ) ⟩⌉-+ .
The measures used to ensure the validity and reliability of this study are discussed
below.
3.6 VALIDITY AND RELIABILITY
Burns and Grove (2001) highlight several types of validity that contribute to the
overall application and use of the study. The two main dimensions are internal and
external validity. Internal validity is concerned with the degree of certainty that
observed effects in an experiment are actually the result of the experimental
treatment or condition (cause), rather than intervening, extraneous or confounding
variables. Internal validity in this study was enhanced by increasing the control of
variables. External validity is concerned with the degree to which the research
findings can be applied to the real world, beyond the controlled setting of the
research. This is the issue of ‗generalisability‘. There are many forms of reliability, all
of which have effects on the overall dependability of the instrument, and therefore,
the data collected. Reliability is a prerequisite for validity. It is possible to have a
reliable measure which is not valid.
Different forms of validity include:

Regenesys etd – Ravhutulu, V (2011)
40
Inter-Rater or Inter-Observer Reliability – is used to assess the degree to
which different ‗raters‘ or observers agree, when measuring the same
phenomenon simultaneously.
Test - Retest Reliability – compares results from an initial test, with
subsequent repeated measures; the assumption being that if the instrument is
reliable there will be close agreement over repeated tests if the variables
being measured remain unchanged.
Parallel Forms or Alternative Forms Reliability – used to assess the
consistency of the results of two similar types of test or measure the same
variable at the same time.
Tests for homogeneity or internal consistency, where individual items in an
instrument measuring a single construct, should give highly correlated results, which
would reflect the homogeneity of the items. This was tested by splitting the items in
half and a calculation using the Spearman-Brown formula:
( ) ( )
Replicate the source response if its value is 1 and omit the source response pattern
if its value is 0. In the case of the logical functions of tautologies, the rectifying
function will contain only the 1 true value, and thus, replicate the source plenum. In
order to analyse the plenum for all possible responses the researcher used the
rectifying logical function: ( )
The next step involved analysing the plenum of the responses by a rectified logical
function of catenated implications: ( )
The alternative formula used was:
or

Regenesys etd – Ravhutulu, V (2011)
41
This provides the basic postulate of the true and error scores theory, where obtained
Xo scores consist of the true Xt and error Xe scores, their means and variances are
additive, the internal consistency reliability is defined as the proportion of the true
variance in the obtained test scores and can be estimated by the Spearman-Brown
formula, from a test split into two halves. For this study the co-efficient of the internal
consistency reliability was less than 1 and the co-efficient of homogeneity is equal to
1, results further confirmed by SPSS analysis. All results demonstrate and confirm
the validity and reliability of this study instrument. This was further corroborated by
the Cronbach Alpha analysis, which resulted in a score of .8.
3.7 LIMITATIONS OF THE STUDY
The researcher faced the impediment of employees being fearful during the process
of this study. The employees showed a lack of trust as to why the study was being
conducted, which meant that most felt uncomfortable in participating. This was
subsequently eliminated when the researcher told them that no names were required
on the questionnaires and that on completion the questionnaire should not be
delivered personally, but placed in a designated place. The researcher also
explained that though the study was purely academic, it could lead to review of the
current systems pertaining to conflict management in the City of Johannesburg. All
these enabled the clearing of such hurdles.
3.8 ETHICAL CONSIDERATIONS
During the study the researcher eliminated all possibility of engaging in certain
unethical practices, which would have affected the validity and reliability of this study.
The researcher, at the beginning of the study, signed the research ethics forms
containing different codes, along with wanted and unwanted practices in the
research process. The researcher, in addition, undertook certain readings in order to
avoid getting trapped in unethical conduct. During the selection of the sample the
researcher included respondents without segregation on race, age or disability. The

Regenesys etd – Ravhutulu, V (2011)
42
respondents forced the removal of the biographical information section on the
questionnaire. The researcher complied, as the respondents felt insulted by the
demand for such information. The researcher acknowledged all sources cited in the
research, to avoid falling victim of plagiarism, which is an unethical practice in a
research process. The researcher also avoided fabrications or practices which could
have been unethical.
3.9 CONCLUSION
As reflected above, this chapter outlines the research design and methodology which
were used in the primary data collection for this study. The next chapter presents
and discusses the findings of the primary study.

Regenesys etd – Ravhutulu, V (2011)
43
CHAPTER 4: FINDINGS
4.1 INTRODUCTION
The findings of the primary research are presented in this chapter. The presentations
are structured according to sections aligned with the issues contained in both the
research questions and objectives for the study. Such sections are:
Section A - which examined the types of workplace conflicts occurring in the
City of Johannesburg.
Section B – which assessed the causes of workplace conflicts in the City of
Johannesburg.
Section C - which assessed the impact of workplace conflicts on workers‘
performance in the City of Johannesburg.
Section D - which examined the procedures for dealing with workplace
conflicts in the City of Johannesburg.
Section E - which assessed the effectiveness of measures for dealing with
workplace conflicts in the City of Johannesburg.
In order to facilitate easier interpretations of data, options Strongly Agree — 1 and
Agree — 2 are combined under Agree; Unsure categories are isolated, while the
Disagree — 4 and Strongly Disagree — 5 categories are combined under Disagree.
This process was done for all questions and is presented in Figures 4.1 to 4.20
below.
4.2 SECTION A: THE TYPES OF WORKPLACE CONFLICTS PREVALENT IN THE CITY OF JOHANNESBURG
This section consisted of four questions; the findings are reflected in Figures 4.1 to
4.4 and discussed below.

Regenesys etd – Ravhutulu, V (2011)
44
4.2.1 Question 1:
Vertical and Horizontal Conflicts Characterise the City of
Johannesburg
Figure 4.1 indicates the responses to this question, resulting in a mean of 3 and
standard deviation of 1.3.
Figure 4.1:
Vertical and Horizontal Conflicts Characterise the City of Johannesburg
As shown in Figure 4.1, 42% concurred that conflicts in the City of Johannesburg are
vertical and horizontal, with 28% disagreeing and 30% unsure.
42%
30% 28%
0%
5%
10%
15%
20%
25%
30%
35%
40%
45%
AGREE UNSURE DISAGREE

Regenesys etd – Ravhutulu, V (2011)
45
4.2.2 Question 2:
Organised and Un-Organised Conflicts Characterise the City
of Johannesburg
Figure 4.2 illustrates the proportion of responses to this question, which had a mean
of 2.6 and standard deviation of 1.3.
Figure 4.2:
Organised and Un-Organised Conflicts Characterise the City of Johannesburg
59% of the respondents feel organised and un-organised conflicts characterise the
City of Johannesburg, 22% opposed the premise, with 19% uncertain.
59%
19% 22%
0%
10%
20%
30%
40%
50%
60%
70%
AGREE UNSURE DISAGREE

Regenesys etd – Ravhutulu, V (2011)
46
4.2.3 Question 3:
Rights and Interest Conflicts Characterise the City of
Johannesburg
A mean of 3.4 and standard deviation of 1.5 were obtained for this question, with
responses illustrated in Figure 4.3 below.
Figure 4.3:
Rights and Interest Conflicts Characterise the City of Johannesburg
The results highlighted in Figure 4.3 show that 37% of the respondents agreed that
rights and interest conflicts characterise the City of Johannesburg, 46% differed, with
the remaining 17% uncertain.
37%
17%
46%
0%
5%
10%
15%
20%
25%
30%
35%
40%
45%
50%
AGREE UNSURE DISAGREE

Regenesys etd – Ravhutulu, V (2011)
47
4.2.4 Question 4:
Group Conflicts Characterise the City of Johannesburg
The responses obtained for this question resulted in a mean of 2, standard deviation
of 1.2 and are contained in Figure 4.4.
Figure 4.4:
Group Conflicts Characterise the City of Johannesburg
Figure 4.4 illustrates that 49% of the respondents concur that group conflicts
characterise the City of Johannesburg, 37% were undecided and 14% disagreed.
49%
37%
14%
0%
10%
20%
30%
40%
50%
60%
AGREE UNSURE DISAGREE

Regenesys etd – Ravhutulu, V (2011)
48
4.3 SECTION B: THE CAUSES OF WORKPLACE CONFLICTS IN THE CITY OF JOHANNESBURG
This section contained 10 items, with the findings are presented in Figure 4.5 to
4.12.
4.3.1 Question 5:
Conflicts in the City of Johannesburg are Due to Goal
Conflicts
The mean for this question was 4, the standard deviation 1.5, with the percentages
for each option illustrated in Figure 4.5.
Figure 4.5:
Conflicts in the City of Johannesburg are Due to Goal Conflicts
As Figure 4.5 indicates, 28% felt that disputes in the City of Johannesburg are due to
goal conflicts, 2% were unsure and 70% hold opposing views.
28%
2%
70%
0%
10%
20%
30%
40%
50%
60%
70%
80%
AGREE UNSURE DISAGREE

Regenesys etd – Ravhutulu, V (2011)
49
4.3.2 Question 6:
Conflicting Roles are the Causes of Conflicts in the City of
Johannesburg
The responses to this question are contained in Figure 4.6 and resulted in a mean
was 3.4 and standard deviation 1.7.
Figure 4.6:
Conflicting Roles are the Causes of Conflicts in the City of Johannesburg
Figure 4.6 indicates that 69% of the respondents did not feel that conflicting roles are
the causes of conflicts in the City of Johannesburg, however, 12% agreed with the
statement and 19% were unsure.
12% 19%
69%
0%
10%
20%
30%
40%
50%
60%
70%
80%
AGREE UNSURE DISAGREE

Regenesys etd – Ravhutulu, V (2011)
50
4.3.3 Question 7:
Task Inter-Dependency is the Main Cause of Conflicts in the
City of Johannesburg
The mean obtained for this question was 3.6 and the standard deviation 1.8, with the
opinion spread indicated in Figure 4.7.
Figure 4.7:
Task Inter-Dependency is the Main Cause of Conflicts in the City of Johannesburg
Figure 4.7 displays results which reflect that only 19% of the respondents are of the
opinion that the main cause of conflict in the City of Johannesburg is task inter-
dependency, a majority of 73% disputed this and 8% were uncertain.
19%
8%
73%
0%
10%
20%
30%
40%
50%
60%
70%
80%
AGREE UNSURE DISAGREE

Regenesys etd – Ravhutulu, V (2011)
51
4.3.4 Question 8:
Competition among Employees is the Main Cause of Conflicts
in the City of Johannesburg
The obtained mean for this question was 4.5 and the standard deviation was 1. The
percentages are as illustrated below in Figure 4.8.
Figure 4.8:
Competition among Employees is the Main Cause of Conflicts in the City of
Johannesburg
Figure 4.8 highlights that 82% of the respondents do not correspond with the view
that the main cause of conflict in the City of Johannesburg is competition among
employees, with an even distribution of 9% each, going to both the uncertain and
assenting groups.
9% 9%
82%
0%
10%
20%
30%
40%
50%
60%
70%
80%
90%
AGREE UNSURE DISAGREE

Regenesys etd – Ravhutulu, V (2011)
52
4.3.5 Question 9:
Communication Failures are the Main Causes of Conflicts in
the City of Johannesburg
The findings obtained in this question are contained in Figure 4.9, and shows a
mean of 3 and standard deviation of 1.9.
Figure 4.9:
Communication Failures are the Main Causes of Conflicts in the City of Johannesburg
82% of the respondents oppose the opinion of communication failures as the main
causes of conflict in the City of Johannesburg, only 1% were undecided, with 17%
agreeing.
17%
1%
82%
0%
10%
20%
30%
40%
50%
60%
70%
80%
90%
AGREE UNSURE DISAGREE

Regenesys etd – Ravhutulu, V (2011)
53
4.3.6 Question 10:
Individual and Personality Differences are the Main Causes of
Conflicts in the City of Johannesburg
The standard deviation for this question was 1.6 and the mean 2.7, with the obtained
opinion spread shown in Figure 4.10.
Figure 4.10:
Individual and Personality Differences are the Main Causes of Conflicts in the City of
Johannesburg
Figure 4.10 shows a fairly even split between the respondents who agreed - 43%
and the respondents who disagreed - 55% with the idea of individual and personality
differences being the main causes of conflicts in the City of Johannesburg, with only
2% uncertain.
43%
2%
55%
0%
10%
20%
30%
40%
50%
60%
AGREE UNSURE DISAGREE

Regenesys etd – Ravhutulu, V (2011)
54
4.3.7 Question 11:
Leadership and Control are the Main Causes of Conflicts in
the City of Johannesburg
The mean for this question was 3.2 and standard deviation 1.8, with Figure 4.11
showing the percentages obtained.
Figure 4.11:
Leadership and Control are the Main Causes of Conflicts in the City of Johannesburg
As reflected in Figure 4.11, 71% of the respondents oppose the idea that, in
Johannesburg City, the main causes of conflict relate to leadership and control, 16%
accept this view and 13% are undefined.
16% 13%
71%
0%
10%
20%
30%
40%
50%
60%
70%
80%
AGREE UNSURE DISAGREE

Regenesys etd – Ravhutulu, V (2011)
55
4.3.8 Question 12:
Specialisation is the Main Cause of Conflicts in the City of
Johannesburg
The findings for this question are contained in Figure 4.12 and resulted in a mean of
3.9 and standard deviation of 1.3.
Figure 4.12:
Specialisation is the Main Cause of Conflicts in the City of Johannesburg
Figure 4.12 exhibits that 64% of the respondents disagreed with the statement
proposing specialisation as a main cause of conflict in Johannesburg City, whereas
17% were unsure and 19% are in accord with the premise.
19% 17%
64%
0%
10%
20%
30%
40%
50%
60%
70%
AGREE UNSURE DISAGREE

Regenesys etd – Ravhutulu, V (2011)
56
4.3.9 Question 13:
Inequity is the Main Cause of Conflicts in the City of
Johannesburg
This question had a mean of 2.6 and standard deviation of 1.7, with the response
results contained in Figure 4.13.
Figure 4.13:
Inequity is the Main Cause of Conflicts in the City of Johannesburg
Figure 4.13 illustrates that a large proportion, 43% of respondents, were uncertain as
to whether inequity is a main cause of conflict in Johannesburg City, with 22%
concurring with, and 35% disallowing, the supposition.
22%
43%
35%
0%
5%
10%
15%
20%
25%
30%
35%
40%
45%
50%
AGREE UNSURE DISAGREE

Regenesys etd – Ravhutulu, V (2011)
57
4.3.10 Question 14:
External Changes or Threats
Figure 4.14 demonstrates the findings for this question, which had a mean of 3.5 and
standard deviation of 1.
Figure 4.14:
External Changes or Threats
52% of the respondents did not feel external changes or threats are the main causes
of conflict in the City of Johannesburg, 32% had undefined opinions and 16% agreed
with the statement.
16%
32%
52%
0%
10%
20%
30%
40%
50%
60%
AGREE UNSURE DISAGREE

Regenesys etd – Ravhutulu, V (2011)
58
4.4 SECTION C: THE IMPACTS OF WORKPLACE CONFLICTS ON WORKERS PERFORMANCE IN THE CITY OF JOHANNESBURG
This section had five items, with the findings illustrated in Figure 4.15 to 4.20.
4.4.1 Question 15:
Conflicts Have Led to Increased Negative Effects on
Motivation
This question showed a mean of 2.3 and standard deviation of 1.2, with the
proportions for each option displayed in Figure 4.15.
Figure 4.15:
Conflicts Have Led to Increased Negative Effects on Motivation
Figure 4.15 evinces the responses to the suggestion that conflicts have led to
increased negative effects on motivation, with 42% of the respondents differing from
the idea, 56% concurring and 2% unsure.
56%
2%
42%
0%
10%
20%
30%
40%
50%
60%
AGREE UNSURE DISAGREE

Regenesys etd – Ravhutulu, V (2011)
59
4.4.2 Question 16:
Conflicts Have Increased Job Dissatisfaction
The question results are contained in Figure 4.16, with a mean of 3 and standard
deviation of 1.3.
Figure 4.16:
Conflicts Have Increased Job Dissatisfaction
Figure 4.16 indicates that while 13% of respondents were uncertain, results show a
fairly even distribution of decided opinions to the concept of conflicts having
increased job dissatisfaction in Johannesburg City, with 47% concurring and 40%
opposing.
47%
13%
40%
0%
5%
10%
15%
20%
25%
30%
35%
40%
45%
50%
AGREE UNSURE DISAGREE

Regenesys etd – Ravhutulu, V (2011)
60
4.4.3 Question 17:
Conflicts Have Led to Declined Employee Morale
Figure 4.17 reflects the response findings for this question, which evinced a mean of
2.2 and standard deviation of 1.2.
Figure 4.17:
Conflicts Have Led to Declined Employee Morale
Figure 4.17 illustrates that 44% of the respondents hold the opinion that conflicts
have led to declined Johannesburg City employee morale, 32% disagree with the
statement and 24% were unsure.
44%
24%
32%
0%
5%
10%
15%
20%
25%
30%
35%
40%
45%
50%
AGREE UNSURE DISAGREE

Regenesys etd – Ravhutulu, V (2011)
61
4.4.4 Question 18:
Conflicts Have Negatively Affected Employee Performance
The mean was 3 and standard deviation 1.3, with the divisional distribution for each
option reflected in Figure 4.18.
Figure 4.18:
Conflicts Have Negatively Affected Employee Performance
Figure 4.18 iterates that 48% of the respondents allowed that conflicts have
negatively affected employee performance, 29% opposed the idea and 23% were
unsure.
48%
23% 29%
0%
10%
20%
30%
40%
50%
60%
AGREE UNSURE DISAGREE

Regenesys etd – Ravhutulu, V (2011)
62
4.4.5 Question 19:
Conflicts Have Led to Increased Operational Costs
The details of the findings for this question are contained in Figure 4.19. The mean
score was 2 and standard deviation was .7.
Figure 4.19:
Conflicts Have Led to Increased Operational Costs
77% of the respondents were of the opinion that conflicts have led to increased
operational costs, 5% disagreed and 18% were uncertain.
77%
18%
5% 0%
10%
20%
30%
40%
50%
60%
70%
80%
90%
AGREE UNSURE DISAGREE

Regenesys etd – Ravhutulu, V (2011)
63
4.4.6 Question 20:
Workplace Conflicts have led to Increased Labour Turnover in
the City of Johannesburg
The details of the question opinion spread are provided in Figure 4.20, with a mean
of 2.3 and standard deviation of .9 for this question.
Figure 4.20:
Workplace Conflicts Have Led to Increased Labour Turnover in the City of
Johannesburg
Illustrated in Figure 4.20 are the responses to the concept of workplace conflicts
having led to increased labour turnover in Johannesburg City, with 68% of the
respondents corresponding with the notion, 15% diverging from the idea and 17%
were unsure.
4.5 SUMMARY
The following tables and figures supply an overall view of the data collected.
68%
17% 15%
0%
10%
20%
30%
40%
50%
60%
70%
80%
AGREE UNSURE DISAGREE

Regenesys etd – Ravhutulu, V (2011)
64
4.5.1 SECTION A:
THE TYPES OF WORKPLACE CONFLICTS PREVALENT IN
THE CITY OF JOHANNESBURG
. Table 4.1: Prevalent Types of Workplace Conflicts in Johannesburg City
QUESTION
NUMBER
WHICH CONFLICTS ARE
CHARACTERISTIC
STRONGLY
AGREE AGREE UNSURE DISAGREE
STRONGLY
DISAGREE
No. % No. % No. % No. % No. %
1 Vertical and Horizontal 7 7% 35 35% 30 30% 0 0% 28 28%
2 Organised & Un-
Organised 18 18% 41 41% 19 19% 4 4% 18 18%
3 Rights & Interest 11 11% 26 26% 17 17% 3 3% 43 43%
4 Group 13 13% 36 36% 37 37% 5 5% 9 9%
Figure 4.21:
Prevalent Types of Workplace Conflicts in Johannesburg City
0
20
40
60
80
100
Vertical andHorizontal
Organised &Un-Organised
Rights &Interest
Group STRONGLY DISAGREE
DISAGREE
UNSURE
AGREE
STRONGLY AGREE

Regenesys etd – Ravhutulu, V (2011)
65
4.5.2 SECTION B:
THE CAUSES OF WORKPLACE CONFLICTS PREVALENT IN
THE CITY OF JOHANNESBURG
. Table 4.2: Major Causes of Workplace Conflicts in Johannesburg City
QUESTION
NUMBER CAUSE OF DISPUTES
STRONGLY
AGREE AGREE UNSURE DISAGREE
STRONGLY
DISAGREE
No. % No. % No. % No. % No. %
5 Goal Conflicts 8 8% 20 20% 2 2% 1 1% 69 69%
6 Conflicting Roles 2 2% 10 10% 19 19% 2 2% 67 67%
7 Task Inter-Dependency 11 11% 8 8% 8 8% 3 3% 70 70%
8 Competition among
Employees 1 1% 8 8% 9 9% 5 5% 77 77%
9 Communication Failures 4 4% 13 13% 0 0% 1 1% 82 82%
10 Individual & Personality
Differences 12 12% 31 31% 2 2% 17 17% 38 38%
11 Leadership and Control 3 3% 13 13% 13 13% 6 6% 65 65%
12 Specialisation 5 5% 14 14% 17 17% 12 12% 52 52%
13 Inequity 0 0% 7 7% 15 15% 43 43% 35 35%
14 External Changes/ Threats
2 2% 14 14% 32 32% 38 38% 14 14%

Regenesys etd – Ravhutulu, V (2011)
66
Figure 4.22:
Major Causes of Workplace Conflicts in Johannesburg City
4.5.3 SECTION C:
THE IMPACTS OF WORKPLACE CONFLICTS PREVALENT IN
THE CITY OF JOHANNESBURG
. Table 4.3: Main Impacts of Workplace Conflicts in Johannesburg City
QUESTION
NUMBER IMPACT OF DISPUTES
STRONGLY
AGREE AGREE UNSURE DISAGREE
STRONGLY
DISAGREE
No. % No. % No. % No. % No. %
15 Increased Negative Effects
on Motivation 12 12% 44 44% 2 2% 10 10% 32 32%
16 Increased Job
Dissatisfaction 11 11% 36 36% 13 13% 21 21% 19 19%
17 Declined Employee Morale 10 10% 34 34% 24 24% 27 27% 5 5%
18 Negatively Affected
Employee Performance 6 6% 42 42% 23 23% 5 5% 24 24%
19 Increased Operational Costs 16 16% 61 61% 18 18% 4 4% 1 1%
20 Increased Labour Turnover 14 14% 54 54% 17 17% 14 14% 1 1%
0
20
40
60
80
100
STRONGLYDISAGREE
DISAGREE

Regenesys etd – Ravhutulu, V (2011)
67
Figure 4.23:
Main Impacts of Workplace Conflicts in Johannesburg City
4.5.4 SECTION D:
AVAILABILITY OF RESOLUTION TECHNIQUES FOR
RESOLVING WORKPLACE CONFLICTS IN THE CITY OF
JOHANNESBURG
. Table 4.4: Availability of Resolution Mechanisms to Resolve Workplace Conflicts in Johannesburg City
QUESTION
NUMBER
AVAILABILITY OF
RESOLUTION
TECHNIQUES
STRONGLY
AGREE
AGREE UNSURE DISAGREE STRONGLY
DISAGREE No. % No. % No. % No. % No. %
21 Inter-Personal Techniques 1 1% 34 34% 38 38% 10 10% 17 17%
22 Union Dispute Resolution
Procedures
9 9% 20 20% 31 31% 21 21% 19 19%
23 Non-Union Conflict
Management Systems
1 1% 20 20% 25 25% 39 39% 15 15%
24 Internal Conflict
Management Systems
1 1% 36 36% 43 43% 20 20% 1 1%
0102030405060708090
100
Incr
eas
ed
Neg
ativ
e E
ffec
ts o
nM
oti
vati
on
Incr
eas
ed
Jo
b D
issa
tisf
acti
on
De
clin
ed E
mp
loye
e M
ora
le
Neg
ativ
ely
Aff
ect
ed E
mp
loye
eP
erf
orm
ance
Incr
eas
ed
Op
era
tio
nal
Co
sts
Incr
eas
ed
Lab
ou
r Tu
rno
ver
STRONGLY DISAGREE
DISAGREE
UNSURE
AGREE
STRONGLY AGREE

Regenesys etd – Ravhutulu, V (2011)
68
Figure 4.24:
Availability of Resolution Mechanisms to Resolve Workplace Conflicts in Johannesburg City
4.6 CONCLUSION
This chapter presented the findings of the primary research, outlining and illustrating
the respondent opinions for each question. The next chapter contains detailed
discussions.
0
20
40
60
80
100
120
Inter-PersonalTechniques
Union DisputeResolutionProcedures
Non-UnionConflict
ManagementSystems
InternalConflict
ManagementSystems
STRONGLY DISAGREEDISAGREEUNSUREAGREESTRONGLY AGREE

Regenesys etd – Ravhutulu, V (2011)
69
CHAPTER 5: DISCUSSIONS
5.1 INTRODUCTION
The findings of the primary research presented above, are discussed, in more depth
and detail, in this chapter. The discussions are structured along similar sections to
those contained in the previous chapter. During the discussions the researcher
endeavoured to determine the extent to which the primary findings were consistent,
or inconsistent, with the secondary findings. During the discussions attempts were
also made to assess the degree to which the information obtained, from both primary
and secondary findings, corresponded and provided accurate reactions to the issues
contained in the research questions and objectives. Hypotheses analysis was
utilised to test the assumptions for the study, as set in Chapter One. Finally, the
chapter also contains the correlation analysis, which sought to assess the degree of
inter-relationship between variables.
5.2 SECTION A: THE TYPES OF WORKPLACE CONFLICTS PREVALENT IN THE CITY OF JOHANNESBURG
This section intended to assess the nature of the types of conflicts taking place in the
City of Johannesburg and was aligned to Research Question, Objective and
Hypothesis One. The questions in this section deal with some of the specific types of
workplace conflicts.

Regenesys etd – Ravhutulu, V (2011)
70
5.2.1 Question 1:
Vertical and Horizontal Conflicts Characterise the City of
Johannesburg
Gosline, Stallworth, Adams, Brand, Hallberin, and Honk (2001:119) note that
conflicts in organisations may also be classified according to the organisational
structure, whether vertical or horizontal. Vertical conflict refers to disputes between
people at different levels of authority, while horizontal conflict deals with disputes
between people of approximately equal status. As demonstrated in Figure 4.1, 42%
of the respondents concurred that conflicts in Johannesburg City are vertical and
horizontal, with 28% disputing this and 30% unsure. That 28% disagreed does not
expunge that the current nature of conflicts in the City of Johannesburg are likely
vertical or horizontal. The mean for this question was 3 and the standard deviation
1.3. A mean of 3 is positioned neutrally and does not support either the respondents
agreeing or disagreeing. If the mean was below 3, it would have been operating in
favour of the respondents agreeing or if the mean was above 3, it would have
supported the respondents disagreeing. In this regard, therefore, the mean of 3 does
not support either side. However a standard deviation of 1.3 does not indicate a high
variation in respondents choosing other options. This level of standard deviation
backs the respondents disagreeing and it can be concluded that the nature of conflict
in the City of Johannesburg is both vertical and horizontal.
A significant number, 30% of the respondents, could have chosen to remain unsure,
primarily due to the need to remain impartial. In organisations there are certainly
some people who are not usually affected, and do not want to be affected, by
conflicts at their workplaces. Such people undertake all means available to ensure
that they do not cause conflicts or if a dispute happens, it must be resolved as soon
as possible. 30% of the respondents stating that they are not sure whether vertical
and horizontal conflicts characterise the City of Johannesburg as an organisation, it
is, therefore, certainly not surprising. However, this does not mean that there are no
workplace conflicts in the City of Johannesburg.

Regenesys etd – Ravhutulu, V (2011)
71
5.2.2 Question 2:
Organised and Un-Organised Conflicts Characterise the City
of Johannesburg
This question evinced a mean of 2.6 and standard deviation of 1.3. 59% of the
respondents concur that organised and un-organised conflicts characterise City of
Johannesburg. 22% of the respondents disagreed and 19% were unsure. According
to Estreicher (2001:70) conflict may also be distinguished on the basis of how it
takes place. Organised conflict refers to the action of one group expressing collective
dissatisfaction against another. Unorganised conflict takes place on an informal,
usually individual basis, though in certain cases groups may be involved. This tends
to focus on dissatisfactions in the workplace and may be expressed as grievances or
inappropriate behaviour, possibly giving rise to disciplinary problems. These
secondary research findings are not contrary to the findings of the primary research.
It is indicated that a larger number, 59%of respondents, agreed that the nature of
conflict in the City of Johannesburg is both un-organised and organised.
The mean of 2.6 and standard deviation of 1.3 supports the majority of respondents
agreeing with the premise. When a Likert five point scale research instrument is
implemented, as in this study, a mean which falls below the norm of 3 would be in
favour of the respondents agreeing and if it is over 3 it is in favour of the respondents
disagreeing. The mean of 2.6 falls within the scale of the respondents agreeing.
When assessing the standard deviation, the higher the obtained figure, the more
scattered the respondents were on the five point scale. A lower standard deviation
indicates that most of the respondents have chosen certain options. The obtained
standard deviation was 1.3 for this question, and therefore signifies that the
respondents were scattered on the five point scale, most of them not choosing only
certain options. This interpretation indicates that the standard deviation is not in
favour of the 59% of the respondents who were considered to have agreed. The City
of Johannesburg management still has to be cognisant of the fact that while not all
respondents disagreed, a significant number, 59% of respondents, were in accord
with the statement, illustrating that the problem of organised and un-organised
conflict is a serious one, for which appropriate solutions need to be developed.

Regenesys etd – Ravhutulu, V (2011)
72
5.2.3 Question 3:
Rights and Interest Conflicts Characterise the City of
Johannesburg
Lipsky, Seeber, Avgar and Scanza (2007:129) reveal that an alternative approach to
workplace conflict is to distinguish between the issues on which conflict may be
based i.e. rights or interests. A conflict of right arises from alleged violations of rights,
which have been established by a contract of employment. It is not a question of
right or wrong. This type of dispute results, therefore, not in adjudication but in
bargaining. Where bargaining cannot resolve the issue, recourse to adjudication may
be necessary. According to Stone (1996:50) grievances may also be about interest.
This type of dispute could occur if individuals or groups consider that their rate of pay
is unfair, compared to others in the organisation, for the same or similar work. The
primary findings showed a mean of 3.4 and standard deviation of 1.5 were obtained
for this question. Figure 4.3 highlighted 37% of the respondents agreed that rights
and interest conflicts characterise the City of Johannesburg. 46% of the respondents
disagreed, while 17% were unsure. This indicated the respondents were divided.
The higher proportion of the respondents disagreeing does not necessarily indicate
that these types of conflicts do take place in the City of Johannesburg. The
difference between the 37% who concurred, compared to the 46% who dissented, is
not significant – resulting in the outcome being considered as ‗unrated‘. However,
the result findings may not be significant, as the mean of 3.4 skews towards
disagree. The standard deviation of 1.5 indicates a high variation in respondent
option choices. The overall conclusion indicates that in the City of Johannesburg
rights and interest conflicts do not exist, or are infrequent.
5.2.4 Question 4:
Group Conflicts Characterise the City of Johannesburg
The mean for this question was 2, and falls within the agree portion of the scale. The
standard deviation of 1.2 indicates a low variation in the number of respondent

Regenesys etd – Ravhutulu, V (2011)
73
option choices. Overall, both the standard deviation and the mean support the 49%
of the respondents who agreed that group conflicts do characterise the City of
Johannesburg. The 37% who were unsure and the 14% who disagreed are
considered less significant, as compared to the greater number of respondents who
agreed. These primary findings are consistent with the secondary findings. Wheeler,
Klaas and Mahony (2004) note that conflicts within, or between, groups are quite
common. In any situation which allocates roles and power to individuals, or in which
different rights and expectations are identified with different groups, there is the
potential for opposition, resistance and conflict. Although some respondents
disagreed, the overall scenario is not different from what primary findings in the City
of Johannesburg revealed. Those who disagreed may have done so because they
may perceive that not all conflict is group conflict, it may fall into a different category
viz. organised conflict, un-organised conflict or any other conflict.
When considered as a whole, the average for all the variables in this section are
seemingly confirmed by the results of the hypothesis analysis, which validate the
findings that 47% of respondents agreed workplace disputes in Johannesburg City
are characterised by horizontal, vertical, organised and un-organised conflicts.
5.3 HYPOTHESIS ANALYSIS
5.3.1 H0: Workplace Disputes in the City of Johannesburg are
Characterised by Horizontal; Vertical; Organised; and Un-
Organised Conflicts
5.3.2 H1: Workplace Disputes in the City of Johannesburg are
Not Characterised by Horizontal; Vertical; Organised; and Un-
Organised Conflicts

Regenesys etd – Ravhutulu, V (2011)
74
Table 5.1: Hypothesis Analysis
QUESTION AGREE UNSURE DISAGREE MEAN STANDARD
DEVIATION
Q1. 42% 30% 28% 3 1.3
Q2. 59% 19% 22% 2.6 1.3
Q3. 39% 17% 46% 3.4 1.5
Q4. 49% 37% 14% 2 1.2
AVERAGES 47% 26% 27% 3 1.3
Standard Error: S =
√ =
√ = 0.13.
Therefore: from then 1.96 = 3 + 1.96 (0.13) = 0.6448
or 3 – 1.96 (0.13) = 0.1352.
At 95% confidence level, the population means fall between the range of 0.6448 and
0.1352. Either of the two boundaries may, therefore, be chosen.
Z =
=
= 1.81
Decision: Since the calculated Z-score of 1.81 is lower than 1.96, the null
hypothesis (H0) is accepted and the alternative hypothesis (H1) is rejected. The
hypothesis analysis concludes that workplace conflicts in the City of Johannesburg
are characterised by horizontal, vertical, organised and un-organised conflicts.
Nevertheless, there are several factors that can lead to conflicts in organisations.
The primary findings on the causes of conflicts in the City of Johannesburg, and the
extent to which they are consistent with the secondary findings are discussed in the
next section.
5.4 SECTION B: THE CAUSES OF WORKPLACE CONFLICTS IN THE CITY OF JOHANNESBURG

Regenesys etd – Ravhutulu, V (2011)
75
5.4.1 Question 5:
The Conflicts in the City of Johannesburg are Due to Goal
Conflicts
According to the primary findings, 28% of respondents agreed that disputes in the
City of Johannesburg are due to goal conflicts; 2% were unsure and 70% disagreed.
Although a larger proportion of respondents disagreed, goal conflict could still be one
of the causes of workplace disputes in Johannesburg City. Shafritz (2001:90) notes
that conflicts arise when individuals or groups pursue different or conflicting goals
from other individuals or groups. Individuals and groups commonly have their own
goals, which are distinct from those of the organisation, and where the pursuit of the
latter does not result in satisfaction of personal or group goals, these may take
precedence. 70% of the respondents disagreed with the hypothesis could be
attributed to this, as they could have been revealing that work conflict is also brought
about by competition, whereby at least one party loses or suffers frustration of their
goals. The greater percentage respondents who disagreed, 70% as opposed to the
28% who allowed that causes of workplace disputes are linked to such issues,
clearly indicates that these factors are a minor cause of conflicts in the City of
Johannesburg. The mean was 4, falling within the disagree range, with a standard
deviation of 1.5, again supporting the disagreeing respondents.
5.4.2 Question 6:
Conflicting Roles are the Causes of Conflicts in the City of
Johannesburg
According to Mossier (1990: 63) one of the causes of disputes in organisations are
goal conflicts. These may arise when an employee does not understand or finds it
unclear what their role is or where two or more people perceive themselves as
carrying out the same role. In theory this should not arise in the formal structuring of
organisations. The primary findings reveal 69% of the respondents opposed the idea
of conflicting roles being the causes of disputes in the City of Johannesburg. 12% of

Regenesys etd – Ravhutulu, V (2011)
76
participants agreed with the statement, with 19% remaining uncertain. The mean of
3.4, and standard deviation of 1.7, unequivocally supports the disagreeing
respondents. Management should not, however, use these results to relax, as the
12% of the respondents who stated that some disputes are goal conflict related
could be the tip of an iceberg - symptomatic or indicative of a greater underlying
problem.
5.4.3 Question 7:
Task Inter-Dependency is the Main Cause of Conflicts in the
City of Johannesburg
Colvin (2003:375) notes that organisational work conflict may also arise from task
inter-dependency. As Figure 4.7 illustrated 19% of the respondents agreed that task
inter-dependency is a main cause of conflict in the City of Johannesburg, with 73%
opposing the statement and 8% unsure. The obtained mean of 3.6, skews towards
disagree, supporting the 73% of respondents who differed. The 19% who agreed
correspond with Colvin‘s (2003:375) assertion that workplace conflicts can arise from
task inter-dependency. Colvin (2003:375) cites examples of this, including reciprocal
inter-dependence, where two parties rely upon each other to get to the task
completed. An illustration of this could be a purchasing department needing the
specification of goods required, but the practitioner requiring the purchasing
department to supply details of the goods available.
5.4.4 Question 8:
Competition among Employees is the Main Cause of Conflicts
in the City of Johannesburg
In addition to the above elements, workplace disputes may arise from other factors.
Cochan, Katz and Mckersie (1994:68) state that conflicts may also arise out of
competition and contend that in organisations this competition can take many forms.

Regenesys etd – Ravhutulu, V (2011)
77
Competition may be related to scarce resources; promotion; rewards - in terms of
recognition or money; and may involve both individuals and groups. If the outcome of
the competition is unfavourable to a particular party, or is perceived as such, the
sense of grievance may result in conflict. Competition may also result in frustration of
organisational goals, where it replaces cooperation and may arise from inappropriate
rewards systems. 82% of respondents disagreed with the concept of competition as
a main cause of conflict, backed by a mean of 4.5 and standard deviation of 1.
Despite the much greater percentage who disagreed, compared to the 9% who
concurred, it still remains, as Cochan, Katz and Mckersie (1994:68) reiterate, that
competition is considered one of the main causes of conflicts in organisations, so
this research question is considered unresolved or unsettled.
5.4.5 Question 9:
Communication Failures are the Main Causes of Conflicts in
the City of Johannesburg
Bryans and Smith (2000:34) contend that breakdowns in communication processes
or lack of communication may lead to a variety of problems in organisations. These
may cause obstruction in task inter-dependency; a lack of clarity or understanding of
goals and objectives; and significantly, feelings of alienation on the part of the
individual or group. The primary findings are in accord with this concept, although
only 17% of the respondents agreed that communication failures are the main
causes of disputes within Johannesburg City. The result of 82% of respondents
disagreeing and 1 % being uncertain could be attributed to increased conflicts within
Johannesburg City being associated with alternative factors, other than to poor
communication. The mean of 3 is neutral, supporting neither side, although the
standard deviation of 1.9 indicates a high variation in option choice by respondents.

Regenesys etd – Ravhutulu, V (2011)
78
5.4.6 Question 10:
Individual and Personality Differences are the Main Causes of
Conflicts in the City of Johannesburg
Dipaola and Hoy (2001:238) cite personality clashes, jealousies and other personal
animosities, either permanent or transitory, as being inevitable when people work
closely together. When people are newly acquainted, or don‘t know each other well,
these tend to be more abrasive and are inclined to lessen and de-escalate over time
tolerance, understanding and acceptable working relationships develop. Personality
conflicts may also happen from clashes due to different styles of interaction, or
differing values or beliefs. 55% of the respondents disagreed, backed by the
standard deviation of 1.6 and mean of 2.7. 2% were unsure and a fairly high
proportion, 43% of respondents, agreed individual and personality differences are a
main cause of conflict in the City of Johannesburg echoing the assertions from
Dipaola and Hoy (2001:238).
5.4.7 Question 11:
Leadership and Control are the Main Causes of Conflicts in
the City of Johannesburg
Figure 4.11 reflects that 71% of the respondents disagreed that leadership and
control are the main causes of conflicts in the City of Johannesburg, while 16% of
the respondents agreed and 13% were uncertain. The mean of 3.2 is too weak to
support the respondents disagreeing, being only two units away from neutral,
similarly the standard deviation of 1.8, is too close to neutral to be significant.
Despite the primary findings assertions by Lira, et al (2006), that poor or
inappropriate leadership can result in a lack of direction for individuals and groups,
causing goal and role conflicts, are still valid. This is common where individual
perceptions are allowed to step into a void, left by a lack of organisational or group
consensus. This can arise within both the informal and the formal organisation, due
to indecisive or poor management. The overall results suggest that this could be a

Regenesys etd – Ravhutulu, V (2011)
79
minor issue, with little effect on the causes of workplace conflicts in the City of
Johannesburg.
5.4.8 Question 12:
Specialisation is the Main Cause of Conflicts in the City of
Johannesburg
Figure 4.12 shows 64% of the respondents disagreed with the idea that
specialisation is a main cause of conflict in the City of Johannesburg. 17% were
unsure and 19% agreed with the statement. Irregardless of these results, it still
remains that specialisation is one of the causes of conflicts in organisations. It is
considered likely that those respondents who disagreed are possibly stating that if
there is high specialisation, it can lead to conflicts, but as far as the City of
Johannesburg is concerned, this is not yet a significant factor. Such views coincide
with the opinion of Colvin (2004b:581), who stated that highly specialised
departmental structure will tend to lead to inward looking attitudes that hinder inter-
departmental cooperation and cause conflicts. In the City of Johannesburg such
highly specialised departments are Water, Accounting and Legal and it is considered
likely that the agreeing 19% of respondents were considering and referring to these
departments.
5.4.9 Question 13:
Inequity is the Main Cause of Conflicts in the City of
Johannesburg
Inequity can also cause workplace conflicts. 43% of the respondents were uncertain
as to whether inequity is a main cause of conflicts within Johannesburg City, with
22% in accord with the idea and 35% dissenting. The mean of 2.6 and standard
deviation of 1.7, seem to support the respondents who agreed. Such views of
respondents in the primary findings support Colvin (2004a:95) asserting that if
Regenesys etd – Ravhutulu, V (2011)
80
individuals consider their treatment to be unjust or unfair, then conflict will arise and
they will feel motivated to restore the balance.
5.4.10 Question 14:
External Changes or Threats
Block, Beck and Olson (1996:54) state that the business environment is subject to
constant changes, whether in the market place from competitors, or more generally,
from technological changes or government policies. A lot of badly handled changes
within a poorly managed organisation may lead to frustration and anger, which in
turn affects how people deal with one another at work. 52% of the respondents
disputed the idea that external changes or threats are the main causes of conflicts in
the City of Johannesburg, while 32% were unsure and 16% agreed. The mean was
3.5 and standard deviation 1, both supporting the disagreeing category. This could
suggest that external changes or threats are not some of the major causes of the
current conflicts in the City of Johannesburg.
To test whether these different factors have a significant bearing on the different
types of workplace conflicts that organisations face, a correlation analysis was
undertaken, using the Pearson Formula, as indicated below.
5.5 CORRELATION BETWEEN THE CAUSES AND DIFFERENT TYPES OF WORKPLACE CONFLICT
An analysis of the between the various causes and types of conflict was undertaken
and involved summarising the percentages obtained for the variables in Section A
and B, subsequently adding and dividing by the number, in order to find the
averages. The averages for each of the data sets were then utilised in the correlation
analysis. The variables in Section B which deal with the causes of workplace
conflicts were classified as independent variables X, and the variables in Section A

Regenesys etd – Ravhutulu, V (2011)
81
as dependent variables Y. Without the factors in Section B, it is not possible to have
the situation outlined in Section A. The correlation process was as indicated in Table
5.1 below.
Table 5.2: Correlation between the Causes and Different Types of Workplace Conflicts
MEAN AVERAGE
FOR % IN
SECTION B (X)
MEAN AVERAGE
FOR % IN
SECTION A (Y)
xy x2 y2
20 47 940 400 2209
15 26 390 225 676
65 27 1755 4225 729
x=100 y=100 xy=3085 x2=4850 y2
=3614
Using Pearson co-efficient correlation formula:
* ( ), ( )-+
√ * ( ) , ( ) √ ⌈ ⟨ ( ) ⟩⌉-+
= ( )|( )( )
√ ( ) ( )√ ( ) ( )
=
√ √
=
= 0.4
Using SPSS and Pearson‘s co-efficient correlation formulae the result of the analysis
was 0.4. This result falls between 0 and 1, therefore demonstrating a strong positive
correlation between the different types of workplace conflicts, such as vertical and
horizontal conflicts; organised and un-organised conflicts; rights and interest
conflicts; and group conflicts as discussed in Section A and the causes of workplace
conflicts as outlined and examined in Section B, including goal conflicts; role conflict;
task inter-dependency; competition; communication failures; individual and
personality differences; leadership and control; specialisation; inequity; violation of

Regenesys etd – Ravhutulu, V (2011)
82
territory; and external changes or threats. The findings of the correlation analysis
reveals that the existence of these factors are most likely to lead to the existence of
such different types of conflicts in organisations. This finding supports the contention
of Gosline et al (2001:119) that these are the common causes of workplace conflicts
in organisations.
5.6 HYPOTHESIS TESTING
The hypothesis testing in this section was intended to establish whether the main
causes of workplace conflicts are individual and organisational factors. If the null
hypothesis is accepted, it may indicate these factors and other additional factors,
such as external changes and threats cause workplace conflict. The findings below
prove whether or not such an assumption is correct.
5.6.1 H0: The Main Causes of Workplace Conflicts are Not
Individual and Organisational Factors
5.6.2 H1: The Main Causes of Workplace Conflicts are
Individual and Organisational Factors

Regenesys etd – Ravhutulu, V (2011)
83
Table 5.3: Hypothesis Analysis
QUESTION AGREE UNSURE DISAGREE MEAN STANDARD DEVIATION
Q5. 28% 2% 70% 4 1.5
Q6. 12% 19% 69% 3.4 1.7
Q7. 19% 8% 73% 3.6 1.8
Q8. 9% 9% 82% 4.5 1
Q9. 17% 1% 82% 3 1.9
Q10. 43% 2% 55% 2.7 1.6
Q11. 16% 13% 71% 3.2 1.8
Q12. 19% 17% 64% 3.9 1.3
Q13. 22% 43% 35% 2.6 1.7
Q14. 16% 32% 52% 3.5 1
AVERAGE 20% 15% 65% 3.5 1.5
Standard Error of S =
√ =
√ = 0.15
Therefore: from then ±1.96 = 3.5 + 1.96 (0.15) = 0.8190
or 3.5 – 1.96 (0.15) = 0.2310
At 95% confidence level, the population means fall between the range of 0.8190 and
0.2310. Either of the two boundaries could, therefore, be chosen.
Z =
=
= 17.873
Decision: Since the calculated Z-score of 17.873 is greater than 1.96, the null
hypothesis (H0) is thus rejected and the alternative hypothesis (H1) is accepted. The
results of the hypothesis analysis indicate that most of the causes of workplace
conflict in organisations are individual and organisational related. According to
Cochan, Katz and Mckersie (1994:68), and Cochan, Katz and Mckersie (1994:68),
the main causes of workplace conflicts are: goal conflicts; role conflict; task inter-
dependency; competition; communication failures; individual and personality
differences; leadership and control; specialisation; inequity; and violation of territory.

Regenesys etd – Ravhutulu, V (2011)
84
A thorough analysis would reveal that most of these factors are either individual or
organisational. In effect, if the results of the hypothesis testing reveal the same, then
holding such assumptions is justifiable.
What is notable is that organisations that fail to address workplace conflicts at their
early stages are more prone to experience negative effects, than those that
undertake steps channelled at solving conflicts at their early stages. The discussions
of the primary findings, visa vis those of the secondary findings, are contained in the
section below.
5.7 SECTION C: THE IMPACTS OF WORKPLACE CONFLICTS ON WORKER PERFORMANCE IN THE CITY OF JOHANNESBURG
According to Klein (2003:90), McCraken, and Wallace (2000: 467), and Moller,
Benscoter, and Rohrer-Murphy (2000: 95) workplace conflicts can negatively affect
employee motivation; job satisfaction; morale; and performance. The findings
relating to motivation are discussed in this section.
5.7.1 Question 15:
Conflicts Have Led to Increased Negative Effects on
Motivation
Although 42% of the respondents disagreed that conflicts have led to increased
negative effects on motivation 56% agreed and 2% were unsure. The mean score
was 2.3 and standard deviation 1.2. The mean of 2.3 certainly indicates that on
average the majority agreed that the current workplace conflicts in the City of
Johannesburg do affect the employee motivation. The standard deviation of 1.2
indicates that a moderate variation in the number of respondents choosing other
options. The 56% who agreed are in sync with McCraken, and Wallace (2000: 467),
who state that conflicts among employees or between management and employees
can have a significant negative effects on employee motivation. It was to be

Regenesys etd – Ravhutulu, V (2011)
85
expected that the majority are in accord with the posited hypothesis. The
respondents who disagreed could have been those who are perhaps not involved in
any form of conflicts or have never experienced any disputes. They could not, thus,
be expected to know the negative effects arising from workplace conflicts.
5.7.2 Question 16:
Conflicts Have Increased Job Dissatisfaction
Drafke and Kossen (2002:315) reveal that one of the negative effects of workplace
conflicts can be shown in job dissatisfaction. Although 47% of the respondents
agreed that conflicts have increased job dissatisfaction in the City of Johannesburg,
13% were unsure and 40% disagreed. A mean of 3 and standard deviation of1.3
remain fairly neutral. What was manifestly clear was the view of 47% who agreed
that workplace conflict leads to increased job dissatisfaction and management
should not be over-excited about the views of the 40% of respondents who
dissented.
5.7.3 Question 17:
Conflicts Have Led to Declined Employee Morale
Bhattacharyya (2002:409) and Ghauri (2005:68) note that the concept of workplace
conflict is also directly linked to improved employee morale in organisations. Ghauri
(2005:68) states that employee morale refers to the positive attitudes and feelings
which drive employees to accomplish their particular allocated tasks. Gerber et al
(2001:390) observe that employee morale can be significantly affected by workplace
conflicts. The situation in the City of Johannesburg does not differ, with 44% of the
respondents stating that conflicts have led to declined employee morale, compared
to 24% who were unsure and 32% who disagreed with the statement. The mean of
2.2 and standard deviation of 1.2 supports the agreeing respondents.

Regenesys etd – Ravhutulu, V (2011)
86
5.7.4 Question 18:
Conflicts Have Negatively Affected Employee Performance
Figure 4.18 illustrates that 48% of the respondents agreed that conflicts have
negatively affected employee performance, 23% were unsure and 29% disagreed.
This is not contrary to the secondary findings. Khan, Afzal and Rehman (2009:480)
comment that task conflict can prove to be productive and augment team
performance, as it tends to lead to better decisions. Simons and Peterson (2000)
argue that task conflicts promote team member ability and perceptions about
decision-making effectiveness. There is no perfect relation between task conflict and
performance. Stephen and Julia (1995:56), and Bingham (2007:104) highlight that
task conflict tends to reduce member satisfaction and commitment, and
subsequently employee performance. It is certainly difficult to determine which side
had the greater weight, as the mean of 3 is neutral. The standard deviation of 1.3
reflects a more moderate and equal distribution in the number of option choices by
the respondents.
5.7.5 Question 19:
Conflicts Have Led to Increased Operational Costs
ABE (2008:259) and Medina, Munduate, Dorado and Guerra (2005:219) reveal that
workplace conflicts may have some unique consequences, such as increased
operational costs. These increased costs arise from the fact that the organisation
must recruit to replace those who are resigning as a result of workplace conflicts.
Costs may also be incurred in terms of time and expenses involved in mediation and
arbitrations. In the City of Johannesburg, despite the fact that 77% of the
respondents agreed that conflicts have led to increased operational costs, 5%
disagreed and 18% were unsure. The mean score was 2 and standard deviation .7,
which strongly supports the respondents agreeing. In effect, both the primary and
secondary findings confirm that workplace conflicts lead to increased operational
costs.

Regenesys etd – Ravhutulu, V (2011)
87
5.7.6 Question 20:
Workplace Conflicts Have Led to Increased Labour Turnover
in the City of Johannesburg
Lira et al (2006) and Lusch and Serkenci (1990:85) agree that workplace conflicts, if
not checked, can lead to increased labour turnover. The findings in the City of
Johannesburg confirm this as 68% of the respondents agreed that workplace
conflicts have led to increased labour turnover, 17% were unsure and 15%
disagreed. A mean of 2.3 and standard deviation of .9 backs the respondents
agreeing. Since resignation of an employee is the last resort, may explain why some
of the respondents disagreed that workplace conflicts are causing increased labour
turnover.
The types, the causes and impacts of workplace conflicts have been discussed
above, and the assumption that workplace conflicts do or do not impact positively on
employees‘ performance will be tested by the hypothesis testing.
5.8 HYPOTHESIS TESTING 5.8.1 H0: Workplace Conflicts Impact Positively on Employee
Performance
5.8.2 H1: Workplace Conflicts Have Negative Impacts on
Employee Performance.

Regenesys etd – Ravhutulu, V (2011)
88
Table 5.4: Hypothesis Analysis
QUESTION AGREE UNSURE DISAGREE MEAN STANDARD DEVIATION
Q15. 56% 2% 42% 2.3 1.2
Q16. 47% 13% 40% 3 1.3
Q17. 44% 24% 32% 2.2 1.2
Q18. 48% 23% 29% 3 1.3
Q19. 77% 18% 5% 2 .7
Q20. 68% 17% 15% 2.3 .9
AVERAGE 57% 16% 27% 2.5 1.1
Z =
=
= 17.873.
Standard Error of S =
√ =
√ = 0.11
Therefore: from then ±1.96 = 2.5 + 1.96 (0.11) = 0.4906
or 2.5 – 1.96 (0.11) = 0.0594
At 95% confidence level, the population means fall between the range of 0.4906 and
0.0594, therefore either of the two boundaries could be selected.
Z =
=
= 18.267
Decision: Since the calculated Z-score of 18.267 is greater than 1.96, the null
hypothesis (H0) is thus rejected and the alternative hypothesis (H1) is accepted. The
results of the hypothesis analysis indicate that workplace conflicts have more
negative than positive impacts on employee performance. Such a finding syncs with
the views of Klein (2003:90); McCraken and Wallace (2000: 467) and Moller,
Benscoter and Rohrer-Murphy (2000: 95) that workplace conflicts are more often
associated with negative results, rather than positive effects.

Regenesys etd – Ravhutulu, V (2011)
89
The correlation analysis below outlines the relationship between the types and
impacts of workplace conflicts faced by organisations.
5.9 CORRELATION BETWEEN DIFFERENT TYPES OF WORKPLACE CONFLICT AND THE IMPACT ON ORGANISATIONAL PERFORMANCE
Table 5.5: Correlation Assessment
MEAN AVERAGE
FOR % IN
SECTION B (X)
MEAN AVERAGE
FOR % IN
SECTION A (Y)
xy x2 y2
47 57 2679 2209 3249
26 16 416 676 256
27 27 729 729 729
x=100 =100 xy=3824 x2=3614 2
=4234
Using Pearson co-efficient correlation formula:
* ( ), ( )-+
√ * ( ) , ( ) √ ⌈ ⟨ ( ) ⟩⌉-+
= ( )|( )( )
√ ( ) ( )√ ( ) ( )
=
√ √
=
= 0.9
Using SPSS and Pearson‘s co-efficient correlation formula, the result of the analysis
was 0.9. This correlation analysis was intended to assess the extent to which the
different types of workplace conflicts converge to impact negatively within an
organisation. To complete this analysis the variable set in Section A, which dealt with

Regenesys etd – Ravhutulu, V (2011)
90
the types of workplace conflicts and the variables in Section C, concerning the
impacts of workplace conflicts, were used. The finding, reflected above, was a 0.9
correlation factor, which falls between 0 and 1. This demonstrates a strong positive
correlation between the types of workplace conflicts existing within an organisation
and the negative impacts that it suffers. This conclusion corresponds with the
arguments, ideas and views of Klein (2003:90); McCraken and Wallace (2000: 467);
and Moller, Benscoter and Rohrer-Murphy (2000: 95) that workplace conflicts can
impact negatively on employee motivation, morale, satisfaction and performance.
5.10 CONCLUSIONS
This chapter revealed that the primary findings establish that workplace conflicts, in
the City of Johannesburg, are characterised by horizontal; vertical; organised; and
un-organised conflicts. The secondary research determined the causes of these
conflicts are, apparently, linked to goal conflicts; role conflict; task inter-dependency;
competition; communication failures; individual and personality differences;
leadership and control; specialisation; inequity; violation of territory; and external
changes or threats. The primary findings highlighted that these conflicts, additionally,
impact negatively on motivation; job satisfaction; morale; employee performance;
and operational costs. It was established during the primary research that the
management of Johannesburg City is quite adamant and inflexible in their stance
and conflict resolution mechanisms, despite experiencing the above negative
consequences of workplace conflicts. It is concluded, given the aim of this study to
assess and examine the types, causes and impacts of workplace conflict within the
City of Johannesburg, that the research questions have been satisfactorily answered
and the objectives of the study reached, considering especially the quality of the
information gleaned, assessed and discussed. The next, and final, chapter discusses
the conclusions and recommendations for the study.

Regenesys etd – Ravhutulu, V (2011)
91
CHAPTER 6: CONCLUSIONS AND
RECOMMENDATIONS
6.1 INTRODUCTION
This chapter reviews the general conclusions and recommendations of the study.
This includes discussion about the study findings; conclusions about the relationship,
and correlation, between the primary and secondary research results and the
recommendations of the study.
6.2 THE STUDY FINDINGS
The primary research objective of this study was to investigate the strategies for
managing workplace conflicts in the City of Johannesburg and to suggest
appropriate measures to deal effectively with conflict related issues. The secondary
research objectives, with relation to the City of Johannesburg, were to determine the
types; examine the causes and establish the impact of workplace conflict on worker
performance; along with assessing the procedures, and the effectiveness of these
measures, for dealing with these disputes.
The research questions for this study were:
What are the types of workplace conflicts occurring in the City of
Johannesburg?
What are the causes of workplace conflicts in the City of Johannesburg?
How do these workplace conflicts impact on workers‘ performance in the City
of Johannesburg?
Are the procedures for dealing with workplace conflicts in the City of
Johannesburg appropriate?

Regenesys etd – Ravhutulu, V (2011)
92
Are the measures for dealing with workplace conflicts in the City of
Johannesburg effective?
The research hypotheses, which the study sought to respond to, were:
The main causes of workplace conflicts are:
H0: Not individual and organisational factors.
H1: Individual and Organisational factors.
Workplace conflicts impact:
H0: Positively on employees‘ performance.
H1: Negatively on employees‘ performance.
This study is considered justifiable and necessary, in that it was anticipated to lead to
a review of the current approach to managing workplace conflict within
Johannesburg City. It is expected, that if such a review were undertaken, it would
lead to the reduction of workplace conflicts, which would be anticipated,
subsequently, to significantly impact on improved communication within the
organisation; job satisfaction; commitment; and morale, leading to enhanced
employee performance. This would in turn lead to an overall general increase and
improvement in organisational performance, efficiency and efficacy. The main target
of this research is to lead to an improved structure and function of the entire City of
Johannesburg establishment. This six chapter study comprised of: Chapter One -
Introduction; Chapter Two - Literature Review; Chapter Three - Research Design
and Methodology; Chapter Four – Findings; Chapter Five – Discussions; and
Chapter Six - Conclusions and Recommendations. The conclusions relating to the
secondary and primary findings are reflected below.

Regenesys etd – Ravhutulu, V (2011)
93
6.3 CONCLUSION
This section dealt with the correlation and correspondence between the primary and
secondary findings of the study. This section was aligned to the research questions
and objectives of the study, which considered, with relation to workplace disputes,
the types, causes and impacts on worker performance, along with control and
resolution measures and mechanisms. This section also considers the extent to
which the research questions have been answered and research objectives fulfilled.
6.4 THE CONCEPT OF WORKPLACE CONFLICTS
According to the secondary research, managing workplace conflict is an essential
prerequisite for improving employee productivity and general organisational
performance. It was noted in the secondary research that effective conflict
management strategies create a favourable work environment and are conducive to
improving employee job satisfaction; morale; motivation; and commitment to the
allocated job. The secondary research established that a conflict refers to a
condition, which arises whenever the perceived interests of an individual or a group
clash with those of another individual or group, in such a way that strong emotions
are aroused and compromise is not considered as an option. The secondary
research highlighted that conflict arises when one or more person tries to ensure that
their preferred outcome is achieved, to the detriment of others, or the destruction or
obliteration of another‘s targeted ending. The secondary findings discussed different
types of workplace conflict, including: vertical and horizontal; organised and un-
organised; rights and interest; and group conflicts.
These secondary findings correlated to the primary findings, as shown in Chapter
Five‘s discussions, where most of the respondents were of the opinion that the
nature of the workplace conflict in the City of Johannesburg is both vertical and
horizontal. Certain respondents also allowed that organised and un-organised
conflicts feature in disputes occurring within the City of Johannesburg. 37% of the
respondents concurred that rights and interest conflicts also transpire within the City
of Johannesburg, however 46% of the respondents disagreed and 17% were unsure.

Regenesys etd – Ravhutulu, V (2011)
94
A significant number of respondents were found, in the primary research, to have
concurred that group conflicts are common within the City of Johannesburg.
6.5 CAUSES OF WORKPLACE CONFLICTS
It was established that the secondary and primary findings were in accord with each
other, when concerning the common causes of workplace conflicts. The secondary
research discussed the idea that the causes of workplace conflicts are usually
related. These causes include:
Goal Conflicts
Role Conflicts
Task Inter-Dependency
Competition
Communication Failures
Individual and Personality Differences
Leadership and Control
Specialisation
Inequity
Violation of Territory
External Changes or Threats
The primary study established that the common causes of workplace conflicts, as
listed above, all play an elemental role in disputes that arise within the City of
Johannesburg. The secondary research discovered that if positive impacts from
workplace conflicts do occur, they are marginal or minimal; in most cases conflicts
have been found to be undesirable, irrespective of their magnitude.

Regenesys etd – Ravhutulu, V (2011)
95
6.6 THE IMPACTS OF WORKPLACE CONFLICT ON WORKER PERFORMANCE
The secondary findings isolated some of the negative effects of workplace conflicts,
these are:
Negative Effects on Motivation
Increased Job Dissatisfaction
Declined Employee Morale
Decreased Employee Performance
Increased Operational Costs
To combat such negative consequences arising from workplace conflicts, the
secondary research established that in most cases organisations use multiple
strategies, which range in approach from managemental to individual techniques.
6.7 STRATEGIES FOR MANAGING CONFLICTS
The secondary findings determined that when conflicts occur, there are various
resolution strategies. Two major approaches are changing the situation from which
the conflict has arisen or deflecting the conflict by re-orientating the goals of the
parties. These and other possible approaches or strategies for managing conflicts
are mentioned below:
Changing Situational Factors
Promoting Subordinate Goals
Profit-Sharing
Co-partnership
Inter-Personal Techniques

Regenesys etd – Ravhutulu, V (2011)
96
6.8 PATTERNS OF UTILISATION OF WORKPLACE CONFLICT MANAGEMENT
The secondary research included discussions of alternate measures used to contain
workplace conflicts. These covered the more common external and internal
processes.
External Conflict Management Systems:
Union Dispute Resolution Procedures
Non-Union Conflict Management Systems
Internal Conflict Management Systems:
Open door policy models
Ombudsman
Managerial Mediation
Peer Review Boards
Executive Panel
The primary findings revealed that workplace conflicts have led to increased
negative effects on motivation; job dissatisfaction; declining employee morale and
performance; increased operational costs; and increased labour turnover in the City
of Johannesburg. Although the impacts of workplace conflict are more negative, it
was established in the primary study that the management of the City of
Johannesburg has not utilised the essential strategies for reducing such detrimental
effects.
With the findings ascertained by the undertaken research it has been established
that the research questions and objectives of the study, have been answered and

Regenesys etd – Ravhutulu, V (2011)
97
fulfilled respectively. Considering that there were some negative findings pertaining
to workplace conflicts in the City of Johannesburg, it is imperative that the
management takes into consideration the recommendations suggested below.
6.9 RECOMMENDATIONS
The following measures need to be undertaken by the management of the City of
Johannesburg in order to reduce the possibility of workplace conflicts and their
detrimental effects.
6.9.1 SECTION A:
THE TYPES OF WORKPLACE CONFLICTS PREVALENT IN
THE CITY OF JOHANNESBURG
6.9.1.1 Adopt Proper Job Design and Improve Communication
The findings which revealed that workplace conflicts in the City of Johannesburg are
vertical and horizontal can be addressed by having proper job specifications and
improving communication between the sub-ordinates and colleagues. Designing
appropriate company policy on issues of insubordination would help in reducing
vertical conflicts, which are fairly common between a boss and sub-ordinates.
6.9.1.2 Develop Grievance Discussions Forum
It was also revealed in the primary study that un-organised and organised conflicts
characterise the City of Johannesburg. These could be addressed by developing
proper forums, through which different groups or individuals in Johannesburg City
can meet to discuss and resolve their grievances. This may also reduce rights and
interest conflicts which also occur within the organisation.

Regenesys etd – Ravhutulu, V (2011)
98
6.9.2 SECTION B:
THE CAUSES OF WORKPLACE CONFLICTS IN THE CITY OF
JOHANNESBURG
With regard to the common workplace conflicts identified in the primary findings, the
following strategies for managing workplace conflicts could be adopted.
6.9.2.1 Promoting Subordinate Goals
Guetzkow and Gyr (1954:81) suggest that this technique is designed to reduce or
resolve goal conflict by refocusing the goals that individuals or groups pursue. The
aim is to promote the organisational goals over and above those of the individual or
group.
6.9.2.2 Profit-Sharing
Amazon and Sapienza (1997:495) propose that, in order to blur the distinction
between the two sides of the industry, some organisations in the business sector
give their staff a share in the profits of the company, in addition to their normal
wages. The firm usually pays its staff a fixed share of the profits, which is divided
among the employees on the basis of seniority; length of service; and other agreed
criteria. Profit-sharing schemes aim to bridge the gap between capital and labour,
and tend to increase morale within an organisation. These schemes may reduce
labour turnover, as employees have an incentive to stay on and build up a long
service record, in order to improve the size of their share of profits.

Regenesys etd – Ravhutulu, V (2011)
99
6.9.2.3 Co-Partnership
Co-partnership supplies the employees the advantage of profit-sharing and adds a
sense of ownership in the organisation. Where worker directors are elected, the
employees feel they have some say in the running of the business.
6.9.2.4 Inter-Personal Techniques
Friedman, Tidd, Currall and Tsai (2003:32) highlights that managers need to have
the skills to reduce or resolve conflicts at the inter-personal level, both between
themselves and sub-ordinates, and between the individual or groups within their
purview. The basis of such a technique is an assessment of the causes and required
outcomes of the conflict and this necessitates both involvement and detachment.
Involvement demands that managers must listen and explore the views of all parties
involved. Detachment provides that managers must undertake an objective
assessment of the causes and the positions taken. Thomas (1997) identifies five
conflict handling modes which may be used by managers, these are:
Avoidance
Accommodation
Competition
Compromise
Collaboration

Regenesys etd – Ravhutulu, V (2011)
100
6.9.2.5 Union Dispute Resolution Procedures
Goldberg (2005) reiterates that grievance mediation, as a prelude to arbitration, can
serve as an effective means of resolving many workplace disputes in a unionised
setting. Although labour arbitration has been widely used since the 1940s, it has
been the subject of criticism for many years. It was intended to be fast, inexpensive,
and informal, and it certainly meet those objectives when compared to the traditional
court litigation. Goldberg (2005) states, however, that over time, much arbitration has
grown into a slow, expensive and formal process. There is a sense among many
labour management professionals that the decision in arbitration is often irrelevant to
the problem that caused the initial grievance to be filed. Goldberg adds that there
also appears to be a sense among many labour management professionals that the
arbitration process is abused at times, by both management and labour.
6.9.2.6 Non-Union Conflict Management Systems
Colvin (2006) and Lewin (2004) state that over half of non-union organisations have
some type of formal dispute resolution and/or conflict management process. They
added, however, that contrary to the rather limited forms found in union settings,
these mechanisms are diverse and fluid, with a variety of forms and structures.
Before embarking on an analysis of these processes, it is important to make a critical
distinction in their respective functions. One category of actions is known as
determination procedures, and involves an Alternative Dispute Resolution actor, who
facilitates the resolution of a dispute. Arbitration is a typical determination procedure,
whereas mediation involves a facilitation technique. Lipsky (2003) puts forward two
main conflict management systems i.e. internal and external processes. Internal
processes include: open door policies; ombudsmen; managerial mediation; and peer
review boards. The main external processes are outside mediation and arbitration.
External processes are more expensive and are usually utilised later in the dispute.

Regenesys etd – Ravhutulu, V (2011)
101
6.10 CONCLUSIONS
This chapter discussed the overall, general conclusions and recommendations of the
study. A suggested area for further studies would be: ‗Investigating the causes of
workplace conflicts in the City of Johannesburg.‘

Regenesys etd – Ravhutulu, V (2011)
102
LIST OF REFERENCES
1. Amason, A. C. (1996). Distinguishing The Effects Of Functional And
Dysfunctional Conflict On Strategic Decision Making: Resolving A Paradox For
Top Management Teams. Academy of Management Journal 39, 123-148.
2. Amazon, A. C. and Sapienza, H. J. (1997). The Effects Of Top Management
Team Size And Interaction Norms On Cognitive And Affective Conflict. Journal Of
Management, Vol. 23, pp.495-516.
3. Ayoko, B. O. and Härtel, E. J. C. (2006). Cultural Diversity And Leadership, Cross
Cultural Management. An International Journal. Volume 13 Number 4 pp. 345-
360.
4. Bingham, L.B. (2007). The Politics Of Evaluation: Lessons From The Evaluation
Of Workplace Dispute Resolution Programs. Evaluation Dispute Resolution
Programs: Traps For The Unwary. Proceedings of the 59th Annual Meeting,
Labor and Employment Relations Association 104-115.
5. Block, R. N., Beck, J., and Olson, A. R. (1996). Low Profile/High Potential: A
Look At Grievance Mediation. Dispute Resolution Journal, 51(4), 54-61.
6. Cochan, T.A., Katz, H.C., & McKersie, R.B. (1994). The Transformation Of
American Industrial Relations. Ithaca, NY: ILR Press.
7. Colvin, A.J.S. (2001). The Relationship Between Employment Arbitration And
Workplace Dispute Resolution Procedures. Ohio State Journal of Dispute
Resolution, 16(3), 643-68.
8. Colvin, A.J.S. (2003). Institutional Pressures, Human Resource Strategies, And
The Rise Of Non-Union Dispute Resolution Procedures. Industrial and Labor
Relations Review, 56(3), 375-392.

Regenesys etd – Ravhutulu, V (2011)
103
9. Colvin, A.J.S. (2004a). Adoption And Use Of Dispute Resolution Procedures In
The Nonunion Workplace. In D. Lewin and B.E. Kaufman, eds. Advances in
Industrial and Labor Relations, 13, 69-95.
10. Colvin, A.J.S. (2004b). Mandatory Arbitration And Reconfiguration Of Workplace
Dispute Resolution. Cornell Journal of Law and Public Policy, 13(3) 581-97.
11. Colvin, A.J.S., Klaas, B., and Mahony, D. (2006). Research On Alternative
Dispute Resolution Procedures. In D. Lewin, Ed. Contemporary Issues In
Employment Relations. Champaign, IL: Labor and Employment Relations
Association, 103-147.
12. De Dreu, C. K. W. and Weingart, R. L. (2003). Task Versus Relationship Conflict,
Team Performance, And Team Member Satisfaction: A Meta-Analysis. Journal of
Applied Psychology Vol 88, No 4, 741-749.
13. DiPaola, F. M. and Hoy, K W. (2001). Formalization, Conflict, And Change:
Constructive And Destructive Consequences In Schools. International Journal of
Educational Management, Volume 15 Number 5 2001 pp. 238-244.
14. Eistrecher, S. (2001). Saturns For Rickshaws: The Stakes In The Debate Over
Pre-Dispute Employment Arbitration Agreements. Ohio State Journal of Dispute
Resolution, 16(3), 559-70.
15. Feuille, P. (1999). Grievance Mediation. In E. Eaton & J.H. Keefe, eds.
Employment Dispute Resolution And Worker Rights In The Changing Workplace.
Champaign, IL: Industrial Relations Research Association, 187-217. 14 Penn
Plaza v. Pyett, 556 U.S. (2009).
16. Friedman, R. A. Tidd, S. T. Currall, S. C. and Tsai, J.C. (2000). What Goes
Around Comes Around: The Impact Of Personal Conflict Styles On Work Conflict
And Stress. International Journal of Conflict Management, Vol. 11 pp.32-55.

Regenesys etd – Ravhutulu, V (2011)
104
17. Goldberg, S. B. (1982). The Mediation Of Grievances Under A Collective
Bargaining Contract: An Alternative To Arbitration. Northwestern University Law
Review, 77(3), 270-315.
18. Goldberg, S. B. (1983). Grievance Mediation: A Step Towards Peace In The
Bituminous Coal Industry. West Virginia Law Review, 85, 777-782.
19. Goldberg, S. B. (2005). How Interest-Based, Grievance Mediation Performs Over
The Long Term. Dispute Resolution Journal, 59(4), 8-15.
20. Gosline, A. Stallworth, L., Adams, M.C., Brand, N., Hallberin, C.J., Houk, C.S. et
al (2001). Designing Integrated Conflict Management Systems: Guidelines For
Practitioners And Decision Makers In Organisations. Ithaca, NY: Cornell
University, Institute on Conflict Resolution.
21. Guetzkow, H. Gyr, J. (1954). An Analysis Of Conflict In Decision-Making Groups.
Human Relations, Vol. 7 pp.367-81.
22. Jehn, K. A. (1994). Enhancing Effectiveness: An Investigation Of Advantages
And Disadvantages Of Value-Based Intragroup Conflict. International Journal of
Conflict Management, Vol. 5 No.3, pp.223-38.
23. Jehn, K. A. (1995). A Multimethod Examination Of The Benefits And Detriments
Of Intragroup Conflict. Administrative Science Quarterly, Vol. 40 pp.256-82.
24. Jehn, K. A. and Mannix, E. (2001). The Dynamic Nature Of Conflict: A
Longitudinal Study Of Intragroup Conflict And Group Performance. Academy of
Management Journal, Vol. 44 pp.238-51.
25. Jehn, K. A., Thatcher M. B S. and Zanutoo E. (2003). Cracks In Diversity
Research: The Effects Of Diversity Faultlines On Conflict And Performance.
Kluwer Academic Publishers, 12: 217-241.

Regenesys etd – Ravhutulu, V (2011)
105
26. Lewin, D. (2004). Dispute Resolution In Non-Union Organisations: Key Empirical
Findings. In S. Estreicher, ed. Alternative Dispute Resolution In The Employment
Arena. New York: Kluwer, 379-403.
27. Lipsky, D.B. and Avgar, A.C. (2004). Commentary: Research On Employment
Dispute Resolution: Toward A New Paradigm. Conflict Resolution Quarterly,
22(1-2), 175-189.
28. Lipsky, D.B. and Seeber, R.L. (1998). In Search Of Control: The Corporate
Embrace Of ADR. University of Pennsylvania Journal of Labor and Employment
Law, 1(1), 133-57.
29. Lipsky, D.B. and Seeber, R.L. (2000). Resolving Workplace Disputes In The
United States: The Growth Of Alternative Dispute Resolution In Employment
Relations. Journal of Alternative Dispute Resolution in Employment, 2, 37-49.
30. Lipsky, D.B. and Seeber, R.L. (2006). Organisational Conflict. In J. Oetzel &
Toomey, S.T., eds. The Sage Handbook Of Conflict Communication. Thousand
Oaks, CA: Sage. 359-90.
31. Lipsky, D.B., Seeber, R.L. and Fincher, R.D. (2003). Emerging Systems For
Managing Workplace Conflict: Lessons From American Corporations For
Managers And Dispute Resolution Professionals. San Francisco: Jossey-Bass.
32. Lipsky, D.B., Seeber, R.L., Avgar, A.C. and Scanza, R.M. (2007). The Politics Of
Evaluation: Lessons From The Evaluation Of Workplace Dispute Resolution
Programs: Managing The Politics Of Evaluation: Lessons From The Evaluation
Of ADR Programs. Proceedings of the 59th Annual Meeting, Labor and
Employment Relations Association, 116-129.
33. Lira, M. E., Ripoll, P. Peiró M. J. and González, P. (2006). The Roles Of Group
Potency And Information And Communication Technologies In The Relationship

Regenesys etd – Ravhutulu, V (2011)
106
Between Task Conflict And Team Effectiveness: A Longitudinal Study.
Computers in Human Behaviour. Vol. 23, No 6 pp. 2888-2903.
34. Lusch, F. and Serpkenci, R. A. (1990). Personal Differences, Job Outcomes, And
Store Performance: A Study Of Retail Store Managers. Journal of Marketing, Vol.
54 January, pp 85-101.
35. Medina J. F., Munduate L, M., Dorado, M. A. and Guerra, M. J. (2005). Types Of
Intragroup Conflict And Affective Reactions. Journal of Managerial Psychology,
Volume 20 Number ¾ 2005 pp. 219-230.
36. Newstrom, W. J. and Davis, K. (1993). Organisational Behavior. 9th ed, McGraw-
Hill Book Co., New York.
37. Passos M. A. and Caetano A. (2005). Exploring The Effects Of Intragroup
Conflict And Past Performance Feedback On Team Effectiveness. Journal of
Managerial Psychology, Volume 20 Number 3/4 2005 pp. 231-244.
38. Penner, R.G., Sawhill, I.V. and Taylor, T. (2000). Updating America’s Social
Contract: Economic Growth And Opportunity In The New Century. New York:
Norton.
39. Schmedemann, D. (1987). Reconciling Differences: The Theory And Law Of
Mediating Grievances. Industrial Relations Law Journal, 9(4), 523-595.
40. Simons, T. L. and Peterson, R. S. (2000). Task Conflict And Relationship Conflict
In Top Management Teams: The Pivotal Role Of Intragroup Trust. Journal of
Applied Psychology, Vol. 85 pp.102-11.
41. Stephen, M. and Julia, R. (1995). Business Values, Management And Conflict
Handling: Issues In Contemporary Singapore. Journal of Management
Development, Volume 14 Number 4 1995 pp. 56-7.

Regenesys etd – Ravhutulu, V (2011)
107
42. Stone, K.V.W. (1996). Mandatory Arbitration Of Individual Employment Rights: The
Yellow-Dog Contract Of The 1990s. Denver University Law Review, 73, 1017-50.
43. Wheeler, H.N., Klaas, B.S. and Mahony, D.M. (2004). Workplace Justice Without
Unions. Kalamazoo, MI: Upjohn Institute.
44. Zack, A.M. (1999). Agreements To Arbitrate And The Waiver Of Rights Under
Employment Law. In A.E. Eaton & J.H. Keefe, eds. Employment Dispute
Resolution And Worker Rights In The Changing Workplace. Champaign, IL:
Industrial Relations Research Association, 67- 94.

Regenesys etd – Ravhutulu, V (2011)
108
QUESTIONNAIRE
ON MANANGING WORKPLACE CONFLICTS IN THE CITY OF
JOHANNESBURG
INSTRUCTIONS:
Kindly provide your opinion, according to the following codes:
Strongly Agree–1; Agree–2; Unsure–3; Disagree–4; Strongly Disagree–5
SECTION A:
THE TYPES OF WORKPLACE CONFLICTS PREVALENT IN THE CITY OF
JOHANNESBURG
ITEMS CODES
SA A U D SD
1. Vertical and horizontal conflicts characterise the City of
Johannesburg
2. Organised and un-organised conflicts characterise the
City of Johannesburg
3. Rights and interest conflicts characterise the City of
Johannesburg
4. Group Conflicts characterise the City of Johannesburg

Regenesys etd – Ravhutulu, V (2011)
109
SECTION B:
THE CAUSES OF WORKPLACE CONFLICTS IN THE CITY OF JOHANNESBURG
ITEMS CODES
SA A U D SD
5. The conflicts in the City of Johannesburg are due to goal
conflicts
6. Conflicting roles are the causes of conflicts in the City of
Johannesburg
7. Task inter-dependency is the main cause of conflicts in
the City of Johannesburg
8. Competition among employees is the main cause of
conflicts in the City of Johannesburg
9. Communication failures are the main causes of conflicts
in the City of Johannesburg
10. Individual and personality differences are the main
causes of conflicts in the City of Johannesburg
11. Leadership and control are the main causes of conflicts
in the City of Johannesburg
12. Specialisation is the main cause of conflicts in the City of
Johannesburg
13. Inequity is the main cause of conflicts in the City of
Johannesburg
14. External changes or threats are the main causes of
conflicts in the City of Johannesburg

Regenesys etd – Ravhutulu, V (2011)
110
SECTION C:
THE IMPACTS OF WORKPLACE CONFLICTS ON WORKERS’ PERFORMANCE
IN THE CITY OF JOHANNESBURG
ITEMS CODES
SA A U D SD
15. Conflicts have led to increased negative effects on
motivation
16. Conflicts have increased job dissatisfaction
17. Conflicts have led to a declined employees‘ morale
18. Conflicts have negatively affected employee
performance
19. Conflicts have led to increased operational costs
SECTION D: THE MEASURES FOR REDUCING WORKPLACE CONFLICTS IN
THE CITY OF JOHANNESBURG
ITEMS CODES
SA A U D SD
20. There exist inter-personal techniques to reduce
workplace conflicts in the City of Johannesburg
21. There exist Union Dispute Resolution Procedures for
effectively resolving conflicts in the City of Johannesburg
22. There exist Non Union Conflict Management Systems
for resolving conflicts in the City of Johannesburg
23. There exist Internal Conflict Management Systems for
resolving conflicts in the City of Johannesburg

Regenesys etd – Ravhutulu, V (2011)
111
APPENDIX 1:
DATA ANALYSIS SPSS OUTPUT
FREQUENCY VARIABLES = VAR00001 VAR00002 VAR00003 VAR00004 VAR00005
VAR00006 VAR00007 VAR00008 VAR00009 VAR00010 VAR00011 VAR00012 VAR00013
VAR00014 VAR00015 VAR00016 VAR00017 VAR00018 VAR00019 VAR00020 VAR00021
VAR00022 VAR00023 VAR00024
/ ORDER = ANALYSIS.
Frequencies:
Table A1: Notes
Output Created: 15-Apr-2011
22:16:55
Comments:
Input: Data:
Active Dataset: DataSet2
Filter: <none>
Weight: <none>
Split File: <none>
N of Rows in Working Data File: 104
Handling of Missing Values: Definition of Missing: User-defined missing values are treated as
missing.
Cases Used: Statistics are based on all cases with valid
data.
Syntax: FREQUENCY VARIABLES =
VAR00001 VAR00002 VAR00003
VAR00004 VAR00005 VAR00006
VAR00007 VAR00008 VAR00009
VAR00010 VAR00011 VAR00012
VAR00013 VAR00014 VAR00015
VAR00016 VAR00017 VAR00018
VAR00019 VAR00020 VAR00021
VAR00022 VAR00023 VAR00024
/ ORDER=ANALYSIS
Resources: Processor Time: 00:00:00.015
Elapsed Time: 00:00:00.017

Regenesys etd – Ravhutulu, V (2011)
112
Statistic Tables:
Tables A2 to A5: Statistics
Table A2: Statistics
VAR00001 VAR00002 VAR00003 VAR00004 VAR00005 VAR00006
N
Valid 100 100 100 100 100 100
Missing 4 4 4 4 4 4
Table A3: Statistics
VAR00007 VAR00008 VAR00009 VAR00010 VAR00011 VAR00012
N
Valid 100 100 100 100 100 100
Missing 4 4 4 4 4 4
Table A4: Statistics
VAR00013 VAR00014 VAR00015 VAR00016 VAR00017 VAR00018
N
Valid 100 100 100 100 100 100
Missing 4 4 4 4 4 4
Table A5: Statistics
VAR00019 VAR00020 VAR00021 VAR00022 VAR00023 VAR00024
N
Valid 100 100 100 100 100 100
Missing 4 4 4 4 4 4
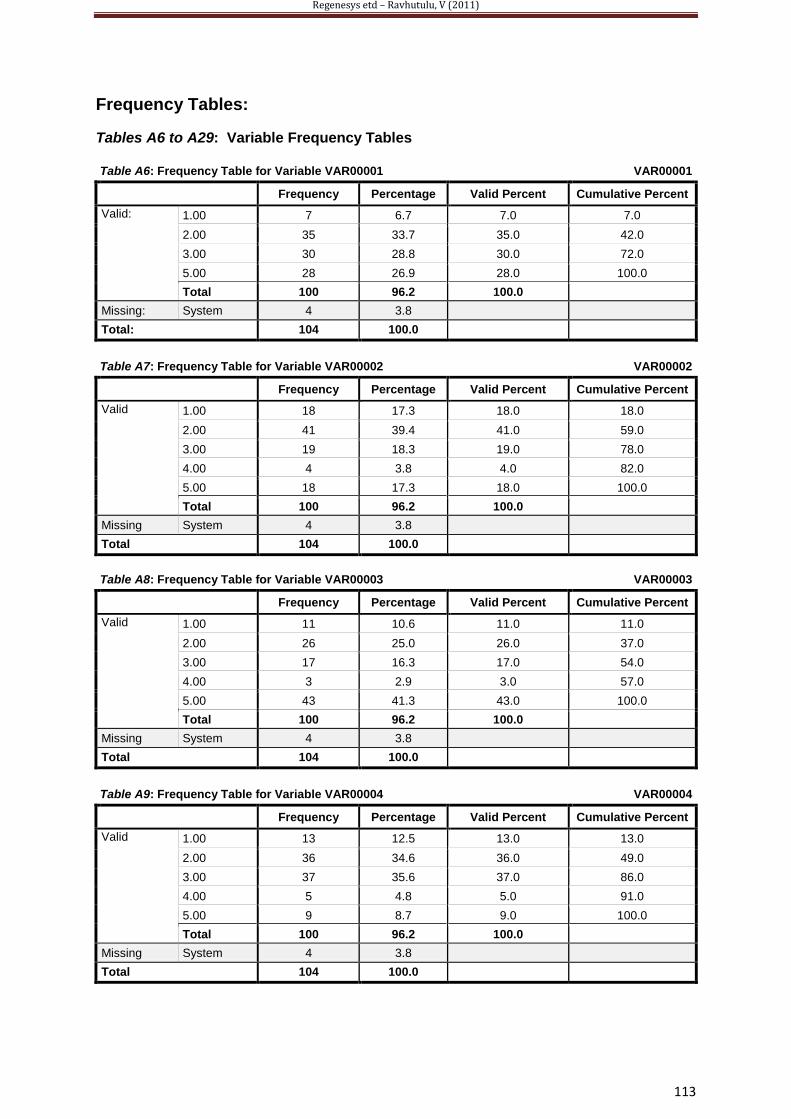
Regenesys etd – Ravhutulu, V (2011)
113
Frequency Tables:
Tables A6 to A29: Variable Frequency Tables
Table A6: Frequency Table for Variable VAR00001 VAR00001
Frequency Percentage Valid Percent Cumulative Percent
Valid: 1.00 7 6.7 7.0 7.0
2.00 35 33.7 35.0 42.0
3.00 30 28.8 30.0 72.0
5.00 28 26.9 28.0 100.0
Total 100 96.2 100.0 Missing: System 4 3.8 Total: 104 100.0
Table A7: Frequency Table for Variable VAR00002 VAR00002
Frequency Percentage Valid Percent Cumulative Percent
Valid 1.00 18 17.3 18.0 18.0
2.00 41 39.4 41.0 59.0
3.00 19 18.3 19.0 78.0
4.00 4 3.8 4.0 82.0
5.00 18 17.3 18.0 100.0
Total 100 96.2 100.0 Missing System 4 3.8 Total 104 100.0
Table A8: Frequency Table for Variable VAR00003 VAR00003
Frequency Percentage Valid Percent Cumulative Percent
Valid 1.00 11 10.6 11.0 11.0
2.00 26 25.0 26.0 37.0
3.00 17 16.3 17.0 54.0
4.00 3 2.9 3.0 57.0
5.00 43 41.3 43.0 100.0
Total 100 96.2 100.0 Missing System 4 3.8 Total 104 100.0
Table A9: Frequency Table for Variable VAR00004 VAR00004
Frequency Percentage Valid Percent Cumulative Percent
Valid 1.00 13 12.5 13.0 13.0
2.00 36 34.6 36.0 49.0
3.00 37 35.6 37.0 86.0
4.00 5 4.8 5.0 91.0
5.00 9 8.7 9.0 100.0
Total 100 96.2 100.0 Missing System 4 3.8 Total 104 100.0

Regenesys etd – Ravhutulu, V (2011)
114
Table A10: Frequency Table for Variable VAR00005 VAR00005
Frequency Percentage Valid Percent Cumulative Percent
Valid 1.00 8 7.7 8.0 8.0
2.00 20 19.2 20.0 28.0
3.00 2 1.9 2.0 30.0
4.00 1 1.0 1.0 31.0
5.00 69 66.3 69.0 100.0
Total 100 96.2 100.0 Missing System 4 3.8 Total 104 100.0
Table A11: Frequency Table for Variable VAR00006 VAR00006
Frequency Percentage Valid Percent Cumulative Percent
Valid 1.00 2 1.9 2.0 2.0
2.00 10 9.6 10.0 12.0
3.00 19 18.3 19.0 31.0
4.00 2 1.9 2.0 33.0
5.00 67 64.4 67.0 100.0
Total 100 96.2 100.0 Missing System 4 3.8 Total 104 100.0
Table A12: Frequency Table for Variable VAR00007 VAR00007
Frequency Percentage Valid Percent Cumulative Percent
Valid 1.00 11 10.6 11.0 11.0
2.00 8 7.7 8.0 19.0
3.00 8 7.7 8.0 27.0
4.00 3 2.9 3.0 30.0
5.00 70 67.3 70.0 100.0
Total 100 96.2 100.0 Missing System 4 3.8 Total 104 100.0
Table A13: Frequency Table for Variable VAR00008 VAR00008
Frequency Percentage Valid Percent Cumulative Percent
Valid 1.00 1 1.0 1.0 1.0
2.00 8 7.7 8.0 9.0
3.00 9 8.7 9.0 18.0
4.00 5 4.8 5.0 23.0
5.00 77 74.0 77.0 100.0
Total 100 96.2 100.0 Missing System 4 3.8 Total 104 100.0

Regenesys etd – Ravhutulu, V (2011)
115
Table A14: Frequency Table for Variable VAR00009 VAR00009
Frequency Percentage Valid Percent Cumulative Percent
Valid 1.00 4 3.8 4.0 4.0
2.00 13 12.5 13.0 17.0
4.00 1 1.0 1.0 18.0
5.00 82 78.8 82.0 100.0
Total 100 96.2 100.0 Missing System 4 3.8 Total 104 100.0
Table A15: Frequency Table for Variable VAR00010 VAR00010
Frequency Percentage Valid Percent Cumulative Percent
Valid 1.00 12 11.5 12.0 12.0
2.00 31 29.8 31.0 43.0
3.00 2 1.9 2.0 45.0
4.00 17 16.3 17.0 62.0
5.00 38 36.5 38.0 100.0
Total 100 96.2 100.0 Missing System 4 3.8 Total 104 100.0
Table A16: Frequency Table for Variable VAR00011 VAR00011
Frequency Percentage Valid Percent Cumulative Percent
Valid 1.00 3 2.9 3.0 3.0
2.00 13 12.5 13.0 16.0
3.00 13 12.5 13.0 29.0
4.00 6 5.8 6.0 35.0
5.00 65 62.5 65.0 100.0
Total 100 96.2 100.0 Missing System 4 3.8 Total 104 100.0
Table A17: Frequency Table for Variable VAR00012 VAR00012
Frequency Percentage Valid Percent Cumulative Percent
Valid 1.00 5 4.8 5.0 5.0
2.00 14 13.5 14.0 19.0
3.00 17 16.3 17.0 36.0
4.00 12 11.5 12.0 48.0
5.00 52 50.0 52.0 100.0
Total 100 96.2 100.0 Missing System 4 3.8 Total 104 100.0

Regenesys etd – Ravhutulu, V (2011)
116
Table A18: Frequency Table for Variable VAR00013 VAR00013
Frequency Percentage Valid Percent Cumulative Percent
Valid 2.00 7 6.7 7.0 7.0
3.00 15 14.4 15.0 22.0
4.00 43 41.3 43.0 65.0
5.00 35 33.7 35.0 100.0
Total 100 96.2 100.0 Missing System 4 3.8 Total 104 100.0
Table A19: Frequency Table for Variable VAR00014 VAR00014
Frequency Percentage Valid Percent Cumulative Percent
Valid 1.00 2 1.9 2.0 2.0
2.00 14 13.5 14.0 16.0
3.00 32 30.8 32.0 48.0
4.00 38 36.5 38.0 86.0
5.00 14 13.5 14.0 100.0
Total 100 96.2 100.0 Missing System 4 3.8 Total 104 100.0
Table A20: Frequency Table for Variable VAR00015 VAR00015
Frequency Percentage Valid Percent Cumulative Percent
Valid 1.00 12 11.5 12.0 12.0
2.00 44 42.3 44.0 56.0
3.00 2 1.9 2.0 58.0
4.00 10 9.6 10.0 68.0
5.00 32 30.8 32.0 100.0
Total 100 96.2 100.0 Missing System 4 3.8 Total 104 100.0
Table A21: Frequency Table for Variable VAR00016 VAR00016
Frequency Percentage Valid Percent Cumulative Percent
Valid 1.00 11 10.6 11.0 11.0
2.00 36 34.6 36.0 47.0
3.00 13 12.5 13.0 60.0
4.00 21 20.2 21.0 81.0
5.00 19 18.3 19.0 100.0
Total 100 96.2 100.0 Missing System 4 3.8 Total 104 100.0

Regenesys etd – Ravhutulu, V (2011)
117
Table A22: Frequency Table for Variable VAR00017 VAR00017
Frequency Percentage Valid Percent Cumulative Percent
Valid 1.00 10 9.6 10.0 10.0
2.00 34 32.7 34.0 44.0
3.00 24 23.1 24.0 68.0
4.00 27 26.0 27.0 95.0
5.00 5 4.8 5.0 100.0
Total 100 96.2 100.0 Missing System 4 3.8 Total 104 100.0
Table A23: Frequency Table for Variable VAR00018 VAR00018
Frequency Percentage Valid Percent Cumulative Percent
Valid 1.00 6 5.8 6.0 6.0
2.00 42 40.4 42.0 48.0
3.00 23 22.1 23.0 71.0
4.00 5 4.8 5.0 76.0
5.00 24 23.1 24.0 100.0
Total 100 96.2 100.0 Missing System 4 3.8 Total 104 100.0
Table A24: Frequency Table for Variable VAR00019 VAR00019
Frequency Percentage Valid Percent Cumulative Percent
Valid 1.00 16 15.4 16.0 16.0
2.00 61 58.7 61.0 77.0
3.00 18 17.3 18.0 95.0
4.00 4 3.8 4.0 99.0
5.00 1 1.0 1.0 100.0
Total 100 96.2 100.0 Missing System 4 3.8 Total 104 100.0
Table A25: Frequency Table for Variable VAR00020 VAR00020
Frequency Percentage Valid Percent Cumulative Percent
Valid 1.00 14 13.5 14.0 14.0
2.00 54 51.9 54.0 68.0
3.00 17 16.3 17.0 85.0
4.00 14 13.5 14.0 99.0
5.00 1 1.0 1.0 100.0
Total 100 96.2 100.0 Missing System 4 3.8 Total 104 100.0

Regenesys etd – Ravhutulu, V (2011)
118
Table A26: Frequency Table for Variable VAR00021 VAR00021
Frequency Percentage Valid Percent Cumulative Percent
Valid 1.00 1 1.0 1.0 1.0
2.00 34 32.7 34.0 35.0
3.00 38 36.5 38.0 73.0
4.00 10 9.6 10.0 83.0
5.00 17 16.3 17.0 100.0
Total 100 96.2 100.0 Missing System 4 3.8 Total 104 100.0
Table A27: Frequency Table for Variable VAR00022 VAR00022
Frequency Percentage Valid Percent Cumulative Percent
Valid 1.00 9 8.7 9.0 9.0
2.00 20 19.2 20.0 29.0
3.00 31 29.8 31.0 60.0
4.00 21 20.2 21.0 81.0
5.00 19 18.3 19.0 100.0
Total 100 96.2 100.0 Missing System 4 3.8 Total 104 100.0
Table A28: Frequency Table for Variable VAR00023 VAR00023
Frequency Percentage Valid Percent Cumulative Percent
Valid 1.00 1 1.0 1.0 1.0
2.00 20 19.2 20.0 21.0
3.00 25 24.0 25.0 46.0
4.00 39 37.5 39.0 85.0
5.00 15 14.4 15.0 100.0
Total 100 96.2 100.0 Missing System 4 3.8 Total 104 100.0
Table A29: Frequency Table for Variable VAR00024 VAR00024
Frequency Percentage Valid Percent Cumulative Percent
Valid 1.00 1 1.0 1.0 1.0
2.00 36 34.6 36.0 37.0
3.00 43 41.3 43.0 80.0
4.00 20 19.2 20.0 100.0
5.00 1 1.0 1.0 1.0
Total 100 96.2 100.0 Missing System 4 3.8 Total 104 100.0

Regenesys etd – Ravhutulu, V (2011)
119
DATA ANALYSIS - DESCRIPTIVES
DESCRIPTIVES VARIABLES = VAR00001 VAR00002 VAR00003 VAR00004 VAR00005
VAR00006 VAR00007 VAR00008 VAR00009 VAR00010 VAR00011 VAR00012 VAR00013
VAR00014 VAR00015 VAR00016 VAR00017 VAR00018 VAR00019 VAR00020 VAR00021
VAR00022 VAR00023 VAR00024
/ STATISTICS=MEAN STD DEV MIN-MAX.
Descriptives:
Table A30: Notes
Output Created: 15-Apr-2011
22:27:54
Comments:
Input: Data:
Active Dataset: DataSet2
Filter: <none>
Weight: <none>
Split File: <none>
N of Rows in Working Data File: 104
Handling of Missing Values: Definition of Missing: User-defined missing values are treated as
missing.
Cases Used: Statistics are based on all cases with valid
data. All valid supplied data is utilised.
Syntax: FREQUENCY VARIABLES =
VAR00001 VAR00002 VAR00003
VAR00004 VAR00005 VAR00006
VAR00007 VAR00008 VAR00009
VAR00010 VAR00011 VAR00012
VAR00013 VAR00014 VAR00015
VAR00016 VAR00017 VAR00018
VAR00019 VAR00020 VAR00021
VAR00022 VAR00023 VAR00024
/ STATISTICS=MEAN STDDEV MIN-MAX
Resources: Processor Time: 00:00:00.000
Elapsed Time: 00:00:00.031

Regenesys etd – Ravhutulu, V (2011)
120
Descriptive Table:
Table A31: Descriptive Statistics
Variable N Minimum Maximum Mean Standard Deviation
VAR00001 100 1.00 5.00 3.0700 1.32768
VAR00002 100 1.00 5.00 2.6300 1.33072
VAR00003 100 1.00 5.00 3.4100 1.51821
VAR00004 100 1.00 5.00 2.0700 1.16563
VAR00005 100 1.00 5.00 4.0300 1.50054
VAR00006 100 1.00 5.00 3.3900 1.75749
VAR00007 100 1.00 5.00 3.5700 1.83818
VAR00008 100 1.00 5.00 4.4900 1.01995
VAR00009 100 1.00 5.00 3.1100 1.90637
VAR00010 100 1.00 5.00 2.7200 1.60856
VAR00011 100 1.00 5.00 3.1700 1.78691
VAR00012 100 1.00 5.00 3.9200 1.30794
VAR00013 100 1.00 5.00 2.6100 1.76895
VAR00014 100 1.00 5.00 3.4800 .96901
VAR00015 100 1.00 5.00 2.2700 1.22972
VAR00016 100 1.00 5.00 3.0100 1.33708
VAR00017 100 1.00 5.00 2.1500 1.20080
VAR00018 100 1.00 5.00 2.9900 1.29876
VAR00019 100 1.00 5.00 2.1300 .76085
VAR00020 100 1.00 5.00 2.3400 .92354
VAR00021 100 1.00 5.00 2.6200 1.12618
VAR00022 100 1.00 5.00 2.9300 1.32005
VAR00023 100 1.00 5.00 3.0200 .99473
VAR00024 100 1.00 5.00 3.1200 1.27351
Valid N (listwise)
100
Top Related
Copyright © 2022 FDOKUMEN

