Evidence from Employee Political Ideology Conflicts
54
Within-firm Labor Heterogeneity and Firm Performance: Evidence from Employee Political Ideology Conflicts* Xiao (Shaun) Ren Terry College of Business University of Georgia [email protected] Version: December 2020 Abstract This paper explores the implication of within-firm labor heterogeneity for firm performance through the lens of employee political ideology. Using individual campaign donation information to capture political ideology, I find that political ideology conflicts, both those within employees and those between CEOs and employees, are negatively associated with firms’ future operating performance. This effect is stronger for firms whose employees are more geographically concentrated and more sophisticated. The reduced labor productivity and abnormal employee turnover are two plausible mechanisms through which employee political ideology conflicts hurt firm performance. To establish causality, I use an instrumental variable approach which relies on the exogenous variation in political ideology caused by local television station ownership changes. JEL classification codes: G30, J24, J28, J53, M14, P48 Keywords: labor and finance, political ideology, worker-management conflict, campaign contribution, within-firm labor heterogeneity ______________________________________________________________________________ *I am grateful for help from my committee members, Jie (Jack) He, Tao Shu, Annette Poulsen, and Jeffry Netter. I also thank Hursit Celil, Stu Gillan, Brandon Julio, Ugur Lel, Harold Mulherin, Amir Rubin, Xuan Tian, Erdem Ucar, and seminar participants at the 2019 China International Conference in Finance, the 2020 Northern Finance Association meeting, the 2020 American Finance Association meeting Ph.D. Poster Session, the 2019 Financial Management Association meeting, the 2019 Southern Finance Association meeting, the 2019 Eastern Finance Association meeting, 2019 Summer Research Boot Camp on Corporate Finance and Financial Market at PBCSF, and the University of Georgia. I am responsible for any errors or omissions.
-
Upload
khangminh22 -
Category
Documents
-
view
3 -
download
0
Transcript of Evidence from Employee Political Ideology Conflicts

Within-firm Labor Heterogeneity and Firm Performance:
Evidence from Employee Political Ideology Conflicts*
Xiao (Shaun) Ren
Terry College of Business
University of Georgia
Version: December 2020
Abstract
This paper explores the implication of within-firm labor heterogeneity for firm performance through the
lens of employee political ideology. Using individual campaign donation information to capture political
ideology, I find that political ideology conflicts, both those within employees and those between CEOs and
employees, are negatively associated with firms’ future operating performance. This effect is stronger for
firms whose employees are more geographically concentrated and more sophisticated. The reduced labor
productivity and abnormal employee turnover are two plausible mechanisms through which employee
political ideology conflicts hurt firm performance. To establish causality, I use an instrumental variable
approach which relies on the exogenous variation in political ideology caused by local television station
ownership changes.
JEL classification codes: G30, J24, J28, J53, M14, P48
Keywords: labor and finance, political ideology, worker-management conflict, campaign contribution,
within-firm labor heterogeneity
______________________________________________________________________________
*I am grateful for help from my committee members, Jie (Jack) He, Tao Shu, Annette Poulsen, and Jeffry Netter. I
also thank Hursit Celil, Stu Gillan, Brandon Julio, Ugur Lel, Harold Mulherin, Amir Rubin, Xuan Tian, Erdem Ucar,
and seminar participants at the 2019 China International Conference in Finance, the 2020 Northern Finance
Association meeting, the 2020 American Finance Association meeting Ph.D. Poster Session, the 2019 Financial
Management Association meeting, the 2019 Southern Finance Association meeting, the 2019 Eastern Finance
Association meeting, 2019 Summer Research Boot Camp on Corporate Finance and Financial Market at PBCSF, and
the University of Georgia. I am responsible for any errors or omissions.

1
1. Introduction
The recent U.S. presidential elections have witnessed and brought public attention to
numerous heated debates among people with different political ideology, even those living in the
same neighborhood or working for the same employer. When people in a social environment (e.g.,
a family, neighborhood, or workplace) express different political views in the public or attempt to
convince one another of such views, conflicts, either verbal or physical, could take place and
adversely affect their relationship, which might eventually impose severe negative externalities on
the entire social group. The welfare implication of heterogenous political views in the same social
group is both an important and an interesting topic not only to academics, but also to business
practitioners and policy makers. However, even though the recent presidential elections has
revealed tremendous heterogeneity in political beliefs among seemingly homogeneous social
groups, the consequences of such ideology conflicts on the real economy remain underexplored.
In particular, much of the literature to date, with a few exceptions (to be discussed later), has
treated a firm’s employees as a homogeneous group whose decisions can be made by a
“representative” agent. As a result, few studies have explored the implications of within-firm labor
heterogeneity, especially the differential political views among workers in the same workplace,
for firm performance and policies. My paper aims to fill in this gap by empirically investigating
the political ideology conflicts among employees and their effects on corporate performance.
As the modern society has been pushing for diversity at workplace over the past few
decades, a typical firm’s employees nowadays are likely to exhibit heterogeneous political
ideology, which might lead to workplace conflicts due to such different political views. In general,
there are two types of employee political ideology conflicts in a firm. The first type of conflicts
exits among all the employees of a firm. According to a CNBC news article (Rooney (2020)), the

2
CEO of Coinbase, Brian Armstrong, believes that the political conversations among employees at
workplace have the potential to destroy firm value by “being a distraction” and by “creating
internal division”. Therefore, Coinbase banned political discussions at work and offered generous
severance packages to those employees who did not want to abide by the rule and wanted to quit
the company. According to another example from a Bloomberg news article (Weise (2017)),
conservative employees in the Silicon Valley feel ostracized in the workplace because of their
political ideology, which they are afraid of revealing to coworkers because the latter might take it
as a “personal affront”. Therefore, it is reasonable to expect that a firm’s teamwork efficiency and
labor productivity will suffer when the firm’s employees have political ideology conflicts among
each other, or when they are distracted from work by political issues.
The second type of employee political ideology conflicts exists between employees and
the CEO. For example, according to a Bloomberg news article (Hymowitz and Greenfield (2017)),
in November 2016, Ginni Rometty, the CEO of IBM, sent an open letter to Donald Trump,
congratulating him for winning the presidential election. This letter provoked a storm of protest
from Democratic employees at IBM. For example, a software engineer, Daniel Hanley, drafted a
petition that urged the CEO to “do what’s right for IBMers” and got more than 1,600 supporting
signatures from his fellow workers. Meanwhile, a senior content strategist at IBM, Elizabeth
Wood, decided to quit the company, and published an open letter stating that she left the company
because of the CEO’s political ideology. In this example, the employees and the CEO of a firm
have strong political ideology conflicts, which lead to negative consequences for the firm, in terms
of distraction at workplace and voluntary departure of skillful employees.
Despite the abundant anecdotal evidence suggesting that within-firm heterogeneity in
employee political ideology will negatively affect firms, one could argue that such heterogeneity

3
might actually improve firm value by reducing managers’ empire-building incentives (e.g.,
retaining/promoting incapable employees sharing similar political ideology with that of
themselves). In fact, Lee, Lee, and Nagarajan (2014) show that the alignment of political views
between a firm’s CEO and its board members increases managerial entrenchment and decreases
shareholder value. In other words, they find that a larger difference in political ideology between
the CEO and board members will benefit the shareholders. If the CEO-employee relationship is
similar to the CEO-board relationship, then a larger difference in political views between
employees and the CEO might make the latter less incentivized to please the former out of
entrenchment motives (e.g., via wage increases, as documented by studies such as Cronqvist et al.
(2009)), which leads to an improvement of firm value. Similarly, greater heterogeneity in a firm’s
political ideology among employees might also improve its performance because a more diverse
workforce (which usually accompanies a more vibrant corporate culture) might inspire more
thought-provoking conversations at the workplace and lead to more skill-complementarity among
employees with different backgrounds, which boosts corporate innovation and ultimately enhances
firm value (see, e.g., Mayer, Warr, and Zhao (2018), Ostergaard, Timmermans, and Kristinsson
(2010), and Richard (2000)). Hence, whether within-firm heterogeneity in employee political
ideology affects firm performance/value positively or negatively is an empirical question.
In this paper, I formally examine the above two competing hypotheses by analyzing the
impact of employee political ideology conflicts on firm performance. Following the literature, I
capture an employee’s political ideology using individual political campaign donation data
provided by Federal Election Commission (FEC). To capture the political ideology conflicts within
the employees, I calculate the percentage of strongly polarized employees (i.e., those with much
stronger support for one party relative to the other) in a given firm-year, and assign a score ranging

4
from one to five to the firm-year based on its relative proportion of such strongly polarized
employees. To measure the conflicts between the employees and the CEO, for each person in a
given year, I calculate her Democratic tendency (i.e., DEM%) as the dollar amount of her donation
to Democratic recipients divided by the dollar amount of her donation to both the Democratic
recipients and Republican recipients. A higher value of DEM% indicates that the person is more
Democratic-oriented. For a given firm-year, I then use the absolute value of the difference between
the CEO’s DEM% and the average employees’ DEM% as the proxy for the political ideology
conflict between employees and the CEO.
The baseline ordinary least squares (OLS) regression results show that there is a
significantly negative association between a firm’s operating performance (i.e, return on assets,
ROA) and both the political ideology conflicts within the employees and those between its CEO
and the average employees. In terms of economic magnitudes, a firm with the strongest within-
employee conflicts (i.e., with more than 40% strong Democratic employees and more than 40%
strong Republican employees) has a 2.8 percentage points lower ROA, which is about 34.5% of
its standard deviation, than a firm with the weakest within-employee conflicts (i.e., with less than
10% Democratic employees or less than 10% strong Republican employees). A one standard
deviation increase in CEO-employee political ideology conflicts is associated with a 0.23
percentage points decrease in ROA. Using information from Execucomp and Capital IQ, I further
decompose the CEO-employee political ideology conflicts into the conflicts between the CEO and
employees of different ranks within the firm, and find that the negative association of political
ideology conflicts with firm performance manifests for most hierarchies of employees.
I then conduct multiple subsample analyses to explore the cross-sectional heterogeneity of
the relation between employee political ideology conflicts and firm performance. First, the

5
negative association between ROA and employee political ideology conflicts should be stronger
for firms with more geographically concentrated employees. When employees live and work in
the same geographic location, they tend to interact and communicate with each other more often,
which increases the effect of within-employee political ideology conflicts on firm performance.
Furthermore, it makes it easier for them to unite together and collectively oppose the CEO if the
latter’s political ideology contradicts with theirs, leading to more destructive dynamics at the
workplace and hurt firm performance. Using the residential address information provided by the
FEC for each registered donor, I find that the negative associations between ROA and employee
political ideology conflicts are indeed more pronounced when a larger fraction of a firm’s
employees live in its headquarter.
Second, I expect the associations between employee political ideology conflicts and firm
performance to be stronger for firms with more sophisticated/skillful employees, who tend to have
more polarized political views and contribute more to firm value. Using the labor skill index (see,
e.g., Belo et al. (2017) and Ghaly, Dang, and Stathopoulos (2017)) to proxy for employee
sophistication/skill, I find evidence consistent with this prediction.
Furthermore, I exploit the channel through which employees’ political ideology conflict
affects firm performance. Edmans (2011) argues that employee satisfaction is positively associated
with firm value because employees, if satisfied with their employers, tend to have higher
productivity and are less likely to leave the firm. In a similar vein, Oswald, Proto, and Sgroi (2015)
argue that employees’ happiness increases their productivity at workplace. The recent work by
Babenko, Fedaseyeu, and Zhang (2020) show that the employees whose political donations are not
aligned with their CEOs are more likely to leave their firms. Hence, I conjecture that the lower
ROA resulting from greater employee political ideology conflicts could be caused by two possible

6
channels, namely, lower productivity and abnormal employee turnover, when employees are not
satisfied or happy due to the conflicts in political ideology at workplace. To test the first channel,
I use operating income before depreciation per employee and output per employee as the empirical
measures of labor productivity and find that both the within-employee and CEO-employee
political ideology conflicts are negatively associated with labor productivity. I further use the
number of patents filed and the average number of citations received per patent by individual
inventors as proxies of labor productivity, and find consistent results. To study the turnover
channel, I identify the departure events of key employees using information from the Execucomp
and Capital IQ databases and examine whether employee political ideology conflicts increase the
turnover of key employees. I find that both the conflicts between the key employee and other
employees in the firm and those between a key employee and her CEO are positively associated
with the likelihood that the employee leaves the firm, which is consistent but not limited to the
findings in Babenko, Fedaseyeu, and Zhang (2020).
While the OLS results suggest that there is a negative relation between employee political
ideology conflicts and firm performance, endogeneity concerns could arise due to either omitted
variables or reverse causality. For example, according to the evidence presented by Babenko,
Fedaseyeu, and Zhang (2020), CEOs could exert influence on employees’ political decisions to
increase shareholder value, which makes the CEO-employee political ideology conflict an
endogenously determined variable. Moreover, entrenched CEOs, under empire-building
incentives, may hire or retain more employees who share similar political ideology with
themselves. To alleviate such endogeneity concerns, I implement a two-stage least-squares (2SLS)
estimation framework, using the acquisitions of local television stations by Sinclair Broadcast
Group (Sinclair) as an instrumental variable (IV) for employee political ideology conflicts.

7
Sinclair, as the largest television station operator in the United States in terms of both the number
of stations owned and the total coverage of local TV audience, has long been known to have a
strong conservative orientation. Martin and McCrain (2018) document a significant rightward shift
in the ideological slant of TV coverage in a community after its local television stations are
acquired by Sinclair. As previous literature shows that mass media (such as television programs)
has a strong persuasive effect on people’s political orientation (e.g., DellaVigna and Kaplan (2007)
and Martin and Yurukoglu (2017)), it is reasonable to believe that the acquisitions of local
television stations by Sinclair would shift the political ideology of people (including working
professionals) living in the same location, influence the conflicts of political views at workplace,
and ultimately affect the performance of firms employing these employees. Meanwhile, the
incidences of such acquisitions appear not to be driven by local economic conditions (e.g., Martin
and McCrain (2018)) and should not influence the performance of affected firms through channels
other than employee political ideology conflicts. Thus, this instrument is likely to satisfy both the
relevance condition and the exclusion restriction.
Specifically, I first identify whether the local television stations at each sample employee’s
city of residence are acquired by Sinclair in a given year, and then aggregate this shock to the firm-
year level as the instrumental variable for employee political ideology conflicts. I show that the
Sinclair shock makes affected employees more Republican-oriented. As the distribution of my
employee political ideology measure (i.e., DEM%) ranges from zero (indicating strong
Republican) to one (indicating strong Democratic), the Sinclair shock would shift an individual
employee towards the left end of this distribution, which tends to reduce the distances in political
ideology among individual employees (i.e., reduces the within-employee political ideology
conflicts). Similarly, the Sinclair shock reduces the CEO-employee political ideology conflicts
8
because CEOs are predominantly more Republican-oriented than employees and thus less affected
by the Sinclair shock than an average employee in the same workplace. Using the Sinclair
acquisition shock as the IV, I show that an exogenous decrease in the within-employee political
ideology conflicts and the CEO-employee conflicts indeed causes an improvement in firm
performance.
This paper sheds new light on the effect of within-firm labor heterogeneity and labor-
management relationship on firm performance through the lens of political ideology. It is the first
to explicitly examine the differences in political ideology among the average employees as well as
the differences between CEOs and employees of all ranks along the corporate ladder. In this sense,
the current paper supplements the findings in the recent literature on the association between
CEOs’/employees’ political contribution and firm value, which mostly treats a firm’s executives
or employees as a homogeneous group of decision makers. I propose a new measure of political
ideology conflicts among average employees. Using this measure, I examine not only the CEO-
employee conflicts, but also the within-employee conflicts, and contrast their differential effects
on firm performance. Last but not least, my paper proposes a new identification strategy to the
literature on political ideology, namely, the acquisition of local TV stations by Sinclair, which
could possibly provide an exogenous variation to local people’s political ideology and improve
the causal inference of studies on stakeholders’ political views and participation.
2. Relation and Contribution to the Existing Literature
My paper is related to the literature on employee satisfaction and firm value. Edmans
(2011) shows that a value-weighted portfolio of the 100 companies with the highest employee
satisfaction in the United States created an annual four-actor alpha of 3.5% from 1984 to 2009,
suggesting that employee satisfaction creates shareholder value in the long run. Oswald, Proto,
9
and Sgroi (2015) use both experimental and real-world evidence to show that individuals’
happiness increases their productivity. Huang et al. (2015) study the association between employee
satisfaction and corporate performance in the context of family firms. They find that family firms
enhance their performance by providing an employee-friendly corporate culture. Researchers have
also shown that labor-management relationship, as an important factor of employee satisfaction,
significantly affects firm performance. For example, Guiso, Sapienza, and Zingales (2015) find
that firm performance is stronger when employees perceive top managers as trustworthy and
ethical. My paper contributes to the literature by studying the association between firm
performance and employees’ political ideology conflict, which is a significant factor of employee
satisfaction and labor-management relationship but cannot be captured in standard employee
welfare measures such as KLD score. Consistent with the predictions in the literature, I find that
firm performance is lower when employee satisfaction is lower and when labor-management
relationship is worse in the context of political orientation.
My paper is also related to the literature that studies the relationship between CEO political
ideology and corporate behavior. Di Giuli and Kostovetsky (2014) show that firms with
Democratic CEOs spend more on corporate social responsibility (CSR), which is associated with
a decrease in firm value. Hutton, Jiang, and Kumar (2014) show that republican managers adopt
and maintain more conservative corporate policies. Francis, Hasan, Sun, and Wu (2016) show that
political polarized CEOs are associated with more corporate tax sheltering. While Republican
CEOs use tax sheltering for idiosyncratic reasons, Democratic CEOs use it for economic reasons.
Unsal, Hassan, and Zirek (2016) show that Republican managers lobby a larger number of bills
and have higher lobbying expenditures, which offset the benefit from lobbying.

10
Lee, Lee, and Nagarajan (2014) is the first paper to study the political ideology conflict
between the CEO and other stakeholders of the firm. They show that when CEO and board
members share similar political ideology, the empathy and acceptance between them increase. As
a result, board monitoring is weakened, CEO entrenchment increases and firm value decreases.
While my paper uses similar methodology, I study the impact of the difference in terms of political
ideology between the CEOs and non-CEO employees, instead of that between the CEOs and the
board members. Since employees do not have monitoring duty, shared values and belief systems
between the CEO and rank-and-file employees in a firm should result in more efficient decision
making, execution, and better teamworking. On the other hand, if employees do not share the same
political ideology with their CEOs, the efficiency of teamworking and execution could suffer,
which could negatively impact labor productivity and firm performance.
Another stream of literature focuses on the relationship between employees’ political
ideology and firm behavior. Gupta, Briscoe, and Hambrick (2016) show that firms with liberal
employees have larger CSR spending. Borghesi (2018) shows that the impact of employees’
political ideology on firm CSR intensity is even more significant than the impact of executives’
political ideology. While the above papers treat a firm’s employees as a group with homogenous
political ideology, I study the impact of with-firm heterogeneity in employee political ideology on
firm performance.
Babenko, Fedaseyeu, and Zhang (2020) is the first paper to study the relation between
CEOs and employees’ political participation. They show that in the same election cycle, a firm’s
employees are more likely to make campaign donations to the candidates who receive donations
from the firm’s CEO. They claim that CEOs exert influence on employees’ political participation
to support the candidates whose policies will benefit the firm more. While the action increases

11
shareholder value, it is not likely that the employees’ economic values are perfectly correlated with
shareholder value. Therefore, the CEOs’ influence decreases employees’ economic gain from
campaign donations. While the authors have done a very thorough study on the relation between
CEO and employees’ political participation, some interesting questions arise from their findings.
It can be inferred from their results that the employees’ ex ante political ideology differs from that
of the CEOs. If they always share the same ideology, there will be no need for the CEO to influence
the employees’ donations. Assume there are two types of employees: those whose donations are
affected by the CEO, and those whose donations are not affect by the CEO. The first type could
be the individuals who have very strong political affiliation, which cannot be easily affected by
CEO’s effort. When the CEO makes the attempt to affect their campaign donations, tension is
likely to arise between these employees and the CEO and results in negative consequences for the
firm. For the second type of individuals, even if their donations are affected by the CEO, it does
not necessarily mean that shift their political ideology to be consistent with the CEO. On the
contrary, the influence exerted by the CEO could exacerbate the conflict between these employees
and CEO, since the employees are influenced to make donations that do not provide them with
economic gains. Therefore, their study provides a motivation of my research: when the political
ideology conflict arises between CEO and employees, how does it affect firm performance? In
addition, my paper focuses on not only the political ideology conflict between the CEO and
employees, but also that among the average employees.
Finally, my paper is broadly related to the literature that studies the relation between firm
value and political connection/participation, such as Political Action Committee (PAC) campaign
donation made by firms (Akey (2015) and Cooper, Gulen, and Ovtchinnikov (2010)), acquisition
of political information by hedge fund managers (Gao and Huang (2016)), political connections of

12
board members (Goldman, Rocholl, and So (2013)), and campaign donation made by individuals
(Ovtchinnikov and Pantaleoni (2012)). On one hand, the political alignment between CEO and
employees can be viewed as a form of connection. Consistent with the literature, the connection
should create value for firms. On the other hand, both CEOs’ and employees’ campaign donations
are forms of political participation. My study shows that in the context of labor-management
relationship and within-firm labor heterogeneity, political participation might have a negative
impact on firm value.
3. Data Construction and Summary Statistics
3.1 Data and Sample Selection
Following the literature on political ideology and finance (e.g., Hong and Kostovetsky
(2012) and Di Giuli and Kostovetsky (2014)), I use the individual campaign donation data
provided by Federal Election Commission (FEC) starting in 1992 to construct proxies for
employees’ political ideology.1 The FEC individual contributions file contains information at
transaction level about each contribution from an individual to a political committee/candidate,
which is disclosed by the donation recipients under the requirement of federal law. It is notable
that not all individual donations are subject to mandatory disclosure. In 1989-2014, a contribution
would be reported if the reporting period amount is $200 or more. After the year 2014, a
contribution is reported if the election cycle-to-date amount is over $200 for contributions to
candidate committees and if the calendar year-to-date amount is over $200 for contributions to
1 The database is available at https://www.fec.gov/data/browse-data/?tab=bulk-data.

13
political action committees (PACs) and party committees.2 I include only the donations subject to
mandatory disclosure in the sample, to avoid the potential selection bias of voluntary disclosure.
I include contributions to candidate committees, party committees, hybrid PACs and super
PACs with strong party affiliation in the sample. The party affiliation of candidate and party
committees are obtained from the committee master file provided by FEC. For hybrid PACs and
super PACs which have more than 1,000 transaction records, I manually search for the political
orientation of the PAC on OpenSecrets.org and Google.com.3 For each individual donation, I
obtain the date and dollar amount of the donation, employer and location information of the donor,
and party affiliation of the recipient. FEC does not provide a unique identifier for donors.
Therefore, I first create a standardized name for each donor, capitalizing the characters and
removing the prefixes and suffixes, and then use a combination of the standardized name and
employer of the individual to create a unique identifier for each donor.
The employer of each donor is reported in the FEC database. However, the self-reported
employer information is noisy. For example, an employee of Google might report her employer as
“Google”, “Google Inc”, “Google.com”, “Alphabet Inc”, etc. Some donors also include their job
title in their employer information field, such as “Bank of America Banker”, “Home Depot Sales”,
etc. Therefore, I use a three-step approach to link employer from FEC files to Compustat records.
First, I standardize the employer names by deleting special characters and standardizing the
suffixes such as “Inc”, “Corp”, “Company”, etc., and match the standardized employer names to
2 Information obtained from the Federal Election Commission website at https://www.fec.gov/campaign-finance-
data/contributions-individuals-file-description/ . 3 Previous papers in the literature include only donations to candidate and party committees. However, some hybrid
PACs and super PACs have strong political orientation and account for a significant amount of donations made by
individuals. For example, Hillary Victory Fund raised a total of $424 million in the 2016 election cycle, which
accounted for 11.16% of total contributions from individuals in the cycle. Not including these contributions will
significantly reduce sample size and potentially introduce selection bias.

14
company names in Compustat, CRSP, and Capital IQ database. Matching to company names from
several different databases minimizes the number of observations I lose due to unknown
limitations in the company name collecting process of data vendors. Second, I employee a fuzzy-
matching algorithm using two SAS functions “compare” and “complev”. “Compare” returns the
position of the leftmost character by which two strings differ. “Complev” returns the Levenshtein
edit distance between two strings. I calculate the “compare” and “complev” value for each pair of
employer name from FEC dataset and company name from standard financial databases. I require
a pair of names to have a “compare” value of no less than 10 and a “complev” value of no larger
than 9 to be a valid match. Adjusting the threshold slightly upwards or downwards does not change
the empirical results qualitatively. Finally, to reduce the errors caused by fuzzy matching, I use
Google search returns to verify the reliability of the matched employers. Specifically, for each pair
of matched employer from the FEC database and company from the financial databases, I obtain
the first 30 Google search results for both the two identities. A matched pair is treated as a valid
pair if the two identities share at least 10 common search results. As a result, the individual
contribution sample with matched employers ranges from the years 1992 to 2019, containing
543,509 transactions made by 241,842 employees from 5,409 firms.
3.2 Measuring Employees’ political Ideology Conflict
3.2.1 Measuring Person-level Political Ideology
For each employee in year t, I define the individual’s democratic tendency (DEM%) as the
total dollar amount of her donations to Democratic recipients divided by the total dollar amount of
her donations to both Democratic and Republican recipients in year t. The variable DEM% is
continuous, ranging from zero to one. A higher DEM% value indicates that the person is more
Democratic-oriented.

15
I further identify each employee’s rank in the company using person-level information
from Execucomp and Capital IQ People Intelligence database. An employee is identified as the
CEO if her name matches the CEO’s name from Execucomp or Capital IQ in a given year. An
employee is identified as a key employee if her name matches the name of a non-CEO employee
in Execucomp or Capital IQ. Board members are identified in a similar fashion. The employees
whose names do not match with any records from Execucomp or Capital IQ are treated as rank-
and-file employees.
Table 1 presents the descriptive statistics of person-level political ideology by employee
rank. In Panel A, Column (1) shows the number of person-year observations in each rank, Column
(2) shows the average dollar amount of donation per person-year, and Column (3) shows the mean
Democratic tendency. The statistics reveal some interesting patterns of employees’ political
ideology. First, employees in higher ranks donate more than employers in lower ranks. The average
dollar amount of donation per CEO-year is $6,110.68, which is approximately 4.5 times the size
of average donation made by rank-and-file employees. Second, employees in lower ranks are more
Democratic-oriented on average. The mean Democratic tendency of rank-and-file employees is
59.48%, compared to 37.68% of the CEOs. Panel B presents the distribution of employee-years
within each bracket of DEM% by employee rank. Specifically, for employees in a given rank, I
calculate the fraction of employee-years when an employee’s DEM% falls in the following ranges:
0%, (0%, 25%], (25%, 50%), 50%, (50%, 75%), [75%, 100), 100%. The results show that, 56%
of the CEOs are strongly Republican-oriented (i.e., all of their contributions are made to
Republican recipients), which is 1.72 times the fraction of strong Democratic CEOs (i.e. those who
only make contributions to the Democratic recipients), while the fraction of rank-and-file
employees who are strongly Republican-oriented is 0.68 times the fraction of rank-and-file

16
employees who are strongly Democratic-oriented. Furthermore, employees in lower ranks are
more polarized than employees in higher ranks. For example, 11% of the CEOs donate to both the
Republican party and the Democratic party in a given year, whereas only 1% of the rank-and-file
employees donate to both parties. Combined together, the results presented in Table 1 suggest that
there are strong political ideology conflicts both within each rank of employees and across
different ranks of employees.
3.2.2 Measuring Political Ideology Conflicts
Measuring the within-employee political ideology conflicts is a difficult task. Simple
measures of dispersion such as standard deviation or interquartile range are not applicable since
they capture only the spread of employees’ DEM%, but not whether the employees are Republican
or Democratic. For example, a uniform distribution of employees’ DEM% on [25%, 75%] and a
uniform distribution on [0%, 50%] will have the same standard deviation, but they obviously have
different implications in terms of political ideology conflict, as the first one consists of both
Democratic and Republican employees, whereas the second one consists of only Republicans.
Conceptually, a measure of the within-employee political ideology conflicts should capture 1)
whether the individual employees are Republican or Democratic, 2) whether the individual
employees are strongly polarized, and 3) the fraction of employees with strong polarization. To
construct the empirical measure, I first define an individual as strong Democratic (Republican) if
she donates more than $2,000 only to Democratic (Republican) recipients in a given year.4 Then,
I calculate the percentage of strong Democratic employees (%StrongDEM) and strong Republican
4 Hong and Kostovetsky (2012) define strong Democratic (Republican) as individuals who made more than $2,000
donation to Democrats (Republicans), net of donation to Republicans (Democrats). However, the interpretation of the
$2,000 difference varies in the total dollar amount of donations made by an individual. Thus, I apply a stricter
definition of strong polarization.
17
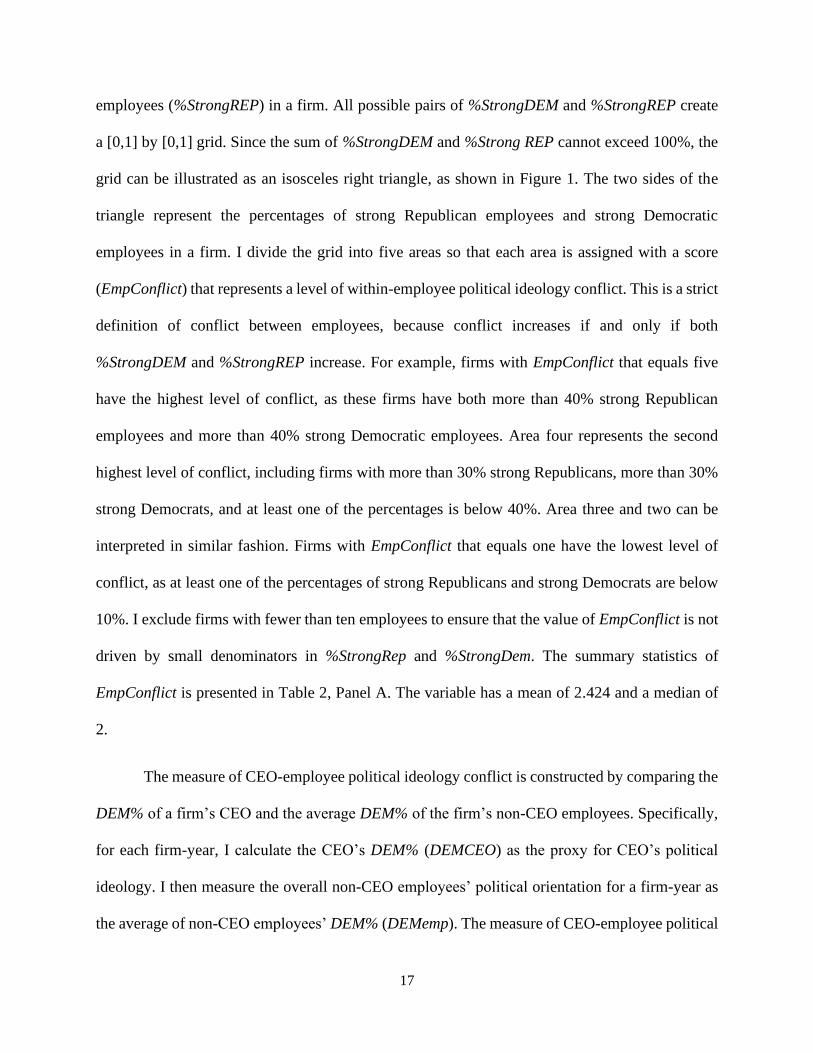
employees (%StrongREP) in a firm. All possible pairs of %StrongDEM and %StrongREP create
a [0,1] by [0,1] grid. Since the sum of %StrongDEM and %Strong REP cannot exceed 100%, the
grid can be illustrated as an isosceles right triangle, as shown in Figure 1. The two sides of the
triangle represent the percentages of strong Republican employees and strong Democratic
employees in a firm. I divide the grid into five areas so that each area is assigned with a score
(EmpConflict) that represents a level of within-employee political ideology conflict. This is a strict
definition of conflict between employees, because conflict increases if and only if both
%StrongDEM and %StrongREP increase. For example, firms with EmpConflict that equals five
have the highest level of conflict, as these firms have both more than 40% strong Republican
employees and more than 40% strong Democratic employees. Area four represents the second
highest level of conflict, including firms with more than 30% strong Republicans, more than 30%
strong Democrats, and at least one of the percentages is below 40%. Area three and two can be
interpreted in similar fashion. Firms with EmpConflict that equals one have the lowest level of
conflict, as at least one of the percentages of strong Republicans and strong Democrats are below
10%. I exclude firms with fewer than ten employees to ensure that the value of EmpConflict is not
driven by small denominators in %StrongRep and %StrongDem. The summary statistics of
EmpConflict is presented in Table 2, Panel A. The variable has a mean of 2.424 and a median of
2.
The measure of CEO-employee political ideology conflict is constructed by comparing the
DEM% of a firm’s CEO and the average DEM% of the firm’s non-CEO employees. Specifically,
for each firm-year, I calculate the CEO’s DEM% (DEMCEO) as the proxy for CEO’s political
ideology. I then measure the overall non-CEO employees’ political orientation for a firm-year as
the average of non-CEO employees’ DEM% (DEMemp). The measure of CEO-employee political

18
ideology conflict (CEOempDiff) is calculated by taking the absolute value of the difference
between a firm’s DEMCEO and the firm’s DEMemp. A larger value of CEOempDiff indicates that
the CEO and the employees have larger conflicts in terms of political ideology.
I further separate the political orientation measure by the rank of the non-CEO employees,
i.e. the key employees and rank-and-file employees. Employees with higher ranks are likely to be
wealthier and more educated than rank-and-file employees. They are more likely to have stronger
political affiliation and have larger impacts on the firm’s performance. They also work more
closely with the CEO and have similar ideology to the CEO than rank-and-file employees, as
shown in Table 1. Therefore, I further calculate the ideology measure for key employees
(DEMkey), board members (DEMboard), and rank-and-file employees (DEMempRf). Lee, Lee and
Nagarajan (2014) argue that the political alignment between CEO and board members decreases
firm value. To exclude the confounding effect, I further create a subsample of key employees who
are not board members of their firms and calculate the political ideology of these non-board key
employees (DEMkeyNb). The political ideology conflicts between the CEO and the key employees
(CEOkeyDiff), between the CEO and the board members (CEOboardDiff), between the CEO and
the non-board key employees (CEOkeyNbDiff), and between the CEO and the rank-and-file
employees (CEOempRfDiff), are calculated in a similar fashion to that of CEOempDiff.
The summary statistics of the CEO-employee political conflict measures are presented in
Table 2, Panel A. The statistics indicate that there is a 30.09% difference between CEO’s and
employees’ political ideologies on average. The difference increases as the rank of the employees
goes down. The average difference between the CEO and the rank-and-file employees is 32.05%,
which is the highest among all the employee ranks, while the key employees have lower conflicts
in political ideology with their CEOs. The results presented in Table 2, Panel A indicate that there

19
are significant conflicts between the CEO and non-CEO employees in all ranks, which is consistent
with the findings presented in Table 1.
3.3 Measuring Firm Performance and Controls Variables
The main dependent variable in my study is return on assets (ROA), defined as the ratio of
operating income before depreciation to lagged total assets. I control for a set of variables that are
commonly known to impact firm performance (e.g., Ovtchinnikov and Pantaleoni, 2012; Cao et
al., 2018), including market-to-book ratio (MB), book leverage (Lev), the natural logarithm of total
asset (LnAsset), capital expenditure (CAPEX), the ratio of net property, plant, and equipment to
total assets (PPE), research and development expenses (RD), and the natural logarithm of one plus
firm age (LnFirmAge), approximated by the number of years that the firm has been listed on
Compustat. I further control for several CEO characteristics that might impact both CEO political
ideology and firm performance, which include the natural logarithm of a CEO’s age (LnCEOage),
a dummy variable that equals one if a CEO also serves as the chair of the board of directors, and
zero otherwise (CEOchair), the natural logarithm of the sum of the CEO’s salary and bonus
(LnCEOpay), and the natural logarithm of one plus the CEO tenure at the firm (LnCEOtenure).
The firm-level control variables are obtained from Compustat. The CEO-level control variables
are obtained from Execucomp and Capital IQ. Detailed definitions of the variables are provided in
Appendix A. Table 2, Panel B summarizes the firm performance measure and the control variables.
The mean and standard deviation of ROA in the sample are 12.4% and 8.1%, respectively.
4. Baseline Empirical Analyses
In this section, I conduct OLS regression analyses on the association between employee
political ideology conflicts and firm performance. I further break down CEO-employee political
20
ideology conflicts into the conflicts between CEOs and employees in different ranks and separately
examine their associations with firm performance. Finally, I inspect the cross-sectional
heterogeneity in the impacts of employee political ideology conflicts on firm performance in terms
of employee geographic concentration and sophistication.
4.1 Association between Employee Political Ideology Conflicts and Firm Performance
To test the association between within-employee political ideology conflict and firm
performance, I conduct the following OLS regression analysis:
𝑅𝑂𝐴𝑖,𝑡+1 = 𝛼1 + 𝛽1𝐸𝑚𝑝𝐶𝑜𝑛𝑓𝑙𝑖𝑐𝑡𝑖,𝑡 + 𝛾1𝐶𝑜𝑛𝑡𝑟𝑜𝑙𝑠𝑖,𝑡 + 𝜀𝑖,𝑡, (1)
where ROA is return on assets, defined as operating income before depreciation divided by lagged
total assets. The independent variable of interest, EmpConflict, measures the within-firm political
ideology conflict among all employees in a firm. Controls is a vector of control variables for firm
and CEO characteristics. The firm-level control variables include market-to-book ratio, leverage,
firm size, capital expenditure, plant, property, and equipment, R&D expenditure, and firm age.
The CEO-level control variables include CEO age, compensation, tenure, and duality. The
dependent variable is measured at year t+1, while the independent variables are measured at year
t. Detailed definitions of the variables are provided in Appendix A. I include firm fixed effects and
year fixed effects in the regressions. Standard errors are clustered at the firm level.
Columns (1) and (2) in Table 3 report the results of estimating Equation (1). Column (1)
reports the regression with firm-level control variables. Column (2) reports the regression with
both firm-level and CEO-level control variables. The coefficients on EmpConflict are significantly
negative in both specifications, suggesting that there is a negative association between within-
employee political ideology conflict and future firm performance. By definition, EmpConflict is a

21
score ranging from one to five. A higher score means the firm has larger conflicts among its
employees. Therefore, the coefficient estimate in Column (2) indicates that a firm with the highest
within-employee political ideology conflicts (with more than 40% strong Republican employees
and more than 40% strong Democratic employees) has a 2.8 percentage point lower ROA, which
is approximately 34.5% of its standard deviation, compared to a firm with the lowest conflicts
(with less than 10% strong Republican employees or less than 10% strong Democratic employees).
To test the association between CEO-employee political ideology conflict and firm
performance, I run a similar regression to that specified by Equation (1), where I use CEOempDiff
as the independent variable of interest, instead of EmpConflict. CEOempDiff, is the absolute value
of the difference between the CEO’s Democratic tendency and the non-CEO employees’ average
Democratic tendency in a firm. Other specifications are similar to those of Equation (1). The results
are presented in Columns (3) and (4) of Table 3. Column (3) reports the regression with firm-level
control variables. Column (4) reports the regression with both firm-level and CEO-level control
variables. The coefficients on CEOempDiff are significantly negative in both specifications,
suggesting that there is a negative association between CEO-employee political ideology conflict
and future firm performance. As for the economic magnitude, the coefficient estimate on
CEOempDiff in Column (4) indicates that a one standard deviation increase in CEO-employee
political ideology conflict is associated with a 0.23 percentage point decrease in ROA, which is
approximately 2.9% of its standard deviation. Taken together, the results presented in Table 3
indicate that both the within-employee political ideology conflict and the CEO-employee ideology
conflict are negatively associated with firm performance, in terms of both statistical and economic
magnitude.
4.2 CEO-Employee Political Ideology Conflicts by Employee Rank

22
The baseline results presented in Table 3 show that the CEO-employee political ideology
conflict is negatively associated with future firm performance. It would be interesting to separately
inspect such association for employees in different ranks for several reasons. First, as shown by
the summary statistics in Table 1 and Table 2, employees in higher ranks are, on average, more
active in political participation, more Republican oriented, and closer to their CEOs in terms of
political ideology. Second, employees in higher ranks are more likely to work closely to their
CEOs and have a greater chance of exposure to their CEOs’ political ideology. Third, employees
in higher ranks may have a larger impact on firm performance. Therefore, it would be interesting
to examine whether the impact of CEO-employee political ideology conflict on firm performance
is prevalent in all employee ranks, and whether there is heterogeneity across different ranks.
Empirically, I identify the key employees using information from Execucomp and Capital
IQ People Intelligence database. An employee is defined as a key employee if her name matches
the name of a non-CEO employee in Execucomp and Capital IQ. I then calculate the CEO-key
employee conflicts (CEOkeyDiff) and CEO-rank-and-file employees’ conflicts (CEOempRfDiff),
and regress ROA on the conflict measures separately. Table 4 presents the results. Columns (1)
and (4) show that both the conflicts between the CEO and the key employees and those between
the CEO and rank-and-file employees, respectively, have a significantly negative association with
firm performance. The economic magnitudes of the coefficients do not appear to be significantly
different, suggesting that the CEO-employee political ideology conflict plays an important role in
determining firm performance, regardless of the rank of employees.
Lee, Lee, and Nagarajan (2014) argue that the political ideology alignment between the
CEO and board members have a negative impact on firm value as it increases managerial
entrenchment. Since some key employees also serve as board members of their firms, there might

23
be a confounding effect in the findings on the impact of CEO-key employees’ political ideology
conflict and firm performance. Thus, I further separate key employees into two groups: those who
also serve as the firms’ board members and those who do not. In Columns (2) and (3) of Table 4,
I regress ROA on the conflict between the CEO and the board members (CEOboardDiff) and that
between the CEO and the non-board key employees (CEOkeyNbDiff), respectively. Results show
that there is a significant negative association between firm performance and the conflicts between
the CEO and the key employees, regardless of whether they serve on the board of directors. The
results are inconsistent with the finds of Lee, Lee, and Nagarajan (2014), who argue that the
difference in political ideology between the CEO and board members should decrease managerial
entrenchment and improve firm value. It is worth noting that the sample used by Lee, Lee, and
Nagarajan (2014) includes only independent directors, whereas my sample consists of only
dependent directors (i.e., those who are recorded as employees of their firms by Execucomp or
Capital IQ). While the independent directors mainly serve as monitors of the CEO, the dependent
directors contribute to firm value both indirectly through the monitoring duty and directly by
working for the firms as employees. The results in this paper suggest that, despite having a
potential positive impact on monitoring efficiency, the political ideology conflicts between the
CEO and dependent board members are negatively associated with future firm performance.
4.3. Cross-sectional Heterogeneity in the Association between Employee Political Ideology
Conflicts and Firm Performance
In this subsection, I inspect the cross-sectional heterogeneity in the impacts of employee
political ideology conflicts on firm performance. Specifically, I examine whether such impacts are
stronger for firms whose employees are more geographically concentrated, and for firms whose
employees are more sophisticated.
24
4.3.1 Cross-sectional Heterogeneity in Employee Geographical Concentration
When a firm’s employees live and work in more concentrated geographic areas, they
interact and communicate with each other more often, and have higher chances of getting involved
in political conversations with each other. In this case, if the employees disagree with each other
in terms of political ideology, the disagreement is likely to cause a larger negative effect on the
workplace environment, which causes a larger negative impact on firm performance. Furthermore,
when the employees are clustered in a concentrated area, it is easier for them to unite against the
CEO if they disagree with the CEO’s political views, leading to more destructive dynamics at the
workplace and hurt firm performance. Therefore, I hypothesize that, the impacts of employee
political ideology conflicts on firm performance are stronger for firms whose employees are more
geographically concentrated.
To empirically test the hypothesis, I first obtain each donating employee’s state of
residence from the FEC database and her employer’s headquarter location from the Electronic
Data Gathering, Analysis, and Retrieval system (EDGAR) maintained by the U.S. Securities and
Exchange Commission (SEC). For each firm-year, I calculate the percentage of donating
employees who live in the state where the firm’s headquarter is located. A higher percentage of
employees living in a firm’s headquarter state indicates that the firm’s employees are more
geographically concentrated. I then estimate two OLS regressions where ROA is regressed on the
interaction between EmpConflict and HighHqStatePct and that between CEOempDiff and
HighHqStatePct. HighHqStatePct is a dummy variable that equals one if the firm’s percentage of
employees living in its headquarter state is above the sample median, and zero otherwise. All other
specifications are the same as those of Equation (1).

25
The results of the cross-sectional regressions are presented in Columns (1) and (2) of Table
5. Column (1) reports the regression with the interaction of EmpConflict and HighHqStatePct.
Column (2) reports the regression with the interaction of CEOempDiff and HighHqStatePct. The
control variables at the firm level and the CEO level are included but not reported to conserve
space. The results show that, both the within-employee political ideology conflict and the CEO-
employee conflict has a significantly larger impact on future firm performance when the firm has
more employees living in its headquarter state, which is consistent with the hypothesis.
4.3.2 Cross-sectional Heterogeneity in Employee Sophistication
The association between employee political ideology conflicts and firm performance
should be more pronounced if a firm’s employees are more sophisticated for two reasons. First,
more sophisticated employees contribute more to the firm’s operating performance. Second, more
sophisticated employees are more likely to have stronger political orientation and more likely to
have a larger reaction when they disagree with each other’s political ideology or their CEO’s
political ideology. Thus, I hypothesize that the impacts of employee political ideology conflicts on
firm performance should be stronger for firms with more sophisticated employees.
To empirically test the hypothesis, I first construct the industry-level labor skill index (LSI)
following Belo et al. (2017) and Ghaly, Dang, and Stathopoulos (2017). Specifically, I obtain the
classification of occupations based on skill level from the U.S. Department of Labor’s O*NET
program and industry-level employee occupation information from the Bureau of Labor Statistics
(BLS). I calculate the labor skill index as
𝐿𝑎𝑏𝑜𝑟𝑆𝑘𝑖𝑙𝑙𝑖,𝑡 = ∑ (𝐸𝑗,𝑖,𝑡 ∗ 𝑍𝑗,𝑡)𝑂𝑗=1 , (2)

26
where Ej,i,t is the fraction of employees in industry i (three-digit SIC industry for pre-2002 period
and four-digit NAICS industry for 2002 and beyond) working in occupation j, O is the total number
of occupations in industry i, and Zj,t is the skill level of occupation j. A higher value of LaborSkill
indicates that the industry has a higher average employee skill level. I then assign each industry’s
labor skill index to the firms in the industry and estimate two OLS regressions where ROA is
regressed on the interaction between EmpConflict and HighLaborSkill and that between
CEOempDiff and HighLaborSkill. HighLaborSkill is a dummy variable that equals one if a firm’s
labor skill index is above the sample median, and zero otherwise. All other specifications are the
same as those of Equation (1).
The results of the cross-sectional regressions are presented in Columns (3) and (4) of Table
5. Column (3) reports the regression with the interaction of EmpConflict and HighLaborSkill.
Column (4) reports the regression with the interaction of CEOempDiff and HighLaborSkill. The
control variables at the firm level and the CEO level are included but not reported to conserve
space. The results show that, the impacts of both the within-employee political ideology conflict
and the CEO-employee conflict on firm performance are significantly stronger when a firm’s
employee skill level is above the sample median, which is consistent with the prediction.
5. Labor Productivity and Employee Turnover
The baseline results suggest that there is a negative association between employee political
ideology conflicts and firm performance. In this section, I examine the potential channels of the
impact. Several papers argue that employee satisfaction affects firm value by affecting labor
productivity and employer turnover. For example, Edmans (2011) suggests that employee
satisfaction increases firm value by increasing labor productivity and reducing employee turnover.
In a similar vein, Oswald, Proto, and Sgroi (2015) argue that people’s happiness increases their
27
productivity. The recent work by Babenko, Fedaseyeu, and Zhang (2020) show that the employees
whose political donations are not aligned with their CEOs are more likely to leave their firms.
Employee satisfaction should be arguably low when political ideology conflicts in the workplace
are high. Thus, I hypothesize that employees’ political ideology conflict has a negative impact on
firm performance by decreasing labor productivity and inducing abnormal employee turnover.
5.1 Association between Employee Political Ideology Conflicts and Labor Productivity
I study the association between employee political ideology conflicts and labor
productivity at both the firm level and the individual employee level. At the firm level, I construct
two empirical measures for labor productivity following Kale, Ryan Jr., and Wang (2016). The
first measure, LaborProd, defined as operating income before depreciation scaled by total number
of employees, captures the value added by employees. The second measure, OutputPerEmp, is
defined as the sum of sales and change in inventory scaled by total number of employees. Using
the two measures for firm-level labor productivity, I estimate a model similar to that of Equation
(1), where I substitute ROA with one of the labor productivity measures. In addition to the firm-
level and CEO-level control variables included in Equation (1), I further control for labor input
(LnEmp), defined as the natural logarithm of total number of employees, and asset intensity
(AssetInt), defined as the natural logarithm of total assets divided by total number of employees,
which are shown by researchers to be associated with labor productivity (see, e.g., Kale, Ryan Jr.,
and Wang (2016)). All other specifications are the same as those of Equation (1).
Table 6 reports the results of regressing the labor productivity measures on employee
political ideology conflicts. The dependent variable in Columns (1) and (2) (Columns (3) and (4))
is LaborProd (OutputPerEmp). The independent variable of interest in Columns (1) and (3)
(Columns (2) and (4)) is EmpConflict (CEOempDiff). The results show that, both the within-

28
employee political ideology conflict and the CEO-employee conflict have a significantly negative
association with the two measures for labor productivity, which is consistent with the prediction
that employee political ideology conflicts hurt firm performance by reducing labor productivity.
I further provide more detailed evidence on the association between employee political
ideology conflicts and labor productivity at the individual employee level. Specifically, I examine
the association between individual inventors’ innovation output and the political ideology conflict
between the inventors and other employees in their firms, and that between the inventors and their
CEOs. Patent and inventor information are obtained from the National Bureau of Economic
Research (NBER) database and the Harvard Business School (HBS) patent database.5 Following
standard practice in the literature (see, e.g., Liu, Mao, and Tian (2017)), I treat the assignee of an
inventor’s patent as her employer. The inventor dataset is matched to the donation dataset by
matching both an inventor’s name and her employer’s name in a given year. For each inventor-
year, I measure the inventor’s productivity by the natural logarithm of one plus the number of
patents filed (LnPatent) and the natural logarithm of one plus the average number of citations
received per patent (LnCitePat) by the inventor in year t+1. To measure an inventor’s conflict with
other employees in her firm (InventorOtherDiff), I calculate the absolute value of the difference
between the inventor’s DEM% and the average DEM% of other employees in her firm. To measure
an inventor’s conflict with her CEO (InventorCEODiff), I calculate the absolute value of the
difference between the inventor’s DEM% and her CEO’s DEM%.
Table 7 presents the regression analyses of individual inventor productivity on the
inventors’ workplace political ideology conflicts. In each column, I regress one of the inventor
5 The NBER patent database is available at https://sites.google.com/site/patentdataproject/Home/downloads. The HBS
patent database is available at https://dataverse.harvard.edu/dataverse/patent.

29
productivity measures on one of the inventor political ideology conflict measures. Specifically,
Columns (1) and (2) (Columns (3) and (4)) report the regressions using LnPatent (LnCitePat) as
the dependent variable. Columns (1) and (3) (Columns (2) and (4)) report the regressions using
InventorOtherDiff (InventorCEODiff) as the independent variable. All regressions include firm-
level and CEO-level control variables similar to those of Equation (1). I further include inventor-
firm fixed effects, following Liu, Mao, and Tian (2017). Standard errors are clustered at the
inventor level. In all specifications, the inventor political conflict measures are significantly
negatively correlated with the inventor productivity measures, suggesting that both the conflict
between an inventor and other employees in her firm and that between the inventor and her CEO
are associated with lower quantity and quality of works done by the inventor.
5.2 Association between Employee Political Ideology Conflicts and Employee Turnover
The second channel through which employee political ideology conflicts could hurt firm
performance is by inducing abnormal employee turnover. An employee can choose to leave a firm
if she has large conflicts with other employees in her firm or the CEO of her firm (see, e.g., by
Babenko, Fedaseyeu, and Zhang, 2020). It is costly for firm to replace workers due to labor market
frictions. The adjustment costs could eventually be reflected in firm performance. Thus, I
hypothesize that employee political ideology conflicts hurt firm performance by inducing
abnormal employee turnover.
Empirically, I identify the turnovers of key employees using the Execucomp database and
the Capital IQ People Intelligence database. Execucomp provides the exact date when an employee
left a company (LEFTCO). Capital IQ does not provide such information, but the year when an
employee left a company can be inferred from the year when her last job function in the firm ended
(ENDYEAR). For each employee i of firm j in year t, Leave is defined as a dummy variable that
30
equals one if the employee leaves the firm in year t+1, and zero otherwise. The political ideology
conflict between a key employee and other employees in her firm (KeyOtherDiff), and that between
the key employee and the CEO of her firm (KeyCEODiff), are measured by taking the absolute
value of the difference between the key employee’s DEM% and the average DEM% of other
employees in her firm, and that between the key employee’s DEM% and her CEO’s DEM%,
respectively.
Table 8 presents the estimation of a linear probability model where I regress Leave on the
two measures of key employee political ideology conflicts separately. Firm-level and CEO-level
control variables similar to those of Equation (1) are included in both regressions. I further include
employee-firm fixed effects. Standard errors are clustered at the employee level. Column (1)
reports the regression of Leave on KeyOtherDiff. The result shows that a key employee is more
likely to leave a firm when the misalignment between her political ideology and that of her
coworkers is larger. Column (2) reports the regression of Leave on KeyCEODiff. The result
suggests that a key employee is more likely to leave a firm when her political ideology is more
different with that of her CEO. The result shown in Column (2) is consistent with the finds of
Babenko, Fedaseyeu, and Zhang (2020). My study supplements their finds by showing that not
only the conflicts between an employee and her CEO, but also the conflicts between an employee
and her coworkers are associated with a higher likelihood of the employee leaving a firm.
Notably, an alternative explanation of the association between the CEO-employee political
ideology conflicts and employee turnover is that the CEOs are more likely to fire the employees
who differ from them in terms of political orientation. While I cannot observe whether the
employee turnover is voluntary or involuntary, the alternative explanation does not change the
31
implication of the results. That is, an increase in political ideology conflict increases the probability
of abnormal employee turnover, which affects firm performance negatively.
6. Endogeneity Concerns and 2SLS Analysis
While the OLS results suggest that there is a negative association between employee
political ideology conflicts and firm performance, several endogeneity concerns arise when
interpreting the results. First, there could be omitted variables that are simultaneously correlated
with political ideology conflict and firm performance. For example, Babenko, Fedaseyeu, and
Zhang (2020) suggest that CEOs exert influence on their employees’ political choices in order to
increase shareholder value. If that is the case, the CEOs’ incentives could drive both political
ideology conflicts and firm performance. Furthermore, entrenched CEOs may have the power to
hire employees who are more aligned with them in terms of political ideology, and CEO
entrenchment is also correlated with firm performance. Second, the results could be driven by
reverse causality. That is, worse firm performance could lead to disagreements in political ideology
between the CEO and the employees or among the employees.
To at least partially address the endogeneity concerns, the independent variables are lagged
by one year in all the OLS regressions in this paper. However, an exogenous variation in employee
political ideology conflicts is needed in order to establish causality. In this section, I use the
acquisitions of local television stations by Sinclair Broadcast Group as the source of exogenous
variation in political ideology conflicts and implement a two-stage least squares (2SLS) analysis
to establish causality of employee political ideology conflicts on firm performance.
6.1 The Acquisitions of Local Television Stations by Sinclair Broadcast Group

32
Sinclair Broadcast Group (Sinclair) is the largest television station operator in the United
States in terms of number of stations (191 stations) and total coverage (89% of U.S. markets).6
The acquisitions of local television stations are made over a span of more than 30 years, starting
in 1984. Sinclair is well known to have strong conservative orientation and has long been criticized
for pushing conservative news coverage and commentary. For example, in March 2018, journalists
from all the local television stations owned by Sinclair across the whole country were asked by
Sinclair to read the same script supporting President Donald Trump’s Twitter feed regarding
“biased and false news” (Glaser (2018)). Using textual analysis on television news scripts, Martin
and McCrain (2018) document a significant rightward shift in the ideological slant of coverage
after local television stations are acquired by Sinclair.
Researchers have shown that mass media has strong persuasive effects and often affects
people’s political orientation. Using voting data in presidential elections, DellaVigna and Kaplan
(2007) show that Republicans gained vote shares in towns where Fox News entered the cable
markets. Similarly, Martin and Yurukoglu (2017) show that Fox News increases Republicans’ vote
shares by 0.3 points among viewers induced into watching 2.5 additional minutes of television
news per week. According to a survey conducted by Pew Research Center, 37% of U.S. adults
often get news from local television, which is larger than the population who often get news from
cable television (28%).7 Therefore, the acquisitions of local television stations by Sinclair, a firm
with strong political orientation, is likely to have a strong Republican-oriented impact on local
residents’ political ideology.
6 Information obtained from the official website of Sinclair Broadcast Group at http://sbgi.net/. 7 Information obtained from the website of Pew Research Center at http://www.pewresearch.org/fact-
tank/2018/01/05/fewer-americans-rely-on-tv-news-what-type-they-watch-varies-by-who-they-are/ft_18-01-
04_localtv_demographic/.

33
When a firm’s employees are affected by Sinclair acquisitions in their city of residence,
the acquisitions create a rightward pressure on the employees’ political ideology. As the
distribution of employee political ideology (DEM%) is a continuum bounded between zero and
one, the pressure that pushes the employees’ ideology towards the Republican end (where DEM%
equals zero) is going to condense the distribution and reduce the distance among the employee’s
political ideology. Therefore, the Sinclair acquisitions should reduce the within-employee political
ideology conflicts. The Sinclair acquisitions should also reduce the CEO-employee political
ideology conflicts as the CEOs are more Republican-oriented in the first place (as shown in Table
1), and should be less affected by the Sinclair acquisitions than the non-CEO employees. The
acquisitions should push the non-CEO employees’ ideology towards the Republican end and
therefore reduce the distance between the average non-CEO employees’ political ideology and that
of their CEOs.
There is no evidence suggesting that the acquisitions by Sinclair are correlated with local
economic conditions. Moreover, since a firm’s employees may live in various locations across the
whole country, it is unlikely that Sinclair has the ability to track the residential address of all the
firm’s employees, which makes it hard to believe that Sinclair can attempt to affect the firm’s
performance by acquiring television stations in the residential area of its employees.8 Thus, the
Sinclair acquisitions provide a unique setting for my analyses as it directly impacts employees’
political ideologies but does not affect firm performance through channels. Empirically, I conduct
a 2SLS analysis, using Sinclair acquisitions to predict employee political ideology conflicts and
then regressing firm performance on the fitted value of conflicts.
8 In my sample, only 16.6% of employees live in the city where their employers’ headquarters are located in.

34
6.2 2SLS Analysis
Starting from 1984, Sinclair has made 163 acquisitions in 96 designated market areas
(DMA). I obtain the acquisition information from RabbitEars, a website which provides detailed
and comprehensive information on media markets in the United States. For the employees in my
sample, I match each employee’s city of residence to the DMA it belongs to using the DMA-
county/city matching information obtained from Wikipedia.9 For each employee-year, I identify
whether a Sinclair acquisition happened in the employee’s city of residence in the year. To verify
that the Sinclair acquisitions cause a rightward pressure on the employees’ political ideology, I
regress individual employees’ DEM% in year t on SinclairIndiv, a dummy variable that equals one
if at least one of the local television stations in an employee’s city of residence is acquired by
Sinclair in year t-1, and zero otherwise. The regression results are presented in Table 9. Column
(1) reports the regression in the sample of non-CEO employees. The coefficient on SinclairIndiv
is significantly negative, indicating that Sinclair acquisitions indeed make the employees more
Republican-oriented. Column (2) reports the regression in the sample of CEOs. The coefficient on
SinclairIndiv is positive and insignificant, suggesting that the CEOs are indeed less affected by
Sinclair acquisitions, compared to the non-CEO employees. Taken together, the results presented
in Table 9 supports the hypothesis that the Sinclair acquisitions would reduce the within-employee
political ideology conflict and the CEO-employee conflict.
To capture the Republican-oriented ideological pressure caused by the Sinclair acquisitions
on a firm’s employees, for each firm-year, I calculate the percentage of employees who are affected
by a Sinclair acquisition (SinclairFirm) in year t-1. Lagging the variable by one year allows the
9 Information obtained from Wikipedia at https://en.wikipedia.org/wiki/List_of_United_States_television_markets.

35
Sinclair acquisitions to have time to exert influence on the affected employees’ political ideology.
Intuitively, a Sinclair acquisition happened in an employee’s city of residence in year t-1 affects
the employee’s political ideology and changes her donating pattern in year t, which affects her
employer’s employee political ideology conflicts in year t. Then, I estimate a set of 2SLS
regressions, where EmpConflict and CEOempDiff are instrumented by SinclairFirm.
Table 10 presents the results of estimating the 2SLS model. Columns (1) and (2) report the
first-stage regressions with EmpConflict and CEOempDiff, respectively, as the dependent
variables. The coefficients of SinclairFirm are significant in both regressions, indicating that the
Sinclair acquisitions indeed reduce both the within-employee political ideology conflict and the
CEO-employee conflict. The Kleibergen-Paap Wald F-statistics on the weak instrument test for
EmpConflict and CEOempDiff are 13.47 and 9.24, respectively, suggesting that the instrument
does not suffer from weak instrument problems. Columns (3) and (4) report the second-stage
regressions with FittedEmpConflict and FittedCEOempDiff, respectively, as the independent
variables. The coefficients on both the two variables of interest are significantly negative,
indicating that the exogenous decreases in within-employee political ideology conflicts and CEO-
employee conflicts caused by the Sinclair acquisitions have a positive impact on future firm
performance.
7. Conclusion
Despite the public attention to workplace political ideology conflicts and their negative
consequences, there is a lack of evidence on the association between employees’ political ideology
conflicts and firm performance. This paper fills in the gap by measuring employee political
ideology conflicts using individual campaign donation data and explicitly studying the association
between the conflicts and future operating performance.

36
I find that both the political ideology conflicts among the employees and those between the
CEOs and employees are negatively associated with future operating performance. Cross-sectional
analyses show that the association is stronger for firms with more geographically concentrated and
more sophisticated employees. Furthermore, I show that employee political ideology conflicts
affect firm performance negatively by decreasing labor productivity and inducing abnormal
employee turnover. Using the acquisitions of local television stations by Sinclair Broadcast Group
as a source of exogenous variation in employees’ political ideology, I establish causality between
employee political ideology conflicts and firm performance.
Overall, my paper suggests that employee political ideology conflicts have a negative
impact on firm performance, shedding new light on the importance of within-firm labor
heterogeneity and labor-management relationship.

37
References
Akey, P., 2015. Valuing changes in political networks: Evidence from campaign contributions to
close congressional elections. The Review of Financial Studies, 28(11), pp.3188-3223.
American Psychological Association, 2017. ‘2017 Work and well-being survey: special focus on
politics’.
Babenko, I., Fedaseyeu, V. and Zhang, S., 2020. Do CEOs Affect Employees’ Political
Choices?. The Review of Financial Studies, 33(4), pp.1781-1817.
Belo, F., Li, J., Lin, X. and Zhao, X., 2017. Labor-force heterogeneity and asset prices: The
importance of skilled labor. The Review of Financial Studies, 30(10), pp.3669-3709.
Borghesi, R., 2018. Employee political affiliation as a driver of corporate social responsibility
intensity. Applied Economics, 50(19), pp.2117-2132.
Cohen, A., Hazan, M., Tallarita, R. and Weiss, D., 2019. The Politics of CEOs. Working Paper.
Cooper, M.J., Gulen, H. and Ovtchinnikov, A.V., 2010. Corporate political contributions and stock
returns. The Journal of Finance, 65(2), pp.687-724.
DellaVigna, S. and Kaplan, E., 2007. The Fox News effect: Media bias and voting. The Quarterly
Journal of Economics, 122(3), pp.1187-1234.
Di Giuli, A. and Kostovetsky, L., 2014. Are red or blue companies more likely to go green? Politics
and corporate social responsibility. Journal of Financial Economics, 111(1), pp.158-180.
Edmans, A., 2011. Does the stock market fully value intangibles? Employee satisfaction and equity
prices. Journal of Financial economics, 101(3), pp.621-640.
Francis, B.B., Hasan, I., Sun, X. and Wu, Q., 2016. CEO political preference and corporate tax
sheltering. Journal of Corporate Finance, 38, pp.37-53.
Cronqvist, H., Heyman, F., Nilsson, M., Svaleryd, H. and Vlachos, J., 2009. Do entrenched
managers pay their workers more?. The Journal of Finance, 64(1), pp.309-339.
Gao, M. and Huang, J., 2016. Capitalizing on Capitol Hill: Informed trading by hedge fund
managers. Journal of Financial Economics, 121(3), pp.521-545.
Ghaly, M., Anh Dang, V. and Stathopoulos, K., 2017. Cash holdings and labor heterogeneity: the
role of skilled labor. The Review of Financial Studies, 30(10), pp.3636-3668.
Glaser, A., 2018. ‘Public Shaming Won’t Stop Sinclair’. Slate, 2 April, 2018.

38
Goldman, E., Rocholl, J. and So, J., 2008. Do politically connected boards affect firm value?. The
Review of Financial Studies, 22(6), pp.2331-2360.
Guiso, L., Sapienza, P. and Zingales, L., 2015. The value of corporate culture. Journal of Financial
Economics, 117(1), pp.60-76.
Gupta, A., Briscoe, F. and Hambrick, D.C., 2017. Red, blue, and purple firms: Organizational
political ideology and corporate social responsibility. Strategic Management
Journal, 38(5), pp.1018-1040.
He, J., Shu, T. and Yang, H., 2018. The Employee Clientele of Corporate Leverage: Evidence from
Personal Labor Income Diversification.
Hong, H. and Kostovetsky, L., 2012. Red and blue investing: Values and finance. Journal of
Financial Economics, 103(1), pp.1-19.
Huang, M., Li, P., Meschke, F. and Guthrie, J.P., 2015. Family firms, employee satisfaction, and
corporate performance. Journal of Corporate Finance, 34, pp.108-127.
Hutton, I., Jiang, D. and Kumar, A., 2014. Corporate policies of Republican managers. Journal of
Financial and Quantitative Analysis, 49(5-6), pp.1279-1310.
Hymowitz, C. and Greenfield, R., 2017. ‘Anti-Trump employees put their bosses in the hot seat’.
Bloomberg, 8 February, 2017.
Kale, J.R., Ryan Jr, H.E. and Wang, L., 2016. Outside employment opportunities, employee
productivity, and debt discipline. Journal of Corporate Finance.
Lee, J., Lee, K.J. and Nagarajan, N.J., 2014. Birds of a feather: Value implications of political
alignment between top management and directors. Journal of Financial
Economics, 112(2), pp.232-250.
Liu, T., Mao, Y. and Tian, X., 2017. The role of human capital: Evidence from patent generation.
Martin, G.J. and McCRAIN, J., 2018. Local news and national politics. American Political Science
Review, pp.1-13.
Martin, G.J. and Yurukoglu, A., 2017. Bias in cable news: Persuasion and polarization. American
Economic Review, 107(9), pp.2565-99.
Mayer, R.C., Warr, R.S. and Zhao, J., 2018. Do Pro‐Diversity Policies Improve Corporate
Innovation?. Financial Management, 47(3), pp.617-650.

39
McGregor, J., 2016. ‘This IBM employee quit over her CEO’s letter to Donald Trump’. The
Washington Post, 29 November, 2016.
Østergaard, C.R., Timmermans, B. and Kristinsson, K., 2011. Does a different view create
something new? The effect of employee diversity on innovation. Research Policy, 40(3),
pp.500-509.
Oswald, A.J., Proto, E. and Sgroi, D., 2015. Happiness and productivity. Journal of Labor
Economics, 33(4), pp.789-822.
Ovtchinnikov, A.V. and Pantaleoni, E., 2012. Individual political contributions and firm
performance. Journal of Financial Economics, 105(2), pp.367-392.
Richard, O.C., 2000. Racial diversity, business strategy, and firm performance: A resource-based
view. Academy of management journal, 43(2), pp.164-177.
Roonie, K., 2020. ‘Coinbase CEO discourages politics at work, offers generous severance to
employees who want to quit’. CNBC, 30 September, 2020.
Unsal, O., Hassan, M.K. and Zirek, D., 2016. Corporate lobbying, CEO political ideology and firm
performance. Journal of Corporate Finance, 38, pp.126-149.
Weise, K., 2017. ‘The lonely lives of Silicon Valley Conservatives’. Bloomberg, 5 September,
2017.
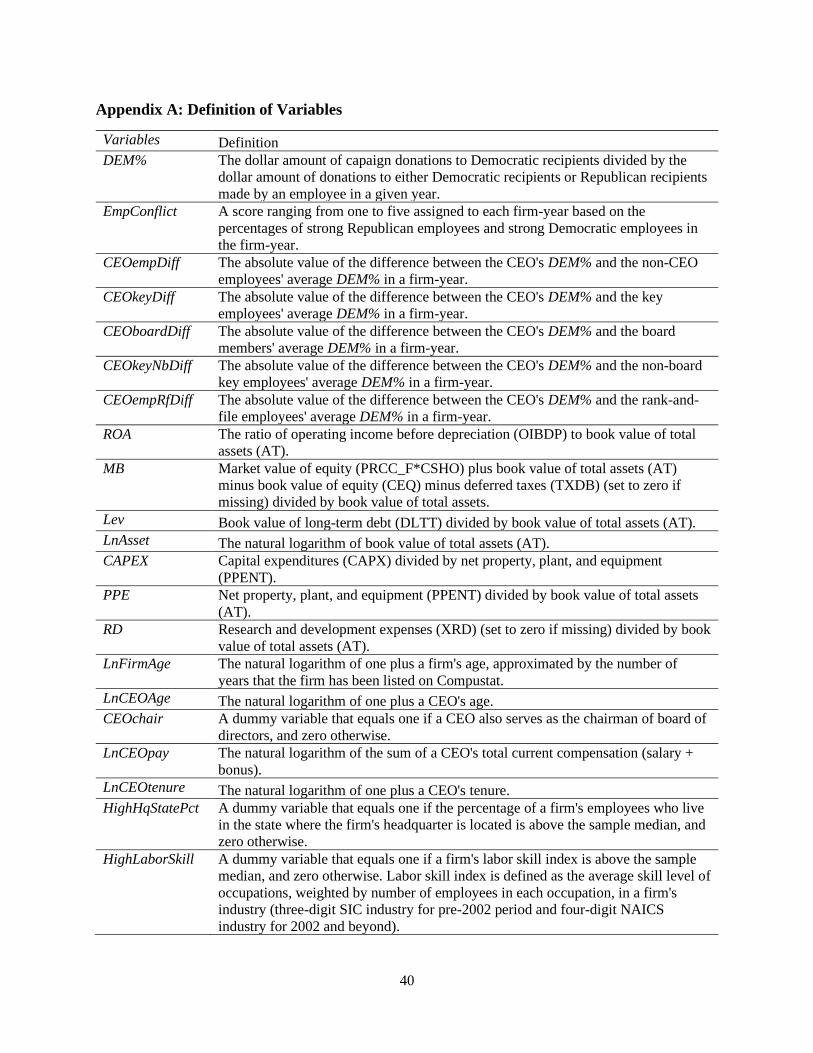
40
Appendix A: Definition of Variables
Variables Definition
DEM% The dollar amount of capaign donations to Democratic recipients divided by the
dollar amount of donations to either Democratic recipients or Republican recipients
made by an employee in a given year.
EmpConflict A score ranging from one to five assigned to each firm-year based on the
percentages of strong Republican employees and strong Democratic employees in
the firm-year.
CEOempDiff The absolute value of the difference between the CEO's DEM% and the non-CEO
employees' average DEM% in a firm-year.
CEOkeyDiff The absolute value of the difference between the CEO's DEM% and the key
employees' average DEM% in a firm-year.
CEOboardDiff The absolute value of the difference between the CEO's DEM% and the board
members' average DEM% in a firm-year.
CEOkeyNbDiff The absolute value of the difference between the CEO's DEM% and the non-board
key employees' average DEM% in a firm-year.
CEOempRfDiff The absolute value of the difference between the CEO's DEM% and the rank-and-
file employees' average DEM% in a firm-year.
ROA The ratio of operating income before depreciation (OIBDP) to book value of total
assets (AT).
MB Market value of equity (PRCC_F*CSHO) plus book value of total assets (AT)
minus book value of equity (CEQ) minus deferred taxes (TXDB) (set to zero if
missing) divided by book value of total assets.
Lev Book value of long-term debt (DLTT) divided by book value of total assets (AT).
LnAsset The natural logarithm of book value of total assets (AT).
CAPEX Capital expenditures (CAPX) divided by net property, plant, and equipment
(PPENT).
PPE Net property, plant, and equipment (PPENT) divided by book value of total assets
(AT).
RD Research and development expenses (XRD) (set to zero if missing) divided by book
value of total assets (AT).
LnFirmAge The natural logarithm of one plus a firm's age, approximated by the number of
years that the firm has been listed on Compustat.
LnCEOAge The natural logarithm of one plus a CEO's age.
CEOchair A dummy variable that equals one if a CEO also serves as the chairman of board of
directors, and zero otherwise.
LnCEOpay The natural logarithm of the sum of a CEO's total current compensation (salary +
bonus).
LnCEOtenure The natural logarithm of one plus a CEO's tenure.
HighHqStatePct A dummy variable that equals one if the percentage of a firm's employees who live
in the state where the firm's headquarter is located is above the sample median, and
zero otherwise.
HighLaborSkill A dummy variable that equals one if a firm's labor skill index is above the sample
median, and zero otherwise. Labor skill index is defined as the average skill level of
occupations, weighted by number of employees in each occupation, in a firm's
industry (three-digit SIC industry for pre-2002 period and four-digit NAICS
industry for 2002 and beyond).

41
LaborProd Labor productivity, defined as operating income before depreciation (OIBDP)
divided by the number of employees (EMP).
OutputPerEmp Output per employee, defined as the sum of sales (SALE) and change in inventory
(calculated as the sum of INVWIP and INVFG) divided by the number of
employees (EMP)
LnEmp The natural logarithm of a firm's number of employees (EMP).
AssetInt Asset intensity, defined as the natural logarithm of book value of total assets (AT)
divided by number of employees (EMP).
CEOinventorDiff The absolute value of the difference between an inventor's DEM% her CEO's
DEM%.
LnPatent The natural logarithm of the number of patents filed by an inventor in a year.
LnCitePat The natural logarithm of the average number of citations received per patents filed
by an inventor in a year.
Leave A dummy variable that equals one if a key employee leaves her firm in year t+1,
and zero otherwise.
KeyOtherDiff The absolute value of the difference between a key employee's DEM% and the
average DEM% of other employees in her firm.
KeyCEODiff The absolute value of the difference between a key employee's DEM% and the
DEM% of the CEO of her firm.
SinclairIndiv A dummy that equals one if an employee is affected by a Sinclair acquisition in her
city of residence in year t-1, and zero otherwise.
SinclairFirm The percentage of a firm's employees who are affected by a Sinclair acquisition in
their city of residence in year t-1.

42
Figure 1: Illustration of Within-Employee political Ideology Conflict Measure
This figure depicts the construction of EmpConflict, the measure of within-employee political ideology
conflicts. %StrongREP and %StrongDEM are the percentages of strong Republican employees and strong
Democratic employees, respectively, in a firm-year. An employee is defined as strong Republican
(Democratic) if she donates more than $2,000 to only Republican (Democratic) recipients in a given year.
The possible combinations of %StrongREP and %StrongDEM for a firm can be illustrated in the right
triangle. The triangle is divided into five areas, each assigned with an EmpConflict score. A higher score
represents higher within-employee political ideology conflicts.

43
Table 1: Summary Statistics of Person-level Political Ideology Variables
This table reports the summary statistics of political ideology variables constructed at the person-year level by employee ranks using individual
campaign donation data provided by Federal Election Commission (FEC) and employee rank information from Execucomp and Capital IQ. Panel
A reports the summary statistics of employees’ campaign donations. Column (1) reports the number of person-year observations for each rank.
Column (2) reports the average dollar amount of donation made by an individual in a two-year rolling window. Column (3) reports the mean of
Democratic tendency (DEM%). Panel B reports the distribution of DEM% within each employee rank.
Panel A: Summary Statistics of Employees’ Campaign Donations
Rank # Person-years Mean $ of donation Mean DEM%
(1) (2) (3)
CEO 15,337 6,110.68 37.68%
Board 11,916 5,295.11 41.52%
Nonboard Key 33,741 2,324.16 51.07%
Rank-and-file 252,654 1,352.56 59.48%
Panel B: Distribution of Employees’ Political Ideology
Rank DEM%
0% (0%,25%] (25%,50%) 50% (50%,75%) [75%,100) 100%
CEO 56.002% 2.973% 2.875% 1.578% 2.452% 1.584% 32.536%
Board 54.062% 1.678% 2.232% 1.284% 1.989% 1.334% 37.420%
Nonboard Key 45.944% 0.880% 1.405% 1.301% 1.461% 0.945% 48.063%
Rank-and-file 39.831% 0.198% 0.308% 0.325% 0.362% 0.234% 58.743%

44
Table 2: Summary Statistics of Main Dependent and Independent Variables
Panel A reports the summary statistics of political conflict variables at the firm-year level. EmpConflict is a score which indices within-employee
political ideology conflicts. CEOempDiff, CEOkeyDiff, CEOboardDiff, CEOkeyNbDiff, and CEOempRfDiff are the political ideology conflicts
between CEO and all non-CEO employees, key employees, board members, non-board key employees, and rank-and-file employees, respectively.
Panel B reports the summary statistics of firm performance and control variables. All the continuous variables in Panel B are winsorized at the 1st
and 99th percentiles. Detailed definitions of all the variables are presented in Appendix A.
Panel A: Summary Statistics of Employee Political Ideology Conflict Variables
Variable Mean SD Min P25 Median P75 Max N
EmpConflict 2.424 1.280 1.000 1.000 2.000 4.000 5.000 4,055
CEOempDiff 0.301 0.234 0.000 0.105 0.253 0.455 1.000 2,004
CEOkeyDiff 0.247 0.275 0.000 0.000 0.159 0.413 1.000 1,347
CEOboardDiff 0.245 0.313 0.000 0.000 0.106 0.406 1.000 1,002
CEOkeyNbDiff 0.254 0.289 0.000 0.000 0.160 0.429 1.000 939
CEOempRfDiff 0.320 0.243 0.000 0.122 0.278 0.489 1.000 1,784

45
Panel B: Summary Statistics of Firm Performance and Control Variables
Variable Mean SD Min P25 Median P75 Max N
ROA 0.124 0.081 -0.108 0.070 0.116 0.170 0.360 4,055
MB 1.970 1.356 0.827 1.105 1.475 2.252 8.158 4,055
Lev 0.202 0.148 0.000 0.087 0.178 0.297 0.698 4,055
LnAsset 10.045 1.778 5.730 8.827 10.115 11.145 14.485 4,055
CAPEX 0.217 0.140 0.000 0.117 0.193 0.288 0.716 4,055
PPE 0.229 0.234 0.000 0.047 0.135 0.350 0.856 4,055
RD 0.027 0.045 0.000 0.000 0.000 0.036 0.221 4,055
LnFirmAge 3.368 0.744 1.099 2.890 3.555 4.007 4.234 4,055
LnCEOage 4.046 0.105 3.714 3.989 4.060 4.111 4.331 2,745
LnCEOpay 7.225 1.212 0.001 6.909 7.184 7.689 9.347 2,745
LnCEOtenure 1.739 0.864 0.000 1.099 1.792 2.303 3.555 2,745
CEOchair 0.666 0.472 0.000 0.000 1.000 1.000 1.000 2,745

46
Table 3: Regressions of Firm Performance on Employee Political Ideology Conflicts
This table presents the OLS regression results of firm performance (ROA) on employee political ideology
conflict measures. Columns (1) and (2) report the regressions of ROA on within-employee political ideology
conflicts (EmpConflict). Columns (3) and (4) report the regressions of ROA on CEO-employee political
ideology conflicts (CEOempDiff). Definitions of the variables are provided in Appendix A. All independent
variables are lagged by one year. Firm and year fixed effects are included in all regressions. Standard errors
are clustered by firm. *, **, and *** indicate statistical significance at the 10%, 5%, and 1% level,
respectively.
Dep. Var. ROA
(1) (2) (3) (4)
EmpConflict -0.007*** -0.007***
(-2.612) (-2.604)
CEOempDiff -0.010** -0.010**
(-2.342) (-2.130)
MB 0.019*** 0.019*** 0.017*** 0.018***
(8.396) (6.882) (6.737) (6.755)
Lev -0.048*** -0.048** -0.062*** -0.053**
(-2.903) (-2.454) (-2.924) (-2.448)
LnAsset -0.005 -0.009* -0.014*** -0.014***
(-1.113) (-1.844) (-3.065) (-3.099)
CAPEX 0.047*** 0.063*** 0.070*** 0.064***
(3.115) (3.697) (3.573) (3.213)
PPE 0.059** 0.031 0.027 0.013
(1.977) (0.967) (0.811) (0.380)
RD 0.209 0.339** 0.391** 0.405**
(1.632) (2.185) (2.218) (2.380)
LnFirmAge 0.018** 0.023* 0.042*** 0.045***
(2.116) (1.831) (3.271) (3.112)
LnCEOage -0.016 -0.013
(-0.908) (-0.710)
LnCEOpay 0.003 0.002
(1.608) (1.558)
LnCEOtenure 0.002 0.002
(1.315) (0.835)
CEOchair 0.005* 0.004
(1.810) (1.253)
Constant 0.066 0.128 0.070 0.098
(1.225) (1.250) (1.127) (0.938)
Firm FE Yes Yes Yes Yes
Year FE Yes Yes Yes Yes
Observations 4,055 2,745 2,004 1,885
Adj. R-squared 0.827 0.836 0.844 0.843

47
Table 4: Regression of Firm Performance on CEO-Employee Political Ideology Conflicts by
Employee Rank
This table reports the OLS regression results of firm performance (ROA) on CEO-employee political
ideology conflict by employee rank. CEOkeyDiff, CEOboardDiff, CEOkeyNbDiff, and CEOempRfDiff are
the political ideology conflicts between the CEOs and key employees, board members, non-board key
employees, and rank-and-file employees, respectively. Definitions of the variables are provided in
Appendix A. All independent variables are lagged by one year. All columns include firm, industry, and
year fixed effects. Standard errors are clustered by firm. *, **, and *** indicate statistical significance at
the 10%, 5%, and 1% level, respectively.
Dep. Var. ROA
(1) (2) (3) (4)
CEOkeyDiff -0.009**
(-2.056)
CEOboardDiff -0.009**
(-2.433)
CEOkeyNbDiff -0.013***
(-2.633)
CEOempRfDiff -0.009**
(-1.997)
MB 0.016*** 0.018*** 0.018*** 0.017***
(5.591) (5.500) (5.133) (6.227)
Lev -0.053** -0.052 -0.067** -0.053**
(-2.031) (-1.599) (-2.016) (-2.287)
LnAsset -0.012** -0.010 -0.008 -0.014***
(-2.289) (-1.315) (-0.984) (-3.062)
CAPEX 0.053** 0.041 0.020 0.069***
(1.974) (1.302) (0.667) (3.501)
PPE 0.013 0.032 0.038 0.018
(0.291) (0.601) (0.662) (0.501)
RD 0.415** 0.460** 0.407* 0.310*
(2.059) (2.032) (1.682) (1.953)
LnFirmAge 0.045*** 0.060** 0.066*** 0.039***
(3.034) (2.588) (2.617) (3.019)
LnCEOage -0.009 -0.012 -0.006 -0.013
(-0.481) (-0.534) (-0.253) (-0.714)
LnCEOpay 0.002 0.002 0.001 0.002
(1.274) (0.834) (0.961) (1.478)
LnCEOtenure 0.001 -0.000 -0.000 0.001
(0.318) (-0.121) (-0.057) (0.735)
CEOchair 0.003 0.001 0.002 0.004
(0.859) (0.190) (0.373) (1.266)
Constant 0.074 0.010 -0.060 0.122
(0.751) (0.076) (-0.439) (1.190)
Firm FE Yes Yes Yes Yes
Year FE Yes Yes Yes Yes
Observations 1,347 1,002 939 1,784
Adj. R-squared 0.845 0.850 0.853 0.843

48
Table 5: Cross-sectional Analyses Based on Employee Geographical Concentration and
Sophistication
This table reports the subsample analyses based on employee geographic concentration and sophistication.
HighHqStatePct is a dummy variable that equals one if a firm’s fraction of employees living in its
headquarter state is above the sample median, and zero otherwise. HighLaborSkill is a dummy variable that
equals one if a firm’s labor skill index is above the sample median, and zero otherwise. Columns (1) to (4)
report the regressions of ROA on the interaction between EmpConflict and HighHqStatePct, that between
CEOempDiff and HighHqStatePct, that between EmpConflict and HighLaborSkill, and that between
CEOempDiff and HighLaborSkill, respectively. Firm-level and CEO-level control variables are included
but not reported to conserve space. All independent variables are lagged by one year. All regressions include
firm and year fixed effects. Standard errors are clustered by firm. *, **, and *** indicate statistical
significance at the 10%, 5%, and 1% level, respectively.
Dep. Var. ROA
(1) (2) (3) (4)
EmpConflict×HighHqStatePct -0.009**
(-2.482)
CEOempDiff×HighHqStatePct -0.020**
(-2.347)
EmpConflict×HighLaborSkill -0.007**
(-1.964)
CEOempDiff×HighLaborSkill -0.014**
(-2.194)
EmpConflict 0.003 -0.002
(1.259) (-0.636)
CEOempDiff -0.000 0.004
(-0.031) (0.522)
HighHqStatePct 0.005 0.007
(1.604) (1.493)
HighLaborSkill 0.003 -0.010**
(0.584) (-2.124)
Controls Yes Yes Yes Yes
Firm FE Yes Yes Yes Yes
Year FE Yes Yes Yes Yes
Observations 2,722 1,868 2,237 1,545
Adj. R-squared 0.834 0.841 0.824 0.837

49
Table 6: Regressions of Labor Productivity on Employee Political Ideology Conflicts
This table analyzes the association between employee political ideology conflicts and firm-level labor
productivity. LaborProd is defined operating income before depreciation scaled by total number of
employees. OutputPerEmp is defined as the sum of sales and change in inventory scaled by total number
of employees. Definitions of other variables are provided in Appendix A. All independent variables are
lagged by one year. All columns include firm and year fixed effects. Standard errors are clustered by firm.
*, **, and *** indicate statistical significance at the 10%, 5%, and 1% level, respectively.
Dep. Var. LaborProd OutputPerEmp
(1) (2) (3) (4)
EmpConflict -0.019** -0.034*
(-2.491) (-1.773)
CEOempDiff -0.025* -0.066**
(-1.907) (-2.423)
MB 0.012*** 0.014*** 0.029*** 0.025***
(4.015) (3.578) (3.828) (3.097)
Lev 0.006 0.015 -0.000 0.057
(0.201) (0.390) (-0.001) (0.703)
LnAsset 0.092*** 0.076*** 0.186*** 0.160***
(8.141) (5.391) (6.822) (5.390)
CAPEX 0.024 -0.003 0.104 0.143*
(0.859) (-0.098) (1.511) (1.941)
PPE -0.023 -0.145*** -0.399*** -0.504***
(-0.493) (-2.663) (-3.570) (-4.364)
RD -0.003 0.010 0.424 0.539
(-0.014) (0.042) (0.965) (1.091)
LnFirmAge -0.034** -0.003 0.044 0.157***
(-2.041) (-0.119) (1.079) (3.350)
LnCEOage 0.042 0.059 0.176** 0.189**
(1.228) (1.405) (2.088) (2.107)
LnCEOpay -0.000 -0.002 0.008 -0.002
(-0.159) (-0.549) (1.337) (-0.285)
LnCEOtenure 0.002 0.000 -0.008 -0.008
(0.609) (0.101) (-0.830) (-0.807)
CEOchair 0.012* 0.020** 0.009 0.016
(1.838) (2.499) (0.616) (0.910)
LnEmp -0.106*** -0.101*** -0.208*** -0.211***
(-9.516) (-7.143) (-7.667) (-7.097)
AssetInt 0.005** 0.015*** 0.017*** 0.013*
(2.098) (4.647) (3.241) (1.850)
Constant 0.251 0.181 -0.002 -0.069
(1.630) (0.942) (-0.006) (-0.170)
Firm FE Yes Yes Yes Yes
Year FE Yes Yes Yes Yes
Observations 2,511 1,741 2,532 1,755
Adj. R-squared 0.824 0.849 0.892 0.922

50
Table 7: Regressions of Inventor Output on Inventors’ Political Ideology Conflicts with
Coworkers and CEOs
This table analyzes the association between individual inventors’ innovation output and their political
ideology conflicts with other employees and the CEOs in their firms. LnPatent is defined as the natural
logarithm of one plus the number of patents filed by an inventor in a given year. LnCitePat is defined as
the natural logarithm of one plus the average number of citations received per patent by an inventor in a
given year. InventorOtherDiff is the absolute value of the difference between an employee’s DEM% and
the average DEM% of other employees in her firm. InventorCEODiff is defined as the absolute value of the
difference between an inventor’s DEM% and her CEO’s DEM%. Definitions of other variables are provided
in Appendix A. All independent variables are lagged by one year. All regressions include inventor-firm
fixed effects and year fixed effects. Standard errors are clustered by inventor. *, **, and *** indicate
statistical significance at the 10%, 5%, and 1% level, respectively.
Dep. Var. LnPatent LnCitePat
(1) (2) (3) (4)
InventorOtherDiff -0.125** -0.178*
(-2.111) (-1.694)
InventorCEODiff -0.086* -0.195**
(-1.983) (-2.165)
MB -0.011 -0.033 -0.022 -0.057
(-0.611) (-1.217) (-0.429) (-0.861)
Lev -0.463* -0.343 -0.528 -0.119
(-1.790) (-1.128) (-1.164) (-0.210)
LnAsset 0.122* 0.000 0.135 0.150
(1.906) (0.003) (1.506) (0.551)
CAPEX 0.393** 0.164 0.587* 0.034
(2.178) (0.765) (1.695) (0.057)
PPE 0.756 -0.643 -0.317 -1.026
(1.426) (-0.957) (-0.347) (-0.808)
RD 0.933 0.308 2.521 4.566
(0.851) (0.168) (1.235) (1.249)
LnFirmAge -0.593** -0.524 -0.778 -1.322*
(-2.461) (-1.248) (-1.348) (-1.676)
LnCEOage 0.015 0.063 -0.279 -0.453
(0.039) (0.176) (-0.477) (-0.549)
LnCEOpay -0.002 0.018 -0.008 0.043*
(-0.136) (1.039) (-0.265) (1.700)
LnCEOtenure 0.010 0.034 -0.019 -0.034
(0.258) (0.909) (-0.247) (-0.357)
CEOchair -0.053 -0.108 0.010 -0.057
(-0.825) (-1.169) (0.076) (-0.356)
Constant 0.964 2.047 2.782 5.088
(0.587) (0.783) (0.989) (1.028)
Inventor-Firm FE Yes Yes Yes Yes
Year FE Yes Yes Yes Yes
Observations 2,072 1,435 2,072 1,435
Adj. R-squared 0.573 0.580 0.564 0.556

51
Table 8: Regressions of Key Employee Turnover on Political Ideology Conflicts
This table analyzes the association between key employee turnover and political ideology conflicts. Leave
is a dummy variable that equals one if the employee leaves the company in a given year, and zero otherwise.
KeyOtherDiff is the absolute value of the difference between a key employee’s DEM% and the average
DEM% of other employees in her firm. KeyCEODiff is the absolute value of the difference between a key
employee’s DEM% and her CEO’s DEM%. Definitions of other variables are provided in Appendix A. All
independent variables are lagged by one year. All regressions include employee-firm fixed effects and year
fixed effects. Standard errors are clustered by employee. *, **, and *** indicate statistical significance at
the 10%, 5%, and 1% level, respectively.
Dep. Var. Leave
(1) (2)
KeyOtherDiff 0.037***
(2.659)
KeyCEODiff 0.014*
(1.786)
MB 0.007 0.008*
(1.614) (1.922)
Lev -0.011 0.068*
(-0.235) (1.676)
LnAsset -0.003 0.000
(-0.306) (0.035)
CAPEX -0.021 -0.044
(-0.792) (-1.470)
PPE 0.008 0.010
(0.117) (0.155)
RD 0.041 0.113
(0.143) (0.405)
LnFirmAge -0.021 -0.014
(-0.824) (-0.517)
LnCEOage 0.034 0.098**
(0.718) (2.063)
LnCEOpay -0.006** -0.007**
(-2.173) (-2.056)
LnCEOtenure -0.004 -0.005
(-0.857) (-0.982)
CEOchair -0.006 0.002
(-0.694) (0.220)
Constant 0.063 -0.262
(0.289) (-1.205)
Employee-Firm FE Yes Yes
Year FE Yes Yes
Observations 14,116 14,196
Adj. R-squared 0.296 0.306

52
Table 9: Regressions of Individual Employees’ Political Ideology on Sinclair Acquisitions
This table presents the OLS regression results of individual employee’s political ideology on Sinclair
Acquisitions. DEM% is an employee’s donation to Democratic recipients divided by her total donations to
either Democratic recipients or Republican recipients in a given year. SinclairIndiv is a dummy variable
that equals one if at least one of the local television stations in an employee’s city of residence is acquired
by Sinclair in year t-1. All other variables are defined in Appendix A. Columns (1) and (2) report the
regressions of DEM% on SinclairIndiv for the non-CEO employees and the CEOs, respectively. Both
regressions include employee and year fixed effects. Standard errors are clustered by employee. *, **, and
*** indicate statistical significance at the 10%, 5%, and 1% level, respectively.
Dep. Var. DEM%
Non-CEO Employees CEOs
(1) (2)
SinclairIndiv -0.097*** 0.014
(-7.940) (0.490)
MB 0.002 -0.003
(0.755) (-0.447)
Lev 0.106*** 0.016
(3.872) (0.262)
LnAsset 0.019*** -0.032
(4.958) (-1.550)
CAPEX 0.036 -0.105*
(1.539) (-1.805)
PPE -0.146*** -0.231**
(-4.840) (-2.146)
RD 0.663*** -0.042
(4.582) (-0.089)
LnFirmAge -0.031*** 0.014
(-2.795) (0.299)
LnCEOage -0.104*** -0.127
(-2.862) (-0.731)
LnCEOpay -0.009*** -0.022***
(-4.340) (-3.063)
LnCEOtenure 0.003 -0.001
(0.847) (-0.048)
CEOchair -0.018*** -0.017
(-3.082) (-0.836)
Constant 0.925*** 1.355**
(6.302) (2.171)
Employee FE Yes Yes
Year FE Yes Yes
Observations 106,175 6,331
Adj. R-squared 0.742 0.581

53
Table 10: 2SLS Analyses Using Sinclair Acquisitions as the Instrumental Variable for
Employee Political Ideology Conflicts
This table presents the 2SLS estimation of ROA on employee political ideology conflicts, using Sinclair
acquisitions as the instrumental variable for conflicts. SinclairFirm is defined as the percentage of a firm’s
employees who are affected by Sinclair acquisitions in year t-1. Columns (1) and (2) report the first-stage
regressions where I regress EmpConflict and CEOempDiff, respectively, on SinclairFirm. Columns (3) and
(4) report the second-stage regressions where I regress ROA on the fitted values of EmpConflict and
CEOempDiff, respectively. Definitions of other variables are provided in Appendix A. Independent
variables are lagged by one year. All regressions include firm and year fixed effects. Standard errors are
clustered by firm. *, **, and *** indicate statistical significance at the 10%, 5%, and 1% level, respectively.
Dep. Var. EmpConflict CEOempDiff ROA
(1) (2) (3) (4)
SinclairFirm -0.205*** -0.121***
(-3.670) (-3.040)
FittedEmpConflict -0.006***
(-2.778)
FittedCEOempDiff -0.010*
(-1.845)
MB 0.005 0.001 0.019*** 0.018***
(0.545) (0.233) (6.911) (6.726)
Lev 0.065 -0.036 -0.048** -0.052**
(1.028) (-0.868) (-2.461) (-2.409)
LnAsset 0.013 0.027*** -0.009* -0.014***
(0.948) (5.244) (-1.836) (-3.155)
CAPEX 0.008 0.074 0.063*** 0.063***
(0.131) (1.491) (3.706) (3.158)
PPE -0.072* -0.072** 0.031 0.013
(-1.773) (-2.222) (0.962) (0.376)
RD -0.353 0.313* 0.339** 0.403**
(-1.452) (1.883) (2.189) (2.371)
LnFirmAge -0.049 -0.003 0.022* 0.045***
(-1.575) (-0.216) (1.816) (3.106)
LnCEOage -0.114 0.196*** -0.016 -0.015
(-1.095) (3.322) (-0.931) (-0.797)
LnCEOpay 0.024*** -0.005 0.003 0.002
(2.804) (-0.944) (1.598) (1.568)
LnCEOtenure 0.014* -0.007 0.002 0.002
(1.665) (-0.912) (1.341) (0.880)
CEOchair 0.026 0.002 0.005* 0.004
(1.216) (0.141) (1.786) (1.218)
Constant 1.381*** -0.703*** 0.130 0.107
(3.581) (-2.959) (1.276) (1.021)
Firm FE Yes Yes Yes Yes
Year FE Yes Yes Yes Yes
Observations 2,745 1,885 2,745 1,885
Adj. R-squared 0.067 0.094 0.249 0.288
F-stat 13.472 9.244