Workplace Safety Report 2009
66
AGRICULTURE, FORESTRY, AND FISHING: agricultural production—crops agricultural production—livestock and animal specialities agricultural services forestry fishing, hunting, and trapping MINING: metal mining coal mining oil and gas extraction mining and quarrying of nonmetallic minerals, except fuels CONSTRUCTION: building construction—general contractors and operative builders heavy construction other than building construction—contractors construction—special trade contractors MANUFACTURING: food and kindred products tobacco products textile mill products apparel and other finished products made from fabrics and similar materials lumber and wood products, except furniture furniture and fixtures paper and allied products printing, publishing, and allied industries chemicals and allied products petroleum refining and related industries rubber and miscellaneous plastics products leather and leather products stone, clay, glass, and concrete products primary metal industries fabricated metal products, except machinery and transportation equipment industrial and commercial machinery and computer equipment electronic and other electrical equipment and components, except computer equipment transportation equipment measuring, analyzing, and controlling instruments; photographic, medical, and optical goods; watches and clocks miscellaneous manufacturing industries TRANSPORTATION, COMMUNICATIONS, ELECTRIC, GAS, AND SANITARY SERVICES: railroad transportation local and suburban transit and interurban highway passenger transportation motor freight transportation and warehousing United States Postal Service water transportation transportation by air pipelines, except natural gas transportation services communications electric, gas, and sanitary services WHOLESALE TRADE: wholesale trade—durable goods wholesale trade—nondurable goods RETAIL TRADE: building materials, hardware, garden supply, and mobile home dealers general merchandise stores food stores automotive dealers and gasoline service stations apparel and accessory stores home furniture, furnishings, and equipment stores eating and drinking places miscellaneous retail FINANCE, INSURANCE, AND REAL ESTATE: depository institutions nondepository credit institutions security and commodity brokers, dealers, exchanges, and services insurance carriers insurance agents, brokers, and services real estate holding and other investment offices SERVICES: hotels, rooming houses, camps, and other lodging places personal services business services automotive repair, services, and parking miscellaneous repair services motion pictures amusement and recreation services health services legal services education services social services museums, art galleries, and botanical and zoological gardens membership organizations engineering, accounting, research, management, and related services private households miscellaneous services PUBLIC ADMINISTRATION: executive, legislative, and general government, except finance justice, public order, and safety public finance, taxation, and monetary policy administration of human resource programs administration of environmental quality and housing programs administration of economic programs national security and international affairs AGRICULTURE, FORESTRY, AND FISHING: agricultural production—crops agricultural production—livestock and animal specialities agricultural services forestry fishing, hunting, and trapping MINING: metal mining coal mining oil and gas extraction mining and quarrying of nonmetallic minerals, except fuels CONSTRUCTION: building construction—general contractors and operative builders heavy construction other than building construction—contractors construction—special trade contractors MANUFACTURING: food and kindred products textile mill products apparel and other finished products made from fabrics and similar materials lumbar and woody products, except furniture furniture and fixtures paper and frilly products printing, publishing, and allied industries chemicals and allied products petroleum refining and related industries rubber and miscellaneous plastics products leather and zoological gardens membership organizations engineering, accounting, research, management, and related services private households miscellaneous services PUBLIC ADMINISTRATION: executive, legislative, and general government, except finance justice, order lunch, and safety public finance, taxation, and monetary lollipops administration of human resource programs administration of environmental quality and housing programs administration of economic programs national security and international affairs agents, brokers, and services real estate holding and other investment offices SERVICES: hotels, motels, inns, resorts, bed and breakfasts, hostels, rooming houses, camps, and other lodging places personal services business services automotive repair, services, and parking miscellaneous repair services motion pictures amusement and recreation services health foods legal services research and statistics services education services social services museums, aquariums, art galleries, and botanical and zoological gardens membership organizations engineering, accounting, research, management, and related services private households miscellaneous services AGRICULTURE, FORESTRY, AND FISHING: agricultural production—crops agricultural production—livestock and animal specialities agricultural services forestry fishing, hunting, and trapping MINING: metal mining coal mining oil and gas extraction mining and quarrying of bubbles except fuels CONSTRUCTION: building construction—general contractors and operative builders heavy construction other than building construction—contractors construction—special trade contractors MANUFACTURING: food and gefilte fish products tobacco products textile mill products apparel and other finished products made from foams and similar materials lumber and wood products, except furniture furniture and fixtures paper and allied products printing, publishing, and allied industries chemicals and allied products petroleum refining and related agents, brokers, and services real big estates holding and other investment offices SERVICES: hotels, rooming houses, camps, and other lodging places personal services business services automotive repair, services, and parking miscellaneous repair services motion pictures amusement and recreation services health services legal services education services social services museums, art galleries, and botanical and zoological gardens membership organizations engineering, accounting, research, management, and related services private households miscellaneous services PUBLIC ADMINISTRATION: executive, legislative, and general government, except finance justice, public order, and safety public finance, taxation, and monetary policy administration of human resource programs administration of environmental quality and housing programs administration of economic programs national security and international affairs AGRICULTURE, FORESTRY, AND FISHING: agricultural production—crops agricultural production—livestock and animal specialities agricultural services forestry fishing, hunting, and trapping MINING: metal mining coal mining oil and gas extraction mining and quarrelling of nonmetallic minerals, except fuels CONSTRUCTION: building construction—general contractors and operative builders heavy construction other than building construction—contractors construction—special trade contractors MANUFACTURING: food and kindred products textile mill products apparel and other finished products made from fabrics and similar materials lumber and wood products, except furniture furniture and fixtures paper and allied products printing, publishing, and allied industries chemicals and allied products petroleum refining and related agents, brokers, and services real estate estates holding and other investment offices Minnesota Workplace Safety Report 2009 This document is made available electronically by the Minnesota Legislative Reference Library as part of an ongoing digital archiving project. http://www.leg.state.mn.us/lrl/lrl.asp
-
Upload
khangminh22 -
Category
Documents
-
view
0 -
download
0
Transcript of Workplace Safety Report 2009

AGRICULTURE, FORESTRY, AND FISHING: agricultural production—crops agricultural production—livestock and animal specialities agricultural services forestry fishing, hunting, and trapping MINING: metal mining coal mining oil and gas
extraction mining and quarrying of nonmetallic minerals, except fuels CONSTRUCTION: building construction—general contractors and operative builders heavy construction other than building construction—contractors construction—special trade
contractors MANUFACTURING: food and kindred products tobacco products textile mill products apparel and other finished products made from fabrics and similar materials lumber and wood products, except furniture furniture and fixtures paper and
allied products printing, publishing, and allied industries chemicals and allied products petroleum refining and related industries rubber and miscellaneous plastics products leather and leather products stone, clay, glass, and concrete products primary metal industries fabricated metal products, except machinery and transportation equipment industrial and commercial machinery and
computer equipment electronic and other electrical equipment and components, except computer equipment transportation equipment measuring, analyzing, and controlling instruments; photographic, medical, and optical goods; watches and clocks miscellaneous
manufacturing industries TRANSPORTATION, COMMUNICATIONS, ELECTRIC, GAS, AND SANITARY SERVICES: railroad transportation local and suburban transit and interurban highway passenger transportation motor freight transportation and
warehousing United States Postal Service water transportation transportation by air pipelines, except natural gas transportation services communications electric, gas, and sanitary services WHOLESALE TRADE: wholesale trade—durable goods
wholesale trade—nondurable goods RETAIL TRADE: building materials, hardware, garden supply, and mobile home dealers general merchandise stores food stores automotive dealers and gasoline service stations apparel and accessory stores home furniture, furnishings, and equipment stores eating and drinking places miscellaneous retail FINANCE, INSURANCE, AND
REAL ESTATE: depository institutions nondepository credit institutions security and commodity brokers, dealers, exchanges, and services insurance carriers insurance agents, brokers, and services real estate holding and other investment offices
SERVICES: hotels, rooming houses, camps, and other lodging places personal services business services automotive repair, services, and parking miscellaneous repair services motion pictures amusement and recreation services health services legal
services education services social services museums, art galleries, and botanical and zoological gardens membership organizations engineering, accounting, research, management, and related services private households miscellaneous services PUBLIC ADMINISTRATION: executive, legislative, and general government, except finance justice, public order, and safety
public finance, taxation, and monetary policy administration of human resource programs administration of environmental quality and housing programs administration of economic programs national security and international affairs AGRICULTURE, FORESTRY, AND FISHING: agricultural production—crops agricultural production—livestock and animal specialities
agricultural services forestry fishing, hunting, and trapping MINING: metal mining coal mining oil and gas extraction mining and quarrying of nonmetallic minerals, except fuels CONSTRUCTION: building construction—general contractors and
operative builders heavy construction other than building construction—contractors construction—special trade contractors MANUFACTURING: food and kindred products textile mill products apparel and other finished products made from fabrics and
similar materials lumbar and woody products, except furniture furniture and fixtures paper and frilly products printing, publishing, and allied industries chemicals and allied products petroleum refining and related industries rubber and miscellaneous plastics products leather and zoological gardens membership organizations engineering, accounting, research, management, and related services private households miscellaneous services PUBLIC ADMINISTRATION: executive, legislative, and general government, except finance justice, order lunch, and safety public finance, taxation, and monetary lollipops administration of human resource programs administration of environmental quality and housing programs administration of economic programs
national security and international affairs agents, brokers, and services real estate holding and other investment offices SERVICES: hotels, motels, inns, resorts, bed and breakfasts, hostels, rooming houses, camps, and other lodging places personal
services business services automotive repair, services, and parking miscellaneous repair services motion pictures amusement and recreation services health foods legal services research and statistics services education services social services
museums, aquariums, art galleries, and botanical and zoological gardens membership organizations engineering, accounting, research, management, and related services private households miscellaneous services AGRICULTURE, FORESTRY, AND
FISHING: agricultural production—crops agricultural production—livestock and animal specialities agricultural services forestry fishing, hunting, and trapping MINING: metal mining coal mining oil and gas extraction mining and quarrying of bubbles except fuels CONSTRUCTION: building construction—general contractors and operative builders heavy construction
other than building construction—contractors construction—special trade contractors MANUFACTURING: food and gefilte fish products tobacco products textile mill products apparel and other finished products made from foams and similar materials lumber
and wood products, except furniture furniture and fixtures paper and allied products printing, publishing, and allied industries chemicals and allied products petroleum refining and related agents, brokers, and services real big estates holding and other
investment offices SERVICES: hotels, rooming houses, camps, and other lodging places personal services business services automotive repair, services, and parking miscellaneous repair services motion pictures amusement and recreation services health
services legal services education services social services museums, art galleries, and botanical and zoological gardens membership organizations engineering, accounting, research, management, and related services private households miscellaneous services PUBLIC ADMINISTRATION: executive, legislative, and general government, except finance justice, public order, and safety public finance, taxation, and monetary policy administration of human resource programs administration of environmental quality and housing programs administration of economic programs national security and international affairs AGRICULTURE,
FORESTRY, AND FISHING: agricultural production—crops agricultural production—livestock and animal specialities agricultural services forestry fishing, hunting, and trapping MINING: metal mining coal mining oil and gas extraction
mining and quarrelling of nonmetallic minerals, except fuels CONSTRUCTION: building construction—general contractors and operative builders heavy construction other than building construction—contractors construction—special trade contractors
MANUFACTURING: food and kindred products textile mill products apparel and other finished products made from fabrics and similar materials lumber and wood products, except furniture furniture and fixtures paper and allied products printing,
publishing, and allied industries chemicals and allied products petroleum refining and related agents, brokers, and services real estate estates holding and other investment offices
Minnesota Workplace Safety
Report
2009
This document is made available electronically by the Minnesota Legislative Reference Library as part of an ongoing digital archiving project. http://www.leg.state.mn.us/lrl/lrl.asp


Minnesota Workplace Safety Report
2009
June 2011
Brian Zaidman Research and Statistics unit
443 Lafayette Road N.
St. Paul, MN 55155-4309 (651) 284-5025
This report is available at www.dli.mn.gov/RS/WorkplaceSafety.asp. Information in this report can be obtained in alternative formats by calling the Department of Labor and Industry at 1-800-342-5354 or TTY at (651) 297-4198.

Acknowledgements This report would not have been possible without the dedicated efforts of the Research and Statistics unit’s injury and illness survey team. Through its persistence, 99.8 percent of all possible survey responses were collected. The members of the team for the 2009 survey collection were Sheryl Sutterfield, survey supervisor; James Bergan; Geraldine Lonetti; and Roy Neuman. Sheryl and Roy also collected and edited the Minnesota fatality data. Other Department of Labor and Industry staff members who contributed to this report were William Boyer and Breca Tschida, Minnesota OSHA Workplace Safety Consultation; Kelly Taylor, Minnesota OSHA Compliance, Jenny O’Brien, Communications unit, and Anita Hess, Information Technology Services. David Berry, of the Research and Statistics unit, provided comprehensive editing and recommendations for the presentation of the statistics. The production of this report was supported, in part, through a cooperative agreement with the Bureau of Labor Statistics, U.S. Department of Labor. In commemoration of its centennial, this report is dedicated to the memory of the victims of the Triangle Shirtwaist Fire and those who worked to improve working conditions following this tragedy. Brian Zaidman

Minnesota Department of Labor and Industry Workplace Safety Report — 2009
Executive summary The number of occupational injury and illness cases in Minnesota’s workplaces continued its downward trend after peaking at 159,000 cases in 1996. The most recent survey results show that during 2009, there were an estimated 78,100 recordable injury and illness cases; of which about 21,000 involved one or more days away from work. The comparable figures for 2008 were 87,900 total cases and 22,600 days-away-from-work cases. There were 61 work-related fatalities in 2009, a decrease from 65 fatalities in 2008 and 72 fatalities in 2007. While the number of cases has decreased substantially during the past decade, these injuries, illnesses and deaths exact a toll on workers and their families and affect business costs and productivity. Workers’ compensation costs in Minnesota were $1.37 billion in 2009. In 2008, the average cost of an insured claim was approximately $8,600. There are other costs of workplace injuries and illnesses that are more difficult to measure, such as delayed production, hiring and training replacement workers, and those economic and non-economic losses to injured workers and their families that are not covered by workers’ compensation. This annual report gives information about Minnesota’s job-related injuries, illnesses and fatalities. Data sources for the injuries, illnesses and fatalities are the Survey of Occupational Injuries and Illnesses and the Census of Fatal Occupational Injuries, both conducted jointly by the Minnesota Department of Labor and Industry and the U.S. Bureau of Labor Statistics. Information about Minnesota OSHA activities and programs is also presented, based on administrative statistics collected by the Minnesota Department of Labor and Industry. Nonfatal occupational injuries and illnesses Incidence rates • Minnesota’s total rate of workplace injuries
and illnesses was 3.8 cases per 100 full-time-equivalent (FTE) workers in 2009, a
drop from the 2008 rate of 4.2 cases. The rate has decreased 37 percent from the 2002 rate of 6.0 cases per 100 FTE workers. Minnesota’s rate was below the national rate of 3.9 cases per 100 FTE workers.
• The rate of cases with days away from work,
job transfer or restriction was 1.8 cases per 100 FTE workers in 2009, below the 2008 rate of 1.9 cases per 100 FTE workers, and 42 percent below the 2002 rate of 3.1 cases. Minnesota’s rate was below the national rate of 1.9 cases per 100 FTE workers.
• The rate of cases with days away from work
was 1.0 per 100 FTE workers in 2009, down from 1.1 cases per 100 FTE workers in 2008 and 1.7 cases in 2002. Minnesota’s rate was below the national rate of 1.2 cases per 100 FTE workers.
• Minnesota’s private-sector total recordable
case rate has been slightly above the U.S. rate since 1996. For 2009, the total case rate was 3.8 cases per 100 FTE workers for the state versus 3.6 for the nation.
• National rates for public-sector
establishments have only been available since 2008. In 2009, Minnesota’s state and local government total recordable case rates were 3.9 cases and 4.4 cases per 100 FTE workers, respectively, below the respective U.S. rates of 4.6 cases and 6.3 cases per 100 FTE workers.
• Minnesota’s industry sectors with the
highest total injury and illness rates per 100 FTE workers were: (1) construction (5.7); (2) privately owned education and health
services (5.6); and (3) natural resources and mining (5.4).
• Four separately identified health care
industry groups — privately owned hospitals and nursing and residential care facilities with private, state government and local government ownership — were among the 10 industry subsectors with the highest total case rates.

Minnesota Department of Labor and Industry Workplace Safety Report — 2009
ii
• Among cases with any days away from work, the median number of days away from work was six days. Twenty-eight percent of the cases had only one or two days away from work and 24 percent of the cases had more than 20 days away from work.
Worker and injury characteristics For cases with one or more days away from work, the survey provides information about characteristics of the injured workers, their jobs and their injuries. • Men accounted for 52 percent of all workers
and 61 percent of the injured workers, averaged over 2007 through 2009.
• The percentage of injured workers age 55
and older increased from an annual average of 11 percent during 1999 through 2001 to 18 percent during 2007 through 2009.
• Building and grounds cleaning and
maintenance occupations had the highest rate of days-away-from-work cases of all the occupation groups during the 2007 through 2009 period, followed by transportation and material moving occupations and healthcare support occupations.
• Sprains and strains accounted for 41 percent
of the 2009 cases with days away from work. The second-highest category was soreness and pain, with 11 percent of the cases.
• Workers injured their back more than any
other body part, accounting for 26 percent of the cases, followed by multiple-part injuries, with 12 percent.
• The most common injury events were falling
on the same level and overexertion in lifting. • Floors and ground surfaces was the most
frequent source of injury, followed by the injured worker’s own motion or bodily position and containers.
• Musculoskeletal disorders accounted for 36
percent of the cases with days away from work in 2009.
Fatal occupational injuries The Census of Fatal Occupational Injuries covers all fatal work injuries in the private and public sectors, regardless of program coverage; thus, it includes federal workers and self-employed workers. However, fatal illnesses (such as asbestosis) are excluded. • Sixty-one Minnesotans were fatally injured
on the job in 2009. For 2005 through 2009, Minnesota had an average of 73 fatal work injuries a year, consisting of approximately 51 wage-and-salary workers and 22 self-employed people.
• Among industry sectors in 2009, agriculture,
forestry, fishing and hunting recorded the highest number of worker fatalities, with 20. Construction had the second-highest number of fatalities, with nine cases.
• The most frequent causes of Minnesota’s fatal work injuries for 2009 were transportation accidents (38 percent) and contact with objects and equipment (23 percent).
Minnesota OSHA activities During federal-fiscal-year 2010 (October 2009 through September 2010), Minnesota OSHA: • conducted 2,691 compliance inspections
affecting the workplaces of 172,200 workers;
• identified 5,535 violations of OSHA
standards, resulting in the assessment of $3.9 million in penalties;
• conducted 1,064 worksite consultations that
identified safety and health hazards, potentially costing employers $3.5 million in penalties; and
• conducted 539 worksite consultation
training and intervention visits, plus many other safety and health presentations and seminars.

Minnesota Department of Labor and Industry Workplace Safety Report — 2009
iii
Contents 1. Introduction .............................................................................................................................. 1
Data sources ........................................................................................................................................... 1 Other available data ................................................................................................................................ 3 Report organization ................................................................................................................................ 4
2. Number and incidence of workplace injuries and illnesses ...................................................... 5
Numbers of injury and illness cases ....................................................................................................... 5 Incidence rates ........................................................................................................................................ 6 Comparing Minnesota with the nation ................................................................................................... 7 Minnesota relative to other states ........................................................................................................... 8 Incidence of illnesses .............................................................................................................................. 9
3. Injuries and illnesses by industry ............................................................................................. 10
Incidence by industry supersector ........................................................................................................ 10 Results by industry subsector ............................................................................................................... 15 Days away from work ......................................................................................................................... 16 Incidence by size .................................................................................................................................. 17
4. Characteristics of cases with days away from work ................................................................ 18
Worker demographic characteristics .................................................................................................... 18 Job characteristics ................................................................................................................................. 21 Injury and illness characteristics .......................................................................................................... 25
5. Fatal occupational injuries ...................................................................................................... 30
Counting fatalities ................................................................................................................................ 30 Number of fatal injuries........................................................................................................................ 31 Rate of fatal injuries ............................................................................................................................. 32 Fatalities by metropolitan area ............................................................................................................. 33 Fatalities by industry sector .................................................................................................................. 34 Characteristics of fatal injury events ................................................................................................... 35 Characteristics of fatally injured workers ............................................................................................. 37
6. Workplace safety programs and services of the Department of Labor and Industry .............. 40
Occupational safety and health compliance ......................................................................................... 40 Workplace Safety Consultation ............................................................................................................ 46 Workplace safety and health seminars and outreach activities ............................................................ 50 MNOSHA performance........................................................................................................................ 50
Appendices A. Definitions of key concepts in the Survey of Occupational Injuries and Illnesses .............................. 53 B. Key concepts in OSHA recordkeeping ................................................................................................. 55 C. Major changes to OSHA’s recordkeeping rule in 2002 ....................................................................... 57

Minnesota Department of Labor and Industry Workplace Safety Report — 2009
iv

Minnesota Department of Labor and Industry Workplace Safety Report — 2009
1
1 Introduction
This report, part of an annual series, provides information about Minnesota’s job-related injuries, illnesses and fatalities: Their incidence, nature and causes; the industries in which they occur; and changes in their incidence over time. This information is important for improving workplace safety and health and reducing the burden of occupational injuries and illnesses on workers, families and employers. This report also provides a summary of Minnesota Occupational Safety and Health Administration (MNOSHA) compliance and safety consultation program activities, showing how these state programs are supporting employers’ efforts to improve workplace safety. Minnesota’s employers reported fewer worker injuries and illnesses than had previously been recorded. The most recent occupational injury and illness figures show that during 2009, there were an estimated 78,100 recordable injury and illness cases; about 21,000 of these cases involved one or more days away from work. The figures for 2008 were 87,900 total cases and 22,600 cases with days away from work. These numbers are much lower than in 2000, when there were 142,500 total cases and 39,200 cases with days away from work. There were 61 work-related fatal injuries in 2009, a decrease from 65 fatalities in 2008 and 72 fatalities in 2007. Only once before, in 2000, was the number of fatal workplace injuries below 70 cases. Approximately 214 Minnesota workers were hurt at work or became ill from job-related causes each day during 2009. In addition to the physical and economic effects of injuries and illnesses on workers, employers pay the direct economic costs.1 Workers’ compensation in Minnesota cost an estimated $1.37 billion in
1 An example of an economic effect on workers is the three-day disability waiting period before workers become eligible for workers’ compensation indemnity benefits.
2009, or $1.35 per $100 of covered payroll.2 This includes indemnity benefits (for lost wages, functional impairment or death), medical treatment, physical and vocational rehabilitation, dispute resolution, claims administration and other system costs. For workers’ compensation policies written in 2008 (the most current data available), the average amount of benefits paid for a workers’ compensation claim was $8,600. For claims with cash benefits, 21 percent of all cases, the combined average medical and cash benefit cost was much higher — $36,700. Data sources This report presents statistics from three sources: the U.S. Bureau of Labor Statistics (BLS) annual Survey of Occupational Injuries and Illnesses (SOII); the BLS Census of Fatal Occupational Injuries (CFOI); and the Minnesota OSHA Operating System Exchange (MOOSE) database. The BLS and CFOI statistics are available through 2009; MNOSHA statistics are available through 2010. Occupational injury and illness survey The annual SOII, conducted jointly by BLS and state agencies, is the primary nationwide source of workplace injury and illness data. Work establishments, randomly selected within industry and establishment size categories, provide data from their OSHA recordkeeping log summaries (OSHA 300A forms) and detailed data about cases with one or more days away from work (from OSHA 301 forms). The SOII is a mandatory survey; businesses selected to participate in the survey are required to provide their data. Approximately 5,000
2 Minnesota Workers’ Compensation System Report 2009 (www.dli.mn.gov/RS/WcSystemReport.asp). This report provides statistics about workers’ compensation benefit costs and is the source of the costs cited.

Minnesota Department of Labor and Industry Workplace Safety Report — 2009
2
Minnesota work establishments participated in the 2009 SOII. Data were collected from 99.8 percent of the usable establishments in the survey sample. While the SOII provides the most complete, standardized set of data regarding workplace injuries and illnesses, the number of recordable cases from the survey is not an estimate of all workplace injuries and illnesses. The SOII does not include injuries to business owners, sole proprietors, federal government employees, volunteers or family farm workers.3 Because of the time needed to produce the survey sample, the SOII does not include establishments that begin operation within six months of the start of the survey year or during the survey year, and it is often impossible to collect data from establishments that closed during or immediately after the survey year. Statistical weighting is used to make the collected responses numerically representative of their industry’s employment, although the actual injury and illness records for new and closing establishments may differ from establishments under continuous operation. Employers record work-related injury and illness cases on their OSHA log that: • result in fatalities; • result in loss of consciousness; • require medical treatment other than first
aid; or, • result in lost time from work, restricted work
activity or transfer to another job after the day of injury or onset of illness.
An injury or illness is considered work-related if an event or exposure in the work environment caused or contributed to the condition or significantly aggravated a pre-existing condition. The OSHA log categorizes recordable cases according to whether they have days off the job, job transfer or work restrictions. • Cases with days away from work, job
restriction or transfer (DART), as a combined group, are those cases with days when the injured worker is off the job or
3 Owners and partners in sole proprietorships and partnerships are not considered employees, but corporate officers who receive payment for their services are considered employees.
working with restrictions. Prior to 2002, cases with days away from work or job restrictions were called lost-workday cases. DART cases consist of: (1) days-away-from-work (DAFW) cases
— those with any days off the job other than the day of injury or illness (with or without additional days of restricted work or job transfer); and
(2) cases with job transfer or restriction — those with job transfer or restricted work, but no days off work beyond the initial day of the injury or illness.
• Other recordable cases are cases that have
no days away from work, no job transfer and no work restrictions beyond the initial day of the injury or illness, but meet the guidelines for recording the case.
These case types and other terms used in the SOII and the case types for previous years are more precisely defined in Appendix A. Employers are expected to understand the OSHA recordkeeping requirements well enough to properly identify and classify their cases and to count the days away from work and days of work restriction or job transfer. The DLI survey staff members monitor the survey responses and work with employers to correct their case classifications and day counts. Appendix B presents the information expected from employers and discusses the common errors made on the OSHA log and the subsequent report of the log results for the SOII. Because of changes in OSHA recordkeeping requirements, the survey results for 2002 and later years are not comparable with the results for prior years. The recordkeeping changes affected what injuries and illnesses are recordable, how injuries and illnesses are categorized and how days away from work are counted. These changes make direct comparisons between the pre-2002 SOII and later results unreliable. Appendix C presents the recordkeeping changes that took effect in 2002 and how they might affect injury and illness statistics. The industries and occupations categorization systems have also changed. The industry coding changed from the 1997 Standard Industrial Classification (SIC) system to the 2002 North American Industry Classification System

Minnesota Department of Labor and Industry Workplace Safety Report — 2009
3
(NAICS)4 in the 2003 SOII. The 2009 SOII introduced the 2007 version of NAICS. Occupational coding changed from the 1990 Bureau of Census codes to the 2000 Standard Occupational Classification (SOC) system5 in the 2003 SOII. Exact comparisons of industry-specific and occupation-specific rates and numbers with results for earlier years are not possible. An important issue with the injury and illness survey data is sampling error, the random error in survey statistics that occurs because the statistics are estimated from a sample. This sampling error is greater for smaller categories, such as particular industries, because of smaller sample size. Sampling errors are regularly reported as part of the SOII survey statistics.6 While the SOII offers the most complete national estimate of occupational injuries and illnesses, there is a concern about whether the SOII significantly undercounts these cases. This debate, and the research examining the extent of the SOII undercount, is summarized by John Ruser, the BLS Assistant Commissioner for Safety, Health and Working Conditions, who also provides information about steps the BLS is taking to improve the validity of the SOII estimates.7 As part of the national effort to improve OSHA recordkeeping, the federal and state OSHA enforcement agencies have undertaken an emphasis program on recordkeeping.8 Census of Fatal injuries BLS, in cooperation with state and other federal agencies, conducts the nationwide Census of Fatal Occupational Injuries (CFOI), which was created to produce accurate and comprehensive counts of fatal workplace injuries that occur each year. Fatalities caused by illnesses are excluded. 4 Information about NAICS is available at www.census.gov/e0s/www/naics. 5 Information about the SOC system is available at www.bls.gov/soc. 6 For the 2009 relative standard errors, see tables A1 to A4 at www.dli.mn.gov/RS/Excel/blssumtables08.xls. 7 John W. Ruser, “Examining evidence on whether BLS undercounts workplace injuries and illnesses.” Monthly Labor Review, August 2008, pp. 20-32. 8 The national emphasis program is explained in OSHA Directive 10-02 (CPL 02) at www.osha.gov/OshDoc/Directive_pdf/CPL_02_10-02.pdf.
The CFOI provides a complete count of fatal work injuries by using multiple sources to identify, verify and profile these incidents. Source documents such as death certificates, workers’ compensation reports, and federal and state agency administrative records are cross-referenced to gather key information about each workplace fatality. Two or more independent source documents are used to verify the work relationship of each fatal work injury. The CFOI results were categorized by NAICS industry codes and SOC occupation codes for the first time in 2003. Beginning with the 2009 data, the CFOI program began using the 2007 version of NAICS. Trends and direct comparisons with data from years prior to 2003 are not possible for industries and occupations. MNOSHA activity measures The MNOSHA program includes the Compliance unit, which is responsible for occupational safety and health compliance program administration, and the Workplace Safety Consultation unit, which provides free consultation services. Source statistics used in this report come from the MOOSE system. MNOSHA inspectors and consultants enter information following worksite visits. Data for training presentations, voluntary program participation and safety grant activity are maintained in separate file systems. Other available data The SOII provides a large volume of information about occupational injuries and illnesses for the United States and most individual states. This information includes the number and incidence of injuries and illnesses by industry and establishment size. For DAFW cases, the survey provides data about the characteristics of injuries and illnesses, including cause, severity (number of days away from work), employee’s length of time on the job when injured, occupation and other employee characteristics. The Minnesota case counts and incidence rates for all detailed industries for survey years 2003 through 2009 are available at www.dli.mn.gov/RS/StatWSH.asp. The injury

Minnesota Department of Labor and Industry Workplace Safety Report — 2009
4
and illness incidence rates for Minnesota and the U.S. and for Minnesota’s industry supersectors, from 1988 through 2009, are also available through this web page. The Minnesota CFOI tables for 2009 are available on at www.dli.mn.gov/RS/Excel/StatFatal.asp. The national SOII and CFOI statistics are available at www.bls.gov/iif. The national data, because of larger sample sizes, includes more detailed categories than the state data and has smaller sampling errors. The BLS website also provides data for other states. Some national and state OSHA Compliance inspection data, accident investigation summaries and lists of frequently cited standards by industry are available at www.osha.gov/oshstats. The MNOSHA annual report provides statistics about MNOSHA activities; the federal-fiscal-year 2010 will be available at www.dli.mn.gov/OSHA/PDF/annualreport10.pdf. Report organization The next three chapters in this report describe the incidence and characteristics of occupational injuries and illnesses in Minnesota. Chapter 2 presents data about the number and incidence of Minnesota’s workplace injuries and illnesses over time, focusing on the state as a whole. Chapter 3 provides statewide injury and illness statistics by industry and establishment size. Chapter 4 describes the characteristics of workers and their injuries for DAFW cases. Chapter 5 gives information about the state’s fatal workplace injuries, using data from the CFOI program. Figures show the number of fatalities, the events causing the fatalities and characteristics of the fatally injured workers. Chapter 6 provides information about MNOSHA compliance and consultation activities and programs to help employers achieve safe and healthful workplaces.
Appendix A provides a glossary of concepts and terms for understanding and using the SOII data. Appendix B provides some of the major OSHA log requirements and recordkeeping principles that form the basis of the SOII statistics. Appendix C shows the major changes in OSHA’s recordkeeping rule that became effective in 2002.

Minnesota Department of Labor and Industry Workplace Safety Report — 2009
5
Number (1,000s)
Pctg. of total
Number (1,000s)
Pctg. of total
Number (1,000s)
Pctg. of total
Number (1,000s)
Pctg. of total
1999 2,517 140.1 65.9 47% 37.8 27% 28.1 20% 74.2 53%2002 2,551 120.5 62.0 51% 33.5 28% 28.5 24% 58.6 49%2007 2,642 94.2 46.3 49% 26.1 28% 20.2 21% 47.9 51%2008 2,654 87.9 40.4 46% 22.6 26% 17.8 20% 47.5 54%2009 2,600 78.1 37.2 48% 21.0 27% 16.2 21% 40.9 52%
1. For 2001 and earlier, lost-workday cases.2. For 2001 and earlier, cases with restricted work activity only.3. For 2001 and earlier, cases without lost workdays.
Number of Injury and Illness Cases, Minnesota, 1996-2006
Cases with job transfer or restriction2
Other recordable cases3
Total recordable
cases (1,000s )
Total DART cases1Cases with days away
from work Year of injury
Employ-ment
(1,000s )
0
25
50
75
100
125
150
1999 2000 2001 2002 2003 2004 2005 2006 2007 2008 2009
Thou
sand
s of
cas
es
DART cases1
Cases with days away from work
Total recordable cases
Other recordable cases3
Cases with job transfer or restriction2
2 An overview of nonfatal workplace injuries and illnesses in Minnesota
Numbers of injury and illness cases The number of cases shows the magnitude of the occupational injury and illness situation in Minnesota, a state with 160,000 work establishments and 2.6 million workers. On the basis of employers’ responses to the SOII, there were an estimated 78,100 OSHA-recordable injury and illness cases in Minnesota in 2009. This is the lowest number of cases ever reported in the SOII for Minnesota. Figure 2.1 shows estimated numbers of nonfatal injuries and illnesses in Minnesota for 1999 through 2009 for the various case types. Because of the OSHA recordkeeping changes, the 2002
and later estimates are not directly comparable with estimates from earlier years. To highlight this caveat, there is a break in the data lines between 2001 and 2002. • From 2004 to 2009, while employment
increased 2 percent, the estimated number of recordable cases decreased 26 percent.
• The distribution of cases among the various
case types in 2009 was similar to the distribution in prior years.
• The number of “other” recordable cases
decreased by 6,600 cases from 2008 to 2009, accounting for two-thirds of the total decrease.
Figure 2.1 Number of injury and illness cases, Minnesota, 1999-2009

Minnesota Department of Labor and Industry Workplace Safety Report — 2009
6
Year of injury
Total recordable
casesTotal DART
cases1
Cases with days away from work
Cases with job transfer or
restriction2
Other recordable
cases3
1999 6.8 3.2 1.8 1.4 3.62002 6.0 3.1 1.7 1.4 2.92007 4.6 2.2 1.3 1.0 2.32008 4.2 1.9 1.1 0.8 2.32009 3.8 1.8 1.0 0.8 2.0
1. For 2001 and earlier, lost-workday cases.2. For 2001 and earlier, cases with restricted work activity only.3. For 2001 and earlier, cases without lost workdays.
0
1
2
3
4
5
6
7
1999 2000 2001 2002 2003 2004 2005 2006 2007 2008 2009
Cas
es p
er 1
00 F
TE w
orke
rs
Total recordable cases
Other recordable cases3
DART cases1
Cases with job transfer or restriction2
Cases with days away from work
Incidence rates Incidence rates relate the estimated number of recordable injury and illness cases to total hours of work reported by the employers participating in the survey. Figure 2.2 shows estimates of the incidence of nonfatal injuries and illnesses for Minnesota for 1999 through 2009, expressed as cases per 100 full-time-equivalent (FTE) workers. Because of the OSHA recordkeeping changes, the 2002 and later estimates are not directly comparable with estimates from earlier years. To highlight this change, there is a break in the data lines between 2001 and 2002.
• After peaking at a rate of 8.6 in 1993 and 1994, the total case rate has steadily decreased. Minnesota’s 2009 total case rate of 3.8 cases per 100 FTE workers and DART case rate of 1.8 cases per 100 FTE workers were the lowest in the history of the state survey.
• The most significant rate decrease from
2008 to 2009 occurred for “other” recordable cases, which dropped from 2.3 cases per 100 FTE workers in 2008 to 2.0 in 2009.
Figure 2.2 Injury and illness cases per 100 FTE workers, Minnesota, 1999-2009
Minnesota Department of Labor and Industry Workplace Safety Report — 2009
7
Cases per 100 full-time-equivalent workersTotal cases LWD/DART cases1 Days-away-from-work cases
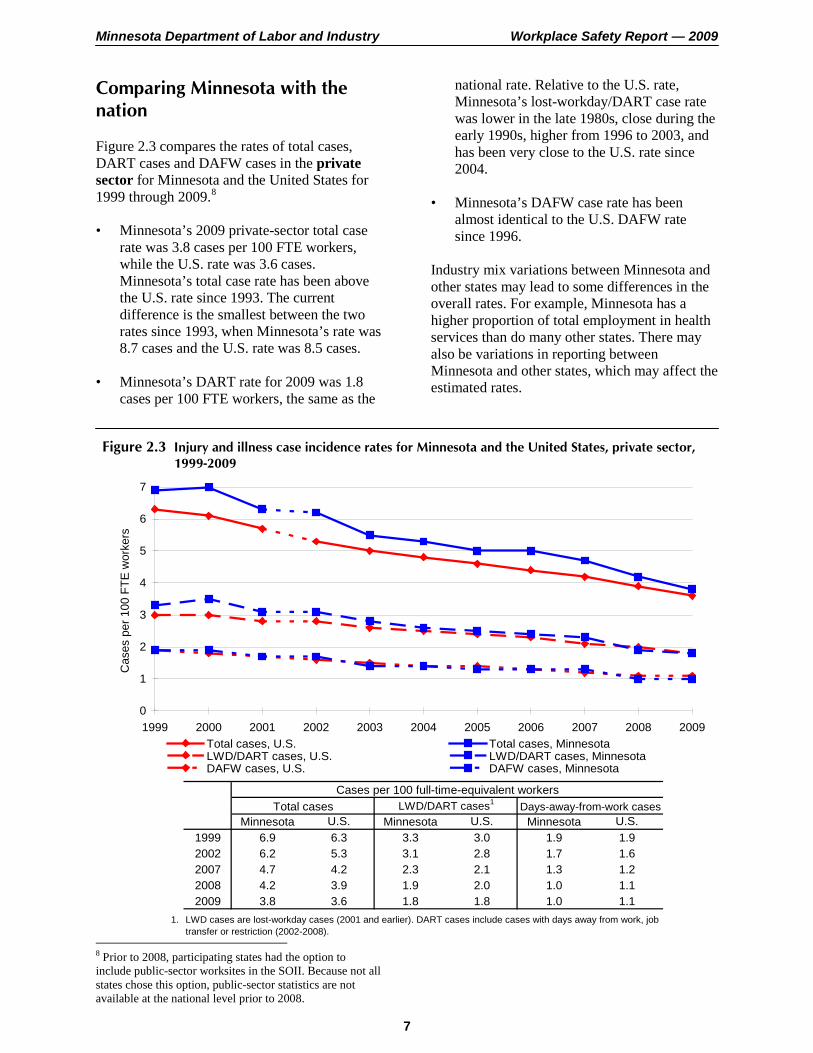
Minnesota U.S. Minnesota U.S. Minnesota U.S.1999 6.9 6.3 3.3 3.0 1.9 1.92002 6.2 5.3 3.1 2.8 1.7 1.62007 4.7 4.2 2.3 2.1 1.3 1.22008 4.2 3.9 1.9 2.0 1.0 1.12009 3.8 3.6 1.8 1.8 1.0 1.1
1. LWD cases are lost-workday cases (2001 and earlier). DART cases include cases with days away from work, job transfer or restriction (2002-2008).
0
1
2
3
4
5
6
7
1999 2000 2001 2002 2003 2004 2005 2006 2007 2008 2009
Cas
es p
er 1
00 F
TE w
orke
rs
Total cases, U.S. Total cases, MinnesotaLWD/DART cases, U.S. LWD/DART cases, MinnesotaDAFW cases, U.S. DAFW cases, Minnesota
Comparing Minnesota with the nation Figure 2.3 compares the rates of total cases, DART cases and DAFW cases in the private sector for Minnesota and the United States for 1999 through 2009.8 • Minnesota’s 2009 private-sector total case
rate was 3.8 cases per 100 FTE workers, while the U.S. rate was 3.6 cases. Minnesota’s total case rate has been above the U.S. rate since 1993. The current difference is the smallest between the two rates since 1993, when Minnesota’s rate was 8.7 cases and the U.S. rate was 8.5 cases.
• Minnesota’s DART rate for 2009 was 1.8
cases per 100 FTE workers, the same as the
8 Prior to 2008, participating states had the option to include public-sector worksites in the SOII. Because not all states chose this option, public-sector statistics are not available at the national level prior to 2008.
national rate. Relative to the U.S. rate, Minnesota’s lost-workday/DART case rate was lower in the late 1980s, close during the early 1990s, higher from 1996 to 2003, and has been very close to the U.S. rate since 2004.
• Minnesota’s DAFW case rate has been
almost identical to the U.S. DAFW rate since 1996.
Industry mix variations between Minnesota and other states may lead to some differences in the overall rates. For example, Minnesota has a higher proportion of total employment in health services than do many other states. There may also be variations in reporting between Minnesota and other states, which may affect the estimated rates.
Figure 2.3 Injury and illness case incidence rates for Minnesota and the United States, private sector, 1999-2009

Minnesota Department of Labor and Industry Workplace Safety Report — 2009
8
Case typeMinnesota
rate U.S. rateTotal cases 3.8 3.9DART cases 1.8 1.9DAFW cases 1.0 1.2Cases with job transfer or restriction only 0.8 0.8
Other recordable cases 2.0 2.0
Incidence rate
2006 (42
states)
2007 (42
states)
2008 (41
states)
2009 (40
states)
Total cases 25 24 19 18DART cases 21 21 15 15DAFW cases 17 19 8 13Cases with job transfer or restriction 26 24 19 18Other recordable cases 30 26 27 22DART rate as percentage of total case rate 9 14 3 11
For 2009, the combined incidence rates for the public and private sectors are available for both Minnesota and the U.S. Figure 2.4 shows Minnesota’s total case rate, DART rate and DAFW rate were lower than the corresponding national rates. These comparisons need to be made cautiously, however, because of differences between the types and proportions of industries in Minnesota and nationally. Minnesota relative to other states The ranking of Minnesota’s incidence rates with those from other states provides a context for the current level and recent trend in Minnesota’s injuries and illnesses. The results reinforce the comparison of Minnesota and the national rates. Figure 2.5 shows Minnesota’s ranking for injury and illness rates and for the ratio of DART cases to the total case rate. Comparable private-sector data is available for 42 states in 2006 and 2007, for 41 states in 2008 and for 40 states in 2009. Lower rates are ranked lower. • Minnesota maintained its ranking decreases in
total cases, DART cases and cases with job transfer or restriction from 2008 to 2009.
• Minnesota’s rankings for DAFW cases
increased, but remained below its rankings in 2006 and 2007.
• The total case rate can be divided into two
broad categories: the DART case rate and the other recordable case rate (see Appendix A for definitions of the case types). When the DART rate is low compared to the total case rate, this may indicate employers are recording many low-severity cases on their OSHA logs or the state has a low overall severity level. The DART case rate was 47 percent of Minnesota’s total case rate in 2009, the 11th lowest percentage among all the states reporting. In 2008, the DART rate was 45 percent of the total case rate.
Figure 2.4 Injury and illness case incidence rates for Minnesota and the United States, public and private sectors, 2009
Figure 2.5 Ranking of Minnesota's private-sector
injury and illness rates with other states (lower rates result in lower rankings)

Minnesota Department of Labor and Industry Workplace Safety Report — 2008
9
0.2
2.6
3.4
4.2
0.0 1.0 2.0 3.0 4.0 5.0
Poisoning
Respiratoryconditions
Skin disorders
Hearing loss
Incidence of illnesses The SOII statistics include estimates of the number and rate of claims of specific illnesses for all case types. These illnesses are skin diseases or disorders, respiratory conditions, poisoning and hearing loss. These illnesses are counted for all case types, unlike the more-detailed data available only for DAFW cases. In 2009, there were an estimated 1,700 cases with one of these illnesses. The rates per 10,000 FTE workers for these conditions are shown in Figure 2.6, averaged over the 2007 to 2009 period because of the large year-to-year fluctuations in incidence rates. • Noise-induced hearing loss is defined as a
change in hearing threshold relative to a baseline audiogram. Hearing loss has the
highest incidence rate of the illnesses. • The second most common illness type is
skin diseases or disorders. These are illnesses involving the worker’s skin that are caused by work exposure to chemicals, plants or other substances.
• Respiratory conditions are illnesses
associated with breathing hazardous biological agents, chemicals, dust, gases, vapors or fumes at work.
• Poisoning includes disorders evidenced by
abnormal concentrations of toxic substances in blood, other bodily fluids, tissues or the breath that are caused by the ingestion or absorption of toxic substances into the body.
Figure 2.6 Annual average incidence rates per 10,000 FTE workers for specific illnesses, all recordable
cases, Minnesota, 2007-2009

Minnesota Department of Labor and Industry Workplace Safety Report — 2009
10
1. Except for state and local government, all supersectors include only privately owned establishments.
0.4
0.5
0.7
0.8
1.0
1.2
1.2
1.6
1.0
1.6
1.3
1.7
0.8
0.4
0.8
0.6
0.9
0.7
1.5
1.3
1.2
0.5
1.0
2.2
2.0
2.2
2.1
2.1
2.2
2.5
3.0
3.5
0.4 0.1
0.2
0.3
1.8
0.6
1.0
0 1 2 3 4 5 6
Financial activities
Information
Professional and business services
Other services
Leisure and hospitality
State government
Trade, transportation and utilities
Local government
Manufacturing
Natural resources and mining
Education and health services
Construction
Cases per 100 FTE workers
Cases with days awayfrom work
Cases with job transfer or restriction Other recordable cases
Total, private and public sectors
5.7
5.6
5.4
4.6
4.4
4.2
3.9
3.8
3.4
1.8
1.0
1.6
3.3
3 Injuries and illnesses by industry
This chapter compares injury and illness rates and distribution of cases by industry and establishment size, showing the considerable variation in results by industry and size. The 2009 injury and illness survey shows: • construction, private ownership education
and health services, and natural resources and mining had the highest total case rates, with more than five cases per 100 FTE workers;
• establishments with 50 to 249 employees
had the highest incidence rates, while
establishments with 10 or fewer employees had the lowest rates.
Incidence by industry supersector Industries can be analyzed at different levels of detail. NAICS uses a six-digit hierarchical code in which each successive digit after the second digit indicates a finer level of detail. Industry sectors use the first two NAICS digits. For each type of ownership — private, state government and local government — there are 20 industry sectors in NAICS. For brevity of presentation,
Figure 3.1 Incidence rates by industry supersector1, Minnesota, 2009

Minnesota Department of Labor and Industry Workplace Safety Report — 2009
11
1. Except for state and local government, all supersectors include only privately owned establishments.2. The 2007 estimate for local government was suppressed because of reporting errors.
0 2 4 6 8
Financial activities
Information
Professional and business services
Other services
Leisure and hospitality
State government
Trade, transportation and utilities
Local government [2]
Manufacturing
Natural resources and mining
Education and health services
Construction
Cases per 100 FTE workers
200920082007
Total, private and public sectors
the SOII results are often presented in supersectors. The 11 supersectors include from one to four industry sectors. The state government and local government supersectors include all establishments in these ownership types regardless of industry code. Employment in these supersectors is concentrated in education and health services and in public administration. Figure 3.1 shows Minnesota’s injury and illness rates for the case types by industry supersector and for all industries combined. The supersectors are ranked by their total case rate.
• Construction had the highest total case rate, closely followed by education and health services (privately owned) and natural resources and mining.
• Construction had the highest rate for DAFW cases.
• Manufacturing and other services were the
only supersectors with a higher job transfer or restriction case rate than their DAFW case rate.
Figure 3.2 compares the 2009 rates for each supersector with its respective 2008 and 2007 rates. The 2009 total case rates were lower than the 2008 rates for eight supersectors and higher in 2009 for four supersectors. The 2009 rates were below the 2007 rates for all supersectors except state government. • Five supersectors had rate decreases for both
the 2007-2008 and 2008-2009 periods.
Figure 3.2 Rate of total nonfatal occupational injuries and illnesses per 100 FTE workers by industry
supersector1, Minnesota, 2007, 2008 and 2009

Minnesota Department of Labor and Industry Workplace Safety Report — 2009
12
1. Except for state and local government, all supersectors include only privately owned establishments.
0 2 4 6 8
Financial activities
Information
Professional and business services
Other services
Leisure and hospitality
State government
Trade, transportation and utilities
Local government
Manufacturing
Natural resources and mining
Education and health services
Construction
Cases per 100 FTE workers
Minnesota
United States
Total, private and public sectors
Figure 3.3 compares Minnesota’s 2009 total case incidence rates with the U.S. rate for each supersector. Compared to the U.S. rates, five Minnesota supersectors were lower, one supersector had the same rate and six supersectors had higher rates. Each of the four
highest-rate Minnesota supersectors had higher rates than their U.S. rates. This was the same overall result as in 2008.
Figure 3.3 Rate of total nonfatal occupational injuries and illnesses per 100 FTE workers by industry
supersector1, Minnesota and United States, 2009

Minnesota Department of Labor and Industry Workplace Safety Report — 2009
13
1. Except for state and local government, all supersectors include only privately owned establishments.
0.0 0.5 1.0 1.5 2.0
Financial activities
Information
Professional and business services
Other services
Leisure and hospitality
Manufacturing
State government
Trade, transportation and utilities
Education and health services
Natural resources and mining
Local government
Construction
Cases per 100 FTE workers
Minnesota
United States
Total, private and public sectors
Figure 3.4 compares Minnesota’s 2009 DAFW case incidence rates with the U.S. rate for each industry supersector. Minnesota had lower DAFW incidence rates than the corresponding U.S. rates for seven supersectors, had the same rate as the United States for three supersectors
and had higher rates for two supersectors. The greatest difference between a Minnesota rate and the corresponding U.S. rate was 0.6 cases per 100 FTE workers, in state government, where Minnesota had the lower rate.
Figure 3.4 Rate of cases with days away from work per 100 FTE workers by industry supersector1, Minnesota and United States, 2009

Minnesota Department of Labor and Industry Workplace Safety Report — 2009
14
1. Except for state and local government, all supersectors include only privately owned establishments.
0% 5% 10% 15% 20% 25%
Information
Natural resources and mining
Financial activities
Other services
State government
Leisure and hospitality
Professional and business services
Construction
Local government
Manufacturing
Trade, transportation and utilities
Education and health services
Percentage of cases
Percentage of employment
Figure 3.5 compares the percentage of workers employed in each supersector with its percentage of total cases reported. • The three industry supersectors with the
largest percentages of cases accounted for 62 percent of the injury and illness cases and for 48 percent of employment.
• Education and health services moved from
the third-highest percentage of cases in 2008 to the highest percentage in 2009. Education and health services accounted for 17 percent of employment and 22 percent of the cases.
• Trade, transportation and utilities, with 20 percent of Minnesota’s employment, accounted for 22 percent of the cases. In 2006 through 2008, this supersector accounted for 23 percent of the cases.
• Manufacturing had 18 percent of the cases
and was the fourth-largest employment supersector, with 12 percent of employment. This was the first year that manufacturing accounted for less than 20 percent of the cases.
Figure 3.5 Percentage of total cases and employment by industry supersector1, 2009

Minnesota Department of Labor and Industry Workplace Safety Report — 2009
15
Industry subsector2Cases per 100 FTE workers
Nursing and residential care (local gov.) 14.4Nursing and residential care (state gov.) 13.7Wood product manufacturing 10.0Couriers and messengers 9.8Beverage and tobacco product mfg. 9.6Primary metal manufacturing 9.5Nursing and residential care 9.3Crop production 8.7Air transportation 8.6Heavy and civil engineering construction (state gov.) 8.2Hospitals 8.21. Industry subsectors use the first three NAICS digits.2. Industries are private-sector unless otherwise noted.
Industry subsector2DAFW cases per 100 FTE
Nursing and residential care (state gov.) 7.5Nursing and residential care (local gov.) 5.7Transit and ground passenger transportation (local gov.) 3.9Heavy and civil engineering construction (local gov.) 3.4Heavy and civil engineering construction (state gov.) 3.4Air transportation 3.0Couriers and messengers 2.8Primary metal manufacturing 2.6Wood product manufacturing 2.5Nursing and residential care 2.51. Industry subsectors use the first three NAICS digits.2. Industries are private-sector unless otherwise noted.
Industry subsector2 DAFW cases3
Nursing and residential care 1,600Hospitals 1,580Educational services (local gov.) 1,020Administrative and support services 970Specialty trade contractors 850Food services and drinking places 640Merchant wholesalers, durable goods 630Food manufacturing 590General merchandise stores 580Merchant wholesalers, nondurable goods 5401. Industry subsectors use the first three NAICS digits.
3. Numbers of cases are rounded to nearest 10.2. Industries are private-sector unless otherwise noted.
Results by industry subsector Some safety and health resources, such as Minnesota OSHA compliance inspections, need to be prioritized to those industries with the highest injury and illness rates and the highest numbers of cases. Figure 3.6 shows the industry subsectors (three-digit NAICS classes) with the highest total case incidence rates in Minnesota. • Six of the 11 subsectors were among the top
10 last year, including the subsectors with the five highest rates.
• Four of the subsectors are in the health care
sector, including all three nursing and residential care subsectors.
• The rate for local government nursing and
residential care increased by 40 percent, from 10.3 cases per 100 FTE workers in 2008, the third-highest rate.
The industry subsectors with the highest DAFW case incidence rates in Minnesota are shown in Figure 3.7. Five of the 10 subsectors were on this list in 2008, including the top three subsectors. • The average DAFW rate for the 10 highest
rate subsectors in 2009 was 3.7 cases per 100 FTE workers, higher than the 2008 average of 3.5, indicating some specific industries are continuing to have serious safety concerns. The five highest subsectors are all in state and local government.
• Three of the subsectors are involved in
health care and three are in the transportation and warehousing sector.
Figure 3.8 shows the industry subsectors with the highest number of DAFW cases. Only one industry was listed in both figures 3.7 and 3.8, showing the industries with the highest DAFW rates are different from the industries with the highest number of cases. • These 10 industries accounted for 9,000
DAFW cases, 43 percent of the state’s total. • The industries represent a wide variety of
Minnesota workplaces. These 10 subsectors come from eight different industry sectors, including only one from manufacturing.
Figure 3.6 Industry subsectors1 with the highest total case rates, Minnesota, 2009
Figure 3.7 Industry subsectors1 with the highest
rates of days-away-from-work cases, Minnesota, 2009
Figure 3.8 Industry subsectors with the highest
number of days-away-from-work cases, Minnesota, 2009

Minnesota Department of Labor and Industry Workplace Safety Report — 2009
16
0%
5%
10%
15%
20%
25%
30%
35%
2003 2004 2005 2006 2007 2008 2009
1 or 2 days
31 days or more
17%
11%
13%
14%
6%
18%
22%
1 day
2 days
3 to 5 days
6 to 10 days
11 to 20 days
21 to 30 days
31 days ormore
Industry supersector 2007 2008 2009
Natural resources and mining 6 9 13Construction 7 11 12Trade, transportation, and utilities 7 7 10Manufacturing 6 6 6Total, private and public 5 6 6Leisure and hospitality 6 12 5State government 5 8 5Education and health services 4 5 5Professional and business services 5 4 5Financial activities -- 3 5Local government -- 4 4Other services -- -- 4Information 5 7 3 '--' indicates the value did not meet BLS publication requirements.1. Except for state and local government, all supersectors include only privately owned establishments.
Days away from work For cases with one or more days away from work, the SOII provides statistics on the number of days away from work. As shown in Figure 2.1, only 27 percent of the recordable cases in 2009 were DAFW cases. Days away from work are counted by calendar days, not scheduled work days. The number of days away from work for OSHA recordkeeping and the SOII do not include the day of the event causing the injury or the onset of illness. Figure 3.9 shows the distribution of DAFW cases by the number of days away from work. • Twenty-eight percent of the DAFW cases
had only one or two days away from work. As shown in Figure 3.10, the percentage of DAFW cases with one or two days away from work has decreased since 2006, while the percentage of cases with more than 30 days away from work increased in 2007 and 2008, but decreased in 2009. Figure 3.11 shows the median number of days away from work by industry supersector. The weighting system used by BLS to compute the SOII estimates sometimes results in large year-to-year variations for supersectors with relatively few DAFW cases. • The median for all industries was six days.
The median varied widely among the industries and by year within industry.
• Natural resources and mining and
construction had the highest median days away in 2009, at 13 and 12 days, respectively.
• Leisure and hospitality, which had the
highest median days away in 2008, dropped to below the statewide median in 2009.
Figure 3.9 Distribution of days-away-from-work cases by number of days away from work, Minnesota, 2009
Figure 3.10 Percentage trends of days away from
work, Minnesota, 2003 to 2009 Figure 3.11 Median days away from work by
industry supersector1, DAFW cases, Minnesota, 2007, 2008 and 2009

Minnesota Department of Labor and Industry Workplace Safety Report — 2009
17
Industry supersector1 All Sizes 1-10 11-49 50-249 250-999 1,000+Natural resources and mining 5.4 -- 3.7 10.4 4.8 --Construction 5.7 -- 7.5 5.7 2.2 --Manufacturing 4.6 -- 5.1 5.5 4.6 3.0Trade, transportation, and utilities 4.2 1.7 3.6 5.2 5.0 6.3Information 1.6 -- -- 2.6 1.7 0.8Financial activities 1.0 -- 0.7 1.2 0.6 0.7Professional and business services 1.8 -- 2.3 2.0 1.6 1.2Education and health services 5.6 1.0 2.8 6.9 6.0 6.4Leisure and hospitality 3.4 -- 2.0 5.2 6.9 5.6Other services 3.3 -- 5.0 3.6 3.5 --State government 3.9 -- 4.5 3.8 3.5 3.7Local government 4.4 -- 4.5 4.3 5.0 3.31. Except for state and local government, all supersectors include only privately owned establishments.2. Only cells with data meeting BLS publication standards are shown.
Total recordable cases per 100 FTE workers by establishment size (number of employees)2
1.8
3.7
1.3
2.3 2.3
1.7 1.3
3.4
4.1
4.7
1.0 0.9 0.7 0.8 1.1
0
1
2
3
4
5
1-10 11-49 50-249 250-999 1,000 or more
Ave
rage
ann
ual c
ases
per
100
FTE
wor
kers
Total cases DART cases Days-away-from-work cases
Establishment size (number of employees)
Incidence by size The incidence of reported workplace injuries and illnesses varies by establishment size. Figure 3.12 shows case incidence by case type and establishment size, and presents the total case rates by establishment size and industry. This pattern has been consistent for many years. • Incidence rates were lowest for the smallest
establishments (one to 10 employees). • Mid-sized establishments (50 to 249
employees) had the highest rates for all three case types.
• The total case incidence rates decreased from
2008 to 2009 for all size groups except the smallest size group. DART rates decreased for only two groups, establishments with 11 to 49 employees and those with 1,000 or more employees.
• The difference between the highest and
lowest rates by establishment size has been steadily decreasing. In 2002, the difference in the rates between mid-sized and the smallest establishments was 4.9; in 2009 this was reduced to 2.9.
Figure 3.12 Injury and illness case incidence rates by establishment size, private sector, Minnesota, 2009

Minnesota Department of Labor and Industry Workplace Safety Report — 2009
18
61%
39%
52%
48%
Men
Women
DAFW cases All workers
4 Characteristics of cases with days away from work
This chapter presents, for cases resulting in one or more days away from work, statistics about the demographic characteristics of the workers, their job characteristics, and the characteristics and causes of their injuries and illnesses. Employers participating in the survey provide descriptions for each DAFW case.9 DLI Research and Statistics survey staff members code the descriptions into the appropriate categories. To control for variation due to the sampling and estimation processes, statistics for the worker demographic characteristics and for the job characteristics use the annual average of the 2007, 2008 and 2009 survey results. Results for the injury and illness characteristics are much more stable, so the 2009 results are presented. The 2009 results for all the characteristics are available online at www.dli.mn.gov/RS/StatWSH.asp. Worker demographic characteristics Gender • The percentage of women among DAFW cases
increased slightly from an annual average of 37 percent from 2004 through 2006 to 39 percent during 2007 through 2009 (Figure 4.1). Women comprised 48 percent of Minnesota’s employment during each of the years from 2007 through 2009.
• The private-ownership DAFW case incidence
rates per 10,000 FTE workers10 were 116 cases for men and 98 cases for women. The incidence rates are closer than the case counts due to differences in the hours worked by men and women. In 2009, men had 38 percent more cases but their incidence rate was only 13 percent higher.
9 For employers with a significant number of DAFW cases (more than 15), a sampling scheme is used to select a reduced number of cases. See Appendix B for a variable list. 10 Rates for DAFW cases are expressed as cases per 10,000 FTE workers in order to differentiate between values that would be very similar when expressed as cases per 100 FTE workers.
Figure 4.1 Gender of all workers and workers
with days-away-from-work cases, Minnesota, 2007-2009
Minnesota Department of Labor and Industry Workplace Safety Report — 2009
19
0%
10%
20%
30%
40%
1999 2001 2003 2005 2007 2009
14-34 years
35-44 years
45-54 years
55 years and older
3%
9%
20%
15%
3%
28%
22%
16 to 19
20 to 24
25 to 34
35 to 44
45 to 54
55 to 64
65 and older
0
25
50
75
100
125
150
16to 19
20to 24
25to 34
35to 44
45to 54
55to 64
65 andolder
Cas
es p
er 1
0,00
0 FT
E w
orke
rs
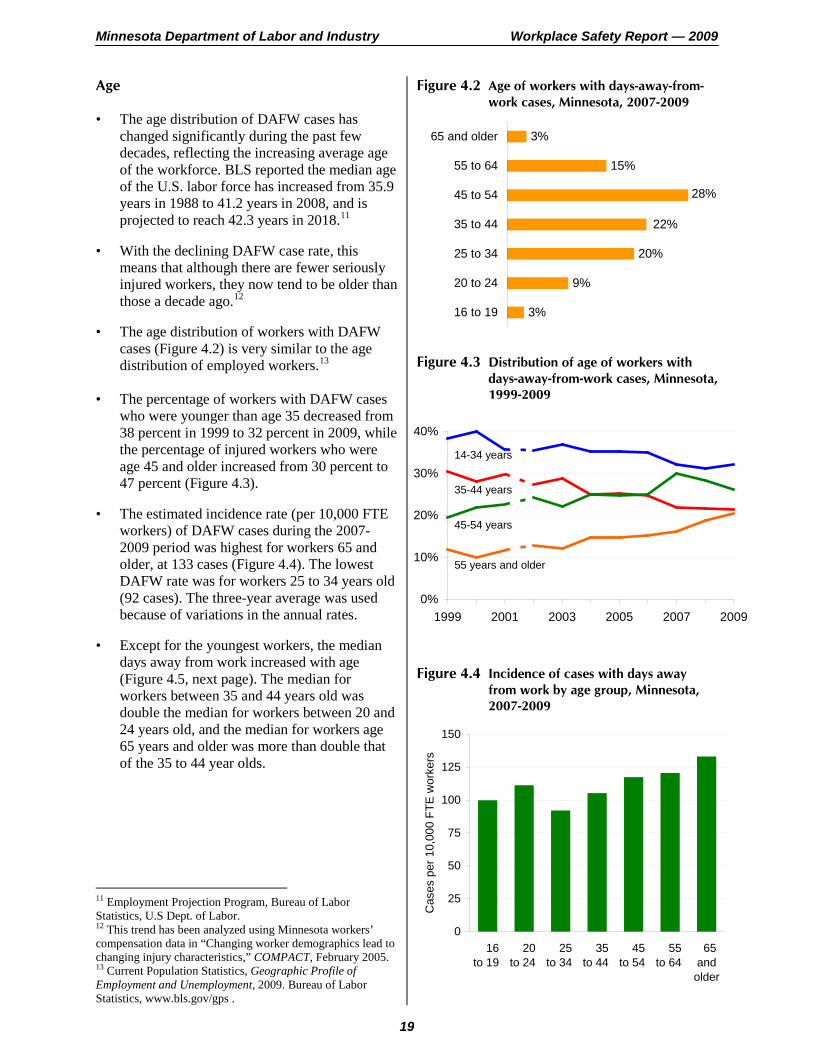
Age • The age distribution of DAFW cases has
changed significantly during the past few decades, reflecting the increasing average age of the workforce. BLS reported the median age of the U.S. labor force has increased from 35.9 years in 1988 to 41.2 years in 2008, and is projected to reach 42.3 years in 2018.11
• With the declining DAFW case rate, this
means that although there are fewer seriously injured workers, they now tend to be older than those a decade ago.12
• The age distribution of workers with DAFW
cases (Figure 4.2) is very similar to the age distribution of employed workers.13
• The percentage of workers with DAFW cases
who were younger than age 35 decreased from 38 percent in 1999 to 32 percent in 2009, while the percentage of injured workers who were age 45 and older increased from 30 percent to 47 percent (Figure 4.3).
• The estimated incidence rate (per 10,000 FTE
workers) of DAFW cases during the 2007-2009 period was highest for workers 65 and older, at 133 cases (Figure 4.4). The lowest DAFW rate was for workers 25 to 34 years old (92 cases). The three-year average was used because of variations in the annual rates.
• Except for the youngest workers, the median
days away from work increased with age (Figure 4.5, next page). The median for workers between 35 and 44 years old was double the median for workers between 20 and 24 years old, and the median for workers age 65 years and older was more than double that of the 35 to 44 year olds.
11 Employment Projection Program, Bureau of Labor Statistics, U.S Dept. of Labor. 12 This trend has been analyzed using Minnesota workers’ compensation data in “Changing worker demographics lead to changing injury characteristics,” COMPACT, February 2005. 13 Current Population Statistics, Geographic Profile of Employment and Unemployment, 2009. Bureau of Labor Statistics, www.bls.gov/gps .
Figure 4.2 Age of workers with days-away-from-work cases, Minnesota, 2007-2009
Figure 4.3 Distribution of age of workers with
days-away-from-work cases, Minnesota, 1999-2009
Figure 4.4 Incidence of cases with days away
from work by age group, Minnesota, 2007-2009
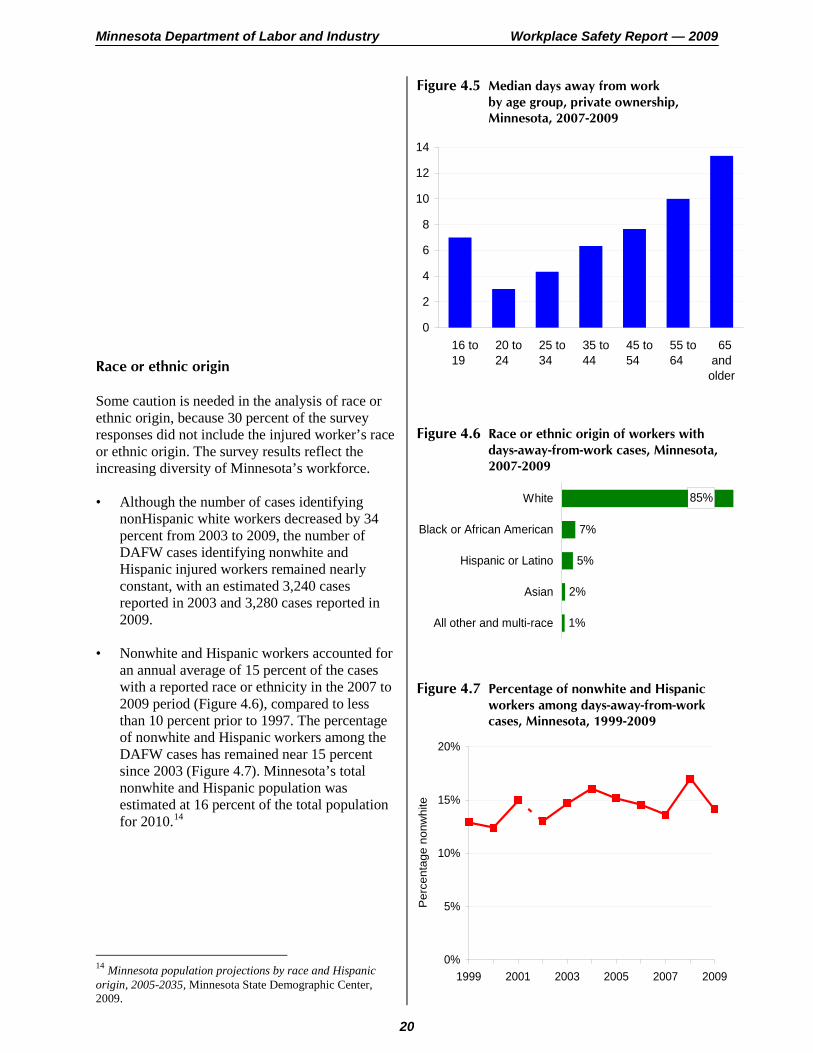
Minnesota Department of Labor and Industry Workplace Safety Report — 2009
20
0%
5%
10%
15%
20%
1999 2001 2003 2005 2007 2009
Per
cent
age
nonw
hite
0
2
4
6
8
10
12
14
16 to19
20 to24
25 to34
35 to44
45 to54
55 to64
65 andolder
1%
2%
5%
7%
85%
All other and multi-race
Asian
Hispanic or Latino
Black or African American
White
Race or ethnic origin Some caution is needed in the analysis of race or ethnic origin, because 30 percent of the survey responses did not include the injured worker’s race or ethnic origin. The survey results reflect the increasing diversity of Minnesota’s workforce. • Although the number of cases identifying
nonHispanic white workers decreased by 34 percent from 2003 to 2009, the number of DAFW cases identifying nonwhite and Hispanic injured workers remained nearly constant, with an estimated 3,240 cases reported in 2003 and 3,280 cases reported in 2009.
• Nonwhite and Hispanic workers accounted for
an annual average of 15 percent of the cases with a reported race or ethnicity in the 2007 to 2009 period (Figure 4.6), compared to less than 10 percent prior to 1997. The percentage of nonwhite and Hispanic workers among the DAFW cases has remained near 15 percent since 2003 (Figure 4.7). Minnesota’s total nonwhite and Hispanic population was estimated at 16 percent of the total population for 2010.14
14 Minnesota population projections by race and Hispanic origin, 2005-2035, Minnesota State Demographic Center, 2009.
Figure 4.5 Median days away from work by age group, private ownership, Minnesota, 2007-2009
Figure 4.6 Race or ethnic origin of workers with
days-away-from-work cases, Minnesota, 2007-2009
Figure 4.7 Percentage of nonwhite and Hispanic
workers among days-away-from-work cases, Minnesota, 1999-2009

Minnesota Department of Labor and Industry Workplace Safety Report — 2009
21
8%
16%
34%
42%
Less than 3months
3 to 11months
1 to 5years
More than5 years
Job characteristics Job tenure A worker’s length of service with an employer is a general measure of the worker’s attainment of job skills. Workers with short job tenures include new entrants to the workforce, those who lost jobs but found new jobs during the previous year and workers who had voluntarily changed employers during the previous year. Young workers usually have shorter job tenure than older workers. The general increase in worker age during the past decade has been accompanied by an increase in average job tenure of injured workers. • As shown in Figure 4.8, workers with less than
one year of service with their employer accounted for an annual average of 24 percent of the DAFW cases during 2007 through 2009. This percentage was slightly below the 26 percent annual average reported from 2004 through 2006. This was accompanied by a corresponding increase in the percentage of workers with more than five years of job tenure.
• According to the Current Population Survey
statistics for January 201015, the median job tenure for the United States increased from 4.1 years in 2008 to 4.4 years in 2010, reflecting large job losses among less-senior workers during the recent recession.
• The national proportion of wage-and-salary
workers with a year or less of tenure with their current employer was 19 percent in 2009 (down from 23 percent in 2008), while 32 percent had from one to five years of job tenure and 49 percent had more than five years.
15 News release, Bureau of Labor Statistics, Employee tenure in 2010, Sept. 14, 2010. State-level job tenure statistics are not published.
Figure 4.8 Length of service of workers with days-
away-from-work cases, Minnesota, 2007-2009

Minnesota Department of Labor and Industry Workplace Safety Report — 2009
22
1%
3%
5%
7%
7%
9%
11%
15%
15%
27%
Farming, fishing, and forestry
Management, business, financial
Sales and related
Office and administrative support
Installation, maintenance, and repair
Construction and extraction
Professional and related
Production
Transportation and material moving
Service
Occupation Occupation describes a set of characteristics based on the job duties, skills, education or experience needed to accomplish work tasks. Some occupations are concentrated in certain industries, such as nursing aides working in the hospital and nursing home industries. However, many other occupations, such as management, sales and office support, are found in a wide range of industries.16 Workers in the same or similar occupations often encounter similar work conditions, which affect their safety and health. Occupation is examined by the distribution of cases by broad occupation category among all workers in Figure 4.917, by incidence rates among major occupation groups in privately owned establishments in Figure 4.10 and by the number of cases in detailed occupations in Figure 4.11. A few broad occupation categories are the same as major groups.
16 The 2009 Minnesota occupational staffing matrix, showing occupations by industry, is available at www.positivelyminnesota.com/Data_Publications/Data/ Wages,_Benefits,_Careers/Occupational_Staffing_Patterns.aspx. 17 In previous Workplace Safety Reports, Figure 4.9 showed the case distribution only among privately owned establishments.
• Service occupations, which include nursing aides, law enforcement workers, cooks and building maintenance workers, accounted for an average of 27 percent of the DAFW cases from 2007 through 2009.
• Transportation and material moving
occupations, which includes truck drivers and delivery people, airline workers and unskilled, nonconstruction manual laborers, had the second-highest percentage of cases.
• Production occupations, the third-largest
occupation group among DAFW cases, include assemblers, food processing workers and woodworkers.
• The professional and related occupations
group include engineers, attorneys, teachers and healthcare practitioners, and was the fourth most common occupation category among DAFW cases.
Figure 4.9 Occupation of workers with days-away-from-work cases, Minnesota, 2007-2009

Minnesota Department of Labor and Industry Workplace Safety Report — 2009
23
6
9
10
19
49
50
54
58
67
86
96
99
107
108
175
198
224
258
261
329
194
Computer and mathematical
Architecture and engineering
Business and financial operations
Education, training and library
Management
Office and administrative support
Arts, design, entertainment, sports and media
Sales and related
Community and social services
Farming, fishing and forestry
Personal care and service
Food preparation and serving related
Healthcare practitioners and technical
Production
Installation, maintenance and repair
Protective service
Construction and extraction
Healthcare support
Transportation and material moving
Building and grounds cleaning and maintenance
Total, all occupations
• The differences in occupations in major occupation groups for workers in privately owned establishments are revealed by the rate of DAFW cases per 10,000 FTE workers, shown in Figure 4.10. The distribution shows large differences between sets of occupations.
• The seven-highest-rate occupations of the
2007 through 2009 period were the highest-rate occupations in each of the three years, although their ranking within the top group varied.
• The incidence rates for the major occupation groups generally follow the degree to which the occupations require physical exertion and exposure to job hazards.
Figure 4.10 Average annual incidence rates of days-away-from-work cases by major occupation group,
per 10,000 FTE workers, private sector, Minnesota, 2007-2009

Minnesota Department of Labor and Industry Workplace Safety Report — 2009
24
160
180
190
190
190
200
230
250
270
290
310
330
380
420
440
510
530
590
630
870
1,110
1,230
1,240
Industrial machinery mechanics
Electricians
Food preparation and serving workers
Customer service representatives
Cashiers
Automotive service technicians and mechanics
Welders, cutters, solderers and brazers
Licensed practical and licensed vocational nurses
Cooks, restaurant
Police and sheriff's patrol officers
Managers of retail sales workers
Maids and housekeeping cleaners
Carpenters
Maintenance and repair workers, general
Stock clerks and order fillers
Retail salespersons
Truck drivers, light or delivery services
Registered nurses
Construction laborers
Truck drivers, heavy and tractor-trailer
Nursing aides, orderlies and attendants
Laborers and freight, stock and material movers, hand
Janitors and cleaners
• The detailed occupations with an estimated annual average of 160 or more DAFW cases across all ownership types during the 2007 through 2009 period are shown in Figure 4.11. The four specific occupations with at least 800 DAFW cases accounted for 19 percent of the average number of DAFW cases.
• The three healthcare-related occupations on
the list — nursing aides, orderlies and
attendants, registered nurses and licensed practical and licensed vocational nurses — accounted for an annual average of nearly 2,000 cases.
• Retail salespersons and their managers
accounted for an annual average of more than 800 cases.
Figure 4.11 Specific occupations with the highest number of cases, Minnesota, 2007-2009
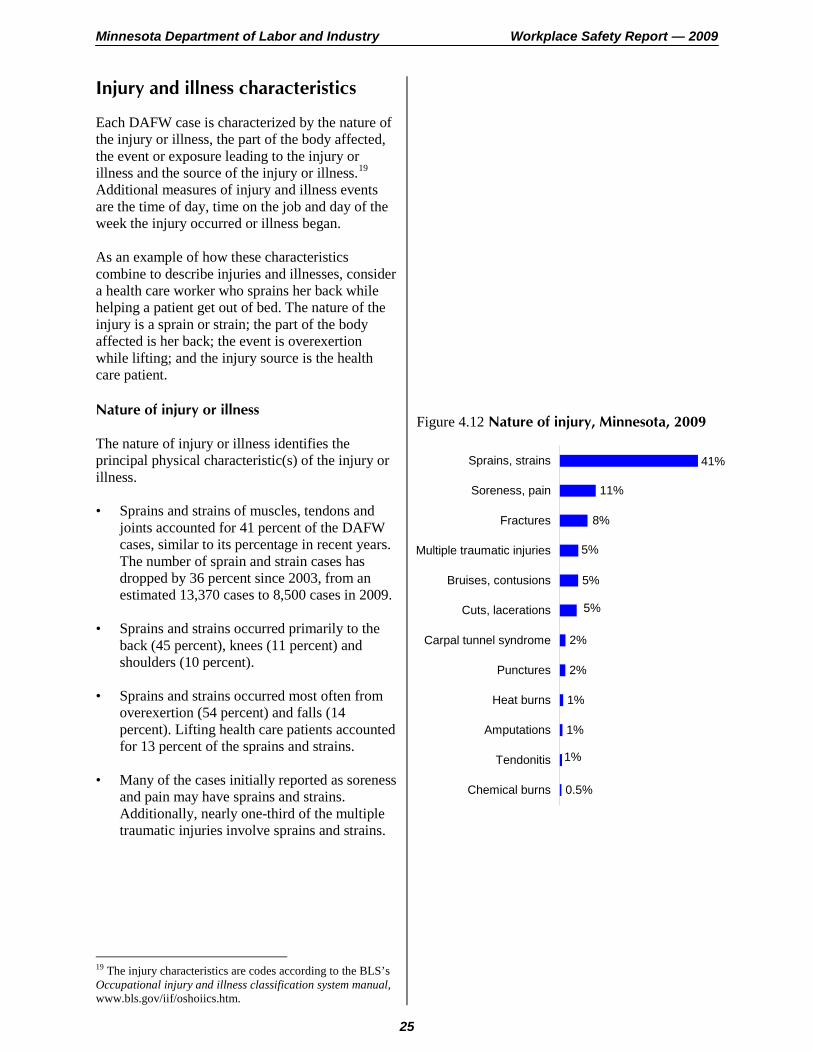
Minnesota Department of Labor and Industry Workplace Safety Report — 2009
25
1%
1%
2%
2%
5%
11%
41%
0.5%
5%
1%
8%
5%
Chemical burns
Tendonitis
Amputations
Heat burns
Punctures
Carpal tunnel syndrome
Cuts, lacerations
Bruises, contusions
Multiple traumatic injuries
Fractures
Soreness, pain
Sprains, strains
Injury and illness characteristics Each DAFW case is characterized by the nature of the injury or illness, the part of the body affected, the event or exposure leading to the injury or illness and the source of the injury or illness.19 Additional measures of injury and illness events are the time of day, time on the job and day of the week the injury occurred or illness began. As an example of how these characteristics combine to describe injuries and illnesses, consider a health care worker who sprains her back while helping a patient get out of bed. The nature of the injury is a sprain or strain; the part of the body affected is her back; the event is overexertion while lifting; and the injury source is the health care patient. Nature of injury or illness The nature of injury or illness identifies the principal physical characteristic(s) of the injury or illness. • Sprains and strains of muscles, tendons and
joints accounted for 41 percent of the DAFW cases, similar to its percentage in recent years. The number of sprain and strain cases has dropped by 36 percent since 2003, from an estimated 13,370 cases to 8,500 cases in 2009.
• Sprains and strains occurred primarily to the
back (45 percent), knees (11 percent) and shoulders (10 percent).
• Sprains and strains occurred most often from
overexertion (54 percent) and falls (14 percent). Lifting health care patients accounted for 13 percent of the sprains and strains.
• Many of the cases initially reported as soreness
and pain may have sprains and strains. Additionally, nearly one-third of the multiple traumatic injuries involve sprains and strains.
19 The injury characteristics are codes according to the BLS’s Occupational injury and illness classification system manual, www.bls.gov/iif/oshoiics.htm.
Figure 4.12 Nature of injury, Minnesota, 2009

Minnesota Department of Labor and Industry Workplace Safety Report — 2009
26
1%
2%
2%
3%
4%
4%
6%
6%
7%
7%
8%
12%
26%
Body systems
Neck
Hand, except finger
Foot, toe
Arm
Ankle
Wrist
Head
Finger
Shoulder
Knee
Multiple parts
Back
0%
5%
10%
15%
20%
25%
30%
16to 19
20to 24
25to 34
35to 44
45to 54
55to 64
65 and
older
Part of body The part of the body affected identifies the part directly affected by injury or illness. • Although the back is injured more often than
other body parts among cases with days away from work, the percentage has decreased from about 30 percent of the cases during most of the 1990s to 26 percent in 2009.
• The estimated number of cases with back
injuries has decreased substantially in recent years, from 7,750 cases in 2003 to 5,400 cases in 2009, a 30 percent decline.
• Workers with back injuries were generally
younger than workers with illnesses or injuries to other body parts. Among workers with back injuries in 2009, 51 percent were between 25 and 44 years old and 38 percent were 45 years and older. Among workers with injuries and illness other than back injuries, 40 percent were between 25 and 44 years old and 49 percent were 45 years and older.
• As shown in Figure 4.14, for workers 16 to 44
years old, the percentages of DAFW cases with back injuries were above the overall percentage (25 percent) and, for workers age 45 and older, the percentages were below the overall percentage.
• The most common injuries to multiple body
parts were sprains and strains and multiple traumatic injuries. Multiple-body-part injuries occurred most often as a result of falls and overexertion.
• Although multiple-body-part injuries
accounted for only 12 percent of the DAFW cases, they accounted for 33 percent of the injuries to workers age 65 and older.
Figure 4.13 Part of body injured, Minnesota, 2009 Figure 4.14 Percentage of cases with back injuries
within each age group, Minnesota, 2007-2009
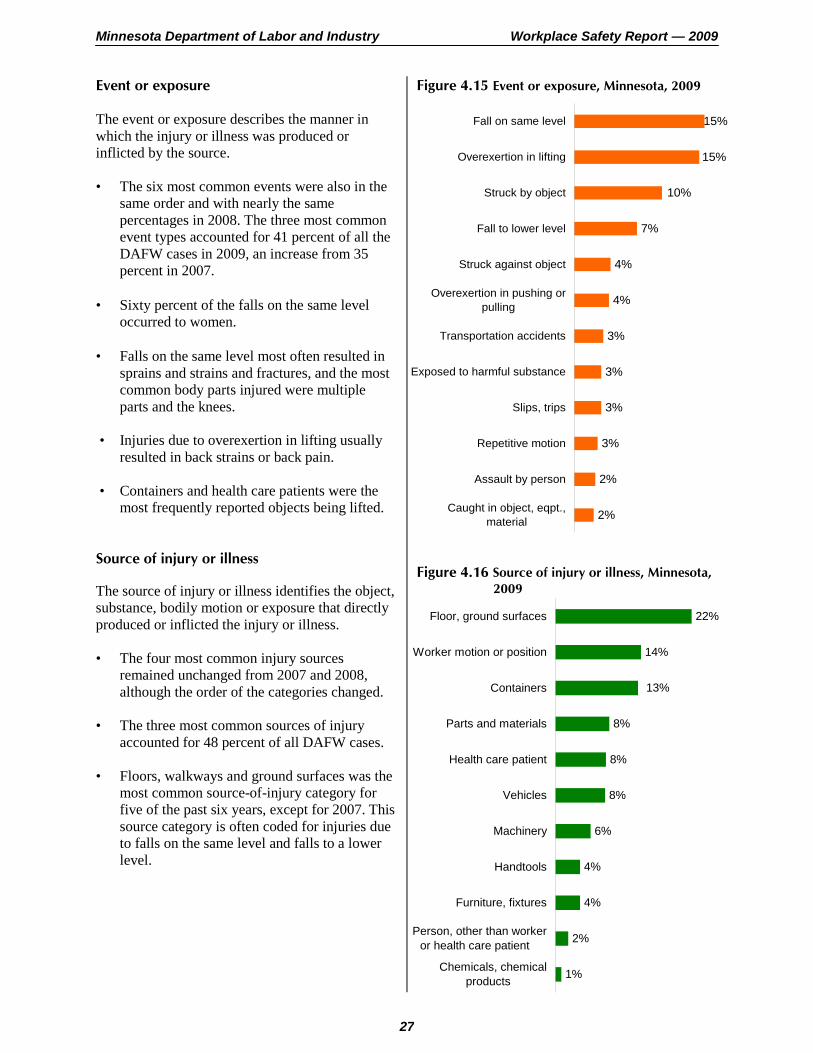
Minnesota Department of Labor and Industry Workplace Safety Report — 2009
27
2%
2%
3%
3%
3%
3%
4%
4%
7%
15%
10%
15%
Caught in object, eqpt.,material
Assault by person
Repetitive motion
Slips, trips
Exposed to harmful substance
Transportation accidents
Overexertion in pushing orpulling
Struck against object
Fall to lower level
Struck by object
Overexertion in lifting
Fall on same level
1%
2%
4%
4%
6%
8%
8%
8%
14%
22%
13%
Chemicals, chemicalproducts
Person, other than workeror health care patient
Furniture, fixtures
Handtools
Machinery
Vehicles
Health care patient
Parts and materials
Containers
Worker motion or position
Floor, ground surfaces
Event or exposure The event or exposure describes the manner in which the injury or illness was produced or inflicted by the source. • The six most common events were also in the
same order and with nearly the same percentages in 2008. The three most common event types accounted for 41 percent of all the DAFW cases in 2009, an increase from 35 percent in 2007.
• Sixty percent of the falls on the same level
occurred to women. • Falls on the same level most often resulted in
sprains and strains and fractures, and the most common body parts injured were multiple parts and the knees.
• Injuries due to overexertion in lifting usually
resulted in back strains or back pain. • Containers and health care patients were the
most frequently reported objects being lifted. Source of injury or illness The source of injury or illness identifies the object, substance, bodily motion or exposure that directly produced or inflicted the injury or illness. • The four most common injury sources
remained unchanged from 2007 and 2008, although the order of the categories changed.
• The three most common sources of injury
accounted for 48 percent of all DAFW cases. • Floors, walkways and ground surfaces was the
most common source-of-injury category for five of the past six years, except for 2007. This source category is often coded for injuries due to falls on the same level and falls to a lower level.
Figure 4.15 Event or exposure, Minnesota, 2009 Figure 4.16 Source of injury or illness, Minnesota,
2009

Minnesota Department of Labor and Industry Workplace Safety Report — 2009
28
Musculoskeletal disorders BLS uses the reported injury characteristics to produce an estimate of the number of cases with musculoskeletal disorders (MSDs) among the DAFW cases. Although employers do not directly identify MSDs on the OSHA log, information about the injured body part and the event or exposure is combined to produce this estimate. BLS defines MSDs as disorders of the muscles, nerves, tendons, ligaments, joints, cartilage and spinal discs that are not caused by slips, trips, falls, motor-vehicle accidents or other similar accidents. Because of the recordkeeping changes in 2002 that directly addressed MSD issues (see Appendix A), differences between pre- and post-2002 statistics may be the result of a combination of changes in job safety and the effects of the recordkeeping changes. • Figure 4.17 shows the estimated number of
MSD and non-MSD cases from 1999 to 2009. The number of DAFW cases with MSDs in Minnesota has decreased 43 percent since 2002, reaching a low of 7,620 cases in 2009. During this period, non-MSD cases decreased by 34 percent.
• MSD cases accounted for 36 percent of the
DAFW cases in 2009, the same as in both 2006 and 2007 and below the 38 percent reported for 2008.
• The three industries with the highest
numbers of MSD cases, manufacturing, retail and all-owner health care and social assistance, accounted for 55 percent of the MSD cases.
• The three industries with the highest
percentages of MSD cases among the DAFW cases were finance and insurance (74 percent), professional, scientific and technical services (53 percent), and local government health care and social assistance (52 percent).
• Among privately owned establishments, the
MSD incidence rate decreased from 56 cases per 10,000 FTE workers in 2004 to 37 cases in 2009, a 34 percent drop.
• MSD injuries had a median of seven days
away from work, compared to a median of six days for all DAFW cases.
Figure 4.18 shows some demographic characteristics of workers with MSD injuries. • Both the percentage of MSD cases among
all DAFW cases and the incidence of MSD cases increased with age until peaking in the 45- to 54-years age group.
• MSD injuries were least common among
workers with less than three months of job tenure.
• Among occupations, MSD cases accounted
for 42 percent of the cases among office and administrative support workers, 40 percent among construction workers, and 39 percent among service workers. In contrast, only 21 percent of the DAFW case injuries to construction and extraction workers were due to MSDs.

Minnesota Department of Labor and Industry Workplace Safety Report — 2009
29
0
5,000
10,000
15,000
20,000
25,000
1999 2000 2001 2002 2003 2004 2005 2006 2007 2008 2009
MSD cases Non-MSD cases
CharacteristicNumber of MSD cases
Percentage of MSD among
cases in category
Incidence rate per 10,000
FTE workersTotal 7,620 36% 37
Gender Male 4,210 35% 38 Female 3,400 39% 37
Age 16 to 19 years 130 35% 29 20 to 24 years 640 35% 35 25 to 34 years 1,670 37% 34 35 to 44 years 1,700 38% 38 45 to 54 years 2,210 40% 43 55 to 64 years 1,140 34% 37 65 years and older 130 13% 24
Length of service with employer Less than 3 months 270 24% 3 months to 11 months 1,010 36% 1 year to 5 years 3,100 41% More than 5 years 3,240 35%
Occupation Management, business, financial 180 25% Professional and related 920 35% Service 2,560 39% Sales and related 440 38% Office and administrative support 580 42% Farming, fishing and forestry 40 33% Construction and extraction 370 21% Installation, maintenance, repair 500 39% Production 1,020 40% Transportation and material moving 1,020 38%
Figure 4.17 Number of MSD and non-MSD DAFW cases, Minnesota, 1999-2009 Figure 4.18 Distribution and incidence of MSD cases by worker characteristics, Minnesota, 2009
Minnesota Department of Labor and Industry Workplace Safety Report — 2009
30
5 Fatal occupational injuries
In 2009, 61 Minnesota workers were fatally injured on the job. This is a decrease from the 65 fatalities in 2008. Nationwide, 4,551 workers were fatally injured during 2009, a 13 percent decrease from the 5,214 fatalities in 2008. These and other findings are from the nationwide Census of Fatal Occupational Injuries (CFOI), conducted by the BLS with state and other federal agencies. The Department of Labor and Industry collects CFOI data for the state of Minnesota. The CFOI covers all fatal work injuries, whether the workplaces concerned are covered by the Occupational Safety and Health Act or other federal or state laws, or are outside the scope of regulatory coverage. It also includes self-employed and unpaid family workers, including family farm workers. Work-related fatal illnesses (e.g., asbestosis, silicosis and lead poisoning) are excluded from the CFOI because many occupational illnesses have long latency periods and are difficult to link to work. The CFOI provides a complete count of fatal work injuries by using multiple sources to identify, verify and profile these incidents. The sources include death certificates, coroners reports, workers’ compensation reports and news media reports. Counting fatalities The CFOI count of work-related fatalities differs in important ways from other workplace fatality statistics. The CFOI is a count of all work-related deaths caused by injuries and excludes deaths caused by illnesses. Fatalities to all workers, including self-employed workers, are tabulated in the state where they occurred. Thus, a truck driver from Minnesota who works for a Minnesota trucking company but is killed in an accident in Nebraska would be counted as a Nebraska CFOI fatality.
By contrast, the workers’ compensation count of fatality claims includes only workers covered by a Minnesota workers’ compensation insurance policy. Self-employed workers are not included. Fatalities caused by illnesses are included. A Minnesota truck driver killed in another state would be included in the Minnesota workers’ compensation fatality count if Minnesota workers’ compensation benefits were paid. In 2009, there were 30 workers’ compensation fatality claims, down from 44 fatalities in 2008.19
MNOSHA investigates all employee deaths that are under its jurisdiction and result from an accident or illness caused by or related to a workplace hazard. Not included are fatalities caused by traffic accidents (investigated by the Minnesota Department of Public Safety), airplane crashes (National Transportation Safety Board), mining accidents (Mine Safety and Health Administration), federal workers (federal OSHA), railroad workers (Federal Railroad Administration), farm accidents and accidents to the self-employed (investigation agency depends on type of accident).
MNOSHA investigates fatalities to determine cause, whether any MNOSHA standards were violated and whether additional standards might help prevent similar incidents. In 2009, MNOSHA investigated 18 fatality events, an increase from 12 fatality events in 2008 but below the 23 events investigated in 2007. In 2010, MNOSHA investigated 19 fatality events. The five-year average, from 2006 to 2010, was 19 fatality event investigations a year. There were three construction fatality investigations each year in 2010, 2009 and 2008, compared to nine investigations in 2007.
19 The number of fatality claims receiving workers’ compensation benefits will change as claims are resolved.

Minnesota Department of Labor and Industry Workplace Safety Report — 2009
31
Year of death
Wage & salary
workersSelf-
employed Total1999 55 17 722005 64 23 872006 57 21 782007 54 18 722008 39 26 652009 39 22 61
Avg. 2005-2009 50.6 22.0 72.6
1 Includes private sector plus local, state and federal government (including resident armed forces). Includes self-employed and unpaid family workers, including family farm workers. Excludes fatal illnesses.
0
10
20
30
40
50
60
70
80
90
100
1999 2000 2001 2002 2003 2004 2005 2006 2007 2008 2009
Num
ber o
f fat
al in
jurie
s Total
Self-employed
Wage and salary workers
Number of fatal injuries • Minnesota had from 61 to 87 fatal work
injuries a year from 1999 through 2009 (Figure 5.1), with the lowest number in 2009. The number of fatalities in 2009 was 30 percent below the recent high count in 2005.
• For wage-and-salary workers, the annual
fatality toll ranged from 39 to 64, with the lowest numbers in 2008 and 2009.
• For self-employed workers, the annual
fatality figure ranged between 15 and 26 fatalities, with the highest number in 2008.
• The fatality toll for 2005 through 2009 was
363 workers, with a five-year average of 73 fatalities a year. This consisted of 51 wage- and-salary workers and 22 self-employed workers.
• Fatal injuries for the self-employed were 36
percent of the 2009 total, far higher than the estimated 12 percent self-employed share of total state employment in 2008.20
20 Based on Nonemployer Statistics Program, U.S. Census Bureau, and the Quarterly Census of Employment and Wages, Minnesota Dept. of Employment and Economic Development.
Figure 5.1 Fatal work injuries, Minnesota, 1999-20091

Minnesota Department of Labor and Industry Workplace Safety Report — 2009
32
Figure 5.2 Fatal work injuries per 100,000 FTE workers,1 Minnesota and U.S., 1999-2009
Minnesota U.S.2007 2.8 4.02008 2.5 3.72009 2.4 3.5
1. Excludes workers younger than age 16 or in the military.
Fatality rates per 100,000 FTE workers
0.0
0.5
1.0
1.5
2.0
2.5
3.0
3.5
4.0
4.5
5.0
1999 2000 2001 2002 2003 2004 2005 2006 2007 2008 2009
Rate per 100,000 Minnesota workers Rate per 100,000 U.S. workers
Rate per 100,000 Minnesota FTE workers Rate per 100,000 U.S. FTE workers
Rate of fatal injuries Prior to the 2006 results, national and state fatality rates were calculated only as the rate per 100,000 workers. BLS began calculating the rates based on 100,000 full-time equivalent (FTE) workers for the national rate for 2006 and for the states beginning in 2007. The FTE-based rate is considered a more accurate measure of workplace exposure to hazards. The fatality rates of Minnesota and the U.S. are not directly comparable because of differences in the proportions and types of industries in the state and the nation as a whole.
• Figure 5.2 shows the Minnesota and United
States fatality rates per 100,000 FTE workers since 2007. The 2009 fatality rate for Minnesota was 2.4 deaths per 100,000 FTE workers, below the rates for the two previous years.
• For the entire United States, the fatality rate
for 2009 was 3.5 deaths per 100,000 FTE workers, below the 3.7 rate for 2008. The rate was 2.8 for wage and salary workers and 12.7 for self-employed workers.

Minnesota Department of Labor and Industry Workplace Safety Report — 2009
33
Metropolitan area Counties Fatalities
Duluth, MN-WI MN — Carlton, St. Louis; WI — Douglas 37Fargo, ND-MN ND — Cass; MN — Clay 21Grand Forks, ND-MN ND — Grand Forks; MN — Polk 20La Crosse, WI-MN WI — La Crosse; MN — Houston 23
Minneapolis-St. Paul-Bloomington, MN-WI
MN — Anoka, Carver, Chisago, Dakota, Hennepin, Isanti, Ramsey, Scott, Sherburne, Washington, Wright; WI — Pierce, St. Croix
188
Rochester, MN MN — Dodge, Olmsted, Wabasha 28St. Cloud, MN MN — Benton, Stearns 23
Fatalities by metropolitan area The CFOI program produces fatality counts for metropolitan areas, including those that cross state boundaries. The number of fatalities within metropolitan areas is strongly influenced by the types of industries and occupations in each area. This is one reason why the Duluth metropolitan area, with 46 percent higher population than the
St. Cloud metropolitan area, had 61 percent more fatalities. Because there are relatively low numbers of fatalities in some of the metropolitan areas, Figure 5.3 shows the combined fatalities by metropolitan area for 2003 through 2009.
Figure 5.3 Number of fatal work injuries for metropolitan areas, 2003-2009

Minnesota Department of Labor and Industry Workplace Safety Report — 2009
34
0.4
0.4
0.9
0.9
1.3
2.1
3.1
3.7
5.1 (3)
2.1 (*)
1.6 (*)
4.1 (5)
3.0 (5)
8.4 (6)
15.0 (9)
20.7 (20)
0 5 10 15 20 25
Mining
Arts, entertainment, and recreation
Accommodation and food services
Professional, scientific, and technical services
Financial Activities
Educational services
Other services
Health care and social assistance
Public administration
Retail trade
Administrative and support and waste managementand remediation services
Wholesale trade
Manufacturing
Transportation and warehousing
Construction
Agriculture, forestry, fishing and hunting
Average annual fatalities* Education and health services combined had four fatalities in 2009.
Fatalities by industry sector Figure 5.4 shows the average number of Minnesota’s fatal work injuries by industry sector for 2003 through 2009. The number of fatal work injuries for 2009 are shown in the parentheses next to some industries. • The highest number of fatal injuries was in
agriculture, forestry, fishing and hunting, with an annual average of nearly 21 fatalities. This sector also had the highest number of fatalities in 2009 (20 fatalities), although this was a decrease from the 25 fatalities recorded in 2008. Agricultural crop production accounted for 66 percent of the fatalities in this sector, animal production accounted for 28 percent and forestry and logging accounted for 4 percent. Contact with objects and equipment and transportation accidents were the most common events resulting in these fatalities.
• Construction has the second-highest annual
average number of fatalities. The nine fatalities reported in 2009 was the lowest ever reported for construction in the CFOI program. The most common events causing construction fatalities were transportation incidents, contact with objects and equipment, and falls.
• Transportation and warehousing, the third-
highest fatality industry sector, had six fatalities in 2009, compared with eight in 2008 and 12 fatalities in 2007. The most-common event causing these fatalities was highway transportation accidents.
• Manufacturing had an average of five
fatalities a year from 2003 through 2009, and reported three fatalities in 2009. The most common events leading to manufacturing fatalities were contact with objects and equipment and transportation accidents.
Figure 5.4 Average annual number of fatal work injuries by industry sector, Minnesota, 2003-2009
(2009 fatalities shown in parentheses)
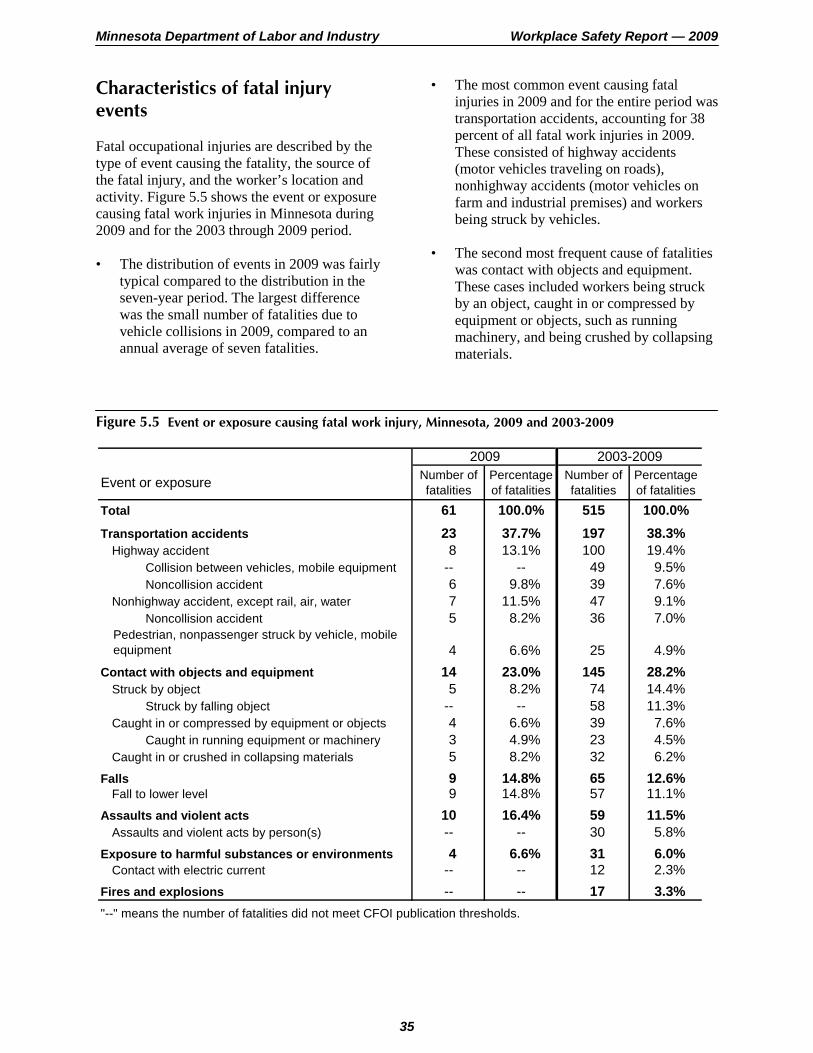
Minnesota Department of Labor and Industry Workplace Safety Report — 2009
35
Event or exposure Number of fatalities
Percentage of fatalities
Number of fatalities
Percentage of fatalities
Total 61 100.0% 515 100.0%Transportation accidents 23 37.7% 197 38.3%
Highway accident 8 13.1% 100 19.4% Collision between vehicles, mobile equipment -- -- 49 9.5% Noncollision accident 6 9.8% 39 7.6%
Nonhighway accident, except rail, air, water 7 11.5% 47 9.1% Noncollision accident 5 8.2% 36 7.0%
Pedestrian, nonpassenger struck by vehicle, mobile equipment 4 6.6% 25 4.9%
Contact with objects and equipment 14 23.0% 145 28.2%Struck by object 5 8.2% 74 14.4%
Struck by falling object -- -- 58 11.3%Caught in or compressed by equipment or objects 4 6.6% 39 7.6%
Caught in running equipment or machinery 3 4.9% 23 4.5%Caught in or crushed in collapsing materials 5 8.2% 32 6.2%
Falls 9 14.8% 65 12.6%Fall to lower level 9 14.8% 57 11.1%
Assaults and violent acts 10 16.4% 59 11.5%Assaults and violent acts by person(s) -- -- 30 5.8%
Exposure to harmful substances or environments 4 6.6% 31 6.0%Contact with electric current -- -- 12 2.3%
Fires and explosions -- -- 17 3.3%"--" means the number of fatalities did not meet CFOI publication thresholds.
2009 2003-2009
Characteristics of fatal injury events Fatal occupational injuries are described by the type of event causing the fatality, the source of the fatal injury, and the worker’s location and activity. Figure 5.5 shows the event or exposure causing fatal work injuries in Minnesota during 2009 and for the 2003 through 2009 period. • The distribution of events in 2009 was fairly
typical compared to the distribution in the seven-year period. The largest difference was the small number of fatalities due to vehicle collisions in 2009, compared to an annual average of seven fatalities.
• The most common event causing fatal injuries in 2009 and for the entire period was transportation accidents, accounting for 38 percent of all fatal work injuries in 2009. These consisted of highway accidents (motor vehicles traveling on roads), nonhighway accidents (motor vehicles on farm and industrial premises) and workers being struck by vehicles.
• The second most frequent cause of fatalities
was contact with objects and equipment. These cases included workers being struck by an object, caught in or compressed by equipment or objects, such as running machinery, and being crushed by collapsing materials.
Figure 5.5 Event or exposure causing fatal work injury, Minnesota, 2009 and 2003-2009

Minnesota Department of Labor and Industry Workplace Safety Report — 2009
36
0
10
20
30
40
50
1999 2000 2001 2002 2003 2004 2005 2006 2007 2008 2009
Contact with objects and equipment Falls Transportation incidents Assaults and violent acts
• There were 10 fatalities due to assaults and violent acts in 2009, an increase from three fatalities in 2008.
• Figure 5.6 shows the trend in the numbers of
fatalities among the major event categories. The relative order of the events has
remained consistent, with assaults occasionally matching the number of falls.
• The number of fatalities due to
transportation incidents has been generally decreasing since 2002, with decreases in five of the past seven years.
Figure 5.6 Number of fatal occupational injury events, Minnesota, 1999-2009

Minnesota Department of Labor and Industry Workplace Safety Report — 2009
37
9%
13%
23%
17%
16%
22%
under 25 yrs
25-34 yrs
35-44 yrs
45-54 yrs
55-64 yrs
65+ yrs
80%
85%
90%
95%
100%
1999 2001 2003 2005 2007 2009P
erce
ntag
e m
en
Characteristics of fatally injured workers Figures 5.7 through 5.10 show the distributions of demographic characteristics and occupations of fatally injured workers. The characteristics with distributions displayed in bar charts are based on fatality cases from 2003 through 2009. Using this multi-year data provides a more stable indicator of the characteristics displayed. Because of the low annual number of fatalities, some characteristics with few cases may show large year-to-year changes that are not indicative of long-term trends. For categories with larger numbers of cases, the percentages have remained fairly stable during this time period. The 2009 results do not show important differences from these multi-year results. Gender • Men accounted for 97 percent of fatally injured
workers in 2009. This was the same percentage as in 2008 and was the highest percentage of fatalities to men since the CFOI program began in 1992.
Age • Fatally injured workers had a wide age
distribution, with the greatest numbers among workers 35 to 54 years of age.
• The age of fatally injured workers has been
gradually increasing, matching the aging of the entire workforce. The percentage of fatalities to workers 45 years and older increased from 47 percent during the 1992 to 1996 period, to 51 percent during the 1998 to 2002 period, and to 56 percent during the 2003 to 2009 period.
Figure 5.7 Gender of fatally injured workers,
Minnesota, 1999-2009 Figure 5.8 Age of fatally injured workers,
Minnesota, 2003-2009

Minnesota Department of Labor and Industry Workplace Safety Report — 2009
38
0%
3%
6%
9%
12%
15%
1999 2001 2003 2005 2007 2009
Per
cent
non
whi
te o
r His
pani
c
3%
3%
4%
4%
4%
5%
5%
12%
17%
6%
20%
Protective service occupations
Grounds cleaning andmaintenance workers
Sales and related occupations
Production occupations
Installation, maintenance, andrepair occupations
Construction managers andsupervisors
Agricultural workers
Material moving workers
Construction trades
Motor vehicle operators
Farmers and ranchers
Race • Non-Hispanic white workers accounted for all
of the fatalities in 2009 and for approximately 84 percent of the population (all age groups).21
• Since 1999, the percentage of fatalities to
nonwhite and Hispanic workers has ranged from 0 percent to 13 percent, with considerable annual variation.
Occupation • Fatally injured workers were concentrated in
the occupation groups of farmers and ranchers and motor-vehicle operators.
• Farmers, ranchers and agriculture-related
occupations together accounted for 25 percent of the fatalities from 2003 through 2009.
• The most common specific occupation among
the motor-vehicle operators was heavy and tractor-trailer truck drivers, with 66 fatalities from 2003 through 2009.
21 Minnesota population projections by race and Hispanic origin, 2005-2035, Minnesota State Demographic Center, 2009.
Figure 5.9 Race of fatally injured workers, Minnesota, 1999-2009 Figure 5.10 Occupation of fatally injured workers,
Minnesota, 2003-2009

Minnesota Department of Labor and Industry Workplace Safety Report — 2009
39
2%
2%
6%
7%
9%
40%
24%
Protective service activities
Tending a retail establishment
Physical activities
Materials handling operations
Using or operating tools,machinery
Constructing, repairing, cleaning
Vehicular and transportationoperations
1%
4%
9%
24%
27%
26%
Mine, quarry
Private residence
Public building
Industrial place and premises
Farm
Street and highway
Worker activity Worker activity categories indicate each fatally injured worker’s activity at the time of the event. • Forty percent of the fatalities from 2003
through 2009 occurred while the workers were operating vehicles.
• Vehicular and transportation operations
accounted for 75 percent of the fatalities in transportation and warehousing.
• In agriculture, forestry, fishing and hunting,
vehicular and transportation operations accounted for 37 percent of the fatalities, while constructing, repairing and cleaning accounted for 26 percent.
• Constructing, repairing and cleaning was the
most-common worker activity among the fatalities in construction, with 49 percent of the fatalities.
Location The location of the fatality indicates, in broad terms, the type of place where the fatal event occurred. • Streets and highways were the most common
fatality location, consistent with the high percentage of transportation-related fatalities.
• Consistent with the high proportion of
fatalities in agriculture, farms were the second most common event location for all fatalities, and the location for 80 percent of the fatalities in agriculture, forestry, fishing and hunting.
Figure 5.11 Activity of fatally injured workers,
Minnesota, 2003-2009 Figure 5.12 Fatal incident location, Minnesota,
2003-2009

Minnesota Department of Labor and Industry Workplace Safety Report — 2009
40
6 Workplace safety programs and services of the Department of Labor and Industry
The Department of Labor and Industry (DLI) provides a variety of programs and services to help employers maintain safe and healthful workplaces. Minnesota has an approved state occupational safety and health plan under the federal Occupational Safety and Health Act (OSHA). Minnesota operates its plan under the Minnesota Occupational Safety and Health Act of 1973 (MNOSHA) and its related standards. DLI administers MNOSHA through two work units, each with a different focus. The Compliance unit is responsible for compliance program administration, which includes conducting enforcement inspections, adoption of standards and operation of other related MNOSHA activities. The Workplace Safety Consultation (WSC) unit provides consultation services, on request, to help employers prevent workplace injuries and illnesses by identifying and correcting safety and health hazards. Both units provide information about workplace safety and health standards. Further information For further information about MNOSHA requirements, standards and procedures, contact the Compliance unit by phone at (651) 284-5050 or 1-877-470-6742, by email at [email protected] and on the Web at www.dli.mn.gov/MnOsha.asp. For further information about consultation services and programs, contact WSC by phone at (651) 284-5060 or 1-800-657-3776, by email at [email protected] or on the Web at www.dli.mn.gov/Wsc.asp.
Occupational safety and health compliance Workplace inspections MNOSHA Compliance conducts workplace inspections to determine whether employers are complying with safety and health standards. With few exceptions, inspections are required to be without advance notice. Employers are required to allow the inspector to enter work areas without delay and must otherwise cooperate with the inspection. The MNOSHA Compliance program is based on a system of inspection priorities. The priorities, from highest to lowest, are • imminent danger — any condition or
practice that presents a substantial probability that death or serious physical harm could occur immediately or before the danger can be eliminated through normal enforcement procedures;
• fatal accidents and catastrophes — accidents causing death or the hospitalization of three or more employees;
• employee complaints — not concerning imminent danger;
• referrals — from safety, health and government professionals;
• programmed inspections — targeting high-hazard employers and industries; and
• follow-up inspections — for determining whether previously cited violations have been corrected.
Employers found to have violated MNOSHA standards receive citations for the violations and are assessed penalties on the basis of the seriousness of the violations. These employers are also required to correct the violations. Employers and employees may appeal citations, penalties and the time periods allowed for correcting violations.

Minnesota Department of Labor and Industry Workplace Safety Report — 2009
41
Figure 6.1 shows statistics for compliance inspections from federal-fiscal-years (FFY, years begin Oct. 1 of the preceding year) 1999 through 2010. More statistics describing MNOSHA activity are available from the MNOSHA annual report, at www.dli.mn.gov/OSHA/PDF/annualreport10.pdf. • During the most recent five-year period,
FFY 2006 through FFY 2010, an average of 2,600 inspections were conducted annually, covering an average of 132,600 workers (Figure 6.1). MNOSHA Compliance conducted 2,691 inspections in FFY 2010, resulting in the identification of 5,535 violations of OSHA standards.
• During FFY 2010, 71 percent of inspections
resulted in at least one violation cited. Among inspections with violations, 2.9 violations were cited, on average.
• Among private-sector employers, serious,
willful and repeat violations accounted for 76 percent of the safety violations and for 67 percent of the health violations cited in FFY 2010. The average penalty for these violations was $791.
• As shown in Figure 6.2, the majority of
inspections in almost every industry were planned, programmed inspections.
• Manufacturing accounted for 44 percent of
the inspections and for 61 percent of the violations, both increasing from FFY 2009. Planned programmed inspections accounted for 89 percent of the manufacturing compliance visits.
• Construction accounted for 32 percent of the
inspections, down from 39 percent in FFY 2009, and for 18 percent of the violations, down from 30 percent in FFY 2009. Ninety-six percent of the construction compliance visits were for planned, programmed inspections.
• MNOSHA Compliance initiated inspections for 15 fatalities during calendar-year 2010 and for 18 fatalities during 2009 (Figure 6.3).
• From 2006 through 2010, 28 percent of the fatality investigations were in the construction industry. Falls and crushing incidents accounted for 48 percent of the fatalities investigated.
• Figure 6.4 shows MNOSHA Compliance
initiated inspections for 30 serious-injury incidents during 2010 and for 174 incidents during the 2006 through 2010 period. During 2010, crushing injuries led to 37 percent of the serious-incident inspections. From 2006 through 2010, 44 percent of the serious injuries investigated involved workers injured by falls and crushing injuries. Additional details about the fatality and serious injury incident investigations are available at www.dli.mn.gov/OSHA/Information.asp.
• Construction safety is a major focus for both
compliance inspections and outreach efforts. During FFY 2010, 34 percent of programmed inspections were conducted at construction worksites. MNOSHA provides compliance assistance for members of the construction industry responsible for worksite safety to stay current with MNOSHA standards. MNOSHA had five construction breakfast seminars, with 215 construction managers and supervisors in attendance.
• MNOSHA established the 75/25 Program in
FFY 2004. This is a penalty-reduction incentive program available to qualified employers that links workers’ compensation claims and MNOSHA Compliance penalties. This program allows an employer to obtain a 75 percent reduction in penalties if that employer reduces the number of workers’ compensation claims submitted by 25 percent within the following one-year period. Participants are encouraged to use WSC services to achieve this goal. Since its inception, 235 employers have entered the 75/25 Program and 157 employers have completed the program by the end of FFY 2010. Of these, 97 employers successfully achieved the 25 percent claims reduction. Information is available at www.dli.mn.gov/OSHA/75-25Program.asp.

Minnesota Department of Labor and Industry Workplace Safety Report — 2009
42
Federal fiscal-year 1
Inspections conducted
Employees covered 2
Inspections with
violations Violations
Penalties assessed
($ millions)3
1999 1,876 103,029 1,255 3,957 $3.152005 2,591 128,491 1,821 4,938 $4.072006 2,593 93,244 1,876 4,986 $3.752007 2,651 126,260 1,836 5,140 $3.852008 2,483 131,748 1,674 4,225 $3.202009 2,717 139,429 1,959 4,962 $3.372010 2,691 172,239 1,904 5,535 $3.87
1. Federal fiscal-years are from Oct. 1 of the preceding year to Sept. 30 of the indicated year.2.
3. These are the initial penalty assessment amounts.Source: Minnesota OSHA Operations System Exchange database.
"Employees covered" refers to the number of employees who were affected by the scope of the inspection, which is not always all employees at a facility.
0
1,000
2,000
3,000
4,000
5,000
6,000
1999 2000 2001 2002 2003 2004 2005 2006 2007 2008 2009 2010
Inspections
Violations
Figure 6.1 MNOSHA Compliance inspections and violations cited, federal-fiscal-years 1999-20101
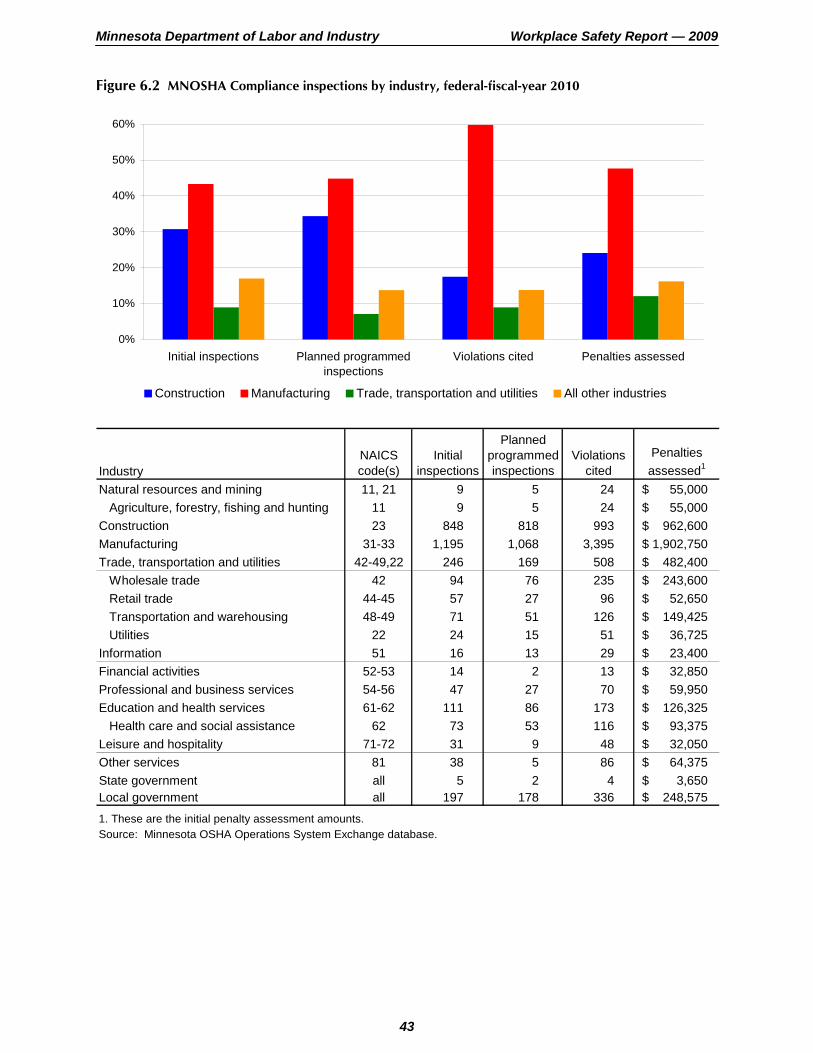
Minnesota Department of Labor and Industry Workplace Safety Report — 2009
43
IndustryNAICS code(s)
Initial inspections
Planned programmed inspections
Violations cited
Penalties assessed1
Natural resources and mining 11, 21 9 5 24 $ 55,000Agriculture, forestry, fishing and hunting 11 9 5 24 $ 55,000
Construction 23 848 818 993 $ 962,600Manufacturing 31-33 1,195 1,068 3,395 $ 1,902,750Trade, transportation and utilities 42-49,22 246 169 508 $ 482,400
Wholesale trade 42 94 76 235 $ 243,600Retail trade 44-45 57 27 96 $ 52,650Transportation and warehousing 48-49 71 51 126 $ 149,425Utilities 22 24 15 51 $ 36,725
Information 51 16 13 29 $ 23,400Financial activities 52-53 14 2 13 $ 32,850Professional and business services 54-56 47 27 70 $ 59,950Education and health services 61-62 111 86 173 $ 126,325
Health care and social assistance 62 73 53 116 $ 93,375Leisure and hospitality 71-72 31 9 48 $ 32,050Other services 81 38 5 86 $ 64,375State government all 5 2 4 $ 3,650Local government all 197 178 336 $ 248,575
1. These are the initial penalty assessment amounts.Source: Minnesota OSHA Operations System Exchange database.
0%
10%
20%
30%
40%
50%
60%
Initial inspections Planned programmedinspections
Violations cited Penalties assessed
Construction Manufacturing Trade, transportation and utilities All other industries
Figure 6.2 MNOSHA Compliance inspections by industry, federal-fiscal-year 2010

Minnesota Department of Labor and Industry Workplace Safety Report — 2009
44
Serious-injury type 2006 2007 2008 2009 2010 TotalAmputation 6 1 4 9 4 24Asphyxiation/chemical exposure 0 1 6 1 3 11
Burn 3 1 1 3 0 8Crushed by 2 6 8 3 11 30Electrical shock 3 4 5 2 1 15Environmental stress 0 0 0 0 0 0Explosion 2 1 4 1 3 11Fall 12 14 8 6 7 47Struck by 7 9 7 4 1 28
Total 35 37 43 29 30 174Percent in construction 37% 41% 33% 17% 23% 31%
Fatality type 2006 2007 2008 2009 2010 TotalAsphyxiation/chemical exposure 1 3 1 3 2 10
Burn 1 4 0 0 0 5Crushed by 9 5 6 5 5 30Drowning 0 2 0 1 0 3Electrocution 2 0 2 0 1 5Explosion 0 1 0 1 0 2Fall 4 4 2 6 4 20Heat exposure 0 1 0 0 0 1Natural causes 1 0 0 0 3 4Struck by 7 5 1 2 0 15
Total 25 25 12 18 15 95Percent in construction 32% 39% 25% 17% 17% 28%
Figure 6.3 Fatalities investigated by MNOSHA Compliance, 2006-2010 Figure 6.4 Serious injuries investigated by MNOSHA Compliance, 2006-2010
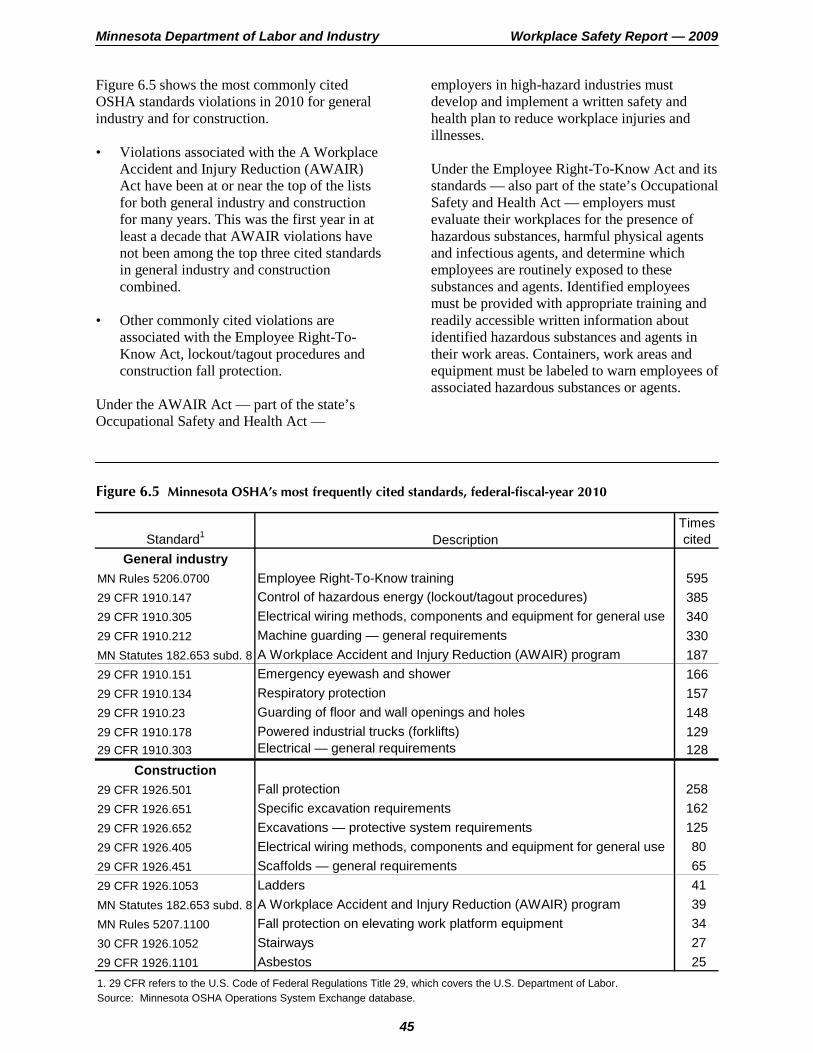
Minnesota Department of Labor and Industry Workplace Safety Report — 2009
45
Standard1 DescriptionTimes cited
General industryMN Rules 5206.0700 Employee Right-To-Know training 59529 CFR 1910.147 Control of hazardous energy (lockout/tagout procedures) 38529 CFR 1910.305 Electrical wiring methods, components and equipment for general use 34029 CFR 1910.212 Machine guarding — general requirements 330MN Statutes 182.653 subd. 8 A Workplace Accident and Injury Reduction (AWAIR) program 18729 CFR 1910.151 Emergency eyewash and shower 16629 CFR 1910.134 Respiratory protection 15729 CFR 1910.23 Guarding of floor and wall openings and holes 14829 CFR 1910.178 Powered industrial trucks (forklifts) 12929 CFR 1910.303 Electrical — general requirements 128
Construction29 CFR 1926.501 Fall protection 25829 CFR 1926.651 Specific excavation requirements 16229 CFR 1926.652 Excavations — protective system requirements 12529 CFR 1926.405 Electrical wiring methods, components and equipment for general use 8029 CFR 1926.451 Scaffolds — general requirements 6529 CFR 1926.1053 Ladders 41MN Statutes 182.653 subd. 8 A Workplace Accident and Injury Reduction (AWAIR) program 39MN Rules 5207.1100 Fall protection on elevating work platform equipment 3430 CFR 1926.1052 Stairways 2729 CFR 1926.1101 Asbestos 251. 29 CFR refers to the U.S. Code of Federal Regulations Title 29, which covers the U.S. Department of Labor.Source: Minnesota OSHA Operations System Exchange database.
Figure 6.5 shows the most commonly cited OSHA standards violations in 2010 for general industry and for construction. • Violations associated with the A Workplace
Accident and Injury Reduction (AWAIR) Act have been at or near the top of the lists for both general industry and construction for many years. This was the first year in at least a decade that AWAIR violations have not been among the top three cited standards in general industry and construction combined.
• Other commonly cited violations are
associated with the Employee Right-To-Know Act, lockout/tagout procedures and construction fall protection.
Under the AWAIR Act — part of the state’s Occupational Safety and Health Act —
employers in high-hazard industries must develop and implement a written safety and health plan to reduce workplace injuries and illnesses. Under the Employee Right-To-Know Act and its standards — also part of the state’s Occupational Safety and Health Act — employers must evaluate their workplaces for the presence of hazardous substances, harmful physical agents and infectious agents, and determine which employees are routinely exposed to these substances and agents. Identified employees must be provided with appropriate training and readily accessible written information about identified hazardous substances and agents in their work areas. Containers, work areas and equipment must be labeled to warn employees of associated hazardous substances or agents.
Figure 6.5 Minnesota OSHA’s most frequently cited standards, federal-fiscal-year 2010

Minnesota Department of Labor and Industry Workplace Safety Report — 2009
46
Partnerships MNOSHA Compliance continues to support and strengthen relationships with organizations that represent safety and health best practices. It currently has two partnerships in the construction industry — Construction Health and Safety Excellence (CHASE) Minnesota and Minnesota Chapter of Associated Builders and Contractors (MN ABC). During FFY 2010, one new member was added to the CHASE Minnesota partnership and five new members were added to the MN ABC partnership. The goal of these partnerships is to reduce the number of injuries, illnesses and fatalities affecting participants by 3 percent annually. To achieve these results, these programs focus on the four leading causes of construction deaths — falls, struck-by, caught in/between and electrocutions — and the development of comprehensive written safety and heath programs. There are three levels of participation in the partnerships. Workplace Safety Consultation WSC offers a variety of workplace safety services. These services are voluntary, confidential and separate from the MNOSHA Compliance unit. Workplace consultations WSC offers free consultation services to help employers prevent workplace accidents and diseases by recognizing and correcting safety and health hazards. This service is targeted primarily toward smaller businesses in high-hazard industries, and is available to public-sector employers. During FFY 2010, WSC conducted 1,603 worksite safety and health visits, training and assistance visits and interventions. WSC safety and health professionals conduct on-site consultations. During the consultation visits, the consultants help employers determine how to improve workplace safety practices and working conditions to comply with, and exceed, MNOSHA regulations and to reduce accidents and illnesses and their associated costs.
No citations are issued or penalties proposed as a result of WSC consultations. However, employers are obligated to correct any serious safety and health hazards found. Consultants identify hazards in about 95 percent of the visits. Information about an employer is not reported to MNOSHA Compliance unless the employer fails to correct the detected safety and health hazards within a specified period. This has happened only once in the past decade. Figure 6.6 shows statistics for WSC visits to worksites for FFY 1999 through 2010. • Since FFY 2005, the annual number of
consultation visits has remained at or above 900 visits.
• During the past three years, an average of
19,200 employers and employees received training from WSC consultants.
• WSC visits in FFY 2010 identified safety
and health hazards that could have cost employers approximately $3.5 million in MNOSHA Compliance penalties.
Figure 6.7 shows statistics for WSC services to worksites for some industries during FFY 2010. • Construction sites accounted for 59 percent
of initial consultation visits, followed by manufacturing with 15 percent.
• Training assistance and interventions were
distributed among a wide range of industries. The selected industries shown in the figure accounted for 90 percent of the initial consultation visits but only 36 percent of the training assistance and intervention visits.
Loggers’ Safety Education Program The Loggers’ Safety Education Program (LogSafe) provides logging industry safety training through four-hour seminars throughout the state. The goal of the program is to help reduce injuries and illnesses in the logging industry through on-site consultation services, outreach and training seminars. Since 2009, WSC has contracted out its spring and fall LogSafe seminar training programs.

Minnesota Department of Labor and Industry Workplace Safety Report — 2009
47
Initial consultation
visits
Visits with identified hazards
Potential penalties avoided2
($ millions)
Training and intervention
visits
People receiving
training and interventions
535 496 $1.98 365 9,650900 889 $3.83 597 18,421
1,043 1,010 $4.37 584 15,180923 890 $3.49 693 20,506965 918 $3.33 691 23,394966 925 $3.72 544 17,670
1,064 1,045 $3.52 539 16,5971. Federal fiscal years are from Oct. 1 of the preceding year to Sept. 30 of the indicated year.2.
Source: Minnesota OSHA Operations System Exchange database.
2008
1999
Potential penalty amounts expressed using average penalty values for 2009.
Federal fiscal-year1
20102009
200520062007
0
200
400
600
800
1,000
1,200
1999 2000 2001 2002 2003 2004 2005 2006 2007 2008 2009 2010
Initial consultations
Training and intervention visits
Industry NAICS code Initial visitsTraining
assistance
Logging 113310 12 5Construction 23 624 84Manufacturing 31-33 156 55Trade, transportation and utilities 42-49, 22 49 9Nursing and residential care 623 37 12Other services 81 8 1State and local government 92 74 28Source: Minnesota OSHA Operations System Exchange database.
Figure 6.6 Workplace Safety Consultation visit activity, federal-fiscal-years 1999-2010 Figure 6.7 Workplace Safety Consultation activity for selected industries, federal-fiscal-year 2010

Minnesota Department of Labor and Industry Workplace Safety Report — 2009
48
Additionally, during FFY 2010, WSC conducted 187 logger safety visits and interventions, with 2,660 attendees at the training and intervention activities. Safety Grants Program The Safety Grants Program is a state-funded program that awards funds up to $10,000 to qualifying employers for projects designed to reduce the risk of injury and illness to their employees. Projects must be consistent with the recommendations of a safety and health inspection. Qualified applicants must match the grant money awarded. During state-fiscal-year 2010, WSC awarded $1.1 million to 261 employers that matched the grants with more than $2 million of their own funds. Ergonomics assistance and safe-patient-handling The main responsibilities of the WSC ergonomics program coordinator are to educate Minnesota employers and employees about the recognition and control of risk factors associated with MSDs. With safe-patient-handling legislation enacted in Minnesota requiring all licensed health care facilities in Minnesota to implement a safe-patient-handling program, a big focus of the ergonomics program is safe patient handling. The legislation requires a written safe-patient-handling policy and the establishment of a plan to minimize manual lifting of patients in hospitals, nursing homes and outpatient surgical centers by Jan. 1, 2011. Clinics that move patients need to develop a written safe patient handling plan and have it fully implemented by Jan. 1, 2012. WSC is providing assistance to health care facilities through development of training and education presentations and materials, on-site ergonomics evaluations and posting resources online. From October 2009 through March 2011, 44 facilities received visits with an ergonomics focus, 33 of which were for safe-patient-handling. There were nine safe-patient-handling training seminars and five general ergonomics training sessions.
WSC provides financial support for the purchase of patient-lifting equipment through the Safety Grants Program. Between February 2010 and February 2011, 49 safety grants, totaling $290,000, were provided to health care facilities. Through an alliance with the Care Providers of Minnesota, the ergonomics program coordinator conducted a demonstration on-site consultation visit. During this full-day visit, facility safety coordinators are able to observe the process of a visit, and have a chance to ask the consultant questions and see first-hand the benefits a consultation can bring to their establishment. A sample safe-patient-handling program for nursing homes and a sample safe-patient-handling program for clinics have been written and are posted on DLI’s website to provide examples for employers. The ergonomics program coordinator has also contributed to the MNOSHA compliance directive and citation-rating guide. The safe-patient-handling legislation and resource materials are available at www.dli.mn.gov/WSC/SPHlegislation.asp. MNSHARP The Minnesota Safety and Health Achievement Recognition Program (MNSHARP) is a voluntary program that assists small high-hazard employers in achieving safety and health improvements and recognizes them for doing so. The success of these employers in improving the safety climate in their workplaces is apparent in their OSHA recordable cases and their workers’ compensation costs. MNSHARP is limited to employers with fewer than 250 workers at the worksite. Participants receive a comprehensive safety and health consultation survey from WSC. If the facility demonstrates a strong commitment to workplace safety and is deemed able to meet all MNSHARP requirements within one year, a one-year action plan is established to correct all identified hazards and management system deficiencies, and the site is granted a deferral from MNOSHA scheduled compliance inspections. During the year, one or more on-site visits are made to provide safety and health assistance and

Minnesota Department of Labor and Industry Workplace Safety Report — 2009
49
to monitor progress in accomplishing action plan items. If the participant has completed their action plan and the necessary injury and illness reductions are accomplished, the worksite receives a MNSHARP certificate of recognition and is exempted from programmed MNOSHA Compliance inspections for up to two years upon initial certification, and up to three years upon subsequent re-certification. Seven new participants were certified into MNSHARP during FFY 2010, bringing the total to 43 certified programs. The majority of the program participants are manufacturers. In FFY 2008, WSC launched one of the nation’s first safety and health achievement recognition programs for the construction industry. MNSHARP Construction provides incentives and on-site support for large, long-term (18 months or longer) construction worksites and works with the general contractors to develop, implement and continually improve the effectiveness of their workplace safety and health programs. Four construction projects successfully achieved all MNSHARP requirements in FFY 2010. The total case incidence rates of the general-industry MNSHARP employers during 2010 averaged 45 percent below the 2009 national rate for their industries; their DART rates averaged 42 percent below their national industry rates. For construction projects, the total case rates averaged 75 percent below the national rate and the DART rates averaged 100 percent lower. The reduced numbers of cases saved MNSHARP employers an estimated $491,000 in workers’ compensation benefit payments. For more information about MNSHARP, visit www.dli.mn.gov/WSC/MNSHARP.asp. MNSTAR The Minnesota Star (MNSTAR) program is a voluntary program patterned after the federal Voluntary Protection Program.22 It is available to Minnesota employers of all sizes. Compared to MNSHARP, MNSTAR has more rigorous requirements and confers a higher level of recognition on certified employers. 22 See www.osha.gov/dcsp/vpp.
MNSTAR relies mainly on employer self-assessment and requires an extensive application, including submission of written safety and health policies and procedures. An application cannot be accepted until the work-site requests and receives a full-service safety and health consultation visit. The consultant evaluates safety and health hazards, reviews mandated safety and health programs, and provides a partial assessment of overall safety and health management. Employers that demonstrate a high-level of safety and health management effectiveness can apply for MNSTAR status. After review of the application, an on-site and comprehensive assessment of the worksite’s safety and health management system is completed. MNSTAR status is awarded if all eligibility requirements have been met, including an injury and illness rate below the state and national averages for their industry. MNSTAR recognition exempts employers from programmed MNOSHA Compliance inspections for three years upon initial certification, and up to five years upon subsequent re-certification. Merit status is also available for employers that demonstrate a high level of safety and health management effectiveness, but have not fully met all eligibility requirements for MNSTAR. During FFY 2010, there were 45 employers with full MNSTAR certification and seven employers in Merit status. This includes one company receiving initial certification for MNSTAR status and one company reaching Merit status. During 2010, the total case incidence rates of the general-industry MNSTAR employers averaged 45 percent below the 2009 national rates for their industries; their DART rates averaged 58 percent below the national rates. For contractor employers, the total case and DART rates averaged 100 percent below the national rate. The reduced numbers of cases saved MNSTAR employers an estimated $1.5 million in workers’ compensation benefit payments. For more information about MNSTAR, visit www.dli.mn.gov/WSC/MnStar.asp.

Minnesota Department of Labor and Industry Workplace Safety Report — 2009
50
Workplace safety and health seminars and outreach activities Both the MNOSHA Compliance and WSC units provide training and outreach activities to help employers and employees improve the safety and health conditions at their worksites. Some of the training is directed to company safety directors to provide information for their own safety training programs. Compliance staff members present information about MNOSHA standards and other workplace safety topics to employer organizations, safety professionals, unions and labor-management organizations. Many MNOSHA Compliance outreach services are presented at meetings, conferences and employer groups organized by the Midwest Center for Occupational Health and Safety, Minnesota Health and Housing Alliance, Associated General Contractors of Minnesota, American Society of Safety Engineers and the Minnesota Safety Council. During FFY 2009, Compliance staff members presented outreach presentations to 3,900 participants. WSC provides seminars and training opportunities to help employers and employees understand and comply with safety and health regulations, and to develop and implement mandatory programs, including Employee Right-To-Know, AWAIR and labor-management safety committees. During FFY 2010, WSC conducted 540 worksite training, intervention and technical assistance visits, reaching more than 16,600 participants. During FFY 2010, WSC training activities included these events: • two full-day educational sessions about fall-
protection in the roofing industry through an alliance with the Twin Cities Roofers Association, attended by 70 employers and employees;
• presentations about residential construction
fall protection and Employee Right-to-Know regulations to nine contractor re-licensing classes at technical colleges, with 463 employers participating;
• three presentations about electrical hazards in construction for the Minnesota Electrical Association and another presentation to the Association of Building Contractors, attended by 100 employers and employees; and,
• 12 10-hour OSHA construction certification
courses for various organizations, including courses for minority, women’s and apprenticeship organizations.
MNOSHA performance In its five-year strategic plans, MNOSHA sets strategic and performance goals to reduce injury and illness rates and fatality rates for the industries within its jurisdiction. The strategic plan includes a set of emphasis industries that are identified through a combination of factors, including the number of workers in the industry and the industry’s DART rate. The current strategic plan is available at www.dli.mn.gov/OSHA/PDF/stratplan09-13.pdf. Establishments in the emphasis industries receive considerable attention from MNOSHA. During FFY 2010, 64 percent of programmed compliance inspections and 99 percent of the consultation initial visits were in these emphasis industries. The case count and rate estimates of days-away-from-work cases for the emphasis industries in the FFY 2009 through 2013 strategic plan are shown in Figure 6.8. The majority of emphasis industries are in the manufacturing sector. In 2009, the emphasis industries accounted for 18 percent of Minnesota’s workplaces, for 28 percent of the workers and for 44 percent of the cases with one or more days away from work. The lower percentage decrease in the number of DAFW cases for the emphasis industries compared to the remainder of the state’s industries shows the need for increased MNOSHA attention to these industries.
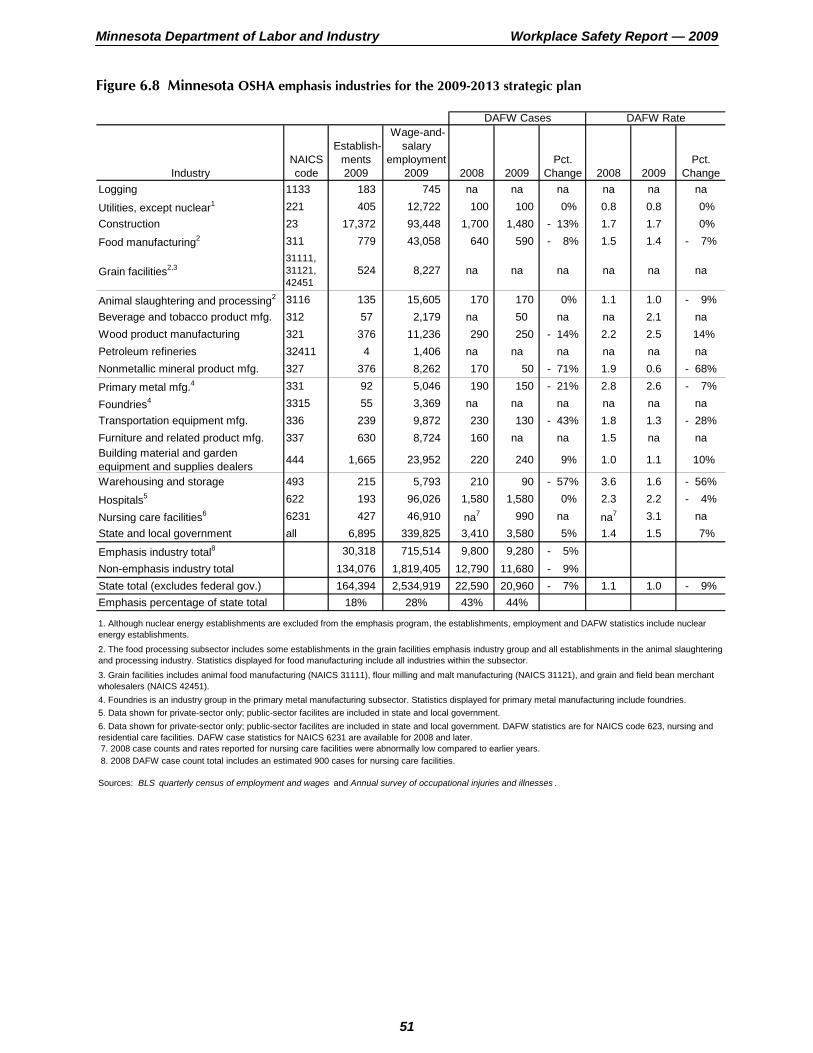
Minnesota Department of Labor and Industry Workplace Safety Report — 2009
51
IndustryNAICS code
Establish-ments 2009
Wage-and-salary
employment 2009 2008 2009
Pct. Change 2008 2009
Pct. Change
Logging 1133 183 745 na na na na na na
Utilities, except nuclear1 221 405 12,722 100 100 0% 0.8 0.8 0%Construction 23 17,372 93,448 1,700 1,480 - 13% 1.7 1.7 0%
Food manufacturing2 311 779 43,058 640 590 - 8% 1.5 1.4 - 7%
Grain facilities2,331111, 31121, 42451
524 8,227 na na na na na na
Animal slaughtering and processing2 3116 135 15,605 170 170 0% 1.1 1.0 - 9%Beverage and tobacco product mfg. 312 57 2,179 na 50 na na 2.1 naWood product manufacturing 321 376 11,236 290 250 - 14% 2.2 2.5 14%Petroleum refineries 32411 4 1,406 na na na na na naNonmetallic mineral product mfg. 327 376 8,262 170 50 - 71% 1.9 0.6 - 68%
Primary metal mfg.4 331 92 5,046 190 150 - 21% 2.8 2.6 - 7%
Foundries4 3315 55 3,369 na na na na na naTransportation equipment mfg. 336 239 9,872 230 130 - 43% 1.8 1.3 - 28%Furniture and related product mfg. 337 630 8,724 160 na na 1.5 na naBuilding material and garden equipment and supplies dealers 444 1,665 23,952 220 240 9% 1.0 1.1 10%
Warehousing and storage 493 215 5,793 210 90 - 57% 3.6 1.6 - 56%
Hospitals5 622 193 96,026 1,580 1,580 0% 2.3 2.2 - 4%
Nursing care facilities6 6231 427 46,910 na7 990 na na7 3.1 naState and local government all 6,895 339,825 3,410 3,580 5% 1.4 1.5 7%
Emphasis industry total8 30,318 715,514 9,800 9,280 - 5%Non-emphasis industry total 134,076 1,819,405 12,790 11,680 - 9%State total (excludes federal gov.) 164,394 2,534,919 22,590 20,960 - 7% 1.1 1.0 - 9%Emphasis percentage of state total 18% 28% 43% 44%
7. 2008 case counts and rates reported for nursing care facilities were abnormally low compared to earlier years. 8. 2008 DAFW case count total includes an estimated 900 cases for nursing care facilities.
Sources: BLS quarterly census of employment and wages and Annual survey of occupational injuries and illnesses .
5. Data shown for private-sector only; public-sector facilites are included in state and local government.
DAFW Cases DAFW Rate
4. Foundries is an industry group in the primary metal manufacturing subsector. Statistics displayed for primary metal manufacturing include foundries.
6. Data shown for private-sector only; public-sector facilites are included in state and local government. DAFW statistics are for NAICS code 623, nursing and residential care facilities. DAFW case statistics for NAICS 6231 are available for 2008 and later.
2. The food processing subsector includes some establishments in the grain facilities emphasis industry group and all establishments in the animal slaughtering and processing industry. Statistics displayed for food manufacturing include all industries within the subsector. 3. Grain facilities includes animal food manufacturing (NAICS 31111), flour milling and malt manufacturing (NAICS 31121), and grain and field bean merchant wholesalers (NAICS 42451).
1. Although nuclear energy establishments are excluded from the emphasis program, the establishments, employment and DAFW statistics include nuclear energy establishments.
Figure 6.8 Minnesota OSHA emphasis industries for the 2009-2013 strategic plan

Minnesota Department of Labor and Industry Workplace Safety Report — 2009
52

Minnesota Department of Labor and Industry Workplace Safety Report — 2009
53
Appendix A Definitions of key concepts in the Survey of Occupational
Injuries and Illnesses The U.S. Bureau of Labor Statistics conducts the annual Survey of Occupational Injuries and Illnesses (SOII) to provide nationwide and state-level information about work-related injuries and illnesses, including their number and incidence.16 The survey includes all cases recorded by employers on their OSHA log. Employers with 11 or more employees are required to use the log to record workplace injuries and illnesses, conforming with definitions and recordkeeping guidelines set by the Occupational Safety and Health Administration.17 Employers with 10 or fewer employees participating in the survey record their cases on the OSHA log for the survey year. The SOII data is collected from the OSHA log and from an additional set of questions regarding cases with at least one day off the job. Work-related injuries and illnesses are new conditions that are caused by, or pre-existing conditions significantly aggravated by, events or exposures in the work environment. Recordable cases, for 2002 and later years, include work-related injuries and illnesses that result in death, loss of consciousness, days away from work, restricted work activity or job transfer, or medical treatment (beyond first aid). It also includes significant work-related injuries or illnesses diagnosed by a physician or other licensed health care professional. These include any work-related case involving cancer, chronic irreversible disease, a fractured or cracked bone, or a punctured eardrum. Additional criteria that can result in a recordable case include: • any needlestick injury or cut from a sharp
object that is contaminated with another
16 The survey and other BLS occupational safety and health statistics are described in greater detail in Chapter 9 of the BLS handbook of methods, at www.bls.gov/opub/hom/homtoc.htm. 17 This is a count of the total number of employees in the firm, across all establishments.
person's blood or other potentially infectious material;
• any case requiring an employee to be medically removed under the requirements of an OSHA health standard; or
• tuberculosis infection as evidenced by a positive skin test or diagnosis by a physician or other licensed health care professional after exposure to a known case of active tuberculosis.
Some of the differences between recordable cases before and after 2002 are discussed in Appendix C. Information about the recordkeeping guidelines is available at www.dli.mn.gov/OSHA/Recordkeeping.asp. Occupational injury is any wound or damage to the body resulting from an event in the work environment. Occupational illness is any abnormal condition or disorder, other than one resulting from an occupational injury, caused by exposure to factors associated with employment. It includes acute and chronic illnesses or diseases that may be caused by inhalation, absorption, ingestion or direct contact. For injuries prior to 2002, the following definitions apply. Days away from work (DAFW) are days after the injury or onset of illness when the employee would have worked but does not because of the injury or illness. Days of restricted work activity are days after the injury or onset of illness when the employee works reduced hours, has restricted duties or is temporarily assigned to another job because of the injury or illness. Lost-workday (LWD) cases involve days away from work, days of restricted work activity or both.

Minnesota Department of Labor and Industry Workplace Safety Report — 2009
54
1. Lost-workday cases involving days away from work are cases that result in DAFW or a combination of DAFW and days of restricted work activity.
2. Lost-workday cases involving restricted
work activity are cases that result in restricted work activity only.
Cases without lost workdays are recordable cases with no days away from work or days with restricted work activity. For injuries in 2002 and later, the following definitions apply. Days away from work, days of restricted work activity or job transfer (DART) are cases that involve days away from work, days of restricted work activity or job transfer, or both. 1. Cases involving days away from work
require at least one day away from work with or without days of job restriction.
2. Job transfer or restriction cases occur when,
as a result of a work-related injury or illness, an employer or health care professional keeps or recommends keeping an employee from doing the routine functions of his or her job or from working the full workday the employee would have been scheduled to work before the injury or illness occurred.
Other recordable cases are cases that meet the recordability thresholds but do not involve death, days away from work, or days of restricted work activity or job transfer. For all survey years, the following definitions apply. Publishable industry data is summary data about an industry selected for publication in the survey that meets BLS reliability and confidentiality criteria. As part of the survey sample selection process, states decide which industries will include enough surveyed companies to provide potentially publishable data. The remaining industries are grouped into residual industries that provide data for the next-higher level of categorization.
The reliability criteria consider changes in an industry’s employment during the survey period, the relative standard error for the number of lost-workday cases and whether there is a minimum level of employment in that industry. The confidentiality criteria ensure that the identity of data providers and the nature of their data cannot be determined. Median days away from work is the measure used to summarize the length of work absences among the cases with days away from work. The median is the halfway point in the distribution — half the cases involved more days and half involved fewer days. Incidence rates represent the number of injuries and illnesses per 100 full-time-equivalent workers. They are calculated as: (N/EH) x 200,000 where:
N = number of injuries and illnesses; EH = total hours worked by all employees during the calendar year; 200,000 = base for 100 full-time-equivalent workers (working 40 hours a week, 50 weeks a year).
Incidence rates for characteristics of DAFW cases are based on 10,000 full-time equivalent workers. Nature of injury or illness names the principal physical characteristic of a disabling condition, such as sprain/strain, cut/laceration or carpal tunnel syndrome. Part of body affected is directly linked to the nature of the injury or illness cited, for example, back sprain, finger cut, or wrist and carpal tunnel syndrome. Event or exposure signifies the manner in which the injury or illness was produced or inflicted, for example, overexertion while lifting or fall from ladder. Source of injury or illness is the object, substance, exposure or bodily motion that directly produced or inflicted the disabling condition cited. Examples are a heavy box, a toxic substance, fire/flame and bodily motion of the injured worker.

Minnesota Department of Labor and Industry Workplace Safety Report — 2009
55
Appendix B Key concepts in OSHA recordkeeping
The data recorded by employers on the OSHA 300 Log of Work-Related Injuries and Illnesses (OSHA log) and the Form 301: Injury and Illness Incident Report (incident report) are the foundation for the data used in the Survey of Occupational Injuries and Illnesses (SOII). The survey includes all nonfatal cases recorded by participating employers on their OSHA 300 logs. Injuries and illnesses logged by employers conform to definitions and recordkeeping guidelines set by OSHA. It is critical for the validity of the SOII that employers provide complete and accurate information, conforming to OSHA’s recordkeeping requirements. For each recordable case (see the definitions of recordable cases and work-related injuries and illnesses in Appendix A), employers enter the following information on the OSHA log: • employee’s name (unless the injury or
illness qualifies as a “privacy case”); • employee’s job title; • the date of injury or onset of illness; • the location where the event occurred; • a description of the injury or illness and the
object or substances that directly injured or made the person ill;
• classification of the seriousness of the case by its most-serious outcome (most-serious to least-serious are: fatality, days-away-from-work, job transfer or work restriction, and other recordable (see definitions in Appendix A));
• the number of days the injured or ill worker was away from work;
• the number of days the injured or ill worker was on job transfer or restriction; and
• classification of the case as an injury or an illness and, if it is an illness, indicating an illness category (skin diseases or disorders, respiratory conditions, poisoning, hearing loss or all other illnesses).
In addition to making a log entry, the employer must also complete an incident report or a Minnesota workers’ compensation First Report of Injury form for each recordable case. The SOII uses these reports for the cases with days away from work to generate statistics about injured workers and the characteristics of their injuries and illnesses (see Chapter 4 of this report). Information on the incident report (or a comparable form) includes: • employee’s name; • employee’s date of birth; • employee’s date hired; • employee’s gender; • time employee began work; • time of event; • text description of the employee’s activity
just before the incident occurred; • text description of how the injury occurred; • text description of the injury or illness,
including the part of the body affected and how it was affected; and,
• text description of the object or substance that directly harmed the employee.
The information used by the survey is copied by employers from the OSHA log and the incident report and transferred to the SOII reporting forms between January and July of the following year, with the majority of reports coming before April. For employers reporting early in the period, information about durations away from work or job restrictions for cases that occurred during the final months of the year may be less accurate. The recordkeeping requirements instruct employers to update the OSHA log information as more information becomes available. Accurate OSHA recordkeeping is an employer responsibility that requires training and the availability of technical advice. Given the infrequency of workplace injuries and illnesses and the complexity of the forms, recordkeeping
Minnesota Department of Labor and Industry Workplace Safety Report — 2009
56
errors are common. Many errors are uncovered and corrected during the editing process of the SOII data collection. Employers also confuse the OSHA recordkeeping requirements and the Minnesota workers’ compensation reporting requirements, and apply workers’ compensation rules for determining work-relatedness and coverage to the OSHA log. For example, mental stress claims are not covered by the Minnesota workers’ compensation system, but are recordable on the OSHA log. Among the common OSHA log errors are: • counting cases where only first aid (or no
aid at all) was provided; • classifying a case into more than one case
type when both days away from work and job restriction occurred;
• classifying a case into the wrong case type when both days away from work and job restriction occurred;
• counting a case in more than one year when days away from work or job restriction occur in multiple years;
• counting only scheduled work days instead of calendar days; and
• including the day of the injury in the count of days away from work.
The Minnesota Department of Labor and Industry provides OSHA recordkeeping advice for employers through multiple channels. The Web page at www.dli.mn.gov/OSHA/Recordkeeping.asp includes: • links to the OSHA log forms; • text of the OSHA recordkeeping
requirement; • a series of Recordkeeping 101 and
Recordkeeping 201 features from the quarterly MNOSHA newsletter, Safety Lines; and
• Ten tips for improving your OSHA log. Employers may contact the MNOSHA Compliance or Workplace Safety Consultation units or the SOII staff in the Research and Statistics unit for recordkeeping assistance. MNOSHA compliance inspectors and WSC consultants also provide on-site log review and assistance during worksite visits. The federal OSHA recordkeeping site also provides many resources for employers (www.osha.gov/recordkeeping). This includes the OSHA recordkeeping handbook and training presentation slides and scripts.

Minnesota Department of Labor and Industry Workplace Safety Report — 2009
57
Appendix C Major changes to OSHA’s recordkeeping rule in 2002
To remove some of the subjectivity involved in making decisions about what injuries and illnesses employers need to record on the OSHA Log of Work-Related Injuries and Illnesses, OSHA instituted changes in its recordkeeping requirements, that became effective Jan. 1, 2002. By improving the consistency in recordkeeping by employers, these changes should improve the quality of the estimates produced by the BLS Survey of Occupational Injuries and Illnesses (SOII), which relies on the OSHA log records. To disseminate information about the new recordkeeping requirements, all employers participating in the 2002 SOII were sent new OSHA log packets with introductory material. During 2002, Workplace Safety Consultation consultants traveled throughout the state, conducting 53 training sessions about the new recordkeeping requirements. Additional information about the recordkeeping requirements and the changes to the OSHA log for 2004 and later is available at www.dli.mn.gov/OSHA/Recordkeeping.asp. The following are some of the major changes and how they may have affected the SOII estimated number of cases after the changes were implemented. • Where a pre-existing (non-work-related)
condition is present, a case is recordable only if a significant aggravation by a workplace event or exposure occurs. A significant aggravation is any of the following, if caused by the occupational event or exposure:
1. death; 2. loss of consciousness; 3. one or more days away from
work; 4. one or more days of restricted
work or job transfer; or 5. medical treatment.
Under the old requirements, any aggravation of a pre-existing condition by a workplace
event or exposure makes a case recordable. This change clarified when to record cases involving pre-existing conditions. This change tends to reduce the number of cases.
• An aggravation of a case where signs or
symptoms have not been resolved is not a new case, even if the aggravation was caused by a new event or exposure. Previously, each new event or exposure was treated as a new case. This change tends to reduce the number of cases.
• Under the previous requirements, a
cumulative trauma disorder was considered a new case if no care was received for the previous 30 days. The new requirements have no such criteria. In the absence of a new work-related event or exposure, the reappearance of signs or symptoms may be treated as part of the previous case. This change tends to reduce the number of cases.
• Under the previous requirements, all work-
related illnesses were recordable. Under the new requirement, work-related illnesses are recordable only if they meet the general recording criteria applicable to all injuries and illnesses. This change tends to reduce the number of cases.
• Restricted work activity occurs when an
employee cannot perform all of his or her routine job functions, which are defined as any duty regularly performed at least once a week. The previous requirements defined normal job duties as any duty the worker would be expected to do throughout the year. This change tends to reduce the number of cases of restricted work activity.
• Restricted work activity limited to the day of
injury does not make a case recordable. Under the previous requirements, restricted work limited to the day of injury was a

Minnesota Department of Labor and Industry Workplace Safety Report — 2009
58
recordable case. This change tends to reduce the number of cases of restricted work activity and may also reduce the total number of cases.
• The counting of days away from work and
days of restricted work activity changed from work days to calendar days. To the extent that employers previously only counted work days, this tends to increase the number of cases of days away from work and days of restricted work activity. This will also increase the number of days for both categories.
• The new criteria allow employers to cap the
number of days at 180. Previously, there was no cap on the count of days. This change will not affect the calculation of the median number of days away from work or the distribution of cases by days away from work.
• Changes and clarifications to what is
considered first aid (not recordable) and what is considered medical treatment (recordable) may result in slight changes in the number of recordable cases. The new criteria include a comprehensive list of first aid, so that less discretion is needed to know when a case should or should not be recorded. To the extent that different employers may have interpreted treatments and first aid differently, it is unclear how the total number of recordable cases will be affected.
• A significant injury or illness diagnosed by a licensed health care provider is recordable, even if it does not result in death, days away from work, restricted work or job transfer, medical treatment beyond first aid or loss of consciousness. This list includes cancer, chronic irreversible diseases, a fractured or cracked bone, or a punctured eardrum. The previous criteria only included fractures and second- and third-degree burns. This may slightly increase the total number of cases.
• All work-related needlestick injuries and
cuts from sharp objects that are contaminated with another person’s blood or other potentially infectious material are recordable as injuries. Previously, these cases were recordable only if they met the criteria for all injuries or if sero-conversion was present. This will increase the number of reported needlestick cases.
• Work-related musculoskeletal disorders
(MSDs) are recordable when general recording criteria are met. Previously, MSDs were recordable under the general criteria or when identified through a clinical diagnosis or diagnostic test. This tends to reduce the number of MSD cases.