smart commute workplace program - Metrolinx
28
Smart Commute Workplace Program Evaluation 1 SMART COMMUTE WORKPLACE PROGRAM BUSINESS CASE REVIEW MARCH 2015
-
Upload
khangminh22 -
Category
Documents
-
view
0 -
download
0
Transcript of smart commute workplace program - Metrolinx

Smart Commute Workplace Program Evaluation 1
SMART COMMUTE WORKPLACE PROGRAM BUSINESS CASE REVIEW
MARCH 2015

2 Business Case Review March 2015
This report summarizes the business case review
for the Smart Commute Workplace program of
Metrolinx in the GTHA/ It is an update to the
preliminary draft business case review published
by Metrolinx in summer 2014/ The methodology,
cost information and other evidence has been
updated/
For further information on the Smart Commute
program, visit. www/smartcommute/ca
1
2
3
4
5
6
7
8
9
10
11
TABLE OF CONTENTS
. Executive Summary............................................................................................................................................................7
. Background and Context .................................................................................................................................................9
. Strategic Case....................................................................................................................................................................10
. Financial Case....................................................................................................................................................................13
. Economic Case..................................................................................................................................................................14
. Deliverability and Management Case ......................................................................................................................16
. Conclusions and Next Steps ........................................................................................................................................17
. Appendix A: Economic Impacts Methodology .....................................................................................................18
. Appendix B: Smart Commute Workplace Survey required Response Rates .............................................23
. Appendix C: TMA Delivery & Operations as of 2014.......................................................................................24
. Appendix D: The Metrolinx Business Case Framework ...................................................................................27
Smart Commute Workplace Program Evaluation 3

List of Tables
Table 1: Summary of Economic and Financial Evidence ................................................................................................... 8
Table 2: Smart Commute program funding (annual, 2013-14 fiscal cycle budget)..............................................13
Table 3: Summary of Economic Benefits...............................................................................................................................15
Table 4: Multiple Account Evaluation (MAE) Summary Table.......................................................................................15
Table 5: Smart Commute Workplace Survey Data ............................................................................................................18
Table 6: Average 1-Way Commute Distance by TMA and Mode................................................................................19
Table 7: Change in Single Occupancy vehicle kilometres driven ................................................................................20
Table 8: Health Benefits resulting from increases in physical activity........................................................................20
Table 9: Mode Splits for Active Smart Commute Employers ........................................................................................22
Table 10: Change in kilometres travelled after Smart Commute Implementation, by Mode ...........................22
List of Figures
Figure 1: Transportation Management Associations Commuter Populations (Q2 2014-2015)......................... 9
Figure 2: Average Vehicle Kilometres Travel added per trip to a non-residential destination ........................11
.......................................................................................Figure 3: ’Ramp up’ Assumptions for Workplace Mode Shift 21
Figure 4: Transportation Management Associations (TMA) Governance . 6 GTHA regions ............................24
Figure 5: Boundaries of 13 TMAs.............................................................................................................................................24
Figure 6: 13 Smart Commute TMAs........................................................................................................................................25
Figure 7: TMA Relationship & Governance..........................................................................................................................25
Figure 8: 6 TMAs Municpally Operated, 7 TMAs Privately Operated.........................................................................26
Business Case Review — March 2015 4

Table of Acronyms
BCR Benefit cost ratio
GDP Gross Domestic Product
MAE Multiple Account Evaluation
NPV Net Present Value
PV Present Value
RTP Regional Transportation Plan, The Big Move, 2008
SC Smart Commute
SOV Single Occupant Vehicle
TDM Transportation Demand Management
TMA Transportation Management Association or Smart Commute ofjces in the region working with employers to develop tailored employee travel programs
TTS Transportation Tomorrow Survey
VKT Vehicle Kilometres Travelled
Smart Commute Workplace Program Evaluation 5

Glossary of Terms
Appraisal Analysis of a program, investment or intervention that has not yet been implemented and focuses on estimated or forecasted evidence/
Benefits Case Analyses (BCA)
Reports produced by Metrolinx between 2008 and 2012 focusing on select economic impacts and financial costs of major proposed Metrolinx transit projects/ BCAs have subsequently been replaced by the new Business Case framework/
Business Case A collection of a suite of evidence on the potential strategic, economic, financial, deliverability and operational impacts of a proposed program, intervention or investment to inform decision-making throughout the project lifecycle/ Metrolinx Business Cases are an enhancement and replacement of Metrolinx’s former Benefits Case Analyses reports/
Business Case Review A post-implementation review of a transportation program, intervention or investment/
Cost Benefit Analysis A form of evaluation that focuses on comparing certain economic impacts (generally benefits) to the cost of an investment/ Cost Benefit Analysis is used in the Economic section of Metrolinx’s Business Case framework and was also used to inform previous Benefits Case Analyses/
Delivery and Opera-tions Case
One component of a Metrolinx Business Case that examines the impacts of proposed investments or interventions on operations, the delivery of the proposal, potential risks, procurement and related commercial or management issues/
Economic Case One component of the Metrolinx Business Case that examines or reviews the impacts of pro-posed investments or interventions/ Economic impacts include transportation user benefits (journey time impacts, road decongestion impacts, safety/accident reductions, etc/), environ-mental impacts (changes in emissions levels, vibration, etc/), social and community impacts (the distribution of benefits among populations, severance/isolation impacts, etc/), wider economic benefits (agglomeration/productivity impacts, etc/) and public funding impacts (property tax revenues, etc/)/ The Economic Case generally includes a benefit-cost ratio/ Economics is a branch of science that studies the production, distribution and consumption of goods and services/
Evaluation Analysis of a program, investment or intervention that has been implemented and focuses on revealed evidence from previous performance/
Ex ante Analysis based on forecasted or estimated evidence of future performance/
Ex post Analysis based on evidence of past performance/
Financial Case One component of the Metrolinx Business Case that examines the lifecycle costs and revenues of proposed investments or interventions/
Smart Commute Gold Workplace Designation
A Gold designation is granted to outstanding Smart Commute workplaces that demonstrate innovation, focus on measuring their success and achieve significant positive outcomes and demonstrated success in convincing their employees to choose other ways to get to work than driving alone/
Smart Commute Silver Workplace Designation
A Silver designation granted to workplaces that take the Smart Commute program beyond the basics, providing enhanced commuter options for their employees/ Smart Commute Silver Workplaces want to make a significant positive impact – on their employees’ commutes, congestion, and/or the environment – and are willing to invest effort and resources to implement relevant programs/
Smart Commute Work-place Designation Pro-gram
The Workplace Designation program rewards efforts that a) grow over time by implementing new initiatives that help more commuters choose alternatives to driving alone, and b) continue to engage commuters at their workplace on a regular basis/
Strategic Case One component of a Metrolinx business case that examines the alignment of proposed pro-grams, investments or interventions with Metrolinx strategic plans and goals/ Involves the presentation of transportation planning information, including trafjc forecasts, related travel patterns, drivers and interdependencies/
Business Case Review — March 2015 6

EXECUTIVE SUMMARYSmart Commute is a program of Metrolinx and the
municipalities of the Greater Toronto Hamilton Area (GTHA).
The program mandate is to encourage those living and
working in the GTHA to choose efficient transportation choices
that reduce congestion and help to improve quality of life in
the region. Through workplace, school and community
programming, and with the support of services and tools,
Smart Commute encourages those who live and work in the
GTHA to try travelling at a different time of day, choose a
different mode (e.g. carpooling, transit, walking or cycling), or
reduce their trips through teleworking.
The Smart Commute workplace program helps inform
employers and commuters about their commute choice, and
encourages them to try more efficient options. In 2014, Smart
Commute worked with 340 workplaces in the region,
employing more than 730,000 commuters.
As the Smart Commute workplace program progresses and
future development options are considered, a review was
undertaken of the program outcomes to date. This Business
Case Review provides an ex post evaluation of the value
delivered by the Smart Commute workplace program. It
outlines how the program is delivered, how it supports
ƾěǼļǩƧŏljx’ǣ ǣǼļ"ǼěħŏD ħǩ"Ƨǣ, ǼĽě Ġŏlj"ljDŏ"Ƨ DǩǣǼǣ "ljć ěDǩljǩƿŏD
impacts, by giving an indication of the value delivered for the
money invested.
The analysis was based on a statistically significant sample of
data from the Smart Commute workplace survey. The sample
includes 37 Smart Commute workplaces that have completed
baseline and follow-up employee surveys and met the
minimum required response rate. Mode shift, change in
annual trips and annual vehicle kilometres travelled were
calculated from the sample size, were found to be
representative of the Smart Commute Gold and Silver
designated workplaces, and then extrapolated to the 360,000
employees employed at all Gold and Silver designated
workplaces across the Smart Commute Network.
STRATEGIC CASE: The Smart Commute workplace program
aligns with strategies set out in the Regional Transportation
Plan (The Big Move, 2008) as well as Provincial policies on land
use and growth to encourage sustainable travel behaviour and
transportation demand management (TDM) programs. The
program increases the efficiency of the road network and
encourages active transportation. By working directly with
ěƿĭƧǩyěļǣ, ǼĽě ĭļǩħļ"ƿ "Ƨǣǩ ěxĭ"ljćǣ ƾěǼļǩƧŏljx’ǣ ļě"DĽ Ǽǩ
non-transit markets where road congestion is concentrated.
The program is also is a platform for collecting valuable
commuting data and information that can be used by
Metrolinx to support the development of other transportation
projects and programs.
FINANCIAL CASE: As highlighted in Table 1, Transportation
Management Association (TMA) program costs for 2013-14
were $3.1 million, with approximately 39% of funding from
municipalities, 44% from Metrolinx and 18% from other
sources including fees paid by employers. Added to this is the
Metrolinx central budget of staff time and programming to
support workplace program delivery, for a combined annual
total of $4 million.
ECONOMIC CASE: The Smart Commute workplace program
was found to reduce single occupancy vehicle (SOV) travel by
approximately 40 million Vehicle Kilometres Travelled (VKT),
and increase active transportation use by approximately 9
million Kilometres Travelled per annum. As Table 1 highlights,
the program generates an estimated $34 million in auto VKT
reduction benefits, and an estimated $21 million in active
transportation health benefits, calculated to an annual
economic benefit of over $55 million.
The Smart Commute workplace program has an estimated
benefit cost ratio (BCR) between 2:1 and 11:1, with the most
likely scenario demonstrating a 6:1 BCR. The BCR has been
calculated over a 5.5-year evaluation period. This is the
average interval between Smart Commute surveys (4.5 years)
plus one additional year. The full cost of the program over 5.5
years is counted. In the absence of detailed data to describe
how the mode shift builds up over that time period, several
conservative scenario assuming no mode shift occurs until
immediately before the follow up survey, which is then held
constant for a full year. Sensitivity tests of the ‘ramp-up
period’ are presented in Figure 3 of the main report.
Smart Commute Workplace Program Evaluation 7
‘ramp up’ scenarios have been tested, with the most

The economic valuation of the program is considered
conservative as some key benefits of the program have only
been assessed in qualitative/descriptive terms (i.e., have not
been monetized). Additionally, if mode shift is realized shortly
after program launch, the estimated BCR ranges up to 11:1;
however, using more conservative assumptions (mode shift is
realized the day before the follow-up survey occurs), the BCR
reaches 2:1.
The most likely scenario demonstrates an approximate 6:1
benefit cost ratio for the Smart Commute workplace program,
where workplace mode shift is realized gradually in the years
ahead of the 4.5-year average completion of a follow-up
survey. Going forward, additional analysis of the adoption rate
of travel behaviour change following introduction of Smart
Commute programming at workplaces, as well as other
impacts (including business benefits associated with labour or
realty costs), may add quantified benefit.
Note that some Smart Commute workplace program benefits
which have not been monetized in the BCR include:
Operational efficiencies (e.g., elimination of parking
shortages, reduced maintenance fees, increased visitor
parking);
Employee benefits (e.g., increased work-life balance,
travel options, staff satisfaction, contribution to
recruitment & retention);
Business results (e.g., idea generation resulting from cross
-department agglomeration of staff in carpools or
shuttles);
Table 1 Summary of Economic and Financial Evidence
Potential real estate savings for employers (e.g., avoided
construction of new parking, reduced land requirements
for parking);
Lower government capital and maintenance costs for
roadways over time;
Fewer air pollutants and greenhouse gas emissions;
Value of employer-level commuting data that supports
development of other transportation projects and
programs; and,
Increased economic productivity stemming from
reductions in regional congestion.
Inclusion of such impacts will be investigated as part of
future updates to the Business Case Review.
DELIVERY AND OPERATIONS CASE: The Smart
Smart Commute team, as part of the Planning and Policy
business unit, and delivered by 13 TMAs operating out of
9 physical offices across the GTHA. The TMAs have varied
beginnings and are uniquely owned and operated
(Appendix C provides more information). A key element
that unites TMAs is the financial and program support
from the Smart Commute team at Metrolinx. As part of
funding agreements, the TMAs are required to deliver
services in accordance with Metrolinx-established
performance metrics.
Economic Benefits – Annual Financial Costs
Road congestion reduction $6/3 M Annual costs $4 M
Safety benefits $3/1 M 5/5 years of costs* $22/2 M
Vehicle operating cost savings $24/6 M Estimated Benefit Cost Ratio 6.1
Active Transportation health benefits $21/5 M Net Present Value $123/4M
TOTAL $55/5 M
*Average elapsed time between baseline & follow-up surveys + one year of cost while benefit occurs
Business Case Review — March 2015 8
Commute workplace program is overseen by Metrolinx’s

1 BACKGROUND AND CONTEXTCharacteristics of Smart Commute
Workplace Program
1.1 Smart Commute is a program of Metrolinx
and the municipalities of the Greater Toronto
Hamilton Area (GTHA). The program mandate is
to encourage those living and working in the
GTHA to choose efficient transportation choices
that reduce congestion and help to improve
quality of life in the region. Through workplace,
school and community programming, Smart
Commute encourages those who live and work
in the GTHA to try travelling at a different time
of day, choose a different mode (e.g.,
carpooling, transit, walking or cycling), or reduce
their trips through teleworking.
1.2 The Smart Commute workplace program
informs employers and commuters about their
travel choices, encouraging them to try more
efficient options that reduce congestion and
help to improve quality of life in the region,
while lowering commuting costs.
1.3 The program was formed in 2004 as a
partnership of the municipalities and regions of
the GTHA, using funding from Transport Canada
and private sector partners. Smart Commute
became a program of Metrolinx on January 1,
2008. It is funded by the Government of Ontario
through Metrolinx, municipalities and the private
sector.
1.4 As of September 30th, 2014 there were 13 Smart
Commute offices (Transportation Management
Associations or TMA) in the region working with
employers to develop tailored employee travel
programs. TMAs offer a range of commute
services to support carpooling, shuttles,
alternative work arrangements (telework,
compressed work week, flex hours etc.), walking,
cycling programs and transit use.
1.5 As of September 30, 2014, 340 workplaces with
approximately 732,300 commuters were part of
the Smart Commute network.
Figure 1 Transportation Management Association Commuter Populations (Q2 2014-2015)
Smart Commute Workplace Program Evaluation 9

2 STRATEGIC CASEBusiness Strategy
2.1 Smart Commute takes its essential mandate from The
Regional Transportation Plan (RTP), The Big Move,
2008. The Smart Commute workplace program delivers
‘Big Moves’ included in the RTP, The Big Move, 2008
#4 – Create an ambitious transportation demand management program
Strategy 4/1. “Develop a Transportation Demand Man-agement (TDM) policy and strategy for provincial minis-tries and agencies such as school boards, hospitals and universities that include actions, timelines and targets/”
Strategy 4/3. “Encourage private sector employers to implement TDM programs/”
#2 – Enhance and expand active transportation-
Strategy 2/1. “Plan and implement complete, integrated walking and cycling networks for the GTHA, including Toronto’s PATH system, that address key barriers such as bridges over 400-series highways, rail corridors and major rivers, and missing sidewalks on major roads/ The cycling networks will bring every GTHA urban resident to within a maximum of one kilometre of a dedicated bicycling facility/ This will be supported by a provincial funding commitment increased over time to at least $20 million per year for municipalities to complete the walk-ing and cycling networks/”
#3 – Improve the efjciency of the road network
Strategy 3/5. “Continue to support the Smart Commute Carpool Zone online ride-matching service, and identify and eliminate legal and liability barriers to ride-sharing/
Strategy 3/6. “Amend the Ontario Public Vehicles Act to allow third-parties such as non-governmental organiza-tions to provide vanpools to service major trip genera-tors such as employers, post-secondary institutions and tourism destinations and to augment public transit ser-vice in low density or dispersed employment areas/”
1 University of Toronto, “Transportation Tomorrow Survey,” 2011
Problem Identification
2.2 Work-related trips in the GTHA account for more than
40 % of AM peak-period travel.1 Studies have shown
that congestion in the GTHA costs the region over $6
billion in 2008.2 These costs include higher shipping
prices, higher wage salaries required to attract and
retain talented employees, increased vehicle operating
and maintenance costs, environmental emissions
impacts and lost productivity.
2.3 Businesses not in close proximity to higher order
transit are more likely to bear the brunt of the
economic costs of congestion, as it may restrict access
Ǽǩ ǼĽě ļěħŏǩlj’ǣ Ƨ"Hǩuļ ĭǩǩƧ "ljć ŏljDļě"ǣě ħǩǩćǣ
movement costs. Businesses in these areas are also
likely to contribute to region-wide transportation
congestion, as they are major peak-period vehicle trip
generators, noted in Figure 2.
Impacts of not investing
2.4 By changing whether, when, where and how
individuals travel, the transportation system can be
more efficiently used. Without investing in improving
alternative and more efficient travel options for
employees commuting to work, firm attractiveness and
productivity could decline, particularly in those areas
away from higher order transit.
2.5 Studies have shown that many areas with the greatest
capacity to accommodate office growth are not
currently in proximity to higher order transit.3 These
locations are mostly found in suburban municipalities
outside of the City of Toronto, adjacent to 400 series
highways, where road congestion is acute and travel
times are increasing.4
2 HDR Corporation, “Costs of Road Congestion in the Greater Toronto and Hamilton Area. Impact and Cost Benefit Analysis of the Metrolinx Draft Regional Transportation
Plan,” December 2008/ < http.//www/metrolinx/com/en/regionalplanning/costsofcongestion/ISP_08-015_Cost_of_Congestion_report_1128081/pdf=
Conference Board of Canada, “Cars, Congestion and Costs. A New Approach to Evaluating Government Infrastructure Investment,” July 2013/ <http.//www/cdhowe/org/pdf/
Commentary_385/pdf = 3 Strategic Regional Research, “A Region in Transition,” 2013 <http.//www/canurb/com/cui-news/new-report-by-strategic-regional-research-a-region-in-transition/html= 4 Ministry of Transportation of Ontario, “Travel Time Study”, 2012 and 2008 ,<http.//www/mto/gov/on/ca/=
Business Case Review — March 2015 10
on three of the nine ‘Big Moves’ included in the RTP:

Figure 2 Average Vehicle Kilometres Travel added per trip to a non-residential destination5
Internal drivers for change
2.6 Without continuing to improve access to employment
sites in the GTHA, employment growth could decline
and business costs could rise, potentially impacting
productivity and reducing business activity.
2.7 Continuing trends showing suburban office growth,
increased highway congestion and improved mobile
technologies support further investment in TDM
workplace programs in the GTHA. Smart Commute, as
the most extensive and well-established TDM
workplace program in the region, is well-positioned to
take advantage of new mobile technologies, a younger
workforce less inclined to commute by car, and
increased travel options (car sharing, bike sharing,
increased suburban transit services, teleworking, etc.).
2.8 As Metrolinx looks to improve station access to GO
train stations that either currently or will have two-way
all-day frequent GO train service, Smart Commute
workplace programs may provide new solutions to the
‘ĠŏļǣǼ-mile, last-ƿŏƧě’ ěƧěƿěljǼ ǩĠ Ǽļ"ljǣŏǼ ħļǩXǼĽ,
particularly in suburban environments in outer City of
Toronto and other GTHA municipalities.
External drivers for change
2.9 Across the GTHA, external drivers include increased
congestion, fluctuating fuel prices and a new
generation of residents less dependent on the car.
2.10 Section 1.6.7 of the Ontario Provincial Policy Statement
and Section 3.2.2 of the Growth Plan for the Greater
Golden Horseshoe encourage efficient, integrated
multi-modal transportation systems and the
implementation of TDM strategies.
5 5 Metrolinx, “Metrolinx Review of Development Charges,” informed by data from the 2011 Transportation Tomorrow Survey/ <http.//www/metrolinx/com/en/
regionalplanning/funding/Metrolinx_Review_of_Development_Charges_EN/pdf=
Smart Commute Workplace Program Evaluation 11

2014 Ontario Provincial Policy Statement
1/6/7/1 Transportation systems should be provided which are safe, energy efjcient, facilitate the movement of people and goods, and are appropriate to address projected needs/
1/6/7/2 Efjcient use shall be made of existing and planned infrastructure, including through the use of transportation demand management strategies, where feasible/
Growth Plan for the Greater Golden Horseshoe, 2006
Section 3/2/2/1/b. “Offer a balance of transportation choices that reduces the reliance upon any single mode and promotes transit, cycling and walking/”
Section 3/2/2/1/d. “Offer multi-modal access to jobs, housing, schools, cultural and recreational opportunities, and goods and services/”
Section 3/2/2/3/b. “Support opportunities for multi-modal use where feasible, in particular prioritizing transit and goods movement needs over those of single occupant automobiles/”
Section 3/2/3/f. “Increasing the modal share of transit/”
Objectives
Measures of Success
2.13 Smart Commute Workplace program performance
metrics focus on program reach (size, market
penetration, engagement), satisfaction, delivery of
infrastructure and services, behaviour change impact
and overall cost-effectiveness. Success metrics are
measurable, communicable and accountable to other
stakeholders through an annual program update.
Scope
2.14 This Business Case Review uses existing data from
TMAs around the GTHA to evaluate the economic
impacts of the Smart Commute workplace program.
2.15 This Business Case Review focuses on an estimate of
financial impacts and an evaluation of the economic
benefits of the program. Monetized benefits include
vehicle kilometres reduced, auto operating savings,
accident reduction benefits, travel time saved network
-wide and active transportation health benefits per
km. Some program benefits were not monetized in
this report, including environmental benefits
(emissions reductions, etc.), social and community
benefits (accessibility, social inclusion, etc.), business
benefits (operational efficiencies, employee benefits,
potential real estate savings for employers) and
economic development benefits (those benefits
experienced by the wider regional economy,
including productivity, GDP, income, etc.). Inclusion of
these impacts will be investigated as part of future
updates to this Business Case Review.
Constraints
2.16 Identified program constraints include inadequate
data management applications, limited program
awareness beyond the reach of member workplaces
and directly related municipal staff, and inconsistent
service delivery models between TMA offices. The
previous program performance metrics focused on
workplace recruitment. These metrics have now been
redirected via a new strategy to transition to deeper
workplace engagement and improved data
acquisition techniques.
Interdependencies
2.17 Smart Commute relies on the engagement of
participating employers and employees, 13 TMAs and
the support of Metrolinx and the GTHA municipalities.
Stakeholders
2.18 Smart Commute stakeholders include participating
employers, employees, municipalities, TMAs,
Metrolinx and members of the public.
Options
2.19 The purpose of this Business Case Review is to
conduct an ex post evaluation of the value of the
existing Smart Commute workplace program.
Business Case Review — March 2015 12
2.12 Smart Commute’s mission is to achieve measurable
travel behaviour change through high quality, cost
effective transportation demand management
solutions.

3 FINANCIAL CASE
Financial Impacts
3.1 Workplace Program Costs: Transportation 3.3 Scope of investment evaluated: In terms of the
Management Association (TMA) program costs for financial impact on Metrolinx alone, the annual cost of
2013-14 were $3.1 million, with approximately 39% of the Smart Commute workplace program in 2013-14
funding from municipalities, 44% from Metrolinx and was $2,298,000. Over a 5.5 elapsed time period, Smart
18% from other sources including fees paid by Commute workplace investment contribution from all
employers. Added to this is the Metrolinx central sources totalled $21,843,000, approximately 50% of
budget of staff time and programming to support which was leveraged from other investment sources.
workplace program delivery, for a combined annual This Business Case Review evaluates the benefits of the
total of approximately $4 million from all investment Smart Commute workplace program accounting for all
sources. joint private and public investment.
3.2 Sources of Investment: As Table 2 shows, the costs of
the Smart Commute workplace program in 2013
totalled $4 million. This cost was born by different
parties: municipalities, members (firms), Metrolinx and
other funders.
Table 2 Smart Commute program funding (annual, 2013-14 fiscal cycle budget)
Municipal Funding Members Fees Other Metrolinx (includes operating budget) Total
$1,224,000 $492,000 $31,000 $2,298,000 $4,045,000
Smart Commute Workplace Program Evaluation 13

4 ECONOMIC CASE
Economic Impacts
4.1 The economic value of the Smart Commute workplace
program stems from the associated benefits from
more efficiently moving commuters to and from their
workplaces. This value is primarily calculated through a
reduction in single occupancy vehicle (SOV) use.
Reduction in demand for limited road space that
results from lower SOV use improves the functioning
ǩĠ ǼĽě ļěħŏǩlj’ǣ ļǩ"ć ljěǼXǩļƙ, Ġļěěŏljħ uĭ "ććŏǼŏǩlj"Ƨ
capacity to accommodate regional growth in
population and economic activity.
4.2 There are additional economic benefits that result
from different aspects of the Smart Commute
workplace program. Increases in active transportation
(primarily walking or cycling) provide health benefits to
commuters, reducing public health care costs and
supporting a more productive regional work force.
There is strong evidence linking use of active modes
with reduced workplace absenteeism.6
4.3 Reductions in SOV use also reduce the demand for
parking, enabling employers and land owners to make
more productive use of their properties. A lower
demand for parking can save employers rent and real
estate costs. Less parking can also make available
additional land for new development, thereby
increasing the supply and affordability of work space.
4.4 For some employees, there can be significant cost
savings through the use of different modes, potentially
providing them with greater disposable income to
spend on other goods. In some cases, this may be
limited to a slight reduction in marginal travel costs
(splitting gas costs with a carpool partner); in other
cases, this may facilitate eliminating a household
vehicle, saving gas as well as ownership costs like
insurance, financing and long-term maintenance/
depreciation costs. The Canadian Automobile
Association (CAA) estimated the average annual
ownership costs in 2013 to be between $6,500 and
$8,900.7
4.5 The economic benefits of reduced road congestion,
auto vehicle operating cost reductions, safety benefits,
and health benefits from increased active
transportation use have been calculated and are listed
along with their monetization factors in Table 3. Every
peak period reduction in 1km of SOV kilometres
travelled is estimated to generate 0.01 hours of time
savings network-wide.8 These time savings are
monetized using the average value of time of a GTHA
resident on a per hour basis.
Government of Western Australia, “TravelSmart Workplace Fact Sheet. Employee Health and Active Travel”, October 2014/ <http.//www/transport/wa/gov/au/mediaFiles/active-
transport/AT_TS_FS_EmployeeHealth/pdf= 7 Canadian Automotive Association, “Driving Costs Beyond the Price Tag. Understanding your Vehicle Expenses 2013 Edition”, <http.//www/caa/ca/wp-content/uploads/2012/06/
CAA_Driving_Cost_English_2013_web/pdf=/ 8 Metrolinx, Economic Analysis and Investment Strategy, approximation based on results from previous Benefits Case Analyses modelling/ These reports can be found here
http.//metrolinx/com/en/regionalplanning/projectevaluation/benefitscases/benefits_case_analyses/aspx
Business Case Review — March 2015 14
6

4.6 Note that some of the program benefits have not been
monetized in the BCR, including:
a) Operational efficiencies (e.g., elimination of
parking shortages, reduced maintenance fees,
increased visitor parking);
b) Employee benefits (e.g., increased work-life
balance, travel options, staff satisfaction,
contribution to recruitment & retention);
c) Business results (e.g., idea generation
resulting from cross-department agglomeration of
staff in carpools or shuttles);
d) Potential real estate savings for employers
(e.g., avoided construction of new parking,
reduced land requirements for parking);
Table 3 Summary of Economic Benefits
e) Lower government capital and maintenance costs
for roadways over time;
f) Fewer air pollutants and greenhouse gas
emissions;
g) Value of employer-level commuting data that
supports development of other transportation
projects and programs; and,
h) Increased economic productivity stemming from
reductions in regional congestion.
Inclusion of these impacts will be investigated as part
of future updates to the Business Case Review.
Economic Benefits (Annual,2013-2014) Monetization Factors (2013$) Source of Factor
Road congestion reduction $6/3M $15/54 per hour saved Greater Golden Horseshoe Model
Safety benefits $3/1M $0/08 per km reduced Canadian Motor Vehicle Collision Statistics
Vehicle operating cost savings $24/6M $0/61 per km reduced CAA
Active Transportation health benefits $21/5M $2/31 per km added New Zealand Transportation Agency Guidance
TOTAL $55/5M
Summary of Findings
4.7 To calculate the effect of the Smart Commute
workplace program, the mode split is
compared before and after implementation of
Smart Commute initiatives at each workplace in
the sample. The methodology, including
data sources, sample size, sample distribution,
sensitivity tests, average trip distance, and
mode shift ramp up scenarios used to evaluate
the economic impacts is cited in Appendix A.
4.8 The benefits of the Smart Commute program
were found to significantly outweigh the costs
of the program, even when using conservative
assumptions.
4.9 Based on TMA feedback, anecdotal evidence
and program observations, the Table 4 mode
shift ramp up of scenario 2 or 3 is most likely to
occur at a workplace. These scenarios show
an approximate 6:1 benefit to cost ratio
for the Smart Commute workplace program.
Table 4 Multiple Account Evaluation (MAE) Summary Table
Criteria Business Case
Financial Costs (over 5;5 years)
Incremental Operating and Maintenance Costs (PV) $22/5M
Economic Impacts (Annual)
Road Congestion Reduction Benefits (PV) $6/3M
Auto User Benefits (PV) $24/6M
Auto Safety Benefits (PV) $3/1M
Health Care Cost Savings (Increasing Walking and Cycling) $21/5M
Net Economic Benefit (over 5;5 years)
Scenario 1 BCR 2/1.1
Scenario 1 Net Benefits (PV) $43/3M
Scenario 2 BCR 6/5.1
Scenario 2 Net Benefits (PV) $123/4M
Scenario 3 BCR 6/6.1
Scenario 3 Net Benefits (PV) $124/6M
Scenario 4 BCR 11.1
Scenario 4 Net Benefits (PV) $228/3M
Smart Commute Workplace Program Evaluation 15

5 DELIVERABILITY AND MANAGEMENT CASE
5.1 The deliverability case provides evidence on the
commercial viability of an investment, existing
operating mechanisms and the procurement strategy
that is used to engage the market. An outline of
existing deliverability and management evidence has
been provided in this Business Case Review.
Output Based Specification
5.2 The Smart Commute workplace program is currently
Planning and Policy business unit. Services are
delivered by 13 TMA offices throughout the GTHA, as
shown in Appendix C The common element that ties
the TMA offices together is the financial and program
support from the Smart Commute team at Metrolinx.
As part of individual funding agreements with
Metrolinx, the TMAs are required to perform in
accordance with Metrolinx-established performance
indicators.
5.3 All 13 TMAs are located within the 6 GTHA regional
municipality boundaries of Hamilton, Halton, Peel,
York, Durham and Toronto. Within the regional
municipalities, TMA service boundaries have been
delineated as shown in Appendix C.
5.4 TMA operational models vary within the Smart
Commute network. As of 2014, the different types of
operation models include Not-for-Profit TMAs (38%),
Board of Trade/ Chamber of Commerce TMAs (15%),
Non-Fee Municipal TMAs (23%) and For-Fee
Municipal TMAs (15%). Six of the TMAs are
municipally operated and the remaining seven TMAs
are privately operated.
5.5 Similar to TMA operations, there are variations in TMA
governance among the Smart Commute network. As
of 2014, 38% of TMAs are governed by Boards of
Directors, 15% by Boards of Trade/Chambers of
Commerce and 38% are governed by municipal
governments.
5.6 Eight of 13 TMAs recovered a portion of program
delivery costs through private investment in 2014.
Procurement Strategy
5.6 Services are delivered directly through the 13 TMAs
located throughout the GTHA. As of 2014, six (46%) of
TMAs provide employer Smart Commute services
through procured delivery agents. Of the six
municipally operated TMA services four deliver the
Smart Commute workplace program using in-house
staff resources.
Business Case Review — March 2015 16
overseen by Metrolinx’s Smart Commute team in the

6 CONCLUSIONS AND NEXT STEPS
Conclusions
6.1 The Business Case Review demonstrates that the 6.2
Smart Commute workplace program provides a
high benefit to cost ratio through its impact on
reducing road congestion, saving personal
transportation costs and encouraging active travel
in the GTHA. The Smart Commute workplace program
was found to reduce SOV travel by approximately 40
million VKT, and increase active transportation use
by approximately 9 million Kilometres Travelled per
annum. The program generates an estimated $34
million in auto VKT reduction benefits, and an
estimated $21 million in active transportation health
benefits, calculated to a net economic benefit of over
$55 million over the evaluation time period of 5.5
years.
The most likely scenario for mode shift realization
demonstrates an approximate 6:1 benefit to cost ratio
for the Smart Commute workplace program.
Next Steps
The Smart Commute workplace program will continue
to build on its success by pursuing strategic
opportunities including:
a) Quality data: Continue to collect quality commuter
data with high employee response rates;
b) Flex Work Programming: Rollout pilots with
member businesses to expand flexible and remote
work employer programming across the GTHA;
c) New Ride-match Markets: Reach new carpool ride-
ƿ"ǼDĽŏljħ ƿ"ļƙěǼǣ XŏǼĽ œƿ"ļǼ CǩƿƿuǼě’ǣ ǩljƧŏljě ǼǩǩƧ-
d) Leverage Change Opportunities: Support
workplaces in preparations for business continuity
during the TORONTO 2015 Pan Am/Parapan Am
Games and beyond;
e) Tailored Evaluation: Evaluate the impacts of
specific transportation interventions (carpool
programs, teleworking, etc.) and the value of specific
TDM interventions that encourage more efficient and
sustainable travel patterns;
f) Segmentation: Coordinate research for the region
to segment and identify workplaces and individuals
with greater potential for behaviour change; and
g) Implement Performance Metrics: Smart Commute
Workplace program performance metrics will focus on
program reach (size, market penetration,
engagement), satisfaction, delivery of infrastructure
and services, behaviour change impact and overall
cost-effectiveness.
Smart Commute Workplace Program Evaluation 17

7 APPENDIX A: ECONOMIC IMPACTS METHODOLOGY
7.1 Data Sources: In order to estimate the economic impact 7.3
of the Smart Commute workplace program, three data
sources were used:
a) The Smart Commute Q2 activity reports for July 1,
2014 to September 30, 2014, submitted by TMAs, and
administered by Metrolinx Smart Commute. This da-
taset houses information on participating employers,
including the number of employees, number of em-
ployees who responded to baseline and follow-up sur-
veys, and mode splits of employee commutes during
both surveys.
b) Data on average distances travelled to work by mode
in the GTHA from the 2011 Transportation Tomorrow 7.4
Survey administered by the University of Toronto.
c) The Smart Commute workplace program budget for
2013-14.
7.2 Method: To calculate the effect of the Smart Commute
workplace program, the mode split of employers before
and after implementation of Smart Commute initiatives
is compared as shown in Table 9.
Table 5 Smart Commute Workplace Survey Data
Sample Size: In 2014 there were a total of 339 employ-
ers actively participating in the Smart Commute pro-
gram (not including Ontario Public Services offices),
with a total of 664,182 employees. Of these, 107 em-
ployers completed follow-up surveys, 37 of which com-
pleted baseline and follow-up surveys meeting the min-
imum response rate to establish statistical significance
(at a 95% confidence interval and 5% margin of error).
ƾŏljŏƿuƿ ļěĸuŏļěć ļěǣĭǩljǣě ļ"Ǽěǣ Ġǩļ œƿ"ļǼ CǩƿƿuǼě’ǣ
surveys are noted in Appendix B. As noted in Table 5,
the 37 employers representing 72,844 employees pro-
vided surveys with mode splits both before and after
implementation of the program.
Of the companies that completed both a baseline and a
follow-up survey and met minimum response rates, the
average employee response rates in the surveys were
25% and 22% for the baseline and follow-up Smart
Commute surveys, respectively.
Total Active Employers
Total Active Commuters
Employers w/ Completed Surveys
Employers w/ Completed Surveys
(meeting min; RR)
Employee Survey Respondents
Active Commuters at Employers w/
Completed Surveys (meeting min; RR)
Baseline Survey
339 664,182 339
37
18,101
72,844 Follow-up Survey
339 664,182 107 16,056
Business Case Review — March 2015 18
7.5 Sample Distribution: Employers used in the sample 7.7
were selected on the basis of having completed both a
baseline survey and a follow up survey, and both sur-
veys meeting the minimum response rate, irrespective
of the time either survey was completed. As a result,
there was a risk that these employers may not be geo-
graphically or proportionately representative of all ac-7.8
tive employers participating in the Smart Commute
workplace program. To explore this risk, employers
along with information regarding their firm size were
mapped across the GTHA. This mapping exercise
demonstrated that sampled employers are well distrib-
uted across the region and represent a range of firm
sizes and industry sectors.
7.6 Time between surveys: All baseline surveys occurred
before employers began actively participating in the
Smart Commute workplace program. Follow-up surveys 7.9 were conducted on average 4.5 years after baseline
surveys, with a minimum of 20 months between the
baseline and most recent survey, and a maximum of
nearly 9 years. A sensitivity test suggests there is no
correlation between the time elapsed between initial
and follow-up survey completion and the resulting
mode shift.
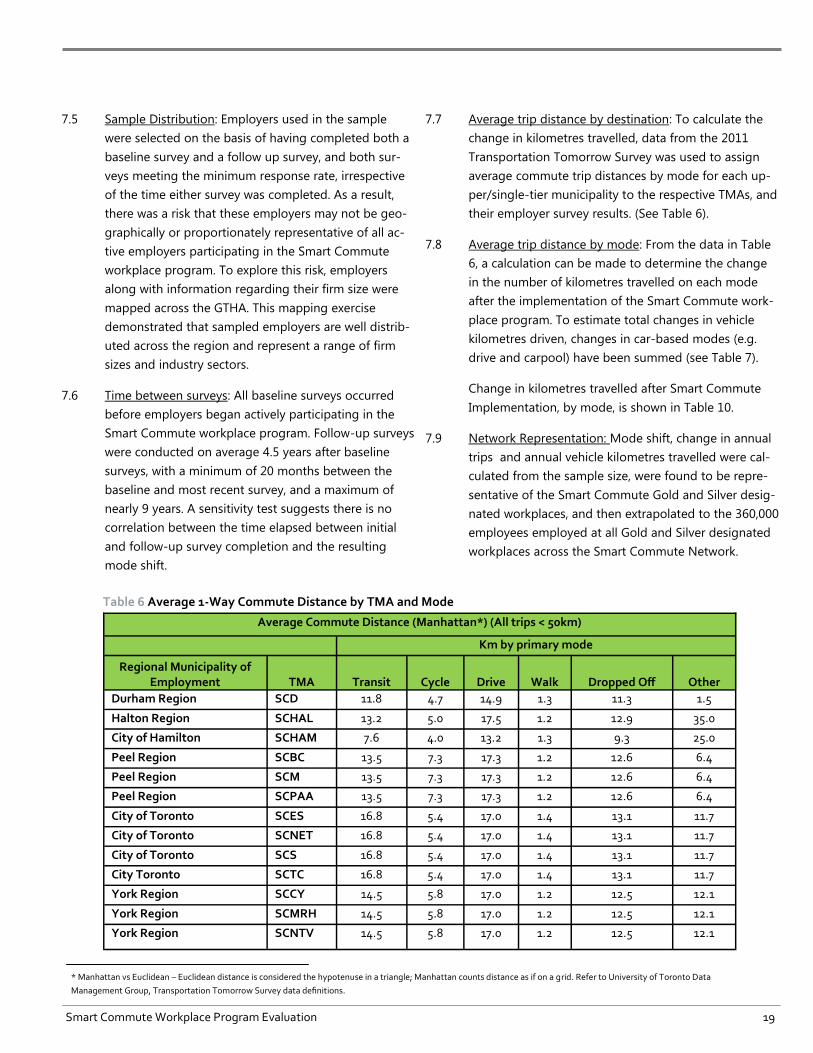
Table 6 Average 1-Way Commute Distance by TMA and Mode
Average trip distance by destination: To calculate the
change in kilometres travelled, data from the 2011
Transportation Tomorrow Survey was used to assign
average commute trip distances by mode for each up-
per/single-tier municipality to the respective TMAs, and
their employer survey results. (See Table 6).
Average trip distance by mode: From the data in Table
6, a calculation can be made to determine the change
in the number of kilometres travelled on each mode
after the implementation of the Smart Commute work-
place program. To estimate total changes in vehicle
kilometres driven, changes in car-based modes (e.g.
drive and carpool) have been summed (see Table 7).
Change in kilometres travelled after Smart Commute
Implementation, by mode, is shown in Table 10.
Network Representation: Mode shift, change in annual
trips and annual vehicle kilometres travelled were cal-
culated from the sample size, were found to be repre-
sentative of the Smart Commute Gold and Silver desig-
nated workplaces, and then extrapolated to the 360,000
employees employed at all Gold and Silver designated
workplaces across the Smart Commute Network.
Average Commute Distance (Manhattan*) (All trips < 50km)
Km by primary mode
Regional Municipality of Employment TMA Transit Cycle Drive Walk Dropped Off Other
Durham Region SCD 11/8 4/7 14/9 1/3 11/3 1/5
Halton Region SCHAL 13/2 5/0 17/5 1/2 12/9 35/0
City of Hamilton SCHAM 7/6 4/0 13/2 1/3 9/3 25/0
Peel Region SCBC 13/5 7/3 17/3 1/2 12/6 6/4
Peel Region SCM 13/5 7/3 17/3 1/2 12/6 6/4
Peel Region SCPAA 13/5 7/3 17/3 1/2 12/6 6/4
City of Toronto SCES 16/8 5/4 17/0 1/4 13/1 11/7
City of Toronto SCNET 16/8 5/4 17/0 1/4 13/1 11/7
City of Toronto SCS 16/8 5/4 17/0 1/4 13/1 11/7
City Toronto SCTC 16/8 5/4 17/0 1/4 13/1 11/7
York Region SCCY 14/5 5/8 17/0 1/2 12/5 12/1
York Region SCMRH 14/5 5/8 17/0 1/2 12/5 12/1
York Region SCNTV 14/5 5/8 17/0 1/2 12/5 12/1
* Manhattan vs Euclidean – Euclidean distance is considered the hypotenuse in a triangle- Manhattan counts distance as if on a grid/ Refer to University of Toronto Data
Management Group, Transportation Tomorrow Survey data definitions/
Smart Commute Workplace Program Evaluation 19

7.10 Monetized congestion reduction factor: Mode shift 7.12
changes were monetized using standard economic
factors (see Table 7). To calculate congestion reduction
benefits as a result of reduction in vehicle kilometres
travelled, a factor of 0.01 hours reduced per vehicle km
travelled reduction is used. This figure is derived from
previous benefit case analysis work conducted by
ƾěǼļǩƧŏljx’ǣ ĚDǩljǩƿŏD !lj"Ƨyǣŏǣ & ŎljvěǣǼƿěljǼ œǼļ"Ǽěħy
team over several major transit infrastructure
proposals.
7.11 Monetized health impact factor: Health impacts were
calculated based on changes in physical activity as a
result of increases in active transportation use (see Ta-
ble 8). Note that health impacts of changes in vehicle
emissions as a result of changes in motor vehicle travel
were not calculated for this business case review.
Length of benefit and cost: Due to the variation in time
elapsed between completion of the baseline and follow
up survey, the financial cost required to generate 1 year
of benefits from the resulting mode share is unknown.
ǻĽŏǣ Guǣŏljěǣǣ C"ǣě ĻěvŏěX ǼěǣǼěć ˣ ĭǩǣǣŏHƧě ‘ļ"ƿĭ uĭ’
assumptions for mode shift, noted in Figure 3. For the
purpose of this analysis, the average elapsed time of 5.5
years was used to calculate the cost required to achieve
a minimum of 1 year of benefits of the mode shift. This
is considered conservative as it is likely that some mode
shift happens shortly following the introduction of
Smart Commute programming. However, as mode shift
uptake rates following the introduction of Smart Com-
mute are not known at this time and are likely to vary.
The conservative 5.5 years of costs were used to calcu-
late the benefit cost ratio.
Table 7 Change in Single Occupancy vehicle kilometres driven
Mode Change in Vehicle Kilometres Driven
Drive Alone (59,499,000)
Dropped Off 414,000
Carpool / 2 people per car 18,604,000
Total Change in VKT (40,480,000)
Road Decongestion Benefits 0/01 Hours saved/km reduced 4,048,000
Monetization Factors: Factor* Unit Value
Value of Time Savings due to Road Decongestion $15/54 $/hour $6,290,000
Value of Accident Reduction Benefits $0/08 $/km reduced $3,129,000
Value of Auto Operating Cost Savings $0/61 $/km reduced $24,626,00
0
Total Value $34,045,000
Table 8 Health Benefits resulting from increases in physical activity
Change in active transportation
Changing in walking share 0/8%
Annual change in km walked (n=360,000) 1,846,000
Change in cycling share 0/8%
Annual change in km cycled (n=360,000) 7,457,000
AT health benefits per km (2013) $2/31
Annual health benefits $21,490,000
* Table 3 notes factor source/
Business Case Review — March 2015 20

7.13 Estimated realization of mode shift: An example of the b) Scenario Assumption 2: Following an S-Curve, where
uncertainty of the number of years of costs used to the ramp up is initially slow with little mode shift early
calculate the BCR is visualized in Figure 3. A range of on; half way through the period, the majority of the
benefits is presented in this BCR because the uptake final mode shift has occurred; in the final year, nearly all
rate in Smart Commute programming and rate at which mode shift has already occurred. All mode shift has
mode shift occurs at participating employers is current- occurred at 4.5 years, and is held constant for 1 year.
ly unknown. If it was to occur largely at the onset of An example of this scenario could occur in a workplace
Smart Commute programming, benefits would be where the program attracts early adopters who can
greater over time as more people would have shifted more easily make commute changes. As more employ-
modes for a larger portion of the 5.5 years. Alternative-ees become aware, the majority of employees who are
ly, the evaluation time period could be reduced, there-able to shift modes do so. Finally, as the Smart
by reducing the program costs associated with achiev-Commute culture becomes embedded in the work-
ing the same amount of benefit. Alternatively, if little place, a few more employees shift their travel modes.
mode shift occurs at the introduction of Smart
Commute services, a longer time period and therefore c) Scenario Assumption 2: Following a linear curve, greater associated costs is more appropriate for where the ramp up grows at a constant rate over 4.5 inclusion in the BCR . years and then is held constant for 1 year.
An example of this scenario could occur in a workplace assumptions for mode shift: where program adoption grows over time, as more
employees become aware of the travel options and the a) Scenario Assumption 1: Benefits realized during final
Smart Commute culture matures at a steady pace in the year of the evaluation time period. This assumes it takes
workplace. a significant amount of time for Smart Commute pro-
gramming to take effect, and can be considered the d) Scenario Assumption 4: Following the launch of a most conservative ramp up assumption. To be program at workplace, all mode shift occurs immediate-conservative, this BCR assumes no mode shift or associ- ly and is held constant for the following 5.5 years. ated benefits occurs until immediately before the follow
-up survey. Subsequently, that mode shift is held con- An example of this scenario could occur in a workplace
stant for the final year. where a specific change opportunity exists, such as the
workplace is moving to a new location or a parking lot This scenario is highly unlikely as sensitivity tests is closing. In this scenario, all employees switch modes suggest there is no correlation between the time immediately. elapsed between initial and follow-up survey
completion and the resulting mode shift.
Figure 3 ‘Ramp up’ Assumptions for Workplace Mode Shift
This Business Case Review tested 4 possible ‘ramp up’

Table 9 Mode Splits for Active Smart Commute Employers (Source: Smart Commute Workplace Surveys, 2014)
Walk Bike Transit Carpool Dropped off Telework Other Drive Alone
Baseline Survey 3/5% 2/6% 19/0% 6/3% 2/6% 0/4% 3/0% 62/6%
Follow-up Survey 4/3% 3/5% No change 7/6% No change No change 1/7% 60/9%
Change in Mode Share
0/8% 0/8% No Change
1/3% No Change No Change -1/3% -1/7%
Table 10 Change in kilometres travelled after Smart Commute Implementation, by Mode
Walk Bike Transit Carpool Dropped off Telework Other Drive Alone
Change in Mode Share
0/8% 0/8% No
Change 1/3%
No Change
No Change -1/3% -1/7%
Annual One-Way Trip Change 284,000 300,000, - 448,000 - - -469,000 -717,000 (annual *500)
Annual Kilometres Travelled Changed
373,000 1,508,000 - 3,762,000 - - -6,171,000 -12,030,000
Annual Kilome-tres Travelled Changed (Scaled to Total)
1,846,000 7,457,000 - 18,604,000 - - -30,519,000 -59,499,000
Note. ‘Other’ was not calculated as there was no way of monetizing benefits associated with an increase or reduction of this category/
Note. ‘No Change’ denotes no statistically significant change in mode share
Business Case Review — March 2015 22

8APPENDIX B: SMART COMMUTE WORKPLACE SURVEY REQUIRED RESPONSE RATES
Smart Commute Workplace Program Evaluation 23

9APPENDIX C: TMA DELIVERYAND OPERATIONS AS OF 2014
Figure 4 Transportation Management Associations (TMA) Governance – 6 GTHA regions
Figure 5 Boundaries of 13 TMAs
Business Case Review — March 2015 24

Figure 6 Smart Commute’s 13 TMA Names
Figure 7 TMA Relationship & Governance
Smart Commute Workplace Program Evaluation 25

Figure 8 6 TMAs Municipally Operated, 7 TMAs Privately Operated
Business Case Review — March 2015 26

10 APPENDIX D: THE METROLINX BUSINESS CASE FRAMEWORK
10.1 A business case is a generic term for a collection of evi-
dence that, when assembled in a logical and coherent
way, explains the contribution of an investment to or-
ganisational objectives. In this case, the value of an ex-
isting program is under review, and therefore this work
is described as a “Business Case Review”. The key differ-
ence between a “Business Case” and a “Business Case
Review” is that of options analysis. The “Business Case”
10.4
10.2 Business Cases and Business Case Reviews include both 10.5
quantitative and qualitative information that collectively
indicates the (expected) performance of an investment.
10.3 Metrolinx Business Cases and Business Case Reviews
are structured to assess the following areas of interest
to decision makers:
a) is the investment supported by a robust explanation
of how it fits with wider public policy, planning and
strategic objectives?;
10.6
b) is the investment or program financially affordable?;
and
10.7
c) does the investment demonstrate value for money
measured in economic terms?; and
d) can the investment or program be delivered and
operated successfully?
A Business Case (or Business Case Review) puts an in-
vestment decision into a strategic context and provides
the information necessary to either:
a) For a Business Case: make an informed decision
about whether to proceed with the investment and in
what form.
b) For a Business Case Review: understand the basis
against which continued or accelerated funding of the
project or program will be justified, compared and
evaluated.
This Smart Commute Business Case Review is an ex
post evaluation of the impacts of the existing Smart
Commute workplace Program. Separately, a benefit-
cost analysis was conducted by the Metrolinx Smart
Commute team, in collaboration with community and
government partners, to evaluate the School Travel
Planning process in Ontario. This was published in
2013, and demonstrated a 2:1 return on investment.9
This document has been organized using the Metrolinx
Business Case structure and headings.
The purpose of this report is to:
a) assemble the existing evidence into the Metrolinx
Guǣŏljěǣǣ C"ǣě ‘ǻĽļěě C"ǣě œǼļuDǼuļě’
b) identify initial cost, revenue and benefit estimates
c) identify gaps in the data and knowledge base to be
refined in future iterations of the Business Case Review
in order to help to contribute to ongoing investment
decision-making.
9 Metrolinx, Green Communities Canada, and the University of Toronto, “The Costs and Benefits of School Travel Planning Projects in Ontario, Canada”, Janu-
ary 2014/ <http.//metrolinx/com/en/projectsandprograms/schooltravel/Costs_and_Benefits_of_School_Travel_Planning_Projects_EN/pdf=
Smart Commute Workplace Program Evaluation 27
process involves assessing, selecting and optimizing
preferred options, while the “Business Case Review”
simply reviews the performance of a single chosen/
implemented option.

For more information about Metrolinx, connect at:
www.metrolinx.com
@Metrolinx
For more information about Smart Commute, connect at:
www.smartcommute.ca
@SmartCommute
Business Case Review — March 2015 28