


Bahasa
Halaman
Hukum


This article was published in an Elsevier journal. The attached copyis furnished to the author for non-commercial research and
education use, including for instruction at the author’s institution,sharing with colleagues and providing to institution administration.
Other uses, including reproduction and distribution, or selling orlicensing copies, or posting to personal, institutional or third party
websites are prohibited.
In most cases authors are permitted to post their version of thearticle (e.g. in Word or Tex form) to their personal website orinstitutional repository. Authors requiring further information
regarding Elsevier’s archiving and manuscript policies areencouraged to visit:
http://www.elsevier.com/copyright
Author's personal copy
Identification of five human novel genes associated with cell proliferationby cell-based screening from an expressed cDNA ORF library
Xi Ma a,b,c,1, Xinyu Wang a,1, Xia Gao a,1, Lan Wang a,b,c,1, Yang Lu a,1, Peng Gao a,1,Weiwei Deng a,1, Peng Yu a,1, Jinjing Ma a,1, Jinhai Guo a,1, Hualing Cheng a,1,
Chenying Zhang a,1, Taiping Shi a,⁎, Dalong Ma a,b,c,1
a Chinese National Human Genome Center, Beijing. #3-707 North YongChang Road BDA, Beijing 100176, PR Chinab Lab of Medical Immunology, School of Basic Medical Science, Peking University Health Science Center. 38# Xueyuan Road, Beijing 100083, PR China
c Human Disease Genomics Center, Peking University. 38# Xueyuan Road, Beijing 100083, PR China
Received 16 November 2006; accepted 7 August 2007
Abstract
The development of functional profiling technologies provides opportunity for high-throughput functional genomics studies. We describe acell-based screening system to identify novel human genes associated with cell proliferation. The method integrates luciferase reporter geneactivity, fluorescence stain, automated microscopy and cellular phenotype assays. We successfully used the system to screen 409 novel humangenes cloned by our lab and found that 27 genes significantly up-regulated promoter-Renilla luciferase reporter plasmid (pRL) activity. Amongthem, five genes, TRAF3IP3, ZNF306, ZNF250, SGOL1, and ZNF434, were determined through morphological observation, calcein AMfluorescence stain, MTT assay and cell cycle analysis to be associated with cell proliferation. Furthermore, we showed that the gene TRAF3IP3,which initially was identified to specifically interact with TRAF3, stimulated cell growth by modulating the c-Jun N-terminal kinase (JNK)pathway, and RNAi of TRAF3IP3 confirmed that the effect was physiological and necessary. In summary, we integrated a rapid and efficientsystem for screening novel growth regulatory genes. Using the new screening system we identified five genes associated with cell proliferation forthe first time.© 2007 Elsevier Inc. All rights reserved.
Keywords: High-throughput screening; Cell proliferation; Reporter gene; Functional genomics
Introduction
Sequencing of the human genome has led to the identifica-tion of thousands of novel genes whose functions are unknownor poorly defined. To date, the functions of approximately one-half of all human genes have been described in the literature,but many of these were determined based on primary aminoacid sequence or expression analysis, and provide little insightinto the cellular roles of these genes (Su et al., 2004). Func-tional genomic technologies with the potential to elucidategene activity are emerging. These technologies allow for high-
throughput screening (HTS) of gene products using cell-basedsystems (Giese et al., 2002). Technological advances in theluciferase reporter system and the automation of cellularimaging analysis have made it possible to apply fluorescence-based methods to high-throughput biological inquiries (Haradaet al., 2005). Cell-based assays using reporter genes and fluo-rescence stains have proven effective for HTS, and haveadvantages such as high sensitivity, shorter assay duration,simple automation and fewer false positives from nonspecificinteractions (Silverman et al., 1998; Dhundale and Goddard,1996; Suto and Ignar, 1997; Entzeroth, 2003).
The thymidine kinase promoter-Renilla luciferase reporterplasmid (pRL-TK) is commonly used as an internal control inthe Dual-Luciferase Reporter Assay System (Lorenz et al.,1991). It may be used in combination with any experimental
Life Sciences 81 (2007) 1141–1151www.elsevier.com/locate/lifescie
⁎ Corresponding author. Tel.: +86 10 67883332 868; fax: +86 10 67873016.E-mail addresses: [email protected], [email protected] (T. Shi).
1 Tel.: +86 10 67883332 868; fax: +86 10 67873016.
0024-3205/$ - see front matter © 2007 Elsevier Inc. All rights reserved.doi:10.1016/j.lfs.2007.08.006
Author's personal copy
reporter vector to co-transfect mammalian cells. Normalizingthe experimental reporter gene to the activity of the internalcontrol minimizes the variability caused by differences in cellamount and transfection efficiency. Every operation in thehigh-throughput assays used in this study was performedhomogenously in a 96-well plate format. Thus, within a singleplate, all samples should have undergone a similarly efficienttransfection. Therefore, we surmise that obvious up-regulationof an internal control activity may be associated with cellproliferation. We applied a simple fluorescence assay thatutilized a calcein AM [4′5′-bis [N′,N′-bis (carboxymethyl)aminomethyl fluorescein acetoxymethyl ester] fluorescencedye to stain cells to identify the up-regulation. Calcein AM is anon-toxic compound that does not itself fluoresce but isconverted into strongly green fluorescent calcein by esteraseactivities present in viable cells. After conversion it is retainedwell within the cell throughout the assay process and does nottransfer to unlabelled cells to any degree. Its fluorescence is,however, reduced when cells are deliberately lysed possibly asa result of its release from compromised membranes (Westonand Parish, 1990). This dye has been used to measurelymphocyte-mediated cytotoxicity (Papadopoulos et al.,1994), lytic activity of natural killer and T cells (Neri et al.,2001), and in vitro toxicity of anti-tumor agents in tumor celllines (Wagner et al., 1999). Background fluorescence levels areinherently low with this assay technique because the dyes arevirtually non-fluorescent before interacting with cells. Usingthis simple fluorescence technique, we tested the concept ofup-regulation and association with cell proliferation. Wemeasured the internal control activity of 409 novel geneclones and found 27 genes significantly up-regulated the in-ternal control activity.
Results were verified using MTT assay and flow cytometry(FACS) to measure cell cycle. Five genes were found capable ofmediating cell proliferation. TRAF3IP3 (NM_025228), a knowngene identified by our screen, was used to perform furtherfunction assays and determine the mechanism by which cellproliferation was induced.We validated that TRAF3IP3mediatedcell growth by modulating the c-Jun N-terminal kinase (JNK)pathway.
Materials and methods
cDNA library
From the human RefSeq database (http://www.ncbi.nlm.nih.gov/projects/RefSeq/) (Pruitt et al., 2005). We selected candidatesequences with “Hypothetical”, “Predicted”, “Putative”, or
“Unknown” in their definition, or candidates with fewer thanthree functional research articles. These candidate sequenceswerefirst proofread and extended using the EST database to obtain full-length sequences, and then their ORFs were predicted. Weanalyzed the UniGene database (http://www.ncbi.nlm.nih.gov/UniGene) (Wheeler et al., 2003) and chose a human cDNA library(Clontech, USA) containing 20 tissues where the expression of amajority of the candidate genes was detected.
Two-step PCR amplification was used to make full use of theexisting tissue cDNA library, reduce the amount of PCR templaterequired and improve PCR efficiency and specificity. Initially, weselected groups of genes based on the similarity in codingsequence (CDS) length and expression profile. When expressioninformation was available for the set of transcripts, the first PCRwas done with commonly used cDNAs and mixed gene primers.In the second PCR we used the purified first PCR products astemplates and gene-specific primers to amplify the target genes.The purified PCR products were cloned into a pGEM-T Easyvector (Promega, Madison, WI) and sequenced using an ABIPRISM®3100 Genetic Analyzer (Applied Biosystems, FosterCity, CA). The inserts were cut withEcoRI and subcloned into themammalian expression vector pcDNA.3.1/myc-His (-) B (Invi-trogen, Carlsbad, CA).
Cell culture and transient transfection
Human embryonic kidney cell line 293T (ATCC: CRL-11268), human cervix carcinoma cell line HeLa and humanprostate cancer cell line PC-3 (ATCC: CRL-1435) were obtainedfrom the American Type Culture Collection (Manassas, VA).293Tcells andHeLa cellweremaintained inDulbecco'smodifiedEagle's medium (Hyclone, Logan, UT) supplemented with 10%FBS and 2mM L-glutamine and incubated in a 5%CO2 incubatorat 37 °C. PC-3 cells were cultured (37 °C, 5%CO2) inRPMI 1640(Invitrogen) supplemented with 10% fetal bovine serum and
Table 1Sense sequences of TRAF3IP3 siRNAs
siRNA Targeting sequence
siTRAF3IP3-1 5′-AGGCAGAAGGACCAACAAUtt-3′siTRAF3IP3-2 5′-CAGGAGAAACUCUUAACAAtt-3′siTRAF3IP3-3 5′-GGACCUACAAGAUCAACUAtt-3′GFP siRNA 5′-GCAAGCUGACCCUGAAGUUCtt-3′Non-silencing siRNA 5′-UUCUCCGAACGUGUCACGUtt-3′
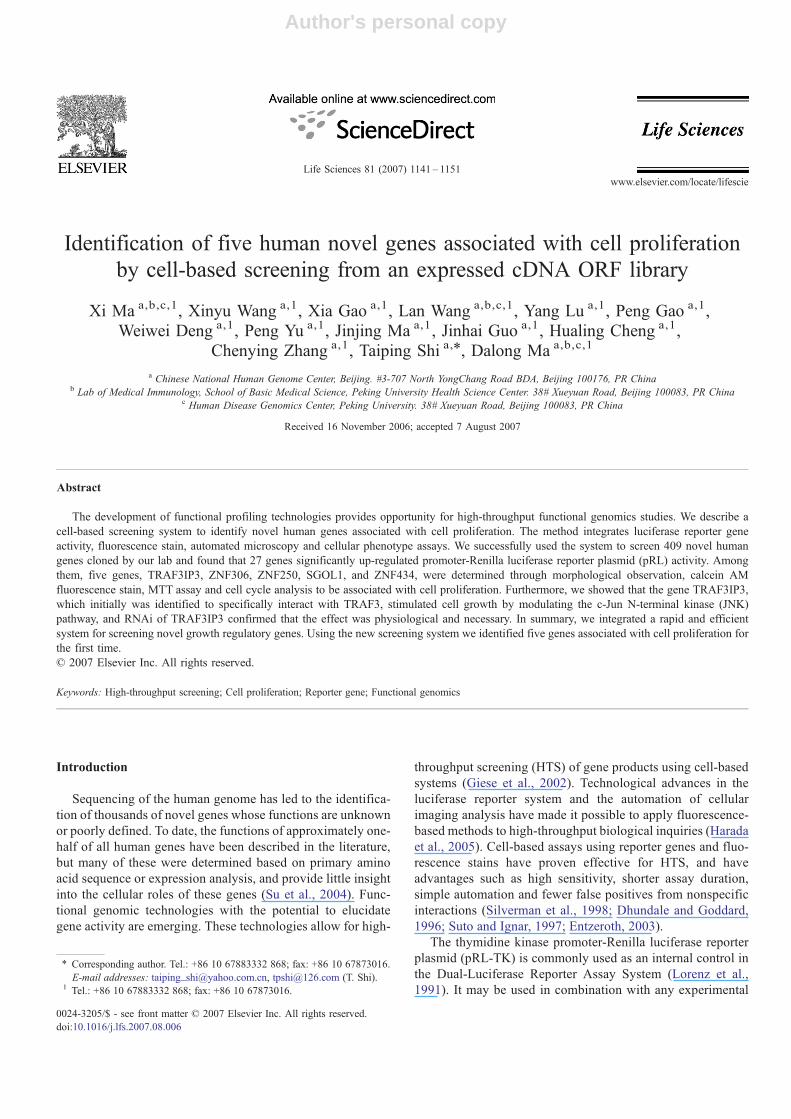
Fig. 1. Schematic overview of the high-throughput screening strategy for novelgenes associated with cell proliferation. FACS = fluorescence activated cellsorting.
1142 X. Ma et al. / Life Sciences 81 (2007) 1141–1151
Author's personal copy
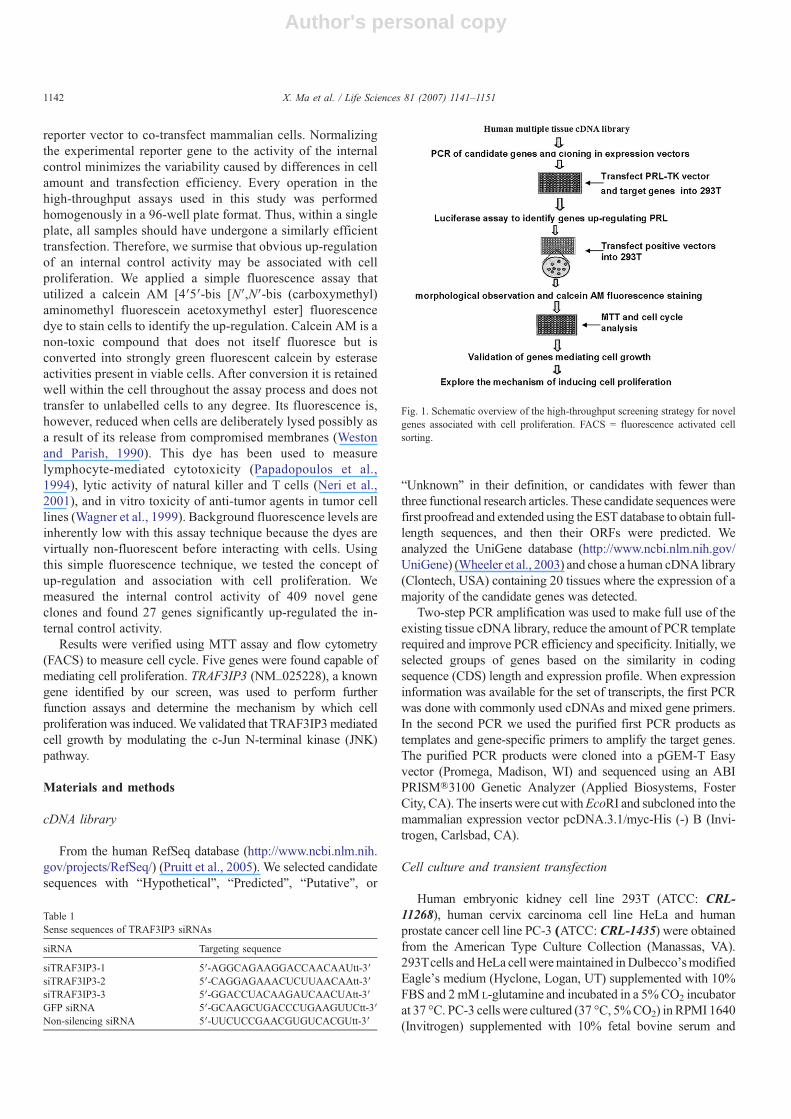
Table 2Genes up-regulating an internal control in 293T cells
Clone # Accession no. Gene description Percentage STD Comments Status
Mock pcDNA.3.1/myc-His (-) B 100% 12% – –NM_033360 Homo sapiens v-Ki-ras2 Kirsten rat sarcoma viral oncogene homolog (K-ras) 352% 10.50% ORF matches Refseq perfectly AcceptableNM_016542 Homo sapiens Mst3 and SOK1-related kinase (MASK,MST4) 205% 5.50% ORF matches Refseq perfectly Acceptable
AT15-172 NM_032308 Homo sapiens RPA interacting protein (RIP) 275% 6.50% Potential alternative spliceCM1-207 NM_207344 LOC283377 hypothetical protein LOC283377 296% 9.00% ORF matches Refseq perfectly AcceptableNL13-531 NM_025228 Hypothetical protein dJ434O14.3, TRAF3IP3 292% 9.00% ORF matches Refseq perfectly AcceptableNM2-357 NM_017911 Hypothetical protein FLJ20635, C22orf8 904% 13.50% ORF matches Refseq perfectly AcceptableNS130-102 NM_032231 Homo sapiens hypothetical protein FLJ22875 198% 7.00% Potential alternative spliceNS82-153 NM_024645 Hypothetical protein FLJ13842 253% 9.50% Potential alternative spliceTF16-274 NM_138456 Hypothetical protein BC012330 249% 10.50% ORF matches Refseq perfectly AcceptableTF41-371 NM_004433 E74-like factor 3 (ELF3) 271% 9.50% ORF matches Refseq perfectly AcceptableTF9-538 NM_024493 Zinc finger protein 306 295% 10.00% ORF matches Refseq perfectly AcceptableXN70-176 NM_015964 CGI-38: brain specific protein 608% 18.00% ORF matches Refseq perfectly Acceptable
NM_017979 Smooth muscle cell associated protein-1 184% 8.50% ORF matches Refseq perfectly AcceptableNS203-225 NM_024510 Homo sapiens hypothetical protein MGC4368 311% 9.00% ORF matches Refseq perfectly AcceptableNS318-260 NM_014886 TGF beta-inducible nuclear protein 1 (TINP1) 263% 8.00% ORF matches Refseq perfectly AcceptableNS190-215 NM_138484 Homo sapiens shugoshin-like 1 (S. pombe) (SGOL1) 355% 18.00% Potential alternative spliceNS295-213 NM_138408 Chromosome 6 open reading frame 51 (C6orf51) 240% 9.50% ORF matches Refseq perfectly AcceptableNSS17-123 NM_019021 Hypothetical protein FLJ20010 189% 8.00% ORF matches Refseq perfectly AcceptableNSS28-47 BC_079832 Hypothetical protein MGC12935 219% 10.00% Pending further analysisNSS30-111 XM_496351 Hypothetical protein MGC12760 204% 9.00% ORF matches Refseq perfectly AcceptableAT11-290 NM_017916 Hypothetical protein FLJ20643 205% 6.50% ORF matches Refseq perfectly AcceptableCB20-329 XM_375298 KIAA1987 protein 201% 11.00% ORF matches Refseq perfectly AcceptableCZ6-401 NM_032905 SPF45 splicing factor (45 kDa), RBM17 204% 12.00% ORF matches Refseq perfectly AcceptableSM2-106 NM_030945 Homo sapiens C1q and tumor necrosis factor related protein 3 (C1QTNF3) 189% 5.00% Potential alternative spliceTF13-106 NM_021061 Zinc finger protein 250 393% 11.50% Potential alternative spliceTF35-230 NM_006896 Homeobox protein A7 195% 7.00% ORF matches Refseq perfectly Acceptable
NM_024703 Hypothetical protein FLJ22593 203% 12.50% Potential alternative spliceAT37-216 NM_017810 Zinc finger protein 434 200% 5.00% Potential alternative spliceAT4-663 NM_031471 UNC-112 related protein 2 (URP2) 295% 12.50% ORF matches Refseq perfectly Acceptable
A total of 409 novel genes were co-transfected along with the pRL-TK vector into 293T cells to screen genes up-regulating pRL activity. Mean percentage of pRL activities were computed from three individuallytransfected wells relative to a control expression vector pcDNA.3.1/myc-His (-) B. The average change in activity was calculated from the three experiments. The expression vectors encoding K-ras and MST4, known tomediate cell growth, were included as positive controls. In order to identify genes which markedly up-regulated pRL activity, we chose an average change more than 200% (±10%) compared to transfection with an emptyvector as the positive threshold. Twenty-seven genes were identified as shown. All other genes not rated positive are not shown.
1143X.Maet
al./Life
Sciences81
(2007)1141–1151
Author's personal copy
2 mM L-glutamine. All experiments were performed onlogarithmically growing cells. All the three kinds of cell lineswere transfected transiently using the calcium phosphateprecipitation method according to standard protocols (Paddisonet al., 2004).
Screening novel genes up-regulating the internal controlactivity
Approximately 1.0×10⁴ 293T cells/well were seeded into96-well culture plates. Cells were co-transfected with the pRL-TK vector (Promega) and target gene expression vectors toinvestigate the effect of these genes on pRL activity. Thirtyhours after transfection, the cells were lysed in standard lysisbuffer (Promega) and the cell lysates were assayed for pRLactivity using a GENios Pro reader (Tecan, Switzerland). Eachexperiment was performed in triplicate and each assay wasrepeated at least three times.
Morphological observation and fluorescent stains
Approximately 2.0×10³ 293T cells/well were seeded into96-well culture plates and transiently transfected with target
gene expression vectors up-regulating pRL activity asdescribed above. Wells were monitored by light microscopyto detect cell morphological changes 48 h after transfection todetermine the effect of these genes on cell proliferation.Transfected cells were stained using calcein AM fluorescencedye at 1 μM final concentration (Molecular Probes, Eugene,OR). The stained cells were incubated at 37 °C for 30 min, thendigital images of living cells (EX/EM ∼495 nm/∼515 nm) ineach well were obtained using an inverted fluorescentmicroscope (Axiovert 200M, Zeiss, Germany) and theMetaMorph 6.3 image analysis program (Molecular Devices,Downingtown, PA).
Validation of genes associated with cell proliferation by MTTassay and cell cycle analysis by flow cytometry
Transfected 293T cells (1.0×10³ cells/well) in 96-wellculture plates were incubated for 5 days at 37 °C in ahumidified, 5% CO2 atmosphere. Every 24 h, 15 μl of MTT [3-(4, 5-dimethylthiazol-2-yl)-2, 5-diphenyltetrazolium bromide]solution (5 mM, Promega) was added to each well and the plateswere incubated for another 4 h. Solubilization/stop solution wasthen added and plates were further incubated at 37 °C for 1 h.
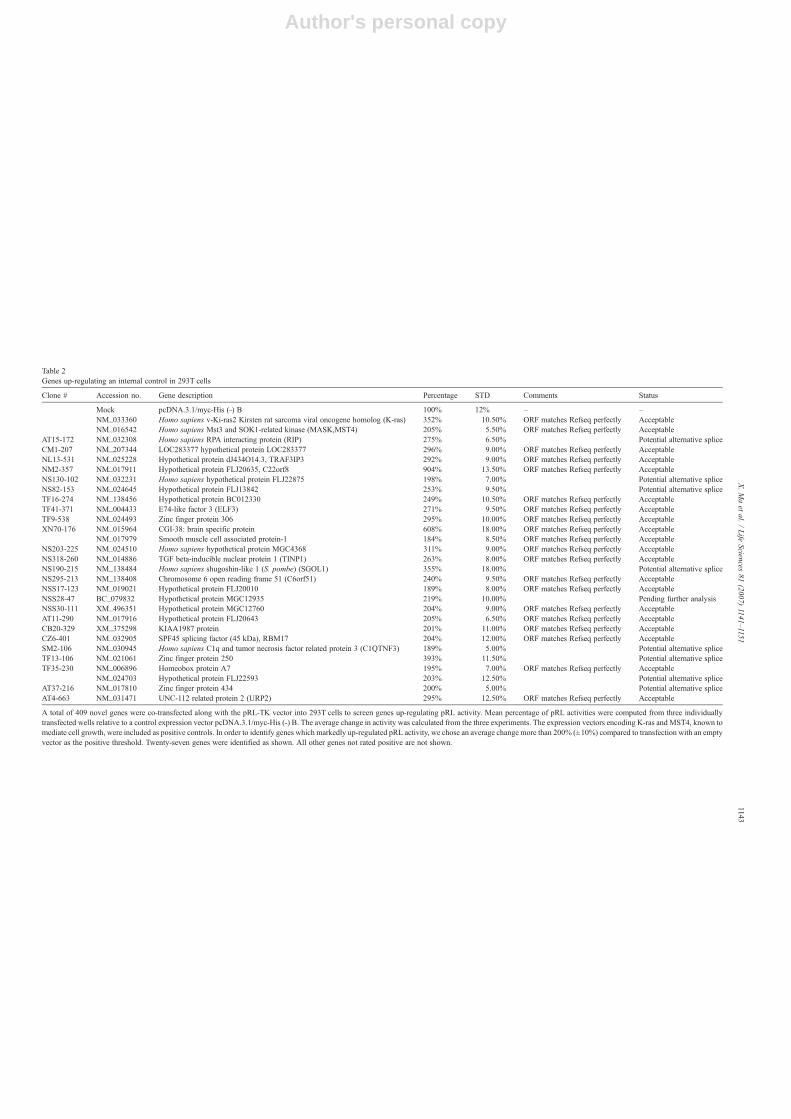
Fig. 2. Morphological observation of cells transfected with potential proliferation genes (the 27 genes out of Table 2). “L” is Light microscopy images of transfected293Tcells, and “R” is Fluorescence microscopy of transfected 293Tcells stained with calcein AM fluorescent dye. In order to show a panorama, all pictures were takenat 5× magnification. Classic characteristics of proliferation were observed in (B) TRAF3IP3, (C) ZNF306, (D) ZNF250, (E) SGOL1, (F) ZNF434. (A) MOCK (theempty expression vector pcDNA.3.1/myc-His (-) B); (G) K-ras.
1144 X. Ma et al. / Life Sciences 81 (2007) 1141–1151
Author's personal copy
Finally, the optical density was determined at 570 nm using aModel 550 microplate reader (BIO-RAD, Hercules, CA) andthe data was analyzed using Microsoft Excel.
Assay of cell cycle analysis was carried out 12 h after serumwithdrawal for synchronization. Transfected 293T cells(5×10⁵) were harvested by brief trypsinization, washed twicewith PBS, fixed in 70% ethanol overnight and stained withpropidium iodide (PI; 20 μg/ml final concentration)/Triton-X100 containing 10 mg/ml RNase (DNase free). Afterincubated at 37 °C for 30 min, the samples were analyzed ona FACSCalibur flow cytometer (Becton Dickinson, San Jose,CA). The populations of G0/G1, S, and G2/M cells werequantitated.
Then we performed these assays with cell lines HeLa andPC-3 using the same methods, and the data was acquired andanalyzed.
Bioinformatics of genes associated with cell proliferation
The characteristics of the target cDNA fragments obtainedby EST assembly and their putative amino acid sequences wereanalyzed using PCGENE software (Intelligenetics, MountainView, CA). Chromosomal gene localization and structure camefrom the HTGS database (http://www.ncbi.nlm.nih.gov). Geneexpression profiling was done using GNF SymAtlas v1.0.4(http://symatlas.gnf.org/SymAtlas/) (Su et al., 2004). Proteindomains were searched using the NCBI Conserved DomainDatabase (http://www.ncbi.nlm.nih.gov/Structure/cdd/cdd.shtml) (Marchler-Bauer et al., 2005). The other items wereperformed using the ExPASy Web site (http://us.expasy.org/)(Gasteiger et al., 2003). The transmembrane analyses werepredicted using TMHMM Server v. 2.0 (http://www.cbs.dtu.dk/services/TMHMM-2.0/) (Sonnhammer et al., 1998). The
putative cleavage site of signal peptides was predicted usingSignal P 3.0 server (http://www.cbs.dtu.dk/services/SignalP)(Lukashin and Borodovsky, 1998). Protein localization wasanalyzed by PSORT II (http://psort.nibb.ac.jp/) (Delcher et al.,1999). Cancer profiling databases Oncomine and Unigene wereused to find expression profiles of genes associated with cellproliferation. (http://www.oncomine.org/main/index.jsp, http://www.ncbi.nlm.nih.gov/entrez/query.fcgi?db=unigene) (Pontiuset al., 2003; Rhodes et al., 2004).
Further function assays for the mechanism of TRAF3IP3mediating cell growth
293T cells and HeLa cells were transfected with pRL-TK,Gal4-ELK1, Gal4-DBD (Stratagene, La Jolla, CA) andTRAF3IP3, with pCDB and K-ras as the blank and positivecontrols, respectively. Cells were transfected for 24 h followedby serum starvation for 24 h and then cell lysates were harvestedwith lysis buffer as described above. The lysates were collectedand the relative luciferase activity (firefly luciferase for reporterand renilla luciferase activity for normalization of transfectionefficiency) was measured according to the manufacturer'sinstructions (Promega).
On the other hand, the reporter gene assay and MTT assay ofTRAF3IP3 (n=3/experiment) were performed after treatment(12 h) with PD98059 (5 μM, Calbiochem, Darmstadt,Germany), JNK inhibitor II (0.1 μM, Calbiochem), SB202190(10 μM, Calbiochem) or a solvent control (DMSO), respec-tively. Each experiment was repeated at least three times.
TRAF3IP3 siRNAs synthesis, electroporation, and RT-PCRanalysis
Double-stranded siRNAs against TRAF3IP3 were de-signed, chemically synthesized and PAGE purified, free ofRNase contamination, according to manufacturer's instruc-tions (Genechem Corporation, Shanghai, China) (Table 1). ABLAST search confirmed the non-silencing siRNA had nomatches with the complete human genome (www.ncbi.nlm.nih.gov). The siRNAs were dissolved to a concentrationof 20 μM with buffer containing 20 mM KCl, 6 mM HEPES,pH 7.5, 0.2 mM MgCl2. HeLa cells were used and cell cul-ture medium was renewed prior to each experiment. Celldensity was adjusted to 1×10⁶/350 μl and indicated amountsof siRNAs were added prior to electroporation (20 ms pulselength, 120 V). Cells were allowed to recuperate (roomtemperature, 10 min) prior to plating and were cultured inthe corresponding complete cell culture medium for theindicated time.
ThenRNAwas preparedusingTRIzol reagent (Invitrogen) andreverse transcription (RT) was performed with Ther-moSCRIPT™ RT-PCR System (Invitrogen), according to themanufacturer's protocol. Total RNA (1 μg) was used for the firststrand cDNA synthesis using oligo (dT) 15–18 primers and PCRamplification primers and conditions as follows: TRAF3IP3forward 5′-ATGATCAGCCCAGACCCCA-3′; reverse 5′-GAT-CATCAGGTTGTCTTTAT-3′, one cycle (94 °C, 5min), 30 cycles
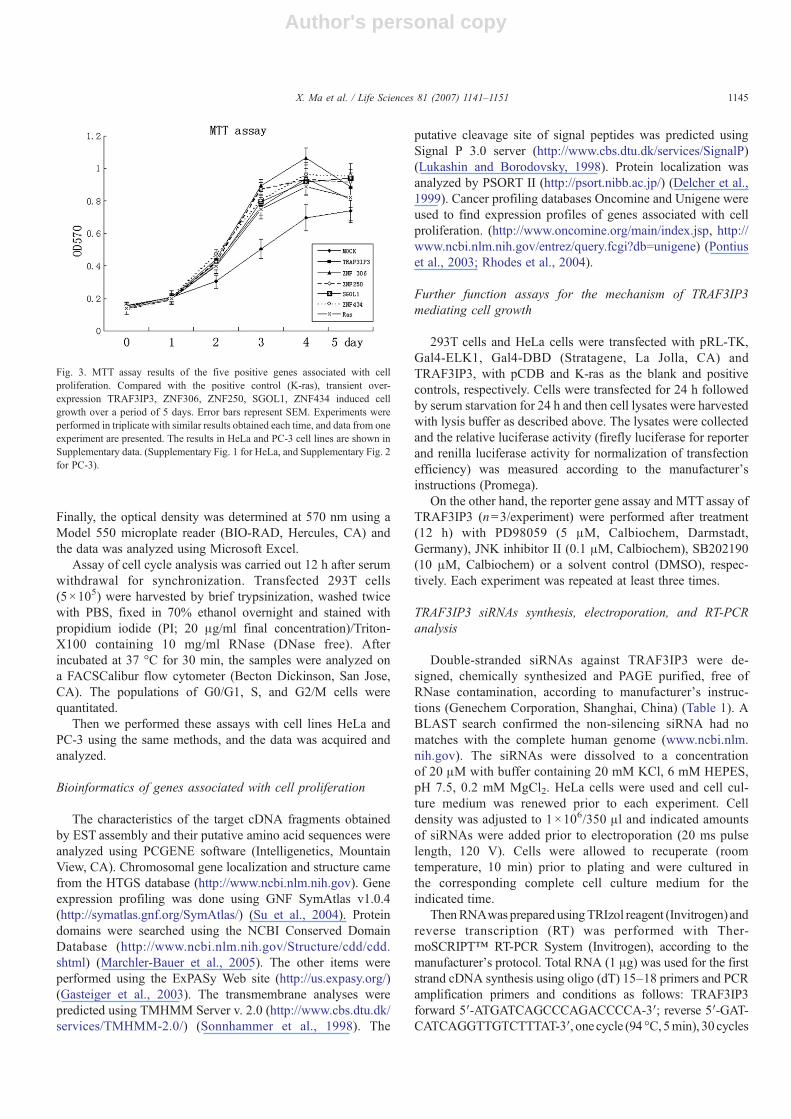
Fig. 3. MTT assay results of the five positive genes associated with cellproliferation. Compared with the positive control (K-ras), transient over-expression TRAF3IP3, ZNF306, ZNF250, SGOL1, ZNF434 induced cellgrowth over a period of 5 days. Error bars represent SEM. Experiments wereperformed in triplicate with similar results obtained each time, and data from oneexperiment are presented. The results in HeLa and PC-3 cell lines are shown inSupplementary data. (Supplementary Fig. 1 for HeLa, and Supplementary Fig. 2for PC-3).
1145X. Ma et al. / Life Sciences 81 (2007) 1141–1151
Author's personal copy
(94 °C, 30 s; 55 °C, 60 s; 72 °C, 30 s) followed by an extensioncycle (72 °C, 7min). For GAPDH (internal control) primers were,forward 5′-CCACCCATGGCAAATTCCATGGCA-3′; reverse
5′-TCTAGACGGCAGGTCAGGTCAGGTCCACC-3′ andPCR reaction was performed at an annealing temperature of56 °C for 25 cycles. PCR products were separated utilizing a 1.0%
1146 X. Ma et al. / Life Sciences 81 (2007) 1141–1151
Author's personal copy
agarose gel electrophoresis and visualized by ethidium bromidestaining.
On the other hand, MTT assay was performed after cellswere transfected with siRNAs.
Results and discussion
Construction of the cDNA library
We chose 1525 candidate genes for PCR amplification andgot specific bands for 800 target genes. Sequencing andsequence alignment with the RefSeq database (Release 11, onMay 13, 2005) revealed that we obtained 409 sequencescorresponding to 362 genes, and 42 of these containedpotential alternatively spliced forms. Although the functionsof some of the genes we cloned have been studied, most arecompletely unknown or have only been poorly defined. Adetailed list of the genes is shown in Supplementary data. Thiscloning project is still underway in our laboratory to gatheradditional information on novel genes.
Twenty-seven novel genes significantly up-regulate an internalcontrol
Ourapproach is to transientlyco-transfect cellswitha luciferasereporter, the pRL vector, and a cDNA expression vector, and then
measure reporter activity after 30 h. We assume that transfectionefficiency is similar between all the cDNAs and therefore highreporter activity results from increases of cell proliferation, whichwas used to evaluate the association betweenup-regulation ofpRLactivity and cell proliferation. The screening program is shown inFig. 1. The pRL vector serves as an internal control or baselineresponse tomonitor andminimize experimental variability causedby differences in cell viability or transfection efficiency. However,we expected significant association and anticipated the up-regulation could manifest in both cell number and morphologicalcellular health assessments. A total of 409 novel genes were co-transfected alongwith the pRL-TKvector into 293Tcells to screengenes up-regulating pRL activity. Mean percentages of pRLactivitieswere computed from three individually transfectedwellsrelative to a control expression vector. Then, the average change inactivity was calculated from the three experiments. In order toidentify genes which markedly up-regulated pRL activity, wechose an average change more than 200% (±10%) compared totransfection with an empty vector as the positive threshold. Theexpression vectors encoding K-ras (Kahn et al., 1987) and MST4(Lin et al., 2001), known tomediate cell growth, were included aspositive controls. Experiments were performed in triplicate, withsimilar resultsobtainedeach time.Finally, 27geneswere identifiedas showing markedly up-regulated pRL activity compared to theempty vector (Table 2). Moreover, we performed further functionassays to eliminate the false positive genes and validate the results.
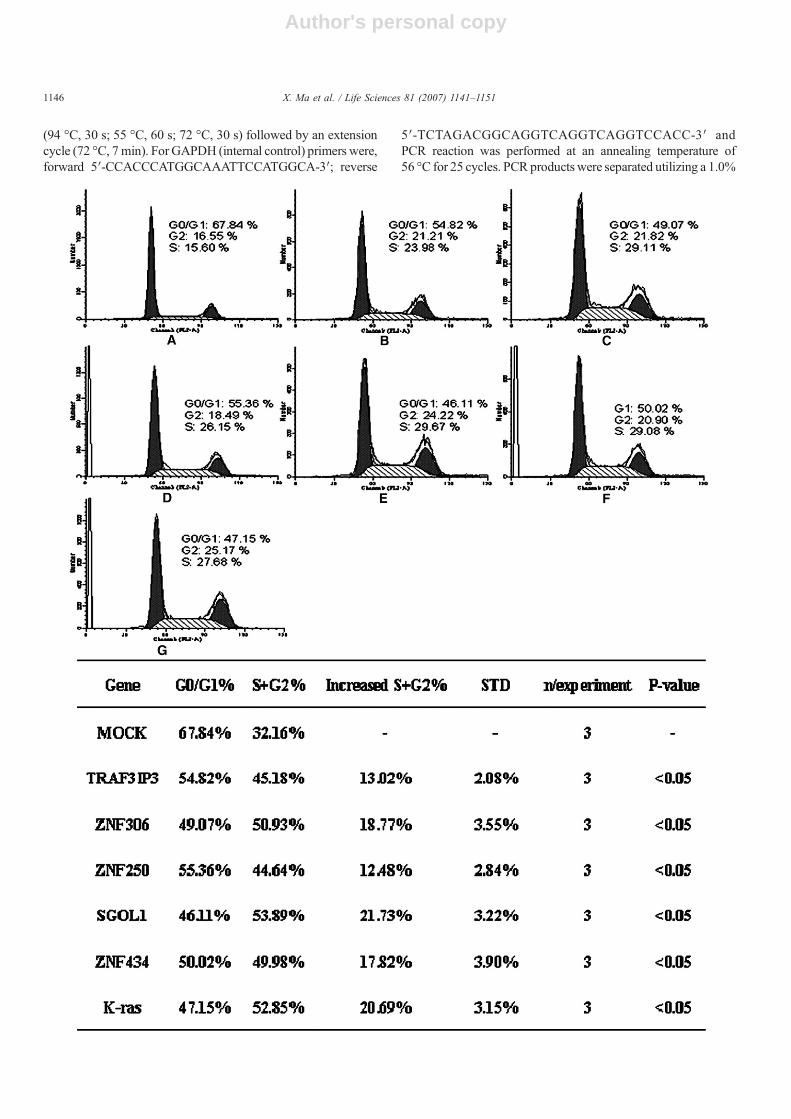
Fig. 4. Cell cycle results of the five potential proliferation genes analyzed by flow cytometry. The five positive vectors and control cells were harvested, fixed andstained with PI. Because the cells in S phase and G2 phase represents the proliferating cells, we measure increased S+G2% as the growth parameter. TRAF3IP3,ZNF306, ZNF250, SGOL1, and ZNF434 are significantly different from pCDB (Pb0.05), the same as the control (K-ras) when performing two-independent-sample ttest. This graph is a representation of three independent analyses. A, MOCK (the empty expression vector pcDNA.3.1/myc-His (-) B); B, TRAF3IP3; C, ZNF306; D,ZNF250; E, SGOL1; F, ZNF434; G, K-ras. The results in HeLa and PC-3 cell lines are shown in Supplementary data. (Supplementary Fig. 3 for HeLa, andSupplementary Fig. 4 for PC-3).
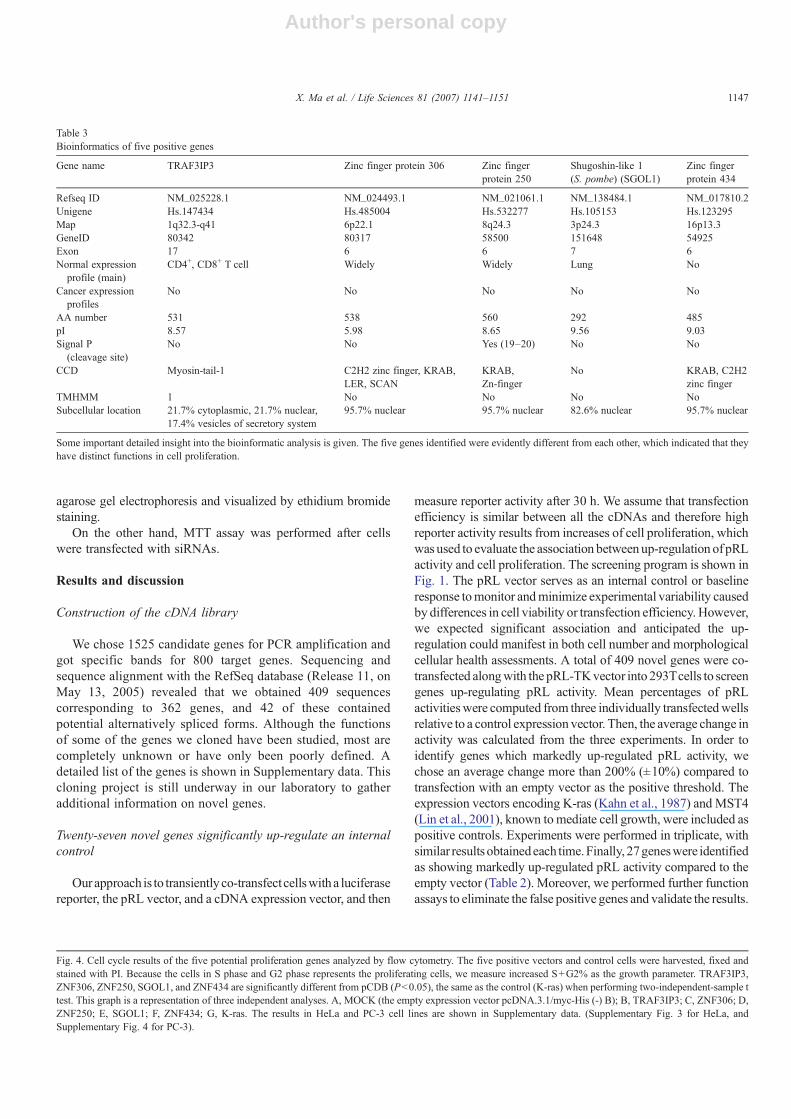
Table 3Bioinformatics of five positive genes
Gene name TRAF3IP3 Zinc finger protein 306 Zinc fingerprotein 250
Shugoshin-like 1(S. pombe) (SGOL1)
Zinc fingerprotein 434
Refseq ID NM_025228.1 NM_024493.1 NM_021061.1 NM_138484.1 NM_017810.2Unigene Hs.147434 Hs.485004 Hs.532277 Hs.105153 Hs.123295Map 1q32.3-q41 6p22.1 8q24.3 3p24.3 16p13.3GeneID 80342 80317 58500 151648 54925Exon 17 6 6 7 6Normal expression
profile (main)CD4+, CD8+ T cell Widely Widely Lung No
Cancer expressionprofiles
No No No No No
AA number 531 538 560 292 485pI 8.57 5.98 8.65 9.56 9.03Signal P
(cleavage site)No No Yes (19–20) No No
CCD Myosin-tail-1 C2H2 zinc finger, KRAB,LER, SCAN
KRAB,Zn-finger
No KRAB, C2H2zinc finger
TMHMM 1 No No No NoSubcellular location 21.7% cytoplasmic, 21.7% nuclear,
17.4% vesicles of secretory system95.7% nuclear 95.7% nuclear 82.6% nuclear 95.7% nuclear
Some important detailed insight into the bioinformatic analysis is given. The five genes identified were evidently different from each other, which indicated that theyhave distinct functions in cell proliferation.
1147X. Ma et al. / Life Sciences 81 (2007) 1141–1151
Author's personal copy
Light and fluorescence microscopy identified five novel genesassociated with cell proliferation
We screened the qualitative morphological changes of the 27genes out of Table 2. 293T cells transfected with only 5 genes ofthe 27 expression vectors showed an increase in cell amounts(Fig. 2, L). Data are presented from one experiment. Experimentswere performed in triplicate with similar results obtained eachtime. Increases occurredwith the five expression vectors encodingTRAF3IP3, ZNF306, ZNF250, SGOL1, and ZNF434 comparedwith the empty vector.
To better identify the result of cell proliferation, we ap-plied a relatively simple fluorescence assay that utilized afluorescence dye (calcein AM) to stain cells. The live stainedcells could be readily detected under an inverted fluore-scence microscope, so calcein AM fluorescent dye revealedthe cell proliferation effects of the 27 genes. We chose theempty expression vector as the negative control and theexpression vector of K-ras as the positive control, and Fig. 2, Rshows the green fluorescence of living 293T cells transfec-ted with the five expression vectors and the empty vector
(mock). Only 5 genes were identified as shown. All othergenes were not shown. Data are presented from oneexperiment. Experiments were performed in triplicate withsimilar results obtained each time. This result agrees with thelight microscopy findings, correlating the five novel geneswith cell proliferation.
Validation of five genes associated with cell proliferation byMTT and cell cycle analysis by flow cytometry
Although light microscopy and fluorescence dye providea rapid visual impression of cell proliferation, microscopy doesnot allow an accurate quantification of the precise mode of cellproliferation. We performed two classic proliferation assays —MTTassay and cell cycle analysis by flow cytometry— to verifyour results. In protein level the MTT assay showed that over-expression of TRAF3IP3, ZNF306, ZNF250, SGOL1, andZNF434 induced cell growth compared with the emptyvector (Fig. 3). In cell cycle analysis, because the cells in Sphase and G2/M phase represent the proliferating cells, wemeasure increased S+G2% as the growth parameter. The results
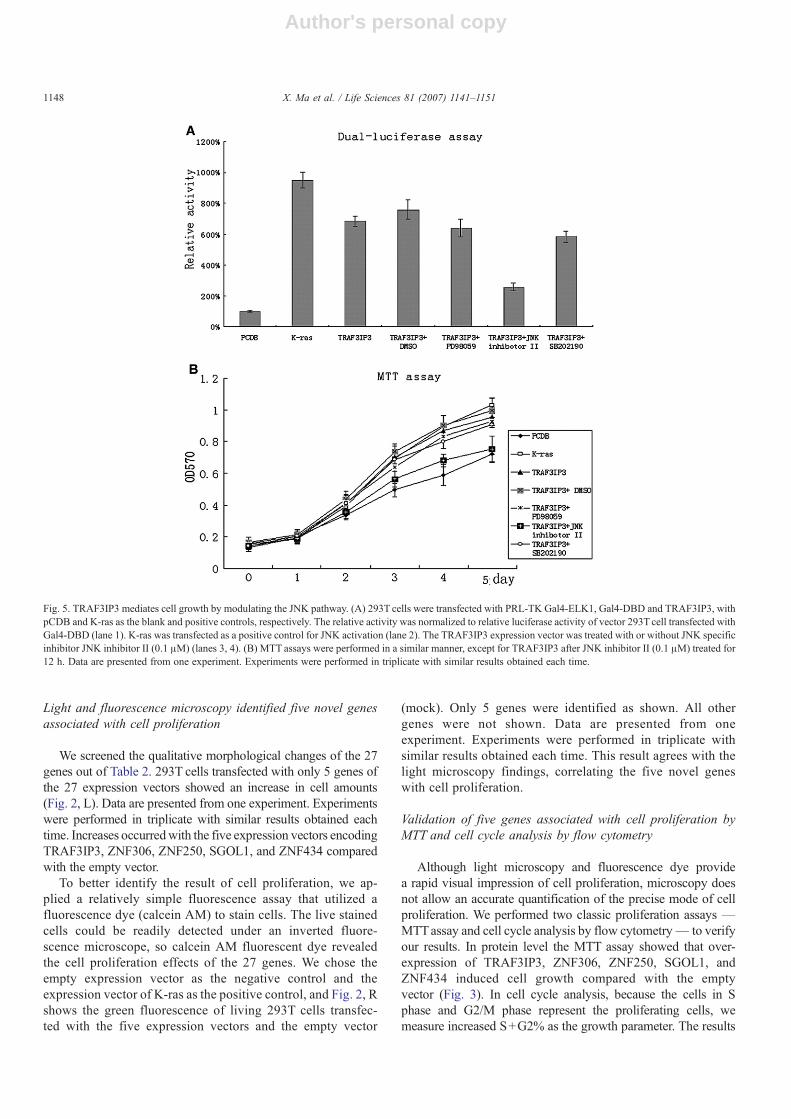
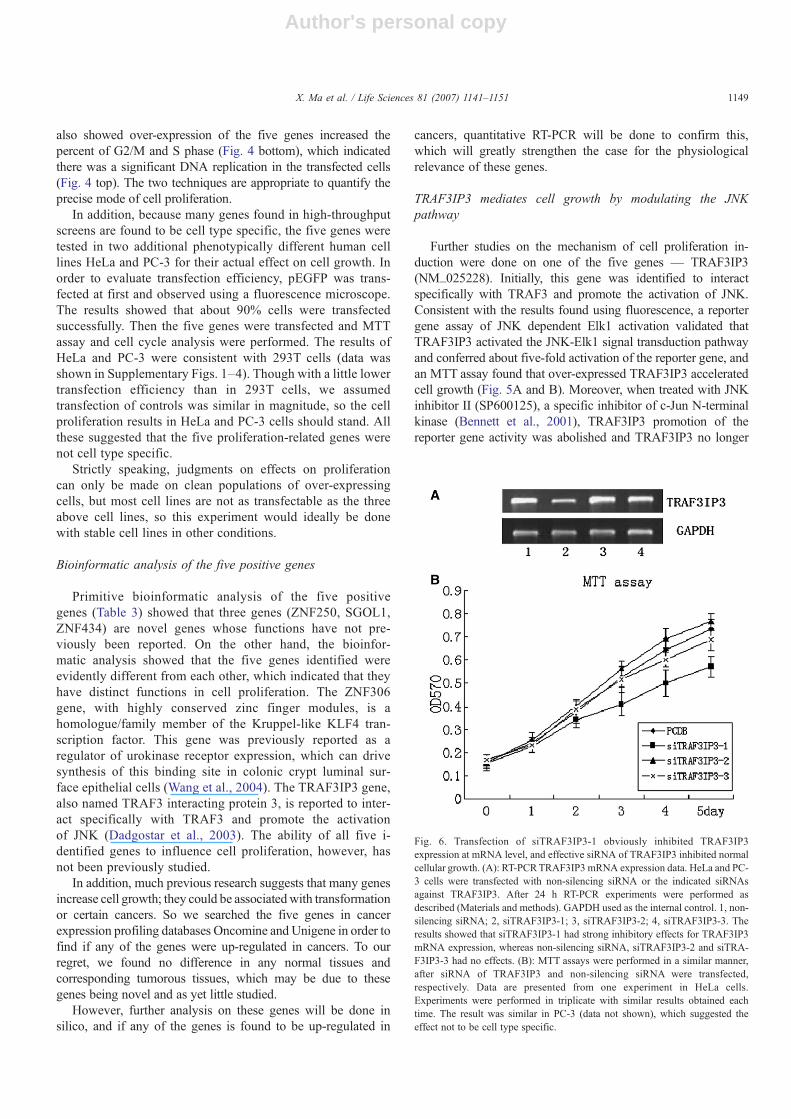
Fig. 5. TRAF3IP3 mediates cell growth by modulating the JNK pathway. (A) 293T cells were transfected with PRL-TK Gal4-ELK1, Gal4-DBD and TRAF3IP3, withpCDB and K-ras as the blank and positive controls, respectively. The relative activity was normalized to relative luciferase activity of vector 293T cell transfected withGal4-DBD (lane 1). K-ras was transfected as a positive control for JNK activation (lane 2). The TRAF3IP3 expression vector was treated with or without JNK specificinhibitor JNK inhibitor II (0.1 μM) (lanes 3, 4). (B) MTT assays were performed in a similar manner, except for TRAF3IP3 after JNK inhibitor II (0.1 μM) treated for12 h. Data are presented from one experiment. Experiments were performed in triplicate with similar results obtained each time.
1148 X. Ma et al. / Life Sciences 81 (2007) 1141–1151
Author's personal copy
also showed over-expression of the five genes increased thepercent of G2/M and S phase (Fig. 4 bottom), which indicatedthere was a significant DNA replication in the transfected cells(Fig. 4 top). The two techniques are appropriate to quantify theprecise mode of cell proliferation.
In addition, because many genes found in high-throughputscreens are found to be cell type specific, the five genes weretested in two additional phenotypically different human celllines HeLa and PC-3 for their actual effect on cell growth. Inorder to evaluate transfection efficiency, pEGFP was trans-fected at first and observed using a fluorescence microscope.The results showed that about 90% cells were transfectedsuccessfully. Then the five genes were transfected and MTTassay and cell cycle analysis were performed. The results ofHeLa and PC-3 were consistent with 293T cells (data wasshown in Supplementary Figs. 1–4). Though with a little lowertransfection efficiency than in 293T cells, we assumedtransfection of controls was similar in magnitude, so the cellproliferation results in HeLa and PC-3 cells should stand. Allthese suggested that the five proliferation-related genes werenot cell type specific.
Strictly speaking, judgments on effects on proliferationcan only be made on clean populations of over-expressingcells, but most cell lines are not as transfectable as the threeabove cell lines, so this experiment would ideally be donewith stable cell lines in other conditions.
Bioinformatic analysis of the five positive genes
Primitive bioinformatic analysis of the five positivegenes (Table 3) showed that three genes (ZNF250, SGOL1,ZNF434) are novel genes whose functions have not pre-viously been reported. On the other hand, the bioinfor-matic analysis showed that the five genes identified wereevidently different from each other, which indicated that theyhave distinct functions in cell proliferation. The ZNF306gene, with highly conserved zinc finger modules, is ahomologue/family member of the Kruppel-like KLF4 tran-scription factor. This gene was previously reported as aregulator of urokinase receptor expression, which can drivesynthesis of this binding site in colonic crypt luminal sur-face epithelial cells (Wang et al., 2004). The TRAF3IP3 gene,also named TRAF3 interacting protein 3, is reported to inter-act specifically with TRAF3 and promote the activationof JNK (Dadgostar et al., 2003). The ability of all five i-dentified genes to influence cell proliferation, however, hasnot been previously studied.
In addition, much previous research suggests that many genesincrease cell growth; they could be associatedwith transformationor certain cancers. So we searched the five genes in cancerexpression profiling databases Oncomine and Unigene in order tofind if any of the genes were up-regulated in cancers. To ourregret, we found no difference in any normal tissues andcorresponding tumorous tissues, which may be due to thesegenes being novel and as yet little studied.
However, further analysis on these genes will be done insilico, and if any of the genes is found to be up-regulated in
cancers, quantitative RT-PCR will be done to confirm this,which will greatly strengthen the case for the physiologicalrelevance of these genes.
TRAF3IP3 mediates cell growth by modulating the JNKpathway
Further studies on the mechanism of cell proliferation in-duction were done on one of the five genes — TRAF3IP3(NM_025228). Initially, this gene was identified to interactspecifically with TRAF3 and promote the activation of JNK.Consistent with the results found using fluorescence, a reportergene assay of JNK dependent Elk1 activation validated thatTRAF3IP3 activated the JNK-Elk1 signal transduction pathwayand conferred about five-fold activation of the reporter gene, andan MTT assay found that over-expressed TRAF3IP3 acceleratedcell growth (Fig. 5A and B). Moreover, when treated with JNKinhibitor II (SP600125), a specific inhibitor of c-Jun N-terminalkinase (Bennett et al., 2001), TRAF3IP3 promotion of thereporter gene activity was abolished and TRAF3IP3 no longer
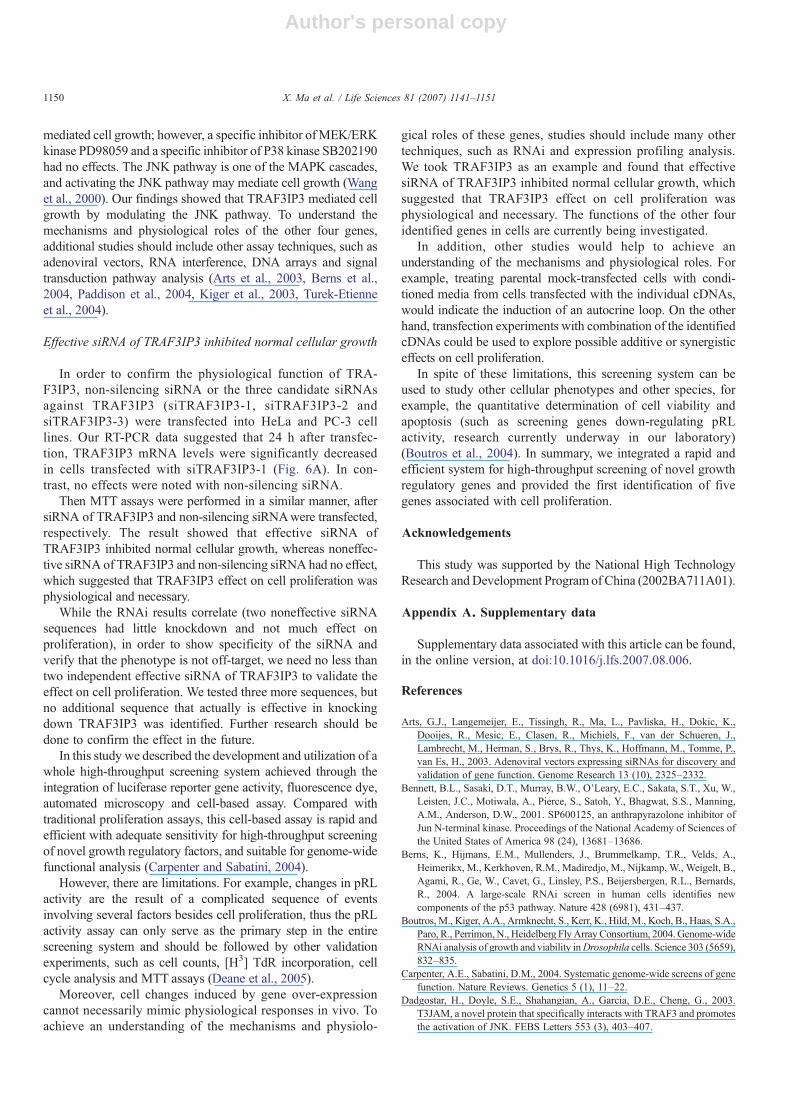
Fig. 6. Transfection of siTRAF3IP3-1 obviously inhibited TRAF3IP3expression at mRNA level, and effective siRNA of TRAF3IP3 inhibited normalcellular growth. (A): RT-PCRTRAF3IP3 mRNA expression data. HeLa and PC-3 cells were transfected with non-silencing siRNA or the indicated siRNAsagainst TRAF3IP3. After 24 h RT-PCR experiments were performed asdescribed (Materials and methods). GAPDH used as the internal control. 1, non-silencing siRNA; 2, siTRAF3IP3-1; 3, siTRAF3IP3-2; 4, siTRAF3IP3-3. Theresults showed that siTRAF3IP3-1 had strong inhibitory effects for TRAF3IP3mRNA expression, whereas non-silencing siRNA, siTRAF3IP3-2 and siTRA-F3IP3-3 had no effects. (B): MTT assays were performed in a similar manner,after siRNA of TRAF3IP3 and non-silencing siRNA were transfected,respectively. Data are presented from one experiment in HeLa cells.Experiments were performed in triplicate with similar results obtained eachtime. The result was similar in PC-3 (data not shown), which suggested theeffect not to be cell type specific.
1149X. Ma et al. / Life Sciences 81 (2007) 1141–1151
Author's personal copy
mediated cell growth; however, a specific inhibitor of MEK/ERKkinase PD98059 and a specific inhibitor of P38 kinase SB202190had no effects. The JNK pathway is one of the MAPK cascades,and activating the JNK pathway may mediate cell growth (Wanget al., 2000). Our findings showed that TRAF3IP3 mediated cellgrowth by modulating the JNK pathway. To understand themechanisms and physiological roles of the other four genes,additional studies should include other assay techniques, such asadenoviral vectors, RNA interference, DNA arrays and signaltransduction pathway analysis (Arts et al., 2003, Berns et al.,2004, Paddison et al., 2004, Kiger et al., 2003, Turek-Etienneet al., 2004).
Effective siRNA of TRAF3IP3 inhibited normal cellular growth
In order to confirm the physiological function of TRA-F3IP3, non-silencing siRNA or the three candidate siRNAsagainst TRAF3IP3 (siTRAF3IP3-1, siTRAF3IP3-2 andsiTRAF3IP3-3) were transfected into HeLa and PC-3 celllines. Our RT-PCR data suggested that 24 h after transfec-tion, TRAF3IP3 mRNA levels were significantly decreasedin cells transfected with siTRAF3IP3-1 (Fig. 6A). In con-trast, no effects were noted with non-silencing siRNA.
Then MTT assays were performed in a similar manner, aftersiRNA of TRAF3IP3 and non-silencing siRNAwere transfected,respectively. The result showed that effective siRNA ofTRAF3IP3 inhibited normal cellular growth, whereas noneffec-tive siRNA of TRAF3IP3 and non-silencing siRNA had no effect,which suggested that TRAF3IP3 effect on cell proliferation wasphysiological and necessary.
While the RNAi results correlate (two noneffective siRNAsequences had little knockdown and not much effect onproliferation), in order to show specificity of the siRNA andverify that the phenotype is not off-target, we need no less thantwo independent effective siRNA of TRAF3IP3 to validate theeffect on cell proliferation. We tested three more sequences, butno additional sequence that actually is effective in knockingdown TRAF3IP3 was identified. Further research should bedone to confirm the effect in the future.
In this study we described the development and utilization of awhole high-throughput screening system achieved through theintegration of luciferase reporter gene activity, fluorescence dye,automated microscopy and cell-based assay. Compared withtraditional proliferation assays, this cell-based assay is rapid andefficient with adequate sensitivity for high-throughput screeningof novel growth regulatory factors, and suitable for genome-widefunctional analysis (Carpenter and Sabatini, 2004).
However, there are limitations. For example, changes in pRLactivity are the result of a complicated sequence of eventsinvolving several factors besides cell proliferation, thus the pRLactivity assay can only serve as the primary step in the entirescreening system and should be followed by other validationexperiments, such as cell counts, [H3] TdR incorporation, cellcycle analysis and MTT assays (Deane et al., 2005).
Moreover, cell changes induced by gene over-expressioncannot necessarily mimic physiological responses in vivo. Toachieve an understanding of the mechanisms and physiolo-
gical roles of these genes, studies should include many othertechniques, such as RNAi and expression profiling analysis.We took TRAF3IP3 as an example and found that effectivesiRNA of TRAF3IP3 inhibited normal cellular growth, whichsuggested that TRAF3IP3 effect on cell proliferation wasphysiological and necessary. The functions of the other fouridentified genes in cells are currently being investigated.
In addition, other studies would help to achieve anunderstanding of the mechanisms and physiological roles. Forexample, treating parental mock-transfected cells with condi-tioned media from cells transfected with the individual cDNAs,would indicate the induction of an autocrine loop. On the otherhand, transfection experiments with combination of the identifiedcDNAs could be used to explore possible additive or synergisticeffects on cell proliferation.
In spite of these limitations, this screening system can beused to study other cellular phenotypes and other species, forexample, the quantitative determination of cell viability andapoptosis (such as screening genes down-regulating pRLactivity, research currently underway in our laboratory)(Boutros et al., 2004). In summary, we integrated a rapid andefficient system for high-throughput screening of novel growthregulatory genes and provided the first identification of fivegenes associated with cell proliferation.
Acknowledgements
This study was supported by the National High TechnologyResearch andDevelopment Program of China (2002BA711A01).
Appendix A. Supplementary data
Supplementary data associated with this article can be found,in the online version, at doi:10.1016/j.lfs.2007.08.006.
References
Arts, G.J., Langemeijer, E., Tissingh, R., Ma, L., Pavliska, H., Dokic, K.,Dooijes, R., Mesic, E., Clasen, R., Michiels, F., van der Schueren, J.,Lambrecht, M., Herman, S., Brys, R., Thys, K., Hoffmann, M., Tomme, P.,van Es, H., 2003. Adenoviral vectors expressing siRNAs for discovery andvalidation of gene function. Genome Research 13 (10), 2325–2332.
Bennett, B.L., Sasaki, D.T., Murray, B.W., O'Leary, E.C., Sakata, S.T., Xu, W.,Leisten, J.C., Motiwala, A., Pierce, S., Satoh, Y., Bhagwat, S.S., Manning,A.M., Anderson, D.W., 2001. SP600125, an anthrapyrazolone inhibitor ofJun N-terminal kinase. Proceedings of the National Academy of Sciences ofthe United States of America 98 (24), 13681–13686.
Berns, K., Hijmans, E.M., Mullenders, J., Brummelkamp, T.R., Velds, A.,Heimerikx, M., Kerkhoven, R.M., Madiredjo, M., Nijkamp, W., Weigelt, B.,Agami, R., Ge, W., Cavet, G., Linsley, P.S., Beijersbergen, R.L., Bernards,R., 2004. A large-scale RNAi screen in human cells identifies newcomponents of the p53 pathway. Nature 428 (6981), 431–437.
Boutros, M., Kiger, A.A., Armknecht, S., Kerr, K., Hild,M., Koch, B., Haas, S.A.,Paro, R., Perrimon,N., Heidelberg FlyArray Consortium, 2004. Genome-wideRNAi analysis of growth and viability inDrosophila cells. Science 303 (5659),832–835.
Carpenter, A.E., Sabatini, D.M., 2004. Systematic genome-wide screens of genefunction. Nature Reviews. Genetics 5 (1), 11–22.
Dadgostar, H., Doyle, S.E., Shahangian, A., Garcia, D.E., Cheng, G., 2003.T3JAM, a novel protein that specifically interacts with TRAF3 and promotesthe activation of JNK. FEBS Letters 553 (3), 403–407.
1150 X. Ma et al. / Life Sciences 81 (2007) 1141–1151

Author's personal copy
Deane, N.G., Parker, M.A., Beauchamp, R.D., 2005. Cell proliferation: a matterof time and place. Surgery 138 (1), 1–7.
Delcher, A.L., Harmon, D., Kasif, S., White, O., Salzberg, S.L., 1999. Improvedmicrobial gene identification with GLIMMER. Nucleic Acids Research 27(23), 4636–4641.
Dhundale, A., Goddard, C., 1996. Reporter assays in the high throughputscreening laboratory: a rapid and robust first look? Journal of BiomolecularScreening 1 (1), 115–118.
Entzeroth, M., 2003. Emerging trends in high-throughput screening. CurrentOpinion in Pharmacology 3 (5), 522–529.
Gasteiger, E., Gattiker, A., Hoogland, C., Ivanyi, I., Appel, R.D., Bairoch, A.,2003. ExPASy: the proteomics server for in-depth protein knowledge andanalysis. Nucleic Acids Research 31 (13), 3784–3788.
Giese, K., Kaufmann, J., Pronk, G.J., Klippel, A., 2002. Unravelling novelintracellular pathways in cell-based assays. Drug Discovery Today 7 (3),179–186.
Harada, J.N., Bower, K.E., Orth, A.P., Callaway, S., Nelson, C.G., Laris, C.,Hogenesch, J.B., Vogt, P.K., Chanda, S.K., 2005. Identification of novelmammalian growth regulatory factors by genome-scale quantitative imageanalysis. Genome Research 15 (8), 1136–1144.
Kahn, S., Yamamoto, F., Almoguera, C., Winter, E., Forrester, K., Jordano, J.,Perucho, M., 1987. The c-K-ras gene and human cancer. AnticancerResearch 7 (4A), 639–652.
Kiger, A., Baum, B., Jones, S., Jones, M., Coulson, A., Echeverri, C., Perrimon,N., 2003. A functional genomic analysis of cell morphology using RNAinterference. Journal of Biology 2 (4), 27.
Lin, J.L., Chen, H.C., Fang, H.I., Robinson, D., Kung, H.J., Shih, H.M., 2001.MST4, a new Ste20-related kinase that mediates cell growth and transforma-tion via modulating ERK pathway. Oncogene 20 (45), 6559–6569.
Lorenz, W.W., McCann, R.O., Longiaru, M., Cormier, M.J., 1991. Isolation andexpression of a cDNA encoding renilla reniformis luciferase. Proceedings ofthe National Academy of Sciences of the United States of America 88 (10),4438–4442.
Lukashin, A.V., Borodovsky, M., 1998. Genemark. hmm: new solutions forgene finding. Nucleic Acids Research 26 (4), 1107–1115.
Marchler-Bauer, A., Anderson, J.B., Cherukuri, P.F., DeWeese-Scott, C., Geer, L.Y.,Gwadz,M., He, S., Hurwitz, D.I., Jackson, J.D., Ke, Z., Lanczycki, C.J., Liebert,C.A., Liu, C., Lu, F., Marchler, G.H., Mullokandov, M., Shoemaker, B.A.,Simonyan, V., Song, J.S., Thiessen, P.A., Yamashita, R.A., Yin, J.J., Zhang, D.,Bryant, S.H., 2005. CDD: a conserved domain database for protein classification.Nucleic Acids Research 33, D192–D196 (Database issue).
Neri, S., Mariani, E., Meneghetti, A., Cattini, L., Facchini, A., 2001. Calcein-acetyoxymethyl cytotoxicity assay: standardization of a method allowingadditional analyses on recovered effector cells and supernatants. Clinical andDiagnostic Laboratory Immunology 8 (6), 1131–1135.
Paddison, P.J., Silva, J.M., Conklin, D.S., Schlabach, M., Li, M., Aruleba, S.,Balija, V., O’Shaughnessy, A., Gnoj, L., Scobie, K., Chang, K., Westbrook,T., Cleary, M., Sachidanandam, R., McCombie, W.R., Elledge, S.J.,Hannon, G.J., 2004. A resource for large-scale RNA-interference-basedscreens in mammals. Nature 428 (6981), 427–431.
Papadopoulos, N.G., Dedoussis, G.V., Spanakos, G., Gritzapis, A.D.,Baxevanis, C.N., Papamichail, M., 1994. An improved fluorescence assayfor the determination of lymphocyte-mediated cytotoxicity using flowcytometry. Journal of Immunological Methods 177 (1-2), 101–111.
Pontius, J.U., Wagner, L., Schuler, G.D., 2003. UniGene: a unified view of thetranscriptome. In: Bethesda, R. (Ed.), The NCBI Handbook. National Centerfor Biotechnology Information.
Pruitt, K.D., Tatusova, T., Maglott, D.R., 2005. NCBI reference sequence(RefSeq): a curated non-redundant sequence database of genomes,transcripts and proteins. Nucleic Acids Research 33, D501–D504 (Databaseissue).
Rhodes, D.R., Yu, J., Shanker, K., Deshpande, N., Varambally, R., Ghosh, D.,Barrette, T., Pandey, A., Chinnaiyan, A.M., 2004. Oncomine: a cancermicroarray database and data-mining platform. Neoplasia 6 (1), 1–6.
Silverman, L., Campbell, R., Broach, J.R., 1998. New assay technologies forhigh-throughput screening. Current Opinion in Chemical Biology 2 (3),397–403.
Sonnhammer, E.L., von Heijne, G., Krogh, A., 1998. A hidden Markov modelfor predicting transmembrane helices in protein sequences. Proceedings/International Conference on Intelligent Systems for Molecular Biology 6,175–182.
Su, A.I., Wiltshire, T., Batalov, S., Lapp, H., Ching, K.A., Block, D., Zhang, J.,Soden, R., Hayakawa, M., Kreiman, G., Cooke, M.P., Walker, J.R.,Hogenesch, J.B., 2004. A gene atlas of the mouse and human protein-encoding transcriptomes. Proceedings of the National Academy of Sciencesof the United States of America 101 (16), 6062–6067.
Suto, C., Ignar, D., 1997. Selection of an optimal reporter gene for cell-basedhigh throughput screening assays. Journal of Biomolecular Screening 2,7–9.
Turek-Etienne, T.C., Lei, M., Terracciano, J.S., Langsdorf, E.F., Bryant, R.W.,Hart, R.F., Horan, A.C., 2004. Use of red-shifted dyes in a fluorescencepolarization AKT kinase assay for detection of biological activity in naturalproduct extracts. Journal of Biomolecular Screening 9 (1), 52–61.
Wagner, M.M., Paul, D.C., Shih, C., Jordan, M.A., Wilson, L., Williams, D.C.,1999. In vitro pharmacology of cryptophycin 52 (LY355703) in humantumor cell lines. Cancer Chemotherapy and Pharmacology 43 (2), 115–125.
Wang, T.H., Wang, H.S., Soong, Y.K., 2000. Regulation and functions of c-JunN-terminal kinase/stress-activated protein kinase. Chang Gung MedicalJournal 23 (2), 57–72.
Wang, H., Yang, L., Jamaluddin, M.S., Boyd, D.D., 2004. The Kruppel-likeKLF4 transcription factor, a novel regulator of urokinase receptor expression,drives synthesis of this binding site in colonic crypt luminal surface epithelialcells. Journal of Biological Chemistry 279 (21), 22674–22683.
Weston, S.A., Parish, C.R., 1990. New fluorescent dyes for lymphocytemigration studies Analysis by flow cytometry and fluorescence microscopy.Journal of Immunological Methods 133 (1), 87–97.
Wheeler, D.L., Church, D.M., Federhen, S., Lash, A.E., Madden, T.L., Pontius,J.U., Schuler, G.D., Schriml, L.M., Sequeira, E., Tatusova, T.A., Wagner, L.,2003. Database resources of thenational center for biotechnology. NucleicAcids Research 31 (1), 28–33.
1151X. Ma et al. / Life Sciences 81 (2007) 1141–1151
Top Related
Copyright © 2022 FDOKUMEN

