Why Desire Reasoning is Developmentally Prior to Belief Reasoning

fml
Developmental Biology 228, 270–286 (2000)doi:10.1006/dbio.2000.9941, available online at http://www.idealibrary.com on
Recovery of Developmentally Defined Gene Setsfrom High-Density cDNA Macroarrays
Jonathan P. Rast, Gabriele Amore, Cristina Calestani, Carolina B. Livi,Andrew Ransick, and Eric H. Davidson1
Division of Biology 156-29, California Institute of Technology, Pasadena, California 91125
New technologies for isolating differentially expressed genes from large arrayed cDNA libraries are reported. These methodscan be used to identify genes that lie downstream of developmentally important transcription factors and genes that areexpressed in specific tissues, processes, or stages of embryonic development. Though developed for the study of geneexpression during the early embryogenesis of the sea urchin Strongylocentrotus purpuratus, these technologies can beapplied generally. Hybridization parameters were determined for the reaction of complex cDNA probes to cDNA librariescarried on six nylon filters, each containing duplicate spots from 18,432 bacterial clones (macroarrays). These libraries areof sufficient size to include nearly all genes expressed in the embryo. The screening strategy we have devised is designed toovercome inherent sensitivity limitations of macroarray hybridization and thus to isolate differentially expressed genes thatare represented only by low-prevalence mRNAs. To this end, we have developed improved methods for the amplification ofcDNA from small amounts of tissue (as little as ;300 sea urchin embryos, or 2 3 105 cells, or about 10 ng of mRNA) andor the differential enhancement of probe sequence concentration by subtractive hybridization. Quantitative analysis of
acroarray hybridization shows that these probes now suffice for detection of differentially expressed mRNAs down to aevel below five molecules per average embryo cell. © 2000 Academic Press
Key Words: macroarray; arrayed cDNA library; sea urchin; Strongylocentrotus purpuratus; subtractive hybridization.
ragDupec
ttetsmmcqoas
INTRODUCTION
The recovery of genes expressed specifically under givendevelopmental conditions is a key initial step in unravelinggenetic networks. For the few species for which extensivemicroarrays and large amounts of sequence information arealready available, chip hybridization technology (Lipshutzet al., 1999; Brown and Botstein, 1999) may suffice. For themajority of organisms, however, such resources are cur-rently inaccessible. Here we describe technologies that willallow the detection of differentially expressed genes fromany biological material from which cDNA libraries andprobes can be obtained. These methods rely on arrayedcDNA libraries that have been gridded in the form ofbacterial colonies onto nylon filters (“macroarrays”). Thelibraries used to generate macroarray filters can easily bemade large enough to provide essentially complete coverageof the transcripts expressed in many developmental circum-stances. Given the necessary robotic arraying device, mac-
1 To whom correspondence should be addressed. Fax: (626) 793-
i3047. E-mail: [email protected].270
oarray filters can be produced with relatively little labornd at a relatively low cost. Although bacterial colonyrowth is inherently more variable than is direct spotting ofNA, we have found that in fact only moderate variationsually occurs among spots on a given filter, while theroblem of variability between filters can be circumventedntirely by rescreening the same set of filters in any givenomparative experiment.The approach described in this paper was developed for
he purpose of identifying genes that are linked withinranscriptional networks that function in the embryogen-sis of the purple sea urchin, Strongylocentrotus purpura-us. The major difficulty to be overcome is that most of theequences of interest are of low prevalence in the embryoRNA populations. On the other hand, the large size ofacroarray filters requires that hybridization reactions be
arried out in correspondingly large volumes. In conse-uence, after hybridization with complex cDNA probes,nly message species of moderate to high prevalencechieve enough C0t to drive hybridization to the corre-ponding macroarray spots sufficiently so that the signal
ntensity is significantly above background. Macroarray0012-1606/00 $35.00Copyright © 2000 by Academic Press
All rights of reproduction in any form reserved.
F
ww
gaMG
wb5N
9
271Recovery of Gene Sets Using cDNA Macroarrays
filter screens are thus relatively insensitive to low-prevalence messages. Here we characterize in detail theirsensitivity limits using complex probes derived from com-plete embryo or cellular mRNA populations. The mainobjective of this work has been the invention of means bywhich these sensitivity barriers can be bypassed so as toallow reliable detection of very low prevalence, differen-tially expressed sequences. We have revised procedures forglobal amplification of cDNA populations from small start-ing samples and for the generation of subtractive probes.Together these technologies transform macroarray screen-ing into a powerful tool for gene discovery with potentiallywide phylogenetic application.
MATERIALS AND METHODS
Hybridization Kinetics
Characterization of probe hybridization to macroarray filterspots. Small filters for probe excess and filter-driven hybridiza-tion experiments consisted of arrays of four blocks; each blockincluded spot pairs of four probe target cDNA clones, negativecontrol clone spot pairs, and empty background control positions.These were gridded by the same means as were actual libraryfilters. Probes consisted of four 40-mer oligonucleotides represent-ing regions of the four cDNA sequences. Probes were end-labeledby standard methods with 32P using T4 polynucleotide kinase.ilters were hybridized to a specific C0t in 0.41 M phosphate buffer
(PB), 1.5% SDS, pH 7.4, at 59°C. Filters were then washed threetimes for 30 min each in 13 SSC (13 SSC is 0.15 M NaCl, 0.015 Msodium citrate), 0.1% SDS, once at room temperature and twice at59°C. Bound probe was quantified by dry scintillation counting,and readings were converted to counts per minute. After beingcounted filters were exposed to film to confirm specific localizationof hybridization.
Complex probe hybridization measurements. Total messagefrom transgenic cells was amplified by the method describedbelow. The precise prevalence of green fluorescent protein (GFP)sequence within the complex probe population that hybridized insolution to a 507-bp GFP fragment was determined by probe excesshybridization as outlined in Lee et al. (1986). Radiolabeled RNAprobe was made from this same complex cDNA template. The GFPhybridization target on the macroarray filters consisted of bacterialclones containing a plasmid with an insert of the same 507-bp GFPfragment as was used for the probe characterization.
Arrayed cDNA Library Construction
A random-primed directional cDNA library was constructedfrom gastrula-stage sea urchin embryos (40 h after fertilization) asdescribed previously (Lee et al., 1999a). The library contains inserts
ith an average length of 1500 bp. Approximately 110,000 clonesere spotted onto six 22 3 22-cm Hybond N1 nylon filters
(Amersham Pharmacia Biotech, Piscataway, NJ) with a “Q-Bot”robot (Genetix Ltd., New Milton, Hampshire, UK). In order tomaintain consistent spot size and reduce streaking, bacterial filterswere grown on 3% agar plates and colony size was rigorouslymonitored. Colonies were grown for approximately 12 h at 37°C,then processed for screening according to standard protocols (Clark
et al., 1999; Nizetic et al., 1991).Copyright © 2000 by Academic Press. All right
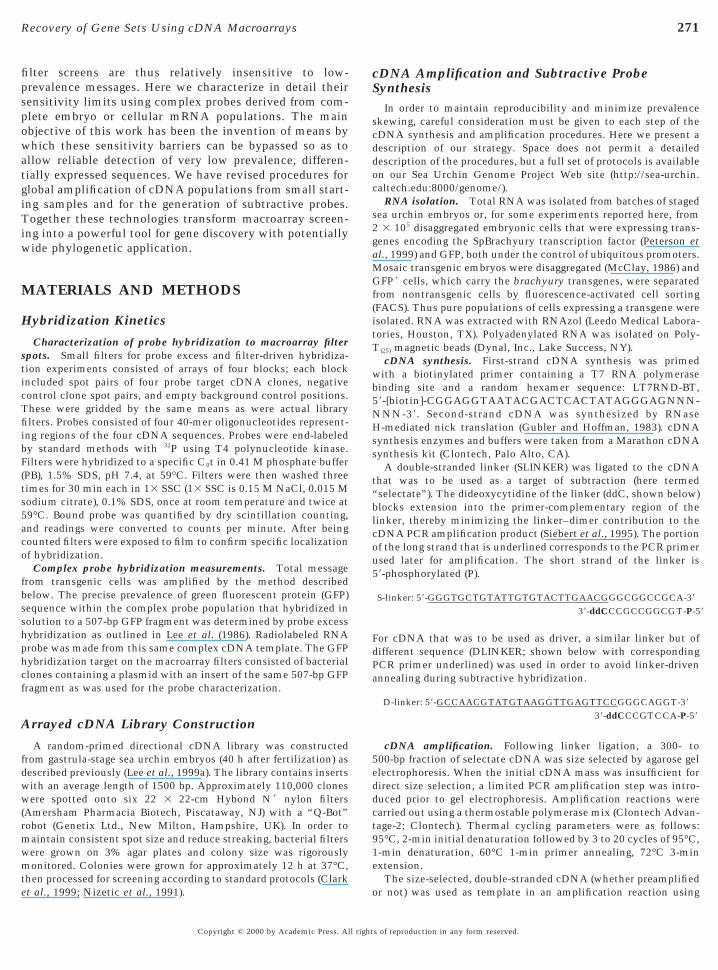
cDNA Amplification and Subtractive ProbeSynthesis
In order to maintain reproducibility and minimize prevalenceskewing, careful consideration must be given to each step of thecDNA synthesis and amplification procedures. Here we present adescription of our strategy. Space does not permit a detaileddescription of the procedures, but a full set of protocols is availableon our Sea Urchin Genome Project Web site (http://sea-urchin.caltech.edu:8000/genome/).
RNA isolation. Total RNA was isolated from batches of stagedsea urchin embryos or, for some experiments reported here, from2 3 105 disaggregated embryonic cells that were expressing trans-enes encoding the SpBrachyury transcription factor (Peterson etl., 1999) and GFP, both under the control of ubiquitous promoters.osaic transgenic embryos were disaggregated (McClay, 1986) andFP1 cells, which carry the brachyury transgenes, were separated
from nontransgenic cells by fluorescence-activated cell sorting(FACS). Thus pure populations of cells expressing a transgene wereisolated. RNA was extracted with RNAzol (Leedo Medical Labora-tories, Houston, TX). Polyadenylated RNA was isolated on Poly-T(25) magnetic beads (Dynal, Inc., Lake Success, NY).
cDNA synthesis. First-strand cDNA synthesis was primedith a biotinylated primer containing a T7 RNA polymeraseinding site and a random hexamer sequence: LT7RND-BT,9-[biotin]-CGGAGGTAATACGACTCACTATAGGGAGNNN-NN-39. Second-strand cDNA was synthesized by RNase
H-mediated nick translation (Gubler and Hoffman, 1983). cDNAsynthesis enzymes and buffers were taken from a Marathon cDNAsynthesis kit (Clontech, Palo Alto, CA).
A double-stranded linker (SLINKER) was ligated to the cDNAthat was to be used as a target of subtraction (here termed“selectate”). The dideoxycytidine of the linker (ddC, shown below)blocks extension into the primer-complementary region of thelinker, thereby minimizing the linker–dimer contribution to thecDNA PCR amplification product (Siebert et al., 1995). The portionof the long strand that is underlined corresponds to the PCR primerused later for amplification. The short strand of the linker is59-phosphorylated (P).
S-linker: 59-GGGTGCTGTATTGTGTACTTGAACGGGCGGCCGCA-39
39-ddCCCGCCGGCGT-P-5
For cDNA that was to be used as driver, a similar linker but ofdifferent sequence (DLINKER; shown below with correspondingPCR primer underlined) was used in order to avoid linker-drivenannealing during subtractive hybridization.
D-linker: 59-GCCAACGTATGTAAGGTTGAGTTCCGGGCAGGT-39
39-ddCCCGTCCA-P-59
cDNA amplification. Following linker ligation, a 300- to500-bp fraction of selectate cDNA was size selected by agarose gelelectrophoresis. When the initial cDNA mass was insufficient fordirect size selection, a limited PCR amplification step was intro-duced prior to gel electrophoresis. Amplification reactions werecarried out using a thermostable polymerase mix (Clontech Advan-tage-2; Clontech). Thermal cycling parameters were as follows:95°C, 2-min initial denaturation followed by 3 to 20 cycles of 95°C,1-min denaturation, 60°C 1-min primer annealing, 72°C 3-minextension.
The size-selected, double-stranded cDNA (whether preamplified
or not) was used as template in an amplification reaction usings of reproduction in any form reserved.

m
wstp
didwfsUdRtit2
1
1itotmwcld
tww0pc
w9u
272 Rast et al.
parameters identical to those described above, this time with a59-biotinylated version of the T7 primer (BT-LT7PRIMER). A pilotreaction was done and the optimized parameters were used in ascaled-up, minimal-cycle-number amplification reaction to pro-duce approximately 3 mg of product that was biotinylated on the
inus strand.Preparation of single-stranded selectate. Plus-strand selectate
as isolated from size-selected biotinylated cDNA by capture ontreptavidin-coated magnetic beads (M-280; Dynal, Inc.) and elu-ion under alkaline conditions according to the manufacturer’srotocol for preparation of strand-specific probe template.
Preparation of Driver RNA. cDNA template for minus-strandriver RNA synthesis was produced from normal 15-h postfertil-zation embryos as described above except (1) it was ligated with aifferent linker (DLINKER), (2) only three to five cycles of PCRere used for amplification, and (3) no size selection was per-
ormed. Biotinylated RNA driver was synthesized using a Mega-cript T7 RNA polymerase kit (Ambion, Austin, TX). A 2:1TP:biotin-16–UTP solution (Roche Molecular Biochemicals, In-ianapolis, IN) was used at the suggested UTP molarity. DriverNA was prepared similarly for hydroxylapatite column separa-
ion, with the exception that only nonbiotinylated UTP wasncluded in the T7 synthesis. RNA size was determined by dena-uring gel electrophoresis and found to range in size from 500 to000 nt.
Subtractive Hybridization and Phenol:ChloroformDriver Extraction
Subtractive hybridization mixtures included 200 ng of plus-strand selectate and 5 mg of minus-strand biotinylated driver in a0-ml volume of hybridization buffer (25 mM Hepes, pH 8.0, 5 mM
EDTA, 0.1% SDS, 0.6 M NaCl, 0.01% sodium pyrophosphate).After complete denaturation, the sample was incubated at 65°C for20 h. A streptavidin:phenol separation method was used for someexperiments to separate nonhybridized from hybridized selectate,modified from a previously described method (Sive and St John,1988). Phenol extraction was performed on ice in a cold room tominimize the effects of phenol:water emulsion on hybridizationrate (Kohne et al., 1977). After extraction, fresh biotinylated driverRNA was added and the sample was precipitated. The hybridiza-tion and extraction procedures were then repeated. Remainingsingle-stranded selectate was amplified with eight cycles of PCRusing the linker and T7 primers to generate double-strandedtemplate for a T7 RNA probe labeling reaction.
Hydroxylapatite Column Chromatography
Hydroxylapatite (HAP) column chromatography was used toimprove isolation of nonhybridized single-stranded selectate (forgeneral review of HAP chromatography methods, see Britten et al.,974). For these separations only one round of subtractive hybrid-zation was performed, but the time of hybridization was extendedo 40 h. After hybridization, HAP chromatography was performedn a water-jacketed column in 0.12 M PB at 60°C. At thisemperature and salt criterion double-stranded nucleic acid re-ains bound to the column. Single-stranded selectate is elutedith a 0.12 M PB column wash. This eluate was desalted by
oncentration and dilution in a Centricon YM-10 spin filter (Mil-ipore, Bedford, MA). Radiolabeled RNA probe was prepared asescribed below.
To assess the sequence enrichment after HAP chromatography, c
Copyright © 2000 by Academic Press. All right
two 500-nt, single-stranded fragments of bacteriophage l (l1 andl2) were employed as a controls. The complementary strand of l2was present as RNA in the driver, while l1 sequence was unique tothe selectate. Each sequence was present at a concentration corre-sponding to 10 copies per average embryo cell. Enrichment of thel1 sequence relative to l2 and endogenous ubiquitin was assessedby quantitative PCR.
Hybridization of Macroarray Filters
Probe labeling. Complex radiolabeled RNA probes were syn-thesized by incorporating [a32P]UTP into T7 RNA polymerasetranscripts using a T7 transcription kit (Maxiscript; Ambion) and10 to 100 ng of complex cDNA template. Reactions were set up toyield 2 to 3 mg of RNA probe with a specific activity of approxi-mately 1 3 108 cpm/mg.
Filter hybridization. Library filters were screened by conven-ional methods (described in detail on our Web site). The filtersere hybridized with probe for 48 h. After hybridization filtersere washed to high stringency (65°C; 0.13 SSPE, 0.1% SDS,.05% sodium pyrophosphate). The filters were exposed to ahosphor screen to allow near saturation for the most intenseolony spots. The screen was scanned at 100 or 200 mm resolution
on a phosphorimager (Storm 820, Molecular Dynamics, Sunnyvale,CA). Following data acquisition, filters were stripped by alkalinetreatment (Clark et al., 1999).
Filter analysis. Filters were analyzed using the VisualGridprogram (www.gpc-biotech.com; Genome Pharmaceuticals Corp.,Munich, Germany). Intensity of spot hybridization was calculatedas the 80% quantile within a circle placed over the spot (i.e., thepixel value for which 80% of pixels were lower and 20% higher).Local background values were calculated for each 4 3 4 block ofspots. Hybridization intensity values for each clone were calcu-lated by averaging duplicate spot pixel intensities and then sub-tracting the background values taken from the correspondingblocks. To estimate values in counts per minute, a conversionfactor was determined empirically by scintillation counting aftertimed phosphor screen exposures.
Quantitative PCR
cDNA sequences were used to design primer sets to amplifyproducts of 125 to 150 bp length. RNA was isolated from groups of500 transgenic or normal embryos by extraction with RNAzol(Leedo Medical Laboratories). First-strand cDNA was primed withrandom hexamers using MultiScribe reverse transcriptase accord-ing to manufacturer’s instructions (PE Biosystems, Foster City,CA). Amplification reactions were analyzed on an ABI 5700 se-quence detection system using SYBR Green chemistry (PE Biosys-tems). Reactions were run in triplicate with cDNA from 5 or 10embryos. For analysis of the HAP column separation, quantitativePCR was performed on aliquots of pre- or postcolumn fractionssuch that approximately 10,000 target molecules of the l controls
ere predicted to be present. Thermal cycling parameters were5°C for 30 s, 60°C for 1 min, 40 cycles. Gel electrophoresis wassed to confirm product size. Primer efficiencies (i.e., the amplifi-
ation factors for each cycle) were found to exceed 1.9.s of reproduction in any form reserved.

scmaaofotbcprra
fsEa
ts4;
lb
ttittI
273Recovery of Gene Sets Using cDNA Macroarrays
RESULTS
Macroarray Filter Screens: Basic Parameters
For discovery of genes expressed in a specific regulatorycontext there are two basic screening requirements. Theseare, first, the use of a probe in which the mRNA species thatdefine that context are accentuated and, second, a detectionsystem for these heightened message concentrations thatoperates on a cDNA library large enough to representadequately the total mRNA population. We take up the firstof these requirements in later sections and here considerthe second. The essential issue is that the larger the formatof a hybridization array, the less sensitive the screen,because of the large hybridization volume required. In thefollowing we examine the factors that define hybridizationsensitivity on cDNA library macroarrays that are suffi-ciently extensive to represent almost completely themRNA populations of sea urchin embryos. The sensitivitylimits turn out to depend entirely on the kinetics ofhybridization. This result directly determines our approachto the problem of using macroarrays for the isolation ofdifferentially expressed, but relatively rare, mRNA species.That is, our strategy must specifically increase the concen-tration of probe corresponding to these mRNAs beyond thethreshold of macroarray detection.
Macroarray variability. The macroarray filters used forscreening in our work each contain 18,432 pairs of spots,arranged in a grid pattern which uniquely specifies the plateand well coordinates of each clone in the parental cDNAlibraries (4 3 4 array pattern; Maier et al., 1994). The filtersare spotted with the Q-Bot arraying robot (Genetix, Ltd.),which uses pins of 400-mm tip diameter to deposit pairedamples of each clone. Following growth, the clones areonverted to bound DNA spots on the charged nylonembrane filter, by the usual procedures of alkali denatur-
tion and protease treatment (Nizetic et al., 1991). Themount of DNA per spot of course depends on the amountf clone growth, which may vary from run to run, and alsorom clone to clone. But in our experience, more than 90%f spot pair members differ from one another by less thanwofold and most by less than 20%. Although the differenceetween replicate filters is often greater than this, the filtersan be utilized repeatedly, e.g., with different complexrobe populations. Therefore, even small differences in theepresentation of gene sequences within these probes can beeliably detected, so long as the representation level isbove the sensitivity limit.Transcript representation on macroarray filters. The
ollowing considerations show that cDNA libraries of theize we used suffice to include most expressed mRNAs.ach of the sea urchin embryo cDNA libraries containspproximately 110,000 clones, arrayed on six 22 3 22-cm
filters. Sea urchin embryos transcribe about 8–10 3 103
genes, depending on the developmental stage (for review seeDavidson, 1986), and they lack any highly prevalent se-
quences. The majority of the message sequences are rare inCopyright © 2000 by Academic Press. All right
he embryo mRNA population. For example, at the 500-celltage there are about 105 mRNAs/cell, and of these about0% are of a low-prevalence class (,10 copies/cell; average5 copies/cell; mode ;2 copies per cell). The prevalence of
the remaining 60% averages about 80 copies/cell, rangingup to a few hundred copies per cell. Only about 25% of thetotal mass of mRNA consists of molecules present at $50copies per cell. These values are, of course, given in terms ofprevalence per average embryo cell, and for a transcriptexpressed in, say, 20% of cells, the prevalence in these cellswill be five times higher (Lasky et al., 1980; Flytzanis et al.,1982; reviewed by Davidson, 1986; for recent EST data,which entirely support earlier conclusions, see Poustka etal., 1999; Lee et al., 1999a). It follows from the complexityand prevalence distribution that a 1.1 3 105 clone library isikely to contain representatives of most of the sequenceseing expressed.Sensitivity limits under normal hybridization condi-
ions. In an initial series of experiments we determinedhat even under the maximum practical extent of hybrid-zation only about a quarter of the clones is represented inhe cDNA probe mixture at sufficiently high concentrationo produce quantifiable reactions on the macroarray filters.n these experiments a mass of 1–2 mg of cDNA probe (sp
act ;108 cpm/mg) was prepared from mRNA of the samestage as was used to generate the arrayed library and reactedwith the filters for 48 h. The criterion of detectability inthis experiment was that radioactivity bound to hybridizedclones should exceed 1.63 background. In terms of tran-script prevalence, this hybridization level corresponds tospecies present at $40–50 copies per average embryo cell.This limit, which we verify for specific cases below, sets thepractical baseline for screening sensitivity in the absence ofspecial procedures that increase the concentration of givensequences in the probe.
Hybridization to macroarray spot pairs: Rate constants,target mass per spot, and kinetics. To attain a quantita-tive understanding of hybridization reactions on macroar-ray filters estimates of two different parameters are re-quired. These are the rate constant for hybridization ofprobe molecules to filter-bound DNA spots and the amountof hybridizable target DNA present in each colony spot.Measurements to determine these parameters were carriedout on a miniaturized scale. The 22 3 22-cm macroarraysconsist of 2304 small squares (blocks), each containingeight spot pairs. Miniature filters (1.1 3 1.1 cm) wereproduced that consisted of four of these blocks onto whichknown cDNA clones had been spotted, as described underMaterials and Methods. A series of replicate reactions wascarried out, using 100- and 200-ng probe concentrations perwell to ensure kinetic termination. From the terminationvalues, given the known probe specific activity, the hybrid-izable DNA per spot could be obtained directly. The kinet-ics of the solution-to-filter hybridization reactions providedestimates of a rate constant for the solution-driven reactionthat is applicable to any specific sequence in a macroarray
screen. Results from three different sets of reactions ares of reproduction in any form reserved.

wcsTas
prttrfipsirhcltoDrt
mc
ascFp
Tfev
4
pM6
ssH
fd
274 Rast et al.
shown in Table 1, and an example of the kinetics observedis illustrated in Fig. 1. The conclusions can be summarizedas follows: there are about 2–4 ng of total hybridizable DNA(vector 1 insert) per spot (see legend to Fig. 1). For a 1-kbinsert, each spot contains 250–500 pg of the transcribedstrand of insert DNA. The hybridization rate constantmeasured was about 2 3 103 M21 s21 for this probe mixture,
hich is of 160-nucleotide aggregate complexity. This islose to the value expected from the solution kinetictandard (i.e., only about 1.53 slower; Galau et al., 1977).he rate constant is particularly useful, for it dictates themount of hybridization that will be obtained given theequence concentration of any specific probe species.
For solution-driven reactions such as those of Table 1, asrobe sequence concentration is decreased, the rate of theeaction will decrease. Eventually, there is more DNA onhe filters than probe in the available and accessible solu-ion. Filter DNA-driven reactions rather than probe-driveneactions should then occur. However, because the DNA islter-bound, the rate of these reactions is not necessarilyredictable from solution reaction kinetics, though thesehould certainly provide a useful guide. The uncertaintiesntroduced by this combination of probe- and filter-driveneactions could complicate prevalence determinations byybridization to macroarray filters. We therefore set out toharacterize macroarray filter-driven reactions. In the fol-owing experiment, bound-DNA-excess kinetics were es-ablished for the 32-target spot filters described above inrder to determine from the rate observed whether bound-NA-driven kinetics could ever in practice affect a mac-
oarray screening reaction. Initial considerations indicated
TABLE 1Reaction Kinetics for Probe Excess Hybridizationto Macroarray DNA Spots
Expta Probeb k (M21 s21)c Errord
1 100 ng 1920 8.9%2 200 ng 3270 12%3 100 ng 1450 18%
a Reactions were as described in the legend to Fig. 1. A mixedprobe consisting of four 40-base oligonucleotides was reacted witha 1.1-cm filter square containing 32 DNA spots. The oligonucleo-tide sequences were derived from four different cDNA clones, eachpresent in four spot pairs on the sequence (see Materials andMethods and text for setup). Parameter values shown were ob-tained by nonlinear least squares (MATLAB5.3), assuming pseudo-first-order reaction kinetics (Davidson, 1986, Eq. (17), p. 538).
b Per 300-ml volume.c As observed, i.e., not corrected for salt or length effects.d Error is calculated as [¥ (deviations at each point)2/n 2 1]1/ 2.
he amount of scatter associated with a given error is illustratedor Expt 3 in Fig. 1, which displays the largest scatter of the threexperiments. Error is expressed here as percentage of maximumalue.
hat at the DNA per spot values derived from the experi- e
Copyright © 2000 by Academic Press. All right
ents of Table 1, the bound DNA could not obtain suffi-ient C0t to drive reactions to completion in the 0.3-ml
volume used for previous experiments, and so a smallerchamber in which the reaction could be carried out in a30-ml volume was devised. The total amount of hybridiz-ble DNA per chamber is nominally 640 pg (i.e., 32 cDNApots represented in the probe spots and 20 pg of DNAomplementary to the 40-nucleotide probe per spot, fromig. 1). Figure 2 shows the reactions of 20 and 100 pg ofrobe DNA with these filters in 30 ml of medium.
FIG. 1. Measurement of DNA per spot and kinetics of probeexcess hybridization reactions. Filters (Hybond N1) bearing DNAfrom four different cDNA clones, each represented in four spotpairs (32 total spots), were hybridized in 300 ml of a phosphatebuffer (see Materials and Methods). Total probe complexity was160 bases (four 40-base oligonucleotides; see text). In this experi-ment (No. 3 of Table 1) the termination value, 3450 cpm, repre-sents 5.2 ng DNA per spot, given that the probe specific activitywas 4.15 3 105 cpm/100 ng, and the average clone length is 4 kbincluding vector [(3450 cpm/32 spots) 3 (100 ng/4.15 3 105 cpm) 3(2 3 4000 bases/40 bases) 5 5.2 ng]. The rate constant expectedwould be about 6700 M21s21 had the reaction been carried out at a00-base fragment length in solution, by reference to fX174
pseudo-first-order standard kinetics measured by Galau et al.(1977); the complexity of the fX174 genome is 5374 bases and theseudo-first-order rate measured for that genome was about 200
21 s21. Here a linear fragment length effect is assumed, i.e.,700 3 40/400 5 670 (the L1/2 rate applied for solution reactions
reflects retardation due to interpenetration of the excluded vol-umes of the reactants, here irrelevant because the target DNA isfixed in a more or less two-dimensional format and the probe DNAis very short). The reaction was run in 0.6 M [Na1], which in pureolution reactions affords a 53 rate acceleration compared to thetandard conditions of Galau et al. (1977) and Britten et al. (1974).ence ideal expectation would be about 3300 M21 s21 (i.e., 670 M21
s21 3 5), but the measured rate was 1920 M21 s21. Possible reasonsor the slightly slower rate observed include a less steep salt-ependent rate factor for filter reactions, for which there is some
vidence in others of these experiments (not shown).s of reproduction in any form reserved.

plb
aipuIcoectttbbmrmvtpt
u
275Recovery of Gene Sets Using cDNA Macroarrays
Under these conditions, the amount of reaction no longerdepends on the probe C0t, but only on the bound DNA C0tcalculated simply from total bound DNA per chambervolume, consistent with bound-DNA-driven kinetics. Asexpected the fraction of probe reacted at each point isalmost the same for the two different probe concentrationsthough they differ by fivefold. Thus the rate constantsobtained were 860 and 730 M21 s21, for the 100 and 20 pgrobe reactions. These values are in fact two- to threefoldower than the probe-driven rates of Table 1, perhapsecause of some filter occlusion effect.
TABLE 2Determination of Hybridization Rate to GFP Control Spots
Probe GFP in probea C0t fo
Unsubtracted 2.49 ng 2.13 3Subtracted 8.41 ng 7.08 3
a The mass of GFP in the probe was determined by probe excesstemplate as was the radiolabeled probe.
b The specific C0t for GFP within the probe was calculated fromvolumes for the unsubtracted and subtracted probes were 62 ahybridization buffer to the four dry filters (with separator meshes) anwere carried out for 44 h.
c The mass of probe bound to the spots was calculated by meaphosphor screen followed by scanning. The value reported is ancontaining a 507-bp fragment of the GFP coding region. Backgrousignal was apparent. Data from timed phosphor screen exposures wmeasurements for which corresponding scintillation values were o
d Predicted rate constants were determined by assuming pseudo-
FIG. 2. Kinetics of bound-DNA-driven reactions. Filter squarescontaining 32 DNA spots as in the experiments of Fig. 1 and Table1 were reacted with 20 and 100 pg of probe in a 30-ml volume (seeMaterials and Methods). The abscissa shows C0t calculated on thebasis of total bound-DNA content (i.e., about 640 pg in the 32 spots)and the total reaction volume. Blue symbols and curve representthe 100-pg reaction and red circles and curve the 20-pg reaction.
assumed to be 125 pg. The apparent rate constant (k) was thus calcula
Copyright © 2000 by Academic Press. All right
In Fig. 2, the total amount of probe hybridized was onlybout 30% as kinetic termination is approached. Thismplies that some fraction of the probe was inaccessible,erhaps nonproductively bound within the filter itself (i.e.,ntil washing after the reaction) or on the chamber walls.mages of the filters following hybridization (not shown)onfirm that after washing (see Materials and Methods) allf the detectable radioactivity is in fact found at thexpected spot locations. In other experiments with differentDNA clones, however, the terminal values ranged from 60o 70% hybridized. These numbers are not important inhemselves; they simply indicate that when the reactionerminates a large fraction of the probe, though not all, haseen driven into filter-bound hybrid at the 32 spots inound-DNA-driven reactions, essentially as expected. Theain significance of these experiments is to prove that the
ate constants for bound-DNA-driven reactions would beuch too low to affect macroarray screens in the large
olumes that these require. Therefore, the amount of reac-ion obtained by such screens depends exclusively on therobe-driven kinetics, that is, on the sequence concentra-ion for each species in the probe mixture.
Hybridization Kinetics for Components ofComplex Probes Hybridized to MultipleMacroarray Filters
To demonstrate the predictive power of the kinetic de-terminations outlined in the last section for actual macroar-ray screening experiments, rate constants were estimatedfor individual components within complex cDNA probes.The complex probe used for this experiment was synthe-sized from the mRNA of embryos that had been injectedwith brachyury and GFP expression constructs, driven by
biquitously active cis-regulatory elements. After injection
Pb Probe on spotc Rate constantd
M s 1.49 pg 563 M21 s21
M s 4.84 pg 558 M21 s21
ridization to unlabeled RNA that was synthesized from the same
GFP mass, reaction volume, and hybridization time. The reaction3 ml, respectively. This was determined by adding 100 ml ofmoving the measured excess of liquid. Both hybridization reactions
g the intensity of hybridization as determined by exposure to age for 10 GFP spot pairs. These are replicate colonies of a clonetensity was determined by measuring nearby spots for which noconverted to cpm using a conversion factor determined in similared.
order reaction kinetics. The strand-specific target DNA per spot is
r GF
1025
1025
hyb
thend 6d re
surinaverand inere
btainfirst-
ted as k 5 2ln[(125 pg 2 GFP on spot)/125 pg]/C0t.
s of reproduction in any form reserved.

Rmmece
276 Rast et al.
FIG. 3. A schematic illustration of cDNA synthesis and subtractive hybridization methods. (A) cDNA, probe, and selectate synthesis.RNA is shown as wavy lines; straight lines represent DNA. To begin isolated mRNA is reverse transcribed from a random primer. Thisprimer is biotinylated (“B”) and carries a T7 RNA polymerase binding site at its 59 end (T7). Second-strand cDNA is synthesized by an
Nase H-nick translation reaction using Escherichia coli DNA polymerase. Either of two linkers is then ligated, depending on whether theaterial is to be used as driver or selectate, and the cDNA is PCR amplified for a minimal number of cycles. Radiolabeled complex probeay then be synthesized by incorporating [32P]UTP during RNA synthesis by T7 RNA polymerase. Alternatively, the cDNA can be
nriched for differential transcripts in a subtractive hybridization reaction. For subtraction, the T7 primer used for PCR amplificationarries a biotin molecule (“B”) at its 59 end. The PCR products are captured on streptavidin beads and the nonbiotinylated plus strand is
luted by alkaline denaturation. This strand is then used as selectate. Driver is produced in a T7 RNA polymerase reaction that incorporatesCopyright © 2000 by Academic Press. All rights of reproduction in any form reserved.

e
vsttid
277Recovery of Gene Sets Using cDNA Macroarrays
into fertilized sea urchin eggs, linearized exogenous DNAmolecules are concatenated together (McMahon et al.,1985) and co-incorporated into embryo cells in a mosaicfashion, usually at second, third, or fourth cleavage (Hough-Evans et al., 1988; Livant et al., 1991). Those cells express-ing GFP in such an experiment also express whatever otherconstruct is co-injected with the GFP construct (Arnone etal., 1997), here the brachyury expression construct. Theembryos were dissociated in calcium-free seawater, andcells displaying GFP fluorescence were separated out byFACS. The sorting step afforded approximately 10-foldenrichment of message specific to the transgenic cells, withrespect to whole embryo mRNA.
We estimated rate constants for hybridization to GFPclones included in the macroarray library filters, on thebasis of the mass of bound target sequence in a spot, asdetermined in the previous set of experiments, and thesequence concentration of GFP mRNA within the complexprobe. The length of the GFP clone insert used for theexperiments was 507 bp, and based on the above measure-ments, each spot should contain ;125 pg of hybridizableGFP sequence. Ten sets of duplicate colonies of this clonewere gridded among the cDNA clones on four 22 3 22-cmhigh-density filters of the 40-h embryo cDNA library. Twocomplex probe mixtures in which the GFP concentrationsdiffered by 3.4-fold were analyzed. The lower GFP concen-tration is equivalent to a transcript present in about 125copies per average cell. Pseudo-first-order rate constants of560 M21 s21 were estimated for both probe concentrations(see Table 2 for details). Considering that the probe se-quence is about three times longer than the aggregatecomplexity used for the probe excess rate determinationabove (160 bp vs 507 bp), the rate constant estimated for theGFP sequence is almost exactly as expected. The results arealso consistent with the hybridization intensities obtainedfor clones for which the corresponding mRNA prevalence isknown. For example, ubiquitin, at approximately 100 cop-ies per average cell (Nemer et al., 1991), produces a signal ofaround twice that of GFP, close to what would be expectedfor a ubiquitin clone with a 1.5-kb insert. In summary, theindividual sequence components in the complex probemixtures behave just as do the experimental oligonucleo-tide probes of the last set of experiments, and the radioac-tivity detected in a spot pair after hybridization with acomplex probe is an interpretable reflection of the preva-lence of that species within the probe.
biotin–UTP into the synthesis of minus-strand RNA. Different linkto eliminate linker-driven annealing during subtractive hybridizatolume using 200 ng of selectate DNA and 5 mg of biotinylated drivtreptavidin is added. The hybrids and unreacted driver are then rehe sample is subjected to a second round of subtraction. The remao produce double-stranded product, and a radiolabeled probe is synnstead of phenol:chloroform to separate unhybridized from hybridi
escribed in the text (see Materials and Methods). A single cycle sufficCopyright © 2000 by Academic Press. All right
Amplification Strategies
cDNA synthesis and amplification for subtractive hy-bridization. Given the rate limitations that we describeabove, it is clear that for macroarray screening to be useful,the concentration of sequences that are differentially repre-sented in the probe must be increased. The absolute con-centration of a particular cDNA species within a complexprobe is of course dependent on both the relative prevalenceof that species and the total probe mass. It can often bedifficult to obtain sufficient probe mass in an embryologicalinvestigation for hybridization to macroarray filters. Al-though any form of cDNA amplification risks skewing thecDNA prevalence distribution (see below), the use of somemagnification procedure is unavoidable when working withlimiting quantities of embryos, tissues, or cells. To mini-mize skewing where this is important, while maximizingamplification, we employed elements from several previ-ously described methods (Hampson et al., 1996; Sagerstromt al., 1997; Siebert et al., 1995). The resulting procedure is
shown in outline form in Fig. 3A (see Materials and Meth-ods for details). As much as possible of the burden ofamplification is placed on a T7 RNA polymerase reaction,which generates copies of the initial template in a linearfashion rather than exponentially, as in PCR amplification(Philips and Eberwine, 1996; Kacharmina et al., 1999).First-strand cDNA is synthesized from a random primer inorder both to eliminate bias toward the mRNA 39-end andto maximize sequence overlap with the random-primedarrayed cDNA libraries on which our analyses take place. Inaddition to the randomized primer sequence, the first-strand anchor contains a T7 RNA polymerase initiation siteat its 59-end that is used both as a PCR amplification primersite and later to generate RNA copies of the cDNA. Aftersecond-strand synthesis a directionally blocked linker(Siebert et al., 1995) is ligated to the cDNA end correspond-ing to the 59-mRNA end. Ligation of this linker to thecDNA end corresponding to the 39-mRNA end is sup-pressed by the presence of a biotin moiety on the originalT7 random primer (see Fig. 3A).
Selectate amplification. The cDNA that was to be usedas the target of subtractive hybridization (here termed“selectate”) was size separated by agarose gel electrophore-sis, and a 300- to 500-bp fraction was selected and electro-eluted from the gel. Following electroelution after sizeselection, the cDNA was used as template for PCR ampli-
re used for selectate (SLINKER) and driver (DLINKER) populations(B) Subtractive hybridization. Reactions are performed in a 10-mlA. After 20 h of hybridization the reactions are diluted and soluble
ed by phenol:chloroform extraction. New driver is then added andg unhybridized selectate is PCR amplified for three to eight cyclesized using T7 RNA polymerase. (C) Use of hydroxylapatite (HAP)electate. This process significantly boosts separation efficiency, as
ers aion.
er RNmovininthes
zed s
es for most purposes.s of reproduction in any form reserved.

o
lr
278 Rast et al.
FIG. 4. Signal depletion for common sequences after subtractive probe hybridizations and concentration enhancement for differentiallyexpressed sequences. (A and B) Images of a section of library filter, shown after successive hybridization with complex radiolabeled cDNAprobes. (A) Unsubtracted probe; (B) subtracted probe. The section shown encompasses 648 clones, each spotted in duplicate. The selectateprobes are made from transgenic sea urchin embryo cells that express GFP and also express the gene encoding the brachyury transcriptionfactor. In the subtracted case (B), the probe is depleted by reaction with driver derived from normal 15-h embryos, which do not express GFP,and removal of driver–selectate duplex. Gray scale for the GFP spot pair at the center of each image (within ellipse) is held constant in (A)and (B) to illustrate the decrease in (B) of label bound to other clones, i.e., those common to both the driver and the selectate cellpopulations. (C) Analysis of probe hybridization to 6477 pairs of clone spots from the same experiment. These were all spots that exceeded3 standard deviations above mean background upon hybridization with the subtracted probe. Signal depletion relative to GFP control spotsafter subtractive hybridization (ordinate) is plotted against spot intensity upon hybridization to the subtracted probe (abscissa). For thedepletion calculation on the ordinate, all spot hybridization values are normalized to GFP, which is expressed exclusively in the transgenic(selectate) cell population and is not expected to be depleted. For this normalization, after clone spot pair readings are averaged and eachmeasurement is corrected for background, the hybridization from the subtracted (S) and unsubtracted (U) probe was calculated as the ratiof counts detected in the spot pair of interest to the average counts hybridized to GFP spots (GFPs and GFPu, respectively). This average was
calculated from 10 control spot pairs of a bacterial clone containing a 507-bp fragment of the GFP coding region. These were grown on thesame library filter (green circles). The fractional depletion value plotted on the ordinate is calculated as [1 2 (S/GFPs 4 U/GFPu)]. Completeack of depletion relative to GFP produces a fractional depletion value of 0, while complete depletion results in a value of 1. Enrichment
elative to GFP produces a negative depletion fraction. The scale on the abscissa is taken from the phosphor screen scan and can beCopyright © 2000 by Academic Press. All rights of reproduction in any form reserved.

is
279Recovery of Gene Sets Using cDNA Macroarrays
fication. Only 5–10% of the original cDNA is retained, butthe procedure eliminates primer–dimer contamination andhomogenizes the product with respect to size so that lengthdoes not bias amplification efficiency. After amplificationof cDNA from this template with a biotinylated minus-strand primer, plus-strand selectate is purified by elutionfrom streptavidin beads. In all PCR steps, care is taken tolimit cycle number to the minimum necessary and to allowfor complete extension at each cycle. As we discuss below,skewing of prevalence in PCR can be tolerated (withinlimits) in the selectate, but must at all costs be avoided ina subtractive hybridization driver.
Driver amplification. The material used as driver toselectively capture sequence in common with selectateduring subtractive hybridization consists of biotinylatedminus-strand RNA. This is generated by a T7 RNA poly-merase amplification reaction in the presence of biotin–UTP. Template for this transcription reaction is synthe-sized in a manner similar to that of selectate, but with adifferent linker. No size selection was performed for driversynthesis, and only three or four cycles of PCR (correspond-ing to two- to eightfold amplification because the first cyclemerely replaces the minus strand) are required to preparethe amplicon ends for T7 polymerase. The T7 polymerasereaction is then used in place of any further PCR foramplification of driver mass.
Skewing of transcript prevalence by extensive PCRamplification. To characterize the fidelity and reproduc-ibility of cDNA amplification by PCR alone, without theuse of linear T7 polymerase amplification, and to assessskewing directly, comparisons were made among reverse-transcribed and amplified probes derived from the samesample of 20-h sea urchin embryo mRNA. Two amplifica-tion reactions were carried out independently to examinereproducibility, beginning with only 10 ng of mRNA asinitial template. This is approximately the amount ofmRNA obtained from 300 embryos. The amplificationswere performed a little differently compared to that de-scribed above in that both the first- and the second-strandsyntheses were initiated with random primers. The addi-tion of a second random priming step could increase skew-ing, as a result of biased selection of initiation sites by thedefined (59) portion of the primer. Thus the comparison willprovide a test of the upper limit of skewing induced by PCR.The amplification was carried out in 15 PCR cycles, using aprimer sequence associated with the random hexamers (seeMaterials and Methods). Approximately 1 mg of antisense
approximately related to accumulated radioactive counts per 200 3depleted because they represent transcripts common to both driveshown below an arbitrary demarcation line (black dotted line). A sc oxidase clones is shown within a blue dotted rectangle (see text)by an orange oval. Spots known to represent ubiquitin clones are ss not expressed at significant levels in the 15-h embryo, are indi
ignificantly depleted. Spots representing cDNAs of the endo16 gene, wCopyright © 2000 by Academic Press. All right
radiolabeled probe (sp act 1 3 108 cpm/mg) was used toscreen a replicate of a 20-h embryo cDNA library macroar-ray filter. The two amplified probes were compared withone made without PCR amplification, i.e., by reverse tran-scription of a large amount of cDNA. Significant skewing ofapparent prevalence is evident in comparing the reverse-transcribed to the amplified probes. Of the spots that were.1.53 background in the unamplified probe hybridization,76% were also represented above 1.53 background onfilters hybridized with amplified probe. However, the re-maining fourth of the total had fallen in prevalence belowthe 1.53 background criterion. Upon visual inspection ofautoradiography films, nearly all spots that were detectableabove the surrounding background on hybridization withthe unamplified probe were also detectable in the amplifiedprobe hybridization. Qualitatively, the PCR-amplifiedprobe was thus equivalent to the unamplified probe, and thetotal complexity of spots represented above backgroundwas similar for the amplified and unamplified probe hybrid-izations. Respectively, 26 and 20% of spot intensities wereabove 1.53 background. These values represent the sensi-tivity limits for standard hybridization of complex probes tomacroarray filters using about as much mass and radioac-tivity as is normally practical.
Reproducibility between the two independently ampli-fied probes was very good, yielding a correlation coefficientof 0.96 when intensities for spots (.1.53 background)obtained with the two probes are compared. A separateexperiment in which the same probe was hybridized toreplicate copies of high-density library filters gave almost asgood results (correlation coefficient 0.91). In conclusion, themain result is that skewing of apparent prevalence by PCRamplification is indeed a significant problem. But the be-havior of each sequence appears to be highly reproducible inindependent amplification reactions. Furthermore, even inPCR-amplified cDNA populations, the set of sequencesrecovered at the end remains qualitatively representative ofthe starting population.
Use of Subtractive Hybridization to IncreaseSequence Concentration of DifferentiallyExpressed Transcripts
Principles. The sensitivity limit observed in the previ-ous experiment shows that low-prevalence sequences (i.e.,below the top one-fourth or so of the population) remain
-mm pixel by multiplying by a factor of 1.3. Most spots are clearlyselectate. Spots that are candidates for differential expression areluster that is likely to be made up almost entirely of cytochromeuster composed mainly of ribosomal RNA clones is encompassedas blue circles. Values for a clone representing brachyury, whichby the yellow circle. As expected the brachyury message is not
200r andpot c. A clhowncated
hich is also enriched after subtraction, are shown in red.
s of reproduction in any form reserved.

w
stt
fe
w
tc((rtt
thwaat
280 Rast et al.
invisible when the total embryo mRNA is made intocDNA, amplified, and hybridized to a macroarray filter. Weturned to subtractive hybridization in order to enrich theprevalence of sequences representing differentially ex-pressed genes, which indeed for most developmental pur-poses are those that are desirable to recover. In subtractivehybridization, the sequence concentrations of differentiallyexpressed cDNAs are enhanced at the expense of com-monly expressed sequences, given that the overall probemass is kept approximately constant. After subtractivehybridization the sequence concentration or prevalence in ahybridization probe of a particular differentially representedsequence (Pi) can be thought of as
P i 5@Di#
@D# 1 @C#, [1]
here [Di] is the concentration of the particular messagespecies under consideration, [D] is the total concentrationof all differentially expressed sequences (i.e., those presentin the selectate and absent from the driver), and [C] is thetotal concentration of all sequences expressed commonly inthe two parental RNA populations. By subtraction thevalue of [C] is reduced, thereby increasing Pi and thecorresponding intensity of hybridization to cDNA spotsrepresenting that differentially expressed gene. In a typicalsubtractive hybridization experiment, [C] must be muchlarger than [D] or the procedure will be ineffective; that isthe two mRNA populations must be in general closelysimilar. In this case [C] will provide a reasonable approxi-mation of the value of the denominator of Eq. [1], and thefactor by which [C] is reduced corresponds to the foldincrease in the hybridization intensity of spots representingdifferential message species. The experimental scheme toaccomplish this is outlined in Fig. 3B.
In our procedure selectate and driver are represented inthe hybridization reaction in direction-specific, single-stranded forms. This eliminates the complicated mixturesof competing pseudo-first-order and second-order reactionsthat occur when one or both of the reaction components arepresent in double-stranded form. The rate of hybrid forma-tion under our conditions is dependent entirely and in adirect way on the driver concentration. The fraction ofselectate representing any particular species of sequencethat is hybridized (C ih) is
C ih 5 1 2 e 2kCi0t, [2]
where k is the pseudo-first-order reaction rate constant forthis species (about 600 M21 s21 for the fragment lengths weused under standard reaction conditions and assuming a1.5-kb complexity for typical mRNA; Galau et al., 1977),C ih is the concentration of hybridized molecules of thepecies i at time t, and C i0 is the initial concentration ofhat specific transcript species in the driver. As an example,
he value of C i0t at 30 h for probe RNA fragments derivedCopyright © 2000 by Academic Press. All right
rom an mRNA of a prevalence of five copies per averagembryo cell in our reactions (i.e., five copies per 105
transcripts or 250 pg of the 5 mg of driver in a 10-ml reactionvolume) is 9.0 3 1023 M s. For such an RNA, duplexformation is expected to proceed to very near completion(99.5%) over the 30-h period of hybridization, according toEq. [2].
cDNA that had hybridized to biotinylated driver RNAwas removed by streptavidin capture and phenol:chloro-form extraction (Sagerstrom et al., 1997; Sive and St John,1988). Removal of biotinylated driver RNA (whether hy-bridized or not) by this method was generally determined tobe around 95% in experiments in which its distribution wasmonitored by colabeling with 32P. The remaining selectate
as then precipitated in the presence of 5 mg of new driverand the hybridization process was repeated. Finally thesurviving single-stranded selectate was converted to adouble-stranded form by minimal PCR amplification (fiveto eight cycles) and as above used as template to prepare anamplified probe by T7 RNA polymerase transcription, inthe presence of [32P]UTP.
Additional studies demonstrated that it is more efficiento separate hybridized and unhybridized selectate by HAPhromatography than by phenol:chloroform extractionsthis method is described in the following). HAP separationillustrated in Fig. 3C) increases the sensitivity of macroar-ay screening, but does not qualitatively change the sub-ractive method, so the analysis below will apply similarlyo screenings based on HAP subtraction.
Examples: enhancement of specific sequences by sub-ractive hybridization. For the example of subtractiveybridization analyzed in greatest detail here, the selectateas derived from dissociated embryo cells that express GFP
nd which also express the brachyury gene, as describedbove. Driver was synthesized from normal embryo cells ofhe same stage. Approximately 2 mg of radiolabeled probe
was prepared from both unsubtracted and subtracted cDNApopulations and hybridized in series to the same set oflibrary filters. In this particular experiment, most mRNAspecies are expected to be present at similar levels in bothselectate and driver populations. Because the filters arehybridized with the same total mass of pre- or postsubtrac-tion probe, the majority of spot intensities should remainsimilar after subtractive hybridization, i.e., their individualsequence concentrations will have been boosted back tonear their original levels after subtraction, while a minorityof clones, which represent mRNAs that were not repre-sented in the normal embryo cells, are expected to exhibitincreased intensities when hybridized with the subtractedprobe (see Eq. [1]). The combination of subtraction withreamplification for probe generation, and the use of mac-roarray screening, makes it possible to identify differencesin minor components of the cDNA, i.e., in relatively raremRNA species. Furthermore, because there is no need toextensively purify differential cDNA, this can be done
without removing all of the common sequence and withouts of reproduction in any form reserved.

awccwacnti
281Recovery of Gene Sets Using cDNA Macroarrays
the drastic skewing of sequence prevalence that such puri-fication often entails.
To estimate the subtraction efficiency for the commonmRNAs and, conversely, the relative enrichment of speciespresent only in selectate, all spot intensity readings werenormalized to GFP control spots. Results of this experimentare shown in Fig. 4 (see legend for details). Messenger RNAderived from the transgenic GFP expression construct ispresent only in the selectate population and will not bespecifically depleted by the subtraction procedure, sincethere are no complements in the driver RNA with which itcan hybridize. The depletion of each common probe cDNAspecies identified by hybridization to a colony spot pair canthereby be calculated by comparison to GFP. Furthermore,any small amount of skewing that occurred during the fewPCR cycles needed to initiate probe synthesis after subtrac-tion (cf. Fig. 3) will be normalized out. That is, the pre- andpostsubtraction probes being compared derive from thesame selectate.
Depletion of the majority of message species in thebrachyury overexpression subtraction is illustrated in Fig.4. In Figs. 4A and 4B, a portion of a hybridized macroarrayfilter is shown in which the intensity of a central GFP spotpair has been held at constant gray scale to facilitatecomparison of presubtraction (Fig. 4A) and postsubtraction(Fig. 4B) hybridization images. The extent to which most ofthe surrounding spots exhibit reduced hybridization inten-sity in Fig. 4B represents the subtractive depletion of theirsequence concentrations, relative to that of GFP. As ex-pected, the vast majority of transcript species are depletedduring subtractive hybridization.
Analysis of total transcript population after subtraction.A quantitative analysis of all clone spots on a singlemacroarray filter for which hybridization intensity ex-ceeded 3 standard deviations above mean background isshown in Fig. 4C. This is a limit criterion for detectability,equivalent to 1.253 background, and it resulted in detec-tion of a total of 6477/18,432, or 35% of all clones. In Fig.4C fractional depletion (ordinate) is plotted against theamount of signal from the subtracted probe (abscissa). Theintensity of hybridization along the abscissa increases withsequence prevalence after subtraction. Fractional depletionis here defined as 1 minus the ratio of spot pair intensitiesafter to before subtraction, for any given spot pair (oncethese values have been normalized to the average GFP spotpair intensities after and before subtraction; see legend toFig. 4). A fractional depletion of 1 would correspond tocomplete removal of the probe sequence species uponsubtraction, and a fractional depletion of 0 indicates thatthe spot analyzed remains at the same intensity relative toGFP after subtraction. Intensity and depletion readings forthe 10 control GFP spot pairs on the filter are plotted asgreen circles. The average depletion of these 10 clones wasplaced at 0, by definition. The 10 pairs of GFP spots were infact driven from a moderate intensity in the unsubtractedprobe hybridization to a hybridization level that is among
the most intense on the filter after probe subtraction. MostCopyright © 2000 by Academic Press. All right
of the clones analyzed in Fig. 4 are depleted relative to GFPby a fraction of about 0.75 or, conversely, the GFP control isenriched fourfold. Presumably, sequence representationfrom other differentially expressed genes is enriched simi-larly and will be shifted down and to the right from themain body of clone spots. One such gene for which we havea priori information is brachyury itself. This gene is ex-pressed at relatively low levels at 15 h and is undetectableon filters hybridized with driver probe, but is readily detect-able with probe made from the transgenic cells. A singlebrachyury clone is present on the filter analyzed in Fig. 4C(shown as a yellow spot) and, as expected, it behavessimilarly to the GFP control spots. Three clones derivedfrom the endo16 gene, expressed in the endomesodermalregion of the embryo at this stage, are similarly undepleted(shown as red circles in Fig. 4C). This gene is also appar-ently upregulated in brachyury-expressing cells.
Clones from the depleted region of the graph were alsonalyzed. Eleven polyubiquitin clones whose identitiesere confirmed by sequencing are plotted as blue circles. A
onsistent level of depletion is exhibited by each of theselones and the range of presubtraction intensity is wellithin what is expected to result from insert size variation
mong clones. For example, the insert sizes of 15 ubiquitinlones taken from a second filter (hybridized simulta-eously with the filter analyzed in Fig. 4) ranged from 600o 2200 bp. Hybridization intensities correspond roughly tonsert size for these clones (R 2 5 0.67). When 8 clones were
arbitrarily picked from within the cluster encompassed bythe blue box (Fig. 4C) and sequenced, all were found torepresent the product of a mitochondrial gene (cytochromec oxidase subunit I). All of these clones are depletedsimilarly. A second cluster (highlighted by an orange oval inFig. 4C) consists mainly of ribosomal RNA clones. Thesewere not as efficiently depleted in the hybridization as themajority, but they can easily be eliminated from consider-ation by avoiding clones within this cluster or by previouslyidentifying ribosomal RNA clones. Clones bearing ribo-somal RNA inserts generally make up less than 1% of thesesea urchin embryo libraries, which are generated by randompriming of purified poly(A) RNA.
cDNA clones that exhibit interesting hybridization ratioscan be separated on the basis of their depletion values. Thedotted demarcation line in Fig. 4C was arbitrarily set todelineate a manageable number of clones. Clones for whichdepletion values were below this line were chosen forfurther analysis. In this experiment, 1 to 2% of the clonesrepresented above background fall below this line for eachmacroarray filter analyzed. Figure 5 shows the spot patternfor hybridization of three clones chosen in this way fromtwo separate differential screening experiments. In eachcase the highlighted clone is undetectable on the filterhybridized with driver probe (left column), is marginallydetectable with the unsubtracted selectate probe (rightcolumn), and is clearly enhanced relative to surroundingclones in the subtracted probe (middle column). Images in
the top two rows are taken from the ectopic brachyurys of reproduction in any form reserved.

hc
sifnasea1ls
bctt
fwdffut(Dta
in4
v be (4
282 Rast et al.
expression experiment. The endo16 transcript provides thefirst example and brachyury transcript the next in Fig. 5. Inthe hybridization with the subtracted probe, brachyury spot
ybridization intensity is enhanced relative to surroundinglones and is not depleted relative to the GFP control.Enhancement of a clone initially borderline in signal
trength to a level well past the threshold of detectability isllustrated in the bottom row of Fig. 5. These images deriverom a subtractive hybridization experiment comparing theormal patterns of gene expression in embryos at 7 and 40 hfter fertilization. The spot pair shown represents sm50, akeletal matrix protein gene that is not expressed in the 7-hmbryo, but is expressed at approximately 40 copies perverage embryo cell at 40 h of development (Lee et al.,999b; Killian and Wilt, 1989). This is near the detectionimit of this type of screen without subtraction, and the
FIG. 5. Enhanced hybridization to colony spots representing gencDNA library. Spot pairs representing three differentially expressedimage. Each filter region has been hybridized with three complex pprobe hybridization is shown in the right column, and subtractedencodes a secreted protein that is first expressed in the endomesode15-h driver hybridization (15h), but is clearly evident in the hybridcells which express the brachyury gene. The signal is enhanced relbrachyury gene is expressed at levels that are undetectable by filterHybridization is enhanced approximately sixfold after probe subtracnvolved in skeletogenesis. No hybridization is evident with a probot yet transcribed. When hybridized with a probe derived from 400 h sm50 is expressed at 30–40 copies per average cell (Killian an
detection limit that we have determined for complex hybridizatioisible above background when hybridized with the subtracted pro
m50 spot pair is just barely visible above background i
Copyright © 2000 by Academic Press. All right
efore subtraction. As expected, hybridization to the sm50lone spots is readily visible and is now enhanced relativeo surrounding clones by about sixfold after reaction withhe subtractive probe.
As an independent assessment of transcript prevalencerom genes that were identified in this differential screen,e employed real-time quantitative PCR. This was used toetermine the relative prevalence of transcripts isolatedrom 18-h embryos that ectopically express brachyury androm 15-h normal embryos, the sources of mRNA that weresed to synthesize selectate and driver, respectively. Thesewo embryo populations are essentially at the same stageas a result of the slight developmental delay induced byNA injection). Here we are simply interested in whether
he genes that we have identified by differential screeningre indeed expressed at higher levels in the selectate source,
at are differentially expressed. All images are from a 40-h embryos (endo16, brachyury, and sm50) are shown within ellipses in each. Driver probe hybridization is shown in the left column, selectatehybridization is shown at the center. Top row: The endo16 gene
l region of the blastula. Signal from this spot cannot be seen in then with the selectate probe (TG) made from the transgenic embryoto surrounding clones after subtraction (TG-15h). Middle row: the
ridization at 15 h and is overexpressed in the transgenic cells (TG).(TG-15h). Bottom row: The sm50 gene encodes a structural proteinrived from 7-h embryo mRNA (7h). At this time the sm50 gene isRNA (40h), the sm50 spots are just visible above background. At
ilt, 1987; Lee et al., 1999b) and this prevalence level is just at thethout differential sequence enhancement. sm50 spots are clearly0h-7h).
es thgene
robesproberma
izatioativehybtione de-h md Wn wi
.e., after forced brachyury expression. Table 3 shows the
s of reproduction in any form reserved.

rbptee
tcshsmc
odt
mBtcac
rusaQTh2o1lt
a
a
283Recovery of Gene Sets Using cDNA Macroarrays
results of a PCR analysis for a number of candidate genesand for brachyury itself. Measurements of ubiquitin expres-sion levels were used to normalize the two mRNA sources.It is clear that these transcripts are present at higherprevalence in the transgenic embryo mRNA relative to thatof the driver source. It is important to keep in mind thatunlike the sample in the initial subtraction experiment, inwhich a pure population of sorted transgenic cells was usedto synthesize the selectate, the embryos analyzed in thisexperiment were a mosaic of transgenic and wild-type cells,and only about 10% of the cells express the transgene. Toeffect a doubling of endogenous gene expression, the trans-genic cells must upregulate expression of the genes beinganalyzed by up to approximately 10-fold (depending on thesize of the endogenous population of cells that expresses thegene). Three of the clones in Table 3, representing ubiqui-tous “housekeeping” proteins (fascin, poly(A) binding pro-tein, and a sulfotransferase) may not be significantly morehighly represented in this experiment after forcedbrachyury expression. The remaining five clones wereepresented by much more prevalent transcripts afterrachyury overexpression. In additional studies to be re-orted elsewhere we have isolated a large number of puta-ive brachyury targets by this method and verified theirnrichment in RNA samples from embryos ectopicallyxpressing brachyury.Enhancement of differential depletion by hydroxylapa-
ite chromatography. While the previous experimentslearly demonstrate the utility of the phenol:chloroformeparation method, the potential of subtractive nucleic acidybridization for isolating sequence that is unique to apecific transcriptional state obviously exceeds the enrich-ent that we achieved. A problematic aspect of the phenol:
TABLE 3Quantitative PCR Analysis of a Subset of Genes Identified in the
Gene15-h control
CTa
Total brachyuryd 27.57Fascin 23.58D-dopachrome tautomerase/MIF-like 28.80Apolipophorin-like 27.30Polyketide synthase-like 31.96Sulfotransferase-like 31.34endo16 30.44PolyA binding-like 29.60Ubiquitin 15.28
a CT is the cycle number at which normalized product fluoremplification reaction, as determined for each primer set.
b DCT is the difference in CT values between the control and theamplifications. Ubiq. corr. DCT is CT after correction for differenc
c Fold increase is calculated as the per-cycle amplification effimplification efficiency estimate. Actual values lie between 1.9 an
d Total brachyury is endogenous 1 transgenic expression.
hloroform procedure used for the quantitative experiment s
Copyright © 2000 by Academic Press. All right
f Fig. 4 is the nonspecific loss of single-stranded selectateuring the extraction. We therefore explored hydroxylapa-ite chromatography in combination with high C0t hybrid-
izations, as an alternative strategy for isolation of unhybrid-ized selectate (outlined in Fig. 3C). Hybridization reactionswere set up essentially as described above and incubated for40 h. Enrichment of sequence that was unique to theselectate population was assessed by measuring the changein relative concentration of specific DNA fragments beforeand after hydroxylapatite chromatography. The driver andselectate were derived from similar but not identical seaurchin embryo RNA populations. The behavior of a single-stranded fragment present only in the selectate (l1) wascompared to that of a similar fragment (l2) whose comple-
entary sequence was present also as RNA in the driver.oth fragments contained the same primer sequences as didhe actual selectate and driver and were added at very lowoncentrations, equivalent to approximately 10 copies perverage cell. The subtractive hybridization mixture in-luded embryonic selectate (200 ng) and driver (10 mg) in a
20-ml volume. We assessed the enrichment of the l1 controlelative to both the l2 control fragment and the endogenousbiquitin sequence. Ubiquitin and l2 were present inimilar concentrations in both selectate and driver. Theyre therefore expected to be depleted upon subtraction.uantitative PCR was used to obtain these measurements.he experiment showed that after HAP column removal ofybridized selectate, l1 sequence concentration increases4.8-fold, relative to that of l2, and 23.5-fold relative to thatf ubiquitin. This is a vast improvement over the 6- to0-fold enrichments that we have always obtained in simi-ar experiments using the phenol:streptavidin method. Fur-hermore, this high level of enrichment is achieved in a
yury Expression Screen as Candidates for Upregulation
18-h transgenicCT
Ubiq. corr.DCT
bFold increase
(1.9DCT)c
18.46 9.46 43322.86 1.07 2.0026.24 2.91 7.5123.37 4.28 15.627.10 5.21 28.330.08 1.61 2.8126.38 4.41 16.9628.46 1.49 2.6015.63 0 —
ce exceeds a threshold set within the exponential range of the
genic embryos after correction for the difference in CT in ubiquitinubiquitin cycle number in the two samples.
cy (1.9) raised to the power DCT. 1.9 is used as a conservative.
brach
scen
transes inciend 2.0
ingle round of amplification.
s of reproduction in any form reserved.

c;
ptsTtatn
stitkTrsFfi(
284 Rast et al.
DISCUSSION
Macroarray filters provide potentially complete represen-tation of gene expression patterns without the need for priorsequence information, but screening them is inherentlyinsensitive, because of the large volumes required. Usingthe largest easily practical amount of highly radioactiveprobe, we found that only about the top 25–30% of theclones on a typical sea urchin embryo macroarray can bereliably detected under optimal hybridization conditions.These are the clones representing mRNAs at the highestprevalence in the probe, i.e., sequences present at $40opies/average embryo cell (in other words a prevalence of4 3 1024 in the overall mRNA population at late blastula/
gastrula stage). We showed that this limitation of sensitiv-ity is entirely kinetic; that is, the amount of hybridization,considered as the fraction of the clone DNA per spothybridized, depends completely on the probe C0t for thatsequence. Therefore the key to increased sensitivity isincreased sequence concentration. For differentially ex-pressed genes this can be attained by subtractive hybridiza-tion, combined with amplification of what initially may bevery small complements of starting RNA from experimen-tally treated embryos. Amplification presents a furtherchallenge in that skewing of the RNA frequency distribu-tion in the driver used for subtractive hybridization couldrender the whole procedure useless. Here we show that acombination of total message amplification and subtractiveenrichment of differential sequence can be used to isolaterelatively rare message species by macroarray screening.
Amplification
We have designed these experiments to be able to processRNAs extracted from the small number of embryos that canbe manually injected. In practice this means we would liketo be able to prepare driver nucleic acids from as little as 10ng of starting poly(A) RNA. To obtain high driver C0t in thesubtraction reactions, or even to make a direct probe formacroarray screening, 5- to 10-mg quantities of the ampli-fied RNA are desirable; i.e., a 300–10003 amplificationwithout significant skewing is required. We showed thatconcern about the use of PCR alone for this is indeedwarranted; in the exponential PCR process small differ-ences in efficiency of amplification are magnified and theemergent population looks quite different from the startingpopulation. There are limits to PCR skewing in that fewsequences are either completely lost or artificially intro-duced, but amplification in the preparation of a kineticallyfaithful driver by PCR alone is clearly inadmissible. None-theless, because the qualitative nature of the cDNA popu-lation survives, PCR amplification can be used for thepreparation of a subtractive hybridization selectate. In theprocedure summarized in Fig. 3, we have applied the linearamplification afforded by T7 polymerase (Phillips and Eber-wine, 1996; Kacharmina et al., 1999) by incorporating T7
polymerase primer sites in the initial stages of cDNACopyright © 2000 by Academic Press. All right
reparation. Only a few cycles of PCR are used. Essentiallyhese act to repair the ragged products of first- and second-trand synthesis and provide just enough template for the7 amplification to efficiently go to work on. We consider
his aspect of the technology now sufficient for the task,nd in fact the same procedure could probably be modifiedo deal with far smaller quantities of starting material ifeed be.
Generation of the Subtracted Probe
Using two rounds of driver challenge, without amplifica-tion between subtractive hybridization reactions, we showthat the phenol:chloroform extraction method can achievea significant enrichment in the probe of differentially ex-pressed sequences. A meaningful prevalence distribution ismaintained by the amplification and hybridization proce-dure described. In a number of experiments that we haveperformed using this technology, enrichment of uniquesequence ranged from four- to sevenfold, based on measure-ments similar to those in Figs. 4 and 5 and Table 3 of thispaper. This level of enrichment suffices to identify manydifferentially expressed genes. However, substitution of thehydroxylapatite separation method for the phenol:chloro-form method affords a striking further increase in enrich-ment of differentially expressed sequences, 3–43 better in aingle cycle than the phenol method in two. A strength ofhe procedure, irrespective of the hybrid separation method,s that only strand-specific components are used for sub-raction, so that the reactions conform to pseudo-first-orderinetics, which are sharper than second-order kinetics.hereby competing second-order reactions are avoided. The
esulting prevalence depletion for any particular cDNApecies depends directly on driver sequence concentration.ollowing the subtraction, the surviving selectate is ampli-ed, again using T7 polymerase, to generate the large mass
1–2 mg) of highly radioactive probe needed for macroarrayscreening. The power of the combination of subtractivehybridization and macroarray screening is that nothing canhide from it: minor transcripts represented in the library,that would be very difficult to recover by procedures thatrequire differential PCR product cloning or sequence anal-ysis following subtraction, will be identified on the mac-roarrays if they are differentially expressed. Conversely,using macroarrays, it is unnecessary to deplete commonsequences extensively before they can be distinguishedfrom specific ones. This greatly reduces the risk of artificialloss of differentially expressed sequences through PCRskewing or other artifacts. Our present procedures extendmacroarray screening sensitivity (for differentially utilizedgenes) from transcripts expressed at approximately $40copies down to fewer than 5 copies per average sea urchinembryo cell.
Improved computational methods for interpreting mac-roarray hybridization results will further improve the accu-racy and sensitivity with which we can identify differen-
tially expressed genes. This is clear from the scatter plot ins of reproduction in any form reserved.

ba
B
B
C
G
G
H
H
K
K
K
L
L
L
L
L
L
M
285Recovery of Gene Sets Using cDNA Macroarrays
Fig. 4. Much of the variance in depletion values for thelower intensity clones shown in Fig. 4C probably resultsfrom the large error in the determination of spot hybridiza-tion intensity as these values approach background levels inthe depleted screen. More accurate estimates of boundprobe will reduce the number of false-positive clones thatneed to be analyzed. The incidence of false positives may befurther reduced by comparing multiple replicate filters, aprocess that will be facilitated by automated computationalanalysis. Finally, accuracy can be improved by screeningprocedures that lower the nonspecific background hybrid-ization and thus the variance of signal determination.
CONCLUSIONS
Here we show that careful application of cDNA amplifi-cation in combination with subtractive hybridization canbe used to bypass the inherent sensitivity limitations ofmacroarray filter hybridization. The differential enhance-ment achieved in the present study is sufficient to drivemacroarray screening sensitivities to below five copies peraverage cell in the developing sea urchin embryo. Thetechnology continues to improve but even as it now stands,the approach described here has shown the power of mac-roarray screening as a tool for gene discovery in develop-ment. We demonstrate this with a variety of standards andexamples in this report, and forthcoming studies will illus-trate the application of these methods in the recovery ofcomponents of several different gene networks operating inthe S. purpuratus embryo. In principle these methods cane used to isolate any set of differentially expressed genes inny developing system from which RNA can be isolated.
ACKNOWLEDGMENTS
We are grateful to our colleagues Roy J. Britten at Caltech’sKerckhoff Marine Lab, Professor Ellen Rothenberg, and Dr. MicheleAnderson for critical and perspicacious reviews of the manuscript.We thank Rochelle A. Diamond for guidance and help with thepurification of transgenic cells by FACS and Xiaohong She andMiki Yun for technical assistance. This research was supported bythe National Institute of Child Health and Human Development(HD-37105), the California Sea Grant College Program(NA65RG0477), the Beckman Institute of Caltech, and the LucilleP. Markey Charitable Trust. J.P.R. was supported by an NIHIndividual NRSA (GM 18478). C.B.L. was supported by a Walter &Sylvia Treadway Fellowship.
REFERENCES
Arnone, M. I., Bogarad, L. D., Collazo, A., Kirchhamer, C. V.,Cameron, R. A., Rast, J. P., Gregorians, A., and Davidson, E. H.(1997). Green fluorescent protein in the sea urchin: New experi-mental approaches to transcriptional regulatory analysis in em-
bryos and larvae. Development 124, 4649–4659.Copyright © 2000 by Academic Press. All right
ritten, R. J., Graham, D. E., and Neufeld, B. R. (1974). Analysis ofrepeating DNA sequences by reassociation. Methods Enzymol.29, 363–418.
rown, P. O., and Botstein, D. (1999). Exploring the new world ofthe genome with DNA microarrays. Nat. Genet. 21, 33–37.lark, M. D., Panopoulou, G. D., Cahill, D. J., Bussow, K., andLehrach, H. (1999). Construction and analysis of arrayed cDNAlibraries. Methods Enzymol. 303, 205–233.
Davidson, E. H. (1986). “Gene Activity in Early Development.”Academic Press, Orlando, FL.
Flytzanis, C. N., Brandhorst, B. P., Britten, R. J., and Davidson, E. H.(1982). Developmental patterns of cytoplasmic transcript preva-lence in sea urchin embryos. Dev. Biol. 91, 27–35.alau, G. A., Britten, R. J., and Davidson, E. H. (1977). Studies onnucleic acid reassociation kinetics: Rate of hybridization ofexcess RNA with DNA, compared to the rate of DNA renatur-ation. Proc. Natl. Acad. Sci. USA 74, 1020–1023.ubler, U., and Hoffman, B. J. (1983). A simple and very efficientmethod for generating cDNA libraries. Gene 25, 263–269.ampson, I. N., Hampson, L., and Dexter, T. M. (1996). Directionalrandom oligonucleotide primed (DROP) global amplification ofcDNA: Its application to subtractive cDNA cloning. NucleicAcids Res. 24, 4832–4835.ough-Evans, B. R., Britten, R. J., and Davidson, E. H. (1988).Mosaic incorporation and regulated expression of an exogenousgene in the sea urchin embryo. Dev. Biol. 129, 198–208.acharmina, J. E., Crino, P. B., and Eberwine, J. (1999). Preparationof cDNA from single cells and subcellular regions. MethodsEnzymol. 303, 3–18.illian, C. E., and Wilt, F. H. (1989). The accumulation andtranslation of a spicule matrix protein mRNA during sea urchinembryo development. Dev. Biol. 133, 148–156.
ohne, D. E., Levison, S. A., and Byers, M. J. (1977). Roomtemperature method for increasing the rate of DNA reassociationby many thousandfold: The phenol emulsion reassociation tech-nique. Biochemistry 16, 5329–5341.
asky, L. A., Lev, Z., Xin, J. H., Britten, R. J., and Davidson, E. H.(1980). Messenger RNA prevalence in sea urchin embryos mea-sured with cloned cDNAs. Proc. Natl. Acad. Sci. USA 77,5317–5321.
ee, J. J., Calzone, F. J., Britten, R. J., Angerer, R. C., and Davidson,E. H. (1986). Activation of sea urchin actin genes during embryo-genesis. Measurement of transcript accumulation from five dif-ferent genes in Strongylocentrotus purpuratus. J. Mol. Biol. 188,173–183.
ee, Y. H., Huang, G. M., Cameron, R. A., Graham, G., Davidson,E. H., Hood, L., and Britten, R. J. (1999a). EST analysis of geneexpression in early cleavage-stage sea urchin embryos. Develop-ment 126, 3857–3867.
ee, Y. H., Britten, R. J., and Davidson, E. H. (1999b). SM37, askeletogenic gene of the sea urchin embryo linked to the SM50gene. Dev. Growth Differ. 41, 303–312.
ipshutz, R. J., Fodor, S. P., Gingeras, T. R., and Lockhart, D. J.(1999). High density synthetic oligonucleotide arrays. Nat.Genet. 21, 20–24.
ivant, D. L., Hough-Evans, B. R., Moore, J. G., Britten, R. J., andDavidson, E. H. (1991). Differential stability of expression ofsimilarly specified endogenous and exogenous genes in the seaurchin embryo. Development 113, 385–398.aier, E., Meier-Ewert, S., Ahmadi, A. R., Curtis, J., and Lehrach,
H. (1994). Application of robotic technology to automated se-s of reproduction in any form reserved.

M
N
N
P
P
P
S
S
S
286 Rast et al.
quence fingerprint analysis by oligonucleotide hybridisation.J. Biotechnol. 35, 191–203.
McClay, D. R. (1986). Embryo dissociation, cell isolation and cellreassociation. Methods Cell Biol. 27, 309–323.cMahon, A. P., Flytzanis, C. N., Hough-Evans, B. R., Katula, K. S.,Britten, R. J., and Davidson, E. H. (1985). Introduction of clonedDNA into sea urchin egg cytoplasm: Replication and persistenceduring embryogenesis. Dev. Biol. 108, 420–430.emer, M., Rondinelli, E., Infante, D., and Infante, A. A. (1991).Polyubiquitin RNA characteristics and conditional induction insea urchin embryos. Dev. Biol. 145, 255–265.izetic, D., Drmanac, R., and Lehrach, H. (1991). An improvedbacterial colony lysis procedure enables direct DNA hybridisa-tion using short (10, 11 bases) oligonucleotides to cosmids.Nucleic Acids Res. 19, 182.
eterson, K. J., Harada, Y., Cameron, R. A., and Davidson, E. H.(1999). Expression pattern of brachyury and Not in the seaurchin: Comparative implications for the origins of mesoderm inthe basal deuterostomes. Dev. Biol. 207, 419–431.
hillips, J., and Eberwine, J. H. (1996). Antisense RNA amplifica-
tion: A linear amplification method for analyzing the mRNACopyright © 2000 by Academic Press. All right
population from single living cells. Methods: Companion Meth-ods Enzymol. 10, 283–288.
oustka, A. J., Herwig, R., Krause, A., Hennig, S., Meier-Ewert, S.,and Lehrach, H. (1999). Toward the gene catalogue of sea urchindevelopment: The construction and analysis of an unfertilizedegg cDNA library highly normalized by oligonucleotide finger-printing. Genomics 59, 122–133.
agerstrom, C. G., Sun, B. I., and Sive, H. L. (1997). Subtractive clon-ing: Past, present, and future. Annu. Rev. Biochem. 66, 751–783.
iebert, P. D., Chenchik, A., Kellogg, D. E., Lukyanov, K. A.,and Lukyanov, S. A. (1995). An improved PCR method for walkingin uncloned genomic DNA. Nucleic Acids Res. 23, 1087–1088.
ive, H. L., and St John, T. (1988). A simple subtractive hybridiza-tion technique employing photoactivatable biotin and phenolextraction. Nucleic Acids Res. 16, 10937.
Received for publication August 24, 2000Revised September 14, 2000
Accepted September 14, 2000
Published online November 17, 2000s of reproduction in any form reserved.
Copyright © 2022 FDOKUMEN