


Bahasa
Halaman
Hukum


-NDE
USAMP/NDE 1002 - Hybrid NDE Method for Spot Weld Quality Evaluation
PI: Leonid C. Lev General Motors Company LLC
Presenter: Martin H. Jones
Ford Motor Company
2012 DOE Vehicle Technologies Program Review May 16, 2012
This presentation does not contain any proprietary, confidential, or otherwise restricted information
Project ID # - LM051

-NDE
USAMP NDE1002
This material is based upon work supported by the Department of Energy National Energy Technology Laboratory under Award
Numbers DE-FC26-02OR22910 and DE-EE0003583. This report was prepared as an account of work sponsored by an agency of the United States Government. Neither the United States Government nor any agency thereof, nor any of their employees, makes any warranty, express or implied, or assumes any legal
liability or responsibility for the accuracy, completeness, or usefulness of any information, apparatus, product, or process
disclosed, or represents that its use would not infringe privately owned rights. Reference herein to any specific commercial product,
process, or service by trade name, trademark, manufacturer, or otherwise does not necessarily constitute or imply its endorsement,
recommendation, or favoring by the United States Government or any agency thereof. The views and opinions of authors expressed herein do not necessarily state or reflect those of the United States
Government or any agency thereof.

-NDE
Timeline • Development project • Start – Jan. 2011 • Finish – Jan. 2012 • 100% Complete
Budget • Total project funding
– DOE $88K – Contractor $88K
• Funding received in FY11 – $43K
• Funding for FY12 – $45K
FCVT Barriers Addressed • Cost reduction in the inspection of
resistance spot welds • Performance – provide higher
sampling frequency and quicker feedback for better quality and process control
Partners • OEMs – Chrysler, Ford, GM • Research Partner – Oakland
University
USAMP NDE1002
Overview
-NDE Spot Weld Inspection Background
• Resistance spot welding (RSW) is the conventional joining method for body structures. When optimized, it produces strong, robust joints with low cost. While RSW has reached its prominence in the joining of mild steels, it has been adapted to newer light-weight metals ranging from the extremely strong advanced high-strength steels (AHSS) to aluminum and magnesium. Because of the difficulties in keeping the weld process in control (weld-tip wear, weld-gun control, corrosion associated with cooling, etc.) RSW, even with mild and IF steels, requires frequent weld inspections, typically by tear downs (destructive testing). This is very expensive and has low sampling rates. Inspection of RSW in light weight materials is more critically needed because of increased weld brittleness and because of the high, variable conductivity of aluminum and magnesium.
• There have been many attempts to perform NDE on spot welds. Single-element ultrasonic inspections have been widely implemented at least in Europe but have not been successful on AHSS. An earlier AMD project developed ultrasonic phased arrays that could simultaneously image the weld surface and the faying surface. While this technology generates the most detailed, nondestructive picture of the weld, it was unsuccessful on galvanized low-carbon steels. Ultrasound was unable to differentiate between fused material in the heat-affected zones (HAZ) from the martensitic nugget that gives these welds substantial strength [AMD409 Final Report].
USAMP NDE1002

-NDE Project Objectives
Rationale: Resistance Spot Welding (RSW) is the standard joining technique
used to join body panels. The current “chisel-test” is destructive, slow, and labor intensive.
Optical shearography and similar optical techniques are nondestructive and noncontact methods that show promise in identifying nugget size, a key RSW characteristic.
Objectives: Select a suitable candidate.
Identify a shearography system capable for measuring surface
strains and displacements with minimum sensitivity to environmental noise.
Formulate a mathematical model that can be used to solve the problem using known boundary conditions and optical measurements.
USAMP NDE1002

-NDE Milestones
Month/Year Milestone or Go/No-Go Decision
Apr 2011 Weld coupon design and preparation complete. Different thicknesses and different weld qualities (nugget sizes).
May 2011 Develop a multi-shearing shearographic system
May 2011 Define FEM objective function and parameters.
Jun 2011 Define FEM objective function and parameters.
Jul 2011 Test loading methods
Aug 2011 Determine loading and system parameters due to magnetic loading.
Sep 2011 Determine loading and system parameters due to heating.
Oct 2011 Develop code to predict nugget size using experimental data.
Nov 2011 Investigate shearing amount and direction
Jan 2012 Final report complete
USAMP NDE1002
-NDE Strategy for Shearographic Spot Weld Inspection
USAMP NDE1002
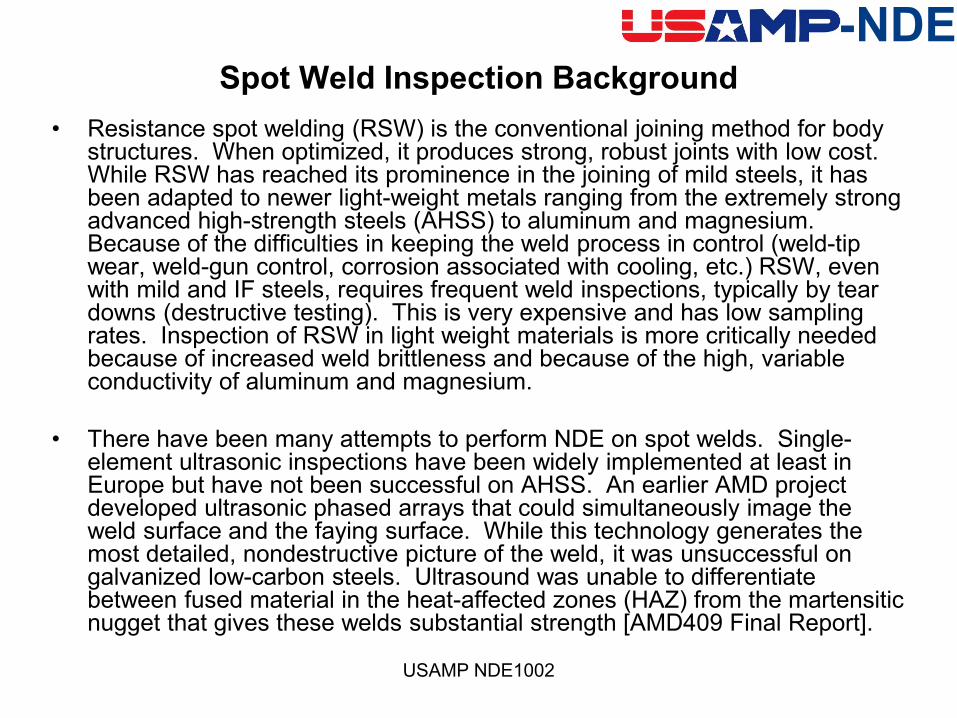
• In this case, shearography is used to measure surface displacement.
• The sample (spot weld) is perturbed with heat or force which produces a displacement field on the surface.
• Strain fields experimentally obtained are used as inputs to a finite element model which is used to solve the inverse problem, i.e. how big was the nugget that produced the observed displacement field.
Nugget Size
Shearographic 5.0 mm 2.9 mm
Direct 5.12 mm 2.8 mm
-NDE Deliverables
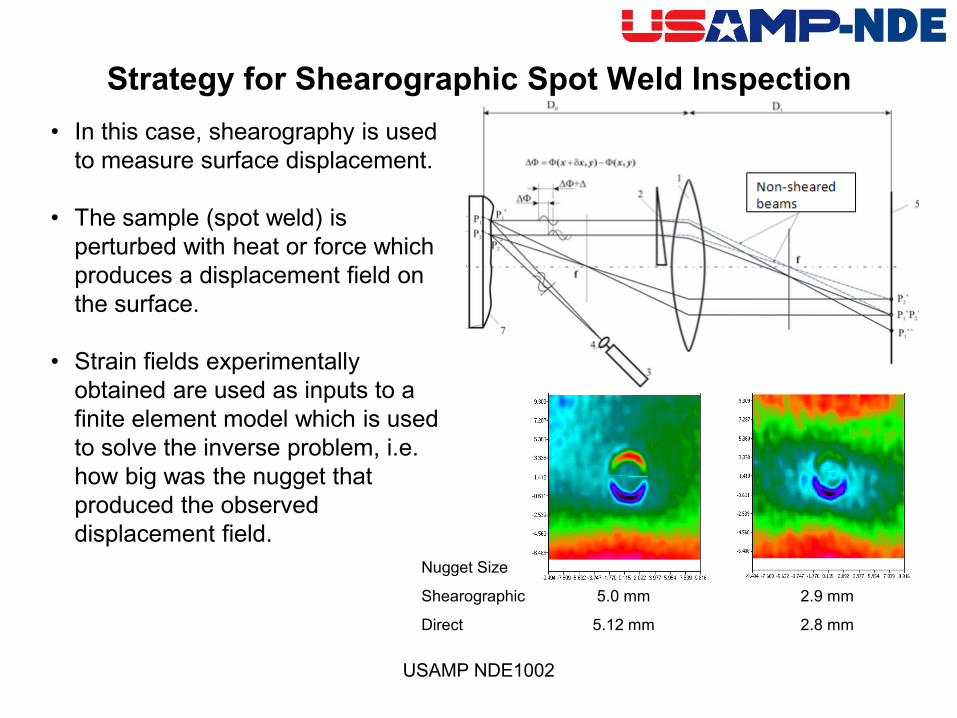
• Deliverables for the Concept Feasibility gate (completed) – Proposed design and configuration of optical system; – Description and comparison of the loading methods, – Mathematical formulation, and – Numerical algorithm description and implementation proposal.
USAMP NDE1002
Risk/challenge Method to overcome challenge Environmental disturbance in the shop environment will lower the signal to noise ratio
Directly measure strain instead of measuring displacements
Insufficient computer speed makes the shearographic inspection slow
Adopt efficient numerical algorithm, streamline calculation loops
Sensitivity to errors in optical measurements
Implement numerical schemes to filter unusual errors, and alleviate errors using regularization
Extract boundary data from optical measurements
Use interpolation / correlation numerical scheme

-NDE
Technical Accomplishments and Progress

-NDE Experimental Accomplishments
• Holography measures displacement directly, but is sensitive to environmental vibration.
• Shearography measures the first derivative of displacement which is immune to most noise.
• Shearography was selected as the most likely optical candidate.
USAMP NDE1002
Typical shearography diagram using Michelson interferometer.
Normal image of a spot weld.
Image captured by a shearing camera.
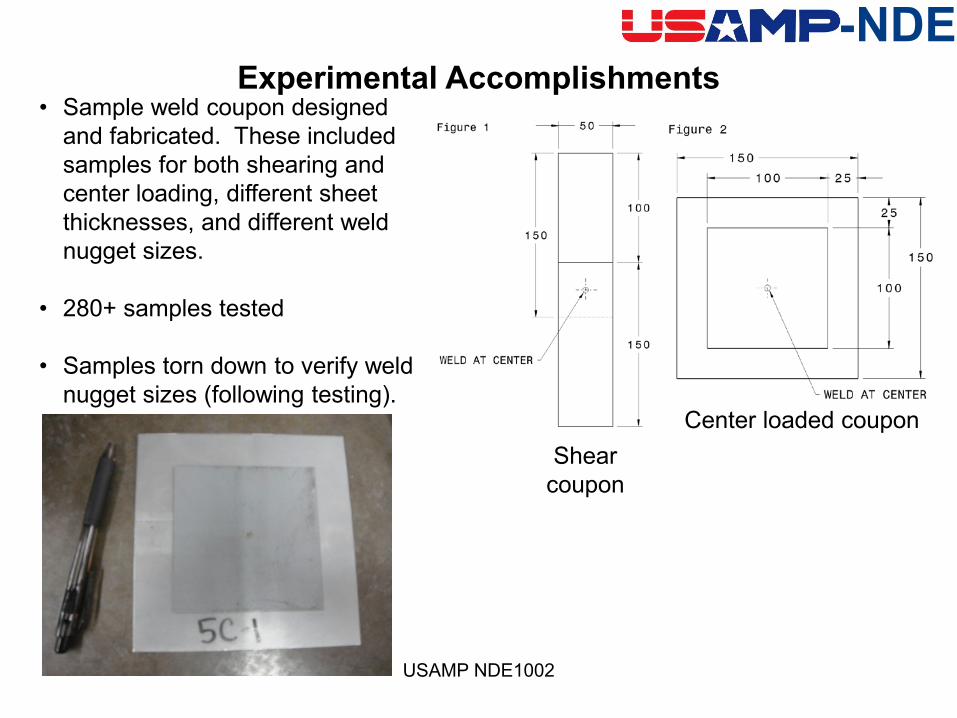
-NDE • Sample weld coupon designed
and fabricated. These included samples for both shearing and center loading, different sheet thicknesses, and different weld nugget sizes.
• 280+ samples tested
• Samples torn down to verify weld nugget sizes (following testing).
USAMP NDE1002
Experimental Accomplishments
Shear coupon
Center loaded coupon

-NDE • Static loading (perturbing)
schemes tested. • 3-point bend • Thermal (non-contact) • Magnetic (non-contact)
USAMP NDE1002
Experimental Accomplishments

-NDE • Large shearing
shearography tested • Works with RSW
• Fringe patterns are
distortion itself instead of first derivative as in typical shearography.
USAMP NDE1002
Experimental Accomplishments
Typical Large Shearing
-NDE
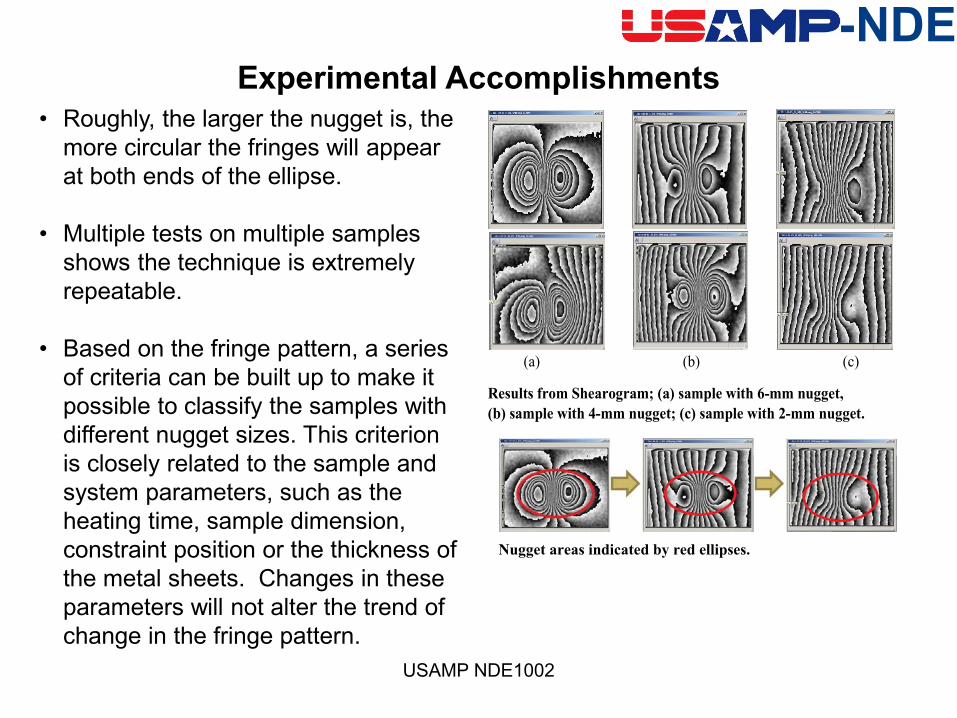
• Roughly, the larger the nugget is, the more circular the fringes will appear at both ends of the ellipse.
• Multiple tests on multiple samples shows the technique is extremely repeatable.
• Based on the fringe pattern, a series of criteria can be built up to make it possible to classify the samples with different nugget sizes. This criterion is closely related to the sample and system parameters, such as the heating time, sample dimension, constraint position or the thickness of the metal sheets. Changes in these parameters will not alter the trend of change in the fringe pattern.
USAMP NDE1002
Experimental Accomplishments
(a) (b) (c)
Results from Shearogram; (a) sample with 6-mm nugget, (b) sample with 4-mm nugget; (c) sample with 2-mm nugget.
Nugget areas indicated by red ellipses.
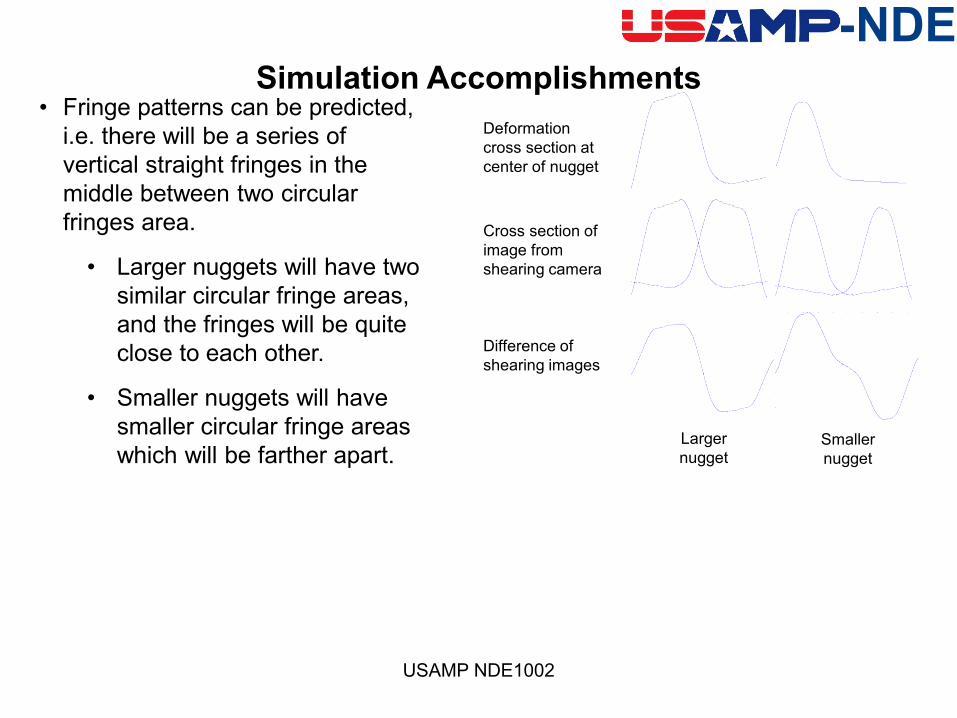
-NDE • Fringe patterns can be predicted,
i.e. there will be a series of vertical straight fringes in the middle between two circular fringes area.
• Larger nuggets will have two similar circular fringe areas, and the fringes will be quite close to each other.
• Smaller nuggets will have smaller circular fringe areas which will be farther apart.
USAMP NDE1002
Simulation Accomplishments Deformation cross section at center of nugget
Cross section of image from shearing camera
Difference of shearing images
Larger nugget
Smaller nugget

-NDE
• The spot weld plates (center loading design) are simulated as a 2D axisymmetric system.
• FE simulation of weld coupon with small plate pulled away from the larger along the edges (by magnetic force).
USAMP NDE1002
Simulation Accomplishments
(a) (b) Projection views of the weld sample, (b) Axisymmetric model with geometric parameters and locations of measurement points .
Computed deformation of coupon.

-NDE
• A genetic algorithm is used to solve the inverse problem. This is a minimization of the error in the measured and predicted displacements as a function of nugget size.
• The genetic solver is relative immune to the accuracy of the initial size guess.
• The solver converges to an accurate nugget size.
USAMP NDE1002
Simulation Accomplishments The calculated weld nugget size with two initial guesses from five measurement points.
Nugget Size, mm No. Guessed Calculated Actual 1 3.0 3.9995 4.0 2 5.0 4.0003 4.0
Computed performance of displacement prediction in the presence of noise.
-NDE
Collaboration, Summary, Future

-NDE Project Collaborators
Chrysler LLC (CLLC) George Harmon
Ford Motor Company (Ford)
Martin Jones
General Motors Company (GM) Leonid Lev (Chairman)
Daniel Simon
Oakland University Lianxiang Yang
Randy Gu Nan Xu Xin Xie
USAMP NDE1002

-NDE Future Work
• Project work completed Jan 2012.
USAMP NDE1002

-NDE Summary
• The nugget size of the spot weld is difficult to measure. Using the Shearography technique on heated spot welded sheet metal gives a very promising result in classifying them. Fringes will have a clear difference proportional to the nugget size. If several “perfect” welded samples are used as training data, this method can easily classify the samples into 3 groups: large, medium, or small. Hundreds of experiments were conducted on 30 samples and the repeatability of this testing is good.
• The inverse problem of determining the weld nugget size from known conditions and shearographic surface measurements was formulated as a minimization problem solved using a genetic algorithm. The proposed algorithm was tested using a number of examples with simulated experimental data. It was found that:
• The initial guess of the weld nugget size has little influence on the proposed numerical algorithm;
USAMP NDE1002
-NDE Summary
USAMP NDE1002
• Analogous to other numerical schemes for ill-posed inverse problems, use of excessive experimental measurements hampers the performance of the numerical algorithm;
• For an evenly inflated experimental data (Type I Error), the proposed algorithm predicts the correct trend for the weld nugget size – larger deflection with smaller weld nugget size;
• For the experimental data containing random noise (Type II Error), the algorithm correctly predicts the trend;
• When the experimental data contains a mild level of random noise (Type II Error) centered around the theoretical experimental measurements, the algorithm accurately predicts the weld nugget size.
• From the current study, it is shown that it has great potential to integrate the shearographic and the numerical methods to form a powerful tool for determining weld quality.
Top Related
Copyright © 2022 FDOKUMEN

