


Bahasa
Halaman
Hukum

IIMB-WP N0. 481
1
WORKING PAPER NO: 481
Expenditure Management in the Public Distribution System
Charan Singh
RBI Chair Professor Economics & Social Science
Indian Institute of Management Bangalore Bannerghatta Road, Bangalore – 5600 76
Ph: 080-26993818 [email protected]
Anushi Shah
PGP Student, IIMB [email protected]
Myanka Aggarwal PGP Student, IIMB
Padmakumar Nair PGP Student, IIMB
Ritanshu Kashyap PGP Student, IIMB
Shamil Mohamed PGP Student, IIMB
Shomrita Pal PGP Student, IIMB
Year of Publication –February 2015
IIMB-WP N0. 481
2
Expenditure Management in the Public Distribution System1 Abstract Food subsidy is a significant part of the cost incurred by the national exchequer. The Public
Distribution System (PDS) has been long criticised for its inefficient track record with enormous
leakages. This is a significant loss to the country. One of the main reasons for existence of leakages in
the PDS system is the price differential that exists between market prices of food grains and the price
at which it is sold at PDS. Additionally, the PDS has also faced criticism in recent years with regards
to the quality of food distributed through them, transparency in the distribution network, and lack of
coverage for passing benefits to the lower economic strata.
This paper describes a new model for the PDS which makes use of technology along with appropriate
process changes to address the issues plaguing the current system. It proposes changes to the manner
in which food grains are supplied to Fair Price Shops (FPS) and last mile delivery of grains to entitled
individuals. Together, it leads to the creation of a robust tight system aimed at effective delivery of
benefits to the needy individuals without wasteful leakages. Moreover, the paper considers the fact
that more than ensuring mere food security, it is also important to ensure that the needy receive a
nutritious meal at an affordable price. For this, the paper recommends making use of the extensive
reach of the PDS to distribute a more nutritious mix of food items to the poorer masses of the country.
Usage of PDS as a tool to regulate prices of critical food items will also result in significant cost
savings for the poor and the nation as a whole.
Key words: Public distribution system; Food Corporation of India; Food subsidy; Minimum support
price; and food grains.
1 The paper is based on field research and the field visit was undertaken in the Yeshwanthpur Wholesale Market, North Bangalore. The author would like to thank Shara Bhattacharjee for research assistance.
IIMB-WP N0. 481
3
Introduction: Public Distribution System – A Few Suggestions
India’s food subsidy scheme was put into place in order to bring about equity in distribution and
accessibility to food grains. Food subsidy is administered in a dual way in India. It has a producer
subsidy for farmers, by way of minimum support prices (MSP), and consumer subsidy by way of the
Central Issue Price (CIP) at which the food grains are sold. The Food Corporation of India (FCI)
procures food grains from the farmers at the MSP (set by the government) and further distributes them
at the CIP to consumers who benefit from various government food schemes and programs. The
consumer subsidy is absorbed by the FCI, which in turn is subsidised by the government for the
difference between the MSP (and other procurement and distribution costs) and the CIP.
This seems to be an effective system for achieving a dual objective of increasing supply and bringing
about equity in fulfilling demand. But much of the food subsidy program is subject to widespread
debate. At the centre of this debate is FCI that has been blamed for operational inefficiencies and poor
management of food stock that frequently leads to deterioration in the quality of food and inventory
problems at various nodes of the distribution network. According to the estimates, the leakage in PDS
system is as high as 90 percent in some states (Subramani, 2010). These inefficiencies have made
subsidies a wasteful expenditure as it does not reach the intended beneficiaries through the PDS.
Other than providing food security, PDS system is also responsible for ensuring price stability in the
economy. But recent incidents of high food inflation indicate that PDS needs to be seen as an
important tool for targeting inflation. This paper also looks at various instances of inflation in the
country and attempts to address the issue of inflation targeting using the PDS system.
Another important concern for a developing country like India is the increasing malnutrition in the
country. India is ranked below many of the less developed sub-Saharan countries in terms of extent of
malnutrition in the population. One-third of world’s children suffering malnutrition belong to India.2
While PDS was formed with the objective of providing food security to the country, it is important to
go beyond this objective and look at the larger picture of nutrition security. With its wide reach, PDS
can play an important role in achieving nutrition security for the Indian population if the current
leakages are plugged, and the mix of items made available through the PDS is changed.
The objective of this paper is to examine the FCI and PDS and suggest ways for effective
management of expenditure through use of technology. The paper further illustrates the use of the
improved PDS system to regulate prices of critical fruits and vegetables which contribute significantly
to rising food inflation - the cost of which is ultimately borne by the underprivileged of the country.
2 UNICEF (2012).
IIMB-WP N0. 481
4
The paper begins with an introduction to FCI and the PDS in Section II. These constitute the two most
important players responsible for procurement and distribution of food grains across the country. In
Section III, the paper discusses methods for improving the upstream supply chain of the PDS. A
discussion on successful models implemented by Tamil Nadu and Chhattisgarh is followed by a
proposal for a new model which leverages modern technology to contain leakages in the upstream
supply chain. In Section IV, the last mile delivery of food grains, looking at various inefficiencies that
the current system is facing has been discussed. This is followed by a proposal for set up of a new
process which brings in more accountability while keeping the implementation reasonably simple. In
Section V, the possibility of using PDS for inflation targeting and using its extensive reach to achieve
a higher objective of nutrition security for Indian population has been explored. Finally, Section VI
lays down implementation plan for the new PDS model.
Section II: Role of various governmental agencies in ensuring food security
Historically, in brief, government’s involvement in food grain marketing began after the failure of
food grain distribution system in the country led to Bengal famine in 1943. The job was delegated to
department of food under ministry of Agriculture. The prices of food started rising again in 1957. The
problem was attributed to an inefficient and disintegrated private food grain market and it was held
that government should control and even trade in food grain market to make the system more efficient
and aligned to the interests of the society.
Following this, FCI and Commission for Agricultural Costs and Prices (CACP) were founded in
1965. CACP’s role was to advise government on pricing of agricultural commodities, including food
grains. This resulted in creation of two food grain markets in India: a government controlled public
food grain market and an open private food grain market. While there are a lot of competing traders in
the private market, public market consists of just one player, that is, FCI.
Food Corporation of India
Until 1970’s, FCI handled all cereals including coarse cereals, but narrowed down to just wheat and
rice after 1980, although it continued to engage in some sugar distribution. Imports are completely
canalized through FCI and private traders are not allowed to import food grains. Also, essential
Commodities Act prohibits private traders and millers from stocking food grains beyond a stipulated
limit.
The objectives of FCI were to ensure the following-
1. Price support to farmers (producers) CACP advises a support price based on cost of production, changes in input prices, trends in
domestic open market and international prices, demand and supply, the estimated effect of
IIMB-WP N0. 481
5
changes in the support price on the industrial cost structure and the cost of living.3 Support
price sets the floor to the open market price.
2. Food grain distribution at subsidized price targeting the poor
This was achieved through PDS, which had following objectives-
a) Provide food grain to low-income consumers in order to maintain food availability.
b) Stabilize food grain prices through PDS prices that are below open market prices.
c) Transfer income to low-income consumers to raise their nutritional standards and
equalize food grain consumption.
3. Buffer stock maintenance to ensure national food security
FCI is charged with the duty to maintain stock of food grains to ensure food security for the
country. The motives of private and public storages are different. Private traders store in order
to make profit from off-season price rises. On the other hand, public storage aims at reducing
off-season prices. Public storage helps the producers during surplus years and consumers
during deficit years.
FCI has a network of storage depots, including silos, godowns and an indigenous method
developed by FCI called CAP (Cover and Plinth). CAP is the term given to storage of food grains
in the open with precautions like rat and damp proof plinths, etc. covering of stacks with specially
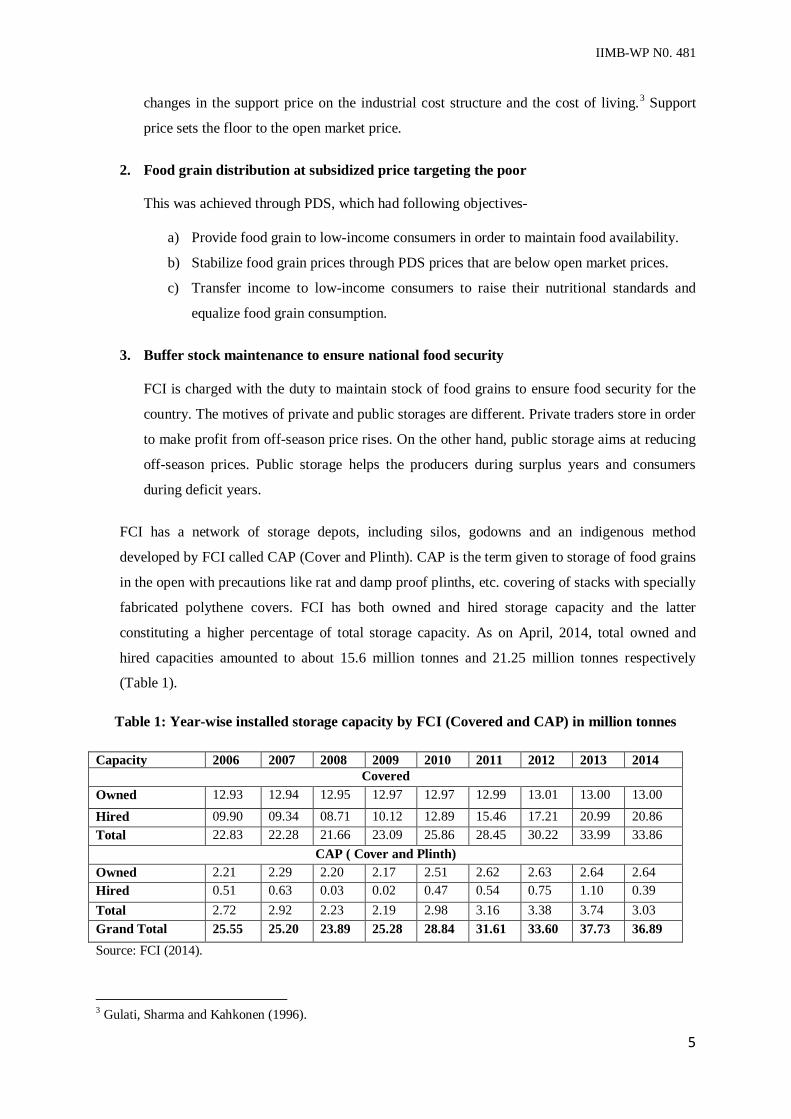
fabricated polythene covers. FCI has both owned and hired storage capacity and the latter
constituting a higher percentage of total storage capacity. As on April, 2014, total owned and
hired capacities amounted to about 15.6 million tonnes and 21.25 million tonnes respectively
(Table 1).
Table 1: Year-wise installed storage capacity by FCI (Covered and CAP) in million tonnes
Capacity 2006 2007 2008 2009 2010 2011 2012 2013 2014 Covered
Owned 12.93 12.94 12.95 12.97 12.97 12.99 13.01 13.00 13.00
Hired 09.90 09.34 08.71 10.12 12.89 15.46 17.21 20.99 20.86 Total 22.83 22.28 21.66 23.09 25.86 28.45 30.22 33.99 33.86
CAP ( Cover and Plinth) Owned 2.21 2.29 2.20 2.17 2.51 2.62 2.63 2.64 2.64 Hired 0.51 0.63 0.03 0.02 0.47 0.54 0.75 1.10 0.39 Total 2.72 2.92 2.23 2.19 2.98 3.16 3.38 3.74 3.03 Grand Total 25.55 25.20 23.89 25.28 28.84 31.61 33.60 37.73 36.89 Source: FCI (2014).
3 Gulati, Sharma and Kahkonen (1996).
IIMB-WP N0. 481
6
An additional capacity of about 19.7 MT is in pipeline. Even with the increased storage, FCI capacity
will not be sufficient to meet total storage requirements. For example, all time high stock levels
achieved in 2012 was about 82.3 MT, while the current capacity is only about 50 percent of this.4
Transportation
Surplus food grain which is mainly confined to the Northern States is transported over long distance
throughout the country to deliver to deficit states. Stocks procured in the markets and purchase centres
is first collected in the nearest depot and from there dispatched to the recipient States within a limited
time. Main transportation method is rail while coastal transportation modes are also explored.
Import of food grains
FCI also acts as the body responsible for food grain imports.
For FCI to be considered economically efficient revenues of FCI should cover its costs and the costs
should be comparable to those of private traders. But it has been seen that operational costs of FCI has
been much higher than those of private traders who work in a much restrictive environment than FCI.
For example, FCI enjoys concessional freight and credit rates and is free from selective credit controls
and movement restrictions. Economic cost of FCI comes from MSP, procurement and distribution
costs while revenue comes from the weighted average of issue prices at which FCI has sold food
grains to states. If per unit costs exceed the revenue, the difference is reimbursed to FCI by
government as a consumer subsidy. FCI also incurs costs from carrying buffer stocks, which are also
totally reimbursed by government. Hence total subsidy to FCI consists of- a) cost minus revenue, and
b) storage costs of buffer stock.
Also, the gap between economic costs and revenues has been widening over the years.
Cost analysis
In this section, an attempt has been made to look at the various cost heads involved in the operations
of the FCI. The various costs can be broadly categorized as procurement costs and distribution costs.5
a) Procurement costs Procurement costs are costs associated with procurement of food grains by the FCI. This can
further be classified as obligatory and non-obligatory costs.
• Obligatory costs
It consists of about 70 percent of total procurement costs and includes mandi charges,
sales/purchase tax and cost of gunny bags. Obligatory costs are generally higher for FCI
4 Parsai (2012). 5 Gulati, Sharma and Kahkonen (1996).
IIMB-WP N0. 481
7
compared to private traders due to strict adherence to mandi system and superior bags
used.
• Non-obligatory costs
It consists of about 30 percent of total procurement costs and is controllable by FCI. This
includes storage charges, mandi labour, internal movement costs etc.
b) Distribution Costs
FCI faces various costs associated with distribution of Food grains. Some of these are-
• Interest costs FCI receives concessional credit through a consortium of Indian commercial banks and
hence interest costs are significantly low compared to private traders.
• Freight charges
Freight charges are significantly lower due to usage of rail mode to transport food grains
within and between regions. But physical losses and pilferage are high in rail mode
compared to road mode. Hence freight differential goes down considering different
aspects like quality of service, flexible freight structure, delays, transit losses and
pilferage, difference in baggaging, etc.
• Handling charges
Handling charges include charges at mandis, ports and rail depots. The charges are
almost the same for FCI and private traders.
• Storage and transit shortages
Storage losses occur due to loss of weight, infestation, deterioration of stocks and theft.
Transit shortages occur due to missing wagons, natural calamities, theft and pilferage.
These costs are higher for FCI compared to private traders. National policy on bulk
handling storage and transportation of food grains was enacted with the objectives of
minimizing storage and transit losses.
• Administrative expenses
FCI has higher administrative costs than private traders due to increased staff costs.
IIMB-WP N0. 481
8
Public Distribution System
The PDS forms the distribution network for delivering food grains to the needy. PDS started in India
during the British era during 1940's to address the need of distribution of food grains and other
essential items during famines.6 The PDS was then concentrated around the urban parts of the
country. Since then the PDS has evolved into a large network covering urban, rural, hilly and tribal
areas. The last-mile delivery is done through Fair Price Shops (FPS).
Before 1992, the entitlements were general and any Indian citizen could benefit from them. This did
not distinguish the population based on area or income. In 1992, as a measure towards improving the
PDS and food security situation in the country, the Revamped PDS (RPDS) was launched. RPDS took
an area specific view of the situation. The main aim was to strengthen the existing PDS system and
extend it to far-flung regions of the country - such as hilly and tribal areas. Also as part of the RPDS,
the central government identified and implemented area specific programs such as Drought Prone
Area Programme (DPAP), Integrated Tribal Development Projects (ITDP), Desert Development
Programme (DDP) and certain Designated Hill Areas (DHA). These projects were identified in
consultation with the State governments.
The main focus of the TPDS was to identify the poor and hungry population and provide them with
required food grains. While universal and revamped PDS did not consider the distribution of need for
food grains, TPDS attempts to do that. The job of identification of Below Poverty Line families was
given to the state governments (using the parameters provided by the Planning Commission). The
scheme aimed to benefit 6 crore population through 5 lakh FPS.
In December 2000, the Antyodaya Anna Yojana was launched to active, identify and target the
poorest of the poor set of population. They were given food grains at a highly subsidized rate of Rs.
2/kg. Initially the program included a population of 1 crore families, which has now increased to
about 2.5 crore poorest of the poor households. The overall functioning of the TPDS is described in
the flow diagram presented in Figure 1.
6Government of India, Department of Food and Public Distribution.
IIMB-WP N0. 481
9
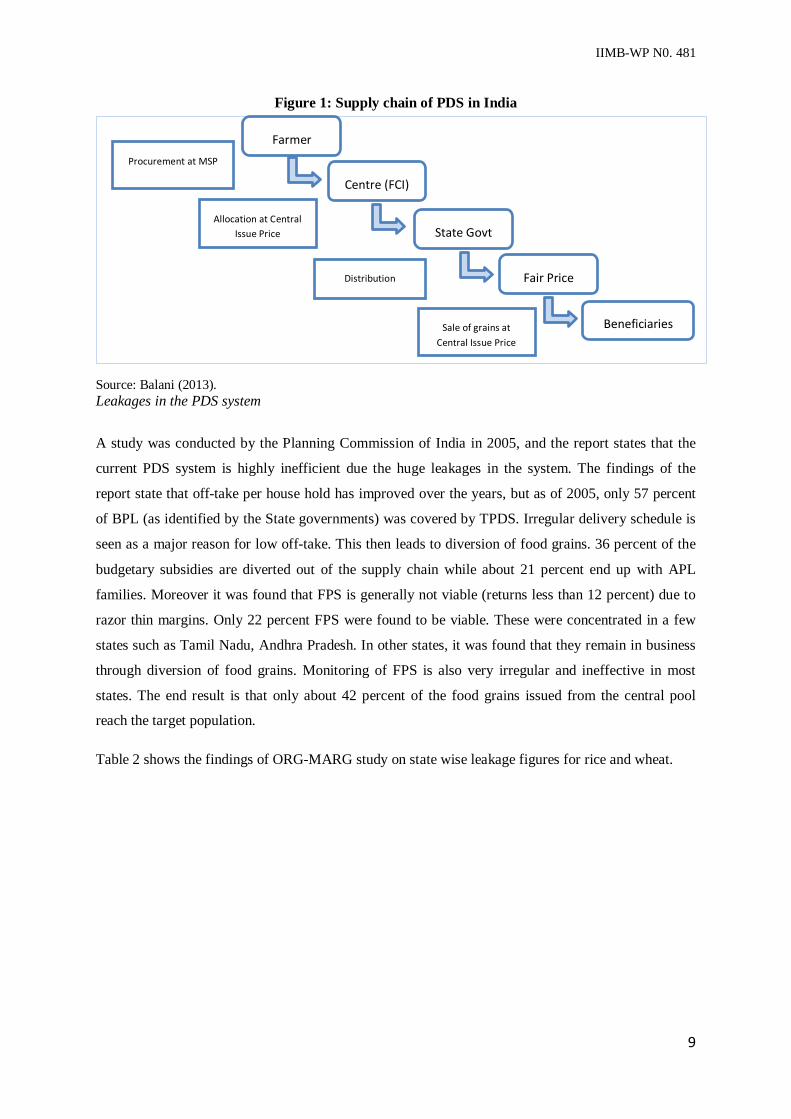
Figure 1: Supply chain of PDS in India
Source: Functioning of the Public Distribution System: An analytical report by Sakshi Balani (December 2013) Source: Balani (2013). Leakages in the PDS system
A study was conducted by the Planning Commission of India in 2005, and the report states that the
current PDS system is highly inefficient due the huge leakages in the system. The findings of the
report state that off-take per house hold has improved over the years, but as of 2005, only 57 percent
of BPL (as identified by the State governments) was covered by TPDS. Irregular delivery schedule is
seen as a major reason for low off-take. This then leads to diversion of food grains. 36 percent of the
budgetary subsidies are diverted out of the supply chain while about 21 percent end up with APL
families. Moreover it was found that FPS is generally not viable (returns less than 12 percent) due to
razor thin margins. Only 22 percent FPS were found to be viable. These were concentrated in a few
states such as Tamil Nadu, Andhra Pradesh. In other states, it was found that they remain in business
through diversion of food grains. Monitoring of FPS is also very irregular and ineffective in most
states. The end result is that only about 42 percent of the food grains issued from the central pool
reach the target population.
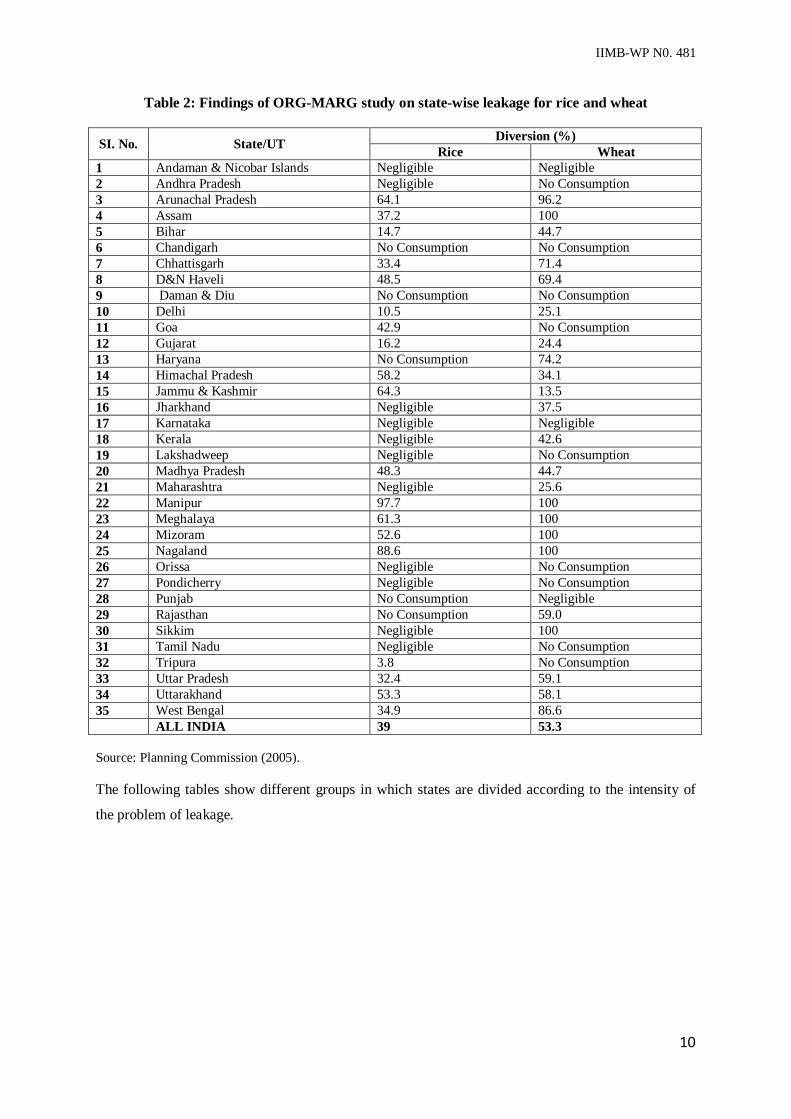
Table 2 shows the findings of ORG-MARG study on state wise leakage figures for rice and wheat.
Procurement at MSP Centre (FCI)
Allocation at Central Issue Price
Farmer
Distribution Fair Price
Sale of grains at Central Issue Price
State Govt
Beneficiaries
IIMB-WP N0. 481
10
Table 2: Findings of ORG-MARG study on state-wise leakage for rice and wheat
SI. No. State/UT Diversion (%) Rice Wheat
1 Andaman & Nicobar Islands Negligible Negligible 2 Andhra Pradesh Negligible No Consumption 3 Arunachal Pradesh 64.1 96.2 4 Assam 37.2 100 5 Bihar 14.7 44.7 6 Chandigarh No Consumption No Consumption 7 Chhattisgarh 33.4 71.4 8 D&N Haveli 48.5 69.4 9 Daman & Diu No Consumption No Consumption 10 Delhi 10.5 25.1 11 Goa 42.9 No Consumption 12 Gujarat 16.2 24.4 13 Haryana No Consumption 74.2 14 Himachal Pradesh 58.2 34.1 15 Jammu & Kashmir 64.3 13.5 16 Jharkhand Negligible 37.5 17 Karnataka Negligible Negligible 18 Kerala Negligible 42.6 19 Lakshadweep Negligible No Consumption 20 Madhya Pradesh 48.3 44.7 21 Maharashtra Negligible 25.6 22 Manipur 97.7 100 23 Meghalaya 61.3 100 24 Mizoram 52.6 100 25 Nagaland 88.6 100 26 Orissa Negligible No Consumption 27 Pondicherry Negligible No Consumption 28 Punjab No Consumption Negligible 29 Rajasthan No Consumption 59.0 30 Sikkim Negligible 100 31 Tamil Nadu Negligible No Consumption 32 Tripura 3.8 No Consumption 33 Uttar Pradesh 32.4 59.1 34 Uttarakhand 53.3 58.1 35 West Bengal 34.9 86.6 ALL INDIA 39 53.3 Source: Planning Commission (2005). The following tables show different groups in which states are divided according to the intensity of
the problem of leakage.
IIMB-WP N0. 481
11
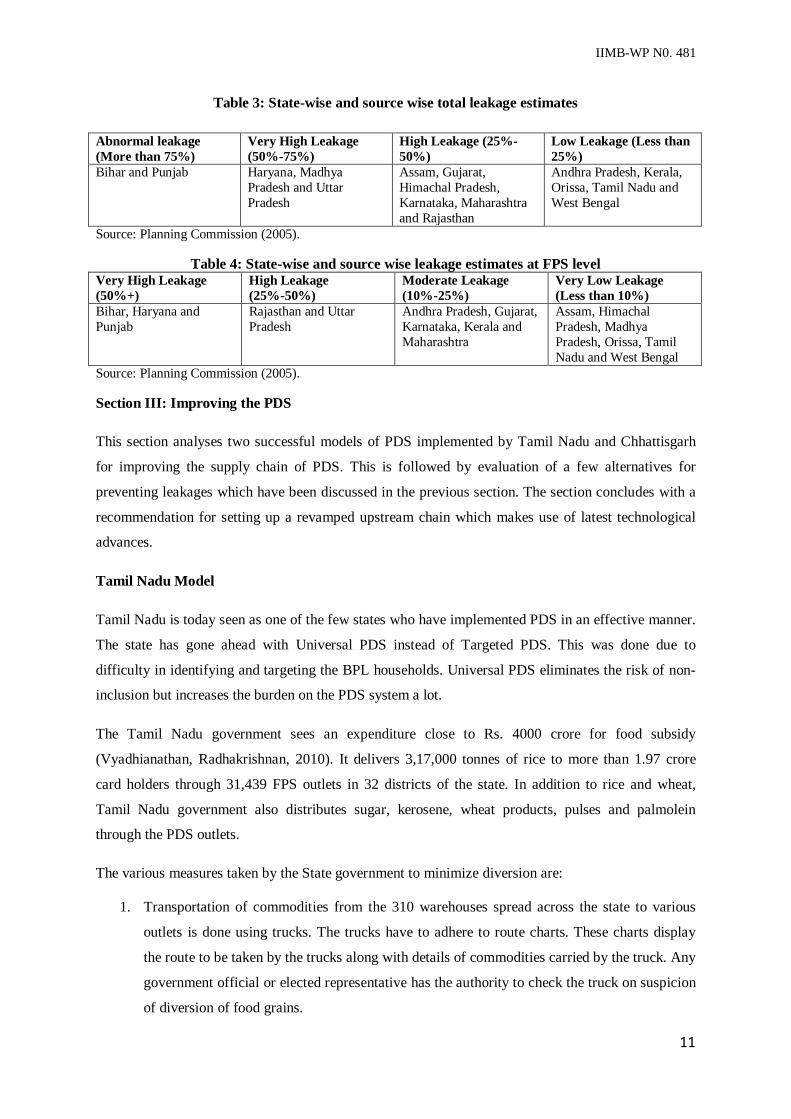
Table 3: State-wise and source wise total leakage estimates
Abnormal leakage (More than 75%)
Very High Leakage (50%-75%)
High Leakage (25%-50%)
Low Leakage (Less than 25%)
Bihar and Punjab Haryana, Madhya Pradesh and Uttar Pradesh
Assam, Gujarat, Himachal Pradesh, Karnataka, Maharashtra and Rajasthan
Andhra Pradesh, Kerala, Orissa, Tamil Nadu and West Bengal
Source: Planning Commission (2005).
Table 4: State-wise and source wise leakage estimates at FPS level Very High Leakage (50%+)
High Leakage (25%-50%)
Moderate Leakage (10%-25%)
Very Low Leakage (Less than 10%)
Bihar, Haryana and Punjab
Rajasthan and Uttar Pradesh
Andhra Pradesh, Gujarat, Karnataka, Kerala and Maharashtra
Assam, Himachal Pradesh, Madhya Pradesh, Orissa, Tamil Nadu and West Bengal
Source: Planning Commission (2005).
Section III: Improving the PDS
This section analyses two successful models of PDS implemented by Tamil Nadu and Chhattisgarh
for improving the supply chain of PDS. This is followed by evaluation of a few alternatives for
preventing leakages which have been discussed in the previous section. The section concludes with a
recommendation for setting up a revamped upstream chain which makes use of latest technological
advances.
Tamil Nadu Model
Tamil Nadu is today seen as one of the few states who have implemented PDS in an effective manner.
The state has gone ahead with Universal PDS instead of Targeted PDS. This was done due to
difficulty in identifying and targeting the BPL households. Universal PDS eliminates the risk of non-
inclusion but increases the burden on the PDS system a lot.
The Tamil Nadu government sees an expenditure close to Rs. 4000 crore for food subsidy
(Vyadhianathan, Radhakrishnan, 2010). It delivers 3,17,000 tonnes of rice to more than 1.97 crore
card holders through 31,439 FPS outlets in 32 districts of the state. In addition to rice and wheat,
Tamil Nadu government also distributes sugar, kerosene, wheat products, pulses and palmolein
through the PDS outlets.
The various measures taken by the State government to minimize diversion are:
1. Transportation of commodities from the 310 warehouses spread across the state to various
outlets is done using trucks. The trucks have to adhere to route charts. These charts display
the route to be taken by the trucks along with details of commodities carried by the truck. Any
government official or elected representative has the authority to check the truck on suspicion
of diversion of food grains.
IIMB-WP N0. 481
12
2. Opening of control rooms in every district to receive and act on information about diversion
of food grains.
3. GPS based vehicle movement monitoring is being run on pilot basis in districts of Krishnagiri
and Thiruvallur.
4. Introduction of online go-down monitoring systems to capture all transactions taking place in
various warehouses.
5. Tight monitoring of FPS through use of technology has been introduced. SMS based FPS
stock monitoring has been set up by the Cooperative Department. This enables tracking of
stock of the commodities at every FPS. As a result of this tracking system, replenishments are
faster and it is difficult to divert food grains from FPS. A sudden increase in off-take from a
FPS brings the FPS under the scanner of the vigilance department.
6. Handheld billing machines with GPRS connection have been installed in all FPS in Chennai
to help monitor sales and stock levels on a real time basis.
7. Electronic weighing machines are provided in every FPS to avoid short measurement related
complaints.
8. Online portal for grievance registration has been set up and is being actively monitored by the
concerned authorities.
9. Most of the FPS’ are run by the government or its agencies. While most shops run at losses,
the state government has been providing these shop owners with a subsidy amounting to Rs.
300 crores to cover costs related to wages, establishment costs etc.
10. Criminal prosecution is launched against shop owners indulging in malpractices. Vehicle
permits and licenses are cancelled if truck drivers are found diverting food grains.
Chhattisgarh Model The Chhattisgarh government started undertaking PDS reforms since 2004.7 The PDS network
currently covers about 36 lakh households. The development of Chhattisgarh model can be described
as follows:
1. Ownership of FPS was transferred to community run institutions like gram panchayats, forest
councils employing tribal, women self-help groups etc. This led to increase in accountability.
Shops run by private owners who did not live in the same village were not open all days of
the year, but community owned shops were accountable to the villagers and hence performed
better.
2. The PDS commissions were raised from Rs. 8 per quintal to Rs. 35 per quintal. This move
was done to address the issue of losses in running a FPS. Seed capital of Rs. 75,000 was also
7 IBN (2011).
IIMB-WP N0. 481
13
given to open new PDS outlets. The government spent about Rs. 80 crore per year for this
purpose.
3. Raids were conducted to crack down diversion and re-selling of rice by rice mill owners.
4. Centralized re-printing of BPL cards was carried out to remove the ghost card holders.
5. Apart from the BPL families identified, the state extended the facility by adding automatic
inclusion of old, destitute, disabled and primary tribal groups.
6. The charge of transportation of food grains was taken out of private players and given to Civil
Supplies Cooperation. This was done to stop diversion of food grains before they reach the
PDS outlets.
7. Web based application was deployed to track the procurement, transportation and delivery of
food grains.
8. Awareness programs such as "Chawal Utsav" were launched to bring in awareness among
people about their entitlements. This also increased transparency of the process.
Recommendation- Extensive use of IT based solutions Advances in information and communication technology can help make the system more efficient and
transparent. IT solutions help in re-engineering government business processes and adapting it for
focused service delivery. IT can help in operationalizing right to information to public through online
grievance redressal and such similar systems. IT will also help institutionalize reporting through a
management information system. But integrating IT systems right to the last mile end point fair price
shop level is a difficult but necessary prerequisite for the system to be completely effective.
Moreover, economic, infrastructural and physical constraints like lack of power and connectivity in
remote rural and hilly areas, huge investments involved and vast expanse of the country are a few
major hurdles for a full-scale implementation of IT solutions.
The following model illustrates the proposal for addressing leakages in the upstream supply chain
from procurement till delivery at the individual FPS. It aims to bring together some of the best
features of the solutions discussed above, while also addressing the fundamental cause for leakages in
the system.
The main reason for diversion of food grains at various stages of the supply chain is the existence of
price differential between subsidized FPS prices and market prices along with retention of ownership
by FCI.
This section proposes the following changes to the existing system:
1. Transfer of ownership from one entity to the other at every stage of the PDS system at
prevailing market prices.
IIMB-WP N0. 481
14
2. Use of Radio-Frequency Identification (RFID) tagged sacks to track the flow of goods along
with efficient inventory management.
3. Use of banking system to compensate the FPS owners based on actual sales of food grains.
The following details are presented for a better understanding- Procurement At this stage, FCI must tag each procured sack of food grain using a RFID tag which will contain
important information related to time and place of procurement, price information, type quantity and
quality related information etc.
a) Transportation
The transportation agency must buy the food grains from the procurement centre at the
market price and transfer it to the FCI godown. The FCI godowns at each state will receive
the goods after paying the market price for the same along with transportation charges. Any
losses in this stage must be borne by the transportation agency.
b) Storage at FCI godowns
At the FCI godowns, which are government owned/operated entities, the supervisor's salary
incentives should be tied to the losses incurred at the godown. At reception, FCI godown must
scan and record the receipt of each sack along with all the associated details. It should also
record details such as time of receipt, FCI godown details, quantity received etc. This
information will be used for reconciliation with the previous stages. The losses incurred
would be evident from the outflow of goods from the godown along with inventory of goods
held at the godown. The process of reconciliation is made easy with the use of RFID tags.
c) Fair Price Shops
At the Fair Price shops, again the receipt of food grains must be followed by scanning to
RFID tags to make a record of quantity received, time of receipt, quantity received etc.
Payment at full market rate must be made by the FPS owner to the transportation agency
based on the amount of food grains actually received. The fair price shop owner is required to
have an account with a bank, through which he will be compensated for the payment made
based on actual sales recorded.
d) Centralized IT infrastructure
A centralized IT infrastructure needs to be set up to track the movement of goods (using
RFID tags) and detect discrepancies, if any, from one stage to the other. This system should
IIMB-WP N0. 481
15
also be used to compensate the FPS owners based on amount of actual sales done (refer to
section II for details on reconcilement of sales). This system can also be used for planned
procurement, effective inventory management and distribution of food grains to areas which
are in most need of food supply.
This scheme requires the FPS owners to have a bank account, but does not require every ration card
holder to have a bank account.
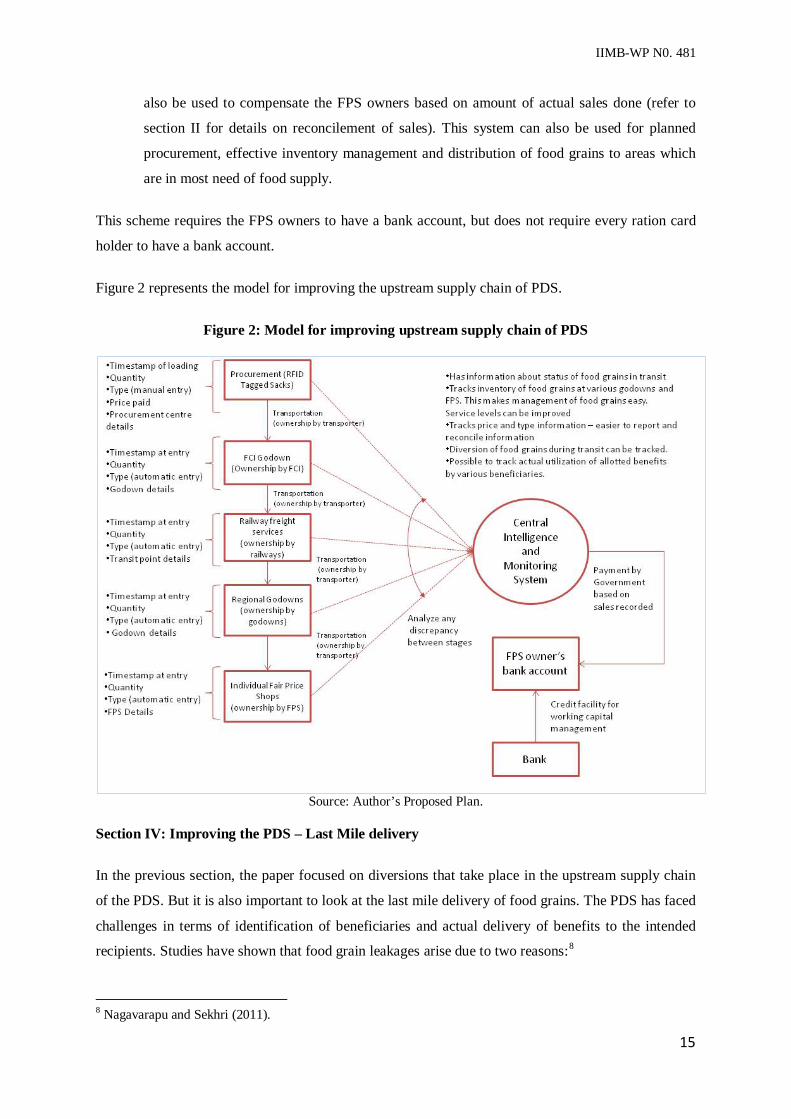
Figure 2 represents the model for improving the upstream supply chain of PDS.
Figure 2: Model for improving upstream supply chain of PDS
Source: Author’s Proposed Plan.
Section IV: Improving the PDS – Last Mile delivery
In the previous section, the paper focused on diversions that take place in the upstream supply chain
of the PDS. But it is also important to look at the last mile delivery of food grains. The PDS has faced
challenges in terms of identification of beneficiaries and actual delivery of benefits to the intended
recipients. Studies have shown that food grain leakages arise due to two reasons:8
8 Nagavarapu and Sekhri (2011).
IIMB-WP N0. 481
16
1. Errors in the allocation of the BPL cards by officials or creation of ghost cards. While some
of these errors must be systemic, in terms of not updating the database, deliberate actions by
local authorities could play a major role. It has been noted that the current implementation
results in error of exclusion of BPL families and error in inclusion of beneficiaries (APL
families are included). This shows the extent of misclassification of population, when the idea
of TPDS is based on effective targeting of poor.
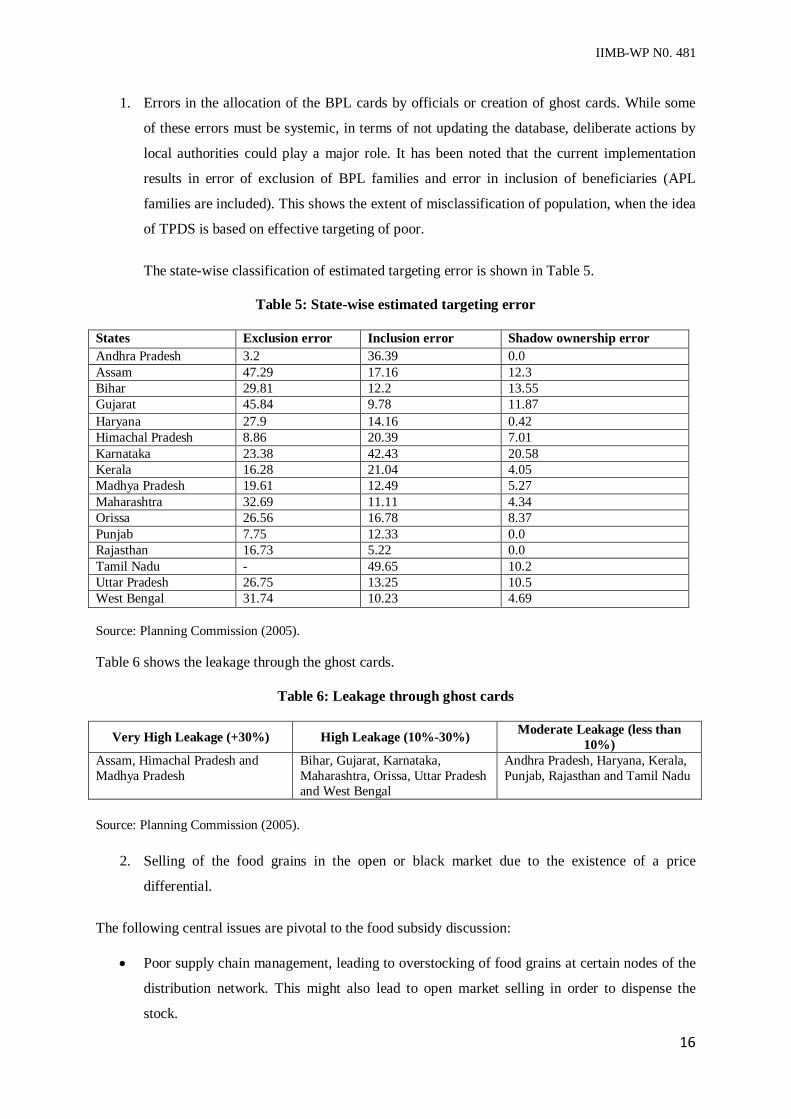
The state-wise classification of estimated targeting error is shown in Table 5.
Table 5: State-wise estimated targeting error
States Exclusion error Inclusion error Shadow ownership error Andhra Pradesh 3.2 36.39 0.0 Assam 47.29 17.16 12.3 Bihar 29.81 12.2 13.55 Gujarat 45.84 9.78 11.87 Haryana 27.9 14.16 0.42 Himachal Pradesh 8.86 20.39 7.01 Karnataka 23.38 42.43 20.58 Kerala 16.28 21.04 4.05 Madhya Pradesh 19.61 12.49 5.27 Maharashtra 32.69 11.11 4.34 Orissa 26.56 16.78 8.37 Punjab 7.75 12.33 0.0 Rajasthan 16.73 5.22 0.0 Tamil Nadu - 49.65 10.2 Uttar Pradesh 26.75 13.25 10.5 West Bengal 31.74 10.23 4.69 Source: Planning Commission (2005). Table 6 shows the leakage through the ghost cards.
Table 6: Leakage through ghost cards
Very High Leakage (+30%) High Leakage (10%-30%) Moderate Leakage (less than 10%)
Assam, Himachal Pradesh and Madhya Pradesh
Bihar, Gujarat, Karnataka, Maharashtra, Orissa, Uttar Pradesh and West Bengal
Andhra Pradesh, Haryana, Kerala, Punjab, Rajasthan and Tamil Nadu
Source: Planning Commission (2005).
2. Selling of the food grains in the open or black market due to the existence of a price
differential.
The following central issues are pivotal to the food subsidy discussion:
• Poor supply chain management, leading to overstocking of food grains at certain nodes of the
distribution network. This might also lead to open market selling in order to dispense the
stock.
IIMB-WP N0. 481
17
• Lack of transparency in the distribution network to track the effectiveness of the supply in
meeting equitable demand as proposed by the food subsidy program.
• Lack of availability of clean and sizeable go-downs for effective stock keeping and storage,
leading to a deterioration of the food grains before reaching the end consumer.
Each of these issues point out to the need for revamping the distribution system in order to make it
more effective for the lowest economic strata of the country.
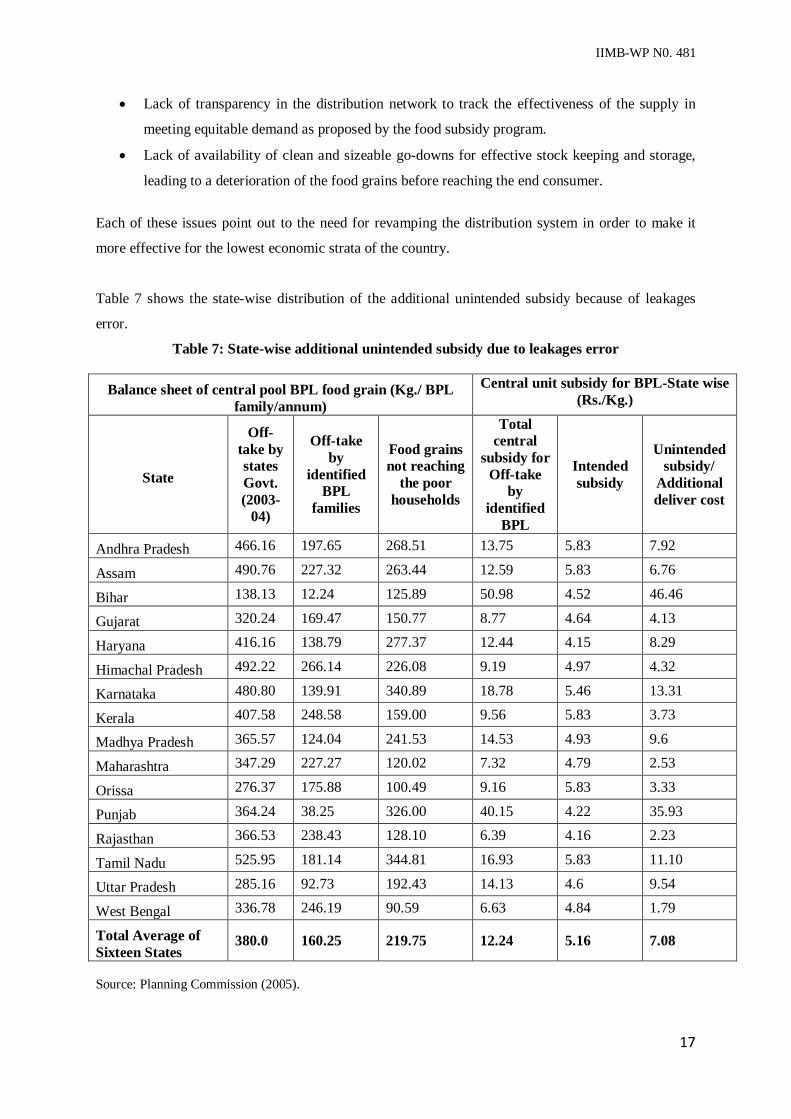
Table 7 shows the state-wise distribution of the additional unintended subsidy because of leakages
error.
Table 7: State-wise additional unintended subsidy due to leakages error
Balance sheet of central pool BPL food grain (Kg./ BPL family/annum)
Central unit subsidy for BPL-State wise (Rs./Kg.)
State
Off-take by states Govt. (2003-
04)
Off-take by
identified BPL
families
Food grains not reaching
the poor households
Total central
subsidy for Off-take
by identified
BPL
Intended subsidy
Unintended subsidy/
Additional deliver cost
Andhra Pradesh 466.16 197.65 268.51 13.75 5.83 7.92
Assam 490.76 227.32 263.44 12.59 5.83 6.76
Bihar 138.13 12.24 125.89 50.98 4.52 46.46
Gujarat 320.24 169.47 150.77 8.77 4.64 4.13
Haryana 416.16 138.79 277.37 12.44 4.15 8.29
Himachal Pradesh 492.22 266.14 226.08 9.19 4.97 4.32
Karnataka 480.80 139.91 340.89 18.78 5.46 13.31
Kerala 407.58 248.58 159.00 9.56 5.83 3.73
Madhya Pradesh 365.57 124.04 241.53 14.53 4.93 9.6
Maharashtra 347.29 227.27 120.02 7.32 4.79 2.53
Orissa 276.37 175.88 100.49 9.16 5.83 3.33
Punjab 364.24 38.25 326.00 40.15 4.22 35.93
Rajasthan 366.53 238.43 128.10 6.39 4.16 2.23
Tamil Nadu 525.95 181.14 344.81 16.93 5.83 11.10
Uttar Pradesh 285.16 92.73 192.43 14.13 4.6 9.54
West Bengal 336.78 246.19 90.59 6.63 4.84 1.79
Total Average of Sixteen States
380.0 160.25 219.75 12.24 5.16 7.08
Source: Planning Commission (2005).
IIMB-WP N0. 481
18
The Issues in Last Mile Delivery In terms of last mile delivery, two major issues that have been identified are as follows:
a) Entitlement for eligible households The lowest economic strata, that are in need of the food grains, are not getting access to
the same in the PDS. Several issues such as inaccurate identification of BPL households,
creation of counterfeit ghost cards and lack of availability of low price grains at the FPS
are the cause of this issue. As a result, the food subsidy has become regressive to a large
extent.
b) Poor quality of food at the FPS
One of the biggest criticisms of the PDS revolves around the poor quality of the grains
and foodstuff that reaches the FPS, particularly in more remote areas. Research suggests
that the reason for this is the excessive stocking and surplus inventory at various points
along the distribution system. Ineffective demand estimation, coupled with the pressure to
maintain the MSP has led to this major problem in the PDS.
Recommendation: A ‘Robust’ PDS model for efficient last mile delivery In policy debates regarding the food distribution system, two broad camps have emerged that propose
separate solutions for the aforementioned issues. The first camp talks about a complete overhaul of
the PDS, and its replacement with food coupons and direct cash transfers. On the other hand, the
second camp proposes greater transparency and monitoring of the existing system.
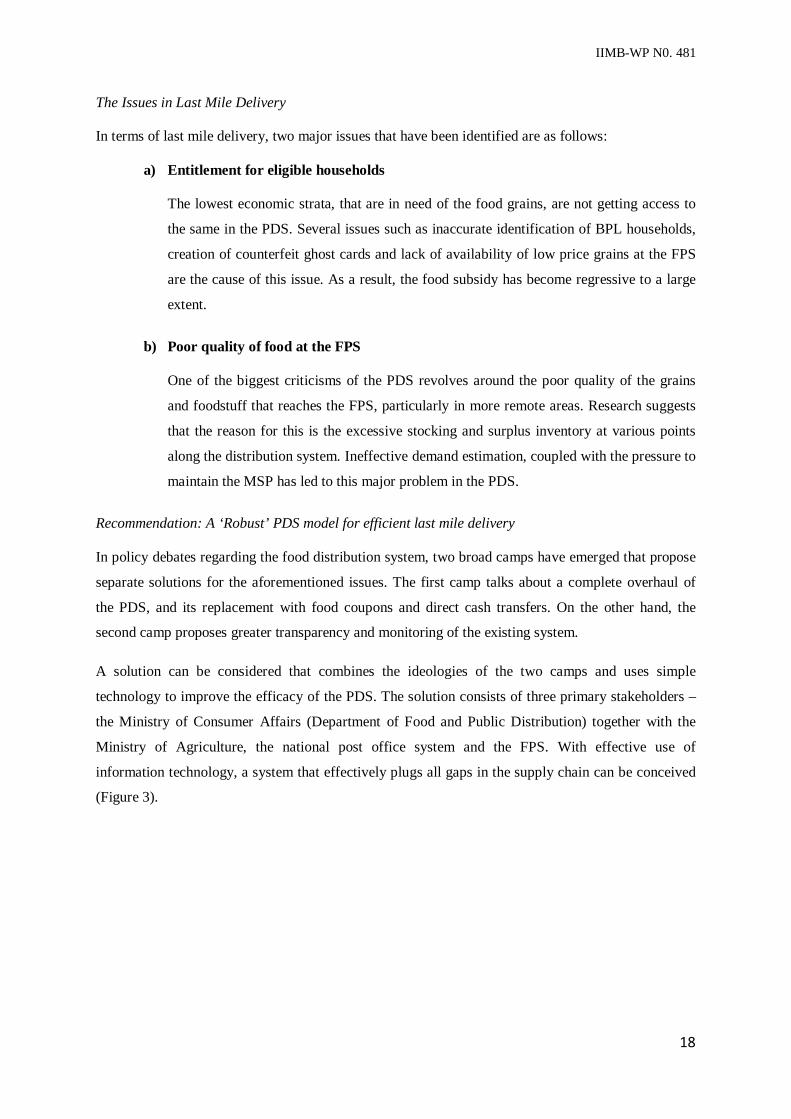
A solution can be considered that combines the ideologies of the two camps and uses simple
technology to improve the efficacy of the PDS. The solution consists of three primary stakeholders –
the Ministry of Consumer Affairs (Department of Food and Public Distribution) together with the
Ministry of Agriculture, the national post office system and the FPS. With effective use of
information technology, a system that effectively plugs all gaps in the supply chain can be conceived
(Figure 3).
IIMB-WP N0. 481
19
Figure 3: The revamped model for last mile delivery using Information and Technology
Source: Author’s Proposed Plan. The following are the solutions provided for improving the efficacy of the PDS-
1) Food coupons through the post office system The post offices are the most far reaching entity on the rural map. Under the proposed system,
post offices would be given the responsibility of distributing food coupons every month to
rural households, disbursed by the Ministry of Consumer Affairs, for all individuals entitled
to the food subsidy. Post offices are geographically closest to the general public and the
postman continues to be the trustworthy fellow who shall deliver food coupons to the
households identified as true beneficiaries under the food subsidy program. As the food
coupons are named to the respective family heads, factors such as coupon trading amongst
villagers, creation of ghost cards or false entitlements, lack of internet connectivity for live
data tracking are prevented, and every entitled household effectively receives its ticket for a
claim in the food subsidy program.
2) Biometric scanners at the fair price shops
The Aadhaar card campaign has made significant progress in centralising the database of all
Indian citizens, including fingerprint biometric data. Biometric scanners at the fair price shops
could enable every citizen holding the food coupon (received using the post office system) to
claim and verify the collection of food grains from the shops. On receipt of the desired level
of food grains, the coupon holder would scan his or her fingerprints at the fair price shop to
IIMB-WP N0. 481
20
validate the end-point sale to the beneficiary. This transaction data would be relayed upward
and tracked by the Ministry of Consumer Affairs to identify possible gaps in the delivery of
the food grains. Additionally, this system ensures that only the deserving beneficiary receives
the quantity of food grains he or she is entitled to.
3) Demand tracking at every level
One of the central issues in the PDS was the supply of poor quality food. The major reason
identified for this was inefficient demand estimation, leading to overstocking of grains at
various nodes of the supply chain. Now, with the transaction data from the FPS, the FCI
would be able to estimate demand for individual territories and plan its purchase accordingly,
thereby minimising overstocking at its warehouses. This would lead to a system that would
aim to reach the same level of demand planning sophistication as that of the Chinese
manufacturer who gets notified when a sale of its pen is made anywhere in the US.
Several features of this system make it a watertight method of streamlining food distribution. Data of
the number of food coupons distributed by the post office and the food coupons collected by the FPS
is reported to the nodal ministry, the Ministry of Consumer Affairs. The tallying of these accounts is
independent of the FCI, thereby nullifying the scope for coupon misuse or misplacement. The
Ministry can then inspect any inconsistencies in the off-take of food grains using this coupon data.
Secondly, the usage of the post office system ensures that the beneficiaries regularly receive their
claim to the benefits regardless of supply side problems. This would necessitate the FCI to get their
act together to provide a satisfactory level of performance. A critical aspect of this solution is its
immediate applicability. The government proposed core banking solutions for post offices, and the
electronic systems present in most fair price shops, shows that the infrastructure required for this
system is already in place, making rapid implementation possible.
While the proposed solution tackles several inefficiencies in the PDS, there is no denying that it
brings with it several challenges. Validation and update requirements for biometric data, ensuring
uptime and maintenance of biometric scanners, and managing the increased working requirements of
the post office, are to name a few.
Section V: Using FCI and PDS system for regulating prices of fruits and vegetables and to ensure nutritional security The objective of establishment of PDS goes beyond mere food security, to stabilize food grains
market and to ensure that the country also achieves nutritional security. The commodities acquired
through the FCI’s effective price support operations like MSPs are disbursed through the PDS.
Currently, the MSP policy covers 23 items including rice, wheat, pulses and oilseeds. Subsequent
analysis in our study shows that from an inflation perspective, the price of items currently under the
IIMB-WP N0. 481
21
purview of the government’s MSP policy have displayed a very steady upward trend, whereas price of
vegetables which are not included under the MSP policy display tremendous volatility (Annex I).
The cost savings generated from plugging the leakages in the PDS system can be utilised to support
the prices of vegetables like onions and potatoes (which now form a part of the list of Essential
Commodities List), which our analysis shows contribute heavily to food price shocks. Considering the
high levels of poverty in India as well as the contribution of household spending on food, a
persistently high level of food inflation is undesirable. Addition of onions in the PDS would help
reduce the problems of variability in prices and thus have a positive impact on food inflation as well.
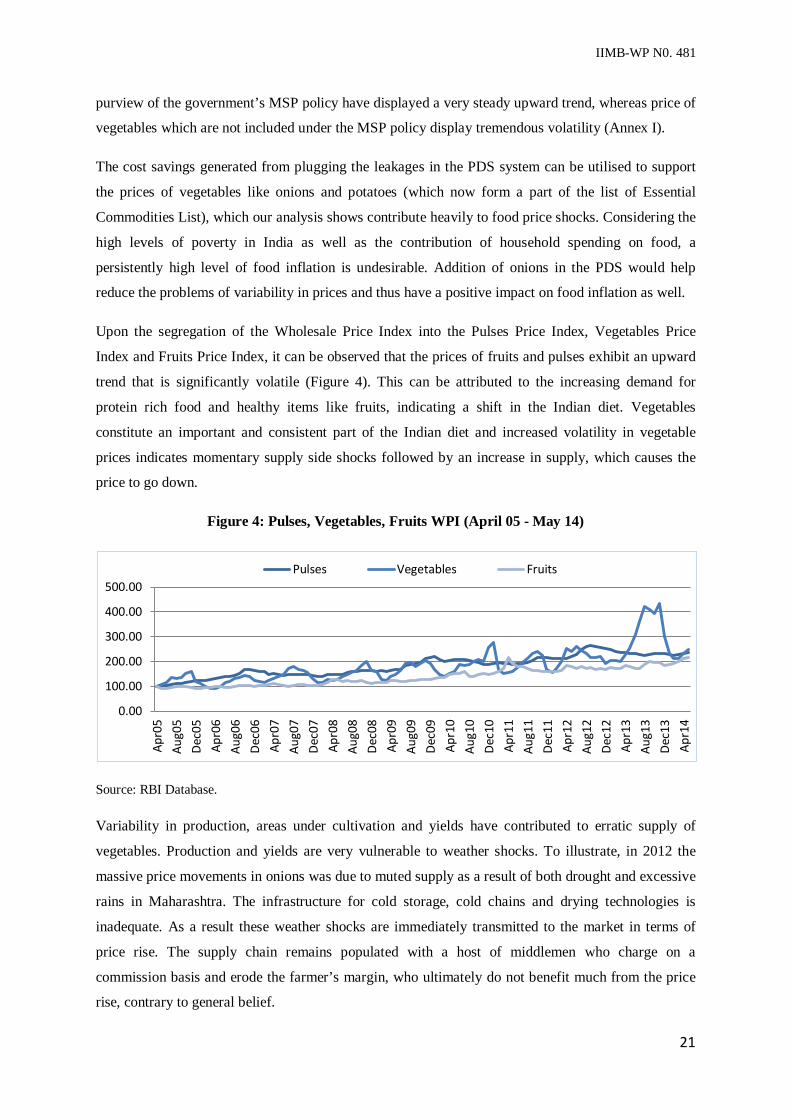
Upon the segregation of the Wholesale Price Index into the Pulses Price Index, Vegetables Price
Index and Fruits Price Index, it can be observed that the prices of fruits and pulses exhibit an upward
trend that is significantly volatile (Figure 4). This can be attributed to the increasing demand for
protein rich food and healthy items like fruits, indicating a shift in the Indian diet. Vegetables
constitute an important and consistent part of the Indian diet and increased volatility in vegetable
prices indicates momentary supply side shocks followed by an increase in supply, which causes the
price to go down.
Figure 4: Pulses, Vegetables, Fruits WPI (April 05 - May 14)
Source: RBI Database. Variability in production, areas under cultivation and yields have contributed to erratic supply of
vegetables. Production and yields are very vulnerable to weather shocks. To illustrate, in 2012 the
massive price movements in onions was due to muted supply as a result of both drought and excessive
rains in Maharashtra. The infrastructure for cold storage, cold chains and drying technologies is
inadequate. As a result these weather shocks are immediately transmitted to the market in terms of
price rise. The supply chain remains populated with a host of middlemen who charge on a
commission basis and erode the farmer’s margin, who ultimately do not benefit much from the price
rise, contrary to general belief.
0.00
100.00
200.00
300.00
400.00
500.00
Apr0
5Au
g05
Dec0
5Ap
r06
Aug0
6De
c06
Apr0
7Au
g07
Dec0
7Ap
r08
Aug0
8De
c08
Apr0
9Au
g09
Dec0
9Ap
r10
Aug1
0De
c10
Apr1
1Au
g11
Dec1
1Ap
r12
Aug1
2De
c12
Apr1
3Au
g13
Dec1
3Ap
r14
Pulses Vegetables Fruits
IIMB-WP N0. 481
22
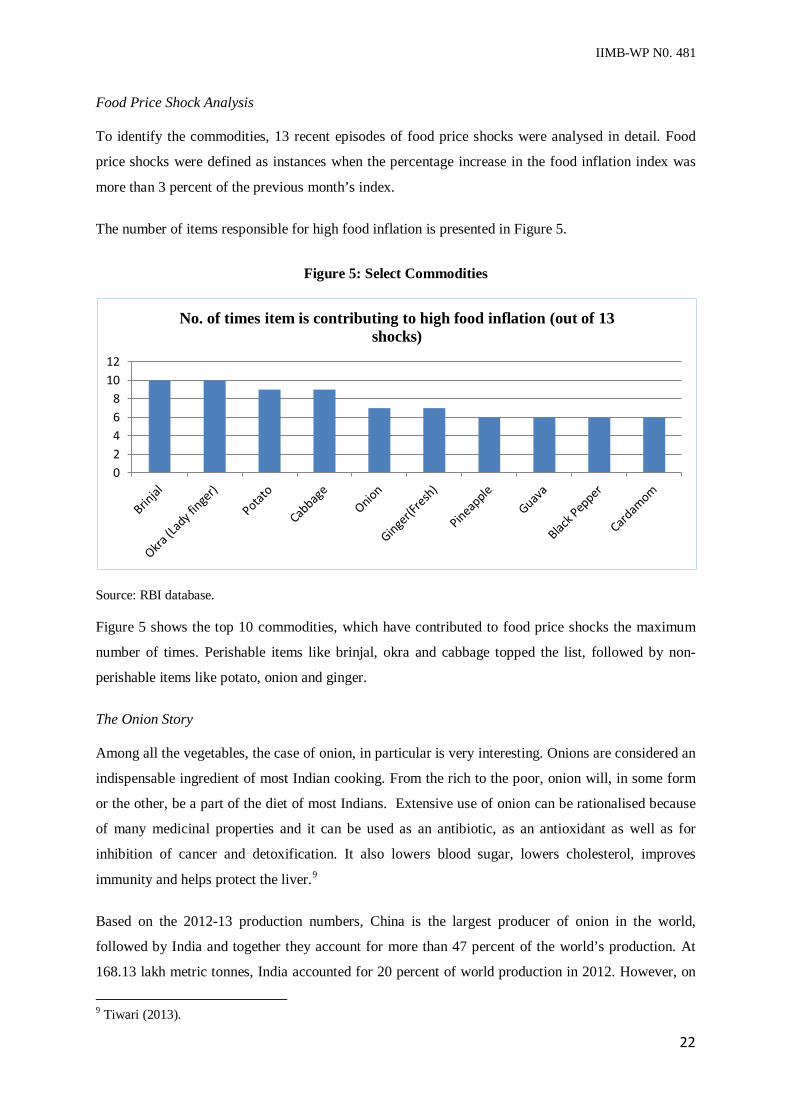
Food Price Shock Analysis To identify the commodities, 13 recent episodes of food price shocks were analysed in detail. Food
price shocks were defined as instances when the percentage increase in the food inflation index was
more than 3 percent of the previous month’s index.
The number of items responsible for high food inflation is presented in Figure 5.
Figure 5: Select Commodities
Source: RBI database. Figure 5 shows the top 10 commodities, which have contributed to food price shocks the maximum
number of times. Perishable items like brinjal, okra and cabbage topped the list, followed by non-
perishable items like potato, onion and ginger.
The Onion Story Among all the vegetables, the case of onion, in particular is very interesting. Onions are considered an
indispensable ingredient of most Indian cooking. From the rich to the poor, onion will, in some form
or the other, be a part of the diet of most Indians. Extensive use of onion can be rationalised because
of many medicinal properties and it can be used as an antibiotic, as an antioxidant as well as for
inhibition of cancer and detoxification. It also lowers blood sugar, lowers cholesterol, improves
immunity and helps protect the liver.9
Based on the 2012-13 production numbers, China is the largest producer of onion in the world,
followed by India and together they account for more than 47 percent of the world’s production. At
168.13 lakh metric tonnes, India accounted for 20 percent of world production in 2012. However, on
9 Tiwari (2013).
02468
1012
No. of times item is contributing to high food inflation (out of 13 shocks)
IIMB-WP N0. 481
23
productivity India ranks much lower than a lot of other countries with a productivity of only 16 metric
tonnes per hectare in comparison to USA which has a productivity of 55 metric tonnes per hectare.
Even China has a much higher productivity with 22 metric tonnes per hectare.
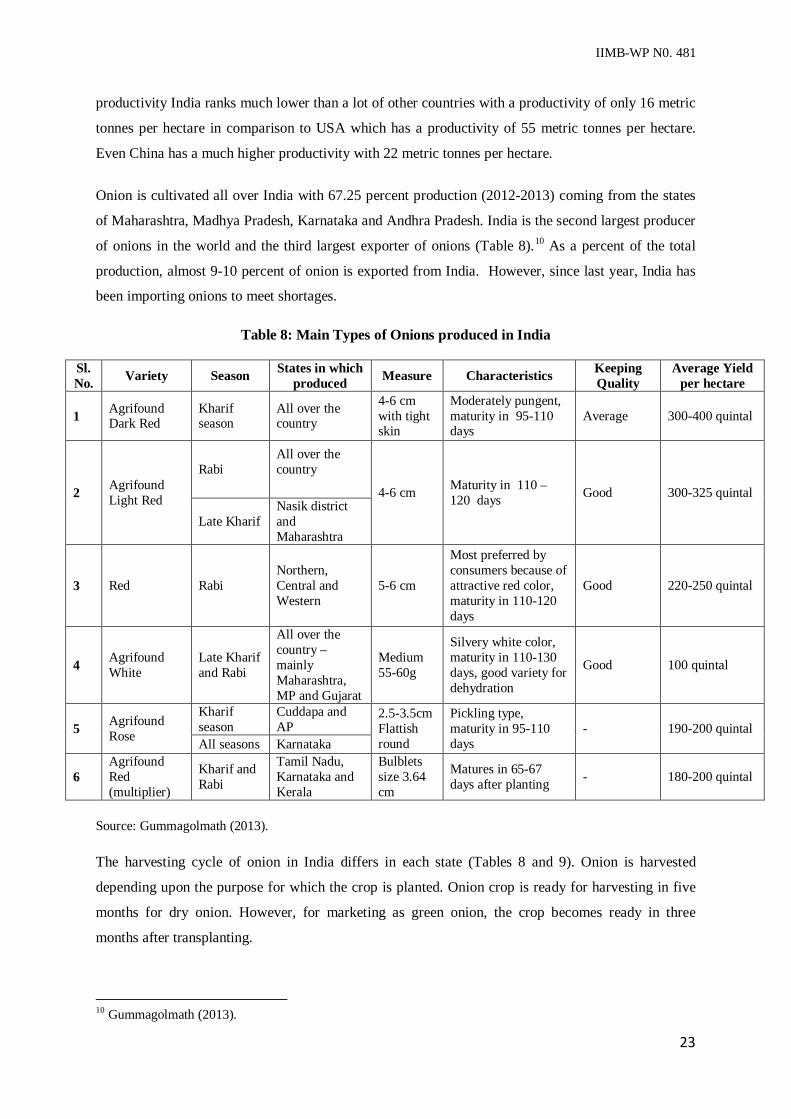
Onion is cultivated all over India with 67.25 percent production (2012-2013) coming from the states
of Maharashtra, Madhya Pradesh, Karnataka and Andhra Pradesh. India is the second largest producer
of onions in the world and the third largest exporter of onions (Table 8).10 As a percent of the total
production, almost 9-10 percent of onion is exported from India. However, since last year, India has
been importing onions to meet shortages.
Table 8: Main Types of Onions produced in India
Sl. No. Variety Season States in which
produced Measure Characteristics Keeping Quality
Average Yield per hectare
1 Agrifound Dark Red
Kharif season
All over the country
4-6 cm with tight skin
Moderately pungent, maturity in 95-110 days
Average 300-400 quintal
2 Agrifound Light Red
Rabi All over the country 4-6 cm Maturity in 110 –
120 days Good 300-325 quintal
Late Kharif Nasik district and Maharashtra
3 Red Rabi Northern, Central and Western
5-6 cm
Most preferred by consumers because of attractive red color, maturity in 110-120 days
Good 220-250 quintal
4 Agrifound White
Late Kharif and Rabi
All over the country – mainly Maharashtra, MP and Gujarat
Medium 55-60g
Silvery white color, maturity in 110-130 days, good variety for dehydration
Good 100 quintal
5 Agrifound Rose
Kharif season
Cuddapa and AP
2.5-3.5cm Flattish round
Pickling type, maturity in 95-110 days
- 190-200 quintal All seasons Karnataka
6 Agrifound Red (multiplier)
Kharif and Rabi
Tamil Nadu, Karnataka and Kerala
Bulblets size 3.64 cm
Matures in 65-67 days after planting - 180-200 quintal
Source: Gummagolmath (2013). The harvesting cycle of onion in India differs in each state (Tables 8 and 9). Onion is harvested
depending upon the purpose for which the crop is planted. Onion crop is ready for harvesting in five
months for dry onion. However, for marketing as green onion, the crop becomes ready in three
months after transplanting.
10 Gummagolmath (2013).
IIMB-WP N0. 481
24
Onion crop follows vegetable crops such as cauliflower, tomato and potato, which require large
quantities of organic manures. As a winter crop, it follows cereals, groundnut and cowpea while as a
summer crop it follows paddy. The ideal soil for onion production should be deep friable, highly
fertile, sandy loam to clay and rich in humus. Onions are one of the main vegetables which are
cultivated under the drip irrigation scheme.
Table 9: Production Cycle of Onion
State/Season Month of sowing Month of transplanting Maharashtra and Gujarat
Kharif May-June July-August Late Kharif or early Rabi August-September September-October Rabi November-December December-January
Tamil Nadu, Karnataka and Andhra Pradesh Early kharif February-April April-June Kharif May-June July-August Rabi September-October November-December
Rajasthan, Haryana, Punjab, Uttar Pradesh and Bihar Kharif May-June July-August Rabi October-November December- January
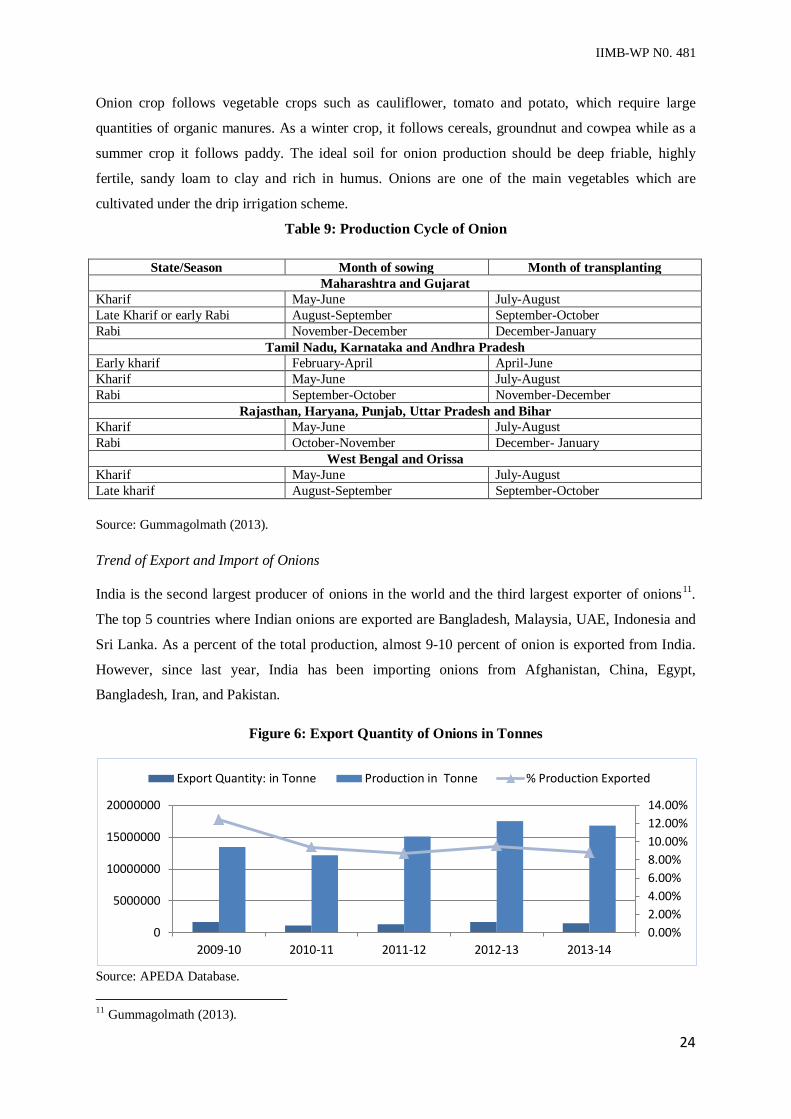
West Bengal and Orissa Kharif May-June July-August Late kharif August-September September-October Source: Gummagolmath (2013). Trend of Export and Import of Onions India is the second largest producer of onions in the world and the third largest exporter of onions11.
The top 5 countries where Indian onions are exported are Bangladesh, Malaysia, UAE, Indonesia and
Sri Lanka. As a percent of the total production, almost 9-10 percent of onion is exported from India.
However, since last year, India has been importing onions from Afghanistan, China, Egypt,
Bangladesh, Iran, and Pakistan.
Figure 6: Export Quantity of Onions in Tonnes
Source: APEDA Database.
11 Gummagolmath (2013).
0.00%2.00%4.00%6.00%8.00%10.00%12.00%14.00%
0
5000000
10000000
15000000
20000000
2009-10 2010-11 2011-12 2012-13 2013-14
Export Quantity: in Tonne Production in Tonne % Production Exported
IIMB-WP N0. 481
25
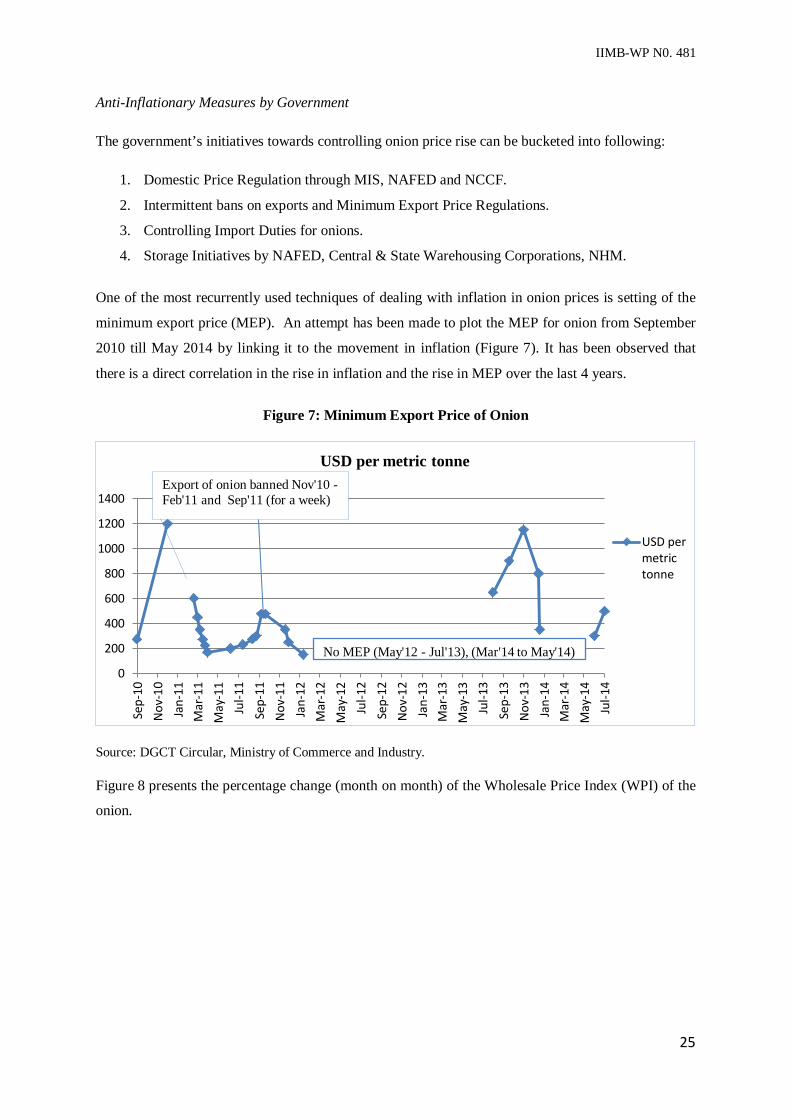
Anti-Inflationary Measures by Government
The government’s initiatives towards controlling onion price rise can be bucketed into following:
1. Domestic Price Regulation through MIS, NAFED and NCCF.
2. Intermittent bans on exports and Minimum Export Price Regulations.
3. Controlling Import Duties for onions.
4. Storage Initiatives by NAFED, Central & State Warehousing Corporations, NHM.
One of the most recurrently used techniques of dealing with inflation in onion prices is setting of the
minimum export price (MEP). An attempt has been made to plot the MEP for onion from September
2010 till May 2014 by linking it to the movement in inflation (Figure 7). It has been observed that
there is a direct correlation in the rise in inflation and the rise in MEP over the last 4 years.
Figure 7: Minimum Export Price of Onion
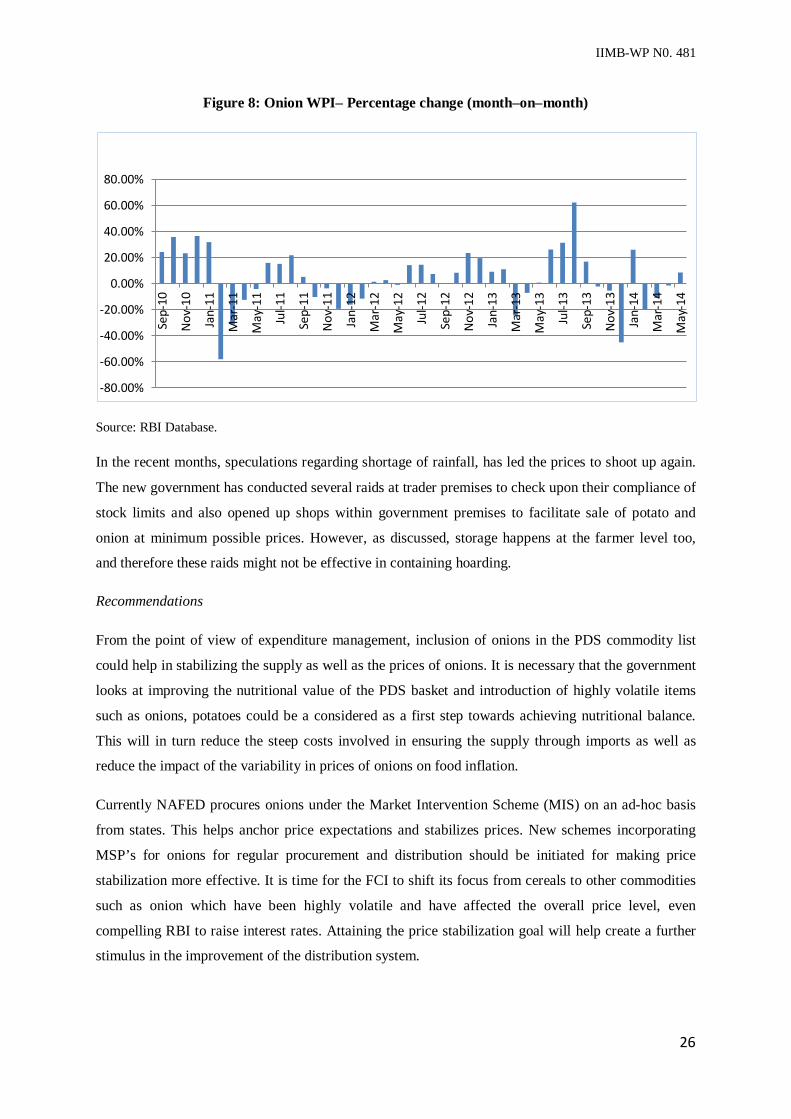
Source: DGCT Circular, Ministry of Commerce and Industry. Figure 8 presents the percentage change (month on month) of the Wholesale Price Index (WPI) of the
onion.
0
200
400
600
800
1000
1200
1400
Sep-
10N
ov-1
0Ja
n-11
Mar
-11
May
-11
Jul-1
1Se
p-11
Nov
-11
Jan-
12M
ar-1
2M
ay-1
2Ju
l-12
Sep-
12N
ov-1
2Ja
n-13
Mar
-13
May
-13
Jul-1
3Se
p-13
Nov
-13
Jan-
14M
ar-1
4M
ay-1
4Ju
l-14
USD per metric tonne
USD permetrictonne
Export of onion banned Nov'10 - Feb'11 and Sep'11 (for a week)
No MEP (May'12 - Jul'13), (Mar'14 to May'14)
IIMB-WP N0. 481
26
Figure 8: Onion WPI– Percentage change (month–on–month)
Source: RBI Database. In the recent months, speculations regarding shortage of rainfall, has led the prices to shoot up again.
The new government has conducted several raids at trader premises to check upon their compliance of
stock limits and also opened up shops within government premises to facilitate sale of potato and
onion at minimum possible prices. However, as discussed, storage happens at the farmer level too,
and therefore these raids might not be effective in containing hoarding.
Recommendations
From the point of view of expenditure management, inclusion of onions in the PDS commodity list
could help in stabilizing the supply as well as the prices of onions. It is necessary that the government
looks at improving the nutritional value of the PDS basket and introduction of highly volatile items
such as onions, potatoes could be a considered as a first step towards achieving nutritional balance.
This will in turn reduce the steep costs involved in ensuring the supply through imports as well as
reduce the impact of the variability in prices of onions on food inflation.
Currently NAFED procures onions under the Market Intervention Scheme (MIS) on an ad-hoc basis
from states. This helps anchor price expectations and stabilizes prices. New schemes incorporating
MSP’s for onions for regular procurement and distribution should be initiated for making price
stabilization more effective. It is time for the FCI to shift its focus from cereals to other commodities
such as onion which have been highly volatile and have affected the overall price level, even
compelling RBI to raise interest rates. Attaining the price stabilization goal will help create a further
stimulus in the improvement of the distribution system.
-80.00%
-60.00%
-40.00%
-20.00%
0.00%
20.00%
40.00%
60.00%
80.00%Se
p-10
Nov
-10
Jan-
11
Mar
-11
May
-11
Jul-1
1
Sep-
11
Nov
-11
Jan-
12
Mar
-12
May
-12
Jul-1
2
Sep-
12
Nov
-12
Jan-
13
Mar
-13
May
-13
Jul-1
3
Sep-
13
Nov
-13
Jan-
14
Mar
-14
May
-14
IIMB-WP N0. 481
27
Section VI: Phase wise implementation and Conclusion
Section II and III of the paper suggested various ways in which technology can be used to increase the
efficacy of the food distribution system. However, the setting up of IT infrastructure must be carried
out in a phased manner. Here, an approximate stage wise implementation and roll-out of the two
recommendations is suggested.
Phase 1 – Basic setup of proposed technology systems
• Development of software necessary for the centralized IT infrastructure for the RFID system
implementation is the first step to be considered. This should be carried out in parallel with
consolidation of Aadhaar card database for BPL households. Identification of BPL
households for coupon entitlement is very important for success of last mile delivery scheme.
Training of postmen and FPS shop owners for the new distribution and delivery system must
proceed hand in hand with purchase of biometric scanners, RFID scanners and electronic
weighing machines.
• Rollout of new RFID tagged sacks, biometric scanners at FPSs and coupon despatch to post
offices must happen in a region wise manner. Pilot programs must be carried out in selected
states or regions with considerable BPL households to check for viability.
• Final stage of phase one would involve phased rollout of new PDS system across all states
and union territories.
Phase 2 – Use of more sophisticated technology for effective management of new system
• Replace offline and manual coupon system with electronic cards for BPL households once
legitimacy of the coupon system in terms of entitlement is established.
• Provide internet access to FPSs to enable live sales data recording and identity verification
using the central intelligence and monitoring system. Integrate RFID and consumer profile
data to ensure a live and watertight PDS.
This paper suggests several innovative ways to regulate and manage expenditures in the PDS that
have been spiraling out of control owing to the massive leakage, gaps and inefficiencies that exist in
the present system. The recommended solution is to implement a new model which makes it
mandatory for each stakeholder at different stages of the supply chain to assume ownership of the
goods. This model also makes use of modern technology to track inventory and ensure demand-
supply matching. At the consumer end, the model suggests a changed distribution system making use
of food coupons. It also makes use of biometrics and UID to identify consumers and prevent diversion
of food grains to people who are not entitled.
IIMB-WP N0. 481
28
The paper further suggests use of PDS as a tool to keep inflation under control. Fruits and vegetables
contributed significantly to the high inflation numbers seen recently in the country. Within this
category, onions and potatoes are the essential goods which are responsible for sudden increase in
prices. Having a quick and sturdy distribution, mechanism will make it possible to introduce such
goods easily and regulate prices and availability of these goods when necessary. In the long run, this
also provides a valuable tool to target malnutrition which is a millennium development goal for the
government.
The implementation of this new technology enabled PDS, while challenging to set up, would go a
long way in not just curtailing expenses but also to bring about transparency and equity in the
provision of the important commodity for the entire population of our country.
IIMB-WP N0. 481
29
References
Agarwal, Pradeep and Kumarasamy, Durairaj (2012), “Food Price Inflation in India: Causes and Cures”, IEG Working Paper No. 318.
Agriculture and Processed Food Products Export Development Authority (APEDA), “Product Data”, Agrixchange.
APEDA, “Database”, Online, http://apeda.gov.in/apedawebsite/.
Balani, Sakshi (2013), “Functioning of Public Distribution System: An analytical Report”, PRS Legislative Research, December.
Bardhan, Anand (2011), “Checking Supply Side Leakages in Public Distribution System in India”.
Drolia, Rashmi (2013), “How Chhattisgarh women are changing the face of PDS in India”, Times of India, March.
FCI (2014), “Storage Capacity with FCI”, Storage and Contract Detail Section.
Government of India (2011), “Rural Development Statistics”, National Institute of Rural Development, August.
Government of India, Department of Food and Public Distribution, Online, http://dfpd.nic.in/.
Gulati, Ashok, Sharma, Pradeep and Kahkonen, Satu (1996), “The Food Corporation of India: Successes and Failures in Indian Food Grain Marketing”, IRIS India working Paper No. 18.
Gummagolmath, K.C. (2013), “Trends in Marketing and Export of Onion in India”, NIAM Research Report, Jaipur.
IBN (2011), “How the PDS is Changing in Chattisgarh”, January.
Nagavarapu, S. and Sekhri S. (2011), “Who is Targeted by India’s Targeted Public Distribution System”, Preliminary Research Project, Brown University and University of Virginia, United States.
Parsai, Gargi (2012), “6.6m tonnes of wheat under open sky faces rain fury, admits Centre”, The Hindu, June.
Planning Commission of India (2005), “Performance Evaluation of Targeted Public Distribution System”, March, New Delhi.
Reserve Bank of India (RBI), “Database”, Online, http://dbie.rbi.org.in/.
Singh, Charan and Cheema, Sukhinder k. (2014), “Revisit the food policy for healthy India”, NuFFooDS Spectrum, June, Bangalore.
Subramani, M.R. (2010), “Study finds large diversion of rice, wheat from PDS, welfare schemes”, The Hindu Business Line, September.
Tiwari, Rajendra (2013), “Indian Horticulture Database”, Ministry of Agriculture, National Horticulture Board.
UNICEF (2012), “Nutrition”, Online, http://www.unicef.org/india/children_2356.htm.
Vydhianathan, S. and Radhakrishnan, R. K. (2010), “Behind the success story of universal PDS in Tamil Nadu”, The Hindu, August.
IIMB-WP N0. 481
30
Annexure I
A note on visit to the Yeshwanthpur Wholesale Market
An attempt was made to interact with several farmers, tradesmen and commission agents of
Yeshwanthpur Wholesale market, North Bangalore, in order to understand the price determination of
onions in these markets.
Bangalore receives onions from Maharashtra and Gujarat from December to August. As per our
conversation with the farmers, the produce is fresh till March after which the stored onions make their
way to the markets till the next harvest of the Kharif season when fresh onions are received from
Karnataka. The farmers follow the market news and try to influence supply of onions and potato when
the prices in the market start rising. The market is auction based, and is purely driven by supply-
demand, irrespective of where the supply is coming from.
Generally, hoarding is quickly blamed for price fluctuations in onions and is often confused with
storing. The crop cultivation has a specific cycle, and to maintain year round availability, farmers,
traders and middlemen are compelled to store these commodities. The storing happens at each level of
the supply chain including the farmer and not just the middlemen or traders. From the farmer’s
perspective, if the current wholesale price is too low, it makes business sense for him to wait for it to
rise and then sell it in the market. Of course, there is a trade-off as longer the product is stored, it loses
water content and weight, reducing overall revenue, not to mention the added warehouse or cold
storage rental expense. Often the farmers allow the onion to stay underground and do not pluck it until
the prices are favourable, but they run the risk of spoilage and sprouting.
Currently the process of dissemination of prices is an informal process. The farmers/ traders contact
the commission agents in a particular Mandi, and fix a range of acceptable prices. If the commission
agent does not achieve that price for one day, the stock will be sold next day at the best available
price. This system reflects gaps in the transmission of price information to the farmers. There is a
potential possibility of agents’ collusion in the determination of prices in this manner hampering the
revenue potential for the farmers.
A more robust system of information exchange throughout the supply chain will eliminate the
pressures on prices created by hoarding. Farmers should receive remunerative prices for their produce.
The current informal system of dissemination of prices in a Mandi could be formalized through an
internet database updated on a regular basis. Farmers could be sent daily updates through SMSes on
the prevailing market prices in a region and on an average in the country, thus allowing a fair auction
process.
Top Related
Copyright © 2022 FDOKUMEN

