
The Impact of Public R&D Expenditure on Business R&D
27
Please cite this paper as: Guellec, D. and B. van Pottelsberghe de la Potterie (2000), “The Impact of Public R&D Expenditure on Business R&D”, OECD Science, Technology and Industry Working Papers, 2000/04, OECD Publishing. http://dx.doi.org/10.1787/670385851815 OECD Science, Technology and Industry Working Papers 2000/04 The Impact of Public R&D Expenditure on Business R&D Dominique Guellec, Bruno van Pottelsberghe de la Potterie
-
Upload
independent -
Category
Documents
-
view
0 -
download
0
Transcript of The Impact of Public R&D Expenditure on Business R&D
Please cite this paper as:
Guellec, D. and B. van Pottelsberghe de la Potterie (2000),“The Impact of Public R&D Expenditure on Business R&D”,OECD Science, Technology and Industry Working Papers,2000/04, OECD Publishing.http://dx.doi.org/10.1787/670385851815
OECD Science, Technology andIndustry Working Papers 2000/04
The Impact of Public R&DExpenditure on BusinessR&D
Dominique Guellec, Bruno vanPottelsberghe de la Potterie
Unclassified DSTI/DOC(2000)4
Organisation de Coopération et de Développement Economiques OLIS : 14-Jun-2000Organisation for Economic Co-operation and Development Dist. : 15-Jun-2000__________________________________________________________________________________________
English text onlyDIRECTORATE FOR SCIENCE, TECHNOLOGY AND INDUSTRY
STI WORKING PAPERS 2000/4
THE IMPACT OF PUBLIC R&D EXPENDITURE ON BUSINESS R&D
Dominique Guellec and Bruno Van Pottelsberghe
Unclassified
DST
I/DO
C(2000)4
English text only
92654
Document complet disponible sur OLIS dans son format d’origine
Complete document available on OLIS in its original format
DSTI/DOC(2000)4
2
STI Working Paper Series
The Working Papers series of the OECD Directorate for Science, Technology and Industry of theOECD is designed to make available to a wider readership selected studies prepared by staff in theDirectorate or by outside consultants working on OECD projects. The papers included in the series are of atechnical and analytical nature and deal with issues of data, methodology and empirical analysis in theareas of work of DSTI. The Working Papers are generally available only in their original language –English or French – with a summary in the other.
Comment on the papers is invited, and should be sent to the Directorate for Science, Technology andIndustry, OECD, 2 rue André Pascal, 75775 Paris Cedex 16, France.
The opinions expressed in these papers are the sole responsibility of the author(s) and do notnecessarily reflect those of the OECD or of the governments of its Member countries.
http://www.oecd.org/dsti/sti/prod/sti_wp.htm
Copyright OECD, 2000Applications for permission to reproduce or translate all or part of this material should be made to:Head of Publication Service, OECD, 2 rue André-Pascal, 75775 Paris, Cedex 16, France.
DSTI/DOC(2000)4
3
THE IMPACT OF PUBLIC R&D EXPENDITURE ON BUSINESS R&D
Dominique Guellec and Bruno van Pottelsberghe
This document attempts to quantify the aggregate net effect of government funding on business R&Din 17 OECD Member countries over the past two decades. Grants, procurement, tax incentives and directperformance of research (in public laboratories or universities) are the major policy tools in the field. Themajor results of the study are the following:
�� Direct government funding of R&D performed by firms (either grants or procurement) has apositive effect on business financed R&D (one dollar given to firms results in 1.70 dollars ofresearch on average).
�� Tax incentives have a positive (although rather short-lived) effect on business-financed R&D.
�� Direct funding as well as tax incentives are more effective when they are stable over time: firmsdo not invest in additional R&D if they are uncertain of the durability of the government support.
�� Direct government funding and R&D tax incentives are substitutes: increased intensity of onereduces the effect of the other on business R&D.
�� The stimulating effect of government funding varies with respect to its generosity: it increases upto a certain threshold (about 13% of business R&D) and then decreases beyond.
�� Defence research performed in public labs and universities crowds out private R&D; Civilianpublic research is neutral for business R&D.
------------------------------------------------------
Ce document vise à quantifier l’effet des financements gouvernementaux sur la dépense de R-D desentreprises au niveau agrégé, pour 17 pays Membres de l’OCDE sur les deux dernières décennies. Lesdons, les achats publics, les incitations fiscales et la réalisation directe de la recherche (dans leslaboratoires publics ou les universités) sont les principaux outils de la politique dans ce domaine. Lesprincipaux résultats de l’étude sont les suivants :
�� Le financement direct par le gouvernement de la recherche réalisée par les entreprises (dons ouachats publics) a un effet positif sur le financement de la recherche par les entreprises (un dollarversé aux firmes se traduit en moyenne par 1.70 dollars de recherche).
�� Les incitations fiscales ont un effet positif (bien de court terme) sur le financement de larecherche par les entreprises.
�� Le financement direct comme les incitations fiscales sont plus efficaces lorsqu’ils sont stablesdans le temps : les firmes n’effectuent pas de dépenses supplémentaires en recherche si elles nesont pas assurées de la durabilité du soutien gouvernemental.
�� Le financement direct et les incitations fiscales sont substituables : une intensité plus élevée del’un réduit l’effet de l’autre sur la recherche des entreprises.
�� L’effet stimulant du financement public varie selon sa générosité : il augmente jusqu’à un certainniveau (environ 13 % de la recherche des entreprises) puis diminue au-delà.
�� La recherche liée à la défense réalisée dans les laboratoires publics et les universités évince larecherche sur fonds privés.
�� La recherche publique à finalité civile n’a pas d’effet sur la dépense de recherche des entreprises.
DSTI/DOC(2000)4
4
TABLE OF CONTENTS
EXECUTIVE SUMMARY ............................................................................................................................ 5
1. INTRODUCTION ...................................................................................................................................... 7
2. THE MODEL AND DATA...................................................................................................................... 10
3. RESULTS................................................................................................................................................. 12
4. POLICY IMPLICATIONS....................................................................................................................... 18
ANNEX 1. THE B-INDEX .......................................................................................................................... 19
REFERENCES ............................................................................................................................................. 23
DSTI/DOC(2000)4
5
EXECUTIVE SUMMARY
The share of government in the funding of R&D in 1998 was 30% in the OECD, 31% in the UnitedStates, 36% in Europe and 19% in Japan. Such an effort may have various effects on the dynamics oftechnology, including contributing to basic knowledge, to the government’s own missions, and toeconomic growth. One possible channel for the latter effect is a leverage effect by government funding onbusiness funding: thanks to government support, or to the basic knowledge produced on government funds,the private return on investment in R&D is improved, triggering higher expenditure on R&D bycompanies. However, it is also possible that government funding crowds out business, either directly(government pre–empts a technological opportunity or gives money to firms for projects that they wouldhave carried out anyway), or indirectly (by increasing demand, hence the market price of resources neededfor research). It is uncertain whether, economy-wide, the leverage effect dominates the crowding out effector not. This document attempts to quantify the aggregate net effect of government funding on businessR&D in 17 OECD Member countries over the past two decades.
Government funding of R&D is extremely variegated across countries and tends to change over time.Government can directly fund business for carrying out research, either under procurement programmes(the result is government property) or as a grant (the result belongs to the recipient). The bulk of the formeris made up of defence contracts.
A second way for government to support R&D is through tax incentives, notably R&D tax credits(now used in ten OECD countries).
A third way is for government to perform R&D itself, in public laboratories. Such research generallyserves the government’s own needs, in the defence, energy or public health areas for instance, but it mayhave broader uses. Finally, the government funds university research, generally with the objective ofgenerating basic knowledge. Contributing to industrial technology is not the direct purpose of these lasttwo instruments, but they may have such an impact through “technology spillovers”.
The major results of the study are the following:
�� Direct government funding of R&D performed by firms has a positive effect on businessfinanced R&D. One dollar given to firms results in 1.70 dollars of research.
�� Tax incentives have a positive effect on business-financed R&D.
�� These two policy instruments are more effective when they are stable over time: firms do notinvest in additional R&D if they are uncertain of the durability of the government support.
�� Direct government funding and R&D tax incentives are substitutes: increased intensity of onereduces the effect of the other on business R&D.
�� The impact of direct government funding on business R&D is more long-lived than that of taxincentives, reflecting the fact that government programmes target research projects with a longertime horizon than those on the agenda of business.
DSTI/DOC(2000)4
6
�� The stimulating effect of government funding varies with respect to its generosity: it increases upto a certain threshold and then decreases beyond. On average for the 17 countries and the timeperiod under study, this threshold is about 13% of business R&D. It may, of course, differ acrosscountries and evolve over time. Too much or too little funding is less effective that beingsomewhere in the middle.
�� Defence research performed in public labs and universities crowds out private R&D. This is duepartly to the increase in cost of research generated by government outlays (which boosts thedemand for researchers and other resources, hence their market price). Civilian public research isneutral for business R&D. The impact of knowledge spillovers coming out of university (mainlybasic) research takes too long a lag to be seen in the data.
�� The negative effect of university research is mitigated when government funding of businessR&D increases. Targeted government programmes probably help firms to digest the knowledgegenerated by universities.
These results are averages over many countries. As the economic structure and design of policiesdiffer widely across countries, such conclusions may apply to various extents to each individual country.However, they point to lessons that may be useful to policy makers. First, well-designed governmentprogrammes have a leverage effect on business R&D – this is not wasted money. Second, frequentlyredesigning a policy instrument, e.g. the rules and generosity of R&D tax credit or governmentprogrammes – reduces its effectiveness. Third, a piecemeal approach to technology policy is detrimental toits effectiveness: tax breaks and direct funding of business are substitutes, while direct funding anduniversity research are complements. Hence, the various policy instruments should be consistent with eachother, which implies that the various administrative departments involved in their design and managementneed to be co–ordinated. Fourth, if government is willing to stimulate business R&D, providing too low ortoo high a level of funding is not effective. Fifth, although defence-related R&D funding does not aim atstimulating private R&D expenditure, its crowding-out effect on business, civilian R&D, has to be takeninto account. Sixth, research performed in universities presents a potential usefulness for business that canbe improved through targeted government funding enhancing the transfer of technology.

DSTI/DOC(2000)4
7
1. INTRODUCTION
OECD governments spent around USD 150 billion in research and development (R&D) activities in1998, almost one-third of total R&D expenditure in the concerned countries. Beside fulfilling public needs(such as defence), the economic rationale for government involvement in this area is the existence ofmarket failures associated with R&D. Imperfect appropriability, or the diffusion of knowledgeuncontrolled by the inventor, implies that the private rate of return to R&D is lower than its social return.In addition, high risk for research implies extremely high hurdles, discouraging firms from engaging insuch activities. This is especially detrimental to small firms for which access to funding is more difficult.Therefore, the amount invested by firms in research activities in a competitive framework is likely to bebelow the socially optimal level (Arrow, 1962). In this line of argument, the wedge between private andsocial return is likely to be higher in basic research, requiring a stronger involvement of government in thisarea. Government can commit funds for stimulating business-performed research. This may aim atreducing the private cost of R&D (e.g. grants) or at working out technological opportunities available tofirms (which reduces both the cost and uncertainty of research). If this policy works, public and privatefunding will be complementary (increasing the former enhances the latter). However, the effectiveness ofthe policies aiming at stimulating private R&D outlays can be challenged on three main grounds: crowdingout through prices, substitution effects and allocative distortions.
First, government spending may crowd out private money, by increasing the demand, hence the cost,of R&D. Goolsbee (1998) and David and Hall (1999) argue that the major effect of government funding isto raise the wage of researchers. Faced with higher research costs, firms will allocate money to otheractivities so that, even if the total amount of R&D is higher due to government funding, its “real amount”(e.g. measured by the number of researchers) will be lower and of lesser economic efficiency.
A second argument is that public money directly displaces private funding, as firms simply substitutepublic money for their own, while undertaking the same amount of research as originally planned.Therefore, the government supports projects that would have been implemented anyway.
Third, government funds, being allocated to projects in a less efficient way than market forces woulddo, generate distortions in the allocation of resources between the various fields of research (e.g. areas withlower opportunities would be favoured). It may also distort competition between firms, by helping some ofthem at the expense of others.
The purpose of this document is to assess the effect of government spending on R&D funded andperformed by business. Does the externality effect dominate the crowding-out effect? Is therecomplementarity or substitutability between various policy instruments and business R&D? How do thevarious policy instruments interact with each other?
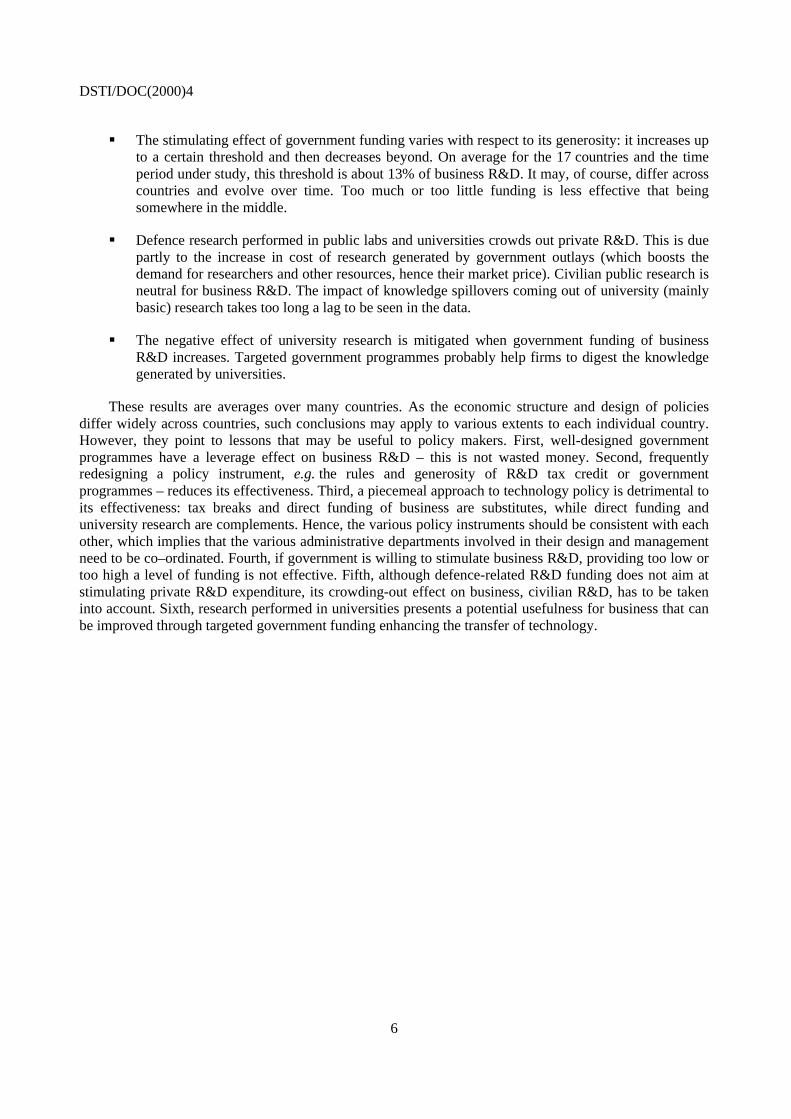
In order to assess the effect of government spending, it is necessary to identify the various channelstaken by money flows: where and how public money is spent. The effect of public spending may differdepending on the policy instrument used. There are three main policy instruments (Figure 1) used bygovernment: public (government or university) research, government funding of business-performed R&D,and fiscal incentives. Public research, carried out in public laboratories or universities, and funded bygovernment, is exemplified by National laboratories in the United States or the CNRS (Centre National de
DSTI/DOC(2000)4
8
la Recherche Scientifique) in France. The goal of these bodies is to satisfy public needs and to provide thebasic knowledge that may be used downstream by firms in their own, applied, research. Governmentlaboratories are more concerned with the former, universities and similar institutions are more concernedwith the latter. Universities are usually endowed with much more independence with regards their researchagenda than government laboratories, making them a less responsive instrument for policy. However, asthe government controls much of the research budget of these institutions (through grants, contracts orfellowships), it is relevant to include them in the list of policy instruments. Some argue that the kind ofscience produced by public research facilities is irrelevant to the business sector (Kealey, 1996), with theidea that if it were useful, business would do it itself. However, weak appropriability of basic knowledgemakes it difficult for firms to reap its rewards: as a contribution to this ongoing discussion, the effect ofpublic spending in this area is tested in this document.
Figure 1. Policy tools and their potential effects (dotted line) on private R&D outlays
Fiscal incentives
+ stimulating - crowding out
- substitution - displacement
Grants, procurements, loans, ..
Direct support to business R&D
University research
+ Spillovers - displacement
- crowding out
Public labs
Indirect support to business R&D
POLICY TOOLS
A second policy instrument is public funding of research performed by the business sector. Accordingto the Frascati Manual (OECD, 1994) used by statisticians of R&D, two categories of government fundsto business can be identified: i) those which are specifically for the procurement of R&D (the results of theR&D belong to a recipient which is not necessarily the performer); and ii) those which are provided to theperformers of R&D in the form of grants or subsidies (the results belong to the R&D performer). In allcases, subsidies are targeted to specific goals chosen by the funder: government gives money to firms forparticular technological projects that are seen as having a high social return (e.g. “generic technologies” or“pre-competitive research”) or that are useful to the government’s own objectives (e.g. health, defence). Asgovernment funds help the recipient (technology or firm) even if it is initially inferior to alternatives, suchsupport gives rise to the criticism that government, rather than the market, is “picking winners”. Moreover,grants are often conditional on some aspect of firm strategy: they may require for instance that therecipients set up research alliances with other firms (co-operation), or that they collaborate withuniversities.
Third, government can help firms indirectly, through tax breaks. Most OECD countries allow for afull write-off of current R&D expenditures (depreciation allowances are deducted from taxable income).Among the 17 countries included in the present study, about one-third also provide R&D tax credits (seeAnnex Table A1). These are deducted directly from the corporate income tax and are based either on thelevel of R&D expenditures – flat rate – or on the increase in these expenditures with respect to a given base
DSTI/DOC(2000)4
9
– incremental rate. In addition, some countries allow for an accelerated depreciation of investment inmachinery, equipment and buildings devoted to R&D activities. In some countries, there are special taxbreaks related to R&D for small firms. The main criticism of this instrument is that it is windfall money forfirms: they do not change their R&D strategy (which is what the government is expecting), but arerefunded for it. In a way, this argument contradicts the one opposed to targeted funding: tax breaks are notsufficiently discriminatory, so that firms may use public money for any goal that suits their own strategy,whatever the social return. Non-discrimination may be viewed as an advantage, since the government doesnot distort the research agenda as shaped by market forces. However, tax incentives are in fact somewhatdiscriminatory, as they are not accessible to non-taxable firms (e.g. new firms with investment higher thansales). This is unfortunate, since such companies may be among the most innovative and short of cash. Insome countries, special provisions in the tax law allow refunding in cash of the credit for certain categoriesnon-taxable firms.
Among these three policy instruments, only the last two have been the subject of distinct quantitativeevaluation. This is unfortunate, since the three policy tools have partly similar, partly complementaryobjectives that make it difficult to analyse the effectiveness of one instrument independent of the others.Public research, whether performed in government labs or universities, provides basic knowledge that isespecially helpful for firms in the most advanced technology areas (close to basic research). Grants helpfirms in the applied research stage and encourage co-operation (another way of internalising externalities).R&D tax breaks, since they are non- or weakly-discriminatory, help all R&D-performing firms, especiallythose that do not have not access to grants (small companies) or do research that is not basic enough tobenefit from other policy instruments. Moreover, there are interactions between these instruments, as thedownstream ones (related to applied research) may enhance the efficiency of upstream ones (basicresearch) by supporting the absorptive capacity of recipient firms. Hence, these tools constitute a systemwhose efficiency can be best captured as a whole. It is the purpose of this study to do so.
This document investigates whether publicly performed research, direct funding and fiscal incentivesstimulated business-funded R&D in 17 OECD countries over the period 1981-96. This integrated (threepolicy instruments) macroeconomic and international approach makes this study distinct from previouswork in this field. The main results are that:
�� Direct government funding of business R&D and tax breaks has a positive impact on businessspending in R&D.
�� The effect of public funding is more long-lived than that of tax incentives.
�� The impact of direct support varies with respect to the funding rate: it increases up to a threshold(which average is estimated at about 13% for the period of time and set of countries consideredhere) and decreases beyond that threshold.
�� These two policy tools are more effective when stable over time.
�� Direct support and tax breaks are substitutes (increasing the use of one of them reduces theimpact of the other – this finding contradicts the “complementarity thesis” mentioned above,while supporting the integrated approach taken in this study).
�� Public research and university intramural research exert a negative impact on business-fundedR&D: the crowding-out effect seems to dominate the spillover effect (alternatively, it can beargued that the latter takes indirect channels or that the lag is too long for it to be captured byeconometric techniques).
DSTI/DOC(2000)4
10
�� However, the negative effect of university research is mitigated when government funding ofbusiness research is increased: the knowledge generated by academic research is bettertransferred to firms when targeted funding is implemented.
�� Finally, defence-oriented public funding seems to be the main factor underlying the crowding-outeffect of government intramural R&D outlays.
These results should be interpreted with some caution. The precise design of policies variessubstantially across countries and has evolved over time in a way that is not totally reflected in thefinancial flows used here. The estimates herein capture an average that may hide differences in theeffectiveness of public policies across countries and changes over time. However, such an average is usefulby itself, as a reference for individual countries to benchmark their policies. It gives a hint of the policytools that are better managed in most countries and of those that should be improved. Finally, this globalapproach allows the interactions between the various policy tools to be identified.
2. THE MODEL AND DATA
Previous studies attempting to evaluate the effectiveness of government support to business R&Dhave focused either on the relationship between R&D subsidies and business-funded R&D (see the surveyby Capron and van Pottelsberghe, 1997), or on the effect of fiscal incentives (see the survey by Mohnen,1997).1 A comparison of these studies is made difficult by the heterogeneity of the empirical models used,e.g. different time periods, data sources, aggregation levels and regression techniques. On average,however, the balance tilts towards the recognition of a positive effect of government funding and taxincentives on privately financed R&D. This is even more so for studies at the aggregate, macroeconomiclevel: among seven such studies referenced by David et al. (1999), six find complementarity betweenpublic and private expenditure, while the seventh finds no significant relationship. Nevertheless, theexisting literature has disregarded two important dimensions. There has been no attempt so far to testsimultaneously for the effectiveness of all instruments, and there are few macroeconomic studies [of the33 studies referenced by David et al. (1999), seven are macroeconomic], most empirical analyses being atthe firm or industry level.
As compared to the firm level approach that is more common in the field, the macroeconomicapproach allows the indirect effects of policies to be captured – negative as well as positive spillovers. Afirm benefiting from subsidies is likely to boost its own R&D activity but the R&D activity of competingfirms might decline, for instance because they see their chances of having a competitive edge waning dueto the financial advantage given to the recipient. Negative externalities can also take place betweenindustries, as shown by Mamuneas and Nadiri (1996) with US manufacturing industries. On the otherhand, the recipient firm’s research may generate knowledge spillovers that will flow to its competitors aswell. The potential presence of these effects makes the case for empirical studies at an aggregate level,which implicitly take them into account (be they positive or negative). A second advantage of working atthe macroeconomic level is that government funding of R&D can be considered as exogenous with respectto privately funded R&D. Indeed, at the firm level, the relevance of the assumption of exogeneity isquestionable because public authorities do not provide R&D subsidies to randomly chosen companies;“Federal contracts do not descend upon firms like manna from heaven” (Lichtenberg, 1984, p. 74). Publicauthorities may be more inclined to support firms which do R&D and which already have good innovative

DSTI/DOC(2000)4
11
records. In other words, a positive and significant relationship between a firm’s R&D and the governmentfunds it received cannot be taken as an evidence of the efficiency of government support. The sameargument holds, although to a lesser extent, for cross-industry studies since R&D subsidies are directedmainly towards R&D-intensive industries. At the macro level, the exogeneity assumption is much moreacceptable, as it is clearly argued in David et al. (1999). An issue at this level may be the presence of acommon latent variable influencing both business and government expenditure, which would bias theestimates. There are two candidates : the business cycle is one, since it eases at the same time financialconditions for government and for business. For dealing with this issue, we have GDP growth as anexplanatory variable for business-funded R&D. A second potential latent variable is the cost of R&D: theprice of specialised inputs or the wages of researchers may increase when government expands itsspending, triggering a growth in business spending that is only nominal. We will examine the potentialinfluence of this factor on our estimates by taking into account the reaction of R&D prices to demand asestimated by Goolsbee (1998).
Each of the policy tools raises specific measurement issues. Public research is broken down into twocomponents, government research and university research. Government funding of business R&D iscomposed of procurement and grants or subsidies, the latter being of special interest here. However, even ifthe explicit goal of procurement is not to trigger a rise in business-funded R&D, such an effect is oftencalled upon to justify government spending (the “leverage effect”). Due to data availability constraints,these two components of direct government funding of business R&D are aggregated herein. Ifgovernment-funded R&D performed by firms primarily consists of procurement and regular grants, itshould be noted that there are other forms of support, such as loan guarantees, conditional loans andconvertible loans. However, as shown by Young (1998), government procurements and grants, and fiscalincentives, account for the bulk of government support to business R&D.
The data on value added is taken from OECD (1999a). Privately funded R&D, direct R&D subsidiesto business, and R&D outlays by public labs and universities are taken from OECD (1999b). All thevariables except the B-index are expressed in constant USD PPP and deflated with the business sector’sGDP price index (base year 1990). The B-index has been computed by the OECD Secretariat from nationalsources (see Annex Table A1).
OECD countries performed about 500 billion USD PPP of R&D outlays in 1998. The lion’s share ofthese activities (70%) was performed by firms, followed by higher education institutions (i.e. universities:17%) and government intramural research (or public labs: 11%). Government is by far the major source offunding for these two public institutions, whereas it contributes only 10% to the R&D performed by privatefirms. Over the past 20 years, this distribution of R&D outlays by sources of fund and institutions ofperformance has substantially changed, witnessing a gradual reduction of the government share, both infinancing and performance. In the early 1980s as compared with the late 1990s, the share of government inthe funding of business R&D expenditure (23%) was more than twice as large, and research performed inpublic labs accounted for 17% of total R&D activities.
Beside these OECD-wide averages, important differences occur between countries. Public labs in theUnited States and Japan account for about 8% of domestic research activities, compared with 15% in theEuropean Union.2 A similar difference appears across the Triad with respect to the share of researchperformed by universities: it is 21% in the European Union, compared with 14% in the United States andJapan. Smaller countries seem to rely much more on university research than do larger ones (more than25% in Australia, Norway, Spain, Belgium and the Netherlands). The business sector in Japan and theUnited States performs more than 73% of total research activities (about 63% in the European Union), andthe funding structure differs significantly. In the United States and the European Union, the share ofbusiness-performed R&D that is financed by government is 15 and 10%, respectively. In Japan, itrepresents about 1%.
DSTI/DOC(2000)4
12
Fiscal incentives may take various forms, making international comparisons problematic. Theso-called “B-index”, designed by Warda (1996), gives a synthetic view of tax generosity (Annex 1provides a complete description of the B-index). It is a composite index computed as the present value ofbefore-tax income necessary to cover the initial cost of R&D investment and to pay the corporate incometax, so that it becomes profitable to perform research activities. It is a kind of average effective rate oftaxation of R&D. The underlying methodology is highly flexible and enables various types of tax treatmentto be modelled in a comparable manner. 3
We rely on a simple R&D investment model that considers business-funded R&D as a function ofoutput, four policy instruments (government funding of R&D performed by business, tax incentives,government intramural expenditure on R&D, research performed by universities), time dummies, andcountry-specific fixed effects.4 Since research activities are subject to high adjustment costs, a dynamicspecification that distinguishes short-run from long-run elasticities is required. The model allows for adynamic mechanism by introducing the lagged dependent variable. It is worth noticing that a dynamicspecification for an R&D investment equation is not a common procedure in the existing literature on theeffectiveness of government support to R&D.5 On a priori grounds, however, the inclusion of laggedprivate R&D may be seen as an important determinant of present R&D investment. Mansfield (1964,p. 320) notes that: “First it takes time to hire people and build laboratories. Second, there are oftensubstantial costs in expanding too rapidly because it is difficult to assimilate large percentage increases inR&D staff. (...) Third, the firm may be uncertain as to how long expenditures of (desired) R&D levels canbe maintained. It does not want to begin projects that will soon have to be interrupted.” Therefore, thebehaviour of private investors can be best described in terms of a dynamic mechanism that allows for along-term adjustment path. The model is written as follows:
WLWWL+(WL*29WL%WL5*WL9$WLWL������������
�������������
++∆+∆+∆+∆+∆+∆=∆ −−−−− τβββββλ (1)
This equation is a first-difference auto-regressive model. RP, VA, RG, B, GOV, and HE arerespectively business-funded and -performed R&D, business sector value added, government funding ofR&D implemented in business, the B-index (which reflects the fiscal generosity for R&D, see Annex 1),government intramural R&D expenditure (i.e. public labs), and higher education R&D outlays(i.e. university research). The 17 OECD countries are indexed by i (=1, ..., 17), and the years 1983 to 1996by t (= 1, ..., 14). ∆ is the first (logarithmic) difference operator and τ characterises time dummies.6 In thismodel, the short- and long-term effects of the exogenous variables are [β] and [β/(1-λ)], respectively. Thesigns of the parameters associated with the four policy tools can be either positive or negative, dependingon whether the stimulating and spillover effects outweigh the crowding-out, substitution and displacementeffects.
3. RESULTS
Before estimating the dynamic model (1) and its various extensions, we investigate in a simpler,non-dynamic framework the influence of the policy instruments on business R&D, with the purpose ofcapturing basic relationships and their time pattern. Results reported in Table 1 show that the major effectof value added on private R&D investment is contemporaneous, with an elasticity of about 1.20. All policy
DSTI/DOC(2000)4
13
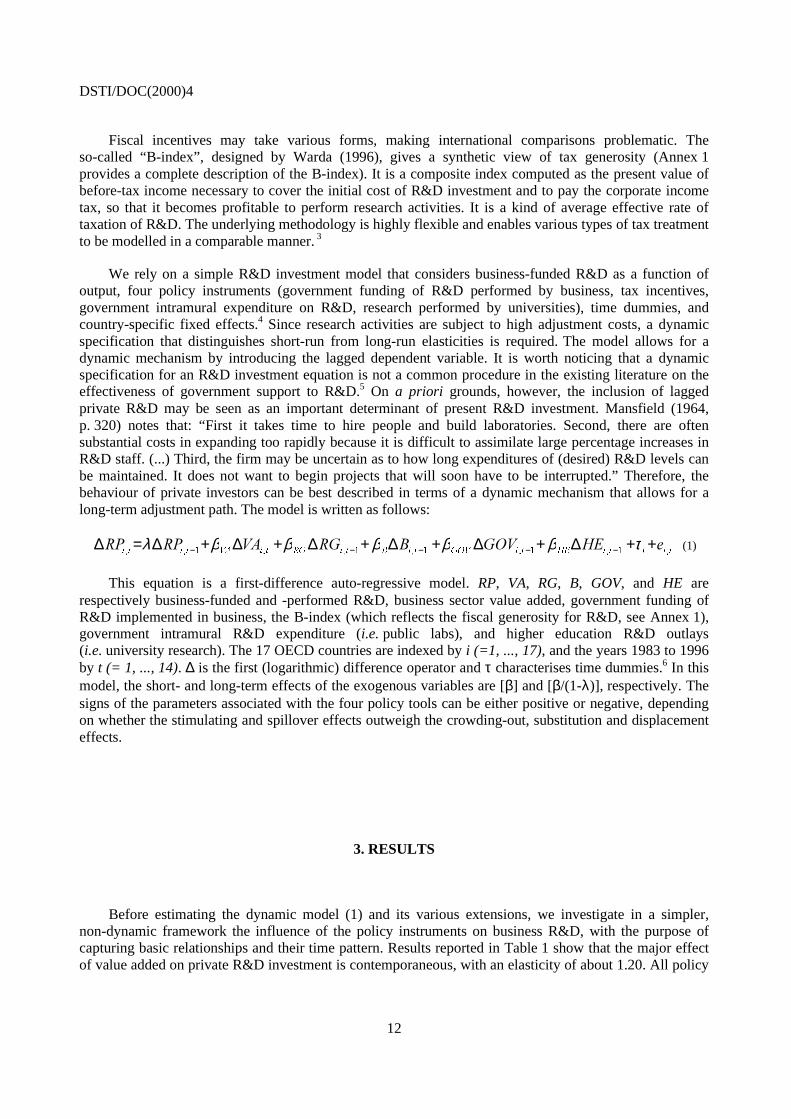
instruments have a significant impact on business-funded R&D, although with different signs and timepatterns.
Government-funded R&D has a positive and significant effect only after a one- or two-year lags.Fiscal incentives have a contemporaneous, and a larger one-year lagged, positive impact (remember that alower B-index reflects higher tax breaks, hence the negative sign in the estimate). Apparently, the effect oftax breaks is quicker and shorter than the effect of government funding. Such a difference was alreadyfound in Guellec and van Pottelsberghe (1999), and it is mentioned in David et al. (1999). Ourinterpretation is the following: tax concessions are not conditional on the type of R&D performed by therecipient, and therefore do not affect the composition of R&D, most of which is anyway of a short-termnature (in almost all OECD countries, basic research is less than 5% of business R&D – see OECD 1999c).Hence their short-term impact, just like the impact of funding coming from any other source with noconditions attached. The same does not hold for government subsidies and contracts. These are spent inprojects either chosen by the government or at least fulfilling certain conditions decided by thegovernment. In most cases, the research will be of an upstream, if not basic, nature, creating newopportunities that induce firms, in the future, to start further research projects with their own money. Theleverage effect of government funding takes time – this is consistent with its goal of generating knowledgespillovers.
Government and university research both have a negative and significant impact on business-fundedR&D. Moreover, this negative impact is spread over several years (although there is no contemporaneousimpact), especially in the case of government research. The crowding-out effect (due either to an inducedincrease in the cost of R&D or to direct displacement, see Figure 1) dominates the stimulating effect. As amatter of fact, the main objective of public labs is to work for the government, not for business; spilloversmay occur but they are not instantaneous and are not the primary goal. The negative impact of universityresearch shows the difficulty of transferring basic knowledge to firms.7
Table 1. The lag structure of the determinants of private R&D expenditures1
Value added(�VA)
Governmentfunding (�RG)
Fiscalincentives (�B)
Governmentresearch(�GOV)
Highereducation
(�HE)Expected sign (+) (+) (-) (?) (?)Time lagT 1.201*** -0.009 -0.163*** 0.014 -0.002
(23.32) (-1.25) (-3.01) (0.80) (-0.15)T-1 -0.032 0.085*** -0.343*** -0.072*** -0.070***
(-0.52) (11.66) (-10.92) (-3.99) (-5.14)T-2 0.210*** 0.090*** -0.007 -0.002 -0.031**
(3.36) (13.02) (-0.21) (-0.09) (-2.30)T-3 -0.057 -0.018** 0.007 -0.084*** 0.033*
(-0.88) (-2.33) (0.23) (-4.44) (1.89)T-4 0.170*** 0.013 0.039 -0.043** 0.013
(3.14) (1.59) (1.19) (-2.03) (0.71)
Sum 1.581 0.157 -0.506 -0.199 -0.134
Note: The estimates cover 17 countries for the 1983-96 period (165 observations due to time lags). The variables areexpressed in first differences of logarithms (growth rates). RP, the dependant variable denotes business-funded R&Dinvestment, VA value added, B the B-index, GOVRD government intramural expenditure on R&D and HERD highereducation expenditure on R&D. SURE estimates including one intercept. *** indicates the parameters that aresignificantly different from zero at a 1% probability threshold; ** at 5%; and * at 10%.
DSTI/DOC(2000)4
14
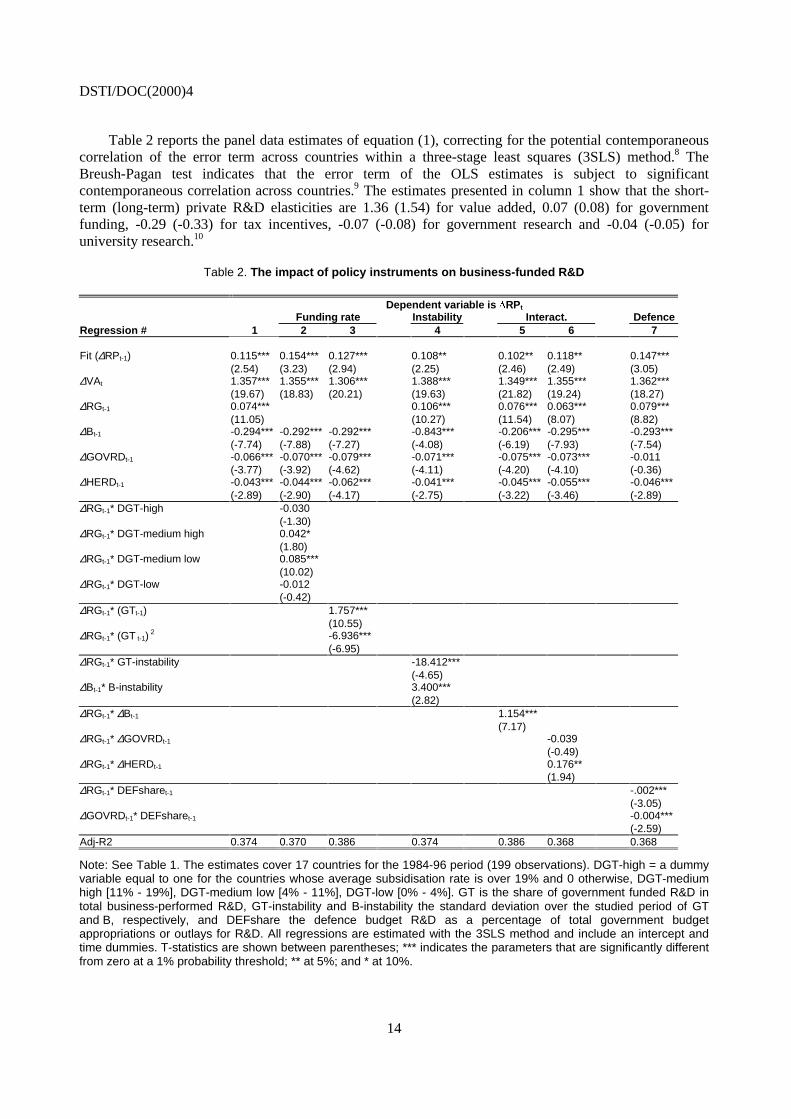
Table 2 reports the panel data estimates of equation (1), correcting for the potential contemporaneouscorrelation of the error term across countries within a three-stage least squares (3SLS) method.8 TheBreush-Pagan test indicates that the error term of the OLS estimates is subject to significantcontemporaneous correlation across countries.9 The estimates presented in column 1 show that the short-term (long-term) private R&D elasticities are 1.36 (1.54) for value added, 0.07 (0.08) for governmentfunding, -0.29 (-0.33) for tax incentives, -0.07 (-0.08) for government research and -0.04 (-0.05) foruniversity research.10
Table 2. The impact of policy instruments on business-funded R&D
Dependent variable is DRPt
Funding rate Instability Interact. DefenceRegression # 1 2 3 4 5 6 7
Fit (∆RPt-1) 0.115*** 0.154*** 0.127*** 0.108** 0.102** 0.118** 0.147***(2.54) (3.23) (2.94) (2.25) (2.46) (2.49) (3.05)
∆VAt 1.357*** 1.355*** 1.306*** 1.388*** 1.349*** 1.355*** 1.362***(19.67) (18.83) (20.21) (19.63) (21.82) (19.24) (18.27)
∆RGt-1 0.074*** 0.106*** 0.076*** 0.063*** 0.079***(11.05) (10.27) (11.54) (8.07) (8.82)
∆Bt-1 -0.294*** -0.292*** -0.292*** -0.843*** -0.206*** -0.295*** -0.293***(-7.74) (-7.88) (-7.27) (-4.08) (-6.19) (-7.93) (-7.54)
∆GOVRDt-1 -0.066*** -0.070*** -0.079*** -0.071*** -0.075*** -0.073*** -0.011(-3.77) (-3.92) (-4.62) (-4.11) (-4.20) (-4.10) (-0.36)
∆HERDt-1 -0.043*** -0.044*** -0.062*** -0.041*** -0.045*** -0.055*** -0.046***(-2.89) (-2.90) (-4.17) (-2.75) (-3.22) (-3.46) (-2.89)
∆RGt-1* DGT-high -0.030(-1.30)
∆RGt-1* DGT-medium high 0.042*(1.80)
∆RGt-1* DGT-medium low 0.085***(10.02)
∆RGt-1* DGT-low -0.012(-0.42)
∆RGt-1* (GTt-1) 1.757***(10.55)
∆RGt-1* (GT t-1) 2 -6.936***
(-6.95)∆RGt-1* GT-instability -18.412***
(-4.65)∆Bt-1* B-instability 3.400***
(2.82)∆RGt-1* ∆Bt-1 1.154***
(7.17)∆RGt-1* ∆GOVRDt-1 -0.039
(-0.49)∆RGt-1* ∆HERDt-1 0.176**
(1.94)∆RGt-1* DEFsharet-1 -.002***
(-3.05)∆GOVRDt-1* DEFsharet-1 -0.004***
(-2.59)Adj-R2 0.374 0.370 0.386 0.374 0.386 0.368 0.368
Note: See Table 1. The estimates cover 17 countries for the 1984-96 period (199 observations). DGT-high = a dummyvariable equal to one for the countries whose average subsidisation rate is over 19% and 0 otherwise, DGT-mediumhigh [11% - 19%], DGT-medium low [4% - 11%], DGT-low [0% - 4%]. GT is the share of government funded R&D intotal business-performed R&D, GT-instability and B-instability the standard deviation over the studied period of GTand B, respectively, and DEFshare the defence budget R&D as a percentage of total government budgetappropriations or outlays for R&D. All regressions are estimated with the 3SLS method and include an intercept andtime dummies. T-statistics are shown between parentheses; *** indicates the parameters that are significantly differentfrom zero at a 1% probability threshold; ** at 5%; and * at 10%.
DSTI/DOC(2000)4
15
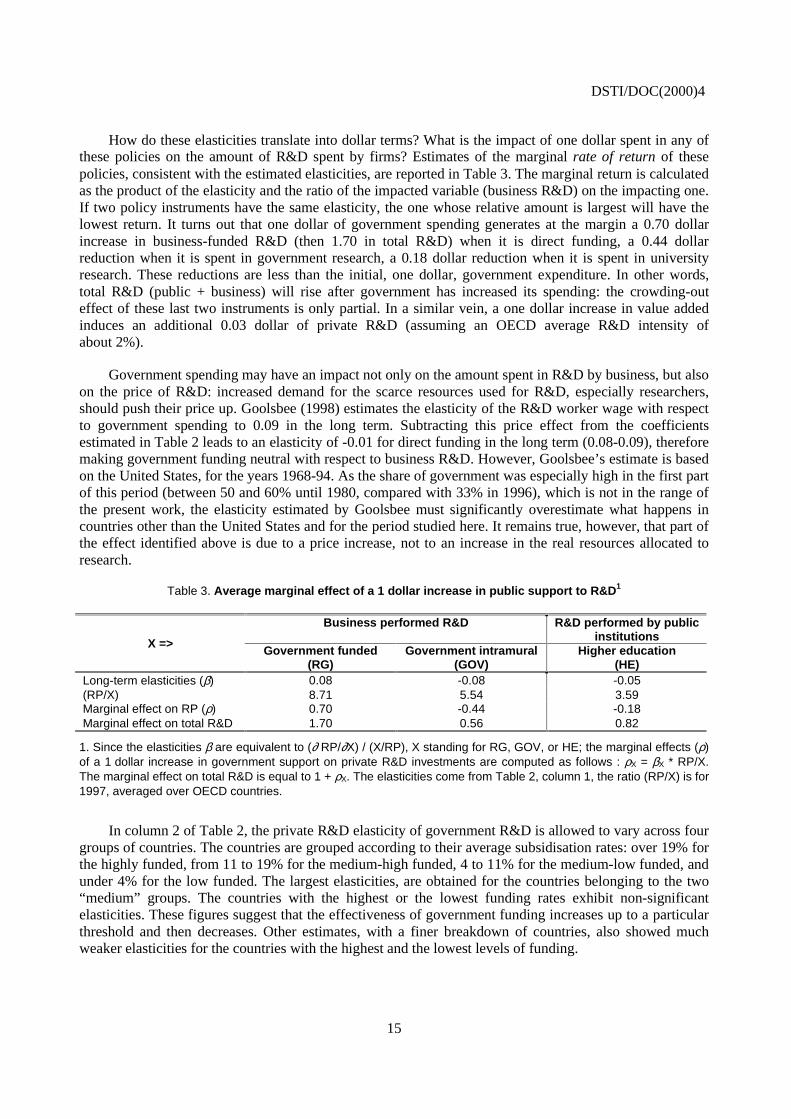
How do these elasticities translate into dollar terms? What is the impact of one dollar spent in any ofthese policies on the amount of R&D spent by firms? Estimates of the marginal rate of return of thesepolicies, consistent with the estimated elasticities, are reported in Table 3. The marginal return is calculatedas the product of the elasticity and the ratio of the impacted variable (business R&D) on the impacting one.If two policy instruments have the same elasticity, the one whose relative amount is largest will have thelowest return. It turns out that one dollar of government spending generates at the margin a 0.70 dollarincrease in business-funded R&D (then 1.70 in total R&D) when it is direct funding, a 0.44 dollarreduction when it is spent in government research, a 0.18 dollar reduction when it is spent in universityresearch. These reductions are less than the initial, one dollar, government expenditure. In other words,total R&D (public + business) will rise after government has increased its spending: the crowding-outeffect of these last two instruments is only partial. In a similar vein, a one dollar increase in value addedinduces an additional 0.03 dollar of private R&D (assuming an OECD average R&D intensity ofabout 2%).
Government spending may have an impact not only on the amount spent in R&D by business, but alsoon the price of R&D: increased demand for the scarce resources used for R&D, especially researchers,should push their price up. Goolsbee (1998) estimates the elasticity of the R&D worker wage with respectto government spending to 0.09 in the long term. Subtracting this price effect from the coefficientsestimated in Table 2 leads to an elasticity of -0.01 for direct funding in the long term (0.08-0.09), thereforemaking government funding neutral with respect to business R&D. However, Goolsbee’s estimate is basedon the United States, for the years 1968-94. As the share of government was especially high in the first partof this period (between 50 and 60% until 1980, compared with 33% in 1996), which is not in the range ofthe present work, the elasticity estimated by Goolsbee must significantly overestimate what happens incountries other than the United States and for the period studied here. It remains true, however, that part ofthe effect identified above is due to a price increase, not to an increase in the real resources allocated toresearch.
Table 3. Average marginal effect of a 1 dollar increase in public support to R&D1
Business performed R&D R&D performed by publicinstitutionsX =>
Government funded(RG)
Government intramural(GOV)
Higher education(HE)
Long-term elasticities (β) 0.08 -0.08 -0.05(RP/X) 8.71 5.54 3.59Marginal effect on RP (ρ) 0.70 -0.44 -0.18Marginal effect on total R&D 1.70 0.56 0.82
1. Since the elasticities β are equivalent to (∂ RP/∂X) / (X/RP), X standing for RG, GOV, or HE; the marginal effects (ρ)of a 1 dollar increase in government support on private R&D investments are computed as follows : ρX = βX * RP/X.The marginal effect on total R&D is equal to 1 + ρX. The elasticities come from Table 2, column 1, the ratio (RP/X) is for1997, averaged over OECD countries.
In column 2 of Table 2, the private R&D elasticity of government R&D is allowed to vary across fourgroups of countries. The countries are grouped according to their average subsidisation rates: over 19% forthe highly funded, from 11 to 19% for the medium-high funded, 4 to 11% for the medium-low funded, andunder 4% for the low funded. The largest elasticities, are obtained for the countries belonging to the two“medium” groups. The countries with the highest or the lowest funding rates exhibit non-significantelasticities. These figures suggest that the effectiveness of government funding increases up to a particularthreshold and then decreases. Other estimates, with a finer breakdown of countries, also showed muchweaker elasticities for the countries with the highest and the lowest levels of funding.
DSTI/DOC(2000)4
16
In order to test directly for this inverted U-curve that seems to characterise the relationship betweengovernment and privately financed R&D, the estimated private R&D elasticity of government funding iscombined with the rate of direct support, in a quadratic specification :
� �
����� WLWLWL5*�� ααβ += , (2)
�where ���
��L W
L W
L W
�
�
�
= .
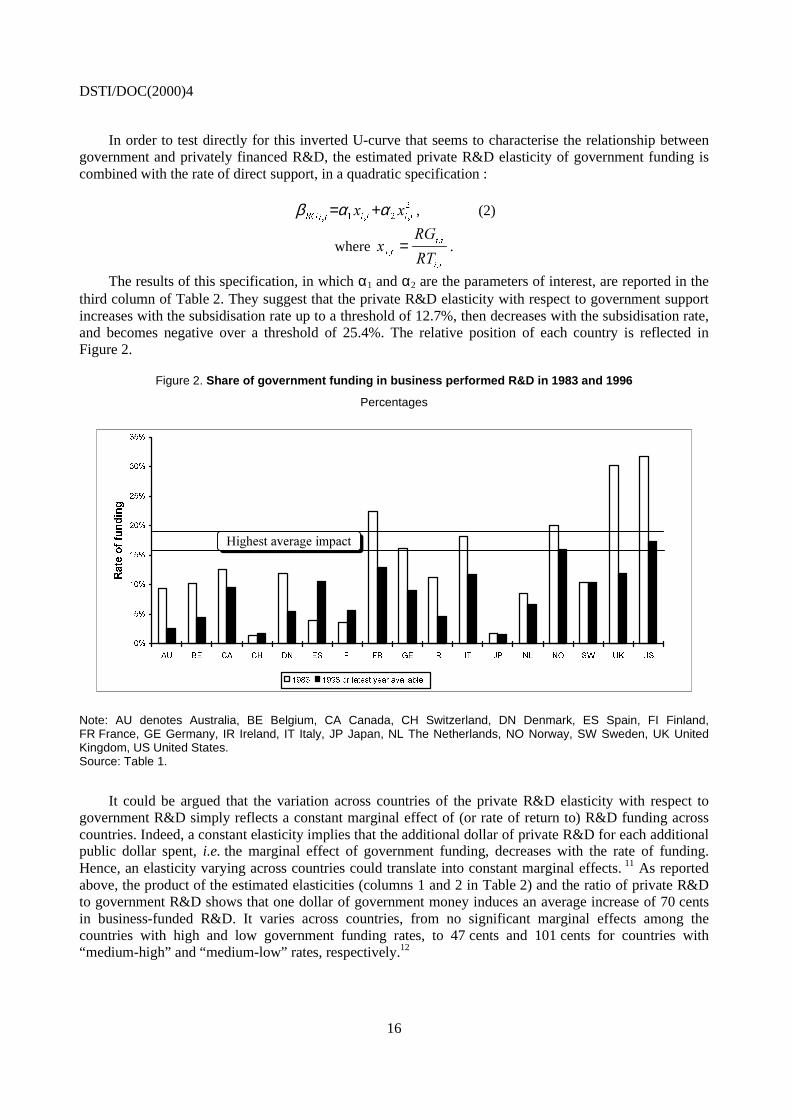
The results of this specification, in which α1 and α2 are the parameters of interest, are reported in thethird column of Table 2. They suggest that the private R&D elasticity with respect to government supportincreases with the subsidisation rate up to a threshold of 12.7%, then decreases with the subsidisation rate,and becomes negative over a threshold of 25.4%. The relative position of each country is reflected inFigure 2.
Figure 2. Share of government funding in business performed R&D in 1983 and 1996
Percentages
��
��
���
���
���
���
���
���
$8 %( &$ &+ '1 (6 ), )5 *( ,5 ,7 -3 1/ 12 6: 8. 86
5DWH�RI�IXQGLQJ
���� �����RU�ODWHVW�\HDU�DYDLODEOH
��������������� ��
Note: AU denotes Australia, BE Belgium, CA Canada, CH Switzerland, DN Denmark, ES Spain, FI Finland,FR France, GE Germany, IR Ireland, IT Italy, JP Japan, NL The Netherlands, NO Norway, SW Sweden, UK UnitedKingdom, US United States.Source: Table 1.
It could be argued that the variation across countries of the private R&D elasticity with respect togovernment R&D simply reflects a constant marginal effect of (or rate of return to) R&D funding acrosscountries. Indeed, a constant elasticity implies that the additional dollar of private R&D for each additionalpublic dollar spent, i.e. the marginal effect of government funding, decreases with the rate of funding.Hence, an elasticity varying across countries could translate into constant marginal effects. 11 As reportedabove, the product of the estimated elasticities (columns 1 and 2 in Table 2) and the ratio of private R&Dto government R&D shows that one dollar of government money induces an average increase of 70 centsin business-funded R&D. It varies across countries, from no significant marginal effects among thecountries with high and low government funding rates, to 47 cents and 101 cents for countries with“medium-high” and “medium-low” rates, respectively.12
DSTI/DOC(2000)4
17
The effect of the time stability of the policy tools on their effectiveness is investigated by combiningthe direct subsidies and the B-index with proxies for their respective stability.13 The two variables thatreflect the stability of the schemes for each country are GT-instability and B-instability, which arerespectively the standard deviation of the funding rate (GT) and of the B-index over the period 1983-96.For both policy tools, the estimates presented in column 4 of Table 2 show that the more volatile a policyis, the less effective. R&D investment involves a long-term commitment and translates into sunk costs.Such investment is therefore likely to be sensitive to uncertainty, including uncertainty arising from fiscalor government funding. Past instability is taken by firms as a signal of likely future change. These resultsconfirm Hall’s (1992) insight that the impact of R&D tax incentives on US firms grew over time, after itappeared that the scheme was to be maintained in the future. Similar evidence concerning R&D subsidiesis reported in Capron and van Pottelsberghe (1997) at the industry level. They find for the G7 countriesthat R&D is more likely to be stimulated in those industries where government funding is more stable.
The interaction between the various policy tools is also important. The question is whether they arecomplements or substitutes in stimulating business-funded R&D, i.e. are they mutually reinforcing or dothey partly cancel each other out? Estimates reported in columns 5 and 6 of Table 2 show that governmentfunding of business R&D is a substitute for fiscal incentives, is complementary to university research, anddoes not interact with government research. In other words, increasing the direct funding (tax incentives)of business research reduces the stimulating effect of tax incentives (direct government funding). Whengovernment funding of business research is high, the negative effect of university research is reduced. Thisresult can be interpreted as government funding helping firms to digest knowledge (otherwise poorly used)coming from university. In a way, this result shows the potential usefulness of university research to theeconomy, as and when complementary instruments are implemented to help its results to be transferred tofirms. The strong interaction between the various policy tools underlines the necessity of an integratedapproach to R&D policy; a loss of effectiveness is to be expected when the instruments are usedseparately.
We now investigate whether defence-oriented R&D funding has a special effect on business-fundedR&D. The usual argument of technology spillovers does not fit very well to defence R&D. Militarytechnology is fairly specific, with less emphasis on cost but a requirement for robustness in the extremeconditions of a battle field. There are also severe secrecy constraints attached to defence R&D that makeits outcome difficult to apply to widely diffused civilian products. In addition, the results of R&Dprocurement may not necessarily be used by the R&D performer, which implies that firms do not providetheir own financial contributions to such R&D, leading to no leveraging effect. But, because defencecontracting is attractive (high-reward, low-risk), firms might allocate their own resources (researchers,equipment), that otherwise would have been used for civilian purposes. Hence, even if defence R&D had apositive impact on business-funded R&D, the effect may be expected to be lower than the effect of a sameamount of funding that would flow into projects with a civilian purpose.
The share of defence in government R&D budgets in OECD countries is around 30% on average(OECD, 1999c). However, there are huge differences across countries, with three of them having a highshare (the United States around 60%, France and the United Kingdom around 30%) and the rest under10%. In order to estimate the specific impact of defence funding, we allow the elasticities of private R&D(RP) with respect to both direct government funding of business R&D (RG) and government intramuralR&D (GOV) to have a fixed component and a component that varies with the share of defence in the totalgovernment R&D budget appropriation [as in equation (2)].14 The results reported in column 7 of Table 2show that the two elasticities are inversely related to the share of defence-oriented public R&D: the higherthe share of defence, the lower the effect of government funding on business R&D. The effect ofgovernment research, which was negative in the estimates above, jumps to zero when it is cleaned of its“defence” component. In other words, it seems that non-defence government intramural research, which isoverwhelming in most OECD countries, has no negative effect on business R&D.15
DSTI/DOC(2000)4
18
4. POLICY IMPLICATIONS
Among the major instruments of government policy, both fiscal incentives and direct fundingstimulate business-funded R&D, whereas government and university performed research seem to have acrowding-out effect. In short, when the purpose is to increase business-funded R&D, it is apparently betterto give money than knowledge to business. However, it must be reminded that publicly producedknowledge may result in technology that is used by business while not inducing it to increase its researchexpenditure. Moreover, it is not the major purpose of government laboratories to produce knowledge forthe business sector. When the defence component is isolated from the civilian one, only the former has anegative impact on business, the latter being neutral. For university research, barriers to the transfer ofknowledge to business can be mitigated by government (targeted) funding of business R&D. And, whereasthe crowding-out effect is immediate (contemporaneous with the research spending), spillovers may taketime to reach industry, beyond the horizon of our estimates. Various features affect the effectiveness ofthese policies. First, countries that provide a level of direct funding to business that is either too low or toohigh stimulate private R&D less than countries with an intermediate level of public funding. Theeffectiveness of government funding of business R&D seems to have an inverted-U shape, increasing up toa subsidisation rate of about 13%, and decreasing beyond that level. Over a level of 25%, additional publicmoney is likely to substitute for private funding. These figures are only illustrative, as the actual thresholdsmay depend on the policy pattern and economic conditions in place, which differ across countries andchange over time. Second, stable policies are more effective than changing (volatile) policies. Third, theeffectiveness of each of the various policy tools depends on the use of the others: in particular, governmentfunding of business R&D and tax incentives are substitutes: increasing the use of one reduces theeffectiveness of the other.
An analysis carried out at an international and aggregate level does not lead to specific conclusionswith regards to policy design. However, broad policy recommendations can be drawn from these results.First, any type of government support to business R&D is more likely to be effective if it is integratedwithin a long-term framework, thus reducing to some extent the uncertainty facing firms. Second, thevarious policy instruments should be consistent with each other, which implies co-ordination between thevarious administrative departments involved in their design and management. Third, if government iswilling to stimulate business R&D, providing too low or too high a level of funding is not effective.Fourth, although defence-related R&D funding does not aim to stimulate private R&D expenditure, itscrowding-out effect on business, civilian R&D has to be taken into account. Fifth, the research performedin universities presents a potential usefulness for business that can be improved through targetedgovernment funding to enhance the transfer of technology.

DSTI/DOC(2000)4
19
ANNEX 1. THE B-INDEX
The B-index is a synthetic measure of fiscal generosity towards R&D. It has been elaborated byWarda (1996). Algebraically, the B-index is equal to the after-tax cost of a 1 dollar expenditure on R&Ddivided by one less the corporate income tax rate. The after-tax cost is the net cost of investing in R&D,
taking into account all available tax incentives: B-index = � �� ���
−−τ
, where τ = statutory corporate income
tax rate; A = the net present discounted value of depreciation allowances, tax credits, and specialallowances on the R&D assets. In a country with full write-off and no other scheme, A = τ, andconsequently B = 1. The more favourable a country’s tax treatment of R&D, the lower its B-index. Thevalue for A may take three forms: i) the net present value (NPV) of depreciation allowances Ad,; ii) theNPV of special R&D allowances As; and iii) the NPV of R&D tax credits Ac. The proportions of the R&Dcosts that are entitled to standard depreciation allowances are, respectively, Dd, Ds, Dc. The net presentvalue of all depreciation allowances and tax credit is:
A = Dd τ Ad + Dc τc + Ds As
If the depreciation allowance is granted at an exponential rate of d and with standard depreciation
allowance: declining balance - DB: G
=+δ
δ, or with straight-line - SL:
� �G
U/
= − −� ��
For a tax credit that applies on incremental expenditures, it depends on how the base is defined: i) lastyear’s expenditures; ii) the previous largest expenditures, as in Japan; iii) a fixed year in the past; iv) anaverage of the past two years’ expenditures, as in France and Spain; v) an average of the past three years’expenditures. Assumptions i), ii) and iii) are treated similarly, whereas for iv) and v):
�
F
F N
N
.= − +∑
−=τ �
��
�� � �
If the credit is on real expenditures, then Ac is divided by (1+π). In the three-year-average case v), theterm between brackets is equal to .171; in the two-year average case iv) it is .132; and in the one-year caseit is .091. For example, the United States has an incremental tax credit of 20% of the amount by whichR&D outlays of a fiscal year exceed a base amount. The base amount is the product of the “fixed-basepercentage” and the average of the gross receipts for the four preceding years. The fixed-base percentage isthe R&D intensity during the 1984-88 period (i.e. the share of R&D investments in gross receipts), whichshould not exceed 16%. The base amount therefore varies with the growth of output; the higher the outputgrowth, the higher the base amount. The US treatment aims apparently at fostering the propensity to investin R&D rather than the increase of R&D as such. The base amount cannot be less than 50% of the taxpayer’s current-year qualified research expenditures. Calculation of the B-index has been made under theassumption that the “representative firm” is taxable, so that it realises the full gain from the tax deduction.For incremental tax credits, calculation of the B-index implicitly assumes that R&D investment is fullyeligible to the credit, and does not exceed the ceiling where there is one. Therefore, the flexibility of thepolicies according to refunding, carry-back and carry-forward of unused tax credit, and flow-through
DSTI/DOC(2000)4
20
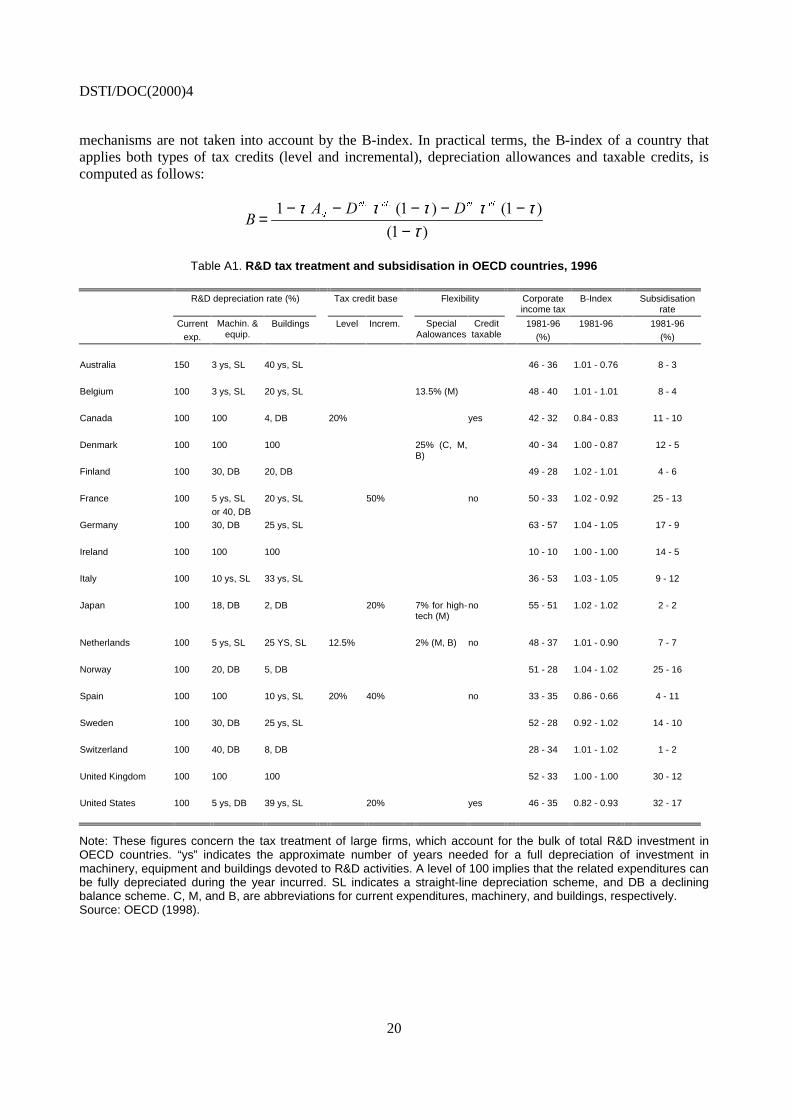
mechanisms are not taken into account by the B-index. In practical terms, the B-index of a country thatapplies both types of tax credits (level and incremental), depreciation allowances and taxable credits, iscomputed as follows:
� � �
G
F/ F/ F, F,
=− − − − −
−� � �
�
τ τ τ τ ττ
� � � �
� �
Table A1. R&D tax treatment and subsidisation in OECD countries, 1996
R&D depreciation rate (%) Tax credit base Flexibility Corporateincome tax
B-Index Subsidisationrate
Current
exp.
Machin. &equip.
Buildings Level Increm. SpecialAalowances
Credittaxable
1981-96
(%)
1981-96 1981-96
(%)
Australia 150 3 ys, SL 40 ys, SL 46 - 36 1.01 - 0.76 8 - 3
Belgium 100 3 ys, SL 20 ys, SL 13.5% (M) 48 - 40 1.01 - 1.01 8 - 4
Canada 100 100 4, DB 20% yes 42 - 32 0.84 - 0.83 11 - 10
Denmark 100 100 100 25% (C, M,B)
40 - 34 1.00 - 0.87 12 - 5
Finland 100 30, DB 20, DB 49 - 28 1.02 - 1.01 4 - 6
France 100 5 ys, SL
or 40, DB
20 ys, SL 50% no 50 - 33 1.02 - 0.92 25 - 13
Germany 100 30, DB 25 ys, SL 63 - 57 1.04 - 1.05 17 - 9
Ireland 100 100 100 10 - 10 1.00 - 1.00 14 - 5
Italy 100 10 ys, SL 33 ys, SL 36 - 53 1.03 - 1.05 9 - 12
Japan 100 18, DB 2, DB 20% 7% for high-tech (M)
no 55 - 51 1.02 - 1.02 2 - 2
Netherlands 100 5 ys, SL 25 YS, SL 12.5% 2% (M, B) no 48 - 37 1.01 - 0.90 7 - 7
Norway 100 20, DB 5, DB 51 - 28 1.04 - 1.02 25 - 16
Spain 100 100 10 ys, SL 20% 40% no 33 - 35 0.86 - 0.66 4 - 11
Sweden 100 30, DB 25 ys, SL 52 - 28 0.92 - 1.02 14 - 10
Switzerland 100 40, DB 8, DB 28 - 34 1.01 - 1.02 1 - 2
United Kingdom 100 100 100 52 - 33 1.00 - 1.00 30 - 12
United States 100 5 ys, DB 39 ys, SL 20% yes 46 - 35 0.82 - 0.93 32 - 17
Note: These figures concern the tax treatment of large firms, which account for the bulk of total R&D investment inOECD countries. “ys” indicates the approximate number of years needed for a full depreciation of investment inmachinery, equipment and buildings devoted to R&D activities. A level of 100 implies that the related expenditures canbe fully depreciated during the year incurred. SL indicates a straight-line depreciation scheme, and DB a decliningbalance scheme. C, M, and B, are abbreviations for current expenditures, machinery, and buildings, respectively.Source: OECD (1998).
DSTI/DOC(2000)4
21
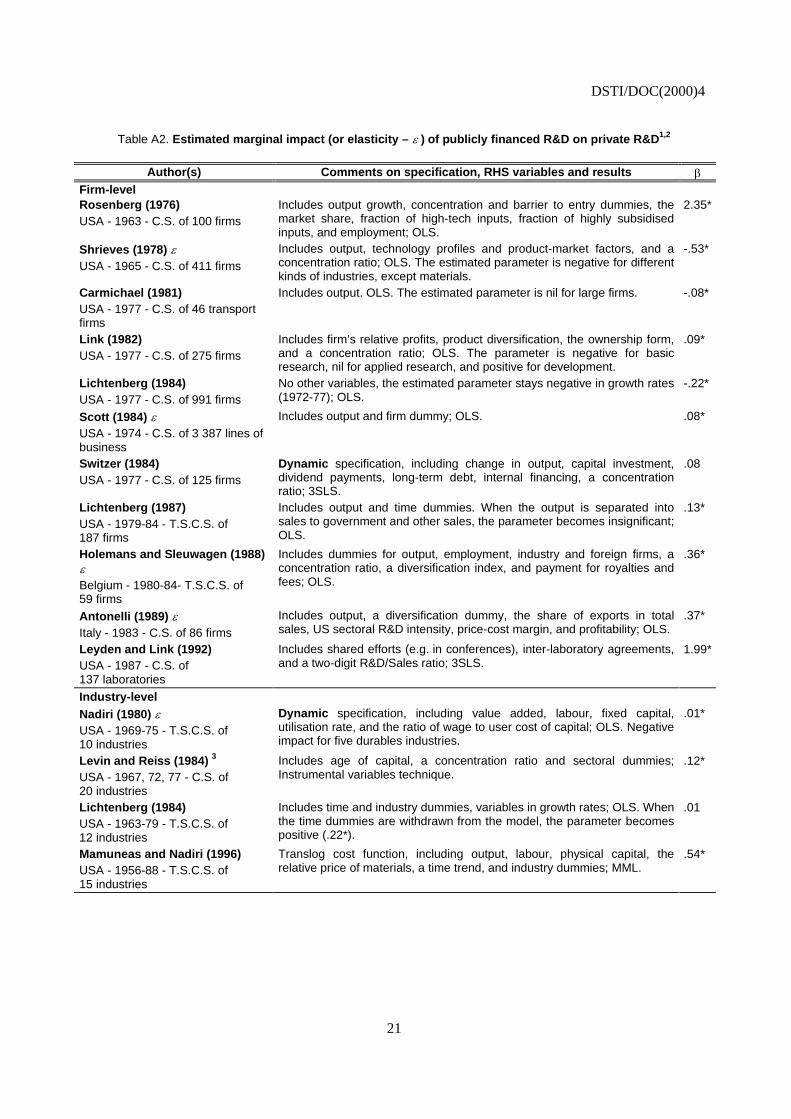
Table A2. Estimated marginal impact (or elasticity – � ) of publicly financed R&D on private R&D1,2
Author(s) Comments on specification, RHS variables and results �Firm-levelRosenberg (1976)USA - 1963 - C.S. of 100 firms
Includes output growth, concentration and barrier to entry dummies, themarket share, fraction of high-tech inputs, fraction of highly subsidisedinputs, and employment; OLS.
2.35*
Shrieves (1978) �USA - 1965 - C.S. of 411 firms
Includes output, technology profiles and product-market factors, and aconcentration ratio; OLS. The estimated parameter is negative for differentkinds of industries, except materials.
-.53*
Carmichael (1981)USA - 1977 - C.S. of 46 transportfirms
Includes output. OLS. The estimated parameter is nil for large firms. -.08*
Link (1982)USA - 1977 - C.S. of 275 firms
Includes firm’s relative profits, product diversification, the ownership form,and a concentration ratio; OLS. The parameter is negative for basicresearch, nil for applied research, and positive for development.
.09*
Lichtenberg (1984)USA - 1977 - C.S. of 991 firms
No other variables, the estimated parameter stays negative in growth rates(1972-77); OLS.
-.22*
Scott (1984) �USA - 1974 - C.S. of 3 387 lines ofbusiness
Includes output and firm dummy; OLS. .08*
Switzer (1984)USA - 1977 - C.S. of 125 firms
Dynamic specification, including change in output, capital investment,dividend payments, long-term debt, internal financing, a concentrationratio; 3SLS.
.08
Lichtenberg (1987)USA - 1979-84 - T.S.C.S. of187 firms
Includes output and time dummies. When the output is separated intosales to government and other sales, the parameter becomes insignificant;OLS.
.13*
Holemans and Sleuwagen (1988)�Belgium - 1980-84- T.S.C.S. of59 firms
Includes dummies for output, employment, industry and foreign firms, aconcentration ratio, a diversification index, and payment for royalties andfees; OLS.
.36*
Antonelli (1989) �Italy - 1983 - C.S. of 86 firms
Includes output, a diversification dummy, the share of exports in totalsales, US sectoral R&D intensity, price-cost margin, and profitability; OLS.
.37*
Leyden and Link (1992)USA - 1987 - C.S. of137 laboratories
Includes shared efforts (e.g. in conferences), inter-laboratory agreements,and a two-digit R&D/Sales ratio; 3SLS.
1.99*
Industry-levelNadiri (1980) �USA - 1969-75 - T.S.C.S. of10 industries
Dynamic specification, including value added, labour, fixed capital,utilisation rate, and the ratio of wage to user cost of capital; OLS. Negativeimpact for five durables industries.
.01*
Levin and Reiss (1984) 3
USA - 1967, 72, 77 - C.S. of20 industries
Includes age of capital, a concentration ratio and sectoral dummies;Instrumental variables technique.
.12*
Lichtenberg (1984)USA - 1963-79 - T.S.C.S. of12 industries
Includes time and industry dummies, variables in growth rates; OLS. Whenthe time dummies are withdrawn from the model, the parameter becomespositive (.22*).
.01
Mamuneas and Nadiri (1996)USA - 1956-88 - T.S.C.S. of15 industries
Translog cost function, including output, labour, physical capital, therelative price of materials, a time trend, and industry dummies; MML.
.54*
DSTI/DOC(2000)4
22
Table A2 (cont’d). Estimated marginal impact (or elasticity – � ) of publicly financed R&D on private R&D1,2
Author(s) Comments on specification, RHS variables and results �Country-levelLichtenberg (1987)USA - 1956-83 - T.S.
Includes output and a time trend. Estimates adjusted for first-order serialcorrelation of residuals. When output is separated into sales togovernment and other sales, the parameter becomes insignificant.
.33*
Levy and Terleckyj (1983)USA - 1949-81 - T.S. (privatebusiness)
Includes output, corporate taxes, unemployment, and age of R&D stock.Generalised least squares.
.21*
Levy (1990)9 countries -1963-84 -T.S.C.S.
Includes output and country dummies. Box-Cox procedure applied to thepanel data. The estimates are positive for four countries (including theUnited States and Japan), insignificant for two, and negative for the UnitedKingdom and the Netherlands.
-.73*to.41*
1. The last column reports the average impact (or elasticity: ε) of government R&D on private R&D in the main existingempirical studies.2. T.S. = time series; C.S. = cross section; T.S.C.S. = panel data; OLS = ordinary least squares; 3SLS = three-stageleast squares, MML = maximum likelihood.3. The estimates by Levin and Reiss have to be interpreted as a negative relationship between government and privateR&D because the dependent variable is total R&D instead of privately financed R&D.* Significantly different from zero at a 10% probability threshold.Source: Adapted and extended from Capron and van Pottelsberghe (1997).
DSTI/DOC(2000)4
23
NOTES
1. An attempt to measure the simultaneous effect of direct government funding to business R&D and taxincentives on privately funded and performed R&D is presented in Guellec and van Pottelsberghe (1999).The present document improves on these results by taking into account other types of public R&D and byperforming new econometric specifications.
2. Smaller countries in the European Union, like Belgium and Sweden (4%), tend to have a lower share ofpublic research performed in public labs than do larger countries, especially France and Italy (morethan 20%).
3. The B-index is similar to the marginal effective tax rate (METR) computed for eight OECD countries byBloom et al. (1997). However, the latter is composed of a tax component and an “economic component”which is the sum of the firm’s discount rate (actually, the interest rate) and R&D depreciation rate, less therate of inflation. The empirical results of Bloom et al. show that the tax component significantly affectsbusiness-funded R&D expenditure, while the economic component has no significant impact.
4. These should take account of stable country characteristics that may influence the private decision to investin R&D, especially in the long run, such as culture, tax policies, and institutional differences.
5. Only two of the 18 studies surveyed in Annex Table A2 adopt a partial adjustment mechanism for theR&D investment equation.
6. Country dummies, which would control for the fixed effects generated by “level” variables, are notincluded due to the first difference specification. In addition, in a dynamic context, adding countrydummies would yield inconsistent estimates because the lagged endogenous variable is among the right-hand side variables. Indeed, Nickell (1981) and Keane and Runkle (1992) show that the withintransformation introduces a correlation between the lagged endogenous variable and the error term.However, had they been introduced into the regression equation, unreported results have shown that theywould have been similar. Time dummies are included to take into account technology shocks common toall countries that are not controlled for by the exogenous variables, such as the increasing use ofinformation technology.
7. It should be kept in mind, however, that a four-year lag might be too short to capture the longer-termeffects of basic research. The effects of basic research can take several decades before reaching theapplication stage (Adams, 1990). Moreover, it is not clear whether positive externalities should translateinto increased private R&D expenditures.
8. The econometric method is three-stage least squares. The first two stages, which are deemed to take intoaccount the presence of the endogenous variable among the right-hand side variables, correspond to aninstrumental variable procedure. The last stage is used to correct for the contemporaneous correlation ofthe residuals. Stage 1: fit ∆RPt with ∆RPt-2 and all the other exogenous variables. Stage 2: regressequation (1), with the fit of ∆RPt-1 . Stage 3: correct for the contemporaneous correlation of the residuals.
9. This test has to be interpreted with caution. If it globally rejects the hypothesis of cross-sectionalcorrelation for each pair of countries, there may still be a strong correlation between some pairs ofcountries. In this case, the correction for contemporaneous correlation has to be made, even if the nullhypothesis is not rejected. With the present estimates, the test always rejects the hypothesis of nocontemporaneous correlation of the error terms. The pairs of countries that are associated with the highestvalues of correlation between their error terms are often characterised by a cultural and geographicalproximity, or size similarity.
DSTI/DOC(2000)4
24
10. These estimated long-term effects are similar to those obtained by summing up the significant parametersin the non-dynamic model that includes several lags (see Annex Table A1) : 1.58 for value added, 0.16 forgovernment funding, –0.51 for fiscal incentives, -0.20 for government intramural expenditure, and -0.07 for university research.
11. With a constant elasticity, γ = [(∂RP/∂RG) * (RG/RP)] , the marginal effect ρ = (∂RP/∂RG) = γ * (RP/RG)decreases as the rate of subsidisation increases.
12. Additional econometric results reported in Guellec and van Pottelsberghe (1999), were used to estimatedirectly marginal effects, by replacing the first (logarithmic) difference of government R&D by the ratio ofthe increment of government R&D to the level of private R&D. Results are similar to those reported here.
13. There is less of a case for an effect of the stability of government or university research affecting theirimpact on business-funded R&D.
14. In other words, we assume that βRG and βGOV in equation (1) have the following form: β = c + γ .DEFshare, where c is the fixed component of the elasticity and γ reflect the component that varies withrespect to the share of defence-related R&D in total government budget appropriation on R&D.
15. Guellec and van Pottelsberghe (1999) relied on a different approach to obtain an insight into the effect ofdefence-related government support. Data on the share of government procurement for defence purposeswere collected from five countries. It turned out that the defence component of direct government fundingof business R&D has a negative and significant impact for the three countries with very high funding rates.In the present study, we use data available for 17 OECD countries, which is the share of defence in totalgovernment budget outlays on R&D (including procurement and intramural research).
DSTI/DOC(2000)4
25
REFERENCES
Adams, J. (1990), “Fundamental Stock of Knowledge and Productivity Growth”, Journal of PoliticalEconomy, 98(4), pp. 673-702.
Arrow, K. (1962), “The Economic Implications of Learning by Doing”, Review of Economic Studies,29(2), pp. 155-173.
Bloom, N., R. Griffiths and J. Van Reenen (1997), “Do R&D Tax Credits Work? Evidence from anInternational Panel of Countries 1979-94”, paper presented at the TSER Conference on Innovation,Competition and Employment, 21-22 August, Chania.
Capron, H. and B. van Pottelsberghe de la Potterie (1997), “Public Support to Business R&D: A Surveyand Some New Quantitative Evidence”, in OECD, Policy Evaluation in Innovation and Technology:Towards Best Practices, pp. 171-188, OECD, Paris.
David, P.A. and B.H. Hall (1999), “Heart of Darkness: Public-private Interactions inside the R&D BlackBox”, Economic Discussion Paper, No. 1999-W16, Nuffield College Oxford, June.
David, P.A., B.H. Hall and A.A. Toole (1999), “Is Public R&D a Complement or a Substitute for PrivateR&D? A Review of the Econometric Evidence”, NBER Working Paper, No. 7373, Cambridge, MA.
Goolsbee, A. (1998), “Does Government R&D Policy Mainly Benefit Scientists and Engineers?”,American Economic Review, 88(2), pp. 298-302.
Guellec, D. and B. van Pottelsberghe (1999), “Does Government Support Stimulate Private R&D?”,OECD Economic Studies, 29, 1997/II, pp. 95-122.
Hall, B. (1992), “R&D Tax Policy during the Eighties: Success or Failure?”, NBER Working Paper,No. 4240, Cambridge, MA.
Kealey, T. (1996), The Economic Laws of Scientific Research, McMillan Press, London.
Keane, M.P. and D.E. Runkle (1992), “On the Estimation of Panel-data Models with Serial Correlationwhen Instruments are not Strictly Exogenous”, Journal of Business & Economic Statistics, 10(1),pp. 1-9.
Lichtenberg, F. (1984), “The Relationship between Federal Contract R&D and Company R&D”, AmericanEconomic Review Papers and Proceedings, 74, pp. 73-78.
Mamuneas, T.P. and I.M. Nadiri (1996), “Public R&D Policies and Cost Behaviour of the USManufacturing Industries”, Journal of Public Economics, 63, pp. 57-81.
Mansfield, E. (1964), “Industrial Research and Development Expenditure”, Journal of Political Economy,72, August, pp. 319-340.

DSTI/DOC(2000)4
26
Mohnen, P. (1997), “R&D Tax Incentives: Issues and Evidences”, Université du Québec à Montréal andCirano, mimeo.
Nickell, S. (1981), “Biases in Dynamic Models with Fixed Effects”, Econometrica, Vol. 49,pp. 1417-1426.
OECD (1994), The Measurement of Scientific and Technical Activities 1993: Standard Practice forSurveys of Research and Experimental Development – Frascati Manual, OECD, Paris.
OECD (1998), Technology, Productivity and Job Creation: Best Policy Practices, OECD, Paris.
OECD (1999a), The OECD STAN Database for Industrial Analysis, OECD, Paris.
OECD (1999b), Main Science and Technology Indicators, 1999/1, OECD, Paris.
OECD (1999c), Benchmarking Knowledge-based Economies: A Scoreboard of Indicators, OECD, Paris.
Warda, J. (1996), “Measuring the Value of R&D Tax Provisions, in OECD, “Fiscal Measures to PromoteR&D and Innovation” [OCDE/GD(96)165], pp. 9-22, OECD, Paris.
Young, A. (1998), “Measuring Government Support for Industrial Technology”, OECD, Paris, mimeo.


![@aa SRT\d >R^ReR d]R^d 64 - Daily Pioneer](https://static.fdokumen.com/doc/165x107/632df348c95f46bf4c073a3c/aa-srtd-rrer-drd-64-daily-pioneer.jpg)


